UNITED STATES
SECURITIES AND EXCHANGE COMMISSION
Washington, D.C. 20549
FORM N-CSRS
CERTIFIED SHAREHOLDER REPORT OF REGISTERED
MANAGEMENT INVESTMENT COMPANIES
Investment Company Act file number: 811-06520
AMG Funds I
(Exact name of registrant as specified in charter)
600 Steamboat Road, Suite 300, Greenwich, Connecticut 06830
(Address of principal executive offices) (Zip code)
AMG Funds LLC
600 Steamboat Road, Suite 300, Greenwich, Connecticut 06830
(Name and address of agent for service)
Registrant’s telephone number, including area code: (203) 299-3500
| | |
| Date of fiscal year end: | | September 30, 2015 |
| |
| Date of reporting period: | | OCTOBER 1, 2015 - MARCH 31, 2016 |
| | (Semi-Annual Shareholder Report) |
| Item 1. | Reports to Shareholders |
| | |
 | | SEMI-ANNUAL REPORT |
|
AMG Funds |
March 31, 2016  |
AMG Managers Brandywine Fund:BRWIX |
AMG Managers Brandywine Blue Fund:BLUEX |
| | |
www.amgfunds.com | | SAR073-0316 |
| | |
|
| |
| AMG Funds |
| Semi-Annual Report—March 31, 2016 (unaudited) |
Nothing contained herein is to be considered an offer, sale or solicitation of an offer to buy shares of any series of the AMG Funds family of mutual funds. Such offering is made only by prospectus, which includes details as to offering price and other material information.
| | |
| | |
| | AMG Managers Brandywine Fund |
| | AMG Managers Brandywine Blue Fund |
DEAR FELLOW SHAREHOLDER:
Sometimes investors change their minds. What was deemed the worst start of a year ever in January became something else by the end of March, with stocks whipsawing their way out of correction territory in concert with a similarly timed bounce in oil prices. Despite the increased optimism, the comeback retained a cautious streak marked by strength in stocks from the utilities and consumer staples sectors.
Investors packed a bunch of worry into a condensed period. The March quarter got off to a rocky start when a report showing contraction in Chinese manufacturing sent Chinese stocks tumbling, stoking fears here about a looming threat to global growth. Stocks swooned with oil as concerns grew about strains on domestic producers and the state of global demand. On January 11, a report from the Royal Bank of Scotland advised investors to “sell everything” (except high quality bonds) and warned of a “cataclysmic” year ahead.
The selling was over one month later. February 11, when major indexes finished the day 10-plus percent below their previous highs, marked the low point for the quarter.
The market’s perceived headwinds abruptly changed direction: Chinese officials struck a stimulative stance in the face of uncertainty. The Federal Reserve signaled that it was likely to dial back expected interest rate increases in deference to the environment. Oil recovered as weekly data showed that domestic drilling’s contribution to supply was in persistent decline with more and more U.S. oil rigs becoming inactive each week.
AMG Managers Brandywine Fund (“Brandywine”) finished the March quarter with a 2.76 percent decline. The Russell 3000® and Russell 3000® Growth Indexes gained 0.97 and 0.34 percent, respectively, in the three months ended March 31, 2016. AMG Managers Brandywine Blue Fund (“Brandywine Blue”) retraced 1.67 percent in the same period as the S&P 500, Russell 1000® and Russell 1000® Growth Indexes added 1.35, 1.17 and 0.74 percent, respectively.
Brandywine’s biggest commitment, the technology sector, was the most significant detractor from performance relative to the Russell 3000® Growth Index. Although the sector was home to a number of the portfolio’s best performers, including Silicon Motion Technology Corp. and NVIDIA Corp., weakness among holdings involved with software and technology services proved to be more pronounced.
Palo Alto Networks, which exceeded the consensus estimate with a 110 percent increase in January-quarter earnings, was the biggest detractor. The company was a full-fledged participant in the market’s early-year plunge as questions arose about technology spending, prompting us to sell Palo Alto Networks to fund a new holding with better visibility. Synchronoss Technologies, which beat estimates with 18 percent December-quarter earnings growth, also weighed on performance as investors struggled to assess the future earnings implications of an announced joint venture.
In Brandywine Blue, where technology holdings comprised the second largest portfolio position, technology was the primary relative performance detractor versus the Russell 1000® Growth Index. Brandywine Blue held NVIDIA and Palo Alto Networks in common with Brandywine. Splunk, an enterprise software maker unique to Brandywine Blue, declined in sympathy with a competitor that cited a deteriorating macro environment for lower-than-expected sales.
Industrial holdings were the next most significant detractor from Brandywine’s relative results. The Advisory Board Co., which provides business services, was the sector’s primary influence on portfolio performance. The company exceeded the consensus estimate with 85 percent December-quarter earnings growth. Its shares declined when the company reduced 2016 earnings guidance due to unexpected issues digesting a recent acquisition.
Consumer discretionary holdings, which comprised Brandywine Blue’s second largest position, were the second greatest detractors from relative performance. Partly due to their affiliation with the technology sector and partly due to their previous share-price success, The Priceline Group and Netflix were among the hardest hit consumer discretionary holdings as investors contemplated a major shift in sentiment during the March-quarter uncertainty.
Health care was the poorest performing sector in the Russell 3000® Growth and Russell 1000® Growth Indexes during the March quarter amid political rhetoric regarding drug pricing. The sector was the biggest relative performance contributor for both Brandywine Funds, where UnitedHealth Group was the top health care contributor. Investors found allure in the company’s reliable dividend during the market’s volatility and in response to dovish comments regarding interest rates from the Federal Reserve. The company also bolstered confidence in its outlook, which the 2016 consensus earnings estimate pegs at 20 percent, via continued strength in its Optum health services platform.
Both Funds held standout performers Norwegian Cruise Lines Holdings and Newell Rubbermaid. With new ships setting to the sea, Norwegian Cruise Lines pleased investors by hoisting its 2016 earnings guidance. In addition to announcing 14 percent December-quarter earnings growth, Newell Rubbermaid reported solid progress in its proposed merger with Jarden Corp., viewed by many as a transformative combination in the consumer goods category.
For more information on companies that influenced March-quarter performance, please see Roses & Thorns on page 6 for Brandywine and page 11 for Brandywine Blue.
At the start of the June quarter, holdings from the consumer discretionary, technology and health care sectors represent Brandywine’s largest positions. Brandywine Blue’s largest sector positions are consumer discretionary, technology and financials. For more information on portfolio characteristics, please see page 5 for Brandywine and page 10 for Brandywine Blue.
With the average holding in both Funds expected to grow earnings at three times the rate of the average S&P 500 Index company in 2016, we’re excited to see how the rest of the year unfolds.
Thanks for your continued confidence and support. Best wishes from your entire Friess team.
|
 |
| Scott Gates |
| Chief Investment Officer |
| Friess Associates, LLC |
| | |
| | | |
| | | |
| About Your Fund’s Expenses (unaudited) | | |
|
As a shareholder of a Fund, you may incur two types of costs: (1) transaction costs, which may include sales charges (loads) on purchase payments; redemption fees; and exchange fees; and (2) ongoing costs, including management fees; distribution (12b-1) fees; and other Fund expenses. This example is intended to help you understand your ongoing costs (in dollars) of investing in the Fund and to compare these costs with the ongoing costs of investing in other mutual funds. The example is based on $1,000 invested at the beginning of the period and held for the entire period as indicated below. ACTUAL EXPENSES The first line of the following table provides information about the actual account values and actual expenses. You may use the information in this line, together with the amount you invested, to estimate the expenses that you paid over the period. Simply divide your account value by $1,000 (for example, an $8,600 account value divided by $1,000 = 8.6), then multiply the result by the number in the first line under the heading entitled “Expenses Paid During Period” to estimate the expenses you paid on your account during this period. HYPOTHETICAL EXAMPLE FOR COMPARISON PURPOSES The second line of the following table provides information about hypothetical account values and hypothetical expenses based on the Fund’s actual expense ratio and an assumed annual rate of return of 5% before expenses, which is not the Fund’s actual return. The hypothetical account values and expenses may not be used to estimate the actual ending account balance or expenses you paid for the period. You may use this information to compare the ongoing costs of investing in the Fund and other funds by comparing this 5% hypothetical example with the 5% hypothetical examples that appear in the shareholder reports of other funds. Please note that the expenses shown in the table are meant to highlight your on going costs only and do not reflect any transactional costs, such as sales charges (loads), redemption fees, or exchange fees. Therefore, the second line of the table is useful in comparing ongoing costs only, and will not help you determine the relative total costs of owning different funds. |
| | | | | | | | | | | | | | | | |
Six Months Ended March 31, 2016 | | Expense
Ratio for
the Period | | | Beginning
Account Value
10/01/15 | | | Ending
Account Value
3/31/16 | | | Expenses
Paid During
the Period* | |
AMG Managers Brandywine Fund | | | | | | | | | | | | | | | | |
Based on Actual Fund Return | | | 1.11 | % | | $ | 1,000 | | | $ | 991 | | | $ | 5.51 | |
Hypothetical (5% return before expenses) | | | 1.11 | % | | $ | 1,000 | | | $ | 1,019 | | | $ | 5.59 | |
AMG Managers Brandywine Blue Fund | | | | | | | | | | | | | | | | |
Based on Actual Fund Return | | | 1.20 | % | | $ | 1,000 | | | $ | 1,027 | | | $ | 6.09 | |
Hypothetical (5% return before expenses) | | | 1.20 | % | | $ | 1,000 | | | $ | 1,019 | | | $ | 6.06 | |
| * | Expenses are equal to the Fund’s annualized expense ratio multiplied by the average account value over the period, multiplied by the number of days in the most recent fiscal half-year (183), then divided by 366. |
|
| |
| Fund Performance (unaudited) |
| Periods ended March 31, 2016 |
The table below shows the average annual total returns for the periods indicated for each Fund, as well as each Fund’s relative index for the same time periods ended March 31, 2016.
| | | | | | | | | | | | | | | | |
| Average Annual Total Retuns1 | | Six Months* | | | One Year | | | Five Years | | | Ten Years | |
| | | | |
AMG Managers Brandywine Fund2,3,4,5,10 | | | (0.93 | )% | | | (8.60 | )% | | | 3.37 | % | | | 1.53 | % |
| | | | |
Russell 3000® Growth Index6 | | | 7.45 | % | | | 1.34 | % | | | 12.00 | % | | | 8.09 | % |
| | | | |
Russell 3000® Index7 | | | 7.30 | % | | | (0.34 | )% | | | 11.01 | % | | | 6.90 | % |
| | | | |
S&P 500 Index8 | | | 8.49 | % | | | 1.78 | % | | | 11.58 | % | | | 7.01 | % |
| | | | |
AMG Managers Brandywine Blue Fund 2,4,9,10 | | | 2.66 | % | | | (5.66 | )% | | | 5.36 | % | | | 2.35 | % |
| | | | |
Russell 1000® Growth Index11 | | | 8.11 | % | | | 2.52 | % | | | 12.38 | % | | | 8.28 | % |
| | | | |
Russell 1000® Index12 | | | 7.75 | % | | | 0.50 | % | | | 11.35 | % | | | 7.06 | % |
| | | | |
S&P 500 Index8 | | | 8.49 | % | | | 1.78 | % | | | 11.58 | % | | | 7.01 | % |
The performance data shown represents past performance. Past performance is not a guarantee of future results. Current performance may be lower or higher than the performance data quoted. The investment return and principal value of an investment in the Fund will fluctuate so that an investor’s shares, when redeemed, may be worth more or less than their original cost.
Investors should carefully consider the Fund’s investment objectives, risks, charges, and expenses before investing. For performance information through the most recent month end, current net asset values per share for the Fund and other information, please call (800) 835-3879 or visit our website at www.amgfunds.com for a free prospectus. Read it carefully before investing or sending money.
Distributed by AMG Distributors, Inc., member FINRA/SIPC.
| 1 | Total return equals income yield plus share price change and assumes reinvestment of all dividends and capital gain distributions. Returns are net of fees and may reflect offsets of Fund expenses as described in the prospectus. No adjustment has been made for taxes payable by shareholders on their reinvested dividends and capital gain distributions. Returns for periods greater than one year are annualized. The listed returns on the Funds are net of expenses and based on the published NAV as of March 31, 2016. All returns are in U.S. dollars ($). |
| 2 | The Fund inception dates and returns for all periods prior to October 1, 2013, reflect performance of the predecessor Funds, Brandywine Fund, Inc. and Brandywine Blue Fund, which were managed by Friess Associates, LLC with the same investment objective and substantially similar investment policies. |
| 3 | The Fund invests in growth stocks, which may be more sensitive to market movements because their prices tend to reflect future investor expectations rather than just current profits. Growth stocks may underperform value stocks during given periods |
| 4 | Investments in international securities are subject to certain risks of overseas investing including currency fluctuations and changes in political and economic conditions, which could result in significant market fluctuations. These risks are magnified in emerging markets. |
| 5 | The Fund is subject to risks associated with investments in small- and mid-capitalization companies, such as erratic earnings patterns, competitive conditions, limited earnings history, and a reliance on one or a limited number of products. |
| | |
| 6 | | The Russell 3000® Growth Index measures the performance of those Russell 3000® Index companies with higher price-to-book ratios and higher forecasted growth values. Unlike the Fund, the Russell 3000® Growth Index is unmanaged, is not available for investment, and does not incur expenses. |
| 7 | | The Russell 3000® Index is composed of the 3,000 largest U.S. companies as measured by market capitalization and represents about 98% of the U.S. stock market. Unlike the Fund, the Russell 3000® Index is unmanaged, is not available for investment, and does not incur expenses. |
| 8 | | The S&P 500 Index is capitalization-weighted index of 500 stocks. The S&P 500 Index is designed to measure performance of the broad domestic economy through changes in the aggregate market value of 500 stocks representing all major industries. Unlike the Fund, the S&P 500 Index is unmanaged, is not available for investment, and does not incur expenses. |
| 9 | | A greater percentage of the Fund’s holdings may be focused in a smaller number of securities which may place the Fund at greater risk than a more diversified fund. |
| 10 | | Active and frequent trading of a fund may result in higher transaction costs and increased tax liability. |
| 11 | | The Russell 1000® Growth Index is a market capitalization weighted index that measures the performance of those Russell 1000® companies with higher price-to-book ratio and higher forecasted growth values. Unlike the Fund, the Russell 1000® Growth Index is unmanaged, is not available for investment, and does not incur expenses. |
12 | | The Russell 1000® Index measures the performance of approximately 1,000 of the largest securities based on a combination of their market cap and current index membership. Unlike the Fund, the Russell 1000® Index is unmanaged, is not available for investment, and does not incur expenses. |
| |
| The Russell Indices are trademarks of the London Stock Exchange Group companies. |
| |
| The S&P 500 Index is proprietary data of Standard & Poor’s, a division of McGraw-Hill Companies, Inc. All rights reserved. |
| |
| Not FDIC insured, nor bank guaranteed. May lose value. |
|
| AMG Managers Brandywine Fund |
| Fund Snapshots (unaudited) |
| March 31, 2016 |
|
PORTFOLIO BREAKDOWN
| | | | | | | | | | | | | | | | |
Industry (Top Ten) | | AMG
Managers
Brandywine
Fund* | | | Russell
3000®
Growth
Index | | | Russell
3000®
Index | | | S&P 500
Index | |
Semiconductors | | | 7.8 | % | | | 2.4 | % | | | 2.7 | % | | | 2.8 | % |
Internet Software & Services | | | 6.7 | % | | | 7.1 | % | | | 3.8 | % | | | 4.4 | % |
Internet Retail | | | 6.2 | % | | | 3.3 | % | | | 1.8 | % | | | 2.0 | % |
Application Software | | | 4.9 | % | | | 5.7 | % | | | 4.4 | % | | | 4.4 | % |
Health Care Equipment | | | 3.9 | % | | | 2.2 | % | | | 2.3 | % | | | 2.2 | % |
Data Processing & Outsourced Services | | | 3.8 | % | | | 0.6 | % | | | 0.4 | % | | | 0.3 | % |
Health Care Facilities | | | 3.2 | % | | | 3.5 | % | | | 2.6 | % | | | 2.7 | % |
Property & Casualty Insurance | | | 3.0 | % | | | 0.5 | % | | | 2.9 | % | | | 2.6 | % |
Apparel Retail | | | 2.9 | % | | | 4.8 | % | | | 2.7 | % | | | 2.7 | % |
Construction & Engineering | | | 2.5 | % | | | 0.1 | % | | | 0.2 | % | | | 0.1 | % |
Other Common Stock | | | 50.6 | % | | | 69.8 | % | | | 76.2 | % | | | 75.8 | % |
Cash & Cash Equivalent† | | | 4.5 | % | | | 0.0 | % | | | 0.0 | % | | | 0.0 | % |
| * | As a percentage of net assets. |
| † | Includes Other Assets and Liabilities. |
TOP TEN HOLDINGS
| | | | | | | | |
| | | | | | | |
Security Name | | % of
Net Assets | | | % Change
from Book
Cost | |
Alphabet, Inc., Class A* | | | 2.7 | % | | | 10.8 | % |
Amazon.com, Inc.* | | | 2.7 | % | | | 31.0 | % |
Broadcom, Ltd. | | | 2.6 | % | | | 84.0 | % |
Salesforce.com, Inc.* | | | 2.2 | % | | | 6.0 | % |
Facebook, Inc., Class A* | | | 2.1 | % | | | 69.6 | % |
KAR Auction Services, Inc.* | | | 2.0 | % | | | 21.2 | % |
Integra LifeSciences Holdings Corp. | | | 2.0 | % | | | 9.5 | % |
Electronic Arts, Inc.* | | | 2.0 | % | | | -8.8 | % |
Visa, Inc., Class A | | | 2.0 | % | | | 4.5 | % |
The Allstate Corp. | | | 2.0 | % | | | 14.0 | % |
| | | | | | | | |
Top Ten as a Group | | | 22.3 | % | | | | |
| | | | | | | | |
| * | Also Top Ten Holding as of December 31, 2015. |
|
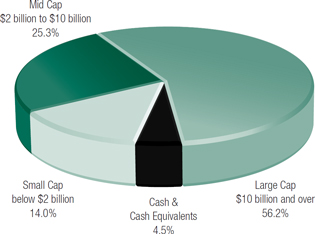
PORTFOLIO MARKET CAPITALIZATION |
| |
 |
|
ESTIMATED EARNINGS GROWTH RATE OF THE FUND’S INVESTMENTS |
|
Forecasted Increase in Earnings Per Share 2016 vs 2015 |
|
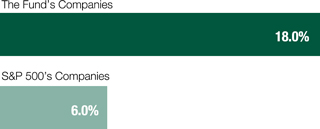
Source: Consensus estimates from FactSet Research Systems Inc. |
| This is not a forecast of the Fund’s future performance. Earnings growth for a Fund holding does not guarantee a corresponding increase in the market value of the holding or the Fund. |
Because a fund’s strategy may result in multiple investments in particular sectors of the economy, its performance may depend on the performance of those sectors and may fluctuate more widely than investments diversified across more sectors. For additional information on these and other risk considerations, please see the Fund’s prospectus.
Any sectors, industries, or securities discussed should not be perceived as investment recommendations. Mention of a specific security should not be considered a recommendation to buy or solicitation to sell that security. Specific securities mentioned in this report may have been sold from the Fund’s portfolio of investments by the time you receive this report.
5
|
| AMG Managers Brandywine Fund |
| Roses and Thorns (unaudited) |
| Quarter Ending March 31, 2016 |
|
| | | | | | | | | | |
| $ Gain | | | | | | | | |
(in millions) | | | % Gain | | | Biggest $ Winners Reason for Move |
| | |
| | | | | | | | Norwegian Cruise Lines Holdings Ltd. (NCLH) |
| $ | 2.6 | | | | 33.3 | % | | The global cruise line operator reported December-quarter earnings of $0.51 per share, up from $0.36 in the year-ago period. Shares gained in the quarter as the company raised 2016 earnings guidance, citing new ships in operation and a related improvement in pricing. |
| | |
| | | | | | | | Silicon Motion Technology Corp. (SIMO) |
| $ | 2.3 | | | | 23.8 | % | | The developer of NAND flash controllers for mobile devices grew December-quarter earnings 15 percent. Sales grew 22 percent, driven by strong NAND controller demand. The company continued to develop new relationships to reduce its reliance on a few large customers. Silicon Motion raised March-quarter guidance due to trends among customers in the solid state drive business. |
| | |
| | | | | | | | Newell Rubbermaid Inc. (NWL) |
| $ | 2.3 | | | | 23.3 | % | | The consumer and commercial products company grew December-quarter earnings 14 percent on 6 percent revenue growth. Sales in the business segment that makes baby products, such as Graco strollers, and the segment that makes writing implements, such as Sharpie markers, exceeded expectations. Newell Rubbermaid is on schedule to complete its announced acquisition of Jarden Corp., which is expected to expand the combined company’s reach and generate significant cost savings. |
| | |
| | | | | | | | CBS Corp. (CBS) |
| $ | 1.9 | | | | 19.1 | % | | The mass media company reported December-quarter earnings of $0.92 per share, up 19 percent versus the year-ago period. Network revenue grew 8 percent. The TV advertising market recovered as strong demand and tight inventory drove up scatter rates, a pricing strategy used by networks to sell airtime at higher rates. |
| | |
| | | | | | | | Duluth Holdings Inc. (DLTH) |
| $ | 1.7 | | | | 33.6 | % | | Duluth Holdings shares climbed as earnings estimates increased ahead of the company’s upcoming January-quarter report. The company makes and markets branded casual and work apparel, footwear and accessories. A late surge in holiday-season sales bolstered investor confidence that Duluth was largely able to remain firm on pricing by avoiding promotional activity. |
$ Loss | | | | | | |
(in millions) | | | % Loss | | | Biggest $ Losers Reason for Move |
| | |
| | | | | | | | Activision Blizzard Inc. (ATVI) |
| $ | 3.6 | | | | 23.4 | % | | The online publisher of interactive entertainment reported December-quarter earnings of $0.83 per share. Revenue grew less than expected due to weakness in two titles and unfavorable foreign exchange. Shares traded lower in the quarter when the company reduced 2016 earnings guidance due to delays that would push a new title release into 2017. We sold Activision to fund a new holding with greater visibility. |
| | |
| | | | | | | | Palo Alto Networks Inc. (PANW) |
| $ | 3.3 | | | | 31.0 | % | | The provider of network security products that allow customers to run complex programs and applications grew January-quarter earnings 110 percent, beating the consensus estimate. Shares declined on concerns that global information technology spending was decreasing. We sold Palo Alto Networks to fund a new opportunity with greater visibility. |
| | |
| | | | | | | | The Advisory Board Co. (ABCO) |
| $ | 3.2 | | | | 38.4 | % | | The technology and consulting firm focused on the health care and higher education markets grew December-quarter earnings 85 percent, exceeding the consensus estimate. Shares traded lower when the company reduced 2016 earnings guidance. The change in outlook raised questions about the pace at which synergies related to Advisory Board’s recent acquisition of Royall & Co. might begin contributing to results. We sold the Advisory Board to fund a new holding with better visibility. |
| | |
| | | | | | | | The Priceline Group Inc. (PCLN) |
| $ | 3.0 | | | | 11.9 | % | | The online travel company grew December-quarter earnings 16 percent, topping the consensus estimate. Sales grew 9 percent on strong organic growth in its international business and hotel room bookings. Shares came under pressure as investors focused on potential for slower European growth and greater direct competition from hotels. |
| | |
| | | | | | | | USG Corp. (USG) |
| $ | 2.8 | | | | 30.3 | % | | Shares of the manufacturer and distributor of building materials came under pressure as investors grew concerned that demand trends would negatively impact wallboard pricing. We sold USG to fund a new holding with greater visibility. |
All gains/losses are calculated on an average cost basis from December 31, 2015 through March 31, 2016.
This commentary reflects the viewpoints of Friess Associates, LLC as of March 31, 2016 and is not intended as a forecast or guarantee of future results.
6
|
| AMG Managers Brandywine Fund |
| Schedule of Portfolio Investments (unaudited) |
| March 31, 2016 |
|
| | | | | | | | | | |
Shares | | | | Cost | | | Value | |
Common Stocks - 95.5% | | | | | | | | |
Consumer Discretionary | | | | | |
| | Apparel Retail - 2.9% | |
| 703,510 | | American Eagle Outfitters, Inc. | | $ | 10,226,896 | | | $ | 11,727,512 | |
| 113,255 | | The TJX Cos., Inc. | | | 7,428,118 | | | | 8,873,529 | |
| | Apparel, Accessories & Luxury Goods - 1.0% | | | | | |
| 114,455 | | Columbia Sportswear Co. | | | 6,576,185 | | | | 6,877,601 | |
| | Auto Parts & Equipment - 1.1% | | | | | |
| 117,710 | | Drew Industries, Inc. | | | 6,581,543 | | | | 7,587,587 | |
| | Automotive Retail - 1.8% | | | | | |
| 7,365 | | Murphy USA, Inc.* | | | 396,587 | | | | 452,579 | |
| 46,010 | | O’Reilly Automotive, Inc.* | | | 11,340,345 | | | | 12,591,097 | |
| | Broadcasting - 1.7% | | | | | |
| 214,725 | | CBS Corp., Class B | | | 9,933,788 | | | | 11,829,200 | |
| | Footwear - 2.4% | | | | | |
| 164,900 | | NIKE, Inc., Class B | | | 8,878,227 | | | | 10,136,403 | |
| 231,245 | | Skechers U.S.A., Inc., Class A* | | | 7,203,169 | | | | 7,041,410 | |
| | General Merchandise Stores - 2.1% | | | | | |
| 121,700 | | Dollar Tree, Inc.* | | | 9,723,281 | | | | 10,035,382 | |
| 206,060 | | Ollie’s Bargain Outlet Holdings, Inc.*,1 | | | 4,176,319 | | | | 4,827,986 | |
| | Home Improvement Retail - 1.5% | | | | | |
| 80,595 | | The Home Depot, Inc. | | | 9,874,412 | | | | 10,753,791 | |
| | Hotels, Resorts & Cruise Lines - 1.5% | | | | | |
| 186,770 | | Norwegian Cruise Line Holdings, Ltd.* | | | 7,749,657 | | | | 10,326,513 | |
| | Housewares & Specialties - 1.7% | | | | | |
| 269,590 | | Newell Rubbermaid, Inc.1 | | | 9,683,445 | | | | 11,940,141 | |
| | Internet Retail - 6.2% | | | | | |
| 31,560 | | Amazon.com, Inc.* | | | 14,304,526 | | | | 18,735,278 | |
| 344,755 | | Duluth Holdings, Inc.*,1 | | | 4,437,184 | | | | 6,719,275 | |
| 78,580 | | Netflix, Inc.* | | | 8,834,926 | | | | 8,033,233 | |
| 7,818 | | The Priceline Group, Inc.* | | | 10,372,565 | | | | 10,077,089 | |
| | Leisure Products - 1.4% | | | | | |
| 100,980 | | Polaris Industries, Inc.1 | | | 10,037,466 | | | | 9,944,510 | |
| | Movies & Entertainment - 1.9% | | | | | |
| 476,415 | | Twenty-First Century Fox, Inc., Class A | | | 13,127,624 | | | | 13,282,450 | |
| | Restaurants - 1.5% | |
| 178,100 | | Starbucks Corp. | | | 9,940,343 | | | | 10,632,570 | |
| | Specialty Stores - 0.7% | | | | | |
| 114,880 | | Dick’s Sporting Goods, Inc. | | | 4,298,748 | | | | 5,370,640 | |
| | | | | | | | | | |
Total Consumer Discretionary | | | 185,125,354 | | | | 207,795,776 | |
| | This sector is 12.2% above your Fund’s cost. | | | | | |
| | |
Consumer Staples | | | | | | | | |
| | Packaged Foods & Meats - 0.1% | | | | | |
| 17,060 | | Calavo Growers, Inc. | | | 855,811 | | | | 973,444 | |
| | | | | | | | | | |
Shares | | | | Cost | | | Value | |
| | Personal Products - 1.9% | | | | | |
| 141,280 | | The Estee Lauder Cos., Inc., Class A | | $ | 11,765,107 | | | $ | 13,324,117 | |
| | | | | | | | | | |
Total Consumer Staples | | | 12,620,918 | | | | 14,297,561 | |
| | This sector is 13.3% above your Fund’s cost. | | | | | |
Financials | | | | | | | | |
| | Investment Banking & Brokerage - 1.6% | | | | | |
| 398,845 | | The Charles Schwab Corp. | | | 11,647,372 | | | | 11,175,637 | |
| | Property & Casualty Insurance - 3.0% | | | | | |
| 205,090 | | The Allstate Corp. | | | 12,117,849 | | | | 13,816,913 | |
| 212,713 | | FNF Group | | | 6,996,363 | | | | 7,210,971 | |
| | Specialized Finance - 1.9% | |
| 137,535 | | CME Group, Inc. | | | 12,922,783 | | | | 13,210,237 | |
| | Specialized REITs - 1.9% | |
| 134,420 | | American Tower Corp., | | | 13,179,075 | | | | 13,760,576 | |
| | Thrifts & Mortgage Finance - 1.1% | | | | | |
| 77,740 | | LendingTree, Inc.* | | | 7,317,673 | | | | 7,601,417 | |
| | | | | | | | | | |
Total Financials | | | 64,181,115 | | | | 66,775,751 | |
| | This sector is 4.0% above your Fund’s cost. | | | | | |
| | |
Health Care | | | | | | | | |
| | Biotechnology - 1.5% | | | | | |
| 111,500 | | Gilead Sciences, Inc. | | | 11,380,926 | | | | 10,242,390 | |
| | Health Care Equipment - 3.9% | | | | | |
| 713,575 | | Boston Scientific Corp.* | | | 12,650,222 | | | | 13,422,346 | |
| 211,380 | | Integra LifeSciences Holdings Corp.* | | | 12,998,749 | | | | 14,238,557 | |
| | Health Care Facilities - 3.2% | | | | | |
| 124,550 | | AmSurg Corp.* | | | 10,255,154 | | | | 9,291,430 | |
| 233,460 | | VCA, Inc.* | | | 11,924,132 | | | | 13,468,307 | |
| | Life Sciences Tools & Services - 1.5% | | | | | |
| 74,950 | | Thermo Fisher Scientific, Inc. | | | 9,754,872 | | | | 10,612,171 | |
| | Managed Health Care - 1.7% | | | | | |
| 91,780 | | UnitedHealth Group, Inc. | | | 7,086,243 | | | | 11,830,442 | |
| | Pharmaceuticals - 1.4% | | | | | |
| 332,245 | | Pfizer, Inc. | | | 9,575,540 | | | | 9,847,742 | |
| | | | | | | | | | |
Total Health Care | | | 85,625,838 | | | | 92,953,385 | |
| | This sector is 8.6% above your Fund’s cost. | | | | | |
Industrials | |
| | Aerospace & Defense - 0.5% | | | | | |
| 41,745 | | Orbital ATK, Inc. | | | 3,416,878 | | | | 3,629,310 | |
| | Airlines - 1.6% | | | | | |
| 228,520 | | Delta Air Lines, Inc. | | | 10,523,285 | | | | 11,124,354 | |
| | Building Products - 2.0% | | | | | |
| 98,845 | | Allegion PLC | | | 6,447,482 | | | | 6,297,415 | |
| 80,415 | | Apogee Enterprises, Inc. | | | 3,902,840 | | | | 3,529,414 | |
| 29,865 | | Lennox International, Inc. | | | 3,411,744 | | | | 4,037,449 | |
The accompanying notes are an integral part of these financial statements.
7
|
| |
| AMG Managers Brandywine Fund |
| Schedule of Portfolio Investments (continued) |
|
| | | | | | | | | | |
Shares | | Cost | | | Value | |
Industrials (continued) | | | | | |
| | Construction & Engineering - 2.5% | | | | | |
| 240,370 | | Comfort Systems USA, Inc. | | $ | 6,844,128 | | | $ | 7,636,555 | |
| 155,105 | | Dycom Industries, Inc.* | | | 12,158,446 | | | | 10,030,640 | |
| | Diversified Support Services - 2.0% | | | | | |
| 375,345 | | KAR Auction Services, Inc. | | | 11,810,036 | | | | 14,315,658 | |
| | Human Resources & Employment Services - 1.3% | | | | | |
| 245,820 | | On Assignment, Inc.* | | | 9,535,379 | | | | 9,075,674 | |
| | Trading Companies & Distributors - 1.5% | | | | | |
| 267,895 | | Beacon Roofing Supply, Inc.* | | | 10,400,242 | | | | 10,986,374 | |
| | | | | | | | | | |
Total Industrials | | | 78,450,460 | | | | 80,662,843 | |
| | This sector is 2.8% above your Fund’s cost. | | | | | |
Information Technology | | | | | |
| | Application Software - 4.9% | | | | | |
| 253,765 | | Atlassian Corp. PLC, Class A* | | | 6,922,842 | | | | 6,382,190 | |
| 225,110 | | Callidus Software, Inc.* | | | 3,262,661 | | | | 3,754,835 | |
| 177,065 | | Guidewire Software, Inc.* | | | 9,065,257 | | | | 9,646,501 | |
| 205,760 | | Salesforce.com, Inc.* | | | 14,333,353 | | | | 15,191,261 | |
| | Communications Equipment - 1.2% | | | | | |
| 507,934 | | Infinera Corp.* | | | 7,342,770 | | | | 8,157,420 | |
| | Data Processing & Outsourced Services - 3.8% | | | | | |
| | Black Knight Financial Services, Inc., | | | | | | | | |
| 273,930 | | Class A*,1 | | | 7,101,249 | | | | 8,500,048 | |
| 153,456 | | Sabre Corp. | | | 3,647,641 | | | | 4,437,948 | |
| 183,705 | | Visa, Inc., Class A | | | 13,439,444 | | | | 14,049,758 | |
| | Electronic Equipment & Instruments - 0.8% | | | | | |
| 370,825 | | Fitbit, Inc. Class A* | | | 5,614,392 | | | | 5,617,999 | |
| | Electronic Manufacturing Services - 0.5% | | | | | |
| 120,730 | | Fabrinet* | | | 3,476,375 | | | | 3,905,616 | |
| | Home Entertainment Software - 2.0% | | | | | |
| 212,600 | | Electronic Arts, Inc.* | | | 15,407,266 | | | | 14,054,986 | |
| | Internet Software & Services - 6.7% | | | | | |
| 24,617 | | Alphabet, Inc., Class A* | | | 16,953,494 | | | | 18,780,309 | |
| 595,515 | | Box, Inc., Class A* | | | 7,662,305 | | | | 7,301,014 | |
| 128,454 | | Facebook, Inc., Class A* | | | 8,640,531 | | | | 14,656,601 | |
| 130,754 | | LogMeln, Inc.* | | | 8,904,738 | | | | 6,597,847 | |
| | Semiconductors - 7.8% | |
| 742,460 | | Applied Micro Circuits Corp.* | | | 4,861,292 | | | | 4,796,292 | |
| 117,415 | | Broadcom, Ltd. | | | 9,856,677 | | | | 18,140,618 | |
| 145,910 | | Mellanox Technologies, Ltd.* | | | 7,664,704 | | | | 7,927,290 | |
| 334,010 | | NVIDIA Corp. | | | 10,575,786 | | | | 11,900,776 | |
| 309,795 | | Silicon Motion Technology Corp., ADR | | | 8,291,252 | | | | 12,023,144 | |
| | Systems Software - 0.5% | | | | | |
| 114,556 | | Gigamon, Inc.* | | | 3,399,077 | | | | 3,553,527 | |
| | | | | | | | | | |
Total Information Technology | | | 176,423,106 | | | | 199,375,980 | |
| | This sector is 13.0% above your Fund’s cost. | | | | | |
| | | | | | | | | | |
Shares | | Cost | | | Value | |
Materials | | | | | | | | | | |
| | Construction Materials - 1.4% | | | | | |
| 93,720 | | Vulcan Materials Co. | | $ | 8,368,313 | | | $ | 9,894,020 | |
| | This sector is 18.2% above your Fund’s cost. | | | | | |
Telecommunication Services | |
| | Alternative Carriers - 0.4% | |
| 246,115 | | ORBCOMM, Inc.*,1 | | | 1,378,244 | | | | 2,493,145 | |
| | This sector is 80.9% above your Fund’s cost. | | | | | |
| | |
Total Common Stocks | | | 612,173,348 | | | | 674,248,461 | |
| | | |
| | | | | Principal
Amount | | | | |
Short-Term Investments - 6.3% | | | | | |
Commercial Paper - 4.0% | | | | | |
| | Autonation, Inc., 0.95%, 04/01/16 | | $ | 28,300,000 | | | | 28,300,000 | |
Repurchase Agreements - 2.2%2 | | | | | |
| | Daiwa Capital Markets America., dated 03/31/16, due 04/01/16, 0.360%, total to be received $3,628,988 (collateralized by various U.S. Government Agency Obligations, 0.000% - 9.000%, 05/31/16 - 09/09/49, totaling $3,701,531) | | | 3,628,952 | | | | 3,628,952 | |
| | JPMorgan Securities LLC., dated 03/31/16, due 04/01/16, 0.31% total to be received $763,876 (collateralized by various U.S. Government Agency Obligations, 0.875% - 1.375%, 02/28/17 - 03/31/20, totaling $779,154) | | | 763,869 | | | | 763,869 | |
| | Merrill Lynch Pierce Fenner & Smith Inc., dated 03/31/16, due 04/01/16, 0.300%, total to be received $3,628,982 (collateralized by various U.S. Government Agency Obligations, 1.406% - 7.000%, 05/15/24 - 01/20/66, totaling $3,701,531) | | | 3,628,952 | | | | 3,628,952 | |
| | Mitsubishi UFJ Securities USA Inc., dated 03/31/16, due 04/01/16, 0.320%, total to be received $3,628,984 (collateralized by various U.S. Government Agency Obligations, 0.875% - 6.000%, 03/31/18 - 08/01/48, totaling $3,701,536) | | | 3,628,952 | | | | 3,628,952 | |
The accompanying notes are an integral part of these financial statements.
8
|
| |
| AMG Managers Brandywine Fund |
| Schedule of Portfolio Investments (continued) |
|
| | | | | | | | | | |
| | | | | Principal Amount | | | Value | |
| | RBC Capital Markets LLC., dated 03/31/16, due 04/01/16, 0.280%, total to be received $3,628,980 (collateralized by various U.S. Government Agency Obligations, 1.750% - 6.000%, 06/01/18 - 04/01/46, totaling $3,701,531) | | $ | 3,628,952 | | | $ | 3,628,952 | |
| | | | | | | | | | |
Total Repurchase Agreements | | | 15,279,677 | | | | 15,279,677 | |
| | | | | | | | | | |
Shares | | Cost | | | Value | |
Other Investment Companies - 0.1%3 | | | | | |
| 1,120,667 | | Dreyfus Institutional Cash Advantage Fund, Institutional Class Shares, 0.38% | | $ | 1,120,667 | | | $ | 1,120,667 | |
| | | | | | | | | | |
| | |
Total Short-Term Investments | | | 44,700,344 | | | | 44,700,344 | |
| | |
Total Investments - 101.8% | | $ | 656,873,692 | | | | 718,948,805 | |
| | | | | | | | | | |
| | |
Other Assets, less Liabilities - (1.8)% | | | | | | | (12,690,887 | ) |
| | |
Total Net Assets - 100.0% | | | | | | $ | 706,257,918 | |
| | | | | | | | | | |
The accompanying notes are an integral part of these financial statements.
9
|
| AMG Managers Brandywine Blue Fund |
| Fund Snapshots (unaudited) |
| March 31, 2016 |
|
PORTFOLIO BREAKDOWN
| | | | | | | | | | | | | | | | |
Industry (Top Ten) | | AMG
Managers
Brandywine
Blue Fund* | | | Russell
1000®
Growth
Index | | | Russell
1000®
Index | | | S&P 500
Index | |
Internet Retail | | | 6.1 | % | | | 3.5 | % | | | 1.9 | % | | | 2.0 | % |
Data Processing & Outsourced Services | | | 5.8 | % | | | 0.5 | % | | | 0.4 | % | | | 0.3 | % |
Semiconductors | | | 5.6 | % | | | 2.2 | % | | | 2.7 | % | | | 2.8 | % |
Internet Software & Services | | | 4.8 | % | | | 7.3 | % | | | 4.0 | % | | | 4.4 | % |
Property & Casualty Insurance | | | 4.1 | % | | | 0.5 | % | | | 2.9 | % | | | 2.6 | % |
Insurance Brokers | | | 3.9 | % | | | 0.9 | % | | | 2.0 | % | | | 2.1 | % |
Pharmaceuticals | | | 3.8 | % | | | 3.2 | % | | | 4.9 | % | | | 5.5 | % |
Application Software | | | 3.2 | % | | | 5.5 | % | | | 4.4 | % | | | 4.4 | % |
Footwear | | | 3.1 | % | | | 4.8 | % | | | 2.7 | % | | | 2.7 | % |
Specialized REITs | | | 2.9 | % | | | 2.7 | % | | | 3.8 | % | | | 3.0 | % |
Other Common Stock | | | 52.6 | % | | | 68.9 | % | | | 70.3 | % | | | 70.2 | % |
Cash & Cash Equivalent† | | | 4.1 | % | | | 0.0 | % | | | 0.0 | % | | | 0.0 | % |
| * | As a percentage of net assets. |
| † | Includes Other Assets and Liabilities. |
TOP TEN HOLDINGS
| | | | | | | | |
| | | | | | | |
Security Name | | % of
Net Assets | | | % Change
from
Book Cost | |
Marsh & McLennan Cos., Inc.* | | | 3.9 | % | | | 87.7 | % |
Amazon.com, Inc.* | | | 3.2 | | | | 29.2 | |
Salesforce.com, Inc.* | | | 3.2 | | | | 5.9 | |
Broadcom, Ltd. | | | 3.1 | | | | 87.2 | |
NIKE, Inc., Class B* | | | 3.1 | | | | 59.6 | |
American Tower Corp.* | | | 2.9 | | | | 8.0 | |
Starbucks Corp.* | | | 2.8 | | | | 62.8 | |
Church & Dwight Co., Inc. | | | 2.8 | | | | 20.8 | |
The Home Depot, Inc. | | | 2.7 | | | | 15.8 | |
Alphabet, Inc., Class A | | | 2.6 | | | | 10.8 | |
| | | | | | | | |
Top Ten as a Group | | | 30.3 | % | | | | |
| | | | | | | | |
| * | Also Top Ten Holding as of December 31, 2015. |
|
| |
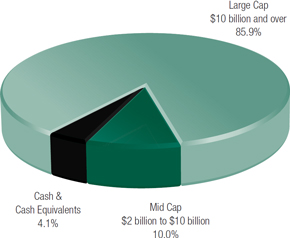
| PORTFOLIO MARKET CAPITALIZATION |
| |
 |
|
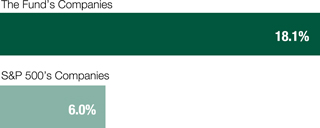
| ESTIMATED EARNINGS GROWTH RATE |
| OF THE FUND’S INVESTMENTS |
|
Forecasted Increase in Earnings Per Share 2016 vs 2015 |
|
 |
|
Source: Consensus estimates from FactSet Research Systems Inc. |
|
| This is not a forecast of the Fund’s future performance. Earnings growth for a Fund holding does not guarantee a corresponding increase in the market value of the holding or the Fund. |
Because a fund’s strategy may result in multiple investments in particular sectors of the economy, its performance may depend on the performance of those sectors and may fluctuate more widely than investments diversified across more sectors. For additional information on these and other risk considerations, please see the Fund’s prospectus.
Any sectors, industries, or securities discussed should not be perceived as investment recommendations. Mention of a specific security should not be considered a recommendation to buy or solicitation to sell that security. Specific securities mentioned in this report may have been sold from the Fund’s portfolio of investments by the time you receive this report.
10
|
| AMG Managers Brandywine Blue Fund |
| Roses and Thorns (unaudited) |
| Quarter Ending March 31, 2016 |
|
| | | | | | | | | | |
$ Gain (in millions) | | | % Gain | | | Biggest $ Winners Reason for Move |
| | | | | | | | Norwegian Cruise Lines Holdings Ltd. (NCLH) |
| $ | 0.8 | | | | 33.6 | % | | The global cruise line operator reported December-quarter earnings of $0.51 per share, up from $0.36 in the year-ago period. Shares gained in the quarter as the company raised 2016 earnings guidance, citing new ships in operation and a related improvement in pricing. |
| | |
| | | | | | | | Newell Rubbermaid Inc. (NWL) |
| $ | 0.8 | | | | 26.6 | % | | The consumer and commercial products company grew December-quarter earnings 14 percent on 6 percent revenue growth. Sales in the business segment that makes baby products, such as Graco strollers, and the segment that makes writing implements, such as Sharpie markers, exceeded expectations. Newell Rubbermaid is on schedule to complete its announced acquisition of Jarden Corp., which is expected to expand the combined company’s reach and generate significant cost savings. |
| | |
| | | | | | | | CBS Corp. (CBS) |
| $ | 0.6 | | | | 19.7 | % | | The mass media company reported December-quarter earnings of $0.92 per share, up 19 percent versus the year-ago period. Network revenue grew 8 percent. The TV advertising market recovered as strong demand and tight inventory drove up scatter rates, a pricing strategy used by networks to sell airtime at higher rates. |
| | |
| | | | | | | | Marsh & McLennan Cos. Inc. (MMC) |
| $ | 0.6 | | | | 9.6 | % | | The global provider of insurance and risk management services grew December-quarter earnings 10 percent. Organic revenue grew 5 percent, reflecting better-than-expected strength in its Risk and Insurance Services segment and its Consulting segment. Shares rose in the quarter as investors grew more confident the reinsurance market will continue to improve. |
| | |
| | | | | | | | Vulcan Materials Co. (VMC) |
| $ | 0.5 | | | | 18.7 | % | | The manufacturer of concrete aggregate to highway, road and commercial markets more than doubled December-quarter earnings to $0.74 per share, topping the consensus estimate. Concrete aggregate revenue increased 14 percent due to better-than-expected price and volume trends. Aggregate volumes were 8 percent above prior-year levels despite continued heavy rains in several key states. Vulcan guided to 7 percent price and volume growth in 2016, driven by strong construction markets. |
| | |
$ Loss
(in millions) | | | % Loss | | | Biggest $ Losers Reason for Move |
| | | | | | | | Splunk Inc. (SPLK) |
| $ | 1.7 | | | | 44.3 | % | | The enterprise software developer offers users a platform to collect, organize and analyze machine data. Shares fell after a competitor reported lower sales due to a weakening macro environment. We sold Splunk to fund a new opportunity. |
| | |
| | | | | | | | Palo Alto Networks Inc. (PANW) |
| $ | 1.0 | | | | 31.0 | % | | The provider of network security products that allow customers to run complex programs and applications grew January-quarter earnings 110 percent, beating the consensus estimate. Shares declined on concerns that global information technology spending was decreasing. We sold Palo Alto Networks to fund a new opportunity with greater visibility. |
| | |
| | | | | | | | Activision Blizzard Inc. (ATVI) |
| $ | 0.9 | | | | 23.3 | % | | The online publisher of interactive entertainment reported December-quarter earnings of $0.83 per share. Revenue grew less than expected due to weakness in two titles and unfavorable foreign exchange. Shares traded lower in the quarter when the company reduced 2016 earnings guidance due to delays that would push a new title release into 2017. We sold Activision to fund a new holding with greater visibility. |
| | |
| | | | | | | | The Priceline Group Inc. (PCLN) |
| $ | 0.7 | | | | 11.2 | % | | The online travel company grew December-quarter earnings 16 percent, topping the consensus estimate. Sales grew 9 percent on strong organic growth in its international business and hotel room bookings. Shares came under pressure as investors focused on potential for slower European growth and greater direct competition from hotels. |
| | |
| | | | | | | | Harman International Industries Inc. (HAR) |
| $ | 0.6 | | | | 18.4 | % | | The designer and manufacturer of infotainment solutions for automobiles and consumer applications saw its shares come under pressure as industry forecasts calling a peak in the auto cycle raised questions about future growth prospects. Potential for new competitors, including Apple and Google, also weighed on sentiment regarding the company’s outlook. We sold Harman to fund a new holding with greater visibility. |
All gains/losses are calculated on an average cost basis from December 31, 2015 through March 31, 2016.
This commentary reflects the viewpoints of Friess Associates, LLC as of March 31, 2016 and is not intended as a forecast or guarantee of future results.
11
|
| AMG Managers Brandywine Blue Fund |
| Schedule of Portfolio Investments (unaudited) |
| March 31, 2016 |
|
| | | | | | | | | | |
Shares | | | | Cost | | | Value | |
Common Stocks - 95.9% | |
Consumer Discretionary | | | | | |
| | Apparel Retail - 2.0% | |
| 41,125 | | The TJX Cos., Inc. | | $ | 2,697,061 | | | $ | 3,222,144 | |
| | Automotive Retail - 2.3% | |
| 13,780 | | O’Reilly Automotive, Inc.* | | | 3,434,073 | | | | 3,771,035 | |
| | Broadcasting - 2.4% | |
| 69,300 | | CBS Corp., Class B | | | 3,190,438 | | | | 3,817,737 | |
| | Footwear - 3.1% | |
| 81,130 | | NIKE, Inc., Class B | | | 3,125,668 | | | | 4,987,061 | |
| | General Merchandise Stores - 1.9% | | | | | |
| 37,705 | | Dollar Tree, Inc.* | | | 3,014,331 | | | | 3,109,154 | |
| | Home Improvement Retail - 2.7% | | | | | |
| 32,150 | | The Home Depot, Inc. | | | 3,703,973 | | | | 4,289,774 | |
| | Homebuilding - 2.5% | |
| 133,495 | | D.R. Horton, Inc. | | | 3,678,054 | | | | 4,035,554 | |
| | Hotels, Resorts & Cruise Lines - 2.0% | | | | | |
| 57,380 | | Norwegian Cruise Line Holdings, Ltd.* | | | 2,373,872 | | | | 3,172,540 | |
| | Housewares & Specialties - 2.3% | | | | | |
| 83,175 | | Newell Rubbermaid, Inc.1 | | | 2,910,600 | | | | 3,683,821 | |
| | Internet Retail - 6.1% | |
| 8,678 | | Amazon.com, Inc.* | | | 3,988,314 | | | | 5,151,608 | |
| 18,260 | | Netflix, Inc.* | | | 2,258,059 | | | | 1,866,720 | |
| 2,150 | | The Priceline Group, Inc.* | | | 2,854,469 | | | | 2,771,264 | |
| | Leisure Products - 1.2% | |
| 19,150 | | Polaris Industries, Inc.1 | | | 1,902,187 | | | | 1,885,892 | |
| | Movies & Entertainment - 2.2% | | | | | |
| 126,275 | | Twenty-First Century Fox, Inc., Class A | | | 3,473,779 | | | | 3,520,547 | |
| | Restaurants - 2.7% | |
| 74,200 | | Starbucks Corp. | | | 2,720,465 | | | | 4,429,740 | |
| | | | | | | | | | |
Total Consumer Discretionary | | | 45,325,343 | | | | 53,714,591 | |
| | This sector is 18.5% above your Fund’s cost. | | | | | |
| | |
Consumer Staples | | | | | | | | |
| | Household Products - 2.7% | |
| 47,960 | | Church & Dwight Co., Inc. | | | 3,660,834 | | | | 4,420,953 | |
| | Personal Products - 2.4% | | | | | | | | |
| 40,500 | | The Estee Lauder Cos., Inc., Class A | | | 3,393,970 | | | | 3,819,555 | |
| | | | | | | | | | |
Total Consumer Staples | | | 7,054,804 | | | | 8,240,508 | |
| | This sector is 16.8% above your Fund’s cost. | | | | | |
| | |
Financials | | | | | | | | |
| | Insurance Brokers - 3.9% | |
| 103,165 | | Marsh & McLennan Cos., Inc. | | | 3,341,679 | | | | 6,271,400 | |
| | Investment Banking & Brokerage - 2.1% | | | | | |
| 119,185 | | The Charles Schwab Corp. | | | 3,480,245 | | | | 3,339,564 | |
| | | | | | | | | | |
Shares | | | | Cost | | | Value | |
| | Property & Casualty Insurance - 4.1% | |
| 58,980 | | The Allstate Corp. | | $ | 3,477,183 | | | $ | 3,973,483 | |
| 77,495 | | FNF Group | | | 2,546,290 | | | | 2,627,080 | |
| | Specialized Finance - 2.4% | |
| 41,225 | | CME Group, Inc. | | | 3,873,325 | | | | 3,959,661 | |
| | Specialized REITs - 2.9% | |
| 45,040 | | American Tower Corp. | | | 4,270,695 | | | | 4,610,745 | |
| | | | | | | | | | |
Total Financials | | | 20,989,417 | | | | 24,781,933 | |
| | This sector is 18.1% above your Fund’s cost. | |
| | |
Health Care | | | | | | | | |
| | Biotechnology - 2.0% | |
| 34,000 | | Gilead Sciences, Inc. | | | 3,478,997 | | | | 3,123,240 | |
| | Health Care Equipment - 2.6% | |
| 225,450 | | Boston Scientific Corp.* | | | 3,928,353 | | | | 4,240,715 | |
| | Life Sciences Tools & Services - 1.8% | |
| 20,500 | | Thermo Fisher Scientific, Inc. | | | 2,685,695 | | | | 2,902,595 | |
| | Managed Health Care - 2.3% | |
| 28,800 | | UnitedHealth Group, Inc. | | | 3,443,317 | | | | 3,712,320 | |
| | Pharmaceuticals - 3.8% | |
| 10,900 | | Allergan PLC* | | | 3,317,733 | | | | 2,921,527 | |
| 107,755 | | Pfizer, Inc. | | | 3,101,513 | | | | 3,193,858 | |
| | | | | | | | | | |
Total Health Care | | | 19,955,608 | | | | 20,094,255 | |
| | This sector is 0.7% above your Fund’s cost. | |
| | |
Industrials | | | | | | | | |
| | Airlines - 2.1% | |
| 69,015 | | Delta Air Lines, Inc. | | | 3,185,398 | | | | 3,359,650 | |
| | Building Products - 1.9% | |
| 49,380 | | Allegion PLC | | | 3,234,971 | | | | 3,146,000 | |
| | Diversified Support Services - 2.1% | |
| 86,800 | | KAR Auction Services, Inc. | | | 3,239,341 | | | | 3,310,552 | |
| | | | | | | | | | |
Total Industrials | | | 9,659,710 | | | | 9,816,202 | |
| | This sector is 1.6% above your Fund’s cost. | |
| | |
Information Technology | | | | | | | | |
| | Application Software - 3.2% | |
| 69,500 | | Salesforce.com, Inc.* | | | 4,843,963 | | | | 5,131,185 | |
| | Data Processing & Outsourced Services - 5.8% | |
| 58,325 | | Sabre Corp. | | | 1,398,473 | | | | 1,686,759 | |
| 63,500 | | Vantiv, Inc., Class A* | | | 2,927,454 | | | | 3,421,380 | |
| 55,500 | | Visa, Inc., Class A | | | 4,034,502 | | | | 4,244,640 | |
| | Home Entertainment Software - 2.0% | |
| 49,030 | | Electronic Arts, Inc.* | | | 3,547,832 | | | | 3,241,373 | |
| | Internet Software & Services - 4.8% | |
| 5,577 | | Alphabet, Inc., Class A* | | | 3,840,827 | | | | 4,254,693 | |
The accompanying notes are an integral part of these financial statements.
12
|
| |
| AMG Managers Brandywine Fund |
| Schedule of Portfolio Investments (continued) |
|
| | | | | | | | | | |
Shares | | | | Cost | | | Value | |
Information Technology (continued) | |
| | Internet Software & Services - 4.8% (continued) | | | | | |
| 29,850 | | Facebook, Inc., Class A* | | $ | 2,009,810 | | | $ | 3,405,885 | |
| | Semiconductors - 5.6% | |
| 32,510 | | Broadcom, Ltd. | | | 2,683,290 | | | | 5,022,795 | |
| 109,400 | | NVIDIA Corp. | | | 3,580,015 | | | | 3,897,922 | |
| | | | | | | | | | |
Total Information Technology | | | 28,866,166 | | | | 34,306,632 | |
| | This sector is 18.8% above your Fund’s cost. | | | | | |
| | |
Materials | | | | | | | | |
| | Construction Materials - 2.0% | |
| 29,710 | | Vulcan Materials Co. | | | 2,642,050 | | | | 3,136,485 | |
| | This sector is 18.7% above your Fund’s cost. | | | | | |
Total Common Stocks | | | 134,493,098 | | | | 154,090,606 | |
| | | |
| | | | | Principal
Amount | | | | |
Short-Term Investments - 6.0% | |
Commercial Paper - 3.0% | | | | | |
| | Autonation, Inc., 0.95%, 04/01/16 | | $ | 4,800,000 | | | | 4,800,000 | |
Repurchase Agreements - 2.7%2 | |
| | Daiwa Capital Markets America, dated 03/31/16, due 04/01/16, 0.360%, total to be received $1,015,416 (collateralized by various U.S. Government Agency Obligations, 0.000% - 9.000%, 05/31/16 - 09/09/49, totaling $1,035,714) | | | 1,015,406 | | | | 1,015,406 | |
| | JPMorgan Securities LLC, dated 03/31/16, due 04/01/16, 0.310%, total to be received $213,747 (collateralized by various U.S. Government Agency Obligations, 0.875% - 1.375%, 02/28/17 - 03/31/20, totaling $218,022) | | | 213,745 | | | | 213,745 | |
| | | | | | | | | | |
Shares | | | | Principal Amount | | | Value | |
| | Merrill Lynch, Pierce, Fenner & Smith, Inc., dated 03/31/16, due 04/01/16, 0.300%, total to be received $1,015,414 (collateralized by various U.S. Government Agency Obligations, 1.406% - 7.000%, 05/15/24 - 01/20/66, totaling $1,035,714) | | $ | 1,015,406 | | | $ | 1,015,406 | |
| | Mitsubishi UFJ Securities USA Inc., dated 03/31/16, due 04/01/16, 0.320%, total to be received $1,015,415 (collateralized by various U.S. Government Agency Obligations, 0.875% - 6.000%, 03/31/18 - 08/01/48, totaling $1,035,716) | | | 1,015,406 | | | | 1,015,406 | |
| | RBC Capital Markets LLC, dated 03/31/16, due 04/01/16, 0.280%, total to be received $1,015,414 (collateralized by various U.S. Government Agency Obligations, 1.750% - 6.000%, 06/01/18 - 04/01/46, totaling $1,035,714) | | | 1,015,406 | | | | 1,015,406 | |
| | | | | | | | | | |
Total Repurchase Agreements | | | 4,275,369 | | | | 4,275,369 | |
| | | |
| | | | | Cost | | | | |
Other Investment Companies - 0.3%3 | |
| 499,937 | | Dreyfus Institutional Cash Advantage Fund, Institutional Class Shares, 0.38% | | | 499,937 | | | | 499,937 | |
| | | | | | | | | | |
| | |
Total Short-Term Investments | | | 9,575,306 | | | | 9,575,306 | |
| | |
Total Investments - 101.9% | | $ | 144,068,404 | | | | 163,665,912 | |
| | | | | | | | | | |
| | |
Other Assets, less Liabilities - (1.9)% | | | | | | | (2,983,417 | ) |
| | |
Total Net Assets - 100.0% | | | | | | $ | 160,682,495 | |
| | | | | | | | | | |
The accompanying notes are an integral part of these financial statements.
13
|
| |
| |
| Notes to Schedule of Portfolio Investments (unaudited) |
|
The following footnotes should be read in conjunction with each of the Schedules of Portfolio Investments previously presented in this report.
At March 31, 2016, the approximate cost of investments and the aggregate gross unrealized appreciation and depreciation for federal income tax were as follows:
| | | | | | | | | | | | | | | | |
| Fund | | Cost | | | Appreciation | | | Depreciation | | | Net | |
AMG Managers Brandywine Fund | | $ | 656,873,692 | | | $ | 73,738,109 | | | $ | (11,662,997 | ) | | $ | 62,075,112 | |
AMG Managers Brandywine Blue Fund | | | 144,174,836 | | | | 21,376,422 | | | | (1,885,346 | ) | | | 19,491,076 | |
| * | Non-income producing security. |
| 1 | Some or all of these shares were out on loan to various brokers as of March 31, 2016, amounting to the following: |
| | | | | | | | |
| | | Market Value | | | % of Net Assets | |
AMG Managers Brandywine Fund | | $ | 14,955,422 | | | | 2.1 | % |
AMG Managers Brandywine Blue Fund | | $ | 4,177,224 | | | | 2.6 | % |
| 2 | Collateral received from brokers for securities lending was invested in these joint repurchase agreements. |
| 3 | Yield shown represents the March 31, 2016, seven-day average yield, which refers to the sum of the previous seven days’ dividends paid, expressed as an annual percentage. |
The following tables summarizes the inputs used to value the Fund’s investments by the fair value hierarchy levels as of March 31, 2016. (See Note 1(a) in the Notes to Financial Statements.)
| | | | | | | | | | | | | | | | |
| | | Quoted Prices in Active
Markets for Identical
Investments Level 1 | | | Significant Other Observable Inputs Level 2 | | | Significant Unobservable Inputs Level 3 | | | Total | |
AMG Managers Brandywine Fund | | | | | | | | | | | | | | | | |
Investments in Securities | | | | | | | | | | | | | | | | |
Common Stocks† | | $ | 674,248,461 | | | | — | | | | — | | | $ | 674,248,461 | |
Short-Term Investments | | | | | | | | | | | | | | | | |
Commercial Paper | | | — | | | $ | 28,300,000 | | | | — | | | | 28,300,000 | |
Repurchase Agreements | | | — | | | | 15,279,677 | | | | — | | | | 15,279,677 | |
Other Investment Companies | | | 1,120,667 | | | | — | | | | — | | | | 1,120,667 | |
| | | | | | | | | | | | | | | | |
Total Investments in Securities | | $ | 675,369,128 | | | $ | 43,579,677 | | | | — | | | $ | 718,948,805 | |
| | | | | | | | | | | | | | | | |
| | | | | | | | | | | | | | | | |
| | | Quoted Prices in Active Markets for Identical Investments Level 1 | | | Significant Other Observable Inputs Level 2 | | | Significant Unobservable Inputs Level 3 | | | Total | |
AMG Managers Brandywine Blue Fund | | | | | | | | | | | | | | | | |
Investments in Securities | | | | | | | | | | | | | | | | |
Common Stocks† | | $ | 154,090,606 | | | | — | | | | — | | | $ | 154,090,606 | |
Short-Term Investments | | | | | | | | | | | | | | | | |
Commercial Paper | | | — | | | $ | 4,800,000 | | | | — | | | | 4,800,000 | |
Repurchase Agreements | | | — | | | | 4,275,369 | | | | — | | | | 4,275,369 | |
Other Investment Companies | | | 499,937 | | | | — | | | | — | | | | 499,937 | |
| | | | | | | | | | | | | | | | |
Total Investments in Securities | | $ | 154,590,543 | | | $ | 9,075,369 | | | | — | | | $ | 163,665,912 | |
| | | | | | | | | | | | | | | | |
| † | All common stocks held in the Funds are Level 1 securities. For a detailed breakout of the common stocks by major industry classification, please refer to the respective Schedule of Portfolio Investments. |
As of March 31, 2016, the Funds had no transfers between levels from the beginning of the reporting period.
The accompanying notes are an integral part of these financial statements.
14
|
| |
| |
| Notes to Schedule of Portfolio Investments (continued) |
|
INVESTMENT DEFINITIONS AND ABBREVIATIONS:
ADR: ADR after the name of a holding stands for American Depositary Receipt, representing ownership of foreign securities on deposit with a domestic custodian bank. The value of the ADR securities is determined or significantly influenced by trading on exchanges not located in the United States or Canada. Sponsored ADRs are initiated by the underlying foreign company.
The accompanying notes are an integral part of these financial statements.
15
|
| |
| Statement of Assets and Liabilities (unaudited) |
| March 31, 2016 |
|
| | | | | | | | |
| | | | | | AMG Managers | |
| | | AMG Managers | | | Brandywine | |
| | | Brandywine Fund | | | Blue Fund | |
Assets: | | | | | | | | |
Investments at value* (including securities on loan valued at $14,955,422 and $4,177,224, respectively) | | $ | 718,948,805 | | | $ | 163,665,912 | |
Receivable for investments sold | | | 9,170,953 | | | | 1,505,689 | |
Dividends, interest and other receivables | | | 413,571 | | | | 88,664 | |
Receivable for Fund shares sold | | | 9,413 | | | | 5,108 | |
Prepaid expenses | | | 17,113 | | | | 11,109 | |
Total assets | | | 728,559,854 | | | | 165,276,482 | |
Liabilities: | | | | | | | | |
Payable upon return of securities loaned | | | 15,279,677 | | | | 4,275,369 | |
Payable for investments purchased | | | 5,614,392 | | | | — | |
Payable for Fund shares repurchased | | | 710,306 | | | | 126,319 | |
Accrued expenses: | | | | | | | | |
Investment advisory and management fees | | | 582,892 | | | | 133,829 | |
Administrative fees | | | 15,046 | | | | 4,015 | |
Shareholder servicing fees | | | 13,407 | | | | 8,699 | |
Trustees fees and expenses | | | 11,134 | | | | 2,648 | |
Other | | | 75,082 | | | | 43,108 | |
Total liabilities | | | 22,301,936 | | | | 4,593,987 | |
| | |
Net Assets | | $ | 706,257,918 | | | $ | 160,682,495 | |
Net Assets Represent: | | | | | | | | |
Paid-in capital | | $ | 1,217,429,514 | | | $ | 1,148,544,726 | |
Accumulated net investment loss | | | (601,498 | ) | | | (52,327 | ) |
Accumulated net realized loss from investments | | | (572,645,211 | ) | | | (1,007,407,412 | ) |
Net unrealized appreciation of investments | | | 62,075,113 | | | | 19,597,508 | |
Net Assets | | $ | 706,257,918 | | | $ | 160,682,495 | |
Shares outstanding | | | 20,639,276 | | | | 4,621,277 | |
Net asset value, offering and redemption price per share | | $ | 34.22 | | | $ | 34.77 | |
| | |
* Investments at cost | | $ | 656,873,692 | | | $ | 144,068,404 | |
The accompanying notes are an integral part of these financial statements.
16
|
| |
| Statement of Operations (unaudited) |
| For the six months ended March 31, 2016 |
|
| | | | | | | | |
| | | | | | AMG Managers | |
| | | AMG Managers | | | Brandywine Blue | |
| | | Brandywine Fund | | | Fund | |
Investment Income: | | | | | | | | |
Dividend income | | $ | 3,203,908 | 1 | | $ | 1,024,915 | 2 |
Securities lending income | | | 125,050 | | | | 6,152 | |
Interest income | | | 85,707 | | | | 27,696 | |
Total investment income | | | 3,414,666 | | | | 1,058,763 | |
Expenses: | | | | | | | | |
Investment advisory and management fees | | | 3,627,010 | | | | 825,226 | |
Administrative fees | | | 92,540 | | | | 24,757 | |
Shareholder servicing fees | | | 83,463 | | | | 53,686 | |
Transfer agent fees | | | 58,501 | | | | 9,103 | |
Professional fees | | | 43,447 | | | | 24,560 | |
Custodian fees | | | 30,944 | | | | 9,566 | |
Reports to shareholders | | | 28,657 | | | | 24,387 | |
Trustees fees and expenses | | | 27,028 | | | | 5,892 | |
Registration fees | | | 11,661 | | | | 10,502 | |
Miscellaneous | | | 12,914 | | | | 3,563 | |
Total expenses | | | 4,016,164 | | | | 991,242 | |
| | |
Net investment income (loss) | | | (601,498 | ) | | | 67,521 | |
Net Realized and Unrealized Gain (Loss): | | | | | | | | |
Net realized loss on investments | | | (39,846,979 | ) | | | (8,236,688 | ) |
Net change in unrealized appreciation (depreciation) of investments | | | 33,326,621 | | | | 12,373,442 | |
Net realized and unrealized gain (loss) | | | (6,520,358 | ) | | | 4,136,754 | |
| | |
Net increase (decrease) in net assets resulting from operations | | $ | (7,121,856 | ) | | $ | 4,204,275 | |
| 1 | Includes non-recurring dividends of $398,851. |
| 2 | Includes non-recurring dividends of $119,552. |
The accompanying notes are an integral part of these financial statements.
17
|
| |
| Statements of Changes in Net Assets |
| For the six months ended March 31, 2016 (unaudited) and the fiscal year ended September 30, 2015 |
|
| | | | | | | | | | | | | | | | |
| | | AMG Managers | | | AMG Managers | |
| | | Brandywine Fund | | | Brandywine Blue Fund | |
| | | March 31, | | | September 31, | | | March 31, | | | September 31, | |
| | | 2016 | | | 2015 | | | 2016 | | | 2015 | |
Increase (Decrease) in Net Assets From Operations: | | | | | | | | | | | | | | | | |
Net investment income (loss) | | $ | (601,498 | ) | | $ | 842,188 | | | $ | 67,521 | | | $ | 591,314 | |
Net realized gain (loss) on investments | | | (39,846,979 | ) | | | 117,270,561 | | | | (8,236,688 | ) | | | 24,081,566 | |
Net change in unrealized appreciation (depreciation) of investments | | | 33,326,621 | | | | (82,922,251 | ) | | | 12,373,442 | | | | (19,411,528 | ) |
Net increase (decrease) in net assets resulting from operations | | | (7,121,856 | ) | | | 35,190,498 | | | | 4,204,275 | | | | 5,261,352 | |
Distributions to Shareholders: | | | | | | | | | | | | | | | | |
From net investment income | | | — | | | | — | | | | (403,233 | ) | | | — | |
Total distributions to shareholders | | | — | | | | — | | | | (403,233 | ) | | | — | |
Capital Share Transactions: | | | | | | | | | | | | | | | | |
Proceeds from sale of shares | | | 1,760,200 | | | | 45,582,971 | | | | 1,074,968 | | | | 13,063,277 | |
Reinvestment of dividends and distributions | | | — | | | | — | | | | 373,025 | | | | — | |
Cost of shares repurchased | | | (47,565,017 | ) | | | (120,633,417 | ) | | | (13,747,008 | ) | | | (65,084,718 | ) |
Net decrease from capital share transactions | | | (45,804,817 | ) | | | (75,050,446 | ) | | | (12,299,015 | ) | | | (52,021,441 | ) |
| | | | |
Total decrease in net assets | | | (52,926,673 | ) | | | (39,859,948 | ) | | | (8,497,973 | ) | | | (46,760,089 | ) |
Net Assets: | | | | | | | | | | | | | | | | |
Beginning of period | | | 759,184,591 | | | | 799,044,539 | | | | 169,180,468 | | | | 215,940,557 | |
End of period | | $ | 706,257,918 | | | $ | 759,184,591 | | | $ | 160,682,495 | | | $ | 169,180,468 | |
End of period undistributed (accumulated) net investment income(loss) | | $ | (601,498 | ) | | | — | | | $ | (52,327 | ) | | $ | 283,385 | |
| | | | | | | | | | | | | | | | |
| | | | |
Share Transactions: | | | | | | | | | | | | | | | | |
Sale of shares | | | 50,298 | | | | 1,282,255 | | | | 31,624 | | | | 362,186 | |
Reinvested shares from dividends and distributions | | | — | | | | — | | | | 10,473 | | | | — | |
Shares repurchased | | | (1,390,047 | ) | | | (3,332,982 | ) | | | (404,387 | ) | | | (1,823,138 | ) |
Net decrease in shares | | | (1,339,749 | ) | | | (2,050,727 | ) | | | (362,290 | ) | | | (1,460,952 | ) |
The accompanying notes are an integral part of these financial statements.
18
|
| AMG Managers Brandywine Fund |
| Financial Highlights |
| For a share outstanding throughout each fiscal period |
|
| | | | | | | | | | | | | | | | | | | | | | | | |
| | | For the six
months ended
March 31, 2016
(unaudited) | | | | |
| | | For the fiscal years ended September 30, | |
| | | 2015 | | | 20143 | | | 2013 | | | 2012 | | | 2011 | |
Net Asset Value, Beginning of Period | | $ | 34.54 | | | $ | 33.25 | | | $ | 28.75 | | | $ | 24.62 | | | $ | 21.38 | | | $ | 22.02 | |
Income (loss) from Investment Operations: | | | | | | | | | | | | | | | | | | | | | | | | |
Net investment income (loss)1 | | | (0.03 | )7 | | | 0.04 | 6 | | | (0.12 | ) | | | (0.03 | ) | | | (0.05 | ) | | | (0.09 | ) |
Net realized and unrealized gain (loss) on investments | | | (0.29 | ) | | | 1.25 | | | | 4.62 | | | | 4.16 | | | | 3.29 | | | | (0.55 | ) |
Total income (loss) from investment operations | | | (0.32 | ) | | | 1.29 | | | | 4.50 | | | | 4.13 | | | | 3.24 | | | | (0.64 | ) |
Net Asset Value, End of Period | | $ | 34.22 | | | $ | 34.54 | | | $ | 33.25 | | | $ | 28.75 | | | $ | 24.62 | | | $ | 21.38 | |
Total Return | | | (0.93 | )%4 | | | 3.88 | % | | | 15.65 | % | | | 16.77 | % | | | 15.15 | % | | | (2.91 | )% |
Ratio of total expenses to average net assets | | | 1.11 | %5 | | | 1.10 | % | | | 1.10 | % | | | 1.11 | %2 | | | 1.08 | % | | | 1.09 | % |
Ratio of net investment income (loss) to average net assets | | | (0.17 | )%5 | | | 0.10 | % | | | (0.37 | )% | | | (0.12 | )% | | | (0.23 | )% | | | (0.36 | )% |
Portfolio turnover | | | 91 | %4 | | | 190 | % | | | 219 | % | | | 214 | % | | | 256 | % | | | 234 | % |
Net assets at end of period (000’s omitted) | | $ | 706,258 | | | $ | 759,185 | | | $ | 799,045 | | | $ | 816,222 | | | $ | 1,062,544 | | | $ | 1,336,871 | |
| | | | | | | | | | | | | | | | | | | | | | | | |
19
|
| AMG Managers Brandywine Blue Fund |
| Financial Highlights |
| For a share outstanding throughout each fiscal period |
|
| | | | | | | | | | | | | | | | | | | | | | | | |
| | | For the six
months ended
March 31, 2016
(unaudited) | | | | |
| | | For the fiscal years ended September 30, | |
| | | 2015 | | | 20143 | | | 2013 | | | 2012 | | | 2011 | |
Net Asset Value, Beginning of Period | | $ | 33.95 | | | $ | 33.51 | | | $ | 30.01 | | | $ | 25.00 | | | $ | 21.50 | | | $ | 21.78 | |
Income (loss) from Investment Operations: | | | | | | | | | | | | | | | | | | | | | | | | |
Net investment income (loss)1 | | | 0.01 | 7 | | | 0.10 | 6 | | | (0.03 | ) | | | 0.12 | | | | (0.11 | ) | | | (0.10 | ) |
Net realized and unrealized gain (loss) on investments | | | 0.89 | | | | 0.34 | | | | 3.53 | | | | 4.89 | | | | 3.61 | | | | (0.18 | ) |
Total income (loss) from investment operations | | | 0.90 | | | | 0.44 | | | | 3.50 | | | | 5.01 | | | | 3.50 | | | | (0.28 | ) |
Distributions to Shareholders from: | | | | | | | | | | | | | | | | | | | | | | | | |
Net investment income | | | (0.08 | ) | | | — | | | | — | | | | — | | | | — | | | | — | |
Net Asset Value, End of Period | | $ | 34.77 | | | $ | 33.95 | | | $ | 33.51 | | | $ | 30.01 | | | $ | 25.00 | | | $ | 21.50 | |
Total Return | | | 2.66 | %4 | | | 1.31 | % | | | 11.66 | % | | | 20.04 | % | | | 16.28 | % | | | (1.29 | )% |
Ratio of total expenses to average net assets | | | 1.20 | %5 | | | 1.20 | % | | | 1.19 | % | | | 1.22 | %2 | | | 1.23 | % | | | 1.18 | % |
Ratio of net investment income (loss) to average net assets | | | 0.08 | %5 | | | 0.29 | % | | | (0.11 | )% | | | 0.45 | % | | | (0.46 | )% | | | (0.38 | )% |
Portfolio turnover | | | 68 | %4 | | | 156 | % | | | 182 | % | | | 202 | % | | | 243 | % | | | 250 | % |
Net assets at end of period (000’s omitted) | | $ | 160,682 | | | $ | 169,180 | | | $ | 215,941 | | | $ | 278,620 | | | $ | 627,622 | | | $ | 1,487,517 | |
| | | | | | | | | | | | | | | | | | | | | | | | |
Notes to Financial Highlights (unaudited)
| 1 | Per share numbers have been calculated using average shares |
| 2 | Interest expense is less than 0.005% of average net assets. |
| 3 | At the start of business October 1, 2013, AMG Managers Brandywine Fund and AMG Managers Brandywine Blue Fund were each reorganized into a respective fund of AMG Funds I. |
| 6 | Includes non-recurring dividends. Without these dividends, net investment loss per share would have been ($0.07) and ($0.08) for the AMG Managers Brandywine and AMG Managers Brandywine Blue Funds, respectively |
| 7 | Includes non-recurring dividends. Without these dividends, net investment loss per share would have been ($0.05) and ($0.01) for the AMG Managers Brandywine and AMG Managers Brandywine Blue Funds, respectively |
20
|
| |
| Notes to Financial Statements (unaudited) |
| March 31, 2016 |
|
1. SUMMARY OF SIGNIFICANT ACCOUNTING POLICIES
AMG Funds I (the “Trust”) is an open-end management investment company, organized as a Massachusetts business trust, and registered under the Investment Company Act of 1940, as amended (the “1940 Act”). Currently, the Trust consists of a number of different funds, each having distinct investment management objectives, strategies, risks, and policies. Included in this report are AMG Managers Brandywine Fund (“Brandywine”) and AMG Managers Brandywine Blue Fund (“Brandywine Blue”), each a “Fund” and collectively the “Funds.”
At the start of business on October 1, 2013, Brandywine, a series of Brandywine Fund, Inc. and Brandywine Blue, a series of Brandywine Blue Fund, Inc. (the “Predecessor Funds”), were each reorganized into a respective fund of the Trust. As a result of the reorganization, the Funds are the successors to the accounting and performance information of the Predecessor Funds.
The Funds’ financial statements are prepared in accordance with accounting principles generally accepted in the United States of America (“U.S. GAAP”), which require management to make estimates and assumptions that affect the reported amounts of assets and liabilities and disclosure of contingent assets and liabilities at the date of the financial statements and the reported amounts of income and expenses during the reporting periods. Actual results could differ from those estimates and such differences could be material. The following is a summary of significant accounting policies followed by the Funds in the preparation of their financial statements:
a. VALUATION OF INVESTMENTS
Equity securities traded on a national securities exchange or reported on the NASDAQ national market system (“NMS”) are valued at the last quoted sales price on the primary exchange or, if applicable, the NASDAQ official closing price or the official closing price of the relevant exchange or, lacking any sales, at the last quoted bid price or the mean between the last quoted bid and ask prices (the “exchange mean price”). Equity securities traded in the over-the-counter market (other than NMS securities) are valued at the exchange mean price. Foreign equity securities (securities principally traded in markets other than U.S. markets) are valued at the official closing price on the primary exchange or, for markets that either do not offer an official closing price or where the official closing price may not be representative of the overall market, the last quoted sale price.
Fixed income securities purchased with a remaining maturity of 60 days or less are valued at amortized cost, provided that the amortized cost value is approximately the same as the fair value of the security valued without the use of amortized cost. Investments in other open-end regulated investment companies are valued at their end of day net asset value per share.
The Funds’ portfolio investments are generally valued based on independent market quotations or prices or, if none, “evaluative” or other market based valuations provided by third-party pricing services approved by the Board of Trustees of the Trust (the “Board”). Under certain circumstances, the value of certain Fund portfolio investments (including derivatives) may be based on an evaluation of fair value, pursuant to procedures established by and under the general supervision of the Board. The Valuation Committee, which is comprised of the Independent Trustees of the Board, and the Pricing Committee, which is
comprised of representatives from AMG Fund, LLC (the “Investment Manager”) are the committees appointed by the Board to make fair value determinations. Each Fund may use the fair value of a portfolio instrument to calculate its net asset value (“NAV”) in the event that the market quotation, price or market based valuation for the portfolio instrument is not readily available or otherwise not determinable pursuant to the Board’s valuation procedures, if the Investment Manager for the Pricing Committee believes the quotation, price or market based valuation to be unreliable, or in certain other circumstances. When determining the fair value of an investment, the Pricing Committee and, if required under the Trust’s securities valuation procedures, the Valuation Committee, seeks to determine the price that the Fund might reasonably expect to receive from current sale of that portfolio investment in an arms-length transaction. Fair value determinations shall be based upon consideration of all available facts and information, including, but not limited to (i) attributes specific to the investment; (ii) fundamental and analytical data relating to the investment; and (iii) the value of other comparable securities or relevant financial instruments, including derivative securities, traded on other markets or among dealers.
The values assigned to fair value investments are based on available information and do not necessarily represent amounts that might ultimately be realized in the future, since such amounts depend on future developments inherent in long-term investments. Because of the inherent uncertainty of valuation, those estimated values may differ significantly from the values that would have been used had a ready market for the investments existed, and the differences could be material. The Board will be presented with a quarterly report showing as of the most recent quarter end, all outstanding securities fair valued by the Fund, including a comparison with the prior quarter end and the percentage of the Fund that the security represents at each quarter end.
With respect to foreign equity securities and certain foreign fixed income securities, the Board has adopted a policy that securities held in a Fund that can be fair valued by the applicable fair value pricing service are fair valued on each business day provided that each individual price exceeds a pre-established confidence level.
U.S. GAAP defines fair value as the price that a fund would receive to sell an asset or pay to transfer a liability in an orderly transaction between market participants at the measurement date. U.S. GAAP also establishes a framework for measuring fair value, and a three-level hierarchy for fair value measurements based upon the transparency of inputs to the valuation of an asset or liability. Inputs may be observable or unobservable and refer broadly to the assumptions that market participants would use in pricing the asset or liability. Observable inputs reflect the assumptions market participants would use in pricing the asset or liability based on market data obtained from sources independent of the Funds. Unobservable inputs reflect the Funds’ own assumptions about the assumptions that market participants would use in pricing the asset or liability developed based on the best information available in the circumstances. Each investment is assigned a level based upon the observability of the inputs which are significant to the overall valuation.
|
| |
| |
| Notes to Financial Statements (continued) |
|
The three-tier hierarchy of inputs is summarized below:
Level 1 – inputs are quoted prices in active markets for identical investments (e.g., equity securities, open-end investment companies)
Level 2 – other observable inputs (including, but not limited to: quoted prices for similar assets or liabilities in markets that are active, quoted prices for identical or similar assets or liabilities in markets that are not active, inputs other than quoted prices that are observable for the assets or liabilities (such as interest rates, yield curves, volatilities, prepayment speeds, loss severities, credit risks and default rates) or other market corroborated inputs) (e.g., debt securities, government securities, foreign currency exchange contracts, foreign securities utilizing international fair value pricing, broker-quoted securities, fair valued securities with observable inputs)
Level 3 – inputs are significant unobservable inputs (including the Fund’s own assumptions used to determine the fair value of investments) (e.g., fair valued securities with unobservable inputs)
Changes in inputs or methodologies used for valuing investments may result in a transfer in or out of levels within the fair value hierarchy. The inputs or methodologies used for valuing investments may not necessarily be an indication of the risk associated with investing in those investments. Transfers between different levels of the fair value disclosure hierarchy are deemed to have occurred as of the beginning of the reporting period.
b. SECURITY TRANSACTIONS
Security transactions are accounted for as of trade date. Realized gains and losses on securities sold are determined on the basis of identified cost.
c. INVESTMENT INCOME AND EXPENSES
Dividend income is recorded on the ex-dividend date. Dividend and interest income on foreign securities is recorded gross of any withholding tax. Interest income, which includes amortization of premium and accretion of discount on debt securities, is accrued as earned. Non-cash dividends included in dividend income, if any, are reported at the fair market value of the securities received. Distributions received in excess of income from return of capital including real estate investment trusts (REITs) are recorded as a reduction of the cost of the related investment and/or as a realized gain. If the Funds no longer own the applicable securities, any distributions received in excess of income are recorded as an adjustment to realized gain. Other income and expenses are recorded on an accrual basis. Expenses that cannot be directly attributed to a Fund are apportioned among the Funds in the Trust and in some cases other trusts within the AMG Funds family of mutual funds (collectively the “AMG Funds family”) and other affiliated funds based upon their relative average net assets or number of shareholders.
The Funds have a “balance credit” arrangement with The Bank of New York Mellon (“BNYM”), the Funds’ custodian, whereby each Fund is credited with an interest factor equal to 0.75% below the effective 90-day T-Bill rate for account balances left uninvested overnight. If the T-Bill rate falls below 0.75%, no credits will be earned. These credits serve to reduce custodian expenses that would otherwise be charged to each Fund. For the fiscal period ended March 31, 2016, the Funds’ custodian expense was not reduced.
Overdraft fees are computed at 1% above the effective Federal Funds rate on the day of the overdraft. For the six months ended March 31, 2016, overdraft fees for Brandywine and Brandywine Blue equaled $103 and $15, respectively.
d. DIVIDENDS AND DISTRIBUTIONS
Fund distributions resulting from either net investment income or realized net capital gains, if any, will normally be declared and paid at least annually in December, as described in the Funds’ prospectus. Distributions to shareholders are recorded on the ex-dividend date. Distributions are determined in accordance with federal income tax regulations, which may differ from net investment income and net realized capital gains for financial statement purposes (U.S. GAAP). Differences may be permanent or temporary. Permanent differences are reclassified among capital accounts in the financial statements to reflect their tax character. Permanent book and tax basis differences, if any, relating to shareholder distributions will result in reclassifications to paid-in capital. Temporary differences arise when certain items of income, expense and gain or loss are recognized in different periods for financial statement and tax purposes; these differences will reverse at some time in the future. Permanent differences are due to fair fund settlements and a net operating loss. Temporary differences are due to wash sales.
e. FEDERAL TAXES
Each Fund intends to comply with the requirements under Subchapter M of the Internal Revenue Code of 1986, as amended, and, to distribute substantially all of its taxable income and gains to its shareholders and to meet certain diversification and income requirements with respect to investment companies. Therefore, no provision for federal income or excise tax is included in the accompanying financial statements.
Additionally, based on each Fund’s understanding of the tax rules and rates related to income, gains and transactions for the foreign jurisdictions in which it invests, each Fund will provide for foreign taxes, and where appropriate, deferred foreign taxes.
Management has analyzed the Funds’ tax positions taken on federal income tax returns as of September 30, 2015, and for all open tax years (generally, the three prior taxable years), and has concluded that no provision for federal income tax is required in the Funds’ financial statements. Additionally, the Funds are not aware of any tax position for which it is reasonably possible that the total amounts of unrecognized tax benefits will change materially in the next twelve months.
Net capital losses incurred in taxable years beginning after the enactment of the Regulated Investment Company Modernization Act of 2010, may be carried forward for an unlimited time period. Such losses will be required to be utilized prior to any loss carryovers incurred in pre-enactment taxable years, which generally expire eight years following the close of the taxable year in which they were incurred. As a result of this ordering rule, pre-enactment capital loss carryovers may be more likely to expire unused. Additionally, post-enactment capital losses that are carried forward retain their tax character as either short-term or long-term capital losses, unlike pre-enactment losses which are considered all short-term.
22
|
| |
| |
| Notes to Financial Statements (continued) |
|
f. CAPITAL LOSS CARRYOVERS AND DEFERRALS
As of March 31, 2016, the Funds had accumulated net realized capital loss carryovers from securities transactions for federal income tax purposes as shown in the following chart. These amounts may be used to offset future realized capital gains, if any, through the expiration dates listed or in the case of post-enactment losses, for an unlimited time period.
| | | | | | | | | | | | |
| | | Capital Loss
Carryover Amount | | | Expires September 30, | |
| Fund | | Short-Term | | | Long-Term | | |
Brandywine | | | | | | | | | | | | |
(Pre-Enactment) | | $ | 29,260,971 | | | | — | | | | 2017 | |
(Pre-Enactment) | | | 503,144,209 | | | | — | | | | 2018 | |
| | | | | | | | | | | | |
Totals | | $ | 532,405,180 | | | | — | | | | | |
| | | | | | | | | | | | |
Brandywine Blue | | | | | | | | | | | | |
(Pre-Enactment) | | $ | 803,178,060 | | | | — | | | | 2017 | |
(Pre-Enactment) | | | 195,886,232 | | | | — | | | | 2018 | |
| | | | | | | | | | | | |
Totals | | $ | 999,064,292 | | | | — | | | | | |
| | | | | | | | | | | | |
g. CAPITAL STOCK
The Trust’s Declaration of Trust authorizes for each fund the issuance of an unlimited number of shares of beneficial interest, without par value. Each Fund records sales and repurchases of its capital stock on the trade date. The cost of securities contributed to the Funds in connection with the issuance of shares is based on the valuation of those securities in accordance with the Funds’ policy on investment valuation.
At March 31, 2016, certain unaffiliated shareholders of record, specifically omnibus accounts, individually or collectively held greater than 10% of the net assets of the Funds as follows: Brandywine Blue - two collectively own 24%. Transactions by these shareholders may have a material impact on the Fund.
h. REPURCHASE AGREEMENTS AND JOINT REPURCHASE AGREEMENTS
The Funds may enter into repurchase agreements provided that the value of the underlying collateral, including accrued interest, will equal or exceed the value of the repurchase agreement during the term of the agreement. The underlying collateral for all repurchase agreements is held in safekeeping by the Fund’s custodian or at the Federal Reserve Bank. If the seller defaults and the value of the collateral declines, or if bankruptcy proceedings commence with respect to the seller of the security, realization of the collateral by the Fund may be delayed or limited.
Additionally, the Funds may enter into joint repurchase agreements for reinvestment of cash collateral on securities lending transactions under the securities lending program offered by BNYM (the “Program”), provided that the value of the underlying collateral, including accrued interest, will equal or exceed the value of the joint repurchase agreement during the term of the agreement. The Funds participate on a pro rata basis with other clients of BNYM in its share of the underlying collateral under such joint repurchase agreements and in its share of proceeds from any repurchase or other disposition of the underlying collateral. The underlying collateral for joint repurchase agreements
is held in safekeeping by the Fund’s custodian or at the Federal Reserve Bank. If the seller defaults and the value of the collateral declines, or if bankruptcy proceedings commence with respect to the seller of the security, realization of the collateral by the Funds may be delayed or limited. Pursuant to the Program, the Funds are indemnified for such losses by BNYM.
At March 31, 2016, the market value of repurchase agreements outstanding for Brandywine and Brandywine Blue was $15,279,677 and $4,275,369, respectively.
2. AGREEMENTS AND TRANSACTIONS WITH AFFILIATES
For each of the Funds, the Trust has entered into an investment advisory agreement under which the Investment Manager, a subsidiary and the U.S. retail distributor arm of Affiliated Managers Group, Inc. (“AMG”), serves as investment manager to the Funds and is responsible for the Funds’ overall administration and operations. The Investment Manager selects one or more subadvisors for the Funds (subject to Board approval) and monitors each subadvisor’s investment performance, security holdings and investment strategies. Each Fund’s investment portfolio is managed by Friess Associates, LLC (“Friess”) through a subadvisory agreement between the Investment Manager and Friess relating to each Fund, and Friess Associates of Delaware, LLC (“Friess of Delaware”) through a sub-subadvisor agreement among the Investment Manager, Friess and Friess of Delaware relating to each Fund.
Investment management fees are paid directly by the Funds to the Investment Manager based on average daily net assets. For the six months ended March 31, 2016, the Funds’ investment management fees were paid at the following annual rates of each Fund’s respective average daily net assets:
| | | | |
Brandywine | | | 1.00 | % |
Brandywine Blue | | | 1.00 | % |
Each Fund has entered into an Administration and Shareholder Servicing Agreement under which the Investment Manager serves as the Funds’ administrator (the “Administrator”) and is responsible for all aspects of managing the Funds’ operations, including administration and shareholder services to each Fund, its shareholders, and certain institutions, such as bank trust departments, broker-dealers and registered investment advisers, that advise or act as intermediary with the Funds’ shareholders. The Funds pay a fee to the Administrator at the rate of 0.03% of each Fund’s average daily net assets for the first $300 million of assets under management, 0.025% for the next $200 million, and 0.02% on amounts in excess of $500 million per annum, subject to a $40,000 annual minimum.
The Funds are distributed by AMG Distributors, Inc. (the “Distributor”), a wholly-owned subsidiary of the Investment Manager. The Distributor serves as the distributor and underwriter for each Fund and is a registered broker-dealer and member of the Financial Industry Regulatory Authority, Inc. (“FINRA”). Shares of each Fund will be continuously offered and will be sold directly to prospective purchasers and through brokers, dealers or other financial intermediaries who have executed selling agreements with the Distributor. Subject to the compensation arrangement discussed below, generally the Distributor bears all or a portion of the expenses of providing services pursuant to the distribution agreement, including the payment of the expenses relating to the distribution of prospectuses for sales purposes and any advertising or sales literature.
23
|
| |
| |
| Notes to Financial Statements (continued) |
|
The Board has approved reimbursement payments to the Investment Manager for shareholder servicing expenses (“shareholder servicing fees”) incurred. Shareholder servicing fees include payments to third parties such as a bank, broker-dealer, trust company or other financial intermediaries who provide shareholder recordkeeping, account servicing and other services. To the extent the Investment Manager makes shareholder servicing payments to a third party, the Fund may reimburse the Investment Manager up to the amounts incurred. For the fiscal year ended March 31, 2016, Brandywine and Brandywine Blue paid $83,463 or 0.01%, and $53,686 or 0.03%, respectively.
The Board provides supervision of the affairs of the Trust, other trusts within the AMG Funds family and other affiliated funds. The Trustees of the Trust who are not affiliated with an Investment Manager receive an annual retainer and per meeting fees for regular, special and telephonic meetings, and they are reimbursed for out-of-pocket expenses incurred while carrying out their duties as Board members. The Chairman of the Board and the Audit Committee Chair receive additional annual retainers. Certain Trustees and Officers of the Funds are Officers and/or Directors of the Investment Manager, AMG, and/or the Distributor.
The Securities and Exchange Commission has granted an exemptive order that permits the Funds to lend and borrow money for certain temporary purposes directly to and from other eligible Funds in the AMG Funds family. Participation in this interfund lending program is voluntary for both the borrowing and lending Funds, and an interfund loan is only made if it benefits each participating Fund. The Investment Manager administers the program according to procedures approved by the Board, and the Board monitors the operation of the program. An interfund loan must comply with certain conditions set out in the exemptive order, which are designed to assure fairness and protect all participating Funds. For the six months ended March 31, 2016, the Funds neither borrowed from nor lent to other Funds in the AMG Funds family.
3. PURCHASES AND SALES OF SECURITIES
Purchases and sales of securities (excluding short-term securities and U.S. Government obligations) for the six months ended March 31, 2016, were as follows:
| | | | | | | | |
| | | Long-Term Securities | |
| Fund | | Purchases | | | Sales | |
Brandywine | | $ | 646,329,909 | | | $ | 702,883,495 | |
Brandywine Blue | | | 108,240,816 | | | | 119,714,178 | |
The Funds had no purchases or sales of U.S. Government obligations during the six months ended March 31, 2016.
4. PORTFOLIO SECURITIES LOANED
The Funds participate in the Program providing for the lending of securities to qualified brokers. Securities lending income includes earnings of such temporary cash investments, plus or minus any rebate to a borrower. These earnings (after any rebate) are then divided between BNYM, as a fee for its services under the Program, and the Funds, according to agreed-upon rates. Collateral on all securities loaned is accepted in cash and is maintained at a minimum level of 102% (105% in the case of certain foreign securities) of the market value, plus interest, if applicable, of investments on loan. It is the Funds’ policy to obtain additional collateral from or return excess collateral to the borrower by the end of the next business day, following the valuation date of the securities loaned. Therefore, the value of the collateral held may be temporarily less than the value of the securities on loan. Lending securities entails a risk of loss to the Funds if and to the extent that the market value of the securities loaned were to increase and the borrower did not increase the collateral accordingly, and the borrower fails to return the securities. Under the terms of the Program, the Funds are indemnified for such losses by BNYM. Cash collateral is held in a separate omnibus account managed by BNYM, who is authorized to exclusively enter into joint overnight government repurchase agreements. BNYM bears the risk of any deficiency in the amount of the cash collateral available for return to the borrower due to any loss on the collateral invested. At March 31, 2016, the value of the securities loaned and cash collateral received were as follows:
| | | | | | | | |
| | | Securities | | | Cash Collateral | |
| Fund | | Loaned | | | Received | |
Brandywine | | $ | 14,955,422 | | | $ | 15,279,677 | |
Brandywine Blue | | | 4,177,224 | | | | 4,275,369 | |
5. COMMITMENTS AND CONTINGENCIES
Under the Trust’s organizational documents, its trustees and officers are indemnified against certain liabilities arising out of the performance of their duties to the Trust. In addition, in the normal course of business, the Funds may enter into contracts and agreements that contain a variety of representations and warranties, which provide general indemnifications. The maximum exposure to the Funds under these arrangements is unknown, as this would involve future claims that may be made against the Funds that have not yet occurred. However, based on experience, the Funds had no prior claims or losses and expect the risks of loss to be remote.
6. MASTER NETTING AGREEMENTS
The Funds may enter into master netting agreements with their counterparties for the securities lending program and repurchase agreements, which provide the right, in the event of default (including bankruptcy or insolvency) for the non-defaulting party to liquidate the collateral and calculate net exposure to the defaulting party or request additional collateral. For financial reporting purposes, the Funds do not offset financial assets and financial liabilities that are subject to master netting agreements in the Statement of Assets and Liabilities. For securities lending transactions, see Note 4.
24
|
| |
| |
| Notes to Financial Statements (continued) |
|
The following table is a summary of the Funds’ open repurchase agreements which are subject to a master netting agreement as of March 31, 2016:
| | | | | | | | | | | | | | | | |
| | | | | | Gross Amount Not Offset in the
Statement of Assets and Liabilities | | | | |
| | | Net Amounts of Assets
Presented in the Statement
of Assets and Liabilities | | | Financial
Instruments
Collateral | | | Cash Collateral
Received | | | Net Amount | |
Brandywine | | | | | | | | | | | | | | | | |
Daiwa Capital Markets America | | $ | 3,628,952 | | | $ | 3,628,952 | | | | — | | | | — | |
JPMorgan Securities LLC | | | 763,869 | | | | 763,869 | | | | — | | | | — | |
Merrill Lynch Pierce Fenner & Smith, Inc. | | | 3,628,952 | | | | 3,628,952 | | | | — | | | | — | |
Mitsubishi UFJ Securities USA, Inc. | | | 3,628,952 | | | | 3,628,952 | | | | — | | | | — | |
RBC Capital Markets LLC | | | 3,628,952 | | | | 3,628,952 | | | | — | | | | — | |
| | | | | | | | | | | | | | | | |
Totals | | $ | 15,279,677 | | | $ | 15,279,677 | | | | — | | | | — | |
| | | | | | | | | | | | | | | | |
Brandywine Blue | | | | | | | | | | | | | | | | |
Daiwa Capital Markets America | | $ | 1,015,406 | | | $ | 1,015,406 | | | | — | | | | — | |
JPMorgan Securities LLC | | | 213,745 | | | | 213,745 | | | | — | | | | — | |
Merrill Lynch, Pierce, Fenner & Smith, Inc. | | | 1,015,406 | | | | 1,015,406 | | | | — | | | | — | |
Mitsubishi UFJ Securities USA, Inc. | | | 1,015,406 | | | | 1,015,406 | | | | — | | | | — | |
RBC Capital Markets LLC | | | 1,015,406 | | | | 1,015,406 | | | | — | | | | — | |
| | | | | | | | | | | | | | | | |
Totals | | $ | 4,275,369 | | | $ | 4,275,369 | | | | — | | | | — | |
| | | | | | | | | | | | | | | | |
7. SUBSEQUENT EVENTS
Each Fund has determined that no material events or transactions occurred through the issuance date of the Funds’ financial statements which require additional disclosure in or adjustment of the Funds’ financial statements.
25
THIS PAGE INTENTIONALLY LEFT BLANK
THIS PAGE INTENTIONALLY LEFT BLANK
THIS PAGE INTENTIONALLY LEFT BLANK
| | | | |
INVESTMENT MANAGER AND ADMINISTRATOR AMG Funds LLC 600 Steamboat Road, Suite 300 Greenwich, CT 06830 (800) 835-3879 DISTRIBUTOR AMG Distributors, Inc. 600 Steamboat Road, Suite 300 Greenwich, CT 06830 (800) 835-3879 SUBADVISOR Friess Associates, LLC P.O. Box 576 Jackson, Wyoming 83001 Friess Associates of Delaware, LLC P.O. Box 4166 Greenville, DE 19807 CUSTODIAN The Bank of New York Mellon 2 Hanson Place Brooklyn, NY 11217 | | LEGAL COUNSEL Ropes & Gray LLP Prudential Tower, 800 Boylston Street Boston, MA 02199-3600 TRANSFER AGENT BNY Mellon Investment Servicing (US) Inc. Attn: AMG Funds P.O. Box 9769 Providence, RI 02940 (800) 548-4539 TRUSTEES Bruce B. Bingham Christine C. Carsman William E. Chapman, II Edward J. Kaier Kurt A. Keilhacker Steven J. Paggioli Richard F. Powers, III Eric Rakowski Victoria L. Sassine Thomas R. Schneeweis | | This report is prepared for the Funds’ shareholders. It is authorized for distribution to prospective investors only when preceded or accompanied by an effective prospectus. To receive a free copy of the prospectus or Statement of Additional Information, which includes additional information about Fund Trustees, please contact us by calling 800.835.3879. Distributed by AMG Distributors, Inc., member FINRA/SIPC. Current net asset values per share for each Fund are available on the Funds’ website at www.amgfunds.com. A description of the policies and procedures each Fund uses to vote its proxies is available: (i) without charge, upon request, by calling 800.835.3879, or (ii) on the Securities and Exchange Commission’s (SEC) website at www.sec.gov For information regarding each Fund’s proxy voting record for the 12-month period ended June 30, call 800.835.3879 or visit the SEC website at www.sec.gov. Each Fund files its complete schedule of portfolio holdings with the SEC for the first and third quarters of each fiscal year on Form N-Q. The Fund’s Form N-Q are available on the SEC’s website at www.sec.gov. A Fund’s Form N-Q may be reviewed and copied at the SEC’s Public Reference Room in Washington, DC. Information on the operation of the Public Reference Room may be obtained by calling 1-800-SEC-0330. To review a complete list of the Fund’s portfolio holdings, or to view the most recent quarterly holdings report, semiannual report, or annual report, please visit www.amgfunds.com. |
| | | | | | |
| | | | AFFILIATE SUBADVISED FUNDS | | |
BALANCED FUNDS AMG Chicago Equity Partners Balanced Chicago Equity Partners, LLC AMG FQ Global Risk-Balanced First Quadrant, L.P. EQUITY FUNDS AMG Chicago Equity Partners Small Cap Value Chicago Equity Partners, LLC AMG FQ Tax-Managed U.S. Equity AMG FQ U.S. Equity First Quadrant, L.P. AMG Frontier Small Cap Growth Frontier Capital Management Company, LLC AMG GW&K Small Cap Core AMG GW&K Small Cap Growth GW&K Investment Management, LLC | | | | AMG Renaissance International Equity AMG Renaissance Large Cap Growth The Renaissance Group LLC AMG SouthernSun Small Cap AMG SouthernSun U.S. Equity SouthernSun Asset Management, LLC AMG Systematic Large Cap Value AMG Systematic Mid Cap Value Systematic Financial Management, L.P. AMG TimesSquare All Cap Growth AMG TimesSquare International Small Cap AMG TimesSquare Mid Cap Growth AMG TimesSquare Small Cap Growth TimesSquare Capital Management, LLC | | AMG Trilogy Emerging Markets Equity AMG Trilogy Emerging Wealth Equity AMG Trilogy Global Equity AMG Trilogy International Small Cap Trilogy Global Advisors, L.P. AMG Yacktman AMG Yacktman Focused AMG Yacktman Special Opportunities Yacktman Asset Management LP FIXED INCOME FUNDS AMG GW&K Core Bond AMG GW&K Enhanced Core Bond AMG GW&K Municipal Bond AMG GW&K Municipal Enhanced Yield GW&K Investment Management, LLC |
| | | | | | |
| | | | OPEN-ARCHITECTURE FUNDS | | |
EQUITY FUNDS AMG Managers Brandywine AMG Managers Brandywine Advisors Mid Cap Growth AMG Managers Brandywine Blue Friess Associates, LLC AMG Managers Cadence Capital Appreciation AMG Managers Cadence Emerging Companies AMG Managers Cadence Mid Cap Cadence Capital Management, LLC AMG Managers Emerging Opportunities Lord, Abbett & Co. LLC WEDGE Capital Management L.L.P. Next Century Growth Investors LLC RBC Global Asset Management (U.S.) Inc. | | | | AMG Managers Essex Small/Micro Cap Growth Essex Investment Management Co., LLC AMG Managers Real Estate Securities CenterSquare Investment Management, Inc. AMG Managers Skyline Special Equities Skyline Asset Management, L.P. AMG Managers Special Equity Ranger Investment Management, L.P. Lord, Abbett & Co. LLC Smith Asset Management Group, L.P. Federated MDTA LLC | | FIXED INCOME FUNDS AMG Managers Bond AMG Managers Global Income Opportunity Loomis, Sayles & Co., L.P. AMG Managers High Yield J.P. Morgan Investment Management Inc. AMG Managers Intermediate Duration Government AMG Managers Short Duration Government Amundi Smith Breeden LLC |
| | | | |
 | | | | www.amgfunds.com |
| | |
 | | SEMI-ANNUAL REPORT |
|
AMG Funds |
March 31, 2016  |
| AMG Managers Brandywine Advisors Mid Cap Growth Fund:BWAFX |
| | |
www.amgfunds.com | | SAR075-0316 |
| | |
|
| |
| AMG Funds |
| Semi-Annual Report—March 31, 2016 (unaudited) |
Nothing contained herein is to be considered an offer, sale or solicitation of an offer to buy shares of any series of the AMG Fund family of mutual funds. Such offering is made only by prospectus, which includes details as to offering price and other material information.
| | |
| | AMG Managers Brandywine Advisors Mid Cap Growth Fund |
DEAR FELLOW SHAREHOLDER:
Sometimes investors change their minds. What was deemed the worst start of a year ever in January became something else by the end of March, with stocks whipsawing their way out of correction territory in concert with a similarly timed bounce in oil prices. Despite the increased optimism, the comeback retained a cautious streak marked by strength in stocks from the utilities and consumer staples sectors.
Investors packed a bunch of worry into a condensed period. The March quarter got off to a rocky start when a report showing contraction in Chinese manufacturing sent Chinese stocks tumbling, stoking fears here about a looming threat to global growth. Stocks swooned with oil as concerns grew about strains on domestic producers and the state of global demand. On January 11, a report from the Royal Bank of Scotland advised investors to “sell everything” (except high quality bonds) and warned of a “cataclysmic” year ahead.
The selling was over one month later. February 11, when major indexes finished the day 10-plus percent below their previous highs, marked the low point for the quarter.
The market’s perceived headwinds abruptly changed direction: Chinese officials struck a stimulative stance in the face of uncertainty. The Federal Reserve signaled that it was likely to dial back expected interest rate increases in deference to the environment. Oil recovered as weekly data showed that domestic drilling’s contribution to supply was in persistent decline with more and more U.S. oil rigs becoming inactive each week.
AMG Managers Brandywine Advisors Mid Cap Growth Fund (“Brandywine Advisors”) finished the March quarter with a 5.04 percent decline. The S&P 500, Russell Midcap® and Russell Midcap® Growth Indexes gained 1.35, 2.24 and 0.58 percent, respectively, in the three months ended March 31, 2016.
Industrial holdings, which comprised the third largest position in the Brandywine Advisors portfolio, were the most significant detractors from performance relative to the Russell Midcap® Growth Index. The Advisory Board Co., which provides business services, was the sector’s primary influence on portfolio performance. Advisory Board exceeded the consensus estimate with 85 percent December-quarter earnings growth, but its shares declined when the company reduced 2016 earnings guidance due to unexpected issues digesting a recent acquisition.
The Fund’s biggest commitment, the technology sector, was the next most notable detractor from performance relative to the benchmark. Although the sector was home to a number of the portfolio’s best performers, including Nvidia Corp. and Sabre Corp., weakness among holdings involved with software and technology services proved to be more pronounced.
Palo Alto Networks, which exceeded the consensus estimate with a 110 percent increase in January-quarter earnings, was the biggest detractor. The company was a full-fledged participant in the market’s early-year plunge as questions arose about technology spending, prompting us to sell Palo Alto Networks to fund a new holding with better visibility. Splunk, an enterprise software maker, declined in sympathy with a competitor that cited a deteriorating macro environment for lower-than-expected sales.
Health care was the poorest performing sector in the Russell Midcap® Growth Index during the March quarter amid political rhetoric regarding drug pricing. The sector was the biggest relative performance contributor for Brandywine Advisors, where VCA was the top health care contributor. VCA, which provides hospital, pharmaceutical and laboratory testing services to the veterinary market, reported 35 percent December-quarter earnings growth, exceeding the consensus estimate by 10 percent.
Other standout performers included Norwegian Cruise Lines Holdings and Newell Rubbermaid. With new ships setting to the sea, Norwegian Cruise Lines pleased investors by hoisting its 2016 earnings guidance. In addition to announcing 14 percent December-quarter earnings growth, Newell Rubbermaid reported solid progress in its proposed merger with Jarden Corp., viewed by many as a transformative combination in the consumer goods category.
For more information on companies that influenced March-quarter performance, please see Roses & Thorns on page 6.
At the start of the June quarter, holdings from the consumer discretionary, technology and industrial sectors represent the largest portfolio positions. For more information on portfolio characteristics, please see page 5.
With the average holding in Brandywine Advisors expected to grow earnings at more than twice the rate of the average S&P 500 Index company in 2016, we’re excited to see how the rest of the year unfolds.
Thanks for your continued confidence and support. Best wishes from your entire Friess team.
|

|
Scott Gates |
Chief Investment Officer |
Friess Associates, LLC |
| | |
| | | |
| | | |
| About Your Fund’s Expenses (unaudited) | | |
|
As a shareholder of a Fund, you may incur two types of costs: (1) transaction costs, which may include sales charges (loads) on purchase payments; redemption fees; and exchange fees; and (2) ongoing costs, including management fees; distribution (12b-1) fees; and other Fund expenses. This example is intended to help you understand your ongoing costs (in dollars) of investing in the Fund and to compare these costs with the ongoing costs of investing in other mutual funds. The example is based on $1,000 invested at the beginning of the period and held for the entire period as indicated below. ACTUAL EXPENSES The first line of the following table provides information about the actual account values and actual expenses. You may use the information in this line, together with the amount you invested, to estimate the expenses that you paid over the period. Simply divide your account value by $1,000 (for example, an $8,600 account value divided by $1,000 = 8.6), then multiply the result by the number in the first line under the heading entitled “Expenses Paid During Period” to estimate the expenses you paid on your account during this period. HYPOTHETICAL EXAMPLE FOR COMPARISON PURPOSES The second line of the following table provides information about hypothetical account values and hypothetical expenses based on the Fund’s actual expense ratio and an assumed annual rate of return of 5% before expenses, which is not the Fund’s actual return. The hypothetical account values and expenses may not be used to estimate the actual ending account balance or expenses you paid for the period. You may use this information to compare the ongoing costs of investing in the Fund and other funds by comparing this 5% hypothetical example with the 5% hypothetical examples that appear in the shareholder reports of other funds. Please note that the expenses shown in the table are meant to highlight your on going costs only and do not reflect any transactional costs, such as sales charges (loads), redemption fees, or exchange fees. Therefore, the second line of the table is useful in comparing ongoing costs only, and will not help you determine the relative total costs of owning different funds. |
| | | | | | | | | | | | | | | | |
Six Months Ended March 31, 2016 | | Expense
Ratio for
the Period | | | Beginning
Account Value
10/01/15 | | | Ending
Account Value
3/31/16 | | | Expenses
Paid During
the Period* | |
AMG Managers Brandywine Advisors Mid Cap Growth Fund | |
Based on Actual Fund Return | | | 1.14 | % | | $ | 1,000 | | | $ | 935 | | | $ | 5.51 | |
Hypothetical (5% return before expenses) | | | 1.14 | % | | $ | 1,000 | | | $ | 1,019 | | | $ | 5.75 | |
| * | Expenses are equal to the Fund’s annualized expense ratio multiplied by the average account value over the period, multiplied by the number of days in the most recent fiscal half-year (183), then divided by 366. |
|
| |
| Fund Performance (unaudited) |
| Periods ended March 31, 2016 |
The table below shows the average annual total returns for the AMG Managers Brandywine Advisors Mid Cap Growth Fund, the Russell Midcap® Growth Index, the Russell Midcap® Index and the S&P 500 Index for the same time periods ended March 31, 2016.
| | | | | | | | | | | | | | | | | | |
| Average Annual Total Retuns1 | | Six Months* | | | One Year | | | Five Years | | | Ten Years | | | |
AMG Managers Brandywine Advisors Mid Cap Growth Fund2,3,4,5,6 | | | (6.48 | )% | | | (16.97 | )% | | | (1.03 | )% | | | (0.78 | )% | | |
Russell Midcap® Growth Index7 | | | 4.72 | % | | | (4.75 | )% | | | 9.99 | % | | | 7.43 | % | | |
Russell Midcap® Index8 | | | 5.94 | % | | | (4.04 | )% | | | 10.30 | % | | | 7.45 | % | | |
S&P 500 Index9 | | | 8.49 | % | | | 1.78 | % | | | 11.58 | % | | | 7.01 | % | | |
The performance data shown represents past performance. Past performance is not a guarantee of future results. Current performance may be lower or higher than the performance data quoted. The investment return and principal value of an investment in the Fund will fluctuate so that an investor’s shares, when redeemed, may be worth more or less than their original cost.
Investors should carefully consider the Fund’s investment objectives, risks, charges, and expenses before investing. For performance information through the most recent month end, current net asset values per share for the Fund and other information, please call (800) 835-3879 or visit our website at www.amgfunds.com for a free prospectus. Read it carefully before investing or sending money.
Distributed by AMG Distributors, Inc., member FINRA/SIPC.
| 1 | Total return equals income yield plus share price change and assumes reinvestment of all dividends and capital gain distributions. Returns are net of fees and may reflect offsets of Fund expenses as described in the prospectus. No adjustment has been made for taxes payable by shareholders on their reinvested dividends and capital gain distributions. Returns for periods greater than one year are annualized. The listed returns on the Fund are net of expenses and based on the published NAV as of March 31, 2016. All returns are in U.S. dollars ($). |
| 2 | The Fund inception dates and returns for all periods beginning prior to October 1, 2013 reflects performance of the predecessor Fund, Brandywine Advisors Midcap Growth Fund, which was managed by Friess Associates, LLC with the same investment objectives and substantially similar investment policies. |
| 3 | The Fund is subject to risks associated with investments in mid-capitalization companies such as erratic earnings patterns, competitive conditions, limited earnings history, and a reliance on one or a limited number of products |
| | |
4 | | The Fund’s investment in foreign securities, even though publicly traded in the United States, may involve risks, which are in addition to those inherent in domestic investments. |
5 | | A greater percentage of the Fund’s holdings may be focused in a smaller number of securities which may place the Fund at greater risk than a more diversified fund. |
6 | | Active and frequent trading of a fund may result in higher transaction costs and increased tax liability. |
7 | | The Russell Midcap® Growth Index measures the performance of the Russell Midcap companies with higher price-to-book ratios and higher forecasted growth values. The stocks are also members of the Russell 1000® Growth Index. Unlike the Fund, the Indices are unmanaged, are not available for investment, and do not incur expenses. |
8 | | The Russell Midcap® Index measures the performance of the 800 smallest companies in the Russell 1000® Index, which represent approximately 25 percent of the total market capitalization of the Russell 1000® Index. Unlike the Fund, the Indices are unmanaged, are not available for investment, and do not incur expenses. |
9 | | The S&P 500 Index is capitalization-weighted index of 500 stocks. The S&P 500 Index is designed to measure performance of the broad domestic economy through changes in the aggregate market value of 500 stocks representing all major industries. Unlike the Fund, the Index is unmanaged, are not available for investment, and do not incur expenses. |
| |
| The Russell Indices are trademarks of the London Stock Exchange Group compaines. |
| |
| The S&P 500 Index is proprietary data of Standard & Poor’s, a division of McGraw-Hill Companies, Inc. All rights reserved. |
| |
| Not FDIC insured, nor bank guaranteed. May lose value. |
4
| | |
| AMG Managers Brandywine Advisors Mid Cap Growth Fund |
| Fund Snapshots (unaudited) | | |
| March 31,2016 | | |
PORTFOLIO BREAKDOWN
| | | | | | | | | | | | | | | | |
| | | Brandywine | | | | | | | | | | |
| | | Advisors | | | Russell | | | | | | | |
| | | Mid Cap | | | Midcap® | | | Russell | | | S&P | |
| | | Growth | | | Growth | | | Midcap® | | | 500 | |
Industry (Top Ten) | | Fund* | | | Index | | | Index | | | Index | |
Semiconductors | | | 10.5 | % | | | 3.7 | % | | | 3.0 | % | | | 2.8 | % |
Data Processing & Outsourced Services | | | 7.3 | % | | | 1.9 | % | | | 1.2 | % | | | 0.3 | % |
Housewares & Specialties | | | 5.8 | % | | | 2.2 | % | | | 1.9 | % | | | 0.5 | % |
Building Products | | | 5.2 | % | | | 1.2 | % | | | 0.8 | % | | | 0.1 | % |
Health Care Facilities | | | 5.2 | % | | | 2.4 | % | | | 2.1 | % | | | 2.7 | % |
Life Sciences Tools & Services | | | 4.0 | % | | | 1.2 | % | | | 1.1 | % | | | 0.6 | % |
Apparel, Accessories & Luxury Goods | | | 3.9 | % | | | 2.1 | % | | | 1.4 | % | | | 0.9 | % |
Household Products | | | 3.2 | % | | | 1.0 | % | | | 0.6 | % | | | 2.0 | % |
Hotels, Resorts & Cruise Lines | | | 3.1 | % | | | 3.8 | % | | | 2.5 | % | | | 1.9 | % |
Diversified Support Services | | | 3.0 | % | | | 0.5 | % | | | 0.3 | % | | | 0.0 | % |
Other Common Stock | | | 43.8 | % | | | 80.0 | % | | | 85.1 | % | | | 88.2 | % |
Cash & Cash Equivalents† | | | 5.0 | % | | | 0.0 | % | | | 0.0 | % | | | 0.0 | % |
|
* As a percentage of net assets. | |
† Includes Other Assets and Liabilities. | |
TOP TEN HOLDINGS
| | | | | | | | |
| | | | | | | |
| | | | | | | |
Security Name | | % of
Net Assets | | | % Change
from
Book Cost | |
Broadcom, Ltd. | | | 3.9 | % | | | 75.7 | % |
Jarden Corp.* | | | 3.3 | % | | | 22.0 | % |
Church & Dwight Co., Inc. | | | 3.2 | % | | | 20.7 | % |
Norwegian Cruise Line Holdings, Ltd. | | | 3.1 | % | | | 29.2 | % |
KAR Auction Services, Inc.* | | | 3.0 | % | | | 19.7 | % |
Integra LifeSciences Holdings Corp.* | | | 3.0 | % | | | 9.6 | % |
VCA, Inc. | | | 2.8 | % | | | 14.2 | % |
American Eagle Outfitters, Inc. | | | 2.8 | % | | | 19.8 | % |
Allegion PLC | | | 2.7 | % | | | (0.8 | )% |
NVIDIA Corp. | | | 2.7 | % | | | 35.2 | % |
| | | | | | | | |
Top Ten as a Group | | | 30.5 | % | | | | |
| | | | | | | | |
|
* Also Top Ten Holding as of December 31, 2015. | |
|
PORTFOLIO MARKET CAPITALIZATION |
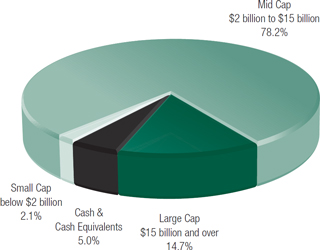 |
| |
|
| ESTIMATED EARNINGS GROWTH RATE |
| OF THE FUND’S INVESTMENTS |
|
Forecasted Increase in Earnings Per Share 2016 vs 2015 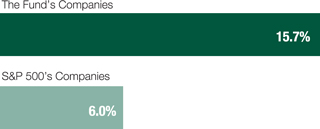
|
Source: Consensus estimates from FactSet Research Systems Inc. |
| This is not a forecast of the Fund’s future performance. Earnings growth for a Fund holding does not guarantee a corresponding increase in the market value of the holding or the Fund. |
Because a fund’s strategy may result in multiple investments in particular sectors of the economy, its performance may depend on the performance of those sectors and may fluctuate more widely than investments diversified across more sectors. For additional information on these and other risk considerations, please see the Fund’s prospectus.
Any sectors, industries, or securities discussed should not be perceived as investment recommendations. Mention of a specific security should not be considered a recommendation to buy or solicitation to sell that security. Specific securities mentioned in this report may have been sold from the Fund’s portfolio of investments by the time you receive this report.
5
|
AMG Managers Brandywine Advisors Mid Cap Growth Fund Roses and Thorns (unaudited) Quarter Ending March 31, 2016 |
| | | | | | | | |
$ Gain (in millions) | | | % Gain | | | Biggest $ Winners Reason for Move |
| | | | | | | | NVIDIA Corp. (NVDA) |
| $ | 0.9 | | | | 35.2 | % | | The developer of graphic semiconductor chips reported January-quarter earnings of $0.35 per share, exceeding the consensus estimate. High-end gaming and data center demand drove 7 percent revenue growth. Automobile end markets continued to play a notable role in earnings due to increased penetration in infotainment and digital instrument clusters. |
| | |
| | | | | | | | Norwegian Cruise Lines Holdings Ltd. (NCLH) |
| $ | 0.9 | | | | 29.2 | % | | The global cruise line operator reported December-quarter earnings of $0.51 per share, up from $0.36 in the year-ago period. Shares gained in the quarter as the company raised 2016 earnings guidance, citing new ships in operation and a related improvement in pricing. |
| | |
| | | | | | | | Newell Rubbermaid Inc. (NWL) |
| $ | 0.7 | | | | 28.1 | % | | The consumer and commercial products company grew December-quarter earnings 14 percent on 6 percent revenue growth. Sales in the business segment that makes baby products, such as Graco strollers, and the segment that makes writing implements, such as Sharpie markers, exceeded expectations. Newell Rubbermaid is on schedule to complete its announced acquisition of Jarden Corp., which is expected to expand the combined company’s reach and generate significant cost savings. |
| | |
| | | | | | | | Dick’s Sporting Goods Inc. (DKS) |
| $ | 0.6 | | | | 24.2 | % | | The sporting goods retailer reported January-quarter earnings of $1.12 per share. Revenue grew 4 percent. Shares rose in the quarter as investors focused on the opportunity to gain significant market share arising from the restructuring of a key competitor. Dick’s announced it planned to bring its e-commerce platform in-house, which is expected to generate significant savings. |
| | |
| | | | | | | | Sabre Corp. (SABR) |
| $ | 0.5 | | | | 20.7 | % | | The provider of technology solutions to the travel and leisure industry grew December-quarter earnings 23 percent, beating the consensus estimate. Shares gained ground in the quarter as Sabre successfully integrated American Airlines onto its electronic reservations platform. The company provided upbeat guidance for 2016, driven by trends in the airline and hospitality businesses. |
| | |
$ Loss (in millions) | | | % Loss | | | Biggest $ Losers Reason for Move |
| | | | | | | | Splunk Inc. (SPLK) |
| $ | 1.5 | | | | 44.3 | % | | The enterprise software developer offers users a platform to collect, organize and analyze machine data. Shares fell after a competitor reported lower sales due to a weakening macro environment. We sold Splunk to fund a new opportunity. |
| | |
| | | | | | | | OneMain Holdings Inc. (OMF) |
| $ | 1.4 | | | | 40.5 | % | | The store-based personal finance company provides consumer finance and credit insurance products to the sub-prime market. Shares declined due to investor concerns surrounding expected cost savings from recent acquisitions and the company’s ability to access capital markets to fund growth. We sold OneMain to fund a new holding with greater visibility. |
| | |
| | | | | | | | The Advisory Board Co. (ABCO) |
| $ | 1.4 | | | | 50.8 | % | | The technology and consulting firm focused on the health care and higher education markets grew December-quarter earnings 85 percent, exceeding the consensus estimate. Shares traded lower when the company reduced 2016 earnings guidance. The change in outlook raised questions about the pace at which synergies related to Advisory Board’s recent acquisition of Royall & Co. might begin contributing to results. We sold the Advisory Board to fund a new holding with better visibility. |
| | |
| | | | | | | | Imperva Inc. (IMPV) |
| $ | 1.0 | | | | 33.1 | % | | The provider of database and application security, reporting and audit solutions reported December-quarter earnings of $0.20 per share versus a loss in the year-ago period, beating the consensus estimate. Revenue increased 41 percent, also exceeding expectations. Shares traded lower due to higher-than-expected guidance for upcoming operating expenses. We sold Imperva to fund a new opportunity with greater earnings visiblity. |
| | |
| | | | | | | | Luxoft Holding Inc. (LXFT) |
| $ | 1.0 | | | | 25.7 | % | | The provider of software development services and information technology solutions reported $0.72 per share in December-quarter earnings. Flat growth among some of the company’s larger customers and exposure to the European financial sector weighed on Luxoft’s share price, prompting our sale to fund an idea with greater near-term earnings visibility. |
All gains/losses are calculated on an average cost basis from December 31, 2015 through March 31, 2016.
This commentary reflects the viewpoints of Friess Associates, LLC as of March 31, 2016 and is not intended as a forecast or guarantee of future results.
6
|
| AMG Managers Brandywine Advisors Mid Cap Growth Fund |
| Schedule of Portfolio Investments (unaudited) |
| March 31, 2016 |
| | | | | | | | | | |
Shares | | Cost | | | Value | |
Common Stocks - 95.0% | |
Consumer Discretionary | | | | | |
| | Apparel Retail - 2.7% | |
| 221,165 | | American Eagle Outfitters, Inc. | | $ | 3,077,033 | | | $ | 3,686,821 | |
| | Apparel, Accessories & Luxury Goods - 3.9% | | | | | |
| 66,300 | | Coach, Inc. | | | 2,585,691 | | | | 2,657,967 | |
| 43,250 | | Columbia Sportswear Co. | | | 2,483,025 | | | | 2,598,892 | |
| | Automotive Retail - 0.9% | | | | | | | | |
| 18,810 | | Murphy USA, Inc.* | | | 1,014,425 | | | | 1,155,874 | |
| | Footwear - 1.9% | |
| 81,630 | | Skechers U.S.A., Inc., Class A* | | | 2,562,430 | | | | 2,485,633 | |
| | General Merchandise Stores - 2.0% | | | | | |
| 32,000 | | Dollar Tree, Inc.* | | | 2,656,653 | | | | 2,638,720 | |
| | Homebuilding - 2.6% | |
| 113,425 | | D.R. Horton, Inc. | | | 3,140,760 | | | | 3,428,838 | |
| | Hotels, Resorts & Cruise Lines - 3.1% | | | | | |
| 73,995 | | Norwegian Cruise Line Holdings, Ltd.* | | | 3,167,130 | | | | 4,091,184 | |
| | Housewares & Specialties - 5.8% | | | | | |
| 75,000 | | Jarden Corp.* | | | 3,623,616 | | | | 4,421,250 | |
| 76,000 | | Newell Rubbermaid, Inc.1 | | | 2,628,180 | | | | 3,366,040 | |
| | Leisure Products - 1.9% | |
| 26,400 | | Polaris Industries, Inc.1 | | | 2,618,304 | | | | 2,599,872 | |
| | Specialty Stores - 2.5% | |
| 71,850 | | Dick’s Sporting Goods, Inc. | | | 2,704,426 | | | | 3,358,987 | |
| | | | | | | | | | |
Total Consumer Discretionary | | | 32,261,673 | | | | 36,490,078 | |
| | This sector is 13.1% above your Fund’s cost. | | | | | |
| | |
Consumer Staples | | | | | | | | |
| | Household Products - 3.2% | |
| 45,810 | | Church & Dwight Co., Inc. | | | 3,499,882 | | | | 4,222,766 | |
| | This sector is 20.7% above your Fund’s cost. | | | | | |
| | |
Financials | | | | | | | | |
| | Consumer Finance - 2.0% | |
| 52,000 | | Discover Financial Services | | | 2,614,414 | | | | 2,647,840 | |
| | Property & Casualty Insurance - 1.8% | | | | | |
| 70,925 | | FNF Group | | | 2,329,345 | | | | 2,404,357 | |
| | | | | | | | | | |
Total Financials | | | 4,943,759 | | | | 5,052,197 | |
| | This sector is 2.2% above your Fund’s cost. | | | | | |
| | |
Health Care | | | | | | | | |
| | Health Care Equipment - 3.0% | |
| 59,445 | | Integra LifeSciences Holdings Corp.* | | | 3,652,273 | | | | 4,004,215 | |
| | Health Care Facilities - 5.2% | |
| 41,900 | | AmSurg Corp.* | | | 3,421,635 | | | | 3,125,740 | |
| 65,500 | | VCA, Inc.* | | | 3,307,930 | | | | 3,778,695 | |
| | | | | | | | | | |
Shares | | Cost | | | Value | |
| | Life Sciences Tools & Services - 4.0% | | | | | |
| 67,410 | | INC Research Holdings, Inc., Class A* | | $ | 3,006,127 | | | $ | 2,777,966 | |
| 18,700 | | Thermo Fisher Scientific, Inc. | | | 2,472,443 | | | | 2,647,733 | |
| | | | | | | | | | |
Total Health Care | | | 15,860,408 | | | | 16,334,349 | |
| | This sector is 3.0% above your Fund’s cost. | | | | | |
Industrials | | | | | | | | |
| | Aerospace & Defense - 1.8% | | | | | |
| 27,745 | | Orbital ATK, Inc. | | | 2,283,547 | | | | 2,412,150 | |
| | Building Products - 5.2% | | | | | |
| 57,860 | | Allegion PLC | | | 3,717,589 | | | | 3,686,261 | |
| 24,000 | | Lennox International, Inc. | | | 2,801,237 | | | | 3,244,560 | |
| | Construction & Engineering - 2.1% | | | | | |
| 43,510 | | Dycom Industries, Inc.*,1 | | | 3,470,493 | | | | 2,813,792 | |
| | Diversified Support Services - 3.0% | | | | | |
| 105,700 | | KAR Auction Services, Inc. | | | 3,367,813 | | | | 4,031,398 | |
| | Environmental & Facilities Services - 2.6% | | | | | |
| 53,300 | | Waste Connections, Inc. | | | 2,561,662 | | | | 3,442,647 | |
| | Human Resources & Employment Services - 2.1% | | | | | |
| 76,700 | | On Assignment, Inc.* | | | 3,383,906 | | | | 2,831,764 | |
| | Trading Companies & Distributors - 2.0% | | | | | |
| 66,270 | | Beacon Roofing Supply, Inc.* | | | 2,568,891 | | | | 2,717,733 | |
| | | | | | | | | | |
Total Industrials | | | 24,155,138 | | | | 25,180,305 | |
| | This sector is 4.2% above your Fund’s cost. | | | | | |
| |
Information Technology | | | | | |
| | Application Software - 2.5% | |
| 61,000 | | Guidewire Software, Inc.* | | | 3,179,225 | | | | 3,323,280 | |
| | Communications Equipment - 1.5% | |
| 128,300 | | Infinera Corp.*,1 | | | 1,947,020 | | | | 2,060,498 | |
| | Data Processing & Outsourced Services - 7.3% | | | | | |
| | Black Knight Financial Services, Inc., | | | | | |
| 99,895 | | Class A*,1 | | | 2,631,732 | | | | 3,099,742 | |
| 112,500 | | Sabre Corp. | | | 2,694,854 | | | | 3,253,500 | |
| 63,700 | | Vantiv, Inc., Class A* | | | 2,940,607 | | | | 3,432,156 | |
| | Electronic Equipment & Instruments - 0.8% | | | | | |
| 69,920 | | Fitbit, Inc.* | | | 1,058,608 | | | | 1,059,288 | |
| | Home Entertainment Software - 2.2% | | | | | |
| 45,400 | | Electronic Arts, Inc.* | | | 3,402,207 | | | | 3,001,394 | |
| | Semiconductors - 10.5% | |
| 33,815 | | Broadcom, Ltd. | | | 2,973,996 | | | | 5,224,418 | |
| 46,100 | | Mellanox Technologies, Ltd.* | | | 2,404,811 | | | | 2,504,613 | |
| 100,000 | | NVIDIA Corp. | | | 2,636,089 | | | | 3,563,000 | |
| 54,000 | | Qorvo, Inc.* | | | 2,387,804 | | | | 2,722,140 | |
The accompanying notes are an integral part of these financial statements.
7
|
| |
| AMG Managers Brandywine Advisors Mid Cap Growth Fund |
| Schedule of Portfolio Investments (continued) |
|
| | | | | | | | | | |
Shares | | Cost | | | Value | |
Information Technology (continued) | |
| | Systems Software - 2.2% | |
| 53,400 | | Proofpoint, Inc.* | | $ | 3,803,810 | | | $ | 2,871,852 | |
| | | | | | | | | | |
Total Information Technology | | | 32,060,763 | | | | 36,115,881 | |
This sector is 12.6% above your Fund’s cost. | |
Materials | |
| | Construction Materials - 2.7% | |
| 33,600 | | Vulcan Materials Co. | | | 3,007,073 | | | | 3,547,152 | |
This sector is 18.0% above your Fund’s cost. | |
| | |
Total Common Stocks | | | 115,788,696 | | | | 126,942,728 | |
| | | |
| | | | | Principal | | | | |
| | | | | Amount | | | | |
Short-Term Investments - 10.5% | |
Commercial Paper - 5.2% | |
| | Autonation, Inc., 0.95%, 04/01/16 | | $ | 6,900,000 | | | | 6,900,000 | |
Repurchase Agreements - 5.0%2 | |
| | HSBC Securities International, Inc., dated 03/31/16, due 04/01/16, 0.290%, total to be received $1,600,373 (collateralized by various U.S. Government Agency Obligations, 1.375% - 6.500%, 07/01/18 - 03/01/46, totaling $1,632,370) | | | 1,600,360 | | | | 1,600,360 | |
| | JPMorgan Securities LLC, dated 03/31/16, due 04/01/16, 0.310%, total to be received $336,893 (secured by various U.S. Government Agency Obligations, 0.875%-1.375%,02/28/17- 03/31/20, totaling $343,631) | | | 336,890 | | | | 336,890 | |
| | Merrill Lynch Pierce Fenner & Smith Inc, dated 03/31/16, due 04/01/16, 0.300%, total to be received $1,600,373 (collateralized by various U.S. Government Agency Obligations, 1.406% - 7.000%, 05/15/24 - 01/20/66, totaling $1,632,367) | | | 1,600,360 | | | | 1,600,360 | |
| | | | | | | | | | |
Shares | | | | Principal Amount | | | Value | |
| | Mizuho Securities USA Inc, dated 03/31/16, due 04/01/16, 0.340%, total to be received $1,600,375 (collateralized by various U.S. Government Agency Obligations, 1.944% - 9.500%, 10/01/19 - 06/01/44, totaling $1,632,367) | | $ | 1,600,360 | | | $ | 1,600,360 | |
| | RBC Capital Markets LLC, dated 03/31/16, due 04/01/16, 0.280%, total to be received $1,600,372 (secured by U.S. Government Agencies, 1.750% - 6.000%, 06/01/18 - 04/01/46, totaling $1,632,367) | | | 1,600,360 | | | | 1,600,360 | |
| | | | | | | | | | |
Total Repurchase Agreements | | | 6,738,330 | | | | 6,738,330 | |
| | | |
| | | | | Cost | | | | |
Other Investment Companies - 0.3%3 | |
479,943 | | Dreyfus Institutional Cash Advantage Fund, Institutional Class Shares, 0.38% | | | 479,943 | | | | 479,943 | |
| | | | | | | | | | |
Total Short-Term Investments | | | 14,118,273 | | | | 14,118,273 | |
Total Investments - 105.5% | | $ | 129,906,969 | | | | 141,061,001 | |
| | | | | | | | | | |
Other Assets, less Liabilities - (5.5)% | | | | | | | (7,388,721 | ) |
Total Net Assets - 100.0% | | | | | | $ | 133,672,280 | |
| | | | | | | | | | |
The accompanying notes are an integral part of these financial statements.
8
|
| |
| |
| Notes to Schedule of Portfolio Investments (unaudited) |
The following footnotes should be read in conjunction with the Schedule of Portfolio Investments previously presented in this report.
Based on the approximate cost of investments of $129,946,101 for federal income tax purposes at March 31, 2016, the aggregate gross unrealized appreciation and depreciation were $14,325,060 and $3,210,160, respectively, resulting in net unrealized appreciation of investments of $11,114,900.
| * | Non-income producing security. |
| 1 | Some or all of these securities, amounting to a market value of $6,640,950, or 5.0% of net assets, were out on loan to various brokers. |
| 2 | Collateral received from brokers for securities lending was invested in these short-term investments. |
| 3 | Yield shown represents the March 31, 2016, seven-day average yield, which refers to the sum of the previous seven days’ dividends paid, expressed as an annual percentage. |
The following table summarizes the inputs used to value the Fund’s investments by the fair value hierarchy levels as of March 31, 2016. (See Note 1(a) in the Notes to the Financial Statements.)
| | | | | | | | | | | | | | | | |
| | | Quoted Prices in Active | | | | | | | | | | |
| | | Markets for Identical | | | Significant Other | | | Significant | | | | |
| | | Investments | | | Observable Inputs | | | Unobservable Inputs | | | | |
| | | Level 1 | | | Level 2 | | | Level 3 | | | Total | |
AMG Managers Brandywine Advisors Mid Cap Growth Fund | | | | | | | | | | | | | | | | |
Investments in Securities | | | | | | | | | | | | | | | | |
Common Stocks† | | $ | 126,942,728 | | | | — | | | | — | | | $ | 126,942,728 | |
Short-Term Investments | | | | | | | | | | | | | | | | |
Commercial Paper | | | — | | | $ | 6,900,000 | | | | — | | | | 6,900,000 | |
Repurchase Agreements | | | — | | | | 6,738,330 | | | | — | | | | 6,738,330 | |
Other Investment Companies | | | 479,943 | | | | — | | | | — | | | | 479,943 | |
| | | | | | | | | | | | | | | | |
Total Investments in Securities | | $ | 127,422,671 | | | $ | 13,638,330 | | | | — | | | $ | 141,061,001 | |
| | | | | | | | | | | | | | | | |
| † | All common stocks held in the Fund are Level 1 securities. For a detailed breakout of the common stocks by major industry classification, please refer to the Schedule of Portfolio Investments. |
As of March 31, 2016, the Fund had no transfers between levels from the beginning of the reporting period.
The accompanying notes are an integral part of these financial statements.
9
|
| |
| Statement of Assets and Liabilities (unaudited) |
| March 31, 2016 |
| | | | |
Assets: | | | | |
Investments at value* (including securities on loan valued at $6,640,950) | | $ | 141,061,001 | |
Receivable for investments sold | | | 5,681,939 | |
Dividends, interest and other receivables | | | 45,335 | |
Receivable for Fund shares sold | | | 87,418 | |
Prepaid expenses | | | 11,237 | |
Total assets | | | 146,886,930 | |
Liabilities: | | | | |
Payable upon return of securities loaned | | | 6,738,330 | |
Payable for investments purchased | | | 6,329,675 | |
Payable for Fund shares repurchased | | | 3,364 | |
Accrued expenses: | | | | |
Investment advisory and management fees | | | 109,797 | |
Administrative fees | | | 3,294 | |
Shareholder servicing fees | | | 1,098 | |
Distribution fees | | | 769 | |
Trustees fees and expenses | | | 2,095 | |
Other | | | 26,228 | |
Total liabilities | | | 13,214,650 | |
| |
Net Assets | | $ | 133,672,280 | |
| |
Net Assets Represent: | | | | |
Paid-in capital | | $ | 158,755,229 | |
Accumulated net investment loss | | | (267,978 | ) |
Accumulated net realized loss from investments | | | (35,969,003 | ) |
Net unrealized appreciation of investments | | | 11,154,032 | |
Net Assets | | $ | 133,672,280 | |
Shares outstanding | | | 15,438,060 | |
Net asset value, offering and redemption price per share | | $ | 8.66 | |
* Investments at cost | | $ | 129,906,969 | |
The accompanying notes are an integral part of these financial statements.
10
|
| |
| Statement of Operations (unaudited) |
| For the six months ended March 31, 2016 |
| | | | |
Investment Income: | | | | |
Dividend income | | $ | 459,018 | |
Securities lending income | | | 8,511 | |
Interest income | | | 38,652 | |
Total investment income | | | 506,181 | |
Expenses: | | | | |
Investment advisory and management fees | | | 679,972 | |
Administrative fees | | | 20,399 | |
Shareholder servicing fees | | | 6,805 | |
Distribution fees | | | 4,764 | |
Professional fees | | | 23,046 | |
Reports to shareholders | | | 11,513 | |
Registration fees | | | 9,273 | |
Custodian | | | 8,534 | |
Trustees fees and expenses | | | 5,121 | |
Transfer agent | | | 2,193 | |
Miscellaneous | | | 2,539 | |
Total expenses | | | 774,159 | |
| |
Net investment loss | | | (267,978 | ) |
Net Realized and Unrealized Gain (Loss): | | | | |
Net realized loss on investments | | | (19,619,383 | ) |
Net change in unrealized appreciation (depreciation) of investments | | | 10,588,609 | |
Net realized and unrealized loss | | | (9,030,774 | ) |
| |
Net decrease in net assets resulting from operations | | $ | (9,298,752 | ) |
The accompanying notes are an integral part of these financial statements.
11
|
| |
| Statements of Changes in Net Assets |
| For the six months ended March 31, 2016 (unaudited) and the fiscal year ended September 30, 2015 |
| | | | | | | | |
| | | March 31,
2016 | | | September 31,
2015 | |
Increase (Decrease) in Net Assets Resulting From Operations: | | | | | | | | |
Net investment income (loss) | | $ | (267,978 | ) | | $ | 430,399 | |
Net realized gain (loss) on investments | | | (19,619,383 | ) | | | 9,561,931 | |
Net change in unrealized appreciation (depreciation) of investments | | | 10,588,609 | | | | (15,157,148 | ) |
Net decrease in net assets resulting from operations | | | (9,298,752 | ) | | | (5,164,818 | ) |
Capital Share Transactions: | | | | | | | | |
Proceeds from sale of shares | | | 156,317 | | | | 364,434 | |
Cost of shares repurchased | | | (390,215 | ) | | | (841,589 | ) |
Net decrease from capital share transactions | | | (233,898 | ) | | | (477,155 | ) |
| | |
Total decrease in net assets | | | (9,532,650 | ) | | | (5,641,973 | ) |
Net Assets: | | | | | | | | |
Beginning of period | | | 143,204,930 | | | | 148,846,903 | |
End of period | | $ | 133,672,280 | | | $ | 143,204,930 | |
End of year accumulated net investment loss | | $ | (267,978 | ) | | | — | |
| | | | | | | | |
| | |
Share Transactions: | | | | | | | | |
Sale of shares | | | 17,982 | | | | 36,485 | |
Shares repurchased | | | (44,971 | ) | | | (86,420 | ) |
Net decrease in shares | | | (26,989 | ) | | | (49,935 | ) |
The accompanying notes are an integral part of these financial statements.
12
|
| AMG Managers Brandywine Advisors Mid Cap Growth Fund |
| Financial Highlights |
| For a share outstanding throughout each fiscal period |
| | | | | | | | | | | | | | | | | | | | | | | | |
| | | For the six
months ended
March 31, 2016
(unaudited) | | | | |
| | | For the fiscal years ended September 30, | |
| | | 2015 | | | 20142 | | | 2013 | | | 2012 | | | 2011 | |
Net Asset Value, Beginning of Period | | $ | 9.26 | | | $ | 9.59 | | | $ | 8.80 | | | $ | 7.63 | | | $ | 6.82 | | | $ | 7.13 | |
Income (loss) from Investment Operations: | | | | | | | | | | | | | | | | | | | | | | | | |
Net investment income (loss)1 | | | (0.02 | ) | | | 0.03 | 3 | | | (0.05 | ) | | | (0.02 | ) | | | (0.03 | ) | | | (0.05 | ) |
Net realized and unrealized gain (loss) on investments | | | (0.58 | ) | | | (0.36 | ) | | | 0.84 | | | | 1.20 | | | | 0.84 | | | | (0.26 | ) |
Total income (loss) from investment operations | | | (0.60 | ) | | | (0.33 | ) | | | 0.79 | | | | 1.18 | | | | 0.81 | | | | (0.31 | ) |
Distributions to Shareholders from: | | | | | | | | | | | | | | | | | | | | | | | | |
Net investment income | | | — | | | | — | | | | — | | | | (0.01 | ) | | | — | | | | — | |
Net Asset Value, End of Period | | $ | 8.66 | | | $ | 9.26 | | | $ | 9.59 | | | $ | 8.80 | | | $ | 7.63 | | | $ | 6.82 | |
Total Return | | | (6.48 | )%5 | | | (3.44 | )% | | | 8.98 | % | | | 15.43 | % | | | 11.88 | % | | | (4.35 | )% |
Ratio of total expenses to average net assets | | | 1.14 | %6 | | | 1.14 | % | | | 1.12 | % | | | 1.22 | % | | | 1.22 | %4 | | | 1.25 | %4 |
Ratio of net investment income (loss) to average net assets | | | (0.39 | )%6 | | | 0.28 | % | | | (0.54 | )% | | | (0.20 | )% | | | (0.37 | )% | | | (0.63 | )% |
Portfolio turnover | | | 116 | %5 | | | 204 | % | | | 249 | % | | | 235 | % | | | 266 | % | | | 241 | % |
Net assets at end of period (000’s omitted) | | $ | 133,672 | | | $ | 143,205 | | | $ | 148,847 | | | $ | 137,246 | | | $ | 119,769 | | | $ | 122,926 | |
| | | | | | | | | | | | | | | | | | | | | | | | |
Notes to Financial Highlights (unaudited)
| 1 | Per share numbers have been calculated using average shares. |
| 2 | At the start of business October 1, 2013, AMG Managers Brandywine Advisors Midcap Growth Fund was re-organized into a fund of AMG Funds I. |
| 3 | Includes non-recurring dividends. Without these dividends, net investment loss per share would have been $(0.03). |
| 4 | Interest expense is less than 0.005% of average net assets. |
13
|
| |
| Notes to Financial Statements (unaudited) |
| March 31, 2016 |
|
1. SUMMARY OF SIGNIFICANT ACCOUNTING POLICIES
AMG Funds I (the “Trust”) is an open-end management investment company, organized as a Massachusetts business trust and registered under the Investment Company Act of 1940, as amended (the “1940 Act”). Currently, the Trust consists of a number of different funds, each having distinct investment management objectives, strategies, risks, and policies. Included in this report is the AMG Managers Brandywine Advisors Mid Cap Growth Fund (the “Fund”).
At the start of business on October 1, 2013, Brandywine Advisors Midcap Growth Fund, a series of Brandywine Blue Fund, Inc. (the “Predecessor Fund”), was reorganized into a fund of the Trust. As a result of the reorganization, the Fund is the successor to the accounting and performance information of the Predecessor Fund.
The Fund’s financial statements are prepared in accordance with accounting principles generally accepted in the United States of America (“U.S. GAAP”), which require management to make estimates and assumptions that affect the reported amount of assets and liabilities and disclosure of contingent assets and liabilities at the date of the financial statements and the reported amounts of income and expenses during the reporting periods. Actual results could differ from those estimates and such differences may be material. The following is a summary of significant accounting policies followed by the Fund in the preparation of its financial statements:
a. VALUATION OF INVESTMENTS
Equity securities traded on a national securities exchange or reported on the NASDAQ national market system (“NMS”) are valued at the last quoted sales price on the primary exchange or, if applicable, the NASDAQ official closing price or the official closing price of the relevant exchange or, lacking any sales, at the last quoted bid price or the mean between the last quoted bid and ask prices (the “exchange mean price”). Equity securities traded in the over-the-counter market (other than NMS securities) are valued at the exchange mean price. Foreign equity securities (securities principally traded in markets other than U.S. markets) are valued at the official closing price on the primary exchange or, for markets that either do not offer an official closing price or where the official closing price may not be representative of the overall market, the last quoted sale price.
Fixed income securities purchased with a remaining maturity of 60 days or less are valued at amortized cost, provided that the amortized cost value is approximately the same as the fair value of the security valued without the use of amortized cost. Investments in other open-end regulated investment companies are valued at their end of day net asset value per share.
The Fund’s portfolio investments are generally valued based on independent market quotations or prices or, if none, “evaluative” or other market based valuations provided by third-party pricing services approved by the Board of Trustees of the Trust (the “Board”). Under certain circumstances, the value of certain Fund portfolio investments (including derivatives) may be based on an evaluation of fair value, pursuant to procedures established by and under the general supervision of the Board. The Valuation Committee, which is comprised of the Independent Trustees of the Board, and the Pricing Committee, which is comprised of representatives from AMG Fund, LLC (the “Investment Manager”) are the committees appointed by the Board to make fair value determinations.
The Fund may use the fair value of a portfolio investment to calculate its net asset value (“NAV”) in the event that the market quotation, price or market based valuation for the portfolio investment is not readily available or otherwise not determinable pursuant to the Board’s valuation procedures, if the Investment Manager for the Pricing Committee believes the quotation, price or market based valuation to be unreliable, or in certain other circumstances. When determining the fair value of an investment, the Pricing Committee and, if required under the Trust’s securities valuation procedures, the Valuation Committee, seeks to determine the price that the Fund might reasonably expect to receive from current sale of that portfolio investment in an arms-length transaction. Fair value determinations shall be based upon consideration of all available facts and information, including, but not limited to (i) attributes specific to the investment; (ii) fundamental and analytical data relating to the investment; and (iii) the value of other comparable securities or relevant financial instruments, including derivative securities, traded on other markets or among dealers.
The values assigned to fair value portfolio investments are based on available information and do not necessarily represent amounts that might ultimately be realized in the future, since such amounts depend on future developments inherent in long-term investments. Because of the inherent uncertainty of valuation, those estimated values may differ significantly from the values that would have been used had a ready market for the investments existed, and the differences could be material. The Board will be presented with a quarterly report showing as of the most recent quarter end, all outstanding securities fair valued by the Fund, including a comparison with the prior quarter end and the percentage of the Fund that the security represents at each quarter end.
With respect to foreign equity securities and certain foreign fixed income securities, the Board has adopted a policy that securities held in a Fund that can be fair valued by the applicable fair value pricing service are fair valued on each business day provided that each individual price exceeds a pre-established confidence level.
U.S. GAAP defines fair value as the price that a fund would receive to sell an asset or pay to transfer a liability in an orderly transaction between market participants at the measurement date. U.S. GAAP also establishes a framework for measuring fair value, and a three-level hierarchy for fair value measurements based upon the transparency of inputs to the valuation of an asset or liability. Inputs may be observable or unobservable and refer broadly to the assumptions that market participants would use in pricing the asset or liability. Observable inputs reflect the assumptions market participants would use in pricing the asset or liability based on market data obtained from sources independent of the Fund. Unobservable inputs reflect the Fund’s own assumptions about the assumptions that market participants would use in pricing the asset or liability developed based on the best information available in the circumstances. Each investment is assigned a level based upon the observability of the inputs which are significant to the overall valuation.
The three-tier hierarchy of inputs is summarized below:
Level 1 – inputs are quoted prices in active markets for identical investments (e.g., equity securities, open-end investment companies)
|
| |
| |
| Notes to Financial Statements (continued) |
|
Level 2 – other observable inputs (including, but not limited to: quoted prices for similar assets or liabilities in markets that are active, quoted prices for identical or similar assets or liabilities in markets that are not active, inputs other than quoted prices that are observable for the assets or liabilities (such as interest rates, yield curves, volatilities, prepayment speeds, loss severities, credit risks and default rates) or other market corroborated inputs) (e.g., debt securities, government securities, foreign currency exchange contracts, foreign securities utilizing international fair value pricing, broker-quoted securities, fair valued securities with observable inputs)
Level 3 – inputs are significant unobservable inputs (including the Fund’s own assumptions used to determine the fair value of investments) (e.g., fair valued securities with unobservable inputs)
Changes in inputs or methodologies used for valuing investments may result in a transfer in or out of levels within the fair value hierarchy. The inputs or methodologies used for valuing investments may not necessarily be an indication of the risk associated with investing in those investments. Transfers between different levels of the fair value disclosure hierarchy are deemed to have occurred as of the beginning of the reporting period.
b. SECURITY TRANSACTIONS
Security transactions are accounted for as of trade date. Realized gains and losses on securities sold are determined on the basis of identified cost.
c. INVESTMENT INCOME AND EXPENSES
Dividend income is recorded on the ex-dividend date. Dividend and interest income on foreign securities is recorded gross of any withholding tax. Interest income, which includes amortization of premium and accretion of discount on debt securities, is accrued as earned. Non-cash dividends included in dividend income, if any, are reported at the fair market value of the securities received. Distributions received in excess of income from return of capital including real estate investment trusts (REITs) are recorded as a reduction of the cost of the related investment and/or as a realized gain. If the Fund no longer owns the applicable securities, any distributions received in excess of income are recorded as an adjustment to realized gain. Other income and expenses are recorded on an accrual basis. Expenses that cannot be directly attributed to a Fund are apportioned among the Funds in the Trust and in some cases other trusts within the AMG Funds family of mutual funds (collectively “AMG Funds family”) and other affiliated funds based upon their relative average net assets or number of shareholders.
The Fund has a “balance credit” arrangement with The Bank of New York Mellon (“BNYM”), the Fund’s custodian, whereby the Fund is credited with an interest factor equal to 0.75% below the effective 90-day T-Bill rate for account balances left uninvested overnight. If the T-Bill rate falls below 0.75%, no credits will be earned. These credits serve to reduce custodian expenses that would otherwise be charged to the Fund. For the six months ended March 31, 2016, the Fund’s custodian expense was not reduced.
Overdraft fees are computed at 1% above the Federal Funds rate on the day of the overdraft. For the six months ended March 31, 2016, overdraft fees for the Fund equaled $8.
d. DIVIDENDS AND DISTRIBUTIONS
Fund distributions resulting from either net investment income or realized net capital gains, if any, will normally be declared and paid at least annually in December, as described in the Fund’s prospectus. Distributions to shareholders are recorded on the ex-dividend date. Distributions are determined in accordance with federal income tax regulations, which may differ from net investment income and net realized capital gains for financial statement purposes (U.S. GAAP). Differences may be permanent or temporary. Permanent differences are reclassified among capital accounts in the financial statements to reflect their tax character. Permanent book and tax basis differences, if any, relating to shareholder distributions will result in reclassifications to paid-in capital. Temporary differences arise when certain items of income, expense and gain or loss are recognized in different periods for financial statement and tax purposes; these differences will reverse at some time in the future. Permanent differences are due to fair fund settlements and a net operating loss. Temporary differences are due to wash sales.
e. FEDERAL TAXES
The Fund intends to comply with the requirements under Subchapter M of the Internal Revenue Code of 1986, as amended, to distribute substantially all of its taxable income and gains to its shareholders and to meet certain diversification and income requirements with respect to investment companies. Therefore, no provision for federal income or excise tax is included in the accompanying financial statements.
Additionally, based on the Fund’s understanding of the tax rules and rates related to income, gains and transactions for the foreign jurisdictions in which it invests, the Fund will provide for foreign taxes, and where appropriate, deferred foreign taxes.
Management has analyzed the Fund’s tax positions taken on federal income tax returns as of September 30, 2015, and for all open tax years (generally, the three prior taxable years), and has concluded that no provision for federal income tax is required in the Fund’s financial statements. Additionally, the Fund is not aware of any tax position for which it is reasonably possible that the total amounts of unrecognized tax benefits will change materially in the next twelve months.
Net capital losses incurred in taxable years beginning after the enactment of the Regulated Investment Company Modernization Act of 2010, may be carried forward for an unlimited time period. Such losses will be required to be utilized prior to any loss carryovers incurred in pre-enactment taxable years, which generally expire eight years following the close of the taxable year in which they were incurred. As a result of this ordering rule, pre-enactment capital loss carryovers may be more likely to expire unused. Additionally, post-enactment capital losses that are carried forward retain their tax character as either short-term or long-term capital losses, unlike pre-enactment losses which are considered all short-term.
f. CAPITAL LOSS CARRYOVERS AND DEFERRALS
As of March 31, 2016, the Fund had an accumulated net realized capital loss carryover from securities transactions for federal income tax purposes as shown in the following chart. This amount may be used to offset future realized capital gains, if any, through the expiration date listed or in the case of post-enactment losses, for an unlimited time period.
|
| |
| |
| Notes to Financial Statements (continued) |
|
| | | | | | | | | | | | |
| | | Capital Loss Carryover Amounts | | | | |
| | | Short-Term | | | Long-Term | | | Expires
September 30, | |
(Pre-Enactment) | | $ | 16,310,488 | | | | — | | | | 2018 | |
| | | | | | | | | | | | |
g. CAPITAL STOCK
The Trust’s Declaration of Trust authorizes for the fund the issuance of an unlimited number of shares of beneficial interest, without par value. The Fund records sales and repurchases of its capital stock on the trade date. The cost of securities contributed to the Fund in connection with the issuance of shares is based on the valuation of those securities in accordance with the Fund’s policy on investment valuation.
At March 31, 2016, certain affiliated shareholders of record, individually or collectively, held greater than 10% of the net assets of the Fund as follows: one owns 98%. Transactions by this shareholder may have a material impact on the Fund.
h. REPURCHASE AGREEMENTS AND JOINT REPURCHASE AGREEMENTS
The Fund may enter into repurchase agreements for temporary cash management purposes provided that the value of the underlying collateral, including accrued interest, will equal or exceed the value of the repurchase agreement during the term of the agreement. The underlying collateral for all repurchase agreements is held in safekeeping by the Fund’s custodian or at the Federal Reserve Bank. If the seller defaults and the value of the collateral declines, or if bankruptcy proceedings commence with respect to the seller of the security, realization of the collateral by the Fund may be delayed or limited.
Additionally, the Fund may enter into joint repurchase agreements for reinvestment of cash collateral on securities lending transactions under the securities lending program offered by BNYM (the “Program”), provided that the value of the underlying collateral, including accrued interest, will equal or exceed the value of the joint repurchase agreement during the term of the agreement. The Fund participates on a pro rata basis with other clients of BNYM in its share of the underlying collateral under such joint repurchase agreements and in its share of proceeds from any repurchase or other disposition of the underlying collateral. The underlying collateral for joint repurchase agreements is held in safekeeping by the Fund’s custodian or at the Federal Reserve Bank. If the seller defaults and the value of the collateral declines, or if bankruptcy proceedings commence with respect to the seller of the security, realization of the collateral by the Funds may be delayed or limited. Pursuant to the Program, the Funds are indemnified for such losses by BNYM.
At March 31, 2016, the market value of repurchase agreements or joint repurchase agreements outstanding was $6,738,330, respectively.
2. AGREEMENTS AND TRANSACTIONS WITH AFFILIATES
The Trust has entered into an investment advisory agreement under which the Investment Manager, a subsidiary and the U.S. retail distribution arm of Affiliated
Managers Group, Inc. (“AMG”), serves as investment manager to the Fund and is responsible for the Fund’s overall administration and operations. The Investment Manager selects subadvisors for the Fund (subject to Board approval) and monitors the subadvisor’s investment performance, security holdings and investment strategies. The Fund’s investment portfolio is managed by Friess Associates, LLC (“Friess”) through a subadvisory agreement between the Investment Manager and Friess relating to the Fund, and Friess Associates of Delaware, LLC (“Friess of Delaware”) through a sub-subadvisory agreement among the Investment Manager, Friess and Friess of Delaware relating to the Fund.
Investment management fees are paid directly by the Fund to the Investment Manager based on average daily net assets. For the six months ended March 31, 2016, the Fund paid an investment management fee at the annual rate of 1.00% of the average daily net assets of the Fund.
The Fund has entered into an Administration and Shareholder Servicing Agreement under which the Investment Manager serves as the Fund’s administrator (the “Administrator”) and is responsible for all aspects of managing the Fund’s operations, including administration and shareholder services to the Fund, its shareholders, and certain institutions, such as bank trust departments, broker-dealers and registered investment advisers, that advise or act as intermediary with the Fund’s shareholders. The Fund pays a fee to the Administrator at the rate of 0.03% of the Fund’s average daily net assets for the first $300 million of assets under management, 0.025% for the next $200 million, and 0.02% on amounts in excess of $500 million per annum, subject to a $40,000 annual minimum.
The Fund is distributed by AMG Distributors, Inc. (the “Distributor”), a wholly-owned subsidiary of the Investment Manager. The Distributor serves as the distributor and underwriter for the Fund and is a registered broker-dealer and member of the Financial Industry Regulatory Authority, Inc. (“FINRA”). Shares of the Fund will be continuously offered and will be sold directly to prospective purchasers and through brokers, dealers or other financial intermediaries who have executed selling agreements with the Distributor. Subject to the compensation arrangement discussed below, generally the Distributor bears all or a portion of the expenses of providing services pursuant to the distribution agreement, including the payment of the expenses relating to the distribution of prospectuses for sales purposes and any advertising or sales literature.
The Trust has adopted a distribution and service plan (the “Plan”) with respect to the Fund in accordance with the requirements of Rule 12b-1 under the 1940 Act and the requirements of the applicable rules of FINRA regarding asset based sales charges. Pursuant to the Plan, the Fund may make payments to reimburse the Distributor for its expenditures in financing any activity primarily intended to result in the sale of Fund shares and for maintenance and personal service provided to existing shareholders. The Plan authorizes payments to the Distributors of up to 0.25% annually of the Fund’s average daily net assets attributable to the sale of the Fund’s shares.
The Board has approved reimbursement payments to the Investment Manager for shareholder servicing expenses (“shareholder servicing fees”) incurred. Shareholder servicing fees include payments to third parties such as a bank, broker-dealer, trust company or other financial intermediaries who provide
|
| |
| |
| Notes to Financial Statements (continued) |
|
shareholder recordkeeping, account servicing and other services. To the extent the Investment Manager makes shareholder servicing payments to a third party, the Fund may reimburse the Investment Manager up to the amounts incurred. For the six months ended March 31, 2016, the Fund paid $6,805 or 0.01%.
The Board provides supervision of the affairs of the Trust, other trusts within the AMG Funds family and other affiliated funds. The Trustees of the Trust who are not affiliated with an Investment Manager receive an annual retainer and per meeting fees for regular, special and telephonic meetings, and they are reimbursed for out-of-pocket expenses incurred while carrying out their duties as Board members. The Chairman of the Board and the Audit Committee Chair receive additional annual retainers. Certain Trustees and Officers of the Fund are Officers and/or Directors of the Investment Manager, AMG and/or the Distributor.
The Securities and Exchange Commission granted an exemptive order that permits the Fund to lend and borrow money for certain temporary purposes directly to and from other eligible Funds in the AMG Funds family. Participation in this interfund lending program is voluntary for both borrowing and lending Funds, and an interfund loan is only made if it benefits each participating Fund. The Investment Manager administers the program according to procedures approved by the Board, and the Board monitors the operation of the program. An interfund loan must comply with certain conditions set out in the exemptive order, which are designed to assure fairness and protect all participating Funds. For the six months ended March 31, 2016, the Fund neither borrowed from nor lent to other Funds in the AMG Funds family.
3. PURCHASES AND SALES OF SECURITIES
Purchases and sales of securities (excluding short-term securities and U.S. Government obligations) for the six months ended March 31, 2016, were $151,351,677 and $152,182,932, respectively. There were no purchases or sales of U.S. Government obligations for the Fund.
4. PORTFOLIO SECURITIES LOANED
The Fund participates in the Program, providing for the lending of securities to qualified brokers. Securities lending income includes earnings of such temporary cash investments, plus or minus any rebate to a borrower. These earnings (after any rebate) are then divided between BNYM, as a fee for its services under the Program, and the Fund, according to agreed-upon rates.
Collateral received on all securities loaned is accepted in cash and is maintained at a minimum level of 102% (105% in the case of certain foreign securities) of the market value, plus interest, if applicable, of investments on loan. It is the Fund’s policy to obtain additional collateral from or return excess collateral to the borrower by the end of the next business day, following the valuation date of the securities loaned. Therefore, the value of the collateral held may be temporarily less than the value of the securities on loan. Lending securities entails a risk of loss to the Fund if and to the extent that the market value of the securities loaned were to increase and the borrower did not increase the collateral accordingly, and the borrower fails to return the securities. Under the terms of the Program, the Fund is indemnified for such losses by BNYM. Cash collateral is held in a separate omnibus account managed by BNYM, who is authorized to exclusively enter into joint overnight government repurchase agreements. BNYM bears the risk of any deficiency in the amount of the cash collateral available for return to the borrower due to any loss on the collateral invested. At March 31, 2016, the value of the securities loaned and cash collateral received was $6,640,950 and $6,738,330, respectively.
5. COMMITMENTS AND CONTINGENCIES
Under the Trust’s organizational documents, its trustees and officers are indemnified against certain liabilities arising out of the performance of their duties to the Trust. In addition, in the normal course of business, the Fund may enter into contracts and agreements that contain a variety of representations and warranties, which provide general indemnifications. The maximum exposure to the Fund under these arrangements is unknown, as this would involve future claims that may be made against a Fund that have not yet occurred. However, based on experience, the Fund had no prior claims or losses and expects the risk of loss to be remote.
6. MASTER NETTING AGREEMENTS
The Fund may enter into master netting agreements with its counterparties for the securities lending program and repurchase agreements, which provide the right, in the event of default (including bankruptcy or insolvency) for the non-defaulting party to liquidate the collateral and calculate net exposure to the defaulting party or request additional collateral. For financial reporting purposes, the Fund does not offset financial assets and financial liabilities that are subject to master netting agreements in the Statement of Assets and Liabilities. For securities lending transactions, see Note 4.
17
|
| |
| |
| Notes to Financial Statements (continued) |
|
The following table is a summary of the Fund’s open repurchase agreements which are subject to a master netting agreement as of March 31, 2016:
| | | | | | | | | | | | | | | | |
| | | | | | Gross Amount Not Offset in the
Statement of Assets and Liabilities | | | | |
| | | Net Amounts of Assets
Presented in the Statement
of Assets and Liabilities | | | Financial
Instruments
Collateral | | | Cash Collateral
Received | | | Net Amount | |
| | | | |
HSBC Securities International, Inc | | $ | 1,600,360 | | | $ | 1,600,360 | | | | — | | | | — | |
JPMorgan Securities LLC | | | 336,890 | | | | 336,890 | | | | — | | | | — | |
Merrill Lynch Pierce Fenner & Smith, Inc | | | 1,600,360 | | | | 1,600,360 | | | | — | | | | — | |
Mizuho Securities USA, Inc | | | 1,600,360 | | | | 1,600,360 | | | | — | | | | — | |
RBC Capital Markets LLC | | | 1,600,360 | | | | 1,600,360 | | | | — | | | | — | |
| | | | | | | | | | | | | | | | |
Total | | $ | 6,738,330 | | | $ | 6,738,330 | | | | — | | | | — | |
| | | | | | | | | | | | | | | | |
7. SUBSEQUENT EVENTS
The Fund has determined that no material events or transactions occurred through the issuance date of the Fund’s financial statements which require additional disclosure in or adjustment of the Fund’s financial statements.
18
THIS PAGE INTENTIONALLY LEFT BLANK
THIS PAGE INTENTIONALLY LEFT BLANK
| | | | |
INVESTMENT MANAGER AND ADMINISTRATOR AMG Funds LLC 600 Steamboat Road, Suite 300 Greenwich, CT 06830 (800) 835-3879 DISTRIBUTOR AMG Distributors, Inc. 600 Steamboat Road, Suite 300 Greenwich, CT 06830 (800) 835-3879 SUBADVISOR Friess Associates, LLC P.O. Box 576 Jackson, Wyoming 83001 Friess Associates of Delaware, LLC P.O. Box 4166 Greenville, DE 19807 CUSTODIAN The Bank of New York Mellon 2 Hanson Place Brooklyn, NY 11217 | | LEGAL COUNCEL Ropes & Gray LLP Prudential Tower, 800 Boylston Street Boston, MA 02199-3600 TRANSFER AGENT BNY Mellon Investment Servicing (US) Inc. Attn: AMG Funds P.O. Box 9769 Providence, RI 02940 (800) 548-4539 TRUSTEES Bruce B. Bingham Christine C. Carsman William E. Chapman II Edward J. Kaier Kurt Keilhacker Steven J. Paggioli Richard F. Powers III Eric Rakowski Victoria Sassine Thomas R. Schneeweis | | This report is prepared for the Fund’s shareholders. It is authorized for distribution to prospective investors only when preceded or accompanied by an effective prospectus. To receive a free copy of the prospectus or Statement of Additional Information, which includes additional information about Fund Trustees, please contact us by calling 800.835.3879. Distributed by AMG Distributors, Inc., member FINRA/SIPC. Current net asset values per share for the Fund are available on the Fund’s website at www.amgfunds.com. A description of the policies and procedures the Fund uses to vote its proxies is available: ( i ) without charge, upon request, by calling 800.835.3879, or (ii) on the Securities and Exchange Commission’s (SEC) website at www.sec.gov. For information regarding the Fund’s proxy voting record for the 12-month period ended June 30, call 800.835.3879 or visit the SEC website at www.sec.gov. The Fund files its complete schedule of portfolio holdings with the SEC for the first and third quarters of each fiscal year on Form N-Q. The Fund’s Forms N-Q are available on the SEC’s website at www.sec.gov. A Fund’s Forms N-Q may be reviewed and copied at the SEC’s Public Reference Room in Washington, DC. Information on the operation of the Public Reference Room may be obtained by calling 1-800-SEC-0330. To review a complete list of the Fund’s portfolio holdings, or to view the most recent quarterly holdings report, semiannual report, or annual report, please visit www.amgfunds.com. |
| | | | | | |
| | | | AFFILIATE SUBADVISED FUNDS | | |
| | | | | | |
BALANCED FUNDS AMG Chicago Equity Partners Balanced Chicago Equity Partners, LLC AMG FQ Global Risk-Balanced First Quadrant, L.P. EQUITY FUNDS AMG Chicago Equity Partners Small Cap Value Chicago Equity Partners, LLC AMG FQ Tax-Managed U.S. Equity AMG FQ U.S. Equity First Quadrant, L.P. AMG Frontier Small Cap Growth Frontier Capital Management Company, LLC AMG GW&K Small Cap Core AMG GW&K Small Cap Growth GW&K Investment Management, LLC | | | | AMG Renaissance International Equity AMG Renaissance Large Cap Growth The Renaissance Group LLC AMG SouthernSun Small Cap AMG SouthernSun U.S. Equity SouthernSun Asset Management, LLC AMG Systematic Large Cap Value AMG Systematic Mid Cap Value Systematic Financial Management, L.P. AMG TimesSquare All Cap Growth AMG TimesSquare International Small Cap AMG TimesSquare Mid Cap Growth AMG TimesSquare Small Cap Growth TimesSquare Capital Management, LLC | | AMG Trilogy Emerging Markets Equity AMG Trilogy Emerging Wealth Equity AMG Trilogy Global Equity AMG Trilogy International Small Cap Trilogy Global Advisors, L.P. AMG Yacktman AMG Yacktman Focused AMG Yacktman Special Opportunities Yacktman Asset Management LP FIXED INCOME FUNDS AMG GW&K Core Bond AMG GW&K Enhanced Core Bond AMG GW&K Municipal Bond AMG GW&K Municipal Enhanced Yield GW&K Investment Management, LLC |
| | | | | | |
| | | | OPEN-ARCHITECTURE FUNDS | | |
| | | | | | | |
EQUITY FUNDS AMG Managers Brandywine AMG Managers Brandywine Advisors Mid Cap Growth AMG Managers Brandywine Blue Friess Associates, LLC AMG Managers Cadence Capital Appreciation AMG Managers Cadence Emerging Companies AMG Managers Cadence Mid Cap Cadence Capital Management, LLC AMG Managers Emerging Opportunities Lord, Abbett & Co. LLC WEDGE Capital Management L.L.P. Next Century Growth Investors LLC RBC Global Asset Management (U.S.) Inc. | | | | AMG Managers Essex Small/Micro Cap Growth Essex Investment Management Co., LLC AMG Managers Real Estate Securities CenterSquare Investment Management, Inc. AMG Managers Skyline Special Equities Skyline Asset Management, L.P. AMG Managers Special Equity Ranger Investment Management, L.P. Lord, Abbett & Co. LLC Smith Asset Management Group, L.P. Federated MDTA LLC | | FIXED INCOME FUNDS AMG Managers Bond AMG Managers Global Income Opportunity Loomis, Sayles & Co., L.P. AMG Managers High Yield J.P. Morgan Investment Management Inc. AMG Managers Intermediate Duration Government AMG Managers Short Duration Government Amundi Smith Breeden LLC |
| | | | |
 | | | | | www.amgfunds.com |
Not applicable for the semi-annual shareholder report.
| Item 3. | AUDIT COMMITTEE FINANCIAL EXPERT |
Not applicable for the semi-annual shareholder report.
| Item 4. | PRINCIPAL ACCOUNTANT FEES AND SERVICES |
Not applicable for the semi-annual shareholder report.
| Item 5. | AUDIT COMMITTEE OF LISTED REGISTRANTS |
Not applicable.
| Item 6. | SCHEDULE OF INVESTMENTS |
The schedule of investments in unaffiliated issuers as of the close of the reporting period is included as part of the shareholder report contained in Item 1 hereof.
| Item 7. | DISCLOSURE OF PROXY VOTING POLICIES AND PROCEDURES FOR CLOSED-END MANAGEMENT INVESTMENT COMPANIES |
Not applicable.
| Item 8. | PORTFOLIO MANAGERS OF CLOSED-END MANAGEMENT INVESTMENT COMPANIES |
Not applicable.
| Item 9. | PURCHASES OF EQUITY SECURITIES BY CLOSED-END MANAGEMENT INVESTMENT COMPANIES AND AFFILIATED PURCHASERS |
Not applicable.
| Item 10. | SUBMISSION OF MATTERS TO A VOTE OF SECURITY HOLDERS |
Not applicable.
| Item 11. | CONTROLS AND PROCEDURES |
| | (a) | The registrant’s principal executive and principal financial officers have concluded, based on their evaluation of the registrant’s disclosure controls and procedures as of a date within 90 days of the filing date of this report, that the registrant’s disclosure controls and procedures are reasonably designed to ensure that information required to be disclosed by the registrant on Form N-CSR is recorded, processed, summarized and reported within the required time periods and that information required to be disclosed by the registrant in the reports that it files or submits on Form N-CSR is accumulated and communicated to the registrant’s management, including its principal executive and principal financial officers, as appropriate to allow timely decisions regarding required disclosure. |
| | (b) | There were no changes in the registrant’s internal control over financial reporting during the registrant’s second fiscal quarter of the period covered by this report that have materially affected, or are reasonably likely to materially affect, the internal control over financial reporting. |
| | |
| (a) (1) | | Not applicable. |
| (a) (2) | | Certifications pursuant to Rule 30a-2(a) under the Investment Company Act of 1940 - Filed herewith. |
| (a) (3) | | Not applicable. |
| |
| (b) | | Certifications pursuant to Rule 30a-2(b) under the Investment Company Act of 1940 - Filed herewith. |
SIGNATURES
Pursuant to the requirements of the Securities Exchange Act of 1934 and the Investment Company Act of 1940, the registrant has duly caused this report to be signed on its behalf by the undersigned, thereunto duly authorized.
| | |
| AMG FUNDS I |
| |
| By: | | /s/ Jeffrey T. Cerutti |
| | Jeffrey T. Cerutti, Principal Executive Officer |
| |
| Date: | | April 29, 2016 |
Pursuant to the requirements of the Securities Exchange Act of 1934 and the Investment Company Act of 1940, this report has been signed below by the following persons on behalf of the registrant and in the capacities and on the dates indicated.
| | |
| By: | | /s/ Jeffrey T. Cerutti |
| | Jeffrey T. Cerutti, Principal Executive Officer |
| |
| Date: | | April 29, 2016 |
| |
| By: | | /s/ Donald S. Rumery |
| | Donald S. Rumery, Principal Financial Officer |
| |
| Date: | | April 29, 2016 |