UNITED STATES
SECURITIES AND EXCHANGE COMMISSION
Washington, D.C. 20549
FORM N-CSRS
CERTIFIED SHAREHOLDER REPORT OF REGISTERED
MANAGEMENT INVESTMENT COMPANIES
Investment Company Act file number: 811-06520
AMG Funds I
(Exact name of registrant as specified in charter)
600 Steamboat Road, Suite 300, Greenwich, Connecticut 06830
(Address of principal executive offices) (Zip code)
AMG Funds LLC
600 Steamboat Road, Suite 300, Greenwich, Connecticut 06830
(Name and address of agent for service)
Registrant’s telephone number, including area code: (203) 299-3500
Date of fiscal year end: September 30
Date of reporting period: OCTOBER 1, 2016 – MARCH 31, 2017
(Semi-Annual Shareholder Report)
| Item 1. | Reports to Shareholders |
| | |
 | | SEMI-ANNUAL REPORT |
AMG Funds
March 31, 2017

AMG Managers Brandywine Fund: Class I: BRWIX
AMG Managers Brandywine Blue Fund: Class I: BLUEX
| | |
| www.amgfunds.com | | SAR073-0317 |
AMG Funds
Semi-Annual Report—March 31, 2017 (unaudited)
| | | | |
TABLE OF CONTENTS | | PAGE | |
LETTER TO SHAREHOLDERS | | | 2 | |
| |
ABOUT YOUR FUND’S EXPENSES | | | 3 | |
| |
FUND PERFORMANCE | | | 4 | |
| |
FUND SNAPSHOTS, ROSES AND THORNS, AND SCHEDULES OF PORTFOLIO INVESTMENTS | | | | |
| |
AMG Managers Brandywine Fund | | | 5 | |
| |
AMG Managers Brandywine Blue Fund | | | 10 | |
| |
NOTES TO SCHEDULES OF PORTFOLIO INVESTMENTS | | | 14 | |
| |
FINANCIAL STATEMENTS | | | | |
| |
Statement of Assets and Liabilities | | | 16 | |
Balance sheets, net asset value (NAV) per share computations and cumulative undistributed amounts | | | | |
| |
Statement of Operations | | | 17 | |
Detail of sources of income, expenses, and realized and unrealized gains (losses) during the fiscal period | | | | |
| |
Statements of Changes in Net Assets | | | 18 | |
Detail of changes in assets for the past two fiscal periods | | | | |
| |
Financial Highlights | | | 19 | |
Historical net asset values per share, distributions, total returns, income and expense ratios, turnover ratios and net assets | | | | |
| |
Notes to Financial Statements | | | 21 | |
Accounting and distribution policies, details of agreements and transactions with Fund management and affiliates, and descriptions of certain investment risks | | | | |
Nothing contained herein is to be considered an offer, sale or solicitation of an offer to buy shares of any series of the AMG Funds family of mutual funds. Such offering is made only by prospectus, which includes details as to offering price and other material information.
| | |
| | | AMG Managers Brandywine Fund AMG Managers Brandywine Blue Fund |
DEAR FELLOW SHAREHOLDER:
Stocks continued to climb in the first three months of 2017, with major indexes rising for the sixth consecutive quarter. March-quarter gains propelled the second longest bull market on record beyond its eighth anniversary.
AMG Managers Brandywine Fund grew 6.36 percent in the three months through March versus gains in the Russell 3000® and Russell 3000® Growth Indexes of 5.74 and 8.63 percent, respectively. AMG Managers Brandywine Blue Fund grew 8.25 percent as the S&P 500, Russell 1000® and Russell 1000® Growth Indexes added 6.07, 6.03 and 8.91 percent, respectively.
High hopes for business-friendly actions from the White House kept the mood mainly upbeat. Optimism regarding the Trump administration’s pro-growth promises on taxation, deregulation and infrastructure spending remained the prevailing theme.
Consumer confidence and employment data were also positive influences on sentiment. Encouraging news on the earnings front, with consensus expectations forecasting that March-quarter reports will show the strongest growth for the companies in the S&P 500 Index in more than five years, contributed to the cause as well.
Present throughout the period was the expectation that the Federal Reserve would increase interest rates at its mid-March meeting. Executed as anticipated, investors chose to interpret the rate hike as a sign that the economy was sufficiently healthy to absorb it without incident.
March-quarter gains were widespread. Brandywine generated positive returns in eight of the nine economic sectors represented in its portfolio during the period. Brandywine Blue notched gains in seven out of nine sectors.
Holdings from the technology sector, which comprised the largest portfolio positions in both Funds, were by far the biggest contributors to returns for the quarter. Semiconductor-related holdings played the most significant role in driving the sector’s advance.
Micron Technology and Advanced Micro Devices were standout performers in both Funds. Micron Technology attracted positive investor attention by reporting earnings results that represented a substantial reversal of fortunes over the past year. The company exceeded February-quarter estimates by earning $0.90 per share, up from a $0.05 loss in the year-ago period. Advanced Micro Devices pleased investors with a host of new contract wins, market-share gains for a new product and increased revenue guidance for 2017.
Arista Networks, a cloud computing network solutions provider, also merits mention for its contribution to both Funds. Revenue jumped by more than one-third in the December quarter on demand for the company’s software and switches amid the ongoing equipment upgrade cycle in the telecommunications space. The company also exceeded the consensus earnings estimate (by 27 percent) and raised guidance for the March quarter.
Despite the success from an absolute perspective, the technology sector was actually a modest detractor on Brandywine’s results relative to the Russell 3000® Growth Index. That wasn’t the case with Brandywine Blue, for which technology was the top contributor to absolute return and results relative to its benchmark, the Russell 1000® Growth Index.
Consumer discretionary holdings, which represented the second largest positions in both Funds, were the next most significant contributors to March-quarter gains. Netflix and Priceline, which both reported expectation-beating earnings growth during the period, were top performers. Netflix and Priceline grew December-quarter earnings 50 and 13 percent, respectively. While a positive force, consumer discretionary holdings were the second greatest negative influence on performance versus the benchmark for both Funds.
The health care sector, which was a relative performance contributor for Brandywine and a detractor for Brandywine Blue, also contributed to gains. In general, health care stocks fared well during the period after Congressional health care reform efforts stalled. Brandywine enjoyed an added boost over Brandywine Blue in holding VCA, which in January agreed to be acquired by Mars.
Energy stocks were the market’s poorest performers during the March quarter. The price of oil declined 15 percent from the high for the period on January 6 to the low on March 23 as crude inventory reports showed persistently elevated supplies and the drilling rig count, according to Baker Hughes North America Rotary Rig Count data, climbed higher with each passing week.
Energy holdings weighed on performance in both Funds as investors worried about the implications for a nascent profit recovery in the sector. While energy holdings detracted the most from the absolute and relative performance of both Funds, the impact was more pronounced in the Brandywine portfolio, which carried higher exposure to the sector.
U.S. Silica Holdings (Brandywine only) was the top detractor from the energy sector. The company, which among other things produces sand used in hydraulic fracturing, grew year-over-year revenue 34 percent in the December quarter thanks to positive demand and pricing trends. Shares fell after U.S. Silica announced plans to significantly boost fracking sand production in 2017, which investors viewed as a threat to pricing.
Keane Group, RPC and Parsley Energy also detracted from Brandywine’s results. Brandywine Blue held only Parsley Energy and Apache Corp., which both declined.
For more information on companies that influenced March-quarter performance, please see Roses & Thorns on page 6 for Brandywine and page 11 for Brandywine Blue.
Technology, consumer discretionary and health care holdings represent the largest positions in the Brandywine Funds at the start of the June quarter. For more information on portfolio characteristics, please see page 5 for Brandywine and page 10 for Brandywine Blue.
We’re grateful for your continued confidence. Your entire Friess Associates team joins me in sending best wishes.

Scott Gates
Chief Investment Officer
Friess Associates, LLC
About Your Fund’s Expenses (unaudited)
As a shareholder of a Fund, you may incur two types of costs: (1) transaction costs, which may include sales charges (loads) on purchase payments; redemption fees; and exchange fees; and (2) ongoing costs, including management fees; distribution (12b-1) fees; and other Fund expenses. This example is intended to help you understand your ongoing costs (in dollars) of investing in the Fund and to compare these costs with the ongoing costs of investing in other mutual funds. The example is based on $1,000 invested at the beginning of the period and held for the entire period as indicated below.
ACTUAL EXPENSES
The first line of the following table provides information about the actual account values and actual expenses. You may use the information in this line, together with the amount you invested, to estimate the expenses that you paid over the period. Simply divide your account value by $1,000 (for example, an $8,600 account value divided by $1,000 = 8.6), then multiply the result by the number in the first line under the heading entitled “Expenses Paid During Period” to estimate the expenses you paid on your account during this period.
HYPOTHETICAL EXAMPLE FOR COMPARISON PURPOSES
The second line of the following table provides information about hypothetical account values and hypothetical expenses based on the Fund’s actual expense ratio and an assumed annual rate of return of 5% before expenses, which is not the Fund’s actual return. The hypothetical account values and expenses may not be used to estimate the actual ending account balance or expenses you paid for the period. You may use this information to compare the ongoing costs of investing in the Fund and other funds by comparing this 5% hypothetical example with the 5% hypothetical examples that appear in the shareholder reports of other funds.
Please note that the expenses shown in the table are meant to highlight your on going costs only and do not reflect any transactional costs, such as sales charges (loads), redemption fees, or exchange fees. Therefore, the second line of the table is useful in comparing ongoing costs only, and will not help you determine the relative total costs of owning different funds.
| | | | | | | | | | | | | | | | |
| Six Months Ended March 31, 2017 | | Expense Ratio for the Period | | | Beginning Account
Value 10/01/16 | | | Ending Account
Value 03/31/17 | | | Expenses Paid During the Period* | |
AMG Managers Brandywine Fund | | | | | | | | | | | | | | | | |
Based on Actual Fund Return | | | 1.11 | % | | $ | 1,000 | | | $ | 1,072 | | | $ | 5.73 | |
Hypothetical (5% return before expenses) | | | 1.11 | % | | $ | 1,000 | | | $ | 1,019 | | | $ | 5.59 | |
AMG Managers Brandywine Blue Fund | | | | | | | | | | | | | | | | |
Based on Actual Fund Return | | | 1.21 | % | | $ | 1,000 | | | $ | 1,099 | | | $ | 6.33 | |
Hypothetical (5% return before expenses) | | | 1.21 | % | | $ | 1,000 | | | $ | 1,019 | | | $ | 6.09 | |
| * | Expenses are equal to the Fund’s annualized expense ratio multiplied by the average account value over the period, multiplied by the number of days in the most recent fiscal half-year (182), then divided by 365. |
Fund Performance (unaudited)
Periods ended March 31, 2017
The table below shows the average annual total returns for the periods indicated for each Fund, as well as each Fund’s relative index for the same time periods ended March 31, 2017.
| | | | | | | | | | | | | | | | |
| Average Annual Total Returns1 | | Six Months* | | | One Year | | | Five Years | | | Ten Years | |
AMG Managers Brandywine Fund2,3,4,5,6,7,12 | | | 7.22 | % | | | 17.24 | % | | | 9.30 | % | | | 2.70 | % |
Russell 3000® Growth Index8 | | | 9.94 | % | | | 16.27 | % | | | 13.22 | % | | | 9.04 | % |
Russell 3000® Index9 | | | 10.19 | % | | | 18.07 | % | | | 13.18 | % | | | 7.54 | % |
S&P 500 Index10 | | | 10.12 | % | | | 17.17 | % | | | 13.30 | % | | | 7.51 | % |
AMG Managers Brandywine Blue Fund 2,3,4,5,7,11,12 | | | 9.93 | % | | | 16.56 | % | | | 8.58 | % | | | 3.37 | % |
Russell 1000® Growth Index13 | | | 10.01 | % | | | 15.76 | % | | | 13.32 | % | | | 9.13 | % |
Russell 1000® Index14 | | | 10.09 | % | | | 17.43 | % | | | 13.26 | % | | | 7.58 | % |
S&P 500 Index10 | | | 10.12 | % | | | 17.17 | % | | | 13.30 | % | | | 7.51 | % |
The performance data shown represents past performance. Past performance is not a guarantee of future results. Current performance may be lower or higher than the performance data quoted. The investment return and principal value of an investment will fluctuate so that an investor’s shares, when redeemed, may be worth more or less than their original cost.
Investors should carefully consider the Fund’s investment objectives, risks, charges, and expenses before investing. For performance information through the most recent month end, current net asset values per share for the Fund and other information, please call (800) 835-3879 or visit our website at www.amgfunds.com for a free prospectus. Read it carefully before investing or sending money.
Distributed by AMG Distributors, Inc., member FINRA/SIPC.
| 1 | Total return equals income yield plus share price change and assumes reinvestment of all dividends and capital gain distributions. Returns are net of fees and may reflect offsets of Fund expenses as described in the prospectus. No adjustment has been made for taxes payable by shareholders on their reinvested dividends and capital gain distributions. Returns for periods greater than one year are annualized. The listed returns on the Funds are net of expenses and based on the published NAV as of March 31, 2017. All returns are in U.S. dollars ($). |
| 2 | The Fund inception dates and returns for all periods prior to October 1, 2013, reflect performance of the predecessor Funds, Brandywine Fund, Inc. and Brandywine Blue Fund, which were managed by Friess Associates, LLC with the same investment objective and substantially similar investment policies. |
| 3 | The Fund invests in growth stocks, which may be more sensitive to market movements because their prices tend to reflect future investor expectations rather than just current profits. |
| 4 | Investments in international securities are subject to certain risks of overseas investing including currency fluctuations and changes in political and economic conditions, which could result in significant market fluctuations. |
| 5 | The Fund is subject to risks associated with investments in mid-capitalization companies, such greater price volatility, lower trading volume, and less liquidity than the stocks of larger, more established companies. |
| 6 | The Fund is subject to risks associated with investments in small-capitalization companies, such as erratic earnings patterns, competitive conditions, limited earnings history and a reliance on one or a limited number of products. |
| 7 | Effective February 27, 2017, the Funds’ Class S shares were renamed Class I. |
| 8 | The Russell 3000® Growth Index measures the performance of those Russell 3000® Index companies with higher price-to-book ratios and higher forecasted growth values. Unlike the Fund, the Russell 3000® Growth Index is unmanaged, is not available for investment, and does not incur expenses. |
| 9 | The Russell 3000® Index is composed of the 3,000 largest U.S. companies as measured by market capitalization and represents about 98% of the U.S. stock market. Unlike the Fund, the Russell 3000® Index is unmanaged, is not available for investment, and does not incur expenses. |
| 10 | The S&P 500 Index is capitalization-weighted index of 500 stocks. The S&P 500 Index is designed to measure performance of the broad domestic economy through changes in the aggregate market value of 500 stocks representing all major industries. Unlike the Fund, the S&P 500 Index is unmanaged, is not available for investment, and does not incur expenses. |
| 11 | A greater percentage of the Fund’s holdings may be focused in a smaller number of securities which may place the Fund at greater risk than a more diversified fund. |
| 12 | Active and frequent trading of a fund may result in higher transaction costs and increased tax liability. |
| 13 | The Russell 1000® Growth Index is a market capitalization weighted index that measures the performance of those Russell 1000® companies with higher price-to-book ratios and higher forecasted growth values. Unlike the Fund, the Russell 1000® Growth Index is unmanaged, is not available for investment, and does not incur expenses. |
| 14 | The Russell 1000® Index measures the performance of approximately 1,000 of the largest securities based on a combination of their market cap and current index membership. The Russell 1000 represents approximately 92% of the U.S. market. Unlike the Fund, the Russell 1000® Index is unmanaged, is not available for investment, and does not incur expenses. |
The Russell Indices are trademarks of the London Stock Exchange Group companies.
The S&P 500 Index is proprietary data of Standard & Poor’s, a division of McGraw-Hill Companies, Inc. All rights reserved.
Not FDIC insured, nor bank guaranteed. May lose value.
AMG Managers Brandywine Fund
Fund Snapshots (unaudited)
March 31, 2017
PORTFOLIO BREAKDOWN
| | | | | | | | | | | | | | | | |
Industry (Top Ten) | | AMG
Managers
Brandywine
Fund* | | | Russell
3000®
Growth
Index | | | Russell
3000®
Index | | | S&P 500
Index | |
Semiconductors | | | 11.2 | % | | | 3.4 | % | | | 3.2 | % | | | 3.4 | % |
Internet Software & Services | | | 8.8 | % | | | 7.6 | % | | | 4.0 | % | | | 4.6 | % |
Internet & Direct Marketing Retail | | | 7.8 | % | | | 4.3 | % | | | 2.2 | % | | | 2.6 | % |
Data Processing & Outsourced Services | | | 5.5 | % | | | 6.6 | % | | | 3.7 | % | | | 3.7 | % |
Application Software | | | 4.4 | % | | | 7.4 | % | | | 4.5 | % | | | 4.6 | % |
Communications Equipment | | | 4.0 | % | | | 0.4 | % | | | 1.2 | % | | | 1.1 | % |
Trading Companies & Distributors | | | 4.0 | % | | | 0.5 | % | | | 0.3 | % | | | 0.2 | % |
Specialty Stores | | | 3.5 | % | | | 3.9 | % | | | 2.4 | % | | | 2.4 | % |
Life Sciences Tools & Services | | | 3.2 | % | | | 0.9 | % | | | 0.7 | % | | | 0.7 | % |
Biotechnology | | | 3.0 | % | | | 5.8 | % | | | 3.0 | % | | | 2.8 | % |
Other Common Stock | | | 42.3 | % | | | 59.2 | % | | | 74.8 | % | | | 73.9 | % |
Cash & Cash Equivalent† | | | 2.3 | % | | | 0.0 | % | | | 0.0 | % | | | 0.0 | % |
| * | As a percentage of net assets. |
| † | Includes Other Assets and Liabilities. |
TOP TEN HOLDINGS
| | | | | | | | |
Security Name | | % of
Net Assets | | |
% Change
from Book
Cost | |
Advanced Micro Devices, Inc. | | | 2.6 | % | | | 100.9 | % |
Facebook, Inc., Class A** | | | 2.5 | % | | | 111.2 | % |
Amazon.com, Inc.** | | | 2.3 | % | | | 110.4 | % |
Micron Technology, Inc.** | | | 2.3 | % | | | 63.8 | % |
Visa, Inc., Class A** | | | 2.2 | % | | | 21.5 | % |
Broadcom, Ltd. | | | 2.1 | % | | | 164.2 | % |
Netflix, Inc.** | | | 2.1 | % | | | 39.7 | % |
Alphabet, Inc., Class A** | | | 2.0 | % | | | 23.3 | % |
Dycom Industries, Inc. | | | 2.0 | % | | | 18.6 | % |
The Priceline Group, Inc. | | | 1.9 | % | | | 25.2 | % |
| | | | | | | | |
Top Ten as a Group | | | 22.0 | % | | | | |
| | | | | | | | |
| ** | Also Top Ten Holding as of December 31, 2016. |
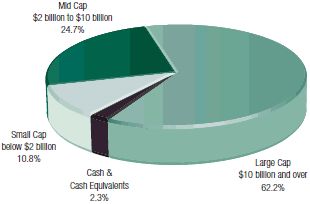
PORTFOLIO MARKET CAPITALIZATION
ESTIMATED EARNINGS GROWTH RATE
OF THE FUND’S INVESTMENTS
Forecasted Increase in Earnings Per Share 2017 vs 2016

Source: Consensus estimates from FactSet Research Systems Inc.
This is not a forecast of the Fund’s future performance. Earnings growth for a Fund holding does not guarantee a corresponding increase in the market value of the holding or the Fund.
Because a fund’s strategy may result in multiple investments in particular sectors of the economy, its performance may depend on the performance of those sectors and may fluctuate more widely than investments diversified across more sectors. For additional information on these and other risk considerations, please see the Fund’s prospectus.
Any sectors, industries, or securities discussed should not be perceived as investment recommendations. Mention of a specific security should not be considered a recommendation to buy or solicitation to sell that security. Specific securities mentioned in this report may have been sold from the Fund’s portfolio of investments by the time you receive this report.
AMG Managers Brandywine Fund
Roses and Thorns (unaudited)
Quarter Ending March 31, 2017
| | | | | | |
$ Gain (in millions) | | % Gain | | Biggest $ Winners | | Reason for Move |
| | | | |
| | | | VCA Inc. (WOOF) |
| $4.5 | | 32.1% | | Shares of VCA, which provides veterinary services and diagnostic testing, rose as it entered an agreement to be acquired by Mars, the maker of candy and pet-care supplies, at a 31 percent premium. VCA shares reached our price target in the process, prompting us to sell. |
| | |
| | | | Micron Technology Inc. (MU) |
| $4.0 | | 31.8% | | The manufacturer of DRAM semiconductors reported February-quarter earnings of $0.90 a share, topping the consensus estimate. The company reported better-than-expected gross profit margins due to higher average selling prices and lower costs. Micron raised 2017 revenue and profit margin guidance above consensus estimates. |
| | |
| | | | Advanced Micro Devices Inc. (AMD) |
| $3.8 | | 25.0% | | The semiconductor manufacturer exceeded December-quarter revenue expectations on strong demand for graphics chips used in game consoles. Ryzen, a high-end central processor built on Advanced Micro’s new Zen architecture, was credited with taking market share from competitor Intel Corp. Advanced Micro reported 17 new customer wins. The company also raised 2017 revenue guidance. |
| | |
| | | | Facebook Inc. (FB) |
| $3.5 | | 23.5% | | The social networking service and website grew earnings 78 percent in the December quarter, exceeding the consensus estimate. Sales increased 51 percent, primarily driven by advertising revenue. Monthly active users grew 17 percent, the fastest pace since March 2013. |
| | |
| | | | Broadcom Ltd. (AVGO) |
| $2.9 | | 23.9% | | The developer of semiconductor connectivity solutions grew earnings 51 percent in the January quarter, topping the consensus estimate. The company raised 2017 earnings guidance as revenue and profitability improved due to demand driven by the launch of Samsung’s new Galaxy 8 smartphones. |
| | | |
$ Loss (in millions) | | % Loss | | Biggest $ Losers | | Reason for Move |
| | | | |
| | | | Lululemon Athletica Inc. (LULU) |
| $2.4 | | 20.9% | | The designer and retailer of athletic apparel grew January-quarter earnings 18 percent. Comparable store sales were higher than expected, but the company’s shares declined due to reduced 2017 earnings guidance. We sold Lululemon to fund a new company with better visibility. |
| | |
| | | | U.S. Silica Holdings Inc. (SLCA) |
| $2.1 | | 19.5% | | The producer of commercial silica, which is an input in a range of end markets including hydraulic fracturing and glass making, grew December-quarter revenue 34 percent, beating the consensus estimate. Shares declined after the company announced plans to increase production capacity for fracking sand by more than 60 percent. Investors worried that the ease with which U.S. Silica and its competitors could add low-cost supply was a threat to pricing. |
| | |
| | | | Medpace Holdings Inc (MEDP) |
| $1.6 | | 20.0% | | The biopharmaceutical services company reported December-quarter earnings of $0.35 per share, beating the consensus estimate. Shares declined on lower bookings and reduced company-issued 2017 revenue guidance. We sold Medpace to fund a new opportunity with better visibility. |
| | |
| | | | J.C. Penney Co. Inc. (JCP) |
| $1.5 | | 16.9% | | Shares of the department store operator declined due to disappointing holiday-season sales. While appliances performed well, women’s apparel weighed on results. We sold J.C. Penney to fund a new opportunity with better visibility. |
| | |
| | | | RPC Inc. (RES) |
| $1.3 | | 13.5% | | We believed the oil and gas service company was positioned to benefit from increasing drilling rig counts and pressure pumping demand. Instead, RPC shares came under pressure amid rising oil inventory and falling oil prices. We sold RPC to fund a new company with better visibility. |
All gains/losses are calculated on an average cost basis from December 31, 2016 through March 31, 2017.
This commentary reflects the viewpoints of Friess Associates, LLC as of March 31, 2017 and is not intended as a forecast or guarantee of future results.
AMG Managers Brandywine Fund
Schedule of Portfolio Investments (unaudited)
March 31, 2017
| | | | | | | | | | | | |
| Shares | | | | | Cost | | | Value | |
| | Common Stocks - 97.7% | | | | | | | | |
| | Consumer Discretionary | | | | | | | | |
| | | | Apparel Retail - 1.3% | | | | | |
| | 76,245 | | | The Children’s Place, Inc.1 | | $ | 7,480,454 | | | $ | 9,153,212 | |
| | | | Automobile Manufacturers - 1.3% | | | | | |
| | 100,235 | | | Thor Industries, Inc. | | | 10,308,660 | | | | 9,635,591 | |
| | | | Automotive Retail - 0.9% | | | | | |
| | 23,141 | | | O’Reilly Automotive, Inc.* | | | 6,407,036 | | | | 6,244,367 | |
| | | | Cable & Satellite - 1.5% | | | | | |
| | 34,276 | | | Charter Communications, Inc., Class A* | | | 7,957,387 | | | | 11,219,220 | |
| | | | Footwear - 1.5% | | | | | |
| | 195,485 | | | NIKE, Inc., Class B | | | 10,896,178 | | | | 10,894,379 | |
| | | | General Merchandise Stores - 2.2% | | | | | |
| | 102,835 | | | Dollar Tree, Inc.* | | | 8,100,131 | | | | 8,068,434 | |
| | 233,275 | | | Ollie’s Bargain Outlet Holdings, Inc.* | | | 7,093,066 | | | | 7,814,713 | |
| | | | Home Furnishings - 0.8% | | | | | |
| | 187,390 | | | Ethan Allen Interiors, Inc. | | | 5,488,106 | | | | 5,743,504 | |
| | | | Internet & Direct Marketing Retail - 7.8% | | | | | |
| | 19,273 | | | Amazon.com, Inc.* | | | 8,122,759 | | | | 17,086,285 | |
| | 88,005 | | | Expedia, Inc. | | | 10,821,046 | | | | 11,103,591 | |
| | 101,609 | | | Netflix, Inc.* | | | 10,747,063 | | | | 15,018,826 | |
| | 7,785 | | | The Priceline Group, Inc.* | | | 11,070,083 | | | | 13,857,066 | |
| | | | Movies & Entertainment - 1.6% | | | | | |
| | 104,255 | | | The Walt Disney Co. | | | 10,616,521 | | | | 11,821,474 | |
| | | | Specialty Stores - 3.5% | | | | | |
| | 283,105 | | | Dick’s Sporting Goods, Inc. | | | 13,376,434 | | | | 13,775,889 | |
| | 41,680 | | | Ulta Beauty Inc.* | | | 10,395,630 | | | | 11,888,386 | |
| | | | | | | | | | | | |
| | Total Consumer Discretionary | | | 138,880,554 | | | | 163,324,937 | |
| | | | This sector is 17.6% above your Fund’s cost. | | | | | |
| | Consumer Staples | | | | | | | | |
| | | | Food Distributors - 1.1% | | | | | |
| | 323,409 | | | Performance Food Group Co.* | | | 7,664,763 | | | | 7,697,134 | |
| | | | Hypermarkets & Super Centers - 1.5% | | | | | |
| | 67,130 | | | Costco Wholesale Corp. | | | 10,730,372 | | | | 11,257,030 | |
| | | | Packaged Foods & Meats - 1.8% | | | | | |
| | 17,060 | | | Calavo Growers, Inc. | | | 855,811 | | | | 1,033,836 | |
| | 203,435 | | | Pinnacle Foods, Inc. | | | 9,211,911 | | | | 11,772,783 | |
| | | | Personal Products - 0.9% | | | | | |
| | 81,129 | | | The Estee Lauder Cos., Inc., Class A | | | 6,968,228 | | | | 6,878,928 | |
| | | | | | | | | | | | |
| | Total Consumer Staples | | | 35,431,085 | | | | 38,639,711 | |
| | | | This sector is 9.1% above your Fund’s cost. | | | | | |
| | | | | | | | | | | | |
| Shares | | | | | Cost | | | Value | |
| | Energy | | | | | | | | |
| | | | Oil & Gas Equipment & Services - 0.5% | | | | | |
| | 504,125 | | | Weatherford International PLC* | | $ | 3,363,576 | | | $ | 3,352,431 | |
| | | | This sector is 0.3% below your Fund’s cost. | | | | | |
| | Financials | | | | | | | | |
| | | | Financial Exchanges & Data - 1.8% | | | | | |
| | 108,725 | | | CME Group, Inc. | | | 10,215,168 | | | | 12,916,530 | |
| | | | Thrifts & Mortgage Finance - 2.7% | | | | | |
| | 68,550 | | | LendingTree, Inc.*,1 | | | 7,401,920 | | | | 8,592,743 | |
| | 611,755 | | | Radian Group, Inc. | | | 10,940,153 | | | | 10,987,120 | |
| | | | | | | | | | | | |
| | Total Financials | | | 28,557,241 | | | | 32,496,393 | |
| | | | This sector is 13.8% above your Fund’s cost. | | | | | |
| | Health Care | | | | | | | | |
| | | | Biotechnology - 3.0% | | | | | |
| | 63,970 | | | Shire PLC, ADR | | | 10,773,968 | | | | 11,145,493 | |
| | 96,830 | | | Vertex Pharmaceuticals, Inc.* | | | 10,422,916 | | | | 10,588,360 | |
| | | | Health Care Equipment - 2.0% | | | | | |
| | 453,670 | | | Boston Scientific Corp.* | | | 10,713,127 | | | | 11,282,773 | |
| | 38,535 | | | Penumbra, Inc.* | | | 3,059,691 | | | | 3,215,746 | |
| | | | Health Care Technology - 0.5% | | | | | |
| | 162,180 | | | Evolent Health, Inc., Class A* | | | 3,707,575 | | | | 3,616,614 | |
| | 9,900 | | | Vocera Communications, Inc.* | | | 215,627 | | | | 245,817 | |
| | | | Life Sciences Tools & Services - 3.2% | | | | | |
| | 66,825 | | | Illumina, Inc.* | | | 11,156,593 | | | | 11,403,018 | |
| | 74,950 | | | Thermo Fisher Scientific, Inc. | | | 9,754,872 | | | | 11,512,320 | |
| | | | Managed Health Care - 1.6% | | | | | |
| | 79,890 | | | Cigna Corp. | | | 10,582,869 | | | | 11,703,086 | |
| | | | Pharmaceuticals - 2.9% | | | | | |
| | 152,240 | | | Eli Lilly & Co. | | | 10,970,282 | | | | 12,804,906 | |
| | 159,435 | | | Zoetis, Inc. | | | 8,577,242 | | | | 8,509,046 | |
| | | | | | | | | | | | |
| | Total Health Care | | | 89,934,762 | | | | 96,027,179 | |
| | | | This sector is 6.8% above your Fund’s cost. | | | | | |
| | Industrials | | | | | | | | |
| | | | Airlines - 1.4% | | | | | |
| | 220,760 | | | Delta Air Lines, Inc. | | | 11,357,594 | | | | 10,146,130 | |
| | | | Construction & Engineering - 2.0% | | | | | |
| | 155,105 | | | Dycom Industries, Inc.*,1 | | | 12,158,446 | | | | 14,417,010 | |
| | | | Construction Machinery & Heavy Trucks - 1.4% | |
| | 154,075 | | | Oshkosh Corp. | | | 10,854,599 | | | | 10,568,004 | |
|
The accompanying notes are an integral part of these financial statements. 7 |
AMG Managers Brandywine Fund
Schedule of Portfolio Investments (continued)
| | | | | | | | | | | | |
| Shares | | | | | Cost | | | Value | |
| | Industrials (continued) | | | | | | | | |
| | | | Trading Companies & Distributors - 4.0% | | | | | |
| | 412,480 | | | BMC Stock Holdings, Inc.* | | $ | 7,252,630 | | | $ | 9,322,048 | |
| | 224,050 | | | GMS, Inc.* | | | 4,926,353 | | | | 7,850,712 | |
| | 89,500 | | | MRC Global, Inc.* | | | 1,636,961 | | | | 1,640,535 | |
| | 82,530 | | | United Rentals, Inc.* | | | 10,229,203 | | | | 10,320,376 | |
| | | | | | | | | | | | |
| | Total Industrials | | | 58,415,786 | | | | 64,264,815 | |
| | | | This sector is 10.0% above your Fund’s cost. | | | | | |
| | Information Technology | | | | | | | | |
| | | | Application Software - 4.4% | | | | | |
| | 346,485 | | | Atlassian Corp. PLC, Class A*,1 | | | 9,024,423 | | | | 10,377,226 | |
| | 152,710 | | | Blackline, Inc.* | | | 3,732,573 | | | | 4,544,650 | |
| | 142,880 | | | Salesforce.com, Inc.* | | | 10,821,895 | | | | 11,786,171 | |
| | 235,742 | | | Snap, Inc., Class A*,1 | | | 5,675,208 | | | | 5,311,267 | |
| | | | Communications Equipment - 4.0% | | | | | |
| | 62,699 | | | Arista Networks, Inc.* | | | 5,848,006 | | | | 8,293,197 | |
| | 438,061 | | | Ciena Corp.* | | | 8,379,321 | | | | 10,342,620 | |
| | 108,185 | | | NETGEAR, Inc.* | | | 6,135,528 | | | | 5,360,567 | |
| | 534,175 | | | Oclaro, Inc.*,1 | | | 4,581,790 | | | | 5,245,599 | |
| | | | Data Processing & Outsourced Services - 5.5% | |
| | 273,930 | | | Black Knight Financial Services, Inc., Class A*,1 | | | 7,101,249 | | | | 10,491,519 | |
| | 48,445 | | | Blackhawk Network Holdings, Inc.* | | | 1,981,251 | | | | 1,966,867 | |
| | 139,960 | | | Global Payments, Inc. | | | 10,039,962 | | | | 11,291,973 | |
| | 183,705 | | | Visa, Inc., Class A | | | 13,439,444 | | | | 16,325,863 | |
| | | | Internet Software & Services - 8.8% | | | | | |
| | 17,429 | | | Alphabet, Inc., Class A* | | | 11,980,700 | | | | 14,776,306 | |
| | 128,454 | | | Facebook, Inc., Class A* | | | 8,640,531 | | | | 18,246,891 | |
| | 117,660 | | | LogMeln, Inc.1 | | | 12,462,324 | | | | 11,471,850 | |
| | 297,282 | | | The Trade Desk, Inc., Class A* | | | 9,626,501 | | | | 11,073,755 | |
| | 257,835 | | | Yelp, Inc.*,1 | | | 8,664,539 | | | | 8,444,096 | |
| | | | Semiconductors - 11.2% | | | | | |
| | 1,303,285 | | | Advanced Micro Devices, Inc.*,1 | | | 9,439,538 | | | | 18,962,797 | |
| | 131,645 | | | Ambarella, Inc.*,1 | | | 7,427,114 | | | | 7,202,298 | |
| | 69,190 | | | Broadcom, Ltd. | | | 5,733,996 | | | | 15,149,842 | |
| | 575,975 | | | Micron Technology, Inc.* | | | 10,165,051 | | | | 16,645,678 | |
| | 188,215 | | | Microsemi Corp.* | | | 10,487,137 | | | | 9,698,719 | |
| | 74,605 | | | NVIDIA Corp. | | | 6,574,603 | | | | 8,126,723 | |
| | 77,180 | | | Qorvo, Inc.* | | | 4,259,015 | | | | 5,291,461 | |
| | | | Systems Software - 2.6% | | | | | |
| | 169,255 | | | Microsoft Corp. | | | 10,853,934 | | | | 11,147,134 | |
| | 91,815 | | | ServiceNow, Inc.* | | | 7,306,472 | | | | 8,031,058 | |
| | | | | | | | | | | | |
| | Total Information Technology | | | 210,382,105 | | | | 265,606,127 | |
| | | | This sector is 26.2% above your Fund’s cost. | | | | | |
| | Materials | | | | | | | | |
| | | | Construction Materials - 2.3% | | | | | |
| | 28,850 | | | Martin Marietta Materials, Inc. | | | 6,367,885 | | | | 6,296,513 | |
| | 82,665 | | | Vulcan Materials Co. | | | 10,346,617 | | | | 9,959,479 | |
| | | | | | | | | | | | |
| Shares | | | | | Cost | | | Value | |
| | | | Specialty Chemicals - 1.7% | | | | | |
| | 119,065 | | | Albemarle Corp. | | $ | 10,828,703 | | | $ | 12,578,027 | |
| | | | | | | | | | | | |
| | Total Materials | | | 27,543,205 | | | | 28,834,019 | |
| | | | This sector is 4.7% above your Fund’s cost. | | | | | |
| | Real Estate | | | | | | | | |
| | | | Specialized REITs - 1.0% | | | | | |
| | 167,410 | | | Potlatch Corp. | | | 7,307,519 | | | | 7,650,637 | |
| | | | This sector is 4.7% above your Fund’s cost. | | | | | |
| | Telecommunication Services | | | | | | | | |
| | | | Wireless Telecommunication Services - 1.5% | |
| | 172,305 | | | T-Mobile US, Inc.* | | | 10,666,044 | | | | 11,129,180 | |
| | | | This sector is 4.3% above your Fund’s cost. | | | | | |
| | Total Common Stocks | | | 610,481,877 | | | | 711,325,429 | |
| | | |
Principal
Amount | | | | | | | | | |
| | Short-Term Investments - 9.8% | | | | | | | | |
| | Commercial Paper - 2.6% | | | | | | | | |
| | | | Johnson Controls International PLC, | | | | | | | | |
| | $18,900,000 | | | 1.07%, 04/03/172 | | | 18,898,876 | | | | 18,898,876 | |
| | Repurchase Agreements - 7.2%3 | | | | | | | | |
| | 12,351,525 | | | Cantor Fitzgerald Securities, Inc., dated 03/31/17, due 04/03/17, 0.810% total to be received $12,352,359 (collateralized by various U.S. Government Agency Obligations, 0.000% - 10.000%, 04/01/17 - 02/20/67, totaling $12,598,559) | | | 12,351,525 | | | | 12,351,525 | |
| | 12,351,525 | | | Daiwa Capital Markets America, dated 03/31/17, due 04/03/17, 0.820% total to be received $12,352,369 (collateralized by various U.S. Government Agency Obligations, 0.000% - 6.500%, 05/11/17 - 12/01/51, totaling $12,598,556) | | | 12,351,525 | | | | 12,351,525 | |
| | 2,598,907 | | | Jefferies LLC, dated 03/31/17, due 04/03/17, 0.980% total to be received $2,599,119 (collateralized by various U.S. Government Agency Obligations, 3.500%, 03/01/37 - 02/01/47, totaling $2,650,885) | | | 2,598,907 | | | | 2,598,907 | |
| | 12,351,525 | | | Nomura Securities International, Inc., dated 03/31/17, due 04/03/17, 0.810% total to be received $12,352,359 (collateralized by various U.S. Government Agency Obligations, 0.000% - 7.500%, 04/19/17 - 02/20/67, totaling $12,598,556) | | | 12,351,525 | | | | 12,351,525 | |
|
The accompanying notes are an integral part of these financial statements. 8 |
AMG Managers Brandywine Fund
Schedule of Portfolio Investments (continued)
| | | | | | | | | | | | |
Principal
Amount | | | | | Cost | | | Value | |
| | $12,351,500 | | | State of Wisconsin Investment Board, dated 03/31/17, due 04/03/17, 0.900% total to be received $12,352,426 (collateralized by various U.S. Government Agency Obligations, 0.125% - 3.875%, 01/15/19 - 02/15/46, totaling $12,598,543) | | $ | 12,351,500 | | | $ | 12,351,500 | |
| | | | | | | | | | | | |
| | Total Repurchase Agreements | | | 52,004,982 | | | | 52,004,982 | |
| | | | | | | | | | | | |
Shares | | | | | Cost | | | Value | |
| | Other Investment Companies - 0.0%# | | | | | |
| | 184,013 | | | Dreyfus Government Cash Management Fund, Institutional Class Shares, 0.65%4 | | $ | 184,013 | | | $ | 184,013 | |
| | | | | | | | | | | | |
| | Total Short-Term Investments | | | 71,087,871 | | | | 71,087,871 | |
| | Total Investments - 107.5% | | $ | 681,569,748 | | | | 782,413,300 | |
| | | | | | | | | | | | |
| | Other Assets, less Liabilities - (7.5)% | | | | | | | (54,248,685 | ) |
| | Total Net Assets - 100.0% | | | | | | $ | 728,164,615 | |
| | | | | | | | | | | | |
|
The accompanying notes are an integral part of these financial statements. 9 |
AMG Managers Brandywine Blue Fund
Fund Snapshots (unaudited)
March 31, 2017
PORTFOLIO BREAKDOWN
| | | | | | | | | | | | | | | | |
Industry (Top Ten) | | AMG
Managers
Brandywine
Blue Fund* | | | Russell
1000®
Growth
Index | | | Russell
1000®
Index | | | S&P 500
Index | |
Semiconductors | | | 14.8 | % | | | 3.2 | % | | | 3.1 | % | | | 3.4 | % |
Internet & Direct Marketing Retail | | | 10.1 | % | | | 4.6 | % | | | 2.3 | % | | | 2.6 | % |
Data Processing & Outsourced Services | | | 7.2 | % | | | 6.9 | % | | | 3.9 | % | | | 3.7 | % |
Internet Software & Services | | | 6.3 | % | | | 7.9 | % | | | 4.2 | % | | | 4.6 | % |
Systems Software | | | 5.9 | % | | | 7.5 | % | | | 4.6 | % | | | 4.6 | % |
Pharmaceuticals | | | 5.8 | % | | | 2.9 | % | | | 4.6 | % | | | 5.1 | % |
Life Sciences Tools & Services | | | 3.8 | % | | | 0.9 | % | | | 0.7 | % | | | 0.7 | % |
Biotechnology | | | 3.6 | % | | | 5.6 | % | | | 2.8 | % | | | 2.8 | % |
Application Software | | | 3.5 | % | | | 7.5 | % | | | 4.6 | % | | | 4.6 | % |
Construction Materials | | | 2.8 | % | | | 0.3 | % | | | 0.2 | % | | | 0.1 | % |
Other Common Stock | | | 34.4 | % | | | 52.7 | % | | | 69.0 | % | | | 67.8 | % |
Cash & Cash Equivalent† | | | 1.8 | % | | | 0.0 | % | | | 0.0 | % | | | 0.0 | % |
| * | As a percentage of net assets. |
| † | Includes Other Assets and Liabilities. |
TOP TEN HOLDINGS
| | | | | | | | |
Security Name | | % of
Net Assets | | |
% Change
from
Book Cost | |
Microsoft Corp. | | | 4.0 | % | | | 3.0 | % |
Advanced Micro Devices, Inc.** | | | 3.9 | % | | | 99.9 | % |
Facebook, Inc., Class A** | | | 3.7 | % | | | 74.3 | % |
Amazon.com, Inc.** | | | 3.0 | % | | | 104.6 | % |
Netflix, Inc.** | | | 2.9 | % | | | 36.0 | % |
Broadcom, Ltd. | | | 2.9 | % | | | 166.2 | % |
Visa, Inc., Class A | | | 2.8 | % | | | 22.8 | % |
NVIDIA Corp.** | | | 2.6 | % | | | 79.8 | % |
Alphabet, Inc., Class A | | | 2.6 | % | | | 23.2 | % |
Vantiv, Inc., Class A | | | 2.5 | % | | | 39.1 | % |
| | | | | | | | |
Top Ten as a Group | | | 30.9 | % | | | | |
| | | | | | | | |
| ** | Also Top Ten Holding as of December 31, 2016. |
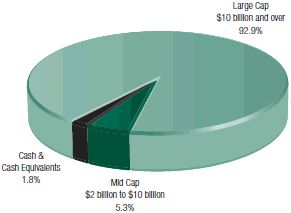
PORTFOLIO MARKET CAPITALIZATION
ESTIMATED EARNINGS GROWTH RATE
OF THE FUND’S INVESTMENTS
Forecasted Increase in Earnings Per Share 2017 vs 2016

Source: Consensus estimates from FactSet Research Systems Inc.
This is not a forecast of the Fund’s future performance. Earnings growth for a Fund holding does not guarantee a corresponding increase in the market value of the holding or the Fund.
Because a fund’s strategy may result in multiple investments in particular sectors of the economy, its performance may depend on the performance of those sectors and may fluctuate more widely than investments diversified across more sectors. For additional information on these and other risk considerations, please see the Fund’s prospectus.
Any sectors, industries, or securities discussed should not be perceived as investment recommendations. Mention of a specific security should not be considered a recommendation to buy or solicitation to sell that security. Specific securities mentioned in this report may have been sold from the Fund’s portfolio of investments by the time you receive this report.
AMG Managers Brandywine Blue Fund
Roses and Thorns (unaudited)
Quarter Ending March 31, 2017
| | | | | | |
$ Gain (in millions) | | % Gain | | Biggest $ Winners | | Reason for Move |
| | | | |
| | | | Advanced Micro Devices Inc. (AMD) |
| $1.3 | | 25.0% | | The semiconductor manufacturer exceeded December-quarter revenue expectations on strong demand for graphics chips used in game consoles. Ryzen, a high-end central processor built on Advanced Micro’s new Zen architecture, was credited with taking market share from competitor Intel Corp. Advanced Micro reported 17 new customer wins. The company also raised 2017 revenue guidance. |
| | |
| | | | Facebook Inc. (FB) |
| $1.1 | | 23.5% | | The social networking service and website grew earnings 78 percent in the December quarter, exceeding the consensus estimate. Sales increased 51 percent, primarily driven by advertising revenue. Monthly active users grew 17 percent, the fastest pace since March 2013. |
| | |
| | | | Micron Technology Inc. (MU) |
| $1.0 | | 31.8% | | The manufacturer of DRAM semiconductors reported February-quarter earnings of $0.90 a share, topping the consensus estimate. The company reported better-than-expected gross profit margins due to higher average selling prices and lower costs. Micron raised 2017 revenue and profit margin guidance above consensus estimates. |
| | |
| | | | Broadcom Ltd. (AVGO) |
| $0.9 | | 23.9% | | The developer of semiconductor connectivity solutions grew earnings 51 percent in the January quarter, topping the consensus estimate. The company raised 2017 earnings guidance as revenue and profitability improved due to demand driven by the launch of Samsung’s new Galaxy 8 smartphones. |
| | |
| | | | Arista Networks Inc. (ANET) |
| $0.9 | | 36.7% | | The provider of cloud networking solutions grew December-quarter earnings 30 percent, exceeding the consensus estimate. Revenue increased 34 percent and operating profit margins expanded due to rapid adoption of new products amid the 100G telecommunications equipment upgrade cycle. Arista Networks also raised March-quarter earnings guidance. |
| | | |
$ Loss (in millions) | | % Loss | | Biggest $ Losers | | Reason for Move |
| | | | |
| | | | Lululemon Athletica Inc. (LULU) |
| $0.8 | | 20.9% | | The designer and retailer of athletic apparel grew January-quarter earnings 18 percent. Comparable store sales were higher than expected, but the company’s shares declined due to reduced 2017 earnings guidance. We sold Lululemon to fund a new company with better visibility. |
| | |
| | | | Apache Corp. (APA) |
| $0.4 | | 15.5% | | The energy exploration and production company grew December-quarter sales 15 percent. Shares declined due to lower-than-expected production in the quarter, a tempered 2017 outlook and higher planned expenditures. We sold Apache to fund a new company with a better earnings outlook. |
| | |
| | | | Parsley Energy Inc. (PE) |
| $0.4 | | 12.6% | | The Permian Basin-focused energy exploration and production company appeared to be positioned to benefit from low-cost production growth. Parsley’s share price declined after the company announced its intention to acquire Double Eagle Energy. We sold Parsley Energy because the proposed transaction undermined our original investment thesis. |
| | |
| | | | Delta Air Lines Inc. (DAL) |
| $0.3 | | 10.7% | | The air transportation provider for passengers and cargo met December-quarter expectations with earnings per share of $0.82. Shares declined when Delta reported lower February operating results, subsequently prompting the company to reduce March-quarter earnings guidance. |
| | |
| | | | Kroger Co. (KR) |
| $0.2 | | 7.7% | | The retail food and drug store operator reported January-quarter earnings of $0.53 per share, topping the consensus estimate. Shares declined when the company reported disappointing same-store sales. We sold Kroger to fund a new holding with better visibility. |
All gains/losses are calculated on an average cost basis from December 31, 2016 through March 31, 2017.
This commentary reflects the viewpoints of Friess Associates, LLC as of March 31, 2017 and is not intended as a forecast or guarantee of future results.
AMG Managers Brandywine Blue Fund
Schedule of Portfolio Investments (unaudited)
March 31, 2017
| | | | | | | | | | | | |
| Shares | | | | | Cost | | | Value | |
| | Common Stocks - 98.2% | | | | | | | | |
| | Consumer Discretionary | | | | | | | | |
| | | | Automotive Retail - 1.7% | | | | | |
| | 10,170 | | | O’Reilly Automotive, Inc.* | | $ | 2,809,577 | | | $ | 2,744,273 | |
| | | | Cable & Satellite - 1.8% | | | | | |
| | 8,957 | | | Charter Communications, Inc., Class A* | | | 2,061,085 | | | | 2,931,805 | |
| | | | Footwear - 2.0% | | | | | |
| | 57,500 | | | NIKE, Inc., Class B | | | 3,212,946 | | | | 3,204,475 | |
| | | | General Merchandise Stores - 1.2% | | | | | |
| | 23,990 | | | Dollar Tree, Inc.* | | | 1,890,008 | | | | 1,882,255 | |
| | | | Internet & Direct Marketing Retail - 10.1% | | | | | |
| | 5,378 | | | Amazon.com, Inc.* | | | 2,330,337 | | | | 4,767,812 | |
| | 23,700 | | | Expedia, Inc. | | | 2,915,501 | | | | 2,990,229 | |
| | 31,660 | | | Netflix, Inc.* | | | 3,441,531 | | | | 4,679,665 | |
| | 2,025 | | | The Priceline Group, Inc.* | | | 2,881,505 | | | | 3,604,439 | |
| | | | Movies & Entertainment - 1.9% | | | | | |
| | 27,200 | | | The Walt Disney Co. | | | 2,765,846 | | | | 3,084,208 | |
| | | | Specialty Stores - 2.4% | | | | | |
| | 13,409 | | | Ulta Beauty, Inc.* | | | 3,365,693 | | | | 3,824,649 | |
| | | | | | | | | | | | |
| | Total Consumer Discretionary | | | 27,674,029 | | | | 33,713,810 | |
| | | | This sector is 21.8% above your Fund’s cost. | | | | | |
| | Consumer Staples | | | | | | | | |
| | | | Hypermarkets & Super Centers - 1.9% | | | | | |
| | 17,515 | | | Costco Wholesale Corp. | | | 2,800,201 | | | | 2,937,090 | |
| | | | Personal Products - 1.8% | | | | | |
| | 34,000 | | | The Estee Lauder Cos., Inc., Class A | | | 2,915,561 | | | | 2,882,860 | |
| | | | | | | | | | | | |
| | Total Consumer Staples | | | 5,715,762 | | | | 5,819,950 | |
| | | | This sector is 1.8% above your Fund’s cost. | | | | | |
| | Energy | | | | | | | | |
| | | | Oil & Gas Equipment & Services - 0.5% | | | | | |
| | 110,715 | | | Weatherford International PLC* | | | 738,702 | | | | 736,255 | |
| | | | This sector is 0.3% below your Fund’s cost. | | | | | |
| | Financials | | | | | | | | |
| | | | Financial Exchanges & Data - 2.2% | | | | | |
| | 30,125 | | | CME Group, Inc. | | | 2,830,126 | | | | 3,578,850 | |
| | | | This sector is 26.5% above your Fund’s cost. | | | | | |
| | Health Care | | | | | | | | |
| | | | Biotechnology - 3.6% | | | | | |
| | 16,800 | | | Shire PLC, ADR | | | 2,829,493 | | | | 2,927,064 | |
| | 26,020 | | | Vertex Pharmaceuticals, Inc.* | | | 2,799,534 | | | | 2,845,287 | |
| | | | | | | | | | | | |
| Shares | | | | | Cost | | | Value | |
| | | | Health Care Equipment - 1.8% | | | | | |
| | 118,800 | | | Boston Scientific Corp.* | | $ | 2,805,164 | | | $ | 2,954,556 | |
| | | | Life Sciences Tools & Services - 3.8% | | | | | |
| | 17,300 | | | Illumina, Inc.* | | | 2,898,333 | | | | 2,952,072 | |
| | 20,500 | | | Thermo Fisher Scientific, Inc. | | | 2,685,695 | | | | 3,148,800 | |
| | | | Managed Health Care - 2.0% | | | | | |
| | 21,700 | | | Cigna Corp. | | | 2,874,556 | | | | 3,178,833 | |
| | | | Pharmaceuticals - 5.8% | | | | | |
| | 52,000 | | | Bristol-Myers Squibb Co. | | | 2,906,301 | | | | 2,827,760 | |
| | 39,900 | | | Eli Lilly & Co. | | | 2,866,376 | | | | 3,355,989 | |
| | 56,260 | | | Zoetis, Inc. | | | 3,028,375 | | | | 3,002,596 | |
| | | | | | | | | | | | |
| | Total Health Care | | | 25,693,827 | | | | 27,192,957 | |
| | | | This sector is 5.8% above your Fund’s cost. | | | | | |
| | Industrials | | | | | | | | |
| | | | Airlines - 1.7% | | | | | |
| | 58,000 | | | Delta Air Lines, Inc. | | | 2,983,967 | | | | 2,665,680 | |
| | | | Environmental & Facilities Services - 2.2% | | | | | |
| | 40,000 | | | Waste Connections, Inc. | | | 2,928,012 | | | | 3,528,800 | |
| | | | Trading Companies & Distributors - 1.4% | | | | | |
| | 18,115 | | | United Rentals, Inc.* | | | 2,245,270 | | | | 2,265,281 | |
| | | | | | | | | | | | |
| | Total Industrials | | | 8,157,249 | | | | 8,459,761 | |
| | | | This sector is 3.7% above your Fund’s cost. | | | | | |
| | Information Technology | | | | | | | | |
| | | | Application Software - 3.5% | | | | | |
| | 36,320 | | | Salesforce.com, Inc.* | | | 2,754,673 | | | | 2,996,037 | |
| | 116,502 | | | Snap, Inc., Class A*,1 | | | 2,784,695 | | | | 2,624,790 | |
| | | | Communications Equipment - 2.0% | | | | | |
| | 24,250 | | | Arista Networks, Inc.* | | | 2,265,468 | | | | 3,207,548 | |
| | | | Data Processing & Outsourced Services - 7.2% | |
| | 37,520 | | | Global Payments, Inc. | | | 2,696,027 | | | | 3,027,114 | |
| | 63,500 | | | Vantiv, Inc., Class A* | | | 2,927,454 | | | | 4,071,620 | |
| | 49,250 | | | Visa, Inc., Class A | | | 3,562,798 | | | | 4,376,848 | |
| | | | Internet Software & Services - 6.3% | | | | | |
| | 4,807 | | | Alphabet, Inc., Class A* | | | 3,308,126 | | | | 4,075,375 | |
| | 41,650 | | | Facebook, Inc., Class A* | | | 3,394,745 | | | | 5,916,382 | |
| | | | Semiconductors - 14.8% | | | | | |
| | 432,830 | | | Advanced Micro Devices, Inc.*,1 | | | 3,149,895 | | | | 6,297,676 | |
| | 20,865 | | | Broadcom, Ltd. | | | 1,716,293 | | | | 4,568,600 | |
| | 139,070 | | | Micron Technology, Inc.* | | | 2,437,003 | | | | 4,019,123 | |
| | 50,800 | | | Microsemi Corp.* | | | 2,822,700 | | | | 2,617,724 | |
| | 38,800 | | | NVIDIA Corp. | | | 2,351,176 | | | | 4,226,484 | |
| | 28,165 | | | Qorvo, Inc.* | | | 1,547,337 | | | | 1,930,992 | |
| | | | Systems Software - 5.9% | | | | | |
| | 95,800 | | | Microsoft Corp. | | | 6,123,044 | | | | 6,309,388 | |
| | 34,800 | | | ServiceNow, Inc.* | | | 2,867,874 | | | | 3,043,956 | |
|
The accompanying notes are an integral part of these financial statements. 12 |
AMG Managers Brandywine Blue Fund
Schedule of Portfolio Investments (continued)
| | | | | | | | | | | | |
Shares | | | | | Cost | | | Value | |
| | Information Technology (continued) | | | | | | | | |
| | | | Technology Hardware, Storage & Peripherals - 2.0% | |
| | 39,300 | | | Western Digital Corp. | | $ | 2,802,110 | | | $ | 3,243,429 | |
| | | | | | | | | | | | |
| | Total Information Technology | | | 49,511,418 | | | | 66,553,086 | |
| | | | This sector is 34.4% above your Fund’s cost. | | | | | |
| | Materials | | | | | | | | |
| | | | Construction Materials - 2.8% | |
| | 8,200 | | | Martin Marietta Materials, Inc. | | | 1,816,422 | | | | 1,789,650 | |
| | 22,295 | | | Vulcan Materials Co. | | | 2,800,343 | | | | 2,686,102 | |
| | | | Specialty Chemicals - 2.0% | |
| | 30,695 | | | Albemarle Corp. | | | 2,790,726 | | | | 3,242,620 | |
| | | | | | | | | | | | |
| | Total Materials | | | 7,407,491 | | | | 7,718,372 | |
| | | | This sector is 4.2% above your Fund’s cost. | | | | | |
| | Telecommunication Services | | | | | | | | |
| | | | Wireless Telecommunication Services - 1.9% | |
| | 46,700 | | | T-Mobile US, Inc.* | | | 2,905,558 | | | | 3,016,353 | |
| | | | This sector is 3.8% above your Fund’s cost. | | | | | |
| | Total Common Stocks | | | 130,634,162 | | | | 156,789,394 | |
| | | |
Principal
Amount | | | | | | | | | |
| | Short-Term Investments - 5.1% | | | | | | | | |
| | Commercial Paper - 1.2% | | | | | | | | |
| | | | Johnson Controls International PLC, | | | | | | | | |
| | $2,000,000 | | | 1.07%, 04/03/172 | | | 1,999,881 | | | | 1,999,881 | |
| | Repurchase Agreements - 3.8%3 | | | | | | | | |
| | 302,491 | | | BNP Paribas S.A., dated 03/31/17, due 04/03/17, 0.810% total to be received $302,511 (collateralized by various U.S. Government Agency Obligations, 0.000% - 8.000%, 11/15/18 - 07/20/63, totaling $308,541) | | | 302,491 | | | | 302,491 | |
| | 1,437,856 | | | Cantor Fitzgerald Securities, Inc., dated 03/31/17, due 04/03/17, 0.810% total to be received $1,437,953 (collateralized by various U.S. Government Agency Obligations, 0.000% - 10.000%, 04/01/17 - 02/20/67, totaling $1,466,614) | | | 1,437,856 | | | | 1,437,856 | |
| | | | | | | | | | | | |
Principal
Amount | | | | | Cost | | | Value | |
| | $1,437,856 | | | Daiwa Capital Markets America, dated 03/31/17, due 04/03/17, 0.820% total to be received $1,437,954 (collateralized by various U.S. Government Agency Obligations, 0.000% - 6.500%, 05/11/17 - 12/01/51, totaling $1,466,613) | | $ | 1,437,856 | | | $ | 1,437,856 | |
| | 1,437,856 | | | Jefferies LLC, dated 03/31/17, due 04/03/17, 0.980% total to be received $1,437,973 (collateralized by various U.S. Government Agency Obligations, 3.500%, 03/01/37 - 02/01/47, totaling $1,466,613) | | | 1,437,856 | | | | 1,437,856 | |
| | 1,437,856 | | | Nomura Securities International, Inc., dated 03/31/17, due 04/03/17, 0.810% total to be received $1,437,953 (collateralized by various U.S. Government Agency Obligations, 0.000% - 7.500%, 04/19/17 - 02/20/67, totaling $1,466,613) | | | 1,437,856 | | | | 1,437,856 | |
| | | | | | | | | | | | |
| | Total Repurchase Agreements | | | 6,053,915 | | | | 6,053,915 | |
| | | |
| Shares | | | | | | | | | |
| | Other Investment Companies - 0.1% | | | | | | | | |
| | 123,027 | | | Dreyfus Government Cash Management Fund, Institutional Class Shares, 0.65%4 | | | 123,027 | | | | 123,027 | |
| | | | | | | | | | | | |
| | Total Short-Term Investments | | | 8,176,823 | | | | 8,176,823 | |
| | Total Investments - 103.3% | | $ | 138,810,985 | | | | 164,966,217 | |
| | | | | | | | | | | | |
| | Other Assets, less Liabilities - (3.3)% | | | | | | | (5,242,633 | ) |
| | Total Net Assets - 100.0% | | | | | | $ | 159,723,584 | |
| | | | | | | | | | | | |
|
The accompanying notes are an integral part of these financial statements. 13 |
Notes to Schedule of Portfolio Investments (unaudited)
The following footnotes should be read in conjunction with each of the Schedules of Portfolio Investments previously presented in this report.
At March 31, 2017, the approximate cost of investments and the aggregate gross unrealized appreciation and depreciation for federal income tax were as follows:
| | | | | | | | | | | | | | | | |
| Fund | | Cost | | | Appreciation | | | Depreciation | | | Net | |
AMG Managers Brandywine Fund | | $ | 682,515,300 | | | $ | 106,361,454 | | | $ | (6,463,454 | ) | | $ | 99,898,000 | |
AMG Managers Brandywine Blue Fund | | | 139,222,076 | | | | 26,789,383 | | | | (1,045,242 | ) | | | 25,744,141 | |
| * | Non-income producing security. |
| 1 | Some or all of these shares were out on loan to various brokers as of March 31, 2017, amounting to the following: |
| | | | | | | | |
| | | Market Value | | | % of Net Assets | |
AMG Managers Brandywine Fund | | $ | 45,835,883 | | | | 6.3 | % |
AMG Managers Brandywine Blue Fund | | | 3,537,915 | | | | 2.2 | % |
| 2 | Represents yield to maturity at March 31, 2017. |
| 3 | Collateral received from brokers for securities lending was invested in these joint repurchase agreements. |
| 4 | Yield shown represents the March 31, 2017, seven-day average yield, which refers to the sum of the previous seven days’ dividends paid, expressed as an annual percentage. |
The following tables summarize the inputs used to value the Funds’ investments by the fair value hierarchy levels as of March 31, 2017: (See Note 1(a) in the Notes to Financial Statements.)
| | | | | | | | | | | | | | | | |
| | | Quoted Prices in Active Markets for
Identical Investments Level 1 | | | Significant
Other Observable Inputs Level 2 | | | Significant Unobservable Inputs Level 3 | | | Total | |
AMG Managers Brandywine Fund | | | | | | | | | | | | | | | | |
Investments in Securities | | | | | | | | | | | | | | | | |
Common Stocks† | | $ | 711,325,429 | | | | — | | | | — | | | $ | 711,325,429 | |
Short-Term Investments | | | | | | | | | | | | | | | | |
Commercial Paper | | | — | | | $ | 18,898,876 | | | | — | | | | 18,898,876 | |
Repurchase Agreements | | | — | | | | 52,004,982 | | | | — | | | | 52,004,982 | |
Other Investment Companies | | | 184,013 | | | | — | | | | — | | | | 184,013 | |
| | | | | | | | | | | | | | | | |
Total Investments in Securities | | $ | 711,509,442 | | | $ | 70,903,858 | | | | — | | | $ | 782,413,300 | |
| | | | | | | | | | | | | | | | |
| | | | |
| | | Quoted Prices
in Active Markets for
Identical Investments Level 1 | | | Significant
Other Observable
Inputs Level 2 | | | Significant Unobservable
Inputs Level 3 | | | Total | |
AMG Managers Brandywine Blue Fund | | | | | | | | | | | | | | | | |
Investments in Securities | | | | | | | | | | | | | | | | |
Common Stocks† | | $ | 156,789,394 | | | | — | | | | — | | | $ | 156,789,394 | |
Short-Term Investments | | | | | | | | | | | | | | | | |
Commercial Paper | | | — | | | $ | 1,999,881 | | | | — | | | | 1,999,881 | |
Repurchase Agreements | | | — | | | | 6,053,915 | | | | — | | | | 6,053,915 | |
Other Investment Companies | | | 123,027 | | | | — | | | | — | | | | 123,027 | |
| | | | | | | | | | | | | | | | |
Total Investments in Securities | | $ | 156,912,421 | | | $ | 8,053,796 | | | | — | | | $ | 164,966,217 | |
| | | | | | | | | | | | | | | | |
| † | All common stocks held in the Funds are Level 1 securities. For a detailed breakout of the common stocks by major industry classification, please refer to the respective Schedule of Portfolio Investments. |
As of March 31, 2017, the Funds had no transfers between levels from the beginning of the reporting period.
|
The accompanying notes are an integral part of these financial statements. 14 |
Notes to Schedule of Portfolio Investments (continued)
INVESTMENT DEFINITIONS AND ABBREVIATIONS:
ADR: ADR after the name of a holding stands for American Depositary Receipt, representing ownership of foreign securities on deposit with a domestic custodian bank. The value of the ADR securities is determined or significantly influenced by trading on exchanges not located in the United States or Canada. Sponsored ADRs are initiated by the underlying foreign company.
REIT: Real Estate Investment Trust.
|
The accompanying notes are an integral part of these financial statements. 15 |
Statement of Assets and Liabilities (unaudited)
March 31, 2017
| | | | | | | | |
| | | AMG Managers
Brandywine
Fund# | | | AMG Managers
Brandywine
Blue Fund# | |
Assets: | | | | | | | | |
Investments at value* (including securities on loan valued at $45,835,883 and $3,537,915, respectively) | | $ | 782,413,300 | | | $ | 164,966,217 | |
Receivable for investments sold | | | 40,256,970 | | | | 7,317,627 | |
Dividends, interest and other receivables | | | 308,643 | | | | 57,048 | |
Receivable for Fund shares sold | | | 16,526 | | | | 5,690 | |
Prepaid expenses | | | 24,725 | | | | 15,723 | |
Receivable from affiliate | | | 2,482 | | | | — | |
Total assets | | | 823,022,646 | | | | 172,362,305 | |
Liabilities: | | | | | | | | |
Payable upon return of securities loaned | | | 52,004,982 | | | | 6,053,915 | |
Payable for investments purchased | | | 41,325,181 | | | | 6,256,613 | |
Payable for Fund shares repurchased | | | 691,505 | | | | 88,666 | |
Accrued expenses: | | | | | | | | |
Investment advisory and management fees | | | 546,105 | | | | 119,573 | |
Administrative fees | | | 93,086 | | | | 20,382 | |
Shareholder servicing fees - Class I | | | 14,894 | | | | 8,289 | |
Trustees fees and expenses | | | 9,499 | | | | 1,954 | |
Other | | | 172,779 | | | | 89,329 | |
Total liabilities | | | 94,858,031 | | | | 12,638,721 | |
Net Assets | | $ | 728,164,615 | | | $ | 159,723,584 | |
Net Assets Represent: | | | | | | | | |
Paid-in capital | | $ | 1,125,212,697 | | | $ | 1,123,384,197 | |
Accumulated net investment loss | | | (3,286,963 | ) | | | (401,151 | ) |
Accumulated net realized loss from investments | | | (494,604,671 | ) | | | (989,414,694 | ) |
Net unrealized appreciation of investments | | | 100,843,552 | | | | 26,155,232 | |
Net Assets | | $ | 728,164,615 | | | $ | 159,723,584 | |
Shares outstanding - Class I | | | 18,150,904 | | | | 3,940,407 | |
Net asset value, offering and redemption price per share - Class I | | $ | 40.12 | | | $ | 40.53 | |
* Investments at cost | | $ | 681,569,748 | | | $ | 138,810,985 | |
| # | Effective February 27, 2017, the Funds’ shares were renamed as described in Note 1 of the Notes to the Financial Statements. |
|
The accompanying notes are an integral part of these financial statements. 16 |
Statement of Operations (unaudited)
For the six months ended March 31, 2017
| | | | | | | | |
| | | AMG Managers
Brandywine
Fund# | | | AMG Managers
Brandywine Blue
Fund# | |
Investment Income: | | | | | | | | |
Dividend income | | $ | 2,046,513 | 1 | | $ | 673,482 | 1 |
Securities lending income | | | 167,526 | | | | 1,644 | |
Interest income | | | 87,453 | | | | 38,386 | |
Foreign withholding tax | | | (362 | ) | | | (2,160 | ) |
Total investment income | | | 2,301,130 | | | | 711,352 | |
Expenses: | | | | | | | | |
Investment advisory and management fees | | | 3,136,192 | | | | 685,426 | |
Administrative fees | | | 534,578 | | | | 116,834 | |
Shareholder servicing fees - Class I | | | 85,533 | | | | 47,639 | |
Transfer agent fees | | | 49,258 | | | | 7,493 | |
Professional fees | | | 44,758 | | | | 27,560 | |
Reports to shareholders | | | 36,565 | | | | 26,600 | |
Trustees fees and expenses | | | 30,853 | | | | 6,747 | |
Custodian fees | | | 24,887 | | | | 6,698 | |
Registration fees | | | 14,599 | | | | 12,642 | |
Miscellaneous | | | 7,820 | | | | 2,186 | |
Total expenses before offsets | | | 3,965,043 | | | | 939,825 | |
Fee waivers | | | (14,255 | ) | | | — | |
Net expenses | | | 3,950,788 | | | | 939,825 | |
Net investment loss | | | (1,649,658 | ) | | | (228,473 | ) |
Net Realized and Unrealized Gain (Loss): | | | | | | | | |
Net realized gain on investments | | | 47,197,845 | | | | 8,824,174 | |
Net change in unrealized appreciation of investments | | | 4,218,469 | | | | 6,219,047 | |
Net realized and unrealized gain | | | 51,416,314 | | | | 15,043,221 | |
Net increase in net assets resulting from operations | | $ | 49,766,656 | | | $ | 14,814,748 | |
| # | Effective February 27, 2017, the Funds’ shares were renamed as described in Note 1 of the Notes to the Financial Statements. |
| 1 | Includes non-recurring dividends of $402,101 and $97,906 for AMG Managers Brandywine Fund and AMG Managers Brandywine Blue Fund, respectively. |
|
The accompanying notes are an integral part of these financial statements. 17 |
Statements of Changes in Net Assets
For the six months ended March 31, 2017 (unaudited) and the fiscal year ended September 30, 2016
| | | | | | | | | | | | | | | | |
| | | AMG Managers
Brandywine Fund | | | AMG Managers
Brandywine Blue Fund | |
| | | March 31
2017# | | | September 30
2016 | | | March 31
2017# | | | September 30
2016 | |
Increase (Decrease) in Net Assets From Operations: | | | | | | | | | | | | | | | | |
Net investment loss | | $ | (1,649,658 | ) | | $ | (1,739,804 | ) | | $ | (228,473 | ) | | $ | (82,881 | ) |
Net realized gain (loss) on investments | | | 47,197,845 | | | | (9,004,284 | ) | | | 8,824,174 | | | | 931,856 | |
Net change in unrealized appreciation of investments | | | 4,218,469 | | | | 67,876,591 | | | | 6,219,047 | | | | 12,712,119 | |
Net increase in net assets resulting from operations | | | 49,766,656 | | | | 57,132,503 | | | | 14,814,748 | | | | 13,561,094 | |
Distributions to Shareholders: | | | | | | | | | | | | | | | | |
From net investment income | | | — | | | | — | | | | — | | | | (403,233 | ) |
Total distributions to shareholders | | | — | | | | — | | | | — | | | | (403,233 | ) |
Capital Share Transactions - Class I: | | | | | | | | | | | | | | | | |
Proceeds from sale of shares | | | 1,504,927 | | | | 2,672,006 | | | | 1,072,750 | | | | 1,687,155 | |
Reinvestment of dividends | | | — | | | | — | | | | — | | | | 373,025 | |
Cost of shares repurchased | | | (43,873,317 | ) | | | (98,222,751 | ) | | | (13,116,664 | ) | | | (27,445,759 | ) |
Net decrease from capital share transactions | | | (42,368,390 | ) | | | (95,550,745 | ) | | | (12,043,914 | ) | | | (25,385,579 | ) |
Total increase (decrease) in net assets | | | 7,398,266 | | | | (38,418,242 | ) | | | 2,770,834 | | | | (12,227,718 | ) |
Net Assets: | | | | | | | | | | | | | | | | |
Beginning of period | | | 720,766,349 | | | | 759,184,591 | | | | 156,952,750 | | | | 169,180,468 | |
End of period | | $ | 728,164,615 | | | $ | 720,766,349 | | | $ | 159,723,584 | | | $ | 156,952,750 | |
End of period accumulated net investment loss | | $ | (3,286,963 | ) | | $ | (1,637,305 | ) | | $ | (401,151 | ) | | $ | (172,678 | ) |
| | | | | | | | | | | | | | | | |
Capital Share Transactions - Class I: | | | | | | | | | | | | | | | | |
Sale of shares | | | 38,425 | | | | 76,221 | | | | 27,685 | | | | 48,842 | |
Reinvested shares from dividends | | | — | | | | — | | | | — | | | | 10,473 | |
Shares repurchased | | | (1,147,434 | ) | | | (2,795,333 | ) | | | (344,373 | ) | | | (785,787 | ) |
Net decrease in shares | | | (1,109,009 | ) | | | (2,719,112 | ) | | | (316,688 | ) | | | (726,472 | ) |
| # | Effective February 27, 2017, the Funds’ shares were renamed as described in Note 1 of the Notes to the Financial Statements. |
|
The accompanying notes are an integral part of these financial statements. 18 |
AMG Managers Brandywine Fund
Financial Highlights
For a share outstanding throughout each period
| | | | | | | | | | | | | | | | | | | | | | | | |
| | | For the six months ended March 31, 2017# | | | For the fiscal years ended September 30, | |
| Class I | | (unaudited) | | | 2016 | | | 2015 | | | 20145 | | | 2013 | | | 2012 | |
Net Asset Value, Beginning of Period | | $ | 37.42 | | | $ | 34.54 | | | $ | 33.25 | | | $ | 28.75 | | | $ | 24.62 | | | $ | 21.38 | |
Income (loss) from Investment Operations: | | | | | | | | | | | | | | | | | | | | | | | | |
Net investment income (loss)1 | | | (0.09 | )2 | | | (0.08 | )3 | | | 0.04 | 4 | | | (0.12 | ) | | | (0.03 | ) | | | (0.05 | ) |
Net realized and unrealized gain on investments | | | 2.79 | | | | 2.96 | | | | 1.25 | | | | 4.62 | | | | 4.16 | | | | 3.29 | |
Total income from investment operations | | | 2.70 | | | | 2.88 | | | | 1.29 | | | | 4.50 | | | | 4.13 | | | | 3.24 | |
Net Asset Value, End of Period | | $ | 40.12 | | | $ | 37.42 | | | $ | 34.54 | | | $ | 33.25 | | | $ | 28.75 | | | $ | 24.62 | |
Total Return | | | 7.22 | %7 | | | 8.34 | % | | | 3.88 | % | | | 15.65 | % | | | 16.77 | % | | | 15.15 | % |
Ratio of net expenses to average net assets | | | 1.11 | %8 | | | 1.11 | % | | | 1.10 | % | | | 1.10 | % | | | 1.11 | %6 | | | 1.08 | % |
Ratio of gross expenses to average net assets | | | 1.11 | %8 | | | — | | | | — | | | | — | | | | — | | | | — | |
Ratio of net investment income (loss) to average net assets | | | (0.46 | )%8 | | | (0.24 | )% | | | 0.10 | % | | | (0.37 | )% | | | (0.12 | )% | | | (0.23 | )% |
Portfolio turnover | | | 113 | %7 | | | 185 | % | | | 190 | % | | | 219 | % | | | 214 | % | | | 256 | % |
Net assets at end of period (000’s omitted) | | $ | 728,165 | | | $ | 720,766 | | | $ | 759,185 | | | $ | 799,045 | | | $ | 816,222 | | | $ | 1,062,544 | |
| | | | | | | | | | | | | | | | | | | | | | | | |
AMG Managers Brandywine Blue Fund
Financial Highlights
For a share outstanding throughout each period
| | | | | | | | | | | | | | | | | | | | | | | | |
| | | For the six months ended March 31, 2017# | | | For the fiscal years ended September 30, | |
| Class I | | (unaudited) | | | 2016 | | | 2015 | | | 20145 | | | 2013 | | | 2012 | |
Net Asset Value, Beginning of Period | | $ | 36.87 | | | $ | 33.95 | | | $ | 33.51 | | | $ | 30.01 | | | $ | 25.00 | | | $ | 21.50 | |
Income (loss) from Investment Operations: | | | | | | | | | | | | | | | | | | | | | | | | |
Net investment income (loss)1 | | | (0.06 | )2 | | | (0.02 | )3 | | | 0.10 | 4 | | | (0.03 | ) | | | 0.12 | | | | (0.11 | ) |
Net realized and unrealized gain on investments | | | 3.72 | | | | 3.02 | | | | 0.34 | | | | 3.53 | | | | 4.89 | | | | 3.61 | |
Total income from investment operations | | | 3.66 | | | | 3.00 | | | | 0.44 | | | | 3.50 | | | | 5.01 | | | | 3.50 | |
Less Distributions to Shareholders from: | | | | | | | | | | | | | | | | | | | | | | | | |
Net investment income | | | — | | | | (0.08 | ) | | | — | | | | — | | | | — | | | | — | |
Net Asset Value, End of Period | | $ | 40.53 | | | $ | 36.87 | | | $ | 33.95 | | | $ | 33.51 | | | $ | 30.01 | | | $ | 25.00 | |
Total Return | | | 9.93 | %7 | | | 8.86 | % | | | 1.31 | % | | | 11.66 | % | | | 20.04 | % | | | 16.28 | % |
Ratio of total expenses to average net assets | | | 1.21 | %8 | | | 1.20 | % | | | 1.20 | % | | | 1.19 | % | | | 1.22 | %6 | | | 1.23 | % |
Ratio of net investment income (loss) to average net assets | | | (0.29 | )%8 | | | (0.05 | )% | | | 0.29 | % | | | (0.11 | )% | | | 0.45 | % | | | (0.46 | )% |
Portfolio turnover | | | 107 | %7 | | | 139 | % | | | 156 | % | | | 182 | % | | | 202 | % | | | 243 | % |
Net assets at end of period (000’s omitted) | | $ | 159,724 | | | $ | 156,953 | | | $ | 169,180 | | | $ | 215,941 | | | $ | 278,620 | | | $ | 627,622 | |
| | | | | | | | | | | | | | | | | | | | | | | | |
Notes to Financial Highlights (unaudited)
| # | Effective February 27, 2017, each Fund’s Class S shares were renamed to Class I shares. |
| 1 | Per share numbers have been calculated using average shares. |
| 2 | Includes non-recurring dividends. Without these dividends, net investment loss per share would have been ($0.11) and (0.08) for AMG Managers Brandywine Fund and AMG Managers Brandywine Blue Fund, respectively. |
| 3 | Includes non-recurring dividends. Without these dividends, net investment loss per share would have been ($0.10) and (0.04) for AMG Managers Brandywine Fund and AMG Managers Brandywine Blue Fund, respectively. |
| 4 | Includes non-recurring dividends. Without these dividends, net investment loss per share would have been ($0.07) and ($0.08) for the AMG Managers Brandywine Fund and AMG Managers Brandywine Blue Fund, respectively. |
| 5 | At the start of business October 1, 2013, AMG Managers Brandywine Fund and AMG Managers Brandywine Blue Fund were each reorganized into a respective fund of AMG Funds I. |
| 6 | Interest expense is less than 0.005% of average net assets. |
Notes to Financial Statements (unaudited)
March 31, 2017
1. SUMMARY OF SIGNIFICANT ACCOUNTING POLICIES
AMG Funds I (the “Trust”) is an open-end management investment company, organized as a Massachusetts business trust, and registered under the Investment Company Act of 1940, as amended (the “1940 Act”). Currently, the Trust consists of a number of different funds, each having distinct investment management objectives, strategies, risks, and policies. Included in this report are AMG Managers Brandywine Fund (“Brandywine”) and AMG Managers Brandywine Blue Fund (“Brandywine Blue”), each a “Fund” and collectively the “Funds.”
A significant portion of the Brandywine Blue’s holdings may be focused in a relatively small number of securities, which may make the Fund more volatile and subject to greater risk than a more diversified fund.
Effective October 1, 2016, each Fund’s shares were reclassified and redesignated as Class S shares. Effective February 27, 2017, each Fund’s Class S shares were renamed to Class I shares. Please refer to a current prospectus for additional information.
The Funds’ financial statements are prepared in accordance with accounting principles generally accepted in the United States of America (“U.S. GAAP”), including accounting and reporting guidance pursuant to Accounting Standards Codification Topic 946 applicable to investment companies. U.S. GAAP requires management to make estimates and assumptions that affect the reported amounts of assets and liabilities and disclosure of contingent assets and liabilities at the date of the financial statements and the reported amounts of income and expenses during the reporting period. Actual results could differ from those estimates and such differences could be material. The following is a summary of significant accounting policies followed by the Funds in the preparation of their financial statements:
a. VALUATION OF INVESTMENTS
Equity securities traded on a national securities exchange or reported on the NASDAQ national market system (“NMS”) are valued at the last quoted sales price on the primary exchange or, if applicable, the NASDAQ official closing price or the official closing price of the relevant exchange or, lacking any sales, at the last quoted bid price or the mean between the last quoted bid and ask prices (the “exchange mean price”). Equity securities traded in the over-the-counter market (other than NMS securities) are valued at the exchange mean price. Foreign equity securities (securities principally traded in markets other than U.S. markets) are valued at the official closing price on the primary exchange or, for markets that either do not offer an official closing price or where the official closing price may not be representative of the overall market, the last quoted sale price.
Fixed income securities purchased with a remaining maturity of 60 days or less are valued at amortized cost, provided that the amortized cost value is approximately the same as the fair value of the security valued without the use of amortized cost. Investments in other open-end regulated investment companies are valued at their end of day net asset value per share.
The Funds’ portfolio investments are generally valued based on independent market quotations or prices or, if none, “evaluative” or other market based valuations provided by third-party pricing services approved by the Board of
Trustees of the Trust (the “Board”). Under certain circumstances, the value of certain Fund portfolio investments (including derivatives) may be based on an evaluation of fair value, pursuant to procedures established by and under the general supervision of the Board. The Valuation Committee, which is comprised of the Independent Trustees of the Board, and the Pricing Committee, which is comprised of representatives from AMG Funds LLC (the “Investment Manager”) are the committees appointed by the Board to make fair value determinations. Each Fund may use the fair value of a portfolio instrument to calculate its net asset value (“NAV”) in the event that the market quotation, price or market based valuation for the portfolio instrument is not readily available or otherwise not determinable pursuant to the Board’s valuation procedures, if the Investment Manager or the Pricing Committee believes the quotation, price or market based valuation to be unreliable, or in certain other circumstances. When determining the fair value of an investment, the Pricing Committee and, if required under the Trust’s securities valuation procedures, the Valuation Committee, seeks to determine the price that the Fund might reasonably expect to receive from current sale of that portfolio investment in an arms-length transaction. Fair value determinations shall be based upon consideration of all available facts and information, including, but not limited to (i) attributes specific to the investment; (ii) fundamental and analytical data relating to the investment; and (iii) the value of other comparable securities or relevant financial instruments, including derivative securities, traded on other markets or among dealers.
The values assigned to fair value portfolio investments are based on available information and do not necessarily represent amounts that might ultimately be realized in the future, since such amounts depend on future developments inherent in long-term investments. Because of the inherent uncertainty of valuation, those estimated values may differ significantly from the values that would have been used had a ready market for the investments existed, and the differences could be material. The Board will be presented with a quarterly report showing as of the most recent quarter end, all outstanding securities fair valued by the Fund, including a comparison with the prior quarter end and the percentage of the Fund that the security represents at each quarter end.
With respect to foreign equity securities and certain foreign fixed income securities, the Board has adopted a policy that securities held in a Fund that can be fair valued by the applicable fair value pricing service are fair valued on each business day provided that each individual price exceeds a pre-established confidence level.
U.S. GAAP defines fair value as the price that a fund would receive to sell an asset or pay to transfer a liability in an orderly transaction between market participants at the measurement date. U.S. GAAP also establishes a framework for measuring fair value, and a three-level hierarchy for fair value measurements based upon the transparency of inputs to the valuation of an asset or liability. Inputs may be observable or unobservable and refer broadly to the assumptions that market participants would use in pricing the asset or liability. Observable inputs reflect the assumptions market participants would use in pricing the asset or liability based on market data obtained from sources independent of the Funds. Unobservable inputs reflect the Funds’ own assumptions about the assumptions that market participants would use in pricing the asset or liability developed based on the best information available in
Notes to Financial Statements (continued)
the circumstances. Each investment is assigned a level based upon the observability of the inputs which are significant to the overall valuation.
The three-tier hierarchy of inputs is summarized below:
Level 1 – inputs are quoted prices in active markets for identical investments (e.g., equity securities, open-end investment companies)
Level 2 – other observable inputs (including, but not limited to: quoted prices for similar assets or liabilities in markets that are active, quoted prices for identical or similar assets or liabilities in markets that are not active, inputs other than quoted prices that are observable for the assets or liabilities (such as interest rates, yield curves, volatilities, prepayment speeds, loss severities, credit risks and default rates) or other market corroborated inputs) (e.g., debt securities, government securities, foreign currency exchange contracts, foreign securities utilizing international fair value pricing, broker-quoted securities, fair valued securities with observable inputs)
Level 3 – inputs are significant unobservable inputs (including the Fund’s own assumptions used to determine the fair value of investments) (e.g., fair valued securities with unobservable inputs)
Changes in inputs or methodologies used for valuing investments may result in a transfer in or out of levels within the fair value hierarchy. The inputs or methodologies used for valuing investments may not necessarily be an indication of the risk associated with investing in those investments. Transfers between different levels of the fair value disclosure hierarchy are deemed to have occurred as of the beginning of the reporting period.
b. SECURITY TRANSACTIONS
Security transactions are accounted for as of trade date. Realized gains and losses on securities sold are determined on the basis of identified cost.
c. INVESTMENT INCOME AND EXPENSES
Dividend income is recorded on the ex-dividend date. Dividends from foreign securities are recorded on the ex-dividend date, and if after the fact as soon as the Fund becomes aware of the ex-dividend date. Interest income, which includes amortization of premium and accretion of discount on debt securities, is accrued as earned. Dividend and interest income on foreign securities is recorded gross of any withholding tax. Non-cash dividends included in dividend income, if any, are reported at the fair market value of the securities received. Upon notification from issuers, distributions received from a real estate investment trust (“REIT”) may be designated as a reduction of cost of investments and/or realized gain. Other income and expenses are recorded on an accrual basis. Expenses that cannot be directly attributed to a Fund are apportioned among the funds in the Trust and other trusts within the AMG Funds family of mutual funds (collectively the “AMG Funds family”) based upon their relative average net assets or number of shareholders.
d. DIVIDENDS AND DISTRIBUTIONS
Fund distributions resulting from either net investment income or realized net capital gains, if any, will normally be declared and paid at least annually in December, as described in the Funds’ prospectus. Distributions to shareholders are recorded on the ex-dividend date. Distributions are determined in accordance with federal income tax regulations, which may differ from net
investment income and net realized capital gains for financial statement purposes (U.S. GAAP). Differences may be permanent or temporary. Permanent differences are reclassified among capital accounts in the financial statements to reflect their tax character. Permanent book and tax basis differences, if any, relating to shareholder distributions will result in reclassifications to paid-in capital. Temporary differences arise when certain items of income, expense and gain or loss are recognized in different periods for financial statement and tax purposes; these differences will reverse at some time in the future. Permanent differences are due to distribution in excess and a net operating loss write off. Temporary differences are due to post October loss deferrals, qualified late year ordinary losses and wash sales.
e. FEDERAL TAXES
Each Fund currently qualifies as an investment company and intends to comply with the requirements under Subchapter M of the Internal Revenue Code of 1986, as amended, to distribute substantially all of its taxable income and gains to its shareholders and to meet certain diversification and income requirements with respect to investment companies. Therefore, no provision for federal income or excise tax is included in the accompanying financial statements.
Additionally, based on each Fund’s understanding of the tax rules and rates related to income, gains and transactions for the foreign jurisdictions in which it invests, each Fund will provide for foreign taxes, and where appropriate, deferred foreign taxes.
Management has analyzed the Funds’ tax positions taken on federal income tax returns as of September 30, 2016, and for all open tax years (generally, the three prior taxable years), and has concluded that no provision for federal income tax is required in the Funds’ financial statements. Additionally, Management is not aware of any tax position for which it is reasonably possible that the total amounts of unrecognized tax benefits will change materially in the next twelve months.
Net capital losses incurred in taxable years beginning after the enactment of the Regulated Investment Company Modernization Act of 2010, may be carried forward for an unlimited time period. Such losses will be required to be utilized prior to any loss carryovers incurred in pre-enactment taxable years, which generally expire eight years following the close of the taxable year in which they were incurred. As a result of this ordering rule, pre-enactment capital loss carryovers may be more likely to expire unused. Additionally, post-enactment capital losses that are carried forward retain their tax character as either short-term or long-term capital losses, unlike pre-enactment losses which are considered all short-term.
f. CAPITAL LOSS CARRYOVERS AND DEFERRALS
As of March 31, 2017, the following Funds had accumulated net realized capital loss carryovers from securities transactions for federal income tax purposes as shown in the following chart. These amounts may be used to offset future realized capital gains, if any, through the expiration dates listed, or in the case of post-enactment losses, for an unlimited time period.
Notes to Financial Statements (continued)
| | | | | | | | | | | | |
| | | Capital Loss Carryover
Amount | | | Expires | |
| Fund | | Short-Term | | | Long-Term | | | September 30, | |
Brandywine | | | | | | | | | | | | |
(Pre-Enactment) | | $ | 8,026,349 | | | | — | | | | 2017 | |
(Pre-Enactment) | | | 503,144,209 | | | | — | | | | 2018 | |
| | | | | | | | | | | | |
Totals | | $ | 511,170,558 | | | | — | | | | | |
| | | | | | | | | | | | |
Brandywine Blue | | | | | | | | | | | | |
(Pre-Enactment) | | $ | 795,849,588 | | | | — | | | | 2017 | |
(Pre-Enactment) | | | 195,886,232 | | | | — | | | | 2018 | |
| | | | | | | | | | | | |
Totals | | $ | 991,735,820 | | | | — | | | | | |
| | | | | | | | | | | | |
g. CAPITAL STOCK
The Trust’s Declaration of Trust authorizes for each Fund the issuance of an unlimited number of shares of beneficial interest, without par value. Each Fund records sales and repurchases of its capital stock on the trade date. The cost of securities contributed to the Funds in connection with the issuance of shares is based on the valuation of those securities in accordance with the Funds’ policy on investment valuation.
At March 31, 2017, certain unaffiliated shareholders of record, including omnibus accounts, individually or collectively held greater than 10% of the net assets of the Funds as follows: Brandywine Blue—two own 24%. Transactions by these shareholders may have a material impact on the Fund.
h. REPURCHASE AGREEMENTS AND JOINT REPURCHASE AGREEMENTS
The Funds may enter into third-party repurchase agreements for temporary cash management purposes and third-party joint repurchase agreements for reinvestment of cash collateral on securities lending transactions under the securities lending program offered by The Bank of New York Mellon (“BNYM”) (the “Program”) (collectively, “Repurchase Agreements”). The value of the underlying collateral, including accrued interest, must equal or exceed the value of the Repurchase Agreements during the term of the agreement. For joint repurchase agreements, the Funds participate on a pro rata basis with other clients of BNYM in its share of the underlying collateral under such joint repurchase agreements and in its share of proceeds from any repurchase or other disposition of the underlying collateral. The underlying collateral for all Repurchase Agreements is held in safekeeping by the Fund’s custodian or at the Federal Reserve Bank. If the seller defaults and the value of the collateral declines, or if bankruptcy proceedings commence with respect to the seller of the security, realization of the collateral by the Funds may be delayed or limited. Pursuant to the Program, the Funds are indemnified for such losses by BNYM on joint repurchase agreements.
At March 31, 2017, the market value of Repurchase Agreements for Brandywine and Brandywine Blue were $52,004,982 and $6,053,915, respectively.
2. AGREEMENTS AND TRANSACTIONS WITH AFFILIATES
For each of the Funds, the Trust has entered into an investment advisory agreement under which the Investment Manager, a subsidiary and the U.S.
retail distributor arm of Affiliated Managers Group, Inc. (“AMG”), serves as investment manager to the Funds and is responsible for the Funds’ overall administration and operations. The Investment Manager selects one or more subadvisors for the Funds (subject to Board approval) and monitors each subadvisor’s investment performance, security holdings and investment strategies. Each Fund’s investment portfolio is managed by Friess Associates, LLC (“Friess”) and Friess Associates of Delaware, LLC (“Friess of Delaware”), who serves pursuant to a subadvisory agreement with the Investment Manager.
Investment management fees are paid directly by the Funds to the Investment Manager based on average daily net assets. Effective October 1, 2016, the Funds’ investment management fees were paid at the following annual rate of each Fund’s respective average daily net assets:
| | | | |
Brandywine | | | 0.88 | % |
Brandywine Blue | | | 0.88 | % |
Prior to October 1, 2016, the annual rate for the investment management fees was 1.00% of both Funds’ average daily net assets.
The Trust, on behalf of the Funds, has entered into an amended and restated Administration Agreement under which the Investment Manager serves as the Funds’ administrator (the “Administrator”) and is responsible for all non-portfolio management aspects of managing the Funds’ operations, including administration and shareholder services to each Fund as further described in each Fund’s prospectus. Effective October 1, 2016, each Fund pays a fee to the Administrator at the rate of 0.15% per annum of the Fund’s average daily net assets for this service. Prior to October 1, 2016, the Funds paid an administrative fee under a similar contract at an annual rate of 0.03% of each Fund’s average net assets for the first $300 million of assets under management, 0.025% for the next $200 million and 0.02% on amounts in excess of $500 million. The Administrator is contractually obligated to waive a portion of the administration fee in an amount equal to an annual rate of 0.004% of the Fund’s average daily net assets through October 1, 2018.
The Funds are distributed by AMG Distributors, Inc. (the “Distributor”), a wholly-owned subsidiary of the Investment Manager. The Distributor serves as the distributor and underwriter for each Fund and is a registered broker-dealer and member of the Financial Industry Regulatory Authority, Inc. (“FINRA”). Shares of each Fund will be continuously offered and will be sold directly to prospective purchasers and through brokers, dealers or other financial intermediaries who have executed selling agreements with the Distributor. Generally the Distributor bears all or a portion of the expenses of providing services pursuant to the distribution agreement, including the payment of the expenses relating to the distribution of prospectuses for sales purposes and any advertising or sales literature.
For Class I shares, the Board has approved reimbursement payments to the Investment Manager for shareholder servicing expenses (“shareholder servicing fees”) incurred. Shareholder servicing fees include payments to each financial intermediary such as broker-dealers (including fund supermarket platforms), banks and trust companies that provide shareholder recordkeeping, account servicing and other services.
Notes to Financial Statements (continued)
The impact on the annualized expense ratio for the six months ended March 31, 2017, were as follows:
| | | | | | | | |
| Fund | | Maximum Amount Approved | | | Actual Amount Incurred | |
Brandywine | | | | | | | | |
Class I* | | | 0.15 | % | | | 0.02 | % |
Brandywine Blue | | | | | | | | |
Class I* | | | 0.15 | % | | | 0.06 | % |
| * | Effective October 1, 2016, the maximum annual rate was decreased to 0.15% from 0.20%. |
The Board provides supervision of the affairs of the Trust and other trusts within the AMG Funds family. The Trustees of the Trust who are not affiliated with an Investment Manager receive an annual retainer and per meeting fees for regular, special and telephonic meetings, and they are reimbursed for out-of-pocket expenses incurred while carrying out their duties as Board members. The Chairman of the Board and the Audit Committee Chair receive additional annual retainers. Certain Trustees and Officers of the Funds are Officers and/or Directors of the Investment Manager, AMG, and/or the Distributor.
The Securities and Exchange Commission (the “SEC”) granted an exemptive order that permits the Funds to lend and borrow money for certain temporary purposes directly to and from other eligible funds in the AMG Funds family. Participation in this interfund lending program is voluntary for both the borrowing and lending funds, and an interfund loan is only made if it benefits each participating fund. The Administrator manages the program according to procedures approved by the Board, and the Board monitors the operation of the program. An interfund loan must comply with certain conditions set out in the exemptive order, which are designed to assure fairness and protect all participating funds. For the six months ended March 31, 2017, the Funds neither borrowed from nor lent to other funds in the AMG Funds family. At March 31, 2017, the Funds had no interfund loans outstanding.
3. PURCHASES AND SALES OF SECURITIES
Purchases and sales of securities (excluding short-term and U.S. Government Obligations) for the six months ended March 31, 2017, were as follows:
| | | | | | | | |
| | | Long-Term Securities | |
| Fund | | Purchases | | | Sales | |
Brandywine | | $ | 779,310,457 | | | $ | 815,699,539 | |
Brandywine Blue | | | 157,919,050 | | | | 163,187,558 | |
The Funds had no purchases or sales of U.S. Government Obligations during the six months ended March 31, 2017.
4. PORTFOLIO SECURITIES LOANED
The Funds participate in the Program providing for the lending of securities to qualified brokers. Securities lending income includes earnings of such temporary cash investments, plus or minus any rebate to a borrower. These earnings (after any rebate) are then divided between BNYM, as a fee for its services under the Program, and the Funds, according to agreed-upon rates. Collateral on all securities loaned is accepted in cash and is maintained at a minimum level of 102% (105% in the case of certain foreign securities) of the market value, plus interest, if applicable, of investments on loan. It is the Funds’ policy to obtain additional collateral from or return excess collateral to the borrower by the end of the next business day, following the valuation date of the securities loaned. Therefore, the value of the collateral held may be temporarily less than the value of the securities on loan. Lending securities entails a risk of loss to the Funds if and to the extent that the market value of the securities loaned were to increase and the borrower did not increase the collateral accordingly, and the borrower fails to return the securities. Under the terms of the Program, the Funds are indemnified for such losses by BNYM. Cash collateral is held in a separate omnibus account managed by BNYM, who is authorized to exclusively enter into joint overnight government repurchase agreements. BNYM bears the risk of any deficiency in the amount of the cash collateral available for return to the borrower due to any loss on the collateral invested. At March 31, 2017, the value of the securities loaned and cash collateral received, were as follows:
| | | | | | | | |
| Fund | | Securities Loaned | | | Cash Collateral Received | |
Brandywine | | $ | 45,835,883 | | | $ | 52,004,982 | |
Brandywine Blue | | | 3,537,915 | | | | 6,053,915 | |
5. COMMITMENTS AND CONTINGENCIES
Under the Trust’s organizational documents, its trustees and officers are indemnified against certain liabilities arising out of the performance of their duties to the Trust. In addition, in the normal course of business, the Funds may enter into contracts and agreements that contain a variety of representations and warranties, which provide general indemnifications. The maximum exposure to the Funds under these arrangements is unknown, as this would involve future claims that may be made against a Fund that have not yet occurred. However, based on experience, the Funds had no prior claims or losses and expect the risks of loss to be remote.
6. MASTER NETTING AGREEMENTS
The Funds may enter into master netting agreements with their counterparties for the securities lending program and Repurchase Agreements, which provide the right, in the event of default (including bankruptcy or insolvency) for the non-defaulting party to liquidate the collateral and calculate net exposure to the defaulting party or request additional collateral. For financial reporting purposes, the Funds do not offset financial assets and financial liabilities that are subject to master netting agreements in the Statement of Assets and Liabilities. For securities lending transactions, see Note 4.
Notes to Financial Statements (continued)
The following table is a summary of the Funds’ open Repurchase Agreements which are subject to a master netting agreement as of March 31, 2017:
| | | | | | | | | | | | | | | | |
| | | | | | Gross Amount Not Offset in the
Statement of Assets and Liabilities | | | | |
| | | Net Amounts
of Assets Presented in
the Statement of Assets and
Liabilities | | | Financial Instruments Collateral | | | Cash
Collateral Received | | | Net
Amount | |
Brandywine | | | | | | | | | | | | | | | | |
Cantor Fitzgerald Securities, Inc. | | $ | 12,351,525 | | | $ | 12,351,525 | | | | — | | | | — | |
Daiwa Capital Markets America | | | 12,351,525 | | | | 12,351,525 | | | | — | | | | — | |
Jefferies LLC | | | 2,598,907 | | | | 2,598,907 | | | | — | | | | — | |
Nomura Securities International, Inc. | | | 12,351,525 | | | | 12,351,525 | | | | — | | | | — | |
State of Wisconsin Investment Board | | | 12,351,500 | | | | 12,351,500 | | | | — | | | | — | |
| | | | | | | | | | | | | | | | |
Totals | | $ | 52,004,982 | | | $ | 52,004,982 | | | | — | | | | — | |
| | | | | | | | | | | | | | | | |
Brandywine Blue | | | | | | | | | | | | | | | | |
BNP Paribas S.A. | | $ | 302,491 | | | $ | 302,491 | | | | — | | | | — | |
Cantor Fitzgerald Securities, Inc. | | | 1,437,856 | | | | 1,437,856 | | | | — | | | | — | |
Daiwa Capital Markets America | | | 1,437,856 | | | | 1,437,856 | | | | — | | | | — | |
Jefferies LLC | | | 1,437,856 | | | | 1,437,856 | | | | — | | | | — | |
Nomura Securities International, Inc. | | | 1,437,856 | | | | 1,437,856 | | | | — | | | | — | |
| | | | | | | | | | | | | | | | |
Totals | | $ | 6,053,915 | | | $ | 6,053,915 | | | | — | | | | — | |
| | | | | | | | | | | | | | | | |
7. REGULATORY UPDATES
On October 13, 2016, the SEC amended existing rules intended to modernize reporting and disclosure of information. These amendments relate to Regulation S-X which sets forth the form and content of financial statements. Management is evaluating the implications of adopting these amendments and their impact on the financial statements and accompanying notes.
8. SUBSEQUENT EVENTS
The Funds have determined that no material events or transactions occurred through the issuance date of the Funds’ financial statements which require an additional disclosure in or adjustment of the Funds’ financial statements.
THIS PAGE INTENTIONALLY LEFT BLANK
THIS PAGE INTENTIONALLY LEFT BLANK
THIS PAGE INTENTIONALLY LEFT BLANK
INVESTMENT MANAGER AND
ADMINISTRATOR
AMG Funds LLC
600 Steamboat Road, Suite 300
Greenwich, CT 06830
(800) 835-3879
DISTRIBUTOR
AMG Distributors, Inc.
600 Steamboat Road, Suite 300
Greenwich, CT 06830
(800) 835-3879
SUBADVISOR
Friess Associates, LLC
P.O. Box 576
Jackson, Wyoming 83001
Friess Associates of Delaware, LLC
P.O. Box 4166
Greenville, DE 19807
CUSTODIAN
The Bank of New York Mellon
2 Hanson Place
Brooklyn, NY 11217
LEGAL COUNSEL
Ropes & Gray LLP
Prudential Tower, 800 Boylston Street
Boston, MA 02199-3600
TRANSFER AGENT
BNY Mellon Investment Servicing (US) Inc.
Attn: AMG Funds
P.O. Box 9769
Providence, RI 02940
(800) 548-4539
TRUSTEES
Bruce B. Bingham
Christine C. Carsman
Edward J. Kaier
Kurt A. Keilhacker
Steven J. Paggioli
Richard F. Powers, III
Eric Rakowski
Victoria L. Sassine
Thomas R. Schneeweis
This report is prepared for the Funds’ shareholders. It is authorized for distribution to prospective investors only when preceded or accompanied by an effective prospectus. To receive a free copy of the prospectus or Statement of Additional Information, which includes additional information about Fund Trustees, please contact us by calling 800.835.3879. Distributed by AMG Distributors, Inc., member FINRA/SIPC.
Current net asset values per share for each Fund are available on the Funds’ website at www.amgfunds.com.
A description of the policies and procedures each Fund uses to vote its proxies is available: (i) without charge, upon request, by calling 800.835.3879, or (ii) on the Securities and Exchange Commission’s (SEC) website at www.sec.gov For information regarding each Fund’s proxy voting record for the 12-month period ended June 30, call 800.835.3879 or visit the SEC website at www.sec.gov.
Each Fund files its complete schedule of portfolio holdings with the SEC for the first and third quarters of each fiscal year on Form N-Q. The Fund’s Form N-Q are available on the SEC’s website at www.sec.gov. A Fund’s Form N-Q may be reviewed and copied at the SEC’s Public Reference Room in Washington, DC. Information on the operation of the Public Reference Room may be obtained by calling 1-800-SEC-0330. To review a complete list of the Fund’s portfolio holdings, or to view the most recent quarterly holdings report, semiannual report, or annual report, please visit www.amgfunds.com.
| | |
| | | |
AFFILIATE SUBADVISED FUNDS
BALANCED FUNDS
AMG Chicago Equity Partners Balanced
Chicago Equity Partners, LLC
AMG FQ Global Risk-Balanced
First Quadrant, L.P.
EQUITY FUNDS
AMG Chicago Equity Partners Small Cap Value
Chicago Equity Partners, LLC
AMG FQ Tax-Managed U.S. Equity
AMG FQ U.S. Equity
First Quadrant, L.P.
AMG Frontier Small Cap Growth
Frontier Capital Management Company, LLC
AMG GW&K Small Cap Core
AMG GW&K Small/Mid Cap
AMG GW&K U.S. Small Cap Growth
GW&K Investment Management, LLC
AMG Renaissance International Equity
AMG Renaissance Large Cap Growth
The Renaissance Group LLC
AMG River Road Dividend All Cap Value
AMG River Road Dividend All Cap Value II
AMG River Road Focused Absolute Value
AMG River Road Long-Short
AMG River Road Select Value
AMG River Road Small Cap Value
River Road Asset Management, LLC
AMG SouthernSun Small Cap
AMG SouthernSun Global Opportunities
AMG SouthernSun U.S. Equity
SouthernSun Asset Management, LLC
AMG Systematic Large Cap Value
AMG Systematic Mid Cap Value
Systematic Financial Management, L.P.
AMG TimesSquare All Cap Growth
AMG TimesSquare Emerging Markets Small Cap
AMG TimesSquare International Small Cap
AMG TimesSquare Mid Cap Growth
AMG TimesSquare Small Cap Growth
TimesSquare Capital Management, LLC
AMG Trilogy Emerging Markets Equity
AMG Trilogy Emerging Wealth Equity
AMG Trilogy Global Equity
AMG Trilogy International Small Cap
Trilogy Global Advisors, L.P.
AMG Yacktman
AMG Yacktman Focused
AMG Yacktman Focused Fund – Security Selection Only
AMG Yacktman Special Opportunities
Yacktman Asset Management LP
FIXED INCOME FUNDS
AMG GW&K Core Bond
AMG GW&K Enhanced Core Bond
AMG GW&K Municipal Bond
AMG GW&K Municipal Enhanced Yield
GW&K Investment Management, LLC
OPEN-ARCHITECTURE FUNDS
ALTERNATIVE FUNDS
AMG Managers Lake Partners LASSO Alternative
Lake Partners, Inc.
BALANCED FUNDS
AMG Managers Montag & Caldwell Balanced
Montag & Caldwell, LLC
EQUITY FUNDS
AMG Managers Brandywine
AMG Managers Brandywine Advisors Mid Cap Growth
AMG Managers Brandywine Blue
Friess Associates, LLC
AMG Managers Cadence Capital Appreciation
AMG Managers Cadence Emerging Companies
AMG Managers Cadence Mid Cap
Cadence Capital Management, LLC
AMG Managers CenterSquare Real Estate
CenterSquare Investment Management, Inc.
AMG Managers Emerging Opportunities
Lord, Abbett & Co. LLC
WEDGE Capital Management L.L.P.
Next Century Growth Investors LLC
RBC Global Asset Management (U.S.) Inc.
AMG Managers Essex Small/Micro Cap Growth
Essex Investment Management Co., LLC
AMG Managers Fairpointe Focused Equity
AMG Managers Fairpointe Mid Cap
Fairpointe Capital LLC
AMG Managers Guardian Capital Global Dividend
Guardian Capital LP
AMG Managers LMCG Small Cap Growth
LMCG Investments, LLC
AMG Managers Montag & Caldwell Growth
AMG Managers Montag & Caldwell Mid Cap Growth
Montag & Caldwell, LLC
AMG Managers Pictet International
Pictet Asset Management Limited
AMG Managers Silvercrest Small Cap
Silvercrest Asset Management Group LLC
AMG Managers Skyline Special Equities
Skyline Asset Management, L.P.
AMG Managers Special Equity
Ranger Investment Management, L.P.
Lord, Abbett & Co. LLC
Smith Asset Management Group, L.P.
Federated MDTA LLC
AMG Managers Value Partners Asia Dividend
Value Partners Hong Kong Limited
FIXED INCOME FUNDS
AMG Managers Amundi Intermediate Government
AMG Managers Amundi Short Duration Government
Amundi Smith Breeden LLC
AMG Managers Doubleline Core Plus Bond
DoubleLine Capital LP
AMG Managers Global Income Opportunity
AMG Managers Loomis Sayles Bond
Loomis, Sayles & Co., L.P.
AMG Managers High Yield
JPMorgan Investment Management, Inc.
| | |
SAR073-0317  | | | www.amgfunds.com |
| | |
 | | SEMI-ANNUAL REPORT |
AMG Funds
March 31, 2017

AMG Managers Brandywine Advisors Mid Cap Growth Fund: Class N: BWAFX
| | |
| www.amgfunds.com | | SAR075-0317 |
AMG Funds
Semi-Annual Report—March 31, 2017 (unaudited)
| | | | |
TABLE OF CONTENTS | | PAGE | |
LETTER TO SHAREHOLDERS | | | 2 | |
| |
ABOUT YOUR FUND’S EXPENSES | | | 3 | |
| |
FUND PERFORMANCE | | | 4 | |
| |
FUND SNAPSHOT, ROSES AND THORNS, AND SCHEDULE OF PORTFOLIO INVESTMENTS | | | 5 | |
| |
NOTES TO SCHEDULE OF PORTFOLIO INVESTMENTS | | | 9 | |
| |
FINANCIAL STATEMENTS | | | | |
| |
Statement of Assets and Liabilities | | | 10 | |
Balance sheet, net asset value (NAV) per share computation and cumulative undistributed amounts | | | | |
| |
Statement of Operations | | | 11 | |
Detail of sources of income, expenses, and realized and unrealized gains (losses) during the fiscal period | | | | |
| |
Statements of Changes in Net Assets | | | 12 | |
Detail of changes in assets for the past two fiscal periods | | | | |
| |
Financial Highlights | | | 13 | |
Historical net asset values per share, distributions, total returns, income and expense ratios, turnover ratios and net assets | | | | |
| |
Notes to Financial Statements | | | 14 | |
Accounting and distribution policies, details of agreements and transactions with Fund management and affiliates, and descriptions of certain investment risks | | | | |
Nothing contained herein is to be considered an offer, sale or solicitation of an offer to buy shares of any series of the AMG Fund family of mutual funds. Such offering is made only by prospectus, which includes details as to offering price and other material information.
| | |
| | | AMG Managers Brandywine Advisors Mid Cap Growth Fund |
DEAR FELLOW SHAREHOLDER:
Stocks continued to climb in the first three months of 2017, with major indexes rising for the sixth consecutive quarter. March-quarter gains propelled the second longest bull market on record beyond its eighth anniversary.
AMG Managers Brandywine Advisors Mid Cap Growth Fund grew 6.15 percent in the three months through March versus gains in the S&P 500, Russell Midcap® and Russell Midcap® Growth Indexes of 6.07, 5.15 and 6.89 percent, respectively.
High hopes for business-friendly actions from the White House kept the mood mainly upbeat. Optimism regarding the Trump administration’s pro-growth promises on taxation, deregulation and infrastructure spending remained the prevailing theme.
Consumer confidence and employment data were also positive influences on sentiment. Encouraging news on the earnings front, with consensus expectations forecasting that March-quarter reports will show the strongest growth for the companies in the S&P 500 Index in more than five years, contributed to the cause as well.
Present throughout the period was the expectation that the Federal Reserve would increase interest rates at its mid-March meeting. Executed as anticipated, investors chose to interpret the rate hike as a sign that the economy was sufficiently healthy to absorb it without incident.
March-quarter gains were widespread. Brandywine Advisors generated positive returns in seven of the nine economic sectors represented in its portfolio during the period.
Holdings from the technology sector, which comprised the largest portfolio position, were by far the biggest contributors to absolute and relative returns for the quarter. The portfolio’s technology holdings outperformed the sector within the Russell Midcap® Growth Index while representing an overweight position. Semiconductor-related holdings played the most significant role in driving the sector’s advance.
Micron Technology and Advanced Micro Devices were standout performers. Micron Technology attracted positive investor attention by reporting earnings results that represented a substantial reversal of fortunes over the past year. The company exceeded February-quarter estimates by earning $0.90 per share, up from a $0.05 loss in the year-ago period. Advanced Micro Devices pleased investors with a host of new contract wins, market-share gains for a new product and increased revenue guidance for 2017.
Arista Networks, a cloud computing network solutions provider, also merits mention for its contribution. Revenue jumped by more than one-third in the December quarter on demand for the company’s software and switches amid the ongoing equipment upgrade cycle in the telecommunications space. The company also exceeded the consensus earnings estimate (by 27 percent) in the December quarter and raised guidance for the March quarter.
The health care sector, which represented the portfolio’s third largest concentration of assets, was the next most notable contributor to absolute and
relative results. In general, health care stocks fared well during the period after Congressional health care reform efforts stalled. VCA, which operates animal hospitals and provides veterinary diagnostic testing services, was the portfolio’s top contributor to total gains. In January, the company agreed to be acquired by candy and pet care-product maker Mars at a 31 percent premium.
Energy stocks were the market’s poorest performers during the March quarter. The price of oil declined 15 percent from the high for the period on January 6 to the low on March 23 as crude inventory reports showed persistently elevated supplies and the drilling rig count, according to Baker Hughes North America Rotary Rig Count data, climbed higher with each passing week.
Energy holdings weighed on performance as investors worried about the implications for a nascent profit recovery in the sector. Energy holdings, which represented an overweight position versus the benchmark and declined more than the overall sector, detracted the most from absolute and relative performance.
U.S. Silica Holdings was the top detractor from the energy sector. The company, which among other things produces sand used in hydraulic fracturing, grew year-over-year revenue 34 percent in the December quarter thanks to positive demand and pricing trends. Shares fell after U.S. Silica announced plans to significantly boost fracking sand production in 2017, which investors viewed as a threat to pricing. Keane Group and Apache Corp. also weighed on performance.
Consumer discretionary holdings, which represented the second largest portfolio position, declined modestly, helping make the consumer discretionary sector the second greatest negative influence on relative performance. Lululemon Athletica was the primary detractor. Upon reporting fiscal fourth-quarter results, the athletic apparel retailer cited a “slow start” to fiscal 2017 as reason for reducing revenue and earnings forecasts.
For more information on companies that influenced March-quarter performance, please see Roses & Thorns on page 6.
Holdings from the technology, health care and industrial sectors represent the largest positions at the start of the June quarter. For more information on portfolio characteristics, please see page 5.
We’re grateful for your continued confidence. Your entire Friess Associates team joins me in sending best wishes.

Scott Gates
Chief Investment Officer
Friess Associates, LLC
About Your Fund’s Expenses (unaudited)
As a shareholder of a Fund, you may incur two types of costs: (1) transaction costs, which may include sales charges (loads) on purchase payments; redemption fees; and exchange fees; and (2) ongoing costs, including management fees; distribution (12b-1) fees; and other Fund expenses. This example is intended to help you understand your ongoing costs (in dollars) of investing in the Fund and to compare these costs with the ongoing costs of investing in other mutual funds. The example is based on $1,000 invested at the beginning of the period and held for the entire period as indicated below.
ACTUAL EXPENSES
The first line of the following table provides information about the actual account values and actual expenses. You may use the information in this line, together with the amount you invested, to estimate the expenses that you paid over the period. Simply divide your account value by $1,000 (for example, an $8,600 account value divided by $1,000 = 8.6), then multiply the result by the number in the first line under the heading entitled “Expenses Paid During Period” to estimate the expenses you paid on your account during this period.
HYPOTHETICAL EXAMPLE FOR COMPARISON PURPOSES
The second line of the following table provides information about hypothetical account values and hypothetical expenses based on the Fund’s actual expense ratio and an assumed annual rate of return of 5% before expenses, which is not the Fund’s actual return. The hypothetical account values and expenses may not be used to estimate the actual ending account balance or expenses you paid for the period. You may use this information to compare the ongoing costs of investing in the Fund and other funds by comparing this 5% hypothetical example with the 5% hypothetical examples that appear in the shareholder reports of other funds.
Please note that the expenses shown in the table are meant to highlight your on going costs only and do not reflect any transactional costs, such as sales charges (loads), redemption fees, or exchange fees. Therefore, the second line of the table is useful in comparing ongoing costs only, and will not help you determine the relative total costs of owning different funds.
| | | | | | | | | | | | | | | | |
| | | Expense | | | Beginning | | | Ending | | | Expenses | |
| | | Ratio for | | | Account Value | | | Account Value | | | Paid During | |
| Six Months Ended March 31, 2017 | | the Period | | | 10/01/16 | | | 03/31/17 | | | the Period* | |
AMG Managers Brandywine Advisors Mid Cap Growth Fund | | | | | |
Based on Actual Fund Return | | | 1.16 | % | | $ | 1,000 | | | $ | 1,071 | | | $ | 5.99 | |
Hypothetical (5% return before expenses) | | | 1.16 | % | | $ | 1,000 | | | $ | 1,019 | | | $ | 5.84 | |
| * | Expenses are equal to the Fund’s annualized expense ratio multiplied by the average account value over the period, multiplied by the number of days in the most recent fiscal half-year (182), then divided by 365. |
Fund Performance (unaudited)
Periods ended March 31, 2017
The table below shows the average annual total returns for the AMG Managers Brandywine Advisors Mid Cap Growth Fund’s Class N, the Russell Midcap® Growth Index, the Russell Midcap® Index and the S&P 500 Index for the same time periods ended March 31, 2017.
| | | | | | | | | | | | | | | | |
| Average Annual Total Returns1 | | Six Months* | | | One Year | | | Five Years | | | Ten Years | |
AMG Managers Brandywine Advisors Mid Cap Growth Fund2,3,4,5,6,7,8 | | | 7.06 | % | | | 15.59 | % | | | 4.29 | % | | | 0.39 | % |
Russell Midcap® Growth Index9 | | | 7.38 | % | | | 14.07 | % | | | 11.95 | % | | | 8.13 | % |
Russell Midcap® Index10 | | | 8.52 | % | | | 17.03 | % | | | 13.09 | % | | | 7.94 | % |
S&P 500 Index11 | | | 10.12 | % | | | 17.17 | % | | | 13.30 | % | | | 7.51 | % |
The performance data shown represents past performance. Past performance is not a guarantee of future results. Current performance may be lower or higher than the performance data quoted. The investment return and principal value of an investment will fluctuate so that an investor’s shares, when redeemed, may be worth more or less than their original cost.
Investors should carefully consider the Fund’s investment objectives, risks, charges, and expenses before investing. For performance information through the most recent month end, current net asset values per share for the Fund and other information, please call (800) 835-3879 or visit our website at www.amgfunds.com for a free prospectus. Read it carefully before investing or sending money.
Distributed by AMG Distributors, Inc., member FINRA/SIPC.
| 1 | Total return equals income yield plus share price change and assumes reinvestment of all dividends and capital gain distributions. Returns are net of fees and may reflect offsets of Fund expenses as described in the prospectus. No adjustment has been made for taxes payable by shareholders on their reinvested dividends and capital gain distributions. Returns for periods greater than one year are annualized. The listed returns on the Fund are net of expenses and based on the published NAV as of March 31, 2017. All returns are in U.S. dollars ($). |
| 2 | The Fund inception dates and returns for all periods beginning prior to October 1, 2013, reflects performance of the predecessor Fund, Brandywine Advisors Midcap Growth Fund, which was managed by Friess Associates, LLC with the same investment objectives and substantially similar investment policies. |
| 3 | The Fund invests in growth stocks, which may be more sensitive to market movements because their prices tend to reflect future investor expectations rather than just current profits. |
| 4 | The Fund is subject to risks associated with investments in mid-capitalization companies such as greater price volatility, lower trading volume, and less liquidity than the stocks of larger, more established companies. |
| 5 | Investments in international securities are subject to certain risks of overseas investing including currency fluctuations and changes in political and economic conditions, which could result in significant market fluctuations. |
| 6 | A greater percentage of the Fund’s holdings may be focused in a smaller number of securities which may place the Fund at greater risk than a more diversified fund. |
| 7 | Active and frequent trading of a fund may result in higher transaction costs and increased tax liability. |
| 8 | Effective October 1, 2016, the Fund’s shares were reclassified and redesignated to Class N. |
| 9 | The Russell Midcap® Growth Index measures the performance of the Russell Midcap companies with higher price-to-book ratios and higher forecasted growth values. The stocks are also members of the Russell 1000® Growth Index. Unlike the Fund, the Russell Midcap® Growth Index is unmanaged, is not available for investment, and does not incur expenses. |
| 10 | The Russell Midcap® Index measures the performance of the 800 smallest companies in the Russell 1000® Index, which represent approximately 25% of the total market capitalization of the Russell 1000® Index. Unlike the Fund, the Russell Midcap® Index is unmanaged, is not available for investment, and does not incur expenses. |
| 11 | The S&P 500 Index is capitalization-weighted index of 500 stocks. The S&P 500 Index is designed to measure performance of the broad domestic economy through changes in the aggregate market value of 500 stocks representing all major industries. Unlike the Fund, the S&P 500 Index is unmanaged, is not available for investment, and does not incur expenses. |
The Russell Indices are trademarks of the London Stock Exchange Group companies.
The S&P 500 Index is proprietary data of Standard & Poor’s, a division of McGraw-Hill Companies, Inc. All rights reserved.
Not FDIC insured, nor bank guaranteed. May lose value.
AMG Managers Brandywine Advisors Mid Cap Growth Fund
Fund Snapshots (unaudited)
March 31, 2017
PORTFOLIO BREAKDOWN
| | | | | | | | | | | | | | | | |
| | | Brandywine | | | | | | | | | | |
| | | Advisors | | | Russell | | | | | | | |
| | | Mid Cap | | | Midcap® | | | Russell | | | S&P | |
| | | Growth | | | Growth | | | Midcap® | | | 500 | |
Industry (Top Ten) | | Fund* | | | Index | | | Index | | | Index | |
Semiconductors | | | 13.7 | % | | | 4.9 | % | | | 3.9 | % | | | 3.4 | % |
Data Processing & Outsourced Services | | | 8.2 | % | | | 6.8 | % | | | 3.7 | % | | | 3.7 | % |
Health Care Equipment | | | 6.0 | % | | | 5.7 | % | | | 3.1 | % | | | 2.6 | % |
Life Sciences Tools & Services | | | 5.9 | % | | | 2.6 | % | | | 1.7 | % | | | 0.7 | % |
Construction & Engineering | | | 4.7 | % | | | 0.1 | % | | | 0.5 | % | | | 0.1 | % |
Internet Software & Services | | | 4.1 | % | | | 1.6 | % | | | 0.8 | % | | | 4.6 | % |
Biotechnology | | | 4.1 | % | | | 2.7 | % | | | 1.3 | % | | | 2.8 | % |
Application Software | | | 4.0 | % | | | 5.7 | % | | | 3.4 | % | | | 4.6 | % |
Communications Equipment | | | 3.9 | % | | | 1.1 | % | | | 1.3 | % | | | 1.1 | % |
Specialty Stores | | | 3.9 | % | | | 5.5 | % | | | 3.5 | % | | | 2.4 | % |
Other Common Stock | | | 37.1 | % | | | 63.3 | % | | | 76.8 | % | | | 74.0 | % |
Cash & Cash Equivalents† | | | 4.4 | % | | | 0.0 | % | | | 0.0 | % | | | 0.0 | % |
| * | As a percentage of net assets. |
| † | Includes Other Assets and Liabilities. |
TOP TEN HOLDINGS
| | | | | | | | |
| | | | | | % Change | |
| | | % of | | | from | |
Security Name | | Net Assets | | | Book Cost | |
Advanced Micro Devices, Inc.** | | | 3.9 | % | | | 126.3 | % |
Vantiv, Inc., Class A** | | | 2.9 | % | | | 39.2 | % |
Dycom Industries, Inc.** | | | 2.9 | % | | | 17.2 | % |
Broadcom, Ltd. | | | 2.8 | % | | | 149.9 | % |
Black Knight Financial Services, Inc., Class A** | | | 2.7 | % | | | 45.9 | % |
Waste Connections, Inc.** | | | 2.7 | % | | | 34.7 | % |
Universal Display Corp. | | | 2.5 | % | | | 44.8 | % |
Micron Technology, Inc. | | | 2.2 | % | | | 67.4 | % |
DexCom, Inc. | | | 2.2 | % | | | 8.9 | % |
LogMeln, Inc. | | | 2.1 | % | | | (3.7 | )% |
| | | | | | | | |
Top Ten as a Group | | | 26.9 | % | | | | |
| | | | | | | | |
| ** | Also Top Ten Holding as of December 31, 2016. |
PORTFOLIO MARKET CAPITALIZATION
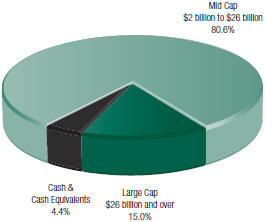
ESTIMATED EARNINGS GROWTH RATE
OF THE FUND’S INVESTMENTS
Forecasted Increase in Earnings Per Share 2017 vs 2016
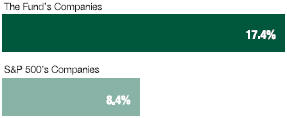
Source: Consensus estimates from FactSet Research Systems Inc.
This is not a forecast of the Fund’s future performance. Earnings growth for a Fund holding does not guarantee a corresponding increase in the market value of the holding or the Fund.
Because a fund’s strategy may result in multiple investments in particular sectors of the economy, its performance may depend on the performance of those sectors and may fluctuate more widely than investments diversified across more sectors. For additional information on these and other risk considerations, please see the Fund’s prospectus.
Any sectors, industries, or securities discussed should not be perceived as investment recommendations. Mention of a specific security should not be considered a recommendation to buy or solicitation to sell that security. Specific securities mentioned in this report may have been sold from the Fund’s portfolio of investments by the time you receive this report.
AMG Managers Brandywine Advisors Mid Cap Growth Fund
Roses and Thorns (unaudited)
Quarter Ending March 31, 2017
| | | | | | |
| $ Gain | | | | | | |
(in millions) | | % Gain | | Biggest $ Winners Reason for Move |
| | | | VCA Inc. (WOOF) | | |
| $1.3 | | 32.1% | | Shares of VCA, which provides veterinary services and diagnostic testing, rose as it entered an agreement to be acquired by Mars, the maker of candy and pet-care supplies, at a 31 percent premium. VCA shares reached our price target in the process, prompting us to sell. |
| | | |
| | | | Universal Display Corp. (OLED) | | |
| $1.2 | | 52.5% | | The developer of light emitting diode technologies and materials grew earnings 41 percent in the December quarter, exceeding the consensus estimate. With results showing its next-generation emitters gaining traction, the company announced it would increase capacity to stay ahead of demand. |
| | | |
| | | | Advanced Micro Devices Inc. (AMD) | | |
| $1.1 | | 25.7% | | The semiconductor manufacturer exceeded December-quarter revenue expectations on strong demand for graphics chips used in game consoles. Ryzen, a high-end central processor built on Advanced Micro’s new Zen architecture, was credited with taking market share from competitor Intel Corp. Advanced Micro reported 17 new customer wins. The company also raised 2017 revenue guidance. |
| | | |
| | | | Broadcom Ltd. (AVGO) | | |
| $0.7 | | 23.1% | | The developer of semiconductor connectivity solutions grew earnings 51 percent in the January quarter, topping the consensus estimate. The company raised 2017 earnings guidance as revenue and profitability improved due to demand driven by the launch of Samsung’s new Galaxy 8 smartphones. |
| | | |
| | | | Incyte Corp. (INCY) | | |
| $0.7 | | 26.9% | | The biopharmaceutical company focused on oncology grew December-quarter sales 34 percent. Demand for its leading drug Jakafi, used in the treatment of myelofibrosis, helped Incyte generate $1.1 billion in revenue in 2016, representing a company record. |
| | | |
| $ Loss | | | | | | |
(in millions) | | % Loss | | Biggest $ Losers Reason for Move |
| | | | Keane Group Inc. (FRAC) | | |
| $0.5 | | 25.1% | | The energy service company reported December-quarter sales of $150 million. Shares traded lower on management comments that input prices, particularly sand used in hydraulic fracking, were rising. We sold Keane Group to fund a new company with stronger earnings potential. |
| | | |
| | | | Lululemon Athletica Inc. (LULU) | | |
| $0.4 | | 17.4% | | The designer and retailer of athletic apparel grew January-quarter earnings 18 percent. Comparable store sales were higher than expected, but the company’s shares declined due to reduced 2017 earnings guidance. We sold Lululemon to fund a new company with better visibility. |
| | | |
| | | | Apache Corp. (APA) | | |
| $0.4 | | 15.7% | | The energy exploration and production company grew December-quarter sales 15 percent. Shares declined due to lower-than-expected production in the quarter, a tempered 2017 outlook and higher planned expenditures. We sold Apache to fund a new company with a better earnings outlook. |
| | | |
| | | | J.C. Penney Co. Inc. (JCP) | | |
| $0.4 | | 16.8% | | Shares of the department store operator declined due to disappointing holiday-season sales. While appliances performed well, women’s apparel weighed on results. We sold J.C. Penney to fund a new opportunity with better visibility. |
| | | |
| | | | RPC Inc. (RES) | | |
| $0.4 | | 13.8% | | We believed the oil and gas service company was positioned to benefit from increasing drilling rig counts and pressure pumping demand. Instead, RPC shares came under pressure amid rising oil inventory and falling oil prices. We sold RPC to fund a new company with better visibility. |
All gains/losses are calculated on an average cost basis from December 31, 2016 through March 31, 2017.
This commentary reflects the viewpoints of Friess Associates, LLC as of March 31, 2017 and is not intended as a forecast or guarantee of future results.
AMG Managers Brandywine Advisors Mid Cap Growth Fund
Schedule of Portfolio Investments (unaudited)
March 31, 2017
| | | | | | | | | | | | |
| Shares | | | | | Cost | | | Value | |
| | Common Stocks - 95.6% | | | | | | | | |
| | Consumer Discretionary | | | | | | | | |
| | | | Automobile Manufacturers - 2.0% | | | | | |
| | 24,110 | | | Thor Industries, Inc. | | $ | 2,521,182 | | | $ | 2,317,694 | |
| | | | Automotive Retail - 1.6% | | | | | | | | |
| | 7,133 | | | O’Reilly Automotive, Inc.* | | | 1,968,212 | | | | 1,924,769 | |
| | | | Cable & Satellite - 1.9% | | | | | | | | |
| | 6,618 | | | Charter Communications, Inc., Class A* | | | 1,546,808 | | | | 2,166,204 | |
| | | | General Merchandise Stores - 1.8% | | | | | |
| | 27,095 | | | Dollar Tree, Inc.* | | | 2,134,085 | | | | 2,125,874 | |
| | | | Internet & Direct Marketing Retail - 1.9% | | | | | |
| | 17,390 | | | Expedia, Inc. | | | 2,135,405 | | | | 2,194,096 | |
| | | | Specialty Stores - 3.9% | | | | | | | | |
| | 45,503 | | | Dick’s Sporting Goods, Inc. | | | 2,156,520 | | | | 2,214,176 | |
| | 7,989 | | | Ulta Beauty, Inc.* | | | 1,983,587 | | | | 2,278,702 | |
| | | | | | | | | | | | |
| | Total Consumer Discretionary | | | 14,445,799 | | | | 15,221,515 | |
| | | | This sector is 5.4% above your Fund’s cost. | | | | | |
| | Consumer Staples | | | | | | | | |
| | | | Food Distributors - 1.8% | | | | | | | | |
| | 89,070 | | | Performance Food Group Co.* | | | 2,108,373 | | | | 2,119,866 | |
| | | | Packaged Foods & Meats - 2.0% | | | | | | | | |
| | 40,168 | | | Pinnacle Foods, Inc. | | | 1,733,709 | | | | 2,324,522 | |
| | | | Personal Products - 1.1% | | | | | |
| | 15,655 | | | The Estee Lauder Cos., Inc., Class A | | | 1,339,224 | | | | 1,327,387 | |
| | | | | | | | | | | | |
| | Total Consumer Staples | | | 5,181,306 | | | | 5,771,775 | |
| | | | This sector is 11.4% above your Fund’s cost. | | | | | |
| | Energy | | | | | | | | |
| | | | Oil & Gas Equipment & Services - 1.0% | | | | | |
| | 182,310 | | | Weatherford International PLC* | | | 1,216,292 | | | | 1,212,361 | |
| | | | Oil & Gas Exploration & Production - 0.3% | | | | | |
| | 50,000 | | | Kosmos Energy, Ltd.* | | | 333,445 | | | | 333,000 | |
| | | | | | | | | | | | |
| | Total Energy | | | 1,549,737 | | | | 1,545,361 | |
| | | | This sector is 0.3% below your Fund’s cost. | | | | | |
| | Financials | | | | | | | | |
| | | | Thrifts & Mortgage Finance - 1.7% | | | | | |
| | 112,919 | | | Radian Group, Inc. | | | 2,014,495 | | | | 2,028,025 | |
| | | | This sector is 0.7% above your Fund’s cost. | | | | | |
| | Health Care | | | | | | | | |
| | | | Biotechnology - 4.1% | | | | | | | | |
| | 100,830 | | | Exact Sciences Corp.*,1 | | | 2,116,356 | | | | 2,381,605 | |
| | 21,600 | | | Vertex Pharmaceuticals, Inc.* | | | 2,323,765 | | | | 2,361,960 | |
| | | | | | | | | | | | |
| Shares | | | | | Cost | | | Value | |
| | | | Health Care Equipment - 6.0% | | | | | | | | |
| | 30,015 | | | DexCom, Inc.* | | $ | 2,334,346 | | | $ | 2,543,171 | |
| | 23,417 | | | Nevro Corp.*,1 | | | 1,990,930 | | | | 2,194,173 | |
| | 26,625 | | | Penumbra, Inc.* | | | 2,098,142 | | | | 2,221,856 | |
| | | | Life Sciences Tools & Services - 5.9% | | | | | |
| | 12,600 | | | Illumina, Inc.* | | | 2,110,201 | | | | 2,150,064 | |
| | 36,200 | | | PRA Health Sciences, Inc.* | | | 2,324,272 | | | | 2,361,326 | |
| | 15,631 | | | Thermo Fisher Scientific, Inc. | | | 2,064,412 | | | | 2,400,922 | |
| | | | Pharmaceuticals - 2.0% | | | | | | | | |
| | 43,400 | | | Zoetis, Inc. | | | 2,330,277 | | | | 2,316,258 | |
| | | | | | | | | | | | |
| | Total Health Care | | | 19,692,701 | | | | 20,931,335 | |
| | | | This sector is 6.3% above your Fund’s cost. | | | | | |
| | Industrials | | | | | | | | |
| | | | Construction & Engineering - 4.7% | | | | | |
| | 36,354 | | | Dycom Industries, Inc.*,1 | | | 2,883,073 | | | | 3,379,104 | |
| | 33,130 | | | EMCOR Group, Inc. | | | 2,088,750 | | | | 2,085,533 | |
| | | | Construction Machinery & Heavy Trucks - 1.8% | |
| | 30,000 | | | Oshkosh Corp. | | | 2,126,366 | | | | 2,057,700 | |
| | | | Environmental & Facilities Services - 2.7% | |
| | 35,594 | | | Waste Connections, Inc. | | | 2,331,407 | | | | 3,140,103 | |
| | | | Trading Companies & Distributors - 2.0% | |
| | 18,880 | | | United Rentals, Inc.* | | | 2,340,091 | | | | 2,360,944 | |
| | | | | | | | | | | | |
| | Total Industrials | | | 11,769,687 | | | | 13,023,384 | |
| | | | This sector is 10.7% above your Fund’s cost. | | | | | |
| | Information Technology | | | | | | | | |
| | | | Application Software - 4.0% | | | | | |
| | 76,452 | | | Atlassian Corp. PLC, Class A*,1 | | | 2,074,426 | | | | 2,289,737 | |
| | 106,426 | | | Snap, Inc., Class A*,1 | | | 2,475,515 | | | | 2,397,778 | |
| | | | Communications Equipment - 3.9% | | | | | |
| | 15,911 | | | Arista Networks, Inc.* | | | 1,485,424 | | | | 2,104,548 | |
| | 101,841 | | | Ciena Corp.* | | | 1,950,245 | | | | 2,404,466 | |
| | | | Data Processing & Outsourced Services - 8.2% | | | | | | | | |
| | 83,466 | | | Black Knight Financial Services, Inc., Class A*,1 | | | 2,191,372 | | | | 3,196,748 | |
| | 21,000 | | | Blackhawk Network Holdings, Inc.* | | | 863,929 | | | | 852,600 | |
| | 26,570 | | | Global Payments, Inc. | | | 1,895,729 | | | | 2,143,668 | |
| | 53,224 | | | Vantiv, Inc., Class A* | | | 2,452,325 | | | | 3,412,723 | |
| | | | Electronic Components - 2.5% | | | | | | | | |
| | 33,730 | | | Universal Display Corp. | | | 2,006,100 | | | | 2,904,153 | |
| | | | Internet Software & Services - 4.1% | | | | | |
| | 25,000 | | | LogMeln, Inc. | | | 2,531,788 | | | | 2,437,500 | |
| | 71,000 | | | Yelp, Inc.* | | | 2,321,490 | | | | 2,325,250 | |
| | | | Semiconductors - 13.7% | | | | | | | | |
| | 316,327 | | | Advanced Micro Devices, Inc.*,1 | | | 2,033,462 | | | | 4,602,558 | |
| | 14,885 | | | Broadcom, Ltd. | | | 1,304,418 | | | | 3,259,220 | |
| | 88,041 | | | Micron Technology, Inc.* | | | 1,519,872 | | | | 2,544,385 | |
|
The accompanying notes are an integral part of these financial statements. 7 |
AMG Managers Brandywine Advisors Mid Cap Growth Fund
Schedule of Portfolio Investments (continued)
| | | | | | | | | | | | |
| Shares | | | | | Cost | | | Value | |
| | Information Technology (continued) | | | | | | | | |
| | | | Semiconductors - 13.7% (continued) | | | | | |
| | 37,599 | | | Microsemi Corp.* | | $ | 2,083,014 | | | $ | 1,937,476 | |
| | 21,139 | | | NVIDIA Corp. | | | 2,359,992 | | | | 2,302,671 | |
| | 20,239 | | | Qorvo, Inc.* | | | 1,148,011 | | | | 1,387,586 | |
| | | | Systems Software - 1.4% | | | | | | | | |
| | 18,058 | | | ServiceNow, Inc.* | | | 1,430,780 | | | | 1,579,533 | |
| | | | Technology Hardware, Storage & Peripherals - 2.1% | | | | | | | | |
| | 29,411 | | | Western Digital Corp. | | | 2,107,998 | | | | 2,427,290 | |
| | | | | | | | | | | | |
| | Total Information Technology | | | 36,235,890 | | | | 46,509,890 | |
| | | | This sector is 28.4% above your Fund’s cost. | | | | | |
| | Materials | | | | | | | | |
| | | | Construction Materials - 3.5% | | | | | |
| | 9,452 | | | Martin Marietta Materials, Inc. | | | 2,093,690 | | | | 2,062,899 | |
| | 16,347 | | | Vulcan Materials Co. | | | 2,049,130 | | | | 1,969,487 | |
| | | | Specialty Chemicals - 2.0% | | | | | | | | |
| | 22,476 | | | Albemarle Corp. | | | 2,040,603 | | | | 2,374,365 | |
| | | | | | | | | | | | |
| | Total Materials | | | 6,183,423 | | | | 6,406,751 | |
| | | | This sector is 3.6% above your Fund’s cost. | | | | | |
| | Total Common Stocks | | | 97,073,038 | | | | 111,438,036 | |
| | | |
Principal
Amount | | | | | | | | | |
| | Short-Term Investments - 19.7% | | | | | | | | |
| | Commercial Paper - 6.6% | | | | | | | | |
| | | | Arrow Electronics, Inc., 1.35%, | | | | | |
| | $7,685,000 | | | 04/03/172 | | | 7,684,424 | | | | 7,684,424 | |
| | Repurchase Agreements - 13.0%3 | | | | | | | | |
| | 757,379 | | | BNP Paribas S.A., dated 03/31/17, due 04/03/17, 0.810% total to be received $757,430 (collateralized by various U.S. Government Agency Obligations, 0.000% - 8.000%, 11/15/18 - 07/20/63, totaling $772,527) | | | 757,379 | | | | 757,379 | |
| | 3,599,191 | | | Cantor Fitzgerald Securities, Inc., dated 03/31/17, due 04/03/17, 0.810% total to be received $3,599,434 (collateralized by various U.S. Government Agency Obligations, 0.000% - 10.000%, 04/01/17 - 02/20/67, totaling $3,671,176) | | | 3,599,191 | | | | 3,599,191 | |
| | | | | | | | | | | | |
Principal
Amount | | | | | Cost | | | Value | |
| | $3,599,191 | | | Jefferies LLC, dated 03/31/17, due 04/03/17, 0.980% total to be received $3,599,485 (collateralized by various U.S. Government Agency Obligations, 3.500%, 03/01/37 - 02/01/47, totaling $3,671,175) | | $ | 3,599,191 | | | $ | 3,599,191 | |
| | 3,599,191 | | | Nomura Securities International, Inc., dated 03/31/17, due 04/03/17, 0.810% total to be received $3,599,434 (collateralized by various U.S. Government Agency Obligations, 0.000% - 7.500%, 04/19/17 - 02/20/67, totaling $3,671,175) | | | 3,599,191 | | | | 3,599,191 | |
| | 3,599,200 | | | State of Wisconsin Investment Board, dated 03/31/17, due 04/03/17, 0.900% total to be received $3,599,470 (collateralized by various U.S. Government Agency Obligations, 0.125% - 3.875%, 01/15/19 - 02/15/46, totaling $3,671,188) | | | 3,599,200 | | | | 3,599,200 | |
| | | | | | | | | | | | |
| | Total Repurchase Agreements | | | 15,154,152 | | | | 15,154,152 | |
| | | |
| Shares | | | | | | | | | |
| | Other Investment Companies - 0.1% | | | | | | | | |
| | 101,604 | | | Dreyfus Government Cash Management Fund, Institutional Class Shares, 0.65%4 | | | 101,604 | | | | 101,604 | |
| | | | | | | | | | | | |
| | Total Short-Term Investments | | | 22,940,180 | | | | 22,940,180 | |
| | Total Investments - 115.3% | | $ | 120,013,218 | | | | 134,378,216 | |
| | | | | | | | | | | | |
| | Other Assets, less Liabilities - (15.3)% | | | | | | | (17,781,913 | ) |
| | Total Net Assets - 100.0% | | | | | | $ | 116,596,303 | |
| | | | | | | | | | | | |
|
The accompanying notes are an integral part of these financial statements. 8 |
Notes to Schedule of Portfolio Investments (unaudited)
The following footnotes should be read in conjunction with the Schedule of Portfolio Investments previously presented in this report.
Based on the approximate cost of investments of $120,378,438 for federal income tax purposes at March 31, 2017, the aggregate gross unrealized appreciation and depreciation were $14,853,681 and $853,903, respectively, resulting in net unrealized appreciation of investments of $13,999,778.
| * | Non-income producing security. |
| 1 | Some or all of these securities, amounting to a market value of $14,275,128, or 12.2% of net assets, were out on loan to various brokers. |
| 2 | Represents yield to maturity at March 31, 2017. |
| 3 | Collateral received from brokers for securities lending was invested in these joint repurchase agreements. |
| 4 | Yield shown represents the March 31, 2017, seven-day average yield, which refers to the sum of the previous seven days’ dividends paid, expressed as an annual percentage. |
The following table summarizes the inputs used to value the Fund’s investments by the fair value hierarchy levels as of March 31, 2017: (See Note 1(a) in the Notes to the Financial Statements.)
| | | | | | | | | | | | | | | | |
| | | Quoted Prices in Active Markets for Identical Investments Level 1 | | | Significant Other Observable Inputs Level 2 | | | Significant Unobservable Inputs Level 3 | | | Total | |
AMG Managers Brandywine Advisors Mid Cap Growth Fund | | | | | | | | | | | | | | | | |
Investments in Securities | | | | | | | | | | | | | | | | |
Common Stocks† | | $ | 111,438,036 | | | | — | | | | — | | | $ | 111,438,036 | |
Short-Term Investments | | | | | | | | | | | | | | | | |
Commercial Paper | | | — | | | $ | 7,684,424 | | | | — | | | | 7,684,424 | |
Repurchase Agreements | | | — | | | | 15,154,152 | | | | — | | | | 15,154,152 | |
Other Investment Companies | | | 101,604 | | | | — | | | | — | | | | 101,604 | |
| | | | | | | | | | | | | | | | |
Total Investments in Securities | | $ | 111,539,640 | | | $ | 22,838,576 | | | | — | | | $ | 134,378,216 | |
| | | | | | | | | | | | | | | | |
| † | All common stocks held in the Fund are Level 1 securities. For a detailed breakout of the common stocks by major industry classification, please refer to the Schedule of Portfolio Investments. |
As of March 31, 2017, the Fund had no transfers between levels from the beginning of the reporting period.
|
The accompanying notes are an integral part of these financial statements. 9 |
AMG Managers Brandywine Advisors Mid Cap Growth Fund
Statement of Assets and Liabilities (unaudited)
March 31, 2017
| | | | |
Assets: | | | | |
Investments at value* (including securities on loan valued at $14,275,128) | | $ | 119,224,064 | |
Repurchase agreements at value** | | | 15,154,152 | |
Receivable for investments sold | | | 9,947,290 | |
Dividends, interest and other receivables | | | 50,771 | |
Prepaid expenses | | | 22,248 | |
Total assets | | | 144,398,525 | |
Liabilities: | | | | |
Payable upon return of securities loaned | | | 15,154,152 | |
Payable for investments purchased | | | 12,476,909 | |
Accrued expenses: | | | | |
Investment advisory and management fees | | | 87,223 | |
Administrative fees | | | 14,868 | |
Shareholder servicing fees - Class N# | | | 1,051 | |
Distribution fees - Class N# | | | 456 | |
Trustees fees and expenses | | | 1,669 | |
Other | | | 65,894 | |
Total liabilities | | | 27,802,222 | |
Net Assets | | $ | 116,596,303 | |
Net Assets Represent: | | | | |
Paid-in capital | | $ | 122,562,437 | |
Accumulated net investment loss | | | (682,436 | ) |
Accumulated net realized loss from investments | | | (19,648,696 | ) |
Net unrealized appreciation of investments | | | 14,364,998 | |
Net Assets | | $ | 116,596,303 | |
Shares outstanding - Class N# | | | 11,648,944 | |
Net asset value, offering and redemption price per share - Class N# | | $ | 10.01 | |
* Investments at cost | | $ | 104,859,066 | |
** Repurchase agreements at cost | | $ | 15,154,152 | |
| # | Effective October 1, 2016, the Fund’s share class was reclassified and redesignated as described in Note 1 of the Notes to the Financial Statements. |
|
The accompanying notes are an integral part of these financial statements. 10 |
AMG Managers Brandywine Advisors Mid Cap Growth Fund
Statement of Operations (unaudited)
For the six months ended March 31, 2017
| | | | |
Investment Income: | | | | |
Dividend income | | $ | 310,646 | |
Securities lending income | | | 8,564 | |
Interest income | | | 36,545 | |
Foreign withholding tax | | | (2,400 | ) |
Total investment income | | | 353,355 | |
Expenses: | | | | |
Investment advisory and management fees | | | 577,321 | |
Administrative fees | | | 98,407 | |
Shareholder servicing fees—Class N# | | | 6,954 | |
Distribution fees—Class N# | | | 3,018 | |
Professional fees | | | 26,899 | |
Reports to shareholders | | | 15,283 | |
Registration fees | | | 16,679 | |
Custodian fees | | | 6,319 | |
Trustees fees and expenses | | | 5,765 | |
Transfer agent fees | | | 1,972 | |
Miscellaneous | | | 1,900 | |
Total expenses | | | 760,517 | |
Net investment loss | | | (407,162 | ) |
Net Realized and Unrealized Gain (Loss): | | | | |
Net realized gain on investments | | | 11,081,362 | |
Net change in unrealized appreciation (depreciation) of investments | | | (1,324,562 | ) |
Net realized and unrealized gain | | | 9,756,800 | |
Net increase in net assets resulting from operations | | $ | 9,349,638 | |
| # | Effective October 1, 2016, the Fund’s share class was reclassified and redesignated as described in Note 1 of the Notes to the Financial Statements. |
|
The accompanying notes are an integral part of these financial statements. 11 |
AMG Managers Brandywine Advisors Mid Cap Growth Fund
Statements of Changes in Net Assets
For the six months ended March 31, 2017 (unaudited) and the fiscal year ended September 30, 2016
| | | | | | | | |
| | | March 31, | | | September 30, | |
| | | 2017# | | | 2016 | |
Increase (Decrease) in Net Assets Resulting From Operations: | | | | | | | | |
Net investment loss | | $ | (407,162 | ) | | $ | (439,982 | ) |
Net realized gain (loss) on investments | | | 11,081,362 | | | | (14,380,438 | ) |
Net change in unrealized appreciation (depreciation) of investments | | | (1,324,562 | ) | | | 15,124,137 | |
Net increase in net assets resulting from operations | | | 9,349,638 | | | | 303,717 | |
Capital Share Transactions - Class N: | | | | | | | | |
Proceeds from sale of shares | | | 56,426 | | | | 333,498 | |
Cost of shares repurchased | | | (25,603,265 | ) | | | (11,048,641 | ) |
Net decrease from capital share transactions | | | (25,546,839 | ) | | | (10,715,143 | ) |
Total decrease in net assets | | | (16,197,201 | ) | | | (10,411,426 | ) |
Net Assets: | | | | | | | | |
Beginning of period | | | 132,793,504 | | | | 143,204,930 | |
End of period | | $ | 116,596,303 | | | $ | 132,793,504 | |
End of period accumulated net investment loss | | $ | (682,436 | ) | | $ | (275,274 | ) |
| | | | | | | | |
Share Transactions - Class N: | | | | | | | | |
Sale of shares | | | 5,753 | | | | 37,820 | |
Shares repurchased | | | (2,566,813 | ) | | | (1,292,865 | ) |
Net decrease in shares | | | (2,561,060 | ) | | | (1,255,045 | ) |
| # | Effective October 1, 2016, the Fund’s share class was reclassified and redesignated as described in Note 1 of the Notes to the Financial Statements. |
|
The accompanying notes are an integral part of these financial statements. 12 |
AMG Managers Brandywine Advisors Mid Cap Growth Fund
Financial Highlights
For a share outstanding throughout each fiscal period
| | | | | | | | | | | | | | | | | | | | | | | | |
| | | For the six | | | | | | | | | | | | | | | | |
| | | months ended | | | For the fiscal years ended September 30, | |
| | | March 31, 2017# | | | | | | | | | | | | | | | | |
| Class N | | (unaudited) | | | 2016 | | | 2015 | | | 20142 | | | 2013 | | | 2012 | |
Net Asset Value, Beginning of Period | | $ | 9.35 | | | $ | 9.26 | | | $ | 9.59 | | | $ | 8.80 | | | $ | 7.63 | | | $ | 6.82 | |
Income (loss) from Investment Operations: | | | | | | | | | | | | | | | | | | | | | | | | |
Net investment income (loss)1 | | | (0.03 | ) | | | (0.03 | ) | | | 0.03 | 3 | | | (0.05 | ) | | | (0.02 | ) | | | (0.03 | ) |
Net realized and unrealized gain (loss) on investments | | | 0.69 | | | | 0.12 | | | | (0.36 | ) | | | 0.84 | | | | 1.20 | | | | 0.84 | |
Total income (loss) from investment operations | | | 0.66 | | | | 0.09 | | | | (0.33 | ) | | | 0.79 | | | | 1.18 | | | | 0.81 | |
Distributions to Shareholders from: | | | | | | | | | | | | | | | | | | | | | | | | |
Net investment income | | | — | | | | — | | | | — | | | | — | | | | (0.01 | ) | | | — | |
Net Asset Value, End of Period | | $ | 10.01 | | | $ | 9.35 | | | $ | 9.26 | | | $ | 9.59 | | | $ | 8.80 | | | $ | 7.63 | |
Total Return | | | 7.06 | %5 | | | 0.97 | % | | | (3.44 | )% | | | 8.98 | % | | | 15.43 | % | | | 11.88 | % |
Ratio of gross expenses to average net assets | | | 1.16 | %6 | | | 1.15 | % | | | 1.14 | % | | | 1.12 | % | | | 1.22 | % | | | 1.22 | %4 |
Ratio of net investment income (loss) to average net assets | | | (0.62 | )%6 | | | (0.33 | )% | | | 0.28 | % | | | (0.54 | )% | | | (0.20 | )% | | | (0.37 | )% |
Portfolio turnover | | | 135 | %5 | | | 195 | % | | | 204 | % | | | 249 | % | | | 235 | % | | | 266 | % |
Net assets at end of period (000’s omitted) | | $ | 116,596 | | | $ | 132,794 | | | $ | 143,205 | | | $ | 148,847 | | | $ | 137,246 | | | $ | 119,769 | |
| | | | | | | | | | | | | | | | | | | | | | | | |
Notes to Financial Highlights(unaudited)
| # | Effective October 1, 2016, the Fund’s shares were reclassified and redesignated to Class N shares. |
| 1 | Per share numbers have been calculated using average shares. |
| 2 | At the start of business October 1, 2013, AMG Managers Brandywine Advisors Midcap Growth Fund was re-organized into a fund of AMG Funds I. |
| 3 | Includes non-recurring dividends. Without these dividends, net investment loss per share would have been $(0.03). |
| 4 | Interest expense is less than 0.005% of average net assets. |
Notes to Financial Statements (unaudited)
March 31, 2017
1. SUMMARY OF SIGNIFICANT ACCOUNTING POLICIES
AMG Funds I (the “Trust”) is an open-end management investment company, organized as a Massachusetts business trust and registered under the Investment Company Act of 1940, as amended (the “1940 Act”). Currently, the Trust consists of a number of different funds, each having distinct investment management objectives, strategies, risks, and policies. Included in this report is the AMG Managers Brandywine Advisors Mid Cap Growth Fund (the “Fund”).
A significant portion of the Fund’s holdings may be focused in a relatively small number of securities, which may make the Fund more volatile and subject to greater risk than a more diversified fund.
Effective October 1, 2016, the Fund’s shares were reclassified and redesignated to Class N shares. Please refer to a current prospectus for additional information.
The Fund’s financial statements are prepared in accordance with accounting principles generally accepted in the United States of America (“U.S. GAAP”), including accounting and reporting guidance pursuant to Accounting Standards Codification Topic 946 applicable to investment companies. U.S. GAAP requires management to make estimates and assumptions that affect the reported amounts of assets and liabilities and disclosure of contingent assets and liabilities at the date of the financial statements and the reported amounts of income and expenses during the reporting period. Actual results could differ from those estimates and such differences could be material. The following is a summary of significant accounting policies followed by the Fund in the preparation of their financial statements:
a. VALUATION OF INVESTMENTS
Equity securities traded on a national securities exchange or reported on the NASDAQ national market system (“NMS”) are valued at the last quoted sales price on the primary exchange or, if applicable, the NASDAQ official closing price or the official closing price of the relevant exchange or, lacking any sales, at the last quoted bid price or the mean between the last quoted bid and ask prices (the “exchange mean price”). Equity securities traded in the over-the-counter market (other than NMS securities) are valued at the exchange mean price. Foreign equity securities (securities principally traded in markets other than U.S. markets) are valued at the official closing price on the primary exchange or, for markets that either do not offer an official closing price or where the official closing price may not be representative of the overall market, the last quoted sale price.
Fixed income securities purchased with a remaining maturity of 60 days or less are valued at amortized cost, provided that the amortized cost value is approximately the same as the fair value of the security valued without the use of amortized cost. Investments in other open-end regulated investment companies are valued at their end of day net asset value per share.
The Fund’s portfolio investments are generally valued based on independent market quotations or prices or, if none, “evaluative” or other market based valuations provided by third-party pricing services approved by the Board of Trustees of the Trust (the “Board”). Under certain circumstances, the value of certain Fund portfolio investments (including derivatives) may be based on an evaluation of fair value, pursuant to procedures established by and under the
general supervision of the Board. The Valuation Committee, which is comprised of the Independent Trustees of the Board, and the Pricing Committee, which is comprised of representatives from AMG Funds LLC (the “Investment Manager”) are the committees appointed by the Board to make fair value determinations. The Fund may use the fair value of a portfolio investment to calculate its net asset value (“NAV”) in the event that the market quotation, price or market based valuation for the portfolio investment is not readily available or otherwise not determinable pursuant to the Board’s valuation procedures, if the Investment Manager or the Pricing Committee believes the quotation, price or market based valuation to be unreliable, or in certain other circumstances. When determining the fair value of an investment, the Pricing Committee and, if required under the Trust’s securities valuation procedures, the Valuation Committee, seeks to determine the price that the Fund might reasonably expect to receive from current sale of that portfolio investment in an arms-length transaction. Fair value determinations shall be based upon consideration of all available facts and information, including, but not limited to (i) attributes specific to the investment; (ii) fundamental and analytical data relating to the investment; and (iii) the value of other comparable securities or relevant financial instruments, including derivative securities, traded on other markets or among dealers.
The values assigned to fair value portfolio investments are based on available information and do not necessarily represent amounts that might ultimately be realized in the future, since such amounts depend on future developments inherent in long-term investments. Because of the inherent uncertainty of valuation, those estimated values may differ significantly from the values that would have been used had a ready market for the investments existed, and the differences could be material. The Board will be presented with a quarterly report showing as of the most recent quarter end, all outstanding securities fair valued by the Fund, including a comparison with the prior quarter end and the percentage of the Fund that the security represents at each quarter end.
With respect to foreign equity securities and certain foreign fixed income securities, the Board has adopted a policy that securities held in a Fund that can be fair valued by the applicable fair value pricing service are fair valued on each business day provided that each individual price exceeds a pre-established confidence level.
U.S. GAAP defines fair value as the price that a fund would receive to sell an asset or pay to transfer a liability in an orderly transaction between market participants at the measurement date. U.S. GAAP also establishes a framework for measuring fair value, and a three-level hierarchy for fair value measurements based upon the transparency of inputs to the valuation of an asset or liability. Inputs may be observable or unobservable and refer broadly to the assumptions that market participants would use in pricing the asset or liability. Observable inputs reflect the assumptions market participants would use in pricing the asset or liability based on market data obtained from sources independent of the Fund. Unobservable inputs reflect the Fund’s own assumptions about the assumptions that market participants would use in pricing the asset or liability developed based on the best information available in the circumstances. Each investment is assigned a level based upon the observability of the inputs which are significant to the overall valuation.
The three-tier hierarchy of inputs is summarized below:
Notes to Financial Statements (continued)
Level 1 – inputs are quoted prices in active markets for identical investments (e.g., equity securities, open-end investment companies)
Level 2 – other observable inputs (including, but not limited to: quoted prices for similar assets or liabilities in markets that are active, quoted prices for identical or similar assets or liabilities in markets that are not active, inputs other than quoted prices that are observable for the assets or liabilities (such as interest rates, yield curves, volatilities, prepayment speeds, loss severities, credit risks and default rates) or other market corroborated inputs) (e.g., debt securities, government securities, foreign currency exchange contracts, foreign securities utilizing international fair value pricing, broker-quoted securities, fair valued securities with observable inputs)
Level 3 – inputs are significant unobservable inputs (including the Fund’s own assumptions used to determine the fair value of investments) (e.g., fair valued securities with unobservable inputs)
Changes in inputs or methodologies used for valuing investments may result in a transfer in or out of levels within the fair value hierarchy. The inputs or methodologies used for valuing investments may not necessarily be an indication of the risk associated with investing in those investments. Transfers between different levels of the fair value disclosure hierarchy are deemed to have occurred as of the beginning of the reporting period.
b. SECURITY TRANSACTIONS
Security transactions are accounted for as of trade date. Realized gains and losses on securities sold are determined on the basis of identified cost.
c. INVESTMENT INCOME AND EXPENSES
Dividend income is recorded on the ex-dividend date. Dividends from foreign securities are recorded on the ex-dividend date, and if after the fact as soon as the Fund becomes aware of the ex-dividend date. Interest income, which includes amortization of premium and accretion of discount on debt securities, is accrued as earned. Dividend and interest income on foreign securities is recorded gross of any withholding tax. Non-cash dividends included in dividend income, if any, are reported at the fair market value of the securities received. Upon notification from issuers, distributions received from a real estate investment trust (“REIT”) may be designated as a reduction of cost of investments and/or realized gain. Other income and expenses are recorded on an accrual basis. Expenses that cannot be directly attributed to a Fund are apportioned among the funds in the Trust and other trusts within the AMG Funds family of mutual funds (collectively the “AMG Funds family”) based upon their relative average net assets or number of shareholders.
d. DIVIDENDS AND DISTRIBUTIONS
Fund distributions resulting from either net investment income or realized net capital gains, if any, will normally be declared and paid at least annually in December, as described in the Fund’s prospectus. Distributions to shareholders are recorded on the ex-dividend date. Distributions are determined in accordance with federal income tax regulations, which may differ from net investment income and net realized capital gains for financial statement purposes (U.S. GAAP). Differences may be permanent or temporary. Permanent differences are reclassified among capital accounts in the financial statements to reflect their tax character. Permanent book and tax basis differences, if any,
relating to shareholder distributions will result in reclassifications to paid-in capital. Temporary differences arise when certain items of income, expense and gain or loss are recognized in different periods for financial statement and tax purposes; these differences will reverse at some time in the future. Permanent differences are due to a net operating loss write off. Temporary differences are due to post October loss deferrals, qualified late year ordinary losses and wash sales.
e. FEDERAL TAXES
The Fund currently qualifies as an investment company and intends to comply with the requirements under Subchapter M of the Internal Revenue Code of 1986, as amended, to distribute substantially all of its taxable income and gains to its shareholders and to meet certain diversification and income requirements with respect to investment companies. Therefore, no provision for federal income or excise tax is included in the accompanying financial statements.
Additionally, based on the Fund’s understanding of the tax rules and rates related to income, gains and transactions for the foreign jurisdictions in which it invests, the Fund will provide for foreign taxes, and where appropriate, deferred foreign taxes.
Management has analyzed the Fund’s tax positions taken on federal income tax returns as of September 30, 2016, and for all open tax years (generally, the three prior taxable years), and has concluded that no provision for federal income tax is required in the Fund’s financial statements. Additionally, Management is not aware of any tax position for which it is reasonably possible that the total amounts of unrecognized tax benefits will change materially in the next twelve months.
Net capital losses incurred in taxable years beginning after the enactment of the Regulated Investment Company Modernization Act of 2010, may be carried forward for an unlimited time period. Such losses will be required to be utilized prior to any loss carryovers incurred in pre-enactment taxable years, which generally expire eight years following the close of the taxable year in which they were incurred. As a result of this ordering rule, pre-enactment capital loss carryovers may be more likely to expire unused. Additionally, post-enactment capital losses that are carried forward retain their tax character as either short-term or long-term capital losses, unlike pre-enactment losses which are considered all short-term.
f. CAPITAL LOSS CARRYOVERS AND DEFERRALS
As of March 31, 2017, the Fund had an accumulated net realized capital loss carryover from securities transactions for federal income tax purposes as shown in the following chart. These amounts may be used to offset future realized capital gains, if any, through the expiration date listed, or in the case of post-enactment losses, for an unlimited time period.
| | | | | | | | | | | | |
| | | Capital Loss Carryover
Amounts | | | | |
| | | | | | | | | Expires | |
| | | Short-Term | | | Long-Term | | | September 30, | |
(Pre-Enactment) | | $ | 16,308,363 | | | | — | | | | 2018 | |
(Post-Enactment) | | | 4,657,867 | | | | — | | | | Unlimited | |
| | | | | | | | | | | | |
Totals | | $ | 20,966,230 | | | | — | | | | | |
| | | | | | | | | | | | |
Notes to Financial Statements (continued)
g. CAPITAL STOCK
The Trust’s Declaration of Trust authorizes for the Fund the issuance of an unlimited number of shares of beneficial interest, without par value. The Fund records sales and repurchases of its capital stock on the trade date. The cost of securities contributed to the Fund in connection with the issuance of shares is based on the valuation of those securities in accordance with the Fund’s policy on investment valuation.
At March 31, 2017, certain affiliated shareholders of record, individually or collectively, held greater than 10% of the net assets of the Fund as follows: one owns 98%. Transactions by this shareholder may have a material impact on the Fund.
h. REPURCHASE AGREEMENTS AND JOINT REPURCHASE AGREEMENTS
The Funds may enter into third-party repurchase agreements for temporary cash management purposes and third-party joint repurchase agreements for reinvestment of cash collateral on securities lending transactions under the securities lending program offered by The Bank of New York Mellon (“BNYM”) (the “Program”) (collectively, “Repurchase Agreements”). The value of the underlying collateral, including accrued interest, must equal or exceed the value of the Repurchase Agreements during the term of the agreement. For joint repurchase agreements, the Funds participate on a pro rata basis with other clients of BNYM in its share of the underlying collateral under such joint repurchase agreements and in its share of proceeds from any repurchase or other disposition of the underlying collateral. The underlying collateral for all Repurchase Agreements is held in safekeeping by the Fund’s custodian or at the Federal Reserve Bank. If the seller defaults and the value of the collateral declines, or if bankruptcy proceedings commence with respect to the seller of the security, realization of the collateral by the Funds may be delayed or limited. Pursuant to the Program, the Funds are indemnified for such losses by BNYM on joint repurchase agreements.
At March 31, 2017, the market value of Repurchase Agreements outstanding was $15,154,152.
2. AGREEMENTS AND TRANSACTIONS WITH AFFILIATES
The Trust has entered into an investment advisory agreement under which the Investment Manager, a subsidiary and the U.S. retail distribution arm of Affiliated Managers Group, Inc. (“AMG”), serves as investment manager to the Fund and is responsible for the Fund’s overall administration and operations. The Investment Manager selects one or more subadvisors for the Fund (subject to Board approval) and monitors the subadvisor’s investment performance, security holdings and investment strategies. The Fund’s investment portfolio is managed by Friess Associates, LLC (“Friess”) and Friess Associates of Delaware, LLC (“Friess of Delaware”) who serves pursuant to a subadvisory agreement with the Investment Manager.
Investment management fees are paid directly by the Fund to the Investment Manager based on average daily net assets. Effective October 1, 2016, the Fund paid an investment management fee at the annual rate of 0.88% of the average daily net assets of the Fund. Prior to October 1, 2016, the annual rate for the investment management fees was 1.00% of the Fund’s average daily net assets.
The Trust, on behalf of the Fund, has entered into an amended and restated Administration Agreement under which the Investment Manager serves as the Fund’s administrator (the “Administrator”) and is responsible for all non-portfolio management aspects of managing the Fund’s operations, including administration and shareholder services to the Fund as further described in the Fund’s prospectus. Effective October 1, 2016, the Fund pays a fee to the Administrator at the rate of 0.15% per annum of the Fund’s average daily net assets for this service. Prior to October 1, 2016, the Fund paid an administrative fee under a similar contract at an annual rate of 0.03% of the Fund’s average net assets for the first $300 million of assets under management, 0.025% for the next $200 million and 0.02% on amounts in excess of $500 million.
The Fund is distributed by AMG Distributors, Inc. (the “Distributor”), a wholly-owned subsidiary of the Investment Manager. The Distributor serves as the distributor and underwriter for the Fund and is a registered broker-dealer and member of the Financial Industry Regulatory Authority, Inc. (“FINRA”). Shares of the Fund will be continuously offered and will be sold directly to prospective purchasers and through brokers, dealers or other financial intermediaries who have executed selling agreements with the Distributor. Generally the Distributor bears all or a portion of the expenses of providing services pursuant to the distribution agreement, including the payment of the expenses relating to the distribution of prospectuses for sales purposes and any advertising or sales literature.
The Trust has adopted a distribution and service plan (the “Plan”) with respect to the Class N shares in accordance with the requirements of Rule 12b-1 under the 1940 Act and the requirements of the applicable rules of FINRA regarding asset-based sales charges. Pursuant to the Plan, the Fund may make payments to reimburse the Distributor for its expenditures in financing any activity primarily intended to result in the sale of the Fund’s shares and for maintenance and personal service provided to existing shareholders. The Plan authorizes payments to the Distributors of up to 0.25% annually of the Fund’s average daily net assets attributable to the Class N shares.
The Board has approved reimbursement payments to the Investment Manager for shareholder servicing expenses (“shareholder servicing fees”) incurred. Shareholder servicing fees include payments to each financial intermediary such as broker-dealers (including fund supermarket platforms), banks and trust companies that provide shareholder recordkeeping, account servicing and other services.
The impact on the annualized expense ratio for the six months ended March 31, 2017, was as follows:
| | | | | | | | |
| | | Maximum | | | Actual | |
| | | Amount | | | Amount | |
| Fund | | Approved | | | Incurred | |
Brandywine Advisors | | | | | | | | |
Class N | | | 0.15 | % | | | 0.01 | % |
The Board provides supervision of the affairs of the Trust and other trusts within the AMG Funds family. The Trustees of the Trust who are not affiliated with an Investment Manager receive an annual retainer and per meeting fees for
Notes to Financial Statements (continued)
regular, special and telephonic meetings, and they are reimbursed for out-of-pocket expenses incurred while carrying out their duties as Board members. The Chairman of the Board and the Audit Committee Chair receive additional annual retainers. Certain Trustees and Officers of the Fund are Officers and/or Directors of the Investment Manager, AMG and/or the Distributor.
The Securities and Exchange Commission (the “SEC”) granted an exemptive order that permits the Fund to lend and borrow money for certain temporary purposes directly to and from other eligible Funds in the AMG Funds family. Participation in this interfund lending program is voluntary for both borrowing and lending funds, and an interfund loan is only made if it benefits each participating fund. The Administrator manages the program according to procedures approved by the Board, and the Board monitors the operation of the program. An interfund loan must comply with certain conditions set out in the exemptive order, which are designed to assure fairness and protect all participating funds. For the six months ended March 31, 2017, the Fund neither borrowed from nor lent to other funds in the AMG Funds family. At March 31, 2017, the Fund had no interfund loans outstanding.
3. PURCHASES AND SALES OF SECURITIES
Purchases and sales of securities (excluding short-term and U.S. Government Obligations) for the six months ended March 31, 2017, were $165,112,622 and $192,375,201, respectively. The Fund had no purchases or sales of U.S. Government Obligations during the six months ended March 31, 2017.
4. PORTFOLIO SECURITIES LOANED
The Fund participates in the Program, providing for the lending of securities to qualified brokers. Securities lending income includes earnings of such temporary cash investments, plus or minus any rebate to a borrower. These earnings (after any rebate) are then divided between BNYM, as a fee for its services under the Program, and the Fund, according to agreed-upon rates. Collateral on all securities loaned is accepted in cash and is maintained at a minimum level of 102% (105% in the case of certain foreign securities) of the market value, plus interest, if applicable, of investments on loan. It is the Fund’s
policy to obtain additional collateral from or return excess collateral to the borrower by the end of the next business day, following the valuation date of the securities loaned. Therefore, the value of the collateral held may be temporarily less than the value of the securities on loan. Lending securities entails a risk of loss to the Fund if and to the extent that the market value of the securities loaned were to increase and the borrower did not increase the collateral accordingly, and the borrower fails to return the securities. Under the terms of the Program, the Fund is indemnified for such losses by BNYM. Cash collateral is held in a separate omnibus account managed by BNYM, who is authorized to exclusively enter into joint repurchase agreements. BNYM bears the risk of any deficiency in the amount of the cash collateral available for return to the borrower due to any loss on the collateral invested. At March 31, 2017, the value of the securities loaned and cash collateral received was $14,275,128 and $15,154,152, respectively.
5. COMMITMENTS AND CONTINGENCIES
Under the Trust’s organizational documents, its trustees and officers are indemnified against certain liabilities arising out of the performance of their duties to the Trust. In addition, in the normal course of business, the Fund may enter into contracts and agreements that contain a variety of representations and warranties, which provide general indemnifications. The maximum exposure to the Fund under these arrangements is unknown, as this would involve future claims that may be made against a Fund that have not yet occurred. However, based on experience, the Fund had no prior claims or losses and expects the risk of loss to be remote.
6. MASTER NETTING AGREEMENTS
The Fund may enter into master netting agreements with its counterparties for the securities lending program and Repurchase Agreements, which provide the right, in the event of default (including bankruptcy or insolvency) for the non-defaulting party to liquidate the collateral and calculate net exposure to the defaulting party or request additional collateral. For financial reporting purposes, the Fund does not offset financial assets and financial liabilities that are subject to master netting agreements in the Statement of Assets and Liabilities. For securities lending transactions, see Note 4.
Notes to Financial Statements (continued)
The following table is a summary of the Funds’ open Repurchase Agreements which are subject to a master netting agreement as of March 31, 2017:
| | | | | | | | | | | | | | | | |
| | | | | | Gross Amount Not Offset in the | | | | |
| | | | | | Statement of Assets and Liabilities | | | | |
| | | Net Amounts of Assets | | | Financial | | | | | | | |
| | | Presented in the Statement | | | Instruments | | | Cash Collateral | | | | |
| | | of Assets and Liabilities | | | Collateral | | | Received | | | Net Amount | |
BNP Paribas S.A. | | $ | 757,379 | | | $ | 757,379 | | | | — | | | | — | |
Cantor Fitzgerald Securities, Inc. | | | 3,599,191 | | | | 3,599,191 | | | | — | | | | — | |
Jefferies LLC | | | 3,599,191 | | | | 3,599,191 | | | | — | | | | — | |
Nomura Securities International, Inc. | | | 3,599,191 | | | | 3,599,191 | | | | — | | | | — | |
State of Wisconsin Investment Board | | | 3,599,200 | | | | 3,599,200 | | | | — | | | | — | |
| | | | | | | | | | | | | | | | |
Totals | | $ | 15,154,152 | | | $ | 15,154,152 | | | | — | | | | — | |
| | | | | | | | | | | | | | | | |
7. REGULATORY UPDATES
On October 13, 2016, the SEC amended existing rules intended to modernize reporting and disclosure of information. These amendments relate to Regulation S-X which sets forth the form and content of financial statements. Management is evaluating the implications of adopting these amendments and their impact on the financial statements and accompanying notes.
8. SUBSEQUENT EVENTS
The Fund has determined that no material events or transactions occurred through the issuance date of the Fund’s financial statements which require an additional disclosure in or adjustment of the Fund’s financial statements.
THIS PAGE INTENTIONALLY LEFT BLANK
THIS PAGE INTENTIONALLY LEFT BLANK
INVESTMENT MANAGER AND
ADMINISTRATOR
AMG Funds LLC
600 Steamboat Road, Suite 300
Greenwich, CT 06830
(800) 835-3879
DISTRIBUTOR
AMG Distributors, Inc.
600 Steamboat Road, Suite 300
Greenwich, CT 06830
(800) 835-3879
SUBADVISOR
Friess Associates, LLC
P.O. Box 576
Jackson, Wyoming 83001
Friess Associates of Delaware, LLC
P.O. Box 4166
Greenville, DE 19807
CUSTODIAN
The Bank of New York Mellon
2 Hanson Place
Brooklyn, NY 11217
LEGAL COUNSEL
Ropes & Gray LLP
Prudential Tower, 800 Boylston Street
Boston, MA 02199-3600
TRANSFER AGENT
BNY Mellon Investment Servicing (US) Inc.
Attn: AMG Funds
P.O. Box 9769
Providence, RI 02940
(800) 548-4539
TRUSTEES
Bruce B. Bingham
Christine C. Carsman
Edward J. Kaier
Kurt Keilhacker
Steven J. Paggioli
Richard F. Powers III
Eric Rakowski
Victoria Sassine
Thomas R. Schneeweis
This report is prepared for the Fund’s shareholders. It is authorized for distribution to prospective investors only when preceded or accompanied by an effective prospectus. To receive a free copy of the prospectus or Statement of Additional Information, which includes additional information about Fund Trustees, please contact us by calling 800.835.3879. Distributed by AMG Distributors, Inc., member FINRA/SIPC.
Current net asset values per share for the Fund are available on the Fund’s website at www.amgfunds.com.
A description of the policies and procedures the Fund uses to vote its proxies is available: (i) without charge, upon request, by calling 800.835.3879, or (ii) on the Securities and Exchange Commission’s (SEC) website at www.sec.gov. For information regarding the Fund’s proxy voting record for the 12-month period ended June 30, call 800.835.3879 or visit the SEC website at www.sec.gov.
The Fund files its complete schedule of portfolio holdings with the SEC for the first and third quarters of each fiscal year on Form N-Q. The Fund’s Forms N-Q are available on the SEC’s website at www.sec.gov. A Fund’s Forms N-Q may be reviewed and copied at the SEC’s Public Reference Room in Washington, DC. Information on the operation of the Public Reference Room may be obtained by calling 1-800-SEC-0330. To review a complete list of the Fund’s portfolio holdings, or to view the most recent quarterly holdings report, semiannual report, or annual report, please visit www.amgfunds.com.
| | |
| | |
AFFILIATE SUBADVISED FUNDS
BALANCED FUNDS
AMG Chicago Equity Partners Balanced
Chicago Equity Partners, LLC
AMG FQ Global Risk-Balanced
First Quadrant, L.P.
EQUITY FUNDS
AMG Chicago Equity Partners Small Cap Value
Chicago Equity Partners, LLC
AMG FQ Tax-Managed U.S. Equity
AMG FQ U.S. Equity
First Quadrant, L.P.
AMG Frontier Small Cap Growth
Frontier Capital Management Company, LLC
AMG GW&K Small Cap Core
AMG GW&K Small/Mid Cap
AMG GW&K U.S. Small Cap Growth
GW&K Investment Management, LLC
AMG Renaissance International Equity
AMG Renaissance Large Cap Growth
The Renaissance Group LLC
AMG River Road Dividend All Cap Value
AMG River Road Dividend All Cap Value II
AMG River Road Focused Absolute Value
AMG River Road Long-Short
AMG River Road Select Value
AMG River Road Small Cap Value
River Road Asset Management, LLC
AMG SouthernSun Small Cap
AMG SouthernSun Global Opportunities
AMG SouthernSun U.S. Equity
SouthernSun Asset Management, LLC
AMG Systematic Large Cap Value
AMG Systematic Mid Cap Value
Systematic Financial Management, L.P.
AMG TimesSquare All Cap Growth
AMG TimesSquare Emerging Markets
Small Cap
AMG TimesSquare International Small Cap
AMG TimesSquare Mid Cap Growth
AMG TimesSquare Small Cap Growth
TimesSquare Capital Management, LLC
AMG Trilogy Emerging Markets Equity
AMG Trilogy Emerging Wealth Equity
AMG Trilogy Global Equity
AMG Trilogy International Small Cap
Trilogy Global Advisors, L.P.
AMG Yacktman
AMG Yacktman Focused
AMG Yacktman Focused Fund - Security
Selection Only
AMG Yacktman Special Opportunities
Yacktman Asset Management LP
FIXED INCOME FUNDS
AMG GW&K Core Bond
AMG GW&K Enhanced Core Bond
AMG GW&K Municipal Bond
AMG GW&K Municipal Enhanced Yield
GW&K Investment Management, LLC
OPEN-ARCHITECTURE FUNDS
ALTERNATIVE FUNDS
AMG Managers Lake Partners LASSO
Alternative
Lake Partners, Inc.
BALANCED FUNDS
AMG Managers Montag & Caldwell Balanced
Montag & Caldwell, LLC
EQUITY FUNDS
AMG Managers Brandywine
AMG Managers Brandywine Advisors Mid Cap Growth
AMG Managers Brandywine Blue
Friess Associates, LLC
AMG Managers Cadence Capital Appreciation
AMG Managers Cadence Emerging Companies
AMG Managers Cadence Mid Cap
Cadence Capital Management, LLC
AMG Managers CenterSquare Real Estate
CenterSquare Investment Management, Inc.
AMG Managers Emerging Opportunities
Lord, Abbett & Co. LLC
WEDGE Capital Management L.L.P.
Next Century Growth Investors LLC
RBC Global Asset Management (U.S.) Inc.
AMG Managers Essex Small/Micro Cap
Growth
Essex Investment Management Co., LLC
AMG Managers Fairpointe Focused Equity
AMG Managers Fairpointe Mid Cap
Fairpointe Capital LLC
AMG Managers Guardian Capital Global
Dividend
Guardian Capital LP
AMG Managers LMCG Small Cap Growth
LMCG Investments, LLC
AMG Managers Montag & Caldwell Growth
AMG Managers Montag & Caldwell Mid Cap
Growth
Montag & Caldwell, LLC
AMG Managers Pictet International
Pictet Asset Management Limited
AMG Managers Silvercrest Small Cap
Silvercrest Asset Management Group LLC
AMG Managers Skyline Special Equities
Skyline Asset Management, L.P.
AMG Managers Special Equity
Ranger Investment Management, L.P.
Lord, Abbett & Co. LLC
Smith Asset Management Group, L.P.
Federated MDTA LLC
AMG Managers Value Partners Asia Dividend
Value Partners Hong Kong Limited
FIXED INCOME FUNDS
AMG Managers Amundi Intermediate
Government
AMG Managers Amundi Short Duration
Government
Amundi Smith Breeden LLC
AMG Managers Doubleline Core Plus Bond
DoubleLine Capital LP
AMG Managers Global Income Opportunity
AMG Managers Loomis Sayles Bond
Loomis, Sayles & Co., L.P.
AMG Managers High Yield
JPMorgan Investment Management, Inc.
| | | | |
| |  | | www.amgfunds.com |
| SAR075-0317 | | | |
Not applicable for the semi-annual shareholder report.
| Item 3. | AUDIT COMMITTEE FINANCIAL EXPERT |
Not applicable for the semi-annual shareholder report.
| Item 4. | PRINCIPAL ACCOUNTANT FEES AND SERVICES |
Not applicable for the semi-annual shareholder report.
| Item 5. | AUDIT COMMITTEE OF LISTED REGISTRANTS |
Not applicable.
| Item 6. | SCHEDULE OF INVESTMENTS |
The schedule of investments in unaffiliated issuers as of the close of the reporting period is included as part of the shareholder report contained in Item 1 hereof.
| Item 7. | DISCLOSURE OF PROXY VOTING POLICIES AND PROCEDURES FOR CLOSED-END MANAGEMENT INVESTMENT COMPANIES |
Not applicable.
| Item 8. | PORTFOLIO MANAGERS OF CLOSED-END MANAGEMENT INVESTMENT COMPANIES |
Not applicable.
| Item 9. | PURCHASES OF EQUITY SECURITIES BY CLOSED-END MANAGEMENT INVESTMENT COMPANIES AND AFFILIATED PURCHASERS |
Not applicable.
| Item 10. | SUBMISSION OF MATTERS TO A VOTE OF SECURITY HOLDERS |
Not applicable.
| Item 11. | CONTROLS AND PROCEDURES |
| | (a) | The registrant’s principal executive and principal financial officers have concluded, based on their evaluation of the registrant’s disclosure controls and procedures as of a date within 90 days of the filing date of this report, that the registrant’s disclosure controls and procedures are reasonably designed to ensure that information required to be disclosed by the registrant on Form N-CSR is recorded, processed, summarized and reported within the required time periods and that information required to be disclosed by the registrant in the reports that it files or submits on Form N-CSR is accumulated and communicated to the registrant’s management, including its principal executive and principal financial officers, as appropriate to allow timely decisions regarding required disclosure. |
| | (b) | There were no changes in the registrant’s internal control over financial reporting during the registrant’s second fiscal quarter of the period covered by this report that have materially affected, or are reasonably likely to materially affect, the internal control over financial reporting. |
| | |
| |
| (a)(1) | | Not applicable. |
| |
| (a)(2) | | Certifications pursuant to Rule 30a-2(a) under the Investment Company Act of 1940 - Filed herewith. |
| |
| (a)(3) | | Not applicable. |
| |
| (b) | | Certifications pursuant to Rule 30a-2(b) under the Investment Company Act of 1940 - Filed herewith. |
SIGNATURES
Pursuant to the requirements of the Securities Exchange Act of 1934 and the Investment Company Act of 1940, the registrant has duly caused this report to be signed on its behalf by the undersigned, thereunto duly authorized.
AMG FUNDS I
| | |
| By: | | /s/ Jeffrey T. Cerutti |
| | Jeffrey T. Cerutti, Principal Executive Officer |
Date: April 26, 2017
Pursuant to the requirements of the Securities Exchange Act of 1934 and the Investment Company Act of 1940, this report has been signed below by the following persons on behalf of the registrant and in the capacities and on the dates indicated.
| | |
| By: | | /s/ Jeffrey T. Cerutti |
| | Jeffrey T. Cerutti, Principal Executive Officer |
Date: April 26, 2017
| | |
| By: | | /s/ Donald S. Rumery |
| | Donald S. Rumery, Principal Financial Officer |
Date: April 26, 2017