UNITED STATES
SECURITIES AND EXCHANGE COMMISSION
Washington, D.C. 20549
FORM N-CSRS
CERTIFIED SHAREHOLDER REPORT OF REGISTERED
MANAGEMENT INVESTMENT COMPANIES
Investment Company Act file number: 811-06520
AMG Funds I
(Exact name of registrant as specified in charter)
600 Steamboat Road, Suite 300, Greenwich, Connecticut 06830
(Address of principal executive offices) (Zip code)
AMG Funds LLC
600 Steamboat Road, Suite 300, Greenwich, Connecticut 06830
(Name and address of agent for service)
Registrant’s telephone number, including area code: (203) 299-3500
Date of fiscal year end: September 30
Date of reporting period: OCTOBER 1, 2017 – MARCH 31, 2018
(Semi-Annual Shareholder Report)
| Item 1. | Reports to Shareholders |
| | |
 | | SEMI-ANNUAL REPORT |
|
AMG Funds |
March 31, 2018  |
AMG Managers Brandywine Fund Class I: BRWIX |
AMG Managers Brandywine Blue Fund Class I: BLUEX |
| | |
amgfunds.com | | |
| | 033118 SAR073 |
|
| |
| AMG Funds |
| Semi-Annual Report — March 31, 2018 (unaudited) |
| | | | |
TABLE OF CONTENTS | | PAGE | |
LETTER TO SHAREHOLDERS | | | 2 | |
| |
ABOUT YOUR FUND’S EXPENSES | | | 3 | |
| |
FUND PERFORMANCE | | | 4 | |
| |
FUND SNAPSHOTS, ROSES AND THORNS AND SCHEDULES OF PORTFOLIO INVESTMENTS | | | | |
| |
AMG Managers Brandywine Fund | | | 5 | |
| |
AMG Managers Brandywine Blue Fund | | | 10 | |
| |
FINANCIAL STATEMENTS | | | | |
| |
Statement of Assets and Liabilities | | | 14 | |
Balance sheets, net asset value (NAV) per share computations and cumulative undistributed amounts | | | | |
| |
Statement of Operations | | | 15 | |
Detail of sources of income, expenses, and realized and unrealized gains (losses) during the fiscal period | | | | |
| |
Statements of Changes in Net Assets | | | 16 | |
Detail of changes in assets for the past two fiscal periods | | | | |
| |
Financial Highlights | | | 17 | |
Historical net asset values per share, distributions, total returns, income and expense ratios, turnover ratios and net assets | | | | |
| |
Notes to Financial Statements | | | 19 | |
Accounting and distribution policies, details of agreements and transactions with Fund management and affiliates, and descriptions of certain investment risks | | | | |
Nothing contained herein is to be considered an offer, sale or solicitation of an offer to buy shares of any series of the AMG Funds family of mutual funds. Such offering is made only by prospectus, which includes details as to offering price and other material information.
| | |
 | | |
| | AMG Managers Brandywine Fund |
| | AMG Managers Brandywine Blue Fund |
DEAR FELLOW SHAREHOLDER:
The stock market’s extended period of calm came to an end during the March quarter, with major market indexes correcting for the first time in two years. While stocks regained all or most of their lost ground by the end of the period, volatility persisted as the key issues credited with sparking the decline remained unresolved.
AMG Managers Brandywine Fund returned 2.40 percent in the three months through March, comparing favorably with a 0.64 percent decline in the Russell 3000® Index and a 1.48 percent gain in the Russell 3000® Growth Index.
AMG Managers Brandywine Blue Fund’s 3.51 percent return in the period outpaced a 1.42 percent gain in the Russell 1000® Growth Index. The S&P 500® and Russell 1000® Indexes declined 0.76 and 0.69 percent, respectively.
The Federal Reserve (the Fed) kept rates unchanged at its January 31 meeting, but its post-meeting statement regarding inflation expectations seemed to raise the market’s sensitivity toward the topic. Two days later, the Labor Department reported a rise in average hourly wages. After notching its best January in 21 years, the S&P 500 Index was 10 percent below its high a little more than a week into February.
Volatility, virtually absent in 2017, spiked to its highest level since the summer of 2015 when China unexpectedly devalued the yuan. Newfound skittishness was on display as investors were forced to digest a series of unusual events against a backdrop of everything-is-great valuations.
News of Facebook user data poaching spurred calls for new tech-sector regulations. Amazon.com, which among many things is a government contractor trusted to store classified information for U.S. spy agencies, was targeted for official scorn via tweet. New tariffs raised fears about the possibility that the U.S. and China, the world’s two largest economies, could be on the verge of a trade war. The Fed ended up raising rates at its March 21 meeting.
As dramatic as it all might sound, final March-quarter returns showed an encouraging amount of resilience. Brandywine generated positive returns in four of the eight economic sectors represented in the Fund’s portfolio during the quarter. The Fund outperformed the same sectors in the Russell 3000® Growth Index in five out of eight sectors. Brandywine Blue enjoyed positive returns in five out of seven sectors and outperformed the sectors within the Russell 1000® Growth Index at the same rate.
Technology holdings were the most prominent contributors to absolute performance for both Funds. Comprising the largest position in each Fund, technology holdings were the most responsible for Brandywine’s performance advantage over the Russell 3000® Growth Index and the second-most responsible for Brandywine Blue’s relative edge over the Russell 1000® Growth Index.
Semiconductors and software drove technology performance, with holdings from both areas reporting significant, expectation-beating results. Micron Technology and Nvidia Corp., held in both Funds, led semiconductor returns. Micron tripled earnings in its most recently reported quarter on 58 percent revenue growth, while Nvidia grew earnings 59 percent on 34 percent revenue growth. ServiceNow was a mutually held standout in software. The company grew December-quarter earnings 46 percent as revenue climbed 41 percent.
Consumer discretionary holdings, which represented the second largest position in each Fund, were the second greatest contributors to total returns. They trailed only technology as relative performance contributors in Brandywine and earned the top relative performance spot in Brandywine Blue.
Investor enthusiasm for technology (and earnings strength) reached into the consumer discretionary sector, where the top contributors operate internet-based business models. Netflix enjoyed its strongest quarter of subscriber growth ever in the three months through December even as it raised prices, helping the company earn $0.41 per share versus $0.15 the year before as it boosted revenue by one-third. Amazon.com grew December-quarter earnings 40 percent on 38 percent revenue growth. Both companies, held by both Funds, exceeded consensus earnings expectations.
Industrial holdings were the biggest absolute and relative performance detractors in both Funds. Both Funds held Oshkosh Corp., which reported robust December-quarter earnings growth, exceeded expectations and raised guidance for its fiscal year ending in September. Still, shares declined amid the emergence of steel tariffs – the company makes commercial specialty vehicles – and what appeared to be waning prospects for broad infrastructure spending in the near term. REV Group (Brandywine only), which also makes specialty vehicles, and Cummins (both Funds), which makes engines, fared similarly.
The only other noteworthy performance detractor was energy, where Halliburton Co. modestly weighed on performance in both Funds. Energy’s negative influence was more pronounced in Brandywine because it held Halcon Resources, an oil and gas production company that disappointed investors with a higher-than-expected 2018 capital expenditure forecast.
Amid concerns about inflation and trade tension, we expect the heightened volatility that emerged in the early months of the year to persist. We plan to be vigilant regarding valuations, as the market’s tempered risk tolerance could prompt some level of repricing, particularly among long-tenured leadership groups. We also plan to capitalize on volatility with a goal to optimize entry and exit points as the Funds evolve with the earnings landscape.
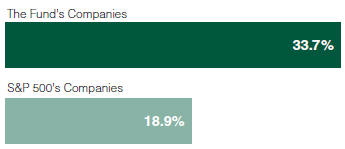
That said, the earnings environment appears strong enough to stand out despite the noise. Based on consensus estimates, the average 2018 earnings growth rates of the Brandywine and Brandywine Blue portfolio companies are 33.7 and 26.9 percent, respectively.
Thanks for your support. We’re committed to building on recent results on your behalf.
|
 |
| Scott Gates |
| Chief Investment Officer |
| Friess Associates, LLC |
2
| | |
| | | |
| | | |
| About Your Fund’s Expenses (unaudited) | | |
As a shareholder of a Fund, you may incur two types of costs: (1) transaction costs, which may include sales charges (loads) on purchase payments; redemption fees; and exchange fees; and (2) ongoing costs, including management fees; distribution (12b-1) fees; and other Fund expenses. This example is intended to help you understand your ongoing costs (in dollars) of investing in the Fund and to compare these costs with the ongoing costs of investing in other mutual funds. The example is based on $1,000 invested at the beginning of the period and held for the entire period as indicated below.
ACTUAL EXPENSES
The first line of the following table provides information about the actual account values and
actual expenses. You may use the information in this line, together with the amount you invested, to estimate the expenses that you paid over the period. Simply divide your account value by $1,000 (for example, an $8,600 account value divided by $1,000 = 8.6), then multiply the result by the number in the first line under the heading entitled “Expenses Paid During Period” to estimate the expenses you paid on your account during this period.
HYPOTHETICAL EXAMPLE FOR COMPARISON PURPOSES
The second line of the following table provides information about hypothetical account values and hypothetical expenses based on the Fund’s actual expense ratio and an assumed annual rate of return of 5% before expenses, which is not the Fund’s
actual return. The hypothetical account values and expenses may not be used to estimate the actual ending account balance or expenses you paid for the period. You may use this information to compare the ongoing costs of investing in the Fund and other funds by comparing this 5% hypothetical example with the 5% hypothetical examples that appear in the shareholder reports of other funds.
Please note that the expenses shown in the table are meant to highlight your ongoing costs only and do not reflect any transactional costs, such as sales charges (loads), redemption fees, or exchange fees. Therefore, the second line of the table is useful in comparing ongoing costs only, and will not help you determine the relative total costs of owning different funds.
| | | | | | | | | | | | | | | | |
Six Months Ended March 31, 2018 | | Expense
Ratio for
the Period | | | Beginning
Account
Value
10/01/17 | | | Ending
Account
Value
03/31/18 | | | Expenses
Paid
During
the Period* | |
AMG Managers Brandywine Fund | |
Based on Actual Fund Return | |
Class I | | | 1.10 | % | | $ | 1,000 | | | $ | 1,074 | | | $ | 5.69 | |
|
Based on Hypothetical 5% Annual Return | |
Class I | | | 1.10 | % | | $ | 1,000 | | | $ | 1,019 | | | $ | 5.54 | |
|
AMG Managers Brandywine Blue Fund | |
Based on Actual Fund Return | |
Class I | | | 1.18 | % | | $ | 1,000 | | | $ | 1,085 | | | $ | 6.13 | |
Based on Hypothetical 5% Annual Return | |
Class I | | | 1.18 | % | | $ | 1,000 | | | $ | 1,019 | | | $ | 5.94 | |
|
* Expenses are equal to the Fund’s annualized expense ratio multiplied by the average account value over the period, multiplied by the number of days in the most recent fiscal half-year (182), then divided by 365. | |
|
| |
| Fund Performance (unaudited) |
| Periods ended March 31, 2018 |
|
The table below shows the average annual total returns for the periods indicated for each Fund, as well as each Fund’s relative index for the same time periods ended March 31, 2018.
| | | | | | | | | | | | | | | | |
| Average Annual Total Returns1 | | Six
Months* | | | One Year | | | Five
Years | | | Ten Years | |
AMG Managers Brandywine Fund2, 3, 4, 5, 6, 7 | | | | | | | | | | | | | | | | |
Class I | | | 7.37 | % | | | 19.04 | % | | | 12.93 | % | | | 4.34 | % |
Russell 3000® Growth Index9 | | | 9.20 | % | | | 21.06 | % | | | 15.32 | % | | | 11.31 | % |
Russell 3000® Index10 | | | 5.65 | % | | | 13.81 | % | | | 13.03 | % | | | 9.62 | % |
S&P 500 Index11 | | | 5.84 | % | | | 13.99 | % | | | 13.31 | % | | | 9.49 | % |
AMG Managers Brandywine Blue Fund2, 3, 5, 6, 8 | | | | | | | | | | | | | | | | |
Class I | | | 8.45 | % | | | 22.26 | % | | | 12.93 | % | | | 4.87 | % |
Russell 1000® Growth Index12 | | | 9.39 | % | | | 21.25 | % | | | 15.53 | % | | | 11.34 | % |
Russell 1000® Index13 | | | 5.85 | % | | | 13.98 | % | | | 13.17 | % | | | 9.61 | % |
S&P 500 Index11 | | | 5.84 | % | | | 13.99 | % | | | 13.31 | % | | | 9.49 | % |
The performance data shown represents past performance. Past performance is not a guarantee of future results. Current performance may be lower or higher than the performance data quoted. The investment return and principal value of an investment will fluctuate so that an investor’s shares, when redeemed, may be worth more or less than their original cost.
Investors should carefully consider the Fund’s investment objectives, risks, charges and expenses before investing. For performance information through the most recent month end, current net asset values per share for the Funds and other information, please call 800.835.3879 or visit our website at amgfunds.com for a free prospectus. Read it carefully before investing or sending money.
Distributed by AMG Distributors, Inc., member FINRA/SIPC.
| 1 | Total return equals income yield plus share price change and assumes reinvestment of all dividends and capital gain distributions. Returns are net of fees and may reflect offsets of Fund expenses as described in the prospectus. No adjustment has been made for taxes payable by shareholders on their reinvested dividends and capital gain distributions. Returns for periods greater than one year are annualized. The listed returns on the Funds are net of expenses and based on the published NAV as of March 31, 2018. All returns are in U.S. dollars ($). |
| 2 | The Fund inception dates and returns for all periods prior to October 1, 2013, reflect performance of the predecessor Funds, Brandywine Fund and Brandywine Blue Fund, which were managed by Friess Associates, LLC with the same investment objective and substantially similar investment policies. |
| 3 | Active and frequent trading of a fund may result in higher transaction costs and increased tax liability. |
| 4 | The Fund invests in growth stocks, which may be more sensitive to market movements because their prices tend to reflect future investor expectations rather than just current profits. |
| 5 | Investments in international securities are subject to certain risks of overseas investing including currency fluctuations and changes in political and economic conditions, which could result in significant market fluctuations. |
| 6 | The Fund is subject to risks associated with investments in mid-capitalization companies such as greater price volatility, lower trading volume, and less liquidity than the stocks of larger, more established companies. |
| 7 | The Fund is subject to risks associated with investments in small-capitalization companies, such as erratic earnings patterns, competitive conditions, limited earnings history and a reliance on one or a limited number of products. |
| 8 | A greater percentage of the Fund’s holdings may be focused in a smaller number of securities which may place the Fund at greater risk than a more diversified fund. |
| 9 | The Russell 3000® Growth Index measures the performance of those Russell 3000® Index companies with higher price-to-book ratios and higher forecasted growth values. Unlike the Fund, the Russell 3000® Growth Index is unmanaged, is not available for investment, and does not incur expenses. |
| 10 | The Russell 3000® Index is composed of the 3,000 largest U.S. companies as measured by market capitalization, and represents about 98% of the U.S. stock market. Unlike the Fund, the Russell 3000® Index is unmanaged, is not available for investment, and does not incur expenses. |
| 11 | The S&P 500 Index is capitalization-weighted index of 500 stocks. The S&P 500 Index is designed to measure performance of the broad domestic economy through changes in the aggregate market value of 500 stocks representing all major industries. Unlike the Fund, the S&P 500 Index is unmanaged, is not available for investment, and does not incur expenses. |
| 12 | The Russell 1000® Growth Index is a market capitalization weighted index that measures the performance of those Russell 1000® companies with higher price-to-book ratios and higher forecasted growth values. Unlike the Fund, the Russell 1000® Growth Index is unmanaged, is not available for investment, and does not incur expenses. |
| 13 | The Russell 1000® Index measures the performance of approximately 1,000 of the largest securities based on a combination of their market cap and current index membership. The Russell 1000® represents approximately 92% of the U.S. market. Unlike the Fund, the Russell 1000® Index is unmanaged, is not available for investment, and does not incur expenses. |
The Russell Indices are trademarks of the London Stock Exchange Group companies.
The S&P 500 Index is proprietary data of Standard & Poor’s, a division of McGraw-Hill Companies, Inc.
Not FDIC insured, nor bank guaranteed. May lose value.
4
|
| AMG Managers Brandywine Fund |
| Fund Snapshots (unaudited) |
| March 31, 2018 |
|
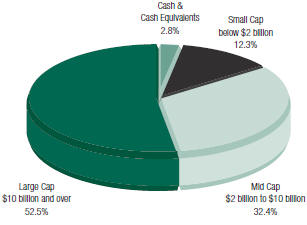
PORTFOLIO BREAKDOWN
| | | | | | | | | | | | | | | | |
| Industry (Top Ten) | | AMG
Managers Brandywine Fund* | | | Russell
3000®
Growth
Index* | | | Russell
3000®
Index* | | | S&P 500
Index* | |
Internet & Direct Marketing Retail | | | 8.8 | % | | | 6.0 | % | | | 3.1 | % | | | 3.7 | % |
Internet Software & Services | | | 8.1 | % | | | 7.9 | % | | | 4.4 | % | | | 4.7 | % |
Semiconductors | | | 7.8 | % | | | 4.0 | % | | | 3.5 | % | | | 3.7 | % |
Data Processing & Outsourced Services | | | 4.8 | % | | | 5.4 | % | | | 2.9 | % | | | 2.9 | % |
Pharmaceuticals | | | 4.7 | % | | | 2.0 | % | | | 4.0 | % | | | 4.6 | % |
Application Software | | | 4.6 | % | | | 3.1 | % | | | 1.7 | % | | | 1.4 | % |
Home Entertainment Software | | | 4.4 | % | | | 0.7 | % | | | 0.4 | % | | | 0.4 | % |
Footwear | | | 4.4 | % | | | 0.7 | % | | | 0.4 | % | | | 0.4 | % |
Systems Software | | | 3.9 | % | | | 5.8 | % | | | 3.5 | % | | | 4.0 | % |
Trading Companies & Distributors | | | 3.7 | % | | | 0.5 | % | | | 0.4 | % | | | 0.2 | % |
Other Common Stock | | | 42.0 | % | | | 63.9 | % | | | 75.7 | % | | | 74.0 | % |
Short-Term Investments1 | | | 4.3 | % | | | 0.0 | % | | | 0.0 | % | | | 0.0 | % |
Other Assets Less Liabilities2 | | | (1.5 | )% | | | 0.0 | % | | | 0.0 | % | | | 0.0 | % |
| * | As a percentage of net assets. |
| 1 | Includes reinvestment of cash collateral into joint repurchase agreements on security lending transactions. |
| 2 | Includes repayment of cash collateral on security lending transactions. |
|
PORTFOLIO MARKET CAPITALIZATION |
|
 |
| | | | | | | | |
TOP TEN HOLDINGS | |
Security Name | | % of
Net Assets | | | % Change from
Book Cost | |
Amazon.com, Inc. | | | 4.2 | | | | 126.4 | |
Netflix, Inc. | | | 3.0 | | | | 183.9 | |
Micron Technology, Inc. | | | 2.3 | | | | 60.4 | |
Alphabet, Inc., Class A | | | 2.3 | | | | 50.9 | |
Zoetis, Inc. | | | 2.1 | | | | 55.8 | |
Salesforce.com, Inc. | | | 2.1 | | | | 53.5 | |
Broadcom, Ltd. | | | 2.0 | | | | 184.4 | |
Bio-Techne Corp. | | | 2.0 | | | | 31.1 | |
NVIDIA Corp. | | | 2.0 | | | | 163.1 | |
Global Payments, Inc. | | | 2.0 | | | | 55.5 | |
| | | | | | | | |
Top Ten as a Group | | | 24.0 | | | | | |
| | | | | | | | |
|
| ESTIMATED EARNINGS GROWTH RATE OF THE FUND’S INVESTMENTS |
|
Forecasted Increase in Earnings Per Share 2018 vs 2017 |
|
Source: Consensus estimates from FactSet Research Systems Inc. |
|
| This is not a forecast of the Fund’s future performance. Earnings growth for a Fund holding does not guarantee a corresponding increase in the market value of the holding or the Fund. |
Because a fund’s strategy may result in multiple investments in particular sectors of the economy, its performance may depend on the performance of those sectors and may fluctuate more widely than investments diversified across more sectors. For additional information on these and other risk considerations, please see the Fund’s prospectus.
Any sectors, industries, or securities discussed should not be perceived as investment recommendations. Mention of a specific security should not be considered a recommendation to buy or solicitation to sell that security. Specific securities mentioned in this report may have been sold from the Fund’s portfolio of investments by the time you receive this report.
5
|
| AMG Managers Brandywine Fund |
| Roses and Thorns (unaudited) |
| Quarter Ending March 31, 2018 |
|
| | | | | | | | |
$ Gain (in millions) | | | % Gain | | | Biggest $ Winners Reason for Move |
| $ | 8.3 | | | | 53.9 | % | | Netflix Inc. (NFLX) The provider of internet subscription services reported December-quarter earnings of $0.41 per share, up from $0.15 per share the year before and ahead of the consensus estimate. Revenue increased 33 percent on strong subscriber growth. |
| | |
| $ | 6.3 | | | | 23.8 | % | | Amazon.com Inc. (AMZN) The provider of online retail shopping services grew December-quarter earnings 40 percent, topping the consensus estimate. Revenue grew 38 percent. The company’s better-than-expected revenue growth was driven by newly acquired Whole Foods, Amazon Web Services and a strong holiday season. |
| | |
| $ | 3.9 | | | | 33.9 | % | | Proofpoint Inc. (PFPT) The provider of cloud-based security and compliance solutions increased revenue 36 percent in the December quarter. The company increased market share through organic growth and acquisition. We sold Proofpoint when it hit our price target. |
| | |
| $ | 3.8 | | | | 26.8 | % | | Micron Technology Inc. (MU) Earnings for the company, which makes semiconductor memory and storage technologies, more than tripled to $2.82 per share in the February quarter, beating the consensus estimate. Revenue increased 58 percent. |
| | |
| $ | 3.2 | | | | 26.9 | % | | ServiceNow Inc. (NOW) The provider of cloud-based services that automate enterprise technology operations grew December-quarter earnings 46 percent. Revenue rose 41 percent. Growth in renewal rates and new subscriptions helped drive results. The company also raised 2018 revenue guidance. |
| | |
$ Loss (in millions) | | | % Loss | | | Biggest $ Losers Reason for Move |
| $ | 3.3 | | | | 30.9 | % | | Halcon Resources Corp. (HK) The onshore oil and natural gas exploration and production company’s shares declined after reduced production and increased costs led to disappointing December-quarter results. We sold Halcon Resources to fund a new opportunity with better visibility. |
| | |
| $ | 3.2 | | | | 12.4 | % | | Facebook Inc. (FEB) The social networking service and website saw its share price decline when it was revealed that a for-profit data analytics firm harvested private information from more than 50 million users. The announcement raised concerns about Facebook’s data privacy policies and the potential for regulatory oversight in the wake of the controversy. We sold Facebook to fund a holding with greater visibility. |
| | |
| $ | 3.0 | | | | 21.7 | % | | Winnebago Industries Inc. (WGO) The manufacturer of motorized and towable recreational vehicles grew earnings 44 percent in the February-quarter, exceeding the consensus estimate. Shares traded lower with concerns surrounding dealer inventory and order backlog in the towable segment. We sold Winnebago to fund a new opportunity. |
| | |
| $ | 2.4 | | | | 15.0 | % | | Oshkosh Corp. (OSK) The manufacturer of commercial specialty vehicles reported December-quarter earnings of $0.84 per share versus $0.26 the year before, exceeding the consensus estimate. The company also raised fiscal year earnings and revenue guidance. Shares came under pressure amid concerns about steel tariffs and dimming prospects for widespread infrastructure spending. |
| | |
| $ | 1.8 | | | | 22.8 | % | | Heska Corp. (HSKA) Excluding a one-time charge, the maker of diagnostic veterinary products grew earnings 37 percent in the December quarter. Modest 2018 revenue guidance disappointed investors, whose forecasts showed more pronounced optimism for new products that the company is scheduled to introduce. We sold Heska to fund a new opportunity with a more promising earnings outlook. |
All gains/losses are calculated on an average cost basis from December 31, 2017 through March 31, 2018.
This commentary reflects the viewpoints of Friess Associates, LLC as of March 31, 2018 and is not intended as a forecast or guarantee of future results.
6
|
| AMG Managers Brandywine Fund |
| Schedule of Portfolio Investments (unaudited) |
| March 31, 2018 |
|
| | | | | | | | | | | | |
Shares | | | | | Cost | | | Value | |
| | Common Stocks - 97.2% | | | | | | | | |
| | Consumer Discretionary | | | | | | | | |
| | | | Apparel Retail - 1.6% | |
| | 445,954 | | | American Eagle Outfitters, Inc. | | $ | 5,982,694 | | | $ | 8,887,863 | |
| | 30,525 | | | The Children’s Place, Inc. | | | 3,010,388 | | | | 4,128,506 | |
| | | | Auto Parts & Equipment - 0.4% | |
| | 144,871 | | | Modine Manufacturing Co.* | | | 2,295,986 | | | | 3,064,022 | |
| | | | Cable & Satellite - 1.3% | |
| | 34,276 | | | Charter Communications, Inc., Class A* | | | 7,957,387 | | | | 10,667,377 | |
| | | | Footwear - 4.4% | | | | | | | | |
| | 164,935 | | | Deckers Outdoor Corp.* | | | 11,280,031 | | | | 14,849,098 | |
| | 228,215 | | | Skechers U.S.A., Inc., Class A* | | | 9,107,896 | | | | 8,875,281 | |
| | 370,564 | | | Wolverine World Wide, Inc. | | | 10,364,578 | | | | 10,709,300 | |
| | | | General Merchandise Stores - 3.3% | |
| | 128,635 | | | Dollar Tree, Inc.* | | | 9,099,730 | | | | 12,207,462 | |
| | 226,345 | | | Ollie’s Bargain Outlet Holdings, Inc.*,1 | | | 9,914,790 | | | | 13,648,603 | |
| | | | Homebuilding - 0.8% | | | | | | | | |
| | 146,055 | | | D.R. Horton, Inc. | | | 6,424,288 | | | | 6,403,051 | |
| | | | Hotels, Resorts & Cruise Lines - 0.9% | |
| | 129,470 | | | Norwegian Cruise Line Holdings, Ltd.* | | | 6,854,019 | | | | 6,858,026 | |
| | | | Internet & Direct Marketing Retail - 8.8% | | | | | |
| | 22,755 | | | Amazon.com, Inc.* | | | 14,549,120 | | | | 32,934,222 | |
| | 6,396 | | | Booking Holdings, Inc.* | | | 12,131,988 | | | | 13,306,174 | |
| | 80,409 | | | Netflix, Inc.* | | | 8,364,077 | | | | 23,748,798 | |
| | | | Leisure Facilities - 1.5% | | | | | |
| | 54,527 | | | Vail Resorts, Inc. | | | 12,051,311 | | | | 12,088,636 | |
| | | | Movies & Entertainment - 2.7% | |
| | 314,660 | | | Liberty Media Corp.-Liberty Formula One, Class C* | | | 11,276,573 | | | | 9,707,261 | |
| | 274,955 | | | Live Nation Entertainment, Inc.* | | | 11,819,990 | | | | 11,586,604 | |
| | | | | | | | | | | | |
| | Total Consumer Discretionary | | | 152,484,846 | | | | 203,670,284 | |
| | | | This sector is 33.6% above your Fund’s cost. | | | | | |
| | Consumer Staples | | | | | | | | |
| | | | Packaged Foods & Meats - 1.3% | |
| | 17,060 | | | Calavo Growers, Inc.1 | | | 855,811 | | | | 1,572,932 | |
| | 535,730 | | | Nomad Foods, Ltd. (United Kingdom)* | | | 7,724,786 | | | | 8,432,390 | |
| | | | | | | | | | | | |
| | Total Consumer Staples | | | 8,580,597 | | | | 10,005,322 | |
| | | | This sector is 16.6% above your Fund’s cost. | | | | | |
| | Financials | | | | | | | | |
| | | | Financial Exchanges & Data - 1.9% | |
| | 93,140 | | | CME Group, Inc. | | | 8,750,461 | | | | 15,064,464 | |
| | | | | | | | | | | | |
Shares | | | | | Cost | | | Value | |
| | | | Regional Banks - 1.0% | |
| | 189,407 | | | Pacific Premier Bancorp, Inc.* | | $ | 8,013,600 | | | $ | 7,614,161 | |
| | | | | | | | | | | | |
| | Total Financials | | | 16,764,061 | | | | 22,678,625 | |
| | | | This sector is 35.3% above your Fund’s cost. | | | | | |
| | Health Care | | | | | | | | |
| | | | Biotechnology - 0.5% | | | | | | | | |
| | 44,869 | | | Incyte Corp.* | | | 4,273,449 | | | | 3,738,934 | |
| | | | Health Care Equipment - 1.5% | | | | | |
| | 205,465 | | | Abbott Laboratories | | | 12,225,583 | | | | 12,311,463 | |
| | | | Health Care Technology - 1.0% | | | | | |
| | 444,915 | | | HMS Holdings Corp.* | | | 7,683,597 | | | | 7,492,368 | |
| | 15,405 | | | Tabula Rasa HealthCare, Inc.* | | | 423,637 | | | | 597,714 | |
| | | | Life Sciences Tools & Services - 3.1% | |
| | 105,319 | | | Bio-Techne Corp. | | | 12,129,213 | | | | 15,907,382 | |
| | 40,385 | | | Thermo Fisher Scientific, Inc. | | | 5,305,297 | | | | 8,337,887 | |
| | | | Pharmaceuticals - 4.7% | | | | | | | | |
| | 187,954 | | | Bristol-Myers Squibb Co. | | | 12,313,496 | | | | 11,888,091 | |
| | 218,270 | | | Intersect ENT, Inc.* | | | 8,506,981 | | | | 8,578,011 | |
| | 199,975 | | | Zoetis, Inc. | | | 10,716,542 | | | | 16,699,912 | |
| | | | | | | | | | | | |
| | Total Health Care | | | 73,577,795 | | | | 85,551,762 | |
| | | | This sector is 16.3% above your Fund’s cost. | |
| | Industrials | | | | | | | | |
| | | | Aerospace & Defense - 1.3% | | | | | | | | |
| | 203,500 | | | Mercury Systems, Inc.* | | | 8,635,350 | | | | 9,833,120 | |
| | | | Agricultural & Farm Machinery - 0.7% | |
| | 417,245 | | | CNH Industrial N.V. (United Kingdom) | | | 6,266,920 | | | | 5,173,838 | |
| | | | Air Freight & Logistics - 1.5% | | | | | | | | |
| | 118,993 | | | XPO Logistics, Inc.* | | | 12,047,660 | | | | 12,114,677 | |
| | | | Construction & Engineering - 3.3% | |
| | 115,795 | | | Jacobs Engineering Group, Inc. | | | 7,205,921 | | | | 6,849,274 | |
| | 251,895 | | | MasTec, Inc.* | | | 10,115,328 | | | | 11,851,660 | |
| | 223,995 | | | Quanta Services, Inc.* | | | 7,809,104 | | | | 7,694,228 | |
| | | | Construction Machinery & Heavy Trucks - 3.1% | |
| | 68,386 | | | Cummins, Inc. | | | 11,960,863 | | | | 11,084,687 | |
| | 175,040 | | | Oshkosh Corp. | | | 12,643,047 | | | | 13,525,341 | |
| | | | Electrical Components & Equipment - 1.1% | | | | | |
| | 50,306 | | | Rockwell Automation, Inc. | | | 9,393,866 | | | | 8,763,305 | |
| | | | Human Resource & Employment Services - 1.3% | |
| | 89,630 | | | ManpowerGroup, Inc. | | | 12,022,547 | | | | 10,316,413 | |
| | | | Industrial Machinery - 0.7% | | | | | | | | |
| | 268,987 | | | Harsco Corp.* | | | 4,784,608 | | | | 5,554,582 | |
| | | | Trading Companies & Distributors - 3.7% | | | | | |
| | 82,743 | | | GMS, Inc.* | | | 1,857,781 | | | | 2,528,626 | |
7
|
| AMG Managers Brandywine Fund |
| Schedule of Portfolio Investments (continued) |
|
| | | | | | | | | | | | |
Shares | | | | | Cost | | | Value | |
| | Industrials (continued) | | | | | | | | |
| | | | Trading Companies & Distributors - 3.7% (continued) | | | | | |
| | 146,501 | | | Herc Holdings, Inc.* | | $ | 8,051,674 | | | $ | 9,515,240 | |
| | 107,450 | | | Rush Enterprises, Inc., Class A* | | | 4,470,713 | | | | 4,565,550 | |
| | 71,523 | | | United Rentals, Inc.* | | | 8,865,986 | | | | 12,354,168 | |
| | | | Trucking - 1.5% | | | | | | | | |
| | 263,550 | | | Knight-Swift Transportation Holdings, Inc. | | | 12,011,604 | | | | 12,125,936 | |
| | | | | | | | | | | | |
| | Total Industrials | | | 138,142,972 | | | | 143,850,645 | |
| | | | This sector is 4.1% above your Fund’s cost. | |
| | Information Technology | | | | | | | | |
| | | | Application Software - 4.6% | |
| | 208,680 | | | Atlassian Corp. PLC, Class A (Australia)* | | | 5,231,753 | | | | 11,252,026 | |
| | 82,920 | | | Blackbaud, Inc. | | | 7,543,736 | | | | 8,442,085 | |
| | 142,880 | | | Salesforce.com, Inc.* | | | 10,821,895 | | | | 16,616,944 | |
| | | | Communications Equipment - 3.0% | |
| | 439,236 | | | ARRIS International PLC* | | | 11,566,072 | | | | 11,670,500 | |
| | 462,901 | | | Ciena Corp.* | | | 11,788,626 | | | | 11,989,136 | |
| | | | Data Processing & Outsourced Services - 4.8% | |
| | 176,960 | | | Black Knight, Inc.* | | | 4,502,085 | | | | 8,334,816 | |
| | 139,960 | | | Global Payments, Inc. | | | 10,039,962 | | | | 15,608,339 | |
| | 119,890 | | | Visa, Inc., Class A | | | 8,635,439 | | | | 14,341,242 | |
| | | | Electronic Manufacturing Services - 1.0% | |
| | 249,730 | | | Fabrinet (Thailand)* | | | 8,208,224 | | | | 7,836,527 | |
| | | | Home Entertainment Software - 4.4% | |
| | 207,755 | | | Activision Blizzard, Inc. | | | 11,084,769 | | | | 14,015,152 | |
| | 86,540 | | | Electronic Arts, Inc.* | | | 8,324,154 | | | | 10,492,110 | |
| | 101,900 | | | Take-Two Interactive Software, Inc.* | | | 10,511,063 | | | | 9,963,782 | |
| | | | Internet Software & Services - 8.1% | |
| | 17,429 | | | Alphabet, Inc., Class A* | | | 11,980,700 | | | | 18,076,313 | |
| | 294,161 | | | Dropbox, Inc., Class A*,1 | | | 8,845,404 | | | | 9,192,531 | |
| | 303,159 | | | Five9, Inc.* | | | 7,155,957 | | | | 9,031,107 | |
| | 1,888,010 | | | Limelight Networks, Inc.* | | | 8,335,267 | | | | 7,759,721 | |
| | 106,551 | | | LogMeIn, Inc. | | | 12,058,991 | | | | 12,311,968 | |
| | 160,662 | | | The Trade Desk, Inc., Class A*,1 | | | 7,554,141 | | | | 7,972,048 | |
| | | | Semiconductors - 7.8% | |
| | 69,190 | | | Broadcom, Ltd. | | | 5,733,996 | | | | 16,304,624 | |
| | 347,485 | | | Micron Technology, Inc.* | | | 11,293,923 | | | | 18,117,868 | |
| | 67,631 | | | NVIDIA Corp. | | | 5,953,664 | | | | 15,662,663 | |
| | 162,400 | | | Xilinx, Inc. | | | 10,984,940 | | | | 11,731,776 | |
| | | | Systems Software - 3.9% | |
| | 169,255 | | | Microsoft Corp. | | | 10,853,934 | | | | 15,447,904 | |
| | | | | | | | | | | | |
Shares | | | | | Cost | | | Value | |
| | 91,815 | | | ServiceNow, Inc.* | | $ | 7,306,472 | | | $ | 15,190,793 | |
| | | | | | | | | | | | |
| | Total Information Technology | | | 216,315,167 | | | | 297,361,975 | |
| | | | This sector is 37.5% above your Fund’s cost. | |
| | Materials | | | | | | | | |
| | | | Commodity Chemicals - 0.5% | |
| | 127,946 | | | AdvanSix, Inc.* | | | 5,139,309 | | | | 4,449,962 | |
| | | | This sector is 13.4% below your Fund’s cost. | |
| | Utilities | | | | | | | | |
| | | | Water Utilities - 0.2% | |
| | 67,319 | | | Evoqua Water Technologies Corp.* | | | 1,279,421 | | | | 1,433,221 | |
| | | | This sector is 12.0% above your Fund’s cost. | |
| | Total Common Stocks | | | 612,284,168 | | | | 769,001,796 | |
| | | |
Principal Amount | | | | | | | | | |
| | Short-Term Investments - 4.3% | | | | | | | | |
| | Commercial Paper - 3.3% | | | | | | | | |
| $ | 26,489,000 | | | Energy Transfer LP, 2.65%, 04/02/182 | | | 26,487,050 | | | | 26,487,050 | |
| | Joint Repurchase Agreements - 1.0%3 | |
| | 383,723 | | | BNP Paribas S.A., dated 03/29/18, due 04/02/18, 1.800% total to be received $383,800 (collateralized by various U.S. Government Agency Obligations, 0.000% - 2.375%, 02/15/23 - 09/09/49, totaling $391,397) | | | 383,723 | | | | 383,723 | |
| | 1,823,329 | | | Daiwa Capital Markets Americas, dated 03/29/18, due 04/02/18, 1.810% total to be received $1,823,696 (collateralized by various U.S. Government Agency Obligations, 0.000% - 6.500%, 04/30/18 - 12/01/51, totaling $1,859,796) | | | 1,823,329 | | | | 1,823,329 | |
| | 1,823,329 | | | HSBC Securities, Inc., dated 03/29/18, due 04/02/18, 1.780% total to be received $1,823,690 (collateralized by various U.S. Government Agency Obligations, 0.000% - 7.250%, 05/15/18 - 01/15/37, totaling $1,866,444) | | | 1,823,329 | | | | 1,823,329 | |
| | 1,823,329 | | | Jefferies LLC, dated 03/29/18, due 04/02/18, 1.820% total to be received $1,823,698 (collateralized by various U.S. Government Agency Obligations, 0.000% - 6.250%, 04/17/18 - 07/15/32, totaling $1,859,804) | | | 1,823,329 | | | | 1,823,329 | |
8
|
| AMG Managers Brandywine Fund |
| Schedule of Portfolio Investments (continued) |
|
| | | | | | | | | | |
Principal Amount | | | | Cost | | | Value | |
| $1,823,329 | | Nomura Securities International, Inc., dated 03/29/18, due 04/02/18, 1.820% total to be received $1,823,698 (collateralized by various U.S. Government Agency Obligations, 0.000% - 7.500%, 04/02/18 - 02/20/68, totaling $1,859,796) | | $ | 1,823,329 | | | $ | 1,823,329 | |
| | | | | | | | | | |
| | Total Joint Repurchase Agreements | | | 7,677,039 | | | | 7,677,039 | |
| | | | | | | | | | |
Shares | | | | Cost | | | Value | |
| | Other Investment Companies - 0.0%# | |
| 108,308 | | Dreyfus Government Cash Management Fund, Institutional Class Shares, 1.54%4 | | $ | 108,308 | | | $ | 108,308 | |
| | | | | | | | | | |
| | Total Short-Term Investments | | | 34,272,397 | | | | 34,272,397 | |
Total Investments - 101.5% | | $ | 646,556,565 | | | | 803,274,193 | |
Other Assets, less Liabilities - (1.5%) | | | | (12,251,744 | ) |
Total Net Assets - 100.0% | | | | | | $ | 791,022,449 | |
| | | | | | | | | | |
| * | Non-income producing security. |
| 1 | Some or all of these securities, amounting to $7,399,789 or 0.9% of net assets, were out on loan to various brokers. |
| 2 | Represents yield to maturity at March 31, 2018. |
| 3 | Collateral received from brokers for securities lending was invested in these joint repurchase agreements. |
| 4 | Yield shown represents the March 31, 2018, seven day average yield, which refers to the sum of the previous seven days’ dividends paid, expressed as an annual percentage. |
The following table summarizes the inputs used to value the Fund’s investments by the fair value hierarchy levels as of March 31, 2018:
| | | | | | | | | | | | | | | | |
| | | Level 1 | | | Level 2 | | | Level 3 | | | Total | |
Investments in Securities | | | | | | | | | | | | | | | | |
Common Stocks† | | $ | 769,001,796 | | | | — | | | | — | | | $ | 769,001,796 | |
Short-Term Investments | | | | | | | | | | | | | | | | |
Commercial Paper | | | — | | | $ | 26,487,050 | | | | — | | | | 26,487,050 | |
Joint Repurchase Agreements | | | — | | | | 7,677,039 | | | | — | | | | 7,677,039 | |
Other Investment Companies | | | 108,308 | | | | — | | | | — | | | | 108,308 | |
| | | | | | | | | | | | | | | | |
Total Investments in Securities | | $ | 769,110,104 | | | $ | 34,164,089 | | | | — | | | $ | 803,274,193 | |
| | | | | | | | | | | | | | | | |
| † | All common stocks held in the Fund are Level 1 securities. For a detailed breakout of common stocks by major industry classification, please refer to the Fund’s Schedule of Portfolio Investments. |
As of March 31, 2018, the Fund had no transfers between levels from the beginning of the reporting period.
9
|
| AMG Managers Brandywine Blue Fund |
| Fund Snapshots (unaudited) |
| March 31, 2018 |
|
PORTFOLIO BREAKDOWN
| | | | | | | | | | | | | | | | |
| | | AMG | | | Russell | | | | | | | |
| | | Managers | | | 1000® | | | Russell | | | | |
| | | Brandywine | | | Growth | | | 1000® | | | S&P 500 | |
Industry (Top Ten) | | Blue Fund* | | | Index* | | | Index* | | | Index* | |
Internet & Direct Marketing Retail | | | 11.3 | % | | | 6.4 | % | | | 3.4 | % | | | 3.7 | % |
Semiconductors | | | 10.8 | % | | | 4.2 | % | | | 3.7 | % | | | 3.7 | % |
Data Processing & Outsourced Services | | | 9.0 | % | | | 5.8 | % | | | 3.1 | % | | | 2.9 | % |
Systems Software | | | 8.1 | % | | | 6.2 | % | | | 3.8 | % | | | 4.0 | % |
Home Entertainment Software | | | 6.4 | % | | | 0.8 | % | | | 0.4 | % | | | 0.4 | % |
Internet Software & Services | | | 4.8 | % | | | 8.1 | % | | | 4.5 | % | | | 4.7 | % |
Pharmaceuticals | | | 4.8 | % | | | 1.8 | % | | | 4.1 | % | | | 4.6 | % |
Life Sciences Tools & Services | | | 4.4 | % | | | 1.0 | % | | | 0.9 | % | | | 0.9 | % |
Health Care Equipment | | | 3.5 | % | | | 2.4 | % | | | 2.6 | % | | | 2.7 | % |
Application Software | | | 2.7 | % | | | 2.9 | % | | | 1.6 | % | | | 1.4 | % |
Other Common Stock | | | 32.8 | % | | | 60.4 | % | | | 71.9 | % | | | 71.0 | % |
Short-Term Investments | | | 1.9 | % | | | 0.0 | % | | | 0.0 | % | | | 0.0 | % |
Other Assets Less Liabilities | | | (0.5 | )% | | | 0.0 | % | | | 0.0 | % | | | 0.0 | % |
| * | As a percentage of net assets. |
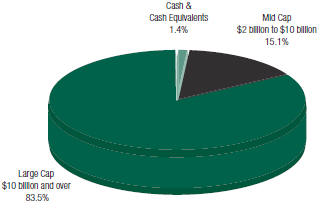
PORTFOLIO MARKET CAPITALIZATION
TOP TEN HOLDINGS
| | | | | | | | |
| | | %of | | | % Change from | |
Security Name | | Net Assets | | | Book Cost | |
Microsoft Corp. | | | 4.9 | | | | 42.8 | |
Amazon.com, Inc. | | | 4.5 | | | | 80.5 | |
Netflix, Inc. | | | 4.5 | | | | 178.3 | |
ServiceNow, Inc. | | | 3.2 | | | | 100.8 | |
Micron Technology, Inc. | | | 3.2 | | | | 61.1 | |
Zoetis, Inc. | | | 2.8 | | | | 55.3 | |
Alphabet, Inc., Class A | | | 2.8 | | | | 50.7 | |
Broadcom, Ltd. | | | 2.7 | | | | 186.5 | |
Salesforce.com, Inc. | | | 2.7 | | | | 49.8 | |
NVIDIA Corp. | | | 2.7 | | | | 167.3 | |
| | | | | | | | |
Top Ten as a Group | | | 34.0 | | | | | |
| | | | | | | | |
ESTIMATED EARNINGS GROWTH RATE OF THE FUND’S INVESTMENTS
Forecasted Increase in Earnings Per Share 2018 vs 2017
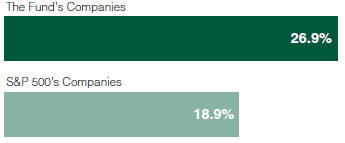
Source: Consensus estimates from FactSet Research Systems Inc.
This is not a forecast of the Fund’s future performance. Earnings growth for a Fund holding does not guarantee a corresponding increase in the market value of the holding or the Fund.
Because a fund’s strategy may result in multiple investments in particular sectors of the economy, its performance may depend on the performance of those sectors and may fluctuate more widely than investments diversified across more sectors. For additional information on these and other risk considerations, please see the Fund’s prospectus.
Any sectors, industries, or securities discussed should not be perceived as investment recommendations. Mention of a specific security should not be considered a recommendation to buy or solicitation to sell that security. Specific securities mentioned in this report may have been sold from the Fund’s portfolio of investments by the time you receive this report.
10
|
| AMG Managers Brandywine Blue Fund |
| Roses and Thorns (unaudited) |
| Quarter Ending March 31, 2018 |
|
| | | | | | | | |
$ Gain (in millions) | | | % Gain | | | Biggest $ Winners Reason for Move |
| $ | 2.8 | | | | 53.9 | % | | Netflix Inc. (NFLX) The provider of internet subscription services reported December-quarter earnings of $0.41 per share, up from $0.15 per share the year before and ahead of the consensus estimate. Revenue increased 33 percent on strong subscriber growth. |
| | |
| $ | 1.9 | | | | 23.6 | % | | Amazon.com Inc. (AMZN) The provider of online retail shopping services grew December-quarter earnings 40 percent, topping the consensus estimate. Revenue grew 38 percent. The company’s better-than-expected revenue growth was driven by newly acquired Whole Foods, Amazon Web Services and a strong holiday season. |
| | |
| $ | 1.2 | | | | 26.9 | % | | ServiceNow Inc. (NOW) The provider of cloud-based services that automate enterprise technology operations grew December-quarter earnings 46 percent. Revenue rose 41 percent. Growth in renewal rates and new subscriptions helped drive results. The company also raised 2018 revenue guidance. |
| | |
| $ | 1.2 | | | | 26.8 | % | | Micron Technology Inc. (MU) Earnings for the company, which makes semiconductor memory and storage technologies, more than tripled to $2.82 per share in the February quarter, beating the consensus estimate. Revenue increased 58 percent. |
| | |
| $ | 0.8 | | | | 19.7 | % | | Nvidia Corp. (NVDA) The developer of computer graphics processors, chipsets and related software grew January-quarter earnings 59 percent, beating the consensus estimate by 35 percent. Revenue increased 34 percent. The company’s data center and gaming businesses were standout contributors to results. |
| | |
$ Loss (in millions) | | | % Loss | | | Biggest $ Losers Reason for Move |
| $ | 0.8 | | | | 12.5 | % | | Facebook Inc. (FB) The social networking service and website saw its share price decline when it was revealed that a for-profit data analytics firm harvested private information from more than 50 million users. The announcement raised concerns about Facebook’s data privacy policies and the potential for regulatory oversight in the wake of the controversy. We sold Facebook to fund a holding with greater visibility. |
| | |
| $ | 0.5 | | | | 15.0 | % | | Oshkosh Corp. (OSK) The manufacturer of commercial specialty vehicles reported December-quarter earnings of $0.84 per share versus $0.26 the year before, exceeding the consensus estimate. The company also raised fiscal year earnings and revenue guidance. Shares came under pressure amid concerns about steel tariffs and dimming prospects for widespread infrastructure spending. |
| | |
| $ | 0.5 | | | | 17.7 | % | | CNH Industrial NV (CNHI) The manufacturer of agricultural equipment and commercial vehicles grew December-quarter revenue 16 percent to $8.1 billion, topping forecasts. Shares came under pressure amid announced steel tariffs and potential for trade disruptions with China. |
| | |
| $ | 0.5 | | | | 13.9 | % | | Manpower Group Inc. (MAN) The provider of workforce solutions and services grew December-quarter earnings 13 percent, topping the consensus estimate. The company continued to experience strong demand in Europe, where it generates two-thirds of revenue. Shares traded lower after management guided investors to expect flat operating profit margins, an outlook that was slightly below expectations. |
| | |
| $ | 0.5 | | | | 13.4 | % | | Biogen Inc. (BIIB) The biotechnology company focused on neurological and autoimmune disorders grew December-quarter earnings to $5.26 per share. Shares declined due to concerns regarding the status of its Alzheimer’s treatment that arose after the company added participants to its phase III clinical trial. The company noted that the increase was to maintain statistical standards and does not reflect on the treatment’s efficacy or the trial’s timing. |
All gains/losses are calculated on an average cost basis from December 31, 2017 through March 31, 2018.
This commentary reflects the viewpoints of Friess Associates, LLC as of March 31, 2018 and is not intended as a forecast or guarantee of future results.
11
|
| AMG Managers Brandywine Blue Fund |
| Schedule of Portfolio Investments (unaudited) |
| March 31, 2018 |
|
| | | | | | | | | | | | |
Shares | | | | | Cost | | | Value | |
| | Common Stocks - 98.6% | | | | | | | | |
| | Consumer Discretionary | | | | | | | | |
| | | | Cable & Satellite - 2.0% | | | | | | | | |
| | 11,325 | | | Charter Communications, Inc., Class A* | | $ | 2,865,263 | | | $ | 3,524,567 | |
| | | | Footwear - 2.0% | | | | | | | | |
| | 93,300 | | | Skechers U.S.A., Inc., Class A* | | | 3,841,504 | | | | 3,628,437 | |
| | | | General Merchandise Stores - 2.0% | | | | | | | | |
| | 38,035 | | | Dollar Tree, Inc.* | | | 2,772,103 | | | | 3,609,521 | |
| | | | Homebuilding - 0.9% | | | | | | | | |
| | 36,200 | | | D.R. Horton, Inc. | | | 1,597,154 | | | | 1,587,008 | |
| | | | Hotels, Resorts & Cruise Lines - 0.7% | | | | | | | | |
| | 25,100 | | | Norwegian Cruise Line Holdings, Ltd.* | | | 1,331,434 | | | | 1,329,547 | |
| | | | Internet & Direct Marketing Retail - 11.3% | | | | | |
| | 5,583 | | | Amazon.com, Inc.* | | | 4,476,567 | | | | 8,080,499 | |
| | 1,955 | | | Booking Holdings, Inc.* | | | 3,712,497 | | | | 4,067,163 | |
| | 26,980 | | | Netflix, Inc.* | | | 2,862,795 | | | | 7,968,543 | |
| | | | Leisure Facilities - 2.0% | | | | | | | | |
| | 15,928 | | | Vail Resorts, Inc. | | | 3,479,722 | | | | 3,531,238 | |
| | | | Movies & Entertainment - 1.9% | | | | | | | | |
| | 81,745 | | | Live Nation Entertainment, Inc.* | | | 3,511,112 | | | | 3,444,734 | |
| | | | | | | | | | | | |
| | Total Consumer Discretionary | | | 30,450,151 | | | | 40,771,257 | |
| | | | This sector is 33.9% above your Fund’s cost. | | | | | | |
| | Consumer Staples | | | | | | | | |
| | | | Packaged Foods & Meats - 2.0% | | | | | | | | |
| | 28,500 | | | The JM Smucker Co. | | | 3,545,970 | | | | 3,534,285 | |
| | | | This sector is 0.3% below your Fund’s cost. | | | | | | |
| | Financials | | | | | | | | |
| | | | Financial Exchanges & Data - 2.4% | | | | | | | | |
| | 27,025 | | | CME Group, Inc. | | | 2,538,802 | | | | 4,371,023 | |
| | | | This sector is 72.2% above your Fund’s cost. | | | | | | |
| | Health Care | | | | | | | | |
| | | | Biotechnology - 2.2% | | | | | | | | |
| | 11,200 | | | Biogen, Inc.* | | | 3,539,756 | | | | 3,066,784 | |
| | 10,140 | | | Incyte Corp.* | | | 965,762 | | | | 844,966 | |
| | | | Health Care Equipment - 3.5% | | | | | | | | |
| | 62,300 | | | Abbott Laboratories | | | 3,825,105 | | | | 3,733,016 | |
| | 17,165 | | | Edwards Lifesciences Corp.* | | | 2,158,929 | | | | 2,394,861 | |
| | | | Life Sciences Tools & Services - 4.4% | | | | | |
| | 60,540 | | | Agilent Technologies, Inc. | | | 4,098,197 | | | | 4,050,126 | |
| | 18,700 | | | Thermo Fisher Scientific, Inc. | | | 2,890,097 | | | | 3,860,802 | |
| | | | Pharmaceuticals - 4.8% | | | | | | | | |
| | 56,100 | | | Bristol-Myers Squibb Co. | | | 3,707,486 | | | | 3,548,325 | |
| | | | | | | | | | | | |
Shares | | | | | Cost | | | Value | |
| | 60,060 | | | Zoetis, Inc. | | $ | 3,229,832 | | | $ | 5,015,611 | |
| | | | | | | | | | | | |
| | Total Health Care | | | 24,415,164 | | | | 26,514,491 | |
| | | | This sector is 8.6% above your Fund’s cost. | | | | | | |
| | Industrials | | | | | | | | |
| | | | Agricultural & Farm Machinery - 1.4% | | | | | |
| | 202,600 | | | CNH Industrial N.V. (United Kingdom) | | | 3,050,627 | | | | 2,512,240 | |
| | | | Air Freight & Logistics - 2.1% | | | | | | | | |
| | 36,000 | | | XPO Logistics, Inc.* | | | 3,638,753 | | | | 3,665,160 | |
| | | | Construction & Engineering - 1.6% | | | | | | | | |
| | 46,700 | | | Jacobs Engineering Group, Inc. | | | 2,815,061 | | | | 2,762,305 | |
| | | | Construction Machinery & Heavy Trucks - 1.7% | | | | | |
| | 39,915 | | | Oshkosh Corp. | | | 3,399,189 | | | | 3,084,232 | |
| | | | Electrical Components & Equipment - 1.9% | | | | | |
| | 19,515 | | | Rockwell Automation, Inc. | | | 3,682,308 | | | | 3,399,513 | |
| | | | Human Resource & Employment Services - 1.8% | | | | | |
| | 28,212 | | | ManpowerGroup, Inc. | | | 3,770,853 | | | | 3,247,201 | |
| | | | Trading Companies & Distributors - 2.1% | | | | | |
| | 21,655 | | | United Rentals, Inc.* | | | 2,682,209 | | | | 3,740,468 | |
| | | | Trucking - 2.1% | | | | | | | | |
| 81,865 | | | Knight-Swift Transportation Holdings, Inc. | | 3,695,124 | | | 3,766,609 | |
| | | | | | | | | | | | |
| | Total Industrials | | | 26,734,124 | | | | 26,177,728 | |
| | | | This sector is 2.1% below your Fund’s cost. | | | | | | |
| | Information Technology | | | | | | | | |
| | | | Application Software - 2.7% | | | | | | | | |
| | 41,060 | | | Salesforce.com, Inc.* | | | 3,187,380 | | | | 4,775,278 | |
| | | | Data Processing & Outsourced Services - 9.0% | | | | | |
| | 37,520 | | | Global Payments, Inc. | | | 2,696,027 | | | | 4,184,230 | |
| | 20,700 | | | Mastercard, Inc., Class A | | | 3,608,354 | | | | 3,625,812 | |
| | 34,550 | | | Visa, Inc., Class A | | | 2,485,668 | | | | 4,132,871 | |
| | 51,000 | | | Worldpay, Inc., Class A* | | | 2,339,257 | | | | 4,194,240 | |
| | | | Home Entertainment Software - 6.4% | | | | | | | | |
| | 61,045 | | | Activision Blizzard, Inc. | | | 3,265,429 | | | | 4,118,096 | |
| | 35,315 | | | Electronic Arts, Inc.* | | | 3,657,040 | | | | 4,281,590 | |
| | 30,800 | | | Take-Two Interactive Software, Inc.* | | | 2,911,926 | | | | 3,011,624 | |
| | | | Internet Software & Services - 4.8% | | | | | | | | |
| | 4,807 | | | Alphabet, Inc., Class A* | | | 3,308,126 | | | | 4,985,532 | |
| | 31,200 | | | LogMeIn, Inc. | | | 3,819,127 | | | | 3,605,160 | |
| | | | Semiconductors - 10.8% | | | | | | | | |
| | 20,865 | | | Broadcom, Ltd. | | | 1,716,293 | | | | 4,916,837 | |
| | 109,460 | | | Micron Technology, Inc.* | | | 3,543,029 | | | | 5,707,245 | |
| | 20,507 | | | NVIDIA Corp. | | | 1,776,598 | | | | 4,749,216 | |
| | 53,645 | | | Xilinx, Inc. | | | 3,683,219 | | | | 3,875,315 | |
12
|
| |
| AMG Managers Brandywine Blue Fund |
| Schedule of Portfolio Investments (continued) |
|
| | | | | | | | |
Shares | | | | Cost | | | Value |
Information Technology (continued) | | | | | | |
| | Systems Software - 8.1% | | | | | | |
95,800 | | Microsoft Corp. | | $ | 6,123,044 | | | $8,743,666 |
34,800 | | ServiceNow, Inc.* | | | 2,867,873 | | | 5,757,660 |
| | | | | | | | |
Total Information Technology | | | 50,988,390 | | | 74,664,372 |
| | This sector is 46.4% above your Fund’s cost. | | | |
Total Common Stocks | | | 138,672,601 | | | 176,033,156 |
| | | |
Principal Amount | | | | | | | |
Short-Term Investments - 1.9% | | | | | | |
Commercial Paper - 1.9% | | | | | | |
$3,351,000 | | Energy Transfer LP, 2.65%, 04/02/181 | | | 3,350,754 | | | 3,350,754 |
| * | Non-income producing security. |
| 1 | Represents yield to maturity at March 31, 2018. |
| | | | | | | | | | |
Shares | | | | Cost | | | Value | |
Other Investment Companies - 0.0%# | | | | | | | | |
| 101,255 | | Dreyfus Government Cash Management Fund, Institutional Class Shares, 1.54%2 | | $ | 101,255 | | | $ | 101,255 | |
| | | | | | | | | | |
Total Short-Term Investments | | | 3,452,009 | | | | 3,452,009 | |
Total Investments - 100.5% | | $ | 142,124,610 | | | | 179,485,165 | |
Other Assets, less Liabilities - (0.5%) | | | | | | | (970,598 | ) |
Total Net Assets - 100.0% | | | | | | | $178,514,567 | |
| | | | | | | | | | |
| 2 | Yield shown represents the March 31, 2018, seven day average yield, which refers to the sum of the previous seven days’ dividends paid, expressed as an annual percentage. |
The following table summarizes the inputs used to value the Fund’s investments by the fair value hierarchy levels as of March 31, 2018:
| | | | | | | | | | | | | | | | |
| | | Level 1 | | | Level 2 | | | Level 3 | | | Total | |
Investments in Securities | | | | | | | | | | | | | | | | |
Common Stocks† | | $ | 176,033,156 | | | | — | | | | — | | | $ | 176,033,156 | |
Short-Term Investments | | | | | | | | | | | | | | | | |
Commercial Paper | | | — | | | $ | 3,350,754 | | | | — | | | | 3,350,754 | |
Other Investment Companies | | | 101,255 | | | | — | | | | — | | | | 101,255 | |
| | | | | | | | | | | | | | | | |
Total Investments in Securities | | $ | 176,134,411 | | | $ | 3,350,754 | | | | — | | | $ | 179,485,165 | |
| | | | | | | | | | | | | | | | |
| † | All common stocks held in the Fund are Level 1 securities. For a detailed breakout of common stocks by major industry classification, please refer to the Fund’s Schedule of Portfolio Investments. |
As of March 31, 2018, the Fund had no transfers between levels from the beginning of the reporting period.
13
|
| |
| Statement of Assets and Liabilities (unaudited) |
| March 31, 2018 |
|
| | | | | | | | |
| | | AMG
Managers
Brandywine Fund | | | AMG
Managers
Brandywine
Blue Fund | |
Assets: | | | | | | | | |
Investments at Value* (including securities on loan valued at $7,399,789, and $0, respectively) | | $ | 803,274,193 | | | $ | 179,485,165 | |
Cash | | | 1,398 | | | | 376 | |
Receivable for investments sold | | | 9,132,421 | | | | 1,185,941 | |
Dividend, interest and other receivables | | | 207,911 | | | | 50,796 | |
Receivable for Fund shares sold | | | 8,106 | | | | 1,234 | |
Receivable from affiliate | | | 2,787 | | | | — | |
Prepaid expenses | | | 21,712 | | | | 12,957 | |
Total assets | | | 812,648,528 | | | | 180,736,469 | |
Liabilities: | | | | | | | | |
Payable upon return of securities loaned | | | 7,677,039 | | | | — | |
Payable for investments purchased | | | 12,635,182 | | | | 1,856,212 | |
Payable for Fund shares repurchased | | | 403,513 | | | | 103,222 | |
Accrued expenses: | | | | | | | | |
Investment advisory and management fees | | | 613,124 | | | | 138,375 | |
Administrative fees | | | 104,510 | | | | 23,587 | |
Shareholder service fees | | | 13,935 | | | | 7,862 | |
Professional fees | | | 55,848 | | | | 30,816 | |
Other | | | 122,928 | | | | 61,828 | |
Total liabilities | | | 21,626,079 | | | | 2,221,902 | |
Net Assets | | $ | 791,022,449 | | | $ | 178,514,567 | |
* Investments at cost | | $ | 646,556,565 | | | $ | 142,124,610 | |
Net Assets Represent: | | | | | | | | |
Paid-in capital | | $ | 1,052,190,976 | | | $ | 324,897,721 | |
Accumulated net investment loss | | | (4,351,065 | ) | | | (822,767 | ) |
Accumulated net realized loss from investments | | | (413,535,090 | ) | | | (182,920,942 | ) |
Net unrealized appreciation on investments | | | 156,717,628 | | | | 37,360,555 | |
Net Assets | | $ | 791,022,449 | | | $ | 178,514,567 | |
| | |
Class I: | | | | | | | | |
Net Assets | | $ | 791,022,449 | | | $ | 178,514,567 | |
Shares outstanding | | | 16,563,008 | | | | 3,602,779 | |
Net asset value, offering and redemption price per share | | $ | 47.76 | | | $ | 49.55 | |
The accompanying notes are an integral part of these financial statements.
14
|
| |
| Statement of Operations (unaudited) |
| For the six months ended March 31, 2018 |
|
| | | | | | | | |
| | | AMG
Managers
Brandywine Fund | | | AMG
Managers
Brandywine
Blue Fund | |
Investment Income: | | | | | | | | |
Dividend income | | $ | 2,418,898 | 1 | | $ | 621,466 | 2 |
Interest income | | | 187,877 | | | | 68,283 | |
Securities lending income | | | 56,256 | | | | 4,264 | |
Total investment income | | | 2,663,031 | | | | 694,013 | |
Expenses: | | | | | | | | |
Investment advisory and management fees | | | 3,515,709 | | | | 793,432 | |
Administrative fees | | | 599,268 | | | | 135,244 | |
Shareholder servicing fees - Class I | | | 79,902 | | | | 45,082 | |
Transfer agent fees | | | 50,518 | | | | 7,433 | |
Professional fees | | | 47,534 | | | | 25,597 | |
Reports to shareholders | | | 38,591 | | | | 29,608 | |
Trustee fees and expenses | | | 26,675 | | | | 6,012 | |
Custodian fees | | | 25,350 | | | | 6,985 | |
Registration fees | | | 14,728 | | | | 13,163 | |
Miscellaneous | | | 9,415 | | | | 2,409 | |
Total expenses before offsets | | | 4,407,690 | | | | 1,064,965 | |
Fee waivers | | | (15,980 | ) | | | — | |
Net expenses | | | 4,391,710 | | | | 1,064,965 | |
Net investment loss | | | (1,728,679 | ) | | | (370,952 | ) |
Net Realized and Unrealized Gain: | | | | | | | | |
Net realized gain on investments | | | 48,631,953 | | | | 13,079,963 | |
Net change in unrealized appreciation/depreciation on investments | | | 9,572,481 | | | | 1,765,856 | |
Net realized and unrealized gain | | | 58,204,434 | | | | 14,845,819 | |
Net increase in net assets resulting from operations | | $ | 56,475,755 | | | $ | 14,474,867 | |
| 1 | Includes non-recurring dividends of $325,990. |
| 2 | Includes non-recurring dividends of $94,588. |
The accompanying notes are an integral part of these financial statements.
15
|
| |
| Statements of Changes in Net Assets |
| For the six months ended March 31, 2018 (unaudited) and the fiscal year ended September 30, 2017 |
|
| | | | | | | | | | | | | | | | |
| | | AMG
Managers
Brandywine Fund | | | AMG
Managers
Brandywine Blue Fund | |
| | | March 31, 2018 | | | September 30, 20171 | | | March 31, 2018 | | | September 30, 20171 | |
Increase in Net Assets Resulting From Operations: | | | | | | | | | | | | | | | | |
Net investment loss | | $ | (1,728,679 | ) | | $ | (3,167,941 | ) | | $ | (370,952 | ) | | $ | (469,725 | ) |
Net realized gain on investments | | | 48,631,953 | | | | 79,635,473 | | | | 13,079,963 | | | | 19,449,670 | |
Net change in unrealized appreciation/depreciation on investments | | | 9,572,481 | | | | 50,520,064 | | | | 1,765,856 | | | | 15,658,514 | |
Net increase in net assets resulting from operations | | | 56,475,755 | | | | 126,987,596 | | | | 14,474,867 | | | | 34,638,459 | |
Capital Share Transactions:2 | | | | | | | | | | | | | | | | |
Net decrease from capital share transactions | | | (36,927,252 | ) | | | (76,279,999 | ) | | | (8,414,076 | ) | | | (19,137,433 | ) |
Total increase in net assets | | | 19,548,503 | | | | 50,707,597 | | | | 6,060,791 | | | | 15,501,026 | |
Net Assets: | | | | | | | | | | | | | | | | |
Beginning of period | | | 771,473,946 | | | | 720,766,349 | | | | 172,453,776 | | | | 156,952,750 | |
End of period | | $ | 791,022,449 | | | $ | 771,473,946 | | | $ | 178,514,567 | | | $ | 172,453,776 | |
End of period accumulated net investment loss | | $ | (4,351,065 | ) | | $ | (2,622,386 | ) | | $ | (822,767 | ) | | $ | (451,815 | ) |
| | | | | | | | | | | | | | | | |
| 1 | Effective February 27, 2017, the Funds’ shares were renamed as described in Note 1 of the Notes to the Financial Statements. |
| 2 | See Note 1(g) of the Notes to Financial Statements. |
The accompanying notes are an integral part of these financial statements.
16
|
| AMG Managers Brandywine Fund |
| Financial Highlights |
| For a share outstanding throughout each fiscal period |
|
| | | | | | | | | | | | | | | | | | | | | | | | |
| | | For the six months ended March 31, 2018
(unaudited) | | | | |
| | | | For the fiscal year ended September 30, | |
| Class I | | | 20171 | | | 2016 | | | 2015 | | | 20142 | | | 2013 | |
Net Asset Value, Beginning of Period | | $ | 44.48 | | | $ | 37.42 | | | $ | 34.54 | | | $ | 33.25 | | | $ | 28.75 | | | $ | 24.62 | |
Income (loss) from Investment Operations: | | | | | | | | | | | | | | | | | | | | | | | | |
Net investment income (loss)3,4 | | | (0.10 | )5 | | | (0.17 | )6 | | | (0.08 | )7 | | | 0.04 | 8 | | | (0.12 | ) | | | (0.03 | ) |
Net realized and unrealized gain on investments | | | 3.38 | | | | 7.23 | | | | 2.96 | | | | 1.25 | | | | 4.62 | | | | 4.16 | |
Total income from investment operations | | | 3.28 | | | | 7.06 | | | | 2.88 | | | | 1.29 | | | | 4.50 | | | | 4.13 | |
Net Asset Value, End of Period | | $ | 47.76 | | | $ | 44.48 | | | $ | 37.42 | | | $ | 34.54 | | | $ | 33.25 | | | $ | 28.75 | |
Total Return4,9 | | | 7.37 | %10 | | | 18.87 | % | | | 8.34 | % | | | 3.88 | % | | | 15.65 | % | | | 16.77 | % |
Ratio of net expenses to average net assets | | | 1.10 | %11 | | | 1.11 | % | | | 1.11 | % | | | 1.10 | % | | | 1.10 | % | | | 1.11 | %12 |
Ratio of gross expenses to average net assets4,13 | | | 1.10 | %11 | | | 1.12 | % | | | 1.11 | % | | | 1.10 | % | | | 1.10 | % | | | 1.11 | % |
Ratio of net investment income (loss) to average net assets | | | (0.43 | )%11 | | | (0.43 | )% | | | (0.24 | )% | | | 0.10 | % | | | (0.37 | )% | | | (0.12 | )% |
Portfolio turnover | | | 72 | %10 | | | 187 | % | | | 185 | % | | | 190 | % | | | 219 | % | | | 214 | % |
Net assets end of period (000’s) omitted | | $ | 791,022 | | | $ | 771,474 | | | $ | 720,766 | | | $ | 759,185 | | | $ | 799,045 | | | $ | 816,222 | |
| | | | | | | | | | | | | | | | | | | | | | | | |
| 1 | Effective February 27, 2017, the Fund’s Class S shares were renamed to Class I shares. |
| 2 | At the start of business October 1, 2013, the Fund was reorganized into a fund of AMG Funds I. |
| 3 | Per share numbers have been calculated using average shares. |
| 4 | Total returns and net investment income (loss) would have been lower had certain expenses not been offset. |
| 5 | Includes non-recurring dividends. Without these dividends, net investment loss per share would have been $(0.12). |
| 6 | Includes non-recurring dividends. Without these dividends, net investment loss per share would have been $(0.22). |
| 7 | Includes non-recurring dividends. Without these dividends, net investment loss per share would have been $(0.10). |
| 8 | Includes non-recurring dividends. Without these dividends, net investment loss per share would have been $(0.07). |
| 9 | The total return is calculated using the published Net Asset Value as of fiscal period end. |
| 12 | Interest expense is less than 0.005% of average net assets. |
| 13 | Excludes the impact of expense reimbursement or fee waivers and expense reductions such as brokerage credits, but includes expense repayments and non-reimbursable expenses, if any, such as interest, taxes, and extraordinary expenses. (See Note 1(c) and 2 in the Notes to Financial Statements.) |
17
|
| AMG Managers Brandywine Blue Fund |
| Financial Highlights |
| For a share outstanding throughout each fiscal period |
|
| | | | | | | | | | | | | | | | | | | | | | | | |
| | | For the six months ended March 31, 2018 (unaudited) | | | | |
| | | | For the fiscal year ended September 30, | |
| Class I | | | 20171 | | | 2016 | | | 2015 | | | 20142 | | | 2013 | |
Net Asset Value, Beginning of Period | | $ | 45.69 | | | $ | 36.87 | | | $ | 33.95 | | | $ | 33.51 | | | $ | 30.01 | | | $ | 25.00 | |
Income (loss) from Investment Operations: | | | | | | | | | | | | | | | | | | | | | | | | |
Net investment income (loss)3 | | | (0.10 | )4 | | | (0.12 | )5 | | | (0.02 | )6 | | | 0.10 | 7 | | | (0.03 | ) | | | 0.12 | |
Net realized and unrealized gain on investments | | | 3.96 | | | | 8.94 | | | | 3.02 | | | | 0.34 | | | | 3.53 | | | | 4.89 | |
Total income from investment operations | | | 3.86 | | | | 8.82 | | | | 3.00 | | | | 0.44 | | | | 3.50 | | | | 5.01 | |
Less Distributions to Shareholders from: | | | | | | | | | | | | | | | | | | | | | | | | |
Net investment income | | | — | | | | — | | | | (0.08 | ) | | | — | | | | — | | | | — | |
Net Asset Value, End of Period | | $ | 49.55 | | | $ | 45.69 | | | $ | 36.87 | | | $ | 33.95 | | | $ | 33.51 | | | $ | 30.01 | |
Total Return8 | | | 8.45 | %9 | | | 23.92 | % | | | 8.86 | % | | | 1.31 | % | | | 11.66 | % | | | 20.04 | % |
Ratio of net expenses to average net assets | | | 1.18 | %10 | | | 1.20 | % | | | 1.20 | % | | | 1.20 | % | | | 1.19 | % | | | 1.22 | % |
Ratio of net investment income (loss) to average net assets | | | (0.41 | )%10 | | | (0.29 | )% | | | (0.05 | )% | | | 0.29 | % | | | (0.11 | )% | | | 0.45 | % |
Portfolio turnover | | | 70 | %9 | | | 167 | % | | | 139 | % | | | 156 | % | | | 182 | % | | | 202 | % |
Net assets end of period (000’s) omitted | | $ | 178,515 | | | $ | 172,454 | | | $ | 156,953 | | | $ | 169,180 | | | $ | 215,941 | | | $ | 278,620 | |
| | | | | | | | | | | | | | | | | | | | | | | | |
| 1 | Effective February 27, 2017, the Fund’s Class S shares were renamed to Class I shares. |
| 2 | At the start of business October 1, 2013, the Fund was reorganized into a fund of AMG Funds I. |
| 3 | Per share numbers have been calculated using average shares. |
| 4 | Includes non-recurring dividends. Without these dividends, net investment loss per share would have been $(0.13). |
| 5 | Includes non-recurring dividends. Without these dividends, net investment loss per share would have been $(0.18). |
| 6 | Includes non-recurring dividends. Without these dividends, net investment loss per share would have been $(0.04). |
| 7 | Includes non-recurring dividends. Without these dividends, net investment loss per share would have been $(0.08). |
| 8 | The total return is calculated using the published Net Asset Value as of fiscal period end. |
18
|
| |
| Notes to Financial Statements (unaudited) |
| March 31, 2018 |
|
1. SUMMARY OF SIGNIFICANT ACCOUNTING POLICIES
AMG Funds I (the “Trust”) is an open-end management investment company, organized as a Massachusetts business trust, and registered under the Investment Company Act of 1940, as amended (the “1940 Act”). Currently, the Trust consists of a number of different funds, each having distinct investment management objectives, strategies, risks, and policies. Included in this report are AMG Managers Brandywine Fund (“Brandywine”) and AMG Managers Brandywine Blue Fund (“Brandywine Blue”), each a “Fund” and collectively, the “Funds.”
A significant portion of the Brandywine Blue’s holdings may be focused in a relatively small number of securities, which may make the Fund more volatile and subject to greater risk than a more diversified fund.
Effective February 27, 2017, each Fund’s Class S shares were renamed to Class I shares. Please refer to a current prospectus for additional information.
The Funds’ financial statements are prepared in accordance with accounting principles generally accepted in the United States of America (“U.S. GAAP”), including accounting and reporting guidance pursuant to Accounting Standards Codification Topic 946 applicable to investment companies. U.S. GAAP requires management to make estimates and assumptions that affect the reported amounts of assets and liabilities and disclosure of contingent assets and liabilities at the date of the financial statements and the reported amounts of income and expenses during the reporting period. Actual results could differ from those estimates and such differences could be material. The following is a summary of significant accounting policies followed by the Funds in the preparation of their financial statements:
a. VALUATION OF INVESTMENTS
Equity securities traded on a national securities exchange or reported on the NASDAQ national market system (“NMS”) are valued at the last quoted sales price on the primary exchange or, if applicable, the NASDAQ official closing price or the official closing price of the relevant exchange or, lacking any sales, at the last quoted bid price or the mean between the last quoted bid and ask prices (the “exchange mean price”). Equity securities traded in the over-the-counter market (other than NMS securities) are valued at the exchange mean price. Foreign equity securities (securities principally traded in markets other than U.S. markets) are valued at the official closing price on the primary exchange or, for markets that either do not offer an official closing price or where the official closing price may not be representative of the overall market, the last quoted sale price.
Fixed income securities purchased with a remaining maturity of 60 days or less are valued at amortized cost, provided that the amortized cost value is approximately the same as the fair value of the security valued without the use of amortized cost. Investments in other open-end regulated investment companies are valued at their end of day net asset value per share.
The Funds’ portfolio investments are generally valued based on independent market quotations or prices or, if none, “evaluative” or other market based valuations provided by third party pricing services approved by the Board of Trustees of the Trust (the “Board”). Under certain circumstances, the value of certain Fund portfolio investments may be based on an evaluation of fair value, pursuant to procedures established by and under the general supervision of the Board. The Valuation Committee, which is comprised of the Independent Trustees of the Board, and the Pricing Committee, which is comprised of representatives from AMG Funds LLC (the “Investment Manager”) are the committees appointed by the Board to make fair value determinations. Each Fund may use the fair value of a
portfolio investment to calculate its net asset value (“NAV”) in the event that the market quotation, price or market based valuation for the portfolio investment is not readily available or otherwise not determinable pursuant to the Board’s valuation procedures, if the Investment Manager or the Pricing Committee believes the quotation, price or market based valuation to be unreliable, or in certain other circumstances. When determining the fair value of an investment, the Pricing Committee and, if required under the Trust’s securities valuation procedures, the Valuation Committee, seeks to determine the price that the Fund might reasonably expect to receive from current sale of that portfolio investment in an arms-length transaction. Fair value determinations shall be based upon consideration of all available facts and information, including, but not limited to (i) attributes specific to the investment; (ii) fundamental and analytical data relating to the investment; and (iii) the value of other comparable securities or relevant financial instruments, including derivative securities, traded on other markets or among dealers.
The values assigned to fair value portfolio investments are based on available information and do not necessarily represent amounts that might ultimately be realized in the future, since such amounts depend on future developments inherent in long-term investments. Because of the inherent uncertainty of valuation, those estimated values may differ significantly from the values that would have been used had a ready market for the investments existed, and the differences could be material. The Board will be presented with a quarterly report showing as of the most recent quarter end, all outstanding securities fair valued by the Fund, including a comparison with the prior quarter end and the percentage of the Fund that the security represents at each quarter end.
With respect to foreign equity securities and certain foreign fixed income securities, the Board has adopted a policy that securities held in a Fund that can be fair valued by the applicable fair value pricing service are fair valued on each business day provided that each individual price exceeds a pre-established confidence level.
U.S. GAAP defines fair value as the price that a fund would receive to sell an asset or pay to transfer a liability in an orderly transaction between market participants at the measurement date. U.S. GAAP also establishes a framework for measuring fair value, and a three level hierarchy for fair value measurements based upon the transparency of inputs to the valuation of an asset or liability. Inputs may be observable or unobservable and refer broadly to the assumptions that market participants would use in pricing the asset or liability. Observable inputs reflect the assumptions market participants would use in pricing the asset or liability based on market data obtained from sources independent of the Funds. Unobservable inputs reflect the Funds’ own assumptions about the assumptions that market participants would use in pricing the asset or liability developed based on the best information available in the circumstances. Each investment is assigned a level based upon the observability of the inputs which are significant to the overall valuation.
The three-tier hierarchy of inputs is summarized below:
Level 1 – inputs are quoted prices in active markets for identical investments (e.g., equity securities, open-end investment companies)
Level 2 – other observable inputs (including, but not limited to: quoted prices for similar assets or liabilities in markets that are active, quoted prices for identical or similar assets or liabilities in markets that are not active, inputs other than quoted prices that are observable for the assets or liabilities (such as interest rates, yield curves, volatilities, prepayment speeds, loss severities, credit risks and default rates) or other market corroborated inputs) (e.g., debt securities, government
19
|
| |
| |
| Notes to Financial Statements (continued) |
|
securities, foreign currency exchange contracts, foreign securities utilizing international fair value pricing, fair valued securities with observable inputs)
Level 3 – inputs are significant unobservable inputs (including the Fund’s own assumptions used to determine the fair value of investments) (e.g., fair valued securities with unobservable inputs)
Changes in inputs or methodologies used for valuing investments may result in a transfer in or out of levels within the fair value hierarchy. The inputs or methodologies used for valuing investments may not necessarily be an indication of the risk associated with investing in those investments. Transfers between different levels of the fair value disclosure hierarchy are deemed to have occurred as of the beginning of the reporting period.
b. SECURITY TRANSACTIONS
Security transactions are accounted for as of trade date. Realized gains and losses on securities sold are determined on the basis of identified cost.
c. INVESTMENT INCOME AND EXPENSES
Dividend income is recorded on the ex-dividend date. Dividends from foreign securities are recorded on the ex-dividend date, and if after the fact, as soon as the Funds become aware of the ex-dividend date. Interest income, which includes amortization of premium and accretion of discount on debt securities, is accrued as earned. Dividend and interest income on foreign securities is recorded gross of any withholding tax. Non-cash dividends included in dividend income, if any, are reported at the fair market value of the securities received. Other income and expenses are recorded on an accrual basis. Expenses that cannot be directly attributed to a Fund are apportioned among the funds in the Trust and other trusts within the AMG Funds family of mutual funds (collectively the “AMG Funds Family”) based upon their relative average net assets or number of shareholders.
d. DIVIDENDS AND DISTRIBUTIONS
Fund distributions resulting from either net investment income or realized net capital gains, if any, will normally be declared and paid at least annually in December. Distributions to shareholders are recorded on the ex-dividend date. Distributions are determined in accordance with federal income tax regulations, which may differ from net investment income and net realized capital gains for financial statement purposes (U.S. GAAP). Differences may be permanent or temporary. Permanent differences are reclassified among capital accounts in the financial statements to reflect their tax character. Permanent book and tax basis differences, if any, relating to shareholder distributions will result in reclassifications to paid-in capital. Temporary differences arise when certain items of income, expense and gain or loss are recognized in different periods for financial statement and tax purposes; these differences will reverse at some time in the future. Permanent differences are primarily due to expired capital loss carryovers and a net operating loss write off. Temporary differences are primarily due to qualified late year ordinary losses and wash sales.
At March 31, 2018, the approximate cost of investments and the aggregate gross unrealized appreciation and depreciation for federal income tax were as follows:
| | | | | | | | | | | | | | | | |
| Fund | | Cost | | | Appreciation | | | Depreciation | | | Net | |
Brandywine | | $ | 647,049,602 | | | $ | 166,793,072 | | | $ | (10,568,481 | ) | | $ | 156,224,591 | |
Brandywine Blue | | | 142,239,283 | | | | 40,368,647 | | | | (3,122,765 | ) | | | 37,245,882 | |
e. FEDERAL TAXES
Each Fund currently qualifies as an investment company and intends to comply with the requirements under Subchapter M of the Internal Revenue Code of 1986, as amended, and to distribute substantially all of its taxable income and gains to its shareholders and to meet certain diversification and income requirements with respect to investment companies. Therefore, no provision for federal income or excise tax is included in the accompanying financial statements.
Additionally, based on each Fund’s understanding of the tax rules and rates related to income, gains and transactions for the foreign jurisdictions in which it invests, each Fund will provide for foreign taxes, and where appropriate, deferred foreign taxes.
Management has analyzed the Funds’ tax positions taken on federal income tax returns as of March 31, 2018, and for all open tax years (generally, the three prior taxable years), and has concluded that no provision for federal income tax is required in the Funds’ financial statements. Additionally, Management is not aware of any tax position for which it is reasonably possible that the total amounts of unrecognized tax benefits will change materially in the next twelve months.
Net capital losses incurred in taxable years beginning after the enactment of the Regulated Investment Company Modernization Act of 2010, may be carried forward for an unlimited time period. Such losses will be required to be utilized prior to any loss carryovers incurred in pre-enactment taxable years, which generally expire eight years following the close of the taxable year in which they were incurred. As a result of this ordering rule, pre-enactment capital loss carryovers may be more likely to expire unused. Additionally, post-enactment capital losses that are carried forward retain their tax character as either short- term or long-term capital losses, unlike pre-enactment losses which are considered all short-term.
f. CAPITAL LOSS CARRYOVERS AND DEFERRALS
As of March 31, 2018, the following Funds had accumulated net realized capital loss carryovers from securities transactions for federal income tax purposes as shown in the following chart. These amounts may be used to offset future realized capital gains, if any, through the expiration date listed, or in the case of post-enactment losses, for an unlimited time period.
| | | | | | | | | | | | |
| | | Capital Loss Carryover Amounts | | | Expires September 31, | |
| Fund | | Short-Term | | | Long-Term | | |
Brandywine | | | | | | | | | | | | |
(Pre-Enactment) | | $ | 461,674,006 | | | | — | | | | 2018 | |
Brandywine Blue | | | | | | | | | | | | |
(Pre-Enactment) | | $ | 195,886,232 | | | | — | | | | 2018 | |
g. CAPITAL STOCK
The Trust’s Declaration of Trust authorizes for each Fund the issuance of an unlimited number of shares of beneficial interest, without par value. Each Fund records sales and repurchases of its capital stock on the trade date.
20
|
| |
| |
| Notes to Financial Statements (continued) |
|
For the six months ended March 31, 2018 (unaudited) and the fiscal year ended September 30, 2017, the capital stock transactions by class for the Funds were as follows:
| | | | | | | | | | | | | | | | | | | | | | | | | | | | | | | | |
| | | | | | Brandywine | | | | | | | | | Brandywine Blue | | | | |
| | | March 31, 2018 | | | September 30, 2017 | | | March 31, 2018 | | | September 30, 2017 | |
| | | Shares | | | Amount | | | Shares | | | Amount | | | Shares | | | Amount | | | Shares | | | Amount | |
Class I: | | | | | | | | | | | | | | | | | | | | | | | | | | | | | | | | |
Proceeds from sale of shares | | | 40,876 | | | $ | 1,931,586 | | | | 69,268 | | | $ | 2,793,859 | | | | 32,796 | | | $ | 1,609,814 | | | | 47,038 | | | $ | 1,908,164 | |
Cost of shares repurchased | | | (822,353 | ) | | | (38,858,838 | ) | | | (1,984,696 | ) | | | (79,073,858 | ) | | | (204,637 | ) | | | (10,023,890 | ) | | | (529,513 | ) | | | (21,045,597 | ) |
| | | | | | | | | | | | | | | | | | | | | | | | | | | | | | | | |
Net decrease | | | (781,477 | ) | | $ | (36,927,252 | ) | | | (1,915,428 | ) | | $ | (76,279,999 | ) | | | (171,841 | ) | | $ | (8,414,076 | ) | | | (482,475 | ) | | $ | (19,137,433 | ) |
| | | | | | | | | | | | | | | | | | | | | | | | | | | | | | | | |
h. REPURCHASE AGREEMENTS AND JOINT REPURCHASE AGREEMENTS
The Funds may enter into third-party repurchase agreements for temporary cash management purposes and third-party joint repurchase agreements for reinvestment of cash collateral on securities lending transactions under the securities lending program offered by The Bank of New York Mellon (“BNYM”) (the “Program”) (collectively, “Repurchase Agreements”). The value of the underlying collateral, including accrued interest, must equal or exceed the value of the Repurchase Agreements during the term of the agreement. For joint repurchase agreements, the Funds participate on a pro rata basis with other clients of BNYM in its share of the underlying collateral under such joint repurchase agreements and in its share of proceeds from any repurchase or other disposition of the underlying collateral. The underlying collateral for all Repurchase Agreements is held in safekeeping by the Funds’ custodian or at the Federal Reserve Bank. If the seller defaults and the value of the collateral declines, or if bankruptcy proceedings commence with respect to the seller of the security, realization of the collateral by the Funds may be delayed or limited. Pursuant to the Program, the Funds are indemnified for such losses by BNYM on joint repurchase agreements.
At March 31, 2018, the market value of Repurchase Agreements outstanding for Brandywine was $7,677,039.
2. AGREEMENTS AND TRANSACTIONS WITH AFFILIATES
For each of the Funds, the Trust has entered into an investment advisory agreement under which the Investment Manager, a subsidiary and the U.S. retail distribution arm of Affiliated Managers Group, Inc. (“AMG”), serves as investment manager to the Funds and is responsible for the Funds’ overall administration and operations. The Investment Manager selects one or more subadvisers for the Funds (subject to Board approval) and monitors each subadviser’s investment performance, security holdings and investment strategies. Each Fund’s investment portfolio is managed by Friess Associates, LLC (“Friess”) and Friess Associates of Delaware, LLC (“Friess of Delaware”) who serve pursuant to a subadvisory agreement with the Investment Manager.
Investment management fees are paid directly by the Funds to the Investment Manager based on average daily net assets. For the six months ended March 31, 2018, the Funds’ investment management fees were paid at the following annual rate of each Fund’s respective average daily net assets:
| | | | |
Brandywine | | | 0.88 | % |
Brandywine Blue | | | 0.88 | % |
The Trust, on behalf of the Funds, has entered into an amended and restated Administration Agreement under which the Investment Manager serves as the Funds’ administrator (the “Administrator”) and is responsible for all non-portfolio management aspects of managing the Fund’s operations, including administration and shareholder services to each Fund. Each Fund pays a fee to the Administrator at the rate of 0.15% per annum of the Fund’s average daily net assets for this service. The Administrator for Brandywine is contractually obligated to waive a portion of the administration fee in an amount equal to an annual rate of 0.004% of the Fund’s average daily net assets through October 1, 2018. For the six months ended March 31, 2018, Brandywine waived $15,980.
The Funds are distributed by AMG Distributors, Inc. (the “Distributor”), a wholly-owned subsidiary of the Investment Manager. The Distributor serves as the distributor and underwriter for each Fund and is a registered broker-dealer and member of the Financial Industry Regulatory Authority, Inc. (“FINRA”). Shares of each Fund will be continuously offered and will be sold directly to prospective purchasers and through brokers, dealers or other financial intermediaries who have executed selling agreements with the Distributor. Generally the Distributor bears all or a portion of the expenses of providing services pursuant to the distribution agreement, including the payment of the expenses relating to the distribution of prospectuses for sales purposes and any advertising or sales literature.
For Class I shares, the Board has approved reimbursement payments to the Investment Manager for shareholder servicing expenses (“shareholder servicing fees”) incurred. Shareholder servicing fees include payments to financial intermediaries, such as broker-dealers (including fund supermarket platforms), banks, and trust companies who provide shareholder recordkeeping, account servicing and other services. The Class I shares may reimburse the Investment Manager for the actual amount incurred up to a maximum annual rate of each Class I shares average daily net assets as shown in the table below.
| | | | | | | | |
| Fund | | Maximum Annual
Amount
Approved | | | Actual
Amount
Incurred | |
Brandywine | | | | | | | | |
Class I | | | 0.15 | % | | | 0.02 | % |
Brandywine Blue | | | | | | | | |
Class I | | | 0.15 | % | | | 0.05 | % |
The Board provides supervision of the affairs of the Trust and other trusts within the AMG Funds family. The Trustees of the Trust who are not affiliated with the Investment Manager receive an annual retainer and per meeting fees for regular,
21
|
| |
| |
| Notes to Financial Statements (continued) |
|
special and telephonic meetings, and they are reimbursed for out-of-pocket expenses incurred while carrying out their duties as Board members. The Chairman of the Board and the Audit Committee Chair receive additional annual retainers. Certain Trustees and Officers of the Funds are Officers and/or Directors of the Investment Manager, AMG and/or the Distributor.
The Securities and Exchange Commission (the “SEC”) granted an exemptive order that permits the Funds to lend and borrow money for certain temporary purposes directly to and from other eligible funds in the AMG Funds family. Participation in this interfund lending program is voluntary for both the borrowing and lending funds, and an interfund loan is only made if it benefits each participating fund. The Administrator manages the program according to procedures approved by the Board, and the Board monitors the operation of the program. An interfund loan must comply with certain conditions set out in the exemptive order, which are designed to assure fairness and protect all participating funds. For the six months ended March 31, 2018, the Funds neither borrowed from nor lent to other funds in the AMG Funds family. At March 31, 2018, the Funds had no interfund loans outstanding.
3. PURCHASES AND SALES OF SECURITIES
Purchases and sales of securities (excluding short-term securities and U.S. Government Obligations) for the six months ended March 31, 2018, were as follows:
| | | | | | | | |
| | | Long Term Securities | |
| Fund | | Purchases | | | Sales | |
Brandywine | | $ | 555,790,119 | | | $ | 589,291,356 | |
Brandywine Blue | | | 119,982,968 | | | | 123,417,285 | |
The Funds had no purchases or sales of U.S. Government Obligations during the six months ended March 31, 2018.
4. PORTFOLIO SECURITIES LOANED
The Funds participate in the Program providing for the lending of securities to qualified brokers. Securities lending income includes earnings of such temporary cash investments, plus or minus any rebate to a borrower. These earnings (after any rebate) are then divided between BNYM, as a fee for its services under the Program, and the Funds, according to agreed-upon rates. Collateral on all securities loaned is accepted in cash and is maintained at a minimum level of 102% (105% in the case of certain foreign securities) of the market value, plus interest, if applicable, of investments on loan. It is the Funds’ policy to obtain additional collateral from or return excess collateral to the borrower by the end of the next business day, following the valuation date of the securities loaned. Therefore, the value of the collateral held may be temporarily less than the value of the securities on loan. Lending securities entails a risk of loss to the Funds if and to the extent that the market value of the securities loaned were to increase and the borrower did not increase the collateral accordingly, and the borrower fails to return the securities. Under the terms of the Program, the Funds are indemnified for such losses by BNYM. Cash collateral is held in a separate omnibus account managed by BNYM, who is authorized to exclusively enter into joint repurchase agreements. BNYM bears the risk of any deficiency in the amount of the cash collateral available for return to the borrower due to any loss on the collateral invested.
The value of securities loaned on positions held and cash collateral received at March 31, 2018, were as follows:
| | | | | | | | |
| Fund | | Securities
Loaned | | | Cash Collateral
Received | |
Brandywine | | $ | 7,399,789 | | | $ | 7,677,039 | |
5. COMMITMENTS AND CONTINGENCIES
Under the Trust’s organizational documents, its trustees and officers are indemnified against certain liabilities arising out of the performance of their duties to the Trust. In addition, in the normal course of business, the Funds may enter into contracts and agreements that contain a variety of representations and warranties, which provide general indemnifications. The maximum exposure to the Funds under these arrangements is unknown, as this would involve future claims that may be made against a Fund that have not yet occurred. However, based on experience, the Funds had no prior claims or losses and expect the risks of loss to be remote.
6. MASTER NETTING AGREEMENTS
The Funds may enter into master netting agreements with their counterparties for the securities lending program and Repurchase Agreements, which provide the right, in the event of default (including bankruptcy or insolvency) for the non-defaulting party to liquidate the collateral and calculate net exposure to the defaulting party or request additional collateral. For financial reporting purposes, the Funds do not offset financial assets and financial liabilities that are subject to master netting agreements in the Statement of Assets and Liabilities. For securities lending transactions, see Note 4.
22
|
| |
| |
| Notes to Financial Statements (continued) |
|
The following table is a summary of the Funds’ open Repurchase Agreements that are subject to a master netting agreement as of March 31, 2018:
| | | | | | | | | | | | | | | | |
| | | | | | Gross Amount Not Offset in the
Statement of Assets and Liabilities | | | | |
| Fund | | Net Amounts of Assets
Presented in the Statement
of Assets and Liabilities | | | Financial
Instruments
Collateral | | | Cash Collateral
Received | | | Net Amount | |
Brandywine | | | | | | | | | | | | | | | | |
BNP Paribas S.A. | | $ | 383,723 | | | $ | 383,723 | | | | — | | | | — | |
Daiwa Capital Markets Americas | | | 1,823,329 | | | | 1,823,329 | | | | — | | | | — | |
HSBC Securities, Inc. | | | 1,823,329 | | | | 1,823,329 | | | | — | | | | — | |
Jefferies LLC | | | 1,823,329 | | | | 1,823,329 | | | | — | | | | — | |
Nomura Securities International, Inc. | | | 1,823,329 | | | | 1,823,329 | | | | — | | | | — | |
| | | | | | | | | | | | | | | | |
Totals | | $ | 7,677,039 | | | $ | 7,677,039 | | | | — | | | | — | |
| | | | | | | | | | | | | | | | |
7. SUBSEQUENT EVENTS
The Funds have determined that no material events or transactions occurred through the issuance date of the Funds’ financial statements, which require an additional disclosure in or adjustment of the Funds’ financial statements.
23
THIS PAGE INTENTIONALLY LEFT BLANK
| | | | |
Investment Manager and Administrator AMG Funds LLC 600 Steamboat Road, Suite 300 Greenwich, CT 06830 800.835.3879 Distributor AMG Distributors, Inc. 600 Steamboat Road, Suite 300 Greenwich, CT 06830 800.835.3879 Subadvisor Friess Associates, LLC P.O. Box 576 Jackson, Wyoming 83001 Friess Associates of Delaware, LLC P.O. Box 4166 Greenville, DE 19807 Custodian The Bank of New York Mellon 111 Sanders Creek Parkway East Syracuse, NY 13057 | | Legal Counsel Ropes & Gray LLP Prudential Tower, 800 Boylston Street Boston, MA 02199-3600 Transfer Agent BNY Mellon Investment Servicing (US) Inc. Attn: AMG Funds P.O. Box 9769 Providence, RI 02940 800.548.4539 Trustees Bruce B. Bingham Christine C. Carsman Edward J. Kaier Kurt Keilhacker Steven J. Paggioli Richard F. Powers III Eric Rakowski Victoria Sassine Thomas R. Schneeweis | | This report is prepared for the Funds’ shareholders. It is authorized for distribution to prospective investors only when preceded or accompanied by an effective prospectus. To receive a free copy of the prospectus or Statement of Additional Information, which includes additional information about Fund Trustees, please contact us by calling 800.835.3879. Distributed by AMG Distributors, Inc., member FINRA/SIPC. Current net asset values per share for each Fund are available on the Funds’ website at amgfunds.com. A description of the policies and procedures each Fund uses to vote its proxies is available: (i) without charge, upon request, by calling 800.835.3879, or (ii) on the Securities and Exchange Commission’s (SEC) website at sec.gov. For information regarding the Funds’ proxy voting record for the 12-month period ended June 30, call 800.835.3879 or visit the SEC website at sec.gov. The Funds file their complete schedule of portfolio holdings with the SEC for the first and third quarters of each fiscal year on Form N-Q. The Funds’ Forms N-Q are available on the SEC’s website at sec.gov. A Fund’s Forms N-Q may be reviewed and copied at the SEC’s Public Reference Room in Washington, DC. Information on the operation of the Public Reference Room may be obtained by calling 1.800.SEC.0330. To review a complete list of the Funds’ portfolio holdings, or to view the most recent quarterly holdings report, semiannual report, or annual report, please visit amgfunds.com. |
| | | | | | |
AFFILIATE SUBADVISED FUNDS BALANCED FUNDS AMG Chicago Equity Partners Balanced Chicago Equity Partners, LLC AMG FQ Global Risk-Balanced First Quadrant, L.P. EQUITY FUNDS AMG FQ Tax-Managed U.S. Equity AMG FQ Long-Short Equity First Quadrant, L.P. AMG Frontier Small Cap Growth Frontier Capital Management Company, LLC AMG GW&K Small Cap Core AMG GW&K Small/Mid Cap AMG GW&K U.S. Small Cap Growth GW&K Investment Management, LLC AMG Renaissance International Equity AMG Renaissance Large Cap Growth The Renaissance Group LLC AMG River Road Dividend All Cap Value AMG River Road Dividend All Cap Value II AMG River Road Focused Absolute Value AMG River Road Long-Short AMG River Road Small-Mid Cap Value AMG River Road Small Cap Value River Road Asset Management, LLC AMG SouthernSun Small Cap AMG SouthernSun Global Opportunities AMG SouthernSun U.S. Equity SouthernSun Asset Management, LLC AMG Systematic Mid Cap Value Systematic Financial Management, L.P. AMG TimesSquare Emerging Markets Small Cap AMG TimesSquare International Small Cap AMG TimesSquare Mid Cap Growth AMG TimesSquare Small Cap Growth TimesSquare Capital Management, LLC | | | | AMG Trilogy Emerging Markets Equity AMG Trilogy Emerging Wealth Equity Trilogy Global Advisors, L.P. AMG Yacktman AMG Yacktman Focused AMG Yacktman Focused Fund - Security Selection Only AMG Yacktman Special Opportunities Yacktman Asset Management LP FIXED INCOME FUNDS AMG GW&K Core Bond AMG GW&K Enhanced Core Bond AMG GW&K Municipal Bond AMG GW&K Municipal Enhanced Yield GW&K Investment Management, LLC OPEN-ARCHITECTURE FUNDS ALTERNATIVE FUNDS AMG Managers Lake Partners LASSO Alternative Lake Partners, Inc. BALANCED FUNDS AMG Managers Montag & Caldwell Balanced Montag & Caldwell, LLC EQUITY FUNDS AMG Managers Brandywine AMG Managers Brandywine Advisors Mid Cap Growth AMG Managers Brandywine Blue Friess Associates, LLC AMG Managers Cadence Emerging Companies AMG Managers Cadence Mid Cap Cadence Capital Management, LLC AMG Managers CenterSquare Real Estate CenterSquare Investment Management, LLC AMG Managers Emerging Opportunities Lord, Abbett & Co. LLC WEDGE Capital Management L.L.P. Next Century Growth Investors LLC RBC Global Asset Management (U.S.) Inc. | | AMG Managers Essex Small/Micro Cap Growth Essex Investment Management Co., LLC AMG Managers Fairpointe ESG Equity AMG Managers Fairpointe Mid Cap Fairpointe Capital LLC AMG Managers Guardian Capital Global Dividend Guardian Capital LP AMG Managers LMCG Small Cap Growth LMCG Investments, LLC AMG Managers Montag & Caldwell Growth AMG Managers Montag & Caldwell Mid Cap Growth Montag & Caldwell, LLC AMG Managers Pictet International Pictet Asset Management Limited AMG Managers Silvercrest Small Cap Silvercrest Asset Management Group LLC AMG Managers Skyline Special Equities Skyline Asset Management, L.P. AMG Managers Special Equity Ranger Investment Management, L.P. Lord, Abbett & Co. LLC Smith Asset Management Group, L.P. Federated MDTA LLC AMG Managers Value Partners Asia Dividend Value Partners Hong Kong Limited FIXED INCOME FUNDS AMG Managers Amundi Intermediate Government AMG Managers Amundi Short Duration Government Amundi Pioneer Institutional Asset Management, Inc. AMG Managers Doubleline Core Plus Bond DoubleLine Capital LP AMG Managers Global Income Opportunity AMG Managers Loomis Sayles Bond Loomis, Sayles & Co., L.P. |
| | |
| | |
| amgfunds.com | | 033118 SAR073 |
| | |
| | SEMI-ANNUAL REPORT |
|
AMG Funds |
March 31, 2018 |
AMG Managers Brandywine Advisors Mid Cap Growth Fund Class N: BWAFX |
| | |
amgfunds.com | | |
| | 033118 SAR075 |
AMG Funds
Semi-Annual Report – March 31, 2018 (unaudited)
| | | | |
| |
TABLE OF CONTENTS | | PAGE | |
LETTER TO SHAREHOLDERS | | | 2 | |
| |
ABOUT YOUR FUND’S EXPENSES | | | 3 | |
| |
FUND PERFORMANCE | | | 4 | |
| |
FUND SNAPSHOTS, ROSES AND THORNS AND SCHEDULE OF PORTFOLIO INVESTMENTS | | | 5 | |
| |
FINANCIAL STATEMENTS | | | | |
| |
Statement of Assets and Liabilities | | | 9 | |
| |
Balance sheet, net asset value (NAV) per share computations and cumulative undistributed amounts | | | | |
| |
Statement of Operations | | | 10 | |
| |
Detail of sources of income, expenses, and realized and unrealized gains (losses) during the fiscal period | | | | |
| |
Statements of Changes in Net Assets | | | 11 | |
| |
Detail of changes in assets for the past two fiscal periods | | | | |
| |
Financial Highlights | | | 12 | |
| |
Historical net asset values per share, distributions, total returns, income and expense ratios, turnover ratios and net assets | | | | |
| |
Notes to Financial Statements | | | 13 | |
| |
Accounting and distribution policies, details of agreements and transactions with Fund management and affiliates, and descriptions of certain investment risks | | | | |
Nothing contained herein is to be considered an offer, sale or solicitation of an offer to buy shares of any series of the AMG Funds family of mutual funds. Such offering is made only by prospectus, which includes details as to offering price and other material information.
| | |
| | AMG Managers Brandywine Advisors Mid Cap Growth Fund |
DEAR FELLOW SHAREHOLDER:
The stock market’s extended period of calm came to an end during the March quarter, with major market indexes correcting for the first time in two years. While stocks regained all or most of their lost ground by the end of the period, volatility persisted as the key issues credited with sparking the decline remained unresolved.
AMG Managers Brandywine Advisors Mid Cap Growth Fund returned 0.08 percent in the three months through March. The S&P 500® and Russell Midcap® Indexes declined 0.76 and 0.46 percent, respectively, as the Russell Midcap® Growth Index added 2.17 percent.
The Federal Reserve (the Fed) kept rates unchanged at its January 31 meeting, but its post-meeting statement regarding inflation expectations seemed to raise the market’s sensitivity toward the topic. Two days later, the Labor Department reported a rise in average hourly wages. After notching its best January in 21 years, the S&P 500 Index was 10 percent below its high a little more than a week into February.
Volatility, virtually absent in 2017, spiked to its highest level since the summer of 2015 when China unexpectedly devalued the yuan. Newfound skittishness was on display as investors were forced to digest a series of unusual events against a backdrop of everything-is-great valuations.
News of Facebook user data poaching spurred calls for new tech-sector regulations. Amazon.com, which among many things is a government contractor trusted to store classified information for U.S. spy agencies, was targeted for official scorn via tweet. New tariffs raised fears about the possibility that the U.S. and China, the world’s two largest economies, could be on the verge of a trade war. The Fed ended up raising rates at its March 21 meeting.
As dramatic as it all might sound, final March-quarter returns showed an encouraging amount of resilience. Fourth-quarter earnings reports and, in many cases, the 2018 guidance that accompanied them provided reason for optimism.
The technology sector outperformed in the March quarter. Technology holdings represented the largest position in the Fund and contributed the most to absolute performance. They also were the most significant positive influence on results relative to the Russell Midcap® Growth Index.
Software makers drove technology performance, with holdings reporting significant, expectation-beating results. ServiceNow and Atlassian Corp. were standout performers. ServiceNow and Atlassian Corp. grew December-quarter earnings 46 and 44 percent, respectively, on revenue growth of 41 and 37 percent, exceeding expectations in both instances. Payment processing companies Worldpay and Global Payments, which topped expectations with 29 and 23 percent earnings growth, respectively, in the December quarter, were also notable performance contributors.
Health care holdings also contributed to total return. Zoetis, which makes medicines and vaccines for animals, was a top contributor. The company beat estimates with 47 percent December-quarter earnings growth and raised earnings and revenue guidance.
Industrial holdings, which comprised the Fund’s second largest position, detracted the most from absolute and relative returns. The Fund was modestly overweight in the sector versus the benchmark.
Oshkosh Corp. reported robust December-quarter earnings growth, exceeded expectations and raised guidance for its fiscal year ending in September. Still, shares declined amid the emergence of steel tariffs – the company makes commercial specialty vehicles – and what appeared to be waning prospects for broad infrastructure spending in the near term. Cummins, which makes engines, and MasTec, an infrastructure construction company, fared similarly in the uncertainty.
Consumer discretionary holdings, the third largest concentration of assets, were the second greatest detractors from absolute and relative returns. Discount retailer Dollar Tree reported 39 percent December-quarter earnings growth, but its shares declined when it cited higher payroll and distribution costs as reasons for a cautious 2018 outlook. Likewise, Children’s Place impressed by beating estimates with 34 percent January-quarter earnings growth, but investors turned when it announced increased spending on digital initiatives, supply chain optimization and a new partnership in China.
For more information on companies that influenced March-quarter performance, please see Roses & Thorns on page 6.
Technology, industrial and consumer discretionary holdings represent the largest positions in the Fund at the start of the June quarter. For more information on the Fund’s portfolio characteristics, please see page 5.
Amid concerns about inflation and trade tension, we expect the heightened volatility that emerged in the early months of the year to persist. We plan to be vigilant regarding valuations, as the market’s tempered risk tolerance could prompt some level of repricing, particularly among long-tenured leadership groups. We also plan to capitalize on volatility with a goal to optimize entry and exit points as the Fund evolves with the earnings landscape.
That said, the earnings environment appears strong enough to stand out despite the noise. Based on consensus estimates, the average 2018 earnings growth rate of the Fund’s portfolio companies is 25.1 percent.
Thanks for your support. We’re committed to building on recent results on your behalf.
|
|
Scott Gates |
Chief Investment Officer |
Friess Associates, LLC |
2
|
| |
| |
| About Your Fund’s Expenses (unaudited) |
| | | | |
As a shareholder of a Fund, you may incur two types of costs: (1) transaction costs, which may include sales charges (loads) on purchase payments; redemption fees; and exchange fees; and (2) ongoing costs, including management fees; distribution (12b-1) fees; and other Fund expenses. This example is intended to help you understand your ongoing costs (in dollars) of investing in the Fund and to compare these costs with the ongoing costs of investing in other mutual funds. The example is based on $1,000 invested at the beginning of the period and held for the entire period as indicated below. ACTUAL EXPENSES The first line of the following table provides information about the actual account values and | | actual expenses. You may use the information in this line, together with the amount you invested, to estimate the expenses that you paid over the period. Simply divide your account value by $1,000 (for example, an $8,600 account value divided by $1,000 = 8.6), then multiply the result by the number in the first line under the heading entitled “Expenses Paid During Period” to estimate the expenses you paid on your account during this period. HYPOTHETICAL EXAMPLE FOR COMPARISON PURPOSES The second line of the following table provides information about hypothetical account values and hypothetical expenses based on the Fund’s actual expense ratio and an assumed annual rate of return of 5% before expenses, which is not the Fund’s | | actual return. The hypothetical account values and expenses may not be used to estimate the actual ending account balance or expenses you paid for the period. You may use this information to compare the ongoing costs of investing in the Fund and other funds by comparing this 5% hypothetical example with the 5% hypothetical examples that appear in the shareholder reports of other funds. Please note that the expenses shown in the table are meant to highlight your ongoing costs only and do not reflect any transactional costs, such as sales charges (loads), redemption fees, or exchange fees. Therefore, the second line of the table is useful in comparing ongoing costs only, and will not help you determine the relative total costs of owning different funds. |
| | |
| | |
| | |
| | |
| | |
| | | | | | | | | | | | | | | | |
Six Months Ended March 31, 2018 | | Expense
Ratio for
the Period | | | Beginning
Account
Value
10/01/17 | | | Ending
Account
Value
03/31/18 | | | Expenses
Paid
During
the Period* | |
AMG Managers Brandywine Advisors Mid Cap Growth Fund | | | | | |
Based on Actual Fund Return | | | | | | | | | | | | | |
Class N | | | 1.13 | % | | $ | 1,000 | | | $ | 1,059 | | | $ | 5.80 | |
Based on Hypothetical 5% Annual Return | | | | | | | | | |
Class N | | | 1.13 | % | | $ | 1,000 | | | $ | 1,019 | | | $ | 5.69 | |
* Expenses are equal to the Fund’s annualized expense ratio multiplied by the average account value over the period, multiplied by the number of days in the most recent fiscal half-year (182), then divided by 365. | |
3
|
|
| Fund Performance (unaudited) |
| Periods ended March 31, 2018 |
The table below shows the average annual total returns for the periods indicated for the Fund, as well as the Fund’s relative index for the same time periods ended March 31, 2018.
| | | | | | | | | | | | | | | | |
| Average Annual Total Returns1 | | Six
Months* | | | One Year | | | Five
Years | | | Ten Years | |
AMG Managers Brandywine Advisors Mid Cap Growth Fund2, 3, 4, 5, 6, 7 | | | | | | | | | | | | | |
Class N | | | 5.92 | % | | | 17.98 | % | | | 7.52 | % | | | 1.63 | % |
Russell Midcap® Growth Index8 | | | 9.13 | % | | | 19.74 | % | | | 13.31 | % | | | 10.61 | % |
Russell Midcap® Index9 | | | 5.58 | % | | | 12.20 | % | | | 12.09 | % | | | 10.21 | % |
S&P 500 Index10 | | | 5.84 | % | | | 13.99 | % | | | 13.31 | % | | | 9.49 | % |
The performance data shown represents past performance. Past performance is not a guarantee of future results. Current performance may be lower or higher than the performance data quoted. The investment return and principal value of an investment will fluctuate so that an investor’s shares, when redeemed, may be worth more or less than their original cost.
Investors should carefully consider the Fund’s investment objectives, risks, charges and expenses before investing. For performance information through the most recent month end, current net asset values per share for the Fund and other information, please call 800.835.3879 or visit our website at amgfunds.com for a free prospectus. Read it carefully before investing or sending money.
Distributed by AMG Distributors, Inc., member FINRA/SIPC.
| 1 | Total return equals income yield plus share price change and assumes reinvestment of all dividends and capital gain distributions. Returns are net of fees and may reflect offsets of Fund expenses as described in the prospectus. No adjustment has been made for taxes payable by shareholders on their reinvested dividends and capital gain distributions. Returns for periods greater than one year are annualized. The listed returns on the Fund are net of expenses and based on the published NAV as of March 31, 2018. All returns are in U.S. dollars ($). |
| 2 | The Fund inception dates and returns for all periods beginning prior to October 1, 2013, reflect performance of the predecessor Fund, Brandywine Advisors Midcap Growth Fund, which was managed by Friess Associates, LLC with the same investment objectives and substantially similar investment policies. |
| 3 | The Fund is subject to risks associated with investments in mid-capitalization companies such as greater price volatility, lower trading volume, and less liquidity than the stocks of larger, more established companies. |
| 4 | Active and frequent trading of a fund may result in higher transaction costs and increased tax liability. |
| 5 | A greater percentage of the Fund’s holdings may be focused in a smaller number of securities which may place the Fund at greater risk than a more diversified fund. |
| 6 | The Fund invests in growth stocks, which may be more sensitive to market movements because their prices tend to reflect future investor expectations rather than just current profits. |
| 7 | Investments in international securities are subject to certain risks of overseas investing including currency fluctuations and changes in political and economic conditions, which could result in significant market fluctuations. |
| 8 | The Russell Midcap® Growth Index measures the performance of those Russell Midcap companies with higher price/book ratios and higher forecasted growth values. The stocks are also members of the Russell 1000® Growth Index. Unlike the Fund, the Russell Midcap® Growth Index is unmanaged, is not available for investment, and does not incur expenses. |
| 9 | The Russell Midcap® Index measures the performance of the 800 smallest companies in the Russell 1000® Index, which represent approximately 25% of the total market capitalization of the Russell 1000 Index. Unlike the Fund, the Russell Midcap® Index is unmanaged, is not available for investment, and does not incur expenses. |
| 10 | The S&P 500 Index is a capitalization-weighted index of 500 stocks. The S&P 500 Index is designed to measure performance of the broad domestic economy through changes in the aggregate market value of 500 stocks representing all major industries. Unlike the Fund, the S&P 500 Index is unmanaged, is not available for investment, and does not incur expenses. |
The Russell Indices are trademarks of the London Stock Exchange Group companies.
The S&P 500 Index is proprietary data of Standard & Poor’s, a division of McGraw-Hill Companies, Inc. All rights reserved.
Not FDIC insured, nor bank guaranteed. May lose value.
4
|
| AMG Managers Brandywine Advisors Mid Cap Growth Fund |
| Fund Snapshots (unaudited) |
| March 31, 2018 |
PORTFOLIO BREAKDOWN
| | | | | | | | | | | | | | | | |
Industry (Top Ten) | | Brandywine
Advisors
Mid Cap
Growth
Fund* | | | Russell
Midcap®
Growth
Index | | | Russell
Midcap®
Index | | | S&P
500
Index | |
Life Sciences Tools & Services | | | 8.2 | % | | | 3.0 | % | | | 1.9 | % | | | 0.9 | % |
Data Processing & Outsourced Services | | | 7.1 | % | | | 7.2 | % | | | 3.6 | % | | | 2.9 | % |
Semiconductors | | | 6.4 | % | | | 4.5 | % | | | 2.4 | % | | | 3.7 | % |
Construction & Engineering | | | 6.1 | % | | | 0.0 | %# | | | 0.4 | % | | | 0.1 | % |
Communications Equipment | | | 5.1 | % | | | 1.4 | % | | | 1.1 | % | | | 1.1 | % |
Application Software | | | 5.0 | % | | | 4.4 | % | | | 2.4 | % | | | 1.4 | % |
Construction Machinery & Heavy Trucks | | | 4.6 | % | | | 0.7 | % | | | 1.1 | % | | | 0.6 | % |
General Merchandise Stores | | | 4.1 | % | | | 1.0 | % | | | 0.7 | % | | | 0.4 | % |
Footwear | | | 3.9 | % | | | 0.1 | % | | | 0.1 | % | | | 0.4 | % |
Packaged Foods & Meats | | | 3.7 | % | | | 1.7 | % | | | 2.0 | % | | | 1.0 | % |
Other Common Stock | | | 42.0 | % | | | 76.0 | % | | | 84.3 | % | | | 87.5 | % |
Short-Term Investments | | | 3.3 | % | | | 0.0 | % | | | 0.0 | % | | | 0.0 | % |
Other Assets Less Liabilities | | | 0.5 | % | | | 0.0 | % | | | 0.0 | % | | | 0.0 | % |
| * | As a percentage of net assets. |
PORTFOLIO MARKET CAPITALIZATION
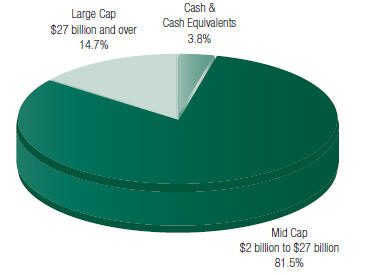
TOP TEN HOLDINGS
| | | | | | | | |
Security Name | | % of
Net Assets | | | % Change from
Book Cost | |
Ciena Corp. | | | 3.0 | | | | 3.7 | |
ServiceNow, Inc. | | | 2.9 | | | | 82.5 | |
Atlassian Corp. PLC, Class A (Australia) | | | 2.9 | | | | 77.5 | |
Worldpay, Inc., Class A | | | 2.8 | | | | 78.7 | |
Zoetis, Inc. | | | 2.6 | | | | 55.6 | |
Green Dot Corp., Class A | | | 2.5 | | | | 33.1 | |
ManpowerGroup, Inc. | | | 2.4 | | | | (11.2 | ) |
Knight-Swift Transportation Holdings, Inc. | | | 2.4 | | | | 1.3 | |
Cummins, Inc. | | | 2.4 | | | | (6.1 | ) |
PRA Health Sciences, Inc. | | | 2.4 | | | | 25.8 | |
| | | | | | | | |
Top Ten as a Group | | | 26.3 | | | | | |
| | | | | | | | |
ESTIMATED EARNINGS GROWTH RATE OF THE FUND’S INVESTMENTS
Forecasted Increase in Earnings Per Share 2018 vs 2017
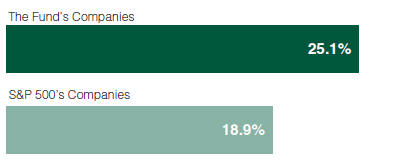
Source: Consensus estimates from FactSet Research Systems Inc.
This is not a forecast of the Fund’s future performance. Earnings growth for a Fund holding does not guarantee a corresponding increase in the market value of the holding or the Fund.
Because a fund’s strategy may result in multiple investments in particular sectors of the economy, its performance may depend on the performance of those sectors and may fluctuate more widely than investments diversified across more sectors. For additional information on these and other risk considerations, please see the Fund’s prospectus.
Any sectors, industries, or securities discussed should not be perceived as investment recommendations. Mention of a specific security should not be considered a recommendation to buy or solicitation to sell that security. Specific securities mentioned in this report may have been sold from the Fund’s portfolio of investments by the time you receive this report.
5
|
| AMG Managers Brandywine Advisors Mid Cap Growth Fund |
| Roses and Thorns (unaudited) |
| Quarter Ending March 31, 2018 |
| | | | | | |
$ Gain (in millions) | | % Gain | | Biggest $ Winners | | Reason for Move |
| $0.9 | | 33.9% | | Proofpoint Inc. (PFPT) |
| | | | The provider of cloud-based security and compliance solutions increased revenue 36 percent in the December quarter. The company increased market share through organic growth and acquisition. We sold Proofpoint when it hit our price target. |
| | |
| $0.8 | | 26.9% | | ServiceNow Inc. (NOW) |
| | | | The provider of cloud-based services that automate enterprise technology operations grew December-quarter earnings 46 percent. Revenue rose 41 percent. Growth in renewal rates and new subscriptions helped drive results. The company also raised 2018 revenue guidance. |
| | |
| $0.6 | | 18.5% | | Atlassian Corp. Plc (TEAM) |
| | | | The enterprise software company grew December-quarter earnings 44 percent, topping the consensus estimate. A record number of new customers drove solid demand across Atlassian’s cloud, server and data center operations. |
| | |
| $0.5 | | 15.9% | | Zoetis Inc. (ZTS) |
| | | | The animal health medicine and vaccine developer grew December-quarter earnings 47 percent, topping the consensus estimate. Strong revenue growth from both U.S. and international markets drove results. The company also provided earnings and revenue guidance above investor expectations. |
| | |
| $0.5 | | 16.6% | | Bio-Techne Corp. (TECH) |
| | | | The company, which makes proteins, reagents and instruments used in the research and clinical diagnostic markets, grew December-quarter earnings 26 percent, exceeding the consensus estimate. In addition to the strong results, the recently passed omnibus spending bill included the largest increase in research funding in more than a decade, which investors viewed as a positive influence on future demand. |
| | | |
$Loss (in millions) | | % Loss | | Biggest $ Losers | | Reason for Move |
| | |
| $0.9 | | 30.2% | | Patterson-UTI Energy Inc. (PTEN) |
| | | | The onshore contract drilling company reported December-quarter revenue of $787 million, up from $305 million in the year-ago period and ahead of the consensus estimate. Shares declined on concerns that increasing capital expenditures would lower cash returns and that uncertain commodity prices could threaten the overall pace of a recovery in the energy sector. We sold Patterson-UTI to fund a new opportunity with greater visibility. |
| | |
| $0.5 | | 14.8% | | Oshkosh Corp. (OSK) |
| | | | The manufacturer of commercial specialty vehicles reported December-quarter earnings of $0.84 per share versus $0.26 the year before, exceeding the consensus estimate. The company also raised fiscal year earnings and revenue guidance. Shares came under pressure amid concerns about steel tariffs and dimming prospects for widespread infrastructure spending. |
| | |
| $0.4 | | 11.2% | | Manpower Group Inc. (MAN) |
| | | | The provider of workforce solutions and services grew December-quarter earnings 13 percent, topping the consensus estimate. The company continued to experience strong demand in Europe, where it generates two-thirds of revenue. Shares traded lower after management guided investors to expect flat operating profit margins, an outlook that was slightly below expectations. |
| | |
| $0.4 | | 11.6% | | Dollar Tree Inc. (DLTR) |
| | | | The discount variety store operator grew January-quarter earnings 39 percent. Shares traded lower when the company released cautious 2018 earnings guidance due to higher payroll and distribution costs. Still, the company noted that employment trends should enhance sales potential. |
| | |
| $0.3 | | 9.0% | | Zimmer Biomet Holdings Inc. (ZBH) |
| | | | The provider of orthopaedic reconstructive surgical products reported December-quarter earnings of $2.10 per share, meeting the consensus estimate. The company tempered revenue guidance for the upcoming quarter, putting pressure on shares. |
All gains/losses are calculated on an average cost basis from December 31, 2017 through March 31, 2018.
This commentary reflects the viewpoints of Friess Associates, LLC as of March 31, 2018 and is not intended as a forecast or guarantee of future results.
6
|
| AMG Managers Brandywine Advisors Mid Cap Growth Fund |
| Schedule of Portfolio Investments (unaudited) |
| March 31, 2018 |
|
| | | | | | | | | | | | |
Shares | | | | | Cost | | | Value | |
| | Common Stocks - 96.2% | | | | | | | | |
| | Consumer Discretionary | | | | | | | | |
| | | | Apparel Retail - 3.7% | | | | | | | | |
| | 113,685 | | | American Eagle Outfitters, Inc. | | $ | 1,526,361 | | | $ | 2,265,742 | |
| | 21,040 | | | The Children’s Place, Inc. | | | 2,545,659 | | | | 2,845,660 | |
| | | | Cable & Satellite - 1.5% | | | | | | | | |
| | 6,618 | | | Charter Communications, Inc., Class A* | | | 1,546,808 | | | | 2,059,654 | |
| | | | Footwear - 3.9% | | | | | | | | |
| | 70,900 | | | Skechers U.S.A., Inc., Class A* | | | 2,817,089 | | | | 2,757,301 | |
| | 89,700 | | | Wolverine World Wide, Inc. | | | 2,511,526 | | | | 2,592,330 | |
| | | | General Merchandise Stores - 4.1% | | | | | | | | |
| | 28,615 | | | Dollar Tree, Inc.* | | | 2,085,622 | | | | 2,715,563 | |
| | 48,540 | | | Ollie’s Bargain Outlet Holdings, Inc.* | | | 2,123,071 | | | | 2,926,962 | |
| | | | Homebuilding - 1.5% | | | | | | | | |
| | 46,700 | | | D.R. Horton, Inc. | | | 2,055,819 | | | | 2,047,328 | |
| | | | Hotels, Resorts & Cruise Lines - 1.2% | | | | | |
| | 29,500 | | | Norwegian Cruise Line Holdings, Ltd.* | | | 1,562,450 | | | | 1,562,615 | |
| | | | Leisure Facilities - 1.9% | | | | | | | | |
| | 11,880 | | | Vail Resorts, Inc. | | | 2,595,482 | | | | 2,633,796 | |
| | | | Movies & Entertainment - 3.5% | | | | | | | | |
| | 69,075 | | | Liberty Media Corp.-Liberty Formula One, Class C* | | | 2,484,790 | | | | 2,130,964 | |
| | 61,435 | | | Live Nation Entertainment, Inc.* | | | 2,638,912 | | | | 2,588,871 | |
| | | | | | | | | | | | |
| | Total Consumer Discretionary | | | 26,493,589 | | | | 29,126,786 | |
| | | | This sector is 9.9% above your Fund’s cost. | | | | | | | | |
| | Consumer Staples | | | | | | | | |
| | | | Packaged Foods & Meats - 3.7% | | | | | | | | |
| | 22,000 | | | The JM Smucker Co. | | | 2,737,327 | | | | 2,728,220 | |
| | 153,035 | | | Nomad Foods, Ltd. (United Kingdom)* | | | 2,204,854 | | | | 2,408,771 | |
| | | | | | | | | | | | |
| | Total Consumer Staples | | | 4,942,181 | | | | 5,136,991 | |
| | | | This sector is 3.9% above your Fund’s cost. | | | | | | | | |
| | Financials | | | | | | | | |
| | | | Consumer Finance - 2.5% | | | | | | | | |
| | 53,000 | | | Green Dot Corp., Class A* | | | 2,554,070 | | | | 3,400,480 | |
| | | | This sector is 33.1% above your Fund’s cost. | | | | | | | | |
| | Health Care | | | | | | | | |
| | | | Biotechnology - 2.0% | | | | | | | | |
| | 32,495 | | | Incyte Corp.* | | | 2,875,247 | | | | 2,707,809 | |
| | | | Health Care Equipment - 2.2% | | | | | | | | |
| | 21,335 | | | Edwards Lifesciences Corp.* | | | 2,702,518 | | | | 2,976,659 | |
| | | | Life Sciences Tools & Services - 8.2% | | | | | | | | |
| | 44,855 | | | Agilent Technologies, Inc. | | | 3,033,979 | | | | 3,000,800 | |
| | 20,981 | | | Bio-Techne Corp. | | | 2,427,672 | | | | 3,168,970 | |
| | | | | | | | | | | | |
Shares | | | | | Cost | | | Value | |
| | 39,400 | | | PRA Health Sciences, Inc.* | | $ | 2,597,647 | | | $ | 3,268,624 | |
| | 8,531 | | | Thermo Fisher Scientific, Inc. | | | 1,134,218 | | | | 1,761,310 | |
| | | | Pharmaceuticals - 2.6% | | | | | | | | |
| | 43,800 | | | Zoetis, Inc. | | | 2,351,483 | | | | 3,657,738 | |
| | | | | | | | | | | | |
| | Total Health Care | | | 17,122,764 | | | | 20,541,910 | |
| | | | This sector is 20.0% above your Fund’s cost. | | | | |
| | Industrials | | | | | | | | |
| | | | Aerospace & Defense - 1.3% | | | | | | | | |
| | 36,154 | | | Mercury Systems, Inc.* | | | 1,513,518 | | | | 1,746,961 | |
| | | | Agricultural & Farm Machinery - 0.9% | | | | | |
| | 102,325 | | | CNH Industrial N.V. (United Kingdom) | | | 1,536,760 | | | | 1,268,830 | |
| | | | Air Freight & Logistics - 2.0% | | | | | | | | |
| | 27,300 | | | XPO Logistics, Inc.* | | | 2,769,268 | | | | 2,779,413 | |
| | | | Construction & Engineering - 6.1% | | | | | | | | |
| | 47,770 | | | Jacobs Engineering Group, Inc. | | | 2,946,967 | | | | 2,825,595 | |
| | 59,670 | | | MasTec, Inc.* | | | 2,369,264 | | | | 2,807,474 | |
| | 76,810 | | | Quanta Services, Inc.* | | | 2,678,775 | | | | 2,638,424 | |
| | | | Construction Machinery & Heavy Trucks - 4.6% | | | | | |
| | 20,225 | | | Cummins, Inc. | | | 3,492,917 | | | | 3,278,270 | |
| | 39,010 | | | Oshkosh Corp. | | | 2,745,770 | | | | 3,014,303 | |
| | | | Electrical Components & Equipment - 1.9% | | | | | |
| | 14,835 | | | Rockwell Automation, Inc. | | | 2,799,574 | | | | 2,584,257 | |
| | | | Human Resource & Employment Services - 2.4% | | | | | |
| | 28,888 | | | ManpowerGroup, Inc. | | | 3,742,601 | | | | 3,325,009 | |
| | | | Trading Companies & Distributors - 2.1% | | | | | |
| | 16,580 | | | United Rentals, Inc.* | | | 2,055,236 | | | | 2,863,863 | |
| | | | Trucking - 2.4% | | | | | | | | |
| 71,520 | | | Knight-Swift Transportation
Holdings, Inc. | | 3,247,612 | | | 3,290,635 | |
| | | | | | | | | | | | |
| | Total Industrials | | | 31,898,262 | | | | 32,423,034 | |
| | | | This sector is 1.6% above your Fund’s cost. | | | | | |
| | Information Technology | | | | | | | | |
| | | | Application Software - 5.0% | | | | | | | | |
| | 73,452 | | | Atlassian Corp. PLC, Class A (Australia)* | | | 2,231,206 | | | | 3,960,532 | |
| | 29,040 | | | Blackbaud, Inc. | | | 2,638,750 | | | | 2,956,562 | |
| | | | Communications Equipment - 5.1% | | | | | |
| | 108,100 | | | ARRIS International PLC* | | | 2,862,492 | | | | 2,872,217 | |
| | 158,900 | | | Ciena Corp.* | | | 3,967,460 | | | | 4,115,510 | |
| | | | Data Processing & Outsourced Services - 7.1% | | | | | |
| | 57,976 | | | Black Knight, Inc.* | | | 1,508,143 | | | | 2,730,670 | |
| | 28,555 | | | Global Payments, Inc. | | | 2,106,166 | | | | 3,184,453 | |
| | 45,824 | | | Worldpay, Inc., Class A* | | | 2,108,842 | | | | 3,768,566 | |
7
|
| |
| AMG Managers Brandywine Advisors Mid Cap Growth Fund |
| Schedule of Portfolio Investments (continued) |
|
| | | | | | | | | | | | |
Shares | | | | | Cost | | | Value | |
| | Information Technology (continued) | | | | | | | | |
| | | | Home Entertainment Software - 1.5% | |
| | 21,000 | | | Take-Two Interactive Software, Inc.* | | $ | 1,985,239 | | | $ | 2,053,380 | |
| | | | Internet Software & Services - 2.0% | |
| | 24,000 | | | LogMeIn, Inc. | | | 2,472,789 | | | | 2,773,200 | |
| | | | Semiconductors - 6.4% | | | | | | | | |
| | 13,185 | | | Broadcom, Ltd. | | | 1,155,180 | | | | 3,107,045 | |
| | 11,193 | | | NVIDIA Corp. | | | 1,249,605 | | | | 2,592,187 | |
| | 42,635 | | | Xilinx, Inc. | | | 2,920,848 | | | | 3,079,953 | |
| | | | Systems Software - 2.9% | | | | | | | | |
| | 23,938 | | | ServiceNow, Inc.* | | | 2,170,633 | | | | 3,960,542 | |
| | | | | | | | | | | | |
| | | | Total Information Technology | | | 29,377,353 | | | | 41,154,817 | |
| | | | This sector is 40.1% above your Fund’s cost. | | | | | | | | |
| | Total Common Stocks | | | 112,388,219 | | | | 131,784,018 | |
| * | Non-income producing security. |
| 1 | Represents yield to maturity at March 31, 2018. |
| | | | | | | | | | | | |
Principal Amount | | | | | Cost | | | Value | |
| | Short-Term Investments - 3.3% | | | | | | | | |
| | | | Commercial Paper - 3.2% | | | | | | | | |
| | $4,434,000 | | | Energy Transfer LP, 2.65%, 04/02/181 | | $ | 4,433,674 | | | $ | 4,433,674 | |
| | | |
Shares | | | | | | | | | |
| | | | Other Investment Companies - 0.1% | | | | | | | | |
| | 101,997 | | | Dreyfus Government Cash Management Fund, Institutional Class Shares, 1.54%2 | | | 101,997 | | | | 101,997 | |
| | | | | | | | | | | | |
| | | | Total Short-Term Investments | | | 4,535,671 | | | | 4,535,671 | |
| | Total Investments - 99.5% | | $ | 116,923,890 | | | | 136,319,689 | |
| | Other Assets, less Liabilities - 0.5% | | | | | | | 666,806 | |
| | Total Net Assets - 100.0% | | | | | | $ | 136,986,495 | |
| | | | | | | | | | | | |
| 2 | Yield shown represents the March 31, 2018, seven day average yield, which refers to the sum of the previous seven days’ dividends paid, expressed as an annual percentage. |
The following table summarizes the inputs used to value the Fund’s investments by the fair value hierarchy levels as of March 31, 2018:
| | | | | | | | | | | | | | | | |
| | | Level 1 | | | Level 2 | | | Level 3 | | | Total | |
Investments in Securities | | | | | | | | | | | | | | | | |
Common Stocks† | | $ | 131,784,018 | | | | — | | | | — | | | $ | 131,784,018 | |
Short-Term Investments | | | | | | | | | | | | | | | | |
Commercial Paper | | | — | | | $ | 4,433,674 | | | | — | | | | 4,433,674 | |
Other Investment Companies | | | 101,997 | | | | — | | | | — | | | | 101,997 | |
| | | | | | | | | | | | | | | | |
Total Investments in Securities | | $ | 131,886,015 | | | $ | 4,433,674 | | | | — | | | $ | 136,319,689 | |
| | | | | | | | | | | | | | | | |
| † | All common stocks held in the Fund are Level 1 securities. For a detailed breakout of common stocks by major industry classification, please refer to the Fund’s Schedule of Portfolio Investments. |
As of March 31, 2018, the Fund had no transfers between levels from the beginning of the reporting period.
8
|
| |
| Statement of Assets and Liabilities (unaudited) |
| March 31, 2018 |
|
| | | | |
| | | AMG
Managers
Brandywine Advisors
Mid Cap
Growth Fund | |
Assets: | | | | |
Investments at Value* | | $ | 136,319,689 | |
Cash | | | 286 | |
Receivable for investments sold | | | 1,912,602 | |
Dividend, interest and other receivables | | | 31,503 | |
Receivable for Fund shares sold | | | 254 | |
Prepaid expenses | | | 12,114 | |
Total assets | | | 138,276,448 | |
Liabilities: | | | | |
Payable for investments purchased | | | 1,099,189 | |
Payable for Fund shares repurchased | | | 10,952 | |
Accrued expenses: | | | | |
Investment advisory and management fees | | | 104,568 | |
Administrative fees | | | 17,824 | |
Distribution fees | | | 547 | |
Shareholder service fees | | | 297 | |
Professional fees | | | 29,191 | |
Other | | | 27,385 | |
Total liabilities | | | 1,289,953 | |
Net Assets | | $ | 136,986,495 | |
* Investments at cost | | $ | 116,923,890 | |
Net Assets Represent: | | | | |
Paid-in capital | | $ | 121,637,559 | |
Accumulated net investment loss | | | (924,421 | ) |
Accumulated net realized loss from investments | | | (3,122,442 | ) |
Net unrealized appreciation on investments | | | 19,395,799 | |
Net Assets | | $ | 136,986,495 | |
| |
Class N: | | | | |
Net Assets | | $ | 136,986,495 | |
Shares outstanding | | | 11,604,015 | |
Net asset value, offering and redemption price per share | | $ | 11.81 | |
9
|
| |
| Statement of Operations (unaudited) |
| For the six months ended March 31, 2018 |
|
| | | | |
| | | AMG
Managers
Brandywine Advisors
Mid Cap
Growth Fund | |
Investment Income: | | | | |
Dividend income | | $ | 372,046 | |
Interest income | | | 69,274 | |
Securities lending income | | | 7,352 | |
Total investment income | | | 448,672 | |
Expenses: | | | | |
Investment advisory and management fees | | | 602,929 | |
Administrative fees | | | 102,772 | |
Distribution fees - Class N | | | 3,152 | |
Shareholder servicing fees - Class N | | | 1,713 | |
Professional fees | | | 24,113 | |
Registration fees | | | 12,898 | |
Reports to shareholders | | | 11,391 | |
Custodian fees | | | 6,665 | |
Trustee fees and expenses | | | 4,548 | |
Transfer agent fees | | | 1,779 | |
Miscellaneous | | | 1,984 | |
Net expenses | | | 773,944 | |
Net investment loss | | | (325,272 | ) |
Net Realized and Unrealized Gain: | | | | |
Net realized gain on investments | | | 9,755,476 | |
Net change in unrealized appreciation/depreciation on investments | | | (1,832,839 | ) |
Net realized and unrealized gain | | | 7,922,637 | |
Net increase in net assets resulting from operations | | $ | 7,597,365 | |
10
|
| |
| Statements of Changes in Net Assets |
| For the six months ended March 31, 2018 (unaudited) and the fiscal year ended September 30, 2017 |
|
| | | | | | | | |
| | | AMG
Managers
Brandywine Advisors
Mid Cap Growth Fund | |
| | | March 31, 2018 | | | September 30, 20171 | |
Increase in Net Assets Resulting From Operations: | | | | | | | | |
Net investment loss | | $ | (325,272 | ) | | $ | (790,066 | ) |
Net realized gain on investments | | | 9,755,476 | | | | 17,852,140 | |
Net change in unrealized appreciation/depreciation on investments | | | (1,832,839 | ) | | | 5,539,078 | |
Net increase in net assets resulting from operations | | | 7,597,365 | | | | 22,601,152 | |
Capital Share Transactions:2 | | | | | | | | |
Net decrease from capital share transactions | | | (143,261 | ) | | | (25,862,265 | ) |
Total increase (decrease) in net assets | | | 7,454,104 | | | | (3,261,113 | ) |
Net Assets: | | | | | | | | |
Beginning of period | | | 129,532,391 | | | | 132,793,504 | |
End of period | | $ | 136,986,495 | | | $ | 129,532,391 | |
End of period accumulated net investment loss | | $ | (924,421 | ) | | $ | (599,149 | ) |
| | | | | | | | |
| 1 | Effective October 1, 2016, the Fund’s share class was reclassified and redesignated as described in Note 1 of the Notes to the Financial Statements. |
| 2 | See Note 1(g) of the Notes to Financial Statements. |
11
|
| AMG Managers Brandywine Advisors Mid Cap Growth Fund |
| Financial Highlights |
| For a share outstanding throughout each fiscal period |
|
| | | | | | | | | | | | | | | | | | | | | | | | |
| | | For the six
months ended
March 31, 2018 | | | For the fiscal year ended September 30, | |
| Class N | | (unaudited) | | | 20171 | | | 2016 | | | 2015 | | | 20142 | | | 2013 | |
Net Asset Value, Beginning of Period | | $ | 11.15 | | | $ | 9.35 | | | $ | 9.26 | | | $ | 9.59 | | | $ | 8.80 | | | $ | 7.63 | |
Income (loss) from Investment Operations: | | | | | | | | | | | | | | | | | | | | | | | | |
Net investment income (loss)3 | | | (0.03 | ) | | | (0.06 | ) | | | (0.03 | ) | | | 0.03 | 4 | | | (0.05 | ) | | | (0.02 | ) |
Net realized and unrealized gain (loss) on investments | | | 0.69 | | | | 1.86 | | | | 0.12 | | | | (0.36 | ) | | | 0.84 | | | | 1.20 | |
Total income (loss) from investment operations | | | 0.66 | | | | 1.80 | | | | 0.09 | | | | (0.33 | ) | | | 0.79 | | | | 1.18 | |
Less Distributions to Shareholders from: | | | | | | | | | | | | | | | | | | | | | | | | |
Net investment income | | | — | | | | — | | | | — | | | | — | | | | — | | | | (0.01 | ) |
Net Asset Value, End of Period | | $ | 11.81 | | | $ | 11.15 | | | $ | 9.35 | | | $ | 9.26 | | | $ | 9.59 | | | $ | 8.80 | |
Total Return5 | | | 5.92 | %6 | | | 19.25 | % | | | 0.97 | % | | | (3.44 | )% | | | 8.98 | % | | | 15.43 | % |
Ratio of net expenses to average net assets | | | 1.13 | %7 | | | 1.15 | % | | | 1.15 | % | | | 1.14 | % | | | 1.12 | % | | | 1.22 | % |
Ratio of net investment income (loss) to average net assets | | | (0.47 | )%7 | | | (0.62 | )% | | | (0.33 | )% | | | 0.28 | % | | | (0.54 | )% | | | (0.20 | )% |
Portfolio turnover | | | 72 | %6 | | | 215 | % | | | 195 | % | | | 204 | % | | | 249 | % | | | 235 | % |
Net assets end of period (000’s) omitted | | $ | 136,986 | | | $ | 129,532 | | | $ | 132,794 | | | $ | 143,205 | | | $ | 148,847 | | | $ | 137,246 | |
| | | | | | | | | | | | | | | | | | | | | | | | |
| 1 | Effective October 1, 2016, the Fund’s shares were reclassified and redesignated to Class N shares. |
| 2 | At the start of business October 1, 2013, AMG Managers Brandywine Advisors Midcap Growth Fund was reorganized into a fund of AMG Funds I. |
| 3 | Per share numbers have been calculated using average shares. |
| 4 | Includes non-recurring dividends. Without these dividends, net investment loss per share would have been $(0.03). |
| 5 | The total return is calculated using the published Net Asset Value as of fiscal period end. |
12
|
| |
| Notes to Financial Statements (unaudited) |
| March 31, 2018 |
|
1. SUMMARY OF SIGNIFICANT ACCOUNTING POLICIES
AMG Funds I (the “Trust”) is an open-end management investment company, organized as a Massachusetts business trust, and registered under the Investment Company Act of 1940, as amended (the “1940 Act”). Currently, the Trust consists of a number of different funds, each having distinct investment management objectives, strategies, risks, and policies. Included in this report is the AMG Managers Brandywine Advisors Mid Cap Growth Fund (the “Fund”).
A significant portion of the Fund’s holdings may be focused in a relatively small number of securities, which may make the Fund more volatile and subject to greater risk than a more diversified fund.
Effective October 1, 2016, the Fund’s shares were reclassified and redesignated to Class N shares. Please refer to the current prospectus for additional information.
The Fund’s financial statements are prepared in accordance with accounting principles generally accepted in the United States of America (“U.S. GAAP”), including accounting and reporting guidance pursuant to Accounting Standards Codification Topic 946 applicable to investment companies. U.S. GAAP requires management to make estimates and assumptions that affect the reported amounts of assets and liabilities and disclosure of contingent assets and liabilities at the date of the financial statements and the reported amounts of income and expenses during the reporting period. Actual results could differ from those estimates and such differences could be material. The following is a summary of significant accounting policies followed by the Fund in the preparation of its financial statements:
a. VALUATION OF INVESTMENTS
Equity securities traded on a national securities exchange or reported on the NASDAQ national market system (“NMS”) are valued at the last quoted sales price on the primary exchange or, if applicable, the NASDAQ official closing price or the official closing price of the relevant exchange or, lacking any sales, at the last quoted bid price or the mean between the last quoted bid and ask prices (the “exchange mean price”). Equity securities traded in the over-the-counter market (other than NMS securities) are valued at the exchange mean price. Foreign equity securities (securities principally traded in markets other than U.S. markets) are valued at the official closing price on the primary exchange or, for markets that either do not offer an official closing price or where the official closing price may not be representative of the overall market, the last quoted sale price.
Fixed income securities purchased with a remaining maturity of 60 days or less are valued at amortized cost, provided that the amortized cost value is approximately the same as the fair value of the security valued without the use of amortized cost. Investments in other open-end regulated investment companies are valued at their end of day net asset value per share.
The Fund’s portfolio investments are generally valued based on independent market quotations or prices or, if none, “evaluative” or other market based valuations provided by third party pricing services approved by the Board of Trustees of the Trust (the “Board”). Under certain circumstances, the value of certain Fund portfolio investments may be based on an evaluation of fair value, pursuant to procedures established by and under the general supervision of the Board. The Valuation Committee, which is comprised of the Independent Trustees of the Board, and the Pricing Committee, which is comprised of representatives from AMG Funds LLC (the “Investment Manager”) are the committees appointed by the Board to make fair value determinations. The Fund may use the fair value of a portfolio investment to calculate its net asset value (“NAV”) in the event that the
market quotation, price or market based valuation for the portfolio investment is not readily available or otherwise not determinable pursuant to the Board’s valuation procedures, if the Investment Manager or the Pricing Committee believes the quotation, price or market based valuation to be unreliable, or in certain other circumstances. When determining the fair value of an investment, the Pricing Committee and, if required under the Trust’s securities valuation procedures, the Valuation Committee, seeks to determine the price that the Fund might reasonably expect to receive from current sale of that portfolio investment in an arms-length transaction. Fair value determinations shall be based upon consideration of all available facts and information, including, but not limited to (i) attributes specific to the investment; (ii) fundamental and analytical data relating to the investment; and (iii) the value of other comparable securities or relevant financial instruments, including derivative securities, traded on other markets or among dealers.
The values assigned to fair value portfolio investments are based on available information and do not necessarily represent amounts that might ultimately be realized in the future, since such amounts depend on future developments inherent in long-term investments. Because of the inherent uncertainty of valuation, those estimated values may differ significantly from the values that would have been used had a ready market for the investments existed, and the differences could be material. The Board will be presented with a quarterly report showing as of the most recent quarter end, all outstanding securities fair valued by the Fund, including a comparison with the prior quarter end and the percentage of the Fund that the security represents at each quarter end.
With respect to foreign equity securities and certain foreign fixed income securities, the Board has adopted a policy that securities held in a Fund that can be fair valued by the applicable fair value pricing service are fair valued on each business day provided that each individual price exceeds a pre-established confidence level.
U.S. GAAP defines fair value as the price that a fund would receive to sell an asset or pay to transfer a liability in an orderly transaction between market participants at the measurement date. U.S. GAAP also establishes a framework for measuring fair value, and a three level hierarchy for fair value measurements based upon the transparency of inputs to the valuation of an asset or liability. Inputs may be observable or unobservable and refer broadly to the assumptions that market participants would use in pricing the asset or liability. Observable inputs reflect the assumptions market participants would use in pricing the asset or liability based on market data obtained from sources independent of the Fund. Unobservable inputs reflect the Fund’s own assumptions about the assumptions that market participants would use in pricing the asset or liability developed based on the best information available in the circumstances. Each investment is assigned a level based upon the observability of the inputs which are significant to the overall valuation.
The three-tier hierarchy of inputs is summarized below:
Level 1 – inputs are quoted prices in active markets for identical investments (e.g., equity securities, open-end investment companies)
Level 2 – other observable inputs (including, but not limited to: quoted prices for similar assets or liabilities in markets that are active, quoted prices for identical or similar assets or liabilities in markets that are not active, inputs other than quoted prices that are observable for the assets or liabilities (such as interest rates, yield curves, volatilities, prepayment speeds, loss severities, credit risks and default rates) or other market corroborated inputs) (e.g., debt securities, government securities, foreign currency exchange contracts, foreign securities utilizing international fair value pricing, fair valued securities with observable inputs)
13
|
| |
| |
| Notes to Financial Statements (continued) |
|
Level 3 – inputs are significant unobservable inputs (including the Fund’s own assumptions used to determine the fair value of investments) (e.g., fair valued securities with unobservable inputs)
Changes in inputs or methodologies used for valuing investments may result in a transfer in or out of levels within the fair value hierarchy. The inputs or methodologies used for valuing investments may not necessarily be an indication of the risk associated with investing in those investments. Transfers between different levels of the fair value disclosure hierarchy are deemed to have occurred as of the beginning of the reporting period.
b. SECURITY TRANSACTIONS
Security transactions are accounted for as of trade date. Realized gains and losses on securities sold are determined on the basis of identified cost.
c. INVESTMENT INCOME AND EXPENSES
Dividend income is recorded on the ex-dividend date. Dividends from foreign securities are recorded on the ex-dividend date, and if after the fact, as soon as the Fund becomes aware of the ex-dividend date. Interest income, which includes amortization of premium and accretion of discount on debt securities, is accrued as earned. Dividend and interest income on foreign securities is recorded gross of any withholding tax. Non-cash dividends included in dividend income, if any, are reported at the fair market value of the securities received. Other income and expenses are recorded on an accrual basis. Expenses that cannot be directly attributed to a Fund are apportioned among the funds in the Trust and other trusts within the AMG Funds family of mutual funds (collectively the “AMG Funds Family”) based upon their relative average net assets or number of shareholders.
d. DIVIDENDS AND DISTRIBUTIONS
Fund distributions resulting from either net investment income or realized net capital gains, if any, will normally be declared and paid at least annually in December. Distributions to shareholders are recorded on the ex-dividend date. Distributions are determined in accordance with federal income tax regulations, which may differ from net investment income and net realized capital gains for financial statement purposes (U.S. GAAP). Differences may be permanent or temporary. Permanent differences are reclassified among capital accounts in the financial statements to reflect their tax character. Permanent book and tax basis differences, if any, relating to shareholder distributions will result in reclassifications to paid-in capital. Temporary differences arise when certain items of income, expense and gain or loss are recognized in different periods for financial statement and tax purposes; these differences will reverse at some time in the future. Permanent differences are primarily due to a net operating loss write off. Temporary differences are primarily due to qualified late year ordinary losses and wash sales.
At March 31, 2018, the approximate cost of investments and the aggregate gross unrealized appreciation and depreciation for federal income tax were as follows:
| | | | | | | | | | | | |
| Cost | | Appreciation | | | Depreciation | | | Net | |
$116,963,022 | | $ | 21,315,747 | | | $ | (1,959,080 | ) | | $ | 19,356,667 | |
e. FEDERAL TAXES
The Fund currently qualifies as an investment company and intends to comply with the requirements under Subchapter M of the Internal Revenue Code of 1986, as amended, and to distribute substantially all of its taxable income and gains to its shareholders and to meet certain diversification and income requirements with respect to investment companies. Therefore, no provision for federal income or excise tax is included in the accompanying financial statements.
Additionally, based on the Fund’s understanding of the tax rules and rates related to income, gains and transactions for the foreign jurisdictions in which it invests, the Fund will provide for foreign taxes, and where appropriate, deferred foreign taxes.
Management has analyzed the Fund’s tax positions taken on federal income tax returns as of March 31, 2018, and for all open tax years (generally, the three prior taxable years), and has concluded that no provision for federal income tax is required in the Fund’s financial statements. Additionally, Management is not aware of any tax position for which it is reasonably possible that the total amounts of unrecognized tax benefits will change materially in the next twelve months.
Net capital losses incurred in taxable years beginning after the enactment of the Regulated Investment Company Modernization Act of 2010, may be carried forward for an unlimited time period. Such losses will be required to be utilized prior to any loss carryovers incurred in pre-enactment taxable years, which generally expire eight years following the close of the taxable year in which they were incurred. As a result of this ordering rule, pre-enactment capital loss carryovers may be more likely to expire unused. Additionally, post-enactment capital losses that are carried forward retain their tax character as either short- term or long-term capital losses, unlike pre-enactment losses which are considered all short-term.
f. CAPITAL LOSS CARRYOVERS AND DEFERRALS
As of March 31, 2018, the Fund had accumulated net realized capital loss carryovers from securities transactions for federal income tax purposes as shown in the following chart. These amounts may be used to offset future realized capital gains, if any, through the expiration date listed, or in the case of post-enactment losses, for an unlimited time period.
| | | | | | | | | | | | |
| | | Capital Loss
Carryover Amounts | | | | |
| | | Short-Term | | | Long-Term | | | Expires
September 30, | |
(Pre-Enactment) | | $ | 12,838,786 | | | | — | | | | 2018 | |
g. CAPITAL STOCK
The Trust’s Declaration of Trust authorizes for the Fund the issuance of an unlimited number of shares of beneficial interest, without par value. The Fund records sales and repurchases of its capital stock on the trade date.
14
|
| |
| |
| Notes to Financial Statements (continued) |
|
For the six months ended March 31, 2018 (unaudited) and the fiscal year ended September 30, 2017, the capital stock transactions by class for the Fund were as follows:
| | | | | | | | | | | | | | | | |
| | | March 31, 2018 | | | September 30, 2017 | |
| | | Shares | | | Amount | | | Shares | | | Amount | |
Class N: | | | | | | | | | | | | | | | | |
Proceeds from sale of shares | | | 8,632 | | | $ | 99,900 | | | | 18,825 | | | $ | 221,949 | |
Cost of shares repurchased | | | (20,271 | ) | | | (243,161 | ) | | | (2,613,175 | ) | | | (26,084,214 | ) |
| | | | | | | | | | | | | | | | |
Net decrease | | | (11,639 | ) | | $ | (143,261 | ) | | | (2,594,350 | ) | | $ | (25,862,265 | ) |
| | | | | | | | | | | | | | | | |
At March 31, 2018, certain affiliated shareholders of record, individually or collectively, held greater than 10% of the net assets of the Fund as follows: one owns 96%. Transactions by this shareholder may have a material impact on the Fund.
h. REPURCHASE AGREEMENTS AND JOINT REPURCHASE AGREEMENTS
The Fund may enter into third-party repurchase agreements for temporary cash management purposes and third-party joint repurchase agreements for reinvestment of cash collateral on securities lending transactions under the securities lending program offered by The Bank of New York Mellon (“BNYM”) (the “Program”) (collectively, “Repurchase Agreements”). The value of the underlying collateral, including accrued interest, must equal or exceed the value of the Repurchase Agreements during the term of the agreement. For joint repurchase agreements, the Fund participates on a pro rata basis with other clients of BNYM in its share of the underlying collateral under such joint repurchase agreements and in its share of proceeds from any repurchase or other disposition of the underlying collateral. The underlying collateral for all Repurchase Agreements is held in safekeeping by the Fund’s custodian or at the Federal Reserve Bank. If the seller defaults and the value of the collateral declines, or if bankruptcy proceedings commence with respect to the seller of the security, realization of the collateral by the Fund may be delayed or limited. Pursuant to the Program, the Fund is indemnified for such losses by BNYM on joint repurchase agreements.
At March 31, 2018, the Fund had no Repurchase Agreements outstanding.
2. AGREEMENTS AND TRANSACTIONS WITH AFFILIATES
The Trust has entered into an investment advisory agreement under which the Investment Manager, a subsidiary and the U.S. retail distribution arm of Affiliated Managers Group, Inc. (“AMG”), serves as investment manager to the Fund and is responsible for the Fund’s overall administration and operations. The Investment Manager selects one or more subadvisers for the Fund (subject to Board approval) and monitors each subadviser’s investment performance, security holdings and investment strategies. The Fund’s investment portfolio is managed by Friess Associates, LLC (“Friess”) and Friess Associates of Delaware, LLC (“Friess of Delaware”) who serve pursuant to a subadvisory agreement with the Investment Manager.
Investment management fees are paid directly by the Fund to the Investment Manager based on average daily net assets. For the six months ended March 31, 2018, the Fund paid an investment management fee at the annual rate of 0.88% of the average daily net assets of the Fund.
The Trust, on behalf of the Fund, has entered into an amended and restated Administration Agreement under which the Investment Manager serves as the Fund’s administrator (the “Administrator”) and is responsible for all non-portfolio
management aspects of managing the Fund’s operations, including administration and shareholder services to the Fund. The Fund pays a fee to the Administrator at the rate of 0.15% per annum of the Fund’s average daily net assets for this service.
The Fund is distributed by AMG Distributors, Inc. (the “Distributor”), a wholly-owned subsidiary of the Investment Manager. The Distributor serves as the distributor and underwriter for the Fund and is a registered broker-dealer and member of the Financial Industry Regulatory Authority, Inc. (“FINRA”). Shares of the Fund will be continuously offered and will be sold directly to prospective purchasers and through brokers, dealers or other financial intermediaries who have executed selling agreements with the Distributor. Generally the Distributor bears all or a portion of the expenses of providing services pursuant to the distribution agreement, including the payment of the expenses relating to the distribution of prospectuses for sales purposes and any advertising or sales literature.
The Trust has adopted a distribution and service plan (the “Plan”) with respect to the Class N shares, in accordance with the requirements of Rule 12b-1 under the 1940 Act and the requirements of the applicable rules of FINRA regarding asset-based sales charges. Pursuant to the Plan, the Fund may make payments to the Distributor for its expenditures in financing any activity primarily intended to result in the sale of the Fund’s Class N shares and for maintenance and personal service provided to existing shareholders of that class. The Plan authorizes payments to the Distributor up to 0.25% annually of the Fund’s average daily net assets attributable to the Class N shares.
The Board has approved reimbursement payments to the Investment Manager for shareholder servicing expenses (“shareholder servicing fees”) incurred. Shareholder servicing fees include payments to financial intermediaries, such as broker-dealers (including fund supermarket platforms), banks, and trust companies who provide shareholder recordkeeping, account servicing and other services. The Fund may reimburse the Investment Manager for the actual amount incurred up to a maximum annual rate of the Class N shares’ average daily net assets as shown in the table below.
The impact on the annualized expense ratio for the six months ended March 31, 2018, was as follows:
| | | | | | | | |
| | | Maximum Annual
Amount
Approved | | | Actual
Amount
Incurred | |
Class N | | | 0.15 | % | | | 0.00 | %1 |
15
|
| |
| |
| Notes to Financial Statements (continued) |
|
The Board provides supervision of the affairs of the Trust and other trusts within the AMG Funds family. The Trustees of the Trust who are not affiliated with the Investment Manager receive an annual retainer and per meeting fees for regular, special and telephonic meetings, and they are reimbursed for out-of-pocket expenses incurred while carrying out their duties as Board members. The Chairman of the Board and the Audit Committee Chair receive additional annual retainers. Certain Trustees and Officers of the Fund are Officers and/or Directors of the Investment Manager, AMG and/or the Distributor.
The Securities and Exchange Commission (the “SEC”) granted an exemptive order that permits the Fund to lend and borrow money for certain temporary purposes directly to and from other eligible funds in the AMG Funds family. Participation in this interfund lending program is voluntary for both the borrowing and lending funds, and an interfund loan is only made if it benefits each participating fund. The Administrator manages the program according to procedures approved by the Board, and the Board monitors the operation of the program. An interfund loan must comply with certain conditions set out in the exemptive order, which are designed to assure fairness and protect all participating funds. For the six months ended March 31, 2018, the Fund neither borrowed from nor lent to other funds in the AMG Funds family. At March 31, 2018, the Fund had no interfund loans outstanding.
3. PURCHASES AND SALES OF SECURITIES
Purchases and sales of securities (excluding short-term securities and U.S. Government Obligations) for the six months ended March 31, 2018, were $93,440,858 and $95,308,427, respectively.
The Fund had no purchases or sales of U.S. Government Obligations during the six months ended March 31, 2018.
4. PORTFOLIO SECURITIES LOANED
The Fund participates in the Program providing for the lending of securities to qualified brokers. Securities lending income includes earnings of such temporary cash investments, plus or minus any rebate to a borrower. These earnings (after any rebate) are then divided between BNYM, as a fee for its services under the Program, and the Fund, according to agreed-upon rates. Collateral on all securities loaned is accepted in cash and is maintained at a minimum level of 102% (105% in the case of certain foreign securities) of the market value, plus interest, if applicable, of investments on loan. It is the Fund’s policy to obtain additional collateral from or return excess collateral to the borrower by the end of the next
business day, following the valuation date of the securities loaned. Therefore, the value of the collateral held may be temporarily less than the value of the securities on loan. Lending securities entails a risk of loss to the Fund if and to the extent that the market value of the securities loaned were to increase and the borrower did not increase the collateral accordingly, and the borrower fails to return the securities. Under the terms of the Program, the Fund is indemnified for such losses by BNYM. Cash collateral is held in a separate omnibus account managed by BNYM, who is authorized to exclusively enter into joint repurchase agreements. BNYM bears the risk of any deficiency in the amount of the cash collateral available for return to the borrower due to any loss on the collateral invested.
At March 31, 2018, there were no securities on loan.
5. COMMITMENTS AND CONTINGENCIES
Under the Trust’s organizational documents, its trustees and officers are indemnified against certain liabilities arising out of the performance of their duties to the Trust. In addition, in the normal course of business, the Fund may enter into contracts and agreements that contain a variety of representations and warranties, which provide general indemnifications. The maximum exposure to the Fund under these arrangements is unknown, as this would involve future claims that may be made against the Fund that have not yet occurred. However, based on experience, the Fund had no prior claims or losses and expects the risks of loss to be remote.
6. MASTER NETTING AGREEMENTS
The Fund may enter into master netting agreements with its counterparties for the securities lending program and Repurchase Agreements, which provide the right, in the event of default (including bankruptcy or insolvency) for the non-defaulting party to liquidate the collateral and calculate net exposure to the defaulting party or request additional collateral. For financial reporting purposes, the Fund does not offset financial assets and financial liabilities that are subject to master netting agreements in the Statement of Assets and Liabilities. For securities lending transactions, see Note 4. At March 31, 2018, the Fund had no open Repurchase Agreements that were subject to a master netting agreement.
7. SUBSEQUENT EVENTS
The Fund has determined that no material events or transactions occurred through the issuance date of the Fund’s financial statements, which require an additional disclosure in or adjustment of the Fund’s financial statements.
16
Investment Manager and Administrator
AMG Funds LLC
600 Steamboat Road, Suite 300
Greenwich, CT 06830
800.835.3879
Distributor
AMG Distributors, Inc.
600 Steamboat Road, Suite 300
Greenwich, CT 06830
800.835.3879
Subadvisor
Friess Associates, LLC
P.O. Box 576
Jackson, Wyoming 83001
Friess Associates of Delaware, LLC
P.O. Box 4166
Greenville, DE 19807
Custodian
The Bank of New York Mellon
111 Sanders Creek Parkway
East Syracuse, NY 13057
Legal Counsel
Ropes & Gray LLP
Prudential Tower, 800 Boylston Street
Boston, MA 02199-3600
Transfer Agent
BNY Mellon Investment Servicing (US) Inc.
Attn: AMG Funds
P.O. Box 9769
Providence, RI 02940
800.548.4539
Trustees
Bruce B. Bingham
Christine C. Carsman
Edward J. Kaier
Kurt Keilhacker
Steven J. Paggioli
Richard F. Powers III
Eric Rakowski
Victoria Sassine
Thomas R. Schneeweis
This report is prepared for the Fund’s shareholders. It is authorized for distribution to prospective investors only when preceded or accompanied by an effective prospectus. To receive a free copy of the prospectus or Statement of Additional Information, which includes additional information about Fund Trustees, please contact us by calling 800.835.3879. Distributed by AMG Distributors, Inc., member FINRA/SIPC.
Current net asset values per share for the Fund are available on the Fund’s website at amgfunds.com.
A description of the policies and procedures the Fund uses to vote its proxies is available: (i) without charge, upon request, by calling 800.835.3879, or (ii) on the Securities and Exchange Commission’s (SEC) website at sec.gov. For information regarding the Fund’s proxy voting record for the 12-month period ended June 30, call 800.835.3879 or visit the SEC website at sec.gov.
The Fund files its complete schedule of portfolio holdings with the SEC for the first and third quarters of each fiscal year on Form N-Q. The Fund’s Forms N-Q are available on the SEC’s website at sec.gov. A Fund’s Forms N-Q may be reviewed and copied at the SEC’s Public Reference Room in Washington, DC. Information on the operation of the Public Reference Room may be obtained by calling 1.800.SEC.0330. To review a complete list of the Fund’s portfolio holdings, or to view the most recent quarterly holdings report, semiannual report, or annual report, please visit amgfunds.com.
| | | | |
AFFILIATE SUBADVISED FUNDS BALANCED FUNDS AMG Chicago Equity Partners Balanced Chicago Equity Partners, LLC AMG FQ Global Risk-Balanced First Quadrant, L.P. EQUITY FUNDS AMG FQ Tax-Managed U.S. Equity AMG FQ Long-Short Equity First Quadrant, L.P. AMG Frontier Small Cap Growth Frontier Capital Management Company, LLC AMG GW&K Small Cap Core AMG GW&K Small/Mid Cap AMG GW&K U.S. Small Cap Growth GW&K Investment Management, LLC AMG Renaissance International Equity AMG Renaissance Large Cap Growth The Renaissance Group LLC AMG River Road Dividend All Cap Value AMG River Road Dividend All Cap Value II AMG River Road Focused Absolute Value AMG River Road Long-Short AMG River Road Small-Mid Cap Value AMG River Road Small Cap Value River Road Asset Management, LLC AMG SouthernSun Small Cap AMG SouthernSun Global Opportunities AMG SouthernSun U.S. Equity SouthernSun Asset Management, LLC AMG Systematic Mid Cap Value Systematic Financial Management, L.P. AMG TimesSquare Emerging Markets Small Cap AMG TimesSquare International Small Cap AMG TimesSquare Mid Cap Growth AMG TimesSquare Small Cap Growth TimesSquare Capital Management, LLC | | AMG Trilogy Emerging Markets Equity AMG Trilogy Emerging Wealth Equity Trilogy Global Advisors, L.P. AMG Yacktman AMG Yacktman Focused AMG Yacktman Focused Fund - Security Selection Only AMG Yacktman Special Opportunities Yacktman Asset Management LP FIXED INCOME FUNDS AMG GW&K Core Bond AMG GW&K Enhanced Core Bond AMG GW&K Municipal Bond AMG GW&K Municipal Enhanced Yield GW&K Investment Management, LLC OPEN-ARCHITECTURE FUNDS ALTERNATIVE FUNDS AMG Managers Lake Partners LASSO Alternative Lake Partners, Inc. BALANCED FUNDS AMG Managers Montag & Caldwell Balanced Montag & Caldwell, LLC EQUITY FUNDS AMG Managers Brandywine AMG Managers Brandywine Advisors Mid Cap Growth AMG Managers Brandywine Blue Friess Associates, LLC AMG Managers Cadence Emerging Companies AMG Managers Cadence Mid Cap Cadence Capital Management, LLC AMG Managers CenterSquare Real Estate CenterSquare Investment Management, LLC AMG Managers Emerging Opportunities Lord, Abbett & Co. LLC WEDGE Capital Management L.L.P. Next Century Growth Investors LLC RBC Global Asset Management (U.S.) Inc. | | AMG Managers Essex Small/Micro Cap Growth Essex Investment Management Co., LLC AMG Managers Fairpointe ESG Equity AMG Managers Fairpointe Mid Cap Fairpointe Capital LLC AMG Managers Guardian Capital Global Dividend Guardian Capital LP AMG Managers LMCG Small Cap Growth LMCG Investments, LLC AMG Managers Montag & Caldwell Growth AMG Managers Montag & Caldwell Mid Cap Growth Montag & Caldwell, LLC AMG Managers Pictet International Pictet Asset Management Limited AMG Managers Silvercrest Small Cap Silvercrest Asset Management Group LLC AMG Managers Skyline Special Equities Skyline Asset Management, L.P. AMG Managers Special Equity Ranger Investment Management, L.P. Lord, Abbett & Co. LLC Smith Asset Management Group, L.P. Federated MDTA LLC AMG Managers Value Partners Asia Dividend Value Partners Hong Kong Limited FIXED INCOME FUNDS AMG Managers Amundi Intermediate Government AMG Managers Amundi Short Duration Government Amundi Pioneer Institutional Asset Management, Inc. AMG Managers Doubleline Core Plus Bond DoubleLine Capital LP AMG Managers Global Income Opportunity AMG Managers Loomis Sayles Bond Loomis, Sayles & Co., L.P. |
| | |
| amgfunds.com | | 033118 SAR075 |
Not applicable for the semi-annual shareholder report.
| Item 3. | AUDIT COMMITTEE FINANCIAL EXPERT |
Not applicable for the semi-annual shareholder report.
| Item 4. | PRINCIPAL ACCOUNTANT FEES AND SERVICES |
Not applicable for the semi-annual shareholder report.
| Item 5. | AUDIT COMMITTEE OF LISTED REGISTRANTS |
Not applicable.
| Item 6. | SCHEDULE OF INVESTMENTS |
The schedule of investments in unaffiliated issuers as of the close of the reporting period is included as part of the shareholder report contained in Item 1 hereof.
| Item 7. | DISCLOSURE OF PROXY VOTING POLICIES AND PROCEDURES FOR CLOSED-END MANAGEMENT INVESTMENT COMPANIES |
Not applicable.
| Item 8. | PORTFOLIO MANAGERS OF CLOSED-END MANAGEMENT INVESTMENT COMPANIES |
Not applicable.
| Item 9. | PURCHASES OF EQUITY SECURITIES BY CLOSED-END MANAGEMENT INVESTMENT COMPANIES AND AFFILIATED PURCHASERS |
Not applicable.
| Item 10. | SUBMISSION OF MATTERS TO A VOTE OF SECURITY HOLDERS |
Not applicable.
| Item 11. | CONTROLS AND PROCEDURES |
| | (a) | The registrant’s principal executive and principal financial officers have concluded, based on their evaluation of the registrant’s disclosure controls and procedures as of a date within 90 days of the filing date of this report, that the registrant’s disclosure controls and procedures are reasonably designed to ensure that information required to be disclosed by the registrant on Form N-CSR is recorded, processed, summarized and reported within the required time periods and that information required to be disclosed by the registrant in the reports that it files or submits on Form N-CSR is accumulated and communicated to the registrant’s management, including its principal executive and principal financial officers, as appropriate to allow timely decisions regarding required disclosure. |
| | (b) | There were no changes in the registrant’s internal control over financial reporting during the registrant’s second fiscal quarter of the period covered by this report that have materially affected, or are reasonably likely to materially affect, the internal control over financial reporting. |
| Item 12. | DISCLOSURE OF SECURITIES LENDING ACTIVITIES FOR CLOSED-END MANAGEMENT INVESTMENT COMPANIES |
| | |
| |
(a) (1) | | Not applicable. |
| |
(a) (2) | | Certifications pursuant to Rule 30a-2(a) under the Investment Company Act of 1940 - Filed herewith. |
| |
(a) (3) | | Not applicable. |
| |
(b) | | Certifications pursuant to Rule 30a-2(b) under the Investment Company Act of 1940 - Filed herewith. |
SIGNATURES
Pursuant to the requirements of the Securities Exchange Act of 1934 and the Investment Company Act of 1940, the registrant has duly caused this report to be signed on its behalf by the undersigned, thereunto duly authorized.
AMG FUNDS I
| | |
| By: | | /s/ Keitha L. Kinne |
| | Keitha L. Kinne, Principal Executive Officer |
| |
| Date: | | May 4, 2018 |
Pursuant to the requirements of the Securities Exchange Act of 1934 and the Investment Company Act of 1940, this report has been signed below by the following persons on behalf of the registrant and in the capacities and on the dates indicated.
| | |
| By: | | /s/ Keitha L. Kinne |
| | Keitha L. Kinne, Principal Executive Officer |
| |
| Date: | | May 4, 2018 |
| |
| By: | | /s/ Thomas Disbrow |
| | Thomas Disbrow, Principal Financial Officer |
| |
| Date: | | May 4, 2018 |