UNITED STATES
SECURITIES AND EXCHANGE COMMISSION
Washington, D.C. 20549
FORMN-CSRS
CERTIFIED SHAREHOLDER REPORT OF REGISTERED
MANAGEMENT INVESTMENT COMPANIES
Investment Company Act file number:811-06520
AMG Funds I
(Exact name of registrant as specified in charter)
600 Steamboat Road, Suite 300, Greenwich, Connecticut 06830
(Address of principal executive offices) (Zip code)
AMG Funds LLC
600 Steamboat Road, Suite 300, Greenwich, Connecticut 06830
(Name and address of agent for service)
Registrant’s telephone number, including area code: (203)299-3500
Date of fiscal year end: September 30
Date of reporting period: OCTOBER 1, 2018 – MARCH 31, 2019
(Semi-Annual Shareholder Report)
| Item 1. | Reports to Shareholders |
| | |
 | | SEMI-ANNUAL REPORT |
AMG Funds
March 31, 2019

AMG Managers Brandywine Advisors Mid Cap Growth Fund
Class N:BWAFX
Beginning on January 1, 2021, as permitted by regulations adopted by the Securities and Exchange Commission, paper copies of the Fund’s shareholder reports like this one will no longer be sent by mail, unless you specifically request paper copies of the reports from the Fund or from your financial intermediary, such as a broker-dealer or bank. Instead, the reports will be made available on the Fund’s website (https://www.amgfunds.com/resources/order_literature.html), and you will be notified by mail each time a report is posted and provided with a website link to access the report.
If you already elected to receive shareholder reports electronically, you will not be affected by this change and you need not take any action. You may elect to receive shareholder reports and other communications from the Fund electronically at any time by contacting your financial intermediary or, if you invest directly with the Fund, by logging into your account at www.amgfunds.com.
You may elect to receive all future reports in paper free of charge. If you invest through a financial intermediary, you can contact your financial intermediary to request that you continue to receive paper copies of your shareholder reports. If you invest directly with the Fund, you can call 1.800.548.4539 to inform the Fund that you wish to continue receiving paper copies of your shareholder reports. Your election to receive reports in paper will apply to all funds in the AMG Funds Family of Funds held in your account if you invest through your financial intermediary or all funds in the AMG Funds Family of Funds held with the fund complex if you invest directly with the Fund.
| | |
| amgfunds.com | | 033119 SAR075 |
AMG Funds
Semi-Annual Report — March 31, 2019(unaudited)
| | | | |
TABLE OF CONTENTS | | PAGE | |
LETTER TO SHAREHOLDERS | | | 2 | |
| |
ABOUT YOUR FUND’S EXPENSES | | | 3 | |
| |
FUND PERFORMANCE | | | 4 | |
| |
FUND SNAPSHOTS, ROSES AND THORNS AND SCHEDULE OF PORTFOLIO INVESTMENTS | | | 5 | |
| |
FINANCIAL STATEMENTS | | | | |
| |
Statement of Assets and Liabilities | | | 9 | |
Balance sheet, net asset value (NAV) per share computation and cumulative distributable earnings (loss) | | | | |
| |
Statement of Operations | | | 10 | |
Detail of sources of income, expenses, and realized and unrealized gains (losses) during the fiscal period | | | | |
| |
Statements of Changes in Net Assets | | | 11 | |
Detail of changes in assets for the past two fiscal periods | | | | |
| |
Financial Highlights | | | 12 | |
Historical net asset values per share, distributions, total returns, income and expense ratios, turnover ratios and net assets | | | | |
| |
Notes to Financial Statements | | | 13 | |
Accounting and distribution policies, details of agreements and transactions with Fund management and affiliates, and descriptions of certain investment risks | | | | |
Nothing contained herein is to be considered an offer, sale or solicitation of an offer to buy shares of any series of the AMG Funds family of mutual funds. Such offering is made only by prospectus, which includes details as to offering price and other material information.
| | |
| | | AMG Managers Brandywine Advisors Mid Cap Growth Fund |
DEAR FELLOW SHAREHOLDER:
Superlatives, with qualifiers, continued to define the stock market in the early months of 2019 as history’s longest bull market resumed with gusto after surrendering to gravity late last year. The worst quarter for stocks since 2011, the fourth quarter of 2018, was followed by their best quarter in nearly a decade in the three months through March.
AMG Managers Brandywine Advisors Mid Cap Growth Fund rose 20.25 percent in the March quarter. The S&P 500®, Russell Midcap® and Russell Midcap® Growth Indexes gained 13.65, 16.54 and 19.62 percent, respectively.
The S&P 500® Index posted its strongest quarterly return since the second quarter of 2009, which represented the market’s first move higher after the wrenching downturn stemming from the 2008 financial crisis. While the most recent progression, from precipitous drop to rapid ascension, was similar on its surface, conditions surrounding the abrupt about-face were far from comparable.
The 2008 downturn occurred amid an extreme credit crunch that threatened systemic collapse on a global scale. The response from the U.S. Federal Reserve and other key central banks matched the magnitude of the emergency, sparking a surge in stocks fueled by renewed optimism. Events unfolded with a lot less drama this time around.
Oil was cause for concern in the last quarter of 2018, when a decline in itsper-barrel price that exceededone-third raised concerns about the economy. Those concerns were exacerbated by the commencement of a government shutdown, followed soon after by the president criticizing the Federal Reserve for increasing interest rates.
Remedies to last year’s troubles seemed to emerge as 2019 got under way. Oil prices climbed throughout the March quarter, eventually recovering into the range of oil’s average price for 2018. The government shutdown, which ultimately stretched 35 days, ended on January 25. Then, on March 20, the Federal Reserve announced a revised outlook, going from envisioning two rate hikes in 2019 to none.
The March-quarter mood was overtly positive. Brandywine Advisors gained ground in all eight economic sectors represented in its portfolio during the three months through March. The Fund outperformed its primary benchmark, the Russell Midcap® Growth Index, in three out of those eight sectors, but the outperformance in those sectors was pronounced enough to offset underperformance elsewhere to generate an overall relative performance advantage.
Technology holdings, which represented the largest portfolio position, contributed the most to absolute returns and the most to performance relative to the Fund’s benchmark. Software and service providers were standouts.
The Fund’s top holding from the sector, Trade Desk, reported 56 percent December-quarter revenue growth. The company, which provides technology that enables advertising campaigns across different media and devices, beat estimates by more than doubling year-over-year earnings. ServiceNow showed similar strength, exceeding December-quarter estimates with 120 percent earnings growth. Revenue for the provider of cloud-based workflow management computing solutions rose 31 percent.
Industrial holdings were also notable performers, contributing the fourth most to absolute performance and the second most to relative results. Alternative decking material company Trex Co. and business service provider Insperity were top contributors on the heels of expectation-beating earnings results. Trex and Insperity grew December-quarter earnings 54 and 27 percent.
Consumer discretionary holdings represented the third largest portfolio position and generated the second biggest contribution to total gains. Top contributors included Chipotle Mexican Grill and Five Below. Chipotle and Five Below exceeded December-quarter expectations with earnings growth of 28 and 31 percent. Still, consumer discretionary holdings detracted from performance versus the benchmark. Consumer product maker Helen of Troy declined amid uncertainty in its sales outlook.
Health care holdings comprised the second largest portfolio position and were the third greatest contributors to absolute results. They were also the biggest relative performance detractors. CryoPort, which provides logistics services for biologics used in the life sciences market, faced near-term margin pressure as the pace of ramping up operations at new facilities weighed on overall utilization. Vocera Communications lowered first-quarter guidance after word of the impending release of Smartbadge prompted customers to put off purchases of its predecessor in anticipation of the new product.
For more information on holdings that influenced December-quarter results, please see Roses & Thorns on page 6.
While the downturn in the waning months of 2018 showed an investor community on edge when it comes to threats to the market’s extended positive run, thethat-was-then-this-is-now reaction to start 2019 indicated that investors remain quick to cast concerns aside when the balance appears to tip in their favor. This is more reason, we believe, to expect volatility to persist as the year moves on.
With that in mind, we’ll strive to take advantage of bouts of volatility as they arise by viewing price swings as opportunities to optimize entry points for companies we’re pursuing and exit points for holdings near their price targets. In the meantime, we’re excited about the earnings strength we continue to isolate at reasonable valuations.
Technology, health care and consumer discretionary holdings represent the largest portfolio positions at the start of the June quarter. For more information on portfolio characteristics, please see page 5.
We’re grateful for the opportunity to serve you, and we’re working hard to build on the recent progress in AMG Managers Brandywine Advisors Mid Cap Growth Fund.

Scott Gates
Chief Investment Officer
Friess Associates, LLC
About Your Fund’s Expenses(unaudited)
As a shareholder of a Fund, you may incur two types of costs: (1) transaction costs, which may include sales charges (loads) on purchase payments; redemption fees; and exchange fees; and (2) ongoing costs, including management fees; distribution(12b-1) fees; and other Fund expenses. This example is intended to help you understand your ongoing costs (in dollars) of investing in the Fund and to compare these costs with the ongoing costs of investing in other mutual funds. The example is based on $1,000 invested at the beginning of the period and held for the entire period as indicated below.
ACTUAL EXPENSES
The first line of the following table provides information about the actual account values and
actual expenses. You may use the information in this line, together with the amount you invested, to estimate the expenses that you paid over the period. Simply divide your account value by $1,000 (for example, an $8,600 account value divided by $1,000 = 8.6), then multiply the result by the number in the first line under the heading entitled “Expenses Paid During Period” to estimate the expenses you paid on your account during this period.
HYPOTHETICAL EXAMPLE FOR COMPARISON PURPOSES
The second line of the following table provides information about hypothetical account values and hypothetical expenses based on the Fund’s actual expense ratio and an assumed annual rate of return of 5% before expenses, which is not the Fund’s
actual return. The hypothetical account values and expenses may not be used to estimate the actual ending account balance or expenses you paid for the period. You may use this information to compare the ongoing costs of investing in the Fund and other funds by comparing this 5% hypothetical example with the 5% hypothetical examples that appear in the shareholder reports of other funds.
Please note that the expenses shown in the table are meant to highlight your ongoing costs only and do not reflect any transactional costs, such as sales charges (loads), redemption fees, or exchange fees. Therefore, the second line of the table is useful in comparing ongoing costs only, and will not help you determine the relative total costs of owning different funds.
| | | | | | | | | | | | | | | | |
Six Months Ended March 31, 2019 | | Expense
Ratio for
the Period | | | Beginning
Account
Value
10/01/18 | | | Ending
Account
Value
03/31/19 | | | Expenses
Paid During
the Period* | |
AMG Managers Brandywine Advisors Mid Cap Growth Fund | |
Based on Actual Fund Return | | | | | | | | | | | | | |
Class N | | | 1.13 | % | | $ | 1,000 | | | $ | 953 | | | $ | 5.50 | |
Based on Hypothetical 5% Annual Return | | | | | | | | | |
Class N | | | 1.13 | % | | $ | 1,000 | | | $ | 1,019 | | | $ | 5.69 | |
| * | Expenses are equal to the Fund’s annualized expense ratio multiplied by the average account value over the period, multiplied by the number of days in the most recent fiscal half-year (182), then divided by 365. |
Fund Performance(unaudited)
Periods ended March 31, 2019
The table below shows the average annual total returns for the periods indicated for the Fund, as well as the Fund’s relative index for the same time periods ended March 31, 2019.
| | | | | | | | | | | | | | | | |
| Average Annual Total Returns1 | | Six Months* | | | One Year | | | Five Years | | | Ten Years | |
AMG Managers Brandywine Advisors Mid Cap Growth Fund2, 3, 4, 5, 6, 7, 8, 9 | | | | | |
Class N | | | (4.66 | %) | | | 8.33 | % | | | 5.18 | % | | | 7.77 | % |
Russell Midcap® Growth Index10 | | | 0.49 | % | | | 11.51 | % | | | 10.89 | % | | | 17.60 | % |
Russell Midcap® Index11 | | | (1.38 | %) | | | 6.47 | % | | | 8.81 | % | | | 16.88 | % |
S&P 500® Index12 | | | (1.72 | %) | | | 9.50 | % | | | 10.91 | % | | | 15.92 | % |
The performance data shown represents past performance. Past performance is not a guarantee of future results. Current performance may be lower or higher than the performance data quoted. The investment return and principal value of an investment will fluctuate so that an investor’s shares, when redeemed, may be worth more or less than their original cost.
Investors should carefully consider the Fund’s investment objectives, risks, charges and expenses before investing. For performance information through the most recent month end, current net asset values per share for the Fund and other information, please call 800.548.4539 or visit our website at amgfunds.com for a free prospectus. Read it carefully before investing or sending money.
Distributed by AMG Distributors, Inc., member FINRA/SIPC.
| 1 | Total return equals income yield plus share price change and assumes reinvestment of all dividends and capital gain distributions. Returns are net of fees and may reflect offsets of Fund expenses as described in the prospectus. No adjustment has been made for taxes payable by shareholders on their reinvested dividends and capital gain distributions. Returns for periods greater than one year are annualized. The listed returns on the Fund are net of expenses and based on the published NAV as of March 31, 2019. All returns are in U.S. dollars ($). |
| 2 | The Fund returns for all periods beginning prior to October 1, 2013, reflect performance of the predecessor fund, Brandywine Advisors Midcap Growth Fund, and was managed by Friess Associates, LLC with the same investment objectives and substantially similar investment policies. |
| 3 | The Fund is subject to risks associated with investments inmid-capitalization companies such as greater price volatility, lower trading volume, and less liquidity than the stocks of larger, more established companies. |
| 4 | The Fund is subject to risks associated with investments in small-capitalization companies, such as erratic earnings patterns, competitive conditions, limited earnings history and a reliance on one or a limited number of products. |
| 5 | Active and frequent trading of a fund may result in higher transaction costs and increased tax liability. |
| 6 | A greater percentage of the Fund’s holdings may be focused in a smaller number of securities which may place the Fund at greater risk than a more diversified fund. |
| 7 | The Fund invests in growth stocks, which may be more sensitive to market movements because their prices tend to reflect future investor expectations rather than just current profits. Growth stocks may underperform value stocks during given periods. |
| 8 | Investments in international securities are subject to certain risks of overseas investing including currency fluctuations and changes in political and economic conditions, which could result in significant market fluctuations. These risks are magnified in emerging markets. |
| 9 | Companies that are in similar businesses may be similarly affected by particular economic or market events; to the extent the Fund has substantial holdings within a particular sector, the risks associated with that sector increase. |
| 10 | The Russell Midcap® Growth Index measures the performance of those Russell Midcap® companies with higher price/book ratios and higher forecasted growth values. The stocks are also members of the Russell 1000® Growth Index. Unlike the Fund, the Russell Midcap® Growth Index is unmanaged, is not available for investment and does not incur expenses. |
| 11 | The Russell Midcap® Index measures the performance of the 800 smallest companies in the Russell 1000® Index, which represent approximately 25% of the total market capitalization of the Russell 1000® Index. Unlike the Fund, the Russell Midcap® Index is unmanaged, is not available for investment and does not incur expenses. |
| 12 | The S&P 500® Index is a capitalization-weighted index of 500 stocks. The S&P 500® Index is designed to measure performance of the broad domestic economy through changes in the aggregate market value of 500 stocks representing all major industries. Unlike the Fund, the S&P 500® Index is unmanaged, is not available for investment and does not incur expenses. |
The Russell Indices are trademarks of the London Stock Exchange Group companies.
The S&P 500® Index is proprietary data of Standard & Poor’s, a division of McGraw-Hill Companies, Inc. All rights reserved.
Not FDIC insured, nor bank guaranteed. May lose value.
AMG Managers Brandywine Advisors Mid Cap Growth Fund
Fund Snapshots(unaudited)
March 31, 2019
PORTFOLIO BREAKDOWN
| | | | | | | | |
Industry (Top Ten) | | Brandywine
Advisors
Mid Cap
Growth Fund1 | | | Russell
Midcap®
Growth
Index | |
Application Software | | | 9.8 | % | | | 8.4 | % |
Communications Equipment | | | 7.1 | % | | | 1.0 | % |
Life Sciences Tools & Services | | | 6.5 | % | | | 1.8 | % |
Apparel Retail | | | 5.0 | % | | | 1.5 | % |
Data Processing & Outsourced Services | | | 4.8 | % | | | 7.2 | % |
Health Care Equipment | | | 4.7 | % | | | 4.5 | % |
Footwear | | | 4.7 | % | | | 0.1 | % |
Personal Products | | | 4.6 | % | | | 0.1 | % |
Pharmaceuticals | | | 4.3 | % | | | 0.6 | % |
Movies & Entertainment | | | 4.3 | % | | | 0.3 | % |
Other Common Stock | | | 37.7 | % | | | 74.5 | % |
Short-Term Investments | | | 6.6 | % | | | 0.0 | % |
Other Assets | | | (0.1 | )% | | | 0.0 | % |
| 1 | As a percentage of net assets. |
TOP TEN HOLDINGS
| | | | | | | | |
Security Name | | % of
Net Assets | | | % Change from
Book Cost | |
PRA Health Sciences, Inc. | | | 2.9 | | | | 67.3 | |
Ceridian HCM Holding, Inc. | | | 2.9 | | | | 56.1 | |
Dollar Tree, Inc. | | | 2.7 | | | | 17.9 | |
Deckers Outdoor Corp. | | | 2.7 | | | | 51.0 | |
Lumentum Holdings, Inc. | | | 2.7 | | | | 14.2 | |
Global Payments, Inc. | | | 2.6 | | | | 85.1 | |
Foot Locker, Inc. | | | 2.5 | | | | 26.8 | |
RingCentral, Inc., Class A | | | 2.5 | | | | 30.1 | |
ServiceNow, Inc. | | | 2.5 | | | | 108.7 | |
Tandem Diabetes Care, Inc. | | | 2.5 | | | | 36.7 | |
| | | | | | | | |
Top Ten as a Group | | | 26.5 | | | | | |
| | | | | | | | |
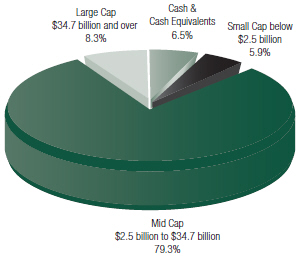
PORTFOLIO MARKET CAPITALIZATION
ESTIMATED EARNINGS GROWTH RATE OF THE FUND’S INVESTMENTS
Forecasted Increase in Earnings Per Share 2019 vs 2018
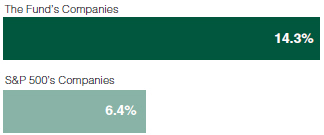
Source: Consensus estimates from FactSet Research Systems Inc.
This is not a forecast of the Fund’s future performance. Earnings growth for a Fund holding does not guarantee a corresponding increase in the market value of the holding or the Fund.
Because a fund’s strategy may result in multiple investments in particular sectors of the economy, its performance may depend on the performance of those sectors and may fluctuate more widely than investments diversified across more sectors. For additional information on these and other risk considerations, please see the Fund’s prospectus.
Any sectors, industries, or securities discussed should not be perceived as investment recommendations. Mention of a specific security should not be considered a recommendation to buy or solicitation to sell that security. Specific securities mentioned in this report may have been sold from the Fund’s portfolio of investments by the time you receive this report.
AMG Managers Brandywine Advisors Mid Cap Growth Fund
Roses and Thorns(unaudited)
Quarter Ending March 31, 2019
| | | | | | | | | | |
$ Gain
(in millions) | | | % Gain | | | Biggest $ Winners Reason for Move |
| $ | 2.3 | | | | 62.1 | % | | Tandem Diabetes Care Inc. (TNDM) |
| | | | | | | | The developer of insulin delivery pumps for diabetics earned $0.06 per share, up from a loss of $1.23 per share in theyear-ago period. The profit came as a surprise to analysts, whose consensus forecast predicted a $0.20 per share loss. Domestic and international sales growth took Wall Street similarly off guard, with Tandem’s 89 percent revenue increase exceeding expectations by more thanone-third. |
| $ | 2.2 | | | | 70.7 | % | | Trade Desk Inc. (TTD) |
| | | | | | | | The company, which provides technology that enables advertising campaigns across different media and devices, more than doubled December-quarter earnings, exceeding the consensus estimate by 38 percent. Revenue climbed 56 percent, driven in part by a 69 percent increase in mobile channel sales. The company provided guidance for investors to expect revenue to grow by at leastone-third in 2019. |
| $ | 1.4 | | | | 48.7 | % | | Ceridian HCM Holding Inc. (CDAY) |
| | | | | | | | The maker of human resource management software grew December-quarter revenue 10 percent, as revenue from its flagship cloud product, Dayforce, grew 34 percent. The company’s commercial customer base increased by 717 versus a year ago to 3,718. Operating profits increased 34 percent as the company’s gross profit margin expanded. |
| $ | 1.2 | | | | 45.9 | % | | Smartsheet Inc. (SMAR) |
| | | | | | | | The company, which provides collaborative spreadsheet solutions and customizable forms for capturing information, exceeded December-quarter expectations for earnings and revenue. December-quarter revenue jumped bytwo-thirds. Smartsheet also lifted revenue guidance for 2019. |
| $ | 1.2 | | | | 39.6 | % | | Chipotle Mexican Grill Inc. (CMG) |
| | | | | | | | The company, which operates quick-casual Mexican food restaurants throughout the U.S., grew December-quarter earnings 28 percent, exceeding the consensus estimate by 23 percent. Sales from online orders surged 66 percent. Enthusiasm surrounding initiatives spearheaded by new leadership, including menu innovation, loyalty rewards and delivery promotions, also contributed to share-price performance. |
| | |
$ Loss (in millions) | | | % Loss | | | Biggest $ Losers Reason for Move |
| $ | 0.7 | | | | 21.1 | % | | Cloudera Inc. (CLDR) |
| | | | | | | | The provider of cloud-based data management solutions exceeded expectations with 40 percent January-quarter revenue growth driven by strength in subscriptions. Uncertainty related to unexpected financial items, including deferred revenue writedowns, billing duration changes andone-time costs, compounded an earnings disappointment, weighing on shares. |
| $ | 0.5 | | | | 18.5 | % | | Teladoc Health Inc. (TDOC) |
| | | | | | | | The company, which provides telehealth services by facilitating health care via mobile devices, the Internet, video and phone, grew December-quarter revenue 59 percent, exceeding expectations. Lower-than-expected revenue and earnings guidance raised concerns about the weaker-than-usual flu season and customer acquisition costs, respectively. |
| $ | 0.5 | | | | 17.5 | % | | Covetrus Inc. (CVET) |
| | | | | | | | The provider of technology and services to veterinarians commenced operations as a standalone business after Henry Schein spun out its animal health business to combine it with Vets First Choice. Shares of the company, which is expected to generate more than $4 billion in annual revenue, began trading at a premium to animal health peers and lost ground from there. |
| $ | 0.4 | | | | 14.8 | % | | Emergent BioSolutions, Inc. (EBS) |
| | | | | | | | The maker of medical countermeasures, such as vaccines and therapeutic antibodies, earned $0.75 per share in the December quarter, exceeding the consensus estimate by 17 percent. Emergent BioSolutions makes Narcan, and the company’s shares declined after competitor Purdue Pharma announced that its anti-opioid product in development received fast-track designation from regulators. |
| $ | 0.3 | | | | 11.1 | % | | II-VI Inc. (IIVI) |
| | | | | | | | The maker of engineered materials and opto-electronic components used in industrial, communications, medical and other applications exceeded December-quarter estimates with 82 percent earnings growth. Revenue increased 22 percent. Shares declined when the company’s outlook for the upcoming quarter came in at the low end of analyst estimates. |
All gains/losses are calculated on an average cost basis from December 31, 2018 through March 31, 2019.
This commentary reflects the viewpoints of Friess Associates, LLC as of March 31, 2019, and is not intended as a forecast or guarantee of future results.
AMG Managers Brandywine Advisors Mid Cap Growth Fund
Schedule of Portfolio Investments(unaudited)
March 31, 2019
| | | | | | | | | | | | |
| Shares | | | | | Cost | | | Value | |
| | Common Stocks - 93.5% | | | | | | | | |
| | Communication Services | | | | | | | | |
| | | | Interactive Media & Services - 2.1% | | | | | |
| | 76,000 | | | CarGurus, Inc.*,1 | | $ | 2,820,832 | | | $ | 3,044,560 | |
| | | | Movies & Entertainment - 4.3% | | | | | |
| | 11,250 | | | The Madison Square Garden Co., Class A* | | | 3,314,568 | | | | 3,297,713 | |
| | 36,200 | | | World Wrestling Entertainment, Inc., Class A1 | | | 3,318,650 | | | | 3,141,436 | |
| | | | | | | | | | | | |
| | Total Communication Services | | | 9,454,050 | | | | 9,483,709 | |
| | | | This sector is 0.3% above your Fund’s cost. | | | | | |
| | Consumer Discretionary | | | | | | | | |
| | | | Apparel Retail - 5.0% | | | | | |
| | 160,842 | | | American Eagle Outfitters, Inc. | | | 3,349,576 | | | | 3,565,867 | |
| | 62,344 | | | Foot Locker, Inc. | | | 2,980,620 | | | | 3,778,047 | |
| | | | Apparel, Accessories & Luxury Goods - 2.0% | | | | | |
| | 33,911 | | | VF Corp. | | | 2,756,918 | | | | 2,947,205 | |
| | | | Automotive Retail - 2.4% | | | | | |
| | 9,050 | | | O’Reilly Automotive, Inc.* | | | 3,332,105 | | | | 3,514,115 | |
| | | | Footwear - 4.7% | | | | | |
| | 114,550 | | | Crocs, Inc.* | | | 3,016,959 | | | | 2,949,662 | |
| | 27,500 | | | Deckers Outdoor Corp.* | | | 2,676,979 | | | | 4,042,225 | |
| | | | General Merchandise Stores - 2.7% | | | | | |
| | 38,728 | | | Dollar Tree, Inc.* | | | 3,451,506 | | | | 4,067,989 | |
| | | | Hotels, Resorts & Cruise Lines - 2.4% | | | | | |
| | 31,150 | | | Royal Caribbean Cruises, Ltd. | | | 3,669,891 | | | | 3,570,413 | |
| | | | | | | | | | | | |
| | Total Consumer Discretionary | | | 25,234,554 | | | | 28,435,523 | |
| | | | This sector is 12.7% above your Fund’s cost. | | | | | |
| | Consumer Staples | | | | | | | | |
| | | | Household Products - 2.4% | | | | | |
| | 50,450 | | | Church & Dwight Co., Inc. | | | 3,294,137 | | | | 3,593,553 | |
| | | | Personal Products - 4.6% | | | | | |
| | 299,300 | | | Coty, Inc., Class A | | | 3,427,180 | | | | 3,441,950 | |
| | 20,500 | | | The Estee Lauder Cos., Inc., Class A | | | 2,739,003 | | | | 3,393,775 | |
| | | | | | | | | | | | |
| | Total Consumer Staples | | | 9,460,320 | | | | 10,429,278 | |
| | | | This sector is 10.2% above your Fund’s cost. | | | | | |
| | Health Care | | | | | | | | |
| | | | Biotechnology - 4.1% | | | | | |
| | 50,142 | | | Emergent BioSolutions, Inc.*,1 | | | 3,416,442 | | | | 2,533,174 | |
| | 40,631 | | | Exact Sciences Corp.*,1 | | | 2,806,831 | | | | 3,519,457 | |
| | | | Health Care Equipment - 4.7% | | | | | |
| | 57,348 | | | Tandem Diabetes Care, Inc.*,1 | | | 2,663,070 | | | | 3,641,598 | |
| | 106,800 | | | Wright Medical Group, N.V.
(Netherlands)* | | | 3,076,589 | | | | 3,358,860 | |
| | | | | | | | | | | | |
| Shares | | | | | Cost | | | Value | |
| | | | Health Care Technology - 1.1% | | | | | |
| | 28,738 | | | Teladoc Health, Inc.*,1 | | $ | 1,909,896 | | | $ | 1,597,833 | |
| | | | Life Sciences Tools & Services - 6.5% | | | | | |
| | 20,500 | | | Charles River Laboratories International, Inc.* | | | 2,925,780 | | | | 2,977,625 | |
| | 39,400 | | | PRA Health Sciences, Inc.* | | | 2,597,647 | | | | 4,345,426 | |
| | 8,531 | | | Thermo Fisher Scientific, Inc. | | | 1,134,218 | | | | 2,335,105 | |
| | | | Pharmaceuticals - 4.3% | | | | | |
| | 106,815 | | | Elanco Animal Health, Inc.* | | | 3,296,112 | | | | 3,425,557 | |
| | 115,533 | | | Horizon Pharma PLC* | | | 2,915,423 | | | | 3,053,537 | |
| | | | | | | | | | | | |
| | Total Health Care | | | 26,742,008 | | | | 30,788,172 | |
| | | | This sector is 15.1% above your Fund’s cost. | | | | | |
| | Industrials | | | | | | | | |
| | | | Airlines - 1.9% | | | | | |
| | 56,075 | | | Delta Air Lines, Inc. | | | 2,663,125 | | | | 2,896,274 | |
| | | | Trucking - 0.9% | | | | | |
| | 16,394 | | | LYFT, Inc., Class A* | | | 1,318,055 | | | | 1,283,486 | |
| | | | | | | | | | | | |
| | Total Industrials | | | 3,981,180 | | | | 4,179,760 | |
| | | | This sector is 5.0% above your Fund’s cost. | | | | | |
| | Information Technology | | | | | | | | |
| | | | Application Software - 9.8% | | | | | |
| | 82,450 | | | Ceridian HCM Holding, Inc.* | | | 2,708,828 | | | | 4,229,685 | |
| | 35,000 | | | RingCentral, Inc., Class A* | | | 2,900,621 | | | | 3,773,000 | |
| | 76,500 | | | Smartsheet, Inc., Class A*,1 | | | 2,168,752 | | | | 3,120,435 | |
| | 16,905 | | | The Trade Desk, Inc., Class A*,1 | | | 1,601,353 | | | | 3,346,345 | |
| | | | Communications Equipment - 7.1% | | | | | |
| | 78,395 | | | Ciena Corp.* | | | 2,151,024 | | | | 2,927,269 | |
| | 70,800 | | | Lumentum Holdings, Inc.*,1 | | | 3,506,370 | | | | 4,003,032 | |
| | 14,880 | | | Palo Alto Networks, Inc.* | | | 2,721,453 | | | | 3,614,055 | |
| | | | Data Processing & Outsourced Services - 4.8% | | | | | |
| | 57,976 | | | Black Knight, Inc.* | | | 1,508,143 | | | | 3,159,692 | |
| | 28,555 | | | Global Payments, Inc. | | | 2,106,166 | | | | 3,898,329 | |
| | | | Electronic Components - 1.8% | | | | | |
| | 72,600 | | | II-VI, Inc.* | | | 3,042,707 | | | | 2,703,624 | |
| | | | Electronic Equipment & Instruments - 2.0% | | | | | |
| | 34,792 | | | Keysight Technologies, Inc.* | | | 2,136,569 | | | | 3,033,862 | |
| | | | IT Consulting & Other Services - 2.4% | | | | | |
| | 61,685 | | | Booz Allen Hamilton Holding Corp. | | | 2,715,808 | | | | 3,586,366 | |
| | | | Semiconductors - 2.3% | | | | | |
| | 41,533 | | | Microchip Technology, Inc. | | | 3,448,564 | | | | 3,445,578 | |
| | | | Systems Software - 2.5% | | | | | |
| | 15,297 | | | ServiceNow, Inc.* | | | 1,806,593 | | | | 3,770,557 | |
|
The accompanying notes are an integral part of these financial statements. 7 |
AMG Managers Brandywine Advisors Mid Cap Growth Fund
Schedule of Portfolio Investments(continued)
| | | | | | | | | | | | |
| Shares | | | | | Cost | | | Value | |
| | Information Technology(continued) | | | | | | | | |
| | | | Technology Hardware, Storage & Peripherals - 2.3% | | | | | |
| | 154,300 | | | Pure Storage, Inc., Class A* | | $ | 2,990,604 | | | $ | 3,362,197 | |
| | | | | | | | | | | | |
| | Total Information Technology | | | 37,513,555 | | | | 51,974,026 | |
| | | | This sector is 38.5% above your Fund’s cost. | | | | | |
| | Materials | | | | | | | | |
| | | | Construction Materials - 2.4% | | | | | |
| | 29,750 | | | Vulcan Materials Co. | | | 3,377,606 | | | | 3,522,400 | |
| | | | This sector is 4.3% above your Fund’s cost. | | | | | |
| | Total Common Stocks | | | 115,763,273 | | | | 138,812,868 | |
| | | |
Principal
Amount | | | | | | | | | |
| | Short-Term Investments - 6.6% | | | | | | | | |
| | Commercial Paper - 5.7% | | | | | | | | |
| | $8,500,000 | | | Kroger Co., 2.57%, 04/01/192 | | | 8,500,000 | | | | 8,500,000 | |
| | Joint Repurchase Agreements - 0.7%3 | | | | | |
| | 967,216 | | | RBC Dominion Securities, Inc., dated 03/29/19, due 04/01/19, 2.650% total to be received $967,430 (collateralized by various U.S. Government Agency Obligations and U.S. Treasuries, 0.000% - 7.000%, 04/11/19 - 09/09/49, totaling $986,560) | | | 967,216 | | | | 967,216 | |
| | | | | | | | | | | | |
| Shares | | | | | Cost | | | Value | |
| | Other Investment Companies - 0.2% | | | | | | | | |
| | 94,332 | | | Dreyfus Government Cash Management Fund, Institutional Shares, 2.34%4 | | $ | 94,332 | | | $ | 94,332 | |
| | 94,331 | | | Dreyfus Institutional Preferred Government Money Market Fund, Institutional Shares, 2.40%4 | | | 94,331 | | | | 94,331 | |
| | 97,190 | | | JPMorgan U.S. Government Money Market Fund, IM Shares, 2.39%4 | | | 97,190 | | | | 97,190 | |
| | | | Total Other Investment Companies | | | 285,853 | | | | 285,853 | |
| | | | | | | | | | | | |
| | Total Short-Term Investments | | | 9,753,069 | | | | 9,753,069 | |
| | Total Investments - 100.1% | | | 125,516,342 | | | | 148,565,937 | |
| | Other Assets, less Liabilities - (0.1%) | | | | | | | (217,589 | ) |
| | Total Net Assets - 100.0% | | | | | | $ | 148,348,348 | |
| | | | | | | | | | | | |
| * | Non-income producing security. |
| 1 | Some or all of these securities, amounting to $14,553,816 or 9.8% of net assets, were out on loan to various brokers and are collateralized by cash and various U.S. Treasury Obligations. See Note 4 of Notes to Financial Statements. |
| 2 | Represents yield to maturity at March 31, 2019. |
| 3 | Cash collateral received from brokers for securities lending was invested in these joint repurchase agreements. |
| 4 | Yield shown represents the March 31, 2019, seven day average yield, which refers to the sum of the previous seven days’ dividends paid, expressed as an annual percentage. |
The following table summarizes the inputs used to value the Fund’s investments by the fair value hierarchy levels as of March 31, 2019:
| | | | | | | | | | | | | | | | |
| | | Level 1 | | | Level 2 | | | Level 3 | | | Total | |
Investments in Securities | | | | | | | | | | | | | | | | |
Common Stocks† | | $ | 138,812,868 | | | | — | | | | — | | | $ | 138,812,868 | |
Short-Term Investments | | | | | | | | | | | | | | | | |
Commercial Paper | | | — | | | $ | 8,500,000 | | | | — | | | | 8,500,000 | |
Joint Repurchase Agreements | | | — | | | | 967,216 | | | | — | | | | 967,216 | |
Other Investment Companies | | | 285,853 | | | | — | | | | — | | | | 285,853 | |
| | | | | | | | | | | | | | | | |
Total Investments in Securities | | $ | 139,098,721 | | | $ | 9,467,216 | | | | — | | | $ | 148,565,937 | |
| | | | | | | | | | | | | | | | |
| † | All common stocks held in the Fund are Level 1 securities. For a detailed breakout of common stocks by major industry classification, please refer to the Fund’s Schedule of Portfolio Investments. |
For the six months ended March 31, 2019, there were no transfers in or out of Level 3.
|
The accompanying notes are an integral part of these financial statements. 8 |
Statement of Assets and Liabilities(unaudited)
March 31, 2019
| | | | |
| | | AMG
Managers
Brandywine Advisors
Mid Cap
Growth Fund | |
Assets: | | | | |
Investments at Value1(including securities on loan valued at $14,553,816) | | $ | 148,565,937 | |
Receivable for investments sold | | | 2,183,146 | |
Dividend, interest and other receivables | | | 52,833 | |
Prepaid expenses and other assets | | | 12,743 | |
Total assets | | | 150,814,659 | |
Liabilities: | | | | |
Payable upon return of securities loaned | | | 967,216 | |
Payable for investments purchased | | | 1,318,054 | |
Payable for Fund shares repurchased | | | 62 | |
Accrued expenses: | | | | |
Investment advisory and management fees | | | 110,010 | |
Administrative fees | | | 18,752 | |
Distribution fees | | | 500 | |
Shareholder service fees | | | 250 | |
Professional fees | | | 22,084 | |
Other | | | 29,383 | |
Total liabilities | | | 2,466,311 | |
Net Assets | | $ | 148,348,348 | |
1Investments at cost | | $ | 125,516,342 | |
Net Assets Represent: | | | | |
Paid-in capital | | $ | 132,340,193 | |
Distributable earnings (loss) | | | 16,008,155 | |
Net Assets | | $ | 148,348,348 | |
Class N: | | | | |
Net Assets | | $ | 148,348,348 | |
Shares outstanding | | | 12,812,383 | |
Net asset value, offering and redemption price per share | | $ | 11.58 | |
|
The accompanying notes are an integral part of these financial statements. 9 |
Statement of Operations(unaudited)
For the six months ended March 31, 2019
| | | | |
| | | AMG
Managers
Brandywine Advisors
Mid Cap
Growth Fund | |
Investment Income: | | | | |
Dividend income | | $ | 232,595 | |
Interest income | | | 99,770 | |
Securities lending income | | | 55,680 | |
Total investment income | | | 388,045 | |
Expenses: | | | | |
Investment advisory and management fees | | | 599,012 | |
Administrative fees | | | 102,104 | |
Distribution fees - Class N | | | 4,197 | |
Shareholder servicing fees - Class N | | | 1,362 | |
Professional fees | | | 19,023 | |
Registration fees | | | 13,633 | |
Custodian fees | | | 12,739 | |
Reports to shareholders | | | 10,997 | |
Trustee fees and expenses | | | 5,720 | |
Transfer agent fees | | | 1,836 | |
Miscellaneous | | | 1,892 | |
Total expenses | | | 772,515 | |
Net investment loss | | | (384,470 | ) |
Net Realized and Unrealized Loss: | | | | |
Net realized gain on investments | | | 1,489,867 | |
Net change in unrealized appreciation/depreciation on investments | | | (8,371,136 | ) |
Net realized and unrealized loss | | | (6,881,269 | ) |
Net decrease in net assets resulting from operations | | $ | (7,265,739 | ) |
|
The accompanying notes are an integral part of these financial statements. 10 |
Statements of Changes in Net Assets
For the six months ended March 31, 2019 (unaudited) and the fiscal year ended September 30, 2018
| | | | | | | | |
| | | AMG
Managers
Brandywine Advisors
Mid Cap Growth Fund | |
| | | March 31, 2019 | | | September 30, 2018 | |
Increase (Decrease) in Net Assets Resulting From Operations: | | | | | | | | |
Net investment loss | | $ | (384,470 | ) | | $ | (626,152 | ) |
Net realized gain on investments | | | 1,489,867 | | | | 16,749,239 | |
Net change in unrealized appreciation/depreciation on investments | | | (8,371,136 | ) | | | 10,192,093 | |
Net increase (decrease) in net assets resulting from operations | | | (7,265,739 | ) | | | 26,315,180 | |
Distributions to Shareholders: | | | | | | | | |
Class N | | | (11,524,622 | ) | | | — | |
Capital Share Transactions:1 | | | | | | | | |
Net increase (decrease) from capital share transactions | | | 11,572,592 | | | | (281,454 | ) |
Total increase (decrease) in net assets | | | (7,217,769 | ) | | | 26,033,726 | |
Net Assets: | | | | | | | | |
Beginning of period | | | 155,566,117 | | | | 129,532,391 | |
End of period2 | | $ | 148,348,348 | | | $ | 155,566,117 | |
| 1 | See Note 1(g) of the Notes to Financial Statements. |
| 2 | Net assets - End of year includes accumulated net investment loss of $(493,536) in 2018. |
|
The accompanying notes are an integral part of these financial statements. 11 |
AMG Managers Brandywine Advisors Mid Cap Growth Fund
Financial Highlights
For a share outstanding throughout each fiscal period
| | | | | | | | | | | | | | | | | | | | | | | | |
| | | For the six | | | | | | | | | | | | | | | | |
| | | months ended | | | For the fiscal years ended September 30, | |
| | | March 31, 2019 | | | | | | | | | | | | | | | | |
| Class N | | (unaudited) | | | 2018 | | | 20171 | | | 2016 | | | 2015 | | | 20142 | |
Net Asset Value, Beginning of Period | | $ | 13.42 | | | $ | 11.15 | | | $ | 9.35 | | | $ | 9.26 | | | $ | 9.59 | | | $ | 8.80 | |
Income (loss) from Investment Operations: | | | | | | | | | | | | | | | | | | | | | | | | |
Net investment income (loss)3 | | | (0.03 | ) | | | (0.05 | ) | | | (0.06 | ) | | | (0.03 | ) | | | 0.03 | 4 | | | (0.05 | ) |
Net realized and unrealized gain (loss) on investments | | | (0.82 | ) | | | 2.32 | | | | 1.86 | | | | 0.12 | | | | (0.36 | ) | | | 0.84 | |
Total income (loss) from investment operations | | | (0.85 | ) | | | 2.27 | | | | 1.80 | | | | 0.09 | | | | (0.33 | ) | | | 0.79 | |
Less Distributions to Shareholders from: | | | | | | | | | | | | | | | | | | | | | | | | |
Net realized gain on investments | | | (0.99 | ) | | | — | | | | — | | | | — | | | | — | | | | — | |
Net Asset Value, End of Period | | $ | 11.58 | | | $ | 13.42 | | | $ | 11.15 | | | $ | 9.35 | | | $ | 9.26 | | | $ | 9.59 | |
Total Return5 | | | (4.66 | )%6 | | | 20.36 | % | | | 19.25 | % | | | 0.97 | % | | | (3.44 | )% | | | 8.98 | % |
Ratio of expenses to average net assets | | | 1.13 | %7 | | | 1.13 | % | | | 1.15 | % | | | 1.15 | % | | | 1.14 | % | | | 1.12 | % |
Ratio of net investment income (loss) to average net assets | | | (0.56 | )%7 | | | (0.45 | )% | | | (0.62 | )% | | | (0.33 | )% | | | 0.28 | % | | | (0.54 | )% |
Portfolio turnover | | | 102 | %6 | | | 167 | % | | | 215 | % | | | 195 | % | | | 204 | % | | | 249 | % |
Net assets end of period (000’s) omitted | | $ | 148,348 | | | $ | 155,566 | | | $ | 129,532 | | | $ | 132,794 | | | $ | 143,205 | | | $ | 148,847 | |
| | | | | | | | | | | | | | | | | | | | | | | | |
| 1 | Effective October 1, 2016, the Fund’s shares were reclassified and redesignated to Class N shares. |
| 2 | At the start of business October 1, 2013, the Fund was reorganized into a fund of AMG Funds I. |
| 3 | Per share numbers have been calculated using average shares. |
| 4 | Includesnon-recurring dividends. Without these dividends, net investment loss per share would have been $(0.03). |
| 5 | The total return is calculated using the published Net Asset Value as of period end. |
Notes to Financial Statements(unaudited)
March 31, 2019
1. SUMMARY OF SIGNIFICANT ACCOUNTING POLICIES
AMG Funds I (the “Trust”) is anopen-end management investment company, organized as a Massachusetts business trust, and registered under the Investment Company Act of 1940, as amended (the “1940 Act”). Currently, the Trust consists of a number of different funds, each having distinct investment management objectives, strategies, risks, and policies. Included in this report is the AMG Managers Brandywine Advisors Mid Cap Growth Fund (the “Fund”).
A significant portion of the Fund’s holdings may be focused in a relatively small number of securities, which may make the Fund more volatile and subject to greater risk than a more diversified fund.
The Fund’s financial statements are prepared in accordance with accounting principles generally accepted in the United States of America (“U.S. GAAP”), including accounting and reporting guidance pursuant to Accounting Standards Codification Topic 946 applicable to investment companies. U.S. GAAP requires management to make estimates and assumptions that affect the reported amounts of assets and liabilities and disclosure of contingent assets and liabilities at the date of the financial statements and the reported amounts of income and expenses during the reporting period. Actual results could differ from those estimates and such differences could be material. The following is a summary of significant accounting policies followed by the Fund in the preparation of its financial statements:
a. VALUATION OF INVESTMENTS
Equity securities traded on a national securities exchange or reported on the NASDAQ national market system (“NMS”) are valued at the last quoted sales price on the primary exchange or, if applicable, the NASDAQ official closing price or the official closing price of the relevant exchange or, lacking any sales, at the last quoted bid price or the mean between the last quoted bid and ask prices (the “exchange mean price”). Equity securities traded in theover-the-counter market (other than NMS securities) are valued at the exchange mean price. Foreign equity securities (securities principally traded in markets other than U.S. markets) are valued at the official closing price on the primary exchange or, for markets that either do not offer an official closing price or where the official closing price may not be representative of the overall market, the last quoted sale price.
Fixed income securities purchased with a remaining maturity of 60 days or less are valued at amortized cost, provided that the amortized cost value is approximately the same as the fair value of the security valued without the use of amortized cost. Investments in otheropen-end regulated investment companies are valued at their end of day net asset value per share.
The Fund’s portfolio investments are generally valued based on independent market quotations or prices or, if none, “evaluative” or other market based valuations provided by third party pricing services approved by the Board of Trustees of the Trust (the “Board”). Under certain circumstances, the value of certain Fund portfolio investments may be based on an evaluation of fair value, pursuant to procedures established by and under the general supervision of the Board. The Valuation Committee, which is comprised of the Independent Trustees of the Board, and the Pricing Committee, which is comprised of representatives from AMG Funds LLC (the “Investment Manager”), are the committees appointed by the Board to make fair value determinations. The Fund may use the fair value of a portfolio investment to calculate its net asset value (“NAV”) in the event that the market quotation, price or market based valuation for the portfolio investment is not readily available or otherwise not determinable pursuant to the Board’s
valuation procedures, if the Investment Manager or the Pricing Committee believes the quotation, price or market based valuation to be unreliable, or in certain other circumstances. When determining the fair value of an investment, the Pricing Committee and, if required under the Trust’s securities valuation procedures, the Valuation Committee, seeks to determine the price that the Fund might reasonably expect to receive from current sale of that portfolio investment in an arms-length transaction. Fair value determinations shall be based upon consideration of all available facts and information, including, but not limited to (i) attributes specific to the investment; (ii) fundamental and analytical data relating to the investment; and (iii) the value of other comparable securities or relevant financial instruments, including derivative securities, traded on other markets or among dealers.
The values assigned to fair value portfolio investments are based on available information and do not necessarily represent amounts that might ultimately be realized in the future, since such amounts depend on future developments inherent in long-term investments. Because of the inherent uncertainty of valuation, those estimated values may differ significantly from the values that would have been used had a ready market for the investments existed, and the differences could be material. The Board will be presented with a quarterly report showing as of the most recent quarter end, all outstanding securities fair valued by the Fund, including a comparison with the prior quarter end and the percentage of the Fund that the security represents at each quarter end.
With respect to foreign equity securities and certain foreign fixed income securities, the Board has adopted a policy that securities held in a Fund that can be fair valued by the applicable fair value pricing service are fair valued on each business day provided that each individual price exceeds apre-established confidence level.
U.S. GAAP defines fair value as the price that a fund would receive to sell an asset or pay to transfer a liability in an orderly transaction between market participants at the measurement date. U.S. GAAP also establishes a framework for measuring fair value, and a three level hierarchy for fair value measurements based upon the transparency of inputs to the valuation of an asset or liability. Inputs may be observable or unobservable and refer broadly to the assumptions that market participants would use in pricing the asset or liability. Observable inputs reflect the assumptions market participants would use in pricing the asset or liability based on market data obtained from sources independent of the Fund. Unobservable inputs reflect the Fund’s own assumptions about the assumptions that market participants would use in pricing the asset or liability developed based on the best information available in the circumstances. Each investment is assigned a level based upon the observability of the inputs which are significant to the overall valuation.
The three-tier hierarchy of inputs is summarized below:
Level 1 – inputs are quoted prices in active markets for identical investments (e.g., equity securities,open-end investment companies)
Level 2 – other observable inputs (including, but not limited to: quoted prices for similar assets or liabilities in markets that are active, quoted prices for identical or similar assets or liabilities in markets that are not active, inputs other than quoted prices that are observable for the assets or liabilities (such as interest rates, yield curves, volatilities, prepayment speeds, loss severities, credit risks and default rates) or other market corroborated inputs) (e.g., debt securities, government securities, foreign currency exchange contracts, swaps, foreign securities utilizing international fair value pricing, fair valued securities with observable inputs)
Notes to Financial Statements(continued)
Level 3 – inputs are significant unobservable inputs (including the Fund’s own assumptions used to determine the fair value of investments) (e.g., fair valued securities with unobservable inputs)
Changes in inputs or methodologies used for valuing investments may result in a transfer in or out of levels within the fair value hierarchy. The inputs or methodologies used for valuing investments may not necessarily be an indication of the risk associated with investing in those investments.
b. SECURITY TRANSACTIONS
Security transactions are accounted for as of trade date. Realized gains and losses on securities sold are determined on the basis of identified cost.
c. INVESTMENT INCOME AND EXPENSES
Dividend income is recorded on theex-dividend date. Dividends from foreign securities are recorded on theex-dividend date, and if after the fact, as soon as the Fund becomes aware of theex-dividend date. Interest income, which includes amortization of premium and accretion of discount on debt securities, is accrued as earned. Dividend and interest income on foreign securities is recorded gross of any withholding tax.Non-cash dividends included in dividend income, if any, are reported at the fair market value of the securities received. Other income and expenses are recorded on an accrual basis. Expenses that cannot be directly attributed to a Fund are apportioned among the funds in the Trust and other trusts within the AMG Funds family of mutual funds (collectively the “AMG Funds Family”) based upon their relative average net assets or number of shareholders.
d. DIVIDENDS AND DISTRIBUTIONS
Fund distributions resulting from either net investment income or realized net capital gains, if any, will normally be declared and paid at least annually in December. Distributions to shareholders are recorded on theex-dividend date. Distributions are determined in accordance with federal income tax regulations, which may differ from net investment income and net realized capital gains for financial statement purposes (U.S. GAAP). Differences may be permanent or temporary. Permanent differences are reclassified among capital accounts in the financial statements to reflect their tax character. Permanent book and tax basis differences, if any, relating to shareholder distributions will result in reclassifications topaid-in capital. Temporary differences arise when certain items of income, expense and gain or loss are recognized in different periods for financial statement and tax purposes; these differences will reverse at some time in the future. Permanent differences are primarily due to a net operating loss write off. Temporary differences are primarily due to qualified late year ordinary losses and wash sales.
At March 31, 2019, the aggregate cost for federal income tax purposes approximates the aggregate cost for book purposes. The approximate cost of investments and the aggregate gross unrealized appreciation and depreciation for federal income tax purposes were as follows:
| | | | | | | | | | | | | | |
| Cost | | | Appreciation | | | Depreciation | | | Net | |
| $ | 125,516,342 | | | $ | 24,982,408 | | | $ | (1,932,813 | ) | | $ | 23,049,595 | |
e. FEDERAL TAXES
The Fund currently qualifies as an investment company and intends to comply with the requirements under Subchapter M of the Internal Revenue Code of 1986, as amended, and to distribute substantially all of its taxable income and gains to its shareholders and to meet certain diversification and income requirements with respect to investment companies. Therefore, no provision for federal income or excise tax is included in the accompanying financial statements.
Additionally, based on the Fund’s understanding of the tax rules and rates related to income, gains and transactions for the foreign jurisdictions in which it invests, the Fund will provide for foreign taxes, and where appropriate, deferred foreign taxes.
Management has analyzed the Fund’s tax positions taken on federal income tax returns as of March 31, 2019, and for all open tax years (generally, the three prior taxable years), and has concluded that no provision for federal income tax is required in the Fund’s financial statements. Additionally, Management is not aware of any tax position for which it is reasonably possible that the total amounts of unrecognized tax benefits will change materially in the next twelve months.
Net capital losses incurred may be carried forward for an unlimited time period, and retain their tax character as either short-term or long-term capital losses.
f. CAPITAL LOSS CARRYOVERS AND DEFERRALS
As of September 30, 2018, the Fund had no accumulated net realized capital loss carryovers from securities transactions for federal income tax purposes. Should the Fund incur net capital losses for the fiscal year ended September 30, 2019, such amounts may be used to offset future realized capital gains, for an unlimited time period.
g. CAPITAL STOCK
The Trust’s Declaration of Trust authorizes for the Fund the issuance of an unlimited number of shares of beneficial interest, without par value. The Fund records sales and repurchases of its capital stock on the trade date.
Notes to Financial Statements(continued)
For the six months ended March 31, 2019 (unaudited) and the fiscal year ended September 30, 2018, the capital stock transactions by class for the Fund were as follows:
| | | | | | | | | | | | | | | | |
| | | March 31, 2019 | | | September 30, 2018 | |
| | | Shares | | | Amount | | | Shares | | | Amount | |
Class N: | | | | | | | | | | | | | | | | |
Proceeds from sale of shares | | | 29,411 | | | $ | 329,121 | | | | 14,767 | | | $ | 177,132 | |
Reinvestment of distributions | | | 1,216,549 | | | | 11,520,715 | | | | — | | | | — | |
Cost of shares repurchased | | | (25,916 | ) | | | (277,244 | ) | | | (38,082 | ) | | | (458,586 | ) |
| | | | | | | | | | | | | | | | |
Net increase (decrease) | | | 1,220,044 | | | $ | 11,572,592 | | | | (23,315 | ) | | $ | (281,454 | ) |
| | | | | | | | | | | | | | | | |
At March 31, 2019, an affiliated shareholder of record individually owns 96% of the net assets of the Fund. Transactions by this shareholder may have a material impact on the Fund.
h. REPURCHASE AGREEMENTS AND JOINT REPURCHASE AGREEMENTS
The Fund may enter into third-party repurchase agreements for temporary cash management purposes and third-party or bilateral joint repurchase agreements for reinvestment of cash collateral on securities lending transactions under the securities lending program offered by The Bank of New York Mellon (“BNYM”) (the “Program”) (collectively, “Repurchase Agreements”). The value of the underlying collateral, including accrued interest, must equal or exceed the value of the Repurchase Agreements during the term of the agreement. For joint repurchase agreements, the Fund participates on a pro rata basis with other clients of BNYM in its share of the underlying collateral under such joint repurchase agreements and in its share of proceeds from any repurchase or other disposition of the underlying collateral. The underlying collateral for all Repurchase Agreements is held in safekeeping by the Fund’s custodian or at the Federal Reserve Bank. If the seller defaults and the value of the collateral declines, or if bankruptcy proceedings commence with respect to the seller of the security, realization of the collateral by the Fund may be delayed or limited. Pursuant to the Program, the Fund is indemnified for such losses by BNYM on joint repurchase agreements.
At March 31, 2019, the market value of Repurchase Agreements outstanding was $967,216.
2. AGREEMENTS AND TRANSACTIONS WITH AFFILIATES
The Trust has entered into an investment advisory agreement under which the Investment Manager, a subsidiary and the U.S. retail distribution arm of Affiliated Managers Group, Inc. (“AMG”), serves as investment manager to the Fund and is responsible for the Fund’s overall administration and operations. The Investment Manager selects one or more subadvisers for the Fund (subject to Board approval) and monitors each subadviser’s investment performance, security holdings and investment strategies. The Fund’s investment portfolio is managed by Friess Associates, LLC (“Friess”) and Friess Associates of Delaware, LLC (“Friess of Delaware”) who serve pursuant to a subadvisory agreement with the Investment Manager.
Investment management fees are paid directly by the Fund to the Investment Manager based on average daily net assets. For the six months ended March 31, 2019, the Fund paid an investment management fee at the annual rate of 0.88% of the average daily net assets of the Fund.
The Trust, on behalf of the Fund, has entered into an amended and restated Administration Agreement under which the Investment Manager serves as the Fund’s administrator (the “Administrator”) and is responsible for allnon-portfolio management aspects of managing the Fund’s operations, including administration and shareholder services to the Fund. The Fund pays a fee to the Administrator at the rate of 0.15% per annum of the Fund’s average daily net assets for this service.
The Fund is distributed by AMG Distributors, Inc. (the “Distributor”), a wholly-owned subsidiary of the Investment Manager. The Distributor serves as the distributor and underwriter for the Fund and is a registered broker-dealer and member of the Financial Industry Regulatory Authority, Inc. (“FINRA”). Shares of the Fund will be continuously offered and will be sold directly to prospective purchasers and through brokers, dealers or other financial intermediaries who have executed selling agreements with the Distributor. Generally the Distributor bears all or a portion of the expenses of providing services pursuant to the distribution agreement, including the payment of the expenses relating to the distribution of prospectuses for sales purposes and any advertising or sales literature.
The Trust has adopted a distribution and service plan (the “Plan”) with respect to the Class N shares, in accordance with the requirements of Rule12b-1 under the 1940 Act and the requirements of the applicable rules of FINRA regarding asset-based sales charges. Pursuant to the Plan, the Fund may make payments to the Distributor for its expenditures in financing any activity primarily intended to result in the sale of the Fund’s Class N shares and for maintenance and personal service provided to existing shareholders of that class. The Plan authorizes payments to the Distributor for expense payments incurred up to 0.25% annually of the Fund’s average daily net assets attributable to the Class N shares. The actual amount incurred for Class N shares was less than 0.01%.
The Board has approved reimbursement payments to the Investment Manager for shareholder servicing expenses (“shareholder servicing fees”) incurred. Shareholder servicing fees include payments to financial intermediaries, such as broker-dealers (including fund supermarket platforms), banks, and trust companies who provide shareholder recordkeeping, account servicing and other services. The Fund may reimburse the Investment Manager for the actual amount incurred up to a maximum annual rate of the Class N shares’ average daily net assets as shown in the table below.
The impact on the annualized expense ratio for the six months ended March 31, 2019, was as follows:
Notes to Financial Statements(continued)
| | | | | | | | |
| | | Maximum Annual
Amount
Approved | | | Actual
Amount
Incurred | |
Class N | | | 0.15 | % | | | 0.00 | %1 |
The Board provides supervision of the affairs of the Trust and other trusts within the AMG Funds family. The Trustees of the Trust who are not affiliated with the Investment Manager receive an annual retainer and per meeting fees for regular, special and telephonic meetings, and they are reimbursed forout-of-pocket expenses incurred while carrying out their duties as Board members. The Chairman of the Board and the Audit Committee Chair receive additional annual retainers. Certain Trustees and Officers of the Fund are Officers and/or Directors of the Investment Manager, AMG and/or the Distributor.
The Securities and Exchange Commission (the “SEC”) granted an exemptive order that permits the Fund to lend and borrow money for certain temporary purposes directly to and from other eligible funds in the AMG Funds family. Participation in this interfund lending program is voluntary for both the borrowing and lending funds, and an interfund loan is only made if it benefits each participating fund. The Administrator manages the program according to procedures approved by the Board, and the Board monitors the operation of the program. An interfund loan must comply with certain conditions set out in the exemptive order, which are designed to assure fairness and protect all participating funds. For the six months ended March 31, 2019, the Fund neither borrowed from nor lent to other funds in the AMG Funds family. At March 31, 2019, the Fund had no interfund loans outstanding.
3. PURCHASES AND SALES OF SECURITIES
Purchases and sales of securities (excluding short-term securities and U.S. Government Obligations) for the six months ended March 31, 2019, were $134,810,719 and $138,554,889, respectively.
The Fund had no purchases or sales of U.S. Government Obligations during the six months ended March 31, 2019.
4. PORTFOLIO SECURITIES LOANED
The Fund participates in the Program providing for the lending of securities to qualified brokers. Securities lending income includes earnings of such temporary cash investments, plus or minus any rebate to a borrower. These earnings (after any rebate) are then divided between BNYM, as a fee for its services under the Program, and the Fund, according to agreed-upon rates. Collateral on all securities loaned is accepted in cash or U.S. Government and Agency Obligations. Collateral is maintained at a minimum level of 102% (105% in the case of certain foreign securities) of the market value, plus interest, if applicable, of investments on loan. It is the Fund’s policy to obtain additional collateral from or return excess collateral to the borrower by the end of the next business day, following the valuation date of
the securities loaned. Therefore, the value of the collateral held may be temporarily less than the value of the securities on loan. Lending securities entails a risk of loss to the Fund if and to the extent that the market value of the securities loaned were to increase and the borrower did not increase the collateral accordingly, and the borrower fails to return the securities. Under the terms of the Program, the Fund is indemnified for such losses by BNYM. Cash collateral is held in separate omnibus accounts managed by BNYM, who is authorized to exclusively enter into joint repurchase agreements for that cash collateral. Securities collateral is held in separate omnibus accounts managed by BNYM that cannot be sold or pledged. BNYM bears the risk of any deficiency in the amount of the cash collateral available for return to the borrower due to any loss on the collateral invested.
The value of securities loaned on positions held, cash and securities collateral received at March 31, 2019, were as follows:
| | | | | | | | | | | | | | |
Securities
Loaned | | | Cash
Collateral
Received | | | Securities
Collateral
Received | | | Total
Collateral
Received | |
| $ | 14,553,816 | | | $ | 967,216 | | | $ | 13,473,520 | | | $ | 14,440,736 | |
The following table summarizes the securities received as collateral for securities lending:
| | | | |
Collateral Type | | Coupon
Range | | Maturity Date Range |
U.S. Treasury Obligations | | 0.000%-8.750% | | 04/15/19-11/15/48 |
5. COMMITMENTS AND CONTINGENCIES
Under the Trust’s organizational documents, its trustees and officers are indemnified against certain liabilities arising out of the performance of their duties to the Trust. In addition, in the normal course of business, the Fund may enter into contracts and agreements that contain a variety of representations and warranties, which provide general indemnifications. The maximum exposure to the Fund under these arrangements is unknown, as this would involve future claims that may be made against the Fund that have not yet occurred. However, based on experience, the Fund had no prior claims or losses and expects the risks of loss to be remote.
6. MASTER NETTING AGREEMENTS
The Fund may enter into master netting agreements with its counterparties for the securities lending program and Repurchase Agreements, which provide the right, in the event of default (including bankruptcy or insolvency) for thenon-defaulting party to liquidate the collateral and calculate net exposure to the defaulting party or request additional collateral. For financial reporting purposes, the Fund does not offset financial assets and financial liabilities that are subject to master netting agreements in the Statement of Assets and Liabilities. For securities lending transactions, see Note 4.
Notes to Financial Statements(continued)
The following table is a summary of the Fund’s open Repurchase Agreements that are subject to a master netting agreement as of March 31, 2019:
| | | | | | | | | | | | | | | | | | | | |
| | | | | | Gross Amount Not Offset in the
Statement of Assets and Liabilities | | | | | | | |
| | | Gross Amounts of
Assets Presented in
the Statement of
Assets and Liabilities | | | Offset
Amount | | | Net Asset Balance | | | Collateral
Received | | | Net
Amount | |
RBC Dominion Securities, Inc. | | $ | 967,216 | | | | — | | | $ | 967,216 | | | $ | 967,216 | | | | — | |
7. REGULATORY UPDATES
In August 2018, the FASB issued Accounting Standards UpdateNo. 2018-13, Fair Value Measurement (Topic 820), Disclosure Framework - Changes to the Disclosure Requirements for Fair Value Measurement (“ASU2018-13”) which is effective for periods starting after December 15, 2019. The primary focus of the update is to improve the effectiveness of ASC 820’s disclosure in the notes to financial statements. The Fund has early adopted these changes and there was no significant impact on the financial statements and accompanying notes.
Effective November 15, 2018, the SEC amended existing rules intended to modernize reporting and disclosure of information. These amendments relate to RegulationS-X which sets forth the form and content of financial statements. The
amendment requires collapsing the components of distributable earnings on the Statement of Assets and Liabilities and collapsing the distributions paid to shareholders on the Statements of Changes in Net Assets. The Fund has adopted these amendments and there was no significant impact on the financial statements and accompanying notes.
8. SUBSEQUENT EVENTS
The Fund has determined that no material events or transactions occurred through the issuance date of the Fund’s financial statements, which require an additional disclosure in or adjustment of the Fund’s financial statements.
THIS PAGE INTENTIONALLY LEFT BLANK
THIS PAGE INTENTIONALLY LEFT BLANK
THIS PAGE INTENTIONALLY LEFT BLANK
INVESTMENT MANAGER AND ADMINISTRATOR
AMG Funds LLC
600 Steamboat Road, Suite 300
Greenwich, CT 06830
800.548.4539
DISTRIBUTOR
AMG Distributors, Inc.
600 Steamboat Road, Suite 300
Greenwich, CT 06830
800.548.4539
SUBADVISER
Friess Associates, LLC
P.O. Box 576
Jackson, Wyoming 83001
Friess Associates of Delaware, LLC
P.O. Box 4166
Greenville, DE 19807
CUSTODIAN
The Bank of New York Mellon
111 Sanders Creek Parkway
East Syracuse, NY 13057
LEGAL COUNSEL
Ropes & Gray LLP
Prudential Tower, 800 Boylston Street
Boston, MA 02199-3600
TRANSFER AGENT
BNY Mellon Investment Servicing (US) Inc.
Attn: AMG Funds
P.O. Box 9769
Providence, RI 02940
800.548.4539
TRUSTEES
Bruce B. Bingham
Christine C. Carsman
Edward J. Kaier
Kurt Keilhacker
Steven J. Paggioli
Richard F. Powers III
Eric Rakowski
Victoria Sassine
Thomas R. Schneeweis
This report is prepared for the Fund’s shareholders. It is authorized for distribution to prospective investors only when preceded or accompanied by an effective prospectus. To receive a free copy of the prospectus or Statement of Additional Information, which includes additional information about Fund Trustees, please contact us by calling 800.548.4539. Distributed by AMG Distributors, Inc., member FINRA/SIPC.
Current net asset values per share for the Fund are available on the Fund’s website at amgfunds.com.
A description of the policies and procedures the Fund uses to vote its proxies is available: (i) without charge, upon request, by calling 800.548.4539, or (ii) on the Securities and Exchange Commission’s (SEC) website at sec.gov. For information regarding the Fund’s proxy voting record for the12-month period ended June 30, call 800.548.4539 or visit the SEC website at sec.gov.
The Fund files its complete schedule of portfolio holdings with the SEC for the first and third quarters of each fiscal year on FormN-PORT-EX. The Fund’s FormsN-PORT-EX are available on the SEC’s website at sec.gov. To review a complete list of the Fund’s portfolio holdings, or to view the semiannual report, or annual report, please visit amgfunds.com.
AFFILIATE SUBADVISED FUNDS
BALANCED FUNDS
AMG Chicago Equity Partners Balanced
Chicago Equity Partners, LLC
AMG FQ Global Risk-Balanced
First Quadrant, L.P.
EQUITY FUNDS
AMG FQTax-Managed U.S. Equity
AMG FQ Long-Short Equity
First Quadrant, L.P.
AMG Frontier Small Cap Growth
Frontier Capital Management Co., LLC
AMG GW&K Small Cap Core
AMG GW&K Small/Mid Cap
AMG GW&K Trilogy Emerging Markets
Equity
AMG GW&K Trilogy Emerging Wealth
Equity
AMG GW&K U.S. Small Cap Growth
GW&K Investment Management, LLC
AMG Renaissance Large Cap Growth
The Renaissance Group LLC
AMG River Road Dividend All Cap
Value
AMG River Road Dividend All Cap
Value II
AMG River Road Focused Absolute
Value
AMG River Road Long-Short
AMG River RoadSmall-Mid Cap Value
AMG River Road Small Cap Value
River Road Asset Management, LLC
AMG SouthernSun Small Cap
AMG SouthernSun U.S. Equity
SouthernSun Asset Management, LLC
AMG Systematic Mid Cap Value
Systematic Financial Management L.P.
AMG TimesSquare Emerging Markets
Small Cap
AMG TimesSquare Global Small Cap
AMG TimesSquare International Small
Cap
AMG TimesSquare Mid Cap Growth
AMG TimesSquare Small Cap Growth
TimesSquare Capital Management, LLC
AMG Yacktman
AMG Yacktman Focused
AMG Yacktman Focused Fund - Security
Selection Only
AMG Yacktman Special Opportunities
Yacktman Asset Management LP
FIXED INCOME FUNDS
AMG GW&K Core Bond
AMG GW&K Enhanced Core Bond
AMG GW&K Municipal Bond
AMG GW&K Municipal Enhanced Yield
GW&K Investment Management, LLC
OPEN-ARCHITECTURE FUNDS
EQUITY FUNDS
AMG Managers Brandywine
AMG Managers Brandywine Advisors Mid
Cap Growth
AMG Managers Brandywine Blue
Friess Associates, LLC
AMG Managers Cadence Emerging
Companies
AMG Managers Cadence Mid Cap
Cadence Capital Management LLC
AMG Managers CenterSquare Real Estate
CenterSquare Investment Management
LLC
AMG Managers Emerging Opportunities
WEDGE Capital Management L.L.P.
Next Century Growth Investors LLC
RBC Global Asset Management (U.S.) Inc.
AMG Managers Essex Small/Micro Cap
Growth
Essex Investment Management Company,
LLC
AMG Managers Fairpointe ESG Equity
AMG Managers Fairpointe Mid Cap
Fairpointe Capital LLC
AMG Managers LMCG Small Cap
Growth
LMCG Investments, LLC
AMG Managers Montag & Caldwell
Growth
Montag & Caldwell, LLC
AMG Managers Pictet International
Pictet Asset Management Limited
AMG Managers Silvercrest Small Cap
Silvercrest Asset Management Group
LLC
AMG Managers Skyline Special Equities
Skyline Asset Management, L.P.
AMG Managers Special Equity
Ranger Investment Management, L.P.
Lord, Abbett & Co. LLC
Smith Asset Management Group, L.P.
Federated MDTA LLC
FIXED INCOME FUNDS
AMG Managers Amundi Intermediate
Government
AMG Managers Amundi Short Duration
Government
Amundi Pioneer Institutional Asset
Management, Inc.
AMG Managers Doubleline Core Plus
Bond
DoubleLine Capital LP
AMG Managers Global Income
Opportunity
AMG Managers Loomis Sayles Bond
Loomis, Sayles & Company, L.P.
| | |
| amgfunds.com | | 033119 SAR075 |
| | |
| | | SEMI-ANNUAL REPORT |
AMG Funds
March 31, 2019
AMG Managers Brandywine Fund
Class I: BRWIX
AMG Managers Brandywine Blue Fund
Class I: BLUEX
Beginning on January 1, 2021, as permitted by regulations adopted by the Securities and Exchange Commission, paper copies of the Funds’ shareholder reports like this one will no longer be sent by mail, unless you specifically request paper copies of the reports from the Funds or from your financial intermediary, such as a broker-dealer or bank. Instead, the reports will be made available on the Funds’ website (https://www.amgfunds.com/resources/order_literature.html), and you will be notified by mail each time a report is posted and provided with a website link to access the report.
If you already elected to receive shareholder reports electronically, you will not be affected by this change and you need not take any action. You may elect to receive shareholder reports and other communications from the Funds electronically at any time by contacting your financial intermediary or, if you invest directly with the Funds, by logging into your account at www.amgfunds.com.
You may elect to receive all future reports in paper free of charge. If you invest through a financial intermediary, you can contact your financial intermediary to request that you continue to receive paper copies of your shareholder reports. If you invest directly with the Funds, you can call 1.800.548.4539 to inform the Funds that you wish to continue receiving paper copies of your shareholder reports. Your election to receive reports in paper will apply to all funds in the AMG Funds Family of Funds held in your account if you invest through your financial intermediary or all funds in the AMG Funds Family of Funds held with the fund complex if you invest directly with the Funds.
| | |
| amgfunds.com | | 033119 SAR073 |
AMG Funds
Semi-Annual Report — March 31, 2019(unaudited)
| | | | |
TABLE OF CONTENTS | | PAGE | |
LETTER TO SHAREHOLDERS | | | 2 | |
| |
ABOUT YOUR FUND’S EXPENSES | | | 3 | |
| |
FUND PERFORMANCE | | | 4 | |
| |
FUND SNAPSHOTS, ROSES AND THORNS AND SCHEDULES OF PORTFOLIO INVESTMENTS | | | 5 | |
| |
AMG Managers Brandywine Fund | | | 5 | |
| |
AMG Managers Brandywine Blue Fund | | | 10 | |
| |
FINANCIAL STATEMENTS | | | | |
| |
Statement of Assets and Liabilities | | | 14 | |
Balance sheets, net asset value (NAV) per share computations and cumulative distributable earnings (loss) | | | | |
| |
Statement of Operations | | | 15 | |
Detail of sources of income, expenses, and realized and unrealized gains (losses) during the fiscal period | | | | |
| |
Statements of Changes in Net Assets | | | 16 | |
Detail of changes in assets for the past two fiscal periods | | | | |
| |
Financial Highlights | | | 17 | |
Historical net asset values per share, distributions, total returns, income and expense ratios, turnover ratios and net assets | | | | |
| |
Notes to Financial Statements | | | 19 | |
Accounting and distribution policies, details of agreements and transactions with Fund management and affiliates, and descriptions of certain investment risks | | | | |
Nothing contained herein is to be considered an offer, sale or solicitation of an offer to buy shares of any series of the AMG Funds family of mutual funds. Such offering is made only by prospectus, which includes details as to offering price and other material information.
| | | | | | |
| | | | | | | AMG Managers Brandywine Fund AMG Managers Brandywine Blue Fund |
DEAR FELLOW SHAREHOLDER:
Superlatives, with qualifiers, continued to define the stock market in the early months of 2019 as history’s longest bull market resumed with gusto after surrendering to gravity late last year. The worst quarter for stocks since 2011, the fourth quarter of 2018, was followed by their best quarter in nearly a decade in the three months through March.
AMG Managers Brandywine Fund (“Brandywine”) rose 18.52 percent in the March quarter. The Russell 3000® and Russell 3000® Growth Indexes gained 14.04 and 16.18 percent, respectively. AMG Managers Brandywine Blue Fund (“Brandywine Blue”) increased 17.72 percent in the quarter as the S&P 500®, Russell 1000® and Russell 1000® Growth Indexes added 13.65, 14.00 and 16.10 percent, respectively.
The S&P 500® Index posted its strongest quarterly return since the second quarter of 2009, which represented the market’s first move higher after the wrenching downturn stemming from the 2008 financial crisis. While the most recent progression, from precipitous drop to rapid ascension, was similar on its surface, conditions surrounding the abrupt about-face were far from comparable.
The 2008 downturn occurred amid an extreme credit crunch that threatened systemic collapse on a global scale. The response from the U.S. Federal Reserve and other key central banks matched the magnitude of the emergency, sparking a surge in stocks fueled by renewed optimism. Events unfolded with a lot less drama this time around.
Oil was cause for concern in the last quarter of 2018, when a decline in itsper-barrel price that exceededone-third raised concerns about the economy. Those concerns were exacerbated by the commencement of a government shutdown, followed soon after by the president criticizing the Federal Reserve for increasing interest rates.
Remedies to last year’s troubles seemed to emerge as 2019 got under way. Oil prices climbed throughout the March quarter, eventually recovering into the range of oil’s average price for 2018. The government shutdown, which ultimately stretched 35 days, ended on January 25. Then, on March 20, the Federal Reserve announced a revised outlook, going from envisioning two rate hikes in 2019 to none.
The March-quarter mood was overtly positive. Brandywine gained ground in all eight economic sectors represented in its portfolio during the three months through March. The Fund outperformed its primary benchmark, the Russell 3000® Growth Index, in five out of those eight sectors. Brandywine Blue generated positive absolute returns in seven out of eight possible sectors, outperforming the Russell 1000® Growth Index in five of those instances.
Technology holdings, which represented the largest portfolio position in both Funds, contributed the most to absolute returns and the most to performance relative to each Fund’s respective benchmark. Software and service providers were standouts.
Brandywine’s top holding from the sector, Trade Desk, reported 56 percent December-quarter revenue growth. The company, which provides technology that enables advertising campaigns across different media and devices, beat estimates by more than doubling year-over-year earnings. ServiceNow, held by both Funds,
showed similar strength, exceeding December-quarter estimates with 120 percent earnings growth. Revenue for the provider of cloud-based workflow management computing solutions rose 31 percent.
Consumer discretionary holdings represented the second largest portfolio position in Brandywine and the third largest in Brandywine Blue. The consumer discretionary sector was the second largest contributor to total gains in both Funds, ranking fourth in terms of its relative performance contribution in Brandywine and third in Brandywine Blue. Notable contributors Chipotle Mexican Grill and Five Below were held by both Funds. Chipotle and Five Below exceeded December-quarter expectations with earnings growth of 28 and 31 percent.
Despite representing limited positions, consumer staples holdings were the second greatest contributors to each Fund’s relative performance advantage versus its benchmark. Held by both Funds, Estee Lauder Co. rose on strong operational performance, particularly in the Asia-Pacific Region. The company grew December-quarter earnings 14 percent to $1.74 per share, exceeding the consensus estimate of $1.55 and overcoming headwinds from foreign exchange and an accounting change estimated to be $0.05 and $0.11 per share, respectively.
While contributing to absolute return, consumer services holdings, particularly media and entertainment companies, weighed on Brandywine’s relative results. Game developerTake-Two Interactive Software (both Funds) reported strong results for its fiscal 2019 third quarter, but declined on its subsequent full-year guidance. The outlook represented a net increase, but portended a slower fourth quarter than anticipated considering the company’s better-than-expected third quarter results.
The financial sector posted a negative absolute return for Brandywine Blue, helping make it the Fund’s biggest relative performance detractor. CME Group (both Funds) was the most significant detractor. The company, which operates security exchanges, reported expectation-beating December-quarter results, benefiting from a spike in volatility surrounding the market downturn late last year. Shares declined as analysts questioned their forecasts amid more subdued trading volume in the early months of 2019.
For more information on holdings that influenced December-quarter results, please see Roses & Thorns on page 6 for Brandywine and page 11 for Brandywine Blue.
Technology, consumer discretionary and health care holdings represent the largest positions in the Brandywine Funds at the start of the June quarter. For more information on portfolio characteristics, please see page 5 for Brandywine and page 10 for Brandywine Blue.
We’re grateful for the opportunity to serve you, and we’re working hard to build on the recent progress in the AMG Managers Brandywine Funds.

Scott Gates
Chief Investment Officer
Friess Associates, LLC
About Your Fund’s Expenses(unaudited)
As a shareholder of a Fund, you may incur two types of costs: (1) transaction costs, which may include sales charges (loads) on purchase payments; redemption fees; and exchange fees; and (2) ongoing costs, including management fees; distribution(12b-1) fees; and other Fund expenses. This example is intended to help you understand your ongoing costs (in dollars) of investing in the Fund and to compare these costs with the ongoing costs of investing in other mutual funds. The example is based on $1,000 invested at the beginning of the period and held for the entire period as indicated below.
ACTUAL EXPENSES
The first line of the following table provides information about the actual account values and
actual expenses. You may use the information in this line, together with the amount you invested, to estimate the expenses that you paid over the period. Simply divide your account value by $1,000 (for example, an $8,600 account value divided by $1,000 = 8.6), then multiply the result by the number in the first line under the heading entitled “Expenses Paid During Period” to estimate the expenses you paid on your account during this period.
HYPOTHETICAL EXAMPLE FOR COMPARISON PURPOSES
The second line of the following table provides information about hypothetical account values and hypothetical expenses based on the Fund’s actual expense ratio and an assumed annual rate of return of 5% before expenses, which is not the Fund’s
actual return. The hypothetical account values and expenses may not be used to estimate the actual ending account balance or expenses you paid for the period. You may use this information to compare the ongoing costs of investing in the Fund and other funds by comparing this 5% hypothetical example with the 5% hypothetical examples that appear in the shareholder reports of other funds.
Please note that the expenses shown in the table are meant to highlight your ongoing costs only and do not reflect any transactional costs, such as sales charges (loads), redemption fees, or exchange fees. Therefore, the second line of the table is useful in comparing ongoing costs only, and will not help you determine the relative total costs of owning different funds.
| | | | | | | | | | | | | | | | |
Six Months Ended March 31, 2019 | | Expense Ratio for the Period | | | Beginning
Account Value
10/01/18 | | | Ending
Account Value
03/31/19 | | | Expenses
Paid During
the Period* | |
AMG Managers Brandywine Fund | | | | | | | | | |
Based on Actual Fund Return | |
Class I | | | 1.10 | % | | $ | 1,000 | | | $ | 951 | | | $ | 5.35 | |
Based on Hypothetical 5% Annual Return | |
Class I | | | 1.10 | % | | $ | 1,000 | | | $ | 1,019 | | | $ | 5.54 | |
AMG Managers Brandywine Blue Fund | |
Based on Actual Fund Return | |
Class I | | | 1.18 | % | | $ | 1,000 | | | $ | 945 | | | $ | 5.72 | |
Based on Hypothetical 5% Annual Return | |
Class I | | | 1.18 | % | | $ | 1,000 | | | $ | 1,019 | | | $ | 5.94 | |
| * | Expenses are equal to the Fund’s annualized expense ratio multiplied by the average account value over the period, multiplied by the number of days in the most recent fiscal half-year (182), then divided by 365. |
Fund Performance(unaudited)
Periods ended March 31, 2019
The table below shows the average annual total returns for the periods indicated for each Fund, as well as each Fund’s relative index for the same time periods ended March 31, 2019.
| | | | | | | | | | | | | | | | |
| Average Annual Total Returns1 | | Six Months* | | | One Year | | | Five Years | | | Ten Years | |
AMG Managers Brandywine Fund2, 3, 4, 5, 6, 7, 8 | |
Class I | | | (4.93 | %) | | | 11.50 | % | | | 10.40 | % | | | 11.01 | % |
Russell 3000® Growth Index10 | | | (2.80 | %) | | | 12.06 | % | | | 13.10 | % | | | 17.44 | % |
Russell 3000® Index11 | | | (2.27 | %) | | | 8.77 | % | | | 10.36 | % | | | 16.00 | % |
S&P 500® Index12 | | | (1.72 | %) | | | 9.50 | % | | | 10.91 | % | | | 15.92 | % |
AMG Managers Brandywine Blue Fund2, 3, 4, 5, 6, 7, 9 | |
Class I | | | (5.53 | %) | | | 8.00 | % | | | 10.78 | % | | | 11.62 | % |
Russell 1000® Growth Index13 | | | (2.34 | %) | | | 12.75 | % | | | 13.50 | % | | | 17.52 | % |
Russell 1000® Index14 | | | (1.76 | %) | | | 9.30 | % | | | 10.63 | % | | | 16.05 | % |
S&P 500® Index12 | | | (1.72 | %) | | | 9.50 | % | | | 10.91 | % | | | 15.92 | % |
The performance data shown represents past performance. Past performance is not a guarantee of future results. Current performance may be lower or higher than the performance data quoted. The investment return and principal value of an investment will fluctuate so that an investor’s shares, when redeemed, may be worth more or less than their original cost.
Investors should carefully consider the Fund’s investment objectives, risks, charges and expenses before investing. For performance information through the most recent month end, current net asset values per share for the Funds and other information, please call 800.548.4539 or visit our website at amgfunds.com for a free prospectus. Read it carefully before investing or sending money.
Distributed by AMG Distributors, Inc., member FINRA/SIPC.
| 1 | Total return equals income yield plus share price change and assumes reinvestment of all dividends and capital gain distributions. Returns are net of fees and may reflect offsets of Fund expenses as described in the prospectus. No adjustment has been made for taxes payable by shareholders on their reinvested dividends and capital gain distributions. Returns for periods greater than one year are annualized. The listed returns on the Funds are net of expenses and based on the published NAV as of March 31, 2019. All returns are in U.S. dollars ($). |
| 2 | The Fund returns for all periods prior to October 1, 2013, reflect performance of the predecessor funds, Brandywine Fund and Brandywine Blue Fund, and were managed by Friess Associates, LLC with the same investment objective and substantially similar investment policies. |
| 3 | Active and frequent trading of a fund may result in higher transaction costs and increased tax liability. |
| 4 | The Fund invests in growth stocks, which may be more sensitive to market movements because their prices tend to reflect future investor expectations rather than just current profits. Growth stocks may underperform value stocks during given periods. |
| 5 | Investments in international securities are subject to certain risks of overseas investing including currency fluctuations and changes in political and economic conditions, which could result in significant market fluctuations. These risks are magnified in emerging markets. |
| 6 | Companies that are in similar businesses may be similarly affected by particular economic or market events; to the extent the Fund has substantial holdings within a particular sector, the risks associated with that sector increase. |
| 7 | The Fund is subject to risks associated with investments inmid-capitalization companies such as greater price volatility, lower trading volume, and less liquidity than the stocks of larger, more established companies. |
| 8 | The Fund is subject to risks associated with investments in small-capitalization companies, such as erratic earnings patterns, competitive conditions, limited earnings history and a reliance on one or a limited number of products. |
| 9 | A greater percentage of the Fund’s holdings may be focused in a smaller number of securities which may place the Fund at greater risk than a more diversified fund. |
| 10 | The Russell 3000® Growth Index measures the performance of those Russell 3000® Index companies with higherprice-to-book ratios and higher forecasted growth values. Unlike the Fund, the Russell 3000® Growth Index is unmanaged, is not available for investment and does not incur expenses. |
| 11 | The Russell 3000® Index is composed of the 3,000 largest U.S. companies as measured by market capitalization, and represents about 98% of the U.S. stock market. Unlike the Fund, the Russell 3000® Index is unmanaged, is not available for investment and does not incur expenses. |
| 12 | The S&P 500® Index is a capitalization-weighted index of 500 stocks. The S&P 500® Index is designed to measure performance of the broad domestic economy through changes in the aggregate market value of 500 stocks representing all major industries. Unlike the Fund, the S&P 500® Index is unmanaged, is not available for investment and does not incur expenses. |
| 13 | The Russell 1000® Growth Index is a market capitalization weighted index that measures the performance of those Russell 1000® companies with higherprice-to-book ratios and higher forecasted growth values. Unlike the Fund, the Russell 1000® Growth Index is unmanaged, is not available for investment and does not incur expenses. |
| 14 | The Russell 1000® Index measures the performance of approximately 1,000 of the largest securities based on a combination of their market cap and current index membership. The Russell 1000® represents approximately 92% of the U.S. market. Unlike the Fund, the Russell 1000® Index is unmanaged, is not available for investment and does not incur expenses. |
The Russell Indices are trademarks of the London Stock Exchange Group companies.
The S&P 500® Index is proprietary data of Standard & Poor’s, a division of McGraw-Hill Companies, Inc. All rights reserved.
Not FDIC insured, nor bank guaranteed. May lose value.
AMG Managers Brandywine Fund
Fund Snapshots(unaudited)
March 31, 2019
PORTFOLIO BREAKDOWN
| | | | | | | | |
| | | AMG | | | Russell | |
| | | Managers | | | 3000® | |
| | | Brandywine | | | Growth | |
Industry (Top Ten) | | Fund1 | | | Index | |
Data Processing & Outsourced Services | | | 10.0 | % | | | 6.4 | % |
Application Software | | | 8.0 | % | | | 4.6 | % |
Communications Equipment | | | 7.0 | % | | | 0.3 | % |
Movies & Entertainment | | | 6.1 | % | | | 2.0 | % |
Systems Software | | | 6.0 | % | | | 7.1 | % |
Health Care Equipment | | | 5.0 | % | | | 2.6 | % |
Apparel Retail | | | 4.7 | % | | | 0.8 | % |
Internet & Direct Marketing Retail | | | 4.2 | % | | | 6.0 | % |
Pharmaceuticals | | | 3.7 | % | | | 2.0 | % |
Footwear | | | 3.6 | % | | | 0.8 | % |
Other Common Stock | | | 40.2 | % | | | 67.4 | % |
Short-Term Investments | | | 2.8 | % | | | 0.0 | % |
Other Assets | | | (1.3 | )% | | | 0.0 | % |
| 1 | As a percentage of net assets. |
TOP TEN HOLDINGS
| | | | | | | | |
| | | % of | | | % Change from | |
Security Name | | Net Assets | | | Book Cost | |
Microsoft Corp. | | | 4.4 | | | | 42.9 | |
Amazon.com, Inc. | | | 4.2 | | | | 51.5 | |
salesforce.com, Inc. | | | 2.8 | | | | 109.1 | |
Mastercard, Inc., Class A | | | 2.5 | | | | 28.7 | |
Alphabet, Inc., Class A | | | 2.5 | | | | 71.2 | |
Tandem Diabetes Care, Inc. | | | 2.5 | | | | 43.1 | |
Global Payments, Inc. | | | 2.3 | | | | 90.3 | |
Visa, Inc., Class A | | | 2.3 | | | | 116.8 | |
RingCentral, Inc., Class A | | | 2.0 | | | | 29.7 | |
Booz Allen Hamilton Holding Corp. | | | 2.0 | | | | 31.5 | |
| | | | | | | | |
Top Ten as a Group | | | 27.5 | | | | | |
| | | | | | | | |
PORTFOLIO MARKET CAPITALIZATION
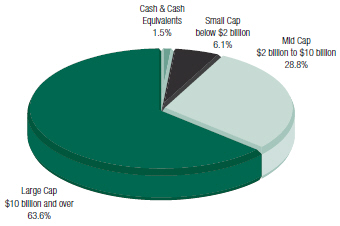
ESTIMATED EARNINGS GROWTH RATE OF THE FUND’S INVESTMENTS
Forecasted Increase in Earnings Per Share 2019 vs 2018
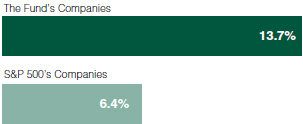
Source: Consensus estimates from FactSet Research Systems Inc.
This is not a forecast of the Fund’s future performance. Earnings growth for a Fund holding does not guarantee a corresponding increase in the market value of the holding or the Fund.
Because a fund’s strategy may result in multiple investments in particular sectors of the economy, its performance may depend on the performance of those sectors and may fluctuate more widely than investments diversified across more sectors. For additional information on these and other risk considerations, please see the Fund’s prospectus.
Any sectors, industries, or securities discussed should not be perceived as investment recommendations. Mention of a specific security should not be considered a recommendation to buy or solicitation to sell that security. Specific securities mentioned in this report may have been sold from the Fund’s portfolio of investments by the time you receive this report.
AMG Managers Brandywine Fund
Roses and Thorns(unaudited)
Quarter Ending March 31, 2019
| | | | | | | | | | |
$ Gain
(in millions) | | | % Gain | | | Biggest $ Winners Reason for Move |
| $ | 12.8 | | | | 68.9 | % | | Trade Desk Inc. (TTD) | | |
| | | | | | | | The company, which provides technology that enables advertising campaigns across different media and devices, more than doubled December-quarter earnings, exceeding the consensus estimate by 38 percent. Revenue climbed 56 percent, driven in part by a 69 percent increase in mobile channel sales. The company provided guidance for investors to expect revenue to grow by at leastone-third in 2019. |
| $ | 10.7 | | | | 65.6 | % | | Tandem Diabetes Care Inc. (TNDM) | | |
| | | | | | | | The developer of insulin delivery pumps for diabetics earned $0.06 per share, up from a loss of $1.23 per share in theyear-ago period. The profit came as a surprise to analysts, whose consensus forecast predicted a $0.20 per share loss. Domestic and international sales growth took Wall Street similarly off guard, with Tandem’s 89 percent revenue increase exceeding expectations by more thanone-third. |
| $ | 5.0 | | | | 16.1 | % | | Microsoft Corp. (MSFT) | | |
| | | | | | | | The software, device and services company exceeded the consensus estimate with 15 percent December-quarter earnings growth. Revenue grew 12 percent, highlighted by a 48 percent year-over-year increase in commercial cloud services sales. The company also raised guidance for the quarter ahead. |
| $ | 4.7 | | | | 32.4 | % | | Global Payments Inc. (GPN) | | |
| | | | | | | | The electronic payment technology provider grew December-quarter earnings 24 percent. Revenue increased 12 percent, with double-digit growth in all geographic markets on a constant-currency basis. |
| $ | 4.6 | | | | 49.4 | % | | eHealth Inc. (EHTH) | | |
| | | | | | | | The online health insurance marketplace operator earned $1.61 per share in the December quarter, up from a $0.93 per share loss in theyear-ago period. Revenue, which more than tripled from the same period the year before, exceeded expectations by 18 percent amid strong gains in Medicare-related business. |
| | | |
| $ Loss | | | | | | | | |
| (in millions) | | | % Loss | | | Biggest $ Losers Reason for Move |
| $ | 2.2 | | | | 17.8 | % | | Teladoc Health Inc. (TDOC) | | |
| | | | | | | | The company, which provides telehealth services by facilitating health care via mobile devices, the Internet, video and phone, grew December-quarter revenue 59 percent, exceeding expectations. Lower-than-expected revenue and earnings guidance raised concerns about the weaker-than-usual flu season and customer acquisition costs, respectively. |
| $ | 2.1 | | | | 20.1 | % | | Cloudera Inc. (CLDR) | | |
| | | | | | | | The provider of cloud-based data management solutions exceeded expectations with 40 percent January-quarter revenue growth driven by strength in subscriptions. Uncertainty related to unexpected financial items, including deferred revenue writedowns, billing duration changes andone-time costs, compounded an earnings disappointment, weighing on shares. |
| $ | 1.8 | | | | 10.5 | % | | CME Group Inc. (CME) | | |
| | | | | | | | The company, which operates security exchanges, reported expectation-beating December-quarter results, benefiting from a spike in volatility surrounding the market downturn late last year. Shares declined as a more subdued trading environment in the early months of 2019 suggested declining volume. |
| $ | 1.6 | | | | 20.0 | % | | Vocera Communications Inc. (VCRA) | | |
| | | | | | | | The company, which facilitates secure mobile communications in health care settings and other mission critical environments, exceeded December-quarter earnings expectations. Shares declined as the company lowered first-quarter guidance after word of the impending release of Smartbadge prompted customers to put off purchases of its predecessor in anticipation of the new product. |
| $ | 1.2 | | | | 12.7 | % | | Helen of Troy Ltd. (HELE) | | |
| | | | | | | | The manufacturer of personal care and household products under brand names including Revlon and Honeywell reported November-quarter results that exceeded consensus estimates for revenue and operating profit. The company raised the midpoint of its fiscal 2019 earnings forecast, but it reduced the high end of its sales projection amid an unresolved pricing dispute with a key retail customer. |
All gains/losses are calculated on an average cost basis from December 31, 2018 through March 31, 2019.
This commentary reflects the viewpoints of Friess Associates, LLC as of March 31, 2019, and is not intended as a forecast or guarantee of future results.
AMG Managers Brandywine Fund
Schedule of Portfolio Investments(unaudited)
March 31, 2019
| | | | | | | | | | | | |
| Shares | | | | | Cost | | | Value | |
| | Common Stocks - 98.5% | | | | | | | | |
| | Communication Services | | | | | | | | |
| | | | Cable & Satellite - 1.5% | | | | | |
| | 296,446 | | | Comcast Corp., Class A | | $ | 11,366,877 | | | $ | 11,851,911 | |
| | | | Interactive Media & Services - 2.5% | | | | | |
| | 17,429 | | | Alphabet, Inc., Class A* | | | 11,980,700 | | | | 20,512,016 | |
| | | | Movies & Entertainment - 6.1% | | | | | |
| | 40,538 | | | The Madison Square Garden Co., Class A* | | | 11,989,976 | | | | 11,882,904 | |
| | 42,587 | | | Netflix, Inc.* | | | 4,776,967 | | | | 15,184,821 | |
| | 104,123 | | | The Walt Disney Co. | | | 11,968,214 | | | | 11,560,776 | |
| | 133,145 | | | World Wrestling Entertainment, Inc., Class A1 | | | 12,230,996 | | | | 11,554,323 | |
| | | | | | | | | | | | |
| | Total Communication Services | | | 64,313,730 | | | | 82,546,751 | |
| | | | This sector is 28.4% above your Fund’s cost. | | | | | |
| | Consumer Discretionary | | | | | | | | |
| | | | Apparel Retail - 4.7% | | | | | |
| | 559,101 | | | American Eagle Outfitters, Inc. | | | 11,709,643 | | | | 12,395,269 | |
| | 189,866 | | | Foot Locker, Inc. | | | 9,239,613 | | | | 11,505,880 | |
| | 272,376 | | | The TJX Cos., Inc. | | | 11,933,268 | | | | 14,493,127 | |
| | | | Apparel, Accessories & Luxury Goods - 1.9% | | | | | |
| | 161,892 | | | Levi Strauss & Co., Class A*,1 | | | 3,634,461 | | | | 3,812,557 | |
| | 134,152 | | | VF Corp. | | | 12,562,226 | | | | 11,659,150 | |
| | | | Automotive Retail - 1.6% | | | | | |
| | 33,141 | | | O’Reilly Automotive, Inc.* | | | 12,446,344 | | | | 12,868,650 | |
| | | | Footwear - 3.6% | | | | | |
| | 105,275 | | | Deckers Outdoor Corp.* | | | 7,329,901 | | | | 15,474,372 | |
| | 167,186 | | | NIKE, Inc., Class B | | | 12,234,368 | | | | 14,078,733 | |
| | | | General Merchandise Stores - 1.7% | | | | | |
| | 129,945 | | | Dollar Tree, Inc.* | | | 11,337,533 | | | | 13,649,423 | |
| | | | Hotels, Resorts & Cruise Lines - 1.3% | | | | | |
| | 95,538 | | | Royal Caribbean Cruises, Ltd. | | | 11,242,814 | | | | 10,950,565 | |
| | | | Internet & Direct Marketing Retail - 4.2% | | | | | |
| | 19,085 | | | Amazon.com, Inc.* | | | 22,436,715 | | | | 33,985,614 | |
| | | | | | | | | | | | |
| | Total Consumer Discretionary | | | 126,106,886 | | | | 154,873,340 | |
| | | | This sector is 22.8% above your Fund’s cost. | | | | | |
| | Consumer Staples | | | | | | | | |
| | | | Household Products - 1.6% | | | | | |
| | 185,612 | | | Church & Dwight Co., Inc. | | | 11,619,367 | | | | 13,221,143 | |
| | | | Hypermarkets & Super Centers - 1.6% | | | | | |
| | 55,592 | | | Costco Wholesale Corp. | | | 12,140,755 | | | | 13,461,047 | |
| | | | Personal Products - 3.1% | | | | | |
| | 963,663 | | | Coty, Inc., Class A1 | | | 11,024,748 | | | | 11,082,125 | |
| | | | | | | | | | | | |
| Shares | | | | | Cost | | | Value | |
| | 83,950 | | | The Estee Lauder Cos., Inc., Class A | | $ | 11,216,551 | | | $ | 13,897,922 | |
| | | | | | | | | | | | |
| | Total Consumer Staples | | | 46,001,421 | | | | 51,662,237 | |
| | | | This sector is 12.3% above your Fund’s cost. | | | | | |
| | Financials | | | | | | | | |
| | | | Financial Exchanges & Data - 1.3% | | | | | |
| | 65,969 | | | CME Group, Inc. | | | 6,197,944 | | | | 10,857,178 | |
| | | | Insurance Brokers - 1.5% | | | | | |
| | 196,408 | | | eHealth, Inc.*,1 | | | 6,995,925 | | | | 12,244,075 | |
| | | | | | | | | | | | |
| | Total Financials | | | 13,193,869 | | | | 23,101,253 | |
| | | | This sector is 75.1% above your Fund’s cost. | | | | | |
| | Health Care | | | | | | | | |
| | | | Biotechnology - 0.9% | | | | | |
| | 140,586 | | | Emergent BioSolutions, Inc.* | | | 9,584,316 | | | | 7,102,404 | |
| | | | Health Care Equipment - 5.0% | | | | | |
| | 205,465 | | | Abbott Laboratories | | | 12,225,582 | | | | 16,424,872 | |
| | 230,236 | | | AxoGen, Inc.*,1 | | | 4,849,411 | | | | 4,848,770 | |
| | 316,424 | | | Tandem Diabetes Care, Inc.*,1 | | | 14,038,019 | | | | 20,092,924 | |
| | | | Health Care Technology - 1.4% | | | | | |
| | 36,519 | | | Tabula Rasa HealthCare, Inc.*,1 | | | 2,761,680 | | | | 2,060,402 | |
| | 158,979 | | | Teladoc Health, Inc.*,1 | | | 10,648,862 | | | | 8,839,232 | |
| | 18,296 | | | Vocera Communications, Inc.*,1 | | | 738,699 | | | | 578,703 | |
| | | | Life Sciences Tools & Services - 3.5% | | | | | |
| | 89,433 | | | Charles River Laboratories International, Inc.* | | | 12,888,796 | | | | 12,990,143 | |
| | 57,255 | | | Thermo Fisher Scientific, Inc. | | | 8,809,594 | | | | 15,671,839 | |
| | | | Managed Health Care - 1.6% | | | | | |
| | 51,781 | | | UnitedHealth Group, Inc. | | | 12,873,599 | | | | 12,803,370 | |
| | | | Pharmaceuticals - 3.7% | | | | | |
| | 313,700 | | | AstraZeneca PLC (United Kingdom) | | | 12,237,377 | | | | 12,682,891 | |
| | 367,343 | | | Elanco Animal Health, Inc.* | | | 11,717,752 | | | | 11,780,690 | |
| | 229,332 | | | Horizon Pharma PLC* | | | 5,800,710 | | | | 6,061,245 | |
| | | | | | | | | | | | |
| | Total Health Care | | | 119,174,397 | | | | 131,937,485 | |
| | | | This sector is 10.7% above your Fund’s cost. | | | | | |
| | Industrials | | | | | | | | |
| | | | Aerospace & Defense - 0.8% | | | | | |
| | 120,065 | | | Cubic Corp.1 | | | 7,172,573 | | | | 6,752,456 | |
| | | | Airlines - 1.5% | | | | | |
| | 236,000 | | | Delta Air Lines, Inc. | | | 11,208,159 | | | | 12,189,400 | |
| | | | Construction & Engineering - 0.6% | | | | | |
| | 90,470 | | | Comfort Systems USA, Inc. | | | 4,305,659 | | | | 4,739,723 | |
| | | | Diversified Support Services - 0.9% | | | | | |
| | 224,360 | | | Mobile Mini, Inc.1 | | | 8,208,211 | | | | 7,614,778 | |
|
The accompanying notes are an integral part of these financial statements. 7 |
AMG Managers Brandywine Fund
Schedule of Portfolio Investments(continued)
| | | | | | | | | | | | |
| Shares | | | | | Cost | | | Value | |
| | Industrials(continued) | | | | | | | | |
| | | | Industrial Machinery - 0.9% | | | | | |
| | 357,310 | | | Harsco Corp.* | | $ | 8,003,911 | | | $ | 7,203,370 | |
| | | | Trucking - 0.3% | | | | | |
| | 30,557 | | | LYFT, Inc., Class A* | | | 2,436,138 | | | | 2,392,307 | |
| | | | | | | | | | | | |
| | Total Industrials | | | 41,334,651 | | | | 40,892,034 | |
| | | | This sector is 1.1% below your Fund’s cost. | | | | | |
| | Information Technology | | | | | | | | |
| | | | Application Software - 8.0% | | | | | |
| | 45,070 | | | Adobe, Inc.* | | | 11,261,231 | | | | 12,010,704 | |
| | 63,522 | | | Ceridian HCM Holding, Inc.* | | | 1,813,269 | | | | 3,258,679 | |
| | 155,485 | | | RingCentral, Inc., Class A* | | | 12,918,163 | | | | 16,761,283 | |
| | 142,880 | | | salesforce.com, Inc.* | | | 10,821,894 | | | | 22,627,905 | |
| | 52,546 | | | The Trade Desk, Inc., Class A*,1 | | | 2,732,392 | | | | 10,401,481 | |
| | | | Communications Equipment - 7.0% | | | | | |
| | 429,169 | | | Ciena Corp.* | | | 12,014,638 | | | | 16,025,171 | |
| | 225,088 | | | Cisco Systems, Inc. | | | 10,061,383 | | | | 12,152,501 | |
| | 225,129 | | | Lumentum Holdings, Inc.*,1 | | | 11,341,436 | | | | 12,728,794 | |
| | 65,913 | | | Palo Alto Networks, Inc.* | | | 11,967,070 | | | | 16,008,949 | |
| | | | Data Processing & Outsourced Services - 10.0% | | | | | |
| | 176,960 | | | Black Knight, Inc.* | | | 4,502,085 | | | | 9,644,320 | |
| | 139,960 | | | Global Payments, Inc. | | | 10,039,962 | | | | 19,107,339 | |
| | 88,532 | | | Mastercard, Inc., Class A | | | 16,194,432 | | | | 20,844,860 | |
| | 131,844 | | | PayPal Holdings, Inc.* | | | 10,876,168 | | | | 13,690,681 | |
| | 119,890 | | | Visa, Inc., Class A1 | | | 8,635,439 | | | | 18,725,619 | |
| | | | Electronic Components - 0.9% | | | | | |
| | 203,960 | | | II-VI, Inc.*,1 | | | 7,897,250 | | | | 7,595,470 | |
| | | | Electronic Equipment & Instruments - 1.5% | | | | | |
| | 143,783 | | | Keysight Technologies, Inc.* | | | 8,797,926 | | | | 12,537,878 | |
| | | | IT Consulting & Other Services - 2.0% | | | | | |
| | 284,161 | | | Booz Allen Hamilton Holding Corp. | | | 12,560,155 | | | | 16,521,120 | |
| | | | Semiconductors - 1.0% | | | | | |
| | 93,450 | | | Microchip Technology, Inc. | | | 8,212,545 | | | | 7,752,612 | |
| | | | Systems Software - 6.0% | | | | | |
| | 306,950 | | | Microsoft Corp. | | | 25,328,855 | | | | 36,201,683 | |
| | 52,206 | | | ServiceNow, Inc.*,1 | | | 4,163,474 | | | | 12,868,257 | |
| | | | Technology Hardware, Storage & Peripherals - 1.7% | | | | | |
| | 640,677 | | | Pure Storage, Inc., Class A* | | | 12,671,439 | | | | 13,960,352 | |
| | | | | | | | | | | | |
| | Total Information Technology | | | 214,811,206 | | | | 311,425,658 | |
| | | | This sector is 45.0% above your Fund’s cost. | | | | | |
| | | | | | | | | | | | |
| Shares | | | | | Cost | | | Value | |
| | Materials | | | | | | | | |
| | | | Construction Materials - 1.1% | | | | | | |
| | 78,089 | | | Vulcan Materials Co. | | $ | 8,845,438 | | | $ | 9,245,738 | |
| | | | This sector is 4.5% above your Fund’s cost. | | | | | |
| | Total Common Stocks | | | 633,781,598 | | | | 805,684,496 | |
| | | |
Principal
Amount | | | | | | | | | |
| | Short-Term Investments - 2.8% | | | | | | | | |
| | Commercial Paper - 1.5% | | | | | | | | |
| | $12,300,000 | | | Kroger Co., 2.57%, 04/01/192 | | | 12,300,000 | | | | 12,300,000 | |
| | Joint Repurchase Agreements - 1.3%3 | | | | | |
| | 2,469,706 | | | Citigroup Global Markets, Inc., dated 03/29/19, due 04/01/19, 2.650% total to be received $2,470,251 (collateralized by various U.S. Government Agency Obligations and U.S. Treasuries, 0.000% - 10.500%, 04/02/19 - 10/20/68, totaling $2,519,100) | | | 2,469,706 | | | | 2,469,706 | |
| | 2,469,706 | | | Daiwa Capital Markets America, dated 03/29/19, due 04/01/19, 2.650% total to be received $2,470,251 (collateralized by various U.S. Government Agency Obligations and U.S. Treasuries, 0.000% - 6.500%, 04/11/19 - 03/20/49, totaling $2,519,100) | | | 2,469,706 | | | | 2,469,706 | |
| | 2,469,706 | | | Jefferies LLC, dated 03/29/19, due 04/01/19, 2.670% total to be received $2,470,256 (collateralized by various U.S. Government Agency Obligations, 0.000% - 6.625%, 04/03/19 - 07/15/36, totaling $2,519,119) | | | 2,469,706 | | | | 2,469,706 | |
| | 519,244 | | | Mizuho Securities USA, LLC, dated 03/29/19, due 04/01/19, 2.570% total to be received $519,355 (collateralized by various U.S. Treasuries, 0.875% - 2.875%, 12/31/20 - 05/15/43, totaling $529,629) | | | 519,244 | | | | 519,244 | |
| | 2,469,706 | | | MUFG Securities America, Inc., dated 03/29/19, due 04/01/19, 2.630% total to be received $2,470,247 (collateralized by various U.S. Government Agency Obligations, 3.000% - 5.000%, 01/01/29 - 01/01/49, totaling $2,519,100) | | | 2,469,706 | | | | 2,469,706 | |
| | | | | | | | | | | | |
| | | | Total Joint Repurchase Agreements | | | 10,398,068 | | | | 10,398,068 | |
| | | |
| Shares | | | | | | | | | |
| | Other Investment Companies - 0.0%# | | | | | |
| | 76,329 | | | Dreyfus Government Cash Management Fund, Institutional Shares, 2.34%4 | | | 76,329 | | | | 76,329 | |
| | 76,328 | | | Dreyfus Institutional Preferred Government Money Market Fund, Institutional Shares, 2.40%4 | | | 76,328 | | | | 76,328 | |
|
The accompanying notes are an integral part of these financial statements. 8 |
AMG Managers Brandywine Fund
Schedule of Portfolio Investments(continued)
| | | | | | | | | | | | |
| Shares | | | | | Cost | | | Value | |
| | Other Investment Companies(continued) | | | | | |
| | 78,642 | | | JPMorgan U.S. Government Money Market Fund, IM Shares, 2.39%4 | | $ | 78,642 | | | $ | 78,642 | |
| | | | Total Other Investment Companies | | | 231,299 | | | | 231,299 | |
| | | | | | | | | | | | |
| | Total Short-Term Investments | | | 22,929,367 | | | | 22,929,367 | |
| | | | | | | | | | |
| | | | | Cost | | | Value | |
Total Investments - 101.3% | | $ | 656,710,965 | | | $ | 828,613,863 | |
Other Assets, less Liabilities - (1.3%) | | | | | | | (10,811,133 | ) |
Total Net Assets - 100.0% | | | | | | $ | 817,802,730 | |
| | | | | | | | | | |
| * | Non-income producing security. |
| 1 | Some or all of these securities, amounting to $89,119,363 or 10.9% of net assets, were out on loan to various brokers and are collateralized by cash and various U.S. Treasury Obligations. See Note 4 of Notes to Financial Statements. |
| 2 | Represents yield to maturity at March 31, 2019. |
| 3 | Cash collateral received from brokers for securities lending was invested in these joint repurchase agreements. |
| 4 | Yield shown represents the March 31, 2019, seven day average yield, which refers to the sum of the previous seven days’ dividends paid, expressed as an annual percentage. |
The following table summarizes the inputs used to value the Fund’s investments by the fair value hierarchy levels as of March 31, 2019:
| | | | | | | | | | | | | | | | |
| | | Level 1 | | | Level 2 | | | Level 3 | | | Total | |
Investments in Securities | | | | | | | | | | | | | | | | |
Common Stocks† | | $ | 805,684,496 | | | | — | | | | — | | | $ | 805,684,496 | |
Short-Term Investments | | | | | | | | | | | | | | | | |
Commercial Paper | | | — | | | $ | 12,300,000 | | | | — | | | | 12,300,000 | |
Joint Repurchase Agreements | | | — | | | | 10,398,068 | | | | — | | | | 10,398,068 | |
Other Investment Companies | | | 231,299 | | | | — | | | | — | | | | 231,299 | |
| | | | | | | | | | | | | | | | |
Total Investments in Securities | | $ | 805,915,795 | | | $ | 22,698,068 | | | | — | | | $ | 828,613,863 | |
| | | | | | | | | | | | | | | | |
| † | All common stocks held in the Fund are Level 1 securities. For a detailed breakout of common stocks by major industry classification, please refer to the Fund’s Schedule of Portfolio Investments. |
For the six months ended March 31, 2019, there were no transfers in or out of Level 3.
|
The accompanying notes are an integral part of these financial statements. 9 |
AMG Managers Brandywine Blue Fund
Fund Snapshots(unaudited)
March 31, 2019
PORTFOLIO BREAKDOWN
| | | | | | | | |
Industry (Top Ten) | | AMG
Managers
Brandywine
Blue Fund1 | | | Russell
1000®
Growth
Index | |
Data Processing & Outsourced Services | | | 13.0 | % | | | 6.8 | % |
Systems Software | | | 9.3 | % | | | 7.5 | % |
Application Software | | | 5.7 | % | | | 4.3 | % |
Pharmaceuticals | | | 5.1 | % | | | 2.0 | % |
Communications Equipment | | | 4.7 | % | | | 0.2 | % |
Movies & Entertainment | | | 4.6 | % | | | 2.1 | % |
Life Sciences Tools & Services | | | 4.4 | % | | | 0.8 | % |
Internet & Direct Marketing Retail | | | 4.2 | % | | | 6.4 | % |
Personal Products | | | 4.0 | % | | | 0.3 | % |
Interactive Media & Services | | | 3.1 | % | | | 8.7 | % |
Other Common Stock | | | 40.3 | % | | | 60.9 | % |
Short-Term Investments | | | 1.0 | % | | | 0.0 | % |
Other Assets | | | 0.6 | % | | | 0.0 | % |
| 1 | As a percentage of net assets. |
TOP TEN HOLDINGS
| | | | | | | | |
Security Name | | % of
Net Assets | | | % Change from
Book Cost | |
Microsoft Corp. | | | 6.6 | | | | 79.7 | |
Amazon.com, Inc. | | | 4.2 | | | | 35.8 | |
salesforce.com, Inc. | | | 3.6 | | | | 104.0 | |
Alphabet, Inc., Class A | | | 3.1 | | | | 71.0 | |
Visa, Inc., Class A | | | 3.0 | | | | 117.1 | |
Global Payments, Inc. | | | 2.9 | | | | 90.0 | |
Thermo Fisher Scientific, Inc. | | | 2.8 | | | | 77.1 | |
Abbott Laboratories | | | 2.8 | | | | 30.2 | |
Exact Sciences Corp. | | | 2.8 | | | | 20.1 | |
Mastercard, Inc., Class A | | | 2.7 | | | | 35.1 | |
| | | | | | | | |
Top Ten as a Group | | | 34.5 | | | | | |
| | | | | | | | |
PORTFOLIO MARKET CAPITALIZATION
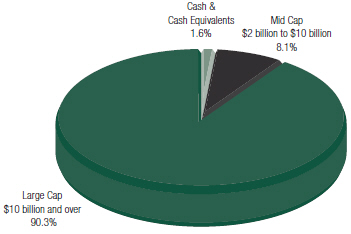
ESTIMATED EARNINGS GROWTH RATE OF THE FUND’S INVESTMENTS
Forecasted Increase in Earnings Per Share 2019 vs 2018
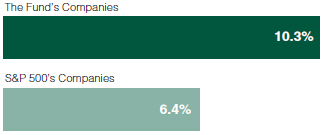
Source: Consensus estimates from FactSet Research Systems Inc.
This is not a forecast of the Fund’s future performance. Earnings growth for a Fund holding does not guarantee a corresponding increase in the market value of the holding or the Fund.
Because a fund’s strategy may result in multiple investments in particular sectors of the economy, its performance may depend on the performance of those sectors and may fluctuate more widely than investments diversified across more sectors. For additional information on these and other risk considerations, please see the Fund’s prospectus.
Any sectors, industries, or securities discussed should not be perceived as investment recommendations. Mention of a specific security should not be considered a recommendation to buy or solicitation to sell that security. Specific securities mentioned in this report may have been sold from the Fund’s portfolio of investments by the time you receive this report.
AMG Managers Brandywine Blue Fund
Roses and Thorns(unaudited)
Quarter Ending March 31, 2019
| | | | | | | | | | |
$ Gain
(in millions) | | | % Gain | | | Biggest $ Winners | | Reason for Move |
| | | | | | | | |
| $ | 1.7 | | | | 16.1 | % | | Microsoft Corp. (MSFT) |
| | | | | | | | The software, device and services company exceeded the consensus estimate with 15 percent December-quarter earnings growth. Revenue grew 12 percent, highlighted by a 48 percent year-over-year increase in commercial cloud services sales. The company also raised guidance for the quarter ahead. |
| $ | 1.4 | | | | 37.3 | % | | Exact Sciences Corp. (EXAS) |
| | | | | | | | The diagnostics company, which focuses on the early detection of colorectal cancer, reported a 64 percent increase in year-over-year revenue for the December quarter as volume for its Cologuard tests climbed 66 percent. Increased 2019 guidance and a strong start to the company’s partnership with Pfizer contributed to investor confidence. |
| $ | 1.3 | | | | 38.4 | % | | ServiceNow Inc. (NOW) |
| | | | | | | | The provider of cloud-based workflow management computing solutions grew December-quarter earnings 120 percent, exceeding the consensus estimate by 21 percent. Revenue rose 31 percent as subscriptions increased byone-third. The results represented a record for the company’s fourth quarter and fiscal year. |
| $ | 1.3 | | | | 39.0 | % | | Chipotle Mexican Grill Inc. (CMG) |
| | | | | | | | The company, which operates quick-casual Mexican food restaurants throughout the U.S., grew December-quarter earnings 28 percent, exceeding the consensus estimate by 23 percent. Sales from online orders surged 66 percent. Enthusiasm surrounding initiatives spearheaded by new leadership, including menu innovation, loyalty rewards and delivery promotions, also contributed to share-price performance. |
| $ | 1.3 | | | | 37.7 | % | | Keysight Technologies Inc. (KEYS) |
| | | | | | | | The maker of electronics design and testing solutions grew January-quarter earnings 82 percent, exceeding the consensus estimate by 16 percent. Revenue grew 20 percent as the company continued to leverage its strategic position as a provider of research and development tools used in next generation wireless communication networks. |
| | | |
| $ Loss | | | | | | | | |
| (in millions) | | | % Loss | | | Biggest $ Losers | | Reason for Move |
| | | | | | | | |
| $ | 0.5 | | | | 10.4 | % | | CME Group Inc. (CME) |
| | | | | | | | The company, which operates security exchanges, reported expectation-beating December-quarter results, benefiting from a spike in volatility surrounding the market downturn late last year. Shares declined as a more subdued trading environment in the early months of 2019 suggested declining volume. |
| $ | 0.3 | | | | 8.9 | % | | Take-Two Interactive Software Inc. (TTWO) |
| | | | | | | | The game developer exceeded December-quarter expectations with 154 percent earnings growth, but its shares declined on the company’s subsequent full-year guidance. The outlook represented a net increase, but foreshadowed a slower fourth quarter than anticipated considering the company’s better-than-expected third quarter results. |
| $ | 0.2 | | | | 28.8 | % | | Covetrus Inc. (CVET) |
| | | | | | | | The provider of technology and services to veterinarians commenced operations as a standalone business after Henry Schein spun out its animal health business to combine it with Vets First Choice. Shares of the company, which is expected to generate more than $4 billion in annual revenue, began trading at a premium to animal health peers and lost ground from there. |
| $ | 0.1 | | | | 3.7 | % | | Booking Holdings Inc. (BKNG) |
| | | | | | | | The online travel company reported December-quarter earnings that grew 33 percent, exceeding the consensus estimate by 16 percent. Booking Holdings and other travel stocks came under pressure amid concerns that a slower economic backdrop could adversely impact discretionary travel spending. |
| $ | 0.1 | | | | 3.4 | % | | The Walt Disney Co. (DIS) |
| | | | | | | | The family entertainment and media company earned $1.84 per share in the December quarter, exceeding the consensus estimate by 19 percent. Shares declined as investors digested costs related to the company’s aggressivedirect-to-consumer strategy and the acquisition of 21st Century Fox, which became final March 20. |
All gains/losses are calculated on an average cost basis from December 31, 2018 through March 31, 2019.
This commentary reflects the viewpoints of Friess Associates, LLC as of March 31, 2019, and is not intended as a forecast or guarantee of future results.
AMG Managers Brandywine Blue Fund
Schedule of Portfolio Investments(unaudited)
March 31, 2019
| | | | | | | | | | | | |
| Shares | | | | | Cost | | | Value | |
| | Common Stocks - 98.4% | | | | | | | | |
| | Communication Services | | | | | | | | |
| | | | Cable & Satellite - 1.9% | | | | | |
| | 86,600 | | | Comcast Corp., Class A | | $ | 3,338,611 | | | $ | 3,462,268 | |
| | | | Interactive Media & Services - 3.1% | | | | | |
| | 4,807 | | | Alphabet, Inc., Class A* | | | 3,308,126 | | | | 5,657,310 | |
| | | | Movies & Entertainment - 4.6% | | | | | |
| | 13,585 | | | Netflix, Inc.* | | | 2,334,489 | | | | 4,843,868 | |
| | 30,312 | | | The Walt Disney Co. | | | 3,485,011 | | | | 3,365,541 | |
| | | | | | | | | | | | |
| | Total Communication Services | | | 12,466,237 | | | | 17,328,987 | |
| | | | This sector is 39.0% above your Fund’s cost. | | | | | |
| | Consumer Discretionary | | | | | | | | |
| | | | Apparel Retail - 2.4% | | | | | |
| | 81,920 | | | The TJX Cos., Inc. | | | 3,562,568 | | | | 4,358,963 | |
| | | | Apparel, Accessories & Luxury Goods - 2.4% | | | | | |
| | 49,039 | | | VF Corp. | | | 3,990,768 | | | | 4,261,979 | |
| | | | Automotive Retail - 2.1% | | | | | |
| | 9,625 | | | O’Reilly Automotive, Inc.* | | | 3,546,682 | | | | 3,737,387 | |
| | | | Footwear - 2.2% | | | | | |
| | 46,723 | | | NIKE, Inc., Class B | | | 3,419,452 | | | | 3,934,544 | |
| | | | General Merchandise Stores - 2.5% | | | | | |
| | 43,163 | | | Dollar Tree, Inc.* | | | 3,768,794 | | | | 4,533,842 | |
| | | | Hotels, Resorts & Cruise Lines - 1.9% | | | | | |
| | 29,300 | | | Royal Caribbean Cruises, Ltd. | | | 3,450,433 | | | | 3,358,366 | |
| | | | Internet & Direct Marketing Retail - 4.2% | | | | | |
| | 4,233 | | | Amazon.com, Inc.* | | | 5,551,345 | | | | 7,537,915 | |
| | | | | | | | | | | | |
| | Total Consumer Discretionary | | | 27,290,042 | | | | 31,722,996 | |
| | | | This sector is 16.2% above your Fund’s cost. | | | | | |
| | Consumer Staples | | | | | | | | |
| | | | Household Products - 2.1% | | | | | |
| | 53,277 | | | Church & Dwight Co., Inc. | | | 3,332,323 | | | | 3,794,921 | |
| | | | Hypermarkets & Super Centers - 2.2% | | | | | |
| | 16,100 | | | Costco Wholesale Corp. | | | 3,516,760 | | | | 3,898,454 | |
| | | | Personal Products - 4.0% | | | | | |
| | 271,690 | | | Coty, Inc., Class A | | | 3,109,110 | | | | 3,124,435 | |
| | 24,500 | | | The Estee Lauder Cos., Inc., Class A | | | 3,210,218 | | | | 4,055,975 | |
| | | | | | | | | | | | |
| | Total Consumer Staples | | | 13,168,411 | | | | 14,873,785 | |
| | | | This sector is 13.0% above your Fund’s cost. | | | | | |
| | Financials | | | | | | | | |
| | | | Financial Exchanges & Data - 1.7% | | | | | |
| | 18,775 | | | CME Group, Inc. | | | 1,763,774 | | | | 3,089,990 | |
| | | | This sector is 75.2% above your Fund’s cost. | | | | | |
| | | | | | | | | | | | |
| Shares | | | | | Cost | | | Value | |
| | Health Care | | | | | | | | |
| | | | Biotechnology - 2.8% | | | | | |
| | 57,479 | | | Exact Sciences Corp.*,1 | | $ | 4,146,075 | | | $ | 4,978,831 | |
| | | | Health Care Equipment - 2.8% | | | | | |
| | 62,300 | | | Abbott Laboratories | | | 3,825,105 | | | | 4,980,262 | |
| | | | Life Sciences Tools & Services - 4.4% | | | | | |
| | 19,267 | | | Charles River Laboratories
International, Inc.* | | | 2,776,854 | | | | 2,798,532 | |
| | 18,700 | | | Thermo Fisher Scientific, Inc. | | | 2,890,097 | | | | 5,118,564 | |
| | | | Managed Health Care - 1.9% | | | | | |
| | 14,099 | | | UnitedHealth Group, Inc. | | | 3,488,171 | | | | 3,486,119 | |
| | | | Pharmaceuticals - 5.1% | | | | | |
| | 89,300 | | | AstraZeneca PLC (United Kingdom)1 | | | 3,502,532 | | | | 3,610,399 | |
| | 117,204 | | | Elanco Animal Health, Inc.* | | | 3,760,198 | | | | 3,758,732 | |
| | 14,500 | | | Eli Lilly & Co. | | | 1,665,908 | | | | 1,881,520 | |
| | | | | | | | | | | | |
| | Total Health Care | | | 26,054,940 | | | | 30,612,959 | |
| | | | This sector is 17.5% above your Fund’s cost. | | | | | |
| | Industrials | | | | | | | | |
| | | | Airlines - 2.0% | | | | | |
| | 68,390 | | | Delta Air Lines, Inc. | | | 3,247,992 | | | | 3,532,343 | |
| | | | Trucking - 0.3% | | | | | |
| | 7,782 | | | LYFT, Inc., Class A* | | | 621,498 | | | | 609,253 | |
| | | | | | | | | | | | |
| | Total Industrials | | | 3,869,490 | | | | 4,141,596 | |
| | | | This sector is 7.0% above your Fund’s cost. | | | | | |
| | Information Technology | | | | | | | | |
| | | | Application Software - 5.7% | | | | | |
| | 14,121 | | | Adobe, Inc.* | | | 3,541,076 | | | | 3,763,106 | |
| | 41,060 | | | salesforce.com, Inc.* | | | 3,187,380 | | | | 6,502,672 | |
| | | | Communications Equipment - 4.7% | | | | | |
| | 72,933 | | | Cisco Systems, Inc. | | | 3,330,534 | | | | 3,937,653 | |
| | 18,795 | | | Palo Alto Networks, Inc.* | | | 3,435,904 | | | | 4,564,929 | |
| | | | Data Processing & Outsourced Services - 13.0% | | | | | |
| | 70,000 | | | Black Knight, Inc.* | | | 3,445,952 | | | | 3,815,000 | |
| | 37,520 | | | Global Payments, Inc. | | | 2,696,027 | | | | 5,122,230 | |
| | 20,700 | | | Mastercard, Inc., Class A | | | 3,608,354 | | | | 4,873,815 | |
| | 40,325 | | | PayPal Holdings, Inc.* | | | 3,351,513 | | | | 4,187,348 | |
| | 34,550 | | | Visa, Inc., Class A1 | | | 2,485,668 | | | | 5,396,365 | |
| | | | Electronic Equipment & Instruments - 2.0% | | | | | |
| | 41,640 | | | Keysight Technologies, Inc.* | | | 2,559,756 | | | | 3,631,008 | |
| | | | IT Consulting & Other Services - 2.7% | | | | | |
| | 82,379 | | | Booz Allen Hamilton Holding Corp. | | | 3,654,782 | | | | 4,789,515 | |
| | | | Semiconductors - 2.3% | | | | | |
| | 49,667 | | | Microchip Technology, Inc. | | | 4,122,423 | | | | 4,120,374 | |
|
The accompanying notes are an integral part of these financial statements. 12 |
AMG Managers Brandywine Blue Fund
Schedule of Portfolio Investments(continued)
| | | | | | | | | | | | |
| Shares | | | | | Cost | | | Value | |
| | Information Technology(continued) | | | | | | | | |
| | | | Systems Software - 9.3% | | | | | | | | |
| | 100,800 | | | Microsoft Corp. | | $ | 6,616,654 | | | $ | 11,888,352 | |
| | 19,309 | | | ServiceNow, Inc.* | | | 1,997,743 | | | | 4,759,475 | |
| | | | | | | | | | | | |
| | Total Information Technology | | | 48,033,766 | | | | 71,351,842 | |
| | | | This sector is 48.5% above your Fund’s cost. | | | | | |
| | Materials | | | | | | | | |
| | | | Construction Materials - 2.1% | | | | | | | | |
| | 31,664 | | | Vulcan Materials Co. | | | 3,583,234 | | | | 3,749,018 | |
| | | | This sector is 4.6% above your Fund’s cost. | | | | | |
| | Total Common Stocks | | | 136,229,894 | | | | 176,871,173 | |
| | | |
Principal
Amount | | | | | | | | | |
| | Short-Term Investments - 1.0% | | | | | | | | |
| | Commercial Paper - 0.8% | | | | | | | | |
| | $1,500,000 | | | Kroger Co., 2.57%, 04/01/192 | | | 1,500,000 | | | | 1,500,000 | |
| | | | | | | | | | | | |
| Shares | | | | | Cost | | | Value | |
| | Other Investment Companies - 0.2% | |
| | 89,084 | | | Dreyfus Government Cash Management Fund, Institutional Shares, 2.34%3 | | $ | 89,084 | | | $ | 89,084 | |
| | 89,083 | | | Dreyfus Institutional Preferred Government Money Market Fund, Institutional Shares, 2.40%3 | | | 89,083 | | | | 89,083 | |
| | 91,783 | | | JPMorgan U.S. Government Money Market Fund, IM Shares, 2.39%3 | | | 91,783 | | | | 91,783 | |
| | | | Total Other Investment Companies | | | 269,950 | | | | 269,950 | |
| | | | | | | | | | | | |
| | Total Short-Term Investments | | | 1,769,950 | | | | 1,769,950 | |
| | Total Investments - 99.4% | | | 137,999,844 | | | | 178,641,123 | |
| | Other Assets, less Liabilities - 0.6% | | | | | | | 1,030,979 | |
| | Total Net Assets - 100.0% | | | | | | $ | 179,672,102 | |
| | | | | | | | | | | | |
| * | Non-income producing security. |
| 1 | Some or all of these securities, amounting to $10,275,107 or 5.7% of net assets, were out on loan to various brokers and are collateralized by cash and various U.S. Treasury Obligations. See Note 4 of Notes to Financial Statements. |
| 2 | Represents yield to maturity at March 31, 2019. |
| 3 | Yield shown represents the March 31, 2019, seven day average yield, which refers to the sum of the previous seven days’ dividends paid, expressed as an annual percentage. |
The following table summarizes the inputs used to value the Fund’s investments by the fair value hierarchy levels as of March 31, 2019:
| | | | | | | | | | | | | | | | |
| | | Level 1 | | | Level 2 | | | Level 3 | | | Total | |
Investments in Securities | | | | | | | | | | | | | | | | |
Common Stocks† | | $ | 176,871,173 | | | | — | | | | — | | | $ | 176,871,173 | |
Short-Term Investments | | | | | | | | | | | | | | | | |
Commercial Paper | | | — | | | $ | 1,500,000 | | | | — | | | | 1,500,000 | |
Other Investment Companies | | | 269,950 | | | | — | | | | — | | | | 269,950 | |
| | | | | | | | | | | | | | | | |
Total Investments in Securities | | $ | 177,141,123 | | | $ | 1,500,000 | | | | — | | | $ | 178,641,123 | |
| | | | | | | | | | | | | | | | |
| † | All common stocks held in the Fund are Level 1 securities. For a detailed breakout of common stocks by major industry classification, please refer to the Fund’s Schedule of Portfolio Investments. |
For the six months ended March 31, 2019, there were no transfers in or out of Level 3.
|
The accompanying notes are an integral part of these financial statements. 13 |
Statement of Assets and Liabilities(unaudited)
March 31, 2019
| | | | | | | | |
| | | | | | AMG | |
| | | AMG | | | Managers | |
| | | Managers | | | Brandywine | |
| | | Brandywine Fund | | | Blue Fund | |
Assets: | | | | | | | | |
Investments at Value1(including securities on loan valued at $89,119,363, and $10,275,107, respectively) | | $ | 828,613,863 | | | $ | 178,641,123 | |
Receivable for investments sold | | | 7,406,654 | | | | 1,873,197 | |
Dividend, interest and other receivables | | | 170,152 | | | | 62,357 | |
Receivable for Fund shares sold | | | 138 | | | | 106,179 | |
Prepaid expenses and other assets | | | 24,569 | | | | 13,867 | |
Total assets | | | 836,215,376 | | | | 180,696,723 | |
Liabilities: | | | | | | | | |
Payable upon return of securities loaned | | | 10,398,068 | | | | — | |
Payable for investments purchased | | | 6,817,761 | | | | 621,498 | |
Payable for Fund shares repurchased | | | 341,347 | | | | 166,762 | |
Accrued expenses: | | | | | | | | |
Investment advisory and management fees | | | 607,815 | | | | 132,475 | |
Administrative fees | | | 103,605 | | | | 22,581 | |
Shareholder service fees | | | 13,814 | | | | 7,527 | |
Professional fees | | | 34,954 | | | | 22,742 | |
Other | | | 95,282 | | | | 51,036 | |
Total liabilities | | | 18,412,646 | | | | 1,024,621 | |
Net Assets | | $ | 817,802,730 | | | $ | 179,672,102 | |
1Investments at cost | | $ | 656,710,965 | | | $ | 137,999,844 | |
Net Assets Represent: | | | | | | | | |
Paid-in capital | | $ | 625,721,859 | | | $ | 154,865,510 | |
Distributable earnings (loss) | | | 192,080,871 | | | | 24,806,592 | |
Net Assets | | $ | 817,802,730 | | | $ | 179,672,102 | |
Class I: | | | | | | | | |
Net Assets | | $ | 817,802,730 | | | $ | 179,672,102 | |
Shares outstanding | | | 15,358,152 | | | | 3,813,624 | |
Net asset value, offering and redemption price per share | | $ | 53.25 | | | $ | 47.11 | |
|
The accompanying notes are an integral part of these financial statements. 14 |
Statement of Operations(unaudited)
For the six months ended March 31, 2019
| | | | | | | | |
| | | AMG
Managers
Brandywine Fund | | | AMG
Managers
Brandywine
Blue Fund | |
Investment Income: | | | | | | | | |
Dividend income | | $ | 2,454,306 | | | $ | 665,434 | |
Interest income | | | 274,150 | | | | 94,140 | |
Securities lending income | | | 144,556 | | | | 43,934 | |
Total investment income | | | 2,873,012 | | | | 803,508 | |
Expenses: | | | | | | | | |
Investment advisory and management fees | | | 3,383,651 | | | | 739,495 | |
Administrative fees | | | 576,759 | | | | 126,050 | |
Shareholder servicing fees - Class I | | | 76,901 | | | | 42,017 | |
Transfer agent fees | | | 47,726 | | | | 6,930 | |
Reports to shareholders | | | 36,845 | | | | 18,291 | |
Professional fees | | | 36,356 | | | | 19,913 | |
Trustee fees and expenses | | | 32,951 | | | | 7,259 | |
Custodian fees | | | 32,454 | | | | 12,835 | |
Registration fees | | | 12,547 | | | | 12,664 | |
Miscellaneous | | | 9,699 | | | | 2,307 | |
Net expenses | | | 4,245,889 | | | | 987,761 | |
Net investment loss | | | (1,372,877 | ) | | | (184,253 | ) |
Net Realized and Unrealized Loss: | | | | | | | | |
Net realized gain on investments | | | 24,538,633 | | | | 3,835,837 | |
Net change in unrealized appreciation/depreciation on investments | | | (69,816,263 | ) | | | (15,514,096 | ) |
Net realized and unrealized loss | | | (45,277,630 | ) | | | (11,678,259 | ) |
Net decrease in net assets resulting from operations | | $ | (46,650,507 | ) | | $ | (11,862,512 | ) |
|
The accompanying notes are an integral part of these financial statements. 15 |
Statements of Changes in Net Assets
For the six months ended March 31, 2019 (unaudited) and the fiscal year ended September 30, 2018
| | | | | | | | | | | | | | | | |
| | | AMG | | | AMG | |
| | | Managers | | | Managers | |
| | | Brandywine Fund | | | Brandywine Blue Fund | |
| | | March 31, 2019 | | | September 30, 2018 | | | March 31, 2019 | | | September 30, 2018 | |
Increase (Decrease) in Net Assets Resulting From Operations: | | | | | | | | | | | | | | | | |
Net investment loss | | $ | (1,372,877 | ) | | $ | (3,495,172 | ) | | $ | (184,253 | ) | | $ | (853,418 | ) |
Net realized gain on investments | | | 24,538,633 | | | | 98,938,137 | | | | 3,835,837 | | | | 19,700,383 | |
Net change in unrealized appreciation/depreciation on investments | | | (69,816,263 | ) | | | 94,574,014 | | | | (15,514,096 | ) | | | 20,560,676 | |
Net increase (decrease) in net assets resulting from operations | | | (46,650,507 | ) | | | 190,016,979 | | | | (11,862,512 | ) | | | 39,407,641 | |
Distributions to Shareholders: | | | | | | | | | | | | | | | | |
Class I | | | — | | | | — | | | | (18,414,047 | ) | | | — | |
Capital Share Transactions:1 | | | | | | | | | | | | | | | | |
Net increase (decrease) from capital share transactions | | | (28,848,120 | ) | | | (68,189,568 | ) | | | 12,948,960 | | | | (14,861,716 | ) |
Total increase (decrease) in net assets | | | (75,498,627 | ) | | | 121,827,411 | | | | (17,327,599 | ) | | | 24,545,925 | |
Net Assets: | | | | | | | | | | | | | | | | |
Beginning of period | | | 893,301,357 | | | | 771,473,946 | | | | 196,999,701 | | | | 172,453,776 | |
End of period2 | | $ | 817,802,730 | | | $ | 893,301,357 | | | $ | 179,672,102 | | | $ | 196,999,701 | |
| 1 | See Note 1(g) of the Notes to Financial Statements. |
| 2 | Net assets - End of year includes accumulated net investment loss of $(2,965,324) and $(708,354) for Brandywine Fund and Brandywine Blue Fund, respectively, in 2018. |
|
The accompanying notes are an integral part of these financial statements. 16 |
AMG Managers Brandywine Fund
Financial Highlights
For a share outstanding throughout each fiscal period
| | | | | | | | | | | | | | | | | | | | | | | | |
| | | For the six | | | | | | | | | | | | | | | | |
| | | months ended | | | For the fiscal years ended September 30, | |
| | | March 31, 2019 | | | | | | | | | | | | | | | | |
| Class I | | (unaudited) | | | 2018 | | | 20171 | | | 2016 | | | 2015 | | | 20142 | |
Net Asset Value, Beginning of Period | | $ | 56.01 | | | $ | 44.48 | | | $ | 37.42 | | | $ | 34.54 | | | $ | 33.25 | | | $ | 28.75 | |
Income (loss) from Investment Operations: | | | | | | | | | | | | | | | | | | | | | | | | |
Net investment income (loss)3 | | | (0.09 | ) | | | (0.21 | )4 | | | (0.17 | )4,5 | | | (0.08 | )4,6 | | | 0.04 | 4,7 | | | (0.12 | )4 |
Net realized and unrealized gain (loss) on investments | | | (2.67 | ) | | | 11.74 | | | | 7.23 | | | | 2.96 | | | | 1.25 | | | | 4.62 | |
Total income (loss) from investment operations | | | (2.76 | ) | | | 11.53 | | | | 7.06 | | | | 2.88 | | | | 1.29 | | | | 4.50 | |
Net Asset Value, End of Period | | $ | 53.25 | | | $ | 56.01 | | | $ | 44.48 | | | $ | 37.42 | | | $ | 34.54 | | | $ | 33.25 | |
Total Return8 | | | (4.93 | )%9 | | | 25.92 | %4 | | | 18.87 | %4 | | | 8.34 | %4 | | | 3.88 | %4 | | | 15.65 | %4 |
Ratio of net expenses to average net assets | | | 1.10 | %10 | | | 1.10 | % | | | 1.11 | % | | | 1.11 | % | | | 1.10 | % | | | 1.10 | % |
Ratio of gross expenses to average net assets | | | 1.10 | %10 | | | 1.10 | %11 | | | 1.12 | %11 | | | 1.11 | %11 | | | 1.10 | %11 | | | 1.10 | %11 |
Ratio of net investment income (loss) to average net assets | | | (0.36 | )%10 | | | (0.43 | )%4 | | | (0.43 | )%4 | | | (0.24 | )%4 | | | 0.10 | %4 | | | (0.37 | )%4 |
Portfolio turnover | | | 83 | %9 | | | 138 | % | | | 187 | % | | | 185 | % | | | 190 | % | | | 219 | % |
Net assets end of period (000’s) omitted | | $ | 817,803 | | | $ | 893,301 | | | $ | 771,474 | | | $ | 720,766 | | | $ | 759,185 | | | $ | 799,045 | |
| | | | | | | | | | | | | | | | | | | | | | | | |
| 1 | Effective February 27, 2017, the Fund’s Class S shares were renamed to Class I shares. |
| 2 | At the start of business October 1, 2013, the Fund was reorganized into a fund of AMG Funds I. |
| 3 | Per share numbers have been calculated using average shares. |
| 4 | Total returns and net investment income would have been lower had certain expenses not been offset. |
| 5 | Includesnon-recurring dividends. Without these dividends, net investment loss per share would have been $(0.22). |
| 6 | Includesnon-recurring dividends. Without these dividends, net investment loss per share would have been $(0.10). |
| 7 | Includesnon-recurring dividends. Without these dividends, net investment loss per share would have been $(0.07). |
| 8 | The total return is calculated using the published Net Asset Value as of period end. |
| 11 | Excludes the impact of expense reimbursement or fee waivers and expense reductions such as brokerage credits, but includes expense repayments andnon-reimbursable expenses, if any, such as interest, taxes, and extraordinary expenses. (See Note 1(c) and 2 in the Notes to Financial Statements.) |
AMG Managers Brandywine Blue Fund
Financial Highlights
For a share outstanding throughout each fiscal period
| | | | | | | | | | | | | | | | | | | | | | | | |
| | | For the six | | | | | | | | | | | | | | | | |
| | | months ended | | | For the fiscal years ended September 30, | |
| | | March 31, 2019 | | | | | | | | | | | | | | | | |
| Class I | | (unaudited) | | | 2018 | | | 20171 | | | 2016 | | | 2015 | | | 20142 | |
Net Asset Value, Beginning of Period | | $ | 56.64 | | | $ | 45.69 | | | $ | 36.87 | | | $ | 33.95 | | | $ | 33.51 | | | $ | 30.01 | |
Income (loss) from Investment Operations: | | | | | | | | | | | | | | | | | | | | | | | | |
Net investment income (loss)3 | | | (0.05 | ) | | | (0.24 | ) | | | (0.12 | )4 | | | (0.02 | )5 | | | 0.10 | 6 | | | (0.03 | ) |
Net realized and unrealized gain (loss) on investments | | | (4.12 | ) | | | 11.19 | | | | 8.94 | | | | 3.02 | | | | 0.34 | | | | 3.53 | |
Total income (loss) from investment operations | | | (4.17 | ) | | | 10.95 | | | | 8.82 | | | | 3.00 | | | | 0.44 | | | | 3.50 | |
Less Distributions to Shareholders from: | | | | | | | | | | | | | | | | | | | | | | | | |
Net investment income | | | — | | | | — | | | | — | | | | (0.08 | ) | | | — | | | | — | |
Net realized gain on investments | | | (5.36 | ) | | | — | | | | — | | | | — | | | | — | | | | — | |
Total distributions to shareholders | | | (5.36 | ) | | | — | | | | — | | | | (0.08 | ) | | | — | | | | — | |
Net Asset Value, End of Period | | $ | 47.11 | | | $ | 56.64 | | | $ | 45.69 | | | $ | 36.87 | | | $ | 33.95 | | | $ | 33.51 | |
Total Return7 | | | (5.53 | )%8 | | | 23.97 | % | | | 23.92 | % | | | 8.86 | % | | | 1.31 | % | | | 11.66 | % |
Ratio of expenses to average net assets | | | 1.18 | %9 | | | 1.16 | % | | | 1.20 | % | | | 1.20 | % | | | 1.20 | % | | | 1.19 | % |
Ratio of net investment income (loss) to average net assets | | | (0.22 | )%9 | | | (0.47 | )% | | | (0.29 | )% | | | (0.05 | )% | | | 0.29 | % | | | (0.11 | )% |
Portfolio turnover | | | 76 | %8 | | | 122 | % | | | 167 | % | | | 139 | % | | | 156 | % | | | 182 | % |
Net assets end of period (000’s) omitted | | $ | 179,672 | | | $ | 197,000 | | | $ | 172,454 | | | $ | 156,953 | | | $ | 169,180 | | | $ | 215,941 | |
| | | | | | | | | | | | | | | | | | | | | | | | |
| 1 | Effective February 27, 2017, the Fund’s Class S shares were renamed to Class I shares. |
| 2 | At the start of business October 1, 2013, the Fund was reorganized into a fund of AMG Funds I. |
| 3 | Per share numbers have been calculated using average shares. |
| 4 | Includesnon-recurring dividends. Without these dividends, net investment loss per share would have been $(0.18). |
| 5 | Includesnon-recurring dividends. Without these dividends, net investment loss per share would have been $(0.04). |
| 6 | Includesnon-recurring dividends. Without these dividends, net investment loss per share would have been $(0.08). |
| 7 | The total return is calculated using the published Net Asset Value as of period end. |
Notes to Financial Statements (unaudited)
March 31, 2019
1. SUMMARY OF SIGNIFICANT ACCOUNTING POLICIES
AMG Funds I (the “Trust”) is anopen-end management investment company, organized as a Massachusetts business trust, and registered under the Investment Company Act of 1940, as amended (the “1940 Act”). Currently, the Trust consists of a number of different funds, each having distinct investment management objectives, strategies, risks, and policies. Included in this report are AMG Managers Brandywine Fund (“Brandywine”) and AMG Managers Brandywine Blue Fund (“Brandywine Blue”), each a “Fund” and collectively, the “Funds.”
A significant portion of the Brandywine Blue’s holdings may be focused in a relatively small number of securities, which may make the Fund more volatile and subject to greater risk than a more diversified fund.
The Funds’ financial statements are prepared in accordance with accounting principles generally accepted in the United States of America (“U.S. GAAP”), including accounting and reporting guidance pursuant to Accounting Standards Codification Topic 946 applicable to investment companies. U.S. GAAP requires management to make estimates and assumptions that affect the reported amounts of assets and liabilities and disclosure of contingent assets and liabilities at the date of the financial statements and the reported amounts of income and expenses during the reporting period. Actual results could differ from those estimates and such differences could be material. The following is a summary of significant accounting policies followed by the Funds in the preparation of their financial statements:
a. VALUATION OF INVESTMENTS
Equity securities traded on a national securities exchange or reported on the NASDAQ national market system (“NMS”) are valued at the last quoted sales price on the primary exchange or, if applicable, the NASDAQ official closing price or the official closing price of the relevant exchange or, lacking any sales, at the last quoted bid price or the mean between the last quoted bid and ask prices (the “exchange mean price”). Equity securities traded in theover-the-counter market (other than NMS securities) are valued at the exchange mean price. Foreign equity securities (securities principally traded in markets other than U.S. markets) are valued at the official closing price on the primary exchange or, for markets that either do not offer an official closing price or where the official closing price may not be representative of the overall market, the last quoted sale price.
Fixed income securities purchased with a remaining maturity of 60 days or less are valued at amortized cost, provided that the amortized cost value is approximately the same as the fair value of the security valued without the use of amortized cost. Investments in otheropen-end regulated investment companies are valued at their end of day net asset value per share.
The Funds’ portfolio investments are generally valued based on independent market quotations or prices or, if none, “evaluative” or other market based valuations provided by third party pricing services approved by the Board of Trustees of the Trust (the “Board”). Under certain circumstances, the value of certain Fund portfolio investments may be based on an evaluation of fair value, pursuant to procedures established by and under the general supervision of the Board. The Valuation Committee, which is comprised of the Independent Trustees of the Board, and the Pricing Committee, which is comprised of representatives from AMG Funds LLC (the “Investment Manager”), are the committees appointed by the Board to make fair value determinations. Each Fund may use the fair value of a portfolio investment to calculate its net asset value (“NAV”) in the event that the market quotation, price or market based valuation for the portfolio investment
is not readily available or otherwise not determinable pursuant to the Board’s valuation procedures, if the Investment Manager or the Pricing Committee believes the quotation, price or market based valuation to be unreliable, or in certain other circumstances. When determining the fair value of an investment, the Pricing Committee and, if required under the Trust’s securities valuation procedures, the Valuation Committee, seeks to determine the price that the Fund might reasonably expect to receive from current sale of that portfolio investment in an arms-length transaction. Fair value determinations shall be based upon consideration of all available facts and information, including, but not limited to (i) attributes specific to the investment; (ii) fundamental and analytical data relating to the investment; and (iii) the value of other comparable securities or relevant financial instruments, including derivative securities, traded on other markets or among dealers.
The values assigned to fair value portfolio investments are based on available information and do not necessarily represent amounts that might ultimately be realized in the future, since such amounts depend on future developments inherent in long-term investments. Because of the inherent uncertainty of valuation, those estimated values may differ significantly from the values that would have been used had a ready market for the investments existed, and the differences could be material. The Board will be presented with a quarterly report showing as of the most recent quarter end, all outstanding securities fair valued by the Funds, including a comparison with the prior quarter end and the percentage of the Funds that the security represents at each quarter end.
With respect to foreign equity securities and certain foreign fixed income securities, the Board has adopted a policy that securities held in a Fund that can be fair valued by the applicable fair value pricing service are fair valued on each business day provided that each individual price exceeds apre-established confidence level.
U.S. GAAP defines fair value as the price that a fund would receive to sell an asset or pay to transfer a liability in an orderly transaction between market participants at the measurement date. U.S. GAAP also establishes a framework for measuring fair value, and a three level hierarchy for fair value measurements based upon the transparency of inputs to the valuation of an asset or liability. Inputs may be observable or unobservable and refer broadly to the assumptions that market participants would use in pricing the asset or liability. Observable inputs reflect the assumptions market participants would use in pricing the asset or liability based on market data obtained from sources independent of the Funds. Unobservable inputs reflect the Funds’ own assumptions about the assumptions that market participants would use in pricing the asset or liability developed based on the best information available in the circumstances. Each investment is assigned a level based upon the observability of the inputs which are significant to the overall valuation.
The three-tier hierarchy of inputs is summarized below:
Level 1 – inputs are quoted prices in active markets for identical investments (e.g., equity securities,open-end investment companies)
Level 2 – other observable inputs (including, but not limited to: quoted prices for similar assets or liabilities in markets that are active, quoted prices for identical or similar assets or liabilities in markets that are not active, inputs other than quoted prices that are observable for the assets or liabilities (such as interest rates, yield curves, volatilities, prepayment speeds, loss severities, credit risks and default rates) or other market corroborated inputs) (e.g., debt securities, government securities, foreign currency exchange contracts, swaps, foreign securities utilizing international fair value pricing, fair valued securities with observable inputs)
Notes to Financial Statements(continued)
Level 3 – inputs are significant unobservable inputs (including the Fund’s own assumptions used to determine the fair value of investments) (e.g., fair valued securities with unobservable inputs)
Changes in inputs or methodologies used for valuing investments may result in a transfer in or out of levels within the fair value hierarchy. The inputs or methodologies used for valuing investments may not necessarily be an indication of the risk associated with investing in those investments.
b. SECURITY TRANSACTIONS
Security transactions are accounted for as of trade date. Realized gains and losses on securities sold are determined on the basis of identified cost.
c. INVESTMENT INCOME AND EXPENSES
Dividend income is recorded on theex-dividend date. Dividends from foreign securities are recorded on theex-dividend date, and if after the fact, as soon as the Fund becomes aware of theex-dividend date. Interest income, which includes amortization of premium and accretion of discount on debt securities, is accrued as earned. Dividend and interest income on foreign securities is recorded gross of any withholding tax.Non-cash dividends included in dividend income, if any, are reported at the fair market value of the securities received. Other income and expenses are recorded on an accrual basis. Expenses that cannot be directly attributed to a Fund are apportioned among the funds in the Trust and other trusts within the AMG Funds family of mutual funds (collectively the “AMG Funds Family”) based upon their relative average net assets or number of shareholders.
d. DIVIDENDS AND DISTRIBUTIONS
Fund distributions resulting from either net investment income or realized net capital gains, if any, will normally be declared and paid at least annually in December. Distributions to shareholders are recorded on theex-dividend date. Distributions are determined in accordance with federal income tax regulations, which may differ from net investment income and net realized capital gains for financial statement purposes (U.S. GAAP). Differences may be permanent or temporary. Permanent differences are reclassified among capital accounts in the financial statements to reflect their tax character. Permanent book and tax basis differences, if any, relating to shareholder distributions will result in reclassifications topaid-in capital. Temporary differences arise when certain items of income, expense and gain or loss are recognized in different periods for financial statement and tax purposes; these differences will reverse at some time in the future. Permanent differences are primarily due to expired capital loss carryovers and a net operating loss write off. Temporary differences are primarily due to qualified late year ordinary losses and wash sales.
At March 31, 2019, the aggregate cost for federal income tax purposes approximates the aggregate cost for book purposes. The approximate cost of
investments and the aggregate gross unrealized appreciation and depreciation for federal income tax purposes were as follows:
| | | | | | | | | | | | | | | | |
| Fund | | Cost | | | Appreciation | | | Depreciation | | | Net | |
Brandywine | | $ | 656,710,965 | | | $ | 182,132,723 | | | $ | (10,229,825 | ) | | $ | 171,902,898 | |
Brandywine Blue | | | 138,004,238 | | | | 40,870,627 | | | | (229,348 | ) | | | 40,641,279 | |
e. FEDERAL TAXES
Each Fund currently qualifies as an investment company and intends to comply with the requirements under Subchapter M of the Internal Revenue Code of 1986, as amended, and to distribute substantially all of its taxable income and gains to its shareholders and to meet certain diversification and income requirements with respect to investment companies. Therefore, no provision for federal income or excise tax is included in the accompanying financial statements.
Additionally, based on each Fund’s understanding of the tax rules and rates related to income, gains and transactions for the foreign jurisdictions in which it invests, each Fund will provide for foreign taxes, and where appropriate, deferred foreign taxes.
Management has analyzed the Funds’ tax positions taken on federal income tax returns as of March 31, 2019, and for all open tax years (generally, the three prior taxable years), and has concluded that no provision for federal income tax is required in the Funds’ financial statements. Additionally, Management is not aware of any tax position for which it is reasonably possible that the total amounts of unrecognized tax benefits will change materially in the next twelve months.
Net capital losses incurred may be carried forward for an unlimited time period, and retain their tax character as either short-term or long-term capital losses.
f. CAPITAL LOSS CARRYOVERS AND DEFERRALS
As of September 30, 2018, the Funds had no accumulated net realized capital loss carryovers from securities transactions for federal income tax purposes. Should the Funds incur net capital losses for the fiscal year ended September 30, 2019, such amounts may be used to offset future realized capital gains, for an unlimited time period.
g. CAPITAL STOCK
The Trust’s Declaration of Trust authorizes for each Fund the issuance of an unlimited number of shares of beneficial interest, without par value. Each Fund records sales and repurchases of its capital stock on the trade date.
Notes to Financial Statements(continued)
For the six months ended March 31, 2019 (unaudited) and the fiscal year ended September 30, 2018, the capital stock transactions by class for the Funds were as follows:
| | | | | | | | | | | | | | | | | | | | | | | | | | | | | | | | |
| | | | | | Brandywine | | | | | | | | | Brandywine Blue | | | | |
| | | March 31, 2019 | | | September 30, 2018 | | | March 31, 2019 | | | September 30, 2018 | |
| | | Shares | | | Amount | | | Shares | | | Amount | | | Shares | | | Amount | | | Shares | | | Amount | |
Class I: | | | | | | | | | | | | | | | | | | | | | | | | | | | | | | | | |
Proceeds from sale of shares | | | 50,165 | | | $ | 2,503,611 | | | | 70,754 | | | $ | 3,508,461 | | | | 190,054 | | | $ | 8,740,737 | | | | 68,721 | | | $ | 3,551,878 | |
Reinvestment of distributions | | | — | | | | — | | | | — | | | | — | | | | 447,028 | | | | 17,639,726 | | | | — | | | | — | |
Cost of shares repurchased | | | (640,582 | ) | | | (31,351,731 | ) | | | (1,466,670 | ) | | | (71,698,029 | ) | | | (301,458 | ) | | | (13,431,503 | ) | | | (365,341 | ) | | | (18,413,594 | ) |
| | | | | | | | | | | | | | | | | | | | | | | | | | | | | | | | |
Net increase (decrease) | | | (590,417 | ) | | $ | (28,848,120 | ) | | | (1,395,916 | ) | | $ | (68,189,568 | ) | | | 335,624 | | | $ | 12,948,960 | | | | (296,620 | ) | | $ | (14,861,716 | ) |
| | | | | | | | | | | | | | | | | | | | | | | | | | | | | | | | |
h. REPURCHASE AGREEMENTS AND JOINT REPURCHASE AGREEMENTS
The Funds may enter into third-party repurchase agreements for temporary cash management purposes and third-party or bilateral joint repurchase agreements for reinvestment of cash collateral on securities lending transactions under the securities lending program offered by The Bank of New York Mellon (“BNYM”) (the “Program”) (collectively, “Repurchase Agreements”). The value of the underlying collateral, including accrued interest, must equal or exceed the value of the Repurchase Agreements during the term of the agreement. For joint repurchase agreements, the Funds participate on a pro rata basis with other clients of BNYM in its share of the underlying collateral under such joint repurchase agreements and in its share of proceeds from any repurchase or other disposition of the underlying collateral. The underlying collateral for all Repurchase Agreements is held in safekeeping by the Funds’ custodian or at the Federal Reserve Bank. If the seller defaults and the value of the collateral declines, or if bankruptcy proceedings commence with respect to the seller of the security, realization of the collateral by the Funds may be delayed or limited. Pursuant to the Program, the Funds are indemnified for such losses by BNYM on joint repurchase agreements.
At March 31, 2019, the market value of Repurchase Agreements outstanding for Brandywine was $10,398,068.
2. AGREEMENTS AND TRANSACTIONS WITH AFFILIATES
For each of the Funds, the Trust has entered into an investment advisory agreement under which the Investment Manager, a subsidiary and the U.S. retail distribution arm of Affiliated Managers Group, Inc. (“AMG”), serves as investment manager to the Funds and is responsible for the Funds’ overall administration and operations. The Investment Manager selects one or more subadvisers for the Funds (subject to Board approval) and monitors each subadviser’s investment performance, security holdings and investment strategies. Each Fund’s investment portfolio is managed by Friess Associates, LLC (“Friess”) and Friess Associates of Delaware, LLC (“Friess of Delaware”) who serve pursuant to a subadvisory agreement with the Investment Manager.
Investment management fees are paid directly by the Funds to the Investment Manager based on average daily net assets. For the six months ended March 31, 2019, the Funds’ investment management fees were paid at the following annual rate of each Fund’s respective average daily net assets:
| | | | |
Brandywine | | | 0.88 | % |
Brandywine Blue | | | 0.88 | % |
The Trust, on behalf of the Funds, has entered into an amended and restated Administration Agreement under which the Investment Manager serves as the Funds’ administrator (the “Administrator”) and is responsible for allnon-portfolio management aspects of managing the Fund’s operations, including administration and shareholder services to each Fund. Each Fund pays a fee to the Administrator at the rate of 0.15% per annum of the Fund’s average daily net assets for this service.
The Funds are distributed by AMG Distributors, Inc. (the “Distributor”), a wholly-owned subsidiary of the Investment Manager. The Distributor serves as the distributor and underwriter for each Fund and is a registered broker-dealer and member of the Financial Industry Regulatory Authority, Inc. (“FINRA”). Shares of each Fund will be continuously offered and will be sold directly to prospective purchasers and through brokers, dealers or other financial intermediaries who have executed selling agreements with the Distributor. Generally the Distributor bears all or a portion of the expenses of providing services pursuant to the distribution agreement, including the payment of the expenses relating to the distribution of prospectuses for sales purposes and any advertising or sales literature.
For Class I shares, the Board has approved reimbursement payments to the Investment Manager for shareholder servicing expenses (“shareholder servicing fees”) incurred. Shareholder servicing fees include payments to financial intermediaries, such as broker-dealers (including fund supermarket platforms), banks, and trust companies who provide shareholder recordkeeping, account servicing and other services. Class I shares may reimburse the Investment Manager for the actual amount incurred up to a maximum annual rate of each Class I shares average daily net assets as shown in the table below.
The impact on the annualized expense ratio for the six months ended March 31, 2019, was as follows:
| | | | | | | | |
| | | Maximum Annual | | | Actual | |
| | | Amount | | | Amount | |
| Fund | | Approved | | | Incurred | |
Brandywine | | | | | | | | |
Class I | | | 0.15 | % | | | 0.02 | % |
Brandywine Blue | | | | | | | | |
Class I | | | 0.15 | % | | | 0.05 | % |
The Board provides supervision of the affairs of the Trust and other trusts within the AMG Funds family. The Trustees of the Trust who are not affiliated with the Investment Manager receive an annual retainer and per meeting fees for regular,
Notes to Financial Statements(continued)
special and telephonic meetings, and they are reimbursed forout-of-pocket expenses incurred while carrying out their duties as Board members. The Chairman of the Board and the Audit Committee Chair receive additional annual retainers. Certain Trustees and Officers of the Funds are Officers and/or Directors of the Investment Manager, AMG and/or the Distributor.
The Securities and Exchange Commission (the “SEC”) granted an exemptive order that permits the Funds to lend and borrow money for certain temporary purposes directly to and from other eligible funds in the AMG Funds family. Participation in this interfund lending program is voluntary for both the borrowing and lending funds, and an interfund loan is only made if it benefits each participating fund. The Administrator manages the program according to procedures approved by the Board, and the Board monitors the operation of the program. An interfund loan must comply with certain conditions set out in the exemptive order, which are designed to assure fairness and protect all participating funds. For the six months ended March 31, 2019, Brandywine borrowed a maximum of $2,731,108, for one day paying interest of $233. The interest expense amount is included in the Statement of Operations as miscellaneous expense. Brandywine Blue neither borrowed nor lent to other funds in the AMG Funds family. At March 31, 2019, the Funds had no interfund loans outstanding.
3. PURCHASES AND SALES OF SECURITIES
Purchases and sales of securities (excluding short-term securities and U.S. Government Obligations) for the six months ended March 31, 2019, were as follows:
| | | | | | | | |
| | | Long Term Securities | |
| Fund | | Purchases | | | Sales | |
Brandywine | | $ | 635,569,245 | | | $ | 661,476,936 | |
Brandywine Blue | | | 125,777,517 | | | | 127,233,646 | |
The Funds had no purchases or sales of U.S. Government Obligations during the six months ended March 31, 2019.
4. PORTFOLIO SECURITIES LOANED
The Funds participate in the Program providing for the lending of securities to qualified brokers. Securities lending income includes earnings of such temporary cash investments, plus or minus any rebate to a borrower. These earnings (after any rebate) are then divided between BNYM, as a fee for its services under the Program, and the Funds, according to agreed-upon rates. Collateral on all securities loaned is accepted in cash or U.S. Government and Agency Obligations. Collateral is maintained at a minimum level of 102% (105% in the case of certain foreign securities) of the market value, plus interest, if applicable, of investments on loan. It is the Funds’ policy to obtain additional collateral from or return excess collateral to the borrower by the end of the next business day, following the valuation date of the securities loaned. Therefore, the value of the collateral held may be temporarily less than the value of the securities on loan. Lending securities entails a risk of loss to the Funds if and to the extent that the market
value of the securities loaned were to increase and the borrower did not increase the collateral accordingly, and the borrower fails to return the securities. Under the terms of the Program, the Funds are indemnified for such losses by BNYM. Cash collateral is held in separate omnibus accounts managed by BNYM, who is authorized to exclusively enter into joint repurchase agreements for that cash collateral. Securities collateral is held in separate omnibus accounts managed by BNYM that cannot be sold or pledged. BNYM bears the risk of any deficiency in the amount of the cash collateral available for return to the borrower due to any loss on the collateral invested.
The value of securities loaned on positions held, cash and securities collateral received at March 31, 2019, were as follows:
| | | | | | | | | | | | | | | | |
| | | | | | Cash | | | Securities | | | Total | |
| | | Securities | | | Collateral | | | Collateral | | | Collateral | |
| Fund | | Loaned | | | Received | | | Received | | | Received | |
Brandywine | | $ | 89,119,363 | | | $ | 10,398,068 | | | $ | 79,036,989 | | | $ | 89,435,057 | |
Brandywine Blue | | | 10,275,107 | | | | — | | | | 10,324,103 | | | | 10,324,103 | |
The following table summarizes the securities received as collateral for securities lending:
| | | | | | | | |
| | | Collateral | | Coupon | | Maturity | |
| Fund | | Type | | Range | | Date Range | |
Brandywine | | U.S. Treasury Obligations | | 0.000%-8.750% | | | 04/04/19-11/15/48 | |
Brandywine Blue | | U.S. Treasury Obligations | | 0.000%-8.750% | | | 04/25/19-05/15/48 | |
5. COMMITMENTS AND CONTINGENCIES
Under the Trust’s organizational documents, its trustees and officers are indemnified against certain liabilities arising out of the performance of their duties to the Trust. In addition, in the normal course of business, the Funds may enter into contracts and agreements that contain a variety of representations and warranties, which provide general indemnifications. The maximum exposure to the Funds under these arrangements is unknown, as this would involve future claims that may be made against a Fund that have not yet occurred. However, based on experience, the Funds had no prior claims or losses and expect the risks of loss to be remote.
6. MASTER NETTING AGREEMENTS
The Funds may enter into master netting agreements with their counterparties for the securities lending program and Repurchase Agreements, which provide the right, in the event of default (including bankruptcy or insolvency) for thenon-defaulting party to liquidate the collateral and calculate net exposure to the defaulting party or request additional collateral. For financial reporting purposes, the Funds do not offset financial assets and financial liabilities that are subject to master netting agreements in the Statement of Assets and Liabilities. For securities lending transactions, see Note 4.
Notes to Financial Statements(continued)
The following table is a summary of the Funds’ open Repurchase Agreements that are subject to a master netting agreement as of March 31, 2019:
| | | | | | | | | | | | | | | | | | | | |
| | | | | | Gross Amount Not Offset in the
Statement of Assets and Liabilities | | | | | | | |
| | | Gross Amounts of Assets Presented in the Statement of Assets and Liabilities | | | | | | | | | | | | | |
| | | | | | Net Asset Balance | | | | | | | |
| | | Offset Amount | | | Collateral Received | | | Net Amount | |
| Fund |
Brandywine | | | | | | | | | | | | | | | | | | | | |
Citigroup Global Markets, Inc. | | $ | 2,469,706 | | | | — | | | $ | 2,469,706 | | | $ | 2,469,706 | | | | — | |
Daiwa Capital Markets America | | | 2,469,706 | | | | — | | | | 2,469,706 | | | | 2,469,706 | | | | — | |
Jefferies LLC | | | 2,469,706 | | | | — | | | | 2,469,706 | | | | 2,469,706 | | | | — | |
Mizuho Securities USA, LLC | | | 519,244 | | | | — | | | | 519,244 | | | | 519,244 | | | | — | |
MUFG Securities America, Inc. | | | 2,469,706 | | | | — | | | | 2,469,706 | | | | 2,469,706 | | | | — | |
| | | | | | | | | | | | | | | | | | | | |
Total | | $ | 10,398,068 | | | | — | | | $ | 10,398,068 | | | $ | 10,398,068 | | | | — | |
| | | | | | | | | | | | | | | | | | | | |
7. REGULATORY UPDATES
In August 2018, the FASB issued Accounting Standards UpdateNo. 2018-13, Fair Value Measurement (Topic 820), Disclosure Framework - Changes to the Disclosure Requirements for Fair Value Measurement (“ASU2018-13”) which is effective for periods starting after December 15, 2019. The primary focus of the update is to improve the effectiveness of ASC 820’s disclosure in the notes to financial statements. The Funds have early adopted these changes and there was no significant impact on the financial statements and accompanying notes.
Effective November 15, 2018, the SEC amended existing rules intended to modernize reporting and disclosure of information. These amendments relate to RegulationS-X which sets forth the form and content of financial statements. The
amendment requires collapsing the components of distributable earnings on the Statement of Assets and Liabilities and collapsing the distributions paid to shareholders on the Statements of Changes in Net Assets. The Funds have adopted these amendments and there was no significant impact on the financial statements and accompanying notes.
8. SUBSEQUENT EVENTS
The Funds have determined that no material events or transactions occurred through the issuance date of the Funds’ financial statements, which require an additional disclosure in or adjustment of the Funds’ financial statements.
THIS PAGE INTENTIONALLY LEFT BLANK
INVESTMENT MANAGER AND
ADMINISTRATOR
AMG Funds LLC
600 Steamboat Road, Suite 300
Greenwich, CT 06830
800.548.4539
DISTRIBUTOR
AMG Distributors, Inc.
600 Steamboat Road, Suite 300
Greenwich, CT 06830
800.548.4539
SUBADVISER
Friess Associates, LLC
P.O. Box 576
Jackson, Wyoming 83001
Friess Associates of Delaware, LLC
P.O. Box 4166
Greenville, DE 19807
CUSTODIAN
The Bank of New York Mellon
111 Sanders Creek Parkway
East Syracuse, NY 13057
LEGAL COUNSEL
Ropes & Gray LLP
Prudential Tower, 800 Boylston Street
Boston, MA 02199-3600
TRANSFER AGENT
BNY Mellon Investment Servicing (US) Inc.
Attn: AMG Funds
P.O. Box 9769
Providence, RI 02940
800.548.4539
TRUSTEES
Bruce B. Bingham
Christine C. Carsman
Edward J. Kaier
Kurt Keilhacker
Steven J. Paggioli
Richard F. Powers III
Eric Rakowski
Victoria Sassine
Thomas R. Schneeweis
This report is prepared for the Funds’ shareholders. It is authorized for distribution to prospective investors only when preceded or accompanied by an effective prospectus. To receive a free copy of the prospectus or Statement of Additional Information, which includes additional information about Fund Trustees, please contact us by calling 800.548.4539. Distributed by AMG Distributors, Inc., member FINRA/SIPC.
Current net asset values per share for each Fund are available on the Funds’ website at amgfunds.com.
A description of the policies and procedures each Fund uses to vote its proxies is available: (i) without charge, upon request, by calling 800.548.4539, or (ii) on the Securities and Exchange Commission’s (SEC) website at sec.gov. For information regarding the Funds’ proxy voting record for the12-month period ended June 30, call 800.548.4539 or visit the SEC website at sec.gov.
The Funds file their complete schedule of portfolio holdings with the SEC for the first and third quarters of each fiscal year on FormN-PORT-EX. The Funds’ FormsN-PORT-EX are available on the SEC’s website at sec.gov. To review a complete list of the Funds’ portfolio holdings, or to view the most recent quarterly holdings report, semiannual report, or annual report, please visit amgfunds.com.
AFFILIATE SUBADVISED FUNDS
BALANCED FUNDS
AMG Chicago Equity Partners Balanced
Chicago Equity Partners, LLC
AMG FQ Global Risk-Balanced
First Quadrant, L.P.
EQUITY FUNDS
AMG FQTax-Managed U.S. Equity
AMG FQ Long-Short Equity
First Quadrant, L.P.
AMG Frontier Small Cap Growth
Frontier Capital Management Co., LLC
AMG GW&K Small Cap Core
AMG GW&K Small/Mid Cap
AMG GW&K Trilogy Emerging Markets
Equity
AMG GW&K Trilogy Emerging Wealth
Equity
AMG GW&K U.S. Small Cap Growth
GW&K Investment Management, LLC
AMG Renaissance Large Cap Growth
The Renaissance Group LLC
AMG River Road Dividend All Cap
Value
AMG River Road Dividend All Cap
Value II
AMG River Road Focused Absolute
Value
AMG River Road Long-Short
AMG River RoadSmall-Mid Cap Value
AMG River Road Small Cap Value
River Road Asset Management, LLC
AMG SouthernSun Small Cap
AMG SouthernSun U.S. Equity
SouthernSun Asset Management, LLC
AMG Systematic Mid Cap Value
Systematic Financial Management L.P.
AMG TimesSquare Emerging Markets
Small Cap
AMG TimesSquare Global Small Cap
AMG TimesSquare International Small
Cap
AMG TimesSquare Mid Cap Growth
AMG TimesSquare Small Cap Growth
TimesSquare Capital Management, LLC
AMG Yacktman
AMG Yacktman Focused
AMG Yacktman Focused Fund - Security
Selection Only
AMG Yacktman Special Opportunities
Yacktman Asset Management LP
FIXED INCOME FUNDS
AMG GW&K Core Bond
AMG GW&K Enhanced Core Bond
AMG GW&K Municipal Bond
AMG GW&K Municipal Enhanced Yield
GW&K Investment Management, LLC
OPEN-ARCHITECTURE FUNDS
EQUITY FUNDS
AMG Managers Brandywine
AMG Managers Brandywine Advisors
Mid Cap Growth
AMG Managers Brandywine Blue
Friess Associates, LLC
AMG Managers Cadence Emerging
Companies
AMG Managers Cadence Mid Cap
Cadence Capital Management LLC
AMG Managers CenterSquare Real Estate
CenterSquare Investment Management
LLC
AMG Managers Emerging Opportunities
WEDGE Capital Management L.L.P.
Next Century Growth Investors LLC
RBC Global Asset Management (U.S.) Inc.
AMG Managers Essex Small/Micro Cap
Growth
Essex Investment Management Company,
LLC
AMG Managers Fairpointe ESG Equity
AMG Managers Fairpointe Mid Cap
Fairpointe Capital LLC
AMG Managers LMCG Small Cap Growth LMCG Investments, LLC
AMG Managers Montag & Caldwell Growth Montag & Caldwell, LLC
AMG Managers Pictet International
Pictet Asset Management Limited
AMG Managers Silvercrest Small Cap
Silvercrest Asset Management Group
LLC
AMG Managers Skyline Special Equities
Skyline Asset Management, L.P.
AMG Managers Special Equity
Ranger Investment Management, L.P.
Lord, Abbett & Co. LLC
Smith Asset Management Group, L.P.
Federated MDTA LLC
FIXED INCOME FUNDS
AMG Managers Amundi Intermediate
Government
AMG Managers Amundi Short Duration
Government
Amundi Pioneer Institutional Asset
Management, Inc.
AMG Managers Doubleline Core Plus
Bond
DoubleLine Capital LP
AMG Managers Global Income
Opportunity
AMG Managers Loomis Sayles Bond
Loomis, Sayles & Company, L.P.
| | |
| amgfunds.com | | 033119 SAR073 |
Not applicable for the semi-annual shareholder report.
| Item 3. | AUDIT COMMITTEE FINANCIAL EXPERT |
Not applicable for the semi-annual shareholder report.
| Item 4. | PRINCIPAL ACCOUNTANT FEES AND SERVICES |
Not applicable for the semi-annual shareholder report.
| Item 5. | AUDIT COMMITTEE OF LISTED REGISTRANTS |
Not applicable.
| Item 6. | SCHEDULE OF INVESTMENTS |
The schedule of investments in unaffiliated issuers as of the close of the reporting period is included as part of the shareholder report contained in Item 1 hereof.
| Item 7. | DISCLOSURE OF PROXY VOTING POLICIES AND PROCEDURES FORCLOSED-END MANAGEMENT INVESTMENT COMPANIES |
Not applicable.
| Item 8. | PORTFOLIO MANAGERS OFCLOSED-END MANAGEMENT INVESTMENT COMPANIES |
Not applicable.
| Item 9. | PURCHASES OF EQUITY SECURITIES BYCLOSED-END MANAGEMENT INVESTMENT COMPANIES AND AFFILIATED PURCHASERS |
Not applicable.
| Item 10. | SUBMISSION OF MATTERS TO A VOTE OF SECURITY HOLDERS |
Not applicable.
| Item 11. | CONTROLS AND PROCEDURES |
| | (a) | The registrant’s principal executive and principal financial officers have concluded, based on their evaluation of the registrant’s disclosure controls and procedures as of a date within 90 days of the filing date of this report, that the registrant’s disclosure controls and procedures are reasonably designed to ensure that information required to be disclosed by the registrant on FormN-CSR is recorded, processed, summarized and reported within the required time periods and that information required to be disclosed by the registrant in the reports that it files or submits on FormN-CSR is accumulated and communicated to the registrant’s management, including its principal executive and principal financial officers, as appropriate to allow timely decisions regarding required disclosure. |
| | (b) | There were no changes in the registrant’s internal control over financial reporting during the registrant’s second fiscal quarter of the period covered by this report that have materially affected, or are reasonably likely to materially affect, the internal control over financial reporting. |
| Item 12. | DISCLOSURE OF SECURITIES LENDING ACTIVITIES FORCLOSED-END MANAGEMENT INVESTMENT COMPANIES |
Not applicable.
| | |
| |
| (a)(1) | | Not applicable. |
| |
| (a)(2) | | Certifications pursuant to Rule30a-2(a) under the Investment Company Act of 1940 - Filed herewith. |
| |
| (a)(3) | | Not applicable. |
| |
| (b) | | Certifications pursuant to Rule30a-2(b) under the Investment Company Act of 1940 - Filed herewith. |
SIGNATURES
Pursuant to the requirements of the Securities Exchange Act of 1934 and the Investment Company Act of 1940, the registrant has duly caused this report to be signed on its behalf by the undersigned, thereunto duly authorized.
AMG FUNDS I
| | |
| By: | | /s/ Keitha L. Kinne |
| | Keitha L. Kinne, Principal Executive Officer |
Date: May 6, 2019
Pursuant to the requirements of the Securities Exchange Act of 1934 and the Investment Company Act of 1940, this report has been signed below by the following persons on behalf of the registrant and in the capacities and on the dates indicated.
| | |
| By: | | /s/ Keitha L. Kinne |
| | Keitha L. Kinne, Principal Executive Officer |
Date: May 6, 2019
| | |
| By: | | /s/ Thomas Disbrow |
| | Thomas Disbrow, Principal Financial Officer |
Date: May 6, 2019