UNITED STATES
SECURITIES AND EXCHANGE COMMISSION
Washington, D.C. 20549
FORM N-CSRS
CERTIFIED SHAREHOLDER REPORT OF
REGISTERED MANAGEMENT INVESTMENT COMPANIES
Investment Company Act file number:811-06520
AMG Funds I
(Exact name of registrant as specified in charter)
600 Steamboat Road,
Suite 300, Greenwich, Connecticut 06830
(Address of principal executive offices) (Zip code)
AMG Funds LLC
600 Steamboat Road, Suite 300, Greenwich, Connecticut 06830
(Name and address of agent for service)
Registrant’s telephone number, including area code: (203)299-3500
Date of fiscal year end: September 30
Date of reporting period: OCTOBER 1, 2019 – MARCH 31, 2020
(Semi-Annual Shareholder Report)
| Item 1. | Reports to Shareholders |
| | |
 | | SEMI-ANNUAL REPORT |
| | |
| | | AMG Funds March 31, 2020 |
| | | 
|
| | |
| | | AMG Managers Brandywine Fund |
| | | Class I:BRWIX |
| | |
| | | AMG Managers Brandywine Blue Fund |
| | | Class I:BLUEX |
| | | |
| | | |
| | | |
| | | |
Beginning on January 1, 2021, as permitted by regulations adopted by the Securities and Exchange Commission, paper copies of the Funds’ shareholder reports like this one will no longer be sent by mail, unless you specifically request paper copies of the reports from the Funds or from your financial intermediary, such as a broker-dealer or bank. Instead, the reports will be made available on the Funds’ website (https://www.amgfunds.com/resources/order_literature.html), and you will be notified by mail each time a report is posted and provided with a website link to access the report.
If you already elected to receive shareholder reports electronically, you will not be affected by this change and you need not take any action. You may elect to receive shareholder reports and other communications from the Funds electronically at any time by contacting your financial intermediary or, if you invest directly with the Funds, by logging into your account at www.amgfunds.com.
You may elect to receive all future reports in paper free of charge. If you invest through a financial intermediary, you can contact your financial intermediary to request that you continue to receive paper copies of your shareholder reports. If you invest directly with the Funds, you can call 1.800.548.4539 to inform the Funds that you wish to continue receiving paper copies of your shareholder reports. Your election to receive reports in paper will apply to all funds in the AMG Funds Family of Funds held in your account if you invest through your financial intermediary or all funds in the AMG Funds Family of Funds held with the fund complex if you invest directly with the Funds.
| | | | |
| amgfunds.com | | | | 033120 SAR073 |
| | |
| | | AMG Funds Semi-Annual Report — March 31, 2020(unaudited) |
| | | | | | |
| | | |
| | | | | | | |
| | | TABLE OF CONTENTS | | PAGE | |
| | | | |
| | | LETTER TO SHAREHOLDERS | | | 2 | |
| | | |
| | | ABOUT YOUR FUND’S EXPENSES | | | 3 | |
| | | |
| | | FUND PERFORMANCE | | | 4 | |
| | | |
| | | FUND SNAPSHOTS, ROSES AND THORNS AND SCHEDULES OF PORTFOLIO INVESTMENTS | | | 5 | |
| | | |
| | | AMG Managers Brandywine Fund | | | 5 | |
| | | |
| | | AMG Managers Brandywine Blue Fund | | | 9 | |
| | | |
| | | FINANCIAL STATEMENTS | | | | |
| | | |
| | | Statement of Assets and Liabilities | | | 13 | |
| | | |
| | | Balance sheets, net asset value (NAV) per share computations and cumulative distributable earnings (loss) | | | | |
| | | |
| | | Statement of Operations | | | 14 | |
| | | |
| | | Detail of sources of income, expenses, and realized and unrealized gains (losses) during the fiscal period | | | | |
| | | |
| | | Statements of Changes in Net Assets | | | 15 | |
| | | |
| | | Detail of changes in assets for the past two fiscal periods | | | | |
| | | |
| | | Financial Highlights | | | 16 | |
| | | |
| | | Historical net asset values per share, distributions, total returns, income and expense ratios, turnover ratios and net assets | | | | |
| | | |
| | | Notes to Financial Statements | | | 18 | |
| | | |
| | | Accounting and distribution policies, details of agreements and transactions with Fund management and affiliates, and descriptions of certain investment risks | | | | |
| | | |
| | | FUNDS LIQUIDITY RISK MANAGEMENT PROGRAM | | | 23 | |
| | | | | | | |
|
| Nothing contained herein is to be considered an offer, sale or solicitation of an offer to buy shares of any series of the AMG Funds Family of Funds. Such offering is made only by prospectus, which includes details as to offering price and other material information. | |
| | |
| | Letter to Shareholders |
DEAR FELLOW SHAREHOLDER:
The infamous achievements of major market barometers sum up the March quarter. It was the worst quarter since the waning months of the 2008 financial crisis for the S&P 500® Index. The Dow Jones Industrial Average declined more than it did in any quarter since 1987, when Black Monday left its mark on the closing quarter of that year. As far as first quarters go, it was just the worst.
Coronavirus-related fears stormed through the market, leaving virtually no shelter as investors repriced stocks in wholesale manner.
AMG Managers Brandywine Fund declined 18.95 percent in the three months through March. The Russell 3000® and Russell 3000® Growth Indexes declined 20.90 and 14.85 percent. AMG Managers Brandywine Blue Fund declined 15.13 percent in the quarter as the S&P 500®, Russell 1000® and Russell 1000® Growth Indexes declined 19.60, 20.22 and 14.10 percent.
Every economic sector in the benchmarks suffered declines, with the energy sector by far the hardest hit. A record-setting collapse in oil prices, triggered by a price war between Russia and Saudi Arabia and compounded by rapidly deteriorating economic conditions, decimated the energy sector’s outlook.
As fighting the pandemic prompted shutdowns,shelter-in-place orders and resource realignment, investors fled cyclical economic sectors. Record jobless claims further dampened expectations for companies in any way reliant on discretionary spending on the part of business or consumer customers.
Most “bright spots” were relative, meaning their declines were less pronounced than average. The consumer staples and health care sectors, where demand is generally static under most circumstances, fit that description.
While there were no exceptional sectors, there were companies that managed to navigate the mayhem thanks to characteristics that investors deemed exceptionally suited for the unusual conditions. Zoom Video Communications was one of those exceptions.
The video-first communications platform operator finished 2019 with about 10 million users of its service. As weeks wore on andstay-at-home advisories spread here and abroad, Zoom enjoyed a previously unimaginable opportunity to showcase its technology. By providing everyone from fitness instructors to corporate executives the means to meetface-to-face without occupying the same space, Zoom was able to grow its base of free and paid users to 200 million by the end of March.
For most companies, however, new restrictive measures were a curse. That was the overwhelming experience of holdings from the consumer discretionary sector, which generated some of the biggest percentage declines during the period.
Tempur Sealy International was a major detractor in both Funds. The bedding product maker came into the quarter with strong operational momentum, partly boosted by are-established relationship with Mattress Firm, a major retail outlet just over a year out of bankruptcy. During the quarter, Mattress Firm announced it would close stores, furlough employees and suspend benefits, among other moves. Tempur Sealy shares fell as it became clear that Mattress Firm and other retail channels for its products were questionable at best.
Consumer discretionary holdings represented the third largest portfolio position in both Funds. In Brandywine, they were the second biggest detractors from absolute performance and the biggest detractors from results relative to the Russell 3000® Growth Index. The third biggest return detractors in Brandywine Blue, they contributed to relative performance versus the Russell 1000® Growth Index.
Technology holdings, which comprised the biggest positions in both Funds, detracted the most from quarterly returns. They were the third and second most significant detractors from relative performance for Brandywine and Brandywine Blue, respectively. Apple was a notable detractor in both Funds. Investors grew concerned about demand trends as the company shuttered retail stores, beginning in China, which is a big market for iPhones.
Comprising the second largest position in both Funds, health care holdings were the third and second largest detractors from returns in Brandywine and Brandywine Blue. They weighed the second most on relative results for Brandywine and the most for Brandywine Blue. IQVIA Holdings, a contract research organization, detracted from performance in both Funds. Shares declined after the company warned about delays in research project timelines and disruptions in site operations among customers.
The financial sector generated a positive absolute return for Brandywine thanks primarily to eHealth, which boasts a combination of attributes that appear well-suited for the times. Health insurance security is an obvious concern amid the outbreak andface-to-face interactions, as we all know, are to be avoided. eHealth operates an online health insurance marketplace, with strong emphasis on Medicare-related plans.
For more information on holdings that influenced March-quarter results, please see Roses & Thorns on page 6 for Brandywine and page 10 for Brandywine Blue.
We’re acutely aware that the near-term environment is likely to be marked by continued volatility. We know that on each day we show up for work, whether in the office or remotely, we need to build on and challenge what we learned the day before. Based on our firm’s 46 years of experience, we also know that unique circumstances like these typically present rare opportunities to emerge better informed and, in time, whole.
In a March 31 article titled “Stocks Cheap After First-Quarter Plummet,” financial research firm Morningstar noted a swift reversal in its view of buying opportunities, writing “The market hasn’t been this heavily discounted in many years.”
Thanks for your confidence in our research-driven investment approach and the team that implements it to capitalize on the opportunities the market will present going forward. We wish you and your family good health.

Scott Gates
Chief Investment Officer
Friess Associates, LLC
2
|
About Your Fund’s Expenses(unaudited) |
| | | | | | | | |
As a shareholder of a Fund, you may incur two types of costs: (1) transaction costs, which may include sales charges (loads) on purchase payments; redemption fees; and exchange fees; and (2) ongoing costs, including management fees; distribution(12b-1) fees; and other Fund expenses. This example is intended to help you understand your ongoing costs (in dollars) of investing in the Fund and to compare these costs with the ongoing costs of investing in other mutual funds. The example is based on $1,000 invested at the beginning of the period and held for the entire period as indicated below. ACTUAL EXPENSES The first line of the following table provides information about the actual account values and | | | | actual expenses. You may use the information in this line, together with the amount you invested, to estimate the expenses that you paid over the period. Simply divide your account value by $1,000 (for example, an $8,600 account value divided by $1,000 = 8.6), then multiply the result by the number in the first line under the heading entitled “Expenses Paid During Period” to estimate the expenses you paid on your account during this period. HYPOTHETICAL EXAMPLE FOR COMPARISON PURPOSES The second line of the following table provides information about hypothetical account values and hypothetical expenses based on the Fund’s actual expense ratio and an assumed annual rate of return of 5% before expenses, which is not the Fund’s | | | | actual return. The hypothetical account values and expenses may not be used to estimate the actual ending account balance or expenses you paid for the period. You may use this information to compare the ongoing costs of investing in the Fund and other funds by comparing this 5% hypothetical example with the 5% hypothetical examples that appear in the shareholder reports of other funds. Please note that the expenses shown in the table are meant to highlight your ongoing costs only and do not reflect any transactional costs, such as sales charges (loads), redemption fees, or exchange fees. Therefore, the second line of the table is useful in comparing ongoing costs only, and will not help you determine the relative total costs of owning different funds. |
| | | | | | | | |
| | | | | | | | |
Six Months Ended March 31, 2020 | | Expense
Ratio for
the Period | | Beginning
Account
Value
10/01/19 | | Ending
Account
Value
03/31/20 | | Expenses
Paid
During
the Period* |
AMG Managers Brandywine Fund |
|
Based on Actual Fund Return |
| | | | |
Class I | | 1.11% | | $1,000 | | $881 | | $5.22 |
|
Based on Hypothetical 5% Annual Return |
| | | | |
Class I | | 1.11% | | $1,000 | | $1,019 | | $5.60 |
AMG Managers Brandywine Blue Fund |
|
Based on Actual Fund Return |
| | | | |
Class I | | 1.16% | | $1,000 | | $923 | | $5.58 |
|
Based on Hypothetical 5% Annual Return |
| | | | |
Class I | | 1.16% | | $1,000 | | $1,019 | | $5.86 |
| * | Expenses are equal to the Fund’s annualized expense ratio multiplied by the average account value over the period, multiplied by the number of days in the most recent fiscal half-year (183), then divided by 366. |
3
|
Fund Performance(unaudited) Periods ended March 31, 2020 |
The table below shows the average annual total returns for the periods indicated for each Fund, as well as each Fund’s relative index for the same time periods ended March 31, 2020.
| | | | | | | | | | | | | | | | |
| Average Annual Total Returns1 | | Six
Months* | | | One
Year | | | Five
Years | | | Ten Years | |
|
AMG Managers Brandywine Fund2, 3, 4, 5, 6, 7, 8 | |
Class I | | | (11.94 | %) | | | (12.54 | %) | | | 4.46 | % | | | 7.26 | % |
Russell 3000® Growth Index10 | | | (5.77 | %) | | | (0.44 | %) | | | 9.74 | % | | | 12.68 | % |
Russell 3000® Index11 | | | (13.70 | %) | | | (9.13 | %) | | | 5.77 | % | | | 10.15 | % |
S&P 500® Index12 | | | (12.31 | %) | | | (6.98 | %) | | | 6.73 | % | | | 10.53 | % |
|
AMG Managers Brandywine Blue Fund2, 3, 4, 5, 6, 8, 9 | |
Class I | | | (7.73 | %) | | | (2.50 | %) | | | 7.20 | % | | | 8.60 | % |
Russell 1000® Growth Index13 | | | (4.98 | %) | | | 0.91 | % | | | 10.36 | % | | | 12.97 | % |
Russell 1000® Index14 | | | (13.01 | %) | | | (8.03 | %) | | | 6.22 | % | | | 10.39 | % |
S&P 500® Index12 | | | (12.31 | %) | | | (6.98 | %) | | | 6.73 | % | | | 10.53 | % |
The performance data shown represents past performance. Past performance is not a guarantee of future results. Current performance may be lower or higher than the performance data quoted. The investment return and principal value of an investment will fluctuate so that an investor’s shares, when redeemed, may be worth more or less than their original cost.
Investors should carefully consider the Fund’s investment objectives, risks, charges and expenses before investing. For performance information through the most recent month end, current net asset values per share for the Funds and other information, please call 800.548.4539 or visit our website at amgfunds.com for a free prospectus. Read it carefully before investing or sending money.
Distributed by AMG Distributors, Inc., member FINRA/SIPC.
* Not annualized.
| 1 | Total return equals income yield plus share price change and assumes reinvestment of all dividends and capital gain distributions. Returns are net of fees and may reflect offsets of Fund expenses as described in the prospectus. No adjustment has been made for taxes payable by shareholders on their reinvested dividends and capital gain distributions. Returns for periods greater than one year are annualized. The listed returns on the Funds are net of expenses and based on the published NAV as of March 31, 2020. All returns are in U.S. dollars ($). |
| 2 | The Fund returns for all periods prior to October 1, 2013, reflect performance of the predecessor funds, Brandywine Fund and Brandywine Blue Fund, and were managed by Friess Associates, LLC with the same investment objective and substantially similar investment policies. |
| 3 | Active and frequent trading of a fund may result in higher transaction costs and increased tax liability. |
| 4 | The Fund invests in growth stocks, which may be more sensitive to market movements because their prices tend to reflect future investor expectations rather than just current profits. Growth stocks may underperform value stocks during given periods. |
| 5 | Investments in international securities are subject to certain risks of overseas investing including currency fluctuations and changes in political and economic conditions, which could result in significant market fluctuations. These risks are magnified in emerging markets. |
| 6 | Companies that are in similar businesses may be similarly affected by particular economic or market events; to the extent the Fund has substantial holdings within a particular sector, the risks associated with that sector increase. |
| 7 | The Fund is subject to risks associated with investments in small-capitalization companies, such as erratic earnings patterns, competitive conditions, limited earnings history and a reliance on one or a limited number of products. |
| | |
| | | 8 The Fund is subject to risks associated with investments inmid-capitalization companies such as greater price volatility, lower trading volume, and less liquidity than the stocks of larger, more established companies. 9 A greater percentage of the Fund’s holdings may be focused in a smaller number of securities which may place the Fund at greater risk than a more diversified fund. 10 The Russell 3000® Growth Index measures the performance of those Russell 3000® Index companies with higherprice-to-book ratios and higher forecasted growth values. Unlike the Fund, the Russell 3000® Growth Index is unmanaged, is not available for investment and does not incur expenses. 11 The Russell 3000® Index is composed of the 3,000 largest U.S. companies as measured by market capitalization, and represents about 98% of the U.S. stock market. Unlike the Fund, the Russell 3000® Index is unmanaged, is not available for investment and does not incur expenses. 12 The S&P 500® Index is a capitalization-weighted index of 500 stocks. The S&P 500® Index is designed to measure performance of the broad domestic economy through changes in the aggregate market value of 500 stocks representing all major industries. Unlike the Fund, the S&P 500® Index is unmanaged, is not available for investment and does not incur expenses. |
| | |
| | | 13 The Russell 1000® Growth Index is a market capitalization weighted index that measures the performance of those Russell 1000® companies with higherprice-to-book ratios and higher forecasted growth values. Unlike the Fund, the Russell 1000® Growth Index is unmanaged, is not available for investment and does not incur expenses. 14 The Russell 1000® Index measures the performance of approximately 1,000 of the largest securities based on a combination of their market cap and current index membership. The Russell 1000® represents approximately 92% of the U.S. market. Unlike the Fund, the Russell 1000® Index is unmanaged, is not available for investment and does not incur expenses. |
| | | The Russell Indices are trademarks of the London Stock Exchange Group companies. The S&P 500® Index is proprietary data of Standard & Poor’s, a division of McGraw-Hill Companies, Inc. All rights reserved. Not FDIC insured, nor bank guaranteed. May lose value. |
4
|
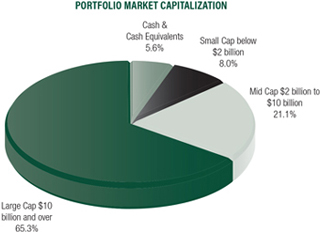
AMG Managers Brandywine Fund Fund Snapshots(unaudited) March 31, 2020 |
PORTFOLIO BREAKDOWN
| | | | | | | | |
| Industry (Top Ten) | | AMG
Managers
Brandywine
Fund1 | | | Russell
3000®
Growth
Index | |
Data Processing & Outsourced Services | | | 9.5 | % | | | 6.7 | % |
| | | |
Health Care Equipment | | | 6.8 | % | | | 3.3 | % |
| | | |
Application Software | | | 6.4 | % | | | 5.1 | % |
| | | |
Biotechnology | | | 6.4 | % | | | 4.0 | % |
| | | |
Semiconductors | | | 5.6 | % | | | 3.8 | % |
| | | |
Interactive Home Entertainment | | | 4.3 | % | | | 0.3 | % |
| | | |
Internet & Direct Marketing Retail | | | 4.2 | % | | | 6.6 | % |
| | | |
Packaged Foods & Meats | | | 3.8 | % | | | 0.4 | % |
| | | |
Pharmaceuticals | | | 3.2 | % | | | 3.8 | % |
| | | |
Technology Hardware, Storage & Peripherals | | | 3.1 | % | | | 7.8 | % |
| | | |
Other Common Stock | | | 41.1 | % | | | 58.2 | % |
| | | |
Short-Term Investments | | | 4.2 | % | | | 0.0 | % |
| | | |
Other Assets | | | 1.4 | % | | | 0.0 | % |
| 1 | As a percentage of net assets. |
TOP TEN HOLDINGS
| | | | | | | | |
| Security Name | | % of
Net Assets | | | % Change from
Book Cost | |
Amazon.com, Inc. | | | 4.2 | | | | 12.5 | |
| | | |
Tandem Diabetes Care, Inc. | | | 4.1 | | | | 29.0 | |
| | | |
NVIDIA Corp. | | | 3.4 | | | | (2.9 | ) |
| | | |
Apple, Inc. | | | 3.1 | | | | (20.0 | ) |
| | | |
Global Payments, Inc. | | | 3.1 | | | | 101.1 | |
| | | |
Visa, Inc., Class A | | | 2.9 | | | | 123.7 | |
| | | |
Electronic Arts, Inc. | | | 2.7 | | | | 2.2 | |
| | | |
Netflix, Inc. | | | 2.6 | | | | 4.1 | |
| | | |
Microsoft Corp. | | | 2.5 | | | | 0.1 | |
| | | |
The Home Depot, Inc. | | | 2.5 | | | | (12.3 | ) |
| | | | | | | | |
| | | |
Top Ten as a Group | | | 31.1 | | | | | |
| | | | | | | | |
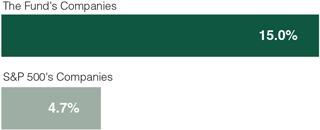
ESTIMATED EARNINGS GROWTH RATE OF THE FUND’S INVESTMENTS
Forecasted Increase in Earnings Per Share 2020 vs 2019
Source: Consensus estimates from FactSet Research Systems Inc.
This is not a forecast of the Fund’s future performance. Earnings growth for a Fund holding does not guarantee a corresponding increase in the market value of the holding or the Fund. Earnings growth rates based on existing estimates on March 31. Widespread estimate reductions occurred in the time since amid deteriorating economic conditions related to theCOVID-19 crisis.
Because a fund’s strategy may result in multiple investments in particular sectors of the economy, its performance may depend on the performance of those sectors and may fluctuate more widely than investments diversified across more sectors. For additional information on these and other risk considerations, please see the Fund’s prospectus.
Any sectors, industries, or securities discussed should not be perceived as investment recommendations. Mention of a specific security should not be considered a recommendation to buy or solicitation to sell that security. Specific securities mentioned in this report may have been sold from the Fund’s portfolio of investments by the time you receive this report.
5
|
AMG Managers Brandywine Fund Roses and Thorns(unaudited) Quarter Ending March 31, 2020 |
| | | | | | |
$ Gain
(in millions) | | % Gain | | | Biggest $ Winners Reason for Move |
| $7.0 | | | 40.1% | | | eHealth Inc. (EHTH) |
| | | | | | | The Internet-based health insurance agency earned $4.13 per share in the December quarter, exceeding the consensus estimate by 65 percent. Medicare-related applications increased 200 percent following significant investment in the company’s online enrollment platform over the past year. eHealth also issued better-than-expected 2020 guidance. Investors viewed the company’s online business model positively as social distancing measures went into effect. |
| $2.3 | | | 9.1% | | | Advanced Micro Devices Inc. (AMD) |
| | | | | | | The semiconductor maker earned $0.32 per share in the December quarter, up from $0.08 in theyear-ago period and ahead of the consensus estimate. Strength in the company’s Computing and Graphics segment drove a 50 percent increase in revenue. Leverage realized through progress in the production of AMD’s Ryzen mainstream computing and Rome server processors helped boost gross profit margins to 45 percent from 38 percent in the same quarter the year before. Guidance for 2020, which exceeded consensus expectations, forecasted accelerating revenue growth. |
| $2.0 | | | 12.0% | | | Vertex Pharmaceuticals Inc. (VRTX) |
| | | | | | | The small molecule drug developer exceeded December-quarter expectations with 31 percent earnings growth. Revenue climbed 63 percent to more than $1.4 billion. Investors applauded the early U.S. approval of the company’s breakthrough cystic fibrosis drug Trikafta, which generated $420 million in sales in the short window between the October 21 regulatory nod and the end of the quarter. Analysts expected $84 million in sales for the new drug. |
| $2.0 | | | 8.0% | | | Tandem Diabetes Care Inc. (TNDM). |
| | | | | | | The maker of insulin pumps for people with diabetes earned $0.04 per share in the December quarter, exceeding expectations for a loss. The company’s 2020 guidance was also better than expected. A pivotal trial for a competing product was suspended in March to correct a software anomaly. Meanwhile, the market share leader in the space is conducting a recall. Tandem drew positive attention as investors saw expanded opportunity for the company’s newControl-IQ in the fractured competitive landscape. |
| $2.0 | | | 11.4% | | | Domino’s Pizza Inc. (DPZ) |
| | | | | | | The company, consisting of more than 17,000 company-owned and franchised pizza stores in the U.S. and overseas, grew December-quarter earnings 19 percent, exceeding the consensus estimate. The period represented the 35th consecutive quarter of U.S. same-store sales growth and the 104th in its international business. As the world’s largest pizza chain, investors viewed the company’s delivery experience and infrastructure as assets asstay-at-home advisories increased demand for food delivery options. |
$Loss
(in millions) | | % Loss | | | Biggest $ Losers Reason for Move |
| $8.4 | | | 68.6% | | | Tempur Sealy International Inc. (TPX) |
| | | | | | | The bedding product maker grew December-quarter earnings 52 percent, exceeding the consensus estimate for the fourth consecutive quarter. Known for its higher-priced memory foam mattresses, shares fell as investors feared the company’s momentum would be disrupted by a falloff in demand. The company previously benefited from a recently renewed relationship with retailer Mattress Firm, which announced cost-cutting measures in March as the outbreak took a toll on customer traffic. |
| $7.5 | | | 47.9% | | | Taylor Morrison Home Corp. (TMHC) |
| | | | | | | The homebuilder earned $0.51 per share in the December quarter, up from $0.08 in theyear-ago period. Revenue increased 13 percent. A 42 percent increase in new sales orders was the highlight of the quarter, reflecting strength in all geographies. Shares declined on concerns about the balance sheet impact of an acquisition and potential disruption related to the pandemic. |
| $7.2 | | | 52.5% | | | Thor Industries Inc. (THO) |
| | | | | | | The recreational vehicle maker delivered mixed January-quarter results, with a modest earnings shortfall on better-than-expected revenue. Share price performance reflected emerging uncertainties related to the coronavirus outbreak, including likely spending restraint among consumers facing the possibility of a recession. Thor ultimately suspended production in late March amid concern for employees and the deteriorating backdrop. |
| $6.5 | | | 29.7% | | | Exact Sciences Corp. (EXAS) |
| | | | | | | The diagnostics company focused on the detection of colorectal cancer grew December-quarter earnings to $0.54 per share from a loss in theyear-ago period, exceeding the consensus estimate. Acquired during the quarter, Genomic Health was a significant contributor to results. Shares declined amid the widespread cancellation of routine medical visits as resources shifted to fight the coronavirus outbreak, potentially weighing on future testing volumes. |
| $6.1 | | | 20.4% | | | The Walt Disney Co. (DIS) |
| | | | | | | Although the entertainment and media company reported expectation-beating earnings and revenue for the December quarter, advisories discouraging and/or forbidding group gatherings prompted the company to shutter its global network of parks. Also, with sporting events suspended indefinitely, concerns grew about the related impact on ESPN viewership and advertising. |
All gains/losses are calculated on an average cost basis from December 31, 2019 through March 31, 2020. Companies still held at the end of the period appear in the accompanying Schedule of Portfolio Investments.
This commentary reflects the viewpoints of Friess Associates, LLC as of March 31, 2020, and is not intended as a forecast or guarantee of future results.
6
|
AMG Managers Brandywine Fund Schedule of Portfolio Investments(unaudited) March 31, 2020 |
| | | | | | | | | | | | |
| | | |
| Shares | | | | | Cost | | | Value | |
| |
| | Common Stocks - 94.4% | | | | | |
| |
| | Communication Services | | | | | |
| | |
| | | | Cable & Satellite - 1.5% | | | | | |
| | | |
| | 22,418 | | | Charter Communications, Inc., Class A* | | | $10,345,221 | | | | $9,781,197 | |
| | |
| | | | Interactive Home Entertainment - 4.3% | | | | | |
| | | |
| | 169,451 | | | Activision Blizzard, Inc. | | | 9,329,579 | | | | 10,078,946 | |
| | | |
| | 176,061 | | | Electronic Arts, Inc.* | | | 17,249,250 | | | | 17,636,030 | |
| | |
| | | | Interactive Media & Services - 2.9% | | | | | |
| | | |
| | 59,671 | | | Facebook, Inc., Class A* | | | 9,669,321 | | | | 9,953,123 | |
| | | |
| | 373,239 | | | Twitter, Inc.* | | | 12,258,691 | | | | 9,166,750 | |
| | |
| | | | Movies & Entertainment - 2.6% | | | | | |
| | | |
| | 45,945 | | | Netflix, Inc.* | | | 16,580,928 | | | | 17,252,347 | |
| | | | | | | | | | | | |
| | |
| | Total Communication Services | | | 75,432,990 | | | | 73,868,393 | |
| | |
| | | | This sector is 2.1% below your Fund’s cost. | | | | |
| | |
| | Consumer Discretionary | | | | | | | | |
| | |
| | | | General Merchandise Stores - 1.7% | | | | | |
| | | |
| | 118,827 | | | Target Corp. | | | 12,312,437 | | | | 11,047,346 | |
| | |
| | | | Home Improvement Retail - 2.5% | | | | | |
| | | |
| | 86,129 | | | The Home Depot, Inc. | | | 18,339,149 | | | | 16,081,146 | |
| | |
| | | | Internet & Direct Marketing Retail - 4.2% | | | | | |
| | | |
| | 14,023 | | | Amazon.com, Inc.* | | | 24,301,664 | | | | 27,340,923 | |
| | |
| | | | Restaurants - 1.5% | | | | | |
| | | |
| | 183,845 | | | Papa John’s International, Inc. | | | 9,868,873 | | | | 9,811,808 | |
| | | | | | | | | | | | |
| | |
| | Total Consumer Discretionary | | | 64,822,123 | | | | 64,281,223 | |
| | |
| | | | This sector is 0.8% below your Fund’s cost. | | | | |
| | |
| | Consumer Staples | | | | | | | | |
| | |
| | | | Hypermarkets & Super Centers - 1.4% | | | | | |
| | | |
| | 31,822 | | | Costco Wholesale Corp. | | | 6,932,047 | | | | 9,073,407 | |
| | |
| | | | Packaged Foods & Meats - 3.8% | | | | | |
| | | |
| | 384,147 | | | The Hain Celestial Group, Inc.*,1 | | | 9,592,285 | | | | 9,976,298 | |
| | | |
| | 29,760 | | | The Hershey Co. | | | 4,018,106 | | | | 3,943,200 | |
| | | |
| | 216,239 | | | Mondelez International, Inc., Class A | | | 12,879,947 | | | | 10,829,249 | |
| | | | | | | | | | | | |
| | |
| | Total Consumer Staples | | | 33,422,385 | | | | 33,822,154 | |
| | |
| | | | This sector is 1.2% above your Fund’s cost. | | | | |
| |
| | Financials | | | | | |
| | |
| | | | Financial Exchanges & Data - 1.7% | | | | | |
| | | |
| | 65,969 | | | CME Group, Inc. | | | 6,197,944 | | | | 11,406,700 | |
| | |
| | | | Insurance Brokers - 2.1% | | | | | |
| | | |
| | 97,615 | | | eHealth, Inc.*,1 | | | 3,530,623 | | | | 13,746,144 | |
| | | | | | | | | | | | |
| | |
| | Total Financials | | | 9,728,567 | | | | 25,152,844 | |
| | |
| | | | This sector is 158.5% above your Fund’s cost. | | | | |
| | | | | | | | | | | | |
| | | |
| Shares | | | | | Cost | | | Value | |
| |
| | Health Care | | | | | |
| | |
| | | | Biotechnology - 6.4% | | | | | |
| | | |
| | 114,552 | | | ACADIA Pharmaceuticals, Inc.* | | | $4,867,104 | | | | $4,839,822 | |
| | | |
| | 183,398 | | | BioMarin Pharmaceutical, Inc.* | | | 16,507,248 | | | | 15,497,131 | |
| | | |
| | 197,719 | | | Exact Sciences Corp.*,1 | | | 16,472,923 | | | | 11,467,702 | |
| | | |
| | 41,298 | | | Vertex Pharmaceuticals, Inc.* | | | 8,672,115 | | | | 9,826,859 | |
| | |
| | | | Health Care Services - 2.5% | | | | | |
| | | |
| | 100,040 | | | Addus HomeCare Corp.* | | | 8,023,768 | | | | 6,762,704 | |
| | | |
| | 36,854 | | | Quest Diagnostics, Inc. | | | 3,248,275 | | | | 2,959,376 | |
| | | |
| | 745,472 | | | R1 RCM, Inc.* | | | 7,923,244 | | | | 6,776,341 | |
| | |
| | | | Health Care Equipment - 6.8% | | | | | |
| | | |
| | 84,687 | | | Abbott Laboratories | | | 4,869,982 | | | | 6,682,651 | |
| | | |
| | 106,556 | | | Hill-Rom Holdings, Inc. | | | 10,204,045 | | | | 10,719,534 | |
| | | |
| | 412,727 | | | Tandem Diabetes Care, Inc.* | | | 20,584,190 | | | | 26,558,982 | |
| | |
| | | | Life Sciences Tools & Services - 1.4% | | | | | |
| | | |
| | 32,617 | | | Thermo Fisher Scientific, Inc. | | | 5,572,949 | | | | 9,250,181 | |
| | |
| | | | Managed Health Care - 1.6% | | | | | |
| | | |
| | 41,983 | | | UnitedHealth Group, Inc. | | | 10,045,179 | | | | 10,469,721 | |
| | |
| | | | Pharmaceuticals - 3.2% | | | | | |
| | | |
| | 181,627 | | | Bristol-Myers Squibb Co. | | | 10,003,755 | | | | 10,123,889 | |
| | | |
| | 88,809 | | | Zoetis, Inc. | | | 12,146,650 | | | | 10,451,931 | |
| | | | | | | | | | | | |
| | |
| | Total Health Care | | | 139,141,427 | | | | 142,386,824 | |
| | |
| | | | This sector is 2.3% above your Fund’s cost. | | | | |
| |
| | Industrials | | | | | |
| | |
| | | | Aerospace & Defense - 1.6% | | | | | |
| | | |
| | 59,100 | | | L3Harris Technologies, Inc. | | | 12,403,563 | | | | 10,645,092 | |
| | |
| | | | Building Products - 2.3% | | | | | |
| | | |
| | 185,017 | | | Fortune Brands Home & Security, Inc. | | | 11,719,633 | | | | 8,001,985 | |
| | | |
| | 180,388 | | | Universal Forest Products, Inc. | | | 9,012,186 | | | | 6,708,630 | |
| | |
| | | | Research & Consulting Services - 1.4% | | | | | |
| | | |
| | 75,052 | | | FTI Consulting, Inc.* | | | 8,725,108 | | | | 8,988,978 | |
| | |
| | | | Trading Companies &
Distributors - 1.2% | | | | | |
| | | |
| | 443,722 | | | BMC Stock Holdings, Inc.* | | | 13,004,520 | | | | 7,867,191 | |
| | | | | | | | | | | | |
| | |
| | Total Industrials | | | 54,865,010 | | | | 42,211,876 | |
| | |
| | | | This sector is 23.1% below your Fund’s cost. | | | | |
| |
| | Information Technology | | | | | |
| | |
| | | | Application Software - 6.4% | | | | | |
| | | |
| | 45,070 | | | Adobe, Inc.* | | | 11,261,231 | | | | 14,343,077 | |
| | | |
| | 75,800 | | | salesforce.com, Inc.* | | | 11,837,726 | | | | 10,913,684 | |
| | | |
| | 670,983 | | | SVMK, Inc.* | | | 13,692,031 | | | | 9,064,980 | |
| | | |
| | 50,043 | | | Zoom Video Communications, Inc., Class A*,1 | | | 5,678,077 | | | | 7,312,283 | |
The accompanying notes are an integral part of these financial statements.
7
|
AMG Managers Brandywine Fund Schedule of Portfolio Investments(continued) |
| | | | | | | | | | | | |
| | | |
| Shares | | | | | Cost | | | Value | |
| |
| | Information Technology(continued) | | | | | |
| | |
| | | | Communications Equipment - 1.6% | | | | | |
| | | |
| | 140,190 | | | Lumentum Holdings, Inc.* | | | $7,086,237 | | | | $10,332,003 | |
| | |
| | | | Data Processing & Outsourced
Services - 9.5% | | | | | |
| | | |
| | 136,360 | | | Fiserv, Inc.* | | | 13,348,057 | | | | 12,952,836 | |
| | | |
| | 139,960 | | | Global Payments, Inc. | | | 10,039,962 | | | | 20,186,431 | |
| | | |
| | 39,602 | | | Mastercard, Inc., Class A | | | 6,992,037 | | | | 9,566,259 | |
| | | |
| | 119,890 | | | Visa, Inc., Class A1 | | | 8,635,439 | | | | 19,316,677 | |
| | |
| | | | Electronic Equipment &Instruments - 1.9% | | | | | |
| | | |
| | 143,783 | | | Keysight Technologies, Inc.* | | | 8,797,926 | | | | 12,031,762 | |
| | |
| | | | IT Consulting & Other
Services - 2.3% | | | | | |
| | | |
| | 161,740 | | | Booz Allen Hamilton Holding Corp. | | | 7,041,068 | | | | 11,101,834 | |
| | | |
| | 152,360 | | | Perficient, Inc.* | | | 6,684,476 | | | | 4,127,432 | |
| | |
| | | | Semiconductors - 5.6% | | | | | |
| | | |
| | 231,472 | | | Advanced Micro Devices, Inc.* | | | 6,487,312 | | | | 10,527,347 | |
| | | |
| | 82,574 | | | NVIDIA Corp. | | | 22,403,962 | | | | 21,766,506 | |
| | | |
| | 105,205 | | | Silicon Motion Technology Corp. ADR (Taiwan) | | | 4,876,502 | | | | 3,856,815 | |
| | |
| | | | Systems Software - 2.5% | | | | | |
| | | |
| | 103,233 | | | Microsoft Corp. | | | 16,262,193 | | | | 16,280,876 | |
| | |
| | | | Technology Hardware, Storage & Peripherals - 3.1% | | | | | |
| | | |
| | 80,502 | | | Apple, Inc. | | | 25,579,314 | | | | 20,470,854 | |
| | | | | | | | | | | | |
| | |
| | Total Information Technology | | | 186,703,550 | | | | 214,151,656 | |
| | |
| | | | This sector is 14.7% above your Fund’s
cost. | | | | |
| | | | | | | | | | | | |
| | | |
| Shares | | | | | Cost | | | Value | |
| |
| | Materials | | | | | |
| | |
| | | | Fertilizers & Agricultural
Chemicals - 2.3% | | | | | |
| | | |
| | 142,775 | | | The ScottsMiracle-Gro Co. | | | $15,898,414 | | | | $14,620,160 | |
| | |
| | | | Gold- 0.6% | | | | | |
| | | |
| | 365,037 | | | SSR Mining, Inc.
(Canada)* | | | 5,956,852 | | | | 4,154,121 | |
| | | | | | | | | | | | |
| | |
| | Total Materials | | | 21,855,266 | | | | 18,774,281 | |
| | |
| | | | This sector is 14.1% below your Fund’s
cost. | | | | |
| | |
| | Total Common Stocks | | | 585,971,318 | | | | 614,649,251 | |
| |
| | Short-Term Investments - 4.2% | | | | | |
| |
| | Other Investment Companies - 4.2% | | | | | |
| | | |
| 9,087,045 | | | Dreyfus Government Cash Management Fund, Institutional Shares,
0.29%2 | | | 9,087,045 | | | | 9,087,045 | |
| | | |
| 9,087,045 | | | Dreyfus Institutional Preferred Government Money Market Fund, Institutional Shares,
0.39%2 | | | 9,087,045 | | | | 9,087,045 | |
| | | |
| 9,362,410 | | | JPMorgan U.S. Government Money Market Fund, IM Shares, 0.35%2 | | | 9,362,410 | | | | 9,362,410 | |
| | | |
| | | | Total Other Investment Companies | | | 27,536,500 | | | | 27,536,500 | |
| | | | | | | | | | | | |
| | |
| | Total Short-Term Investments | | | 27,536,500 | | | | 27,536,500 | |
| | |
| | Total Investments - 98.6% | | | 613,507,818 | | | | 642,185,751 | |
| | |
| | Other Assets, less Liabilities - 1.4% | | | | | | | 8,954,112 | |
| | |
| | Total Net Assets - 100.0% | | | | | | $ | 651,139,863 | |
| | | | | | | | | | | | |
| * | Non-income producing security. |
| 1 | Some of these securities, amounting to $47,946,933 or 7.4% of net assets, were out on loan to various borrowers and are collateralized by various U.S. Treasury Obligations. See Note 4 of Notes to Financial Statements. |
| 2 | Yield shown represents the March 31, 2020, seven day average yield, which refers to the sum of the previous seven days’ dividends paid, expressed as an annual percentage. |
ADR American Depositary Receipt
The following table summarizes the inputs used to value the Fund’s investments by the fair value hierarchy levels as of March 31, 2020:
| | | | | | | | | | | | | | | | | | | | |
| | | Level 1 | | Level 2 | | Level 3 | | Total |
Investments in Securities | | | | | | | | | | | | | | | | | | | | |
Common Stocks† | | | $ | 614,649,251 | | | | | — | | | | | — | | | | $ | 614,649,251 | |
| | | | |
Short-Term Investments | | | | | | | | | | | | | | | | | | | | |
Other Investment Companies | | | | 27,536,500 | | | | | — | | | | | — | | | | | 27,536,500 | |
| | | | | | | | | | | | | | | | | | | | |
Total Investments in Securities | | | $ | 642,185,751 | | | | | — | | | | | — | | | | $ | 642,185,751 | |
| | | | | | | | | | | | | | | | | | | | |
| † | All common stocks held in the Fund are Level 1 securities. For a detailed breakout of common stocks by major industry classification, please refer to the Fund’s Schedule of Portfolio Investments. |
For the six months ended March 31, 2020, there were no transfers in or out of Level 3.
The accompanying notes are an integral part of these financial statements.
8
|
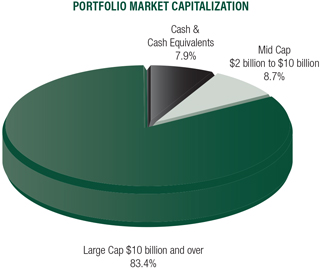
MG Managers Brandywine Blue Fund Fund Snapshots(unaudited) March 31, 2020 |
PORTFOLIO BREAKDOWN
| | | | | | | | | | |
| Industry (Top Ten) | | AMG
Managers
Brandywine
Blue Fund1 | | Russell 1000®
Growth
Index |
| | | |
Data Processing & Outsourced Services | | | | 11.4 | % | | | | 7.0 | % |
| | | |
Application Software | | | | 7.3 | % | | | | 5.1 | % |
| | | |
Biotechnology | | | | 6.7 | % | | | | 3.3 | % |
| | | |
Semiconductors | | | | 6.0 | % | | | | 3.9 | % |
| | | |
Interactive Home Entertainment | | | | 5.5 | % | | | | 0.3 | % |
| | | |
Internet & Direct Marketing Retail | | | | 4.2 | % | | | | 7.0 | % |
| | | |
Pharmaceuticals | | | | 4.1 | % | | | | 7.0 | % |
| | | |
Interactive Media & Services | | | | 4.1 | % | | | | 8.7 | % |
| | | |
Systems Software | | | | 3.6 | % | | | | 10.7 | % |
| | | |
Packaged Foods & Meats | | | | 3.1 | % | | | | 0.3 | % |
| | | |
Other Common Stock | | | | 36.1 | % | | | | 46.7 | % |
| | | |
Short-Term Investments | | | | 7.5 | % | | | | 0.0 | % |
| | | |
Other Assets | | | | 0.4 | % | | | | 0.0 | % |
| 1 | As a percentage of net assets. |
TOP TEN HOLDINGS
| | | | | | | | | | |
| Security Name | | % of
Net Assets | | % Change from
Book Cost |
| | | |
Amazon.com, Inc. | | | | 4.2 | | | | | 12.6 | |
| | | |
NVIDIA Corp. | | | | 3.8 | | | | | (1.9 | ) |
| | | |
Microsoft Corp. | | | | 3.6 | | | | | (3.7 | ) |
| | | |
Electronic Arts, Inc. | | | | 3.5 | | | | | (0.8 | ) |
| | | |
Visa, Inc., Class A | | | | 3.5 | | | | | 124.0 | |
| | | |
Global Payments, Inc. | | | | 3.5 | | | | | 100.7 | |
| | | |
Apple, Inc. | | | | 3.1 | | | | | (20.0 | ) |
| | | |
salesforce.com, Inc. | | | | 2.9 | | | | | (10.2 | ) |
| | | |
Netflix, Inc. | | | | 2.9 | | | | | 5.9 | |
| | | |
Adobe, Inc. | | | | 2.9 | | | | | 26.9 | |
| | | | | | | | | | |
Top Ten as a Group | | | | 33.9 | | | | | | |
| | | | | | | | | | |
ESTIMATED EARNINGS GROWTH RATE OF THE FUND’S INVESTMENTS
Forecasted Increase in Earnings Per Share 2020 vs 2019
Source: Consensus estimates from FactSet Research Systems Inc.
This is not a forecast of the Fund’s future performance. Earnings growth for a Fund holding does not guarantee a corresponding increase in the market value of the holding or the Fund. Earnings growth rates based on existing estimates on March 31. Widespread estimate reductions occurred in the time since amid deteriorating economic conditions related to theCOVID-19 crisis.
Because a fund’s strategy may result in multiple investments in particular sectors of the economy, its performance may depend on the performance of those sectors and may fluctuate more widely than investments diversified across more sectors. For additional information on these and other risk considerations, please see the Fund’s prospectus.
Any sectors, industries, or securities discussed should not be perceived as investment recommendations. Mention of a specific security should not be considered a recommendation to buy or solicitation to sell that security. Specific securities mentioned in this report may have been sold from the Fund’s portfolio of investments by the time you receive this report.
9
|
AMG Managers Brandywine Blue Fund Roses and Thorns(unaudited) Quarter Ending March 31, 2020 |
| | | | | | | | | | |
$ Gain
(in millions) | | | | % Gain | | | | Biggest $ Winners | | Reason for Move |
| | | | |
$0.6 | | | | 7.5% | | | | Advanced Micro Devices Inc. (AMD) |
| | | | | | | | | The semiconductor maker earned $0.32 per share in the December quarter, up from $0.08 in theyear-ago period and ahead of the consensus estimate. Strength in the company’s Computing and Graphics segment drove a 50 percent increase in revenue. Leverage realized through progress in the production of AMD’s Ryzen mainstream computing and Rome server processors helped boost gross profit margins to 45 percent from 38 percent in the same quarter the year before. Guidance for 2020, which exceeded consensus expectations, forecasted accelerating revenue growth. |
| | | | |
| $0.6 | | | | 12.0% | | | | Vertex Pharmaceuticals Inc. (VRTX) |
| | | | | | | | | The small molecule drug developer exceeded December-quarter expectations with 31 percent earnings growth. Revenue climbed 63 percent to more than $1.4 billion. Investors applauded the early U.S. approval of the company’s breakthrough cystic fibrosis drug Trikafta, which generated $420 million in sales in the short window between the October 21 regulatory nod and the end of the quarter. Analysts expected $84 million in sales for the new drug. |
| | | | |
| $0.5 | | | | 29.1% | | | | Zoom Video Communications Inc. (ZM) |
| | | | | | | | | The company, which provides a video conferencing and content sharing communications platform, earned $0.15 per share in the January quarter, up from a breakeven quarter in theyear-ago period and ahead of the consensus estimate. Revenue surged 78 percent. Enthusiasm grew regarding the potential for future results asshelter-in-place orders helped drive Zoom’s free and paid subscriber base to 200 million from 10 million in the first three months of 2020. |
| | | | |
| $0.5 | | | | 11.4% | | | | Domino’s Pizza Inc. (DPZ) |
| | | | | | | | | The company, consisting of more than 17,000 company-owned and franchised pizza stores in the U.S. and overseas, grew December-quarter earnings 19 percent, exceeding the consensus estimate. The period represented the 35th consecutive quarter of U.S. same-store sales growth and the 104th in its international business. As the world’s largest pizza chain, investors viewed the company’s delivery experience and infrastructure as assets asstay-at-home advisories increased demand for food delivery options. |
| | | | |
| $0.3 | | | | 4.0% | | | | Amazon.com Inc. (AMZN) |
| | | | | | | | | The online shopping service earned $6.47 per share in the December quarter versus a consensus estimate of $4.04. Revenue increased 21 percent to more than $87 billion as the company experienced record Prime membership growth. With extensive essential wares for sale online andfar-reaching delivery capabilities, investors viewed Amazon as a likely recipient of increased demand during the pandemic. |
| | | | | |
$ Loss
(in millions) | | | | % Loss | | | | Biggest $ Losers | | Reason for Move |
| | | | |
| $2.0 | | | | 31.3% | | | | Exact Sciences Corp. (EXAS) |
| | | | | | | | | The diagnostics company focused on the detection of colorectal cancer grew December-quarter earnings to $0.54 per share from a loss in theyear-ago period, exceeding the consensus estimate. Acquired during the quarter, Genomic Health was a significant contributor to results. Shares declined amid the widespread cancellation of routine medical visits as resources shifted to fight the coronavirus outbreak, potentially weighing on future testing volumes. |
| | | | |
| $1.8 | | | | 37.0% | | | | IQVIA Holdings Inc. (IQV) |
| | | | | | | | | The company, which provides contract research services to customers in the life sciences market, grew December-quarter earnings 16 percent, exceeding the consensus estimate. Shares declined after management advised that the coronavirus outbreak was increasingly delaying clinical trial timelines and impacting customer site operations in ways likely to constrict demand. |
| | | | |
| $1.7 | | | | 19.5% | | | | The Walt Disney Co. (DIS) |
| | | | | | | | | Although the entertainment and media company reported expectation-beating earnings and revenue for the December quarter, advisories discouraging and/or forbidding group gatherings prompted the company to shutter its global network of parks. Also, with sporting events suspended indefinitely, concerns grew about the related impact on ESPN viewership and advertising. |
| | | | |
| $1.4 | | | | 21.0% | | | | Global Payments Inc. (GPN) |
| | | | | | | | | The provider of electronic transaction processing technology solutions grew December-quarter earnings 22 percent, exceeding the consensus estimate. The company’s growth was aided by a merger with Total Systems Services, a combination expected to deliver costs synergies in 2020. Shares declined due to concerns about the company’s exposure to small and midsized businesses, which face hardships stemming from precautions taken to fight the spread of coronavirus. |
| | | | |
| $1.2 | | | | 19.8% | | | | Apple Inc. (APPL) |
| | | | | | | | | The provider of consumer electronics, software and online services grew December-quarter earnings 19 percent, exceeding the consensus estimate. Revenue climbed 9 percent on solid demand for Apple’s iPhone 11. Shares declined as the company closed retail stores in response to the pandemic, with closures starting in China, where Apple generates aboutone-fifth of its handset sales. |
All gains/losses are calculated on an average cost basis from December 31, 2019 through March 31, 2020. Companies still held at the end of the period appear in the accompanying Schedule of Portfolio Investments.
This commentary reflects the viewpoints of Friess Associates, LLC as of March 31, 2020, and is not intended as a forecast or guarantee of future results.
10
|
AMG Managers Brandywine Blue Fund Schedule of Portfolio Investments(unaudited) March 31, 2020 |
| | | | | | | | | | | | |
| | | |
| Shares | | | | | Cost | | | Value | |
| |
| | Common Stocks - 92.1% | | | | | |
| |
| | Communication Services | | | | | |
| | |
| | | | Cable & Satellite - 2.0% | | | | | |
| | | |
| | 7,450 | | | Charter Communications, Inc., Class A* | | | $3,437,947 | | | | $3,250,510 | |
| | |
| | | | Interactive Home Entertainment - 5.5% | | | | | |
| | | |
| | 51,678 | | | Activision Blizzard, Inc. | | | 2,846,961 | | | | 3,073,807 | |
| | | |
| | 55,576 | | | Electronic Arts, Inc.* | | | 5,613,969 | | | | 5,567,048 | |
| | |
| | | | Interactive Media & Services - 4.1% | | | | | |
| | | |
| | 21,000 | | | Facebook, Inc., Class A* | | | 3,402,922 | | | | 3,502,800 | |
| | | |
| | 118,282 | | | Twitter, Inc.* | | | 3,889,245 | | | | 2,905,006 | |
| | |
| | | | Movies & Entertainment - 2.9% | | | | | |
| | | |
| | 12,200 | | | Netflix, Inc.* | | | 4,326,292 | | | | 4,581,100 | |
| | | | | | | | | | | | |
| | |
| | Total Communication Services | | | 23,517,336 | | | | 22,880,271 | |
| | |
| | | | This sector is 2.7% below your Fund’s cost. | | | | |
| |
| | Consumer Discretionary | | | | | |
| | |
| | | | Footwear - 2.1% | | | | | |
| | | |
| | 38,800 | | | NIKE, Inc., Class B | | | 3,974,598 | | | | 3,210,312 | |
| | |
| | | | General Merchandise Stores - 1.9% | | | | | |
| | | |
| | 32,821 | | | Target Corp. | | | 3,437,586 | | | | 3,051,369 | |
| | |
| | | | Home Improvement Retail - 2.5% | | | | | |
| | | |
| | 20,692 | | | The Home Depot, Inc. | | | 4,562,378 | | | | 3,863,403 | |
| | |
| | | | Internet & Direct Marketing Retail - 4.2% | | | | | |
| | | |
| | 3,414 | | | Amazon.com, Inc.* | | | 5,911,773 | | | | 6,656,344 | |
| | | | | | | | | | | | |
| | |
| | Total Consumer Discretionary | | | 17,886,335 | | | | 16,781,428 | |
| | |
| | | | This sector is 6.2% below your Fund’s cost. | | | | |
| |
| | Consumer Staples | | | | | |
| | |
| | | | Hypermarkets & Super Centers - 1.8% | | | | | |
| | | |
| | 9,820 | | | Costco Wholesale Corp. | | | 2,140,276 | | | | 2,799,977 | |
| | |
| | | | Packaged Foods & Meats - 3.1% | | | | | |
| | | |
| | 11,661 | | | The Hershey Co. | | | 1,570,184 | | | | 1,545,082 | |
| | | |
| | 67,500 | | | Mondelez International, Inc., Class A | | | 4,020,455 | | | | 3,380,400 | |
| | | | | | | | | | | | |
| | |
| | Total Consumer Staples | | | 7,730,915 | | | | 7,725,459 | |
| | |
| | | | This sector is 0.1% below your Fund’s cost. | | | | |
| |
| | Financials | | | | | |
| | |
| | | | Financial Exchanges & Data - 2.1% | | | | | |
| | | |
| | 18,775 | | | CME Group, Inc. | | | 1,763,774 | | | | 3,246,385 | |
| | |
| | | | This sector is 84.1% above your Fund’s cost. | | | | |
| |
| | Health Care | | | | | |
| | |
| | | | Biotechnology - 6.7% | | | | | |
| | | |
| | 46,700 | | | BioMarin Pharmaceutical, Inc.* | | | 3,958,619 | | | | 3,946,150 | |
| | | |
| | 58,761 | | | Exact Sciences Corp.*,1 | | | 4,879,080 | | | | 3,408,138 | |
| | | |
| | 13,541 | | | Vertex Pharmaceuticals, Inc.* | | | 2,852,468 | | | | 3,222,081 | |
| | | | | | | | | | | | |
| | | |
| Shares | | | | | Cost | | | Value | |
| | |
| | | | Health Care Services - 0.5% | | | | | |
| | | |
| | 8,915 | | | Quest Diagnostics, Inc. | | | $862,429 | | | | $715,875 | |
| | |
| | | | Health Care Equipment - 1.0% | | | | | |
| | | |
| | 20,519 | | | Abbott Laboratories | | | 1,244,320 | | | | 1,619,154 | |
| | |
| | | | Life Sciences Tools & Services - 2.7% | | | | | |
| | | |
| | 15,250 | | | Thermo Fisher Scientific, Inc. | | | 3,112,829 | | | | 4,324,900 | |
| | |
| | | | Managed Health Care - 2.1% | | | | | |
| | | |
| | 13,017 | | | UnitedHealth Group, Inc. | | | 3,101,560 | | | | 3,246,180 | |
| | |
| | | | Pharmaceuticals - 4.1% | | | | | |
| | | |
| | 58,373 | | | Bristol-Myers Squibb Co. | | | 3,204,513 | | | | 3,253,711 | |
| | | |
| | 27,444 | | | Zoetis, Inc. | | | 3,756,326 | | | | 3,229,884 | |
| | | | | | | | | | | | |
| | |
| | Total Health Care | | | 26,972,144 | | | | 26,966,073 | |
| | |
| | | | This sector is less than 0.1% below your
Fund’s cost. | | | | |
| |
| | Industrials | | | | | |
| | |
| | | | Aerospace & Defense - 2.5% | | | | | |
| | | |
| | 22,400 | | | L3Harris Technologies, Inc. | | | 4,687,864 | | | | 4,034,688 | |
| | |
| | | | Building Products - 1.6% | | | | | |
| | | |
| | 56,915 | | | Fortune Brands Home & Security, Inc. | | | 3,597,731 | | | | 2,461,574 | |
| | | | | | | | | | | | |
| | |
| | Total Industrials | | | 8,285,595 | | | | 6,496,262 | |
| | |
| | | | This sector is 21.6% below your Fund’s cost. | | | | |
| |
| | Information Technology | | | | | |
| | |
| | | | Application Software - 7.3% | | | | | |
| | | |
| | 14,121 | | | Adobe, Inc.* | | | 3,541,076 | | | | 4,493,867 | |
| | | |
| | 32,050 | | | salesforce.com, Inc.* | | | 5,140,470 | | | | 4,614,559 | |
| | | |
| | 16,470 | | | Zoom Video Communications, Inc., Class A*,1 | | | 1,864,561 | | | | 2,406,596 | |
| | |
| | | | Data Processing & Outsourced
Services - 11.4% | | | | | |
| | | |
| | 41,420 | | | Fiserv, Inc.* | | | 4,111,354 | | | | 3,934,486 | |
| | | |
| | 37,520 | | | Global Payments, Inc. | | | 2,696,027 | | | | 5,411,510 | |
| | | |
| | 12,374 | | | Mastercard, Inc., Class A | | | 2,164,570 | | | | 2,989,063 | |
| | | |
| | 34,550 | | | Visa, Inc., Class A1 | | | 2,485,668 | | | | 5,566,696 | |
| | |
| | | | Electronic Equipment &
Instruments - 2.2% | | | | | |
| | | |
| | 41,640 | | | Keysight Technologies, Inc.* | | | 2,559,756 | | | | 3,484,435 | |
| | |
| | | | IT Consulting & Other Services - 2.8% | | | | | |
| | | |
| | 63,776 | | | Booz Allen Hamilton Holding Corp. | | | 3,134,855 | | | | 4,377,585 | |
| | |
| | | | Semiconductors - 6.0% | | | | | |
| | | |
| | 76,441 | | | Advanced Micro Devices, Inc.* | | | 2,166,570 | | | | 3,476,536 | |
| | | |
| | 22,948 | | | NVIDIA Corp. | | | 6,165,606 | | | | 6,049,093 | |
| | |
| | | | Systems Software - 3.6% | | | | | |
| | | |
| | 36,200 | | | Microsoft Corp. | | | 5,927,938 | | | | 5,709,102 | |
The accompanying notes are an integral part of these financial statements.
11
|
AMG Managers Brandywine Blue Fund Schedule of Portfolio Investments(continued) |
| | | | | | | | | | | | |
| | | |
| Shares | | | | | Cost | | | Value | |
| |
| | Information Technology(continued) | | | | | |
| | |
| | | | Technology Hardware, Storage & Peripherals - 3.1% | | | | | |
| | | |
| | 19,058 | | | Apple, Inc. | | | $6,055,632 | | | | $4,846,259 | |
| | | | | | | | | | | | |
| | |
| | Total Information Technology | | | 48,014,083 | | | | 57,359,787 | |
| | |
| | | | This sector is 19.5% above your Fund’s
cost. | | | | |
| |
| | Materials | | | | | |
| | |
| | | | Fertilizers & Agricultural
Chemicals - 2.3% | | | | | |
| | | |
| | 34,781 | | | The ScottsMiracle-Gro Co. | | | 3,993,823 | | | | 3,561,574 | |
| | |
| | | | This sector is 10.8% below your Fund’s
cost. | | | | |
| | |
| | Total Common Stocks | | | 138,164,005 | | | | 145,017,239 | |
| |
| | Short-Term Investments - 7.5% | | | | | |
| |
| | Other Investment Companies - 7.5% | | | | | |
| | | |
| | 3,892,718 | | | Dreyfus Government Cash Management Fund, Institutional Shares, 0.29%2 | | | 3,892,718 | | | | 3,892,718 | |
| | | | | | | | | | | | |
| | | |
| Shares | | | | | Cost | | | Value | |
| | | |
| | 3,892,718 | | | Dreyfus Institutional Preferred Government Money Market Fund, Institutional Shares, 0.39%2 | | | $3,892,718 | | | | $3,892,718 | |
| | | |
| | 4,010,679 | | | JPMorgan U.S. Government Money Market Fund, IM Shares, 0.35%2 | | | 4,010,679 | | | | 4,010,679 | |
| | | |
| | | | Total Other Investment Companies | | | 11,796,115 | | | | 11,796,115 | |
| | | | | | | | | | | | |
| | |
| | Total Short-Term Investments | | | 11,796,115 | | | | 11,796,115 | |
| | |
| | Total Investments - 99.6% | | | 149,960,120 | | | | 156,813,354 | |
| | |
| | Other Assets, less Liabilities - 0.4% | | | | | | | 578,048 | |
| | |
| | Total Net Assets - 100.0% | | | | | | $ | 157,391,402 | |
| | | | | | | | | | | | |
| * | Non-income producing security. |
| 1 | Some of these securities, amounting to $11,267,469 or 7.2% of net assets, were out on loan to various borrowers and are collateralized by various U.S. Treasury Obligations. See Note 4 of Notes to Financial Statements. |
| 2 | Yield shown represents the March 31, 2020, seven day average yield, which refers to the sum of the previous seven days’ dividends paid, expressed as an annual percentage. |
The following table summarizes the inputs used to value the Fund’s investments by the fair value hierarchy levels as of March 31, 2020:
| | | | | | | | | | | | | | | | | | | | |
| | | Level 1 | | Level 2 | | Level 3 | | Total |
Investments in Securities | | | | | | | | | | | | | | | | | | | | |
| | | | |
Common Stocks† | | | $ | 145,017,239 | | | | | — | | | | | — | | | | | $145,017,239 | |
| | | | |
Short-Term Investments | | | | | | | | | | | | | | | | | | | | |
| | | | |
Other Investment Companies | | | | 11,796,115 | | | | | — | | | | | — | | | | | 11,796,115 | |
| | | | | | | | | | | | | | | | | | | | |
Total Investments in Securities | | | $ | 156,813,354 | | | | | — | | | | | — | | | | $ | 156,813,354 | |
| | | | | | | | | | | | | | | | | | | | |
| † | All common stocks held in the Fund are Level 1 securities. For a detailed breakout of common stocks by major industry classification, please refer to the Fund’s Schedule of Portfolio Investments. |
For the six months ended March 31, 2020, there were no transfers in or out of Level 3.
The accompanying notes are an integral part of these financial statements.
12
| | |
| | | Statement of Assets and Liabilities(unaudited) March 31, 2020 |
| | | |
| | | |
| | | | | | | | |
| | | AMG
Managers
Brandywine Fund | | | AMG
Managers
Brandywine
Blue Fund | |
| | |
Assets: | | | | | | | | |
| | |
Investments at value1(including securities on loan valued at $47,946,933, and $11,267,469, respectively) | | | $642,185,751 | | | | $156,813,354 | |
| | |
Receivable for investments sold | | | 29,494,388 | | | | 5,510,582 | |
| | |
Dividend and interest receivables | | | 75,803 | | | | 33,426 | |
| | |
Securities lending income receivable | | | 6,918 | | | | 1,233 | |
| | |
Receivable for Fund shares sold | | | 3,361 | | | | 3,597 | |
| | |
Prepaid expenses and other assets | | | 28,026 | | | | 13,908 | |
| | |
Total assets | | | 671,794,247 | | | | 162,376,100 | |
| | |
Liabilities: | | | | | | | | |
| | |
Payable for investments purchased | | | 19,870,855 | | | | 4,774,698 | |
| | |
Payable for Fund shares repurchased | | | 56,822 | | | | 20,415 | |
| | |
Accrued expenses: | | | | | | | | |
| | |
Investment advisory and management fees | | | 509,256 | | | | 120,460 | |
| | |
Administrative fees | | | 86,805 | | | | 20,533 | |
| | |
Shareholder service fees | | | 14,467 | | | | 6,844 | |
| | |
Other | | | 116,179 | | | | 41,748 | |
| | |
Total liabilities | | | 20,654,384 | | | | 4,984,698 | |
| | | | | | | | |
| | |
Net Assets | | | $651,139,863 | | | | $157,391,402 | |
| | |
1Investments at cost | | | $613,507,818 | | | | $149,960,120 | |
| | |
Net Assets Represent: | | | | | | | | |
| | |
Paid-in capital | | | $625,471,820 | | | | $158,013,201 | |
| | |
Total distributable earnings (loss) | | | 25,668,043 | | | | (621,799 | ) |
| | |
Net Assets | | | $651,139,863 | | | | $157,391,402 | |
| | |
Class I: | | | | | | | | |
| | |
Net Assets | | | $651,139,863 | | | | $157,391,402 | |
| | |
Shares outstanding | | | 15,440,104 | | | | 3,902,454 | |
| | |
Net asset value, offering and redemption price per share | | | $42.17 | | | | $40.33 | |
The accompanying notes are an integral part of these financial statements.
13
| | |
| | | Statement of Operations(unaudited) For the six months ended March 31, 2020 |
| | | |
| | | |
| | | | | | | | |
| | | AMG
Managers
Brandywine Fund | | | AMG
Managers
Brandywine
Blue Fund | |
| | |
Investment Income: | | | | | | | | |
| | |
Dividend income | | | $2,579,686 | | | | $757,562 | |
| | |
Interest income | | | 220,318 | | | | 76,073 | |
| | |
Securities lending income | | | 142,878 | | | | 7,828 | |
| | |
Total investment income | | | 2,942,882 | | | | 841,463 | |
| | |
Expenses: | | | | | | | | |
| | |
Investment advisory and management fees | | | 3,515,678 | | | | 821,846 | |
| | |
Administrative fees | | | 599,263 | | | | 140,087 | |
| | |
Shareholder servicing fees - Class I | | | 99,877 | | | | 46,696 | |
| | |
Transfer agent fees | | | 46,760 | | | | 6,894 | |
| | |
Professional fees | | | 41,622 | | | | 21,118 | |
| | |
Trustee fees and expenses | | | 35,477 | | | | 8,219 | |
| | |
Custodian fees | | | 33,884 | | | | 14,115 | |
| | |
Reports to shareholders | | | 29,325 | | | | 10,928 | |
| | |
Registration fees | | | 14,801 | | | | 13,033 | |
| | |
Miscellaneous | | | 12,411 | | | | 3,050 | |
| | |
Total expenses | | | 4,429,098 | | | | 1,085,986 | |
| | | | | | | | |
| | |
Net investment loss | | | (1,486,216 | ) | | | (244,523 | ) |
| | |
Net Realized and Unrealized Loss: | | | | | | | | |
| | |
Net realized gain on investments | | | 17,865,171 | | | | 12,582,808 | |
| | |
Net change in unrealized appreciation/depreciation on investments | | | (103,690,850 | ) | | | (24,624,397 | ) |
| | |
Net realized and unrealized loss | | | (85,825,679 | ) | | | (12,041,589 | ) |
| | | | | | | | |
| | |
Net decrease in net assets resulting from operations | | | $(87,311,895 | ) | | | $(12,286,112 | ) |
The accompanying notes are an integral part of these financial statements.
14
| | |
| | | Statements of Changes in Net Assets For the six months ended March 31, 2020 (unaudited) and the fiscal year ended September 30, 2019 |
| | | |
| | | |
| | | | | | | | | | | | | | | | |
| | | AMG
Managers
Brandywine Fund | | AMG
Managers
Brandywine Blue Fund |
| | | March 31, 2020 | | September 30, 2019 | | March 31, 2020 | | September 30, 2019 |
| | | | |
Decrease in Net Assets Resulting From Operations: | | | | | | | | | | | | | | | | |
| | | | |
Net investment loss | | | $(1,486,216 | ) | | | $(2,046,989 | ) | | | $(244,523 | ) | | | $(351,529 | ) |
| | | | |
Net realized gain on investments | | | 17,865,171 | | | | 60,047,241 | | | | 12,582,808 | | | | 23,261,222 | |
| | | | |
Net change in unrealized appreciation/depreciation on investments | | | (103,690,850 | ) | | | (109,350,378 | ) | | | (24,624,397 | ) | | | (24,677,744 | ) |
| | | | |
Net decrease in net assets resulting from operations | | | (87,311,895 | ) | | | (51,350,126 | ) | | | (12,286,112 | ) | | | (1,768,051 | ) |
| | | | |
Distributions to Shareholders: | | | | | | | | | | | | | | | | |
| | | | |
Class I | | | (78,234,351 | ) | | | — | | | | (24,116,514 | ) | | | (18,414,046 | ) |
| | | | |
Capital Share Transactions:1 | | | | | | | | | | | | | | | | |
| | | | |
Net increase (decrease) from capital share transactions | | | 30,537,355 | | | | (55,802,477 | ) | | | 11,549,663 | | | | 5,426,761 | |
| | | | | | | | | | | | | | | | |
| | | | |
Total decrease in net assets | | | (135,008,891 | ) | | | (107,152,603 | ) | | | (24,852,963 | ) | | | (14,755,336 | ) |
| | | | |
Net Assets: | | | | | | | | | | | | | | | | |
| | | | |
Beginning of period | | | 786,148,754 | | | | 893,301,357 | | | | 182,244,365 | | | | 196,999,701 | |
| | | | |
End of period | | | $651,139,863 | | | | $786,148,754 | | | | $157,391,402 | | | | $182,244,365 | |
1See Note 1(g) of the Notes to Financial Statements.
The accompanying notes are an integral part of these financial statements.
15
| | |
| | | AMG Managers Brandywine Fund Financial Highlights For a share outstanding throughout each fiscal period |
| | | |
| | | |
| | | | | | | | | | | | | | | | | | | | | | | | | | | | | | |
| Class I | | For the six
months ended
March 31, 2020
(unaudited) | | For the fiscal years ended September 30, |
| | 2019 | | 2018 | | 20171 | | 2016 | | 2015 |
| | | | | | |
Net Asset Value, Beginning of Period | | | | $52.89 | | | | | $56.01 | | | | | $44.48 | | | | | $37.42 | | | | | $34.54 | | | | | $33.25 | |
| | | | | | |
Income (loss) from Investment Operations: | | | | | | | | | | | | | | | | | | | | | | | | | | | | | | |
| | | | | | |
Net investment income (loss)2 | | | | (0.10 | ) | | | | (0.13 | ) | | | | (0.21 | )3 | | | | (0.17 | )3,4 | | | | (0.08 | )3,5 | | | | 0.04 | 3,6 |
| | | | | | | |
Net realized and unrealized gain (loss) on investments | | | | (5.26 | ) | | | | (2.99 | ) | | | | 11.74 | | | | | 7.23 | | | | | 2.96 | | | | | 1.25 | |
| | | | | | |
Total income (loss) from investment operations | | | | (5.36 | ) | | | | (3.12 | ) | | | | 11.53 | | | | | 7.06 | | | | | 2.88 | | | | | 1.29 | |
| | | | | | |
Less Distributions to Shareholders from: | | | | | | | | | | | | | | | | | | | | | | | | | | | | | | |
| | | | | | |
Net realized gain on investments | | | | (5.36 | ) | | | | — | | | | | — | | | | | — | | | | | — | | | | | — | |
| | | | | | |
Net Asset Value, End of Period | | | | $42.17 | | | | | $52.89 | | | | | $56.01 | | | | | $44.48 | | | | | $37.42 | | | | | $34.54 | |
| | | | | | |
Total Return7 | | | | (11.94 | )%8 | | | | (5.57 | )% | | | | 25.92 | %3 | | | | 18.87 | %3 | | | | 8.34 | %3 | | | | 3.88 | %3 |
| | | | | | |
Ratio of net expenses to average net assets | | | | 1.11 | %9 | | | | 1.10 | % | | | | 1.10 | % | | | | 1.11 | % | | | | 1.11 | % | | | | 1.10 | % |
| | | | | | |
Ratio of gross expenses to average net assets | | | | 1.11 | %9 | | | | 1.10 | % | | | | 1.10 | %10 | | | | 1.12 | %10 | | | | 1.11 | %10 | | |
| 1.10
| %10
|
| | | | | | |
Ratio of net investment income (loss) to average net assets | | | | (0.37 | )%9 | | | | (0.26 | )% | | | | (0.43 | )%3 | | | | (0.43 | )%3 | | | | (0.24 | )%3 | | |
| 0.10
| %3
|
| | | | | | |
Portfolio turnover | | | | 100 | %8 | | | | 145 | % | | | | 138 | % | | | | 187 | % | | | | 185 | % | | | | 190 | % |
| | | | | | |
Net assets end of period (000’s) omitted | | | | $651,140 | | | | | $786,149 | | | | | $893,301 | | | | | $771,474 | | | | | $720,766 | | | | | $759,185 | |
| 1 | Effective February 27, 2017, the Fund’s Class S shares were renamed to Class I shares. |
| 2 | Per share numbers have been calculated using average shares. |
| 3 | Total returns and net investment income (loss) would have been lower had certain expenses not been offset. |
| 4 | Includesnon-recurring dividends. Without these dividends, net investment loss per share would have been $(0.22). |
| 5 | Includesnon-recurring dividends. Without these dividends, net investment loss per share would have been $(0.10). |
| 6 | Includesnon-recurring dividends. Without these dividends, net investment loss per share would have been $(0.07). |
| 7 | The total return is calculated using the published Net Asset Value as of period end. |
| 10 | Excludes the impact of expense reimbursement or fee waivers and expense reductions such as brokerage credits, but includes expense repayments andnon-reimbursable expenses, if any, such as interest, taxes, and extraordinary expenses. (See Note 1(c) and 2 in the Notes to Financial Statements.) |
16
| | |
| | | AMG Managers Brandywine Blue Fund Financial Highlights For a share outstanding throughout each fiscal period |
| | | |
| | | |
| | | | | | | | | | | | | | | | | | | | | | | | | | | | | | |
| Class I | | For the six
months ended
March 31, 2020
(unaudited) | | For the fiscal years ended September 30, |
| | 2019 | | 2018 | | 20171 | | 2016 | | 2015 |
| | | | | | | | | | | | | | | | | | | | | | | | | | | | | | |
| | | | | | |
Net Asset Value, Beginning of Period | | | | $49.78 | | | | | $56.64 | | | | | $45.69 | | | | | $36.87 | | | | | $33.95 | | | | | $33.51 | |
| | | | | | |
Income (loss) from Investment Operations: | | | | | | | | | | | | | | | | | | | | | | | | | | | | | | |
| | | | | | |
Net investment income (loss)2 | | | | (0.06 | ) | | | | (0.10 | ) | | | | (0.24 | ) | | | | (0.12 | )3 | | | | (0.02 | )4 | | | | 0.10 | 5 |
| | | | | | | |
Net realized and unrealized gain (loss) on investments | | | | (2.87 | ) | | | | (1.40 | ) | | | | 11.19 | | | | | 8.94 | | | | | 3.02 | | | | | 0.34 | |
| | | | | | |
Total income (loss) from investment operations | | | | (2.93 | ) | | | | (1.50 | ) | | | | 10.95 | | | | | 8.82 | | | | | 3.00 | | | | | 0.44 | |
| | | | | | |
Less Distributions to Shareholders from: | | | | | | | | | | | | | | | | | | | | | | | | | | | | | | |
| | | | | | |
Net investment income | | | | — | | | | | — | | | | | — | | | | | — | | | | | (0.08 | ) | | | | — | |
| | | | | | |
Net realized gain on investments | | | | (6.52 | ) | | | | (5.36 | ) | | | | — | | | | | — | | | | | — | | | | | — | |
| | | | | | |
Total distributions to shareholders | | | | (6.52 | ) | | | | (5.36 | ) | | | | — | | | | | — | | | | | (0.08 | ) | | | | — | |
| | | | | | |
Net Asset Value, End of Period | | | | $40.33 | | | | | $49.78 | | | | | $56.64 | | | | | $45.69 | | | | | $36.87 | | | | | $33.95 | |
| | | | | | |
Total Return6 | | | | (7.73 | )%7 | | | | (0.17 | )% | | | | 23.97 | % | | | | 23.92 | % | | | | 8.86 | % | | | | 1.31 | % |
| | | | | | |
Ratio of expenses to average net assets | | | | 1.16 | %8 | | | | 1.15 | % | | | | 1.16 | % | | | | 1.20 | % | | | | 1.20 | % | | | | 1.20 | % |
| | | | | | |
Ratio of net investment income (loss) to average net assets | | | | (0.26 | )%8 | | | | (0.20 | )% | | | | (0.47 | )% | | | | (0.29 | )% | | | | (0.05 | )% | | | | 0.29 | % |
| | | | | | |
Portfolio turnover | | | | 89 | %7 | | | | 135 | % | | | | 122 | % | | | | 167 | % | | | | 139 | % | | | | 156 | % |
| | | | | | |
Net assets end of period (000’s) omitted | | | | $157,391 | | | | | $182,244 | | | | | $197,000 | | | | | $172,454 | | | | | $156,953 | | | | | $169,180 | |
| 1 | Effective February 27, 2017, the Fund’s Class S shares were renamed to Class I shares. |
| 2 | Per share numbers have been calculated using average shares. |
| 3 | Includesnon-recurring dividends. Without these dividends, net investment loss per share would have been $(0.18). |
| 4 | Includesnon-recurring dividends. Without these dividends, net investment loss per share would have been $(0.04). |
| 5 | Includesnon-recurring dividends. Without these dividends, net investment loss per share would have been $(0.08). |
| 6 | The total return is calculated using the published Net Asset Value as of period end. |
17
| | |
| | | Notes to Financial Statements(unaudited) March 31, 2020 |
| | | |
| | | |
1. ORGANIZATION AND SUMMARY OF SIGNIFICANT ACCOUNTING POLICIES
AMG Funds I (the “Trust”) is anopen-end management investment company, organized as a Massachusetts business trust, and registered under the Investment Company Act of 1940, as amended (the “1940 Act”). Currently, the Trust consists of a number of different funds, each having distinct investment management objectives, strategies, risks, and policies. Included in this report are AMG Managers Brandywine Fund (“Brandywine”) and AMG Managers Brandywine Blue Fund (“Brandywine Blue”), each a “Fund” and collectively, the “Funds”.
A significant portion of the Brandywine Blue’s holdings may be focused in a relatively small number of securities, which may make the Fund more volatile and subject to greater risk than a more diversified fund.
The Funds’ financial statements are prepared in accordance with accounting principles generally accepted in the United States of America (“U.S. GAAP”), including accounting and reporting guidance pursuant to Accounting Standards Codification Topic 946 applicable to investment companies. U.S. GAAP requires management to make estimates and assumptions that affect the reported amounts of assets and liabilities and disclosure of contingent assets and liabilities at the date of the financial statements and the reported amounts of income and expenses during the reporting period. Actual results could differ from those estimates and such differences could be material. The following is a summary of significant accounting policies followed by the Funds in the preparation of their financial statements:
a. VALUATION OF INVESTMENTS
Equity securities traded on a national securities exchange or reported on the NASDAQ national market system (“NMS”) are valued at the last quoted sales price on the primary exchange or, if applicable, the NASDAQ official closing price or the official closing price of the relevant exchange or, lacking any sales, at the last quoted bid price or the mean between the last quoted bid and ask prices (the “mean price”). Equity securities traded in theover-the-counter market (other than NMS securities) are valued at the mean price. Foreign equity securities (securities principally traded in markets other than U.S. markets) are valued at the official closing price on the primary exchange or, for markets that either do not offer an official closing price or where the official closing price may not be representative of the overall market, the last quoted sale price.
Fixed income securities purchased with a remaining maturity of 60 days or less are valued at amortized cost, provided that the amortized cost value is approximately the same as the fair value of the security valued without the use of amortized cost. Investments in otheropen-end registered investment companies are valued at their end of day net asset value per share.
The Funds’ portfolio investments are generally valued based on independent market quotations or prices or, if none, “evaluative” or other market based valuations provided by third party pricing services approved by the Board of Trustees of the Trust (the “Board”). Under certain circumstances, the value of certain Fund portfolio investments may be based on an evaluation of fair value, pursuant to procedures established by and under the general supervision of the Board. The Valuation Committee, which is comprised of the Independent Trustees of the Board, and the Pricing Committee, which is comprised of representatives from AMG Funds LLC (the “Investment Manager”) are the committees appointed by the Board to make fair value determinations. Each Fund may use the fair value of a portfolio investment to calculate its net asset value (“NAV”) in the event that the
market quotation, price or market based valuation for the portfolio investment is not readily available or otherwise not determinable pursuant to the Board’s valuation procedures, if the Investment Manager or the Pricing Committee believes the quotation, price or market based valuation to be unreliable, or in certain other circumstances. When determining the fair value of an investment, the Pricing Committee and, if required under the Trust’s securities valuation procedures, the Valuation Committee, seeks to determine the price that the Fund might reasonably expect to receive from current sale of that portfolio investment in an arms-length transaction. Fair value determinations shall be based upon consideration of all available facts and information, including, but not limited to (i) attributes specific to the investment; (ii) fundamental and analytical data relating to the investment; and (iii) the value of other comparable securities or relevant financial instruments, including derivative securities, traded on other markets or among dealers.
The values assigned to fair value portfolio investments are based on available information and do not necessarily represent amounts that might ultimately be realized in the future, since such amounts depend on future developments inherent in long-term investments. Because of the inherent uncertainty of valuation, those estimated values may differ significantly from the values that would have been used had a ready market for the investments existed, and the differences could be material. The Board will be presented with a quarterly report showing as of the most recent quarter end, all outstanding securities fair valued by the Funds, including a comparison with the prior quarter end and the percentage of the Funds that the security represents at each quarter end.
With respect to foreign equity securities and certain foreign fixed income securities, the Board has adopted a policy that securities held in the Funds that can be fair valued by the applicable fair value pricing service are fair valued on each business day provided that each individual price exceeds apre-established confidence level.
U.S. GAAP defines fair value as the price that a fund would receive to sell an asset or pay to transfer a liability in an orderly transaction between market participants at the measurement date. U.S. GAAP also establishes a framework for measuring fair value, and a three level hierarchy for fair value measurements based upon the transparency of inputs to the valuation of an asset or liability. Inputs may be observable or unobservable and refer broadly to the assumptions that market participants would use in pricing the asset or liability. Observable inputs reflect the assumptions market participants would use in pricing the asset or liability based on market data obtained from sources independent of the Funds.
Unobservable inputs reflect the Funds’ own assumptions about the assumptions that market participants would use in pricing the asset or liability developed based on the best information available in the circumstances. Each investment is assigned a level based upon the observability of the inputs which are significant to the overall valuation.
The three-tier hierarchy of inputs is summarized below:
Level 1 – inputs are quoted prices in active markets for identical investments (e.g., equity securities,open-end investment companies)
Level 2 – other observable inputs (including, but not limited to: quoted prices for similar assets or liabilities in markets that are active, quoted prices for identical or similar assets or liabilities in markets that are not active, inputs other than quoted prices that are observable for the assets or liabilities (such as interest rates, yield curves, volatilities, prepayment speeds, loss severities, credit risks and default rates) or other market corroborated inputs) (e.g., debt securities, government securities, foreign currency exchange contracts, swaps, foreign securities utilizing international fair value pricing, fair valued securities with observable inputs)
18
| | |
| | | Notes to Financial Statements(continued) |
| | | |
| | | |
Level 3 – inputs are significant unobservable inputs (including the Fund’s own assumptions used to determine the fair value of investments) (e.g., fair valued securities with unobservable inputs)
Changes in inputs or methodologies used for valuing investments may result in a transfer in or out of levels within the fair value hierarchy. The inputs or methodologies used for valuing investments may not necessarily be an indication of the risk associated with investing in those investments.
b. SECURITY TRANSACTIONS
Security transactions are accounted for as of trade date. Realized gains and losses on securities sold are determined on the basis of identified cost.
c. INVESTMENT INCOME AND EXPENSES
Dividend income is recorded on theex-dividend date. Dividends from foreign securities are recorded on theex-dividend date, and if after the fact, as soon as the Fund becomes aware of theex-dividend date. Interest income, which includes amortization of premium and accretion of discount on debt securities, is accrued as earned. Dividend and interest income on foreign securities is recorded gross of any withholding tax.Non-cash dividends included in dividend income, if any, are reported at the fair market value of the securities received. Other income and expenses are recorded on an accrual basis. Expenses that cannot be directly attributed to a Fund are apportioned among the funds in the Trust and other trusts or funds within the AMG Funds Family of Funds (collectively the “AMG Funds Family”) based upon their relative average net assets or number of shareholders.
d. DIVIDENDS AND DISTRIBUTIONS
Fund distributions resulting from either net investment income or realized net capital gains, if any, will normally be declared and paid at least annually in December. Distributions to shareholders are recorded on theex-dividend date. Distributions are determined in accordance with federal income tax regulations, which may differ from net investment income and net realized capital gains for financial statement purposes (U.S. GAAP). Differences may be permanent or temporary. Permanent differences are reclassified among capital accounts in the financial statements to reflect their tax character. Permanent book and tax basis differences, if any, relating to shareholder distributions will result in reclassifications topaid-in capital. Temporary differences arise when certain items of income, expense and gain or loss are recognized in different periods for financial statement and tax purposes; these differences will reverse at some time
in the future. Permanent differences are primarily due to a net operating loss write off. Temporary differences are primarily due to qualified late year ordinary losses and wash sales.
At March 31, 2020, the aggregate cost for federal income tax purposes approximates the aggregate cost for book purposes. The approximate cost of investments and the aggregate gross unrealized appreciation and depreciation for federal income tax purposes were as follows:
| | | | | | | | | | | | | | | | |
| Fund | | Cost | | | Appreciation | | | Depreciation | | | Net | |
| | | | |
Brandywine | | | $613,507,818 | | | | $79,740,815 | | | | $(51,062,882 | ) | | | $28,677,933 | |
| | | | |
Brandywine Blue | | | 149,960,120 | | | | 17,211,958 | | | | (10,358,724 | ) | | | 6,853,234 | |
e. FEDERAL TAXES
Each Fund currently qualifies as an investment company and intends to comply with the requirements under Subchapter M of the Internal Revenue Code of 1986, as amended, and to distribute substantially all of its taxable income and gains to its shareholders and to meet certain diversification and income requirements with respect to investment companies. Therefore, no provision for federal income or excise tax is included in the accompanying financial statements.
Additionally, based on each Fund’s understanding of the tax rules and rates related to income, gains and transactions for the foreign jurisdictions in which it invests, each Fund will provide for foreign taxes, and where appropriate, deferred foreign taxes.
Management has analyzed the Funds’ tax positions taken on federal income tax returns for all open tax years (generally, the three prior taxable years), and has concluded that no provision for federal income tax is required in the Funds’ financial statements. Additionally, Management is not aware of any tax position for which it is reasonably possible that the total amounts of unrecognized tax benefits will change materially in the next twelve months.
f. CAPITAL LOSS CARRYOVERS AND DEFERRALS
As of September 30, 2019, the Funds had no capital loss carryovers for federal income tax purposes. Should the Funds incur net capital losses for the fiscal year ended September 30, 2020, such amounts may be used to offset future realized capital gains indefinitely, and retain their character as short-term and/or long-term.
19
| | |
| | | Notes to Financial Statements(continued) |
| | | |
| | | |
g. CAPITAL STOCK
The Trust’s Declaration of Trust authorizes for each Fund the issuance of an unlimited number of shares of beneficial interest, without par value. Each Fund records sales and repurchases of its capital stock on the trade date.
For the six months ended March 31, 2020 (unaudited) and the fiscal year ended September 30, 2019, the capital stock transactions by class for the Funds were as follows:
| | | | | | | | | | | | | | | | | | | | | | | | | | | | | | | | |
| | | Brandywine | | | Brandywine Blue | |
| | | March 31, 2020 | | | September 30, 2019 | | | March 31, 2020 | | | September 30, 2019 | |
| | | Shares | | | Amount | | | Shares | | | Amount | | | Shares | | | Amount | | | Shares | | | Amount | |
| | | | | | | | |
Class I: | | | | | | | | | | | | | | | | | | | | | | | | | | | | | | | | |
| | | | | | | | |
Proceeds from sale of shares | | | 29,066 | | | | $1,515,875 | | | | 76,721 | | | | $3,962,287 | | | | 199,184 | | | | $9,708,198 | | | | 416,273 | | | | $19,917,676 | |
| | | | | | | | |
Reinvestment of distributions | | | 1,413,629 | | | | 72,476,754 | | | | — | | | | — | | | | 493,674 | | | | 23,168,103 | | | | 447,028 | | | | 17,639,726 | |
| | | | | | | | |
Cost of shares repurchased | | | (865,168) | | | | (43,455,274) | | | | (1,162,713) | | | | (59,764,764) | | | | (451,454) | | | | (21,326,638) | | | | (680,251) | | | | (32,130,641) | |
| | | | | | | | | | | | | | | | | | | | | | | | | | | | | | | | |
| | | | | | | | |
Net increase (decrease) | | | 577,527 | | | | $30,537,355 | | | | (1,085,992) | | | | $(55,802,477) | | | | 241,404 | | | | $11,549,663 | | | | 183,050 | | | | $5,426,761 | |
| | | | | | | | | | | | | | | | | | | | | | | | | | | | | | | | |
h. REPURCHASE AGREEMENTS AND JOINT REPURCHASE AGREEMENTS
The Funds may enter into third-party repurchase agreements for temporary cash management purposes and third-party or bilateral joint repurchase agreements for reinvestment of cash collateral on securities lending transactions under the securities lending program offered by The Bank of New York Mellon (“BNYM”) (the “Program”) (collectively, “Repurchase Agreements”). The value of the underlying collateral, including accrued interest, must equal or exceed the value of the Repurchase Agreements during the term of the agreement. For joint repurchase agreements, the Funds participate on a pro rata basis with other clients of BNYM in its share of the underlying collateral under such joint repurchase agreements and in its share of proceeds from any repurchase or other disposition of the underlying collateral. The underlying collateral for all Repurchase Agreements is held in safekeeping by the Funds’ custodian or at the Federal Reserve Bank. If the seller defaults and the value of the collateral declines, or if bankruptcy proceedings commence with respect to the seller of the security, realization of the collateral by the Funds may be delayed or limited. Pursuant to the Program, the Funds are indemnified for such losses by BNYM on joint repurchase agreements.
At March 31, 2020, the Funds had no Repurchase Agreements outstanding.
2. AGREEMENTS AND TRANSACTIONS WITH AFFILIATES
For each of the Funds, the Trust has entered into an investment advisory agreement under which the Investment Manager, a subsidiary and the U.S. retail distribution arm of Affiliated Managers Group, Inc. (“AMG”), serves as investment manager to the Funds and is responsible for the Funds’ overall administration and operations. The Investment Manager selects one or more subadvisers for the Funds (subject to Board approval) and monitors each subadviser’s investment performance, security holdings and investment strategies. Each Fund’s investment portfolio is managed by Friess Associates, LLC (“Friess”) and Friess Associates of Delaware, LLC (“Friess of Delaware”) who serve pursuant to a subadvisory agreement with the Investment Manager.
Investment management fees are paid directly by the Funds to the Investment Manager based on average daily net assets. For the six months ended March 31, 2020, the Funds’ investment management fees were paid at the following annual rate of each Fund’s respective average daily net assets:
| | | | |
| |
Brandywine | | | 0.88% | |
| |
Brandywine Blue | | | 0.88% | |
The Trust, on behalf of the Funds, has entered into an amended and restated Administration Agreement under which the Investment Manager serves as the Funds’ administrator (the “Administrator”) and is responsible for allnon-portfolio management aspects of managing the Funds’ operations, including administration and shareholder services to each Fund. Each Fund pays a fee to the Administrator at the rate of 0.15% per annum of the Fund’s average daily net assets for this service.
The Funds are distributed by AMG Distributors, Inc. (the “Distributor”), a wholly-owned subsidiary of the Investment Manager. The Distributor serves as the distributor and underwriter for each Fund and is a registered broker-dealer and member of the Financial Industry Regulatory Authority, Inc. (“FINRA”). Shares of each Fund will be continuously offered and will be sold directly to prospective purchasers and through brokers, dealers or other financial intermediaries who have executed selling agreements with the Distributor. Generally the Distributor bears all or a portion of the expenses of providing services pursuant to the distribution agreement, including the payment of the expenses relating to the distribution of prospectuses for sales purposes and any advertising or sales literature.
For Class I shares, the Board has approved reimbursement payments to the Investment Manager for shareholder servicing expenses (“shareholder servicing fees”) incurred. Shareholder servicing fees include payments to financial intermediaries, such as broker-dealers (including fund supermarket platforms), banks, and trust companies who provide shareholder recordkeeping, account servicing and other services. The Class I shares may reimburse the Investment Manager for the actual amount incurred up to a maximum annual rate of each Class’s average daily net assets as shown in the table below.
The impact on the annualized expense ratios for the six months ended March 31, 2020, were as follows:
20
| | |
| | | Notes to Financial Statements(continued) |
| | | |
| | | |
| | | | | | | | |
| Fund | | Maximum Annual
Amount
Approved | | | Actual
Amount
Incurred | |
| | |
Brandywine | | | | | | | | |
| | |
Class I | | | 0.15% | | | | 0.03% | |
| | |
Brandywine Blue | | | | | | | | |
| | |
Class I | | | 0.15% | | | | 0.05% | |
The Board provides supervision of the affairs of the Trust and other trusts within the AMG Funds Family. The Trustees of the Trust who are not affiliated with the Investment Manager receive an annual retainer and per meeting fees for regular, special and telephonic meetings, and they are reimbursed forout-of-pocket expenses incurred while carrying out their duties as Board members. The Chairman of the Board and the Audit Committee Chair receive additional annual retainers. Certain Trustees and Officers of the Funds are Officers and/or Directors of the Investment Manager, AMG and/or the Distributor.
The Securities and Exchange Commission (the “SEC”) granted an exemptive order that permits the Funds to lend and borrow money for certain temporary purposes directly to and from other eligible funds in the AMG Funds Family. Participation in this interfund lending program is voluntary for both the borrowing and lending funds, and an interfund loan is only made if it benefits each participating fund. The Administrator manages the program according to procedures approved by the Board, and the Board monitors the operation of the program. An interfund loan must comply with certain conditions set out in the exemptive order, which are designed to assure fairness and protect all participating funds. For the six months ended March 31, 2020, the Funds neither borrowed nor lent to other funds in the AMG Funds Family. At March 31, 2020, the Funds had no interfund loans outstanding.
3. PURCHASES AND SALES OF SECURITIES
Purchases and sales of securities (excluding short-term securities and U.S. Government Obligations) for the six months ended March 31, 2020, were as follows:
| | | | | | | | |
| | | Long Term Securities | |
| | |
| Fund | | Purchases | | | Sales | |
| | |
Brandywine | | | $758,492,781 | | | | $812,184,757 | |
| | |
Brandywine Blue | | | 155,349,225 | | | | 172,547,021 | |
The Funds had no purchases or sales of U.S. Government Obligations during the six months ended March 31, 2020.
4. PORTFOLIO SECURITIES LOANED
The Funds participate in the Program providing for the lending of securities to qualified borrowers. Securities lending income includes earnings of such temporary cash investments, plus or minus any rebate to a borrower. These earnings (after any rebate) are then divided between BNYM, as a fee for its services under the Program, and the Funds, according to agreed-upon rates. Collateral on all securities loaned is accepted in cash, U.S. Treasury Obligations or U.S. Government Agency Obligations. Collateral is maintained at a minimum level of 102% (105% in the case of certain foreign securities) of the market value, plus
interest, if applicable, of investments on loan. It is the Funds’ policy to obtain additional collateral from or return excess collateral to the borrower by the end of the next business day, following the valuation date of the securities loaned. Therefore, the value of the collateral held may be temporarily less than the value of the securities on loan. Lending securities entails a risk of loss to the Funds if and to the extent that the market value of the securities loaned were to increase and the borrower did not increase the collateral accordingly, and the borrower fails to return the securities. Under the terms of the Program, the Funds are indemnified for such losses by BNYM. Cash collateral is held in separate omnibus accounts managed by BNYM, who is authorized to exclusively enter into joint repurchase agreements for that cash collateral. Securities collateral is held in separate omnibus accounts managed by BNYM that cannot be sold or pledged. BNYM bears the risk of any deficiency in the amount of the cash collateral available for return to the borrower due to any loss on the collateral invested. Loans of securities are terminable at any time and the borrower, after notice, is required to return borrowed securities as soon as practical, which is normally within three business days.
The value of securities loaned on positions held, cash collateral and securities collateral received at March 31, 2020, were as follows:
| | | | | | | | | | | | | | | | |
| Fund | | Securities
Loaned | | | Cash
Collateral
Received | | | Securities
Collateral
Received | | | Total
Collateral
Received | |
| | | | |
Brandywine | | | $47,946,933 | | | | — | | | | $51,212,653 | | | | $51,212,653 | |
| | | | |
Brandywine Blue | | | 11,267,469 | | | | — | | | | 11,760,351 | | | | 11,760,351 | |
The following table summarizes the securities received as collateral for securities lending at March 31, 2020:
| | | | | | | | |
| Fund | | Collateral Type | | Coupon
Range | | Maturity Date Range | |
| | | |
Brandywine | | U.S. Treasury Obligations | | 0.000%-6.875% | | | 04/07/20-02/15/50 | |
| | | |
Brandywine Blue | | U.S. Treasury Obligations | | 0.000%-6.875% | | | 04/07/20-02/15/50 | |
5. COMMITMENTS AND CONTINGENCIES
Under the Trust’s organizational documents, its trustees and officers are indemnified against certain liabilities arising out of the performance of their duties to the Trust. In addition, in the normal course of business, the Funds may enter into contracts and agreements that contain a variety of representations and warranties, which provide general indemnifications. The maximum exposure to the Funds under these arrangements is unknown, as this would involve future claims that may be made against a Fund that have not yet occurred. However, based on experience, the Funds had no prior claims or losses and expect the risks of loss to be remote.
6. MASTER NETTING AGREEMENTS
The Funds may enter into master netting agreements with their counterparties for the securities lending program and Repurchase Agreements, which provide the right, in the event of default (including bankruptcy or insolvency) for thenon-defaulting party to liquidate the collateral and calculate net exposure to the defaulting party or request additional collateral. For financial reporting purposes, the Funds do not offset financial assets and financial liabilities that are subject to master netting agreements in the Statement of Assets and Liabilities. For
21
| | |
| | | Notes to Financial Statements(continued) |
| | | |
| | | |
securities lending transactions, see Note 4. At March 31, 2020, the Funds had no open Repurchase Agreements that were subject to a master netting agreement.
7. SUBSEQUENT EVENTS
The Funds have determined that no material events or transactions occurred through the issuance date of the Funds’ financial statements which require an additional disclosure in or adjustment of the Funds’ financial statements.
22
|
Funds Liquidity Risk Management Program |
| | | | | | | | |
The Securities and Exchange Commission (the “SEC”) adopted Rule22e-4 under the Investment Company Act of 1940, as amended (the “Liquidity Rule”), to promote effective liquidity risk management throughout theopen-end investment company industry, thereby reducing the risk that a fund will be unable to meet its redemption obligations and mitigating dilution of the interests of fund shareholders. The AMG Funds Family of Funds (each a “Fund,” and collectively, the “Funds”) have adopted and implemented a Liquidity Risk Management Program (the “Program”) as required by the Liquidity Rule. The Program is reasonably designed to assess and manage each Fund’s liquidity risk, taking into consideration the Fund’s investment strategy and the liquidity of its portfolio investments during normal and reasonably foreseeable stressed conditions, its short and long-term cash flow projections, and its holdings of cash and cash equivalents, as well as borrowing arrangements and other funding sources, including access to the Funds’ credit facility. Under the Liquidity Rule, each liquidity classification category (highly liquid, moderately liquid, less liquid and illiquid) is defined with respect to the time it is reasonably expected to take to convert the investment to cash (or sell or dispose of the investment) in current market conditions without significantly changing the market value of the investment. The Funds’ Board of Trustees (the “Board”) appointed AMG Funds, LLC (“AMGF”) as the Program administrator. AMGF formed a Liquidity Risk Management Committee (“LRMC”), which includes | | | | members of various departments across AMGF, including Legal, Compliance, Mutual Fund Services, Investment Research and Product Analysis & Operations and, as needed, other representatives of AMGF and/or representatives of the subadvisers to the Funds. The LRMC meets on a periodic basis, no less frequently than monthly. The LRMC is responsible for the Program’s administration and oversight and for reporting to the Board on at least an annual basis regarding the Program’s operation and effectiveness. At a meeting of the Board held on March 19, 2020, the Board received a report from the LRMC regarding the design and operational effectiveness of the Program for the period December 1, 2018 through December 31, 2019 (the “Program Reporting Period”). The Program complied with the key factors for consideration under the Liquidity Rule for assessing, managing and periodically reviewing a Fund’s liquidity risk, as follows: A. The Fund’s investment strategy and liquidity of portfolio investments during both normal and reasonably foreseeable stressed conditions: During the Program Reporting Period, the LRMC reviewed whether each Fund’s investment strategy and liquidity of portfolio investments during both normal and reasonably foreseeable stressed conditions is appropriate for anopen-end fund structure. The LRMC also factored a Fund’s concentration in an issuer into the liquidity classification methodology by taking issuer position sizes into account. | | | | B. Short-term and long-term cash flow projections during both normal and reasonably foreseeable stressed conditions: During the Program Reporting Period, the LRMC reviewed historical net redemption activity and used this information as a component to establish each Fund’s reasonably anticipated trading size. The Funds maintain anin-kind redemption policy, which may be utilized to meet larger redemption requests, when appropriate. The LRMC may also take into consideration a Fund’s shareholder ownership concentration, a Fund’s distribution channels, and the degree of certainty associated with a Fund’s short-term and long-term cash flow projections. C. Holdings of cash and cash equivalents, as well as borrowing arrangements: The LRMC considered the terms of the credit facilities available to the Funds. The report concluded that, based upon the review of the Program, using resources and methodologies that AMGF considers reasonable, AMGF believes that the Program and Funds’ Liquidity Risk Management Policies and Procedures are adequate, effective, and reasonably designed to effectively manage the Funds’ liquidity risk. There can be no assurance that the Program will achieve its objectives in the future. Please refer to each Fund’s prospectus or statement of additional information for more information regarding a Fund’s exposure to liquidity risk and other principal risks to which an investment in a Fund may be subject. |
| | | | | | | | |
23
THIS PAGE INTENTIONALLY LEFT BLANK
|
|
| | | | | | | | |
INVESTMENT MANAGER AND ADMINISTRATOR AMG Funds LLC 600 Steamboat Road, Suite 300 Greenwich, CT 06830 800.548.4539 DISTRIBUTOR AMG Distributors, Inc. 600 Steamboat Road, Suite 300 Greenwich, CT 06830 800.548.4539 SUBADVISER Friess Associates, LLC P.O. Box 576 Jackson, Wyoming 83001 Friess Associates of Delaware, LLC P.O. Box 4166 Greenville, DE 19807 CUSTODIAN The Bank of New York Mellon 111 Sanders Creek Parkway East Syracuse, NY 13057 | | | | LEGAL COUNSEL Ropes & Gray LLP Prudential Tower, 800 Boylston Street Boston, MA 02199-3600 TRANSFER AGENT BNY Mellon Investment Servicing (US) Inc. Attn: AMG Funds P.O. Box 9769 Providence, RI 02940 800.548.4539 TRUSTEES Bruce B. Bingham Christine C. Carsman Edward J. Kaier Kurt Keilhacker Steven J. Paggioli Richard F. Powers III Eric Rakowski Victoria Sassine Thomas R. Schneeweis | | | | This report is prepared for the Funds’ shareholders. It is authorized for distribution to prospective investors only when preceded or accompanied by an effective prospectus. To receive a free copy of the prospectus or Statement of Additional Information, which includes additional information about Fund Trustees, please contact us by calling 800.548.4539. Distributed by AMG Distributors, Inc., member FINRA/SIPC. Current net asset values per share for each Fund are available on the Funds’ website at amgfunds.com. A description of the policies and procedures each Fund uses to vote its proxies is available: (i) without charge, upon request, by calling 800.548.4539, or (ii) on the Securities and Exchange Commission’s (SEC) website at sec.gov. For information regarding the Funds’ proxy voting record for the12-month period ended June 30, call 800.548.4539 or visit the SEC website at sec.gov. The Funds file their complete schedule of portfolio holdings with the SEC for the first and third quarters of each fiscal year as an exhibit to their reports on FormN-PORT. The Funds’ portfolio holdings on FormN-PORT are available on the SEC’s website at sec.gov. To review a complete list of the Funds’ portfolio holdings, or to view the most recent quarterly holdings report, semiannual report or annual report, please visit amgfunds.com. |
| | | | | | | | |
|
|
| | | | | | | | |
AFFILIATE SUBADVISED FUNDS BALANCED FUNDS AMG GW&K Global Allocation GW&K Investment Management, LLC AMG FQ Global Risk-Balanced First Quadrant, L.P. EQUITY FUNDS AMG FQTax-Managed U.S. Equity AMG FQ Long-Short Equity First Quadrant, L.P. AMG Frontier Small Cap Growth Frontier Capital Management Co., LLC AMG GW&K Small Cap Core AMG GW&K Small/Mid Cap AMG GW&K Emerging Markets Equity AMG GW&K Emerging Wealth Equity GW&K Investment Management, LLC AMG Renaissance Large Cap Growth The Renaissance Group LLC AMG River Road Dividend All Cap Value AMG River Road Focused Absolute Value AMG River Road Long-Short AMG River RoadSmall-Mid Cap Value AMG River Road Small Cap Value River Road Asset Management, LLC AMG SouthernSun Small Cap AMG SouthernSun U.S. Equity SouthernSun Asset Management, LLC | | | | AMG TimesSquare Emerging Markets Small Cap AMG TimesSquare Global Small Cap AMG TimesSquare International Small Cap AMG TimesSquare Mid Cap Growth AMG TimesSquare Small Cap Growth TimesSquare Capital Management, LLC AMG Yacktman AMG Yacktman Focused AMG Yacktman Focused Fund - Security Selection Only AMG Yacktman Special Opportunities Yacktman Asset Management LP FIXED INCOME FUNDS AMG GW&K Core Bond ESG AMG GW&K Enhanced Core Bond ESG AMG GW&K Municipal Bond AMG GW&K Municipal Enhanced Yield GW&K Investment Management, LLC OPEN-ARCHITECTURE FUNDS EQUITY FUNDS AMG Managers Brandywine AMG Managers Brandywine Blue Friess Associates, LLC AMG Managers Cadence Emerging Companies AMG Managers Cadence Mid Cap Cadence Capital Management LLC AMG Managers CenterSquare Real Estate CenterSquare Investment Management LLC | | | | AMG Managers Emerging Opportunities WEDGE Capital Management L.L.P. Next Century Growth Investors LLC RBC Global Asset Management (U.S.) Inc. AMG Managers Fairpointe Mid Cap Fairpointe Capital LLC AMG Managers LMCG Small Cap Growth LMCG Investments, LLC AMG Managers Montag & Caldwell Growth Montag & Caldwell, LLC AMG Managers Pictet International Pictet Asset Management Limited AMG Managers Silvercrest Small Cap Silvercrest Asset Management Group LLC AMG Managers Skyline Special Equities Skyline Asset Management, L.P. AMG Managers Special Equity Ranger Investment Management, L.P. Lord, Abbett & Co. LLC Smith Asset Management Group, L.P. Federated MDTA LLC FIXED INCOME FUNDS AMG Managers Doubleline Core Plus Bond DoubleLine Capital LP AMG Managers Global Income Opportunity AMG Managers Loomis Sayles Bond Loomis, Sayles & Company, L.P. |
| | | | | | | | | |
| | | | | | | | | |
| | | | | | | | | |
| | | | | | | | | |
| | | | | | | | | |
| | | | | | | | | |
| | | | | | | | | |
| | | | | | | | | |
| | | | | | | | | |
| | | | | | | | | |
| | | | |
| amgfunds.com | | | | 033120 SAR073 |
| | |
| | | SEMI-ANNUAL REPORT |
| | | | | | |
| | | | AMG Funds March 31, 2020
AMG Managers Brandywine Advisors Mid Cap Growth Fund |
| | | | | | | |
| | | | |
| | | | | Class N: BWAFX | | |
| | | | |
| | | | | | | |
Beginning on January 1, 2021, as permitted by regulations adopted by the Securities and Exchange Commission, paper copies of the Fund’s shareholder reports like this one will no longer be sent by mail, unless you specifically request paper copies of the reports from the Fund or from your financial intermediary, such as a broker-dealer or bank. Instead, the reports will be made available on the Fund’s website (https://www.amgfunds.com/resources/order_literature.html), and you will be notified by mail each time a report is posted and provided with a website link to access the report.
If you already elected to receive shareholder reports electronically, you will not be affected by this change and you need not take any action. You may elect to receive shareholder reports and other communications from the Fund electronically at any time by contacting your financial intermediary or, if you invest directly with the Fund, by logging into your account at www.amgfunds.com.
You may elect to receive all future reports in paper free of charge. If you invest through a financial intermediary, you can contact your financial intermediary to request that you continue to receive paper copies of your shareholder reports. If you invest directly with the Fund, you can call 1.800.548.4539 to inform the Fund that you wish to continue receiving paper copies of your shareholder reports. Your election to receive reports in paper will apply to all funds in the AMG Funds Family of Funds held in your account if you invest through your financial intermediary or all funds in the AMG Funds Family of Funds held with the fund complex if you invest directly with the Fund.
| | | | |
| amgfunds.com | | | | 033120 SAR075 |
| | |
| | | AMG Funds Semi-Annual Report — March 31, 2020(unaudited) |
| | | | | | |
| | | |
| | | | | | | |
| | | TABLE OF CONTENTS | | PAGE | |
| | | | |
| | | |
| | | LETTER TO SHAREHOLDERS | | | 2 | |
| | | |
| | | ABOUT YOUR FUND’S EXPENSES | | | 3 | |
| | | |
| | | FUND PERFORMANCE | | | 4 | |
| | | |
| | | FUND SNAPSHOTS, ROSES AND THORNS AND SCHEDULE OF PORTFOLIO INVESTMENTS | | | 5 | |
| | | |
| | | FINANCIAL STATEMENTS | | | | |
| | | |
| | | Statement of Assets and Liabilities | | | 10 | |
| | | |
| | | Balance sheet, net asset value (NAV) per share computation
and cumulative distributable earnings (loss) | | | | |
| | | |
| | | Statement of Operations | | | 11 | |
| | | |
| | | Detail of sources of income, expenses, and realized and
unrealized gains (losses) during the fiscal period | | | | |
| | | |
| | | Statements of Changes in Net Assets | | | 12 | |
| | | |
| | | Detail of changes in assets for the past two fiscal periods | | | | |
| | | |
| | | Financial Highlights | | | 13 | |
| | | |
| | | Historical net asset values per share, distributions, total returns, income
and expense ratios, turnover ratios and net assets | | | | |
| | | |
| | | Notes to Financial Statements | | | 14 | |
| | | |
| | | Accounting and distribution policies, details of agreements and
transactions with Fund management and affiliates, and descriptions of
certain investment risks | | | | |
| | | |
| | | FUNDS LIQUIDITY RISK MANAGEMENT PROGRAM | | | 19 | |
| | | | | | | |
|
| |
Nothing contained herein is to be considered an offer, sale or solicitation of an offer to buy shares of any series of the AMG Funds Family of Funds. Such offering is made only by prospectus, which includes details as to offering price and other material information.
| | |
| | Letter to Shareholders |
DEAR FELLOW SHAREHOLDER:
The infamous achievements of major market barometers sum up the March quarter. It was the worst quarter since the waning months of the 2008 financial crisis for the S&P 500® Index. The Dow Jones Industrial Average declined more than it did in any quarter since 1987, when Black Monday left its mark on the closing quarter of that year. As far as first quarters go, it was just the worst.
Coronavirus-related fears stormed through the market, leaving virtually no shelter as investors repriced stocks in wholesale manner.
AMG Managers Brandywine Advisors Mid Cap Growth Fund (the “Fund”) declined 27.05 percent in the three months through March. The S&P 500®, Russell Midcap® and Russell Midcap® Growth Indexes declined 19.60, 27.07 and 20.04 percent.
Every economic sector in the benchmarks suffered declines, with the energy sector by far the hardest hit. A record-setting collapse in oil prices, triggered by a price war between Russia and Saudi Arabia and compounded by rapidly deteriorating economic conditions, decimated the energy sector’s outlook.
As fighting the pandemic prompted shutdowns,shelter-in-place orders and resource realignment, investors fled cyclical economic sectors. Record jobless claims further dampened expectations for companies in any way reliant on discretionary spending on the part of business or consumer customers.
Most “bright spots” were relative, meaning their declines were less pronounced than average. The consumer staples and health care sectors, where demand is generally static under most circumstances, fit that description.
For most companies, new restrictive measures were a curse. That was the overwhelming experience of holdings from the consumer discretionary sector, which generated some of the biggest percentage declines during the three-month period.
Consumer discretionary holdings represented the third largest portfolio position. They were the biggest detractors from absolute performance and the biggest detractors from results relative to the Russell Midcap® Growth Index. Makers of apparel and durable consumer goods, including Crocs, Taylor Morrison Home Corp. and Yeti Holdings, bore the brunt of the abrupt change in sentiment regarding the sector.
Tempur Sealy International was also a major detractor. The bedding product maker came into the quarter with strong operational momentum, partly boosted by are-established relationship with Mattress Firm, a major retail outlet just over a year out of bankruptcy. During the quarter, Mattress Firm announced it would close stores, furlough employees and suspend benefits, among other moves. Tempur Sealy shares fell as it became clear that Mattress Firm and other retail channels for its products were questionable at best.
Technology holdings, which comprised the largest portfolio position, were the next greatest detractors from absolute and relative results. Global Payments was a notable detractor. Shares of the provider of electronic transaction processing technology solutions declined on concerns regarding declining outlooks among the kind of small and midsized businesses that make up a significant share of the company’s customer base. Other detractors from the technology sector included EVO Payments, Perficient and Verra Mobility Corp.
Representing the second largest portfolio position, health care holdings were the third largest detractors from absolute and relative returns. IQVIA Holdings, a contract research organization, was among the top detractors from the sector. Shares declined after the company warned about delays in research project timelines and disruptions in site operations among customers. Exact Sciences and NuVasive were also negative performance influences.
The financial sector generated a positive absolute return thanks primarily to eHealth, which boasts a combination of attributes that appear fit for the times. Health insurance security is an obvious concern amid the outbreak andface-to-face interactions, as we all know, are to be avoided. eHealth operates an online health insurance marketplace, with strong emphasis on Medicare-related plans.
The portfolio held other companies that managed to navigate the mayhem thanks to characteristics that investors deemed exceptionally suited for the unusual conditions. Domino’s Pizza and Zoom Video Conferencing were two of those exceptions.
Long known for emphasizing delivery, expansivestay-at-home advisories created captive customer bases for Domino’s here and abroad. In March, the company introduced contactless delivery, enabling customers to purchase pizza for delivery to a specified location such as a front porch without requiringperson-to-person interaction. The world’s largest pizza chain based on sales announced that it plans to hire 10,000 new employees in the U.S. to keep up with demand.
Zoom, a video-first communications platform operator, finished 2019 with about 10 million users of its service. As weeks wore on andstay-at-home advisories spread around the world, Zoom enjoyed a previously unimaginable opportunity to showcase its technology. By providing everyone from fitness instructors to corporate executives the means to meetface-to-face without occupying the same space, Zoom was able to grow its base of free and paid users to 200 million by the end of March.
For more information on holdings that influenced March-quarter results, please see Roses & Thorns on page 6.
The Fund is expected to be liquidated on or about May 15, 2020. The Fund began selling portfolio investments in early April to accumulate cash and cash equivalents to help facilitate distributing liquidation proceeds to shareholders as soon as possible following the liquidation date.
It was an honor to serve you. We consider your decision to invest in the Fund as a high compliment to our team at Friess Associates. Thank you. Please don’t hesitate to call on us if we can be of service to you in the future. Best wishes for success and good health from your entire Friess team.
Scott Gates
Chief Investment Officer
Friess Associates, LLC
2
|
About Your Fund’s Expenses(unaudited) |
| | | | | | | | |
As a shareholder of a Fund, you may incur two types of costs: (1) transaction costs, which may include sales charges (loads) on purchase payments; redemption fees; and exchange fees; and (2) ongoing costs, including management fees; distribution(12b-1) fees; and other Fund expenses. This example is intended to help you understand your ongoing costs (in dollars) of investing in the Fund and to compare these costs with the ongoing costs of investing in other mutual funds. The example is based on $1,000 invested at the beginning of the period and held for the entire period as indicated below. ACTUAL EXPENSES The first line of the following table provides information about the actual account values and | | | | actual expenses. You may use the information in this line, together with the amount you invested, to estimate the expenses that you paid over the period. Simply divide your account value by $1,000 (for example, an $8,600 account value divided by $1,000 = 8.6), then multiply the result by the number in the first line under the heading entitled “Expenses Paid During Period” to estimate the expenses you paid on your account during this period. HYPOTHETICAL EXAMPLE FOR COMPARISON PURPOSES The second line of the following table provides information about hypothetical account values and hypothetical expenses based on the Fund’s actual expense ratio and an assumed annual rate of return of 5% before expenses, which is not the Fund’s | | | | actual return. The hypothetical account values and expenses may not be used to estimate the actual ending account balance or expenses you paid for the period. You may use this information to compare the ongoing costs of investing in the Fund and other funds by comparing this 5% hypothetical example with the 5% hypothetical examples that appear in the shareholder reports of other funds. Please note that the expenses shown in the table are meant to highlight your ongoing costs only and do not reflect any transactional costs, such as sales charges (loads), redemption fees, or exchange fees. Therefore, the second line of the table is useful in comparing ongoing costs only, and will not help you determine the relative total costs of owning different funds. |
| | | | | | | | |
| | | | | | | | |
Six Months Ended March 31, 2020 | | Expense
Ratio for
the Period | | Beginning
Account
Value
10/01/19 | | Ending
Account
Value
03/31/20 | | Expenses
Paid
During
the Period* |
AMG Managers Brandywine Advisors Mid Cap Growth Fund |
|
Based on Actual Fund Return |
| | | | |
Class N | | 1.13% | | $1,000 | | $807 | | $5.11 |
|
Based on Hypothetical 5% Annual Return |
| | | | |
Class N | | 1.13% | | $1,000 | | $1,019 | | $5.70 |
| | * | Expenses are equal to the Fund’s annualized expense ratio multiplied by the average account value over the period, multiplied by the number of days in the most recent fiscal half-year (183), then divided by 366. | |
3
|
Fund Performance(unaudited) Periods ended March 31, 2020 |
The table below shows the average annual total returns for the periods indicated for the Fund, as well as the Fund’s relative index for the same time periods ended March 31, 2020.
| | | | | | | | | | | | | | | | |
| Average Annual Total Returns1 | | Six
Months* | | | One Year | | | Five
Years | | | Ten Years | |
|
AMG Managers Brandywine Advisors Mid Cap Growth
Fund2, 3, 4, 5, 6, 7, 8, 9 | |
| | | | |
Class N | | | (19.29 | %) | | | (22.50 | %) | | | (1.01 | %) | | | 2.88 | % |
| | | | |
Russell Midcap® Growth Index10 | | | (13.50 | %) | | | (9.45 | %) | | | 5.61 | % | | | 10.89 | % |
| | | | |
Russell Midcap® Index11 | | | (21.92 | %) | | | (18.31 | %) | | | 1.85 | % | | | 8.77 | % |
| | | | |
S&P 500® Index12 | | | (12.31 | %) | | | (6.98 | %) | | | 6.73 | % | | | 10.53 | % |
|
The performance data shown represents past performance. Past performance is not a guarantee of future results.Current performance may be lower or higher than the performance data quoted. The investment return andprincipal value of an investment will fluctuate so that an investor’s shares, when redeemed, may be worth more orless than their original cost. |
|
| Investors should carefully consider the Fund’s investment objectives, risks, charges and expenses beforeinvesting. For performance information through the most recent month end, current net asset values per share forthe Fund and other information, please call 800.548.4539 or visit our website at amgfunds.com for a freeprospectus. Read it carefully before investing or sending money. |
|
Distributed by AMG Distributors, Inc., member FINRA/SIPC. |
* Not annualized. 1 Total return equals income yield plus share price change and assumes reinvestment of all dividends and capital gain distributions. Returns are net of fees and may reflect offsets of Fund expenses as described in the prospectus. No adjustment has been made for taxes payable by shareholders on their reinvested dividends and capital gain distributions. Returns for periods greater than one year are annualized. The listed returns on the Fund are net of expenses and based on the published NAV as of March 31, 2020. All returns are in U.S. dollars ($). 2 The Fund returns for all periods beginning prior to October 1, 2013, reflect performance of the predecessor fund, Brandywine Advisors Midcap Growth Fund, and was managed by Friess Associates, LLC with the same investment objectives and substantially similar investment policies. 3 The Fund is subject to risks associated with investments inmid-capitalization companies such as greater price volatility, lower trading volume, and less liquidity than the stocks of larger, more established companies. 4 The Fund is subject to risks associated with investments in small-capitalization companies, such as erratic earnings patterns, competitive conditions, limited earnings history and a reliance on one or a limited number of products. 5 Active and frequent trading of a fund may result in higher transaction costs and increased tax liability. 6 A greater percentage of the Fund’s holdings may be focused in a smaller number of securities which may place the Fund at greater risk than a more diversified fund. 7 The Fund invests in growth stocks, which may be more sensitive to market movements because their prices tend to reflect future investor expectations rather than just current profits. Growth stocks may underperform value stocks during given periods. |
| | |
| | | 8 Investments in international securities are subject to certain risks of overseas investing including currency fluctuations and changes in political and economic conditions, which could result in significant market fluctuations. These risks are magnified in emerging markets. 9 Companies that are in similar businesses may be similarly affected by particular economic or market events; to the extent the Fund has substantial holdings within a particular sector, the risks associated with that sector increase. 10 The Russell Midcap® Growth Index measures the performance of those Russell Midcap® companies with higher price/book ratios and higher forecasted growth values. The stocks are also members of the Russell 1000® Growth Index. Unlike the Fund, the Russell Midcap® Growth Index is unmanaged, is not available for investment and does not incur expenses. 11 The Russell Midcap® Index measures the performance of the 800 smallest companies in the Russell 1000® Index, which represent approximately 25% of the total market capitalization of the Russell 1000® Index. Unlike the Fund, the Russell Midcap® Index is unmanaged, is not available for investment and does not incur expenses. 12 The S&P 500® Index is a capitalization-weighted index of 500 stocks. The S&P 500® Index is designed to measure performance of the broad domestic economy through changes in the aggregate market value of 500 stocks representing all major industries. Unlike the Fund, the S&P 500® Index is unmanaged, is not available for investment and does not incur expenses. The Russell Indices are trademarks of the London Stock Exchange Group companies. The S&P 500® Index is proprietary data of Standard & Poor’s, a division of McGraw-Hill Companies, Inc. All rights reserved. Not FDIC insured, nor bank guaranteed. May lose value. |
| | | |
| | | |
| | | |
| | | |
| | | |
| | | |
| | | |
| | | |
| | | |
| | | |
| | | |
| | | |
| | | |
| | | |
4
|
AMG Managers Brandywine Advisors Mid Cap Growth Fund Fund Snapshots(unaudited) March 31, 2020 |
PORTFOLIO BREAKDOWN
| | | | | | | | |
| Industry (Top Ten) | | Brandywine
Advisors
Mid Cap
Growth Fund1
| | | Russell
Midcap®
Growth
Index | |
| | | |
Biotechnology | | | 13.0 | % | | | 3.6 | % |
| | | |
Packaged Foods & Meats | | | 9.1 | % | | | 1.7 | % |
| | | |
Data Processing & Outsourced Services | | | 8.5 | % | | | 7.8 | % |
| | | |
Health Care Equipment | | | 6.3 | % | | | 5.2 | % |
| | | |
Interactive Home Entertainment | | | 4.4 | % | | | 0.3 | % |
| | | |
Semiconductors | | | 4.2 | % | | | 3.5 | % |
| | | |
Application Software | | | 4.0 | % | | | 11.0 | % |
| | | |
IT Consulting & Other Services | | | 3.9 | % | | | 1.1 | % |
| | | |
Building Products | | | 3.9 | % | | | 1.5 | % |
| | | |
Health Care Technology | | | 3.5 | % | | | 1.6 | % |
| | | |
Other Common Stock | | | 35.3 | % | | | 62.7 | % |
| | | |
Short-Term Investments | | | 7.7 | % | | | 0.0 | % |
| | | |
Other Assets Less Liabilities | | | (3.8 | )% | | | 0.0 | % |
| 1 | As a percentage of net assets. |
TOP TEN HOLDINGS
| | | | | | | | |
| Security Name | | % of
Net Assets | | | % Change from
Book Cost | |
| | | |
Tandem Diabetes Care, Inc. | | | 4.1 | | | | 32.7 | |
| | | |
Global Payments, Inc. | | | 3.5 | | | | 103.0 | |
| | | |
Advanced Micro Devices, Inc. | | | 3.3 | | | | 50.3 | |
| | | |
Lumentum Holdings, Inc. | | | 3.2 | | | | 46.9 | |
| | | |
Papa John’s International, Inc. | | | 3.2 | | | | (2.1 | ) |
| | | |
Target Corp. | | | 2.9 | | | | (11.4 | ) |
| | | |
Veracyte, Inc. | | | 2.8 | | | | 1.1 | |
| | | |
Fiserv, Inc. | | | 2.7 | | | | (1.0 | ) |
| | | |
BioMarin Pharmaceutical, Inc. | | | 2.6 | | | | (2.1 | ) |
| | | |
Electronic Arts, Inc. | | | 2.6 | | | | 1.1 | |
| | | | | | | | | |
| | | |
Top Ten as a Group | | | 30.9 | | | | | |
| | | | | | | | |
| | | | | | | | | |
ESTIMATED EARNINGS GROWTH RATE OF THE FUND’S INVESTMENTS
Forecasted Increase in Earnings Per Share 2020 vs 2019
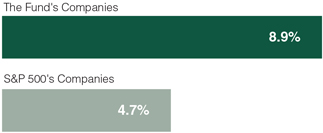
Source: Consensus estimates from FactSet Research Systems Inc.
This is not a forecast of the Fund’s future performance. Earnings growth for a Fund holding does not guarantee a corresponding increase in the market value of the holding or the Fund. Earnings growth rates based on existing estimates on March 31. Widespread estimate reductions occurred in the time since amid deteriorating economic conditions related to theCOVID-19 crisis.
Because a fund’s strategy may result in multiple investments in particular sectors of the economy, its performance may depend on the performance of those sectors and may fluctuate more widely than investments diversified across more sectors. For additional information on these and other risk considerations, please see the Fund’s prospectus.
Any sectors, industries, or securities discussed should not be perceived as investment recommendations. Mention of a specific security should not be considered a recommendation to buy or solicitation to sell that security. Specific securities mentioned in this report may have been sold from the Fund’s portfolio of investments by the time you receive this report.
5
| | |
| | | AMG Managers Brandywine Advisors Mid Cap Growth Fund Roses and Thorns(unaudited) Quarter Ending March 31, 2020 |
| | | |
| | | |
| | | | | | | | | | |
$ Gain
(in millions) | | | | % Gain | | | | Biggest $ Winners | | Reason for Move |
| | | | |
| $1.0 | | | | 32.4% | | | | eHealth Inc. (EHTH) |
| | | | | | | | | The Internet-based health insurance agency earned $4.13 per share in the December quarter, exceeding the consensus estimate by 65 percent. Medicare-related applications increased 200 percent following significant investment in the company’s online enrollment platform over the past year. eHealth also issued better-than-expected 2020 guidance. Investors also viewed the company’s online business model positively as social distancing measures went into effect. |
| | | | |
| $0.5 | | | | 9.5% | | | | Advanced Micro Devices Inc. (AMD) |
| | | | | | | | | The semiconductor maker earned $0.32 per share in the December quarter, up from $0.08 in theyear-ago period and ahead of the consensus estimate. Strength in the company’s Computing and Graphics segment drove a 50 percent increase in revenue. Leverage realized through progress in the production of AMD’s Ryzen mainstream computing and Rome server processors helped boost gross profit margins to 45 percent from 38 percent in the same quarter the year before. Guidance for 2020, which exceeded consensus expectations, forecasted accelerating revenue growth. |
| | | | |
| $0.5 | | | | 10.0% | | | | Tandem Diabetes Care Inc. (TNDM) |
| | | | | | | | | The maker of insulin pumps for people with diabetes earned $0.04 per share in the December quarter, exceeding expectations for a loss. The company’s 2020 guidance was also better than expected. A pivotal trial for a competing product was suspended in March to correct a software anomaly. Meanwhile, the market share leader in the space is conducting a recall. Tandem drew positive attention as investors saw expanded opportunity for the company’s newControl-IQ in the fractured competitive landscape. |
| | | | |
| $0.4 | | | | 10.2% | | | | Domino’s Pizza Inc. (DPZ) |
| | | | | | | | | The company, consisting of more than 17,000 company-owned and franchised pizza stores in the U.S. and overseas, grew December-quarter earnings 19 percent, exceeding the consensus estimate. The period represented the 35th consecutive quarter of U.S. same-store sales growth and the 104th in its international business. As the world’s largest pizza chain, investors viewed the company’s delivery experience and infrastructure as assets asstay-at-home advisories increased demand for food delivery options. |
| | | | |
| $0.3 | | | | 9.7% | | | | Quidel Corp. (QDEL) |
| | | | | | | | | The provider of rapid diagnostic testing solutions earned $0.71 per share in the December quarter, exceeding the consensus estimate. Results reflected a strong start to the flu season. The Food and Drug Administration inmid-March granted the company Emergency Use Authorization for its LyraSARS-CoV-2 Assay for testing patients suspected ofCOVID-19 infection. Similar authorizations followed in Canada and Europe. |
| | | | | |
$ Loss
(in millions) | | | | % Loss | | | | Biggest $ Losers | | Reason for Move |
| | | | |
| $2.7 | | | | 56.7% | | | | Crocs Inc. (CROX) |
| | | | | | | | | The casual footwear maker earned $0.12 per share in the December quarter, exceeding expectations for a loss. Revenue grew 13 percent in the period, capping off a record year. Shares fell when the company tempered 2020 guidance due to uncertainty related to the global pandemic. |
| | | | |
| $1.8 | | | | 34.6% | | | | Scorpio Tankers Inc. (STNG) |
| | | | | | | | | The company, which provides marine transportation of petroleum products, reported solid December-quarter results and encouraging booking trends developing in the quarter ahead. Shares declined as the coronavirus outbreak spread in China, prompting restrictions on mobility in the country and crimping demand to the detriment of day rates paid to tanker operators. |
| | | | |
| $1.4 | | | | 38.6% | | | | Boot Barn Holdings Inc. (BOOT) |
| | | | | | | | | The retailer of western and work-related footwear, apparel and accessories grew December-quarter earnings 21 percent. Net sales rose 12 percent. Shares declined on concerns that demand for work gear could fall in energy-heavy economic regions such as Texas amid an oil price war between Saudi Arabia and Russia. |
| | | | |
| $1.4 | | | | 28.7% | | | | Exact Sciences Corp. (EXAS) |
| | | | | | | | | The diagnostics company focused on the detection of colorectal cancer grew December-quarter earnings to $0.54 per share from a loss in theyear-ago period, exceeding the consensus estimate. Acquired during the quarter, Genomic Health was a significant contributor to results. Shares declined amid the widespread cancellation of routine medical visits as resources shifted to fight the coronavirus outbreak, potentially weighing on future testing volumes. |
| | | | |
| $1.4 | | | | 43.3% | | | | MasTec Inc. (MTZ) |
| | | | | | | | | The infrastructure engineering and construction company exceeded the consensus estimate with 21 percent December-quarter earnings growth. While the company serves customers in a range of markets, including communications, industrial and power generation, it also derives significant revenue from energy infrastructure projects such as pipelines and treatment facilities. A precipitous drop in oil prices raised questions about demand from the energy sector. |
All gains/losses are calculated on an average cost basis from December 31, 2019 through March 31, 2020. Companies still held at the end of the period appear in the accompanying Schedule of Portfolio Investments.
This commentary reflects the viewpoints of Friess Associates, LLC as of March 31, 2020, and is not intended as a forecast or guarantee of future results.
6
| | |
| | | AMG Managers Brandywine Advisors Mid Cap Growth Fund Schedule of Portfolio Investments (unaudited) March 31, 2020 |
| | | |
| | | |
| | | | | | | | | | |
| Shares | | | | Cost | | | Value | |
Common Stocks - 96.1% | | | | | | | | |
| | |
Communication Services | | | | | | | | |
| | |
| | Interactive Home Entertainment - 4.4% | | | | | |
| | | |
| 17,938 | | Activision Blizzard, Inc. | | | $988,563 | | | | $1,066,952 | |
| | | |
| 14,667 | | Electronic Arts, Inc.* | | | 1,453,773 | | | | 1,469,194 | |
| | |
| | Interactive Media & Services - 2.0% | | | | | |
| | | |
| 46,377 | | Twitter, Inc.* | | | 1,520,470 | | | | 1,139,019 | |
| | | | | | | | | | |
| | |
Total Communication Services | | | 3,962,806 | | | | 3,675,165 | |
| | |
| | This sector is 7.3% below your Fund’s cost. | | | | | |
| |
Consumer Discretionary | | | | | |
| | |
| | Automobile Manufacturers - 1.1% | | | | | |
| | | |
| 15,332 | | Thor Industries, Inc.1 | | | 1,324,133 | | | | 646,704 | |
| | | |
| | Footwear - 0.3% | | | | | | | | |
| | | |
| 10,877 | | Crocs, Inc.* | | | 275,803 | | | | 184,800 | |
| | |
| | General Merchandise Stores - 2.9% | | | | | |
| | | |
| 17,655 | | Target Corp. | | | 1,852,480 | | | | 1,641,385 | |
| | | |
| | Restaurants - 3.2% | | | | | | | | |
| | | |
| 34,069 | | Papa John’s International, Inc.1 | | | 1,856,757 | | | | 1,818,263 | |
| | | | | | | | | | |
| | |
Total Consumer Discretionary | | | 5,309,173 | | | | 4,291,152 | |
| | |
| | This sector is 19.2% below your Fund’s cost. | | | | | |
| |
Consumer Staples | | | | | |
| | |
| | Packaged Foods & Meats - 9.1% | | | | | |
| | | |
| 44,359 | | The Hain Celestial Group, Inc.*,1 | | | 1,101,937 | | | | 1,152,003 | |
| | | |
| 3,356 | | The Hershey Co. | | | 452,403 | | | | 444,670 | |
| | | |
| 115,152 | | Hostess Brands, Inc.* | | | 1,603,152 | | | | 1,227,520 | |
| | | |
| 23,000 | | Mondelez International, Inc., Class A | | | 1,000,962 | | | | 1,151,840 | |
| | | |
| 65,399 | | The Simply Good Foods Co.* | | | 1,067,093 | | | | 1,259,585 | |
| | | |
| | Personal Products - 1.8% | | | | | | | | |
| | | |
| 59,576 | | BellRing Brands, Inc., Class A*,1 | | | 971,605 | | | | 1,015,771 | |
| | | | | | | | | | |
| | |
Total Consumer Staples | | | 6,197,152 | | | | 6,251,389 | |
| | |
| | This sector is 0.9% above your Fund’s cost. | | | | | |
| |
Financials | | | | | |
| | |
| | Insurance Brokers - 2.4% | | | | | |
| | | |
| 9,558 | | eHealth, Inc.*,1 | | | 913,192 | | | | 1,345,958 | |
| | |
| | This sector is 47.4% above your Fund’s cost. | | | | | |
| |
Health Care | | | | | |
| | |
| | Biotechnology - 13.0% | | | | | |
| | | |
| 17,184 | | ACADIA Pharmaceuticals, Inc.* | | | 716,216 | | | | 726,024 | |
| | | |
| 17,969 | | BioMarin Pharmaceutical, Inc.* | | | 1,551,355 | | | | 1,518,381 | |
| | | |
| 72,741 | | Coherus Biosciences, Inc.* | | | 1,532,268 | | | | 1,179,859 | |
| | | |
| 22,081 | | Exact Sciences Corp.*,1 | | | 1,805,201 | | | | 1,280,698 | |
| | | |
| 66,717 | | Veracyte, Inc.* | | | 1,604,866 | | | | 1,621,890 | |
| | | |
| 4,722 | | Vertex Pharmaceuticals, Inc.* | | | 993,993 | | | | 1,123,600 | |
| | | | | | | | | | |
| Shares | | | | Cost | | | Value | |
| | |
| | Health Care Services - 2.5% | | | | | |
| | | |
| 3,227 | | Quest Diagnostics, Inc. | | | $284,424 | | | | $259,128 | |
| | | |
| 132,411 | | R1 RCM, Inc.* | | | 1,607,911 | | | | 1,203,616 | |
| | |
| | Health Care Equipment - 6.3% | | | | | |
| | | |
| 12,300 | | Hill-Rom Holdings, Inc. | | | 1,170,553 | | | | 1,237,380 | |
| | | |
| 36,464 | | Tandem Diabetes Care, Inc.* | | | 1,768,063 | | | | 2,346,458 | |
| | |
| | Health Care Technology - 3.5% | | | | | |
| | | |
| 47,975 | | Health Catalyst, Inc.*,1 | | | 1,561,716 | | | | 1,254,546 | |
| | | |
| 13,910 | | Tabula Rasa HealthCare, Inc.* | | | 705,644 | | | | 727,354 | |
| | | |
| | Pharmaceuticals - 2.2% | | | | | | | | |
| | | |
| 10,698 | | Zoetis, Inc. | | | 1,442,419 | | | | 1,259,048 | |
| | | | | | | | | | |
| | |
Total Health Care | | | 16,744,629 | | | | 15,737,982 | |
| | |
| | This sector is 6.0% below your Fund’s cost. | | | | | |
| |
Industrials | | | | | |
| | | |
| | Building Products - 3.9% | | | | | | | | |
| | | |
| 24,298 | | Fortune Brands Home & Security, Inc. | | | 1,532,457 | | | | 1,050,889 | |
| | | |
| 31,064 | | Universal Forest Products, Inc. | | | 1,528,745 | | | | 1,155,270 | |
| | |
| | Research & Consulting Services - 2.0% | | | | | |
| | | |
| 9,663 | | FTI Consulting, Inc.* | | | 1,102,636 | | | | 1,157,337 | |
| | |
| | Trading Companies & Distributors - 1.6% | | | | | |
| | | |
| 51,781 | | BMC Stock Holdings, Inc.* | | | 1,503,143 | | | | 918,077 | |
| | | | | | | | | | |
| | |
Total Industrials | | | 5,666,981 | | | | 4,281,573 | |
| | |
| | This sector is 24.4% below your Fund’s cost. | | | | | |
| |
Information Technology | | | | | |
| | | |
| | Application Software - 4.0% | | | | | | | | |
| | | |
| 107,002 | | SVMK, Inc.* | | | 2,058,963 | | | | 1,445,597 | |
| | | |
| 5,712 | | Zoom Video Communications, Inc., Class A*,1 | | | 647,723 | | | | 834,638 | |
| | |
| | Communications Equipment - 3.2% | | | | | |
| | | |
| 24,979 | | Lumentum Holdings, Inc.* | | | 1,253,027 | | | | 1,840,952 | |
| | |
| | Data Processing & Outsourced Services - 8.5% | | | | | |
| | | |
| 17,188 | | EVO Payments, Inc., Class A* | | | 491,389 | | | | 262,976 | |
| | | |
| 16,123 | | Fiserv, Inc.* | | | 1,547,323 | | | | 1,531,524 | |
| | | |
| 13,750 | | Global Payments, Inc. | | | 976,822 | | | | 1,983,163 | |
| | | |
| 73,998 | | Repay Holdings Corp.* | | | 1,079,733 | | | | 1,061,871 | |
| | |
| | Electronic Equipment & Instruments - 2.4% | | | | | |
| | | |
| 16,752 | | Keysight Technologies, Inc.* | | | 1,020,501 | | | | 1,401,807 | |
| | |
| | Internet Services & Infrastructure - 2.1% | | | | | |
| | | |
| 210,000 | | Limelight Networks, Inc.* | | | 1,145,108 | | | | 1,197,000 | |
| | |
| | IT Consulting & Other Services - 3.9% | | | | | |
| | | |
| 19,618 | | Booz Allen Hamilton Holding Corp. | | | 827,143 | | | | 1,346,579 | |
| | | |
| 33,117 | | Perficient, Inc.* | | | 1,562,714 | | | | 897,140 | |
The accompanying notes are an integral part of these financial statements.
7
| | |
| | | AMG Managers Brandywine Advisors Mid Cap Growth Fund Schedule of Portfolio Investments (continued) |
| | | |
| | | |
| | | | | | | | | | |
| Shares | | | | Cost | | | Value | |
| |
Information Technology(continued) | | | | | |
| | |
| | Semiconductor Equipment - 1.9% | | | | | |
| | | |
| 34,000 | | Enphase Energy, Inc.* | | | $1,108,783 | | | | $1,097,860 | |
| | |
| | Semiconductors - 4.2% | | | | | |
| | | |
| 41,156 | | Advanced Micro Devices, Inc.* | | | 1,245,735 | | | | 1,871,775 | |
| | | |
| 14,358 | | Silicon Motion Technology Corp. ADR (Taiwan) | | | 674,355 | | | | 526,364 | |
| | | | | | | | | | |
| | |
Total Information Technology | | | 15,639,319 | | | | 17,299,246 | |
| | |
| | This sector is 10.6% above your Fund’s cost. | | | | | |
| | |
Materials | | | | | | | | |
| | |
| | Fertilizers & Agricultural Chemicals - 2.3% | | | | | |
| | | |
| 12,748 | | The ScottsMiracle-Gro Co. | | | 1,446,459 | | | | 1,305,395 | |
| | |
| | Gold - 1.4% | | | | | |
| | | |
| 71,008 | | SSR Mining, Inc. (Canada)* | | | 1,161,356 | | | | 808,071 | |
| | | | | | | | | | |
| | |
Total Materials | | | 2,607,815 | | | | 2,113,466 | |
| | |
| | This sector is 19.0% below your Fund’s cost. | | | | | |
| | |
Total Common Stocks | | | 57,041,067 | | | | 54,995,931 | |
| | | |
Principal
Amount | | | | | | | | | | |
Short-Term Investments - 7.7% | | | | | | | | |
| |
Joint Repurchase Agreements - 2.8%2 | | | | | |
| | | |
| $1,000,000 | | Citigroup Global Markets, Inc., dated 03/31/20, due 04/01/20, 0.020% total to be received $1,000,001 (collateralized by various U.S. Government Agency Obligations and U.S. Treasuries, 2.000% - 11.000%, 04/15/20 - 01/01/59, totaling $1,020,000) | | | 1,000,000 | | | | 1,000,000 | |
| | | | | | | | | | |
Principal
Amount | | | | Cost | | | Value | |
| | | |
| $608,412 | | Royal Bank of Canada, dated 03/31/20, due 04/01/20, 0.010% total to be received $608,412 (collateralized by various U.S. Government Agency Obligations, 2.500% - 5.000%, 08/01/23 - 06/01/51, totaling $620,580) | | | $608,412 | | | | $608,412 | |
| | | | | | | | | | |
| | | |
| | Total Joint Repurchase Agreements | | | 1,608,412 | | | | 1,608,412 | |
| | | |
| Shares | | | | | | | | | | |
| |
Other Investment Companies - 4.9% | | | | | |
| | | |
| 921,424 | | Dreyfus Government Cash Management Fund, Institutional Shares, 0.29%3 | | | 921,424 | | | | 921,424 | |
| | | |
| 921,424 | | Dreyfus Institutional Preferred Government Money Market Fund, Institutional Shares, 0.39%3 | | | 921,424 | | | | 921,424 | |
| | | |
| 949,345 | | JPMorgan U.S. Government Money Market Fund, IM Shares, 0.35%3 | | | 949,345 | | | | 949,345 | |
| | | |
| | Total Other Investment Companies | | | 2,792,193 | | | | 2,792,193 | |
| | | | | | | | | | |
| | |
Total Short-Term Investments | | | 4,400,605 | | | | 4,400,605 | |
| | |
Total Investments - 103.8% | | | 61,441,672 | | | | 59,396,536 | |
| | |
Other Assets, less Liabilities - (3.8%) | | | | | | | (2,188,043 | ) |
| | |
Total Net Assets - 100.0% | | | | | | | $57,208,493 | |
| | | | | | | | | | |
| * | Non-income producing security. |
| 1 | Some of these securities, amounting to $6,666,281 or 11.7% of net assets, were out on loan to various borrowers and are collateralized by cash and various U.S. Treasury Obligations. See Note 4 of Notes to Financial Statements. |
| 2 | Cash collateral received for securities lending activity was invested in these joint repurchase agreements. |
| 3 | Yield shown represents the March 31, 2020, seven day average yield, which refers to the sum of the previous seven days’ dividends paid, expressed as an annual percentage. |
ADR American Depositary Receipt
The accompanying notes are an integral part of these financial statements.
8
| | |
| | | AMG Managers Brandywine Advisors Mid Cap Growth Fund Schedule of Portfolio Investments (continued) |
| | | |
| | | |
The following table summarizes the inputs used to value the Fund’s investments by the fair value hierarchy levels as of March 31, 2020:
| | | | | | | | | | | | | | | | |
| | | Level 1 | | | Level 2 | | | Level 3 | | | Total | |
| | | | |
Investments in Securities | | | | | | | | | | | | | | | | |
| | | | |
Common Stocks† | | | $54,995,931 | | | | – | | | | – | | | $ | 54,995,931 | |
| | | | |
Short-Term Investments | | | | | | | | | | | | | | | | |
| | | | |
Joint Repurchase Agreements | | | – | | | $ | 1,608,412 | | | | – | | | | 1,608,412 | |
| | | | |
Other Investment Companies | | | 2,792,193 | | | | – | | | | – | | | | 2,792,193 | |
| | | | | | | | | | | | | | | | |
| | | | |
Total Investments in Securities | | | $57,788,124 | | | $ | 1,608,412 | | | | – | | | $ | 59,396,536 | |
| | | | | | | | | | | | | | | | |
| † | All common stocks held in the Fund are Level 1 securities. For a detailed breakout of common stocks by major industry classification, please refer to the Fund’s Schedule of Portfolio Investments. |
For the six months ended March 31, 2020, there were no transfers in or out of Level 3.
The accompanying notes are an integral part of these financial statements.
9
| | |
| | | Statement of Assets and Liabilities(unaudited) March 31, 2020 |
| | | |
| | | |
| | | | |
| | | AMG
Managers
Brandywine Advisors
Mid Cap
Growth Fund | |
| |
Assets: | | | | |
| |
Investments at value1(including securities on loan valued at $6,666,281) | | | $59,396,536 | |
| |
Receivable for investments sold | | | 2,535,733 | |
| |
Dividend and interest receivables | | | 7,191 | |
| |
Securities lending income receivable | | | 1,563 | |
| |
Receivable for Fund shares sold | | | 317 | |
| |
Prepaid expenses and other assets | | | 12,587 | |
| |
Total assets | | | 61,953,927 | |
| |
Liabilities: | | | | |
| |
Payable upon return of securities loaned | | | 1,608,412 | |
| |
Payable for investments purchased | | | 3,023,439 | |
| |
Payable for Fund shares repurchased | | | 2,451 | |
| |
Accrued expenses: | | | | |
| |
Investment advisory and management fees | | | 62,069 | |
| |
Administrative fees | | | 10,580 | |
| |
Distribution fees | | | 317 | |
| |
Shareholder service fees | | | 150 | |
| |
Other | | | 38,016 | |
| |
Total liabilities | | | 4,745,434 | |
| | | | |
| |
Net Assets | | | $57,208,493 | |
| |
1 Investments at cost | | | $61,441,672 | |
| |
Net Assets Represent: | | | | |
| |
Paid-in capital | | | $61,400,704 | |
| |
Total distributable loss | | | (4,192,211 | ) |
| |
Net Assets | | | $57,208,493 | |
| |
Class N: | | | | |
| |
Net Assets | | | $57,208,493 | |
| |
Shares outstanding | | | 6,565,217 | |
| |
Net asset value, offering and redemption price per share | | | $8.71 | |
The accompanying notes are an integral part of these financial statements.
10
| | |
| | | Statement of Operations(unaudited) For the six months ended March 31, 2020 |
| | | |
| | | |
| | | | |
| | | AMG
Managers
Brandywine Advisors
Mid Cap
Growth Fund | |
| |
Investment Income: | | | | |
| |
Dividend income | | | $357,374 | |
| |
Interest income | | | 44,421 | |
| |
Securities lending income | | | 38,600 | |
| |
Total investment income | | | 440,395 | |
| |
Expenses: | | | | |
| |
Investment advisory and management fees | | | 621,770 | |
| |
Administrative fees | | | 105,984 | |
| |
Distribution fees - Class N | | | 3,180 | |
| |
Shareholder servicing fees - Class N | | | 1,505 | |
| |
Professional fees | | | 19,859 | |
| |
Custodian fees | | | 13,323 | |
| |
Registration fees | | | 12,133 | |
| |
Reports to shareholders | | | 9,987 | |
| |
Trustee fees and expenses | | | 6,522 | |
| |
Transfer agent fees | | | 2,130 | |
| |
Miscellaneous | | | 4,063 | |
| |
Total expenses | | | 800,456 | |
| | | | |
| |
Net investment loss | | | (360,061 | ) |
| |
Net Realized and Unrealized Loss: | | | | |
| |
Net realized gain on investments | | | 3,312,946 | |
| |
Net change in unrealized appreciation/depreciation on investments | | | (20,639,700 | ) |
| |
Net realized and unrealized loss | | | (17,326,754 | ) |
| | | | |
| |
Net decrease in net assets resulting from operations | | | $(17,686,815 | ) |
The accompanying notes are an integral part of these financial statements.
11
| | |
| | | Statements of Changes in Net Assets For the six months ended March 31, 2020 (unaudited) and the fiscal year ended September 30, 2019 |
| | | |
| | | |
| | | | | | | | |
| | | AMG Managers Brandywine Advisors Mid Cap Growth Fund | |
| | |
| | | March 31, 2020 | | | September 30, 2019 | |
| | |
Decrease in Net Assets Resulting From Operations: | | | | | | | | |
| | |
Net investment loss | | | $(360,061 | ) | | | $(541,003 | ) |
| | |
Net realized gain on investments | | | 3,312,946 | | | | 207,945 | |
| | |
Net change in unrealized appreciation/depreciation on investments | | | (20,639,700 | ) | | | (12,826,167 | ) |
| | |
Net decrease in net assets resulting from operations | | | (17,686,815 | ) | | | (13,159,225 | ) |
| | |
Distributions to Shareholders: | | | | | | | | |
| | |
Class N | | | (4,510,940 | ) | | | (11,524,622 | ) |
| | |
Capital Share Transactions:1 | | | | | | | | |
| | |
Net increase (decrease) from capital share transactions | | | (62,877,822 | ) | | | 11,401,800 | |
| | | | | | | | |
| | |
Total decrease in net assets | | | (85,075,577 | ) | | | (13,282,047 | ) |
| | |
Net Assets: | | | | | | | | |
| | |
Beginning of period | | | 142,284,070 | | | | 155,566,117 | |
| | |
End of period | | | $57,208,493 | | | | $142,284,070 | |
1 See Note 1(g) of the Notes to Financial Statements.
The accompanying notes are an integral part of these financial statements.
12
| | |
| | | AMG Managers Brandywine Advisors Mid Cap Growth Fund Financial Highlights For a share outstanding throughout each fiscal period |
| | | |
| | | |
| | | | | | | | | | | | | | | | | | | | | | | | |
| | | For the six
months ended
March 31, 2020 (unaudited) | | | For the fiscal years ended September 30, | |
| Class N | | 2019 | | | 2018 | | | 20171 | | | 2016 | | | 2015 | |
|
| | | | | | |
Net Asset Value, Beginning of Period | | | $11.12 | | | | $13.42 | | | | $11.15 | | | | $9.35 | | | | $9.26 | | | | $9.59 | |
| | | | | | |
Income (loss) from Investment Operations: | | | | | | | | | | | | | | | | | | | | | | | | |
| | | | | | |
Net investment income (loss)2 | | | (0.03 | ) | | | (0.04 | ) | | | (0.05 | ) | | | (0.06 | ) | | | (0.03 | ) | | | 0.03 | 3 |
| | | | | | |
Net realized and unrealized gain (loss) on investments | | | (2.03 | ) | | | (1.27 | ) | | | 2.32 | | | | 1.86 | | | | 0.12 | | | | (0.36 | ) |
| | | | | | |
Total income (loss) from investment operations | | | (2.06 | ) | | | (1.31 | ) | | | 2.27 | | | | 1.80 | | | | 0.09 | | | | (0.33 | ) |
| | | | | | |
Less Distributions to Shareholders from: | | | | | | | | | | | | | | | | | | | | | | | | |
| | | | | | |
Net realized gain on investments | | | (0.35 | ) | | | (0.99 | ) | | | — | | | | — | | | | — | | | | — | |
| | | | | | |
Net Asset Value, End of Period | | | $8.71 | | | | $11.12 | | | | $13.42 | | | | $11.15 | | | | $9.35 | | | | $9.26 | |
| | | | | | |
Total Return4 | | | (19.29 | )%5 | | | (8.45 | )% | | | 20.36 | % | | | 19.25 | % | | | 0.97 | % | | | (3.44 | )% |
| | | | | | |
Ratio of expenses to average net assets | | | 1.13 | %6 | | | 1.12 | % | | | 1.13 | % | | | 1.15 | % | | | 1.15 | % | | | 1.14 | % |
| | | | | | |
Ratio of net investment income (loss) to average net assets | | | (0.51 | )%6 | | | (0.38 | )% | | | (0.45 | )% | | | (0.62 | )% | | | (0.33 | )% | | | 0.28 | % |
| | | | | | |
Portfolio turnover | | | 108 | %5 | | | 177 | % | | | 167 | % | | | 215 | % | | | 195 | % | | | 204 | % |
| | | | | | |
Net assets end of period (000’s) omitted | | | $57,208 | | | | $142,284 | | | | $155,566 | | | | $129,532 | | | | $132,794 | | | | $143,205 | |
| | |
| | |
| 1 | Effective October 1, 2016, the Fund’s shares were reclassified and redesignated to Class N shares. |
| 2 | Per share numbers have been calculated using average shares. |
| 3 | Includesnon-recurring dividends. Without these dividends, net investment loss per share would have been $(0.03). |
| 4 | The total return is calculated using the published Net Asset Value as of period end. |
13
| | |
| | | Notes to Financial Statements(unaudited) March 31, 2020 |
| | | |
| | | |
1. ORGANIZATION AND SUMMARY OF SIGNIFICANT ACCOUNTING POLICIES
AMG Funds I (the “Trust”) is anopen-end management investment company, organized as a Massachusetts business trust, and registered under the Investment Company Act of 1940, as amended (the “1940 Act”). Currently, the Trust consists of a number of different funds, each having distinct investment management objectives, strategies, risks, and policies. Included in this report is the AMG Managers Brandywine Advisors Mid Cap Growth Fund (the “Fund”).
A significant portion of the Fund’s holdings may be focused in a relatively small number of securities, which may make the Fund more volatile and subject to greater risk than a more diversified fund.
The Fund’s financial statements are prepared in accordance with accounting principles generally accepted in the United States of America (“U.S. GAAP”), including accounting and reporting guidance pursuant to Accounting Standards Codification Topic 946 applicable to investment companies. U.S. GAAP requires management to make estimates and assumptions that affect the reported amounts of assets and liabilities and disclosure of contingent assets and liabilities at the date of the financial statements and the reported amounts of income and expenses during the reporting period. Actual results could differ from those estimates and such differences could be material. The following is a summary of significant accounting policies followed by the Fund in the preparation of its financial statements:
a. VALUATION OF INVESTMENTS
Equity securities traded on a national securities exchange or reported on the NASDAQ national market system (“NMS”) are valued at the last quoted sales price on the primary exchange or, if applicable, the NASDAQ official closing price or the official closing price of the relevant exchange or, lacking any sales, at the last quoted bid price or the mean between the last quoted bid and ask prices (the “mean price”). Equity securities traded in theover-the-counter market (other than NMS securities) are valued at the mean price. Foreign equity securities (securities principally traded in markets other than U.S. markets) are valued at the official closing price on the primary exchange or, for markets that either do not offer an official closing price or where the official closing price may not be representative of the overall market, the last quoted sale price.
Fixed income securities purchased with a remaining maturity of 60 days or less are valued at amortized cost, provided that the amortized cost value is approximately the same as the fair value of the security valued without the use of amortized cost. Investments in otheropen-end registered investment companies are valued at their end of day net asset value per share.
The Fund’s portfolio investments are generally valued based on independent market quotations or prices or, if none, “evaluative” or other market based valuations provided by third party pricing services approved by the Board of Trustees of the Trust (the “Board”). Under certain circumstances, the value of certain Fund portfolio investments may be based on an evaluation of fair value, pursuant to procedures established by and under the general supervision of the Board. The Valuation Committee, which is comprised of the Independent Trustees of the Board, and the Pricing Committee, which is comprised of representatives from AMG Funds LLC (the “Investment Manager”) are the committees appointed by the Board to make fair value determinations. The Fund may use the fair value of a portfolio investment to calculate its net asset value (“NAV”) in the event that the market quotation, price or market based valuation for the portfolio investment is
not readily available or otherwise not determinable pursuant to the Board’s valuation procedures, if the Investment Manager or the Pricing Committee believes the quotation, price or market based valuation to be unreliable, or in certain other circumstances. When determining the fair value of an investment, the Pricing Committee and, if required under the Trust’s securities valuation procedures, the Valuation Committee, seeks to determine the price that the Fund might reasonably expect to receive from current sale of that portfolio investment in an arms-length transaction. Fair value determinations shall be based upon consideration of all available facts and information, including, but not limited to (i) attributes specific to the investment; (ii) fundamental and analytical data relating to the investment; and (iii) the value of other comparable securities or relevant financial instruments, including derivative securities, traded on other markets or among dealers.
The values assigned to fair value portfolio investments are based on available information and do not necessarily represent amounts that might ultimately be realized in the future, since such amounts depend on future developments inherent in long-term investments. Because of the inherent uncertainty of valuation, those estimated values may differ significantly from the values that would have been used had a ready market for the investments existed, and the differences could be material. The Board will be presented with a quarterly report showing as of the most recent quarter end, all outstanding securities fair valued by the Fund, including a comparison with the prior quarter end and the percentage of the Fund that the security represents at each quarter end.
With respect to foreign equity securities and certain foreign fixed income securities, the Board has adopted a policy that securities held in the Fund that can be fair valued by the applicable fair value pricing service are fair valued on each business day provided that each individual price exceeds apre-established confidence level.
U.S. GAAP defines fair value as the price that a fund would receive to sell an asset or pay to transfer a liability in an orderly transaction between market participants at the measurement date. U.S. GAAP also establishes a framework for measuring fair value, and a three level hierarchy for fair value measurements based upon the transparency of inputs to the valuation of an asset or liability. Inputs may be observable or unobservable and refer broadly to the assumptions that market participants would use in pricing the asset or liability. Observable inputs reflect the assumptions market participants would use in pricing the asset or liability based on market data obtained from sources independent of the Fund. Unobservable inputs reflect the Fund’s own assumptions about the assumptions that market participants would use in pricing the asset or liability developed based on the best information available in the circumstances. Each investment is assigned a level based upon the observability of the inputs which are significant to the overall valuation.
The three-tier hierarchy of inputs is summarized below:
Level 1 – inputs are quoted prices in active markets for identical investments (e.g., equity securities,open-end investment companies)
Level 2 – other observable inputs (including, but not limited to: quoted prices for similar assets or liabilities in markets that are active, quoted prices for identical or similar assets or liabilities in markets that are not active, inputs other than quoted prices that are observable for the assets or liabilities (such as interest rates, yield curves, volatilities, prepayment speeds, loss severities, credit risks and default rates) or other market corroborated inputs) (e.g., debt securities, government securities, foreign currency exchange contracts, swaps, foreign securities utilizing international fair value pricing, fair valued securities with observable inputs)
14
| | |
| | | Notes to Financial Statements(continued) |
| | | |
| | | |
Level 3 – inputs are significant unobservable inputs (including the Fund’s own assumptions used to determine the fair value of investments) (e.g., fair valued securities with unobservable inputs)
Changes in inputs or methodologies used for valuing investments may result in a transfer in or out of levels within the fair value hierarchy. The inputs or methodologies used for valuing investments may not necessarily be an indication of the risk associated with investing in those investments.
b. SECURITY TRANSACTIONS
Security transactions are accounted for as of trade date. Realized gains and losses on securities sold are determined on the basis of identified cost.
c. INVESTMENT INCOME AND EXPENSES
Dividend income is recorded on theex-dividend date. Dividends from foreign securities are recorded on theex-dividend date, and if after the fact, as soon as the Fund becomes aware of theex-dividend date. Interest income, which includes amortization of premium and accretion of discount on debt securities, is accrued as earned. Dividend and interest income on foreign securities is recorded gross of any withholding tax.Non-cash dividends included in dividend income, if any, are reported at the fair market value of the securities received. Other income and expenses are recorded on an accrual basis. Expenses that cannot be directly attributed to a Fund are apportioned among the funds in the Trust and other trusts or funds within the AMG Funds Family of Funds (collectively the “AMG Funds Family”) based upon their relative average net assets or number of shareholders.
d. DIVIDENDS AND DISTRIBUTIONS
Fund distributions resulting from either net investment income or realized net capital gains, if any, will normally be declared and paid at least annually in December. Distributions to shareholders are recorded on theex-dividend date. Distributions are determined in accordance with federal income tax regulations, which may differ from net investment income and net realized capital gains for financial statement purposes (U.S. GAAP). Differences may be permanent or temporary. Permanent differences are reclassified among capital accounts in the financial statements to reflect their tax character. Permanent book and tax basis differences, if any, relating to shareholder distributions will result in reclassifications topaid-in capital. Temporary differences arise when certain items of income, expense and gain or loss are recognized in different periods for
financial statement and tax purposes; these differences will reverse at some time in the future. Permanent differences are primarily due to a net operating loss write off and distributions in excess of accumulated realized gain. Temporary differences are primarily due to qualified late year ordinary losses and wash sales.
At March 31, 2020, the aggregate cost for federal income tax purposes approximates the aggregate cost for book purposes. The approximate cost of investments and the aggregate gross unrealized appreciation and depreciation for federal income tax purposes were as follows:
| | | | | | | | | | | | |
| Cost | | Appreciation | | | Depreciation | | | Net | |
| | | |
| $61,441,672 | | | $5,202,106 | | | | $(7,247,242) | | | | $(2,045,136 | ) |
e. FEDERAL TAXES
The Fund currently qualifies as an investment company and intends to comply with the requirements under Subchapter M of the Internal Revenue Code of 1986, as amended, and to distribute substantially all of its taxable income and gains to its shareholders and to meet certain diversification and income requirements with respect to investment companies. Therefore, no provision for federal income or excise tax is included in the accompanying financial statements.
Additionally, based on the Fund’s understanding of the tax rules and rates related to income, gains and transactions for the foreign jurisdictions in which it invests, the Fund will provide for foreign taxes, and where appropriate, deferred foreign taxes.
Management has analyzed the Fund’s tax positions taken on federal income tax returns for all open tax years (generally, the three prior taxable years), and has concluded that no provision for federal income tax is required in the Fund’s financial statements. Additionally, Management is not aware of any tax position for which it is reasonably possible that the total amounts of unrecognized tax benefits will change materially in the next twelve months.
f. CAPITAL LOSS CARRYOVERS AND DEFERRALS
As of September 30, 2019, the Fund had no capital loss carryovers for federal income tax purposes. Should the Fund incur net capital losses for the fiscal year ended September 30, 2020, such amounts may be used to offset future realized capital gains indefinitely, and retain their character as short-term and/or long-term.
15
| | |
| | | Notes to Financial Statements(continued) |
| | | |
| | | |
g. CAPITAL STOCK
The Trust’s Declaration of Trust authorizes for the Fund the issuance of an unlimited number of shares of beneficial interest, without par value. The Fund records sales and repurchases of its capital stock on the trade date.
For the six months ended March 31, 2020 (unaudited) and the fiscal year ended September 30, 2019, the capital stock transactions by class for the Fund were as follows:
| | | | | | | | | | | | | | | | |
| | | March 31, 2020 | | | September 30, 2019 | |
| | | | |
| | | Shares | | | Amount | | | Shares | | | Amount | |
Class N: | | | | | | | | | | | | | | | | |
| | | | |
Proceeds from sale of shares | | | 23,794 | | | | $271,310 | | | | 32,097 | | | | $360,912 | |
| | | | |
Reinvestment of distributions | | | 388,750 | | | | 4,509,500 | | | | 1,216,548 | | | | 11,520,715 | |
| | | | |
Cost of shares repurchased | | | (6,644,988) | | | | (67,658,632) | | | | (43,323) | | | | (479,827) | |
| | | | | | | | | | | | | | | | |
| | | | |
Net increase (decrease) | | | (6,232,444) | | | | $(62,877,822) | | | | 1,205,322 | | | | $11,401,800 | |
| | | | | | | | | | | | | | | | |
At March 31, 2020, an affiliated shareholder of record individually owns 92% of the net assets of the Fund. Transactions by this shareholder may have a material impact on the Fund.
h. REPURCHASE AGREEMENTS AND JOINT REPURCHASE AGREEMENTS
The Fund may enter into third-party repurchase agreements for temporary cash management purposes and third-party or bilateral joint repurchase agreements for reinvestment of cash collateral on securities lending transactions under the securities lending program offered by The Bank of New York Mellon (“BNYM”) (the “Program”) (collectively, “Repurchase Agreements”). The value of the underlying collateral, including accrued interest, must equal or exceed the value of the Repurchase Agreements during the term of the agreement. For joint repurchase agreements, the Fund participates on a pro rata basis with other clients of BNYM in its share of the underlying collateral under such joint repurchase agreements and in its share of proceeds from any repurchase or other disposition of the underlying collateral. The underlying collateral for all Repurchase Agreements is held in safekeeping by the Fund’s custodian or at the Federal Reserve Bank. If the seller defaults and the value of the collateral declines, or if bankruptcy proceedings commence with respect to the seller of the security, realization of the collateral by the Fund may be delayed or limited. Pursuant to the Program, the Fund is indemnified for such losses by BNYM on joint repurchase agreements.
At March 31, 2020, the market value of Repurchase Agreements outstanding was $1,608,412.
2. AGREEMENTS AND TRANSACTIONS WITH AFFILIATES
The Trust has entered into an investment advisory agreement under which the Investment Manager, a subsidiary and the U.S. retail distribution arm of Affiliated Managers Group, Inc. (“AMG”), serves as investment manager to the Fund and is responsible for the Fund’s overall administration and operations. The Investment Manager selects one or more subadvisers for the Fund (subject to Board approval) and monitors each subadviser’s investment performance, security holdings and investment strategies. The Fund’s investment portfolio is managed by Friess Associates, LLC (“Friess”) and Friess Associates of Delaware, LLC (“Friess of Delaware”) who serve pursuant to a subadvisory agreement with the Investment Manager.
Investment management fees are paid directly by the Fund to the Investment Manager based on average daily net assets. For the six months ended March 31, 2020, the Fund’s investment management fee was paid at the annual rate of 0.88% of the average daily net assets of the Fund.
The Trust, on behalf of the Fund, has entered into an amended and restated Administration Agreement under which the Investment Manager serves as the Fund’s administrator (the “Administrator”) and is responsible for allnon-portfolio management aspects of managing the Fund’s operations, including administration and shareholder services to the Fund. The Fund pays a fee to the Administrator at the rate of 0.15% per annum of the Fund’s average daily net assets for this service.
The Fund is distributed by AMG Distributors, Inc. (the “Distributor”), a wholly-owned subsidiary of the Investment Manager. The Distributor serves as the distributor and underwriter for the Fund and is a registered broker-dealer and member of the Financial Industry Regulatory Authority, Inc. (“FINRA”). Shares of the Fund will be continuously offered and will be sold directly to prospective purchasers and through brokers, dealers or other financial intermediaries who have executed selling agreements with the Distributor. Generally the Distributor bears all or a portion of the expenses of providing services pursuant to the distribution agreement, including the payment of the expenses relating to the distribution of prospectuses for sales purposes and any advertising or sales literature.
The Trust has adopted a distribution and service plan (the “Plan”) with respect to the Class N shares, in accordance with the requirements of Rule12b-1 under the 1940 Act and the requirements of the applicable rules of FINRA regarding asset-based sales charges. Pursuant to the Plan, the Fund may make payments to the Distributor for its expenditures in financing any activity primarily intended to result in the sale of the Fund’s Class N shares and for maintenance and personal service provided to existing shareholders of that class. The Plan authorized payments to the Distributor up to 0.25% annually of the Fund’s average daily net assets attributable to the Class N shares. The actual amount incurred for Class N shares was less than 0.01%.
The Board has approved reimbursement payments to the Investment Manager for shareholder servicing expenses (“shareholder servicing fees”) incurred. Shareholder servicing fees include payments to financial intermediaries, such as
16
| | |
| | | Notes to Financial Statements(continued) |
| | | |
| | | |
broker-dealers (including fund supermarket platforms), banks, and trust companies who provide shareholder recordkeeping, account servicing and other services. The Fund may reimburse the Investment Manager for the actual amount incurred up to a maximum annual rate of the Fund’s average daily net assets as shown in the table below.
The impact on the annualized expense ratios for the six months ended March 31, 2020, were as follows:
| | | | | | | | |
| | | Maximum Annual
Amount
Approved | | | Actual
Amount
Incurred | |
Class N | | | 0.15 | % | | | 0.00%1 | |
1 Less than 0.005%.
The Board provides supervision of the affairs of the Trust and other trusts within the AMG Funds Family. The Trustees of the Trust who are not affiliated with the Investment Manager receive an annual retainer and per meeting fees for regular, special and telephonic meetings, and they are reimbursed forout-of-pocket expenses incurred while carrying out their duties as Board members. The Chairman of the Board and the Audit Committee Chair receive additional annual retainers. Certain Trustees and Officers of the Fund are Officers and/or Directors of the Investment Manager, AMG and/or the Distributor.
The Securities and Exchange Commission (the “SEC”) granted an exemptive order that permits the Fund to lend and borrow money for certain temporary purposes directly to and from other eligible funds in the AMG Funds Family. Participation in this interfund lending program is voluntary for both the borrowing and lending funds, and an interfund loan is only made if it benefits each participating fund. The Administrator manages the program according to procedures approved by the Board, and the Board monitors the operation of the program. An interfund loan must comply with certain conditions set out in the exemptive order, which are designed to assure fairness and protect all participating funds. For the six months ended March 31, 2020, the Fund borrowed an average of $6,133,535, for four days paying interest in the amount of $1,583 at a weighted average rate of 2.355%. The interest expense amount is included in the Statement of Operations as miscellaneous expense. At March 31, 2020, the Fund had no interfund loans outstanding.
3. PURCHASES AND SALES OF SECURITIES
Purchases and sales of securities (excluding short-term securities and U.S. Government Obligations) for the six months ended March 31, 2020, were $141,645,884 and $204,570,924, respectively.
The Fund had no purchases or sales of U.S. Government Obligations during the six months ended March 31, 2020.
4. PORTFOLIO SECURITIES LOANED
The Fund participates in the Program providing for the lending of securities to qualified borrowers. Securities lending income includes earnings of such
temporary cash investments, plus or minus any rebate to a borrower. These earnings (after any rebate) are then divided between BNYM, as a fee for its services under the Program, and the Fund, according to agreed-upon rates.
Collateral on all securities loaned is accepted in cash, U.S. Treasury Obligations or U.S. Government Agency Obligations. Collateral is maintained at a minimum level of 102% (105% in the case of certain foreign securities) of the market value, plus interest, if applicable, of investments on loan. It is the Fund’s policy to obtain additional collateral from or return excess collateral to the borrower by the end of the next business day, following the valuation date of the securities loaned. Therefore, the value of the collateral held may be temporarily less than the value of the securities on loan. Lending securities entails a risk of loss to the Fund if and to the extent that the market value of the securities loaned were to increase and the borrower did not increase the collateral accordingly, and the borrower fails to return the securities. Under the terms of the Program, the Fund is indemnified for such losses by BNYM. Cash collateral is held in separate omnibus accounts managed by BNYM, who is authorized to exclusively enter into joint repurchase agreements for that cash collateral. Securities collateral is held in separate omnibus accounts managed by BNYM that cannot be sold or pledged. BNYM bears the risk of any deficiency in the amount of the cash collateral available for return to the borrower due to any loss on the collateral invested. Loans of securities are terminable at any time and the borrower, after notice, is required to return borrowed securities as soon as practical, which is normally within three business days.
The value of securities loaned on positions held, cash collateral and securities collateral received at March 31, 2020, were as follows:
| | | | | | |
Securities Loaned | | Cash Collateral Received | | Securities Collateral Received | | Total Collateral Received |
$6,666,281 | | $1,608,412 | | $5,559,008 | | $7,167,420 |
The following table summarizes the securities received as collateral for securities lending at March 31, 2020:
| | | | |
Collateral Type | | Coupon Range | | Maturity Date Range |
U.S. Treasury Obligations | | 0.000%-6.875% | | 04/07/20-08/15/49 |
5. COMMITMENTS AND CONTINGENCIES
Under the Trust’s organizational documents, its trustees and officers are indemnified against certain liabilities arising out of the performance of their duties to the Trust. In addition, in the normal course of business, the Fund may enter into contracts and agreements that contain a variety of representations and warranties, which provide general indemnifications. The maximum exposure to the Fund under these arrangements is unknown, as this would involve future claims that may be made against the Fund that have not yet occurred. However, based on experience, the Fund had no prior claims or losses and expects the risks of loss to be remote.
17
| | |
| | | Notes to Financial Statements(continued) |
| | | |
| | | |
6. MASTER NETTING AGREEMENTS
The Fund may enter into master netting agreements with its counterparties for the securities lending program and Repurchase Agreements, which provide the right, in the event of default (including bankruptcy or insolvency) for thenon-defaulting party to liquidate the collateral and calculate net exposure to the defaulting party or request additional collateral. For financial reporting purposes, the Fund does not offset financial assets and financial liabilities that are subject to master netting agreements in the Statement of Assets and Liabilities. For securities lending transactions, see Note 4.
The following table is a summary of the Fund’s open Repurchase Agreements that are subject to a master netting agreement as of March 31, 2020:
| | | | | | | | | | | | | | | | | | | | | | | | | |
| | | | | Gross Amount Not Offset in the Statement of Assets and Liabilities | | | | |
| | | Gross Amounts of
Assets Presented in the Statement of
Assets and Liabilities | | Offset Amount | | Net Asset Balance | | Collateral Received | | Net Amount |
| | | | | | | | | | | |
| | | | | | | | | | | | | | | | | | | | | | | | | |
| | | | | |
Citigroup Global Markets, Inc. | | | | $1,000,000 | | | | | – | | | | | $1,000,000 | | | | | $1,000,000 | | | | | – | |
| | | | | |
Royal Bank of Canada | | | | 608,412 | | | | | – | | | | | 608,412 | | | | | 608,412 | | | | | – | |
| | | | | | | | | | | | | | | | | | | | | | | | | |
| | | | | |
Total | | | | $1,608,412 | | | | | – | | | | | $1,608,412 | | | | | $1,608,412 | | | | | – | |
| | | | | | | | | | | | | | | | | | | | | | | | | |
7. SUBSEQUENT EVENTS
The Fund has determined that no material events or transactions occurred through the issuance date of the Fund’s financial statements which require an additional disclosure in or adjustment of the Fund’s financial statements. On April 2, 2020, the Board approved a plan to liquidate and terminate the Fund, which is expected to occur on or about May 15, 2020.
18
| | |
| | | Funds Liquidity Risk Management Program |
| | | |
| | | |
| | | | | | | | |
The Securities and Exchange Commission (the “SEC”) adopted Rule22e-4 under the Investment Company Act of 1940, as amended (the “Liquidity Rule”), to promote effective liquidity risk management throughout theopen-end investment company industry, thereby reducing the risk that a fund will be unable to meet its redemption obligations and mitigating dilution of the interests of fund shareholders. The AMG Funds Family of Funds (each a “Fund,” and collectively, the “Funds”) have adopted and implemented a Liquidity Risk Management Program (the “Program”) as required by the Liquidity Rule. The Program is reasonably designed to assess and manage each Fund’s liquidity risk, taking into consideration the Fund’s investment strategy and the liquidity of its portfolio investments during normal and reasonably foreseeable stressed conditions, its short and long-term cash flow projections, and its holdings of cash and cash equivalents, as well as borrowing arrangements and other funding sources, including access to the Funds’ credit facility. Under the Liquidity Rule, each liquidity classification category (highly liquid, moderately liquid, less liquid and illiquid) is defined with respect to the time it is reasonably expected to take to convert the investment to cash (or sell or dispose of the investment) in current market conditions without significantly changing the market value of the investment. The Funds’ Board of Trustees (the “Board”) appointed AMG Funds, LLC (“AMGF”) as the Program administrator. AMGF formed a Liquidity Risk Management Committee (“LRMC”), which includes | | | | members of various departments across AMGF, including Legal, Compliance, Mutual Fund Services, Investment Research and Product Analysis & Operations and, as needed, other representatives of AMGF and/or representatives of the subadvisers to the Funds. The LRMC meets on a periodic basis, no less frequently than monthly. The LRMC is responsible for the Program’s administration and oversight and for reporting to the Board on at least an annual basis regarding the Program’s operation and effectiveness. At a meeting of the Board held on March 19, 2020, the Board received a report from the LRMC regarding the design and operational effectiveness of the Program for the period December 1, 2018 through December 31, 2019 (the “Program Reporting Period”). The Program complied with the key factors for consideration under the Liquidity Rule for assessing, managing and periodically reviewing a Fund’s liquidity risk, as follows: A. The Fund’s investment strategy and liquidity of portfolio investments during both normal and reasonably foreseeable stressed conditions: During the Program Reporting Period, the LRMC reviewed whether each Fund’s investment strategy and liquidity of portfolio investments during both normal and reasonably foreseeable stressed conditions is appropriate for anopen-end fund structure. The LRMC also factored a Fund’s concentration in an issuer into the liquidity classification methodology by taking issuer position sizes into account. | | | | B. Short-term and long-term cash flow projections during both normal and reasonably foreseeable stressed conditions: During the Program Reporting Period, the LRMC reviewed historical net redemption activity and used this information as a component to establish each Fund’s reasonably anticipated trading size. The Funds maintain anin-kind redemption policy, which may be utilized to meet larger redemption requests, when appropriate. The LRMC may also take into consideration a Fund’s shareholder ownership concentration, a Fund’s distribution channels, and the degree of certainty associated with a Fund’s short-term and long-term cash flow projections. C. Holdings of cash and cash equivalents, as well as borrowing arrangements: The LRMC considered the terms of the credit facilities available to the Funds. The report concluded that, based upon the review of the Program, using resources and methodologies that AMGF considers reasonable, AMGF believes that the Program and Funds’ Liquidity Risk Management Policies and Procedures are adequate, effective, and reasonably designed to effectively manage the Funds’ liquidity risk. There can be no assurance that the Program will achieve its objectives in the future. Please refer to each Fund’s prospectus or statement of additional information for more information regarding a Fund’s exposure to liquidity risk and other principal risks to which an investment in a Fund may be subject. |
19
THIS PAGE INTENTIONALLY LEFT BLANK
| | |
|
| | | |
| | | |
| | | | |
INVESTMENT MANAGER AND ADMINISTRATOR AMG Funds LLC 600 Steamboat Road, Suite 300 Greenwich, CT 06830 800.548.4539 DISTRIBUTOR AMG Distributors, Inc. 600 Steamboat Road, Suite 300 Greenwich, CT 06830 800.548.4539 SUBADVISER Friess Associates, LLC P.O. Box 576 Jackson, Wyoming 83001 Friess Associates of Delaware, LLC P.O. Box 4166 Greenville, DE 19807 CUSTODIAN The Bank of New York Mellon 111 Sanders Creek Parkway East Syracuse, NY 13057 | | LEGAL COUNSEL Ropes & Gray LLP Prudential Tower, 800 Boylston Street Boston, MA 02199-3600 TRANSFER AGENT BNY Mellon Investment Servicing (US) Inc. Attn: AMG Funds P.O. Box 9769 Providence, RI 02940 800.548.4539 TRUSTEES Bruce B. Bingham Christine C. Carsman Edward J. Kaier Kurt Keilhacker Steven J. Paggioli Richard F. Powers III Eric Rakowski Victoria Sassine Thomas R. Schneeweis | | This report is prepared for the Fund’s shareholders. It is authorized for distribution to prospective investors only when preceded or accompanied by an effective prospectus. To receive a free copy of the prospectus or Statement of Additional Information, which includes additional information about Fund Trustees, please contact us by calling 800.548.4539. Distributed by AMG Distributors, Inc., member FINRA/SIPC. Current net asset values per share for the Fund are available on the Fund’s website at amgfunds.com. A description of the policies and procedures the Fund uses to vote its proxies is available: (i) without charge, upon request, by calling 800.548.4539, or (ii) on the Securities and Exchange Commission’s (SEC) website at sec.gov. For information regarding the Fund’s proxy voting record for the12-month period ended June 30, call 800.548.4539 or visit the SEC website at sec.gov. The Fund files its complete schedule of portfolio holdings with the SEC for the first and third quarters of each fiscal year as an exhibit to their reports on FormN-PORT. The Fund’s portfolio holdings on FormN-PORT are available on the SEC’s website at sec.gov. To review a complete list of the Fund’s portfolio holdings, or to view the most recent quarterly holdings report, semiannual report or annual report, please visit amgfunds.com. amgfunds.com. |
| | |
|
| | | |
| | | |
| | | | | | | | | | |
AFFILIATE SUBADVISED FUNDS BALANCED FUNDS AMG GW&K Global Allocation GW&K Investment Management, LLC AMG FQ Global Risk-Balanced First Quadrant, L.P. EQUITY FUNDS AMG FQ Tax-Managed U.S. Equity AMG FQ Long-Short Equity First Quadrant, L.P. AMG Frontier Small Cap Growth Frontier Capital Management Co., LLC AMG GW&K Small Cap Core AMG GW&K Small/Mid Cap AMG GW&K Emerging Markets Equity AMG GW&K Emerging Wealth Equity GW&K Investment Management, LLC AMG Renaissance Large Cap Growth The Renaissance Group LLC AMG River Road Dividend All Cap Value AMG River Road Focused Absolute Value AMG River Road Long-Short AMG River Road Small-Mid Cap Value AMG River Road Small Cap Value River Road Asset Management, LLC AMG SouthernSun Small Cap AMG SouthernSun U.S. Equity SouthernSun Asset Management, LLC | | | | AMG TimesSquare Emerging Markets Small Cap AMG TimesSquare Global Small Cap AMG TimesSquare International Small Cap AMG TimesSquare Mid Cap Growth AMG TimesSquare Small Cap Growth TimesSquare Capital Management, LLC AMG Yacktman AMG Yacktman Focused AMG Yacktman Focused Fund - Security Selection Only AMG Yacktman Special Opportunities Yacktman Asset Management LP FIXED INCOME FUNDS AMG GW&K Core Bond ESG AMG GW&K Enhanced Core Bond ESG AMG GW&K Municipal Bond AMG GW&K Municipal Enhanced Yield GW&K Investment Management, LLC OPEN-ARCHITECTURE FUNDS EQUITY FUNDS AMG Managers Brandywine AMG Managers Brandywine Blue Friess Associates, LLC AMG Managers Cadence Emerging Companies AMG Managers Cadence Mid Cap Cadence Capital Management LLC AMG Managers CenterSquare Real Estate CenterSquare Investment Management LLC | | | | AMG Managers Emerging Opportunities WEDGE Capital Management L.L.P. Next Century Growth Investors LLC RBC Global Asset Management (U.S.) Inc. AMG Managers Fairpointe Mid Cap Fairpointe Capital LLC AMG Managers LMCG Small Cap Growth LMCG Investments, LLC AMG Managers Montag & Caldwell Growth Montag & Caldwell, LLC AMG Managers Pictet International Pictet Asset Management Limited AMG Managers Silvercrest Small Cap Silvercrest Asset Management Group LLC AMG Managers Skyline Special Equities Skyline Asset Management, L.P. AMG Managers Special Equity Ranger Investment Management, L.P. Lord, Abbett & Co. LLC Smith Asset Management Group, L.P. Federated MDTA LLC FIXED INCOME FUNDS AMG Managers Doubleline Core Plus Bond DoubleLine Capital LP AMG Managers Global Income Opportunity AMG Managers Loomis Sayles Bond Loomis, Sayles & Company, L.P. | | |
| | | | |
amgfunds.com | | | | 033120 SAR075 |
Not applicable for the semi-annual shareholder report.
| Item 3. | AUDIT COMMITTEE FINANCIAL EXPERT |
Not applicable for the semi-annual shareholder report.
| Item 4. | PRINCIPAL ACCOUNTANT FEES AND SERVICES |
Not applicable for the semi-annual shareholder report.
| Item 5. | AUDIT COMMITTEE OF LISTED REGISTRANTS |
Not applicable.
| Item 6. | SCHEDULE OF INVESTMENTS |
The schedule of investments in unaffiliated issuers as of the close of the reporting period is included as part of the shareholder report contained in Item 1 hereof.
| Item 7. | DISCLOSURE OF PROXY VOTING POLICIES AND PROCEDURES FORCLOSED-END MANAGEMENT INVESTMENT COMPANIES |
Not applicable.
| Item 8. | PORTFOLIO MANAGERS OFCLOSED-END MANAGEMENT INVESTMENT COMPANIES |
Not applicable.
| Item 9. | PURCHASES OF EQUITY SECURITIES BYCLOSED-END MANAGEMENT INVESTMENT COMPANIES AND AFFILIATED PURCHASERS |
Not applicable.
| Item 10. | SUBMISSION OF MATTERS TO A VOTE OF SECURITY HOLDERS |
Not applicable.
| Item 11. | CONTROLS AND PROCEDURES |
| | (a) | The registrant’s principal executive and principal financial officers have concluded, based on their evaluation of the registrant’s disclosure controls and procedures as of a date within 90 days of the filing date of this report, that the registrant’s disclosure controls and procedures are reasonably designed to ensure that information required to be disclosed by the registrant on FormN-CSR is recorded, processed, summarized and reported within the required time periods and that information required to be disclosed by the registrant in the reports that it files or submits on FormN-CSR is accumulated and communicated to the registrant’s management, including its principal executive and principal financial officers, as appropriate to allow timely decisions regarding required disclosure. |
| | (b) | There were no changes in the registrant’s internal control over financial reporting during the period covered by this report that have materially affected, or are reasonably likely to materially affect, the internal control over financial reporting. |
| Item 12. | DISCLOSURE OF SECURITIES LENDING ACTIVITIES FORCLOSED-END MANAGEMENT INVESTMENT COMPANIES |
Not applicable.
SIGNATURES
Pursuant to the requirements of the Securities Exchange Act of 1934 and the Investment Company Act of 1940, the registrant has duly caused this report to be signed on its behalf by the undersigned, thereunto duly authorized.
| | |
| AMG FUNDS I |
| |
| By: | | /s/ Keitha L. Kinne |
| | Keitha L. Kinne, Principal Executive Officer |
| |
| Date: | | May 19, 2020 |
Pursuant to the requirements of the Securities Exchange Act of 1934 and the Investment Company Act of 1940, this report has been signed below by the following persons on behalf of the registrant and in the capacities and on the dates indicated.
| | |
| |
| By: | | /s/ Keitha L. Kinne |
| | Keitha L. Kinne, Principal Executive Officer |
| |
| Date: | | May 19, 2020 |
| | |
| |
| By: | | /s/ Thomas Disbrow |
| | Thomas Disbrow, Principal Financial Officer |
| |
| Date: | | May 19, 2020 |