UNITED STATES
SECURITIES AND EXCHANGE COMMISSION
Washington, D.C. 20549
FORM N-CSR
CERTIFIED SHAREHOLDER REPORT OF REGISTERED MANAGEMENT INVESTMENT COMPANIES
Investment Company Act file number
(Exact name of registrant as specified in charter)
680 Washington Boulevard, Suite 500, Stamford, Connecticut 06901
(Address of principal executive offices) (Zip code)
AMG Funds LLC
680 Washington Boulevard, Suite 500, Stamford, Connecticut 06901
(Name and address of agent for service)
Registrant's telephone number, including area code:
Date of reporting period:
October 01, 2023 - September 30, 2024
(Annual Shareholder Report)
Item 1. Reports to Shareholders
(a)
AMG Boston Common Global Impact Fund
Class I/BRWIX
ANNUAL SHAREHOLDER REPORT | September 30, 2024
This annual shareholder report contains important information about AMG Boston Common Global Impact Fund (the “Fund”) for the period of October 1, 2023 to September 30, 2024. You can find additional information about the Fund at https://wealth.amg.com/resources/order-literature. You can also request this information by contacting us at 800.548.4539.
Fund Expenses
What were the Fund costs for the last year?
(Based on a hypothetical $10,000 investment)
| Fund (Class) | Costs of a $10,000 investment | Costs paid as a percentage of a $10,000 investment |
AMG Boston Common Global Impact Fund
(Class I/BRWIX) | $105 | 0.93% |
Management's Discussion of Fund Performance
Performance Overview
• The Fund’s Class I shares returned 25.26% during the fiscal year ended September 30, 2024, led by performance in the Fund's nine Impact Investment Themes (each, a “Theme”).
• Resilient labor markets and moderating inflationary pressures supported consumer confidence and investor sentiment. Prospects for easier monetary policy and large stimulus initiatives in China fueled global equity markets to reach all-time highs.
Relative Performance
• The Fund underperformed the MSCI ACWI Index, which returned 31.76% for the period.
• Lack of exposure to each of the “Magnificent Seven” (Apple, Microsoft, Alphabet, Amazon, Nvidia, Meta, and Tesla) stocks, is the main reason the Fund was not able to fully match the benchmark’s return. The strategy remains largely underweight large & mega-cap companies, but the difference was gradually reduced during the reporting period.
• Being fossil-fuel-free helped relative performance in a welcome divergence from 2022’s sharp spike in energy prices. The portfolio’s carbon footprint is 40% less carbon intensive than the benchmark.
• On a regional basis, stock selection in Emerging Markets detracted most from returns. Indonesian micro-lender Bank Rakyat and broadband provider PT Telkom posted disappointing results. Chilean chemical company SQM faced headwinds as lithium prices declined more than anticipated. Mortgage lender HDFC in India encountered delays in a merger process. The Fund exited its position in PT Telkom and SQM during the period.
Impact Investment Theme Performance and Positioning
• The Fund invests in nine different Impact Investment Themes and seeks to deliver impact through the allocation of capital among solution-oriented companies while actively engaging the Fund’s holdings. During the reporting period, all regions posted strong, double-digit returns with the U.S. market claiming the highest total return of 36%.
• The Fund’s most successful Theme was organic & healthier products, as healthy food grocer Sprouts Farmers Market rose 158%. Electrification was another favorable Theme, including Italy-based electric cable producer, Prysmian (+83%), and U.S.-based Vertiv Holdings (+68%).
• The Fund’s largest thematic exposures remain efficiency & recycling, water quality & waste management, and sustainable transportation.
Fund Performance
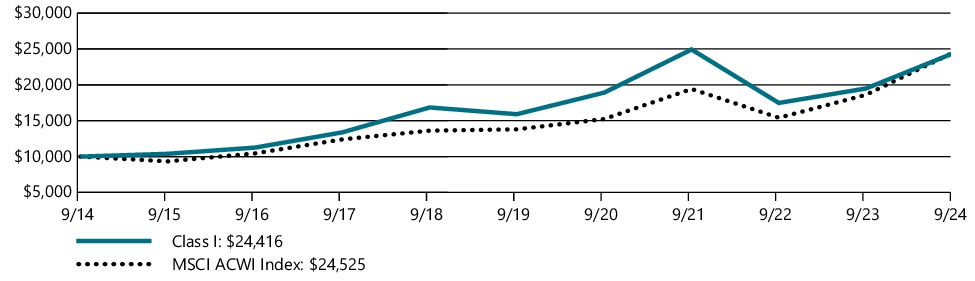
The performance line graph below shows the performance of a hypothetical $10,000 investment in the class of shares noted over a ten year period, as compared to the performance of a broad based index. The performance table below shows the average annual total returns of the class of shares noted for the past one-, five-, and ten-year periods ended as of September 30, 2024. It also shows the average total returns of a broad based index over the same periods.
The Fund’s past performance is not a good predictor of the Fund’s future performance.
The graph and table do not reflect the deduction of taxes that a shareholder would pay on fund distributions or redemption of fund shares.
GROWTH OF $10,000
| AVERAGE ANNUAL TOTAL RETURNS | 1 Year | 5 Years | 10 Years |
| Class I | 25.26% | 8.95% | 9.34% |
| MSCI ACWI Index | 31.76% | 12.19% | 9.39% |
As of March 19, 2021, the Fund's Subadviser was changed to Boston Common Asset Management, LLC. Prior to March 19, 2021, the Fund had different principal investment strategies and corresponding risks. The Fund's performance before March 19, 2021, might be less pertinent for investors considering whether to purchase shares of the Fund.
All MSCI data is provided "as is". The products described herein are not sponsored or endorsed and have not been reviewed or passed on by MSCI. In no event shall MSCI, its affiliates or any MSCI data provider have any liability of any kind in connection with the MSCI data or the products described herein. Copying or redistributing the MSCI data is strictly prohibited.
For updated Fund performance information, please visit: https://wealth.amg.com/.
Key Fund Statistics (as of September 30, 2024)
| Fund net assets | $588,806,344 |
| Total number of portfolio holdings | 66 |
| Net advisory fees paid | $3,991,425 |
| Portfolio turnover rate as of the end of the reporting period | 37% |
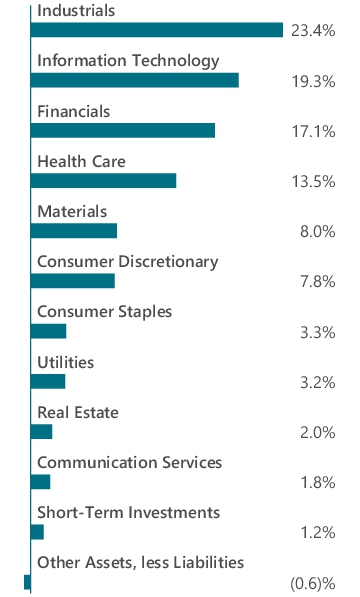
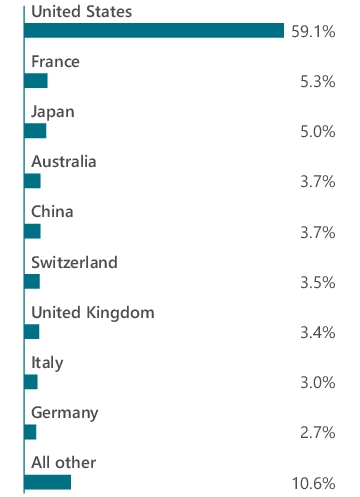
Graphical Representation of Holdings (as of September 30, 2024)
Top ten holdings and portfolio breakdown are shown as a percentage of net assets of the Fund and country allocation is shown as a percentage of total long-term investments of the Fund.
| Schneider Electric SE (France) | 2.6% |
| Westinghouse Air Brake Technologies Corp. (United States) | 2.6% |
| BYD Co., Ltd., Class H (China) | 2.5% |
| Taiwan Semiconductor Manufacturing Co., Ltd., Sponsored ADR (Taiwan) | 2.5% |
| Chubb, Ltd. (Switzerland) | 2.4% |
| Ecolab, Inc. (United States) | 2.3% |
| RELX PLC (United Kingdom) | 2.3% |
| Salesforce, Inc. (United States) | 2.3% |
| Macquarie Group, Ltd. (Australia) | 2.3% |
| Micron Technology, Inc. (United States) | 2.2% |
| Top Ten as a Group | 24.0% |
Availability of Additional Information
You can find additional information about the Fund such as the prospectus, financial information, fund holdings and proxy voting information at https://wealth.amg.com/resources/order-literature. You can also request this information by contacting us at 800.548.4539.
Householding
In order to reduce expenses, we will deliver a single copy of prospectuses, proxies, financial reports and other communication to shareholders with the same residential address, provided they have the same last name or we reasonably believe them to be members of the same family. Unless we are notified otherwise, we will continue to send recipients only one copy of these materials for as long as they remain a shareholder of the Fund. If you would like to receive individual mailings, please call 800.548.4539 and we will begin sending you separate copies of these materials within 30 days after receiving your request.
For additional information, please navigate to the additional material at https://wealth.amg.com/resources/order-literature.
AMG Systematica Managed Futures Strategy Fund
Class N/SMFNX
ANNUAL SHAREHOLDER REPORT | September 30, 2024
This annual shareholder report contains important information about AMG Systematica Managed Futures Strategy Fund (the “Fund”) for the period of May 1, 2024 (commencement of operations) to September 30, 2024. You can find additional information about the Fund at https://wealth.amg.com/resources/order-literature. You can also request this information by contacting us at 800-548-4539.
Fund Expenses
What were the Fund costs for the last year?
(Based on a hypothetical $10,000 investment)
| Fund (Class) | Costs of a $10,000 investment | Costs paid as a percentage of a $10,000 investment |
AMG Systematica Managed Futures Strategy Fund
(Class N/SMFNX) | $57 | 1.40% |
Costs of a $10,000 investment would have been higher for a full reporting period.
Key Fund Statistics (as of September 30, 2024)
| Fund net assets | $6,033,843 |
| Total number of portfolio holdings | 230 |
| Net advisory fees paid | $0 |
| Portfolio turnover rate as of the end of the reporting period | 0% |
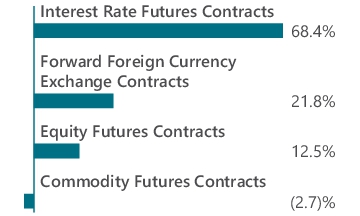
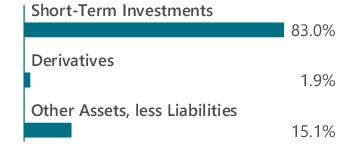
Graphical Representation of Holdings (as of September 30, 2024)
The portfolio breakdown is shown as a percentage of net assets of the Fund and notional allocation is shown as a percentage of total notional value of the Fund's derivatives holdings. The portfolio breakdown and notional allocation are inclusive of the Fund's wholly-owned subsidiary.
Availability of Additional Information
You can find additional information about the Fund such as the prospectus, financial information, fund holdings and proxy voting information at https://wealth.amg.com/resources/order-literature. You can also request this information by contacting us at 800.548.4539.
Householding
In order to reduce expenses, we will deliver a single copy of prospectuses, proxies, financial reports and other communication to shareholders with the same residential address, provided they have the same last name or we reasonably believe them to be members of the same family. Unless we are notified otherwise, we will continue to send recipients only one copy of these materials for as long as they remain a shareholder of the Fund. If you would like to receive individual mailings, please call 800.548.4539 and we will begin sending you separate copies of these materials within 30 days after receiving your request.
For additional information, please navigate to the additional material at https://wealth.amg.com/resources/order-literature.
AMG Systematica Managed Futures Strategy Fund
Class I/SMFIX
ANNUAL SHAREHOLDER REPORT | September 30, 2024
This annual shareholder report contains important information about AMG Systematica Managed Futures Strategy Fund (the “Fund”) for the period of May 1, 2024 (commencement of operations) to September 30, 2024. You can find additional information about the Fund at https://wealth.amg.com/resources/order-literature. You can also request this information by contacting us at 800-548-4539.
Fund Expenses
What were the Fund costs for the last year?
(Based on a hypothetical $10,000 investment)
| Fund (Class) | Costs of a $10,000 investment | Costs paid as a percentage of a $10,000 investment |
AMG Systematica Managed Futures Strategy Fund
(Class I/SMFIX) | $57 | 1.40% |
Costs of a $10,000 investment would have been higher for a full reporting period.
Key Fund Statistics (as of September 30, 2024)
| Fund net assets | $6,033,843 |
| Total number of portfolio holdings | 230 |
| Net advisory fees paid | $0 |
| Portfolio turnover rate as of the end of the reporting period | 0% |
Graphical Representation of Holdings (as of September 30, 2024)
The portfolio breakdown is shown as a percentage of net assets of the Fund and notional allocation is shown as a percentage of total notional value of the Fund's derivatives holdings. The portfolio breakdown and notional allocation are inclusive of the Fund's wholly-owned subsidiary.
Availability of Additional Information
You can find additional information about the Fund such as the prospectus, financial information, fund holdings and proxy voting information at https://wealth.amg.com/resources/order-literature. You can also request this information by contacting us at 800.548.4539.
Householding
In order to reduce expenses, we will deliver a single copy of prospectuses, proxies, financial reports and other communication to shareholders with the same residential address, provided they have the same last name or we reasonably believe them to be members of the same family. Unless we are notified otherwise, we will continue to send recipients only one copy of these materials for as long as they remain a shareholder of the Fund. If you would like to receive individual mailings, please call 800.548.4539 and we will begin sending you separate copies of these materials within 30 days after receiving your request.
For additional information, please navigate to the additional material at https://wealth.amg.com/resources/order-literature.
AMG Systematica Managed Futures Strategy Fund
Class Z/SMFZX
ANNUAL SHAREHOLDER REPORT | September 30, 2024
This annual shareholder report contains important information about AMG Systematica Managed Futures Strategy Fund (the “Fund”) for the period of May 1, 2024 (commencement of operations) to September 30, 2024. You can find additional information about the Fund at https://wealth.amg.com/resources/order-literature. You can also request this information by contacting us at 800-548-4539.
Fund Expenses
What were the Fund costs for the last year?
(Based on a hypothetical $10,000 investment)
| Fund (Class) | Costs of a $10,000 investment | Costs paid as a percentage of a $10,000 investment |
AMG Systematica Managed Futures Strategy Fund
(Class Z/SMFZX) | $57 | 1.40% |
Costs of a $10,000 investment would have been higher for a full reporting period.
Key Fund Statistics (as of September 30, 2024)
| Fund net assets | $6,033,843 |
| Total number of portfolio holdings | 230 |
| Net advisory fees paid | $0 |
| Portfolio turnover rate as of the end of the reporting period | 0% |
Graphical Representation of Holdings (as of September 30, 2024)
The portfolio breakdown is shown as a percentage of net assets of the Fund and notional allocation is shown as a percentage of total notional value of the Fund's derivatives holdings. The portfolio breakdown and notional allocation are inclusive of the Fund's wholly-owned subsidiary.
Availability of Additional Information
You can find additional information about the Fund such as the prospectus, financial information, fund holdings and proxy voting information at https://wealth.amg.com/resources/order-literature. You can also request this information by contacting us at 800.548.4539.
Householding
In order to reduce expenses, we will deliver a single copy of prospectuses, proxies, financial reports and other communication to shareholders with the same residential address, provided they have the same last name or we reasonably believe them to be members of the same family. Unless we are notified otherwise, we will continue to send recipients only one copy of these materials for as long as they remain a shareholder of the Fund. If you would like to receive individual mailings, please call 800.548.4539 and we will begin sending you separate copies of these materials within 30 days after receiving your request.
For additional information, please navigate to the additional material at https://wealth.amg.com/resources/order-literature.
AMG Veritas Global Real Return Fund
Class I/BLUEX
ANNUAL SHAREHOLDER REPORT | September 30, 2024
This annual shareholder report contains important information about AMG Veritas Global Real Return Fund (the “Fund”) for the period of October 1, 2023 to September 30, 2024. You can find additional information about the Fund at https://wealth.amg.com/resources/order-literature. You can also request this information by contacting us at 800.548.4539.
Fund Expenses
What were the Fund costs for the last year?
(Based on a hypothetical $10,000 investment)
| Fund (Class) | Costs of a $10,000 investment | Costs paid as a percentage of a $10,000 investment |
AMG Veritas Global Real Return Fund
(Class I/BLUEX) | $126 | 1.16% |
Management's Discussion of Fund Performance
Performance Overview
• The Fund’s Class I shares advanced 16.54% for the fiscal year ended September 30, 2024, driven mainly by the Fund’s holdings in long equities, specifically in the industrials and financials sectors.
Relative Performance
• The Fund outperformed the Bloomberg U.S. Treasury Inflation-Linked Bond Index, which returned 9.79% for the period.
Top Contributors and Detractors
• The Fund’s holdings in the industrials and financials sectors were top relative contributors, including Aena, a global airport operator; Safran, an aircraft engine manufacturer; Airbus, a leading commercial aircraft producer; and Fiserv, a global fintech and payments company. The Fund exited its position in Fiserv during the period.
• An underweight to the top performing information technology sector detracted from relative performance, along with the underperformance of Fund holdings in the communication services and health care sectors, including Charter Communications and Becton, Dickinson & Company.
Positioning Update
• While the market has been led by a narrow group of companies focused on artificial intelligence (AI) within the information technology sector, Veritas sees compelling opportunities in companies that are leveraging AI to enhance existing, well-established products, which may be outside the technology sector.
• These firms often present better valuations and lower risks compared to those heavily invested in AI development. We are particularly focused on companies with proprietary data and software vendors that manage mission-critical systems of record—databases essential to business operations, such as transaction ledgers, airline booking systems, and product design databases.
• Recent additions to the Fund include Amadeus IT, Salesforce, and Siemens, all of which provide these vital systems of record.
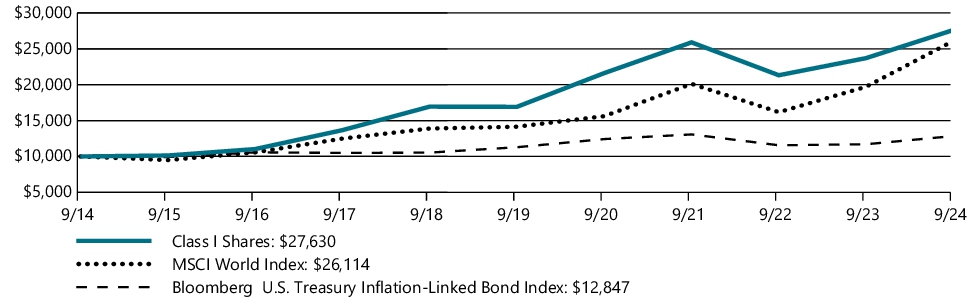
Fund Performance
The performance line graph below shows the performance of a hypothetical $10,000 investment in the class of shares noted over a ten year period, as compared to the performance of (i) a broad based index and (ii) an additional index reflecting the market segment(s) in which the Fund invests. The performance table below shows the average annual total returns of the class of shares noted for the past one-, five-, and ten-year periods ended as of September 30, 2024. It also shows the average total returns of (i) a broad based index and (ii) an additional index reflecting the market segment(s) in which the Fund invests over the same periods.
The Fund’s past performance is not a good predictor of the Fund’s future performance.
The graph and table do not reflect the deduction of taxes that a shareholder would pay on fund distributions or redemption of fund shares.
GROWTH OF $10,000
| AVERAGE ANNUAL TOTAL RETURNS | 1 Year | 5 Years | 10 Years |
| Class I | 16.54% | 10.31% | 10.70% |
| MSCI World Index | 32.43% | 13.04% | 10.07% |
| Bloomberg U.S. Treasury Inflation-Linked Bond Index | 9.79% | 2.62% | 2.54% |
Effective September 30, 2024, the MSCI World Index was added as a broad measure of market performance in accordance with recent changes to regulatory disclosure requirements. The Fund continues to use the Bloomberg U.S. Treasury Inflation-Linked Bond Index as an additional benchmark that reflects the market segment(s) in which the Fund invests.
As of March 19, 2021, the Fund's subadviser was changed to Veritas Asset Management LLP. Prior to March 19, 2021, the Fund had different principal investment strategies and corresponding risks. The Fund's performance before March 19, 2021, might be less pertinent for investors considering whether to purchase shares of the Fund.
All MSCI data is provided "as is". The products described herein are not sponsored or endorsed and have not been reviewed or passed on by MSCI. In no event shall MSCI, its affiliates or any MSCI data provider have any liability of any kind in connection with the MSCI data or the products described herein. Copying or redistributing the MSCI data is strictly prohibited.
“Bloomberg®” and Bloomberg U.S. Treasury Inflation-Linked Bond Index are service marks of Bloomberg Finance L.P. and its affiliates, including Bloomberg Index Services Limited (“BISL”), the administrator of the index (collectively, “Bloomberg”) and have been licensed for use for certain purposes by AMG Funds LLC. Bloomberg is not affiliated with AMG Funds LLC, and Bloomberg does not approve, endorse, review, or recommend the AMG Veritas Global Real Return Fund. Bloomberg does not guarantee the timeliness, accurateness, or completeness of any data or information relating to the AMG Veritas Global Real Return Fund.
For updated Fund performance information, please visit: https://wealth.amg.com/.
Key Fund Statistics (as of September 30, 2024)
| Fund net assets | $104,728,802 |
| Total number of portfolio holdings | 35 |
| Net advisory fees paid | $876,917 |
| Portfolio turnover rate as of the end of the reporting period | 33% |
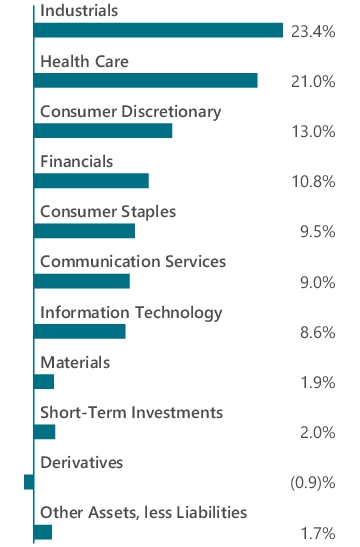
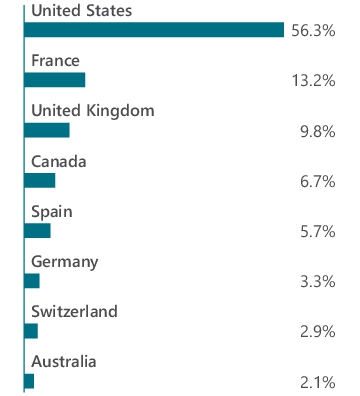
Graphical Representation of Holdings (as of September 30, 2024)
Top ten holdings and portfolio breakdown are shown as a percentage of net assets of the Fund and country allocation is shown as a percentage of total long-term investments of the Fund.
| Amazon.com, Inc. (United States) | 6.6% |
| Alphabet, Inc., Class A (United States) | 6.1% |
| Diageo PLC (United Kingdom) | 5.1% |
| Aon PLC, Class A (United States) | 4.7% |
| UnitedHealth Group, Inc. (United States) | 4.7% |
| Canadian Pacific Kansas City, Ltd. (Canada) | 4.6% |
| Unilever PLC (United Kingdom) | 4.4% |
| Microsoft Corp. (United States) | 4.2% |
| Airbus SE (France) | 4.0% |
| Vinci, S.A. (France) | 3.9% |
| Top Ten as a Group | 48.3% |
Availability of Additional Information
You can find additional information about the Fund such as the prospectus, financial information, fund holdings and proxy voting information at https://wealth.amg.com/resources/order-literature. You can also request this information by contacting us at 800.548.4539.
Householding
In order to reduce expenses, we will deliver a single copy of prospectuses, proxies, financial reports and other communication to shareholders with the same residential address, provided they have the same last name or we reasonably believe them to be members of the same family. Unless we are notified otherwise, we will continue to send recipients only one copy of these materials for as long as they remain a shareholder of the Fund. If you would like to receive individual mailings, please call 800.548.4539 and we will begin sending you separate copies of these materials within 30 days after receiving your request.
For additional information, please navigate to the additional material at https://wealth.amg.com/resources/order-literature.
(b) Not applicable.
Item 2. CODE OF ETHICS
Registrant has adopted a code of ethics (the “Code of Ethics”) that applies to the Registrant’s principal executive officer, principal financial officer, principal accounting officer or controller, or persons performing similar functions, regardless of whether these individuals are employed by the registrant or a third party. During the period covered by this report, there were not any amendments to a provision of the Code of Ethics that relates to any element of the code of ethics definition enumerated in paragraph (c) of Item 2 of Form N-CSR. During the period covered by this report, there were no waivers, including any implicit waivers, from a provision of the Code that relates to one or more of the items set forth in paragraph (d) of Item 2 of Form N-CSR. See attached Exhibit (a)(1).
Item 3. AUDIT COMMITTEE FINANCIAL EXPERT
Registrant’s Board of Trustees (the “Board”) has determined that the Registrant has at least one Audit Committee Financial Expert serving on its audit committee. The Board has determined that independent Trustee Mr. Steven J. Paggioli qualifies as the Audit Committee Financial Expert. Mr. Paggioli is “independent” as such term is defined in paragraph (a)(2) of Item 3 of Form N-CSR.
Item 4. PRINCIPAL ACCOUNTANT FEES AND SERVICES
(a) Audit Fees
The aggregate fees billed by the Funds’ independent registered public accounting firm, PricewaterhouseCoopers LLP (“PwC”), to the Funds for the Funds’ two most recent fiscal years for professional services rendered for audits of annual financial statements, or services that are normally provided in connection with statutory and regulatory filings or engagements (“Audit Fees”) were as follows:
| | | | | | | | |
| | | Fiscal 2024 | | | Fiscal 2023 | |
AMG Boston Common Global Impact Fund | | $ | 33,888 | | | $ | 32,725 | |
AMG Veritas Global Real Return Fund | | $ | 29,873 | | | $ | 27,948 | |
AMG Systematica Managed Futures Strategy Fund | | $ | 47,072 | | | $ | 0 | |
(b) Audit-Related Fees
There were no fees billed by PwC to the Funds in their two recent fiscal years for services rendered for assurance and related services that are reasonably related to the performance of the audit or review of the Funds’ financial statements, but are not reported as Audit Fees (“Audit-Related Fees”).
For the Funds’ two most recent fiscal years, there were no Audit-Related Fees billed by PwC for engagements related directly to the operations and financial reporting of one or more Funds by a Fund Service Provider. A Fund Service Provider is (a) any investment adviser to a Fund (not including any Subadviser whose role is primarily portfolio management and is subcontracted with or overseen by another investment adviser) or (b) any entity that provides ongoing services to a Fund and is controlling, controlled by or under common control with a Fund investment adviser described in (a).
(c) Tax Fees
The aggregate fees billed by PwC to the Funds for the two most recent fiscal years for professional services rendered for tax compliance, tax advice, and tax planning (“Tax Fees”) were as follows:
| | | | | | | | |
| | | Fiscal 2024 | | | Fiscal 2023 | |
AMG Boston Common Global Impact Fund | | $ | 8,535 | | | $ | 8,370 | |
AMG Veritas Global Real Return Fund | | $ | 8,535 | | | $ | 8,370 | |
AMG Systematica Managed Futures Strategy Fund | | $ | 7,870 | | | $ | 0 | |
For the Funds’ two most recent fiscal years, Tax Fees billed by PwC for engagements by Fund Service Providers that related directly to the operations and financial reporting of the Funds were $0 for fiscal 2024 and $0 for fiscal 2023, respectively.
The services for which Tax Fees were charged comprise all services performed by professional staff in PwC’s tax division except those services related to the audit. Typically, this category would include fees for tax compliance, tax planning, and tax advice. Tax compliance, tax advice, and tax planning services include preparation of original and amended tax returns, claims for refund and tax payment-planning services, assistance with tax audits and appeals, tax advice related to mergers and acquisitions and requests for rulings or technical advice from taxing authorities.
(d) All Other Fees
There were no other fees billed by PwC to the Funds for all other non-audit services (“Other Fees”) during the Funds’ two most recent fiscal years. During the same period, there were no Other Fees billed by PwC for engagements by Fund Service Providers that related directly to the operations and financial reporting of the Funds.
(e)(1) According to policies adopted by the Audit Committee, services provided by PwC to the Funds must be pre-approved by the Audit Committee. On an annual basis, the Audit Committee reviews and pre-approves various types of services that PwC may perform for the Funds without specific approval of each engagement, subject to specified budget limitations. As contemplated by the Sarbanes-Oxley Act of 2002 and related SEC rules, the Audit Committee also pre-approves non-audit services provided by PwC to any Fund Service Provider for any engagement that relates directly to the operations and financial reporting of the Funds. Any engagement that is not already pre-approved or that will exceed a pre-approved budget must be submitted to the Audit Committee for pre-approval. The Chairman of the Audit Committee is authorized on behalf of the Board of Trustees and the Audit Committee to approve the engagement of PwC to perform non-audit services subject to certain conditions, including notification to the Audit Committee of such pre-approval not later than the next meeting of the Audit Committee following the date of such pre-approval.
(e)(2) None.
(f) Not applicable.
(g) The aggregate fees billed by PwC in 2024 and 2023 for non-audit services rendered to the Funds and Fund Service Providers were $64,940 and $55,740, respectively. For the fiscal year ended September 30, 2024, this amount reflects the amounts disclosed above in Item 4(b),(c),(d), plus $40,000 in fees billed to the Fund Service Providers for non-audit services that did not relate directly to the operations and financial reporting of the Funds. For the fiscal year ended September 30, 2023, this amount reflects the amounts disclosed above in Item 4(b),(c),(d), plus $39,000 in fees billed to the Fund Service Providers for non-audit services that did not relate directly to the operations and financial reporting of the Funds.
(h) The Trust’s Audit Committee has considered whether the provision of non-audit services by registrant’s independent registered public accounting firm to the registrant’s investment adviser, and any entity controlling, controlled, or under common control with the investment adviser that provided ongoing services to the registrant that were not pre-approved by the Committee (because such services did not relate directly to the operations and financial reporting of the registrant) was compatible with maintaining the independence of the independent registered public accounting firm.
Item 5. AUDIT COMMITTEE OF LISTED REGISTRANTS
Not applicable.
Item 6. INVESTMENTS
The schedule of investments in securities of unaffiliated issuers as of the close of the reporting period is included in the financial statements filed under Item 7 hereof.
Item 7. FINANCIAL STATEMENTS AND FINANCIAL HIGHLIGHTS FOR OPEN-END MANAGEMENT INVESTMENT COMPANIES.
| | |
 | | ANNUAL FINANCIAL STATEMENTS |
| | | | | | |
| | | AMG Funds |
| | | | |
| | | September 30, 2024 | | | | |
| | |
| | |  |
| | |
| | | AMG Boston Common Global Impact Fund |
| | | Class I: BRWIX | | | | |
| | | | |
| | | | | | | |
| | | | | | |
| | | | | | | |
| | | |
| wealth.amg.com | | 093024 | | | AR074 | |
| | |
| | AMG Funds Annual Financial Statements — September 30, 2024 |
Nothing contained herein is to be considered an offer, sale or solicitation of an offer to buy shares of any series of the AMG Funds Family of Funds. Such offering is made only by prospectus, which includes details as to offering price and other material information.
| | |
| | AMG Boston Common Global Impact Fund Schedule of Portfolio Investments September 30, 2024 |
| | | | | | | | |
| | | Shares | | | Value | |
| | |
Common Stocks - 99.4% | | | | | | | | |
| |
Communication Services - 1.8% | | | | | |
| | |
Alphabet, Inc., Class A (United States) | | | 63,106 | | | | $10,466,130 | |
| |
Consumer Discretionary - 7.8% | | | | | |
| | |
BYD Co., Ltd., Class H (China) | | | 421,590 | | | | 15,041,474 | |
| | |
KB Home (United States) | | | 125,272 | | | | 10,734,557 | |
| | |
LKQ Corp. (United States) | | | 96,893 | | | | 3,867,968 | |
| | |
Shimano, Inc. (Japan) | | | 35,300 | | | | 6,719,984 | |
| | |
TopBuild Corp. (United States)* | | | 24,049 | | | | 9,783,374 | |
| | |
Total Consumer Discretionary | | | | | | | 46,147,357 | |
| |
Consumer Staples - 3.3% | | | | | |
| | |
McCormick & Co., Inc., Non-Voting Shares (United States) | | | 92,010 | | | | 7,572,423 | |
| | |
Sprouts Farmers Market, Inc. (United States)* | | | 106,928 | | | | 11,805,921 | |
| | |
Total Consumer Staples | | | | | | | 19,378,344 | |
| |
Financials - 17.1% | | | | | |
| | |
Bank Rakyat Indonesia Persero Tbk PT, ADR (Indonesia) | | | 665,899 | | | | 10,854,154 | |
| | |
The Charles Schwab Corp. (United States) | | | 177,755 | | | | 11,520,302 | |
| | |
Chubb, Ltd. (Switzerland) | | | 49,260 | | | | 14,206,091 | |
| | |
HA Sustainable Infrastructure Capital, Inc. (United States)1 | | | 255,201 | | | | 8,796,778 | |
| | |
Hannover Rueck SE (Germany) | | | 35,468 | | | | 10,124,677 | |
| | |
HDFC Bank, Ltd., ADR (India)1 | | | 93,667 | | | | 5,859,808 | |
| | |
Macquarie Group, Ltd. (Australia) | | | 82,987 | | | | 13,278,890 | |
| | |
ORIX Corp. (Japan) | | | 532,750 | | | | 12,465,740 | |
| | |
PayPal Holdings, Inc. (United States)* | | | 93,710 | | | | 7,312,191 | |
| | |
Ping An Insurance Group Co. of China, Ltd., Class H (China) | | | 1,019,000 | | | | 6,398,841 | |
| | |
Total Financials | | | | | | | 100,817,472 | |
| |
Health Care - 13.5% | | | | | |
| | |
Agilent Technologies, Inc. (United States) | | | 52,049 | | | | 7,728,236 | |
| | |
CSL, Ltd. (Australia) | | | 41,992 | | | | 8,294,829 | |
| | |
Danaher Corp. (United States) | | | 41,209 | | | | 11,456,926 | |
| | |
Edwards Lifesciences Corp. (United States)* | | | 118,053 | | | | 7,790,317 | |
| | |
Eli Lilly & Co. (United States) | | | 6,000 | | | | 5,315,640 | |
| | |
Gilead Sciences, Inc. (United States) | | | 109,890 | | | | 9,213,178 | |
| | |
Hologic, Inc. (United States)* | | | 140,888 | | | | 11,476,736 | |
| | |
Regeneron Pharmaceuticals, Inc. (United States)* | | | 10,950 | | | | 11,511,078 | |
| | |
Vertex Pharmaceuticals, Inc. (United States)* | | | 14,039 | | | | 6,529,258 | |
| | |
Total Health Care | | | | | | | 79,316,198 | |
| |
Industrials - 23.4% | | | | | |
| | |
Ashtead Group PLC (United Kingdom) | | | 78,760 | | | | 6,102,389 | |
| | |
The AZEK Co., Inc. (United States)* | | | 182,786 | | | | 8,554,385 | |
| | | | | | | | |
| | | Shares | | | Value | |
| | |
Carrier Global Corp. (United States) | | | 91,457 | | | | $7,361,374 | |
| | |
Industrie De Nora S.P.A. (Italy)1 | | | 568,767 | | | | 5,953,616 | |
| | |
Kurita Water Industries, Ltd. (Japan) | | | 233,100 | | | | 10,085,608 | |
| | |
Prysmian SpA (Italy) | | | 160,508 | | | | 11,678,328 | |
| | |
RELX PLC (United Kingdom) | | | 286,512 | | | | 13,528,043 | |
| | |
Rexel, S.A. (France)1 | | | 341,751 | | | | 9,906,233 | |
| | |
Schneider Electric SE (France) | | | 57,975 | | | | 15,282,670 | |
| | |
TOMRA Systems A.S.A. (Norway) | | | 384,610 | | | | 5,653,203 | |
| | |
Vertiv Holdings Co., Class A (United States) | | | 105,739 | | | | 10,519,973 | |
| | |
Vestas Wind Systems A/S (Denmark)* | | | 247,026 | | | | 5,435,485 | |
| | |
Westinghouse Air Brake Technologies Corp. (United States) | | | 82,864 | | | | 15,062,189 | |
| | |
Xylem, Inc. (United States) | | | 93,019 | | | | 12,560,355 | |
| | |
Total Industrials | | | | | | | 137,683,851 | |
| |
Information Technology - 19.3% | | | | | |
| | |
Adobe, Inc. (United States)* | | | 20,544 | | | | 10,637,272 | |
| | |
Akamai Technologies, Inc. (United States)* | | | 105,675 | | | | 10,667,891 | |
| | |
Applied Materials, Inc. (United States) | | | 53,991 | | | | 10,908,882 | |
| | |
Enphase Energy, Inc. (United States)* | | | 36,776 | | | | 4,156,423 | |
| | |
First Solar, Inc. (United States)* | | | 40,733 | | | | 10,160,439 | |
| | |
Infineon Technologies AG (Germany) | | | 155,067 | | | | 5,444,081 | |
| | |
Intuit, Inc. (United States) | | | 17,995 | | | | 11,174,895 | |
| | |
Micron Technology, Inc. (United States) | | | 125,922 | | | | 13,059,371 | |
| | |
Microsoft Corp. (United States) | | | 22,000 | | | | 9,466,600 | |
| | |
Salesforce, Inc. (United States) | | | 49,007 | | | | 13,413,706 | |
| | |
Taiwan Semiconductor Manufacturing Co., Ltd., | | | | | | | | |
| | |
Sponsored ADR (Taiwan) | | | 83,822 | | | | 14,557,367 | |
| | |
Total Information Technology | | | | | | | 113,646,927 | |
| |
Materials - 8.0% | | | | | |
| | |
Borregaard A.S.A. (Norway) | | | 503,366 | | | | 9,463,497 | |
| | |
CRH PLC (United States) | | | 77,211 | | | | 7,160,548 | |
| | |
DSM-Firmenich AG (Switzerland) | | | 45,689 | | | | 6,305,416 | |
| | |
Ecolab, Inc. (United States) | | | 54,070 | | | | 13,805,693 | |
| | |
Smurfit WestRock PLC (Ireland) | | | 215,370 | | | | 10,643,586 | |
| | |
Total Materials | | | | | | | 47,378,740 | |
| |
Real Estate - 2.0% | | | | | |
| | |
Weyerhaeuser Co., REIT (United States) | | | 340,033 | | | | 11,513,517 | |
| |
Utilities - 3.2% | | | | | |
| | |
American Water Works Co., Inc. (United States) | | | 85,815 | | | | 12,549,586 | |
| | |
Veolia Environnement SA (France) | | | 183,852 | | | | 6,053,012 | |
| | |
Total Utilities | | | | | | | 18,602,598 | |
| | |
Total Common Stocks | | | | | | | | |
(Cost $501,837,586) | | | | | | | 584,951,134 | |
The accompanying notes are an integral part of these financial statements.
2
| | |
| | AMG Boston Common Global Impact Fund Schedule of Portfolio Investments (continued) |
| | | | | | | | |
| | | Principal
Amount | | | Value | |
| |
Short-Term Investments - 1.2% | | | | | |
| |
Joint Repurchase Agreements - 0.6%2 | | | | | |
| | |
Bethesda Securities LLC, dated 09/30/24, due 10/01/24, 5.000% total to be received $1,000,139 (collateralized by various U.S. Government Agency Obligations, 2.500% - 7.026%, 10/01/27 - 01/01/57, totaling $1,020,000) | | | $1,000,000 | | | | $1,000,000 | |
| | |
Cantor Fitzgerald Securities, Inc., dated 09/30/24, due 10/01/24, 5.000% total to be received $1,000,139 (collateralized by various U.S. Government Agency Obligations, 1.500% - 7.408%, 05/01/26 - 08/20/74, totaling $1,020,000) | | | 1,000,000 | | | | 1,000,000 | |
| | |
Marex Capital Markets, Inc., dated 09/30/24, due 10/01/24, 5.000% total to be received $1,000,139 (collateralized by various U.S. Government Agency Obligations and U.S. Treasuries, 0.750% - 5.500%, 07/15/28 - 09/01/54, totaling $1,020,000) | | | 1,000,000 | | | | 1,000,000 | |
| | |
National Bank Financial, Inc., dated 09/30/24, due 10/01/24, 4.900% total to be received $693,703 (collateralized by various U.S. Treasuries, 0.375% - 5.000%, 10/01/24 - 09/09/49, totaling $707,481) | | | 693,609 | | | | 693,609 | |
| | |
Total Joint Repurchase Agreements | | | | | | | 3,693,609 | |
| | | | | | | | |
| | |
Shares | | | Value | |
| |
Other Investment Companies - 0.6% | | | | | |
| | |
Dreyfus Government Cash Management Fund, Institutional Shares, 4.80%3 | | | 1,388,372 | | | | $1,388,372 | |
| | |
Dreyfus Institutional Preferred Government Money Market Fund, Institutional Shares, 4.88%3 | | | 2,082,558 | | | | 2,082,558 | |
| | |
Total Other Investment Companies | | | | | | | 3,470,930 | |
| | |
Total Short-Term Investments | | | | | | | | |
(Cost $7,164,539) | | | | | | | 7,164,539 | |
| | |
Total Investments - 100.6% | | | | | | | | |
(Cost $509,002,125) | | | | | | | 592,115,673 | |
| |
Other Assets, less Liabilities - (0.6)% | | | | (3,309,329 | ) |
| | |
Net Assets - 100.0% | | | | | | | $588,806,344 | |
| | * | Non-income producing security. |
| | 1 | Some of these securities, amounting to $20,313,610 or 3.5% of net assets, were out on loan to various borrowers and are collateralized by cash and various U.S. Treasury Obligations. See Note 4 of Notes to Financial Statements. |
| | 2 | Cash collateral received for securities lending activity was invested in these joint repurchase agreements. |
| | 3 | Yield shown represents the September 30, 2024, seven day average yield, which refers to the sum of the previous seven days’ dividends paid, expressed as an annual percentage. |
ADR American Depositary Receipt
REIT Real Estate Investment Trust
The accompanying notes are an integral part of these financial statements.
3
| | |
| | AMG Boston Common Global Impact Fund Schedule of Portfolio Investments (continued) |
The following table summarizes the inputs used to value the Fund’s investments by the fair value hierarchy levels as of September 30, 2024:
| | | | | | | | | | | | | | | | |
| | | Level 1 | | | Level 21 | | | Level 3 | | | Total | |
| | | | |
Investments in Securities | | | | | | | | | | | | | | | | |
| | | | |
Common Stocks | | | | | | | | | | | | | | | | |
| | | | |
Industrials | | | $54,058,276 | | | | $83,625,575 | | | | — | | | $ | 137,683,851 | |
| | | | |
Information Technology | | | 108,202,846 | | | | 5,444,081 | | | | — | | | | 113,646,927 | |
| | | | |
Financials | | | 58,549,324 | | | | 42,268,148 | | | | — | | | | 100,817,472 | |
| | | | |
Health Care | | | 71,021,369 | | | | 8,294,829 | | | | — | | | | 79,316,198 | |
| | | | |
Materials | | | 41,073,324 | | | | 6,305,416 | | | | — | | | | 47,378,740 | |
| | | | |
Consumer Discretionary | | | 24,385,899 | | | | 21,761,458 | | | | — | | | | 46,147,357 | |
| | | | |
Consumer Staples | | | 19,378,344 | | | | — | | | | — | | | | 19,378,344 | |
| | | | |
Utilities | | | 12,549,586 | | | | 6,053,012 | | | | — | | | | 18,602,598 | |
| | | | |
Real Estate | | | 11,513,517 | | | | — | | | | — | | | | 11,513,517 | |
| | | | |
Communication Services | | | 10,466,130 | | | | — | | | | — | | | | 10,466,130 | |
| | | | |
Short-Term Investments | | | | | | | | | | | | | | | | |
| | | | |
Joint Repurchase Agreements | | | — | | | | 3,693,609 | | | | — | | | | 3,693,609 | |
| | | | |
Other Investment Companies | | | 3,470,930 | | | | — | | | | — | | | | 3,470,930 | |
| | | | | | | | | | | | | | | | |
| | | | |
Total Investments in Securities | | $ | 414,669,545 | | | $ | 177,446,128 | | | | — | | | $ | 592,115,673 | |
| | | | | | | | | | | | | | | | |
| | 1 | An external pricing service is used to reflect any impact on security value due to market movements between the time the Fund valued such foreign securities and the earlier closing of foreign markets. |
For the fiscal year ended September 30, 2024, there were no transfers in or out of Level 3.
The accompanying notes are an integral part of these financial statements.
4
| | |
| | Statement of Assets and Liabilities September 30, 2024 |
| | | | | |
| | | AMG
Boston Common
Global Impact
Fund |
| |
Assets: | | | | | |
| |
Investments at value1 (including securities on loan valued at $20,313,610) | | | | $592,115,673 | |
| |
Foreign currency2 | | | | 124 | |
| |
Dividend and interest receivables | | | | 961,337 | |
| |
Securities lending income receivable | | | | 7,480 | |
| |
Receivable for Fund shares sold | | | | 3,468 | |
| |
Receivable from affiliate | | | | 8,868 | |
| |
Prepaid expenses and other assets | | | | 16,644 | |
| |
Total assets | | | | 593,113,594 | |
| |
Liabilities: | | | | | |
| |
Payable upon return of securities loaned | | | | 3,693,609 | |
| |
Payable for Fund shares repurchased | | | | 56,485 | |
| |
Accrued expenses: | | | | | |
| |
Investment advisory and management fees | | | | 343,553 | |
| |
Administrative fees | | | | 70,593 | |
| |
Other | | | | 143,010 | |
| |
Total liabilities | | | | 4,307,250 | |
| |
Commitments and Contingencies (Notes 2 & 6) | | | | | |
| |
Net Assets | | | | $588,806,344 | |
| |
1 Investments at cost | | | | $509,002,125 | |
| |
2 Foreign currency at cost | | | | $124 | |
| |
Net Assets Represent: | | | | | |
| |
Paid-in capital | | | | $600,988,937 | |
| |
Total distributable loss | | | | (12,182,593 | ) |
| |
Net Assets | | | | $588,806,344 | |
| |
Class I: | | | | | |
| |
Net Assets | | | | $588,806,344 | |
| |
Shares outstanding | | | | 14,061,748 | |
| |
Net asset value, offering and redemption price per share | | | | $41.87 | |
The accompanying notes are an integral part of these financial statements.
5
| | |
| | Statement of Operations For the fiscal year ended September 30, 2024 |
| | | | |
| | | AMG
Boston Common
Global Impact
Fund |
| |
Investment Income: | | | | |
| |
Dividend income | | | $8,565,379 | |
| |
Securities lending income | | | 121,701 | |
| |
Foreign withholding tax | | | (823,142 | ) |
| |
Total investment income | | | 7,863,938 | |
| |
Expenses: | | | | |
| |
Investment advisory and management fees | | | 4,114,390 | |
| |
Administrative fees | | | 845,423 | |
| |
Custodian fees | | | 100,173 | |
| |
Transfer agent fees | | | 73,519 | |
| |
Professional fees | | | 73,243 | |
| |
Trustee fees and expenses | | | 44,449 | |
| |
Reports to shareholders | | | 39,165 | |
| |
Registration fees | | | 31,738 | |
| |
Interest expense | | | 1,950 | |
| |
Miscellaneous | | | 42,485 | |
| |
Total expenses before offsets | | | 5,366,535 | |
| |
Expense reimbursements | | | (122,965 | ) |
| |
Total expenses | | | 5,243,570 | |
| | | | |
| |
Net investment income | | | 2,620,368 | |
| |
Net Realized and Unrealized Gain: | | | | |
| |
Net realized loss on investments | | | (28,611,194 | ) |
| |
Net realized gain on foreign currency transactions | | | 120,964 | |
| |
Net change in unrealized appreciation/depreciation on investments | | | 152,891,315 | |
| |
Net change in unrealized appreciation/depreciation on foreign currency translations | | | 74,321 | |
| |
Net realized and unrealized gain | | | 124,475,406 | |
| | | | |
| |
Net increase in net assets resulting from operations | | | $127,095,774 | |
The accompanying notes are an integral part of these financial statements.
6
| | |
| | Statements of Changes in Net Assets For the fiscal years ended September 30, |
| | | | | | | | | | |
| | | AMG
Boston Common
Global Impact
Fund |
| | |
| | | 2024 | | 2023 |
| | |
Increase in Net Assets Resulting From Operations: | | | | | | | | | | |
| | |
Net investment income | | | | $2,620,368 | | | | | $2,819,754 | |
| | |
Net realized loss on investments | | | | (28,490,230 | ) | | | | (59,612,729 | ) |
| | |
Net change in unrealized appreciation/depreciation on investments | | | | 152,965,636 | | | | | 122,194,762 | |
| | |
Net increase in net assets resulting from operations | | | | 127,095,774 | | | | | 65,401,787 | |
| | |
Distributions to Shareholders: | | | | | | | | | | |
| | |
Class I | | | | (3,726,011 | ) | | | | (2,788,916 | ) |
| | |
Capital Share Transactions:1 | | | | | | | | | | |
| | |
Net decrease from capital share transactions | | | | (73,554,780 | ) | | | | (65,944,835 | ) |
| | | | | | | | | | |
| | |
Total increase (decrease) in net assets | | | | 49,814,983 | | | | | (3,331,964 | ) |
| | |
Net Assets: | | | | | | | | | | |
| | |
Beginning of year | | | | 538,991,361 | | | | | 542,323,325 | |
| | |
End of year | | | | $588,806,344 | | | | | $538,991,361 | |
| 1 | See Note 1(g) of the Notes to Financial Statements. |
The accompanying notes are an integral part of these financial statements.
7
| | |
| | AMG Boston Common Global Impact Fund Financial Highlights For a share outstanding throughout each fiscal year |
| | | | | | | | | | | | | | | | | | | | | | | | | | | |
| | | | | For the fiscal years ended September 30, |
| Class I | | | | 2024 | | 2023 | | 2022 | | 2021 | | 2020 |
| | | | | | |
Net Asset Value, Beginning of Year | | | | | | $33.65 | | | | | $30.31 | | | | | $43.52 | | | | | $56.96 | | | | | $52.89 | |
| | | | | | |
Income (loss) from Investment Operations: | | | | | | | | | | | | | | | | | | | | | | | | | | | |
| | | | | | |
Net investment income (loss)1 | | | | | | 0.17 | 2 | | | | 0.17 | 2 | | | | 0.28 | 2,3 | | | | 0.02 | 2 | | | | (0.27 | ) |
| | | | | | |
Net realized and unrealized gain (loss) on investments | | | | | | 8.29 | | | | | 3.33 | | | | | (13.19 | ) | | | | 15.47 | | | | | 9.70 | |
| | | | | | |
Total income (loss) from investment operations | | | | | | 8.46 | | | | | 3.50 | | | | | (12.91 | ) | | | | 15.49 | | | | | 9.43 | |
| | | | | | |
Less Distributions to Shareholders from: | | | | | | | | | | | | | | | | | | | | | | | | | | | |
| | | | | | |
Net investment income | | | | | | (0.24 | ) | | | | (0.16 | ) | | | | (0.10 | ) | | | | — | | | | | — | |
| | | | | | |
Net realized gain on investments | | | | | | — | | | | | — | | | | | (0.20 | ) | | | | (28.93 | ) | | | | (5.36 | ) |
| | | | | | |
Total distributions to shareholders | | | | | | (0.24 | ) | | | | (0.16 | ) | | | | (0.30 | ) | | | | (28.93 | ) | | | | (5.36 | ) |
| | | | | | |
Net Asset Value, End of Year | | | | | | $41.87 | | | | | $33.65 | | | | | $30.31 | | | | | $43.52 | | | | | $56.96 | |
| | | | | | |
Total Return4 | | | | | | 25.26 | %2 | | | | 11.54 | %2 | | | | (29.90 | )%2 | | | | 31.75 | %2 | | | | 18.95 | % |
| | | | | | |
Ratio of net expenses to average net assets | | | | | | 0.93 | %5 | | | | 0.93 | % | | | | 0.93 | % | | | | 1.03 | % | | | | 1.11 | % |
| | | | | | |
Ratio of gross expenses to average net assets | | | | | | 0.95 | %6 | | | | 0.95 | %6 | | | | 0.95 | %6 | | | | 1.03 | %6 | | | | 1.11 | % |
| | | | | | |
Ratio of net investment income (loss) to average net assets | | | | | | 0.46 | %2 | | | | 0.47 | %2 | | | | 0.72 | %2 | | | | 0.04 | %2 | | | | (0.51 | )% |
| | | | | | |
Portfolio turnover | | | | | | 37 | % | | | | 25 | % | | | | 25 | % | | | | 202 | % | | | | 221 | % |
| | | | | | |
Net assets end of year (000’s) omitted | | | | | | $588,806 | | | | | $538,991 | | | | | $542,323 | | | | | $904,295 | | | | | $835,057 | |
| | | | | | | | | | | | | | | | | | | | | | | | | | | | |
| 1 | Per share numbers have been calculated using average shares. |
| 2 | Total returns and net investment income (loss) would have been lower had certain expenses not been offset. |
| 3 | Includes non-recurring dividends. Without these dividends, net investment income per share would have been $0.16. |
| 4 | The total return is calculated using the published Net Asset Value as of fiscal year end. |
| 5 | Includes interest expense totaling less than 0.01% related to participation in the interfund lending program. |
| 6 | Excludes the impact of expense reimbursement or fee waivers and expense reductions such as brokerage credits, but includes expense repayments and non-reimbursable expenses, if any, such as interest, taxes, and extraordinary expenses. (See Note 1(c) and 2 in the Notes to Financial Statements.) |
The accompanying notes are an integral part of these financial statements.
8
| | |
| | Notes to Financial Statements September 30, 2024 |
1. ORGANIZATION AND SUMMARY OF SIGNIFICANT ACCOUNTING POLICIES
AMG Funds I (the “Trust”) is an open-end management investment company, organized as a Massachusetts business trust, and registered under the Investment Company Act of 1940, as amended (the “1940 Act”). Currently, the Trust consists of a number of different funds, each having distinct investment management objectives, strategies, risks, and policies. Included in this report is AMG Boston Common Global Impact Fund (the “Fund”).
The Fund’s financial statements are prepared in accordance with accounting principles generally accepted in the United States of America (“U.S. GAAP”), including accounting and reporting guidance pursuant to Accounting Standards Codification Topic 946 applicable to investment companies. U.S. GAAP requires management to make estimates and assumptions that affect the reported amounts of assets and liabilities and disclosure of contingent assets and liabilities at the date of the financial statements and the reported amounts of income and expenses during the reporting period. Actual results could differ from those estimates and such differences could be material. The following is a summary of significant accounting policies followed by the Fund in the preparation of its financial statements:
a. VALUATION OF INVESTMENTS
Equity securities traded on a national securities exchange or reported on the NASDAQ national market system (“NMS”) are valued at the last quoted sales price on the primary exchange or, if applicable, the NASDAQ official closing price or the official closing price of the relevant exchange or, lacking any sales, at the last quoted bid price. Equity securities held by the Fund that are traded in the over-the-counter market (other than NMS securities) are valued at the bid price. Foreign equity securities (securities principally traded in markets other than U.S. markets) held by the Fund are valued at the official closing price on the primary exchange or, for markets that either do not offer an official closing price or where the official closing price may not be representative of the overall market, the last quoted sale price.
Fixed income securities purchased with a remaining maturity of 60 days or less are valued at amortized cost, provided that the amortized cost value is approximately the same as the fair value of the security valued without the use of amortized cost. Investments in other open-end registered investment companies are valued at their end of day net asset value per share.
The Fund’s portfolio investments are generally valued based on independent market quotations or prices or, if none, “evaluative” or other market based valuations provided by third party pricing services. Pursuant to Rule 2a-5 under the 1940 Act, the Fund’s Board of Trustees (the “Board”) designated AMG Funds LLC (the “Investment Manager”) as the Fund’s Valuation Designee to perform the Fund’s fair value determinations. Such determinations are subject to Board oversight and certain reporting and other requirements intended to ensure that the Board receives the information it needs to oversee the Investment Manager’s fair value determinations.
Under certain circumstances, the value of certain Fund portfolio investments may be based on an evaluation of fair value, pursuant to procedures established by the Investment Manager and under the general supervision of the Board. The Fund may use the fair value of a portfolio investment to calculate its net asset value (“NAV”) in the event that the market quotation, price or market based valuation for the portfolio investment is not readily available or otherwise not determinable
pursuant to the Fund’s valuation procedures, if the Investment Manager believes the quotation, price or market based valuation to be unreliable, or in certain other circumstances. When determining the fair value of an investment, the Investment Manager seeks to determine the price that the Fund might reasonably expect to receive from current sale of that portfolio investment in an arms-length transaction. Fair value determinations shall be based upon consideration of all available facts and information, including, but not limited to (i) attributes specific to the investment; (ii) fundamental and analytical data relating to the investment; and (iii) the value of other comparable securities or relevant financial instruments, including derivative securities, traded on other markets or among dealers.
The values assigned to fair value portfolio investments are based on available information and do not necessarily represent amounts that might ultimately be realized in the future, since such amounts depend on future developments inherent in long-term investments. Because of the inherent uncertainty of valuation, those estimated values may differ significantly from the values that would have been used had a ready market for the investments existed, and the differences could be material. The Board will be presented with quarterly reports, as of the most recent quarter end, summarizing all fair value activity, material fair value matters that occurred during the quarter, and all outstanding securities fair valued by the Fund. Additionally, the Board will be presented with an annual report that assesses the adequacy and effectiveness of the Investment Manager’s process for determining the fair value of the Fund’s investments.
With respect to foreign equity securities and certain foreign fixed income securities, securities held in the Fund that can be fair valued by the applicable fair value pricing service are fair valued on each business day provided that each individual price exceeds a pre-established confidence level.
U.S. GAAP defines fair value as the price that a fund would receive to sell an asset or pay to transfer a liability in an orderly transaction between market participants at the measurement date. U.S. GAAP also establishes a framework for measuring fair value, and a three level hierarchy for fair value measurements based upon the transparency of inputs to the valuation of an asset or liability. Inputs may be observable or unobservable and refer broadly to the assumptions that market participants would use in pricing the asset or liability. Observable inputs reflect the assumptions market participants would use in pricing the asset or liability based on market data obtained from sources independent of the Fund. Unobservable inputs reflect the Fund’s own assumptions about the assumptions that market participants would use in pricing the asset or liability developed based on the best information available in the circumstances. Each investment is assigned a level based upon the observability of the inputs which are significant to the overall valuation.
The three-tier hierarchy of inputs is summarized below:
Level 1 – inputs are quoted prices in active markets for identical investments (e.g., equity securities, open-end investment companies)
Level 2 – other observable inputs (including, but not limited to: quoted prices for similar assets or liabilities in markets that are active, quoted prices for identical or similar assets or liabilities in markets that are not active, inputs other than quoted prices that are observable for the assets or liabilities (such as interest rates, yield curves, volatilities, prepayment speeds, loss severities, credit risks and default rates) or other market corroborated inputs) (e.g., debt securities, government securities, forward foreign currency exchange contracts, foreign securities utilizing international fair value pricing, fair valued securities with observable inputs)
9
| | |
| | Notes to Financial Statements (continued) |
Level 3 – inputs are significant unobservable inputs (including the Fund’s own assumptions used to determine the fair value of investments) (e.g., fair valued securities with unobservable inputs)
Changes in inputs or methodologies used for valuing investments may result in a transfer in or out of levels within the fair value hierarchy. The inputs or methodologies used for valuing investments may not necessarily be an indication of the risk associated with investing in those investments.
b. SECURITY TRANSACTIONS
Security transactions are accounted for as of trade date. Realized gains and losses on securities sold are determined on the basis of identified cost.
c. INVESTMENT INCOME AND EXPENSES
Dividend income is recorded on the ex-dividend date. Dividends from foreign securities are recorded on the ex-dividend date, and if after the fact, as soon as the Fund becomes aware of the ex-dividend date. Interest income, which includes amortization of premium and accretion of discount on debt securities, is accrued as earned. Dividend and interest income on foreign securities is recorded gross of any withholding tax. Non-cash dividends included in dividend income, if any, are reported at the fair market value of the securities received. Other income and expenses are recorded on an accrual basis. Expenses that cannot be directly attributed to the Fund are apportioned among the funds in the Trust and other trusts or funds within the AMG Funds Family of Funds (collectively, the “AMG Funds Family”) based upon their relative average net assets or number of shareholders.
d. DIVIDENDS AND DISTRIBUTIONS
Fund distributions resulting from either net investment income or realized net capital gains, if any, will normally be declared and paid at least annually in December. Distributions to shareholders are recorded on the ex-dividend date. Distributions are determined in accordance with federal income tax law, which may differ from net investment income and net realized capital gains for financial statement purposes (U.S. GAAP). Differences may be permanent or temporary. Permanent differences are reclassified among capital accounts in the financial statements to reflect their tax character. Permanent book and tax basis differences, if any, relating to shareholder distributions will result in reclassifications to paid-in capital. Temporary differences arise when certain items of income, expense and gain or loss are recognized in different periods for financial statement and tax purposes; these differences will reverse at some time in the future. There were no permanent differences. Temporary differences are primarily due to mark to market on passive foreign investment companies and wash sale loss deferrals.
The tax character of distributions paid during the fiscal years ended September 30, 2024 and September 30, 2023 was as follows:
| | | | | | | | |
| | |
| Distributions paid from: | | 2024 | | | 2023 | |
| | |
Ordinary income * | | | $3,726,011 | | | | $2,788,916 | |
| | | | | | | | |
| | | $3,726,011 | | | $2,788,916 | |
| | | | | | | | |
| * | For tax purposes, short-term capital gain distributions, if any, are considered ordinary income distributions. |
As of September 30, 2024, the components of distributable earnings (excluding unrealized appreciation/depreciation) on a tax basis consisted of:
| | | | |
| |
Capital loss carryforward | | | $98,065,672 | |
| |
Undistributed ordinary income | | | 6,152,775 | |
At September 30, 2024, the cost of investments and the aggregate gross unrealized appreciation and depreciation for federal income tax purposes were as follows:
| | | | | | | | | | | | | | |
Cost | | | Appreciation | | | Depreciation | | | Net Appreciation | |
| | | |
| $ | 512,412,023 | | | $ | 117,865,667 | | | | $(38,135,363) | | | | $79,730,304 | |
e. FEDERAL TAXES
The Fund currently qualifies as an investment company and intends to comply with the requirements under Subchapter M of the Internal Revenue Code of 1986, as amended (the “Code”), and to distribute substantially all of its taxable income and gains to its shareholders and to meet certain diversification and income requirements with respect to investment companies. The Investment Manager has analyzed the Fund’s tax positions taken on federal income tax returns as of September 30, 2024, and for all open tax years (generally, the three prior taxable years), and has concluded that no provision for federal income tax is required in the Fund’s financial statements. Additionally, the Investment Manager is not aware of any tax position for which it is reasonably possible that the total amounts of unrecognized tax benefit/detriment will change materially in the next twelve months.
Furthermore, based on the Fund’s understanding of the tax rules and rates related to income, gains and transactions for the foreign jurisdictions in which it invests, the Fund will provide for foreign taxes, and where appropriate, deferred foreign taxes.
f. CAPITAL LOSS CARRYOVERS AND DEFERRALS
As of September 30, 2024, the Fund had capital loss carryovers for federal income tax purposes as shown in the following chart. These amounts may be used to offset future realized capital gains indefinitely, and retain their character as short-term and/or long-term.
| | | | | | | | |
Short-Term | | Long-Term | | | Total | |
| | |
| $8,340,630 | | $ | 89,725,042 | | | $ | 98,065,672 | |
For the fiscal year ended September 30, 2024, the Fund did not utilize capital loss carryovers.
10
| | |
| | Notes to Financial Statements (continued) |
g. CAPITAL STOCK
The Trust’s Amended and Restated Agreement and Declaration of Trust authorizes for the Fund the issuance of an unlimited number of shares of beneficial interest, without par value. The Fund records sales and repurchases of its capital stock on the trade date.
For the fiscal years ended September 30, 2024 and September 30, 2023, the capital stock transactions by class for the Fund were as follows:
| | | | | | | | | | | | | | | | |
| | | September 30, 2024 | | | September 30, 2023 | |
| | | | |
| | | Shares | | | | Amount | | | | Shares | | | | Amount | |
| | | | |
Class I: | | | | | | | | | | | | | | | | |
| | | | |
Shares sold | | | 28,921 | | | $ | 1,069,375 | | | | 27,371 | | | $ | 946,414 | |
| | | | |
Shares issued in reinvestment of distributions | | | 92,716 | | | | 3,429,571 | | | | 74,740 | | | | 2,566,572 | |
| | | | |
Shares redeemed | | | (2,075,256 | ) | | | (78,053,726 | ) | | | (1,980,409 | ) | | | (69,457,821 | ) |
| | | | | | | | | | | | | | | | |
| | | | |
Net decrease | | | (1,953,619 | ) | | $ | (73,554,780 | ) | | | (1,878,298 | ) | | $ | (65,944,835 | ) |
| | | | | | | | | | | | | | | | |
h. REPURCHASE AGREEMENTS AND JOINT REPURCHASE AGREEMENTS
The Fund may enter into third-party and bilateral repurchase agreements for temporary cash management purposes and for reinvestment of cash collateral on securities lending transactions under the securities lending program offered by The Bank of New York Mellon (“BNYM”) (the “Securities Lending Program”) (collectively, “Repurchase Agreements”). The value of the underlying collateral, including accrued interest, must equal or exceed the value of the Repurchase Agreements during the term of the agreement. For joint repurchase agreements, the Fund participates on a pro rata basis with other clients of BNYM in its share of the underlying collateral under such joint repurchase agreements and in its share of proceeds from any repurchase or other disposition of the underlying collateral. The underlying collateral for all Repurchase Agreements is held by the Fund’s custodian or at the Federal Reserve Bank. If the seller defaults and the value of the collateral declines, or if bankruptcy proceedings commence with respect to the seller of the security, realization of the collateral by the Fund may be delayed or limited. Pursuant to the Securities Lending Program, the Fund is indemnified for such losses by BNYM on joint repurchase agreements.
At September 30, 2024, the market value of Repurchase Agreements outstanding was $3,693,609.
i. FOREIGN CURRENCY TRANSLATION
The books and records of the Fund are maintained in U.S. Dollars. The value of investments, assets and liabilities denominated in currencies other than U.S. Dollars are translated into U.S. Dollars based upon current foreign exchange rates. Purchases and sales of foreign investments, income and expenses are converted into U.S. Dollars based on currency exchange rates prevailing on the respective dates of such transactions. Net realized and unrealized gain (loss) on foreign currency transactions represent: (1) foreign exchange gains and losses from the sale and holdings of foreign currencies; (2) gains and losses between trade date and settlement date on investment securities transactions and forward foreign currency exchange contracts; and (3) gains and losses from the difference between amounts of interest and dividends recorded and the amounts actually received.
The Fund does not isolate the net realized and unrealized gain or loss resulting from changes in exchange rates from the fluctuations in market prices of
securities held. Such fluctuations are included with the net realized and unrealized gain or loss on investments.
2. AGREEMENTS AND TRANSACTIONS WITH AFFILIATES
The Trust has entered into an investment advisory agreement under which the Investment Manager, a subsidiary and the U.S. wealth platform of Affiliated Managers Group, Inc. (“AMG”), serves as investment manager to the Fund and is responsible for the Fund’s overall administration and operations. The Investment Manager selects and recommends, subject to the approval of the Board and, in certain circumstances, shareholders, the subadviser for the Fund and monitors the subadviser’s investment performance, security holdings and investment strategies. The Fund’s investment portfolio is managed by Boston Common Asset Management, LLC (“Boston Common”) who serves as subadviser pursuant to a subadvisory agreement with the Investment Manager. AMG owns a minority equity interest in Boston Common.
Investment management fees are paid directly by the Fund to the Investment Manager based on average daily net assets. For the fiscal year ended September 30, 2024, the Fund paid an investment management fee at the annual rate of 0.73% of the average daily net assets of the Fund. The fee paid to Boston Common for its services as subadviser is paid out of the fee the Investment Manager receives from the Fund and does not increase the expenses of the Fund.
The Investment Manager has contractually agreed, through at least February 1, 2025, to waive management fees and/or pay or reimburse fund expenses in order to limit total annual Fund operating expenses after fee waiver and expense reimbursements (exclusive of taxes, interest (including interest incurred in connection with bank and custody overdrafts, and in connection with securities sold short), shareholder servicing fees, distribution and service (12b-1) fees, brokerage commissions and other transaction costs, dividends payable with respect to securities sold short, acquired fund fees and expenses and extraordinary expenses) of the Fund to the annual rate of 0.93% of the Fund’s average daily net assets (this annual rate or such other annual rate that may be in effect from time to time, the “Expense Cap”), subject to later reimbursement by the Fund in certain circumstances.
In general, for a period of up to 36 months after the date any amounts are paid, waived or reimbursed by the Investment Manager, the Investment Manager may
11
| | |
| | Notes to Financial Statements (continued) |
recover such amounts from the Fund, provided that such repayment would not cause the Fund’s total annual operating expenses after fee waiver and expense reimbursements (exclusive of the items noted in the parenthetical above) to exceed either (i) the Expense Cap in effect at the time such amounts were paid, waived or reimbursed, or (ii) the Expense Cap in effect at the time of such repayment by the Fund.
The contractual expense limitation may only be terminated in the event the Investment Manager or a successor ceases to be the investment manager of the Fund or a successor fund, by mutual agreement between the Investment Manager and the Board, or in the event of the Fund’s liquidation unless the Fund is reorganized or is a party to a merger in which the surviving entity is successor to the accounting and performance information of the Fund.
For the fiscal year ended September 30, 2024, the Investment Manager reimbursed the Fund $122,965, and did not recoup any previously reimbursed expenses. At September 30, 2024, the Fund’s expiration of reimbursements subject to recoupment is as follows:
| | | | |
Expiration Period | | | |
| |
Less than 1 year | | $ | 130,405 | |
| |
1-2 years | | | 92,433 | |
| |
2-3 years | | | 122,965 | |
| | | | |
| |
Total | | $ | 345,803 | |
| | | | |
The Trust, on behalf of the Fund, has entered into an amended and restated Administration Agreement under which the Investment Manager serves as the Fund’s administrator (the “Administrator”) and is responsible for certain aspects of managing the Fund’s operations, including administration and shareholder services to the Fund. The Fund pays a fee to the Administrator at the rate of 0.15% per annum of the Fund’s average daily net assets for this service.
The Fund is distributed by AMG Distributors, Inc. (the “Distributor”), a wholly-owned subsidiary of the Investment Manager. The Distributor serves as the distributor and underwriter for the Fund and is a registered broker-dealer and member of the Financial Industry Regulatory Authority, Inc. (“FINRA”). Shares of the Fund will be continuously offered and will be sold directly to prospective purchasers and through brokers, dealers or other financial intermediaries who have executed selling agreements with the Distributor. Generally, the Distributor bears all or a portion of the expenses of providing services pursuant to the distribution agreement, including the payment of the expenses relating to the distribution of prospectuses for sales purposes and any advertising or sales literature.
The Board provides supervision of the affairs of the Trust and other trusts within the AMG Funds Family. The Trustees of the Trust who are not affiliated with the Investment Manager receive an annual retainer and per meeting fees for regular, special and telephonic meetings, and they are reimbursed for out-of-pocket expenses incurred while carrying out their duties as Board members. The Chairman of the Board and the Audit Committee Chair receive additional annual retainers. Certain Trustees and Officers of the Fund are Officers and/or Directors of the Investment Manager, AMG and/or the Distributor.
The Securities and Exchange Commission (the “SEC”) granted an exemptive order that permits certain eligible funds in the AMG Funds Family to lend and borrow money for certain temporary purposes directly to and from other eligible funds in the AMG Funds Family. Participation in this interfund lending program is voluntary
for both the borrowing and lending funds, and an interfund loan is only made if it benefits each participating fund. The Administrator manages the program according to procedures approved by the Board, and the Board monitors the operation of the program. An interfund loan must comply with certain conditions set out in the exemptive order, which are designed to assure fairness and protect all participating funds. The interest earned and interest paid on interfund loans are included on the Statement of Operations as interest income and interest expense, respectively. At September 30, 2024, the Fund had no interfund loans outstanding. The Fund did not lend during the fiscal year ended September 30, 2024.
The Fund utilized the interfund loan program during the fiscal year ended September 30, 2024 as follows:
| | | | | | | | | | | | | | |
Average Borrowed | | | Number
of Days | | | Interest Paid | | | Average
Interest Rate | |
| | | |
| | $2,857,744 | | | | 4 | | | | $1,950 | | | | 6.226% | |
3. PURCHASES AND SALES OF SECURITIES
Purchases and sales of securities (excluding short-term securities and U.S. Government Obligations) for the fiscal year ended September 30, 2024, were $205,367,746 and $279,926,305, respectively.
The Fund had no purchases or sales of U.S. Government Obligations during the fiscal year ended September 30, 2024.
4. PORTFOLIO SECURITIES LOANED
The Fund participates in the Securities Lending Program providing for the lending of securities to qualified borrowers. Securities lending income includes earnings of such temporary cash investments, plus or minus any rebate to a borrower. These earnings (after any rebate) are then divided between BNYM, as a fee for its services under the Securities Lending Program, and the Fund, according to agreed-upon rates. Collateral on all securities loaned is accepted in cash, U.S. Treasury Obligations or U.S. Government Agency Obligations. Collateral is maintained at a minimum level of 102% (105% in the case of certain foreign securities) of the market value, plus interest, if applicable, of investments on loan. It is the Fund’s policy to obtain additional collateral from or return excess collateral to the borrower by the end of the next business day, following the valuation date of the securities loaned. Therefore, the value of the collateral held may be temporarily less than the value of the securities on loan. Lending securities entails a risk of loss to the Fund if and to the extent that the market value of the securities loaned were to increase and the borrower did not increase the collateral accordingly, and the borrower fails to return the securities. Under the terms of the Securities Lending Program, the Fund is indemnified for such losses by BNYM. Cash collateral is held in separate omnibus accounts managed by BNYM, who is authorized to exclusively enter into joint repurchase agreements for that cash collateral. Securities collateral is held in separate omnibus accounts managed by BNYM and cannot be sold or pledged. BNYM bears the risk of any deficiency in the amount of the cash collateral available for return to the borrower due to any loss on the collateral invested. Loans of securities are terminable at any time and the borrower, after notice, is required to return borrowed securities as soon as practical, which is normally within three business days.
The value of securities loaned on positions held, cash collateral and securities collateral received at September 30, 2024, was as follows:
12
| | |
| | Notes to Financial Statements (continued) |
| | | | | | |
Securities
Loaned | | Cash
Collateral
Received | | Securities
Collateral
Received | | Total
Collateral
Received |
| | | |
| $20,313,610 | | $3,693,609 | | $17,730,838 | | $21,424,447 |
The following table summarizes the securities received as collateral for securities lending at September 30, 2024:
| | | | | | | | | | |
Collateral
Type | | Coupon
Range | | Maturity
Date Range | |
| | | |
| U.S. Treasury Obligations | | | 0.125 | %-7.625% | | | | | 11/15/24-11/15/53 | |
5. FUND RISKS
In the normal course of business, the Fund invests in securities or other instruments and may enter into certain transactions, and such activities subject the Fund to various risks. The value of securities or other instruments may also be affected by various factors, including, without limitation: (i) the general economy; (ii) the overall market as well as local, regional or global political and/or social instability; or (iii) currency and price fluctuations. Please refer to the Fund’s current prospectus for additional information about the Fund’s principal risks.
Market Risk: Market prices of investments held by the Fund may fall rapidly or unpredictably due to a variety of factors, including economic, political, or market conditions, or other factors including terrorism, war, natural disasters and the spread of infectious illness or other public health issues, including epidemics or pandemics, or in response to events that affect particular industries or companies.
Management Risk: Because the Fund is an actively managed investment portfolio, security selection or focus on securities in a particular style, market sector or group of companies may cause the Fund to incur losses or underperform relative to its benchmarks or other funds with a similar investment objective. There can be no guarantee that Boston Common’s investment techniques and risk analysis will produce the desired result.
Sector Risk: Issuers and companies that are in similar industry sectors may be similarly affected by particular economic or market events; to the extent the Fund has substantial holdings within a particular sector, the risks associated with that sector increase.
Foreign Investment Risk: Investments in foreign issuers involve additional risks (such as risks arising from less frequent trading, changes in political or social conditions, and less publicly available information about non-U.S. issuers) that differ from those associated with investments in U.S. issuers and may result in greater price volatility.
Emerging Markets Risk: Investments in emerging markets are subject to the general risks of foreign investments, as well as additional risks which can result in greater price volatility. Such additional risks include the risk that markets in emerging market countries are typically less developed and less liquid than markets in developed countries and such markets are subjected to increased economic, political, or regulatory uncertainties.
Political Risk: Changes in the general political and social environment of a country can have substantial effects on the value of investments exposed to that country.
Currency Risk: Fluctuations in exchange rates may affect the total loss or gain on a non-U.S. dollar investment when converted back to U.S. dollars and exposure to
non-U.S. currencies may subject the Fund to the risk that those currencies will decline in value relative to the U.S. dollar.
ESG Investing Risk: Because applying the Fund’s ESG investment criteria may result in the selection or exclusion of securities of certain issuers for reasons other than financial performance, the Fund’s investment returns may underperform funds that do not incorporate ESG factors into their investment process. The incorporation of ESG criteria into the investment process may affect the Fund’s investment exposure to certain companies, sectors, regions, countries or types of investments, which could negatively impact the Fund’s performance depending on whether such investments are in or out of favor. Applying ESG criteria to investment decisions is qualitative and subjective by nature, and there is no guarantee that the criteria utilized by Boston Common or any judgment exercised by Boston Common will improve the financial performance of the Fund or reflect the beliefs or values of any particular investor. ESG standards differ by region and industry, and a company’s ESG practices or Boston Common’s assessment of a company’s ESG practices may change over time.
Large Capitalization Stock Risk: The stocks of large-capitalization companies are generally more mature and may not be able to reach the same levels of growth as the stocks of small- or mid-capitalization companies.
Mid-Capitalization Stock Risk: Although the Fund may invest in securities in any capitalization range, securities of mid-capitalization companies may pose additional risks. The stocks of mid-capitalization companies often have greater price volatility, lower trading volume, and less liquidity than the stocks of larger, more established companies.
Small-Capitalization Stock Risk: Although the Fund may invest in securities in any capitalization range, securities of small-capitalization companies may pose additional risks. The stocks of small-capitalization companies often have greater price volatility, lower trading volume, and less liquidity than the stocks of larger, more established companies.
Value Stock Risk: Value stocks may perform differently from the market as a whole and may be undervalued by the market for a long period of time.
Growth Stock Risk: The prices of equity securities of companies that are expected to experience relatively rapid earnings growth, or “growth stocks,” may be more sensitive to market movements because the prices tend to reflect future investor expectations rather than just current profits.
Liquidity Risk: The Fund may not be able to dispose of particular investments, such as illiquid securities, readily at favorable times or prices or the Fund may have to sell them at a loss.
6. COMMITMENTS AND CONTINGENCIES
Under the Trust’s organizational documents, its Trustees and Officers are indemnified against certain liabilities arising out of the performance of their duties to the Trust. In addition, in the normal course of business, the Fund may enter into contracts and agreements that contain a variety of representations and warranties, which provide general indemnifications. The maximum exposure to the Fund under these arrangements is unknown, as this would involve future claims that may be made against the Fund that have not yet occurred. However, based on experience, the Fund had no prior claims or losses and expects the risks of loss to be remote.
13
| | |
| | Notes to Financial Statements (continued) |
7. MASTER NETTING AGREEMENTS
The Fund may enter into master netting agreements with its counterparties for the Securities Lending Program and Repurchase Agreements, which provide the right, in the event of default (including bankruptcy or insolvency) for the non-defaulting party to liquidate the collateral and calculate net exposure to the defaulting party or request additional collateral. For financial reporting purposes, the Fund does not offset financial assets and financial liabilities that are subject to master netting agreements in the Statement of Assets and Liabilities. For securities lending transactions, see Note 4.
The following table is a summary of the Fund’s open Repurchase Agreements that are subject to a master netting agreement as of September 30, 2024:
| | | | | | | | | | | | | | | | | | | | |
| | | | | | Gross Amount Not Offset in the
Statement of Assets and Liabilities | | | | | | | |
| | | Gross Amounts of
Assets Presented in
the Statement of
Assets and Liabilities | | | Offset
Amount | | | Net
Asset
Balance | | | Collateral
Received | | | Net
Amount | |
| | | | | | | | | | | | | | | | | | | | |
| | | | | |
| | | | | | | | | | | | | | | | | | | | |
| | | | | |
Bethesda Securities LLC | | | $1,000,000 | | | | — | | | | $1,000,000 | | | | $1,000,000 | | | | — | |
| | | | | |
Cantor Fitzgerald Securities, Inc. | | | 1,000,000 | | | | — | | | | 1,000,000 | | | | 1,000,000 | | | | — | |
| | | | | |
Marex Capital Markets, Inc. | | | 1,000,000 | | | | — | | | | 1,000,000 | | | | 1,000,000 | | | | — | |
| | | | | |
National Bank Financial, Inc. | | | 693,609 | | | | — | | | | 693,609 | | | | 693,609 | | | | — | |
| | | | | | | | | | | | | | | | | | | | |
| | | | | |
Total | | | $3,693,609 | | | | — | | | | $3,693,609 | | | | $3,693,609 | | | | — | |
| | | | | | | | | | | | | | | | | | | | |
8. SUBSEQUENT EVENTS
The Fund has determined that no material events or transactions occurred through the issuance date of the Fund’s financial statements which require an additional disclosure in or adjustment of the Fund’s financial statements.
14
| | |
| | Report of Independent Registered Public Accounting Firm |
To the Board of Trustees of AMG Funds I and Shareholders of AMG Boston Common Global Impact Fund
Opinion on the Financial Statements
We have audited the accompanying statement of assets and liabilities, including the schedule of portfolio investments, of AMG Boston Common Global Impact Fund (one of the funds constituting AMG Funds I, referred to hereafter as the “Fund”) as of September 30, 2024, the related statement of operations for the year ended September 30, 2024, the statements of changes in net assets for each of the two years in the period ended September 30, 2024, including the related notes, and the financial highlights for each of the five years in the period ended September 30, 2024 (collectively referred to as the “financial statements”). In our opinion, the financial statements present fairly, in all material respects, the financial position of the Fund as of September 30, 2024, the results of its operations for the year then ended, the changes in its net assets for each of the two years in the period ended September 30, 2024 and the financial highlights for each of the five years in the period ended September 30, 2024 in conformity with accounting principles generally accepted in the United States of America.
Basis for Opinion
These financial statements are the responsibility of the Fund’s management. Our responsibility is to express an opinion on the Fund’s financial statements based on our audits. We are a public accounting firm registered with the Public Company Accounting Oversight Board (United States) (PCAOB) and are required to be independent with respect to the Fund in accordance with the U.S. federal securities laws and the applicable rules and regulations of the Securities and Exchange Commission and the PCAOB.
We conducted our audits of these financial statements in accordance with the standards of the PCAOB. Those standards require that we plan and perform the audit to obtain reasonable assurance about whether the financial statements are free of material misstatement, whether due to error or fraud.
Our audits included performing procedures to assess the risks of material misstatement of the financial statements, whether due to error or fraud, and performing procedures that respond to those risks. Such procedures included examining, on a test basis, evidence regarding the amounts and disclosures in the financial statements. Our audits also included evaluating the accounting principles used and significant estimates made by management, as well as evaluating the overall presentation of the financial statements. Our procedures included confirmation of securities owned as of September 30, 2024 by correspondence with the custodian. We believe that our audits provide a reasonable basis for our opinion.
/s/PricewaterhouseCoopers LLP
Boston, Massachusetts
November 27, 2024
We have served as the auditor of one or more investment companies in the AMG Funds Family since 1993.
15
| | |
| | Other Information (unaudited) |
TAX INFORMATION
AMG Boston Common Global Impact Fund hereby designates the maximum amount allowable of its net taxable income as qualified dividends as provided in the Jobs and Growth Tax Relief Reconciliation Act of 2003. The 2024 Form 1099-DIV you receive for the Fund will show the tax status of all distributions paid to you during the calendar year.
Pursuant to section 852 of the Internal Revenue Code of 1986, as amended, AMG Boston Common Global Impact Fund hereby designates $0 as a capital gain distribution with respect to the taxable year ended September 30, 2024, or if subsequently determined to be different, the net capital gains of such year.
ITEM 8. CHANGES IN AND DISAGREEMENTS WITH ACCOUNTANTS FOR OPEN-END MANAGEMENT INVESTMENT COMPANIES
During the fiscal year ended September 30, 2024, there were no changes in and/or disagreements with accountants.
ITEM 9. PROXY DISCLOSURES FOR OPEN-END MANAGEMENT INVESTMENT COMPANIES
Not applicable.
ITEM 10. REMUNERATION PAID TO DIRECTORS, OFFICERS, AND OTHERS OF OPEN-END MANAGEMENT INVESTMENT COMPANIES
The remuneration paid to the Trustees during the fiscal year ended September 30, 2024, was $44,449, which is reflected as “Trustee fees and expenses” on the Statement of Operations. There was no remuneration paid to any Fund officer or to any affiliated person of any Fund Trustee or officer during the fiscal year ended September 30, 2024.
16
| | |
| | ITEM 11. STATEMENT REGARDING BASIS FOR APPROVAL OF INVESTMENT ADVISORY CONTRACT |
| | | | | | | | |
AMG Boston Common Global Impact Fund: Approval of Investment Management Agreement and Subadvisory Agreement on June 12, 2024 At an in-person meeting held on June 12, 2024, the Board of Trustees (the “Board” or the “Trustees”), and separately a majority of the Trustees who are not “interested persons” of AMG Funds I (the “Trust”) (the “Independent Trustees”), approved (i) the Investment Management Agreement, as amended pursuant to letter agreements at any time prior to the date of the meeting, with AMG Funds LLC (the “Investment Manager”) for AMG Boston Common Global Impact Fund (the “Fund”) and separately each of Amendment No. 1 thereto dated July 1, 2015, and Amendment No. 2 thereto dated October 1, 2016 (collectively, the “Investment Management Agreement”); and (ii) the Subadvisory Agreement with respect to the Fund, as amended at any time prior to the date of the meeting (the “Subadvisory Agreement”), with Boston Common Asset Management, LLC, the Fund’s subadviser (the “Subadviser”). The Independent Trustees were separately represented by independent legal counsel in connection with their consideration of the approval of these agreements. In considering the Investment Management Agreement and Subadvisory Agreement, the Trustees reviewed a variety of materials relating to the Fund, the Investment Manager and the Subadviser, including the nature, extent and quality of services, comparative performance, fee and expense information for an appropriate peer group of similar mutual funds for the Fund (the “Peer Group”), performance information for the relevant benchmark index for the Fund (the “Fund Benchmark”), other relevant matters, including management fees, the profitability of the Investment Manager and the Subadviser, and the potential for economies of scale that may be shared with the Fund, and other information provided to them on a periodic basis throughout the year. Prior to voting, the Independent Trustees: (a) reviewed the foregoing information with their independent legal counsel; (b) received materials from their independent legal counsel discussing the legal standards applicable to their consideration of the Investment Management Agreement and the Subadvisory Agreement; and (c) met with their independent legal counsel in private sessions at which no representatives of management were present. NATURE, EXTENT AND QUALITY OF SERVICES In considering the nature, extent and quality of the services provided by the Investment Manager, the Trustees reviewed information provided by the | | | | Investment Manager at the June 12, 2024 meeting and prior meetings relating to the Investment Manager’s operations and personnel. Among other things, the Investment Manager provided financial information, information about its supervisory and professional staff and descriptions of its organizational and management structure. The Trustees also took into account information provided periodically throughout the previous year by the Investment Manager in Board meetings relating to the performance of its duties with respect to the Fund and the Trustees’ knowledge of the Investment Manager’s management and the quality of the performance of the Investment Manager’s duties under the Investment Management Agreement and Administration Agreement. In the course of their deliberations regarding the Investment Manager, the Trustees evaluated, among other things: (a) the extent and quality of the Investment Manager’s oversight of the operation and management of the Fund; (b) the quality of the Investment Manager’s oversight of the performance by the Subadviser of its portfolio management duties; (c) the Investment Manager’s ability to supervise the Fund’s other service providers; and (d) the Investment Manager’s compliance program. The Trustees also took into account that, in performing its functions under the Investment Management Agreement and supervising the Subadviser, the Investment Manager: performs periodic detailed analyses and reviews of the performance by the Subadviser of its obligations to the Fund, including without limitation, analysis and review of portfolio and other compliance matters and review of the Subadviser’s investment performance with respect to the Fund; prepares and presents periodic reports to the Board regarding the investment performance of the Subadviser and other information regarding the Subadviser, at such times and in such forms as the Board may reasonably request; reviews and considers any changes in the personnel of the Subadviser responsible for performing the Subadviser’s obligations and makes appropriate reports to the Board; reviews and considers any changes in the ownership or senior management of the Subadviser and makes appropriate reports to the Board; performs periodic in-person, telephonic or videoconference diligence meetings, including with respect to compliance matters, with representatives of the Subadviser; assists the Board and management of the Trust in developing and reviewing information with respect to the initial approval of the Subadvisory Agreement and annual consideration of the Subadvisory Agreement thereafter; prepares recommendations with respect to the continued retention of the Subadviser or the replacement of the Subadviser, | | | | including at the request of the Board; identifies potential successors to, or replacements of, the Subadviser or potential additional subadvisers, including performing appropriate due diligence, and developing and presenting to the Board a recommendation as to any such successor, replacement, or additional subadviser, including at the request of the Board; designates and compensates from its own resources such personnel as the Investment Manager may consider necessary or appropriate to the performance of its services; and performs such other review and reporting functions as the Board shall reasonably request consistent with the Investment Management Agreement and applicable law. The Trustees noted the affiliation of the Subadviser with the Investment Manager, noting any potential conflicts of interest. The Trustees also took into account the financial condition of the Investment Manager with respect to its ability to provide the services required under the Investment Management Agreement and the Investment Manager’s undertaking to maintain a contractual expense limitation for the Fund. The Trustees also considered the Investment Manager’s risk management processes. The Trustees also reviewed information relating to the Subadviser’s operations and personnel and the investment philosophy, strategies and techniques (its “Investment Strategy”) used in managing the Fund. Among other things, the Trustees reviewed information on portfolio management and other professional staff, information regarding the Subadviser’s organizational and management structure and the Subadviser’s brokerage policies and practices. The Trustees considered specific information provided regarding the experience of the individuals at the Subadviser with portfolio management responsibility for the Fund, including the information set forth in the Fund’s prospectus and statement of additional information. In the course of their deliberations, the Trustees evaluated, among other things: (a) the services rendered by the Subadviser in the past; (b) the qualifications and experience of the Subadviser’s personnel; and (c) the Subadviser’s compliance program. The Trustees also took into account the financial condition of the Subadviser with respect to its ability to provide the services required under the Subadvisory Agreement. The Trustees also considered the Subadviser’s risk management processes. |
17
| | |
| | ITEM 11. STATEMENT REGARDING BASIS FOR APPROVAL OF INVESTMENT ADVISORY CONTRACT (continued) |
| | | | | | | | |
PERFORMANCE The Board considered the Fund’s net performance during relevant time periods as compared to the Fund’s Peer Group and Fund Benchmark, considered the gross performance of the Fund as compared to the Subadviser’s relevant performance composite that utilizes a similar investment strategy and approach, and noted that the Board reviews on a quarterly basis detailed information about both the Fund’s performance results and portfolio composition, as well as the Subadviser’s Investment Strategy. The Board was mindful of the Investment Manager’s expertise, resources and attention to monitoring the Subadviser’s performance, investment style and risk-adjusted performance with respect to the Fund and its discussions with the management of the Fund’s subadviser during the period regarding the factors that contributed to the performance of the Fund. Among other information relating to the Fund’s performance, the Trustees noted that the Fund’s performance for Class I shares (the Fund’s sole share class) for the 1-year, 3-year, 5-year and 10-year periods ended March 31, 2024, was below the median performance of the Peer Group and below, below, below, and above, respectively, the performance of the Fund Benchmark, the MSCI ACWI Index. The Trustees also took into account management’s discussion of the Fund’s performance, including the reasons for the Fund’s underperformance. The Trustees also took into account that the Fund ranked in the top half of its Peer Group for the 2022 calendar year. The Trustees also took into account the fact that the Fund’s subadviser, investment strategy, and Fund Benchmark changed effective March 19, 2021, and that the performance information prior to that date reflected that of the Fund’s prior subadviser and investment strategy. The Trustees concluded that the Fund’s overall performance has been satisfactory in light of the Fund’s investment objective, strategies, and policies. ADVISORY AND SUBADVISORY FEES; FUND EXPENSES; PROFITABILITY; AND ECONOMIES OF SCALE In considering the reasonableness of the advisory fee payable to the Investment Manager, the Trustees reviewed information provided by the Investment Manager at the June 12, 2024 meeting and prior meetings setting forth all revenues and other benefits, both direct and indirect (including any so-called “fallout benefits” such as reputational value derived from the Investment Manager serving as Investment Manager to the Fund), received by the | | | | Investment Manager and its affiliates attributable to managing the Fund and all the mutual funds in the AMG Funds Family of Funds; the cost of providing such services; the significant risks undertaken as Investment Manager and sponsor of the Fund, including investment, operational, enterprise, entrepreneurial, litigation, regulatory and compliance risks; and the resulting profitability to the Investment Manager and its affiliates from these relationships. The Trustees also considered the amount of the advisory fee retained by the Investment Manager after payment of the subadvisory fee with respect to the Fund. The Trustees also noted payments are made from the Subadviser to the Investment Manager, and other payments are made from the Investment Manager to the Subadviser. The Trustees also considered management’s discussion of the current asset level of the Fund, and the impact on profitability of both the current asset level and any future growth of assets of the Fund. In considering the cost of services to be provided by the Investment Manager under the Investment Management Agreement and the profitability to the Investment Manager of its relationship with the Fund, the Trustees noted the undertaking by the Investment Manager to maintain a contractual expense limitation for the Fund. The Board also took into account management’s discussion of the advisory fee structure, and the services the Investment Manager provides in performing its functions under the Investment Management Agreement and supervising the Subadviser. Based on the foregoing, the Trustees concluded that the profitability to the Investment Manager is reasonable and that the Investment Manager is not realizing material benefits from economies of scale that would warrant adjustments to the advisory fee at this time. Also, with respect to economies of scale, the Trustees noted that as the Fund’s assets increase over time, the Fund may realize other economies of scale to the extent the increase in assets is proportionally greater than the increase in certain other expenses. In considering the reasonableness of the subadvisory fee payable by the Investment Manager to the Subadviser, the Trustees reviewed information regarding the cost to the Subadviser of providing subadvisory services to the Fund and the resulting profitability from the relationship. The Trustees noted that, because the Subadviser is an affiliate of the Investment Manager, a portion of the Subadviser’s revenues or profits might be shared directly or indirectly with the Investment Manager. The Trustees also noted that the subadvisory fees are paid by the Investment Manager out of its advisory fee. The Board also took into account management’s | | | | discussion of the subadvisory fee structure, and the services the Subadviser provides in performing its functions under the Subadvisory Agreement. Based on the foregoing, the Trustees concluded that the profitability to the Subadviser is reasonable and that the Subadviser is not realizing material benefits from economies of scale that would warrant adjustments to the subadvisory fees at this time. Also, with respect to economies of scale, the Trustees noted that as the Fund’s assets increase over time, the Fund may realize other economies of scale to the extent the increase in assets is proportionally greater than the increase in certain other expenses. The Trustees noted that the Fund’s management fees (which include both the advisory and administration fees) and total expenses (net of applicable expense waivers/reimbursements) as of March 31, 2024, were both rated in the Above Average rating level of the Fund’s Peer Group. The Trustees noted that the rating level corresponded to the Fund’s quintile ranking in its Peer Group. The Trustees took into account the fact that the Investment Manager has contractually agreed, through February 1, 2025, to limit the Fund’s net annual operating expenses (subject to certain excluded expenses) to 0.93%. The Trustees took into account management’s discussion of the Fund’s expenses and competitiveness with comparably sized funds and select competitors. The Trustees concluded that, in light of the nature, extent and quality of the services provided by the Investment Manager and the Subadviser (which is an affiliate of the Investment Manager), the foregoing expense limitation and the considerations noted above with respect to the Investment Manager and the Subadviser, the Fund’s advisory and subadvisory fees are reasonable. * * * * * After consideration of the foregoing, the Trustees also reached the following conclusions (in addition to the conclusions discussed above) regarding the Investment Management Agreement and the Subadvisory Agreement: (a) the Investment Manager and the Subadviser have demonstrated that they possess the capability and resources to perform the duties required of them under the Investment Management Agreement and the Subadvisory Agreement and (b) the Investment Manager and Subadviser maintain appropriate compliance programs. Based on all of the above-mentioned factors and their related conclusions, with no single factor or conclusion being determinative and with each Trustee not necessarily attributing the same weight to each factor, the Trustees concluded that approval |
18
| | |
| | ITEM 11. STATEMENT REGARDING BASIS FOR APPROVAL OF INVESTMENT ADVISORY CONTRACT (continued) |
| | | | | | | | |
| of the Investment Management Agreement and the Subadvisory Agreement would be in the best interests of the Fund and its shareholders. Accordingly, on June 12, 2024, the Trustees, and | | | | separately a majority of the Independent Trustees, voted to approve the Investment Management Agreement and the Subadvisory Agreement for the Fund. | | | | |
19
THIS PAGE INTENTIONALLY LEFT BLANK
| | |
 | | |
| | | | |
INVESTMENT MANAGER AND ADMINISTRATOR AMG Funds LLC 680 Washington Blvd., Suite 500 Stamford, CT 06901 800.548.4539 DISTRIBUTOR AMG Distributors, Inc. 680 Washington Blvd., Suite 500 Stamford, CT 06901 800.548.4539 SUBADVISER Boston Common Asset Management, LLC 200 State Street 7th Floor Boston, MA 02109 CUSTODIAN The Bank of New York Mellon Mutual Funds Custody 240 Greenwich Street New York, NY 10286 | | LEGAL COUNSEL Ropes & Gray LLP Prudential Tower, 800 Boylston Street Boston, MA 02199-3600 TRANSFER AGENT BNY Mellon Investment Servicing (US) Inc. AMG Funds Attn: 534426 AIM 154-0520 500 Ross Street Pittsburgh, PA 15262 800.548.4539 | | This report is prepared for the Fund’s shareholders. It is authorized for distribution to prospective investors only when preceded or accompanied by an effective prospectus. To receive a free copy of the prospectus or Statement of Additional Information, which includes additional information about Fund Trustees, please contact us by calling 800.548.4539. Distributed by AMG Distributors, Inc., member FINRA/SIPC. Current net asset values per share for the Fund are available on the Fund’s website at wealth.amg.com. A description of the policies and procedures the Fund uses to vote its proxies is available: (i) without charge, upon request, by calling 800.548.4539, or (ii) on the Securities and Exchange Commission’s (SEC) website at sec.gov. For information regarding the Fund’s proxy voting record for the 12-month period ended June 30, call 800.548.4539 or visit the SEC website at sec.gov. The Fund files its complete schedule of portfolio holdings with the SEC for the first and third quarters of each fiscal year as an exhibit to its reports on Form N-PORT. The Fund’s portfolio holdings on Form N-PORT are available on the SEC’s website at sec.gov and the Fund’s website at wealth.amg.com. To review a complete list of the Fund’s portfolio holdings, or to view the most recent semi-annual report or annual report, please visit wealth.amg.com. |
| | |
| | |
| | | | | | |
EQUITY FUNDS AMG Boston Common Global Impact Boston Common Asset Management, LLC AMG Frontier Small Cap Growth Frontier Capital Management Co., LLC AMG GW&K Small Cap Core AMG GW&K Small Cap Value AMG GW&K Small/Mid Cap Core AMG GW&K Small/Mid Cap Growth AMG GW&K International Small Cap GW&K Investment Management, LLC AMG Montrusco Bolton Large Cap Growth Montrusco Bolton Investments, Inc. AMG Renaissance Large Cap Growth The Renaissance Group LLC | | | | AMG River Road Dividend All Cap Value AMG River Road Focused Absolute Value AMG River Road Large Cap Value Select AMG River Road Mid Cap Value AMG River Road Small-Mid Cap Value AMG River Road Small Cap Value River Road Asset Management, LLC AMG TimesSquare International Small Cap AMG TimesSquare Mid Cap Growth AMG TimesSquare Small Cap Growth TimesSquare Capital Management, LLC AMG Veritas Asia Pacific AMG Veritas China AMG Veritas Global Focus AMG Veritas Global Real Return Veritas Asset Management LLP AMG Yacktman AMG Yacktman Focused AMG Yacktman Global AMG Yacktman Special Opportunities Yacktman Asset Management LP | | FIXED INCOME FUNDS AMG Beutel Goodman Core Plus Bond Beutel, Goodman & Company Ltd. AMG GW&K Core Bond ESG AMG GW&K ESG Bond AMG GW&K Municipal Bond AMG GW&K Municipal Enhanced Yield GW&K Investment Management, LLC ALTERNATIVE FUNDS AMG Systematica Managed Futures Strategy Systematica Investments Limited, acting as general partner of Systematica Investments LP |
| | | | | | |
| | | | | | | |
| | | |
| wealth.amg.com | | 093024 | | | AR074 | |
| | |
| | ANNUAL FINANCIAL STATEMENTS |
| | | | |
| | | AMG Funds |
| | | |
| | | September 30, 2024 | | |
| | | |
| | |  | | |
| | |
| | | AMG Veritas Global Real Return Fund |
| | | |
| | | Class I: BLUEX | | |
| | | | |
| | | | | |
wealth.amg.com | | 093024 | | AR073 |
| | |
| | | |
| | | AMG Funds Annual Financial Statements — September 30, 2024 |
Nothing contained herein is to be considered an offer, sale or solicitation of an offer to buy shares of any
series of the AMG Funds Family of Funds. Such offering is made only by prospectus, which includes details as to
offering price and other material information.
| | |
| | AMG Veritas Global Real Return Fund Schedule of Portfolio Investments September 30, 2024 |
| | | | | | | | |
| | | Shares | | | Value | |
| | |
Common Stocks - 97.2% | | | | | | | | |
| | |
Communication Services - 9.0% | | | | | | | | |
| | |
Alphabet, Inc., Class A (United States) | | | 38,484 | | | | $6,382,571 | |
| | |
Charter Communications, Inc., Class A
(United States)*,1 | | | 9,319 | | | | 3,020,102 | |
| | |
Total Communication Services | | | | | | | 9,402,673 | |
| |
Consumer Discretionary - 13.0% | | | | | |
| | |
Amadeus IT Group SA (Spain) | | | 51,505 | | | | 3,730,123 | |
| | |
Amazon.com, Inc. (United States)* | | | 37,219 | | | | 6,935,016 | |
| | |
Cie Financiere Richemont SA (Switzerland) | | | 18,461 | | | | 2,931,686 | |
| | |
Total Consumer Discretionary | | | | | | | 13,596,825 | |
| |
Consumer Staples - 9.5% | | | | | |
| | |
Diageo PLC (United Kingdom) | | | 151,958 | | | | 5,307,879 | |
| | |
Unilever PLC (United Kingdom) | | | 71,351 | | | | 4,631,294 | |
| | |
Total Consumer Staples | | | | | | | 9,939,173 | |
| |
Financials - 10.8% | | | | | |
| | |
Aon PLC, Class A (United States) | | | 14,363 | | | | 4,969,454 | |
| | |
Intercontinental Exchange, Inc. (United States) | | | 19,032 | | | | 3,057,301 | |
| | |
Mastercard, Inc., Class A (United States) | | | 6,553 | | | | 3,235,871 | |
| | |
Total Financials | | | | | | | 11,262,626 | |
| |
Health Care - 21.0% | | | | | |
| | |
Becton Dickinson & Co. (United States) | | | 12,720 | | | | 3,066,792 | |
| | |
Bio-Rad Laboratories, Inc., Class A (United States)* | | | 6,491 | | | | 2,171,759 | |
| | |
The Cooper Cos., Inc. (United States)* | | | 18,589 | | | | 2,051,110 | |
| | |
Elevance Health, Inc. (United States) | | | 6,030 | | | | 3,135,600 | |
| | |
Sonic Healthcare, Ltd. (Australia) | | | 112,821 | | | | 2,122,016 | |
| | |
Thermo Fisher Scientific, Inc. (United States) | | | 5,082 | | | | 3,143,573 | |
| | |
UnitedHealth Group, Inc. (United States) | | | 8,401 | | | | 4,911,897 | |
| | |
Zoetis, Inc. (United States) | | | 7,378 | | | | 1,441,514 | |
| | |
Total Health Care | | | | | | | 22,044,261 | |
| |
Industrials - 23.4% | | | | | |
| | |
Aena SME SA (Spain)2 | | | 9,600 | | | | 2,108,886 | |
| | |
Airbus SE (France) | | | 28,232 | | | | 4,131,932 | |
| | |
Automatic Data Processing, Inc. (United States) | | | 7,578 | | | | 2,097,060 | |
| | |
Canadian Pacific Kansas City, Ltd. (Canada)1 | | | 56,517 | | | | 4,834,464 | |
| | |
Safran SA (France) | | | 16,580 | | | | 3,901,655 | |
| | |
Siemens AG (Germany) | | | 16,569 | | | | 3,352,041 | |
| | |
Vinci, S.A. (France) | | | 35,021 | | | | 4,093,836 | |
| | |
Total Industrials | | | | | | | 24,519,874 | |
| | | | | | | | |
| | | Shares | | | Value | |
| |
Information Technology - 8.6% | | | | | |
| | |
Dassault Systemes SE (France) | | | 32,690 | | | | $1,298,473 | |
| | |
Microsoft Corp. (United States) | | | 10,156 | | | | 4,370,127 | |
| | |
Salesforce, Inc. (United States) | | | 12,160 | | | | 3,328,313 | |
| | |
Total Information Technology | | | | | | | 8,996,913 | |
| |
Materials - 1.9% | | | | | |
| | |
Franco-Nevada Corp. (Canada) | | | 16,437 | | | | 2,042,297 | |
| |
Total Common Stocks
(Cost $88,560,961) | | | | 101,804,642 | |
| | |
| |
| Principal
Amount |
| | | | |
| |
Short-Term Investments - 2.0% | | | | | |
| |
Joint Repurchase Agreements - 1.5%3 | | | | | |
| | |
Cantor Fitzgerald Securities, Inc., dated 09/30/24, due 10/01/24, 5.000% total to be received $1,000,139 (collateralized by various U.S. Government Agency Obligations, 1.500% - 7.408%, 05/01/26 - 08/20/74, totaling $1,020,000) | | | $1,000,000 | | | | 1,000,000 | |
| | |
National Bank Financial, Inc., dated 09/30/24, due 10/01/24, 4.900% total to be received $602,470 (collateralized by various U.S. Treasuries, 0.375% - 5.000%, 10/01/24 - 09/09/49, totaling $614,436) | | | 602,388 | | | | 602,388 | |
| | |
Total Joint Repurchase Agreements | | | | | | | 1,602,388 | |
| | |
| | | Shares | | | | | |
| |
Other Investment Companies - 0.5% | | | | | |
| | |
Dreyfus Government Cash Management Fund, Institutional Shares, 4.80%4 | | | 187,576 | | | | 187,576 | |
| | |
Dreyfus Institutional Preferred Government Money Market Fund, Institutional Shares, 4.88%4 | | | 281,365 | | | | 281,365 | |
| | |
Total Other Investment Companies | | | | | | | 468,941 | |
| | |
Total Short-Term Investments
(Cost $2,071,329) | | | | | | | 2,071,329 | |
| | |
Total Investments - 99.2%
(Cost $90,632,290) | | | | | | | 103,875,971 | |
| | |
Derivatives - (0.9)%5 | | | | | | | (950,749 | ) |
| |
Other Assets, less Liabilities - 1.7% | | | | 1,803,580 | |
| | |
Net Assets - 100.0% | | | | | | | $104,728,802 | |
The accompanying notes are an integral part of these financial statements.
2
| | |
| | AMG Veritas Global Real Return Fund Schedule of Portfolio Investments (continued) |
| | * | Non-income producing security. |
| | 1 | Some of these securities, amounting to $4,557,586 or 4.4% of net assets, were out on loan to various borrowers and are collateralized by cash and various U.S. Treasury Obligations. See Note 4 of Notes to Financial Statements. |
| | 2 | Security exempt from registration under Rule 144A of the Securities Act of 1933. This security may be resold in transactions exempt from registration, normally to qualified institutional buyers. At September 30, 2024, the value of this security amounted to $2,108,886 or 2.0% of net assets. |
| | 3 | Cash collateral received for securities lending activity was invested in these joint repurchase agreements. |
| | 4 | Yield shown represents the September 30, 2024, seven day average yield, which refers to the sum of the previous seven days’ dividends paid, expressed as an annual percentage. |
| | 5 | Includes Futures Contracts. Please refer to the Open Futures Contracts table for the details. |
| | | | | | | | | | | | | | | | | | | | | | | | | | | | | | |
Open Futures Contracts |
Description | | Currency | | Number of
Contracts | | Position | | Expiration
Date | | Current
Notional
Amount | | Value and
Unrealized
Gain/(Loss) |
EURO STOXX 50 | | | | EUR | | | | | 260 | | | | | Short | | | | | 12/20/24 | | | | $ | (14,557,776 | ) | | | $ | (393,179 | ) |
| | | | | | |
S&P 500 E-Mini Index | | | | USD | | | | | 97 | | | | | Short | | | | | 12/20/24 | | | | | (28,199,112 | ) | | | | (557,570 | ) |
| | | | | | | | | | | | | | | | | | | | | | | | | | | | | | |
| | | | | | |
| | | | | | | | | | | | | | | | | | | | | | | | Total | | | | $ | (950,749 | ) |
| | | | | | | | | | | | | | | | | | | | | | | | | | | | | | |
CURRENCY ABBREVIATIONS:
| | |
| EUR | | Euro Dollar |
| |
| USD | | U.S. Dollar |
The following table summarizes the inputs used to value the Fund’s investments by the fair value hierarchy levels as of September 30, 2024:
| | | | | | | | | | | | | | | | | | | | | | | | |
| | | Level 1 | | | Level 21 | | | Level 3 | | | Total | |
Investments in Securities | | | | | | | | | | | | | | | | | | | | | | | | |
| | | | | | |
Common Stocks | | | | | | | | | | | | | | | | | | | | | | | | |
| | | | | | |
Industrials | | | $6,931,524 | | | | | | | | $17,588,350 | | | | — | | | | | | | | $24,519,874 | |
| | | | | | |
Health Care | | | 19,922,245 | | | | | | | | 2,122,016 | | | | — | | | | | | | | 22,044,261 | |
| | | | | | |
Consumer Discretionary | | | 6,935,016 | | | | | | | | 6,661,809 | | | | — | | | | | | | | 13,596,825 | |
| | | | | | |
Financials | | | 11,262,626 | | | | | | | | — | | | | — | | | | | | | | 11,262,626 | |
| | | | | | |
Consumer Staples | | | — | | | | | | | | 9,939,173 | | | | — | | | | | | | | 9,939,173 | |
| | | | | | |
Communication Services | | | 9,402,673 | | | | | | | | — | | | | — | | | | | | | | 9,402,673 | |
| | | | | | |
Information Technology | | | 7,698,440 | | | | | | | | 1,298,473 | | | | — | | | | | | | | 8,996,913 | |
| | | | | | |
Materials | | | 2,042,297 | | | | | | | | — | | | | — | | | | | | | | 2,042,297 | |
| | | | | | |
Short-Term Investments | | | | | | | | | | | | | | | | | | | | | | | | |
| | | | | | |
Joint Repurchase Agreements | | | — | | | | | | | | 1,602,388 | | | | — | | | | | | | | 1,602,388 | |
| | | | | | |
Other Investment Companies | | | 468,941 | | | | | | | | — | | | | — | | | | | | | | 468,941 | |
| | | | | | | | | | | | | | | | | | | | | | | | |
| | | | | | |
Total Investments in Securities | | | $64,663,762 | | | | | | | | $39,212,209 | | | | — | | | | | | | | $103,875,971 | |
| | | | | | | | | | | | | | | | | | | | | | | | |
| | | | | | |
Financial Derivative Instruments - Liabilities | | | | | | | | | | | | | | | | | | | | | | | | |
| | | | | | |
Equity Futures Contracts | | | $ (950,749 | ) | | | | | | | — | | | | — | | | | | | | | $ (950,749 | ) |
| | | | | | | | | | | | | | | | | | | | | | | | |
| | | | | | |
Total Financial Derivative Instruments | | | $ (950,749 | ) | | | | | | | — | | | | — | | | | | | | | $ (950,749 | ) |
| | | | | | | | | | | | | | | | | | | | | | | | |
| | 1 | An external pricing service is used to reflect any impact on security value due to market movements between the time the Fund valued such foreign securities and the earlier closing of foreign markets. |
For the fiscal year ended September 30, 2024, there were no transfers in or out of Level 3.
The accompanying notes are an integral part of these financial statements.
3
| | |
| | AMG Veritas Global Real Return Fund Schedule of Portfolio Investments (continued) |
The following schedule shows the value of derivative instruments at September 30, 2024:
| | | | | | | | | | |
| | | Asset Derivatives | | Liability Derivatives | |
Derivatives not accounted for as hedging instruments | | Statement of Assets and Liabilities Location | | Fair Value | | Statement of Assets and Liabilities Location | | Fair Value | |
Equity contracts | | — | | — | | Unrealized depreciation on futures contracts1 | | $ | 950,749 | |
For the fiscal year ended September 30, 2024, the effect of derivative instruments on the Statement of Operations for the Fund and the amount of realized gain/loss and unrealized appreciation/depreciation on derivatives recognized in income were as follows:
| | | | | | | | | | | | |
| | | Realized Gain/(Loss) | | | Change in Unrealized Appreciation/Depreciation | |
Derivatives not accounted for as hedging instruments | | Statement of Operations
Location | | Realized
Gain/(Loss) | | | Statement of Operations Location | | Change in
Unrealized
Appreciation/
Depreciation | |
Equity contracts | | Net realized loss on futures contracts | | | $(5,658,438) | | | Net change in unrealized appreciation/
depreciation on futures contracts | | | $(1,938,328 | ) |
| | 1 | The Fund had cash deposits with the futures broker of $3,453,464. |
The accompanying notes are an integral part of these financial statements.
4
| | |
| | Statement of Assets and Liabilities September 30, 2024 |
| | | | |
| | | AMG
Veritas Global
Real Return
Fund |
| |
Assets: | | | | |
| |
Investments at value1 (including securities on loan valued at $4,557,586) | | | $103,875,971 | |
| |
Cash deposits for futures contracts | | | 3,453,464 | |
| |
Receivable for investments sold | | | 869,153 | |
| |
Dividend and interest receivables | | | 199,266 | |
| |
Securities lending income receivable | | | 693 | |
| |
Receivable for Fund shares sold | | | 13,884 | |
| |
Receivable from affiliate | | | 8,964 | |
| |
Prepaid expenses and other assets | | | 9,852 | |
| |
Total assets | | | 108,431,247 | |
| |
Liabilities: | | | | |
| |
Payable upon return of securities loaned | | | 1,602,388 | |
| |
Payable for investments purchased | | | 962,145 | |
| |
Payable for Fund shares repurchased | | | 33,410 | |
| |
Unrealized depreciation on futures contracts | | | 950,749 | |
| |
Accrued expenses: | | | | |
| |
Investment advisory and management fees | | | 76,005 | |
| |
Administrative fees | | | 12,955 | |
| |
Shareholder service fees | | | 4,405 | |
| |
Other | | | 60,388 | |
| |
Total liabilities | | | 3,702,445 | |
|
Commitments and Contingencies (Notes 2 & 6) | |
| |
Net Assets | | | $104,728,802 | |
| |
1 Investments at cost | | | $90,632,290 | |
| |
Net Assets Represent: | | | | |
| |
Paid-in capital | | | $102,409,159 | |
| |
Total distributable earnings | | | 2,319,643 | |
| |
Net Assets | | | $104,728,802 | |
| |
Class I: | | | | |
| |
Net Assets | | | $104,728,802 | |
| |
Shares outstanding | | | 2,644,995 | |
| |
Net asset value, offering and redemption price per share | | | $39.60 | |
The accompanying notes are an integral part of these financial statements.
5
| | |
| | Statement of Operations For the fiscal year ended September 30, 2024 |
| | | | |
| | | AMG
Veritas Global
Real Return
Fund | |
| |
Investment Income: | | | | |
| |
Dividend income | | | $1,698,866 | |
| |
Securities lending income | | | 2,673 | |
| |
Foreign withholding tax | | | (127,645 | ) |
| |
Total investment income | | | 1,573,894 | |
| |
Expenses: | | | | |
| |
Investment advisory and management fees | | | 966,415 | |
| |
Administrative fees | | | 164,730 | |
| |
Shareholder servicing fees - Class I | | | 50,023 | |
| |
Custodian fees | | | 44,324 | |
| |
Professional fees | | | 43,810 | |
| |
Registration fees | | | 32,744 | |
| |
Reports to shareholders | | | 31,609 | |
| |
Transfer agent fees | | | 9,806 | |
| |
Trustee fees and expenses | | | 8,721 | |
| |
Interest expense | | | 4,016 | |
| |
Miscellaneous | | | 6,549 | |
| |
Total expenses before offsets | | | 1,362,747 | |
| |
Expense reimbursements | | | (89,498 | ) |
| |
Total expenses | | | 1,273,249 | |
| | | | |
| |
Net investment income | | | 300,645 | |
| |
Net Realized and Unrealized Gain: | | | | |
| |
Net realized gain on investments | | | 8,741,139 | |
| |
Net realized loss on futures contracts | | | (5,658,438 | ) |
| |
Net realized loss on foreign currency transactions | | | (11,634 | ) |
| |
Net change in unrealized appreciation/depreciation on investments | | | 15,281,519 | |
| |
Net change in unrealized appreciation/depreciation on futures contracts | | | (1,938,328 | ) |
| |
Net change in unrealized appreciation/depreciation on foreign currency translations | | | 8,482 | |
| |
Net realized and unrealized gain | | | 16,422,740 | |
| | | | |
| |
Net increase in net assets resulting from operations | | | $16,723,385 | |
The accompanying notes are an integral part of these financial statements.
6
| | |
| | Statements of Changes in Net Assets For the fiscal years ended September 30, |
| | | | | | | | |
| | | AMG
Veritas Global
Real Return
Fund |
| | |
| | | 2024 | | 2023 |
| | |
Increase in Net Assets Resulting From Operations: | | | | | | | | |
| | |
Net investment income | | | $300,645 | | | | $100,365 | |
| | |
Net realized gain (loss) on investments | | | 3,071,067 | | | | (8,432,213 | ) |
| | |
Net change in unrealized appreciation/depreciation on investments | | | 13,351,673 | | | | 19,970,380 | |
| | |
Net increase in net assets resulting from operations | | | 16,723,385 | | | | 11,638,532 | |
| | |
Distributions to Shareholders: | | | | | | | | |
| | |
Class I | | | (33,698 | ) | | | (11,517,886 | ) |
| | |
Capital Share Transactions:1 | | | | | | | | |
| | |
Net decrease from capital share transactions | | | (21,563,228 | ) | | | (2,194,912 | ) |
| | | | | | | | |
| | |
Total decrease in net assets | | | (4,873,541 | ) | | | (2,074,266 | ) |
| | |
Net Assets: | | | | | | | | |
| | |
Beginning of year | | | 109,602,343 | | | | 111,676,609 | |
| | |
End of year | | | $104,728,802 | | | | $109,602,343 | |
| 1 | See Note 1(g) of the Notes to Financial Statements. |
The accompanying notes are an integral part of these financial statements.
7
| | |
| | AMG Veritas Global Real Return Fund Financial Highlights For a share outstanding throughout each fiscal year |
| | | | | | | | | | | | | | | | | | | | | | | | | |
| | | For the fiscal years ended September 30, |
| Class I | | 2024 | | 2023 | | 2022 | | 2021 | | 2020 |
| | | | | |
Net Asset Value, Beginning of Year | | | | $33.99 | | | | | $34.19 | | | | | $41.54 | | | | | $55.88 | | | | | $49.78 | |
| | | | | |
Income (loss) from Investment Operations: | | | | | | | | | | | | | | | | | | | | | | | | | |
| | | | | |
Net investment income (loss)1 | | | | 0.10 | 2 | | | | 0.03 | 2 | | | | (0.07 | )2 | | | | (0.20 | )2 | | | | (0.22 | ) |
| | | | | |
Net realized and unrealized gain (loss) on investments | | | | 5.52 | | | | | 3.51 | | | | | (7.28 | ) | | | | 9.99 | | | | | 12.84 | |
| | | | | |
Total income (loss) from investment operations | | | | 5.62 | | | | | 3.54 | | | | | (7.35 | ) | | | | 9.79 | | | | | 12.62 | |
| | | | | |
Less Distributions to Shareholders from: | | | | | | | | | | | | | | | | | | | | | | | | | |
| | | | | |
Net investment income | | | | (0.01 | ) | | | | (0.60 | ) | | | | — | | | | | — | | | | | — | |
| | | | | |
Net realized gain on investments | | | | — | | | | | (3.14 | ) | | | | — | | | | | (24.01 | ) | | | | (6.52 | ) |
| | | | | |
Paid in capital | | | | — | | | | | — | | | | | — | | | | | (0.12 | ) | | | | — | |
| | | | | |
Total distributions to shareholders | | | | (0.01 | ) | | | | (3.74 | ) | | | | — | | | | | (24.13 | ) | | | | (6.52 | ) |
| | | | | |
Net Asset Value, End of Year | | | | $39.60 | | | | | $33.99 | | | | | $34.19 | | | | | $41.54 | | | | | $55.88 | |
| | | | | |
Total Return3 | | | | 16.54 | %2 | | | | 11.19 | %2 | | | | (17.69 | )%2 | | | | 19.79 | %2,4 | | | | 27.84 | % |
| | | | | |
Ratio of expenses to average net assets | | | | 1.16 | %5 | | | | 1.16 | %5 | | | | 1.15 | % | | | | 1.15 | % | | | | 1.17 | % |
| | | | | |
Ratio of gross expenses to average net assets | | | | 1.24 | %6 | | | | 1.22 | %6 | | | | 1.18 | %6 | | | | 1.16 | %6 | | | | 1.17 | % |
| | | | | |
Ratio of net investment income (loss) to average net assets | | | | 0.27 | %2 | | | | 0.09 | %2 | | | | (0.17 | )%2 | | | | (0.42 | )%2 | | | | (0.46 | )% |
| | | | | |
Portfolio turnover | | | | 33 | % | | | | 34 | % | | | | 22 | % | | | | 235 | % | | | | 215 | % |
| | | | | |
Net assets end of year (000’s) omitted | | | $ | 104,729 | | | | $ | 109,602 | | | | $ | 111,677 | | | | $ | 164,206 | | | | $ | 194,647 | |
| | | | | | | | | | | | | | | | | | | | | | | | | | |
| 1 | Per share numbers have been calculated using average shares. |
| 2 | Total returns and net investment income (loss) would have been lower had certain expenses not been offset. |
| 3 | The total return is calculated using the published Net Asset Value as of fiscal year end. |
| 4 | Includes a non-recurring securities litigation gain. Had the Fund not received the payment total return would have been 19.18%. |
| 5 | Includes interest expense totaling less than 0.01% for the fiscal year ended September 30, 2024 and 0.01% for the fiscal year ended September 30, 2023 related to participation in the interfund lending program. |
| 6 | Excludes the impact of expense reimbursement or fee waivers and expense reductions such as brokerage credits, but includes expense repayments and non-reimbursable expenses, if any, such as interest, taxes, and extraordinary expenses. (See Note 1(c) and 2 in the Notes to Financial Statements.) |
The accompanying notes are an integral part of these financial statements.
8
| | |
| | Notes to Financial Statements September 30, 2024 |
1. ORGANIZATION AND SUMMARY OF SIGNIFICANT ACCOUNTING POLICIES
AMG Funds I (the “Trust”) is an open-end management investment company, organized as a Massachusetts business trust, and registered under the Investment Company Act of 1940, as amended (the “1940 Act”). Currently, the Trust consists of a number of different funds, each having distinct investment management objectives, strategies, risks, and policies. Included in this report is AMG Veritas Global Real Return Fund (the “Fund”).
The Fund is non-diversified.
The Fund’s financial statements are prepared in accordance with accounting principles generally accepted in the United States of America (“U.S. GAAP”), including accounting and reporting guidance pursuant to Accounting Standards Codification Topic 946 applicable to investment companies. U.S. GAAP requires management to make estimates and assumptions that affect the reported amounts of assets and liabilities and disclosure of contingent assets and liabilities at the date of the financial statements and the reported amounts of income and expenses during the reporting period. Actual results could differ from those estimates and such differences could be material. The following is a summary of significant accounting policies followed by the Fund in the preparation of its financial statements:
a. VALUATION OF INVESTMENTS
Equity securities traded on a national securities exchange or reported on the NASDAQ national market system (“NMS”) are valued at the last quoted sales price on the primary exchange or, if applicable, the NASDAQ official closing price or the official closing price of the relevant exchange or, lacking any sales, at the last quoted bid price. Equity securities held by the Fund that are traded in the over-the-counter market (other than NMS securities) are valued at the bid price. Foreign equity securities (securities principally traded in markets other than U.S. markets) held by the Fund are valued at the official closing price on the primary exchange or, for markets that either do not offer an official closing price or where the official closing price may not be representative of the overall market, the last quoted sale price.
Fixed income securities purchased with a remaining maturity of 60 days or less are valued at amortized cost, provided that the amortized cost value is approximately the same as the fair value of the security valued without the use of amortized cost. Investments in other open-end registered investment companies are valued at their end of day net asset value per share.
Futures contracts for which market quotations are readily available are valued at the settlement price as of the close of the futures exchange.
The Fund’s portfolio investments are generally valued based on independent market quotations or prices or, if none, “evaluative” or other market based valuations provided by third party pricing services. Pursuant to Rule 2a-5 under the 1940 Act, the Fund’s Board of Trustees (the “Board”) designated AMG Funds LLC (the “Investment Manager”) as the Fund’s Valuation Designee to perform the Fund’s fair value determinations. Such determinations are subject to Board oversight and certain reporting and other requirements intended to ensure that the Board receives the information it needs to oversee the Investment Manager’s fair value determinations.
Under certain circumstances, the value of certain Fund portfolio investments may be based on an evaluation of fair value, pursuant to procedures established by the
Investment Manager and under the general supervision of the Board. The Fund may use the fair value of a portfolio investment to calculate its net asset value (“NAV”) in the event that the market quotation, price or market based valuation for the portfolio investment is not readily available or otherwise not determinable pursuant to the Fund’s valuation procedures, if the Investment Manager believes the quotation, price or market based valuation to be unreliable, or in certain other circumstances. When determining the fair value of an investment, the Investment Manager seeks to determine the price that the Fund might reasonably expect to receive from current sale of that portfolio investment in an arms-length transaction. Fair value determinations shall be based upon consideration of all available facts and information, including, but not limited to (i) attributes specific to the investment; (ii) fundamental and analytical data relating to the investment; and (iii) the value of other comparable securities or relevant financial instruments, including derivative securities, traded on other markets or among dealers.
The values assigned to fair value portfolio investments are based on available information and do not necessarily represent amounts that might ultimately be realized in the future, since such amounts depend on future developments inherent in long-term investments. Because of the inherent uncertainty of valuation, those estimated values may differ significantly from the values that would have been used had a ready market for the investments existed, and the differences could be material. The Board will be presented with quarterly reports, as of the most recent quarter end, summarizing all fair value activity, material fair value matters that occurred during the quarter, and all outstanding securities fair valued by the Fund. Additionally, the Board will be presented with an annual report that assesses the adequacy and effectiveness of the Investment Manager’s process for determining the fair value of the Fund’s investments.
With respect to foreign equity securities and certain foreign fixed income securities, securities held in the Fund that can be fair valued by the applicable fair value pricing service are fair valued on each business day provided that each individual price exceeds a pre-established confidence level.
U.S. GAAP defines fair value as the price that a fund would receive to sell an asset or pay to transfer a liability in an orderly transaction between market participants at the measurement date. U.S. GAAP also establishes a framework for measuring fair value, and a three level hierarchy for fair value measurements based upon the transparency of inputs to the valuation of an asset or liability. Inputs may be observable or unobservable and refer broadly to the assumptions that market participants would use in pricing the asset or liability. Observable inputs reflect the assumptions market participants would use in pricing the asset or liability based on market data obtained from sources independent of the Fund. Unobservable inputs reflect the Fund’s own assumptions about the assumptions that market participants would use in pricing the asset or liability developed based on the best information available in the circumstances. Each investment is assigned a level based upon the observability of the inputs which are significant to the overall valuation.
The three-tier hierarchy of inputs is summarized below:
Level 1 – inputs are quoted prices in active markets for identical investments (e.g., equity securities, futures contracts, open-end investment companies)
Level 2 – other observable inputs (including, but not limited to: quoted prices for similar assets or liabilities in markets that are active, quoted prices for identical or similar assets or liabilities in markets that are not active, inputs other than quoted prices that are observable for the assets or liabilities (such as interest rates, yield curves, volatilities, prepayment speeds, loss severities, credit risks and default rates) or other market corroborated inputs) (e.g., debt securities, government
9
| | |
| | Notes to Financial Statements (continued) |
securities, forward foreign currency exchange contracts, foreign securities utilizing international fair value pricing, fair valued securities with observable inputs)
Level 3 – inputs are significant unobservable inputs (including the Fund’s own assumptions used to determine the fair value of investments) (e.g., fair valued securities with unobservable inputs)
Changes in inputs or methodologies used for valuing investments may result in a transfer in or out of levels within the fair value hierarchy. The inputs or methodologies used for valuing investments may not necessarily be an indication of the risk associated with investing in those investments.
b. SECURITY TRANSACTIONS
Security transactions are accounted for as of trade date. Realized gains and losses on securities sold are determined on the basis of identified cost.
c. INVESTMENT INCOME AND EXPENSES
Dividend income is recorded on the ex-dividend date. Dividends from foreign securities are recorded on the ex-dividend date, and if after the fact, as soon as the Fund becomes aware of the ex-dividend date. Interest income, which includes amortization of premium and accretion of discount on debt securities, is accrued as earned. Dividend and interest income on foreign securities is recorded gross of any withholding tax. Non-cash dividends included in dividend income, if any, are reported at the fair market value of the securities received. Other income and expenses are recorded on an accrual basis. Expenses that cannot be directly attributed to the Fund are apportioned among the funds in the Trust and other trusts or funds within the AMG Funds Family of Funds (collectively, the “AMG Funds Family”) based upon their relative average net assets or number of shareholders.
d. DIVIDENDS AND DISTRIBUTIONS
Fund distributions resulting from either net investment income or realized net capital gains, if any, will normally be declared and paid at least annually in December. Distributions to shareholders are recorded on the ex-dividend date. Distributions are determined in accordance with federal income tax law, which may differ from net investment income and net realized capital gains for financial statement purposes (U.S. GAAP). Differences may be permanent or temporary. Permanent differences are reclassified among capital accounts in the financial statements to reflect their tax character. Permanent book and tax basis differences, if any, relating to shareholder distributions will result in reclassifications to paid-in capital. Temporary differences arise when certain items of income, expense and gain or loss are recognized in different periods for financial statement and tax purposes; these differences will reverse at some time in the future. There were no permanent differences. Temporary differences are primarily due to wash sale loss deferrals and mark to market of open futures contracts.
The tax character of distributions paid during the fiscal years ended September 30, 2024 and September 30, 2023 was as follows:
| | | | | | | | |
| | |
| Distributions paid from: | | 2024 | | | 2023 | |
| | | | | | | | |
| | |
Ordinary income * | | | $33,698 | | | | $4,128,919 | |
| | |
Long-term capital gains | | | — | | | | 7,388,967 | |
| | | | | | | | |
| | | $33,698 | | | | $11,517,886 | |
| | | | | | | | |
| * | For tax purposes, short-term capital gain distributions, if any, are considered ordinary income distributions. |
As of September 30, 2024, the components of distributable earnings (excluding unrealized appreciation/depreciation) on a tax basis consisted of:
| | | | | | | | |
Capital loss carryforward | | | | | | | $11,038,192 | |
| | |
Undistributed ordinary income | | | | | | | 279,179 | |
At September 30, 2024, the cost of investments and the aggregate gross unrealized appreciation and depreciation for federal income tax purposes were as follows:
| | | | | | | | | | | | |
| Cost | | Appreciation | | | Depreciation | | | Net Appreciation | |
| | | |
| $90,798,239 | | | $18,221,034 | | | | $(5,142,378) | | | | $13,078,656 | |
e. FEDERAL TAXES
The Fund currently qualifies as an investment company and intends to comply with the requirements under Subchapter M of the Internal Revenue Code of 1986, as amended (the “Code”), and to distribute substantially all of its taxable income and gains to its shareholders and to meet certain diversification and income requirements with respect to investment companies. The Investment Manager has analyzed the Fund’s tax positions taken on federal income tax returns as of September 30, 2024, and for all open tax years (generally, the three prior taxable years), and has concluded that no provision for federal income tax is required in the Fund’s financial statements. Additionally, the Investment Manager is not aware of any tax position for which it is reasonably possible that the total amounts of unrecognized tax benefit/detriment will change materially in the next twelve months.
Furthermore, based on the Fund’s understanding of the tax rules and rates related to income, gains and transactions for the foreign jurisdictions in which it invests, the Fund will provide for foreign taxes, and where appropriate, deferred foreign taxes.
10
| | |
| | Notes to Financial Statements (continued) |
f. CAPITAL LOSS CARRYOVERS AND DEFERRALS
As of September 30, 2024, the Fund had capital loss carryovers for federal income tax purposes as shown in the following chart. These amounts may be used to offset future realized capital gains indefinitely, and retain their character as short-term and/or
long-term.
| | | | | | | | | | |
Short-Term | | | Long-Term | | | Total | |
| | |
| | $6,685,020 | | | | $4,353,172 | | | | $11,038,192 | |
For the fiscal year ended September 30, 2024, the Fund utilized capital loss carryovers in the amount of:
| | |
Short-Term | | Long-Term |
| |
— | | $2,984,693 |
g. CAPITAL STOCK
The Trust’s Amended and Restated Agreement and Declaration of Trust authorizes for the Fund the issuance of an unlimited number of shares of beneficial interest, without par value. The Fund records sales and repurchases of its capital stock on the trade date.
For the fiscal years ended September 30, 2024 and September 30, 2023, the capital stock transactions by class for the Fund were as follows:
| | | | | | | | | | | | | | | | |
| | | September 30, 2024 | | | September 30, 2023 | |
| | | | |
| | | Shares | | | | Amount | | | | Shares | | | | Amount | |
| | | | |
Class I: | | | | | | | | | | | | | | | | |
| | | | |
Shares sold | | | 117,961 | | | | $4,236,645 | | | | 421,591 | | | | $14,592,747 | |
| | | | |
Shares issued in reinvestment of distributions | | | 903 | | | | 32,114 | | | | 319,544 | | | | 10,065,650 | |
| | | | |
Shares redeemed | | | (697,991 | ) | | | (25,831,987 | ) | | | (783,762 | ) | | | (26,853,309 | ) |
| | | | | | | | | | | | | | | | |
| | | | |
Net decrease | | | (579,127 | ) | | | $(21,563,228 | ) | | | (42,627 | ) | | | $(2,194,912 | ) |
| | | | | | | | | | | | | | | | |
h. REPURCHASE AGREEMENTS AND JOINT REPURCHASE AGREEMENTS
The Fund may enter into third-party and bilateral repurchase agreements for temporary cash management purposes and for reinvestment of cash collateral on securities lending transactions under the securities lending program offered by The Bank of New York Mellon (“BNYM”) (the “Securities Lending Program”) (collectively, “Repurchase Agreements”). The value of the underlying collateral, including accrued interest, must equal or exceed the value of the Repurchase Agreements during the term of the agreement. For joint repurchase agreements, the Fund participates on a pro rata basis with other clients of BNYM in its share of the underlying collateral under such joint repurchase agreements and in its share of proceeds from any repurchase or other disposition of the underlying collateral. The underlying collateral for all Repurchase Agreements is held by the Fund’s custodian or at the Federal Reserve Bank. If the seller defaults and the value of the collateral declines, or if bankruptcy proceedings commence with respect to the seller of the security, realization of the collateral by the Fund may be delayed or limited. Pursuant to the Securities Lending Program, the Fund is indemnified for such losses by BNYM on joint repurchase agreements.
At September 30, 2024, the market value of Repurchase Agreements outstanding was $1,602,388.
i. FOREIGN CURRENCY TRANSLATION
The books and records of the Fund are maintained in U.S. Dollars. The value of investments, assets and liabilities denominated in currencies other than U.S. Dollars are translated into U.S. Dollars based upon current foreign exchange rates. Purchases and sales of foreign investments, income and expenses are converted into U.S. Dollars based on currency exchange rates prevailing on the
respective dates of such transactions. Net realized and unrealized gain (loss) on foreign currency transactions represent: (1) foreign exchange gains and losses from the sale and holdings of foreign currencies; (2) gains and losses between trade date and settlement date on investment securities transactions and forward foreign currency exchange contracts; and (3) gains and losses from the difference between amounts of interest and dividends recorded and the amounts actually received.
The Fund does not isolate the net realized and unrealized gain or loss resulting from changes in exchange rates from the fluctuations in market prices of securities held. Such fluctuations are included with the net realized and unrealized gain or loss on investments.
2. AGREEMENTS AND TRANSACTIONS WITH AFFILIATES
The Trust has entered into an investment advisory agreement under which the Investment Manager, a subsidiary and the U.S. wealth platform of Affiliated Managers Group, Inc. (“AMG”), serves as investment manager to the Fund and is responsible for the Fund’s overall administration and operations. The Investment Manager selects and recommends, subject to the approval of the Board and, in certain circumstances, shareholders, the subadviser for the Fund and monitors the subadviser’s investment performance, security holdings and investment strategies. The Fund’s investment portfolio is managed by Veritas Asset Management LLP (“Veritas”) who serves as subadviser pursuant to a subadvisory agreement with the Investment Manager. AMG indirectly owns a majority interest in Veritas.
Investment management fees are paid directly by the Fund to the Investment Manager based on average daily net assets. For the fiscal year ended
11
| | |
| | Notes to Financial Statements (continued) |
September 30, 2024, the Fund paid an investment management fee at the annual rate of 0.88% of the average daily net assets of the Fund. The fee paid to Veritas for its services as subadviser is paid out of the fee the Investment Manager receives from the Fund and does not increase the expenses of the Fund.
The Investment Manager has contractually agreed, through at least February 1, 2025, to waive management fees and/or pay or reimburse fund expenses in order to limit total annual Fund operating expenses after fee waiver and expense reimbursements (exclusive of taxes, interest (including interest incurred in connection with bank and custody overdrafts, and in connection with securities sold short), shareholder servicing fees, distribution and service (12b-1) fees, brokerage commissions and other transaction costs, dividends payable with respect to securities sold short, acquired fund fees and expenses and extraordinary expenses) of the Fund to the annual rate of 1.11% of the Fund’s average daily net assets (this annual rate or such other annual rate that may be in effect from time to time, the “Expense Cap”), subject to later reimbursement by the Fund in certain circumstances.
In general, for a period of up to 36 months after the date any amounts are paid, waived or reimbursed by the Investment Manager, the Investment Manager may recover such amounts from the Fund, provided that such repayment would not cause the Fund’s total annual operating expenses after fee waiver and expense reimbursements (exclusive of the items noted in the parenthetical above) to exceed either (i) the Expense Cap in effect at the time such amounts were paid, waived or reimbursed, or (ii) the Expense Cap in effect at the time of such repayment by the Fund.
The contractual expense limitation may only be terminated in the event the Investment Manager or a successor ceases to be the investment manager of the Fund or a successor fund, by mutual agreement between the Investment Manager and the Board, or in the event of the Fund’s liquidation unless the Fund is reorganized or is a party to a merger in which the surviving entity is successor to the accounting and performance information of the Fund.
For the fiscal year ended September 30, 2024, the Investment Manager reimbursed the Fund $89,498, and did not recoup any previously reimbursed expenses. At September 30, 2024, the Fund’s expiration of reimbursements subject to recoupment is as follows:
| | | | |
Expiration Period | | | |
| |
Less than 1 year | | | $43,426 | |
| |
1-2 years | | | 67,562 | |
| |
2-3 years | | | 89,498 | |
| | | | |
| |
Total | | | $200,486 | |
| | | | |
The Trust, on behalf of the Fund, has entered into an amended and restated Administration Agreement under which the Investment Manager serves as the Fund’s administrator (the “Administrator”) and is responsible for certain aspects of managing the Fund’s operations, including administration and shareholder services to the Fund. The Fund pays a fee to the Administrator at the rate of 0.15% per annum of the Fund’s average daily net assets for this service.
The Fund is distributed by AMG Distributors, Inc. (the “Distributor”), a wholly-owned subsidiary of the Investment Manager. The Distributor serves as the distributor and underwriter for the Fund and is a registered broker-dealer and member of the Financial Industry Regulatory Authority, Inc. (“FINRA”). Shares of the Fund will be
continuously offered and will be sold directly to prospective purchasers and through brokers, dealers or other financial intermediaries who have executed selling agreements with the Distributor. Generally, the Distributor bears all or a portion of the expenses of providing services pursuant to the distribution agreement, including the payment of the expenses relating to the distribution of prospectuses for sales purposes and any advertising or sales literature.
For Class I shares, the Board has approved reimbursement payments to the Investment Manager for shareholder servicing expenses (“shareholder servicing fees”) incurred. Shareholder servicing fees include payments to financial intermediaries, such as broker-dealers (including fund supermarket platforms), banks, and trust companies who provide shareholder recordkeeping, account servicing and other services. The Class I shares may reimburse the Investment Manager for the actual amount incurred up to a maximum annual rate of the Class’s average daily net assets as shown in the table below.
The impact on the annualized expense ratios for the fiscal year ended September 30, 2024, was as follows:
| | | | |
| | | Maximum Annual
Amount
Approved | | Actual
Amount
Incurred |
| | |
Class I | | 0.15% | | 0.05% |
The Board provides supervision of the affairs of the Trust and other trusts within the AMG Funds Family. The Trustees of the Trust who are not affiliated with the Investment Manager receive an annual retainer and per meeting fees for regular, special and telephonic meetings, and they are reimbursed for out-of-pocket expenses incurred while carrying out their duties as Board members. The Chairman of the Board and the Audit Committee Chair receive additional annual retainers. Certain Trustees and Officers of the Fund are Officers and/or Directors of the Investment Manager, AMG and/or the Distributor.
The Securities and Exchange Commission (the “SEC”) granted an exemptive order that permits certain eligible funds in the AMG Funds Family to lend and borrow money for certain temporary purposes directly to and from other eligible funds in the AMG Funds Family. Participation in this interfund lending program is voluntary for both the borrowing and lending funds, and an interfund loan is only made if it benefits each participating fund. The Administrator manages the program according to procedures approved by the Board, and the Board monitors the operation of the program. An interfund loan must comply with certain conditions set out in the exemptive order, which are designed to assure fairness and protect all participating funds. The interest earned and interest paid on interfund loans are included on the Statement of Operations as interest income and interest expense, respectively. At September 30, 2024, the Fund had no interfund loans outstanding. The Fund did not lend during the fiscal year ended September 30, 2024.
The Fund utilized the interfund loan program during the fiscal year ended September 30, 2024 as follows:
| | | | | | | | | | | | | | | | | | |
Average Borrowed | | Number
of Days | | Interest
Paid | | Average
Interest Rate |
| | | |
| | | $1,075,401 | | | | | 22 | | | | | $4,016 | | | | | 6.195% | |
3. PURCHASES AND SALES OF SECURITIES
Purchases and sales of securities (excluding short-term securities and U.S. Government Obligations) for the fiscal year ended September 30, 2024, were $35,208,354 and $59,060,404, respectively.
12
| | |
| | Notes to Financial Statements (continued) |
The Fund had no purchases or sales of U.S. Government Obligations during the fiscal year ended September 30, 2024.
4. PORTFOLIO SECURITIES LOANED
The Fund participates in the Securities Lending Program providing for the lending of securities to qualified borrowers. Securities lending income includes earnings of such temporary cash investments, plus or minus any rebate to a borrower. These earnings (after any rebate) are then divided between BNYM, as a fee for its services under the Securities Lending Program, and the Fund, according to agreed-upon rates. Collateral on all securities loaned is accepted in cash, U.S. Treasury Obligations or U.S. Government Agency Obligations. Collateral is maintained at a minimum level of 102% (105% in the case of certain foreign securities) of the market value, plus interest, if applicable, of investments on loan. It is the Fund’s policy to obtain additional collateral from or return excess collateral to the borrower by the end of the next business day, following the valuation date of the securities loaned. Therefore, the value of the collateral held may be temporarily less than the value of the securities on loan. Lending securities entails a risk of loss to the Fund if and to the extent that the market value of the securities loaned were to increase and the borrower did not increase the collateral accordingly, and the borrower fails to return the securities. Under the terms of the Securities Lending Program, the Fund is indemnified for such losses by BNYM. Cash collateral is held in separate omnibus accounts managed by BNYM, who is authorized to exclusively enter into joint repurchase agreements for that cash collateral. Securities collateral is held in separate omnibus accounts managed by BNYM and cannot be sold or pledged. BNYM bears the risk of any deficiency in the amount of the cash collateral available for return to the borrower due to any loss on the collateral invested. Loans of securities are terminable at any time and the borrower, after notice, is required to return borrowed securities as soon as practical, which is normally within three business days.
The value of securities loaned on positions held, cash collateral and securities collateral received at September 30, 2024, was as follows:
| | | | | | | | | | | | |
Securities Loaned | | Cash
Collateral
Received | | | Securities
Collateral
Received | | | Total
Collateral
Received | |
| | | |
| $4,557,586 | | | $1,602,388 | | | | $3,092,511 | | | | $4,694,899 | |
The following table summarizes the securities received as collateral for securities lending at September 30, 2024:
| | | | | | |
Collateral Type | | Coupon
Range | | Maturity Date Range | |
| | |
| U.S. Treasury Obligations | | 0.125%-7.625% | | | 11/15/24-02/15/52 | |
5. FUND RISKS
In the normal course of business, the Fund invests in securities or other instruments and may enter into certain transactions, and such activities subject the Fund to various risks. The value of securities or other instruments may also be affected by various factors, including, without limitation: (i) the general economy; (ii) the overall market as well as local, regional or global political and/or social instability; or (iii) currency and price fluctuations. Please refer to the Fund’s prospectus for additional information about the Fund’s principal risks.
Market Risk: Market prices of investments held by the Fund may fall rapidly or unpredictably due to a variety of factors, including economic, political, or market conditions, or other factors including terrorism, war, natural disasters and the
spread of infectious illness or other public health issues, including epidemics or pandemics, or in response to events that affect particular industries or companies.
Management Risk: Because the Fund is an actively managed investment portfolio, security selection or focus on securities in a particular style, market sector or group of companies may cause the Fund to incur losses or underperform relative to its benchmarks or other funds with a similar investment objective. There can be no guarantee that the Veritas’s investment techniques and risk analysis will produce the desired result.
Non-Diversified Fund Risk: The Fund is non-diversified and therefore a greater percentage of holdings may be focused in a small number of issuers or a single issuer, which can place the Fund at greater risk. Notwithstanding the Fund’s status as a “non-diversified” investment company under the 1940 Act, the Fund intends to qualify as a regulated investment company accorded favorable tax treatment under the Code, which imposes its own diversification requirements that are less restrictive than the requirements applicable to “diversified” investment companies under the 1940 Act. The Fund’s intention to qualify as a regulated investment company may limit its pursuit of its investment strategy and its investment strategy could limit its ability to so qualify.
Focused Investment Risk: A significant portion of the Fund’s holdings may be focused in a relatively small number of securities, which may make the Fund more volatile and subject to greater risk than a more diversified fund.
Sector Risk: Issuers and companies that are in similar industry sectors may be similarly affected by particular economic or market events; to the extent the Fund has substantial holdings within a particular sector, the risks associated with that sector increase.
Foreign Investment Risk: Investments in foreign issuers involve additional risks (such as risks arising from less frequent trading, changes in political or social conditions, and less publicly available information about non-U.S. issuers) that differ from those associated with investments in U.S. issuers and may result in greater price volatility.
Emerging Markets Risk: Investments in emerging markets are subject to the general risks of foreign investments, as well as additional risks which can result in greater price volatility. Such additional risks include the risk that markets in emerging market countries are typically less developed and less liquid than markets in developed countries and such markets are subjected to increased economic, political, or regulatory uncertainties.
Political Risk: Changes in the general political and social environment of a country can have substantial effects on the value of investments exposed to that country.
Currency Risk: Fluctuations in exchange rates may affect the total loss or gain on a non U.S. dollar investment when converted back to U.S. dollars and exposure to non-U.S. currencies may subject the Fund to the risk that those currencies will decline in value relative to the U.S. dollar.
Derivatives Risk: The use of derivatives involves costs, the risk that the value of derivatives may not correlate perfectly with their underlying assets, rates or indices, liquidity risk, and the risk of mispricing or improper valuation. The use of derivatives may not succeed for various reasons, and the complexity and rapidly changing structure of derivatives markets may increase the possibility of market losses.
13
| | |
| | Notes to Financial Statements (continued) |
Leverage Risk: Borrowing and some derivative investments such as futures, forward commitment transactions and swaps may increase volatility and magnify smaller adverse market movements into relatively larger losses.
Credit and Counterparty Risk: The issuer of bonds or other debt securities or a counterparty to a derivatives contract (including over-the-counter counterparties as well as brokers and clearinghouses in respect of exchange-traded and/or cleared products) may be unable or unwilling, or may be perceived as unable or unwilling, to make timely interest, principal or settlement payments or otherwise honor its obligations.
Large-Capitalization Stock Risk: The stocks of large capitalization companies are generally more mature and may not be able to reach the same levels of growth as the stocks of small- or mid-capitalization companies.
Mid-Capitalization Stock Risk: The stocks of mid-capitalization companies often have greater price volatility, lower trading volume, and less liquidity than the stocks of larger, more established companies.
Small-Capitalization Stock Risk: Although the Fund may invest in securities in any capitalization range, securities of small-capitalization companies may pose additional risks. The stocks of small-capitalization companies often have greater price volatility, lower trading volume, and less liquidity than the stocks of larger, more established companies.
Value Stock Risk: Value stocks may perform differently from the market as a whole and may be undervalued by the market for a long period of time.
Exchange-Traded Fund Risk: Because exchange-traded funds incur their own costs, investing in them could result in a higher cost to the investor.
High Cash Balance Risk: When the Fund has a significant cash balance for a sustained period, the benefit to the Fund of any market upswing may likely be reduced, and the Fund’s performance may be adversely affected.
Liquidity Risk: The Fund may not be able to dispose of particular investments, such as illiquid securities, readily at favorable times or prices or the Fund may have to sell them at a loss.
6. COMMITMENTS AND CONTINGENCIES
Under the Trust’s organizational documents, its Trustees and Officers are indemnified against certain liabilities arising out of the performance of their duties to the Trust. In addition, in the normal course of business, the Fund may enter into contracts and agreements that contain a variety of representations and warranties, which provide general indemnifications. The maximum exposure to the Fund under these arrangements is unknown, as this would involve future claims that may be made against the Fund that have not yet occurred. However, based on experience, the Fund had no prior claims or losses and expects the risks of loss to be remote.
7. DERIVATIVE INSTRUMENTS
The following disclosures contain information on how and why the Fund uses derivative instruments, the credit risk and how derivative instruments affect the Fund’s financial position, and results of operations. The location and fair value amounts of these instruments on the Statement of Assets and Liabilities, and the realized gains and losses and changes in unrealized appreciation and depreciation on the Statement of Operations, each categorized by type of derivative contract, are included in a table at the end of the Fund’s Schedule of Portfolio Investments.
For the fiscal year ended September 30, 2024, the average monthly balances of derivative financial instruments outstanding were as follows:
| | | | |
| |
| Financial Futures Contracts | | | |
| |
Average number of contracts sold | | | 344 | |
| |
Average notional value of contracts sold | | $ | 36,781,302 | |
8. FUTURES CONTRACTS
The Fund generally expects to take short positions in index futures as an alternative to selling short individual stocks in order to adjust the Fund’s exposure to a particular market and seek to preserve capital.
On entering into a futures contract, either cash or securities in an amount equal to a certain percentage of the contract value (initial margin) must be deposited with the futures broker. Subsequent variation margin payments are made or received by the Fund depending on the fluctuations in the value of the futures contracts and the value of cash or securities on deposit with the futures broker. The Fund must have total value at the futures broker consisting of either net unrealized gains, cash or securities collateral to meet the initial margin requirement, and any value over the initial margin requirement may be transferred to the Fund. The Fund pays or receives variation margin periodically. As of September 30, 2024, the Fund had total equity in the futures account of $2,502,715 which consists of cash deposited with the futures broker of $3,453,464 and net unrealized depreciation on open futures contracts of $950,749.
Variation margin on futures contracts is recorded as unrealized appreciation or depreciation until the futures contract is closed or expired. The Fund recognizes a realized gain or loss when the contract is closed or expires equal to the difference between the value of the contract at the time it was opened and the value at the time it was closed. Fluctuations in the value of the contracts are recorded in the Statement of Assets and Liabilities as an asset (liability) and in the Statement of Operations as net change in unrealized appreciation (depreciation) on futures contracts until the contracts are closed, when they are recorded as net realized gains (loss) on futures contracts.
14
| | |
| | Notes to Financial Statements (continued) |
9. MASTER NETTING AGREEMENTS
The Fund may enter into master netting agreements with its counterparties for the Securities Lending Program, Repurchase Agreements and derivatives, which provide the right, in the event of default (including bankruptcy or insolvency) for the non-defaulting party to liquidate the collateral and calculate net exposure to the defaulting party or request additional collateral. For financial reporting purposes, the Fund does not offset financial assets and financial liabilities that are subject to master netting agreements in the Statement of Assets and Liabilities. For securities lending transactions, see Note 4 and for futures transactions, see Note 10.
The following table is a summary of the Fund’s open Repurchase Agreements that are subject to a master netting agreement as of September 30, 2024:
| | | | | | | | | | | | | | | | | | | | |
| | | | | | Gross Amount Not Offset in the
Statement of Assets and Liabilities | | | | | | | |
| | | Gross Amounts of
Assets Presented in
the Statement of
Assets and Liabilities | | | Offset Amount | | | Net
Asset
Balance | | | Collateral
Received | | | Net
Amount | |
| | | | | | | | | | | | | | | | | | | | |
| | | | | |
| | | | | | | | | | | | | | | | | | | | |
| | | | | |
Cantor Fitzgerald Securities, Inc. | | | $1,000,000 | | | | — | | | | $1,000,000 | | | | $1,000,000 | | | | — | |
| | | | | |
National Bank Financial, Inc. | | | 602,388 | | | | — | | | | 602,388 | | | | 602,388 | | | | — | |
| | | | | | | | | | | | | | | | | | | | |
| | | | | |
Total | | | $1,602,388 | | | | — | | | | $1,602,388 | | | | $1,602,388 | | | | — | |
| | | | | | | | | | | | | | | | | | | | |
10. SUBSEQUENT EVENTS
The Fund has determined that no material events or transactions occurred through the issuance date of the Fund’s financial statements which require an additional disclosure in or adjustment of the Fund’s financial statements.
15
| | |
| | Report of Independent Registered Public Accounting Firm |
To the Board of Trustees of AMG Funds I and Shareholders of AMG Veritas Global Real Return Fund
Opinion on the Financial Statements
We have audited the accompanying statement of assets and liabilities, including the schedule of portfolio investments, of AMG Veritas Global Real Return Fund (one of the funds constituting AMG Funds I, referred to hereafter as the “Fund”) as of September 30, 2024, the related statement of operations for the year ended September 30, 2024, the statements of changes in net assets for each of the two years in the period ended September 30, 2024, including the related notes, and the financial highlights for each of the five years in the period ended September 30, 2024 (collectively referred to as the “financial statements”). In our opinion, the financial statements present fairly, in all material respects, the financial position of the Fund as of September 30, 2024, the results of its operations for the year then ended, the changes in its net assets for each of the two years in the period ended September 30, 2024 and the financial highlights for each of the five years in the period ended September 30, 2024 in conformity with accounting principles generally accepted in the United States of America.
Basis for Opinion
These financial statements are the responsibility of the Fund’s management. Our responsibility is to express an opinion on the Fund’s financial statements based on our audits. We are a public accounting firm registered with the Public Company Accounting Oversight Board (United States) (PCAOB) and are required to be independent with respect to the Fund in accordance with the U.S. federal securities laws and the applicable rules and regulations of the Securities and Exchange Commission and the PCAOB.
We conducted our audits of these financial statements in accordance with the standards of the PCAOB. Those standards require that we plan and perform the audit to obtain reasonable assurance about whether the financial statements are free of material misstatement, whether due to error or fraud.
Our audits included performing procedures to assess the risks of material misstatement of the financial statements, whether due to error or fraud, and performing procedures that respond to those risks. Such procedures included examining, on a test basis, evidence regarding the amounts and disclosures in the financial statements. Our audits also included evaluating the accounting principles used and significant estimates made by management, as well as evaluating the overall presentation of the financial statements. Our procedures included confirmation of securities owned as of September 30, 2024 by correspondence with the custodian and brokers; when replies were not received from brokers, we performed other auditing procedures. We believe that our audits provide a reasonable basis for our opinion.
/s/PricewaterhouseCoopers LLP
Boston, Massachusetts
November 27, 2024
We have served as the auditor of one or more investment companies in the AMG Funds Family since 1993.
16
| | |
| | Other Information (unaudited) |
TAX INFORMATION
AMG Veritas Global Real Return Fund hereby designates the maximum amount allowable of its net taxable income as qualified dividends as provided in the Jobs and Growth Tax Relief Reconciliation Act of 2003. The 2024 Form 1099-DIV you receive for the Fund will show the tax status of all distributions paid to you during the calendar year.
Pursuant to section 852 of the Internal Revenue Code of 1986, as amended, AMG Veritas Global Real Return Fund hereby designates $0 as a capital gain distribution with respect to the taxable year ended September 30, 2024, or if subsequently determined to be different, the net capital gains of such year.
ITEM 8. CHANGES IN AND DISAGREEMENTS WITH ACCOUNTANTS FOR OPEN-END MANAGEMENT INVESTMENT COMPANIES
During the fiscal year ended September 30, 2024, there were no changes in and/or disagreements with accountants.
ITEM 9. PROXY DISCLOSURES FOR OPEN-END MANAGEMENT INVESTMENT COMPANIES
Not applicable.
ITEM 10. REMUNERATION PAID TO DIRECTORS, OFFICERS, AND OTHERS OF OPEN-END MANAGEMENT INVESTMENT COMPANIES
The remuneration paid to the Trustees during the fiscal year ended September 30, 2024, was $8,721, which is reflected as “Trustee fees and expenses” on the Statement of Operations. There was no remuneration paid to any Fund officer or to any affiliated person of any Fund Trustee or officer during the fiscal year ended September 30, 2024.
17
| | |
| | ITEM 11. STATEMENT REGARDING BASIS FOR APPROVAL OF INVESTMENT ADVISORY CONTRACT |
| | | | | | | | |
AMG Veritas Global Real Return Fund: Approval of Investment Management Agreement and Subadvisory Agreement on June 12, 2024 At an in-person meeting held on June 12, 2024, the Board of Trustees (the “Board” or the “Trustees”), and separately a majority of the Trustees who are not “interested persons” of AMG Funds I (the “Trust”) (the “Independent Trustees”), approved (i) the Investment Management Agreement, as amended pursuant to letter agreements at any time prior to the date of the meeting, with AMG Funds LLC (the “Investment Manager”) for AMG Veritas Global Real Return Fund (the “Fund”) and separately each of Amendment No. 1 thereto dated July 1, 2015, and Amendment No. 2 thereto dated October 1, 2016 (collectively, the “Investment Management Agreement”); and (ii) the Subadvisory Agreement with respect to the Fund, as amended at any time prior to the date of the meeting (the “Subadvisory Agreement”), with Veritas Asset Management LLP, the Fund’s subadviser (the “Subadviser”). The Independent Trustees were separately represented by independent legal counsel in connection with their consideration of the approval of these agreements. In considering the Investment Management Agreement and Subadvisory Agreement, the Trustees reviewed a variety of materials relating to the Fund, the Investment Manager and the Subadviser, including the nature, extent and quality of services, comparative performance, fee and expense information for an appropriate peer group of similar mutual funds for the Fund (the “Peer Group”), performance information for the relevant benchmark index for the Fund (the “Fund Benchmark”), other relevant matters, including management fees, the profitability of the Investment Manager and the Subadviser, and the potential for economies of scale that may be shared with the Fund, and other information provided to them on a periodic basis throughout the year. Prior to voting, the Independent Trustees: (a) reviewed the foregoing information with their independent legal counsel; (b) received materials from their independent legal counsel discussing the legal standards applicable to their consideration of the Investment Management Agreement and the Subadvisory Agreement; and (c) met with their independent legal counsel in private sessions at which no representatives of management were present. NATURE, EXTENT AND QUALITY OF SERVICES In considering the nature, extent and quality of the services provided by the Investment Manager, the Trustees reviewed information provided by the Investment Manager at the June 12, 2024 meeting | | | | and prior meetings relating to the Investment Manager’s operations and personnel. Among other things, the Investment Manager provided financial information, information about its supervisory and professional staff and descriptions of its organizational and management structure. The Trustees also took into account information provided periodically throughout the previous year by the Investment Manager in Board meetings relating to the performance of its duties with respect to the Fund and the Trustees’ knowledge of the Investment Manager’s management and the quality of the performance of the Investment Manager’s duties under the Investment Management Agreement and Administration Agreement. In the course of their deliberations regarding the Investment Manager, the Trustees evaluated, among other things: (a) the extent and quality of the Investment Manager’s oversight of the operation and management of the Fund; (b) the quality of the Investment Manager’s oversight of the performance by the Subadviser of its portfolio management duties; (c) the Investment Manager’s ability to supervise the Fund’s other service providers; and (d) the Investment Manager’s compliance program. The Trustees also took into account that, in performing its functions under the Investment Management Agreement and supervising the Subadviser, the Investment Manager: performs periodic detailed analyses and reviews of the performance by the Subadviser of its obligations to the Fund, including without limitation, analysis and review of portfolio and other compliance matters and review of the Subadviser’s investment performance with respect to the Fund; prepares and presents periodic reports to the Board regarding the investment performance of the Subadviser and other information regarding the Subadviser, at such times and in such forms as the Board may reasonably request; reviews and considers any changes in the personnel of the Subadviser responsible for performing the Subadviser’s obligations and makes appropriate reports to the Board; reviews and considers any changes in the ownership or senior management of the Subadviser and makes appropriate reports to the Board; performs periodic in-person, telephonic or videoconference diligence meetings, including with respect to compliance matters, with representatives of the Subadviser; assists the Board and management of the Trust in developing and reviewing information with respect to the initial approval of the Subadvisory Agreement and annual consideration of the Subadvisory Agreement thereafter; prepares recommendations with respect to the continued retention of the Subadviser or the replacement of the Subadviser, including at the request of the Board; identifies | | | | potential successors to, or replacements of, the Subadviser or potential additional subadvisers, including performing appropriate due diligence, and developing and presenting to the Board a recommendation as to any such successor, replacement, or additional subadviser, including at the request of the Board; designates and compensates from its own resources such personnel as the Investment Manager may consider necessary or appropriate to the performance of its services; and performs such other review and reporting functions as the Board shall reasonably request consistent with the Investment Management Agreement and applicable law. The Trustees noted the affiliation of the Subadviser with the Investment Manager, noting any potential conflicts of interest. The Trustees also took into account the financial condition of the Investment Manager with respect to its ability to provide the services required under the Investment Management Agreement and the Investment Manager’s undertaking to maintain a contractual expense limitation for the Fund. The Trustees also considered the Investment Manager’s risk management processes. The Trustees also reviewed information relating to the Subadviser’s operations and personnel and the investment philosophy, strategies and techniques (its “Investment Strategy”) used in managing the Fund. Among other things, the Trustees reviewed information on portfolio management and other professional staff, information regarding the Subadviser’s organizational and management structure and the Subadviser’s brokerage policies and practices. The Trustees considered specific information provided regarding the experience of the individuals at the Subadviser with portfolio management responsibility for the Fund, including the information set forth in the Fund’s prospectus and statement of additional information. In the course of their deliberations, the Trustees evaluated, among other things: (a) the services rendered by the Subadviser in the past; (b) the qualifications and experience of the Subadviser’s personnel; and (c) the Subadviser’s compliance program. The Trustees also took into account the financial condition of the Subadviser with respect to its ability to provide the services required under the Subadvisory Agreement. The Trustees also considered the Subadviser’s risk management processes. PERFORMANCE The Board considered the Fund’s net performance during relevant time periods as compared to the Fund’s Peer Group and Fund Benchmark, considered the gross performance of the Fund as compared to |
18
| | |
| | ITEM 11. STATEMENT REGARDING BASIS FOR APPROVAL OF INVESTMENT ADVISORY CONTRACT (continued) |
| | | | | | | | |
the Subadviser’s relevant performance composite that utilizes a similar investment strategy and approach, and noted that the Board reviews on a quarterly basis detailed information about both the Fund’s performance results and portfolio composition, as well as the Subadviser’s Investment Strategy. The Board was mindful of the Investment Manager’s expertise, resources and attention to monitoring the Subadviser’s performance, investment style and risk-adjusted performance with respect to the Fund and its discussions with the management of the Fund’s subadviser during the period regarding the factors that contributed to the performance of the Fund. Among other information relating to the Fund’s performance, the Trustees noted that the Fund’s performance for Class I shares (the Fund’s sole share class) for the 1-year, 3-year, 5-year and 10-year periods ended March 31, 2024, was below, below, above, and above, respectively, the median performance of the Peer Group and above the performance of the Fund Benchmark, the Bloomberg U.S. Treasury Inflation-Linked Bond Index. The Trustees also took into account management’s discussion of the Fund’s performance, including the reasons for the Fund’s more recent underperformance relative to the Peer Group and the fact that the Fund ranked in the top percentile relative to its Peer Group for the 10-year period and the top quintile relative to its Peer Group for the 5-year period and also outperformed the Benchmark for the 1-year and 3-year periods. The Trustees also took into account the fact that the Fund’s subadviser, investment strategy, and Fund Benchmark changed effective March 19, 2021, and that the performance information prior to that date reflected that of the Fund’s prior subadviser and investment strategy. The Trustees concluded that the Fund’s overall performance has been satisfactory. ADVISORY AND SUBADVISORY FEES; FUND EXPENSES; PROFITABILITY; AND ECONOMIES OF SCALE In considering the reasonableness of the advisory fee payable to the Investment Manager, the Trustees reviewed information provided by the Investment Manager at the June 12, 2024 meeting and prior meetings setting forth all revenues and other benefits, both direct and indirect (including any so-called “fallout benefits” such as reputational value derived from the Investment Manager serving as Investment Manager to the Fund), received by the Investment Manager and its affiliates attributable to managing the Fund and all the mutual funds in the AMG Funds Family of Funds; the cost of providing such services; the significant risks undertaken as | | | | Investment Manager and sponsor of the Fund, including investment, operational, enterprise, entrepreneurial, litigation, regulatory and compliance risks; and the resulting profitability to the Investment Manager and its affiliates from these relationships. The Trustees also considered the amount of the advisory fee retained by the Investment Manager after payment of the subadvisory fee with respect to the Fund. The Trustees also noted payments are made from the Subadviser to the Investment Manager, and other payments are made from the Investment Manager to the Subadviser. The Trustees also considered management’s discussion of the current asset level of the Fund, and the impact on profitability of both the current asset level and any future growth of assets of the Fund. In considering the cost of services to be provided by the Investment Manager under the Investment Management Agreement and the profitability to the Investment Manager of its relationship with the Fund, the Trustees noted the undertaking by the Investment Manager to maintain a contractual expense limitation for the Fund. The Board also took into account management’s discussion of the advisory fee structure, and the services the Investment Manager provides in performing its functions under the Investment Management Agreement and supervising the Subadviser. Based on the foregoing, the Trustees concluded that the profitability to the Investment Manager is reasonable and that the Investment Manager is not realizing material benefits from economies of scale that would warrant adjustments to the advisory fee at this time. Also, with respect to economies of scale, the Trustees noted that as the Fund’s assets increase over time, the Fund may realize other economies of scale to the extent the increase in assets is proportionally greater than the increase in certain other expenses. In considering the reasonableness of the subadvisory fee payable by the Investment Manager to the Subadviser, the Trustees reviewed information regarding the cost to the Subadviser of providing subadvisory services to the Fund and the resulting profitability from the relationship. The Trustees noted that, because the Subadviser is an affiliate of the Investment Manager, a portion of the Subadviser’s revenues or profits might be shared directly or indirectly with the Investment Manager. The Trustees also noted that the subadvisory fees are paid by the Investment Manager out of its advisory fee. The Board also took into account management’s discussion of the subadvisory fee structure, and the services the Subadviser provides in performing its functions under the Subadvisory Agreement. Based on the foregoing, the Trustees concluded that the profitability to the Subadviser is reasonable and that | | | | the Subadviser is not realizing material benefits from economies of scale that would warrant adjustments to the subadvisory fees at this time. Also, with respect to economies of scale, the Trustees noted that as the Fund’s assets increase over time, the Fund may realize other economies of scale to the extent the increase in assets is proportionally greater than the increase in certain other expenses. The Trustees noted that the Fund’s management fees (which include both the advisory and administration fees) and total expenses (net of applicable expense waivers/reimbursements) as of March 31, 2024, were both rated in the Below Average rating level of the Fund’s Peer Group. The Trustees noted that the rating level corresponded to the Fund’s quintile ranking in its Peer Group. The Trustees took into account the fact that the Investment Manager has contractually agreed, through February 1, 2025, to limit the Fund’s net annual operating expenses (subject to certain excluded expenses) to 1.11%. The Trustees concluded that, in light of the nature, extent and quality of the services provided by the Investment Manager and the Subadviser (which is an affiliate of the Investment Manager), the foregoing expense limitation and the considerations noted above with respect to the Investment Manager and the Subadviser, the Fund’s advisory and subadvisory fees are reasonable. * * * * * After consideration of the foregoing, the Trustees also reached the following conclusions (in addition to the conclusions discussed above) regarding the Investment Management Agreement and the Subadvisory Agreement: (a) the Investment Manager and the Subadviser have demonstrated that they possess the capability and resources to perform the duties required of them under the Investment Management Agreement and the Subadvisory Agreement and (b) the Investment Manager and Subadviser maintain appropriate compliance programs. Based on all of the above-mentioned factors and their related conclusions, with no single factor or conclusion being determinative and with each Trustee not necessarily attributing the same weight to each factor, the Trustees concluded that approval of the Investment Management Agreement and the Subadvisory Agreement would be in the best interests of the Fund and its shareholders. Accordingly, on June 12, 2024, the Trustees, and separately a majority of the Independent Trustees, voted to approve the Investment Management Agreement and the Subadvisory Agreement for the Fund. |
19
THIS PAGE INTENTIONALLY LEFT BLANK
| | |
| | |
| | | | |
INVESTMENT MANAGER AND ADMINISTRATOR AMG Funds LLC 680 Washington Blvd., Suite 500 Stamford, CT 06901 800.548.4539 DISTRIBUTOR AMG Distributors, Inc. 680 Washington Blvd., Suite 500 Stamford, CT 06901 800.548.4539 SUBADVISER Veritas Asset Management LLP 1 Smart’s Place London, WC2B 5LW CUSTODIAN The Bank of New York Mellon Mutual Funds Custody 240 Greenwich Street New York, NY 10286 | | LEGAL COUNSEL Ropes & Gray LLP Prudential Tower, 800 Boylston Street Boston, MA 02199-3600 TRANSFER AGENT BNY Mellon Investment Servicing (US) Inc. AMG Funds Attn: 534426 AIM 154-0520 500 Ross Street Pittsburgh, PA 15262 800.548.4539 | | This report is prepared for the Fund’s shareholders. It is authorized for distribution to prospective investors only when preceded or accompanied by an effective prospectus. To receive a free copy of the prospectus or Statement of Additional Information, which includes additional information about Fund Trustees, please contact us by calling 800.548.4539. Distributed by AMG Distributors, Inc., member FINRA/SIPC. Current net asset values per share for the Fund are available on the Fund’s website at wealth.amg.com. A description of the policies and procedures the Fund uses to vote its proxies is available: (i) without charge, upon request, by calling 800.548.4539, or (ii) on the Securities and Exchange Commission’s (SEC) website at sec.gov. For information regarding the Fund’s proxy voting record for the 12-month period ended June 30, call 800.548.4539 or visit the SEC website at sec.gov. The Fund files its complete schedule of portfolio holdings with the SEC for the first and third quarters of each fiscal year as an exhibit to its reports on Form N-PORT. The Fund’s portfolio holdings on Form N-PORT are available on the SEC’s website at sec.gov and the Fund’s website at wealth.amg.com. To review a complete list of the Fund’s portfolio holdings, or to view the most recent semi-annual report or annual report, please visit wealth.amg.com. |
| | |
| | |
| | | | | | |
EQUITY FUNDS AMG Boston Common Global Impact Boston Common Asset Management, LLC AMG Frontier Small Cap Growth Frontier Capital Management Co., LLC AMG GW&K Small Cap Core AMG GW&K Small Cap Value AMG GW&K Small/Mid Cap Core AMG GW&K Small/Mid Cap Growth AMG GW&K International Small Cap GW&K Investment Management, LLC AMG Montrusco Bolton Large Cap Growth Montrusco Bolton Investments, Inc. AMG Renaissance Large Cap Growth The Renaissance Group LLC | | | | AMG River Road Dividend All Cap Value AMG River Road Focused Absolute Value AMG River Road Large Cap Value Select AMG River Road Mid Cap Value AMG River Road Small-Mid Cap Value AMG River Road Small Cap Value River Road Asset Management, LLC AMG TimesSquare International Small Cap AMG TimesSquare Mid Cap Growth AMG TimesSquare Small Cap Growth TimesSquare Capital Management, LLC AMG Veritas Asia Pacific AMG Veritas China AMG Veritas Global Focus AMG Veritas Global Real Return Veritas Asset Management LLP AMG Yacktman AMG Yacktman Focused AMG Yacktman Global AMG Yacktman Special Opportunities Yacktman Asset Management LP | | FIXED INCOME FUNDS AMG Beutel Goodman Core Plus Bond Beutel, Goodman & Company Ltd. AMG GW&K Core Bond ESG AMG GW&K ESG Bond AMG GW&K Municipal Bond AMG GW&K Municipal Enhanced Yield GW&K Investment Management, LLC ALTERNATIVE FUNDS AMG Systematica Managed Futures Strategy Systematica Investments Limited, acting as general partner of Systematica Investments LP |
| | | | | | |
| | | | | | | |
| | | |
| wealth.amg.com | | 093024 | | | AR073 | |
| | |
| | ANNUAL FINANCIAL STATEMENTS |
| | | |
| | | | | | |
| | | AMG Funds |
| | | | |
| | | September 30, 2024 | | | | |
| | |
| | |  |
| | |
| | | AMG Systematica Managed Futures Strategy Fund |
| | | Class N: SMFNX | | Class I: SMFIX | | Class Z: SMFZX |
| | | | | | | |
| | | | | | | |
| | | | |
| | | | | |
wealth.amg.com | | 093024 | | AR092 |
| | |
| | AMG Funds Annual Financial Statements — September 30, 2024 |
Nothing contained herein is to be considered an offer, sale or solicitation of an offer to buy shares of any series of the AMG Funds Family of Funds. Such offering is made only by prospectus, which includes details as to offering price and other material information.
| | |
| | AMG Systematica Managed Futures Strategy Fund Consolidated Schedule of Portfolio Investments September 30, 2024 |
| | | | | | | | |
| | | Principal
Amount | | | Value | |
| | |
Short-Term Investments - 83.0% | | | | | | | | |
| | |
Repurchase Agreements - 83.0% | | | | | | | | |
| | |
Fixed Income Clearing Corp., dated 09/30/24, due 10/01/24, 4.650% total to be received $5,008,647 (collateralized by a U.S. Treasury, 0.125%, 04/15/25, totaling $5,108,210) | | | $5,008,000 | | | | $5,008,000 | |
| | |
Total Short-Term Investments
(Cost $5,008,000) | | | | | | | 5,008,000 | |
| 1 | Includes Futures Contracts and Forward Foreign Currency Exchange Contracts. Please refer to the Open Futures Contracts table and Open Forward Foreign Currency Exchange Contracts table for the details. |
| 2 | Includes cash deposits for futures contracts of $873,298, and cash deposits for forward foreign currency exchange contracts of $50,000, which equates to 15.3% of net assets. |
| | | | | | | | |
| | |
| | | Value | |
| | |
Total Investments - 83.0%
(Cost $5,008,000) | | | | | | $ | 5,008,000 | |
| |
Derivatives - 1.9%1 | | | | 115,233 | |
| |
Other Assets, less Liabilities - 15.1%2 | | | | 910,610 | |
| | |
Net Assets - 100.0% | | | | | | $ | 6,033,843 | |
| | | | | | | | | | | | | | | | | | | | | | | | | | | | | | |
Open Futures Contracts |
| Description | | Currency | | Number of
Contracts | | Position | | Expiration Date | | Current Notional Amount | | Value and Unrealized Gain/(Loss) |
| | | | | | |
3 Month Euribor | | | | EUR | | | | | 6 | | | | | Long | | | | | 03/15/27 | | | | | $1,636,164 | | | | | $2,321 | |
| | | | | | |
3-Month Secured Overnight Financing Rate | | | | USD | | | | | 1 | | | | | Long | | | | | 06/15/27 | | | | | 242,325 | | | | | 1,124 | |
| | | | | | |
3-Month Secured Overnight Financing Rate | | | | USD | | | | | 1 | | | | | Long | | | | | 06/20/28 | | | | | 242,038 | | | | | 774 | |
| | | | | | |
3-Month Secured Overnight Financing Rate | | | | USD | | | | | 1 | | | | | Long | | | | | 09/14/27 | | | | | 242,250 | | | | | 874 | |
| | | | | | |
3-Month Secured Overnight Financing Rate | | | | USD | | | | | 1 | | | | | Long | | | | | 09/19/28 | | | | | 241,963 | | | | | 761 | |
| | | | | | |
3-Month Secured Overnight Financing Rate | | | | USD | | | | | 1 | | | | | Long | | | | | 12/19/28 | | | | | 241,888 | | | | | (39 | ) |
| | | | | | |
3-Month Secured Overnight Financing Rate | | | | USD | | | | | 1 | | | | | Long | | | | | 12/14/27 | | | | | 242,188 | | | | | 824 | |
| | | | | | |
3-Month Secured Overnight Financing Rate | | | | USD | | | | | 2 | | | | | Long | | | | | 03/14/28 | | | | | 484,225 | | | | | 735 | |
| | | | | | |
Australian 10 Year Treasury Bond | | | | AUD | | | | | 7 | | | | | Long | | | | | 12/16/24 | | | | | 563,294 | | | | | (4,387 | ) |
| | | | | | |
Australian 3 Year Treasury Bond | | | | AUD | | | | | 16 | | | | | Long | | | | | 12/16/24 | | | | | 1,185,572 | | | | | (2,812 | ) |
| | | | | | |
Canadian 10 Year Government Bond | | | | CAD | | | | | 13 | | | | | Long | | | | | 12/18/24 | | | | | 1,201,619 | | | | | 8,883 | |
| | | | | | |
CMX HG Copper 1 | | | | USD | | | | | 1 | | | | | Long | | | | | 12/27/24 | | | | | 113,825 | | | | | (702 | ) |
| | | | | | |
E-mini Dow Jones Industrial Average Index | | | | USD | | | | | 1 | | | | | Long | | | | | 12/20/24 | | | | | 213,215 | | | | | 4,099 | |
| | | | | | |
E-mini Russell 2000 Index | | | | USD | | | | | 1 | | | | | Long | | | | | 12/20/24 | | | | | 112,460 | | | | | (1,036 | ) |
| | | | | | |
EURO STOXX 50 | | | | EUR | | | | | 1 | | | | | Long | | | | | 12/20/24 | | | | | 55,991 | | | | | (45 | ) |
| | | | | | |
Euro-Bobl | | | | EUR | | | | | 2 | | | | | Long | | | | | 12/06/24 | | | | | 267,267 | | | | | 3,005 | |
| | | | | | |
EURO-BTP | | | | EUR | | | | | 3 | | | | | Long | | | | | 12/06/24 | | | | | 405,643 | | | | | 10,518 | |
| | | | | | |
Euro-Bund | | | | EUR | | | | | 2 | | | | | Long | | | | | 12/06/24 | | | | | 300,372 | | | | | 2,370 | |
| | | | | | |
Euro-OAT | | | | EUR | | | | | 5 | | | | | Long | | | | | 12/06/24 | | | | | 705,960 | | | | | (1 | ) |
| | | | | | |
Euro-Schatz | | | | EUR | | | | | 7 | | | | | Long | | | | | 12/06/24 | | | | | 835,113 | | | | | 2,936 | |
| | | | | | |
FTSE 100 Index | | | | GBP | | | | | 2 | | | | | Long | | | | | 12/20/24 | | | | | 221,626 | | | | | (1,205 | ) |
| | | | | | |
FTSE MIB Index | | | | EUR | | | | | 1 | | | | | Long | | | | | 12/20/24 | | | | | 189,530 | | | | | 2,497 | |
| | | | | | |
FTSE Taiwan Index | | | | USD | | | | | 2 | | | | | Long | | | | | 10/30/24 | | | | | 149,280 | | | | | (3,746 | ) |
| | | | | | |
Gold1 | | | | USD | | | | | 3 | | | | | Long | | | | | 12/27/24 | | | | | 797,820 | | | | | 45,494 | |
| | | | | | |
Hang Seng Index | | | | HKD | | | | | 1 | | | | | Long | | | | | 10/30/24 | | | | | 136,856 | | | | | 7,825 | |
The accompanying notes are an integral part of these consolidated financial statements.
2
| | |
| | AMG Systematica Managed Futures Strategy Fund Consolidated Schedule of Portfolio Investments (continued) |
| | | | | | | | | | | | | | | | | | | | | | | | | | | | | | |
|
| Description | | Currency | | Number of
Contracts | | Position | | Expiration Date | | Current Notional Amount | | Value and Unrealized Gain/(Loss) |
| | | | | | |
Hang Seng China Enterprises Index | | | | HKD | | | | | 1 | | | | | Long | | | | | 10/30/24 | | | | | $48,592 | | | | | $2,835 | |
| | | | | | |
Japan 10 Year Government Bond | | | | JPY | | | | | 1 | | | | | Long | | | | | 12/13/24 | | | | | 1,006,436 | | | | | 2,763 | |
| | | | | | |
Korea 10-Year Government Bond | | | | KRW | | | | | 9 | | | | | Long | | | | | 12/17/24 | | | | | 807,846 | | | | | (2,096 | ) |
| | | | | | |
Korea 3-Year Government Bond | | | | KRW | | | | | 28 | | | | | Long | | | | | 12/17/24 | | | | | 2,277,128 | | | | | 302 | |
| | | | | | |
Lean Hogs1 | | | | USD | | | | | 1 | | | | | Long | | | | | 12/13/24 | | | | | 29,310 | | | | | (392 | ) |
| | | | | | |
LME Copper 1 | | | | USD | | | | | 1 | | | | | Long | | | | | 10/14/24 | | | | | 242,902 | | | | | 11,649 | |
| | | | | | |
LME Copper 1 | | | | USD | | | | | 2 | | | | | Long | | | | | 11/18/24 | | | | | 488,612 | | | | | 20,633 | |
| | | | | | |
LME Copper 1 | | | | USD | | | | | 1 | | | | | Long | | | | | 12/16/24 | | | | | 245,509 | | | | | 8,144 | |
| | | | | | |
Long Gilt | | | | GBP | | | | | 5 | | | | | Long | | | | | 12/27/24 | | | | | 657,980 | | | | | (10,725 | ) |
| | | | | | |
MSCI Singapore Index | | | | SGD | | | | | 6 | | | | | Long | | | | | 10/29/24 | | | | | 160,311 | | | | | 672 | |
| | | | | | |
NIFTY 50 | | | | USD | | | | | 5 | | | | | Long | | | | | 10/31/24 | | | | | 260,065 | | | | | (1,699 | ) |
| | | | | | |
OMX Stockholm 30 | | | | SEK | | | | | 6 | | | | | Long | | | | | 10/18/24 | | | | | 155,127 | | | | | 632 | |
| | | | | | |
S&P 500 E-Mini Index | | | | USD | | | | | 1 | | | | | Long | | | | | 12/20/24 | | | | | 290,713 | | | | | 1,674 | |
| | | | | | |
S&P/TSX 60 Index Standard | | | | CAD | | | | | 4 | | | | | Long | | | | | 12/19/24 | | | | | 854,390 | | | | | 8,611 | |
| | | | | | |
SET50 Index | | | | THB | | | | | 44 | | | | | Long | | | | | 12/27/24 | | | | | 250,155 | | | | | (2,762 | ) |
| | | | | | |
SFE SPI 200 Index | | | | AUD | | | | | 4 | | | | | Long | | | | | 12/19/24 | | | | | 574,235 | | | | | 7,667 | |
| | | | | | |
Short-Term Euro-BTP | | | | EUR | | | | | 15 | | | | | Long | | | | | 12/06/24 | | | | | 1,797,793 | | | | | 13,894 | |
| | | | | | |
Silver1 | | | | USD | | | | | 2 | | | | | Long | | | | | 12/27/24 | | | | | 314,580 | | | | | 476 | |
| | | | | | |
Sugar #11 1 | | | | USD | | | | | 1 | | | | | Long | | | | | 02/28/25 | | | | | 25,166 | | | | | 98 | |
| | | | | | |
U.S. Treasury 10-Year Note | | | | USD | | | | | 4 | | | | | Long | | | | | 12/19/24 | | | | | 457,125 | | | | | (551 | ) |
| | | | | | |
U.S. Treasury 10-Year Ultra Bond | | | | USD | | | | | 3 | | | | | Long | | | | | 12/19/24 | | | | | 354,891 | | | | | (1,550 | ) |
| | | | | | |
U.S. Treasury 2-Year Note | | | | USD | | | | | 5 | | | | | Long | | | | | 12/31/24 | | | | | 1,041,211 | | | | | 1,402 | |
| | | | | | |
U.S. Treasury 5-Year Note | | | | USD | | | | | 6 | | | | | Long | | | | | 12/31/24 | | | | | 659,297 | | | | | (279 | ) |
| | | | | | |
U.S. Treasury Bond | | | | USD | | | | | 2 | | | | | Long | | | | | 12/19/24 | | | | | 248,375 | | | | | 186 | |
| | | | | | |
U.S. Treasury Ultra Bond | | | | USD | | | | | 1 | | | | | Long | | | | | 12/19/24 | | | | | 133,094 | | | | | (1,672 | ) |
| | | | | | |
Brent Crude Oil1 | | | | USD | | | | | 1 | | | | | Short | | | | | 11/29/24 | | | | | (71,460 | ) | | | | 1,679 | |
| | | | | | |
Brent Crude Oil1 | | | | USD | | | | | 1 | | | | | Short | | | | | 12/30/24 | | | | | (71,280 | ) | | | | 2,169 | |
| | | | | | |
Brent Crude Oil1 | | | | USD | | | | | 1 | | | | | Short | | | | | 10/31/24 | | | | | (71,700 | ) | | | | (721 | ) |
| | | | | | |
CAC 40 | | | | EUR | | | | | 1 | | | | | Short | | | | | 10/18/24 | | | | | (85,150 | ) | | | | (1,824 | ) |
| | | | | | |
Canola1 | | | | CAD | | | | | 5 | | | | | Short | | | | | 11/14/24 | | | | | (44,645 | ) | | | | (1,807 | ) |
| | | | | | |
Corn 1 | | | | USD | | | | | 12 | | | | | Short | | | | | 12/13/24 | | | | | (254,850 | ) | | | | 16,585 | |
| | | | | | |
FTSE China A50 Index | | | | USD | | | | | 15 | | | | | Short | | | | | 10/30/24 | | | | | (208,500 | ) | | | | (18,388 | ) |
| | | | | | |
LME Copper 1 | | | | USD | | | | | 1 | | | | | Short | | | | | 10/14/24 | | | | | (242,902 | ) | | | | (16,010 | ) |
| | | | | | |
LME Copper 1 | | | | USD | | | | | 2 | | | | | Short | | | | | 11/18/24 | | | | | (488,613 | ) | | | | (32,514 | ) |
| | | | | | |
LME Copper 1 | | | | USD | | | | | 1 | | | | | Short | | | | | 12/16/24 | | | | | (245,509 | ) | | | | (7,279 | ) |
| | | | | | |
Low Sulphur Gasoil1 | | | | USD | | | | | 1 | | | | | Short | | | | | 01/10/25 | | | | | (65,650 | ) | | | | (426 | ) |
| | | | | | |
Low Sulphur Gasoil1 | | | | USD | | | | | 1 | | | | | Short | | | | | 11/12/24 | | | | | (66,025 | ) | | | | 4,124 | |
| | | | | | |
Low Sulphur Gasoil1 | | | | USD | | | | | 1 | | | | | Short | | | | | 12/12/24 | | | | | (65,650 | ) | | | | 3,649 | |
| | | | | | |
Natural Gas1 | | | | USD | | | | | 3 | | | | | Short | | | | | 12/27/24 | | | | | (108,060 | ) | | | | (1,535 | ) |
The accompanying notes are an integral part of these consolidated financial statements.
3
| | |
| | AMG Systematica Managed Futures Strategy Fund Consolidated Schedule of Portfolio Investments (continued) |
| | | | | | | | | | | | | | | | | | | | | | | | | | | | | | |
|
| Description | | Currency | | Number of
Contracts | | Position | | Expiration Date | | Current Notional Amount | | Value and Unrealized Gain/(Loss) |
| | | | | | |
Natural Gas1 | | | | USD | | | | | 3 | | | | | Short | | | | | 01/29/25 | | | | | $(104,520 | ) | | | | $(8,233 | ) |
| | | | | | |
Natural Gas1 | | | | USD | | | | | 1 | | | | | Short | | | | | 10/29/24 | | | | | (29,230 | ) | | | | (2,881 | ) |
| | | | | | |
Natural Gas1 | | | | USD | | | | | 2 | | | | | Short | | | | | 11/26/24 | | | | | (66,900 | ) | | | | (824 | ) |
| | | | | | |
RBOB Gasoline 1 | | | | USD | | | | | 1 | | | | | Short | | | | | 10/31/24 | | | | | (81,274 | ) | | | | (1,199 | ) |
| | | | | | |
RBOB Gasoline 1 | | | | USD | | | | | 1 | | | | | Short | | | | | 11/29/24 | | | | | (80,060 | ) | | | | (325 | ) |
| | | | | | |
Soybean1 | | | | USD | | | | | 3 | | | | | Short | | | | | 11/14/24 | | | | | (158,550 | ) | | | | (2,319 | ) |
| | | | | | |
Soybean Meal1 | | | | USD | | | | | 2 | | | | | Short | | | | | 12/13/24 | | | | | (68,320 | ) | | | | (7,515 | ) |
| | | | | | |
Soybean Oil 1 | | | | USD | | | | | 7 | | | | | Short | | | | | 12/13/24 | | | | | (181,902 | ) | | | | 1,178 | |
| | | | | | |
ULSD NY Harbor 1 | | | | USD | | | | | 1 | | | | | Short | | | | | 10/31/24 | | | | | (90,485 | ) | | | | 10,738 | |
| | | | | | |
ULSD NY Harbor 1 | | | | USD | | | | | 1 | | | | | Short | | | | | 11/29/24 | | | | | (90,850 | ) | | | | (195 | ) |
| | | | | | |
Wheat1 | | | | USD | | | | | 8 | | | | | Short | | | | | 12/13/24 | | | | | (233,600 | ) | | | | (11,726 | ) |
| | | | | | | | | | | | | | | | | | | | | | | | | | | | | | |
| | | | | | |
| | | | | | | | | | | | | | | | | | | | | | | | Total | | | | | $65,380 | |
| | | | | | | | | | | | | | | | | | | | | | | | | | | | | | |
| 1 | Investment is held by AMG Systematica Subsidiary Fund I, a wholly-owned subsidiary of AMG Systematica Managed Futures Strategy Fund. |
CURRENCY ABBREVIATIONS:
| | |
| AUD | | Australian Dollar |
| |
| CAD | | Canadian Dollar |
| |
| EUR | | Euro Dollar |
| |
| GBP | | British Pound |
| |
| HKD | | Hong Kong Dollar |
| |
| JPY | | Japanese Yen |
| |
| KRW | | South Korean Won |
| |
| SEK | | Sweden Krona |
| |
| SGD | | Singapore Dollar |
| |
| THB | | Thai Baht |
| |
| USD | | U.S. Dollar |
| | | | | | | | | | | | | | | | | | |
Open Forward Foreign Currency Exchange Contracts | |
Currency Purchased | | Amount | | | Currency Sold | | Amount | | | Expiration | | Counterparty | | Unrealized
Appreciation/
Depreciation | |
| | | | | | |
Australian Dollar | | | 22,012 | | | U.S. Dollar | | | 14,808 | | | 10/16/24 | | UBS AG | | | $414 | |
| | | | | | |
Australian Dollar | | | 154,080 | | | U.S. Dollar | | | 103,655 | | | 10/16/24 | | UBS AG | | | 2,897 | |
| | | | | | |
Australian Dollar | | | 200,000 | | | U.S. Dollar | | | 136,685 | | | 10/16/24 | | UBS AG | | | 1,622 | |
| | | | | | |
Australian Dollar | | | 100,000 | | | U.S. Dollar | | | 67,812 | | | 10/16/24 | | UBS AG | | | 1,341 | |
| | | | | | |
Australian Dollar | | | 100,000 | | | U.S. Dollar | | | 68,238 | | | 10/16/24 | | UBS AG | | | 915 | |
| | | | | | |
Australian Dollar | | | 100,000 | | | U.S. Dollar | | | 68,828 | | | 10/16/24 | | UBS AG | | | 325 | |
| | | | | | |
Australian Dollar | | | 100,000 | | | U.S. Dollar | | | 68,620 | | | 10/16/24 | | UBS AG | | | 533 | |
| | | | | | |
Australian Dollar | | | 200,714 | | | U.S. Dollar | | | 134,056 | | | 10/16/24 | | UBS AG | | | 4,745 | |
| | | | | | |
Australian Dollar | | | 145,206 | | | U.S. Dollar | | | 97,901 | | | 10/16/24 | | UBS AG | | | 2,514 | |
| | | | | | |
Australian Dollar | | | 20,744 | | | U.S. Dollar | | | 13,986 | | | 10/16/24 | | UBS AG | | | 359 | |
| | | | | | |
Canadian Dollar | | | 1,550 | | | U.S. Dollar | | | 1,147 | | | 10/01/24 | | UBS AG | | | (1 | ) |
| | | | | | |
Canadian Dollar | | | 174 | | | U.S. Dollar | | | 129 | | | 10/01/24 | | UBS AG | | | (0 | ) |
The accompanying notes are an integral part of these consolidated financial statements.
4
| | |
| | AMG Systematica Managed Futures Strategy Fund Consolidated Schedule of Portfolio Investments (continued) |
| | | | | | | | | | | | | | | | | | |
Currency Purchased | | Amount | | | Currency Sold | | Amount | | | Expiration | | Counterparty | | Unrealized Appreciation/ Depreciation | |
| | | | | | |
Canadian Dollar | | | 134,458 | | | U.S. Dollar | | | 99,592 | | | 10/01/24 | | UBS AG | | | $(171 | ) |
| | | | | | |
Canadian Dollar | | | 187 | | | U.S. Dollar | | | 139 | | | 10/01/24 | | UBS AG | | | (0 | ) |
| | | | | | |
Canadian Dollar | | | 54 | | | U.S. Dollar | | | 40 | | | 10/16/24 | | UBS AG | | | 0 | |
| | | | | | |
Canadian Dollar | | | 270,271 | | | U.S. Dollar | | | 200,210 | | | 10/16/24 | | UBS AG | | | (295 | ) |
| | | | | | |
Canadian Dollar | | | 1,550 | | | U.S. Dollar | | | 1,147 | | | 10/16/24 | | UBS AG | | | (1 | ) |
| | | | | | |
Canadian Dollar | | | 349 | | | U.S. Dollar | | | 257 | | | 10/16/24 | | UBS AG | | | 1 | |
| | | | | | |
Canadian Dollar | | | 132,605 | | | U.S. Dollar | | | 98,514 | | | 10/16/24 | | UBS AG | | | (428 | ) |
| | | | | | |
Canadian Dollar | | | 143 | | | U.S. Dollar | | | 106 | | | 10/16/24 | | UBS AG | | | 0 | |
| | | | | | |
Canadian Dollar | | | 26 | | | U.S. Dollar | | | 19 | | | 10/16/24 | | UBS AG | | | 0 | |
| | | | | | |
Canadian Dollar | | | 1,610 | | | U.S. Dollar | | | 1,189 | | | 10/16/24 | | UBS AG | | | 2 | |
| | | | | | |
Canadian Dollar | | | 14 | | | U.S. Dollar | | | 10 | | | 10/16/24 | | UBS AG | | | 0 | |
| | | | | | |
Canadian Dollar | | | 1,018 | | | U.S. Dollar | | | 756 | | | 10/16/24 | | UBS AG | | | (3 | ) |
| | | | | | |
Canadian Dollar | | | 268,801 | | | U.S. Dollar | | | 199,755 | | | 10/16/24 | | UBS AG | | | (927 | ) |
| | | | | | |
Canadian Dollar | | | 270,871 | | | U.S. Dollar | | | 200,129 | | | 10/16/24 | | UBS AG | | | 229 | |
| | | | | | |
Canadian Dollar | | | 134,041 | | | U.S. Dollar | | | 99,034 | | | 10/16/24 | | UBS AG | | | 113 | |
| | | | | | |
Canadian Dollar | | | 1,385 | | | U.S. Dollar | | | 1,026 | | | 10/16/24 | | UBS AG | | | (1 | ) |
| | | | | | |
Swiss Franc | | | 2,639 | | | U.S. Dollar | | | 3,135 | | | 10/01/24 | | UBS AG | | | (17 | ) |
| | | | | | |
Swiss Franc | | | 85,495 | | | U.S. Dollar | | | 101,357 | | | 10/16/24 | | UBS AG | | | (145 | ) |
| | | | | | |
Swiss Franc | | | 2,184 | | | U.S. Dollar | | | 2,592 | | | 10/16/24 | | UBS AG | | | (7 | ) |
| | | | | | |
Swiss Franc | | | 2,889 | | | U.S. Dollar | | | 3,433 | | | 10/16/24 | | UBS AG | | | (13 | ) |
| | | | | | |
Swiss Franc | | | 84,034 | | | U.S. Dollar | | | 98,809 | | | 10/16/24 | | UBS AG | | | 674 | |
| | | | | | |
Swiss Franc | | | 171,457 | | | U.S. Dollar | | | 202,645 | | | 10/16/24 | | UBS AG | | | 333 | |
| | | | | | |
Swiss Franc | | | 4,508 | | | U.S. Dollar | | | 5,345 | | | 10/16/24 | | UBS AG | | | (8 | ) |
| | | | | | |
Swiss Franc | | | 1,793 | | | U.S. Dollar | | | 2,120 | | | 10/16/24 | | UBS AG | | | 3 | |
| | | | | | |
Swiss Franc | | | 508,031 | | | U.S. Dollar | | | 602,906 | | | 10/16/24 | | UBS AG | | | (1,477 | ) |
| | | | | | |
Swiss Franc | | | 1,475 | | | U.S. Dollar | | | 1,750 | | | 10/16/24 | | UBS AG | | | (4 | ) |
| | | | | | |
Euro | | | 100,000 | | | U.S. Dollar | | | 111,258 | | | 10/16/24 | | UBS AG | | | 136 | |
| | | | | | |
Euro | | | 100,000 | | | U.S. Dollar | | | 111,304 | | | 10/16/24 | | UBS AG | | | 90 | |
| | | | | | |
Euro | | | 100,000 | | | U.S. Dollar | | | 111,428 | | | 10/16/24 | | UBS AG | | | (34 | ) |
| | | | | | |
Euro | | | 100,000 | | | U.S. Dollar | | | 110,596 | | | 10/16/24 | | UBS AG | | | 798 | |
| | | | | | |
Euro | | | 307,957 | | | U.S. Dollar | | | 342,762 | | | 10/16/24 | | UBS AG | | | 284 | |
| | | | | | |
Euro | | | 100,000 | | | U.S. Dollar | | | 111,529 | | | 10/16/24 | | UBS AG | | | (135 | ) |
| | | | | | |
Euro | | | 392,043 | | | U.S. Dollar | | | 433,586 | | | 10/16/24 | | UBS AG | | | 3,127 | |
| | | | | | |
Euro | | | 100,000 | | | U.S. Dollar | | | 110,933 | | | 10/16/24 | | UBS AG | | | 461 | |
| | | | | | |
British Pound | | | 700,000 | | | U.S. Dollar | | | 918,181 | | | 10/16/24 | | UBS AG | | | 17,676 | |
| | | | | | |
British Pound | | | 100,000 | | | U.S. Dollar | | | 133,356 | | | 10/16/24 | | UBS AG | | | 338 | |
| | | | | | |
British Pound | | | 100,000 | | | U.S. Dollar | | | 131,039 | | | 10/16/24 | | UBS AG | | | 2,655 | |
| | | | | | |
Japanese Yen | | | 135,387 | | | U.S. Dollar | | | 931 | | | 10/01/24 | | UBS AG | | | 11 | |
| | | | | | |
Japanese Yen | | | 205,845 | | | U.S. Dollar | | | 1,428 | | | 10/16/24 | | UBS AG | | | 8 | |
The accompanying notes are an integral part of these consolidated financial statements.
5
| | |
| | AMG Systematica Managed Futures Strategy Fund Consolidated Schedule of Portfolio Investments (continued) |
| | | | | | | | | | | | | | | | | | |
Currency Purchased | | Amount | | | Currency Sold | | Amount | | | Expiration | | Counterparty | | Unrealized Appreciation/ Depreciation | |
| | | | | | |
Japanese Yen | | | 14,231,731 | | | U.S. Dollar | | | 99,139 | | | 10/16/24 | | UBS AG | | | $118 | |
| | | | | | |
Japanese Yen | | | 29,095,252 | | | U.S. Dollar | | | 201,802 | | | 10/16/24 | | UBS AG | | | 1,118 | |
| | | | | | |
Japanese Yen | | | 439,333 | | | U.S. Dollar | | | 3,074 | | | 10/16/24 | | UBS AG | | | (10 | ) |
| | | | | | |
Japanese Yen | | | 46,094 | | | U.S. Dollar | | | 323 | | | 10/16/24 | | UBS AG | | | (2 | ) |
| | | | | | |
Japanese Yen | | | 204,974 | | | U.S. Dollar | | | 1,446 | | | 10/16/24 | | UBS AG | | | (17 | ) |
| | | | | | |
Japanese Yen | | | 588,679 | | | U.S. Dollar | | | 4,086 | | | 10/16/24 | | UBS AG | | | 20 | |
| | | | | | |
Japanese Yen | | | 14,113,528 | | | U.S. Dollar | | | 99,841 | | | 10/16/24 | | UBS AG | | | (1,408 | ) |
| | | | | | |
Japanese Yen | | | 134,388 | | | U.S. Dollar | | | 948 | | | 10/16/24 | | UBS AG | | | (11 | ) |
| | | | | | |
Japanese Yen | | | 92,392 | | | U.S. Dollar | | | 657 | | | 10/16/24 | | UBS AG | | | (12 | ) |
| | | | | | |
Norwegian Krone | | | 5,929 | | | U.S. Dollar | | | 565 | | | 10/01/24 | | UBS AG | | | (3 | ) |
| | | | | | |
Norwegian Krone | | | 1,065,796 | | | U.S. Dollar | | | 100,606 | | | 10/16/24 | | UBS AG | | | 407 | |
| | | | | | |
Norwegian Krone | | | 12,959 | | | U.S. Dollar | | | 1,224 | | | 10/16/24 | | UBS AG | | | 4 | |
| | | | | | |
Norwegian Krone | | | 4,374 | | | U.S. Dollar | | | 413 | | | 10/16/24 | | UBS AG | | | 2 | |
| | | | | | |
Norwegian Krone | | | 28,848 | | | U.S. Dollar | | | 2,731 | | | 10/16/24 | | UBS AG | | | 4 | |
| | | | | | |
Norwegian Krone | | | 1,044,299 | | | U.S. Dollar | | | 100,238 | | | 10/16/24 | | UBS AG | | | (1,263 | ) |
| | | | | | |
Norwegian Krone | | | 10,276 | | | U.S. Dollar | | | 973 | | | 10/16/24 | | UBS AG | | | 1 | |
| | | | | | |
Norwegian Krone | | | 1,051,934 | | | U.S. Dollar | | | 100,649 | | | 10/16/24 | | UBS AG | | | (950 | ) |
| | | | | | |
New Zealand Dollar | | | 100,000 | | | U.S. Dollar | | | 63,623 | | | 10/02/24 | | UBS AG | | | (93 | ) |
| | | | | | |
New Zealand Dollar | | | 100,000 | | | U.S. Dollar | | | 63,583 | | | 10/02/24 | | UBS AG | | | (53 | ) |
| | | | | | |
New Zealand Dollar | | | 300,000 | | | U.S. Dollar | | | 186,996 | | | 10/16/24 | | UBS AG | | | 3,606 | |
| | | | | | |
New Zealand Dollar | | | 400,000 | | | U.S. Dollar | | | 247,936 | | | 10/16/24 | | UBS AG | | | 6,199 | |
| | | | | | |
New Zealand Dollar | | | 100,000 | | | U.S. Dollar | | | 62,511 | | | 10/16/24 | | UBS AG | | | 1,023 | |
| | | | | | |
New Zealand Dollar | | | 100,000 | | | U.S. Dollar | | | 62,240 | | | 10/16/24 | | UBS AG | | | 1,294 | |
| | | | | | |
New Zealand Dollar | | | 100,000 | | | U.S. Dollar | | | 63,246 | | | 10/16/24 | | UBS AG | | | 287 | |
| | | | | | |
Sweden Krona | | | 45,329 | | | U.S. Dollar | | | 4,493 | | | 10/01/24 | | UBS AG | | | (29 | ) |
| | | | | | |
Sweden Krona | | | 1,011,799 | | | U.S. Dollar | | | 99,486 | | | 10/16/24 | | UBS AG | | | 222 | |
| | | | | | |
Sweden Krona | | | 12,744 | | | U.S. Dollar | | | 1,229 | | | 10/16/24 | | UBS AG | | | 27 | |
| | | | | | |
Sweden Krona | | | 5,648 | | | U.S. Dollar | | | 557 | | | 10/16/24 | | UBS AG | | | 0 | |
| | | | | | |
Sweden Krona | | | 5,177,053 | | | U.S. Dollar | | | 500,232 | | | 10/16/24 | | UBS AG | | | 9,945 | |
| | | | | | |
Sweden Krona | | | 1,006,767 | | | U.S. Dollar | | | 99,076 | | | 10/16/24 | | UBS AG | | | 136 | |
| | | | | | |
Sweden Krona | | | 31,573 | | | U.S. Dollar | | | 3,061 | | | 10/16/24 | | UBS AG | | | 50 | |
| | | | | | |
Sweden Krona | | | 974,735 | | | U.S. Dollar | | | 94,184 | | | 10/16/24 | | UBS AG | | | 1,872 | |
| | | | | | |
Sweden Krona | | | 48,335 | | | U.S. Dollar | | | 4,764 | | | 10/16/24 | | UBS AG | | | (1 | ) |
| | | | | | |
Sweden Krona | | | 15,863 | | | U.S. Dollar | | | 1,571 | | | 10/16/24 | | UBS AG | | | (8 | ) |
| | | | | | |
U.S. Dollar | | | 68,831 | | | Australian Dollar | | | 100,000 | | | 10/16/24 | | UBS AG | | | (322 | ) |
| | | | | | |
U.S. Dollar | | | 28,557 | | | Australian Dollar | | | 42,756 | | | 10/16/24 | | UBS AG | | | (1,011 | ) |
| | | | | | |
U.S. Dollar | | | 1,147 | | | Canadian Dollar | | | 1,550 | | | 10/01/24 | | UBS AG | | | 1 | |
| | | | | | |
U.S. Dollar | | | 42,857 | | | Canadian Dollar | | | 57,779 | | | 10/01/24 | | UBS AG | | | 134 | |
| | | | | | |
U.S. Dollar | | | 57,143 | | | Canadian Dollar | | | 77,040 | | | 10/01/24 | | UBS AG | | | 179 | |
The accompanying notes are an integral part of these consolidated financial statements.
6
| | |
| | AMG Systematica Managed Futures Strategy Fund Consolidated Schedule of Portfolio Investments (continued) |
| | | | | | | | | | | | | | | | | | |
Currency Purchased | | Amount | | | Currency Sold | | Amount | | | Expiration | | Counterparty | | Unrealized Appreciation/ Depreciation | |
| | | | | | |
U.S. Dollar | | | 420 | | | Canadian Dollar | | | 571 | | | 10/16/24 | | UBS AG | | | $(2) | |
| | | | | | |
U.S. Dollar | | | 315 | | | Canadian Dollar | | | 427 | | | 10/16/24 | | UBS AG | | | (1 | ) |
| | | | | | |
U.S. Dollar | | | 11 | | | Canadian Dollar | | | 15 | | | 10/16/24 | | UBS AG | | | (0 | ) |
| | | | | | |
U.S. Dollar | | | 865 | | | Canadian Dollar | | | 1,168 | | | 10/16/24 | | UBS AG | | | 1 | |
| | | | | | |
U.S. Dollar | | | 98,967 | | | Canadian Dollar | | | 134,381 | | | 10/16/24 | | UBS AG | | | (432 | ) |
| | | | | | |
U.S. Dollar | | | 220 | | | Canadian Dollar | | | 297 | | | 10/16/24 | | UBS AG | | | (0 | ) |
| | | | | | |
U.S. Dollar | | | 99,623 | | | Canadian Dollar | | | 134,458 | | | 10/16/24 | | UBS AG | | | 167 | |
| | | | | | |
U.S. Dollar | | | 100,249 | | | Canadian Dollar | | | 136,199 | | | 10/16/24 | | UBS AG | | | (495 | ) |
| | | | | | |
U.S. Dollar | | | 3,105 | | | Swiss Franc | | | 2,630 | | | 10/01/24 | | UBS AG | | | (3 | ) |
| | | | | | |
U.S. Dollar | | | 9 | | | Swiss Franc | | | 8 | | | 10/01/24 | | UBS AG | | | 0 | |
| | | | | | |
U.S. Dollar | | | 4,832 | | | Swiss Franc | | | 4,067 | | | 10/02/24 | | UBS AG | | | 25 | |
| | | | | | |
U.S. Dollar | | | 97,602 | | | Swiss Franc | | | 82,800 | | | 10/16/24 | | UBS AG | | | (420 | ) |
| | | | | | |
U.S. Dollar | | | 1,148 | | | Swiss Franc | | | 970 | | | 10/16/24 | | UBS AG | | | (0 | ) |
| | | | | | |
U.S. Dollar | | | 947 | | | Swiss Franc | | | 800 | | | 10/16/24 | | UBS AG | | | (0 | ) |
| | | | | | |
U.S. Dollar | | | 1,398 | | | Swiss Franc | | | 1,184 | | | 10/16/24 | | UBS AG | | | (4 | ) |
| | | | | | |
U.S. Dollar | | | 1,721 | | | Swiss Franc | | | 1,451 | | | 10/16/24 | | UBS AG | | | 3 | |
| | | | | | |
U.S. Dollar | | | 3,299 | | | Swiss Franc | | | 2,780 | | | 10/16/24 | | UBS AG | | | 7 | |
| | | | | | |
U.S. Dollar | | | 2,458 | | | Swiss Franc | | | 2,070 | | | 10/16/24 | | UBS AG | | | 8 | |
| | | | | | |
U.S. Dollar | | | 3,140 | | | Swiss Franc | | | 2,639 | | | 10/16/24 | | UBS AG | | | 16 | |
| | | | | | |
U.S. Dollar | | | 4,071 | | | Swiss Franc | | | 3,426 | | | 10/16/24 | | UBS AG | | | 15 | |
| | | | | | |
U.S. Dollar | | | 3,736 | | | Swiss Franc | | | 3,130 | | | 10/16/24 | | UBS AG | | | 30 | |
| | | | | | |
U.S. Dollar | | | 110,767 | | | Euro | | | 100,000 | | | 10/16/24 | | UBS AG | | | (627 | ) |
| | | | | | |
U.S. Dollar | | | 110,301 | | | Euro | | | 100,000 | | | 10/16/24 | | UBS AG | | | (1,093 | ) |
| | | | | | |
U.S. Dollar | | | 110,614 | | | Euro | | | 100,000 | | | 10/16/24 | | UBS AG | | | (780 | ) |
| | | | | | |
U.S. Dollar | | | 111,318 | | | Euro | | | 100,000 | | | 10/16/24 | | UBS AG | | | (76 | ) |
| | | | | | |
U.S. Dollar | | | 111,871 | | | Euro | | | 100,000 | | | 10/16/24 | | UBS AG | | | 477 | |
| | | | | | |
U.S. Dollar | | | 131,085 | | | British Pound | | | 100,000 | | | 10/16/24 | | UBS AG | | | (2,609 | ) |
| | | | | | |
U.S. Dollar | | | 133,500 | | | British Pound | | | 100,000 | | | 10/16/24 | | UBS AG | | | (194 | ) |
| | | | | | |
U.S. Dollar | | | 7 | | | Japanese Yen | | | 999 | | | 10/01/24 | | UBS AG | | | 0 | |
| | | | | | |
U.S. Dollar | | | 946 | | | Japanese Yen | | | 134,388 | | | 10/01/24 | | UBS AG | | | 11 | |
| | | | | | |
U.S. Dollar | | | 6,471 | | | Japanese Yen | | | 923,123 | | | 10/02/24 | | UBS AG | | | 46 | |
| | | | | | |
U.S. Dollar | | | 2 | | | Japanese Yen | | | 284 | | | 10/02/24 | | UBS AG | | | 0 | |
| | | | | | |
U.S. Dollar | | | 405 | | | Japanese Yen | | | 57,651 | | | 10/16/24 | | UBS AG | | | 3 | |
| | | | | | |
U.S. Dollar | | | 405 | | | Japanese Yen | | | 57,651 | | | 10/16/24 | | UBS AG | | | 3 | |
| | | | | | |
U.S. Dollar | | | 2,264 | | | Japanese Yen | | | 323,247 | | | 10/16/24 | | UBS AG | | | 10 | |
| | | | | | |
U.S. Dollar | | | 1,482 | | | Japanese Yen | | | 207,524 | | | 10/16/24 | | UBS AG | | | 35 | |
| | | | | | |
U.S. Dollar | | | 30 | | | Japanese Yen | | | 4,374 | | | 10/16/24 | | UBS AG | | | (0 | ) |
| | | | | | |
U.S. Dollar | | | 2,401 | | | Japanese Yen | | | 339,978 | | | 10/16/24 | | UBS AG | | | 30 | |
| | | | | | |
U.S. Dollar | | | 571 | | | Japanese Yen | | | 81,167 | | | 10/16/24 | | UBS AG | | | 5 | |
The accompanying notes are an integral part of these consolidated financial statements.
7
| | |
| | AMG Systematica Managed Futures Strategy Fund Consolidated Schedule of Portfolio Investments (continued) |
| | | | | | | | | | | | | | | | | | |
Currency Purchased | | Amount | | | Currency Sold | | Amount | | | Expiration | | Counterparty | | Unrealized Appreciation/ Depreciation | |
| | | | | | |
U.S. Dollar | | | 1,306 | | | Japanese Yen | | | 186,509 | | | 10/16/24 | | UBS AG | | | $5 | |
| | | | | | |
U.S. Dollar | | | 719 | | | Japanese Yen | | | 100,634 | | | 10/16/24 | | UBS AG | | | 17 | |
| | | | | | |
U.S. Dollar | | | 560 | | | Norwegian Krone | | | 5,918 | | | 10/01/24 | | UBS AG | | | (1 | ) |
| | | | | | |
U.S. Dollar | | | 644 | | | Norwegian Krone | | | 6,758 | | | 10/02/24 | | UBS AG | | | 4 | |
| | | | | | |
U.S. Dollar | | | 84 | | | Norwegian Krone | | | 881 | | | 10/16/24 | | UBS AG | | | 1 | |
| | | | | | |
U.S. Dollar | | | 565 | | | Norwegian Krone | | | 5,929 | | | 10/16/24 | | UBS AG | | | 3 | |
| | | | | | |
U.S. Dollar | | | 671 | | | Norwegian Krone | | | 7,108 | | | 10/16/24 | | UBS AG | | | (3 | ) |
| | | | | | |
U.S. Dollar | | | 716 | | | Norwegian Krone | | | 7,750 | | | 10/16/24 | | UBS AG | | | (19 | ) |
| | | | | | |
U.S. Dollar | | | 101,160 | | | Norwegian Krone | | | 1,079,728 | | | 10/16/24 | | UBS AG | | | (1,173 | ) |
| | | | | | |
U.S. Dollar | | | 149 | | | Norwegian Krone | | | 1,574 | | | 10/16/24 | | UBS AG | | | (0 | ) |
| | | | | | |
U.S. Dollar | | | 12 | | | Norwegian Krone | | | 127 | | | 10/16/24 | | UBS AG | | | 0 | |
| | | | | | |
U.S. Dollar | | | 333 | | | Norwegian Krone | | | 3,487 | | | 10/16/24 | | UBS AG | | | 3 | |
| | | | | | |
U.S. Dollar | | | 354 | | | Norwegian Krone | | | 3,790 | | | 10/16/24 | | UBS AG | | | (5 | ) |
| | | | | | |
U.S. Dollar | | | 61,992 | | | New Zealand Dollar | | | 100,000 | | | 10/16/24 | | UBS AG | | | (1,542 | ) |
| | | | | | |
U.S. Dollar | | | 4,462 | | | Sweden Krona | | | 45,288 | | | 10/01/24 | | UBS AG | | | 2 | |
| | | | | | |
U.S. Dollar | | | 4 | | | Sweden Krona | | | 41 | | | 10/01/24 | | UBS AG | | | 0 | |
| | | | | | |
U.S. Dollar | | | 961 | | | Sweden Krona | | | 9,708 | | | 10/02/24 | | UBS AG | | | 5 | |
| | | | | | |
U.S. Dollar | | | 4,496 | | | Sweden Krona | | | 45,329 | | | 10/16/24 | | UBS AG | | | 29 | |
| | | | | | |
U.S. Dollar | | | 615 | | | Sweden Krona | | | 6,235 | | | 10/16/24 | | UBS AG | | | 0 | |
| | | | | | |
U.S. Dollar | | | 50 | | | Sweden Krona | | | 508 | | | 10/16/24 | | UBS AG | | | (0 | ) |
| | | | | | |
U.S. Dollar | | | 5,094 | | | Sweden Krona | | | 51,719 | | | 10/16/24 | | UBS AG | | | (3 | ) |
| | | | | | |
U.S. Dollar | | | 3,135 | | | Sweden Krona | | | 31,858 | | | 10/16/24 | | UBS AG | | | (5 | ) |
| | | | | | |
U.S. Dollar | | | 4,723 | | | Sweden Krona | | | 47,911 | | | 10/16/24 | | UBS AG | | | 1 | |
| | | | | | |
U.S. Dollar | | | 97,891 | | | Sweden Krona | | | 1,013,796 | | | 10/16/24 | | UBS AG | | | (2,014 | ) |
| | | | | | |
U.S. Dollar | | | 600 | | | Sweden Krona | | | 6,098 | | | 10/16/24 | | UBS AG | | | (1 | ) |
| | | | | | | | | | | | | | | | | | |
| | | | | | |
| | | | | | | | | | | | | | Total | | | $49,853 | |
| | | | | | | | | | | | | | | | | | |
The accompanying notes are an integral part of these consolidated financial statements.
8
| | |
| | AMG Systematica Managed Futures Strategy Fund Consolidated Schedule of Portfolio Investments (continued) |
The following table summarizes the inputs used to value the Fund’s investments by the fair value hierarchy levels as of September 30, 2024:
| | | | | | | | | | | | | | | | |
| | | Level 1 | | | Level 2 | | | Level 3 | | | Total | |
Investments in Securities | | | | | | | | | | | | | | | | |
| | | | |
Short-Term Investments | | | | | | | | | | | | | | | | |
| | | | |
Repurchase Agreements | | | — | | | | $5,008,000 | | | | — | | | | $5,008,000 | |
| | | | | | | | | | | | | | | | |
| | | | |
Total Investments in Securities | | | — | | | | $5,008,000 | | | | — | | | | $5,008,000 | |
| | | | | | | | | | | | | | | | |
| | | | |
Financial Derivative Instruments - Assets | | | | | | | | | | | | | | | | |
| | | | |
Commodity Futures Contracts | | | $126,616 | | | | — | | | | — | | | | $126,616 | |
| | | | |
Equity Futures Contracts | | | 36,512 | | | | — | | | | — | | | | 36,512 | |
| | | | |
Forward Foreign Currency Exchange Contracts | | | — | | | | $70,215 | | | | — | | | | 70,215 | |
| | | | |
Interest Rate Futures Contracts | | | 53,672 | | | | — | | | | — | | | | 53,672 | |
| | | | |
Financial Derivative Instruments - Liabilities | | | | | | | | | | | | | | | | |
| | | | |
Commodity Futures Contracts | | | (96,603 | ) | | | — | | | | — | | | | (96,603 | ) |
| | | | |
Equity Futures Contracts | | | (30,705 | ) | | | — | | | | — | | | | (30,705 | ) |
| | | | |
Forward Foreign Currency Exchange Contracts | | | — | | | | (20,362 | ) | | | — | | | | (20,362 | ) |
| | | | |
Interest Rate Futures Contracts | | | (24,112 | ) | | | — | | | | — | | | | (24,112 | ) |
| | | | | | | | | | | | | | | | |
| | | | |
Total Financial Derivative Instruments | | | $65,380 | | | | $49,853 | | | | — | | | | $115,233 | |
| | | | | | | | | | | | | | | | |
For the fiscal period ended September 30, 2024, there were no transfers in or out of Level 3.
The accompanying notes are an integral part of these consolidated financial statements.
9
| | |
| | AMG Systematica Managed Futures Strategy Fund Consolidated Schedule of Portfolio Investments (continued) |
The following schedule shows the value of derivative instruments at September 30, 2024:
| | | | | | | | | | | | |
| | | Asset Derivatives | | | Liability Derivatives | |
Derivatives not accounted for as hedging instruments | | Consolidated Statement of Assets and
Liabilities Location | | Fair Value | | | Consolidated Statement of Assets and
Liabilities Location | | Fair Value | |
| | | | |
Commodity contracts | | Unrealized appreciation on futures contracts | | | $126,616 | | | Unrealized depreciation on futures contracts | | | $96,603 | |
| | | | |
Equity contracts | | Unrealized appreciation on futures contracts | | | 36,512 | | | Unrealized depreciation on futures contracts | | | 30,705 | |
| | | | |
Interest rate contracts | | Unrealized appreciation on futures contracts | | | 53,672 | | | Unrealized depreciation on futures contracts | | | 24,112 | |
| | | | |
Forward Foreign currency exchange contracts | | Unrealized appreciation on forward foreign currency contracts | | | 70,215 | | | Unrealized depreciation on forward foreign currency contracts | | | 20,362 | |
| | | | | | | | | | | | |
| | | | |
| | Totals | | | $287,015 | | | | | | $171,782 | |
| | | | | | | | | | | | |
For the fiscal period ended September 30, 2024, the effect of derivative instruments on the Consolidated Statement of Operations for the Fund and the amount of realized gain/loss and unrealized appreciation/depreciation on derivatives recognized in income were as follows:
| | | | | | | | | | | | |
| | | Realized Gain/(Loss) | | | Change in Unrealized Appreciation/Depreciation | |
Derivatives not accounted
for as hedging instruments | | Consolidated Statement of Operations
Location | | Realized
Gain/(Loss) | | | Consolidated Statement of Operations
Location | | Change in
Unrealized
Appreciation/
Depreciation | |
| | | | |
Commodity contracts | | Net realized loss on futures contracts | | | $(28,140 | ) | | Net change in unrealized appreciation/ depreciation on futures contracts | | | $30,013 | |
| | | | |
Equity contracts | | Net realized loss on futures contracts | | | (125,456 | ) | | Net change in unrealized appreciation/ depreciation on futures contracts | | | 5,807 | |
| | | | |
Interest rate contracts | | Net realized loss on futures contracts | | | (130,155 | ) | | Net change in unrealized appreciation/ depreciation on futures contracts | | | 29,560 | |
| | | | |
Forward Foreign currency exchange contracts | | Net realized loss on forward foreign currency exchange contracts | | | (184,768 | ) | | Net change in unrealized appreciation/ depreciation on forward foreign currency exchange contracts | | | 49,853 | |
| | | | | | | | | | | | |
| | | | |
| | Totals | | | $(468,519 | ) | | | | | $115,223 | |
| | | | | | | | | | | | |
The accompanying notes are an integral part of these consolidated financial statements.
10
| | |
| | Consolidated Statement of Assets and Liabilities September 30, 2024 |
| | | | | |
| | | AMG
Systematica Managed
Futures
Strategy Fund |
| |
Assets: | | | | | |
| |
Repurchase Agreements at value1 | | | | $5,008,000 | |
| |
Cash deposits for futures contracts | | | | 873,298 | |
| |
Cash deposits for forward foreign currency exchange contracts | | | | 50,000 | |
| |
Unrealized appreciation on futures contracts | | | | 216,800 | |
| |
Unrealized appreciation on forward foreign currency exchange contracts | | | | 70,215 | |
| |
Interest receivables | | | | 740 | |
| |
Receivable from affiliate | | | | 27,371 | |
| |
Deferred offering costs | | | | 81,208 | |
| |
Total assets | | | | 6,327,632 | |
| |
Liabilities: | | | | | |
| |
Unrealized depreciation on futures contracts | | | | 151,420 | |
| |
Unrealized depreciation on forward foreign currency exchange contracts | | | | 20,362 | |
| |
Payable to Affiliate | | | | 93,208 | |
| |
Accrued expenses: | | | | | |
| |
Investment advisory and management fees | | | | 5,998 | |
| |
Administrative fees | | | | 750 | |
| |
Other | | | | 22,051 | |
| |
Total liabilities | | | | 293,789 | |
|
Commitments and Contingencies (Notes 2 & 5) | |
| |
Net Assets | | | | $6,033,843 | |
| |
1 Repurchase Agreements at cost | | | | $5,008,000 | |
The accompanying notes are an integral part of these consolidated financial statements.
11
| | |
| | Consolidated Statement of Assets and Liabilities (continued) |
| | | | | |
| | | AMG
Systematica Managed
Futures
Strategy Fund |
| |
Net Assets Represent: | | | | | |
| |
Paid-in capital | | | | $6,228,670 | |
| |
Total distributable loss | | | | (194,827 | ) |
| |
Net Assets | | | | $6,033,843 | |
| |
Class N: | | | | | |
| |
Net Assets | | | | $47,784 | |
| |
Shares outstanding | | | | 5,000 | |
| |
Net asset value, offering and redemption price per share | | | | $9.56 | |
| |
Class I: | | | | | |
| |
Net Assets | | | | $47,784 | |
| |
Shares outstanding | | | | 5,000 | |
| |
Net asset value, offering and redemption price per share | | | | $9.56 | |
| |
Class Z: | | | | | |
| |
Net Assets | | | | $5,938,275 | |
| |
Shares outstanding | | | | 621,381 | |
| |
Net asset value, offering and redemption price per share | | | | $9.56 | |
The accompanying notes are an integral part of these consolidated financial statements.
12
| | |
| | Consolidated Statement of Operations For the period ended September 30, 2024 |
| | | | | |
| | | AMG
Systematica Managed
Futures
Strategy Fund1 |
| |
Investment Income: | | | | | |
| |
Dividend income | | | | $23,930 | |
| |
Interest income | | | | 100,929 | |
| |
Total investment income | | | | 124,859 | |
| |
Expenses: | | | | | |
| |
Investment advisory and management fees | | | | 32,085 | |
| |
Administrative fees | | | | 4,010 | |
| |
Distribution fees - Class N | | | | 51 | |
| |
Organizational costs | | | | 286,681 | |
| |
Amortization of offering costs | | | | 55,673 | |
| |
Professional fees | | | | 49,810 | |
| |
Custodian fees | | | | 16,435 | |
| |
Registration fees | | | | 9,000 | |
| |
Reports to shareholders | | | | 7,606 | |
| |
Trustee fees and expenses | | | | 222 | |
| |
Transfer agent fees | | | | 186 | |
| |
Miscellaneous | | | | 2,207 | |
| |
Total expenses before offsets | | | | 463,966 | |
| |
Expense reimbursements | | | | (426,538 | ) |
| |
Investment advisory and management fees waiver | | | | (2,137 | ) |
| |
Administrative fees waiver | | | | (267 | ) |
| |
Distribution fees waiver - Class N | | | | (51 | ) |
| |
Net expenses | | | | 34,973 | |
| | | | | |
| |
Net investment income | | | | 89,886 | |
| |
Net Realized and Unrealized Loss: | | | | | |
| |
Net realized loss on forward foreign currency exchange contracts | | | | (184,768 | ) |
| |
Net realized loss on futures contracts | | | | (283,751 | ) |
| |
Net realized loss on foreign currency transactions | | | | (5,766 | ) |
| |
Net change in unrealized appreciation/depreciation on forward foreign currency exchange contracts | | | | 49,853 | |
| |
Net change in unrealized appreciation/depreciation on futures contracts | | | | 65,380 | |
| |
Net change in unrealized appreciation/depreciation on foreign currency translations | | | | 3,009 | |
| |
Net realized and unrealized loss | | | | (356,043 | ) |
| | | | | |
| |
Net decrease in net assets resulting from operations | | | | $(266,157 | ) |
|
1 Commencement of operations was May 1, 2024. | |
The accompanying notes are an integral part of these consolidated financial statements.
13
| | |
| | Consolidated Statement of Changes in Net Assets For the period ended September 30, 2024 |
| | | | | |
| | | AMG
Systematica Managed
Futures Strategy Fund |
| |
| | | 20241 |
| |
Decrease in Net Assets Resulting From Operations: | | | | | |
| |
Net investment income | | | | $89,886 | |
| |
Net realized loss on investments | | | | (474,285 | ) |
| |
Net change in unrealized appreciation/depreciation on investments | | | | 118,242 | |
| |
Net decrease in net assets resulting from operations | | | | (266,157 | ) |
| |
Capital Share Transactions:2 | | | | | |
| |
Net increase from capital share transactions | | | | 6,300,000 | |
| | | | | |
| |
Total increase in net assets | | | | 6,033,843 | |
| |
Net Assets: | | | | | |
| |
Beginning of period | | | | – | |
| |
End of period | | | | $6,033,843 | |
| 1 | Commencement of operations was May 1, 2024. |
| 2 | See Note 1(h) of the Notes to Consolidated Financial Statements. |
The accompanying notes are an integral part of these consolidated financial statements.
14
| | |
| | AMG Systematica Managed Futures Strategy Fund Consolidated Financial Highlights For a share outstanding throughout the fiscal period |
| | | | |
| | | For the fiscal
period ended
September 30, |
| |
Class N | | | 2024 | 1 |
| |
Net Asset Value, Beginning of Period | | | $10.00 | |
| |
Income (loss) from Investment Operations: | | | | |
| |
Net investment income2,3 | | | 0.15 | |
| |
Net realized and unrealized loss on investments | | | (0.59 | ) |
| |
Total loss from investment operations | | | (0.44 | ) |
| |
Net Asset Value, End of Period | | | $9.56 | |
| |
Total Return3,4 | | | (4.40 | )%5 |
| |
Ratio of net expenses to average net assets | | | 1.40 | %6 |
| |
Ratio of gross expenses to average net assets7 | | | 10.96 | %6,8 |
| |
Ratio of net investment income to average net assets3 | | | 3.61 | %6 |
| |
Portfolio turnover | | | 0 | %5,9 |
| |
Net assets end of period (000’s) omitted | | | $48 | |
| | | | | |
The accompanying notes are an integral part of these consolidated financial statements.
15
| | |
| | AMG Systematica Managed Futures Strategy Fund Consolidated Financial Highlights For a share outstanding throughout the fiscal period |
| | | | |
| | | For the fiscal
period ended
September 30, |
| |
Class I | | | 2024 | 1 |
| |
Net Asset Value, Beginning of Period | | | $10.00 | |
| |
Income (loss) from Investment Operations: | | | | |
| |
Net investment income2,3 | | | 0.15 | |
| |
Net realized and unrealized loss on investments | | | (0.59 | ) |
| |
Total loss from investment operations | | | (0.44 | ) |
| |
Net Asset Value, End of Period | | | $9.56 | |
| |
Total Return3,4 | | | (4.40 | )%5 |
| |
Ratio of net expenses to average net assets | | | 1.40 | %6 |
| |
Ratio of gross expenses to average net assets7 | | | 10.71 | %6,8 |
| |
Ratio of net investment income to average net assets3 | | | 3.61 | %6 |
| |
Portfolio turnover | | | 0 | %5,9 |
| |
Net assets end of period (000’s) omitted | | | $48 | |
| | | | | |
The accompanying notes are an integral part of these consolidated financial statements.
16
| | |
| | AMG Systematica Managed Futures Strategy Fund Consolidated Financial Highlights For a share outstanding throughout the fiscal period |
| | | | |
| | | For the fiscal
period ended
September 30, |
| |
Class Z | | | 2024 | 1 |
| |
Net Asset Value, Beginning of Period | | | $10.00 | |
| |
Income (loss) from Investment Operations: | | | | |
| |
Net investment income2,3 | | | 0.15 | |
| |
Net realized and unrealized loss on investments | | | (0.59 | ) |
| |
Total loss from investment operations | | | (0.44 | ) |
| |
Net Asset Value, End of Period | | | $9.56 | |
| |
Total Return3,4 | | | (4.40 | )%5 |
| |
Ratio of net expenses to average net assets | | | 1.40 | %6 |
| |
Ratio of gross expenses to average net assets7 | | | 10.71 | %6,8 |
| |
Ratio of net investment income to average net assets3 | | | 3.61 | %6 |
| |
Portfolio turnover | | | 0 | %5,9 |
| |
Net assets end of period (000’s) omitted | | | $5,938 | |
| | | | | |
| 1 | Commencement of operations was May 1, 2024. |
| 2 | Per share numbers have been calculated using average shares. |
| 3 | Total returns and net investment income would have been lower had certain expenses not been offset. |
| 4 | The total return is calculated using the published Net Asset Value as of period end. |
| 7 | Excludes the impact of expense reimbursement or fee waivers and expense reductions such as brokerage credits, but includes expense repayments and non-reimbursable expenses, if any, such as interest, taxes, and extraordinary expenses. (See Note 1(d) and 2 in the Notes to Consolidated Financial Statements.) |
| 8 | Ratio does not reflect the annualization of audit fees and organizational costs. |
| 9 | There were no long-term transactions for the fiscal period ended September 30, 2024. |
The accompanying notes are an integral part of these consolidated financial statements.
17
| | |
| | Notes to Consolidated Financial Statements September 30, 2024 |
1. ORGANIZATION AND SUMMARY OF SIGNIFICANT ACCOUNTING POLICIES
AMG Funds I (the “Trust”) is an open-end management investment company, organized as a Massachusetts business trust, and registered under the Investment Company Act of 1940, as amended (the “1940 Act”). Currently, the Trust consists of a number of different funds, each having distinct investment management objectives, strategies, risks, and policies. Included in this report is AMG Systematica Managed Futures Strategy Fund (the “Fund”). The Fund commenced operations on May 1, 2024.
The Fund offers Class N, Class I, and Class Z shares. Each class represents an interest in the same assets of the Fund. Although all share classes generally have identical voting rights, each share class votes separately when required by law. Different share classes may have different net asset values per share to the extent the share classes pay different distribution amounts and/or the expenses of such share classes differ. Each share class has its own expense structure. Please refer to a current prospectus for additional information on each share class.
The Fund is non-diversified.
The Fund’s consolidated financial statements are prepared in accordance with accounting principles generally accepted in the United States of America (“U.S. GAAP”), including accounting and reporting guidance pursuant to Accounting Standards Codification Topic 946 applicable to investment companies. U.S. GAAP requires management to make estimates and assumptions that affect the reported amounts of assets and liabilities and disclosure of contingent assets and liabilities at the date of the consolidated financial statements and the reported amounts of income and expenses during the reporting period. Actual results could differ from those estimates and such differences could be material. The following is a summary of significant accounting policies followed by the Fund in the preparation of its consolidated financial statements:
a. BASIS OF CONSOLIDATION
The accompanying consolidated financial statements of the Fund include the accounts of AMG Systematica Subsidiary Fund I (the “Subsidiary”), which is a wholly-owned subsidiary of the Fund and organized under the laws of the Cayman Islands.
The Fund may invest up to 25% of its total assets in the Subsidiary and the Subsidiary acts as an investment vehicle for the Fund to invest in certain types of commodity-linked derivative instruments.
Intercompany accounts and transactions have been eliminated.
At September 30, 2024, the Subsidiary’s net assets were $407,575 or 6.8% of the Fund’s net assets.
b. VALUATION OF INVESTMENTS
Futures contracts for which market quotations are readily available are valued at the settlement price as of the close of the futures exchange.
Fixed income securities purchased with a remaining maturity of 60 days or less are valued at amortized cost, provided that the amortized cost value is approximately the same as the fair value of the security valued without the use of amortized cost. Investments in other open-end registered investment companies are valued at their end of day net asset value per share.
The Fund’s portfolio investments are generally valued based on independent market quotations or prices or, if none, “evaluative” or other market based valuations provided by third party pricing services. Pursuant to Rule 2a-5 under the 1940 Act, the Fund’s Board of Trustees (the “Board”) designated AMG Funds LLC (the “Investment Manager”) as the Fund’s Valuation Designee to perform the Fund’s fair value determinations. Such determinations are subject to Board oversight and certain reporting and other requirements intended to ensure that the Board receives the information it needs to oversee the Investment Manager’s fair value determinations.
Under certain circumstances, the value of certain Fund portfolio investments may be based on an evaluation of fair value, pursuant to procedures established by the Investment Manager and under the general supervision of the Board. The Fund may use the fair value of a portfolio investment to calculate its net asset value (“NAV”) in the event that the market quotation, price or market based valuation for the portfolio investment is not readily available or otherwise not determinable pursuant to the Fund’s valuation procedures, if the Investment Manager believes the quotation, price or market based valuation to be unreliable, or in certain other circumstances. When determining the fair value of an investment, the Investment Manager seeks to determine the price that the Fund might reasonably expect to receive from current sale of that portfolio investment in an arms-length transaction. Fair value determinations shall be based upon consideration of all available facts and information, including, but not limited to (i) attributes specific to the investment; (ii) fundamental and analytical data relating to the investment; and (iii) the value of other comparable securities or relevant financial instruments, including derivative securities, traded on other markets or among dealers.
The values assigned to fair value portfolio investments are based on available information and do not necessarily represent amounts that might ultimately be realized in the future, since such amounts depend on future developments inherent in long-term investments. Because of the inherent uncertainty of valuation, those estimated values may differ significantly from the values that would have been used had a ready market for the investments existed, and the differences could be material. The Board will be presented with quarterly reports, as of the most recent quarter end, summarizing all fair value activity, material fair value matters that occurred during the quarter, and all outstanding securities fair valued by the Fund. Additionally, the Board will be presented with an annual report that assesses the adequacy and effectiveness of the Investment Manager’s process for determining the fair value of the Fund’s investments.
U.S. GAAP defines fair value as the price that a fund would receive to sell an asset or pay to transfer a liability in an orderly transaction between market participants at the measurement date. U.S. GAAP also establishes a framework for measuring fair value, and a three level hierarchy for fair value measurements based upon the transparency of inputs to the valuation of an asset or liability. Inputs may be observable or unobservable and refer broadly to the assumptions that market participants would use in pricing the asset or liability. Observable inputs reflect the assumptions market participants would use in pricing the asset or liability based on market data obtained from sources independent of the Fund. Unobservable inputs reflect the Fund’s own assumptions about the assumptions that market participants would use in pricing the asset or liability developed based on the best information available in the circumstances. Each investment is assigned a level based upon the observability of the inputs which are significant to the overall valuation.
The three-tier hierarchy of inputs is summarized below:
18
| | |
| | Notes to Consolidated Financial Statements (continued) |
Level 1 – inputs are quoted prices in active markets for identical investments (e.g., equity securities, futures contracts, open-end investment companies)
Level 2 – other observable inputs (including, but not limited to: quoted prices for similar assets or liabilities in markets that are active, quoted prices for identical or similar assets or liabilities in markets that are not active, inputs other than quoted prices that are observable for the assets or liabilities (such as interest rates, yield curves, volatilities, prepayment speeds, loss severities, credit risks and default rates) or other market corroborated inputs) (e.g., forward foreign currency exchange contracts, debt securities, government securities, fair valued securities with observable inputs)
Level 3 – inputs are significant unobservable inputs (including the Fund’s own assumptions used to determine the fair value of investments) (e.g., fair valued securities with unobservable inputs)
Changes in inputs or methodologies used for valuing investments may result in a transfer in or out of levels within the fair value hierarchy. The inputs or methodologies used for valuing investments may not necessarily be an indication of the risk associated with investing in those investments.
c. SECURITY TRANSACTIONS
Security transactions are accounted for as of trade date. Realized gains and losses on securities sold are determined on the basis of identified cost.
d. INVESTMENT INCOME AND EXPENSES
Dividend income is recorded on the ex-dividend date. Interest income, which includes amortization of premium and accretion of discount on debt securities, is accrued as earned. Other income and expenses are recorded on an accrual basis. Expenses that cannot be directly attributed to the Fund are apportioned among the funds in the Trust and other trusts or funds within the AMG Funds Family of Funds (collectively, the “AMG Funds Family”) based upon their relative average net assets or number of shareholders. Investment income, realized and unrealized capital gains and losses, the common expenses of the Fund, and certain fund level expense reductions, if any, are allocated on a pro-rata basis to each class based on the relative net assets of each class to the total net assets of the Fund.
e. DIVIDENDS AND DISTRIBUTIONS
Fund distributions resulting from either net investment income or realized net capital gains, if any, will normally be declared and paid at least annually in December. Distributions to shareholders are recorded on the ex-dividend date. Distributions are determined in accordance with federal income tax law, which may differ from net investment income and net realized capital gains for financial statement purposes (U.S. GAAP). Differences may be permanent or temporary. Permanent differences are reclassified among capital accounts in the consolidated financial statements to reflect their tax character. Permanent book and tax basis differences, if any, relating to shareholder distributions will result in reclassifications to paid-in capital. Temporary differences arise when certain items of income, expense and gain or loss are recognized in different periods for financial statement and tax purposes; these differences will reverse at some time
in the future. Permanent differences are primarily due to the write-off of net operating losses. Temporary differences are primarily due to mark to market of open forward and futures contracts.
As of September 30, 2024, the components of distributable earnings (excluding unrealized appreciation/depreciation) on a tax basis consisted of:
| | |
| Capital loss carryforward | | $187,478 |
At September 30, 2024, the cost of investments and the aggregate gross unrealized appreciation and depreciation for federal income tax purposes were as follows:
| | | | | | | | | | |
| Cost | | Appreciation | | | Depreciation | | | Net Depreciation |
| | | |
| $5,133,591 | | | $46,114 | | | | $(53,463) | | | $(7,349) |
f. FEDERAL TAXES
The Fund intends to qualify as an investment company and intends to comply with the requirements under Subchapter M of the Internal Revenue Code of 1986, as amended (the “Code”), and to distribute substantially all of its taxable income and gains to its shareholders and to meet certain diversification and income requirements with respect to investment companies. The Investment Manager has analyzed the Fund’s tax positions taken on federal income tax returns as of September 30, 2024, and for all open tax years, and has concluded that no provision for federal income tax is required in the Fund’s consolidated financial statements. Additionally, the Investment Manager is not aware of any tax position for which it is reasonably possible that the total amounts of unrecognized tax benefit/detriment will change materially in the next twelve months.
The Subsidiary is classified as a “controlled foreign corporation” under Subchapter N of the Code. Therefore, the Fund is required to increase its taxable income by its share of the Subsidiary’s income. Net investment losses of the Subsidiary cannot be deducted by the Fund in the current period nor carried forward by the Subsidiary to offset taxable income in future periods.
Furthermore, based on the Fund’s understanding of the tax rules and rates related to income, gains and transactions for the foreign jurisdictions in which it invests, the Fund will provide for foreign taxes, and where appropriate, deferred foreign taxes.
g. CAPITAL LOSS CARRYOVERS AND DEFERRALS
As of September 30, 2024, the Fund had capital loss carryovers for federal income tax purposes as shown in the following chart. These amounts may be used to offset future realized capital gains indefinitely, and retain their character as short-term and/or long-term.
| | | | | | | | |
| Short-Term | | Long-Term | | | Total | |
$117,419 | | | $70,059 | | | | $187,478 | |
h. CAPITAL STOCK
The Trust’s Amended and Restated Agreement and Declaration of Trust authorizes for the Fund the issuance of an unlimited number of shares of beneficial interest, without par value. The Fund records sales and repurchases of its capital stock on the trade date.
19
| | |
| | Notes to Consolidated Financial Statements (continued) |
For the fiscal period ended September 30, 2024, the capital stock transactions by class for the Fund were as follows:
| | | | | | | | |
| |
| | | September 30, 20241 | |
| | |
| | | Shares | | | Amount | |
| | |
Class N: | | | | | | | | |
| | |
Shares sold | | | 5,000 | | | | $50,000 | |
| | |
Class I: | | | | | | | | |
| | |
Shares sold | | | 5,000 | | | | $50,000 | |
| | |
Class Z: | | | | | | | | |
| | |
Shares sold | | | 621,381 | | | | $6,200,000 | |
| | | | | | | | |
| | |
Net increase | | | 631,381 | | | | $6,300,000 | |
| | | | | | | | |
| 1 | Commencement of operations was May 1, 2024. |
At September 30, 2024, certain affiliated or unaffiliated shareholders of record individually or collectively held greater than 5% of the net assets of the Fund as follows: two own 100%. Transactions by these shareholders may have a material impact on the Fund.
i. REPURCHASE AGREEMENTS
The Fund may enter into third-party and bilateral repurchase agreements (“Repurchase Agreements”) for temporary cash management purposes. The value of the underlying collateral, including accrued interest, must equal or exceed the value of the repurchase agreements during the term of the agreement. The underlying collateral for all repurchase agreements is held by the Fund’s custodian or at the Federal Reserve Bank. If the seller defaults and the value of the collateral declines, or if bankruptcy proceedings commence with respect to the seller of the security, realization of the collateral by the Fund may be delayed or limited.
At September 30, 2024, the market value of Repurchase Agreements outstanding was $5,008,000.
j. FOREIGN CURRENCY TRANSLATION
The books and records of the Fund are maintained in U.S. Dollars. The value of investments, assets and liabilities denominated in currencies other than U.S. Dollars are translated into U.S. Dollars based upon current foreign exchange rates. Purchases and sales of foreign investments, income and expenses are converted into U.S. Dollars based on currency exchange rates prevailing on the respective dates of such transactions. Net realized and unrealized gain (loss) on foreign currency transactions represent: (1) foreign exchange gains and losses from the sale and holdings of foreign currencies; (2) gains and losses between trade date and settlement date on investment securities transactions and forward foreign currency exchange contracts; and (3) gains and losses from the difference between amounts of interest and dividends recorded and the amounts actually received.
The Fund does not isolate the net realized and unrealized gain or loss resulting from changes in exchange rates from the fluctuations in market prices of securities held. Such fluctuations are included with the net realized and unrealized gain or loss on investments.
k. ORGANIZATIONAL AND OFFERING COSTS
The Investment Manager paid organizational costs of $286,681 and offering costs of $136,880 on behalf of the Fund amounting to $423,562, which will be repaid by the Fund for the full amount thereof. Organizational costs were expensed in full during the fiscal period ended September 30, 2024. All offering costs were deferred and are being amortized on the straight-line method over a period of one year from the commencement of operations. The Fund expensed $55,673 of offering costs during the fiscal period ended September 30, 2024. The amount of organizational and offering costs owed by the Fund to the Investment Manager is reflected as Payable to Affiliate on the Consolidated Statement of Assets and Liabilities.
2. AGREEMENTS AND TRANSACTIONS WITH AFFILIATES
The Trust, on behalf of the Fund, the Subsidiary and the Investment Manager entered into an investment advisory agreement under which the Investment Manager, a subsidiary and the U.S. wealth platform of Affiliated Managers Group, Inc. (“AMG”), serves as investment manager to the Fund and the Subsidiary and is responsible for the Fund’s and the Subsidiary’s overall administration and operations. The Investment Manager selects and recommends, subject to the approval of the Board and, in certain circumstances, shareholders, the subadviser for the Fund and the Subsidiary and monitors the subadviser’s investment performance, security holdings and investment strategies. Systematica Investments Limited, acting as general partner of Systematica Investments LP (“Systematica”), serves as subadviser to the Fund and the Subsidiary pursuant to subadvisory agreements with the Investment Manager. Each of Systematica Investments GP Limited, Systematica Investments Singapore Pte. Ltd, and Systematica Investments UK LLP (together with Systematica, the “Systematica Group”) serves as sub-subadviser to the Fund and the Subsidiary pursuant to sub-subadvisory agreements with Systematica. The Fund’s investment portfolio is managed by the Systematica Group.
Investment management fees are paid directly by the Fund and the Subsidiary to the Investment Manager based on average daily net assets of the Fund and the Subsidiary. For the fiscal period ended September 30, 2024, each of the Fund and
20
| | |
| | Notes to Consolidated Financial Statements (continued) |
Subsidiary paid an investment management fee at the annual rate of 1.20% of the average daily net assets of the Fund and the Subsidiary. The Investment Manager has agreed to waive the portion of the management fee that the Investment Manager otherwise would have been entitled to receive from the Fund in an amount equal to the investment management fee paid to the Investment Manager by the Subsidiary. During the period from the commencement of operations to September 30, 2024, the Investment Manager waived investment management fees payable by the Fund in the amount of $2,137. The fee paid to Systematica for its services as subadviser is paid out of the fee the Investment Manager receives from the Fund and the Subsidiary, and the fee paid to each sub-subadviser is paid out of the fee that Systematica receives from the Investment Manager. These fees do not increase the expenses of the Fund or the Subsidiary.
The Investment Manager has contractually agreed, through at least February 1, 2026, to waive management fees and/or pay or reimburse the Fund’s and/or the Subsidiary’s expenses in order to limit the aggregate of the Fund’s total annual operating expenses and the Subsidiary’s total annual operating expenses (exclusive of taxes, interest (including interest incurred in connection with bank and custody overdrafts and in connection with securities sold short), shareholder servicing fees, distribution and service (12b-1) fees, brokerage commissions and other transaction costs, dividends payable with respect to securities sold short, acquired fund fees and expenses, and extraordinary expenses) to the annual rate of 1.40% of the aggregate average daily net assets attributable to the Fund and the Subsidiary (this annual rate or such other annual rate that may be in effect from time to time, the “Expense Cap”), subject to later reimbursement by the Fund and the Subsidiary in certain circumstances.
In general, for a period of up to 36 months after the date any amounts are paid, waived or reimbursed by the Investment Manager, the Investment Manager may recover such amounts from the Fund or the Subsidiary, provided that such repayment would not cause the aggregate of the Fund’s total annual operating expenses and the Subsidiary’s total annual operating expenses (exclusive of the items noted in the parenthetical above) to exceed either (i) the Expense Cap in effect at the time such amounts were paid, waived or reimbursed, or (ii) the Expense Cap in effect at the time of such repayment by the Fund or the Subsidiary.
The contractual expense limitation may only be terminated in the event the Investment Manager or a successor ceases to be the investment manager of the Fund or a successor fund, by mutual agreement between the Investment Manager and the Board or in the event of the Fund’s liquidation unless the Fund is reorganized or is a party to a merger in which the surviving entity is successor to the accounting and performance information of the Fund.
For the fiscal period ended September 30, 2024, the Investment Manager reimbursed the Fund $426,538, which is subject to recoupment and will expire within two to three years.
The Trust, on behalf of the Fund, and the Subsidiary have entered into an amended and restated Administration Agreement under which the Investment Manager serves as the Fund’s and the Subsidiary’s administrator (the “Administrator”) and is responsible for certain aspects of managing the Fund’s and the Subsidiary’s operations, including administration and shareholder services to the Fund and the Subsidiary. The Fund and the Subsidiary each pay a fee to the Administrator at the rate of 0.15% per annum of the Fund’s and the Subsidiary’s average daily net assets for this service. The Administrator has agreed to waive the portion of the administrative fee that the Administrator otherwise would have been entitled to receive from the Fund in an amount equal to the administrative fee paid to the Administrator by the Subsidiary. During the period from the commencement of
operations to September 30, 2024, the Administrator waived administrative fees payable by the Fund in the amount of $267.
The Fund is distributed by AMG Distributors, Inc. (the “Distributor”), a wholly-owned subsidiary of the Investment Manager. The Distributor serves as the distributor and underwriter for the Fund and is a registered broker-dealer and member of the Financial Industry Regulatory Authority, Inc. (“FINRA”). Shares of the Fund will be continuously offered and will be sold directly to prospective purchasers and through brokers, dealers or other financial intermediaries who have executed selling agreements with the Distributor. Generally, the Distributor bears all or a portion of the expenses of providing services pursuant to the distribution agreement, including the payment of the expenses relating to the distribution of prospectuses for sales purposes and any advertising or sales literature.
The Trust has adopted a distribution and service plan (the “Plan”) with respect to the Class N shares, in accordance with the requirements of Rule 12b-1 under the 1940 Act and the requirements of the applicable rules of FINRA regarding asset-based sales charges. Pursuant to the Plan, the Fund may make payments to the Distributor for its expenditures in financing any activity primarily intended to result in the sale of the Fund’s Class N shares and for maintenance and personal service provided to existing shareholders of that class. The Plan authorizes payments to the Distributor up to 0.25% annually of the Fund’s average daily net assets attributable to the Class N shares. Effective May 1, 2024, the Investment Manager agreed to waive 12b-1 distribution fees until expenses are incurred by the Distributor.
For each of the Class N and Class I shares, the Board has approved reimbursement payments to the Investment Manager for shareholder servicing expenses (“shareholder servicing fees”) incurred. Shareholder servicing fees include payments to financial intermediaries, such as broker-dealers (including fund supermarket platforms), banks, and trust companies who provide shareholder recordkeeping, account servicing and other services. The Class N and Class I shares may reimburse the Investment Manager for the actual amount incurred up to a maximum annual rate of each Class’s average daily net assets as shown in the table below.
The impact on the annualized expense ratios for the period from commencement of operations to September 30, 2024, was as follows:
| | | | | | | | |
| | |
| | | Maximum Annual Amount Approved | | | Actual Amount Incurred | |
| | |
Class N | | | 0.15 | % | | | 0.00 | % |
| | |
Class I | | | 0.10 | % | | | 0.00 | % |
The Board provides supervision of the affairs of the Trust and other trusts within the AMG Funds Family. The Trustees of the Trust who are not affiliated with the Investment Manager receive an annual retainer and per meeting fees for regular, special and telephonic meetings, and they are reimbursed for out-of-pocket expenses incurred while carrying out their duties as Board members. The Chairman of the Board and the Audit Committee Chair receive additional annual retainers. Certain Trustees and Officers of the Fund are Officers and/or Directors of the Investment Manager, AMG and/or the Distributor.
The Securities and Exchange Commission (the “SEC”) granted an exemptive order that permits certain eligible funds in the AMG Funds Family to lend and borrow money for certain temporary purposes directly to and from other eligible funds in the AMG Funds Family. Participation in this interfund lending program is voluntary
21
| | |
| | Notes to Consolidated Financial Statements (continued) |
for both the borrowing and lending funds, and an interfund loan is only made if it benefits each participating fund. The Administrator manages the program according to procedures approved by the Board, and the Board monitors the operation of the program. An interfund loan must comply with certain conditions set out in the exemptive order, which are designed to assure fairness and protect all participating funds. The interest earned and interest paid on interfund loans are included on the Consolidated Statement of Operations as interest income and interest expense, respectively. At September 30, 2024, the Fund had no interfund loans outstanding. The Fund did not lend or borrow during the fiscal period ended September 30, 2024.
3. PURCHASES AND SALES OF SECURITIES
There were no purchases and sales of securities (excluding short-term securities and U.S. Government Obligations) for the fiscal period ended September 30, 2024.
The Fund had no purchases or sales of U.S. Government Obligations during the fiscal period ended September 30, 2024.
4. FUND RISKS
In the normal course of business, the Fund invests in securities or other instruments and may enter into certain transactions, and such activities subject the Fund to various risks. The value of securities or other instruments may also be affected by various factors, including, without limitation: (i) the general economy; (ii) the overall market as well as local, regional or global political and/or social instability; or (iii) currency and price fluctuations. By investing in the Subsidiary, the Fund is exposed to the risks associated with the Subsidiary’s investments. References to investments of the Fund and risks of investing in the Fund include underlying investments of the Subsidiary and risks associated therewith. Please refer to the Fund’s current prospectus for additional information about the Fund’s principal risks.
Management Risk: The Systematica Group’s investment process, techniques and analyses may not achieve their desired results and the securities or other financial instruments selected for the Fund may result in returns that are inconsistent with the Fund’s investment objective. In addition, in the event of the death, incapacity, departure, insolvency or withdrawal of any key individuals, the performance of the Fund may be adversely affected.
Market Risk: Market prices of investments held by the Fund may fall rapidly or unpredictably due to a variety of factors, including economic, political, or market conditions, or other factors including terrorism, war, natural disasters and the spread of infectious illness or other public health issues, including epidemics or pandemics, or in response to events that affect particular industries or companies.
Non-Diversified Fund Risk: The Fund is non-diversified and therefore a greater percentage of holdings may be focused in a small number of issuers or a single issuer, which can place the Fund at greater risk. Notwithstanding the Fund’s status as a “non-diversified” investment company under the 1940 Act, the Fund intends to qualify as a regulated investment company accorded favorable tax treatment under the Code, which imposes its own diversification requirements that are less restrictive than the requirements applicable to “diversified” investment companies under the 1940 Act. The Fund’s intention to qualify as a regulated investment company may limit its pursuit of its investment strategy and its investment strategy could limit its ability to so qualify.
Analytical Model Risk: The Fund’s investment strategy depends upon the reliability, accuracy and analyses on systematic trading models, which are
analytical models. To the extent that such models (or the assumptions underlying them) do not prove to be correct, the Fund may not perform as anticipated, which could result in substantial losses. All models ultimately depend upon the judgement of the investment team and the assumptions embedded in the models. To the extent that the judgment or assumptions are incorrect with respect to any investment, the Fund can suffer substantial losses.
From time to time the Systematica Group may exercise discretion over trading orders. Such discretion may cause the Fund to incur losses or cause the Fund to forego profits which it may have otherwise earned had such discretion not been used.
The model’s computerized trading systems rely on the ability of the Systematica Group’s personnel to accurately process such systems’ outputs and to use the proper trading orders to execute the transactions called for by the systems. In addition, the model is highly dependent on the proper functioning of its internal computer systems. The Systematica Group systems are accordingly subject to human errors and any defects, failures or interruptions of such systems could disrupt trading or make trading impossible until such failure is remedied. Any such failure, and consequential inability to trade, could cause the Fund to experience significant trading losses or to miss opportunities for profitable trading.
Derivatives Risk: The use of derivatives involves costs, the risk that the value of derivatives may not correlate perfectly with their underlying assets, rates or indices, liquidity risk, and the risk of mispricing or improper valuation. The use of derivatives may not succeed for various reasons, and the complexity and rapidly changing structure of derivatives markets may increase the possibility of market losses.
Leverage Risk: Borrowing and some derivative investments such as futures and forward commitment transactions may increase volatility and magnify smaller adverse market movements into relatively larger losses.
Short Position Risk: The Fund will incur a loss from a short position if the value of the reference instrument increases after the time the Fund entered into the short position. Short positions generally involve a form of leverage, which can exaggerate the Fund’s losses. A fund that enters into a short position may lose more money than the actual cost of the short position and its potential losses may be unlimited if the fund does not own the reference instrument and it is unable to close out of the short position. Any gain from a short position will be offset in whole or in part by the transaction costs associated with the short position.
Forward and Futures Contract Risk: The successful use of forward and futures contracts will depend upon the Systematica Group’s skill and experience with respect to such instruments and are subject to special risk considerations. Entering into forward or futures contracts involves all of the risks generally associated with entering into derivatives. However, the primary risks associated with the use of forward and futures contracts include (i) the imperfect correlation between the change in market value of the instruments held by the Fund and the price of the forward or futures contract; (ii) possible lack of a liquid market for a forward or futures contract and the resulting inability to close a forward or futures contract when desired; (iii) losses caused by unanticipated market movements, which are potentially unlimited; (iv) the Systematica Group’s inability to predict correctly the direction of commodity and/or securities prices, interest rates, currency exchange rates and other economic factors; (v) the possibility that the counterparty will default in the performance of its obligations; (vi) if the Fund has insufficient cash, it may have to sell assets to meet daily variation margin requirements, and it may have to sell at a time when it is disadvantageous to do so; (vii) the possibility that the Fund may be delayed or prevented from recovering
22
| | |
| | Notes to Consolidated Financial Statements (continued) |
margin or other amounts deposited with a counterparty (including a futures commission merchant or clearinghouse); (viii) the possibility that position or trading limits will preclude the Systematica Group from taking positions in certain futures contracts on behalf of the Fund; and (ix) the risks typically associated with foreign investments to the extent the Fund invests in derivatives traded on markets outside the United States.
Credit and Counterparty Risk: The issuer of bonds or other debt securities or a counterparty to a derivatives contract (including over-the-counter counterparties as well as brokers and clearinghouses in respect of exchange-traded and/or cleared products) may be unable or unwilling, or may be perceived as unable or unwilling, to make timely interest, principal or settlement payments or otherwise honor its obligations.
Subsidiary Risk: By investing in the Subsidiary, the Fund is indirectly exposed to the commodities risks associated with the Subsidiary’s investments in commodity-related instruments. There can be no assurance that the Subsidiary’s investments will contribute favorably to the Fund’s returns. The Subsidiary is not registered under the 1940 Act, and is not subject to all the investor protections of the 1940 Act. Changes in the laws of the United States and/or the Cayman Islands could result in the inability of the Fund and/or the Subsidiary to operate as described in the prospectus and could adversely affect the Fund, such as by reducing the Fund’s investment returns. The Fund’s ability to invest in the Subsidiary will potentially be limited by the Fund’s intention to qualify as a regulated investment company, and might adversely affect the Fund’s ability to so qualify.
Commodities Exposure Risk: Exposure to the commodities markets may subject the Fund to greater volatility than investments in traditional securities. The value of commodity-linked derivative instruments may be affected by changes in overall market movements, commodity index volatility, changes in interest rates, or factors affecting a particular industry or commodity. The Fund’s ability to invest in commodity-linked derivative instruments may be limited by the Fund’s intention to qualify as a regulated investment company, and could adversely affect the Fund’s ability to so qualify.
Tax Risk: The Fund intends to elect to be treated and intends to qualify and to be eligible to be treated each taxable year as a “regulated investment company” accorded special tax treatment under the Code. The Fund’s investments in commodities or commodity-related investments can be limited by the Fund’s intention to qualify as a regulated investment company, and can limit the Fund’s ability to so qualify.
Foreign Investment Risk: Investments in foreign issuers involve additional risks (such as risks arising from less frequent trading, changes in political or social conditions, and less publicly available information about non-U.S. issuers) that differ from those associated with investments in U.S. issuers and may result in greater price volatility.
Emerging Markets Risk: Investments in emerging markets are subject to the general risks of foreign investments, as well as additional risks which can result in greater price volatility. Such additional risks include the risk that markets in emerging market countries are typically less developed and less liquid than markets in developed countries and such markets are subjected to increased economic, political, or regulatory uncertainties.
Currency Risk: Fluctuations in exchange rates may affect the total loss or gain on a non-U.S. dollar investment when converted back to U.S. dollars and exposure to non-U.S. currencies may subject the Fund to the risk that those currencies will
decline in value relative to the U.S. dollar. The values of foreign currencies relative to the U.S. dollar may fluctuate in response to, among other factors, interest rate changes, intervention (or failure to intervene) by national governments, central banks, or supranational entities such as the International Monetary Fund, the imposition of currency controls, and other political or regulatory developments.
Debt Securities Risk: The value of a debt security changes in response to various factors, including, for example, market-related factors, such as changes in interest rates or changes in the actual or perceived ability of an issuer to meet its obligations. Investments in debt securities are subject to, among other risks, credit risk, interest rate risk, extension risk, prepayment risk and liquidity risk.
Interest Rate Risk: Fixed coupon payments (cash flows) of bonds and debt securities may become less competitive with the market in periods of rising interest rates and cause bond prices to decline. During periods of increasing interest rates, the Fund may experience high levels of volatility and shareholder redemptions, and may have to sell securities at times when it would otherwise not do so, and at unfavorable prices, which could reduce the returns of the Fund.
High Portfolio Turnover Risk: The Fund’s portfolio turnover excludes transactions related to forward and futures contracts in accordance with regulatory requirements. If such transactions were included, the Fund’s portfolio turnover may be higher. Higher portfolio turnover may adversely affect Fund performance by increasing Fund transaction costs and may increase a shareholder’s tax liability.
Liquidity Risk: The Fund may not be able to dispose of particular investments, such as illiquid securities, readily at favorable times or prices or the Fund may have to sell them at a loss.
5. COMMITMENTS AND CONTINGENCIES
Under the Trust’s organizational documents, its Trustees and Officers are indemnified against certain liabilities arising out of the performance of their duties to the Trust. In addition, in the normal course of business, the Fund may enter into contracts and agreements that contain a variety of representations and warranties, which provide general indemnifications. The maximum exposure to the Fund under these arrangements is unknown, as this would involve future claims that may be made against the Fund that have not yet occurred. However, based on experience, the Fund had no prior claims or losses and expects the risks of loss to be remote.
6. DERIVATIVE INSTRUMENTS
The following disclosures contain information on how and why the Fund uses derivative instruments, the credit risk and how derivative instruments affect the Fund’s financial position, and results of operations. The location and fair value amounts of these instruments on the Consolidated Statement of Assets and Liabilities, and the realized gains and losses and changes in unrealized appreciation and depreciation on the Consolidated Statement of Operations, each categorized by type of derivative contract, are included in a table at the end of the Fund’s Consolidated Schedule of Portfolio Investments.
For the fiscal period ended September 30, 2024, the average monthly balances of derivative financial instruments outstanding were as follows:
23
| | |
| | Notes to Consolidated Financial Statements (continued) |
| | | | |
| |
Forward Foreign Currency Exchange Contracts | | | | |
| |
Average U.S. Dollar notional value | | | $10,788,775 | |
| |
Financial Futures Contracts | | | | |
| |
Average number of contracts bought | | | 149 | |
| |
Average number of contracts sold | | | 120 | |
| |
Average notional value of contracts bought | | | $15,729,499 | |
| |
Average notional value of contracts sold | | | $5,364,182 | |
7. FORWARD FOREIGN CURRENCY EXCHANGE CONTRACTS
The Fund may enter into forward foreign currency exchange contracts for any purpose, including to attempt to hedge currency exposure or to enhance return. A forward foreign currency exchange contract is an agreement between a fund and another party to buy or sell a currency at a set price at a future date. The market value of the contract will fluctuate with changes in currency exchange rates. The contract is marked-to-market daily, and the change in market value is recorded as an unrealized appreciation or depreciation. As of September 30, 2024, the Fund had cash collateral deposited in a segregated account with the Fund’s custodian of $50,000. In the event of default by the counterparty, the amount of cash collateral deposited in the segregated account will be returned to the Fund.
8. FUTURES CONTRACTS
The Fund may utilize futures contracts, including futures contracts in global equity and fixed-income securities, commodities, interest rate futures contracts, foreign currency futures contracts on security and commodities indices (including broad-based security indices), for any purpose, including for investment purposes and for hedging purposes.
On entering into a futures contract, either cash or securities in an amount equal to a certain percentage of the contract value (initial margin) must be deposited with the futures broker. Subsequent variation margin payments are made or received by the Fund depending on the fluctuations in the value of the futures contracts and the value of cash or securities on deposit with the futures broker. The Fund must have total value at the futures broker consisting of either net unrealized gains, cash or securities collateral to meet the initial margin requirement, and any value over the initial margin requirement may be transferred to the Fund. The Fund pays or receives variation margin periodically. As of September 30, 2024, the Fund had total equity in the futures account of $938,678, which consists of cash deposited with the futures broker of $873,298, and net unrealized appreciation on open futures contracts of $65,380.
Variation margin on futures contracts is recorded as unrealized appreciation or depreciation until the futures contract is closed or expired. The Fund recognizes a realized gain or loss when the contract is closed or expires equal to the difference between the value of the contract at the time it was opened and the value at the time it was closed. Fluctuations in the value of the contracts are recorded in the Consolidated Statement of Assets and Liabilities as an asset (liability) and in the Consolidated Statement of Operations as net change in unrealized appreciation (depreciation) on futures contracts until the contracts are closed, when they are recorded as net realized gain (loss) on futures contracts.
9. MASTER NETTING AGREEMENTS
The Fund may enter into master netting agreements with its counterparties for repurchase agreements and derivatives contracts, which provide the right, in the event of default (including bankruptcy or insolvency) for the non-defaulting party to liquidate the collateral and calculate net exposure to the defaulting party or request additional collateral. For financial reporting purposes, the Fund does not offset financial assets and financial liabilities that are subject to master netting agreements in the Consolidated Statement of Assets and Liabilities. For futures contracts, see Note 10.
The following table is a summary of the Fund’s open Repurchase Agreements and forward foreign currency exchange contracts that are subject to a master netting agreement as of September 30, 2024:
| | | | | | | | | | | | | | | | | | | | |
| | | | | | Gross Amount Not Offset in the
Consolidated Statement of Assets and
Liabilities | | | | | | | |
| | | | | |
| | | Gross Amounts of Assets (Liabilities) Presented in the Consolidated Statement of Assets and Liabilities | | | Offset Amount | | | Net Asset (Liability) Balance | | | Collateral Received | | | Net Amount | |
| | | | | |
UBS AG | | | $70,215 | | | | $(20,362) | | | | $49,853 | | | | — | | | | $49,853 | |
| | | | | |
Fixed Income Clearing Corp. | | | 5,008,000 | | | | — | | | | 5,008,000 | | | | $(5,008,000) | | | | — | |
| | | | | | | | | | | | | | | | | | | | |
| | | | | |
Total | | | $5,078,215 | | | | $(20,362) | | | | $5,057,853 | | | | $(5,008,000) | | | | $49,853 | |
| | | | | | | | | | | | | | | | | | | | |
24
| | |
| | Notes to Consolidated Financial Statements (continued) |
| | | | | | | | | | | | | | |
| | | | | | Gross Amount Not Offset in the
Consolidated Statement of Assets and
Liabilities | | | | |
| | | | | |
| | | Gross Amounts of Assets (Liabilities) Presented in the Consolidated Statement of Assets and Liabilities | | | Offset Amount | | | Net Asset (Liability) Balance | | Collateral Received | | Net Amount |
| | | | | |
UBS AG | | | $(20,362) | | | | $20,362 | | | — | | — | | — |
10. SUBSEQUENT EVENTS
The Fund has determined that no material events or transactions occurred through the issuance date of the Fund’s consolidated financial statements which require an additional disclosure in or adjustment of the Fund’s consolidated financial statements.
25
| | |
| | Report of Independent Registered Public Accounting Firm |
To the Board of Trustees of AMG Funds I and Shareholders of AMG Systematica Managed Futures Strategy Fund
Opinion on the Financial Statements
We have audited the accompanying consolidated statement of assets and liabilities, including the consolidated schedule of portfolio investments, of AMG Systematica Managed Futures Strategy Fund and its subsidiary (one of the funds constituting AMG Funds I, referred to hereafter as the “Fund”) as of September 30, 2024, and the related consolidated statements of operations and changes in net assets, including the related notes, and the consolidated financial highlights for the period May 1, 2024 (commencement of operations) through September 30, 2024 (collectively referred to as the “consolidated financial statements”). In our opinion, the consolidated financial statements present fairly, in all material respects, the financial position of the Fund as of September 30, 2024, and the results of its operations, changes in its net assets, and the financial highlights for the period May 1, 2024 (commencement of operations) through September 30, 2024 in conformity with accounting principles generally accepted in the United States of America.
Basis for Opinion
These consolidated financial statements are the responsibility of the Fund’s management. Our responsibility is to express an opinion on the Fund’s consolidated financial statements based on our audit. We are a public accounting firm registered with the Public Company Accounting Oversight Board (United States) (PCAOB) and are required to be independent with respect to the Fund in accordance with the U.S. federal securities laws and the applicable rules and regulations of the Securities and Exchange Commission and the PCAOB.
We conducted our audit of these consolidated financial statements in accordance with the standards of the PCAOB. Those standards require that we plan and perform the audit to obtain reasonable assurance about whether the consolidated financial statements are free of material misstatement, whether due to error or fraud.
Our audit included performing procedures to assess the risks of material misstatement of the consolidated financial statements, whether due to error or fraud, and performing procedures that respond to those risks. Such procedures included examining, on a test basis, evidence regarding the amounts and disclosures in the consolidated financial statements. Our audit also included evaluating the accounting principles used and significant estimates made by management, as well as evaluating the overall presentation of the consolidated financial statements. Our procedures included confirmation of securities owned as of September 30, 2024 by correspondence with the custodian and brokers. We believe that our audit provides a reasonable basis for our opinion.
/s/ PricewaterhouseCoopers LLP
Boston, Massachusetts
November 27, 2024
We have served as the auditor of one or more investment companies in the AMG Funds Family since 1993.
26
| | |
| | Other Information (unaudited) |
TAX INFORMATION
AMG Systematica Managed Futures Strategy Fund hereby designates the maximum amount allowable of its net taxable income as qualified dividends as provided in the Jobs and Growth Tax Relief Reconciliation Act of 2003. The 2024 Form 1099-DIV you receive for the Fund will show the tax status of all distributions paid to you during the calendar year.
Pursuant to section 852 of the Internal Revenue Code of 1986, as amended, AMG Systematica Managed Futures Strategy Fund hereby designates $0 as a capital gain distribution with respect to the taxable year ended September 30, 2024, or if subsequently determined to be different, the net capital gains of such year.
ITEM 8. CHANGES IN AND DISAGREEMENTS WITH ACCOUNTANTS FOR OPEN-END MANAGEMENT INVESTMENT COMPANIES
During the period from May 1, 2024 (commencement of operations) to September 30, 2024, there were no changes in and/or disagreements with accountants.
ITEM 9. PROXY DISCLOSURES FOR OPEN-END MANAGEMENT INVESTMENT COMPANIES
Not applicable.
ITEM 10. REMUNERATION PAID TO DIRECTORS, OFFICERS, AND OTHERS OF OPEN-END MANAGEMENT INVESTMENT COMPANIES
The remuneration paid to the Trustees during the period from May 1, 2024 (commencement of operations) to September 30, 2024, was $222, which is reflected as “Trustee fees and expenses” on the Consolidated Statement of Operations. There was no remuneration paid to any Fund officer or to any affiliated person of any Fund Trustee or officer during the fiscal period ended September 30, 2024.
27
| | |
| | ITEM 11. STATEMENT REGARDING BASIS FOR APPROVAL OF INVESTMENT
ADVISORY CONTRACT |
| | | | | | | | |
Approval of Amendment to Fund Management Agreement, Subadvisory Agreements, and Sub-Subadvisory Agreements with Respect to AMG Systematica Managed Futures Strategy Fund and AMG Systematica Subsidiary Fund I At an in-person meeting held on December 7, 2023, the Board of Trustees (the “Board” or the “Trustees”) of AMG Funds I (the “Trust”), and separately a majority of the Trustees who are not “interested persons” of the Trust (the “Independent Trustees”) within the meaning of the Investment Company Act of 1940, as amended (the “1940 Act”), unanimously voted to approve an amendment to the Fund Management Agreement (the “Fund Management Agreement”) between AMG Funds LLC (the “Investment Manager”) and the Trust relating to AMG Systematica Managed Futures Strategy Fund, a new series of the Trust (the “New Fund”), and AMG Systematica Subsidiary Fund I, a wholly owned subsidiary of the New Fund (the “Subsidiary”); a Subadvisory Agreement between the Investment Manager and Systematica Investments Limited, acting as general partner of Systematica Investments LP (the “Subadviser”) relating to the New Fund (the “New Fund Subadvisory Agreement”); a Subadvisory Agreement between the Investment Manager and the Subadviser relating to the Subsidiary (together with the New Fund Subadvisory Agreement, the “Subadvisory Agreements”); a Sub-Subadvisory Agreement between the Subadviser and each of Systematica Investments GP Limited, Systematica Investments Singapore Pte. Ltd, and Systematica Investments UK LLP (each a “Sub-Subadviser”) with respect to the New Fund (each a ”New Fund Sub-Subadvisory Agreement”); and a Sub-Subadvisory Agreement between the Subadviser and each Sub-Subadviser with respect to the Subsidiary (together with the New Fund Sub-Subadvisory Agreements, the “Sub-Subadvisory Agreements”). (The Subadviser and the Sub-Subadvisers are collectively referred to as the “Systematica Group,” the Fund Management Agreement, the Subadvisory Agreements, and the Sub-Subadvisory Agreements are collectively referred to as the “New Fund Agreements”, and for the remainder of this appendix, “New Fund” includes the Subsidiary except where otherwise noted.) The Independent Trustees were separately represented by independent legal counsel in their consideration of the New Fund Agreements and met with their independent legal counsel in a private session at which no representatives of management were present to consider the New Fund and the New Fund Agreements. | | | | In considering the New Fund Agreements, the Trustees reviewed a variety of materials relating to the New Fund, the Investment Manager, and the Systematica Group provided in connection with meetings of the Board held on September 14, 2023 and December 7, 2023, including fee and expense information for an appropriate peer group of similar mutual funds for the New Fund (the “Peer Group”) and other information regarding the nature, extent and quality of services to be provided by the Investment Manager and the Systematica Group under their respective agreements. Because the New Fund is a newly created series of the Trust and has not yet begun operations, no comparative performance information for the New Fund was provided. The Trustees, however, considered the performance of other products managed by the Systematica Group. Prior to voting, the Independent Trustees: (a) reviewed the foregoing information with their independent legal counsel and (b) discussed with legal counsel the legal standards applicable to their consideration of the New Fund Agreements. NATURE, EXTENT AND QUALITY OF SERVICES In considering the nature, extent and quality of the services to be provided by the Investment Manager under the Fund Management Agreement, the Trustees took into account information provided periodically throughout the previous year by the Investment Manager in Board meetings relating to the Investment Manager’s financial information, operations and personnel, the performance of its duties with respect to other funds in the AMG Fund Complex, which, as of December 7, 2023, consisted of 43 funds, the quality of the performance of the Investment Manager’s duties under the Fund Management Agreement and the Administration Agreement between the Investment Manager and the Trust and the Trustees’ knowledge of the Investment Manager’s management team. In the course of their deliberations regarding the Investment Manager, the Trustees evaluated, among other things: (a) the quality of the monitoring services intended to be performed by the Investment Manager in overseeing the portfolio management responsibilities of the Systematica Group; (b) the Investment Manager’s ability to supervise the New Fund’s other service providers; and (c) the Investment Manager’s compliance program. The Trustees also took into account that, in performing its functions under the Fund Management Agreement and supervising the Systematica Group, the Investment Manager will: perform periodic detailed analyses and reviews of the performance by the Systematica Group of its obligations to the New Fund, including without limitation analysis and | | | | review of portfolio and other compliance matters and review of the Systematica Group’s investment performance with respect to the New Fund; prepare and present periodic reports to the Trustees regarding the investment performance of the Systematica Group and other information regarding the Systematica Group, at such times and in such forms as the Trustees may reasonably request; review and consider any changes in the personnel of the Systematica Group responsible for performing the Systematica Group’s obligations and make appropriate reports to the Trustees; review and consider any changes in the ownership or senior management of the Systematica Group and make appropriate reports to the Trustees; perform periodic in-person, telephonic or videoconference diligence meetings, including with respect to compliance matters, with representatives of the Systematica Group; assist the Trustees and management of the Trust in developing and reviewing information with respect to the initial approval of the Subadvisory Agreements and Sub-Subadvisory Agreements and, after an initial two-year period, annual consideration of such agreements; prepare recommendations with respect to the continued retention of the Systematica Group or the replacement of the Systematica Group, including at the request of the Board; identify potential successors to, or replacements of, the Systematica Group or potential additional subadvisers, including performing appropriate due diligence, and developing and presenting to the Trustees a recommendation as to any such successor, replacement, or additional subadviser, including at the request of the Board; designate and compensate from its own resources such personnel as the Investment Manager may consider necessary or appropriate to the performance of its services; and perform such other review and reporting functions as the Trustees shall reasonably request consistent with the Fund Management Agreement and applicable law. The Trustees noted the affiliation of the Systematica Group with the Investment Manager, noting any potential conflicts of interest. The Trustees also took into account the financial condition of the Investment Manager with respect to its ability to provide the services required under the Fund Management Agreement and noted that, as of October 31, 2023, the Investment Manager had approximately $22 billion in mutual fund assets under management. The Trustees also considered the Investment Manager’s risk management processes. In the course of their deliberations regarding the nature, extent and quality of services to be provided by the Subadviser under the Subadvisory Agreements and each Sub-Subadviser under the |
28
| | |
| | ITEM 11. STATEMENT REGARDING BASIS FOR APPROVAL OF INVESTMENT ADVISORY CONTRACT (continued) |
| | | | | | | | |
Sub-Subadvisory Agreements, the Trustees evaluated, among other things: (a) the expected services to be rendered by the Subadviser and each Sub-Subadviser to the New Fund; (b) the qualifications and experience of the Systematica Group personnel; and (c) the Systematica Group compliance program. The Trustees also took into account the financial condition of the Systematica Group with respect to its ability to provide the services required under the Subadvisory Agreements and Sub-Subadvisory Agreements and noted that, as of October 31, 2023, the Systematica Group managed approximately $18.2 billion in assets. The Trustees also considered the Systematica Group’s risk management processes. The Trustees also considered information regarding the nature, extent and quality of services provided by the Investment Manager to funds in the AMG Fund Complex in connection with the Trustees’ annual consideration of the existing funds’ contractual arrangements. The Trustees considered the investment philosophy, strategies and techniques that are intended to be used in managing the New Fund. Among other things, the Trustees reviewed information about portfolio management and other professional staff and information regarding the Systematica Group’s organizational and management structure. The Trustees considered specific information provided regarding the experience of the individuals at the Systematica Group that are expected to have portfolio management responsibility for the New Fund, including the information set forth in the New Fund’s prospectus and statement of additional information to be filed with the Securities and Exchange Commission. The Trustees noted that the New Fund is proposed to be managed by a team that includes the Systematica Group’s Founder and Chief Executive Officer, its Chief Investment Officer and Head of Research, its Head of Trading and Counterparty Management, and five of its Product Managers. The Trustees also took into account a presentation made at the September 14, 2023 Board meeting by representatives from the Systematica Group regarding its managed futures strategy. PERFORMANCE Because the New Fund has not yet commenced operations, the Trustees noted that they could not draw any conclusions regarding the performance of the New Fund. The Trustees, however, considered the performance of other products managed by the Systematica Group. | | | | ADVISORY FEES, FUND EXPENSES, PROFITABILITY AND ECONOMIES OF SCALE In considering the reasonableness of the advisory fee to be charged by the Investment Manager for managing the New Fund, the Trustees noted that the Investment Manager, and not the New Fund, will be responsible for paying the fees charged by the Subadviser, and, in turn, the Subadviser will be responsible for paying the fees charged by each Sub-Subadviser, and, therefore, that the fees paid to the Investment Manager cover the cost of providing portfolio management services as well as the cost of providing search, selection and monitoring services in operating a “manager-of-managers” complex of mutual funds. The Trustees also noted that the Investment Manager would indirectly benefit from compensation received by the Systematica Group because the Investment Manager and the Systematica Group are affiliated. The Trustees also noted that the Subadviser and certain affiliates of both the Subadviser and the Investment Manager intend to enter into a revenue and expense sharing agreement that includes terms related to the revenue and expenses of the New Fund. The Trustees noted that the New Fund’s proposed combined advisory and administration fees were lower than the mean for the New Fund’s Peer Group and that the anticipated total gross expenses for the New Fund’s first fiscal period were lower than the Peer Group mean with respect to Class I and Class Z of the New Fund and higher with respect to Class N, measured as of October 31, 2023. The Trustees also took into account the fact that the Investment Manager has contractually agreed, through at least February 1, 2026, to limit the total annual operating expenses (exclusive of taxes, interest (including interest incurred in connection with bank and custody overdrafts and in connection with securities sold short), shareholder servicing fees, distribution and service (12b-1) fees, brokerage commissions and other transaction costs, dividends payable with respect to securities sold short, acquired fund fees and expenses, and extraordinary expenses) of the New Fund to the annual rate of 1.40% of the New Fund’s average daily net assets, noting that the anticipated net expenses of the New Fund were lower than the mean for the New Fund’s Peer Group with respect to Class I and Class Z of the New Fund and higher than the mean with respect to Class N. The Trustees concluded that, in light of the nature, extent and quality of the services to be provided by the Investment Manager and the Systematica Group and the considerations noted above with respect to the Investment Manager and the Systematica Group, the New Fund’s advisory fees, subadvisory fees, and sub-subadvisory fees are reasonable. | | | | In considering the anticipated profitability of the Investment Manager with respect to the provision of investment advisory services to the New Fund, the Trustees considered all revenues and other benefits, both direct and indirect (including any so-called “fallout benefits” such as reputational value derived from the Investment Manager serving as investment manager to the New Fund), received by the Investment Manager and its affiliates attributable to managing the New Fund; the cost of providing such services; the significant risks undertaken as Investment Manager and sponsor of the New Fund, including investment, operational, enterprise, entrepreneurial, litigation, regulatory and compliance risks; and the resulting profitability to the Investment Manager and its affiliates from these relationships. The Trustees also considered the amount of the advisory fee retained by the Investment Manager after payment of the subadvisory fee with respect to the New Fund. Based on the foregoing, the Trustees concluded that the profitability to the Investment Manager is expected to be reasonable and that, since the New Fund does not currently have any assets, the Investment Manager is not realizing any material benefits from economies of scale. With respect to economies of scale, the Trustees also noted that as the New Fund’s assets increase over time, the Investment Manager may realize economies of scale to the extent that the increase in assets is proportionally greater than the increase in certain other expenses, but noted the existence of the proposed expense limitation agreement and the expense cap described above. In considering the anticipated profitability of the Systematica Group with respect to the provision of subadvisory and sub-subadvisory services to the New Fund, although recognizing that profitability with respect to the New Fund is speculative, the Trustees considered information regarding the Systematica Group’s organization, management and financial stability. The Trustees noted that, because the Systematica Group is an affiliate of the Investment Manager, a portion of the Systematica Group’s revenues or anticipated profitability might be shared directly or indirectly with the Investment Manager. The Trustees also noted that the subadvisory fees are to be paid by the Investment Manager out of its advisory fee and that the sub-subadvisory fees are to be paid by the Subadviser out of its subadvisory fee. The Trustees |
29
| | |
| | ITEM 11. STATEMENT REGARDING BASIS FOR APPROVAL OF INVESTMENT ADVISORY CONTRACT (continued) |
| | | | | | | | |
| also took into account management’s discussion of the services the Subadviser and each Sub-Subadviser is expected to provide in performing its functions under the Subadvisory Agreements and the Sub-Subadvisory Agreements, respectively. The Trustees also considered the anticipated net assets of the New Fund for its first year of operations. Based on the foregoing, the Trustees concluded that the profitability to the Systematica Group is expected to be reasonable and that, since the New Fund does not currently have any assets, the Systematica Group is not realizing material benefits from economies of scale. Also with respect to economies of scale, the Trustees noted that as the New Fund’s assets increase over time, the Systematica Group may realize other economies of scale to the extent the increase in assets is proportionally greater than the | | | | increase in certain other expenses, but noted the existence of the proposed expense limitation agreement and the expense cap described above. * * * * * After consideration of the foregoing, the Trustees also reached the following conclusions (in addition to the conclusions discussed above) regarding the New Fund Agreements: (a) the Investment Manager and the Systematica Group have demonstrated that they possess the capability and resources to perform the duties required of them under the Fund Management Agreement, the Subadvisory Agreements, and the Sub-Subadvisory Agreements; (b) the Systematica Group’s investment strategy is appropriate for pursuing the New Fund’s investment objectives; (c) | | | | the Systematica Group is reasonably likely to execute its investment strategy consistently over time; and (d) the Investment Manager and the Systematica Group maintain appropriate compliance programs. Based on all of the above-mentioned factors and their related conclusions, with no single factor or conclusion being determinative and with each Trustee not necessarily attributing the same weight to each factor, the Trustees concluded that approval of the New Fund Agreements would be in the best interests of the New Fund and its shareholders. Accordingly, on December 7, 2023, the Trustees, and separately a majority of the Independent Trustees, unanimously voted to approve the New Fund Agreements. |
30
THIS PAGE INTENTIONALLY LEFT BLANK
THIS PAGE INTENTIONALLY LEFT BLANK
| | |
| | |
| | | | |
INVESTMENT MANAGER AND ADMINISTRATOR AMG Funds LLC 680 Washington Blvd., Suite 500 Stamford, CT 06901 800.548.4539 DISTRIBUTOR AMG Distributors, Inc. 680 Washington Blvd., Suite 500 Stamford, CT 06901 800.548.4539 SUBADVISER Systematica Investments Limited, acting as general partner of Systematica Investments LP. First Floor, 29 Esplanade St Helier, Jersey, JE2 3QA CUSTODIAN The Bank of New York Mellon Mutual Funds Custody 240 Greenwich Street New York, NY 10286 | | LEGAL COUNSEL Ropes & Gray LLP Prudential Tower, 800 Boylston Street Boston, MA 02199-3600 TRANSFER AGENT BNY Mellon Investment Servicing (US) Inc. AMG Funds Attn: 534426 AIM 154-0520 500 Ross Street Pittsburgh, PA 15262 800.548.4539 | | This report is prepared for the Fund’s shareholders. It is authorized for distribution to prospective investors only when preceded or accompanied by an effective prospectus. To receive a free copy of the prospectus or Statement of Additional Information, which includes additional information about Fund Trustees, please contact us by calling 800.548.4539. Distributed by AMG Distributors, Inc., member FINRA/SIPC. Current net asset values per share for the Fund are available on the Fund’s website at wealth.amg.com. A description of the policies and procedures the Fund uses to vote its proxies is available: (i) without charge, upon request, by calling 800.548.4539, or (ii) on the Securities and Exchange Commission’s (SEC) website at sec.gov. For information regarding the Fund’s proxy voting record for the 12-month period ended June 30, call 800.548.4539 or visit the SEC website at sec.gov. The Fund files its complete schedule of portfolio holdings with the SEC for the first and third quarters of each fiscal year as an exhibit to its reports on Form N-PORT. The Fund’s portfolio holdings on Form N-PORT are available on the SEC’s website at sec.gov and the Fund’s website at wealth.amg.com. To review a complete list of the Fund’s portfolio holdings, or to view the most recent semi-annual report or annual report, please visit wealth.amg.com. |
| | |
| | |
| | | | | | | | |
EQUITY FUNDS AMG Boston Common Global Impact Boston Common Asset Management, LLC AMG Frontier Small Cap Growth Frontier Capital Management Co., LLC AMG GW&K Small Cap Core AMG GW&K Small Cap Value AMG GW&K Small/Mid Cap Core AMG GW&K Small/Mid Cap Growth AMG GW&K International Small Cap GW&K Investment Management, LLC AMG Montrusco Bolton Large Cap Growth Montrusco Bolton Investments, Inc. AMG Renaissance Large Cap Growth The Renaissance Group LLC | | | | AMG River Road Dividend All Cap Value AMG River Road Focused Absolute Value AMG River Road Large Cap Value Select AMG River Road Mid Cap Value AMG River Road Small-Mid Cap Value AMG River Road Small Cap Value River Road Asset Management, LLC AMG TimesSquare International Small Cap AMG TimesSquare Mid Cap Growth AMG TimesSquare Small Cap Growth TimesSquare Capital Management, LLC AMG Veritas Asia Pacific AMG Veritas China AMG Veritas Global Focus AMG Veritas Global Real Return Veritas Asset Management LLP AMG Yacktman AMG Yacktman Focused AMG Yacktman Global AMG Yacktman Special Opportunities Yacktman Asset Management LP | | FIXED INCOME FUNDS AMG Beutel Goodman Core Plus Bond Beutel, Goodman & Company Ltd. AMG GW&K Core Bond ESG AMG GW&K ESG Bond AMG GW&K Municipal Bond AMG GW&K Municipal Enhanced Yield GW&K Investment Management, LLC ALTERNATIVE FUNDS AMG Systematica Managed Futures Strategy Systematica Investments Limited, acting as general partner of Systematica Investments LP | | |
Item 12. DISCLOSURE OF PROXY VOTING POLICIES AND PROCEDURES FOR CLOSED-END MANAGEMENT INVESTMENT COMPANIES.
Not applicable.
Item 13. PORTFOLIO MANAGERS OF CLOSED-END MANAGEMENT INVESTMENT COMPANIES.
Not applicable.
Item 14. PURCHASES OF EQUITY SECURITIES BY CLOSED-END MANAGEMENT INVESTMENT COMPANIES AND AFFILIATED PURCHASERS.
Not applicable.
Item 15. SUBMISSION OF MATTERS TO A VOTE OF SECURITY HOLDERS.
Not applicable.
Item 16. CONTROLS AND PROCEDURES.
(a) The Registrant’s principal executive and principal financial officers have concluded, based on their evaluation of the Registrant’s disclosure controls and procedures as of a date within 90 days of the filing of this report, that the Registrant’s disclosure controls and procedures are reasonably designed to ensure that information required to be disclosed by the Registrant on Form N-CSR is recorded, processed, summarized and reported within the required time periods and that information required to be disclosed by the Registrant in the reports that it files or submits on Form N-CSR is accumulated and communicated to the Registrant’s management, including its principal executive and principal financial officers, as appropriate to allow timely decisions regarding required disclosure.
(b) There were no changes in the Registrant’s internal control over financial reporting during the period covered by this report that have materially affected, or are reasonably likely to materially affect, the internal control over financial reporting.
Item 17. DISCLOSURE OF SECURITIES LENDING ACTIVITIES FOR CLOSED-END MANAGEMENT INVESTMENT COMPANIES.
Not applicable.
Item 18. RECOVERY OF ERRONEOUSLY AWARDED COMPENSATION.
Not applicable.
Item 19. EXHIBITS
SIGNATURES
Pursuant to the requirements of the Securities Exchange Act of 1934 and the Investment Company Act of 1940, the registrant has duly caused this report to be signed on its behalf by the undersigned, thereunto duly authorized.
| | |
| AMG FUNDS I |
| |
| By: | | /s/ Keitha L. Kinne |
| | Keitha L. Kinne, Principal Executive Officer |
| |
| Date: | | December 9, 2024 |
Pursuant to the requirements of the Securities Exchange Act of 1934 and the Investment Company Act of 1940, this report has been signed below by the following persons on behalf of the registrant and in the capacities and on the dates indicated.
| | |
| By: | | /s/ Keitha L. Kinne |
| | Keitha L. Kinne, Principal Executive Officer |
| |
| Date: | | December 9, 2024 |
| |
| By: | | /s/ Thomas Disbrow |
| | Thomas Disbrow, Principal Financial Officer |
| |
| Date: | | December 9, 2024 |