UNITED STATES
SECURITIES AND EXCHANGE COMMISSION
Washington, D.C. 20549
FORM N-CSR
CERTIFIED SHAREHOLDER REPORT OF REGISTERED MANAGEMENT INVESTMENT COMPANIES
Investment Company Act file number
(Exact name of registrant as specified in charter)
680 Washington Boulevard, Suite 500, Stamford, Connecticut 06901
(Address of principal executive offices) (Zip code)
AMG Funds LLC
680 Washington Boulevard, Suite 500, Stamford, Connecticut 06901
(Name and address of agent for service)
Registrant's telephone number, including area code:
Date of reporting period:
November 01, 2023 - October 31, 2024
(Annual Shareholder Report)
Item 1. Reports to Shareholders
(a)
AMG Frontier Small Cap Growth Fund
Class N/MSSVX
ANNUAL SHAREHOLDER REPORT | October 31, 2024
This annual shareholder report contains important information about AMG Frontier Small Cap Growth Fund (the “Fund”) for the period of November 1, 2023 to October 31, 2024. You can find additional information about the Fund at https://wealth.amg.com/resources/order-literature. You can also request this information by contacting us at 800.548.4539.
Fund Expenses
What were the Fund costs for the last year?
(Based on a hypothetical $10,000 investment)
| Fund (Class) | Costs of a $10,000 investment | Costs paid as a percentage of a $10,000 investment |
AMG Frontier Small Cap Growth Fund
(Class N/MSSVX) | $152 | 1.30% |
Management's Discussion of Fund Performance
PERFORMANCE OVERVIEW
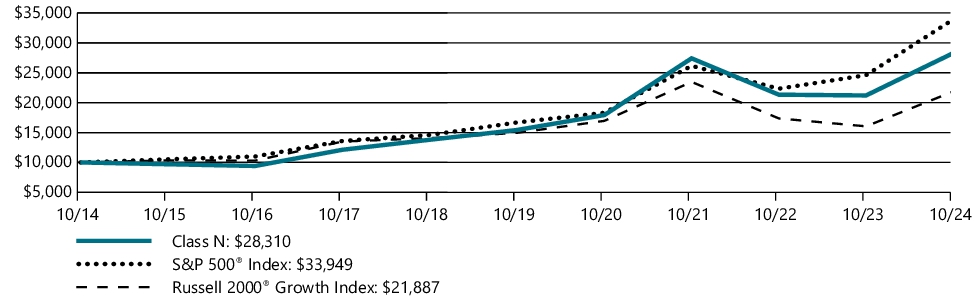
• The Fund’s Class N shares returned 33.53% for the fiscal year that ended October 31, 2024, underperforming the Russell 2000® Growth Index, which returned 36.49% for the period. The S&P 500® Index returned 38.02% for the period.
• The first eight months of the fiscal year were defined by a shifting market sentiment towards declining interest rates as inflation cooled. During this time, technology stocks, specifically those related to artificial intelligence (AI), led the market and contributed meaningfully to the Fund’s performance.
• The last four months were defined by the market realization that interest rates would not be lowered as quickly as anticipated, a decline in tech stocks, but an overall broadening of the market’s performance.
TOP CONTRIBUTORS AND DETRACTORS
• The industrials sector was a positive contributor with several strong performers in the commercial aerospace and building product markets, including FTAI Aviation (+264%) and Granite Construction (+109%).
• The materials sector was a positive contributor due to strength from Carpenter Technology (+140%) and Eagle Materials (+86%).
• Technology stocks contributed strongly to performance through the first half of the year, but declined in the third quarter as the technology sector overall, and especially our semiconductor-related stocks, sold off. Top contributors included Coherent (+212%) and Pure Storage (+51%). Top detractors included indie Semiconductor (-32%) and MaxLinear (-15%).
• The consumer discretionary sector was the top detractor as the Fund’s 11% return could not keep pace with the 35% return for the Russell 2000® Growth Index. The top detractor in the sector was Xponential Fitness (-26%). The Fund exited its position in Xponential Fitness during the period.
Fund Performance
The performance line graph below shows the performance of a hypothetical $10,000 investment in the class of shares noted over a ten year period, as compared to the performance of (i) a broad based index and (ii) an additional index reflecting the market segment(s) in which the Fund invests. The performance table below shows the average annual total returns of the class of shares noted for the past one-, five-, and ten-year periods ended as of October 31, 2024. It also shows the average total returns of (i) a broad based index and (ii) an additional index reflecting the market segment(s) in which the Fund invests over the same periods.
Performance for other share classes will vary. The Fund’s past performance is not a good predictor of the Fund’s future performance.
The graph and table do not reflect the deduction of taxes that a shareholder would pay on fund distributions or redemption of fund shares.
GROWTH OF $10,000
| AVERAGE ANNUAL TOTAL RETURNS | 1 Year | 5 Years | 10 Years |
| Class N | 33.53% | 12.92% | 10.97% |
| S&P 500® Index | 38.02% | 15.27% | 13.00% |
| Russell 2000® Growth Index | 36.49% | 7.92% | 8.15% |
Effective October 31, 2024, the S&P 500® Index was added as a broad measure of market performance in accordance with recent changes to regulatory disclosure requirements. The Fund continues to use the Russell 2000® Growth Index as an additional benchmark that reflects the market segment(s) in which the Fund invests.
The S&P Index is proprietary data of Standard & Poor’s, a division of McGraw-Hill Companies, Inc. All rights reserved.
The Russell Index is a trademark of the London Stock Exchange Group companies.
For updated Fund performance information, please visit: https://wealth.amg.com/.
Key Fund Statistics (as of October 31, 2024)
| Fund net assets | $78,712,660 |
| Total number of portfolio holdings | 122 |
| Net advisory fees paid | $347,097 |
| Portfolio turnover rate as of the end of the reporting period | 234% |
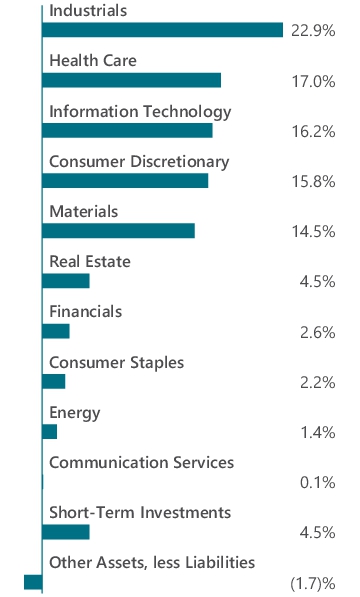
Graphical Representation of Holdings (as of October 31, 2024)
Top ten holdings and portfolio breakdown are shown as a percentage of net assets of the Fund.
| Summit Materials, Inc., Class A | 4.1% |
| Eagle Materials, Inc. | 3.8% |
| Lithia Motors, Inc. | 3.8% |
| United Therapeutics Corp. | 3.2% |
| Beacon Roofing Supply, Inc. | 3.2% |
| Viking Therapeutics, Inc. | 3.1% |
| Caesars Entertainment, Inc. | 3.1% |
| Granite Construction, Inc. | 3.1% |
| Credo Technology Group Holding, Ltd. | 2.8% |
| ATI, Inc. | 2.3% |
| Top Ten as a Group | 32.5% |
Availability of Additional Information
You can find additional information about the Fund such as the prospectus, financial information, fund holdings and proxy voting information at https://wealth.amg.com/resources/order-literature. You can also request this information by contacting us at 800.548.4539.
Householding
In order to reduce expenses, we will deliver a single copy of prospectuses, proxies, financial reports and other communication to shareholders with the same residential address, provided they have the same last name or we reasonably believe them to be members of the same family. Unless we are notified otherwise, we will continue to send recipients only one copy of these materials for as long as they remain a shareholder of the Fund. If you would like to receive individual mailings, please call 800.548.4539 and we will begin sending you separate copies of these materials within 30 days after receiving your request.
For additional information, please navigate to the additional material at https://wealth.amg.com/resources/order-literature.
AMG Frontier Small Cap Growth Fund
Class I/MSSCX
ANNUAL SHAREHOLDER REPORT | October 31, 2024
This annual shareholder report contains important information about AMG Frontier Small Cap Growth Fund (the “Fund”) for the period of November 1, 2023 to October 31, 2024. You can find additional information about the Fund at https://wealth.amg.com/resources/order-literature. You can also request this information by contacting us at 800.548.4539.
Fund Expenses
What were the Fund costs for the last year?
(Based on a hypothetical $10,000 investment)
| Fund (Class) | Costs of a $10,000 investment | Costs paid as a percentage of a $10,000 investment |
AMG Frontier Small Cap Growth Fund
(Class I/MSSCX) | $116 | 0.99% |
Management's Discussion of Fund Performance
PERFORMANCE OVERVIEW
• The Fund’s Class I shares returned 33.86% for the fiscal year that ended October 31, 2024, underperforming the Russell 2000® Growth Index, which returned 36.49% for the period. The S&P 500® Index returned 38.02% for the period.
• The first eight months of the fiscal year were defined by a shifting market sentiment towards declining interest rates as inflation cooled. During this time, technology stocks, specifically those related to artificial intelligence (AI), led the market and contributed meaningfully to the Fund’s performance.
• The last four months were defined by the market realization that interest rates would not be lowered as quickly as anticipated, a decline in tech stocks, but an overall broadening of the market’s performance.
TOP CONTRIBUTORS AND DETRACTORS
• The industrials sector was a positive contributor with several strong performers in the commercial aerospace and building product markets, including FTAI Aviation (+264%) and Granite Construction (+109%).
• The materials sector was a positive contributor due to strength from Carpenter Technology (+140%) and Eagle Materials (+86%).
• Technology stocks contributed strongly to performance through the first half of the year, but declined in the third quarter as the technology sector overall, and especially our semiconductor-related stocks, sold off. Top contributors included Coherent (+212%) and Pure Storage (+51%). Top detractors included indie Semiconductor (-32%) and MaxLinear (-15%).
• The consumer discretionary sector was the top detractor as the Fund’s 11% return could not keep pace with the 35% return for the Russell 2000® Growth Index. The top detractor in the sector was Xponential Fitness (-26%). The Fund exited its position in Xponential Fitness during the period.
Fund Performance
The performance line graph below shows the performance of a hypothetical $10,000 investment in the class of shares noted over a ten year period, as compared to the performance of (i) a broad based index and (ii) an additional index reflecting the market segment(s) in which the Fund invests. The performance table below shows the average annual total returns of the class of shares noted for the past one-, five-, and ten-year periods ended as of October 31, 2024. It also shows the average total returns of (i) a broad based index and (ii) an additional index reflecting the market segment(s) in which the Fund invests over the same periods.
Performance for other share classes will vary. The Fund’s past performance is not a good predictor of the Fund’s future performance.
The graph and table do not reflect the deduction of taxes that a shareholder would pay on fund distributions or redemption of fund shares.
GROWTH OF $10,000
| AVERAGE ANNUAL TOTAL RETURNS | 1 Year | 5 Years | 10 Years |
| Class I | 33.86% | 13.30% | 11.30% |
| S&P 500® Index | 38.02% | 15.27% | 13.00% |
| Russell 2000® Growth Index | 36.49% | 7.92% | 8.15% |
Effective October 31, 2024, the S&P 500® Index was added as a broad measure of market performance in accordance with recent changes to regulatory disclosure requirements. The Fund continues to use the Russell 2000® Growth Index as an additional benchmark that reflects the market segment(s) in which the Fund invests.
The S&P Index is proprietary data of Standard & Poor’s, a division of McGraw-Hill Companies, Inc. All rights reserved.
The Russell Index is a trademark of the London Stock Exchange Group companies.
For updated Fund performance information, please visit: https://wealth.amg.com/.
Key Fund Statistics (as of October 31, 2024)
| Fund net assets | $78,712,660 |
| Total number of portfolio holdings | 122 |
| Net advisory fees paid | $347,097 |
| Portfolio turnover rate as of the end of the reporting period | 234% |
Graphical Representation of Holdings (as of October 31, 2024)
Top ten holdings and portfolio breakdown are shown as a percentage of net assets of the Fund.
| Summit Materials, Inc., Class A | 4.1% |
| Eagle Materials, Inc. | 3.8% |
| Lithia Motors, Inc. | 3.8% |
| United Therapeutics Corp. | 3.2% |
| Beacon Roofing Supply, Inc. | 3.2% |
| Viking Therapeutics, Inc. | 3.1% |
| Caesars Entertainment, Inc. | 3.1% |
| Granite Construction, Inc. | 3.1% |
| Credo Technology Group Holding, Ltd. | 2.8% |
| ATI, Inc. | 2.3% |
| Top Ten as a Group | 32.5% |
Availability of Additional Information
You can find additional information about the Fund such as the prospectus, financial information, fund holdings and proxy voting information at https://wealth.amg.com/resources/order-literature. You can also request this information by contacting us at 800.548.4539.
Householding
In order to reduce expenses, we will deliver a single copy of prospectuses, proxies, financial reports and other communication to shareholders with the same residential address, provided they have the same last name or we reasonably believe them to be members of the same family. Unless we are notified otherwise, we will continue to send recipients only one copy of these materials for as long as they remain a shareholder of the Fund. If you would like to receive individual mailings, please call 800.548.4539 and we will begin sending you separate copies of these materials within 30 days after receiving your request.
For additional information, please navigate to the additional material at https://wealth.amg.com/resources/order-literature.
AMG Frontier Small Cap Growth Fund
Class Z/MSSYX
ANNUAL SHAREHOLDER REPORT | October 31, 2024
This annual shareholder report contains important information about AMG Frontier Small Cap Growth Fund (the “Fund”) for the period of November 1, 2023 to October 31, 2024. You can find additional information about the Fund at https://wealth.amg.com/resources/order-literature. You can also request this information by contacting us at 800.548.4539.
Fund Expenses
What were the Fund costs for the last year?
(Based on a hypothetical $10,000 investment)
| Fund (Class) | Costs of a $10,000 investment | Costs paid as a percentage of a $10,000 investment |
AMG Frontier Small Cap Growth Fund
(Class Z/MSSYX) | $105 | 0.90% |
Management's Discussion of Fund Performance
PERFORMANCE OVERVIEW
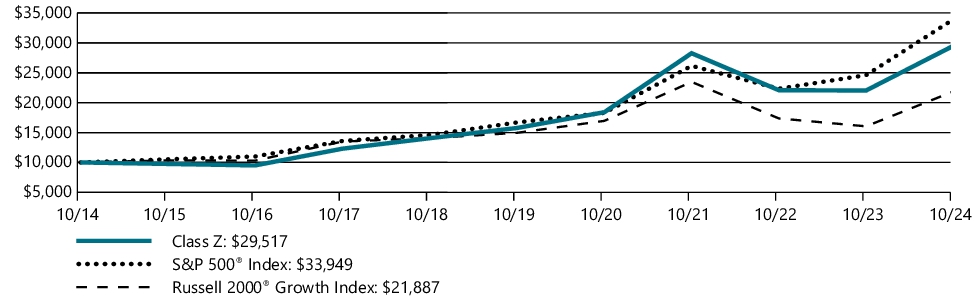
• The Fund’s Class Z shares returned 34.01% for the fiscal year that ended October 31, 2024, underperforming the Russell 2000® Growth Index, which returned 36.49% for the period. The S&P 500® Index returned 38.02% for the period.
• The first eight months of the fiscal year were defined by a shifting market sentiment towards declining interest rates as inflation cooled. During this time, technology stocks, specifically those related to artificial intelligence (AI), led the market and contributed meaningfully to the Fund’s performance.
• The last four months were defined by the market realization that interest rates would not be lowered as quickly as anticipated, a decline in tech stocks, but an overall broadening of the market’s performance.
TOP CONTRIBUTORS AND DETRACTORS
• The industrials sector was a positive contributor with several strong performers in the commercial aerospace and building product markets, including FTAI Aviation (+264%) and Granite Construction (+109%).
• The materials sector was a positive contributor due to strength from Carpenter Technology (+140%) and Eagle Materials (+86%).
• Technology stocks contributed strongly to performance through the first half of the year, but declined in the third quarter as the technology sector overall, and especially our semiconductor-related stocks, sold off. Top contributors included Coherent (+212%) and Pure Storage (+51%). Top detractors included indie Semiconductor (-32%) and MaxLinear (-15%).
• The consumer discretionary sector was the top detractor as the Fund’s 11% return could not keep pace with the 35% return for the Russell 2000® Growth Index. The top detractor in the sector was Xponential Fitness (-26%). The Fund exited its position in Xponential Fitness during the period.
Fund Performance
The performance line graph below shows the performance of a hypothetical $10,000 investment in the class of shares noted over a ten year period, as compared to the performance of (i) a broad based index and (ii) an additional index reflecting the market segment(s) in which the Fund invests. The performance table below shows the average annual total returns of the class of shares noted for the past one-, five-, and ten-year periods ended as of October 31, 2024. It also shows the average total returns of (i) a broad based index and (ii) an additional index reflecting the market segment(s) in which the Fund invests over the same periods.
Performance for other share classes will vary. The Fund’s past performance is not a good predictor of the Fund’s future performance.
The graph and table do not reflect the deduction of taxes that a shareholder would pay on fund distributions or redemption of fund shares.
GROWTH OF $10,000
| AVERAGE ANNUAL TOTAL RETURNS | 1 Year | 5 Years | 10 Years |
| Class Z | 34.01% | 13.37% | 11.43% |
| S&P 500® Index | 38.02% | 15.27% | 13.00% |
| Russell 2000® Growth Index | 36.49% | 7.92% | 8.15% |
Effective October 31, 2024, the S&P 500® Index was added as a broad measure of market performance in accordance with recent changes to regulatory disclosure requirements. The Fund continues to use the Russell 2000® Growth Index as an additional benchmark that reflects the market segment(s) in which the Fund invests.
The S&P Index is proprietary data of Standard & Poor’s, a division of McGraw-Hill Companies, Inc. All rights reserved.
The Russell Index is a trademark of the London Stock Exchange Group companies.
For updated Fund performance information, please visit: https://wealth.amg.com/.
Key Fund Statistics (as of October 31, 2024)
| Fund net assets | $78,712,660 |
| Total number of portfolio holdings | 122 |
| Net advisory fees paid | $347,097 |
| Portfolio turnover rate as of the end of the reporting period | 234% |
Graphical Representation of Holdings (as of October 31, 2024)
Top ten holdings and portfolio breakdown are shown as a percentage of net assets of the Fund.
| Summit Materials, Inc., Class A | 4.1% |
| Eagle Materials, Inc. | 3.8% |
| Lithia Motors, Inc. | 3.8% |
| United Therapeutics Corp. | 3.2% |
| Beacon Roofing Supply, Inc. | 3.2% |
| Viking Therapeutics, Inc. | 3.1% |
| Caesars Entertainment, Inc. | 3.1% |
| Granite Construction, Inc. | 3.1% |
| Credo Technology Group Holding, Ltd. | 2.8% |
| ATI, Inc. | 2.3% |
| Top Ten as a Group | 32.5% |
Availability of Additional Information
You can find additional information about the Fund such as the prospectus, financial information, fund holdings and proxy voting information at https://wealth.amg.com/resources/order-literature. You can also request this information by contacting us at 800.548.4539.
Householding
In order to reduce expenses, we will deliver a single copy of prospectuses, proxies, financial reports and other communication to shareholders with the same residential address, provided they have the same last name or we reasonably believe them to be members of the same family. Unless we are notified otherwise, we will continue to send recipients only one copy of these materials for as long as they remain a shareholder of the Fund. If you would like to receive individual mailings, please call 800.548.4539 and we will begin sending you separate copies of these materials within 30 days after receiving your request.
For additional information, please navigate to the additional material at https://wealth.amg.com/resources/order-literature.
AMG GW&K Core Bond ESG Fund
Class N/MBGVX
ANNUAL SHAREHOLDER REPORT | October 31, 2024
This annual shareholder report contains important information about AMG GW&K Core Bond ESG Fund (the “Fund”) for the period of November 1, 2023 to October 31, 2024. You can find additional information about the Fund at https://wealth.amg.com/resources/order-literature. You can also request this information by contacting us at 800.548.4539.
Fund Expenses
What were the Fund costs for the last year?
(Based on a hypothetical $10,000 investment)
| Fund (Class) | Costs of a $10,000 investment | Costs paid as a percentage of a $10,000 investment |
AMG GW&K Core Bond ESG Fund
(Class N/MBGVX) | $93 | 0.88% |
Management's Discussion of Fund Performance
Performance Overview
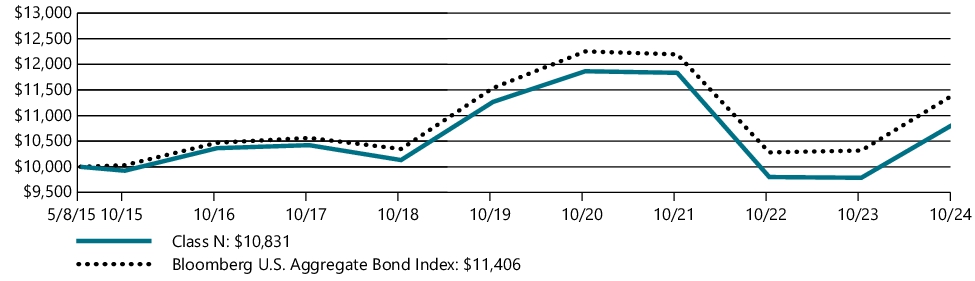
• The Fund’s Class N shares returned 10.70% for the fiscal year that ended October 31, 2024, outperforming the Bloomberg U.S. Aggregate Bond Index, which returned 10.55% during the period.
• The fixed income market generated strong returns during the past fiscal year, as interest rates fell and credit spreads narrowed amidst a decrease in the pace of inflation and a solid economy.
Top Contributors and Detractors
• The primary driver of this outperformance was the Fund’s overweight position to corporates.
• An overweight position to the securitized debt sector and allocation decisions also contributed positively, particularly the Fund’s focus on higher coupon mortgage-backed securities (MBS).
• Security selection within MBS played a significant role in the Fund’s outperformance.
• An out-of-benchmark allocation to preferreds further enhanced overall performance.
Positioning Update
• The Fund is generally neutral duration and is focused on the intermediate part of the yield curve where we find the best risk-adjusted value in the spread sectors.
• The Fund is overweight corporate bonds, and its allocation is expressed in higher-quality issuers with strong cash flows and solid balance sheets. Corporates continue to benefit from the strong fundamental environment supported by solid balance sheets and resilient earnings. Conversely, spreads are historically tight and further moves lower from here are likely limited.
• MBS valuations look attractive at these levels, but interest rate volatility has been a headwind.
• Asset-backed securities (ABS) has proven to be a good diversifier in the securitized space, with less correlation to rate volatility versus the MBS sector, and market demand remains strong.
• Preferred securities potentially offer attractive income and diversification.
• The Fund is overweight taxable municipal bonds given strong fundamentals and the recession-resistant characteristics offered by the asset class.
Fund Performance
The performance line graph below shows the performance of a hypothetical $10,000 investment in the class of shares noted since the class's inception on May 08, 2015, as compared to the performance of a broad based index. The performance table below shows the average annual total returns of the class of shares noted for the past one-year and five-year periods and the period from the class's inception through October 31, 2024. It also shows the average total returns of a broad based index over the same periods.
Performance for other share classes will vary. The Fund’s past performance is not a good predictor of the Fund’s future performance.
The graph and table do not reflect the deduction of taxes that a shareholder would pay on fund distributions or redemption of fund shares.
GROWTH OF $10,000
| AVERAGE ANNUAL TOTAL RETURNS | 1 Year | 5 Years | Since Inception |
| Class N | 10.70% | (0.78%) | 0.85% |
| Bloomberg U.S. Aggregate Bond Index | 10.55% | (0.23%) | 1.40% |
"Bloomberg®" and any Bloomberg index described herein are service marks of Bloomberg Finance L. P. and its affiliates, including Bloomberg Index Services Limited ("BISL"), the administrator of the index (collectively, "Bloomberg") and have been licensed for use for certain purposes by AMG Funds LLC. Bloomberg is not affiliated with AMG Funds LLC, and Bloomberg does not approve, endorse, review, or recommend the fund described herein. Bloomberg does not guarantee the timeliness, accurateness, or completeness of any data or information relating to such fund.
For updated Fund performance information, please visit: https://wealth.amg.com/.
Key Fund Statistics (as of October 31, 2024)
| Fund net assets | $118,779,576 |
| Total number of portfolio holdings | 121 |
| Net advisory fees paid | $194,655 |
| Portfolio turnover rate as of the end of the reporting period | 34% |
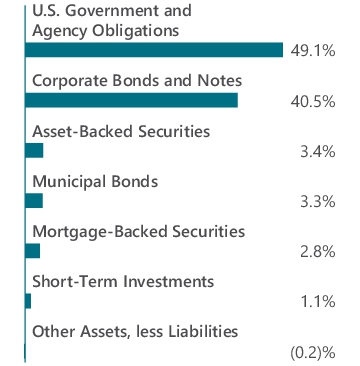
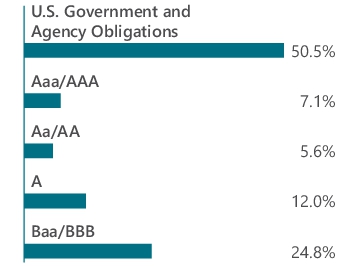
Graphical Representation of Holdings (as of October 31, 2024)
Top ten holdings and portfolio breakdown are shown as a percentage of net assets of the Fund and ratings are shown as a percentage of total long-term investments of the Fund.
| U.S. Treasury Bonds, 2.250%, 05/15/41 | 4.4% |
| U.S. Treasury Bonds, 3.125%, 05/15/48 | 2.9% |
| FHLMC, 3.500%, 10/01/45 | 2.4% |
| U.S. Treasury Bonds, 3.500%, 02/15/39 | 2.3% |
| FHLMC, 5.500%, 06/01/53 | 2.0% |
| FHLMC, 3.000%, 11/01/49 | 2.0% |
| U.S. Treasury Bonds, 1.875%, 02/15/51 | 1.8% |
| FNMA, 4.500%, 06/01/41 | 1.6% |
| FHLMC, 2.500%, 10/01/34 | 1.6% |
| California State General Obligation, School Improvements, Build America Bonds, 7.550%, 04/01/39 | 1.5% |
| Top Ten as a Group | 22.5% |
Availability of Additional Information
You can find additional information about the Fund such as the prospectus, financial information, fund holdings and proxy voting information at https://wealth.amg.com/resources/order-literature. You can also request this information by contacting us at 800.548.4539.
Householding
In order to reduce expenses, we will deliver a single copy of prospectuses, proxies, financial reports and other communication to shareholders with the same residential address, provided they have the same last name or we reasonably believe them to be members of the same family. Unless we are notified otherwise, we will continue to send recipients only one copy of these materials for as long as they remain a shareholder of the Fund. If you would like to receive individual mailings, please call 800.548.4539 and we will begin sending you separate copies of these materials within 30 days after receiving your request.
For additional information, please navigate to the additional material at https://wealth.amg.com/resources/order-literature.
AMG GW&K Core Bond ESG Fund
Class I/MBDFX
ANNUAL SHAREHOLDER REPORT | October 31, 2024
This annual shareholder report contains important information about AMG GW&K Core Bond ESG Fund (the “Fund”) for the period of November 1, 2023 to October 31, 2024. You can find additional information about the Fund at https://wealth.amg.com/resources/order-literature. You can also request this information by contacting us at 800.548.4539.
Fund Expenses
What were the Fund costs for the last year?
(Based on a hypothetical $10,000 investment)
| Fund (Class) | Costs of a $10,000 investment | Costs paid as a percentage of a $10,000 investment |
AMG GW&K Core Bond ESG Fund
(Class I/MBDFX) | $58 | 0.55% |
Management's Discussion of Fund Performance
Performance Overview
• The Fund’s Class I shares returned 11.06% for the fiscal year that ended October 31, 2024, outperforming the Bloomberg U.S. Aggregate Bond Index, which returned 10.55% during the period.
• The fixed income market generated strong returns during the past fiscal year, as interest rates fell and credit spreads narrowed amidst a decrease in the pace of inflation and a solid economy.
Top Contributors and Detractors
• The primary driver of this outperformance was the Fund’s overweight position to corporates.
• An overweight position to the securitized debt sector and allocation decisions also contributed positively, particularly the Fund’s focus on higher coupon mortgage-backed securities (MBS).
• Security selection within MBS played a significant role in the Fund’s outperformance.
• An out-of-benchmark allocation to preferreds further enhanced overall performance.
Positioning Update
• The Fund is generally neutral duration and is focused on the intermediate part of the yield curve where we find the best risk-adjusted value in the spread sectors.
• The Fund is overweight corporate bonds, and its allocation is expressed in higher-quality issuers with strong cash flows and solid balance sheets. Corporates continue to benefit from the strong fundamental environment supported by solid balance sheets and resilient earnings. Conversely, spreads are historically tight and further moves lower from here are likely limited.
• MBS valuations look attractive at these levels, but interest rate volatility has been a headwind.
• Asset-backed securities (ABS) has proven to be a good diversifier in the securitized space, with less correlation to rate volatility versus the MBS sector, and market demand remains strong.
• Preferred securities potentially offer attractive income and diversification.
• The Fund is overweight taxable municipal bonds given strong fundamentals and the recession-resistant characteristics offered by the asset class.
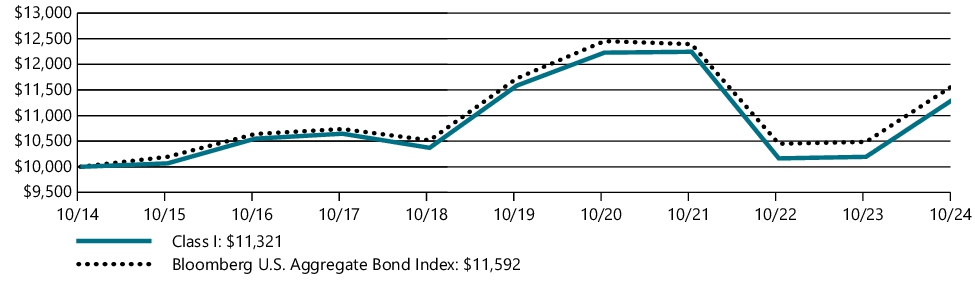
Fund Performance
The performance line graph below shows the performance of a hypothetical $10,000 investment in the class of shares noted over a ten year period, as compared to the performance of a broad based index. The performance table below shows the average annual total returns of the class of shares noted for the past one-, five-, and ten-year periods ended as of October 31, 2024. It also shows the average total returns of a broad based index over the same periods.
Performance for other share classes will vary. The Fund’s past performance is not a good predictor of the Fund’s future performance.
The graph and table do not reflect the deduction of taxes that a shareholder would pay on fund distributions or redemption of fund shares.
GROWTH OF $10,000
| AVERAGE ANNUAL TOTAL RETURNS | 1 Year | 5 Years | 10 Years |
| Class I | 11.06% | (0.46%) | 1.25% |
| Bloomberg U.S. Aggregate Bond Index | 10.55% | (0.23%) | 1.49% |
"Bloomberg®" and any Bloomberg index described herein are service marks of Bloomberg Finance L. P. and its affiliates, including Bloomberg Index Services Limited ("BISL"), the administrator of the index (collectively, "Bloomberg") and have been licensed for use for certain purposes by AMG Funds LLC. Bloomberg is not affiliated with AMG Funds LLC, and Bloomberg does not approve, endorse, review, or recommend the fund described herein. Bloomberg does not guarantee the timeliness, accurateness, or completeness of any data or information relating to such fund.
For updated Fund performance information, please visit: https://wealth.amg.com/.
Key Fund Statistics (as of October 31, 2024)
| Fund net assets | $118,779,576 |
| Total number of portfolio holdings | 121 |
| Net advisory fees paid | $194,655 |
| Portfolio turnover rate as of the end of the reporting period | 34% |
Graphical Representation of Holdings (as of October 31, 2024)
Top ten holdings and portfolio breakdown are shown as a percentage of net assets of the Fund and ratings are shown as a percentage of total long-term investments of the Fund.
| U.S. Treasury Bonds, 2.250%, 05/15/41 | 4.4% |
| U.S. Treasury Bonds, 3.125%, 05/15/48 | 2.9% |
| FHLMC, 3.500%, 10/01/45 | 2.4% |
| U.S. Treasury Bonds, 3.500%, 02/15/39 | 2.3% |
| FHLMC, 5.500%, 06/01/53 | 2.0% |
| FHLMC, 3.000%, 11/01/49 | 2.0% |
| U.S. Treasury Bonds, 1.875%, 02/15/51 | 1.8% |
| FNMA, 4.500%, 06/01/41 | 1.6% |
| FHLMC, 2.500%, 10/01/34 | 1.6% |
| California State General Obligation, School Improvements, Build America Bonds, 7.550%, 04/01/39 | 1.5% |
| Top Ten as a Group | 22.5% |
Availability of Additional Information
You can find additional information about the Fund such as the prospectus, financial information, fund holdings and proxy voting information at https://wealth.amg.com/resources/order-literature. You can also request this information by contacting us at 800.548.4539.
Householding
In order to reduce expenses, we will deliver a single copy of prospectuses, proxies, financial reports and other communication to shareholders with the same residential address, provided they have the same last name or we reasonably believe them to be members of the same family. Unless we are notified otherwise, we will continue to send recipients only one copy of these materials for as long as they remain a shareholder of the Fund. If you would like to receive individual mailings, please call 800.548.4539 and we will begin sending you separate copies of these materials within 30 days after receiving your request.
For additional information, please navigate to the additional material at https://wealth.amg.com/resources/order-literature.
AMG GW&K Core Bond ESG Fund
Class Z/MBDLX
ANNUAL SHAREHOLDER REPORT | October 31, 2024
This annual shareholder report contains important information about AMG GW&K Core Bond ESG Fund (the “Fund”) for the period of November 1, 2023 to October 31, 2024. You can find additional information about the Fund at https://wealth.amg.com/resources/order-literature. You can also request this information by contacting us at 800.548.4539.
Fund Expenses
What were the Fund costs for the last year?
(Based on a hypothetical $10,000 investment)
| Fund (Class) | Costs of a $10,000 investment | Costs paid as a percentage of a $10,000 investment |
AMG GW&K Core Bond ESG Fund
(Class Z/MBDLX) | $51 | 0.48% |
Management's Discussion of Fund Performance
Performance Overview
• The Fund’s Class Z shares returned 11.15% for the fiscal year that ended October 31, 2024, outperforming the Bloomberg U.S. Aggregate Bond Index, which returned 10.55% during the period.
• The fixed income market generated strong returns during the past fiscal year, as interest rates fell and credit spreads narrowed amidst a decrease in the pace of inflation and a solid economy.
Top Contributors and Detractors
• The primary driver of this outperformance was the Fund’s overweight position to corporates.
• An overweight position to the securitized debt sector and allocation decisions also contributed positively, particularly the Fund’s focus on higher coupon mortgage-backed securities (MBS).
• Security selection within MBS played a significant role in the Fund’s outperformance.
• An out-of-benchmark allocation to preferreds further enhanced overall performance.
Positioning Update
• The Fund is generally neutral duration and is focused on the intermediate part of the yield curve where we find the best risk-adjusted value in the spread sectors.
• The Fund is overweight corporate bonds, and its allocation is expressed in higher-quality issuers with strong cash flows and solid balance sheets. Corporates continue to benefit from the strong fundamental environment supported by solid balance sheets and resilient earnings. Conversely, spreads are historically tight and further moves lower from here are likely limited.
• MBS valuations look attractive at these levels, but interest rate volatility has been a headwind.
• Asset-backed securities (ABS) has proven to be a good diversifier in the securitized space, with less correlation to rate volatility versus the MBS sector, and market demand remains strong.
• Preferred securities potentially offer attractive income and diversification.
• The Fund is overweight taxable municipal bonds given strong fundamentals and the recession-resistant characteristics offered by the asset class.
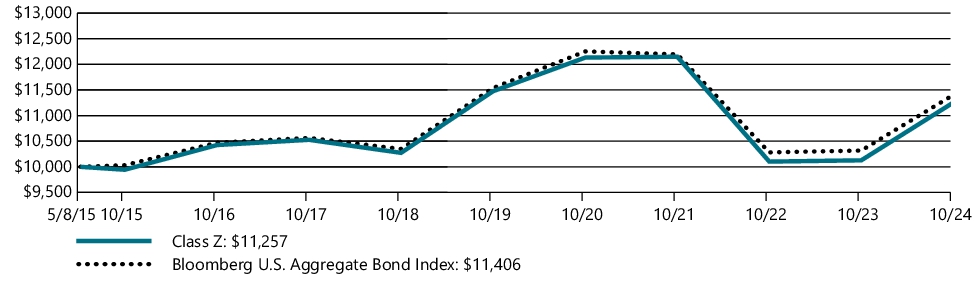
Fund Performance
The performance line graph below shows the performance of a hypothetical $10,000 investment in the class of shares noted since the class's inception on May 08, 2015, as compared to the performance of a broad based index. The performance table below shows the average annual total returns of the class of shares noted for the past one-year and five-year periods and the period from the class's inception through October 31, 2024. It also shows the average total returns of a broad based index over the same periods.
Performance for other share classes will vary. The Fund’s past performance is not a good predictor of the Fund’s future performance.
The graph and table do not reflect the deduction of taxes that a shareholder would pay on fund distributions or redemption of fund shares.
GROWTH OF $10,000
| AVERAGE ANNUAL TOTAL RETURNS | 1 Year | 5 Years | Since Inception |
| Class Z | 11.15% | (0.39%) | 1.26% |
| Bloomberg U.S. Aggregate Bond Index | 10.55% | (0.23%) | 1.40% |
"Bloomberg®" and any Bloomberg index described herein are service marks of Bloomberg Finance L. P. and its affiliates, including Bloomberg Index Services Limited ("BISL"), the administrator of the index (collectively, "Bloomberg") and have been licensed for use for certain purposes by AMG Funds LLC. Bloomberg is not affiliated with AMG Funds LLC, and Bloomberg does not approve, endorse, review, or recommend the fund described herein. Bloomberg does not guarantee the timeliness, accurateness, or completeness of any data or information relating to such fund.
For updated Fund performance information, please visit: https://wealth.amg.com/.
Key Fund Statistics (as of October 31, 2024)
| Fund net assets | $118,779,576 |
| Total number of portfolio holdings | 121 |
| Net advisory fees paid | $194,655 |
| Portfolio turnover rate as of the end of the reporting period | 34% |
Graphical Representation of Holdings (as of October 31, 2024)
Top ten holdings and portfolio breakdown are shown as a percentage of net assets of the Fund and ratings are shown as a percentage of total long-term investments of the Fund.
| U.S. Treasury Bonds, 2.250%, 05/15/41 | 4.4% |
| U.S. Treasury Bonds, 3.125%, 05/15/48 | 2.9% |
| FHLMC, 3.500%, 10/01/45 | 2.4% |
| U.S. Treasury Bonds, 3.500%, 02/15/39 | 2.3% |
| FHLMC, 5.500%, 06/01/53 | 2.0% |
| FHLMC, 3.000%, 11/01/49 | 2.0% |
| U.S. Treasury Bonds, 1.875%, 02/15/51 | 1.8% |
| FNMA, 4.500%, 06/01/41 | 1.6% |
| FHLMC, 2.500%, 10/01/34 | 1.6% |
| California State General Obligation, School Improvements, Build America Bonds, 7.550%, 04/01/39 | 1.5% |
| Top Ten as a Group | 22.5% |
Availability of Additional Information
You can find additional information about the Fund such as the prospectus, financial information, fund holdings and proxy voting information at https://wealth.amg.com/resources/order-literature. You can also request this information by contacting us at 800.548.4539.
Householding
In order to reduce expenses, we will deliver a single copy of prospectuses, proxies, financial reports and other communication to shareholders with the same residential address, provided they have the same last name or we reasonably believe them to be members of the same family. Unless we are notified otherwise, we will continue to send recipients only one copy of these materials for as long as they remain a shareholder of the Fund. If you would like to receive individual mailings, please call 800.548.4539 and we will begin sending you separate copies of these materials within 30 days after receiving your request.
For additional information, please navigate to the additional material at https://wealth.amg.com/resources/order-literature.
AMG River Road Large Cap Value Select Fund
Class N/FQUAX
ANNUAL SHAREHOLDER REPORT | October 31, 2024
This annual shareholder report contains important information about AMG River Road Large Cap Value Select Fund (the “Fund”) for the period of November 1, 2023 to October 31, 2024. You can find additional information about the Fund at https://wealth.amg.com/resources/order-literature. You can also request this information by contacting us at 800.548.4539.
Fund Expenses
What were the Fund costs for the last year?
(Based on a hypothetical $10,000 investment)
| Fund (Class) | Costs of a $10,000 investment | Costs paid as a percentage of a $10,000 investment |
AMG River Road Large Cap Value Select Fund
(Class N/FQUAX) | $112 | 0.95% |
Management's Discussion of Fund Performance
Performance Overview
• The Fund’s Class N shares returned 36.62% for the fiscal year that ended October 31, 2024, underperforming the S&P 500® Index, which returned 38.02% for the period.
Top Contributors and Detractors
• Stock selection was positive, while sector allocation was negative.
• The sectors with the highest contribution to relative return were industrials and materials. Industrials benefited from positive stock selection and an underweight allocation. Materials benefited from positive stock selection, partially offset by an overweight allocation.
• The holdings with the highest contribution to active return were KKR, Talen Energy, and CRH.
• The sectors with the lowest contribution to relative return were information technology and consumer discretionary. Information technology suffered from lack of exposure. Consumer discretionary suffered from negative stock selection, partially offset by an overweight allocation.
• The holdings with the lowest contribution to active return were Nestle, LKQ, and Valaris Limited.
Positioning
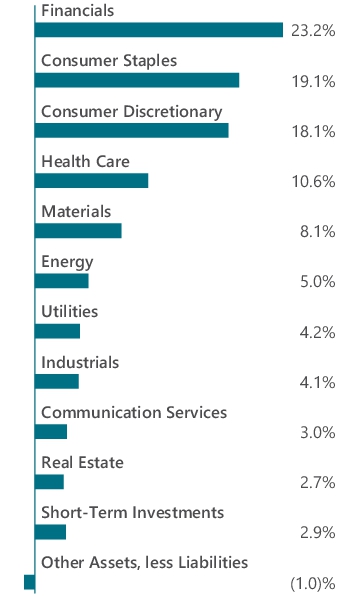
• As of October 31, 2024, the Fund is meaningfully overweight (greater than 5%) in four sectors and meaningfully underweight (greater than -5%) in two. The largest overweight allocations were consumer staples and financials. The largest underweight allocations were information technology and communication services.
Fund Performance
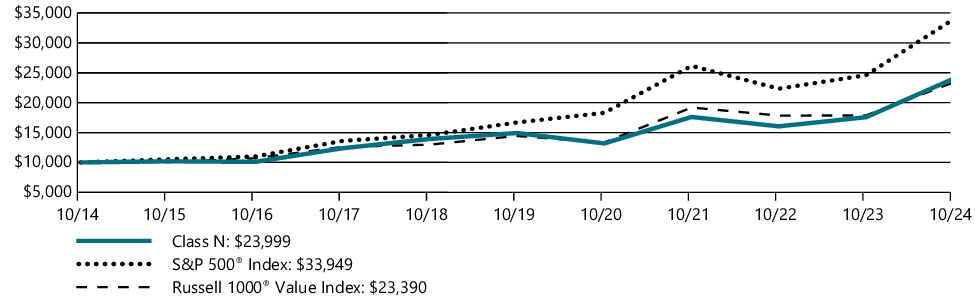
The performance line graph below shows the performance of a hypothetical $10,000 investment in the class of shares noted over a ten year period, as compared to the performance of (i) a broad based index and (ii) an additional index reflecting the market segment(s) in which the Fund invests. The performance table below shows the average annual total returns of the class of shares noted for the past one-, five-, and ten-year periods ended as of October 31, 2024. It also shows the average total returns of (i) a broad based index and (ii) an additional index reflecting the market segment(s) in which the Fund invests over the same periods.
Performance for other share classes will vary. The Fund’s past performance is not a good predictor of the Fund’s future performance.
The graph and table do not reflect the deduction of taxes that a shareholder would pay on fund distributions or redemption of fund shares.
GROWTH OF $10,000
| AVERAGE ANNUAL TOTAL RETURNS | 1 Year | 5 Years | 10 Years |
| Class N | 36.62% | 9.97% | 9.15% |
| S&P 500® Index | 38.02% | 15.27% | 13.00% |
| Russell 1000® Value Index | 30.98% | 10.14% | 8.87% |
Effective October 31, 2024, the S&P 500® Index was added as a broad measure of market performance in accordance with recent changes to regulatory disclosure requirements. The Fund continues to use the Russell 1000® Value Index as an additional benchmark that reflects the market segment(s) in which the Fund invests.
As of March 22, 2021, the Fund's Subadviser was changed to River Road Asset Management, LLC. Prior to March 22, 2021, the Fund had different principal investment strategies and corresponding risks. The Fund's performance before March 22, 2021, might be less pertinent for investors considering whether to purchase shares of the Fund.
The S&P Index is proprietary data of Standard & Poor’s, a division of McGraw-Hill Companies, Inc. All rights reserved.
The Russell Index is a trademark of the London Stock Exchange Group companies.
For updated Fund performance information, please visit: https://wealth.amg.com/.
Key Fund Statistics (as of October 31, 2024)
| Fund net assets | $46,111,504 |
| Total number of portfolio holdings | 28 |
| Net advisory fees paid | $58,846 |
| Portfolio turnover rate as of the end of the reporting period | 106% |
Graphical Representation of Holdings (as of October 31, 2024)
Top ten holdings and portfolio breakdown are shown as a percentage of net assets of the Fund.
| CRH PLC | 8.1% |
| BJ's Wholesale Club Holdings, Inc. | 6.3% |
| Willis Towers Watson PLC (United Kingdom) | 6.0% |
| Fairfax Financial Holdings, Ltd. (Canada) | 5.7% |
| Lululemon Athletica, Inc. (Canada) | 5.1% |
| The Kroger Co. | 5.0% |
| Labcorp Holdings, Inc. | 4.9% |
| Lennar Corp., Class A | 4.6% |
| KKR & Co., Inc. | 4.5% |
| Casey's General Stores, Inc. | 4.3% |
| Top Ten as a Group | 54.5% |
Availability of Additional Information
You can find additional information about the Fund such as the prospectus, financial information, fund holdings and proxy voting information at https://wealth.amg.com/resources/order-literature. You can also request this information by contacting us at 800.548.4539.
Householding
In order to reduce expenses, we will deliver a single copy of prospectuses, proxies, financial reports and other communication to shareholders with the same residential address, provided they have the same last name or we reasonably believe them to be members of the same family. Unless we are notified otherwise, we will continue to send recipients only one copy of these materials for as long as they remain a shareholder of the Fund. If you would like to receive individual mailings, please call 800.548.4539 and we will begin sending you separate copies of these materials within 30 days after receiving your request.
For additional information, please navigate to the additional material at https://wealth.amg.com/resources/order-literature.
AMG River Road Large Cap Value Select Fund
Class I/MEQFX
ANNUAL SHAREHOLDER REPORT | October 31, 2024
This annual shareholder report contains important information about AMG River Road Large Cap Value Select Fund (the “Fund”) for the period of November 1, 2023 to October 31, 2024. You can find additional information about the Fund at https://wealth.amg.com/resources/order-literature. You can also request this information by contacting us at 800.548.4539.
Fund Expenses
What were the Fund costs for the last year?
(Based on a hypothetical $10,000 investment)
| Fund (Class) | Costs of a $10,000 investment | Costs paid as a percentage of a $10,000 investment |
AMG River Road Large Cap Value Select Fund
(Class I/MEQFX) | $75 | 0.63% |
Management's Discussion of Fund Performance
Performance Overview
• The Fund’s Class I shares returned 37.06% for the fiscal year that ended October 31, 2024, underperforming the S&P 500® Index, which returned 38.02% for the period.
Top Contributors and Detractors
• Stock selection was positive, while sector allocation was negative.
• The sectors with the highest contribution to relative return were industrials and materials. Industrials benefited from positive stock selection and an underweight allocation. Materials benefited from positive stock selection, partially offset by an overweight allocation.
• The holdings with the highest contribution to active return were KKR, Talen Energy, and CRH.
• The sectors with the lowest contribution to relative return were information technology and consumer discretionary. Information technology suffered from lack of exposure. Consumer discretionary suffered from negative stock selection, partially offset by an overweight allocation.
• The holdings with the lowest contribution to active return were Nestle, LKQ, and Valaris Limited.
Positioning
• As of October 31, 2024, the Fund is meaningfully overweight (greater than 5%) in four sectors and meaningfully underweight (greater than -5%) in two. The largest overweight allocations were consumer staples and financials. The largest underweight allocations were information technology and communication services.
Fund Performance
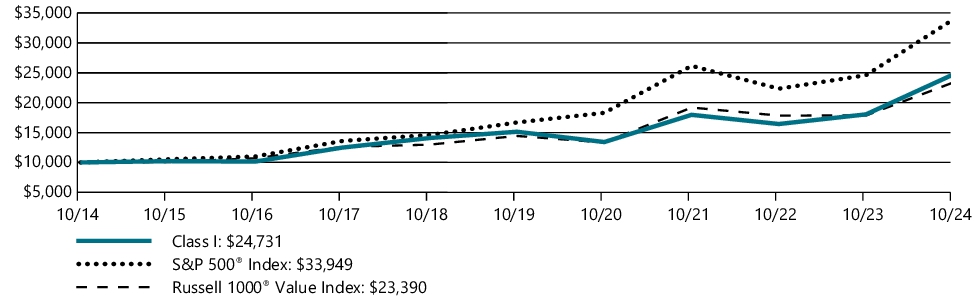
The performance line graph below shows the performance of a hypothetical $10,000 investment in the class of shares noted over a ten year period, as compared to the performance of (i) a broad based index and (ii) an additional index reflecting the market segment(s) in which the Fund invests. The performance table below shows the average annual total returns of the class of shares noted for the past one-, five-, and ten-year periods ended as of October 31, 2024. It also shows the average total returns of (i) a broad based index and (ii) an additional index reflecting the market segment(s) in which the Fund invests over the same periods.
Performance for other share classes will vary. The Fund’s past performance is not a good predictor of the Fund’s future performance.
The graph and table do not reflect the deduction of taxes that a shareholder would pay on fund distributions or redemption of fund shares.
GROWTH OF $10,000
| AVERAGE ANNUAL TOTAL RETURNS | 1 Year | 5 Years | 10 Years |
| Class I | 37.06% | 10.32% | 9.47% |
| S&P 500® Index | 38.02% | 15.27% | 13.00% |
| Russell 1000® Value Index | 30.98% | 10.14% | 8.87% |
Effective October 31, 2024, the S&P 500® Index was added as a broad measure of market performance in accordance with recent changes to regulatory disclosure requirements. The Fund continues to use the Russell 1000® Value Index as an additional benchmark that reflects the market segment(s) in which the Fund invests.
As of March 22, 2021, the Fund's Subadviser was changed to River Road Asset Management, LLC. Prior to March 22, 2021, the Fund had different principal investment strategies and corresponding risks. The Fund's performance before March 22, 2021, might be less pertinent for investors considering whether to purchase shares of the Fund.
The S&P Index is proprietary data of Standard & Poor’s, a division of McGraw-Hill Companies, Inc. All rights reserved.
The Russell Index is a trademark of the London Stock Exchange Group companies.
For updated Fund performance information, please visit: https://wealth.amg.com/.
Key Fund Statistics (as of October 31, 2024)
| Fund net assets | $46,111,504 |
| Total number of portfolio holdings | 28 |
| Net advisory fees paid | $58,846 |
| Portfolio turnover rate as of the end of the reporting period | 106% |
Graphical Representation of Holdings (as of October 31, 2024)
Top ten holdings and portfolio breakdown are shown as a percentage of net assets of the Fund.
| CRH PLC | 8.1% |
| BJ's Wholesale Club Holdings, Inc. | 6.3% |
| Willis Towers Watson PLC (United Kingdom) | 6.0% |
| Fairfax Financial Holdings, Ltd. (Canada) | 5.7% |
| Lululemon Athletica, Inc. (Canada) | 5.1% |
| The Kroger Co. | 5.0% |
| Labcorp Holdings, Inc. | 4.9% |
| Lennar Corp., Class A | 4.6% |
| KKR & Co., Inc. | 4.5% |
| Casey's General Stores, Inc. | 4.3% |
| Top Ten as a Group | 54.5% |
Availability of Additional Information
You can find additional information about the Fund such as the prospectus, financial information, fund holdings and proxy voting information at https://wealth.amg.com/resources/order-literature. You can also request this information by contacting us at 800.548.4539.
Householding
In order to reduce expenses, we will deliver a single copy of prospectuses, proxies, financial reports and other communication to shareholders with the same residential address, provided they have the same last name or we reasonably believe them to be members of the same family. Unless we are notified otherwise, we will continue to send recipients only one copy of these materials for as long as they remain a shareholder of the Fund. If you would like to receive individual mailings, please call 800.548.4539 and we will begin sending you separate copies of these materials within 30 days after receiving your request.
For additional information, please navigate to the additional material at https://wealth.amg.com/resources/order-literature.
AMG Veritas China Fund
Class N/MMCFX
ANNUAL SHAREHOLDER REPORT | October 31, 2024
This annual shareholder report contains important information about AMG Veritas China Fund (the “Fund”) for the period of November 1, 2023 to October 31, 2024. You can find additional information about the Fund at https://wealth.amg.com/resources/order-literature. You can also request this information by contacting us at 800.548.4539.
Fund Expenses
What were the Fund costs for the last year?
(Based on a hypothetical $10,000 investment)
| Fund (Class) | Costs of a $10,000 investment | Costs paid as a percentage of a $10,000 investment |
AMG Veritas China Fund
(Class N/MMCFX) | $115 | 1.15% |
Management's Discussion of Fund Performance
Performance Overview
• The Fund’s Class N shares delivered a positive return of 0.36% for the fiscal year that ended October 31, 2024, but underperformed the MSCI China Index, which returned 21.75% for the period.
• For much of the year, China’s equity markets lagged behind regional peers like India, South Korea, and Taiwan, despite high initial optimism post-COVID-19.
• Investor sentiment was dampened by a slower-than-expected economic recovery and weak consumer spending. However, signs of stabilisation began to surface midway through the year, and a market rebound ensued after China’s extensive stimulus measures boosted market confidence.
Relative Performance
• The Fund’s largest detractors were in consumer discretionary, with notable weaknesses in Meituan, China’s major food delivery platform, and New Oriental, a leading private education provider.
• Alibaba showed signs of recovery toward the end of the period, while Tencent delivered strong returns, backed by diversified revenues in gaming, advertising, and strategic investments.
Positioning and Outlook
• September’s policy easing by President Xi’s administration marked a shift from China’s previous moderate stance. Increased corporate buybacks suggest improved governance and shareholder returns, potentially translating to stronger earnings per share growth.
• With Chinese equities trading at attractive valuations relative to global and Emerging Markets, we are optimistic that these policies will support sustained recovery and strengthen market confidence.
Fund Performance
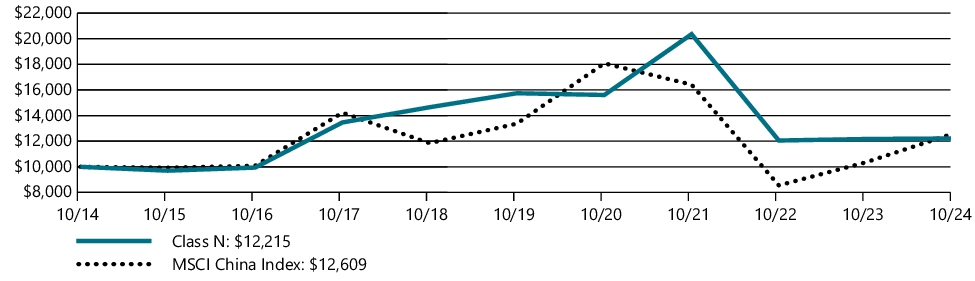
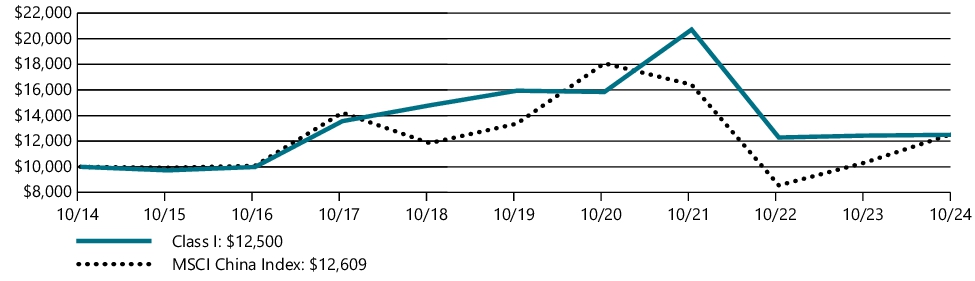
The performance line graph below shows the performance of a hypothetical $10,000 investment in the class of shares noted over a ten year period, as compared to the performance of a broad based index. The performance table below shows the average annual total returns of the class of shares noted for the past one-, five-, and ten-year periods ended as of October 31, 2024. It also shows the average total returns of a broad based index over the same periods.
Performance for other share classes will vary. The Fund’s past performance is not a good predictor of the Fund’s future performance.
The graph and table do not reflect the deduction of taxes that a shareholder would pay on fund distributions or redemption of fund shares.
GROWTH OF $10,000
| AVERAGE ANNUAL TOTAL RETURNS | 1 Year | 5 Years | 10 Years |
| Class N | 0.36% | (4.95%) | 2.02% |
| MSCI China Index | 21.75% | (1.17%) | 2.35% |
As of May 21, 2021, the Fund's Subadviser was changed to Veritas Asset Management LLP. Prior to May 21, 2021, the Fund had different principal investment strategies and corresponding risks. The Fund's performance before May 21, 2021, might be less pertinent for investors considering whether to purchase shares of the Fund.
All MSCI data is provided "as is". The products described herein are not sponsored or endorsed and have not been reviewed or passed on by MSCI. In no event shall MSCI, its affiliates or any MSCI data provider have any liability of any kind in connection with the MSCI data or the products described herein. Copying or redistributing the MSCI data is strictly prohibited.
For updated Fund performance information, please visit: https://wealth.amg.com/.
Key Fund Statistics (as of October 31, 2024)
| Fund net assets | $43,196,442 |
| Total number of portfolio holdings | 36 |
| Net advisory fees paid | $168,265 |
| Portfolio turnover rate as of the end of the reporting period | 100% |
Graphical Representation of Holdings (as of October 31, 2024)
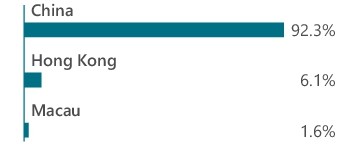
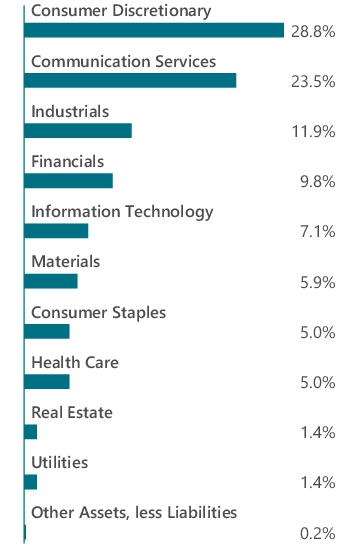
Top ten holdings and portfolio breakdown are shown as a percentage of net assets of the Fund and country allocation is shown as a percentage of total long-term investments of the Fund.
| Tencent Holdings, Ltd. (China) | 19.4% |
| Alibaba Group Holding, Ltd. (China) | 9.5% |
| Zijin Mining Group Co., Ltd., Class H (China) | 4.9% |
| NARI Technology Co., Ltd., Class A (China) | 4.8% |
| Meituan, Class B (China) | 4.4% |
| Contemporary Amperex Technology Co., Ltd., Class A (China) | 4.0% |
| BYD Co., Ltd., Class A (China) | 3.8% |
| PDD Holdings, Inc., ADR (China) | 3.7% |
| NetEase, Inc. (China) | 3.1% |
| Tsingtao Brewery Co., Ltd., Class H (China) | 2.9% |
| Top Ten as a Group | 60.5% |
Availability of Additional Information
You can find additional information about the Fund such as the prospectus, financial information, fund holdings and proxy voting information at https://wealth.amg.com/resources/order-literature. You can also request this information by contacting us at 800.548.4539.
Householding
In order to reduce expenses, we will deliver a single copy of prospectuses, proxies, financial reports and other communication to shareholders with the same residential address, provided they have the same last name or we reasonably believe them to be members of the same family. Unless we are notified otherwise, we will continue to send recipients only one copy of these materials for as long as they remain a shareholder of the Fund. If you would like to receive individual mailings, please call 800.548.4539 and we will begin sending you separate copies of these materials within 30 days after receiving your request.
For additional information, please navigate to the additional material at https://wealth.amg.com/resources/order-literature.
AMG Veritas China Fund
Class I/MIMFX
ANNUAL SHAREHOLDER REPORT | October 31, 2024
This annual shareholder report contains important information about AMG Veritas China Fund (the “Fund”) for the period of November 1, 2023 to October 31, 2024. You can find additional information about the Fund at https://wealth.amg.com/resources/order-literature. You can also request this information by contacting us at 800.548.4539.
Fund Expenses
What were the Fund costs for the last year?
(Based on a hypothetical $10,000 investment)
| Fund (Class) | Costs of a $10,000 investment | Costs paid as a percentage of a $10,000 investment |
AMG Veritas China Fund
(Class I/MIMFX) | $94 | 0.94% |
Management's Discussion of Fund Performance
Performance Overview
• The Fund’s Class I shares delivered a positive return of 0.53% for the fiscal year that ended October 31, 2024, but underperformed the MSCI China Index, which returned 21.75% for the period.
• For much of the year, China’s equity markets lagged behind regional peers like India, South Korea, and Taiwan, despite high initial optimism post-COVID-19.
• Investor sentiment was dampened by a slower-than-expected economic recovery and weak consumer spending. However, signs of stabilisation began to surface midway through the year, and a market rebound ensued after China’s extensive stimulus measures boosted market confidence.
Relative Performance
• The Fund’s largest detractors were in consumer discretionary, with notable weaknesses in Meituan, China’s major food delivery platform, and New Oriental, a leading private education provider.
• Alibaba showed signs of recovery toward the end of the period, while Tencent delivered strong returns, backed by diversified revenues in gaming, advertising, and strategic investments.
Positioning and Outlook
• September’s policy easing by President Xi’s administration marked a shift from China’s previous moderate stance. Increased corporate buybacks suggest improved governance and shareholder returns, potentially translating to stronger earnings per share growth.
• With Chinese equities trading at attractive valuations relative to global and Emerging Markets, we are optimistic that these policies will support sustained recovery and strengthen market confidence.
Fund Performance
The performance line graph below shows the performance of a hypothetical $10,000 investment in the class of shares noted over a ten year period, as compared to the performance of a broad based index. The performance table below shows the average annual total returns of the class of shares noted for the past one-, five-, and ten-year periods ended as of October 31, 2024. It also shows the average total returns of a broad based index over the same periods.
Performance for other share classes will vary. The Fund’s past performance is not a good predictor of the Fund’s future performance.
The graph and table do not reflect the deduction of taxes that a shareholder would pay on fund distributions or redemption of fund shares.
GROWTH OF $10,000
| AVERAGE ANNUAL TOTAL RETURNS | 1 Year | 5 Years | 10 Years |
| Class I | 0.53% | (4.74%) | 2.26% |
| MSCI China Index | 21.75% | (1.17%) | 2.35% |
As of May 21, 2021, the Fund's Subadviser was changed to Veritas Asset Management LLP. Prior to May 21, 2021, the Fund had different principal investment strategies and corresponding risks. The Fund's performance before May 21, 2021, might be less pertinent for investors considering whether to purchase shares of the Fund.
All MSCI data is provided "as is". The products described herein are not sponsored or endorsed and have not been reviewed or passed on by MSCI. In no event shall MSCI, its affiliates or any MSCI data provider have any liability of any kind in connection with the MSCI data or the products described herein. Copying or redistributing the MSCI data is strictly prohibited.
For updated Fund performance information, please visit: https://wealth.amg.com/.
Key Fund Statistics (as of October 31, 2024)
| Fund net assets | $43,196,442 |
| Total number of portfolio holdings | 36 |
| Net advisory fees paid | $168,265 |
| Portfolio turnover rate as of the end of the reporting period | 100% |
Graphical Representation of Holdings (as of October 31, 2024)
Top ten holdings and portfolio breakdown are shown as a percentage of net assets of the Fund and country allocation is shown as a percentage of total long-term investments of the Fund.
| Tencent Holdings, Ltd. (China) | 19.4% |
| Alibaba Group Holding, Ltd. (China) | 9.5% |
| Zijin Mining Group Co., Ltd., Class H (China) | 4.9% |
| NARI Technology Co., Ltd., Class A (China) | 4.8% |
| Meituan, Class B (China) | 4.4% |
| Contemporary Amperex Technology Co., Ltd., Class A (China) | 4.0% |
| BYD Co., Ltd., Class A (China) | 3.8% |
| PDD Holdings, Inc., ADR (China) | 3.7% |
| NetEase, Inc. (China) | 3.1% |
| Tsingtao Brewery Co., Ltd., Class H (China) | 2.9% |
| Top Ten as a Group | 60.5% |
Availability of Additional Information
You can find additional information about the Fund such as the prospectus, financial information, fund holdings and proxy voting information at https://wealth.amg.com/resources/order-literature. You can also request this information by contacting us at 800.548.4539.
Householding
In order to reduce expenses, we will deliver a single copy of prospectuses, proxies, financial reports and other communication to shareholders with the same residential address, provided they have the same last name or we reasonably believe them to be members of the same family. Unless we are notified otherwise, we will continue to send recipients only one copy of these materials for as long as they remain a shareholder of the Fund. If you would like to receive individual mailings, please call 800.548.4539 and we will begin sending you separate copies of these materials within 30 days after receiving your request.
For additional information, please navigate to the additional material at https://wealth.amg.com/resources/order-literature.
AMG Veritas Global Focus Fund
Class N/MFQAX
ANNUAL SHAREHOLDER REPORT | October 31, 2024
This annual shareholder report contains important information about AMG Veritas Global Focus Fund (the “Fund”) for the period of November 1, 2023 to October 31, 2024. You can find additional information about the Fund at https://wealth.amg.com/resources/order-literature. You can also request this information by contacting us at 800.548.4539.
Fund Expenses
What were the Fund costs for the last year?
(Based on a hypothetical $10,000 investment)
| Fund (Class) | Costs of a $10,000 investment | Costs paid as a percentage of a $10,000 investment |
AMG Veritas Global Focus Fund
(Class N/MFQAX) | $127 | 1.13% |
Management's Discussion of Fund Performance
Performance Overview
• The Fund’s Class N shares delivered strong absolute returns of 25.27% for the fiscal year that ended October 31, 2024, but underperformed the MSCI World Index, which returned 33.68% for the period.
Relative Performance
• The primary detractor to relative performance was the underweight in information technology. The Fund held Amazon, Alphabet, and Microsoft, but not NVIDIA, Apple, Meta, or Tesla, which has been a drag to relative performance.
• Without an outsized position in these select few securities, the odds have been stacked against beating the market. Being underweight, these securities were in hindsight a significant risk to relative returns, and the more concentrated and levered you were to them the better.
• Another large detractor was Charter Communications. The company’s shares fell after its Q4 results due to a 61,000 drop in broadband subscribers, impacted by a dispute with Disney and rising competition from fiber and fixed wireless access (FWA). Charter’s long-term prospects remain positive, with plans to upgrade its network for faster, multigigabit speeds, providing a competitive edge over FWA.
• Another key detractor was Diageo where there has been fear that growth has stalled due to a weak economic environment in the U.S., their single largest market. Weak consumer demand in China, along with uncertainty around GLP-1 weight loss drugs—which reportedly reduce alcohol consumption—has also driven weak sentiment.
Positioning and Outlook
• As we know, market participants are drawn to what works, like moths are drawn to flames. The more concentrated the focus, the greater the number is of excellent businesses dumped unceremoniously by the wayside. We recently had the chance to invest in several such opportunities, and when the flame burns out for other market participants, we believe our pipeline of new ideas will ignite.
Fund Performance
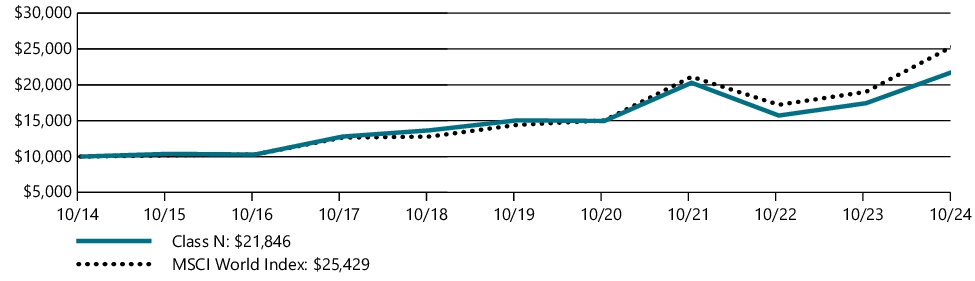
The performance line graph below shows the performance of a hypothetical $10,000 investment in the class of shares noted over a ten year period, as compared to the performance of a broad based index. The performance table below shows the average annual total returns of the class of shares noted for the past one-, five-, and ten-year periods ended as of October 31, 2024. It also shows the average total returns of a broad based index over the same periods.
Performance for other share classes will vary. The Fund’s past performance is not a good predictor of the Fund’s future performance.
The graph and table do not reflect the deduction of taxes that a shareholder would pay on fund distributions or redemption of fund shares.
GROWTH OF $10,000
| AVERAGE ANNUAL TOTAL RETURNS | 1 Year | 5 Years | 10 Years |
| Class N | 25.27% | 7.74% | 8.13% |
| MSCI World Index | 33.68% | 12.03% | 9.78% |
As of May 21, 2021, the Fund's subadviser was changed to Veritas Asset Management LLP. Prior to May 21, 2021, the Fund had different principal investment strategies and corresponding risks. The Fund's performance before May 21, 2021, might be less pertinent for investors considering whether to purchase shares of the Fund.
All MSCI data is provided "as is". The products described herein are not sponsored or endorsed and have not been reviewed or passed on by MSCI. In no event shall MSCI, its affiliates or any MSCI data provider have any liability of any kind in connection with the MSCI data or the products described herein. Copying or redistributing the MSCI data is strictly prohibited.
For updated Fund performance information, please visit: https://wealth.amg.com/.
Key Fund Statistics (as of October 31, 2024)
| Fund net assets | $32,420,249 |
| Total number of portfolio holdings | 31 |
| Net advisory fees paid | $109,693 |
| Portfolio turnover rate as of the end of the reporting period | 42% |
Graphical Representation of Holdings (as of October 31, 2024)
Top ten holdings and portfolio breakdown are shown as a percentage of net assets of the Fund and country allocation is shown as a percentage of total long-term investments of the Fund.
| Amazon.com, Inc. (United States) | 6.7% |
| Alphabet, Inc., Class A (United States) | 6.3% |
| Diageo PLC (United Kingdom) | 4.6% |
| Aon PLC, Class A (United States) | 4.6% |
| UnitedHealth Group, Inc. (United States) | 4.5% |
| Unilever PLC (United Kingdom) | 4.3% |
| Airbus SE (France) | 4.2% |
| Safran SA (France) | 4.2% |
| Canadian Pacific Kansas City, Ltd. (Canada) | 4.2% |
| Microsoft Corp. (United States) | 4.0% |
| Top Ten as a Group | 47.6% |
Availability of Additional Information
You can find additional information about the Fund such as the prospectus, financial information, fund holdings and proxy voting information at https://wealth.amg.com/resources/order-literature. You can also request this information by contacting us at 800.548.4539.
Householding
In order to reduce expenses, we will deliver a single copy of prospectuses, proxies, financial reports and other communication to shareholders with the same residential address, provided they have the same last name or we reasonably believe them to be members of the same family. Unless we are notified otherwise, we will continue to send recipients only one copy of these materials for as long as they remain a shareholder of the Fund. If you would like to receive individual mailings, please call 800.548.4539 and we will begin sending you separate copies of these materials within 30 days after receiving your request.
For additional information, please navigate to the additional material at https://wealth.amg.com/resources/order-literature.
AMG Veritas Global Focus Fund
Class I/MFQTX
ANNUAL SHAREHOLDER REPORT | October 31, 2024
This annual shareholder report contains important information about AMG Veritas Global Focus Fund (the “Fund”) for the period of November 1, 2023 to October 31, 2024. You can find additional information about the Fund at https://wealth.amg.com/resources/order-literature. You can also request this information by contacting us at 800.548.4539.
Fund Expenses
What were the Fund costs for the last year?
(Based on a hypothetical $10,000 investment)
| Fund (Class) | Costs of a $10,000 investment | Costs paid as a percentage of a $10,000 investment |
AMG Veritas Global Focus Fund
(Class I/MFQTX) | $99 | 0.88% |
Management's Discussion of Fund Performance
Performance Overview
• The Fund’s Class I shares delivered strong absolute returns of 25.58% for the fiscal year that ended October 31, 2024, but underperformed the MSCI World Index, which returned 33.68% for the period.
Relative Performance
• The primary detractor to relative performance was the underweight in information technology. The Fund held Amazon, Alphabet, and Microsoft, but not NVIDIA, Apple, Meta, or Tesla, which has been a drag to relative performance.
• Without an outsized position in these select few securities, the odds have been stacked against beating the market. Being underweight, these securities were in hindsight a significant risk to relative returns, and the more concentrated and levered you were to them the better.
• Another large detractor was Charter Communications. The company’s shares fell after its Q4 results due to a 61,000 drop in broadband subscribers, impacted by a dispute with Disney and rising competition from fiber and fixed wireless access (FWA). Charter’s long-term prospects remain positive, with plans to upgrade its network for faster, multigigabit speeds, providing a competitive edge over FWA.
• Another key detractor was Diageo where there has been fear that growth has stalled due to a weak economic environment in the U.S., their single largest market. Weak consumer demand in China, along with uncertainty around GLP-1 weight loss drugs—which reportedly reduce alcohol consumption—has also driven weak sentiment.
Positioning and Outlook
• As we know, market participants are drawn to what works, like moths are drawn to flames. The more concentrated the focus, the greater the number is of excellent businesses dumped unceremoniously by the wayside. We recently had the chance to invest in several such opportunities, and when the flame burns out for other market participants, we believe our pipeline of new ideas will ignite.
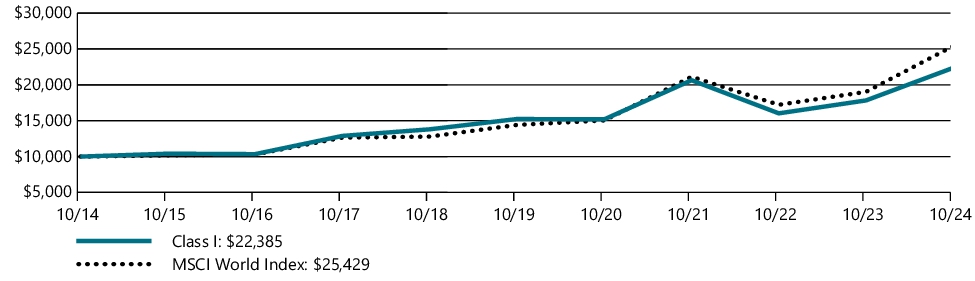
Fund Performance
The performance line graph below shows the performance of a hypothetical $10,000 investment in the class of shares noted over a ten year period, as compared to the performance of a broad based index. The performance table below shows the average annual total returns of the class of shares noted for the past one-, five-, and ten-year periods ended as of October 31, 2024. It also shows the average total returns of a broad based index over the same periods.
Performance for other share classes will vary. The Fund’s past performance is not a good predictor of the Fund’s future performance.
The graph and table do not reflect the deduction of taxes that a shareholder would pay on fund distributions or redemption of fund shares.
GROWTH OF $10,000
| AVERAGE ANNUAL TOTAL RETURNS | 1 Year | 5 Years | 10 Years |
| Class I | 25.58% | 8.00% | 8.39% |
| MSCI World Index | 33.68% | 12.03% | 9.78% |
As of May 21, 2021, the Fund's subadviser was changed to Veritas Asset Management LLP. Prior to May 21, 2021, the Fund had different principal investment strategies and corresponding risks. The Fund's performance before May 21, 2021, might be less pertinent for investors considering whether to purchase shares of the Fund.
All MSCI data is provided "as is". The products described herein are not sponsored or endorsed and have not been reviewed or passed on by MSCI. In no event shall MSCI, its affiliates or any MSCI data provider have any liability of any kind in connection with the MSCI data or the products described herein. Copying or redistributing the MSCI data is strictly prohibited.
For updated Fund performance information, please visit: https://wealth.amg.com/.
Key Fund Statistics (as of October 31, 2024)
| Fund net assets | $32,420,249 |
| Total number of portfolio holdings | 31 |
| Net advisory fees paid | $109,693 |
| Portfolio turnover rate as of the end of the reporting period | 42% |
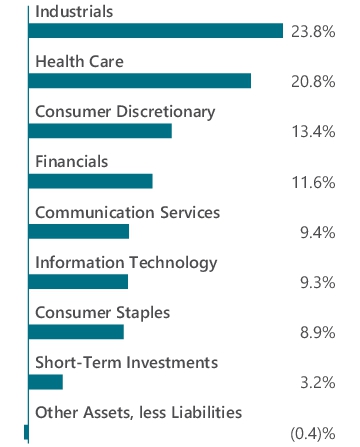
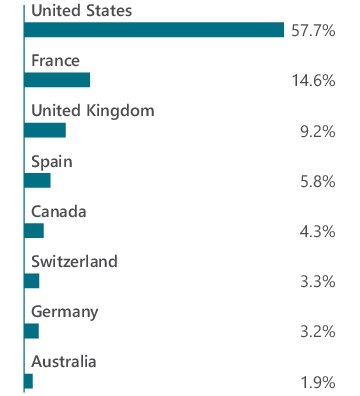
Graphical Representation of Holdings (as of October 31, 2024)
Top ten holdings and portfolio breakdown are shown as a percentage of net assets of the Fund and country allocation is shown as a percentage of total long-term investments of the Fund.
| Amazon.com, Inc. (United States) | 6.7% |
| Alphabet, Inc., Class A (United States) | 6.3% |
| Diageo PLC (United Kingdom) | 4.6% |
| Aon PLC, Class A (United States) | 4.6% |
| UnitedHealth Group, Inc. (United States) | 4.5% |
| Unilever PLC (United Kingdom) | 4.3% |
| Airbus SE (France) | 4.2% |
| Safran SA (France) | 4.2% |
| Canadian Pacific Kansas City, Ltd. (Canada) | 4.2% |
| Microsoft Corp. (United States) | 4.0% |
| Top Ten as a Group | 47.6% |
Availability of Additional Information
You can find additional information about the Fund such as the prospectus, financial information, fund holdings and proxy voting information at https://wealth.amg.com/resources/order-literature. You can also request this information by contacting us at 800.548.4539.
Householding
In order to reduce expenses, we will deliver a single copy of prospectuses, proxies, financial reports and other communication to shareholders with the same residential address, provided they have the same last name or we reasonably believe them to be members of the same family. Unless we are notified otherwise, we will continue to send recipients only one copy of these materials for as long as they remain a shareholder of the Fund. If you would like to receive individual mailings, please call 800.548.4539 and we will begin sending you separate copies of these materials within 30 days after receiving your request.
For additional information, please navigate to the additional material at https://wealth.amg.com/resources/order-literature.
(b) Not applicable.
Item 2. CODE OF ETHICS
Registrant has adopted a code of ethics (the “Code of Ethics”) that applies to the Registrant’s principal executive officer, principal financial officer, principal accounting officer or controller, or persons performing similar functions, regardless of whether these individuals are employed by the registrant or a third party. During the period covered by this report, there were not any amendments to a provision of the Code of Ethics that relates to any element of the code of ethics definition enumerated in paragraph (c) of Item 2 of Form N-CSR. During the period covered by this report, there were no waivers, including any implicit waivers, from a provision of the Code that relates to one or more of the items set forth in paragraph (d) of Item 2 of Form N-CSR. See attached Exhibit (a)(1).
Item 3. AUDIT COMMITTEE FINANCIAL EXPERT
Registrant’s Board of Trustees (the “Board”) has determined that the Registrant has at least one Audit Committee Financial Expert serving on its audit committee. The Board has determined that independent Trustee Mr. Steven J. Paggioli qualifies as the Audit Committee Financial Expert. Mr. Paggioli is “independent” as such term is defined in paragraph (a)(2) of Item 3 of Form N-CSR.
Item 4. PRINCIPAL ACCOUNTANT FEES AND SERVICES
The aggregate fees billed by the Funds’ independent registered public accounting firm, PricewaterhouseCoopers LLP (“PwC”), to the Funds for the Funds’ two most recent fiscal years for professional services rendered for audits of annual financial statements, or services that are normally provided in connection with statutory and regulatory filings or engagements (“Audit Fees”) were as follows:
| | | | | | | | |
| | | Fiscal 2024 | | | Fiscal 2023 | |
AMG Frontier Small Cap Growth Fund | | | $26,231 | | | | $25,261 | |
AMG GW&K Core Bond ESG Fund | | | $45,805 | | | | $44,735 | |
AMG River Road Large Cap Value Select Fund | | | $30,207 | | | | $29,055 | |
AMG Veritas China Fund | | | $24,404 | | | | $23,644 | |
AMG Veritas Global Focus Fund | | | $27,250 | | | | $26,281 | |
There were no fees billed by PwC to the Funds in their two recent fiscal years for services rendered for assurance and related services that are reasonably related to the performance of the audit or review of the Funds’ financial statements, but are not reported as Audit Fees (“Audit-Related Fees”).
For the Funds’ two most recent fiscal years, there were no Audit-Related Fees billed by PwC for engagements related directly to the operations and financial reporting of one or more Funds by a Fund Service Provider. A Fund Service Provider is (a) any investment adviser to a Fund (not including any Subadviser whose role is primarily portfolio management and is subcontracted with or overseen by another investment adviser) or (b) any entity that provides ongoing services to a
Fund and is controlling, controlled by or under common control with a Fund investment adviser described in (a).
The aggregate fees billed by PwC to the Funds for the two most recent fiscal years for professional services rendered for tax compliance, tax advice, and tax planning (“Tax Fees”) were as follows:
| | | | | | | | |
| | | Fiscal 2024 | | | Fiscal 2023 | |
AMG Frontier Small Cap Growth Fund | | | $5,565 | | | | $5,455 | |
AMG GW&K Core Bond ESG Fund | | | $5,565 | | | | $5,455 | |
AMG River Road Large Cap Value Select Fund | | | $6,935 | | | | $6,800 | |
AMG Veritas China Fund | | | $6,935 | | | | $6,800 | |
AMG Veritas Global Focus Fund | | | $6,935 | | | | $6,800 | |
For the Funds’ two most recent fiscal years, Tax Fees billed by PwC for engagements by Fund Service Providers that related directly to the operations and financial reporting of the Funds were $0 for fiscal 2024 and $0 for fiscal 2023, respectively.
The services for which Tax Fees were charged comprise all services performed by professional staff in PwC’s tax division except those services related to the audit. Typically, this category would include fees for tax compliance, tax planning, and tax advice. Tax compliance, tax advice, and tax planning services include preparation of original and amended tax returns, claims for refund and tax payment-planning services, assistance with tax audits and appeals, tax advice related to mergers and acquisitions and requests for rulings or technical advice from taxing authorities.
There were no other fees billed by PwC to the Funds for all other non-audit services (“Other Fees”) during the Funds’ two most recent fiscal years. During the same period, there were no Other Fees billed by PwC for engagements by Fund Service Providers that related directly to the operations and financial reporting of the Funds.
(e)(1) According to policies adopted by the Audit Committee, services provided by PwC to the Funds must be pre-approved by the Audit Committee. On an annual basis, the Audit Committee reviews and pre-approves various types of services that PwC may perform for the Funds without specific approval of each engagement, subject to specified budget limitations. As contemplated by the Sarbanes-Oxley Act of 2002 and related SEC rules, the Audit Committee also pre-approves non-audit services provided by PwC to any Fund Service Provider for any engagement that relates directly to the operations and financial reporting of the Funds. Any engagement that is not already pre-approved or that will exceed a pre-approved budget must be submitted to the Audit Committee for pre-approval. The Chairman of the Audit Committee is authorized on behalf of the Board of Trustees and the Audit Committee to approve the engagement of PwC to perform non-audit services subject to certain conditions, including notification to the Audit Committee of such pre-approval not later than the next meeting of the Audit Committee following the date of such pre-approval.
(e)(2) None.
(f) Not applicable.
(g) The aggregate fees billed by PwC in 2024 and 2023 for non-audit services rendered to the Funds and Fund Service Providers were $71,935 and $70,643, respectively. For the fiscal year ended October 31, 2024, this amount reflects the amounts disclosed above in Item 4(b),(c),(d), plus $40,000 in fees billed to the Fund Service Providers for non-audit services that did not relate directly to the operations and financial reporting of the Funds. For the fiscal year ended October 31, 2023, this amount reflects the amounts disclosed above in Item 4(b),(c),(d), plus $39,333 in fees billed to the Fund Service Providers for non-audit services that did not relate directly to the operations and financial reporting of the Funds.
(h) The Trust’s Audit Committee has considered whether the provision of non-audit services by registrant’s independent registered public accounting firm to the registrant’s investment adviser, and any entity controlling, controlled, or under common control with the investment adviser that provided ongoing services to the registrant that were not pre-approved by the Committee (because such services did not relate directly to the operations and financial reporting of the registrant) was compatible with maintaining the independence of the independent registered public accounting firm.
Item 5. AUDIT COMMITTEE OF LISTED REGISTRANTS
Not applicable.
Item 6. INVESTMENTS
The schedule of investments in securities of unaffiliated issuers as of the close of the reporting period is included in the financial statements filed under Item 7 hereof.
Item 7. FINANCIAL STATEMENTS AND FINANCIAL HIGHLIGHTS FOR OPEN-END MANAGEMENT INVESTMENT COMPANIES.
| | |

| | ANNUAL FINANCIAL STATEMENTS |
| | | | | | |
| | | AMG Funds |
| | | |
| | | October 31, 2024 | | |
| | |
| | |  |
| | |
| | | AMG GW&K Core Bond ESG Fund |
| | | Class N: MBGVX | | Class I: MBDFX | | Class Z: MBDLX |
| | |
| | | AMG GW&K Small/Mid Cap Growth Fund |
| | | | |
| | | Class N: ACWDX | | Class I: ACWIX | | Class Z: ACWZX |
| | | | |
| | | | | | | |
| | | | | | |
| | | | | | | |
| | | |
| wealth.amg.com | | 103124 | | | AR069 | |
| | |
| | AMG Funds Annual Financial Statements — October 31, 2024 |
Nothing contained herein is to be considered an offer, sale or solicitation of an offer to buy shares of any series of the AMG Funds Family of Funds. Such offering is made only by prospectus, which includes details as to offering price and other material information.
| | |
| | AMG GW&K Core Bond ESG Fund Schedule of Portfolio Investments October 31, 2024 |
| | | | | | | | |
| | | Principal
Amount | | | Value | |
| | |
Corporate Bonds and Notes - 40.5% | | | | | | | | |
| |
Basic Materials - 1.1% | | | | | |
| | |
Air Products and Chemicals, Inc.
4.800%, 03/03/33 | | | $780,000 | | | | $777,723 | |
| | |
Steel Dynamics, Inc.
5.375%, 08/15/34 | | | 460,000 | | | | 463,287 | |
| | |
Total Basic Materials | | | | | | | 1,241,010 | |
| |
Communications - 2.9% | | | | | |
| | |
AT&T, Inc.
1.650%, 02/01/28 | | | 331,000 | | | | 300,672 | |
4.300%, 02/15/30 | | | 700,000 | | | | 681,440 | |
| | |
Comcast Corp.
4.650%, 02/15/331 | | | 915,000 | | | | 900,426 | |
| | |
Verizon Communications, Inc.
3.875%, 02/08/291 | | | 1,553,000 | | | | 1,502,644 | |
| | |
Total Communications | | | | | | | 3,385,182 | |
| |
Consumer, Cyclical - 3.1% | | | | | |
| | |
Hasbro, Inc.
3.900%, 11/19/291 | | | 980,000 | | | | 923,651 | |
| | |
Hyatt Hotels Corp.
5.250%, 06/30/29 | | | 610,000 | | | | 613,527 | |
| | |
Mattel, Inc.
3.750%, 04/01/292 | | | 975,000 | | | | 917,375 | |
| | |
PulteGroup, Inc.
6.375%, 05/15/33 | | | 573,000 | | | | 613,201 | |
| | |
United Airlines, Inc. Pass-Through Trust
Series 2024-1, AA, 5.450%, 02/15/37 | | | 585,000 | | | | 593,593 | |
| | |
Total Consumer, Cyclical | | | | | | | 3,661,347 | |
| |
Consumer, Non-cyclical - 8.0% | | | | | |
| | |
Ashtead Capital, Inc.
1.500%, 08/12/261,2 | | | 986,000 | | | | 928,549 | |
| | |
Campbell Soup Co.
2.375%, 04/24/30 | | | 1,578,000 | | | | 1,384,854 | |
| | |
CommonSpirit Health
3.347%, 10/01/29 | | | 1,737,000 | | | | 1,615,833 | |
| | |
The Ford Foundation
Series 2020, 2.415%, 06/01/50 | | | 2,207,000 | | | | 1,363,901 | |
| | |
HCA, Inc.
4.125%, 06/15/29 | | | 950,000 | | | | 914,936 | |
| | |
Kraft Heinz Foods Co.
3.875%, 05/15/27 | | | 918,000 | | | | 900,318 | |
| | |
Smith & Nephew PLC (United Kingdom)
2.032%, 10/14/30 | | | 1,010,000 | | | | 853,126 | |
| | |
Sysco Corp.
2.400%, 02/15/301 | | | 1,759,000 | | | | 1,555,360 | |
| | |
Total Consumer, Non-cyclical | | | | | | | 9,516,877 | |
| | | | | | | | |
| | | Principal
Amount | | | Value | |
| |
Financials - 15.4% | | | | | |
| | |
AerCap Ireland Capital DAC/AerCap Global Aviation Trust (Ireland)
6.450%, 04/15/271 | | | $1,098,000 | | | | $1,136,679 | |
| | |
Air Lease Corp., MTN
5.200%, 07/15/31 | | | 315,000 | | | | 313,846 | |
| | |
Aircastle, Ltd./Aircastle Ireland DAC (Bermuda)
5.750%, 10/01/312 | | | 1,025,000 | | | | 1,040,695 | |
| | |
American Homes 4 Rent LP
3.625%, 04/15/32 | | | 685,000 | | | | 618,764 | |
| | |
American Tower Corp.
3.600%, 01/15/28 | | | 1,280,000 | | | | 1,233,239 | |
| | |
Bank of America Corp. MTN, (4.330% to 03/15/49 then 3 month SOFR + 1.782%), 4.330%, 03/15/503,4 | | | 1,300,000 | | | | 1,114,966 | |
| | |
The Bank of New York Mellon Corp. | | | | | | | | |
Series H, (3.700% to 03/20/26 then U.S. Treasury Yield Curve CMT 5 year + 3.352%), 3.700%, 03/20/263,4,5 | | | 985,000 | | | | 951,019 | |
| | |
The Charles Schwab Corp. | | | | | | | | |
Series G, (5.375% to 06/01/25 then U.S. Treasury Yield Curve CMT 5 year + 4.971%), 5.375%, 06/01/253,4,5 | | | 1,190,000 | | | | 1,183,850 | |
| | |
Citigroup, Inc. | | | | | | | | |
(3.980% to 03/20/29 then 3 month SOFR + 1.600%), 3.980%, 03/20/303,4 | | | 1,502,000 | | | | 1,439,677 | |
| | |
Crown Castle, Inc.
4.000%, 03/01/27 | | | 1,250,000 | | | | 1,228,141 | |
| | |
Equinix, Inc.
3.200%, 11/18/29 | | | 663,000 | | | | 612,538 | |
| | |
JPMorgan Chase & Co. | | | | | | | | |
(6.254% to 10/23/33 then SOFR + 1.810%), 6.254%, 10/23/343,4 | | | 818,000 | | | | 879,006 | |
| | |
MetLife, Inc. | | | | | | | | |
Series G, (3.850% to 09/15/25 then U.S. Treasury Yield Curve CMT 5 year + 3.576%), 3.850%, 09/15/253,4,5 | | | 959,000 | | | | 938,445 | |
| | |
Morgan Stanley | | | | | | | | |
(4.431% to 01/23/29 then 3 month SOFR + 1.890%), 4.431%, 01/23/303,4 | | | 1,374,000 | | | | 1,346,646 | |
| | |
The PNC Financial Services Group, Inc. | | | | | | | | |
(5.068% to 01/24/33 then SOFR + 1.933%), 5.068%, 01/24/343,4 | | | 1,226,000 | | | | 1,209,092 | |
| | |
Truist Financial Corp., MTN | | | | | | | | |
(4.873% to 01/26/28 then SOFR + 1.435%), 4.873%, 01/26/293,4 | | | 610,000 | | | | 607,704 | |
| | |
US Bancorp | | | | | | | | |
(5.775% to 06/12/28 then SOFR + 2.020%), 5.775%, 06/12/293,4 | | | 615,000 | | | | 632,694 | |
| | |
Wells Fargo & Co. | | | | | | | | |
MTN, (5.013% to 04/04/50 then 3 month SOFR + 4.502%), 5.013%, 04/04/513,4 | | | 1,261,000 | | | | 1,178,274 | |
The accompanying notes are an integral part of these financial statements.
2
| | |
| | AMG GW&K Core Bond ESG Fund Schedule of Portfolio Investments (continued) |
| | | | | | | | |
| | | Principal
Amount | | | Value | |
| | |
Financials - 15.4% (continued) | | | | | | | | |
| | |
Wells Fargo & Co. | | | | | | | | |
Series U, 5.875%, 06/15/254,5 | | | $636,000 | | | | $634,512 | |
| | |
Total Financials | | | | | | | 18,299,787 | |
| | |
Industrials - 3.8% | | | | | | | | |
| | |
Jacobs Engineering Group, Inc.
5.900%, 03/01/33 | | | 1,141,000 | | | | 1,170,410 | |
| | |
L3Harris Technologies, Inc.
5.050%, 06/01/29 | | | 1,233,000 | | | | 1,242,763 | |
| | |
Packaging Corp. of America
5.700%, 12/01/331 | | | 640,000 | | | | 663,482 | |
| | |
Parker-Hannifin Corp.
3.250%, 06/14/29 | | | 1,573,000 | | | | 1,477,151 | |
| | |
Total Industrials | | | | | | | 4,553,806 | |
| | |
Technology - 4.1% | | | | | | | | |
| | |
Broadcom, Inc.
4.150%, 11/15/30 | | | 1,347,000 | | | | 1,292,605 | |
| | |
Dell International LLC/EMC Corp.
6.200%, 07/15/30 | | | 1,112,000 | | | | 1,178,706 | |
| | |
Kyndryl Holdings, Inc.
3.150%, 10/15/31 | | | 691,000 | | | | 591,247 | |
| | |
Microsoft Corp.
2.525%, 06/01/50 | | | 1,890,000 | | | | 1,209,947 | |
| | |
Roper Technologies, Inc.
4.750%, 02/15/32 | | | 612,000 | | | | 602,677 | |
| | |
Total Technology | | | | | | | 4,875,182 | |
| | |
Utilities - 2.1% | | | | | | | | |
| | |
Duke Energy Corp.
2.550%, 06/15/31 | | | 1,392,000 | | | | 1,196,674 | |
| | |
National Rural Utilities Cooperative Finance Corp.
1.350%, 03/15/31 | | | 1,649,000 | | | | 1,334,080 | |
| | |
Total Utilities | | | | | | | 2,530,754 | |
| |
Total Corporate Bonds and Notes
(Cost $51,418,765) | | | | 48,063,945 | |
| |
| Asset-Backed Securities - 3.4% | | | | | |
| | |
American Express Credit Account Master Trust
Series 2022-4, Class A 4.950%, 10/15/27 | | | 630,000 | | | | 632,143 | |
| | |
Compass Datacenters Issuer II LLC | | | | | | | | |
Series 2024-1A, Class A1 5.250%, 02/25/492 | | | 950,000 | | | | 942,259 | |
| | |
Ford Credit Auto Owner Trust | | | | | | | | |
Series 2022-B, Class A4 3.930%, 08/15/27 | | | 697,000 | | | | 690,598 | |
| | |
John Deere Owner Trust | | | | | | | | |
Series 2022-A, Class A4 2.490%, 01/16/29 | | | 650,000 | | | | 637,581 | |
| | |
Santander Drive Auto Receivables Trust | | | | | | | | |
Series 2020-4, Class D 1.480%, 01/15/27 | | | 135,574 | | | | 134,924 | |
| | | | | | | | |
| | | Principal
Amount | | | Value | |
| | |
Santander Drive Auto Receivables Trust | | | | | | | | |
Series 2022-7, Class B 5.950%, 01/17/28 | | | $625,000 | | | | $629,816 | |
| | |
Toyota Auto Receivables Owner Trust | | | | | | | | |
Series 2021-B, Class A3 0.260%, 11/17/25 | | | 8,610 | | | | 8,592 | |
Series 2021-B, Class A4 0.530%, 10/15/26 | | | 317,000 | | | | 311,019 | |
| |
Total Asset-Backed Securities
(Cost $3,984,590) | | | | 3,986,932 | |
| |
| Mortgage-Backed Securities - 2.8% | | | | | |
| | |
Chase Home Lending Mortgage Trust Series | | | | | | | | |
Series 2024-1, Class A6 6.500%, 01/25/552,4 | | | 393,766 | | | | 396,061 | |
| | |
DATA Mortgage Trust | | | | | | | | |
Series 2023-CNTR, Class A 5.728%, 08/12/432,4 | | | 600,000 | | | | 614,001 | |
| | |
FREMF Mortgage Trust | | | | | | | | |
Series 2016-K53, Class B 4.024%, 03/25/492,4 | | | 700,000 | | | | 688,964 | |
| | |
GS Mortgage-Backed Securities Corp. Trust | | | | | | | | |
Series 2021-PJ4, Class A6 2.500%, 09/25/512,4 | | | 806,677 | | | | 739,929 | |
Series 2021-PJ9, Class A8 2.500%, 02/26/522,4 | | | 475,272 | | | | 415,287 | |
| | |
JP Morgan Mortgage Trust | | | | | | | | |
Series 2021-7, Class A6 2.500%, 11/25/512,4 | | | 586,671 | | | | 536,891 | |
| |
Total Mortgage-Backed Securities
(Cost $3,386,234) | | | | 3,391,133 | |
| |
| Municipal Bonds - 3.3% | | | | | |
| | |
California Health Facilities Financing Authority
4.190%, 06/01/37 | | | 775,000 | | | | 720,305 | |
| | |
California State General Obligation, School Improvements, Build America Bonds
7.550%, 04/01/39 | | | 1,460,000 | | | | 1,769,687 | |
| | |
JobsOhio Beverage System, Series B Build America Bonds,
4.532%, 01/01/35 | | | 1,505,000 | | | | 1,489,134 | |
| |
Total Municipal Bonds
(Cost $4,478,419) | | | | 3,979,126 | |
| |
| U.S. Government and Agency Obligations - 49.1% | | | | | |
| | |
Fannie Mae - 21.3% | | | | | | | | |
| | |
FNMA | | | | | | | | |
2.000%, 02/01/36 | | | 631,330 | | | | 568,477 | |
3.000%, 06/01/38 to 12/01/50 | | | 1,187,800 | | | | 1,098,769 | |
3.500%, 03/01/30 to 07/01/50 | | | 6,540,600 | | | | 6,038,838 | |
4.000%, 03/01/44 to 01/01/51 | | | 6,767,347 | | | | 6,375,061 | |
4.500%, 04/01/39 to 08/01/52 | | | 6,918,852 | | | | 6,752,391 | |
5.000%, 07/01/47 to 02/01/49 | | | 1,613,057 | | | | 1,611,334 | |
5.500%, 07/01/53 | | | 1,749,313 | | | | 1,733,547 | |
6.500%, 02/01/54 | | | 1,089,545 | | | | 1,130,056 | |
| | |
Total Fannie Mae | | | | | | | 25,308,473 | |
The accompanying notes are an integral part of these financial statements.
3
| | |
| | AMG GW&K Core Bond ESG Fund Schedule of Portfolio Investments (continued) |
| | | | | | | | |
| | | Principal
Amount | | | Value | |
| |
Freddie Mac - 14.4% | | | | | |
| | |
FHLMC
2.500%, 10/01/34 | | | $2,042,825 | | | | $1,884,913 | |
3.000%, 11/01/49 to 03/01/50 | | | 3,543,136 | | | | 3,113,475 | |
3.500%, 10/01/45 | | | 3,126,234 | | | | 2,856,486 | |
4.000%, 07/01/48 to 09/01/50 | | | 1,913,354 | | | | 1,797,515 | |
5.000%, 07/01/44 | | | 945,669 | | | | 948,274 | |
5.500%, 06/01/53 | | | 2,387,294 | | | | 2,383,451 | |
| | |
FHLMC Gold Pool
3.500%, 07/01/32 to 05/01/44 | | | 940,392 | | | | 893,908 | |
| | |
Freddie Mac REMICS | | | | | | | | |
Series 5106, Class KA
2.000%, 03/25/41 | | | 1,283,142 | | | | 1,187,122 | |
Series 5297, Class DA
5.000%, 12/25/52 | | | 589,366 | | | | 578,908 | |
| | |
Freddie Mac STACR REMIC Trust | | | | | | | | |
Series 2022-DNA1, Class M1A 5.857%, 01/25/422,4 | | | 879,329 | | | | 879,328 | |
Series 2024-DNA1, Class M1 6.207%, 02/25/442,4 | | | 574,802 | | | | 575,513 | |
| | |
Total Freddie Mac | | | | | | | 17,098,893 | |
| |
Ginnie Mae - 0.5% | | | | | |
| | |
GNMA | | | | | | | | |
Series 2023-111, Class FD
(1 month SOFR + 1.000%, Cap 7.000%, Floor 1.000%), 5.890%, 08/20/534 | | | 592,133 | | | | 592,137 | |
| |
U.S. Treasury Obligations - 12.9% | | | | | |
| | |
U.S. Treasury Bonds
1.875%, 02/15/51 | | | 3,558,000 | | | | 2,096,440 | |
2.250%, 05/15/41 | | | 7,147,000 | | | | 5,252,208 | |
| 1 | Some of these securities, amounting to $5,395,413 or 4.5% of net assets, were out on loan to various borrowers and are collateralized by cash and various U.S. Treasury Obligations. See Note 4 of Notes to Financial Statements. |
| 2 | Security exempt from registration under Rule 144A of the Securities Act of 1933. These securities may be resold in transactions exempt from registration, normally to qualified institutional buyers. At October 31, 2024, the value of these securities amounted to $8,674,852 or 7.3% of net assets. |
| 3 | Fixed to variable rate investment. The rate shown reflects the fixed rate in effect at October 31, 2024. Rate will reset at a future date. |
| 4 | Variable rate security. The rate shown is based on the latest available information as of October 31, 2024. Certain variable rate securities are not based on a published reference rate and spread but are determined by the issuer or agent and are based on current market conditions. These securities do not indicate a reference rate and spread in their description above. |
| 5 | Perpetuity Bond. The date shown represents the next call date. |
| | | | | | | | |
| | | Principal
Amount | | | Value | |
| | |
U.S. Treasury Bonds
3.125%, 05/15/48 | | | $4,369,000 | | | | $3,426,081 | |
3.500%, 02/15/39 | | | 3,037,000 | | | | 2,756,315 | |
3.625%, 02/15/53 | | | 1,500,000 | | | | 1,287,363 | |
| | |
U.S. Treasury Notes
4.000%, 02/28/30 | | | 456,000 | | | | 452,170 | |
| | |
Total U.S. Treasury Obligations | | | | | | | 15,270,577 | |
| |
Total U.S. Government and Agency Obligations
(Cost $65,862,854) | | | | 58,270,080 | |
| |
Short-Term Investments - 1.1% | | | | | |
| |
Joint Repurchase Agreements - 0.8%6 | | | | | |
| | |
Daiwa Capital Markets America, dated 10/31/24, due 11/01/24, 4.890% total to be received $966,642 (collateralized by various U.S. Government Agency Obligations and U.S. Treasuries, 0.625% - 7.500%, 05/15/25 - 11/01/54, totaling $985,841) | | | 966,511 | | | | 966,511 | |
| |
Repurchase Agreements - 0.3% | | | | | |
| | |
Fixed Income Clearing Corp., dated 10/31/24, due 11/01/24, 4.650% total to be received $371,048 (collateralized by a U.S. Treasury Note, 3.375%, 05/15/33, totaling $378,491) | | | 371,000 | | | | 371,000 | |
| | |
Total Short-Term Investments
(Cost $1,337,511) | | | | | | | 1,337,511 | |
| | |
Total Investments - 100.2%
(Cost $130,468,373) | | | | | | | 119,028,727 | |
| |
Other Assets, less Liabilities - (0.2)% | | | | (249,151 | ) |
| | |
Net Assets - 100.0% | | | | | | | $118,779,576 | |
| 6 | Cash collateral received for securities lending activity was invested in these joint repurchase agreements. |
| | |
| CMT | | Constant Maturity Treasury |
| |
| DAC | | Designated Activity Co. |
| |
| FHLMC | | Freddie Mac |
| |
| FNMA | | Fannie Mae |
| |
| GNMA | | Ginnie Mae |
| |
| MTN | | Medium-Term Note |
| |
| REMICS | | Real Estate Mortgage Investment Conduit |
| |
| SOFR | | Secured Overnight Financing Rate |
| |
| STACR | | Structured Agency Credit Risk |
The accompanying notes are an integral part of these financial statements.
4
| | |
| | AMG GW&K Core Bond ESG Fund Schedule of Portfolio Investments (continued) |
The following table summarizes the inputs used to value the Fund’s investments by the fair value hierarchy levels as of October 31, 2024:
| | | | | | | | | | | | | | | | | | | | | | | | | | | | |
| | | Level 1 | | | | | | Level 2 | | | | | | Level 3 | | | | | | Total | |
Investments in Securities | | | | | | | | | | | | | | | | | | | | | | | | | | | | |
| | | | | | | |
Corporate Bonds and Notes† | | | — | | | | | | | | $48,063,945 | | | | | | | | — | | | | | | | | $48,063,945 | |
| | | | | | | |
Asset-Backed Securities | | | — | | | | | | | | 3,986,932 | | | | | | | | — | | | | | | | | 3,986,932 | |
| | | | | | | |
Mortgage-Backed Securities | | | — | | | | | | | | 3,391,133 | | | | | | | | — | | | | | | | | 3,391,133 | |
| | | | | | | |
Municipal Bonds | | | — | | | | | | | | 3,979,126 | | | | | | | | — | | | | | | | | 3,979,126 | |
| | | | | | | |
U.S. Government and Agency Obligations† | | | — | | | | | | | | 58,270,080 | | | | | | | | — | | | | | | | | 58,270,080 | |
| | | | | | | |
Short-Term Investments | | | | | | | | | | | | | | | | | | | | | | | | | | | | |
| | | | | | | |
Joint Repurchase Agreements | | | — | | | | | | | | 966,511 | | | | | | | | — | | | | | | | | 966,511 | |
| | | | | | | |
Repurchase Agreements | | | — | | | | | | | | 371,000 | | | | | | | | — | | | | | | | | 371,000 | |
| | | | | | | | | | | | | | | | | | | | | | | | | | | | |
| | | | | | | |
Total Investments in Securities | | | — | | | | | | | | $119,028,727 | | | | | | | | — | | | | | | | | $119,028,727 | |
| | | | | | | | | | | | | | | | | | | | | | | | | | | | |
| | † | All corporate bonds and notes and U.S. government and agency obligations held in the Fund are Level 2 securities. For a detailed breakout of corporate bonds and notes and U.S. government and agency obligations by major industry or agency classification, please refer to the Fund’s Schedule of Portfolio Investments. |
For the fiscal year ended October 31, 2024, there were no transfers in or out of Level 3.
The accompanying notes are an integral part of these financial statements.
5
| | |
| | AMG GW&K Small/Mid Cap Growth Fund Schedule of Portfolio Investments October 31, 2024 |
| | | | | | | | |
| | | Shares | | | Value | |
| |
Common Stocks - 97.3% | | | | | |
| |
Consumer Discretionary - 12.8% | | | | | |
| | |
Asbury Automotive Group, Inc.* | | | 1,841 | | | | $419,454 | |
| | |
Bright Horizons Family Solutions, Inc.* | | | 1,983 | | | | 264,671 | |
| | |
Burlington Stores, Inc.* | | | 3,195 | | | | 791,625 | |
| | |
Churchill Downs, Inc. | | | 4,714 | | | | 660,431 | |
| | |
Grand Canyon Education, Inc.* | | | 4,799 | | | | 657,991 | |
| | |
Krispy Kreme, Inc.1 | | | 21,510 | | | | 244,569 | |
| | |
LKQ Corp. | | | 10,159 | | | | 373,750 | |
| | |
Pool Corp. | | | 1,324 | | | | 478,811 | |
| | |
Revolve Group, Inc.*,1 | | | 13,870 | | | | 344,253 | |
| | |
Texas Roadhouse, Inc. | | | 4,885 | | | | 933,621 | |
| | |
Vail Resorts, Inc. | | | 990 | | | | 164,033 | |
| | |
Total Consumer Discretionary | | | | | | | 5,333,209 | |
| |
Consumer Staples - 1.4% | | | | | |
| | |
Performance Food Group Co.* | | | 7,434 | | | | 604,013 | |
| |
Energy - 4.0% | | | | | |
| | |
ChampionX Corp. | | | 10,280 | | | | 290,102 | |
| | |
Matador Resources Co. | | | 13,110 | | | | 683,162 | |
| | |
Ovintiv, Inc. | | | 9,062 | | | | 355,230 | |
| | |
Permian Resources Corp. | | | 24,700 | | | | 336,661 | |
| | |
Total Energy | | | | | | | 1,665,155 | |
| |
Financials - 7.1% | | | | | |
| | |
Evercore, Inc., Class A | | | 2,814 | | | | 743,374 | |
| | |
Houlihan Lokey, Inc. | | | 4,955 | | | | 856,075 | |
| | |
MarketAxess Holdings, Inc. | | | 1,485 | | | | 429,789 | |
| | |
Pinnacle Financial Partners, Inc. | | | 5,099 | | | | 537,690 | |
| | |
RLI Corp. | | | 2,600 | | | | 405,522 | |
| | |
Total Financials | | | | | | | 2,972,450 | |
| |
Health Care - 23.0% | | | | | |
| | |
Acadia Healthcare Co., Inc.* | | | 9,695 | | | | 413,880 | |
| | |
Agios Pharmaceuticals, Inc.* | | | 12,454 | | | | 553,331 | |
| | |
Azenta, Inc.* | | | 11,992 | | | | 492,751 | |
| | |
Bio-Rad Laboratories, Inc., Class A* | | | 1,031 | | | | 369,294 | |
| | |
Chemed Corp. | | | 859 | | | | 464,066 | |
| | |
Crinetics Pharmaceuticals, Inc.* | | | 12,455 | | | | 696,982 | |
| | |
Globus Medical, Inc., Class A* | | | 8,673 | | | | 637,813 | |
| | |
Halozyme Therapeutics, Inc.* | | | 9,735 | | | | 492,299 | |
| | |
HealthEquity, Inc.* | | | 7,036 | | | | 599,819 | |
| | |
Insmed, Inc.* | | | 8,630 | | | | 580,626 | |
| | |
Intra-Cellular Therapies, Inc.* | | | 7,643 | | | | 647,744 | |
| | |
Medpace Holdings, Inc.* | | | 1,439 | | | | 452,163 | |
| | |
Natera, Inc.* | | | 4,751 | | | | 574,681 | |
| | | | | | | | |
| | | Shares | | | Value | |
| | |
Neurocrine Biosciences, Inc.* | | | 4,233 | | | | $509,103 | |
| | |
Phathom Pharmaceuticals, Inc.*,1 | | | 33,153 | | | | 568,574 | |
| | |
SpringWorks Therapeutics, Inc.*,1 | | | 13,310 | | | | 401,030 | |
| | |
Ultragenyx Pharmaceutical, Inc.* | | | 11,764 | | | | 599,846 | |
| | |
Veracyte, Inc.* | | | 16,515 | | | | 557,216 | |
| | |
Total Health Care | | | | | | | 9,611,218 | |
| |
Industrials - 22.0% | | | | | |
| | |
API Group Corp.* | | | 20,096 | | | | 686,077 | |
| | |
Applied Industrial Technologies, Inc. | | | 1,852 | | | | 428,905 | |
| | |
Booz Allen Hamilton Holding Corp. | | | 3,666 | | | | 665,966 | |
| | |
CACI International, Inc., Class A* | | | 1,433 | | | | 791,819 | |
| | |
Chart Industries, Inc.*,1 | | | 4,085 | | | | 493,141 | |
| | |
Graco, Inc. | | | 5,081 | | | | 413,848 | |
| | |
IDEX Corp. | | | 2,914 | | | | 625,461 | |
| | |
ITT, Inc. | | | 5,741 | | | | 804,429 | |
| | |
Knight-Swift Transportation Holdings, Inc. | | | 5,802 | | | | 302,168 | |
| | |
Nordson Corp. | | | 1,542 | | | | 382,246 | |
| | |
Paylocity Holding Corp.* | | | 3,704 | | | | 683,647 | |
| | |
RBC Bearings, Inc.* | | | 2,364 | | | | 662,747 | |
| | |
SiteOne Landscape Supply, Inc.* | | | 4,788 | | | | 669,075 | |
| | |
SS&C Technologies Holdings, Inc. | | | 4,094 | | | | 286,293 | |
| | |
Sterling Infrastructure, Inc.* | | | 3,217 | | | | 496,866 | |
| | |
The Toro Co. | | | 4,627 | | | | 372,381 | |
| | |
Trex Co., Inc.* | | | 6,288 | | | | 445,505 | |
| | |
Total Industrials | | | | | | | 9,210,574 | |
| |
Information Technology - 20.2% | | | | | |
| | |
CCC Intelligent Solutions Holdings, Inc.* | | | 53,565 | | | | 557,612 | |
| | |
Cognex Corp. | | | 16,590 | | | | 667,416 | |
| | |
CyberArk Software, Ltd. (Israel)* | | | 3,721 | | | | 1,028,931 | |
| | |
The Descartes Systems Group, Inc. (Canada)* | | | 5,177 | | | | 538,046 | |
| | |
Entegris, Inc. | | | 7,512 | | | | 786,582 | |
| | |
Globant SA (Uruguay)* | | | 3,705 | | | | 777,642 | |
| | |
MACOM Technology Solutions Holdings, Inc.* | | | 6,651 | | | | 747,572 | |
| | |
Manhattan Associates, Inc.* | | | 2,898 | | | | 763,217 | |
| | |
Power Integrations, Inc.1 | | | 4,194 | | | | 253,443 | |
| | |
Procore Technologies, Inc.* | | | 8,469 | | | | 555,990 | |
| | |
Silicon Laboratories, Inc.* | | | 2,819 | | | | 292,781 | |
| | |
Tyler Technologies, Inc.* | | | 1,479 | | | | 895,668 | |
| | |
Zebra Technologies Corp., Class A* | | | 1,520 | | | | 580,594 | |
| | |
Total Information Technology | | | | | | | 8,445,494 | |
| |
Materials - 4.8% | | | | | |
| | |
AptarGroup, Inc. | | | 2,975 | | | | 499,532 | |
| | |
Avient Corp. | | | 9,499 | | | | 442,748 | |
The accompanying notes are an integral part of these financial statements.
6
| | |
| | AMG GW&K Small/Mid Cap Growth Fund Schedule of Portfolio Investments (continued) |
| | | | | | | | |
| | | Shares | | | Value | |
| | |
Materials - 4.8% (continued) | | | | | | | | |
| | |
Eagle Materials, Inc. | | | 1,710 | | | | $488,137 | |
| | |
RPM International, Inc. | | | 4,575 | | | | 581,528 | |
| | |
Total Materials | | | | | | | 2,011,945 | |
| |
Real Estate - 2.0% | | | | | |
| | |
EastGroup Properties, Inc., REIT | | | 2,816 | | | | 482,324 | |
| | |
Sun Communities, Inc., REIT | | | 2,792 | | | | 370,443 | |
| | |
Total Real Estate | | | | | | | 852,767 | |
| | |
Total Common Stocks | | | | | | | | |
(Cost $34,816,133) | | | | | | | 40,706,825 | |
| | |
Rights - 0.0% | | | | | | | | |
| |
Health Care - 0.0% | | | | | |
| | |
Abiomed, Inc.*,2,3 | | | | | | | | |
(Cost $0) | | | 1,175 | | | | 0 | |
| * | Non-income producing security. |
| 1 | Some of these securities, amounting to $1,950,912 or 4.7% of net assets, were out on loan to various borrowers and are collateralized by various U.S. Treasury Obligations. See Note 4 of Notes to Financial Statements. |
| 2 | Security’s value was determined by using significant unobservable inputs. |
| 3 | This security is restricted and not available for re-sale. The Fund received Contingent Value Rights (“CVRs”) of Abiomed Inc (“ABIOMED”) from a corporate action where Johnson & Johnson acquired ABIOMED on December 23, 2022. The total value of this restricted security held is $0 which represents 0% of net assets. |
| | | | | | | | |
| | |
| | | Principal
Amount | | | Value | |
| |
Short-Term Investments - 2.9% | | | | | |
| |
Repurchase Agreements - 2.9% | | | | | |
| | |
Fixed Income Clearing Corp., dated 10/31/24, due 11/01/24, 4.650% total to be received $1,194,154 (collateralized by a U.S. Treasury Note, 3.375%, 05/15/33, totaling $1,217,888) | | | $1,194,000 | | | | $1,194,000 | |
| | |
Total Short-Term Investments | | | | | | | | |
(Cost $1,194,000) | | | | | | | 1,194,000 | |
| |
Total Investments - 100.2% | | | | | |
(Cost $36,010,133) | | | | | | | 41,900,825 | |
| |
Other Assets, less Liabilities - (0.2)% | | | | (66,619 | ) |
| | |
Net Assets - 100.0% | | | | | | | $41,834,206 | |
REIT Real Estate Investment Trust
The accompanying notes are an integral part of these financial statements.
7
| | |
| | AMG GW&K Small/Mid Cap Growth Fund Schedule of Portfolio Investments (continued) |
The following table summarizes the inputs used to value the Fund’s investments by the fair value hierarchy levels as of October 31, 2024:
| | | | | | | | | | | | | | | | | | | | | | | | | | | | | | | | |
| | | | | | Level 1 | | | | | | Level 2 | | | | | | Level 3 | | | | | | Total | |
Investments in Securities | | | | | | | | | | | | | | | | | | | | | | | | | | | | | | | | |
| | | | | | | | |
Common Stocks† | | | | | | | $40,706,825 | | | | | | | | — | | | | | | | | — | | | | | | | | $40,706,825 | |
| | | | | | | | |
Rights | | | | | | | | | | | | | | | | | | | | | | | | | | | | | | | | |
| | | | | | | | |
Health Care | | | | | | | — | | | | | | | | — | | | | | | | | $0 | | | | | | | | — | |
| | | | | | | | |
Short-Term Investments | | | | | | | | | | | | | | | | | | | | | | | | | | | | | | | | |
| | | | | | | | |
Repurchase Agreements | | | | | | | — | | | | | | | | $1,194,000 | | | | | | | | — | | | | | | | | 1,194,000 | |
| | | | | | | | | | | | | | | | | | | | | | | | | | | | | | | | |
| | | | | | | | |
Total Investments in Securities | | | | | | | $40,706,825 | | | | | | | | $1,194,000 | | | | | | | | $0 | | | | | | | | $41,900,825 | |
| | | | | | | | | | | | | | | | | | | | | | | | | | | | | | | | |
| † | All common stocks held in the Fund are Level 1 securities. For a detailed breakout of common stocks by major industry classification, please refer to the Fund’s Schedule of Portfolio Investments. |
For the fiscal year ended October 31, 2024, there were no transfers in or out of Level 3. The Fund did not have any purchases and sales of Level 3 securities for the same period. The Level 3 rights were received as a result of a corporate action. The security’s value was determined by using significant unobservable inputs. For the fiscal year ended October 31, 2024, the change in unrealized appreciation (depreciation) was $0.
The accompanying notes are an integral part of these financial statements.
8
| | |
| | Statement of Assets and Liabilities October 31, 2024 |
| | | | | | | | |
| | | AMG GW&K
Core Bond
ESG Fund | | | AMG GW&K
Small/Mid Cap
Growth Fund | |
| | |
Assets: | | | | | | | | |
| | |
Investments at value1 (including securities on loan valued at $5,395,413, and $1,950,912, respectively) | | | $119,028,727 | | | | $41,900,825 | |
| | |
Cash | | | 939 | | | | 863 | |
| | |
Dividend and interest receivables | | | 915,849 | | | | 4,293 | |
| | |
Securities lending income receivable | | | 1,895 | | | | 1,452 | |
| | |
Receivable for Fund shares sold | | | 824 | | | | 1,507 | |
| | |
Receivable from affiliate | | | 23,610 | | | | 10,246 | |
| | |
Prepaid expenses and other assets | | | 13,164 | | | | 9,305 | |
| | |
Total assets | | | 119,985,008 | | | | 41,928,491 | |
| | |
Liabilities: | | | | | | | | |
| | |
Payable upon return of securities loaned | | | 966,511 | | | | — | |
| | |
Payable for Fund shares repurchased | | | 75,393 | | | | 5,445 | |
| | |
Accrued expenses: | | | | | | | | |
| | |
Investment advisory and management fees | | | 30,766 | | | | 22,179 | |
| | |
Administrative fees | | | 15,383 | | | | 5,366 | |
| | |
Distribution fees | | | 478 | | | | 5,386 | |
| | |
Shareholder service fees | | | 8,755 | | | | 399 | |
| | |
Other | | | 108,146 | | | | 55,510 | |
| | |
Total liabilities | | | 1,205,432 | | | | 94,285 | |
|
Commitments and Contingencies (Notes 2 & 6) | |
| | |
Net Assets | | | $118,779,576 | | | | $41,834,206 | |
| | |
1 Investments at cost | | | $130,468,373 | | | | $36,010,133 | |
The accompanying notes are an integral part of these financial statements.
9
| | |
| | Statement of Assets and Liabilities (continued) |
| | | | | | | | |
| | | AMG GW&K
Core Bond
ESG Fund | | | AMG GW&K
Small/Mid Cap
Growth Fund |
| | |
Net Assets Represent: | | | | | | | | |
| | |
Paid-in capital | | | $142,074,915 | | | | $35,796,714 | |
| | |
Total distributable earnings (loss) | | | (23,295,339 | ) | | | 6,037,492 | |
| | |
Net Assets | | | $118,779,576 | | | | $41,834,206 | |
| | |
Class N: | | | | | | | | |
| | |
Net Assets | | | $2,229,091 | | | | $32,462,605 | |
| | |
Shares outstanding | | | 249,253 | | | | 1,897,147 | |
| | |
Net asset value, offering and redemption price per share | | | $8.94 | | | | $17.11 | |
| | |
Class I: | | | | | | | | |
| | |
Net Assets | | | $115,231,786 | | | | $9,341,074 | |
| | |
Shares outstanding | | | 12,877,492 | | | | 522,032 | |
| | |
Net asset value, offering and redemption price per share | | | $8.95 | | | | $17.89 | |
| | |
Class Z: | | | | | | | | |
| | |
Net Assets | | | $1,318,699 | | | | $30,527 | |
| | |
Shares outstanding | | | 147,470 | | | | 1,703 | |
| | |
Net asset value, offering and redemption price per share | | | $8.94 | | | | $17.93 | |
The accompanying notes are an integral part of these financial statements.
10
| | |
| | Statement of Operations For the fiscal year ended October 31, 2024 |
| | | | | | | | | | |
| | | AMG GW&K
Core Bond
ESG Fund | | AMG GW&K
Small/Mid Cap
Growth Fund |
| | |
Investment Income: | | | | | | | | | | |
| | |
Dividend income | | | | — | | | | | $225,555 | |
| | |
Interest income | | | | $4,887,574 | | | | | 41,805 | |
| | |
Securities lending income | | | | 6,918 | | | | | 9,780 | |
| | |
Foreign withholding tax | | | | — | | | | | (1,696 | ) |
| | |
Total investment income | | | | 4,894,492 | | | | | 275,444 | |
| | |
Expenses: | | | | | | | | | | |
| | |
Investment advisory and management fees | | | | 370,276 | | | | | 246,740 | |
| | |
Administrative fees | | | | 185,138 | | | | | 59,695 | |
| | |
Distribution fees - Class N | | | | 5,346 | | | | | 60,376 | |
| | |
Shareholder servicing fees - Class N | | | | 3,207 | | | | | — | |
| | |
Shareholder servicing fees - Class I | | | | 81,439 | | | | | 4,271 | |
| | |
Professional fees | | | | 66,576 | | | | | 29,735 | |
| | |
Reports to shareholders | | | | 49,125 | | | | | 18,179 | |
| | |
Registration fees | | | | 33,944 | | | | | 23,623 | |
| | |
Custodian fees | | | | 28,182 | | | | | 21,597 | |
| | |
Transfer agent fees | | | | 14,697 | | | | | 7,101 | |
| | |
Trustee fees and expenses | | | | 10,544 | | | | | 3,347 | |
| | |
Interest expense | | | | 1,518 | | | | | 426 | |
| | |
Miscellaneous | | | | 9,581 | | | | | 5,606 | |
| | |
Total expenses before offsets | | | | 859,573 | | | | | 480,696 | |
| | |
Expense reimbursements | | | | (175,621 | ) | | | | (89,289 | ) |
| | |
Expense reductions | | | | — | | | | | (1,441 | ) |
| | |
Net expenses | | | | 683,952 | | | | | 389,966 | |
| | |
| | | | | | | | | | |
| | |
Net investment income (loss) | | | | 4,210,540 | | | | | (114,522 | ) |
| | |
Net Realized and Unrealized Gain: | | | | | | | | | | |
| | |
Net realized gain (loss) on investments | | | | (2,662,819 | ) | | | | 545,745 | |
| | |
Net change in unrealized appreciation/depreciation on investments | | | | 11,526,621 | | | | | 9,064,856 | |
| | |
Net realized and unrealized gain | | | | 8,863,802 | | | | | 9,610,601 | |
| | |
| | | | | | | | | | |
| | |
Net increase in net assets resulting from operations | | | | $13,074,342 | | | | | $9,496,079 | |
The accompanying notes are an integral part of these financial statements.
11
| | |
| | Statements of Changes in Net Assets For the fiscal years ended October 31, |
| | | | | | | | | | | | | | | | |
| | | AMG GW&K
Core Bond ESG Fund | | AMG GW&K
Small/Mid Cap
Growth Fund |
| | | | |
| | | 2024 | | 2023 | | 2024 | | 2023 |
| | | | |
Increase in Net Assets Resulting From Operations: | | | | | | | | | | | | | | | | |
| | | | |
Net investment income (loss) | | | $4,210,540 | | | | $4,046,025 | | | | $(114,522 | ) | | | $(90,598 | ) |
| | | | |
Net realized gain (loss) on investments | | | (2,662,819 | ) | | | (5,580,179 | ) | | | 545,745 | | | | (174,467 | ) |
| | | | |
Net change in unrealized appreciation/depreciation on investments | | | 11,526,621 | | | | 2,763,863 | | | | 9,064,856 | | | | 436,818 | |
| | | | |
Net increase in net assets resulting from operations | | | 13,074,342 | | | | 1,229,709 | | | | 9,496,079 | | | | 171,753 | |
| | | | |
Distributions to Shareholders: | | | | | | | | | | | | | | | | |
| | | | |
Class N | | | (65,847 | ) | | | (51,357 | ) | | | — | | | | (496,550 | ) |
| | | | |
Class I | | | (4,094,887 | ) | | | (3,948,393 | ) | | | — | | | | (126,577 | ) |
| | | | |
Class Z | | | (46,940 | ) | | | (47,130 | ) | | | — | | | | (448 | ) |
| | | | |
Total distributions to shareholders | | | (4,207,674 | ) | | | (4,046,880 | ) | | | — | | | | (623,575 | ) |
| | | | |
Capital Share Transactions:1 | | | | | | | | | | | | | | | | |
| | | | |
Net increase (decrease) from capital share transactions | | | (12,493,997 | ) | | | (16,492,501 | ) | | | (2,366,458 | ) | | | 3,611,251 | |
| | | | | | | | | | | | | | | | |
| | | | |
Total increase (decrease) in net assets | | | (3,627,329 | ) | | | (19,309,672 | ) | | | 7,129,621 | | | | 3,159,429 | |
| | | | |
Net Assets: | | | | | | | | | | | | | | | | |
| | | | |
Beginning of year | | | 122,406,905 | | | | 141,716,577 | | | | 34,704,585 | | | | 31,545,156 | |
| | | | |
End of year | | | $118,779,576 | | | | $122,406,905 | | | | $41,834,206 | | | | $34,704,585 | |
1 See Note 1(g) of the Notes to Financial Statements.
The accompanying notes are an integral part of these financial statements.
12
| | |
| | AMG GW&K Core Bond ESG Fund Financial Highlights For a share outstanding throughout each fiscal year |
| | | | | | | | | | | | | | | | | | | | | | | | | |
| | | For the fiscal years ended October 31, |
| | | | | |
| Class N | | 2024 | | 2023 | | 2022 | | 2021 | | 2020 |
| | | | | |
Net Asset Value, Beginning of Year | | | | $8.33 | | | | | $8.56 | | | | | $10.75 | | | | | $10.90 | | | | | $10.53 | |
| | | | | |
Income (loss) from Investment Operations: | | | | | | | | | | | | | | | | | | | | | | | | | |
| | | | | |
Net investment income1,2 | | | | 0.28 | | | | | 0.23 | | | | | 0.14 | | | | | 0.12 | | | | | 0.18 | |
| | | | | |
Net realized and unrealized gain (loss) on investments | | | | 0.61 | | | | | (0.23 | ) | | | | (1.93 | ) | | | | (0.15 | ) | | | | 0.37 | |
| | | | | |
Total income (loss) from investment operations | | | | 0.89 | | | | | — | | | | | (1.79 | ) | | | | (0.03 | ) | | | | 0.55 | |
| | | | | |
Less Distributions to Shareholders from: | | | | | | | | | | | | | | | | | | | | | | | | | |
| | | | | |
Net investment income | | | | (0.28 | ) | | | | (0.23 | ) | | | | (0.15 | ) | | | | (0.12 | ) | | | | (0.18 | ) |
| | | | | |
Net realized gain on investments | | | | — | | | | | — | | | | | (0.25 | ) | | | | — | | | | | — | |
| | | | | |
Total distributions to shareholders | | | | (0.28 | ) | | | | (0.23 | ) | | | | (0.40 | ) | | | | (0.12 | ) | | | | (0.18 | ) |
| | | | | |
Net Asset Value, End of Year | | | | $8.94 | | | | | $8.33 | | | | | $8.56 | | | | | $10.75 | | | | | $10.90 | |
| | | | | |
Total Return2,3 | | | | 10.70 | % | | | | (0.15 | )% | | | | (17.18 | )% | | | | (0.27 | )% | | | | 5.31 | % |
| | | | | |
Ratio of net expenses to average net assets | | | | 0.88 | %4 | | | | 0.88 | % | | | | 0.88 | % | | | | 0.88 | % | | | | 0.88 | % |
| | | | | |
Ratio of gross expenses to average net assets5 | | | | 1.02 | % | | | | 0.99 | % | | | | 0.95 | % | | | | 0.94 | % | | | | 0.96 | % |
| | | | | |
Ratio of net investment income to average net assets2 | | | | 3.08 | % | | | | 2.55 | % | | | | 1.49 | % | | | | 1.12 | % | | | | 1.69 | % |
| | | | | |
Portfolio turnover | | | | 34 | % | | | | 25 | % | | | | 34 | % | | | | 62 | % | | | | 56 | % |
| | | | | |
Net assets end of year (000’s) omitted | | | | $2,229 | | | | | $1,937 | | | | | $1,716 | | | | | $2,125 | | | | | $1,905 | |
| | | | | | | | | | | | | | | | | | | | | | | | | | |
The accompanying notes are an integral part of these financial statements.
13
| | |
| | AMG GW&K Core Bond ESG Fund Financial Highlights For a share outstanding throughout each fiscal year |
| | | | | | | | | | | | | | | | | | | | | | | | | |
| | | For the fiscal years ended October 31, |
| | | | | |
| Class I | | 2024 | | 2023 | | 2022 | | 2021 | | 2020 |
| | | | | |
Net Asset Value, Beginning of Year | | | | $8.34 | | | | | $8.56 | | | | | $10.76 | | | | | $10.90 | | | | | $10.54 | |
| | | | | |
Income (loss) from Investment Operations: | | | | | | | | | | | | | | | | | | | | | | | | | |
| | | | | |
Net investment income1,2 | | | | 0.30 | | | | | 0.25 | | | | | 0.18 | | | | | 0.16 | | | | | 0.22 | |
| | | | | |
Net realized and unrealized gain (loss) on investments | | | | 0.62 | | | | | (0.21 | ) | | | | (1.95 | ) | | | | (0.14 | ) | | | | 0.36 | |
| | | | | |
Total income (loss) from investment operations | | | | 0.92 | | | | | 0.04 | | | | | (1.77 | ) | | | | 0.02 | | | | | 0.58 | |
| | | | | |
Less Distributions to Shareholders from: | | | | | | | | | | | | | | | | | | | | | | | | | |
| | | | | |
Net investment income | | | | (0.31 | ) | | | | (0.26 | ) | | | | (0.18 | ) | | | | (0.16 | ) | | | | (0.22 | ) |
| | | | | |
Net realized gain on investments | | | | — | | | | | — | | | | | (0.25 | ) | | | | — | | | | | — | |
| | | | | |
Total distributions to shareholders | | | | (0.31 | ) | | | | (0.26 | ) | | | | (0.43 | ) | | | | (0.16 | ) | | | | (0.22 | ) |
| | | | | |
Net Asset Value, End of Year | | | | $8.95 | | | | | $8.34 | | | | | $8.56 | | | | | $10.76 | | | | | $10.90 | |
| | | | | |
Total Return2,3 | | | | 11.06 | % | | | | 0.30 | % | | | | (16.99 | )% | | | | 0.15 | % | | | | 5.55 | % |
| | | | | |
Ratio of net expenses to average net assets | | | | 0.55 | %4 | | | | 0.55 | % | | | | 0.55 | % | | | | 0.56 | % | | | | 0.55 | % |
| | | | | |
Ratio of gross expenses to average net assets5 | | | | 0.69 | % | | | | 0.66 | % | | | | 0.62 | % | | | | 0.62 | % | | | | 0.63 | % |
| | | | | |
Ratio of net investment income to average net assets2 | | | | 3.41 | % | | | | 2.88 | % | | | | 1.82 | % | | | | 1.44 | % | | | | 2.01 | % |
| | | | | |
Portfolio turnover | | | | 34 | % | | | | 25 | % | | | | 34 | % | | | | 62 | % | | | | 56 | % |
| | | | | |
Net assets end of year (000’s) omitted | | | | $115,232 | | | | | $119,191 | | | | | $137,806 | | | | | $190,306 | | | | | $202,363 | |
| | | | | | | | | | | | | | | | | | | | | | | | | | |
The accompanying notes are an integral part of these financial statements.
14
| | |
| | AMG GW&K Core Bond ESG Fund Financial Highlights For a share outstanding throughout each fiscal year |
| | | | | | | | | | | | | | | | | | | | | | | | | |
| | | For the fiscal years ended October 31, |
| | | | | |
| Class Z | | 2024 | | 2023 | | 2022 | | 2021 | | 2020 |
| | | | | |
Net Asset Value, Beginning of Year | | | | $8.33 | | | | | $8.56 | | | | | $10.75 | | | | | $10.90 | | | | | $10.53 | |
| | | | | |
Income (loss) from Investment Operations: | | | | | | | | | | | | | | | | | | | | | | | | | |
| | | | | |
Net investment income1,2 | | | | 0.31 | | | | | 0.26 | | | | | 0.18 | | | | | 0.16 | | | | | 0.22 | |
| | | | | |
Net realized and unrealized gain (loss) on investments | | | | 0.61 | | | | | (0.23 | ) | | | | (1.94 | ) | | | | (0.15 | ) | | | | 0.38 | |
| | | | | |
Total income (loss) from investment operations | | | | 0.92 | | | | | 0.03 | | | | | (1.76 | ) | | | | 0.01 | | | | | 0.60 | |
| | | | | |
Less Distributions to Shareholders from: | | | | | | | | | | | | | | | | | | | | | | | | | |
| | | | | |
Net investment income | | | | (0.31 | ) | | | | (0.26 | ) | | | | (0.18 | ) | | | | (0.16 | ) | | | | (0.23 | ) |
| | | | | |
Net realized gain on investments | | | | — | | | | | — | | | | | (0.25 | ) | | | | — | | | | | — | |
| | | | | |
Total distributions to shareholders | | | | (0.31 | ) | | | | (0.26 | ) | | | | (0.43 | ) | | | | (0.16 | ) | | | | (0.23 | ) |
| | | | | |
Net Asset Value, End of Year | | | | $8.94 | | | | | $8.33 | | | | | $8.56 | | | | | $10.75 | | | | | $10.90 | |
| | | | | |
Total Return2,3 | | | | 11.15 | % | | | | 0.25 | % | | | | (16.85 | )% | | | | 0.13 | % | | | | 5.73 | % |
| | | | | |
Ratio of net expenses to average net assets | | | | 0.48 | %4 | | | | 0.48 | % | | | | 0.48 | % | | | | 0.48 | % | | | | 0.48 | % |
| | | | | |
Ratio of gross expenses to average net assets5 | | | | 0.62 | % | | | | 0.59 | % | | | | 0.55 | % | | | | 0.54 | % | | | | 0.56 | % |
| | | | | |
Ratio of net investment income to average net assets2 | | | | 3.48 | % | | | | 2.95 | % | | | | 1.89 | % | | | | 1.52 | % | | | | 2.09 | % |
| | | | | |
Portfolio turnover | | | | 34 | % | | | | 25 | % | | | | 34 | % | | | | 62 | % | | | | 56 | % |
| | | | | |
Net assets end of year (000’s) omitted | | | | $1,319 | | | | | $1,279 | | | | | $2,195 | | | | | $3,724 | | | | | $3,812 | |
| | | | | | | | | | | | | | | | | | | | | | | | | | |
| 1 | Per share numbers have been calculated using average shares. |
| 2 | Total returns and net investment income would have been lower had certain expenses not been offset. |
| 3 | The total return is calculated using the published Net Asset Value as of fiscal year end. |
| 4 | Includes interest expense of less than 0.01% related to participation in the interfund lending program. |
| 5 | Excludes the impact of expense reimbursement or fee waivers and expense reductions such as brokerage credits, but includes expense repayments and non-reimbursable expenses, if any, such as interest, taxes, and extraordinary expenses. (See Note 1(c) and 2 in the Notes to Financial Statements.) |
The accompanying notes are an integral part of these financial statements.
15
| | |
| | AMG GW&K Small/Mid Cap Growth Fund Financial Highlights For a share outstanding throughout each fiscal year |
| | | | | | | | | | | | | | | | | | | | | | | | | |
| | | For the fiscal years ended October 31, |
| | | | | |
| Class N | | 2024 | | 2023 | | 2022 | | 2021 | | 2020 |
| | | | | |
Net Asset Value, Beginning of Year | | | | $13.33 | | | | | $13.45 | | | | | $17.67 | | | | | $21.14 | | | | | $17.02 | |
| | | | | |
Income (loss) from Investment Operations: | | | | | | | | | | | | | | | | | | | | | | | | | |
| | | | | |
Net investment loss1,2 | | | | (0.05 | ) | | | | (0.04 | ) | | | | (0.08 | ) | | | | (0.17 | ) | | | | (0.17 | ) |
| | | | | |
Net realized and unrealized gain (loss) on investments | | | | 3.83 | | | | | 0.19 | | | | | (4.14 | ) | | | | 7.74 | | | | | 4.29 | |
| | | | | |
Total income (loss) from investment operations | | | | 3.78 | | | | | 0.15 | | | | | (4.22 | ) | | | | 7.57 | | | | | 4.12 | |
| | | | | |
Less Distributions to Shareholders from: | | | | | | | | | | | | | | | | | | | | | | | | | |
| | | | | |
Net realized gain on investments | | | | — | | | | | (0.27 | ) | | | | — | | | | | (10.55 | ) | | | | — | |
| | | | | |
Paid in capital | | | | — | | | | | — | | | | | — | | | | | (0.49 | ) | | | | — | |
| | | | | |
Total distributions to shareholders | | | | — | | | | | (0.27 | ) | | | | — | | | | | (11.04 | ) | | | | — | |
| | | | | |
Net Asset Value, End of Year | | | | $17.11 | | | | | $13.33 | | | | | $13.45 | | | | | $17.67 | | | | | $21.14 | |
| | | | | |
Total Return2,3 | | | | 28.36 | % | | | | 1.12 | % | | | | (23.88 | )%4 | | | | 46.66 | % | | | | 24.27 | % |
| | | | | |
Ratio of net expenses to average net assets5 | | | | 1.01 | %6 | | | | 1.00 | % | | | | 1.00 | % | | | | 1.17 | % | | | | 1.29 | %6 |
| | | | | |
Ratio of gross expenses to average net assets7 | | | | 1.24 | % | | | | 1.24 | % | | | | 1.25 | % | | | | 1.42 | % | | | | 1.60 | % |
| | | | | |
Ratio of net investment loss to average net assets2 | | | | (0.32 | )% | | | | (0.28 | )% | | | | (0.56 | )% | | | | (0.91 | )% | | | | (0.92 | )% |
| | | | | |
Portfolio turnover | | | | 19 | % | | | | 25 | % | | | | 23 | % | | | | 158 | % | | | | 126 | % |
| | | | | |
Net assets end of year (000’s) omitted | | | | $32,463 | | | | | $27,120 | | | | | $24,994 | | | | | $37,471 | | | | | $28,908 | |
| | | | | | | | | | | | | | | | | | | | | | | | | | |
The accompanying notes are an integral part of these financial statements.
16
| | |
| | AMG GW&K Small/Mid Cap Growth Fund Financial Highlights For a share outstanding throughout each fiscal year |
| | | | | | | | | | | | | | | | | | | | | | | | | |
| | | For the fiscal years ended October 31, |
| | | | | |
| Class I | | 2024 | | 2023 | | 2022 | | 2021 | | 2020 |
| | | | | |
Net Asset Value, Beginning of Year | | | | $13.93 | | | | | $14.01 | | | | | $18.39 | | | | | $21.60 | | | | | $17.35 | |
| | | | | |
Income (loss) from Investment Operations: | | | | | | | | | | | | | | | | | | | | | | | | | |
| | | | | |
Net investment loss1,2 | | | | (0.03 | ) | | | | (0.02 | ) | | | | (0.06 | ) | | | | (0.15 | ) | | | | (0.14 | ) |
| | | | | |
Net realized and unrealized gain (loss) on investments | | | | 3.99 | | | | | 0.21 | | | | | (4.32 | ) | | | | 7.98 | | | | | 4.39 | |
| | | | | |
Total income (loss) from investment operations | | | | 3.96 | | | | | 0.19 | | | | | (4.38 | ) | | | | 7.83 | | | | | 4.25 | |
| | | | | |
Less Distributions to Shareholders from: | | | | | | | | | | | | | | | | | | | | | | | | | |
| | | | | |
Net realized gain on investments | | | | — | | | | | (0.27 | ) | | | | — | | | | | (10.55 | ) | | | | — | |
| | | | | |
Paid in capital | | | | — | | | | | — | | | | | — | | | | | (0.49 | ) | | | | — | |
| | | | | |
Total distributions to shareholders | | | | — | | | | | (0.27 | ) | | | | — | | | | | (11.04 | ) | | | | — | |
| | | | | |
Net Asset Value, End of Year | | | | $17.89 | | | | | $13.93 | | | | | $14.01 | | | | | $18.39 | | | | | $21.60 | |
| | | | | |
Total Return2,3 | | | | 28.43 | % | | | | 1.36 | % | | | | (23.82 | )%4 | | | | 46.94 | % | | | | 24.48 | % |
| | | | | |
Ratio of net expenses to average net assets5 | | | | 0.87 | %6 | | | | 0.86 | % | | | | 0.86 | % | | | | 1.02 | % | | | | 1.10 | %6 |
| | | | | |
Ratio of gross expenses to average net assets7 | | | | 1.10 | % | | | | 1.10 | % | | | | 1.11 | % | | | | 1.27 | % | | | | 1.41 | % |
| | | | | |
Ratio of net investment loss to average net assets2 | | | | (0.18 | )% | | | | (0.14 | )% | | | | (0.42 | )% | | | | (0.76 | )% | | | | (0.73 | )% |
| | | | | |
Portfolio turnover | | | | 19 | % | | | | 25 | % | | | | 23 | % | | | | 158 | % | | | | 126 | % |
| | | | | |
Net assets end of year (000’s) omitted | | | | $9,341 | | | | | $7,561 | | | | | $6,540 | | | | | $6,612 | | | | | $6,483 | |
| | | | | | | | | | | | | | | | | | | | | | | | | | |
The accompanying notes are an integral part of these financial statements.
17
| | |
| | AMG GW&K Small/Mid Cap Growth Fund Financial Highlights For a share outstanding throughout each fiscal period |
| | | | | | | | | | | | | | | | | | | | |
| | | For the fiscal year ended October 31, | | For the fiscal
period ended
October 31, |
| | | | |
| Class Z | | 2024 | | 2023 | | 2022 | | 20218 |
| | | | |
Net Asset Value, Beginning of Period | | | | $13.95 | | | | | $14.02 | | | | | $18.39 | | | | | $17.84 | |
| | | | |
Income (loss) from Investment Operations: | | | | | | | | | | | | | | | | | | | | |
| | | | |
Net investment loss1,2 | | | | (0.02 | ) | | | | (0.01 | ) | | | | (0.06 | ) | | | | (0.01 | ) |
| | | | |
Net realized and unrealized gain (loss) on investments | | | | 4.00 | | | | | 0.21 | | | | | (4.31 | ) | | | | 0.56 | |
| | | | |
Total income (loss) from investment operations | | | | 3.98 | | | | | 0.20 | | | | | (4.37 | ) | | | | 0.55 | |
| | | | |
Less Distributions to Shareholders from: | | | | | | | | | | | | | | | | | | | | |
| | | | |
Net realized gain on investments | | | | — | | | | | (0.27 | ) | | | | — | | | | | — | |
| | | | |
Net Asset Value, End of Period | | | | $17.93 | | | | | $13.95 | | | | | $14.02 | | | | | $18.39 | |
| | | | |
Total Return2,3 | | | | 28.53 | % | | | | 1.43 | % | | | | (23.76 | )%4 | | | | 3.08 | %9 |
| | | | |
Ratio of net expenses to average net assets10 | | | | 0.82 | %6 | | | | 0.81 | % | | | | 0.81 | % | | | | 0.82 | %11 |
| | | | |
Ratio of gross expenses to average net assets7 | | | | 1.05 | % | | | | 1.05 | % | | | | 1.06 | % | | | | 1.13 | %11 |
| | | | |
Ratio of net investment loss to average net assets2 | | | | (0.13 | )% | | | | (0.09 | )% | | | | (0.37 | )% | | | | (0.49 | )%11 |
| | | | |
Portfolio turnover | | | | 19 | % | | | | 25 | % | | | | 23 | % | | | | 158 | % |
| | | | |
Net assets end of period (000’s) omitted | | | | $31 | | | | | $24 | | | | | $12 | | | | | $15 | |
| | | | | | | | | | | | | | | | | | | | | |
| 1 | Per share numbers have been calculated using average shares. |
| 2 | Total returns and net investment loss would have been lower had certain expenses not been offset. |
| 3 | The total return is calculated using the published Net Asset Value as of fiscal year end. |
| 4 | Includes a non-recurring securities litigation gain. Had the Fund not received the payment total return would have been (24.68%), (24.53%) and (24.53%) for Class N, Class I and Class Z, respectively. |
| 5 | Includes reduction from broker recapture amounting to less than 0.01%, 0.01%, 0.01%, less than 0.01% and 0.01% for the fiscal years ended 2024, 2023, 2022, 2021 and 2020, respectively. |
| 6 | Includes interest expense of less than 0.01% related to participation in the interfund lending program. |
| 7 | Excludes the impact of expense reimbursement or fee waivers and expense reductions such as brokerage credits, but includes expense repayments and non-reimbursable expenses, if any, such as interest, taxes, and extraordinary expenses. (See Note 1(c) and 2 in the Notes to Financial Statements.) |
| 8 | Commencement of operations was on August 31, 2021. |
| 10 | Includes reduction from broker recapture amounting to less than 0.01%, 0.01% and 0.01% for the fiscal years ended 2024, 2023 and 2022, respectively, and less than 0.01% for the fiscal period ended October 31, 2021. |
The accompanying notes are an integral part of these financial statements.
18
| | |
| | Notes to Financial Statements October 31, 2024 |
1. ORGANIZATION AND SUMMARY OF SIGNIFICANT ACCOUNTING POLICIES
AMG Funds I and AMG Funds IV (the “Trusts”) are open-end management investment companies. AMG Funds I is organized as a Massachusetts business trust, while AMG Funds IV is organized as a Delaware Statutory Trust. The Trusts are registered under the Investment Company Act of 1940, as amended (the “1940 Act”). Currently, the Trusts consist of a number of different funds, each having distinct investment management objectives, strategies, risks, and policies. Included in this report are AMG Funds I: AMG GW&K Core Bond ESG Fund (“Core Bond ESG”) and AMG Funds IV: AMG GW&K Small/Mid Cap Growth Fund (“Small/Mid Cap Growth”), each a “Fund” and collectively, the “Funds”.
Each Fund offers Class N, Class I and Class Z shares. Each class represents an interest in the same assets of the respective Fund. Although all share classes generally have identical voting rights, each share class votes separately when required by law. Different share classes may have different net asset values per share to the extent the share classes pay different distribution amounts and/or the expenses of such share classes differ. Each share class has its own expense structure. Please refer to a current prospectus for additional information on each share class.
The Funds’ financial statements are prepared in accordance with accounting principles generally accepted in the United States of America (“U.S. GAAP”), including accounting and reporting guidance pursuant to Accounting Standards Codification Topic 946 applicable to investment companies. U.S. GAAP requires management to make estimates and assumptions that affect the reported amounts of assets and liabilities and disclosure of contingent assets and liabilities at the date of the financial statements and the reported amounts of income and expenses during the reporting period. Actual results could differ from those estimates and such differences could be material. The following is a summary of significant accounting policies followed by the Funds in the preparation of their financial statements:
a. VALUATION OF INVESTMENTS
Equity securities traded on a national securities exchange or reported on the NASDAQ national market system (“NMS”) are valued at the last quoted sales price on the primary exchange or, if applicable, the NASDAQ official closing price or the official closing price of the relevant exchange or, lacking any sales, at the last quoted bid price. Equity securities held by the Funds that are traded in the over-the-counter market (other than NMS securities) are valued at the bid price. Foreign equity securities (securities principally traded in markets other than U.S. markets) held by the Funds are valued at the official closing price on the primary exchange or, for markets that either do not offer an official closing price or where the official closing price may not be representative of the overall market, the last quoted sale price.
Fixed income securities purchased with a remaining maturity exceeding 60 days are valued at the evaluated bid price provided by an authorized pricing service or, if an evaluated price is not available, by reference to other securities which are considered comparable in credit rating, interest rate, due date and other features (generally referred to as “matrix pricing”) or other similar pricing methodologies.
Fixed income securities purchased with a remaining maturity of 60 days or less are valued at amortized cost, provided that the amortized cost value is approximately the same as the fair value of the security valued without the use of amortized cost.
The Funds’ portfolio investments are generally valued based on independent market quotations or prices or, if none, “evaluative” or other market based valuations provided by third party pricing services. Pursuant to Rule 2a-5 under the 1940 Act, the Funds’ Boards of Trustees (the “Board”) designated AMG Funds LLC (the “Investment Manager”) as the Funds’ Valuation Designee to perform the Funds’ fair value determinations. Such determinations are subject to Board oversight and certain reporting and other requirements intended to ensure that the Board receives the information it needs to oversee the Investment Manager’s fair value determinations.
Under certain circumstances, the value of certain Fund portfolio investments may be based on an evaluation of fair value, pursuant to procedures established by the Investment Manager and under the general supervision of the Board. The Funds may use the fair value of a portfolio investment to calculate its net asset value (“NAV”) in the event that the market quotation, price or market based valuation for the portfolio investment is not readily available or otherwise not determinable pursuant to the Funds’ valuation procedures, if the Investment Manager believes the quotation, price or market based valuation to be unreliable, or in certain other circumstances. When determining the fair value of an investment, the Investment Manager seeks to determine the price that the Funds might reasonably expect to receive from current sale of that portfolio investment in an arms-length transaction. Fair value determinations shall be based upon consideration of all available facts and information, including, but not limited to (i) attributes specific to the investment; (ii) fundamental and analytical data relating to the investment; and (iii) the value of other comparable securities or relevant financial instruments, including derivative securities, traded on other markets or among dealers.
The values assigned to fair value portfolio investments are based on available information and do not necessarily represent amounts that might ultimately be realized in the future, since such amounts depend on future developments inherent in long-term investments. Because of the inherent uncertainty of valuation, those estimated values may differ significantly from the values that would have been used had a ready market for the investments existed, and the differences could be material. The Board will be presented with quarterly reports, as of the most recent quarter end, summarizing all fair value activity, material fair value matters that occurred during the quarter, and all outstanding securities fair valued by the Funds. Additionally, the Board will be presented with an annual report that assesses the adequacy and effectiveness of the Investment Manager’s process for determining the fair value of the Funds’ investments.
With respect to foreign equity securities and certain foreign fixed income securities, securities held in the Funds that can be fair valued by the applicable fair value pricing service are fair valued on each business day provided that each individual price exceeds a pre-established confidence level.
U.S. GAAP defines fair value as the price that a fund would receive to sell an asset or pay to transfer a liability in an orderly transaction between market participants at the measurement date. U.S. GAAP also establishes a framework for measuring fair value, and a three level hierarchy for fair value measurements based upon the transparency of inputs to the valuation of an asset or liability. Inputs may be observable or unobservable and refer broadly to the assumptions that market participants would use in pricing the asset or liability. Observable inputs reflect the assumptions market participants would use in pricing the asset or liability based on market data obtained from sources independent of the Funds. Unobservable inputs reflect the Funds’ own assumptions about the assumptions that market participants would use in pricing the asset or liability developed based on the best information available in the circumstances. Each investment is
19
| | |
| | Notes to Financial Statements (continued) |
assigned a level based upon the observability of the inputs which are significant to the overall valuation.
The three-tier hierarchy of inputs is summarized below:
Level 1 – inputs are quoted prices in active markets for identical investments (e.g., equity securities, open-end investment companies)
Level 2 – other observable inputs (including, but not limited to: quoted prices for similar assets or liabilities in markets that are active, quoted prices for identical or similar assets or liabilities in markets that are not active, inputs other than quoted prices that are observable for the assets or liabilities (such as interest rates, yield curves, volatilities, prepayment speeds, loss severities, credit risks and default rates) or other market corroborated inputs) (e.g., debt securities, government securities, foreign securities utilizing international fair value pricing, fair valued securities with observable inputs)
Level 3 – inputs are significant unobservable inputs (including the Fund’s own assumptions used to determine the fair value of investments) (e.g., fair valued securities with unobservable inputs)
Changes in inputs or methodologies used for valuing investments may result in a transfer in or out of levels within the fair value hierarchy. The inputs or methodologies used for valuing investments may not necessarily be an indication of the risk associated with investing in those investments.
b. SECURITY TRANSACTIONS
Security transactions are accounted for as of trade date. Realized gains and losses on securities sold are determined on the basis of identified cost.
c. INVESTMENT INCOME AND EXPENSES
Dividend income is recorded on the ex-dividend date. Interest income, which includes amortization of premium and accretion of discount on debt securities, is accrued as earned. Dividend and interest income on foreign securities is recorded gross of any withholding tax. Non-cash dividends included in dividend income, if any, are reported at the fair market value of the securities received. Upon notification from the issuer, distributions received from a real estate investment trust (REIT) may be redesignated as a reduction of cost of investments and/or realized gain. Other income and expenses are recorded on an accrual basis. Expenses that cannot be directly attributed to a Fund are apportioned among the funds in the Trusts and other trusts or funds within the AMG Funds Family of Funds (collectively, the “AMG Funds Family”) based upon their relative average net assets or number of shareholders. Investment income, realized and unrealized capital gains and losses, the common expenses of each Fund, and certain fund level expense reductions, if any, are allocated on a pro-rata basis to each class based on the relative net assets of each class to the total net assets of each Fund.
Small/Mid Cap Growth had certain portfolio trades directed to various brokers under a brokerage recapture program. Credits received from the brokerage recapture program are earned and paid on a monthly basis, and are recorded as expense offsets, which serve to reduce the Fund’s overall expense ratio. For the fiscal year ended October 31, 2024, the impact on the expenses and expense ratios was $1,441 or less than 0.01%.
d. DIVIDENDS AND DISTRIBUTIONS
Fund distributions resulting from net investment income will normally be declared and paid monthly for Core Bond ESG and annually for Small/Mid Cap Growth. Realized net capital gains distributions, if any, will normally be declared and paid at least annually in December. Distributions to shareholders are recorded on the ex-dividend date. Distributions are determined in accordance with federal income tax law, which may differ from net investment income and net realized capital gains for financial statement purposes (U.S. GAAP). Differences may be permanent or temporary. Permanent differences are reclassified among capital accounts in the financial statements to reflect their tax character. Permanent book and tax basis differences, if any, relating to shareholder distributions will result in reclassifications to paid-in capital. Temporary differences arise when certain items of income, expense and gain or loss are recognized in different periods for financial statement and tax purposes; these differences will reverse at some time in the future. There were no permanent differences during the year for Core Bond ESG. Permanent differences are primarily due to net operating losses and tax equalization utilized for Small/Mid Cap Growth. Temporary differences for Small/Mid Cap Growth are due to qualified late-year ordinary loss deferrals and return of capital from REITs. In addition, temporary differences for each fund are due to wash sale loss deferrals.
The tax character of distributions paid during the fiscal years ended October 31, 2024 and October 31, 2023 was as follows:
| | | | | | | | | | | | | | | | |
| | | Core Bond ESG | | | | Small/Mid Cap Growth | |
| | | | |
Distributions paid from: | | | 2024 | | | | 2023 | | | | 2024 | | | | 2023 | |
| | | | |
Ordinary income * | | | $4,207,674 | | | | $4,046,880 | | | | — | | | | — | |
| | | | |
Long-term capital gains | | | — | | | | — | | | | — | | | | $623,575 | |
| | | | | | | | | | | | | | | | |
| | | $4,207,674 | | | | $4,046,880 | | | | — | | | | $623,575 | |
| | | | | | | | | | | | | | | | |
* For tax purposes, short-term capital gain distributions, if any, are considered ordinary income distributions.
20
| | |
| | Notes to Financial Statements (continued) |
As of October 31, 2024, the components of distributable earnings (excluding unrealized appreciation/depreciation) on a tax basis consisted of:
| | | | | | | | |
| | | Core Bond ESG | | | Small/Mid Cap Growth | |
| | |
Capital loss carryforward | | | $11,837,838 | | | | — | |
| | |
Undistributed ordinary income | | | 41,685 | | | | — | |
| | |
Undistributed long-term capital gains | | | — | | | | $303,465 | |
| | |
Late-year ordinary loss deferral | | | — | | | | 110,433 | |
At October 31, 2024, the cost of investments and the aggregate gross unrealized appreciation and depreciation for federal income tax purposes were as follows:
| | | | | | | | | | | | | | | | |
| Fund | | Cost | | | Appreciation | | | Depreciation | | | Net Appreciation
(Depreciation) | |
| | | | |
Core Bond ESG | | | $130,527,913 | | | | $506,445 | | | | $(12,005,631 | ) | | | $(11,499,186 | ) |
| | | | |
Small/Mid Cap Growth | | | 36,055,966 | | | | 8,758,043 | | | | (2,913,184 | ) | | | 5,844,859 | |
e. FEDERAL TAXES
Each Fund currently qualifies as an investment company and intends to comply with the requirements under Subchapter M of the Internal Revenue Code of 1986, as amended (the “Code”), and to distribute substantially all of its taxable income and gains to its shareholders and to meet certain diversification and income requirements with respect to investment companies. The Investment Manager has analyzed the Funds’ tax positions taken on federal income tax returns as of October 31, 2024, and for all open tax years (generally, the three prior taxable years), and has concluded that no provision for federal income tax is required in the Funds’ financial statements. Additionally, the Investment Manager is not aware of any tax position for which it is reasonably possible that the total amounts of unrecognized tax benefit/detriment will change materially in the next twelve months.
Furthermore, based on each Fund’s understanding of the tax rules and rates related to income, gains and transactions for the foreign jurisdictions in which it invests, each Fund will provide for foreign taxes, and where appropriate, deferred foreign taxes.
f. CAPITAL LOSS CARRYOVERS AND DEFERRALS
As of October 31, 2024, the following Fund had capital loss carryovers for federal income tax purposes as shown in the following chart. These amounts may be used to offset future realized capital gains indefinitely, and retain their character as short-term and/or long-term.
| | | | | | |
| Fund | | Short-Term | | Long-Term | | Total |
| | | |
Core Bond ESG | | $2,801,748 | | $9,036,090 | | $11,837,838 |
For the fiscal year ended October 31, 2024, the following Fund utilized capital loss carryovers in the amount of:
| | | | | | |
| Fund | | Short-Term | | Long-Term |
| | |
Small/Mid Cap Growth | | $114,896 | | $82,363 |
g. CAPITAL STOCK
Each Trust’s Amended and Restated Agreement and Declaration of Trust or Trust Instrument, as applicable, authorizes for each Fund the issuance of an unlimited number of shares of beneficial interest, without par value. Each Fund records sales and repurchases of its capital stock on the trade date.
For the fiscal years ended October 31, 2024 and October 31, 2023, the capital stock transactions by class for the Funds were as follows:
| | | | | | | | | | | | | | | | |
| | | Core Bond ESG | |
| | |
| | | October 31, 2024 | | | October 31, 2023 | |
| | | | |
| | | Shares | | | Amount | | | Shares | | | Amount | |
| | | | |
Class N: | | | | | | | | | | | | | | | | |
| | | | |
Shares sold | | | 71,326 | | | | $636,906 | | | | 38,736 | | | | $343,128 | |
| | | | |
Shares issued in reinvestment of distributions | | | 7,393 | | | | 65,847 | | | | 5,818 | | | | 51,356 | |
| | | | |
Shares redeemed | | | (61,929) | | | | (547,022) | | | | (12,581) | | | | (108,577) | |
| | | | | | | | | | | | | | | | |
| | | | |
Net increase | | | 16,790 | | | | $155,731 | | | | 31,973 | | | | $285,907 | |
| | | | | | | | | | | | | | | | |
21
| | |
| | Notes to Financial Statements (continued) |
| | | | | | | | | | | | | | | | |
| |
| | | Core Bond ESG | |
| | |
| | | October 31, 2024 | | | October 31, 2023 | |
| | | | |
| | | Shares | | | Amount | | | Shares | | | Amount | |
| | | | |
Class I: | | | | | | | | | | | | | | | | |
| | | | |
Shares sold | | | 1,420,819 | | | | $12,678,644 | | | | 1,161,567 | | | | $10,219,195 | |
| | | | |
Shares issued in reinvestment of distributions | | | 442,345 | | | | 3,939,940 | | | | 428,813 | | | | 3,793,245 | |
| | | | |
Shares redeemed | | | (3,281,551) | | | | (29,214,653) | | | | (3,389,263) | | | | (29,861,655) | |
| | | | | | | | | | | | | | | | |
| | | | |
Net decrease | | | (1,418,387) | | | | $(12,596,069) | | | | (1,798,883) | | | | $(15,849,215) | |
| | | | | | | | | | | | | | | | |
| | | | |
Class Z: | | | | | | | | | | | | | | | | |
| | | | |
Shares sold | | | 4,881 | | | | $43,769 | | | | 21,349 | | | | $186,192 | |
| | | | |
Shares issued in reinvestment of distributions | | | 5,273 | | | | 46,940 | | | | 5,322 | | | | 47,130 | |
| | | | |
Shares redeemed | | | (16,155) | | | | (144,368) | | | | (129,774) | | | | (1,162,515) | |
| | | | | | | | | | | | | | | | |
| | | | |
Net decrease | | | (6,001) | | | | $(53,659) | | | | (103,103) | | | | $(929,193) | |
| | | | | | | | | | | | | | | | |
| | | | | | | | | | | | | | | | |
| | | Small/Mid Cap Growth | |
| | |
| | | October 31, 2024 | | | October 31, 2023 | |
| | | | |
| | | Shares | | | Amount | | | Shares | | | Amount | |
| | | | |
Class N: | | | | | | | | | | | | | | | | |
| | | | |
Shares sold | | | 123,098 | | | | $2,059,438 | | | | 437,431 | | | | $6,245,304 | |
| | | | |
Shares issued in reinvestment of distributions | | | — | | | | — | | | | 36,604 | | | | 484,632 | |
| | | | |
Shares redeemed | | | (259,725) | | | | (4,175,433) | | | | (298,744) | | | | (4,248,267) | |
| | | | | | | | | | | | | | | | |
| | | | |
Net increase (decrease) | | | (136,627) | | | | $(2,115,995) | | | | 175,291 | | | | $2,481,669 | |
| | | | | | | | | | | | | | | | |
| | | | |
Class I: | | | | | | | | | | | | | | | | |
| | | | |
Shares sold | | | 136,909 | | | | $2,393,314 | | | | 122,572 | | | | $1,800,280 | |
| | | | |
Shares issued in reinvestment of distributions | | | — | | | | — | | | | 8,963 | | | | 123,780 | |
| | | | |
Shares redeemed | | | (157,840) | | | | (2,643,777) | | | | (55,284) | | | | (806,677) | |
| | | | | | | | | | | | | | | | |
| | | | |
Net increase (decrease) | | | (20,931) | | | | $(250,463) | | | | 76,251 | | | | $1,117,383 | |
| | | | | | | | | | | | | | | | |
| | | | |
Class Z: | | | | | | | | | | | | | | | | |
| | | | |
Shares sold | | | — | | | | — | | | | 829 | | | | $11,751 | |
| | | | |
Shares issued in reinvestment of distributions | | | — | | | | — | | | | 32 | | | | 448 | |
| | | | | | | | | | | | | | | | |
| | | | |
Net increase | | | — | | | | — | | | | 861 | | | | $12,199 | |
| | | | | | | | | | | | | | | | |
h. REPURCHASE AGREEMENTS AND JOINT REPURCHASE AGREEMENTS
The Funds may enter into third-party and bilateral repurchase agreements for temporary cash management purposes and for reinvestment of cash collateral on securities lending transactions under the securities lending program offered by The Bank of New York Mellon (“BNYM”) (the “Securities Lending Program”) (collectively, “Repurchase Agreements”). The value of the underlying collateral, including accrued interest, must equal or exceed the value of the Repurchase Agreements during the term of the agreement. For joint repurchase agreements, the Funds participate on a pro rata basis with other clients of BNYM in their share of the underlying collateral under such joint repurchase agreements and in their share of proceeds from any repurchase or other disposition of the underlying collateral. The underlying collateral for all Repurchase Agreements is held by the
Funds’ custodian or at the Federal Reserve Bank. If the seller defaults and the value of the collateral declines, or if bankruptcy proceedings commence with respect to the seller of the security, realization of the collateral by the Funds may be delayed or limited. Pursuant to the Securities Lending Program, the Funds are indemnified for such losses by BNYM on joint repurchase agreements.
At October 31, 2024, the market value of Repurchase Agreements outstanding for Core Bond ESG and Small/Mid Cap Growth was $1,337,511 and $1,194,000, respectively.
22
| | |
| | Notes to Financial Statements (continued) |
2. AGREEMENTS AND TRANSACTIONS WITH AFFILIATES
For each of the Funds, the Trusts have entered into an investment advisory agreement under which the Investment Manager, a subsidiary and the U.S. wealth platform of Affiliated Managers Group, Inc. (“AMG”), serves as investment manager to the Funds and is responsible for the Funds’ overall administration and operations. The Investment Manager selects and recommends, subject to the approval of the Board and, in certain circumstances, shareholders, the subadviser for the Funds and monitors the subadviser’s investment performance, security holdings and investment strategies. Each Fund’s investment portfolio is managed by GW&K Investment Management, LLC (“GW&K”), who serves pursuant to a subadvisory agreement with the Investment Manager. AMG indirectly owns a majority interest in GW&K.
Investment management fees are paid directly by the Funds to the Investment Manager based on average daily net assets. For the fiscal year ended October 31, 2024, the Funds’ investment management fees were paid at the following annual rate of each Fund’s respective average daily net assets:
| | | | |
| |
Core Bond ESG | | | 0.30% | |
| |
Small/Mid Cap Growth | | | 0.62% | |
| | | | | |
The fee paid to GW&K for its services as subadviser is paid out of the fee the Investment Manager receives from each Fund and does not increase the expenses of each Fund.
The Investment Manager has contractually agreed, through at least March 1, 2025, to waive management fees and/or pay or reimburse fund expenses in order to limit total annual Fund operating expenses after fee waiver and expense reimbursements (exclusive of taxes, interest (including interest incurred in connection with bank and custody overdrafts, and in connection with securities sold short), shareholder servicing fees, distribution and service (12b-1) fees, brokerage commissions and other transaction costs, dividends payable with respect to securities sold short, acquired fund fees and expenses and extraordinary expenses) of Core Bond ESG and Small/Mid Cap Growth to 0.48% and 0.82%, respectively, of each Fund’s average daily net assets (this annual rate or such other annual rate that may be in effect from time to time, the “Expense Cap”), subject to later reimbursement by the Funds in certain circumstances.
In general, for a period of up to 36 months after the date any amounts are paid, waived or reimbursed by the Investment Manager, the Investment Manager may recover such amounts from a Fund, provided that such repayment would not cause the Fund’s total annual operating expenses after fee waiver and expense reimbursements (exclusive of the items noted in the parenthetical above) to exceed either (i) the Expense Cap in effect at the time such amounts were paid, waived or reimbursed, or (ii) the Expense Cap in effect at the time of such repayment by the Fund.
The contractual expense limitation may only be terminated in the event the Investment Manager or a successor ceases to be the investment manager of a Fund or a successor fund, by mutual agreement between the Investment Manager and the Board, or in the event of a Fund’s liquidation unless the Fund is reorganized or is a party to a merger in which the surviving entity is successor to the accounting and performance information of a Fund.
For the fiscal year ended October 31, 2024, the Investment Manager’s expense reimbursements, and repayments of prior reimbursements by the Funds to the Investment Manager, if any, are as follows:
| | | | |
| | | Expense
Reimbursements | | Repayment of
Prior Reimbursements |
| | |
Core Bond ESG | | $175,621 | | — |
| | |
Small/Mid Cap Growth | | 89,289 | | — |
At October 31, 2024, the Funds’ expiration of reimbursements subject to recoupment is as follows:
| | | | | | | | |
Expiration Period | | Core Bond ESG | | | Small/Mid Cap Growth | |
| | |
Less than 1 year | | | $121,994 | | | | $89,139 | |
| | |
1-2 years | | | 156,088 | | | | 82,386 | |
| | |
2-3 years | | | 175,621 | | | | 89,289 | |
| | | | | | | | |
| | |
Total | | | $453,703 | | | | $260,814 | |
| | | | | | | | |
The Trusts, on behalf of the Funds, have entered into an amended and restated Administration Agreement under which the Investment Manager serves as the Funds’ administrator (the “Administrator”) and is responsible for certain aspects of managing the Funds’ operations, including administration and shareholder services to each Fund. Each Fund pays a fee to the Administrator at the rate of 0.15% per annum of the Fund’s average daily net assets for this service.
The Funds are distributed by AMG Distributors, Inc. (the “Distributor”), a wholly-owned subsidiary of the Investment Manager. The Distributor serves as the distributor and underwriter for each Fund and is a registered broker-dealer and member of the Financial Industry Regulatory Authority, Inc. (“FINRA”). Shares of each Fund will be continuously offered and will be sold directly to prospective purchasers and through brokers, dealers or other financial intermediaries who have executed selling agreements with the Distributor. Generally, the Distributor bears all or a portion of the expenses of providing services pursuant to the distribution agreement, including the payment of the expenses relating to the distribution of prospectuses for sales purposes and any advertising or sales literature.
The Trusts have adopted a distribution and service plan (the “Plan”) with respect to the Class N shares of each Fund, in accordance with the requirements of Rule 12b-1 under the 1940 Act and the requirements of the applicable rules of FINRA regarding asset-based sales charges. Pursuant to the Plan, each Fund may make payments to the Distributor for its expenditures in financing any activity primarily intended to result in the sale of each Fund’s Class N shares and for maintenance and personal service provided to existing shareholders of that class. The Plan authorizes payments to the Distributor up to 0.25% annually of each Fund’s average daily net assets attributable to the Class N shares. For Small/Mid Cap Growth, the Plan is characterized as a reimbursement plan and is directly tied to expenses incurred by the Distributor; the payments the Distributor receives during any year may not exceed its actual expenses. The impact on the Class N annualized expense ratios for the fiscal year ended October 31, 2024, was 0.25% for Core Bond ESG and 0.19% for Small/Mid Cap Growth.
For Class N of Core Bond ESG and for each of the Class I shares, the Board has approved reimbursement payments to the Investment Manager for shareholder
23
| | |
| | Notes to Financial Statements (continued) |
servicing expenses (“shareholder servicing fees”) incurred. Shareholder servicing fees include payments to financial intermediaries, such as broker-dealers (including fund supermarket platforms), banks, and trust companies who provide shareholder recordkeeping, account servicing and other services. The Class N and Class I shares may reimburse the Investment Manager for the actual amount incurred up to a maximum annual rate of each Class’s average daily net assets as shown in the table below.
The impact on the annualized expense ratios for the fiscal year ended October 31, 2024, was as follows:
| | | | | | | | |
Fund | | Maximum Annual
Amount
Approved | | | Actual
Amount Incurred | |
| | |
Core Bond ESG | | | | | | | | |
| | |
Class N | | | 0.15% | | | | 0.15% | |
| | |
Class I | | | 0.10% | | | | 0.07% | |
| | |
Small/Mid Cap Growth | | | | | | | | |
| | |
Class I | | | 0.05% | | | | 0.05% | |
| | | | | | | | | |
The Board provides supervision of the affairs of the Trusts and other trusts within the AMG Funds Family. The Trustees of the Trusts who are not affiliated with the Investment Manager receive an annual retainer and per meeting fees for regular, special and telephonic meetings, and they are reimbursed for out-of-pocket expenses incurred while carrying out their duties as Board members. The Chairman of the Board and the Audit Committee Chair receive additional annual retainers. Certain Trustees and Officers of the Funds are Officers and/or Directors of the Investment Manager, AMG and/or the Distributor.
The Securities and Exchange Commission (the “SEC”) granted an exemptive order that permits certain eligible funds in the AMG Funds Family to lend and borrow money for certain temporary purposes directly to and from other eligible funds in the AMG Funds Family. Participation in this interfund lending program is voluntary for both the borrowing and lending funds, and an interfund loan is only made if it benefits each participating fund. The Administrator manages the program according to procedures approved by the Board, and the Board monitors the operation of the program. An interfund loan must comply with certain conditions set out in the exemptive order, which are designed to assure fairness and protect all participating funds. The interest earned and interest paid on interfund loans are included on the Statement of Operations as interest income and interest expense, respectively. At October 31, 2024, the Funds had no interfund loans outstanding. The Funds did not lend during the fiscal year ended October 31, 2024.
The following Funds utilized the interfund lending program during the fiscal year ended October 31, 2024 as follows:
| | | | | | | | | | | | | | | | |
| Fund | | Average Borrowed | | | Number of Days | | | Interest Paid | | | Average
Interest Rate | |
| | | | |
Core Bond ESG | | | $1,780,275 | | | | 5 | | | | $1,518 | | | | 6.225% | |
| | | | |
Small/Mid Cap Growth | | | 1,250,266 | | | | 2 | | | | 426 | | | | 6.225% | |
| | | | | | | | | | | | | | | | | |
3. PURCHASES AND SALES OF SECURITIES
Purchases and sales of securities (excluding short-term securities and U.S. Government Obligations) for the fiscal year ended October 31, 2024, were as follows:
| | | | | | | | |
| | | Long Term Securities | |
| | |
| Fund | | Purchases | | | Sales | |
| | |
Core Bond ESG | | | $30,880,033 | | | | $31,627,721 | |
| | |
Small/Mid Cap Growth | | | 7,503,056 | | | | 9,900,572 | |
| | | | | | | | | |
Core Bond ESG purchases and sales of U.S. Government obligations for the fiscal year ended October 31, 2024 were $10,684,544 and $19,171,550, respectively.
4. PORTFOLIO SECURITIES LOANED
The Funds participate in the Securities Lending Program providing for the lending of securities to qualified borrowers. Securities lending income includes earnings of such temporary cash investments, plus or minus any rebate to a borrower. These earnings (after any rebate) are then divided between BNYM, as a fee for its services under the Securities Lending Program, and the Funds, according to agreed-upon rates. Collateral on all securities loaned is accepted in cash, U.S. Treasury Obligations or U.S. Government Agency Obligations. Collateral is maintained at a minimum level of 102% (105% in the case of certain foreign securities) of the market value, plus interest, if applicable, of investments on loan. It is the Funds’ policy to obtain additional collateral from or return excess collateral to the borrower by the end of the next business day, following the valuation date of the securities loaned. Therefore, the value of the collateral held may be temporarily less than the value of the securities on loan. Lending securities entails a risk of loss to the Funds if and to the extent that the market value of the securities loaned were to increase and the borrower did not increase the collateral accordingly, and the borrower fails to return the securities. Under the terms of the Securities Lending Program, the Funds are indemnified for such losses by BNYM. Cash collateral is held in separate omnibus accounts managed by BNYM, who is authorized to exclusively enter into joint repurchase agreements for that cash collateral. Securities collateral is held in separate omnibus accounts managed by BNYM and cannot be sold or pledged. BNYM bears the risk of any deficiency in the amount of the cash collateral available for return to the borrower due to any loss on the collateral invested. Loans of securities are terminable at any time and the borrower, after notice, is required to return borrowed securities as soon as practical, which is normally within three business days.
The value of securities loaned on positions held, cash collateral and securities collateral received at October 31, 2024, was as follows:
| | | | | | | | | | | | | | | | |
| Fund | | Securities
Loaned | | | Cash
Collateral
Received | | | Securities
Collateral Received | | | Total
Collateral Received | |
| | | | |
Core Bond ESG | | | $5,395,413 | | | | $966,511 | | | | $4,601,813 | | | | $5,568,324 | |
| | | | |
Small/Mid Cap Growth | | | 1,950,912 | | | | — | | | | 2,020,739 | | | | 2,020,739 | |
| | | | | | | | | | | | | | | | | |
The following table summarizes the securities received as collateral for securities lending at October 31, 2024:
| | | | | | | | | | |
| Fund | | Collateral Type | | Coupon Range | | | Maturity Date Range | |
| | | |
Core Bond ESG | | U.S. Treasury Obligations | | | 0.125%-5.000% | | | | 01/15/25-08/15/49 | |
| | | |
Small/Mid Cap Growth | | U.S. Treasury Obligations | | | 0.125%-7.625% | | | | 11/15/24-11/15/52 | |
| | | | | | | | | | | |
24
| | |
| | Notes to Financial Statements (continued) |
5. FUND RISKS
In the normal course of business, the Funds invest in securities or other instruments and may enter into certain transactions, and such activities subject the Funds to various risks. Below is a summary of some, but not all, of those risks. Each risk described below does not necessarily apply to each Fund. Please refer to each Fund’s prospectus for a description of the principal risks associated with investing in a particular Fund. The value of securities or other instruments may also be affected by various factors, including, without limitation: (i) the general economy; (ii) the overall market as well as local, regional or global political and/or social instability; or (iii) price fluctuations.
Market Risk: Market prices of investments held by the Funds may fall rapidly or unpredictably due to a variety of factors, including economic, political, or market conditions, or other factors including terrorism, war, natural disasters and the spread of infectious illness or other public health issues, including epidemics or pandemics, or in response to events that affect particular industries or companies.
Management Risk: Because the Funds are actively managed investment portfolios, security selection or focus on securities in a particular style, market sector or group of companies may cause the Funds to incur losses or underperform relative to their benchmarks or other funds with a similar investment objective. There can be no guarantee that GW&K’s investment techniques and risk analysis will produce the desired result.
Sector Risk: Issuers and companies that are in similar industry sectors may be similarly affected by particular economic or market events; to the extent the Funds have substantial holdings within a particular sector, the risks associated with that sector increase.
Liquidity Risk: The Funds may not be able to dispose of particular investments, such as illiquid securities, readily at favorable times or prices or the Funds may have to sell them at a loss.
Debt Securities Risk: The value of a debt security changes in response to various factors, including, for example, market related factors, such as changes in interest rates or changes in the actual or perceived ability of an issuer to meet its obligations. Investments in debt securities are subject to, among other risks, credit risk, interest rate risk, extension risk, prepayment risk and liquidity risk.
Interest Rate Risk: Fixed coupon payments (cash flows) of bonds and debt securities may become less competitive with the market in periods of rising interest rates and cause bond prices to decline.
Credit Risk: The issuer of bonds or other debt securities may be unable or unwilling, or may be perceived as unable or unwilling, to make timely interest or principal payments or otherwise honor its obligations.
Extension Risk: During periods of rising interest rates, a debtor may pay back a bond or other fixed income security slower than expected or required, and the value of such security may fall.
Prepayment Risk: A debtor may exercise its right to pay back a bond or other debt security earlier than expected or required during periods of decreasing interest rates.
Inflation/Deflation Risk: Inflation risk is the risk that the value of assets or income from investments will be worth less in the future. Inflation rates may change frequently and drastically as a result of various factors and a Fund’s investments may not keep pace with inflation, which may result in losses to Fund investors or adversely affect the real value of shareholders’ investments in the
Fund. As inflation rates increase, fixed income securities markets may experience heightened levels of interest rate volatility and liquidity risk. Deflation risk is the risk that the prices throughout the economy decline over time – the opposite of inflation. Deflation may have an adverse effect on the creditworthiness of issuers and may make issuer default more likely, which may result in a decline in the value of a Fund’s portfolio.
Reinvestment Risk: A Fund may have difficulty reinvesting payments from debtors and may receive lower rates than from its original investments.
U.S. Government Securities Risk: Obligations issued by some U.S. Government agencies, authorities, instrumentalities, or sponsored enterprises such as Government National Mortgage Association (“GNMA”) are backed by the full faith and credit of the U.S. Government, while obligations issued by others, such as Federal National Mortgage Association (“FNMA”), Federal Home Loan Mortgage Corporation (“FHLMC”), and Federal Home Loan Banks (“FHLBs”), are not backed by the full faith and credit of the U.S. Government and are backed solely by the entity’s own resources or by the ability of the entity to borrow from the U.S. Treasury. If one of these agencies defaults on a loan, there is no guarantee that the U.S. Government will provide financial support.
Asset-Backed and Mortgage-Backed Securities Risk: Investments in asset-backed and mortgage-backed securities involve risk of severe credit downgrades, loss due to prepayments that occur earlier or later than expected, illiquidity and default.
Municipal Market Risk: Factors unique to the municipal bond market may negatively affect the value of a Fund’s investment in municipal bonds. These factors include political or legislative changes, and uncertainties related to the tax status of the securities and the rights of investors in the securities. A Fund may invest in a group of municipal obligations that are related in such a way that an economic, business, or political development affecting one would also affect the others.
Environmental, Social and Governance (“ESG”) Investing Risk: Because applying a Fund’s ESG investment criteria may result in the selection or exclusion of securities of certain issuers for reasons other than financial performance, a Fund’s investment returns may underperform funds that do not incorporate ESG factors into their investment process. The incorporation of ESG criteria into the investment process may affect a Fund’s investment exposure to certain companies, sectors, regions, countries or types of investments, which could negatively impact a Fund’s performance depending on whether such investments are in or out of favor. Applying ESG criteria to investment decisions is qualitative and subjective by nature, and there is no guarantee that the criteria utilized by GW&K or any judgment exercised by GW&K will improve the financial performance of a Fund or reflect the beliefs or values of any particular investor. ESG standards differ by region and industry, and a company’s ESG practices or GW&K’s assessment of a company’s ESG practices may change over time.
Small- and Mid-Capitalization Stock Risk: The stocks of small- and mid-capitalization companies often have greater price volatility, lower trading volume, and less liquidity than the stocks of larger, more established companies.
Growth Stock Risk: The prices of equity securities of companies that are expected to experience relatively rapid earnings growth, or “growth stocks,” may be more sensitive to market movements because the prices tend to reflect future investor expectations rather than just current profits.
25
| | |
| | Notes to Financial Statements (continued) |
6. COMMITMENTS AND CONTINGENCIES
Under the Trusts’ organizational documents, their Trustees and Officers are indemnified against certain liabilities arising out of the performance of their duties to the Trusts. In addition, in the normal course of business, the Funds may enter into contracts and agreements that contain a variety of representations and
warranties, which provide general indemnifications. The maximum exposure to the Funds under these arrangements is unknown, as this would involve future claims that may be made against a Fund that have not yet occurred. However, based on experience, the Funds had no prior claims or losses and expect the risks of loss to be remote.
7. MASTER NETTING AGREEMENTS
The Funds may enter into master netting agreements with their counterparties for the Securities Lending Program and Repurchase Agreements, which provide the right, in the event of default (including bankruptcy or insolvency) for the non-defaulting party to liquidate the collateral and calculate net exposure to the defaulting party or request additional collateral. For financial reporting purposes, the Funds do not offset financial assets and financial liabilities that are subject to master netting agreements in the Statement of Assets and Liabilities. For securities lending transactions, see Note 4.
The following table is a summary of the Funds’ open Repurchase Agreements that are subject to a master netting agreement as of October 31, 2024:
| | | | | | | | | | | | | | | | | | | | |
| | | | | | Gross Amount Not Offset in the
Statement of Assets and Liabilities | | | | | | | |
| Fund | | Gross Amounts of Assets Presented in the Statement of Assets and Liabilities | | | Offset Amount | | | Net Asset Balance | | | Collateral
Received | | | Net Amount | |
| | | | | | | | | | | | | | | | | | | | | |
| | | | | |
Core Bond ESG | | | | | | | | | | | | | | | | | | | | |
| | | | | |
Daiwa Capital Markets America | | | $966,511 | | | | — | | | | $966,511 | | | | $966,511 | | | | — | |
| | | | | |
Fixed Income Clearing Corp. | | | 371,000 | | | | — | | | | 371,000 | | | | 371,000 | | | | — | |
| | | | | | | | | | | | | | | | | | | | |
| | | | | |
Total | | | $1,337,511 | | | | — | | | | $1,337,511 | | | | $1,337,511 | | | | — | |
| | | | | | | | | | | | | | | | | | | | |
| | | | | |
Small/Mid Cap Growth | | | | | | | | | | | | | | | | | | | | |
| | | | | |
Fixed Income Clearing Corp. | | | $1,194,000 | | | | — | | | | $1,194,000 | | | | $1,194,000 | | | | — | |
8. RECENT ACCOUNTING STANDARDS UPDATE
In November 2023, the Financial Accounting Standards Board issued ASU No. 2023-07, Segment Reporting (Topic 280), which improves reportable segment disclosure requirements, primarily through enhanced disclosures about significant segment expenses. The amendments are effective for fiscal years beginning after December 15, 2023, and interim periods within fiscal years beginning after December 15, 2024. The Funds are currently evaluating the requirements and do not expect this guidance to materially impact the Funds’ financial statements.
9. SUBSEQUENT EVENTS
The Funds have determined that no material events or transactions occurred through the issuance date of the Funds’ financial statements which require an additional disclosure in or adjustment of the Funds’ financial statements.
26
| | |
| | Report of Independent Registered Public Accounting Firm |
| | |
| To the Board of Trustees of AMG Funds I and AMG Funds IV and Shareholders of AMG GW&K Core Bond ESG Fund and AMG GW&K Small/Mid Cap Growth Fund | | |
| |
| Opinions on the Financial Statements | | |
| |
| We have audited the accompanying statements of assets and liabilities, including the schedules of portfolio investments, of AMG GW&K Core Bond ESG Fund (one of the funds constituting AMG Funds I) and AMG GW&K Small/Mid Cap Growth Fund (one of the funds constituting AMG Funds IV) (hereafter collectively referred to as the “Funds”) as of October 31, 2024, the related statements of operations for the year ended October 31, 2024, the statements of changes in net assets for each of the two years in the period ended October 31, 2024, including the related notes, and the financial highlights for each the periods indicated therein (collectively referred to as the “financial statements”). In our opinion, the financial statements present fairly, in all material respects, the financial position of each of the Funds as of October 31, 2024, the results of each of their operations for the year then ended, the changes in each of their net assets for each of the two years in the period ended October 31, 2024 and each of the financial highlights for each of the periods indicated therein in conformity with accounting principles generally accepted in the United States of America. | | |
| |
| Basis for Opinions | | |
| |
| These financial statements are the responsibility of the Funds’ management. Our responsibility is to express an opinion on the Funds’ financial statements based on our audits. We are a public accounting firm registered with the Public Company Accounting Oversight Board (United States) (PCAOB) and are required to be independent with respect to the Funds in accordance with the U.S. federal securities laws and the applicable rules and regulations of the Securities and Exchange Commission and the PCAOB. | | |
| |
| We conducted our audits of these financial statements in accordance with the standards of the PCAOB. Those standards require that we plan and perform the audit to obtain reasonable assurance about whether the financial statements are free of material misstatement, whether due to error or fraud. | | |
| |
| Our audits included performing procedures to assess the risks of material misstatement of the financial statements, whether due to error or fraud, and performing procedures that respond to those risks. Such procedures included examining, on a test basis, evidence regarding the amounts and disclosures in the financial statements. Our audits also included evaluating the accounting principles used and significant estimates made by management, as well as evaluating the overall presentation of the financial statements. Our procedures included confirmation of securities owned as of October 31, 2024 by correspondence with the custodian. We believe that our audits provide a reasonable basis for our opinions. | | |
/s/PricewaterhouseCoopers LLP
Boston, Massachusetts
December 23, 2024
We have served as the auditor of one or more investment companies in the AMG Funds Family since 1993.
27
| | |
| | Other Information (unaudited) |
TAX INFORMATION
AMG GW&K Core Bond ESG Fund and AMG GW&K Small/Mid Cap Growth Fund each hereby designates the maximum amount allowable of their net taxable income as qualified dividends as provided in the Jobs and Growth Tax Relief Reconciliation Act of 2003. The 2023/2024 Form 1099-DIV you receive for each Fund will show the tax status of all distributions paid to you during the year.
Pursuant to section 852 of the Internal Revenue Code of 1986, as amended, AMG GW&K Core Bond ESG Fund and AMG GW&K Small/Mid Cap Growth Fund each hereby designates as a capital gain distribution with respect to the taxable period ended October 31, 2024, $0 and $309,001, respectively, or, if subsequently determined to be different, the net capital gains of such period.
ITEM 8. CHANGES IN AND DISAGREEMENTS WITH ACCOUNTANTS FOR OPEN-END MANAGEMENT INVESTMENT COMPANIES
During the fiscal year ended October 31, 2024, there were no changes in and/or disagreements with accountants.
ITEM 9. PROXY DISCLOSURES FOR OPEN-END MANAGEMENT INVESTMENT COMPANIES
Not applicable.
ITEM 10. REMUNERATION PAID TO DIRECTORS, OFFICERS, AND OTHERS OF OPEN-END MANAGEMENT INVESTMENT COMPANIES
The remuneration paid to the Trustees during the fiscal year ended October 31, 2024, is reflected as “Trustee fees and expenses” on the Statement of Operations and is set forth in the table below. There was no remuneration paid to any Fund officer or to any affiliated person of any Fund Trustee or officer during the fiscal year ended October 31, 2024.
| | | | |
| | | Trustee fees and expenses | |
| |
AMG GW&K Core Bond ESG Fund | | | $10,544 | |
| |
AMG GW&K Small/Mid Cap Growth Fund | | | 3,347 | |
| | | | | |
28
| | |
| | ITEM 11. STATEMENT REGARDING BASIS FOR APPROVAL OF INVESTMENT ADVISORY CONTRACT |
| | | | | | | | |
AMG GW&K Core Bond ESG Fund and AMG GW&K Small/Mid Cap Growth Fund: Approval of Investment Management and Subadvisory Agreements on June 12, 2024 At an in-person meeting held on June 12, 2024, the Board of Trustees (the “Board” or the “Trustees”) of each of AMG Funds I and AMG Funds IV (each, a “Trust” and collectively, the “Trusts”), and separately a majority of the Trustees who are not “interested persons” of the Trusts (the “Independent Trustees”), approved (i) the Fund Management Agreement, as amended pursuant to letter agreements at any time prior to the date of the meeting, with AMG Funds LLC (the “Investment Manager”) and AMG Funds I for AMG GW&K Core Bond ESG Fund, and separately each of Amendment No. 1 thereto dated July 1, 2015, and Amendment No. 2 thereto dated October 1, 2016; and the Investment Advisory Agreement, as amended pursuant to letter agreements at any time prior to the date of the meeting, with the Investment Manager and AMG Funds IV for AMG GW&K Small/Mid Cap Growth Fund, and separately Amendment No. 1 thereto dated October 1, 2016 (collectively, the “Investment Management Agreements”); and (ii) the Subadvisory Agreement with respect to each of AMG GW&K Core Bond ESG Fund and AMG GW&K Small/Mid Cap Growth Fund (each, a “Fund,” and collectively, the “Funds”), as amended at any time prior to the date of the meeting (collectively, the “Subadvisory Agreements”), with GW&K Investment Management, LLC, the Funds’ subadviser (the “Subadviser”). The Independent Trustees were separately represented by independent legal counsel in connection with their consideration of the approval of these agreements. In considering the Investment Management Agreements and the Subadvisory Agreements, the Trustees reviewed a variety of materials relating to each Fund, the Investment Manager and the Subadviser, including the nature, extent and quality of services, comparative performance, fee and expense information for an appropriate peer group of similar mutual funds for each Fund (each, a “Peer Group”), performance information for the relevant benchmark index for each Fund (each, a “Fund Benchmark”), other relevant matters, including management fees, the profitability of the Investment Manager and the Subadviser, and the potential for economies of scale that may be shared with the Funds, and other information provided to them on a periodic basis throughout the year. Prior to voting, the Independent Trustees: (a) reviewed the foregoing information with their independent legal counsel; (b) received materials from their independent legal counsel discussing the legal standards applicable to | | | | their consideration of the Investment Management Agreements and the Subadvisory Agreements; and (c) met with their independent legal counsel in private sessions at which no representatives of management were present. NATURE, EXTENT AND QUALITY OF SERVICES In considering the nature, extent and quality of the services provided by the Investment Manager, the Trustees reviewed information provided by the Investment Manager at the June 12, 2024 meeting and prior meetings relating to the Investment Manager’s operations and personnel. Among other things, the Investment Manager provided financial information, information about its supervisory and professional staff and descriptions of its organizational and management structure. The Trustees also took into account information provided periodically throughout the previous year by the Investment Manager in Board meetings relating to the performance of its duties with respect to the Funds and the Trustees’ knowledge of the Investment Manager’s management and the quality of the performance of the Investment Manager’s duties under the Investment Management Agreements and Administration Agreement. In the course of their deliberations regarding the Investment Manager, the Trustees evaluated, among other things: (a) the extent and quality of the Investment Manager’s oversight of the operation and management of the Funds; (b) the quality of the Investment Manager’s oversight of the performance by the Subadviser of its portfolio management duties; (c) the Investment Manager’s ability to supervise the Funds’ other service providers; and (d) the Investment Manager’s compliance program. The Trustees also took into account that, in performing its functions under the Investment Management Agreements and supervising the Subadviser, the Investment Manager: performs periodic detailed analyses and reviews of the performance by the Subadviser of its obligations to each Fund, including without limitation, analysis and review of portfolio and other compliance matters and review of the Subadviser’s investment performance with respect to each Fund; prepares and presents periodic reports to the Board regarding the investment performance of the Subadviser and other information regarding the Subadviser, at such times and in such forms as the Board may reasonably request; reviews and considers any changes in the personnel of the Subadviser responsible for performing the Subadviser’s obligations and makes appropriate reports to the Board; reviews and considers any changes in the ownership or senior management of | | | | the Subadviser and makes appropriate reports to the Board; performs periodic in-person, telephonic or videoconference diligence meetings, including with respect to compliance matters, with representatives of the Subadviser; assists the Board and management of the Trusts in developing and reviewing information with respect to the initial approval of each Subadvisory Agreement and annual consideration of each Subadvisory Agreement thereafter; prepares recommendations with respect to the continued retention of the Subadviser or the replacement of the Subadviser, including at the request of the Board; identifies potential successors to, or replacements of, the Subadviser or potential additional subadvisers, including performing appropriate due diligence, and developing and presenting to the Board a recommendation as to any such successor, replacement, or additional subadviser, including at the request of the Board; designates and compensates from its own resources such personnel as the Investment Manager may consider necessary or appropriate to the performance of its services; and performs such other review and reporting functions as the Board shall reasonably request consistent with the Investment Management Agreements and applicable law. The Trustees noted the affiliation of the Subadviser with the Investment Manager, noting any potential conflicts of interest. The Trustees also took into account the financial condition of the Investment Manager with respect to its ability to provide the services required under the Investment Management Agreements and the Investment Manager’s undertaking to maintain contractual expense limitations for the Funds. The Trustees also considered the Investment Manager’s risk management processes. The Trustees also reviewed information relating to the Subadviser’s operations and personnel and the investment philosophy, strategies and techniques (its “Investment Strategy”) used in managing each Fund. Among other things, the Trustees reviewed information on portfolio management and other professional staff, information regarding the Subadviser’s organizational and management structure and the Subadviser’s brokerage policies and practices. The Trustees considered specific information provided regarding the experience of the individuals at the Subadviser with portfolio management responsibility for each Fund, including the information set forth in the Fund’s prospectus and statement of additional information. In the course of their deliberations, the Trustees evaluated, among other things: (a) the services rendered by the Subadviser in the past; (b) the qualifications and |
| | | | | | | | |
| | | | | | | | |
29
| | |
| | ITEM 11. STATEMENT REGARDING BASIS FOR APPROVAL OF INVESTMENT ADVISORY CONTRACT (continued) |
| | | | | | | | |
experience of the Subadviser’s personnel; and (c) the Subadviser’s compliance program. The Trustees also took into account the financial condition of the Subadviser with respect to its ability to provide the services required under each Subadvisory Agreement. The Trustees also considered the Subadviser’s risk management processes. PERFORMANCE The Board considered each Fund’s net performance during relevant time periods as compared to the Fund’s Peer Group and Fund Benchmark, considered the gross performance of each Fund as compared to the Subadviser’s relevant performance composite that utilizes a similar investment strategy and approach, and noted that the Board reviews on a quarterly basis detailed information about both a Fund’s performance results and portfolio composition, as well as the Subadviser’s Investment Strategy. The Board was mindful of the Investment Manager’s expertise, resources and attention to monitoring the Subadviser’s performance, investment style and risk-adjusted performance with respect to the Funds and its discussions with the management of the Funds’ subadviser during the period regarding the factors that contributed to the performance of the Funds. With respect to AMG GW&K Core Bond ESG Fund, among other information relating to the Fund’s performance, the Trustees noted that the Fund’s performance for Class I shares (which share class has the earliest inception date and the largest amount of assets of all the share classes of the Fund) for the 1-year, 3-year, 5-year and 10-year periods ended March 31, 2024, was below the median performance of the Peer Group and below the performance of the Fund Benchmark, the Bloomberg U.S. Aggregate Bond Index. The Trustees took into account management’s discussion of the Fund’s performance, including the reasons for the Fund’s underperformance relative to the Peer Group and the Fund Benchmark. The Trustees also took into account the fact that Class I shares of the Fund ranked in the top half relative to its Peer Group for the 2023 calendar year. The Trustees concluded that the Fund’s overall performance has been satisfactory in light of the Fund’s investment objective, strategies and policies. With respect to AMG GW&K Small/Mid Cap Growth Fund, among other information relating to the Fund’s performance, the Trustees noted that the Fund’s performance for Class N shares (which share class has the earliest inception date and the largest amount of assets of all the share classes of the | | | | Fund) for the 1-year, 3-year, 5-year, and 10-year periods ended March 31, 2024, was below, above, below, and below, respectively, the median performance of the Peer Group and above, above, above, and below, respectively, the performance of the Fund Benchmark, the Russell 2500 Growth Index. The Trustees took into account management’s discussion of the Fund’s performance, including the reasons for the Fund’s more recent and longer-term underperformance relative to the Peer Group and its more recent outperformance relative to the Fund Benchmark. The Trustees noted that the Fund ranked in the top quartile relative to its Peer Group for the 3-year period. The Trustees also took into account the fact that the Fund’s subadviser changed effective March 19, 2021, that the Fund’s investment strategy changed effective March 19, 2021 and further on May 21, 2021, that the Fund Benchmark changed effective May 21, 2021, and that the performance information prior to those dates reflected that of the Fund’s prior subadviser and investment strategy. The Trustees concluded that the Fund’s overall performance has been satisfactory in light of the Fund’s investment objective, strategies and policies. ADVISORY AND SUBADVISORY FEES; FUND EXPENSES; PROFITABILITY; AND ECONOMIES OF SCALE In considering the reasonableness of the advisory fee payable to the Investment Manager, the Trustees reviewed information provided by the Investment Manager at the June 12, 2024 meeting and prior meetings setting forth all revenues and other benefits, both direct and indirect (including any so-called “fallout benefits” such as reputational value derived from the Investment Manager serving as Investment Manager to a Fund), received by the Investment Manager and its affiliates attributable to managing each Fund and all the mutual funds in the AMG Funds Family of Funds; the cost of providing such services; the significant risks undertaken as Investment Manager and sponsor of the Funds, including investment, operational, enterprise, entrepreneurial, litigation, regulatory and compliance risks; and the resulting profitability to the Investment Manager and its affiliates from these relationships. The Trustees also considered the amount of the advisory fee retained by the Investment Manager after payment of the subadvisory fee with respect to each Fund. The Trustees also noted payments are made from the Subadviser to the Investment Manager, and other payments are made from the Investment Manager to the Subadviser. The Trustees also considered management’s discussion of the | | | | current asset levels of the Funds, and the impact on profitability of both the current asset levels and any future growth of assets of the Funds. In considering the cost of services to be provided by the Investment Manager under each Investment Management Agreement and the profitability to the Investment Manager of its relationship with each Fund, the Trustees noted the undertaking by the Investment Manager to maintain contractual expense limitations for the Funds. The Board also took into account management’s discussion of the advisory fee structure, and the services the Investment Manager provides in performing its functions under each Investment Management Agreement and supervising the Subadviser. Based on the foregoing, the Trustees concluded that the profitability to the Investment Manager is reasonable and that the Investment Manager is not realizing material benefits from economies of scale that would warrant adjustments to the advisory fee at this time. Also, with respect to economies of scale, the Trustees noted that as each Fund’s assets increase over time, the Fund may realize other economies of scale to the extent the increase in assets is proportionally greater than the increase in certain other expenses. In considering the reasonableness of the subadvisory fees payable by the Investment Manager to the Subadviser, the Trustees reviewed information regarding the cost to the Subadviser of providing subadvisory services to each Fund and the resulting profitability from these relationships. The Trustees noted that, because the Subadviser is an affiliate of the Investment Manager, a portion of the Subadviser’s revenues or profits might be shared directly or indirectly with the Investment Manager. The Trustees also noted that the subadvisory fees are paid by the Investment Manager out of its advisory fee. The Board also took into account management’s discussion of the subadvisory fee structure, and the services the Subadviser provides in performing its functions under each Subadvisory Agreement. Based on the foregoing, the Trustees concluded that the profitability to the Subadviser is reasonable and that the Subadviser is not realizing material benefits from economies of scale that would warrant adjustments to the subadvisory fees at this time. Also, with respect to economies of scale, the Trustees noted that as a Fund’s assets increase over time, the Fund may realize other economies of scale to the extent the increase in assets is proportionally greater than the increase in certain other expenses. With respect to AMG GW&K Core Bond ESG Fund, the Trustees noted that the management fees (which include both the advisory and administration fees) |
| | | | | | | | |
| | | | | | | | |
30
| | |
| | ITEM 11. STATEMENT REGARDING BASIS FOR APPROVAL OF INVESTMENT ADVISORY CONTRACT (continued) |
| | | | | | | | |
and total expenses (net of applicable expense waivers/reimbursements) of Class I shares (the class of shares which is the primary focus of the Fund’s distribution) of the Fund as of March 31, 2024, were rated in the Average and the Above Average rating level, respectively, of the Fund’s Peer Group. The Trustees noted that the rating levels corresponded to the Fund’s quintile ranking in its Peer Group. The Trustees took into account the fact that the Investment Manager has contractually agreed, through March 1, 2025, to limit the Fund’s net annual operating expenses (subject to certain excluded expenses) to 0.48%. The Trustees also took into account management’s discussion of the Fund’s expenses and competitiveness with comparably sized funds and select competitors. The Trustees concluded that, in light of the nature, extent and quality of the services provided by the Investment Manager and the Subadviser (which is an affiliate of the Investment Manager), the foregoing expense limitation and the considerations noted above with respect to the Investment Manager and the Subadviser, the Fund’s advisory and subadvisory fees are reasonable. With respect to AMG GW&K Small/Mid Cap Growth Fund, the Trustees noted that the management fees | | | | (which include both the advisory and administration fees) and total expenses (net of applicable expense waivers/reimbursements) of Class I shares (the class of shares which is the primary focus of the Fund’s distribution) of the Fund as of March 31, 2024, were both rated in the Average rating level of the Fund’s Peer Group. The Trustees noted that the rating levels corresponded to the Fund’s quintile ranking in its Peer Group. The Trustees took into account the fact that the Investment Manager has contractually agreed, through March 1, 2025, to limit the Fund’s net annual operating expenses (subject to certain excluded expenses) to 0.82%. The Trustees concluded that, in light of the nature, extent and quality of the services provided by the Investment Manager and the Subadviser (which is an affiliate of the Investment Manager), the foregoing expense limitation and the considerations noted above with respect to the Investment Manager and the Subadviser, the Fund’s advisory and subadvisory fees are reasonable. * * * * * After consideration of the foregoing, the Trustees also reached the following conclusions (in addition to the | | | | conclusions discussed above) regarding the Investment Management and Subadvisory Agreements: (a) the Investment Manager and the Subadviser have demonstrated that they possess the capability and resources to perform the duties required of them under each Investment Management Agreement and each Subadvisory Agreement and (b) the Investment Manager and Subadviser maintain appropriate compliance programs. Based on all of the above-mentioned factors and their related conclusions, with no single factor or conclusion being determinative and with each Trustee not necessarily attributing the same weight to each factor, the Trustees concluded that approval of each Investment Management Agreement and each Subadvisory Agreement would be in the best interests of the applicable Fund and its shareholders. Accordingly, on June 12, 2024, the Trustees, and separately a majority of the Independent Trustees, voted to approve the Investment Management Agreement and the Subadvisory Agreement for each Fund. |
| | | | | | | | |
| | | | | | | | |
31
THIS PAGE INTENTIONALLY LEFT BLANK
| | |
| | |
| | | | |
INVESTMENT MANAGER AND ADMINISTRATOR AMG Funds LLC 680 Washington Blvd., Suite 500 Stamford, CT 06901 800.548.4539 DISTRIBUTOR AMG Distributors, Inc. 680 Washington Blvd., Suite 500 Stamford, CT 06901 800.548.4539 SUBADVISER GW&K Investment Management, LLC 222 Berkeley St. Boston, MA 02116 | | CUSTODIAN The Bank of New York Mellon Mutual Funds Custody 240 Greenwich Street New York, NY 10286 LEGAL COUNSEL Ropes & Gray LLP Prudential Tower, 800 Boylston Street Boston, MA 02199-3600 TRANSFER AGENT BNY Mellon Investment Servicing (US) Inc. AMG Funds Attn: 534426 AIM 154-0520 500 Ross Street Pittsburgh, PA 15262 800.548.4539 | | This report is prepared for the Funds’ shareholders. It is authorized for distribution to prospective investors only when preceded or accompanied by an effective prospectus. To receive a free copy of the prospectus or Statement of Additional Information, which includes additional information about Fund Trustees, please contact us by calling 800.548.4539. Distributed by AMG Distributors, Inc., member FINRA/SIPC. Current net asset values per share for each Fund are available on the Funds’ website at wealth.amg.com. A description of the policies and procedures each Fund uses to vote its proxies is available: (i) without charge, upon request, by calling 800.548.4539, or (ii) on the Securities and Exchange Commission’s (SEC) website at sec.gov. For information regarding each Fund’s proxy voting record for the 12-month period ended June 30, call 800.548.4539 or visit the SEC website at sec.gov. The Funds file their complete schedule of portfolio holdings with the SEC for the first and third quarters of each fiscal year as an exhibit to their reports on Form N-PORT. The Funds’ portfolio holdings on Form N-PORT are available on the SEC’s website at sec.gov and the Funds’ website at wealth.amg.com. To review a complete list of the Funds’ portfolio holdings, or to view the most recent semi-annual report or annual report, please visit wealth.amg.com. |
| | |
| | |
| | | | | | |
EQUITY FUNDS AMG Boston Common Global Impact Boston Common Asset Management, LLC AMG Frontier Small Cap Growth Frontier Capital Management Co., LLC AMG GW&K Small Cap Core AMG GW&K Small Cap Value AMG GW&K Small/Mid Cap Core AMG GW&K Small/Mid Cap Growth AMG GW&K International Small Cap GW&K Investment Management, LLC AMG Montrusco Bolton Large Cap Growth Montrusco Bolton Investments, Inc. AMG Renaissance Large Cap Growth The Renaissance Group LLC | | | | AMG River Road Dividend All Cap Value AMG River Road Focused Absolute Value AMG River Road Large Cap Value Select AMG River Road Mid Cap Value AMG River Road Small-Mid Cap Value AMG River Road Small Cap Value River Road Asset Management, LLC AMG TimesSquare International Small Cap AMG TimesSquare Mid Cap Growth AMG TimesSquare Small Cap Growth TimesSquare Capital Management, LLC AMG Veritas Asia Pacific AMG Veritas China AMG Veritas Global Focus AMG Veritas Global Real Return Veritas Asset Management LLP AMG Yacktman AMG Yacktman Focused AMG Yacktman Global AMG Yacktman Special Opportunities Yacktman Asset Management LP | | FIXED INCOME FUNDS AMG Beutel Goodman Core Plus Bond Beutel, Goodman & Company Ltd. AMG GW&K Core Bond ESG AMG GW&K ESG Bond AMG GW&K Municipal Bond AMG GW&K Municipal Enhanced Yield GW&K Investment Management, LLC ALTERNATIVE FUNDS AMG Systematica Managed Futures Strategy Systematica Investments Limited, acting as general partner of Systematica Investments LP |
| | | | | | |
| | | | | | | |
| | | |
| wealth.amg.com | | 103124 | | | AR069 | |
| | |
 | | ANNUAL FINANCIAL STATEMENTS |
| | | | | | |
| | | AMG Funds |
| | | | |
| | | October 31, 2024 | | | | |
| | |
| | |  |
| | |
| | | AMG River Road Mid Cap Value Fund |
| | | Class N: CHTTX | | Class I: ABMIX | | Class Z: ABIZX |
| | |
| | | AMG River Road Large Cap Value Select Fund |
| | | | |
| | | Class N: FQUAX | | Class I: MEQFX | | |
| | |
| | | AMG River Road Small Cap Value Fund |
| | | | |
| | | Class N: ARSVX | | Class I: ARSIX | | Class Z: ARZMX |
| | |
| | | AMG River Road Dividend All Cap Value Fund |
| | | | |
| | | Class N: ARDEX | | Class I: ARIDX | | Class Z: ARZDX |
| | |
| | | AMG River Road Small-Mid Cap Value Fund |
| | | | |
| | | Class N: ARSMX | | Class I: ARIMX | | Class Z: ARSZX |
| | |
| | | AMG River Road Focused Absolute Value Fund |
| | | | |
| | | Class N: ARRFX | | Class I: AFAVX | | Class Z: ARRZX |
| | | | |
| | | | | | | |
| | | | | | |
| | | | | | | |
| | | |
| wealth.amg.com | | 103124 | | | AR082 | |
| | |
| | AMG Funds Annual Financial Statements — October 31, 2024 |
Nothing contained herein is to be considered an offer, sale or solicitation of an offer to buy shares of any series of the AMG Funds Family of Funds. Such offering is made only by prospectus, which includes details as to offering price and other material information.
| | |
| | AMG River Road Mid Cap Value Fund Schedule of Portfolio Investments October 31, 2024 |
| | | | | | | | |
| | | Shares | | | Value | |
| | |
Common Stocks - 93.8% | | | | | | | | |
| | |
Communication Services - 1.7% | | | | | | | | |
| | |
Atlanta Braves Holdings, Inc., Class C* | | | 75,874 | | | | $2,997,782 | |
| | |
Madison Square Garden Sports Corp.* | | | 11,708 | | | | 2,607,371 | |
| | |
Total Communication Services | | | | | | | 5,605,153 | |
| | |
Consumer Discretionary - 19.4% | | | | | | | | |
| | |
Expedia Group, Inc.* | | | 57,101 | | | | 8,925,457 | |
| | |
Genuine Parts Co. | | | 58,341 | | | | 6,691,713 | |
| | |
LGI Homes, Inc.* | | | 33,415 | | | | 3,393,627 | |
| | |
Lithia Motors, Inc. | | | 39,892 | | | | 13,258,904 | |
| | |
LKQ Corp. | | | 227,918 | | | | 8,385,103 | |
| | |
Lululemon Athletica, Inc. (Canada)* | | | 44,586 | | | | 13,282,170 | |
| | |
MGM Resorts International* | | | 147,837 | | | | 5,450,750 | |
| | |
Ulta Beauty, Inc.* | | | 16,426 | | | | 6,060,866 | |
| | |
Total Consumer Discretionary | | | | | | | 65,448,590 | |
| | |
Consumer Staples - 10.2% | | | | | | | | |
| | |
Albertsons Cos., Inc., Class A | | | 268,296 | | | | 4,856,158 | |
| | |
BJ’s Wholesale Club Holdings, Inc.* | | | 138,450 | | | | 11,730,868 | |
| | |
Casey’s General Stores, Inc. | | | 17,991 | | | | 7,088,814 | |
| | |
The Kroger Co. | | | 191,640 | | | | 10,687,763 | |
| | |
Total Consumer Staples | | | | | | | 34,363,603 | |
| | |
Energy - 1.0% | | | | | | | | |
| | |
Tidewater, Inc.* | | | 57,101 | | | | 3,430,057 | |
| | |
Financials - 16.4% | | | | | | | | |
| | |
Ares Management Corp., Class A | | | 16,426 | | | | 2,754,312 | |
| | |
Brookfield Asset Management, Ltd., | | | | | | | | |
| | |
Class A (Canada) | | | 144,541 | | | | 7,666,455 | |
| | |
Fairfax Financial Holdings, Ltd. (Canada) | | | 12,447 | | | | 15,502,987 | |
| | |
Global Payments, Inc. | | | 65,705 | | | | 6,814,265 | |
| | |
WEX, Inc.* | | | 45,368 | | | | 7,830,517 | |
| | |
Willis Towers Watson PLC (United Kingdom) | | | 49,735 | | | | 15,029,420 | |
| | |
Total Financials | | | | | | | 55,597,956 | |
| | |
Health Care - 7.7% | | | | | | | | |
| | |
Centene Corp.* | | | 104,815 | | | | 6,525,782 | |
| | |
GE HealthCare Technologies, Inc. | | | 46,932 | | | | 4,099,510 | |
| | |
Humana, Inc. | | | 14,080 | | | | 3,630,246 | |
| | |
Labcorp Holdings, Inc. | | | 52,066 | | | | 11,885,106 | |
| | |
Total Health Care | | | | | | | 26,140,644 | |
| | |
Industrials - 21.2% | | | | | | | | |
| | |
AerCap Holdings, N.V. (Ireland) | | | 72,271 | | | | 6,760,952 | |
| | |
API Group Corp.* | | | 240,137 | | | | 8,198,277 | |
| | |
Carlisle Cos., Inc. | | | 7,822 | | | | 3,302,683 | |
| | | | | | | | |
| | | Shares | | | Value | |
| | |
CNH Industrial N.V. (United Kingdom) | | | 624,199 | | | | $7,009,755 | |
| | |
Delta Air Lines, Inc. | | | 128,282 | | | | 7,340,296 | |
| | |
Expeditors International of Washington, Inc. | | | 54,754 | | | | 6,515,726 | |
| | |
Ferguson Enterprises, Inc. | | | 20,337 | | | | 4,001,101 | |
| | |
McGrath RentCorp | | | 73,898 | | | | 8,402,203 | |
| | |
Robert Half, Inc. | | | 121,349 | | | | 8,265,080 | |
| | |
SS&C Technologies Holdings, Inc. | | | 121,242 | | | | 8,478,453 | |
| | |
Valmont Industries, Inc. | | | 10,951 | | | | 3,413,208 | |
| | |
Total Industrials | | | | | | | 71,687,734 | |
| | |
Materials - 3.7% | | | | | | | | |
| | |
Summit Materials, Inc., Class A* | | | 152,530 | | | | 7,231,447 | |
| | |
Warrior Met Coal, Inc. | | | 81,349 | | | | 5,135,563 | |
| | |
Total Materials | | | | | | | 12,367,010 | |
| | |
Real Estate - 7.4% | | | | | | | | |
| | |
Alexandria Real Estate Equities, Inc., REIT | | | 55,537 | | | | 6,195,152 | |
| | |
Howard Hughes Holdings, Inc.* | | | 91,518 | | | | 6,959,029 | |
| | |
Mid-America Apartment Communities, Inc., REIT | | | 41,457 | | | | 6,274,102 | |
| | |
The St. Joe Co. | | | 104,815 | | | | 5,418,936 | |
| | |
Total Real Estate | | | | | | | 24,847,219 | |
| | |
Utilities - 5.1% | | | | | | | | |
| | |
IDACORP, Inc. | | | 32,070 | | | | 3,318,603 | |
| | |
Talen Energy Corp.* | | | 77,438 | | | | 14,044,156 | |
| | |
Total Utilities | | | | | | | 17,362,759 | |
| | |
Total Common Stocks | | | | | | | | |
(Cost $271,391,400) | | | | | | | 316,850,725 | |
| |
Exchange Traded Funds - 5.4% | | | | | |
| | |
iShares Russell Mid-Cap Value ETF | | | | | | | | |
(Cost $18,426,204) | | | 140,643 | | | | 18,351,099 | |
| | |
| | | Principal
Amount | | | | |
| |
Short-Term Investments - 1.8% | | | | | |
| |
Repurchase Agreements - 1.8% | | | | | |
| | |
Fixed Income Clearing Corp., dated 10/31/24, due 11/01/24, 4.650% total to be received $6,164,796 (collateralized by a U.S. Treasury Note, 3.375%, 05/15/33, totaling $6,287,364) | | | $6,164,000 | | | | 6,164,000 | |
| | |
Total Short-Term Investments | | | | | | | | |
| | |
(Cost $6,164,000) | | | | | | | 6,164,000 | |
| | |
Total Investments - 101.0% | | | | | | | | |
| | |
(Cost $295,981,604) | | | | | | | 341,365,824 | |
| |
Other Assets, less Liabilities - (1.0)% | | | | (3,425,431 | ) |
| | |
Net Assets - 100.0% | | | | | | | $337,940,393 | |
The accompanying notes are an integral part of these financial statements.
2
| | |
| | AMG River Road Mid Cap Value Fund Schedule of Portfolio Investments (continued) |
| | |
* Non-income producing security. | | REIT Real Estate Investment Trust |
ETF Exchange Traded Fund
The following table summarizes the inputs used to value the Fund’s investments by the fair value hierarchy levels as of October 31, 2024:
| | | | | | | | | | | | | | | | |
| | | Level 1 | | | Level 2 | | | Level 3 | | | Total | |
| | | | |
Investments in Securities | | | | | | | | | | | | | | | | |
| | | | |
Common Stocks† | | $ | 316,850,725 | | | | — | | | | — | | | $ | 316,850,725 | |
| | | | |
Exchange Traded Funds | | | 18,351,099 | | | | — | | | | — | | | | 18,351,099 | |
| | | | |
Short-Term Investments | | | | | | | | | | | | | | | | |
| | | | |
Repurchase Agreements | | | — | | | $ | 6,164,000 | | | | — | | | | 6,164,000 | |
| | | | | | | | | | | | | | | | |
| | | | |
Total Investments in Securities | | $ | 335,201,824 | | | $ | 6,164,000 | | | | — | | | $ | 341,365,824 | |
| | | | | | | | | | | | | | | | |
| | † | All common stocks held in the Fund are Level 1 securities. For a detailed breakout of common stocks by major industry classification, please refer to the Fund’s Schedule of Portfolio Investments. |
For the fiscal year ended October 31, 2024, there were no transfers in or out of Level 3.
The accompanying notes are an integral part of these financial statements.
3
| | |
| | AMG River Road Large Cap Value Select Fund Schedule of Portfolio Investments October 31, 2024 |
| | | | | | | | |
| | | Shares | | | Value | |
| | |
Common Stocks - 98.1% | | | | | | | | |
| |
Communication Services - 3.0% | | | | | |
| | |
Alphabet, Inc., Class C | | | 8,100 | | | | $1,398,789 | |
| |
Consumer Discretionary - 18.1% | | | | | |
| | |
Lennar Corp., Class A | | | 12,469 | | | | 2,123,471 | |
| | |
LKQ Corp. | | | 37,497 | | | | 1,379,514 | |
| | |
Lululemon Athletica, Inc. (Canada)* | | | 7,920 | | | | 2,359,368 | |
| | |
LVMH Moet Hennessy Louis Vuitton SE, ADR (France) | | | 8,971 | | | | 1,189,465 | |
| | |
Starbucks Corp. | | | 4,770 | | | | 466,029 | |
| | |
Vail Resorts, Inc. | | | 4,903 | | | | 812,378 | |
| | |
Total Consumer Discretionary | | | | | | | 8,330,225 | |
| |
Consumer Staples - 19.1% | | | | | |
| | |
BJ’s Wholesale Club Holdings, Inc.* | | | 34,351 | | | | 2,910,560 | |
| | |
Casey’s General Stores, Inc. | | | 5,074 | | | | 1,999,257 | |
| | |
The Kroger Co. | | | 41,158 | | | | 2,295,382 | |
| | |
Nestle SA, Sponsored ADR (Switzerland) | | | 16,909 | | | | 1,598,239 | |
| | |
Total Consumer Staples | | | | | | | 8,803,438 | |
| |
Energy - 5.0% | | | | | |
| | |
Suncor Energy, Inc. (Canada) | | | 36,250 | | | | 1,369,162 | |
| | |
Valaris, Ltd.* | | | 18,390 | | | | 930,534 | |
| | |
Total Energy | | | | | | | 2,299,696 | |
| |
Financials - 23.2% | | | | | |
| | |
Berkshire Hathaway, Inc., Class B* | | | 3,940 | | | | 1,776,625 | |
| | |
Fairfax Financial Holdings, Ltd. (Canada) | | | 2,101 | | | | 2,616,837 | |
| | |
Global Payments, Inc. | | | 14,421 | | | | 1,495,602 | |
| | |
KKR & Co., Inc. | | | 14,940 | | | | 2,065,306 | |
| | |
Willis Towers Watson PLC (United Kingdom) | | | 9,104 | | | | 2,751,138 | |
| | |
Total Financials | | | | | | | 10,705,508 | |
| |
Health Care - 10.6% | | | | | |
| | |
Elevance Health, Inc. | | | 3,680 | | | | 1,493,197 | |
| | | | | | | | |
| | | Shares | | | Value | |
| | |
Labcorp Holdings, Inc. | | | 9,915 | | | | $2,263,297 | |
| | |
UnitedHealth Group, Inc. | | | 2,014 | | | | 1,136,903 | |
| | |
Total Health Care | | | | | | | 4,893,397 | |
| |
Industrials - 4.1% | | | | | |
| | |
Carlisle Cos., Inc. | | | 987 | | | | 416,741 | |
| | |
CSX Corp. | | | 24,120 | | | | 811,397 | |
| | |
United Parcel Service, Inc., Class B | | | 5,130 | | | | 687,728 | |
| | |
Total Industrials | | | | | | | 1,915,866 | |
| |
Materials - 8.1% | | | | | |
| | |
CRH PLC | | | 39,051 | | | | 3,726,637 | |
| |
Real Estate - 2.7% | | | | | |
| | |
Mid-America Apartment Communities, Inc., REIT | | | 8,124 | | | | 1,229,486 | |
| |
Utilities - 4.2% | | | | | |
| | |
Talen Energy Corp.* | | | 10,771 | | | | 1,953,429 | |
| | |
Total Common Stocks | | | | | | | | |
(Cost $39,335,262) | | | | | | | 45,256,471 | |
| | |
| | | Principal
Amount | | | | |
Short-Term Investments - 2.9% | | | | | | | | |
| |
Repurchase Agreements - 2.9% | | | | | |
| | |
Fixed Income Clearing Corp., dated 10/31/24, due 11/01/24, 4.650% total to be received $1,331,172 (collateralized by a U.S. Treasury Note, 3.375%, 05/15/33, totaling $1,357,628) | | | $1,331,000 | | | | 1,331,000 | |
| | |
Total Short-Term Investments | | | | | | | | |
(Cost $1,331,000) | | | | | | | 1,331,000 | |
| | |
Total Investments - 101.0% | | | | | | | | |
(Cost $40,666,262) | | | | | | | 46,587,471 | |
| |
Other Assets, less Liabilities - (1.0)% | | | | (475,967 | ) |
| | |
Net Assets - 100.0% | | | | | | | $46,111,504 | |
* Non-income producing security.
ADR American Depositary Receipt
REIT Real Estate Investment Trust
The accompanying notes are an integral part of these financial statements.
4
| | |
| | AMG River Road Large Cap Value Select Fund Schedule of Portfolio Investments (continued) |
The following table summarizes the inputs used to value the Fund’s investments by the fair value hierarchy levels as of October 31, 2024:
| | | | | | | | | | | | | | | | |
| | | Level 1 | | | Level 2 | | | Level 3 | | | Total | |
| | | | |
Investments in Securities | | | | | | | | | | | | | | | | |
| | | | |
Common Stocks† | | $ | 45,256,471 | | | | — | | | | — | | | $ | 45,256,471 | |
| | | | |
Short-Term Investments | | | | | | | | | | | | | | | | |
| | | | |
Repurchase Agreements | | | — | | | $ | 1,331,000 | | | | — | | | | 1,331,000 | |
| | | | | | | | | | | | | | | | |
| | | | |
Total Investments in Securities | | $ | 45,256,471 | | | $ | 1,331,000 | | | | — | | | $ | 46,587,471 | |
| | | | | | | | | | | | | | | | |
| | † | All common stocks held in the Fund are Level 1 securities. For a detailed breakout of common stocks by major industry classification, please refer to the Fund’s Schedule of Portfolio Investments. |
For the fiscal year ended October 31, 2024, there were no transfers in or out of Level 3.
The accompanying notes are an integral part of these financial statements.
5
| | |
| | AMG River Road Small Cap Value Fund Schedule of Portfolio Investments October 31, 2024 |
| | | | | | | | |
| | | Shares | | | Value | |
| | |
Common Stocks - 90.8% | | | | | | | | |
| |
Communication Services - 2.2% | | | | | |
| | |
TripAdvisor, Inc.* | | | 880,243 | | | | $14,119,098 | |
| | |
Yelp, Inc.* | | | 299,951 | | | | 10,240,327 | |
| | |
Total Communication Services | | | | | | | 24,359,425 | |
| |
Consumer Discretionary - 9.9% | | | | | |
| | |
Advance Auto Parts, Inc.1 | | | 194,716 | | | | 6,949,414 | |
| | |
Asbury Automotive Group, Inc.* | | | 36,501 | | | | 8,316,388 | |
| | |
LGI Homes, Inc.* | | | 159,589 | | | | 16,207,859 | |
| | |
Murphy USA, Inc. | | | 67,057 | | | | 32,753,992 | |
| | |
Papa John’s International, Inc.1 | | | 432,363 | | | | 22,651,497 | |
| | |
United Parks & Resorts, Inc.*,1 | | | 381,309 | | | | 20,068,293 | |
| | |
Total Consumer Discretionary | | | | | | | 106,947,443 | |
| |
Consumer Staples - 6.1% | | | | | |
| | |
Dole PLC (Ireland) | | | 1,320,566 | | | | 21,327,141 | |
| | |
The Duckhorn Portfolio, Inc.*,1 | | | 950,718 | | | | 10,419,869 | |
| | |
Ingles Markets, Inc., Class A | | | 284,356 | | | | 18,158,974 | |
| | |
Nomad Foods, Ltd. (United Kingdom) | | | 953,461 | | | | 16,733,241 | |
| | |
Total Consumer Staples | | | | | | | 66,639,225 | |
| |
Energy - 3.6% | | | | | |
| | |
Delek US Holdings, Inc. | | | 723,354 | | | | 11,334,957 | |
| | |
Evolution Petroleum Corp.1 | | | 832,335 | | | | 4,286,525 | |
| | |
SM Energy Co.1 | | | 494,426 | | | | 20,751,059 | |
| | |
World Kinect Corp.1 | | | 105,342 | | | | 2,754,694 | |
| | |
Total Energy | | | | | | | 39,127,235 | |
| |
Financials - 18.2% | | | | | |
| | |
Assured Guaranty, Ltd. (Bermuda) | | | 205,853 | | | | 17,180,491 | |
| | |
Axis Capital Holdings, Ltd. (Bermuda) | | | 374,620 | | | | 29,317,761 | |
| | |
Cannae Holdings, Inc. | | | 1,110,351 | | | | 22,040,467 | |
| | |
EVERTEC, Inc. (Puerto Rico) | | | 454,742 | | | | 14,897,348 | |
| | |
Genworth Financial, Inc., Class A* | | | 3,748,018 | | | | 25,261,641 | |
| | |
P10, Inc., Class A | | | 2,036,591 | | | | 22,504,331 | |
| | |
Radian Group, Inc. | | | 323,540 | | | | 11,294,782 | |
| | |
Repay Holdings Corp.* | | | 1,295,547 | | | | 10,306,076 | |
| | |
White Mountains Insurance Group, Ltd. | | | 24,814 | | | | 44,594,232 | |
| | |
Total Financials | | | | | | | 197,397,129 | |
| |
Health Care - 3.9% | | | | | |
| | |
Embecta Corp. | | | 871,294 | | | | 12,267,820 | |
| | |
Enovis Corp.* | | | 381,420 | | | | 15,741,203 | |
| | |
Inmode, Ltd. (Israel)* | | | 307,656 | | | | 5,254,764 | |
| | |
Patterson Cos., Inc.1 | | | 427,711 | | | | 8,986,208 | |
| | |
Total Health Care | | | | | | | 42,249,995 | |
| | | | | | | | |
| | | Shares | | | Value | |
| |
Industrials - 27.9% | | | | | |
| | |
Air Transport Services Group, Inc.* | | | 1,426,480 | | | | $24,592,515 | |
| | |
Alight, Inc., Class A* | | | 2,041,046 | | | | 14,144,449 | |
| | |
Argan, Inc. | | | 120,362 | | | | 15,892,598 | |
| | |
Armstrong World Industries, Inc. | | | 104,136 | | | | 14,532,179 | |
| | |
Atkore, Inc. | | | 225,713 | | | | 19,357,147 | |
| | |
BlueLinx Holdings, Inc.* | | | 40,343 | | | | 4,415,945 | |
| | |
Brady Corp., Class A | | | 80,228 | | | | 5,707,420 | |
| | |
CoreCivic, Inc.* | | | 1,882,400 | | | | 25,995,944 | |
| | |
DNOW, Inc.* | | | 367,344 | | | | 4,345,679 | |
| | |
The GEO Group Inc.* | | | 1,702,280 | | | | 25,840,610 | |
| | |
Hub Group Inc. , Class A | | | 193,169 | | | | 8,381,603 | |
| | |
Janus International Group, Inc.*,1 | | | 1,353,245 | | | | 9,959,883 | |
| | |
Kelly Services, Inc., Class A | | | 230,019 | | | | 4,598,080 | |
| | |
McGrath RentCorp | | | 342,628 | | | | 38,956,804 | |
| | |
MSC Industrial Direct Co., Inc., Class A1 | | | 93,031 | | | | 7,355,961 | |
| | |
OPENLANE, Inc.* | | | 1,161,211 | | | | 18,347,134 | |
| | |
Park Aerospace Corp. | | | 756,768 | | | | 10,239,071 | |
| | |
UniFirst Corp. | | | 175,326 | | | | 31,525,368 | |
| | |
Viad Corp.* | | | 508,499 | | | | 19,038,203 | |
| | |
Total Industrials | | | | | | | 303,226,593 | |
| |
Information Technology - 5.3% | | | | | |
| | |
ACI Worldwide, Inc.* | | | 221,449 | | | | 10,895,291 | |
| | |
ePlus, Inc.* | | | 138,886 | | | | 12,353,910 | |
| | |
Ituran Location and Control, Ltd. (Israel) | | | 230,417 | | | | 6,159,046 | |
| | |
NCR Voyix, Corp.*,1 | | | 505,727 | | | | 6,478,363 | |
| | |
Vontier Corp. | | | 589,739 | | | | 21,867,522 | |
| | |
Total Information Technology | | | | | | | 57,754,132 | |
| |
Materials - 5.1% | | | | | |
| | |
Summit Materials, Inc., Class A* | | | 657,042 | | | | 31,150,361 | |
| | |
TriMas Corp.1 | | | 431,568 | | | | 11,587,601 | |
| | |
Warrior Met Coal, Inc. | | | 192,054 | | | | 12,124,369 | |
| | |
Total Materials | | | | | | | 54,862,331 | |
| |
Real Estate - 0.1% | | | | | |
| | |
Howard Hughes Holdings, Inc.* | | | 18,070 | | | | 1,374,043 | |
| |
Utilities - 8.5% | | | | | |
| | |
Northwestern Energy Group, Inc. | | | 375,339 | | | | 20,065,623 | |
| | |
Southwest Gas Holdings, Inc. | | | 232,845 | | | | 17,055,896 | |
| | |
Talen Energy Corp.* | | | 197,545 | | | | 35,826,761 | |
| | |
TXNM Energy, Inc. | | | 445,589 | | | | 19,400,945 | |
| | |
Total Utilities | | | | | | | 92,349,225 | |
| | |
Total Common Stocks | | | | | | | | |
(Cost $794,010,198) | | | | | | | 986,286,776 | |
The accompanying notes are an integral part of these financial statements.
6
| | |
| | AMG River Road Small Cap Value Fund Schedule of Portfolio Investments (continued) |
| | | | | | | | |
| | | Principal
Amount | | | Value | |
| |
Short-Term Investments - 9.3% | | | | | |
| |
Joint Repurchase Agreements - 0.0%#,2 | | | | | |
| | |
Daiwa Capital Markets America, dated 10/31/24, due 11/01/24, 4.890% total to be received $136,991 (collateralized by various U.S. Government Agency Obligations and U.S. Treasuries, 0.625% - 7.500%, 05/15/25 - 11/01/54, totaling $139,711) | | | $136,972 | | | | $136,972 | |
| |
Repurchase Agreements - 9.3% | | | | | |
| | |
Fixed Income Clearing Corp., dated 10/31/24, due 11/01/24, 4.650% total to be received $100,233,945 (collateralized by a U.S. Treasury Note, 3.375%, 05/15/33, totaling $102,225,485) | | | 100,221,000 | | | | 100,221,000 | |
| |
Total Short-Term Investments | | | | | |
(Cost $100,357,972) | | | | | | | 100,357,972 | |
| | | | | | | | |
| | | | | | Value | |
| | |
Total Investments - 100.1% | | | | | | | | |
(Cost $894,368,170) | | | | | | | $1,086,644,748 | |
| |
Other Assets, less Liabilities - (0.1)% | | | | (864,349 | ) |
| | |
Net Assets - 100.0% | | | | | | | $1,085,780,399 | |
| | * | Non-income producing security. |
| | 1 | Some of these securities, amounting to $65,950,074 or 6.1% of net assets, were out on loan to various borrowers and are collateralized by cash and various U.S. Treasury Obligations. See Note 4 of Notes to Financial Statements. |
| | 2 | Cash collateral received for securities lending activity was invested in these joint repurchase agreements. |
The following table summarizes the inputs used to value the Fund’s investments by the fair value hierarchy levels as of October 31, 2024:
| | | | | | | | | | | | | | | | |
| | | Level 1 | | | Level 2 | | | Level 3 | | | Total | |
| | | | |
Investments in Securities | | | | | | | | | | | | | | | | |
| | | | |
Common Stocks† | | $ | 986,286,776 | | | | — | | | | — | | | | $986,286,776 | |
| | | | |
Short-Term Investments | | | | | | | | | | | | | | | | |
| | | | |
Joint Repurchase Agreements | | | — | | | | $136,972 | | | | — | | | | 136,972 | |
| | | | |
Repurchase Agreements | | | — | | | | 100,221,000 | | | | — | | | | 100,221,000 | |
| | | | | | | | | | | | | | | | |
| | | | |
Total Investments in Securities | | $ | 986,286,776 | | | $ | 100,357,972 | | | | — | | | $ | 1,086,644,748 | |
| | | | | | | | | | | | | | | | |
| | † | All common stocks held in the Fund are Level 1 securities. For a detailed breakout of common stocks by major industry classification, please refer to the Fund’s Schedule of Portfolio Investments. |
For the fiscal year ended October 31, 2024, there were no transfers in or out of Level 3.
The accompanying notes are an integral part of these financial statements.
7
| | |
| | AMG River Road Dividend All Cap Value Fund Schedule of Portfolio Investments October 31, 2024 |
| | | | | | | | |
| | | Shares | | | Value | |
| | |
Common Stocks - 97.1% | | | | | | | | |
| | |
Communication Services - 8.1% | | | | | | | | |
| | |
Cogent Communications Holdings, Inc.1 | | | 32,514 | | | | $2,609,899 | |
| | |
Comcast Corp., Class A | | | 62,652 | | | | 2,736,013 | |
| | |
The Interpublic Group of Cos., Inc. | | | 29,796 | | | | 876,002 | |
| | |
Warner Music Group Corp., Class A | | | 22,340 | | | | 713,986 | |
| | |
Total Communication Services | | | | | | | 6,935,900 | |
| |
Consumer Discretionary - 2.7% | | | | | |
| | |
Genuine Parts Co. | | | 6,374 | | | | 731,098 | |
| | |
NIKE, Inc., Class B | | | 5,676 | | | | 437,790 | |
| | |
Starbucks Corp. | | | 11,146 | | | | 1,088,964 | |
| | |
Total Consumer Discretionary | | | | | | | 2,257,852 | |
| |
Consumer Staples - 12.9% | | | | | |
| | |
Kimberly-Clark Corp. | | | 12,456 | | | | 1,671,346 | |
| | |
The Kroger Co. | | | 37,523 | | | | 2,092,658 | |
| | |
PepsiCo, Inc. | | | 6,833 | | | | 1,134,825 | |
| | |
Primo Water Corp. | | | 31,972 | | | | 838,625 | |
| | |
Sysco Corp. | | | 12,567 | | | | 941,897 | |
| | |
Target Corp. | | | 10,883 | | | | 1,632,885 | |
| | |
Unilever PLC, Sponsored ADR (United Kingdom)1 | | | 43,914 | | | | 2,674,802 | |
| | |
Total Consumer Staples | | | | | | | 10,987,038 | |
| |
Energy - 12.3% | | | | | |
| | |
Chesapeake Energy Corp. | | | 7,582 | | | | 642,347 | |
| | |
Enterprise Products Partners LP, MLP | | | 70,342 | | | | 2,016,002 | |
| | |
EOG Resources, Inc. | | | 7,956 | | | | 970,314 | |
| | |
Kinder Morgan, Inc. | | | 130,622 | | | | 3,201,545 | |
| | |
The Williams Cos., Inc. | | | 69,913 | | | | 3,661,344 | |
| | |
Total Energy | | | | | | | 10,491,552 | |
| |
Financials - 16.1% | | | | | |
| | |
Axis Capital Holdings, Ltd. (Bermuda) | | | 20,092 | | | | 1,572,400 | |
| | |
Chubb, Ltd. (Switzerland) | | | 6,919 | | | | 1,954,202 | |
| | |
CNA Financial Corp. | | | 12,960 | | | | 620,914 | |
| | |
Fidelity National Financial, Inc. | | | 13,703 | | | | 824,510 | |
| | |
The PNC Financial Services Group, Inc. | | | 14,698 | | | | 2,767,192 | |
| | |
The Progressive Corp. | | | 12,817 | | | | 3,112,352 | |
| | |
U.S. Bancorp | | | 43,388 | | | | 2,096,074 | |
| | |
Willis Towers Watson PLC (United Kingdom) | | | 2,559 | | | | 773,304 | |
| | |
Total Financials | | | | | | | 13,720,948 | |
| |
Health Care - 9.2% | | | | | |
| | |
AbbVie, Inc. | | | 6,300 | | | | 1,284,381 | |
| | |
Amgen, Inc. | | | 5,489 | | | | 1,757,358 | |
| | |
Bristol-Myers Squibb Co. | | | 24,741 | | | | 1,379,806 | |
| | |
Johnson & Johnson | | | 5,714 | | | | 913,440 | |
| | | | | | | | |
| | | Shares | | | Value | |
| | |
Pfizer, Inc. | | | 37,023 | | | | $1,047,751 | |
| | |
Royalty Pharma PLC, Class A | | | 54,241 | | | | 1,464,507 | |
| | |
Total Health Care | | | | | | | 7,847,243 | |
| |
Industrials - 7.0% | | | | | |
| | |
CSG Systems International, Inc. | | | 10,040 | | | | 467,964 | |
| | |
Dun & Bradstreet Holdings, Inc. | | | 57,083 | | | | 678,717 | |
| | |
Lockheed Martin Corp. | | | 1,062 | | | | 579,905 | |
| | |
Paycom Software, Inc. | | | 7,233 | | | | 1,511,914 | |
| | |
United Parcel Service, Inc., Class B | | | 14,977 | | | | 2,007,817 | |
| | |
Watsco, Inc.1 | | | 1,585 | | | | 749,721 | |
| | |
Total Industrials | | | | | | | 5,996,038 | |
| |
Information Technology - 15.8% | | | | | |
| | |
Avnet, Inc. | | | 19,112 | | | | 1,036,062 | |
| | |
Cisco Systems, Inc. | | | 16,343 | | | | 895,106 | |
| | |
Corning, Inc. | | | 55,377 | | | | 2,635,391 | |
| | |
Micron Technology, Inc. | | | 21,354 | | | | 2,127,926 | |
| | |
Oracle Corp. | | | 23,445 | | | | 3,935,009 | |
| | |
QUALCOMM, Inc. | | | 3,162 | | | | 514,679 | |
| | |
Salesforce, Inc. | | | 4,120 | | | | 1,200,444 | |
| | |
Texas Instruments, Inc. | | | 5,656 | | | | 1,149,073 | |
| | |
Total Information Technology | | | | | | | 13,493,690 | |
| |
Real Estate - 3.5% | | | | | |
| | |
American Tower Corp., REIT | | | 10,695 | | | | 2,283,810 | |
| | |
Crown Castle, Inc., REIT | | | 6,776 | | | | 728,352 | |
| | |
Total Real Estate | | | | | | | 3,012,162 | |
| |
Utilities - 9.5% | | | | | |
| | |
The AES Corp. | | | 117,206 | | | | 1,932,727 | |
| | |
Duke Energy Corp. | | | 13,204 | | | | 1,522,025 | |
| | |
IDACORP, Inc. | | | 15,599 | | | | 1,614,185 | |
| | |
Northwestern Energy Group, Inc. | | | 19,540 | | | | 1,044,608 | |
| | |
TXNM Energy, Inc. | | | 29,358 | | | | 1,278,247 | |
| | |
Vistra Corp. | | | 5,484 | | | | 685,281 | |
| | |
Total Utilities | | | | | | | 8,077,073 | |
| | |
Total Common Stocks | | | | | | | | |
(Cost $52,862,960) | | | | | | | 82,819,496 | |
| | |
Preferred Stock - 0.5% | | | | | | | | |
| |
Information Technology - 0.5% | | | | | |
| | |
Hewlett Packard Enterprise Co. | | | 7,476 | | | | 432,487 | |
| | |
Total Preferred Stock | | | | | | | | |
(Cost $453,782) | | | | | | | 432,487 | |
The accompanying notes are an integral part of these financial statements.
8
| | |
| | AMG River Road Dividend All Cap Value Fund Schedule of Portfolio Investments (continued) |
| | | | | | | | |
| | | Principal
Amount | | | Value | |
| | |
Short-Term Investments - 2.5% | | | | | | | | |
| |
Repurchase Agreements - 2.5% | | | | | |
| | |
Fixed Income Clearing Corp., dated 10/31/24, due 11/01/24, 4.650% total to be received $2,127,275 (collateralized by a U.S. Treasury Note, 3.375%, 05/15/33, totaling $2,169,553) | | | $2,127,000 | | | | $2,127,000 | |
| | |
Total Short-Term Investments | | | | | | | | |
(Cost $2,127,000) | | | | | | | 2,127,000 | |
| | | | |
| | | | | Value |
| | |
Total Investments - 100.1% | | | | |
(Cost $55,443,742) | | | | $85,378,983 |
| | |
Other Assets, less Liabilities - (0.1)% | | | | (74,818) |
| | |
Net Assets - 100.0% | | | | $85,304,165 |
| | 1 | Some of these securities, amounting to $ 3,415,359 or 4.0% of net assets, were out on loan to various borrowers and are collateralized by various U.S. Treasury Obligations. See Note 4 of Notes to Financial Statements. |
ADR American Depositary Receipt
MLP Master Limited Partnership
REIT Real Estate Investment Trust
The following table summarizes the inputs used to value the Fund’s investments by the fair value hierarchy levels as of October 31, 2024:
| | | | | | | | | | | | | | | | |
| | | Level 1 | | | Level 2 | | | Level 3 | | | Total | |
| | | | |
Investments in Securities | | | | | | | | | | | | | | | | |
| | | | |
Common Stocks† | | $ | 82,819,496 | | | | — | | | | — | | | $ | 82,819,496 | |
| | | | |
Preferred Stock† | | | 432,487 | | | | — | | | | — | | | | 432,487 | |
| | | | |
Short-Term Investments | | | | | | | | | | | | | | | | |
| | | | |
Repurchase Agreements | | | — | | | $ | 2,127,000 | | | | — | | | | 2,127,000 | |
| | | | | | | | | | | | | | | | |
Total Investments in Securities | | $ | 83,251,983 | | | $ | 2,127,000 | | | | — | | | $ | 85,378,983 | |
| | | | | | | | | | | | | | | | |
| | † | All common stocks and preferred stocks held in the Fund are Level 1 securities. For a detailed breakout of common stocks and preferred stocks by major industry classification, please refer to the Fund’s Schedule of Portfolio Investments. |
For the fiscal year ended October 31, 2024, there were no transfers in or out of Level 3.
The accompanying notes are an integral part of these financial statements.
9
| | |
| | AMG River Road Small-Mid Cap Value Fund Schedule of Portfolio Investments October 31, 2024 |
| | | | | | | | |
| | | Shares | | | Value | |
| | |
Common Stocks - 96.2% | | | | | | | | |
| |
Communication Services - 1.9% | | | | | |
| | |
GCI Liberty, Inc. Escrow Share*,1,2 | | | 79,662 | | | | $0 | |
| | |
TripAdvisor, Inc.* | | | 211,918 | | | | 3,399,165 | |
| | |
Yelp, Inc.* | | | 77,534 | | | | 2,647,011 | |
| | |
Total Communication Services | | | | | | | 6,046,176 | |
| |
Consumer Discretionary - 14.8% | | | | | |
| | |
LGI Homes, Inc.* | | | 42,477 | | | | 4,313,964 | |
| | |
Lithia Motors, Inc. | | | 26,792 | | | | 8,904,857 | |
| | |
LKQ Corp. | | | 196,351 | | | | 7,223,753 | |
| | |
Murphy USA, Inc. | | | 20,999 | | | | 10,256,962 | |
| | |
Papa John’s International, Inc.3 | | | 98,493 | | | | 5,160,048 | |
| | |
Polaris, Inc.3 | | | 39,325 | | | | 2,749,211 | |
| | |
United Parks & Resorts, Inc.* | | | 76,205 | | | | 4,010,669 | |
| | |
Vail Resorts, Inc. | | | 28,699 | | | | 4,755,138 | |
| | |
Total Consumer Discretionary | | | | | | | 47,374,602 | |
| | |
Consumer Staples - 8.7% | | | | | | | | |
| | |
BJ’s Wholesale Club Holdings, Inc.* | | | 142,233 | | | | 12,051,402 | |
| | |
Dole PLC (Ireland) | | | 146,154 | | | | 2,360,387 | |
| | |
Ingles Markets, Inc., Class A | | | 49,976 | | | | 3,191,467 | |
| | |
Molson Coors Beverage Co., Class B | | | 117,357 | | | | 6,392,436 | |
| | |
Nomad Foods, Ltd. (United Kingdom) | | | 213,882 | | | | 3,753,629 | |
| | |
Total Consumer Staples | | | | | | | 27,749,321 | |
| | |
Energy - 4.7% | | | | | | | | |
| | |
Delek US Holdings, Inc. | | | 152,023 | | | | 2,382,200 | |
| | |
HF Sinclair Corp. | | | 61,111 | | | | 2,359,496 | |
| | |
Ovintiv, Inc. | | | 27,318 | | | | 1,070,866 | |
| | |
Permian Resources Corp. | | | 422,615 | | | | 5,760,242 | |
| | |
SM Energy Co. | | | 81,811 | | | | 3,433,608 | |
| | |
Total Energy | | | | | | | 15,006,412 | |
| | |
Financials - 17.8% | | | | | | | | |
| | |
Assured Guaranty, Ltd. (Bermuda) | | | 48,665 | | | | 4,061,581 | |
| | |
Axis Capital Holdings, Ltd. (Bermuda) | | | 90,635 | | | | 7,093,095 | |
| | |
Cannae Holdings, Inc. | | | 278,778 | | | | 5,533,743 | |
| | |
CNA Financial Corp. | | | 73,537 | | | | 3,523,158 | |
| | |
EVERTEC, Inc. (Puerto Rico) | | | 99,024 | | | | 3,244,026 | |
| | |
Genworth Financial, Inc., Class A* | | | 937,834 | | | | 6,321,001 | |
| | |
P10, Inc., Class A | | | 389,948 | | | | 4,308,925 | |
| | |
Radian Group, Inc. | | | 100,538 | | | | 3,509,782 | |
| | |
WEX, Inc.* | | | 43,823 | | | | 7,563,850 | |
| | |
White Mountains Insurance Group, Ltd. | | | 6,515 | | | | 11,708,367 | |
| | |
Total Financials | | | | | | | 56,867,528 | |
| | | | | | | | |
| | | Shares | | | Value | |
| | |
Health Care - 4.2% | | | | | | | | |
| | |
Bausch + Lomb Corp. (Canada)* | | | 136,529 | | | | $2,768,808 | |
| | |
Embecta Corp. | | | 158,633 | | | | 2,233,553 | |
| | |
Enovis Corp.* | | | 51,966 | | | | 2,144,637 | |
| | |
Patterson Cos., Inc. | | | 94,321 | | | | 1,981,684 | |
| | |
Smith & Nephew PLC, ADR (United Kingdom)3 | | | 169,063 | | | | 4,241,791 | |
| | |
Total Health Care | | | | | | | 13,370,473 | |
| | |
Industrials - 26.3% | | | | | | | | |
| | |
Air Transport Services Group, Inc.* | | | 404,675 | | | | 6,976,597 | |
| | |
Alight, Inc., Class A* | | | 509,406 | | | | 3,530,183 | |
| | |
Argan, Inc. | | | 21,744 | | | | 2,871,078 | |
| | |
Armstrong World Industries, Inc. | | | 24,228 | | | | 3,381,017 | |
| | |
Atkore, Inc. | | | 60,003 | | | | 5,145,857 | |
| | |
Clarivate PLC (United Kingdom)*,3 | | | 380,989 | | | | 2,514,527 | |
| | |
CNH Industrial N.V. (United Kingdom) | | | 292,947 | | | | 3,289,795 | |
| | |
CoreCivic, Inc.* | | | 492,853 | | | | 6,806,300 | |
| | |
Dun & Bradstreet Holdings, Inc. | | | 334,608 | | | | 3,978,489 | |
| | |
GXO Logistics, Inc.* | | | 83,259 | | | | 4,979,721 | |
| | |
Janus International Group, Inc.* | | | 82,647 | | | | 608,282 | |
| | |
McGrath RentCorp | | | 89,357 | | | | 10,159,891 | |
| | |
OPENLANE, Inc.* | | | 271,897 | | | | 4,295,973 | |
| | |
Rentokil Initial PLC, | | | | | | | | |
| | |
Sponsored ADR (United Kingdom)3 | | | 195,958 | | | | 4,967,535 | |
| | |
UniFirst Corp. | | | 49,357 | | | | 8,874,882 | |
| | |
Viad Corp.* | | | 122,072 | | | | 4,570,376 | |
| | |
WESCO International, Inc. | | | 18,475 | | | | 3,546,646 | |
| | |
WillScot Holdings Corp.* | | | 107,929 | | | | 3,576,767 | |
| | |
Total Industrials | | | | | | | 84,073,916 | |
| | |
Information Technology - 6.5% | | | | | | | | |
| | |
ACI Worldwide, Inc.* | | | 47,945 | | | | 2,358,894 | |
| | |
ePlus, Inc.* | | | 30,663 | | | | 2,727,474 | |
| | |
Ituran Location and Control, Ltd. (Israel) | | | 26,666 | | | | 712,782 | |
| | |
NCR Voyix, Corp.* | | | 141,412 | | | | 1,811,488 | |
| | |
TD SYNNEX Corp. | | | 69,362 | | | | 8,000,906 | |
| | |
Vontier Corp. | | | 143,784 | | | | 5,331,511 | |
| | |
Total Information Technology | | | | | | | 20,943,055 | |
| | |
Materials - 3.5% | | | | | | | | |
| | |
Summit Materials, Inc., Class A* | | | 146,356 | | | | 6,938,738 | |
| | |
TriMas Corp. | | | 58,742 | | | | 1,577,223 | |
| | |
Warrior Met Coal, Inc. | | | 40,618 | | | | 2,564,214 | |
| | |
Total Materials | | | | | | | 11,080,175 | |
| | |
Utilities - 7.8% | | | | | | | | |
| | |
Northwestern Energy Group, Inc. | | | 99,297 | | | | 5,308,418 | |
The accompanying notes are an integral part of these financial statements.
10
| | |
| | AMG River Road Small-Mid Cap Value Fund Schedule of Portfolio Investments (continued) |
| | | | | | | | |
| | | Shares | | | Value | |
| | |
Utilities - 7.8% (continued) | | | | | | | | |
| | |
Southwest Gas Holdings, Inc. | | | 69,529 | | | | $5,092,999 | |
| | |
Talen Energy Corp.* | | | 52,415 | | | | 9,505,984 | |
| | |
TXNM Energy, Inc. | | | 118,015 | | | | 5,138,373 | |
| | |
Total Utilities | | | | | | | 25,045,774 | |
| | |
Total Common Stocks | | | | | | | | |
(Cost $258,854,823) | | | | | | | 307,557,432 | |
| | |
| |
| Principal
Amount |
| | | | |
| |
Short-Term Investments - 4.7% | | | | | |
| |
Joint Repurchase Agreements - 1.0%4 | | | | | |
| | |
Cantor Fitzgerald Securities, Inc., dated 10/31/24, due 11/01/24, 4.930% total to be received $1,000,137 (collateralized by various U.S. Government Agency Obligations and U.S. Treasuries, 0.000% - 6.500%, 02/25/25 -02/01/57, totaling $1,020,000) | | | $1,000,000 | | | | 1,000,000 | |
| | |
Citigroup Global Markets, Inc., dated 10/31/24, due 11/01/24, 4.860% total to be received $1,000,135 (collateralized by various U.S. Government Agency Obligations, 2.000% -7.964%, 02/01/36 - 08/20/67, totaling $1,020,000) | | | 1,000,000 | | | | 1,000,000 | |
| |
| | | | | |
| | | | | | | | |
| | | Principal Amount | | | Value | |
| | |
Daiwa Capital Markets America, dated 10/31/24, due 11/01/24, 4.890% total to be received $202,687 (collateralized by various U.S. Government Agency Obligations and U.S. Treasuries, 0.625% - 7.500%, 05/15/25 - 11/01/54, totaling $206,712) | | | $202,659 | | | | $202,659 | |
| | |
HSBC Securities USA, Inc., dated 10/31/24, due 11/01/24, 4.860% total to be received $1,000,135 (collateralized by various U.S. Government Agency Obligations, 2.000% -7.500%, 05/01/28 - 10/01/54, totaling $1,020,000) | | | 1,000,000 | | | | 1,000,000 | |
| | |
Total Joint Repurchase Agreements | | | | | | | 3,202,659 | |
| |
Repurchase Agreements - 3.7% | | | | | |
| | |
Fixed Income Clearing Corp., dated 10/31/24, due 11/01/24, 4.650% total to be received $11,805,525 (collateralized by a U.S. Treasury Note, 3.375%, 05/15/33, totaling $12,040,089) | | | 11,804,000 | | | | 11,804,000 | |
| | |
Total Short-Term Investments | | | | | | | | |
(Cost $15,006,659) | | | | | | | 15,006,659 | |
| | |
Total Investments - 100.9% | | | | | | | | |
(Cost $273,861,482) | | | | | | | 322,564,091 | |
| |
Other Assets, less Liabilities - (0.9)% | | | | (2,728,178 | ) |
| | |
Net Assets - 100.0% | | | | | | | $319,835,913 | |
| | |
| | | | | | | | |
| | * | Non-income producing security. |
| | 1 | Security’s value was determined by using significant unobservable inputs. |
| | 2 | This security is restricted and not available for re-sale. Liberty Broadband Corp. (“Liberty”) acquired GCI Liberty, Inc. on December 21, 2020. On May 24, 2023, Liberty shareholders received GCI Liberty, Inc. Escrow Shares for potential proceeds from a pending class action lawsuit. The market value of the escrow shares was $0 on the date of the distribution. At October 31, 2024, the cost and market value of the escrow shares is $0, which represents 0% of net assets. |
| | 3 | Some of these securities, amounting to $18,262,258 or 5.7% of net assets, were out on loan to various borrowers and are collateralized by cash and various U.S. Treasury Obligations. See Note 4 of Notes to Financial Statements. |
| | 4 | Cash collateral received for securities lending activity was invested in these joint repurchase agreements. |
ADR American Depositary Receipt
The accompanying notes are an integral part of these financial statements.
11
| | |
| | AMG River Road Small-Mid Cap Value Fund Schedule of Portfolio Investments (continued) |
The following table summarizes the inputs used to value the Fund’s investments by the fair value hierarchy levels as of October 31, 2024:
| | | | | | | | | | | | | | | | |
| | | Level 1 | | | Level 2 | | | Level 3 | | | Total | |
| | | | |
Investments in Securities | | | | | | | | | | | | | | | | |
| | | | |
Common Stocks | | | | | | | | | | | | | | | | |
| | | | |
Industrials | | | $84,073,916 | | | | — | | | | — | | | | $84,073,916 | |
| | | | |
Financials | | | 56,867,528 | | | | — | | | | — | | | | 56,867,528 | |
| | | | |
Consumer Discretionary | | | 47,374,602 | | | | — | | | | — | | | | 47,374,602 | |
| | | | |
Consumer Staples | | | 27,749,321 | | | | — | | | | — | | | | 27,749,321 | |
| | | | |
Utilities | | | 25,045,774 | | | | — | | | | — | | | | 25,045,774 | |
| | | | |
Information Technology | | | 20,943,055 | | | | — | | | | — | | | | 20,943,055 | |
| | | | |
Energy | | | 15,006,412 | | | | — | | | | — | | | | 15,006,412 | |
| | | | |
Health Care | | | 13,370,473 | | | | — | | | | — | | | | 13,370,473 | |
| | | | |
Materials | | | 11,080,175 | | | | — | | | | — | | | | 11,080,175 | |
| | | | |
Communication Services | | | 6,046,176 | | | | — | | | | $0 | | | | 6,046,176 | |
| | | | |
Short-Term Investments | | | | | | | | | | | | | | | | |
| | | | |
Joint Repurchase Agreements | | | — | | | | $3,202,659 | | | | — | | | | 3,202,659 | |
| | | | |
Repurchase Agreements | | | — | | | | 11,804,000 | | | | — | | | | 11,804,000 | |
| | | | | | | | | | | | | | | | |
| | | | |
Total Investments in Securities | | | $307,557,432 | | | | $15,006,659 | | | | $0 | | | | $322,564,091 | |
| | | | | | | | | | | | | | | | |
The Level 3 common stock held by the Fund at October 31, 2024 was received as a result of a corporate action. The security’s value of $0 was determined by using significant unobservable inputs, which generated a change in unrealized depreciation of $0.
For the fiscal year ended October 31, 2024, there were no transfers in or out of Level 3. The Fund did not have any purchases and sales of Level 3 securities for the same period.
The accompanying notes are an integral part of these financial statements.
12
| | |
| | AMG River Road Focused Absolute Value Fund Schedule of Portfolio Investments October 31, 2024 |
| | | | | | | | |
| | | Shares | | | Value | |
| | |
Common Stocks - 99.2% | | | | | | | | |
| |
Communication Services - 3.3% | | | | | |
| | |
Comcast Corp., Class A | | | 37,507 | | | | $1,637,931 | |
| | |
GCI Liberty, Inc. Escrow Share*,1,2 | | | 108,700 | | | | 0 | |
| | |
Total Communication Services | | | | | | | 1,637,931 | |
| |
Consumer Discretionary - 19.2% | | | | | |
| | |
Expedia Group, Inc.* | | | 7,184 | | | | 1,122,931 | |
| | |
Genuine Parts Co. | | | 10,095 | | | | 1,157,897 | |
| | |
Lennar Corp., Class A | | | 9,786 | | | | 1,666,556 | |
| | |
LKQ Corp. | | | 27,131 | | | | 998,149 | |
| | |
Lululemon Athletica, Inc. (Canada)* | | | 5,534 | | | | 1,648,579 | |
| | |
MGM Resorts International* | | | 26,253 | | | | 967,948 | |
| | |
Papa John’s International, Inc.3 | | | 35,137 | | | | 1,840,827 | |
| | |
Total Consumer Discretionary | | | | | | | 9,402,887 | |
| |
Consumer Staples - 13.8% | | | | | |
| | |
BJ’s Wholesale Club Holdings, Inc.* | | | 28,805 | | | | 2,440,648 | |
| | |
The Kroger Co. | | | 42,720 | | | | 2,382,494 | |
| | |
Molson Coors Beverage Co., Class B | | | 20,867 | | | | 1,136,625 | |
| | |
Unilever PLC, Sponsored ADR (United Kingdom)3 | | | 13,102 | | | | 798,043 | |
| | |
Total Consumer Staples | | | | | | | 6,757,810 | |
| |
Energy - 4.5% | | | | | |
| | |
Delek US Holdings, Inc. | | | 54,282 | | | | 850,599 | |
| | |
Kinder Morgan, Inc. | | | 54,445 | | | | 1,334,447 | |
| | |
Total Energy | | | | | | | 2,185,046 | |
| |
Financials - 21.3% | | | | | |
| | |
Berkshire Hathaway, Inc., Class B* | | | 6,496 | | | | 2,929,176 | |
| | |
Fairfax Financial Holdings, Ltd. (Canada) | | | 2,613 | | | | 3,254,544 | |
| | |
Global Payments, Inc. | | | 10,329 | | | | 1,071,220 | |
| | |
WEX, Inc.* | | | 9,108 | | | | 1,572,041 | |
| | |
Willis Towers Watson PLC (United Kingdom) | | | 5,348 | | | | 1,616,112 | |
| | |
Total Financials | | | | | | | 10,443,093 | |
| |
Health Care - 5.8% | | | | | |
| | |
Elevance Health, Inc. | | | 3,895 | | | | 1,580,435 | |
| | |
Labcorp Holdings, Inc. | | | 5,498 | | | | 1,255,029 | |
| | |
Total Health Care | | | | | | | 2,835,464 | |
| |
Industrials - 13.0% | | | | | |
| | |
CNH Industrial N.V. (United Kingdom) | | | 148,707 | | | | 1,669,980 | |
| | * | Non-income producing security. |
| | 1 | Security’s value was determined by using significant unobservable inputs. |
| | | | | | | | |
| | | Shares | | | Value | |
| | |
McGrath RentCorp | | | 13,577 | | | | $1,543,705 | |
| | |
Rentokil Initial PLC, | | | | | | | | |
| | |
Sponsored ADR (United Kingdom)3 | | | 58,848 | | | | 1,491,797 | |
| | |
SS&C Technologies Holdings, Inc. | | | 23,992 | | | | 1,677,760 | |
| | |
Total Industrials | | | | | | | 6,383,242 | |
| |
Materials - 7.6% | | | | | |
| | |
CRH PLC | | | 23,036 | | | | 2,198,325 | |
| | |
Summit Materials, Inc., Class A* | | | 32,697 | | | | 1,550,165 | |
| | |
Total Materials | | | | | | | 3,748,490 | |
| |
Real Estate - 3.7% | | | | | |
| | |
Mid-America Apartment Communities, Inc., REIT | | | 11,993 | | | | 1,815,021 | |
| |
Utilities - 7.0% | | | | | |
| | |
Northwestern Energy Group, Inc. | | | 31,689 | | | | 1,694,094 | |
| | |
Talen Energy Corp.* | | | 9,633 | | | | 1,747,041 | |
| | |
Total Utilities | | | | | | | 3,441,135 | |
| | |
Total Common Stocks | | | | | | | | |
(Cost $40,267,254) | | | | | | | 48,650,119 | |
| | |
| | | Principal
Amount | | | | |
| | |
Short-Term Investments - 1.1% | | | | | | | | |
| |
Joint Repurchase Agreements - 0.2%4 | | | | | |
| | |
Daiwa Capital Markets America, dated 10/31/24, due 11/01/24, 4.890% total to be received $124,910 (collateralized by various U.S. Government Agency Obligations and U.S. Treasuries, 0.625% - 7.500%, 05/15/25 - 11/01/54, totaling $127,391) | | $ | 124,893 | | | | 124,893 | |
| |
Repurchase Agreements - 0.9% | | | | | |
| | |
Fixed Income Clearing Corp., dated 10/31/24, due 11/01/24, 4.650% total to be received $448,058 (collateralized by a U.S. Treasury Note, 3.375%, 05/15/33, totaling $456,994) | | | 448,000 | | | | 448,000 | |
| | |
Total Short-Term Investments | | | | | | | | |
(Cost $572,893) | | | | | | | 572,893 | |
Total Investments - 100.3% | | | | | | | | |
(Cost $40,840,147) | | | | | | | 49,223,012 | |
Other Assets, less Liabilities - (0.3)% | | | | (168,692 | ) |
| | |
Net Assets - 100.0% | | | | | | | $49,054,320 | |
| | 2 | This security is restricted and not available for re-sale. Liberty Broadband Corp. (“Liberty”) acquired GCI Liberty, Inc. on December 21, 2020. On May 24, 2023, Liberty shareholders received GCI Liberty, Inc. Escrow Shares for potential proceeds from a pending class action lawsuit. The market value of the escrow shares was $0 on the date of the distribution. At October 31, 2024, the cost and market value of the escrow shares is $0, which represents 0% of net assets. |
The accompanying notes are an integral part of these financial statements.
13
| | |
| | AMG River Road Focused Absolute Value Fund Schedule of Portfolio Investments (continued) |
| | 3 | Some of these securities, amounting to $3,705,525 or 7.6% of net assets, were out on loan to various borrowers and are collateralized by cash and various U.S. Treasury Obligations. See Note 4 of Notes to Financial Statements. |
| | 4 | Cash collateral received for securities lending activity was invested in these joint repurchase agreements. |
ADR American Depositary Receipt
REIT Real Estate Investment Trust
The following table summarizes the inputs used to value the Fund’s investments by the fair value hierarchy levels as of October 31, 2024:
| | | | | | | | | | | | | | | | |
| | | Level 1 | | | Level 2 | | | Level 3 | | | Total | |
| | | | |
Investments in Securities | | | | | | | | | | | | | | | | |
| | | | |
Common Stocks | | | | | | | | | | | | | | | | |
| | | | |
Financials | | | $10,443,093 | | | | — | | | | — | | | | $10,443,093 | |
| | | | |
Consumer Discretionary | | | 9,402,887 | | | | — | | | | — | | | | 9,402,887 | |
| | | | |
Consumer Staples | | | 6,757,810 | | | | — | | | | — | | | | 6,757,810 | |
| | | | |
Industrials | | | 6,383,242 | | | | — | | | | — | | | | 6,383,242 | |
| | | | |
Materials | | | 3,748,490 | | | | — | | | | — | | | | 3,748,490 | |
| | | | |
Utilities | | | 3,441,135 | | | | — | | | | — | | | | 3,441,135 | |
| | | | |
Health Care | | | 2,835,464 | | | | — | | | | — | | | | 2,835,464 | |
| | | | |
Energy | | | 2,185,046 | | | | — | | | | — | | | | 2,185,046 | |
| | | | |
Real Estate | | | 1,815,021 | | | | — | | | | — | | | | 1,815,021 | |
| | | | |
Communication Services | | | 1,637,931 | | | | — | | | | $0 | | | | 1,637,931 | |
| | | | |
Short-Term Investments | | | | | | | | | | | | | | | | |
| | | | |
Joint Repurchase Agreements | | | — | | | | $124,893 | | | | — | | | | 124,893 | |
| | | | |
Repurchase Agreements | | | — | | | | 448,000 | | | | — | | | | 448,000 | |
| | | | | | | | | | | | | | | | |
| | | | |
Total Investments in Securities | | | $48,650,119 | | | | $572,893 | | | | $0 | | | | $49,223,012 | |
| | | | | | | | | | | | | | | | |
The Level 3 common stock held by the Fund at October 31, 2024 was received as a result of a corporate action. The security’s value of $0 was determined by using significant unobservable inputs, which generated a change in unrealized depreciation of $0.
For the fiscal year ended October 31, 2024, there were no transfers in or out of Level 3. The Fund did not have any purchases and sales of Level 3 securities for the same period.
The accompanying notes are an integral part of these financial statements.
14
| | |
| | Statement of Assets and Liabilities October 31, 2024 |
| | | | | | | | | | | | | | | |
| | | AMG
River Road
Mid Cap
Value Fund | | AMG
River Road Large
Cap Value
Select Fund | | AMG
River Road
Small Cap
Value Fund |
| | | |
Assets: | | | | | | | | | | | | | | | |
| | | |
Investments at value1 (including securities on loan valued at $0, $0, and $65,950,074, respectively) | | | | $341,365,824 | | | | | $46,587,471 | | | | | $1,086,644,748 | |
| | | |
Cash | | | | 629 | | | | | 769 | | | | | 2,163 | |
| | | |
Receivable for investments sold | | | | 7,217,745 | | | | | 271,322 | | | | | 2,397,186 | |
| | | |
Dividend and interest receivables | | | | 128,722 | | | | | 14,351 | | | | | 513,034 | |
| | | |
Securities lending income receivable | | | | 731 | | | | | 138 | | | | | 4,861 | |
| | | |
Receivable for Fund shares sold | | | | 49,718 | | | | | 4,277 | | | | | 534,876 | |
| | | |
Receivable from affiliate | | | | 16,547 | | | | | 8,563 | | | | | — | |
| | | |
Prepaid expenses and other assets | | | | 20,743 | | | | | 11,917 | | | | | 20,552 | |
| | | |
Total assets | | | | 348,800,659 | | | | | 46,898,808 | | | | | 1,090,117,420 | |
| | | |
Liabilities: | | | | | | | | | | | | | | | |
| | | |
Payable upon return of securities loaned | | | | — | | | | | — | | | | | 136,972 | |
| | | |
Payable for investments purchased | | | | 10,401,463 | | | | | 700,059 | | | | | 2,788,637 | |
| | | |
Payable for Fund shares repurchased | | | | 83,287 | | | | | 1,345 | | | | | 292,389 | |
| | | |
Accrued expenses: | | | | | | | | | | | | | | | |
| | | |
Investment advisory and management fees | | | | 160,938 | | | | | 13,661 | | | | | 738,665 | |
| | | |
Administrative fees | | | | 43,108 | | | | | 5,855 | | | | | 138,500 | |
| | | |
Distribution fees | | | | 53,450 | | | | | 1,100 | | | | | 9,899 | |
| | | |
Shareholder service fees | | | | 24,410 | | | | | 1,479 | | | | | 79,039 | |
| | | |
Other | | | | 93,610 | | | | | 63,805 | | | | | 152,920 | |
| | | |
Total liabilities | | | | 10,860,266 | | | | | 787,304 | | | | | 4,337,021 | |
| | | |
Commitments and Contingencies (Notes 2 & 6) | | | | | | | | | | | | | | | |
| | | |
Net Assets | | | | $337,940,393 | | | | | $46,111,504 | | | | | $1,085,780,399 | |
| | | |
1 Investments at cost | | | | $295,981,604 | | | | | $40,666,262 | | | | | $894,368,170 | |
The accompanying notes are an integral part of these financial statements.
15
| | |
| | Statement of Assets and Liabilities (continued) |
| | | | | | | | | | | | | | | |
| | | |
| | | AMG
River Road
Mid Cap
Value Fund | | AMG
River Road Large
Cap Value
Select Fund | | AMG
River Road
Small Cap
Value Fund |
| | | |
Net Assets Represent: | | | | | | | | | | | | | | | |
| | | |
Paid-in capital | | | | $250,549,904 | | | | | $38,320,893 | | | | | $806,806,538 | |
| | | |
Total distributable earnings | | | | 87,390,489 | | | | | 7,790,611 | | | | | 278,973,861 | |
| | | |
Net Assets | | | | $337,940,393 | | | | | $46,111,504 | | | | | $1,085,780,399 | |
| | | |
Class N: | | | | | | | | | | | | | | | |
| | | |
Net Assets | | | | $244,184,364 | | | | | $5,291,117 | | | | | $46,396,314 | |
| | | |
Shares outstanding | | | | 10,911,779 | | | | | 257,312 | | | | | 2,940,281 | |
| | | |
Net asset value, offering and redemption price per share | | | | $22.38 | | | | | $20.56 | | | | | $15.78 | |
| | | |
Class I: | | | | | | | | | | | | | | | |
| | | |
Net Assets | | | | $85,569,169 | | | | | $40,820,387 | | | | | $1,035,498,194 | |
| | | |
Shares outstanding | | | | 3,536,804 | | | | | 1,970,881 | | | | | 62,915,305 | |
| | | |
Net asset value, offering and redemption price per share | | | | $24.19 | | | | | $20.71 | | | | | $16.46 | |
| | | |
Class Z: | | | | | | | | | | | | | | | |
| | | |
Net Assets | | | | $8,186,860 | | | | | — | | | | | $3,885,891 | |
| | | |
Shares outstanding | | | | 340,573 | | | | | — | | | | | 235,467 | |
| | | |
Net asset value, offering and redemption price per share | | | | $24.04 | | | | | — | | | | | $16.50 | |
The accompanying notes are an integral part of these financial statements.
16
| | |
| | Statement of Assets and Liabilities (continued) |
| | | | | | | | | | | | | | | |
| | | |
| | | AMG
River Road
Dividend All Cap
Value Fund | | AMG
River Road
Small-Mid Cap
Value Fund | | AMG
River Road
Focused Absolute
Value Fund |
| | | |
Assets: | | | | | | | | | | | | | | | |
| | | |
Investments at value1 (including securities on loan valued at $3,415,359, $18,262,258, and $3,705,525, respectively) | | | | $85,378,983 | | | | | $322,564,091 | | | | | $49,223,012 | |
| | | |
Cash | | | | 228 | | | | | 332 | | | | | 386 | |
| | | |
Receivable for investments sold | | | | 639,543 | | | | | 1,355,974 | | | | | — | |
| | | |
Dividend and interest receivables | | | | 177,796 | | | | | 123,309 | | | | | 30,824 | |
| | | |
Securities lending income receivable | | | | 685 | | | | | 9,202 | | | | | 621 | |
| | | |
Receivable for Fund shares sold | | | | 1,810 | | | | | 33,314 | | �� | | | 2,398 | |
| | | |
Receivable from affiliate | | | | 17,024 | | | | | — | | | | | 11,517 | |
| | | |
Prepaid expenses and other assets | | | | 13,411 | | | | | 12,213 | | | | | 15,626 | |
| | | |
Total assets | | | | 86,229,480 | | | | | 324,098,435 | | | | | 49,284,384 | |
| | | |
Liabilities: | | | | | | | | | | | | | | | |
| | | |
Payable upon return of securities loaned | | | | — | | | | | 3,202,659 | | | | | 124,893 | |
| | | |
Payable for investments purchased | | | | 645,802 | | | | | 564,760 | | | | | — | |
| | | |
Payable for Fund shares repurchased | | | | 139,040 | | | | | 154,576 | | | | | 16,572 | |
| | | |
Accrued expenses: | | | | | | | | | | | | | | | |
| | | |
Investment advisory and management fees | | | | 39,140 | | | | | 204,318 | | | | | 25,263 | |
| | | |
Administrative fees | | | | 11,742 | | | | | 40,864 | | | | | 6,316 | |
| | | |
Distribution fees | | | | 5,071 | | | | | 5,275 | | | | | 405 | |
| | | |
Shareholder service fees | | | | 3,040 | | | | | 13,203 | | | | | 1,613 | |
| | | |
Other | | | | 81,480 | | | | | 76,867 | | | | | 55,002 | |
| | | |
Total liabilities | | | | 925,315 | | | | | 4,262,522 | | | | | 230,064 | |
| | | |
Commitments and Contingencies (Notes 2 & 6) | | | | | | | | | | | | | | | |
| | | |
Net Assets | | | | $85,304,165 | | | | | $319,835,913 | | | | | $49,054,320 | |
| | | |
1 Investments at cost | | | | $55,443,742 | | | | | $273,861,482 | | | | | $40,840,147 | |
The accompanying notes are an integral part of these financial statements.
17
| | |
| | Statement of Assets and Liabilities (continued) |
| | | | | | | | | | | | | | | |
| | | |
| | | AMG
River Road
Dividend All Cap
Value Fund | | AMG
River Road
Small-Mid Cap
Value Fund | | AMG
River Road
Focused Absolute
Value Fund |
| | | |
Net Assets Represent: | | | | | | | | | | | | | | | |
| | | |
Paid-in capital | | | | $22,568,642 | | | | | $243,671,269 | | | | | $34,164,396 | |
| | | |
Total distributable earnings | | | | 62,735,523 | | | | | 76,164,644 | | | | | 14,889,924 | |
| | | |
Net Assets | | | | $85,304,165 | | | | | $319,835,913 | | | | | $49,054,320 | |
| | | |
Class N: | | | | | | | | | | | | | | | |
| | | |
Net Assets | | | | $26,733,692 | | | | | $21,263,419 | | | | | $1,949,129 | |
| | | |
Shares outstanding | | | | 2,473,062 | | | | | 2,108,365 | | | | | 132,426 | |
| | | |
Net asset value, offering and redemption price per share | | | | $10.81 | | | | | $10.09 | | | | | $14.72 | |
| | | |
Class I: | | | | | | | | | | | | | | | |
| | | |
Net Assets | | | | $54,673,669 | | | | | $263,399,410 | | | | | $45,021,813 | |
| | | |
Shares outstanding | | | | 5,065,849 | | | | | 25,124,114 | | | | | 3,055,544 | |
| | | |
Net asset value, offering and redemption price per share | | | | $10.79 | | | | | $10.48 | | | | | $14.73 | |
| | | |
Class Z: | | | | | | | | | | | | | | | |
| | | |
Net Assets | | | | $3,896,804 | | | | | $35,173,084 | | | | | $2,083,378 | |
| | | |
Shares outstanding | | | | 360,904 | | | | | 3,349,313 | | | | | 141,382 | |
| | | |
Net asset value, offering and redemption price per share | | | | $10.80 | | | | | $10.50 | | | | | $14.74 | |
The accompanying notes are an integral part of these financial statements.
18
| | |
| | Statement of Operations For the fiscal year ended October 31, 2024 |
| | | | | | | | | | | | | | | |
| | | |
| | | AMG
River Road
Mid Cap
Value Fund | | AMG
River Road Large
Cap Value
Select Fund | | AMG
River Road
Small Cap
Value Fund |
| | | |
Investment Income: | | | | | | | | | | | | | | | |
| | | |
Dividend income | | | | $4,554,298 | | | | | $605,361 | | | | | $10,997,574 | |
| | | |
Interest income | | | | 280,474 | | | | | 44,229 | | | | | 4,766,186 | |
| | | |
Securities lending income | | | | 39,906 | | | | | 599 | | | | | 41,807 | |
| | | |
Foreign withholding tax | | | | (65,082 | ) | | | | (41,339 | ) | | | | (81,222 | ) |
| | | |
Total investment income | | | | 4,809,596 | | | | | 608,850 | | | | | 15,724,345 | |
| | | |
Expenses: | | | | | | | | | | | | | | | |
| | | |
Investment advisory and management fees | | | | 1,923,753 | | | | | 137,354 | | | | | 8,114,815 | |
| | | |
Administrative fees | | | | 515,291 | | | | | 58,866 | | | | | 1,521,528 | |
| | | |
Distribution fees - Class N | | | | 614,101 | | | | | 10,073 | | | | | 111,365 | |
| | | |
Shareholder servicing fees - Class N | | | | 246,792 | | | | | 4,029 | | | | | 45,013 | |
| | | |
Shareholder servicing fees - Class I | | | | 44,374 | | | | | 10,387 | | | | | 844,517 | |
| | | |
Reports to shareholders | | | | 64,586 | | | | | 13,531 | | | | | 161,673 | |
| | | |
Registration fees | | | | 59,735 | | | | | 27,383 | | | | | 65,796 | |
| | | |
Professional fees | | | | 53,156 | | | | | 39,064 | | | | | 127,517 | |
| | | |
Custodian fees | | | | 40,821 | | | | | 21,506 | | | | | 79,865 | |
| | | |
Trustee fees and expenses | | | | 29,158 | | | | | 3,283 | | | | | 86,677 | |
| | | |
Transfer agent fees | | | | 26,404 | | | | | 8,193 | | | | | 25,297 | |
| | | |
Interest expense | | | | 2,600 | | | | | 180 | | | | | — | |
| | | |
Miscellaneous | | | | 18,301 | | | | | 4,792 | | | | | 154,688 | |
| | | |
Total expenses before offsets | | | | 3,639,072 | | | | | 338,641 | | | | | 11,338,751 | |
| | | |
Expense reimbursements | | | | (120,397 | ) | | | | (78,508 | ) | | | | — | |
| | | |
Expense reductions | | | | (4,364 | ) | | | | (694 | ) | | | | (34,970 | ) |
| | | |
Net expenses | | | | 3,514,311 | | | | | 259,439 | | | | | 11,303,781 | |
| | | | | | | | | | | | | | | |
| | | |
Net investment income | | | | 1,295,285 | | | | | 349,411 | | | | | 4,420,564 | |
| | | |
Net Realized and Unrealized Gain: | | | | | | | | | | | | | | | |
| | | |
Net realized gain on investments | | | | 47,038,162 | | | | | 7,665,900 | | | | | 91,033,375 | |
| | | |
Net change in unrealized appreciation/depreciation on investments | | | | 36,639,022 | | | | | 3,931,192 | | | | | 72,674,060 | |
| | | |
Net realized and unrealized gain | | | | 83,677,184 | | | | | 11,597,092 | | | | | 163,707,435 | |
| | | | | | | | | | | | | | | |
| | | |
Net increase in net assets resulting from operations | | | | $84,972,469 | | | | | $11,946,503 | | | | | $168,127,999 | |
The accompanying notes are an integral part of these financial statements.
19
| | |
| | Statement of Operations (continued) |
| | | | | | | | | | | | | | | |
| | | |
| | | AMG
River Road
Dividend All Cap
Value Fund | | AMG
River Road
Small-Mid Cap
Value Fund | | AMG
River Road
Focused Absolute
Value Fund |
| | | |
Investment Income: | | | | | | | | | | | | | | | |
| | | |
Dividend income | | | | $3,387,533 | | | | | $3,953,605 | | | | | $930,085 | |
| | | |
Interest income | | | | 32,901 | | | | | 557,316 | | | | | 27,314 | |
| | | |
Securities lending income | | | | 6,488 | | | | | 45,927 | | | | | 2,003 | |
| | | |
Foreign withholding tax | | | | (15,250 | ) | | | | (9,400 | ) | | | | (8,271 | ) |
| | | |
Total investment income | | | | 3,411,672 | | | | | 4,547,448 | | | | | 951,131 | |
| | | |
Expenses: | | | | | | | | | | | | | | | |
| | | |
Investment advisory and management fees | | | | 696,724 | | | | | 2,250,580 | | | | | 289,960 | |
| | | |
Administrative fees | | | | 209,017 | | | | | 450,116 | | | | | 72,490 | |
| | | |
Distribution fees - Class N | | | | 69,154 | | | | | 50,950 | | | | | 5,077 | |
| | | |
Shareholder servicing fees - Class N | | | | 11,205 | | | | | 12,365 | | | | | 839 | |
| | | |
Shareholder servicing fees - Class I | | | | 43,208 | | | | | 132,914 | | | | | 17,287 | |
| | | |
Professional fees | | | | 55,762 | | | | | 58,131 | | | | | 37,220 | |
| | | |
Reports to shareholders | | | | 45,662 | | | | | 34,023 | | | | | 10,541 | |
| | | |
Registration fees | | | | 38,887 | | | | | 47,284 | | | | | 30,695 | |
| | | |
Custodian fees | | | | 36,324 | | | | | 37,826 | | | | | 22,428 | |
| | | |
Trustee fees and expenses | | | | 11,767 | | | | | 25,489 | | | | | 4,144 | |
| | | |
Transfer agent fees | | | | 5,097 | | | | | 8,307 | | | | | 1,496 | |
| | | |
Interest expense | | | | 25,825 | | | | | — | | | | | 492 | |
| | | |
Miscellaneous | | | | 25,342 | | | | | 32,010 | | | | | 5,934 | |
| | | |
Total expenses before offsets | | | | 1,273,974 | | | | | 3,139,995 | | | | | 498,603 | |
| | | |
Expense reimbursements | | | | (177,037 | ) | | | | — | | | | | (97,960 | ) |
| | | |
Expense reductions | | | | (24,739 | ) | | | | (5,393 | ) | | | | (1,661 | ) |
| | | |
Net expenses | | | | 1,072,198 | | | | | 3,134,602 | | | | | 398,982 | |
| | | | | | | | | | | | | | | |
| | | |
Net investment income | | | | 2,339,474 | | | | | 1,412,846 | | | | | 552,149 | |
| | | |
Net Realized and Unrealized Gain: | | | | | | | | | | | | | | | |
| | | |
Net realized gain on investments | | | | 58,266,342 | | | | | 28,254,972 | | | | | 7,253,837 | |
| | | |
Net change in unrealized appreciation/depreciation on investments | | | | (15,944,244 | ) | | | | 27,922,392 | | | | | 4,637,938 | |
| | | |
Net realized and unrealized gain | | | | 42,322,098 | | | | | 56,177,364 | | | | | 11,891,775 | |
| | | | | | | | | | | | | | | |
| | | |
Net increase in net assets resulting from operations | | | | $44,661,572 | | | | | $57,590,210 | | | | | $12,443,924 | |
The accompanying notes are an integral part of these financial statements.
20
| | |
| | Statements of Changes in Net Assets For the fiscal years ended October 31, |
| | | | | | | | | | | | | | | | | | | | | | | | |
| | | |
| | | AMG
River Road
Mid Cap Value Fund | | | AMG
River Road Large
Cap Value Select Fund | | | AMG
River Road
Small Cap Value Fund | |
| | | | | | |
| | | 2024 | | | 2023 | | | 2024 | | | 2023 | | | 2024 | | | 2023 | |
| | | | | | |
Increase in Net Assets Resulting From Operations: | | | | | | | | | | | | | | | | | | | | | | | | |
| | | | | | |
Net investment income | | | $1,295,285 | | | | $665,399 | | | | $349,411 | | | | $310,281 | | | | $4,420,564 | | | | $2,057,052 | |
| | | | | | |
Net realized gain on investments | | | 47,038,162 | | | | 901,364 | | | | 7,665,900 | | | | 952,984 | | | | 91,033,375 | | | | 46,717,796 | |
| | | | | | |
Net change in unrealized appreciation/depreciation on investments | | | 36,639,022 | | | | 21,147,317 | | | | 3,931,192 | | | | 1,954,790 | | | | 72,674,060 | | | | (33,287,036 | ) |
| | | | | | |
Net increase in net assets resulting from operations | | | 84,972,469 | | | | 22,714,080 | | | | 11,946,503 | | | | 3,218,055 | | | | 168,127,999 | | | | 15,487,812 | |
| | | | | | |
Distributions to Shareholders: | | | | | | | | | | | | | | | | | | | | | | | | |
| | | | | | |
Class N | | | (998,862 | ) | | | (19,489,451 | ) | | | (23,168 | ) | | | (65,123 | ) | | | (2,038,957 | ) | | | (1,388,209 | ) |
| | | | | | |
Class I | | | (570,426 | ) | | | (5,976,906 | ) | | | (314,623 | ) | | | (618,612 | ) | | | (40,327,619 | ) | | | (28,767,483 | ) |
| | | | | | |
Class Z | | | (53,192 | ) | | | (608,991 | ) | | | — | | | | — | | | | (526,135 | ) | | | (343,645 | ) |
| | | | | | |
Total distributions to shareholders | | | (1,622,480 | ) | | | (26,075,348 | ) | | | (337,791 | ) | | | (683,735 | ) | | | (42,892,711 | ) | | | (30,499,337 | ) |
| | | | | | |
Capital Share Transactions:1 | | | | | | | | | | | | | | | | | | | | | | | | |
| | | | | | |
Net increase (decrease) from capital share transactions | | | (51,305,217 | ) | | | 428,469 | | | | 2,299,376 | | | | (4,532,536 | ) | | | 78,139,109 | | | | 30,420,185 | |
| | | | | | | | | | | | | | | | | | | | | | | | |
| | | | | | |
Total increase (decrease) in net assets | | | 32,044,772 | | | | (2,932,799 | ) | | | 13,908,088 | | | | (1,998,216 | ) | | | 203,374,397 | | | | 15,408,660 | |
| | | | | | |
Net Assets: | | | | | | | | | | | | | | | | | | | | | | | | |
| | | | | | |
Beginning of year | | | 305,895,621 | | | | 308,828,420 | | | | 32,203,416 | | | | 34,201,632 | | | | 882,406,002 | | | | 866,997,342 | |
| | | | | | |
End of year | | | $337,940,393 | | | | $305,895,621 | | | | $46,111,504 | | | | $32,203,416 | | | | $1,085,780,399 | | | | $882,406,002 | |
| 1 | See Note 1(g) of the Notes to Financial Statements. |
The accompanying notes are an integral part of these financial statements.
21
| | |
| | Statements of Changes in Net Assets (continued) For the fiscal years ended October 31, |
| | | | | | | | | | | | | | | | | | | | | | | | |
| | | |
| | | AMG
River Road
Dividend All Cap
Value Fund | | | AMG
River Road
Small-Mid Cap
Value Fund | | | AMG
River Road
Focused Absolute
Value Fund | |
| | | | | | |
| | | 2024 | | | 2023 | | | 2024 | | | 2023 | | | 2024 | | | 2023 | |
| | | | | | |
Increase (Decrease) in Net Assets Resulting From Operations: | | | | | | | | | | | | | | | | | | | | | | | | |
| | | | | | |
Net investment income | | | $2,339,474 | | | | $6,797,921 | | | | $1,412,846 | | | | $894,783 | | | | $552,149 | | | | $653,739 | |
| | | | | | |
Net realized gain on investments | | | 58,266,342 | | | | 9,443,458 | | | | 28,254,972 | | | | 11,328,295 | | | | 7,253,837 | | | | 1,333,699 | |
| | | | | | |
Net change in unrealized appreciation/depreciation on investments | | | (15,944,244 | ) | | | (35,081,495 | ) | | | 27,922,392 | | | | (14,491,664 | ) | | | 4,637,938 | | | | 38,458 | |
| | | | | | |
Net increase (decrease) in net assets resulting from operations | | | 44,661,572 | | | | (18,840,116 | ) | | | 57,590,210 | | | | (2,268,586 | ) | | | 12,443,924 | | | | 2,025,896 | |
| | | | | | |
Distributions to Shareholders: | | | | | | | | | | | | | | | | | | | | | | | | |
| | | | | | |
Class N | | | (1,488,716 | ) | | | (4,683,046 | ) | | | (765,228 | ) | | | (841,013 | ) | | | (51,351 | ) | | | (16,781 | ) |
| | | | | | |
Class I | | | (7,827,414 | ) | | | (37,442,154 | ) | | | (9,009,615 | ) | | | (8,300,606 | ) | | | (1,205,279 | ) | | | (521,709 | ) |
| | | | | | |
Class Z | | | (176,926 | ) | | | (451,503 | ) | | | (1,277,335 | ) | | | (1,508,182 | ) | | | (146,167 | ) | | | (81,036 | ) |
| | | | | | |
Total distributions to shareholders | | | (9,493,056 | ) | | | (42,576,703 | ) | | | (11,052,178 | ) | | | (10,649,801 | ) | | | (1,402,797 | ) | | | (619,526 | ) |
| | | | | | |
Capital Share Transactions:1 | | | | | | | | | | | | | | | | | | | | | | | | |
| | | | | | |
Net increase (decrease) from capital share transactions | | | (183,444,327 | ) | | | (35,265,575 | ) | | | 11,163,606 | | | | 33,451,833 | | | | (10,551,496 | ) | | | (16,381,325 | ) |
| | | | | | | | | | | | | | | | | | | | | | | | |
| | | | | | |
Total increase (decrease) in net assets | | | (148,275,811 | ) | | | (96,682,394 | ) | | | 57,701,638 | | | | 20,533,446 | | | | 489,631 | | | | (14,974,955 | ) |
| | | | | | |
Net Assets: | | | | | | | | | | | | | | | | | | | | | | | | |
| | | | | | |
Beginning of year | | | 233,579,976 | | | | 330,262,370 | | | | 262,134,275 | | | | 241,600,829 | | | | 48,564,689 | | | | 63,539,644 | |
| | | | | | |
End of year | | | $85,304,165 | | | | $233,579,976 | | | | $319,835,913 | | | | $262,134,275 | | | | $49,054,320 | | | | $48,564,689 | |
| 1 | See Note 1(g) of the Notes to Financial Statements. |
The accompanying notes are an integral part of these financial statements.
22
| | |
| | AMG River Road Mid Cap Value Fund Financial Highlights For a share outstanding throughout each fiscal year |
| | | | | | | | | | | | | | | | | | | | | | | | | | | |
| |
| | | For the fiscal years ended October 31, |
| | | | | | |
| Class N | | 2024 | | | | 2023 | | 2022 | | 2021 | | 2020 |
| | | | | | |
Net Asset Value, Beginning of Year | | | | $17.43 | | | | | | | $17.74 | | | | | $19.43 | | | | | $29.75 | | | | | $34.95 | |
| | | | | | |
Income (loss) from Investment Operations: | | | | | | | | | | | | | | | | | | | | | | | | | | | |
| | | | | | |
Net investment income1,2 | | | | 0.06 | | | | | | | 0.02 | | | | | 0.17 | 3 | | | | 0.02 | 4 | | | | 0.16 | |
| | | | | | |
Net realized and unrealized gain (loss) on investments | | | | 4.97 | | | | | | | 1.21 | | | | | (1.22 | ) | | | | 11.69 | | | | | (2.85 | ) |
| | | | | | |
Total income (loss) from investment operations | | | | 5.03 | | | | | | | 1.23 | | | | | (1.05 | ) | | | | 11.71 | | | | | (2.69 | ) |
| | | | | | |
Less Distributions to Shareholders from: | | | | | | | | | | | | | | | | | | | | | | | | | | | |
| | | | | | |
Net investment income | | | | (0.03 | ) | | | | | | (0.16 | ) | | | | (0.04 | ) | | | | (0.02 | ) | | | | (0.33 | ) |
| | | | | | |
Net realized gain on investments | | | | (0.05 | ) | | | | | | (1.38 | ) | | | | (0.60 | ) | | | | (22.01 | ) | | | | (2.18 | ) |
| | | | | | |
Total distributions to shareholders | | | | (0.08 | ) | | | | | | (1.54 | ) | | | | (0.64 | ) | | | | (22.03 | ) | | | | (2.51 | ) |
| | | | | | |
Net Asset Value, End of Year | | | | $22.38 | | | | | | | $17.43 | | | | | $17.74 | | | | | $19.43 | | | | | $29.75 | |
| | | | | | |
Total Return2,5 | | | | 28.92 | % | | | | | | 7.39 | % | | | | (5.67 | )% | | | | 50.65 | % | | | | (8.62 | )% |
| | | | | | |
Ratio of net expenses to average net assets | | | | 1.11 | %6,7 | | | | | | 1.10 | %6 | | | | 1.09 | %6 | | | | 1.13 | %6 | | | | 1.14 | % |
| | | | | | |
Ratio of gross expenses to average net assets8 | | | | 1.14 | % | | | | | | 1.13 | % | | | | 1.11 | % | | | | 1.18 | % | | | | 1.16 | % |
| | | | | | |
Ratio of net investment income to average net assets2 | | | | 0.29 | % | | | | | | 0.13 | % | | | | 0.90 | % | | | | 0.08 | % | | | | 0.52 | % |
| | | | | | |
Portfolio turnover | | | | 77 | % | | | | | | 75 | % | | | | 71 | % | | | | 149 | % | | | | 50 | % |
| | | | | | |
Net assets end of year (000’s) omitted | | | | $244,184 | | | | | | | $220,480 | | | | | $227,513 | | | | | $287,165 | | | | | $259,561 | |
| | | | | | | | | | | | | | | | | | | | | | | | | | | | |
The accompanying notes are an integral part of these financial statements.
23
| | |
| | AMG River Road Mid Cap Value Fund Financial Highlights For a share outstanding throughout each fiscal year |
| | | | | | | | | | | | | | | | | | | | | | | | | | | |
| |
| | | For the fiscal years ended October 31, |
| | | | | | |
| Class I | | 2024 | | | | 2023 | | 2022 | | 2021 | | 2020 |
| | | | | | |
Net Asset Value, Beginning of Year | | | | $18.84 | | | | | | | $19.05 | | | | | $20.82 | | | | | $30.68 | | | | | $35.96 | |
| | | | | | |
Income (loss) from Investment Operations: | | | | | | | | | | | | | | | | | | | | | | | | | | | |
| | | | | | |
Net investment income1,2 | | | | 0.13 | | | | | | | 0.08 | | | | | 0.24 | 3 | | | | 0.09 | 4 | | | | 0.25 | |
| | | | | | |
Net realized and unrealized gain (loss) on investments | | | | 5.35 | | | | | | | 1.31 | | | | | (1.32 | ) | | | | 12.16 | | | | | (2.94 | ) |
| | | | | | |
Total income (loss) from investment operations | | | | 5.48 | | | | | | | 1.39 | | | | | (1.08 | ) | | | | 12.25 | | | | | (2.69 | ) |
| | | | | | |
Less Distributions to Shareholders from: | | | | | | | | | | | | | | | | | | | | | | | | | | | |
| | | | | | |
Net investment income | | | | (0.08 | ) | | | | | | (0.22 | ) | | | | (0.09 | ) | | | | (0.10 | ) | | | | (0.41 | ) |
| | | | | | |
Net realized gain on investments | | | | (0.05 | ) | | | | | | (1.38 | ) | | | | (0.60 | ) | | | | (22.01 | ) | | | | (2.18 | ) |
| | | | | | |
Total distributions to shareholders | | | | (0.13 | ) | | | | | | (1.60 | ) | | | | (0.69 | ) | | | | (22.11 | ) | | | | (2.59 | ) |
| | | | | | |
Net Asset Value, End of Year | | | | $24.19 | | | | | | | $18.84 | | | | | $19.05 | | | | | $20.82 | | | | | $30.68 | |
| | | | | | |
Total Return2,5 | | | | 29.27 | % | | | | | | 7.72 | % | | | | (5.41 | )% | | | | 51.11 | % | | | | (8.38 | )% |
| | | | | | |
Ratio of net expenses to average net assets | | |
| 0.81
| %6,7
| | | | | | 0.80 | %6 | | | | 0.80 | %6 | | | | 0.87 | %6 | | | | 0.90 | % |
| | | | | | |
Ratio of gross expenses to average net assets8 | | | | 0.84 | % | | | | | | 0.83 | % | | | | 0.82 | % | | | | 0.92 | % | | | | 0.92 | % |
| | | | | | |
Ratio of net investment income to average net assets2 | | | | 0.59 | % | | | | | | 0.43 | % | | | | 1.19 | % | | | | 0.34 | % | | | | 0.76 | % |
| | | | | | |
Portfolio turnover | | | | 77 | % | | | | | | 75 | % | | | | 71 | % | | | | 149 | % | | | | 50 | % |
| | | | | | |
Net assets end of year (000’s) omitted | | | | $85,569 | | | | | | | $78,562 | | | | | $74,094 | | | | | $112,741 | | | | | $176,807 | |
| | | | | | | | | | | | | | | | | | | | | | | | | | | | |
The accompanying notes are an integral part of these financial statements.
24
| | |
| | AMG River Road Mid Cap Value Fund Financial Highlights For a share outstanding throughout each fiscal year |
| | | | | | | | | | | | | | | | | | | | | | | | | | | |
| |
| | | For the fiscal years ended October 31, |
| | | | | | |
| Class Z | | 2024 | | | | 2023 | | 2022 | | 2021 | | 2020 |
| | | | | | |
Net Asset Value, Beginning of Year | | | | $18.71 | | | | | | | $18.94 | | | | | $20.71 | | | | | $30.63 | | | | | $35.95 | |
| | | | | | |
Income (loss) from Investment Operations: | | | | | | | | | | | | | | | | | | | | | | | | | | | |
| | | | | | |
Net investment income1,2 | | | | 0.14 | | | | | | | 0.09 | | | | | 0.24 | 3 | | | | 0.10 | 4 | | | | 0.28 | |
| | | | | | |
Net realized and unrealized gain (loss) on investments | | | | 5.33 | | | | | | | 1.29 | | | | | (1.29 | ) | | | | 12.13 | | | | | (2.94 | ) |
| | | | | | |
Total income (loss) from investment operations | | | | 5.47 | | | | | | | 1.38 | | | | | (1.05 | ) | | | | 12.23 | | | | | (2.66 | ) |
| | | | | | |
Less Distributions to Shareholders from: | | | | | | | | | | | | | | | | | | | | | | | | | | | |
| | | | | | |
Net investment income | | | | (0.09 | ) | | | | | | (0.23 | ) | | | | (0.12 | ) | | | | (0.14 | ) | | | | (0.48 | ) |
| | | | | | |
Net realized gain on investments | | | | (0.05 | ) | | | | | | (1.38 | ) | | | | (0.60 | ) | | | | (22.01 | ) | | | | (2.18 | ) |
| | | | | | |
Total distributions to shareholders | | | | (0.14 | ) | | | | | | (1.61 | ) | | | | (0.72 | ) | | | | (22.15 | ) | | | | (2.66 | ) |
| | | | | | |
Net Asset Value, End of Year | | | | $24.04 | | | | | | | $18.71 | | | | | $18.94 | | | | | $20.71 | | | | | $30.63 | |
| | | | | | |
Total Return2,5 | | | | 29.37 | % | | | | | | 7.73 | % | | | | (5.34 | )% | | | | 51.18 | % | | | | (8.32 | )% |
| | | | | | |
Ratio of net expenses to average net assets | | |
| 0.76
| %6,7
| | | | | | 0.75 | %6 | | | | 0.75 | %6 | | | | 0.80 | %6 | | | | 0.82 | % |
| | | | | | |
Ratio of gross expenses to average net assets8 | | | | 0.79 | % | | | | | | 0.78 | % | | | | 0.77 | % | | | | 0.85 | % | | | | 0.84 | % |
| | | | | | |
Ratio of net investment income to average net assets2 | | | | 0.64 | % | | | | | | 0.48 | % | | | | 1.24 | % | | | | 0.41 | % | | | | 0.84 | % |
| | | | | | |
Portfolio turnover | | | | 77 | % | | | | | | 75 | % | | | | 71 | % | | | | 149 | % | | | | 50 | % |
| | | | | | |
Net assets end of year (000’s) omitted | | | | $8,187 | | | | | | | $6,853 | | | | | $7,221 | | | | | $8,237 | | | | | $9,786 | |
| | | | | | | | | | | | | | | | | | | | | | | | | | | | |
| 1 | Per share numbers have been calculated using average shares. |
| 2 | Total returns and net investment income would have been lower had certain expenses not been offset. |
| 3 | Includes non-recurring dividends. Without these dividends, net investment income per share would have been $0.05, $0.11 and $0.11 for Class N, Class I and Class Z, respectively. |
| 4 | Includes non-recurring dividends. Without these dividends, net investment income (loss) per share would have been $(0.02), $0.05 and $0.06 for Class N, Class I and Class Z, respectively. |
| 5 | The total return is calculated using the published Net Asset Value as of fiscal year end. |
| 6 | Includes reduction from brokerage recapture amounting to less than 0.01%, 0.01%, 0.01% and less than 0.01% for the fiscal years ended October 31, 2024, 2023, 2022 and 2021, respectively. |
| 7 | Includes interest expense of less than 0.01% related to participation in the interfund lending program. |
| 8 | Excludes the impact of expense reimbursement or fee waivers and expense reductions such as brokerage credits, but includes expense repayments and non-reimbursable expenses, if any, such as interest, taxes, and extraordinary expenses. (See Note 1(c) and 2 in the Notes to Financial Statements.) |
The accompanying notes are an integral part of these financial statements.
25
| | |
| | AMG River Road Large Cap Value Select Fund Financial Highlights For a share outstanding throughout each fiscal year |
| | | | | | | | | | | | | | | | | | | | | | | | | | | |
| |
| | | For the fiscal years ended October 31, |
| | | | | | |
| Class N | | 2024 | | | | 2023 | | 2022 | | 2021 | | 2020 |
| | | | | | |
Net Asset Value, Beginning of Year | | | | $15.15 | | | | | | | $14.08 | | | | | $15.45 | | | | | $13.73 | | | | | $16.22 | |
| | | | | | |
Income (loss) from Investment Operations: | | | | | | | | | | | | | | | | | | | | | | | | | | | |
| | | | | | |
Net investment income1,2 | | | | 0.11 | | | | | | | 0.10 | | | | | 0.22 | 3 | | | | 0.01 | | | | | 0.04 | 4 |
| | | | | | | |
Net realized and unrealized gain (loss) on investments | | | | 5.41 | | | | | | | 1.22 | | | | | (1.59 | ) | | | | 4.27 | | | | | (1.84 | ) |
| | | | | | |
Total income (loss) from investment operations | | | | 5.52 | | | | | | | 1.32 | | | | | (1.37 | ) | | | | 4.28 | | | | | (1.80 | ) |
| | | | | | |
Less Distributions to Shareholders from: | | | | | | | | | | | | | | | | | | | | | | | | | | | |
| | | | | | |
Net investment income | | | | (0.11 | ) | | | | | | (0.25 | ) | | | | — | | | | | (2.56 | ) | | | | — | |
| | | | | | |
Net realized gain on investments | | | | — | | | | | | | — | | | | | — | | | | | — | | | | | (0.69 | ) |
| | | | | | |
Total distributions to shareholders | | | | (0.11 | ) | | | | | | (0.25 | ) | | | | — | | | | | (2.56 | ) | | | | (0.69 | ) |
| | | | | | |
Net Asset Value, End of Year | | | | $20.56 | | | | | | | $15.15 | | | | | $14.08 | | | | | $15.45 | | | | | $13.73 | |
| | | | | | |
Total Return2,5 | | | | 36.62 | % | | | | | | 9.50 | % | | | | (8.87 | )% | | | | 33.53 | % | | | | (11.66 | )% |
| | | | | | |
Ratio of net expenses to average net assets | | |
| 0.95
| %6,7
| | | | |
| 0.95
| %6
| | |
| 0.95
| %6
| | |
| 1.00
| %6
| | | | 1.04 | % |
| | | | | | |
Ratio of gross expenses to average net assets8 | | | | 1.15 | % | | | | | | 1.18 | % | | | | 1.07 | % | | | | 1.14 | % | | | | 1.08 | % |
| | | | | | |
Ratio of net investment income to average net assets2 | | | | 0.60 | % | | | | | | 0.64 | % | | | | 1.51 | % | | | | 0.08 | % | | | | 0.25 | % |
| | | | | | |
Portfolio turnover | | | | 106 | % | | | | | | 77 | % | | | | 91 | % | | | | 256 | % | | | | 750 | % |
| | | | | | |
Net assets end of year (000’s) omitted | | | | $5,291 | | | | | | | $3,373 | | | | | $3,683 | | | | | $4,623 | | | | | $4,716 | |
| | | | | | | | | | | | | | | | | | | | | | | | | | | | |
The accompanying notes are an integral part of these financial statements.
26
| | |
| | AMG River Road Large Cap Value Select Fund Financial Highlights For a share outstanding throughout each fiscal year |
| | | | | | | | | | | | | | | | | | | | | | | | | | | |
| |
| | | For the fiscal years ended October 31, |
| | | | | | |
| Class I | | 2024 | | | | 2023 | | 2022 | | 2021 | | 2020 |
| | | | | | |
Net Asset Value, Beginning of Year | | | | $15.26 | | | | | | | $14.19 | | | | | $15.58 | | | | | $13.80 | | | | | $16.25 | |
| | | | | | |
Income (loss) from Investment Operations: | | | | | | | | | | | | | | | | | | | | | | | | | | | |
| | | | | | |
Net investment income1,2 | | | | 0.17 | | | | | | | 0.14 | | | | | 0.27 | 3 | | | | 0.06 | | | | | 0.08 | 4 |
| | | | | | | |
Net realized and unrealized gain (loss) on investments | | | | 5.44 | | | | | | | 1.23 | | | | | (1.60 | ) | | | | 4.29 | | | | | (1.84 | ) |
| | | | | | |
Total income (loss) from investment operations | | | | 5.61 | | | | | | | 1.37 | | | | | (1.33 | ) | | | | 4.35 | | | | | (1.76 | ) |
| | | | | | |
Less Distributions to Shareholders from: | | | | | | | | | | | | | | | | | | | | | | | | | | | |
| | | | | | |
Net investment income | | | | (0.16 | ) | | | | | | (0.30 | ) | | | | (0.06 | ) | | | | (2.57 | ) | | | | — | |
| | | | | | |
Net realized gain on investments | | | | — | | | | | | | — | | | | | — | | | | | — | | | | | (0.69 | ) |
| | | | | | |
Total distributions to shareholders | | | | (0.16 | ) | | | | | | (0.30 | ) | | | | (0.06 | ) | | | | (2.57 | ) | | | | (0.69 | ) |
| | | | | | |
Net Asset Value, End of Year | | | | $20.71 | | | | | | | $15.26 | | | | | $14.19 | | | | | $15.58 | | | | | $13.80 | |
| | | | | | |
Total Return2,5 | | | | 37.06 | % | | | | | | 9.83 | % | | | | (8.55 | )% | | | | 33.93 | % | | | | (11.38 | )% |
| | | | | | |
Ratio of net expenses to average net assets | | |
| 0.63
| %6,7
| | | | | | 0.63 | %6 | | | | 0.63 | %6 | | | | 0.69 | %6 | | | | 0.76 | % |
| | | | | | |
Ratio of gross expenses to average net assets8 | | | | 0.83 | % | | | | | | 0.86 | % | | | | 0.75 | % | | | | 0.83 | % | | | | 0.80 | % |
| | | | | | |
Ratio of net investment income to average net assets2 | | | | 0.92 | % | | | | | | 0.96 | % | | | | 1.83 | % | | | | 0.39 | % | | | | 0.53 | % |
| | | | | | |
Portfolio turnover | | | | 106 | % | | | | | | 77 | % | | | | 91 | % | | | | 256 | % | | | | 750 | % |
| | | | | | |
Net assets end of year (000’s) omitted | | | | $40,820 | | | | | | | $28,831 | | | | | $30,519 | | | | | $36,900 | | | | | $38,990 | |
| | | | | | | | | | | | | | | | | | | | | | | | | | | | |
| 1 | Per share numbers have been calculated using average shares. |
| 2 | Total returns and net investment income would have been lower had certain expenses not been offset. |
| 3 | Includes non-recurring dividends. Without these dividends, net investment income per share would have been $0.08 and $0.13 for Class N and Class I, respectively. |
| 4 | Includes non-recurring dividends. Without these dividends, net investment income (loss) per share would have been $(0.01) and $0.03 for Class N and Class I, respectively. |
| 5 | The total return is calculated using the published Net Asset Value as of fiscal year end. |
| 6 | Includes reduction from broker recapture amounting to less than 0.01% for the each of the fiscal years ended October 31, 2024, 2023, 2022, and 2021. |
| 7 | Includes interest expense of less than 0.01% related to participation in the interfund lending program. |
| 8 | Excludes the impact of expense reimbursement or fee waivers and expense reductions such as brokerage credits, but includes expense repayments and non-reimbursable expenses, if any, such as interest, taxes, and extraordinary expenses. (See Note 1(c) and 2 in the Notes to Financial Statements.) |
The accompanying notes are an integral part of these financial statements.
27
| | |
| | AMG River Road Small Cap Value Fund Financial Highlights For a share outstanding throughout each fiscal year |
| | | | | | | | | | | | | | | | | | | | | | | | | | | |
| |
| | | For the fiscal years ended October 31, |
| | | | | | |
| Class N | | 2024 | | | | 2023 | | 2022 | | 2021 | | 2020 |
| | | | | | |
Net Asset Value, Beginning of Year | | | | $13.94 | | | | | | | $14.26 | | | | | $15.45 | | | | | $10.76 | | | | | $13.00 | |
| | | | | | |
Income (loss) from Investment Operations: | | | | | | | | | | | | | | | | | | | | | | | | | | | |
| | | | | | |
Net investment income (loss)1,2 | | | | 0.03 | | | | | | | (0.00 | )3 | | | | (0.09 | ) | | | | (0.09 | ) | | | | (0.02 | ) |
| | | | | | |
Net realized and unrealized gain (loss) on investments | | | | 2.51 | | | | | | | 0.20 | | | | | 0.06 | | | | | 4.78 | | | | | (1.43 | ) |
| | | | | | |
Total income (loss) from investment operations | | | | 2.54 | | | | | | | 0.20 | | | | | (0.03 | ) | | | | 4.69 | | | | | (1.45 | ) |
| | | | | | |
Less Distributions to Shareholders from: | | | | | | | | | | | | | | | | | | | | | | | | | | | |
| | | | | | |
Net realized gain on investments | | | | (0.70 | ) | | | | | | (0.52 | ) | | | | (1.16 | ) | | | | — | | | | | (0.79 | ) |
| | | | | | |
Net Asset Value, End of Year | | | | $15.78 | | | | | | | $13.94 | | | | | $14.26 | | | | | $15.45 | | | | | $10.76 | |
| | | | | | |
Total Return2,4 | | | | 18.69 | % | | | | | | 1.58 | % | | | | (0.35 | )% | | | | 43.59 | % | | | | (12.09 | )% |
| | | | | | |
Ratio of net expenses to average net assets5 | | | | 1.37 | % | | | | | | 1.35 | % | | | | 1.35 | % | | | | 1.33 | % | | | | 1.34 | % |
| | | | | | |
Ratio of gross expenses to average net assets6 | | | | 1.37 | % | | | | | | 1.35 | % | | | | 1.35 | % | | | | 1.35 | % | | | | 1.36 | % |
| | | | | | |
Ratio of net investment income (loss) to average net assets2 | | | | 0.19 | % | | | | | | (0.01 | )% | | | | (0.60 | )% | | | | (0.61 | )% | | | | (0.19 | )% |
| | | | | | |
Portfolio turnover | | | | 42 | % | | | | | | 25 | % | | | | 33 | % | | | | 39 | % | | | | 42 | % |
| | | | | | |
Net assets end of year (000’s) omitted | | | | $46,396 | | | | | | | $41,927 | | | | | $37,265 | | | | | $34,246 | | | | | $25,920 | |
| | | | | | | | | | | | | | | | | | | | | | | | | | | | |
The accompanying notes are an integral part of these financial statements.
28
| | |
| | AMG River Road Small Cap Value Fund Financial Highlights For a share outstanding throughout each fiscal year |
| | | | | | | | | | | | | | | | | | | | | | | | | | | |
| |
| | | For the fiscal years ended October 31, |
| | | | | | |
| Class I | | 2024 | | | | 2023 | | 2022 | | 2021 | | 2020 |
| | | | | | |
Net Asset Value, Beginning of Year | | | | $14.48 | | | | | | | $14.76 | | | | | $15.91 | | | | | $11.05 | | | | | $13.30 | |
| | | | | | |
Income (loss) from Investment Operations: | | | | | | | | | | | | | | | | | | | | | | | | | | | |
| | | | | | |
Net investment income (loss)1,2 | | | | 0.07 | | | | | | | 0.04 | | | | | (0.05 | ) | | | | (0.05 | ) | | | | 0.01 | |
| | | | | | |
Net realized and unrealized gain (loss) on investments | | | | 2.62 | | | | | | | 0.20 | | | | | 0.06 | | | | | 4.91 | | | | | (1.46 | ) |
| | | | | | |
Total income (loss) from investment operations | | | | 2.69 | | | | | | | 0.24 | | | | | 0.01 | | | | | 4.86 | | | | | (1.45 | ) |
| | | | | | |
Less Distributions to Shareholders from: | | | | | | | | | | | | | | | | | | | | | | | | | | | |
| | | | | | |
Net investment income | | | | (0.01 | ) | | | | | | — | | | | | — | | | | | (0.00 | )3 | | | | (0.01 | ) |
| | | | | | |
Net realized gain on investments | | | | (0.70 | ) | | | | | | (0.52 | ) | | | | (1.16 | ) | | | | — | | | | | (0.79 | ) |
| | | | | | |
Total distributions to shareholders | | | | (0.71 | ) | | | | | | (0.52 | ) | | | | (1.16 | ) | | | | (0.00 | )3 | | | | (0.80 | ) |
| | | | | | |
Net Asset Value, End of Year | | | | $16.46 | | | | | | | $14.48 | | | | | $14.76 | | | | | $15.91 | | | | | $11.05 | |
| | | | | | |
Total Return2,4 | | | | 19.02 | % | | | | | | 1.81 | % | | | | (0.07 | )% | | | | 43.99 | % | | | | (11.91 | )% |
| | | | | | |
Ratio of net expenses to average net assets5 | | | | 1.11 | % | | | | | | 1.09 | % | | | | 1.09 | % | | | | 1.07 | % | | | | 1.07 | % |
| | | | | | |
Ratio of gross expenses to average net assets6 | | | | 1.11 | % | | | | | | 1.09 | % | | | | 1.09 | % | | | | 1.09 | % | | | | 1.09 | % |
| | | | | | |
Ratio of net investment income (loss) to average net assets2 | | | | 0.45 | % | | | | | | 0.25 | % | | | | (0.34 | )% | | | | (0.35 | )% | | | | 0.07 | % |
| | | | | | |
Portfolio turnover | | | | 42 | % | | | | | | 25 | % | | | | 33 | % | | | | 39 | % | | | | 42 | % |
| | | | | | |
Net assets end of year (000’s) omitted | | | | $1,035,498 | | | | | | | $830,022 | | | | | $819,940 | | | | | $835,473 | | | | | $487,637 | |
| | | | | | | | | | | | | | | | | | | | | | | | | | | | |
The accompanying notes are an integral part of these financial statements.
29
| | |
| | AMG River Road Small Cap Value Fund Financial Highlights For a share outstanding throughout each fiscal year |
| | | | | | | | | | | | | | | | | | | | | | | | | | | |
| |
| | | For the fiscal years ended October 31, |
| | | | | | |
| Class Z | | 2024 | | | | 2023 | | 2022 | | 2021 | | 2020 |
| | | | | | |
Net Asset Value, Beginning of Year | | | | $14.52 | | | | | | | $14.78 | | | | | $15.92 | | | | | $11.05 | | | | | $13.30 | |
| | | | | | |
Income (loss) from Investment Operations: | | | | | | | | | | | | | | | | | | | | | | | | | | | |
| | | | | | |
Net investment income (loss)1,2 | | | | 0.08 | | | | | | | 0.05 | | | | | (0.04 | ) | | | | (0.04 | ) | | | | 0.02 | |
| | | | | | |
Net realized and unrealized gain (loss) on investments | | | | 2.62 | | | | | | | 0.21 | | | | | 0.06 | | | | | 4.92 | | | | | (1.46 | ) |
| | | | | | |
Total income (loss) from investment operations | | | | 2.70 | | | | | | | 0.26 | | | | | 0.02 | | | | | 4.88 | | | | | (1.44 | ) |
| | | | | | |
Less Distributions to Shareholders from: | | | | | | | | | | | | | | | | | | | | | | | | | | | |
| | | | | | |
Net investment income | | | | (0.02 | ) | | | | | | — | | | | | — | | | | | (0.01 | ) | | | | (0.02 | ) |
| | | | | | |
Net realized gain on investments | | | | (0.70 | ) | | | | | | (0.52 | ) | | | | (1.16 | ) | | | | — | | | | | (0.79 | ) |
| | | | | | |
Total distributions to shareholders | | | | (0.72 | ) | | | | | | (0.52 | ) | | | | (1.16 | ) | | | | (0.01 | ) | | | | (0.81 | ) |
| | | | | | |
Net Asset Value, End of Year | | | | $16.50 | | | | | | | $14.52 | | | | | $14.78 | | | | | $15.92 | | | | | $11.05 | |
| | | | | | |
Total Return2,4 | | | | 19.07 | % | | | | | | 1.94 | % | | | | (0.00 | )%7 | | | | 44.17 | % | | | | (11.78 | )% |
| | | | | | |
Ratio of net expenses to average net assets5 | | | | 1.02 | % | | | | | | 1.00 | % | | | | 1.00 | % | | | | 0.98 | % | | | | 0.99 | % |
| | | | | | |
Ratio of gross expenses to average net assets6 | | | | 1.02 | % | | | | | | 1.00 | % | | | | 1.00 | % | | | | 1.00 | % | | | | 1.01 | % |
| | | | | | |
Ratio of net investment income (loss) to average net assets2 | | | | 0.54 | % | | | | | | 0.34 | % | | | | (0.25 | )% | | | | (0.26 | )% | | | | 0.16 | % |
| | | | | | |
Portfolio turnover | | | | 42 | % | | | | | | 25 | % | | | | 33 | % | | | | 39 | % | | | | 42 | % |
| | | | | | |
Net assets end of year (000’s) omitted | | | | $3,886 | | | | | | | $10,457 | | | | | $9,792 | | | | | $7,911 | | | | | $1,025 | |
| | | | | | | | | | | | | | | | | | | | | | | | | | | | |
| 1 | Per share numbers have been calculated using average shares. |
| 2 | Total returns and net investment income (loss) would have been lower had certain expenses not been offset. |
| 3 | Less than $(0.005) per share. |
| 4 | The total return is calculated using the published Net Asset Value as of fiscal year end. |
| 5 | Includes reduction from broker recapture amounting to less than 0.01%, less than 0.01%, less than 0.01%, 0.02% and 0.02% for the fiscal years ended October 31, 2024, 2023, 2022, 2021 and 2020, respectively. |
| 6 | Excludes the impact of expense reimbursement or fee waivers and expense reductions such as brokerage credits, but includes expense repayments and non-reimbursable expenses, if any, such as interest, taxes, and extraordinary expenses. (See Note 1(c) and 2 in the Notes to Financial Statements.) |
The accompanying notes are an integral part of these financial statements.
30
| | |
| | AMG River Road Dividend All Cap Value Fund Financial Highlights For a share outstanding throughout each fiscal year |
| | | | | | | | | | | | | | | | | | | | | | | | | | | |
| |
| | | For the fiscal years ended October 31, |
| | | | | | |
| Class N | | 2024 | | | | 2023 | | 2022 | | 2021 | | 2020 |
| | | | | | |
Net Asset Value, Beginning of Year | | | | $8.63 | | | | | | | $10.70 | | | | | $13.28 | | | | | $10.02 | | | | | $12.34 | |
| | | | | | |
Income (loss) from Investment Operations: | | | | | | | | | | | | | | | | | | | | | | | | | | | |
| | | | | | |
Net investment income1,2 | | | | 0.14 | | | | | | | 0.20 | | | | | 0.18 | | | | | 0.19 | | | | | 0.25 | |
| | | | | | |
Net realized and unrealized gain (loss) on investments | | | | 2.55 | | | | | | | (0.88 | ) | | | | (0.29 | ) | | | | 3.27 | | | | | (1.49 | ) |
| | | | | | |
Total income (loss) from investment operations | | | | 2.69 | | | | | | | (0.68 | ) | | | | (0.11 | ) | | | | 3.46 | | | | | (1.24 | ) |
| | | | | | |
Less Distributions to Shareholders from: | | | | | | | | | | | | | | | | | | | | | | | | | | | |
| | | | | | |
Net investment income | | | | (0.26 | ) | | | | | | (0.23 | ) | | | | (0.27 | ) | | | | (0.20 | ) | | | | (0.34 | ) |
| | | | | | |
Net realized gain on investments | | | | (0.25 | ) | | | | | | (1.16 | ) | | | | (2.20 | ) | | | | — | | | | | (0.74 | ) |
| | | | | | |
Total distributions to shareholders | | | | (0.51 | ) | | | | | | (1.39 | ) | | | | (2.47 | ) | | | | (0.20 | ) | | | | (1.08 | ) |
| | | | | | |
Net Asset Value, End of Year | | | | $10.81 | | | | | | | $8.63 | | | | | $10.70 | | | | | $13.28 | | | | | $10.02 | |
| | | | | | |
Total Return2,3 | | | | 31.94 | % | | | | | | (7.50 | )% | | | | (1.34 | )% | | | | 34.74 | % | | | | (10.96 | )% |
| | | | | | |
Ratio of net expenses to average net assets4 | | | | 0.97 | %5 | | | | | | 0.97 | %6 | | | | 1.03 | % | | | | 1.06 | % | | | | 1.13 | % |
| | | | | | |
Ratio of gross expenses to average net assets7 | | | | 1.12 | % | | | | | | 1.02 | % | | | | 1.07 | % | | | | 1.09 | % | | | | 1.13 | % |
| | | | | | |
Ratio of net investment income to average net assets2 | | | | 1.48 | % | | | | | | 2.10 | % | | | | 1.61 | % | | | | 1.51 | % | | | | 2.38 | % |
| | | | | | |
Portfolio turnover | | | | 26 | % | | | | | | 25 | % | | | | 30 | % | | | | 20 | % | | | | 35 | % |
| | | | | | |
Net assets end of year (000’s) omitted | | | | $26,734 | | | | | | | $28,325 | | | | | $36,432 | | | | | $43,430 | | | | | $41,358 | |
| | | | | | | | | | | | | | | | | | | | | | | | | | | | |
The accompanying notes are an integral part of these financial statements.
31
| | |
| | AMG River Road Dividend All Cap Value Fund Financial Highlights For a share outstanding throughout each fiscal year |
| | | | | | | | | | | | | | | | | | | | | | | | | | | |
| |
| | | For the fiscal years ended October 31, |
| | | | | | |
| Class I | | 2024 | | | | 2023 | | 2022 | | 2021 | | 2020 |
| | | | | | |
Net Asset Value, Beginning of Year | | | | $8.62 | | | | | | | $10.68 | | | | | $13.27 | | | | | $10.01 | | | | | $12.33 | |
| | | | | | |
Income (loss) from Investment Operations: | | | | | | | | | | | | | | | | | | | | | | | | | | | |
| | | | | | |
Net investment income1,2 | | | | 0.16 | | | | | | | 0.23 | | | | | 0.21 | | | | | 0.22 | | | | | 0.28 | |
| | | | | | |
Net realized and unrealized gain (loss) on investments | | | | 2.54 | | | | | | | (0.88 | ) | | | | (0.30 | ) | | | | 3.27 | | | | | (1.49 | ) |
| | | | | | |
Total income (loss) from investment operations | | | | 2.70 | | | | | | | (0.65 | ) | | | | (0.09 | ) | | | | 3.49 | | | | | (1.21 | ) |
| | | | | | |
Less Distributions to Shareholders from: | | | | | | | | | | | | | | | | | | | | | | | | | | | |
| | | | | | |
Net investment income | | | | (0.28 | ) | | | | | | (0.25 | ) | | | | (0.30 | ) | | | | (0.23 | ) | | | | (0.37 | ) |
| | | | | | |
Net realized gain on investments | | | | (0.25 | ) | | | | | | (1.16 | ) | | | | (2.20 | ) | | | | — | | | | | (0.74 | ) |
| | | | | | |
Total distributions to shareholders | | | | (0.53 | ) | | | | | | (1.41 | ) | | | | (2.50 | ) | | | | (0.23 | ) | | | | (1.11 | ) |
| | | | | | |
Net Asset Value, End of Year | | | | $10.79 | | | | | | | $8.62 | | | | | $10.68 | | | | | $13.27 | | | | | $10.01 | |
| | | | | | |
Total Return2,3 | | | | 32.19 | % | | | | | | (7.17 | )% | | | | (1.18 | )% | | | | 35.10 | % | | | | (10.69 | )% |
| | | | | | |
Ratio of net expenses to average net assets4 | | | | 0.72 | %5 | | | | | | 0.72 | %6 | | | | 0.78 | % | | | | 0.81 | % | | | | 0.86 | % |
| | | | | | |
Ratio of gross expenses to average net assets7 | | | | 0.87 | % | | | | | | 0.77 | % | | | | 0.82 | % | | | | 0.84 | % | | | | 0.86 | % |
| | | | | | |
Ratio of net investment income to average net assets2 | | | | 1.73 | % | | | | | | 2.35 | % | | | | 1.86 | % | | | | 1.76 | % | | | | 2.65 | % |
| | | | | | |
Portfolio turnover | | | | 26 | % | | | | | | 25 | % | | | | 30 | % | | | | 20 | % | | | | 35 | % |
| | | | | | |
Net assets end of year (000’s) omitted | | | | $54,674 | | | | | | | $202,039 | | | | | $290,632 | | | | | $382,571 | | | | | $408,844 | |
| | | | | | | | | | | | | | | | | | | | | | | | | | | | |
The accompanying notes are an integral part of these financial statements.
32
| | |
| | AMG River Road Dividend All Cap Value Fund Financial Highlights For a share outstanding throughout each fiscal year |
| | | | | | | | | | | | | | | | | | | | | | | | | | | |
| |
| | | For the fiscal years ended October 31, |
| | | | | | |
| Class Z | | 2024 | | | | 2023 | | 2022 | | 2021 | | 2020 |
| | | | | | |
Net Asset Value, Beginning of Year | | | | $8.62 | | | | | | | $10.69 | | | | | $13.28 | | | | | $10.01 | | | | | $12.33 | |
| | | | | | |
Income (loss) from Investment Operations: | | | | | | | | | | | | | | | | | | | | | | | | | | | |
| | | | | | |
Net investment income1,2 | | | | 0.17 | | | | | | | 0.23 | | | | | 0.21 | | | | | 0.22 | | | | | 0.27 | |
| | | | | | |
Net realized and unrealized gain (loss) on investments | | | | 2.55 | | | | | | | (0.88 | ) | | | | (0.29 | ) | | | | 3.29 | | | | | (1.47 | ) |
| | | | | | |
Total income (loss) from investment operations | | | | 2.72 | | | | | | | (0.65 | ) | | | | (0.08 | ) | | | | 3.51 | | | | | (1.20 | ) |
| | | | | | |
Less Distributions to Shareholders from: | | | | | | | | | | | | | | | | | | | | | | | | | | | |
| | | | | | |
Net investment income | | | | (0.29 | ) | | | | | | (0.26 | ) | | | | (0.31 | ) | | | | (0.24 | ) | | | | (0.38 | ) |
| | | | | | |
Net realized gain on investments | | | | (0.25 | ) | | | | | | (1.16 | ) | | | | (2.20 | ) | | | | — | | | | | (0.74 | ) |
| | | | | | |
Total distributions to shareholders | | | | (0.54 | ) | | | | | | (1.42 | ) | | | | (2.51 | ) | | | | (0.24 | ) | | | | (1.12 | ) |
| | | | | | |
Net Asset Value, End of Year | | | | $10.80 | | | | | | | $8.62 | | | | | $10.69 | | | | | $13.28 | | | | | $10.01 | |
| | | | | | |
Total Return2,3 | | | | 32.37 | % | | | | | | (7.22 | )% | | | | (1.12 | )% | | | | 35.26 | % | | | | (10.65 | )% |
| | | | | | |
Ratio of net expenses to average net assets4 | | | | 0.68 | %5 | | | | | | 0.68 | %6 | | | | 0.74 | % | | | | 0.77 | % | | | | 0.81 | % |
| | | | | | |
Ratio of gross expenses to average net assets7 | | | | 0.83 | % | | | | | | 0.73 | % | | | | 0.78 | % | | | | 0.80 | % | | | | 0.81 | % |
| | | | | | |
Ratio of net investment income to average net assets2 | | | | 1.77 | % | | | | | | 2.39 | % | | | | 1.90 | % | | | | 1.80 | % | | | | 2.69 | % |
| | | | | | |
Portfolio turnover | | | | 26 | % | | | | | | 25 | % | | | | 30 | % | | | | 20 | % | | | | 35 | % |
| | | | | | |
Net assets end of year (000’s) omitted | | | | $3,897 | | | | | | | $3,216 | | | | | $3,199 | | | | | $2,430 | | | | | $1,901 | |
| | | | | | | | | | | | | | | | | | | | | | | | | | | | |
| 1 | Per share numbers have been calculated using average shares. |
| 2 | Total returns and net investment income would have been lower had certain expenses not been offset. |
| 3 | The total return is calculated using the published Net Asset Value as of fiscal year end. |
| 4 | Includes reduction from broker recapture amounting to 0.02%, 0.01%, 0.01%, 0.01%, and less than 0.01% for the fiscal years ended October 31, 2024, 2023, 2022, 2021 and 2020, respectively. |
| 5 | Includes interest expense of 0.02% related to participation in the interfund lending program. |
| 6 | Includes interest expense totaling 0.01% related to utilization of the line of credit. |
| 7 | Excludes the impact of expense reimbursement or fee waivers and expense reductions such as brokerage credits, but includes expense repayments and non-reimbursable expenses, if any, such as interest, taxes, and extraordinary expenses. (See Note 1(c) and 2 in the Notes to Financial Statements.) |
The accompanying notes are an integral part of these financial statements.
33
| | |
| | AMG River Road Small-Mid Cap Value Fund Financial Highlights For a share outstanding throughout each fiscal year |
| | | | | | | | | | | | | | | | | | | | | | | | | | | |
| |
| | | For the fiscal years ended October 31, |
| | | | | | |
| Class N | | 2024 | | | | 2023 | | 2022 | | 2021 | | 2020 |
| | | | | | |
Net Asset Value, Beginning of Year | | | | $8.61 | | | | | | | $9.10 | | | | | $9.81 | | | | | $6.80 | | | | | $7.84 | |
| | | | | | |
Income (loss) from Investment Operations: | | | | | | | | | | | | | | | | | | | | | | | | | | | |
| | | | | | |
Net investment income (loss)1,2 | | | | 0.02 | | | | | | | 0.01 | | | | | (0.03 | ) | | | | (0.04 | ) | | | | (0.01 | )3 |
| | | | | | |
Net realized and unrealized gain (loss) on investments | | | | 1.82 | | | | | | | (0.09 | ) | | | | (0.11 | ) | | | | 3.05 | | | | | (0.88 | ) |
| | | | | | |
Total income (loss) from investment operations | | | | 1.84 | | | | | | | (0.08 | ) | | | | (0.14 | ) | | | | 3.01 | | | | | (0.89 | ) |
| | | | | | |
Less Distributions to Shareholders from: | | | | | | | | | | | | | | | | | | | | | | | | | | | |
| | | | | | |
Net investment income | | | | (0.01 | ) | | | | | | (0.00 | )4 | | | | — | | | | | — | | | | | (0.01 | ) |
| | | | | | |
Net realized gain on investments | | | | (0.35 | ) | | | | | | (0.41 | ) | | | | (0.57 | ) | | | | — | | | | | (0.14 | ) |
| | | | | | |
Total distributions to shareholders | | | | (0.36 | ) | | | | | | (0.41 | ) | | | | (0.57 | ) | | | | — | | | | | (0.15 | ) |
| | | | | | |
Net Asset Value, End of Year | | | | $10.09 | | | | | | | $8.61 | | | | | $9.10 | | | | | $9.81 | | | | | $6.80 | |
| | | | | | |
Total Return2,5 | | | | 21.83 | % | | | | | | (0.77 | )% | | | | (1.64 | )% | | | | 44.27 | % | | | | (11.65 | )% |
| | | | | | |
Ratio of net expenses to average net assets6 | | | | 1.29 | % | | | | | | 1.27 | % | | | | 1.28 | % | | | | 1.25 | % | | | | 1.31 | % |
| | | | | | |
Ratio of gross expenses to average net assets7 | | | | 1.29 | % | | | | | | 1.28 | % | | | | 1.28 | % | | | | 1.27 | % | | | | 1.33 | % |
| | | | | | |
Ratio of net investment income (loss) to average net assets2 | | | | 0.23 | % | | | | | | 0.10 | % | | | | (0.28 | )% | | | | (0.38 | )% | | | | (0.16 | )% |
| | | | | | |
Portfolio turnover | | | | 42 | % | | | | | | 30 | % | | | | 32 | % | | | | 44 | % | | | | 47 | % |
| | | | | | |
Net assets end of year (000’s) omitted | | | | $21,263 | | | | | | | $18,655 | | | | | $18,961 | | | | | $22,702 | | | | | $21,618 | |
| | | | | | | | | | | | | | | | | | | | | | | | | | | | |
The accompanying notes are an integral part of these financial statements.
34
| | |
| | AMG River Road Small-Mid Cap Value Fund Financial Highlights For a share outstanding throughout each fiscal year |
| | | | | | | | | | | | | | | | | | | | | | | | | | | |
| |
| | | For the fiscal years ended October 31, |
| | | | | | |
| Class I | | 2024 | | | | 2023 | | 2022 | | 2021 | | 2020 |
| | | | | | |
Net Asset Value, Beginning of Year | | | | $8.94 | | | | | | | $9.41 | | | | | $10.10 | | | | | $6.98 | | | | | $8.04 | |
| | | | | | |
Income (loss) from Investment Operations: | | | | | | | | | | | | | | | | | | | | | | | | | | | |
| | | | | | |
Net investment income (loss)1,2 | | | | 0.05 | | | | | | | 0.03 | | | | | (0.00 | )4 | | | | (0.01 | ) | | | | 0.01 | 3 |
| | | | | | | |
Net realized and unrealized gain (loss) on investments | | | | 1.87 | | | | | | | (0.09 | ) | | | | (0.12 | ) | | | | 3.13 | | | | | (0.91 | ) |
| | | | | | |
Total income (loss) from investment operations | | | | 1.92 | | | | | | | (0.06 | ) | | | | (0.12 | ) | | | | 3.12 | | | | | (0.90 | ) |
| | | | | | |
Less Distributions to Shareholders from: | | | | | | | | | | | | | | | | | | | | | | | | | | | |
| | | | | | |
Net investment income | | | | (0.03 | ) | | | | | | (0.00 | )4 | | | | — | | | | | (0.00 | )4 | | | | (0.02 | ) |
| | | | | | |
Net realized gain on investments | | | | (0.35 | ) | | | | | | (0.41 | ) | | | | (0.57 | ) | | | | — | | | | | (0.14 | ) |
| | | | | | |
Total distributions to shareholders | | | | (0.38 | ) | | | | | | (0.41 | ) | | | | (0.57 | ) | | | | (0.00 | )4 | | | | (0.16 | ) |
| | | | | | |
Net Asset Value, End of Year | | | | $10.48 | | | | | | | $8.94 | | | | | $9.41 | | | | | $10.10 | | | | | $6.98 | |
| | | | | | |
Total Return2,5 | | | | 21.97 | % | | | | | | (0.48 | )% | | | | (1.38 | )% | | | | 44.70 | % | | | | (11.47 | )% |
| | | | | | |
Ratio of net expenses to average net assets6 | | | | 1.03 | % | | | | | | 1.02 | % | | | | 1.02 | % | | | | 1.00 | % | | | | 1.05 | % |
| | | | | | |
Ratio of gross expenses to average net assets7 | | | | 1.03 | % | | | | | | 1.03 | % | | | | 1.02 | % | | | | 1.02 | % | | | | 1.07 | % |
| | | | | | |
Ratio of net investment income (loss) to average net assets2 | | | | 0.49 | % | | | | | | 0.35 | % | | | | (0.02 | )% | | | | (0.13 | )% | | | | 0.09 | % |
| | | | | | |
Portfolio turnover | | | | 42 | % | | | | | | 30 | % | | | | 32 | % | | | | 44 | % | | | | 47 | % |
| | | | | | |
Net assets end of year (000’s) omitted | | | | $263,399 | | | | | | | $214,093 | | | | | $188,163 | | | | | $218,698 | | | | | $156,350 | |
| | | | | | | | | | | | | | | | | | | | | | | | | | | | |
The accompanying notes are an integral part of these financial statements.
35
| | |
| | AMG River Road Small-Mid Cap Value Fund Financial Highlights For a share outstanding throughout each fiscal year |
| | | | | | | | | | | | | | | | | | | | | | | | | | | |
| |
| | | For the fiscal years ended October 31, |
| | | | | | |
| Class Z | | 2024 | | | | 2023 | | 2022 | | 2021 | | 2020 |
| | | | | | |
Net Asset Value, Beginning of Year | | | | $8.95 | | | | | | | $9.42 | | | | | $10.10 | | | | | $6.98 | | | | | $8.04 | |
| | | | | | |
Income (loss) from Investment Operations: | | | | | | | | | | | | | | | | | | | | | | | | | | | |
| | | | | | |
Net investment income (loss)1,2 | | | | 0.05 | | | | | | | 0.04 | | | | | 0.00 | 8 | | | | (0.01 | ) | | | | 0.01 | 3 |
| | | | | | | |
Net realized and unrealized gain (loss) on investments | | | | 1.89 | | | | | | | (0.10 | ) | | | | (0.11 | ) | | | | 3.13 | | | | | (0.91 | ) |
| | | | | | |
Total income (loss) from investment operations | | | | 1.94 | | | | | | | (0.06 | ) | | | | (0.11 | ) | | | | 3.12 | | | | | (0.90 | ) |
| | | | | | |
Less Distributions to Shareholders from: | | | | | | | | | | | | | | | | | | | | | | | | | | | |
| | | | | | |
Net investment income | | | | (0.04 | ) | | | | | | (0.00 | )4 | | | | (0.00 | )4 | | | | (0.00 | )4 | | | | (0.02 | ) |
| | | | | | |
Net realized gain on investments | | | | (0.35 | ) | | | | | | (0.41 | ) | | | | (0.57 | ) | | | | — | | | | | (0.14 | ) |
| | | | | | |
Total distributions to shareholders | | | | (0.39 | ) | | | | | | (0.41 | ) | | | | (0.57 | ) | | | | (0.00 | )4 | | | | (0.16 | ) |
| | | | | | |
Net Asset Value, End of Year | | | | $10.50 | | | | | | | $8.95 | | | | | $9.42 | | | | | $10.10 | | | | | $6.98 | |
| | | | | | |
Total Return2,5 | | | | 22.13 | % | | | | | | (0.47 | )% | | | | (1.26 | )% | | | | 44.77 | % | | | | (11.43 | )% |
| | | | | | |
Ratio of net expenses to average net assets6 | | | | 0.98 | % | | | | | | 0.97 | % | | | | 0.97 | % | | | | 0.95 | % | | | | 1.00 | % |
| | | | | | |
Ratio of gross expenses to average net assets7 | | | | 0.98 | % | | | | | | 0.98 | % | | | | 0.97 | % | | | | 0.97 | % | | | | 1.02 | % |
| | | | | | |
Ratio of net investment income (loss) to average net assets2 | | | | 0.54 | % | | | | | | 0.40 | % | | | | 0.03 | % | | | | (0.08 | )% | | | | 0.14 | % |
| | | | | | |
Portfolio turnover | | | | 42 | % | | | | | | 30 | % | | | | 32 | % | | | | 44 | % | | | | 47 | % |
| | | | | | |
Net assets end of year (000’s) omitted | | | | $35,173 | | | | | | | $29,387 | | | | | $34,477 | | | | | $35,766 | | | | | $553 | |
| | | | | | | | | | | | | | | | | | | | | | | | | | | | |
| 1 | Per share numbers have been calculated using average shares. |
| 2 | Total returns and net investment income (loss) would have been lower had certain expenses not been offset. |
| 3 | Includes non-recurring dividends. Without these dividends, net investment income (loss) per share would have been $(0.02), $(0.00) and $0.00 for Class N, Class I and Class Z, respectively. |
| 4 | Less than $(0.005) per share. |
| 5 | The total return is calculated using the published Net Asset Value as of fiscal year end. |
| 6 | Includes reduction from broker recapture amounting to less than 0.01%, 0.01%, 0.01%, 0.02% and 0.02% for the fiscal years ended October 31, 2024, 2023, 2022, 2021 and 2020, respectively. |
| 7 | Excludes the impact of expense reimbursement or fee waivers and expense reductions such as brokerage credits, but includes expense repayments and non-reimbursable expenses, if any, such as interest, taxes, and extraordinary expenses. (See Note 1(c) and 2 in the Notes to Financial Statements.) |
| 8 | Less than $0.005 per share. |
The accompanying notes are an integral part of these financial statements.
36
| | |
| | AMG River Road Focused Absolute Value Fund Financial Highlights For a share outstanding throughout each fiscal year |
| | | | | | | | | | | | | | | | | | | | | | | | | | | |
| |
| | | For the fiscal years ended October 31, |
| | | | | | |
| Class N | | 2024 | | | | 2023 | | 2022 | | 2021 | | 2020 |
| | | | | | |
Net Asset Value, Beginning of Year | | | | $11.73 | | | | | | | $11.50 | | | | | $14.44 | | | | | $11.05 | | | | | $12.65 | |
| | | | | | |
Income (loss) from Investment Operations: | | | | | | | | | | | | | | | | | | | | | | | | | | | |
| | | | | | |
Net investment income1,2 | | | | 0.12 | | | | | | | 0.11 | | | | | 0.04 | | | | | 0.01 | | | | | 0.04 | 3 |
| | | | | | | |
Net realized and unrealized gain (loss) on investments | | | | 3.19 | | | | | | | 0.21 | | | | | (2.03 | ) | | | | 3.38 | | | | | (1.39 | ) |
| | | | | | |
Total income (loss) from investment operations | | | | 3.31 | | | | | | | 0.32 | | | | | (1.99 | ) | | | | 3.39 | | | | | (1.35 | ) |
| | | | | | |
Less Distributions to Shareholders from: | | | | | | | | | | | | | | | | | | | | | | | | | | | |
| | | | | | |
Net investment income | | | | (0.13 | ) | | | | | | (0.02 | ) | | | | — | | | | | — | | | | | (0.02 | ) |
| | | | | | |
Net realized gain on investments | | | | (0.19 | ) | | | | | | (0.07 | ) | | | | (0.95 | ) | | | | — | | | | | (0.23 | ) |
| | | | | | |
Total distributions to shareholders | | | | (0.32 | ) | | | | | | (0.09 | ) | | | | (0.95 | ) | | | | — | | | | | (0.25 | ) |
| | | | | | |
Net Asset Value, End of Year | | | | $14.72 | | | | | | | $11.73 | | | | | $11.50 | | | | | $14.44 | | | | | $11.05 | |
| | | | | | |
Total Return2,4 | | | | 28.70 | % | | | | | | 2.76 | % | | | | (14.80 | )% | | | | 30.68 | % | | | | (11.03 | )% |
| | | | | | |
Ratio of net expenses to average net assets5 | | |
| 1.06
| %6
| | | | | | 1.05 | % | | | | 1.05 | % | | | | 1.06 | % | | | | 1.03 | % |
| | | | | | |
Ratio of gross expenses to average net assets7 | | | | 1.26 | % | | | | | | 1.22 | % | | | | 1.14 | % | | | | 1.12 | % | | | | 1.15 | % |
| | | | | | |
Ratio of net investment income to average net assets2 | | | | 0.91 | % | | | | | | 0.93 | % | | | | 0.30 | % | | | | 0.10 | % | | | | 0.34 | % |
| | | | | | |
Portfolio turnover | | | | 86 | % | | | | | | 63 | % | | | | 113 | % | | | | 83 | % | | | | 103 | % |
| | | | | | |
Net assets end of year (000’s) omitted | | | | $1,949 | | | | | | | $1,910 | | | | | $2,243 | | | | | $3,666 | | | | | $12,466 | |
| | | | | | | | | | | | | | | | | | | | | | | | | | | | |
The accompanying notes are an integral part of these financial statements.
37
| | |
| | AMG River Road Focused Absolute Value Fund Financial Highlights For a share outstanding throughout each fiscal year |
| | | | | | | | | | | | | | | | | | | | | | | | | | | |
| |
| | | For the fiscal years ended October 31, |
| | | | | | |
| Class I | | 2024 | | | | 2023 | | 2022 | | 2021 | | 2020 |
| | | | | | |
Net Asset Value, Beginning of Year | | | | $11.75 | | | | | | | $11.51 | | | | | $14.48 | | | | | $11.12 | | | | | $12.72 | |
| | | | | | |
Income (loss) from Investment Operations: | | | | | | | | | | | | | | | | | | | | | | | | | | | |
| | | | | | |
Net investment income1,2 | | | | 0.16 | | | | | | | 0.14 | | | | | 0.07 | | | | | 0.05 | | | | | 0.07 | 3 |
| | | | | | | |
Net realized and unrealized gain (loss) on investments | | | | 3.18 | | | | | | | 0.22 | | | | | (2.04 | ) | | | | 3.39 | | | | | (1.40 | ) |
| | | | | | |
Total income (loss) from investment operations | | | | 3.34 | | | | | | | 0.36 | | | | | (1.97 | ) | | | | 3.44 | | | | | (1.33 | ) |
| | | | | | |
Less Distributions to Shareholders from: | | | | | | | | | | | | | | | | | | | | | | | | | | | |
| | | | | | |
Net investment income | | | | (0.17 | ) | | | | | | (0.05 | ) | | | | (0.05 | ) | | | | (0.08 | ) | | | | (0.04 | ) |
| | | | | | |
Net realized gain on investments | | | | (0.19 | ) | | | | | | (0.07 | ) | | | | (0.95 | ) | | | | — | | | | | (0.23 | ) |
| | | | | | |
Total distributions to shareholders | | | | (0.36 | ) | | | | | | (0.12 | ) | | | | (1.00 | ) | | | | (0.08 | ) | | | | (0.27 | ) |
| | | | | | |
Net Asset Value, End of Year | | | | $14.73 | | | | | | | $11.75 | | | | | $11.51 | | | | | $14.48 | | | | | $11.12 | |
| | | | | | |
Total Return2,4 | | | | 28.90 | % | | | | | | 3.11 | % | | | | (14.64 | )% | | | | 30.98 | % | | | | (10.81 | )% |
| | | | | | |
Ratio of net expenses to average net assets5 | | | | 0.82 | %6 | | | | | | 0.81 | % | | | | 0.80 | % | | | | 0.81 | % | | | | 0.78 | % |
| | | | | | |
Ratio of gross expenses to average net assets7 | | | | 1.02 | % | | | | | | 0.98 | % | | | | 0.89 | % | | | | 0.87 | % | | | | 0.90 | % |
| | | | | | |
Ratio of net investment income to average net assets2 | | | | 1.15 | % | | | | | | 1.17 | % | | | | 0.55 | % | | | | 0.35 | % | | | | 0.59 | % |
| | | | | | |
Portfolio turnover | | | | 86 | % | | | | | | 63 | % | | | | 113 | % | | | | 83 | % | | | | 103 | % |
| | | | | | |
Net assets end of year (000’s) omitted | | | | $45,022 | | | | | | | $40,205 | | | | | $53,620 | | | | | $176,460 | | | | | $130,758 | |
| | | | | | | | | | | | | | | | | | | | | | | | | | | | |
The accompanying notes are an integral part of these financial statements.
38
| | |
| | AMG River Road Focused Absolute Value Fund Financial Highlights For a share outstanding throughout each fiscal year |
| | | | | | | | | | | | | | | | | | | | | | | | | | | |
| |
| | | For the fiscal years ended October 31, |
| | | | | | |
| Class Z | | 2024 | | | | 2023 | | 2022 | | 2021 | | 2020 |
| | | | | | |
Net Asset Value, Beginning of Year | | | | $11.75 | | | | | | | $11.52 | | | | | $14.49 | | | | | $11.12 | | | | | $12.73 | |
| | | | | | |
Income (loss) from Investment Operations: | | | | | | | | | | | | | | | | | | | | | | | | | | | |
| | | | | | |
Net investment income1,2 | | | | 0.16 | | | | | | | 0.15 | | | | | 0.08 | | | | | 0.06 | | | | | 0.07 | 3 |
| | | | | | | |
Net realized and unrealized gain (loss) on investments | | | | 3.19 | | | | | | | 0.21 | | | | | (2.04 | ) | | | | 3.39 | | | | | (1.41 | ) |
| | | | | | |
Total income (loss) from investment operations | | | | 3.35 | | | | | | | 0.36 | | | | | (1.96 | ) | | | | 3.45 | | | | | (1.34 | ) |
| | | | | | |
Less Distributions to Shareholders from: | | | | | | | | | | | | | | | | | | | | | | | | | | | |
| | | | | | |
Net investment income | | | | (0.17 | ) | | | | | | (0.06 | ) | | | | (0.06 | ) | | | | (0.08 | ) | | | | (0.04 | ) |
| | | | | | |
Net realized gain on investments | | | | (0.19 | ) | | | | | | (0.07 | ) | | | | (0.95 | ) | | | | — | | | | | (0.23 | ) |
| | | | | | |
Total distributions to shareholders | | | | (0.36 | ) | | | | | | (0.13 | ) | | | | (1.01 | ) | | | | (0.08 | ) | | | | (0.27 | ) |
| | | | | | |
Net Asset Value, End of Year | | | | $14.74 | | | | | | | $11.75 | | | | | $11.52 | | | | | $14.49 | | | | | $11.12 | |
| | | | | | |
Total Return2,4 | | | | 29.04 | % | | | | | | 3.10 | % | | | | (14.59 | )% | | | | 31.12 | % | | | | (10.86 | )% |
| | | | | | |
Ratio of net expenses to average net assets5 | | | | 0.78 | %6 | | | | | | 0.77 | % | | | | 0.76 | % | | | | 0.77 | % | | | | 0.74 | % |
| | | | | | |
Ratio of gross expenses to average net assets7 | | | | 0.98 | % | | | | | | 0.94 | % | | | | 0.85 | % | | | | 0.83 | % | | | | 0.86 | % |
| | | | | | |
Ratio of net investment income to average net assets2 | | | | 1.19 | % | | | | | | 1.21 | % | | | | 0.59 | % | | | | 0.39 | % | | | | 0.63 | % |
| | | | | | |
Portfolio turnover | | | | 86 | % | | | | | | 63 | % | | | | 113 | % | | | | 83 | % | | | | 103 | % |
| | | | | | |
Net assets end of year (000’s) omitted | | | | $2,083 | | | | | | | $6,450 | | | | | $7,677 | | | | | $13,323 | | | | | $2,462 | |
| | | | | | | | | | | | | | | | | | | | | | | | | | | | |
| 1 | Per share numbers have been calculated using average shares. |
| 2 | Total returns and net investment income would have been lower had certain expenses not been offset. |
| 3 | Includes non-recurring dividends. Without these dividends, net investment income per share would have been $0.02, $0.05 and $0.05 for Class N, Class I and Class Z, respectively. |
| 4 | The total return is calculated using the published Net Asset Value as of fiscal year end. |
| 5 | Includes reduction from broker recapture amounting to less than 0.01%, 0.01%, 0.02%, 0.01% and 0.01%, for the fiscal years ended October 31, 2024, 2023, 2022, 2021 and 2020, respectively. |
| 6 | Includes interest expense of less than 0.01% related to participation in the interfund lending program. |
| 7 | Excludes the impact of expense reimbursement or fee waivers and expense reductions such as brokerage credits, but includes expense repayments and non-reimbursable expenses, if any, such as interest, taxes, and extraordinary expenses. (See Note 1(c) and 2 in the Notes to Financial Statements.) |
The accompanying notes are an integral part of these financial statements.
39
| | |
| | Notes to Financial Statements October 31, 2024 |
1. ORGANIZATION AND SUMMARY OF SIGNIFICANT ACCOUNTING POLICIES
AMG Funds I and AMG Funds IV (the “Trusts”) are open-end management investment companies. AMG Funds I is organized as a Massachusetts business trust, while AMG Funds IV is organized as a Delaware Statutory Trust. The Trusts are registered under the Investment Company Act of 1940, as amended (the “1940 Act”). Currently, the Trusts consist of a number of different funds, each having distinct investment management objectives, strategies, risks, and policies. Included in this report are AMG Funds I: AMG River Road Large Cap Value Select Fund (“Large Cap Value Select”), and AMG Funds IV: AMG River Road Mid Cap Value Fund (“Mid Cap Value”), AMG River Road Small Cap Value Fund (“Small Cap Value”), AMG River Road Dividend All Cap Value Fund (“Dividend All Cap Value”), AMG River Road Small-Mid Cap Value Fund (“Small-Mid Cap Value”), and AMG River Road Focused Absolute Value Fund (“Focused Absolute Value”), each a “Fund” and collectively, the “Funds”.
Each Fund is authorized to issue Class N and Class I shares. The Funds, except for Large Cap Value Select, are also authorized to issue Class Z shares. Each class represents an interest in the same assets of the respective Fund. Although all share classes generally have identical voting rights, each share class votes separately when required by law. Different share classes may have different net asset values per share to the extent the share classes pay different distribution amounts and/or the expenses of such share classes differ. Each share class has its own expense structure. Please refer to a current prospectus for additional information on each share class.
Large Cap Value Select and Focused Absolute Value are non-diversified funds.
The Funds’ financial statements are prepared in accordance with accounting principles generally accepted in the United States of America (“U.S. GAAP”), including accounting and reporting guidance pursuant to Accounting Standards Codification Topic 946 applicable to investment companies. U.S. GAAP requires management to make estimates and assumptions that affect the reported amounts of assets and liabilities and disclosure of contingent assets and liabilities at the date of the financial statements and the reported amounts of income and expenses during the reporting period. Actual results could differ from those estimates and such differences could be material. The following is a summary of significant accounting policies followed by the Funds in the preparation of their financial statements:
a. VALUATION OF INVESTMENTS
Equity securities traded on a national securities exchange or reported on the NASDAQ national market system (“NMS”) are valued at the last quoted sales price on the primary exchange or, if applicable, the NASDAQ official closing price or the official closing price of the relevant exchange or, lacking any sales, at the last quoted bid price. Equity securities held by the Funds that are traded in the over-the-counter market (other than NMS securities) are valued at the bid price. Foreign equity securities (securities principally traded in markets other than U.S. markets) held by the Funds are valued at the official closing price on the primary exchange or, for markets that either do not offer an official closing price or where the official closing price may not be representative of the overall market, the last quoted sale price.
Fixed income securities purchased with a remaining maturity of 60 days or less are valued at amortized cost, provided that the amortized cost value is approximately the same as the fair value of the security valued without the use of
amortized cost. Investments in other open-end registered investment companies are valued at their end of day net asset value per share.
The Funds’ portfolio investments are generally valued based on independent market quotations or prices or, if none, “evaluative” or other market based valuations provided by third party pricing services. Pursuant to Rule 2a-5 under the 1940 Act, the Funds’ Boards of Trustees (the “Board”) designated AMG Funds LLC (the “Investment Manager”) as the Funds’ Valuation Designee to perform the Funds’ fair value determinations. Such determinations are subject to Board oversight and certain reporting and other requirements intended to ensure that the Board receives the information it needs to oversee the Investment Manager’s fair value determinations.
Under certain circumstances, the value of certain Fund portfolio investments may be based on an evaluation of fair value, pursuant to procedures established by the Investment Manager and under the general supervision of the Board. The Funds may use the fair value of a portfolio investment to calculate its net asset value (“NAV”) in the event that the market quotation, price or market based valuation for the portfolio investment is not readily available or otherwise not determinable pursuant to the Funds’ valuation procedures, if the Investment Manager believes the quotation, price or market based valuation to be unreliable, or in certain other circumstances. When determining the fair value of an investment, the Investment Manager seeks to determine the price that the Funds might reasonably expect to receive from current sale of that portfolio investment in an arms-length transaction. Fair value determinations shall be based upon consideration of all available facts and information, including, but not limited to (i) attributes specific to the investment; (ii) fundamental and analytical data relating to the investment; and (iii) the value of other comparable securities or relevant financial instruments, including derivative securities, traded on other markets or among dealers.
The values assigned to fair value portfolio investments are based on available information and do not necessarily represent amounts that might ultimately be realized in the future, since such amounts depend on future developments inherent in long-term investments. Because of the inherent uncertainty of valuation, those estimated values may differ significantly from the values that would have been used had a ready market for the investments existed, and the differences could be material. The Board will be presented with quarterly reports, as of the most recent quarter end, summarizing all fair value activity, material fair value matters that occurred during the quarter, and all outstanding securities fair valued by the Funds. Additionally, the Board will be presented with an annual report that assesses the adequacy and effectiveness of the Investment Manager’s process for determining the fair value of the Funds’ investments.
With respect to foreign equity securities and certain foreign fixed income securities, securities held in the Funds that can be fair valued by the applicable fair value pricing service are fair valued on each business day provided that each individual price exceeds a pre-established confidence level.
U.S. GAAP defines fair value as the price that a fund would receive to sell an asset or pay to transfer a liability in an orderly transaction between market participants at the measurement date. U.S. GAAP also establishes a framework for measuring fair value, and a three level hierarchy for fair value measurements based upon the transparency of inputs to the valuation of an asset or liability. Inputs may be observable or unobservable and refer broadly to the assumptions that market participants would use in pricing the asset or liability. Observable inputs reflect the assumptions market participants would use in pricing the asset or liability based on market data obtained from sources independent of the Funds. Unobservable inputs reflect the Funds’ own assumptions about the assumptions
40
| | |
| | Notes to Financial Statements (continued) |
that market participants would use in pricing the asset or liability developed based on the best information available in the circumstances. Each investment is assigned a level based upon the observability of the inputs which are significant to the overall valuation.
The three-tier hierarchy of inputs is summarized below:
Level 1 – inputs are quoted prices in active markets for identical investments (e.g., equity securities, open-end investment companies)
Level 2 – other observable inputs (including, but not limited to: quoted prices for similar assets or liabilities in markets that are active, quoted prices for identical or similar assets or liabilities in markets that are not active, inputs other than quoted prices that are observable for the assets or liabilities (such as interest rates, yield curves, volatilities, prepayment speeds, loss severities, credit risks and default rates) or other market corroborated inputs) (e.g., debt securities, government securities, foreign securities utilizing international fair value pricing, fair valued securities with observable inputs)
Level 3 – inputs are significant unobservable inputs (including the Fund’s own assumptions used to determine the fair value of investments) (e.g., fair valued securities with unobservable inputs)
Changes in inputs or methodologies used for valuing investments may result in a transfer in or out of levels within the fair value hierarchy. The inputs or methodologies used for valuing investments may not necessarily be an indication of the risk associated with investing in those investments.
b. SECURITY TRANSACTIONS
Security transactions are accounted for as of trade date. Realized gains and losses on securities sold are determined on the basis of identified cost.
c. INVESTMENT INCOME AND EXPENSES
Dividend income is recorded on the ex-dividend date. Interest income, which includes amortization of premium and accretion of discount on debt securities, is accrued as earned. Dividend and interest income on foreign securities is recorded gross of any withholding tax. Non-cash dividends included in dividend income, if any, are reported at the fair market value of the securities received. Upon notification from the issuer, distributions received from a real estate investment trust (REIT) may be redesignated as a reduction of cost of investments and/or realized gain. Other income and expenses are recorded on an accrual basis. Expenses that cannot be directly attributed to a Fund are apportioned among the funds in the Trusts and other trusts or funds within the AMG Funds Family of Funds (collectively, the “AMG Funds Family”) based upon their relative average net assets or number of shareholders. Investment income, realized and unrealized capital
gains and losses, the common expenses of each Fund, and certain fund level expense reductions, if any, are allocated on a pro-rata basis to each class based on the relative net assets of each class to the total net assets of each Fund.
The following Funds had certain portfolio trades directed to various brokers under a brokerage recapture program. Credits received from the brokerage recapture program are earned and paid on a monthly basis, and are recorded as expense offsets, which serve to reduce the Funds’ overall expense ratio.
For the fiscal year ended October 31, 2024, the impact on the expenses and expense ratios was as follows:
| | | | | | | | |
| | | Amount | | | Percentage Reduction |
| | |
Mid Cap Value | | | $4,364 | | | | 0.00% | 1 |
| | |
Large Cap Value Select | | | 694 | | | | 0.00% | 1 |
| | |
Small Cap Value | | | 34,970 | | | | 0.00% | 1 |
| | |
Dividend All Cap Value | | | 24,739 | | | | 0.02% | |
| | |
Small-Mid Cap Value | | | 5,393 | | | | 0.00% | 1 |
| | |
Focused Absolute Value | | | 1,661 | | | | 0.00% | 1 |
1 Less than 0.005%
d. DIVIDENDS AND DISTRIBUTIONS
Fund distributions, except those of Dividend All Cap Value, resulting from net investment income will normally be declared and paid at least annually. Dividend All Cap Value will declare and pay net investment income distributions quarterly. Each Fund will normally declare and pay realized net capital gains, if any, at least annually in December. Distributions to shareholders are recorded on the ex-dividend date. Distributions are determined in accordance with federal income tax regulations, which may differ from net investment income and net realized capital gains for financial statement purposes (U.S. GAAP). Differences may be permanent or temporary. Permanent differences are reclassified among capital accounts in the financial statements to reflect their tax character. Permanent book and tax basis differences, if any, relating to shareholder distributions will result in reclassification to paid-in capital. Temporary differences arise when certain items of income, expense and gain or loss are recognized in different periods for financial statement and tax purposes; these differences will reverse at some time in the future. Permanent differences are primarily due to tax equalization utilized for all of the Funds. Temporary differences are primarily due to wash sale loss deferrals for all of the Funds, and investments in partnerships for Dividend All Cap Value.
The tax character of distributions paid during the fiscal years ended October 31, 2024 and October 31, 2023 was as follows:
| | | | | | | | | | | | | | | | | | | | | | | | |
| | | Mid Cap Value | | | | Large Cap Value Select | | | | Small Cap Value | |
| | | | | | |
Distributions paid from: | | | 2024 | | | | 2023 | | | | 2024 | | | | 2023 | | | | 2024 | | | | 2023 | |
| | | | | | |
Ordinary income * | | | $1,622,480 | | | | $19,216,056 | | | | $337,791 | | | | $683,735 | | | | $2,863,576 | | | | — | |
| | | | | | |
Long-term capital gains | | | — | | | | 6,859,292 | | | | — | | | | — | | | | 40,029,135 | | | | $30,499,337 | |
| | | | | | |
| | | | | | | | | | | | | | | | | | | | | | | | |
| | | | | | |
| | | $1,622,480 | | | | $26,075,348 | | | | $337,791 | | | | $683,735 | | | | $42,892,711 | | | | $30,499,337 | |
| | | | | | | | | | | | | | | | | | | | | | | | |
41
| | |
| | Notes to Financial Statements (continued) |
| | | | | | | | | | | | | | | | | | | | | | | | |
| | | |
| | | Dividend All Cap Value | | | | Small-Mid Cap Value | | | | Focused Absolute Value | |
| | | | | | |
Distributions paid from: | | | 2024 | | | | 2023 | | | | 2024 | | | | 2023 | | | | 2024 | | | | 2023 | |
| | | | | | |
Ordinary income * | | | $3,413,275 | | | | $7,069,532 | | | | $3,895,589 | | | | $98,109 | | | | $900,127 | | | | $249,051 | |
| | | | | | |
Long-term capital gains | | | 6,079,781 | | | | 35,507,171 | | | | 7,156,589 | | | | 10,551,692 | | | | 502,670 | | | | 370,475 | |
| | | | | | | | | | | | | | | | | | | | | | | | |
| | | | | | |
| | | $9,493,056 | | | | $42,576,703 | | | | $11,052,178 | | | | $10,649,801 | | | | $1,402,797 | | | | $619,526 | |
| | | | | | | | | | | | | | | | | | | | | | | | |
* For tax purposes, short-term capital gain distributions, if any, are considered ordinary income distributions.
As of October 31, 2024, the components of distributable earnings (excluding unrealized appreciation/depreciation) on a tax basis consisted of:
| | | | | | | | | | | | | | | | | | | | | | | | |
| | | | | | | | | | | | | | | | | | Focused | |
| | | | | | Large Cap | | | Small Cap | | | Dividend All | | | Small-Mid | | | Absolute | |
| | | Mid Cap Value | | | Value Select | | | Value | | | Cap Value | | | Cap Value | | | Value | |
| | | | | | |
Undistributed ordinary income | | | $4,761,991 | | | | $273,824 | | | | $4,407,774 | | | | $277,549 | | | | $2,416,227 | | | | $3,661,008 | |
| | | | | | |
Undistributed long-term capital gains | | | 37,655,382 | | | | 1,680,081 | | | | 82,825,137 | | | | 36,275,249 | | | | 25,457,127 | | | | 3,043,377 | |
At October 31, 2024, the cost of investments and the aggregate gross unrealized appreciation and depreciation for federal income tax purposes were as follows:
| | | | | | | | | | | | | | | | |
| Fund | | Cost | | | Appreciation | | | Depreciation | | | Net Appreciation | |
| | | | |
Mid Cap Value | | | $296,392,708 | | | | $50,277,117 | | | | $(5,304,001) | | | | $44,973,116 | |
| | | | |
Large Cap Value Select | | | 40,750,765 | | | | 7,415,409 | | | | (1,578,703) | | | | 5,836,706 | |
| | | | |
Small Cap Value | | | 894,903,798 | | | | 241,330,431 | | | | (49,589,481) | | | | 191,740,950 | |
| | | | |
Dividend All Cap Value | | | 59,194,392 | | | | 32,361,834 | | | | (6,177,243) | | | | 26,184,591 | |
| | | | |
Small-Mid Cap Value | | | 274,272,801 | | | | 64,512,773 | | | | (16,221,483) | | | | 48,291,290 | |
| | | | |
Focused Absolute Value | | | 41,036,339 | | | | 10,029,567 | | | | (1,842,894) | | | | 8,186,673 | |
e. FEDERAL TAXES
Each Fund currently qualifies as an investment company and intends to comply with the requirements under Subchapter M of the Internal Revenue Code of 1986, as amended (the “Code”), and to distribute substantially all of its taxable income and gains to its shareholders and to meet certain diversification and income requirements with respect to investment companies. The Investment Manager has analyzed the Funds’ tax positions taken on federal income tax returns as of October 31, 2024, and for all open tax years (generally, the three prior taxable years), and has concluded that no provision for federal income tax is required in the Funds’ financial statements. Additionally, the Investment Manager is not aware of any tax position for which it is reasonably possible that the total amounts of unrecognized tax benefit/detriment will change materially in the next twelve months.
Furthermore, based on each Fund’s understanding of the tax rules and rates related to income, gains and transactions for the foreign jurisdictions in which it
invests, each Fund will provide for foreign taxes, and where appropriate, deferred foreign taxes.
f. CAPITAL LOSS CARRYOVERS AND DEFERRALS
As of October 31, 2024, the Funds had no capital loss carryovers for federal income tax purposes. Should the Funds incur net capital losses for the fiscal year ended October 31, 2025, such amounts may be used to offset future realized capital gains indefinitely, and retain their character as short-term and/or long-term.
For the fiscal year ended October 31, 2024, the following Fund utilized capital loss carryovers in the amount of:
| | | | | | |
Fund | | Short-Term | | | | Long-Term |
| | | |
Large Cap Value Select | | $4,768,092 | | | | $1,223,833 |
42
| | |
| | Notes to Financial Statements (continued) |
g. CAPITAL STOCK
Each Trust’s Amended and Restated Agreement and Declaration of Trust or Trust Instrument, as applicable, authorizes for each Fund the issuance of an unlimited number of shares of beneficial interest, without par value. Each Fund records sales and repurchases of its capital stock on the trade date.
For the fiscal years ended October 31, 2024 and October 31, 2023, the capital stock transactions by class for the Funds were as follows:
| | $ | | | | $ | | | | $ | | | | $ | | | | $ | | | | $ | | | | $ | | | | $ | | |
| | | Mid Cap Value | | | | Large Cap Value Select | |
| | | | |
| | | October 31, 2024 | | | October 31, 2023 | | | October 31, 2024 | | | October 31, 2023 | |
| | | | | | | | |
| | | Shares | | | | Amount | | | | Shares | | | | Amount | | | | Shares | | | | Amount | | | | Shares | | | | Amount | |
| | | | | | | | |
Class N: | | | | | | | | | | | | | | | | | | | | | | | | | | | | | | | | |
| | | | | | | | |
Shares sold | | | 794,989 | | | | $16,506,109 | | | | 949,737 | | | | $16,906,043 | | | | 88,174 | | | | $1,696,217 | | | | 9,777 | | | | $149,655 | |
| | | | | | | | |
Shares issued in reinvestment of distributions | | | 49,240 | | | | 980,863 | | | | 1,150,594 | | | | 19,157,394 | | | | 1,090 | | | | 18,011 | | | | 3,502 | | | | 49,510 | |
| | | | | | | | |
Shares redeemed | | | (2,579,753) | | | | (53,819,568) | | | | (2,275,505) | | | | (40,543,318) | | | | (54,577) | | | | (969,498) | | | | (52,163) | | | | (782,760) | |
| | | | | | | | | | | | | | | | | | | | | | | | | | | | | | | | |
| | | | | | | | |
Net increase (decrease) | | | (1,735,524) | | | | $(36,332,596) | | | | (175,174) | | | | $(4,479,881) | | | | 34,687 | | | | $744,730 | | | | (38,884) | | | | $(583,595) | |
| | | | | | | | | | | | | | | | | | | | | | | | | | | | | | | | |
| | | | | | | | |
Class I: | | | | | | | | | | | | | | | | | | | | | | | | | | | | | | | | |
| | | | | | | | |
Shares sold | | | 635,833 | | | | $13,909,133 | | | | 1,247,002 | | | | $24,317,449 | | | | 408,352 | | | | $7,383,448 | | | | 41,393 | | | | $607,275 | |
| | | | | | | | |
Shares issued in reinvestment of distributions | | | 26,111 | | | | 560,867 | | | | 323,884 | | | | 5,813,710 | | | | 17,865 | | | | 296,371 | | | | 41,467 | | | | 589,249 | |
| | | | | | | | |
Shares redeemed | | | (1,296,168) | | | | (28,843,362) | | | | (1,289,620) | | | | (24,891,173) | | | | (344,558) | | | | (6,125,173) | | | | (344,500) | | | | (5,145,465) | |
| | | | | | | | | | | | | | | | | | | | | | | | | | | | | | | | |
| | | | | | | | |
Net increase (decrease) | | | (634,224) | | | | $(14,373,362) | | | | 281,266 | | | | $5,239,986 | | | | 81,659 | | | | $1,554,646 | | | | (261,640) | | | | $(3,948,941) | |
| | | | | | | | | | | | | | | | | | | | | | | | | | | | | | | | |
| | | | | | | | |
Class Z: | | | | | | | | | | | | | | | | | | | | | | | | | | | | | | | | |
| | | | | | | | |
Shares sold | | | 25,647 | | | | $572,080 | | | | 24,038 | | | | $462,371 | | | | — | | | | — | | | | — | | | | — | |
| | | | | | | | |
Shares issued in reinvestment of distributions | | | 2,494 | | | | 53,192 | | | | 34,175 | | | | 608,992 | | | | — | | | | — | | | | — | | | | — | |
| | | | | | | | |
Shares redeemed | | | (53,789) | | | | (1,224,531) | | | | (73,280) | | | | (1,402,999) | | | | — | | | | — | | | | — | | | | — | |
| | | | | | | | | | | | | | | | | | | | | | | | | | | | | | | | |
| | | | | | | | |
Net decrease | | | (25,648) | | | | $(599,259) | | | | (15,067) | | | | $(331,636) | | | | — | | | | — | | | | — | | | | — | |
| | | | | | | | | | | | | | | | | | | | | | | | | | | | | | | | |
| | | | | | | | | | | | | | | | | | | | | | | | | | | | | | | | |
| | | Small Cap Value | | | Dividend All Cap Value | |
| | | | |
| | | October 31, 2024 | | | October 31, 2023 | | | October 31, 2024 | | | October 31, 2023 | |
| | | | | | | | |
| | | Shares | | | | Amount | | | | Shares | | | | Amount | | | | Shares | | | | Amount | | | | Shares | | | | Amount | |
| | | | | | | | |
Class N: | | | | | | | | | | | | | | | | | | | | | | | | | | | | | | | | |
| | | | | | | | |
Shares sold | | | 452,751 | | | | $6,795,883 | | | | 764,537 | | | | $10,743,123 | | | | 26,514 | | | | $260,617 | | | | 46,461 | | | | $442,670 | |
| | | | | | | | |
Shares issued in reinvestment of distributions | | | 138,739 | | | | 2,008,947 | | | | 102,870 | | | | 1,367,145 | | | | 153,303 | | | | 1,472,882 | | | | 484,141 | | | | 4,635,571 | |
| | | | | | | | |
Shares redeemed | | | (658,414) | | | | (9,822,095) | | | | (473,354) | | | | (6,575,876) | | | | (988,208) | | | | (9,611,700) | | | | (655,492) | | | | (6,218,758) | |
| | | | | | | | | | | | | | | | | | | | | | | | | | | | | | | | |
| | | | | | | | |
Net increase (decrease) | | | (66,924) | | | | $(1,017,265) | | | | 394,053 | | | | $5,534,392 | | | | (808,391) | | | | $(7,878,201) | | | | (124,890) | | | | $(1,140,517) | |
| | | | | | | | | | | | | | | | | | | | | | | | | | | | | | | | |
| | | | | | | | |
Class I: | | | | | | | | | | | | | | | | | | | | | | | | | | | | | | | | |
| | | | | | | | |
Shares sold | | | 16,351,743 | | | | $256,882,837 | | | | 11,870,466 | | | | $172,416,580 | | | | 666,381 | | | | $6,289,704 | | | | 4,314,310 | | | | $42,038,542 | |
| | | | | | | | |
Shares issued in reinvestment of distributions | | | 2,410,433 | | | | 36,325,218 | | | | 1,896,970 | | | | 26,121,284 | | | | 807,218 | | | | 7,602,496 | | | | 3,845,260 | | | | 36,735,160 | |
| | | | | | | | |
Shares redeemed | | | (13,149,676) | | | | (206,488,350) | | | | (12,026,638) | | | | (174,467,625) | | | | (19,847,712) | | | | (189,367,166) | | | | (11,920,574) | | | | (113,621,232) | |
| | | | | | | | | | | | | | | | | | | | | | | | | | | | | | | | |
| | | | | | | | |
Net increase (decrease) | | | 5,612,500 | | | | $86,719,705 | | | | 1,740,798 | | | | $24,070,239 | | | | (18,374,113) | | | | $(175,474,966) | | | | (3,761,004) | | | | $(34,847,530) | |
| | | | | | | | | | | | | | | | | | | | | | | | | | | | | | | | |
| | | | | | | | |
Class Z: | | | | | | | | | | | | | | | | | | | | | | | | | | | | | | | | |
| | | | | | | | |
Shares sold | | | 33,809 | | | | $527,171 | | | | 52,181 | | | | $757,394 | | | | 144,668 | | | | $1,537,514 | | | | 62,411 | | | | $597,509 | |
| | | | | | | | |
Shares issued in reinvestment of distributions | | | 34,843 | | | | 526,134 | | | | 24,902 | | | | 343,645 | | | | 18,481 | | | | 176,926 | | | | 47,325 | | | | 451,503 | |
| | | | | | | | |
Shares redeemed | | | (553,274) | | | | (8,616,636) | | | | (19,520) | | | | (285,485) | | | | (175,284) | | | | (1,805,600) | | | | (36,056) | | | | (326,540) | |
| | | | | | | | | | | | | | | | | | | | | | | | | | | | | | | | |
| | | | | | | | |
Net increase (decrease) | | | (484,622) | | | | $(7,563,331) | | | | 57,563 | | | | $815,554 | | | | (12,135) | | | | $(91,160) | | | | 73,680 | | | | $722,472 | |
| | | | | | | | | | | | | | | | | | | | | | | | | | | | | | | | |
43
| | |
| | Notes to Financial Statements (continued) |
| | | | | | | | | | | | | | | | | | | | | | | | | | | | | | | | |
| | | Small-Mid Cap Value | | | Focused Absolute Value | |
| | | | |
| | | October 31, 2024 | | | October 31, 2023 | | | October 31, 2024 | | | October 31, 2023 | |
| | | | | | | | |
| | | Shares | | | | Amount | | | | Shares | | | | Amount | | | | Shares | | | | Amount | | | | Shares | | | | Amount | |
| | | | | | | | |
Class N: | | | | | | | | | | | | | | | | | | | | | | | | | | | | | | | | |
| | | | | | | | |
Shares sold | | | 281,895 | | | | $2,672,905 | | | | 338,659 | | | | $3,001,785 | | | | 3,938 | | | | $52,645 | | | | 3,416 | | | | $41,517 | |
| | | | | | | | |
Shares issued in reinvestment of distributions | | | 78,401 | | | | 717,368 | | | | 98,766 | | | | 829,638 | | | | 4,056 | | | | 51,307 | | | | 1,436 | | | | 16,781 | |
| | | | | | | | |
Shares redeemed | | | (418,232) | | | | (3,948,636) | | | | (355,139) | | | | (3,097,453) | | | | (38,348) | | | | (540,479) | | | | (37,148) | | | | (450,738) | |
| | | | | | | | | | | | | | | | | | | | | | | | | | | | | | | | |
| | | | | | | | |
Net increase (decrease) | | | (57,936) | | | | $(558,363) | | | | 82,286 | | | | $733,970 | | | | (30,354) | | | | $(436,527) | | | | (32,296) | | | | $(392,440) | |
| | | | | | | | | | | | | | | | | | | | | | | | | | | | | | | | |
| | | | | | | | |
Class I: | | | | | | | | | | | | | | | | | | | | | | | | | | | | | | | | |
| | | | | | | | |
Shares sold | | | 5,749,023 | | | | $56,371,157 | | | | 9,330,366 | | | | $85,230,959 | | | | 117,808 | | | | $1,618,737 | | | | 629,484 | | | | $7,592,330 | |
| | | | | | | | |
Shares issued in reinvestment of distributions | | | 866,026 | | | | 8,218,589 | | | | 881,405 | | | | 7,668,227 | | | | 95,245 | | | | 1,202,944 | | | | 44,601 | | | | 520,939 | |
| | | | | | | | |
Shares redeemed | | | (5,446,610) | | | | (53,478,130) | | | | (6,257,178) | | | | (56,859,310) | | | | (579,333) | | | | (7,654,640) | | | | (1,909,131) | | | | (22,710,674) | |
| | | | | | | | | | | | | | | | | | | | | | | | | | | | | | | | |
| | | | | | | | |
Net increase (decrease) | | | 1,168,439 | | | | $11,111,616 | | | | 3,954,593 | | | | $36,039,876 | | | | (366,280) | | | | $(4,832,959) | | | | (1,235,046) | | | | $(14,597,405) | |
| | | | | | | | | | | | | | | | | | | | | | | | | | | | | | | | |
| | | | | | | | |
Class Z: | | | | | | | | | | | | | | | | | | | | | | | | | | | | | | | | |
| | | | | | | | |
Shares sold | | | 41,382 | | | | $413,912 | | | | 183,363 | | | | $1,632,341 | | | | 9,773 | | | | $130,782 | | | | 17,596 | | | | $209,361 | |
| | | | | | | | |
Shares issued in reinvestment of distributions | | | 89,801 | | | | 853,113 | | | | 114,008 | | | | 993,011 | | | | 6,796 | | | | 85,836 | | | | 2,706 | | | | 31,583 | |
| | | | | | | | |
Shares redeemed | | | (64,802) | | | | (656,672) | | | | (675,110) | | | | (5,947,365) | | | | (424,107) | | | | (5,498,628) | | | | (137,875) | | | | (1,632,424) | |
| | | | | | | | | | | | | | | | | | | | | | | | | | | | | | | | |
| | | | | | | | |
Net increase (decrease) | | | 66,381 | | | | $610,353 | | | | (377,739) | | | | $(3,322,013) | | | | (407,538) | | | | $(5,282,010) | | | | (117,573) | | | | $(1,391,480) | |
| | | | | | | | | | | | | | | | | | | | | | | | | | | | | | | | |
h. REPURCHASE AGREEMENTS AND JOINT REPURCHASE AGREEMENTS
The Funds may enter into third-party and bilateral repurchase agreements for temporary cash management purposes and for reinvestment of cash collateral on securities lending transactions under the securities lending program offered by The Bank of New York Mellon (“BNYM”) (the “Securities Lending Program”) (collectively, “Repurchase Agreements”). The value of the underlying collateral, including accrued interest, must equal or exceed the value of the Repurchase Agreements during the term of the agreement. For joint repurchase agreements, the Funds participate on a pro rata basis with other clients of BNYM in their share of the underlying collateral under such joint repurchase agreements and in their share of proceeds from any repurchase or other disposition of the underlying collateral. The underlying collateral for all Repurchase Agreements is held by the Funds’ custodian or at the Federal Reserve Bank. If the seller defaults and the value of the collateral declines, or if bankruptcy proceedings commence with respect to the seller of the security, realization of the collateral by the Funds may be delayed or limited. Pursuant to the Securities Lending Program, the Funds are indemnified for such losses by BNYM on joint repurchase agreements.
At October 31, 2024, the market value of Repurchase Agreements outstanding is as follows:
| | | | |
| | | Market Value | |
| |
Mid Cap Value | | | $6,164,000 | |
| |
Large Cap Value Select | | | 1,331,000 | |
| |
Small Cap Value | | | 100,357,972 | |
| |
Dividend All Cap Value | | | 2,127,000 | |
| |
Small-Mid Cap Value | | | 15,006,659 | |
| |
Focused Absolute Value | | | 572,893 | |
2. AGREEMENTS AND TRANSACTIONS WITH AFFILIATES
For each of the Funds, the Trusts have entered into an investment advisory agreement under which the Investment Manager, a subsidiary and the U.S. wealth platform of Affiliated Managers Group, Inc. (“AMG”), serves as investment manager to the Funds and is responsible for the Funds’ overall administration and operations. The Investment Manager selects and recommends, subject to the approval of the Board and, in certain circumstances, shareholders, the Funds’ subadviser and monitors the subadviser’s investment performance, security holdings and investment strategies. Each Fund’s investment portfolio is managed by River Road Asset Management, LLC (“River Road”) who serves pursuant to a subadvisory agreement with the Investment Manager. AMG indirectly owns a majority interest in River Road.
44
| | |
| | Notes to Financial Statements (continued) |
Investment management fees are paid directly by the Funds to the Investment Manager based on average daily net assets. For the fiscal year ended October 31, 2024, the Funds’ investment management fees were paid at the following annual rate of each Fund’s respective average daily net assets:
| | | | |
Mid Cap Value | | | 0.56% | |
| |
Large Cap Value Select | | | 0.35% | |
| |
Small Cap Value | | | 0.80% | |
| |
Dividend All Cap Value | | | 0.50% | |
| |
Small-Mid Cap Value | | | 0.75% | |
| |
Focused Absolute Value | | | 0.60% | |
The fee paid to River Road for its services as subadviser is paid out of the fee the Investment Manager receives from each Fund and does not increase the expenses of each Fund.
The Investment Manager has contractually agreed, through at least March 1, 2025, to waive management fees and/or reimburse fund expenses in order to limit total annual Fund operating expenses after fee waiver and expense reimbursements (exclusive of taxes, interest (including interest incurred in connection with bank and custody overdrafts and in connection with securities sold short), shareholder servicing fees, distribution and service 12b-1 fees, brokerage commissions and other transaction costs, dividends payable with respect to securities sold short, acquired fund fees and expenses and extraordinary expenses) of the Funds other than Small Cap Value to the below percentages of each such Fund’s average daily net assets (this annual rate or such other annual rate that may be in effect from time to time, the “Expense Cap”), subject to later reimbursement by such Funds in certain circumstances.
| | | | |
Mid Cap Value | | | 0.76% | |
| |
Large Cap Value Select | | | 0.60% | |
| |
Small Cap Value | | | N/A | |
| |
Dividend All Cap Value | | | 0.68% | |
| |
Small-Mid Cap Value | | | 1.04% | |
| |
Focused Absolute Value | | | 0.78% | |
In general, for a period of up to 36 months after the date any amounts are paid, waived or reimbursed by the Investment Manager, the Investment Manager may recover such amounts from a Fund, provided that such repayment would not cause the Fund’s total annual operating expenses after fee waiver and expense reimbursements (exclusive of the items noted in the parenthetical above) to exceed either (i) the Expense Cap in effect at the time such amounts were paid, waived or reimbursed, or (ii) the Expense Cap in effect at the time of such repayment by the Fund.
The contractual expense limitation may only be terminated in the event the Investment Manager or a successor ceases to be the investment manager of the Fund or a successor fund, by mutual agreement between the Investment Manager and the Board, or in the event of the Fund’s liquidation unless the Fund is reorganized or is a party to a merger in which the surviving entity is successor to the accounting and performance information of the Fund.
For the fiscal year ended October 31, 2024, the Investment Manager’s expense reimbursements, and repayments of prior reimbursements by the Funds to the Investment Manager, if any, are as follows:
| | | | |
| | | Expense Reimbursements | | Repayment of Prior Reimbursements |
| | |
Mid Cap Value | | $120,397 | | — |
| | |
Large Cap Value Select | | 78,508 | | — |
| | |
Dividend All Cap Value | | 177,037 | | — |
| | |
Focused Absolute Value | | 97,960 | | — |
At October 31, 2024, the Funds’ expiration of reimbursements subject to recoupment, if any, is as follows:
| | | | | | | | |
Expiration Period | | Mid Cap Value | | | Large Cap Value Select | |
| | |
Less than 1 year | | | $27,037 | | | | $46,891 | |
| | |
1-2 years | | | 79,604 | | | | 77,427 | |
| | |
2-3 years | | | 120,397 | | | | 78,508 | |
| | | | | | | | |
| | |
Total | | | $227,038 | | | | $202,826 | |
| | | | | | | | |
| | | | | | | | |
Expiration Period | | Dividend All Cap Value | | | Focused Absolute Value | |
| | |
Less than 1 year | | | $117,693 | | | | $98,288 | |
| | |
1-2 years | | | 132,074 | | | | 89,807 | |
| | |
2-3 years | | | 177,037 | | | | 97,960 | |
| | | | | | | | |
| | |
Total | | | $426,804 | | | | $286,055 | |
| | | | | | | | |
The Trusts, on behalf of the Funds, have entered into an amended and restated Administration Agreement under which the Investment Manager serves as the Funds’ administrator (the “Administrator”) and is responsible for certain aspects of managing the Funds’ operations, including administration and shareholder services to each Fund. Each Fund pays a fee to the Administrator at the rate of 0.15% per annum of the Fund’s average daily net assets for this service.
The Funds are distributed by AMG Distributors, Inc. (the “Distributor”), a wholly-owned subsidiary of the Investment Manager. The Distributor serves as the distributor and underwriter for each Fund and is a registered broker-dealer and member of the Financial Industry Regulatory Authority, Inc. (“FINRA”). Shares of each Fund will be continuously offered and will be sold directly to prospective purchasers and through brokers, dealers or other financial intermediaries who have executed selling agreements with the Distributor. Generally, the Distributor bears all or a portion of the expenses of providing services pursuant to the distribution agreement, including the payment of the expenses relating to the distribution of prospectuses for sales purposes and any advertising or sales literature.
45
| | |
| | Notes to Financial Statements (continued) |
The Trusts have adopted a distribution and service plan (the “Plan”) with respect to the Class N shares of each Fund in accordance with the requirements of Rule 12b-1 under the 1940 Act and the requirements of the applicable rules of FINRA regarding asset based sales charges. Pursuant to the Plan, each Fund may make payments to the Distributor for its expenditures in financing any activity primarily intended to result in the sale of each Fund’s Class N shares and for maintenance and personal service provided to existing shareholders of that class. The Plan authorizes payments to the Distributor of up to 0.25% annually of each Fund’s average daily net assets attributable to the Class N shares. For all Funds, except Large Cap Value Select, the Plan is characterized as a reimbursement plan and is directly tied to expenses incurred by the Distributor; the payments the Distributor receives during any year may not exceed its actual expenses.
The impact on the annualized expense ratios for the fiscal year ended October 31, 2024, was as follows:
| | | | |
Fund | | Actual Amount Incurred | |
| |
Mid Cap Value | | | | |
| |
Class N | | | 0.25% | |
| |
Large Cap Value Select | | | | |
| |
Class N | | | 0.25% | |
| |
Small Cap Value | | | | |
| |
Class N | | | 0.25% | |
| |
Dividend All Cap Value | | | | |
| |
Class N | | | 0.25% | |
| |
Small-Mid Cap Value | | | | |
| |
Class N | | | 0.25% | |
| |
Focused Absolute Value | | | | |
| |
Class N | | | 0.24% | |
For each of the Class N and Class I shares, the Board has approved reimbursement payments to the Investment Manager for shareholder servicing expenses (“shareholder servicing fees”) incurred. Shareholder servicing fees include payments to financial intermediaries, such as broker-dealers (including fund supermarket platforms), banks, and trust companies who provide shareholder record keeping, account servicing and other services. The Class N and Class I shares may reimburse the Investment Manager for the actual amount incurred up to a maximum annual rate of each Class’s average daily net assets as shown in the table below.
The impact on the annualized expense ratios for the fiscal year ended October 31, 2024, was as follows:
| | | | | | | | |
| Fund | | Maximum Annual
Amount
Approved | | | Actual
Amount
Incurred | |
| | |
Mid Cap Value | | | | | | | | |
| | |
Class N | | | 0.10% | | | | 0.10% | |
| | |
Class I | | | 0.05% | | | | 0.05% | |
| | |
Large Cap Value Select | | | | | | | | |
| | |
Class N | | | 0.10% | | | | 0.10% | |
| | |
Class I | | | 0.05% | | | | 0.03% | |
| | |
Small Cap Value | | | | | | | | |
| | |
Class N | | | 0.15% | | | | 0.10% | |
| | |
Class I | | | 0.15% | | | | 0.09% | |
| | |
Dividend All Cap Value | | | | | | | | |
| | |
Class N | | | 0.04% | | | | 0.04% | |
| | |
Class I | | | 0.04% | | | | 0.04% | |
| | |
Small-Mid Cap Value | | | | | | | | |
| | |
Class N | | | 0.15% | | | | 0.06% | |
| | |
Class I | | | 0.15% | | | | 0.05% | |
| | |
Focused Absolute Value | | | | | | | | |
| | |
Class N | | | 0.15% | | | | 0.04% | |
| | |
Class I | | | 0.15% | | | | 0.04% | |
The Board provides supervision of the affairs of the Trusts and other trusts within the AMG Funds Family. The Trustees of the Trusts who are not affiliated with the Investment Manager receive an annual retainer and per meeting fees for regular, special and telephonic meetings, and they are reimbursed for out-of-pocket expenses incurred while carrying out their duties as Board members. The Chairman of the Board and the Audit Committee Chair receive additional annual retainers. Certain Trustees and Officers of the Funds are Officers and/or Directors of the Investment Manager, AMG and/or the Distributor.
The Securities and Exchange Commission (the “SEC”) granted an exemptive order that permits certain eligible funds in the AMG Funds Family to lend and borrow money for certain temporary purposes directly to and from other eligible funds in the AMG Funds Family. Participation in this interfund lending program is voluntary for both the borrowing and lending funds, and an interfund loan is only made if it benefits each participating fund. The Administrator manages the program according to procedures approved by the Board, and the Board monitors the operation of the program. An interfund loan must comply with certain conditions set out in the exemptive order, which are designed to assure fairness and protect all participating funds. The interest earned and interest paid on interfund loans are included on the Statement of Operations as interest income and interest expense, respectively. At October 31, 2024, the Funds had no interfund loans outstanding.
46
| | |
| | Notes to Financial Statements (continued) |
The following Funds utilized the interfund lending program during the fiscal year ended October 31, 2024 as follows:
| | | | | | | | | | | | | | | | |
| Fund | | Average
Lent | | | Number
of Days | | | Interest
Earned | | | Average
Interest Rate | |
| | | | |
Mid Cap Value | | | $2,192,974 | | | | 1 | | | | $344 | | | | 5.730% | |
| | | | |
Small Cap Value | | | 2,824,954 | | | | 26 | | | | 12,184 | | | | 6.055% | |
| | | | |
Small-Mid Cap Value | | | 1,557,433 | | | | 11 | | | | 2,790 | | | | 5.944% | |
| | | | | | | | | | | | | | | | |
| Fund | | Average
Borrowed | | | Number
of Days | | | Interest
Paid | | | Average
Interest Rate | |
| | | | |
Mid Cap Value | | | $5,069,227 | | | | 3 | | | | $2,600 | | | | 6.240% | |
| | | | |
Large Cap Value Select | | | 1,053,427 | | | | 1 | | | | 180 | | | | 6.238% | |
| | | | |
Dividend All Cap Value | | | 6,906,308 | | | | 22 | | | | 25,825 | | | | 6.196% | |
| | | | |
Focused Absolute Value | | | 1,443,711 | | | | 2 | | | | 492 | | | | 6.215% | |
3. PURCHASES AND SALES OF SECURITIES
Purchases and sales of securities (excluding short-term securities and U.S. Government Obligations) for the fiscal year ended October 31, 2024, were as follows:
| | | | | | | | |
| | | Long Term Securities | |
| | |
| Fund | | Purchases | | | Sales | |
| | |
Mid Cap Value | | $ | 258,638,554 | | | $ | 302,558,803 | |
| | |
Large Cap Value Select | | | 42,702,656 | | | | 40,716,067 | |
| | |
Small Cap Value | | | 413,180,267 | | | | 388,460,594 | |
| | |
Dividend All Cap Value | | | 36,107,108 | | | | 224,724,874 | |
| | |
Small-Mid Cap Value | | | 121,955,399 | | | | 123,424,063 | |
| | |
Focused Absolute Value | | | 41,345,534 | | | | 52,977,600 | |
The Funds had no purchases or sales of U.S. Government Obligations during the fiscal year ended October 31, 2024.
4. PORTFOLIO SECURITIES LOANED
The Funds participate in the Securities Lending Program providing for the lending of securities to qualified borrowers. Securities lending income includes earnings of such temporary cash investments, plus or minus any rebate to a borrower. These earnings (after any rebate) are then divided between BNYM, as a fee for its services under the Securities Lending Program, and the Funds, according to agreed-upon rates. Collateral on all securities loaned is accepted in cash, U.S. Treasury Obligations or U.S. Government Agency Obligations. Collateral is maintained at a minimum level of 102% (105% in the case of certain foreign securities) of the market value, plus interest, if applicable, of investments on loan. It is the Funds’ policy to obtain additional collateral from or return excess collateral to the borrower by the end of the next business day, following the valuation date of the securities loaned. Therefore, the value of the collateral held may be temporarily less than the value of the securities on loan. Lending securities entails a risk of loss to the Funds if and to the extent that the market value of the securities loaned were to increase and the borrower did not increase the collateral accordingly, and the borrower fails to return the securities. Under the terms of the Securities Lending Program, the Funds are indemnified for such losses by BNYM. Cash
collateral is held in separate omnibus accounts managed by BNYM, who is authorized to exclusively enter into joint repurchase agreements for that cash collateral. Securities collateral is held in separate omnibus accounts managed by BNYM and cannot be sold or pledged. BNYM bears the risk of any deficiency in the amount of the cash collateral available for return to the borrower due to any loss on the collateral invested. Loans of securities are terminable at any time and the borrower, after notice, is required to return borrowed securities as soon as practical, which is normally within three business days.
The value of securities loaned on positions held, cash collateral and securities collateral received at October 31, 2024, was as follows:
| | | | | | | | | | | | | | | | |
| Fund | | Securities
Loaned | | | Cash
Collateral
Received | | | Securities
Collateral Received | | | Total Collateral Received | |
| | | | |
Small Cap Value | | | $65,950,074 | | | | $136,972 | | | | $67,441,354 | | | | $67,578,326 | |
| | | | |
Dividend All Cap Value | | | 3,415,359 | | | | — | | | | 3,520,958 | | | | 3,520,958 | |
| | | | |
Small-Mid Cap Value | | | 18,262,258 | | | | 3,202,659 | | | | 16,067,297 | | | | 19,269,956 | |
| | | | |
Focused Absolute Value | | | 3,705,525 | | | | 124,893 | | | | 3,631,353 | | | | 3,756,246 | |
The following table summarizes the securities received as collateral for securities lending at October 31, 2024:
| | | | | | | | |
| Fund | | Collateral Type | | Coupon
Range | | Maturity Date Range | |
| | | |
Small Cap Value | | U.S. Treasury
Obligations | | 0.125%-7.625% | | | 11/15/24-02/15/52 | |
| | | |
Dividend All Cap Value | | U.S. Treasury
Obligations | | 0.125%-7.625% | | | 11/15/24-02/15/52 | |
| | | |
Small-Mid Cap Value | | U.S. Treasury
Obligations | | 0.000%-5.000% | | | 11/15/24-08/15/49 | |
| | | |
Focused Absolute Value | | U.S. Treasury
Obligations | | 0.125%-5.000% | | | 11/15/24-08/15/49 | |
5. FUND RISKS
In the normal course of business, the Funds invest in securities or other instruments and may enter into certain transactions, and such activities subject the Funds to various risks. Below is a summary of some, but not all, of those risks. Each risk described below does not necessarily apply to each Fund. Please refer to each Fund’s prospectus for a description of the principal risks associated with investing in a particular Fund. The value of securities or other instruments may also be affected by various factors, including, without limitation: (i) the general economy; (ii) the overall market as well as local, regional or global political and/or social instability; or (iii) price fluctuations.
Market Risk: Market prices of investments held by the Funds may fall rapidly or unpredictably due to a variety of factors, including economic, political, or market conditions, or other factors including terrorism, war, natural disasters and the spread of infectious illness or other public health issues, including epidemics or pandemics, or in response to events that affect particular industries or companies.
Management Risk: Because the Funds are actively managed investment portfolios, security selection or focus on securities in a particular style, market sector or group of companies may cause the Funds to incur losses or underperform relative to their benchmarks or other funds with a similar investment objective. There can be no guarantee that River Road’s investment techniques and risk analysis will produce the desired result.
47
| | |
| | Notes to Financial Statements (continued) |
Non-Diversified Fund Risk: Large Cap Value Select and Focused Absolute Value are non-diversified and therefore a greater percentage of holdings may be focused in a small number of issuers or a single issuer, which can place Large Cap Value Select and Focused Absolute Value at greater risk. Notwithstanding each Fund’s status as a “non-diversified” investment company under the 1940 Act, each Fund intends to qualify as a regulated investment company accorded favorable tax treatment under the Code, which imposes its own diversification requirements that are less restrictive than the requirements applicable to “diversified” investment companies under the 1940 Act. Each Fund’s intention to qualify as a regulated investment company may limit its pursuit of its investment strategy and its investment strategy could limit its ability to so qualify.
Focused Investment Risk: To the extent a Fund invests a substantial portion of its assets in a relatively small number of securities or a particular market, industry, group of industries, country, region, group of countries, asset class or sector, it generally will be subject to greater risk than a fund that invests in a more diverse investment portfolio. In addition, the value of a Fund would be more susceptible to any single economic, market, political or regulatory occurrence affecting, for example, that particular market, industry, region or sector.
Sector Risk: Issuers and companies that are in similar industry sectors may be similarly affected by particular economic or market events; to the extent the Funds have substantial holdings within a particular sector, the risks associated with that sector increase.
Large-Capitalization Stock Risk: The stocks of large-capitalization companies are generally more mature and may not be able to reach the same levels of growth as the stocks of small-or mid-capitalization companies.
Small- and Mid-Capitalization Stock Risk: The stocks of small- and mid-capitalization companies often have greater price volatility, lower trading volume, and less liquidity than the stocks of larger, more established companies.
Value Stock Risk: Value stocks may perform differently from the market as a whole and may be undervalued by the market for a long period of time.
Liquidity Risk: The Funds may not be able to dispose of particular investments, such as illiquid securities, readily at favorable times or prices or the Funds may have to sell them at a loss.
Real Estate Industry Risk: Investments in certain Funds may be subject to many of the same risks as a direct investment in real estate. The stock prices of companies in the real estate industry, including REITs, are typically sensitive to changes in real estate values, property taxes, interest rates, cash flow of underlying real estate assets, occupancy rates, government regulations affecting zoning, land use, and rents, as well as the management skill and creditworthiness
of the issuer. REITs also depend generally on their ability to generate cash flow to make distributions to shareholders or unitholders and are subject to the risk of failing to qualify for favorable tax treatment under the Code.
High Portfolio Turnover Risk: Higher portfolio turnover may adversely affect Fund performance by increasing Fund transaction costs and may increase a shareholder’s tax liability.
6. COMMITMENTS AND CONTINGENCIES
Under the Trusts’ organizational documents, their Trustees and Officers are indemnified against certain liabilities arising out of the performance of their duties to the Trusts. In addition, in the normal course of business, the Funds may enter into contracts and agreements that contain a variety of representations and warranties, which provide general indemnifications. The maximum exposure to the Funds under these arrangements is unknown, as this would involve future claims that may be made against a Fund that have not yet occurred. However, based on experience, the Funds had no prior claims or losses and expect the risks of loss to be remote.
7. CREDIT AGREEMENT
Through December 31, 2023, Small Cap Value, Dividend All Cap Value, Small-Mid Cap Value, Focused Absolute Value, and certain other funds in AMG Funds II and AMG Funds III (the “Participating Funds”) were subject to a Credit Agreement among BNYM, AMG Funds II, AMG Funds III, and AMG Funds IV (the “Credit Agreement”) that provided a revolving line of credit of up to $50 million to the Participating Funds. On December 31, 2023, the Credit Agreement was terminated. The facility was shared by the Participating Funds, and was available for temporary, emergency purposes including liquidity needs in meeting redemptions. The interest rate on outstanding Alternate Base Rate Loans was equal to the greater of the Prime Rate plus 1.25%, or 0.50% plus the Federal Funds Effective Rate plus 1.25%. The interest rate on outstanding Overnight Loans was equal to the greater of the Federal Funds Effective Rate plus 1.25%, or the Adjusted Daily Simple SOFR plus 1.25%. The aforementioned Adjusted Daily Simple SOFR was the sum of Daily Simple SOFR plus 0.10% plus a floor rate of 0.00%. The Participating Funds paid a commitment fee on the unutilized commitment amount of 0.175% per annum, which was allocated to the Participating Funds based on average daily net assets and is included in miscellaneous expense on the Participating Funds’ Statement of Operations. Interest incurred on loans utilized, if any, is included in the Statement of Operations as interest expense.
The Funds did not utilize the line of credit during the fiscal year ended October 31, 2024.
8. MASTER NETTING AGREEMENTS
The Funds may enter into master netting agreements with their counterparties for the Securities Lending Program and Repurchase Agreements, which provide the right, in the event of default (including bankruptcy or insolvency) for the non-defaulting party to liquidate the collateral and calculate net exposure to the defaulting party or request additional collateral. For financial reporting purposes, the Funds do not offset financial assets and financial liabilities that are subject to master netting agreements in the Statement of Assets and Liabilities. For securities lending transactions, see Note 4.
48
| | |
| | Notes to Financial Statements (continued) |
| | | | | | | | | | | | | | | | | | |
| | | | | | Gross Amount Not Offset in the
Statement of Assets and Liabilities | | | | | | | |
| Fund | | Gross Amounts of Assets Presented in
the Statement of Assets and Liabilities | | | Offset Amount | | Net Asset Balance | | | Collateral Received | | | Net
Amount | |
| | | | | |
Mid Cap Value | | | | | | | | | | | | | | | | | | |
| | | | | |
Fixed Income Clearing Corp. | | | $6,164,000 | | | — | | | $6,164,000 | | | | $6,164,000 | | | | — | |
| | | | | |
Large Cap Value Select | | | | | | | | | | | | | | | | | | |
| | | | | |
Fixed Income Clearing Corp. | | | $1,331,000 | | | — | | | $1,331,000 | | | | $1,331,000 | | | | — | |
| | | | | |
Small Cap Value | | | | | | | | | | | | | | | | | | |
| | | | | |
Daiwa Capital Markets America | | | $136,972 | | | — | | | $136,972 | | | | $136,972 | | | | — | |
| | | | | |
Fixed Income Clearing Corp. | | | 100,221,000 | | | — | | | 100,221,000 | | | | 100,221,000 | | | | — | |
| | | | | | | | | | | | | | | | | | |
| | | | | |
Total | | | $100,357,972 | | | — | | | $100,357,972 | | | | $100,357,972 | | | | — | |
| | | | | | | | | | | | | | | | | | |
| | | | | |
Dividend All Cap Value | | | | | | | | | | | | | | | | | | |
| | | | | |
Fixed Income Clearing Corp. | | | $2,127,000 | | | — | | | $2,127,000 | | | | $2,127,000 | | | | — | |
| | | | | |
Small-Mid Cap Value | | | | | | | | | | | | | | | | | | |
| | | | | |
Cantor Fitzgerald Securities, Inc. | | | $1,000,000 | | | — | | | $1,000,000 | | | | $1,000,000 | | | | — | |
| | | | | |
Citigroup Global Markets, Inc. | | | 1,000,000 | | | — | | | 1,000,000 | | | | 1,000,000 | | | | — | |
| | | | | |
Daiwa Capital Markets America | | | 202,659 | | | — | | | 202,659 | | | | 202,659 | | | | — | |
| | | | | |
HSBC Securities USA, Inc. | | | 1,000,000 | | | — | | | 1,000,000 | | | | 1,000,000 | | | | — | |
| | | | | |
Fixed Income Clearing Corp. | | | 11,804,000 | | | — | | | 11,804,000 | | | | 11,804,000 | | | | — | |
| | | | | | | | | | | | | | | | | | |
| | | | | |
Total | | | $15,006,659 | | | — | | | $15,006,659 | | | | $15,006,659 | | | | — | |
| | | | | | | | | | | | | | | | | | |
| | | | | |
Focused Absolute Value | | | | | | | | | | | | | | | | | | |
| | | | | |
Daiwa Capital Markets America | | | $124,893 | | | — | | | $124,893 | | | | $124,893 | | | | — | |
| | | | | |
Fixed Income Clearing Corp. | | | 448,000 | | | — | | | 448,000 | | | | 448,000 | | | | — | |
| | | | | | | | | | | | | | | | | | |
| | | | | |
Total | | | $572,893 | | | — | | | $572,893 | | | | $572,893 | | | | — | |
| | | | | | | | | | | | | | | | | | |
9. RECENT ACCOUNTING STANDARDS UPDATE
In November 2023, the Financial Accounting Standards Board issued ASU No. 2023-07, Segment Reporting (Topic 280), which improves reportable segment disclosure requirements, primarily through enhanced disclosures about significant segment expenses. The amendments are effective for fiscal years beginning after December 15, 2023, and interim periods within fiscal years beginning after December 15, 2024. The Funds are currently evaluating the requirements and do not expect this guidance to materially impact the Funds’ financial statements.
10. SUBSEQUENT EVENTS
The Funds have determined that no material events or transactions occurred
through the issuance date of the Funds’ financial statements which require an
additional disclosure in or adjustment of the Funds’ financial statements.
49
| | |
| | Report of Independent Registered Public Accounting Firm |
To the Board of Trustees of AMG Funds I and AMG Funds IV and Shareholders of AMG River Road Large Cap Value Select Fund, AMG River Road Mid Cap Value Fund, AMG River Road Small Cap Value Fund, AMG River Road Dividend All Cap Value Fund, AMG River Road Small-Mid Cap Value Fund and AMG River Road Focused Absolute Value Fund
Opinions on the Financial Statements
We have audited the accompanying statements of assets and liabilities, including the schedules of portfolio investments of AMG River Road Large Cap Value Select Fund (one of the funds constituting AMG Funds I), AMG River Road Mid Cap Value Fund, AMG River Road Small Cap Value Fund, AMG River Road Dividend All Cap Value Fund, AMG River Road Small-Mid Cap Value Fund and AMG River Road Focused Absolute Value Fund (five of the funds constituting AMG Funds IV) (hereafter collectively referred to as the “Funds”) as of October 31, 2024, the related statements of operations for the year ended October 31, 2024, the statements of changes in net assets for each of the two years in the period ended October 31, 2024, including the related notes, and the financial highlights for each of the five years in the period ended October 31, 2024 (collectively referred to as the “financial statements”). In our opinion, the financial statements present fairly, in all material respects, the financial position of each of the Funds as of October 31, 2024, the results of each of their operations for the year then ended, the changes in each of their net assets for each of the two years in the period ended October 31, 2024 and each of the financial highlights for each of the five years in the period ended October 31, 2024 in conformity with accounting principles generally accepted in the United States of America.
Basis for Opinions
These financial statements are the responsibility of the Funds’ management. Our responsibility is to express an opinion on the Funds’ financial statements based on our audits. We are a public accounting firm registered with the Public Company Accounting Oversight Board (United States) (PCAOB) and are required to be independent with respect to the Funds in accordance with the U.S. federal securities laws and the applicable rules and regulations of the Securities and Exchange Commission and the PCAOB.
We conducted our audits of these financial statements in accordance with the standards of the PCAOB. Those standards require that we plan and perform the audit to obtain reasonable assurance about whether the financial statements are free of material misstatement, whether due to error or fraud.
Our audits included performing procedures to assess the risks of material misstatement of the financial statements, whether due to error or fraud, and performing procedures that respond to those risks. Such procedures included examining, on a test basis, evidence regarding the amounts and disclosures in the financial statements. Our audits also included evaluating the accounting principles used and significant estimates made by management, as well as evaluating the overall presentation of the financial statements. Our procedures included confirmation of securities owned as of October 31, 2024 by correspondence with the custodian and brokers; when replies were not received from brokers, we performed other auditing procedures. We believe that our audits provide a reasonable basis for our opinions.
/s/PricewaterhouseCoopers LLP
Boston, Massachusetts
December 23, 2024
We have served as the auditor of one or more investment companies in the AMG Funds Family since 1993.
50
| | |
| | Other Information (unaudited) |
TAX INFORMATION
AMG River Road Mid Cap Value Fund, AMG River Road Large Cap Value Select Fund, AMG River Road Small Cap Value Fund, AMG River Road Dividend All Cap Value Fund, AMG River Road Small-Mid Cap Value Fund and AMG River Road Focused Absolute Value Fund each hereby designates the maximum amount allowable of its net taxable income as qualified dividends as provided in the Jobs and Growth Tax Relief Reconciliation Act of 2003. The 2023/2024 Form 1099-DIV you receive for each Fund will show the tax status of all distributions paid to you during the year.
Pursuant to section 852 of the Internal Revenue Code, the Funds each hereby designate the amounts in the below table as a capital gain distribution with respect to the taxable period ended October 31, 2024, or if subsequently determined to be different, the net capital gains of such period.
| | | | |
| Fund | | Amount | |
| |
AMG River Road Mid Cap Value Fund | | | $5,012,833 | |
| |
AMG River Road Large Cap Value Select Fund | | | 22,776 | |
| |
AMG River Road Small Cap Value Fund | | | 47,679,921 | |
| |
AMG River Road Dividend All Cap Value Fund | | | 25,188,216 | |
| |
AMG River Road Small-Mid Cap Value Fund | | | 8,525,506 | |
| |
AMG River Road Focused Absolute Value Fund | | | 819,247 | |
ITEM 8. CHANGES IN AND DISAGREEMENTS WITH ACCOUNTANTS FOR OPEN-END MANAGEMENT INVESTMENT COMPANIES
During the fiscal year ended October 31, 2024, there were no changes in and/or disagreements with accountants.
ITEM 9. PROXY DISCLOSURES FOR OPEN-END MANAGEMENT INVESTMENT COMPANIES
Not applicable.
ITEM 10. REMUNERATION PAID TO DIRECTORS, OFFICERS, AND OTHERS OF OPEN-END MANAGEMENT INVESTMENT COMPANIES
The remuneration paid to the Trustees during the fiscal year ended October 31, 2024, is reflected as “Trustee fees and expenses” on the Statement of Operations and is set forth in the table below. There was no remuneration paid to any Fund officer or to any affiliated person of any Fund Trustee or officer during the fiscal year ended October 31, 2024.
| | | | |
| | | Trustee fees and expenses | |
| |
AMG River Road Mid Cap Value Fund | | | $29,158 | |
| |
AMG River Road Large Cap Value Select Fund | | | 3,283 | |
| |
AMG River Road Small Cap Value Fund | | | 86,677 | |
| |
AMG River Road Dividend All Cap Value Fund | | | 11,767 | |
| |
AMG River Road Small-Mid Cap Value Fund | | | 25,489 | |
| |
AMG River Road Focused Absolute Value Fund | | | 4,144 | |
51
| | |
| | ITEM 11. STATEMENT REGARDING BASIS FOR APPROVAL OF INVESTMENT ADVISORY CONTRACT |
| | | | | | | | |
AMG River Road Dividend All Cap Value Fund, AMG River Road Focused Absolute Value Fund, AMG River Road Large Cap Value Select Fund, AMG River Road Mid Cap Value Fund, AMG River Road Small-Mid Cap Value Fund, and AMG River Road Small Cap Value Fund: Approval of Investment Management and Subadvisory Agreements on June 12, 2024 At an in-person meeting held on June 12, 2024, the Board of Trustees (the “Board” or the “Trustees”) of each of AMG Funds I and AMG Funds IV (each, a “Trust” and collectively, the “Trusts”), and separately a majority of the Trustees who are not “interested persons” of the Trusts (the “Independent Trustees”), approved (i) the Fund Management Agreement, as amended pursuant to letter agreements at any time prior to the date of the meeting, with AMG Funds LLC (the “Investment Manager”) and AMG Funds I for AMG River Road Large Cap Value Select Fund and separately each of Amendment No. 1 thereto dated July 1, 2015, and Amendment No. 2 thereto dated October 1, 2016; and the Investment Advisory Agreement, as amended pursuant to letter agreements at any time prior to the date of the meeting, with the Investment Manager and AMG Funds IV for each of AMG River Road Dividend All Cap Value Fund, AMG River Road Focused Absolute Value Fund, AMG River Road Mid Cap Value Fund, AMG River Road Small-Mid Cap Value Fund, and AMG River Road Small Cap Value Fund, and separately Amendment No. 1 thereto dated October 1, 2016 (collectively, the “Investment Management Agreements”); and (ii) the Sub-Investment Advisory Agreement (or, in the case of AMG River Road Large Cap Value Select Fund and AMG River Road Mid Cap Value Fund, the Subadvisory Agreement) with respect to each of AMG River Road Dividend All Cap Value Fund, AMG River Road Focused Absolute Value Fund, AMG River Road Large Cap Value Select Fund, AMG River Road Mid Cap Value Fund, AMG River Road Small-Mid Cap Value Fund, and AMG River Road Small Cap Value Fund (each, a “Fund,” and collectively, the “Funds”), as amended at any time prior to the date of the meeting (collectively, the “Subadvisory Agreements”), with River Road Asset Management, LLC, the Funds’ subadviser (the “Subadviser”). The Independent Trustees were separately represented by independent legal counsel in connection with their consideration of the approval of these agreements. In considering the Investment Management Agreements and the Subadvisory Agreements, the Trustees reviewed a variety of materials relating to each Fund, the Investment Manager and the Subadviser, including the nature, extent and quality of services, | | | | comparative performance, fee and expense information for an appropriate peer group of similar mutual funds for each Fund (each, a “Peer Group”), performance information for the relevant benchmark index for each Fund (each, a “Fund Benchmark”), other relevant matters, including management fees, the profitability of the Investment Manager and the Subadviser, and the potential for economies of scale that may be shared with the Funds, and other information provided to them on a periodic basis throughout the year. Prior to voting, the Independent Trustees: (a) reviewed the foregoing information with their independent legal counsel; (b) received materials from their independent legal counsel discussing the legal standards applicable to their consideration of the Investment Management Agreements and the Subadvisory Agreements; and (c) met with their independent legal counsel in private sessions at which no representatives of management were present. NATURE, EXTENT AND QUALITY OF SERVICES In considering the nature, extent and quality of the services provided by the Investment Manager, the Trustees reviewed information provided by the Investment Manager at the June 12, 2024 meeting and prior meetings relating to the Investment Manager’s operations and personnel. Among other things, the Investment Manager provided financial information, information about its supervisory and professional staff and descriptions of its organizational and management structure. The Trustees also took into account information provided periodically throughout the previous year by the Investment Manager in Board meetings relating to the performance of its duties with respect to the Funds and the Trustees’ knowledge of the Investment Manager’s management and the quality of the performance of the Investment Manager’s duties under the Investment Management Agreements and Administration Agreement. In the course of their deliberations regarding the Investment Manager, the Trustees evaluated, among other things: (a) the extent and quality of the Investment Manager’s oversight of the operation and management of the Funds; (b) the quality of the Investment Manager’s oversight of the performance by the Subadviser of its portfolio management duties; (c) the Investment Manager’s ability to supervise the Funds’ other service providers; and (d) the Investment Manager’s compliance program. The Trustees also took into account that, in performing its functions under the Investment Management Agreements and supervising the Subadviser, the Investment | | | | Manager: performs periodic detailed analyses and reviews of the performance by the Subadviser of its obligations to each Fund, including without limitation, analysis and review of portfolio and other compliance matters and review of the Subadviser’s investment performance with respect to each Fund; prepares and presents periodic reports to the Board regarding the investment performance of the Subadviser and other information regarding the Subadviser, at such times and in such forms as the Board may reasonably request; reviews and considers any changes in the personnel of the Subadviser responsible for performing the Subadviser’s obligations and makes appropriate reports to the Board; reviews and considers any changes in the ownership or senior management of the Subadviser and makes appropriate reports to the Board; performs periodic in-person, telephonic or videoconference diligence meetings, including with respect to compliance matters, with representatives of the Subadviser; assists the Board and management of the Trusts in developing and reviewing information with respect to the initial approval of each Subadvisory Agreement and annual consideration of each Subadvisory Agreement thereafter; prepares recommendations with respect to the continued retention of the Subadviser or the replacement of the Subadviser, including at the request of the Board; identifies potential successors to, or replacements of, the Subadviser or potential additional subadvisers, including performing appropriate due diligence, and developing and presenting to the Board a recommendation as to any such successor, replacement, or additional subadviser, including at the request of the Board; designates and compensates from its own resources such personnel as the Investment Manager may consider necessary or appropriate to the performance of its services; and performs such other review and reporting functions as the Board shall reasonably request consistent with the Investment Management Agreements and applicable law. The Trustees noted the affiliation of the Subadviser with the Investment Manager, noting any potential conflicts of interest. The Trustees also took into account the financial condition of the Investment Manager with respect to its ability to provide the services required under the Investment Management Agreements and the Investment Manager’s undertaking to maintain contractual expense limitations for each Fund other than AMG River Road Small Cap Value Fund, as described below. The Trustees also considered the Investment Manager’s risk management processes. |
52
| | |
| | ITEM 11. STATEMENT REGARDING BASIS FOR APPROVAL OF INVESTMENT ADVISORY CONTRACT (continued) |
| | | | | | | | |
The Trustees also reviewed information relating to the Subadviser’s operations and personnel and the investment philosophy, strategies and techniques (its “Investment Strategy”) used in managing each Fund. Among other things, the Trustees reviewed information on portfolio management and other professional staff, information regarding the Subadviser’s organizational and management structure and the Subadviser’s brokerage policies and practices. The Trustees considered specific information provided regarding the experience of the individuals at the Subadviser with portfolio management responsibility for each Fund, including the information set forth in each Fund’s prospectus and statement of additional information. In the course of their deliberations, the Trustees evaluated, among other things: (a) the services rendered by the Subadviser in the past; (b) the qualifications and experience of the Subadviser’s personnel; and (c) the Subadviser’s compliance program. The Trustees also took into account the financial condition of the Subadviser with respect to its ability to provide the services required under each Subadvisory Agreement. The Trustees also considered the Subadviser’s risk management processes. PERFORMANCE The Board considered each Fund’s net performance during relevant time periods as compared to the Fund’s Peer Group and Fund Benchmark, considered the gross performance of each Fund as compared to the Subadviser’s relevant performance composite that utilizes a similar investment strategy and approach, and noted that the Board reviews on a quarterly basis detailed information about both a Fund’s performance results and portfolio composition, as well as the Subadviser’s Investment Strategy. The Board was mindful of the Investment Manager’s expertise, resources and attention to monitoring the Subadviser’s performance, investment style and risk-adjusted performance with respect to the Funds and its discussions with the management of the Funds’ subadviser during the period regarding the factors that contributed to the performance of the Funds. With respect to AMG River Road Dividend All Cap Value Fund, among other information relating to the Fund’s performance, the Trustees noted that the Fund’s performance for Class N shares (which share class has the earliest inception date of all the share classes of the Fund) for the 1-year, 3-year, 5-year and 10-year periods ended March 31, 2024, was below the median performance of the Peer Group and below the performance of the Fund Benchmark, the Russell 3000 Value Index. The Trustees took into account | | | | management’s discussion of the Fund’s performance, including the reasons for the Fund’s underperformance relative to the Fund Benchmark and the Peer Group. The Trustees also took into account the fact that the Fund ranked in top third relative to its Peer Group for the 2022 calendar year. The Trustees concluded that the Fund’s overall performance has been satisfactory in light of the Fund’s investment objective, strategies and policies. With respect to AMG River Road Focused Absolute Value Fund, among other information relating to the Fund’s performance, the Trustees noted that the Fund’s performance for Class I shares (which share class has one of the earliest inception dates and the largest amount of assets of all the share classes of the Fund) for the 1-year, 3-year, and 5-year periods ended March 31, 2024 and for the period from the Fund’s inception on November 3, 2015 through March 31, 2024, was above, below, below, and below, respectively, the median performance of the Peer Group and above, below, below, and below, respectively, the performance of the Fund Benchmark, the Russell 3000 Value Index. The Trustees also took into account management’s discussion of the Fund’s performance, including the reasons for the Fund’s more recent outperformance and longer-term underperformance, and the fact that the Fund ranked in the top third relative to its Peer Group for the 1-year period. The Trustees concluded that the Fund’s overall performance has been satisfactory in light of the Fund’s investment objective, strategies and policies. With respect to AMG River Road Large Cap Value Select Fund, among other information relating to the Fund’s performance, the Trustees noted that the Fund’s performance for Class I shares (which share class has the earliest inception date and the largest amount of assets of all the share classes of the Fund) for the 1-year, 3-year, 5-year and 10-year periods ended March 31, 2024, was above, above, below, and below, respectively, the median performance of the Peer Group and above, above, below, and below, respectively, the performance of the Fund Benchmark, the Russell 1000 Value Index. The Trustees took into account management’s discussion of the Fund’s performance, including the reasons for the Fund’s recent outperformance and longer-term underperformance and the fact that the Fund ranked in the top decile relative to the Peer Group for the 1-year and 3-year periods. The Trustees also took into account the fact that the Fund’s subadviser, investment strategy, and Fund Benchmark changed effective March 22, 2021, and that the performance information prior to that date reflected that of the Fund’s prior subadviser and | | | | investment strategy. The Trustees considered management’s discussion that the Fund’s performance has been in line with management’s expectations since the current Subadviser assumed subadvisory responsibilities. The Trustees concluded that the Fund’s overall performance has been satisfactory in light of the Fund’s investment objective, strategies and policies. With respect to AMG River Road Mid Cap Value Fund, among other information relating to the Fund’s performance, the Trustees noted that the Fund’s performance for Class N shares (which share class has the earliest inception date and the largest amount of assets of all the share classes of the Fund) for the 1-year, 3-year, 5-year and 10-year periods ended March 31, 2024, was above, above, above, and below, respectively, the median performance of the Peer Group and above, above, above, and below, respectively, the performance of the Fund Benchmark, the Russell Midcap Value Index. The Trustees took into account management’s discussion of the Fund’s performance, including the reasons for the Fund’s recent outperformance relative to the Peer Group and the Fund Benchmark. The Trustees also noted that the Fund ranked in the top decile relative to the Peer Group for the 3-year period and in the top quintile relative to the Peer Group for the 1-year period. The Trustees also took into account the fact that the Fund’s subadviser, investment strategy, and Fund Benchmark changed effective March 19, 2021, and that the performance information prior to that date reflected that of the Fund’s prior subadviser and investment strategy. The Trustees considered management’s discussion that the Fund’s performance has been in line with management’s expectations since the current Subadviser assumed subadvisory responsibilities. The Trustees concluded that the Fund’s overall performance has been satisfactory. With respect to AMG River Road Small-Mid Cap Value Fund, among other information relating to the Fund’s performance, the Trustees noted that the Fund’s performance for Class N shares (which share class has the earliest inception date of all the share classes of the Fund) for the 1-year, 3-year, 5-year and 10-year periods ended March 31, 2024, was above the median performance of the Peer Group and above the performance of the Fund Benchmark, the Russell 2500 Value Index. The Trustees also took into account management’s discussion of the Fund’s performance, noting that Class N shares of the Fund ranked in the top decile relative to its Peer Group for the 10-year period and the Fund ranked in the top |
53
| | |
| | ITEM 11. STATEMENT REGARDING BASIS FOR APPROVAL OF INVESTMENT ADVISORY CONTRACT (continued) |
| | | | | | | | |
third relative to its Peer Group for the 3-year period. The Trustees concluded that the Fund’s overall performance has been satisfactory. With respect to AMG River Road Small Cap Value Fund, among other information relating to the Fund’s performance, the Trustees noted that the Fund’s performance for Class N shares (which share class has the earliest inception date of all the share classes of the Fund) for the 1-year, 3-year, 5-year and 10-year periods ended March 31, 2024, was above the median performance of the Peer Group and above the performance of the Fund Benchmark, the Russell 2000 Value Index. The Trustees also took into account management’s discussion of the Fund’s performance, including the fact that Class N shares of the Fund ranked in the top quintile relative to its Peer Group for the 10-year period and the Fund ranked in the top third relative to its Peer Group for the 3-year period. The Trustees concluded that the Fund’s overall performance has been satisfactory. ADVISORY AND SUBADVISORY FEES; FUND EXPENSES; PROFITABILITY; AND ECONOMIES OF SCALE In considering the reasonableness of the advisory fee payable to the Investment Manager, the Trustees reviewed information provided by the Investment Manager at the June 12, 2024 meeting and prior meetings setting forth all revenues and other benefits, both direct and indirect (including any so-called “fallout benefits” such as reputational value derived from the Investment Manager serving as Investment Manager to a Fund), received by the Investment Manager and its affiliates attributable to managing each Fund and all the mutual funds in the AMG Funds Family of Funds; the cost of providing such services; the significant risks undertaken as Investment Manager and sponsor of the Funds, including investment, operational, enterprise, entrepreneurial, litigation, regulatory and compliance risks; and the resulting profitability to the Investment Manager and its affiliates from these relationships. The Trustees also considered the amount of the advisory fee retained by the Investment Manager after payment of the subadvisory fee with respect to each Fund. The Trustees also noted payments are made from the Subadviser to the Investment Manager, and other payments are made from the Investment Manager to the Subadviser. The Trustees also considered management’s discussion of the current asset levels of the Funds, and the impact on profitability of both the current asset levels and any future growth of assets of the Funds. | | | | In considering the cost of services to be provided by the Investment Manager under each Investment Management Agreement and the profitability to the Investment Manager of its relationship with each Fund, the Trustees noted the undertaking by the Investment Manager to maintain contractual expense limitations for each Fund other than AMG River Road Small Cap Value Fund. The Board also took into account management’s discussion of the advisory fee structure, and the services the Investment Manager provides in performing its functions under each Investment Management Agreement and supervising the Subadviser. Based on the foregoing, the Trustees concluded that the profitability to the Investment Manager is reasonable and that the Investment Manager is not realizing material benefits from economies of scale that would warrant adjustments to the advisory fee at this time. Also, with respect to economies of scale, the Trustees noted that as each Fund’s assets increase over time, the Fund may realize other economies of scale to the extent the increase in assets is proportionally greater than the increase in certain other expenses. In considering the reasonableness of the subadvisory fees payable by the Investment Manager to the Subadviser, the Trustees reviewed information regarding the cost to the Subadviser of providing subadvisory services to each Fund and the resulting profitability from these relationships. The Trustees noted that, because the Subadviser is an affiliate of the Investment Manager, a portion of the Subadviser’s revenues or profits might be shared directly or indirectly with the Investment Manager. The Trustees also noted that the subadvisory fees are paid by the Investment Manager out of its advisory fee. The Board also took into account management’s discussion of the subadvisory fee structure, and the services the Subadviser provides in performing its functions under each Subadvisory Agreement. Based on the foregoing, the Trustees concluded that the profitability to the Subadviser is reasonable and that the Subadviser is not realizing material benefits from economies of scale that would warrant adjustments to the subadvisory fees at this time. Also, with respect to economies of scale, the Trustees noted that as a Fund’s assets increase over time, the Fund may realize other economies of scale to the extent the increase in assets is proportionally greater than the increase in certain other expenses. With respect to AMG River Road Dividend All Cap Value Fund, the Trustees noted that the management fees (which include both the advisory and administration fees) and total expenses (net of applicable expense waivers/reimbursements) of Class I shares (the class of shares which is the primary focus of the Fund’s distribution) of the Fund | | | | as of March 31, 2024, were both rated in the Average rating level of the Fund’s Peer Group. The Trustees noted that the rating level corresponded to the Fund’s quintile ranking in its Peer Group. The Trustees took into account the fact that the Investment Manager has contractually agreed, through March 1, 2025, to limit the Fund’s net annual operating expenses (subject to certain excluded expenses) to 0.68%. The Trustees concluded that, in light of the nature, extent and quality of the services provided by the Investment Manager and the Subadviser (which is an affiliate of the Investment Manager), the foregoing expense limitation and the considerations noted above with respect to the Investment Manager and the Subadviser, the Fund’s advisory and subadvisory fees are reasonable. With respect to AMG River Road Focused Absolute Value Fund, the Trustees noted that the management fees (which include both the advisory and administration fees) and total expenses (net of applicable expense waivers/reimbursements) of Class I shares (the class of shares which is the primary focus of the Fund’s distribution) of the Fund as of March 31, 2024, were both rated in the Average rating level of Fund’s Peer Group. The Trustees noted that the rating level corresponded to the Fund’s quintile ranking in its Peer Group. The Trustees took into account the fact that the Investment Manager has contractually agreed, through March 1, 2025, to limit the Fund’s net annual operating expenses (subject to certain excluded expenses) to 0.78%. The Trustees concluded that, in light of the nature, extent and quality of the services provided by the Investment Manager and the Subadviser (which is an affiliate of the Investment Manager), the foregoing expense limitation and the considerations noted above with respect to the Investment Manager and the Subadviser, the Fund’s advisory and subadvisory fees are reasonable. With respect to AMG River Road Large Cap Value Select Fund, the Trustees noted that the management fees (which include both the advisory and administration fees) and total expenses (net of applicable expense waivers/reimbursements) of Class I shares (the class of shares which is the primary focus of the Fund’s distribution) of the Fund as of March 31, 2024, were both rated in the Below Average rating level of the Fund’s Peer Group. The Trustees noted that the rating level corresponded to the Fund’s quintile ranking in its Peer Group. The Trustees took into account the fact that the Investment Manager has contractually agreed, through March 1, 2025, to limit the Fund’s net annual operating expenses (subject to certain excluded expenses) to 0.60%. The Trustees concluded that, in light of the nature, extent and quality of the services |
54
| | |
| | ITEM 11. STATEMENT REGARDING BASIS FOR APPROVAL OF INVESTMENT ADVISORY CONTRACT (continued) |
| | | | | | | | |
provided by the Investment Manager and the Subadviser (which is an affiliate of the Investment Manager), the foregoing expense limitation and the considerations noted above with respect to the Investment Manager and the Subadviser, the Fund’s advisory and subadvisory fees are reasonable. With respect to AMG River Road Mid Cap Value Fund, the Trustees noted that the management fees (which include both the advisory and administration fees) and total expenses (net of applicable expense waivers/reimbursements) of Class I shares (the class of shares which is the primary focus of the Fund’s distribution) of the Fund as of March 31, 2024, were rated in the Below Average and the Average rating level, respectively, of the Fund’s Peer Group. The Trustees noted that the rating level corresponded to the Fund’s quintile ranking in its Peer Group. The Trustees took into account the fact that the Investment Manager has contractually agreed, through March 1, 2025, to limit the Fund’s net annual operating expenses (subject to certain excluded expenses) to 0.76%. The Trustees concluded that, in light of the nature, extent and quality of the services provided by the Investment Manager and the Subadviser (which is an affiliate of the Investment Manager), the foregoing expense limitation and the considerations noted above with respect to the Investment Manager and the Subadviser, the Fund’s advisory and subadvisory fees are reasonable. With respect to AMG River Road Small-Mid Cap Value Fund, the Trustees noted that the management fees (which include both the advisory and administration fees) and total expenses (net of applicable expense waivers/reimbursements) of Class I shares (the class | | | | of shares which is the primary focus of the Fund’s distribution) of the Fund as of March 31, 2024, were both rated in the Above Average rating level of the Fund’s Peer Group. The Trustees noted that the rating level corresponded to the Fund’s quintile ranking in its Peer Group. The Trustees took into account the fact that the Investment Manager has contractually agreed, through March 1, 2025, to limit the Fund’s net annual operating expenses (subject to certain excluded expenses) to 1.04%. The Trustees also took into account management’s discussion of the Fund’s expenses, including fees and expenses relative to comparably sized funds and select competitors. The Trustees concluded that, in light of the nature, extent and quality of the services provided by the Investment Manager and the Subadviser (which is an affiliate of the Investment Manager), the foregoing expense limitation and the considerations noted above with respect to the Investment Manager and the Subadviser, the Fund’s advisory and subadvisory fees are reasonable. With respect to AMG River Road Small Cap Value Fund, the Trustees noted that the management fees (which include both the advisory and administration fees) and total expenses of Class I shares (the class of shares which is the primary focus of the Fund’s distribution) of the Fund as of March 31, 2024, were rated in the Above Average and the High rating level, respectively, of the Fund’s Peer Group. The Trustees noted that the rating levels corresponded to the Fund’s quintile ranking in its Peer Group. The Trustees took into account management’s discussion of the Fund’s expenses, including fees and expenses relative to comparably sized funds and select competitors. The Trustees concluded that, in light of | | | | the nature, extent and quality of the services provided by the Investment Manager and the Subadviser (which is an affiliate of the Investment Manager) and the considerations noted above with respect to the Investment Manager and the Subadviser, the Fund’s advisory and subadvisory fees are reasonable. * * * * * After consideration of the foregoing, the Trustees also reached the following conclusions (in addition to the conclusions discussed above) regarding the Investment Management Agreements and Subadvisory Agreements: (a) the Investment Manager and the Subadviser have demonstrated that they possess the capability and resources to perform the duties required of them under the Investment Management Agreements and each Subadvisory Agreement and (b) the Investment Manager and Subadviser maintain appropriate compliance programs. Based on all of the above-mentioned factors and their related conclusions, with no single factor or conclusion being determinative and with each Trustee not necessarily attributing the same weight to each factor, the Trustees concluded that approval of each Investment Management Agreement and each Subadvisory Agreement would be in the best interests of the applicable Fund and its shareholders. Accordingly, on June 12, 2024, the Trustees, and separately a majority of the Independent Trustees, voted to approve the Investment Management Agreement and the Subadvisory Agreement for each Fund. |
55
THIS PAGE INTENTIONALLY LEFT BLANK
| | |
| | |
| | | | | | | | | | |
| | | INVESTMENT MANAGER AND ADMINISTRATOR AMG Funds LLC 680 Washington Blvd., Suite 500 Stamford, CT 06901 800.548.4539 DISTRIBUTOR AMG Distributors, Inc. 680 Washington Blvd., Suite 500 Stamford, CT 06901 800.548.4539 SUBADVISER River Road Asset Management, LLC Meidinger Tower 462 South Fourth Street, Suite 2000 Louisville, KY 40202 | | | | CUSTODIAN The Bank of New York Mellon Mutual Funds Custody 240 Greenwich Street New York, NY 10286 LEGAL COUNSEL Ropes & Gray LLP Prudential Tower, 800 Boylston Street Boston, MA 02199-3600 TRANSFER AGENT BNY Mellon Investment Servicing (US) Inc. AMG Funds Attn: 534426 AIM 154-0520 500 Ross Street Pittsburgh, PA 15262 800.548.4539 | | | | This report is prepared for the Funds’ shareholders. It is authorized for distribution to prospective investors only when preceded or accompanied by an effective prospectus. To receive a free copy of the prospectus or Statement of Additional Information, which includes additional information about Fund Trustees, please contact us by calling 800.548.4539. Distributed by AMG Distributors, Inc., member FINRA/SIPC. Current net asset values per share for each Fund are available on the Funds’ website at wealth.amg.com. A description of the policies and procedures each Fund uses to vote its proxies is available: (i) without charge, upon request, by calling 800.548.4539, or (ii) on the Securities and Exchange Commission’s (SEC) website at sec.gov. For information regarding each Fund’s proxy voting record for the 12-month period ended June 30, call 800.548.4539 or visit the SEC website at sec.gov. The Funds file their complete schedule of portfolio holdings with the SEC for the first and third quarters of each fiscal year as an exhibit to their reports on Form N-PORT. The Funds’ portfolio holdings on Form N-PORT are available on the SEC’s website at sec.gov and the Funds’ website at wealth.amg.com. To review a complete list of the Funds’ portfolio holdings, or to view the most recent semi-annual report or annual report, please visit wealth.amg.com. |
| | |
| | |
| | | | | | | | | | |
| | | EQUITY FUNDS AMG Boston Common Global Impact Boston Common Asset Management, LLC AMG Frontier Small Cap Growth Frontier Capital Management Co., LLC AMG GW&K Small Cap Core AMG GW&K Small Cap Value AMG GW&K Small/Mid Cap Core AMG GW&K Small/Mid Cap Growth AMG GW&K International Small Cap GW&K Investment Management, LLC AMG Montrusco Bolton Large Cap Growth Montrusco Bolton Investments, Inc. AMG Renaissance Large Cap Growth The Renaissance Group LLC | | | | AMG River Road Dividend All Cap Value AMG River Road Focused Absolute Value AMG River Road Large Cap Value Select AMG River Road Mid Cap Value AMG River Road Small-Mid Cap Value AMG River Road Small Cap Value River Road Asset Management, LLC AMG TimesSquare International Small Cap AMG TimesSquare Mid Cap Growth AMG TimesSquare Small Cap Growth TimesSquare Capital Management, LLC AMG Veritas Asia Pacific AMG Veritas China AMG Veritas Global Focus AMG Veritas Global Real Return Veritas Asset Management LLP AMG Yacktman AMG Yacktman Focused AMG Yacktman Global AMG Yacktman Special Opportunities Yacktman Asset Management LP | | | | FIXED INCOME FUNDS AMG Beutel Goodman Core Plus Bond Beutel, Goodman & Company Ltd. AMG GW&K Core Bond ESG AMG GW&K ESG Bond AMG GW&K Municipal Bond AMG GW&K Municipal Enhanced Yield GW&K Investment Management, LLC ALTERNATIVE FUNDS AMG Systematica Managed Futures Strategy Systematica Investments Limited, acting as general partner of Systematica Investments LP |
| | | | | | | | | | | |
| | | | | | |
| | | | | | | |
| | | |
| wealth.amg.com | | 103124 | | | AR082 | |
| | |

| | ANNUAL FINANCIAL STATEMENTS |
| | | |
| | | | | | |
| | | AMG Funds |
| | | | |
| | | October 31, 2024 | | | | |
| | |
| | |  |
| | |
| | | AMG Veritas China Fund |
| | | Class N: MMCFX | | Class I: MIMFX | | |
| | |
| | | AMG Veritas Global Focus Fund |
| | | Class N: MFQAX | | Class I: MFQTX | | |
| | | | |
| | | | | |
wealth.amg.com | | 103124 | | AR084 |
| | |
| | | |
| | | AMG Funds Annual Financial Statements — October 31, 2024 |
| | |
| | | |
Nothing contained herein is to be considered an offer, sale or solicitation of an offer to buy shares of any series of the AMG Funds Family of Funds. Such offering is made only by prospectus, which includes details as to offering price and other material information.
| | |
| | AMG Veritas China Fund Schedule of Portfolio Investments October 31, 2024 |
| | | | | | | | |
| | | Shares | | | Value | |
| | |
Common Stocks - 99.8% | | | | | | | | |
| | |
Communication Services - 23.5% | | | | | | | | |
| | |
China Tower Corp., Ltd., Class H (China)1 | | | 3,380,000 | | | | $456,067 | |
| | |
NetEase, Inc. (China) | | | 83,900 | | | | 1,349,850 | |
| | |
Tencent Holdings, Ltd. (China) | | | 160,400 | | | | 8,363,598 | |
| | |
Total Communication Services | | | | | | | 10,169,515 | |
| | |
Consumer Discretionary - 28.8% | | | | | | | | |
| | |
Alibaba Group Holding, Ltd. (China) | | | 334,900 | | | | 4,096,602 | |
| | |
BYD Co., Ltd., Class A (China) | | | 39,700 | | | | 1,635,823 | |
| | |
JD.com, Inc., ADR (China) | | | 11,652 | | | | 473,304 | |
| | |
Meituan, Class B (China)*,1 | | | 80,200 | | | | 1,895,156 | |
| | |
MGM China Holdings, Ltd. (Macau) | | | 520,400 | | | | 675,349 | |
| | |
Midea Group Co., Ltd. (China)* | | | 47,600 | | | | 447,278 | |
| | |
New Oriental Education & Technology Group, Inc., ADR (China) | | | 17,571 | | | | 1,099,945 | |
| | |
PDD Holdings, Inc., ADR (China)* | | | 13,379 | | | | 1,613,374 | |
| | |
Trip.com Group, Ltd., ADR (China)* | | | 7,961 | | | | 512,688 | |
| | |
Total Consumer Discretionary | | | | | | | 12,449,519 | |
| | |
Consumer Staples - 5.0% | | | | | | | | |
| | |
Luzhou Laojiao Co., Ltd., Class A (China) | | | 48,000 | | | | 915,203 | |
| | |
Tsingtao Brewery Co., Ltd., Class H (China) | | | 196,000 | | | | 1,264,378 | |
| | |
Total Consumer Staples | | | | | | | 2,179,581 | |
| | |
Financials - 9.8% | | | | | | | | |
| | |
AIA Group, Ltd. (Hong Kong) | | | 119,300 | | | | 941,554 | |
| | |
China Merchants Bank Co., Ltd., Class H (China) | | | 221,500 | | | | 1,083,916 | |
| | |
East Money Information Co., Ltd., Class A (China) | | | 154,500 | | | | 503,518 | |
| | |
Futu Holdings, Ltd., ADR (Hong Kong)* | | | 8,123 | | | | 771,604 | |
| | |
Hong Kong Exchanges & Clearing, Ltd. (Hong Kong) | | | 22,800 | | | | 912,920 | |
| | |
Total Financials | | | | | | | 4,213,512 | |
| | |
Health Care - 5.0% | | | | | | | | |
| | |
CSPC Pharmaceutical Group, Ltd. (China) | | | 1,234,000 | | | | 913,571 | |
| | |
Innovent Biologics, Inc. (China)*,1 | | | 65,500 | | | | 284,740 | |
| | |
Shenzhen Mindray Bio-Medical Electronics Co., Ltd., Class A (China) | | | 26,100 | | | | 977,859 | |
| | |
Total Health Care | | | | | | | 2,176,170 | |
| * | Non-income producing security. |
| 1 | Security exempt from registration under Rule 144A of the Securities Act of 1933. These securities may be resold in transactions exempt from registration, normally to qualified institutional buyers. At October 31, 2024, the value of these securities amounted to $3,097,627 or 7.2% of net assets. |
| | | | | | | | |
| | | Shares | | | Value | |
| |
Industrials - 11.9% | | | | | |
| | |
Centre Testing International Group Co., Ltd., Class A (China) | | | 240,700 | | | | $466,883 | |
| | |
Contemporary Amperex Technology Co., Ltd., Class A (China) | | | 49,080 | | | | 1,703,417 | |
| | |
DiDi Global, Inc., ADR (China)* | | | 94,651 | | | | 471,362 | |
| | |
Full Truck Alliance Co., Ltd., Sponsored ADR (China) | | | 48,555 | | | | 434,567 | |
| | |
NARI Technology Co., Ltd., Class A (China) | | | 562,871 | | | | 2,056,716 | |
| | |
Total Industrials | | | | | | | 5,132,945 | |
| |
Information Technology - 7.1% | | | | | |
| | |
Foxconn Industrial Internet Co., Ltd., Class A (China) | | | 297,900 | | | | 999,125 | |
| | |
Luxshare Precision Industry Co., Ltd., Class A (China) | | | 72,900 | | | | 429,506 | |
| | |
NAURA Technology Group Co., Ltd., Class A (China) | | | 10,000 | | | | 550,477 | |
| | |
Xiaomi Corp., Class B (China)*,1 | | | 134,600 | | | | 461,664 | |
| | |
Zhongji Innolight Co., Ltd., Class A (China) | | | 30,700 | | | | 606,612 | |
| | |
Total Information Technology | | | | | | | 3,047,384 | |
| |
Materials - 5.9% | | | | | |
| | |
China National Building Material Co., Ltd., Class H (China) | | | 984,000 | | | | 418,634 | |
| | |
Zijin Mining Group Co., Ltd., Class H (China) | | | 1,002,000 | | | | 2,134,332 | |
| | |
Total Materials | | | | | | | 2,552,966 | |
| |
Real Estate - 1.4% | | | | | |
| | |
Onewo, Inc., Class H (China) | | | 205,900 | | | | 607,609 | |
| |
Utilities - 1.4% | | | | | |
| | |
ENN Energy Holdings, Ltd. (China) | | | 83,800 | | | | 590,396 | |
| | |
Total Common Stocks
(Cost $41,959,812) | | | | | | | 43,119,597 | |
| | |
Total Investments - 99.8%
(Cost $41,959,812) | | | | | | | 43,119,597 | |
| | |
Other Assets, less Liabilities - 0.2% | | | | | | | 76,845 | |
| | |
Net Assets - 100.0% | | | | | | | $43,196,442 | |
ADR American Depositary Receipt
The accompanying notes are an integral part of these financial statements.
2
| | |
| | AMG Veritas China Fund Schedule of Portfolio Investments (continued) |
The following table summarizes the inputs used to value the Fund’s investments by the fair value hierarchy levels as of October 31, 2024:
| | | | | | | | | | | | | | | | | | | | |
| | | Level 1 | | Level 21 | | Level 3 | | Total |
| | | | |
Investments in Securities | | | | | | | | | | | | | | | | | | | | |
| | | | |
Common Stocks | | | | | | | | | | | | | | | | | | | | |
| | | | |
Consumer Discretionary | | | | $4,146,589 | | | | | $8,302,930 | | | | | — | | | | | $12,449,519 | |
| | | | |
Communication Services | | | | — | | | | | 10,169,515 | | | | | — | | | | | 10,169,515 | |
| | | | |
Industrials | | | | 905,929 | | | | | 4,227,016 | | | | | — | | | | | 5,132,945 | |
| | | | |
Financials | | | | 1,275,122 | | | | | 2,938,390 | | | | | — | | | | | 4,213,512 | |
| | | | |
Information Technology | | | | — | | | | | 3,047,384 | | | | | — | | | | | 3,047,384 | |
| | | | |
Materials | | | | — | | | | | 2,552,966 | | | | | — | | | | | 2,552,966 | |
| | | | |
Consumer Staples | | | | 1,264,378 | | | | | 915,203 | | | | | — | | | | | 2,179,581 | |
| | | | |
Health Care | | | | — | | | | | 2,176,170 | | | | | — | | | | | 2,176,170 | |
| | | | |
Real Estate | | | | — | | | | | 607,609 | | | | | — | | | | | 607,609 | |
| | | | |
Utilities | | | | — | | | | | 590,396 | | | | | — | | | | | 590,396 | |
| | | | | | | | | | | | | | | | | | | | |
| | | | |
Total Investments in Securities | | | | $7,592,018 | | | | | $35,527,579 | | | | | — | | | | | $43,119,597 | |
| | | | | | | | | | | | | | | | | | | | |
| | 1 | An external pricing service is used to reflect any impact on security value due to market movements between the time the Fund valued such foreign securities and the earlier closing of foreign markets. |
For the fiscal year ended October 31, 2024, there were no transfers in or out of Level 3.
The accompanying notes are an integral part of these financial statements.
3
| | |
| | AMG Veritas Global Focus Fund Schedule of Portfolio Investments October 31, 2024 |
| | | | | | | | |
| | | Shares | | | Value | |
| | |
Common Stocks - 97.2% | | | | | | | | |
| | |
Communication Services - 9.4% | | | | | | | | |
| | |
Alphabet, Inc., Class A (United States) | | | 12,000 | | | | $2,053,320 | |
| | |
Charter Communications, Inc., Class A (United States)* | | | 2,978 | | | | 975,623 | |
| | |
Total Communication Services | | | | | | | 3,028,943 | |
| |
Consumer Discretionary - 13.4% | | | | | |
| | |
Amadeus IT Group SA (Spain) | | | 15,802 | | | | 1,145,539 | |
| | |
Amazon.com, Inc. (United States)* | | | 11,623 | | | | 2,166,527 | |
| | |
Cie Financiere Richemont SA (Switzerland) | | | 7,077 | | | | 1,030,415 | |
| | |
Total Consumer Discretionary | | | | | | | 4,342,481 | |
| |
Consumer Staples - 8.9% | | | | | |
| | |
Diageo PLC (United Kingdom) | | | 48,848 | | | | 1,508,513 | |
| | |
Unilever PLC (United Kingdom) | | | 22,587 | | | | 1,379,200 | |
| | |
Total Consumer Staples | | | | | | | 2,887,713 | |
| |
Financials - 11.6% | | | | | |
| | |
Aon PLC, Class A (United States) | | | 4,048 | | | | 1,485,090 | |
| | |
The Charles Schwab Corp. (United States) | | | 4,834 | | | | 342,392 | |
| | |
Intercontinental Exchange, Inc. (United States) | | | 6,141 | | | | 957,198 | |
| | |
Mastercard, Inc., Class A (United States) | | | 1,979 | | | | 988,688 | |
| | |
Total Financials | | | | | | | 3,773,368 | |
| |
Health Care - 20.8% | | | | | |
| | |
Becton Dickinson & Co. (United States) | | | 4,106 | | | | 959,121 | |
| | |
Bio-Rad Laboratories, Inc., Class A (United States)* | | | 1,776 | | | | 636,145 | |
| | |
The Cooper Cos., Inc. (United States)* | | | 6,204 | | | | 649,435 | |
| | |
Elevance Health, Inc. (United States) | | | 1,965 | | | | 797,318 | |
| | |
Sonic Healthcare, Ltd. (Australia) | | | 34,594 | | | | 609,558 | |
| | |
Thermo Fisher Scientific, Inc. (United States) | | | 1,646 | | | | 899,243 | |
| | |
UnitedHealth Group, Inc. (United States) | | | 2,593 | | | | 1,463,749 | |
| | | | | | | | |
| | | Shares | | | Value | |
| | |
Zoetis, Inc. (United States) | | | 4,098 | | | | $732,640 | |
| | |
Total Health Care | | | | | | | 6,747,209 | |
| |
Industrials - 23.8% | | | | | |
| | |
Aena SME SA (Spain)1 | | | 3,022 | | | | 669,736 | |
| | |
Airbus SE (France) | | | 8,975 | | | | 1,369,057 | |
| | |
Automatic Data Processing, Inc. (United States) | | | 2,392 | | | | 691,862 | |
| | |
Canadian Pacific Kansas City, Ltd. (Canada) | | | 17,542 | | | | 1,353,541 | |
| | |
Safran SA (France) | | | 5,980 | | | | 1,353,667 | |
| | |
Siemens AG (Germany) | | | 5,245 | | | | 1,020,414 | |
| | |
Vinci, S.A. (France) | | | 11,340 | | | | 1,270,315 | |
| | |
Total Industrials | | | | | | | 7,728,592 | |
| |
Information Technology - 9.3% | | | | | |
| | |
Dassault Systemes SE (France) | | | 17,729 | | | | 606,778 | |
| | |
Microsoft Corp. (United States) | | | 3,213 | | | | 1,305,603 | |
| | |
Salesforce, Inc. (United States) | | | 3,777 | | | | 1,100,504 | |
| | |
Total Information Technology | | | | | | | 3,012,885 | |
| |
Total Common Stocks
(Cost $28,703,563) | | | | 31,521,191 | |
| | |
Short-Term Investments - 3.2% | | | | | | | | |
| |
Other Investment Companies - 3.2% | | | | | |
| | |
Dreyfus Government Cash Management Fund, Institutional Shares, 4.76%2 | | | 415,393 | | | | 415,393 | |
| | |
Dreyfus Institutional Preferred Government Money Market Fund, Institutional Shares, 4.82%2 | | | 623,090 | | | | 623,090 | |
| |
Total Short-Term Investments
(Cost $1,038,483) | | | | 1,038,483 | |
| |
Total Investments - 100.4%
(Cost $29,742,046) | | | | 32,559,674 | |
| |
Other Assets, less Liabilities - (0.4)% | | | | (139,425 | ) |
| |
Net Assets - 100.0% | | | | $32,420,249 | |
| * | Non-income producing security. |
| 1 | Security exempt from registration under Rule 144A of the Securities Act of 1933. This security may be resold in transactions exempt from registration, normally to qualified institutional buyers. At October 31, 2024, the value of this security amounted to $669,736 or 2.1% of net assets. |
| 2 | Yield shown represents the October 31, 2024, seven day average yield, which refers to the sum of the previous seven days’ dividends paid, expressed as an annual percentage. |
The accompanying notes are an integral part of these financial statements.
4
| | |
| | AMG Veritas Global Focus Fund Schedule of Portfolio Investments (continued) |
The following table summarizes the inputs used to value the Fund’s investments by the fair value hierarchy levels as of October 31, 2024:
| | | | | | | | | | | | | | | | | | | | |
| | | Level 1 | | Level 21 | | Level 3 | | Total |
| | | | |
Investments in Securities | | | | | | | | | | | | | | | | | | | | |
| | | | |
Common Stocks | | | | | | | | | | | | | | | | | | | | |
| | | | |
Industrials | | | | $2,045,403 | | | | | $5,683,189 | | | | | — | | | | | $7,728,592 | |
| | | | |
Health Care | | | | 6,137,651 | | | | | 609,558 | | | | | — | | | | | 6,747,209 | |
| | | | |
Consumer Discretionary | | | | 2,166,527 | | | | | 2,175,954 | | | | | — | | | | | 4,342,481 | |
| | | | |
Financials | | | | 3,773,368 | | | | | — | | | | | — | | | | | 3,773,368 | |
| | | | |
Communication Services | | | | 3,028,943 | | | | | — | | | | | — | | | | | 3,028,943 | |
| | | | |
Information Technology | | | | 2,406,107 | | | | | 606,778 | | | | | — | | | | | 3,012,885 | |
| | | | |
Consumer Staples | | | | — | | | | | 2,887,713 | | | | | — | | | | | 2,887,713 | |
| | | | |
Short-Term Investments | | | | | | | | | | | | | | | | | | | | |
| | | | |
Other Investment Companies | | | | 1,038,483 | | | | | — | | | | | — | | | | | 1,038,483 | |
| | | | | | | | | | | | | | | | | | | | |
| | | | |
Total Investments in Securities | | | | $20,596,482 | | | | | $11,963,192 | | | | | — | | | | | $32,559,674 | |
| | | | | | | | | | | | | | | | | | | | |
| | 1 | An external pricing service is used to reflect any impact on security value due to market movements between the time the Fund valued such foreign securities and the earlier closing of foreign markets. |
For the fiscal year ended October 31, 2024, there were no transfers in or out of Level 3.
The accompanying notes are an integral part of these financial statements.
5
| | |
| | Statement of Assets and Liabilities October 31, 2024 |
| | | | | | | | |
| | |
| | | AMG Veritas
China Fund | | AMG Veritas
Global
Focus Fund |
| | |
Assets: | | | | | | | | |
| | |
Investments at value1 | | | $43,119,597 | | | | $32,559,674 | |
| | |
Receivable for investments sold | | | 1,037,291 | | | | 64,823 | |
| | |
Dividend and interest receivables | | | 30,647 | | | | 28,508 | |
| | |
Receivable for Fund shares sold | | | 622 | | | | — | |
| | |
Receivable from affiliate | | | 17,896 | | | | 11,211 | |
| | |
Prepaid expenses and other assets | | | 12,643 | | | | 11,683 | |
| | |
Total assets | | | 44,218,696 | | | | 32,675,899 | |
| | |
Liabilities: | | | | | | | | |
| | |
Payable for investments purchased | | | 447,700 | | | | 151,606 | |
| | |
Payable for Fund shares repurchased | | | 36,072 | | | | 12,319 | |
| | |
Due to custodian | | | 394,603 | | | | — | |
| | |
Accrued expenses: | | | | | | | | |
| | |
Investment advisory and management fees | | | 27,997 | | | | 18,766 | |
| | |
Administrative fees | | | 5,915 | | | | 4,202 | |
| | |
Distribution fees | | | — | | | | 395 | |
| | |
Shareholder service fees | | | 7,652 | | | | — | |
| | |
Other | | | 102,315 | | | | 68,362 | |
| | |
Total liabilities | | | 1,022,254 | | | | 255,650 | |
| | |
Commitments and Contingencies (Notes 2 & 6) | | | | | | | | |
| | |
Net Assets | | | $43,196,442 | | | | $32,420,249 | |
| | |
1 Investments at cost | | | $41,959,812 | | | | $29,742,046 | |
The accompanying notes are an integral part of these financial statements.
6
| | |
| | Statement of Assets and Liabilities (continued) |
| | | | | | | | |
| | |
| | | AMG Veritas China Fund | | AMG Veritas
Global Focus Fund |
| | |
Net Assets Represent: | | | | | | | | |
| | |
Paid-in capital | | | $95,552,677 | | | | $26,908,254 | |
| | |
Total distributable earnings (loss) | | | (52,356,235 | ) | | | 5,511,995 | |
| | |
Net Assets | | | $43,196,442 | | | | $32,420,249 | |
| | |
Class N: | | | | | | | | |
| | |
Net Assets | | | $38,482,433 | | | | $1,835,798 | |
| | |
Shares outstanding | | | 2,680,735 | | | | 99,360 | |
| | |
Net asset value, offering and redemption price per share | | | $14.36 | | | | $18.48 | |
| | |
Class I: | | | | | | | | |
| | |
Net Assets | | | $4,714,009 | | | | $30,584,451 | |
| | |
Shares outstanding | | | 310,977 | | | | 1,653,721 | |
| | |
Net asset value, offering and redemption price per share | | | $15.16 | | | | $18.49 | |
The accompanying notes are an integral part of these financial statements.
7
| | |
| | Statement of Operations For the fiscal year ended October 31, 2024 |
| | | | | | | | |
| | |
| | | AMG Veritas
China Fund | | | AMG Veritas
Global
Focus Fund | |
| | |
Investment Income: | | | | | | | | |
| | |
Dividend income | | | $1,126,758 | | | | $479,090 | |
| | |
Interest income | | | 376 | | | | 60 | |
| | |
Foreign withholding tax | | | (59,153 | ) | | | (33,833 | ) |
| | |
Total investment income | | | 1,067,981 | | | | 445,317 | |
| | |
Expenses: | | | | | | | | |
| | |
Investment advisory and management fees | | | 322,447 | | | | 207,109 | |
| | |
Administrative fees | | | 68,123 | | | | 46,368 | |
| | |
Distribution fees - Class N | | | — | | | | 4,743 | |
| | |
Shareholder servicing fees - Class N | | | 85,749 | | | | — | |
| | |
Custodian fees | | | 56,171 | | | | 22,609 | |
| | |
Professional fees | | | 40,269 | | | | 35,637 | |
| | |
Registration fees | | | 29,953 | | | | 24,044 | |
| | |
Reports to shareholders | | | 29,506 | | | | 15,872 | |
| | |
Transfer agent fees | | | 18,411 | | | | 10,622 | |
| | |
Trustee fees and expenses | | | 4,013 | | | | 2,605 | |
| | |
Interest expense | | | 4,267 | | | | 841 | |
| | |
Miscellaneous | | | 7,649 | | | | 4,573 | |
| | |
Total expenses before offsets | | | 666,558 | | | | 375,023 | |
| | |
Expense reimbursements | | | (154,182 | ) | | | (97,416 | ) |
| | |
Net expenses | | | 512,376 | | | | 277,607 | |
| | |
| | | | | | | | |
| | |
Net investment income | | | 555,605 | | | | 167,710 | |
| | |
Net Realized and Unrealized Gain (Loss): | | | | | | | | |
| | |
Net realized gain (loss) on investments | | | (14,707,022 | ) | | | 2,722,932 | |
| | |
Net realized loss on foreign currency transactions | | | (23,502 | ) | | | (1,464 | ) |
| | |
Net change in unrealized appreciation/depreciation on investments | | | 13,789,977 | | | | 4,082,207 | |
| | |
Net change in unrealized appreciation/depreciation on foreign currency translations | | | 211 | | | | 131 | |
| | |
Net realized and unrealized gain (loss) | | | (940,336 | ) | | | 6,803,806 | |
| | |
| | | | | | | | |
| | |
Net increase (decrease) in net assets resulting from operations | | | $(384,731 | ) | | | $6,971,516 | |
The accompanying notes are an integral part of these financial statements.
8
| | |
| | Statements of Changes in Net Assets For the fiscal years ended October 31, |
| | | | | | | | | | | | | | | | |
| | |
| | | AMG Veritas
China Fund | | AMG Veritas
Global Focus Fund |
| | | | |
| | | 2024 | | 2023 | | 2024 | | 2023 |
| | | | |
Increase (Decrease) in Net Assets Resulting From Operations: | | | | | | | | | | | | | | | | |
| | | | |
Net investment income | | | $555,605 | | | | $297,243 | | | | $167,710 | | | | $101,075 | |
| | | | |
Net realized gain (loss) on investments | | | (14,730,524) | | | | (15,900,351) | | | | 2,721,468 | | | | 644,035 | |
| | | | |
Net change in unrealized appreciation/depreciation on investments | | | 13,790,188 | | | | 17,401,526 | | | | 4,082,338 | | | | 2,524,779 | |
| | | | |
Net increase (decrease) in net assets resulting from operations | | | (384,731) | | | | 1,798,418 | | | | 6,971,516 | | | | 3,269,889 | |
| | | | |
Distributions to Shareholders: | | | | | | | | | | | | | | | | |
| | | | |
Class N | | | (369,167) | | | | — | | | | (43,904) | | | | (105,159) | |
| | | | |
Class I | | | (52,071) | | | | — | | | | (699,797) | | | | (1,469,160) | |
| | | | |
Total distributions to shareholders | | | (421,238) | | | | — | | | | (743,701) | | | | (1,574,319) | |
| | | | |
Capital Share Transactions:1 | | | | | | | | | | | | | | | | |
| | | | |
Net decrease from capital share transactions | | | (13,946,192) | | | | (5,363,205) | | | | (2,199,500) | | | | (3,080,647) | |
| | | | |
| | | | | | | | | | | | | | | | |
| | | | |
Total increase (decrease) in net assets | | | (14,752,161) | | | | (3,564,787) | | | | 4,028,315 | | | | (1,385,077) | |
| | | | |
Net Assets: | | | | | | | | | | | | | | | | |
| | | | |
Beginning of year | | | 57,948,603 | | | | 61,513,390 | | | | 28,391,934 | | | | 29,777,011 | |
| | | | |
End of year | | | $43,196,442 | | | | $57,948,603 | | | | $32,420,249 | | | | $28,391,934 | |
| | | | |
1 See Note 1(g) of the Notes to Financial Statements. | | | | | | | | | | | | | | | | |
The accompanying notes are an integral part of these financial statements.
9
| | |
| | AMG Veritas China Fund Financial Highlights For a share outstanding throughout each fiscal year |
| | | | | | | | | | | | | | | | | | | | | | | | | |
| |
| | | For the fiscal years ended October 31, |
| | | | | |
| Class N | | 2024 | | 2023 | | 2022 | | 2021 | | 2020 |
| | | | | |
Net Asset Value, Beginning of Year | | | | $14.43 | | | | | $14.29 | | | | | $24.13 | | | | | $37.61 | | | | | $41.44 | |
| | | | | |
Income (loss) from Investment Operations: | | | | | | | | | | | | | | | | | | | | | | | | | |
| | | | | |
Net investment income (loss)1,2 | | | | 0.16 | | | | | 0.07 | 3 | | | | (0.05 | )4 | | | | (0.02 | ) | | | | 0.09 | |
| | | | | |
Net realized and unrealized gain (loss) on investments | | | | (0.12 | ) | | | | 0.07 | | | | | (9.79 | ) | | | | 15.11 | | | | | (0.23 | ) |
| | | | | |
Total income (loss) from investment operations | | | | 0.04 | | | | | 0.14 | | | | | (9.84 | ) | | | | 15.09 | | | | | (0.14 | ) |
| | | | | |
Less Distributions to Shareholders from: | | | | | | | | | | | | | | | | | | | | | | | | | |
| | | | | |
Net investment income | | | | (0.11 | ) | | | | — | | | | | — | | | | | (0.01 | ) | | | | — | |
| | | | | |
Net realized gain on investments | | | | — | | | | | — | | | | | — | | | | | (24.49 | ) | | | | (3.69 | ) |
| | | | | |
Paid in capital | | | | — | | | | | — | | | | | — | | | | | (4.07 | ) | | | | — | |
| | | | | |
Total distributions to shareholders | | | | (0.11 | ) | | | | — | | | | | — | | | | | (28.57 | ) | | | | (3.69 | ) |
| | | | | |
Net Asset Value, End of Year | | | | $14.36 | | | | | $14.43 | | | | | $14.29 | | | | | $24.13 | | | | | $37.61 | |
| | | | | |
Total Return2,5 | | | | 0.36 | % | | | | 0.98 | % | | | | (40.78 | )% | | | | 30.40 | % | | | | (0.86 | )% |
| | | | | |
Ratio of net expenses to average net assets | | | | 1.15 | %6 | | | | 1.14 | % | | | | 1.14 | % | | | | 1.16 | %7 | | | | 1.18 | %7 |
| | | | | |
Ratio of gross expenses to average net assets8 | | | | 1.49 | % | | | | 1.33 | % | | | | 1.32 | % | | | | 1.24 | % | | | | 1.26 | % |
| | | | | |
Ratio of net investment income (loss) to average net assets2 | | | | 1.20 | % | | | | 0.43 | % | | | | (0.23 | )% | | | | (0.05 | )% | | | | 0.24 | % |
| | | | | |
Portfolio turnover | | | | 100 | % | | | | 83 | % | | | | 82 | % | | | | 184 | % | | | | 75 | % |
| | | | | |
Net assets end of year (000’s) omitted | | | | $38,482 | | | | | $47,618 | | | | | $54,250 | | | | | $111,537 | | | | | $114,122 | |
| | | | | | | | | | | | | | | | | | | | | | | | | | |
The accompanying notes are an integral part of these financial statements.
10
| | |
| | AMG Veritas China Fund Financial Highlights For a share outstanding throughout each fiscal year |
| | | | | | | | | | | | | | | | | | | | | | | | | |
| |
| | | For the fiscal years ended October 31, |
| | | | | |
| Class I | | 2024 | | 2023 | | 2022 | | 2021 | | 2020 |
| | | | | |
Net Asset Value, Beginning of Year | | | | $15.24 | | | | | $15.06 | | | | | $25.38 | | | | | $38.58 | | | | | $42.31 | |
| | | | | |
Income (loss) from Investment Operations: | | | | | | | | | | | | | | | | | | | | | | | | | |
| | | | | |
Net investment income (loss)1,2 | | | | 0.20 | | | | | 0.11 | 3 | | | | (0.00 | )4,9 | | | | 0.07 | | | | | 0.18 | |
| | | | | |
Net realized and unrealized gain (loss) on investments | | | | (0.13 | ) | | | | 0.07 | | | | | (10.32 | ) | | | | 15.40 | | | | | (0.22 | ) |
| | | | | |
Total income (loss) from investment operations | | | | 0.07 | | | | | 0.18 | | | | | (10.32 | ) | | | | 15.47 | | | | | (0.04 | ) |
| | | | | |
Less Distributions to Shareholders from: | | | | | | | | | | | | | | | | | | | | | | | | | |
| | | | | |
Net investment income | | | | (0.15 | ) | | | | — | | | | | — | | | | | (0.11 | ) | | | | — | |
| | | | | |
Net realized gain on investments | | | | — | | | | | — | | | | | — | | | | | (24.47 | ) | | | | (3.69 | ) |
| | | | | |
Paid in capital | | | | — | | | | | — | | | | | — | | | | | (4.09 | ) | | | | — | |
| | | | | |
Total distributions to shareholders | | | | (0.15 | ) | | | | — | | | | | — | | | | | (28.67 | ) | | | | (3.69 | ) |
| | | | | |
Net Asset Value, End of Year | | | | $15.16 | | | | | $15.24 | | | | | $15.06 | | | | | $25.38 | | | | | $38.58 | |
| | | | | |
Total Return2,5 | | | | 0.53 | % | | | | 1.20 | % | | | | (40.66 | )% | | | | 30.75 | % | | | | (0.62 | )% |
| | | | | |
Ratio of net expenses to average net assets | | |
| 0.94
| %6
| | | | 0.93 | % | | | | 0.93 | % | | | | 0.93 | %7 | | | | 0.93 | %7 |
| | | | | |
Ratio of gross expenses to average net assets8 | | | | 1.28 | % | | | | 1.12 | % | | | | 1.11 | % | | | | 1.00 | % | | | | 1.01 | % |
| | | | | |
Ratio of net investment income (loss) to average net assets2 | | | | 1.41 | % | | | | 0.64 | % | | | | (0.02 | )% | | | | 0.19 | % | | | | 0.49 | % |
| | | | | |
Portfolio turnover | | | | 100 | % | | | | 83 | % | | | | 82 | % | | | | 184 | % | | | | 75 | % |
| | | | | |
Net assets end of year (000’s) omitted | | | | $4,714 | | | | | $10,331 | | | | | $7,263 | | | | | $19,354 | | | | | $26,957 | |
| | | | | | | | | | | | | | | | | | | | | | | | | | |
| 1 | Per share numbers have been calculated using average shares. |
| 2 | Total returns and net investment income (loss) would have been lower had certain expenses not been offset. |
| 3 | Includes non-recurring dividends. Without these dividends, net investment income per share would have been $0.04 and $0.08 for Class N and Class I shares, respectively. |
| 4 | Includes non-recurring dividends. Without these dividends, net investment loss per share would have been $(0.08) and $(0.04) for Class N and Class I shares, respectively. |
| 5 | The total return is calculated using the published Net Asset Value as of fiscal year end. |
| 6 | Includes interest expense of 0.01% related to participation in the interfund lending program. |
| 7 | Includes reduction from broker recapture amounting to less than 0.01%, and 0.01% for the fiscal years ended 2021 and 2020, respectively. |
| 8 | Excludes the impact of expense reimbursement or fee waivers and expense reductions such as brokerage credits, but includes expense repayments and non-reimbursable expenses, if any, such as interest, taxes, and extraordinary expenses. (See Note 1(c) and 2 in the Notes to Financial Statements.) |
| 9 | Less than $(0.005) per share. |
The accompanying notes are an integral part of these financial statements.
11
| | |
| | AMG Veritas Global Focus Fund Financial Highlights For a share outstanding throughout each fiscal year |
| | | | | | | | | | | | | | | | | | | | | | | | | |
| |
| | | For the fiscal years ended October 31, |
| | | | | |
| Class N | | 2024 | | 2023 | | 2022 | | 2021 | | 2020 |
| | | | | |
Net Asset Value, Beginning of Year | | | | $15.08 | | | | | $14.33 | | | | | $19.85 | | | | | $34.02 | | | | | $34.33 | |
| | | | | |
Income (loss) from Investment Operations: | | | | | | | | | | | | | | | | | | | | | | | | | |
| | | | | |
Net investment income (loss)1,2 | | | | 0.05 | | | | | 0.02 | | | | | (0.03 | ) | | | | (0.05 | ) | | | | 0.07 | |
| | | | | |
Net realized and unrealized gain (loss) on investments | | | | 3.72 | | | | | 1.49 | | | | | (4.16 | ) | | | | 10.91 | | | | | (0.25 | ) |
| | | | | |
Total income (loss) from investment operations | | | | 3.77 | | | | | 1.51 | | | | | (4.19 | ) | | | | 10.86 | | | | | (0.18 | ) |
| | | | | |
Less Distributions to Shareholders from: | | | | | | | | | | | | | | | | | | | | | | | | | |
| | | | | |
Net investment income | | | | (0.02 | ) | | | | — | | | | | — | | | | | (0.05 | ) | | | | (0.08 | ) |
| | | | | |
Net realized gain on investments | | | | (0.35 | ) | | | | (0.76 | ) | | | | (1.33 | ) | | | | (24.98 | ) | | | | (0.05 | ) |
| | | | | |
Total distributions to shareholders | | | | (0.37 | ) | | | | (0.76 | ) | | | | (1.33 | ) | | | | (25.03 | ) | | | | (0.13 | ) |
| | | | | |
Net Asset Value, End of Year | | | | $18.48 | | | | | $15.08 | | | | | $14.33 | | | | | $19.85 | | | | | $34.02 | |
| | | | | |
Total Return2,3 | | | | 25.27 | % | | | | 10.95 | % | | | | (22.51 | )% | | | | 35.54 | % | | | | (0.54 | )% |
| | | | | |
Ratio of net expenses to average net assets | | | | 1.13 | %4 | | | | 1.13 | % | | | | 1.13 | % | | | | 1.13 | %5 | | | | 1.13 | %5 |
| | | | | |
Ratio of gross expenses to average net assets6 | | | | 1.45 | % | | | | 1.47 | % | | | | 1.35 | % | | | | 1.29 | % | | | | 1.29 | % |
| | | | | |
Ratio of net investment income (loss) to average net assets2 | | | | 0.31 | % | | | | 0.10 | % | | | | (0.16 | )% | | | | (0.17 | )% | | | | 0.22 | % |
| | | | | |
Portfolio turnover | | | | 42 | % | | | | 27 | % | | | | 21 | % | | | | 109 | % | | | | 45 | % |
| | | | | |
Net assets end of year (000’s) omitted | | | | $1,836 | | | | | $1,921 | | | | | $2,164 | | | | | $4,230 | | | | | $6,922 | |
| | | | | | | | | | | | | | | | | | | | | | | | | | |
The accompanying notes are an integral part of these financial statements.
12
| | |
| | AMG Veritas Global Focus Fund Financial Highlights For a share outstanding throughout each fiscal year |
| | | | | | | | | | | | | | | | | | | | | | | | | |
| |
| | | For the fiscal years ended October 31, |
| | | | | |
| Class I | | 2024 | | 2023 | | 2022 | | 2021 | | 2020 |
| | | | | |
Net Asset Value, Beginning of Year | | | | $15.09 | | | | | $14.32 | | | | | $19.80 | | | | | $34.00 | | | | | $34.31 | |
| | | | | |
Income (loss) from Investment Operations: | | | | | | | | | | | | | | | | | | | | | | | | | |
| | | | | |
Net investment income1,2 | | | | 0.10 | | | | | 0.05 | | | | | 0.02 | | | | | 0.02 | | | | | 0.16 | |
| | | | | |
Net realized and unrealized gain (loss) on investments | | | | 3.71 | | | | | 1.50 | | | | | (4.17 | ) | | | | 10.91 | | | | | (0.25 | ) |
| | | | | |
Total income (loss) from investment operations | | | | 3.81 | | | | | 1.55 | | | | | (4.15 | ) | | | | 10.93 | | | | | (0.09 | ) |
| | | | | |
Less Distributions to Shareholders from: | | | | | | | | | | | | | | | | | | | | | | | | | |
| | | | | |
Net investment income | | | | (0.06 | ) | | | | (0.02 | ) | | | | — | | | | | (0.15 | ) | | | | (0.17 | ) |
| | | | | |
Net realized gain on investments | | | | (0.35 | ) | | | | (0.76 | ) | | | | (1.33 | ) | | | | (24.98 | ) | | | | (0.05 | ) |
| | | | | |
Total distributions to shareholders | | | | (0.41 | ) | | | | (0.78 | ) | | | | (1.33 | ) | | | | (25.13 | ) | | | | (0.22 | ) |
| | | | | |
Net Asset Value, End of Year | | | | $18.49 | | | | | $15.09 | | | | | $14.32 | | | | | $19.80 | | | | | $34.00 | |
| | | | | |
Total Return2,3 | | | | 25.58 | % | | | | 11.24 | % | | | | (22.35 | )% | | | | 35.85 | % | | | | (0.27 | )% |
| | | | | |
Ratio of net expenses to average net assets | | | | 0.88 | %4 | | | | 0.88 | % | | | | 0.88 | % | | | | 0.88 | %5 | | | | 0.88 | %5 |
| | | | | |
Ratio of gross expenses to average net assets6 | | | | 1.20 | % | | | | 1.22 | % | | | | 1.10 | % | | | | 1.04 | % | | | | 1.04 | % |
| | | | | |
Ratio of net investment income to average net assets2 | | | | 0.56 | % | | | | 0.35 | % | | | | 0.09 | % | | | | 0.08 | % | | | | 0.47 | % |
| | | | | |
Portfolio turnover | | | | 42 | % | | | | 27 | % | | | | 21 | % | | | | 109 | % | | | | 45 | % |
| | | | | |
Net assets end of year (000’s) omitted | | | | $30,584 | | | | | $26,471 | | | | | $27,613 | | | | | $44,598 | | | | | $55,746 | |
| | | | | | | | | | | | | | | | | | | | | | | | | | |
| 1 | Per share numbers have been calculated using average shares. |
| 2 | Total returns and net investment income (loss) would have been lower had certain expenses not been offset. |
| 3 | The total return is calculated using the published Net Asset Value as of fiscal year end. |
| 4 | Includes interest expense of less than 0.01% related to participation in the interfund lending program. |
| 5 | Includes reduction from broker recapture amounting to less than 0.01% and 0.01% for the fiscal years ended 2021 and 2020, respectively. |
| 6 | Excludes the impact of expense reimbursement or fee waivers and expense reductions such as brokerage credits, but includes expense repayments and non-reimbursable expenses, if any, such as interest, taxes, and extraordinary expenses. (See Note 1(c) and 2 in the Notes to Financial Statements.) |
The accompanying notes are an integral part of these financial statements.
13
| | |
| | Notes to Financial Statements October 31, 2024 |
1. ORGANIZATION AND SUMMARY OF SIGNIFICANT ACCOUNTING POLICIES
AMG Funds I (the “Trust”) is an open-end management investment company, organized as a Massachusetts business trust, and registered under the Investment Company Act of 1940, as amended (the “1940 Act”). Currently, the Trust consists of a number of different funds, each having distinct investment management objectives, strategies, risks, and policies. Included in this report are AMG Veritas China Fund (“China Fund”) and AMG Veritas Global Focus Fund (“Global Focus”), each a “Fund” and collectively, the “Funds”.
Each Fund offers Class N and Class I shares. Each class represents an interest in the same assets of the respective Fund. Although all share classes generally have identical voting rights, each share class votes separately when required by law. Different share classes may have different net asset values per share to the extent the share classes pay different distribution amounts and/or the expenses of such share classes differ. Each share class has its own expense structure. Please refer to a current prospectus for additional information on each share class.
The Funds are non-diversified.
The Funds’ financial statements are prepared in accordance with accounting principles generally accepted in the United States of America (“U.S. GAAP”), including accounting and reporting guidance pursuant to Accounting Standards Codification Topic 946 applicable to investment companies. U.S. GAAP requires management to make estimates and assumptions that affect the reported amounts of assets and liabilities and disclosure of contingent assets and liabilities at the date of the financial statements and the reported amounts of income and expenses during the reporting period. Actual results could differ from those estimates and such differences could be material. The following is a summary of significant accounting policies followed by the Funds in the preparation of their financial statements:
a. VALUATION OF INVESTMENTS
Equity securities traded on a national securities exchange or reported on the NASDAQ national market system (“NMS”) are valued at the last quoted sales price on the primary exchange or, if applicable, the NASDAQ official closing price or the official closing price of the relevant exchange or, lacking any sales, at the last quoted bid price. Equity securities held by the Funds that are traded in the over-the-counter market (other than NMS securities) are valued at the bid price. Foreign equity securities (securities principally traded in markets other than U.S. markets) held by the Funds are valued at the official closing price on the primary exchange or, for markets that either do not offer an official closing price or where the official closing price may not be representative of the overall market, the last quoted sale price.
Fixed income securities purchased with a remaining maturity of 60 days or less are valued at amortized cost, provided that the amortized cost value is approximately the same as the fair value of the security valued without the use of amortized cost. Investments in other open-end registered investment companies are valued at their end of day net asset value per share.
The Funds’ portfolio investments are generally valued based on independent market quotations or prices or, if none, “evaluative” or other market based valuations provided by third party pricing services. Pursuant to Rule 2a-5 under the 1940 Act, the Funds’ Board of Trustees (the “Board”) designated AMG Funds LLC (the “Investment Manager”) as the Funds’ Valuation Designee to perform the Funds’ fair value determinations. Such determinations are subject to Board
oversight and certain reporting and other requirements intended to ensure that the Board receives the information it needs to oversee the Investment Manager’s fair value determinations.
Under certain circumstances, the value of certain Fund portfolio investments may be based on an evaluation of fair value, pursuant to procedures established by the Investment Manager and under the general supervision of the Board. The Funds may use the fair value of a portfolio investment to calculate its net asset value (“NAV”) in the event that the market quotation, price or market based valuation for the portfolio investment is not readily available or otherwise not determinable pursuant to the Funds’ valuation procedures, if the Investment Manager believes the quotation, price or market based valuation to be unreliable, or in certain other circumstances. When determining the fair value of an investment, the Investment Manager seeks to determine the price that the Funds might reasonably expect to receive from current sale of that portfolio investment in an arms-length transaction. Fair value determinations shall be based upon consideration of all available facts and information, including, but not limited to (i) attributes specific to the investment; (ii) fundamental and analytical data relating to the investment; and (iii) the value of other comparable securities or relevant financial instruments, including derivative securities, traded on other markets or among dealers.
The values assigned to fair value portfolio investments are based on available information and do not necessarily represent amounts that might ultimately be realized in the future, since such amounts depend on future developments inherent in long-term investments. Because of the inherent uncertainty of valuation, those estimated values may differ significantly from the values that would have been used had a ready market for the investments existed, and the differences could be material. The Board will be presented with quarterly reports, as of the most recent quarter end, summarizing all fair value activity, material fair value matters that occurred during the quarter, and all outstanding securities fair valued by the Funds. Additionally, the Board will be presented with an annual report that assesses the adequacy and effectiveness of the Investment Manager’s process for determining the fair value of the Funds’ investments.
With respect to foreign equity securities and certain foreign fixed income securities, securities held in the Funds that can be fair valued by the applicable fair value pricing service are fair valued on each business day provided that each individual price exceeds a pre-established confidence level.
U.S. GAAP defines fair value as the price that a fund would receive to sell an asset or pay to transfer a liability in an orderly transaction between market participants at the measurement date. U.S. GAAP also establishes a framework for measuring fair value, and a three level hierarchy for fair value measurements based upon the transparency of inputs to the valuation of an asset or liability. Inputs may be observable or unobservable and refer broadly to the assumptions that market participants would use in pricing the asset or liability. Observable inputs reflect the assumptions market participants would use in pricing the asset or liability based on market data obtained from sources independent of the Funds.
Unobservable inputs reflect the Funds’ own assumptions about the assumptions that market participants would use in pricing the asset or liability developed based on the best information available in the circumstances. Each investment is assigned a level based upon the observability of the inputs which are significant to the overall valuation.
The three-tier hierarchy of inputs is summarized below:
Level 1 – inputs are quoted prices in active markets for identical investments (e.g., equity securities, open-end investment companies)
14
| | |
| | Notes to Financial Statements (continued) |
Level 2 – other observable inputs (including, but not limited to: quoted prices for similar assets or liabilities in markets that are active, quoted prices for identical or similar assets or liabilities in markets that are not active, inputs other than quoted prices that are observable for the assets or liabilities (such as interest rates, yield curves, volatilities, prepayment speeds, loss severities, credit risks and default rates) or other market corroborated inputs) (e.g., debt securities, government securities, foreign securities utilizing international fair value pricing, fair valued securities with observable inputs)
Level 3 – inputs are significant unobservable inputs (including the Fund’s own assumptions used to determine the fair value of investments) (e.g., fair valued securities with unobservable inputs)
Changes in inputs or methodologies used for valuing investments may result in a transfer in or out of levels within the fair value hierarchy. The inputs or methodologies used for valuing investments may not necessarily be an indication of the risk associated with investing in those investments.
b. SECURITY TRANSACTIONS
Security transactions are accounted for as of trade date. Realized gains and losses on securities sold are determined on the basis of identified cost.
c. INVESTMENT INCOME AND EXPENSES
Dividend income is recorded on the ex-dividend date. Dividends from foreign securities are recorded on the ex-dividend date, and if after the fact, as soon as the Funds become aware of the ex-dividend date. Interest income, which includes amortization of premium and accretion of discount on debt securities, is accrued as earned. Dividend and interest income on foreign securities is recorded gross of any withholding tax. Non-cash dividends included in dividend income, if any, are
reported at the fair market value of the securities received. Other income and expenses are recorded on an accrual basis. Expenses that cannot be directly attributed to a Fund are apportioned among the funds in the Trust and other trusts or funds within the AMG Funds Family of Funds (collectively, the “AMG Funds Family”) based upon their relative average net assets or number of shareholders. Investment income, realized and unrealized capital gains and losses, the common expenses of each Fund, and certain fund level expense reductions, if any, are allocated on a pro-rata basis to each class based on the relative net assets of each class to the total net assets of each Fund.
d. DIVIDENDS AND DISTRIBUTIONS
Fund distributions resulting from either net investment income or realized net capital gains, if any, will normally be declared and paid at least annually in December. Distributions to shareholders are recorded on the ex-dividend date. Distributions are determined in accordance with federal income tax law, which may differ from net investment income and net realized capital gains for financial statement purposes (U.S. GAAP). Differences may be permanent or temporary. Permanent differences are reclassified among capital accounts in the financial statements to reflect their tax character. Permanent book and tax basis differences, if any, relating to shareholder distributions will result in reclassifications to paid-in capital. Temporary differences arise when certain items of income, expense and gain or loss are recognized in different periods for financial statement and tax purposes; these differences will reverse at some time in the future. For China Fund there are no permanent differences. Permanent differences for Global Focus are primarily due to tax equalization utilized. Temporary differences for China Fund and Global Focus are primarily due to wash sale loss deferrals.
The tax character of distributions paid during the fiscal years ended October 31, 2024 and October 31, 2023 was as follows:
| | | | | | | | | | | | | | | | |
| | | China Fund | | | Global Focus | |
| | | | |
| Distributions paid from: | | 2024 | | | 2023 | | | 2024 | | | 2023 | |
| | | | |
Ordinary income * | | | $421,238 | | | | — | | | | $101,942 | | | | $34,025 | |
| | | | |
Long-term capital gains | | | — | | | | — | | | | 641,759 | | | | 1,540,294 | |
| | | | | | | | | | | | | | | | |
| | | | |
| | | $421,238 | | | | — | | | | $743,701 | | | | $1,574,319 | |
| | | | | | | | | | | | | | | | |
* For tax purposes, short-term capital gain distributions, if any, are considered ordinary income distributions.
As of October 31, 2024, the components of distributable earnings (excluding unrealized appreciation/depreciation) on a tax basis consisted of:
| | | | | | | | |
| | | China Fund | | | Global Focus | |
| | |
Capital loss carryforward | | | $53,834,489 | | | | — | |
| | |
Undistributed ordinary income | | | 531,864 | | | | $305,819 | |
| | |
Undistributed long-term capital gains | | | — | | | | 2,561,291 | |
At October 31, 2024, the cost of investments and the aggregate gross unrealized appreciation and depreciation for federal income tax purposes were as follows:
| | | | | | | | | | | | | | | | |
| Fund | | Cost | | | Appreciation | | | Depreciation | | | Net Appreciation | |
| | | | |
China Fund | | | $42,173,418 | | | | $4,041,018 | | | | $(3,094,628) | | | | $946,390 | |
| | | | |
Global Focus | | | 29,914,770 | | | | 4,792,042 | | | | (2,147,157) | | | | 2,644,885 | |
15
| | |
| | Notes to Financial Statements (continued) |
e. FEDERAL TAXES
Each Fund currently qualifies as an investment company and intends to comply with the requirements under Subchapter M of the Internal Revenue Code of 1986, as amended (the “Code”), and to distribute substantially all of its taxable income and gains to its shareholders and to meet certain diversification and income requirements with respect to investment companies. The Investment Manager has analyzed the Funds’ tax positions taken on federal income tax returns as of October 31, 2024, and for all open tax years (generally, the three prior taxable years), and has concluded that no provision for federal income tax is required in the Funds’ financial statements. Additionally, the Investment Manager is not aware of any tax position for which it is reasonably possible that the total amounts of unrecognized tax benefit/detriment will change materially in the next twelve months.
Furthermore, based on each Fund’s understanding of the tax rules and rates related to income, gains and transactions for the foreign jurisdictions in which it invests, each Fund will provide for foreign taxes, and where appropriate, deferred foreign taxes.
f. CAPITAL LOSS CARRYOVERS AND DEFERRALS
As of October 31, 2024, the following Fund had capital loss carryovers for federal income tax purposes as shown in the following chart. These amounts may be used to offset future realized capital gains indefinitely, and retain their character as short-term and/or long-term.
| | | | | | | | | | | | |
| Fund | | Short-Term | | | Long-Term | | | Total | |
| | | |
China Fund | | | $30,959,841 | | | | $22,874,648 | | | | $53,834,489 | |
As of October 31, 2024, Global Focus had no capital loss carryovers for federal income tax purposes. Should Global Focus incur net capital losses for the fiscal year ended October 31, 2025, such amounts may be used to offset future realized capital gains indefinitely, and retain their character as either short-term and/or long-term.
For the fiscal year ended October 31, 2024, the Funds did not utilize capital loss carryovers.
g. CAPITAL STOCK
The Trust’s Amended and Restated Agreement and Declaration of Trust authorizes for each Fund the issuance of an unlimited number of shares of beneficial interest, without par value. Each Fund records sales and repurchases of its capital stock on the trade date.
For the fiscal years ended October 31, 2024 and October 31, 2023, the capital stock transactions by class for the Funds were as follows:
| | | | | | | | | | | | | | | | | | | | | | | | | | | | | | | | |
| | |
| | | China Fund | | | Global Focus | |
| | | | |
| | | October 31, 2024 | | | October 31, 2023 | | | October 31, 2024 | | | October 31, 2023 | |
| | | | | | | | |
| | | Shares | | | Amount | | | Shares | | | Amount | | | Shares | | | Amount | | | Shares | | | Amount | |
| | | | | | | | |
Class N: | | | | | | | | | | | | | | | | | | | | | | | | | | | | | | | | |
| | | | | | | | |
Shares sold | | | 36,921 | | | | $508,896 | | | | 55,548 | | | | $958,600 | | | | 2,405 | | | | $40,991 | | | | 4,263 | | | | $64,262 | |
| | | | | | | | |
Shares issued in reinvestment of distributions | | | 27,022 | | | | 364,260 | | | | — | | | | — | | | | 2,457 | | | | 40,152 | | | | 6,655 | | | | 92,505 | |
| | | | | | | | |
Shares redeemed | | | (682,936) | | | | (9,195,659) | | | | (552,675) | | | | (9,080,182) | | | | (32,893) | | | | (555,304) | | | | (34,603) | | | | (525,536) | |
| | | | | | | | | | | | | | | | | | | | | | | | | | | | | | | | |
| | | | | | | | |
Net decrease | | | (618,993) | | | | $(8,322,503) | | | | (497,127) | | | | $(8,121,582) | | | | (28,031) | | | | $(474,161) | | | | (23,685) | | | | $(368,769) | |
| | | | | | | | | | | | | | | | | | | | | | | | | | | | | | | | |
| | | | | | | | |
Class I: | | | | | | | | | | | | | | | | | | | | | | | | | | | | | | | | |
| | | | | | | | |
Shares sold | | | 217,060 | | | | $3,288,229 | | | | 366,125 | | | | $5,886,089 | | | | 178,307 | | | | $3,135,894 | | | | 7,405 | | | | $110,220 | |
| | | | | | | | |
Shares issued in reinvestment of distributions | | | 3,600 | | | | 51,149 | | | | — | | | | — | | | | 42,198 | | | | 688,669 | | | | 104,088 | | | | 1,445,776 | |
| | | | | | | | |
Shares redeemed | | | (587,596) | | | | (8,963,067) | | | | (170,569) | | | | (3,127,712) | | | | (320,467) | | | | (5,549,902) | | | | (285,637) | | | | (4,267,874) | |
| | | | | | | | | | | | | | | | | | | | | | | | | | | | | | | | |
| | | | | | | | |
Net increase (decrease) | | | (366,936) | | | | $(5,623,689) | | | | 195,556 | | | | $2,758,377 | | | | (99,962) | | | | $(1,725,339) | | | | (174,144) | | | | $(2,711,878) | |
| | | | | | | | | | | | | | | | | | | | | | | | | | | | | | | | |
h. REPURCHASE AGREEMENTS AND JOINT REPURCHASE AGREEMENTS
The Funds may enter into third-party and bilateral repurchase agreements for temporary cash management purposes and for reinvestment of cash collateral on securities lending transactions under the securities lending program offered by The Bank of New York Mellon (“BNYM”) (the “Securities Lending Program”) (collectively, “Repurchase Agreements”). The value of the underlying collateral, including accrued interest, must equal or exceed the value of the Repurchase Agreements during the term of the agreement. For joint repurchase agreements, the Funds participate on a pro rata basis with other clients of BNYM in their share of the underlying collateral under such joint repurchase agreements and in their share of proceeds from any repurchase or other disposition of the underlying
collateral. The underlying collateral for all Repurchase Agreements is held by the Funds’ custodian or at the Federal Reserve Bank. If the seller defaults and the value of the collateral declines, or if bankruptcy proceedings commence with respect to the seller of the security, realization of the collateral by the Funds may be delayed or limited. Pursuant to the Securities Lending Program, the Funds are indemnified for such losses by BNYM on joint repurchase agreements.
At October 31, 2024, the Funds had no Repurchase Agreements outstanding.
16
| | |
| | Notes to Financial Statements (continued) |
i. FOREIGN CURRENCY TRANSLATION
The books and records of the Funds are maintained in U.S. Dollars. The value of investments, assets and liabilities denominated in currencies other than U.S. Dollars are translated into U.S. Dollars based upon current foreign exchange rates. Purchases and sales of foreign investments, income and expenses are converted into U.S. Dollars based on currency exchange rates prevailing on the respective dates of such transactions. Net realized and unrealized gain (loss) on foreign currency transactions represent: (1) foreign exchange gains and losses from the sale and holdings of foreign currencies; (2) gains and losses between trade date and settlement date on investment securities transactions and foreign currency exchange contracts; and (3) gains and losses from the difference between amounts of interest and dividends recorded and the amounts actually received.
The Funds do not isolate the net realized and unrealized gain or loss resulting from changes in exchange rates from the fluctuations in market prices of securities held. Such fluctuations are included with the net realized and unrealized gain or loss on investments.
2. AGREEMENTS AND TRANSACTIONS WITH AFFILIATES
For each of the Funds, the Trust has entered into an investment advisory agreement under which the Investment Manager, a subsidiary and the U.S. wealth platform of Affiliated Managers Group, Inc. (“AMG”), serves as investment manager to the Funds and is responsible for the Funds’ overall administration and operations. The Investment Manager selects and recommends, subject to the approval of the Board and, in certain circumstances, shareholders, the subadviser for the Funds and monitors the subadviser’s investment performance, security holdings and investment strategies. Each Fund’s investment portfolio is managed by Veritas Asset Management LLP (“Veritas”) who serves pursuant to a subadvisory agreement with the Investment Manager. AMG indirectly owns a majority interest in Veritas.
Investment management fees are paid directly by the Funds to the Investment Manager based on average daily net assets. For the fiscal year ended October 31, 2024, the Funds’ investment management fees were paid at the following annual rate of each Fund’s respective average daily net assets:
| | | | |
| |
China Fund | | | 0.71% | |
| |
Global Focus | | | 0.67% | |
| |
The fee paid to Veritas for its services as subadviser is paid out of the fee the Investment Manager receives from each Fund and does not increase the expenses of each Fund.
The Investment Manager has contractually agreed, through at least March 1, 2025, to waive management fees and/or pay or reimburse fund expenses in order to limit total annual Fund operating expenses after fee waiver and expense reimbursements (exclusive of taxes, interest (including interest incurred in connection with bank and custody overdrafts, and in connection with securities sold short), shareholder servicing fees, distribution and service (12b-1) fees, brokerage commissions and other transaction costs, dividends payable with respect to securities sold short, acquired fund fees and expenses and extraordinary expenses) of China Fund and Global Focus to 0.93% and 0.88%, respectively, of each Fund’s average daily net assets (this annual rate or such
other annual rate that may be in effect from time to time, the “Expense Cap”), subject to later reimbursement by the Funds in certain circumstances.
In general, for a period of up to 36 months after the date any amounts are paid, waived or reimbursed by the Investment Manager, the Investment Manager may recover such amounts from a Fund, provided that such repayment would not cause the Fund’s total annual operating expenses after fee waiver and expense reimbursements (exclusive of the items noted in the parenthetical above) to exceed either (i) the Expense Cap in effect at the time such amounts were paid, waived or reimbursed, or (ii) the Expense Cap in effect at the time of such repayment by the Fund.
The contractual expense limitation may only be terminated in the event the Investment Manager or a successor ceases to be the investment manager of a Fund or a successor fund, by mutual agreement between the Investment Manager and the Board, or in the event of a Fund’s liquidation unless the Fund is reorganized or is a party to a merger in which the surviving entity is successor to the accounting and performance information of a Fund.
For the fiscal year ended October 31, 2024, the Investment Manager’s expense reimbursements, and repayments of prior reimbursements by the Funds to the Investment Manager, if any, are as follows:
| | | | |
| | | Expense
Reimbursements | | Repayment of
Prior Reimbursements |
| | |
China Fund | | $154,182 | | — |
| | |
Global Focus | | 97,416 | | — |
At October 31, 2024, the Funds’ expiration of reimbursements subject to recoupment is as follows:
| | | | | | | | |
| | |
Expiration Period | | China Fund | | | Global Focus | |
| | |
Less than 1 year | | | $167,199 | | | | $83,530 | |
| | |
1-2 years | | | 121,271 | | | | 103,085 | |
| | |
2-3 years | | | 154,182 | | | | 97,416 | |
| | |
| | | | | | | | |
| | |
Total | | | $442,652 | | | | $284,031 | |
| | | | | | | | |
The Trust, on behalf of the Funds, has entered into an amended and restated Administration Agreement under which the Investment Manager serves as the Funds’ administrator (the “Administrator”) and is responsible for certain aspects of managing the Funds’ operations, including administration and shareholder services to each Fund. Each Fund pays a fee to the Administrator at the rate of 0.15% per annum of the Fund’s average daily net assets for this service.
The Funds are distributed by AMG Distributors, Inc. (the “Distributor”), a wholly-owned subsidiary of the Investment Manager. The Distributor serves as the distributor and underwriter for each Fund and is a registered broker-dealer and member of the Financial Industry Regulatory Authority, Inc. (“FINRA”). Shares of each Fund will be continuously offered and will be sold directly to prospective purchasers and through brokers, dealers or other financial intermediaries who have executed selling agreements with the Distributor. Generally, the Distributor bears all or a portion of the expenses of providing services pursuant to the distribution agreement, including the payment of the expenses relating to the distribution of prospectuses for sales purposes and any advertising or sales literature.
17
| | |
| | Notes to Financial Statements (continued) |
Global Focus has adopted a distribution and service plan (the “Plan”) with respect to the Class N shares, in accordance with the requirements of Rule 12b-1 under the 1940 Act and the requirements of the applicable rules of FINRA regarding asset-based sales charges. Pursuant to the Plan, Global Focus may make payments to the Distributor for its expenditures in financing any activity primarily intended to result in the sale of the Fund’s Class N shares and for maintenance and personal service provided to existing shareholders of that class. The Plan authorizes payments to the Distributor up to 0.25% annually of the Fund’s average daily net assets attributable to the Class N shares.
For Class N shares of China Fund, the Board has approved reimbursement payments to the Investment Manager for shareholder servicing expenses (“shareholder servicing fees”) incurred. Shareholder servicing fees include payments to financial intermediaries, such as broker-dealers (including fund supermarket platforms), banks, and trust companies who provide shareholder recordkeeping, account servicing and other services. The Class N shares of China Fund may reimburse the Investment Manager for the actual amount incurred up to a maximum annual rate of Class N’s average daily net assets as shown in the table below.
The impact on the annualized expense ratios for the fiscal year ended October 31, 2024, was as follows:
| | | | | | | | |
| | |
Fund | | Maximum Annual
Amount
Approved | | | Actual
Amount
Incurred | |
| | |
China Fund | | | | | | | | |
| | |
Class N | | | 0.25 | % | | | 0.21 | % |
The Board provides supervision of the affairs of the Trust and other trusts within the AMG Funds Family. The Trustees of the Trust who are not affiliated with the Investment Manager receive an annual retainer and per meeting fees for regular, special and telephonic meetings, and they are reimbursed for out-of-pocket expenses incurred while carrying out their duties as Board members. The Chairman of the Board and the Audit Committee Chair receive additional annual retainers. Certain Trustees and Officers of the Funds are Officers and/or Directors of the Investment Manager, AMG and/or the Distributor.
The Securities and Exchange Commission (the “SEC”) granted an exemptive order that permits certain eligible funds in the AMG Funds Family to lend and borrow money for certain temporary purposes directly to and from other eligible funds in the AMG Funds Family. Participation in this interfund lending program is voluntary for both the borrowing and lending funds, and an interfund loan is only made if it benefits each participating fund. The Administrator manages the program according to procedures approved by the Board, and the Board monitors the operation of the program. An interfund loan must comply with certain conditions set out in the exemptive order, which are designed to assure fairness and protect all participating funds. The interest earned and interest paid on interfund loans are included on the Statement of Operations as interest income and interest expense, respectively. At October 31, 2024, the Funds had no interfund loans outstanding.
The following Funds utilized the interfund lending program during the fiscal year ended October 31, 2024 as follows:
| | | | | | | | | | | | | | | | |
| Fund | | Average Lent | | | Number of Days | | | Interest Earned | | | Average Interest Rate | |
| | | | |
| China Fund | | | $2,206,943 | | | | 1 | | | | $376 | | | | 6.225% | |
| | | | |
| Global Focus | | | 350,818 | | | | 1 | | | | 60 | | | | 6.235% | |
| |
| | | | | | | | | | | | | | | | |
| Fund | | Average Borrowed | | | Number of Days | | | Interest Paid | | | Average Interest Rate | |
| | | | |
| China Fund | | | $1,390,463 | | | | 18 | | | | $4,267 | | | | 6.223% | |
| | | | |
| Global Focus | | | 2,465,451 | | | | 2 | | | | 841 | | | | 6.225% | |
| |
3. PURCHASES AND SALES OF SECURITIES
Purchases and sales of securities (excluding short-term securities and U.S. Government Obligations) for the fiscal year ended October 31, 2024, were as follows:
| | | | | | | | |
| | | Long Term Securities | |
| | |
| Fund | | Purchases | | | Sales | |
| | |
China Fund | | $ | 44,054,869 | | | $ | 53,105,674 | |
| | |
Global Focus | | | 12,563,261 | | | | 15,409,367 | |
The Funds had no purchases or sales of U.S. Government Obligations during the fiscal year ended October 31, 2024.
4. PORTFOLIO SECURITIES LOANED
The Funds participate in the Securities Lending Program providing for the lending of securities to qualified borrowers. Securities lending income includes earnings of such temporary cash investments, plus or minus any rebate to a borrower. These earnings (after any rebate) are then divided between BNYM, as a fee for its services under the Securities Lending Program, and the Funds, according to agreed-upon rates. Collateral on all securities loaned is accepted in cash, U.S. Treasury Obligations or U.S. Government Agency Obligations. Collateral is maintained at a minimum level of 102% (105% in the case of certain foreign securities) of the market value, plus interest, if applicable, of investments on loan. It is the Funds’ policy to obtain additional collateral from or return excess collateral to the borrower by the end of the next business day, following the valuation date of the securities loaned. Therefore, the value of the collateral held may be temporarily less than the value of the securities on loan. Lending securities entails a risk of loss to the Funds if and to the extent that the market value of the securities loaned were to increase and the borrower did not increase the collateral accordingly, and the borrower fails to return the securities. Under the terms of the Securities Lending Program, the Funds are indemnified for such losses by BNYM. Cash collateral is held in separate omnibus accounts managed by BNYM, who is authorized to exclusively enter into joint repurchase agreements for that cash collateral. Securities collateral is held in separate omnibus accounts managed by BNYM and cannot be sold or pledged. BNYM bears the risk of any deficiency in the amount of the cash collateral available for return to the borrower due to any loss on the collateral invested. Loans of securities are terminable at any time and the borrower, after notice, is required to return borrowed securities as soon as practical, which is normally within three business days.
18
| | |
| | Notes to Financial Statements (continued) |
The Funds did not have any securities on loan at October 31, 2024.
5. FUND RISKS
In the normal course of business, the Funds invest in securities or other instruments and may enter into certain transactions, and such activities subject the Funds to various risks. The value of securities or other instruments may also be affected by various factors, including, without limitation: (i) the general economy; (ii) the overall market as well as local, regional or global political and/or social instability; or (iii) currency and price fluctuations. Each risk described below does not necessarily apply to each Fund. Please refer to each Fund’s prospectus for a description of the principal risks associated with investing in a particular Fund.
Market Risk: Market prices of investments held by the Funds may fall rapidly or unpredictably due to a variety of factors, including economic, political, or market conditions, or other factors including terrorism, war, natural disasters and the spread of infectious illness or other public health issues, including epidemics or pandemics, or in response to events that affect particular industries or companies.
Management Risk: Because the Funds are actively managed investment portfolios, security selection or focus on securities in a particular style, market sector or group of companies may cause the Funds to incur losses or underperform relative to its benchmarks or other funds with a similar investment objective. There can be no guarantee that Veritas’ investment techniques and risk analysis will produce the desired result.
Non-Diversified Fund Risk: The Funds are non-diversified and therefore a greater percentage of holdings may be focused in a small number of issuers or a single issuer, which can place the Funds at greater risk. Notwithstanding the Funds’ status as “non-diversified” investment companies under the 1940 Act, each Fund intends to qualify as a regulated investment company accorded favorable tax treatment under the Code, which imposes its own diversification requirements that are less restrictive than the requirements applicable to “diversified” investment companies under the 1940 Act. Each Fund’s intention to qualify as a regulated investment company may limit its pursuit of its investment strategy and its investment strategy could limit its ability to so qualify.
Focused Investment Risk: To the extent a Fund invests a substantial portion of its assets in a relatively small number of securities or a particular market, industry, group of industries, country, region, group of countries, asset class or sector, it generally will be subject to greater risk than a fund that invests in a more diverse investment portfolio. In addition, the value of a Fund would be more susceptible to any single economic, market, political or regulatory occurrence affecting, for example, that particular market, industry, region or sector.
Sector Risk: Issuers and companies that are in similar industry sectors may be similarly affected by particular economic or market events; to the extent the Funds have substantial holdings within a particular sector, the risks associated with that sector increase.
Foreign Investment Risk: Investments in foreign issuers involve additional risks (such as risks arising from less frequent trading, changes in political or social conditions, and less publicly available information about non-U.S. issuers) that differ from those associated with investments in U.S. issuers and may result in greater price volatility.
Emerging Markets Risk: Investments in emerging markets are subject to the general risks of foreign investments, as well as additional risks which can result in greater price volatility. Such additional risks include the risk that markets in
emerging market countries are typically less developed and less liquid than markets in developed countries and such markets are subjected to increased economic, political, or regulatory uncertainties.
Currency Risk: Fluctuations in exchange rates may affect the total loss or gain on a non-U.S. dollar investment when converted back to U.S. dollars and exposure to non-U.S. currencies may subject the Funds to the risk that those currencies will decline in value relative to the U.S. dollar.
Political Risk: Changes in the general political and social environment of a country can have substantial effects on the value of investments exposed to that country.
Geographic Focus Risk: To the extent China Fund focuses its investments in a particular country, group of countries or geographic region, China Fund is particularly susceptible to economic, political, regulatory or other events or conditions affecting such countries or region, and China Fund’s NAV may be more volatile than the NAV of a more geographically diversified fund and may result in losses.
The China Fund is particularly susceptible to risks in the Greater China region, which consists of Hong Kong, The People’s Republic of China (“PRC”) and Taiwan, among other countries. Economies in the Greater China region are dependent on the economies of other countries and can be significantly affected by currency fluctuations and increasing competition from other emerging economies in Asia with lower costs. Adverse events in any one country within the region may impact the other countries in the region or Asia as a whole. Markets in the Greater China region can experience significant volatility due to social, economic, regulatory and political uncertainties. Significant portions of the Chinese securities markets may become rapidly illiquid, as Chinese issuers have the ability to suspend the trading of their equity securities, and have shown a willingness to exercise that option in response to market volatility and other events. U.S. or foreign government restrictions or intervention could negatively affect the implementation of China Fund’s investment strategies, for example by precluding China Fund from making certain investments or causing China Fund to sell investments at disadvantageous times. China has yet to develop comprehensive securities, corporate, or commercial laws, its market is relatively new and less developed, and its economy may be adversely impacted by a slowdown in export growth.
Stock Connect Risk: Trading in China A-Shares through Stock Connect is subject to sudden changes in quota limitations, application of trading suspensions, differences in trading days between the PRC and Stock Connect, operational risk, clearing and settlement risk and regulatory and taxation risk.
PRC Tax Risk: The application of the tax laws and regulations of the PRC to income, including capital gains, derived from certain investments of China Fund remains unclear, and may well continue to evolve, possibly with retroactive effect. Any taxes imposed on the investments of China Fund pursuant to such laws and regulations will reduce China Fund’s overall returns.
Participatory Notes Risk: An investment in participatory notes is subject to market risk. The performance results of participatory notes may not exactly replicate the performance of the underlying securities. An investment in participatory notes is also subject to counterparty risk, relating to the non-U.S. bank or broker-dealer that issues the participatory notes, and may be subject to liquidity risk.
Variable Interest Entity Risk: The China Fund may gain investment exposure to certain Chinese companies through variable interest entity (“VIE”) structures. A VIE
19
| | |
| | Notes to Financial Statements (continued) |
structure enables foreign investors, such as China Fund, to obtain investment exposure to a Chinese company in situations in which the Chinese government has limited or prohibited non-Chinese ownership of such company. A VIE does not have equity ownership in its corresponding China-based company but has claims to the China-based company’s profits and control of its assets through contractual arrangements. VIEs are a common industry practice and well known to officials and regulators in China; however, VIEs are not formally recognized under Chinese law. If the Chinese government takes action adversely affecting VIEs, the market value of China Fund’s associated portfolio holdings would likely suffer significant, detrimental, and possibly permanent consequences, which could result in substantial investment losses.
Large-Capitalization Stock Risk: The stocks of large-capitalization companies are generally more mature and may not be able to reach the same levels of growth as the stocks of small- or mid-capitalization companies.
Small- and Mid-Capitalization Stock Risk: The stocks of small- and mid-capitalization companies often have greater price volatility, lower trading volume, and less liquidity than the stocks of larger, more established companies.
Value Stock Risk: Value stocks may perform differently from the market as a whole and may be undervalued by the market for a long period of time.
Liquidity Risk: The Funds may not be able to dispose of particular investments, such as illiquid securities, readily at favorable times or prices or the Funds may have to sell them at a loss.
High Cash Balance Risk: When the Funds have a significant cash balance for a sustained period, the benefit to the Funds of any market upswing may likely be reduced, and the Funds’ performance may be adversely affected.
6. COMMITMENTS AND CONTINGENCIES
Under the Trust’s organizational documents, its Trustees and Officers are indemnified against certain liabilities arising out of the performance of their duties to the Trust. In addition, in the normal course of business, the Funds may enter into
contracts and agreements that contain a variety of representations and warranties, which provide general indemnifications. The maximum exposure to the Funds under these arrangements is unknown, as this would involve future claims that may be made against a Fund that have not yet occurred. However, based on experience, the Funds had no prior claims or losses and expect the risks of loss to be remote.
7. MASTER NETTING AGREEMENTS
The Funds may enter into master netting agreements with their counterparties for the Securities Lending Program and Repurchase Agreements, which provide the right, in the event of default (including bankruptcy or insolvency) for the non-defaulting party to liquidate the collateral and calculate net exposure to the defaulting party or request additional collateral. For financial reporting purposes, the Funds do not offset financial assets and financial liabilities that are subject to master netting agreements in the Statement of Assets and Liabilities. For securities lending transactions, see Note 4. At October 31, 2024, the Funds had no Repurchase Agreements outstanding.
8. RECENT ACCOUNTING STANDARDS UPDATE
In November 2023, the Financial Accounting Standards Board issued ASU No. 2023-07, Segment Reporting (Topic 280), which improves reportable segment disclosure requirements, primarily through enhanced disclosures about significant segment expenses. The amendments are effective for fiscal years beginning after December 15, 2023, and interim periods within fiscal years beginning after December 15, 2024. The Funds are currently evaluating the requirements and do not expect this guidance to materially impact the Funds’ financial statements.
9. SUBSEQUENT EVENTS
The Funds have determined that no material events or transactions occurred through the issuance date of the Funds’ financial statements which require an additional disclosure in or adjustment of the Funds’ financial statements.
20
| | |
| | Report of Independent Registered Public Accounting Firm |
To the Board of Trustees of AMG Funds I and Shareholders of AMG Veritas China Fund and AMG Veritas Global Focus Fund
Opinions on the Financial Statements
We have audited the accompanying statements of assets and liabilities, including the schedules of portfolio investments, of AMG Veritas China Fund and AMG Veritas Global Focus Fund (two of the funds constituting AMG Funds I, hereafter collectively referred to as the “Funds”) as of October 31, 2024, the related statements of operations for the year ended October 31, 2024, the statements of changes in net assets for each of the two years in the period ended October 31, 2024, including the related notes, and the financial highlights for each of the five years in the period ended October 31, 2024 (collectively referred to as the “financial statements”). In our opinion, the financial statements present fairly, in all material respects, the financial position of each of the Funds as of October 31, 2024, the results of each of their operations for the year then ended, the changes in each of their net assets for each of the two years in the period ended October 31, 2024 and each of the financial highlights for each of the five years in the period ended October 31, 2024 in conformity with accounting principles generally accepted in the United States of America.
Basis for Opinions
These financial statements are the responsibility of the Funds’ management. Our responsibility is to express an opinion on the Funds’ financial statements based on our audits. We are a public accounting firm registered with the Public Company Accounting Oversight Board (United States) (PCAOB) and are required to be independent with respect to the Funds in accordance with the U.S. federal securities laws and the applicable rules and regulations of the Securities and Exchange Commission and the PCAOB.
We conducted our audits of these financial statements in accordance with the standards of the PCAOB. Those standards require that we plan and perform the audit to obtain reasonable assurance about whether the financial statements are free of material misstatement, whether due to error or fraud.
Our audits included performing procedures to assess the risks of material misstatement of the financial statements, whether due to error or fraud, and performing procedures that respond to those risks. Such procedures included examining, on a test basis, evidence regarding the amounts and disclosures in the financial statements. Our audits also included evaluating the accounting principles used and significant estimates made by management, as well as evaluating the overall presentation of the financial statements. Our procedures included confirmation of securities owned as of October 31, 2024 by correspondence with the custodian and brokers; when replies were not received from brokers, we performed other auditing procedures. We believe that our audits provide a reasonable basis for our opinions.
/s/PricewaterhouseCoopers LLP
Boston, Massachusetts
December 23, 2024
We have served as the auditor of one or more investment companies in the AMG Funds Family since 1993.
21
| | |
| | Other Information (unaudited) |
TAX INFORMATION
AMG Veritas China Fund and AMG Veritas Global Focus Fund each hereby designates the maximum amount allowable of its net taxable income as qualified dividends as provided in the Jobs and Growth Tax Relief Reconciliation Act of 2003. The 2023/2024 Form 1099-DIV you receive for each Fund will show the tax status of all distributions paid to you during the year.
Pursuant to section 852 of the Internal Revenue Code of 1986, as amended, AMG Veritas China Fund and AMG Veritas Global Focus Fund hereby designate $0 and $781,857, respectively, as a capital gain distribution with respect to the taxable year ended October 31, 2024, or if subsequently determined to be different, the net capital gains of such fiscal year.
ITEM 8. CHANGES IN AND DISAGREEMENTS WITH ACCOUNTANTS FOR OPEN-END MANAGEMENT INVESTMENT COMPANIES
During the fiscal year ended October 31, 2024, there were no changes in and/or disagreements with accountants.
ITEM 9. PROXY DISCLOSURES FOR OPEN-END MANAGEMENT INVESTMENT COMPANIES
Not applicable.
ITEM 10. REMUNERATION PAID TO DIRECTORS, OFFICERS, AND OTHERS OF OPEN-END MANAGEMENT INVESTMENT COMPANIES
The remuneration paid to the Trustees during the fiscal year ended October 31, 2024, is reflected as “Trustee fees and expenses” on the Statement of Operations and is set forth in the table below. There was no remuneration paid to any Fund officer or to any affiliated person of any Fund Trustee or officer during the fiscal year ended October 31, 2024.
| | | | |
| | | Trustee fees and expenses | |
| |
AMG Veritas China Fund | | | $4,013 | |
| |
AMG Veritas Global Focus Fund | | | 2,605 | |
| |
22
| | |
| | ITEM 11. STATEMENT REGARDING BASIS FOR APPROVAL OF INVESTMENT ADVISORY CONTRACT |
| | | | |
AMG Veritas China Fund and AMG Veritas Global Focus Fund: Approval of Investment Management Agreements and Subadvisory Agreements on June 12, 2024 At an in-person meeting held on June 12, 2024, the Board of Trustees (the “Board” or the “Trustees”), and separately a majority of the Trustees who are not “interested persons” of AMG Funds I (the “Trust”) (the “Independent Trustees”), approved (i) the Fund Management Agreement, as amended pursuant to letter agreements at any time prior to the date of the meeting, with AMG Funds LLC (the “Investment Manager”) for AMG Veritas China Fund and separately each of Amendment No. 1 thereto dated July 1, 2015, and Amendment No. 2 thereto dated October 1, 2016; and the Investment Management Agreement, as amended pursuant to letter agreements at any time prior to the date of the meeting, with the Investment Manager for AMG Veritas Global Focus Fund and separately each of Amendment No. 1 thereto dated July 1, 2015, and Amendment No. 2 thereto dated October 1, 2016 (collectively, the “Investment Management Agreements”); and (ii) the Subadvisory Agreement with respect to each of AMG Veritas China Fund and AMG Veritas Global Focus Fund (each, a “Fund,” and collectively, the “Funds”), as amended at any time prior to the date of the meeting (collectively, the “Subadvisory Agreements”), with Veritas Asset Management LLP, the Funds’ subadviser (the “Subadviser”). The Independent Trustees were separately represented by independent legal counsel in connection with their consideration of the approval of these agreements. In considering the Investment Management Agreements and the Subadvisory Agreements, the Trustees reviewed a variety of materials relating to each Fund, the Investment Manager and the Subadviser, including the nature, extent and quality of services, comparative performance, fee and expense information for an appropriate peer group of similar mutual funds for each Fund (each, a “Peer Group”), performance information for the relevant benchmark index for each Fund (each, a “Fund Benchmark”), other relevant matters, including management fees, the profitability of the Investment Manager and the Subadviser, and the potential for economies of scale that may be shared with the Funds, and other information provided to them on a periodic basis throughout the year. Prior to voting, the Independent Trustees: (a) reviewed the foregoing information with their independent legal counsel; (b) received materials from their independent legal counsel discussing the legal standards applicable to their consideration of the Investment Management | | Agreements and the Subadvisory Agreements; and (c) met with their independent legal counsel in private sessions at which no representatives of management were present. NATURE, EXTENT AND QUALITY OF SERVICES In considering the nature, extent and quality of the services provided by the Investment Manager, the Trustees reviewed information provided by the Investment Manager at the June 12, 2024 meeting and prior meetings relating to the Investment Manager’s operations and personnel. Among other things, the Investment Manager provided financial information, information about its supervisory and professional staff and descriptions of its organizational and management structure. The Trustees also took into account information provided periodically throughout the previous year by the Investment Manager in Board meetings relating to the performance of its duties with respect to the Funds and the Trustees’ knowledge of the Investment Manager’s management and the quality of the performance of the Investment Manager’s duties under the Investment Management Agreements and Administration Agreement. In the course of their deliberations regarding the Investment Manager, the Trustees evaluated, among other things: (a) the extent and quality of the Investment Manager’s oversight of the operation and management of the Funds; (b) the quality of the Investment Manager’s oversight of the performance by the Subadviser of its portfolio management duties; (c) the Investment Manager’s ability to supervise the Funds’ other service providers; and (d) the Investment Manager’s compliance program. The Trustees also took into account that, in performing its functions under the Investment Management Agreements and supervising the Subadviser, the Investment Manager: performs periodic detailed analyses and reviews of the performance by the Subadviser of its obligations to each Fund, including without limitation, analysis and review of portfolio and other compliance matters and review of the Subadviser’s investment performance with respect to a Fund; prepares and presents periodic reports to the Board regarding the investment performance of the Subadviser and other information regarding the Subadviser, at such times and in such forms as the Board may reasonably request; reviews and considers any changes in the personnel of the Subadviser responsible for performing the Subadviser’s obligations and makes appropriate reports to the Board; reviews and considers any changes in the ownership or senior management of the Subadviser and makes appropriate reports to the | | Board; performs periodic in-person, telephonic or videoconference diligence meetings, including with respect to compliance matters, with representatives of the Subadviser; assists the Board and management of the Trust in developing and reviewing information with respect to the initial approval of each Subadvisory Agreement and annual consideration of each Subadvisory Agreement thereafter; prepares recommendations with respect to the continued retention of the Subadviser or the replacement of the Subadviser, including at the request of the Board; identifies potential successors to, or replacements of, the Subadviser or potential additional subadvisers, including performing appropriate due diligence, and developing and presenting to the Board a recommendation as to any such successor, replacement, or additional subadviser, including at the request of the Board; designates and compensates from its own resources such personnel as the Investment Manager may consider necessary or appropriate to the performance of its services; and performs such other review and reporting functions as the Board shall reasonably request consistent with the Investment Management Agreements and applicable law. The Trustees noted the affiliation of the Subadviser with the Investment Manager, noting any potential conflicts of interest. The Trustees also took into account the financial condition of the Investment Manager with respect to its ability to provide the services required under the Investment Management Agreements and the Investment Manager’s undertaking to maintain contractual expense limitations for the Funds. The Trustees also considered the Investment Manager’s risk management processes. The Trustees also reviewed information relating to the Subadviser’s operations and personnel and the investment philosophy, strategies and techniques (its “Investment Strategy”) used in managing each Fund. Among other things, the Trustees reviewed information on portfolio management and other professional staff, information regarding the Subadviser’s organizational and management structure and the Subadviser’s brokerage policies and practices. The Trustees considered specific information provided regarding the experience of the individuals at the Subadviser with portfolio management responsibility for each Fund, including the information set forth in the Fund’s prospectus and statement of additional information. In the course of their deliberations, the Trustees evaluated, among other things: (a) the services rendered by the Subadviser in the past; (b) the qualifications and experience of the Subadviser’s personnel; and (c) the |
| | | | |
| | | | |
23
| | |
| | ITEM 11. STATEMENT REGARDING BASIS FOR APPROVAL OF INVESTMENT ADVISORY CONTRACT (continued) |
| | | | |
Subadviser’s compliance program. The Trustees also took into account the financial condition of the Subadviser with respect to its ability to provide the services required under the Subadvisory Agreements. The Trustees also considered the Subadviser’s risk management processes. PERFORMANCE The Board considered each Fund’s net performance during relevant time periods as compared to the Fund’s Peer Group and Fund Benchmark, considered the gross performance of each Fund as compared to the Subadviser’s relevant performance composite that utilizes a similar investment strategy and approach, and noted that the Board reviews on a quarterly basis detailed information about both the Fund’s performance results and portfolio composition, as well as the Subadviser’s Investment Strategy. The Board was mindful of the Investment Manager’s expertise, resources and attention to monitoring the Subadviser’s performance, investment style and risk-adjusted performance with respect to the Funds and its discussions with the management of the Funds’ subadviser during the period regarding the factors that contributed to the performance of the Funds. With respect to AMG Veritas China Fund, among other information relating to the Fund’s performance, the Trustees noted that the Fund’s performance for Class N shares (which share class has the earliest inception date and the largest amount of assets of all the share classes of the Fund) for the 1-year, 3-year, 5-year and 10-year periods ended March 31, 2024, was below the median performance of the Peer Group and below, below, above, and below, respectively, the performance of the Fund Benchmark, the MSCI China Index. The Trustees took into account management’s discussion of the Fund’s performance, including the reasons for the Fund’s more recent underperformance. The Trustees also took into account the fact that the Fund’s subadviser, investment strategy, and Fund Benchmark changed effective May 21, 2021, and that the performance information prior to that date reflected that of the Fund’s prior subadvisers and investment strategy. The Trustees considered management’s discussion that the Fund’s performance has been in line with management’s expectations since the current Subadviser assumed subadvisory responsibilities. The Trustees concluded that the Fund’s overall performance has been satisfactory in light of the Fund’s investment objective, strategies, and policies. With respect to AMG Veritas Global Focus Fund, among other information relating to the Fund’s performance, the Trustees noted that the Fund’s | | performance for Class I shares (which share class has the earliest inception date and the largest amount of assets of all the share classes of the Fund) for the 1-year, 3-year, 5-year and 10-year periods ended March 31, 2024, was below, below, below, and above, respectively, the median performance of the Peer Group and below the performance of the Fund Benchmark, the MSCI World Index. The Trustees took into account management’s discussion of the Fund’s performance, including the reasons for the Fund’s underperformance. The Trustees noted that the Fund ranked in the top quartile relative to its Peer Group for the 2023 calendar year. The Trustees also took into account the fact that the Fund’s subadviser, investment strategy, and Fund Benchmark changed effective May 21, 2021, and that the performance information prior to that date reflected that of the Fund’s prior subadviser and investment strategy. The Trustees concluded that the Fund’s overall performance has been satisfactory in light of the Fund’s investment objective, strategies, and policies. ADVISORY AND SUBADVISORY FEES; FUND EXPENSES; PROFITABILITY; AND ECONOMIES OF SCALE In considering the reasonableness of the advisory fee payable to the Investment Manager, the Trustees reviewed information provided by the Investment Manager at the June 12, 2024 meeting and prior meetings setting forth all revenues and other benefits, both direct and indirect (including any so-called “fallout benefits” such as reputational value derived from the Investment Manager serving as Investment Manager to a Fund), received by the Investment Manager and its affiliates attributable to managing each Fund and all the mutual funds in the AMG Funds Family of Funds; the cost of providing such services; the significant risks undertaken as Investment Manager and sponsor of the Funds, including investment, operational, enterprise, entrepreneurial, litigation, regulatory and compliance risks; and the resulting profitability to the Investment Manager and its affiliates from these relationships. The Trustees also considered the amount of the advisory fee retained by the Investment Manager after payment of the subadvisory fee with respect to each Fund. The Trustees also noted payments are made from the Subadviser to the Investment Manager, and other payments are made from the Investment Manager to the Subadviser. The Trustees also considered management’s discussion of the current asset levels of the Funds, and the impact on profitability of both the current asset levels and any future growth of assets of the Funds. | | In considering the cost of services to be provided by the Investment Manager under each Investment Management Agreement and the profitability to the Investment Manager of its relationship with each Fund, the Trustees noted the undertaking by the Investment Manager to maintain contractual expense limitations for the Funds. The Board also took into account management’s discussion of the advisory fee structure and the services the Investment Manager provides in performing its functions under each Investment Management Agreement and supervising the Subadviser. Based on the foregoing, the Trustees concluded that the profitability to the Investment Manager is reasonable and that the Investment Manager is not realizing material benefits from economies of scale that would warrant adjustments to the advisory fee at this time. Also, with respect to economies of scale, the Trustees noted that as a Fund’s assets increase over time, the Fund may realize other economies of scale to the extent the increase in assets is proportionally greater than the increase in certain other expenses. In considering the reasonableness of the subadvisory fees payable by the Investment Manager to the Subadviser, the Trustees reviewed information regarding the cost to the Subadviser of providing subadvisory services to each Fund and the resulting profitability from the relationships. The Trustees noted that, because the Subadviser is an affiliate of the Investment Manager, a portion of the Subadviser’s revenues or profits might be shared directly or indirectly with the Investment Manager. The Trustees also noted that the subadvisory fees are paid by the Investment Manager out of its advisory fee. The Board also took into account management’s discussion of the subadvisory fee structure, and the services the Subadviser provides in performing its functions under the Subadvisory Agreements. Based on the foregoing, the Trustees concluded that the profitability to the Subadviser is reasonable and that the Subadviser is not realizing material benefits from economies of scale that would warrant adjustments to the subadvisory fees at this time. Also, with respect to economies of scale, the Trustees noted that as a Fund’s assets increase over time, the Fund may realize other economies of scale to the extent the increase in assets is proportionally greater than the increase in certain other expenses. With respect to AMG Veritas China Fund, the Trustees noted that the management fees (which include both the advisory and administration fees) and total expenses (net of applicable expense waivers/reimbursements) of Class I shares (the class of shares which is the primary focus of the Fund’s distribution) of the Fund as of March 31, 2024, were |
| | | | |
| | | | |
24
| | |
| | ITEM 11. STATEMENT REGARDING BASIS FOR APPROVAL OF INVESTMENT ADVISORY CONTRACT (continued) |
| | | | |
both rated in the Below Average rating level of the Fund’s Peer Group. The Trustees noted that the rating level corresponded to the Fund’s quintile ranking in its Peer Group. The Trustees took into account the fact that the Investment Manager has contractually agreed, through March 1, 2025, to limit the Fund’s net annual operating expenses (subject to certain excluded expenses) to 0.93%. The Trustees concluded that, in light of the nature, extent and quality of the services provided by the Investment Manager and the Subadviser (which is an affiliate of the Investment Manager), the foregoing expense limitation and the considerations noted above with respect to the Investment Manager and the Subadviser, the Fund’s advisory and subadvisory fees are reasonable. With respect to AMG Veritas Global Focus Fund, the Trustees noted that the management fees (which include both the advisory and administration fees) and total expenses (net of applicable expense waivers/reimbursements) of Class I shares (the class of shares which is the primary focus of the Fund’s | | distribution) of the Fund as of March 31, 2024, were rated in the Above Average and Average rating level, respectively, of the Fund’s Peer Group. The Trustees noted that the rating levels corresponded to the Fund’s quintile ranking in its Peer Group. The Trustees took into account the fact that the Investment Manager has contractually agreed, through March 1, 2025, to limit the Fund’s net annual operating expenses (subject to certain excluded expenses) to 0.88%. The Trustees concluded that, in light of the nature, extent and quality of the services provided by the Investment Manager and the Subadviser (which is an affiliate of the Investment Manager), the foregoing expense limitation and the considerations noted above with respect to the Investment Manager and the Subadviser, the Fund’s advisory and subadvisory fees are reasonable. * * * * * After consideration of the foregoing, the Trustees also reached the following conclusions (in addition to the conclusions discussed above) regarding the Investment Management Agreements and the | | Subadvisory Agreements: (a) the Investment Manager and the Subadviser have demonstrated that they possess the capability and resources to perform the duties required of them under each Investment Management Agreement and each Subadvisory Agreement and (b) the Investment Manager and Subadviser maintain appropriate compliance programs. Based on all of the above-mentioned factors and their related conclusions, with no single factor or conclusion being determinative and with each Trustee not necessarily attributing the same weight to each factor, the Trustees concluded that approval of each Investment Management Agreement and each Subadvisory Agreement would be in the best interests of the applicable Fund and its shareholders. Accordingly, on June 12, 2024, the Trustees, and separately a majority of the Independent Trustees, voted to approve the Investment Management Agreement and the Subadvisory Agreement for each Fund. |
| | | | |
| | | | |
25
THIS PAGE INTENTIONALLY LEFT BLANK
THIS PAGE INTENTIONALLY LEFT BLANK
THIS PAGE INTENTIONALLY LEFT BLANK
| | | | |
INVESTMENT MANAGER AND ADMINISTRATOR AMG Funds LLC 680 Washington Blvd., Suite 500 Stamford, CT 06901 800.548.4539 DISTRIBUTOR AMG Distributors, Inc. 680 Washington Blvd., Suite 500 Stamford, CT 06901 800.548.4539 SUBADVISER Veritas Asset Management LLP 1 Smart’s Place London, WC2B 5LW CUSTODIAN The Bank of New York Mellon Mutual Funds Custody 240 Greenwich Street New York, NY 10286 | | LEGAL COUNSEL Ropes & Gray LLP Prudential Tower, 800 Boylston Street Boston, MA 02199-3600 TRANSFER AGENT BNY Mellon Investment Servicing (US) Inc. AMG Funds Attn: 534426 AIM 154-0520 500 Ross Street Pittsburgh, PA 15262 800.548.4539 | | This report is prepared for the Funds’ shareholders. It is authorized for distribution to prospective investors only when preceded or accompanied by an effective prospectus. To receive a free copy of the prospectus or Statement of Additional Information, which includes additional information about Fund Trustees, please contact us by calling 800.548.4539. Distributed by AMG Distributors, Inc., member FINRA/SIPC. Current net asset values per share for each Fund are available on the Funds’ website at wealth.amg.com. A description of the policies and procedures each Fund uses to vote its proxies is available: (i) without charge, upon request, by calling 800.548.4539, or (ii) on the Securities and Exchange Commission’s (SEC) website at sec.gov. For information regarding the Funds’ proxy voting record for the 12-month period ended June 30, call 800.548.4539 or visit the SEC website at sec.gov. The Funds file their complete schedule of portfolio holdings with the SEC for the first and third quarters of each fiscal year as an exhibit to their reports on Form N-PORT. The Funds’ portfolio holdings on Form N-PORT are available on the SEC’s website at sec.gov and the Funds’ website at wealth.amg.com. To review a complete list of the Funds’ portfolio holdings, or to view the most recent semi-annual report or annual report, please visit wealth.amg.com. |
| | | | | |
| | | | | |
| | | | | | | | |
EQUITY FUNDS AMG Boston Common Global Impact Boston Common Asset Management, LLC AMG Frontier Small Cap Growth Frontier Capital Management Co., LLC AMG GW&K Small Cap Core AMG GW&K Small Cap Value AMG GW&K Small/Mid Cap Core AMG GW&K Small/Mid Cap Growth AMG GW&K International Small Cap GW&K Investment Management, LLC AMG Montrusco Bolton Large Cap Growth Montrusco Bolton Investments, Inc. AMG Renaissance Large Cap Growth The Renaissance Group LLC | | | | AMG River Road Dividend All Cap Value AMG River Road Focused Absolute Value AMG River Road Large Cap Value Select AMG River Road Mid Cap Value AMG River Road Small-Mid Cap Value AMG River Road Small Cap Value River Road Asset Management, LLC AMG TimesSquare International Small Cap AMG TimesSquare Mid Cap Growth AMG TimesSquare Small Cap Growth TimesSquare Capital Management, LLC AMG Veritas Asia Pacific AMG Veritas China AMG Veritas Global Focus AMG Veritas Global Real Return Veritas Asset Management LLP AMG Yacktman AMG Yacktman Focused AMG Yacktman Global AMG Yacktman Special Opportunities Yacktman Asset Management LP | | FIXED INCOME FUNDS AMG Beutel Goodman Core Plus Bond Beutel, Goodman & Company Ltd. AMG GW&K Core Bond ESG AMG GW&K ESG Bond AMG GW&K Municipal Bond AMG GW&K Municipal Enhanced Yield GW&K Investment Management, LLC ALTERNATIVE FUNDS AMG Systematica Managed Futures Strategy Systematica Investments Limited, acting as general partner of Systematica Investments LP | | |
| | | | | | | | | |
| | | | | |
| | | | | | | | | |
| | | | | | |
| | | | | | | |
wealth.amg.com | | | | 103124 | | AR084 |
| | |

| | ANNUAL FINANCIAL STATEMENTS |
| | | | | | |
| | | AMG Funds |
| | | |
| | | October 31, 2024 | | |
| | |
| | |  |
| | |
| | | AMG Frontier Small Cap Growth Fund |
| | | Class N: MSSVX | | Class I: MSSCX | | Class Z: MSSYX |
| | | | |
| | | | | | | |
| | | | | | |
| | | | | | | |
| | | |
| wealth.amg.com | | 103124 | | | AR085 | |
| | |
| | AMG Funds Annual Financial Statements — October 31, 2024 |
Nothing contained herein is to be considered an offer, sale or solicitation of an offer to buy shares of any series of the AMG Funds Family of Funds. Such offering is made only by prospectus, which includes details as to offering price and other material information.
| | |
| | AMG Frontier Small Cap Growth Fund Schedule of Portfolio Investments October 31, 2024 |
| | | | | | | | |
| | | Shares | | | Value | |
| | |
Common Stocks - 97.2% | | | | | | | | |
| | |
Communication Services - 0.1% | | | | | | | | |
| | |
ZoomInfo Technologies, Inc.* | | | 4,981 | | | | $55,040 | |
| |
Consumer Discretionary - 15.8% | | | | | |
| | |
BorgWarner, Inc. | | | 7,515 | | | | 252,729 | |
| | |
Boyd Gaming Corp. | | | 8,067 | | | | 558,962 | |
| | |
Bright Horizons Family Solutions, Inc.* | | | 301 | | | | 40,174 | |
| | |
Burlington Stores, Inc.* | | | 64 | | | | 15,857 | |
| | |
Caesars Entertainment, Inc.* | | | 60,473 | | | | 2,421,944 | |
| | |
Cava Group, Inc.* | | | 200 | | | | 26,712 | |
| | |
Five Below, Inc.* | | | 82 | | | | 7,773 | |
| | |
Floor & Decor Holdings, Inc., Class A* | | | 60 | | | | 6,183 | |
| | |
LCI Industries | | | 198 | | | | 22,033 | |
| | |
LGI Homes, Inc.* | | | 80 | | | | 8,125 | |
| | |
Life Time Group Holdings, Inc.* | | | 36,772 | | | | 819,280 | |
| | |
Lithia Motors, Inc. | | | 9,002 | | | | 2,991,995 | |
| | |
Mattel, Inc.* | | | 86,243 | | | | 1,757,632 | |
| | |
Meritage Homes Corp. | | | 680 | | | | 123,216 | |
| | |
Modine Manufacturing Co.* | | | 7,502 | | | | 883,511 | |
| | |
Planet Fitness, Inc., Class A* | | | 13,090 | | | | 1,027,827 | |
| | |
Stoneridge, Inc.* | | | 1,111 | | | | 7,766 | |
| | |
Stride, Inc.* | | | 1,002 | | | | 93,467 | |
| | |
Sweetgreen, Inc., Class A* | | | 37,830 | | | | 1,365,663 | |
| | |
Total Consumer Discretionary | | | | | | | 12,430,849 | |
| |
Consumer Staples - 2.2% | | | | | |
| | |
The Chefs’ Warehouse, Inc.* | | | 7,258 | | | | 289,739 | |
| | |
Darling Ingredients, Inc.* | | | 36,068 | | | | 1,410,620 | |
| | |
Total Consumer Staples | | | | | | | 1,700,359 | |
| |
Energy - 1.4% | | | | | |
| | |
Cameco Corp. (Canada) | | | 6,986 | | | | 364,809 | |
| | |
International Seaways, Inc. | | | 11,130 | | | | 484,600 | |
| | |
Permian Resources Corp. | | | 1,175 | | | | 16,015 | |
| | |
Tidewater, Inc.* | | | 3,841 | | | | 230,729 | |
| | |
Total Energy | | | | | | | 1,096,153 | |
| |
Financials - 2.6% | | | | | |
| | |
The Carlyle Group, Inc. | | | 3,600 | | | | 180,108 | |
| | |
NMI Holdings, Inc., Class A* | | | 5,278 | | | | 204,153 | |
| | |
Paymentus Holdings, Inc., Class A* | | | 7,098 | | | | 174,682 | |
| | |
Popular, Inc. (Puerto Rico) | | | 11,600 | | | | 1,035,068 | |
| | |
Toast, Inc., Class A* | | | 15,997 | | | | 480,390 | |
| | |
Total Financials | | | | | | | 2,074,401 | |
| |
Health Care - 17.0% | | | | | |
| | |
Apogee Therapeutics, Inc.* | | | 12,657 | | | | 658,670 | |
| | | | | | | | |
| | | Shares | | | Value | |
| | |
Axsome Therapeutics, Inc.*,1 | | | 4,467 | | | | $397,697 | |
| | |
Blueprint Medicines Corp.* | | | 2,643 | | | | 231,289 | |
| | |
Bridgebio Pharma, Inc.* | | | 20,010 | | | | 468,434 | |
| | |
Dyne Therapeutics, Inc.* | | | 15,886 | | | | 458,470 | |
| | |
Exact Sciences Corp.*,1 | | | 1,728 | | | | 119,111 | |
| | |
Halozyme Therapeutics, Inc.* | | | 16,901 | | | | 854,684 | |
| | |
Insmed, Inc.* | | | 15,197 | | | | 1,022,454 | |
| | |
Inspire Medical Systems, Inc.* | | | 283 | | | | 55,196 | |
| | |
Insulet Corp.* | | | 33 | | | | 7,641 | |
| | |
Keros Therapeutics, Inc.* | | | 11,683 | | | | 678,081 | |
| | |
Kymera Therapeutics, Inc.*,1 | | | 15,942 | | | | 736,042 | |
| | |
Lantheus Holdings, Inc.* | | | 5,934 | | | | 651,791 | |
| | |
Natera, Inc.* | | | 4,110 | | | | 497,146 | |
| | |
Novocure, Ltd. (Jersey)* | | | 19,791 | | | | 300,427 | |
| | |
Sarepta Therapeutics, Inc.* | | | 190 | | | | 23,940 | |
| | |
Stevanato Group S.P.A. (Italy) | | | 29,107 | | | | 553,324 | |
| | |
Tempus AI, Inc.*,1 | | | 10,362 | | | | 462,352 | |
| | |
United Therapeutics Corp.* | | | 6,851 | | | | 2,562,069 | |
| | |
Vericel Corp.* | | | 4,854 | | | | 213,770 | |
| | |
Viking Therapeutics, Inc.*,1 | | | 33,655 | | | | 2,441,334 | |
| | |
Total Health Care | | | | | | | 13,393,922 | |
| |
Industrials - 22.9% | | | | | |
| | |
ACV Auctions, Inc., Class A* | | | 37,140 | | | | 642,151 | |
| | |
Alaska Air Group, Inc.* | | | 33,921 | | | | 1,625,155 | |
| | |
Atmus Filtration Technologies, Inc. | | | 13,757 | | | | 535,697 | |
| | |
Beacon Roofing Supply, Inc.* | | | 27,038 | | | | 2,489,389 | |
| | |
Builders FirstSource, Inc.* | | | 6,188 | | | | 1,060,623 | |
| | |
BWX Technologies, Inc. | | | 2,581 | | | | 314,237 | |
| | |
Chart Industries, Inc.*,1 | | | 933 | | | | 112,632 | |
| | |
Enovix Corp.*,1 | | | 54,731 | | | | 492,853 | |
| | |
FTAI Aviation, Ltd.1 | | | 3,706 | | | | 498,235 | |
| | |
GMS, Inc.* | | | 3,343 | | | | 300,502 | |
| | |
Granite Construction, Inc.1 | | | 28,752 | | | | 2,416,606 | |
| | |
The Greenbrier Cos., Inc. | | | 7,801 | | | | 462,365 | |
| | |
Helios Technologies, Inc. | | | 10,088 | | | | 465,359 | |
| | |
Hexcel Corp. | | | 5,676 | | | | 333,124 | |
| | |
Knight-Swift Transportation Holdings, Inc. | | | 26,970 | | | | 1,404,598 | |
| | |
Kratos Defense & Security Solutions, Inc.* | | | 23,504 | | | | 534,011 | |
| | |
Quanta Services, Inc. | | | 64 | | | | 19,304 | |
| | |
Regal Rexnord Corp. | | | 8,299 | | | | 1,382,115 | |
| | |
RXO, Inc.* | | | 45,607 | | | | 1,285,661 | |
| | |
Shoals Technologies Group, Inc., Class A* | | | 42,324 | | | | 228,973 | |
| | |
Stratasys, Ltd.* | | | 13,000 | | | | 92,950 | |
The accompanying notes are an integral part of these financial statements.
2
| | |
| | AMG Frontier Small Cap Growth Fund Schedule of Portfolio Investments (continued) |
| | | | | | | | |
| | | Shares | | | Value | |
| | |
Industrials - 22.9% (continued) | | | | | | | | |
| | |
Symbotic, Inc.*,1 | | | 22,878 | | | | $635,780 | |
| | |
XPO, Inc.* | | | 5,518 | | | | 720,264 | |
| | |
Total Industrials | | | | | | | 18,052,584 | |
| |
Information Technology - 16.2% | | | | | |
| | |
Bill.com Holdings, Inc.* | | | 14,393 | | | | 839,975 | |
| | |
Cloudflare, Inc., Class A* | | | 1,328 | | | | 116,479 | |
| | |
Coherent Corp.* | | | 8,286 | | | | 765,958 | |
| | |
Couchbase, Inc.* | | | 21,878 | | | | 351,579 | |
| | |
Credo Technology Group Holding, Ltd.* | | | 58,953 | | | | 2,222,528 | |
| | |
DocuSign, Inc.* | | | 2,330 | | | | 161,655 | |
| | |
Elastic, N.V.* | | | 2,946 | | | | 236,358 | |
| | |
Gitlab, Inc., Class A* | | | 10,371 | | | | 557,441 | |
| | |
Grid Dynamics Holdings, Inc.* | | | 4,672 | | | | 74,378 | |
| | |
Guidewire Software, Inc.* | | | 43 | | | | 8,009 | |
| | |
indie Semiconductor, Inc., Class A*,1 | | | 413,526 | | | | 1,368,771 | |
| | |
Lattice Semiconductor Corp.* | | | 11,016 | | | | 558,071 | |
| | |
MaxLinear, Inc.* | | | 80,206 | | | | 1,040,272 | |
| | |
MongoDB, Inc.* | | | 4,114 | | | | 1,112,426 | |
| | |
Monolithic Power Systems, Inc. | | | 19 | | | | 14,427 | |
| | |
Okta, Inc.* | | | 1,443 | | | | 103,737 | |
| | |
Pagaya Technologies, Ltd., Class A* | | | 27,755 | | | | 319,738 | |
| | |
Penguin Solutions, Inc.* | | | 1,517 | | | | 22,831 | |
| | |
Pure Storage, Inc., Class A* | | | 1,041 | | | | 52,102 | |
| | |
Sanmina Corp.* | | | 8,238 | | | | 577,484 | |
| | |
SentinelOne, Inc., Class A* | | | 31,869 | | | | 821,901 | |
| | |
Super Micro Computer, Inc.* | | | 98 | | | | 2,853 | |
| | |
UiPath, Inc., Class A* | | | 3,202 | | | | 39,577 | |
| | |
Ultra Clean Holdings, Inc.* | | | 26,283 | | | | 879,166 | |
| | |
Western Digital Corp.* | | | 135 | | | | 8,817 | |
| | |
Wolfspeed, Inc.*,1 | | | 20,722 | | | | 275,810 | |
| | |
Zscaler, Inc.* | | | 1,077 | | | | 194,711 | |
| | |
Total Information Technology | | | | | | | 12,727,054 | |
| |
Materials - 14.5% | | | | | |
| | |
Aspen Aerogels, Inc.*,1 | | | 1,032 | | | | 18,411 | |
| | |
ATI, Inc.* | | | 34,236 | | | | 1,804,579 | |
| | |
Carpenter Technology Corp. | | | 7,977 | | | | 1,192,561 | |
| | |
Eagle Materials, Inc. | | | 10,634 | | | | 3,035,582 | |
| | |
ERO Copper Corp. (Canada)*,1 | | | 29,646 | | | | 543,708 | |
| | |
FMC Corp. | | | 1,546 | | | | 100,474 | |
| | |
Knife River Corp.* | | | 12,915 | | | | 1,256,888 | |
| | | | | | | | |
| | | Shares | | | Value | |
| | |
MP Materials Corp.* | | | 6,415 | | | | $115,406 | |
| | |
Sigma Lithium Corp. (Brazil)*,1 | | | 11,211 | | | | 152,245 | |
| | |
Summit Materials, Inc., Class A* | | | 67,436 | | | | 3,197,141 | |
| | |
Total Materials | | | | | | | 11,416,995 | |
| |
Real Estate - 4.5% | | | | | |
| | |
Agree Realty Corp., REIT1 | | | 12,553 | | | | 932,060 | |
| | |
DigitalBridge Group, Inc. | | | 86,543 | | | | 1,357,860 | |
| | |
First Industrial Realty Trust, Inc., REIT | | | 1,306 | | | | 68,552 | |
| | |
Independence Realty Trust, Inc., REIT1 | | | 20,868 | | | | 409,430 | |
| | |
Sila Realty Trust, Inc., REIT | | | 23,141 | | | | 582,691 | |
| | |
STAG Industrial, Inc., REIT | | | 5,644 | | | | 210,408 | |
| | |
Total Real Estate | | | | | | | 3,561,001 | |
| | |
Total Common Stocks
(Cost $68,520,094) | | | | | | | 76,508,358 | |
| | |
| | | Principal
Amount | | | | |
| | |
Short-Term Investments - 4.5% | | | | | | | | |
| |
Joint Repurchase Agreements - 2.3%2 | | | | | |
| | |
Bank of Montreal, dated 10/31/24, due 11/01/24, 4.860% total to be received $1,000,135 (collateralized by various U.S. Government Agency Obligations, 1.713% - 7.623%, 01/01/26 - 12/01/52, totaling $1,020,000) | | | $1,000,000 | | | | 1,000,000 | |
| | |
Daiwa Capital Markets America, dated 10/31/24, due 11/01/24, 4.890% total to be received $793,467 (collateralized by various U.S. Government Agency Obligations and U.S. Treasuries, 0.625% - 7.500%, 05/15/25 - 11/01/54, totaling $809,226) | | | 793,359 | | | | 793,359 | |
| |
Total Joint Repurchase Agreements | | | | 1,793,359 | |
| | |
| | | Shares | | | | |
| |
Other Investment Companies - 2.2% | | | | | |
| | |
Dreyfus Government Cash Management Fund, Institutional Shares, 4.76%3 | | | 686,184 | | | | 686,184 | |
| | |
Dreyfus Institutional Preferred Government Money Market Fund, Institutional Shares, 4.82%3 | | | 1,029,276 | | | | 1,029,276 | |
| |
Total Other Investment Companies | | | | 1,715,460 | |
| |
Total Short-Term Investments
(Cost $3,508,819) | | | | 3,508,819 | |
| |
Total Investments - 101.7%
(Cost $72,028,913) | | | | 80,017,177 | |
| |
Other Assets, less Liabilities - (1.7)% | | | | (1,304,517 | ) |
| |
Net Assets - 100.0% | | | | $78,712,660 | |
The accompanying notes are an integral part of these financial statements.
3
| | |
| | AMG Frontier Small Cap Growth Fund Schedule of Portfolio Investments (continued) |
| * | Non-income producing security. |
| 1 | Some of these securities, amounting to $9,701,466 or 12.3% of net assets, were out on loan to various borrowers and are collateralized by cash and various U.S. Treasury Obligations. See Note 4 of Notes to Financial Statements. |
| 2 | Cash collateral received for securities lending activity was invested in these joint repurchase agreements. |
| 3 | Yield shown represents the October 31, 2024, seven day average yield, which refers to the sum of the previous seven days’ dividends paid, expressed as an annual percentage. |
REIT Real Estate Investment Trust
The following table summarizes the inputs used to value the Fund’s investments by the fair value hierarchy levels as of October 31, 2024:
| | | | | | | | | | | | | | | | |
| | | Level 1 | | | Level 2 | | | Level 3 | | | Total | |
| | | | |
Investments in Securities | | | | | | | | | | | | | | | | |
| | | | |
Common Stocks† | | $ | 76,508,358 | | | | — | | | | — | | | $ | 76,508,358 | |
| | | | |
Short-Term Investments | | | | | | | | | | | | | | | | |
| | | | |
Joint Repurchase Agreements | | | — | | | $ | 1,793,359 | | | | — | | | | 1,793,359 | |
| | | | |
Other Investment Companies | | | 1,715,460 | | | | — | | | | — | | | | 1,715,460 | |
| | | | | | | | | | | | | | | | |
| | | | |
Total Investments in Securities | | $ | 78,223,818 | | | $ | 1,793,359 | | | | — | | | $ | 80,017,177 | |
| | | | | | | | | | | | | | | | |
| | † | All common stocks held in the Fund are Level 1 securities. For a detailed breakout of common stocks by major industry classification, please refer to the Fund’s Schedule of Portfolio Investments. |
For the fiscal year ended October 31, 2024, there were no transfers in or out of Level 3.
The accompanying notes are an integral part of these financial statements.
4
| | |
| | Statement of Assets and Liabilities October 31, 2024 |
| | | | |
| | | AMG Frontier
Small Cap
Growth Fund |
| |
Assets: | | | | |
| |
Investments at value1 (including securities on loan valued at $9,701,466) | | | $80,017,177 | |
| |
Receivable for investments sold | | | 1,291,370 | |
| |
Dividend and interest receivables | | | 13,068 | |
| |
Securities lending income receivable | | | 23,350 | |
| |
Receivable for Fund shares sold | | | 73,921 | |
| |
Receivable from affiliate | | | 13,933 | |
| |
Prepaid expenses and other assets | | | 11,947 | |
| |
Total assets | | | 81,444,766 | |
| |
Liabilities: | | | | |
| |
Payable upon return of securities loaned | | | 1,793,359 | |
| |
Payable for investments purchased | | | 690,831 | |
| |
Payable for Fund shares repurchased | | | 74,426 | |
| |
Accrued expenses: | | | | |
| |
Investment advisory and management fees | | | 47,724 | |
| |
Administrative fees | | | 10,227 | |
| |
Distribution fees | | | 765 | |
| |
Shareholder service fees | | | 7,785 | |
| |
Other | | | 106,989 | |
| |
Total liabilities | | | 2,732,106 | |
| |
Commitments and Contingencies (Notes 2 & 6) | | | | |
| |
Net Assets | | | $78,712,660 | |
| |
1 Investments at cost | | | $72,028,913 | |
The accompanying notes are an integral part of these financial statements.
5
| | |
| | Statement of Assets and Liabilities (continued) |
| | | | |
| | | AMG Frontier Small Cap Growth Fund |
| |
Net Assets Represent: | | | | |
| |
Paid-in capital | | | $67,603,021 | |
| |
Total distributable earnings | | | 11,109,639 | |
| |
Net Assets | | | $78,712,660 | |
| |
Class N: | | | | |
| |
Net Assets | | | $3,546,896 | |
| |
Shares outstanding | | | 410,690 | |
| |
Net asset value, offering and redemption price per share | | | $8.64 | |
| |
Class I: | | | | |
| |
Net Assets | | | $61,813,840 | |
| |
Shares outstanding | | | 6,477,503 | |
| |
Net asset value, offering and redemption price per share | | | $9.54 | |
| |
Class Z: | | | | |
| |
Net Assets | | | $13,351,924 | |
| |
Shares outstanding | | | 1,310,875 | |
| |
Net asset value, offering and redemption price per share | | | $10.19 | |
The accompanying notes are an integral part of these financial statements.
6
| | |
| | Statement of Operations For the fiscal year ended October 31, 2024 |
| | | | |
| | | AMG Frontier
Small Cap
Growth Fund | |
| |
Investment Income: | | | | |
| |
Dividend income | | | $538,987 | 1 |
| |
Interest income | | | 349 | |
| |
Securities lending income | | | 131,911 | |
| |
Total investment income | | | 671,247 | |
| |
Expenses: | | | | |
| |
Investment advisory and management fees | | | 525,549 | |
| |
Administrative fees | | | 112,618 | |
| |
Distribution fees - Class N | | | 8,564 | |
| |
Shareholder servicing fees - Class N | | | 5,139 | |
| |
Shareholder servicing fees - Class I | | | 57,475 | |
| |
Custodian fees | | | 71,907 | |
| |
Registration fees | | | 55,495 | |
| |
Professional fees | | | 35,531 | |
| |
Reports to shareholders | | | 33,103 | |
| |
Transfer agent fees | | | 7,429 | |
| |
Trustee fees and expenses | | | 6,264 | |
| |
Miscellaneous | | | 6,262 | |
| |
Total expenses before offsets | | | 925,336 | |
| |
Expense reimbursements | | | (178,452 | ) |
| |
Net expenses | | | 746,884 | |
| | | | |
| |
Net investment loss | | | (75,637 | ) |
| |
Net Realized and Unrealized Gain: | | | | |
| |
Net realized gain on investments | | | 10,696,410 | |
| |
Net change in unrealized appreciation/depreciation on investments | | | 9,090,215 | |
| |
Net realized and unrealized gain | | | 19,786,625 | |
| | | | |
| |
Net increase in net assets resulting from operations | | | $19,710,988 | |
|
1 Includes non-recurring dividends of $147,322. | |
The accompanying notes are an integral part of these financial statements.
7
| | |
| | Statements of Changes in Net Assets For the fiscal years ended October 31, |
| | | | | | | | |
| | | AMG Frontier
Small Cap Growth Fund | |
| | |
| | | 2024 | | | 2023 | |
| | |
Increase (Decrease) in Net Assets Resulting From Operations: | | | | | | | | |
| | |
Net investment income (loss) | | | $(75,637 | ) | | | $11,027 | |
| | |
Net realized gain (loss) on investments | | | 10,696,410 | | | | (2,992,464 | ) |
| | |
Net change in unrealized appreciation/depreciation on investments | | | 9,090,215 | | | | (2,181,070 | ) |
| | |
Net increase (decrease) in net assets resulting from operations | | | 19,710,988 | | | | (5,162,507 | ) |
| | |
Distributions to Shareholders: | | | | | | | | |
| | |
Class N | | | (34,128 | ) | | | — | |
| | |
Class I | | | (650,752 | ) | | | — | |
| | |
Class Z | | | (84,864 | ) | | | — | |
| | |
Total distributions to shareholders | | | (769,744 | ) | | | — | |
| | |
Capital Share Transactions:1 | | | | | | | | |
| | |
Net increase from capital share transactions | | | 4,037,621 | | | | 36,667,103 | |
| | | | | | | | |
| | |
Total increase in net assets | | | 22,978,865 | | | | 31,504,596 | |
| | |
Net Assets: | | | | | | | | |
| | |
Beginning of year | | | 55,733,795 | | | | 24,229,199 | |
| | |
End of year | | | $78,712,660 | | | | $55,733,795 | |
| 1 | See Note 1(g) of the Notes to Financial Statements. |
The accompanying notes are an integral part of these financial statements.
8
| | |
| | AMG Frontier Small Cap Growth Fund Financial Highlights For a share outstanding throughout each fiscal year |
| | | | | | | | | | | | | | | | | | | | | | | | | |
| | | For the fiscal years ended October 31, |
| Class N | | 2024 | | 2023 | | 2022 | | 2021 | | 2020 |
| | | | | |
Net Asset Value, Beginning of Year | | | | $6.54 | | | | | $6.58 | | | | | $12.60 | | | | | $8.55 | | | | | $8.03 | |
| | | | | |
Income (loss) from Investment Operations: | | | | | | | | | | | | | | | | | | | | | | | | | |
| | | | | |
Net investment income (loss)1,2 | | |
| (0.03
| )3
| | |
| (0.02
| )4
| | |
| (0.06
| )5
| | | | (0.12 | ) | | | | (0.06 | ) |
| | | | | |
Net realized and unrealized gain (loss) on investments | | | | 2.21 | | | | | (0.02 | ) | | | | (2.05 | ) | | | | 4.56 | | | | | 1.30 | |
| | | | | |
Total income (loss) from investment operations | | | | 2.18 | | | | | (0.04 | ) | | | | (2.11 | ) | | | | 4.44 | | | | | 1.24 | |
| | | | | |
Less Distributions to Shareholders from: | | | | | | | | | | | | | | | | | | | | | | | | | |
| | | | | |
Net investment income | | | | (0.08 | ) | | | | — | | | | | — | | | | | — | | | | | — | |
| | | | | |
Net realized gain on investments | | | | — | | | | | — | | | | | (3.91 | ) | | | | (0.39 | ) | | | | (0.72 | ) |
| | | | | |
Total distributions to shareholders | | | | (0.08 | ) | | | | — | | | | | (3.91 | ) | | | | (0.39 | ) | | | | (0.72 | ) |
| | | | | |
Net Asset Value, End of Year | | | | $8.64 | | | | | $6.54 | | | | | $6.58 | | | | | $12.60 | | | | | $8.55 | |
| | | | | |
Total Return2,6 | | | | 33.53 | % | | | | (0.61 | )% | | | | (22.17 | )% | | | | 52.92 | % | | | | 16.22 | % |
| | | | | |
Ratio of net expenses to average net assets | | | | 1.30 | % | | | | 1.30 | % | | | | 1.30 | % | | | | 1.30 | % | | | | 1.30 | % |
| | | | | |
Ratio of gross expenses to average net assets7 | | | | 1.54 | % | | | | 1.70 | % | | | | 1.74 | % | | | | 1.72 | % | | | | 1.90 | % |
| | | | | |
Ratio of net investment loss to average net assets2 | | | | (0.41 | )% | | | | (0.30 | )% | | | | (0.86 | )% | | | | (0.98 | )% | | | | (0.73 | )% |
| | | | | |
Portfolio turnover | | | | 234 | % | | | | 227 | % | | | | 231 | % | | | | 217 | % | | | | 206 | % |
| | | | | |
Net assets end of year (000’s) omitted | | | | $3,547 | | | | | $2,701 | | | | | $1,179 | | | | | $834 | | | | | $306 | |
| | | | | | | | | | | | | | | | | | | | | | | | | | |
The accompanying notes are an integral part of these financial statements.
9
| | |
| | AMG Frontier Small Cap Growth Fund Financial Highlights For a share outstanding throughout each fiscal year |
| | | | | | | | | | | | | | | | | | | | | | | | | |
| | | For the fiscal years ended October 31, |
| Class I | | 2024 | | 2023 | | 2022 | | 2021 | | 2020 |
| | | | | |
Net Asset Value, Beginning of Year | | | | $7.21 | | | | | $7.23 | | | | | $13.40 | | | | | $9.04 | | | | | $8.43 | |
| | | | | |
Income (loss) from Investment Operations: | | | | | | | | | | | | | | | | | | | | | | | | | |
| | | | | |
Net investment income (loss)1,2 | | | | (0.01 | )3 | | | | 0.00 | 4,8 | | | | (0.04 | )5 | | | | (0.08 | ) | | | | (0.03 | ) |
| | | | | |
Net realized and unrealized gain (loss) on investments | | | | 2.44 | | | | | (0.02 | ) | | | | (2.22 | ) | | | | 4.83 | | | | | 1.36 | |
| | | | | |
Total income (loss) from investment operations | | | | 2.43 | | | | | (0.02 | ) | | | | (2.26 | ) | | | | 4.75 | | | | | 1.33 | |
| | | | | |
Less Distributions to Shareholders from: | | | | | | | | | | | | | | | | | | | | | | | | | |
| | | | | |
Net investment income | | | | (0.10 | ) | | | | — | | | | | — | | | | | — | | | | | — | |
| | | | | |
Net realized gain on investments | | | | — | | | | | — | | | | | (3.91 | ) | | | | (0.39 | ) | | | | (0.72 | ) |
| | | | | |
Total distributions to shareholders | | | | (0.10 | ) | | | | — | | | | | (3.91 | ) | | | | (0.39 | ) | | | | (0.72 | ) |
| | | | | |
Net Asset Value, End of Year | | | | $9.54 | | | | | $7.21 | | | | | $7.23 | | | | | $13.40 | | | | | $9.04 | |
| | | | | |
Total Return2,6 | | | | 33.86 | % | | | | (0.28 | )% | | | | (21.92 | )% | | | | 53.49 | % | | | | 16.69 | % |
| | | | | |
Ratio of net expenses to average net assets | | | | 0.99 | % | | | | 0.97 | % | | | | 0.94 | % | | | | 0.94 | % | | | | 0.95 | % |
| | | | | |
Ratio of gross expenses to average net assets7 | | | | 1.23 | % | | | | 1.37 | % | | | | 1.38 | % | | | | 1.36 | % | | | | 1.55 | % |
| | | | | |
Ratio of net investment income (loss) to average net assets2 | | | | (0.10 | )% | | | | 0.03 | % | | | | (0.50 | )% | | | | (0.62 | )% | | | | (0.38 | )% |
| | | | | |
Portfolio turnover | | | | 234 | % | | | | 227 | % | | | | 231 | % | | | | 217 | % | | | | 206 | % |
| | | | | |
Net assets end of year (000’s) omitted | | | | $61,814 | | | | | $46,657 | | | | | $17,023 | | | | | $17,230 | | | | | $11,547 | |
| | | | | | | | | | | | | | | | | | | | | | | | | | |
The accompanying notes are an integral part of these financial statements.
10
| | |
| | AMG Frontier Small Cap Growth Fund Financial Highlights For a share outstanding throughout each fiscal year |
| | | | | | | | | | | | | | | | | | | | | | | | | |
| | | For the fiscal years ended October 31, |
| Class Z | | 2024 | | 2023 | | 2022 | | 2021 | | 2020 |
| | | | | |
Net Asset Value, Beginning of Year | | | | $7.69 | | | | | $7.71 | | | | | $14.01 | | | | | $9.43 | | | | | $8.75 | |
| | | | | |
Income (loss) from Investment Operations: | | | | | | | | | | | | | | | | | | | | | | | | | |
| | | | | |
Net investment income (loss)1,2 | | | | (0.00 | )3,9 | | | | 0.01 | 4 | | | | (0.04 | )5 | | | | (0.07 | ) | | | | (0.03 | ) |
| | | | | |
Net realized and unrealized gain (loss) on investments | | | | 2.60 | | | | | (0.03 | ) | | | | (2.35 | ) | | | | 5.04 | | | | | 1.43 | |
| | | | | |
Total income (loss) from investment operations | | | | 2.60 | | | | | (0.02 | ) | | | | (2.39 | ) | | | | 4.97 | | | | | 1.40 | |
| | | | | |
Less Distributions to Shareholders from: | | | | | | | | | | | | | | | | | | | | | | | | | |
| | | | | |
Net investment income | | | | (0.10 | ) | | | | — | | | | | — | | | | | — | | | | | — | |
| | | | | |
Net realized gain on investments | | | | — | | | | | — | | | | | (3.91 | ) | | | | (0.39 | ) | | | | (0.72 | ) |
| | | | | |
Total distributions to shareholders | | | | (0.10 | ) | | | | — | | | | | (3.91 | ) | | | | (0.39 | ) | | | | (0.72 | ) |
| | | | | |
Net Asset Value, End of Year | | | | $10.19 | | | | | $7.69 | | | | | $7.71 | | | | | $14.01 | | | | | $9.43 | |
| | | | | |
Total Return2,6 | | | | 34.01 | % | | | | (0.26 | )% | | | | (21.87 | )% | | | | 53.62 | % | | | | 16.74 | % |
| | | | | |
Ratio of net expenses to average net assets | | | | 0.90 | % | | | | 0.90 | % | | | | 0.90 | % | | | | 0.90 | % | | | | 0.90 | % |
| | | | | |
Ratio of gross expenses to average net assets7 | | | | 1.14 | % | | | | 1.30 | % | | | | 1.34 | % | | | | 1.32 | % | | | | 1.50 | % |
| | | | | |
Ratio of net investment income (loss) to average net assets2 | | | | (0.01 | )% | | | | 0.10 | % | | | | (0.46 | )% | | | | (0.58 | )% | | | | (0.33 | )% |
| | | | | |
Portfolio turnover | | | | 234 | % | | | | 227 | % | | | | 231 | % | | | | 217 | % | | | | 206 | % |
| | | | | |
Net assets end of year (000’s) omitted | | | | $13,352 | | | | | $6,376 | | | | | $6,027 | | | | | $8,672 | | | | | $7,850 | |
| | | | | | | | | | | | | | | | | | | | | | | | | | |
| 1 | Per share numbers have been calculated using average shares. |
| 2 | Total returns and net investment income (loss) would have been lower had certain expenses not been offset. |
| 3 | Includes non-recurring dividends. Without these dividends, net investment loss per share would have been $(0.05), $(0.03) and $(0.02) for Class N, Class I and Class Z shares, respectively. |
| 4 | Includes non-recurring dividends. Without these dividends, net investment loss per share would have been $(0.03), $(0.01) and $(0.01) for Class N, Class I and Class Z shares, respectively. |
| 5 | Includes non-recurring dividends. Without these dividends, net investment loss per share would have been $(0.07), $(0.04) and $(0.04) for Class N, Class I and Class Z shares, respectively. |
| 6 | The total return is calculated using the published Net Asset Value as of fiscal year end. |
| 7 | Excludes the impact of expense reimbursement or fee waivers and expense reductions such as brokerage credits, but includes expense repayments and non-reimbursable expenses, if any, such as interest, taxes, and extraordinary expenses. (See Note 1(c) and 2 in the Notes to Financial Statements.) |
| 8 | Less than $0.005 per share. |
| 9 | Less than $(0.005) per share. |
The accompanying notes are an integral part of these financial statements.
11
| | |
| | Notes to Financial Statements October 31, 2024 |
1. ORGANIZATION AND SUMMARY OF SIGNIFICANT ACCOUNTING POLICIES
AMG Funds I (the “Trust”) is an open-end management investment company, organized as a Massachusetts business trust, and registered under the Investment Company Act of 1940, as amended (the “1940 Act”). Currently, the Trust consists of a number of different funds, each having distinct investment management objectives, strategies, risks, and policies. Included in this report is AMG Frontier Small Cap Growth Fund (the “Fund”).
The Fund offers Class N, I and Z shares. Each class represents an interest in the same assets of the Fund. Although all share classes generally have identical voting rights, each share class votes separately when required by law. Different share classes may have different net asset values per share to the extent the share classes pay different distribution amounts and/or the expenses of such share classes differ. Each share class has its own expense structure. Please refer to a current prospectus for additional information on each share class.
The Fund’s financial statements are prepared in accordance with accounting principles generally accepted in the United States of America (“U.S. GAAP”), including accounting and reporting guidance pursuant to Accounting Standards Codification Topic 946 applicable to investment companies. U.S. GAAP requires management to make estimates and assumptions that affect the reported amounts of assets and liabilities and disclosure of contingent assets and liabilities at the date of the financial statements and the reported amounts of income and expenses during the reporting period. Actual results could differ from those estimates and such differences could be material. The following is a summary of significant accounting policies followed by the Fund in the preparation of its financial statements:
a. VALUATION OF INVESTMENTS
Equity securities traded on a national securities exchange or reported on the NASDAQ national market system (“NMS”) are valued at the last quoted sales price on the primary exchange or, if applicable, the NASDAQ official closing price or the official closing price of the relevant exchange or, lacking any sales, at the last quoted bid price. Equity securities held by the Fund that are traded in the over-the-counter market (other than NMS securities) are valued at the bid price. Foreign equity securities (securities principally traded in markets other than U.S. markets) held by the Fund are valued at the official closing price on the primary exchange or, for markets that either do not offer an official closing price or where the official closing price may not be representative of the overall market, the last quoted sale price.
Fixed income securities purchased with a remaining maturity of 60 days or less are valued at amortized cost, provided that the amortized cost value is approximately the same as the fair value of the security valued without the use of amortized cost. Investments in other open-end registered investment companies are valued at their end of day net asset value per share.
The Fund’s portfolio investments are generally valued based on independent market quotations or prices or, if none, “evaluative” or other market based valuations provided by third party pricing services. Pursuant to Rule 2a-5 under the 1940 Act, the Fund’s Board of Trustees (the “Board”) designated AMG Funds LLC (the “Investment Manager”) as the Fund’s Valuation Designee to perform the Fund’s fair value determinations. Such determinations are subject to Board oversight and certain reporting and other requirements intended to ensure that
the Board receives the information it needs to oversee the Investment Manager’s fair value determinations.
Under certain circumstances, the value of certain Fund portfolio investments may be based on an evaluation of fair value, pursuant to procedures established by the Investment Manager and under the general supervision of the Board. The Fund may use the fair value of a portfolio investment to calculate its net asset value (“NAV”) in the event that the market quotation, price or market based valuation for the portfolio investment is not readily available or otherwise not determinable pursuant to the Fund’s valuation procedures, if the Investment Manager believes the quotation, price or market based valuation to be unreliable, or in certain other circumstances. When determining the fair value of an investment, the Investment Manager seeks to determine the price that the Fund might reasonably expect to receive from current sale of that portfolio investment in an arms-length transaction. Fair value determinations shall be based upon consideration of all available facts and information, including, but not limited to (i) attributes specific to the investment; (ii) fundamental and analytical data relating to the investment; and (iii) the value of other comparable securities or relevant financial instruments, including derivative securities, traded on other markets or among dealers.
The values assigned to fair value portfolio investments are based on available information and do not necessarily represent amounts that might ultimately be realized in the future, since such amounts depend on future developments inherent in long-term investments. Because of the inherent uncertainty of valuation, those estimated values may differ significantly from the values that would have been used had a ready market for the investments existed, and the differences could be material. The Board will be presented with quarterly reports, as of the most recent quarter end, summarizing all fair value activity, material fair value matters that occurred during the quarter, and all outstanding securities fair valued by the Fund. Additionally, the Board will be presented with an annual report that assesses the adequacy and effectiveness of the Investment Manager’s process for determining the fair value of the Fund’s investments.
With respect to foreign equity securities and certain foreign fixed income securities, securities held in the Fund that can be fair valued by the applicable fair value pricing service are fair valued on each business day provided that each individual price exceeds a pre-established confidence level.
U.S. GAAP defines fair value as the price that a fund would receive to sell an asset or pay to transfer a liability in an orderly transaction between market participants at the measurement date. U.S. GAAP also establishes a framework for measuring fair value, and a three level hierarchy for fair value measurements based upon the transparency of inputs to the valuation of an asset or liability. Inputs may be observable or unobservable and refer broadly to the assumptions that market participants would use in pricing the asset or liability. Observable inputs reflect the assumptions market participants would use in pricing the asset or liability based on market data obtained from sources independent of the Fund. Unobservable inputs reflect the Fund’s own assumptions about the assumptions that market participants would use in pricing the asset or liability developed based on the best information available in the circumstances. Each investment is assigned a level based upon the observability of the inputs which are significant to the overall valuation.
The three-tier hierarchy of inputs is summarized below:
Level 1 – inputs are quoted prices in active markets for identical investments (e.g., equity securities, open-end investment companies)
12
| | |
| | Notes to Financial Statements (continued) |
Level 2 – other observable inputs (including, but not limited to: quoted prices for similar assets or liabilities in markets that are active, quoted prices for identical or similar assets or liabilities in markets that are not active, inputs other than quoted prices that are observable for the assets or liabilities (such as interest rates, yield curves, volatilities, prepayment speeds, loss severities, credit risks and default rates) or other market corroborated inputs) (e.g., debt securities, government securities, foreign securities utilizing international fair value pricing, fair valued securities with observable inputs)
Level 3 – inputs are significant unobservable inputs (including the Fund’s own assumptions used to determine the fair value of investments) (e.g., fair valued securities with unobservable inputs)
Changes in inputs or methodologies used for valuing investments may result in a transfer in or out of levels within the fair value hierarchy. The inputs or methodologies used for valuing investments may not necessarily be an indication of the risk associated with investing in those investments.
b. SECURITY TRANSACTIONS
Security transactions are accounted for as of trade date. Realized gains and losses on securities sold are determined on the basis of identified cost.
c. INVESTMENT INCOME AND EXPENSES
Dividend income is recorded on the ex-dividend date. Interest income, which includes amortization of premium and accretion of discount on debt securities, is accrued as earned. Dividend and interest income on foreign securities is recorded gross of any withholding tax. Non-cash dividends included in dividend income, if any, are reported at the fair market value of the securities received. Upon notification from the issuer, distributions received from a real estate investment trust (REIT) may be redesignated as a reduction of cost of investments and/or realized gain. Other income and expenses are recorded on an accrual basis. Expenses that cannot be directly attributed to the Fund are apportioned among the funds in the Trust and other trusts or funds within the AMG Funds Family of Funds (collectively, the “AMG Funds Family”) based upon their relative average net assets or number of shareholders. Investment income, realized and unrealized capital gains and losses, the common expenses of the Fund, and certain fund level expense reductions, if any, are allocated on a pro-rata basis to each class based on the relative net assets of each class to the total net assets of the Fund.
d. DIVIDENDS AND DISTRIBUTIONS
Fund distributions resulting from either net investment income or realized net capital gains, if any, will normally be declared and paid at least annually in December. Distributions to shareholders are recorded on the ex-dividend date. Distributions are determined in accordance with federal income tax law, which may differ from net investment income and net realized capital gains for financial statement purposes (U.S. GAAP). Differences may be permanent or temporary. Permanent differences are reclassified among capital accounts in the financial statements to reflect their tax character. Permanent book and tax basis differences, if any, relating to shareholder distributions will result in reclassifications to paid-in capital. Temporary differences arise when certain items of income, expense and gain or loss are recognized in different periods for financial statement and tax purposes; these differences will reverse at some time in the future. Permanent differences are primarily due to tax equalization utilized.
Temporary differences are primarily due to mark to market on passive foreign investment companies and wash sales loss deferrals.
The tax character of distributions paid during the fiscal years ended October 31, 2024 and October 31, 2023 was as follows:
| | | | | | | | |
| | |
| Distributions paid from: | | 2024 | | | 2023 | |
| | |
Ordinary income * | | | $769,744 | | | | — | |
| * | For tax purposes, short-term capital gain distributions, if any, are considered ordinary income distributions. |
As of October 31, 2024, the components of distributable earnings (excluding unrealized appreciation/depreciation) on a tax basis consisted of:
| | | | |
| |
Undistributed ordinary income | | $ | 4,025,559 | |
| |
Undistributed long-term capital gains | | | 3,472,303 | |
At October 31, 2024, the cost of investments and the aggregate gross unrealized appreciation and depreciation for federal income tax purposes were as follows:
| | | | | | |
| Cost | | Appreciation | | Depreciation | | Net Appreciation |
| | | |
| $76,405,400 | | $10,150,306 | | $(6,538,529) | | $3,611,777 |
e. FEDERAL TAXES
The Fund currently qualifies as an investment company and intends to comply with the requirements under Subchapter M of the Internal Revenue Code of 1986, as amended (the “Code”), and to distribute substantially all of its taxable income and gains to its shareholders and to meet certain diversification and income requirements with respect to investment companies. The Investment Manager has analyzed the Fund’s tax positions taken on federal income tax returns as of October 31, 2024, and for all open tax years (generally, the three prior taxable years), and has concluded that no provision for federal income tax is required in the Fund’s financial statements. Additionally, the Investment Manager is not aware of any tax position for which it is reasonably possible that the total amounts of unrecognized tax benefit/detriment will change materially in the next twelve months.
Furthermore, based on the Fund’s understanding of the tax rules and rates related to income, gains and transactions for the foreign jurisdictions in which it invests, the Fund will provide for foreign taxes, and where appropriate, deferred foreign taxes.
f. CAPITAL LOSS CARRYOVERS AND DEFERRALS
As of October 31, 2024, the Fund had no capital loss carryovers for federal income tax purposes. Should the Fund incur net capital losses for the fiscal year ended October 31, 2025, such amounts may be used to offset future realized capital gains indefinitely, and retain their character as short-term and/or long-term.
For the fiscal year ended October 31, 2024, the Fund utilized capital loss carryovers in the amount of:
| | | | |
| | |
| Short-Term | | Long-Term | | |
| | |
$1,799,946 | | — | | |
13
| | |
| | Notes to Financial Statements (continued) |
g. CAPITAL STOCK
The Trust’s Amended and Restated Agreement and Declaration of Trust authorizes for the Fund the issuance of an unlimited number of shares of beneficial interest, without par value. The Fund records sales and repurchases of its capital stock on the trade date.
For the fiscal years ended October 31, 2024 and October 31, 2023, the capital stock transactions by class for the Fund were as follows:
| | | | | | | | | | | | | | | | |
| | |
| | | October 31, 2024 | | | October 31, 2023 | |
| | | | |
| | | Shares | | | Amount | | | Shares | | | Amount | |
| | | | |
Class N: | | | | | | | | | | | | | | | | |
| | | | |
Shares sold | | | 133,861 | | | | $1,063,563 | | | | 283,803 | | | | $2,131,959 | |
| | | | |
Shares issued in reinvestment of distributions | | | 4,455 | | | | 34,128 | | | | — | | | | — | |
| | | | |
Shares redeemed | | | (140,648) | | | | (1,138,522) | | | | (50,051) | | | | (364,640) | |
| | | | | | | | | | | | | | | | |
| | | | |
Net increase (decrease) | | | (2,332) | | | | $(40,831) | | | | 233,752 | | | | $1,767,319 | |
| | | | | | | | | | | | | | | | |
| | | | |
Class I: | | | | | | | | | | | | | | | | |
| | | | |
Shares sold | | | 1,411,571 | | | | $12,372,222 | | | | 5,456,657 | | | | $44,655,918 | |
| | | | |
Shares issued in reinvestment of distributions | | | 76,935 | | | | 649,337 | | | | — | | | | — | |
| | | | |
Shares redeemed | | | (1,482,676) | | | | (13,477,013) | | | | (1,338,783) | | | | (10,125,309) | |
| | | | | | | | | | | | | | | | |
| | | | |
Net increase (decrease) | | | 5,830 | | | | $(455,454) | | | | 4,117,874 | | | | $34,530,609 | |
| | | | | | | | | | | | | | | | |
| | | | |
Class Z: | | | | | | | | | | | | | | | | |
| | | | |
Shares sold | | | 577,839 | | | | $5,473,667 | | | | 93,430 | | | | $763,578 | |
| | | | |
Shares issued in reinvestment of distributions | | | 9,419 | | | | 84,864 | | | | — | | | | — | |
| | | | |
Shares redeemed | | | (105,953) | | | | (1,024,625) | | | | (46,001) | | | | (394,403) | |
| | | | | | | | | | | | | | | | |
| | | | |
Net increase | | | 481,305 | | | | $4,533,906 | | | | 47,429 | | | | $369,175 | |
| | | | | | | | | | | | | | | | |
h. REPURCHASE AGREEMENTS AND JOINT REPURCHASE AGREEMENTS
The Fund may enter into third-party and bilateral repurchase agreements for temporary cash management purposes and for reinvestment of cash collateral on securities lending transactions under the securities lending program offered by The Bank of New York Mellon (“BNYM”) (the “Securities Lending Program”) (collectively, “Repurchase Agreements”). The value of the underlying collateral, including accrued interest, must equal or exceed the value of the Repurchase Agreements during the term of the agreement. For joint repurchase agreements, the Fund participates on a pro rata basis with other clients of BNYM in its share of the underlying collateral under such joint repurchase agreements and in its share of proceeds from any repurchase or other disposition of the underlying collateral. The underlying collateral for all Repurchase Agreements is held by the Fund’s custodian or at the Federal Reserve Bank. If the seller defaults and the value of the collateral declines, or if bankruptcy proceedings commence with respect to the seller of the security, realization of the collateral by the Fund may be delayed or limited. Pursuant to the Securities Lending Program, the Fund is indemnified for such losses by BNYM on joint repurchase agreements.
At October 31, 2024, the market value of Repurchase Agreements outstanding was $1,793,359.
2. AGREEMENTS AND TRANSACTIONS WITH AFFILIATES
The Trust has entered into an investment advisory agreement under which the Investment Manager, a subsidiary and the U.S. wealth platform of Affiliated Managers Group, Inc. (“AMG”), serves as investment manager to the Fund and is responsible for the Fund’s overall administration and operations. The Investment Manager selects and recommends, subject to the approval of the Board and, in certain circumstances, shareholders, the subadviser for the Fund and monitors the subadviser’s investment performance, security holdings and investment strategies. The Fund’s investment portfolio is managed by Frontier Capital Management Co., LLC (“Frontier”) who serves pursuant to a subadvisory agreement with the Investment Manager. AMG indirectly owns a majority interest in Frontier.
Investment management fees are paid directly by the Fund to the Investment Manager based on average daily net assets. For the fiscal year ended October 31, 2024, the Fund paid an investment management fee at the annual rate of 0.70% of the average daily net assets of the Fund. The fee paid to Frontier for its services as subadviser is paid out of the fee the Investment Manager receives from the Fund and does not increase the expenses of the Fund.
The Investment Manager has contractually agreed, through at least March 1, 2025, to waive management fees and/or pay or reimburse fund expenses in order to limit total annual Fund operating expenses after fee waiver and expense reimbursements (exclusive of taxes, interest (including interest incurred in connection with bank and custody overdrafts, and in connection with securities
14
| | |
| | Notes to Financial Statements (continued) |
sold short), shareholder servicing fees, distribution and service (12b-1) fees, brokerage commissions and other transaction costs, dividends payable with respect to securities sold short, acquired fund fees and expenses and extraordinary expenses) of the Fund to the annual rate of 0.90% of the Fund’s average daily net assets (this annual rate or such other annual rate that may be in effect from time to time, the “Expense Cap”), subject to later reimbursement by the Fund in certain circumstances.
In general, for a period of up to 36 months after the date any amounts are paid, waived or reimbursed by the Investment Manager, the Investment Manager may recover such amounts from the Fund, provided that such repayment would not cause the Fund’s total annual operating expenses after fee waiver and expense reimbursements (exclusive of the items noted in the parenthetical above) to exceed either (i) the Expense Cap in effect at the time such amounts were paid, waived or reimbursed, or (ii) the Expense Cap in effect at the time of such repayment by the Fund.
The contractual expense limitation may only be terminated in the event the Investment Manager or a successor ceases to be the investment manager of the Fund or a successor fund, by mutual agreement between the Investment Manager and the Board, or in the event of the Fund’s liquidation unless the Fund is reorganized or is a party to a merger in which the surviving entity is successor to the accounting and performance information of the Fund.
For the fiscal year ended October 31, 2024, the Investment Manager reimbursed the Fund $178,452, and did not recoup any previously reimbursed expenses. At October 31, 2024, the Fund’s expiration of reimbursements subject to recoupment is as follows:
| | | | |
Expiration Period | | | |
| |
Less than 1 year | | | $102,867 | |
| |
1-2 years | | | 156,669 | |
| |
2-3 years | | | 178,452 | |
| | | | |
| |
Total | | | $437,988 | |
| | | | |
The Trust, on behalf of the Fund, has entered into an amended and restated Administration Agreement under which the Investment Manager serves as the Fund’s administrator (the “Administrator”) and is responsible for certain aspects of managing the Fund’s operations, including administration and shareholder services to the Fund. The Fund pays a fee to the Administrator at the rate of 0.15% per annum of the Fund’s average daily net assets for this service.
The Fund is distributed by AMG Distributors, Inc. (the “Distributor”), a wholly-owned subsidiary of the Investment Manager. The Distributor serves as the distributor and underwriter for the Fund and is a registered broker-dealer and member of the Financial Industry Regulatory Authority, Inc. (“FINRA”). Shares of the Fund will be continuously offered and will be sold directly to prospective purchasers and through brokers, dealers or other financial intermediaries who have executed selling agreements with the Distributor. Generally, the Distributor bears all or a portion of the expenses of providing services pursuant to the distribution agreement, including the payment of the expenses relating to the distribution of prospectuses for sales purposes and any advertising or sales literature.
The Fund has adopted a distribution and service plan (the “Plan”) with respect to the Class N shares, in accordance with the requirements of Rule 12b-1 under the 1940 Act and the requirements of the applicable rules of FINRA regarding
asset-based sales charges. Pursuant to the Plan, the Fund may make payments to the Distributor for its expenditures in financing any activity primarily intended to result in the sale of the Fund’s Class N shares and for maintenance and personal service provided to existing shareholders of that class. The Plan authorizes payments to the Distributor up to 0.25% annually of the Fund’s average daily net assets attributable to the Class N shares.
For Class N and Class I shares, the Board has approved reimbursement payments to the Investment Manager for shareholder servicing expenses (“shareholder servicing fees”) incurred. Shareholder servicing fees include payments to financial intermediaries, such as broker-dealers (including fund supermarket platforms), banks, and trust companies who provide shareholder recordkeeping, account servicing and other services. The Class N and Class I shares may reimburse the Investment Manager for the actual amount incurred up to a maximum annual rate of each Class’s average daily net assets as shown in the table below.
The impact on the annualized expense ratios for the fiscal year ended October 31, 2024, was as follows:
| | | | | | | | |
| | Maximum Annual
Amount
Approved | | | Actual
Amount
Incurred | |
| | |
Class N | | | 0.15 | % | | | 0.15 | % |
| | |
Class I | | | 0.15 | % | | | 0.09 | % |
The Board provides supervision of the affairs of the Trust and other trusts within the AMG Funds Family. The Trustees of the Trust who are not affiliated with the Investment Manager receive an annual retainer and per meeting fees for regular, special and telephonic meetings, and they are reimbursed for out-of-pocket expenses incurred while carrying out their duties as Board members. The Chairman of the Board and the Audit Committee Chair receive additional annual retainers. Certain Trustees and Officers of the Fund are Officers and/or Directors of the Investment Manager, AMG and/or the Distributor.
The Securities and Exchange Commission (the “SEC”) granted an exemptive order that permits certain eligible funds in the AMG Funds Family to lend and borrow money for certain temporary purposes directly to and from other eligible funds in the AMG Funds Family. Participation in this interfund lending program is voluntary for both the borrowing and lending funds, and an interfund loan is only made if it benefits each participating fund. The Administrator manages the program according to procedures approved by the Board, and the Board monitors the operation of the program. An interfund loan must comply with certain conditions set out in the exemptive order, which are designed to assure fairness and protect all participating funds. The interest earned and interest paid on interfund loans are included on the Statement of Operations as interest income and interest expense, respectively. At October 31, 2024, the Fund had no interfund loans outstanding. The Fund did not borrow during the fiscal year ended October 31, 2024.
The Fund utilized the interfund lending program during the fiscal year ended October 31, 2024 as follows:
| | | | | | | | | | | | |
Average Lent | | Number
of Days | | | Interest Earned | | | Average Interest Rate | |
| | | |
| $2,049,864 | | | 1 | | | | $349 | | | | 6.215% | |
15
| | |
| | Notes to Financial Statements (continued) |
3. PURCHASES AND SALES OF SECURITIES
Purchases and sales of securities (excluding short-term securities and U.S. Government Obligations) for the fiscal year ended October 31, 2024, were $174,864,973 and $170,994,323, respectively.
The Fund had no purchases or sales of U.S. Government Obligations during the fiscal year ended October 31, 2024.
4. PORTFOLIO SECURITIES LOANED
The Fund participates in the Securities Lending Program providing for the lending of securities to qualified borrowers. Securities lending income includes earnings of such temporary cash investments, plus or minus any rebate to a borrower. These earnings (after any rebate) are then divided between BNYM, as a fee for its services under the Securities Lending Program, and the Fund, according to agreed-upon rates. Collateral on all securities loaned is accepted in cash, U.S. Treasury Obligations or U.S. Government Agency Obligations. Collateral is maintained at a minimum level of 102% (105% in the case of certain foreign securities) of the market value, plus interest, if applicable, of investments on loan. It is the Fund’s policy to obtain additional collateral from or return excess collateral to the borrower by the end of the next business day, following the valuation date of the securities loaned. Therefore, the value of the collateral held may be temporarily less than the value of the securities on loan. Lending securities entails a risk of loss to the Fund if and to the extent that the market value of the securities loaned were to increase and the borrower did not increase the collateral accordingly, and the borrower fails to return the securities. Under the terms of the Securities Lending Program, the Fund is indemnified for such losses by BNYM. Cash collateral is held in separate omnibus accounts managed by BNYM, who is authorized to exclusively enter into joint repurchase agreements for that cash collateral. Securities collateral is held in separate omnibus accounts managed by BNYM and cannot be sold or pledged. BNYM bears the risk of any deficiency in the amount of the cash collateral available for return to the borrower due to any loss on the collateral invested. Loans of securities are terminable at any time and the borrower, after notice, is required to return borrowed securities as soon as practical, which is normally within three business days.
The value of securities loaned on positions held, cash collateral and securities collateral received at October 31, 2024, was as follows:
| | | | | | |
Securities Loaned | | Cash Collateral Received | | Securities Collateral Received | | Total Collateral Received |
| | | |
| $9,701,466 | | $1,793,359 | | $8,415,516 | | $10,208,875 |
The following table summarizes the securities received as collateral for securities lending at October 31, 2024:
| | | | |
Collateral
Type | | Coupon
Range | | Maturity Date Range |
| | |
| U.S. Treasury Obligations | | 0.000%-7.625% | | 11/07/24-08/15/53 |
5. FUND RISKS
In the normal course of business, the Fund invests in securities or other instruments and may enter into certain transactions, and such activities subject
the Fund to various risks. The value of securities or other instruments may also be affected by various factors, including, without limitation: (i) the general economy; ii) the overall market; or (iii) price fluctuations. Please refer to the Fund’s current prospectus for additional information about the Fund’s principal risks.
Management Risk: Because the Fund is an actively managed investment portfolio, security selection or focus on securities in a particular style, market sector or group of companies may cause the Fund to incur losses or underperform relative to its benchmarks or other funds with a similar investment objective. There can be no guarantee that the Subadviser’s investment techniques and risk analysis will produce the desired result.
Market Risk: Market prices of investments held by the Fund may fall rapidly or unpredictably due to a variety of factors, including economic, political, or market conditions, or other factors including terrorism, war, natural disasters and the spread of infectious illness or other public health issues, including epidemics or pandemics, or in response to events that affect particular industries or companies.
Small- and Mid-Capitalization Stock Risk: The stocks of small- and mid-capitalization companies often have greater price volatility, lower trading volume, and less liquidity than the stocks of larger, more established companies.
Growth Stock Risk: The prices of equity securities of companies that are expected to experience relatively rapid earnings growth, or “growth stocks,” may be more sensitive to market movements because the prices tend to reflect future investor expectations rather than just current profits.
Sector Risk: Issuers and companies that are in similar industry sectors may be similarly affected by particular economic or market events; to the extent the Fund has substantial holdings within a particular sector, the risks associated with that sector increase.
High Portfolio Turnover Risk: Higher portfolio turnover may adversely affect Fund performance by increasing Fund transaction costs and may increase a shareholder’s tax liability.
Liquidity Risk: The Fund may not be able to dispose of particular investments, such as illiquid securities, readily at favorable times or prices or the Fund may have to sell them at a loss.
6. COMMITMENTS AND CONTINGENCIES
Under the Trust’s organizational documents, its Trustees and Officers are indemnified against certain liabilities arising out of the performance of their duties to the Trust. In addition, in the normal course of business, the Fund may enter into contracts and agreements that contain a variety of representations and warranties, which provide general indemnifications. The maximum exposure to the Fund under these arrangements is unknown, as this would involve future claims that may be made against the Fund that have not yet occurred. However, based on experience, the Fund had no prior claims or losses and expects the risks of loss to be remote.
16
| | |
| | Notes to Financial Statements (continued) |
7. MASTER NETTING AGREEMENTS
The Fund may enter into master netting agreements with its counterparties for the Securities Lending Program and Repurchase Agreements, which provide the right, in the event of default (including bankruptcy or insolvency) for the non-defaulting party to liquidate the collateral and calculate net exposure to the defaulting party or request additional collateral. For financial reporting purposes, the Fund does not offset financial assets and financial liabilities that are subject to master netting agreements in the Statement of Assets and Liabilities. For securities lending transactions, see Note 4.
The following table is a summary of the Fund’s open Repurchase Agreements that are subject to a master netting agreement as of October 31, 2024:
| | | | | | | | | | | | | | | | | | | | |
| | | | | | Gross Amount Not Offset in the
Statement of Assets and Liabilities | | | | | | | |
| | | | | |
| | | Gross Amounts of
Assets Presented in
the Statement of
Assets and Liabilities | | | Offset Amount | | | Net Asset Balance | | | Collateral
Received | | | Net
Amount | |
| | | | | | | | | | | | | | | | | | | | |
| | | | | |
| | | | | | | | | | | | | | | | | | | | |
| | | | | |
Bank of Montreal | | | $1,000,000 | | | | — | | | | $1,000,000 | | | | $1,000,000 | | | | — | |
| | | | | |
Daiwa Capital Markets America | | | 793,359 | | | | — | | | | 793,359 | | | | 793,359 | | | | — | |
| | | | | | | | | | | | | | | | | | | | |
| | | | | |
Total | | | $1,793,359 | | | | — | | | | $1,793,359 | | | | $1,793,359 | | | | — | |
| | | | | | | | | | | | | | | | | | | | |
8. RECENT ACCOUNTING STANDARDS UPDATE
In November 2023, the Financial Accounting Standards Board issued ASU No. 2023-07, Segment Reporting (Topic 280), which improves reportable segment disclosure requirements, primarily through enhanced disclosures about significant segment expenses. The amendments are effective for fiscal years beginning after December 15, 2023, and interim periods within fiscal years beginning after December 15, 2024. The Fund is currently evaluating the requirements and does not expect this guidance to materially impact the Fund’s financial statements.
9. SUBSEQUENT EVENTS
The Fund has determined that no material events or transactions occurred through the issuance date of the Fund’s financial statements which require an additional disclosure in or adjustment of the Fund’s financial statements.
17
| | |
| | Report of Independent Registered Public Accounting Firm |
To the Board of Trustees of AMG Funds I and Shareholders of AMG Frontier Small Cap Growth Fund
Opinion on the Financial Statements
We have audited the accompanying statement of assets and liabilities, including the schedule of portfolio investments, of AMG Frontier Small Cap Growth Fund (one of the funds constituting AMG Funds I, referred to hereafter as the “Fund”) as of October 31, 2024, the related statement of operations for the year ended October 31, 2024, the statements of changes in net assets for each of the two years in the period ended October 31, 2024, including the related notes, and the financial highlights for each of the five years in the period ended October 31, 2024 (collectively referred to as the “financial statements”). In our opinion, the financial statements present fairly, in all material respects, the financial position of the Fund as of October 31, 2024, the results of its operations for the year then ended, the changes in its net assets for each of the two years in the period ended October 31, 2024 and the financial highlights for each of the five years in the period ended October 31, 2024 in conformity with accounting principles generally accepted in the United States of America.
Basis for Opinion
These financial statements are the responsibility of the Fund’s management. Our responsibility is to express an opinion on the Fund’s financial statements based on our audits. We are a public accounting firm registered with the Public Company Accounting Oversight Board (United States) (PCAOB) and are required to be independent with respect to the Fund in accordance with the U.S. federal securities laws and the applicable rules and regulations of the Securities and Exchange Commission and the PCAOB.
We conducted our audits of these financial statements in accordance with the standards of the PCAOB. Those standards require that we plan and perform the audit to obtain reasonable assurance about whether the financial statements are free of material misstatement, whether due to error or fraud.
Our audits included performing procedures to assess the risks of material misstatement of the financial statements, whether due to error or fraud, and performing procedures that respond to those risks. Such procedures included examining, on a test basis, evidence regarding the amounts and disclosures in the financial statements. Our audits also included evaluating the accounting principles used and significant estimates made by management, as well as evaluating the overall presentation of the financial statements. Our procedures included confirmation of securities owned as of October 31, 2024 by correspondence with the custodian and brokers; when replies were not received from brokers, we performed other auditing procedures. We believe that our audits provide a reasonable basis for our opinion.
/s/PricewaterhouseCoopers LLP
Boston, Massachusetts
December 23, 2024
We have served as the auditor of one or more investment companies in the AMG Funds Family since 1993.
18
| | |
| | Other Information (unaudited) |
TAX INFORMATION
AMG Frontier Small Cap Growth Fund hereby designates the maximum amount allowable of its net taxable income as qualified dividends as provided in the Jobs and Growth Tax Relief Reconciliation Act of 2003. The 2023/2024 Form 1099-DIV you receive for the Fund will show the tax status of all distributions paid to you during the year.
Pursuant to section 852 of the Internal Revenue Code of 1986, as amended, AMG Frontier Small Cap Growth Fund hereby designates $376,217 as a capital gain distribution with respect to the taxable year ended October 31, 2024, or if subsequently determined to be different, the net capital gains of such fiscal year.
ITEM 8. CHANGES IN AND DISAGREEMENTS WITH ACCOUNTANTS FOR OPEN-END MANAGEMENT INVESTMENT COMPANIES
During the fiscal year ended October 31, 2024, there were no changes in and/or disagreements with accountants.
ITEM 9. PROXY DISCLOSURES FOR OPEN-END MANAGEMENT INVESTMENT COMPANIES
Not applicable.
ITEM 10. REMUNERATION PAID TO DIRECTORS, OFFICERS, AND OTHERS OF OPEN-END MANAGEMENT INVESTMENT COMPANIES
The remuneration paid to the Trustees during the fiscal year ended October 31, 2024, was $6,264, which is reflected as “Trustee fees and expenses” on the Statement of Operations. There was no remuneration paid to any Fund officer or to any affiliated person of any Fund Trustee or officer during the fiscal year ended October 31, 2024.
19
| | |
| | ITEM 11. STATEMENT REGARDING BASIS FOR APPROVAL OF INVESTMENT ADVISORY CONTRACT |
| | | | |
AMG Frontier Small Cap Growth Fund: Approval of Fund Management Agreement and Subadvisory Agreement on June 12, 2024 At an in-person meeting held on June 12, 2024, the Board of Trustees (the “Board” or the “Trustees”), and separately a majority of the Trustees who are not “interested persons” of AMG Funds I (the “Trust”) (the “Independent Trustees”), approved (i) the Fund Management Agreement, as amended pursuant to letter agreements at any time prior to the date of the meeting, with AMG Funds LLC (the “Investment Manager”) for AMG Frontier Small Cap Growth Fund (the “Fund”) and separately each of Amendment No. 1 thereto dated July 1, 2015, and Amendment No. 2 thereto dated October 1, 2016 (collectively, the “Fund Management Agreement”); and (ii) the Subadvisory Agreement with respect to the Fund, as amended at any time prior to the date of the meeting (the “Subadvisory Agreement”), with Frontier Capital Management Co., LLC, the Fund’s subadviser (the “Subadviser”). The Independent Trustees were separately represented by independent legal counsel in connection with their consideration of the approval of these agreements. In considering the Fund Management Agreement and Subadvisory Agreement, the Trustees reviewed a variety of materials relating to the Fund, the Investment Manager and the Subadviser, including the nature, extent and quality of services, comparative performance, fee and expense information for an appropriate peer group of similar mutual funds for the Fund (the “Peer Group”), performance information for the relevant benchmark index for the Fund (the “Fund Benchmark”), other relevant matters, including management fees, the profitability of the Investment Manager and the Subadviser, and the potential for economies of scale that may be shared with the Fund, and other information provided to them on a periodic basis throughout the year. Prior to voting, the Independent Trustees: (a) reviewed the foregoing information with their independent legal counsel; (b) received materials from their independent legal counsel discussing the legal standards applicable to their consideration of the Fund Management Agreement and the Subadvisory Agreement; and (c) met with their independent legal counsel in private sessions at which no representatives of management were present. NATURE, EXTENT AND QUALITY OF SERVICES In considering the nature, extent and quality of the services provided by the Investment Manager, the Trustees reviewed information provided by the Investment Manager at the June 12, 2024 meeting and prior meetings relating to the Investment | | Manager’s operations and personnel. Among other things, the Investment Manager provided financial information, information about its supervisory and professional staff and descriptions of its organizational and management structure. The Trustees also took into account information provided periodically throughout the previous year by the Investment Manager in Board meetings relating to the performance of its duties with respect to the Fund and the Trustees’ knowledge of the Investment Manager’s management and the quality of the performance of the Investment Manager’s duties under the Fund Management Agreement and Administration Agreement. In the course of their deliberations regarding the Investment Manager, the Trustees evaluated, among other things: (a) the extent and quality of the Investment Manager’s oversight of the operation and management of the Fund; (b) the quality of the Investment Manager’s oversight of the performance by the Subadviser of its portfolio management duties; (c) the Investment Manager’s ability to supervise the Fund’s other service providers; and (d) the Investment Manager’s compliance program. The Trustees also took into account that, in performing its functions under the Fund Management Agreement and supervising the Subadviser, the Investment Manager: performs periodic detailed analyses and reviews of the performance by the Subadviser of its obligations to the Fund, including without limitation, analysis and review of portfolio and other compliance matters and review of the Subadviser’s investment performance with respect to the Fund; prepares and presents periodic reports to the Board regarding the investment performance of the Subadviser and other information regarding the Subadviser, at such times and in such forms as the Board may reasonably request; reviews and considers any changes in the personnel of the Subadviser responsible for performing the Subadviser’s obligations and makes appropriate reports to the Board; reviews and considers any changes in the ownership or senior management of the Subadviser and makes appropriate reports to the Board; performs periodic in-person, telephonic or videoconference diligence meetings, including with respect to compliance matters, with representatives of the Subadviser; assists the Board and management of the Trust in developing and reviewing information with respect to the initial approval of the Subadvisory Agreement and annual consideration of the Subadvisory Agreement thereafter; prepares recommendations with respect to the continued retention of the Subadviser or the replacement of the Subadviser, including at the request of the Board; identifies potential successors to, or replacements of, the | | Subadviser or potential additional subadvisers, including performing appropriate due diligence, and developing and presenting to the Board a recommendation as to any such successor, replacement, or additional subadviser, including at the request of the Board; designates and compensates from its own resources such personnel as the Investment Manager may consider necessary or appropriate to the performance of its services; and performs such other review and reporting functions as the Board shall reasonably request consistent with the Fund Management Agreement and applicable law. The Trustees noted the affiliation of the Subadviser with the Investment Manager, noting any potential conflicts of interest. The Trustees also took into account the financial condition of the Investment Manager with respect to its ability to provide the services required under the Fund Management Agreement and the Investment Manager’s undertaking to maintain a contractual expense limitation for the Fund. The Trustees also considered the Investment Manager’s risk management processes. The Trustees also reviewed information relating to the Subadviser’s operations and personnel and the investment philosophy, strategies and techniques (its “Investment Strategy”) used in managing the Fund. Among other things, the Trustees reviewed information on portfolio management and other professional staff, information regarding the Subadviser’s organizational and management structure and the Subadviser’s brokerage policies and practices. The Trustees considered specific information provided regarding the experience of the individuals at the Subadviser with portfolio management responsibility for the Fund, including the information set forth in the Fund’s prospectus and statement of additional information. In the course of their deliberations, the Trustees evaluated, among other things: (a) the services rendered by the Subadviser in the past; (b) the qualifications and experience of the Subadviser’s personnel; and (c) the Subadviser’s compliance program. The Trustees also took into account the financial condition of the Subadviser with respect to its ability to provide the services required under the Subadvisory Agreement. The Trustees also considered the Subadviser’s risk management processes. PERFORMANCE The Board considered the Fund’s net performance during relevant time periods as compared to the Fund’s Peer Group and Fund Benchmark, considered the gross performance of the Fund as compared to the Subadviser’s relevant performance composite |
20
| | |
| | ITEM 11. STATEMENT REGARDING BASIS FOR APPROVAL OF INVESTMENT ADVISORY CONTRACT (continued) |
| | | | |
that utilizes a similar investment strategy and approach, and noted that the Board reviews on a quarterly basis detailed information about both the Fund’s performance results and portfolio composition, as well as the Subadviser’s Investment Strategy. The Board was mindful of the Investment Manager’s expertise, resources and attention to monitoring the Subadviser’s performance, investment style and risk-adjusted performance with respect to the Fund and its discussions with the management of the Fund’s subadviser during the period regarding the factors that contributed to the performance of the Fund. Among other information relating to the Fund’s performance, the Trustees noted that the Fund’s performance for Class I shares (which share class has the earliest inception date and the largest amount of assets of all the share classes of the Fund) for the 1-year, 3-year, 5-year and 10-year periods ended March 31, 2024, was above the median performance of the Peer Group and above the performance of the Fund Benchmark, the Russell 2000 Growth Index. The Trustees took into account management’s discussion of the Fund’s performance, including the fact that the Class I shares of the Fund ranked in the top decile relative to its Peer Group for the 1-year, 3-year, 5-year, and 10-year periods. The Trustees concluded that the Fund’s overall performance has been satisfactory. ADVISORY AND SUBADVISORY FEES; FUND EXPENSES; PROFITABILITY; AND ECONOMIES OF SCALE In considering the reasonableness of the advisory fee payable to the Investment Manager, the Trustees reviewed information provided by the Investment Manager at the June 12, 2024 meeting and prior meetings setting forth all revenues and other benefits, both direct and indirect (including any so-called “fallout benefits” such as reputational value derived from the Investment Manager serving as Investment Manager to the Fund), received by the Investment Manager and its affiliates attributable to managing the Fund and all the mutual funds in the AMG Funds Family of Funds; the cost of providing such services; the significant risks undertaken as Investment Manager and sponsor of the Fund, including investment, operational, enterprise, entrepreneurial, litigation, regulatory and compliance risks; and the resulting profitability to the Investment Manager and its affiliates from these relationships. The Trustees also considered the amount of the advisory fee retained by the Investment Manager | | after payment of the subadvisory fee with respect to the Fund. The Trustees also noted payments are made from the Subadviser to the Investment Manager, and other payments are made from the Investment Manager to the Subadviser. The Trustees also considered management’s discussion of the current asset level of the Fund, and the impact on profitability of both the current asset level and any future growth of assets of the Fund. In considering the cost of services to be provided by the Investment Manager under the Fund Management Agreement and the profitability to the Investment Manager of its relationship with the Fund, the Trustees noted the undertaking by the Investment Manager to maintain a contractual expense limitation for the Fund. The Board also took into account management’s discussion of the advisory fee structure and the services the Investment Manager provides in performing its functions under the Fund Management Agreement and supervising the Subadviser. Based on the foregoing, the Trustees concluded that the profitability to the Investment Manager is reasonable and that the Investment Manager is not realizing material benefits from economies of scale that would warrant adjustments to the advisory fee at this time. Also, with respect to economies of scale, the Trustees noted that as the Fund’s assets increase over time, the Fund may realize other economies of scale to the extent the increase in assets is proportionally greater than the increase in certain other expenses. In considering the reasonableness of the subadvisory fee payable by the Investment Manager to the Subadviser, the Trustees reviewed information regarding the cost to the Subadviser of providing subadvisory services to the Fund and the resulting profitability from the relationship. The Trustees noted that, because the Subadviser is an affiliate of the Investment Manager, a portion of the Subadviser’s revenues or profits might be shared directly or indirectly with the Investment Manager. The Trustees also noted that the subadvisory fees are paid by the Investment Manager out of its advisory fee. The Board also took into account management’s discussion of the subadvisory fee structure, and the services the Subadviser provides in performing its functions under the Subadvisory Agreement. Based on the foregoing, the Trustees concluded that the profitability to the Subadviser is reasonable and that the Subadviser is not realizing material benefits from economies of scale that would warrant adjustments to the subadvisory fees at this time. Also, with respect to economies of scale, the Trustees noted | | that as the Fund’s assets increase over time, the Fund may realize other economies of scale to the extent the increase in assets is proportionally greater than the increase in certain other expenses. The Trustees noted that the management fees (which include both the advisory and administration fees) and total expenses (net of applicable expense waivers/reimbursements) of Class I shares (the class of shares which is the primary focus of the Fund’s distribution) of the Fund as of March 31, 2024, were both rated in the Average rating level of the Fund’s Peer Group. The Trustees noted that the rating level corresponded to the Fund’s quintile ranking in its Peer Group. The Trustees took into account the fact that the Investment Manager has contractually agreed, through March 1, 2025, to limit the Fund’s net annual operating expenses (subject to certain excluded expenses) to 0.90%. The Trustees concluded that, in light of the nature, extent and quality of the services provided by the Investment Manager and the Subadviser (which is an affiliate of the Investment Manager), the foregoing expense limitation and the considerations noted above with respect to the Investment Manager and the Subadviser, the Fund’s advisory and subadvisory fees are reasonable. * * * * * After consideration of the foregoing, the Trustees also reached the following conclusions (in addition to the conclusions discussed above) regarding the Fund Management Agreement and the Subadvisory Agreement: (a) the Investment Manager and the Subadviser have demonstrated that they possess the capability and resources to perform the duties required of them under the Fund Management Agreement and the Subadvisory Agreement and (b) the Investment Manager and Subadviser maintain appropriate compliance programs. Based on all of the above-mentioned factors and their related conclusions, with no single factor or conclusion being determinative and with each Trustee not necessarily attributing the same weight to each factor, the Trustees concluded that approval of the Fund Management Agreement and the Subadvisory Agreement would be in the best interests of the Fund and its shareholders. Accordingly, on June 12, 2024, the Trustees, and separately a majority of the Independent Trustees, voted to approve the Fund Management Agreement and the Subadvisory Agreement for the Fund. |
21
THIS PAGE INTENTIONALLY LEFT BLANK
THIS PAGE INTENTIONALLY LEFT BLANK
THIS PAGE INTENTIONALLY LEFT BLANK

| | | | |
INVESTMENT MANAGER AND ADMINISTRATOR AMG Funds LLC 680 Washington Blvd., Suite 500 Stamford, CT 06901 800.548.4539 DISTRIBUTOR AMG Distributors, Inc. 680 Washington Blvd., Suite 500 Stamford, CT 06901 800.548.4539 SUBADVISER Frontier Capital Management Co., LLC 99 Summer Street Boston, MA 02110 | | CUSTODIAN The Bank of New York Mellon Mutual Funds Custody 240 Greenwich Street New York, NY 10286 LEGAL COUNSEL Ropes & Gray LLP Prudential Tower, 800 Boylston Street Boston, MA 02199-3600 TRANSFER AGENT BNY Mellon Investment Servicing (US) Inc. AMG Funds Attn: 534426 AIM 154-0520 500 Ross Street Pittsburgh, PA 15262 800.548.4539 | | This report is prepared for the Fund’s shareholders. It is authorized for distribution to prospective investors only when preceded or accompanied by an effective prospectus. To receive a free copy of the prospectus or Statement of Additional Information, which includes additional information about Fund Trustees, please contact us by calling 800.548.4539. Distributed by AMG Distributors, Inc., member FINRA/SIPC. Current net asset values per share for the Fund are available on the Fund’s website at wealth.amg.com. A description of the policies and procedures the Fund uses to vote its proxies is available: (i) without charge, upon request, by calling 800.548.4539, or (ii) on the Securities and Exchange Commission’s (SEC) website at sec.gov. For information regarding the Fund’s proxy voting record for the 12-month period ended June 30, call 800.548.4539 or visit the SEC website at sec.gov. The Fund files its complete schedule of portfolio holdings with the SEC for the first and third quarters of each fiscal year as an exhibit to its reports on Form N-PORT. The Fund’s portfolio holdings on Form N-PORT are available on the SEC’s website at sec.gov and the Fund’s website at wealth.amg.com. To review a complete list of the Fund’s portfolio holdings, or to view the most recent semi-annual report or annual report, please visit wealth.amg.com. |
| | | | | |
| | | | | |
| | | | | |
| | | | | | | | |
EQUITY FUNDS AMG Boston Common Global Impact Boston Common Asset Management, LLC AMG Frontier Small Cap Growth Frontier Capital Management Co., LLC AMG GW&K Small Cap Core AMG GW&K Small Cap Value AMG GW&K Small/Mid Cap Core AMG GW&K Small/Mid Cap Growth AMG GW&K International Small Cap GW&K Investment Management, LLC AMG Montrusco Bolton Large Cap Growth Montrusco Bolton Investments, Inc. AMG Renaissance Large Cap Growth The Renaissance Group LLC | | | | AMG River Road Dividend All Cap Value AMG River Road Focused Absolute Value AMG River Road Large Cap Value Select AMG River Road Mid Cap Value AMG River Road Small-Mid Cap Value AMG River Road Small Cap Value River Road Asset Management, LLC AMG TimesSquare International Small Cap AMG TimesSquare Mid Cap Growth AMG TimesSquare Small Cap Growth TimesSquare Capital Management, LLC AMG Veritas Asia Pacific AMG Veritas China AMG Veritas Global Focus AMG Veritas Global Real Return Veritas Asset Management LLP AMG Yacktman AMG Yacktman Focused AMG Yacktman Global AMG Yacktman Special Opportunities Yacktman Asset Management LP | | FIXED INCOME FUNDS AMG Beutel Goodman Core Plus Bond Beutel, Goodman & Company Ltd. AMG GW&K Core Bond ESG AMG GW&K ESG Bond AMG GW&K Municipal Bond AMG GW&K Municipal Enhanced Yield GW&K Investment Management, LLC ALTERNATIVE FUNDS AMG Systematica Managed Futures Strategy Systematica Investments Limited, acting as general partner of Systematica Investments LP | | |
| | | | | | |
| | | | | | | |
wealth.amg.com | | | | 103124 | | AR085 |
Item 12. DISCLOSURE OF PROXY VOTING POLICIES AND PROCEDURES FOR CLOSED-END MANAGEMENT INVESTMENT COMPANIES.
Not applicable.
Item 13. PORTFOLIO MANAGERS OF CLOSED-END MANAGEMENT INVESTMENT COMPANIES.
Not applicable.
Item 14. PURCHASES OF EQUITY SECURITIES BY CLOSED-END MANAGEMENT INVESTMENT COMPANIES AND AFFILIATED PURCHASERS.
Not applicable.
Item 15. SUBMISSION OF MATTERS TO A VOTE OF SECURITY HOLDERS.
Not applicable.
Item 16. CONTROLS AND PROCEDURES.
(a) The Registrant’s principal executive and principal financial officers have concluded, based on their evaluation of the Registrant’s disclosure controls and procedures as of a date within 90 days of the filing of this report, that the Registrant’s disclosure controls and procedures are reasonably designed to ensure that information required to be disclosed by the Registrant on Form N-CSR is recorded, processed, summarized and reported within the required time periods and that information required to be disclosed by the Registrant in the reports that it files or submits on Form N-CSR is accumulated and communicated to the Registrant’s management, including its principal executive and principal financial officers, as appropriate to allow timely decisions regarding required disclosure.
(b) There were no changes in the Registrant’s internal control over financial reporting during the period covered by this report that have materially affected, or are reasonably likely to materially affect, the internal control over financial reporting.
Item 17. DISCLOSURE OF SECURITIES LENDING ACTIVITIES FOR CLOSED-END MANAGEMENT INVESTMENT COMPANIES.
Not applicable.
Item 18. RECOVERY OF ERRONEOUSLY AWARDED COMPENSATION.
Not applicable.
Item 19. EXHIBITS
SIGNATURES
Pursuant to the requirements of the Securities Exchange Act of 1934 and the Investment Company Act of 1940, the registrant has duly caused this report to be signed on its behalf by the undersigned, thereunto duly authorized.
| | |
| AMG FUNDS I |
| |
| By: | | /s/ Keitha L. Kinne |
| | Keitha L. Kinne, Principal Executive Officer |
| |
| Date: | | January 3, 2025 |
Pursuant to the requirements of the Securities Exchange Act of 1934 and the Investment Company Act of 1940, this report has been signed below by the following persons on behalf of the registrant and in the capacities and on the dates indicated.
| | |
| By: | | /s/ Keitha L. Kinne |
| | Keitha L. Kinne, Principal Executive Officer |
| |
| Date: | | January 3, 2025 |
| |
| By: | | /s/ Thomas Disbrow |
| | Thomas Disbrow, Principal Financial Officer |
| |
| Date: | | January 3, 2025 |