UNITED STATES
SECURITIES AND EXCHANGE COMMISSION
Washington, D.C. 20549
FORM N-CSR
CERTIFIED SHAREHOLDER REPORT OF REGISTERED
MANAGEMENT INVESTMENT COMPANIES
Investment Company Act File Number 811-06526
Boston Trust Walden Funds
(Exact name of registrant as specified in charter)
One Beacon Street
Boston, MA 02108
(Address of principal executive offices) (Zip code)
50 South La Salle Street
Chicago, IL 60603
(Name and address of agent for service)
1-800-282-8782
Registrant's telephone number, including area code
Date of fiscal year end: December 31
Date of reporting period: December 31, 2023
Item 1. Reports to Stockholders.
(a)
Annual Report
December 31, 2023

| Boston Trust Asset Management Fund | Boston Trust Walden Balanced Fund |
| Boston Trust Equity Fund | Boston Trust Walden Equity Fund |
| Boston Trust Midcap Fund | Boston Trust Walden Midcap Fund |
| Boston Trust SMID Cap Fund | Boston Trust Walden SMID Cap Fund |
| | Boston Trust Walden Small Cap Fund |
| | Boston Trust Walden International Equity Fund |
Important Update for Shareholders: New Reporting Format from July 2024
Starting July 2024, you will receive a streamlined shareholder report. This concise report will cover key fund details, including expense data, performance metrics, and other essential statistics.
Prefer the report in digital format? Easy instructions are available on the back cover of this report for opting in for e-delivery.
For those interested, more detailed information, such as the Fund’s financial statements, will be accessible online. You also can request that a free copy be sent to you in either paper or electronic format.
| Table of Contents | Annual Report |
| | December 31, 2023 |
| Boston Trust Asset Management Fund | |
| Manager Commentary | 2 |
| Investment Performance | 3 |
| Schedule of Portfolio Investments | 8 |
| Financial Statements | 10 |
| Financial Highlights | 12 |
| | |
| Boston Trust Equity Fund | |
| Manager Commentary | 2 |
| Investment Performance | 3 |
| Schedule of Portfolio Investments | 13 |
| Financial Statements | 14 |
| Financial Highlights | 16 |
| | |
| Boston Trust Midcap Fund | |
| Manager Commentary | 4 |
| Investment Performance | 5 |
| Schedule of Portfolio Investments | 17 |
| Financial Statements | 19 |
| Financial Highlights | 21 |
| | |
| Boston Trust SMID Cap Fund | |
| Manager Commentary | 6 |
| Investment Performance | 7 |
| Schedule of Portfolio Investments | 22 |
| Financial Statements | 24 |
| Financial Highlights | 26 |
| | |
| Annual ESG Report | 27 |
| | |
| Boston Trust Walden Balanced Fund | |
| Manager Commentary | 28 |
| Investment Performance | 29 |
| Schedule of Portfolio Investments | 38 |
| Financial Statements | 40 |
| Financial Highlights | 42 |
| | |
| Boston Trust Walden Equity Fund | |
| Manager Commentary | 28 |
| Investment Performance | 29 |
| Schedule of Portfolio Investments | 43 |
| Financial Statements | 44 |
| Financial Highlights | 46 |
| | |
| Boston Trust Walden Midcap Fund | |
| Manager Commentary | 30 |
| Investment Performance | 31 |
| Schedule of Portfolio Investments | 47 |
| Financial Statements | 49 |
| Financial Highlights | 51 |
| | |
| Boston Trust Walden SMID Cap Fund | |
| Manager Commentary | 32 |
| Investment Performance | 33 |
| Schedule of Portfolio Investments | 52 |
| Financial Statements | 53 |
| Financial Highlights | 55 |
| | |
| Boston Trust Walden Small Cap Fund | |
| Manager Commentary | 34 |
| Investment Performance | 35 |
| Schedule of Portfolio Investments | 56 |
| Financial Statements | 58 |
| Financial Highlights | 60 |
| | |
| Boston Trust Walden International Equity Fund | |
| Manager Commentary | 36 |
| Investment Performance | 37 |
| Schedule of Portfolio Investments | 61 |
| Financial Statements | 63 |
| Financial Highlights | 65 |
| | |
| Notes to the Financial Statements | 66 |
| Report of Independent Registered Public Accounting Firm | 75 |
| Supplementary Information | 76 |
| Investment Adviser Contract Approval | 83 |
| Information about Trustees and Officers | 85 |
Boston Trust Walden Inc., a subsidiary of Boston Trust Walden Company, serves as investment adviser (the “Adviser”) to the Boston Trust Walden Funds and receives a fee for its services. Boston Trust Walden Company provides certain administrative, operational, and investment support functions for the Adviser and is paid a fee for these services by the Adviser.
Shares of the Funds are not deposits of, obligations of, or guaranteed by Boston Trust Walden Company or its affiliates, nor are they federally insured by the FDIC. Investments in the Funds involve investment risks, including the possible loss of principal. Funds are distributed by Foreside Financial Services, LLC.
The foregoing information and opinions are for general information only. The Boston Trust Walden Funds and Boston Trust Walden Company do not assume liability for any loss, which may result from the reliance by any person upon any such information or opinions. Such information and opinions are subject to change without notice, are for general information only, and are not intended as an offer or solicitation with respect to the purchase or sale of any security or offering individual or personalized investment advice. Portfolio composition is as of December 31, 2023 and is subject to change without notice.
The Boston Trust Walden Funds may invest in foreign securities, which may involve risk not typically associated with U.S. investments.
The Funds’ ESG integration and, as applicable, values based screening could cause the Funds to avoid investments that may result in the Funds underperforming similar funds without comparable ESG Policies.
Boston Trust Asset Management Fund Boston Trust Equity Fund December 31, 2023 Amy Crandall Kaser, CFP® Co-Portfolio Manager Jason T. O’Connell, CFA, CAIA, CFP® Co-Portfolio Manager Boston Trust Walden Inc. Asset Management Fund Objective The Fund seeks long-term capital growth and income through an actively managed portfolio of stocks, bonds and money market instruments. Equity Fund Objective The Fund seeks long-term growth of capital through an actively managed portfolio of stocks. Investment Concerns Equity securities (stocks) are more volatile and carry more risk and return potential than other forms of investments, including investments in high-grade fixed income securities. Foreign investing involves risks not typically associated with U.S. investments, including adverse political, social and economic developments and differing auditing and legal standards. These risks are magnified in emerging markets. Small- to mid-capitalization companies typically have a higher risk of failure and historically have experienced a greater degree of volatility. Bonds offer a relatively stable level of income, although bond prices will fluctuate, providing the potential for principal gain or loss. Intermediate-term, higher quality bonds generally offer less risk than longer-term bonds and a lower rate of return. Cash equivalents offer low risk and low return potential. | Manager Commentary (Unaudited) Management Discussion of Fund Performance Stocks closed a strikingly strong year with most of the primary indices registering gains well into the double-digits in 2023. The S&P 500 Index led the way with a more than 26% return for the calendar year. The Index’s impressive gains were driven, in large part, by just a small group of technology-oriented companies thought to have outsized growth prospects well into the future. Dubbed the Magnificent Seven by the financial media, the group consists of Alphabet (Google) Amazon, Apple, Meta (Facebook), Microsoft, Nvidia, and Tesla. At points during the year, those seven companies accounted for a near 30% weight in the S&P 500 and thoroughly dominated its performance to the extent that they were collectively responsible for 99% of the Index’s return through the month of October. Notably, the average stock in the Index had a far different experience, advancing a still healthy but comparatively mild 13.8% for the year. Gains became far more broad-based later in the year, with a larger, more diverse set of businesses taking part in the continued market rally. The bond market experienced volatility throughout the year, precipitated by the Federal Reserve’s aggressive policy maneuvers to curb inflation. However, the moves in US government bond yields largely amounted to a round trip by year-end, meaning that investors holding such bonds throughout the period earned a return approximately equal to the income. The broader bond markets, which include non-government securities, fared better as investors were compensated for taking on credit risk that began to appear less severe amidst stronger than anticipated economic data and an end to rate increases by the Federal Reserve. Boston Trust Asset Management Fund and Boston Trust Equity Fund Both delivered substantial but comparatively muted gains in 2023. For the full year, the Funds' values advanced 13.72% and 17.29%, respectively. During the year, the Boston Trust Asset Management Fund's performance was supported by its higher-than-average allocation to equities. However, while the equity holdings in both funds delivered strong absolute returns, on average, those securities trailed the S&P 500 benchmark given the team’s decision not to veer from its diversification and valuation disciplines. Similarly, the relatively conservative tack taken in the Boston Trust Asset Management Fund's fixed income segment led to a positive result but did not meet the return of the broader indices, which generally carry more credit risk and interest rate sensitivity. We begin 2024 with improved business conditions versus a year ago: inflation is down, a historic interest hiking cycle is behind us, and the labor market and consumer spending remain reasonably healthy. Furthermore, the Federal Reserve’s indications that it may be in a position to reverse course to a more accommodative interest rate policy increases our confidence that the US has sidestepped a deep or prolonged recession. With that economic backdrop and the select availability of sound businesses whose shares do not imply overly optimistic outcomes, the Boston Trust Asset Mangement Fund’s asset allocation remains tilted in favor of equities. Of course, plenty of macroeconomic and geopolitical uncertainty remains. Therefore, the Fund’s fixed income segment is designed to play the important role of providing ballast against not only the inherent volatility in stocks but also should the presently benign economic conditions deteriorate, or an exogenous event undermine investor confidence.* * Portfolio composition is subject to change. |
| Investment Performance (Unaudited) | Boston Trust Asset Management Fund |
| | Boston Trust Equity Fund |
| | December 31, 2023 |
| | For the periods ended 12/31/23 |
| | Average Annual Total Returns |
| | 1 Year | 3 Years | 5 Years | 10 Years | 15 Years | 20 Years | Since Inception (12/1/95) | Since Inception (10/1/03) |
| Boston Trust Asset Management Fund | 13.72% | 5.69% | 9.88% | 8.17% | 9.38% | 7.60% | 8.10% | — |
| Boston Trust Equity Fund | 17.29% | 9.32% | 14.54% | 10.85% | 12.51% | 9.16% | — | 9.48% |
| S&P 500 Total Return Index | 26.29% | 10.00% | 15.69% | 12.03% | 13.97% | 9.69% | 9.64% | 10.07% |
| Bloomberg U.S. Government/Credit Bond Index | 5.72% | -3.53% | 1.41% | 1.97% | 2.77% | 3.24% | 4.30% | 3.19% |
| FTSE 3-Month U.S. Treasury Bill Index | 5.26% | 2.24% | 1.91% | 1.26% | 0.87% | 1.42% | 2.19% | 1.42% |
Hypothetical Growth of a $100,000 Investment

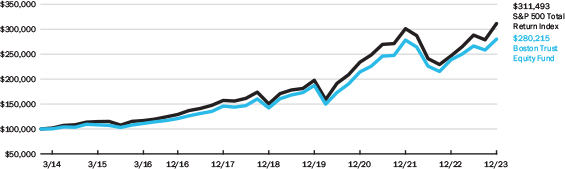
The above charts represent a 10-year hypothetical $100,000 investment in the Boston Trust Asset Management Fund and the Boston Trust Equity Fund, and includes the reinvestment of dividends and capital gains in the Funds. The returns shown on the table and the graphs do not reflect the deduction of taxes a shareholder would pay on Fund distributions or the redemption of Fund shares.
The Boston Trust Asset Management Fund is measured against a combination of equity and fixed income indices. The Boston Trust Equity Fund is measured against the Standard & Poor’s 500 Total Return Index (“S&P 500”), which is widely regarded as a gauge of the U.S. equities market, includes 500 leading companies in leading industries of the U.S. economy. Although the S&P 500 focuses on the large-cap segment of the market, with approximately 75% coverage of U.S. equities, it is also widely viewed as a proxy for the total market. The Bloomberg U.S. Government/Credit Bond Index includes Treasuries (i.e., public obligations of the U.S. Treasury that have remaining maturities of more than one year), government-related issues (e.g., agency, sovereign, supranational, and local authority debt), and USD Corporates. The Bloomberg U.S. Government/Credit Bond Index is a component of the Bloomberg U.S. Aggregate Bond Index. The FTSE 3-Month U.S. T-Bill Index reflects monthly return equivalents of yield averages that are not marked to the market. The index is an average of the last three-month treasury bill issues. The three-month treasury bills are the short-term debt obligations of the U.S. Government. The indexes are unmanaged and their performance does not reflect the deduction of expenses associated with a mutual fund, such as investment management and fund accounting fees. The Funds’ performance reflects the deduction of fees for these services. Investors cannot invest directly in an index.
| Boston Trust Asset Management Fund |
| |
| Fund Net Asset Value: | $58.81 |
| Gross Expense Ratio1: | 0.83% |
| | |
| Boston Trust Equity Fund | |
| | |
| Fund Net Asset Value: | $39.96 |
| Gross Expense Ratio1: | 0.86% |
Past performance does not guarantee future results. The performance data quoted represents past performance and current returns may be lower or higher. The investment return and principal value will fluctuate so that an investor’s shares, when redeemed may be worth more or less than the original cost. To obtain performance information current to the most recent month-end, please call 1-800-282-8782 ext. 7050.
| 1 | The Gross Expense Ratio is from each Fund’s prospectus dated May 1, 2023. Please see the Fund’s most recent prospectus for details. Additional information pertaining to each Fund’s expense ratio as of December 31, 2023 can be found in the financial highlights included in this report. |
Boston Trust Midcap Fund December 31, 2023 Stephen J. Amyouny, CFA Lead Portfolio Manager Richard Q. Williams, CFA Co-Portfolio Manager Mark Zagata, CFA Co-Portfolio Manager Boston Trust Walden Inc. Fund Objective The Fund seeks long-term capital growth through an actively managed portfolio of stocks of middle capitalization (“mid cap”) companies. Investment Concerns Equity securities (stocks) are more volatile and carry more risk and return potential than other forms of investments, including investments in high-grade fixed income securities. Mid cap funds typically carry additional risks since smaller companies generally have a higher risk of failure. | Manager Commentary (Unaudited) Management Discussion of Fund Performance The Boston Trust Midcap Fund returned 13.05% in the calendar year 2023, trailing the Russell Midcap®Index return of 17.23%. The Adviser's analysis of the year suggests the Fund’s valuation discipline (which seeks to identify the stocks of companies that are reasonably valued) detracted from performance results. Outlook The valuation of the mid cap market (as measured by the Russell Midcap®Index price-to-earnings ratio) as of the end of 2023 was approximately in line with historical averages. The Adviser believes that pockets of speculative valuation exist, however, and remain a risk. Further, index earnings may have reached a new record in 2023, and the increasingly supportive economic backdrop suggests this trajectory may continue in 2024. The Adviser believes that over the long-term, companies with stronger fundamentals generate superior returns. The Adviser believes that a well-diversified Fund comprised of reasonably valued stocks of higher quality companies will add value over full market cycles. A full market cycle includes one bear and one bull market.* * Portfolio composition is subject to change. |
| Investment Performance (Unaudited) | Boston Trust Midcap Fund |
| | December 31, 2023 |
| | For the periods ended 12/31/23 |
| | Average Annual Total Returns |
| | 1 Year | 3 Years | 5 Years | 10 Years | 15 Years | Since Inception (9/24/07) |
| Boston Trust Midcap Fund | 13.05% | 7.91% | 11.95% | 9.79% | 13.17% | 9.40% |
| Russell MidCap®Index | 17.23% | 5.92% | 12.68% | 9.42% | 13.58% | 8.64% |
Hypothetical Growth of a $100,000 Investment
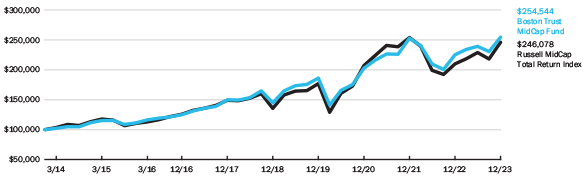
The above chart represents a 10-year hypothetical $100,000 investment in the Boston Trust Midcap Fund, and includes the reinvestment of dividends and capital gains in the Fund. The returns shown on the table and graph do not reflect the deduction of taxes a shareholder would pay on Fund distributions or the redemption of Fund shares.
The Boston Trust Midcap Fund is measured against the Russell Midcap®Index, which is an unmanaged index that tracks the performance of the mid-cap segment of the U.S. equity universe. The Russell Midcap®Index is a subset of the Russell 1000®Index. It includes approximately 800 of the smallest securities based on a combination of their market capitalization and current index membership. The Russell Midcap®Index represents approximately 31% of the total market capitalization of the Russell 1000 companies. Russell Investment Group is the source and owner of the trademarks, service marks and copyrights related to the Russell Indexes. Russell®is a trademark of Russell Investment Group. The performance of an index does not reflect the deduction of expenses associated with a mutual fund, such as investment management and fund accounting fees. The Fund’s performance reflects the deduction of fees for these services. Investors cannot invest directly in an index.
| Fund Net Asset Value: | $22.98 |
| Gross Expense Ratio1: | 1.00% |
Past performance does not guarantee future results. The performance data quoted represents past performance and current returns may be lower or higher. The investment return and principal value will fluctuate so that an investor’s shares, when redeemed may be worth more or less than the original cost. To obtain performance information current to the most recent month-end, please call 1-800-282-8782 ext. 7050.
| 1 | The Gross Expense Ratio is from the Fund’s prospectus dated May 1, 2023. The contractual fee limit under the Fund’s expense limitation agreement is 1.00% of the Fund’s average annual net assets, subject to certain limitations as described in the Fund’s prospectus. Please see the Fund’s most recent prospectus for details. The investment performance may reflect fee recoupments. If such fee recoupments had not occurred, the quoted performance would have been higher. The contractual fee waivers continue through May 1, 2024 and may be renewed thereafter. Additional information pertaining to the Fund’s expense ratio as of December 31, 2023 can be found in the financial highlights included in this report. |
Boston Trust SMID Cap Fund December 31, 2023 Kenneth P. Scott, CFA Lead Portfolio Manager Richard Q. Williams, CFA Co-Portfolio Manager Leanne Moore Co-Portfolio Manager Boston Trust Walden Inc. Fund Objective The Fund seeks long-term capital growth through an actively managed portfolio of stocks of small to middle capitalization (“SMID cap”) companies. Investment Concerns Equity securities (stocks) are more volatile and carry more risk and return potential than other forms of investments, including investments in high-grade fixed income securities. SMID cap companies typically have a higher risk of failure and historically have experienced a greater degree of volatility. | Manager Commentary (Unaudited) Management Discussion of Fund Performance The Boston Trust SMID Cap Fund returned 13.14% in the calendar year 2023, trailing the Russell 2500™ Index return of 17.42%. Despite the strong absolute market return, analysis of the data suggests there was no evidence of a performance headwind due to the Fund’s investment style. Thus, the Adviser attributes the performance shortfall to unfavorable stock selection during the year, a contrast to the prior two years, when the Fund enjoyed style tailwinds and incrementally favorable performance of Fund holdings relative to the high quality opportunity set. Outlook The valuation of the small-mid cap market (as measured by the Russell 2500™ Index price-to-earnings ratio) as of the end of 2023 was approximately in line with historical averages. The Adviser believes that pockets of speculative valuation exist, however, and remain a risk. Further, index earnings may have reached a new record in 2023, and the increasingly supportive economic backdrop suggests this trajectory may continue in 2024. The Adviser believes that over the long-term, companies with stronger fundamentals generate superior returns. The Adviser believes that a well-diversified Fund comprised of reasonably valued stocks of higher quality companies will add value over full market cycles. A full market cycle includes one bear and one bull market.* * Portfolio composition is subject to change. |
| Investment Performance (Unaudited) | Boston Trust SMID Cap Fund |
| | December 31, 2023 |
| | For the periods ended 12/31/23 |
| | Average Annual Total Returns |
| | 1 Year | 3 Years | 5 Years | 10 Years | Since Inception (11/30/11) |
| Boston Trust SMID Cap Fund | 13.14% | 9.09% | 12.24% | 9.28% | 10.97% |
| Russell 2500™ Index | 17.42% | 4.24% | 11.67% | 8.36% | 11.20% |
Hypothetical Growth of a $1,000,000 Investment
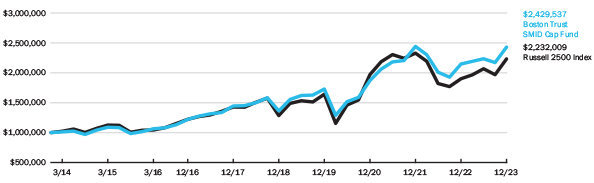
The above chart represents a 10-year hypothetical $1,000,000 investment in the Boston Trust SMID Cap Fund, and includes the reinvestment of dividends and capital gains in the Fund. The returns shown on the table and the graph do not reflect the deduction of taxes a shareholder would pay on Fund distributions or the redemption of Fund shares.
The Boston Trust SMID Cap Fund is measured against the Russell 2500™ Index, which is an unmanaged index that tracks the performance of the small- to mid-cap segment of the U.S. equity universe, commonly referred to as “SMID” cap. The Russell 2500™ Index is a subset of the Russell 3000®Index. It includes approximately 2500 of the smallest securities based on a combination of their market cap and current index membership. Russell Investment Group is the source and owner of the trademarks, service marks and copyrights related to the Russell Indexes. Russell®is a trademark of Russell Investment Group. The performance of an index does not reflect the deduction of expenses associated with a mutual fund, such as investment management and fund accounting fees. The Fund’s performance reflects the deduction of fees for these services. Investors cannot invest directly in an index.
| Fund Net Asset Value: | $23.07 |
| Gross Expense Ratio1: | 0.86% |
Past performance does not guarantee future results. The performance data quoted represents past performance and current returns may be lower or higher. The investment return and principal value will fluctuate so that an investor’s shares, when redeemed may be worth more or less than the original cost. To obtain performance information current to the most recent month-end, please call 1-800-282-8782 ext. 7050.
| 1 | The Gross Expense Ratio is from the Fund’s prospectus dated May 1, 2023. The contractual fee limit under the Fund’s expense limitation agreement is 0.75% of the Fund’s average annual net assets, subject to certain limitations as described in the Fund’s prospectus. Please see the Fund’s most recent prospectus for details. The investment performance may reflect fee reductions. If such fee reductions had not occurred, the quoted performance would have been lower. The contractual fee waivers continue through May 1, 2024 and may be renewed thereafter. Additional information pertaining to the Fund’s expense ratio as of December 31, 2023 can be found in the financial highlights included in this report. |
| | Boston Trust Asset Management Fund |
| Schedule of Portfolio Investments | December 31, 2023 |
| Common Stocks (75.7%) | | | | | | |
| | | Shares | | | Fair Value ($) | |
| Communication Services (8.0%) | | | | | | |
| Alphabet, Inc., Class A (a) | | | 40,000 | | | | 5,587,600 | |
| Alphabet, Inc., Class C (a) | | | 220,000 | | | | 31,004,600 | |
| Comcast Corp., Class A | | | 200,000 | | | | 8,770,000 | |
| | | | | | | | 45,362,200 | |
| Consumer Discretionary (5.2%) | | | | | | | | |
| Lowe's Cos., Inc. | | | 25,000 | | | | 5,563,750 | |
| NIKE, Inc., Class B | | | 102,500 | | | | 11,128,425 | |
| O'Reilly Automotive, Inc. (a) | | | 4,500 | | | | 4,275,360 | |
| Ross Stores, Inc. | | | 15,000 | | | | 2,075,850 | |
| Starbucks Corp. | | | 67,000 | | | | 6,432,670 | |
| | | | | | | | 29,476,055 | |
| Consumer Staples (7.4%) | | | | | | | | |
| Church & Dwight Co., Inc. | | | 50,000 | | | | 4,728,000 | |
| Costco Wholesale Corp. | | | 30,000 | | | | 19,802,400 | |
| Diageo PLC, Sponsored ADR | | | 25,000 | | | | 3,641,500 | |
| McCormick & Co., Inc. (Non Voting) | | | 40,000 | | | | 2,736,800 | |
| PepsiCo, Inc. | | | 30,000 | | | | 5,095,200 | |
| Procter & Gamble (The) Co. | | | 25,000 | | | | 3,663,500 | |
| Sysco Corp. | | | 35,000 | | | | 2,559,550 | |
| | | | | | | | 42,226,950 | |
| Energy (3.4%) | | | | | | | | |
| Chevron Corp. | | | 20,000 | | | | 2,983,200 | |
| ConocoPhillips | | | 25,000 | | | | 2,901,750 | |
| Exxon Mobil Corp. | | | 110,000 | | | | 10,997,800 | |
| Schlumberger NV | | | 45,000 | | | | 2,341,800 | |
| | | | | | | | 19,224,550 | |
| Financials (12.3%) | | | | | | | | |
| American Express Co. | | | 30,000 | | | | 5,620,200 | |
| Berkshire Hathaway, Inc., Class B (a) | | | 22,500 | | | | 8,024,850 | |
| Chubb Ltd. | | | 20,000 | | | | 4,520,000 | |
| Cincinnati Financial Corp. | | | 60,000 | | | | 6,207,600 | |
| FactSet Research Systems, Inc. | | | 13,720 | | | | 6,545,126 | |
| JPMorgan Chase & Co. | | | 92,750 | | | | 15,776,775 | |
| Northern Trust Corp. | | | 40,000 | | | | 3,375,200 | |
| T. Rowe Price Group, Inc. | | | 45,000 | | | | 4,846,050 | |
| Visa, Inc., Class A | | | 57,500 | | | | 14,970,125 | |
| | | | | | | | 69,885,926 | |
| Health Care (9.6%) | | | | | | | | |
| Agilent Technologies, Inc. | | | 1,000 | | | | 139,030 | |
| Becton, Dickinson and Co. | | | 35,000 | | | | 8,534,050 | |
| Edwards Lifesciences Corp. (a) | | | 95,000 | | | | 7,243,750 | |
| Johnson & Johnson | | | 56,500 | | | | 8,855,810 | |
| Merck & Co., Inc. | | | 50,000 | | | | 5,451,000 | |
| Mettler-Toledo International, Inc. (a) | | | 3,500 | | | | 4,245,360 | |
| Stryker Corp. | | | 25,000 | | | | 7,486,500 | |
| UnitedHealth Group, Inc. | | | 19,750 | | | | 10,397,782 | |
| Waters Corp. (a) | | | 7,500 | | | | 2,469,225 | |
| | | | | | | | 54,822,507 | |
| Industrials (10.1%) | | | | | | | | |
| Automatic Data Processing, Inc. | | | 65,000 | | | | 15,143,050 | |
| Donaldson Co., Inc. | | | 50,000 | | | | 3,267,500 | |
| Hubbell, Inc. | | | 23,500 | | | | 7,729,855 | |
| Illinois Tool Works, Inc. | | | 25,400 | | | | 6,653,276 | |
| Union Pacific Corp. | | | 41,000 | | | | 10,070,420 | |
| United Parcel Service, Inc., Class B | | | 54,000 | | | | 8,490,420 | |
| W.W. Grainger, Inc. | | | 7,300 | | | | 6,049,437 | |
| | | | | | | | 57,403,958 | |
| Information Technology (17.4%) | | | | | | | | |
| Accenture PLC, Class A | | | 62,000 | | | | 21,756,420 | |
| Apple, Inc. | | | 167,000 | | | | 32,152,510 | |
| Cisco Systems, Inc. | | | 65,000 | | | | 3,283,800 | |
| Microsoft Corp. | | | 98,150 | | | | 36,908,326 | |
| Oracle Corp. | | | 50,000 | | | | 5,271,500 | |
| | | | | | | | 99,372,556 | |
| Materials (1.9%) | | | | | | | | |
| Air Products and Chemicals, Inc. | | | 25,500 | | | | 6,981,900 | |
| AptarGroup, Inc. | | | 32,500 | | | | 4,017,650 | |
| | | | | | | | 10,999,550 | |
| Utilities (0.4%) | | | | | | | | |
| Eversource Energy | | | 35,500 | | | | 2,191,060 | |
| TOTAL COMMON STOCKS (Cost $102,608,421) | | | | | | | 430,965,312 | |
Corporate Bonds (4.0%)
| | | Principal
Amount ($) | | | | |
| Communication Services (0.0%)(b) | | | | | | |
| Verizon Communications, Inc., | | | | | | |
| 4.02%, 12/3/29, Callable 9/3/29 @ 100 | | | 250,000 | | | | 242,007 | |
| Consumer Discretionary (0.5%) | | | | | | | | |
| Home Depot (The), Inc., 2.70%, | | | | | | | | |
| 4/15/30 | | | 1,000,000 | | | | 911,132 | |
| Lowe's Cos., Inc., 3.10%, 5/3/27, | | | | | | | | |
| Callable 2/3/27 @ 100 | | | 750,000 | | | | 718,501 | |
| Lowe's Cos., Inc., 1.30%, 4/15/28 | | | 750,000 | | | | 659,567 | |
| McDonald's Corp., 2.62%, 9/1/29, | | | | | | | | |
| MTN, Callable 6/1/29 @ 100 | | | 500,000 | | | | 458,075 | |
| Toyota Motor Credit Corp., 3.65%, 1/8/29 | | | 350,000 | | | | 342,331 | |
| | | | | | | | 3,089,606 | |
| Consumer Staples (0.1%) | | | | | | | | |
| The Estee Lauder Cos., Inc., | | | | | | | | |
| 2.38%, 12/1/29, Callable 9/1/29 @ 100 | | | 750,000 | | | | 668,469 | |
| | | | | | | | | |
| Financials (1.5%) | | | | | | | | |
| Bank of America Corp., 4.18%, | | | | | | | | |
| 11/25/27, Callable 11/25/26 @100 | | | 500,000 | | | | 486,326 | |
| Berkshire Hathaway, Inc., 3.13%, | | | | | | | | |
| 3/15/26, Callable 12/15/25 @100 | | | 2,000,000 | | | | 1,944,395 | |
| Cincinnati Financial Corp., 6.92%, 5/15/28 | | | 500,000 | | | | 536,553 | |
| JPMorgan Chase & Co., 3.90%, | | | | | | | | |
| 7/15/25, Callable 4/15/25 @ 100 | | | 1,000,000 | | | | 984,503 | |
| JPMorgan Chase & Co., (Variable, | | | | | | | | |
| 3M CME Term SOFR + 1.38%), | | | | | | | | |
| 4.01%, 4/23/29(c) | | | 500,000 | | | | 481,510 | |
| 8 | See Notes to Financial Statements | |
| | Boston Trust Asset Management Fund |
| Schedule of Portfolio Investments | December 31, 2023 |
| Corporate Bonds (continued) | | | | | | |
| | | Principal
Amount ($) | | | Fair Value ($) | |
| Financials (continued) | | | | | | |
| Visa, Inc., 3.15%, 12/14/25, Callable 9/14/25 @ 100 | | | 2,000,000 | | | | 1,951,801 | |
| Wells Fargo & Co., 3.55%, 9/29/25, MTN | | | 2,000,000 | | | | 1,954,550 | |
| | | | | | | | 8,339,638 | |
| Health Care (0.6%) | | | | | | | | |
| Becton, Dickinson & Co., 6.70%, 12/1/26 | | | 750,000 | | | | 786,985 | |
| Merck & Co., Inc., 1.70%, 6/10/27 | | | 350,000 | | | | 321,061 | |
| Pfizer, Inc., 3.60%, 9/15/28 | | | 500,000 | | | | 488,071 | |
| Stryker Corp., 1.95%, 6/15/30 | | | 1,000,000 | | | | 856,389 | |
| UnitedHealth Group, Inc., 3.37%, 4/15/27 | | | 500,000 | | | | 484,501 | |
| Zoetis, Inc., 3.90%, 8/20/28 | | | 750,000 | | | | 734,271 | |
| | | | | | | | 3,671,278 | |
| Industrials (0.8%) | | | | | | | | |
| Emerson Electric Co., 2.00%, | | | | | | | | |
| 12/21/28, Callable 10/21/28 @ 100 | | | 1,400,000 | | | | 1,253,584 | |
| Hubbell, Inc., 3.50%, 2/15/28 | | | 1,000,000 | | | | 958,879 | |
| John Deere Capital, 2.80%, 9/8/27, MTN | | | 500,000 | | | | 473,996 | |
| John Deere Capital, 3.45%, 3/7/29, MTN | | | 1,250,000 | | | | 1,199,331 | |
| Union Pacific Corp., 3.95%, 9/10/28 | | | 400,000 | | | | 397,067 | |
| | | | | | | | 4,282,857 | |
| Information Technology (0.4%) | | | | | | | | |
| Apple, Inc., 3.25%, 2/23/26, Callable 11/23/25 @ 100 | | | 2,500,000 | | | | 2,439,957 | |
| | | | | | | | | |
| Materials (0.1%) | | | | | | | | |
| Air Products and Chemicals, Inc., 1.85%, 5/15/27 | | | 400,000 | | | | 368,955 | |
| TOTAL CORPORATE BONDS (Cost $23,612,568) | | | | | | | 23,102,767 | |
| U.S. Government & U.S. Government Agency Obligations (19.3%) |
| |
| Federal Farm Credit Bank (2.3%) | | | | | | |
| 3.39%, 2/1/28 | | | 2,000,000 | | | | 1,953,616 | |
| 3.85%, 12/26/25 | | | 2,770,000 | | | | 2,745,659 | |
| 2.95%, 1/27/25 | | | 2,000,000 | | | | 1,966,736 | |
| 3.25%, 2/27/34 | | | 1,500,000 | | | | 1,364,476 | |
| 3.87%, 9/20/32 | | | 1,000,000 | | | | 970,074 | |
| 4.37%, 3/3/33 | | | 1,500,000 | | | | 1,510,534 | |
| 3.50%, 3/2/34 | | | 3,000,000 | | | | 2,791,603 | |
| | | | | | | | 13,302,698 | |
| Federal Home Loan Bank (1.3%) | | | | | | | | |
| 2.87%, 9/13/24 | | | 2,500,000 | | | | 2,464,924 | |
| 3.50%, 7/20/32 | | | 1,500,000 | | | | 1,413,584 | |
| 4.00%, 6/10/33 | | | 2,500,000 | | | | 2,439,863 | |
| 2.50%, 12/10/27 | | | 1,500,000 | | | | 1,418,027 | |
| | | | | | | | 7,736,398 | |
| U.S. Treasury Bond (4.7%) | | | | | | | | |
| 5.37%, 2/15/31 | | | 5,500,000 | | | | 6,035,820 | |
| 4.50%, 2/15/36 | | | 15,250,000 | | | | 16,307,373 | |
| 4.37%, 8/15/43 | | | 4,000,000 | | | | 4,098,125 | |
| | | | | | | | 26,441,318 | |
| U.S. Treasury Inflation Indexed Note (1.2%) | | | | | | | | |
| 0.13%, 4/15/27 | | | 4,358,760 | | | | 4,098,589 | |
| 0.63%, 7/15/32 | | | 3,176,790 | | | | 2,910,417 | |
| | | | | | | | 7,009,006 | |
| U.S. Treasury Note (9.8%) | | | | | | | | |
| 2.25%, 11/15/27 | | | 6,500,000 | | | | 6,116,348 | |
| 2.88%, 5/15/28 | | | 7,500,000 | | | | 7,198,242 | |
| 2.13%, 5/31/26 | | | 5,000,000 | | | | 4,775,391 | |
| 0.88%, 11/15/30 | | | 11,000,000 | | | | 9,051,797 | |
| 1.63%, 5/15/31 | | | 10,000,000 | | | | 8,592,578 | |
| 3.37%, 5/15/33 | | | 6,000,000 | | | | 5,770,312 | |
| 3.87%, 8/15/33 | | | 14,000,000 | | | | 14,010,937 | |
| | | | | | | | 55,515,605 | |
| TOTAL U.S. GOVERNMENT & U.S. GOVERNMENT AGENCY OBLIGATIONS (Cost $106,953,017) | | | | | | | 110,005,025 | |
Investment Companies (0.7%)
| | | Shares | | | | |
| Northern Institutional Treasury | | | | | | |
| Portfolio (Premier Class), 5.22% (d) | | | 3,870,712 | | | | 3,870,712 | |
| TOTAL INVESTMENT COMPANIES (Cost $3,870,712) | | | | | | | 3,870,712 | |
| Total Investments (Cost $237,044,718) — 99.7%(e) | | | | | | | 567,943,816 | |
| Other assets in excess of liabilities — 0.3% | | | | | | | 1,563,463 | |
| Net Assets — 100.0% | | | | | | $ | 569,507,279 | |
| (a) | Non-income producing security. |
| (b) | Represents less than 0.05%. |
| (c) | Variable or floating rate security. Security issued at a fixed coupon rate, which converts to a variable rate at a future date. Rate shown is the rate in effect as of December 31, 2023. |
| (d) | Rate disclosed is the seven day yield as of December 31, 2023. |
| (e) | See Federal Tax Information listed in the Notes to the Financial Statements. |
| ADR | American Depositary Receipt |
| MTN | Medium Term Note |
| PLC | Public Limited Company |
| | See Notes to Financial Statements | 9 |
| Financial Statements | Boston Trust Asset Management Fund |
Statement of Assets and Liabilities
December 31, 2023
| Assets: | | | |
| Investments, at fair value(cost $237,044,718) | | $ | 567,943,816 | |
| Interest and dividends receivable | | | 2,032,940 | |
| Receivable for tax reclaims | | | 3,440 | |
| Receivable for capital shares issued | | | 1,155 | |
| Prepaid expenses | | | 20,180 | |
| Total Assets | | | 570,001,531 | |
| Liabilities: | | | | |
| Payable for capital shares redeemed | | | 23,989 | |
| Payable to Custodian | | | 41,641 | |
| Accrued expenses and other liabilities: | | | | |
| Investment adviser | | | 348,582 | |
| Administration and accounting | | | 31,015 | |
| Chief compliance officer | | | 1,852 | |
| Custodian | | | 4,391 | |
| Shareholder servicing fees | | | 11,387 | |
| Transfer agent | | | 3,983 | |
| Other | | | 27,412 | |
| Total Liabilities | | | 494,252 | |
| Net Assets | | $ | 569,507,279 | |
| Composition of Net Assets: | | | | |
| Paid in capital | | $ | 237,876,260 | |
| Total distributable earnings | | | 331,631,019 | |
| Net Assets | | $ | 569,507,279 | |
| Shares outstanding (par value $0.01, unlimited number of shares authorized) | | | 9,683,918 | |
| Net Asset Value, Offering Price and Redemption price per share | | $ | 58.81 | |
Statement of Operations
For the year ended December 31, 2023
| Investment Income: | | | |
| Dividends | | $ | 7,871,186 | |
| Interest | | | 5,222,569 | |
| Less: Foreign tax withholding | | | (2,580 | ) |
| Total Investment Income | | | 13,091,175 | |
| Expenses: | | | | |
| Investment adviser | | | 4,130,044 | |
| Administration and accounting | | | 180,192 | |
| Chief compliance officer | | | 24,789 | |
| Custodian | | | 81,716 | |
| Shareholder servicing | | | 138,062 | |
| Transfer agency | | | 24,468 | |
| Trustee | | | 54,051 | |
| Other | | | 115,490 | |
| Total expenses | | | 4,748,812 | |
| Net Expenses | | | 4,748,812 | |
| Net Investment Income | | | 8,342,363 | |
| Net Realized/Unrealized Gains (Losses) from | | | | |
| Investments: | | | | |
| Net realized gains from investment transactions | | | 26,487,937 | |
| Net realized gains from redemptions in-kind (a) | | | 4,356,353 | |
| Change in unrealized appreciation on investments | | | 33,974,692 | |
| Net realized/unrealized gains on investments | | | 64,818,982 | |
| Change in Net Assets Resulting from Operations | | $ | 73,161,345 | |
| (a) | | See Note 3 in the Notes to Financial Statements. |
| 10 | See Notes to Financial Statements | |
| Financial Statements | Boston Trust Asset Management Fund |
Statements of Changes in Net Assets
| | | For the year ended
December 31, 2023 | | | For the year ended
December 31, 2022 | |
| Investment Activities: | | | | | | |
| Operations: | | | | | | |
| Net investment income | | $ | 8,342,363 | | | $ | 6,326,739 | |
| Net realized gains from investment transactions | | | 30,844,290 | | | | 6,394,661 | |
| Change in unrealized appreciation (depreciation) on investments | | | 33,974,692 | | | | (114,355,885 | ) |
| Change in Net Assets Resulting from Operations | | | 73,161,345 | | | | (101,634,485 | ) |
| Distributions To Shareholders: | | | | | | | | |
| Total Distributions | | | (35,809,356 | ) | | | (24,865,921 | ) |
| Change in Net Assets Resulting from distributions to shareholders | | | (35,809,356 | ) | | | (24,865,921 | ) |
| Capital Share Transactions: | | | | | | | | |
| Proceeds from shares issued | | | 17,349,182 | | | | 13,998,321 | |
| Dividends reinvested | | | 17,136,793 | | | | 12,757,441 | |
| Cost of shares redeemed | | | (48,970,508 | ) | | | (51,657,993 | ) |
| Cost of in-kind shares redeemed (a) | | | (4,698,109 | ) | | | — | |
| Change in Net Assets Resulting from Capital Share Transactions | | | (19,182,642 | ) | | | (24,902,231 | ) |
| Change in Net Assets | | | 18,169,347 | | | | (151,402,637 | ) |
| Net Assets: | | | | | | | | |
| Beginning of year | | | 551,337,932 | | | | 702,740,569 | |
| End of year | | $ | 569,507,279 | | | $ | 551,337,932 | |
| Share Transactions: | | | | | | | | |
| Issued | | | 295,997 | | | | 232,525 | |
| Reinvested | | | 297,565 | | | | 223,345 | |
| Redeemed | | | (833,092 | ) | | | (872,055 | ) |
| Redeemed in-kind (a) | | | (77,706 | ) | | | — | |
| Change in shares | | | (317,236 | ) | | | (416,185 | ) |
| (a) | See Note 3 in the Notes to Financial Statements. |
| | See Notes to Financial Statements | 11 |
| Financial Statements | Boston Trust Asset Management Fund |
Financial Highlights
Selected data for a share outstanding throughout the years indicated.
| | | For the year
ended
December
31, 2023 | | | For the year
ended
December
31, 2022 | | | For the year
ended
December
31, 2021 | | | For the year
ended
December
31, 2020 | | | For the year
ended
December
31, 2019 | |
| Net Asset Value, Beginning of Period | | $ | 55.13 | | | $ | 67.46 | | | $ | 56.29 | | | $ | 55.17 | | | $ | 44.27 | |
| | | | | | | | | | | | | | | | | | | | | |
| Investment Activities: | | | | | | | | | | | | | | | | | | | | |
| Operations: | | | | | | | | | | | | | | | | | | | | |
| Net investment income | | | 0.89 | | | | 0.63 | | | | 0.48 | | | | 0.53 | | | | 0.48 | |
| Net realized/unrealized gains (losses) from investments | | | 6.60 | | | | (10.42 | ) | | | 11.69 | | | | 3.74 | | | | 10.93 | |
| Total from investment activities | | | 7.49 | | | | (9.79 | ) | | | 12.17 | | | | 4.27 | | | | 11.41 | |
| Distributions from: | | | | | | | | | | | | | | | | | | | | |
| Net investment income | | | (0.80 | ) | | | (0.65 | ) | | | (0.49 | ) | | | (0.53 | ) | | | (0.48 | ) |
| Net realized gains from investment transactions | | | (3.01 | ) | | | (1.89 | ) | | | (0.51 | ) | | | (2.62 | ) | | | (0.03 | ) |
| Total distributions | | | (3.81 | ) | | | (2.54 | ) | | | (1.00 | ) | | | (3.15 | ) | | | (0.51 | ) |
| | | | | | | | | | | | | | | | | | | | | |
| Net Asset Value, End of Period | | $ | 58.81 | | | $ | 55.13 | | | $ | 67.46 | | | $ | 56.29 | | | $ | 55.17 | |
| | | | | | | | | | | | | | | | | | | | | |
| Total Return | | | 13.72 | % | | | (14.65 | )% | | | 21.65 | % | | | 7.83 | % | | | 25.81 | % |
| | | | | | | | | | | | | | | | | | | | | |
| Ratios/Supplemental Data: | | | | | | | | | | | | | | | | | | | | |
| Net assets at end of year (000's) | | $ | 569,507 | | | $ | 551,338 | | | $ | 702,741 | | | $ | 597,013 | | | $ | 623,151 | |
| Ratio of net expenses to average net assets | | | 0.82 | % | | | 0.83 | % | | | 0.81 | % | | | 0.88 | % | | | 0.90 | % |
| Ratio of net investment income to average net assets | | | 1.45 | % | | | 1.05 | % | | | 0.77 | % | | | 0.96 | % | | | 1.02 | % |
| Portfolio turnover rate | | | 24.76 | %(a) | | | 35.52 | % | | | 6.51 | % | | | 12.18 | % | | | 5.76 | % |
| (a) | Excludes impact of in-kind transactions. |
| 12 | See Notes to Financial Statements | |
| | Boston Trust Equity Fund |
| Schedule of Portfolio Investments | December 31, 2023 |
| Common Stocks (99.2%) | | | | | | |
| | | Shares | | | Fair Value ($) | |
| Communication Services (9.6%) | | | | | | |
| Alphabet, Inc., Class A (a) | | | 15,000 | | | | 2,095,350 | |
| Alphabet, Inc., Class C (a) | | | 100,000 | | | | 14,093,000 | |
| Comcast Corp., Class A | | | 116,500 | | | | 5,108,525 | |
| | | | | | | | 21,296,875 | |
| Consumer Discretionary (6.9%) | | | | | | | | |
| Lowe's Cos., Inc. | | | 10,000 | | | | 2,225,500 | |
| NIKE, Inc., Class B | | | 30,000 | | | | 3,257,100 | |
| O'Reilly Automotive, Inc. (a) | | | 3,300 | | | | 3,135,264 | |
| Ross Stores, Inc. | | | 7,000 | | | | 968,730 | |
| Starbucks Corp. | | | 40,000 | | | | 3,840,400 | |
| TJX (The) Cos., Inc. | | | 21,500 | | | | 2,016,915 | |
| | | | | | | | 15,443,909 | |
| Consumer Staples (8.2%) | | | | | | | | |
| Church & Dwight Co., Inc. | | | 15,000 | | | | 1,418,400 | |
| Costco Wholesale Corp. | | | 13,750 | | | | 9,076,100 | |
| Diageo PLC, Sponsored ADR | | | 7,500 | | | | 1,092,450 | |
| McCormick & Co., Inc. (Non Voting) | | | 14,000 | | | | 957,880 | |
| PepsiCo, Inc. | | | 18,000 | | | | 3,057,120 | |
| Procter & Gamble (The) Co. | | | 9,000 | | | | 1,318,860 | |
| Sysco Corp. | | | 20,000 | | | | 1,462,600 | |
| | | | | | | | 18,383,410 | |
| Energy (4.7%) | | | | | | | | |
| Chevron Corp. | | | 13,000 | | | | 1,939,080 | |
| Exxon Mobil Corp. | | | 50,000 | | | | 4,999,000 | |
| Schlumberger NV | | | 67,500 | | | | 3,512,700 | |
| | | | | | | | 10,450,780 | |
| Financials (14.2%) | | | | | | | | |
| American Express Co. | | | 12,000 | | | | 2,248,080 | |
| Berkshire Hathaway, Inc., Class B (a) | | | 10,000 | | | | 3,566,600 | |
| Chubb Ltd. | | | 10,000 | | | | 2,260,000 | |
| Cincinnati Financial Corp. | | | 20,000 | | | | 2,069,200 | |
| FactSet Research Systems, Inc. | | | 5,500 | | | | 2,623,775 | |
| JPMorgan Chase & Co. | | | 44,250 | | | | 7,526,925 | |
| Northern Trust Corp. | | | 22,500 | | | | 1,898,550 | |
| T. Rowe Price Group, Inc. | | | 20,000 | | | | 2,153,800 | |
| Visa, Inc., Class A | | | 28,000 | | | | 7,289,800 | |
| | | | | | | | 31,636,730 | |
| Health Care (15.1%) | | | | | | | | |
| Agilent Technologies, Inc. | | | 13,600 | | | | 1,890,808 | |
| Becton, Dickinson and Co. | | | 15,000 | | | | 3,657,450 | |
| Cooper (The) Cos., Inc. | | | 8,250 | | | | 3,122,130 | |
| Edwards Lifesciences Corp. (a) | | | 22,500 | | | | 1,715,625 | |
| Johnson & Johnson | | | 25,500 | | | | 3,996,870 | |
| Merck & Co., Inc. | | | 22,500 | | | | 2,452,950 | |
| Mettler-Toledo International, Inc. (a) | | | 1,500 | | | | 1,819,440 | |
| Stryker Corp. | | | 12,000 | | | | 3,593,520 | |
| UnitedHealth Group, Inc. | | | 12,000 | | | | 6,317,640 | |
| Waters Corp. (a) | | | 8,250 | | | | 2,716,147 | |
| Zoetis, Inc. | | | 12,000 | | | | 2,368,440 | |
| | | | | | | | 33,651,020 | |
| Industrials (13.1%) | | | | | | | | |
| Automatic Data Processing, Inc. | | | 20,000 | | | | 4,659,400 | |
| Deere & Co. | | | 4,750 | | | | 1,899,383 | |
| Donaldson Co., Inc. | | | 15,000 | | | | 980,250 | |
| Hubbell, Inc. | | | 12,500 | | | | 4,111,625 | |
| Illinois Tool Works, Inc. | | | 15,000 | | | | 3,929,100 | |
| Union Pacific Corp. | | | 22,500 | | | | 5,526,450 | |
| United Parcel Service, Inc., Class B | | | 15,000 | | | | 2,358,450 | |
| W.W. Grainger, Inc. | | | 7,000 | | | | 5,800,830 | |
| | | | | | | | 29,265,488 | |
| Information Technology (23.9%) | | | | | | | | |
| Accenture PLC, Class A | | | 25,000 | | | | 8,772,750 | |
| Analog Devices, Inc. | | | 16,500 | | | | 3,276,240 | |
| Apple, Inc. | | | 80,750 | | | | 15,546,797 | |
| Microsoft Corp. | | | 51,000 | | | | 19,178,040 | |
| Oracle Corp. | | | 40,000 | | | | 4,217,200 | |
| TE Connectivity Ltd. | | | 16,500 | | | | 2,318,250 | |
| | | | | | | | 53,309,277 | |
| Materials (2.6%) | | | | | | | | |
| Air Products and Chemicals, Inc. | | | 14,800 | | | | 4,052,240 | |
| AptarGroup, Inc. | | | 14,250 | | | | 1,761,585 | |
| | | | | | | | 5,813,825 | |
| Utilities (0.9%) | | | | | | | | |
| Eversource Energy | | | 31,700 | | | | 1,956,524 | |
| TOTAL COMMON STOCKS (Cost $69,787,257) | | | | | | | 221,207,838 | |
| | | | | | | |
| Investment Companies (0.7%) | | | | | | |
| Northern Institutional Treasury | | | | | | |
| Portfolio (Premier Class), 5.22% (b) | | | 1,437,531 | | | | 1,437,531 | |
| TOTAL INVESTMENT COMPANIES (Cost $1,437,531) | | | | | | | 1,437,531 | |
| Total Investments (Cost $71,224,788) — 99.9%(c) | | | | | | | 222,645,369 | |
| Other assets in excess of liabilities — 0.1% | | | | | | | 258,801 | |
| Net Assets — 100.0% | | | | | | $ | 222,904,170 | |
| (a) | Non-income producing security. |
| (b) | Rate disclosed is the seven day yield as of December 31, 2023. |
| (c) | See Federal Tax Information listed in the Notes to the Financial Statements. |
| ADR | American Depositary Receipt |
| PLC | Public Limited Company |
| | See Notes to Financial Statements | 13 |
| Financial Statements | Boston Trust Equity Fund |
Statement of Assets and Liabilities
December 31, 2023
| Assets: | | | |
| Investments, at fair value(cost $71,224,788) | | $ | 222,645,369 | |
| Cash | | | 31 | |
| Dividend receivable | | | 423,899 | |
| Receivable for tax reclaims | | | 1,720 | |
| Prepaid expenses | | | 6,347 | |
| Total Assets | | | 223,077,366 | |
| Liabilities: | | | | |
| Payable for capital shares redeemed | | | 2,038 | |
| Accrued expenses and other liabilities: | | | | |
| Investment adviser | | | 140,602 | |
| Administration and accounting | | | 14,406 | |
| Chief compliance officer | | | 685 | |
| Custodian | | | 1,852 | |
| Shareholder servicing fees | | | 1,039 | |
| Transfer agent | | | 3,738 | |
| Other | | | 8,836 | |
| Total Liabilities | | | 173,196 | |
| Net Assets | | $ | 222,904,170 | |
| Composition of Net Assets: | | | | |
| Paid in capital | | $ | 71,533,955 | |
| Total distributable earnings | | | 151,370,215 | |
| Net Assets | | $ | 222,904,170 | |
| Shares outstanding (par value $0.01, unlimited number of shares authorized) | | | 5,578,577 | |
| Net Asset Value, Offering Price and Redemption price per share | | $ | 39.96 | |
Statement of Operations
For the year ended December 31, 2023
| Investment Income: | | | |
| Dividends | | $ | 3,418,812 | |
| Less: Foreign tax withholding | | | (1,290 | ) |
| Total Investment Income | | | 3,417,522 | |
| Expenses: | | | | |
| Investment adviser | | | 1,543,975 | |
| Administration and accounting | | | 75,824 | |
| Chief compliance officer | | | 8,084 | |
| Custodian | | | 26,821 | |
| Shareholder servicing | | | 9,942 | |
| Transfer agency | | | 19,884 | |
| Trustee | | | 17,692 | |
| Other | | | 39,514 | |
| Total expenses | | | 1,741,736 | |
| Net Expenses | | | 1,741,736 | |
| Net Investment Income | | | 1,675,786 | |
| Net Realized/Unrealized Gains (Losses) from | | | | |
| Investments: | | | | |
| Net realized gains from investment transactions | | | 631,737 | |
| Change in unrealized appreciation on investments | | | 30,524,230 | |
| Net realized/unrealized gains on investments | | | 31,155,967 | |
| Change in Net Assets Resulting from Operations | | $ | 32,831,753 | |
| 14 | See Notes to Financial Statements | |
| Financial Statements | Boston Trust Equity Fund |
Statements of Changes in Net Assets
| | | For the year ended
December 31, 2023 | | | For the year ended
December 31, 2022 | |
| Investment Activities: | | | | | | | | |
| Operations: | | | | | | | | |
| Net investment income | | $ | 1,675,786 | | | $ | 1,308,874 | |
| Net realized gains from investment transactions | | | 631,737 | | | | 2,008,906 | |
| Change in unrealized appreciation (depreciation) on investments | | | 30,524,230 | | | | (34,852,417 | ) |
| Change in Net Assets Resulting from Operations | | | 32,831,753 | | | | (31,534,637 | ) |
| Distributions To Shareholders: | | | | | | | | |
| Total Distributions | | | (3,434,420 | ) | | | (6,000,589 | ) |
| Change in Net Assets Resulting from distributions to shareholders | | | (3,434,420 | ) | | | (6,000,589 | ) |
| Capital Share Transactions: | | | | | | | | |
| Proceeds from shares issued | | | 10,808,134 | | | | 12,205,790 | |
| Dividends reinvested | | | 1,341,506 | | | | 2,789,935 | |
| Cost of shares redeemed | | | (10,072,720 | ) | | | (8,896,664 | ) |
| Change in Net Assets Resulting from Capital Share Transactions | | | 2,076,920 | | | | 6,099,061 | |
| Change in Net Assets | | | 31,474,253 | | | | (31,436,165 | ) |
| Net Assets: | | | | | | | | |
| Beginning of year | | | 191,429,917 | | | | 222,866,082 | |
| End of year | | $ | 222,904,170 | | | $ | 191,429,917 | |
| Share Transactions: | | | | | | | | |
| Issued | | | 281,535 | | | | 337,500 | |
| Reinvested | | | 34,389 | | | | 77,628 | |
| Redeemed | | | (268,351 | ) | | | (247,975 | ) |
| Change in shares | | | 47,573 | | | | 167,153 | |
| | See Notes to Financial Statements | 15 |
| Financial Statements | Boston Trust Equity Fund |
Financial Highlights
Selected data for a share outstanding throughout the years indicated.
| | | For the year
ended
December
31, 2023 | | | For the year
ended
December
31, 2022 | | | For the year
ended
December
31, 2021 | | | For the year
ended
December
31, 2020 | | | For the year
ended
December
31, 2019 | |
| Net Asset Value, Beginning of Period | | $ | 34.61 | | | $ | 41.55 | | | $ | 32.89 | | | $ | 29.55 | | | $ | 22.64 | |
| | | | | | | | | | | | | | | | | | | | | |
| Investment Activities: | | | | | | | | | | | | | | | | | | | | |
| Operations: | | | | | | | | | | | | | | | | | | | | |
| Net investment income | | | 0.30 | | | | 0.24 | | | | 0.20 | | | | 0.27 | | | | 0.24 | |
| Net realized/unrealized gains (losses) from investments | | | 5.67 | | | | (6.08 | ) | | | 9.56 | | | | 4.00 | | | | 6.94 | |
| Total from investment activities | | | 5.97 | | | | (5.84 | ) | | | 9.76 | | | | 4.27 | | | | 7.18 | |
| Distributions from: | | | | | | | | | | | | | | | | | | | | |
| Net investment income | | | (0.26 | ) | | | (0.24 | ) | | | (0.20 | ) | | | (0.27 | ) | | | (0.24 | ) |
| Net realized gains from investment transactions | | | (0.36 | ) | | | (0.86 | ) | | | (0.90 | ) | | | (0.66 | ) | | | (0.03 | ) |
| Total distributions | | | (0.62 | ) | | | (1.10 | ) | | | (1.10 | ) | | | (0.93 | ) | | | (0.27 | ) |
| | | | | | | | | | | | | | | | | | | | | |
| Net Asset Value, End of Period | | $ | 39.96 | | | $ | 34.61 | | | $ | 41.55 | | | $ | 32.89 | | | $ | 29.55 | |
| | | | | | | | | | | | | | | | | | | | | |
| Total Return | | | 17.29 | % | | | (14.16 | )% | | | 29.77 | % | | | 14.53 | % | | | 31.74 | % |
| | | | | | | | | | | | | | | | | | | | | |
| Ratios/Supplemental Data: | | | | | | | | | | | | | | | | | | | | |
| Net assets at end of year (000's) | | $ | 222,904 | | | $ | 191,430 | | | $ | 222,866 | | | $ | 168,487 | | | $ | 159,651 | |
| Ratio of net expenses to average net assets | | | 0.85 | % | | | 0.86 | % | | | 0.85 | % | | | 0.90 | % | | | 0.91 | % |
| Ratio of net investment income to average net assets | | | 0.81 | % | | | 0.66 | % | | | 0.53 | % | | | 0.93 | % | | | 0.88 | % |
| Portfolio turnover rate | | | 6.19 | % | | | 10.30 | % | | | 7.33 | % | | | 9.30 | % | | | 2.61 | % |
| 16 | See Notes to Financial Statements | |
| Boston Trust Midcap Fund |
| Schedule of Portfolio Investments | December 31, 2023 |
| Common Stocks (98.8%) | | | | | | |
| | | Shares | | | Fair Value ($) | |
| Communication Services (3.2%) | | | | | | |
| Cable One, Inc. | | | 2,890 | | | | 1,608,545 | |
| Electronic Arts, Inc. | | | 26,195 | | | | 3,583,738 | |
| Omnicom Group, Inc. | | | 25,445 | | | | 2,201,247 | |
| | | | | | | | 7,393,530 | |
| Consumer Discretionary (10.5%) | | | | | | | | |
| AutoZone, Inc. (a) | | | 1,375 | | | | 3,555,214 | |
| Carter's, Inc. | | | 31,980 | | | | 2,394,982 | |
| Choice Hotels International, Inc. | | | 21,485 | | | | 2,434,251 | |
| Columbia Sportswear Co. | | | 29,265 | | | | 2,327,738 | |
| Ross Stores, Inc. | | | 39,055 | | | | 5,404,821 | |
| Ulta Beauty, Inc. (a) | | | 9,005 | | | | 4,412,360 | |
| Williams-Sonoma, Inc. | | | 17,115 | | | | 3,453,465 | |
| | | | | | | | 23,982,831 | |
| Consumer Staples (6.1%) | | | | | | | | |
| BJ's Wholesale Club Holdings, Inc. (a) | | | 48,455 | | | | 3,230,010 | |
| Church & Dwight Co., Inc. | | | 23,170 | | | | 2,190,955 | |
| Dollar General Corp. | | | 17,895 | | | | 2,432,825 | |
| Hershey (The) Co. | | | 15,890 | | | | 2,962,532 | |
| Sysco Corp. | | | 42,000 | | | | 3,071,460 | |
| | | | | | | | 13,887,782 | |
| Energy (4.4%) | | | | | | | | |
| Baker Hughes Co. | | | 183,895 | | | | 6,285,531 | |
| Marathon Oil Corp. | | | 158,715 | | | | 3,834,555 | |
| | | | | | | | 10,120,086 | |
| Financials (14.5%) | | | | | | | | |
| American Financial Group, Inc. | | | 20,850 | | | | 2,478,857 | |
| Brown & Brown, Inc. | | | 45,915 | | | | 3,265,016 | |
| Cboe Global Markets, Inc. | | | 16,650 | | | | 2,973,024 | |
| East West Bancorp, Inc. | | | 35,600 | | | | 2,561,420 | |
| Everest Re Group Ltd. | | | 7,850 | | | | 2,775,603 | |
| FactSet Research Systems, Inc. | | | 10,310 | | | | 4,918,385 | |
| M&T Bank Corp. | | | 16,300 | | | | 2,234,404 | |
| Northern Trust Corp. | | | 38,425 | | | | 3,242,301 | |
| SEI Investments Co. | | | 82,310 | | | | 5,230,800 | |
| T. Rowe Price Group, Inc. | | | 31,530 | | | | 3,395,466 | |
| | | | | | | | 33,075,276 | |
| Health Care (14.4%) | | | | | | | | |
| Agilent Technologies, Inc. | | | 24,515 | | | | 3,408,320 | |
| Chemed Corp. | | | 3,830 | | | | 2,239,593 | |
| Cooper (The) Cos., Inc. | | | 12,625 | | | | 4,777,805 | |
| Laboratory Corp. of America Holdings | | | 6,820 | | | | 1,550,118 | |
| Medpace Holdings, Inc. (a) | | | 12,300 | | | | 3,770,319 | |
| Mettler-Toledo International, Inc. (a) | | | 2,980 | | | | 3,614,621 | |
| STERIS PLC | | | 14,170 | | | | 3,115,275 | |
| Teleflex, Inc. | | | 10,695 | | | | 2,666,691 | |
| Waters Corp. (a) | | | 17,140 | | | | 5,643,002 | |
| West Pharmaceutical Services, Inc. | | | 5,645 | | | | 1,987,717 | |
| | | | | | | | 32,773,461 | |
| Industrials (19.6%) | | | | | | | | |
| A O Smith Corp. | | | 36,395 | | | | 3,000,404 | |
| AMETEK, Inc. | | | 25,645 | | | | 4,228,604 | |
| Broadridge Financial Solutions, Inc. | | | 17,545 | | | | 3,609,884 | |
| Cummins, Inc. | | | 9,185 | | | | 2,200,450 | |
| Donaldson Co., Inc. | | | 57,355 | | | | 3,748,149 | |
| Expeditors International of Washington, Inc. | | | 27,990 | | | | 3,560,328 | |
| Graco, Inc. | | | 29,910 | | | | 2,594,992 | |
| Hubbell, Inc. | | | 8,745 | | | | 2,876,493 | |
| Lincoln Electric Holdings, Inc. | | | 16,485 | | | | 3,584,828 | |
| Nordson Corp. | | | 12,595 | | | | 3,327,095 | |
| Paychex, Inc. | | | 56,210 | | | | 6,695,173 | |
| Rockwell Automation, Inc. | | | 10,010 | | | | 3,107,905 | |
| W.W. Grainger, Inc. | | | 2,730 | | | | 2,262,324 | |
| | | | | | | | 44,796,629 | |
| Information Technology (10.7%) | | | | | | | | |
| Amdocs Ltd. | | | 26,190 | | | | 2,301,839 | |
| ANSYS, Inc. (a) | | | 13,485 | | | | 4,893,437 | |
| Check Point Software Technologies Ltd. (a) | | | 16,575 | | | | 2,532,494 | |
| F5, Inc. (a) | | | 14,355 | | | | 2,569,258 | |
| Fortinet, Inc. (a) | | | 50,000 | | | | 2,926,500 | |
| TE Connectivity Ltd. | | | 28,770 | | | | 4,042,185 | |
| Teradyne, Inc. | | | 22,000 | | | | 2,387,440 | |
| Zebra Technologies Corp., Class A (a) | | | 10,330 | | | | 2,823,499 | |
| | | | | | | | 24,476,652 | |
| Materials (6.4%) | | | | | | | | |
| AptarGroup, Inc. | | | 29,215 | | | | 3,611,558 | |
| Avery Dennison Corp. | | | 14,950 | | | | 3,022,292 | |
| Ball Corp. | | | 46,420 | | | | 2,670,078 | |
| Packaging Corp. of America | | | 14,970 | | | | 2,438,763 | |
| RPM International, Inc. | | | 26,365 | | | | 2,943,125 | |
| | | | | | | | 14,685,816 | |
| Real Estate (3.9%) | | | | | | | | |
| AvalonBay Communities, Inc. | | | 14,460 | | | | 2,707,201 | |
| CubeSmart | | | 47,775 | | | | 2,214,371 | |
| Jones Lang LaSalle, Inc. (a) | | | 20,470 | | | | 3,866,169 | |
| | | | | | | | 8,787,741 | |
| Utilities (5.1%) | | | | | | | | |
| Atmos Energy Corp. | | | 20,615 | | | | 2,389,278 | |
| Essential Utilities, Inc. | | | 71,300 | | | | 2,663,055 | |
| Eversource Energy | | | 73,790 | | | | 4,554,319 | |
| ONE Gas, Inc. | | | 32,390 | | | | 2,063,891 | |
| | | | | | | | 11,670,543 | |
| TOTAL COMMON STOCKS (Cost $167,569,271) | | | | | | | 225,650,347 | |
| | | | | | | | | |
| Investment Companies (0.8%) | | | | | | | | |
| Northern Institutional Treasury | | | | | | | | |
| Portfolio (Premier Class), 5.22% (b) | | | 1,857,573 | | | | 1,857,573 | |
| TOTAL INVESTMENT COMPANIES (Cost $1,857,573) | | | | | | | 1,857,573 | |
| Total Investments (Cost $169,426,844) —99.6%(c) | | | | | | | 227,507,920 | |
| Other assets in excess of liabilities — 0.4% | | | | | | | 1,013,923 | |
| Net Assets — 100.0% | | | | | | $ | 228,521,843 | |
| | See Notes to Financial Statements | 17 |
| | Boston Trust Midcap Fund |
| Schedule of Portfolio Investments | December 31, 2023 |
| (a) | Non-income producing security. |
| (b) | Rate disclosed is the seven day yield as of December 31, 2023. |
| (c) | See Federal Tax Information listed in the Notes to the Financial Statements. |
| PLC | Public Limited Company |
| 18 | See Notes to Financial Statements | |
| Financial Statements | Boston Trust Midcap Fund |
| Statement of Assets and Liabilities | | | |
| December 31, 2023 | | | |
| | | | |
| Assets: | | | |
| Investments, at fair value(cost $169,426,844) | | $ | 227,507,920 | |
| Cash | | | 1,341,437 | |
| Dividend receivable | | | 224,030 | |
| Receivable for capital shares issued | | | 501,021 | |
| Prepaid expenses | | | 18,778 | |
| Total Assets | | | 229,593,186 | |
| Liabilities: | | | | |
| Payable for investments purchased | | | 844,849 | |
| Payable for capital shares redeemed | | | 23,660 | |
| Accrued expenses and other liabilities: | | | | |
| Investment adviser | | | 141,977 | |
| Administration and accounting | | | 14,357 | |
| Chief compliance officer | | | 685 | |
| Custodian | | | 2,517 | |
| Shareholder servicing fees | | | 19,838 | |
| Transfer agent | | | 4,507 | |
| Other | | | 18,953 | |
| Total Liabilities | | | 1,071,343 | |
| Net Assets | | $ | 228,521,843 | |
| Composition of Net Assets: | | | | |
| Paid in capital | | $ | 169,865,559 | |
| Total distributable earnings | | | 58,656,284 | |
| Net Assets | | $ | 228,521,843 | |
| Shares outstanding (par value $0.01, unlimited number of shares authorized) | | | 9,945,534 | |
| Net Asset Value, Offering Price and Redemption price per share | | $ | 22.98 | |
| Statement of Operations | | | |
| For the year ended December 31, 2023 | | | |
| | | | |
| Investment Income: | | | |
| Dividends | | $ | 3,037,794 | |
| Total Investment Income | | | 3,037,794 | |
| Expenses: | | | | |
| Investment adviser | | | 1,446,915 | |
| Administration and accounting | | | 62,474 | |
| Chief compliance officer | | | 7,547 | |
| Custodian | | | 24,236 | |
| Shareholder servicing | | | 233,935 | |
| Transfer agency | | | 24,469 | |
| Trustee | | | 16,778 | |
| Other | | | 70,934 | |
| Gross expense before recoupment | | | 1,887,288 | |
| Recoupment of prior expenses reimbursed by the investment adviser | | | 42,027 | |
| Total expenses | | | 1,929,315 | |
| Net Expenses | | | 1,929,315 | |
| Net Investment Income | | | 1,108,479 | |
| Net Realized/Unrealized Gains (Losses) from Investments: | | | | |
| Net realized gains from investment transactions | | | 9,001,956 | |
| Change in unrealized appreciation on investments | | | 15,103,204 | |
| Net realized/unrealized gains on investments | | | 24,105,160 | |
| Change in Net Assets Resulting from Operations | | $ | 25,213,639 | |
| | See Notes to Financial Statements | 19 |
| Financial Statements | Boston Trust Midcap Fund |
| Statements of Changes in Net Assets | | | | | | |
| | | For the year ended
December 31, 2023 | | | For the year ended
December 31, 2022 | |
| Investment Activities: | | | | | | |
| Operations: | | | | | | |
| Net investment income | | $ | 1,108,479 | | | $ | 710,622 | |
| Net realized gains from investment transactions | | | 9,001,956 | | | | 7,210,769 | |
| Change in unrealized appreciation (depreciation) on investments | | | 15,103,204 | | | | (27,325,299 | ) |
| Change in Net Assets Resulting from Operations | | | 25,213,639 | | | | (19,403,908 | ) |
| Distributions To Shareholders: | | | | | | | | |
| Total Distributions | | | (9,691,068 | ) | | | (7,363,133 | ) |
| Change in Net Assets Resulting from distributions to shareholders | | | (9,691,068 | ) | | | (7,363,133 | ) |
| Capital Share Transactions: | | | | | | | | |
| Proceeds from shares issued | | | 79,231,729 | | | | 37,031,229 | |
| Dividends reinvested | | | 7,840,523 | | | | 5,968,235 | |
| Cost of shares redeemed | | | (36,586,492 | ) | | | (26,483,479 | ) |
| Change in Net Assets Resulting from Capital Share Transactions | | | 50,485,760 | | | | 16,515,985 | |
| Change in Net Assets | | | 66,008,331 | | | | (10,251,056 | ) |
| Net Assets: | | | | | | | | |
| Beginning of year | | | 162,513,512 | | | | 172,764,568 | |
| End of year | | $ | 228,521,843 | | | $ | 162,513,512 | |
| Share Transactions: | | | | | | | | |
| Issued | | | 3,603,931 | | | | 1,654,281 | |
| Reinvested | | | 355,257 | | | | 271,407 | |
| Redeemed | | | (1,658,914 | ) | | | (1,203,248 | ) |
| Change in shares | | | 2,300,274 | | | | 722,440 | |
| 20 | See Notes to Financial Statements | |
| Financial Statements | Boston Trust Midcap Fund |
Financial Highlights
Selected data for a share outstanding throughout the years indicated.
| | | For the year
ended
December
31, 2023 | | | For the year
ended
December
31, 2022 | | | For the year
ended
December
31, 2021 | | | For the year
ended
December
31, 2020 | | | For the year
ended
December
31, 2019 | |
| Net Asset Value, Beginning of Period | | $ | 21.26 | | | $ | 24.96 | | | $ | 21.02 | | | $ | 19.55 | | | $ | 15.78 | |
| | | | | | | | | | | | | | | | | | | | | |
| Investment Activities: | | | | | | | | | | | | | | | | | | | | |
| Operations: | | | | | | | | | | | | | | | | | | | | |
| Net investment income | | | 0.13 | | | | 0.10 | | | | 0.08 | | | | 0.12 | | | | 0.10 | |
| Net realized/unrealized gains (losses) from investments | | | 2.60 | | | | (2.80 | ) | | | 5.09 | | | | 1.60 | | | | 4.39 | |
| Total from investment activities | | | 2.73 | | | | (2.70 | ) | | | 5.17 | | | | 1.72 | | | | 4.49 | |
| Distributions from: | | | | | | | | | | | | | | | | | | | | |
| Net investment income | | | (0.10 | ) | | | (0.09 | ) | | | (0.10 | ) | | | (0.12 | ) | | | (0.09 | ) |
| Net realized gains from investment transactions | | | (0.91 | ) | | | (0.91 | ) | | | (1.13 | ) | | | (0.13 | ) | | | (0.63 | ) |
| Total distributions | | | (1.01 | ) | | | (1.00 | ) | | | (1.23 | ) | | | (0.25 | ) | | | (0.72 | ) |
| | | | | | | | | | | | | | | | | | | | | |
| Net Asset Value, End of Period | | $ | 22.98 | | | $ | 21.26 | | | $ | 24.96 | | | $ | 21.02 | | | $ | 19.55 | |
| | | | | | | | | | | | | | | | | | | | | |
| Total Return | | | 13.05 | % | | | (10.94 | )% | | | 24.81 | % | | | 8.81 | % | | | 28.59 | % |
| | | | | | | | | | | | | | | | | | | | | |
| Ratios/Supplemental Data: | | | | | | | | | | | | | | | | | | | | |
| Net assets at end of year (000's) | | $ | 228,522 | | | $ | 162,514 | | | $ | 172,765 | | | $ | 139,723 | | | $ | 145,305 | |
| Ratio of net expenses to average net assets | | | 1.00 | % | | | 1.00 | % | | | 1.00 | % | | | 1.00 | % | | | 1.00 | % |
| Ratio of net investment income to average net assets | | | 0.57 | % | | | 0.45 | % | | | 0.36 | % | | | 0.59 | % | | | 0.67 | % |
| Ratio of expenses (before fee reductions or recoupment of fees previously reimbursed by the investment adviser) to average net assets (a) | | | 0.98 | % | | | 1.00 | % | | | 1.00 | % | | | 1.05 | % | | | 1.04 | % |
| Portfolio turnover rate | | | 26.29 | % | | | 27.89 | % | | | 19.72 | % | | | 38.33 | % | | | 18.46 | % |
| (a) | During the periods, certain fees may have been reduced or recouped by the investment adviser. If such fee reductions/recoupments had not occurred, the ratio would have been as indicated. |
| | See Notes to Financial Statements | 21 |
| | Boston Trust SMID Cap Fund |
| Schedule of Portfolio Investments | December 31, 2023 |
| Common Stocks (98.5%) | | | | | | |
| | | Shares | | | Fair Value ($) | |
| Communication Services (2.7%) | | | | | | |
| Cable One, Inc. | | | 8,890 | | | | 4,948,085 | |
| Interpublic Group of (The) Cos., Inc. | | | 320,395 | | | | 10,457,693 | |
| Omnicom Group, Inc. | | | 71,550 | | | | 6,189,790 | |
| | | | | | | | 21,595,568 | |
| Consumer Discretionary (11.0%) | | | | | | | | |
| Carter's, Inc. | | | 100,055 | | | | 7,493,119 | |
| Cavco Industries, Inc. (a) | | | 17,381 | | | | 6,024,602 | |
| Choice Hotels International, Inc. | | | 89,150 | | | | 10,100,695 | |
| Columbia Sportswear Co. | | | 118,563 | | | | 9,430,501 | |
| Service Corp. International | | | 232,039 | | | | 15,883,070 | |
| Texas Roadhouse, Inc. | | | 65,920 | | | | 8,057,402 | |
| TopBuild Corp. (a) | | | 31,725 | | | | 11,873,398 | |
| Williams-Sonoma, Inc. | | | 88,371 | | | | 17,831,500 | |
| | | | | | | | 86,694,287 | |
| Consumer Staples (3.3%) | | | | | | | | |
| BJ's Wholesale Club Holdings, Inc. (a) | | | 228,836 | | | | 15,254,208 | |
| Flowers Foods, Inc. | | | 470,535 | | | | 10,591,743 | |
| | | | | | | | 25,845,951 | |
| Energy (3.8%) | | | | | | | | |
| Cactus, Inc., Class A | | | 208,025 | | | | 9,444,335 | |
| Callon Petroleum Co. (a) | | | 212,298 | | | | 6,878,455 | |
| Core Laboratories, Inc. | | | 304,420 | | | | 5,376,057 | |
| Helmerich & Payne, Inc. | | | 230,275 | | | | 8,340,561 | |
| | | | | | | | 30,039,408 | |
| Financials (15.1%) | | | | | | | | |
| American Financial Group, Inc. | | | 98,300 | | | | 11,686,887 | |
| Cboe Global Markets, Inc. | | | 83,325 | | | | 14,878,512 | |
| Cohen & Steers, Inc. | | | 80,685 | | | | 6,110,275 | |
| Commerce Bancshares, Inc. | | | 103,578 | | | | 5,532,082 | |
| East West Bancorp, Inc. | | | 138,345 | | | | 9,953,923 | |
| FactSet Research Systems, Inc. | | | 34,795 | | | | 16,598,955 | |
| International Bancshares Corp. | | | 61,256 | | | | 3,327,426 | |
| Jack Henry & Associates, Inc. | | | 51,845 | | | | 8,471,991 | |
| Northern Trust Corp. | | | 112,025 | | | | 9,452,670 | |
| SEI Investments Co. | | | 245,440 | | | | 15,597,712 | |
| Selective Insurance Group, Inc. | | | 105,990 | | | | 10,543,885 | |
| UMB Financial Corp. | | | 85,093 | | | | 7,109,520 | |
| | | | | | | | 119,263,838 | |
| Health Care (13.2%) | | | | | | | | |
| Charles River Laboratories | | | | | | | | |
| International, Inc. (a) | | | 68,800 | | | | 16,264,320 | |
| Chemed Corp. | | | 24,210 | | | | 14,156,798 | |
| Cooper (The) Cos., Inc. | | | 47,100 | | | | 17,824,524 | |
| Medpace Holdings, Inc. (a) | | | 57,885 | | | | 17,743,489 | |
| Revvity, Inc. | | | 61,632 | | | | 6,736,994 | |
| Teleflex, Inc. | | | 53,919 | | | | 13,444,163 | |
| Waters Corp. (a) | | | 55,125 | | | | 18,148,804 | |
| | | | | | | | 104,319,092 | |
| Industrials (21.4%) | | | | | | | | |
| A O Smith Corp. | | | 140,335 | | | | 11,569,217 | |
| Allegion PLC | | | 64,700 | | | | 8,196,843 | |
| Applied Industrial Technologies, Inc. | | | 65,700 | | | | 11,345,733 | |
| Donaldson Co., Inc. | | | 214,970 | | | | 14,048,289 | |
| ExlService Holdings, Inc. (a) | | | 447,077 | | | | 13,792,325 | |
| Expeditors International of Washington, Inc. | | | 99,950 | | | | 12,713,640 | |
| Hubbell, Inc. | | | 33,030 | | | | 10,864,558 | |
| IDEX Corp. | | | 54,471 | | | | 11,826,199 | |
| Lincoln Electric Holdings, Inc. | | | 55,675 | | | | 12,107,086 | |
| Masco Corp. | | | 87,603 | | | | 5,867,649 | |
| Nordson Corp. | | | 62,379 | | | | 16,478,037 | |
| Paycom Software, Inc. | | | 61,082 | | | | 12,626,871 | |
| Robert Half International, Inc. | | | 71,443 | | | | 6,281,269 | |
| Snap-on, Inc. | | | 45,360 | | | | 13,101,782 | |
| The Toro Co. | | | 82,665 | | | | 7,935,013 | |
| | | | | | | | 168,754,511 | |
| Information Technology (13.0%) | | | | | | | | |
| Akamai Technologies, Inc. (a) | | | 89,475 | | | | 10,589,366 | |
| Amdocs Ltd. | | | 123,070 | | | | 10,816,622 | |
| Check Point Software Technologies Ltd. (a) | | | 50,300 | | | | 7,685,337 | |
| Dolby Laboratories, Inc., Class A | | | 89,810 | | | | 7,739,826 | |
| F5, Inc. (a) | | | 88,375 | | | | 15,817,357 | |
| Manhattan Associates, Inc. (a) | | | 24,553 | | | | 5,286,752 | |
| NetApp, Inc. | | | 107,860 | | | | 9,508,938 | |
| Progress Software Corp. | | | 194,375 | | | | 10,554,563 | |
| Qualys, Inc. (a) | | | 79,359 | | | | 15,576,585 | |
| Zebra Technologies Corp., Class A (a) | | | 33,795 | | | | 9,237,187 | |
| | | | | | | | 102,812,533 | |
| Materials (6.3%) | | | | | | | | |
| AptarGroup, Inc. | | | 99,290 | | | | 12,274,230 | |
| Avery Dennison Corp. | | | 51,950 | | | | 10,502,212 | |
| Packaging Corp. of America | | | 50,740 | | | | 8,266,053 | |
| RPM International, Inc. | | | 114,350 | | | | 12,764,891 | |
| Silgan Holdings, Inc. | | | 126,265 | | | | 5,713,491 | |
| | | | | | | | 49,520,877 | |
| Real Estate (6.6%) | | | | | | | | |
| Camden Property Trust | | | 50,299 | | | | 4,994,188 | |
| CubeSmart | | | 186,350 | | | | 8,637,323 | |
| Jones Lang LaSalle, Inc. (a) | | | 76,075 | | | | 14,368,285 | |
| Lamar Advertising Co., Class A | | | 87,935 | | | | 9,345,732 | |
| Physicians Realty Trust | | | 502,130 | | | | 6,683,350 | |
| STAG Industrial, Inc. | | | 215,298 | | | | 8,452,599 | |
| | | | | | | | 52,481,477 | |
| Utilities (2.1%) | | | | | | | | |
| Atmos Energy Corp. | | | 41,725 | | | | 4,835,928 | |
| IDACORP, Inc. | | | 51,845 | | | | 5,097,400 | |
| ONE Gas, Inc. | | | 101,820 | | | | 6,487,970 | |
| | | | | | | | 16,421,298 | |
| TOTAL COMMON STOCKS (Cost $665,835,725) | | | | | | | 777,748,840 | |
| 22 | See Notes to Financial Statements | |
| | Boston Trust SMID Cap Fund |
| Schedule of Portfolio Investments | December 31, 2023 |
| Investment Companies (1.5%) | | | | | | |
| | | Shares | | | Fair Value ($) | |
| Northern Institutional Treasury | | | | | | |
| Portfolio (Premier Class), 5.22% (b) | | | 11,730,244 | | | | 11,730,244 | |
| TOTAL INVESTMENT COMPANIES (Cost $11,730,244) | | | | | | | 11,730,244 | |
| Total Investments (Cost $677,565,969) — 100.0%(c) | | | | | | | 789,479,084 | |
| Other assets in excess of liabilities — 0.0% | | | | | | | 353,999 | |
| Net Assets — 100.0% | | | | | | $ | 789,833,083 | |
| (a) | Non-income producing security. |
| (b) | Rate disclosed is the seven day yield as of December 31, 2023. |
| (c) | See Federal Tax Information listed in the Notes to the Financial Statements. |
| PLC | Public Limited Company |
| | See Notes to Financial Statements | 23 |
| Financial Statements | Boston Trust SMID Cap Fund |
| Statement of Assets and Liabilities | | | |
| December 31, 2023 | | | |
| | | | |
| Assets: | | | |
| Investments, at fair value(cost $677,565,969) | | $ | 789,479,084 | |
| Dividend receivable | | | 775,691 | |
| Receivable for investments sold | | | 1,230,680 | |
| Receivable for capital shares issued | | | 771,514 | |
| Prepaid expenses | | | 48,518 | |
| Total Assets | | | 792,305,487 | |
| Liabilities: | | | | |
| Payable for investments purchased | | | 516,002 | |
| Payable for capital shares redeemed | | | 206,530 | |
| Payable to Custodian | | | 1,209,495 | |
| Accrued expenses and other liabilities: | | | | |
| Investment adviser | | | 431,955 | |
| Administration and accounting | | | 36,736 | |
| Chief compliance officer | | | 2,296 | |
| Custodian | | | 7,557 | |
| Transfer agent | | | 4,004 | |
| Other | | | 57,829 | |
| Total Liabilities | | | 2,472,404 | |
| Net Assets | | $ | 789,833,083 | |
| Composition of Net Assets: | | | | |
| Paid in capital | | $ | 687,187,336 | |
| Total distributable earnings | | | 102,645,747 | |
| Net Assets | | $ | 789,833,083 | |
| Shares outstanding (par value $0.01, unlimited number of shares authorized) | | | 34,232,899 | |
| Net Asset Value, Offering Price and Redemption price per share | | $ | 23.07 | |
| Statement of Operations | | | |
| For the year ended December 31, 2023 | | | |
| | | | |
| Investment Income: | | | |
| Dividends | | $ | 10,630,927 | |
| Less: Foreign tax withholding | | | (375 | ) |
| Total Investment Income | | | 10,630,552 | |
| Expenses: | | | | |
| Investment adviser | | | 4,776,295 | |
| Administration and accounting | | | 199,601 | |
| Chief compliance officer | | | 27,731 | |
| Custodian | | | 87,158 | |
| Transfer agency | | | 26,080 | |
| Trustee | | | 61,162 | |
| Other | | | 210,525 | |
| Total expenses before fee reductions | | | 5,388,552 | |
| Fees contractually reduced by the investment adviser | | | (612,046 | ) |
| Net Expenses | | | 4,776,506 | |
| Net Investment Income | | | 5,854,046 | |
| Net Realized/Unrealized Gains (Losses) from | | | | |
| Investments: | | | | |
| Net realized loss from investment transactions | | | (4,442,009 | ) |
| Change in unrealized appreciation on investments | | | 90,053,741 | |
| Net realized/unrealized gains on investments | | | 85,611,732 | |
| Change in Net Assets Resulting from Operations | | $ | 91,465,778 | |
| 24 | See Notes to Financial Statements | |
| Financial Statements | Boston Trust SMID Cap Fund |
| Statements of Changes in Net Assets | | | | | | |
| | | For the year ended
December 31, 2023 | | | For the year ended
December 31, 2022 | |
| Investment Activities: | | | | | | |
| Operations: | | | | | | |
| Net investment income | | $ | 5,854,046 | | | $ | 4,698,043 | |
| Net realized gains/(loss) from investment transactions | | | (4,442,009 | ) | | | 44,130,396 | |
| Change in unrealized appreciation (depreciation) on investments | | | 90,053,741 | | | | (121,384,207 | ) |
| Change in Net Assets Resulting from Operations | | | 91,465,778 | | | | (72,555,768 | ) |
| Distributions To Shareholders: | | | | | | | | |
| Total Distributions | | | (6,159,511 | ) | | | (20,356,159 | ) |
| Change in Net Assets Resulting from distributions to shareholders | | | (6,159,511 | ) | | | (20,356,159 | ) |
| Capital Share Transactions: | | | | | | | | |
| Proceeds from shares issued | | | 274,481,597 | | | | 156,173,450 | |
| Dividends reinvested | | | 4,946,955 | | | | 13,637,139 | |
| Cost of shares redeemed | | | (108,356,325 | ) | | | (53,318,588 | ) |
| Cost of in-kind shares redeemed (a) | | | — | | | | (105,672,275 | ) |
| Change in Net Assets Resulting from Capital Share Transactions | | | 171,072,227 | | | | 10,819,726 | |
| Change in Net Assets | | | 256,378,494 | | | | (82,092,201 | ) |
| Net Assets: | | | | | | | | |
| Beginning of year | | | 533,454,589 | | | | 615,546,790 | |
| End of year | | $ | 789,833,083 | | | $ | 533,454,589 | |
| Share Transactions: | | | | | | | | |
| Issued | | | 13,185,673 | | | | 7,188,415 | |
| Reinvested | | | 225,682 | | | | 646,004 | |
| Redeemed | | | (5,130,119 | ) | | | (2,478,045 | ) |
| Redeemed in-kind (a) | | | — | | | | (4,710,076 | ) |
| Change in shares | | | 8,281,236 | | | | 646,298 | |
| (a) | See Note 3 in the Notes to Financial Statements. |
| | See Notes to Financial Statements | 25 |
| Financial Statements | Boston Trust SMID Cap Fund |
Financial Highlights
Selected data for a share outstanding throughout the years indicated.
| | | For the year
ended
December
31, 2023 | | | For the year
ended
December
31, 2022 | | | For the year
ended
December
31, 2021 | | | For the year
ended
December
31, 2020 | | | For the year
ended
December
31, 2019 | |
| Net Asset Value, Beginning of Period | | $ | 20.56 | | | $ | 24.32 | | | $ | 19.23 | | | $ | 17.90 | | | $ | 14.63 | |
| | | | | | | | | | | | | | | | | | | | | |
| Investment Activities: | | | | | | | | | | | | | | | | | | | | |
| Operations: | | | | | | | | | | | | | | | | | | | | |
| Net investment income | | | 0.20 | | | | 0.19 | | | | 0.17 | | | | 0.12 | | | | 0.14 | |
| Net realized/unrealized gains (losses) from investments | | | 2.49 | | | | (3.10 | ) | | | 5.66 | | | | 1.36 | | | | 3.76 | |
| Total from investment activities | | | 2.69 | | | | (2.91 | ) | | | 5.83 | | | | 1.48 | | | | 3.90 | |
| Distributions from: | | | | | | | | | | | | | | | | | | | | |
| Net investment income | | | (0.16 | ) | | | (0.21 | ) | | | (0.19 | ) | | | (0.13 | ) | | | (0.12 | ) |
| Net realized gains from investment transactions | | | (0.02 | ) | | | (0.64 | ) | | | (0.55 | ) | | | (0.02 | ) | | | (0.51 | ) |
| Total distributions | | | (0.18 | ) | | | (0.85 | ) | | | (0.74 | ) | | | (0.15 | ) | | | (0.63 | ) |
| | | | | | | | | | | | | | | | | | | | | |
| Net Asset Value, End of Period | | $ | 23.07 | | | $ | 20.56 | | | $ | 24.32 | | | $ | 19.23 | | | $ | 17.90 | |
| | | | | | | | | | | | | | | | | | | | | |
| Total Return | | | 13.14 | % | | | (12.04 | )% | | | 30.46 | % | | | 8.26 | % | | | 26.74 | % |
| | | | | | | | | | | | | | | | | | | | | |
| Ratios/Supplemental Data: | | | | | | | | | | | | | | | | | | | | |
| Net assets at end of year (000's) | | $ | 789,833 | | | $ | 533,455 | | | $ | 615,547 | | | $ | 226,075 | | | $ | 126,376 | |
| Ratio of net expenses to average net assets | | | 0.75 | % | | | 0.75 | % | | | 0.75 | % | | | 0.75 | % | | | 0.75 | % |
| Ratio of net investment income to average net assets | | | 0.92 | % | | | 0.89 | % | | | 0.80 | % | | | 0.89 | % | | | 0.85 | % |
| Ratio of expenses (before fee reductions or recoupment of fees previously reimbursed by the investment adviser) to average net assets (a) | | | 0.85 | % | | | 0.86 | % | | | 0.85 | % | | | 0.91 | % | | | 0.95 | % |
| Portfolio turnover rate | | | 31.10 | % | | | 27.54 | %(b) | | | 35.83 | %(b) | | | 51.26 | %(b) | | | 24.08 | % |
| (a) | During the periods, certain fees may have been reduced or recouped by the investment adviser. If such fee reductions/recoupments had not occurred, the ratio would have been as indicated. |
| (b) | Excludes impact of in-kind transactions. |
| 26 | See Notes to Financial Statements | |
| Annual ESG Impact Report | December 31, 2023 |
Read Boston Trust Walden’s Annual ESG Impact Report online when it becomes available in March 2024. The report can be found at: www.bostontrustwalden.com/insight-cat/impact-investing/
In this report, we share examples of actions taken to accelerate progress in the areas of climate risk, equality, and governance, and offer industry-leading measurements and disclosure on the impact of our initiatives.
Boston Trust Walden Balanced Fund Boston Trust Walden Equity Fund December 31, 2023 Balanced Fund Portfolio Management Stephen J. Amyouny, CFA Lead Portfolio Manager Tchintcia S. Barros, CFA Co-Portfolio Manager Sean A. Cameron, CFA Co-Portfolio Manager Equity Fund Portfolio Management Tchintcia S. Barros, CFA Lead Portfolio Manager Stephen J. Amyouny, CFA Co-Portfolio Manager Mark B. Zagata, CFA Co-Portfolio Manager Boston Trust Walden Inc. Balanced Fund Objective The Fund seeks long-term capital growth and income through an actively managed portfolio of stocks, bonds and money market instruments. Equity Fund Objective The Fund seeks long-term growth of capital through an actively managed portfolio of stocks. Investment Concerns Equity securities (stocks) are more volatile and carry more risk and return potential than other forms of investments, including investments in high-grade fixed income securities. The net asset value per share of these Funds will fluctuate as the value of the securities in the portfolio changes. Foreign investing involves risks not typically associated with U.S. investments, including adverse political, social and economic developments and differing auditing and legal standards. These risks are magnified in emerging markets. Small- to mid-capitalization companies typically have a higher risk of failure and historically have experienced a greater degree of volatility. Bonds offer a relatively stable level of income, although bond prices will fluctuate, providing the potential for principal gain or loss. Intermediate term, higher quality bonds generally offer less risk than longer-term bonds and a lower rate of return. Cash equivalents offer low risk and low return potential. | Manager Commentary (Unaudited) Management Discussion of Fund Performance The Boston Trust Walden Balanced Fund and the Boston Trust Walden Equity Fund returned 12.18% and 16.29%, respectively for the 12-month period ended December 31, 2023. The relevant market indices, the S&P 500 Index and the Bloomberg U.S. Government/Credit Bond Index, returned 26.29% and 5.72%, respectively, for the year. The S&P 500 Index returned 26.29% in 2023, posting a strong return after delivering a -18.11% total return in the prior year. While the Funds’ valuation discipline provided downside protection in 2022, this valuation discipline weighed on relative performance in 2023 as more speculatively priced pockets of the equity market delivered outsized returns. Examining through an equity sector lens, information technology represented the sector exhibiting particular strength during the year. The market continued to favor information technology companies such as software-oriented businesses and semiconductor firms with strong growth prospects; in particular, companies with perceived leverage to the emerging artificial intelligence (AI) industry performed exceptionally well. For the full year, the three standout sectors were information technology, communication services, and consumer discretionary – three sectors that tend to exhibit attractive growth profiles. Conversely, energy and utilities – two of the more traditional value sectors — represented the two sectors that declined in total return terms in 2023. Overall, the Funds maintain broad diversification across several sectors and industries in the strategies’ holdings. The Balanced Fund’s high-quality focus within investment grade fixed income served as a detractor to relative performance in 2023 as lower quality credits generally outperformed higher quality fixed income securities. Nonetheless, as spreads on corporate bonds tightened, the Fund benefitted in absolute terms across its corporate bond holdings. Moreover, a primary determinant of fixed income returns is the interest rate sensitivity, or duration, of portfolio holding. The Balanced Fund maintained a below index duration relative to the Bloomberg U.S. Government/Credit Bond Index in the first half of the year and then increased the duration of the Fund to neutral in the second half of the year as it became clear the Federal Reserve was nearing the end of its hiking cycle. These moves have helped lock in more attractive fixed income yields priced at higher levels. Outlook The real US Gross Domestic Product increased by 2.5% in 2023, compared with an increase of 1.9% in 2022 and 6% in 2021. The probability of a recession within the next year still exists in response to the Fed’s commitment to getting inflation under control and pockets of stress in the banking sector weighing on consumer and business sentiment. Nonetheless, while we expect economic and corporate profit growth to moderate, we believe that present equity valuations largely reflect these expectations. We acknowledge, however, that the prospect of tighter financial conditions remains a powerful force and the unwinding of the US Federal Reserve's balance sheet may weigh on sentiment and near-term returns. Despite the modestly constructive outlook, we remain vigilant for risks. Among the most pressing are segments of the market that continue to exhibit elevated valuations, geopolitical and military risks that threaten global trade and stability, banking system stresses becoming more broad-based, and the potential for inflation to remain elevated longer term. This latter issue may hamper discretionary consumer spending as well as corporate profits for companies unable to pass along higher input prices. We remain focused on identifying and investing in a diversified portfolio of high-quality securities at reasonable valuations. We believe that this long-held discipline will allow the strategy to capitalize on our outlook for economic strength yet effectively navigate risks along the way, thereby achieving an attractive risk-adjusted return performance pattern over full market cycles.* * Portfolio composition is subject to change. |
| Investment Performance (Unaudited) | Boston Trust Walden Balanced Fund |
| | Boston Trust Walden Equity Fund |
| | December 31, 2023 |
| | For the periods ended 12/31/23 |
| | Average Annual Total Returns |
| | | | | | | | Since Inception |
| | 1 Year | 3 Years | 5 Years | 10 Years | 15 Years | 20 Years | (6/20/99) |
| Boston Trust Walden Balanced Fund | 12.18% | 4.96% | 9.14% | 7.47% | 8.79% | 6.57% | 5.88% |
| Boston Trust Walden Equity Fund | 16.29% | 8.77% | 14.03% | 10.76% | 12.59% | 8.90% | 7.57% |
| S&P 500 Total Return Index | 26.29% | 10.00% | 15.69% | 12.03% | 13.97% | 9.69% | 7.30% |
| Bloomberg U.S. Government/Credit Bond Index | 5.72% | -3.53% | 1.41% | 1.97% | 2.77% | 3.24% | 4.10% |
| FTSE 3-Month U.S. Treasury Bill Index | 5.26% | 2.24% | 1.91% | 1.26% | 0.87% | 1.42% | 1.78% |
Hypothetical Growth of a $100,000 Investment
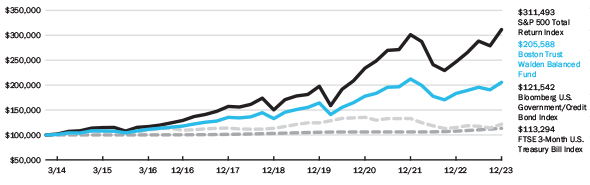
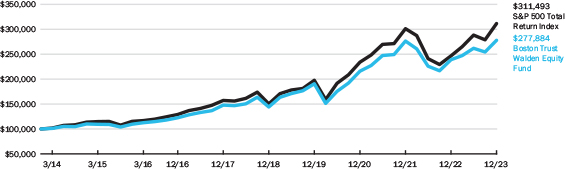
The above charts represent a 10-year hypothetical $100,000 investment in the Boston Trust Walden Balanced Fund and Boston Trust Walden Equity Fund, and includes the reinvestment of dividends and capital gains in the Funds. The returns shown on the table and the graphs do not reflect the deduction of taxes a shareholder would pay on Fund distributions or the redemption of Fund shares.
The Boston Trust Walden Balanced Fund is measured against a combination of equity and fixed income indices. The Boston Trust Walden Equity Fund is measured against the Standard & Poor’s 500 Total Return Index (“S&P 500”), which is widely regarded as a gauge of the U.S. equities market. This index includes 500 leading companies in leading industries of the U.S. economy. Although the S&P 500 focuses on the large-cap segment of the market, with approximately 75% coverage of U.S. equities, it is also widely viewed as a proxy for the total market. The Bloomberg U.S. Government/Credit Bond Index includes Treasuries (i.e., public obligations of the U.S. Treasury that have remaining maturities of more than one year), government-related issues (i.e., agency, sovereign, supranational, and local authority debt), and USD Corporates. The Bloomberg U.S. Government/Credit Bond Index is a component of the Bloomberg U.S. Aggregate Bond Index. The FTSE 3-Month U.S. T-Bill Index reflects monthly return equivalents of yield averages that are not marked to the market. The index is an average of the last three-month treasury bill issues. The three-month treasury bills are the short-term debt obligations of the U.S. Government. The indexes are unmanaged and their performance does not reflect the deduction of expenses associated with a mutual fund, such as investment management and fund accounting fees. The Funds’ performance reflects the deduction of fees for these services. Investors cannot invest directly in an index.
| Boston Trust Walden Balanced Fund |
| |
| Fund Net Asset Value: | $21.81 |
| Gross Expense Ratio1: | 1.00% |
| Boston Trust Walden Equity Fund |
| |
| Fund Net Asset Value: | $34.09 |
| Gross Expense Ratio1: | 1.02% |
Past performance does not guarantee future results. The performance data quoted represents past performance and current returns may be lower or higher. The investment return and principal value will fluctuate so that an investor’s shares, when redeemed may be worth more or less than the original cost. To obtain performance information current to the most recent month-end, please call 1-800-282-8782 ext. 7050.
| 1 | The Gross Expense Ratio is from each Fund’s prospectus dated May 1, 2023. The contractual fee limit under each Fund’s expense limitation agreement is 1.00% of each Fund’s average annual net assets, subject to certain limitations as described in each Fund’s prospectus. Please see each Fund’s most recent prospectus for details. The investment performance may reflect fee recoupments. If such fee recoupments had not occurred, the quoted performance would have been higher. The contractual fee waivers continue through May 1, 2024 and may be renewed thereafter. Additional information pertaining to each Fund’s expense ratio as of December 31, 2023 can be found in the financial highlights included in this report. |
Boston Trust Walden Midcap Fund December 31, 2023 Stephen J. Amyouny, CFA Lead Portfolio Manager Richard Q. Williams, CFA Co-Portfolio Manager Mark Zagata, CFA Co-Portfolio Manager Boston Trust Walden Inc. Fund Objective The Fund seeks long-term capital growth through an actively managed portfolio of stocks of middle capitalization (“mid cap”) companies. Investment Concerns Equity securities (stocks) are more volatile and carry more risk and return potential than other forms of investments, including investments in high-grade fixed income securities. Mid cap funds typically carry additional risks since smaller companies generally have a higher risk of failure. | Manager Commentary (Unaudited) Management Discussion of Fund Performance The Boston Trust Walden Midcap Fund returned 13.88% in calendar year 2023, trailing the Russell Midcap®Index return of 17.23%. The Adviser's analysis of the year suggests the Fund’s valuation discipline (which seeks to identify the stocks of companies that are reasonably valued) detracted from performance results. Outlook The valuation of the mid cap market (as measured by the Russell Midcap®Index price-to-earnings ratio) as of the end of 2023 was approximately in line with historical averages. The Adviser believes that pockets of speculative valuation exist, however, and remain a risk. Further, index earnings may have reached a new record in 2023, and the increasingly supportive economic backdrop suggests this trajectory may continue in 2024. The Adviser believes that over the long-term, companies with stronger fundamentals generate superior returns. The Adviser believes that a well-diversified Fund comprised of reasonably valued stocks of higher quality companies will add value over full market cycles. A full market cycle includes one bear and one bull market.* * Portfolio composition is subject to change. |
| Investment Performance (Unaudited) | Boston Trust Walden Midcap Fund |
| | December 31, 2023 |
| | For the periods ended 12/31/23 |
| | Average Annual Total Returns |
| | | | | | Since Inception |
| | 1 Year | 3 Years | 5 Years | 10 Years | (8/1/11) |
| Boston Trust Walden Midcap Fund | 13.88% | 8.21% | 12.09% | 9.73% | 10.77% |
| Russell MidCap®Index | 17.23% | 5.92% | 12.68% | 9.42% | 11.13% |
Hypothetical Growth of a $100,000 Investment
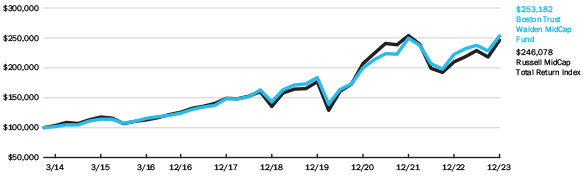
The above chart represents a 10-year hypothetical $100,000 investment in the Boston Trust Walden Midcap Fund, and includes the reinvestment of dividends and capital gains in the Fund. The returns shown on the table and graph do not reflect the deduction of taxes a shareholder would pay on Fund distributions or the redemption of Fund shares.
Boston Trust Walden Midcap Fund is measured against the Russell Midcap®Index, which is an unmanaged index that tracks the performance of the mid-cap segment of the U.S. equity universe. The Russell Midcap®Index is a subset of the Russell 1000®Index. It includes approximately 800 of the smallest securities based on a combination of their market capitalization and current index membership. The Russell Midcap®Index represents approximately 31% of the total market capitalization of the Russell 1000 companies. Russell Investment Group is the source and owner of the trademarks, service marks and copyrights related to the Russell Indexes. Russell®is a trademark of Russell Investment Group. The performance of an index does not reflect the deduction of expenses associated with a mutual fund, such as investment management and fund accounting fees. The Fund’s performance reflects the deduction of fees for these services. Investors cannot invest directly in an index.
| Fund Net Asset Value: | $21.49 |
| Gross Expense Ratio1: | 1.00% |
Past performance does not guarantee future results. The performance data quoted represents past performance and current returns may be lower or higher. The investment return and principal value will fluctuate so that an investor’s shares, when redeemed may be worth more or less than the original cost. To obtain performance information current to the most recent month-end, please call 1-800-282-8782 ext. 7050.
| 1 | The Gross Expense Ratio is from the Fund’s prospectus dated May 1, 2023. The contractual fee limit under the Fund’s expense limitation agreement is 1.00% of the Fund’s average annual net assets, subject to certain limitations as described in the Fund’s prospectus. Please see the Fund’s most recent prospectus for details. Additional information pertaining to the Fund’s expense ratio as of December 31, 2023 can be found in the financial highlights included in this report. |
Boston Trust Walden SMID Cap Fund December 31, 2023 Kenneth P. Scott, CFA Lead Portfolio Manager Richard Q. Williams, CFA Co-Portfolio Manager Leanne Moore Co-Portfolio Manager Boston Trust Walden Inc. Fund Objective The Fund seeks long-term capital growth through an actively managed portfolio of stocks of small and middle capitalization (“SMID cap”) companies. Investment Concerns Equity securities (stocks) are more volatile and carry more risk and return potential than other forms of investments, including investments in high-grade fixed income securities. SMID cap companies typically have a higher risk of failure and historically have experienced a greater degree of volatility. | Manager Commentary (Unaudited) Management Discussion of Fund Performance The Boston Trust Walden SMID Cap Fund returned 16.39% in the calendar year 2023, trailing the Russell 2500™ Index return of 17.42%. Despite the strong absolute market return, analysis of the data suggests there was no evidence of a performance headwind due to the Fund’s investment style. Thus, the Adviser attributes the performance shortfall to unfavorable stock selection during the year, although the Fund’s avoidance of the energy and utilities sectors was additive. Outlook The valuation of the small-mid cap market (as measured by the Russell 2500™ Index price-to-earnings ratio) as of the end of 2023 was approximately in line with historical averages. The Adviser believes that pockets of speculative valuation exist, however, and remain a risk. Further, index earnings may have reached a new record in 2023, and the increasingly supportive economic backdrop suggests this trajectory may continue in 2024. The Adviser believes that over the long-term, companies with stronger fundamentals generate superior returns. The Adviser believes that a well-diversified Fund comprised of reasonably valued stocks of higher quality companies will add value over full market cycles. A full market cycle includes one bear and one bull market.* * Portfolio composition is subject to change. |
| Investment Performance (Unaudited) | Boston Trust Walden SMID Cap Fund |
| | December 31, 2023 |
| | For the periods ended 12/31/23 |
| | Average Annual Total Returns |
| | | | | | Since
Inception |
| | 1 Year | 3 Years | 5 Years | 10 Years | (6/28/12) |
| Boston Trust Walden SMID Cap Fund | 16.39% | 8.94% | 12.22% | 9.09% | 11.31% |
| Russell 2500™ Index | 17.42% | 4.24% | 11.67% | 8.36% | 11.27% |
Hypothetical Growth of a $100,000 Investment
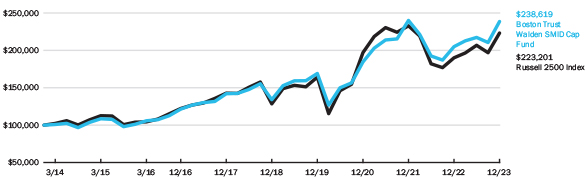
The above chart represents a 10-year hypothetical $100,000 investment in the Boston Trust Walden SMID Cap Fund, and includes the reinvestment of dividends and capital gains in the Fund. The returns shown on the table and the graph do not reflect the deduction of taxes a shareholder would pay on Fund distributions or the redemption of Fund shares.
The Boston Trust Walden SMID Cap Fund is measured against the Russell 2500™ Index, which is an unmanaged index that tracks the performance of the small- to mid-cap segment of the U.S. equity universe, commonly referred to as “SMID” cap. The Russell 2500™ Index is a subset of the Russell 3000®Index. It includes approximately 2500 of the smallest securities based on a combination of their market cap and current index membership. Russell Investment Group is the source and owner of the trademarks, service marks and copyrights related to the Russell Indexes. Russell®is a trademark of Russell Investment Group. The performance of an index does not reflect the deduction of expenses associated with a mutual fund, such as investment management and fund accounting fees. The Fund’s performance reflects the deduction of fees for these services. Investors cannot invest directly in an index.
| Fund Net Asset Value: | $22.70 |
| Gross Expense Ratio1: | 1.01% |
Past performance does not guarantee future results. The performance data quoted represents past performance and current returns may be lower or higher. The investment return and principal value will fluctuate so that an investor’s shares, when redeemed may be worth more or less than the original cost. To obtain performance information current to the most recent month-end, please call 1-800-282-8782 ext. 7050.
| 1 | The Gross Expense Ratio is from the Fund’s prospectus dated May 1, 2023. The contractual fee limit under the Fund’s expense limitation agreement is 1.00% of the Fund’s average annual net assets, subject to certain limitations as described in the Fund’s prospectus. Please see the Fund’s most recent prospectus for details. The investment performance may reflect fee reductions. If such fee reductions had not occurred, the quoted performance would have been lower. The contractual fee waivers continue through May 1, 2024 and may be renewed thereafter. Additional information pertaining to the Fund’s expense ratio as of December 31, 2023 can be found in the financial highlights included in this report. |
Boston Trust Walden Small Cap Fund December 31, 2023 Kenneth P. Scott, CFA Lead Portfolio Manager Richard Q. Williams, CFA Co-Portfolio Manager Leanne Moore Co-Portfolio Manager Boston Trust Walden Inc. Fund Objective The Fund seeks long-term capital growth through an actively managed portfolio of stocks of small capitalization (“small cap”) companies. Investment Concerns Equity securities (stocks) are more volatile and carry more risk and return potential than other forms of investments, including investments in high-grade fixed income securities. Small cap funds typically carry additional risks since smaller companies generally have a higher risk of failure, and historically, their stocks have experienced a greater degree of market volatility than stocks on average. | Manager Commentary (Unaudited) Management Discussion of Fund Performance The Boston Trust Walden Small Cap Fund returned 10.09% in the calendar year 2023, trailing the Russell 2000®Index return of 16.93%. Despite the strong absolute return in the market, analysis of the data suggests there was no evidence of a performance headwind due to the Fund’s investment style. Thus, the Adviser attributes the performance shortfall to unfavorable stock selection during the year, a contrast to the prior two years, when the Fund enjoyed both style tailwinds and incrementally favorable performance of strategy holdings relative to the high quality opportunity set. Outlook The valuation of the small cap market (as measured by the Russell 2000®Index price-to-earnings ratio) as of the end of 2023 was approximately in line with historical averages. The Adviser believes that pockets of speculative valuation exist, however, and remain a risk. Further, index earnings may have reached a new record in 2023, and the increasingly supportive economic backdrop suggests this trajectory may continue in 2024. The Adviser believes that over the long-term, companies with stronger fundamentals generate superior returns. The Adviser believes that a well-diversified Fund comprised of reasonably valued stocks of higher quality companies will add value over full market cycles. A full market cycle includes one bear and one bull market.* * Portfolio composition is subject to change. |
| Investment Performance (Unaudited) | Boston Trust Walden Small Cap Fund |
| | December 31, 2023 |
| | For the periods ended 12/31/23 |
| | Average Annual Total Returns |
| | | | | | | | Since
Inception |
| | 1 Year | 3 Years | 5 Years | 10 Years | 15 Years | 20 Years | (12/31/94) |
| Boston Trust Walden Small Cap Fund | 10.09% | 8.66% | 12.51% | 8.41% | 11.87% | 9.52% | 10.66% |
| Russell 2000®Index | 16.93% | 2.22% | 9.97% | 7.16% | 11.30% | 8.11% | 8.94% |
Hypothetical Growth of a $100,000 Investment
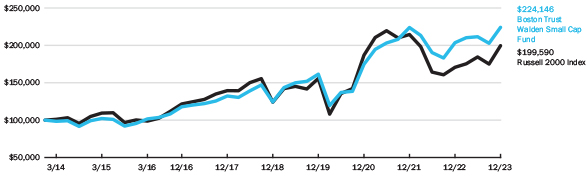
The above chart represents a 10-year hypothetical $100,000 investment in the Boston Trust Walden Small Cap Fund and includes the reinvestment of dividends and capital gains in the Fund. The returns shown on the table and graph do not reflect the deduction of taxes a shareholder would pay on Fund distributions or the redemption of Fund shares.
The Boston Trust Walden Small Cap Fund is measured against the Russell 2000®Index, which is an unmanaged index that tracks the performance of the small-cap segment of the U.S. equity universe. The Russell 2000®Index is a subset of the Russell 3000®Index representing approximately 10% of the total market capitalization of that index. It includes approximately 2,000 of the smallest securities based on a combination of their market cap and current index membership. Russell Investment Group is the source and owner of the trademarks, service marks and copyrights related to the Russell Indexes. Russell®is a trademark of Russell Investment Group. The performance of an index does not reflect the deduction of expenses associated with a mutual fund, such as investment management and fund accounting fees. The Fund’s performance reflects the deduction of fees for these services. Investors cannot invest directly in an index.
| Fund Net Asset Value: | $16.99 |
| Gross Expense Ratio1: | 1.04% |
Past performance does not guarantee future results. The performance data quoted represents past performance and current returns may be lower or higher. The investment return and principal value will fluctuate so that an investor’s shares, when redeemed may be worth more or less than the original cost. To obtain performance information current to the most recent month-end, please call 1-800-282-8782 ext. 7050.
| 1 | The Gross Expense Ratio is from the Fund’s prospectus dated May 1, 2023. The contractual fee limit under the Fund’s expense limitation agreement is 1.00% of the Fund’s average annual net assets, subject to certain limitations as described in the Fund’s prospectus. Please see the Fund’s most recent prospectus for details. The investment performance may reflect fee reductions. If such fee reductions had not occurred, the quoted performance would have been lower. The contractual fee waivers continue through May 1, 2024 and may be renewed thereafter. Additional information pertaining to the Fund’s expense ratio as of December 31, 2023 can be found in the financial highlights included in this report. |
Boston Trust Walden International Equity Fund December 31, 2023 Nathaniel J. Riley, CFA Co-Portfolio Manager David A. Sandell, CFA Co-Portfolio Manager Boston Trust Walden Inc. Fund Objective The Fund seeks long-term capital growth through an actively managed portfolio of equities of international companies. Investment Concerns Foreign investing involves risks not typically associated with U.S. investments, including adverse political, regulatory, social and economic developments and differing auditing and legal standards. These risks are magnified in emerging markets. Equity securities (stocks) are more volatile and carry more risk and return potential than other forms of investments, including investments in high-grade fixed income securities. Mid-capitalization funds typically carry additional risks since smaller companies generally have a higher risk of failure. | Manager Commentary (Unaudited) Management Discussion of Fund Performance For the 12-month period ended December 31, 2023, the Boston Trust Walden International Equity Fund posted a total return of 16.19%. The Fund’s return trailed its primary benchmark, the MSCI World ex-USA Index (net), which posted a return of 17.94% for the year. International equity markets had a choppy year. After a strong start to 2023, the banking crisis, that began in the US with Silicon Valley Bank, quickly affected markets around the world. In addition to the concern around the health of banks and the banking system, investors also considered the broader effects of a possible financial crisis. But investors quickly regained confidence as central banks showed their willingness to protect against widespread contagion, and stocks rebounded. Later in the year, price inflation in many parts of the world, and the consequent monetary policy responses, weighed on equities. But this downturn also reversed when, in the final quarter of the year, inflation statistics showed a general deceleration and central banks indicated that they may soon begin to curtail their restrictive monetary policies. Such a move could benefit corporations and asset prices generally, and the market responded accordingly. The rise in international markets was widespread. Of the 18 countries represented in the Fund, all but two had a positive return during 2023. Those two included Hong Kong, which suffered from China’s economic volatility through the year, and Norway, represented by a single Energy stock that was down slightly. Among sectors, all but one had a positive return during 2023 in the Fund, though there was a wide dispersion of returns across sectors. The Fund’s holdings within Real Estate sector fared the worst, with a decline of 4.5%, due to underperformance of Hong Kong real estate companies. Holdings in Information Technology performed best, with a rise of 34.0%, helped by strong performance of semiconductor equipment and software holdings. Turning to other market dynamics, fundamental business quality, as measured by the Adviser’s proprietary metric, was a modest detractor to performance relative to the benchmark. Stocks with poor quality profiles outperformed those with average or high quality profiles during 2023. The quality factor is typically a driver of relative returns for the Fund since the Fund generally maintains a positive exposure on this factor relative to the benchmark. Because the Fund is priced in US dollars, but its holdings are predominantly denominated in other currencies, the weakening US dollar during 2023 affected reported, USD-denominated, returns. While the MSCI World ex-USA Index (net) return in US dollars was 17.9% for the year, the same index’s return measured in local currency was 15.8%. The difference of 2.1% is due to the depreciation of the US dollar relative to the basket of currencies represented by the Index constituents. Because the Fund holdings represent roughly the same basket of currencies as the Index, the Adviser estimates that the Fund’s reported returns were affected by the dollar’s decline by a similar magnitude.* * Portfolio composition is subject to change. |
| Investment Performance (Unaudited) | Boston Trust Walden International Equity Fund |
| | December 31, 2023 |
| | For the periods ended 12/31/23 |
| | Average Annual Total Returns |
| | | | | Since
Inception |
| | 1 Year | 3 Years | 5 Years | (6/9/15) |
| Boston Trust Walden International Equity Fund | 16.19% | 4.63% | 8.16% | 5.04% |
| MSCI World ex-USA Index (Net) | 17.94% | 4.42% | 8.45% | 4.96% |
Hypothetical Growth of a $1,000,000 Investment
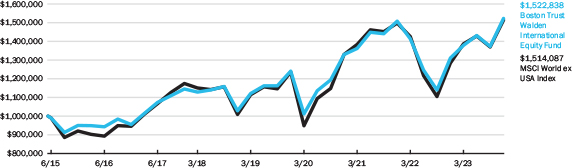
The above chart represents a hypothetical $1,000,000 investment in the Boston Trust Walden International Equity Fund from June 9, 2015 to December 31, 2023, and includes the reinvestment of dividends and capital gains in the Fund. The returns shown on the table and the graph do not reflect the deduction of taxes a shareholder would pay on Fund distributions or the redemption of Fund shares.
The Boston Trust Walden International Equity Fund Fund is measured against the MSCI World ex-USA Index. The MSCI World ex-USA Index captures large- and mid-cap representation of developed markets countries (excluding the United States) which represents the largest securities in developed countries equity markets (excluding the United States) based on all investable equity securities. Index returns reflect neither the deduction of expenses associated with a mutual fund, such as investment management and fund accounting fees. The Fund's performance reflects the deduction of fees for these services. Investors cannot invest directly in an index.
| Fund Net Asset Value: | $13.42 |
| Gross Expense Ratio1: | 0.93% |
Past performance does not guarantee future results. The performance data quoted represents past performance and current returns may be lower or higher. The investment return and principal value will fluctuate so that an investor’s shares, when redeemed may be worth more or less than the original cost. To obtain performance information current to the most recent month-end, please call 1-800-282-8782 ext. 7050.
| 1 | The Gross Expense Ratio is from the Fund’s prospectus dated May 1, 2023. Please see the Fund’s most recent prospectus for details. Additional information pertaining to the Fund’s expense ratio as of December 31, 2023 can be found in the financial highlights included in this report. |
| | Boston Trust Walden Balanced Fund |
| Schedule of Portfolio Investments | December 31, 2023 |
Common Stocks (68.4%)
| | | Shares | | | Fair Value ($) | |
| Communication Services (6.3%) | | | | | | |
| Alphabet, Inc., Class A (a) | | | 20,000 | | | | 2,793,800 | |
| Alphabet, Inc., Class C (a) | | | 42,300 | | | | 5,961,339 | |
| Comcast Corp., Class A | | | 37,575 | | | | 1,647,664 | |
| | | | | | | | 10,402,803 | |
| Consumer Discretionary (5.2%) | | | | | | | | |
| AutoZone, Inc. (a) | | | 780 | | | | 2,016,776 | |
| Lowe's Cos., Inc. | | | 5,800 | | | | 1,290,790 | |
| NIKE, Inc., Class B | | | 17,000 | | | | 1,845,690 | |
| Ross Stores, Inc. | | | 13,000 | | | | 1,799,070 | |
| Starbucks Corp. | | | 16,340 | | | | 1,568,803 | |
| | | | | | | | 8,521,129 | |
| Consumer Staples (3.9%) | | | | | | | | |
| Costco Wholesale Corp. | | | 4,200 | | | | 2,772,336 | |
| Dollar General Corp. | | | 7,000 | | | | 951,650 | |
| PepsiCo, Inc. | | | 16,240 | | | | 2,758,202 | |
| | | | | | | | 6,482,188 | |
| Energy (4.0%) | | | | | | | | |
| ConocoPhillips | | | 39,580 | | | | 4,594,050 | |
| Schlumberger NV | | | 38,690 | | | | 2,013,428 | |
| | | | | | | | 6,607,478 | |
| Financials (10.4%) | | | | | | | | |
| Chubb Ltd. | | | 9,500 | | | | 2,147,000 | |
| FactSet Research Systems, Inc. | | | 3,000 | | | | 1,431,150 | |
| JPMorgan Chase & Co. | | | 26,875 | | | | 4,571,438 | |
| Marsh & McLennan Cos., Inc. | | | 8,000 | | | | 1,515,760 | |
| Northern Trust Corp. | | | 13,285 | | | | 1,120,988 | |
| T. Rowe Price Group, Inc. | | | 10,000 | | | | 1,076,900 | |
| US Bancorp | | | 25,990 | | | | 1,124,847 | |
| Visa, Inc., Class A | | | 16,465 | | | | 4,286,663 | |
| | | | | | | | 17,274,746 | |
| Health Care (10.6%) | | | | | | | | |
| Agilent Technologies, Inc. | | | 8,000 | | | | 1,112,240 | |
| Becton, Dickinson and Co. | | | 7,250 | | | | 1,767,768 | |
| Cooper (The) Cos., Inc. | | | 3,000 | | | | 1,135,320 | |
| Johnson & Johnson | | | 21,410 | | | | 3,355,803 | |
| Merck & Co., Inc. | | | 18,970 | | | | 2,068,109 | |
| Stryker Corp. | | | 9,250 | | | | 2,770,005 | |
| UnitedHealth Group, Inc. | | | 6,750 | | | | 3,553,672 | |
| Waters Corp. (a) | | | 5,425 | | | | 1,786,073 | |
| | | | | | | | 17,548,990 | |
| Industrials (7.4%) | | | | | | | | |
| Automatic Data Processing, Inc. | | | 6,695 | | | | 1,559,734 | |
| Cummins, Inc. | | | 4,980 | | | | 1,193,059 | |
| Deere & Co. | | | 5,500 | | | | 2,199,285 | |
| Donaldson Co., Inc. | | | 15,060 | | | | 984,171 | |
| Hubbell, Inc. | | | 7,000 | | | | 2,302,510 | |
| Union Pacific Corp. | | | 9,755 | | | | 2,396,023 | |
| United Parcel Service, Inc., Class B | | | 10,000 | | | | 1,572,300 | |
| | | | | | | | 12,207,082 | |
| Information Technology (18.3%) | | | | | | | | |
| Accenture PLC, Class A | | | 12,000 | | | | 4,210,920 | |
| Adobe, Inc. (a) | | | 4,000 | | | | 2,386,400 | |
| Analog Devices, Inc. | | | 8,745 | | | | 1,736,407 | |
| Apple, Inc. | | | 36,265 | | | | 6,982,100 | |
| Applied Materials, Inc. | | | 3,000 | | | | 486,210 | |
| Cisco Systems, Inc. | | | 35,515 | | | | 1,794,218 | |
| Microsoft Corp. | | | 31,275 | | | | 11,760,651 | |
| TE Connectivity Ltd. | | | 6,500 | | | | 913,250 | |
| | | | | | | | 30,270,156 | |
| Materials (1.8%) | | | | | | | | |
| Air Products and Chemicals, Inc. | | | 6,365 | | | | 1,742,737 | |
| AptarGroup, Inc. | | | 10,500 | | | | 1,298,010 | |
| | | | | | | | 3,040,747 | |
| Utilities (0.5%) | | | | | | | | |
| Eversource Energy | | | 13,755 | | | | 848,959 | |
| TOTAL COMMON STOCKS (Cost $42,740,689) | | | | | | | 113,204,278 | |
Corporate Bonds (9.3%)
| | | Principal
Amount ($) | | | | |
| Communication Services (0.8%) | | | | | | |
| Comcast Corp., 3.95%, 10/15/25 | | | 250,000 | | | | 246,634 | |
| Comcast Corp., 3.30%, 4/1/27 | | | 250,000 | | | | 241,188 | |
| Verizon Communications, Inc., 1.50%, 9/18/30 | | | 1,000,000 | | | | 825,179 | |
| | | | | | | | 1,313,001 | |
| Consumer Discretionary (1.8%) | | | | | | | | |
| Home Depot, Inc., 1.38%, 3/15/31 | | | 1,500,000 | | | | 1,227,500 | |
| NIKE, Inc., 2.75%, 3/27/27 | | | 500,000 | | | | 476,444 | |
| Starbucks Corp., 2.45%, 6/15/26, | | | | | | | | |
| Callable 3/15/26 @ 100 | | | 350,000 | | | | 333,196 | |
| Toyota Motor Credit Corp., 1.45%, 1/13/25, MTN | | | 1,000,000 | | | | 965,148 | |
| | | | | | | | 3,002,288 | |
| Consumer Staples (0.8%) | | | | | | | | |
| The Estee Lauder Cos., Inc., 1.95%, 3/15/31 | | | 1,675,000 | | | | 1,405,213 | |
| | | | | | | | | |
| Financials (0.8%) | | | | | | | | |
| John Deere Capital, 2.80%, 7/18/29, MTN | | | 350,000 | | | | 325,127 | |
| JPMorgan Chase & Co., 2.95%, 10/1/26, Callable 7/1/26 @ 100 | | | 500,000 | | | | 476,488 | |
| Mastercard, Inc., 2.95%, 11/21/26, Callable 8/21/26 @ 100 | | | 100,000 | | | | 96,492 | |
| Mastercard, Inc., 3.30%, 3/26/27 | | | 150,000 | | | | 145,566 | |
| Visa, Inc., 3.15%, 12/14/25, Callable 9/14/25 @ 100 | | | 275,000 | | | | 268,373 | |
| | | | | | | | 1,312,046 | |
| Health Care (1.8%) | | | | | | | | |
| Abbott Laboratories, 2.95%, 3/15/25, Callable 12/15/24 @ 100 | | | 100,000 | | | | 97,951 | |
| Kaiser Foundation Hospitals, 3.15%, 5/1/27, Callable 2/1/27 @ 100 | | | 250,000 | | | | 239,254 | |
| Pfizer, Inc., 3.40%, 5/15/24 | | | 100,000 | | | | 99,281 | |
| Pfizer, Inc., 1.70%, 5/28/30 | | | 1,300,000 | | | | 1,108,780 | |
| Stryker Corp., 1.15%, 6/15/25 | | | 100,000 | | | | 94,559 | |
| 38 | See Notes to Financial Statements | |
| | Boston Trust Walden Balanced Fund |
| Schedule of Portfolio Investments | December 31, 2023 |
Corporate Bonds (continued)
| | | Principal
Amount ($) | | | Fair Value ($) | |
| Health Care (continued) | | | | | | |
| Stryker Corp., 3.50%, 3/15/26, Callable 12/15/25 @ 100 | | | 300,000 | | | | 292,736 | |
| UnitedHealth Group, Inc., 2.87%, 8/15/29 | | | 1,200,000 | | | | 1,115,388 | |
| | | | | | | | 3,047,949 | |
| Industrials (0.7%) | | | | | | | | |
| 3M Co., 3.00%, 8/7/25, MTN | | | 250,000 | | | | 242,471 | |
| Hubbell, Inc., 3.35%, 3/1/26, | | | | | | | | |
| Callable 12/1/25 @ 100 | | | 145,000 | | | | 140,487 | |
| Hubbell, Inc., 3.50%, 2/15/28 | | | 150,000 | | | | 143,832 | |
| Hubbell, Inc., 2.30%, 3/15/31 | | | 500,000 | | | | 421,036 | |
| United Parcel Service, Inc., 2.40%, 11/15/26, Callable 8/15/26 @ 100 | | | 200,000 | | | | 190,095 | |
| | | | | | | | 1,137,921 | |
| Information Technology (1.2%) | | | | | | | | |
| Apple, Inc., 3.00%, 6/20/27 | | | 200,000 | | | | 192,422 | |
| Apple, Inc., 2.20%, 9/11/29 | | | 350,000 | | | | 316,925 | |
| Intel Corp., 3.90%, 3/25/30 | | | 1,000,000 | | | | 971,188 | |
| Oracle Corp., 3.40%, 7/8/24, Callable 4/8/24 @ 100 | | | 300,000 | | | | 296,481 | |
| Oracle Corp., 2.50%, 4/1/25 | | | 200,000 | | | | 193,365 | |
| | | | | | | | 1,970,381 | |
| Materials (0.8%) | | | | | | | | |
| Air Products and Chemicals, Inc., 2.05%, 5/15/30 | | | 1,425,000 | | | | 1,246,962 | |
| | | | | | | | | |
| Utilities (0.6%) | | | | | | | | |
| Consolidated Edison Co. of New York, Inc., 3.35%, 4/1/30 | | | 1,000,000 | | | | 933,409 | |
| TOTAL CORPORATE BONDS (Cost $16,716,016) | | | | | | | 15,369,170 | |
| | | | | | | | | |
| Municipal Bonds (0.4%) | | | | | | | | |
| Georgia (0.2%) | | | | | | | | |
| State of Georgia, GO, Series B, 1.40%, 8/1/33 | | | 350,000 | | | | 269,433 | |
| | | | | | | | | |
| Hawaii (0.2%) | | | | | | | | |
| State of Hawaii, GO, Series FZ, 1.87%, 8/1/33, Callable 8/1/30 @ 100 | | | 500,000 | | | | 395,935 | |
| TOTAL MUNICIPAL BONDS (Cost $857,050) | | | | | | | 665,368 | |
| | | | | | | | | |
| U.S. Government & U.S. Government Agency Obligations (20.2%) | | | | | | | | |
| Federal Farm Credit Bank (0.5%) | | | | | | | | |
| 2.75%, 7/16/27 | | | 250,000 | | | | 239,476 | |
| 2.85%, 3/2/28 | | | 750,000 | | | | 718,084 | |
| | | | | | | | 957,560 | |
| | | | | | | | | |
| Federal Home Loan Bank (0.8%) | | | | | | | | |
| 5.50%, 7/15/36 | | | 700,000 | | | | 792,881 | |
| 2.87%, 9/13/24 | | | 500,000 | | | | 492,985 | |
| | | | | | | | 1,285,866 | |
| Federal National Mortgage Association (1.3%) | | | | | | | | |
| 2.13%, 4/24/26 | | | 1,250,000 | | | | 1,194,830 | |
| 1.88%, 9/24/26 | | | 1,000,000 | | | | 943,590 | |
| | | | | | | | 2,138,420 | |
| Government National Mortgage Association (0.0%)(b) | | | | | | | | |
| 4.00%, 9/15/41 | | | 25,864 | | | | 25,120 | |
| 4.00%, 9/15/40 | | | 9,040 | | | | 8,735 | |
| | | | | | | | 33,855 | |
| U.S. Treasury Bond (2.1%) | | | | | | | | |
| 3.87%, 5/15/43 | | | 3,725,000 | | | | 3,564,359 | |
| | | | | | | | | |
| U.S. Treasury Inflation Index Note (3.7%) | | | | | | | | |
| 0.75%, 7/15/28 | | | 612,850 | | | | 587,185 | |
| 0.25%, 7/15/29 | | | 1,202,810 | | | | 1,113,371 | |
| 0.13%, 1/15/32 | | | 4,800,361 | | | | 4,227,332 | |
| | | | | | | | 5,927,888 | |
| U.S. Treasury Note (11.8%) | | | | | | | | |
| 2.75%, 8/15/32 | | | 9,575,000 | | | | 8,785,437 | |
| 3.87%, 8/15/33 | | | 10,750,000 | | | | 10,758,398 | |
| | | | | | | | 19,543,835 | |
| TOTAL U.S. GOVERNMENT & U.S. GOVERNMENT AGENCY OBLIGATIONS (Cost $33,222,766) | | | | | | | 33,451,783 | |
Investment Companies (0.8%)
| | | Shares | | | | |
| Northern Institutional Treasury Portfolio (Premier Class), 5.22% (c) | | | 1,357,140 | | | | 1,357,140 | |
| TOTAL INVESTMENT COMPANIES (Cost $1,357,140) | | | | | | | 1,357,140 | |
| Total Investments (Cost $94,893,661) — 99.1%(d) | | | | | | | 164,047,739 | |
| Other assets in excess of liabilities — 0.9% | | | | | | | 1,543,400 | |
| Net Assets — 100.0% | | | | | | $ | 165,591,139 | |
| (a) | Non-income producing security. |
| (b) | Represents less than 0.05%. |
| (c) | Rate disclosed is the seven day yield as of December 31, 2023. |
| (d) | See Federal Tax Information listed in the Notes to the Financial Statements. |
| GO | General Obligation |
| MTN | Medium Term Note |
| PLC | Public Limited Company |
| | See Notes to Financial Statements | 39 |
| Financial Statements | Boston Trust Walden Balanced Fund |
Statement of Assets and Liabilities
December 31, 2023
| Assets: | | | | |
| Investments, at fair value(cost $94,893,661) | | $ | 164,047,739 | |
| Cash | | | 1,014,574 | |
| Interest and dividends receivable | | | 626,902 | |
| Receivable for tax reclaims | | | 1,634 | |
| Receivable for capital shares issued | | | 63,462 | |
| Prepaid expenses | | | 13,758 | |
| Total Assets | | | 165,768,069 | |
| | | | | |
| Liabilities: | | | | |
| Payable for capital shares redeemed | | | 30,810 | |
| Accrued expenses and other liabilities: | | | | |
| Investment adviser | | | 104,011 | |
| Administration and accounting | | | 13,655 | |
| Chief compliance officer | | | 518 | |
| Custodian | | | 1,566 | |
| Shareholder servicing fees | | | 13,715 | |
| Transfer agent | | | 3,900 | |
| Other | | | 8,755 | |
| Total Liabilities | | | 176,930 | |
| Net Assets | | $ | 165,591,139 | |
| Composition of Net Assets: | | | | |
| Paid in capital | | $ | 96,278,592 | |
| Total distributable earnings | | | 69,312,547 | |
| Net Assets | | $ | 165,591,139 | |
| Shares outstanding (par value $0.01, unlimited number of shares authorized) | | | 7,591,566 | |
| Net Asset Value, Offering Price and Redemption price per share | | $ | 21.81 | |
Statement of Operations
For the year ended December 31, 2023
| Investment Income: | | | |
| Dividends | | $ | 1,924,662 | |
| Interest | | | 1,652,721 | |
| Less: Foreign tax withholding | | | (1,226 | ) |
| Total Investment Income | | | 3,576,157 | |
| Expenses: | | | | |
| Investment adviser | | | 1,217,430 | |
| Administration and accounting | | | 61,672 | |
| Chief compliance officer | | | 6,323 | |
| Custodian | | | 22,842 | |
| Shareholder servicing | | | 162,240 | |
| Transfer agency | | | 19,696 | |
| Trustee | | | 13,698 | |
| Other | | | 49,928 | |
| Gross expense before recoupment | | | 1,553,829 | |
| Recoupment of prior expenses reimbursed by the investment adviser | | | 33,272 | |
| Total expenses | | | 1,587,101 | |
| Net Expenses | | | 1,587,101 | |
| Net Investment Income | | | 1,989,056 | |
| Net Realized/Unrealized Gains (Losses) from Investments: | | | | |
| Net realized gains from investment transactions | | | 11,201,212 | |
| Change in unrealized appreciation on investments | | | 5,460,687 | |
| Net realized/unrealized gains on investments | | | 16,661,899 | |
| Change in Net Assets Resulting from Operations | | $ | 18,650,955 | |
| 40 | See Notes to Financial Statements | |
| Financial Statements | Boston Trust Walden Balanced Fund |
Statements of Changes in Net Assets
| | | For the year ended
December 31, 2023 | | | For the year ended
December 31, 2022 | |
| Investment Activities: | | | | | | |
| Operations: | | | | | | |
| Net investment income | | $ | 1,989,056 | | | $ | 1,807,608 | |
| Net realized gains from investment transactions | | | 11,201,212 | | | | 3,132,343 | |
| Change in unrealized appreciation (depreciation) on investments | | | 5,460,687 | | | | (33,303,817 | ) |
| Change in Net Assets Resulting from Operations | | | 18,650,955 | | | | (28,363,866 | ) |
| Distributions To Shareholders: | | | | | | | | |
| Total Distributions | | | (11,929,599 | ) | | | (6,389,731 | ) |
| Change in Net Assets Resulting from distributions to shareholders | | | (11,929,599 | ) | | | (6,389,731 | ) |
| Capital Share Transactions: | | | | | | | | |
| Proceeds from shares issued | | | 12,818,999 | | | | 16,120,035 | |
| Dividends reinvested | | | 9,451,290 | | | | 5,165,518 | |
| Cost of shares redeemed | | | (42,262,120 | ) | | | (17,206,499 | ) |
| Change in Net Assets Resulting from Capital Share Transactions | | | (19,991,831 | ) | | | 4,079,054 | |
| Change in Net Assets | | | (13,270,475 | ) | | | (30,674,543 | ) |
| Net Assets: | | | | | | | | |
| Beginning of year | | | 178,861,614 | | | | 209,536,157 | |
| End of year | | $ | 165,591,139 | | | $ | 178,861,614 | |
| Share Transactions: | | | | | | | | |
| Issued | | | 583,821 | | | | 738,110 | |
| Reinvested | | | 443,514 | | | | 238,703 | |
| Redeemed | | | (1,965,659 | ) | | | (778,128 | ) |
| Change in shares | | | (938,324 | ) | | | 198,685 | |
| | See Notes to Financial Statements | 41 |
| Financial Statements | Boston Trust Walden Balanced Fund |
Financial Highlights
Selected data for a share outstanding throughout the years indicated.
| | | For the year
ended
December
31, 2023 | | | For the year
ended
December
31, 2022 | | | For the year
ended
December
31, 2021 | | | For the year
ended
December
31, 2020 | | | For the year
ended
December
31, 2019 | |
| Net Asset Value, Beginning of Period | | $ | 20.97 | | | $ | 25.15 | | | $ | 21.82 | | | $ | 20.76 | | | $ | 17.06 | |
| | | | | | | | | | | | | | | | | | | | | |
| Investment Activities: | | | | | | | | | | | | | | | | | | | | |
| Operations: | | | | | | | | | | | | | | | | | | | | |
| Net investment income | | | 0.27 | | | | 0.22 | | | | 0.14 | | | | 0.17 | | | | 0.19 | |
| Net realized/unrealized gains (losses) from investments | | | 2.24 | | | | (3.63 | ) | | | 4.07 | | | | 1.54 | | | | 3.85 | |
| Total from investment activities | | | 2.51 | | | | (3.41 | ) | | | 4.21 | | | | 1.71 | | | | 4.04 | |
| Distributions from: | | | | | | | | | | | | | | | | | | | | |
| Net investment income | | | (0.25 | ) | | | (0.22 | ) | | | (0.14 | ) | | | (0.17 | ) | | | (0.20 | ) |
| Net realized gains from investment transactions | | | (1.42 | ) | | | (0.55 | ) | | | (0.74 | ) | | | (0.48 | ) | | | (0.14 | ) |
| Total distributions | | | (1.67 | ) | | | (0.77 | ) | | | (0.88 | ) | | | (0.65 | ) | | | (0.34 | ) |
| Net Asset Value, End of Period | | $ | 21.81 | | | $ | 20.97 | | | $ | 25.15 | | | $ | 21.82 | | | $ | 20.76 | |
| Total Return | | | 12.18 | % | | | (13.67 | )% | | | 19.38 | % | | | 8.26 | % | | | 23.70 | % |
| Ratios/Supplemental Data: | | | | | | | | | | | | | | �� | | | | | | |
| Net assets at end of year (000's) | | $ | 165,591 | | | $ | 178,862 | | | $ | 209,536 | | | $ | 177,383 | | | $ | 157,892 | |
| Ratio of net expenses to average net assets | | | 0.98 | % | | | 1.00 | % | | | 1.00 | % | | | 1.00 | % | | | 1.00 | % |
| Ratio of net investment income to average net assets | | | 1.23 | % | | | 0.98 | % | | | 0.60 | % | | | 0.84 | % | | | 1.01 | % |
| Ratio of expenses (before fee reductions or recoupment of fees previously reimbursed by the investment adviser) to average net assets (a) | | | 0.96 | % | | | 0.99 | % | | | 1.00 | % | | | 1.02 | % | | | 1.02 | % |
| Portfolio turnover rate | | | 11.76 | % | | | 28.62 | % | | | 20.88 | % | | | 18.73 | % | | | 12.99 | % |
| (a) | | During the periods, certain fees may have been reduced or recouped by the investment adviser. If such fee reductions/recoupments had not occurred, the ratio would have been as indicated. |
| 42 | See Notes to Financial Statements | |
| | Boston Trust Walden Equity Fund |
| Schedule of Portfolio Investments | December 31, 2023 |
Common Stocks (99.2%)
| | | Shares | | | Fair Value ($) | |
| Communication Services (8.6%) | | | | | | |
| Alphabet, Inc., Class A (a) | | | 48,420 | | | | 6,763,790 | |
| Alphabet, Inc., Class C (a) | | | 75,865 | | | | 10,691,654 | |
| Comcast Corp., Class A | | | 120,615 | | | | 5,288,968 | |
| | | | | | | | 22,744,412 | |
| Consumer Discretionary (7.6%) | | | | | | | | |
| AutoZone, Inc. (a) | | | 1,510 | | | | 3,904,271 | |
| Home Depot (The), Inc. | | | 4,240 | | | | 1,469,372 | |
| Lowe's Cos., Inc. | | | 11,420 | | | | 2,541,521 | |
| McDonald's Corp. | | | 8,510 | | | | 2,523,300 | |
| NIKE, Inc., Class B | | | 34,140 | | | | 3,706,580 | |
| Ross Stores, Inc. | | | 20,990 | | | | 2,904,806 | |
| Starbucks Corp. | | | 30,335 | | | | 2,912,463 | |
| | | | | | | | 19,962,313 | |
| Consumer Staples (5.3%) | | | | | | | | |
| Costco Wholesale Corp. | | | 7,470 | | | | 4,930,798 | |
| Dollar General Corp. | | | 13,950 | | | | 1,896,503 | |
| Hershey (The) Co. | | | 5,810 | | | | 1,083,216 | |
| PepsiCo, Inc. | | | 35,230 | | | | 5,983,463 | |
| | | | | | | | 13,893,980 | |
| Energy (5.4%) | | | | | | | | |
| ConocoPhillips | | | 103,105 | | | | 11,967,397 | |
| Schlumberger NV | | | 44,320 | | | | 2,306,413 | |
| | | | | | | | 14,273,810 | |
| Financials (14.5%) | | | | | | | | |
| American Express Co. | | | 11,355 | | | | 2,127,246 | |
| Chubb Ltd. | | | 24,870 | | | | 5,620,620 | |
| FactSet Research Systems, Inc. | | | 6,125 | | | | 2,921,931 | |
| JPMorgan Chase & Co. | | | 52,440 | | | | 8,920,044 | |
| Marsh & McLennan Cos., Inc. | | | 15,415 | | | | 2,920,680 | |
| Northern Trust Corp. | | | 33,025 | | | | 2,786,649 | |
| T. Rowe Price Group, Inc. | | | 20,435 | | | | 2,200,645 | |
| US Bancorp | | | 54,570 | | | | 2,361,790 | |
| Visa, Inc., Class A | | | 31,500 | | | | 8,201,025 | |
| | | | | | | | 38,060,630 | |
| Health Care (14.9%) | | | | | | | | |
| Agilent Technologies, Inc. | | | 21,375 | | | | 2,971,766 | |
| Becton, Dickinson and Co. | | | 15,350 | | | | 3,742,791 | |
| Cooper (The) Cos., Inc. | | | 7,530 | | | | 2,849,653 | |
| Danaher Corp. | | | 4,410 | | | | 1,020,209 | |
| Johnson & Johnson | | | 47,795 | | | | 7,491,388 | |
| Merck & Co., Inc. | | | 35,690 | | | | 3,890,924 | |
| Stryker Corp. | | | 20,885 | | | | 6,254,222 | |
| UnitedHealth Group, Inc. | | | 14,960 | | | | 7,875,991 | |
| Waters Corp. (a) | | | 9,090 | | | | 2,992,701 | |
| | | | | | | | 39,089,645 | |
| Industrials (12.1%) | | | | | | | | |
| Automatic Data Processing, Inc. | | | 15,790 | | | | 3,678,596 | |
| Cummins, Inc. | | | 6,635 | | | | 1,589,547 | |
| Deere & Co. | | | 12,145 | | | | 4,856,421 | |
| Donaldson Co., Inc. | | | 33,155 | | | | 2,166,679 | |
| Hubbell, Inc. | | | 10,815 | | | | 3,557,378 | |
| Masco Corp. | | | 23,120 | | | | 1,548,578 | |
| Union Pacific Corp. | | | 32,515 | | | | 7,986,334 | |
| United Parcel Service, Inc., Class B | | | 26,395 | | | | 4,150,086 | |
| Veralto Corp. | | | 1,453 | | | | 119,524 | |
| W.W. Grainger, Inc. | | | 2,605 | | | | 2,158,738 | |
| | | | | | | | 31,811,881 | |
| Information Technology (27.6%) | | | | | | | | |
| Accenture PLC, Class A | | | 28,185 | | | | 9,890,398 | |
| Adobe, Inc. (a) | | | 7,915 | | | | 4,722,089 | |
| Analog Devices, Inc. | | | 22,515 | | | | 4,470,579 | |
| Apple, Inc. | | | 105,440 | | | | 20,300,363 | |
| Applied Materials, Inc. | | | 28,505 | | | | 4,619,805 | |
| Cisco Systems, Inc. | | | 81,745 | | | | 4,129,757 | |
| Microsoft Corp. | | | 57,500 | | | | 21,622,300 | |
| TE Connectivity Ltd. | | | 19,185 | | | | 2,695,493 | |
| | | | | | | | 72,450,784 | |
| Materials (2.3%) | | | | | | | | |
| Air Products and Chemicals, Inc. | | | 13,325 | | | | 3,648,385 | |
| AptarGroup, Inc. | | | 20,025 | | | | 2,475,491 | |
| | | | | | | | 6,123,876 | |
| Utilities (0.9%) | | | | | | | | |
| Eversource Energy | | | 39,055 | | | | 2,410,475 | |
| TOTAL COMMON STOCKS (Cost $102,510,854) | | | | | | | 260,821,806 | |
| | | | | | | | | |
| Investment Companies (0.8%) | | | | | | | | |
| Northern Institutional Treasury Portfolio (Premier Class), 5.22% (b) | | | 2,006,515 | | | | 2,006,515 | |
| TOTAL INVESTMENT COMPANIES (Cost $2,006,515) | | | | | | | 2,006,515 | |
| Total Investments (Cost $104,517,369) — 100.0%(c) | | | | | | | 262,828,321 | |
| Other assets in excess of liabilities — 0.0% | | | | | | | 83,829 | |
| Net Assets — 100.0% | | | | | | $ | 262,912,150 | |
| (a) | Non-income producing security. |
| (b) | Rate disclosed is the seven day yield as of December 31, 2023. |
| (c) | See Federal Tax Information listed in the Notes to the Financial Statements. |
| PLC | Public Limited Company |
| | See Notes to Financial Statements | 43 |
| Financial Statements | Boston Trust Walden Equity Fund |
Statement of Assets and Liabilities
December 31, 2023
| Assets: | | | |
| Investments, at fair value(cost $104,517,369) | | $ | 262,828,321 | |
| Dividend receivable | | | 369,851 | |
| Receivable for tax reclaims | | | 4,316 | |
| Receivable for capital shares issued | | | 98,462 | |
| Prepaid expenses | | | 13,321 | |
| Total Assets | | | 263,314,271 | |
| Liabilities: | | | | |
| Payable for capital shares redeemed | | | 83,422 | |
| Payable to Custodian | | | 66,832 | |
| Accrued expenses and other liabilities: | | | | |
| Investment adviser | | | 166,420 | |
| Administration and accounting | | | 15,538 | |
| Chief compliance officer | | | 830 | |
| Custodian | | | 2,640 | |
| Shareholder servicing fees | | | 31,747 | |
| Transfer agent | | | 4,022 | |
| Other | | | 30,670 | |
| Total Liabilities | | | 402,121 | |
| Net Assets | | $ | 262,912,150 | |
| Composition of Net Assets: | | | | |
| Paid in capital | | $ | 102,415,545 | |
| Total distributable earnings | | | 160,496,605 | |
| Net Assets | | $ | 262,912,150 | |
| Shares outstanding (par value $0.01, unlimited number of shares authorized) | | | 7,712,393 | |
| Net Asset Value, Offering Price and Redemption price per share | | $ | 34.09 | |
Statement of Operations
For the year ended December 31, 2023
| Investment Income: | | | |
| Dividends | | $ | 4,500,244 | |
| Less: Foreign tax withholding | | | (3,237 | ) |
| Total Investment Income | | | 4,497,007 | |
| Expenses: | | | | |
| Investment adviser | | | 1,937,337 | |
| Administration and accounting | | | 84,031 | |
| Chief compliance officer | | | 10,599 | |
| Custodian | | | 36,432 | |
| Shareholder servicing | | | 365,353 | |
| Transfer agency | | | 21,933 | |
| Trustee | | | 23,001 | |
| Other | | | 69,463 | |
| Gross expense before recoupment | | | 2,548,149 | |
| Recoupment of prior expenses reimbursed by the investment adviser | | | 35,429 | |
| Total expenses | | | 2,583,578 | |
| Net Expenses | | | 2,583,578 | |
| Net Investment Income | | | 1,913,429 | |
| Net Realized/Unrealized Gains (Losses) from Investments: | | | | |
| Net realized gains from investment transactions | | | 8,470,213 | |
| Change in unrealized appreciation on investments | | | 28,918,657 | |
| Net realized/unrealized gains on investments | | | 37,388,870 | |
| Change in Net Assets Resulting from Operations | | $ | 39,302,299 | |
| 44 | See Notes to Financial Statements | |
| Financial Statements | Boston Trust Walden Equity Fund |
Statements of Changes in Net Assets
| | | For the year ended
December 31, 2023 | | | For the year ended
December 31, 2022 | |
| Investment Activities: | | | | | | |
| Operations: | | | | | | |
| Net investment income | | $ | 1,913,429 | | | $ | 1,656,719 | |
| Net realized gains from investment transactions | | | 8,470,213 | | | | 52,503,343 | |
| Change in unrealized appreciation (depreciation) on investments | | | 28,918,657 | | | | (97,105,448 | ) |
| Change in Net Assets Resulting from Operations | | | 39,302,299 | | | | (42,945,386 | ) |
| Distributions To Shareholders: | | | | | | | | |
| Total Distributions | | | (7,764,808 | ) | | | (7,929,551 | ) |
| Change in Net Assets Resulting from distributions to shareholders | | | (7,764,808 | ) | | | (7,929,551 | ) |
| Capital Share Transactions: | | | | | | | | |
| Proceeds from shares issued | | | 22,283,699 | | | | 41,364,923 | |
| Dividends reinvested | | | 5,477,709 | | | | 5,790,292 | |
| Cost of shares redeemed | | | (46,373,571 | ) | | | (53,647,017 | ) |
| Cost of in-kind shares redeemed (a) | | | — | | | | (51,649,023 | ) |
| Change in Net Assets Resulting from Capital Share Transactions | | | (18,612,163 | ) | | | (58,140,825 | ) |
| Change in Net Assets | | | 12,925,328 | | | | (109,015,762 | ) |
| Net Assets: | | | | | | | | |
| Beginning of year | | | 249,986,822 | | | | 359,002,584 | |
| End of year | | $ | 262,912,150 | | | $ | 249,986,822 | |
| Share Transactions: | | | | | | | | |
| Issued | | | 699,674 | | | | 1,308,674 | |
| Reinvested | | | 164,298 | | | | 184,580 | |
| Redeemed | | | (1,427,056 | ) | | | (1,643,226 | ) |
| Redeemed in-kind (a) | | | — | | | | (1,529,888 | ) |
| Change in shares | | | (563,084 | ) | | | (1,679,860 | ) |
| (a) | See Note 3 in the Notes to Financial Statements. |
| | See Notes to Financial Statements | 45 |
| Financial Statements | Boston Trust Walden Equity Fund |
Financial Highlights
Selected data for a share outstanding throughout the years indicated.
| | | For the year
ended
December
31, 2023 | | | For the year
ended
December
31, 2022 | | | For the year
ended
December
31, 2021 | | | For the year ended December 31, 2020 | | | For the year
ended
December
31, 2019 | |
| Net Asset Value, Beginning of Period | | $ | 30.21 | | | $ | 36.06 | | | $ | 28.82 | | | $ | 26.47 | | | $ | 20.63 | |
| | | | | | | | | | | | | | | | | | | | | |
| Investment Activities: | | | | | | | | | | | | | | | | | | | | |
| Operations: | | | | | | | | | | | | | | | | | | | | |
| Net investment income | | | 0.24 | | | | 0.21 | | | | 0.12 | | | | 0.21 | | | | 0.20 | |
| Net realized/unrealized gains (losses) from investments | | | 4.66 | | | | (5.06 | ) | | | 7.93 | | | | 3.28 | | | | 6.44 | |
| Total from investment activities | | | 4.90 | | | | (4.85 | ) | | | 8.05 | | | | 3.49 | | | | 6.64 | |
| Distributions from: | | | | | | | | | | | | | | | | | | | | |
| Net investment income | | | (0.24 | ) | | | (0.21 | ) | | | (0.12 | ) | | | (0.21 | ) | | | (0.20 | ) |
| Net realized gains from investment transactions | | | (0.78 | ) | | | (0.79 | ) | | | (0.69 | ) | | | (0.93 | ) | | | (0.60 | ) |
| Total distributions | | | (1.02 | ) | | | (1.00 | ) | | | (0.81 | ) | | | (1.14 | ) | | | (0.80 | ) |
| Net Asset Value, End of Period | | $ | 34.09 | | | $ | 30.21 | | | $ | 36.06 | | | $ | 28.82 | | | $ | 26.47 | |
| Total Return | | | 16.29 | % | | | (13.55 | )% | | | 28.00 | % | | | 13.28 | % | | | 32.30 | % |
| Ratios/Supplemental Data: | | | | | | | | | | | | | | | | | | | | |
| Net assets at end of year (000's) | | $ | 262,912 | | | $ | 249,987 | | | $ | 359,003 | | | $ | 264,418 | | | $ | 248,529 | |
| Ratio of net expenses to average net assets | | | 1.00 | % | | | 1.00 | % | | | 1.00 | % | | | 1.00 | % | | | 1.00 | % |
| Ratio of net investment income to average net assets | | | 0.74 | % | | | 0.65 | % | | | 0.38 | % | | | 0.82 | % | | | 0.83 | % |
| Ratio of expenses (before fee reductions or recoupment of fees previously reimbursed by the investment adviser) to average net assets (a) | | | 0.99 | % | | | 1.02 | % | | | 1.02 | % | | | 1.06 | % | | | 1.07 | % |
| Portfolio turnover rate | | | 6.69 | % | | | 19.32 | %(b) | | | 8.00 | % | | | 14.96 | % | | | 10.57 | % |
| (a) | During the periods, certain fees may have been reduced or recouped by the investment adviser. If such fee reductions/recoupments had not occurred, the ratio would have been as indicated. |
| (b) | Excludes impact of in-kind transactions. |
| 46 | See Notes to Financial Statements | |
| | Boston Trust Walden Midcap Fund |
| Schedule of Portfolio Investments | December 31, 2023 |
Common Stocks (99.0%)
| | | Shares | | | Fair Value ($) | |
| Communication Services (3.3%) | | | | | | |
| Cable One, Inc. | | | 1,640 | | | | 912,808 | |
| Electronic Arts, Inc. | | | 14,345 | | | | 1,962,539 | |
| Omnicom Group, Inc. | | | 14,000 | | | | 1,211,140 | |
| | | | | | | | 4,086,487 | |
| Consumer Discretionary (10.6%) | | | | | | | | |
| AutoZone, Inc. (a) | | | 710 | | | | 1,835,783 | |
| Carter's, Inc. | | | 17,205 | | | | 1,288,482 | |
| Choice Hotels International, Inc. | | | 11,910 | | | | 1,349,403 | |
| Columbia Sportswear Co. | | | 15,260 | | | | 1,213,780 | |
| Ross Stores, Inc. | | | 23,630 | | | | 3,270,156 | |
| Ulta Beauty, Inc. (a) | | | 4,840 | | | | 2,371,552 | |
| Williams-Sonoma, Inc. | | | 9,165 | | | | 1,849,314 | |
| | | | | | | | 13,178,470 | |
| Consumer Staples (6.1%) | | | | | | | | |
| BJ's Wholesale Club Holdings, Inc. (a) | | | 27,230 | | | | 1,815,152 | |
| Church & Dwight Co., Inc. | | | 12,040 | | | | 1,138,502 | |
| Dollar General Corp. | | | 10,010 | | | | 1,360,859 | |
| Hershey (The) Co. | | | 8,595 | | | | 1,602,452 | |
| Sysco Corp. | | | 22,375 | | | | 1,636,284 | |
| | | | | | | | 7,553,249 | |
| Energy (3.2%) | | | | | | | | |
| Baker Hughes Co. | | | 116,140 | | | | 3,969,665 | |
| | | | | | | | | |
| Financials (14.5%) | | | | | | | | |
| American Financial Group, Inc. | | | 11,350 | | | | 1,349,401 | |
| Brown & Brown, Inc. | | | 25,225 | | | | 1,793,750 | |
| Cboe Global Markets, Inc. | | | 9,005 | | | | 1,607,933 | |
| East West Bancorp, Inc. | | | 20,525 | | | | 1,476,774 | |
| Everest Re Group Ltd. | | | 4,355 | | | | 1,539,841 | |
| FactSet Research Systems, Inc. | | | 5,705 | | | | 2,721,570 | |
| M&T Bank Corp. | | | 8,905 | | | | 1,220,697 | |
| Northern Trust Corp. | | | 20,420 | | | | 1,723,040 | |
| SEI Investments Co. | | | 44,315 | | | | 2,816,218 | |
| T. Rowe Price Group, Inc. | | | 16,520 | | | | 1,779,039 | |
| | | | | | | | 18,028,263 | |
| Health Care (14.2%) | | | | | | | | |
| Agilent Technologies, Inc. | | | 13,320 | | | | 1,851,880 | |
| Chemed Corp. | | | 2,045 | | | | 1,195,814 | |
| Cooper (The) Cos., Inc. | | | 6,740 | | | | 2,550,685 | |
| Laboratory Corp. of America Holdings | | | 4,415 | | | | 1,003,485 | |
| Medpace Holdings, Inc. (a) | | | 6,390 | | | | 1,958,727 | |
| Mettler-Toledo International, Inc. (a) | | | 1,600 | | | | 1,940,736 | |
| STERIS PLC | | | 7,730 | | | | 1,699,440 | |
| Teleflex, Inc. | | | 5,615 | | | | 1,400,044 | |
| Waters Corp. (a) | | | 8,630 | | | | 2,841,255 | |
| West Pharmaceutical Services, Inc. | | | 3,265 | | | | 1,149,672 | |
| | | | | | | | 17,591,738 | |
| Industrials (20.9%) | | | | | | | | |
| A O Smith Corp. | | | 19,300 | | | | 1,591,092 | |
| AMETEK, Inc. | | | 13,750 | | | | 2,267,237 | |
| Broadridge Financial Solutions, Inc. | | | 9,230 | | | | 1,899,072 | |
| Cummins, Inc. | | | 5,130 | | | | 1,228,994 | |
| Donaldson Co., Inc. | | | 30,145 | | | | 1,969,976 | |
| Expeditors International of Washington, Inc. | | | 14,870 | | | | 1,891,464 | |
| Graco, Inc. | | | 15,775 | | | | 1,368,639 | |
| Hubbell, Inc. | | | 5,475 | | | | 1,800,892 | |
| Lincoln Electric Holdings, Inc. | | | 8,710 | | | | 1,894,077 | |
| Nordson Corp. | | | 6,940 | | | | 1,833,270 | |
| Paychex, Inc. | | | 30,230 | | | | 3,600,695 | |
| Paycom Software, Inc. | | | 3,175 | | | | 656,336 | |
| Rockwell Automation, Inc. | | | 5,260 | | | | 1,633,125 | |
| W.W. Grainger, Inc. | | | 2,720 | | | | 2,254,037 | |
| | | | | | | | 25,888,906 | |
| Information Technology (10.8%) | | | | | | | | |
| Amdocs Ltd. | | | 13,955 | | | | 1,226,505 | |
| ANSYS, Inc. (a) | | | 7,270 | | | | 2,638,138 | |
| Check Point Software Technologies | | | | | | | | |
| Ltd. (a) | | | 8,810 | | | | 1,346,080 | |
| F5, Inc. (a) | | | 8,245 | | | | 1,475,690 | |
| Fortinet, Inc. (a) | | | 28,525 | | | | 1,669,568 | |
| TE Connectivity Ltd. | | | 15,560 | | | | 2,186,180 | |
| Teradyne, Inc. | | | 11,600 | | | | 1,258,832 | |
| Zebra Technologies Corp., Class A (a) | | | 5,745 | | | | 1,570,281 | |
| | | | | | | | 13,371,274 | |
| Materials (6.5%) | | | | | | | | |
| AptarGroup, Inc. | | | 15,870 | | | | 1,961,850 | |
| Avery Dennison Corp. | | | 8,245 | | | | 1,666,809 | |
| Ball Corp. | | | 24,465 | | | | 1,407,227 | |
| Packaging Corp. of America | | | 8,425 | | | | 1,372,517 | |
| RPM International, Inc. | | | 14,345 | | | | 1,601,332 | |
| | | | | | | | 8,009,735 | |
| Real Estate (3.8%) | | | | | | | | |
| AvalonBay Communities, Inc. | | | 7,215 | | | | 1,350,792 | |
| CubeSmart | | | 28,965 | | | | 1,342,528 | |
| Jones Lang LaSalle, Inc. (a) | | | 11,000 | | | | 2,077,570 | |
| | | | | | | | 4,770,890 | |
| Utilities (5.1%) | | | | | | | | |
| Atmos Energy Corp. | | | 11,425 | | | | 1,324,157 | |
| Essential Utilities, Inc. | | | 34,050 | | | | 1,271,768 | |
| Eversource Energy | | | 40,850 | | | | 2,521,262 | |
| ONE Gas, Inc. | | | 18,125 | | | | 1,154,925 | |
| | | | | | | | 6,272,112 | |
| TOTAL COMMON STOCKS (Cost $87,144,832) | | | | | | | 122,720,789 | |
| Investment Companies (0.8%) | | | | | | | | |
| Northern Institutional Treasury | | | | | | | | |
| Portfolio (Premier Class), 5.22% (b) | | | 1,003,375 | | | | 1,003,375 | |
| TOTAL INVESTMENT COMPANIES (Cost $1,003,375) | | | | | | | 1,003,375 | |
| Total Investments (Cost $88,148,207) — 99.8%(c) | | | | | | | 123,724,164 | |
| Other assets in excess of liabilities — 0.2% | | | | | | | 280,648 | |
| Net Assets — 100.0% | | | | | | $ | 124,004,812 | |
| | See Notes to Financial Statements | 47 |
| | Boston Trust Walden Midcap Fund |
| Schedule of Portfolio Investments | December 31, 2023 |
| (a) | Non-income producing security. |
| (b) | Rate disclosed is the seven day yield as of December 31, 2023. |
| (c) | See Federal Tax Information listed in the Notes to the Financial Statements. |
| PLC | Public Limited Company |
| 48 | See Notes to Financial Statements | |
| Financial Statements | Boston Trust Walden Midcap Fund |
Statement of Assets and Liabilities
December 31, 2023
| Assets: | | | |
| Investments, at fair value(cost $88,148,207) | | $ | 123,724,164 | |
| Cash | | | 174,134 | |
| Dividend receivable | | | 123,538 | |
| Receivable for capital shares issued | | | 110,324 | |
| Prepaid expenses | | | 14,685 | |
| Total Assets | | | 124,146,845 | |
| Liabilities: | | | | |
| Payable for capital shares redeemed | | | 25,228 | |
| Accrued expenses and other liabilities: | | | | |
| Investment adviser | | | 77,638 | |
| Administration and accounting | | | 12,262 | |
| Chief compliance officer | | | 373 | |
| Custodian | | | 3,931 | |
| Shareholder servicing fees | | | 10,729 | |
| Transfer agent | | | 3,891 | |
| Other | | | 7,981 | |
| Total Liabilities | | | 142,033 | |
| Net Assets | | $ | 124,004,812 | |
| Composition of Net Assets: | | | | |
| Paid in capital | | $ | 88,595,792 | |
| Total distributable earnings | | | 35,409,020 | |
| Net Assets | | $ | 124,004,812 | |
| Shares outstanding (par value $0.01, unlimited number of shares authorized) | | | 5,769,686 | |
| Net Asset Value, Offering Price and Redemption price per share | | $ | 21.49 | |
Statement of Operations
For the year ended December 31, 2023
| Investment Income: | | | |
| Dividends | | $ | 1,752,117 | |
| Total Investment Income | | | 1,752,117 | |
| Expenses: | | | | |
| Investment adviser | | | 831,046 | |
| Administration and accounting | | | 44,398 | |
| Chief compliance officer | | | 3,783 | |
| Custodian | | | 16,683 | |
| Shareholder servicing | | | 133,206 | |
| Transfer agency | | | 17,851 | |
| Trustee | | | 8,325 | |
| Other | | | 37,568 | |
| Total expenses | | | 1,092,860 | |
| Net Expenses | | | 1,092,860 | |
| Net Investment Income | | | 659,257 | |
| Net Realized/Unrealized Gains (Losses) from Investments: | | | | |
| Net realized gains from investment transactions | | | 5,257,931 | |
| Change in unrealized appreciation on investments | | | 8,729,219 | |
| Net realized/unrealized gains on investments | | | 13,987,150 | |
| Change in Net Assets Resulting from Operations | | $ | 14,646,407 | |
| | See Notes to Financial Statements | 49 |
| Financial Statements | Boston Trust Walden Midcap Fund |
Statements of Changes in Net Assets
| | | For the year ended December 31, 2023 | | | For the year ended December 31, 2022 | |
| Investment Activities: | | | | | | | | |
| Operations: | | | | | | | | |
| Net investment income | | $ | 659,257 | | | $ | 440,516 | |
| Net realized gains from investment transactions | | | 5,257,931 | | | | 4,220,688 | |
| Change in unrealized appreciation (depreciation) on investments | | | 8,729,219 | | | | (15,946,322 | ) |
| Change in Net Assets Resulting from Operations | | | 14,646,407 | | | | (11,285,118 | ) |
| Distributions To Shareholders: | | | | | | | | |
| Total Distributions | | | (5,793,806 | ) | | | (5,156,604 | ) |
| Change in Net Assets Resulting from distributions to shareholders | | | (5,793,806 | ) | | | (5,156,604 | ) |
| Capital Share Transactions: | | | | | | | | |
| Proceeds from shares issued | | | 30,983,581 | | | | 24,619,006 | |
| Dividends reinvested | | | 4,492,037 | | | | 4,407,625 | |
| Cost of shares redeemed | | | (17,788,536 | ) | | | (21,071,150 | ) |
| Change in Net Assets Resulting from Capital Share Transactions | | | 17,687,082 | | | | 7,955,481 | |
| Change in Net Assets | | | 26,539,683 | | | | (8,486,241 | ) |
| Net Assets: | | | | | | | | |
| Beginning of year | | | 97,465,129 | | | | 105,951,370 | |
| End of year | | $ | 124,004,812 | | | $ | 97,465,129 | |
| Share Transactions: | | | | | | | | |
| Issued | | | 1,497,941 | | | | 1,195,637 | |
| Reinvested | | | 217,532 | | | | 215,006 | |
| Redeemed | | | (863,315 | ) | | | (1,013,858 | ) |
| Change in shares | | | 852,158 | | | | 396,785 | |
| 50 | See Notes to Financial Statements | |
| Financial Statements | Boston Trust Walden Midcap Fund |
Financial Highlights
Selected data for a share outstanding throughout the years indicated.
| | | For the year ended December 31, 2023 | | | For the year ended December 31, 2022 | | | For the year ended December 31, 2021 | | | For the year ended December 31, 2020 | | | For the year ended December 31, 2019 | |
| Net Asset Value, Beginning of Period | | $ | 19.82 | | | $ | 23.44 | | | $ | 19.71 | | | $ | 18.71 | | | $ | 15.57 | |
| | | | | | | | | | | | | | | | | | | | | |
| Investment Activities: | | | | | | | | | | | | | | | | | | | | |
| Operations: | | | | | | | | | | | | | | | | | | | | |
| Net investment income | | | 0.12 | | | | 0.09 | | | | 0.08 | | | | 0.10 | | | | 0.12 | |
| Net realized/unrealized gains (losses) from investments | | | 2.59 | | | | (2.61 | ) | | | 4.78 | | | | 1.53 | | | | 4.27 | |
| Total from investment activities | | | 2.71 | | | | (2.52 | ) | | | 4.86 | | | | 1.63 | | | | 4.39 | |
| Distributions from: | | | | | | | | | | | | | | | | | | | | |
| Net investment income | | | (0.12 | ) | | | (0.09 | ) | | | (0.09 | ) | | | (0.09 | ) | | | (0.10 | ) |
| Net realized gains from investment transactions | | | (0.92 | ) | | | (1.01 | ) | | | (1.04 | ) | | | (0.54 | ) | | | (1.15 | ) |
| Total distributions | | | (1.04 | ) | | | (1.10 | ) | | | (1.13 | ) | | | (0.63 | ) | | | (1.25 | ) |
| | | | | | | | | | | | | | | | | | | | | |
| Net Asset Value, End of Period | | $ | 21.49 | | | $ | 19.82 | | | $ | 23.44 | | | $ | 19.71 | | | $ | 18.71 | |
| | | | | | | | | | | | | | | | | | | | | |
| Total Return | | | 13.88 | % | | | (10.90 | )% | | | 24.89 | % | | | 8.76 | % | | | 28.380 | % |
| | | | | | | | | | | | | | | | | | | | | |
| Ratios/Supplemental Data: | | | | | | | | | | | | | | | | | | | | |
| Net assets at end of year (000's) | | $ | 124,005 | | | $ | 97,465 | | | $ | 105,951 | | | $ | 82,948 | | | $ | 62,538 | |
| Ratio of net expenses to average net assets | | | 0.98 | % | | | 1.00 | % | | | 0.99 | % | | | 1.00 | % | | | 1.00 | % |
| Ratio of net investment income to average net assets | | | 0.59 | % | | | 0.45 | % | | | 0.37 | % | | | 0.61 | % | | | 0.68 | % |
| Portfolio turnover rate | | | 25.92 | % | | | 29.80 | % | | | 21.82 | % | | | 38.28 | % | | | 23.17 | % |
| | See Notes to Financial Statements | 51 |
| Schedule of Portfolio Investments | Boston Trust Walden SMID Cap Fund December 31, 2023 |
| Common Stocks (98.2%) | | | | | | |
| | | Shares | | | Fair Value ($) | |
| Communication Services (3.2%) | | | | | | | | |
| Cable One, Inc. | | | 2,834 | | | | 1,577,376 | |
| Interpublic Group of (The) Cos., Inc. | | | 84,645 | | | | 2,762,813 | |
| Omnicom Group, Inc. | | | 29,319 | | | | 2,536,387 | |
| | | | | | | | 6,876,576 | |
| Consumer Discretionary (9.7%) | | | | | | | | |
| Carter's, Inc. | | | 26,224 | | | | 1,963,915 | |
| Cavco Industries, Inc. (a) | | | 4,535 | | | | 1,571,922 | |
| Choice Hotels International, Inc. | | | 27,561 | | | | 3,122,661 | |
| Columbia Sportswear Co. | | | 31,494 | | | | 2,505,033 | |
| Texas Roadhouse, Inc. | | | 17,087 | | | | 2,088,544 | |
| TopBuild Corp. (a) | | | 12,775 | | | | 4,781,171 | |
| Williams-Sonoma, Inc. | | | 22,533 | | | | 4,546,709 | |
| | | | | | | | 20,579,955 | |
| Consumer Staples (3.6%) | | | | | | | | |
| BJ's Wholesale Club Holdings, Inc. (a) | | | 61,716 | | | | 4,113,989 | |
| Flowers Foods, Inc. | | | 155,306 | | | | 3,495,938 | |
| | | | | | | | 7,609,927 | |
| | | | | | | | | |
| Financials (14.9%) | | | | | | | | |
| American Financial Group, Inc. | | | 25,450 | | | | 3,025,751 | |
| Cboe Global Markets, Inc. | | | 21,768 | | | | 3,886,894 | |
| Cohen & Steers, Inc. | | | 21,065 | | | | 1,595,252 | |
| Commerce Bancshares, Inc. | | | 27,391 | | | | 1,462,969 | |
| East West Bancorp, Inc. | | | 38,764 | | | | 2,789,070 | |
| FactSet Research Systems, Inc. | | | 9,294 | | | | 4,433,703 | |
| International Bancshares Corp. | | | 17,256 | | | | 937,346 | |
| Jack Henry & Associates, Inc. | | | 14,281 | | | | 2,333,658 | |
| Northern Trust Corp. | | | 30,840 | | | | 2,602,279 | |
| SEI Investments Co. | | | 64,910 | | | | 4,125,031 | |
| Selective Insurance Group, Inc. | | | 26,795 | | | | 2,665,567 | |
| UMB Financial Corp. | | | 23,708 | | | | 1,980,803 | |
| | | | | | | | 31,838,323 | |
| | | | | | | | | |
| Health Care (11.1%) | | | | | | | | |
| Chemed Corp. | | | 6,421 | | | | 3,754,680 | |
| Cooper (The) Cos., Inc. | | | 12,065 | | | | 4,565,879 | |
| Medpace Holdings, Inc. (a) | | | 15,372 | | | | 4,711,979 | |
| Revvity, Inc. | | | 16,811 | | | | 1,837,610 | |
| Teleflex, Inc. | | | 14,524 | | | | 3,621,414 | |
| Waters Corp. (a) | | | 15,740 | | | | 5,182,080 | |
| | | | | | | | 23,673,642 | |
| | | | | | | | | |
| Industrials (26.6%) | | | | | | | | |
| A O Smith Corp. | | | 36,815 | | | | 3,035,029 | |
| Acuity Brands, Inc. | | | 11,904 | | | | 2,438,296 | |
| Allegion PLC | | | 17,400 | | | | 2,204,406 | |
| Applied Industrial Technologies, Inc. | | | 28,050 | | | | 4,843,955 | |
| C.H. Robinson Worldwide, Inc. | | | 14,544 | | | | 1,256,456 | |
| Donaldson Co., Inc. | | | 56,691 | | | | 3,704,757 | |
| ExlService Holdings, Inc. (a) | | | 121,104 | | | | 3,736,058 | |
| Expeditors International of Washington, Inc. | | | 25,512 | | | | 3,245,126 | |
| Franklin Electric Co., Inc. | | | 19,963 | | | | 1,929,424 | |
| Hubbell, Inc. | | | 10,970 | | | | 3,608,362 | |
| IDEX Corp. | | | 14,791 | | | | 3,211,274 | |
| Lincoln Electric Holdings, Inc. | | | 14,305 | | | | 3,110,765 | |
| Masco Corp. | | | 32,300 | | | | 2,163,454 | |
| Nordson Corp. | | | 16,593 | | | | 4,383,207 | |
| Paycom Software, Inc. | | | 16,360 | | | | 3,381,939 | |
| Robert Half International, Inc. | | | 28,732 | | | | 2,526,118 | |
| Snap-on, Inc. | | | 11,480 | | | | 3,315,883 | |
| The Middleby Corp. (a) | | | 15,761 | | | | 2,319,546 | |
| The Toro Co. | | | 23,841 | | | | 2,288,498 | |
| | | | | | | | 56,702,553 | |
| | | | | | | | | |
| Information Technology (15.2%) | | | | | | | | |
| Akamai Technologies, Inc. (a) | | | 24,202 | | | | 2,864,307 | |
| Amdocs Ltd. | | | 32,325 | | | | 2,841,044 | |
| Aspen Technology, Inc. (a) | | | 11,445 | | | | 2,519,617 | |
| Check Point Software Technologies Ltd. (a) | | | 13,500 | | | | 2,062,665 | |
| Dolby Laboratories, Inc., Class A | | | 34,168 | | | | 2,944,598 | |
| F5, Inc. (a) | | | 24,080 | | | | 4,309,839 | |
| Manhattan Associates, Inc. (a) | | | 11,606 | | | | 2,499,004 | |
| NetApp, Inc. | | | 31,657 | | | | 2,790,881 | |
| Progress Software Corp. | | | 51,048 | | | | 2,771,906 | |
| Qualys, Inc. (a) | | | 21,297 | | | | 4,180,175 | |
| Zebra Technologies Corp., Class A (a) | | | 9,115 | | | | 2,491,403 | |
| | | | | | | | 32,275,439 | |
| | | | | | | | | |
| Materials (6.4%) | | | | | | | | |
| AptarGroup, Inc. | | | 30,670 | | | | 3,791,425 | |
| Avery Dennison Corp. | | | 13,295 | | | | 2,687,717 | |
| Packaging Corp. of America | | | 14,355 | | | | 2,338,573 | |
| RPM International, Inc. | | | 29,570 | | | | 3,300,899 | |
| Silgan Holdings, Inc. | | | 34,915 | | | | 1,579,904 | |
| | | | | | | | 13,698,518 | |
| | | | | | | | | |
| Real Estate (7.5%) | | | | | | | | |
| Camden Property Trust | | | 14,124 | | | | 1,402,372 | |
| CubeSmart | | | 52,045 | | | | 2,412,285 | |
| Jones Lang LaSalle, Inc. (a) | | | 19,440 | | | | 3,671,633 | |
| Lamar Advertising Co., Class A | | | 25,482 | | | | 2,708,227 | |
| Physicians Realty Trust | | | 179,264 | | | | 2,386,004 | |
| STAG Industrial, Inc. | | | 84,212 | | | | 3,306,163 | |
| | | | | | | | 15,886,684 | |
| TOTAL COMMON STOCKS (Cost $167,492,524) | | | | | | | 209,141,617 | |
| | | | | | | | | |
| Investment Companies (1.9%) | | | | | | | | |
| Northern Institutional Treasury | | | | | | | | |
| Portfolio (Premier Class), 5.22% (b) | | | 4,031,879 | | | | 4,031,879 | |
| TOTAL INVESTMENT COMPANIES (Cost $4,031,879) | | | | | | | 4,031,879 | |
| Total Investments (Cost $171,524,403) — 100.1%(c) | | | | | | | 213,173,496 | |
| Liabilities in excess of other assets — (0.1)% | | | | | | | (299,798 | ) |
| Net Assets — 100.0% | | | | | | $ | 212,873,698 | |
| (a) | Non-income producing security. |
| (b) | Rate disclosed is the seven day yield as of December 31, 2023. |
| (c) | See Federal Tax Information listed in the Notes to the Financial Statements. |
| PLC | Public Limited Company |
| 52 | See Notes to Financial Statements | |
| Financial Statements | Boston Trust Walden SMID Cap Fund |
Statement of Assets and Liabilities
December 31, 2023
| Assets: | | | |
| Investments, at fair value(cost $171,524,403) | | $ | 213,173,496 | |
| Cash | | | 2,439,244 | |
| Dividend receivable | | | 222,242 | |
| Receivable for capital shares issued | | | 151,830 | |
| Prepaid expenses | | | 10,976 | |
| Total Assets | | | 215,997,788 | |
| Liabilities: | | | | |
| Payable for investments purchased | | | 2,944,628 | |
| Payable for capital shares redeemed | | | 11,626 | |
| Accrued expenses and other liabilities: | | | | |
| Investment adviser | | | 118,445 | |
| Administration and accounting | | | 13,405 | |
| Chief compliance officer | | | 576 | |
| Custodian | | | 4,503 | |
| Shareholder servicing fees | | | 13,100 | |
| Transfer agent | | | 3,950 | |
| Other | | | 13,857 | |
| Total Liabilities | | | 3,124,090 | |
| Net Assets | | $ | 212,873,698 | |
| Composition of Net Assets: | | | | |
| Paid in capital | | $ | 172,641,775 | |
| Total distributable earnings | | | 40,231,923 | |
| Net Assets | | $ | 212,873,698 | |
| Shares outstanding (par value $0.01, unlimited number of shares authorized) | | | 9,376,880 | |
| Net Asset Value, Offering Price and Redemption price per share | | $ | 22.70 | |
Statement of Operations
For the year ended December 31, 2023
| Investment Income: | | | |
| Dividends | | $ | 2,435,959 | |
| Total Investment Income | | | 2,435,959 | |
| Expenses: | | | | |
| Investment adviser | | | 1,143,663 | |
| Administration and accounting | | | 49,887 | |
| Chief compliance officer | | | 5,487 | |
| Custodian | | | 21,590 | |
| Shareholder servicing | | | 229,207 | |
| Transfer agency | | | 20,420 | |
| Trustee | | | 12,232 | |
| Other | | | 50,224 | |
| Total expenses before fee reductions | | | 1,532,710 | |
| Fees contractually reduced by the investment adviser | | | (7,734 | ) |
| Net Expenses | | | 1,524,976 | |
| Net Investment Income | | | 910,983 | |
| Net Realized/Unrealized Gains (Losses) from | | | | |
| Investments: | | | | |
| Net realized gains from investment transactions | | | 371,761 | |
| Change in unrealized appreciation on investments | | | 24,946,457 | |
| Net realized/unrealized gains on investments | | | 25,318,218 | |
| Change in Net Assets Resulting from Operations | | $ | 26,229,201 | |
| | See Notes to Financial Statements | 53 |
| Financial Statements | Boston Trust Walden SMID Cap Fund |
Statements of Changes in Net Assets
| | | For the year ended
December 31, 2023 | | | For the year ended
December 31, 2022 | |
| Investment Activities: | | | | | | | | |
| Operations: | | | | | | | | |
| Net investment income | | $ | 910,983 | | | $ | 661,248 | |
| Net realized gains from investment transactions | | | 371,761 | | | | 2,707,664 | |
| Change in unrealized appreciation (depreciation) on investments | | | 24,946,457 | | | | (18,968,465 | ) |
| Change in Net Assets Resulting from Operations | | | 26,229,201 | | | | (1,599,553 | ) |
| Distributions To Shareholders: | | | | | | | | |
| Total Distributions | | | (1,040,929 | ) | | | (5,944,462 | ) |
| Change in Net Assets Resulting from distributions to shareholders | | | (1,040,929 | ) | | | (5,944,462 | ) |
| Capital Share Transactions: | | | | | | | | |
| Proceeds from shares issued | | | 78,540,411 | | | | 55,481,230 | |
| Dividends reinvested | | | 848,950 | | | | 5,073,140 | |
| Cost of shares redeemed | | | (19,037,489 | ) | | | (19,229,798 | ) |
| Change in Net Assets Resulting from Capital Share Transactions | | | 60,351,872 | | | | 41,324,572 | |
| Change in Net Assets | | | 85,540,144 | | | | 19,780,557 | |
| Net Assets: | | | | | | | | |
| Beginning of year | | | 127,333,554 | | | | 107,552,997 | |
| End of year | | $ | 212,873,698 | | | $ | 127,333,554 | |
| Share Transactions: | | | | | | | | |
| Issued | | | 3,773,910 | | | | 2,701,092 | |
| Reinvested | | | 39,321 | | | | 250,649 | |
| Redeemed | | | (929,566 | ) | | | (930,701 | ) |
| Change in shares | | | 2,883,665 | | | | 2,021,040 | |
| 54 | See Notes to Financial Statements | |
Financial Statements | Boston Trust Walden SMID Cap Fund |
Financial Highlights
Selected data for a share outstanding throughout the years indicated.
| | | For the year ended December 31, 2023 | | | For the year ended December 31, 2022 | | | For the year ended December 31, 2021 | | | For the year ended December 31, 2020 | | | For the year ended December 31, 2019 | |
| Net Asset Value, Beginning of Period | | $ | 19.61 | | | $ | 24.05 | | | $ | 19.40 | | | $ | 18.10 | | | $ | 15.12 | |
| | | | | | | | | | | | | | | | | | | | | |
| Investment Activities: | | | | | | | | | | | | | | | | | | | | |
| Operations: | | | | | | | | | | | | | | | | | | | | |
| Net investment income | | | 0.12 | | | | 0.13 | | | | 0.10 | | | | 0.09 | | | | 0.10 | |
| Net realized/unrealized gains (losses) from investments | | | 3.09 | | | | (3.61 | ) | | | 5.69 | | | | 1.55 | | | | 3.83 | |
| Total from investment activities | | | 3.21 | | | | (3.48 | ) | | | 5.79 | | | | 1.64 | | | | 3.93 | |
| Distributions from: | | | | | | | | | | | | | | | | | | | | |
| Net investment income | | | (0.10 | ) | | | (0.09 | ) | | | (0.12 | ) | | | (0.10 | ) | | | (0.10 | ) |
| Net realized gains from investment transactions | | | (0.02 | ) | | | (0.87 | ) | | | (1.02 | ) | | | (0.25 | ) | | | (0.85 | ) |
| Total distributions | | | (0.12 | ) | | | (0.96 | ) | | | (1.14 | ) | | | (0.35 | ) | | | (0.95 | ) |
| | | | | | | | | | | | | | | | | | | | | |
| Net Asset Value, End of Period | | $ | 22.70 | | | $ | 19.61 | | | $ | 24.05 | | | $ | 19.40 | | | $ | 18.10 | |
| | | | | | | | | | | | | | | | | | | | | |
| Total Return | | | 16.39 | % | | | (14.59 | )% | | | 30.08 | % | | | 9.13 | % | | | 26.12 | % |
| | | | | | | | | | | | | | | | | | | | | |
| Ratios/Supplemental Data: | | | | | | | | | | | | | | | | | | | | |
| Net assets at end of year (000's) | | $ | 212,874 | | | $ | 127,334 | | | $ | 107,553 | | | $ | 64,734 | | | $ | 61,582 | |
| Ratio of net expenses to average net assets | | | 1.00 | % | | | 1.00 | % | | | 1.00 | % | | | 1.00 | % | | | 1.00 | % |
| Ratio of net investment income to average net assets | | | 0.60 | % | | | 0.61 | % | | | 0.48 | % | | | 0.61 | % | | | 0.61 | % |
| Ratio of expenses (before fee reductions or recoupment of fees previously reimbursed by the investment adviser) to average net assets (a) | | | 1.01 | % | | | 1.01 | % | | | 1.00 | % | | | 1.05 | % | | | 1.07 | % |
| Portfolio turnover rate | | | 23.72 | % | | | 28.66 | % | | | 30.00 | %(b) | | | 38.70 | % | | | 29.75 | % |
| (a) | During the periods, certain fees may have been reduced or recouped by the investment adviser. If such fee reductions/recoupments had not occurred, the ratio would have been as indicated. |
| (b) | Excludes impact of in-kind transactions. |
| | See Notes to Financial Statements | 55 |
| Schedule of Portfolio Investments | Boston Trust Walden Small Cap Fund
December 31, 2023 |
Common Stocks (99.4%)
| | | Shares | | | Fair Value ($) | |
| Communication Services (2.0%) | | | | | | | | |
| Cable One, Inc. | | | 26,576 | | | | 14,791,936 | |
| Shutterstock, Inc. | | | 240,246 | | | | 11,599,077 | |
| | | | | | | | 26,391,013 | |
| | | | | | | | | |
| Consumer Discretionary (8.2%) | | | | | | | | |
| Carter's, Inc. | | | 266,550 | | | | 19,961,930 | |
| Cavco Industries, Inc. (a) | | | 52,447 | | | | 18,179,179 | |
| Choice Hotels International, Inc. | | | 149,075 | | | | 16,890,198 | |
| Columbia Sportswear Co. | | | 315,200 | | | | 25,071,008 | |
| Texas Roadhouse, Inc. | | | 212,350 | | | | 25,955,540 | |
| | | | | | | | 106,057,855 | |
| | | | | | | | | |
| Consumer Staples (6.5%) | | | | | | | | |
| Central Garden & Pet Co., Class A (a) | | | 214,916 | | | | 9,464,901 | |
| Flowers Foods, Inc. | | | 1,127,426 | | | | 25,378,359 | |
| Lancaster Colony Corp. | | | 127,529 | | | | 21,219,550 | |
| Sprouts Farmers Market, Inc. (a) | | | 591,300 | | | | 28,447,443 | |
| | | | | | | | 84,510,253 | |
| | | | | | | | | |
| Energy (4.3%) | | | | | | | | |
| Cactus, Inc., Class A | | | 536,048 | | | | 24,336,579 | |
| Core Laboratories, Inc. | | | 511,602 | | | | 9,034,891 | |
| Helmerich & Payne, Inc. | | | 618,703 | | | | 22,409,423 | |
| | | | | | | | 55,780,893 | |
| | | | | | | | | |
| Financials (15.3%) | | | | | | | | |
| 1st Source Corp. | | | 174,867 | | | | 9,608,942 | |
| Cathay General Bancorp | | | 392,132 | | | | 17,477,323 | |
| Cohen & Steers, Inc. | | | 250,761 | | | | 18,990,131 | |
| Commerce Bancshares, Inc. | | | 263,078 | | | | 14,050,969 | |
| Donnelley Financial Solutions, Inc. (a) | | | 283,241 | | | | 17,665,741 | |
| Evercore, Inc. | | | 122,174 | | | | 20,897,863 | |
| German American Bancorp, Inc. | | | 16,603 | | | | 538,103 | |
| Hanover Insurance Group (The), Inc. | | | 146,975 | | | | 17,845,705 | |
| Independent Bank Corp. | | | 209,325 | | | | 13,775,678 | |
| International Bancshares Corp. | | | 318,543 | | | | 17,303,256 | |
| Lakeland Financial Corp. | | | 136,131 | | | | 8,870,296 | |
| Selective Insurance Group, Inc. | | | 241,805 | | | | 24,054,761 | |
| Tompkins Financial Corp. | | | 66,422 | | | | 4,000,597 | |
| UMB Financial Corp. | | | 147,144 | | | | 12,293,881 | |
| | | | | | | | 197,373,246 | |
| | | | | | | | | |
| Health Care (15.2%) | | | | | | | | |
| Atrion Corp. | | | 13,790 | | | | 5,223,514 | |
| Chemed Corp. | | | 39,107 | | | | 22,867,818 | |
| Corcept Therapeutics, Inc. (a) | | | 779,150 | | | | 25,306,792 | |
| CorVel Corp. (a) | | | 111,908 | | | | 27,664,777 | |
| Globus Medical, Inc., Class A (a) | | | 306,252 | | | | 16,320,169 | |
| Haemonetics Corp. (a) | | | 291,806 | | | | 24,952,331 | |
| ICU Medical, Inc. (a) | | | 108,629 | | | | 10,834,656 | |
| Inmode Ltd. (a) | | | 586,392 | | | | 13,041,358 | |
| Medpace Holdings, Inc. (a) | | | 97,575 | | | | 29,909,665 | |
| US Physical Therapy, Inc. | | | 217,775 | | | | 20,283,564 | |
| | | | | | | | 196,404,644 | |
| | | | | | | | | |
| Industrials (19.6%) | | | | | | | | |
| Acuity Brands, Inc. | | | 81,482 | | | | 16,689,958 | |
| Applied Industrial Technologies, Inc. | | | 154,411 | | | | 26,665,236 | |
| Comfort Systems USA, Inc. | | | 79,900 | | | | 16,433,033 | |
| CSG Systems International, Inc. | | | 334,262 | | | | 17,786,081 | |
| Donaldson Co., Inc. | | | 391,688 | | | | 25,596,811 | |
| ExlService Holdings, Inc. (a) | | | 835,494 | | | | 25,774,990 | |
| Forward Air Corp. | | | 119,450 | | | | 7,509,822 | |
| Franklin Electric Co., Inc. | | | 192,330 | | | | 18,588,694 | |
| Insperity, Inc. | | | 94,384 | | | | 11,063,692 | |
| Landstar System, Inc. | | | 93,993 | | | | 18,201,744 | |
| MSC Industrial Direct Co., Inc., Class A | | | 211,492 | | | | 21,415,680 | |
| UniFirst Corp. | | | 83,565 | | | | 15,284,874 | |
| Valmont Industries, Inc. | | | 48,329 | | | | 11,285,305 | |
| Watts Water Technologies, Inc., Class A | | | 103,174 | | | | 21,495,271 | |
| | | | | | | | 253,791,191 | |
| | | | | | | | | |
| Information Technology (14.3%) | | | | | | | | |
| Badger Meter, Inc. | | | 99,900 | | | | 15,421,563 | |
| InterDigital, Inc. | | | 256,300 | | | | 27,818,802 | |
| Littelfuse, Inc. | | | 93,670 | | | | 25,062,345 | |
| Plexus Corp. (a) | | | 162,177 | | | | 17,536,199 | |
| Power Integrations, Inc. | | | 329,799 | | | | 27,079,796 | |
| Progress Software Corp. | | | 393,625 | | | | 21,373,838 | |
| Qualys, Inc. (a) | | | 143,666 | | | | 28,198,762 | |
| Teradata Corp. (a) | | | 507,828 | | | | 22,095,596 | |
| | | | | | | | 184,586,901 | |
| | | | | | | | | |
| Materials (6.0%) | | | | | | | | |
| AptarGroup, Inc. | | | 195,979 | | | | 24,226,924 | |
| Minerals Technologies, Inc. | | | 260,988 | | | | 18,611,054 | |
| Sensient Technologies Corp. | | | 222,025 | | | | 14,653,650 | |
| Silgan Holdings, Inc. | | | 436,690 | | | | 19,760,223 | |
| | | | | | | | 77,251,851 | |
| | | | | | | | | |
| Real Estate (5.2%) | | | | | | | | |
| Jones Lang LaSalle, Inc. (a) | | | 134,725 | | | | 25,445,511 | |
| Physicians Realty Trust | | | 1,127,525 | | | | 15,007,358 | |
| STAG Industrial, Inc. | | | 668,285 | | | | 26,236,869 | |
| | | | | | | | 66,689,738 | |
| | | | | | | | | |
| Utilities (2.8%) | | | | | | | | |
| IDACORP, Inc. | | | 160,554 | | | | 15,785,669 | |
| ONE Gas, Inc. | | | 194,410 | | | | 12,387,805 | |
| Unitil Corp. | | | 162,854 | | | | 8,561,235 | |
| | | | | | | | 36,734,709 | |
| | | | | | | | | |
| TOTAL COMMON STOCKS (Cost $1,021,962,487) | | | | | | | 1,285,572,294 | |
| | | | | | | | | |
| Investment Companies (0.9%) | | | | | | | | |
| Northern Institutional Treasury | | | | | | | | |
| Portfolio (Premier Class), 5.22% (b) | | | 11,673,300 | | | | 11,673,300 | |
| TOTAL INVESTMENT COMPANIES (Cost $11,673,300) | | | | | | | 11,673,300 | |
| Total Investments (Cost $1,033,635,787) — 100.3%(c) | | | | | | | 1,297,245,594 | |
| Liabilities in excess of other assets — (0.3)% | | | | | | | (3,486,725 | ) |
| Net Assets — 100.0% | | | | | | $ | 1,293,758,869 | |
| 56 | See Notes to Financial Statements | |
| Schedule of Portfolio Investments | Boston Trust Walden Small Cap Fund December 31, 2023 |
| (a) | Non-income producing security. |
| (b) | Rate disclosed is the seven day yield as of December 31, 2023. |
| (c) | See Federal Tax Information listed in the Notes to the Financial Statements. |
| | See Notes to Financial Statements | 57 |
| Financial Statements | Boston Trust Walden Small Cap Fund |
Statement of Assets and Liabilities
December 31, 2023
| Assets: | | | |
| Investments, at fair value(cost $1,033,635,787) | | $ | 1,297,245,594 | |
| Dividend receivable | | | 370,392 | |
| Receivable for investments sold | | | 119,355 | |
| Receivable for capital shares issued | | | 939,473 | |
| Prepaid expenses | | | 46,084 | |
| Total Assets | | | 1,298,720,898 | |
| Liabilities: | | | | |
| Payable for investments purchased | | | 1,997,339 | |
| Payable for capital shares redeemed | | | 1,377,642 | |
| Payable to Custodian | | | 413,751 | |
| Accrued expenses and other liabilities: | | | | |
| Investment adviser | | | 796,995 | |
| Administration and accounting | | | 62,410 | |
| Chief compliance officer | | | 3,870 | |
| Custodian | | | 10,051 | |
| Shareholder servicing fees | | | 194,114 | |
| Transfer agent | | | 7,486 | |
| Other | | | 98,371 | |
| Total Liabilities | | | 4,962,029 | |
| Net Assets | | $ | 1,293,758,869 | |
| Composition of Net Assets: | | | | |
| Paid in capital | | $ | 1,059,254,352 | |
| Total distributable earnings | | | 234,504,517 | |
| Net Assets | | $ | 1,293,758,869 | |
| Shares outstanding (par value $0.01, unlimited number of shares authorized) | | | 76,136,601 | |
| Net Asset Value, Offering Price and Redemption price per share | | $ | 16.99 | |
Statement of Operations
For the year ended December 31, 2023
| Investment Income: | | | |
| Dividends | | $ | 18,338,770 | |
| Less: Foreign tax withholding | | | (680 | ) |
| Total Investment Income | | | 18,338,090 | |
| Expenses: | | | | |
| Investment adviser | | | 8,688,568 | |
| Administration and accounting | | | 378,224 | |
| Chief compliance officer | | | 53,154 | |
| Custodian | | | 170,646 | |
| Interest expense | | | 87 | |
| Shareholder servicing | | | 2,133,082 | |
| Transfer agency | | | 51,668 | |
| Trustee | | | 116,274 | |
| Other | | | 326,724 | |
| Total expenses before fee reductions | | | 11,918,427 | |
| Fees contractually reduced by the investment adviser | | | (333,527 | ) |
| Net Expenses | | | 11,584,900 | |
| Net Investment Income | | | 6,753,190 | |
| Net Realized/Unrealized Gains (Losses) from | | | | |
| Investments: | | | | |
| Net realized loss from investment transactions | | | (22,711,496 | ) |
| Change in unrealized appreciation on investments | | | 129,093,126 | |
| Net realized/unrealized gains on investments | | | 106,381,630 | |
| Change in Net Assets Resulting from Operations | | $ | 113,134,820 | |
| 58 | See Notes to Financial Statements | |
| Financial Statements | Boston Trust Walden Small Cap Fund |
Statements of Changes in Net Assets
| | | For the year ended December 31, 2023 | | | For the year ended December 31, 2022 | |
| Investment Activities: | | | | | | |
| Operations: | | | | | | | | |
| Net investment income | | $ | 6,753,190 | | | $ | 4,266,375 | |
| Net realized gains/(loss) from investment transactions | | | (22,711,496 | ) | | | 29,989,592 | |
| Change in unrealized appreciation (depreciation) on investments | | | 129,093,126 | | | | (118,650,708 | ) |
| Change in Net Assets Resulting from Operations | | | 113,134,820 | | | | (84,394,741 | ) |
| Distributions To Shareholders: | | | | | | | | |
| Total Distributions | | | (10,095,720 | ) | | | (48,310,887 | ) |
| Change in Net Assets Resulting from distributions to shareholders | | | (10,095,720 | ) | | | (48,310,887 | ) |
| Capital Share Transactions: | | | | | | | | |
| Proceeds from shares issued | | | 413,904,217 | | | | 340,566,372 | |
| Dividends reinvested | | | 8,217,851 | | | | 39,678,678 | |
| Cost of shares redeemed | | | (234,811,838 | ) | | | (183,661,499 | ) |
| Change in Net Assets Resulting from Capital Share Transactions | | | 187,310,230 | | | | 196,583,551 | |
| Change in Net Assets | | | 290,349,330 | | | | 63,877,923 | |
| Net Assets: | | | | | | | | |
| Beginning of year | | | 1,003,409,539 | | | | 939,531,616 | |
| End of year | | $ | 1,293,758,869 | | | $ | 1,003,409,539 | |
| Share Transactions: | | | | | | | | |
| Issued | | | 25,882,221 | | | | 21,034,513 | |
| Reinvested | | | 507,275 | | | | 2,487,691 | |
| Redeemed | | | (14,739,591 | ) | | | (11,358,002 | ) |
| Change in shares | | | 11,649,905 | | | | 12,164,202 | |
| | See Notes to Financial Statements | 59 |
| Financial Statements | Boston Trust Walden Small Cap Fund |
Financial Highlights
Selected data for a share outstanding throughout the years indicated.
| | | For the year ended December 31, 2023 | | | For the year ended December 31, 2022 | | | For the year ended December 31, 2021 | | | For the year ended December 31, 2020 | | | For the year ended December 31, 2019 | |
| Net Asset Value, Beginning of Period | | $ | 15.56 | | | $ | 17.96 | | | $ | 15.31 | | | $ | 14.62 | | | $ | 12.00 | |
| | | | | | | | | | | | | | | | | | | | | |
| Investment Activities: | | | | | | | | | | | | | | | | | | | | |
| Operations: | | | | | | | | | | | | | | | | | | | | |
| Net investment income | | | 0.09 | | | | 0.07 | | | | 0.03 | | | | 0.08 | | | | 0.09 | |
| Net realized/unrealized gains (losses) from investments | | | 1.47 | | | | (1.68 | ) | | | 4.22 | | | | 1.00 | | | | 3.47 | |
| Total from investment activities | | | 1.56 | | | | (1.61 | ) | | | 4.25 | | | | 1.08 | | | | 3.56 | |
| Distributions from: | | | | | | | | | | | | | | | | | | | | |
| Net investment income | | | (0.08 | ) | | | (0.05 | ) | | | (0.05 | ) | | | (0.08 | ) | | | (0.06 | ) |
| Net realized gains from investment transactions | | | (0.05 | ) | | | (0.74 | ) | | | (1.55 | ) | | | (0.31 | ) | | | (0.88 | ) |
| Total distributions | | | (0.13 | ) | | | (0.79 | ) | | | (1.60 | ) | | | (0.39 | ) | | | (0.94 | ) |
| | | | | | | | | | | | | | | | | | | | | |
| Net Asset Value, End of Period | | $ | 16.99 | | | $ | 15.56 | | | $ | 17.96 | | | $ | 15.31 | | | $ | 14.62 | |
| Total Return | | | 10.09 | % | | | (9.06 | )% | | | 28.17 | % | | | 8.17 | % | | | 29.88 | % |
| | | | | | | | | | | | | | | | | | | | | |
| Ratios/Supplemental Data: | | | | | | | | | | | | | | | | | | | | |
| Net assets at end of year (000's) | | $ | 1,293,759 | | | $ | 1,003,410 | | | $ | 939,532 | | | $ | 602,978 | | | $ | 235,469 | |
| Ratio of net expenses to average net assets | | | 1.00 | % | | | 1.00 | % | | | 1.00 | % | | | 1.00 | % | | | 1.00 | % |
| Ratio of net investment income to average net assets | | | 0.58 | % | | | 0.46 | % | | | 0.18 | % | | | 0.64 | % | | | 0.58 | % |
| Ratio of expenses (before fee reductions or recoupment of fees previously reimbursed by the investment adviser) to average net assets (a) | | | 1.03 | % | | | 1.04 | % | | | 1.01 | % | | | 1.06 | % | | | 1.07 | % |
| Portfolio turnover rate | | | 23.98 | % | | | 20.87 | % | | | 31.72 | % | | | 39.89 | %(b) | | | 23.23 | %(c) |
| (a) | During the periods, certain fees may have been reduced or recouped by the investment adviser. If such fee reductions/recoupments had not occurred, the ratio would have been as indicated. |
| (b) | Excludes impact of merger transaction. |
| (c) | Excludes impact of in-kind transactions. |
| 60 | See Notes to Financial Statements | |
| Schedule of Portfolio Investments | Boston Trust Walden International Equity Fund
December 31, 2023 |
Common Stocks (97.6%)
| | | Shares | | | Fair Value ($) | |
| Australia (4.8%) | | | | | | | | |
| Brambles Ltd. | | | 221,800 | | | | 2,053,671 | |
| Insurance Australia Group Ltd. | | | 640,300 | | | | 2,466,922 | |
| Woodside Energy Group Ltd. | | | 91,300 | | | | 1,934,136 | |
| | | | | | | | 6,454,729 | |
| | | | | | | | | |
| Canada (9.3%) | | | | | | | | |
| BCE, Inc. | | | 19,300 | | | | 759,882 | |
| Canadian National Railway Co. | | | 20,300 | | | | 2,551,575 | |
| Intact Financial Corp. | | | 5,200 | | | | 800,024 | |
| Magna International, Inc. | | | 38,200 | | | | 2,257,030 | |
| Royal Bank of Canada | | | 36,100 | | | | 3,650,730 | |
| The Toronto-Dominion Bank | | | 29,100 | | | | 1,880,338 | |
| Tourmaline Oil Corp. | | | 15,100 | | | | 679,076 | |
| | | | | | | | 12,578,655 | |
| | | | | | | | | |
| Denmark (2.9%) | | | | | | | | |
| Novo Nordisk A/S, Class B | | | 30,000 | | | | 3,103,045 | |
| Novozymes A/S, Class B | | | 14,500 | | | | 798,372 | |
| | | | | | | | 3,901,417 | |
| | | | | | | | | |
| Finland (2.0%) | | | | | | | | |
| Kone OYJ, Class B | | | 55,000 | | | | 2,752,331 | |
| | | | | | | | | |
| France (11.7%) | | | | | | | | |
| Air Liquide SA | | | 15,900 | | | | 3,093,048 | |
| Dassault Systemes SE | | | 36,100 | | | | 1,767,262 | |
| EssilorLuxottica SA | | | 5,400 | | | | 1,085,377 | |
| Legrand SA | | | 15,200 | | | | 1,583,234 | |
| L'Oreal SA | | | 5,600 | | | | 2,784,351 | |
| Publicis Groupe SA | | | 12,700 | | | | 1,181,031 | |
| Schneider Electric SE | | | 16,700 | | | | 3,362,547 | |
| Societe BIC SA | | | 14,300 | | | | 992,366 | |
| | | | | | | | 15,849,216 | |
| | | | | | | | | |
| Germany (6.5%) | | | | | | | | |
| Allianz SE (Registered) | | | 3,400 | | | | 908,142 | |
| Deutsche Boerse AG | | | 14,200 | | | | 2,923,588 | |
| Hannover Rueck SE | | | 5,600 | | | | 1,338,030 | |
| Merck KGaA | | | 10,500 | | | | 1,670,106 | |
| SAP SE | | | 12,600 | | | | 1,938,200 | |
| | | | | | | | 8,778,066 | |
| | | | | | | | | |
| Hong Kong (0.5%) | | | | | | | | |
| Sino Land Co. Ltd. | | | 548,000 | | | | 597,466 | |
| | | | | | | | | |
| Ireland (1.0%) | | | | | | | | |
| Smurfit Kappa Group PLC | | | 34,100 | | | | 1,344,281 | |
| | | | | | | | | |
| Israel (1.1%) | | | | | | | | |
| Check Point Software Technologies Ltd. (a) | | | 5,500 | | | | 840,345 | |
| Nice Ltd. (a) | | | 3,500 | | | | 698,588 | |
| | | | | | | | 1,538,933 | |
| | | | | | | | | |
| Italy (1.8%) | | | | | | | | |
| FinecoBank Banca Fineco SpA | | | 64,000 | | | | 961,583 | |
| Terna - Rete Elettrica Nazionale | | | 175,500 | | | | 1,464,306 | |
| | | | | | | | 2,425,889 | |
| | | | | | | | | |
| Japan (18.3%) | | | | | | | | |
| Chiba Bank (The) Ltd. | | | 236,200 | | | | 1,702,971 | |
| Inpex Corp. | | | 113,100 | | | | 1,524,420 | |
| Kakaku.com, Inc. | | | 53,700 | | | | 663,182 | |
| Mitsubishi Estate Co. Ltd. | | | 98,500 | | | | 1,353,129 | |
| Nippon Telegraph & Telephone | | | | | | | | |
| Corp. | | | 2,030,200 | | | | 2,478,655 | |
| Nitto Denko Corp. | | | 34,000 | | | | 2,534,869 | |
| Nomura Research Institute Ltd. | | | 54,000 | | | | 1,564,684 | |
| Oracle Corp. | | | 27,200 | | | | 2,095,337 | |
| Sumitomo Mitsui Financial Group, Inc. | | | 51,800 | | | | 2,523,184 | |
| Sysmex Corp. | | | 40,500 | | | | 2,250,411 | |
| Terumo Corp. | | | 39,300 | | | | 1,282,419 | |
| Tokio Marine Holdings, Inc. | | | 44,200 | | | | 1,103,471 | |
| Toyota Motor Corp. | | | 196,300 | | | | 3,603,436 | |
| | | | | | | | 24,680,168 | |
| | | | | | | | | |
| Jersey, C.I. (1.0%) | | | | | | | | |
| Experian PLC | | | 34,100 | | | | 1,389,635 | |
| | | | | | | | | |
| Luxembourg (0.9%) | | | | | | | | |
| Tenaris SA | | | 69,200 | | | | 1,203,205 | |
| | | | | | | | | |
| Netherlands (5.3%) | | | | | | | | |
| ASML Holding NV | | | 3,300 | | | | 2,491,543 | |
| ING Groep NV | | | 78,700 | | | | 1,178,154 | |
| Koninklijke Ahold Delhaize NV | | | 32,200 | | | | 924,542 | |
| Koninklijke Vopak NV | | | 34,700 | | | | 1,168,959 | |
| Wolters Kluwer NV | | | 10,000 | | | | 1,421,044 | |
| | | | | | | | 7,184,242 | |
| | | | | | | | | |
| Norway (1.4%) | | | | | | | | |
| Equinor ASA | | | 59,100 | | | | 1,872,265 | |
| | | | | | | | | |
| Singapore (1.7%) | | | | | | | | |
| DBS Group Holdings Ltd. | | | 58,900 | | | | 1,488,094 | |
| Singapore Exchange Ltd. | | | 110,000 | | | | 817,651 | |
| | | | | | | | 2,305,745 | |
| | | | | | | | | |
| Spain (1.6%) | | | | | | | | |
| Industria de Diseno Textil SA | | | 47,900 | | | | 2,089,226 | |
| | | | | | | | | |
| Sweden (3.5%) | | | | | | | | |
| Assa Abloy AB, Class B | | | 39,500 | | | | 1,137,972 | |
| Atlas Copco AB, Class A | | | 119,400 | | | | 2,056,030 | |
| Svenska Handelsbanken AB, Class A | | | 140,200 | | | | 1,521,691 | |
| | | | | | | | 4,715,693 | |
| | | | | | | | | |
| Switzerland (9.5%) | | | | | | | | |
| Cie Financiere Richemont SA | | | | | | | | |
| (Registered) | | | 20,000 | | | | 2,758,666 | |
| Nestle SA (Registered) | | | 39,100 | | | | 4,525,331 | |
| Roche Holding AG | | | 12,000 | | | | 3,477,986 | |
| Sonova Holding AG (Registered) | | | 3,100 | | | | 1,013,726 | |
| Zurich Insurance Group AG | | | 1,900 | | | | 993,335 | |
| | | | | | | | 12,769,044 | |
| | | | | | | | | |
| United Kingdom (12.8%) | | | | | | | | |
| Compass Group PLC | | | 67,200 | | | | 1,836,234 | |
| Croda International PLC | | | 16,100 | | | | 1,034,625 | |
| Johnson Matthey PLC | | | 86,700 | | | | 1,874,143 | |
| National Grid PLC | | | 113,100 | | | | 1,527,114 | |
| Next PLC | | | 24,300 | | | | 2,508,507 | |
| | See Notes to Financial Statements | 61 |
| Schedule of Portfolio Investments | Boston Trust Walden International Equity Fund
December 31, 2023 |
Common Stocks (continued)
| | | Shares | | | Fair Value ($) | |
| United Kingdom (continued) | | | | | | | | |
| Reckitt Benckiser Group PLC | | | 17,100 | | | | 1,179,724 | |
| RELX PLC (London Exchange) | | | 69,300 | | | | 2,748,458 | |
| Schroders PLC | | | 203,400 | | | | 1,110,250 | |
| Severn Trent PLC | | | 37,300 | | | | 1,226,759 | |
| Smith & Nephew PLC | | | 71,300 | | | | 976,058 | |
| Unilever PLC | | | 26,200 | | | | 1,267,658 | |
| | | | | | | | 17,289,530 | |
| TOTAL COMMON STOCKS (Cost $107,925,551) | | | | | | | 131,719,736 | |
Investment Companies (1.7%)
| | | Principal Amount ($) | | | | |
| Northern Institutional Treasury | | | | | | |
| Portfolio (Premier Class), 5.22% (b) | | | 2,327,680 | | | | 2,327,680 | |
| TOTAL INVESTMENT COMPANIES (Cost $2,327,680) | | | | | | | 2,327,680 | |
| Total Investments (Cost $110,253,231) — 99.3%(c) | | | | | | | 134,047,416 | |
| Other assets in excess of liabilities — 0.7% | | | | | | | 927,086 | |
| Net Assets — 100.0% | | | | | | $ | 134,974,502 | |
| (a) | Non-income producing security. |
| (b) | Rate disclosed is the seven day yield as of December 31, 2023. |
| (c) | See Federal Tax Information listed in the Notes to the Financial Statements. |
PLC Public Limited Company
The Fund invested, as a percentage of net assets at value, in the following industries as of December 31, 2023:
| Industry | | Percentage of Total Net Assets | |
| Financials | | | 20.3 | % |
| Industrials | | | 16.2 | |
| Consumer Discretionary | | | 11.3 | |
| Health Care | | | 11.0 | |
| Information Technology | | | 8.3 | |
| Materials | | | 8.0 | |
| Consumer Staples | | | 7.9 | |
| Energy | | | 6.3 | |
| Communication Services | | | 3.7 | |
| Utilities | | | 3.1 | |
| Investment Companies | | | 1.7 | |
| Real Estate | | | 1.5 | |
| Other net assets | | | 0.7 | |
| Total | | | 100.0 | % |
| 62 | See Notes to Financial Statements | |
| Financial Statements | Boston Trust Walden International Equity Fund |
Statement of Assets and Liabilities
December 31, 2023
| Assets: | | | |
| Investments, at fair value(cost $110,253,231) | | $ | 134,047,416 | |
| Cash | | | 215,328 | |
| Foreign currencies, at fair value (cost $5,636) | | | 5,631 | |
| Interest and dividends receivable | | | 141,040 | |
| Receivable for tax reclaims | | | 391,749 | |
| Receivable for capital shares issued | | | 286,123 | |
| Prepaid expenses | | | 23,181 | |
| Total Assets | | | 135,110,468 | |
| Liabilities: | | | | |
| Payable for capital shares redeemed | | | 21,160 | |
| Accrued expenses and other liabilities: | | | | |
| Investment adviser | | | 83,311 | |
| Administration and accounting | | | 12,887 | |
| Chief compliance officer | | | 396 | |
| Custodian | | | 4,879 | |
| Shareholder servicing fees | | | 2,354 | |
| Transfer agent | | | 3,690 | |
| Other | | | 7,289 | |
| Total Liabilities | | | 135,966 | |
| Net Assets | | $ | 134,974,502 | |
| Composition of Net Assets: | | | | |
| Paid in capital | | $ | 113,525,093 | |
| Total distributable earnings | | | 21,449,409 | |
| Net Assets | | $ | 134,974,502 | |
| Shares outstanding (par value $0.01, unlimited number of shares authorized) | | | 10,056,862 | |
| Net Asset Value, Offering Price and Redemption price per share | | $ | 13.42 | |
Statement of Operations
For the year ended December 31, 2023
| Investment Income: | | | |
| Dividends | | $ | 3,331,597 | |
| Interest | | | 20 | |
| Less: Foreign tax withholding | | | (359,965 | ) |
| Total Investment Income | | | 2,971,652 | |
| Expenses: | | | | |
| Investment adviser | | | 789,316 | |
| Administration and accounting | | | 68,908 | |
| Chief compliance officer | | | 3,271 | |
| Custodian | | | 26,923 | |
| Shareholder servicing | | | 30,232 | |
| Transfer agency | | | 15,772 | |
| Trustee | | | 7,065 | |
| Other | | | 20,763 | |
| Total expenses | | | 962,250 | |
| Net Expenses | | | 962,250 | |
| Net Investment Income | | | 2,009,402 | |
| Net Realized/Unrealized Gains (Losses) from | | | | |
| Investments: | | | | |
| Net realized loss from investment transactions and foreign currency transactions | | | (1,182,968 | ) |
| Change in unrealized appreciation on investments and foreign currency transactions | | | 16,699,089 | |
| Net realized/unrealized gains on investments | | | 15,516,121 | |
| Change in Net Assets Resulting from Operations | | $ | 17,525,523 | |
| | See Notes to Financial Statements | 63 |
| Financial Statements | Boston Trust Walden International Equity Fund |
Statements of Changes in Net Assets
| | | For the year ended December 31, 2023 | | | For the year ended December 31, 2022 | |
| Investment Activities: | | | | | | |
| Operations: | | | | | | | | |
| Net investment income | | $ | 2,009,402 | | | $ | 1,552,363 | |
| Net realized loss from investment transactions and foreign currency transactions | | | (1,182,968 | ) | | | (1,292,374 | ) |
| Change in unrealized appreciation (depreciation) on investments and foreign currency transactions | | | 16,699,089 | | | | (12,646,457 | ) |
| Change in Net Assets Resulting from Operations | | | 17,525,523 | | | | (12,386,468 | ) |
| Distributions To Shareholders: | | | | | | | | |
| Total Distributions | | | (2,099,998 | ) | | | (1,445,386 | ) |
| Change in Net Assets Resulting from distributions to shareholders | | | (2,099,998 | ) | | | (1,445,386 | ) |
| Capital Share Transactions: | | | | | | | | |
| Proceeds from shares issued | | | 34,101,731 | | | | 14,678,062 | |
| Dividends reinvested | | | 1,509,097 | | | | 964,387 | |
| Cost of shares redeemed | | | (8,868,945 | ) | | | (4,508,109 | ) |
| Change in Net Assets Resulting from Capital Share Transactions | | | 26,741,883 | | | | 11,134,340 | |
| Change in Net Assets | | | 42,167,408 | | | | (2,697,514 | ) |
| Net Assets: | | | | | | | | |
| Beginning of year | | | 92,807,094 | | | | 95,504,608 | |
| End of year | | $ | 134,974,502 | | | $ | 92,807,094 | |
| Share Transactions: | | | | | | | | |
| Issued | | | 2,740,503 | | | | 1,244,686 | |
| Reinvested | | | 115,817 | | | | 80,232 | |
| Redeemed | | | (705,648 | ) | | | (381,872 | ) |
| Change in shares | | | 2,150,672 | | | | 943,046 | |
| 64 | See Notes to Financial Statements | |
| Financial Statements | Boston Trust Walden International Equity Fund |
Financial Highlights
Selected data for a share outstanding throughout the years indicated.
| | | For the year ended December 31, 2023 | | | For the year ended December 31, 2022 | | | For the year ended December 31, 2021 | | | For the year ended December 31, 2020 | | | For the year ended December 31, 2019 | |
| Net Asset Value, Beginning of Period | | $ | 11.74 | | | $ | 13.72 | | | $ | 12.29 | | | $ | 11.60 | | | $ | 9.78 | |
| | | | | | | | | | | | | | | | | | | | | |
| Investment Activities: | | | | | | | | | | | | | | | | | | | | |
| Operations: | | | | | | | | | | | | | | | | | | | | |
| Net investment income | | | 0.20 | | | | 0.21 | | | | 0.17 | | | | 0.15 | | | | 0.20 | |
| Net realized/unrealized gains (losses) from investments and foreign currency transactions | | | 1.69 | | | | (2.00 | ) | | | 1.47 | | | | 0.69 | | | | 1.81 | |
| Total from investment activities | | | 1.89 | | | | (1.79 | ) | | | 1.64 | | | | 0.84 | | | | 2.01 | |
| Distributions from: | | | | | | | | | | | | | | | | | | | | |
| Net investment income | | | (0.21 | ) | | | (0.18 | ) | | | (0.17 | ) | | | (0.14 | ) | | | (0.19 | ) |
| Net realized gains from investment transactions | | | — | | | | (0.01 | ) | | | (0.04 | ) | | | — | | | | — | |
| Total distributions | | | (0.21 | ) | | | (0.19 | ) | | | (0.21 | ) | | | (0.14 | ) | | | (0.19 | ) |
| | | | | | | | | | | | | | | | | | | | | |
| Net Asset Value, End of Period | | $ | 13.42 | | | $ | 11.74 | | | $ | 13.72 | | | $ | 12.29 | | | $ | 11.60 | |
| Total Return | | | 16.19 | % | | | (13.10 | )% | | | 13.43 | % | | | 7.16 | % | | | 20.62 | % |
| | | | | | | | | | | | | | | | | | | | | |
| Ratios/Supplemental Data: | | | | | | | | | | | | | | | | | | | | |
| Net assets at end of year (000's) | | $ | 134,975 | | | $ | 92,807 | | | $ | 95,505 | | | $ | 73,720 | | | $ | 56,960 | |
| Ratio of net expenses to average net assets | | | 0.91 | % | | | 0.93 | % | | | 0.94 | % | | | 1.00 | % | | | 1.04 | % |
| Ratio of net investment income to average net assets | | | 1.91 | % | | | 1.77 | % | | | 1.36 | % | | | 1.41 | % | | | 1.93 | % |
| Portfolio turnover rate | | | 23.46 | % | | | 10.47 | % | | | 13.09 | % | | | 8.38 | % | | | 10.70 | % |
| | See Notes to Financial Statements | 65 |
| Notes to the Financial Statements | December 31, 2023 |
The Boston Trust Walden Funds (the “Trust”) was organized on January 8, 1992 as a Massachusetts business trust and is registered under the Investment Company Act of 1940, as amended (the “1940 Act”), as an open-end management investment company. The Trust contains the following funds (individually a “Fund”, collectively the “Funds”), each of which are registered as a diversified fund under the 1940 Act:
| Fund | Short Name |
| Boston Trust Asset Management Fund | Asset Management Fund |
| Boston Trust Equity Fund | Equity Fund |
| Boston Trust Midcap Fund | Midcap Fund |
| Boston Trust SMID Cap Fund | SMID Cap Fund |
| Boston Trust Walden Balanced Fund | BTW Balanced Fund |
| Boston Trust Walden Equity Fund | BTW Equity Fund |
| Boston Trust Walden Midcap Fund | BTW Midcap Fund |
| Boston Trust Walden SMID Cap Fund | BTW SMID Cap Fund |
| Boston Trust Walden Small Cap Fund | BTW Small Cap Fund |
| Boston Trust Walden International Equity Fund | BTW International Equity Fund |
The investment objective of the Asset Management Fund and BTW Balanced Fund is to seek long-term capital growth and income through an actively managed portfolio of stocks, bonds and money market instruments. The investment objective of the Equity Fund and BTW Equity Fund is to seek long-term capital growth through an actively managed portfolio of stocks. The investment objective of the Midcap Fund and BTW Midcap Fund is to seek long-term capital growth through an actively managed portfolio of stocks of middle capitalization companies. The investment objective of the SMID Cap Fund and BTW SMID Cap Fund is to seek long-term capital growth through an actively managed portfolio of stocks of small to middle capitalization companies. The investment objective of the BTW Small Cap Fund is to seek long-term capital growth through an actively managed portfolio of stocks of small capitalization companies. The investment objective of the BTW International Equity Fund is to seek long-term capital growth through an actively managed portfolio of equities of international companies.
Under the Trust’s organizational documents, its officers and trustees are indemnified against certain liabilities arising out of the performance of their duties to the Trust. In addition, in the normal course of business, the Trust may enter into contracts with its vendors and others that provide for general indemnifications. Each Fund’s maximum exposure under these arrangements is unknown, as this would involve future claims that may be made against the Funds. However, based on experience, the Funds expect risk of loss to be remote.
| 2. | Significant Accounting Policies: |
The following is a summary of significant accounting policies followed by the Funds in the preparation of their financial statements. The policies are in conformity with accounting principles generally accepted in the United States of America (“GAAP”).
The preparation of financial statements in conformity with GAAP requires management to make estimates and assumptions that affect the reported amounts of assets and liabilities, the disclosure of contingent assets and liabilities at the date of the financial statements and the reported amounts of increases and decreases in net assets from operations during the reporting period. Actual results may differ from those estimates.
The Funds are investment companies and accordingly follow the investment company accounting and reporting guidance of the Financial Accounting Standards Board (FASB) Accounting Standards Codification Topic 946, “Financial Services - Investment Companies”.
Security Valuation:
The Funds record their investments at fair value. Fair value is defined as the price that would be received to sell an asset or paid to transfer a liability in an orderly transaction between market participants at the measurement date. The valuation techniques used to determine fair value are further described below.
The value of each equity security, including common stocks, is based either on the last sale price on a national securities exchange, or in the absence of recorded sales, at the closing bid price on such exchanges, or at the quoted bid price in the over-the-counter market. Equity securities traded on the NASDAQ stock market are valued at the NASDAQ official closing price. The prices for foreign securities are reported in local currency and converted to U.S dollars using current exchange rates. Prices for most securities held in the Funds are provided daily by a recognized independent pricing service.
Bonds and other fixed income securities (other than short-term obligations but including listed issues) are provided by an independent pricing service, the use of which has been approved by the Board of Trustees (“Board”). In making such valuations, the pricing service utilizes both dealer-supplied valuations and electronic data processing techniques that take into account appropriate factors such as institutional-size trading in similar groups of securities, yield, quality, coupon rate, maturity, type of issue, and trading characteristics other than market data and without exclusive reliance upon quoted prices or exchanges or over-the-counter prices, since such valuations are believed to reflect more accurately the fair value of such securities. All debt portfolio securities with a remaining maturity of 60 days or less may be valued at amortized cost, which approximates fair value.
The Board has designated the Adviser as its fair valuation designee to perform fair value determinations for the Trust. The Trust may use one or more pricing services to value certain portfolio securities where the prices provided are believed to reflect the fair value of such securities. If market prices are not readily available or, in the opinion of the Adviser, market prices do not reflect fair value, or if an event occurs after the close of trading on the exchange or market on which the security is principally traded (but prior to the time the net asset value (“NAV”) is calculated) that materially affects fair value, the Adviser will value the Funds’ assets at their fair value according to policies approved by the Board. The Adviser believes that foreign security values may be affected by volatility that occurs in global markets on a trading day after the close of any given foreign securities markets. The fair valuation procedures, therefore, include a procedure whereby foreign security prices may be “fair valued” by an independent pricing service through the use of factors which take such volatility into account.
| Notes to the Financial Statements | December 31, 2023 |
Investments in investment companies and money market funds are valued at NAV per share.
Fair Value Measurements:
The valuation techniques employed by the Funds, as described above in Security Valuation, maximize the use of observable inputs and minimize the use of unobservable inputs in determining fair value. The inputs used for valuing the Funds’ investments are summarized in the three broad levels listed below:
Level 1 — Quoted prices in active markets for identical assets
Level 2 — Other significant observable inputs (including quoted prices for similar securities, interest rates, prepayment speeds, credit risk, etc.)
Level 3 — Significant unobservable inputs (including the Funds’ own assumptions in determining the fair value of investments)
The inputs or methodology used to value investments are not necessarily an indication of the risk associated with investing in those investments.
Pursuant to the valuation techniques described above in Security Valuation, equity securities are generally categorized as Level 1 securities in the fair value hierarchy (unless there is a fair valuation event, in which case affected securities are generally categorized as Level 2 securities). Fixed income securities, including those with a remaining maturity of 60 days or less, are generally categorized as Level 2 securities in the fair value hierarchy. Open-ended investment companies and money market funds are generally categorized as Level 1 securities in the fair value hierarchy.
Investments for which there are no quotations available, or for which quotations do not appear reliable, are valued at fair value as determined in good faith by the Adviser under the direction of the Board. These valuations are typically categorized as Level 2 or Level 3 in the fair value hierarchy.
The Funds did not hold any Level 3 investments during the year ended December 31, 2023.
The following is a summary of the investments by valuation inputs used as of December 31, 2023 in valuing the Funds’ investments based on the three levels defined above:
| Fund Name | | Level 1 Quoted Prices ($) | | | Level 2 Other Significant Observable Inputs ($) | | | Total Investments in Securities ($) | |
| Asset Management Fund | | | | | | | | | |
| Common Stocks(1) | | | 430,965,312 | | | | — | | | | 430,965,312 | |
| Corporate Bonds(1) | | | — | | | | 23,102,767 | | | | 23,102,767 | |
| U.S. Government & U.S. Government Agency Obligations | | | — | | | | 110,005,025 | | | | 110,005,025 | |
| Investment Companies | | | 3,870,712 | | | | — | | | | 3,870,712 | |
| Total | | | 434,836,024 | | | | 133,107,792 | | | | 567,943,816 | |
| Equity Fund | | | | | | | | | | | | |
| Common Stocks(1) | | | 221,207,838 | | | | — | | | | 221,207,838 | |
| Investment Companies | | | 1,437,531 | | | | — | | | | 1,437,531 | |
| Total | | | 222,645,369 | | | | — | | | | 222,645,369 | |
| Midcap Fund | | | | | | | | | | | | |
| Common Stocks(1) | | | 225,650,347 | | | | — | | | | 225,650,347 | |
| Investment Companies | | | 1,857,573 | | | | — | | | | 1,857,573 | |
| Total | | | 227,507,920 | | | | — | | | | 227,507,920 | |
| SMID Cap Fund | | | | | | | | | | | | |
| Common Stocks(1) | | | 777,748,840 | | | | — | | | | 777,748,840 | |
| Investment Companies | | | 11,730,244 | | | | — | | | | 11,730,244 | |
| Total | | | 789,479,084 | | | | — | | | | 789,479,084 | |
| BTW Balanced Fund | | | | | | | | | | | | |
| Common Stocks(1) | | | 113,204,278 | | | | — | | | | 113,204,278 | |
| Corporate Bonds(1) | | | — | | | | 15,369,170 | | | | 15,369,170 | |
| Municipal Bonds(2) | | | — | | | | 665,368 | | | | 665,368 | |
| U.S. Government & U.S. Government Agency Obligations | | | — | | | | 33,451,783 | | | | 33,451,783 | |
| Investment Companies | | | 1,357,140 | | | | — | | | | 1,357,140 | |
| Total | | | 114,561,418 | | | | 49,486,321 | | | | 164,047,739 | |
| Notes to the Financial Statements | December 31, 2023 |
| Fund Name | | Level 1 Quoted Prices ($) | | | Level 2 Other Significant Observable Inputs ($) | | | Total Investments in Securities ($) | |
| BTW Equity Fund | | | | | | | | | |
| Common Stocks(1) | | | 260,821,806 | | | | — | | | | 260,821,806 | |
| Investment Companies | | | 2,006,515 | | | | — | | | | 2,006,515 | |
| Total | | | 262,828,321 | | | | — | | | | 262,828,321 | |
| BTW Midcap Fund | | | | | | | | | | | | |
| Common Stocks(1) | | | 122,720,789 | | | | — | | | | 122,720,789 | |
| Investment Companies | | | 1,003,375 | | | | — | | | | 1,003,375 | |
| Total | | | 123,724,164 | | | | — | | | | 123,724,164 | |
| BTW SMID Cap Fund | | | | | | | | | | | | |
| Common Stocks(1) | | | 209,141,617 | | | | — | | | | 209,141,617 | |
| Investment Companies | | | 4,031,879 | | | | — | | | | 4,031,879 | |
| Total | | | 213,173,496 | | | | — | | | | 213,173,496 | |
| BTW Small Cap Fund | | | | | | | | | | | | |
| Common Stocks(1) | | | 1,285,572,294 | | | | — | | | | 1,285,572,294 | |
| Investment Companies | | | 11,673,300 | | | | — | | | | 11,673,300 | |
| Total | | | 1,297,245,594 | | | | — | | | | 1,297,245,594 | |
| BTW International Equity Fund | | | | | | | | | | | | |
| Common Stocks(3) | | | | | | | | | | | | |
| Communication Services | | | 759,882 | | | | 4,322,868 | | | | 5,082,750 | |
| Consumer Discretionary | | | 2,257,030 | | | | 12,796,069 | | | | 15,053,099 | |
| Energy | | | 679,076 | | | | 7,702,985 | | | | 8,382,061 | |
| Financials | | | 6,331,092 | | | | 21,037,066 | | | | 27,368,158 | |
| Industrials | | | 2,551,575 | | | | 19,497,288 | | | | 22,048,863 | |
| Information Technology | | | 840,345 | | | | 10,555,614 | | | | 11,395,959 | |
| Other Common Stocks | | | — | | | | 42,388,846 | | | | 42,388,846 | |
| Investment Companies | | | 2,327,680 | | | | — | | | | 2,327,680 | |
| Total | | | 15,746,680 | | | | 118,300,736 | | | | 134,047,416 | |
| (1) | For detailed industry descriptions, see the accompanying Schedules of Portfolio Investments. |
| (2) | For detailed state classifications, see the accompanying Schedules of Portfolio Investments. |
| (3) | For detailed country classifications, see the accompanying Schedules of Portfolio Investments. |
Investment Transactions and Related Income:
Investment transactions are accounted for no later than one business day after the trade date. However, for financial reporting purposes, investment transactions are accounted for on the trade date. Investment gains and losses are calculated on an identified cost basis. Interest income is recognized on an accrual basis and includes, where applicable, the amortization or accretion of premium or discount based on effective yield. Dividend income is recorded on the ex-dividend date except in the case of certain foreign securities, in which case dividends are recorded as soon as such information becomes available.
Real Estate Investment Trusts:
The Funds may own shares of real estate investment trusts (“REITs”), which report information on the source of their distribution annually. Certain distributions received from REITs during the year, which are known to be return of capital, are recorded as a reduction to the cost of the individual REIT. These cost adjustments are typically based on estimates since actual return of capital amounts are not known at the time the annual report is prepared.
Expenses:
In general, expenses uniquely attributable to a Fund are charged directly to that Fund. Expenses relating to the Trust, or on occasion certain minimum fees within Trust's fee structure, are allocated proportionately to each Fund within the Trust according to the relative net assets of each Fund or on another reasonable basis.
Distributions to Shareholders:
Distributions to shareholders are recorded on the ex-dividend date. Dividends to shareholders from net investment income, if any, are declared and paid annually by the relevant Fund. Dividends to shareholders from net realized gains, if any, are declared and distributed at least annually by the relevant Fund. The amounts of distributions to shareholders from net investment income and of distributions from net realized gains are determined in accordance with federal income tax regulations, which may differ from GAAP.
| Notes to the Financial Statements | December 31, 2023 |
Federal Income Taxes:
Each Fund qualifies and intends to continue to qualify as a regulated investment company by complying with the provisions available to certain investment companies, as defined in Subchapter M of the Internal Revenue Code, and to make distributions from net investment income and from net realized capital gains sufficient to relieve it from all, or substantially all, federal income and excise taxes. Therefore, no federal income tax provision is required.
Management has reviewed tax positions taken in tax years that remain subject to examination by all major tax jurisdictions, including U.S. federal (i.e., the last four tax year ends and the interim tax period since then, as applicable), and believes that there is no tax liability resulting from unrecognized tax benefits related to uncertain tax positions taken as of and during the year ended December 31, 2023. The Funds recognize interest and penalties, if any, related to unrecognized tax benefits, as income tax expense in the Statements of Operations as incurred. There is no income tax noted as due for the year ended December 31, 2023.
Foreign Currency Transactions:
The accounting records of the Funds are maintained in U.S. dollars. Non-U.S. dollar denominated amounts are translated into U.S. dollars as follows, with the resultant exchange gains and losses recorded in the Statements of Operations:
i) Value of investment securities and other assets and liabilities at the exchange rate on the valuation date; and
ii) Purchases and sales of Investment securities and income and expenses at the exchange rate prevailing on the respective date of such transactions.
The Funds do not isolate realized and unrealized gains and losses attributable to changes in the exchange rates from gains and losses that arise from changes in the value of investments. Such fluctuations are included with net realized and unrealized gain or loss from investments.
Investment income from non-U.S. sources received by a Fund is generally subject to non-U.S. withholding taxes at rates ranging up to 30%. Such withholding taxes may be reduced or eliminated under the terms of applicable U.S. income tax treaties. The Funds may be subject to foreign taxes (a portion of which may be reclaimable) on gains in investments or currency repatriation. The Funds accrue such taxes, as applicable, based on their current interpretation of tax rules in the foreign markets in which they invest. Withholding taxes and reclaims on foreign dividends have been provided for in accordance with the Funds’ understanding of the applicable country’s tax rules and rates.
| 3. | Related Party Transactions and Other Service Arrangements: |
Investment Adviser:
The Trust, with respect to the Funds, and the Adviser are parties to an Investment Advisory Agreement under which the Adviser is entitled to receive an annual fee, computed daily and paid monthly, equal to the average daily net assets of each Fund, at the following annual percentage rates before contractual waivers:
| Fund | Fee Rate |
| Asset Management Fund | 0.72%* |
| Equity Fund | 0.75% |
| Midcap Fund | 0.75% |
| SMID Cap Fund | 0.75% |
| Fund | Fee Rate |
| BTW Balanced Fund | 0.75% |
| BTW Equity Fund | 0.75% |
| BTW Midcap Fund | 0.75% |
| BTW SMID Cap Fund | 0.75% |
| BTW Small Cap Fund | 0.75% |
| BTW International Equity Fund | 0.75% |
| * | Effective rate for the year ended December 31, 2023. The Asset Management Fund has an Investment Management Agreement with the Adviser under which the Fund pays: (a) 0.75% of the first $500 million of average daily net assets; (b) 0.50% of average daily net assets in excess of $500 million. |
Additionally, one trustee of the Trust is an officer of the Trust and an officer of the Adviser. This person is not paid directly by the Funds.
Administration and Fund Accounting:
Effective October 2, 2023, the Northern Trust Company (“Northern Trust”) serves as the administrator and fund accounting agent for the Funds pursuant to a written agreement with the Trust on behalf of the Funds. The Funds have agreed to pay Northern Trust a tiered basis-point fee based on the Boston Walden Funds Trust’s complex level net assets, certain per account and transaction charges, other fees for additional service activities, and reimbursement of certain expenses.
Prior to October 2, 2023, Citi Fund Services Ohio, Inc. (“Citi”) served the Funds as administrator. Citi provided administrative and fund accounting services for a fee that was computed daily and paid monthly, based on the aggregate daily net assets of the Trust plus certain base fees.
Certain officers of the Trust are affiliated with Northern Trust or PINE Advisor Solutions (“PINE”). Such persons receive no compensation directly from the Funds for serving in their respective roles. PINE receives fees from the Funds for providing Chief Compliance Officer (“CCO”) services under a Services Agreement between the Funds and PINE (the “CCO Agreement”). Under the CCO Agreement, PINE provides infrastructure and support in implementing written policies and procedures comprising the Funds' compliance program, including support services to the CCO. For the services provided under the CCO Agreement, the Funds pay PINE $145,000 annually, plus certain out of pocket expenses. PINE pays the salary and other compensation earned by the CCO as an employee of PINE.
| Notes to the Financial Statements | December 31, 2023 |
Prior to October 2, 2023, certain officers of the Trust were affiliated with Citi. Such persons were paid no fees directly by the Funds for serving as Officers of the Trust. Citi made an employee available to serve as the Trust’s Chief Compliance Officer (“CCO”) under a Compliance Service Agreement between the Funds and Citi (the “CCO Agreement”). Under the CCO Agreement, Citi also provided infrastructure and support in implementing the written policies and procedures comprising the Trust’s compliance program, including support services to the CCO. For the services provided under the CCO Agreement, the Funds paid Citi an annual fee of $150,000, plus certain out of pocket expenses. Citi paid the salary and other compensation earned by the CCO as an employee of Citi.
Distribution:
Foreside Financial Services, LLC (“Foreside”), which is not affiliated with the Adviser, serves as the Funds’ distribution agent. Fees for these services are paid monthly by the Adviser and not by the Funds.
Shareholder Services:
Each Fund, other than the Boston Trust SMID Cap Fund, may enter into shareholder services agreements with investment advisers, banks, trust companies and other types of organizations (“Authorized Service Providers”), which may include affiliates of the Funds, for providing administrative services with respect to shares of the Funds attributable to or held in the name of the Authorized Service Provider for its clients or other parties with whom they have a servicing relationship. Fees paid by the Funds under shareholder services agreements may not exceed 0.25% of the average daily net assets of each Fund and are presented separately on the Statements of Operations. Affiliates of the Funds did not receive any fees during the year ended December 31, 2023.
Custodian and Transfer Agency:
FIS Investor Services, LLC ("FIS") acts as the Funds' transfer agent. Under the transfer agency agreement, FIS receives $19,338 annually per fund, accrued daily and paid monthly, plus annual per account fees and certain out of pocket expenses for its services to the Trust. Expenses incurred under the transfer agency agreement are presented collectively as “Transfer Agency” expenses on the Statements of Operations.
Effective October 2, 2023, Northern Trust serves as the custodian for the Boston Trust Walden Funds pursuant to a written agreement with the Trust on behalf of the Funds. The Funds have agreed to pay Northern Trust a fee based on a percentage of assets held on behalf of the Funds, transaction fees and certain out of pocket expenses for its services. Such percentages vary by the jurisdiction in which the assets are held.
Prior to October 2, 2023, Boston Trust Walden Company acted as the custodian for all Funds except the BTW International Equity Fund. Under the custody agreement, Boston Trust Walden Company received an annual asset based fee of 0.014% of the value of securities held. Citibank, N.A. received sub-custodian fees from Boston Trust Walden Funds for each Fund except the BTW International Equity Fund. Under a separate custody agreement, Citibank, N.A., an affiliate of Citi, served as custodian for the BTW International Equity Fund and received a fee based on a percentage of assets held on behalf of the BTW International Equity Fund, transaction fees and certain out of pocket expenses for its services. Such percentages vary by the jurisdiction in which the assets are held.
Fee Reductions:
The Adviser has agreed to reduce its fees payable by the Funds to the extent necessary, exclusive of brokerage costs, interest, taxes, dividends, litigation, indemnification, expenses associated with the investments in underlying investment companies and extraordinary expenses (as determined under GAAP) of each Fund, except the SMID Cap Fund, to 1.00% of the average daily net assets. The Adviser has agreed to reduce its fees payable by the SMID Cap Fund to the extent necessary, subject to certain exclusions, to limit the aggregate annual operating expenses to 0.75% of its average daily net assets. Any such reductions made by the Adviser in its fees or in the payment or reimbursement of expenses that are a Fund’s obligation may be subject to repayment by the Fund within three years provided the Fund receiving the reduction, payment or reimbursement is able to effect such repayment and remain in compliance with applicable expense limitations. The expense limitation agreement shall automatically renew effective May 1 of every year until the Adviser provides written notice of non-renewal to the Trust.
Pursuant to its agreement, the Adviser reimbursed, and has yet to recoup, fees in the following amounts for the years ended December 31, 2021 (expiring 12/31/24), December 31, 2022 (expiring 12/31/25) and December 31, 2023 (expiring 12/31/26):
| Fund | | Amount | | | Expires |
| Midcap Fund | | $ | 3,138 | | | 12/31/2025 |
| | | | | | | |
| SMID Cap Fund | | | 488,764 | | | 12/31/2024 |
| | | | 562,932 | | | 12/31/2025 |
| | | | 612,046 | | | 12/31/2026 |
| Fund | | Amount | | | Expires |
| BTW Equity Fund | | $ | 53,589 | | | 12/31/2024 |
| | | | 47,676 | | | 12/31/2025 |
| | | | | | | |
| BTW SMID Cap Fund | | | 14,534 | | | 12/31/2025 |
| | | | 7,734 | | | 12/31/2026 |
| BTW Small Cap Fund | | | 96,885 | | | 12/31/2024 |
| | | | 335,112 | | | 12/31/2025 |
| | | | 333,527 | | | 12/31/2026 |
During the year ended December 31, 2023, the Adviser recouped $42,027, $33,272 and $35,429 of previous fiscal year waivers from Midcap Fund, BTW Balanced Fund and BTW Equity Fund, respectively.
| Notes to the Financial Statements | December 31, 2023 |
As of December 31, 2023, the Adviser may recoup amounts from the Funds as follows:
| Total Potential Recoupment | | | |
| Asset Management Fund | | $ | — | |
| Equity Fund | | | — | |
| Midcap Fund | | | 3,138 | |
| SMID Cap Fund | | | 1,663,742 | |
| Total Potential Recoupment | | | |
| BTW Balanced Fund | | $ | — | |
| BTW Equity Fund | | | 101,265 | |
| BTW Midcap Fund | | | — | |
| BTW SMID Cap Fund | | | 22,268 | |
| BTW Small Cap Fund | | | 765,524 | |
| BTW International Equity Fund | | | — | |
In-Kind Subscriptions and Redemptions:
During the year ended December 31, 2023, the Funds delivered securities in exchange for the redemption of shares (redemptions in-kind) as follows:
| Fund | | Fair Value | | | Fund Shares
Redeemed | | | Realized
Gain/(Loss) | |
| Asset Management Fund | | $ | 4,698,109 | | | | 77,706 | | | $ | 4,356,353 | |
During the year ended December 31, 2022, the Funds delivered securities in exchange for the redemption of shares (redemptions in-kind) as follows:
| Fund | | Fair Value | | | Fund Shares
Redeemed | | | Realized
Gain/(Loss) | |
| SMID Cap Fund | | $ | 105,672,275 | | | | 4,710,076 | | | $ | 34,777,232 | |
| BTW Equity Fund | | | 51,649,023 | | | | 1,529,888 | | | | 40,556,290 | |
Interfund Lending:
Pursuant to an Exemptive Order issued by the Securities and Exchange Commission (“SEC”), the Funds may participate in an interfund lending program (the “Program”). The Program provides an alternative credit facility under which the Funds may lend to, or borrow from, one another, consistent with each Fund’s investment objectives, limitations and organization documents. The Program provides a borrowing Fund with a source of liquidity at a rate lower than the bank borrowing rate at times when the cash position of the Fund is insufficient to meet temporary cash requirements. In addition, Funds making short-term cash loans directly to other Funds would earn interest at a rate higher than they otherwise could obtain from investing their cash in repurchase agreements or certain other short-term money market instruments. Interfund loans have a maximum duration of seven days and may be called on one business day’s notice. Any open loans at period end are presented under the caption “Payable” for interfund lending in the Statements of Assets and Liabilities. As of December 31, 2023, the Funds had no outstanding loans to or from another fund under the Program. The Funds' activity in the Program during the year ended December 31, 2023 for which loans were outstanding was as follows:
| Fund | | Borrower or
Lender | | Weighted Average Loan
Balance | | | Days
Outstanding | | | Weighted
Average
Annualized
Interest Rate | | | Interest Income
(Expense) | |
| Asset Management Fund | | Lender | | $ | 455,736 | | | | 1 | | | | 6.95 | % | | $ | 87 | |
| BTW Small Cap Fund | | Borrower | | | 455,736 | | | | 1 | * | | | 6.95 | | | | (87 | ) |
| BTW Small Cap Fund | | Lender | | | 3,365,665 | | | | 1 | | | | 6.09 | | | | 562 | |
| BTW Balanced Fund | | Borrower | | | 3,365,665 | | | | 1 | * | | | 6.09 | | | | (562 | ) |
| * | Aggregate days Fund had loan outstanding as lender for all borrowers. |
| 4. | Purchases and Sales of Securities: |
Cost of purchases and proceeds from sales and maturities of securities, excluding in-kinds, short-term securities and U.S. government securities, for the Funds for the year ended December 31, 2023, totaled:
| Fund | | Purchases | | | Sales and
Maturities | |
| Asset Management Fund | | $ | 21,994,072 | | | $ | 71,853,172 | |
| Equity Fund | | | 15,396,510 | | | | 12,604,332 | |
| Midcap Fund | | | 91,001,886 | | | | 49,989,640 | |
| SMID Cap Fund | | | 363,655,844 | | | | 195,673,842 | |
| BTW Balanced Fund | | | 2,326,505 | | | | 28,606,320 | |
| BTW Equity Fund | | | 17,105,291 | | | | 39,362,318 | |
| BTW Midcap Fund | | | 41,155,593 | | | | 28,366,735 | |
| BTW SMID Cap Fund | | | 96,303,407 | | | | 35,920,088 | |
| BTW Small Cap Fund | | | 458,454,763 | | | | 275,033,017 | |
| BTW International Equity Fund | | | 49,731,166 | | | | 24,462,420 | |
| Notes to the Financial Statements | December 31, 2023 |
Cost of purchases and proceeds from sales and maturities of U.S. government securities, excluding short-term securities, for the Funds for the year ended December 31, 2023, totaled:
| Fund | | Purchases | | | Sales and
Maturities | |
| Asset Management Fund | | $ | 94,092,694 | | | $ | 75,389,936 | |
| BTW Balanced Fund | | | 16,535,872 | | | | 21,217,099 | |
| 5. | Federal Income Tax Information: |
As of the tax year ended December 31, 2023, the cost, gross unrealized appreciation and gross unrealized depreciation on investments, for federal income tax purposes, were as follows:
| Fund | | Tax Cost | | | Gross Tax Unrealized
Appreciation | | | Gross Tax Unrealized
(Depreciation) | | | Net Unrealized
Appreciation
(Depreciation) | |
| Asset Management Fund | | $ | 237,065,709 | | | $ | 331,878,708 | | | $ | (1,000,601 | ) | | $ | 330,878,107 | |
| Equity Fund | | | 71,364,572 | | | | 151,629,341 | | | | (348,544 | ) | | | 151,280,797 | |
| Midcap Fund | | | 170,582,357 | | | | 60,097,418 | | | | (3,171,855 | ) | | | 56,925,563 | |
| SMID Cap Fund | | | 686,412,425 | | | | 121,189,734 | | | | (18,123,075 | ) | | | 103,066,659 | |
| BTW Balanced Fund | | | 95,030,251 | | | | 71,608,747 | | | | (2,591,259 | ) | | | 69,017,488 | |
| BTW Equity Fund | | | 105,184,695 | | | | 157,643,626 | | | | — | | | | 157,643,626 | |
| BTW Midcap Fund | | | 88,725,023 | | | | 36,313,164 | | | | (1,314,023 | ) | | | 34,999,141 | |
| BTW SMID Cap Fund | | | 173,445,121 | | | | 42,413,981 | | | | (2,685,606 | ) | | | 39,728,375 | |
| BTW Small Cap Fund | | | 1,055,180,319 | | | | 277,439,564 | | | | (35,374,289 | ) | | | 242,065,275 | |
| BTW International Equity Fund | | | 110,432,846 | | | | 25,546,300 | | | | (1,931,730 | ) | | | 23,614,570 | |
The tax character of distributions paid during the fiscal year ended December 31, 2023 was as follows:
| | | Distributions paid from | | | | | | | | | | |
| Fund | | Ordinary
Income | | | Net Long Term
Gains | | | Total Taxable
Distributions | | | Return of
Capital | | | Total
Distributions
Paid | |
| Asset Management Fund | | $ | 7,499,998 | * | | $ | 28,309,358 | | | $ | 35,809,356 | | | $ | — | | | $ | 35,809,356 | |
| Equity Fund | | | 1,424,997 | * | | | 2,009,423 | | | | 3,434,420 | | | | — | | | | 3,434,420 | |
| Midcap Fund | | | 2,101,166 | * | | | 7,589,902 | | | | 9,691,068 | | | | — | | | | 9,691,068 | |
| SMID Cap Fund | | | 5,709,153 | | | | 450,358 | | | | 6,159,511 | | | | — | | | | 6,159,511 | |
| BTW Balanced Fund | | | 1,799,997 | * | | | 10,129,602 | | | | 11,929,599 | | | | — | | | | 11,929,599 | |
| BTW Equity Fund | | | 1,889,606 | | | | 5,875,202 | | | | 7,764,808 | | | | — | | | | 7,764,808 | |
| BTW Midcap Fund | | | 1,250,001 | | | | 4,543,805 | | | | 5,793,806 | | | | — | | | | 5,793,806 | |
| BTW SMID Cap Fund | | | 996,041 | | | | 44,888 | | | | 1,040,929 | | | | — | | | | 1,040,929 | |
| BTW Small Cap Fund | | | 7,573,144 | | | | 2,522,576 | | | | 10,095,720 | | | | — | | | | 10,095,720 | |
| BTW International Equity Fund | | | 2,099,998 | | | | — | | | | 2,099,998 | | | | — | | | | 2,099,998 | |
| * | The amount does not include tax equalization utilized of $164,938, $101,500, $61,790, and $1,169,650 which Asset Management Fund, Equity Fund, Midcap Fund, and BTW Balanced Fund, respectively, designated as being distributed to shareholders on their redemption of shares. |
The tax character of distributions paid during the fiscal year ended December 31, 2022 was as follows:
| | | Distributions paid from | | | | | | | | | | |
| Fund | | Ordinary
Income | | | Net Long Term
Gains | | | Total Taxable
Distributions | | | Return of
Capital | | | Total
Distributions
Paid | |
| Asset Management Fund | | $ | 6,330,380 | | | $ | 18,535,541 | | | $ | 24,865,921 | | | $ | — | | | $ | 24,865,921 | |
| Equity Fund | | | 1,308,874 | | | | 4,691,715 | | | | 6,000,589 | | | | — | | | | 6,000,589 | |
| Midcap Fund | | | 701,711 | | | | 6,661,422 | | | | 7,363,133 | | | | — | | | | 7,363,133 | |
| SMID Cap Fund | | | 11,477,233 | | | | 8,878,926 | | | | 20,356,159 | | | | — | | | | 20,356,159 | |
| BTW Balanced Fund | | | 2,073,418 | | | | 4,316,313 | | | | 6,389,731 | | | | — | | | | 6,389,731 | |
| BTW Equity Fund | | | 1,656,719 | | | | 6,272,832 | | | | 7,929,551 | | | | — | | | | 7,929,551 | |
| BTW Midcap Fund | | | 584,615 | | | | 4,571,989 | | | | 5,156,604 | | | | — | | | | 5,156,604 | |
| BTW SMID Cap Fund | | | 1,016,875 | | | | 4,927,587 | | | | 5,944,462 | | | | — | | | | 5,944,462 | |
| BTW Small Cap Fund | | | 6,237,418 | | | | 42,073,469 | | | | 48,310,887 | | | | — | | | | 48,310,887 | |
| BTW International Equity Fund | | | 1,445,386 | | | | — | | | | 1,445,386 | | | | — | | | | 1,445,386 | |
| Notes to the Financial Statements | December 31, 2023 |
As of December 31, 2023, the components of distributable earnings (deficit) on a tax basis were as follows:
| Fund | | Undistributed
Ordinary
Income | | | Undistributed
Long-Term
Capital Gains | | | Accumulated
Earnings | | | Accumulated
Capital and
Other Losses | | | Unrealized
Appreciation/
(Depreciation)1 | | | Total
Distributable
Earnings
(Deficit) | |
| Asset Management Fund | | $ | 752,912 | | | $ | — | | | $ | 752,912 | | | $ | — | | | | 330,878,107 | | | | 331,631,019 | |
| Equity Fund | | | 149,289 | | | | — | | | | 149,289 | | | | (59,871 | ) | | | 151,280,797 | | | | 151,370,215 | |
| Midcap Fund | | | — | | | | 1,944,373 | | | | 1,944,373 | | | | (213,652 | ) | | | 56,925,563 | | | | 58,656,284 | |
| SMID Cap Fund | | | 354,045 | | | | — | | | | 354,045 | | | | (774,957 | ) | | | 103,066,659 | | | | 102,645,747 | |
| BTW Balanced Fund | | | 188,558 | | | | 106,501 | | | | 295,059 | | | | — | | | | 69,017,488 | | | | 69,312,547 | |
| BTW Equity Fund | | | 45,126 | | | | 2,807,853 | | | | 2,852,979 | | | | — | | | | 157,643,626 | | | | 160,496,605 | |
| BTW Midcap Fund | | | — | | | | 589,549 | | | | 589,549 | | | | (179,670 | ) | | | 34,999,141 | | | | 35,409,020 | |
| BTW SMID Cap Fund | | | 10,986 | | | | 492,562 | | | | 503,548 | | | | — | | | | 39,728,375 | | | | 40,231,923 | |
| BTW Small Cap Fund | | | 753,172 | | | | — | | | | 753,172 | | | | (8,313,930 | ) | | | 242,065,275 | | | | 234,504,517 | |
| BTW International Equity Fund | | | — | | | | — | | | | — | | | | (2,165,161 | ) | | | 23,614,570 | | | | 21,449,409 | |
| 1 | Accumulated Capital and Other Losses consists primarily of capital loss carryforwards and losses on foreign currency. The differences between book-basis and tax-basis unrealized appreciation (depreciation) is attributable primarily to tax deferral of losses on wash sales. |
For the period subsequent to October 31, 2023, through the fiscal year ended December 31, 2023, the Equity Fund, Midcap Fund, and BTW Midcap Fund incurred net capital losses in the amount of $59,871, $213,652 and $179,670, respectively, which the Funds intend to treat as having been incurred in the following fiscal year.
As of the end of its tax year ended December 31, 2023, the following Funds have a net capital loss carry forwards (“CLCFs”) not subject to expiration as summarized in the table below. The Board does not intend to authorize a distribution of any realized gain for the Funds until any applicable CLCFs have been offset.
| Fund | | Short-Term
Amount | | | Long-Term
Amount | | | Total | |
| SMID Cap Fund | | $ | 774,957 | | | $ | — | | | $ | 774,957 | |
| BTW Small Cap Fund | | | 1,193,497 | | | | 7,120,433 | | | | 8,313,930 | |
| BTW International Equity Fund | | | 445,109 | | | | 1,743,384 | | | | 2,188,493 | |
As of December 31, 2023, the following reclassifications have been made on the Statements of Assets and Liabilities to increase (decrease) such accounts with offsetting adjustments as indicated:
| Fund | | Total Distributable
Earnings | | | Paid in Capital | |
| Asset Management Fund | | $ | (4,521,290 | ) | | $ | 4,521,290 | |
| Equity Fund | | | (101,500 | ) | | | 101,500 | |
| Midcap Fund | | | (61,791 | ) | | | 61,791 | |
| SMID Cap Fund | | | 1 | | | | (1 | ) |
| BTW Balanced Fund | | | (1,169,650 | ) | | | 1,169,650 | |
| BTW SMID Cap Fund | | | (2 | ) | | | 2 | |
| BTW International Equity Fund | | | 4,768 | | | | (4,768 | ) |
These “book/tax” differences are either considered temporary or permanent in nature. To the extent these differences are permanent in nature (e.g. return of capital, distribution reclass, foreign currency reclass, and equalization), such amounts are reclassified within the composition of net assets based on their federal tax-basis treatment; temporary differences (e.g. wash sales and post October losses) do not require reclassification. To the extent dividends to shareholders exceed net investment income and net realized gains for tax purposes, they are reported as return of capital.
| 6. | Control Ownership and Principal Holders: |
The beneficial ownership, either directly or indirectly, of more than 25% of the voting securities of a Fund creates presumptions of control of the Fund under section 2 (a)(9) of the 1940 Act. As of December 31, 2023, the Funds had individual shareholder accounts and/or omnibus shareholder accounts (comprised of a group of individual shareholders), owning more than 25% of the total shares outstanding of the Fund as detailed below.
| Fund | | Control Ownership | | Percentage of
Ownership | |
| Asset Management Fund | | U.S. Bank, N.A. | | | 88.24 | % |
| Equity Fund | | U.S. Bank, N.A. | | | 93.30 | |
| Midcap Fund | | U.S. Bank, N.A. | | | 31.49 | |
| | | Charles Schwab & Co., Inc. | | | 26.36 | |
| SMID Cap Fund | | National Financial Services | | | 40.44 | |
| Notes to the Financial Statements | December 31, 2023 |
| BTW Balanced Fund | | U.S. Bank, N.A. | | | 58.90 | % |
| BTW Equity Fund | | U.S. Bank, N.A. | | | 40.81 | |
| | | National Financial Services | | | 28.03 | |
| BTW Midcap Fund | | U.S. Bank, N.A. | | | 37.22 | |
| BTW SMID Cap Fund | | Charles Schwab & Co., Inc. | | | 41.69 | |
| BTW International Equity Fund | | U.S. Bank, N.A. | | | 66.27 | |
Management has evaluated events and transactions through the date these financial statements were issued and concluded no additional subsequent events required recognition or disclosure in these financial statements.

REPORT OF INDEPENDENT REGISTERED PUBLIC ACCOUNTING FIRM
To the Shareholders and Board of
Trustees of Boston Trust Walden Funds
Opinion on the Financial Statements
We have audited the accompanying statements of assets and liabilities, including the schedules of investments, of Boston Trust Walden Funds comprising Boston Trust Asset Management Fund, Boston Trust Equity Fund, Boston Trust Midcap Fund, Boston Trust SMID Cap Fund, Boston Trust Walden Balanced Fund, Boston Trust Walden Equity Fund, Boston Trust Walden Midcap Fund, Boston Trust Walden SMID Cap Fund, Boston Trust Walden Small Cap Fund and Boston Trust Walden International Equity Fund (the “Funds”) as of December 31, 2023, the related statements of operations for the year then ended, the statements of changes in net assets for each of the two years in the period then ended, the related notes, and the financial highlights for each of the five years in the period then ended (collectively referred to as the “financial statements”). In our opinion, the financial statements present fairly, in all material respects, the financial position of each of the Funds, as of December 31, 2023, the results of their operations for the year then ended, the changes in net assets for each of the two years in the period then ended, and the financial highlights for each of the five years in the period then ended, in conformity with accounting principles generally accepted in the United States of America.
Basis for Opinion
These financial statements are the responsibility of the Funds’ management. Our responsibility is to express an opinion on the Funds’ financial statements based on our audits. We are a public accounting firm registered with the Public Company Accounting Oversight Board (United States) (“PCAOB”) and are required to be independent with respect to the Funds in accordance with the U.S. federal securities laws and the applicable rules and regulations of the Securities and Exchange Commission and the PCAOB.
We conducted our audits in accordance with the standards of the PCAOB. Those standards require that we plan and perform the audit to obtain reasonable assurance about whether the financial statements are free of material misstatement whether due to error or fraud.
Our audits included performing procedures to assess the risks of material misstatement of the financial statements, whether due to error or fraud, and performing procedures that respond to those risks. Such procedures included examining, on a test basis, evidence regarding the amounts and disclosures in the financial statements. Our procedures included confirmation of securities owned as of December 31, 2023, by correspondence with the custodian and brokers; when replies were not received from brokers, we performed other auditing procedures. Our audits also included evaluating the accounting principles used and significant estimates made by management, as well as evaluating the overall presentation of the financial statements. We believe that our audits provide a reasonable basis for our opinion.
We have served as the Funds’ auditor since 2008.

COHEN & COMPANY, LTD.
Milwaukee, Wisconsin
February 26, 2024
COHEN & COMPANY, LTD.
800.229.1099 | 866.818.4538 fax | cohencpa.com
| Registered with the Public Company Accounting Oversight Board | 75 |
| Supplementary Information (Unaudited) | December 31, 2023 |
Federal Income Tax Information:
During the fiscal year ended December 31, 2023, the Funds declared long-term realized gain distributions in the following amounts:
| Fund | | Long-Term Capital Gain Distributions | |
| Asset Management Fund | | $ | 28,309,358 | |
| Equity Fund | | | 2,009,423 | |
| Midcap Fund | | | 7,589,902 | |
| SMID Cap Fund | | | 450,358 | |
| BTW Balanced Fund | | | 10,129,602 | |
| BTW Equity Fund | | | 5,875,202 | |
| BTW Midcap Fund | | | 4,543,805 | |
| BTW SMID Cap Fund | | | 44,888 | |
| BTW Small Cap Fund | | | 2,522,576 | |
For the fiscal year ended December 31, 2023, the following percentage of the total ordinary income distributions paid by the Funds qualify for the distributions received deduction available to corporate shareholders.
| Fund | | Distribution Received Deduction | |
| Asset Management Fund | | | 91.52 | % |
| Equity Fund | | | 100.00 | |
| Midcap Fund | | | 100.00 | |
| SMID Cap Fund | | | 100.00 | |
| BTW Balanced Fund | | | 95.73 | |
| BTW Equity Fund | | | 100.00 | |
| BTW Midcap Fund | | | 100.00 | |
| BTW SMID Cap Fund | | | 100.00 | |
| BTW Small Cap Fund | | | 100.00 | |
For the fiscal year ended December 31, 2023, distributions paid by the Funds may be subject to a maximum tax rate of 15%, as provided for by the Jobs and Growth Tax Relief Reconciliation Act of 2003. The Funds intend to designate the maximum amount allowable as taxed at a maximum rate of 15%. Complete information will be reported in conjunction with your 2020 Form 1099-DIV.
| Fund | | Qualified Dividend Income | |
| Asset Management Fund | | | 96.40 | % |
| Equity Fund | | | 100.00 | |
| Midcap Fund | | | 100.00 | |
| SMID Cap Fund | | | 100.00 | |
| BTW Balanced Fund | | | 100.00 | |
| BTW Equity Fund | | | 100.00 | |
| BTW Midcap Fund | | | 100.00 | |
| BTW SMID Cap Fund | | | 100.00 | |
| BTW Small Cap Fund | | | 100.00 | |
| BTW International Equity Fund | | | 100.00 | |
During the year ended December 31, 2023, the following Funds designated the maximum amount allowable as interest-related dividends for certain non-U.S. resident investors:
| Fund | | Qualified Interest Income | |
| Asset Management Fund | | | 36.54 | % |
| BTW Balanced Fund | | | 29.38 | |
The following Funds intend to elect to pass through to shareholders the income tax credit for taxes paid to foreign countries. Foreign source income and foreign tax expense per outstanding share on December 31, 2023 are as follows:
| Fund | | Foreign Source
Income Per Share | | | Foreign Tax Expense
Per Share | |
| BTW International Equity Fund | | | 0.24 | | | | 0.04 | |
The pass-through of this foreign tax credit will only affect those persons who are shareholders on the dividend record date in December 31, 2023. These shareholders will receive more detailed information along with their 2023 Form 1099-DIV.
| Supplementary Information (Unaudited) | December 31, 2023 |
Table of Shareholder Expenses:
As a shareholder of the Trust, you incur ongoing costs, including management fees, and other Fund expenses. These examples are intended to help you understand your ongoing costs (in dollars) of investing in the Boston Trust Walden Funds and to compare these costs with the ongoing costs of investing in other mutual funds.
These examples are based on an investment of $1,000 invested at the beginning of the period and held for the entire period from July 1, 2022 through December 31, 2023.
Actual Expenses
The table below provides information about actual account values and actual expenses. You may use the information below together with the amount you invested, to estimate the expenses that you paid over the period. Simply divide your account value by $1,000 (for example, an $8,600 account value divided by $1,000 = 8.6), then multiply the result by the number in the table under the heading entitled “Expenses Paid During Period” to estimate the expenses you paid on your account during this period.
Please note that the expenses shown in the tables are meant to highlight your ongoing costs only and do not reflect the costs incurred by the Funds for buying and selling securities. The Funds do not charge transaction fees, such as redemption fees, nor do the Funds charge a sales charge (load). Therefore, the table is useful in comparing ongoing costs only, and will not help you determine the relative total costs of owning different funds.
| | | Beginning
Account Value
7/1/23 | | | Ending
Account Value
12/31/23 | | | Expenses Paid
During Period
7/1/23 - 12/31/23* | | | Annualized
Expense Ratio
During Period
7/1/23 - 12/31/23 | |
| Asset Management Fund | | $ | 1,000.00 | | | $ | 1,043.30 | | | $ | 4.22 | | | | 0.82 | % |
| Equity Fund | | | 1,000.00 | | | | 1,051.30 | | | | 4.29 | | | | 0.83 | |
| Midcap Fund | | | 1,000.00 | | | | 1,064.00 | | | | 5.20 | | | | 1.00 | |
| SMID Cap Fund | | | 1,000.00 | | | | 1,087.00 | | | | 3.95 | | | | 0.75 | |
| BTW Balanced Fund | | | 1,000.00 | | | | 1,050.70 | | | | 4.96 | | | | 0.96 | |
| BTW Equity Fund | | | 1,000.00 | | | | 1,061.10 | | | | 5.20 | | | | 1.00 | |
| BTW Midcap Fund | | | 1,000.00 | | | | 1,065.20 | | | | 5.21 | | | | 1.00 | |
| BTW SMID Cap Fund | | | 1,000.00 | | | | 1,097.90 | | | | 5.29 | | | | 1.00 | |
| BTW Small Cap Fund | | | 1,000.00 | | | | 1,059.30 | | | | 5.19 | | | | 1.00 | |
| BTW International Equity Fund | | | 1,000.00 | | | | 1,064.00 | | | | 4.73 | | | | 0.91 | |
| * | Expenses are equal to the average account value multiplied by the Fund's annualized expense ratio multiplied by 184/365 (the number of days in the most recent fiscal half-year divided by the number of days in the fiscal year). |
Hypothetical Example for Comparison Purposes
The table below provides information about hypothetical account values and hypothetical expenses based on each Fund’s actual expense ratio and an assumed rate of return of 5% per year before expenses, which is not the Fund’s actual return. The hypothetical account values and expenses may not be used to estimate the actual ending account balance or expenses you paid for the period. You may use this information to compare this 5% hypothetical example with the 5% hypothetical examples that appear in the shareholder reports of other funds.
Please note that the expenses shown in the table are meant to highlight your ongoing costs only and do not reflect the costs incurred by the Funds for buying and selling securities. The Funds do not charge transaction fees, such as redemption fees, nor do the Funds charge a sales charge (load). Therefore, the table is useful in comparing ongoing costs only, and will not help you determine the relative total costs of owning different funds.
| | | Beginning
Account Value
7/1/23 | | | Ending
Account Value
12/31/23 | | | Expenses Paid
During Period
7/1/23 - 12/31/23* | | | Annualized
Expense Ratio
During Period
7/1/23 - 12/31/23 | |
| Asset Management Fund | | $ | 1,000.00 | | | $ | 1,021.07 | | | $ | 4.18 | | | | 0.82 | % |
| Equity Fund | | | 1,000.00 | | | | 1,021.02 | | | | 4.23 | | | | 0.83 | |
| Midcap Fund | | | 1,000.00 | | | | 1,020.16 | | | | 5.09 | | | | 1.00 | |
| SMID Cap Fund | | | 1,000.00 | | | | 1,021.42 | | | | 3.82 | | | | 0.75 | |
| BTW Balanced Fund | | | 1,000.00 | | | | 1,020.37 | | | | 4.89 | | | | 0.96 | |
| BTW Equity Fund | | | 1,000.00 | | | | 1,020.16 | | | | 5.09 | | | | 1.00 | |
| BTW Midcap Fund | | | 1,000.00 | | | | 1,020.16 | | | | 5.09 | | | | 1.00 | |
| BTW SMID Cap Fund | | | 1,000.00 | | | | 1,020.16 | | | | 5.09 | | | | 1.00 | |
| BTW Small Cap Fund | | | 1,000.00 | | | | 1,020.16 | | | | 5.09 | | | | 1.00 | |
| BTW International Equity Fund | | | 1,000.00 | | | | 1,020.62 | | | | 4.63 | | | | 0.91 | |
| * | Expenses are equal to the average account value multiplied by the Fund's annualized expense ratio multiplied by 184/365 (the number of days in the most recent fiscal half-year divided by the number of days in the fiscal year). |
| Supplementary Information (Unaudited) | December 31, 2023 |
Tabular Summary of Schedules of Portfolio Investments:
The Boston Trust Walden Funds invested, as a percentage of total net assets, in the following industries and countries as of December 31, 2023.
| Asset Management Fund | | | |
| | | | |
| Security Allocation for the Schedule of Portfolio Investments | | Percentage of
Total Net Assets | |
| U.S. Government & U.S. Government Agency Obligations | | | 19.3 | % |
| Information Technology | | | 17.8 | |
| Financials | | | 13.8 | |
| Industrials | | | 10.9 | |
| Health Care | | | 10.2 | |
| Communication Services | | | 8.0 | |
| Consumer Staples | | | 7.5 | |
| Consumer Discretionary | | | 5.7 | |
| Energy | | | 3.4 | |
| Materials | | | 2.0 | |
| Investment Companies | | | 0.7 | |
| Utilities | | | 0.4 | |
| Other net assets | | | 0.3 | |
| Total | | | 100.0 | % |
| Equity Fund | | | |
| | | | |
| Security Allocation for the Schedule of Portfolio Investments | | Percentage of
Total Net Assets | |
| Information Technology | | | 23.9 | % |
| Health Care | | | 15.1 | |
| Financials | | | 14.2 | |
| Industrials | | | 13.1 | |
| Communication Services | | | 9.6 | |
| Consumer Staples | | | 8.2 | |
| Consumer Discretionary | | | 6.9 | |
| Energy | | | 4.7 | |
| Materials | | | 2.6 | |
| Utilities | | | 0.9 | |
| Investment Companies | | | 0.7 | |
| Other net assets | | | 0.1 | |
| Total | | | 100.0 | % |
| Midcap Fund | | | |
| | | | |
| Security Allocation for the Schedule of Portfolio Investments | | Percentage of
Total Net Assets | |
| Industrials | | | 19.6 | % |
| Financials | | | 14.5 | |
| Health Care | | | 14.4 | |
| Information Technology | | | 10.7 | |
| Consumer Discretionary | | | 10.5 | |
| Materials | | | 6.4 | |
| Consumer Staples | | | 6.1 | |
| Utilities | | | 5.1 | |
| Energy | | | 4.4 | |
| Real Estate | | | 3.9 | |
| Communication Services | | | 3.2 | |
| Investment Companies | | | 0.8 | |
| Other net assets | | | 0.4 | |
| Total | | | 100.0 | % |
| SMID Cap Fund | | | |
| | | | |
| Security Allocation for the Schedule of Portfolio Investments | | Percentage of
Total Net Assets | |
| Industrials | | | 21.4 | % |
| Financials | | | 15.1 | |
| Health Care | | | 13.2 | |
| Information Technology | | | 13.0 | |
| Consumer Discretionary | | | 11.0 | |
| Real Estate | | | 6.6 | |
| Materials | | | 6.3 | |
| Energy | | | 3.8 | |
| Consumer Staples | | | 3.3 | |
| Communication Services | | | 2.7 | |
| Utilities | | | 2.1 | |
| Investment Companies | | | 1.5 | |
| Other net assets | | | 0.0 | |
| Total | | | 100.0 | % |
| Supplementary Information (Unaudited) | December 31, 2023 |
Tabular Summary of Schedules of Portfolio Investments: (continued)
| BTW Balanced Fund | | | |
| | | | |
| Security Allocation for the Schedule of Portfolio Investments | | Percentage of
Total Net Assets | |
| U.S. Government & U.S. Government Agency Obligations | | | 20.2 | % |
| Information Technology | | | 19.5 | |
| Health Care | | | 12.4 | |
| Financials | | | 11.2 | |
| Industrials | | | 8.1 | |
| Communication Services | | | 7.1 | |
| Consumer Discretionary | | | 7.0 | |
| Consumer Staples | | | 4.7 | |
| Energy | | | 4.0 | |
| Materials | | | 2.6 | |
| Utilities | | | 1.1 | |
| Investment Companies | | | 0.8 | |
| Municipal Bonds | | | 0.4 | |
| Other net assets | | | 0.9 | |
| Total | | | 100.0 | % |
| BTW Equity Fund | | | |
| | | | |
| Security Allocation for the Schedule of Portfolio Investments | | Percentage of
Total Net Assets | |
| Information Technology | | | 27.6 | % |
| Health Care | | | 14.9 | |
| Financials | | | 14.5 | |
| Industrials | | | 12.1 | |
| Communication Services | | | 8.6 | |
| Consumer Discretionary | | | 7.6 | |
| Energy | | | 5.4 | |
| Consumer Staples | | | 5.3 | |
| Materials | | | 2.3 | |
| Utilities | | | 0.9 | |
| Investment Companies | | | 0.8 | |
| Other net assets | | | 0.0 | |
| Total | | | 100.0 | % |
| BTW Midcap Fund | | | |
| | | | |
| Security Allocation for the Schedule of Portfolio Investments | | Percentage of
Total Net Assets | |
| Industrials | | | 20.9 | % |
| Financials | | | 14.5 | |
| Health Care | | | 14.2 | |
| Information Technology | | | 10.8 | |
| Consumer Discretionary | | | 10.6 | |
| Materials | | | 6.5 | |
| Consumer Staples | | | 6.1 | |
| Utilities | | | 5.1 | |
| Real Estate | | | 3.8 | |
| Communication Services | | | 3.3 | |
| Energy | | | 3.2 | |
| Investment Companies | | | 0.8 | |
| Other net assets | | | 0.2 | |
| Total | | | 100.0 | % |
| BTW SMID Cap Fund | | | |
| | | | |
| Security Allocation for the Schedule of Portfolio Investments | | Percentage of
Total Net Assets | |
| Industrials | | | 26.6 | % |
| Information Technology | | | 15.2 | |
| Financials | | | 14.9 | |
| Health Care | | | 11.1 | |
| Consumer Discretionary | | | 9.7 | |
| Real Estate | | | 7.5 | |
| Materials | | | 6.4 | |
| Consumer Staples | | | 3.6 | |
| Communication Services | | | 3.2 | |
| Investment Companies | | | 1.9 | |
| Other net assets | | | (0.1 | ) |
| Total | | | 100.0 | % |
| BTW Small Cap Fund | | | |
| | | | |
| Security Allocation for the Schedule of Portfolio Investments | | Percentage of
Total Net Assets | |
| Industrials | | | 19.6 | % |
| Financials | | | 15.3 | |
| Health Care | | | 15.2 | |
| Information Technology | | | 14.3 | |
| Consumer Discretionary | | | 8.2 | |
| Consumer Staples | | | 6.5 | |
| Materials | | | 6.0 | |
| Real Estate | | | 5.2 | |
| Energy | | | 4.3 | |
| Utilities | | | 2.8 | |
| Communication Services | | | 2.0 | |
| Investment Companies | | | 0.9 | |
| Other net assets | | | (0.3 | ) |
| Total | | | 100.0 | % |
| Supplementary Information (Unaudited) | December 31, 2023 |
Tabular Summary of Schedules of Portfolio Investments: (continued)
BTW International Equity Fund
| Security Allocation for the Schedule of Portfolio Investments | | Percentage of
Total Net Assets | |
| Japan | | | 18.3 | % |
| United Kingdom | | | 12.8 | |
| France | | | 11.7 | |
| Switzerland | | | 9.5 | |
| Canada | | | 9.3 | |
| Germany | | | 6.5 | |
| Netherlands | | | 5.3 | |
| Australia | | | 4.8 | |
| Sweden | | | 3.5 | |
| Denmark | | | 2.9 | |
| Finland | | | 2.0 | |
| Italy | | | 1.8 | |
| Singapore | | | 1.7 | |
| United States | | | 1.7 | |
| Spain | | | 1.6 | |
| Norway | | | 1.4 | |
| Israel | | | 1.1 | |
| Jersey, C.I. | | | 1.0 | |
| Ireland | | | 1.0 | |
| Luxembourg | | | 0.9 | |
| Hong Kong | | | 0.5 | |
| Other net assets | | | 0.7 | |
| Total | | | 100.0 | % |
| Supplementary Information (Unaudited) | December 31, 2023 |
Other Information:
A description of the policies and guidelines that the Funds use to determine how to vote proxies related to portfolio securities is available: (i) without charge, upon request, by calling 1-800-282-8782 ext. 7050, and (ii) on the Securities and Exchange Commission’s (the “Commission”) website at http://www.sec.gov.
Proxy voting policies and guidelines as well as information regarding how the Funds voted proxies relating to portfolio securities during the most recent 12-month period ended June 30 is available (i) without charge, upon request, by calling 1-800-282-8782 ext. 7050, (ii) online at https://www. bostontrustwalden.com/investment-services/mutual-funds/; and (iii) on the Commission’s website at http://www.sec.gov.
The Funds file their portfolio holdings information for each month in a fiscal quarter within 60 days after the end of the relevant fiscal quarter with the SEC on Form N-PORT. Portfolio holdings information for the third month of each fiscal quarter is available on the SEC’s website at http://www.sec.gov. The Funds’ Schedules of Portfolio Investments will be available no later than 60 days after each period end, without charge, online at https://www. bostontrustwalden.com/investment-services/mutual-funds/.
Liquidity Risk Management Program:
The Funds have adopted and implemented a written liquidity risk management program as required by Rule 22e-4 (the “Liquidity Rule”) under the Investment Company Act. The program is reasonably designed to assess and manage each Fund’s liquidity risk, taking into consideration, among other factors, each respective Fund’s investment strategy and the liquidity of its portfolio investments during normal and reasonably foreseeable stressed conditions; its short and long-term cash flow projections; and its cash holdings and access to other funding sources.
During the fiscal year ended December 31, 2023, the Trust’s Liquidity Risk Management Program Administrator (the “Program Administrator”) reviewed the Funds’ investments and determined that the Funds held adequate levels of cash and highly liquid investments to meet shareholder redemption activities in accordance with applicable requirements. Accordingly, the Program Administrator concluded that (i) the Funds’ liquidity risk management program is reasonably designed to prevent violations of the Liquidity Rule and (ii) the Funds’ liquidity risk management program has been effectively implemented.
| Investment Adviser Contract Approval (Unaudited) | December 31, 2023 |
The annual consideration by the Board of Trustees (the “Board”) of the continuation of the investment advisory agreement between Boston Trust Walden Inc (the “Adviser”) and Boston Trust Asset Management Fund, Boston Trust Equity Fund, Boston Trust Midcap Fund, Boston Trust SMID Cap Fund, Boston Trust Walden Balanced Fund, Boston Trust Walden Equity Fund, Boston Trust Walden Midcap Fund, Boston Trust SMID Cap Fund, Boston Trust Walden Small Cap Fund, and Boston Trust Walden International Equity Fund (the “Funds”).
Section 15 of the Investment Company Act of 1940 (the “1940 Act”) requires that the Investment Advisory Agreement with the Adviser be renewed annually by the Board of Boston Trust Walden Funds (the “Trust”), including a majority of the Board who are not “interested persons” of the Trust or of the Adviser. It is the duty of the Board to request as much information as is reasonably necessary to evaluate the terms of the Investment Advisory Agreement and determine whether its continuance is fair to the Funds and their shareholders. The Board considered the continuation of the Investment Advisory Agreement at an in-person meeting held on August 29, 2023. The Board requested, and the Adviser provided, information and data relating to: (i) the investment performance of each Fund and the Adviser; (ii) the nature, extent and quality of the services provided by the Adviser to the Funds; (iii) the cost of the services to be provided and the profits to be realized by the Adviser and its affiliates from the relationship with the Funds; (iv) the extent to which economies of scale will be realized as the Funds grow; (v) whether the fee levels reflect these economies of scale to the benefit of Funds’ shareholders; (vi) the advisory fees paid by other comparable funds advised by the Adviser or by a different investment adviser; (vii) the Funds’ expense ratios and the expense ratios of similar funds; and (viii) the effect of any fee waivers and expense reimbursements made by the Adviser.
At the meeting on August 29, 2023, the Board engaged in a thorough review process to determine whether to continue the Investment Advisory Agreement. The Board met directly with representatives of the Adviser and reviewed the information and data listed above, and performance peer group and expense peer group information constructed by ISS/Strategic Insight ("ISS"). As part of its deliberations, the Board also considered and relied upon the information about the Funds and the Adviser that it had received throughout the year as part of its ongoing oversight of the Funds and their operations.
The Board carefully considered the nature, extent and quality of the services provided by the Adviser. The Board discussed the organizational structure of Adviser and its investment philosophy, type of clients, ESG integration, portfolio construction process and equity and fixed income approach. The Board discussed the Adviser’s approach to sustainable, responsible and impact investing, including its ESG framework and its portfolio screening guidelines. The Board reviewed the Adviser’s experience and the capabilities of its personnel, as well as the quality of the reports and other materials received from the Adviser. The Board reviewed biographical information about the employees of the Adviser and its parent, Boston Trust Walden Company (“Boston Trust”). The Board addressed the Adviser’s brokerage allocation and execution strategy, noting that the Adviser does not take into consideration sales of Fund shares in selecting brokers through which it effects Fund portfolio transactions. The Board also discussed the Adviser’s compliance program, business continuity and disaster recovery plans, succession planning and employee ownership. Considering the personnel involved in servicing the Funds, as well as the materials and services described above, the Board expressed satisfaction with the quality of the services received from the Adviser.
Next, the Board reviewed the performance of the Funds from inception through June 30, 2023, comparing each Fund's performance to a performance peer group constructed by ISS and the performance of the relevant Morningstar Category. The Board noted that as of June 30, 2023, while each Fund outperformed the index and its peer group at various times for the Year-to-Date, 1-year, 3-year, 5-year and Since Inception periods, each Fund generally performed in line with its peer group during the same periods. The Board noted that while the Funds underperformed their benchmarks at various times, performance was consistent with the long-term performance pattern of each Fund’s investment style, as they participated in rising markets and outperformed in falling markets. The Board noted that this downside protection is consistent with the Adviser’s strategy and is routinely communicated to clients and investors. The Board also noted that during a rising market lasting over a decade, the Funds have consistently adhered to a lower risk, higher quality strategy.
The Board noted that the advisory fees for each Fund are within the range of their peer groups. The Board noted that the Adviser has been operating under an Expense Limitation Agreement that requires the Adviser to waive fees and/or reimburse expenses to the extent total operating expenses exceed 0.75% for the Boston Trust SMID Cap Fund and 1.00% for all the other Funds.
Turning to total operating expenses, the Board discussed the components of the Funds’ expense ratios and the services and value shareholders receive in exchange for the fees paid and expense borne by the Funds. The Board noted that the expense ratios for all the Funds were within the range of total operating expenses of the funds in the peer groups. After considering the comparative data as described above, and the Expense Limitation Agreement that was previously renewed by the Board at its February 28, 2023 meeting, the Board concluded that the advisory fees and expense ratios were reasonable.
| Investment Adviser Contract Approval (Unaudited) | December 31, 2023 |
In reviewing the costs of the services to be provided and the profits to be realized by the Adviser, the Board reviewed the Adviser’s income statement for the 12-months ended December 31, 2022 and the six-months ended June 30, 2023, as well as the gross and net profit margins realized on each Fund. The Board noted that the Adviser is a wholly-owned subsidiary of Boston Trust and the payment of direct and indirect Trust expenses is governed by an Intercompany Services Agreement between the Adviser and Boston Trust Walden. The Board noted that the Adviser’s relationship with the Funds was profitable even though the Adviser is operating under an Expense Limitation Agreement with the Trust. The Board discussed the custody and transfer agency fees earned by the Adviser for services provided to the Funds, which are reduced by amounts paid for sub-custodian services.
| Information about Trustees and Officers (Unaudited) | December 31, 2023 |
Overall responsibility for management of the Funds rests with the Board. The names of the Trustees and Officers of the Funds, their addresses, years of birth and principal occupations during the past five years are provided in the tables below. Trustees who are deemed “interested persons,” as defined in the 1940 Act, are referred to as Interested Trustees. Trustees who are not interested persons are referred to as Independent Trustees. The Funds’ Statement of Additional Information includes additional information about the Funds’ Trustees and is available, without charge and upon request, by calling 1-800-282-8782 or by visiting www.bostontrustwalden.com.
Name, Address,
and Year of Birth | Position(s)
Held with
the Funds | Term of Office*
and Length of
Time Served | Principal Occupation(s)
During Past Five Years | Number of Funds
in Fund Complex
Overseen by
Trustee*** | Other
Directorships
Held by Trustee
during the past
five years |
| INTERESTED TRUSTEES** | |
Lucia B. Santini
One Beacon Street
Boston, MA 02108
Year of Birth: 1958 | Trustee and President | Since 2011 | President, Boston Trust Walden Inc., January 2017 to present; Managing Director, Boston Trust Walden Company, November 1993 to present. | 10 | None |
| INDEPENDENT TRUSTEES | | |
Diane E. Armstrong
One Beacon Street
Boston, MA 02108
Year of Birth: 1964 | Trustee and Chairperson of the Board | Since 2005; Chairperson since 2021 | Owner, Armstrong Financial Services LLC, November 2012 to present; Advisor, Premier Private Wealth LLC, June 2022 to present; Advisor, Investment Partners LTD, January 2018 to December 2019 | 10 | None |
Louis G. Hutt, Jr.
One Beacon Street
Boston, MA 02108
Year of Birth: 1954 | Trustee | Since 2021 | Chief Executive Officer, The Hutt Company, Certified Public Accountants, LLC, February 1982 to Present; Chief Executive Officer, The Hutt Law Firm, January 1983 to present. | 10 | Brown Capital Management Mutual Fund, (2014–Present); SFS Series Trust, (2020–Present) |
Elizabeth E. McGeveran
One Beacon Street
Boston, MA 02108
Year of Birth: 1971 | Trustee | Since 2016 | Director of Investments, The McKnight Foundation, January 2019 to present; Director of Impact Investing, September 2014 to December 2018; Advisory Committee, Columbia Threadneedle (fund manager), January 2019 to present. | 10 | None |
Dina A Tantra
One Beacon Street
Boston, MA 02108
Year of Birth: 1969 | Trustee | Since 2021 | Co-Chief Executive Officer Global Rhino LLC (consulting firm), October 2018 to present; Chief Strategy Officer, CCO Technology, LLC (consulting and technology firm), February 2019 - January 2023; Executive Vice President, Ultimus Fund Solutions (fund administrator), August 2017– September 2018 | 10 | Thornburg Income Builder opportunities Trust, (October 2020– Present), Heartland Funds (April 2022–Present) |
| OFFICERS WHO ARE NOT TRUSTEES |
Name, Address,
and Year of Birth | Position(s)
Held with
the Funds | Term of Office*
and Length of
Time Served | Principal Occupation(s)
During Past Five Years |
Jennifer Ellis
One Beacon Street
Boston, MA 02108
Year of Birth: 1972 | Treasurer | Since 2011 | Director of Finance/Treasurer, Boston Trust Walden Company, May 2011 to present. |
| Information about Trustees and Officers (Unaudited) | December 31, 2023 |
Usman Yousaf
One Beacon Street
Boston, MA 02108
Year of Birth: 1989 | Assistant Treasurer | Since 2023 | Accounting Analyst/Accounting Manager, Boston Trust Walden Company, December 2016 to present. |
Katrina Pelsue
One Beacon Street
Boston, MA 02108
Year of Birth: 1985 | Vice-President | Since 2023 | Director, Boston Trust Walden Inc., January 2022 to present; Director of Fund Services, Boston Trust Walden Company, January 2021 to present; Manager, Fund Services, Boston Trust Walden Company, October 2015 to January 2021 |
Jennifer A. Craig ****
The Northern Trust Company
50 South La Salle Street
Chicago, Illionois 60603
Year of Birth: 1973 | Secretary | Since 2023 | Vice President of The Northern Trust Company, September 2021 to present; Assistant Vice President, Paralegal Manager of SS&C/ALPS Fund Services Inc., 2007 to 2021. |
Randi Jean Roessler****
501 S. Cherry St., Suite 610
Denver, CO 80246
Year of Birth: 1981 | Chief Compliance Officer and AML Officer | Since 2023 | Director, PINE Advisor Solutions, March 2023 to present; Chief Compliance Officer, Davis Selected Advisers, L.P., Davis Funds, Selected Funds, the Clipper Fund Trust, the Davis Fundamental ETF Trust, and Davis Distributors, LLC, January 2018 to February 2023 |
| * | Trustees and officers hold their position until resignation or removal. |
| ** | Ms. Santini is considered an “interested person” of the Trust as defined in the 1940 Act due to her employment with Boston Trust Walden Inc., the Funds’ investment adviser. |
| *** | The “Fund Complex” consists of the Boston Trust Walden Funds. |
| **** | Ms. Craig is Secretary effective October 2, 2023, and Ms. Roessler is Chief Compliance Officer and AML Officer effective October 2, 2023. |
This page is intentionally left blank.
| Investment Adviser |
| Boston Trust Walden Inc. |
| One Beacon Street |
| Boston, MA 02108 |
| |
| Transfer Agent |
| FIS Investor Services, LLC |
| 4249 Easton Way, Suite 400 |
| Columbus, OH 43219 |
| |
| Administrator |
| The Northern Trust Company |
| 50 South LaSalle Street |
| Chicago, IL 60603 |
| |
| Distributor |
| Foreside Financial Services, LLC |
| Three Canal Plaza, Suite 100 |
| Portland, ME 04101 |
| |
| Independent Registered Public Accounting Firm |
| Cohen & Company, Ltd. |
| 342 North Water Street, Suite 830 |
| Milwaukee, WI 53202 |
| |
| Legal Counsel |
| Thompson Hine LLP |
| 41 South High Street, Suite 1700 |
| Columbus, OH 43215 |
This report is intended for the shareholders of the Funds and may not be used as sales literature unless preceded or accompanied by a current prospectus.
Past performance results shown should not be considered a representation of future performance.
Share price and returns will fluctuate so that shares, when redeemed, may be worth more or less than their original cost.
Statements and other information herein are dated and subject to change.
For Electronic delivery of annual and semi-annual shareholder reports, please contact your financial advisor or for direct shareholders the Funds at 888-248-1954 for assistance in going paperless (e-delivery) for shareholder materials.
02/24
(b) Not applicable.
Item 2. Code of Ethics.
(a) The registrant has adopted a code of ethics that applies to the registrant’s principal executive officer, principal financial officer, principal accounting officer or controller, or persons performing similar functions. This code of ethics is included as an Exhibit.
(b) During the period covered by the report, with respect to the registrant's code of ethics that applies to its principal executive officer, principal financial officer, principal accounting officer or controller, or persons performing similar functions; there have been no amendments to, nor any waivers granted from, a provision that relates to any element of the code of ethics definition enumerated in paragraph (b) of this Item 2.
Item 3. Audit Committee Financial Expert.
| (a)(1) | The registrant’s board of directors has determined that the registrant has at least one audit committee financial expert serving on its audit committee. |
| (a)(2) | The audit committee financial experts are Diane Armstrong and Louis F. Hutt, and each are “independent” for purposes of this Item 3 of Form N-CSR. |
Item 4. Principal Accountant Fees and Services.
| | | | | December 2023 | | | December 2022 | |
| (a) | | Audit Fees | | $ | 114,100 | | | $ | 101,100 | |
| (b) | | Audit-Related Fees | | $ | 11,800 | | | $ | 17,220 | |
The fees for 2023 and 2022 relate to the consent issuance in three Form 17f-2 filings filed with the Securities and Exchange Commission (“SEC”).
| | | | | December 2023 | | | December 2022 | |
| (c) | | Tax Fees | | $ | 31,000 | | | $ | 30,000 | |
Tax fees for both 2023 and 2022 relate to the preparation of the Funds’ federal and state income tax returns, federal excise tax return review and review of capital gain and income distribution calculations.
| | | | | December 2023 | | | December 2022 | |
| (d) | | All Other Fees | | $ | 0 | | | $ | 0 | |
| (e)(1) | The Audit Committee may pre-approve at any regularly scheduled Audit Committee meeting audit, audit-related, tax and other non-audit services to be rendered or that may be rendered by the Auditor to the Funds and certain non-audit services to be rendered by the Auditor to the Advisor which require pre-approval by the Audit Committee. In connection with such pre-approvals, the Auditor, or a Fund officer, with the assistance of the Auditor, shall provide the Audit Committee with a report containing information about each type of service to be pre-approved at the meeting. |
| (e)(2) | For the fiscal years ended December 31, 2023 and December 31, 2022, 100% of all the fees in paragraph (b) through (d) were approved by the Audit Committee. |
| (g) | For the fiscal year ended December 31, 2023, Cohen & Company, Ltd. billed non-audit fees of $42,800. For the fiscal year ended December 31, 2022, Cohen & Company, Ltd. billed non-audit fees of $47,220. |
Item 5. Audit Committee of Listed Registrants.
Not applicable.
Item 6. Schedule of Investments.
| (a) | Included as part of the report to shareholders filed under Item 1. |
Item 7. Disclosure of Proxy Voting Policies and Procedures for Closed-End Management Investment Companies.
Not applicable.
Item 8. Portfolio Managers of Closed-End Management Investment Companies.
Not applicable.
Item 9. Purchases of Equity Securities by Closed-End Management Investment Company and Affiliated Purchasers.
Not applicable.
Item 10. Submission of Matters to a Vote of Security Holders.
Not applicable.
Item 11. Controls and Procedures.
| (a) | The registrant’s principal executive officer and principal financial officer have concluded, based on their evaluation of the registrant's disclosure controls and procedures as conducted within 90 days of the filing date of this report, that these disclosure controls and procedures are adequately designed and are operating effectively to ensure that information required to be disclosed by the registrant on Form N-CSR is recorded, processed, summarized and reported within the time periods specified in the Securities and Exchange Commission's rules and forms. |
| (b) | There were no changes in the registrant’s internal control over financial reporting (as defined in Rule 30a-3(d) under the Act (17 CFR 270.30a-3(d)) that occurred during the period covered by this report that have materially affected or are reasonably likely to materially affect, the registrant’s internal control over financial reporting. |
Item 12. Disclosure of Securities Lending Activities for Closed-End Management Investment Companies.
Not applicable.
Item 13. Exhibits.
| (a)(4) | There has been no change to the registrant’s independent public accountant. |
SIGNATURES
Pursuant to the requirements of the Securities Exchange Act of 1934 and the Investment Company Act of 1940, the registrant has duly caused this report to be signed on its behalf by the undersigned, thereunto duly authorized.
Boston Trust Walden Funds
| By: | /s/Lucia Santini | |
| | Lucia Santini | |
| | President and Principal Executive Officer | |
Date: March 4, 2024
Pursuant to the requirements of the Securities Exchange Act of 1934 and the Investment Company Act of 1940, this report has been signed below by the following persons on behalf of the registrant and in the capacities and on the dates indicated.
| By: | /s/Lucia Santini | |
| | Lucia Santini | |
| | President and Principal Executive Officer | |
Date: March 4, 2024
| By: | /s/Jennifer Ellis | |
| | Jennifer Ellis | |
| | Treasurer and Principal Financial Officer | |
Date: March 4, 2024