UNITED STATES
SECURITIES AND EXCHANGE COMMISSION
Washington, D.C. 20549
FORM N-CSR
CERTIFIED SHAREHOLDER REPORT OF REGISTERED
MANAGEMENT INVESTMENT COMPANIES
Investment Company Act file number 811-06526
| Boston Trust Walden Funds |
| (Exact name of registrant as specified in charter) |
| |
| | One Beacon Street, Boston MA | | 02108 | |
| | (Address of principal executive offices) | | (Zip code) | |
| | | | | |
| 4400 Easton Commons, Suite 200, Columbus, OH | 43219 |
| (Name and address of agent for service) |
Registrant’s telephone number, including area code: 1-800-282-8782
Date of fiscal year end: December 31
Date of reporting period: December 31, 2020
Item 1. Reports to Stockholders.
The report on Form N-CSR filed herewith amends and restates the Form N-CSR filed on March 8, 2021 (Accession # 0001104659-21-033339) as follows (all changes are to Item 1, “Reports to Stockholders,” of the original filing):
The Financial Highlights were titled Financial Statements on the Table of Contents for Boston Trust Walden Equity Fund. The title has been corrected to Financial Highlights.
The Average Annual Total Return - Since Inception (for the period 11/30/11 - 12/31/20) for the Russell 2500 Index was presented as 13.24% in the Investment Performance section for Boston Trust SMID Cap Fund. That figure is corrected to 13.60% in this restated filing.
The Average Annual Total Return - Since Inception (for the period 8/1/11 - 12/31/20) for the Russell Midcap Index was presented as 13.54% in the Investment Performance section for Boston Trust Walden Midcap Fund. That figure is corrected to 12.84% in this restated filing.
The Average Annual Total Return - Since Inception (for the period 6/28/12 - 12/31/20) for the Russell 2500 Index was presented as 13.24% in the Investment Performance section for Boston Trust Walden SMID Cap Fund. That figure is corrected to 13.86% in this restated filing.
The Hypothetical Growth of a $1,000,000 Investment - Since Inception (for the period 6/9/15 - 12/31/20) for the FTSE All-World Developed ex-US Index was presented as $1,368,285 in the line graph for Boston Trust Walden International Equity Fund within the Investment Performance section. That figure is corrected to $1,405,304 in this restated filing.
A reference to 2019 Form 1099-DIV given in the Supplementary Information - Federal Income Tax Information section has been corrected to 2020 Form 1099-DIV.
A footnote, “The `Fund Complex' consists of the Boston Trust Walden Funds.” was omitted from below the Information about Trustees and Officers table.
No other information or disclosures contained in the original filing, including the Funds' performance information, are being amended by this Form N-CSR/A. This Form N-CSR/A does not reflect events occurring after the filing of the original Form N-CSR.
Annual Report
December 31, 2020


Boston Trust Asset Management Fund Boston Trust Equity Fund Boston Trust Midcap Fund Boston Trust SMID Cap Fund | Boston Trust Walden Balanced Fund (formerly known as the Walden Balanced Fund) Boston Trust Walden Equity Fund (formerly known as the Walden Equity Fund) Boston Trust Walden Midcap Fund (formerly known as the Walden Midcap Fund) Boston Trust Walden SMID Cap Fund (formerly known as the Walden SMID Cap Fund) Boston Trust Walden Small Cap Fund Boston Trust Walden International Equity Fund (formerly known as the Walden International Equity Fund) |
This page is intentionally left blank.
| Table of Contents | Annual Report |
| | December 31, 2019 |
| Boston Trust Asset Management Fund | |
| Manager Commentary | 2 |
| Investment Performance | 3 |
| Schedule of Portfolio Investments | 8 |
| Financial Statements | 10 |
| Financial Highlights | 12 |
| | |
| Boston Trust Equity Fund | |
| Manager Commentary | 2 |
| Investment Performance | 3 |
| Schedule of Portfolio Investments | 13 |
| Financial Statements | 14 |
| Financial Highlights | 16 |
| | |
| Boston Trust Midcap Fund | |
| Manager Commentary | 4 |
| Investment Performance | 5 |
| Schedule of Portfolio Investments | 17 |
| Financial Statements | 19 |
| Financial Highlights | 21 |
| | |
| Boston Trust SMID Cap Fund | |
| Manager Commentary | 6 |
| Investment Performance | 7 |
| Schedule of Portfolio Investments | 22 |
| Financial Statements | 24 |
| Financial Highlights | 26 |
| | |
| Annual ESG Report | 27 |
| | |
| Boston Trust Walden Balanced Fund | |
| Manager Commentary | 28 |
| Investment Performance | 29 |
| Schedule of Portfolio Investments | 38 |
| Financial Statements | 41 |
| Financial Highlights | 43 |
| | |
| Boston Trust Walden Equity Fund | |
| Manager Commentary | 28 |
| Investment Performance | 29 |
| Schedule of Portfolio Investments | 44 |
| Financial Statements | 45 |
| Financial Highlights | 47 |
| | |
| Boston Trust Walden Midcap Fund | |
| Manager Commentary | 30 |
| Investment Performance | 31 |
| Schedule of Portfolio Investments | 48 |
| Financial Statements | 49 |
| Financial Highlights | 51 |
| | |
| Boston Trust Walden SMID Cap Fund | |
| Manager Commentary | 32 |
| Investment Performance | 33 |
| Schedule of Portfolio Investments | 52 |
| Financial Statements | 53 |
| Financial Highlights | 55 |
| | |
| Boston Trust Walden Small Cap Fund | |
| Manager Commentary | 34 |
| Investment Performance | 35 |
| Schedule of Portfolio Investments | 56 |
| Financial Statements | 58 |
| Financial Highlights | 60 |
| | |
| Boston Trust Walden International Equity Fund | |
| Manager Commentary | 36 |
| Investment Performance | 37 |
| Schedule of Portfolio Investments | 61 |
| Financial Statements | 63 |
| Financial Highlights | 65 |
| | |
| Notes to the Financial Statements | 66 |
| Report of Independent Registered Public Accounting Firm | 75 |
| Supplementary Information | 77 |
| Investment Adviser Contract Approval | 83 |
| Information about Trustees and Officers | 85 |
Boston Trust Walden Inc., a subsidiary of Boston Trust Walden Company, serves as investment adviser (the “Adviser”) to the Boston Trust Walden Funds and receives a fee for its services. Boston Trust Walden Company provides certain administrative, operational, and investment support functions for the Adviser and is paid a fee for these services by the Adviser.
Shares of the Funds are not deposits of, obligations of, or guaranteed by Boston Trust Walden Company or its affiliates, nor are they federally insured by the FDIC. Investments in the Funds involve investment risks, including the possible loss of principal. Funds are distributed by Foreside Financial Services, LLC.
The foregoing information and opinions are for general information only. The Boston Trust Walden Funds and Boston Trust Walden Company do not assume liability for any loss, which may result from the reliance by any person upon any such information or opinions. Such information and opinions are subject to change without notice, are for general information only, and are not intended as an offer or solicitation with respect to the purchase or sale of any security or offering individual or personalized investment advice. Portfolio composition is as of December 31, 2020 and is subject to change without notice.
The Boston Trust Walden Funds may invest in foreign securities, which may involve risk not typically associated with U.S. investments.
To reduce expenses, we may only mail one copy of the Funds’ shareholder updates, such as their prospectus, annual report, and semi-annual report, to those addresses shared by two or more accounts. If you are a direct shareholder and wish to receive individual copies of these documents, please call us at 1-800- 282-8782 x7050. If you are not a direct shareholder, please contact your financial institution to opt out of householding. We will begin sending you individual copies thirty days after receiving your request.
Important Notice: The Securities and Exchange Commission will permit funds to deliver shareholder reports electronically beginning January 1, 2021. At that time, the Boston Trust Walden Funds will send a notice, either by mail or email, each time your fund’s updated report is available on our website (www.bostontrustwalden.com). Investors enrolled in electronic delivery will receive the notice by email with links to the updated report. Investors who are not enrolled in electronic delivery by January 1, 2021 will receive the notice in the mail. All investors who prefer to receive shareholder reports in paper may, at any time, choose that option free of charge by calling 1-800-282-8782 x7050.
Boston Trust Asset Management Fund
Boston Trust Equity Fund
December 31, 2020
Domenic Colasacco, CFA
Lead Portfolio Manager
Amy Crandall Kaser, CFP®
Portfolio Manager
Jason T. O’Connell, CFA, CAIA, CFP®
Portfolio Manager
Boston Trust Walden Inc.
Asset Management Fund Objective
The Fund seeks long-term capital growth and income through an actively managed portfolio of stocks, bonds and money market instruments.
Equity Fund Objective
The Fund seeks long-term growth of capital through an actively managed portfolio of stocks.
Investment Concerns
Equity securities (stocks) are more volatile and carry more risk and return potential than other forms of investments, including investments in high-grade fixed income securities.
Foreign investing involves risks not typically associated with U.S. investments, including adverse political, social and economic developments and differing auditing and legal standards. These risks are magnified in emerging markets.
Small- to mid-capitalization companies typically have a higher risk of failure and historically have experienced a greater degree of volatility.
Bonds offer a relatively stable level of income, although bond prices will fluctuate, providing the potential for principal gain or loss. Intermediate-term, higher quality bonds generally offer less risk than longer-term bonds and a lower rate of return.
Cash equivalents offer low risk and low return potential.
Manager Commentary (Unaudited)
Management Discussion of Fund Performance
Stocks, as measured by the S&P 500 Index, rose by 18.40% in 2020, a remarkable outcome in its own right but more striking when considering the Index declined by one third during the first quarter of the year. Bond indices also advanced, with the Bloomberg Barclays U.S. Government/Credit Bond Index posting a total return of 8.93%. The rise in value of the Boston Trust Asset Management Fund and the Boston Trust Equity Fund was more muted compared to the rapid rise in many stock indices. For the 12-month period ended December 31, 2020, the Boston Trust Asset Management Fund posted a total return of 7.83%, while the Boston Trust Equity Fund had a total return of 14.53%.
Despite the prevailing turmoil associated with the Coronavirus (COVID-19) pandemic, we remained confident that the crisis would pass eventually. Yet the unknowable depth and duration of the pandemic, and the extent of the associated damage to overall business conditions, led us to assume a more conservative investment position in the Boston Trust Asset Management Fund. For the first time in nearly a decade, we decided to reduce the Fund’s equity allocation closer to the middle, rather than retain equities near the upper end of its specified policy range. We concluded that an equity allocation closer to 60% more prudently reflected the combination of clear near-term economic risks with our core confidence in a return to more normal conditions in time.
As time went on, economic reports suggested that the aggressive fiscal and monetary policy initiatives taken by the federal government had succeeded in removing the worst-case economic scenarios feared broadly in March, 2020. With the full benefit of hindsight, it became clear as well that the pandemic had aided rather than hurt operating conditions of many businesses, in particular those in the distribution and technology sectors that facilitated logistics and communication in our suddenly less mobile society. The cohort of stocks that led the market recovery included several of the giant technology-related companies but also a myriad of newer, less proven companies with, in some cases, astounding expectations for future growth. The Funds had sufficient exposure in the better-situated companies to participate in the market recovery. However, we remained disciplined in our approach and determined it was prudent to avoid what we judged to be more speculative securities, despite the fact that they were enjoying significant stock price momentum. Performance was aided by our decision to increase the Boston Trust Asset Management Fund’s equity allocation gradually through the summer and fall months closer to 70% of total asset value as our confidence in the resilience of the economy improved.*
Looking back, the Funds’ performance for 2020 may have been several percentage points higher had we taken more risk through the year—first by ignoring the pandemic related uncertainty in March, and later by including newer, less proven companies in the portfolio even though their stock valuations were at extreme levels. However, in each Fund’s long life, 2020 was not the first year when our lower risk approach was not rewarded. Nor is it likely to be the last. Yet we remain confident that the balanced, more prudent investment process we have followed since the Funds’ inception will continue to serve shareholders well over the longer term.
As we begin a new year, none of us know if another exogenous event may develop in 2021, or the actual business and political paths that lie ahead. With most stock indices at or near record highs, however, it is reasonable to assume that investors generally expect broad-based economic improvement through the year, with the adverse impact of the pandemic effectively behind us by next summer or fall. Strong gains in overall corporate profits, with continued low inflation and near-zero interest rates, also appear to be embedded in current aggregate stock values. Stocks generally are not undervalued at this time by virtually any traditional metric, but history suggests that overall equity values are likely to continue to trend higher in an environment of rising employment, corporate profits, and overall gross domestic product1, which we expect through the year. Despite our general optimism about trends in overall equity values, we prefer to continue to avoid the stocks of companies with extreme valuations and overly optimistic estimates of future business performance. In our experience, most of these newer companies will fail to achieve the business success embedded in current stock prices, disappointing their shareholders. Within the equity segment, we have focused instead on companies with a long history of profitability and business models that are tested against the usual competitive forces that surface eventually in every industry.*
* Portfolio composition is subject to change.
1 The Gross Domestic Product (GDP) is the value of goods and services produced in a given country in a given year.
| Investment Performance (Unaudited) | Boston Trust Asset Management Fund |
| | Boston Trust Equity Fund |
| | December 31, 2020 |
| | | For the periods ended 12/31/20 | |
| | | Average Annual Total Returns | |
| | | | | | | | | | | | | | | | | | | | | | | | | | | | Since | | | | Since | |
| | | | | | | | | | | | | | | | | | | | | | | | | | | | Inception | | | | Inception | |
| | | | 1 Year | | | | 3 Years | | | | 5 Years | | | | 10 Years | | | | 15 Years | | | | 20 Years | | | | (12/1/95) | | | | (10/1/03) | |
| Boston Trust Asset Management Fund | | | 7.83 | % | | | 10.10 | % | | | 11.20 | % | | | 9.81 | % | | | 8.32 | % | | | 7.30 | % | | | 8.39 | % | | | — | |
| Boston Trust Equity Fund | | | 14.53 | % | | | 13.71 | % | | | 14.72 | % | | | 12.11 | % | | | 9.57 | % | | | — | | | | — | | | | 9.51 | % |
| S&P 500 Index | | | 18.40 | % | | | 14.18 | % | | | 15.22 | % | | | 13.88 | % | | | 9.88 | % | | | 7.47 | % | | | 9.60 | % | | | 10.08 | % |
| Bloomberg Barclays U.S. Government/Credit Bond Index | | | 8.93 | % | | | 5.97 | % | | | 4.98 | % | | | 4.19 | % | | | 4.64 | % | | | 5.01 | % | | | 5.28 | % | | | 4.41 | % |
| FTSE 3 Month US T-Bill Index | | | 0.58 | % | | | 1.56 | % | | | 1.16 | % | | | 0.60 | % | | | 1.16 | % | | | 1.43 | % | | | 2.19 | % | | | 1.27 | % |
Hypothetical Growth of a $100,000 Investment

The above charts represent a 10-year hypothetical $100,000 investment in the Boston Trust Asset Management Fund and the Boston Trust Equity Fund, and includes the reinvestment of dividends and capital gains in the Funds. The returns shown on the table and the graphs do not reflect the deduction of taxes a shareholder would pay on Fund distributions or the redemption of Fund shares.
The Boston Trust Asset Management Fund is measured against a combination of equity and fixed income indices. The Boston Trust Equity Fund is measured against the Standard & Poor’s 500 Index (“S&P 500”), which is widely regarded as a gauge of the U.S. equities market, includes 500 leading companies in leading industries of the U.S. economy. Although the S&P 500 focuses on the large-cap segment of the market, with approximately 75% coverage of U.S. equities, it is also widely viewed as a proxy for the total market. The Bloomberg Barclays U.S. Government/Credit Index includes Treasuries (i.e., public obligations of the U.S. Treasury that have remaining maturities of more than one year), government-related issues (e.g., agency, sovereign, supranational, and local authority debt), and USD Corporates. The Bloomberg Barclays U.S. Government/Credit Bond Index is a component of the Bloomberg Barclays U.S. Aggregate Bond Index. The FTSE 3 Month US T-Bill Index reflects monthly return equivalents of yield averages that are not marked to the market. The index is an average of the last three-month treasury bill issues. The three-month treasury bills are the short-term debt obligations of the U.S. Government. The indexes are unmanaged and their performance does not reflect the deduction of expenses associated with a mutual fund, such as investment management and fund accounting fees. The Funds’ performance reflects the deduction of fees for these services. Investors cannot invest directly in an index.
Boston Trust Asset Management Fund
| Fund Net Asset Value: | | $ | 56.29 | |
| Gross Expense Ratio1: | | | 0.90 | % |
Boston Trust Equity Fund
| Fund Net Asset Value: | | $ | 32.89 | |
| Gross Expense Ratio1: | | | 0.91 | % |
Past performance does not guarantee future results. The performance data quoted represents past performance and current returns may be lower or higher. The investment return and principal value will fluctuate so that an investor’s shares, when redeemed may be worth more or less than the original cost. To obtain performance information current to the most recent month-end, please call 1-800-282-8782 ext. 7050.
| 1 | The Gross Expense Ratio is from each Fund’s most recent prospectus, dated May 1, 2020. Additional information pertaining to each Fund’s expense ratio as of December 31, 2020 can be found in the financial highlights included in this report. |
Boston Trust Midcap Fund
December 31, 2020
Stephen J. Amyouny, CFA
Lead Portfolio Manager
Richard Q. Williams, CFA
Portfolio Manager
Mark Zagata, CFA
Portfolio Manager
Boston Trust Walden Inc.
Fund Objective
The Fund seeks long-term capital growth through an actively managed portfolio of stocks of middle capitalization (“mid cap”) companies.
Investment Concerns
Equity securities (stocks) are more volatile and carry more risk and return potential than other forms of investments, including investments in high-grade fixed income securities.
Mid cap funds typically carry additional risks since smaller companies generally have a higher risk of failure.
Manager Commentary (Unaudited)
Management Discussion of Fund Performance
The fourth quarter performance capped off a strong year for the Russell Midcap® Index (“Index”), which finished the year 17% higher than where it started in 2020, even with the 27.07% decline in the first quarter. Indeed, from the market trough in late March, the Index advanced nearly 90%. Even though the Boston Trust Midcap Fund outperformed the Index return (-24.25% versus -27.07%) during the first quarter decline, the Fund’s total return of 8.81% for the 12-month period ended December 31, 2020 trailed the Index by a wide margin.
It should perhaps not be surprising that the Fund failed to keep up in the strong market rally of the second, third, and fourth quarters of 2020. In contrast to the fourth quarter where our emphasis on quality and value detracted from results, the Fund’s full year underperformance stemmed primarily from maintaining our valuation discipline. That said, despite the in-line performance of high-quality stocks in general, it is worth highlighting the relative outperformance of loss making entities over profitable peers, which was stunning: loss-makers1 outperformed profitable companies by more than 60%. Loss-making entities also now comprise 10% of Index value. Given the Fund is entirely invested in stocks of profitable companies, avoiding the loss-making cohort explains much of the relative underperformance.
Outlook
Entering 2021, we can point to several reasons for the optimism that propelled the Index to new all-time highs in the fourth quarter. Among them included: the success in clinical trials and initial distribution of several Coronavirus (COVID-19) vaccines; continued economic recovery supported by significant monetary and fiscal stimuli; somewhat less political uncertainty following the presidential election; and historically low interest rates. However, we also continue to see risk in the current environment: a surge of COVID-19 case counts that is leading to new restrictions on economic activity; a fragile economic recovery still dependent on monetary and fiscal support; and continuing evidence of speculative activity among investors. We believe valuation risk in the market overall to be elevated.
While we do not seek to gain an edge through market timing, we continue to believe that over the long term stock prices ultimately reflect company fundamentals. We do not believe investors will perpetually favor as a group companies that cannot consistently generate profits or free cash flow and yet trade at elevated valuation multiples of sales. Of course, some of these individual companies will emerge as high-quality industry leaders. However, not all, or even a majority of them will succeed. As such, we continue to emphasize in our research and portfolio management activities those companies that have a demonstrated history of profitability, stability, and growth, have sustainable business models, high quality of earnings, and that are trading at reasonable valuations. As of December 31, 2020, the Fund exhibited strong financial characteristics and a more reasonable valuation profile than the Index. As a result, we continue to believe the Fund may provide favorable risk-adjusted returns over the long term.*
| * | Portfolio composition is subject to change. |
| 1 | Loss-makers are defined as companies with five-year cumulative EBIT (earnings before interest and taxes) less than $0. |
| Investment Performance (Unaudited) | Boston Trust Midcap Fund |
| | December 31, 2020 |
| | | For the periods ended 12/31/20 | |
| | | Average Annual Total Returns | |
| | | | | | | | | | | | | | | | | | | Since | |
| | | | | | | | | | | | | | | | | | | Inception | |
| | | 1 Year | | | 3 Years | | | 5 Years | | | 10 Years | | | (09/24/07) | |
| Boston Trust Midcap Fund1 | | | 8.81 | % | | | 10.58 | % | | | 12.72 | % | | | 11.25 | % | | | 9.74 | % |
| Russell Midcap® Index | | | 17.10 | % | | | 11.61 | % | | | 13.40 | % | | | 12.41 | % | | | 9.26 | % |
Hypothetical Growth of a $100,000 Investment
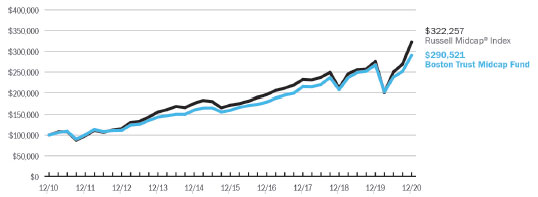
The above chart represents a 10-year hypothetical $100,000 investment in the Boston Trust Midcap Fund, and includes the reinvestment of dividends and capital gains in the Fund. The returns shown on the table and graph do not reflect the deduction of taxes a shareholder would pay on Fund distributions or the redemption of Fund shares.
The Boston Trust Midcap Fund is measured against the Russell Midcap® Index, which is an unmanaged index that tracks the performance of the mid-cap segment of the U.S. equity universe. The Russell Midcap® Index is a subset of the Russell 1000® Index. It includes approximately 800 of the smallest securities based on a combination of their market capitalization and current index membership. The Russell Midcap® Index represents approximately 31% of the total market capitalization of the Russell 1000 companies. The performance of an index does not reflect the deduction of expenses associated with a mutual fund, such as investment management and fund accounting fees. The Fund’s performance reflects the deduction of fees for these services. Investors cannot invest directly in an index.
| Fund Net Asset Value: | | $ | 21.02 | |
| Gross Expense Ratio1: | | | 1.04 | % |
Past performance does not guarantee future results. The performance data quoted represents past performance and current returns may be lower or higher. The investment return and principal value will fluctuate so that an investor’s shares, when redeemed may be worth more or less than the original cost. Returns less than one year are not annualized. To obtain performance information current to the most recent month-end, please call 1-800-282-8782 ext. 7050.
| 1 | The Gross Expense Ratio is from the Fund’s most recent prospectus, dated May 1, 2020. The contractual fee limit under the Fund’s expense limitation agreement is 1.00% of the Fund’s average annual net assets, subject to certain limitations as described in the Fund’s prospectus. Additional information pertaining to the Fund’s expense ratio as of December 31, 2020 can be found in the financial highlights included in this report. The investment performance may reflect fee reductions. If such fee reductions had not occurred, the quoted performance would have been lower. The contractual fee waiver continues through May 1, 2021 and may be renewed thereafter. |
Boston Trust SMID Cap Fund
December 31, 2020
Kenneth P. Scott, CFA
Lead Portfolio Manager
Richard Q. Williams, CFA
Portfolio Manager
Leanne Moore
Portfolio Manager
Boston Trust Walden Inc.
Fund Objective
The Fund seeks long-term capital growth through an actively managed portfolio of stocks of small to middle capitalization (“smid cap”) companies.
Investment Concerns
Equity securities (stocks) are more volatile and carry more risk and return potential than other forms of investments, including investments in high-grade fixed income securities.
Smid cap companies typically have a higher risk of failure and historically have experienced a greater degree of volatility.
Manager Commentary (Unaudited)
Management Discussion of Fund Performance
The fourth quarter performance capped off a year of superlatives for the Russell 2500™ Index (“Index”), which finished the year 20% higher than where it started in 2020, despite the 29.72% decline in the first quarter. Indeed, from the market trough in late March, the Index doubled in value. Even with the outperformance of the Fund during the first quarter drawdown (-25.42% versus -29.72%), the Fund’s total return of 8.26% for the 12-month period ended December 31, 2020 underperformed the Index by a wide margin.
It should perhaps not be surprising that the Fund failed to keep up in the strong market rally of the second, third, and fourth quarters of 2020. But to reiterate a theme consistent throughout the year, the underperformance was largely due to style: stocks of higher quality companies, particularly the more reasonably valued cohort, underperformed the overall index by a wide margin, and the Fund performed similarly. The performance gap between stocks of profitable and unprofitable companies was stunning: loss-makers1 outperformed by more than 65%. Loss-making entities also now comprise 18% of the index’s value. Given the Fund is entirely invested in stocks of profitable companies, the “allocation” effect of avoiding the loss-making cohort presented headwinds too strong to overcome, even with execution of our approach that was consistent with expectations.
Outlook
Entering 2021, we can point to several reasons for the optimism that has propelled the Index to new all-time highs in the fourth quarter. Among them included: the success in clinical trials and initial distribution of several Coronavirus (COVID-19) vaccines; continued economic recovery; somewhat less political uncertainty following the U.S. presidential election; and historically low interest rates. However, we also continue to see some risks in the current environment: a new surge of COVID-19 case counts that is leading to new restrictions on economic activity; a fragile economic recovery still dependent on monetary and fiscal support; and continuing evidence of speculative activity among investors. We believe valuation risk in the market overall to be elevated.
While we do not seek to gain an edge through market timing, we continue to believe that over the long term stock prices ultimately reflect company fundamentals. We do not believe investors will perpetually favor as a group companies that cannot consistently generate profits or free cash flow and yet trade at elevated valuation multiples of sales. Of course, some of these individual companies will emerge as high-quality industry leaders. However, not all, or even a majority of them will succeed. As such, we continue to emphasize in our research and portfolio management activities those companies that have a demonstrated history of profitability, stability, and growth, have sustainable business models, high quality of earnings, and that are trading at reasonable valuations. As of December 31, 2020, the Fund exhibited strong financial characteristics and a more reasonable valuation profile than the Index. As a result, we continue to believe the Fund may provide favorable risk-adjusted returns over the long term.*
| * | Portfolio composition is subject to change. |
| 1 | Loss-makers are defined as companies with five-year cumulative EBIT (earnings before interest and taxes) less than $0. |
| Investment Performance (Unaudited) | | Boston Trust SMID Cap Fund |
| | | December 31, 2020 |
| | | For the periods ended 12/31/20 | |
| | | Average Annual Total Returns | |
| | | | | | | | | | | | | | | Since | |
| | | | | | | | | | | | | | | Inception | |
| | | 1 Year | | | 3 Years | | | 5 Years | | | (11/30/11) | |
| Boston Trust SMID Cap Fund1 | | | 8.26 | % | | | 9.00 | % | | | 13.00 | % | | | 11.60 | % |
| Russell 2500TM Index | | | 19.99 | % | | | 11.33 | % | | | 13.64 | % | | | 13.60 | % |
Hypothetical Growth of a $1,000,000 Investment
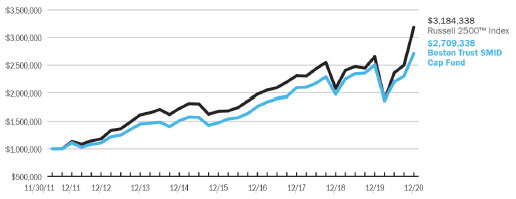
The above chart represents a hypothetical $1,000,000 investment in the Boston Trust SMID Cap Fund from November 30, 2011 to December 31, 2020, and includes the reinvestment of dividends and capital gains in the Fund. The returns shown on the table and the graph do not reflect the deduction of taxes a shareholder would pay on Fund distributions or the redemption of Fund shares.
The Boston Trust SMID Cap Fund is measured against the Russell 2500™ Index, which is an unmanaged index that tracks the performance of the small- to mid-cap segment of the U.S. equity universe, commonly referred to as “smid” cap. The Russell 2500™ Index is a subset of the Russell 3000® Index. It includes approximately 2500 of the smallest securities based on a combination of their market cap and current index membership. Russell Investment Group is the source and owner of the trademarks, service marks and copyrights related to the Russell Indexes. Russell® is a trademark of Russell Investment Group. The performance of an index does not reflect the deduction of expenses associated with a mutual fund, such as investment management and fund accounting fees. The Fund’s performance reflects the deduction of fees for these services. Investors cannot invest directly in an index.
| Fund Net Asset Value: | | $ | 19.23 | |
| Gross Expense Ratio1: | | | 0.95 | % |
Past performance does not guarantee future results. The performance data quoted represents past performance and current returns may be lower or higher. The investment return and principal value will fluctuate so that an investor’s shares, when redeemed may be worth more or less than the original cost. Returns less than one year are not annualized. To obtain performance information current to the most recent month-end, please call 1-800-282-8782 ext. 7050.
| 1 | The Gross Expense Ratio is from the Fund’s most recent prospectus, dated May 1, 2020. The contractual fee limit under the Fund’s expense limitation agreement is 0.75% of the Fund’s average annual net assets, subject to certain limitations as described in the Fund’s prospectus. Please see the Fund’s most recent prospectus for details. Additional information pertaining to the Fund’s expense ratio as of December 31, 2020 can be found in the financial highlights included in this report. The investment performance may reflect fee reductions. If such fee reductions had not occurred, the quoted performance would have been lower. The contractual fee waiver continues through May 1, 2021 and may be renewed thereafter. |
| Schedule of Portfolio Investments | | Boston Trust Asset Management Fund
December 31, 2020 |
| Security Description | | Shares | | | Fair Value ($) | |
| Common Stocks (72.7%) | | | | | | | | |
| Communication Services (7.6%) | | | | | | | | |
| Alphabet, Inc., Class A (a) | | | 2,000 | | | | 3,505,280 | |
| Alphabet, Inc., Class C (a) | | | 11,000 | | | | 19,270,680 | |
| Comcast Corp., Class A | | | 200,000 | | | | 10,480,000 | |
| Facebook, Inc., Class B (a) | | | 22,500 | | | | 6,146,100 | |
| Omnicom Group, Inc. | | | 10,000 | | | | 623,700 | |
| Verizon Communications, Inc. | | | 90,000 | | | | 5,287,500 | |
| | | | | | | | 45,313,260 | |
| Consumer Discretionary (6.1%) | | | | | | | | |
| Autoliv, Inc. | | | 20,000 | | | | 1,842,000 | |
| Lowe’s Cos., Inc. | | | 25,000 | | | | 4,012,750 | |
| NIKE, Inc., Class B | | | 115,000 | | | | 16,269,050 | |
| Ross Stores, Inc. | | | 15,000 | | | | 1,842,150 | |
| Starbucks Corp. | | | 100,000 | | | | 10,698,000 | |
| The Home Depot, Inc. | | | 5,000 | | | | 1,328,100 | |
| The TJX Cos., Inc. | | | 10,000 | | | | 682,900 | |
| | | | | | | | 36,674,950 | |
| Consumer Staples (6.7%) | | | | | | | | |
| Church & Dwight Co., Inc. | | | 50,000 | | | | 4,361,500 | |
| Costco Wholesale Corp. | | | 40,000 | | | | 15,071,200 | |
| Diageo PLC, Sponsored ADR | | | 25,000 | | | | 3,970,250 | |
| McCormick & Co., Inc. | | | 40,000 | | | | 3,824,000 | |
| PepsiCo, Inc. | | | 30,000 | | | | 4,449,000 | |
| Procter & Gamble Co. (The) | | | 25,000 | | | | 3,478,500 | |
| Sysco Corp. | | | 35,000 | | | | 2,599,100 | |
| The Hershey Co. | | | 15,000 | | | | 2,284,950 | |
| | | | | | | | 40,038,500 | |
| Energy (1.2%) | | | | | | | | |
| Chevron Corp. | | | 20,000 | | | | 1,689,000 | |
| ConocoPhillips | | | 25,000 | | | | 999,750 | |
| Exxon Mobil Corp. | | | 60,000 | | | | 2,473,200 | |
| Schlumberger NV | | | 100,000 | | | | 2,183,000 | |
| | | | | | | | 7,344,950 | |
| Financials (8.9%) | | | | | | | | |
| American Express Co. | | | 30,000 | | | | 3,627,300 | |
| Berkshire Hathaway, Inc., Class B (a) | | | 22,500 | | | | 5,217,075 | |
| Chubb Ltd. | | | 20,000 | | | | 3,078,400 | |
| Cincinnati Financial Corp. | | | 60,000 | | | | 5,242,200 | |
| Comerica, Inc. | | | 20,000 | | | | 1,117,200 | |
| JPMorgan Chase & Co. | | | 85,000 | | | | 10,800,950 | |
| Moody’s Corp. | | | 3,500 | | | | 1,015,840 | |
| Northern Trust Corp. | | | 50,000 | | | | 4,657,000 | |
| PNC Financial Services Group, Inc. | | | 30,000 | | | | 4,470,000 | |
| State Street Corp. | | | 10,000 | | | | 727,800 | |
| T. Rowe Price Group, Inc. | | | 55,000 | | | | 8,326,450 | |
| U.S. Bancorp | | | 100,000 | | | | 4,659,000 | |
| | | | | | | | 52,939,215 | |
| Health Care (9.9%) | | | | | | | | |
| Amgen, Inc. | | | 10,000 | | | | 2,299,200 | |
| Becton, Dickinson & Co. | | | 35,000 | | | | 8,757,700 | |
| Dentsply Sirona, Inc. | | | 50,000 | | | | 2,618,000 | |
| Edwards Lifesciences Corp. (a) | | | 105,000 | | | | 9,579,150 | |
| Henry Schein, Inc. (a) | | | 10,000 | | | | 668,600 | |
| Johnson & Johnson | | | 50,000 | | | | 7,869,000 | |
| Medtronic PLC | | | 27,500 | | | | 3,221,350 | |
| Merck & Co., Inc. | | | 50,000 | | | | 4,090,000 | |
| Mettler-Toledo International, Inc. (a) | | | 5,000 | | | | 5,698,400 | |
| Stryker Corp. | | | 25,000 | | | | 6,126,000 | |
| UnitedHealth Group, Inc. | | | 17,500 | | | | 6,136,900 | |
| Waters Corp. (a) | | 7,500 | | | 1,855,650 | |
| | | | | | 58,919,950 | |
| Industrials (8.2%) | | | | | | |
| 3M Co. | | 32,500 | | | 5,680,675 | |
| Donaldson Co., Inc. | | 50,000 | | | 2,794,000 | |
| Honeywell International, Inc. | | 15,000 | | | 3,190,500 | |
| Hubbell, Inc. | | 42,500 | | | 6,663,575 | |
| Illinois Tool Works, Inc. | | 30,000 | | | 6,116,400 | |
| Union Pacific Corp. | | 45,000 | | | 9,369,900 | |
| United Parcel Service, Inc., Class B | | 54,000 | | | 9,093,600 | |
| W.W. Grainger, Inc. | | 15,000 | | | 6,125,100 | |
| | | | | | 49,033,750 | |
| Information Technology (21.8%) | | | | | | |
| Accenture PLC, Class A | | 67,500 | | | 17,631,675 | |
| Apple, Inc. | | 300,000 | | | 39,807,000 | |
| Automatic Data Processing, Inc. | | 81,000 | | | 14,272,200 | |
| Cisco Systems, Inc. | | 65,000 | | | 2,908,750 | |
| Intuit, Inc. | | 3,500 | | | 1,329,475 | |
| Microsoft Corp. | | 145,000 | | | 32,250,900 | |
| Oracle Corp. | | 100,000 | | | 6,469,000 | |
| Visa, Inc., Class A | | 70,000 | | | 15,311,100 | |
| | | | | | 129,980,100 | |
| Materials (1.4%) | | | | | | |
| Air Products & Chemicals, Inc. | | 15,000 | | | 4,098,300 | |
| AptarGroup, Inc. | | 32,500 | | | 4,448,925 | |
| | | | | | 8,547,225 | |
| Utilities (0.9%) | | | | | | |
| Eversource Energy | | 60,000 | | | 5,190,600 | |
| | | | | | 5,190,600 | |
| TOTAL COMMON STOCKS (Cost $135,053,716) | | 433,982,500 | |
| | Principal | | | | | |
| | | Amount ($) | | | | | |
| Corporate Bonds (3.0%) | | | | | | | | |
| | | | | | | | | |
| Communication Services (0.2%) | | | | | | | | |
| Comcast Corp., 4.25%, 10/15/30, Callable 7/15/30 @ 100 | | | 900,000 | | | | 1,109,106 | |
| | | | | | | | | |
| Financials (1.6%) | | | | | | | | |
| American Express Co., 2.65%, 12/2/22 | | | 1,926,000 | | | | 2,011,000 | |
| Berkshire Hathaway, Inc., 3.13%, 3/15/26, Callable 12/15/25 @ 100 | | | 2,000,000 | | | | 2,235,643 | |
| Cincinnati Financial Corp., 6.92%, 5/15/28 | | | 500,000 | | | | 659,803 | |
| JPMorgan Chase & Co., 3.90%, 7/15/25, Callable 4/15/25 @ 100 | | | 1,000,000 | | | | 1,136,719 | |
| JPMorgan Chase & Co., 4.01%, 4/23/29, Callable 4/23/28 @ 100 | | | 1,000,000 | | | | 1,175,174 | |
| Wells Fargo & Co., 3.55%, 9/29/25, MTN | | | 2,000,000 | | | | 2,247,670 | |
| | | | | | | | 9,466,009 | |
| Health Care (0.2%) | | | | | | | | |
| Becton, Dickinson & Co., 3.13%, 11/8/21 | | | 1,000,000 | | | | 1,022,298 | |
| | | | | | | | | |
| Industrials (0.2%) | | | | | | | | |
| Hubbell, Inc., 3.50%, 2/15/28, Callable 11/15/27 @ 100 | | | 1,000,000 | | | | 1,089,705 | |
See Notes to Financial Statements
| Schedule of Portfolio Investments | | Boston Trust Asset Management Fund
December 31, 2020 |
| | | Principal | | | | |
| Security Description | | Amount ($) | | | Fair Value ($) | |
| Corporate Bonds, Continued | | | | | | |
| | | | | | | |
| Information Technology (0.8%) | | | | | | |
| Apple, Inc., 3.25%, 2/23/26, Callable 11/23/25 @ 100 | | 2,500,000 | | | 2,807,453 | |
| Visa, Inc., 3.15%, 12/14/25, Callable 9/14/25 @ 100 | | 2,000,000 | | | 2,245,174 | |
| | | | | | 5,052,627 | |
| TOTAL CORPORATE BONDS (Cost $16,244,007) | | | | | 17,739,745 | |
| | | | | | | | | |
| Municipal Bonds (3.8%) | | | | | | | | |
| | | | | | | | | |
| Massachusetts (3.8%) | | | | | | | | |
| City of Newton Massachusetts, GO, 2.00%, 2/15/36, Callable 2/15/29 @ 100 | | | 545,000 | | | | 563,334 | |
| Commonwealth of Massachusetts Transportation Fund Revenue, Series A, 4.00%, 6/1/36, Callable 12/1/27 @ 100 | | | 500,000 | | | | 591,775 | |
| Commonwealth of Massachusetts, GO, Series C, 5.50%, 12/1/22, AGM | | | 600,000 | | | | 661,176 | |
| Commonwealth of Massachusetts, GO, Series C, 4.00%, 7/1/31, Callable 7/1/22 @ 100 | | | 1,000,000 | | | | 1,054,360 | |
| Commonwealth of Massachusetts, GO, Series A, 5.00%, 3/1/32, Callable 3/1/24 @ 100 | | | 200,000 | | | | 229,682 | |
| Commonwealth of Massachusetts, GO, Series D, 3.00%, 5/1/35, Callable 5/1/29 @ 100 (b) | | | 7,550,000 | | | | 8,545,920 | |
| Commonwealth of Massachusetts, GO, Series D, 3.00%, 5/1/36, Callable 5/1/29 @ 100 (b) | | | 5,000,000 | | | | 5,632,049 | |
| Commonwealth of Massachusetts, GO, Series B, 5.00%, 4/1/37, Callable 4/1/27 @ 100 | | | 250,000 | | | | 310,395 | |
| Commonwealth of Massachusetts, GO, Series E, 4.00%, 9/1/37, Callable 9/1/25 @ 100 | | | 1,600,000 | | | | 1,827,888 | |
| Commonwealth of Massachusetts, GO, Series B, 5.00%, 7/1/38, Callable 7/1/26 @ 100 | | | 260,000 | | | | 316,163 | |
| Commonwealth of Massachusetts, GO, Series A, 5.00%, 1/1/43, Callable 1/1/28 @ 100 | | | 250,000 | | | | 311,268 | |
| Commonwealth of Massachusetts, GO, Series C, 5.00%, 5/1/46, Callable 5/1/29 @ 100 | | | 2,000,000 | | | | 2,551,160 | |
| | | | | | | | 22,595,170 | |
| Washington (0.0%) (c) | | | | | | | | |
| State of Washington, Series A, 5.00%, 8/1/35, Callable 8/1/23 @ 100 | | | 250,000 | | | | 278,508 | |
| TOTAL MUNICIPAL BONDS (Cost $21,310,055) | | | | | | | 22,873,678 | |
| | | | | | | | | |
| U.S. Government & U.S. Government Agency Obligations (19.5%) | | | | | | | | |
| | | | | | | | | |
| Federal Farm Credit Bank (2.3%) | | | | | | | | |
| 2.85%, 3/2/28 | | | 2,400,000 | | | | 2,744,039 | |
| 2.95%, 1/27/25 | | | 2,000,000 | | | | 2,210,943 | |
| 3.14%, 12/5/29 | | | 2,500,000 | | | | 2,957,835 | |
| 3.39%, 2/1/28 | | | 2,000,000 | | | | 2,358,736 | |
| 3.85%, 12/26/25 | | | 2,770,000 | | | | 3,229,599 | |
| | | | | | | | 13,501,152 | |
| Federal Home Loan Bank (2.6%) | | | | | | | | |
| 2.38%, 3/13/26 | | | 6,000,000 | | | | 6,596,891 | |
| 2.50%, 12/10/27 | | | 1,500,000 | | | | 1,695,340 | |
| 2.63%, 6/11/27 | | | 1,500,000 | | | | 1,698,089 | |
| 2.88%, 9/13/24 | | | 2,500,000 | | | | 2,742,677 | |
| 3.50%, 9/24/29 | | | 2,000,000 | | | | 2,461,778 | |
| | | | | | | | 15,194,775 | |
| U.S. Treasury Bill (2.1%) | | | | | | | | |
| 0.06%, 3/25/21 | | | | | | | 12,498,195 | |
| | | | | | | | | |
| U.S. Treasury Note (12.5%) | | | | | | | | |
| 1.63%, 8/15/29 | | | | | | | 32,097,657 | |
| 2.75%, 2/15/24 | | | | | | | 43,220,313 | |
| | | | | | | 75,317,970 | |
| TOTAL U.S. GOVERNMENT & U.S. GOVERNMENT AGENCY OBLIGATIONS (Cost $109,432,127) | | | | | | | 116,512,092 | |
| | | Shares | | | | | |
| Investment Companies (1.0%) | | | | | | | | |
| | | | | | | | | |
| JPMorgan U.S. Government Money Market Fund, Capital Shares, 0.03% (d) | | | 5,892,835 | | | | 5,892,835 | |
| TOTAL INVESTMENT COMPANIES (Cost $5,892,835) | | | | | | | 5,892,835 | |
| | | | | | | | | |
| Total Investments (Cost $287,932,740) — 100.0% (e) | | | | | | | 597,000,850 | |
| Other assets in excess of liabilities — 0.0% | | | | | | | 11,954 | |
| NET ASSETS — 100.0% | | | | | | $ | 597,012,804 | |
| (a) | Non-income producing security. |
| (b) | These securities have been deemed illiquid and represents 2.37% of the Fund’s net assets. |
| (c) | Represents less than 0.05%. |
| (d) | Rate disclosed is the seven day yield as of December 31, 2020. |
| (e) | See Federal Tax Information listed in the Notes to the Financial Statements. |
ADR American Depositary Receipt
AGM Assured Guaranty Municipal Corporation
GO General Obligation
MTN Medium Term Note
PLC Public Limited Company
See Notes to Financial Statements
| Financial Statements | | Boston Trust Asset Management Fund |
Statement of Assets and Liabilities
December 31, 2020
| Assets: | | | | |
| Investments, at fair value (cost $287,932,740) | | $ | 597,000,850 | |
| Interest and dividends receivable | | | 1,458,093 | |
| Receivable for capital shares issued | | | 88,346 | |
| Prepaid expenses | | | 22,622 | |
| Total Assets | | | 598,569,911 | |
| Liabilities: | | | | |
| Payable for investments purchased | | | 775,042 | |
| Payable for capital shares redeemed | | | 352,282 | |
| Accrued expenses and other liabilities: | | | | |
| Investment adviser | | | 358,365 | |
| Administration and accounting | | | 22,272 | |
| Chief compliance officer | | | 2,718 | |
| Custodian | | | 5,430 | |
| Shareholder servicing fees | | | 12,953 | |
| Transfer agent | | | 3,311 | |
| Trustee | | | 7,374 | |
| Other | | | 17,360 | |
| Total Liabilities | | | 1,557,107 | |
| Net Assets | | $ | 597,012,804 | |
| Composition of Net Assets: | | | | |
| Paid in capital | | $ | 284,350,728 | |
| Total distributable earnings/(loss) | | | 312,662,076 | |
| Net Assets | | $ | 597,012,804 | |
| Shares outstanding (par value $0.01, unlimited number of shares authorized) | | | 10,606,202 | |
| Net Asset Value, Offering Price and Redemption price per share | | $ | 56.29 | |
Statement of Operations
For the year ended December 31, 2020
| Investment Income: | | | | |
| Interest | | $ | 3,106,909 | |
| Dividends | | | 7,351,806 | |
| Total Investment Income | | | 10,458,715 | |
| Expenses: | | | | |
| Investment adviser | | | 4,097,254 | |
| Administration and accounting | | | 340,255 | |
| Chief compliance officer | | | 44,078 | |
| Custodian | | | 80,041 | |
| Shareholder servicing | | | 163,291 | |
| Transfer agency | | | 40,966 | |
| Trustee | | | 38,733 | |
| Other | | | 194,419 | |
| Total expenses | | | 4,999,037 | |
| Net Expenses | | | 4,999,037 | |
| Net Investment Income | | | 5,459,678 | |
| Net Realized/Unrealized Gains (Losses) from | | | | |
| Investments: | | | | |
| Net realized gains from investment transactions | | | 29,356,144 | |
| Change in unrealized appreciation/depreciation on investments | | | 3,371,961 | |
| Net realized/unrealized gains (losses) on investments | | | 32,728,105 | |
| Change in Net Assets Resulting from Operations | | $ | 38,187,783 | |
See Notes to Financial Statements
| Financial Statements | | Boston Trust Asset Management Fund |
Statements of Changes in Net Assets
| | | For the year ended
December 31, 2020 | | | For the year ended
December 31, 2019 | |
| Investment Activities: | | | | | | | | |
| Operations: | | | | | | | | |
| Net investment income | | $ | 5,459,678 | | | $ | 5,405,837 | |
| Net realized gains from investment transactions | | | 29,356,144 | | | | 6,224,056 | |
| Change in unrealized appreciation/depreciation on investments | | | 3,371,961 | | | | 107,980,131 | |
| Change in Net Assets Resulting from Operations | | | 38,187,783 | | | | 119,610,024 | |
| Distributions to shareholders: | | | | | | | | |
| Total Distributions | | | (32,394,639 | ) | | | (5,742,144 | ) |
| Change in Net Assets Resulting from distributions to shareholders | | | (32,394,639 | ) | | | (5,742,144 | ) |
| Capital Share Transactions: | | | | | | | | |
| Proceeds from shares issued | | | 30,212,741 | | | | 50,601,734 | |
| Proceeds from shares issued in subscriptions in-kind (a) | | | — | | | | 43,771,772 | |
| Dividends reinvested | | | 17,020,652 | | | | 2,889,950 | |
| Cost of shares redeemed | | | (79,164,955 | ) | | | (43,328,375 | ) |
| Cost of in-kind shares redeemed (a) | | | — | | | | (5,777,713 | ) |
| Change in Net Assets Resulting from Capital Share Transactions | | | (31,931,562 | ) | | | 48,157,368 | |
| Change in Net Assets | | | (26,138,418 | ) | | | 162,025,248 | |
| Net Assets: | | | | | | | | |
| Beginning of period | | | 623,151,222 | | | | 461,125,974 | |
| End of period | | $ | 597,012,804 | | | $ | 623,151,222 | |
| Share Transactions: | | | | | | | | |
| Issued | | | 563,599 | | | | 1,000,119 | |
| Issued in-kind (a) | | | — | | | | 808,358 | |
| Reinvested | | | 307,232 | | | | 53,597 | |
| Redeemed | | | (1,560,561 | ) | | | (863,743 | ) |
| Redeemed in-kind (a) | | | — | | | | (118,834 | ) |
| Change in shares | | | (689,730 | ) | | | 879,497 | |
| (a) | See Note 3 in Notes to Financial Statements. |
See Notes to Financial Statements
| Financial Statements | | Boston Trust Asset Management Fund |
| Financial Highlights | | | | | | | | | | | | | | | | | |
| Selected data for a share outstanding throughout the years indicated. | | | | | | | | | | | | | | | |
| | | | | | | | | | | | | | | For the nine | | | | |
| | | For the year | | | For the year | | | For the year | | | For the year | | | months | | | For the year | |
| | | ended | | | ended | | | ended | | | ended | | | ended | | | ended | |
| | | December | | | December | | | December | | | December | | | December | | | March 31, | |
| | | 31, 2020 | | | 31, 2019 | | | 31, 2018 | | | 31, 2017 | | | 31, 2016 | | | 2016 | |
| Net Asset Value, Beginning of Period | | $ | 55.17 | | | $ | 44.27 | | | $ | 46.88 | | | $ | 41.33 | | | $ | 40.92 | | | $ | 41.80 | |
| Investment Activities: | | | | | | | | | | | | | | | | | | | | | | | | |
| Operations: | | | | | | | | | | | | | | | | | | | | | | | | |
| Net investment income | | | 0.53 | | | | 0.48 | | | | 0.52 | | | | 0.49 | | | | 0.35 | | | | 0.55 | |
| Net realized/unrealized gains (losses) from investments | | | 3.74 | | | | 10.93 | | | | (1.20 | ) | | | 6.22 | | | | 2.18 | | | | 0.92 | |
| Total from investment activities | | | 4.27 | | | | 11.41 | | | | (0.68 | ) | | | 6.71 | | | | 2.53 | | | | 1.47 | |
| Dividends: | | | | | | | | | | | | | | | | | | | | | | | | |
| Net investment income | | | (0.53 | ) | | | (0.48 | ) | | | (0.52 | ) | | | (0.49 | ) | | | (0.46 | ) | | | (0.57 | ) |
| Net realized gains from investments | | | (2.62 | ) | | | (0.03 | ) | | | (1.41 | ) | | | (0.67 | ) | | | (1.66 | ) | | | (1.78 | ) |
| Total dividends | | | (3.15 | ) | | | (0.51 | ) | | | (1.93 | ) | | | (1.16 | ) | | | (2.12 | ) | | | (2.35 | ) |
| Net Asset Value, End of Period | | $ | 56.29 | | | $ | 55.17 | | | $ | 44.27 | | | $ | 46.88 | | | $ | 41.33 | | | $ | 40.92 | |
| Total Return | | | 7.83 | % | | | 25.81 | % | | | (1.61 | )% | | | 16.23 | % | | | 6.19 | %(a) | | | 3.65 | % |
| Ratios/Supplemental Data: | | | | | | | | | | | | | | | | | | | | | | | | |
| Net assets at end of period (000’s) | | $ | 597,013 | | | $ | 623,151 | | | $ | 461,126 | | | $ | 496,710 | | | $ | 403,969 | | | $ | 354,405 | |
| Ratio of net expenses to average net assets | | | 0.88 | % | | | 0.90 | % | | | 0.93 | % | | | 0.92 | % | | | 0.95 | %(b) | | | 0.94 | % |
| Ratio of net investment income to average net assets | | | 0.96 | % | | | 1.02 | % | | | 1.05 | % | | | 1.13 | % | | | 1.15 | %(b) | | | 1.32 | % |
| Ratio of expenses (before fee reductions or recoupment of fees previously reimbursed by the investment adviser) to average net assets | | | 0.88 | % | | | 0.90 | % | | | 0.93 | % | | | 0.92 | % | | | 0.95 | %(b) | | | 0.94 | % |
| Portfolio turnover rate | | | 12.18 | % | | | 5.76 | %(c) | | | 2.53 | % | | | 6.96 | % | | | 8.42 | %(a) | | | 11.64 | % |
(a) Not annualized for periods less than one year.
(b) Annualized for periods less than one year.
(c) Excludes impact of in-kind transactions.
See Notes to Financial Statements
| Schedule of Portfolio Investments | | Boston Trust Equity Fund
December 31, 2020 |
| Security Description | | | Shares | | | | Fair Value ($) | |
| Common Stocks (99.4%) | | | | | | | | |
| Communication Services (10.8%) | | | | | | | | |
| Alphabet, Inc., Class A (a) | | | 750 | | | | 1,314,480 | |
| Alphabet, Inc., Class C (a) | | | 5,250 | | | | 9,197,370 | |
| Comcast Corp., Class A | | | 65,000 | | | | 3,406,000 | |
| Facebook, Inc., Class B (a) | | | 10,000 | | | | 2,731,600 | |
| Omnicom Group, Inc. | | | 5,000 | | | | 311,850 | |
| Verizon Communications, Inc. | | | 20,000 | | | | 1,175,000 | |
| | | | | | | | 18,136,300 | |
| Consumer Discretionary (7.5%) | | | | | | | | |
| Autoliv, Inc. | | | 10,000 | | | | 921,000 | |
| Lowe’s Cos., Inc. | | | 10,000 | | | | 1,605,100 | |
| NIKE, Inc., Class B | | | 30,000 | | | | 4,244,100 | |
| Ross Stores, Inc. | | | 7,000 | | | | 859,670 | |
| Starbucks Corp. | | | 40,000 | | | | 4,279,200 | |
| The Home Depot, Inc. | | | 3,000 | | | | 796,860 | |
| | | | | | | | 12,705,930 | |
| Consumer Staples (9.1%) | | | | | | | | |
| Church & Dwight Co., Inc. | | | 15,000 | | | | 1,308,450 | |
| Costco Wholesale Corp. | | | 15,000 | | | | 5,651,700 | |
| Diageo PLC, Sponsored ADR | | | 7,500 | | | | 1,191,075 | |
| McCormick & Co., Inc. | | | 14,000 | | | | 1,338,400 | |
| PepsiCo, Inc. | | | 10,000 | | | | 1,483,000 | |
| Procter & Gamble Co. (The) | | | 10,000 | | | | 1,391,400 | |
| Sysco Corp. | | | 20,000 | | | | 1,485,200 | |
| The Hershey Co. | | | 10,000 | | | | 1,523,300 | |
| | | | | | | | 15,372,525 | |
| Energy (1.8%) | | | | | | | | |
| Chevron Corp. | | | 7,500 | | | | 633,375 | |
| Exxon Mobil Corp. | | | 17,500 | | | | 721,350 | |
| Schlumberger NV | | | 75,000 | | | | 1,637,250 | |
| | | | | | | | 2,991,975 | |
| Financials (12.3%) | | | | | | | | |
| American Express Co. | | | 15,000 | | | | 1,813,650 | |
| Berkshire Hathaway, Inc., Class B (a) | | | 10,000 | | | | 2,318,700 | |
| Chubb Ltd. | | | 10,000 | | | | 1,539,200 | |
| Cincinnati Financial Corp. | | | 20,000 | | | | 1,747,400 | |
| Commerce Bancshares, Inc. | | | 2,625 | | | | 172,463 | |
| JPMorgan Chase & Co. | | | 30,000 | | | | 3,812,100 | |
| Moody’s Corp. | | | 1,500 | | | | 435,360 | |
| Northern Trust Corp. | | | 22,500 | | | | 2,095,650 | |
| PNC Financial Services Group, Inc. | | | 17,500 | | | | 2,607,500 | |
| T. Rowe Price Group, Inc. | | | 20,000 | | | | 3,027,800 | |
| U.S. Bancorp | | | 25,000 | | | | 1,164,750 | |
| | | | | | | | 20,734,573 | |
| Health Care (12.5%) | | | | | | | | |
| Becton, Dickinson & Co. | | | 15,000 | | | | 3,753,300 | |
| Dentsply Sirona, Inc. | | | 25,000 | | | | 1,309,000 | |
| Edwards Lifesciences Corp. (a) | | | 22,500 | | | | 2,052,675 | |
| Henry Schein, Inc. (a) | | | 2,500 | | | | 167,150 | |
| Johnson & Johnson | | | 17,500 | | | | 2,754,150 | |
| Medtronic PLC | | | 10,000 | | | | 1,171,400 | |
| Merck & Co., Inc. | | | 12,500 | | | | 1,022,500 | |
| Mettler-Toledo International, Inc. (a) | | | 1,500 | | | | 1,709,520 | |
| Stryker Corp. | | | 12,000 | | | | 2,940,480 | |
| UnitedHealth Group, Inc. | | | 12,000 | | | | 4,208,160 | |
| | | | | | | | 21,088,335 | |
| Industrials (13.6%) | | | | | | | | |
| 3M Co. | | | 10,000 | | | | 1,747,900 | |
| Deere & Co. | | | 10,000 | | | | 2,690,500 | |
| Donaldson Co., Inc. | | | 15,000 | | | | 838,200 | |
| Honeywell International, Inc. | | | 10,000 | | | | 2,127,000 | |
| Hubbell, Inc. | | | 15,000 | | | | 2,351,850 | |
| Illinois Tool Works, Inc. | | | 15,000 | | | | 3,058,200 | |
| Union Pacific Corp. | | | 22,500 | | | | 4,684,950 | |
| United Parcel Service, Inc., Class B | | | 15,000 | | | | 2,526,000 | |
| W.W. Grainger, Inc. | | | 7,000 | | | | 2,858,380 | |
| | | | | | | | 22,882,980 | |
| Information Technology (28.0%) | | | | | | | | |
| Accenture PLC, Class A | | | 25,000 | | | | 6,530,250 | |
| Apple, Inc. | | | 110,000 | | | | 14,595,900 | |
| Automatic Data Processing, Inc. | | | 20,000 | | | | 3,524,000 | |
| Cisco Systems, Inc. | | | 20,000 | | | | 895,000 | |
| Intuit, Inc. | | | 2,000 | | | | 759,700 | |
| Microsoft Corp. | | | 55,000 | | | | 12,233,100 | |
| Oracle Corp. | | | 40,000 | | | | 2,587,600 | |
| Visa, Inc., Class A | | | 28,000 | | | | 6,124,440 | |
| | | | | | | | 47,249,990 | |
| Materials (2.5%) | | | | | | | | |
| Air Products & Chemicals, Inc. | | | 5,000 | | | | 1,366,100 | |
| AptarGroup, Inc. | | | 10,000 | | | | 1,368,900 | |
| PPG Industries, Inc. | | | 10,000 | | | | 1,442,200 | |
| | | | | | | | 4,177,200 | |
| Utilities (1.3%) | | | | | | | | |
| Eversource Energy | | | 25,000 | | | | 2,162,750 | |
| | | | | | | | 2,162,750 | |
| TOTAL COMMON STOCKS (Cost $54,818,821) | | | | | | | 167,502,558 | |
| | | | | | | | | |
| Investment Companies (0.6%) | | | | | | | | |
| JPMorgan U.S. Government Money Market Fund, Capital Shares, 0.03% (b) | | | 947,755 | | | | 947,755 | |
| TOTAL INVESTMENT COMPANIES (Cost $947,755) | | | | | | | 947,755 | |
| | | | | | | | | |
| Total Investments (Cost $55,766,576) — 100.0% (c) | | | | | | | 168,450,313 | |
| Other assets in excess of liabilities — 0.0% | | | | | | | 36,976 | |
| NET ASSETS — 100.0% | | | | | | | $ 168,487,289 | |
| (a) | Non-income producing security. |
| (b) | Rate disclosed is the seven day yield as of December 31, 2020. |
| (c) | See Federal Tax Information listed in the Notes to the Financial Statements. |
| ADR | American Depositary Receipt |
| PLC | Public Limited Company |
See Notes to Financial Statements
| Financial Statements | Boston Trust Equity Fund |
Statement of Assets and Liabilities
December 31, 2020
| Assets: | | |
| Investments, at fair value (cost $55,766,576) | $ | 168,450,313 |
| Dividends receivable | | 144,542 |
| Receivable for capital shares issued | | 10,003 |
| Prepaid expenses | | 5,575 |
| Total Assets | | 168,610,433 |
| Liabilities: | | |
| Accrued expenses and other liabilities: | | |
| Investment adviser | | 105,759 |
| Administration and accounting | | 5,994 |
| Chief compliance officer | | 740 |
| Custodian | | 1,366 |
| Shareholder servicing fees | | 247 |
| Transfer agent | | 2,864 |
| Trustee | | 1,981 |
| Other | | 4,193 |
| Total Liabilities | | 123,144 |
| Net Assets | $ | 168,487,289 |
| Composition of Net Assets: | | |
| Paid in capital | $ | 54,128,202 |
| Total distributable earnings/(loss) | | 114,359,087 |
| Net Assets | $ | 168,487,289 |
| Shares outstanding (par value $0.01, unlimited number of shares authorized) | | 5,123,449 |
| Net Asset Value, Offering Price and Redemption price per share | $ | 32.89 |
Statement of Operations
For the year ended December 31, 2020
| Investment Income: | | |
| Dividends | $ | 2,724,630 |
| Total Investment Income | | 2,724,630 |
| Expenses: | | |
| Investment adviser | | 1,116,954 |
| Administration and accounting | | 86,673 |
| Chief compliance officer | | 11,246 |
| Custodian | | 20,429 |
| Shareholder servicing | | 3,580 |
| Transfer agency | | 35,164 |
| Trustee | | 9,878 |
| Other | | 50,935 |
| Total expenses | | 1,334,859 |
| Net Expenses | | 1,334,859 |
| Net Investment Income | | 1,389,771 |
| Net Realized/Unrealized Gains (Losses) from | | |
| Investments: | | |
| Net realized gains from investment transactions | | 4,210,057 |
| Change in unrealized appreciation/depreciation on investments | | 14,438,744 |
| Net realized/unrealized gains (losses) on investments | | 18,648,801 |
| Change in Net Assets Resulting from Operations | $ | 20,038,572 |
See Notes to Financial Statements
| Financial Statements | Boston Trust Equity Fund |
Statements of Changes in Net Assets
| | For the year ended | | For the year ended |
| | December 31, 2020 | | December 31, 2019 |
| Investment Activities: | | | | | |
| Operations: | | | | | |
| Net investment income | $ | 1,389,771 | | $ | 1,280,402 |
| Net realized gains from investment transactions | | 4,210,057 | | | 1,332,110 |
| Change in unrealized appreciation/depreciation on investments | | 14,438,744 | | | 36,580,729 |
| Change in Net Assets Resulting from Operations | | 20,038,572 | | | 39,193,241 |
| Distributions to shareholders: | | | | | |
| Total Distributions | | (4,722,166 ) | | | (1,442,463 ) |
| Change in Net Assets Resulting from distributions to shareholders | | (4,722,166 ) | | | (1,442,463 ) |
| Capital Share Transactions: | | | | | |
| Proceeds from shares issued | | 2,383,276 | | | 1,613,063 |
| Dividends reinvested | | 2,304,416 | | | 651,454 |
| Cost of shares redeemed | | (11,167,756 ) | | | (6,208,577 ) |
| Change in Net Assets Resulting from Capital Share Transactions | | (6,480,064 ) | | | (3,944,060 ) |
| Change in Net Assets | | 8,836,342 | | | 33,806,718 |
| Net Assets: | | | | | |
| Beginning of period | | 159,650,947 | | | 125,844,229 |
| End of period | $ | 168,487,289 | | $ | 159,650,947 |
| Share Transactions: | | | | | |
| Issued | | 86,983 | | | 58,549 |
| Reinvested | | 71,588 | | | 22,675 |
| Redeemed | | (437,884 ) | | | (237,992 ) |
| Change in shares | | (279,313 ) | | | (156,768 ) |
See Notes to Financial Statements
| Financial Statements | Boston Trust Equity Fund |
| Financial Highlights | | | | | | | | | | | | | | | | | | |
| Selected data for a share outstanding throughout the years indicated. | | | | | | | | | | | | | |
| | | | | | | | | | | | | | | | | | | | | | | | | |
| | | | For the year | | | | For the year | | | | For the year | | | | For the year | | | | For the nine
months | | | | For the year | |
| | | | ended | | | | ended | | | | ended | | | | ended | | | | ended | | | | ended | |
| | | | December | | | | December | | | | December | | | | December | | | | December | | | | March 31, | |
| | | | 31, 2020 | | | | 31, 2019 | | | | 31, 2018 | | | | 31, 2017 | | | | 31, 2016 | | | | 2016 | |
| Net Asset Value, Beginning of Period | | $ | 29.55 | | | $ | 22.64 | | | $ | 23.63 | | | $ | 20.09 | | | $ | 19.70 | | | $ | 20.66 | |
| Investment Activities: | | | | | | | | | | | | | | | | | | | | | | | | |
| Operations: | | | | | | | | | | | | | | | | | | | | | | | | |
| Net investment income | | | 0.27 | | | | 0.24 | | | | 0.22 | | | | 0.23 | | | | 0.16 | | | | 0.23 | |
| Net realized/unrealized gains (losses) from | | | | | | | | | | | | | | | | | | | | | | | | |
| investments | | | 4.00 | | | | 6.94 | | | | (0.80 | ) | | | 3.92 | | | | 1.58 | | | | 0.27 | |
| Total from investment activities | | | 4.27 | | | | 7.18 | | | | (0.58 | ) | | | 4.15 | | | | 1.74 | | | | 0.50 | |
| Dividends: | | | | | | | | | | | | | | | | | | | | | | | | |
| Net investment income | | | (0.27 | ) | | | (0.24 | ) | | | (0.23 | ) | | | (0.23 | ) | | | (0.20 | ) | | | (0.24 | ) |
| Net realized gains from investments | | | (0.66 | ) | | | (0.03 | ) | | | (0.18 | ) | | | (0.38 | ) | | | (1.15 | ) | | | (1.22 | ) |
| Total dividends | | | (0.93 | ) | | | (0.27 | ) | | | (0.41 | ) | | | (0.61 | ) | | | (1.35 | ) | | | (1.46 | ) |
| Net Asset Value, End of Period | | $ | 32.89 | | | $ | 29.55 | | | $ | 22.64 | | | $ | 23.63 | | | $ | 20.09 | | | $ | 19.70 | |
| Total Return | | | 14.53 | % | | | 31.74 | % | | | (2.55 | )% | | | 20.67 | % | | | 8.82 | %(a) | | | 2.59 | % |
| Ratios/Supplemental Data: | | | | | | | | | | | | | | | | | | | | | | | | |
| Net assets at end of period (000’s) | | $ | 168,487 | | | $ | 159,651 | | | $ | 125,844 | | | $ | 134,006 | | | $ | 118,824 | | | $ | 10,831 | |
| Ratio of net expenses to average net assets | | | 0.90 | % | | | 0.91 | % | | | 0.92 | % | | | 0.93 | % | | | 0.96 | %(b) | | | 0.95 | % |
| Ratio of net investment income to average net assets | | | 0.93 | % | | | 0.88 | % | | | 0.91 | % | | | 1.02 | % | | | 1.01 | %(b) | | | 1.14 | % |
| Ratio of expenses (before fee reductions or recoupment of fees previously reimbursed by the investment adviser) to average net assets (c) | | | 0.90 | % | | | 0.91 | % | | | 0.92 | % | | | 0.93 | % | | | 0.96 | %(b) | | | 0.96 | % |
| Portfolio turnover rate | | | 9.30 | % | | | 2.61 | % | | | 1.67 | % | | | 9.00 | % | | | 6.65 | %(a) | | | 18.04 | % |
| (a) | Not annualized for periods less than one year. |
| (b) | Annualized for periods less than one year. |
| (c) | During the periods ended March 31, 2016 and December 31, 2016, certain fees were reduced. If such fee reduction had not occurred, the ratio would have been as indicated. |
See Notes to Financial Statements
| Schedule of Portfolio Investments | | Boston Trust Midcap Fund
December 31, 2020 |
| Security Description | | | Shares | | | | Fair Value ($) | |
| Common Stocks (98.8%) | | | | | | | | |
| Communication Services (2.8%) | | | | | | | | |
| Electronic Arts, Inc. | | | 14,450 | | | | 2,075,020 | |
| Omnicom Group, Inc. | | | 29,300 | | | | 1,827,441 | |
| | | | | | | | 3,902,461 | |
| Consumer Discretionary (10.7%) | | | | | | | | |
| AutoZone, Inc. (a) | | | 1,450 | | | | 1,718,888 | |
| Carter’s, Inc. | | | 24,850 | | | | 2,337,640 | |
| eBay, Inc. | | | 45,000 | | | | 2,261,250 | |
| Hyatt Hotels Corp., Class A | | | 23,450 | | | | 1,741,163 | |
| O’Reilly Automotive, Inc. (a) | | | 3,100 | | | | 1,402,967 | |
| Ross Stores, Inc. | | | 18,525 | | | | 2,275,054 | |
| Service Corporation International | | | 29,325 | | | | 1,439,858 | |
| Tractor Supply Co. | | | 12,550 | | | | 1,764,279 | |
| | | | | | | | 14,941,099 | |
| Consumer Staples (5.1%) | | | | | | | | |
| Church & Dwight Co., Inc. | | | 14,125 | | | | 1,232,124 | |
| Lancaster Colony Corp. | | | 6,125 | | | | 1,125,346 | |
| Sysco Corp. | | | 16,225 | | | | 1,204,869 | |
| The Hershey Co. | | | 13,125 | | | | 1,999,331 | |
| The JM Smucker Co. | | | 13,280 | | | | 1,535,168 | |
| | | | | | | | 7,096,838 | |
| Energy (1.1%) | | | | | | | | |
| Baker Hughes Co. | | | 76,575 | | | | 1,596,589 | |
| | | | | | | | 1,596,589 | |
| Financials (12.0%) | | | | | | | | |
| Brown & Brown, Inc. | | | 25,675 | | | | 1,217,252 | |
| CBOE Global Markets, Inc. | | | 17,450 | | | | 1,624,944 | |
| Everest Re Group Ltd. | | | 5,525 | | | | 1,293,347 | |
| FactSet Research Systems, Inc. | | | 6,725 | | | | 2,236,062 | |
| M&T Bank Corp. | | | 20,475 | | | | 2,606,468 | |
| Northern Trust Corp. | | | 25,625 | | | | 2,386,712 | |
| SEI Investments Co. | | | 36,425 | | | | 2,093,345 | |
| Signature Bank | | | 8,400 | | | | 1,136,436 | |
| T. Rowe Price Group, Inc. | | | 14,325 | | | | 2,168,662 | |
| | | | | | | | 16,763,228 | |
| Health Care (13.6%) | | | | | | | | |
| Agilent Technologies, Inc. | | | 16,250 | | | | 1,925,463 | |
| Cerner Corp. | | | 22,300 | | | | 1,750,104 | |
| Henry Schein, Inc. (a) | | | 18,375 | | | | 1,228,553 | |
| Hill-Rom Holdings, Inc. | | | 21,450 | | | | 2,101,456 | |
| Laboratory Corp. of America Holdings (a) | | | 5,900 | | | | 1,200,945 | |
| Mettler-Toledo International, Inc. (a) | | | 1,235 | | | | 1,407,505 | |
| Steris PLC | | | 11,150 | | | | 2,113,370 | |
| Teleflex, Inc. | | | 3,450 | | | | 1,419,917 | |
| The Cooper Companies., Inc. | | | 5,150 | | | | 1,871,098 | |
| Waters Corp. (a) | | | 10,000 | | | | 2,474,199 | |
| Zimmer Biomet Holdings, Inc. | | | 9,475 | | | | 1,460,003 | |
| | | | | | | | 18,952,613 | |
| Industrials (14.8%) | | | | | | | | |
| AMETEK, Inc. | | | 17,875 | | | | 2,161,802 | |
| AO Smith Corp. | | | 25,750 | | | | 1,411,615 | |
| Cummins, Inc. | | | 7,700 | | | | 1,748,670 | |
| Donaldson Co., Inc. | | | 35,875 | | | | 2,004,694 | |
| Expeditors International of Washington, Inc. | | | 17,950 | | | | 1,707,225 | |
| Hubbell, Inc. | | | 11,325 | | | | 1,775,647 | |
| Lincoln Electric Holdings, Inc. | | | 12,750 | | | | 1,482,188 | |
| Masco Corp. | | | 22,725 | | | | 1,248,284 | |
| Nordson Corp. | | | 6,525 | | | | 1,311,199 | |
| Snap-on, Inc. | | | 10,275 | | | | 1,758,463 | |
| The Middleby Corp. (a) | | | 9,000 | | | | 1,160,280 | |
| Verisk Analytics, Inc. | | | 6,925 | | | | 1,437,561 | |
| W.W. Grainger, Inc. | | | 3,450 | | | | 1,408,773 | |
| | | | | | | | 20,616,401 | |
| Information Technology (20.4%) | | | | | | | | |
| Akamai Technologies, Inc. (a) | | | 14,375 | | | | 1,509,231 | |
| Amdocs Ltd. | | | 20,450 | | | | 1,450,519 | |
| Amphenol Corp., Class A | | | 16,450 | | | | 2,151,167 | |
| ANSYS, Inc. (a) | | | 3,875 | | | | 1,409,725 | |
| Aspen Technology, Inc. (a) | | | 18,275 | | | | 2,380,318 | |
| Broadridge Finance Solutions, Inc. | | | 11,525 | | | | 1,765,629 | |
| CDK Global, Inc. | | | 25,600 | | | | 1,326,848 | |
| Check Point Software Technologies Ltd. (a) | | | 12,450 | | | | 1,654,730 | |
| Citrix Systems, Inc. | | | 17,025 | | | | 2,214,952 | |
| Cognizant Technology Solutions Corp., Class A | | | 17,500 | | | | 1,434,125 | |
| Dolby Laboratories, Inc., Class A | | | 20,525 | | | | 1,993,593 | |
| F5 Networks, Inc. (a) | | | 11,475 | | | | 2,018,912 | |
| IPG Photonics Corp. (a) | | | 8,025 | | | | 1,795,915 | |
| Paychex, Inc. | | | 34,175 | | | | 3,184,426 | |
| TE Connectivity Ltd. | | | 19,175 | | | | 2,321,517 | |
| | | | | | | | 28,611,607 | |
| Materials (5.9%) | | | | | | | | |
| AptarGroup, Inc. | | | 14,175 | | | | 1,940,416 | |
| Avery Dennison Corp. | | | 15,375 | | | | 2,384,816 | |
| Packaging Corporation of America | | | 13,800 | | | | 1,903,158 | |
| RPM International, Inc. | | | 21,575 | | | | 1,958,579 | |
| | | | | | | | 8,186,969 | |
| Real Estate (6.2%) | | | | | | | | |
| Alexandria Real Estate Equities, Inc. | | | 7,475 | | | | 1,332,195 | |
| AvalonBay Communities, Inc. | | | 7,525 | | | | 1,207,236 | |
| Camden Property Trust | | | 12,375 | | | | 1,236,510 | |
| CyrusOne, Inc. | | | 15,950 | | | | 1,166,743 | |
| Jones Lang LaSalle, Inc. (a) | | | 15,375 | | | | 2,281,189 | |
| Realty Income Corp. | | | 23,900 | | | | 1,485,862 | |
| | | | | | | | 8,709,735 | |
| Utilities (6.2%) | | | | | | | | |
| Atmos Energy Corp. | | | 16,750 | | | | 1,598,453 | |
| Consolidated Edison, Inc. | | | 25,175 | | | | 1,819,397 | |
| Eversource Energy | | | 34,925 | | | | 3,021,362 | |
| ONE Gas, Inc. | | | 29,600 | | | | 2,272,392 | |
| | | | | | | | 8,711,604 | |
| TOTAL COMMON STOCKS (Cost $94,481,661) | | | | | | | 138,089,144 | |
| | | | | | | | | |
| Investment Companies (1.1%) | | | | | | | | |
| JPMorgan U.S. Government Money Market Fund, Capital Shares, 0.03% (b) | | | 1,487,845 | | | | 1,487,845 | |
| TOTAL INVESTMENT COMPANIES (Cost $1,487,845) | | | | | | | 1,487,845 | |
| | | | | | | | | |
| Total Investments (Cost $95,969,506) — 99.9% (c) | | | | | | | 139,576,989 | |
| Other assets in excess of liabilities — 0.1% | | | | | | | 145,901 | |
| NET ASSETS — 100.0% | | | | | | $ | 139,722,890 | |
| (a) | Non-income producing security. |
| (b) | Rate disclosed is the seven day yield as of December 31, 2020. |
See Notes to Financial Statements
| (c) | See Federal Tax Information listed in the Notes to the Financial Statements. |
PLC Public Limited Company
See Notes to Financial Statements
| Financial Statements | Boston Trust Midcap Fund |
Statement of Assets and Liabilities
December 31, 2020
| Assets: | | |
| Investments, at fair value (cost $95,969,506) | $ | 139,576,989 |
| Dividends receivable | | 142,758 |
| Receivable for capital shares issued | | 109,092 |
| Prepaid expenses | | 14,598 |
| Total Assets | | 139,843,437 |
| Liabilities: | | |
| Payable for capital shares redeemed | | 2,282 |
| Accrued expenses and other liabilities: | | |
| Investment adviser | | 87,967 |
| Administration and accounting | | 5,197 |
| Chief compliance officer | | 634 |
| Custodian | | 1,165 |
| Shareholder servicing fees | | 12,720 |
| Transfer agent | | 3,485 |
| Trustee | | 1,681 |
| Other | | 5,416 |
| Total Liabilities | | 120,547 |
| Net Assets | $ | 139,722,890 |
| Composition of Net Assets: | | |
| Paid in capital | $ | 96,013,042 |
| Total distributable earnings/(loss) | | 43,709,848 |
| Net Assets | $ | 139,722,890 |
| Shares outstanding (par value $0.01, unlimited number of shares authorized) | | 6,647,927 |
| Net Asset Value, Offering Price and Redemption price per share | $ | 21.02 |
Statement of Operations
For the year ended December 31, 2020
| Investment Income: | | | |
| Dividends | $ | 2,039,397 | |
| Less: Foreign tax withholding | | (538 | ) |
| Total Investment Income | | 2,038,859 | |
| Expenses: | | | |
| Investment adviser | | 960,313 | |
| Administration and accounting | | 77,819 | |
| Chief compliance officer | | 10,229 | |
| Custodian | | 18,382 | |
| Shareholder servicing | | 160,958 | |
| Transfer agency | | 41,089 | |
| Trustee | | 9,010 | |
| Interest fees | | 183 | |
| Other | | 71,527 | |
| Total expenses before fee reductions | | 1,349,510 | |
| Fees contractually reduced by the investment adviser | | (68,764 | ) |
| Net Expenses | | 1,280,746 | |
| Net Investment Income | | 758,113 | |
| Net Realized/Unrealized Gains (Losses) from Investments: | | | |
| Net realized gains from investment transactions | | 620,497 | |
| Change in unrealized appreciation/depreciation on investments | | 6,536,438 | |
| Net realized/unrealized gains (losses) on investments | | 7,156,935 | |
| Change in Net Assets Resulting from Operations | $ | 7,915,048 | |
See Notes to Financial Statements
| Financial Statements | Boston Trust Midcap Fund |
Statements of Changes in Net Assets
| | | For the year ended | | | For the year ended | |
| | | December 31, 2020 | | | December 31, 2019 | |
| Investment Activities: | | | | | | | | |
| Operations: | | | | | | | | |
| Net investment income | | $ | 758,113 | | | $ | 741,000 | |
| Net realized gains from investment transactions | | | 620,497 | | | | 3,967,963 | |
| Change in unrealized appreciation/depreciation on investments | | | 6,536,438 | | | | 20,892,329 | |
| Change in Net Assets Resulting from Operations | | | 7,915,048 | | | | 25,601,292 | |
| Distributions to shareholders: | | | | | | | | |
| Total Distributions | | | (1,650,010 | ) | | | (5,145,785 | ) |
| Change in Net Assets Resulting from distributions to shareholders | | | (1,650,010 | ) | | | (5,145,785 | ) |
| Capital Share Transactions: | | | | | | | | |
| Proceeds from shares issued | | | 38,228,874 | | | | 60,147,066 | |
| Dividends reinvested | | | 1,347,943 | | | | 4,094,485 | |
| Cost of shares redeemed | | | (51,423,640 | ) | | | (14,255,219 | ) |
| Change in Net Assets Resulting from Capital Share Transactions | | | (11,846,823 | ) | | | 49,986,332 | |
| Change in Net Assets | | | (5,581,785 | ) | | | 70,441,839 | |
| Net Assets: | | | | | | | | |
| Beginning of period | | | 145,304,675 | | | | 74,862,836 | |
| End of period | | $ | 139,722,890 | | | $ | 145,304,675 | |
| Share Transactions: | | | | | | | | |
| Issued | | | 2,120,345 | | | | 3,233,471 | |
| Reinvested | | | 64,805 | | | | 214,483 | |
| Redeemed | | | (2,969,777 | ) | | | (759,976 | ) |
| Change in shares | | | (784,627 | ) | | | 2,687,978 | |
See Notes to Financial Statements
| Financial Statements | Boston Trust Midcap Fund |
| Financial Highlights | | | | | | | | | | | | | | | | | | |
| Selected data for a share outstanding throughout the years indicated. | | | | | |
| | | | | | | | | | | | | | | | | | | | | | | | |
| | | | For the year | | | | For the year | | | | For the year | | | | For the year | | | | For the nine
months | | | | For the year | |
| | | | ended | | | | ended | | | | ended | | | | ended | | | | ended | | | | ended | |
| | | | December | | | | December | | | | December | | | | December | | | | December | | | | March 31, | |
| | | | 31, 2020 | | | | 31, 2019 | | | | 31, 2018 | | | | 31, 2017 | | | | 31, 2016 | | | | 2016 | |
| Net Asset Value, Beginning of Period | | $ | 19.55 | | | $ | 15.78 | | | $ | 17.26 | | | $ | 15.34 | | | $ | 15.29 | | | $ | 16.12 | |
| Investment Activities: | | | | | | | | | | | | | | | | | | | | | | | | |
| Operations: | | | | | | | | | | | | | | | | | | | | | | | | |
| Net investment income | | | 0.12 | | | | 0.10 | | | | 0.08 | | | | 0.08 | | | | 0.12 | | | | 0.09 | |
| Net realized/unrealized gains (losses) from investments | | | 1.60 | | | | 4.39 | | | | (0.62 | ) | | | 2.98 | | | | 1.01 | | | | 0.05 | |
| Total from investment activities | | | 1.72 | | | | 4.49 | | | | (0.54 | ) | | | 3.06 | | | | 1.13 | | | | 0.14 | |
| Dividends: | �� | | | | | | | | | | | | | | | | | | | | | | | |
| Net investment income | | | (0.12 | ) | | | (0.09 | ) | | | (0.08 | ) | | | (0.08 | ) | | | (0.13 | ) | | | (0.09 | ) |
| Net realized gains from investments | | | (0.13 | ) | | | (0.63 | ) | | | (0.86 | ) | | | (1.06 | ) | | | (0.95 | ) | | | (0.88 | ) |
| Total dividends | | | (0.25 | ) | | | (0.72 | ) | | | (0.94 | ) | | | (1.14 | ) | | | (1.08 | ) | | | (0.97 | ) |
| Net Asset Value, End of Period | | $ | 21.02 | | | $ | 19.55 | | | $ | 15.78 | | | $ | 17.26 | | | $ | 15.34 | | | $ | 15.29 | |
| Total Return | | | 8.81 | % | | | 28.59 | % | | | (3.36 | )% | | | 20.01 | % | | | 7.29 | %(a) | | | 1.07 | % |
| Ratios/Supplemental Data: | | | | | | | | | | | | | | | | | | | | | | | | |
| Net assets at end of period (000’s) | | $ | 139,723 | | | $ | 145,305 | | | $ | 74,863 | | | $ | 61,548 | | | $ | 50,495 | | | $ | 47,941 | |
| Ratio of net expenses to average net assets | | | 1.00 | % | | | 1.00 | % | | | 0.98 | % | | | 1.00 | % | | | 1.00 | %(b) | | | 1.00 | % |
| Ratio of net investment income to average net assets | | | 0.59 | % | | | 0.67 | % | | | 0.54 | % | | | 0.46 | % | | | 0.99 | %(b) | | | 0.58 | % |
| Ratio of expenses (before fee reductions or recoupment of fees previously reimbursed by the investment adviser) to average net assets (c) | | | 1.05 | % | | | 1.04 | % | | | 0.98 | % | | | 0.98 | % | | | 1.02 | %(b) | | | 1.03 | % |
| Portfolio turnover rate | | | 38.33 | % | | | 18.46 | % | | | 19.34 | % | | | 23.22 | % | | | 14.53 | %(a) | | | 21.02 | % |
| (a) | Not annualized for periods less than one year. |
| (b) | Annualized for periods less than one year. |
| (c) | During the periods, certain fees were reduced or recouped by the investment adviser. If such fee reductions/recoupments had not occurred, the ratio would have been as indicated. |
See Notes to Financial Statements
| Financial Statements | | Boston Trust SMID Cap Fund
December 31, 2020 |
| Security Description | | | Shares | | | | Fair Value ($) | |
| Common Stocks (98.8%) | | | | | | | | |
| Communication Services (2.8%) | | | | | | | | |
| Interpublic Group of Cos., Inc. | | | 158,654 | | | | 3,731,542 | |
| Omnicom Group, Inc. | | | 40,589 | | | | 2,531,536 | |
| | | | | | | | 6,263,078 | |
| Consumer Discretionary (9.8%) | | | | | | | | |
| Carter’s, Inc. | | | 31,083 | | | | 2,923,978 | |
| Choice Hotels International, Inc. | | | 15,345 | | | | 1,637,772 | |
| Columbia Sportswear Co. | | | 27,134 | | | | 2,370,969 | |
| Dorman Products, Inc. (a) | | | 29,392 | | | | 2,551,813 | |
| Service Corporation International | | | 71,268 | | | | 3,499,259 | |
| Texas Roadhouse, Inc. | | | 29,803 | | | | 2,329,402 | |
| TopBuild Corp. (a) | | | 6,922 | | | | 1,274,202 | |
| Tractor Supply Co. | | | 16,941 | | | | 2,381,566 | |
| Williams Sonoma, Inc. | | | 31,367 | | | | 3,194,415 | |
| | | | | | | | 22,163,376 | |
| Consumer Staples (4.4%) | | | | | | | | |
| Flowers Foods, Inc. | | | 112,987 | | | | 2,556,896 | |
| Lamb Weston Holdings, Inc. | | | 22,776 | | | | 1,793,382 | |
| Lancaster Colony Corp. | | | 10,365 | | | | 1,904,361 | |
| The JM Smucker Co. | | | 31,774 | | | | 3,673,075 | |
| | | | | | | | 9,927,714 | |
| Energy (1.7%) | | | | | | | | |
| Baker Hughes Co. | | | 97,148 | | | | 2,025,536 | |
| Helmerich & Payne, Inc. | | | 75,832 | | | | 1,756,269 | |
| | | | | | | | 3,781,805 | |
| Financials (13.8%) | | | | | | | | |
| American Financial Group, Inc. | | | 21,160 | | | | 1,854,039 | |
| Brown & Brown, Inc. | | | 43,067 | | | | 2,041,807 | |
| CBOE Global Markets, Inc. | | | 23,888 | | | | 2,224,451 | |
| Cohen & Steers, Inc. | | | 30,682 | | | | 2,279,673 | |
| East West Bancorp, Inc. | | | 45,510 | | | | 2,307,812 | |
| FactSet Research Systems, Inc. | | | 8,949 | | | | 2,975,543 | |
| M&T Bank Corp. | | | 36,681 | | | | 4,669,491 | |
| SEI Investments Co. | | | 80,535 | | | | 4,628,345 | |
| Signature Bank | | | 20,401 | | | | 2,760,051 | |
| SVB Financial Group (a) | | | 9,126 | | | | 3,539,337 | |
| UMB Financial Corp. | | | 26,718 | | | | 1,843,275 | |
| | | | | | | | 31,123,824 | |
| Health Care (18.3%) | | | | | | | | |
| Charles River Laboratories International, Inc. (a) | | | 17,563 | | | | 4,388,291 | |
| Chemed Corp. | | | 6,790 | | | | 3,616,422 | |
| Dentsply Sirona, Inc. | | | 32,548 | | | | 1,704,213 | |
| Henry Schein, Inc. (a) | | | 23,315 | | | | 1,558,841 | |
| Hill-Rom Holdings, Inc. | | | 34,849 | | | | 3,414,157 | |
| Masimo Corp. (a) | | | 5,901 | | | | 1,583,710 | |
| Medpace Holdings, Inc. (a) | | | 37,141 | | | | 5,170,027 | |
| PerkinElmer, Inc. | | | 34,173 | | | | 4,903,826 | |
| Steris PLC | | | 24,921 | | | | 4,723,526 | |
| The Cooper Companies., Inc. | | | 13,812 | | | | 5,018,177 | |
| Waters Corp. (a) | | | 21,880 | | | | 5,413,550 | |
| | | | | | | | 41,494,740 | |
| Industrials (13.3%) | | | | | | | | |
| AO Smith Corp. | | | 49,751 | | | | 2,727,350 | |
| Applied Industrial Technologies, Inc. | | | 32,739 | | | | 2,553,315 | |
| C.H. Robinson Worldwide, Inc. | | | 19,534 | | | | 1,833,657 | |
| Donaldson Co., Inc. | | | 56,687 | | | | 3,167,670 | |
| Expeditors International of Washington, Inc. | | | 34,771 | | | | 3,307,069 | |
| Hubbell, Inc. | | | 26,365 | | | | 4,133,768 | |
| Lincoln Electric Holdings, Inc. | | | 23,324 | | | | 2,711,415 | |
| Masco Corp. | | | 46,695 | | | | 2,564,956 | |
| Nordson Corp. | | | 9,243 | | | | 1,857,381 | |
| The Middleby Corp. (a) | | | 17,064 | | | | 2,199,891 | |
| UniFirst Corp. | | | 14,488 | | | | 3,066,965 | |
| | | | | | | | 30,123,437 | |
| Information Technology (17.3%) | | | | | | | | |
| Akamai Technologies, Inc. (a) | | | 31,656 | | | | 3,323,563 | |
| Amdocs Ltd. | | | 21,160 | | | | 1,500,879 | |
| Aspen Technology, Inc. (a) | | | 33,111 | | | | 4,312,708 | |
| Broadridge Finance Solutions, Inc. | | | 15,673 | | | | 2,401,104 | |
| CDK Global, Inc. | | | 37,998 | | | | 1,969,436 | |
| Citrix Systems, Inc. | | | 35,789 | | | | 4,656,148 | |
| Dolby Laboratories, Inc., Class A | | | 26,287 | | | | 2,553,256 | |
| F5 Networks, Inc. (a) | | | 16,422 | | | | 2,889,287 | |
| IPG Photonics Corp. (a) | | | 18,809 | | | | 4,209,266 | |
| Jack Henry & Associates, Inc. | | | 9,596 | | | | 1,554,456 | |
| Manhattan Associates, Inc. (a) | | | 34,066 | | | | 3,583,062 | |
| NetApp, Inc. | | | 41,669 | | | | 2,760,155 | |
| Progress Software Corp. | | | 78,836 | | | | 3,562,599 | |
| | | | | | | | 39,275,919 | |
| Materials (6.2%) | | | | | | | | |
| AptarGroup, Inc. | | | 22,556 | | | | 3,087,691 | |
| Avery Dennison Corp. | | | 21,488 | | | | 3,333,003 | |
| Packaging Corporation of America | | | 23,804 | | | | 3,282,810 | |
| RPM International, Inc. | | | 47,067 | | | | 4,272,742 | |
| | | | | | | | 13,976,246 | |
| Real Estate (6.6%) | | | | | | | | |
| Camden Property Trust | | | 23,520 | | | | 2,350,118 | |
| CoreSite Realty Corp. | | | 22,237 | | | | 2,785,851 | |
| CubeSmart | | | 46,695 | | | | 1,569,419 | |
| CyrusOne, Inc. | | | 17,852 | | | | 1,305,874 | |
| Jones Lang LaSalle, Inc. (a) | | | 24,294 | | | | 3,604,501 | |
| Lamar Advertising Co., Class A | | | 25,861 | | | | 2,152,152 | |
| STAG Industrial, Inc. | | | 33,968 | | | | 1,063,878 | |
| | | | | | | | 14,831,793 | |
| Utilities (4.6%) | | | | | | | | |
| Atmos Energy Corp. | | | 44,276 | | | | 4,225,259 | |
| New Jersey Resources Corp. | | | 48,008 | | | | 1,706,684 | |
| ONE Gas, Inc. | | | 57,907 | | | | 4,445,520 | |
| | | | | | | | 10,377,463 | |
| TOTAL COMMON STOCKS (Cost $174,619,714) | | | | | | | 223,339,395 | |
| | | | | | | | | |
| Investment Companies (1.2%) | | | | | | | | |
| JPMorgan U.S. Government Money Market Fund, Capital Shares, 0.03% (b) | | | 2,752,352 | | | | 2,752,352 | |
| TOTAL INVESTMENT COMPANIES (Cost $2,752,352) | | | | | | | 2,752,352 | |
| | | | | | | | | |
| Total Investments (Cost $177,372,066) — 100.0% (c) | | | | | | | 226,091,747 | |
| Liabilities in excess of other assets — 0.0% | | | | | | | (16,610 ) | |
| NET ASSETS — 100.0% | | | | | | | $ 226,075,137 | |
| (a) | Non-income producing security. |
| (b) | Rate disclosed is the seven day yield as of December 31, 2020. |
See Notes to Financial Statements
| (c) | See Federal Tax Information listed in the Notes to the Financial Statements. |
PLC Public Limited Company
See Notes to Financial Statements
| Financial Statements | Boston Trust SMID Cap Fund |
Statement of Assets and Liabilities
December 31, 2020
| Assets: | | |
| Investments, at fair value (cost $177,372,066) | $ | 226,091,747 |
| Dividends receivable | | 229,007 |
| Receivable for capital shares issued | | 72,073 |
| Prepaid expenses | | 14,681 |
| Total Assets | | 226,407,508 |
| Liabilities: | | |
| Payable for capital shares redeemed | | 194,089 |
| Accrued expenses and other liabilities: | | |
| Investment adviser | | 109,451 |
| Administration and accounting | | 8,595 |
| Chief compliance officer | | 1,071 |
| Custodian | | 1,447 |
| Transfer agent | | 2,935 |
| Trustee | | 2,768 |
| Other | | 12,015 |
| Total Liabilities | | 332,371 |
| Net Assets | $ | 226,075,137 |
| Composition of Net Assets: | | |
| Paid in capital | $ | 180,657,670 |
| Total distributable earnings/(loss) | | 45,417,467 |
| Net Assets | $ | 226,075,137 |
| Shares outstanding (par value $0.01, unlimited number of shares authorized) | | 11,753,606 |
| Net Asset Value, Offering Price and Redemption price per share | $ | 19.23 |
Statement of Operations
For the year ended December 31, 2020
| Investment Income: | | | |
| Dividends | | $ | 2,617,462 | |
| Total Investment Income | | | 2,617,462 | |
| Expenses: | | | | |
| Investment adviser | | | 1,201,015 | |
| Administration and accounting | | | 90,135 | |
| Chief compliance officer | | | 11,630 | |
| Custodian | | | 22,537 | |
| Transfer agency | | | 35,786 | |
| Trustee | | | 10,508 | |
| Interest fees | | | 152 | |
| Other | | | 81,719 | |
| Total expenses before fee reductions | | | 1,453,482 | |
| Fees contractually reduced by the investment adviser | | | (251,750 | ) |
| Net Expenses | | | 1,201,732 | |
| Net Investment Income | | | 1,415,730 | |
| Net Realized/Unrealized Gains (Losses) from | | | | |
| Investments: | | | | |
| Net realized (losses) from investment transactions | | | (3,117,108 | ) |
| Net realized gains from redemptions in-kind | | | 4,664 | |
| Change in unrealized appreciation/depreciation on | | | | |
| investments | | | 32,345,630 | |
| Net realized/unrealized gains (losses) on investments | | | 29,233,186 | |
| Change in Net Assets Resulting from Operations | | $ | 30,648,916 | |
See Notes to Financial Statements
| Financial Statements | Boston Trust SMID Cap Fund |
Statements of Changes in Net Assets
| | | For the year ended | | | For the year ended | |
| | | December 31, 2020 | | | December 31, 2019 | |
| Investment Activities: | | | | | | | | |
| Operations: | | | | | | | | |
| Net investment income | | $ | 1,415,730 | | | $ | 743,711 | |
| Net realized gains/(losses) from investment transactions | | | (3,112,444 | ) | | | 2,407,151 | |
| Change in unrealized appreciation/depreciation on investments | | | 32,345,630 | | | | 16,700,103 | |
| Change in Net Assets Resulting from Operations | | | 30,648,916 | | | | 19,850,965 | |
| Distributions to shareholders: | | | | | | | | |
| Total Distributions | | | (1,697,179 | ) | | | (3,234,772 | ) |
| Return of capital | | | (46,102 | ) | | | — | |
| Change in Net Assets Resulting from distributions to shareholders | | | (1,743,281 | ) | | | (3,234,772 | ) |
| Capital Share Transactions: | | | | | | | | |
| Proceeds from shares issued | | | 114,366,780 | | | | 43,659,409 | |
| Dividends reinvested | | | 1,716,616 | | | | 3,166,407 | |
| Cost of shares redeemed | | | (40,626,345 | ) | | | (11,365,725 | ) |
| Cost of in-kind shares redeemed (a) | | | (4,663,238 | ) | | | — | |
| Change in Net Assets Resulting from Capital Share Transactions | | | 70,793,813 | | | | 35,460,091 | |
| Change in Net Assets | | | 99,699,448 | | | | 52,076,284 | |
| Net Assets: | | | | | | | | |
| Beginning of period | | | 126,375,689 | | | | 74,299,405 | |
| End of period | | $ | 226,075,137 | | | $ | 126,375,689 | |
| Share Transactions: | | | | | | | | |
| Issued | | | 7,221,313 | | | | 2,472,566 | |
| Reinvested | | | 89,828 | | | | 181,041 | |
| Redeemed | | | (2,372,199 | ) | | | (672,234 | ) |
| Redeemed in-kind (a) | | | (244,533 | ) | | | — | |
| Change in shares | | | 4,694,409 | | | | 1,981,373 | |
(a) See Note 3 in Notes to Financial Statements.
See Notes to Financial Statements
| Financial Statements | Boston Trust SMID Cap Fund |
| Financial Highlights | | | | | | | | | | | | | | | | | | |
| Selected data for a share outstanding throughout the years indicated. | | | | | | | | | |
| | | | | | | | | | | | | | | | | | | | | | | | |
| | | | For the year | | | | For the year | | | | For the year | | | | For the year | | | | For the nine
months | | | | For the year | |
| | | | ended | | | | ended | | | | ended | | | | ended | | | | ended | | | | ended | |
| | | | December | | | | December | | | | December | | | | December | | | | December | | | | March 31, | |
| | | | 31, 2020 | | | | 31, 2019 | | | | 31, 2018 | | | | 31, 2017 | | | | 31, 2016 | | | | 2016 | |
| Net Asset Value, Beginning of Period | | $ | 17.90 | | | $ | 14.63 | | | $ | 15.79 | | | $ | 13.48 | | | $ | 12.49 | | | $ | 13.72 | |
| Investment Activities: | | | | | | | | | | | | | | | | | | | | | | | | |
| Operations: | | | | | | | | | | | | | | | | | | | | | | | | |
| Net investment income | | | 0.12 | | | | 0.14 | | | | 0.11 | | | | 0.07 | | | | 0.13 | | | | 0.06 | |
| Net realized/unrealized gains (losses) from investments | | | 1.36 | | | | 3.76 | | | | (0.98 | ) | | | 2.41 | | | | 1.72 | | | | (0.41 | ) |
| Total from investment activities | | | 1.48 | | | | 3.90 | | | | (0.87 | ) | | | 2.48 | | | | 1.85 | | | | (0.35 | ) |
| Dividends: | | | | | | | | | | | | | | | | | | | | | | | | |
| Net investment income | | | (0.13 | ) | | | (0.12 | ) | | | (0.12 | ) | | | (0.08 | ) | | | (0.15 | ) | | | (0.04 | ) |
| Net realized gains from investments | | | (0.02 | ) | | | (0.51 | ) | | | (0.17 | ) | | | (0.09 | ) | | | (0.71 | ) | | | (0.84 | ) |
| Return of capital | | | — | | | | — | | | | — | | | | — | | | | — | | | | — | |
| Total dividends | | | (0.15 | ) | | | (0.63 | ) | | | (0.29 | ) | | | (0.17 | ) | | | (0.86 | ) | | | (0.88 | ) |
| Net Asset Value, End of Period | | $ | 19.23 | | | $ | 17.90 | | | $ | 14.63 | | | $ | 15.79 | | | $ | 13.48 | | | $ | 12.49 | |
| Total Return | | | 8.26 | % | | | 26.74 | % | | | (5.62 | )% | | | 18.39 | % | | | 14.67 | %(a) | | | (2.34 | )% |
| Ratios/Supplemental Data: | | | | | | | | | | | | | | | | | | | | | | | | |
| Net assets at end of period (000’s) | | $ | 226,075 | | | $ | 126,376 | | | $ | 74,299 | | | $ | 56,443 | | | $ | 6,510 | | | $ | 5,589 | |
| Ratio of net expenses to average net assets | | | 0.75 | % | | | 0.75 | % | | | 0.75 | % | | | 0.75 | % | | | 0.75 | %(b) | | | 0.79 | %(c) |
| Ratio of net investment income to average net assets | | | 0.89 | % | | | 0.85 | % | | | 0.77 | % | | | 0.85 | % | | | 1.31 | %(b) | | | 0.49 | % |
| Ratio of expenses (before fee reductions or recoupment of fees previously reimbursed by the investment adviser) to average net assets (d) | | | 0.91 | % | | | 0.95 | % | | | 0.98 | % | | | 1.04 | % | | | 1.61 | %(b) | | | 1.73 | % |
| Portfolio turnover rate | | | 51.26 | %(e) | | | 24.08 | % | | | 14.98 | % | | | 37.44 | % | | | 22.69 | %(a) | | | 50.15 | % |
| (a) | Not annualized for periods less than one year. |
| (b) | Annualized for periods less than one year. |
| (c) | The net expense ratio shown for the period presented represents the blended ratio of the current expense limit in effect as of June 1, 2015 and the higher expense limit in effect prior to that date. |
| (d) | During the periods, certain fees were reduced. If such fee reduction had not occurred, the ratio would have been as indicated. |
| (e) | Excludes impact of in-kind transactions. |
Amounts designated as “-” are $0.00 or have been rounded to $0.00.
See Notes to Financial Statements

Read our 2020 Annual ESG Impact Report online
We invite you to read our Annual ESG Impact Report online, which provides an in-depth view of the ways in which Boston Trust Walden Company promotes business sustainability and achieve impact on behalf of clients.
The report can be found at: www.bostontrustwalden.com/insights/annual-esg-impact-report-2020/
Included in this report:

Boston Trust Walden Balanced Fund
(formerly known as the Walden Balanced Fund)
Boston Trust Walden Equity Fund
(formerly known as the Walden Equity Fund)
December 31, 2020
William H. Apfel, CFA
Portfolio Manager
Boston Trust Walden Inc.
Balanced Fund Objective
The Fund seeks long-term capital growth and income through an actively managed portfolio of stocks, bonds and money market instruments.
Equity Fund Objective
The Fund seeks long-term growth of capital through an actively managed portfolio of stocks.
Investment Concerns
Equity securities (stocks) are more volatile and carry more risk and return potential than other forms of investments, including investments in high-grade fixed income securities. The net asset value per share of these Funds will fluctuate as the value of the securities in the portfolio changes.
Foreign investing involves risks not typically associated with U.S. investments, including adverse political, social and economic developments and differing auditing and legal standards. These risks are magnified in emerging markets.
Small- to mid-capitalization companies typically have a higher risk of failure and historically have experienced a greater degree of volatility.
Bonds offer a relatively stable level of income, although bond prices will fluctuate, providing the potential for principal gain or loss. Intermediate term, higher quality bonds generally offer less risk than longer-term bonds and a lower rate of return.
Cash equivalents offer low risk and low return potential.
Manager Commentary (Unaudited)
Management Discussion of Fund Performance
The Boston Trust Walden Balanced Fund and the Boston Trust Walden Equity Fund returned 8.26% and 13.28%, respectively for the 12-month period ended December 31, 2020. The relevant market indices, the S&P 500 Index and the Bloomberg Barclays Government/Credit Bond Index, returned 18.40% and 8.93%, respectively, for the year. Both Funds’ equity segments underperformed the S&P 500 Index benchmark, and the Balanced Fund’s fixed income segment underperformed the bond benchmark as well. The Balanced Fund’s relative returns were further negatively impacted by asset allocation. To begin the year, the Balanced Fund’s equity allocation was at the upper end of its range, a stance that had positively aided the Balanced Fund’s returns for much of the last decade. However, as the pandemic caused stocks to sell off sharply in February and March, this significantly detracted from the Balanced Fund’s performance. Though asset allocation decisions in the latter parts of the year were additive, asset allocation on balance was a detractor relative to a static blended benchmark.
That the S&P 500 Index rose more than 18% in 2020 is a remarkable outcome in its own right, but it is more striking when considering the Index declined by one third during the year’s first quarter. Investor confidence oscillated throughout the year, highlighting the tension between economic uncertainty, above average valuations, fiscal and monetary policy intervention, and already low interest rates. The Funds’ relative equity performance tended to follow the shifts in investors’ attitude toward risk, albeit with a more muted degree of protection compared to previous downturns given the unique nature of the pandemic.
According to our analysis of full year returns, the stocks of businesses that had, on average, track records of good fundamental performance regardless of economic conditions fared moderately better on average than their lower quality counterparts. Furthermore, for much of the year the market was especially focused on companies perceived to be capable of delivering improving growth rates, regardless of the challenges presented by the pandemic.
In contrast, our valuation discipline proved to be a substantial headwind for much of 2020, a challenge that was most pronounced in the earlier stages of the recovery from the March market lows. Through much of the spring, investor sentiment seemed to entail a near total suspension of the normal concern regarding extreme valuations. As 2020 neared its end, there was some evidence that valuation was again getting its due consideration. Whether that was exclusively related to optimism about more cyclical parts of the economy or a renewed sensitivity to risk management remains to be seen.
At the sector level, positions in technology and consumer discretionary detracted most from relative results, with a pronounced headwind due to our valuation discipline. Meanwhile, industrial sector holdings contributed positively, as did the absence of investments in the real estate sector.
Outlook
After gaining 55% in value over the last two years, stocks are no longer cheap. But current prices, in our view, still allow for further appreciation. With continued support from the Fed and Congress, and a vast pool of pent up consumer demand, prospects for the economy appear bright. We anticipate that corporate profits will rise substantially in 2021. This includes continued momentum for those companies who either benefited from or were unaffected by the stay-at-home policies, and a rebound for the more economically sensitive companies that saw sharp declines in earnings in 2020. Accordingly, we favor stocks. We remain steadfast in identifying financially strong companies with sustainable business models and reasonable valuations. These stocks should participate in the above tailwinds, but also provide a measure of protection relative to those with riskier businesses and/or shares that imply an unsustainable level of future growth.
Alternatives to stocks have limited appeal. Courtesy of the Fed’s actions, yields on cash and money market funds are effectively zero. Longer dated bonds aren’t much better with the 10-year US Treasury yielding roughly 1%. (Indeed, so-called “real” bond yields – the amount earned after subtracting anticipated inflation – are negative!) But even at these levels, bonds still have a place in the Balanced Fund. Even under the most optimistic forecasts, the path toward full economic recovery is unlikely to be smooth. Stock prices will be volatile, subject to changes in sentiment as well as economic conditions. In contrast, high quality bonds should provide some ballast to the Balanced Fund’s portfolio if equity market conditions worsen. As such, we continue to retain an allocation to bonds.*
* Portfolio composition is subject to change.
| Investment Performance (Unaudited) | Boston Trust Walden Balanced Fund |
| | Boston Trust Walden Equity Fund |
| | December 31, 2020 |
| | | For the periods ended 12/31/20 |
| | | Average Annual Total Returns | |
| | | | | | | | | | | | | | | | | | | | | | | | | | | | Since | |
| | | | | | | | | | | | | | | | | | | | | | | | | | | | Inception | |
| | | | 1 Year | | | | 3 Years | | | | 5 Years | | | | 10 Years | | | | 15 Years | | | | 20 Years | | | | (06/20/99) | |
| Boston Trust Walden Balanced Fund1 | | | 8.26 | % | | | 9.52 | % | | | 10.48 | % | | | 9.01 | % | | | 7.11 | % | | | 6.05 | % | | | 6.01 | % |
| Boston Trust Walden Equity Fund1 | | | 13.28 | % | | | 13.46 | % | | | 14.55 | % | | | 12.19 | % | | | 9.35 | % | | | 7.73 | % | | | 7.41 | % |
| S&P 500 Index | | | 18.40 | % | | | 14.18 | % | | | 15.22 | % | | | 13.88 | % | | | 9.88 | % | | | 7.47 | % | | | 6.92 | % |
| Bloomberg Barclays U.S. Government/Credit Bond Index | | | 8.93 | % | | | 5.97 | % | | | 4.98 | % | | | 4.19 | % | | | 4.64 | % | | | 5.01 | % | | | 5.21 | % |
| FTSE 3 Month US T-Bill Index | | | 0.58 | % | | | 1.56 | % | | | 1.16 | % | | | 0.60 | % | | | 1.16 | % | | | 1.43 | % | | | 1.73 | % |
Hypothetical Growth of a $100,000 Investment
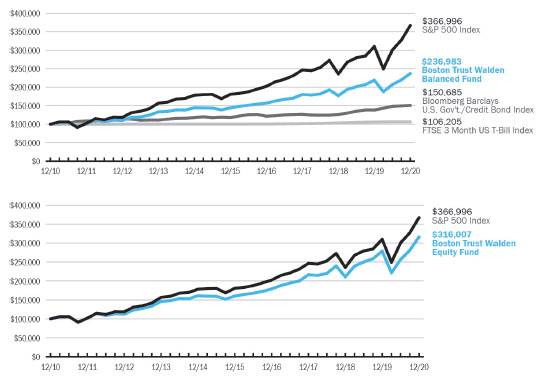
The above charts represent a 10-year hypothetical $100,000 investment in the Boston Trust Walden Balanced Fund and Boston Trust Walden Equity Fund, and includes the reinvestment of dividends and capital gains in the Funds. The returns shown on the table and the graphs do not reflect the deduction of taxes a shareholder would pay on Fund distributions or the redemption of Fund shares.
The Boston Trust Walden Balanced Fund is measured against a combination of equity and fixed income indices. The Boston Trust Walden Equity Fund is measured against the Standard & Poor’s 500 Index (“S&P 500”), which is widely regarded as a gauge of the U.S. equities market. This index includes 500 leading companies in leading industries of the U.S. economy. Although the S&P 500 focuses on the large-cap segment of the market, with approximately 75% coverage of U.S. equities, it is also widely viewed as a proxy for the total market. The Bloomberg Barclays U.S. Government/Credit Bond Index includes Treasuries (i.e., public obligations of the U.S. Treasury that have remaining maturities of more than one year), government-related issues (i.e., agency, sovereign, supranational, and local authority debt), and USD Corporates. The Bloomberg Barclays U.S. Government/Credit Bond Index is a component of the Bloomberg Barclays U.S. Aggregate Bond Index. The FTSE 3 Month US T-Bill Index reflects monthly return equivalents of yield averages that are not marked to the market. The index is an average of the last three-month treasury bill issues. The three-month treasury bills are the short-term debt obligations of the U.S. Government. The indexes are unmanaged and their performance does not reflect the deduction of expenses associated with a mutual fund, such as investment management and fund accounting fees. The Funds’ performance reflects the deduction of fees for these services. Investors cannot invest directly in an index.
Boston Trust Walden Balanced Fund
| Fund Net Asset Value: | | $ | 21.82 | |
| Gross Expense Ratio1: | | | 1.02 | % |
Boston Trust Walden Equity Fund
| Fund Net Asset Value: | | $ | 28.82 | |
| Gross Expense Ratio1: | | | 1.07 | % |
Past performance does not guarantee future results. The performance data quoted represents past performance and current returns may be lower or higher. The investment return and principal value will fluctuate so that an investor’s shares, when redeemed may be worth more or less than the original cost. To obtain performance information current to the most recent month-end, please call 1-800-282-8782 ext. 7050.
| 1 | The Gross Expense Ratio is from each Fund’s most recent prospectus, dated May 1, 2020. The contractual fee limit under each Fund’s expense limitation agreement is 1.00% of each Fund’s average annual net assets, subject to certain limitations as described in each Fund’s prospectus. Please see each Fund’s most recent prospectus for details. Additional information pertaining to each Fund’s expense ratio as of December 31, 2020 can be found in the financial highlights included in this report. The investment performance may reflect fee reductions. If such fee reductions had not occurred, the quoted performance would have been lower. The contractual fee waiver continues through May 1, 2021 and may be renewed thereafter. |
Boston Trust Walden Midcap Fund
(formerly Known as the Walden Midcap Fund)
December 31, 2020
Stephen J. Amyouny, CFA
Lead Portfolio Manager
Richard Q. Williams, CFA
Portfolio Manager
Mark Zagata, CFA
Portfolio Manager
Boston Trust Walden Inc.
Fund Objective
The Fund seeks long-term capital growth through an actively managed portfolio of stocks of middle capitalization (“mid cap”) companies.
Investment Concerns
Equity securities (stocks) are more volatile and carry more risk and return potential than other forms of investments, including investments in high-grade fixed income securities.
Mid cap funds typically carry additional risks since smaller companies generally have a higher risk of failure.
Manager Commentary (Unaudited)
Management Discussion of Fund Performance
The fourth quarter performance capped off a strong year for the Russell Midcap® Index (“Index”), which finished the year 17% higher than where it started in 2020, even with the 27.07% decline in the first quarter. Indeed, from the market trough in late March, the Index advanced nearly 90%. Even though the Boston Trust Walden Midcap Fund outperformed the Index return (-24.05% versus -27.07%) during the first quarter decline, the Fund’s total return of 8.76% for the 12-month period ended December 31, 2020 trailed the Index by a wide margin.
It should perhaps not be surprising that the Fund failed to keep up in the strong market rally of the second, third, and fourth quarters of 2020. In contrast to the fourth quarter where our emphasis on quality and value detracted from results, the Fund’s full year underperformance stemmed primarily from maintaining our valuation discipline. That said, despite the in-line performance of high-quality stocks in general, it is worth highlighting the relative outperformance of loss making entities over profitable peers, which was stunning: loss-makers1 outperformed profitable companies by more than 60%. Loss-making entities also now comprise 10% of Index value. Given the Fund is entirely invested in stocks of profitable companies, avoiding the loss-making cohort explains much of the relative underperformance.
Outlook
Entering 2021, we can point to several reasons for the optimism that propelled Index to new all-time highs in the fourth quarter. Among them included: the success in clinical trials and initial distribution of several Coronavirus (COVID-19) vaccines; continued economic recovery supported by significant monetary and fiscal stimuli; somewhat less political uncertainty following the presidential election; and historically low interest rates. However, we also continue to see risk in the current environment: a surge of COVID-19 case counts that is leading to new restrictions on economic activity; a fragile economic recovery still dependent on monetary and fiscal support; and continuing evidence of speculative activity among investors. We believe valuation risk in the market overall to be elevated.
While we do not seek to gain an edge through market timing, we continue to believe that over the long term stock prices ultimately reflect company fundamentals. We do not believe investors will perpetually favor as a group companies that cannot consistently generate profits or free cash flow and yet trade at elevated valuation multiples of sales. Of course, some of these individual companies will emerge as high-quality industry leaders. However, not all, or even a majority of them will succeed. As such, we continue to emphasize in our research and portfolio management activities those companies that have a demonstrated history of profitability, stability, and growth, have sustainable business models, high quality of earnings, and that are trading at reasonable valuations. As of December 31, 2020, the Fund exhibited strong financial characteristics and a more reasonable valuation profile than the Index. As a result, we continue to believe the Fund may provide favorable risk-adjusted returns over the long term.*
* Portfolio composition is subject to change.
1 Loss-makers are defined as companies with five-year cumulative EBIT (earnings before interest and taxes) less than $0
| Investment Performance (Unaudited) | Boston Trust Walden Midcap Fund |
| | | | December 31, 2020 |
| | | For the periods ended 12/31/20 | |
| | | Average Annual Total Returns | |
| | | | | | | | | | | | | | | | Since | |
| | | | | | | | | | | | | | | | Inception | |
| | | | 1 Year | | | | 3 Years | | | | 5 Years | | | | (08/1/11) | |
| Boston Trust Walden Midcap Fund | | | 8.76 | % | | | 10.42 | % | | | 12.55 | % | | | 11.59 | % |
| Russell Midcap® Index | | | 17.10 | % | | | 11.61 | % | | | 13.40 | % | | | 12.84 | % |
Hypothetical Growth of a $100,000 Investment
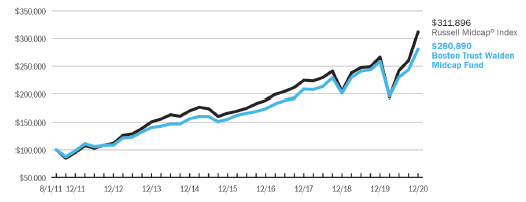
The above chart represents a hypothetical $100,000 investment in the Boston Trust Walden Midcap Fund from August 1, 2011 to December 31, 2020, and includes the reinvestment of dividends and capital gains in the Fund. The returns shown on the table and graph do not reflect the deduction of taxes a shareholder would pay on Fund distributions or the redemption of Fund shares.
The Boston Trust Walden Midcap Fund is measured against the Russell Midcap® Index, which is an unmanaged index that tracks the performance of the mid-cap segment of the U.S. equity universe. The Russell Midcap® Index is a subset of the Russell 1000® Index. It includes approximately 800 of the smallest securities based on a combination of their market capitalization and current index membership. The Russell Midcap® Index represents approximately 31% of the total market capitalization of the Russell 1000 companies. Russell Investment Group is the source and owner of the trademarks, service marks and copyrights related to the Russell Indexes. Russell® is a trademark of Russell Investment Group. The performance of an index does not reflect the deduction of expenses associated with a mutual fund, such as investment management and fund accounting fees. The Fund’s performance reflects the deduction of fees for these services. Investors cannot invest directly in an index.
| Fund Net Asset Value: | | $ | 19.71 | |
| Gross Expense Ratio1: | | | 1.00 | % |
Past performance does not guarantee future results. The performance data quoted represents past performance and current returns may be lower or higher. The investment return and principal value will fluctuate so that an investor’s shares, when redeemed may be worth more or less than the original cost. Returns less than one year are not annualized. To obtain performance information current to the most recent month-end, please call 1-800-282-8782 ext. 7050.
| 1 | The Gross Expense Ratio is from the Fund’s most recent prospectus, dated May 1, 2020. The contractual fee limit under the Fund’s expense limitation agreement is 1.00% of the Fund’s average annual net assets, subject to certain limitations as described in the Fund’s prospectus. Additional information pertaining to the Fund’s expense ratio as of December 31, 2020 can be found in the financial highlights included in this report. The investment performance may reflect fee reductions. If such fee reductions had not occurred, the quoted performance would have been lower. The contractual fee waiver continues through May 1, 2021 and may be renewed thereafter. |
Boston Trust Walden SMID Cap Fund
(formerly known as the Walden SMID Cap Fund)
December 31, 2020
Kenneth P. Scott, CFA
Lead Portfolio Manager
Richard Q. Williams, CFA
Portfolio Manager
Leanne Moore
Portfolio Manager
Boston Trust Walden Inc.
Fund Objective
The Fund seeks long-term capital growth through an actively managed portfolio of stocks of small and middle capitalization (“smid cap”) companies.
Investment Concerns
Equity securities (stocks) are more volatile and carry more risk and return potential than other forms of investments, including investments in high-grade fixed income securities.
Smid cap companies typically have a higher risk of failure and historically have experienced a greater degree of volatility.
Manager Commentary (Unaudited)
Management Discussion of Fund Performance
The fourth quarter performance capped off a year of superlatives for the Russell 2500™ Index (“Index”), which finished the year 20% higher than where it started in 2020, despite the 29.72% decline in the first quarter. Indeed, from the market trough in late March, the Index doubled in value. Even with the outperformance of the Fund during the first quarter drawdown (-25.03% versus -29.72%), the Fund’s total return of 9.13% for the 12-month period ended December 31, 2020 underperformed the Index by a wide margin.
It should perhaps not be surprising that the Fund failed to keep up in the strong market rally of the second, third, and fourth quarters of 2020. But to reiterate a theme consistent throughout the year, the underperformance was largely due to style: stocks of higher quality companies, particularly the more reasonably valued cohort, underperformed the overall index by a wide margin, and the Fund performed similarly. The performance gap between stocks of profitable and unprofitable companies was stunning: loss-makers1 outperformed by more than 65%. Loss-making entities also now comprise 18% of the index’s value. Given the Fund is entirely invested in stocks of profitable companies, the “allocation” effect of avoiding the loss-making cohort presented headwinds too strong to overcome, even with execution of our approach that was consistent with expectations.
Outlook
Entering 2021, we can point to several reasons for the optimism that has propelled the Index to new all-time highs in the fourth quarter. Among them included: the success in clinical trials and initial distribution of several Coronavirus (COVID-19) vaccines; continued economic recovery; somewhat less political uncertainty following the U.S. presidential election; and historically low interest rates. However, we also continue to see some risks in the current environment: a new surge of COVID-19 case counts that is leading to new restrictions on economic activity; a fragile economic recovery still dependent on monetary and fiscal support; and continuing evidence of speculative activity among investors. We believe valuation risk in the market overall to be elevated.
While we do not seek to gain an edge through market timing, we continue to believe that over the long term stock prices ultimately reflect company fundamentals. We do not believe investors will perpetually favor as a group companies that cannot consistently generate profits or free cash flow and yet trade at elevated valuation multiples of sales. Of course, some of these individual companies will emerge as high-quality industry leaders. However, not all, or even a majority of them will succeed. As such, we continue to emphasize in our research and portfolio management activities those companies that have a demonstrated history of profitability, stability, and growth, have sustainable business models, high quality of earnings, and that are trading at reasonable valuations. As of December 31, 2020, the Fund exhibited strong financial characteristics and a more reasonable valuation profile than the Index. As a result, we continue to believe the Fund may provide favorable risk-adjusted returns over the long term.*
* Portfolio composition is subject to change.
1 Loss-makers are defined as companies with five-year cumulative EBIT (earnings before interest and taxes) less than $0.
| Investment Performance (Unaudited) | Boston Trust Walden SMID Cap Fund |
| | | | December 31, 2020 |
| | | For the periods ended 12/31/20 | |
| | | Average Annual Total Returns | |
| | | | | | | | | | | | | | | | Since | |
| | | | | | | | | | | | | | | | Inception | |
| | | | 1 Year | | | | 3 Years | | | | 5 Years | | | | (06/28/12) | |
| Boston Trust Walden SMID Cap Fund1 | | | 9.13 | % | | | 9.12 | % | | | 12.79 | % | | | 12.16 | % |
| Russell 2500TM Index | | | 19.99 | % | | | 11.33 | % | | | 13.64 | % | | | 13.86 | % |
Hypothetical Growth of a $100,000 Investment
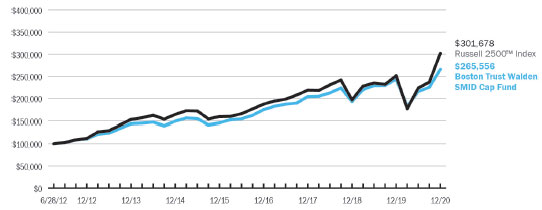
The above chart represents a hypothetical $100,000 investment in the Boston Trust Walden SMID Cap Fund from June 28, 2012 to December 31, 2020, and includes the reinvestment of dividends and capital gains in the Fund. The returns shown on the table and the graph do not reflect the deduction of taxes a shareholder would pay on Fund distributions or the redemption of Fund shares.
The Boston Trust Walden SMID Cap Fund is measured against the Russell 2500™ Index, which is an unmanaged index that tracks the performance of the small- to mid-cap segment of the U.S. equity universe, commonly referred to as “smid” cap. The Russell 2500™ is a subset of the Russell 3000® Index. It includes approximately 2500 of the smallest securities based on a combination of their market cap and current index membership. Russell Investment Group is the source and owner of the trademarks, service marks and copyrights related to the Russell Indexes. Russell® is a trademark of Russell Investment Group. The performance of an index does not reflect the deduction of expenses associated with a mutual fund, such as investment management and fund accounting fees. The Fund’s performance reflects the deduction of fees for these services. Investors cannot invest directly in an index.
| Fund Net Asset Value: | | $ | 19.40 | |
| Gross Expense Ratio1: | | | 1.07 | % |
Past performance does not guarantee future results. The performance data quoted represents past performance and current returns may be lower or higher. The investment return and principal value will fluctuate so that an investor’s shares, when redeemed may be worth more or less than the original cost. To obtain performance information current to the most recent month-end, please call 1-800-282-8782 ext. 7050.
| 1 | The Gross Expense Ratio is from the Fund’s most recent prospectus, dated May 1, 2020. The contractual fee limit under the Fund’s expense limitation agreement is 1.00% of the Fund’s average annual net assets, subject to certain limitations as described in the Fund’s prospectus. Please see the Fund’s most recent prospectus for details. Additional information pertaining to the Fund’s expense ratio as of December 31, 2020 can be found in the financial highlights included in this report. The investment performance may reflect fee reductions. If such fee reductions had not occurred, the quoted performance would have been lower. The contractual fee waiver continues through May 1, 2021 and may be renewed thereafter. |
Boston Trust Walden Small Cap Fund
December 31, 2020
Kenneth P. Scott, CFA
Lead Portfolio Manager
Richard Q. Williams, CFA
Portfolio Manager
Leanne Moore
Portfolio Manager
Boston Trust Walden Inc.
Fund Objective
The Fund seeks long-term capital growth through an actively managed portfolio of stocks of small capitalization (“small cap”) companies.
Investment Concerns
Equity securities (stocks) are more volatile and carry more risk and return potential than other forms of investments, including investments in high-grade fixed income securities.
Small cap funds typically carry additional risks since smaller companies generally have a higher risk of failure, and historically, their stocks have experienced a greater degree of market volatility than stocks on average.
Manager Commentary (Unaudited)
Management Discussion of Fund Performance
The fourth quarter performance capped off a year of superlatives for the Russell 2000® Index (“Index”), which finished the year 20% higher than where it started in 2020, despite the 30.61% decline in the first quarter. Indeed, from the market trough in late March, the Index doubled in value. Even with the outperformance of the Fund during the first quarter drawdown (-26.16% versus -30.61%), the Fund’s total return of 8.17% for the 12-month period ended December 31, 2020 underperformed the Index by a wide margin.
It should perhaps not be surprising that the Fund failed to keep up in the strong market rally of the second, third, and fourth quarters. But to reiterate a theme consistent throughout the year, the underperformance was largely due to style: stocks of higher quality companies, particularly the more reasonably valued cohort, underperformed the overall index by a wide margin, and the Fund performed similarly. The performance divide between stocks of profitable and unprofitable companies was stunning: loss-makers1 outperformed by more than 50%. Loss-making entities now comprise 23% of the Index’s value. Given the Fund is entirely invested in stocks of profitable companies, the “allocation” effect of avoiding the loss-making cohort presented headwinds too strong to overcome, even with execution of our approach that was consistent with expectations.
Outlook
Entering 2021, we can point to several reasons for the optimism that have propelled the Index to new all-time highs in the fourth quarter. Among them included: the success in clinical trials and initial distribution of several Coronavirus (COVID-19) vaccines; continued economic recovery; somewhat less political uncertainty following the presidential election; and historically low interest rates. However, we also continue to see risk in the current environment: a new surge of COVID-19 case counts that is leading to new restrictions on economic activity; a fragile economic recovery still dependent on monetary and fiscal support; and continuing evidence of speculative activity among investors. We believe valuation risk in the market overall to be elevated.
While we do not seek to gain an edge through market timing, we continue to believe that over the long term stock prices ultimately reflect company fundamentals. We do not believe investors will perpetually favor, as a group, companies that cannot consistently generate profits or free cash flow and yet trade at elevated valuation multiples of sales. Of course, some of these individual companies will emerge as high-quality industry leaders. However, not all, or even a majority of them will succeed. As such, we continue to emphasize in our research and portfolio management activities those companies that have a demonstrated history of profitability, stability, and growth, have sustainable business models, high quality of earnings, and that are trading at reasonable valuations. As of December 31, 2020, the Fund exhibits strong financial characteristics and a more reasonable valuation profile than the Index. As a result, we continue to believe the strategy may provide favorable risk-adjusted returns over the long term.*
* Portfolio composition is subject to change.
1 Loss-makers are defined as companies with five-year cumulative EBIT (earnings before interest and taxes) less than $0.
| Investment Performance (Unaudited) | Boston Trust Walden Small Cap Fund |
| | | | | December 31, 2020 |
| | | For the periods ended 12/31/20 | |
| | | Average Annual Total Returns | |
| | | | | | | | | | | | | | | | | | | | | | | | Since | |
| | | | | | | | | | | | | | | | | | | | | | | | Inception | |
| | | | 1 Year | | | | 3 Years | | | | 5 Years | | | | 10 Years | | | | 15 Years | | | | (12/31/94) | |
| Boston Trust Walden Small Cap Fund1 | | | 8.17 | % | | | 9.71 | % | | | 12.82 | % | | | 9.93 | % | | | 9.32 | % | | | 10.90 | % |
| Russell 2000® Index | | | 19.96 | % | | | 10.25 | % | | | 13.26 | % | | | 11.20 | % | | | 8.91 | % | | | 9.74 | % |
Hypothetical Growth of a $100,000 Investment
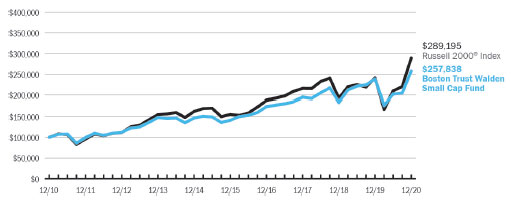
The above chart represents a 10-year hypothetical $100,000 investment in the Boston Trust Walden Small Cap Fund and includes the reinvestment of dividends and capital gains in the Fund. The returns shown on the table and graph do not reflect the deduction of taxes a shareholder would pay on Fund distributions or the redemption of Fund shares.
The Boston Trust Walden Small Cap Fund is measured against the Russell 2000® Index, which is an unmanaged index that tracks the performance of the small-cap segment of the U.S. equity universe. The Russell 2000® Index is a subset of the Russell 3000® Index representing approximately 10% of the total market capitalization of that index. It includes approximately 2,000 of the smallest securities based on a combination of their market cap and current index membership. Russell Investment Group is the source and owner of the trademarks, service marks and copyrights related to the Russell Indexes. Russell® is a trademark of Russell Investment Group. The performance of an index does not reflect the deduction of expenses associated with a mutual fund, such as investment management and fund accounting fees. The Fund’s performance reflects the deduction of fees for these services. Investors cannot invest directly in an index.
| Fund Net Asset Value: | | $ | 15.31 | |
| Gross Expense Ratio1: | | | 1.07 | % |
Past performance does not guarantee future results. The performance data quoted represents past performance and current returns may be lower or higher. The investment return and principal value will fluctuate so that an investor’s shares, when redeemed may be worth more or less than the original cost. To obtain performance information current to the most recent month-end, please call 1-800-282-8782 ext. 7050.
| 1 | The Gross Expense Ratio is from the Fund’s most recent prospectus, dated May 1, 2020. The contractual fee limit under the Fund’s expense limitation agreement is 1.00% of the Fund’s average annual net assets, subject to certain limitations as described in the Fund’s prospectus. Please see the Fund’s most recent prospectus for details. Additional information pertaining to the Fund’s expense ratio as of December 31, 2020 can be found in the financial highlights included in this report. The investment performance may reflect fee reductions. If such fee reductions had not occurred, the quoted performance would have been lower. The contractual fee waiver continues through May 1, 2021 and may be renewed thereafter. |
Boston Trust Walden International Equity Fund
(formerly known as the Walden International Equity Fund)
December 31, 2020
William H. Apfel, CFA
Lead Portfolio Manager
Nathaniel J. Riley, CFA
Portfolio Manager
David A. Sandell, CFA
Portfolio Manager
Boston Trust Walden Inc.
Fund Objective
The Fund seeks long-term capital growth through an actively managed portfolio of equities of international companies.
Investment Concerns
Foreign investing involves risks not typically associated with U.S. investments, including adverse political, regulatory, social and economic developments and differing auditing and legal standards. These risks are magnified in emerging markets.
Equity securities (stocks) are more volatile and carry more risk and return potential than other forms of investments, including investments in high-grade fixed income securities.
Mid-capitalization funds typically carry additional risks since smaller companies generally have a higher risk of failure.
Manager Commentary (Unaudited)
Management Discussion of Fund Performance
For the 12-month period ended December 31, 2020, the Boston Trust Walden International Equity Fund posted a total return of 7.16%. The Fund’s return trailed that of its primary benchmark, the MSCI World ex-USA Index (net) (“Index”), which posted a return of 7.59% for the year.
Global equity markets declined sharply in the first quarter of 2020 as economies slowed when the Coronavirus (COVID-19) pandemic took hold and government policies, along with fear of contagion, compelled people to stay home as much as possible. This led to lower spending on the part of consumers and businesses, and corporate earnings estimates for the year declined. Deterioration in fundamentals and rising volatility in financial markets led many investors to sell stocks; at its trough on March 23, 2020, the Index was down 34.21% year-to-date.
Governments around the globe answered with fiscal and monetary policy moves that quickly reversed the rout in financial markets. As the pandemic waned in the summer, economic activity in many parts of the world increased to near-normal levels, and stocks rose commensurately. In the fall, COVID-19 cases increased in many developed markets, but promising vaccine results and their initial rollout, along with continued government support of economies around the globe, propelled the equity market ever-higher through the remainder of the year.
Certain market segments fared better than others did. Most geographies performed well; of the 22 countries represented in the Index, all but six achieved a positive return for 2020. Of the decliners, most were smaller and less diversified equity markets; the only one of significant size was the UK, which grappled with the effects of an impending Brexit and a worse pandemic than many other countries. Most sectors also posted positive returns for the year, though there was a notable gap between the best performers and the worst. Certain sectors, like Information Technology, benefited from the stay-at-home lifestyle, while others, like Energy, suffered from lower use of their products worldwide.
Turning to other market factors, quality was a slight tailwind for the year. Stocks that appear to be high quality, as measured by the Adviser’s proprietary quality metric, outperformed lower quality stocks for the year. All the outperformance came in the first quarter as more stable companies with lower levels of debt were rewarded during the economic and market downturn; during the following nine months of the year higher quality stocks underperformed slightly. The Fund was overweight higher quality stocks relative to its benchmark throughout 2020, so this provided a modest performance benefit.
Expensive stocks, as measured by the Adviser’s proprietary valuation metric, outperformed the broader market for the year. This negatively affected the Fund’s performance, as it was underweight that segment of the market. This was offset, however, by an underweight position in the cheapest stocks relative to its benchmark, which underperformed the market during the year.*
* Portfolio composition is subject to change.
| Investment Performance (Unaudited) | Boston Trust Walden International Equity Fund |
| | | | | December 31, 2020 |
| | | For the periods ended 12/31/20 | |
| | | Average Annual Total Returns | |
| | | | | | | | | | | | | | | | Since | |
| | | | | | | | | | | | | | | | Inception | |
| | | | 1 Year | | | | 3 Years | | | | 5 Years | | | | (06/9/15) | |
| Boston Trust Walden International Equity Fund | | | 7.16 | % | | | 5.10 | % | | | 6.95 | % | | | 5.26 | % |
| MSCI World ex-USA Index (Net) | | | 7.59 | % | | | 4.22 | % | | | 7.64 | % | | | 5.26 | % |
| FTSE All-World Developed ex-US Index | | | 10.24 | % | | | 5.12 | % | | | 8.69 | % | | | 6.31 | % |
Hypothetical Growth of a $1,000,000 Investment

The above chart represents a hypothetical $1,000,000 investment in the Boston Trust Walden International Equity Fund from June 9, 2015 to December 31, 2020, and includes the reinvestment of dividends and capital gains in the Fund. The returns shown on the table and the graph do not reflect the deduction of taxes a shareholder would pay on Fund distributions or the redemption of Fund shares.
The Boston Trust Walden International Equity Fund is measured against the MSCI World ex-USA Index, which captures large and mid cap representation across 22 of 23 Developed Markets countries (excluding the United States) and the FTSE All World Developed ex-US Index, which represents the largest securities in developed countries equity markets (excluding the United States) based on all investable equity securities. Index returns reflect neither the deduction of expenses associated with a mutual fund, such as investment management and fund accounting fees. The Fund’s performance reflects the deduction of fees for these services. Investors cannot invest directly in an index.
| Fund Net Asset Value: | | $ | 12.29 | |
| Gross Expense Ratio1: | | | 1.04 | % |
Past performance does not guarantee future results. The performance data quoted represents past performance and current returns may be lower or higher. The investment return and principal value will fluctuate so that an investor’s shares, when redeemed may be worth more or less than the original cost. To obtain performance information current to the most recent month-end, please call 1-800-282-8782 ext. 7050.
1 The Gross Expense Ratio is from the Fund’s prospectus, dated May 1, 2020. Please see the Fund’s most recent prospectus for details. Additional information pertaining to the Fund’s expense ratio as of December 31, 2020 can be found in the financial highlights included in this report.
| Schedule of Portfolio Investments | | Boston Trust Walden Balanced Fund
December 31, 2020 |
| Security Description | | | Shares | | | | Fair Value ($) | |
| Common Stocks (68.0%) | | | | | | | | |
| Communication Services (7.3%) | | | | | | | | |
| Alphabet, Inc., Class A (a) | | | 1,000 | | | | 1,752,640 | |
| Alphabet, Inc., Class C (a) | | | 2,450 | | | | 4,292,106 | |
| Charter Communications, Inc., Class A (a) | | | 2,445 | | | | 1,617,490 | |
| Comcast Corp., Class A | | | 26,000 | | | | 1,362,400 | |
| Electronic Arts, Inc. | | | 7,000 | | | | 1,005,200 | |
| The Walt Disney Co. (a) | | | 8,500 | | | | 1,540,030 | |
| Verizon Communications, Inc. | | | 22,000 | | | | 1,292,500 | |
| | | | | | | | 12,862,366 | |
| Consumer Discretionary (6.4%) | | | | | | | | |
| AutoZone, Inc. (a) | | | 800 | | | | 948,352 | |
| Dollar General Corp. | | | 7,000 | | | | 1,472,100 | |
| Lowe’s Cos., Inc. | | | 4,500 | | | | 722,295 | |
| McDonald’s Corp. | | | 5,500 | | | | 1,180,190 | |
| NIKE, Inc., Class B | | | 17,000 | | | | 2,404,990 | |
| Ross Stores, Inc. | | | 13,000 | | | | 1,596,530 | |
| Starbucks Corp. | | | 18,000 | | | | 1,925,640 | |
| The Home Depot, Inc. | | | 4,000 | | | | 1,062,480 | |
| | | | | | | | 11,312,577 | |
| Consumer Staples (5.3%) | | | | | | | | |
| Church & Dwight Co., Inc. | | | 6,000 | | | | 523,380 | |
| Colgate-Palmolive Co. | | | 15,000 | | | | 1,282,650 | |
| Costco Wholesale Corp. | | | 6,500 | | | | 2,449,070 | |
| Estee Lauder Cos., Inc., Class A | | | 6,000 | | | | 1,597,140 | |
| PepsiCo, Inc. | | | 12,000 | | | | 1,779,600 | |
| Procter & Gamble Co. (The) | | | 6,000 | | | | 834,840 | |
| The Hershey Co. | | | 6,500 | | | | 990,145 | |
| | | | | | | | 9,456,825 | |
| Energy (1.1%) | | | | | | | | |
| ConocoPhillips | | | 49,000 | | | | 1,959,510 | |
| | | | | | | | 1,959,510 | |
| Financials (7.9%) | | | | | | | | |
| American Express Co. | | | 11,000 | | | | 1,330,010 | |
| Chubb Ltd. | | | 6,500 | | | | 1,000,480 | |
| Cincinnati Financial Corp. | | | 13,500 | | | | 1,179,495 | |
| Commerce Bancshares, Inc. | | | 11,550 | | | | 758,835 | |
| JPMorgan Chase & Co. | | | 20,000 | | | | 2,541,400 | |
| Moody’s Corp. | | | 2,500 | | | | 725,600 | |
| Northern Trust Corp. | | | 20,000 | | | | 1,862,800 | |
| PNC Financial Services Group, Inc. | | | 11,500 | | | | 1,713,500 | |
| T. Rowe Price Group, Inc. | | | 10,000 | | | | 1,513,900 | |
| U.S. Bancorp | | | 30,500 | | | | 1,420,995 | |
| | | | | | | | 14,047,015 | |
| Health Care (10.7%) | | | | | | | | |
| Amgen, Inc. | | | 4,000 | | | | 919,680 | |
| Becton, Dickinson & Co. | | | 7,250 | | | | 1,814,095 | |
| Cerner Corp. | | | 11,000 | | | | 863,280 | |
| Danaher Corp. | | | 4,500 | | | | 999,630 | |
| Intuitive Surgical, Inc. (a) | | | 1,700 | | | | 1,390,770 | |
| Johnson & Johnson | | | 8,250 | | | | 1,298,385 | |
| Medtronic PLC | | | 17,000 | | | | 1,991,380 | |
| Merck & Co., Inc. | | | 15,000 | | | | 1,227,000 | |
| Mettler-Toledo International, Inc. (a) | | | 1,400 | | | | 1,595,552 | |
| Stryker Corp. | | | 9,250 | | | | 2,266,620 | |
| The Cooper Companies., Inc. | | | 2,600 | | | | 944,632 | |
| UnitedHealth Group, Inc. | | | 6,750 | | | | 2,367,090 | |
| Waters Corp. (a) | | | 5,500 | | | | 1,360,810 | |
| | | | | | | | 19,038,924 | |
| Industrials (7.6%) | | | | | | | | |
| 3M Co. | | | 8,500 | | | | 1,485,715 | |
| Cummins, Inc. | | | 5,500 | | | | 1,249,050 | |
| Deere & Co. | | | 6,000 | | | | 1,614,300 | |
| Donaldson Co., Inc. | | | 22,000 | | | | 1,229,360 | |
| Hubbell, Inc. | | | 9,500 | | | | 1,489,505 | |
| Illinois Tool Works, Inc. | | | 5,000 | | | | 1,019,400 | |
| Lincoln Electric Holdings, Inc. | | | 5,000 | | | | 581,250 | |
| Union Pacific Corp. | | | 9,500 | | | | 1,978,090 | |
| United Parcel Service, Inc., Class B | | | 9,500 | | | | 1,599,800 | |
| W.W. Grainger, Inc. | | | 3,000 | | | | 1,225,020 | |
| | | | | | | | 13,471,490 | |
| Information Technology (17.9%) | | | | | | | | |
| Accenture PLC, Class A | | | 12,000 | | | | 3,134,520 | |
| Akamai Technologies, Inc. (a) | | | 9,500 | | | | 997,405 | |
| Analog Devices, Inc. | | | 7,500 | | | | 1,107,975 | |
| Apple, Inc. | | | 66,000 | | | | 8,757,540 | |
| Automatic Data Processing, Inc. | | | 13,000 | | | | 2,290,600 | |
| Cisco Systems, Inc. | | | 39,000 | | | | 1,745,250 | |
| Intel Corp. | | | 25,000 | | | | 1,245,500 | |
| Intuit, Inc. | | | 2,000 | | | | 759,700 | |
| Microsoft Corp. | | | 30,000 | | | | 6,672,601 | |
| Oracle Corp. | | | 32,000 | | | | 2,070,080 | |
| Visa, Inc., Class A | | | 13,500 | | | | 2,952,855 | |
| | | | | | | | 31,734,026 | |
| Materials (2.2%) | | | | | | | | |
| Air Products & Chemicals, Inc. | | | 5,000 | | | | 1,366,100 | |
| AptarGroup, Inc. | | | 10,500 | | | | 1,437,345 | |
| PPG Industries, Inc. | | | 8,000 | | | | 1,153,760 | |
| | | | | | | | 3,957,205 | |
| Utilities (1.6%) | | | | | | | | |
| Atmos Energy Corp. | | | 8,000 | | | | 763,440 | |
| Eversource Energy | | | 24,000 | | | | 2,076,240 | |
| | | | | | | | 2,839,680 | |
| TOTAL COMMON STOCKS (Cost $53,525,965) | | | | | | | 120,679,618 | |
| | | Principal | | | | | |
| | | | Amount ($) | | | | | |
| Certificate of Deposit (0.1%) | | | | | | | | |
| Certificate of Deposit (0.1%) | | | | | | | | |
| Self-Help Federal Credit Union, 1.90%, 12/20/21 (b) | | | 200,000 | | | | 203,625 | |
| TOTAL CERTIFICATE OF DEPOSIT (Cost $200,000) | | | | | | | 203,625 | |
| Corporate Bonds (4.1%) | | | | | | | | |
| Communication Services (0.3%) | | | | | | | | |
| Comcast Corp., 3.30%, 4/1/27, Callable 2/1/27 @ 100 | | | 250,000 | | | | 284,590 | |
| Comcast Corp., 3.95%, 10/15/25, Callable 8/15/25 @ 100 | | | 250,000 | | | | 287,404 | |
| | | | | | | | 571,994 | |
| Consumer Discretionary (0.5%) | | | | | | | | |
| NIKE, Inc., 2.75%, 3/27/27, Callable 1/27/27 @ 100 | | | 500,000 | | | | 553,729 | |
See Notes to Financial Statements
| Schedule of Portfolio Investments | | Boston Trust Walden Balanced Fund
December 31, 2020 |
| | | | Principal | | | | | |
| Security Description | | | Amount ($) | | | | Fair Value ($) | |
| Corporate Bonds, Continued | | | | | | | | |
| Consumer Discretionary, continued | | | | | | | | |
| Starbucks Corp., 2.45%, 6/15/26, Callable 3/15/26 @ 100 | | | 350,000 | | | | 378,465 | |
| | | | | | | | 932,194 | |
| Financials (0.8%) | | | | | | | | |
| American Express Co., 2.65%, 12/2/22 | | | 287,000 | | | | 299,666 | |
| John Deere Capital Corp., 2.80%, 7/18/29 | | | 350,000 | | | | 390,209 | |
| John Deere Capital Corp., 2.95%, 4/1/22, MTN | | | 150,000 | | | | 155,026 | |
| JPMorgan Chase & Co., 2.95%, 10/1/26, Callable 7/1/26 @ 100 | | | 500,000 | | | | 555,005 | |
| | | | | | | | 1,399,906 | |
| Health Care (0.6%) | | | | | | | | |
| Abbott Laboratories, 2.95%, 3/15/25, Callable 12/15/24 @ 100 | | | 100,000 | | | | 109,784 | |
| Healthcare Corp., 1.15%, 6/15/25, Callable 5/15/25 @ 100 | | | 100,000 | | | | 102,099 | |
| Kaiser Foundation Hospitals, 3.15%, 5/1/27, Callable 2/1/27 @ 100 | | | 250,000 | | | | 282,731 | |
| Merck & Co., Inc., 3.88%, 1/15/21 | | | 150,000 | | | | 150,101 | |
| Pfizer, Inc., 3.40%, 5/15/24 | | | 100,000 | | | | 109,997 | |
| Stryker Corp., 3.50%, 3/15/26, Callable 12/15/25 @ 100 | | | 300,000 | | | | 339,335 | |
| | | | | | | | 1,094,047 | |
| Industrials (0.6%) | | | | | | | | |
| 3M Co., 3.00%, 8/7/25 | | | 250,000 | | | | 277,770 | |
| Emerson Electric Co., 2.63%, 2/15/23, Callable 11/15/22 @ 100 | | | 200,000 | | | | 208,690 | |
| Hubbell, Inc., 3.35%, 3/1/26, Callable 12/1/25 @ 100 | | | 145,000 | | | | 159,578 | |
| Hubbell, Inc., 3.50%, 2/15/28, Callable 11/15/27 @ 100 | | | 150,000 | | | | 163,456 | |
| Hubbell, Inc., 3.63%, 11/15/22 | | | 75,000 | | | | 79,241 | |
| United Parcel Service, Inc., 2.40%, 11/15/26, Callable 8/15/26 @ 100 | | | 200,000 | | | | 218,598 | |
| | | | | | | | 1,107,333 | |
| Information Technology (1.2%) | | | | | | | | |
| Apple, Inc., 2.20%, 9/11/29, Callable 6/11/29 @ 100 | | | 350,000 | | | | 378,197 | |
| Apple, Inc., 2.85%, 2/23/23, Callable 12/23/22 @ 100 | | | 150,000 | | | | 157,565 | |
| Apple, Inc., 3.00%, 6/20/27, Callable 3/20/27 @ 100 | | | 200,000 | | | | 224,167 | |
| Mastercard, Inc., 2.95%, 11/21/26, Callable 8/21/26 @ 100 | | | 100,000 | | | | 111,918 | |
| Mastercard, Inc., 3.30%, 3/26/27, Callable 1/26/27 @ 100 | | | 150,000 | | | | 171,275 | |
| Oracle Corp., 2.50%, 4/1/25, Callable 3/1/25 @ 100 | | | 200,000 | | | | 215,122 | |
| Oracle Corp., 3.40%, 7/8/24, Callable 4/8/24 @ 100 | | | 300,000 | | | | 328,518 | |
| Visa, Inc., 3.15%, 12/14/25, Callable 9/14/25 @ 100 | | | 275,000 | | | | 308,712 | |
| | | | | | | | 1,895,474 | |
| Utilities (0.1%) | | | | | | | | |
| Midamerican Energy Co., 3.10%, 5/1/27,Callable 2/1/27 @ 100 | | | 200,000 | | | | 224,514 | |
| | | | | | | | | |
| TOTAL CORPORATE BONDS (Cost $6,770,858) | | | | | | | 7,225,462 | |
| | | | | | | | | |
| Municipal Bonds (2.4%) | | | | | | | | |
| | | | | | | | | |
| Georgia (0.2%) | | | | | | | | |
| State of Georgia, GO, 1.40%, 8/1/33, Callable 8/1/30 @ 100 | | | 350,000 | | | | 348,688 | |
| | | | | | | | | |
| Hawaii (0.3%) | | | | | | | | |
| State of Hawaii, GO, 1.87%, 8/1/33, Callable 8/1/30 @ 100 | | | 500,000 | | | | 507,580 | |
| | | | | | | | | |
| Massachusetts (1.7%) | | | | | | | | |
| Commonwealth of Massachusetts, GO, Series D, 3.00%, 5/1/35, Callable 5/1/29 @ 100 (b) | | | 1,150,000 | | | | 1,301,697 | |
| Commonwealth of Massachusetts, GO, Series D, 3.00%, 5/1/36, Callable 5/1/29 @ 100 (b) | | | 1,500,000 | | | | 1,689,614 | |
| | | | | | | | 2,991,311 | |
| New York (0.1%) | | | | | | | | |
| New York State Environmental Facilities Corp., Series C, 1.89%, 7/15/22 | | | 190,000 | | | | 194,180 | |
| | | | | | | | | |
| Wisconsin (0.1%) | | | | | | | | |
| Wisconsin State, Build America Bonds, GO, 4.60%, 5/1/26, Callable 5/1/21 @ 100 | | | 250,000 | | | | 253,473 | |
| | | | | | | | | |
| TOTAL MUNICIPAL BONDS (Cost $4,034,411) | | | | | | | 4,295,232 | |
| | | | | | | | | |
| U.S. Government & U.S. Government Agency Obligations (23.4%) | | | | | | | | |
| | | | | | | | | |
| Federal Farm Credit Bank (0.8%) | | | | | | | | |
| 2.60%, 10/6/22 | | | 150,000 | | | | 156,485 | |
| 2.75%, 7/16/27 | | | 250,000 | | | | 282,379 | |
| 2.85%, 3/2/28 | | | 750,000 | | | | 857,512 | |
| | | | | | | | 1,296,376 | |
| Federal Home Loan Bank (3.6%) | | | | | | | | |
| 2.13%, 3/10/23 | | | 1,000,000 | | | | 1,043,455 | |
| 2.50%, 3/11/22 | | | 200,000 | | | | 205,685 | |
| 2.88%, 6/14/24 | | | 1,000,000 | | | | 1,091,932 | |
| 2.88%, 9/13/24 | | | 1,000,000 | | | | 1,097,071 | |
| 3.25%, 6/9/23 | | | 850,000 | | | | 913,146 | |
| 5.25%, 8/15/22 | | | 1,000,000 | | | | 1,082,638 | |
| 5.50%, 7/15/36 | | | 700,000 | | | | 1,082,734 | |
| | | | | | | | 6,516,661 | |
| Federal National Mortgage Association (3.4%) | | | | | | | | |
| 1.88%, 9/24/26 | | | 1,000,000 | | | | 1,081,840 | |
| 2.13%, 4/24/26 | | | 1,250,000 | | | | 1,362,561 | |
| 2.63%, 9/6/24 | | | 3,250,000 | | | | 3,536,019 | |
| | | | | | | | 5,980,420 | |
| Government National Mortgage Association (0.0%) (c) | | | | | | | | |
| 4.00%, 9/15/40 | | | 18,105 | | | | 19,601 | |
| 4.00%, 9/15/41 | | | 67,915 | | | | 73,416 | |
| 6.50%, 5/15/32 | | | 1,251 | | | | 1,389 | |
| | | | | | | | 94,406 | |
See Notes to Financial Statements
| Schedule of Portfolio Investments | | Boston Trust Walden Balanced Fund
December 31, 2020 |
U.S. Government & U.S. Government Agency Obligations, Continued
| | | | Principal | | | | | |
| Security Description | | | Amount ($) | | | | Fair Value ($) | |
| Housing & Urban Development (0.3%) | | | | | | | | |
| 2.70%, 8/1/22 | | | 491,000 | | | | 497,892 | |
| U.S. Treasury Inflation Index Note (1.0%) | | | | | | | | |
| 0.25%, 7/15/29 | | | 1,017,950 | | | | 1,153,211 | |
| 0.75%, 7/15/28 | | | 518,660 | | | | 603,618 | |
| | | | | | | | 1,756,829 | |
| U.S. Treasury Note (14.3%) | | | | | | | | |
| 0.63%, 8/15/30 | | | 1,500,000 | | | | 1,462,734 | |
| 1.63%, 8/15/29 | | | 5,000,000 | | | | 5,349,608 | |
| 1.75%, 5/15/23 | | | 2,500,000 | | | | 2,595,605 | |
| 2.13%, 11/30/23 | | | 2,000,000 | | | | 2,114,766 | |
| 2.13%, 5/15/25 | | | 3,500,000 | | | | 3,778,633 | |
| 2.50%, 2/28/26 | | | 750,000 | | | | 831,621 | |
| 2.63%, 12/31/23 | | | 1,000,000 | | | | 1,073,516 | |
| 2.75%, 8/31/23 | | | 1,500,000 | | | | 1,603,594 | |
| 2.75%, 11/15/23 | | | 1,500,000 | | | | 1,611,797 | |
| 2.75%, 2/28/25 | | | 3,500,000 | | | | 3,858,545 | |
| 2.88%, 9/30/23 | | | 1,000,000 | | | | 1,074,453 | |
| | | | | | | | 25,354,872 | |
| TOTAL U.S. GOVERNMENT & U.S. GOVERNMENT AGENCY OBLIGATIONS (Cost $38,865,939) | | | | | | | 41,497,456 | |
| | | | | | | | | |
| Yankee Dollar (0.2%) | | | | | | | | |
| Financials (0.2%) | | | | | | | | |
| The Toronto-Dominion Bank, 3.50%, 7/19/23, MTN | | | 350,000 | | | | 378,950 | |
| TOTAL YANKEE DOLLAR (Cost $354,212) | | | | | | | 378,950 | |
| | | | | | | | | |
| Investment Companies (1.6%) | | | Shares | | | | | |
| JPMorgan U.S. Government Money Market Fund, Capital Shares, 0.03% (d) | | | 2,795,394 | | | | 2,795,394 | |
| TOTAL INVESTMENT COMPANIES (Cost $2,795,394) | | | | | | | 2,795,394 | |
| Total Investments (Cost $106,546,779) — 99.8% (e) | | | | | | | 177,075,737 | |
| Other assets in excess of liabilities — 0.2% | | | | | | | 307,273 | |
| NET ASSETS — 100.0% | | | | | | $ | 177,383,010 | |
| (a) | Non-income producing security. |
| (b) | These securities have been deemed illiquid and represents 1.80% of the Fund’s net assets. |
| (c) | Represents less than 0.05%. |
| (d) | Rate disclosed is the seven day yield as of December 31, 2020. |
| (e) | See Federal Tax Information listed in the Notes to the Financial Statements. |
| PLC | Public Limited Company |
See Notes to Financial Statements
| Financial Statements | Boston Trust Walden Balanced Fund |
Statement of Assets and Liabilities
December 31, 2020
| Assets: | | |
| Investments, at fair value (cost $106,546,779) | $ | 177,075,737 |
| Interest and dividends receivable | | 419,941 |
| Receivable for capital shares issued | | 23,045 |
| Prepaid expenses | | 15,560 |
| Total Assets | | 177,534,283 |
| Liabilities: | | |
| Payable for capital shares redeemed | | 4,355 |
| Accrued expenses and other liabilities: | | |
| Investment adviser | | 110,966 |
| Administration and accounting | | 7,051 |
| Chief compliance officer | | 812 |
| Custodian | | 1,608 |
| Shareholder servicing fees | | 15,533 |
| Transfer agent | | 3,096 |
| Trustee | | 2,194 |
| Other | | 5,658 |
| Total Liabilities | | 151,273 |
| Net Assets | $ | 177,383,010 |
| Composition of Net Assets: | | |
| Paid in capital | $ | 105,948,728 |
| Total distributable earnings/(loss) | | 71,434,282 |
| Net Assets | $ | 177,383,010 |
| Shares outstanding (par value $0.01, unlimited number of shares authorized) | | 8,128,169 |
| Net Asset Value, Offering Price and Redemption price per share | $ | 21.82 |
Statement of Operations
For the year ended December 31, 2020
| Investment Income: | | |
| Interest | $ | 1,002,130 |
| Dividends | | 1,936,774 |
| Total Investment Income | | 2,938,904 |
| Expenses: | | |
| Investment adviser | | 1,198,883 |
| Administration and accounting | | 99,005 |
| Chief compliance officer | | 12,179 |
| Custodian | | 22,489 |
| Shareholder servicing | | 178,114 |
| Transfer agency | | 37,310 |
| Trustee | | 10,739 |
| Other | | 73,290 |
| Total expenses before fee reductions | | 1,632,009 |
| Fees contractually reduced by the investment adviser | | (33,272 ) |
| Net Expenses | | 1,598,737 |
| Net Investment Income | | 1,340,167 |
| Net Realized/Unrealized Gains (Losses) from Investments: | | |
| Net realized gains from investment transactions | | 4,321,388 |
| Change in unrealized appreciation/depreciation on investments | | 8,652,006 |
| Net realized/unrealized gains (losses) on investments | | 12,973,394 |
| Change in Net Assets Resulting from Operations | $ | 14,313,561 |
See Notes to Financial Statements
| Financial Statements | Boston Trust Walden Balanced Fund |
Statements of Changes in Net Assets
| | | For the year ended | | | For the year ended | |
| | | December 31, 2020 | | | December 31, 2019 | |
| Investment Activities: | | | | | | | | |
| Operations: | | | | | | | | |
| Net investment income | | $ | 1,340,167 | | | $ | 1,453,834 | |
| Net realized gains from investment transactions | | | 4,321,388 | | | | 1,420,529 | |
| Change in unrealized appreciation/depreciation on investments | | | 8,652,006 | | | | 27,075,874 | |
| Change in Net Assets Resulting from Operations | | | 14,313,561 | | | | 29,950,237 | |
| Distributions to shareholders: | | | | | | | | |
| Total Distributions | | | (5,142,308 | ) | | | (2,514,243 | ) |
| Change in Net Assets Resulting from distributions to shareholders | | | (5,142,308 | ) | | | (2,514,243 | ) |
| Capital Share Transactions: | | | | | | | | |
| Proceeds from shares issued | | | 28,024,694 | | | | 17,881,885 | |
| Dividends reinvested | | | 4,213,462 | | | | 2,015,907 | |
| Cost of shares redeemed | | | (21,918,263 | ) | | | (13,937,371 | ) |
| Change in Net Assets Resulting from Capital Share Transactions | | | 10,319,893 | | | | 5,960,421 | |
| Change in Net Assets | | | 19,491,146 | | | | 33,396,415 | |
| Net Assets: | | | | | | | | |
| Beginning of period | | | 157,891,864 | | | | 124,495,449 | |
| End of period | | $ | 177,383,010 | | | $ | 157,891,864 | |
| Share Transactions: | | | | | | | | |
| Issued | | | 1,413,309 | | | | 943,180 | |
| Reinvested | | | 195,884 | | | | 99,208 | |
| Redeemed | | | (1,088,200 | ) | | | (732,434 | ) |
| Change in shares | | | 520,993 | | | | 309,954 | |
See Notes to Financial Statements
| Financial Statements | Boston Trust Walden Balanced Fund |
| Financial Highlights | | | | | | | | | | | | | | | | | | |
| Selected data for a share outstanding throughout the years indicated. | | | | | | | | |
| | | | | | | | | | | | | | | | | | | | | | | | |
| | | | For the year | | | | For the year | | | | For the year | | | | For the year | | | | For the nine
months | | | | For the year | |
| | | | ended | | | | ended | | | | ended | | | | ended | | | | ended | | | | ended | |
| | | | December | | | | December | | | | December | | | | December | | | | December | | | | March 31, | |
| | | | 31, 2020 | | | | 31, 2019 | | | | 31, 2018 | | | | 31, 2017 | | | | 31, 2016 | | | | 2016 | |
| Net Asset Value, Beginning of Period | | $ | 20.76 | | | $ | 17.06 | | | $ | 17.76 | | | $ | 15.74 | | | $ | 15.32 | | | $ | 15.96 | |
| Investment Activities: | | | | | | | | | | | | | | | | | | | | | | | | |
| Operations: | | | | | | | | | | | | | | | | | | | | | | | | |
| Net investment income | | | 0.17 | | | | 0.19 | | | | 0.19 | | | | 0.18 | | | | 0.13 | | | | 0.20 | |
| Net realized/unrealized gains (losses) from | | | | | | | | | | | | | | | | | | | | | | | | |
| investments | | | 1.54 | | | | 3.85 | | | | (0.52 | ) | | | 2.16 | | | | 0.77 | | | | 0.27 | |
| Total from investment activities | | | 1.71 | | | | 4.04 | | | | (0.33 | ) | | | 2.34 | | | | 0.90 | | | | 0.47 | |
| Dividends: | | | | | | | | | | | | | | | | | | | | | | | | |
| Net investment income | | | (0.17 | ) | | | (0.20 | ) | | | (0.18 | ) | | | (0.18 | ) | | | (0.17 | ) | | | (0.21 | ) |
| Net realized gains from investments | | | (0.48 | ) | | | (0.14 | ) | | | (0.19 | ) | | | (0.14 | ) | | | (0.31 | ) | | | (0.90 | ) |
| Total dividends | | | (0.65 | ) | | | (0.34 | ) | | | (0.37 | ) | | | (0.32 | ) | | | (0.48 | ) | | | (1.11 | ) |
| Net Asset Value, End of Period | | $ | 21.82 | | | $ | 20.76 | | | $ | 17.06 | | | $ | 17.76 | | | $ | 15.74 | | | $ | 15.32 | |
| Total Return | | | 8.26 | % | | | 23.70 | % | | | (1.90 | )% | | | 14.88 | % | | | 5.87 | %(a) | | | 3.10 | % |
| Ratios/Supplemental Data: | | | | | | | | | | | | | | | | | | | | | | | | |
| Net assets at end of period (000’s) | | $ | 177,383 | | | $ | 157,892 | | | $ | 124,495 | | | $ | 121,356 | | | $ | 101,126 | | | $ | 86,891 | |
| Ratio of net expenses to average net assets | | | 1.00 | % | | | 1.00 | % | | | 1.00 | % | | | 1.00 | % | | | 1.00 | %(b) | | | 1.00 | % |
| Ratio of net investment income to average net assets | | | 0.84 | % | | | 1.01 | % | | | 1.02 | % | | | 1.08 | % | | | 1.13 | %(b) | | | 1.29 | % |
| Ratio of expenses (before fee reductions or recoupment of fees previously reimbursed by the investment adviser) to average net assets (c) | | | 1.02 | % | | | 1.02 | % | | | 1.04 | % | | | 1.03 | % | | | 1.05 | %(b) | | | 1.06 | % |
| Portfolio turnover rate | | | 18.73 | % | | | 12.99 | % | | | 8.47 | % | | | 8.40 | % | | | 10.18 | %(a) | | | 15.56 | % |
| (a) | Not annualized for periods less than one year. |
| (b) | Annualized for periods less than one year. |
| (c) | During the periods, certain fees were reduced. If such fee reduction had not occurred, the ratio would have been as indicated. |
See Notes to Financial Statements
| Schedule of Portfolio Investments | | Boston Trust Walden Equity Fund
December 31, 2020 |
| Security Description | | | Shares | | | Fair Value ($) | |
| Common Stocks (98.7%) | | | | | | | | |
| Communication Services (10.7%) | | | | | | | | |
| Alphabet, Inc., Class A (a) | | | 2,700 | | | | 4,732,128 | |
| Alphabet, Inc., Class C (a) | | | 4,700 | | | | 8,233,836 | |
| Charter Communications, Inc., Class A (a) | | | 4,879 | | | | 3,227,702 | |
| Comcast Corp., Class A | | | 66,725 | | | | 3,496,390 | |
| Electronic Arts, Inc. | | | 14,000 | | | | 2,010,400 | |
| The Walt Disney Co. (a) | | | 19,000 | | | | 3,442,420 | |
| Verizon Communications, Inc. | | | 54,500 | | | | 3,201,875 | |
| | | | | | | | 28,344,751 | |
| Consumer Discretionary (8.4%) | | | | | | | | |
| Dollar General Corp. | | | 18,000 | | | | 3,785,400 | |
| McDonald’s Corp. | | | 10,250 | | | | 2,199,445 | |
| NIKE, Inc., Class B | | | 41,000 | | | | 5,800,270 | |
| Ross Stores, Inc. | | | 32,500 | | | | 3,991,325 | |
| Starbucks Corp. | | | 39,000 | | | | 4,172,220 | |
| The Home Depot, Inc. | | | 7,000 | | | | 1,859,340 | |
| The TJX Cos., Inc. | | | 5,000 | | | | 341,450 | |
| | | | | | | | 22,149,450 | |
| Consumer Staples (8.1%) | | | | | | | | |
| Church & Dwight Co., Inc. | | | 9,000 | | | | 785,070 | |
| Colgate-Palmolive Co. | | | 30,000 | | | | 2,565,300 | |
| Costco Wholesale Corp. | | | 16,500 | | | | 6,216,870 | |
| Estee Lauder Cos., Inc., Class A | | | 12,500 | | | | 3,327,375 | |
| PepsiCo, Inc. | | | 30,000 | | | | 4,449,000 | |
| Procter & Gamble Co. (The) | | | 6,500 | | | | 904,410 | |
| The Clorox Co. | | | 5,500 | | | | 1,110,560 | |
| The Hershey Co. | | | 14,000 | | | | 2,132,620 | |
| | | | | | | | 21,491,205 | |
| Energy (1.2%) | | | | | | | | |
| ConocoPhillips | | | 77,000 | | | | 3,079,230 | |
| | | | | | | | 3,079,230 | |
| Financials (12.0%) | | | | | | | | |
| American Express Co. | | | 24,375 | | | | 2,947,181 | |
| Chubb Ltd. | | | 20,000 | | | | 3,078,400 | |
| Cincinnati Financial Corp. | | | 17,550 | | | | 1,533,344 | |
| Discover Financial Services | | | 2,000 | | | | 181,060 | |
| JPMorgan Chase & Co. | | | 45,000 | | | | 5,718,150 | |
| M&T Bank Corp. | | | 5,000 | | | | 636,500 | |
| Marsh & McLennan Cos., Inc. | | | 17,000 | | | | 1,989,000 | |
| Moody’s Corp. | | | 5,000 | | | | 1,451,200 | |
| Northern Trust Corp. | | | 40,500 | | | | 3,772,170 | |
| PNC Financial Services Group, Inc. | | | 29,500 | | | | 4,395,500 | |
| T. Rowe Price Group, Inc. | | | 20,000 | | | | 3,027,800 | |
| U.S. Bancorp | | | 66,000 | | | | 3,074,940 | |
| | | | | | | | 31,805,245 | |
| Health Care (16.1%) | | | | | | | | |
| Amgen, Inc. | | | 7,000 | | | | 1,609,440 | |
| Becton, Dickinson & Co. | | | 16,500 | | | | 4,128,630 | |
| Cerner Corp. | | | 22,000 | | | | 1,726,560 | |
| Danaher Corp. | | | 11,000 | | | | 2,443,540 | |
| Dentsply Sirona, Inc. | | | 15,000 | | | | 785,400 | |
| Intuitive Surgical, Inc. (a) | | | 4,000 | | | | 3,272,400 | |
| Johnson & Johnson | | | 18,000 | | | | 2,832,840 | |
| Medtronic PLC | | | 33,000 | | | | 3,865,620 | |
| Merck & Co., Inc. | | | 33,000 | | | | 2,699,400 | |
| Mettler-Toledo International, Inc. (a) | | | 3,000 | | | | 3,419,040 | |
| Stryker Corp. | | | 21,000 | | | | 5,145,840 | |
| The Cooper Companies., Inc. | | | 5,000 | | | | 1,816,600 | |
| UnitedHealth Group, Inc. | | | 17,000 | | | | 5,961,560 | |
| Waters Corp. (a) | | | 11,700 | | | | 2,894,814 | |
| | | | | | | | 42,601,684 | |
| Industrials (11.1%) | | | | | | | | |
| 3M Co. | | | 19,500 | | | | 3,408,405 | |
| Cummins, Inc. | | | 11,000 | | | | 2,498,100 | |
| Deere & Co. | | | 13,300 | | | | 3,578,365 | |
| Donaldson Co., Inc. | | | 41,450 | | | | 2,316,226 | |
| Hubbell, Inc. | | | 22,500 | | | | 3,527,775 | |
| Illinois Tool Works, Inc. | | | 15,500 | | | | 3,160,140 | |
| Union Pacific Corp. | | | 23,300 | | | | 4,851,526 | |
| United Parcel Service, Inc., Class B | | | 20,500 | | | | 3,452,200 | |
| W.W. Grainger, Inc. | | | 6,500 | | | | 2,654,210 | |
| | | | | | | | 29,446,947 | |
| Information Technology (25.9%) | | | | | | | | |
| Accenture PLC, Class A | | | 27,000 | | | | 7,052,670 | |
| Akamai Technologies, Inc. (a) | | | 22,000 | | | | 2,309,780 | |
| Analog Devices, Inc. | | | 18,000 | | | | 2,659,140 | |
| Apple, Inc. | | | 145,000 | | | | 19,240,050 | |
| Automatic Data Processing, Inc. | | | 25,850 | | | | 4,554,770 | |
| Cisco Systems, Inc. | | | 74,000 | | | | 3,311,500 | |
| Intel Corp. | | | 42,500 | | | | 2,117,350 | |
| Microsoft Corp. | | | 74,000 | | | | 16,459,080 | |
| Oracle Corp. | | | 60,000 | | | | 3,881,400 | |
| Visa, Inc., Class A | | | 30,000 | | | | 6,561,900 | |
| | | | | | | | 68,147,640 | |
| Materials (3.0%) | | | | | | | | |
| Air Products & Chemicals, Inc. | | | 8,000 | | | | 2,185,760 | |
| AptarGroup, Inc. | | | 26,000 | | | | 3,559,140 | |
| PPG Industries, Inc. | | | 16,000 | | | | 2,307,520 | |
| | | | | | | | 8,052,420 | |
| Utilities (2.2%) | | | | | | | | |
| Atmos Energy Corp. | | | 15,000 | | | | 1,431,450 | |
| Eversource Energy | | | 51,500 | | | | 4,455,265 | |
| | | | | | | | 5,886,715 | |
| TOTAL COMMON STOCKS (Cost $104,601,594) | | | | | | | 261,005,287 | |
| | | | | | | | | |
| Investment Companies (1.2%) | | | | | | | | |
| JPMorgan U.S. Government Money Market Fund, Capital Shares, 0.03% (b) | | | 3,267,571 | | | | 3,267,571 | |
| TOTAL INVESTMENT COMPANIES (Cost $3,267,571) | | | | | | | 3,267,571 | |
| | | | | | | | | |
| Total Investments (Cost $107,869,165) — 99.9% (c) | | | | | | | 264,272,858 | |
| Other assets in excess of liabilities — 0.1% | | | | | | | 145,269 | |
| NET ASSETS — 100.0% | | | | | | $ | 264,418,127 | |
| (a) | Non-income producing security. |
| (b) | Rate disclosed is the seven day yield as of December 31, 2020. |
| (c) | See Federal Tax Information listed in the Notes to the Financial Statements. |
PLC Public Limited Company
See Notes to Financial Statements
| Financial Statements | Boston Trust Walden Equity Fund |
Statement of Assets and Liabilities
December 31, 2020
| Assets: | | |
| Investments, at fair value (cost $107,869,165) | $ | 264,272,858 |
| Dividends receivable | | 229,912 |
| Receivable for capital shares issued | | 171,054 |
| Prepaid expenses | | 14,908 |
| Total Assets | | 264,688,732 |
| Liabilities: | | |
| Payable for capital shares redeemed | | 53,102 |
| Accrued expenses and other liabilities: | | |
| Investment adviser | | 157,133 |
| Administration and accounting | | 9,439 |
| Chief compliance officer | | 1,166 |
| Custodian | | 2,171 |
| Shareholder servicing fees | | 31,823 |
| Transfer agent | | 3,232 |
| Trustee | | 3,137 |
| Other | | 9,402 |
| Total Liabilities | | 270,605 |
| Net Assets | $ | 264,418,127 |
| Composition of Net Assets: | | |
| Paid in capital | $ | 106,724,327 |
| Total distributable earnings/(loss) | | 157,693,800 |
| Net Assets | $ | 264,418,127 |
| Shares outstanding (par value $0.01, unlimited number of shares authorized) | | 9,173,301 |
| Net Asset Value, Offering Price and Redemption price per share | $ | 28.82 |
Statement of Operations
For the year ended December 31, 2020
| Investment Income: | | | |
| Dividends | | $ | 4,197,381 | |
| Total Investment Income | | | 4,197,381 | |
| Expenses: | | | | |
| Investment adviser | | | 1,726,719 | |
| Administration and accounting | | | 135,719 | |
| Chief compliance officer | | | 17,733 | |
| Custodian | | | 32,088 | |
| Shareholder servicing | | | 377,651 | |
| Transfer agency | | | 39,195 | |
| Trustee | | | 15,610 | |
| Other | | | 101,361 | |
| Total expenses before fee reductions | | | 2,446,076 | |
| Fees contractually reduced by the investment adviser | | | (143,297 | ) |
| Net Expenses | | | 2,302,779 | |
| Net Investment Income | | | 1,894,602 | |
| Net Realized/Unrealized Gains (Losses) from | | | | |
| Investments: | | | | |
| Net realized gains from investment transactions | | | 7,022,165 | |
| Change in unrealized appreciation/depreciation on | | | | |
| investments | | | 20,925,528 | |
| Net realized/unrealized gains (losses) on investments | | | 27,947,693 | |
| Change in Net Assets Resulting from Operations | | $ | 29,842,295 | |
See Notes to Financial Statements
| Financial Statements | Boston Trust Walden Equity Fund |
Statements of Changes in Net Assets
| | For the year ended | | For the year ended |
| | December 31, 2020 | | December 31, 2019 |
| Investment Activities: | | | | | |
| Operations: | | | | | |
| Net investment income | $ | 1,894,602 | | $ | 1,866,744 |
| Net realized gains from investment transactions | | 7,022,165 | | | 7,908,081 |
| Change in unrealized appreciation/depreciation on investments | | 20,925,528 | | | 51,904,859 |
| Change in Net Assets Resulting from Operations | | 29,842,295 | | | 61,679,684 |
| Distributions to shareholders: | | | | | |
| Total Distributions | | (10,053,152) | | | (7,360,570) |
| Change in Net Assets Resulting from distributions to shareholders | | (10,053,152) | | | (7,360,570) |
| Capital Share Transactions: | | | | | |
| Proceeds from shares issued | | 38,832,045 | | | 32,110,753 |
| Dividends reinvested | | 7,984,924 | | | 6,014,991 |
| Cost of shares redeemed | | (50,717,437) | | | (36,513,094) |
| Change in Net Assets Resulting from Capital Share Transactions | | (3,900,468) | | | 1,612,650 |
| Change in Net Assets | | 15,888,675 | | | 55,931,764 |
| Net Assets: | | | | | |
| Beginning of period | | 248,529,452 | | | 192,597,688 |
| End of period | $ | 264,418,127 | | $ | 248,529,452 |
| Share Transactions: | | | | | |
| Issued | | 1,564,906 | | | 1,327,796 |
| Reinvested | | 282,952 | | | 233,773 |
| Redeemed | | (2,061,965) | | | (1,509,693) |
| Change in shares | | (214,107) | | | 51,876 |
See Notes to Financial Statements
| Financial Statements | Boston Trust Walden Equity Fund |
| Financial Highlights | | | | | | | | | | | | | | | | | | |
| Selected data for a share outstanding throughout the years indicated. | | | | | | | | | | | | |
| | | | | | | | | | | | | | | | | | | | | | | | |
| | | | For the year | | | | For the year | | | | For the year | | | | For the year | | | | For the nine
months | | | | For the year | |
| | | | ended | | | | ended | | | | ended | | | | ended | | | | ended | | | | ended | |
| | | | December | | | | December | | | | December | | | | December | | | | December | | | | March 31, | |
| | | | 31, 2020 | | | | 31, 2019 | | | | 31, 2018 | | | | 31, 2017 | | | | 31, 2016 | | | | 2016 | |
| Net Asset Value, Beginning of Period | | $ | 26.47 | | | $ | 20.63 | | | $ | 21.61 | | | $ | 18.82 | | | $ | 17.88 | | | $ | 18.55 | |
| Investment Activities: | | | | | | | | | | | | | | | | | | | | | | | | |
| Operations: | | | | | | | | | | | | | | | | | | | | | | | | |
| Net investment income | | | 0.21 | | | | 0.20 | | | | 0.19 | | | | 0.20 | | | | 0.14 | | | | 0.23 | |
| Net realized/unrealized gains (losses) from | | | | | | | | | | | | | | | | | | | | | | | | |
| investments | | | 3.28 | | | | 6.44 | | | | (0.72 | ) | | | 3.70 | | | | 1.44 | | | | 0.29 | |
| Total from investment activities | | | 3.49 | | | | 6.64 | | | | (0.53 | ) | | | 3.90 | | | | 1.58 | | | | 0.52 | |
| Dividends: | | | | | | | | | | | | | | | | | | | | | | | | |
| Net investment income | | | (0.21 | ) | | | (0.20 | ) | | | (0.18 | ) | | | (0.20 | ) | | | (0.18 | ) | | | (0.24 | ) |
| Net realized gains from investments | | | (0.93 | ) | | | (0.60 | ) | | | (0.27 | ) | | | (0.91 | ) | | | (0.46 | ) | | | (0.95 | ) |
| Total dividends | | | (1.14 | ) | | | (0.80 | ) | | | (0.45 | ) | | | (1.11 | ) | | | (0.64 | ) | | | (1.19 | ) |
| Net Asset Value, End of Period | | $ | 28.82 | | | $ | 26.47 | | | $ | 20.63 | | | $ | 21.61 | | | $ | 18.82 | | | $ | 17.88 | |
| Total Return | | | 13.28 | % | | | 32.30 | % | | | (2.54 | )% | | | 20.77 | % | | | 8.80 | %(a) | | | 2.92 | % |
| Ratios/Supplemental Data: | | | | | | | | | | | | | | | | | | | | | | | | |
| Net assets at end of period (000’s) | | $ | 264,418 | | | $ | 248,529 | | | $ | 192,598 | | | $ | 197,439 | | | $ | 181,830 | | | $ | 164,566 | |
| Ratio of net expenses to average net assets | | | 1.00 | % | | | 1.00 | % | | | 1.00 | % | | | 1.00 | % | | | 1.00 | %(b) | | | 1.00 | % |
| Ratio of net investment income to average net assets | | | 0.82 | % | | | 0.83 | % | | | 0.82 | % | | | 0.93 | % | | | 1.00 | %(b) | | | 1.21 | % |
| Ratio of expenses (before fee reductions or recoupment of fees previously reimbursed by the investment adviser) to average net assets (c) | | | 1.06 | % | | | 1.07 | % | | | 1.08 | % | | | 1.07 | % | | | 1.09 | %(b) | | | 1.10 | % |
| Portfolio turnover rate | | | 14.96 | % | | | 10.57 | % | | | 6.51 | % | | | 9.88 | % | | | 9.94 | %(a) | | | 17.78 | % |
| (a) | Not annualized for periods less than one year. |
| (b) | Annualized for periods less than one year. |
| (c) | During the periods, certain fees were reduced. If such fee reduction had not occurred, the ratio would have been as indicated. |
See Notes to Financial Statements
| Schedule of Portfolio Investments | | Boston Trust Walden Midcap Fund
December 31, 2020 |
| Security Description | | Shares | | | Fair Value ($) | |
| Common Stocks (98.8%) | | | | | | |
| Communication Services (2.8%) | | | | | | | | |
| Electronic Arts, Inc. | | | 8,475 | | | | 1,217,010 | |
| Omnicom Group, Inc. | | | 17,400 | | | | 1,085,238 | |
| | | | | | | | 2,302,248 | |
| Consumer Discretionary (9.8%) | | | | | | | | |
| AutoZone, Inc. (a) | | | 850 | | | | 1,007,624 | |
| Carter’s, Inc. | | | 14,600 | | | | 1,373,422 | |
| eBay, Inc. | | | 26,975 | | | | 1,355,494 | |
| Hyatt Hotels Corp., Class A | | | 15,225 | | | | 1,130,456 | |
| O’Reilly Automotive, Inc. (a) | | | 1,925 | | | | 871,197 | |
| Ross Stores, Inc. | | | 11,000 | | | | 1,350,910 | |
| Tractor Supply Co. | | | 7,575 | | | | 1,064,894 | |
| | | | | | | | 8,153,997 | |
| Consumer Staples (5.3%) | | | | | | | | |
| Church & Dwight Co., Inc. | | | 8,700 | | | | 758,901 | |
| Lancaster Colony Corp. | | | 3,575 | | | | 656,835 | |
| Sysco Corp. | | | 11,150 | | | | 827,999 | |
| The Hershey Co. | | | 8,100 | | | | 1,233,873 | |
| The JM Smucker Co. | | | 8,075 | | | | 933,470 | |
| | | | | | | | 4,411,078 | |
| Energy (1.1%) | | | | | | | | |
| Baker Hughes Co. | | | 45,075 | | | | 939,814 | |
| | | | | | | | 939,814 | |
| Financials (12.4%) | | | | | | | | |
| Brown & Brown, Inc. | | | 14,800 | | | | 701,668 | |
| CBOE Global Markets, Inc. | | | 10,350 | | | | 963,792 | |
| Everest Re Group Ltd. | | | 3,250 | | | | 760,793 | |
| FactSet Research Systems, Inc. | | | 4,125 | | | | 1,371,563 | |
| M&T Bank Corp. | | | 10,825 | | | | 1,378,022 | |
| Northern Trust Corp. | | | 15,150 | | | | 1,411,070 | |
| SEI Investments Co. | | | 22,750 | | | | 1,307,443 | |
| Signature Bank | | | 7,050 | | | | 953,795 | |
| T. Rowe Price Group, Inc. | | | 9,350 | | | | 1,415,496 | |
| | | | | | | | 10,263,642 | |
| Health Care (13.0%) | | | | | | | | |
| Agilent Technologies, Inc. | | | 9,700 | | | | 1,149,353 | |
| Cerner Corp. | | | 13,425 | | | | 1,053,594 | |
| Henry Schein, Inc. (a) | | | 11,625 | | | | 777,248 | |
| Hill-Rom Holdings, Inc. | | | 12,700 | | | | 1,244,219 | |
| Mettler-Toledo International, Inc. (a) | | | 715 | | | | 814,871 | |
| Steris PLC | | | 6,625 | | | | 1,255,702 | |
| Teleflex, Inc. | | | 1,950 | | | | 802,562 | |
| The Cooper Companies., Inc. | | | 3,275 | | | | 1,189,873 | |
| Waters Corp. (a) | | | 6,350 | | | | 1,571,117 | |
| Zimmer Biomet Holdings, Inc. | | | 6,225 | | | | 959,210 | |
| | | | | | | | 10,817,749 | |
| Industrials (15.4%) | | | | | | | | |
| AMETEK, Inc. | | | 10,425 | | | | 1,260,799 | |
| AO Smith Corp. | | | 18,650 | | | | 1,022,393 | |
| Cummins, Inc. | | | 4,350 | | | | 987,885 | |
| Donaldson Co., Inc. | | | 22,750 | | | | 1,271,269 | |
| Expeditors International of Washington, Inc. | | | 12,150 | | | | 1,155,587 | |
| Hubbell, Inc. | | | 6,950 | | | | 1,089,691 | |
| Lincoln Electric Holdings, Inc. | | | 8,650 | | | | 1,005,562 | |
| Masco Corp. | | | 13,775 | | | | 756,661 | |
| Nordson Corp. | | | 4,050 | | | | 813,848 | |
| Snap-on, Inc. | | | 5,550 | | | | 949,827 | |
| The Middleby Corp. (a) | | | 5,400 | | | | 696,168 | |
| Verisk Analytics, Inc. | | | 4,200 | | | | 871,878 | |
| W.W. Grainger, Inc. | | | 2,100 | | | | 857,514 | |
| | | | | | | | 12,739,082 | |
| Information Technology (19.7%) | | | | | | | | |
| Akamai Technologies, Inc. (a) | | | 8,425 | | | | 884,541 | |
| Amdocs Ltd. | | | 12,175 | | | | 863,573 | |
| ANSYS, Inc. (a) | | | 2,250 | | | | 818,550 | |
| Aspen Technology, Inc. (a) | | | 10,725 | | | | 1,396,930 | |
| Broadridge Finance Solutions, Inc. | | | 7,075 | | | | 1,083,890 | |
| CDK Global, Inc. | | | 15,100 | | | | 782,633 | |
| Check Point Software Technologies Ltd. (a) | | | 7,450 | | | | 990,180 | |
| Citrix Systems, Inc. | | | 10,025 | | | | 1,304,253 | |
| Cognizant Technology Solutions Corp., Class A | | | 12,525 | | | | 1,026,424 | |
| Dolby Laboratories, Inc., Class A | | | 11,975 | | | | 1,163,132 | |
| F5 Networks, Inc. (a) | | | 7,100 | | | | 1,249,174 | |
| IPG Photonics Corp. (a) | | | 6,075 | | | | 1,359,524 | |
| Paychex, Inc. | | | 21,575 | | | | 2,010,358 | |
| TE Connectivity Ltd. | | | 11,725 | | | | 1,419,546 | |
| | | | | | | | 16,352,708 | |
| Materials (6.3%) | | | | | | | | |
| AptarGroup, Inc. | | | 8,525 | | | | 1,166,987 | |
| Avery Dennison Corp. | | | 10,425 | | | | 1,617,021 | |
| Packaging Corporation of America | | | 9,125 | | | | 1,258,429 | |
| RPM International, Inc. | | | 12,625 | | | | 1,146,098 | |
| | | | | | | | 5,188,535 | |
| Real Estate (6.0%) | | | | | | | | |
| Alexandria Real Estate Equities, Inc. | | | 5,125 | | | | 913,378 | |
| AvalonBay Communities, Inc. | | | 500 | | | | 80,215 | |
| Camden Property Trust | | | 9,525 | | | | 951,738 | |
| CyrusOne, Inc. | | | 9,750 | | | | 713,213 | |
| Jones Lang LaSalle, Inc. (a) | | | 9,100 | | | | 1,350,167 | |
| Realty Income Corp. | | | 15,325 | | | | 952,754 | |
| | | | | | | | 4,961,465 | |
| Utilities (7.0%) | | | | | | | | |
| Atmos Energy Corp. | | | 11,325 | | | | 1,080,745 | |
| Consolidated Edison, Inc. | | | 16,750 | | | | 1,210,523 | |
| Eversource Energy | | | 23,855 | | | | 2,063,696 | |
| ONE Gas, Inc. | | | 18,975 | | | | 1,456,710 | |
| | | | | | | | 5,811,674 | |
| TOTAL COMMON STOCKS (Cost $55,634,886) | | | | | | | 81,941,992 | |
| | | | | | | | | |
| Investment Companies (1.0%) | | | | | | | | |
| JPMorgan U.S. Government Money Market Fund, Capital Shares, 0.03% (b) | | | 844,274 | | | | 844,274 | |
| TOTAL INVESTMENT COMPANIES (Cost $844,274) | | | | | | | 844,274 | |
| | | | | | | | | |
| Total Investments (Cost $56,479,160) — 99.8% (c) | | | | | | | 82,786,266 | |
| Other assets in excess of liabilities — 0.2% | | | | | | | 161,742 | |
| NET ASSETS — 100.0% | | | | | | $ | 82,948,008 | |
| (a) | Non-income producing security. |
| (b) | Rate disclosed is the seven day yield as of December 31, 2020. |
| (c) | See Federal Tax Information listed in the Notes to the Financial Statements. |
PLC Public Limited Company
See Notes to Financial Statements
| Financial Statements | Boston Trust Walden Midcap Fund |
Statement of Assets and Liabilities
December 31, 2020
| Assets: | | |
| Investments, at fair value (cost $56,479,160) | $ | 82,786,266 |
| Dividends receivable | | 80,829 |
| Receivable for capital shares issued | | 140,312 |
| Prepaid expenses | | 7,975 |
| Total Assets | | 83,015,382 |
| Liabilities: | | |
| Payable for capital shares redeemed | | 28 |
| Accrued expenses and other liabilities: | | |
| Investment adviser | | 51,735 |
| Administration and accounting | | 3,017 |
| Chief compliance officer | | 366 |
| Custodian | | 602 |
| Shareholder servicing fees | | 4,701 |
| Transfer agent | | 2,957 |
| Trustee | | 964 |
| Other | | 3,004 |
| Total Liabilities | | 67,374 |
| Net Assets | $ | 82,948,008 |
| Composition of Net Assets: | | |
| Paid in capital | $ | 56,130,198 |
| Total distributable earnings/(loss) | | 26,817,810 |
| Net Assets | $ | 82,948,008 |
| Shares outstanding (par value $0.01, unlimited number of shares authorized) | | 4,208,594 |
| Net Asset Value, Offering Price and Redemption price per share | $ | 19.71 |
Statement of Operations
For the year ended December 31, 2020
| Investment Income: | | |
| Dividends | $ | 1,064,875 |
| Less: Foreign tax withholding | | (555 ) |
| Total Investment Income | | 1,064,320 |
| Expenses: | | |
| Investment adviser | | 496,850 |
| Administration and accounting | | 38,981 |
| Chief compliance officer | | 5,050 |
| Custodian | | 9,280 |
| Shareholder servicing | | 48,318 |
| Transfer agency | | 35,613 |
| Trustee | | 4,448 |
| Interest fees | | 109 |
| Other | | 39,295 |
| Total expenses before fee reductions | | 677,944 |
| Fees contractually reduced by the investment adviser | | (15,213 ) |
| Net Expenses | | 662,731 |
| Net Investment Income | | 401,589 |
| Net Realized/Unrealized Gains (Losses) from Investments: | | |
| Net realized gains from investment transactions | | 2,226,292 |
| Change in unrealized appreciation/depreciation on investments | | 6,162,796 |
| Net realized/unrealized gains (losses) on investments | | 8,389,088 |
| Change in Net Assets Resulting from Operations | $ | 8,790,677 |
See Notes to Financial Statements
| Financial Statements | Boston Trust Walden Midcap Fund |
Statements of Changes in Net Assets
| | | For the year ended | | | For the year ended | |
| | | December 31, 2020 | | | December 31, 2019 | |
| Investment Activities: | | | | | | | | |
| Operations: | | | | | | | | |
| Net investment income | | $ | 401,589 | | | $ | 370,355 | |
| Net realized gains from investment transactions | | | 2,226,292 | | | | 3,543,017 | |
| Change in unrealized appreciation/depreciation on investments | | | 6,162,796 | | | | 9,362,398 | |
| Change in Net Assets Resulting from Operations | | | 8,790,677 | | | | 13,275,770 | |
| Distributions to shareholders: | | | | | | | | |
| Total Distributions | | | (2,575,502 | ) | | | (3,932,964 | ) |
| Change in Net Assets Resulting from distributions to shareholders | | | (2,575,502 | ) | | | (3,932,964 | ) |
| Capital Share Transactions: | | | | | | | | |
| Proceeds from shares issued | | | 25,455,556 | | | | 10,311,717 | |
| Dividends reinvested | | | 2,228,870 | | | | 3,313,873 | |
| Cost of shares redeemed | | | (13,489,526 | ) | | | (6,249,705 | ) |
| Change in Net Assets Resulting from Capital Share Transactions | | | 14,194,900 | | | | 7,375,885 | |
| Change in Net Assets | | | 20,410,075 | | | | 16,718,691 | |
| Net Assets: | | | | | | | | |
| Beginning of period | | | 62,537,933 | | | | 45,819,242 | |
| End of period | | $ | 82,948,008 | | | $ | 62,537,933 | |
| Share Transactions: | | | | | | | | |
| Issued | | | 1,548,805 | | | | 567,958 | |
| Reinvested | | | 114,360 | | | | 181,284 | |
| Redeemed | | | (797,789 | ) | | | (349,003 | ) |
| Change in shares | | | 865,376 | | | | 400,239 | |
See Notes to Financial Statements
| Financial Statements | Boston Trust Walden Midcap Fund |
| Financial Highlights | | | | | | | | | | | | | | | | | | |
| Selected data for a share outstanding throughout the years indicated. | | | | | | | |
| | | | | | | | | | | | | | | | | | | | | | | | |
| | | | For the year | | | | For the year | | | | For the year | | | | For the year | | | | For the nine
months | | | | For the year | |
| | | | ended | | | | ended | | | | ended | | | | ended | | | | ended | | | | ended | |
| | | | December | | | | December | | | | December | | | | December | | | | December | | | | March 31, | |
| | | | 31, 2020 | | | | 31, 2019 | | | | 31, 2018 | | | | 31, 2017 | | | | 31, 2016 | | | | 2016 | |
| Net Asset Value, Beginning of Period | | $ | 18.71 | | | $ | 15.57 | | | $ | 17.24 | | | $ | 14.90 | | | $ | 14.57 | | | $ | 15.18 | |
| Investment Activities: | | | | | | | | | | | | | | | | | | | | | | | | |
| Operations: | | | | | | | | | | | | | | | | | | | | | | | | |
| Net investment income | | | 0.10 | | | | 0.12 | | | | 0.09 | | | | 0.07 | | | | 0.11 | | | | 0.09 | |
| Net realized/unrealized gains (losses) from investments | | | 1.53 | | | | 4.27 | | | | (0.66 | ) | | | 2.85 | | | | 0.97 | | | | 0.07 | |
| Total from investment activities | | | 1.63 | | | | 4.39 | | | | (0.57 | ) | | | 2.92 | | | | 1.08 | | | | 0.16 | |
| Dividends: | | | | | | | | | | | | | | | | | | | | | | | | |
| Net investment income | | | (0.09 | ) | | | (0.10 | ) | | | (0.09 | ) | | | (0.08 | ) | | | (0.12 | ) | | | (0.08 | ) |
| Net realized gains from investments | | | (0.54 | ) | | | (1.15 | ) | | | (1.01 | ) | | | (0.50 | ) | | | (0.63 | ) | | | (0.69 | ) |
| Total dividends | | | (0.63 | ) | | | (1.25 | ) | | | (1.10 | ) | | | (0.58 | ) | | | (0.75 | ) | | | (0.77 | ) |
| Net Asset Value, End of Period | | $ | 19.71 | | | $ | 18.71 | | | $ | 15.57 | | | $ | 17.24 | | | $ | 14.90 | | | $ | 14.57 | |
| Total Return | | | 8.76 | % | | | 28.38 | % | | | (3.58 | )% | | | 19.62 | % | | | 7.36 | %(a) | | | 1.27 | % |
| Ratios/Supplemental Data: | | | | | | | | | | | | | | | | | | | | | | | | |
| Net assets at end of period (000’s) | | $ | 82,948 | | | $ | 62,538 | | | $ | 45,819 | | | $ | 46,562 | | | $ | 39,059 | | | $ | 35,543 | |
| Ratio of net expenses to average net assets | | | 1.00 | % | | | 1.00 | % | | | 1.00 | % | | | 1.00 | % | | | 1.00 | %(b) | | | 1.00 | % |
| Ratio of net investment income to average net assets | | | 0.61 | % | | | 0.68 | % | | | 0.54 | % | | | 0.45 | % | | | 0.97 | %(b) | | | 0.59 | % |
| Ratio of expenses (before fee reductions or recoupment of fees previously reimbursed by the investment adviser) to average net assets (c) | | | 1.02 | % | | | 1.00 | % | | | 1.00 | % | | | 1.01 | % | | | 1.04 | %(b) | | | 1.07 | % |
| Portfolio turnover rate | | | 38.28 | % | | | 23.17 | % | | | 18.66 | % | | | 24.85 | % | | | 12.59 | %(a) | | | 20.10 | % |
| (a) | Not annualized for periods less than one year. |
| (b) | Annualized for periods less than one year. |
| (c) | During the periods, certain fees were reduced. If such fee reduction had not occurred, the ratio would have been as indicated. |
See Notes to Financial Statements
| Schedule of Portfolio Investments | | Boston Trust Walden SMID Cap Fund
December 31, 2020 |
| Security Description | | Shares | | | Fair Value ($) | |
| Common Stocks (98.6%) | | | | | | |
| Communication Services (3.3%) | | | | | | | | |
| Interpublic Group of Cos., Inc. | | | 46,115 | | | | 1,084,625 | |
| Omnicom Group, Inc. | | | 17,025 | | | | 1,061,849 | |
| | | | | | | | 2,146,474 | |
| Consumer Discretionary (10.2%) | | | | | | | | |
| Carter’s, Inc. | | | 8,780 | | | | 825,934 | |
| Choice Hotels International, Inc. | | | 4,365 | | | | 465,876 | |
| Columbia Sportswear Co. | | | 7,175 | | | | 626,952 | |
| Dorman Products, Inc. (a) | | | 8,360 | | | | 725,815 | |
| Texas Roadhouse, Inc. | | | 10,870 | | | | 849,600 | |
| TopBuild Corp. (a) | | | 6,700 | | | | 1,233,336 | |
| Tractor Supply Co. | | | 6,700 | | | | 941,886 | |
| Williams Sonoma, Inc. | | | 9,135 | | | | 930,308 | |
| | | | | | | | 6,599,707 | |
| Consumer Staples (4.4%) | | | | | | | | |
| Flowers Foods, Inc. | | | 33,725 | | | | 763,197 | |
| Lamb Weston Holdings, Inc. | | | 6,475 | | | | 509,842 | |
| Lancaster Colony Corp. | | | 3,015 | | | | 553,946 | |
| The JM Smucker Co. | | | 8,730 | | | | 1,009,187 | |
| | | | | | | | 2,836,172 | |
| Energy (1.7%) | | | | | | | | |
| Baker Hughes Co. | | | 28,070 | | | | 585,260 | |
| Helmerich & Payne, Inc. | | | 22,350 | | | | 517,626 | |
| | | | | | | | 1,102,886 | |
| Financials (13.9%) | | | | | | | | |
| American Financial Group, Inc. | | | 6,175 | | | | 541,054 | |
| Brown & Brown, Inc. | | | 13,135 | | | | 622,730 | |
| CBOE Global Markets, Inc. | | | 6,855 | | | | 638,338 | |
| Cohen & Steers, Inc. | | | 9,030 | | | | 670,929 | |
| East West Bancorp, Inc. | | | 13,690 | | | | 694,220 | |
| FactSet Research Systems, Inc. | | | 2,700 | | | | 897,750 | |
| M&T Bank Corp. | | | 9,890 | | | | 1,258,997 | |
| SEI Investments Co. | | | 22,055 | | | | 1,267,500 | |
| Signature Bank | | | 6,000 | | | | 811,740 | |
| SVB Financial Group (a) | | | 2,700 | | | | 1,047,141 | |
| UMB Financial Corp. | | | 7,805 | | | | 538,467 | |
| | | | | | | | 8,988,866 | |
| Health Care (16.5%) | | | | | | | | |
| Chemed Corp. | | | 2,000 | | | | 1,065,220 | |
| Dentsply Sirona, Inc. | | | 15,300 | | | | 801,108 | |
| Henry Schein, Inc. (a) | | | 6,575 | | | | 439,605 | |
| Hill-Rom Holdings, Inc. | | | 10,225 | | | | 1,001,743 | |
| Masimo Corp. (a) | | | 2,285 | | | | 613,248 | |
| Medpace Holdings, Inc. (a) | | | 10,100 | | | | 1,405,920 | |
| PerkinElmer, Inc. | | | 9,600 | | | | 1,377,600 | |
| Steris PLC | | | 6,600 | | | | 1,250,964 | |
| The Cooper Companies., Inc. | | | 3,675 | | | | 1,335,201 | |
| Waters Corp. (a) | | | 5,600 | | | | 1,385,552 | |
| | | | | | | | 10,676,161 | |
| Industrials (13.9%) | | | | | | | | |
| AO Smith Corp. | | | 14,835 | | | | 813,255 | |
| Applied Industrial Technologies, Inc. | | | 9,590 | | | | 747,924 | |
| C.H. Robinson Worldwide, Inc. | | | 7,415 | | | | 696,046 | |
| Donaldson Co., Inc. | | | 16,875 | | | | 942,974 | |
| Expeditors International of Washington, Inc. | | | 10,200 | | | | 970,122 | |
| Hubbell, Inc. | | | 6,700 | | | | 1,050,493 | |
| Lincoln Electric Holdings, Inc. | | | 6,730 | | | | 782,363 | |
| Masco Corp. | | | 14,115 | | | | 775,337 | |
| Nordson Corp. | | | 2,655 | | | | 533,522 | |
| The Middleby Corp. (a) | | | 4,905 | | | | 632,353 | |
| UniFirst Corp. | | | 4,830 | | | | 1,022,463 | |
| | | | | | | | 8,966,852 | |
| Information Technology (17.8%) | | | | | | | | |
| Akamai Technologies, Inc. (a) | | | 9,200 | | | | 965,909 | |
| Amdocs Ltd. | | | 6,140 | | | | 435,510 | |
| Aspen Technology, Inc. (a) | | | 9,500 | | | | 1,237,374 | |
| Broadridge Finance Solutions, Inc. | | | 4,300 | | | | 658,760 | |
| CDK Global, Inc. | | | 11,120 | | | | 576,350 | |
| Citrix Systems, Inc. | | | 9,800 | | | | 1,274,979 | |
| Dolby Laboratories, Inc., Class A | | | 9,565 | | | | 929,048 | |
| F5 Networks, Inc. (a) | | | 5,600 | | | | 985,264 | |
| IPG Photonics Corp. (a) | | | 5,275 | | | | 1,180,493 | |
| Jack Henry & Associates, Inc. | | | 2,755 | | | | 446,282 | |
| Manhattan Associates, Inc. (a) | | | 9,275 | | | | 975,545 | |
| NetApp, Inc. | | | 12,740 | | | | 843,898 | |
| Progress Software Corp. | | | 23,445 | | | | 1,059,480 | |
| | | | | | | | 11,568,892 | |
| Materials (5.9%) | | | | | | | | |
| AptarGroup, Inc. | | | 6,490 | | | | 888,416 | |
| Avery Dennison Corp. | | | 6,300 | | | | 977,194 | |
| Packaging Corporation of America | | | 5,775 | | | | 796,430 | |
| RPM International, Inc. | | | 12,485 | | | | 1,133,388 | |
| | | | | | | | 3,795,428 | |
| Real Estate (6.5%) | | | | | | | | |
| Camden Property Trust | | | 6,700 | | | | 669,464 | |
| CoreSite Realty Corp. | | | 6,500 | | | | 814,319 | |
| CubeSmart | | | 13,815 | | | | 464,322 | |
| CyrusOne, Inc. | | | 5,225 | | | | 382,209 | |
| Jones Lang LaSalle, Inc. (a) | | | 6,415 | | | | 951,794 | |
| Lamar Advertising Co., Class A | | | 7,555 | | | | 628,727 | |
| STAG Industrial, Inc. | | | 9,915 | | | | 310,538 | |
| | | | | | | | 4,221,373 | |
| Utilities (4.5%) | | | | | | | | |
| Atmos Energy Corp. | | | 12,360 | | | | 1,179,515 | |
| New Jersey Resources Corp. | | | 14,385 | | | | 511,387 | |
| ONE Gas, Inc. | | | 16,105 | | | | 1,236,380 | |
| | | | | | | | 2,927,282 | |
| TOTAL COMMON STOCKS (Cost $44,050,524) | | | | | | | 63,830,093 | |
| | | | | | | | | |
| Investment Companies (1.4%) | | | | | | | | |
| JPMorgan U.S. Government Money Market Fund, Capital Shares, 0.03% (b) | | | 878,077 | | | | 878,077 | |
| TOTAL INVESTMENT COMPANIES (Cost $878,077) | | | | | | | 878,077 | |
| | | | | | | | | |
| Total Investments (Cost $44,928,601) — 100.0% (c) | | | | | | | 64,708,170 | |
| Other assets in excess of liabilities — 0.0% | | | | | | | 26,233 | |
| NET ASSETS — 100.0% | | | | | | $ | 64,734,403 | |
| (a) | Non-income producing security. |
| (b) | Rate disclosed is the seven day yield as of December 31, 2020. |
| (c) | See Federal Tax Information listed in the Notes to the Financial Statements. |
PLC Public Limited Company
See Notes to Financial Statements
| Financial Statements | Boston Trust Walden SMID Cap Fund |
Statement of Assets and Liabilities
December 31, 2020
| Assets: | | |
| Investments, at fair value (cost $44,928,601) | $ | 64,708,170 |
| Dividends receivable | | 69,148 |
| Receivable for capital shares issued | | 1,570 |
| Prepaid expenses | | 9,702 |
| Total Assets | | 64,788,590 |
| Liabilities: | | |
| Payable for capital shares redeemed | | 233 |
| Accrued expenses and other liabilities: | | |
| Investment adviser | | 41,261 |
| Administration and accounting | | 2,367 |
| Chief compliance officer | | 284 |
| Custodian | | 504 |
| Shareholder servicing fees | | 3,553 |
| Transfer agent | | 3,073 |
| Trustee | | 760 |
| Other | | 2,152 |
| Total Liabilities | | 54,187 |
| Net Assets | $ | 64,734,403 |
| Composition of Net Assets: | | |
| Paid in capital | $ | 44,534,690 |
| Total distributable earnings/(loss) | | 20,199,713 |
| Net Assets | $ | 64,734,403 |
| Shares outstanding (par value $0.01, unlimited number of shares authorized) | | 3,337,682 |
| Net Asset Value, Offering Price and Redemption price per share | $ | 19.40 |
Statement of Operations
For the year ended December 31, 2020
| Investment Income: | | | |
| Dividends | | $ | 895,276 | |
| Total Investment Income | | | 895,276 | |
| Expenses: | | | | |
| Investment adviser | | | 416,412 | |
| Administration and accounting | | | 32,981 | |
| Chief compliance officer | | | 4,259 | |
| Custodian | | | 7,684 | |
| Shareholder servicing | | | 42,701 | |
| Transfer agency | | | 36,223 | |
| Trustee | | | 3,753 | |
| Interest fees | | | 54 | |
| Other | | | 41,771 | |
| Total expenses before fee reductions | | | 585,838 | |
| Fees contractually reduced by the investment adviser | | | (30,484 | ) |
| Net Expenses | | | 555,354 | |
| Net Investment Income | | | 339,922 | |
| Net Realized/Unrealized Gains (Losses) from | | | | |
| Investments: | | | | |
| Net realized gains from investment transactions | | | 1,041,519 | |
| Change in unrealized appreciation/depreciation on investments | | | 3,152,893 | |
| Net realized/unrealized gains (losses) on investments | | | 4,194,412 | |
| Change in Net Assets Resulting from Operations | | $ | 4,534,334 | |
See Notes to Financial Statements
| Financial Statements | Boston Trust Walden SMID Cap Fund |
Statements of Changes in Net Assets
| | For the year ended | | | For the year ended | |
| | December 31, 2020 | | | December 31, 2019 | |
| Investment Activities: | | | | | | | |
| Operations: | | | | | | | |
| Net investment income | $ | 339,922 | | | $ | 338,685 | |
| Net realized gains from investment transactions | | 1,041,519 | | | | 2,742,242 | |
| Change in unrealized appreciation/depreciation on investments | | 3,152,893 | | | | 9,402,172 | |
| Change in Net Assets Resulting from Operations | | 4,534,334 | | | | 12,483,099 | |
| Distributions to shareholders: | | | | | | | |
| Total Distributions | | (1,133,962 | ) | | | (3,068,662 | ) |
| Change in Net Assets Resulting from distributions to shareholders | | (1,133,962 | ) | | | (3,068,662 | ) |
| Capital Share Transactions: | | | | | | | |
| Proceeds from shares issued | | 10,653,961 | | | | 8,038,546 | |
| Dividends reinvested | | 805,985 | | | | 2,312,967 | |
| Cost of shares redeemed | | (11,707,864 | ) | | | (5,804,826 | ) |
| Change in Net Assets Resulting from Capital Share Transactions | | (247,918 | ) | | | 4,546,687 | |
| Change in Net Assets | | 3,152,454 | | | | 13,961,124 | |
| Net Assets: | | | | | | | |
| Beginning of period | | 61,581,949 | | | | 47,620,825 | |
| End of period | $ | 64,734,403 | | | $ | 61,581,949 | |
| Share Transactions: | | | | | | | |
| Issued | | 628,131 | | | | 459,149 | |
| Reinvested | | 41,782 | | | | 130,529 | |
| Redeemed | | (734,546 | ) | | | (337,040 | ) |
| Change in shares | | (64,633 | ) | | | 252,638 | |
See Notes to Financial Statements
| Financial Statements | Boston Trust Walden SMID Cap Fund |
| Financial Highlights | | | | | | | | | | | | | | | | | | |
| Selected data for a share outstanding throughout the years indicated. | | | | | | | | | |
| | | | | | | | | | | | | | | | | | | | | | | | |
| | | | For the year | | | | For the year | | | | For the year | | | | For the year | | | | For the nine
months | | | | For the year | |
| | | | ended | | | | ended | | | | ended | | | | ended | | | | ended | | | | ended | |
| | | | December | | | | December | | | | December | | | | December | | | | December | | | | March 31, | |
| | | | 31, 2020 | | | | 31, 2019 | | | | 31, 2018 | | | | 31, 2017 | | | | 31, 2016 | | | | 2016 | |
| Net Asset Value, Beginning of Period | | $ | 18.10 | | | $ | 15.12 | | | $ | 16.69 | | | $ | 14.60 | | | $ | 13.40 | | | $ | 14.70 | |
| Investment Activities: | | | | | | | | | | | | | | | | | | | | | | | | |
| Operations: | | | | | | | | | | | | | | | | | | | | | | | | |
| Net investment income | | | 0.09 | | | | 0.10 | | | | 0.09 | | | | 0.07 | | | | 0.12 | | | | 0.04 | |
| Net realized/unrealized gains (losses) from investments | | | 1.55 | | | | 3.83 | | | | (0.99 | ) | | | 2.40 | | | | 1.87 | | | | (0.44 | ) |
| Total from investment activities | | | 1.64 | | | | 3.93 | | | | (0.90 | ) | | | 2.47 | | | | 1.99 | | | | (0.40 | ) |
| Dividends: | | | | | | | | | | | | | | | | | | | | | | | | |
| Net investment income | | | (0.10 | ) | | | (0.10 | ) | | | (0.09 | ) | | | (0.09 | ) | | | (0.14 | ) | | | (0.02 | ) |
| Net realized gains from investments | | | (0.25 | ) | | | (0.85 | ) | | | (0.58 | ) | | | (0.29 | ) | | | (0.65 | ) | | | (0.88 | ) |
| Total dividends | | | (0.35 | ) | | | (0.95 | ) | | | (0.67 | ) | | | (0.38 | ) | | | (0.79 | ) | | | (0.90 | ) |
| Net Asset Value, End of Period | | $ | 19.40 | | | $ | 18.10 | | | $ | 15.12 | | | $ | 16.69 | | | $ | 14.60 | | | $ | 13.40 | |
| Total Return | | | 9.13 | % | | | 26.12 | % | | | (5.59 | )% | | | 16.94 | % | | | 14.73 | %(a) | | | (2.47 | )% |
| Ratios/Supplemental Data: | | | | | | | | | | | | | | | | | | | | | | | | |
| Net assets at end of period (000’s) | | $ | 64,734 | | | $ | 61,582 | | | $ | 47,621 | | | $ | 45,632 | | | $ | 38,128 | | | $ | 32,452 | |
| Ratio of net expenses to average net assets | | | 1.00 | % | | | 1.00 | % | | | 1.00 | % | | | 1.00 | % | | | 1.00 | %(b) | | | 1.00 | % |
| Ratio of net investment income to average net assets | | | 0.61 | % | | | 0.61 | % | | | 0.52 | % | | | 0.48 | % | | | 1.12 | %(b) | | | 0.30 | % |
| Ratio of expenses (before fee reductions or recoupment of fees previously reimbursed by the investment adviser) to average net assets (c) | | | 1.05 | % | | | 1.07 | % | | | 1.08 | % | | | 1.08 | % | | | 1.12 | %(b) | | | 1.15 | % |
| Portfolio turnover rate | | | 38.70 | % | | | 29.75 | % | | | 18.61 | % | | | 31.92 | % | | | 20.85 | %(a) | | | 43.24 | % |
| (a) | Not annualized for periods less than one year. |
| (b) | Annualized for periods less than one year. |
| (c) | During the periods, certain fees were reduced. If such fee reduction had not occurred, the ratio would have been as indicated. |
See Notes to Financial Statements
| Schedule of Portfolio Investments | | Boston Trust Walden Small Cap Fund
December 31, 2020 |
| Security Description | | Shares | | | Fair Value ($) | |
| Common Stocks (98.3%) | | | | | | |
| Consumer Discretionary (10.9%) | | | | | | | | |
| Carter’s, Inc. | | | 99,620 | | | | 9,371,253 | |
| Choice Hotels International, Inc. | | | 49,400 | | | | 5,272,462 | |
| Columbia Sportswear Co. | | | 105,000 | | | | 9,174,900 | |
| Dorman Products, Inc. (a) | | | 76,560 | | | | 6,646,939 | |
| Monro, Inc. | | | 83,435 | | | | 4,447,086 | |
| Nordstrom, Inc. | | | 181,000 | | | | 5,649,010 | |
| Texas Roadhouse, Inc. | | | 93,000 | | | | 7,268,880 | |
| TopBuild Corp. (a) | | | 61,500 | | | | 11,320,920 | |
| Williams Sonoma, Inc. | | | 64,600 | | | | 6,578,864 | |
| | | | | | | | 65,730,314 | |
| Consumer Staples (2.6%) | | | | | | | | |
| Flowers Foods, Inc. | | | 362,800 | | | | 8,210,164 | |
| Lancaster Colony Corp. | | | 40,900 | | | | 7,514,557 | |
| | | | | | | | 15,724,721 | |
| Energy (1.4%) | | | | | | | | |
| Cactus, Inc., Class A | | | 122,375 | | | | 3,190,316 | |
| Helmerich & Payne, Inc. | | | 222,810 | | | | 5,160,280 | |
| | | | | | | | 8,350,596 | |
| Financials (14.3%) | | | | | | | | |
| 1st Source Corp. | | | 83,500 | | | | 3,365,050 | |
| Bank of Hawaii Corp. | | | 49,355 | | | | 3,781,580 | |
| Bank of Marin Bancorp | | | 34,000 | | | | 1,167,560 | |
| Camden National Corp. | | | 61,095 | | | | 2,185,979 | |
| Cathay General Bancorp | | | 148,335 | | | | 4,774,904 | |
| Cohen & Steers, Inc. | | | 123,000 | | | | 9,138,900 | |
| East West Bancorp, Inc. | | | 105,220 | | | | 5,335,706 | |
| First Hawaiian, Inc. | | | 181,000 | | | | 4,267,980 | |
| German American Bancorp | | | 63,000 | | | | 2,084,670 | |
| Green Dot Corp., Class A (a) | | | 90,640 | | | | 5,057,712 | |
| Independent Bank Corp. | | | 73,265 | | | | 5,351,276 | |
| Lakeland Financial Corp. | | | 107,400 | | | | 5,754,492 | |
| Morningstar, Inc. | | | 35,900 | | | | 8,313,363 | |
| Selective Insurance Group, Inc. | | | 68,595 | | | | 4,594,493 | |
| Signature Bank | | | 52,880 | | | | 7,154,135 | |
| Tompkins Financial Corp. | | | 55,500 | | | | 3,918,300 | |
| UMB Financial Corp. | | | 85,945 | | | | 5,929,346 | |
| Washington Trust Bancorp, Inc. | | | 94,300 | | | | 4,224,640 | |
| | | | | | | | 86,400,086 | |
| Health Care (22.5%) | | | | | | | | |
| Anika Therapeutics, Inc. (a) | | | 108,000 | | | | 4,888,080 | |
| Atrion Corp. | | | 7,600 | | | | 4,881,024 | |
| Bruker Corp. | | | 226,000 | | | | 12,233,380 | |
| Cantel Medical Corp. | | | 192,855 | | | | 15,208,544 | |
| Corcept Therapeutics, Inc. (a) | | | 121,900 | | | | 3,188,904 | |
| CorVel Corp. (a) | | | 98,160 | | | | 10,404,960 | |
| Ensign Group, Inc. | | | 57,500 | | | | 4,192,900 | |
| Globus Medical, Inc., Class A (a) | | | 145,850 | | | | 9,512,337 | |
| Haemonetics Corp. (a) | | | 68,500 | | | | 8,134,375 | |
| Hill-Rom Holdings, Inc. | | | 106,000 | | | | 10,384,820 | |
| HMS Holdings Corp. (a) | | | 317,350 | | | | 11,662,613 | |
| ICU Medical, Inc. (a) | | | 30,950 | | | | 6,638,466 | |
| Medpace Holdings, Inc. (a) | | | 90,745 | | | | 12,631,704 | |
| Premier, Inc. | | | 256,815 | | | | 9,014,207 | |
| U.S. Physical Therapy, Inc. | | | 107,800 | | | | 12,962,949 | |
| | | | | | | | 135,939,263 | |
| Industrials (16.9%) | | | | | | | | |
| Applied Industrial Technologies, Inc. | | | 122,020 | | | | 9,516,340 | |
| Donaldson Co., Inc. | | | 173,870 | | | | 9,715,856 | |
| Douglas Dynamics, Inc. | | | 94,640 | | | | 4,047,753 | |
| 4,73Forward Air Corp. | | | 105,180 | | | | 8,082,031 | |
| Franklin Electric Co., Inc. | | | 97,340 | | | | 6,736,901 | |
| Insperity, Inc. | | | 35,880 | | | | 2,921,350 | |
| Landstar System, Inc. | | | 71,000 | | | | 9,560,860 | |
| Lincoln Electric Holdings, Inc. | | | 89,280 | | | | 10,378,800 | |
| Tennant Co. | | | 74,000 | | | | 5,192,580 | |
| The Middleby Corp. (a) | | | 62,310 | | | | 8,033,005 | |
| UniFirst Corp. | | | 51,500 | | | | 10,902,035 | |
| Valmont Industries, Inc. | | | 42,000 | | | | 7,347,060 | |
| Watts Water Technologies, Inc., Class A | | | 76,870 | | | | 9,355,079 | |
| | | | | | | | 101,789,650 | |
| Information Technology (16.2%) | | | | | | | | |
| Badger Meter, Inc. | | | 85,230 | | | | 8,016,734 | |
| CDK Global, Inc. | | | 86,200 | | | | 4,467,746 | |
| Coherent, Inc. (a) | | | 31,600 | | | | 4,740,632 | |
| CSG Systems International, Inc. | | | 206,195 | | | | 9,293,209 | |
| ExlService Holdings, Inc. (a) | | | 87,000 | | | | 7,406,310 | |
| InterDigital, Inc. | | | 117,300 | | | | 7,117,764 | |
| Manhattan Associates, Inc. (a) | | | 111,500 | | | | 11,727,570 | |
| NETGEAR, Inc. (a) | | | 127,000 | | | | 5,160,010 | |
| NIC, Inc. | | | 468,000 | | | | 12,088,440 | |
| Power Integrations, Inc. | | | 174,340 | | | | 14,271,472 | |
| Progress Software Corp. | | | 191,030 | | | | 8,632,646 | |
| Teradata Corp. (a) | | | 214,000 | | | | 4,808,580 | |
| | | | | | | | 97,731,113 | |
| Materials (3.8%) | | | | | | | | |
| Minerals Technologies, Inc. | | | 97,340 | | | | 6,046,761 | |
| Sensient Technologies Corp. | | | 114,270 | | | | 8,429,698 | |
| Silgan Holdings, Inc. | | | 222,555 | | | | 8,252,339 | |
| | | | | | | | 22,728,798 | |
| Real Estate (4.9%) | | | | | | | | |
| CoreSite Realty Corp. | | | 75,250 | | | | 9,427,320 | |
| CubeSmart | | | 162,230 | | | | 5,452,550 | |
| Jones Lang LaSalle, Inc. (a) | | | 48,800 | | | | 7,240,456 | |
| Physicians Realty Trust | | | 205,000 | | | | 3,649,000 | |
| STAG Industrial, Inc. | | | 112,000 | | | | 3,507,840 | |
| | | | | | | | 29,277,166 | |
| Utilities (4.8%) | | | | | | | | |
| Chesapeake Utilities Corp. | | | 72,230 | | | | 7,816,008 | |
| IDACORP, Inc. | | | 43,790 | | | | 4,205,154 | |
| New Jersey Resources Corp. | | | 123,200 | | | | 4,379,760 | |
| ONE Gas, Inc. | | | 107,710 | | | | 8,268,897 | |
| Unitil Corp. | | | 101,000 | | | | 4,471,270 | |
| | | | | | | | 29,141,089 | |
| TOTAL COMMON STOCKS (Cost $441,271,461) | | | | | | | 592,812,796 | |
| Investment Companies (1.4%) | | | | | | | | |
| JPMorgan U.S. Government Money Market Fund, Capital Shares, 0.03% (b) | | | 8,548,575 | | | | 8,548,575 | |
| TOTAL INVESTMENT COMPANIES (Cost $8,548,575) | | | | | | | 8,548,575 | |
| Total Investments (Cost $449,820,036) — 99.7% (c) | | | | | | | 601,361,371 | |
| Other assets in excess of liabilities — 0.3% | | | | | | | 1,616,332 | |
| NET ASSETS — 100.0% | | | | | | $ | 602,977,703 | |
| (a) | Non-income producing security. |
| (b) | Rate disclosed is the seven day yield as of December 31, 2020. |
See Notes to Financial Statements
| (c) | See Federal Tax Information listed in the Notes to the Financial Statements. |
See Notes to Financial Statements
| Financial Statements | Boston Trust Walden Small Cap Fund |
Statement of Assets and Liabilities
December 31, 2020
| Assets: | | |
| Investments, at fair value (cost $449,820,036) | $ | 601,361,371 |
| Dividends receivable | | 449,856 |
| Receivable for capital shares issued | | 2,338,054 |
| Prepaid expenses | | 25,033 |
| Total Assets | | 604,174,314 |
| Liabilities: | | |
| Payable for investments purchased | | 480,998 |
| Payable for capital shares redeemed | | 260,566 |
| Accrued expenses and other liabilities: | | |
| Investment adviser | | 321,308 |
| Administration and accounting | | 21,651 |
| Chief compliance officer | | 2,604 |
| Custodian | | 4,026 |
| Shareholder servicing fees | | 65,248 |
| Transfer agent | | 5,979 |
| Trustee | | 6,762 |
| Other | | 27,469 |
| Total Liabilities | | 1,196,611 |
| Net Assets | $ | 602,977,703 |
| Composition of Net Assets: | | |
| Paid in capital | $ | 447,663,031 |
| Total distributable earnings/(loss) | | 155,314,672 |
| Net Assets | $ | 602,977,703 |
| Shares outstanding (par value $0.01, unlimited number of shares authorized) | | 39,378,471 |
| Net Asset Value, Offering Price and Redemption price per share | $ | 15.31 |
Statement of Operations
For the year ended December 31, 2020
| Investment Income: | | | |
| Dividends | | $ | 6,648,371 | |
| Total Investment Income | | | 6,648,371 | |
| Expenses: | | | | |
| Investment adviser | | | 3,021,382 | |
| Administration and accounting | | | 230,649 | |
| Chief compliance officer | | | 30,031 | |
| Custodian | | | 58,341 | |
| Shareholder servicing | | | 675,170 | |
| Transfer agency | | | 61,536 | |
| Trustee | | | 25,643 | |
| Other | | | 175,613 | |
| Total expenses before fee reductions | | | 4,278,365 | |
| Fees contractually reduced by the investment adviser | | | (247,032 | ) |
| Net Expenses | | | 4,031,333 | |
| Net Investment Income | | | 2,617,038 | |
| Net Realized/Unrealized Gains (Losses) from Investments: | | | | |
| Net realized gains from investment transactions (a) | | | 10,924,392 | |
| Change in unrealized appreciation/depreciation on investments | | | 104,324,721 | |
| Net realized/unrealized gains (losses) on investments | | | 115,249,113 | |
| Change in Net Assets Resulting from Operations | | $ | 117,866,151 | |
(a) Includes Class Action related litigation gains of $270,322.
See Notes to Financial Statements
| Financial Statements | Boston Trust Walden Small Cap Fund |
Statements of Changes in Net Assets
| | For the year ended | | For the year ended | |
| | December 31, 2020 | | December 31, 2019 | |
| Investment Activities: | | | | | | |
| Operations: | | | | | | |
| Net investment income | | $ | 2,617,038 | | | $ | 1,407,401 | |
| Net realized gains from investment transactions | | | 10,924,392 | | | | 55,008,647 | |
| Change in unrealized appreciation/depreciation on investments | | | 104,324,721 | | | | 9,542,517 | |
| Change in Net Assets Resulting from Operations | | | 117,866,151 | | | | 65,958,565 | |
| Distributions to shareholders: | | | | | | | | |
| Total Distributions | | | (10,155,733 | ) | | | (15,569,783 | ) |
| Change in Net Assets Resulting from distributions to shareholders | | | (10,155,733 | ) | | | (15,569,783 | ) |
| Capital Share Transactions: | | | | | | | | |
| Proceeds from shares issued | | | 258,244,300 | | | | 80,119,024 | |
| Proceeds from merger (b) | | | 103,030,710 | | | | — | |
| Dividends reinvested | | | 9,187,705 | | | | 14,461,506 | |
| Cost of shares redeemed | | | (110,664,229 | ) | | | (31,775,419 | ) |
| Cost of in-kind shares redeemed (a) | | | — | | | | (119,901,316 | ) |
| Change in Net Assets Resulting from Capital Share Transactions | | | 259,798,486 | | | | (57,096,205 | ) |
| Change in Net Assets | | | 367,508,904 | | | | (6,707,423 | ) |
| Net Assets: | | | | | | | | |
| Beginning of period | | | 235,468,799 | | | | 242,176,222 | |
| End of period | | $ | 602,977,703 | | | $ | 235,468,799 | |
| Share Transactions: | | | | | | | | |
| Issued | | | 20,922,885 | | | | 5,601,029 | |
| Issued from merger (b) | | | 10,376,826 | | | | — | |
| Reinvested | | | 721,349 | | | | 1,010,587 | |
| Redeemed | | | (8,746,308 | ) | | | (2,272,358 | ) |
| Redeemed in-kind (a) | | | — | | | | (8,413,292 | ) |
| Change in shares | | | 23,274,752 | | | | (4,074,034 | ) |
(a) See Note 3 in Notes to Financial Statements.
(b) See Note 7 in Notes to Financial Statements.
See Notes to Financial Statements
| Financial Statements | Boston Trust Walden Small Cap Fund |
| Financial Highlights | | | | | | | | | | | | | | | | | | |
| Selected data for a share outstanding throughout the years indicated. | | | | | | |
| | | | | | | | | | | | | | | | | | | | | | | | |
| | | | For the year | | | | For the year | | | | For the year | | | | For the year | | | | For the nine
months | | | | For the year | |
| | | | ended | | | | ended | | | | ended | | | | ended | | | | ended | | | | ended | |
| | | | December | | | | December | | | | December | | | | December | | | | December | | | | March 31, | |
| | | | 31, 2020 | | | | 31, 2019 | | | | 31, 2018 | | | | 31, 2017 | | | | 31, 2016 | | | | 2016 | |
| Net Asset Value, Beginning of Period | | $ | 14.62 | | | $ | 12.00 | | | $ | 14.73 | | | $ | 14.33 | | | $ | 12.74 | | | $ | 15.20 | |
| Investment Activities: | | | | | | | | | | | | | | | | | | | | | | | | |
| Operations: | | | | | | | | | | | | | | | | | | | | | | | | |
| Net investment income | | | 0.08 | | | | 0.09 | | | | 0.07 | | | | 0.07 | | | | 0.12 | | | | 0.06 | |
| Net realized/unrealized gains (losses) from | | | | | | | | | | | | | | | | | | | | | | | | |
| investments | | | 1.00 | | | | 3.47 | | | | (0.86 | ) | | | 1.67 | | | | 1.92 | | | | (0.25 | ) |
| Total from investment activities | | | 1.08 | | | | 3.56 | | | | (0.79 | ) | | | 1.74 | | | | 2.04 | | | | (0.19 | ) |
| Dividends: | | | | | | | | | | | | | | | | | | | | | | | | |
| Net investment income | | | (0.08 | ) | | | (0.06 | ) | | | (0.07 | ) | | | (0.08 | ) | | | (0.14 | ) | | | (0.06 | ) |
| Net realized gains from investments | | | (0.31 | ) | | | (0.88 | ) | | | (1.87 | ) | | | (1.26 | ) | | | (0.31 | ) | | | (2.21 | ) |
| Total dividends | | | (0.39 | ) | | | (0.94 | ) | | | (1.94 | ) | | | (1.34 | ) | | | (0.45 | ) | | | (2.27 | ) |
| Net Asset Value, End of Period | | $ | 15.31 | | | $ | 14.62 | | | $ | 12.00 | | | $ | 14.73 | | | $ | 14.33 | | | $ | 12.74 | |
| Total Return | | | 8.17 | % | | | 29.88 | % | | | (6.00 | )% | | | 12.26 | % | | | 15.94 | %(a) | | | (0.52 | )% |
| Ratios/Supplemental Data: | | | | | | | | | | | | | | | | | | | | | | | | |
| Net assets at end of period (000’s) | | $ | 602,978 | | | $ | 235,469 | | | $ | 242,176 | | | $ | 366,113 | | | $ | 327,593 | | | $ | 338,656 | |
| Ratio of net expenses to average net assets | | | 1.00 | % | | | 1.00 | % | | | 1.00 | % | | | 1.00 | % | | | 1.00 | %(b) | | | 1.00 | % |
| Ratio of net investment income to average net assets | | | 0.64 | % | | | 0.58 | % | | | 0.39 | % | | | 0.46 | % | | | 1.21 | %(b) | | | 0.44 | % |
| Ratio of expenses (before fee reductions or recoupment of fees previously reimbursed by the investment adviser) to average net assets (c) | | | 1.06 | % | | | 1.07 | % | | | 1.09 | % | | | 1.02 | % | | | 1.06 | %(b) | | | 1.08 | % |
| Portfolio turnover rate | | | 39.89 | %(d) | | | 23.23 | %(e) | | | 24.60 | % | | | 23.78 | % | | | 51.92 | %(a) | | | 37.42 | % |
| (a) | Not annualized for periods less than one year. |
| (b) | Annualized for periods less than one year. |
| (c) | During the periods, certain fees were reduced or recouped by the investment adviser. If such fee reductions/recoupments had not occurred, the ratio would have been as indicated. |
| (d) | Excludes impact of merger transaction. |
| (e) | Excludes impact of in-kind transactions. |
See Notes to Financial Statements
| Schedule of Portfolio Investments | | Boston Trust Walden International Equity Fund
December 31, 2020 |
| Security Description | | | Shares | | | | Fair Value ($) | |
| Common Stocks (97.9%) | | | | | | | | |
| Australia (5.4%) | | | | | | | | |
| Brambles Ltd. | | | 87,777 | | | | 718,999 | |
| CSL Ltd. | | | 5,211 | | | | 1,138,424 | |
| Origin Energy Ltd. | | | 181,339 | | | | 666,338 | |
| Telstra Corp. Ltd. | | | 314,337 | | | | 722,620 | |
| Woodside Petroleum Ltd. | | | 40,322 | | | | 707,030 | |
| | | | | | | | 3,953,411 | |
| | | | | | | | | |
| Belgium (0.6%) | | | | | | | | |
| Colruyt SA | | | 7,585 | | | | 449,354 | |
| | | | | | | | 449,354 | |
| | | | | | | | | |
| Canada (8.8%) | | | | | | | | |
| Bank of Montreal | | | 10,978 | | | | 834,801 | |
| BCE, Inc. | | | 11,100 | | | | 474,718 | |
| Canadian National Railway Co. | | | 5,074 | | | | 557,913 | |
| Great-West Lifeco, Inc. | | | 19,284 | | | | 459,864 | |
| Intact Financial Corp. | | | 4,300 | | | | 509,229 | |
| Magna International, Inc. | | | 9,900 | | | | 700,942 | |
| Metro, Inc. | | | 15,206 | | | | 678,637 | |
| Royal Bank of Canada | | | 6,484 | | | | 532,853 | |
| The Bank of Nova Scotia | | | 15,028 | | | | 812,388 | |
| The Toronto-Dominion Bank | | | 15,933 | | | | 900,369 | |
| | | | | | | | 6,461,714 | |
| | | | | | | | | |
| Denmark (2.4%) | | | | | | | | |
| Novo Nordisk A/S | | | 17,517 | | | | 1,225,437 | |
| Novozymes A/S | | | 9,400 | | | | 539,562 | |
| | | | | | | | 1,764,999 | |
| | | | | | | | | |
| Finland (0.8%) | | | | | | | | |
| Kone OYJ | | | 7,661 | | | | 621,608 | |
| | | | | | | | 621,608 | |
| France (9.9%) | | | | | | | | |
| Air Liquide SA | | | 5,794 | | | | 950,840 | |
| Danone SA | | | 13,126 | | | | 862,608 | |
| Dassault Systemes | | | 3,556 | | | | 722,285 | |
| EssilorLuxottica SA | | | 3,331 | | | | 519,423 | |
| Imerys SA | | | 13,978 | | | | 660,533 | |
| Legrand SA | | | 6,214 | | | | 554,548 | |
| L’Oreal SA | | | 2,400 | | | | 911,779 | |
| Publicis Groupe SA | | | 13,743 | | | | 684,772 | |
| Schneider Electric SE | | | 6,500 | | | | 940,074 | |
| Societe BIC SA | | | 8,443 | | | | 477,282 | |
| | | | | | | | 7,284,144 | |
| Germany (8.4%) | | | | | | | | |
| Allianz SE | | | 2,118 | | | | 518,150 | |
| Beiersdorf AG | | | 3,165 | | | | 364,855 | |
| Deutsche Boerse AG | | | 3,056 | | | | 518,751 | |
| Fresenius SE & Co. KGaA | | | 12,955 | | | | 598,549 | |
| Fuchs Petrolub SE | | | 7,320 | | | | 415,470 | |
| Hannover Rueck SE | | | 2,400 | | | | 381,308 | |
| Henkel AG & Co. KGaA | | | 4,900 | | | | 471,625 | |
| Hugo Boss AG | | | 17,301 | | | | 576,880 | |
| Merck KGaA | | | 3,586 | | | | 614,610 | |
| Muenchener Rueckversicherungs-Gesellschaft AG in Muenchen | | | 1,600 | | | | 473,797 | |
| SAP AG | | | 9,606 | | | | 1,262,149 | |
| | | | | | | | 6,196,144 | |
| | | | | | | | | |
| Hong Kong (3.2%) | | | | | | | | |
| Hang Lung Properties Ltd. | | | 178,400 | | | | 472,187 | |
| Hang Seng Bank Ltd. | | | 41,020 | | | | 708,820 | |
| MTR Corp. Ltd. | | | 83,900 | | | | 469,326 | |
| Sino Land Co. Ltd. | | | 548,000 | | | | 714,236 | |
| | | | | | | | 2,364,569 | |
| Ireland (0.7%) | | | | | | | | |
| Experian PLC | | | 14,071 | | | | 536,096 | |
| | | | | | | | 536,096 | |
| Israel (1.6%) | | | | | | | | |
| Check Point Software Technologies Ltd. (a) | | | 3,600 | | | | 478,476 | |
| Nice Ltd. (a) | | | 2,574 | | | | 727,721 | |
| | | | | | | | 1,206,197 | |
| Italy (1.3%) | | | | | | | | |
| Snam SpA | | | 90,171 | | | | 506,299 | |
| Terna Rete Elettrica Nazionale SpA | | | 62,748 | | | | 478,688 | |
| | | | | | | | 984,987 | |
| Japan (22.9%) | | | | | | | | |
| Astellas Pharma, Inc. | | | 37,300 | | | | 576,722 | |
| Benesse Holdings, Inc. | | | 14,760 | | | | 288,187 | |
| Central Japan Railway Co. | | | 5,215 | | | | 740,834 | |
| Chugai Pharmaceutical Co. Ltd. | | | 12,900 | | | | 688,817 | |
| Daiwa House Industry Co. Ltd. | | | 18,590 | | | | 554,986 | |
| Denso Corp. | | | 8,900 | | | | 529,976 | |
| East Japan Railway Co. | | | 7,900 | | | | 528,898 | |
| Fast Retailing Co. Ltd. | | | 805 | | | | 722,468 | |
| INPEX Corp. | | | 71,800 | | | | 388,064 | |
| JSR Corp. | | | 24,500 | | | | 684,419 | |
| Kao Corp. | | | 10,400 | | | | 804,192 | |
| Kurita Water Industries Ltd. | | | 13,000 | | | | 497,681 | |
| Mitsubishi Estate Co. Ltd. | | | 29,300 | | | | 473,245 | |
| Nippon Telegraph & Telephone Corp. | | | 35,000 | | | | 897,574 | |
| Nitto Denko Corp. | | | 8,200 | | | | 736,410 | |
| Nomura Research Institute Ltd. | | | 19,564 | | | | 699,145 | |
| Oracle Corporation Japan | | | 5,100 | | | | 663,726 | |
| Oriental Land Co. Ltd. | | | 3,765 | | | | 622,399 | |
| Sumitomo Mitsui Financial Group, Inc. | | | 27,600 | | | | 854,153 | |
| Sysmex Corp. | | | 5,900 | | | | 709,662 | |
| Terumo Corp. | | | 15,200 | | | | 635,827 | |
| The Chiba Bank Ltd. | | | 82,800 | | | | 456,703 | |
| The Hachijuni Bank Ltd. | | | 104,900 | | | | 351,215 | |
| Tokio Marine Holdings, Inc. | | | 8,300 | | | | 430,028 | |
| Tokyo Gas Co. Ltd. | | | 19,000 | | | | 441,747 | |
| Toyota Motor Corp. | | | 9,340 | | | | 716,286 | |
| Trend Micro, Inc. | | | 10,800 | | | | 621,862 | |
| Yamato Holdings Co. Ltd. | | | 19,500 | | | | 498,175 | |
| | | | | | | | 16,813,401 | |
| | | | | | | | | |
| Luxembourg (0.7%) | | | | | | | | |
| Tenaris SA | | | 62,086 | | | | 501,500 | |
| | | | | | | | 501,500 | |
| | | | | | | | | |
| Netherlands (3.1%) | | | | | | | | |
| Koninklijke Ahold Delhaize NV | | | 30,583 | | | | 863,559 | |
| Koninklijke Vopak NV | | | 11,512 | | | | 603,592 | |
| Wolters Kluwer NV | | | 9,875 | | | | 833,373 | |
| | | | | | | | 2,300,524 | |
| Norway (0.7%) | | | | | | | | |
| Equinor ASA | | | 32,025 | | | | 532,207 | |
| | | | | | | | 532,207 | |
See Notes to Financial Statements
| Schedule of Portfolio Investments | | Boston Trust Walden International Equity Fund
December 31, 2020 |
| Security Description | | Shares | | | Fair Value ($) | |
| Common Stocks, Continued | | | | | | |
| Singapore (1.3%) | | | | | | | | |
| ComfortDelGro Corp. Ltd. | | | 354,550 | | | | 448,543 | |
| Singapore Exchange Ltd. | | | 77,200 | | | | 543,469 | |
| | | | | | | | 992,012 | |
| Spain (2.2%) | | | | | | | | |
| Enagas SA | | | 15,598 | | | | 342,463 | |
| Gas Natural SDG SA | | | 22,135 | | | | 516,488 | |
| Industria de Diseno Textil SA | | | 24,813 | | | | 789,993 | |
| | | | | | | | 1,648,944 | |
| Sweden (2.9%) | | | | | | | | |
| Assa Abloy AB, Class B | | | 16,750 | | | | 412,181 | |
| Atlas Copco AB, Class A | | | 10,300 | | | | 526,993 | |
| Hennes & Mauritz AB (a) | | | 32,624 | | | | 681,776 | |
| Svenska Handelsbanken AB (a) | | | 54,726 | | | | 549,357 | |
| | | | | | | | 2,170,307 | |
| Switzerland (8.8%) | | | | | | | | |
| ABB Ltd. | | | 18,018 | | | | 504,158 | |
| Cie Financiere Richemont SA | | | 9,344 | | | | 844,632 | |
| Givaudan SA | | | 191 | | | | 804,818 | |
| Nestle SA | | | 8,100 | | | | 953,928 | |
| Roche Holding AG | | | 4,859 | | | | 1,695,919 | |
| SGS SA | | | 175 | | | | 527,742 | |
| Sonova Holding AG (a) | | | 2,653 | | | | 683,227 | |
| Zurich Insurance Group AG | | | 1,200 | | | | 508,781 | |
| | | | | | | | 6,523,205 | |
| United Kingdom (12.2%) | | | | | | | | |
| Admiral Group PLC | | | 16,782 | | | | 667,048 | |
| Compass Group PLC | | | 28,893 | | | | 539,075 | |
| Croda International PLC | | | 9,274 | | | | 837,743 | |
| ITV PLC (a) | | | 329,444 | | | | 481,518 | |
| Johnson Matthey PLC | | | 15,576 | | | | 517,034 | |
| London Stock Exchange Group PLC | | | 4,980 | | | | 613,768 | |
| Marks & Spencer Group PLC (a) | | | 318,860 | | | | 595,374 | |
| National Grid PLC | | | 47,157 | | | | 561,584 | |
| Next PLC (a) | | | 5,512 | | | | 534,430 | |
| Reckitt Benckiser Group PLC | | | 5,600 | | | | 500,765 | |
| RELX PLC | | | 19,100 | | | | 469,731 | |
| Sage Group PLC | | | 88,106 | | | | 701,678 | |
| Schroders PLC | | | 8,337 | | | | 380,742 | |
| Smith & Nephew PLC | | | 25,431 | | | | 530,971 | |
| Unilever PLC | | | 9,200 | | | | 553,733 | |
| WPP PLC | | | 37,770 | | | | 410,311 | |
| | | | | | | | 8,895,505 | |
| TOTAL COMMON STOCKS (Cost $60,636,260) | | | | | | | 72,200,828 | |
| Investment Companies (0.4%) | | | | | | | | |
| JPMorgan U.S. Government Money Market Fund, Capital Shares, 0.03% (b) | | | 291,309 | | | | 291,309 | |
| TOTAL INVESTMENT COMPANIES (Cost $291,309) | | | | | | | 291,309 | |
| Total Investments (Cost $60,927,569) — 98.3%(c) | | | | | | | 72,492,137 | |
| Other assets in excess of liabilities — 1.7% | | | | | | | 1,227,680 | |
| NET ASSETS — 100.0% | | | | | | $ | 73,719,817 | |
| (a) | Non-income producing security. |
| (b) | Rate disclosed is the seven day yield as of December 31, 2020. |
| (c) | See Federal Tax Information listed in the Notes to the Financial Statements. |
PLC Public Limited Company
The Fund invested, as a percentage of net assets at value, in the following industries as of December 31, 2020:
| | | Percentage of | |
| Industry | | Total Net Assets | |
| Financials | | | 16.4 | % |
| Industrials | | | 14.7 | |
| Health Care | | | 12.9 | |
| Consumer Discretionary | | | 11.0 | |
| Consumer Staples | | | 10.1 | |
| Materials | | | 8.5 | |
| Information Technology | | | 7.9 | |
| Energy | | | 5.8 | |
| Communication Services | | | 4.9 | |
| Real Estate | | | 3.0 | |
| Utilities | | | 2.7 | |
| Investment Companies | | | 0.4 | |
| Other net assets | | | 1.7 | |
| Total | | | 100.0 | % |
See Notes to Financial Statements
| Financial Statements | Boston Trust Walden International Equity Fund |
Statement of Assets and Liabilities
December 31, 2020
| Assets: | | |
| Investments, at fair value (cost $60,927,569) | $ | 72,492,137 |
| Cash | | 631,672 |
| Foreign currency, at fair value (cost $624,794) | | 628,820 |
| Dividends receivable | | 60,424 |
| Receivable for investments sold | | 556,730 |
| Receivable for capital shares issued | | 95,000 |
| Receivable for tax reclaims | | 134,455 |
| Prepaid expenses | | 3,663 |
| Total Assets | | 74,602,901 |
| Liabilities: | | |
| Payable for investments purchased | | 824,946 |
| Accrued expenses and other liabilities: | | |
| Investment adviser | | 45,405 |
| Administration and accounting | | 5,742 |
| Chief compliance officer | | 327 |
| Custodian | | 1,720 |
| Shareholder servicing fees | | 599 |
| Transfer agent | | 2,462 |
| Trustee | | 853 |
| Other | | 1,030 |
| Total Liabilities | | 883,084 |
| Net Assets | $ | 73,719,817 |
| Composition of Net Assets: | | |
| Paid in capital | $ | 62,968,363 |
| Total distributable earnings/(loss) | | 10,751,454 |
| Net Assets | $ | 73,719,817 |
| Shares outstanding (par value $0.01, unlimited number of shares authorized) | | 5,999,972 |
| Net Asset Value, Offering Price and Redemption price per share | $ | 12.29 |
Statement of Operations
For the year ended December 31, 2020
| Investment Income: | | | |
| Dividends | | $ | 1,542,736 | |
| Less: Foreign tax withholding | | | (162,706 | ) |
| Total Investment Income | | | 1,380,030 | |
| Expenses: | | | | |
| Investment adviser | | | 428,918 | |
| Administration and accounting | | | 52,979 | |
| Chief compliance officer | | | 4,243 | |
| Custodian | | | 25,147 | |
| Shareholder servicing | | | 6,236 | |
| Transfer agency | | | 28,766 | |
| Trustee | | | 3,708 | |
| Other | | | 23,074 | |
| Total expenses | | | 573,071 | |
| Net Expenses | | | 573,071 | |
| Net Investment Income | | | 806,959 | |
| Net Realized/Unrealized Gains (Losses) from Investments: | | | | |
| Net realized (losses) from investment securities and foreign currency transactions | | | (723,614 | ) |
| Change in unrealized appreciation/depreciation on investment securities and foreign currency translations | | | 4,982,128 | |
| Net realized/unrealized gains (losses) on investments | | | 4,258,514 | |
| Change in Net Assets Resulting from Operations | | $ | 5,065,473 | |
See Notes to Financial Statements
| Financial Statements | Boston Trust Walden International Equity Fund |
Statements of Changes in Net Assets
| | | For the year ended | | | For the year ended | |
| | | December 31, 2020 | | | December 31, 2019 | |
| Investment Activities: | | | | | | | | |
| Operations: | | | | | | | | |
| Net investment income | | $ | 806,959 | | | $ | 951,745 | |
| Net realized gains/(losses) from investment securities and foreign currency transactions | | | (723,614 | ) | | | 156,236 | |
| Change in unrealized appreciation/depreciation on investment securities and foreign currency translations | | | 4,982,128 | | | | 7,758,251 | |
| Change in Net Assets Resulting from Operations | | | 5,065,473 | | | | 8,866,232 | |
| Distributions to shareholders: | | | | | | | | |
| Total Distributions | | | (804,178 | ) | | | (929,213 | ) |
| Change in Net Assets Resulting from distributions to shareholders | | | (804,178 | ) | | | (929,213 | ) |
| Capital Share Transactions: | | | | | | | | |
| Proceeds from shares issued | | | 14,880,095 | | | | 10,921,617 | |
| Dividends reinvested | | | 576,531 | | | | 611,610 | |
| Cost of shares redeemed | | | (2,957,779 | ) | | | (1,566,941 | ) |
| Change in Net Assets Resulting from Capital Share Transactions | | | 12,498,847 | | | | 9,966,286 | |
| Change in Net Assets | | | 16,760,142 | | | | 17,903,305 | |
| Net Assets: | | | | | | | | |
| Beginning of period | | | 56,959,675 | | | | 39,056,370 | |
| End of period | | $ | 73,719,817 | | | $ | 56,959,675 | |
| Share Transactions: | | | | | | | | |
| Issued | | | 1,335,777 | | | | 1,010,684 | |
| Reinvested | | | 47,925 | | | | 54,029 | |
| Redeemed | | | (292,056 | ) | | | (148,651 | ) |
| Change in shares | | | 1,091,646 | | | | 916,062 | |
See Notes to Financial Statements
| Financial Statements | Boston Trust Walden International Equity Fund |
| Financial Highlights | | | | | | | | | | | | | | | | | | |
| Selected data for a share outstanding throughout the years indicated. | | | | | | | | | | |
| | | | | | | | | | | | | | | | | | | | | | | Period | |
| | | | For the year | | | | For the year | | | | For the year | | | | For the year | | | | For the nine
months | | | | June 9, 2015 | |
| | | | ended | | | | ended | | | | ended | | | | ended | | | | ended | | | | through | |
| | | | December | | | | December | | | | December | | | | December | | | | December | | | | March 31, | |
| | | | 31, 2020 | | | | 31, 2019 | | | | 31, 2018 | | | | 31, 2017 | | | | 31, 2016 | | | | 2016(a) | |
| Net Asset Value, Beginning of Period | | $ | 11.60 | | | $ | 9.78 | | | $ | 11.07 | | | $ | 9.34 | | | $ | 9.45 | | | $ | 10.00 | |
| Investment Activities: | | | | | | | | | | | | | | | | | | | | | | | | |
| Operations: | | | | | | | | | | | | | | | | | | | | | | | | |
| Net investment income | | | 0.15 | | | | 0.20 | | | | 0.17 | | | | 0.13 | | | | 0.12 | | | | 0.08 | |
| Net realized/unrealized gains (losses) from investments | | | 0.69 | | | | 1.81 | | | | (1.29 | ) | | | 1.73 | | | | (0.06 | ) | | | (0.59 | ) |
| Total from investment activities | | | 0.84 | | | | 2.01 | | | | (1.12 | ) | | | 1.86 | | | | 0.06 | | | | (0.51 | ) |
| Dividends: | | | | | | | | | | | | | | | | | | | | | | | | |
| Net investment income | | | (0.14 | ) | | | (0.19 | ) | | | (0.17 | ) | | | (0.13 | ) | | | (0.17 | ) | | | (0.04 | ) |
| Net realized gains from investments | | | — | | | | — | | | | — | | | | — | | | | — | | | | — | |
| Total dividends | | | (0.14 | ) | | | (0.19 | ) | | | (0.17 | ) | | | (0.13 | ) | | | (0.17 | ) | | | (0.04 | ) |
| Net Asset Value, End of Period | | $ | 12.29 | | | $ | 11.60 | | | $ | 9.78 | | | $ | 11.07 | | | $ | 9.34 | | | $ | 9.45 | |
| Total Return | | | 7.16 | % | | | 20.62 | % | | | (10.18 | )% | | | 19.92 | % | | | 0.62 | %(b) | | | (5.09 | )%(b) |
| Ratios/Supplemental Data: | | | | | | | | | | | | | | | | | | | | | | | | |
| Net assets at end of period (000’s) | | $ | 73,720 | | | $ | 56,960 | | | $ | 39,056 | | | $ | 41,234 | | | $ | 14,713 | | | $ | 12,786 | |
| Ratio of net expenses to average net assets | | | 1.00 | % | | | 1.04 | % | | | 1.15 | % | | | 1.15 | % | | | 1.15 | %(c) | | | 1.15 | %(c) |
| Ratio of net investment income to average net assets | | | 1.41 | % | | | 1.93 | % | | | 1.57 | % | | | 1.57 | % | | | 1.87 | %(c) | | | 1.22 | %(c) |
| Ratio of expenses (before fee reductions or recoupment of fees previously reimbursed by the investment adviser) to average net assets (d) | | | 1.00 | % | | | 1.02 | % | | | 1.17 | % | | | 1.31 | % | | | 1.86 | %(c) | | | 2.21 | %(c) |
| Portfolio turnover rate | | | 8.38 | % | | | 10.70 | % | | | 3.44 | % | | | 10.16 | % | | | 4.90 | %(b) | | | 5.11 | %(b) |
| (a) | Commencement of operations on June 9, 2015. |
| (b) | Not annualized for periods less than one year. |
| (c) | Annualized for periods less than one year. |
| (d) | During the periods, certain fees were reduced. If such fee reduction had not occurred, the ratio would have been as indicated. |
See Notes to Financial Statements
| Notes to the Financial Statements | December 31, 2020 |
The Boston Trust Walden Funds (the “Trust”) was organized on January 8, 1992 as a Massachusetts business trust and is registered under the Investment Company Act of 1940, as amended (the “1940 Act”), as an open-end management investment company. The Trust contains the following funds (individually a “Fund”, collectively the “Funds”), each of which are registered as a diversified Fund under the 1940 Act:
| Fund | Short Name |
| Boston Trust Asset Management Fund | Asset Management Fund |
| Boston Trust Equity Fund | Equity Fund |
| Boston Trust Midcap Fund | Midcap Fund |
| Boston Trust SMID Cap Fund | SMID Cap Fund |
| Boston Trust Walden Balanced Fund (formerly Walden Balanced Fund)* | BTW Balanced Fund |
| Boston Trust Walden Equity Fund (formerly Walden Equity Fund)* | BTW Equity Fund |
| Boston Trust Walden Midcap Fund (formerly Walden Midcap Fund)* | BTW Midcap Fund |
| Boston Trust Walden SMID Cap Fund (formerly Walden SMID Cap Fund)* | BTW SMID Cap Fund |
| Boston Trust Walden Small Cap Fund | BTW Small Cap Fund |
| Boston Trust Walden International Equity Fund (formerly Walden International Equity Fund)* | BTW International Equity Fund |
* The Fund changed its name effective September 30, 2020.
The investment objective of the Asset Management Fund and BTW Balanced Fund is to seek long-term capital growth and income through an actively managed portfolio of stocks, bonds and money market instruments. The investment objective of the Equity Fund and BTW Equity Fund is to seek long-term capital growth through an actively managed portfolio of stocks. The investment objective of the Midcap Fund and BTW Midcap Fund is to seek long-term capital growth through an actively managed portfolio of stocks of middle capitalization companies. The investment objective of the SMID Cap Fund and BTW SMID Cap Fund is to seek long-term capital growth through an actively managed portfolio of stocks of small to middle capitalization companies. The investment objective of the BTW Small Cap Fund is to seek long-term capital growth through an actively managed portfolio of stocks of small capitalization companies. The investment objective of the BTW International Equity Fund is to seek long-term capital growth through an actively managed portfolio of equities of international companies.
Under the Trust’s organizational documents, its officers and trustees are indemnified against certain liabilities arising out of the performance of their duties to the Trust. In addition, in the normal course of business, the Trust may enter into contracts with its vendors and others that provide for general indemnifications. Each Fund’s maximum exposure under these arrangements is unknown, as this would involve future claims that may be made against the Funds. However, based on experience, the Funds expect risk of loss to be remote.
| 2. | Significant Accounting Policies: |
The following is a summary of significant accounting policies followed by the Funds in the preparation of their financial statements. The policies are in conformity with accounting principles generally accepted in the United States of America (“GAAP”).
The preparation of financial statements in conformity with GAAP requires management to make estimates and assumptions that affect the reported amounts of assets and liabilities, the disclosure of contingent assets and liabilities at the date of the financial statements and the reported amounts of increases and decreases in net assets from operations during the reporting period. Actual results may differ from those estimates.
The Funds are investment companies and accordingly follow the investment company accounting and reporting guidance of the Financial Accounting Standards Board (FASB) Accounting Standards Codification Topic 946, “Financial Services - Investment Companies”.
Security Valuation:
The Funds record their investments at fair value. Fair value is defined as the price that would be received to sell an asset or paid to transfer a liability in an orderly transaction between market participants at the measurement date. The valuation techniques used to determine fair value are further described below.
The value of each equity security, including common stocks, is based either on the last sale price on a national securities exchange, or in the absence of recorded sales, at the closing bid price on such exchanges, or at the quoted bid price in the over-the-counter market. Equity securities traded on the NASDAQ stock market are valued at the NASDAQ official closing price. The prices for foreign securities are reported in local currency and converted to U.S dollars using currency exchange rates. Prices for most securities held in the Funds are provided daily by a recognized independent pricing service.
Bonds and other fixed income securities (other than short-term obligations but including listed issues) are provided by an independent pricing service, the use of which has been approved by the Board of Trustees (“Board”). In making such valuations, the pricing service utilizes both dealer-supplied valuations and electronic data processing techniques that take into account appropriate factors such as institutional-size trading in similar groups of securities, yield, quality, coupon rate, maturity, type of issue, and trading characteristics other than market data and without exclusive reliance upon quoted prices or exchanges or over-the-counter prices, since such valuations are believed to reflect more accurately the fair value of such securities. All debt portfolio securities with a remaining maturity of 60 days or less may be valued at amortized cost, which approximates fair value.
The Trust may use a pricing service to value certain portfolio securities where the prices provided are believed to reflect the fair value of such securities. If market prices are not readily available or, in the opinion of the Adviser, market prices do not reflect fair value, or if an event occurs after the close of trading on the exchange or market on which the security is principally traded (but prior to the time the NAV is calculated) that materially affects fair value, the Adviser will value the Funds’ assets at their fair value according to policies approved by the Board. The Adviser believes that foreign security values may be affected by volatility that occurs in global markets on a trading day after the close of any given foreign securities
| Notes to the Financial Statements | December 31, 2020 |
markets. The fair valuation procedures, therefore, include a procedure whereby foreign security prices may be “fair valued” by an independent pricing service through the use of factors which take such volatility into account.
Investments in investment companies and money market funds are valued at NAV per share.
Fair Value Measurements:
The valuation techniques employed by the Funds, as described above in Security Valuation, maximize the use of observable inputs and minimize the use of unobservable inputs in determining fair value. The inputs used for valuing the Funds’ investments are summarized in the three broad levels listed below:
Level 1 — Quoted prices in active markets for identical assets
Level 2 — Other significant observable inputs (including quoted prices for similar securities, interest rates, prepayment speeds, credit risk, etc.)
Level 3 — Significant unobservable inputs (including the Funds’ own assumptions in determining the fair value of investments)
The inputs or methodology used to value investments are not necessarily an indication of the risk associated with investing in those investments.
Pursuant to the valuation techniques described above in Security Valuation, equity securities are generally categorized as Level 1 securities in the fair value hierarchy (unless there is a fair valuation event, in which case affected securities are generally categorized as Level 2 securities). Fixed income securities, including those with a remaining maturity of 60 days or less, are generally categorized as Level 2 securities in the fair value hierarchy.
Open-ended investment companies and money market funds are generally categorized as Level 1 securities in the fair value hierarchy.
Investments for which there are no quotations available, or for which quotations do not appear reliable, are valued at fair value as determined in good faith by the Adviser under the direction of the Board. These valuations are typically categorized as Level 2 or Level 3 in the fair value hierarchy.
The Funds did not hold any Level 3 investments during the year ended December 31, 2020
The following is a summary of the valuation inputs used as of December 31, 2020 in valuing the Funds’ investments based on the three levels defined above:
| | | | | | Level 2 | | | | |
| | | Level 1 | | | Other Significant | | | Total Investments | |
| Fund Name | | Quoted Prices | | | Observable Inputs | | | in Securities | |
| Asset Management Fund | | | | | | | | | | | | |
| Investment Companies | | $ | 5,892,835 | | | $ | — | | | $ | 5,892,835 | |
| U.S. Government & U.S. Government Agency Obligations | | | — | | | | 116,512,092 | | | | 116,512,092 | |
| Municipal Bonds1 | | | — | | | | 22,873,678 | | | | 22,873,678 | |
| Common Stocks2 | | | 433,982,500 | | | | — | | | | 433,982,500 | |
| Corporate Bonds2 | | | — | | | | 17,739,745 | | | | 17,739,745 | |
| Total | | | 439,875,335 | | | | 157,125,515 | | | | 597,000,850 | |
| | | | | | | | | | | | | |
| Equity Fund | | | | | | | | | | | | |
| Investment Companies | | | 947,755 | | | | — | | | | 947,755 | |
| Common Stocks2 | | | 167,502,558 | | | | — | | | | 167,502,558 | |
| Total | | | 168,450,313 | | | | — | | | | 168,450,313 | |
| | | | | | | | | | | | | |
| Midcap Fund | | | | | | | | | | | | |
| Investment Companies | | | 1,487,845 | | | | — | | | | 1,487,845 | |
| Common Stocks2 | | | 138,089,144 | | | | — | | | | 138,089,144 | |
| Total | | | 139,576,989 | | | | — | | | | 139,576,989 | |
| | | | | | | | | | | | | |
| SMID Cap Fund | | | | | | | | | | | | |
| Investment Companies | | | 2,752,352 | | | | — | | | | 2,752,352 | |
| Common Stocks2 | | | 223,339,395 | | | | — | | | | 223,339,395 | |
| Total | | | 226,091,747 | | | | — | | | | 226,091,747 | |
| | | | | | | | | | | | | |
| BTW Balanced Fund | | | | | | | | | | | | |
| Investment Companies | | | 2,795,394 | | | | — | | | | 2,795,394 | |
| U.S. Government & U.S. Government Agency Obligations | | | — | | | | 41,497,456 | | | | 41,497,456 | |
| Municipal Bonds1 | | | — | | | | 4,295,232 | | | | 4,295,232 | |
| Common Stocks2 | | | 120,679,618 | | | | — | | | | 120,679,618 | |
| Certificate of Deposit | | | — | | | | 203,625 | | | | 203,625 | |
| Corporate Bonds2 | | | — | | | | 7,225,462 | | | | 7,225,462 | |
| Yankee Dollar | | | — | | | | 378,950 | | | | 378,950 | |
| Total | | | 123,475,012 | | | | 53,600,725 | | | | 177,075,737 | |
| | | | | | | | | | | | | |
| BTW Equity Fund | | | | | | | | | | | | |
| Investment Companies | | | 3,267,571 | | | | — | | | | 3,267,571 | |
| Common Stocks2 | | | 261,005,287 | | | | — | | | | 261,005,287 | |
| Total | | | 264,272,858 | | | | — | | | | 264,272,858 | |
| Notes to the Financial Statements | | | | | | December 31, 2020 |
| | | | | | Level 2 | | | | |
| | | Level 1 | | | Other Significant | | | Total Investments | |
| Fund Name | | Quoted Prices | | | Observable Inputs | | | in Securities | |
| BTW Midcap Fund | | | | | | | | | | | | |
| Investment Companies | | $ | 844,274 | | | $ | — | | | $ | 844,274 | |
| Common Stocks2 | | | 81,941,992 | | | | — | | | | 81,941,992 | |
| Total | | | 82,786,266 | | | | — | | | | 82,786,266 | |
| | | | | | | | | | | | | |
| BTW SMID Cap Fund | | | | | | | | | | | | |
| Investment Companies | | | 878,077 | | | | — | | | | 878,077 | |
| Common Stocks2 | | | 63,830,093 | | | | — | | | | 63,830,093 | |
| Total | | | 64,708,170 | | | | — | | | | 64,708,170 | |
| | | | | | | | | | | | | |
| BTW Small Cap Fund | | | | | | | | | | | | |
| Investment Companies | | | 8,548,575 | | | | — | | | | 8,548,575 | |
| Common Stocks2 | | | 592,812,796 | | | | — | | | | 592,812,796 | |
| Total | | | 601,361,371 | | | | — | | | | 601,361,371 | |
| | | | | | | | | | | | | |
| BTW International Equity Fund | | | | | | | | | | | | |
| Investment Companies | | | 291,309 | | | | — | | | | 291,309 | |
| Common Stocks2 | | | 6,940,190 | | | | 65,260,638 | | | | 72,200,828 | |
| Total | | | 7,231,499 | | | | 65,260,638 | | | | 72,492,137 | |
| 1 | For detailed State classifications, see the accompanying Schedules of Portfolio Investments. |
| 2 | For detailed industry descriptions, see the accompanying Schedules of Portfolio Investments. |
Investment Transactions and Related Income:
Investment transactions are accounted for no later than one business day after trade date. However, for financial reporting purposes, investment transactions are accounted for on trade date. Investment gains and losses are calculated on an identified cost basis. Interest income is recognized on an accrual basis and includes, where applicable, the amortization or accretion of premium or discount based on effective yield. Dividend income is recorded on the ex-dividend date except in the case of certain foreign securities, in which case dividends are recorded as soon as such information becomes available.
Real Estate Investment Trusts:
The Funds may own shares of real estate investment trusts (“REITs”), which report information on the source of their distribution annually. Certain distributions received from REITs during the year, which are known to be return of capital, are recorded as a reduction to the cost of the individual REIT. These cost adjustments are typically based on estimates since actual return of capital amounts are not known at the time the annual report is prepared.
Expenses:
Expenses directly attributable to a Fund are charged directly to that Fund. Expenses relating to the Trust are allocated proportionately to each Fund within the Trust according to the relative net assets of each Fund or on another reasonable basis.
Distributions to Shareholders:
Distributions to shareholders are recorded on the ex-dividend date. Dividends to shareholders from net investment income, if any, are declared and paid annually by the Funds. Dividends to shareholders from net realized gains, if any, are declared and distributed at least annually by the Funds. The amounts of distributions to shareholders from net investment income and of distributions from net realized gains are determined in accordance with federal income tax regulations, which may differ from GAAP.
Federal Income Taxes:
Each Fund qualifies and intends to continue to qualify as a regulated investment company by complying with the provisions available to certain investment companies, as defined in Subchapter M of the Internal Revenue Code, and to make distributions from net investment income and from net realized capital gains sufficient to relieve it from all, or substantially all, federal income and excise taxes. Therefore, no federal income tax provision is required.
Management has reviewed tax positions taken in tax years that remain subject to examination by all major tax jurisdictions, including U.S. Federal (i.e., the last four tax year ends and the interim tax period since then, as applicable), and believes that there is no tax liability resulting from unrecognized tax benefits related to uncertain tax positions taken as of and during the year ended December 31, 2020. The Funds recognize interest and penalties, if any, related to unrecognized tax benefits, as income tax expense in the Statements of Operations as incurred. There is no income tax noted as due for the year ended December 31, 2020.
Foreign Currency Transactions:
The accounting records of the Funds are maintained in U.S. dollars. Non-U.S. dollar denominated amounts are translated into U.S. dollars as follows, with the resultant exchange gains and losses recorded in the Statements of Operations:
| i) | Value of investment securities and other assets and liabilities at the exchange rate on the valuation date; and |
ii) Purchases and sales of Investment securities and income and expenses at the exchange rate prevailing on the respective date of such transactions.
| Notes to the Financial Statements | December 31, 2020 |
The Funds do not isolate realized and unrealized gains and losses attributable to changes in the exchange rates from gains and losses that arise from changes in the value of investments. Such fluctuations are included with net realized and unrealized gain or loss from investments.
Investment income from non-U.S. sources received by a Fund is generally subject to non-U.S. withholding taxes at rates ranging up to 30%. Such withholding taxes may be reduced or eliminated under the terms of applicable U.S. income tax treaties. The Funds may be subject to foreign taxes on gains in investments or currency repatriation. The Funds accrue such taxes, as applicable, based on their current interpretation of tax rules in the foreign markets in which they invest.
| 3. | Related Party Transactions and Other Service Arrangements: |
Investment Adviser:
The Trust, with respect to the Funds, and the Adviser are parties to an Investment Advisory Agreement under which the Adviser is entitled to receive an annual fee, computed daily and paid monthly, equal to the average daily net assets of each Fund, at the following annual percentage rates before contractual waivers:
| Fund | | Fee Rate | |
| Asset Management Fund | | | 0.72 | %* |
| Equity Fund | | | 0.75 | % |
| Midcap Fund | | | 0.75 | % |
| SMID Cap Fund | | | 0.75 | % |
| Fund | | Fee Rate | |
| BTW Balanced Fund | | | 0.75 | % |
| BTW Equity Fund | | | 0.75 | % |
| BTW Midcap Fund | | | 0.75 | % |
| BTW SMID Cap Fund | | | 0.75 | % |
| BTW Small Cap Fund | | | 0.75 | % |
| BTW International Equity Fund | | | 0.75 | % |
| * | Effective rate for year ended December 31, 2020. The Asset Management Fund has an Investment Management Agreement with the Adviser under which the Fund pays: (a) 0.75% of the first $500 million of average daily net assets; (b) 0.50% of average daily net assets in excess of $500 million. |
Additionally, two trustees of the Trust are officers of the Adviser or its affiliate, and an officer of the Trust is an officer of the Adviser. These persons are not paid directly by the Funds.
Administration and Fund Accounting:
Citi Fund Services Ohio, Inc. (“Citi”) serves the Funds as administrator. Citi provides administrative and fund accounting services for a fee that is computed daily and paid monthly, based on the aggregate daily net assets of the Trust plus certain base fees.
Certain officers of the Trust are affiliated with Citi. Such persons were paid no fees directly by the Funds for serving as Officers of the Trust. Citi makes an employee available to serve as the Trust’s Chief Compliance Officer (“CCO”) under a Compliance Service Agreement between the Funds and Citi (the “CCO Agreement”). Under the CCO Agreement, Citi also provides infrastructure and support in implementing the written policies and procedures comprising the Trust’s compliance program, including support services to the CCO. For the services provided under the CCO Agreement, the Funds paid Citi $150,000 for the year ended December 31, 2020, plus certain out of pocket expenses. Citi pays the salary and other compensation earned by the CCO as an employee of Citi.
Distribution:
Foreside Financial Services, LLC (“Foreside”), which is not affiliated with Citi or the Adviser, serves as the Funds’ distribution agent. Fees for these services are paid monthly by the Adviser and not by the Funds.
Shareholder Services:
The Funds may enter into shareholder services agreements with investment advisers, banks, trust companies and other types of organizations (“Authorized Service Providers”), which may include affiliates of the Funds, for providing administrative services with respect to shares of the Funds attributable to or held in the name of the Authorized Service Provider for its clients or other parties with whom they have a servicing relationship. Fees paid by the Funds under shareholder services agreements may not exceed 0.25% of the average daily net assets of each Fund and are presented separately on the Statements of Operations. Affiliates of the Funds did not receive any fees during the year ended December 31, 2020.
Custodian and Transfer Agency:
Boston Trust Walden Company (“Boston Trust”), the parent company of the Adviser, acts as the Funds’ transfer agent. Under the transfer agency agreement, Boston Trust receives a fixed fee of $18,000 annually per fund, accrued daily and paid monthly for its services. Under a sub-transfer agency agreement, FIS Investor Services, LLC receives a fixed annual fee accrued daily and paid monthly, plus annual per account fees and certain out of pocket expenses for its services to the Trust. Expenses incurred under the transfer agency agreement and sub-transfer agency agreement are presented collectively as “Transfer Agency” expenses on the Statements of Operations.
Boston Trust acts as the custodian for all Funds except the BTW International Equity Fund. Under the custody agreement, Boston Trust receives an annual asset based fee of 0.014% of the value of securities held. Citibank, N.A. receives sub-custodian fees from Boston Trust for each Fund except the BTW International Equity Fund. Under a separate custody agreement, Citibank, N.A., an affiliate of Citi, serves as custodian for the BTW International Equity Fund and receives a fee based on a percentage of assets held on behalf of the BTW International Equity Fund, transaction fees and certain out of pocket expenses for its services. Such percentages vary by the jurisdiction in which the assets are held.
Fee Reductions:
The Adviser has agreed to reduce its fees payable by the Funds to the extent necessary, exclusive of brokerage costs, interest, taxes, dividends, litigation, indemnification, expenses associated with the investments in underlying investment companies and extraordinary expenses (as determined under GAAP) of each Fund, except the SMID Cap Fund , to 1.00% of the average daily net assets. The Adviser has agreed to reduce its fees payable by the SMID Cap Fund to the extent necessary, subject to certain exclusions, to limit the aggregate annual operating expenses to 0.75% of its average daily net assets. Prior to December 31, 2020, the contractual expense limitation for the BTW International Equity Fund was 1.10%. Any such
| Notes to the Financial Statements | December 31, 2020 |
reductions made by the Adviser in its fees or in the payment or reimbursement of expenses that are a Fund’s obligation may be subject to repayment by the Fund within three years provided the Fund receiving the reduction, payment or reimbursement is able to effect such repayment and remain in compliance with applicable expense limitations. The expense limitation agreement shall automatically renew effective May 1 of every year until the Adviser provides written notice of non-renewal to the Trust.
Pursuant to its agreement, the Adviser reimbursed, and has yet to recoup, fees in the following amounts for the years ended December 31, 2018 (expiring 12/31/2021), December 31, 2019 (expiring 12/31/2022) and December 31, 2020 (expiring 12/31/2023):
| Fund | | | Amount | | | Expires | |
| Midcap Fund | | | $ | 42,703 | | | | 12/31/2022 | |
| | | | | 68,764 | | | | 12/31/2023 | |
| SMID Cap Fund | | | | 168,823 | | | | 12/31/2021 | |
| | | | | | | | | | |
| | | | | 170,506 | | | | 12/31/2022 | |
| | | | | 251,750 | | | | 12/31/2023 | |
| Fund | | Amount | | | Expires | |
| BTW Balanced Fund | | $ | 45,249 | | | | 12/31/2021 | |
| | | | 34,853 | | | | 12/31/2022 | |
| | | | 33,272 | | | | 12/31/2023 | |
| | | | | | | | | |
| BTW Equity Fund | | | 166,166 | | | | 12/31/2021 | |
| | | | 158,316 | | | | 12/31/2022 | |
| | | | 143,297 | | | | 12/31/2023 | |
| | | | | | | | | |
| BTW Midcap Fund | | | 15,213 | | | | 12/31/2023 | |
| | | | | | | | | |
| BTW SMID Cap Fund | | | 42,347 | | | | 12/31/2021 | |
| | | | 36,311 | | | | 12/31/2022 | |
| | | | 30,485 | | | | 12/31/2023 | |
| | | | | | | | | |
| BTW Small Cap Fund | | | 261,419 | | | | 12/31/2021 | |
| | | | 168,952 | | | | 12/31/2022 | |
| | | | 247,032 | | | | 12/31/2023 | |
| | | | | | | | | |
| BTW International Equity Fund | | | 7,070 | | | | 12/31/2021 | |
During the year ended December 31, 2020, the Funds did not recoup any waivers.
As of December 31, 2020, the Adviser may recoup amounts from the Funds as follows:
| Total Potential Recoupment | | | |
| Asset Management Fund | | $ | — | |
| Equity Fund | | | — | |
| Midcap Fund | | | 111,467 | |
| SMID Cap Fund | | | 591,079 | |
| Total Potential Recoupment | | | |
| BTW Balanced Fund | | $ | 113,374 | |
| BTW Equity Fund | | | 467,779 | |
| BTW Midcap Fund | | | 15,213 | |
| BTW SMID Cap Fund | | | 109,143 | |
| BTW Small Cap Fund | | | 677,403 | |
| BTW International Equity Fund | | | 7,070 | |
In-Kind Subscriptions and Redemptions:
During the year ended December 31, 2020, the Funds delivered securities in exchange for the redemption of shares (redemptions in-kind) as follows:
| | | | | | | Fund Shares | | | Realized | |
| Fund | | | Fair Value | | | Redeemed | | | Gain/(Loss) | |
| SMID Cap Fund | | | $ | 4,663,238 | | | | 244,533 | | | $ | 4,664 | |
During the year ended December 31, 2019, the Asset Management Fund acquired securities and other assets from a common trust fund managed by an affiliate (Boston Trust Walden Company) of the Adviser, the Boston Trust Managed Growth Fund. The subscription proceeds were accomplished through an in-kind contribution of investments and other assets. The contribution was not a taxable event under the provisions of Section 584 of the Internal Revenue Code, and therefore the historical cost basis of those investments was carried forward. The Asset Management Fund issued 808,358 shares to the holders of Boston Trust Managed Growth Fund in exchange for investments and other assets valued at $43,771,772. The value and historical cost of the contributed investments was $43,613,987and $16,186,943, respectively, which was carried forward to align the ongoing reporting of realized and unrealized gains and losses for tax purposes.
During the year ended December 31, 2019, the Funds delivered securities in exchange for the redemption of shares (redemptions in-kind) as follows:
| | | | | | Fund Shares | | | Realized | |
| Fund | | Fair Value | | | Redeemed | | | Gain/(Loss) | |
| Asset Management Fund | | $ | 5,777,713 | | | | 118,834 | | | $ | 5,029,044 | |
| BTW Small Cap Fund | | | 119,901,316 | | | | 8,413,292 | | | | 42,132,134 | |
Interfund Lending:
Pursuant to an Exemptive Order issued by the Securities and Exchange Commission (“SEC”), the Funds may participate in an interfund lending program (the “Program”). The Program provides an alternative credit facility under which the Funds may lend to, or borrow from, one another, consistent with each Fund’s investment objectives, limitations and organization documents. The Program provides a borrowing Fund with a source of liquidity at a rate lower than the bank borrowing rate at times when the cash position of the Fund is insufficient to meet temporary cash requirements. In addition, Funds making short-term cash loans directly to other Funds would earn interest at a rate higher than they otherwise could obtain from investing their cash in repurchase agreements or certain other short-term money market instruments. Interfund loans have a maximum duration of seven days and may be called on one business day’s notice. Any open loans at period end are presented under the caption “Payable” for interfund lending in the Statements of
| Notes to the Financial Statements | December 31, 2020 |
Assets and Liabilities. As of December 31, 2020, the Funds had no outstanding loans to or from another fund under the Program. The Funds’ activity in the Program during the period for which loans were outstanding was as follows:
| | | | | Weighted Average loan | | | Days | | | Weighted Average | | | Interest Income | |
| Fund | | Borrower or Lender | | Balance | | | Outstanding | | | Annualized Interest Rate | | | (Expense) | |
| Asset Management Fund | | Lender | | $ | 637,090 | | | | 12 | * | | | 2.36 | % | | $ | 499 | |
| Midcap Fund | | Borrower | | | 693,960 | | | | 5 | | | | 1.90 | | | | (184 | ) |
| SMID Cap | | Borrower | | | 640,314 | | | | 3 | | | | 2.86 | | | | (152 | ) |
| BTW Midcap Fund | | Borrower | | | 592,127 | | | | 2 | | | | 3.32 | | | | (109 | ) |
| BTW SMID Cap Fund | | Borrower | | | 535,042 | | | | 2 | | | | 1.81 | | | | (54 | ) |
| * | Aggregate days Fund had loan outstanding as lender for all borrowers. |
| 4. | Purchases and Sales of Securities: |
Cost of purchases and proceeds from sales and maturities of securities, excluding in-kinds, short-term securities and U.S. Government securities, for the Funds for the year ended December 31, 2020, totaled:
| | | | | | Sales and | |
| Fund | | Purchases | | | Maturities | |
| Asset Management Fund | | $ | 34,531,876 | | | $ | 121,284,221 | |
| Equity Fund | | | 13,657,607 | | | | 23,636,828 | |
| Midcap Fund | | | 48,371,041 | | | | 60,827,024 | |
| SMID Cap Fund | | | 155,543,256 | | | | 81,295,780 | |
| BTW Balanced Fund | | | 24,439,675 | | | | 27,073,663 | |
| BTW Equity Fund | | | 34,200,576 | | | | 47,513,926 | |
| BTW Midcap Fund | | | 36,999,210 | | | | 24,905,872 | |
| BTW SMID Cap Fund | | | 21,289,891 | | | | 22,595,726 | |
| BTW Small Cap Fund | | | 305,697,643 | | | | 155,780,175 | |
| BTW International Equity Fund | | | 16,103,387 | | | | 4,723,655 | |
Cost of purchases and proceeds from sales and maturities of U.S. Government Securities, excluding short-term securities, for the Funds for the year ended December 31, 2020, totaled:
| | | | | | | Sales and | |
| Fund | | | Purchases | | | Maturities | |
| Asset Management Fund | | | $ | 29,632,168 | | | $ | 6,281,758 | |
| BTW Balanced Fund | | | | 10,533,340 | | | | 1,550,674 | |
| 5. | Federal Income Tax Information: |
As of the tax year ended December 31, 2020, the cost, gross unrealized appreciation and gross unrealized depreciation on investments, for federal income tax purposes, were as follows:
| | | | | | | | | | | | Net Unrealized | |
| | | | | | Gross Tax Unrealized | | | Gross Tax Unrealized | | | Appreciation | |
| Fund | | Tax Cost | | | Appreciation | | | (Depreciation) | | | (Depreciation) | |
| Asset Management Fund | | $ | 287,980,143 | | | $ | 309,123,882 | | | $ | (103,175 | ) | | $ | 309,020,707 | |
| Equity Fund | | | 55,919,392 | | | | 112,683,737 | | | | (152,816 | ) | | | 112,530,921 | |
| Midcap Fund | | | 96,553,206 | | | | 44,547,354 | | | | (1,523,571 | ) | | | 43,023,783 | |
| SMID Cap Fund | | | 180,454,897 | | | | 48,916,416 | | | | (3,279,566 | ) | | | 45,636,850 | |
| BTW Balanced Fund | | | 106,683,302 | | | | 71,140,384 | | | | (747,949 | ) | | | 70,392,435 | |
| BTW Equity Fund | | | 108,307,285 | | | | 157,317,691 | | | | (1,352,118 | ) | | | 155,965,573 | |
| BTW Midcap Fund | | | 56,583,399 | | | | 26,448,251 | | | | (245,384 | ) | | | 26,202,867 | |
| BTW SMID Cap Fund | | | 45,190,010 | | | | 20,283,704 | | | | (765,544 | ) | | | 19,518,160 | |
| BTW Small Cap Fund | | | 453,865,749 | | | | 154,783,659 | | | | (7,288,037 | ) | | | 147,495,622 | |
| BTW International Equity Fund | | | 60,927,592 | | | | 14,617,687 | | | | (3,053,142 | ) | | | 11,564,545 | |
| Notes to the Financial Statements | December 31, 2020 |
The tax character of distributions paid during the fiscal year ended December 31, 2020 was as follows:
| | | | Distributions paid from | | | | | | | | | | | | |
| | | | Ordinary | | | Net Long Term | | | | Total Taxable | | | | Return of | | | | Total Distributions | |
| Fund | | | Income | | | | Gains | | | | Distributions | | | | Capital | | | | Paid | | | |
| Asset Management Fund | | $ | 5,477,265 | | | $ | 26,917,374 | | | $ | 32,394,639 | | | $ | – | | | $ | 32,394,639 | |
| Equity Fund | | | 1,389,771 | | | | 3,332,395 | | | | 4,722,166 | | | | – | | | | 4,722,166 | |
| Midcap Fund | | | 911,395 | | | | 738,615 | | | | 1,650,010 | | | | – | | | | 1,650,010 | |
| SMID Cap Fund | | | 1,415,731 | | | | 281,448 | | | | 1,697,179 | | | | 46,102 | | | | 1,743,281 | |
| BTW Balanced Fund | | | 1,502,423 | | | | 3,639,885 | | | | 5,142,308 | | | | – | | | | 5,142,308 | |
| BTW Equity Fund | | | 2,025,655 | | | | 8,027,497 | | | | 10,053,152 | | | | – | | | | 10,053,152 | |
| BTW Midcap Fund | | | 419,577 | | | | 2,155,925 | | | | 2,575,502 | | | | – | | | | 2,575,502 | |
| BTW SMID Cap Fund | | | 340,093 | | | | 793,869 | | | | 1,133,962 | | | | – | | | | 1,133,962 | |
| BTW Small Cap Fund | | | 2,825,984 | | | | 7,329,749 | | | | 10,155,733 | | | | – | | | | 10,155,733 | |
| BTW International Equity Fund | | | 804,177 | | | | – | | | | 804,177 | | | | – | | | | 804,177 | |
The tax character of distributions paid during the fiscal year ended December 31, 2019 was as follows:
| | | | Distributions paid from | | | | | | | | | | | | | |
| Fund | | | Ordinary
Income | | | | Net Long Term
Gains | | | | Total Taxable
Distributions | | | | Return of
Capital | | | | Total Distributions
Paid | | | |
| Asset Management Fund | | $ | 5,391,202 | | | | 350,942 | | | $ | 5,742,144 | | | $ | – | | | $ | 5,742,144 | |
| Equity Fund | | | 1,281,596 | | | | 160,867 | | | | 1,442,463 | | | | – | | | | 1,442,463 | |
| Midcap Fund | | | 1,776,041 | | | | 3,369,743 | | | | 5,145,784 | | | | – | | | | 5,145,784 | |
| SMID Cap Fund | | | 1,290,766 | | | | 1,944,006 | | | | 3,234,772 | | | | – | | | | 3,234,772 | |
| BTW Balanced Fund | | | 1,608,080 | | | | 906,163 | | | | 2,514,243 | | | | – | | | | 2,514,243 | |
| BTW Equity Fund | | | 2,122,863 | | | | 5,237,707 | | | | 7,360,570 | | | | – | | | | 7,360,570 | |
| BTW Midcap Fund | | | 559,523 | | | | 3,373,441 | | | | 3,932,964 | | | | – | | | | 3,932,964 | |
| BTW SMID Cap Fund | | | 462,200 | | | | 2,606,462 | | | | 3,068,662 | | | | – | | | | 3,068,662 | |
| BTW Small Cap Fund | | | 1,133,540 | | | | 14,436,243 | | | | 15,569,783 | | | | – | | | | 15,569,783 | |
| BTW International Equity Fund | | | 929,213 | | | | – | | | | 929,213 | | | | – | | | | 929,213 | |
As of December 31, 2020, the components of distributable earnings (deficit) on a tax basis were as follows:
| Fund | | | | | | | | | |
| | Undistributed
Ordinary Income | Undistributed
Long-Term
Capital Gains | Accumulated
Earnings | | Accumulated
Capital and
Other Losses1 | Unrealized
Appreciation/
(Depreciation) | Total
Distributable
Earnings
(Deficit) | |
| Asset Management Fund | $ | 20,468 | $ 3,620,901 | $ 3,641,369 | $ | — | $ 309,020,707 | $ 312,662,076 | |
| Equity Fund | | — | 1,828,166 | 1,828,166 | | — | 112,530,921 | 114,359,087 | |
| Midcap Fund | | — | 686,065 | 686,065 | | — | 43,023,783 | 43,709,848 | |
| SMID Cap Fund | | — | — | — | | (219,383) | 45,636,850 | 45,417,467 | |
| BTW Balanced Fund | | 37,116 | 1,004,731 | 1,041,847 | | — | 70,392,435 | 71,434,282 | |
| BTW Equity Fund | | 3,239 | 1,724,988 | 1,728,227 | | — | 155,965,573 | 157,693,800 | |
| BTW Midcap Fund | | — | 614,943 | 614,943 | | — | 26,202,867 | 26,817,810 | |
| BTW SMID Cap Fund | | — | 681,553 | 681,553 | | — | 19,518,160 | 20,199,713 | |
| BTW Small Cap Fund | | 3,049,853 | 4,769,197 | 7,819,050 | | — | 147,495,622 | 155,314,672 | |
| BTW International Equity Fund | | 1,202 | — | 1,202 | | (829,667) | 11,579,919 | 10,751,454 | |
| 1 | The differences between book-basis and tax-basis unrealized appreciation (depreciation) is attributable primarily to tax deferral of losses on wash sales and return of capital distributions from REIT securities and other investments. |
As of the end of its tax year ended December 31, 2020, the following Funds have a net capital loss carry forwards (“CLCFs”) not subject to expiration as summarized in the tables below. The Board does not intend to authorize a distribution of any realized gain for the Fund until any applicable CLCF has been offset or expires.
| | | Short-Term | | | Long-Term | | | | |
| Fund | | Amount | | | Amount | | | Total | |
| SMID Cap Fund | | $ | – | | | $ | 219,383 | | | $ | 219,383 | |
| BTW International Equity Fund | | | – | | | | 829,667 | | | | 829,667 | |
| Notes to the Financial Statements | December 31, 2020 |
As of December 31, 2020, the following reclassifications have been made on the Statements of Assets and Liabilities to increase (decrease) such accounts with offsetting adjustments as indicated:
| | | Total Distributable | | | | |
| Fund | | Earnings | | | Paid in Capital | |
| SMID Cap Fund | | $ | 83,041 | | | $ | (83,041 | ) |
| BTW Midcap Fund | | | (34,628 | ) | | | 34,628 | |
| BTW SMID Cap Fund | | | (3,828 | ) | | | 3,828 | |
| BTW Small Cap Fund | | | (1,271,029 | ) | | | 1,271,029 | |
These “book/tax” differences are either considered temporary or permanent in nature. To the extent these differences are permanent in nature (e.g. return of capital, distribution reclass, foreign currency reclass, and equalization), such amounts are reclassified within the composition of net assets based on their federal tax-basis treatment; temporary differences (e.g. wash sales and post October losses) do not require reclassification. To the extent dividends to shareholders exceed net investment income and net realized gains for tax purposes, they are reported as return of capital.
| 6. | Control Ownership and Principal Holders: |
The beneficial ownership, either directly or indirectly, of more than 25% of the voting securities of a Fund creates presumptions of control of the Fund under section 2 (a)(9) of the 1940 Act. As of December 31, 2020, the Funds had individual shareholder accounts and/or omnibus shareholder accounts (comprised of a group of individual shareholders), owning more than 25% of the total shares outstanding of the Fund as detailed below.
| Fund | | Control Ownership | | Percentage of
Ownership |
| Asset Management Fund | | US Bank N.A. | | 88.82% |
| Equity Fund | | US Bank N.A. | | 95.33 |
| Midcap Fund | | US Bank N.A. | | 45.82 |
| SMID Fund | | National Financial Services | | 40.97 |
| BTW Balanced Fund | | US Bank N.A. | | 52.58 |
| BTW Equity Fund | | US Bank N.A. | | 29.82 |
| BTW Midcap Fund | | US Bank N.A. | | 56.13 |
| BTW SMID Fund | | US Bank N.A. | | 50.76 |
| BTW International Equity Fund | | US Bank N.A. | | 75.85 |
In December 2019, the Board approved Boston Trust Walden’s proposal to merge Walden Small Cap Fund (the “Target Fund”) into Boston Trust Walden Small Cap Fund (the “Acquiring Fund”). The Agreement and Plan of Reorganization was approved by shareholders on March 26, 2020. The Target Fund and the Acquiring Fund shared identical investment goals, principal investment strategies, risks, and ESG screens. They also shared the same investment adviser. The transaction was effective after the close of business on April 3, 2020. The Acquiring Fund acquired all of the assets and assumed all of the liabilities of the Target Fund as shown in the table below. The transaction was structured to qualify as a tax-free reorganization under the Code. Pursuant to the Agreement and Plan of Reorganization, shareholders of the Target Fund received a number of shares of the corresponding class in the Acquiring Fund, with a value equal to their holdings in the Target Fund as of the close of business on April 3, 2020. The investment portfolio of the Target Fund, with a fair value of $103,000,783 and identified cost of $111,464,003 as of the date of the reorganization, was the principal asset acquired by the Acquiring Fund. For financial statement purposes, assets received and shares issued by the Acquiring Fund were recorded at fair value; however, the cost basis of the investments received from the Target Fund was carried forward to align ongoing reporting of the Acquiring Fund’s realized and unrealized gains and losses with amounts distributable to shareholders for tax purposes.
The following is a summary of Shares Outstanding, Net Assets, NAV and Net Unrealized Appreciation (Depreciation) immediately before and after the reorganization:
| | | | | | | | | | | | Net Unrealized | |
| | | Shares | | | | | | Net Asset Value | | | Appreciation | |
| Target Fund | | Outstanding | | | Net Assets | | | Per Share | | | (Depreciation) | |
| Walden Small Cap Fund | | | 7,088,420 | | | $ | 103,030,710 | | | $ | 14.54 | | | $ | (8,463,220 | ) |
| | | | | | | | | | | | | | | | | |
| Acquiring Fund | | | | | | | | | | | | | | | | |
| Boston Trust Walden Walden Small Cap Fund | | | 19,128,805 | | | $ | 189,922,749 | | | $ | 9.93 | | | $ | (23,454,940 | ) |
| | | | | | | | | | | | | | | | | |
| Post Reorganization | | | | | | | | | | | | | | | | |
| Boston Trust Walden Walden Small Cap Fund | | | 29,505,631 | | | $ | 292,953,459 | | | $ | 9.93 | | | $ | (31,918,160 | ) |
Expenses related to reorganization were incurred by the Adviser. Expenses incurred by the Funds in the ordinary course during the reorganization continue to be treated as a Fund expense in accordance with the Funds’ advisory contracts.
| Notes to the Financial Statements | December 31, 2020 |
Assuming the reorganization had been completed on January 1, 2020, the beginning of the annual reporting period, the pro forma results of operations of the Acquiring Fund, post reorganization for the year ended December 31, 2020, are as follows:
| Net Investment income (loss) | | $ | 3,155,490 | |
| Net realized/unrealized gains (losses) | | | 72,763,265 | |
| Change in net assets resulting from operations | | $ | 75,918,755 | |
Because the combined investment portfolios have been managed as a single integrated portfolio since the reorganization was completed, it is not practicable to separate the amounts of revenue and earnings of the Target Fund that have been included in the Statements of Operations of the Acquiring Fund, post reorganization since April 4, 2020
Management has evaluated events and transactions through the date these financial statements were issued and concluded no subsequent events required recognition or disclosure in these financial statements.
Report of Independent Registered Public Accounting Firm
To the Shareholders and Board of Trustees of
Boston Trust Walden Funds
Opinion on the Financial Statements
We have audited the accompanying statements of assets and liabilities, including the schedules of portfolio investments, of Boston Trust Walden Funds comprising the funds listed below (the “Funds”) as of December 31, 2020, the related statements of operations, the statements of changes in net assets, the related notes, and the financial highlights for the periods indicated below (collectively referred to as the “financial statements”). In our opinion, the financial statements present fairly, in all material respects, the financial position of each of the Funds as of December 31, 2020, the results of their operations, the changes in net assets and the financial highlights for the periods indicated below, in conformity with accounting principles generally accepted in the United States of America.
| | | Statement of | | Statements of Changes | | Financial |
| Fund Name | | Operations | | In Net Assets | | Highlights |
Boston Trust Asset Management Fund Boston Trust Equity Fund Boston Trust Midcap Fund Boston Trust SMID Cap Fund Boston Trust Walden Balanced Fund (Formerly, Walden Balanced Fund) Boston Trust Walden Equity Fund (For merly, Walden Equity Fund) Boston Trust Walden Midcap Fund (For merly, Walden Midcap Fund) Boston Trust Walden SMID Cap Fund (Formerly, Walden SMID Cap Fund) Boston Trust Walden Small Cap Fund | | For the year ended December 31, 2020 | | For the two years ended December 31, 2020 and 2019 | | For the years ended December 31, 2020, 2019, 2018 and 2017, for the period ended December 31, 2016 and for the year ended March 31, 2016 |
| Boston Trust Walden International Equity Fund (Formerly, Walden International Equity Fund) | | For the year ended December 31, 2020 | | For the two years ended December 31, 2020 and 2019 | | For the years ended December 31, 2020, 2019, 2018 and 2017, for the period ended December 31, 2016 and for the period June 9, 2015 (commencement of operations) through March 31, 2016 |
Basis for Opinion
These financial statements are the responsibility of the Funds’ management. Our responsibility is to express an opinion on the Funds’ financial statements based on our audits. We are a public accounting firm registered with the Public Company Accounting Oversight Board (United States) (“PCAOB”) and are required to be independent with respect to the Funds in accordance with the U.S. federal securities laws and the applicable rules and regulations of the Securities and Exchange Commission and the PCAOB.
We conducted our audits in accordance with the standards of the PCAOB. Those standards require that we plan and perform the audit to obtain reasonable assurance about whether the financial statements are free of material misstatement whether due to error or fraud.
Our audits included performing procedures to assess the risks of material misstatement of the financial statements, whether due to error or fraud, and performing procedures that respond to those risks. Such procedures included examining, on a test basis, evidence regarding the amounts and disclosures in the financial statements. Our procedures included confirmation of securities owned as of December 31, 2020, by correspondence with the custodian and brokers; when replies were not received from brokers, we performed other auditing procedures. Our audits also included evaluating the accounting principles used and significant estimates made by management, as well as evaluating the overall presentation of the financial statements.
Report of Independent Registered Public Accounting Firm
We believe that our audits provide a reasonable basis for our opinion.
We have served as the Funds’ auditor since 2008.

COHEN & COMPANY, LTD.
Cleveland, Ohio
February 26, 2021
| Supplementary Information (Unaudited) | December 31, 2020 |
Federal Income Tax Information:
During the fiscal year ended December 31, 2020, the Funds declared long-term realized gain distributions in the following amounts:
| Fund | | Long-Term Capital Gain Distributions |
| Asset Management Fund | | $ | 26,917,374 |
| Equity Fund | | | 3,332,395 |
| Midcap Fund | | | 738,615 |
| SMID Cap Fund | | | 281,448 |
| BTW Balanced Fund | | | 3,639,885 |
| BTW Equity Fund | | | 8,027,497 |
| BTW Midcap Fund | | | 2,155,925 |
| BTW SMID Cap Fund | | | 793,869 |
| BTW Small Cap Fund | | | 7,329,749 |
During the fiscal year ended December 31, 2020, the Funds declared short-term realized gain distributions in the following amounts:
| Fund | | Short-Term Capital Gains Distributions |
| Asset Management Fund | | $ | 12,876 |
| Midcap Fund | | | 153,282 |
| BTW Balanced Fund | | | 162,256 |
| BTW Equity Fund | | | 134,292 |
| BTW Midcap Fund | | | 52,617 |
| BTW SMID Cap Fund | | | 4,002 |
| BTW Small Cap Fund | | | 344,160 |
For the fiscal year ended December 31, 2020, the following percentage of the total ordinary income distributions paid by the Funds qualify for the distributions received deduction available to corporate shareholders.
| Fund | | Distribution Received Deduction |
| Asset Management Fund | | 100.00% |
| Equity Fund | | 100.00 |
| Midcap Fund | | 96.43 |
| SMID Cap Fund | | 100.00 |
| BTW Balanced Fund | | 100.00 |
| BTW Equity Fund | | 100.00 |
| BTW Midcap Fund | | 100.00 |
| BTW SMID Cap Fund | | 100.00 |
| BTW Small Cap Fund | | 100.00 |
For the fiscal year ended December 31, 2020, distributions paid by the Funds may be subject to a maximum tax rate of 15%, as provided for by the Jobs and Growth Tax Relief Reconciliation Act of 2003. The Funds intend to designate the maximum amount allowable as taxed at a maximum rate of 15%. Complete information will be reported in conjunction with your 2020 Form 1099-DIV.
| Fund | | Qualified Dividend Income |
| Asset Management Fund | | 100.00 % |
| Equity Fund | | 100.00 |
| Midcap Fund | | 97.02 |
| SMID Cap Fund | | 100.00 |
| BTW Balanced Fund | | 100.00 |
| BTW Equity Fund | | 100.00 |
| BTW Midcap Fund | | 100.00 |
| BTW SMID Cap Fund | | 100.00 |
| BTW Small Cap Fund | | 100.00 |
| BTW International Equity Fund | | 100.00 |
During the year ended December 31, 2020, the following Funds designated the maximum amount allowable as interest-related dividends for certain non-U.S. resident investors:
| Fund | | Qualified Interest Income |
| Asset Management Fund | | 29.57% |
| Equity Fund | | 0.07 |
| BTW Balanced Fund | | 34.10 |
| Supplementary Information (Unaudited) | December 31, 2020 |
Federal Income Tax Information: (cont.)
The following Funds intend to elect to pass through to shareholders the income tax credit for taxes paid to foreign countries. Foreign source income and foreign tax expense per outstanding share on December 31, 2020 are as follows:
| Fund | | Foreign Source
Income Per Share | | | Foreign Tax Expense
Per Share | |
| BTW International Equity Fund | | | 0.26 | | | | 0.03 | |
The pass-through of this foreign tax credit will only affect those persons who are shareholders on the dividend record date in December 2020. These shareholders will receive more detailed information along with their 2020 Form 1099-DIV.
Continued
| Supplementary Information (Unaudited) | December 31, 2020 |
Table of Shareholder Expenses:
As a shareholder of the Trust, you incur ongoing costs, including management fees, and other Fund expenses. These examples are intended to help you understand your ongoing costs (in dollars) of investing in the Boston Trust Walden Funds and to compare these costs with the ongoing costs of investing in other mutual funds.
These examples are based on an investment of $1,000 invested at the beginning of the period and held for the entire period from July 1, 2020 through December 31, 2020.
Actual Expenses
The table below provides information about actual account values and actual expenses. You may use the information below together with the amount you invested, to estimate the expenses that you paid over the period. Simply divide your account value by $1,000 (for example, an $8,600 account value divided by $1,000 = 8.6), then multiply the result by the number in the table under the heading entitled “Expenses Paid During Period” to estimate the expenses you paid on your account during this period.
Please note that the expenses shown in the tables are meant to highlight your ongoing costs only and do not reflect the costs incurred by the Funds for buying and selling securities. The Funds do not charge transaction fees, such as redemption fees, nor do the Funds charge a sales charge (load). Therefore, the table is useful in comparing ongoing costs only, and will not help you determine the relative total costs of owning different funds.
| | | | | Annualized |
| | Beginning | Ending | Expenses Paid | Expense Ratio |
| | Account Value | Account Value | During Period | During Period |
| | 7/1/20 | 12/31/20 | 7/1/20 - 12/31/20* | 7/1/20 - 12/31/20 |
| Asset Management Fund | $1,000.00 | $1,154.00 | $4.66 | 0.86% |
| Equity Fund | 1,000.00 | 1,237.50 | 4.95 | 0.88 |
| Midcap Fund | 1,000.00 | 1,222.60 | 5.59 | 1.00 |
| SMID Cap Fund | 1,000.00 | 1,233.50 | 4.21 | 0.75 |
| BTW Balanced Fund | 1,000.00 | 1,145.00 | 5.39 | 1.00 |
| BTW Equity Fund | 1,000.00 | 1,230.90 | 5.61 | 1.00 |
| BTW Midcap Fund | 1,000.00 | 1,220.70 | 5.58 | 1.00 |
| BTW SMID Cap Fund | 1,000.00 | 1,230.60 | 5.61 | 1.00 |
| BTW Small Cap Fund | 1,000.00 | 1,274.60 | 5.72 | 1.00 |
| BTW International Equity Fund | 1,000.00 | 1,170.50 | 5.40 | 0.99 |
| * | Expenses are equal to the average account value multiplied by the Fund’s annualized expense ratio multiplied by 184/365 (the number of days in the most recent fiscal half-year divided by the number of days in the fiscal year). |
Hypothetical Example for Comparison Purposes
The table below provides information about hypothetical account values and hypothetical expenses based on each Fund’s actual expense ratio and an assumed rate of return of 5% per year before expenses, which is not the Fund’s actual return. The hypothetical account values and expenses may not be used to estimate the actual ending account balance or expenses you paid for the period. You may use this information to compare this 5% hypothetical example with the 5% hypothetical examples that appear in the shareholder reports of other funds.
Please note that the expenses shown in the table are meant to highlight your ongoing costs only and do not reflect the costs incurred by the Funds for buying and selling securities. The Funds do not charge transaction fees, such as redemption fees, nor do the Funds charge a sales charge (load). Therefore, the table is useful in comparing ongoing costs only, and will not help you determine the relative total costs of owning different funds.
| | | | | Annualized |
| | Beginning | Ending | Expenses Paid | Expense Ratio |
| | Account Value | Account Value | During Period | During Period |
| | 7/1/20 | 12/31/20 | 7/1/20 - 12/31/20* | 7/1/20 - 12/31/20 |
| Asset Management Fund | $1,000.00 | $1,020.81 | $4.37 | 0.86% |
| Equity Fund | 1,000.00 | 1,020.71 | 4.47 | 0.88 |
| Midcap Fund | 1,000.00 | 1,020.11 | 5.08 | 1.00 |
| SMID Cap Fund | 1,000.00 | 1,021.37 | 3.81 | 0.75 |
| BTW Balanced Fund | 1,000.00 | 1,020.11 | 5.08 | 1.00 |
| BTW Equity Fund | 1,000.00 | 1,020.11 | 5.08 | 1.00 |
| BTW Midcap Fund | 1,000.00 | 1,020.11 | 5.08 | 1.00 |
| BTW SMID Cap Fund | 1,000.00 | 1,020.11 | 5.08 | 1.00 |
| BTW Small Cap Fund | 1,000.00 | 1,020.11 | 5.08 | 1.00 |
| BTW International Equity Fund | 1,000.00 | 1,020.16 | 5.03 | 0.99 |
| * | Expenses are equal to the average account value multiplied by the Fund’s annualized expense ratio multiplied by 184/365 (the number of days in the most recent fiscal half-year divided by the number of days in the fiscal year). |
Continued
| Supplementary Information (Unaudited) | December 31, 2020 |
Tabular Summary of Schedules of Portfolio Investments:
The Boston Trust Walden Funds invested, as a percentage of total net assets, in the following industries and countries as of December 31, 2020.
Asset Management Fund
| | | Percentage of |
| Security Allocation for the Schedule of Portfolio Investments | | Total Net Assets |
| Information Technology | | 22.6 % |
| U.S. Government & U.S. Government Agency Obligations | | 19.5 |
| Financials | | 10.5 |
| Health Care | | 10.1 |
| Industrials | | 8.4 |
| Communication Services | | 7.8 |
| Consumer Staples | | 6.7 |
| Consumer Discretionary | | 6.1 |
| Municipal Bonds | | 3.8 |
| Materials | | 1.4 |
| Energy | | 1.2 |
| Investment Companies | | 1.0 |
| Utilities | | 0.9 |
| Other net assets | | 0.0 |
| Total | | 100.0% |
| | | |
| Equity Fund | | |
| | | Percentage of |
| Security Allocation for the Schedule of Portfolio Investments | | Total Net Assets |
| Information Technology | | 28.0 % |
| Industrials | | 13.6 |
| Health Care | | 12.5 |
| Financials | | 12.3 |
| Communication Services | | 10.8 |
| Consumer Staples | | 9.1 |
| Consumer Discretionary | | 7.5 |
| Materials | | 2.5 |
| Energy | | 1.8 |
| Utilities | | 1.3 |
| Investment Companies | | 0.6 |
| Other net assets | | 0.0 |
| Total | | 100.0% |
| | | |
| Midcap Fund | | |
| | | Percentage of |
| Security Allocation for the Schedule of Portfolio Investments | | Total Net Assets |
| Information Technology | | 20.4 % |
| Industrials | | 14.8 |
| Health Care | | 13.6 |
| Financials | | 12.0 |
| Consumer Discretionary | | 10.7 |
| Real Estate | | 6.2 |
| Utilities | | 6.2 |
| Materials | | 5.9 |
| Consumer Staples | | 5.1 |
| Communication Services | | 2.8 |
| Investment Companies | | 1.1 |
| Energy | | 1.1 |
| Other net assets | | 0.1 |
| Total | | 100.0% |
SMID Cap Fund
| | | Percentage of |
| Security Allocation for the Schedule of Portfolio Investments | | Total Net Assets |
| Health Care | | 18.3 % |
| Information Technology | | 17.3 |
| Financials | | 13.8 |
| Industrials | | 13.3 |
| Consumer Discretionary | | 9.8 |
| Real Estate | | 6.6 |
| Materials | | 6.2 |
| Utilities | | 4.6 |
| Consumer Staples | | 4.4 |
| Communication Services | | 2.8 |
| Energy | | 1.7 |
| Investment Companies | | 1.2 |
| Other net assets | | 0.0 |
| Total | | 100.0% |
Continued
| Supplementary Information (Unaudited) | December 31, 2020 |
Tabular Summary of Schedules of Portfolio Investments: (cont.)
BTW Balanced Fund
| | | Percentage of |
| Security Allocation for the Schedule of Portfolio Investments | | Total Net Assets |
| U.S. Government & U.S. Government Agency Obligations | | 23.4 % |
| Information Technology | | 19.1 |
| Health Care | | 11.3 |
| Financials | | 8.9 |
| Industrials | | 8.2 |
| Communication Services | | 7.6 |
| Consumer Discretionary | | 6.9 |
| Consumer Staples | | 5.3 |
| Municipal Bonds | | 2.4 |
| Materials | | 2.2 |
| Utilities | | 1.7 |
| Investment Companies | | 1.6 |
| Energy | | 1.1 |
| Certificate of Deposit | | 0.1 |
| Other net assets | | 0.2 |
| Total | | 100.0% |
| BTW Equity Fund | | |
| | | Percentage of |
| Security Allocation for the Schedule of Portfolio Investments | | Total Net Assets |
| Information Technology | | 25.9 % |
| Health Care | | 16.1 |
| Financials | | 12.0 |
| Industrials | | 11.1 |
| Communication Services | | 10.7 |
| Consumer Discretionary | | 8.4 |
| Consumer Staples | | 8.1 |
| Materials | | 3.0 |
| Utilities | | 2.2 |
| Energy | | 1.2 |
| Investment Companies | | 1.2 |
| Other net assets | | 0.1 |
| Total | | 100.0% |
| | | |
| BTW Midcap Fund | | |
| | | Percentage of |
| Security Allocation for the Schedule of Portfolio Investments | | Total Net Assets |
| Information Technology | | 19.7 % |
| Industrials | | 15.4 |
| Health Care | | 13.0 |
| Financials | | 12.4 |
| Consumer Discretionary | | 9.8 |
| Utilities | | 7.0 |
| Materials | | 6.3 |
| Real Estate | | 6.0 |
| Consumer Staples | | 5.3 |
| Communication Services | | 2.8 |
| Energy | | 1.1 |
| Investment Companies | | 1.0 |
| Other net assets | | 0.2 |
| Total | | 100.0% |
BTW SMID Cap Fund
| | | Percentage of |
| Security Allocation for the Schedule of Portfolio Investments | | Total Net Assets |
| Information Technology | | 17.8 % |
| Health Care | | 16.5 |
| Industrials | | 13.9 |
| Financials | | 13.9 |
| Consumer Discretionary | | 10.2 |
| Real Estate | | 6.5 |
| Materials | | 5.9 |
| Utilities | | 4.5 |
| Consumer Staples | | 4.4 |
| Communication Services | | 3.3 |
| Energy | | 1.7 |
| Investment Companies | | 1.4 |
| Other net assets | | 0.0 |
| Total | | 100.0% |
| | | |
| BTW Small Cap Fund | | |
| | | Percentage of |
| Security Allocation for the Schedule of Portfolio Investments | | Total Net Assets |
| Health Care | | 22.5 % |
| Industrials | | 16.9 |
| Information Technology | | 16.2 |
| Financials | | 14.3 |
| Consumer Discretionary | | 10.9 |
| Real Estate | | 4.9 |
| Utilities | | 4.8 |
| Materials | | 3.8 |
| Consumer Staples | | 2.6 |
| Energy | | 1.4 |
| Investment Companies | | 1.4 |
| Other net assets | | 0.3 |
| Total | | 100.0% |
| | | |
| BTW International Equity Fund | | |
| | | Percentage of |
| Security Allocation for the Schedule of Portfolio Investments | | Total Net Assets |
| Japan | | 22.9 % |
| United Kingdom | | 12.2 |
| France | | 9.9 |
| Switzerland | | 8.8 |
| Canada | | 8.8 |
| Germany | | 8.4 |
| Australia | | 5.4 |
| Hong Kong | | 3.2 |
| Netherlands | | 3.1 |
| Sweden | | 2.9 |
| Denmark | | 2.4 |
| Spain | | 2.2 |
| Israel | | 1.6 |
| Singapore | | 1.3 |
| Italy | | 1.3 |
| Finland | | 0.8 |
| Luxembourg | | 0.7 |
| Ireland | | 0.7 |
| Norway | | 0.7 |
| Belgium | | 0.6 |
| United States | | 0.4 |
| Other net assets | | 1.7 |
| Total | | 100.0% |
Continued
| Supplementary Information (Unaudited) | December 31, 2020 |
Other Information:
A description of the policies and guidelines that the Funds use to determine how to vote proxies related to portfolio securities is available: (i) without charge, upon request, by calling 1-800-282-8782 ext. 7050, and (ii) on the Securities and Exchange Commission’s (the “Commission”) website at http:// www.sec.gov.
Proxy voting policies and guidelines as well as information regarding how the Funds voted proxies relating to portfolio securities during the most recent 12-month period ended June 30 is available (i) without charge, upon request, by calling 1-800-282-8782 ext. 7050, (ii) online at https://www. bostontrustwalden.com/investment-services/mutual-funds/; and (iii) on the Commission’s website at http://www.sec.gov.
The Funds file their portfolio holdings information for each month in a fiscal quarter within 60 days after the end of the relevant fiscal quarter with the SEC on Form N-PORT. Portfolio holdings information for the third month of each fiscal quarter is available on the SEC’s website at http://www.sec.gov. The Funds’ Schedules of Portfolio Investments will be available no later than 60 days after each period end, without charge, online at https://www. bostontrustwalden.com/investment-services/mutual-funds/.
Continued
| Investment Adviser Contract Approval (Unaudited) | December 31, 2020 |
The annual consideration by the Board of Trustees (the “Board”) of the continuation of the investment advisory agreement between Boston Trust Walden Inc., (the “Adviser”) and Boston Trust Asset Management Fund, Boston Trust Equity Fund, Boston Trust Midcap Fund, Boston Trust SMID Cap Fund, Boston Trust Walden Small Cap Fund, Boston Trust Walden Balanced Fund, Boston Trust Walden Equity Fund, Boston Trust Walden Midcap Fund, Boston Trust Walden SMID Cap Fund, and Boston Trust Walden International Equity Fund (the “Funds”).
Section 15 of the Investment Company Act of 1940 (the “1940 Act”) requires that the Investment Advisory Agreement with Boston Trust Walden Inc. (the “Adviser”) be renewed annually by the Board of Trustees of Boston Trust Walden Funds (the “Trust”), including a majority of the Board who are not “interested persons” of the Trust or of the Adviser. It is the duty of the Board to request as much information as is reasonably necessary to evaluate the terms of the Investment Advisory Agreement and determine whether its continuance is fair to the Funds and their shareholders. The Board considered the continuation of the Investment Advisory Agreement at an in-person meeting held on August 18, 2020. The Board requested, and the Adviser provided, information and data relating to: (i) the investment performance of each series of the Trust (the “Funds”) and the Adviser; (ii) the nature, extent and quality of the services provided by the Adviser to the Funds; (iii) the cost of the services to be provided and the profits to be realized by the Adviser and its affiliates from the relationship with the Funds; (iv) the extent to which economies of scale will be realized as the Funds grow; (v) whether the fee levels reflect these economies of scale to the benefit of Funds’ shareholders; (vi) the advisory fees paid by other comparable funds advised by the Adviser or by a different investment adviser; (vii) the Funds’ expense ratios and the expense ratios of similar funds; and (viii) the effect of any fee waivers and expense reimbursements made by the Adviser.
At the meeting on August 18, 2020, the Board engaged in a thorough review process to determine whether to continue the Investment Advisory Agreement. The Board met directly with representatives of the Adviser and reviewed the information and data listed above, as supplemented by Citi Fund Services Ohio, Inc., the Trust’s administrator. As part of its deliberations, the Board also considered and relied upon the information about the Funds and the Adviser that it had received throughout the year as part of its ongoing oversight of the Funds and their operations.
The Board carefully considered the nature, extent and quality of the services provided by the Adviser. The Board discussed the organizational structure of Adviser and its investment philosophy, portfolio construction process and fixed income approach. The Board discussed the Adviser’s approach to sustainable, responsible and impact investing, including its environmental, social and governance research framework and its portfolio screening guidelines. The Board reviewed the Adviser’s experience and the capabilities of its personnel, as well as the quality of the reports and other materials received from the Adviser. The Board reviewed biographical information about the employees of the Adviser and its parent, Boston Trust Walden Company (“Boston Trust”). The Board addressed the Adviser’s brokerage allocation and execution strategy, noting that the Adviser does not take into consideration sales of Fund shares in selecting brokers through which its affects Fund portfolio transactions. The Board also discussed the Adviser’s compliance program, business continuity and disaster recovery plans, succession planning and employee ownership. Considering the personnel involved in servicing the Funds, as well as the materials and services described above, the Board expressed satisfaction with the quality of the services received from the Adviser.
Next, the Board reviewed the performance of the Funds from inception through June 30, 2020, comparing the performance to various indices and, in the case of the Boston Trust Asset Management Fund and the Walden Balanced Fund, to a bond index, equity index and Treasury bills. The Board noted that as of June 30, 2020, while each Fund outperformed the index and its peer group at various times for the Year-to-Date, 1-year, 3-year, 5-year and Since Inception periods, each Fund generally performed in line with its peer group during the same periods. The Board noted that while the Funds underperformed their benchmarks at various times, performance was consistent with the long-term performance pattern of each Fund’s investment style, as they participated in rising markets and outperformed in falling markets. The Board noted that this downside protection is consistent with the Adviser’s strategy and is routinely communicated to clients and investors. The Board also noted that during a rising market lasting over a decade, the Funds have consistently adhered to a lower risk, higher quality strategy.
The Board noted that the advisory fees for each Fund are within the range of their peer groups. The Board noted that the Adviser has been operating under an Expense Limitation Agreement that requires the Adviser to waive fees and/or reimburse expenses to the extent total operating expenses exceed 0.75% for the Boston Trust SMID Cap Fund, 1.10% for the Walden International Equity Fund and 1.00% for all the other Funds.
Turning to total operating expenses, the Board discussed the components of the Funds’ expense ratios and the services and value shareholders receive in exchange for the fees paid and expense borne by the Funds. The Board noted that the expense ratios for all the Funds were within the range of total operating expenses of the funds in the peer groups. After considering the comparative data as described above, and the Expense Limitation Agreement that was previously renewed by the Board at its February 26, 2020 meeting, the Board concluded that the advisory fees and expense ratios were reasonable.
In reviewing the costs of the services to be provided and the profits to be realized by the Adviser, the Board reviewed the Adviser’s income statement for the 12-months ended December 31, 2019 and the six-months ended June 30, 2020, as well as the gross and net profit
| Investment Adviser Contract Approval (Unaudited) | December 31, 2020 |
margins realized on each Fund. The Board noted that the Adviser is a wholly-owned subsidiary of Boston Trust and the payment of direct and indirect Trust expenses is governed by an Intercompany Services Agreement between the Adviser and Boston Trust. The Board noted that the Adviser’s relationship with the Funds was profitable even though the Adviser is operating under an Expense Limitation Agreement with the Trust. The Board discussed the custody and transfer agency fees earned by the Adviser for services provided to the Funds, which are reduced by amounts paid for sub-custody and sub-transfer agency services.
| Information about Trustees and Officers (Unaudited) | December 31, 2020 |
Overall responsibility for management of the Funds rests with the Board of Trustees. The names of the Trustees and Officers of the Funds, their addresses, years of birth and principal occupations during the past five years are provided in the tables below. Trustees who are deemed “interested persons,” as defined in the 1940 Act, are referred to as Interested Trustees. Trustees who are not interested persons are referred to as Independent Trustees. The Funds’ Statement of Additional Information includes additional information about the Funds’ Trustees and is available, without charge and upon request, by calling 1-800-282-8782 or by visiting www.bostontrustwalden.com.
Name, Address,
and Year of Birth | | Position(s)
Held with
the Funds | | Term of Office*
and Length of
Time Served | | Principal Occupation(s)
During Past Five Years | | Number of Funds
in Fund Complex
Overseen by
Trustee*** | | Other
Directorships
Held by Trustee
during the past
five years |
| INTERESTED TRUSTEES** | | | | | | | | |
| | | | | | | | | | | |
Lucia B. Santini
One Beacon Street
Boston, MA 02108
Year of Birth: 1958 | | Trustee and President | | Since 2011 | | President, Boston Trust Walden Inc., January 2017 to present, Managing Director, February, 2001 to December 31, 2016; Managing Director and Senior Portfolio Manager, Boston Trust Walden Company (bank trust company), November 1993 to present. | | 10 | | None |
Heidi Soumerai
One Beacon Street
Boston, MA 02108
Year of Birth: 1957 | | Trustee | | Since 2013 | | Managing Director and Director of ESG Research, Boston Trust Walden Company, August 2004 to present; Research Analyst, Boston Trust Walden Company, January 1985 to present. | | 10 | | None |
| | | | | | | | | | | |
| INDEPENDENT TRUSTEES | | | | | | | | |
Diane E. Armstrong
One Beacon Street
Boston, MA 02108
Year of Birth: 1964 | | Trustee | | Since 2005 | | Advisor, Investment Partners (financial planning firm), January 2018 to present; President, Armstrong Financial Services (financial planning firm), November 2012 to present. | | 10 | | None |
| | | | | | | | | | | |
Elizabeth E. McGeveran
One Beacon Street
Boston, MA 02108
Year of Birth: 1971 | | Trustee | | Since 2016 | | Head of Investments, The McKnight Foundation, September 2014 to present. | | 10 | | None |
| | | | | | | | | | | |
Michael M. Van Buskirk
One Beacon Street
Boston, MA 02108
Year of Birth: 1947 | | Trustee and Chairman of the Board | | Since 1992; Chairman Since 2006 | | Retired since 2014. | | 10 | | Advisers Investment Trust (2011 to present) (Chairman of the Board) |
| | | | | | | | | |
| OFFICERS WHO ARE NOT TRUSTEES | | | | | | | |
Jennifer Ellis
One Beacon Street
Boston, MA 02108
Year of Birth: 1972 | | Treasurer | | Since 2011 | | Director of Finance/Treasurer, Boston Trust Walden Company, May 2011 to present. | | N/A | | N/A |
| | | | | | | | | | | |
Curtis Barnes
4400 Easton Commons
Suite 200
Columbus, OH 43219
Year of Birth: 1953 | | Secretary | | Since 2007 | | Senior Vice President, Citi Fund Services Ohio, Inc. (fund administrator), August 2007 to present. | | N/A | | N/A |
| | | | | | | | | | | |
Amy E. Siefer
4400 Easton Commons
Suite 200
Columbus, OH 43219
Year of Birth: 1977 | | Chief Compliance Officer and AML Officer | | Since 2018 | | Vice President, Citi Fund Services Ohio, Inc. (fund administrator), May 2012 to present. | | N/A | | N/A |
| * | Trustees and officers hold their position until resignation or removal. |
| ** | Ms. Santini and Ms. Soumerai are considered “interested persons” of the Trust as defined in the 1940 Act due to their employment with Boston Trust Walden Inc., the Funds’ investment adviser. |
| *** | The "Fund Complex" consists of the Boston Trust Walden Funds. |
Investment Adviser
Boston Trust Walden Inc.
One Beacon Street
Boston, MA 02108
Transfer Agent
Boston Trust Walden Company
One Beacon Street
Boston, MA 02108
Administrator
Citi Fund Services Ohio, Inc.
4400 Easton Commons, Suite 200
Columbus, OH 43219
Distributor
Foreside Financial Services, LLC
Three Canal Plaza, Suite 100
Portland, ME 04101
Independent Registered Public Accounting Firm
Cohen & Company, Ltd.
1350 Euclid Avenue, Suite 800
Cleveland, OH 44115
Legal Counsel
Thompson Hine LLP
41 South High Street, Suite 1700
Columbus, OH 43215
This report is intended for the shareholders of the Funds and may not be used as sales literature unless preceded or accompanied by a current prospectus.
Past performance results shown should not be considered a representation of future performance.
Share price and returns will fluctuate so that shares, when redeemed, may be worth more or less than their original cost.
Statements and other information herein are dated and subject to change.
02/21
Item 2. Code of Ethics.
(a) The registrant has adopted a code of ethics that applies to the registrant’s principal executive officer, principal financial officer, principal accounting officer or controller, or persons performing similar functions. This code of ethics is included as an Exhibit.
(b) During the period covered by the report, with respect to the registrant's code of ethics that applies to its principal executive officer, principal financial officer, principal accounting officer or controller, or persons performing similar functions; there have been no amendments to, nor any waivers granted from, a provision that relates to any element of the code of ethics definition enumerated in paragraph (b) of this Item 2.
Item 3. Audit Committee Financial Expert.
3(a)(1) The registrant’s board of directors has determined that the registrant has at least one audit committee financial expert serving on its audit committee.
3(a)(2) The audit committee financial expert is Diane Armstrong, who is “independent” for purposes of this Item 3 of Form N-CSR.
Item 4. Principal Accountant Fees and Services.
| | | | December 2020 | | | December 2019 | |
| (a) | Audit Fees | | $ | 101,100 | | | $ | 114,500 | |
| | | | | | | | | | |
| (b) | Audit-Related Fees | | $ | 17,220 | | | $ | 17,250 | |
The fees for 2019 and 2020 relate to the consent issuance in three Form 17f-2 filings filed with the Securities and Exchange Commission (“SEC”).
| | | | December 2020 | | | December 2019 | |
| (c) | Tax Fees | | $ | 33,000 | | | $ | 27,500 | |
Tax fees for both 2019 and 2020 relate to the preparation of the Funds’ federal and state income tax returns, federal excise tax return review and review of capital gain and income distribution calculations.
| | December 2020 | | | December 2019 | |
| (d) | All Other Fees | | $ | 0 | | | $ | 0 | |
| (e)(1) | The Audit Committee may pre-approve at any regularly scheduled Audit Committee meeting audit, audit-related, tax and other non-audit services to be rendered or that may be rendered by the Auditor to the Funds and certain non-audit services to be rendered by the Auditor to the Advisor which require pre-approval by the Audit Committee. In connection with such pre-approvals, the Auditor, or a Fund officer, with the assistance of the Auditor, shall provide the Audit Committee with a report containing information about each type of service to be pre-approved at the meeting. |
| (e)(2) | For the fiscal years ended December 31, 2020 and 2019, 100% of all the fees in paragraph (b) through (d) were approved by the Audit Committee. |
| (g) | For the fiscal year ended December 31, 2020, Cohen Fund Audit Services, Ltd. billed non-audit fees of $50,220. For the fiscal year ended December 31, 2019, Cohen Fund Audit Services, Ltd. billed non-audit fees of $44,750. |
| Item 5. | Audit Committee of Listed Registrants. |
Not applicable.
(a) Included as part of the report to shareholders filed under Item 1.
(b) Not applicable.
Item 7. Disclosure of Proxy Voting Policies and Procedures for Closed-End Management Investment Companies.
Not applicable.
Item 8. Portfolio Managers of Closed-End Management Investment Companies.
Not applicable
Item 9. Purchases of Equity Securities by Closed-End Management Investment Company and Affiliated Purchasers.
Not applicable.
Item 10. Submission of Matters to a Vote of Security Holders.
Not applicable.
Item 11. Controls and Procedures.
(a)The registrant’s principal executive officer and principal financial officer have concluded, based on their evaluation of the registrant's disclosure controls and procedures as conducted within 90 days of the filing date of this report, that these disclosure controls and procedures are adequately designed and are operating effectively to ensure that information required to be disclosed by the registrant on Form N-CSR is recorded, processed, summarized and reported within the time periods specified in the Securities and Exchange Commission's rules and forms.
(b)There were no changes in the registrant’s internal control over financial reporting (as defined in Rule 30a-3(d) under the Act (17 CFR 270.30a-3(d)) that occurred during the period covered by this report that have materially affected or are reasonably likely to materially affect, the registrant’s internal control over financial reporting.
Item 12. Disclosure of Securities Lending Activities for Closed-End Management Investment Companies.
Not applicable.
Item 13. Exhibits.
(a)(1) The code of ethics that is the subject of the disclosure required by Item 2 is attached hereto.
(a)(2) Certifications pursuant to Rule 30a-2(a) are attached hereto.
(a)(3) Not applicable.
(b) Certifications pursuant to Rule 30a-2(b) are furnished herewith.
SIGNATURES
Pursuant to the requirements of the Securities Exchange Act of 1934 and the Investment Company Act of 1940, the registrant has duly caused this report to be signed on its behalf by the undersigned, thereunto duly authorized.
| (Registrant) | Boston Trust Walden Funds | |
| By (Signature and Title)* | /s/ Lucia Santini, President | |
Pursuant to the requirements of the Securities Exchange Act of 1934 and the Investment Company Act of 1940, this report has been signed below by the following persons on behalf of the registrant and in the capacities and on the dates indicated.
| By (Signature and Title)* | /s/ Lucia Santini, President | |
| By (Signature and Title)* | /s/ Jennifer Ellis, Treasurer | |