UNITED STATES
SECURITIES AND EXCHANGE COMMISSION
Washington, D.C. 20549
FORM N-CSR
CERTIFIED SHAREHOLDER REPORT OF REGISTERED
MANAGEMENT INVESTMENT COMPANIES
Investment Company Act file number | 811-06526 |
|
The Boston Trust & Walden Funds |
(Exact name of registrant as specified in charter) |
|
One Beacon Street, Boston MA | | 02108 |
(Address of principal executive offices) | | (Zip code) |
|
4400 Easton Commons, Columbus, OH 43219 |
(Name and address of agent for service) |
|
Registrant’s telephone number, including area code: | 1-800-282-8782 | |
|
Date of fiscal year end: | December 31 | |
|
Date of reporting period: | December 31, 2018 | |
| | | | | | | | |
Item 1. Reports to Stockholders.
This page intentionally left blank.
Annual Report
December 31, 2018
Table of Contents
Boston Trust and Walden Funds Economic and Market Summary | 3 |
| |
Boston Trust Asset Management Fund | |
Manager Commentary | 4 |
Investment Performance | 5 |
Schedule of Portfolio Investments | 12 |
Financial Statements | 14 |
Financial Highlights | 16 |
| |
Boston Trust Equity Fund | |
Manager Commentary | 4 |
Investment Performance | 5 |
Schedule of Portfolio Investments | 17 |
Financial Statements | 18 |
Financial Highlights | 20 |
| |
Boston Trust Midcap Fund | |
Manager Commentary | 6 |
Investment Performance | 7 |
Schedule of Portfolio Investments | 21 |
Financial Statements | 22 |
Financial Highlights | 24 |
| |
Boston Trust SMID Cap Fund | |
Manager Commentary | 8 |
Investment Performance | 9 |
Schedule of Portfolio Investments | 25 |
Financial Statements | 26 |
Financial Highlights | 28 |
| |
Boston Trust Small Cap Fund | |
Manager Commentary | 10 |
Investment Performance | 11 |
Schedule of Portfolio Investments | 29 |
Financial Statements | 30 |
Financial Highlights | 32 |
| |
Annual ESG Impact Report | 34 |
| |
Walden Asset Management Fund | |
Manager Commentary | 36 |
Investment Performance | 37 |
Schedule of Portfolio Investments | 46 |
Financial Statements | 48 |
Financial Highlights | 50 |
| |
Walden Equity Fund | |
Manager Commentary | 36 |
Investment Performance | 37 |
Schedule of Portfolio Investments | 51 |
Financial Statements | 52 |
Financial Highlights | 54 |
| |
Walden Midcap Fund | |
Manager Commentary | 38 |
Investment Performance | 39 |
Schedule of Portfolio Investments | 55 |
Financial Statements | 56 |
Financial Highlights | 58 |
| |
Walden SMID Cap Fund | |
Manager Commentary | 40 |
Investment Performance | 41 |
Schedule of Portfolio Investments | 59 |
Financial Statements | 60 |
Financial Highlights | 62 |
| |
Walden Small Cap Fund | |
Manager Commentary | 42 |
Investment Performance | 43 |
Schedule of Portfolio Investments | 63 |
Financial Statements | 64 |
Financial Highlights | 66 |
| |
Walden International Equity Fund | |
Manager Commentary | 44 |
Investment Performance | 45 |
Schedule of Portfolio Investments | 67 |
Financial Statements | 69 |
Financial Highlights | 71 |
| |
Notes to Financial Statements | 72 |
Report of Registered Independent Public Accounting Firm | 80 |
Supplementary Information | 81 |
Investment Adviser Contract Approval | 86 |
Information About Trustees and Officers | 88 |
Boston Trust Investment Management, Inc. (BTIM), a subsidiary of Boston Trust & Investment Management Company, serves as investment adviser (the “Adviser”) to The Boston Trust & Walden Funds and receives a fee for its services. Boston Trust & Investment Management Company provides certain administrative, operational, and investment support functions for the Adviser and is paid a fee for these services by the Adviser.
Shares of the Funds are not deposits of, obligations of, or guaranteed by BTIM or its affiliates, nor are they federally insured by the FDIC. Investments in the Funds involve investment risks, including the possible loss of principal. Funds are distributed by Foreside Financial Services, LLC.
The foregoing information and opinions are for general information only. The Boston Trust & Walden Funds and BTIM do not assume liability for any loss, which may result from the reliance by any person upon any such information or opinions. Such information and opinions are subject to change without notice, are for general information only, and are not intended as an offer or solicitation with respect to the purchase or sale of any security or offering individual or personalized investment advice. Portfolio composition is as of December 31, 2018 and is subject to change without notice.
The Boston Trust & Walden Funds may invest in foreign securities, which may involve risk not typically associated with U.S. investments.
To reduce expenses, we may only mail one copy of the Funds’ shareholder updates, such as their prospectus, annual report, semi-annual report, to those addresses shared by two or more accounts. If you are a direct shareholder and wish to receive individual copies of these documents, please call us at 800-282-8782 x7050. If you are not a direct shareholder, please contact your financial institution to opt out of householding. We will begin sending you individual copies thirty days after receiving your request.
Important Notice: The Securities and Exchange Commission will permit funds to deliver shareholder reports electronically beginning January 1, 2021. At that time, The Boston Trust & Walden Funds will send a notice, either by mail or email, each time your fund’s updated report is available on our website (www.btim.com). Investors enrolled in electronic delivery will receive the notice by email, with links to the updated report. Investors who are not enrolled in electronic delivery by January 1, 2021 will receive the notice in the mail. All investors who prefer to receive shareholder reports in paper may, at any time, choose that option free of charge by calling 1.800.282-8782 x7050.
Photography credits:
· Cover: Bruce Field
· Pages 7, 39, 43 and 45: Jim Gallagher
· Pages 5, 9, and 41: Rebecca Monette
· Pages 11 and 37: Janet C. Dygert
1
This page intentionally left blank.
2

| The Boston Trust & Walden Funds A Registered Investment Company | 
|
Boston Trust and Walden Funds | Domenic Colasacco, CFA |
Economic and Market Summary | Portfolio Manager |
(Unaudited) | Boston Trust Investment Management, Inc. |
Greater investor concern about the global economic outlook led to a sharp drop in stock prices at the end of 2018. As measured by the S&P 500 Index(1), stock values fell by 13.52% in the fourth quarter; the decline completely offset the rise recorded during the third quarter, and resulted in a drop, including dividends, of 4.38% for all of 2018. Returns of other popular domestic equity indices such as the Russell 2000® Index(1), which measures the performance of smaller company stocks, and the NASDAQ Composite Index(1), where many faster growing, large and small companies are the primary components, performed even worse. And there was not much cheer in global markets either, which in the aggregate posted double-digit decreases for the 2018 calendar year.
The Boston Trust & Walden Funds experienced similar, though more muted, price patterns compared to their respective market indices. Without near perfect foresight that would have allowed well-timed stock trading, however, increasing asset value last year in any diversified securities portfolio was difficult. Not only did all of the primary equity indices decline for the full year, but many bond investments also fell due to the increase in interest rates.
To achieve an attractive longer-term investment return, we have usually ignored the many short-term price movements of the market generally and individual stocks in particular. The reason reflects the fact that not all stock market declines correctly signal that an economic recession is about to occur. Indeed, during the past 20 years, the S&P 500 has fallen more than 10% from prior peak levels on 10 different occasions. Each decline led to angst and concern similar to what we are all feeling through the current downturn. Yet only two of these last ten stock market declines preceded an actual economic recession. The first recession occurred amid the dot-com bust and 9/11 terrorist attack, and lasted from 2000 through 2002. The other even more severe economic and stock market decline was during the 2007-2009 financial crisis. The remaining eight market declines were false alarms, usually lasting just three- to six-months. Today, we agree with many economic pundits that the business outlook for the year ahead is far from certain, particularly in many international regions. Nonetheless, a slower rate of global gross domestic product (GDP)(1) growth appears more likely to us in 2019 than another financial crisis or outright economic contraction.
With respect to the overall economy, conditions here in the United States have been improving since 2010, and for the past two years many metrics have exceeded expectations of even the more optimistic forecasters. Among the positives: real GDP growth reached 3% in 2018, unemployment (due to excellent job creation) dropped below 4%, and the rate of inflation remained near a historically low level of 2%, even though wages finally began to accelerate. Moreover, aggregate net operating profits for the companies within the S&P 500 increased by more than 30% over the past two years, albeit aided by last year’s corporate tax rate cut.
The current broad stock market decline and the high day-to-day price volatility, however, clearly imply that many investors fear the positive economic metrics noted above will deteriorate in the months ahead. Several recent economic reports stoked investor concerns. For example, we have seen moderation in the key domestic housing and automotive sectors. There have also been numerous reports of economic weakness within the euro zone, with fear of further deterioration no doubt exacerbated by continuing global trade tension, the unresolved Brexit negotiations, economically induced street riots in France, and changing political leadership in Germany and Italy. Even China, which has been the fastest growing major global economy for nearly 20 years, signaled some softness in economic activity through the second-half of 2018, though it did so amid forecasts that GDP growth above 6% is expected in 2019. When we balance the still positive core economic trends with nascent reports of weakness, our opinion is similar to the Federal Reserve Board’s latest position that a slower rate of global GDP growth is more likely than an actual recession in 2019. History suggests stock values will stabilize and begin to improve in the months ahead if this view proves correct.
(1) The Gross Domestic Product (GDP) is the value of goods and services produced in a given country in a given year. The Standard & Poor’s 500 Index (S&P 500), which is widely regarded as a gauge of the U.S. equities market, includes 500 of the largest publicly traded U.S. companies. The Russell 2000® Index tracks the performance of the small-cap segment of the U.S. equity universe. The Russell 2000® Index is a subset of the Russell 3000® Index, and represents approximately 10% of the total market capitalization of that index. It includes approximately 2000 of the smallest securities based on a combination of their market cap and current index membership. Russell Investment Group is the source and owner of the trademarks, service marks and copyrights related to the Russell Indexes. The NASDAQ Composite Index is the market capitalization-weighted index of over 3,300 common equities listed on the Nasdaq stock exchange. The types of securities in the index include American depositary receipts, common stocks, real estate investment trusts (REITs) and tracking stocks, as well as limited partnership interests. The index includes all Nasdaq-listed stocks that are not derivatives, preferred shares, funds, exchange-traded funds (ETFs) or debenture securities.
3
Boston Trust Asset Management Fund
Boston Trust Equity Fund
December 31, 2018
Domenic Colasacco, CFA
Portfolio Manager
Boston Trust Investment Management, Inc.
Asset Management Fund Objective
The Fund seeks long-term capital growth and income through an actively managed portfolio of stocks, bonds, and money market instruments.
Equity Fund Objective
The Fund seeks long-term capital growth through an actively managed portfolio of stocks.
Investment Concerns
Equity securities (stocks) are more volatile and carry more risk and return potential than other forms of investments, including investments in high-grade fixed income securities.
Foreign investing involves risks not typically associated with U.S. investments, including adverse political, social and economic developments and differing auditing and legal standards. These risks are magnified in emerging markets.
Small- to mid-capitalization companies typically have a higher risk of failure and historically have experienced a greater degree of volatility.
Bonds offer a relatively stable level of income, although bond prices will fluctuate, providing the potential for principal gain or loss. Intermediate-term, higher quality bonds generally offer less risk than longer-term bonds and a lower rate of return.
Cash equivalents offer low risk and low return potential.
Manager Commentary (Unaudited)
Management Discussion of Fund Performance
Stocks, as measured by the S&P 500, fell by 4.38% for the 12-month period ended December 31, 2018. Bond indices were also in negative territory, with the Bloomberg Barclays U.S. Government/Credit Bond Index declining 0.42% for the year. The Boston Trust Asset Management Fund and the Boston Trust Equity Fund fell by 1.61% and 2.55%, respectively.
Amid the disappointing year for absolute returns, we are pleased that the Asset Management Fund’s overall value held up comparatively well, despite our decision to keep equity allocation near the upper-end of the 40% to 80% long-term policy range. Primary credit for that, as well as the Equity Fund’s better than S&P 500 performance, belongs to the higher quality, lower risk equity style we employ in selecting individual stocks.*
In prior reports we have mentioned that it would not be unusual for stock prices to retrace part of the strong returns posted in recent years. Frankly, though, the severity of the recent price decline and the sudden change in investor confidence about the economic outlook surprised us. From the peak level reached on September 20 to the lowest point close on December 24, the S&P 500 fell by nearly 20%, with most of the drop occurring during the few weeks just before Christmas. Even though about one-third of the decline was recouped during the last few trading days of the year, it is understandable that we continue to receive more than the usual number of client questions about the prospects for stock values. The questions asked most frequently involve the duration and extent of any further stock price declines. The simple, honest answer is that neither we nor anyone else knows for certain. Much will depend on the actual direction of economic activity in the months ahead.
Investment Strategy
Selecting a successful investment strategy for a long-term oriented securities portfolio always involves accepting prudent investment risk in an ever evolving and frequently uncertain world. For the Boston Trust Asset Management Fund, since 2010 our view has been that an equity allocation near the upper-end of the Fund’s 40% to 80% equity policy range best incorporated the prevailing risk and return tradeoffs among stocks, bonds, and money market instruments. Our preference for equities has been based on a combination of improving economic conditions, rising corporate profits, historically low interest rates, and generally reasonable stock price valuations. Cumulatively, our decision to emphasize stocks rather than bonds or money market instruments has added substantial value. From the end of 2009 through year-end 2018, the S&P 500 increased at a compound annual rate of 11.73%. Investment-grade bond indices, as represented by Bloomberg Barclays Government/Credit Bond Index, returned only about 3% per annum during this nine-year period, and money market instruments, as represented by 90-day U.S. Treasury bills, averaged less than 1%.*
A salient question as we begin 2019 is whether the long bull market is now behind us, and if it is best to invest most of the Fund’s assets in fixed income securities until the economic environment is less volatile and better defined. After considering the risks and opportunities, we believe it is best to retain the current, still high allocation to equities.*
Our asset allocation decision mostly reflects our view that an economic recession is unlikely in 2019. Further, the silver lining after a year of lower stock prices and good business conditions is that most equity valuation metrics are more attractive today than they were a year ago. For example, the average price-to-earnings ratio(1) for stocks in the S&P 500 is now close to the historical average of 15x, down from nearly 20x for most of the past five years. At current valuation levels, stocks do not need an ideal economic environment to perform well. Even a modest change in investor confidence about the 2019 economic outlook should suffice, particularly given that interest rates remain historically low and pose minimal competition for investment assets that have a longer-term time horizon.*
Among the individual stocks in both Funds, we continue to emphasize companies with below average financial leverage and lower business model risk. As was the case during the fourth quarter of 2018—and most other adverse market periods—we believe this equity style is likely to protect the Funds’ value comparatively well in the event our market assessment is wrong and stock values continue to fall. Also worth noting is that the market decline has made stocks of many above average companies available at more attractive prices, which provides us with an opportunity to strengthen the Funds’ portfolios.*
* Portfolio composition is subject to change.
(1) The price-to-earnings ratio (P/E Ratio) is a valuation ratio of a company’s current share price to its per-share earnings.
4
Investment Performance (Unaudited) | Boston Trust Asset Management Fund |
| Boston Trust Equity Fund |
| December 31, 2018 |
| | For the periods ended 12/31/18 | |
| | Average Annual Total Returns | |
| | | | | | | | | | | | | | Since | | Since | |
| | | | | | | | | | | | | | Inception | | Inception | |
| | 1 Year | | 3 Years | | 5 Years | | 10 Years | | 15 Years | | 20 Years | | (12/1/95) | | (10/1/03) | |
Boston Trust Asset Management Fund(1) | | -1.61 | % | 7.81 | % | 6.48 | % | 9.13 | % | 6.85 | % | 5.93 | % | 7.71 | % | — | |
Boston Trust Equity Fund(1) | | -2.55 | % | 9.62 | % | 7.29 | % | 11.51 | % | 7.42 | % | — | | — | | 7.88 | % |
S&P 500 Index | | -4.38 | % | 9.26 | % | 8.49 | % | 13.12 | % | 7.77 | % | 5.62 | % | 8.37 | % | 8.29 | % |
Bloomberg Barclays U.S. Government/ Credit Bond Index | | -0.42 | % | 2.19 | % | 2.53 | % | 3.46 | % | 3.85 | % | 4.54 | % | 4.94 | % | — | |
FTSE 3 Month US T-Bill Index | | 1.86 | % | 0.99 | % | 0.60 | % | 0.35 | % | 1.26 | % | 1.81 | % | 2.26 | % | — | |
Hypothetical Growth of a $100,000 Investment


The above charts represent a 10-year hypothetical $100,000 investment in the Boston Trust Asset Management Fund and the Boston Trust Equity Fund, and includes the reinvestment of dividends and capital gains in the Funds. The returns shown on the table and the graphs do not reflect the deduction of taxes a shareholder would pay on Fund distributions or the redemption of Fund shares.
The Boston Trust Asset Management Fund is measured against a combination of equity and fixed income indices. The Boston Trust Equity Fund is measured against the Standard & Poor’s 500 Index (“S&P 500”), which is widely regarded as a gauge of the U.S. equities market, includes 500 leading companies in leading industries of the U.S. economy. Although the S&P 500 focuses on the large-cap segment of the market, with approximately 75% coverage of U.S. equities, it is also widely viewed as a proxy for the total market. The Bloomberg Barclays U.S. Government/Credit Index includes Treasuries (i.e., public obligations of the U.S. Treasury that have remaining maturities of more than one year), government-related issues (e.g., agency, sovereign, supranational, and local authority debt), and USD Corporates. The Bloomberg Barclays U.S. Government/Credit Bond Index is a component of the Bloomberg Barclays U.S. Aggregate Bond Index. The FTSE 3 Month US T-Bill Index reflects monthly return equivalents of yield averages that are not marked to the market. The index is an average of the last three-month treasury bill issues. The three-month treasury bills are the short-term debt obligations of the U.S. Government. The indexes are unmanaged and their performance does not reflect the deduction of expenses associated with a mutual fund, such as investment management and fund accounting fees. The Funds’ performance reflects the deduction of fees for these services. Investors cannot invest directly in an index.

Boston Trust Asset Management Fund
Fund Net Asset Value: | | $ | 44.27 | |
Gross Expense Ratio(1): | | 0.92 | % |
Boston Trust Equity Fund
Fund Net Asset Value: | | $ | 22.64 | |
Gross Expense Ratio(1): | | 0.93 | % |
Past performance does not guarantee future results. The performance data quoted represents past performance and current returns may be lower or higher. The investment return and principal value will fluctuate so that an investor’s shares, when redeemed may be worth more or less than the original cost. To obtain performance information current to the most recent month-end, please call 1-800-282-8782 ext. 7050.
(1) The Gross Expense Ratio is from each Fund’s most recent prospectus, dated May 1, 2018. Additional information pertaining to each Fund’s expense ratio as of December 31, 2018 can be found in the financial highlights included in this report.
5
Boston Trust Midcap Fund
December 31, 2018
Stephen J. Amyouny, CFA
Lead Portfolio Manager
Belinda Cavazos, CFA
Portfolio Manager
Richard Q. Williams, CFA
Portfolio Manager
Boston Trust Investment Management, Inc.
Fund Objective
The Fund seeks long-term capital growth through an actively managed portfolio of stocks of middle capitalization (“mid cap”) companies.
Investment Concerns
Equity securities (stocks) are more volatile and carry more risk and return potential than other forms of investments, including investments in high-grade fixed income securities.
Mid cap funds typically carry additional risks since smaller companies generally have a higher risk of failure.
Manager Commentary (Unaudited)
Management Discussion of Fund Performance
Portfolio Review
For the 12-month period ended December 31, 2018, the Boston Trust Midcap Fund returned -3.36%, outperforming the -9.06% return of the Russell Midcap® Index. The Fund is also ahead of the index for the trailing 3- and 5-year time periods and since inception, with lower volatility than the index.
Our preference for higher-quality stocks was the primary driver of relative performance for the year. At a sector level, consumer discretionary and consumer staples stocks contributed most to relative performance. Within discretionary, our positioning among retailers was additive, while our avoidance of the most cyclical, economically sensitive industries (e.g. autos) also proved beneficial. Performance in consumer staples benefitted from the market favoring higher quality stocks. On the negative side the strategy’s modest underweight to utilities, the only sector posting a positive return for the year, detracted from results.*
Church & Dwight was the top individual stock contributor for the year. A leading manufacturer of household and personal care products, Church & Dwight produced strong sales and earnings results thanks to market share gains in laundry, positive price increases, and the successful integration of recent bolt-on acquisitions. On the negative side, IPG Photonics, the dominant provider of industrial fiber lasers, declined on disappointing revenue due to slowing orders from customers in Europe and China.*
Outlook
It is difficult to know how long the market correction will last. The underlying fundamentals of the U.S. economy, including growth in employment, retail sales, capital investments, and corporate earnings, remain solid. However, there are signs of increasing macroeconomic uncertainty as well. Several indicators point to a deceleration of gross domestic product(1) growth from the very healthy levels experienced in 2018. Some areas of concern include a growth slowdown among key trading partners like Germany, Japan, and China, increasing concerns the U.S. Federal Reserve will be too aggressive in raising interest rates, and the potential for protectionist trade policies to weaken U.S. economic growth. While some market participants fear a recession, our base case outlook remains that fundamentals for the US equity market remain solid. Valuations have become more reasonable, and some areas of speculative activity are less evident now than they were a year ago.
We remain focused on constructing a well-diversified portfolio of higher quality, reasonably valued companies that we believe can generate stronger economic returns across a full market cycle. Compared to the Russell Midcap® Index, the Boston Trust Midcap Fund is invested in companies with higher and more stable returns on invested capital, stronger revenue and earnings growth, and less reliance on capital markets to fund investments. Despite this higher quality financial profile, valuation for the Fund on a GAAP price-to-earnings(2) basis is in line with the index at 22x. The combination of superior fundamentals, more resilient balance sheets, and reasonable valuation relative to the benchmark gives us confidence the Fund is well-positioned for the future.*
* Portfolio composition is subject to change.
(1) The gross domestic product (GDP) is the measure of the market value of the goods and services produced by labor and property in the United States
(2) The price-to-earnings Ratio (P/E Ratio) is a valuation ratio of a company’s current share price to its per-share earnings.
6
Investment Performance (Unaudited) | Boston Trust Midcap Fund |
| December 31, 2018 |
| | For the periods ended 12/31/18 | |
| | Average Annual Total Returns | |
| | | | | | | | | | Since | |
| | | | | | | | | | Inception | |
| | 1 Year | | 3 Years | | 5 Years | | 10 Years | | (9/24/07) | |
Boston Trust Midcap Fund(1) | | -3.36 | % | 9.15 | % | 7.68 | % | 13.79 | % | 8.29 | % |
Russell Midcap® Index | | -9.06 | % | 7.04 | % | 6.26 | % | 14.03 | % | 6.89 | % |
Hypothetical Growth of a $100,000 Investment
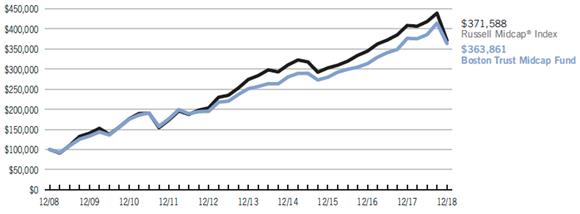
The above chart represents a 10-year hypothetical $100,000 investment in the Boston Trust Midcap Fund, and includes the reinvestment of dividends and capital gains in the Fund. The returns shown on the table and the graph do not reflect the deduction of taxes a shareholder would pay on Fund distributions or the redemption of Fund shares.
The Boston Trust Midcap Fund is measured against the Russell Midcap® Index, which is an unmanaged index that tracks the performance of the mid-cap segment of the U.S. equity universe. The Russell Midcap® Index is a subset of the Russell 1000® Index. It includes approximately 800 of the smallest securities based on a combination of their market capitalization and current index membership. The Russell Midcap® Index represents approximately 31% of the total market capitalization of the Russell 1000 companies. The performance of an index does not reflect the deduction of expenses associated with a mutual fund, such as investment management and fund accounting fees. The Fund’s performance reflects the deduction of fees for these services. Investors cannot invest directly in an index.

Fund Net Asset Value: | | $ | 15.78 | |
Gross Expense Ratio(1): | | 1.00 | % |
Past performance does not guarantee future results. The performance data quoted represents past performance and current returns may be lower or higher. The investment return and principal value will fluctuate so that an investor’s shares, when redeemed may be worth more or less than the original cost. To obtain performance information current to the most recent month-end, please call 1-800-282-8782 ext. 7050.
(1) The Gross Expense Ratio is from the Fund’s most recent prospectus, dated May 1, 2018. Additional information pertaining to the Fund’s expense ratio as of December 31, 2018 can be found in the financial highlights included in this report.
7
Boston Trust SMID Cap Fund
December 31, 2018
Kenneth P. Scott, CFA
Lead Portfolio Manager
Belinda Cavazos, CFA
Portfolio Manager
Richard Q. Williams, CFA
Portfolio Manager
Boston Trust Investment Management, Inc.
Fund Objective
The Fund seeks long-term capital growth through an actively managed portfolio of stocks of small to middle capitalization (“smid cap”) companies.
Investment Concerns
Equity securities (stocks) are more volatile and carry more risk and return potential than other forms of investments, including investments in high-grade fixed income securities.
Smid cap companies typically have a higher risk of failure and historically have experienced a greater degree of volatility.
Manager Commentary (Unaudited)
Management Discussion of Fund Performance
For the 12-month period ended December 31, 2018, the Boston Trust SMID Cap Fund declined 5.62%, outperforming the -10.00% return of the Russell 2500™ Index. The Fund is also ahead of the index for the three- and five-year periods, with less volatility than the benchmark.
Our analysis suggests that stocks of higher-quality firms outperformed the Russell 2500™ Index in 2018. On a relative basis, Fund holdings in consumer discretionary and materials contributed most positively to performance, while returns in information technology and financials detracted most from results this year. Relative underperformance in information technology was partly driven by our underweight to the internet software and services industry, which is overwhelmingly comprised of stocks we view as less reasonably valued. One of the top individual stock contributors for the year was Church & Dwight, a leading manufacturer of household and personal care products, that benefitted from strong sales and earnings results due to market share gains in laundry, positive price increases, and the successful integration of recent bolt-on acquisitions. Among detractors, Big Lots, a discount retailer, declined due to earnings that came in below expectations driven by higher labor and transportation costs.*
Outlook
It is difficult to know how long the market correction will last. The underlying fundamentals of the U.S. economy, including growth in employment, retail sales, capital investments, and corporate earnings, remain solid. However, there are signs of increasing macroeconomic uncertainty as well. Several indicators point to a deceleration of gross domestic product(1) growth from the very healthy levels experienced in 2018. Some areas of concern include a growth slowdown among key trading partners like Germany, Japan, and China, concerns that the U.S. Federal Reserve will be too aggressive in raising interest rates, and the potential for protectionist trade policies to weaken U.S. economic growth. While some market participants fear a recession, our base case outlook is that fundamentals for the U.S. smaller cap market remain solid. Valuations have become more reasonable, and some areas of speculative activity are less evident now than they were a year ago.
We remain focused on constructing a well-diversified Fund of higher quality, reasonably valued companies that we believe can generate stronger economic returns across a full market cycle. Compared to the benchmark, the Fund is invested in companies with higher and more stable returns on invested capital, stronger revenue and earnings growth, and less reliance on capital markets to fund investments. Despite this higher quality financial profile, valuation for the Fund currently stands at an average operating price-to-earnings (P/E) ratio(2) of 23x, lower than the Russell 2500™ operating P/E of 24x. On a GAAP basis, the Fund trades at a 25x P/E, a discount to the benchmark’s 29x GAAP P/E. The combination of superior fundamentals, more resilient balance sheets, and more reasonable valuation relative to the benchmark gives us confidence the Fund is well-positioned for the future.*
* Portfolio composition is subject to change.
(1) The gross domestic product (GDP) is the measure of the market value of the goods and services produced by labor and property in the United States
(2) The price-to-earnings Ratio (P/E Ratio) is a valuation ratio of a company’s current share price to its per-share earnings.
8
Investment Performance (Unaudited) | Boston Trust SMID Cap Fund |
| December 31, 2018 |
| | For the periods ended 12/31/18 | |
| | Average Annual Total Returns | |
| | | | | | | | Since | |
| | | | | | | | Inception | |
| | 1 Year | | 3 Years | | 5 Years | | (11/30/11) | |
Boston Trust SMID Cap Fund(1) | | -5.62 | % | 10.32 | % | 6.40 | % | 10.08 | % |
Russell 2500™ Index | | -10.00 | % | 7.32 | % | 5.15 | % | 10.87 | % |
Hypothetical Growth of a $1,000,000 Investment
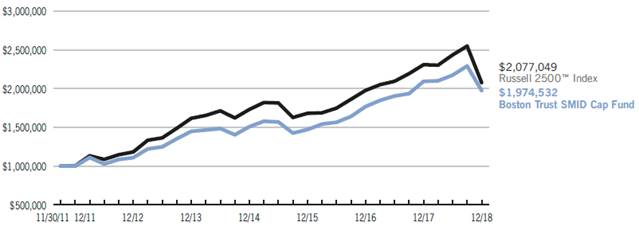
The above chart represents a hypothetical $1,000,000 investment in the Boston Trust SMID Cap Fund from November 30, 2011 to December 31, 2018, and includes the reinvestment of dividends and capital gains in the Fund. The returns shown on the table and the graph do not reflect the deduction of taxes a shareholder would pay on Fund distributions or the redemption of Fund shares.
The Boston Trust SMID Cap Fund is measured against the Russell 2500™ Index, which is an unmanaged index that tracks the performance of the small- to mid-cap segment of the U.S. equity universe, commonly referred to as “smid” cap. The Russell 2500 is a subset of the Russell 3000® Index. It includes approximately 2500 of the smallest securities based on a combination of their market cap and current index membership. Russell Investment Group is the source and owner of the trademarks, service marks and copyrights related to the Russell Indexes. Russell® is a trademark of Russell Investment Group. The performance of an index does not reflect the deduction of expenses associated with a mutual fund, such as investment management and fund accounting fees. The Fund’s performance reflects the deduction of fees for these services. Investors cannot invest directly in an index.

Fund Net Asset Value: | | $ | 14.63 | |
Gross Expense Ratio(1): | | 1.04 | % |
Past performance does not guarantee future results. The performance data quoted represents past performance and current returns may be lower or higher. The investment return and principal value will fluctuate so that an investor’s shares, when redeemed may be worth more or less than the original cost. Returns less than one year are not annualized. To obtain performance information current to the most recent month-end, please call 1-800-282-8782 ext. 7050.
(1) The Gross Expense Ratio is from the Fund’s most recent prospectus, dated May 1, 2018. The contractual fee limit under the Fund’s expense limitation agreement is 0.75% of the Fund’s average annual net assets, subject to certain limitations as described in the Fund’s prospectus. Please see the Fund’s most recent prospectus for details. Additional information pertaining to the Fund’s expense ratio as of December 31, 2018 can be found in the financial highlights included in this report. The investment performance may reflect fee reductions. If such fee reductions had not occurred, the quoted performance would have been lower. The contractual fee waiver continues through May 1, 2019 and may be renewed thereafter.
9
Boston Trust Small Cap Fund
December 31, 2018
Kenneth P. Scott, CFA
Lead Portfolio Manager
Belinda Cavazos, CFA
Portfolio Manager
Richard Q. Williams, CFA
Portfolio Manager
Boston Trust Investment Management, Inc.
Fund Objective
The Fund seeks long-term capital growth through an actively managed portfolio of stocks of small capitalization (“small cap”) companies.
Investment Concerns
Equity securities (stocks) are more volatile and carry more risk and return potential than other forms of investments, including investments in high-grade fixed income securities.
Small cap funds typically carry additional risks since smaller companies generally have a higher risk of failure, and historically, their stocks have experienced a greater degree of market volatility than stocks on average.
Manager Commentary (Unaudited)
Management Discussion of Fund Performance
For the 12-month period ended December 31, 2018, the Boston Trust Small Cap Fund declined 6.00%, outperforming the -11.01% return of the Russell 2000® Index. The Fund is also ahead of the index for the three-, five-, and twenty-year periods, with less volatility than the benchmark.
Our analysis suggests that stocks of higher-quality firms outperformed the Russell 2000® Index in 2018. On a relative basis, Fund holdings in health care and consumer discretionary contributed most positively to performance, while returns in information technology and financials detracted most from results this year. Relative underperformance in information technology was driven by our underweight to the internet software and services industry, which is overwhelmingly comprised of stocks we view as less reasonably valued. The top individual stock contributor for the year was Haemonetics, a global leader in blood management solutions, in part a reflection of their successful launch of a next generation system. The top detractor was Coherent, a leader in industrial lasers, which was impacted by a cyclical slowdown in orders for its OLED mobile phone display technology, as well as weakening demand in China.*
Outlook
It is difficult to know how long the market correction will last. The underlying fundamentals of the U.S. economy, including growth in employment, retail sales, capital investments, and corporate earnings, remain solid. However, there are signs of increasing macroeconomic uncertainty as well. Several indicators point to a deceleration of gross domestic product(1) growth from the very healthy levels experienced in 2018. Some areas of concern include a growth slowdown among key trading partners like Germany, Japan, and China, concerns that the US Federal Reserve will be too aggressive in raising interest rates, and the potential for protectionist trade policies to weaken U.S. economic growth. While some market participants fear a recession, our base case outlook is that fundamentals for the U.S. small-cap market remain solid. Valuations have become more reasonable, and some areas of speculative activity are less evident now than they were a year ago.
We remain focused on constructing a well-diversified Fund of higher quality, reasonably valued companies that we believe can generate stronger economic returns across a full market cycle. Compared to the benchmark, the Fund is invested in companies with higher and more stable returns on invested capital, stronger revenue and earnings growth, and less reliance on capital markets to fund investments. Despite this higher quality financial profile, valuation for the Fund currently stands at an average operating price-to-earnings (P/E) ratio(2) of 26x, lower than the Russell 2000® operating P/E of 30x. The combination of superior fundamentals, more resilient balance sheets, and more reasonable valuation relative to the benchmark, gives us confidence the Fund is well-positioned for the future.*
* Portfolio composition is subject to change.
(1) The gross domestic product (GDP) is the measure of the market value of the goods and services produced by labor and property in the United States
(2) The price-to-earnings ratio (P/E Ratio) is a valuation ratio of a company’s current share price to its per-share earnings.
10
Investment Performance (Unaudited) | Boston Trust Small Cap Fund |
| December 31, 2018 |
| | For the periods ended 12/31/18 | |
| | Average Annual Total Returns | |
| | | | | | | | | | | | | | Since | |
| | | | | | | | | | | | | | Inception | |
| | 1 Year | | 3 Years | | 5 Years | | 10 Years | | 15 Years | | 20 Years | | (12/31/94) | |
Boston Trust Small Cap Fund(1) | | -6.00 | % | 9.17 | % | 4.46 | % | 11.56 | % | 8.54 | % | 9.29 | % | 10.28 | % |
Russell 2000® Index | | -11.01 | % | 7.36 | % | 4.41 | % | 11.97 | % | 7.50 | % | 7.40 | % | 8.73 | % |
Hypothetical Growth of a $100,000 Investment
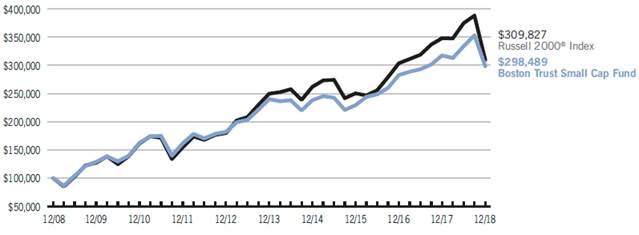
The above chart represents a 10-year hypothetical $100,000 investment in the Boston Trust Small Cap Fund and includes the reinvestment of dividends and capital gains in the Fund. The returns shown on the table and the graph do not reflect the deduction of taxes a shareholder would pay on Fund distributions or the redemption of Fund shares.
The Boston Trust Small Cap Fund is measured against the Russell 2000® Index, which is an unmanaged index that tracks the performance of the small-cap segment of the U.S. equity universe. The Russell 2000® Index is a subset of the Russell 3000® Index representing approximately 10% of the total market capitalization of that index. It includes approximately 2000 of the smallest securities based on a combination of their market cap and current index membership. Russell Investment Group is the source and owner of the trademarks, service marks and copyrights related to the Russell Indexes. Russell® is a trademark of Russell Investment Group. The performance of an index does not reflect the deduction of expenses associated with a mutual fund, such as investment management and fund accounting fees. The Fund’s performance reflects the deduction of fees for these services. Investors cannot invest directly in an index.

Fund Net Asset Value: | | $ | 12.00 | |
Gross Expense Ratio(1): | | 1.02 | % |
Past performance does not guarantee future results. The performance data quoted represents past performance and current returns may be lower or higher. The investment return and principal value will fluctuate so that an investor’s shares, when redeemed may be worth more or less than the original cost. To obtain performance information current to the most recent month-end, please call 1-800-282-8782 ext. 7050.
(1) The Gross Expense Ratio is from the Fund’s most recent prospectus, dated May 1, 2018. The contractual fee limit under the Fund’s expense limitation agreement is 1.00% of the Fund’s average annual net assets, subject to certain limitations as described in the Fund’s prospectus. Please see the Fund’s most recent prospectus for details. Additional information pertaining to the Fund’s expense ratio as of December 31, 2018 can be found in the financial highlights included in this report. The investment performance may reflect fee reductions. If such fee reductions had not occurred, the quoted performance would have been lower. The contractual fee waiver continues through May 1, 2019 and may be renewed thereafter.
11
Schedule of Portfolio Investments | Boston Trust Asset Management Fund |
| December 31, 2018 |
Security Description | | Shares | | Fair Value ($) | |
COMMON STOCKS (76.0%) | | | | | |
Communication Services (6.4%) | | | | | |
Alphabet, Inc., Class A (a) | | 2,000 | | 2,089,920 | |
Alphabet, Inc., Class C (a) | | 15,000 | | 15,534,150 | |
Comcast Corp., Class A | | 275,000 | | 9,363,750 | |
Omnicom Group, Inc. | | 35,000 | | 2,563,400 | |
| | | | 29,551,220 | |
Consumer Discretionary (4.4%) | | | | | |
Autoliv, Inc. | | 20,000 | | 1,404,600 | |
Garrett Motion, Inc. (a) | | 3,250 | | 40,105 | |
NIKE, Inc., Class B | | 115,000 | | 8,526,100 | |
Ross Stores, Inc. | | 30,000 | | 2,496,000 | |
Starbucks Corp. | | 110,000 | | 7,084,000 | |
Veoneer, Inc. (a) | | 25,000 | | 589,250 | |
| | | | 20,140,055 | |
Consumer Staples (6.6%) | | | | | |
Church & Dwight Co., Inc. | | 75,000 | | 4,932,000 | |
Costco Wholesale Corp. | | 45,000 | | 9,166,950 | |
Diageo PLC, Sponsored ADR | | 25,000 | | 3,545,000 | |
McCormick & Co., Inc. | | 25,000 | | 3,481,000 | |
PepsiCo, Inc. | | 30,000 | | 3,314,400 | |
Procter & Gamble Co. | | 30,000 | | 2,757,600 | |
Sysco Corp. | | 35,000 | | 2,193,100 | |
The Hershey Co. | | 10,000 | | 1,071,800 | |
| | | | 30,461,850 | |
Energy (2.6%) | | | | | |
Chevron Corp. | | 27,500 | | 2,991,725 | |
ConocoPhillips | | 50,000 | | 3,117,500 | |
Exxon Mobil Corp. | | 75,000 | | 5,114,250 | |
Schlumberger Ltd. | | 20,000 | | 721,600 | |
| | | | 11,945,075 | |
Financials (14.6%) | | | | | |
American Express Co. | | 55,000 | | 5,242,600 | |
BB&T Corp. | | 100,000 | | 4,332,000 | |
Berkshire Hathaway, Inc., Class B (a) | | 60,000 | | 12,250,800 | |
Chubb Ltd. | | 35,000 | | 4,521,300 | |
Cincinnati Financial Corp. | | 60,000 | | 4,645,200 | |
Comerica, Inc. | | 30,000 | | 2,060,700 | |
Commerce Bancshares, Inc. | | 33,501 | | 1,888,451 | |
JPMorgan Chase & Co. | | 100,000 | | 9,762,000 | |
M&T Bank Corp. | | 10,000 | | 1,431,300 | |
Northern Trust Corp. | | 50,000 | | 4,179,500 | |
PNC Financial Services Group, Inc. | | 45,000 | | 5,260,950 | |
State Street Corp. | | 40,000 | | 2,522,800 | |
T. Rowe Price Group, Inc. | | 40,000 | | 3,692,800 | |
U.S. Bancorp | | 125,000 | | 5,712,500 | |
| | | | 67,502,901 | |
Health Care (12.3%) | | | | | |
Becton, Dickinson & Co. | | 60,000 | | 13,519,200 | |
Dentsply Sirona, Inc. | | 50,000 | | 1,860,500 | |
Edwards Lifesciences Corp. (a) | | 45,000 | | 6,892,650 | |
Henry Schein, Inc. (a) | | 50,000 | | 3,926,000 | |
Johnson & Johnson, Inc. | | 55,000 | | 7,097,750 | |
Medtronic PLC | | 20,000 | | 1,819,200 | |
Merck & Co., Inc. | | 40,000 | | 3,056,400 | |
Mettler-Toledo International, Inc. (a) | | 7,500 | | 4,241,850 | |
Stryker Corp. | | 25,000 | | 3,918,750 | |
UnitedHealth Group, Inc. | | 32,500 | | 8,096,400 | |
Varian Medical Systems, Inc. (a) | | 20,000 | | 2,266,200 | |
| | | | 56,694,900 | |
| | Shares or | | | |
| | Principal | | | |
| | Amount($) | | | |
Industrials (8.7%) | | | | | |
3M Co. | | 40,000 | | 7,621,600 | |
Donaldson Co., Inc. | | 50,000 | | 2,169,500 | |
Emerson Electric Co. | | 25,000 | | 1,493,750 | |
Honeywell International, Inc. | | 20,000 | | 2,642,400 | |
Hubbell, Inc. | | 40,000 | | 3,973,600 | |
Illinois Tool Works, Inc. | | 50,000 | | 6,334,500 | |
Union Pacific Corp. | | 50,000 | | 6,911,500 | |
United Parcel Service, Inc., Class B | | 50,000 | | 4,876,500 | |
W.W. Grainger, Inc. | | 15,000 | | 4,235,400 | |
| | | | 40,258,750 | |
Information Technology (16.3%) | | | | | |
Accenture PLC, Class A | | 70,000 | | 9,870,700 | |
Apple, Inc. | | 100,000 | | 15,774,000 | |
Automatic Data Processing, Inc. | | 70,000 | | 9,178,400 | |
Cisco Systems, Inc. | | 175,000 | | 7,582,750 | |
Microsoft Corp. | | 155,000 | | 15,743,350 | |
Oracle Corp. | | 150,000 | | 6,772,500 | |
Visa, Inc., Class A | | 75,000 | | 9,895,500 | |
| | | | 74,817,200 | |
Materials (2.2%) | | | | | |
Air Products & Chemicals, Inc. | | 20,000 | | 3,201,000 | |
AptarGroup, Inc. | | 30,000 | | 2,822,100 | |
PPG Industries, Inc. | | 40,000 | | 4,089,200 | |
| | | | 10,112,300 | |
Utilities (1.9%) | | | | | |
Consolidated Edison, Inc. | | 50,000 | | 3,823,000 | |
Eversource Energy | | 75,000 | | 4,878,000 | |
| | | | 8,701,000 | |
| | | | | |
TOTAL COMMON STOCKS (Cost $178,668,745) | | | | 350,185,251 | |
| | | | | |
CORPORATE BONDS (2.6%) | | | | | |
| | | | | |
Financials (1.4%) | | | | | |
American Express Co., 2.65%, 12/2/22 | | 1,926,000 | | 1,864,927 | |
Berkshire Hathaway, Inc., 3.13%, 3/15/26, | | | | | |
Callable 12/15/25 @ 100 | | 2,000,000 | | 1,940,336 | |
JPMorgan Chase & Co., 3.90%, 7/15/25, | | | | | |
Callable 4/15/25 @ 100 | | 1,000,000 | | 991,774 | |
Wells Fargo & Co., 3.55%, 9/29/25, MTN | | 2,000,000 | | 1,939,474 | |
| | | | 6,736,511 | |
Health Care (0.2%) | | | | | |
Becton, Dickinson & Co., 3.13%, 11/8/21 | | 1,000,000 | | 986,922 | |
| | | | | |
Information Technology (1.0%) | | | | | |
Apple, Inc., 3.25%, 2/23/26, Callable 11/23/25 @ 100 | | 2,500,000 | | 2,442,626 | |
Visa, Inc., 3.15%, 12/14/25, Callable 9/14/25 @ 100 | | 2,000,000 | | 1,967,204 | |
| | | | 4,409,830 | |
TOTAL CORPORATE BONDS (Cost $12,516,417) | | | | 12,133,263 | |
See Notes to Financial Statements
12
| | Principal | | | |
Security Description | | Amount($) | | Fair Value ($) | |
MUNICIPAL BONDS (0.8%) | | | | | |
Massachusetts (0.7%): | | | | | |
Massachusetts State, Series E, GO, 4.00%, 9/1/37, Callable 9/1/25 @ 100 | | 1,000,000 | | 1,031,840 | |
Massachusetts State, Series E, GO, 5.00%, 7/1/38, Callable 7/1/26 @ 100 | | 260,000 | | 295,417 | |
Massachusetts State Development Finance Agency Revenue, Series R-2, 5.00%, 7/1/28, Callable 7/1/20 @ 100 | | 460,000 | | 480,498 | |
Massachusetts State Health & Educational Facilities Authority Revenue, Series A, 5.00%, 12/15/26, Prerefunded 12/15/19 @ 100 | | 1,500,000 | | 1,545,855 | |
| | | | 3,353,610 | |
Washington (0.1%): | | | | | |
Washington State, Series C, GO, 5.00%, 2/1/26, Prerefunded 2/1/19 @ 100 | | 250,000 | | 250,655 | |
| | | | | |
TOTAL MUNICIPAL BONDS (Cost $3,789,094) | | | | 3,604,265 | |
| | | | | |
U.S. GOVERNMENT & U.S. GOVERNMENT AGENCY OBLIGATIONS (18.5%) | | | | | |
| | | | | |
Federal Farm Credit Bank (4.6%) | | | | | |
2.63%, 8/12/19 | | 10,000,000 | | 10,003,880 | |
2.85%, 3/2/28 | | 2,000,000 | | 1,971,388 | |
2.95%, 1/27/25 | | 2,000,000 | | 2,008,212 | |
3.14%, 12/5/29 | | 2,500,000 | | 2,504,310 | |
3.39%, 2/1/28 | | 2,000,000 | | 2,057,496 | |
3.85%, 12/26/25 | | 2,770,000 | | 2,932,347 | |
| | | | 21,477,633 | |
Federal Home Loan Bank (2.9%) | | | | | |
2.38%, 3/13/26 | | 6,000,000 | | 5,759,820 | |
2.50%, 12/10/27 | | 1,500,000 | | 1,418,852 | |
2.63%, 6/11/27 | | 1,500,000 | | 1,445,976 | |
2.88%, 9/13/24 | | 2,500,000 | | 2,515,275 | |
3.50%, 9/24/29 | | 2,000,000 | | 2,041,266 | |
| | | | 13,181,189 | |
U.S. Treasury Bill (3.3%) | | | | | |
2.40%, 7/18/19 | | 8,000,000 | | 7,891,924 | |
2.50%, 8/15/19 | | 7,500,000 | | 7,382,285 | |
| | | | 15,274,209 | |
U.S. Treasury Note (7.7%) | | | | | |
2.75%, 2/15/24 | | 35,000,000 | | 35,385,546 | |
| | | | | |
TOTAL U.S. GOVERNMENT & U.S. GOVERNMENT AGENCY OBLIGATIONS (Cost $85,979,385) | | | | 85,318,577 | |
| | Shares | | | |
INVESTMENT COMPANIES (1.9%) | | | | | |
JPMorgan U.S. Government Money Market Fund, Capital Shares, 2.28%(b) | | 8,899,795 | | 8,899,795 | |
TOTAL INVESTMENT COMPANIES (Cost $8,899,795) | | | | 8,899,795 | |
| | | | | |
Total Investments (Cost $289,853,436) — 99.8%(c) | | | | 460,141,151 | |
Other assets in excess of liabilities — 0.2% | | | | 984,823 | |
NET ASSETS — 100.0% | | | | $ | 461,125,974 | |
| | | | | | |
(a) Non-income producing security.
(b) Rate disclosed is the seven day yield as of December 31, 2018.
(c) See Federal Tax Information listed in the Notes to the Financial Statements.
ADR American Depositary Receipt
GO General Obligation
MTN Medium Term Note
PLC Public Limited Company
See Notes to Financial Statements
13
Financial Statements | Boston Trust Asset Management Fund |
STATEMENT OF ASSETS AND LIABILITIES
December 31, 2018
Assets: | | | |
Investments, at fair value (cost $289,853,436) | | $ | 460,141,151 | |
Interest and dividends receivable | | 1,280,494 | |
Receivable for capital shares issued | | 119,304 | |
Prepaid expenses | | 23,042 | |
Total Assets | | 461,563,991 | |
Liabilities: | | | |
Payable for capital shares redeemed | | 33,604 | |
Accrued expenses and other liabilities: | | | |
Investment adviser | | 298,383 | |
Administration and accounting | | 20,798 | |
Custodian | | 6,217 | |
Shareholder servicing fees | | 11,684 | |
Transfer agent | | 3,312 | |
Trustee | | 625 | |
Other | | 63,394 | |
Total Liabilities | | 438,017 | |
Net Assets | �� | $ | 461,125,974 | |
Composition of Net Assets: | | | |
Paid in capital | | $ | 290,524,182 | |
Total distributable earnings/(loss) | | 170,601,792 | |
Net Assets | | $ | 461,125,974 | |
Shares outstanding (par value $0.01, unlimited number of shares authorized) | | 10,416,435 | |
Net Asset Value, Offering Price and Redemption price per share | | $ | 44.27 | |
STATEMENT OF OPERATIONS
For the year ended December 31, 2018
Investment Income: | | | |
Interest | | $ | 2,595,160 | |
Dividends | | 7,151,156 | |
Total Investment Income | | 9,746,316 | |
Expenses: | | | |
Investment adviser | | 3,677,409 | |
Administration and accounting | | 408,442 | |
Chief compliance officer | | 44,561 | |
Custodian | | 68,618 | |
Shareholder servicing | | 146,166 | |
Transfer agency | | 39,216 | |
Trustee | | 28,536 | |
Other | | 172,058 | |
Total expenses | | 4,585,006 | |
Net Expenses | | 4,585,006 | |
Net Investment Income | | 5,161,310 | |
Net Realized/Unrealized Gains (Losses) from Investments: | | | |
Net realized gains from investment transactions | | 7,439,455 | |
Change in unrealized appreciation/depreciation from investments | | (19,626,925 | ) |
Net realized/unrealized gains (losses) from investments | | (12,187,470 | ) |
Change in Net Assets Resulting from Operations | | $ | (7,026,160 | ) |
See Notes to Financial Statements
14
STATEMENTS OF CHANGES IN NET ASSETS
| | For the year | | For the year | |
| | ended | | ended | |
| | December 31, | | December 31, | |
| | 2018 | | 2017 | |
| | | | | |
Investment Activities: | | | | | |
Operations: | | | | | |
Net investment income | | $ | 5,161,310 | | $ | 5,033,185 | |
Net realized gains from investment transactions | | 7,439,455 | | 12,348,048 | |
Change in unrealized appreciation/depreciation from investments | | (19,626,925 | ) | 50,152,480 | |
Change in Net Assets Resulting from Operations | | (7,026,160 | ) | 67,533,713 | |
Distributions to shareholders: | | | | | |
Total Distributions | | (19,206,469 | ) | (11,899,110 | ) |
Change in Net Assets Resulting from distributions to shareholders | | (19,206,469 | ) | (11,899,110 | ) |
Capital Share Transactions: | | | | | |
Proceeds from shares issued | | 34,500,765 | | 59,469,516 | |
Dividends reinvested | | 16,531,889 | | 10,543,397 | |
Cost of shares redeemed | | (60,384,310 | ) | (32,905,814 | ) |
Change in Net Assets Resulting from Capital Share Transactions | | (9,351,656 | ) | 37,107,099 | |
Change in Net Assets | | (35,584,285 | ) | 92,741,702 | |
Net Assets: | | | | | |
Beginning of period | | 496,710,259 | | 403,968,557 | |
End of period | | $ | 461,125,974 | | $ | 496,710,259 | |
Share Transactions: | | | | | |
Issued | | 733,719 | | 1,338,314 | |
Reinvested | | 359,858 | | 224,998 | |
Redeemed | | (1,272,289 | ) | (741,639 | ) |
Change in shares | | (178,712 | ) | 821,673 | |
See Notes to Financial Statements
15
FINANCIAL HIGHLIGHTS
Selected data for a share outstanding throughout the periods indicated.
| | | | | | For the nine | | | | | | | |
| | For the year | | For the year | | months | | For the year | | For the year | | For the year | |
| | ended | | ended | | ended | | ended | | ended | | ended | |
| | December 31, | | December 31, | | December 31, | | March 31, | | March 31, | | March 31, | |
| | 2018 | | 2017 | | 2016 | | 2016 | | 2015 | | 2014 | |
| | | | | | | | | | | | | |
Net Asset Value, Beginning of Period | | $ | 46.88 | | $ | 41.33 | | $ | 40.92 | | $ | 41.80 | | $ | 40.03 | | $ | 36.08 | |
| | | | | | | | | | | | | |
Investment Activities: | | | | | | | | | | | | | |
Operations: | | | | | | | | | | | | | |
Net investment income | | 0.52 | | 0.49 | | 0.35 | | 0.55 | | 0.50 | | 0.44 | |
Net realized/unrealized gains (losses) from investments | | (1.20 | ) | 6.22 | | 2.18 | | 0.92 | | 2.77 | | 4.28 | |
Total from investment activities | | (0.68 | ) | 6.71 | | 2.53 | | 1.47 | | 3.27 | | 4.72 | |
Dividends: | | | | | | | | | | | | | |
Net investment income | | (0.52 | ) | (0.49 | ) | (0.46 | ) | (0.57 | ) | (0.47 | ) | (0.44 | ) |
Net realized gains from investment transactions | | (1.41 | ) | (0.67 | ) | (1.66 | ) | (1.78 | ) | (1.03 | ) | (0.33 | ) |
Total dividends | | (1.93 | ) | (1.16 | ) | (2.12 | ) | (2.35 | ) | (1.50 | ) | (0.77 | ) |
| | | | | | | | | | | | | |
Net Asset Value, End of Period | | $ | 44.27 | | $ | 46.88 | | $ | 41.33 | | $ | 40.92 | | $ | 41.80 | | $ | 40.03 | |
| | | | | | | | | | | | | |
Total Return | | (1.61 | )% | 16.23 | % | 6.19 | %(a) | 3.65 | % | 8.21 | % | 13.13 | % |
| | | | | | | | | | | | | |
Ratios/Supplemental Data: | | | | | | | | | | | | | |
Net assets at end of period (000’s) | | $ | 461,126 | | $ | 496,710 | | $ | 403,969 | | $ | 354,405 | | $ | 353,851 | | $ | 340,963 | |
Ratio of net expenses to average net assets | | 0.93 | % | 0.92 | % | 0.95 | %(b) | 0.94 | % | 0.92 | % | 0.92 | % |
Ratio of net investment income to average net assets | | 1.05 | % | 1.13 | % | 1.15 | %(b) | 1.32 | % | 1.19 | % | 1.17 | % |
Ratio of expenses (before fee reductions or recoupment of fees previously reimbursed by the investment adviser) to average net assets | | 0.93 | % | 0.92 | % | 0.95 | %(b) | 0.94 | % | 0.93 | % | 0.93 | % |
Portfolio turnover rate | | 2.53 | % | 6.96 | % | 8.42 | %(a) | 11.64 | % | 17.74 | % | 8.94 | % |
(a) Not annualized for periods less than one year.
(b) Annualized for periods less than one year.
See Notes to Financial Statements
16
Schedule of Portfolio Investments | Boston Trust Equity Fund |
| December 31, 2018 |
Security Description | | Shares | | Fair Value ($) | |
COMMON STOCKS (99.5%) | | | | | |
Communication Services (8.5%) | | | | | |
Alphabet, Inc., Class A (a) | | 750 | | 783,720 | |
Alphabet, Inc., Class C (a) | | 5,500 | | 5,695,855 | |
Comcast Corp., Class A | | 90,000 | | 3,064,500 | |
Omnicom Group, Inc. | | 15,000 | | 1,098,600 | |
| | | | 10,642,675 | |
Consumer Discretionary (5.2%) | | | | | |
Autoliv, Inc. | | 10,000 | | 702,300 | |
Garrett Motion, Inc. (a) | | 1,400 | | 17,276 | |
NIKE, Inc., Class B | | 30,000 | | 2,224,200 | |
Ross Stores, Inc. | | 10,000 | | 832,000 | |
Starbucks Corp. | | 40,000 | | 2,576,000 | |
Veoneer, Inc. (a) | | 10,000 | | 235,700 | |
| | | | 6,587,476 | |
Consumer Staples (9.1%) | | | | | |
Church & Dwight Co., Inc. | | 25,000 | | 1,644,000 | |
Colgate-Palmolive Co. | | 2,500 | | 148,800 | |
Costco Wholesale Corp. | | 17,000 | | 3,463,070 | |
Diageo PLC, Sponsored ADR | | 7,500 | | 1,063,500 | |
McCormick & Co., Inc. | | 7,000 | | 974,680 | |
PepsiCo, Inc. | | 10,000 | | 1,104,800 | |
Procter & Gamble Co. | | 10,000 | | 919,200 | |
Sysco Corp. | | 25,000 | | 1,566,500 | |
The Hershey Co. | | 5,000 | | 535,900 | |
| | | | 11,420,450 | |
Energy (3.3%) | | | | | |
Chevron Corp. | | 15,000 | | 1,631,850 | |
ConocoPhillips | | 15,000 | | 935,250 | |
Exxon Mobil Corp. | | 22,500 | | 1,534,275 | |
Schlumberger Ltd. | | 2,500 | | 90,200 | |
| | | | 4,191,575 | |
Financials (19.5%) | | | | | |
American Express Co. | | 25,000 | | 2,383,000 | |
BB&T Corp. | | 30,000 | | 1,299,600 | |
Berkshire Hathaway, Inc., Class B (a) | | 20,000 | | 4,083,600 | |
Chubb Ltd. | | 15,000 | | 1,937,700 | |
Cincinnati Financial Corp. | | 25,000 | | 1,935,500 | |
Commerce Bancshares, Inc. | | 10,048 | | 566,406 | |
JPMorgan Chase & Co. | | 37,500 | | 3,660,750 | |
M&T Bank Corp. | | 5,000 | | 715,650 | |
Northern Trust Corp. | | 15,000 | | 1,253,850 | |
PNC Financial Services Group, Inc. | | 20,000 | | 2,338,200 | |
State Street Corp. | | 15,000 | | 946,050 | |
T. Rowe Price Group, Inc. | | 15,000 | | 1,384,800 | |
U.S. Bancorp | | 45,000 | | 2,056,500 | |
| | | | 24,561,606 | |
Health Care (15.0%) | | | | | |
Becton, Dickinson & Co. | | 16,000 | | 3,605,120 | |
Dentsply Sirona, Inc. | | 25,000 | | 930,250 | |
Edwards Lifesciences Corp. (a) | | 7,500 | | 1,148,775 | |
Henry Schein, Inc. (a) | | 15,000 | | 1,177,800 | |
Johnson & Johnson, Inc. | | 22,500 | | 2,903,625 | |
Medtronic PLC | | 10,000 | | 909,600 | |
Merck & Co., Inc. | | 15,000 | | 1,146,150 | |
Mettler-Toledo International, Inc. (a) | | 1,500 | | 848,370 | |
Stryker Corp. | | 12,000 | | 1,881,000 | |
UnitedHealth Group, Inc. | | 14,000 | | 3,487,680 | |
Varian Medical Systems, Inc. (a) | | 7,500 | | 849,825 | |
| | | | 18,888,195 | |
Industrials (12.6%) | | | | | |
3M Co. | | 16,000 | | 3,048,640 | |
Deere & Co. | | 7,500 | | 1,118,775 | |
Donaldson Co., Inc. | | 10,000 | | 433,900 | |
Honeywell International, Inc. | | 10,000 | | 1,321,200 | |
Hubbell, Inc. | | 15,000 | | 1,490,100 | |
Illinois Tool Works, Inc. | | 15,000 | | 1,900,350 | |
Union Pacific Corp. | | 22,500 | | 3,110,175 | |
United Parcel Service, Inc., Class B | | 15,000 | | 1,462,950 | |
W.W. Grainger, Inc. | | 7,000 | | 1,976,520 | |
| | | | 15,862,610 | |
Information Technology (20.8%) | | | | | |
Accenture PLC, Class A | | 25,000 | | 3,525,250 | |
Apple, Inc. | | 35,000 | | 5,520,900 | |
Automatic Data Processing, Inc. | | 20,000 | | 2,622,400 | |
Cisco Systems, Inc. | | 50,000 | | 2,166,500 | |
Microsoft Corp. | | 55,000 | | 5,586,350 | |
Oracle Corp. | | 55,000 | | 2,483,250 | |
Visa, Inc., Class A | | 32,500 | | 4,288,050 | |
| | | | 26,192,700 | |
Materials (3.3%) | | | | | |
Air Products & Chemicals, Inc. | | 7,000 | | 1,120,350 | |
AptarGroup, Inc. | | 10,000 | | 940,700 | |
PPG Industries, Inc. | | 20,000 | | 2,044,600 | |
| | | | 4,105,650 | |
Utilities (2.2%) | | | | | |
Consolidated Edison, Inc. | | 15,000 | | 1,146,900 | |
Eversource Energy | | 25,000 | | 1,626,000 | |
| | | | 2,772,900 | |
| | | | | |
TOTAL COMMON STOCKS (Cost $63,561,573) | | | | 125,225,837 | |
| | | | | |
INVESTMENT COMPANIES (0.4%) | | | | | |
| | | | | |
JPMorgan U.S. Government Money Market Fund, Capital Shares, 2.28%(b) | | 548,868 | | 548,868 | |
TOTAL INVESTMENT COMPANIES (Cost $548,868) | | | | 548,868 | |
| | | | | |
Total Investments (Cost $64,110,441) — 99.9%(c) | | | | 125,774,705 | |
Other assets in excess of liabilities — 0.1% | | | | 69,524 | |
NET ASSETS — 100.0% | | | | $ | 125,844,229 | |
| | | | | | |
(a) Non-income producing security.
(b) Rate disclosed is the seven day yield as of December 31, 2018.
(c) See Federal Tax Information listed in the Notes to the Financial Statements.
ADR American Depositary Receipt
PLC Public Limited Company
See Notes to Financial Statements
17
Financial Statements | Boston Trust Equity Fund |
STATEMENT OF ASSETS AND LIABILITIES
December 31, 2018
Assets: | | | |
Investments, at fair value (cost $64,110,441) | | $ | 125,774,705 | |
Dividends receivable | | 173,792 | |
Receivable for capital shares issued | | 1,031 | |
Prepaid expenses | | 5,558 | |
Total Assets | | 125,955,086 | |
Liabilities: | | | |
Accrued expenses and other liabilities: | | | |
Investment adviser | | 82,616 | |
Administration and accounting | | 5,629 | |
Custodian | | 1,711 | |
Shareholder servicing fees | | 341 | |
Transfer agent | | 2,992 | |
Trustee | | 173 | |
Other | | 17,395 | |
Total Liabilities | | 110,857 | |
Net Assets | | $ | 125,844,229 | |
Composition of Net Assets: | | | |
Paid in capital | | $ | 64,552,326 | |
Total distributable earnings/(loss) | | 61,291,903 | |
Net Assets | | $ | 125,844,229 | |
Shares outstanding (par value $0.01, unlimited number of shares authorized) | | 5,559,530 | |
Net Asset Value, Offering Price and Redemption price per share | | $ | 22.64 | |
STATEMENT OF OPERATIONS
For the year ended December 31, 2018
Investment Income: | | | |
Dividends | | $ | 2,494,852 | |
Total Investment Income | | 2,494,852 | |
Expenses: | | | |
Investment adviser | | 1,018,964 | |
Administration and accounting | | 111,974 | |
Chief compliance officer | | 12,232 | |
Custodian | | 18,906 | |
Shareholder servicing | | 3,455 | |
Transfer agency | | 34,648 | |
Trustee | | 7,826 | |
Other | | 48,470 | |
Total expenses | | 1,256,475 | |
Net Expenses | | 1,256,475 | |
Net Investment Income | | 1,238,377 | |
Net Realized/Unrealized Gains (Losses) from Investments: | | | |
Net realized gains from investment transactions | | 177,204 | |
Change in unrealized appreciation/depreciation from investments | | (4,627,270 | ) |
Net realized/unrealized gains (losses) from investments | | (4,450,066 | ) |
Change in Net Assets Resulting from Operations | | $ | (3,211,689 | ) |
See Notes to Financial Statements
18
STATEMENTS OF CHANGES IN NET ASSETS
| | For the year ended | | For the year ended | |
| | December 31, 2018 | | December 31, 2017 | |
| | | | | |
Investment Activities: | | | | | |
Operations: | | | | | |
Net investment income | | $ | 1,238,377 | | $ | 1,294,849 | |
Net realized gains from investment transactions | | 177,204 | | 6,837,726 | |
Change in unrealized appreciation/depreciation from investments | | (4,627,270 | ) | 15,897,512 | |
Change in Net Assets Resulting from Operations | | (3,211,689 | ) | 24,030,087 | |
Distributions to shareholders: | | | | | |
Total Distributions | | (2,243,322 | ) | (3,410,164 | ) |
Change in Net Assets Resulting from distributions to shareholders | | (2,243,322 | ) | (3,410,164 | ) |
Capital Share Transactions: | | | | | |
Proceeds from shares issued | | 1,327,119 | | 3,018,404 | |
Dividends reinvested | | 1,559,628 | | 2,546,279 | |
Cost of shares redeemed | | (5,593,745 | ) | (5,651,405 | ) |
Cost of in-kind shares redeemed (a) | | — | | (5,350,555 | ) |
Change in Net Assets Resulting from Capital Share Transactions | | (2,706,998 | ) | (5,437,277 | ) |
Change in Net Assets | | (8,162,009 | ) | 15,182,646 | |
Net Assets: | | | | | |
Beginning of period | | 134,006,238 | | 118,823,592 | |
End of period | | $ | 125,844,229 | | $ | 134,006,238 | |
Share Transactions: | | | | | |
Issued | | 53,942 | | 139,831 | |
Reinvested | | 65,586 | | 107,802 | |
Redeemed | | (231,373 | ) | (260,095 | ) |
Redeemed in-kind (a) | | — | | (231,726 | ) |
Change in shares | | (111,845 | ) | (244,188 | ) |
Amounts designated as “—” are $0 or have been rounded to $0.
(a) See Note 3 in Notes to Financial Statements.
See Notes to Financial Statements
19
FINANCIAL HIGHLIGHTS
Selected data for a share outstanding throughout the periods indicated.
| | | | | | For the nine | | | | | | | |
| | For the year | | For the year | | months | | For the year | | For the year | | For the year | |
| | ended | | ended | | ended | | ended | | ended | | ended | |
| | December 31, | | December 31, | | December 31, | | March 31, | | March 31, | | March 31, | |
| | 2018 | | 2017 | | 2016 | | 2016 | | 2015 | | 2014 | |
| | | | | | | | | | | | | |
Net Asset Value, Beginning of Period | | $ | 23.63 | | $ | 20.09 | | $ | 19.70 | | $ | 20.66 | | $ | 19.67 | | $ | 16.85 | |
| | | | | | | | | | | | | |
Investment Activities: | | | | | | | | | | | | | |
Operations: | | | | | | | | | | | | | |
Net investment income | | 0.22 | | 0.23 | | 0.16 | | 0.23 | | 0.19 | | 0.19 | |
Net realized/unrealized gains (losses) from investments | | (0.80 | ) | 3.92 | | 1.58 | | 0.27 | | 1.38 | | 2.81 | |
Total from investment activities | | (0.58 | ) | 4.15 | | 1.74 | | 0.50 | | 1.57 | | 3.00 | |
Dividends: | | | | | | | | | | | | | |
Net investment income | | (0.23 | ) | (0.23 | ) | (0.20 | ) | (0.24 | ) | (0.19 | ) | (0.18 | ) |
Net realized gains from investment transactions | | (0.18 | ) | (0.38 | ) | (1.15 | ) | (1.22 | ) | (0.39 | ) | — | |
Total dividends | | (0.41 | ) | (0.61 | ) | (1.35 | ) | (1.46 | ) | (0.58 | ) | (0.18 | ) |
| | | | | | | | | | | | | |
Net Asset Value, End of Period | | $ | 22.64 | | $ | 23.63 | | $ | 20.09 | | $ | 19.70 | | $ | 20.66 | | $ | 19.67 | |
| | | | | | | | | | | | | |
Total Return | | (2.55 | )% | 20.67 | % | 8.82 | %(a) | 2.59 | % | 8.01 | % | 17.84 | % |
| | | | | | | | | | | | | |
Ratios/Supplemental Data: | | | | | | | | | | | | | |
Net assets at end of period (000’s) | | $ | 125,844 | | $ | 134,006 | | $ | 118,824 | | $ | 110,831 | | $ | 110,664 | | $ | 98,408 | |
Ratio of net expenses to average net assets | | 0.92 | % | 0.93 | % | 0.96 | %(b) | 0.95 | % | 0.94 | % | 0.94 | % |
Ratio of net investment income to average net assets | | 0.91 | % | 1.02 | % | 1.01 | %(b) | 1.14 | % | 0.96 | % | 1.05 | % |
Ratio of expenses (before fee reductions or recoupment of fees previously reimbursed by the investment adviser) to average net assets (c) | | 0.92 | % | 0.93 | % | 0.96 | %(b) | 0.96 | % | 0.95 | % | 0.96 | % |
Portfolio turnover rate | | 1.67 | % | 9.00 | % | 6.65 | %(a) | 18.04 | % | 19.49 | % | 6.29 | % |
Amounts designated as “—” are $0 or have been rounded to $0.
(a) Not annualized for periods less than one year.
(b) Annualized for periods less than one year.
(c) During the periods ending March 31, 2014 through December 31, 2016, certain fees were reduced. If such fee reduction had not occurred, the ratio would have been as indicated.
See Notes to Financial Statements
20
Schedule of Portfolio Investments | Boston Trust Midcap Fund |
December 31, 2018
Security Description | | Shares | | Fair Value ($) | |
COMMON STOCKS (97.4%) | | | | | |
Communication Services (1.4%) | | | | | |
Omnicom Group, Inc. | | 14,000 | | 1,025,360 | |
| | | | 1,025,360 | |
Consumer Discretionary (12.0%) | | | | | |
Dollar General Corp. | | 11,200 | | 1,210,496 | |
Dunkin’ Brands Group, Inc. | | 12,275 | | 787,073 | |
Expedia, Inc. | | 6,700 | | 754,755 | |
Hasbro, Inc. | | 8,125 | | 660,156 | |
Hyatt Hotels Corp., Class A | | 18,600 | | 1,257,360 | |
O’Reilly Automotive, Inc. (a) | | 3,075 | | 1,058,815 | |
Polaris Industries, Inc. | | 7,400 | | 567,432 | |
Ross Stores, Inc. | | 16,200 | | 1,347,840 | |
Service Corp. International | | 17,125 | | 689,453 | |
Williams Sonoma, Inc. | | 12,700 | | 640,715 | |
| | | | 8,974,095 | |
Consumer Staples (6.6%) | | | | | |
Brown-Forman Corp., Class B | | 15,862 | | 754,714 | |
Church & Dwight Co., Inc. | | 20,450 | | 1,344,791 | |
McCormick & Co., Inc. | | 5,175 | | 720,567 | |
The Clorox Co. | | 8,325 | | 1,283,216 | |
The Hershey Co. | | 7,800 | | 836,004 | |
| | | | 4,939,292 | |
Energy (2.4%) | | | | | |
Apache Corp. | | 29,950 | | 786,188 | |
Dril-Quip, Inc. (a) | | 14,100 | | 423,423 | |
Helmerich & Payne, Inc. | | 12,500 | | 599,250 | |
| | | | 1,808,861 | |
Financials (15.9%) | | | | | |
Brown & Brown, Inc. | | 27,250 | | 751,010 | |
Commerce Bancshares, Inc. | | 18,681 | | 1,053,047 | |
Discover Financial Services | | 14,925 | | 880,277 | |
East West Bancorp, Inc. | | 11,850 | | 515,831 | |
Eaton Vance Corp. | | 13,925 | | 489,882 | |
FactSet Research Systems, Inc. | | 6,925 | | 1,385,899 | |
M&T Bank Corp. | | 7,025 | | 1,005,488 | |
Northern Trust Corp. | | 14,700 | | 1,228,773 | |
SEI Investments Co. | | 18,150 | | 838,530 | |
Signature Bank | | 7,050 | | 724,811 | |
State Street Corp. | | 12,350 | | 778,915 | |
SunTrust Banks, Inc. | | 17,050 | | 860,002 | |
T. Rowe Price Group, Inc. | | 8,125 | | 750,100 | |
W. R. Berkley Corp. | | 9,895 | | 731,339 | |
| | | | 11,993,904 | |
Health Care (11.5%) | | | | | |
Agilent Technologies, Inc. | | 12,225 | | 824,699 | |
Cerner Corp. (a) | | 13,975 | | 732,849 | |
Henry Schein, Inc. (a) | | 10,225 | | 802,867 | |
Laboratory Corp. of America Holdings (a) | | 4,650 | | 587,574 | |
Mettler-Toledo International, Inc. (a) | | 1,400 | | 791,812 | |
PerkinElmer, Inc. | | 9,475 | | 744,261 | |
STERIS PLC | | 7,825 | | 836,101 | |
The Cooper Companies, Inc. | | 3,775 | | 960,738 | |
Varian Medical Systems, Inc. (a) | | 5,125 | | 580,714 | |
Waters Corp. (a) | | 5,175 | | 976,263 | |
Zimmer Biomet Holdings, Inc. | | 7,100 | | 736,412 | |
| | | | 8,574,290 | |
Industrials (13.3%) | | | | | |
AMETEK, Inc. | | 15,700 | | 1,062,890 | |
Donaldson Co., Inc. | | 25,000 | | 1,084,749 | |
Expeditors International of Washington, Inc. | | 7,925 | | 539,613 | |
Hubbell, Inc. | | 11,225 | | 1,115,092 | |
IDEX Corp. | | 5,175 | | 653,396 | |
Kansas City Southern | | 7,950 | | 758,828 | |
Lincoln Electric Holdings, Inc. | | 9,450 | | 745,133 | |
Nordson Corp. | | 8,000 | | 954,799 | |
Roper Technologies, Inc. | | 3,750 | | 999,450 | |
Sensata Technologies Holding PLC (a) | | 13,400 | | 600,856 | |
The Middleby Corp. (a) | | 6,150 | | 631,790 | |
Verisk Analytics, Inc. (a) | | 7,125 | | 776,910 | |
| | | | 9,923,506 | |
Information Technology (15.6%) | | | | | |
Akamai Technologies, Inc. (a) | | 10,925 | | 667,299 | |
Amdocs Ltd. | | 13,875 | | 812,798 | |
Amphenol Corp., Class A | | 11,500 | | 931,730 | |
ANSYS, Inc. (a) | | 5,000 | | 714,700 | |
Aspen Technology, Inc. (a) | | 8,075 | | 663,604 | |
Check Point Software Technologies Ltd. (a) | | 7,275 | | 746,779 | |
Citrix Systems, Inc. | | 7,850 | | 804,310 | |
F5 Networks, Inc. (a) | | 7,975 | | 1,292,190 | |
Fiserv, Inc. (a) | | 11,575 | | 850,647 | |
IPG Photonics Corp. (a) | | 6,600 | | 747,714 | |
Juniper Networks, Inc. | | 34,275 | | 922,340 | |
Paychex, Inc. | | 25,000 | | 1,628,749 | |
TE Connectivity Ltd. | | 12,375 | | 935,921 | |
| | | | 11,718,781 | |
Materials (7.7%) | | | | | |
AptarGroup, Inc. | | 13,025 | | 1,225,262 | |
Avery Dennison Corp. | | 13,200 | | 1,185,756 | |
Ball Corp. | | 16,250 | | 747,175 | |
International Flavors & Fragrances, Inc. | | 10,300 | | 1,382,981 | |
RPM International, Inc. | | 20,550 | | 1,207,929 | |
| | | | 5,749,103 | |
Real Estate (5.9%) | | | | | |
Alexandria Real Estate Equities, Inc. | | 5,000 | | 576,200 | |
Digital Realty Trust, Inc. | | 6,575 | | 700,566 | |
Host Hotels & Resorts, Inc. | | 37,100 | | 618,457 | |
Jones Lang LaSalle, Inc. | | 5,900 | | 746,940 | |
Lamar Advertising Co., Class A | | 9,275 | | 641,645 | |
Realty Income Corp. | | 17,975 | | 1,133,144 | |
| | | | 4,416,952 | |
Utilities (5.1%) | | | | | |
American Water Works Co., Inc. | | 7,175 | | 651,275 | |
Consolidated Edison, Inc. | | 9,150 | | 699,609 | |
Eversource Energy | | 26,100 | | 1,697,544 | |
ONE Gas, Inc. | | 10,000 | | 796,000 | |
| | | | 3,844,428 | |
| | | | | |
TOTAL COMMON STOCKS (Cost $56,789,856) | | | | 72,968,572 | |
| | | | | |
INVESTMENT COMPANIES (4.1%) | | | | | |
| | | | | |
JPMorgan U.S. Government Money Market Fund, Capital Shares, 2.28%(b) | | 3,034,757 | | 3,034,757 | |
TOTAL INVESTMENT COMPANIES (Cost $3,034,757) | | | | 3,034,757 | |
| | | | | |
Total Investments (Cost $59,824,613) — 101.5%(c) | | | | 76,003,329 | |
Liabilities in excess of other assets — (1.5)% | | | | (1,140,493 | ) |
NET ASSETS — 100.0% | | | | $ | 74,862,836 | |
| | | | | | |
(a) Non-income producing security.
(b) Rate disclosed is the seven day yield as of December 31, 2018.
(c) See Federal Tax Information listed in the Notes to the Financial Statements.
PLC Public Limited Company
See Notes to Financial Statements
21
Financial Statements | Boston Trust Midcap Fund |
STATEMENT OF ASSETS AND LIABILITIES
December 31, 2018
Assets: | | | |
Investments, at fair value (cost $59,824,613) | | $ | 76,003,329 | |
Dividends receivable | | 85,256 | |
Receivable for investments sold | | 878,769 | |
Receivable for capital shares issued | | 351,945 | |
Receivable for tax reclaims | | 539 | |
Prepaid expenses | | 17,316 | |
Total Assets | | 77,337,154 | |
Liabilities: | | | |
Payable for investments purchased | | 2,411,142 | |
Payable for capital shares redeemed | | 1,386 | |
Accrued expenses and other liabilities: | | | |
Investment adviser | | 46,662 | |
Administration and accounting | | 3,010 | |
Custodian | | 698 | |
Shareholder servicing fees | | 720 | |
Transfer agent | | 2,606 | |
Trustee | | 65 | |
Other | | 8,029 | |
Total Liabilities | | 2,474,318 | |
Net Assets | | $ | 74,862,836 | |
Composition of Net Assets: | | | |
Paid in capital | | $ | 57,773,741 | |
Total distributable earnings/(loss) | | 17,089,095 | |
Net Assets | | $ | 74,862,836 | |
Shares outstanding (par value $0.01, unlimited number of shares authorized) | | 4,744,576 | |
Net Asset Value, Offering Price and Redemption price per share | | $ | 15.78 | |
STATEMENT OF OPERATIONS
For the year ended December 31, 2018
Investment Income: | | | |
Dividends | | $ | 978,307 | |
Total Investment Income | | 978,307 | |
Expenses: | | | |
Investment adviser | | 481,717 | |
Administration and accounting | | 52,967 | |
Chief compliance officer | | 5,719 | |
Custodian | | 8,872 | |
Shareholder servicing | | 6,673 | |
Transfer agency | | 34,686 | |
Trustee | | 3,651 | |
Other | | 29,766 | |
Recoupment of prior expenses reimbursed by the investment adviser | | 8,081 | |
Total expenses | | 632,132 | |
Net Expenses | | 632,132 | |
Net Investment Income | | 346,175 | |
Net Realized/Unrealized Gains (Losses) from Investments: | | | |
Net realized gains from investment transactions | | 3,814,615 | |
Change in unrealized appreciation/depreciation from investments | | (7,142,288 | ) |
Net realized/unrealized gains (losses) from investments | | (3,327,673 | ) |
Change in Net Assets Resulting from Operations | | $ | (2,981,498 | ) |
See Notes to Financial Statements
22
STATEMENTS OF CHANGES IN NET ASSETS
| | For the year ended | | For the year ended | |
| | December 31, 2018 | | December 31, 2017 | |
| | | | | |
Investment Activities: | | | | | |
Operations: | | | | | |
Net investment income | | $ | 346,175 | | $ | 254,744 | |
Net realized gains from investment transactions | | 3,814,615 | | 3,948,758 | |
Change in unrealized appreciation/depreciation from investments | | (7,142,288 | ) | 6,095,730 | |
Change in Net Assets Resulting from Operations | | (2,981,498 | ) | 10,299,232 | |
Distributions to shareholders: | | | | | |
Total Distributions | | (4,017,880 | ) | (3,858,721 | ) |
Change in Net Assets Resulting from distributions to shareholders | | (4,017,880 | ) | (3,858,721 | ) |
Capital Share Transactions: | | | | | |
Proceeds from shares issued | | 21,747,824 | | 3,134,848 | |
Dividends reinvested | | 3,308,277 | | 3,284,122 | |
Cost of shares redeemed | | (4,741,801 | ) | (1,806,705 | ) |
Change in Net Assets Resulting from Capital Share Transactions | | 20,314,300 | | 4,612,265 | |
Change in Net Assets | | 13,314,922 | | 11,052,776 | |
Net Assets: | | | | | |
Beginning of period | | 61,547,914 | | 50,495,138 | |
End of period | | $ | 74,862,836 | | $ | 61,547,914 | |
Share Transactions: | | | | | |
Issued | | 1,245,052 | | 190,996 | |
Reinvested | | 200,623 | | 191,942 | |
Redeemed | | (267,350 | ) | (107,853 | ) |
Change in shares | | 1,178,325 | | 275,085 | |
See Notes to Financial Statements
23
FINANCIAL HIGHLIGHTS
Selected data for a share outstanding throughout the periods indicated.
| | | | | | For the nine | | | | | | | |
| | For the year | | For the year | | months | | For the year | | For the year | | For the year | |
| | ended | | ended | | ended | | ended | | ended | | ended | |
| | December 31, | | December 31, | | December 31, | | March 31, | | March 31, | | March 31, | |
| | 2018 | | 2017 | | 2016 | | 2016 | | 2015 | | 2014 | |
| | | | | | | | | | | | | |
Net Asset Value, Beginning of Period | | $ | 17.26 | | $ | 15.34 | | $ | 15.29 | | $ | 16.12 | | $ | 15.03 | | $ | 13.08 | |
| | | | | | | | | | | | | |
Investment Activities: | | | | | | | | | | | | | |
Operations: | | | | | | | | | | | | | |
Net investment income | | 0.08 | | 0.08 | | 0.12 | | 0.09 | | 0.05 | | 0.04 | |
Net realized/unrealized gains (losses) from investments | | (0.62 | ) | 2.98 | | 1.01 | | 0.05 | | 1.82 | | 2.30 | |
Total from investment activities | | (0.54 | ) | 3.06 | | 1.13 | | 0.14 | | 1.87 | | 2.34 | |
Dividends: | | | | | | | | | | | | | |
Net investment income | | (0.08 | ) | (0.08 | ) | (0.13 | ) | (0.09 | ) | (0.05 | ) | (0.04 | ) |
Net realized gains from investment transactions | | (0.86 | ) | (1.06 | ) | (0.95 | ) | (0.88 | ) | (0.73 | ) | (0.35 | ) |
Total dividends | | (0.94 | ) | (1.14 | ) | (1.08 | ) | (0.97 | ) | (0.78 | ) | (0.39 | ) |
| | | | | | | | | | | | | |
Net Asset Value, End of Period | | $ | 15.78 | | $ | 17.26 | | $ | 15.34 | | $ | 15.29 | | $ | 16.12 | | $ | 15.03 | |
| | | | | | | | | | | | | |
Total Return | | (3.36 | )% | 20.01 | % | 7.29 | %(a) | 1.07 | % | 12.65 | % | 18.02 | % |
| | | | | | | | | | | | | |
Ratios/Supplemental Data: | | | | | | | | | | | | | |
Net assets at end of period (000’s) | | $ | 74,863 | | $ | 61,548 | | $ | 50,495 | | $ | 47,941 | | $ | 47,682 | | $ | 41,793 | |
Ratio of net expenses to average net assets | | 0.98 | % | 1.00 | % | 1.00 | %(b) | 1.00 | % | 1.00 | % | 1.00 | % |
Ratio of net investment income to average net assets | | 0.54 | % | 0.46 | % | 0.99 | %(b) | 0.58 | % | 0.34 | % | 0.30 | % |
Ratio of expenses (before fee reductions or recoupment of fees previously reimbursed by the investment adviser) to average net assets (c) | | 0.98 | % | 0.98 | % | 1.02 | %(b) | 1.03 | % | 1.02 | % | 1.01 | % |
Portfolio turnover rate | | 19.34 | % | 23.22 | % | 14.53 | %(a) | 21.02 | % | 15.76 | % | 16.09 | % |
(a) Not annualized for periods less than one year.
(b) Annualized for periods less than one year.
(c) During the periods, certain fees were reduced or recouped by the investment adviser. If such fee reductions/recoupments had not occurred, the ratio would have been as indicated.
See Notes to Financial Statements
24
Schedule of Portfolio Investments | Boston Trust SMID Cap Fund |
| December 31, 2018 |
Security Description | | Shares | | Fair Value ($) | |
COMMON STOCKS (98.6%) | | | | | |
Communication Services (1.2%) | | | | | |
Interpublic Group of Cos., Inc. | | 44,975 | | 927,834 | |
| | | | 927,834 | |
Consumer Discretionary (10.8%) | | | | | |
Big Lots, Inc. | | 15,900 | | 459,828 | |
Brinker International, Inc. | | 13,500 | | 593,730 | |
Cheesecake Factory, Inc. | | 17,600 | | 765,776 | |
Choice Hotels International, Inc. | | 12,300 | | 880,434 | |
Dorman Products, Inc. (a) | | 11,000 | | 990,220 | |
Dunkin’ Brands Group, Inc. | | 8,900 | | 570,668 | |
Polaris Industries, Inc. | | 6,900 | | 529,092 | |
Service Corp. International | | 31,000 | | 1,248,060 | |
Texas Roadhouse, Inc. | | 12,400 | | 740,280 | |
Tiffany & Co. | | 6,400 | | 515,264 | |
Williams Sonoma, Inc. | | 14,900 | | 751,705 | |
| | | | 8,045,057 | |
Consumer Staples (4.4%) | | | | | |
Church & Dwight Co., Inc. | | 19,925 | | 1,310,268 | |
Flowers Foods, Inc. | | 39,200 | | 724,024 | |
Lancaster Colony Corp. | | 4,400 | | 778,184 | |
Tootsie Roll Industries, Inc. | | 14,200 | | 474,280 | |
| | | | 3,286,756 | |
Energy (2.7%) | | | | | |
Apache Corp. | | 16,700 | | 438,375 | |
Dril-Quip, Inc. (a) | | 14,000 | | 420,420 | |
Helmerich & Payne, Inc. | | 15,200 | | 728,688 | |
National Oilwell Varco, Inc. | | 16,200 | | 416,340 | |
| | | | 2,003,823 | |
Financials (15.0%) | | | | | |
American Financial Group, Inc. | | 5,800 | | 525,074 | |
Bank of Hawaii Corp. | | 11,000 | | 740,520 | |
Brown & Brown, Inc. | | 31,500 | | 868,140 | |
Cincinnati Financial Corp. | | 9,000 | | 696,780 | |
Cohen & Steers, Inc. | | 13,800 | | 473,616 | |
Commerce Bancshares, Inc. | | 14,175 | | 799,045 | |
CVB Financial Corp. | | 23,900 | | 483,497 | |
East West Bancorp, Inc. | | 12,100 | | 526,713 | |
Eaton Vance Corp. | | 21,000 | | 738,780 | |
FactSet Research Systems, Inc. | | 5,500 | | 1,100,715 | |
SEI Investments Co. | | 18,550 | | 857,010 | |
Signature Bank | | 10,000 | | 1,028,100 | |
SVB Financial Group (a) | | 2,500 | | 474,800 | |
Texas Capital Bancshares, Inc. (a) | | 6,400 | | 326,976 | |
UMB Financial Corp. | | 12,400 | | 756,028 | |
W. R. Berkley Corp. | | 9,800 | | 724,318 | |
| | | | 11,120,112 | |
Health Care (14.8%) | | | | | |
Chemed Corp. | | 3,200 | | 906,496 | |
Dentsply Sirona, Inc. | | 14,000 | | 520,940 | |
Henry Schein, Inc. (a) | | 7,900 | | 620,308 | |
Masimo Corp. (a) | | 11,700 | | 1,256,229 | |
Mettler-Toledo International, Inc. (a) | | 1,700 | | 961,486 | |
PerkinElmer, Inc. | | 14,300 | | 1,123,265 | |
ResMed, Inc. | | 11,300 | | 1,286,731 | |
STERIS PLC | | 8,600 | | 918,910 | |
The Cooper Companies, Inc. | | 4,300 | | 1,094,350 | |
Varian Medical Systems, Inc. (a) | | 7,200 | | 815,832 | |
Waters Corp. (a) | | 8,100 | | 1,528,065 | |
| | | | 11,032,612 | |
Industrials (16.7%) | | | | | |
Applied Industrial Technologies, Inc. | | 16,500 | | 890,010 | |
C.H. Robinson Worldwide, Inc. | | 8,400 | | 706,356 | |
Donaldson Co., Inc. | | 28,000 | | 1,214,919 | |
Expeditors International of Washington, Inc. | | 11,300 | | 769,417 | |
Franklin Electric Co., Inc. | | 14,500 | | 621,760 | |
Hexcel Corp. | | 8,700 | | 498,858 | |
Hubbell, Inc. | | 11,075 | | 1,100,191 | |
IDEX Corp. | | 5,200 | | 656,552 | |
Kansas City Southern | | 5,600 | | 534,520 | |
Lincoln Electric Holdings, Inc. | | 10,700 | | 843,695 | |
Nordson Corp. | | 9,800 | | 1,169,630 | |
Sensata Technologies Holding PLC (a) | | 16,500 | | 739,860 | |
The Middleby Corp. (a) | | 5,800 | | 595,834 | |
UniFirst Corp. | | 6,850 | | 980,030 | |
Valmont Industries, Inc. | | 4,500 | | 499,275 | |
Wabtec Corp. | | 8,500 | | 597,125 | |
| | | | 12,418,032 | |
Information Technology (14.3%) | | | | | |
Akamai Technologies, Inc. (a) | | 14,200 | | 867,336 | |
Amdocs Ltd. | | 15,500 | | 907,990 | |
ANSYS, Inc. (a) | | 5,100 | | 728,994 | |
Aspen Technology, Inc. (a) | | 13,300 | | 1,092,994 | |
Coherent, Inc. (a) | | 3,200 | | 338,272 | |
F5 Networks, Inc. (a) | | 8,200 | | 1,328,646 | |
IPG Photonics Corp. (a) | | 6,300 | | 713,727 | |
Jack Henry & Associates, Inc. | | 7,500 | | 948,900 | |
Juniper Networks, Inc. | | 34,000 | | 914,940 | |
Manhattan Associates, Inc. (a) | | 15,400 | | 652,498 | |
NETGEAR, Inc. (a) | | 13,700 | | 712,811 | |
Tech Data Corp. (a) | | 8,300 | | 679,023 | |
Teradata Corp. (a) | | 18,900 | | 725,004 | |
| | | | 10,611,135 | |
Materials (6.5%) | | | | | |
AptarGroup, Inc. | | 13,000 | | 1,222,910 | |
Avery Dennison Corp. | | 8,300 | | 745,589 | |
International Flavors & Fragrances, Inc. | | 7,000 | | 939,890 | |
RPM International, Inc. | | 23,500 | | 1,381,330 | |
Silgan Holdings, Inc. | | 21,800 | | 514,916 | |
| | | | 4,804,635 | |
Real Estate (8.4%) | | | | | |
American Campus Communities, Inc. | | 14,000 | | 579,460 | |
Camden Property Trust | | 11,800 | | 1,038,990 | |
CoreSite Realty Corp. | | 11,100 | | 968,253 | |
CubeSmart | | 21,500 | | 616,835 | |
Highwoods Properties, Inc. | | 14,000 | | 541,660 | |
Jones Lang LaSalle, Inc. | | 7,400 | | 936,840 | |
Lamar Advertising Co., Class A | | 12,100 | | 837,078 | |
Ryman Hospitality Properties, Inc. | | 10,300 | | 686,907 | |
| | | | 6,206,023 | |
Utilities (3.8%) | | | | | |
Atmos Energy Corp. | | 9,800 | | 908,656 | |
New Jersey Resources Corp. | | 17,000 | | 776,390 | |
ONE Gas, Inc. | | 14,000 | | 1,114,400 | |
| | | | 2,799,446 | |
| | | | | |
TOTAL COMMON STOCKS (Cost $73,581,517) | | | | 73,255,465 | |
| | | | | |
INVESTMENT COMPANIES (1.3%) | | | | | |
JPMorgan U.S. Government Money Market Fund, Capital Shares, 2.28%(b) | | 993,206 | | 993,206 | |
TOTAL INVESTMENT COMPANIES (Cost $993,206) | | | | 993,206 | |
| | | | | |
Total Investments (Cost $74,574,723) — 99.9%(c) | | | | 74,248,671 | |
Other assets in excess of liabilities — 0.1% | | | | 50,734 | |
NET ASSETS — 100.0% | | | | $ | 74,299,405 | |
| | | | | | |
(a) Non-income producing security.
(b) Rate disclosed is the seven day yield as of December 31, 2018.
(c) See Federal Tax Information listed in the Notes to the Financial Statements.
PLC Public Limited Company
See Notes to Financial Statements
25
Financial Statements | Boston Trust SMID Cap Fund |
STATEMENT OF ASSETS AND LIABILITIES
December 31, 2018
Assets: | | | |
Investments, at fair value (cost $74,574,723) | | $ | 74,248,671 | |
Dividends receivable | | 88,780 | |
Receivable for capital shares issued | | 6,290 | |
Prepaid expenses | | 10,861 | |
Total Assets | | 74,354,602 | |
Liabilities: | | | |
Payable for capital shares redeemed | | 5,199 | |
Accrued expenses and other liabilities: | | | |
Investment adviser | | 32,648 | |
Administration and accounting | | 3,181 | |
Custodian | | 827 | |
Transfer agent | | 2,952 | |
Trustee | | 110 | |
Other | | 10,280 | |
Total Liabilities | | 55,197 | |
Net Assets | | $ | 74,299,405 | |
Composition of Net Assets: | | | |
Paid in capital | | $ | 74,376,517 | |
Total distributable earnings/(loss) | | (77,112 | ) |
Net Assets | | $ | 74,299,405 | |
Shares outstanding (par value $0.01, unlimited number of shares authorized) | | 5,077,824 | |
Net Asset Value, Offering Price and Redemption price per share | | $ | 14.63 | |
STATEMENT OF OPERATIONS
For the year ended December 31, 2018
Investment Income: | | | |
Dividends | | $ | 1,121,522 | |
Total Investment Income | | 1,121,522 | |
Expenses: | | | |
Investment adviser | | 554,604 | |
Administration and accounting | | 62,959 | |
Chief compliance officer | | 6,901 | |
Custodian | | 10,920 | |
Transfer agency | | 35,326 | |
Trustee | | 4,335 | |
Other | | 48,735 | |
Total expenses before fee reductions | | 723,780 | |
Fees contractually reduced by the investment adviser | | (168,823 | ) |
Net Expenses | | 554,957 | |
Net Investment Income | | 566,565 | |
Net Realized/Unrealized Gains (Losses) from Investments: | | | |
Net realized gains from investment transactions | | 960,363 | |
Change in unrealized appreciation/depreciation from investments | | (6,823,876 | ) |
Net realized/unrealized gains (losses) from investments | | (5,863,513 | ) |
Change in Net Assets Resulting from Operations | | $ | (5,296,948 | ) |
See Notes to Financial Statements
26
STATEMENTS OF CHANGES IN NET ASSETS
| | For the year ended | | For the year ended | |
| | December 31, 2018 | | December 31, 2017 | |
| | | | | |
Investment Activities: | | | | | |
Operations: | | | | | |
Net investment income | | $ | 566,565 | | $ | 253,128 | |
Net realized gains from investment transactions | | 960,363 | | 511,700 | |
Change in unrealized appreciation/depreciation from investments | | (6,823,876 | ) | 5,147,292 | |
Change in Net Assets Resulting from Operations | | (5,296,948 | ) | 5,912,120 | |
Distributions to shareholders: | | | | | |
Total Distributions | | (1,420,548 | ) | (588,629 | ) |
Change in Net Assets Resulting from distributions to shareholders | | (1,420,548 | ) | (588,629 | ) |
Capital Share Transactions: | | | | | |
Proceeds from shares issued | | 28,631,006 | | 49,339,156 | |
Dividends reinvested | | 1,390,368 | | 574,905 | |
Cost of shares redeemed | | (5,447,086 | ) | (5,305,384 | ) |
Change in Net Assets Resulting from Capital Share Transactions | | 24,574,288 | | 44,608,677 | |
Change in Net Assets | | 17,856,792 | | 49,932,168 | |
Net Assets: | | | | | |
Beginning of period | | 56,442,613 | | 6,510,445 | |
End of period | | $ | 74,299,405 | | $ | 56,442,613 | |
Share Transactions: | | | | | |
Issued | | 1,748,779 | | 3,417,299 | |
Reinvested | | 90,696 | | 36,806 | |
Redeemed | | (336,839 | ) | (361,781 | ) |
Change in shares | | 1,502,636 | | 3,092,324 | |
See Notes to Financial Statements
27
FINANCIAL HIGHLIGHTS
Selected data for a share outstanding throughout the periods indicated.
| | | | | | For the nine | | | | | | | |
| | For the year | | For the year | | months | | For the��year | | For the year | | For the year | |
| | ended | | ended | | ended | | ended | | ended | | ended | |
| | December 31, | | December 31, | | December 31, | | March 31, | | March 31, | | March 31, | |
| | 2018 | | 2017 | | 2016 | | 2016 | | 2015 | | 2014 | |
| | | | | | | | | | | | | |
Net Asset Value, Beginning of Period | | $ | 15.79 | | $ | 13.48 | | $ | 12.49 | | $ | 13.72 | | $ | 13.49 | | $ | 12.05 | |
| | | | | | | | | | | | | |
Investment Activities: | | | | | | | | | | | | | |
Operations: | | | | | | | | | | | | | |
Net investment income/(loss) | | 0.11 | | 0.07 | | 0.13 | | 0.06 | | 0.01 | | (0.01 | ) |
Net realized/unrealized gains (losses) from investments | | (0.98 | ) | 2.41 | | 1.72 | | (0.41 | ) | 0.97 | | 2.40 | |
Total from investment activities | | (0.87 | ) | 2.48 | | 1.85 | | (0.35 | ) | 0.98 | | 2.39 | |
Dividends: | | | | | | | | | | | | | |
Net investment income | | (0.12 | ) | (0.08 | ) | (0.15 | ) | (0.04 | ) | — | | — | |
Net realized gains from investment transactions | | (0.17 | ) | (0.09 | ) | (0.71 | ) | (0.84 | ) | (0.75 | ) | (0.95 | ) |
Total dividends | | (0.29 | ) | (0.17 | ) | (0.86 | ) | (0.88 | ) | (0.75 | ) | (0.95 | ) |
| | | | | | | | | | | | | |
Net Asset Value, End of Period | | $ | 14.63 | | $ | 15.79 | | $ | 13.48 | | $ | 12.49 | | $ | 13.72 | | $ | 13.49 | |
| | | | | | | | | | | | | |
Total Return | | (5.62 | )% | 18.39 | % | 14.67 | %(a) | (2.34 | )% | 7.69 | % | 20.05 | % |
| | | | | | | | | | | | | |
Ratios/Supplemental Data: | | | | | | | | | | | | | |
Net assets at end of period (000’s) | | $ | 74,299 | | $ | 56,443 | | $ | 6,510 | | $ | 5,589 | | $ | 5,386 | | $ | 4,808 | |
Ratio of net expenses to average net assets | | 0.75 | % | 0.75 | % | 0.75 | %(b) | 0.79 | %(c) | 1.00 | % | 1.00 | % |
Ratio of net investment income/(loss) to average net assets | | 0.77 | % | 0.85 | % | 1.31 | %(b) | 0.49 | % | 0.09 | % | (0.06 | )% |
Ratio of expenses (before fee reductions or recoupment of fees previously reimbursed by the investment adviser) to average net assets (d) | | 0.98 | % | 1.04 | % | 1.61 | %(b) | 1.73 | % | 1.73 | % | 1.59 | % |
Portfolio turnover rate | | 14.98 | % | 37.44 | % | 22.69 | %(a) | 50.15 | % | 33.07 | % | 35.97 | % |
Amounts designated as “—” are $0 or have been rounded to $0.
(a) Not annualized for periods less than one year.
(b) Annualized for periods less than one year.
(c) The net expense ratio shown for the period presented represents the blended ratio of the current expense limit in effect as of June 1, 2015 and the higher expense limit in effect prior to that date.
(d) During the periods, certain fees were reduced. If such fee reduction had not occurred, the ratio would have been as indicated.
See Notes to Financial Statements
28
Schedule of Portfolio Investments | Boston Trust Small Cap Fund |
| December 31, 2018 |
Security Description | | Shares | | Fair Value ($) | |
COMMON STOCKS (99.8%) | | | | | |
Communication Services (0.8%) | | | | | |
Cable One, Inc. | | 2,500 | | 2,050,250 | |
| | | | 2,050,250 | |
Consumer Discretionary (13.2%) | | | | | |
Big Lots, Inc. | | 81,375 | | 2,353,365 | |
Brinker International, Inc. | | 44,875 | | 1,973,603 | |
Carter’s, Inc. | | 22,825 | | 1,862,977 | |
Cheesecake Factory, Inc. | | 56,950 | | 2,477,895 | |
Choice Hotels International, Inc. | | 61,450 | | 4,398,590 | |
Dorman Products, Inc. (a) | | 48,000 | | 4,320,960 | |
Dunkin’ Brands Group, Inc. | | 39,700 | | 2,545,564 | |
Gentherm, Inc. (a) | | 52,000 | | 2,078,960 | |
Monro Muffler Brake, Inc. | | 48,900 | | 3,361,875 | |
Texas Roadhouse, Inc. | | 58,875 | | 3,514,837 | |
Williams Sonoma, Inc. | | 60,600 | | 3,057,270 | |
| | | | 31,945,896 | |
Consumer Staples (4.3%) | | | | | |
Flowers Foods, Inc. | | 175,000 | | 3,232,250 | |
Lancaster Colony Corp. | | 19,200 | | 3,395,712 | |
The Boston Beer Co., Inc., Class A (a) | | 8,825 | | 2,125,413 | |
Tootsie Roll Industries, Inc. | | 48,612 | | 1,623,641 | |
| | | | 10,377,016 | |
Energy (2.6%) | | | | | |
Dril-Quip, Inc. (a) | | 61,325 | | 1,841,589 | |
Forum Energy Technologies, Inc. (a) | | 153,750 | | 634,988 | |
Natural Gas Services Group, Inc. (a) | | 46,675 | | 767,337 | |
Newpark Resources, Inc. (a) | | 218,000 | | 1,497,660 | |
RPC, Inc. | | 148,700 | | 1,467,669 | |
| | | | 6,209,243 | |
Financials (16.3%) | | | | | |
1st Source Corp. | | 49,100 | | 1,980,694 | |
Artisan Partners Asset Management, Inc., Class A | | 55,450 | | 1,226,000 | |
Bank of Hawaii Corp. | | 50,325 | | 3,387,878 | |
Bridge BanCorp, Inc. | | 37,525 | | 956,512 | |
Bryn Mawr Bank Corp. | | 45,750 | | 1,573,800 | |
Camden National Corp. | | 36,000 | | 1,294,920 | |
Cohen & Steers, Inc. | | 59,825 | | 2,053,194 | |
Commerce Bancshares, Inc. | | 56,993 | | 3,212,695 | |
CVB Financial Corp. | | 85,300 | | 1,725,619 | |
Eaton Vance Corp. | | 76,375 | | 2,686,873 | |
German American BanCorp | | 37,575 | | 1,043,458 | |
Independent Bank Corp. | | 28,950 | | 2,035,475 | |
Lakeland Financial Corp. | | 61,325 | | 2,462,812 | |
Morningstar, Inc. | | 27,275 | | 2,995,885 | |
Texas Capital Bancshares, Inc. (a) | | 25,575 | | 1,306,627 | |
Tompkins Financial Corp. | | 32,600 | | 2,445,326 | |
UMB Financial Corp. | | 50,725 | | 3,092,703 | |
Washington Federal, Inc. | | 67,100 | | 1,792,241 | |
Washington Trust BanCorp, Inc. | | 44,375 | | 2,109,144 | |
| | | | 39,381,856 | |
Health Care (17.6%) | | | | | |
Anika Therapeutics, Inc. (a) | | 53,900 | | 1,811,579 | |
Atrion Corp. | | 2,600 | | 1,926,808 | |
Bio-Techne Corp. | | 22,625 | | 3,274,290 | |
Bruker Corp. | | 123,250 | | 3,669,153 | |
Charles River Laboratories International, Inc. (a) | | 35,600 | | 4,029,208 | |
Chemed Corp. | | 16,275 | | 4,610,381 | |
CorVel Corp. (a) | | 23,300 | | 1,438,076 | |
Ensign Group, Inc. | | 67,450 | | 2,616,386 | |
Globus Medical, Inc., Class A (a) | | 61,675 | | 2,669,294 | |
Haemonetics Corp. (a) | | 31,350 | | 3,136,568 | |
Hill-Rom Holdings, Inc. | | 40,200 | | 3,559,710 | |
Masimo Corp. (a) | | 52,825 | | 5,671,819 | |
Premier, Inc. (a) | | 51,600 | | 1,927,260 | |
U.S. Physical Therapy, Inc. | | 23,725 | | 2,428,254 | |
| | | | 42,768,786 | |
Industrials (15.8%) | | | | | |
Applied Industrial Technologies, Inc. | | 57,800 | | 3,117,732 | |
Donaldson Co., Inc. | | 102,000 | | 4,425,780 | |
Forward Air Corp. | | 47,200 | | 2,588,920 | |
Franklin Electric Co., Inc. | | 88,100 | | 3,777,728 | |
Herman Miller, Inc. | | 71,175 | | 2,153,044 | |
Hub Group, Inc., Class A (a) | | 80,075 | | 2,968,380 | |
Kadant, Inc. | | 26,150 | | 2,130,179 | |
Landstar System, Inc. | | 41,200 | | 3,941,604 | |
Lincoln Electric Holdings, Inc. | | 45,125 | | 3,558,106 | |
Tennant Co. | | 29,200 | | 1,521,612 | |
UniFirst Corp. | | 23,400 | | 3,347,838 | |
Valmont Industries, Inc. | | 15,650 | | 1,736,368 | |
Watts Water Technologies, Inc., Class A | | 45,400 | | 2,929,662 | |
| | | | 38,196,953 | |
Information Technology (14.1%) | | | | | |
Aspen Technology, Inc. (a) | | 41,325 | | 3,396,088 | |
Coherent, Inc. (a) | | 21,050 | | 2,225,196 | |
CSG Systems International, Inc. | | 108,175 | | 3,436,720 | |
ExlService Holdings, Inc. (a) | | 51,375 | | 2,703,353 | |
InterDigital, Inc. | | 43,600 | | 2,896,348 | |
Manhattan Associates, Inc. (a) | | 72,550 | | 3,073,944 | |
NETGEAR, Inc. (a) | | 74,625 | | 3,882,739 | |
NIC, Inc. | | 232,175 | | 2,897,544 | |
Power Integrations, Inc. | | 36,750 | | 2,241,015 | |
Tech Data Corp. (a) | | 41,000 | | 3,354,210 | |
Teradata Corp. (a) | | 104,200 | | 3,997,111 | |
| | | | 34,104,268 | |
Materials (4.5%) | | | | | |
AptarGroup, Inc. | | 49,250 | | 4,632,947 | |
Minerals Technologies, Inc. | | 32,725 | | 1,680,102 | |
Quaker Chemical Corp. | | 13,025 | | 2,314,672 | |
Silgan Holdings, Inc. | | 97,175 | | 2,295,274 | |
| | | | 10,922,995 | |
Real Estate (5.7%) | | | | | |
American Campus Communities, Inc. | | 48,400 | | 2,003,276 | |
CoreSite Realty Corp. | | 36,500 | | 3,183,895 | |
CubeSmart | | 95,025 | | 2,726,267 | |
HFF, Inc., Class A | | 58,000 | | 1,923,280 | |
Highwoods Properties, Inc. | | 45,500 | | 1,760,395 | |
Ryman Hospitality Properties, Inc. | | 34,850 | | 2,324,147 | |
| | | | 13,921,260 | |
Utilities (4.9%) | | | | | |
Chesapeake Utilities Corp. | | 32,950 | | 2,678,835 | |
Hawaiian Electric Industries, Inc. | | 68,375 | | 2,503,893 | |
New Jersey Resources Corp. | | 58,275 | | 2,661,419 | |
ONE Gas, Inc. | | 50,775 | | 4,041,690 | |
| | | | 11,885,837 | |
| | | | | |
TOTAL COMMON STOCKS (Cost $196,013,067) | | | | 241,764,360 | |
| | | | | |
INVESTMENT COMPANIES (0.3%) | | | | | |
| | | | | |
JPMorgan U.S. Government Money Market Fund, Capital Shares, 2.28%(b) | | 711,329 | | 711,329 | |
TOTAL INVESTMENT COMPANIES (Cost $711,329) | | | | 711,329 | |
| | | | | |
Total Investments (Cost $196,724,396) — 100.1%(c) | | | | 242,475,689 | |
Liabilities in excess of other assets — (0.1)% | | | | (299,467 | ) |
NET ASSETS — 100.0% | | | | $ | 242,176,222 | |
| | | | | | |
(a) Non-income producing security.
(b) Rate disclosed is the seven day yield as of December 31, 2018.
(c) See Federal Tax Information listed in the Notes to the Financial Statements.
See Notes to Financial Statements
29
Financial Statements | Boston Trust Small Cap Fund |
STATEMENT OF ASSETS AND LIABILITIES
December 31, 2018
Assets: | | | |
Investments, at fair value (cost $196,724,396) | | $ | 242,475,689 | |
Dividends receivable | | 242,528 | |
Receivable for capital shares issued | | 58,412 | |
Prepaid expenses | | 18,007 | |
Total Assets | | 242,794,636 | |
Liabilities: | | | |
Payable for capital shares redeemed | | 369,276 | |
Accrued expenses and other liabilities: | | | |
Investment adviser | | 151,333 | |
Administration and accounting | | 11,708 | |
Custodian | | 4,182 | |
Shareholder servicing fees | | 37,374 | |
Transfer agent | | 3,325 | |
Trustee | | 200 | |
Other | | 41,016 | |
Total Liabilities | | 618,414 | |
Net Assets | | $ | 242,176,222 | |
Composition of Net Assets: | | | |
Paid in capital | | $ | 193,226,138 | |
Total distributable earnings/(loss) | | 48,950,084 | |
Net Assets | | $ | 242,176,222 | |
Shares outstanding (par value $0.01, unlimited number of shares authorized) | | 20,177,753 | |
Net Asset Value, Offering Price and Redemption price per share | | $ | 12.00 | |
STATEMENT OF OPERATIONS
For the year ended December 31, 2018
Investment Income: | | | |
Dividends | | $ | 4,048,610 | |
Total Investment Income | | 4,048,610 | |
Expenses: | | | |
Investment adviser | | 2,181,419 | |
Administration and accounting | | 242,250 | |
Chief compliance officer | | 26,859 | |
Custodian | | 40,159 | |
Shareholder servicing | | 493,705 | |
Transfer agency | | 39,234 | |
Trustee | | 17,468 | |
Other | | 125,437 | |
Total expenses before fee reductions | | 3,166,531 | |
Fees contractually reduced by the investment adviser | | (261,419 | ) |
Net Expenses | | 2,905,112 | |
Net Investment Income | | 1,143,498 | |
Net Realized/Unrealized Gains (Losses) from Investments: | | | |
Net realized gains from investment transactions | | 43,824,649 | |
Change in unrealized appreciation/depreciation from investments | | (55,806,560 | ) |
Net realized/unrealized gains (losses) from investments | | (11,981,911 | ) |
Change in Net Assets Resulting from Operations | | $ | (10,838,413 | ) |
See Notes to Financial Statements
30
STATEMENTS OF CHANGES IN NET ASSETS
| | For the year ended | | For the year ended | |
| | December 31, 2018 | | December 31, 2017 | |
| | | | | |
Investment Activities: | | | | | |
Operations: | | | | | |
Net investment income | | $ | 1,143,498 | | $ | 1,583,070 | |
Net realized gains from investment transactions | | 43,824,649 | | 16,055,505 | |
Change in unrealized appreciation/depreciation from investments | | (55,806,560 | ) | 22,621,553 | |
Change in Net Assets Resulting from Operations | | (10,838,413 | ) | 40,260,128 | |
Distributions to shareholders: | | | | | |
Total Distributions | | (34,637,332 | ) | (30,670,654 | ) |
Change in Net Assets Resulting from distributions to shareholders | | (34,637,332 | ) | (30,670,654 | ) |
Capital Share Transactions: | | | | | |
Proceeds from shares issued | | 30,104,415 | | 48,805,738 | |
Dividends reinvested | | 32,559,881 | | 30,030,732 | |
Cost of shares redeemed | | (141,125,269 | ) | (49,906,454 | ) |
Change in Net Assets Resulting from Capital Share Transactions | | (78,460,973 | ) | 28,930,016 | |
Change in Net Assets | | (123,936,718 | ) | 38,519,490 | |
Net Assets: | | | | | |
Beginning of period | | 366,112,940 | | 327,593,450 | |
End of period | | $ | 242,176,222 | | $ | 366,112,940 | |
Share Transactions: | | | | | |
Issued | | 1,948,859 | | 3,318,058 | |
Reinvested | | 2,577,979 | | 2,056,899 | |
Redeemed | | (9,208,620 | ) | (3,373,765 | ) |
Change in shares | | (4,681,782 | ) | 2,001,192 | |
See Notes to Financial Statements
31
FINANCIAL HIGHLIGHTS
Selected data for a share outstanding throughout the periods indicated.
| | | | | | For the nine | | | | | | | |
| | For the year | | For the year | | months | | For the year | | For the year | | For the year | |
| | ended | | ended | | ended | | ended | | ended | | ended | |
| | December 31, | | December 31, | | December 31, | | March 31, | | March 31, | | March 31, | |
| | 2018 | | 2017 | | 2016 | | 2016 | | 2015 | | 2014 | |
| | | | | | | | | | | | | |
Net Asset Value, Beginning of Period | | $ | 14.73 | | $ | 14.33 | | $ | 12.74 | | $ | 15.20 | | $ | 15.73 | | $ | 14.25 | |
| | | | | | | | | | | | | |
Investment Activities: | | | | | | | | | | | | | |
Operations: | | | | | | | | | | | | | |
Net investment income | | 0.07 | | 0.07 | | 0.12 | | 0.06 | | 0.03 | | — | |
Net realized/unrealized gains (losses) from investments | | (0.86 | ) | 1.67 | | 1.92 | | (0.25 | ) | 0.51 | | 2.66 | |
Total from investment activities | | (0.79 | ) | 1.74 | | 2.04 | | (0.19 | ) | 0.54 | | 2.66 | |
Dividends: | | | | | | | | | | | | | |
Net investment income | | (0.07 | ) | (0.08 | ) | (0.14 | ) | (0.06 | ) | (0.01 | ) | — | |
Net realized gains from investment transactions | | (1.87 | ) | (1.26 | ) | (0.31 | ) | (2.21 | ) | (1.06 | ) | (1.18 | ) |
Total dividends | | (1.94 | ) | (1.34 | ) | (0.45 | ) | (2.27 | ) | (1.07 | ) | (1.18 | ) |
| | | | | | | | | | | | | |
Net Asset Value, End of Period | | $ | 12.00 | | $ | 14.73 | | $ | 14.33 | | $ | 12.74 | | $ | 15.20 | | $ | 15.73 | |
| | | | | | | | | | | | | |
Total Return | | (6.00 | )% | 12.26 | % | 15.94 | %(a) | (0.52 | )% | 3.81 | % | 18.74 | % |
| | | | | | | | | | | | | |
Ratios/Supplemental Data: | | | | | | | | | | | | | |
Net assets at end of period (000’s) | | $ | 242,176 | | $ | 366,113 | | $ | 327,593 | | $ | 338,656 | | $ | 439,681 | | $ | 536,292 | |
Ratio of net expenses to average net assets | | 1.00 | % | 1.00 | % | 1.00 | %(b) | 1.00 | % | 1.00 | % | 1.00 | % |
Ratio of net investment income to average net assets | | 0.39 | % | 0.46 | % | 1.21 | %(b) | 0.44 | % | 0.17 | % | 0.02 | % |
Ratio of expenses (before fee reductions or recoupment of fees previously reimbursed by the investment adviser) to average net assets (c) | | 1.09 | % | 1.02 | % | 1.06 | %(b) | 1.08 | % | 1.05 | % | 1.07 | % |
Portfolio turnover rate | | 24.60 | % | 23.78 | % | 51.92 | %(a) | 37.42 | % | 28.62 | % | 34.50 | % |
Amounts designated as “—” are $0 or have been rounded to $0.
(a) Not annualized for periods less than one year.
(b) Annualized for periods less than one year.
(c) During the periods, certain fees were reduced or recouped by the investment adviser. If such fee reductions/recoupments had not occurred, the ratio would have been as indicated.
See Notes to Financial Statements
32
This page intentionally left blank.
33

Read our 2018 Annual ESG Impact Report online
We invite you to read our Annual ESG Impact Report online, which provides an in-depth view of the ways in which Boston Trust & Investment Management Company and Walden promote business sustainability and achieve impact on behalf of clients.
The report can be found at: https://waldenassetmgmt.com/wp-content/uploads/2019/02/annualreport2018.pdf

Included in this report:
· Results of our shareholder engagement initiatives
· Sustainable Development Goals (SDG) engagement mapping
· Proxy voting record
· Principles for Responsible Investment (PRI) assessment
· Portfolio carbon footprints
· Public policy initiatives
· Industry thought leadership examples
· Our company’s ESG performance
34
This page intentionally left blank.
35
Walden Asset Management Fund
Walden Equity Fund
December 31, 2018
William H. Apfel, CFA
Portfolio Manager
Boston Trust Investment Management, Inc.
Asset Management Fund Objective
The Fund seeks long-term capital growth and income through an actively managed portfolio of stocks, bonds and money market instruments.
Equity Fund Objective
The Fund seeks long-term growth of capital through an actively managed portfolio of stocks.
Investment Concerns
Equity securities (stocks) are more volatile and carry more risk and return potential than other forms of investments, including investments in high-grade fixed income securities. The net asset value per share of these Funds will fluctuate as the value of the securities in the portfolio changes.
Foreign investing involves risks not typically associated with U.S. investments, including adverse political, social and economic developments and differing auditing and legal standards. These risks are magnified in emerging markets.
Small- to mid-capitalization companies typically have a higher risk of failure and historically have experienced a greater degree of volatility.
Bonds offer a relatively stable level of income, although bond prices will fluctuate, providing the potential for principal gain or loss. Intermediate term, higher quality bonds generally offer less risk than longer-term bonds and a lower rate of return.
Manager Commentary (Unaudited)
Management Discussion of Fund Performance
For the 12-month period ended December 31, 2018, the Walden Asset Management Fund and the Walden Equity Fund returned -1.90% and -2.54%, respectively. The results compared favorably to the relevant market indices, including the S&P 500 Index and the Bloomberg Barclays U.S. Government Credit Bond Index, which fell by 4.38% and 0.42%, respectively, for the year. Despite an equity allocation near the upper-end of the 40% to 80% policy range, the Walden Asset Management Fund’s equity segment returns outpaced the S&P 500 by roughly the same degree as the Walden Equity Fund and allowed the Fund’s overall value to hold up relatively well. This performance pattern of providing protection during market downturns has been typical over both Funds’ histories; an investment focus on reasonably valued, high-quality companies has typically been at the core of such index outperformance, and the recent period was a case in point.*
Within the equity portfolios, stock selection was the predominant driver of relative returns. Portfolio holdings within the information technology sector were positive contributors to both absolute and relative returns for the year ended December 31, 2018. Investments are concentrated among business models with high recurring revenue streams (i.e. software and services), while generally avoiding those that are dependent on ramping economic expansion (e.g. semiconductors)—both preferences worked well for the portfolio during the period given market sentiment, especially in the latter part of the year. An overweight position to financials, and banks and lenders in particular, however, was a drag on both relative and absolute performance. These stocks did not perform well, likely due to concerns relating to a flattening yield curve and murkier economic outlook. The same economic concern may also have led to stronger relative returns for the less economically sensitive consumer staples sector. The equity portfolios were overweight to the group relative to the Index, while three individual holdings—Costco, Church & Dwight, and Clorox—were significant contributors to overall outperformance.*
Outlook
Despite the market’s recent correction, we believe that most evidence supports a positive outlook for stocks. Low interest rates, a strong labor market, and healthy corporate cash flows reflect a robust domestic economy. And while economic indicators and geopolitical matters bear watching, most global economies continue to expand. Further, the combination of rising corporate profits and the market pullback has produced equity valuations that are reasonable by recent and historical standards, as well as our own metrics. As such, we continue to favor equities over both fixed income and money market instruments in the Walden Asset Management Fund and remain steadfast in focusing investments in financially strong companies that we believe are well-suited to weather potential economic turbulence.*
* Portfolio composition is subject to change.
36
Investment Performance (Unaudited) | Walden Asset Management Fund |
| Walden Equity Fund |
| December 31, 2018 |
| | For the periods ended 12/31/18 | |
| | Average Annual Total Returns | |
| | | | | | | | | | | | Since | |
| | | | | | | | | | | | Inception | |
| | 1 Year | | 3 years | | 5 Years | | 10 Years | | 15 Years | | (6/18/99) | |
Walden Asset Management Fund(1) | | -1.90 | % | 7.12 | % | 5.83 | % | 8.61 | % | 5.73 | % | 5.06 | % |
Walden Equity Fund(1) | | -2.54 | % | 9.58 | % | 7.58 | % | 11.87 | % | 7.23 | % | 5.98 | % |
S&P 500 Index | | -4.38 | % | 9.26 | % | 8.49 | % | 13.12 | % | 7.77 | % | 5.25 | % |
Bloomberg Barclays U.S. Government/Credit Bond Index | | -0.42 | % | 2.19 | % | 2.53 | % | 3.46 | % | 3.85 | % | 4.80 | % |
FTSE 3 Month US T-Bill Index | | 1.86 | % | 0.99 | % | 0.60 | % | 0.35 | % | 1.26 | % | 1.76 | % |
Hypothetical Growth of a $100,000 Investment

The above charts represent a 10-year hypothetical $100,000 investment in the Walden Asset Management Fund and Walden Equity Fund, and includes the reinvestment of dividends and capital gains in the Funds. The returns shown on the table and the graphs do not reflect the deduction of taxes a shareholder would pay on Fund distributions or the redemption of Fund shares.
The Walden Asset Management Fund is measured against a combination of equity and fixed income indices. The Walden Equity Fund is measured against the Standard & Poor’s 500 Index (“S&P 500”), which is widely regarded as a gauge of the U.S. equities market. This index includes 500 leading companies in leading industries of the U.S. economy. Although the S&P 500 focuses on the large-cap segment of the market, with approximately 75% coverage of U.S. equities, it is also also widely viewed as a proxy for the total market. The Bloomberg Barclays U.S. Government/Credit Bond Index includes Treasuries (i.e., public obligations of the U.S. Treasury that have remaining maturities of more than one year), government-related issues (i.e., agency, sovereign, supranational, and local authority debt), and USD Corporates. The Bloomberg Barclays U.S. Government/Credit Bond Index is a component of the Bloomberg Barclays U.S. Aggregate Bond Index. The FTSE 3 Month US T-Bill Index reflects monthly return equivalents of yield averages that are not marked to the market. The index is an average of the last three-month treasury bill issues. The three-month treasury bills are the short-term debt obligations of the U.S. Government. The indexes are unmanaged and their performance does not reflect the deduction of expenses associated with a mutual fund, such as investment management and fund accounting fees. The Funds’ performance reflects the deduction of fees for these services. Investors cannot invest directly in an index.

Walden Asset Management Fund
Fund Net Asset Value: | | $ | 17.06 | |
Gross Expense Ratio(1): | | 1.03 | % |
Walden Equity Fund
Fund Net Asset Value: | | $ | 20.63 | |
Gross Expense Ratio(1): | | 1.07 | % |
Past performance does not guarantee future results. The performance data quoted represents past performance and current returns may be lower or higher. The investment return and principal value will fluctuate so that an investor’s shares, when redeemed may be worth more or less than the original cost. To obtain performance information current to the most recent month-end, please call 1-800-282-8782 ext. 7050.
(1) The Gross Expense Ratio is from each Fund’s most recent prospectus, dated May 1, 2018. The contractual fee limit under each Fund’s expense limitation agreement is 1.00% of each Fund’s average annual net assets, subject to certain limitations as described in each Fund’s prospectus. Please see each Fund’s most recent prospectus for details. Additional information pertaining to each Fund’s expense ratio as of December 31, 2018 can be found in the financial highlights included in this report. The investment performance may reflect fee reductions. If such fee reductions had not occurred, the quoted performance would have been lower. The contractual fee waiver continues through May 1, 2019 and may be renewed thereafter.
37
Walden Midcap Fund
December 31, 2018
Stephen J. Amyouny, CFA
Lead Portfolio Manager
Belinda Cavazos, CFA
Portfolio Manager
Richard Q. Williams, CFA
Portfolio Manager
Boston Trust Investment Management, Inc.
Fund Objective
The Fund seeks long-term capital growth through an actively managed portfolio of stocks of middle capitalization (“mid cap”) companies.
Investment Concerns
Equity securities (stocks) are more volatile and carry more risk and return potential than other forms of investments, including investments in high-grade fixed income securities.
Mid cap funds typically carry additional risks since smaller companies generally have a higher risk of failure.
Manager Commentary (Unaudited)
Management Discussion of Fund Performance
Portfolio Review
For the 12-month period ended December 31, 2018, the Walden Midcap Fund returned -3.58% in 2018, outperforming the -9.06% return of the Russell Midcap® Index. The Fund is also ahead of the index for the trailing three- and five-year time periods, with lower volatility than the index.
Our preference for higher-quality stocks was the primary driver of relative performance for the year. At a sector level, consumer discretionary and consumer staples stocks contributed most to relative performance. Within discretionary, our positioning among retailers was additive, while our avoidance of the most cyclical, economically sensitive industries (e.g. autos) also proved beneficial. Performance in consumer staples benefitted from the market favoring higher quality stocks. On the negative side the strategy’s modest underweight to utilities, the only sector posting a positive return for the year, detracted from results.*
Church & Dwight was the top individual stock contributor for the year. A leading manufacturer of household and personal care products, Church & Dwight produced strong sales and earnings results thanks to market share gains in laundry, positive price increases, and the successful integration of recent bolt-on acquisitions. On the negative side, IPG Photonics, the dominant provider of industrial fiber lasers, declined on disappointing revenue due to slowing orders from customers in Europe and China.
Outlook
It is difficult to know how long the market correction will last. The underlying fundamentals of the U.S. economy, including growth in employment, retail sales, capital investments, and corporate earnings, remain solid. However, there are signs of increasing macroeconomic uncertainty as well. Several indicators point to a deceleration of gross domestic product(1) growth from the very healthy levels experienced in 2018. Some areas of concern include a growth slowdown among key trading partners like Germany, Japan, and China, increasing concerns the U.S. Federal Reserve will be too aggressive in raising interest rates, and the potential for protectionist trade policies to weaken U.S. economic growth. While some market participants fear a recession, our base case outlook remains that fundamentals for the U.S. equity market remain solid. Valuations have become more reasonable, and some areas of speculative activity are less evident now than they were a year ago.
We remain focused on constructing a well-diversified portfolio of higher quality, reasonably valued companies that we believe can generate stronger economic returns across a full market cycle. Compared to the Russell Midcap® Index, the Walden Midcap Fund is invested in companies with higher and more stable returns on invested capital, stronger revenue and earnings growth, and less reliance on capital markets to fund investments. Despite this higher quality financial profile, valuation for the Fund on a GAAP price-to-earnings(2) basis, at 23x is approximately in line with the index at 22x. The combination of superior fundamentals, more resilient balance sheets, and reasonable valuation relative to the benchmark gives us confidence the Fund is well-positioned for the future.
* Portfolio composition is subject to change.
(1) The gross domestic product (GDP) is the measure of the market value of the goods and services produced by labor and property in the United States
(2) The price-to-earnings ratio (P/E Ratio) is a valuation ratio of a company’s current share price to its per-share earnings.
38
Investment Performance (Unaudited) | | Walden Midcap Fund |
| | December 31, 2018 |
| | For the periods ended 12/31/18 | |
| | Average Annual Total Returns | |
| | | | | | | | Since | |
| | | | | | | | Inception | |
| | 1 Year | | 3 Years | | 5 Years | | (8/1/11) | |
Walden Midcap Fund(1) | | -3.58 | % | 8.95 | % | 7.43 | % | 9.88 | % |
Russell Midcap® Index | | -9.06 | % | 7.04 | % | 6.26 | % | 10.09 | % |
Hypothetical Growth of a $100,000 Investment

The above chart represents a hypothetical $100,000 investment in the Walden Midcap Fund from August 1, 2011 to December 31, 2018, and includes the reinvestment of dividends and capital gains in the Fund. The returns shown on the table and graph do not reflect the deduction of taxes a shareholder would pay on Fund distributions or the redemption of Fund shares.
The Walden Midcap Fund is measured against the Russell Midcap® Index, which is an unmanaged index that tracks the performance of the mid-cap segment of the U.S. equity universe. The Russell Midcap® Index is a subset of the Russell 1000® Index. It includes approximately 800 of the smallest securities based on a combination of their market capitalization and current index membership. The Russell Midcap® Index represents approximately 31% of the total market capitalization of the Russell 1000 companies. Russell Investment Group is the source and owner of the trademarks, service marks and copyrights related to the Russell Indexes. Russell® is a trademark of Russell Investment Group. The performance of an index does not reflect the deduction of expenses associated with a mutual fund, such as investment management and fund accounting fees. The Fund’s performance reflects the deduction of fees for these services. Investors cannot invest directly in an index.

Fund Net Asset Value: | | $ | 15.57 | |
Gross Expense Ratio(1): | | 1.01 | % |
Past performance does not guarantee future results. The performance data quoted represents past performance and current returns may be lower or higher. The investment return and principal value will fluctuate so that an investor’s shares, when redeemed may be worth more or less than the original cost. Returns less than one year are not annualized. To obtain performance information current to the most recent month-end, please call 1-800-282-8782 ext. 7050.
(1) The Gross Expense Ratio is from the Fund’s most recent prospectus, dated May 1, 2018. Additional information pertaining to the Fund’s expense ratio as of December 31, 2018 can be found in the financial highlights included in this report.
39
Walden SMID Cap Fund
December 31, 2018
Kenneth P. Scott, CFA
Lead Portfolio Manager
Belinda Cavazos, CFA
Portfolio Manager
Richard Q. Williams, CFA
Portfolio Manager
Boston Trust Investment Management, Inc.
Fund Objective
The Fund seeks long-term capital growth through an actively managed portfolio of stocks of small to middle capitalization (“smid cap”) companies.
Investment Concerns
Equity securities (stocks) are more volatile and carry more risk and return potential than other forms of investments, including investments in high-grade fixed income securities.
Smid cap companies typically have a higher risk of failure and historically have experienced a greater degree of volatility.
Manager Commentary (Unaudited)
Management Discussion of Fund Performance
For the 12-month period ended December 31, 2018, the Walden SMID Cap Fund declined 5.59%, outperforming the -10.00% return of the Russell 2500™ Index. The Fund is also ahead of the index for the three- and five-year periods, with less volatility than the benchmark.
Our analysis suggests that stocks of higher-quality firms outperformed the Russell 2500™ Index in 2018. On a relative basis, Fund holdings in materials and health care contributed most positively to performance, while returns in information technology and financials detracted most from results this year. Relative underperformance in information technology was partly driven by our underweight to the internet software and services industry, which is overwhelmingly comprised of stocks we view as less reasonably valued. One of the top individual stock contributors for the year was Church & Dwight, a leading manufacturer of household and personal care products, that benefitted from strong sales and earnings results due to market share gains in laundry, positive price increases, and the successful integration of recent bolt-on acquisitions. Among detractors, Big Lots, a discount retailer, declined due to earnings that came in below expectations driven by higher labor and transportation costs.*
Outlook
It is difficult to know how long the market correction will last. The underlying fundamentals of the U.S. economy, including growth in employment, retail sales, capital investments, and corporate earnings, remain solid. However, there are signs of increasing macroeconomic uncertainty as well. Several indicators point to a deceleration of gross domestic product(1) growth from the very healthy levels experienced in 2018. Some areas of concern include a growth slowdown among key trading partners like Germany, Japan, and China, concerns that the U.S. Federal Reserve will be too aggressive in raising interest rates, and the potential for protectionist trade policies to weaken U.S. economic growth. While some market participants fear a recession, our base case outlook is that fundamentals for the U.S. smaller cap market remain solid. Valuations have become more reasonable, and some areas of speculative activity are less evident now than they were a year ago.
We remain focused on constructing a well-diversified Fund of higher quality, reasonably valued companies that we believe can generate stronger economic returns across a full market cycle. Compared to the benchmark, the Fund is invested in companies with higher and more stable returns on invested capital, stronger revenue and earnings growth, and less reliance on capital markets to fund investments. Despite this higher quality financial profile, valuation for the Fund currently stands at an average operating price-to-earnings (P/E) ratio(2) of 23x, lower than the Russell 2500™ operating P/E of 24x. On a GAAP basis, the Fund trades at a 25x P/E, a discount to the benchmark’s 29x GAAP P/E. The combination of superior fundamentals, more resilient balance sheets, and more reasonable valuation relative to the benchmark gives us confidence the Fund is well-positioned for the future.*
* Portfolio composition is subject to change.
(1) The gross domestic product (GDP) is the measure of the market value of the goods and services produced by labor and property in the United States
(2) The price-to-earnings ratio (P/E Ratio) is a valuation ratio of a company’s current share price to its per-share earnings.
40
Investment Performance (Unaudited) | | Walden SMID Cap Fund |
| | December 31, 2018 |
| | For the periods ended 12/31/18 | |
| | Average Annual Total Returns | |
| | | | | | | | Since | |
| | | | | | | | Inception | |
| | 1 Year | | 3 Years | | 5 Years | | (6/28/12) | |
Walden SMID Cap Fund(1) | | -5.59 | % | 9.86 | % | 6.04 | % | 10.62 | % |
Russell 2500™ Index | | -10.00 | % | 7.32 | % | 5.15 | % | 10.96 | % |
Hypothetical Growth of a $100,000 Investment

The above chart represents a hypothetical $100,000 investment in the Walden SMID Cap Fund from June 28, 2012 to December 31, 2018, and includes the reinvestment of dividends and capital gains in the Fund. The returns shown on the table and the graph do not reflect the deduction of taxes a shareholder would pay on Fund distributions or the redemption of Fund shares.
The Walden SMID Cap Fund is measured against the Russell 2500™ Index, which is an unmanaged index that tracks the performance of the small- to mid-cap segment of the U.S. equity universe, commonly referred to as “smid” cap. The Russell 2500 is a subset of the Russell 3000® Index. It includes approximately 2500 of the smallest securities based on a combination of their market cap and current index membership. Russell Investment Group is the source and owner of the trademarks, service marks and copyrights related to the Russell Indexes. Russell® is a trademark of Russell Investment Group. The performance of an index does not reflect the deduction of expenses associated with a mutual fund, such as investment management and fund accounting fees. The Fund’s performance reflects the deduction of fees for these services. Investors cannot invest directly in an index.

Fund Net Asset Value: | | $ | 15.12 | |
Gross Expense Ratio(1): | | 1.08 | % |
Past performance does not guarantee future results. The performance data quoted represents past performance and current returns may be lower or higher. The investment return and principal value will fluctuate so that an investor’s shares, when redeemed may be worth more or less than the original cost. To obtain performance information current to the most recent month-end, please call 1-800-282-8782 ext. 7050.
(1) The Gross Expense Ratio is from the Fund’s most recent prospectus, dated May 1, 2018. The contractual fee limit under the Fund’s expense limitation agreement is 1.00% of the Fund’s average annual net assets, subject to certain limitations as described in the Fund’s prospectus. Please see the Fund’s most recent prospectus for details. Additional information pertaining to the Fund’s expense ratio as of December 31, 2018 can be found in the financial highlights included in this report. The investment performance may reflect fee reductions. If such fee reductions had not occurred, the quoted performance would have been lower. The contractual fee waiver continues through May 1, 2019 and may be renewed thereafter.
41
Walden Small Cap Fund
December 31, 2018
Kenneth P. Scott, CFA
Lead Portfolio Manager
Belinda Cavazos, CFA
Portfolio Manager
Richard Q. Williams, CFA
Portfolio Manager
Boston Trust Investment Management, Inc.
Fund Objective
The Fund seeks long-term capital growth through an actively managed portfolio of stocks of small capitalization (“small cap”) companies.
Investment Concerns
Equity securities (stocks) are more volatile and carry more risk and return potential than other forms of investments, including investments in high-grade fixed income securities.
Small cap funds typically carry additional risks since smaller companies generally have a higher risk of failure, and historically, their stocks have experienced a greater degree of market volatility than stocks on average.
Manager Commentary (Unaudited)
Management Discussion of Fund Performance
For the 12-month period ended December 31, 2018, the Walden Small Cap Fund declined 6.05%, outperforming the -11.01% return of the Russell 2000® Index. The Fund is also ahead of the index for the three-year period, with less volatility than the benchmark.
Our analysis suggests that stocks of higher-quality firms outperformed the Russell 2000® Index in 2018. On a relative basis, Fund holdings in health care and consumer discretionary contributed most positively to performance, while returns in information technology and financials detracted most from results this year. Relative underperformance in information technology was driven by our underweight to the internet software and services industry, which is overwhelmingly comprised of stocks we view as less reasonably valued. The top individual stock contributor for the year was Haemonetics, a global leader in blood management solutions, in part a reflection of their successful launch of a next generation system. The top detractor was Coherent, a leader in industrial lasers, that was impacted by a cyclical slow down in orders for its OLED mobile phone display technology, as well as weakening demand in China.*
Outlook
It is difficult to know how long the market correction will last. The underlying fundamentals of the U.S. economy, including growth in employment, retail sales, capital investments, and corporate earnings, remain solid. However, there are signs of increasing macroeconomic uncertainty as well. Several indicators point to a deceleration of gross domestic product(1) growth from the very healthy levels experienced in 2018. Some areas of concern include a growth slowdown among key trading partners like Germany, Japan, and China, concerns that the U.S. Federal Reserve will be too aggressive in raising interest rates, and the potential for protectionist trade policies to weaken U.S. economic growth. While some market participants fear a recession, our base case outlook is that fundamentals for the U.S. small-cap market remain solid. Valuations have become more reasonable, and some areas of speculative activity are less evident now than they were a year ago.
We remain focused on constructing a well-diversified Fund of higher quality, reasonably valued companies that we believe can generate stronger economic returns across a full market cycle. Compared to the benchmark, the Fund is invested in companies with higher and more stable returns on invested capital, stronger revenue and earnings growth, and less reliance on capital markets to fund investments. Despite this higher quality financial profile, valuation for the Fund currently stands at an average operating price-to-earnings (P/E) ratio(2) of 25x, lower than the Russell 2000® operating P/E of 30x. The combination of superior fundamentals, more resilient balance sheets, and more reasonable valuation relative to the benchmark, gives us confidence the Fund is well-positioned for the future.*
* Portfolio composition is subject to change.
(1) The gross domestic product (GDP) is the measure of the market value of the goods and services produced by labor and property in the United States
(2) The price-to-earnings ratio (P/E Ratio) is a valuation ratio of a company’s current share price to its per-share earnings.
42
Investment Performance (Unaudited) | | Walden Small Cap Fund |
| | December 31, 2018 |
| | For the periods ended 12/31/18 | |
| | Average Annual Total Returns | |
| | | | | | | | | | Since | |
| | | | | | | | | | Inception | |
| | 1 Year | | 3 Years | | 5 Years | | 10 Years | | (10/24/08) | |
Walden Small Cap Fund(1) | | -6.05 | % | 9.10 | % | 4.37 | % | 11.70 | % | 12.02 | % |
Russell 2000® Index | | -11.01 | % | 7.36 | % | 4.41 | % | 11.97 | % | 12.44 | % |
Hypothetical Growth of a $100,000 Investment

The above chart represents a 10-year hypothetical $100,000 investment in the Walden Small Cap Fund and includes the reinvestment of dividends and capital gains in the Fund. The returns shown on the table and graph do not reflect the deduction of taxes a shareholder would pay on Fund distributions or the redemption of Fund shares.
The Walden Small Cap Fund is measured against the Russell 2000® Index, which is an unmanaged index that tracks the performance of the small-cap segment of the U.S. equity universe. The Russell 2000® Index is a subset of the Russell 3000® Index representing approximately 10% of the total market capitalization of that index. It includes approximately 2,000 of the smallest securities based on a combination of their market cap and current index membership. Russell Investment Group is the source and owner of the trademarks, service marks and copyrights related to the Russell Indexes. Russell® is a trademark of Russell Investment Group. The performance of an index does not reflect the deduction of expenses associated with a mutual fund, such as investment management and fund accounting fees. The Fund’s performance reflects the deduction of fees for these services. Investors cannot invest directly in an index.

Fund Net Asset Value: | | $ | 17.24 | |
Gross Expense Ratio(1): | | 1.03 | % |
Past performance does not guarantee future results. The performance data quoted represents past performance and current returns may be lower or higher. The investment return and principal value will fluctuate so that an investor’s shares, when redeemed may be worth more or less than the original cost. To obtain performance information current to the most recent month-end, please call 1-800-282-8782 ext. 7050.
(1) The Gross Expense Ratio is from the Fund’s most recent prospectus, dated May 1, 2018. The contractual fee limit under the Fund’s expense limitation agreement is 1.00% of the Fund’s average annual net assets, subject to certain limitations as described in the Fund’s prospectus. Please see the Fund’s most recent prospectus for details. Additional information pertaining to the Fund’s expense ratio as of December 31, 2018 can be found in the financial highlights included in this report. The investment performance may reflect fee reductions. If such fee reductions had not occurred, the quoted performance would have been lower. The contractual fee waiver continues through May 1, 2019 and may be renewed thereafter.
43
Walden International Equity Fund
December 31, 2018
William H. Apfel, CFA
Lead Portfolio Manager
Nathaniel J. Riley, CFA
Portfolio Manager
David A. Sandell, CFA
Portfolio Manager
Boston Trust Investment Management, Inc.
Fund Objective
The Fund seeks long-term capital growth through an actively managed portfolio of equities of international companies.
Investment Concerns
International investing involves increased risk and volatility. An investment in international funds entails the special risks of international investing, including currency exchange fluctuation, government regulations and intervention, and the potential for political and economic instability.
Foreign investing involves risks not typically associated with U.S. investments, including adverse political, regulatory, social and economic developments and differing auditing and legal standards. These risks are magnified in emerging markets.
Equity securities (stocks) are more volatile and carry more risk and return potential than other forms of investments, including investments in high-grade fixed income securities.
Mid-capitalization funds typically carry additional risks since smaller companies generally have a higher risk of failure.
The net asset value per share of these Funds will fluctuate as the value of the securities in the portfolio changes.
Cash equivalents offer low risk and low return potential.
Manager Commentary (Unaudited)
Management Discussion of Fund Performance
For the 12-month period ended December 31, 2018, the Walden International Equity Fund posted a total return of -10.18%. The Fund’s return exceeded that of its primary benchmark, the MSCI World ex-USA Index (net), which posted a return of -14.09% for the year.
Returns in most developed international markets were negative for the year. Slowing rates of economic growth in many regions throughout 2018 reduced prospects for corporate profit growth. Gross domestic product (GDP) growth rates are currently expected to fall further in 2019 across much of the developed world. This moderation in growth and in growth expectations is one factor which contributed to increased market volatility experienced in the Fund during the prior year. Other factors include political issues that threaten to further disrupt the global economy, including escalating trade restrictions between the US and China, and tensions within Europe including Brexit and a rising influence of nationalist political parties.
Against this backdrop, the Fund’s outperformance relative to its benchmark can be attributed largely to its investment style. Stocks of companies we view as higher-than-average quality, a characteristic we emphasize, outperformed during the year. This includes companies that are more profitable and have had earnings that are more stable over time than their peers, and therefore rely less on growth to meet investor expectations.*
* Portfolio composition is subject to change.
44
Investment Performance (Unaudited) | | Walden International |
| | Equity Fund |
| | December 31, 2018 |
| | For the periods ended 12/31/18 | |
| | Average Annual Total Returns | |
| | | | | | Since | |
| | | | | | Inception | |
| | 1 Year | | 3 Years | | (6/9/15) | |
Walden International Equity Fund(1) | | -10.18 | % | 2.68 | % | 0.80 | % |
MSCI World ex-USA Index (net) | | -14.09 | % | 3.11 | % | 0.26 | % |
Hypothetical Growth of a $1,000,000 Investment
The above chart represents a hypothetical $1,000,000 investment in the Walden International Equity Fund from June 9, 2015 to December 31, 2018, and includes the reinvestment of dividends and capital gains in the Fund. The returns shown on the table and the graph do not reflect the deduction of taxes a shareholder would pay on Fund distributions or the redemption of Fund shares.
The Walden International Equity Fund is measured against the MSCI World ex-USA Index. The MSCI World ex-USA Index captures large- and mid-cap representation of developed markets countries, excluding the United States. This index is unmanaged and the performance of an index does not reflect the deduction of expenses associated with a mutual fund, such as investment management and fund accounting fees. The Fund’s performance reflects the deduction of fees for these services. Investors cannot invest directly in an index.

Fund Net Asset Value: | | $ | 9.78 | |
Gross Expense Ratio(1): | | 1.31 | % |
Past performance does not guarantee future results. The performance data quoted represents past performance and current returns may be lower or higher. The investment return and principal value will fluctuate so that an investor’s shares, when redeemed may be worth more or less than the original cost. To obtain performance information current to the most recent month-end, please call 1-800-282-8782 ext. 7050.
(1) The Gross Expense Ratio is from the Fund’s most recent prospectus, dated May 1, 2018. The contractual fee limit under the Fund’s expense limitation agreement is 1.15% of the Fund’s average annual net assets, subject to certain limitations as described in the Fund’s prospectus. Please see the Fund’s most recent prospectus for details. Additional information pertaining to the Fund’s expense ratio as of December 31, 2018 can be found in the financial highlights included in this report. The investment performance may reflect fee reductions. If such fee reductions had not occurred, the quoted performance would have been lower. The contractual fee waiver continues through May 1, 2019 and may be renewed thereafter.
45
Schedule of Portfolio Investments | Walden Asset Management Fund |
| December 31, 2018 |
Security Description | | Shares | | Fair Value ($) | |
COMMON STOCKS (67.3%) | | | | | |
Communication Services (5.1%) | | | | | |
Alphabet, Inc., Class A (a) | | 1,000 | | 1,044,960 | |
Alphabet, Inc., Class C (a) | | 2,550 | | 2,640,805 | |
Charter Communications, Inc., Class A (a) | | 2,445 | | 696,752 | |
Comcast Corp., Class A | | 27,000 | | 919,350 | |
Omnicom Group, Inc. | | 14,000 | | 1,025,360 | |
| | | | 6,327,227 | |
Consumer Discretionary (5.5%) | | | | | |
Advance Auto Parts, Inc. | | 2,500 | | 393,650 | |
Autoliv, Inc. | | 3,000 | | 210,690 | |
Booking Holdings, Inc. (a) | | 450 | | 775,089 | |
Dollar General Corp. | | 9,600 | | 1,037,568 | |
McDonald’s Corp. | | 2,000 | | 355,140 | |
NIKE, Inc., Class B | | 18,000 | | 1,334,520 | |
Ross Stores, Inc. | | 14,000 | | 1,164,800 | |
Starbucks Corp. | | 19,000 | | 1,223,600 | |
The Home Depot, Inc. | | 2,000 | | 343,640 | |
Veoneer, Inc. (a) | | 3,000 | | 70,710 | |
| | | | 6,909,407 | |
Consumer Staples (7.1%) | | | | | |
Church & Dwight Co., Inc. | | 12,000 | | 789,120 | |
Colgate-Palmolive Co. | | 17,500 | | 1,041,600 | |
Costco Wholesale Corp. | | 8,600 | | 1,751,906 | |
Estee Lauder Cos., Inc. | | 10,000 | | 1,301,000 | |
PepsiCo, Inc. | | 13,000 | | 1,436,240 | |
Reckitt Benckiser Group PLC, Sponsored | | | | | |
ADR | | 25,000 | | 378,250 | |
The Clorox Co. | | 8,500 | | 1,310,190 | |
The Hershey Co. | | 8,000 | | 857,440 | |
| | | | 8,865,746 | |
Energy (2.2%) | | | | | |
Apache Corp. | | 22,000 | | 577,500 | |
ConocoPhillips | | 35,000 | | 2,182,250 | |
| | | | 2,759,750 | |
Financials (11.2%) | | | | | |
American Express Co. | | 10,000 | | 953,200 | |
BB&T Corp. | | 26,000 | | 1,126,320 | |
Cincinnati Financial Corp. | | 15,000 | | 1,161,300 | |
Comerica, Inc. | | 9,000 | | 618,210 | |
Commerce Bancshares, Inc. | | 13,891 | | 783,036 | |
Discover Financial Services | | 14,000 | | 825,720 | |
JPMorgan Chase & Co. | | 20,000 | | 1,952,400 | |
Northern Trust Corp. | | 14,000 | | 1,170,260 | |
PNC Financial Services Group, Inc. | | 11,500 | | 1,344,465 | |
State Street Corp. | | 10,500 | | 662,235 | |
SunTrust Banks, Inc. | | 20,000 | | 1,008,800 | |
T. Rowe Price Group, Inc. | | 10,000 | | 923,200 | |
U.S. Bancorp | | 31,500 | | 1,439,550 | |
| | | | 13,968,696 | |
Health Care (10.7%) | | | | | |
Becton, Dickinson & Co. | | 7,750 | | 1,746,230 | |
Danaher Corp. | | 11,000 | | 1,134,320 | |
Henry Schein, Inc. (a) | | 14,000 | | 1,099,280 | |
Johnson & Johnson, Inc. | | 16,000 | | 2,064,800 | |
Medtronic PLC | | 10,000 | | 909,600 | |
Merck & Co., Inc. | | 15,600 | | 1,191,996 | |
Mettler-Toledo International, Inc. (a) | | 1,800 | | 1,018,044 | |
Stryker Corp. | | 8,000 | | 1,254,000 | |
UnitedHealth Group, Inc. | | 8,000 | | 1,992,960 | |
Waters Corp. (a) | | 5,000 | | 943,250 | |
| | | | 13,354,480 | |
| | Shares or | | | |
| | Principal | | | |
| | Amount($) | | | |
Industrials (8.0%) | | | | | |
3M Co. | | 8,000 | | 1,524,320 | |
Deere & Co. | | 6,500 | | 969,605 | |
Donaldson Co., Inc. | | 12,000 | | 520,680 | |
Emerson Electric Co. | | 15,100 | | 902,225 | |
Hubbell, Inc. | | 8,000 | | 794,720 | |
Illinois Tool Works, Inc. | | 8,000 | | 1,013,520 | |
Lincoln Electric Holdings, Inc. | | 9,000 | | 709,650 | |
Union Pacific Corp. | | 11,500 | | 1,589,645 | |
United Parcel Service, Inc., Class B | | 10,000 | | 975,300 | |
W.W. Grainger, Inc. | | 3,500 | | 988,260 | |
| | | | 9,987,925 | |
Information Technology (14.0%) | | | | | |
Accenture PLC, Class A | | 12,500 | | 1,762,625 | |
Apple, Inc. | | 21,000 | | 3,312,540 | |
Automatic Data Processing, Inc. | | 13,000 | | 1,704,560 | |
Cisco Systems, Inc. | | 39,000 | | 1,689,870 | |
Cognizant Technology Solutions Corp., | | | | | |
Class A | | 10,000 | | 634,800 | |
Microsoft Corp. | | 36,000 | | 3,656,520 | |
Oracle Corp. | | 39,000 | | 1,760,850 | |
TE Connectivity Ltd. | | 10,000 | | 756,300 | |
Visa, Inc., Class A | | 15,000 | | 1,979,099 | |
| | | | 17,257,164 | |
Materials (1.6%) | | | | | |
AptarGroup, Inc. | | 11,000 | | 1,034,770 | |
Linde PLC | | 6,000 | | 936,240 | |
PPG Industries, Inc. | | 500 | | 51,115 | |
| | | | 2,022,125 | |
Utilities (1.9%) | | | | | |
Consolidated Edison, Inc. | | 15,000 | | 1,146,900 | |
Eversource Energy | | 19,000 | | 1,235,760 | |
| | | | 2,382,660 | |
| | | | | |
TOTAL COMMON STOCKS (Cost $48,788,025) | | | | 83,835,180 | |
| | | | | |
CERTIFICATE OF DEPOSIT (0.1%) | | | | | |
Certificate of Deposit (0.1%) | | | | | |
Self Help Federal Credit Union, 1.30%, 6/21/19 (b) | | 100,000 | | 99,354 | |
| | | | | |
TOTAL CERTIFICATE OF DEPOSIT (Cost $100,000) | | | | 99,354 | |
| | | | | |
CORPORATE BONDS (2.6%) | | | | | |
| | | | | |
Consumer Discretionary (0.3%) | | | | | |
Starbucks Corp., 2.45%, 6/15/26, Callable 3/15/26 @ 100 | | 350,000 | | 315,410 | |
| | | | | |
Consumer Staples (0.1%) | | | | | |
Campbell Soup Co., 4.50%, 2/15/19 | | 150,000 | | 150,228 | |
| | | | | |
Financials (0.5%) | | | | | |
American Express Co., 2.65%, 12/2/22 | | 287,000 | | 277,898 | |
KFW, 1.88%, 11/30/20 | | 250,000 | | 246,448 | |
North American Development Bank, 4.38%, 2/11/20 | | 100,000 | | 101,598 | |
| | | | 625,944 | |
See Notes to Financial Statements
46
| | Principal | | | |
Security Description | | Amount($) | | Fair Value ($) | |
CORPORATE BONDS, CONTINUED | | | | | |
Health Care (0.4%) | | | | | |
Abbott Laboratories, 2.95%, 3/15/25, Callable 12/15/24 @ 100 | | 100,000 | | 96,331 | |
Kaiser Foundation Hospitals, 3.15%, 5/1/27, Callable 2/1/27 @ 100 | | 250,000 | | 240,594 | |
Merck & Co., Inc., 3.88%, 1/15/21, Callable 10/15/20 @ 100 | | 150,000 | | 153,118 | |
| | | | 490,043 | |
Industrials (0.3%) | | | | | |
Emerson Electric Co., 2.63%, 2/15/23, Callable 11/15/22 @ 100 | | 200,000 | | 196,023 | |
Hubbell, Inc., 3.35%, 3/1/26, Callable 12/1/25 @ 100 | | 145,000 | | 137,292 | |
Hubbell, Inc., 3.63%, 11/15/22 | | 75,000 | | 74,883 | |
| | | | 408,198 | |
Information Technology (1.0%) | | | | | |
Apple, Inc., 2.85%, 5/6/21 | | 350,000 | | 350,546 | |
Apple, Inc., 2.85%, 2/23/23, Callable 12/23/22 @ 100 | | 150,000 | | 148,247 | |
Apple, Inc., 3.00%, 6/20/27, Callable 3/20/27 @ 100 | | 200,000 | | 190,798 | |
Oracle Corp., 3.40%, 7/8/24, Callable 4/8/24 @ 100 | | 300,000 | | 299,628 | |
Visa, Inc., 3.15%, 12/14/25, Callable 9/14/25 @ 100 | | 275,000 | | 270,491 | |
| | | | 1,259,710 | |
| | | | | |
TOTAL CORPORATE BONDS (Cost $3,324,129) | | | | 3,249,533 | |
| | | | | |
MUNICIPAL BONDS (0.4%) | | | | | |
| | | | | |
New York (0.1%): | | | | | |
New York State Environmental Facilities Corp., Series C, 1.89%, 7/15/22 | | 190,000 | | 184,743 | |
| | | | | |
Wisconsin (0.3%): | | | | | |
Wisconsin State, Build America Bonds, GO, 4.60%, 5/1/26, Callable 5/1/21 @ 100 | | 250,000 | | 259,715 | |
| | | | | |
TOTAL MUNICIPAL BONDS (Cost $440,801) | | | | 444,458 | |
| | | | | |
U.S. GOVERNMENT & U.S. GOVERNMENT AGENCY OBLIGATIONS (25.4%) | | | | | |
| | | | | |
Federal Farm Credit Bank (1.2%) | | | | | |
2.60%, 10/6/22 | | 250,000 | | 249,429 | |
2.75%, 7/16/27 | | 250,000 | | 245,379 | |
2.85%, 3/2/28 | | 750,000 | | 739,271 | |
5.38%, 11/10/20 | | 250,000 | | 262,649 | |
| | | | 1,496,728 | |
Federal Home Loan Bank (5.6%) | | | | | |
1.88%, 11/29/21 | | 1,000,000 | | 982,360 | |
2.13%, 3/10/23 | | 1,000,000 | | 980,093 | |
2.50%, 3/11/22 | | 200,000 | | 199,685 | |
2.88%, 6/14/24 | | 1,000,000 | | 1,006,187 | |
2.88%, 9/13/24 | | 1,000,000 | | 1,006,110 | |
3.25%, 6/9/23 | | 850,000 | | 872,080 | |
5.25%, 8/15/22 | | 1,000,000 | | 1,089,647 | |
5.50%, 7/15/36 | | 700,000 | | 901,671 | |
| | | | 7,037,833 | |
Federal Home Loan Mortgage Corp. (4.6%) | | | | | |
2.38%, 1/13/22 | | 5,750,000 | | 5,729,598 | |
| | Shares or | | | |
| | Principal | | | |
| | Amount($) | | | |
Federal National Mortgage Association (5.2%) | | | | | |
1.38%, 2/26/21 | | 150,000 | | 146,391 | |
1.88%, 4/5/22 | | 1,000,000 | | 980,336 | |
1.88%, 9/24/26 | | 1,000,000 | | 931,443 | |
2.13%, 4/24/26 | | 1,250,000 | | 1,191,826 | |
2.63%, 9/6/24 | | 3,250,000 | | 3,241,232 | |
| | | | 6,491,228 | |
Government National Mortgage Association (0.2%) | | | | | |
4.00%, 9/15/40 | | 36,146 | | 37,292 | |
4.00%, 9/15/41 | | 143,133 | | 147,680 | |
6.50%, 5/15/32 | | 7,853 | | 8,463 | |
| | | | 193,435 | |
Housing & Urban Development (0.4%) | | | | | |
2.70%, 8/1/22 | | 491,000 | | 489,081 | |
| | | | | |
U.S. Treasury Inflation Index Note (0.9%) | | | | | |
0.63%, 7/15/21 | | 280,490 | | 277,486 | |
1.25%, 7/15/20 | | 869,625 | | 868,010 | |
| | | | 1,145,496 | |
U.S. Treasury Note (7.3%) | | | | | |
1.88%, 1/31/22 | | 1,500,000 | | 1,473,633 | |
2.75%, 8/31/23 | | 1,500,000 | | 1,517,080 | |
2.75%, 11/15/23 | | 1,500,000 | | 1,516,904 | |
2.75%, 2/28/25 | | 3,500,000 | | 3,536,299 | |
2.88%, 9/30/23 | | 1,000,000 | | 1,016,406 | |
| | | | 9,060,322 | |
TOTAL U.S. GOVERNMENT & U.S. GOVERNMEN T AGENCY | | | | | |
OBLIGATIONS (Cost $31,818,213) | | | | 31,643,721 | |
| | | | | |
INVESTMENT COMPANIES (3.4%) | | | | | |
| | | | | |
JPMorgan U.S. Government Money Market Fund, Capital Shares, 2.28%(c) | | 4,216,980 | | 4,216,980 | |
TOTAL INVESTMENT COMPANIES (Cost $4,216,980) | | | | 4,216,980 | |
| | | | | |
Total Investments (Cost $88,688,148) — 99.2%(d) | | | | 123,489,226 | |
Other assets in excess of liabilities — 0.8% | | | | 1,006,223 | |
NET ASSETS — 100.0% | | | | $ | 124,495,449 | |
| | | | | | |
(a) Non-income producing security.
(b) This security has been deemed illiquid and represents 0.08% of the Fund’s net assets.
(c) Rate disclosed is the seven day yield as of December 31, 2018.
(d) See Federal Tax Information listed in the Notes to the Financial Statements.
ADR American Depositary Receipt
GO General Obligation
See Notes to Financial Statements
47
Financial Statements | Walden Asset Management Fund |
STATEMENT OF ASSETS AND LIABILITIES
December 31, 2018
Assets: | | | |
Investments, at fair value (cost $88,688,148) | | $ | 123,489,226 | |
Interest and dividends receivable | | 403,845 | |
Receivable for capital shares issued | | 815,700 | |
Prepaid expenses | | 12,565 | |
Total Assets | | 124,721,336 | |
Liabilities: | | | |
Payable for capital shares redeemed | | 115,963 | |
Accrued expenses and other liabilities: | | | |
Investment adviser | | 73,155 | |
Administration and accounting | | 5,716 | |
Custodian | | 1,575 | |
Shareholder servicing fees | | 9,596 | |
Transfer agent | | 3,385 | |
Trustee | | 158 | |
Other | | 16,339 | |
Total Liabilities | | 225,887 | |
Net Assets | | $ | 124,495,449 | |
Composition of Net Assets: | | | |
Paid in capital | | $ | 89,668,414 | |
Total distributable earnings/(loss) | | 34,827,035 | |
Net Assets | | $ | 124,495,449 | |
Shares outstanding (par value $0.01, unlimited number of shares authorized) | | 7,297,222 | |
Net Asset Value, Offering Price and Redemption price per share | | $ | 17.06 | |
STATEMENT OF OPERATIONS
For the year ended December 31, 2018
Investment Income: | | | |
Interest | | $ | 860,040 | |
Dividends | | 1,686,860 | |
Total Investment Income | | 2,546,900 | |
Expenses: | | | |
Investment adviser | | 944,398 | |
Administration and accounting | | 108,823 | |
Chief compliance officer | | 11,379 | |
Custodian | | 17,637 | |
Shareholder servicing | | 111,363 | |
Transfer agency | | 41,234 | |
Trustee | | 7,261 | |
Other | | 62,395 | |
Total expenses before fee reductions | | 1,304,490 | |
Fees contractually reduced by the investment adviser | | (45,249 | ) |
Net Expenses | | 1,259,241 | |
Net Investment Income | | 1,287,659 | |
Net Realized/Unrealized Gains (Losses) from Investments: | | | |
Net realized gains from investment transactions | | 1,472,942 | |
Change in unrealized appreciation/depreciation from investments | | (4,974,428 | ) |
Net realized/unrealized gains (losses) from investments | | (3,501,486 | ) |
Change in Net Assets Resulting from Operations | | $ | (2,213,827 | ) |
See Notes to Financial Statements
48
STATEMENTS OF CHANGES IN NET ASSETS
| | For the year ended | | For the year ended | |
| | December 31, 2018 | | December 31, 2017 | |
| | | | | |
Investment Activities: | | | | | |
Operations: | | | | | |
Net investment income | | $ | 1,287,659 | | $ | 1,203,506 | |
Net realized gains from investment transactions | | 1,472,942 | | 734,267 | |
Change in unrealized appreciation/depreciation from investments | | (4,974,428 | ) | 13,570,535 | |
Change in Net Assets Resulting from Operations | | (2,213,827 | ) | 15,508,308 | |
Distributions to shareholders: | | | | | |
Total Distributions | | (2,600,816 | ) | (2,154,656 | ) |
Change in Net Assets Resulting from distributions to shareholders | | (2,600,816 | ) | (2,154,656 | ) |
Capital Share Transactions: | | | | | |
Proceeds from shares issued | | 15,978,645 | | 16,456,804 | |
Dividends reinvested | | 2,139,780 | | 1,829,653 | |
Cost of shares redeemed | | (10,164,112 | ) | (11,410,706 | ) |
Change in Net Assets Resulting from Capital Share Transactions | | 7,954,313 | | 6,875,751 | |
Change in Net Assets | | 3,139,670 | | 20,229,403 | |
Net Assets: | | | | | |
Beginning of period | | 121,355,779 | | 101,126,376 | |
End of period | | $ | 124,495,449 | | $ | 121,355,779 | |
Share Transactions: | | | | | |
Issued | | 900,825 | | 989,294 | |
Reinvested | | 121,371 | | 103,312 | |
Redeemed | | (559,444 | ) | (681,099 | ) |
Change in shares | | 462,752 | | 411,507 | |
See Notes to Financial Statements
49
FINANCIAL HIGHLIGHTS
Selected data for a share outstanding throughout the periods indicated.
| | | | | | For the nine | | | | | | | |
| | For the year | | For the year | | months | | For the year | | For the year | | For the year | |
| | ended | | ended | | ended | | ended | | ended | | ended | |
| | December 31, | | December 31, | | December 31, | | March 31, | | March 31, | | March 31, | |
| | 2018 | | 2017 | | 2016 | | 2016 | | 2015 | | 2014 | |
| | | | | | | | | | | | | |
Net Asset Value, Beginning of Period | | $ | 17.76 | | $ | 15.74 | | $ | 15.32 | | $ | 15.96 | | $ | 15.17 | | $ | 13.53 | |
| | | | | | | | | | | | | |
Investment Activities: | | | | | | | | | | | | | |
Operations: | | | | | | | | | | | | | |
Net investment income | | 0.19 | | 0.18 | | 0.13 | | 0.20 | | 0.17 | | 0.13 | |
Net realized/unrealized gains (losses) from investments | | (0.52 | ) | 2.16 | | 0.77 | | 0.27 | | 0.89 | | 1.72 | |
Total from investment activities | | (0.33 | ) | 2.34 | | 0.90 | | 0.47 | | 1.06 | | 1.85 | |
Dividends: | | | | | | | | | | | | | |
Net investment income | | (0.18 | ) | (0.18 | ) | (0.17 | ) | (0.21 | ) | (0.16 | ) | (0.13 | ) |
Net realized gains from investment transactions | | (0.19 | ) | (0.14 | ) | (0.31 | ) | (0.90 | ) | (0.11 | ) | (0.08 | ) |
Total dividends | | (0.37 | ) | (0.32 | ) | (0.48 | ) | (1.11 | ) | (0.27 | ) | (0.21 | ) |
| | | | | | | | | | | | | |
Net Asset Value, End of Period | | $ | 17.06 | | $ | 17.76 | | $ | 15.74 | | $ | 15.32 | | $ | 15.96 | | $ | 15.17 | |
| | | | | | | | | | | | | |
Total Return | | (1.90 | )% | 14.88 | % | 5.87 | %(a) | 3.10 | % | 7.00 | % | 13.73 | % |
| | | | | | | | | | | | | |
Ratios/Supplemental Data: | | | | | | | | | | | | | |
Net assets at end of period (000’s) | | $ | 124,495 | | $ | 121,356 | | $ | 101,126 | | $ | 86,891 | | $ | 84,499 | | $ | 79,168 | |
Ratio of net expenses to average net assets | | 1.00 | % | 1.00 | % | 1.00 | %(b) | 1.00 | % | 1.00 | % | 1.00 | % |
Ratio of net investment income to average net assets | | 1.02 | % | 1.08 | % | 1.13 | %(b) | 1.29 | % | 1.06 | % | 0.95 | % |
Ratio of expenses (before fee reductions or recoupment of fees previously reimbursed by the investment adviser) to average net assets (c) | | 1.04 | % | 1.03 | % | 1.05 | %(b) | 1.06 | % | 1.04 | % | 1.05 | % |
Portfolio turnover rate | | 8.47 | % | 8.40 | % | 10.18 | %(a) | 15.56 | % | 21.62 | % | 6.50 | % |
(a) Not annualized for periods less than one year.
(b) Annualized for periods less than one year.
(c) During the periods, certain fees were reduced. If such fee reduction had not occurred, the ratio would have been as indicated.
See Notes to Financial Statements
50
Schedule of Portfolio Investments | Walden Equity Fund |
| December 31, 2018 |
Security Description | | Shares | | Fair Value ($) | |
COMMON STOCKS (98.3%) | | | | | |
Communication Services (7.3%) | | | | | |
Alphabet, Inc., Class A (a) | | 2,800 | | 2,925,888 | |
Alphabet, Inc., Class C (a) | | 4,900 | | 5,074,489 | |
Charter Communications, Inc., Class A (a) | | 4,879 | | 1,390,369 | |
Comcast Corp., Class A | | 70,000 | | 2,383,500 | |
Omnicom Group, Inc. | | 30,000 | | 2,197,200 | |
| | | | 13,971,446 | |
Consumer Discretionary (8.8%) | | | | | |
Advance Auto Parts, Inc. | | 7,000 | | 1,102,220 | |
Autoliv, Inc. | | 5,500 | | 386,265 | |
Booking Holdings, Inc. (a) | | 1,000 | | 1,722,420 | |
Dollar General Corp. | | 22,000 | | 2,377,760 | |
McDonald’s Corp. | | 11,000 | | 1,953,270 | |
NIKE, Inc., Class B | | 43,500 | | 3,225,090 | |
Ross Stores, Inc. | | 41,000 | | 3,411,200 | |
Starbucks Corp. | | 37,000 | | 2,382,800 | |
The TJX Cos., Inc. | | 6,000 | | 268,440 | |
Veoneer, Inc. (a) | | 5,500 | | 129,635 | |
| | | | 16,959,100 | |
Consumer Staples (10.2%) | | | | | |
Church & Dwight Co., Inc. | | 30,000 | | 1,972,800 | |
Colgate-Palmolive Co. | | 30,000 | | 1,785,600 | |
Costco Wholesale Corp. | | 19,000 | | 3,870,490 | |
Estee Lauder Cos., Inc., Class A | | 25,000 | | 3,252,500 | |
PepsiCo, Inc. | | 28,000 | | 3,093,440 | |
Procter & Gamble Co. | | 5,000 | | 459,600 | |
Reckitt Benckiser Group PLC, Sponsored ADR | | 60,000 | | 907,800 | |
The Clorox Co. | | 18,000 | | 2,774,520 | |
The Hershey Co. | | 15,000 | | 1,607,700 | |
| | | | 19,724,450 | |
Energy (3.1%) | | | | | |
Apache Corp. | | 56,500 | | 1,483,125 | |
ConocoPhillips | | 72,500 | | 4,520,375 | |
| | | | 6,003,500 | |
Financials (16.1%) | | | | | |
American Express Co. | | 25,000 | | 2,383,000 | |
BB&T Corp. | | 55,000 | | 2,382,600 | |
Chubb Ltd. | | 8,000 | | 1,033,440 | |
Cincinnati Financial Corp. | | 18,000 | | 1,393,560 | |
Comerica, Inc. | | 23,000 | | 1,579,870 | |
Discover Financial Services | | 33,000 | | 1,946,340 | |
JPMorgan Chase & Co. | | 52,000 | | 5,076,240 | |
Northern Trust Corp. | | 28,000 | | 2,340,520 | |
PNC Financial Services Group, Inc. | | 28,500 | | 3,331,935 | |
State Street Corp. | | 26,000 | | 1,639,820 | |
SunTrust Banks, Inc. | | 45,000 | | 2,269,800 | |
T. Rowe Price Group, Inc. | | 21,500 | | 1,984,880 | |
U.S. Bancorp | | 80,000 | | 3,656,000 | |
| | | | 31,018,005 | |
Health Care (16.1%) | | | | | |
Becton, Dickinson & Co. | | 17,000 | | 3,830,440 | |
Danaher Corp. | | 23,000 | | 2,371,760 | |
Dentsply Sirona, Inc. | | 17,000 | | 632,570 | |
Henry Schein, Inc. (a) | | 29,000 | | 2,277,080 | |
Johnson & Johnson, Inc. | | 35,000 | | 4,516,750 | |
Medtronic PLC | | 28,000 | | 2,546,880 | |
Merck & Co., Inc. | | 32,000 | | 2,445,120 | |
Mettler-Toledo International, Inc. (a) | | 4,500 | | 2,545,110 | |
Stryker Corp. | | 20,000 | | 3,135,000 | |
UnitedHealth Group, Inc. | | 18,000 | | 4,484,160 | |
Waters Corp. (a) | | 12,000 | | 2,263,800 | |
| | | | 31,048,670 | |
Industrials (11.7%) | | | | | |
3M Co. | | 19,000 | | 3,620,260 | |
Deere & Co. | | 14,000 | | 2,088,380 | |
Donaldson Co., Inc. | | 35,000 | | 1,518,650 | |
Emerson Electric Co. | | 38,500 | | 2,300,375 | |
Hubbell, Inc. | | 21,000 | | 2,086,140 | |
Illinois Tool Works, Inc. | | 18,000 | | 2,280,420 | |
Union Pacific Corp. | | 31,500 | | 4,354,245 | |
United Parcel Service, Inc., Class B | | 23,000 | | 2,243,190 | |
W.W. Grainger, Inc. | | 7,000 | | 1,976,520 | |
| | | | 22,468,180 | |
Information Technology (19.7%) | | | | | |
Accenture PLC, Class A | | 27,000 | | 3,807,270 | |
Apple, Inc. | | 48,500 | | 7,650,390 | |
Automatic Data Processing, Inc. | | 31,000 | | 4,064,720 | |
Cisco Systems, Inc. | | 65,000 | | 2,816,450 | |
International Business Machines Corp. | | 2,000 | | 227,340 | |
Microsoft Corp. | | 88,000 | | 8,938,160 | |
Oracle Corp. | | 90,000 | | 4,063,500 | |
TE Connectivity Ltd. | | 20,000 | | 1,512,600 | |
Visa, Inc., Class A | | 37,000 | | 4,881,780 | |
| | | | 37,962,210 | |
Materials (2.5%) | | | | | |
AptarGroup, Inc. | | 26,000 | | 2,445,820 | |
Linde PLC | | 15,000 | | 2,340,600 | |
PPG Industries, Inc. | | 1,000 | | 102,230 | |
| | | | 4,888,650 | |
Utilities (2.8%) | | | | | |
Consolidated Edison, Inc. | | 31,000 | | 2,370,260 | |
Eversource Energy | | 45,000 | | 2,926,800 | |
| | | | 5,297,060 | |
| | | | | |
TOTAL COMMON STOCKS (Cost $105,767,965) | | | | 189,341,271 | |
| | | | | |
INVESTMENT COMPANIES (1.6%) | | | | | |
| | | | | |
JPMorgan U.S. Government Money Market Fund, Capital Shares, 2.28%(b) | | 3,081,315 | | 3,081,315 | |
TOTAL INVESTMENT COMPANIES (Cost $3,081,315) | | | | 3,081,315 | |
| | | | | |
Total Investments (Cost $108,849,280) — 99.9%(c) | | | | 192,422,586 | |
Other assets in excess of liabilities — 0.1% | | | | 175,102 | |
NET ASSETS — 100.0% | | | | $ | 192,597,688 | |
| | | | | | |
(a) Non-income producing security.
(b) Rate disclosed is the seven day yield as of December 31, 2018.
(c) See Federal Tax Information listed in the Notes to the Financial Statements.
ADR American Depositary Receipt
PLC Public Limited Company
See Notes to Financial Statements
51
Financial Statements | Walden Equity Fund |
STATEMENT OF ASSETS AND LIABILITIES
December 31, 2018
Assets: | | | |
Investments, at fair value (cost $108,849,280) | | $ | 192,422,586 | |
Dividends receivable | | 253,877 | |
Receivable for capital shares issued | | 151,313 | |
Prepaid expenses | | 12,694 | |
Total Assets | | 192,840,470 | |
Liabilities: | | | |
Payable for capital shares redeemed | | 63,352 | |
Accrued expenses and other liabilities: | | | |
Investment adviser | | 107,722 | |
Administration and accounting | | 8,648 | |
Custodian | | 2,669 | |
Shareholder servicing fees | | 28,097 | |
Transfer agent | | 3,441 | |
Trustee | | 256 | |
Other | | 28,597 | |
Total Liabilities | | 242,782 | |
Net Assets | | $ | 192,597,688 | |
Composition of Net Assets: | | | |
Paid in capital | | $ | 109,012,144 | |
Total distributable earnings/(loss) | | 83,585,544 | |
Net Assets | | $ | 192,597,688 | |
Shares outstanding (par value $0.01, unlimited number of shares authorized) | | 9,335,532 | |
Net Asset Value, Offering Price and Redemption price per share | | $ | 20.63 | |
STATEMENT OF OPERATIONS
For the year ended December 31, 2018
Investment Income: | | | |
Dividends | | $ | 3,773,934 | |
Total Investment Income | | 3,773,934 | |
Expenses: | | | |
Investment adviser | | 1,553,636 | |
Administration and accounting | | 170,418 | |
Chief compliance officer | | 18,605 | |
Custodian | | 28,944 | |
Shareholder servicing | | 318,990 | |
Transfer agency | | 43,697 | |
Trustee | | 11,867 | |
Other | | 91,345 | |
Total expenses before fee reductions | | 2,237,502 | |
Fees contractually reduced by the investment adviser | | (166,166 | ) |
Net Expenses | | 2,071,336 | |
Net Investment Income | | 1,702,598 | |
Net Realized/Unrealized Gains (Losses) from Investments: | | | |
Net realized gains from investment transactions | | 2,964,658 | |
Change in unrealized appreciation/depreciation from investments | | (9,554,393 | ) |
Net realized/unrealized gains (losses) from investments | | (6,589,735 | ) |
Change in Net Assets Resulting from Operations | | $ | (4,887,137 | ) |
See Notes to Financial Statements
52
STATEMENTS OF CHANGES IN NET ASSETS
| | For the year ended | | For the year ended | |
| | December 31, 2018 | | December 31, 2017 | |
| | | | | |
Investment Activities: | | | | | |
Operations: | | | | | |
Net investment income | | $ | 1,702,598 | | $ | 1,737,276 | |
Net realized gains from investment transactions | | 2,964,658 | | 7,172,343 | |
Change in unrealized appreciation/depreciation from investments | | (9,554,393 | ) | 26,282,872 | |
Change in Net Assets Resulting from Operations | | (4,887,137 | ) | 35,192,491 | |
Distributions to shareholders: | | | | | |
Total Distributions | | (4,155,199 | ) | (9,793,672 | ) |
Change in Net Assets Resulting from distributions to shareholders | | (4,155,199 | ) | (9,793,672 | ) |
Capital Share Transactions: | | | | | |
Proceeds from shares issued | | 26,392,394 | | 25,865,919 | |
Dividends reinvested | | 3,440,593 | | 8,724,992 | |
Cost of shares redeemed | | (25,632,176 | ) | (44,380,575 | ) |
Change in Net Assets Resulting from Capital Share Transactions | | 4,200,811 | | (9,789,664 | ) |
Change in Net Assets | | (4,841,525 | ) | 15,609,155 | |
Net Assets: | | | | | |
Beginning of period | | 197,439,213 | | 181,830,058 | |
End of period | | $ | 192,597,688 | | $ | 197,439,213 | |
Share Transactions: | | | | | |
Issued | | 1,181,162 | | 1,267,580 | |
Reinvested | | 158,632 | | 405,060 | |
Redeemed | | (1,139,738 | ) | (2,196,814 | ) |
Change in shares | | 200,056 | | (524,174 | ) |
See Notes to Financial Statements
53
FINANCIAL HIGHLIGHTS
Selected data for a share outstanding throughout the periods indicated.
| | | | | | For the nine | | | | | | | |
| | For the year | | For the year | | months | | For the year | | For the year | | For the year | |
| | ended | | ended | | ended | | ended | | ended | | ended | |
| | December 31, | | December 31, | | December 31, | | March 31, | | March 31, | | March 31, | |
| | 2018 | | 2017 | | 2016 | | 2016 | | 2015 | | 2014 | |
| | | | | | | | | | | | | |
Net Asset Value, Beginning of Period | | $ | 21.61 | | $ | 18.82 | | $ | 17.88 | | $ | 18.55 | | $ | 18.19 | | $ | 15.41 | |
| | | | | | | | | | | | | |
Investment Activities: | | | | | | | | | | | | | |
Operations: | | | | | | | | | | | | | |
Net investment income | | 0.19 | | 0.20 | | 0.14 | | 0.23 | | 0.18 | | 0.16 | |
Net realized/unrealized gains (losses) from investments | | (0.72 | ) | 3.70 | | 1.44 | | 0.29 | | 1.29 | | 2.86 | |
Total from investment activities | | (0.53 | ) | 3.90 | | 1.58 | | 0.52 | | 1.47 | | 3.02 | |
Dividends: | | | | | | | | | | | | | |
Net investment income | | (0.18 | ) | (0.20 | ) | (0.18 | ) | (0.24 | ) | (0.18 | ) | (0.15 | ) |
Net realized gains from investment transactions | | (0.27 | ) | (0.91 | ) | (0.46 | ) | (0.95 | ) | (0.93 | ) | (0.09 | ) |
Total dividends | | (0.45 | ) | (1.11 | ) | (0.64 | ) | (1.19 | ) | (1.11 | ) | (0.24 | ) |
| | | | | | | | | | | | | |
Net Asset Value, End of Period | | $ | 20.63 | | $ | 21.61 | | $ | 18.82 | | $ | 17.88 | | $ | 18.55 | | $ | 18.19 | |
| | | | | | | | | | | | | |
Total Return | | (2.54 | )% | 20.77 | % | 8.80 | %(a) | 2.92 | % | 8.13 | % | 19.66 | % |
| | | | | | | | | | | | | |
Ratios/Supplemental Data: | | | | | | | | | | | | | |
Net assets at end of period (000’s) | | $ | 192,598 | | $ | 197,439 | | $ | 181,830 | | $ | 164,566 | | $ | 157,499 | | $ | 151,879 | |
Ratio of net expenses to average net assets | | 1.00 | % | 1.00 | % | 1.00 | %(b) | 1.00 | % | 1.00 | % | 1.00 | % |
Ratio of net investment income to average net assets | | 0.82 | % | 0.93 | % | 1.00 | %(b) | 1.21 | % | 0.95 | % | 0.95 | % |
Ratio of expenses (before fee reductions or recoupment of fees previously reimbursed by the investment adviser) to average net assets (c) | | 1.08 | % | 1.07 | % | 1.09 | %(b) | 1.10 | % | 1.09 | % | 1.08 | % |
Portfolio turnover rate | | 6.51 | % | 9.88 | % | 9.94 | %(a) | 17.78 | % | 21.31 | % | 12.33 | % |
(a) Not annualized for periods less than one year.
(b) Annualized for periods less than one year.
(c) During the periods, certain fees were reduced. If such fee reduction had not occurred, the ratio would have been as indicated.
See Notes to Financial Statements
54
Schedule of Portfolio Investments | Walden Midcap Fund |
| December 31, 2018 |
Security Description | | Shares | | Fair Value ($) | |
COMMON STOCKS (98.7%) | | | | | |
Communication Services (1.3%) | | | | | |
Omnicom Group, Inc. | | 7,900 | | 578,596 | |
| | | | 578,596 | |
Consumer Discretionary (11.1%) | | | | | |
Dollar General Corp. | | 6,775 | | 732,242 | |
Dunkin’ Brands Group, Inc. | | 7,400 | | 474,488 | |
Expedia, Inc. | | 4,000 | | 450,600 | |
Hasbro, Inc. | | 5,000 | | 406,250 | |
Hyatt Hotels Corp., Class A | | 12,375 | | 836,550 | |
O’Reilly Automotive, Inc. (a) | | 1,800 | | 619,794 | |
Polaris Industries, Inc. | | 4,150 | | 318,222 | |
Ross Stores, Inc. | | 9,900 | | 823,680 | |
Williams Sonoma, Inc. | | 8,250 | | 416,213 | |
| | | | 5,078,039 | |
Consumer Staples (6.3%) | | | | | |
Church & Dwight Co., Inc. | | 13,050 | | 858,168 | |
McCormick & Co., Inc. | | 4,100 | | 570,884 | |
The Clorox Co. | | 5,750 | | 886,305 | |
The Hershey Co. | | 5,425 | | 581,452 | |
| | | | 2,896,809 | |
Energy (2.6%) | | | | | |
Apache Corp. | | 17,300 | | 454,125 | |
Dril-Quip, Inc. (a) | | 9,925 | | 298,048 | |
Helmerich & Payne, Inc. | | 9,100 | | 436,254 | |
| | | | 1,188,427 | |
Financials (16.9%) | | | | | |
Brown & Brown, Inc. | | 17,450 | | 480,922 | |
Commerce Bancshares, Inc. | | 13,251 | | 746,958 | |
Discover Financial Services | | 9,000 | | 530,820 | |
East West Bancorp, Inc. | | 8,450 | | 367,829 | |
Eaton Vance Corp. | | 9,900 | | 348,282 | |
FactSet Research Systems, Inc. | | 4,575 | | 915,594 | |
M&T Bank Corp. | | 5,250 | | 751,432 | |
Northern Trust Corp. | | 8,975 | | 750,220 | |
SEI Investments Co. | | 11,375 | | 525,525 | |
Signature Bank | | 4,750 | | 488,348 | |
State Street Corp. | | 6,900 | | 435,183 | |
SunTrust Banks, Inc. | | 10,425 | | 525,837 | |
T. Rowe Price Group, Inc. | | 4,600 | | 424,672 | |
W. R. Berkley Corp. | | 6,310 | | 466,372 | |
| | | | 7,757,994 | |
Health Care (11.0%) | | | | | |
Agilent Technologies, Inc. | | 7,500 | | 505,950 | |
Cerner Corp. (a) | | 8,500 | | 445,740 | |
Henry Schein, Inc. (a) | | 6,750 | | 530,010 | |
Mettler-Toledo International, Inc. (a) | | 900 | | 509,022 | |
PerkinElmer, Inc. | | 5,875 | | 461,481 | |
STERIS PLC | | 4,400 | | 470,140 | |
The Cooper Companies, Inc. | | 2,275 | | 578,987 | |
Varian Medical Systems, Inc. (a) | | 4,725 | | 535,390 | |
Waters Corp. (a) | | 3,050 | | 575,383 | |
Zimmer Biomet Holdings, Inc. | | 4,225 | | 438,217 | |
| | | | 5,050,320 | |
Industrials (14.0%) | | | | | |
AMETEK, Inc. | | 10,575 | | 715,928 | |
Donaldson Co., Inc. | | 16,100 | | 698,579 | |
Dover Corp. | | 5,275 | | 374,261 | |
Expeditors International of Washington, Inc. | | 5,225 | | 355,770 | |
Hubbell, Inc. | | 7,275 | | 722,698 | |
IDEX Corp. | | 3,450 | | 435,597 | |
Lincoln Electric Holdings, Inc. | | 6,175 | | 486,899 | |
Nordson Corp. | | 5,525 | | 659,409 | |
Roper Technologies, Inc. | | 2,325 | | 619,659 | |
Sensata Technologies Holding PLC (a) | | 8,900 | | 399,076 | |
The Middleby Corp. (a) | | 4,475 | | 459,717 | |
Verisk Analytics, Inc. (a) | | 4,600 | | 501,584 | |
| | | | 6,429,177 | |
Information Technology (15.3%) | | | | | |
Akamai Technologies, Inc. (a) | | 6,900 | | 421,452 | |
Amdocs Ltd. | | 9,125 | | 534,543 | |
ANSYS, Inc. (a) | | 2,850 | | 407,379 | |
Aspen Technology, Inc. (a) | | 5,100 | | 419,118 | |
Check Point Software Technologies Ltd. (a) | | 5,200 | | 533,780 | |
Citrix Systems, Inc. | | 5,325 | | 545,599 | |
F5 Networks, Inc. (a) | | 5,475 | | 887,114 | |
Fiserv, Inc. (a) | | 7,900 | | 580,571 | |
IPG Photonics Corp. (a) | | 4,325 | | 489,979 | |
Juniper Networks, Inc. | | 21,550 | | 579,911 | |
Paychex, Inc. | | 15,700 | | 1,022,854 | |
TE Connectivity Ltd. | | 7,550 | | 571,007 | |
| | | | 6,993,307 | |
Materials (8.0%) | | | | | |
AptarGroup, Inc. | | 7,700 | | 724,339 | |
Avery Dennison Corp. | | 8,075 | | 725,378 | |
Ball Corp. | | 11,400 | | 524,172 | |
International Flavors & Fragrances, Inc. | | 6,625 | | 889,538 | |
RPM International, Inc. | | 13,675 | | 803,817 | |
| | | | 3,667,244 | |
Real Estate (6.3%) | | | | | |
Alexandria Real Estate Equities, Inc. | | 3,200 | | 368,768 | |
Digital Realty Trust, Inc. | | 4,150 | | 442,183 | |
Host Hotels & Resorts, Inc. | | 24,075 | | 401,330 | |
Jones Lang LaSalle, Inc. | | 3,875 | | 490,575 | |
Lamar Advertising Co., Class A | | 6,075 | | 420,269 | |
Realty Income Corp. | | 11,900 | | 750,175 | |
| | | | 2,873,300 | |
Utilities (5.9%) | | | | | |
American Water Works Co., Inc. | | 4,525 | | 410,734 | |
Consolidated Edison, Inc. | | 7,400 | | 565,804 | |
Eversource Energy | | 18,305 | | 1,190,557 | |
ONE Gas, Inc. | | 7,000 | | 557,200 | |
| | | | 2,724,295 | |
| | | | | |
TOTAL COMMON STOCKS (Cost $34,455,595) | | | | 45,237,508 | |
| | | | | |
INVESTMENT COMPANIES (0.9%) | | | | | |
| | | | | |
JPMorgan U.S. Government Money Market Fund, Capital Shares, 2.28%(b) | | 408,850 | | 408,850 | |
TOTAL INVESTMENT COMPANIES (Cost $408,850) | | | | 408,850 | |
| | | | | |
Total Investments (Cost $34,864,445) — 99.6%(c) | | | | 45,646,358 | |
Other assets in excess of liabilities — 0.4% | | | | 172,884 | |
NET ASSETS — 100.0% | | | | $ | 45,819,242 | |
| | | | | | |
(a) Non-income producing security.
(b) Rate disclosed is the seven day yield as of December 31, 2018.
(c) See Federal Tax Information listed in the Notes to the Financial Statements.
PLC Public Limited Company
See Notes to Financial Statements
55
Financial Statements | Walden Midcap Fund |
STATEMENT OF ASSETS AND LIABILITIES
December 31, 2018
Assets: | | | |
Investments, at fair value (cost $34,864,445) | | $ | 45,646,358 | |
Dividends receivable | | 49,597 | |
Receivable for investments sold | | 512,615 | |
Receivable for capital shares issued | | 25,092 | |
Receivable for tax reclaims | | 555 | |
Prepaid expenses | | 5,621 | |
Total Assets | | 46,239,838 | |
Liabilities: | | | |
Payable for investments purchased | | 378,993 | |
Payable for capital shares redeemed | | 19 | |
Accrued expenses and other liabilities: | | | |
Investment adviser | | 28,934 | |
Administration and accounting | | 2,117 | |
Custodian | | 652 | |
Shareholder servicing fees | | 481 | |
Transfer agent | | 2,934 | |
Trustee | | 51 | |
Other | | 6,415 | |
Total Liabilities | | 420,596 | |
Net Assets | | $ | 45,819,242 | |
Composition of Net Assets: | | | |
Paid in capital | | $ | 34,471,778 | |
Total distributable earnings/(loss) | | 11,347,464 | |
Net Assets | | $ | 45,819,242 | |
Shares outstanding (par value $0.01, unlimited number of shares authorized) | | 2,942,979 | |
Net Asset Value, Offering Price and Redemption price per share | | $ | 15.57 | |
STATEMENT OF OPERATIONS
For the year ended December 31, 2018
Investment Income: | | | |
Dividends | | $ | 747,690 | |
Total Investment Income | | 747,690 | |
Expenses: | | | |
Investment adviser | | 364,895 | |
Administration and accounting | | 40,639 | |
Chief compliance officer | | 4,397 | |
Custodian | | 6,857 | |
Shareholder servicing | | 5,349 | |
Transfer agency | | 34,549 | |
Trustee | | 2,804 | |
Other | | 25,914 | |
Recoupment of prior expenses reimbursed by the investment adviser | | 1,091 | |
Total expenses | | 486,495 | |
Net Expenses | | 486,495 | |
Net Investment Income | | 261,195 | |
Net Realized/Unrealized Gains (Losses) from Investments: | | | |
Net realized gains from investment transactions | | 2,611,419 | |
Change in unrealized appreciation/depreciation from investments | | (4,638,576 | ) |
Net realized/unrealized gains (losses) from investments | | (2,027,157 | ) |
Change in Net Assets Resulting from Operations | | $ | (1,765,962 | ) |
See Notes to Financial Statements
56
STATEMENTS OF CHANGES IN NET ASSETS
| | For the year ended | | For the year ended | |
| | December 31, 2018 | | December 31, 2017 | |
| | | | | |
Investment Activities: | | | | | |
Operations: | | | | | |
Net investment income | | $ | 261,195 | | $ | 194,063 | |
Net realized gains from investment transactions | | 2,611,419 | | 2,158,098 | |
Change in unrealized appreciation/depreciation from investments | | (4,638,576 | ) | 5,350,670 | |
Change in Net Assets Resulting from Operations | | (1,765,962 | ) | 7,702,831 | |
Distributions to shareholders: | | | | | |
Total Distributions | | (3,064,044 | ) | (1,518,704 | ) |
Change in Net Assets Resulting from distributions to shareholders | | (3,064,044 | ) | (1,518,704 | ) |
Capital Share Transactions: | | | | | |
Proceeds from shares issued | | 5,213,428 | | 2,254,433 | |
Dividends reinvested | | 2,641,329 | | 1,393,823 | |
Cost of shares redeemed | | (3,767,045 | ) | (2,329,398 | ) |
Change in Net Assets Resulting from Capital Share Transactions | | 4,087,712 | | 1,318,858 | |
Change in Net Assets | | (742,294 | ) | 7,502,985 | |
Net Assets: | | | | | |
Beginning of period | | 46,561,536 | | 39,058,551 | |
End of period | | $ | 45,819,242 | | $ | 46,561,536 | |
Share Transactions: | | | | | |
Issued | | 294,070 | | 142,246 | |
Reinvested | | 161,945 | | 81,701 | |
Redeemed | | (213,991 | ) | (144,502 | ) |
Change in shares | | 242,024 | | 79,445 | |
See Notes to Financial Statements
57
FINANCIAL HIGHLIGHTS
Selected data for a share outstanding throughout the periods indicated.
| | | | | | For the nine | | | | | | | |
| | For the year | | For the year | | months | | For the year | | For the year | | For the year | |
| | ended | | ended | | ended | | ended | | ended | | ended | |
| | December 31, | | December 31, | | December 31, | | March 31, | | March 31, | | March 31, | |
| | 2018 | | 2017 | | 2016 | | 2016 | | 2015 | | 2014 | |
| | | | | | | | | | | | | |
Net Asset Value, Beginning of Period | | $ | 17.24 | | $ | 14.90 | | $ | 14.57 | | $ | 15.18 | | $ | 14.06 | | $ | 12.06 | |
| | | | | | | | | | | | | |
Investment Activities: | | | | | | | | | | | | | |
Operations: | | | | | | | | | | | | | |
Net investment income | | 0.09 | | 0.07 | | 0.11 | | 0.09 | | 0.05 | | 0.04 | |
Net realized/unrealized gains (losses) from investments | | (0.66 | ) | 2.85 | | 0.97 | | 0.07 | | 1.65 | | 2.08 | |
Total from investment activities | | (0.57 | ) | 2.92 | | 1.08 | | 0.16 | | 1.70 | | 2.12 | |
Dividends: | | | | | | | | | | | | | |
Net investment income | | (0.09 | ) | (0.08 | ) | (0.12 | ) | (0.08 | ) | (0.05 | ) | (0.03 | ) |
Net realized gains from investment transactions | | (1.01 | ) | (0.50 | ) | (0.63 | ) | (0.69 | ) | (0.53 | ) | (0.09 | ) |
Total dividends | | (1.10 | ) | (0.58 | ) | (0.75 | ) | (0.77 | ) | (0.58 | ) | (0.12 | ) |
| | | | | | | | | | | | | |
Net Asset Value, End of Period | | $ | 15.57 | | $ | 17.24 | | $ | 14.90 | | $ | 14.57 | | $ | 15.18 | | $ | 14.06 | |
| | | | | | | | | | | | | |
Total Return | | (3.58 | )% | 19.62 | % | 7.36 | %(a) | 1.27 | % | 12.25 | % | 17.65 | % |
| | | | | | | | | | | | | |
Ratios/Supplemental Data: | | | | | | | | | | | | | |
Net assets at end of period (000’s) | | $ | 45,819 | | $ | 46,562 | | $ | 39,059 | | $ | 35,543 | | $ | 34,959 | | $ | 30,577 | |
Ratio of net expenses to average net assets | | 1.00 | % | 1.00 | % | 1.00 | %(b) | 1.00 | % | 1.00 | % | 1.00 | % |
Ratio of net investment income to average net assets | | 0.54 | % | 0.45 | % | 0.97 | %(b) | 0.59 | % | 0.35 | % | 0.30 | % |
Ratio of expenses (before fee reductions or recoupment of fees previously reimbursed by the investment adviser) to average net assets (c) | | 1.00 | % | 1.01 | % | 1.04 | %(b) | 1.07 | % | 1.04 | % | 1.04 | % |
Portfolio turnover rate | | 18.66 | % | 24.85 | % | 12.59 | %(a) | 20.10 | % | 16.06 | % | 14.86 | % |
(a) Not annualized for periods less than one year.
(b) Annualized for periods less than one year.
(c) During the periods, certain fees were reduced. If such fee reduction had not occurred, the ratio would have been as indicated.
See Notes to Financial Statements
58
Schedule of Portfolio Investments | Walden SMID Cap Fund |
| December 31, 2018 |
Security Description | | Shares | | Fair Value ($) | |
COMMON STOCKS (101.9%) | | | | | |
Communication Services (1.3%) | | | | | |
Interpublic Group of Cos., Inc. | | 29,825 | | 615,290 | |
| | | | 615,290 | |
Consumer Discretionary (9.9%) | | | | | |
Big Lots, Inc. | | 11,175 | | 323,181 | |
Brinker International, Inc. | | 9,200 | | 404,616 | |
Cheesecake Factory, Inc. | | 12,100 | | 526,471 | |
Choice Hotels International, Inc. | | 8,400 | | 601,272 | |
Dorman Products, Inc. (a) | | 7,900 | | 711,158 | |
Dunkin’ Brands Group, Inc. | | 6,000 | | 384,720 | |
Polaris Industries, Inc. | | 5,100 | | 391,068 | |
Texas Roadhouse, Inc. | | 8,500 | | 507,450 | |
Tiffany & Co. | | 4,400 | | 354,244 | |
Williams Sonoma, Inc. | | 9,900 | | 499,455 | |
| | | | 4,703,635 | |
Consumer Staples (4.7%) | | | | | |
Church & Dwight Co., Inc. | | 13,225 | | 869,676 | |
Flowers Foods, Inc. | | 27,950 | | 516,237 | |
Lancaster Colony Corp. | | 3,000 | | 530,580 | |
Tootsie Roll Industries, Inc. | | 9,600 | | 320,640 | |
| | | | 2,237,133 | |
Energy (2.3%) | | | | | |
Apache Corp. | | 11,275 | | 295,969 | |
Dril-Quip, Inc. (a) | | 8,600 | | 258,258 | |
Helmerich & Payne, Inc. | | 11,425 | | 547,714 | |
| | | | 1,101,941 | |
Financials (16.4%) | | | | | |
American Financial Group, Inc. | | 5,400 | | 488,862 | |
Bank of Hawaii Corp. | | 7,300 | | 491,436 | |
Brown & Brown, Inc. | | 21,325 | | 587,717 | |
Cincinnati Financial Corp. | | 5,925 | | 458,714 | |
Cohen & Steers, Inc. | | 9,500 | | 326,040 | |
Commerce Bancshares, Inc. | | 9,985 | | 562,854 | |
CVB Financial Corp. | | 16,700 | | 337,841 | |
East West Bancorp, Inc. | | 8,400 | | 365,652 | |
Eaton Vance Corp. | | 14,100 | | 496,038 | |
FactSet Research Systems, Inc. | | 3,550 | | 710,462 | |
SEI Investments Co. | | 12,500 | | 577,500 | |
Signature Bank | | 6,400 | | 657,983 | |
SVB Financial Group (a) | | 2,625 | | 498,540 | |
Texas Capital Bancshares, Inc. (a) | | 4,300 | | 219,687 | |
UMB Financial Corp. | | 8,400 | | 512,148 | |
W. R. Berkley Corp. | | 6,900 | | 509,979 | |
| | | | 7,801,453 | |
Health Care (15.5%) | | | | | |
Chemed Corp. | | 2,150 | | 609,052 | |
Dentsply Sirona, Inc. | | 9,850 | | 366,519 | |
Henry Schein, Inc. (a) | | 5,500 | | 431,860 | |
Masimo Corp. (a) | | 7,900 | | 848,223 | |
Mettler-Toledo International, Inc. (a) | | 1,400 | | 791,812 | |
PerkinElmer, Inc. | | 9,000 | | 706,950 | |
ResMed, Inc. | | 7,100 | | 808,477 | |
STERIS PLC | | 6,100 | | 651,785 | |
The Cooper Companies, Inc. | | 2,650 | | 674,425 | |
Varian Medical Systems, Inc. (a) | | 4,500 | | 509,895 | |
Waters Corp. (a) | | 5,100 | | 962,115 | |
| | | | 7,361,113 | |
Industrials (17.3%) | | | | | |
Applied Industrial Technologies, Inc. | | 10,300 | | 555,582 | |
C.H. Robinson Worldwide, Inc. | | 5,575 | | 468,802 | |
Donaldson Co., Inc. | | 20,900 | | 906,850 | |
Expeditors International of Washington, Inc. | | 7,800 | | 531,102 | |
Franklin Electric Co., Inc. | | 12,800 | | 548,864 | |
Hexcel Corp. | | 6,000 | | 344,040 | |
Hubbell, Inc. | | 7,200 | | 715,248 | |
IDEX Corp. | | 3,600 | | 454,536 | |
Lincoln Electric Holdings, Inc. | | 7,250 | | 571,663 | |
Nordson Corp. | | 6,000 | | 716,100 | |
Sensata Technologies Holding PLC (a) | | 11,400 | | 511,176 | |
The Middleby Corp. (a) | | 4,800 | | 493,104 | |
UniFirst Corp. | | 5,300 | | 758,271 | |
Valmont Industries, Inc. | | 3,000 | | 332,850 | |
Wabtec Corp. | | 5,700 | | 400,425 | |
| | | | 8,308,613 | |
Information Technology (15.3%) | | | | | |
Akamai Technologies, Inc. (a) | | 9,500 | | 580,260 | |
Amdocs Ltd. | | 10,550 | | 618,018 | |
ANSYS, Inc. (a) | | 3,700 | | 528,878 | |
Aspen Technology, Inc. (a) | | 8,400 | | 690,312 | |
Coherent, Inc. (a) | | 2,400 | | 253,704 | |
F5 Networks, Inc. (a) | | 5,950 | | 964,079 | |
IPG Photonics Corp. (a) | | 4,250 | | 481,483 | |
Jack Henry & Associates, Inc. | | 4,800 | | 607,296 | |
Juniper Networks, Inc. | | 23,900 | | 643,149 | |
Manhattan Associates, Inc. (a) | | 10,700 | | 453,359 | |
NETGEAR, Inc. (a) | | 9,600 | | 499,488 | |
Tech Data Corp. (a) | | 5,500 | | 449,955 | |
Teradata Corp. (a) | | 13,200 | | 506,352 | |
| | | | 7,276,333 | |
Materials (6.7%) | | | | | |
AptarGroup, Inc. | | 8,300 | | 780,781 | |
Avery Dennison Corp. | | 5,700 | | 512,031 | |
International Flavors & Fragrances, Inc. | | 4,700 | | 631,069 | |
RPM International, Inc. | | 15,400 | | 905,212 | |
Silgan Holdings, Inc. | | 15,400 | | 363,748 | |
| | | | 3,192,841 | |
Real Estate (8.5%) | | | | | |
American Campus Communities, Inc. | | 9,500 | | 393,205 | |
Camden Property Trust | | 7,100 | | 625,155 | |
CoreSite Realty Corp. | | 6,900 | | 601,887 | |
CubeSmart | | 14,600 | | 418,874 | |
Highwoods Properties, Inc. | | 9,100 | | 352,079 | |
Jones Lang LaSalle, Inc. | | 4,900 | | 620,340 | |
Lamar Advertising Co., Class A | | 8,200 | | 567,276 | |
Ryman Hospitality Properties, Inc. | | 6,900 | | 460,161 | |
| | | | 4,038,977 | |
Utilities (4.0%) | | | | | |
Atmos Energy Corp. | | 6,600 | | 611,952 | |
New Jersey Resources Corp. | | 11,375 | | 519,496 | |
ONE Gas, Inc. | | 9,600 | | 764,160 | |
| | | | 1,895,608 | |
| | | | | |
TOTAL COMMON STOCKS (Cost $41,308,433) | | | | 48,532,937 | |
| | | | | |
INVESTMENT COMPANIES (0.3%) | | | | | |
| | | | | |
JPMorgan U.S. Government Money Market Fund, Capital Shares, 2.28%(b) | | 141,823 | | 141,823 | |
TOTAL INVESTMENT COMPANIES (Cost $141,823) | | | | 141,823 | |
| | | | | |
Total Investments (Cost $41,450,256) — 102.2%(c) | | | | 48,674,760 | |
Liabilities in excess of other assets — (2.2)% | | | | (1,053,935 | ) |
NET ASSETS — 100.0% | | | | $ | 47,620,825 | |
| | | | | | |
(a) Non-income producing security.
(b) Rate disclosed is the seven day yield as of December 31, 2018.
(c) See Federal Tax Information listed in the Notes to the Financial Statements.
PLC Public Limited Company
See Notes to Financial Statements
59
Financial Statements | Walden SMID Cap Fund |
STATEMENT OF ASSETS AND LIABILITIES
December 31, 2018
Assets: | | | |
Investments, at fair value (cost $41,450,256) | | $ | 48,674,760 | |
Dividends receivable | | 57,306 | |
Receivable for capital shares issued | | 9,671 | |
Prepaid expenses | | 8,062 | |
Total Assets | | 48,749,799 | |
Liabilities: | | | |
Payable for capital shares redeemed | | 1,086,284 | |
Accrued expenses and other liabilities: | | | |
Investment adviser | | 26,092 | |
Administration and accounting | | 2,290 | |
Custodian | | 697 | |
Shareholder servicing fees | | 3,503 | |
Transfer agent | | 3,137 | |
Trustee | | 54 | |
Other | | 6,917 | |
Total Liabilities | | 1,128,974 | |
Net Assets | | $ | 47,620,825 | |
Composition of Net Assets: | | | |
Paid in capital | | $ | 40,195,549 | |
Total distributable earnings/(loss) | | 7,425,276 | |
Net Assets | | $ | 47,620,825 | |
Shares outstanding (par value $0.01, unlimited number of shares authorized) | | 3,149,677 | |
Net Asset Value, Offering Price and Redemption price per share | | $ | 15.12 | |
STATEMENT OF OPERATIONS
For the year ended December 31, 2018
Investment Income: | | | |
Dividends | | $ | 800,834 | |
Total Investment Income | | 800,834 | |
Expenses: | | | |
Investment adviser | | 394,738 | |
Administration and accounting | | 43,943 | |
Chief compliance officer | | 4,739 | |
Custodian | | 7,454 | |
Shareholder servicing | | 37,784 | |
Transfer agency | | 37,540 | |
Trustee | | 3,012 | |
Other | | 39,525 | |
Total expenses before fee reductions | | 568,735 | |
Fees contractually reduced by the investment adviser | | (42,347 | ) |
Net Expenses | | 526,388 | |
Net Investment Income | | 274,446 | |
Net Realized/Unrealized Gains (Losses) from Investments: | | | |
Net realized gains from investment transactions | | 1,583,837 | |
Change in unrealized appreciation/depreciation from investments | | (4,903,119 | ) |
Net realized/unrealized gains (losses) from investments | | (3,319,282 | ) |
Change in Net Assets Resulting from Operations | | $ | (3,044,836 | ) |
See Notes to Financial Statements
60
STATEMENTS OF CHANGES IN NET ASSETS
| | For the year ended | | For the year ended | |
| | December 31, 2018 | | December 31, 2017 | |
| | | | | |
Investment Activities: | | | | | |
Operations: | | | | | |
Net investment income | | $ | 274,446 | | $ | 202,024 | |
Net realized gains from investment transactions | | 1,583,837 | | 1,342,837 | |
Change in unrealized appreciation/depreciation from investments | | (4,903,119 | ) | 5,029,481 | |
Change in Net Assets Resulting from Operations | | (3,044,836 | ) | 6,574,342 | |
Distributions to shareholders: | | | | | |
Total Distributions | | (2,123,241 | ) | (1,023,323 | ) |
Change in Net Assets Resulting from distributions to shareholders | | (2,123,241 | ) | (1,023,323 | ) |
Capital Share Transactions: | | | | | |
Proceeds from shares issued | | 13,129,291 | | 8,072,991 | |
Dividends reinvested | | 1,610,869 | | 777,475 | |
Cost of shares redeemed | | (7,583,025 | ) | (6,898,171 | ) |
Change in Net Assets Resulting from Capital Share Transactions | | 7,157,135 | | 1,952,295 | |
Change in Net Assets | | 1,989,058 | | 7,503,314 | |
Net Assets: | | | | | |
Beginning of period | | 45,631,767 | | 38,128,453 | |
End of period | | $ | 47,620,825 | | $ | 45,631,767 | |
Share Transactions: | | | | | |
Issued | | 772,168 | | 519,460 | |
Reinvested | | 101,825 | | 47,091 | |
Redeemed | | (458,240 | ) | (445,035 | ) |
Change in shares | | 415,753 | | 121,516 | |
See Notes to Financial Statements
61
FINANCIAL HIGHLIGHTS
Selected data for a share outstanding throughout the periods indicated.
| | | | | | For the nine | | | | | | | |
| | For the year | | For the year | | months | | For the year | | For the year | | For the year | |
| | ended | | ended | | ended | | ended | | ended | | Ended | |
| | December 31, | | December 31, | | December 31, | | March 31, | | March 31, | | March 31, | |
| | 2018 | | 2017 | | 2016 | | 2016 | | 2015 | | 2014 | |
| | | | | | | | | | | | | |
Net Asset Value, Beginning of Period | | $ | 16.69 | | $ | 14.60 | | $ | 13.40 | | $ | 14.70 | | $ | 13.97 | | $ | 12.09 | |
| | | | | | | | | | | | | |
Investment Activities: | | | | | | | | | | | | | |
Operations: | | | | | | | | | | | | | |
Net investment income/(loss) | | 0.09 | | 0.07 | | 0.12 | | 0.04 | | 0.01 | | (0.01 | ) |
Net realized/unrealized gains (losses) from investments | | (0.99 | ) | 2.40 | | 1.87 | | (0.44 | ) | 1.03 | | 2.38 | |
Total from investment activities | | (0.90 | ) | 2.47 | | 1.99 | | (0.40 | ) | 1.04 | | 2.37 | |
Dividends: | | | | | | | | | | | | | |
Net investment income | | (0.09 | ) | (0.09 | ) | (0.14 | ) | (0.02 | ) | (0.01 | ) | — | |
Net realized gains from investment transactions | | (0.58 | ) | (0.29 | ) | (0.65 | ) | (0.88 | ) | (0.30 | ) | (0.49 | ) |
Total dividends | | (0.67 | ) | (0.38 | ) | (0.79 | ) | (0.90 | ) | (0.31 | ) | (0.49 | ) |
| | | | | | | | | | | | | |
Net Asset Value, End of Period | | $ | 15.12 | | $ | 16.69 | | $ | 14.60 | | $ | 13.40 | | $ | 14.70 | | $ | 13.97 | |
| | | | | | | | | | | | | |
Total Return | | (5.59 | )% | 16.94 | % | 14.73 | %(a) | (2.47 | )% | 7.60 | % | 19.68 | % |
| | | | | | | | | | | | | |
Ratios/Supplemental Data: | | | | | | | | | | | | | |
Net assets at end of period (000’s) | | $ | 47,621 | | $ | 45,632 | | $ | 38,128 | | $ | 32,452 | | $ | 28,369 | | $ | 25,780 | |
Ratio of net expenses to average net assets | | 1.00 | % | 1.00 | % | 1.00 | %(b) | 1.00 | % | 1.00 | % | 1.00 | % |
Ratio of net investment income/(loss) to average net assets | | 0.52 | % | 0.48 | % | 1.12 | %(b) | 0.30 | % | 0.08 | % | (0.05 | )% |
Ratio of expenses (before fee reductions or recoupment of fees previously reimbursed by the investment adviser) to average net assets (c) | | 1.08 | % | 1.08 | % | 1.12 | %(b) | 1.15 | % | 1.12 | % | 1.12 | % |
Portfolio turnover rate | | 18.61 | % | 31.92 | % | 20.85 | %(a) | 43.24 | % | 33.61 | % | 51.57 | % |
Amounts designated as “—” are $0 or have been rounded to $0.
(a) Not annualized for periods less than one year.
(b) Annualized for periods less than one year.
(c) During the periods, certain fees were reduced. If such fee reduction had not occurred, the ratio would have been as indicated.
See Notes to Financial Statements
62
Schedule of Portfolio Investments | Walden Small Cap Fund |
| December 31, 2018 |
Security Description | | Shares | | Fair Value ($) | |
COMMON STOCKS (99.1%) | | | | | |
Communication Services (0.9%) | | | | | |
Cable One, Inc. | | 890 | | 729,889 | |
| | | | 729,889 | |
Consumer Discretionary (13.1%) | | | | | |
Big Lots, Inc. | | 27,750 | | 802,530 | |
Brinker International, Inc. | | 15,350 | | 675,093 | |
Carter’s, Inc. | | 7,900 | | 644,798 | |
Cheesecake Factory, Inc. | | 19,775 | | 860,410 | |
Choice Hotels International, Inc. | | 20,675 | | 1,479,916 | |
Dorman Products, Inc. (a) | | 15,825 | | 1,424,567 | |
Dunkin’ Brands Group, Inc. | | 13,700 | | 878,444 | |
Gentherm, Inc. (a) | | 18,100 | | 723,638 | |
Monro Muffler Brake, Inc. | | 17,100 | | 1,175,625 | |
Texas Roadhouse, Inc. | | 19,975 | | 1,192,508 | |
Williams Sonoma, Inc. | | 20,375 | | 1,027,919 | |
| | | | 10,885,448 | |
Consumer Staples (4.8%) | | | | | |
Flowers Foods, Inc. | | 71,625 | | 1,322,914 | |
Lancaster Colony Corp. | | 10,000 | | 1,768,600 | |
Tootsie Roll Industries, Inc. | | 27,675 | | 924,345 | |
| | | | 4,015,859 | |
Energy (2.5%) | | | | | |
Dril-Quip, Inc. (a) | | 20,800 | | 624,624 | |
Forum Energy Technologies, Inc. (a) | | 53,950 | | 222,814 | |
Natural Gas Services Group, Inc. (a) | | 14,200 | | 233,448 | |
Newpark Resources, Inc. (a) | | 70,700 | | 485,709 | |
RPC, Inc. | | 50,500 | | 498,435 | |
| | | | 2,065,030 | |
Financials (16.3%) | | | | | |
1st Source Corp. | | 17,300 | | 697,882 | |
Artisan Partners Asset Management, Inc., Class A | | 19,100 | | 422,301 | |
Bank of Hawaii Corp. | | 16,925 | | 1,139,391 | |
Bridge BanCorp, Inc. | | 13,025 | | 332,007 | |
Bryn Mawr Bank Corp. | | 15,600 | | 536,640 | |
Camden National Corp. | | 12,700 | | 456,819 | |
Cohen & Steers, Inc. | | 21,000 | | 720,720 | |
Commerce Bancshares, Inc. | | 19,709 | | 1,110,996 | |
CVB Financial Corp. | | 29,200 | | 590,716 | |
Eaton Vance Corp. | | 26,550 | | 934,029 | |
German American BanCorp | | 13,225 | | 367,258 | |
Independent Bank Corp. | | 12,075 | | 848,993 | |
Lakeland Financial Corp. | | 20,425 | | 820,268 | |
Morningstar, Inc. | | 9,175 | | 1,007,781 | |
Texas Capital Bancshares, Inc. (a) | | 8,500 | | 434,265 | |
Tompkins Financial Corp. | | 11,150 | | 836,362 | |
UMB Financial Corp. | | 16,800 | | 1,024,296 | |
Washington Federal, Inc. | | 22,950 | | 612,995 | |
Washington Trust BanCorp, Inc. | | 15,200 | | 722,456 | |
| | | | 13,616,175 | |
Health Care (16.2%) | | | | | |
Anika Therapeutics, Inc. (a) | | 18,325 | | 615,903 | |
Atrion Corp. | | 925 | | 685,499 | |
Bio-Techne Corp. | | 7,600 | | 1,099,872 | |
Bruker Corp. | | 41,300 | | 1,229,501 | |
Chemed Corp. | | 5,425 | | 1,536,794 | |
CorVel Corp. (a) | | 13,025 | | 803,903 | |
Ensign Group, Inc. | | 23,000 | | 892,170 | |
Globus Medical, Inc., Class A (a) | | 20,800 | | 900,224 | |
Haemonetics Corp. (a) | | 10,575 | | 1,058,029 | |
Hill-Rom Holdings, Inc. | | 13,600 | | 1,204,280 | |
Masimo Corp. (a) | | 17,800 | | 1,911,186 | |
Premier, Inc. (a) | | 17,800 | | 664,830 | |
U.S. Physical Therapy, Inc. | | 8,000 | | 818,800 | |
| | | | 13,420,991 | |
Industrials (15.9%) | | | | | |
Applied Industrial Technologies, Inc. | | 19,675 | | 1,061,270 | |
Donaldson Co., Inc. | | 34,350 | | 1,490,446 | |
Forward Air Corp. | | 16,250 | | 891,313 | |
Franklin Electric Co., Inc. | | 31,000 | | 1,329,279 | |
Herman Miller, Inc. | | 24,400 | | 738,100 | |
Hub Group, Inc., Class A (a) | | 28,150 | | 1,043,520 | |
Kadant, Inc. | | 9,150 | | 745,359 | |
Landstar System, Inc. | | 14,125 | | 1,351,339 | |
Lincoln Electric Holdings, Inc. | | 15,250 | | 1,202,463 | |
Tennant Co. | | 9,900 | | 515,889 | |
UniFirst Corp. | | 7,725 | | 1,105,216 | |
Valmont Industries, Inc. | | 6,475 | | 718,401 | |
Watts Water Technologies, Inc., Class A | | 15,500 | | 1,000,215 | |
| | | | 13,192,810 | |
Information Technology (14.4%) | | | | | |
Aspen Technology, Inc. (a) | | 14,800 | | 1,216,264 | |
Coherent, Inc. (a) | | 7,100 | | 750,541 | |
CSG Systems International, Inc. | | 36,600 | | 1,162,782 | |
ExlService Holdings, Inc. (a) | | 17,400 | | 915,588 | |
InterDigital, Inc. | | 15,175 | | 1,008,075 | |
Manhattan Associates, Inc. (a) | | 24,500 | | 1,038,065 | |
NETGEAR, Inc. (a) | | 25,425 | | 1,322,863 | |
NIC, Inc. | | 78,975 | | 985,608 | |
Power Integrations, Inc. | | 17,300 | | 1,054,954 | |
Tech Data Corp. (a) | | 13,925 | | 1,139,204 | |
Teradata Corp. (a) | | 35,650 | | 1,367,534 | |
| | | | 11,961,478 | |
Materials (4.6%) | | | | | |
AptarGroup, Inc. | | 16,850 | | 1,585,079 | |
Minerals Technologies, Inc. | | 11,250 | | 577,575 | |
Quaker Chemical Corp. | | 4,550 | | 808,581 | |
Silgan Holdings, Inc. | | 37,225 | | 879,255 | |
| | | | 3,850,490 | |
Real Estate (5.5%) | | | | | |
American Campus Communities, Inc. | | 10,700 | | 442,873 | |
CoreSite Realty Corp. | | 12,625 | | 1,101,278 | |
CubeSmart | | 33,600 | | 963,984 | |
HFF, Inc., Class A | | 20,000 | | 663,200 | |
Highwoods Properties, Inc. | | 15,900 | | 615,171 | |
Ryman Hospitality Properties, Inc. | | 11,850 | | 790,277 | |
| | | | 4,576,783 | |
Utilities (4.9%) | | | | | |
Chesapeake Utilities Corp. | | 11,100 | | 902,430 | |
Hawaiian Electric Industries, Inc. | | 23,800 | | 871,556 | |
New Jersey Resources Corp. | | 19,550 | | 892,849 | |
ONE Gas, Inc. | | 17,150 | | 1,365,140 | |
| | | | 4,031,975 | |
| | | | | |
TOTAL COMMON STOCKS (Cost $68,960,516) | | | | 82,346,928 | |
| | | | | |
INVESTMENT COMPANIES (0.9%) | | | | | |
| | | | | |
JPMorgan U.S. Government Money Market Fund, Capital Shares, 2.28%(b) | | 720,599 | | 720,599 | |
TOTAL INVESTMENT COMPANIES (Cost $720,599) | | | | 720,599 | |
| | | | | |
Total Investments (Cost $69,681,115) — 100.0%(c) | | | | 83,067,527 | |
Other assets in excess of liabilities — 0.0% | | | | 9,011 | |
NET ASSETS — 100.0% | | | | $ | 83,076,538 | |
| | | | | | |
(a) Non-income producing security.
(b) Rate disclosed is the seven day yield as of December 31, 2018.
(c) See Federal Tax Information listed in the Notes to the Financial Statements.
See Notes to Financial Statements
63
Financial Statements | Walden Small Cap Fund |
STATEMENT OF ASSETS AND LIABILITIES
December 31, 2018
Assets: | | | |
Investments, at fair value (cost $69,681,115) | | $ | 83,067,527 | |
Dividends receivable | | 85,388 | |
Receivable for capital shares issued | | 72,106 | |
Prepaid expenses | | 14,442 | |
Total Assets | | 83,239,463 | |
Liabilities: | | | |
Payable for capital shares redeemed | | 88,167 | |
Accrued expenses and other liabilities: | | | |
Investment adviser | | 46,346 | |
Administration and accounting | | 4,019 | |
Custodian | | 1,322 | |
Shareholder servicing fees | | 7,555 | |
Transfer agent | | 3,077 | |
Trustee | | 91 | |
Other | | 12,348 | |
Total Liabilities | | 162,925 | |
Net Assets | | $ | 83,076,538 | |
Composition of Net Assets: | | | |
Paid in capital | | $ | 68,892,324 | |
Total distributable earnings/(loss) | | 14,184,214 | |
Net Assets | | $ | 83,076,538 | |
Shares outstanding (par value $0.01, unlimited number of shares authorized) | | 4,817,739 | |
Net Asset Value, Offering Price and Redemption price per share | | $ | 17.24 | |
STATEMENT OF OPERATIONS
For the year ended December 31, 2018
Investment Income: | | | |
Dividends | | $ | 1,382,388 | |
Total Investment Income | | 1,382,388 | |
Expenses: | | | |
Investment adviser | | 718,382 | |
Administration and accounting | | 80,067 | |
Chief compliance officer | | 8,780 | |
Custodian | | 13,555 | |
Shareholder servicing | | 81,659 | |
Transfer agency | | 36,801 | |
Trustee | | 5,586 | |
Other | | 60,882 | |
Total expenses before fee reductions | | 1,005,712 | |
Fees contractually reduced by the investment adviser | | (48,303 | ) |
Net Expenses | | 957,409 | |
Net Investment Income | | 424,979 | |
Net Realized/Unrealized Gains (Losses) from Investments: | | | |
Net realized gains from investment transactions | | 5,465,977 | |
Change in unrealized appreciation/depreciation from investments | | (11,223,623 | ) |
Net realized/unrealized gains (losses) from investments | | (5,757,646 | ) |
Change in Net Assets Resulting from Operations | | $ | (5,332,667 | ) |
See Notes to Financial Statements
64
STATEMENTS OF CHANGES IN NET ASSETS
| | For the year ended | | For the year ended | |
| | December 31, 2018 | | December 31, 2017 | |
| | | | | |
Investment Activities: | | | | | |
Operations: | | | | | |
Net investment income | | $ | 424,979 | | $ | 410,814 | |
Net realized gains from investment transactions | | 5,465,977 | | 3,897,223 | |
Change in unrealized appreciation/depreciation from investments | | (11,223,623 | ) | 5,447,583 | |
Change in Net Assets Resulting from Operations | | (5,332,667 | ) | 9,755,620 | |
Distributions to shareholders: | | | | | |
Total Distributions | | (4,848,431 | ) | (5,286,908 | ) |
Change in Net Assets Resulting from distributions to shareholders | | (4,848,431 | ) | (5,286,908 | ) |
Capital Share Transactions: | | | | | |
Proceeds from shares issued | | 8,254,682 | | 14,199,045 | |
Dividends reinvested | | 4,120,461 | | 4,225,840 | |
Cost of shares redeemed | | (17,260,949 | ) | (9,948,923 | ) |
Change in Net Assets Resulting from Capital Share Transactions | | (4,885,806 | ) | 8,475,962 | |
Change in Net Assets | | (15,066,904 | ) | 12,944,674 | |
Net Assets: | | | | | |
Beginning of period | | 98,143,442 | | 85,198,768 | |
End of period | | $ | 83,076,538 | | $ | 98,143,442 | |
Share Transactions: | | | | | |
Issued | | 407,232 | | 743,521 | |
Reinvested | | 227,650 | | 219,867 | |
Redeemed | | (873,346 | ) | (522,532 | ) |
Change in shares | | (238,464 | ) | 440,856 | |
See Notes to Financial Statements
65
FINANCIAL HIGHLIGHTS
Selected data for a share outstanding throughout the periods indicated.
| | | | | | For the nine | | | | | | | |
| | For the year | | For the year | | months | | For the year | | For the year | | For the year | |
| | ended | | ended | | ended | | ended | | ended | | ended | |
| | December 31, | | December 31, | | December 31, | | March 31, | | March 31, | | March 31, | |
| | 2018 | | 2017 | | 2016 | | 2016 | | 2015 | | 2014 | |
| | | | | | | | | | | | | |
Net Asset Value, Beginning of Period | | $ | 19.41 | | $ | 18.46 | | $ | 16.45 | | $ | 19.66 | | $ | 20.43 | | $ | 18.48 | |
| | | | | | | | | | | | | |
Investment Activities: | | | | | | | | | | | | | |
Operations: | | | | | | | | | | | | | |
Net investment income | | 0.09 | | 0.09 | | 0.16 | | 0.08 | | 0.04 | | 0.01 | |
Net realized/unrealized gains (losses) from investments | | (1.21 | ) | 2.02 | | 2.58 | | (0.38 | ) | 0.66 | | 3.42 | |
Total from investment activities | | (1.12 | ) | 2.11 | | 2.74 | | (0.30 | ) | 0.70 | | 3.43 | |
Dividends: | | | | | | | | | | | | | |
Net investment income | | (0.10 | ) | (0.10 | ) | (0.17 | ) | (0.07 | ) | (0.02 | ) | — | |
Net realized gains from investment transactions | | (0.95 | ) | (1.06 | ) | (0.56 | ) | (2.84 | ) | (1.45 | ) | (1.48 | ) |
Total dividends | | (1.05 | ) | (1.16 | ) | (0.73 | ) | (2.91 | ) | (1.47 | ) | (1.48 | ) |
| | | | | | | | | | | | | |
Net Asset Value, End of Period | | $ | 17.24 | | $ | 19.41 | | $ | 18.46 | | $ | 16.45 | | $ | 19.66 | | $ | 20.43 | |
| | | | | | | | | | | | | |
Total Return | | (6.05 | )% | 11.50 | % | 16.57 | %(a) | (0.80 | )% | 3.86 | % | 18.58 | % |
| | | | | | | | | | | | | |
Ratios/Supplemental Data: | | | | | | | | | | | | | |
Net assets at end of period (000’s) | | $ | 83,077 | | $ | 98,143 | | $ | 85,199 | | $ | 69,754 | | $ | 87,740 | | $ | 103,791 | |
Ratio of net expenses to average net assets | | 1.00 | % | 1.00 | % | 1.00 | %(b) | 1.00 | % | 1.00 | % | 1.00 | % |
Ratio of net investment income to average net assets | | 0.44 | % | 0.47 | % | 1.14 | %(b) | 0.45 | % | 0.17 | % | 0.03 | % |
Ratio of expenses (before fee reductions or recoupment of fees previously reimbursed by the investment adviser) to average net assets (c) | | 1.05 | % | 1.03 | % | 1.06 | %(b) | 1.06 | % | 1.01 | % | 1.05 | % |
Portfolio turnover rate | | 22.47 | % | 27.16 | % | 14.71 | %(a) | 38.05 | % | 28.74 | % | 36.60 | % |
(a) Not annualized for periods less than one year.
(b) Annualized for periods less than one year.
(c) During the periods, certain fees were reduced. If such fee reduction had not occurred, the ratio would have been as indicated.
See Notes to Financial Statements
66
Schedule of Portfolio Investments | Walden International Equity Fund |
| December 31, 2018 |
Security Description | | Shares | | Fair Value ($) | |
COMMON STOCKS (98.5%) | | | | | |
Australia (5.7%) | | | | | |
Australia & New Zealand Banking Group Ltd. | | 11,096 | | 191,126 | |
Brambles Ltd. | | 34,113 | | 243,827 | |
Commonwealth Bank of Australia | | 7,569 | | 385,847 | |
CSL Ltd. | | 2,877 | | 375,131 | |
Origin Energy Ltd.(a) | | 50,479 | | 229,991 | |
Telstra Corp. Ltd. | | 97,283 | | 195,244 | |
Westpac Banking Corp. | | 14,352 | | 253,071 | |
Woodside Petroleum Ltd. | | 16,719 | | 368,747 | |
| | | | 2,242,984 | |
Belgium (1.1%) | | | | | |
Colruyt SA | | 5,856 | | 417,543 | |
| | | | 417,543 | |
Canada (8.0%) | | | | | |
ARC Resources Ltd. | | 23,987 | | 142,340 | |
Bank of Montreal | | 6,130 | | 400,538 | |
Canadian National Railway Co. | | 4,673 | | 346,144 | |
Great-West Lifeco, Inc. | | 12,649 | | 261,135 | |
Intact Financial Corp. | | 3,270 | | 237,620 | |
Magna International, Inc. | | 4,266 | | 193,673 | |
Metro, Inc. | | 8,019 | | 278,109 | |
Royal Bank of Canada | | 6,484 | | 443,858 | |
The Bank of Nova Scotia | | 6,900 | | 343,989 | |
The Toronto-Dominion Bank | | 9,285 | | 461,598 | |
| | | | 3,109,004 | |
Denmark (1.5%) | | | | | |
Novo Nordisk A/S | | 7,776 | | 355,549 | |
Novozymes A/S | | 4,918 | | 219,586 | |
| | | | 575,135 | |
Finland (1.6%) | | | | | |
Kone OYJ | | 7,661 | | 365,449 | |
Nordea Bank AB | | 32,843 | | 276,519 | |
| | | | 641,968 | |
France (8.8%) | | | | | |
Air Liquide SA | | 3,792 | | 471,117 | |
Danone SA | | 5,673 | | 399,751 | |
Dassault Systemes | | 2,927 | | 347,722 | |
Essilor International SA | | 2,907 | | 367,825 | |
Imerys SA | | 4,154 | | 199,774 | |
Legrand SA | | 4,891 | | 276,233 | |
L’Oreal SA | | 1,784 | | 411,200 | |
Publicis Groupe SA | | 5,538 | | 317,722 | |
Schneider Electric SE | | 5,551 | | 379,770 | |
Societe BIC SA | | 2,623 | | 267,886 | |
| | | | 3,439,000 | |
Germany (8.0%) | | | | | |
Allianz SE | | 1,845 | | 370,180 | |
Beiersdorf AG | | 2,649 | | 276,641 | |
Deutsche Boerse AG | | 3,056 | | 367,423 | |
Fresenius SE & Co. KGaA | | 5,158 | | 250,422 | |
Fuchs Petrolub SE | | 4,952 | | 204,114 | |
Hannover Rueck SE | | 1,789 | | 241,222 | |
Henkel AG & Co. KGaA | | 2,115 | | 207,766 | |
Hugo Boss AG | | 2,890 | | 178,516 | |
Merck KGaA | | 3,586 | | 369,647 | |
Muenchener Rueckversicherungs- Gesellschaft AG | | 1,010 | | 220,476 | |
SAP AG | | 4,429 | | 441,068 | |
| | | | 3,127,475 | |
Hong Kong (3.3%) | | | | | |
Hang Lung Properties Ltd. | | 176,400 | | 336,129 | |
Hang Seng Bank Ltd. | | 14,820 | | 332,740 | |
Hysan Development Co. Ltd. | | 62,000 | | 294,955 | |
MTR Corp. Ltd. | | 64,900 | | 341,492 | |
| | | | 1,305,316 | |
Ireland (1.5%) | | | | | |
Experian PLC | | 14,071 | | 341,607 | |
Kerry Group PLC | | 2,544 | | 249,909 | |
| | | | 591,516 | |
Israel (0.6%) | | | | | |
Nice Systems Ltd.(a) | | 2,355 | | 253,596 | |
| | | | 253,596 | |
| | | | | |
Italy (2.4%) | | | | | |
Luxottica Group SpA | | 5,132 | | 303,954 | |
Snam SpA | | 78,869 | | 345,054 | |
Terna Rete Elettrica Nazionale SpA | | 50,472 | | 286,384 | |
| | | | 935,392 | |
Japan (22.6%) | | | | | |
Astellas Pharma, Inc. | | 18,850 | | 241,065 | |
Benesse Holdings, Inc. | | 7,560 | | 193,018 | |
Canon, Inc. | | 10,775 | | 295,061 | |
Central Japan Railway Co. | | 1,415 | | 299,101 | |
Chugai Pharmaceutical Co. Ltd. | | 5,300 | | 308,550 | |
Daiwa House Industry Co. Ltd. | | 13,590 | | 433,779 | |
East Japan Railway Co. | | 2,725 | | 241,468 | |
Fast Retailing Co. Ltd. | | 805 | | 414,069 | |
JSR Corp. | | 13,200 | | 199,343 | |
Kao Corp. | | 3,600 | | 267,857 | |
KDDI Corp. | | 12,600 | | 301,692 | |
Kurita Water Industries Ltd. | | 8,200 | | 199,332 | |
Mitsubishi Estate Co. Ltd. | | 22,400 | | 353,507 | |
Nippon Telegraph & Telephone Corp. | | 7,632 | | 312,133 | |
Nitto Denko Corp. | | 3,400 | | 171,970 | |
Nomura Research Institute Ltd. | | 6,688 | | 248,687 | |
NTT DOCOMO, Inc. | | 14,310 | | 322,853 | |
Oracle Corporation Japan | | 3,700 | | 236,335 | |
Oriental Land Co. Ltd. | | 4,225 | | 426,201 | |
Secom Co. Ltd. | | 3,935 | | 327,252 | |
Sumitomo Mitsui Financial Group, Inc. | | 9,150 | | 304,331 | |
Terumo Corp. | | 6,800 | | 386,196 | |
The Chiba Bank Ltd. | | 40,245 | | 225,481 | |
The Hachijuni Bank Ltd. | | 54,240 | | 223,216 | |
The Shizuoka Bank Ltd. | | 33,180 | | 260,681 | |
Tokio Marine Holdings, Inc. | | 6,950 | | 332,058 | |
Tokyo Gas Co. Ltd. | | 12,200 | | 310,093 | |
Toyota Motor Corp. | | 6,540 | | 382,291 | |
Yahoo Japan Corp. | | 94,835 | | 237,109 | |
Yamato Holdings Co. Ltd. | | 13,075 | | 360,788 | |
| | | | 8,815,517 | |
Luxembourg (0.5%) | | | | | |
Tenaris SA | | 19,307 | | 208,794 | |
| | | | 208,794 | |
Netherlands (4.5%) | | | | | |
Akzo Nobel NV | | 4,164 | | 335,826 | |
Core Laboratories NV | | 3,056 | | 182,321 | |
Koninklijke Ahold Delhaize NV | | 18,813 | | 475,761 | |
Koninklijke Vopak NV | | 8,095 | | 367,976 | |
Wolters Kluwer NV | | 6,754 | | 399,711 | |
| | | | 1,761,595 | |
See Notes to Financial Statements
67
Security Description | | Shares | | Fair Value ($) | |
COMMON STOCKS, CONTINUED | | | | | |
Norway (0.6%) | | | | | |
Statoil ASA | | 10,777 | | 229,182 | |
| | | | 229,182 | |
Singapore (1.2%) | | | | | |
ComfortDelGro Corp. Ltd. | | 150,350 | | 237,232 | |
Singapore Exchange Ltd. | | 41,400 | | 217,239 | |
| | | | 454,471 | |
Spain (2.8%) | | | | | |
Banco Bilbao Vizcaya Argentaria SA | | 50,988 | | 270,767 | |
Enagas SA | | 11,341 | | 306,744 | |
Gas Natural SDG SA | | 12,002 | | 306,062 | |
Inditex SA | | 8,595 | | 220,067 | |
| | | | 1,103,640 | |
Sweden (1.6%) | | | | | |
Atlas Copco AB, Class A | | 6,310 | | 149,948 | |
Hennes & Mauritz AB | | 16,596 | | 236,104 | |
Svenska Handelsbanken AB | | 20,076 | | 222,787 | |
| | | | 608,839 | |
Switzerland (7.8%) | | | | | |
ABB Ltd. | | 10,427 | | 198,405 | |
Cie Financiere Richemont SA | | 3,329 | | 213,463 | |
Givaudan SA | | 118 | | 273,352 | |
Nestle SA | | 7,548 | | 613,059 | |
Roche Holding AG | | 3,235 | | 801,423 | |
SGS SA | | 134 | | 301,415 | |
Sonova Holding AG-REG | | 1,830 | | 299,133 | |
Zurich Insurance Group AG | | 1,174 | | 350,228 | |
| | | | 3,050,478 | |
United Kingdom (14.4%) | | | | | |
Admiral Group PLC | | 9,911 | | 258,549 | |
Burberry Group PLC | | 12,989 | | 287,282 | |
Compass Group PLC | | 17,226 | | 362,223 | |
Croda International PLC | | 5,711 | | 340,979 | |
Investec PLC | | 34,827 | | 195,776 | |
ITV PLC | | 114,566 | | 182,285 | |
Johnson Matthey PLC | | 8,313 | | 296,530 | |
Linde PLC | | 1,851 | | 293,794 | |
London Stock Exchange Group PLC | | 6,576 | | 340,416 | |
Marks & Spencer Group PLC | | 56,865 | | 179,143 | |
National Grid PLC | | 39,270 | | 382,451 | |
Next PLC | | 3,982 | | 202,531 | |
Reckitt Benckiser Group PLC | | 5,118 | | 392,192 | |
RELX PLC | | 14,529 | | 299,308 | |
Sage Group PLC | | 41,182 | | 315,630 | |
Schroders PLC | | 6,790 | | 211,398 | |
Smith & Nephew PLC | | 13,802 | | 257,508 | |
Smiths Group PLC | | 12,557 | | 218,277 | |
Unilever PLC | | 8,526 | | 446,412 | |
WPP PLC | | 14,697 | | 158,568 | |
| | | | 5,621,252 | |
| | | | | |
TOTAL COMMON STOCKS (Cost $39,652,182) | | | | 38,492,697 | |
| | | | | |
INVESTMENT COMPANIES (1.0%) | | | | | |
JPMorgan U.S. Government Money Market Fund, Capital Shares, 2.28%(b) | �� | 384,032 | | 384,032 | |
TOTAL INVESTMENT COMPANIES (Cost $384,032) | | | | 384,032 | |
| | | | | |
Total Investments (Cost $40,036,214) — 99.5%(c) | | | | 38,876,729 | |
Other assets in excess of liabilities — 0.5% | | | | 179,641 | |
NET ASSETS — 100.0% | | | | $ | 39,056,370 | |
| | | | | | |
(a) Non-income producing security.
(b) Rate disclosed is the seven day yield as of December 31, 2018.
(c) See Federal Tax Information listed in the Notes to the Financial Statements.
PLC Public Limited Company
The Fund invested, as a percentage of net assets at value, in the following industries as of December 31, 2018:
| | Percentage of Total | |
Industry | | Net Assets | |
Financials | | 21.1 | % |
Industrials | | 14.9 | % |
Consumer Staples | | 11.3 | % |
Health Care | | 10.2 | % |
Consumer Discretionary | | 9.8 | % |
Materials | | 7.7 | % |
Energy | | 6.0 | % |
Information Technology | | 5.5 | % |
Communication Services | | 5.2 | % |
Real Estate | | 3.5 | % |
Utilities | | 3.3 | % |
Investment Companies | | 1.0 | % |
Other net assets | | 0.5 | % |
Total | | 100.0 | % |
See Notes to Financial Statements
68
Financial Statements | Walden International Equity Fund |
STATEMENT OF ASSETS AND LIABILITIES
December 31, 2018
Assets: | | | |
Investments, at fair value (cost $40,036,214) | | $ | 38,876,729 | |
Cash | | 113,430 | |
Foreign currency, at fair value (cost $4,489) | | 4,489 | |
Dividends receivable | | 34,988 | |
Receivable for tax reclaims | | 66,647 | |
Prepaid expenses | | 2,742 | |
Total Assets | | 39,099,025 | |
Liabilities: | | | |
Accrued expenses and other liabilities: | | | |
Investment adviser | | 25,973 | |
Administration and accounting | | 4,728 | |
Custodian | | 4,099 | |
Shareholder servicing fees | | 2 | |
Transfer agent | | 2,465 | |
Trustee | | 55 | |
Other | | 5,333 | |
Total Liabilities | | 42,655 | |
Net Assets | | $ | 39,056,370 | |
Composition of Net Assets: | | | |
Paid in capital | | $ | 40,503,230 | |
Total distributable earnings/(loss) | | (1,446,860 | ) |
Net Assets | | $ | 39,056,370 | |
Shares outstanding (par value $0.01, unlimited number of shares authorized) | | 3,992,264 | |
Net Asset Value, Offering Price and Redemption price per share | | $ | 9.78 | |
STATEMENT OF OPERATIONS
For the year ended December 31, 2018
Investment Income: | | | |
Dividends | | $ | 1,284,216 | |
Less: Foreign tax withholding | | (130,421 | ) |
Total Investment Income | | 1,153,795 | |
Expenses: | | | |
Investment adviser | | 318,281 | |
Administration and accounting | | 69,909 | |
Chief compliance officer | | 3,938 | |
Custodian | | 54,519 | |
Shareholder servicing | | 5 | |
Transfer agency | | 28,617 | |
Trustee | | 2,495 | |
Other | | 17,270 | |
Total expenses before fee reductions | | 495,034 | |
Fees contractually reduced by the investment adviser | | (7,070 | ) |
Net Expenses | | 487,964 | |
Net Investment Income | | 665,831 | |
Net Realized/Unrealized Gains (Losses) from Investments: | | | |
Net realized (losses) from investment securities and foreign currency transactions | | (80,636 | ) |
Change in unrealized appreciation/depreciation from investment securities and foreign currency transactions | | (5,048,658 | ) |
Net realized/unrealized gains (losses) from investments | | (5,129,294 | ) |
Change in Net Assets Resulting from Operations | | $ | (4,463,463 | ) |
See Notes to Financial Statements
69
STATEMENTS OF CHANGES IN NET ASSETS
| | For the year ended | | For the year ended | |
| | December 31, 2018 | | December 31, 2017 | |
Investment Activities: | | | | | |
Operations: | | | | | |
Net investment income | | $ | 665,831 | | $ | 467,578 | |
Net realized losses from investment transactions | | (80,636 | ) | (91,800 | ) |
Change in unrealized appreciation/depreciation from investments | | (5,048,658 | ) | 4,623,573 | |
Change in Net Assets Resulting from Operations | | (4,463,463 | ) | 4,999,351 | |
Distributions to shareholders: | | | | | |
Total Distributions | | (649,752 | ) | (471,514 | ) |
Change in Net Assets Resulting from distributions to shareholders | | (649,752 | ) | (471,514 | ) |
Capital Share Transactions: | | | | | |
Proceeds from shares issued | | 3,925,039 | | 21,755,505 | |
Dividends reinvested | | 416,559 | | 335,788 | |
Cost of shares redeemed | | (1,406,297 | ) | (97,588 | ) |
Change in Net Assets Resulting from Capital Share Transactions | | 2,935,301 | | 21,993,705 | |
Change in Net Assets | | (2,177,914 | ) | 26,521,542 | |
Net Assets: | | | | | |
Beginning of period | | 41,234,284 | | 14,712,742 | |
End of period | | $ | 39,056,370 | | $ | 41,234,284 | |
Share Transactions: | | | | | |
Issued | | 361,674 | | 2,130,028 | |
Reinvested | | 42,077 | | 30,582 | |
Redeemed | | (136,574 | ) | (10,065 | ) |
Change in shares | | 267,177 | | 2,150,545 | |
See Notes to Financial Statements
70
FINANCIAL HIGHLIGHTS
Selected data for a share outstanding throughout the periods indicated.
| | | | | | For the nine | | Period | |
| | For the year | | For the year | | months | | June 9, 2015 | |
| | ended | | ended | | ended | | through | |
| | December 31, | | December 31, | | December 31, | | March 31, | |
| | 2018 | | 2017 | | 2016 | | 2016(a) | |
| | | | | | | | | |
Net Asset Value, Beginning of Period | | $ | 11.07 | | $ | 9.34 | | $ | 9.45 | | $ | 10.00 | |
| | | | | | | | | |
Investment Activities: | | | | | | | | | |
Operations: | | | | | | | | | |
Net investment income | | 0.17 | | 0.13 | | 0.12 | | 0.08 | |
Net realized/unrealized gains (losses) from investments | | (1.29 | ) | 1.73 | | (0.06 | ) | (0.59 | ) |
Total from investment activities | | (1.12 | ) | 1.86 | | 0.06 | | (0.51 | ) |
Dividends: | | | | | | | | | |
Net investment income | | (0.17 | ) | (0.13 | ) | (0.17 | ) | (0.04 | ) |
Net realized gains from investment transactions | | — | | — | | — | | — | |
Total dividends | | (0.17 | ) | (0.13 | ) | (0.17 | ) | (0.04 | ) |
| | | | | | | | | |
Net Asset Value, End of Period | | $ | 9.78 | | $ | 11.07 | | $ | 9.34 | | $ | 9.45 | |
| | | | | | | | | |
Total Return | | (10.18 | )% | 19.92 | % | 0.62 | %(b) | (5.09 | )%(b) |
| | | | | | | | | |
Ratios/Supplemental Data: | | | | | | | | | |
Net assets at end of period (000’s) | | $ | 39,056 | | $ | 41,234 | | $ | 14,713 | | $ | 12,786 | |
Ratio of net expenses to average net assets | | 1.15 | % | 1.15 | % | 1.15 | %(c) | 1.15 | %(c) |
Ratio of net investment income to average net assets | | 1.57 | % | 1.57 | % | 1.87 | %(c) | 1.22 | %(c) |
Ratio of expenses (before fee reductions or recoupment of fees previously reimbursed by the investment adviser) to average net assets (d) | | 1.17 | % | 1.31 | % | 1.86 | %(c) | 2.21 | %(c) |
Portfolio turnover rate | | 3.44 | % | 10.16 | % | 4.90 | %(b) | 5.11 | %(b) |
Amounts designated as “—” are $0 or have been rounded to $0.
(a) Commencement of operations on June 9, 2015.
(b) Not annualized for periods less than one year.
(c) Annualized for periods less than one year.
(d) During the periods, certain fees were reduced. If such fee reduction had not occurred, the ratio would have been as indicated.
See Notes to Financial Statements
71
Notes to Financial Statements | December 31, 2018 |
1. Organization:
The Boston Trust & Walden Funds (the “Trust”) was organized on January 8, 1992 as a Massachusetts business trust and is registered under the Investment Company Act of 1940, as amended (the “1940 Act”), as an open-end management investment company. The Trust contains the following funds (individually a “Fund”, collectively the “Funds”), each of which are registered as a diversified Fund under the 1940 Act:
Fund | | Short Name |
Boston Trust Asset Management Fund | | Asset Management Fund |
Boston Trust Equity Fund | | Equity Fund |
Boston Trust Midcap Fund | | Midcap Fund |
Boston Trust SMID Cap Fund | | SMID Cap Fund |
Boston Trust Small Cap Fund | | Small Cap Fund |
Walden Asset Management Fund | | Walden Asset Management Fund |
Walden Equity Fund | | Walden Equity Fund |
Walden Midcap Fund | | Walden Midcap Fund |
Walden SMID Cap Fund | | Walden SMID Cap Fund |
Walden Small Cap Fund | | Walden Small Cap Fund |
Walden International Equity Fund | | Walden International Equity Fund |
The investment objective of the Asset Management Fund and Walden Asset Management Fund is to seek long-term capital growth and income through an actively managed portfolio of stocks, bonds and money market instruments. The investment objective of the Equity Fund and Walden Equity Fund is to seek long-term capital growth through an actively managed portfolio of stocks. The investment objective of the Midcap Fund and Walden Midcap Fund is to seek long-term capital growth through an actively managed portfolio of stocks of middle capitalization companies. The investment objective of the SMID Cap Fund and Walden SMID Cap Fund is to seek long-term capital growth through an actively managed portfolio of stocks of small to middle capitalization companies. The investment objective of the Small Cap Fund and Walden Small Cap Fund is to seek long-term capital growth through an actively managed portfolio of stocks of small capitalization companies. The investment objective of the Walden International Equity Fund is to seek long-term capital growth through an actively managed portfolio of equities of international companies.
Under the Trust’s organizational documents, its officers and trustees are indemnified against certain liabilities arising out of the performance of their duties to the Trust. In addition, in the normal course of business, the Trust may enter into contracts with its vendors and others that provide for general indemnifications. Each Fund’s maximum exposure under these arrangements is unknown, as this would involve future claims that may be made against the Funds. However, based on experience, the Funds expect risk of loss to be remote.
2. Significant Accounting Policies:
The following is a summary of significant accounting policies followed by the Funds in the preparation of their financial statements. The policies are in conformity with accounting principles generally accepted in the United States of America (“GAAP”).
The preparation of financial statements in conformity with GAAP requires management to make estimates and assumptions that affect the reported amounts of assets and liabilities, the disclosure of contingent assets and liabilities at the date of the financial statements and the reported amounts of increases and decreases in net assets from operations during the reporting period. Actual results may differ from those estimates.
The Funds are investment companies and accordingly follow the investment company accounting and reporting guidance of the Financial Accounting Standards Board (FASB) Accounting Standards Codification Topic 946 Financial Services - Investment Companies.
Security Valuation:
The Funds record their investments at fair value. Fair value is defined as the price that would be received to sell an asset or paid to transfer a liability in an orderly transaction between market participants at the measurement date. The valuation techniques used to determine fair value are further described below.
The value of each equity security, including common stocks, is based either on the last sale price on a national securities exchange, or in the absence of recorded sales, at the closing bid prices on such exchanges, or at the quoted bid price in the over-the-counter market. Equity securities traded on the NASDAQ stock market are valued at the NASDAQ official closing price. The prices for foreign securities are reported in local currency and converted to U.S dollars using currency exchange rates. Prices for most securities held in the Funds are provided daily by a recognized independent pricing service.
Bonds and other fixed income securities (other than short-term obligations but including listed issues) are provided by an independent pricing service, the use of which has been approved by the Board. In making such valuations, the pricing service utilizes both dealer-supplied valuations and electronic data processing techniques that take into account appropriate factors such as institutional-size trading in similar groups of securities, yield, quality, coupon rate, maturity, type of issue, and trading characteristics other than market data and without exclusive reliance upon quoted prices or exchanges or over-the-counter prices, since such valuations are believed to reflect more accurately the fair value of such securities. All debt portfolio securities with a remaining maturity of 60 days or less may be valued at amortized cost, which approximates fair value.
The Trust may use a pricing service to value certain portfolio securities where the prices provided are believed to reflect the fair value of such securities. If market prices are not readily available or, in the opinion of the Adviser, market prices do not reflect fair value, or if an event occurs after the close of trading on the exchange or market on which the security is principally traded (but prior to the time the NAV is calculated) that materially affects fair value, the Adviser will value the Funds’ assets at their fair value according to policies approved by the Board. The Adviser believes that foreign security values may be affected by volatility that occurs in global markets on a trading day after the close of any given foreign securities markets. The fair valuation procedures, therefore, include a procedure whereby foreign security prices may be “fair valued” by an independent pricing service through the use of factors which take such volatility into account.
Investments in investment companies and money market funds are valued at net asset value per share.
Continued
72
Notes to Financial Statements | December 31, 2018 |
Fair Value Measurements:
The valuation techniques employed by the Funds, as described above in Security Valuation, maximize the use of observable inputs and minimize the use of unobservable inputs in determining fair value. The inputs used for valuing the Funds’ investments are summarized in the three broad levels listed below:
Level 1 — quoted prices in active markets for identical assets
Level 2 — other significant observable inputs (including quoted prices for similar securities, interest rates, prepayment speeds, credit risk, etc.)
Level 3 — significant unobservable inputs (including the Funds’ own assumptions in determining the fair value of investments)
The inputs or methodology used to value investments are not necessarily an indication of the risk associated with investing in those investments.
Pursuant to the valuation techniques described above in Security Valuation, equity securities are generally categorized as Level 1 securities in the fair value hierarchy (unless there is a fair valuation event, in which case affected securities are generally categorized as Level 2 securities). Fixed income securities, including those with a remaining maturity of 60 days or less, are generally categorized as Level 2 securities in the fair value hierarchy. Open-ended investment companies and money market funds are generally categorized as Level 1 securities in the fair value hierarchy.
Investments for which there are no quotations available, or for which quotations do not appear reliable, are valued at fair value as determined in good faith by the Adviser under the direction of the Board. These valuations are typically categorized as Level 2 or Level 3 in the fair value hierarchy.
The following is a summary of the valuation inputs used as of December 31, 2018 in valuing the Funds’ investments based on the three levels defined above:
| | | | Level 2 | | | |
| | Level 1 | | Other Significant | | Total Investments | |
Fund Name | | Quoted Prices | | Observable Inputs | | in Securities | |
Asset Management Fund | | | | | | | |
Common Stocks(1) | | $ | 350,185,251 | | $ | — | | $ | 350,185,251 | |
Corporate Bonds(1) | | — | | 12,133,263 | | 12,133,263 | |
Municipal Bonds(2) | | — | | 3,604,265 | | 3,604,265 | |
U.S. Government & U.S. Government Agency Obligations | | — | | 85,318,577 | | 85,318,577 | |
Investment Companies | | 8,899,795 | | — | | 8,899,795 | |
Total | | 359,085,046 | | 101,056,105 | | 460,141,151 | |
Equity Fund | | | | | | | |
Common Stocks(1) | | 125,225,837 | | — | | 125,225,837 | |
Investment Companies | | 548,868 | | — | | 548,868 | |
Total | | 125,774,705 | | — | | 125,774,705 | |
Midcap Fund | | | | | | | |
Common Stocks(1) | | 72,968,572 | | — | | 72,968,572 | |
Investment Companies | | 3,034,757 | | — | | 3,034,757 | |
Total | | 76,003,329 | | — | | 76,003,329 | |
SMID Cap Fund | | | | | | | |
Common Stocks(1) | | 73,255,465 | | — | | 73,255,465 | |
Investment Companies | | 993,206 | | — | | 993,206 | |
Total | | 74,248,671 | | — | | 74,248,671 | |
Small Cap Fund | | | | | | | |
Common Stocks(1) | | 241,764,360 | | — | | 241,764,360 | |
Investment Companies | | 711,329 | | — | | 711,329 | |
Total | | 242,475,689 | | — | | 242,475,689 | |
Walden Asset Management Fund | | | | | | | |
Common Stocks(1) | | 83,835,180 | | — | | 83,835,180 | |
Certificate of Deposit | | — | | 99,354 | | 99,354 | |
Corporate Bonds(1) | | — | | 3,249,533 | | 3,249,533 | |
Municipal Bonds(2) | | — | | 444,458 | | 444,458 | |
U.S. Government & U.S. Government Agency Obligations | | — | | 31,643,721 | | 31,643,721 | |
Investment Companies | | 4,216,980 | | — | | 4,216,980 | |
Total | | 88,052,160 | | 35,437,066 | | 123,489,226 | |
Walden Equity Fund | | | | | | | |
Common Stocks(1) | | 189,341,271 | | — | | 189,341,271 | |
Investment Companies | | 3,081,315 | | — | | 3,081,315 | |
Total | | 192,422,586 | | — | | 192,422,586 | |
Walden Midcap Fund | | | | | | | |
Common Stocks(1) | | 45,237,508 | | — | | 45,237,508 | |
Investment Companies | | 408,850 | | — | | 408,850 | |
Total | | 45,646,358 | | — | | 45,646,358 | |
| | | | | | | | | | |
Continued
73
Notes to Financial Statements | December 31, 2018 |
| | | | Level 2 | | | |
| | Level 1 | | Other Significant | | Total Investments | |
Fund Name | | Quoted Prices | | Observable Inputs | | in Securities | |
Walden SMID Cap Fund | | | | | | | |
Common Stocks(1) | | $ | 48,532,937 | | $ | — | | $ | 48,532,937 | |
Investment Companies | | 141,823 | | — | | 141,823 | |
Total | | 48,674,760 | | — | | 48,674,760 | |
Walden Small Cap Fund | | | | | | | |
Common Stocks(1) | | 82,346,928 | | — | | 82,346,928 | |
Investment Companies | | 720,599 | | — | | 720,599 | |
Total | | 83,067,527 | | — | | 83,067,527 | |
Walden International Equity Fund | | | | | | | |
Common Stocks(3) | | 38,492,697 | | — | | 38,492,697 | |
Investment Companies | | 384,032 | | — | | 384,032 | |
Total | | 38,876,729 | | — | | 38,876,729 | |
| | | | | | | | | | |
(1) For detailed industry classifications, see the accompanying Schedules of Portfolio Investments.
(2) For detailed state descriptions, see the accompanying Schedules of Portfolio Investments.
(3) For detailed country classifications, see the accompanying Schedules of Portfolio Investments.
Investment Transactions and Related Income:
Investment transactions are accounted for no later than one business day after trade date. However, for financial reporting purposes, investment transactions are accounted for on trade date. Investment gains and losses are calculated on the identified cost basis. Interest income is recognized on the accrual basis and includes, where applicable, the amortization or accretion of premium or discount based on effective yield. Dividend income is recorded on the ex-dividend date except in the case of certain foreign securities, in which case dividends are recorded as soon as such information becomes available.
Real Estate Investment Trusts:
The Funds may own shares of real estate investment trusts (“REITs”), which report information on the source of their distribution annually. Certain distributions received from REITs during the year, which are known to be return of capital, are recorded as a reduction to the cost of the individual REIT.
Expenses:
Expenses directly attributable to a Fund are charged directly to that Fund. Expenses relating to the Trust are allocated proportionately to each Fund within the Trust according to the relative net assets of each Fund or on another reasonable basis.
Distributions to Shareholders:
Distributions to shareholders are recorded on the ex-dividend date. Dividends to shareholders from net investment income, if any, are declared and paid annually by the Funds. Dividends to shareholders from net realized gains, if any, are declared and distributed at least annually by the Funds. The amounts of distributions to shareholders from net investment income and of distributions from net realized gains are determined in accordance with federal income tax regulations, which may differ from GAAP.
Federal Income Taxes:
Each Fund qualifies and intends to continue to qualify as a regulated investment company by complying with the provisions available to certain investment companies, as defined in Subchapter M of the Internal Revenue Code, and to make distributions from net investment income and from net realized capital gains sufficient to relieve it from all, or substantially all, federal income and excise taxes. Therefore, no federal income tax provision is required.
Management has reviewed tax positions taken in tax years that remain subject to examination by all major tax jurisdictions, including Federal (i.e., the last four tax year ends and the interim tax period since then, as applicable) and believes that there is no tax liability resulting from unrecognized tax benefits related to uncertain tax positions taken as of and during the year ended December 31, 2018. The Funds recognize interest and penalties, if any, related to unrecognized tax benefits, as income tax expense in the Statements of Operations as incurred. There are no income tax noted as due for the year ended December 31, 2018.
Foreign Currency Transactions:
The accounting records of the Funds are maintained in U.S. dollars denominated amounts are translated into U.S. dollars as follows, with the resultant exchange gains and losses recorded in the Statements of Operations:
i) value of investment securities and other assets and liabilities at the exchange rate on the valuation date; and
ii) purchases and sales of investment securities and income and expenses at the exchange rate prevailing on the respective date of such transactions.
The Funds do not isolate realized and unrealized gains and losses attributable to changes in the exchange rates from gains and losses that arise from changes in the value of investments. Such fluctuations are included with net realized and unrealized gain or loss from investments.
Investment income from non-U.S. sources received by a Fund is generally subject to non-U.S. withholding taxes at rates ranging up to 30%. Such withholding taxes may be reduced or eliminated under the terms of applicable U.S. income tax treaties. The Funds may be subject to foreign taxes on gains in investments or currency repatriation. The Funds accrue such taxes, as applicable, based on their current interpretation of tax rules in the foreign markets in which they invest.
New Accounting Pronouncements:
In March 2017, FASB issued Accounting Standards Update No. 2017-08 “Premium Amortization on Purchased Callable Debt Securities” (“ASU 2017-08”), which shortens the premium amortization period for purchased non-contingently callable debt securities. ASU 2017-08 specifies that the premium amortization period ends at the earliest call date, for purchased non-contingently callable debt securities. ASU 2017-08 is effective for fiscal years, and interim periods within those fiscal years, beginning after December 15, 2018. Management is currently evaluating the implications of ASU 2017-08 and its impact on the financial statements and related disclosures has not yet been determined.
Continued
74
Notes to Financial Statements | December 31, 2018 |
In August 2018, the FASB issued Accounting Standards Update No. 2018-13, “Fair Value Measurements” (“ASU 2018-13”). This update makes certain removals from, changes to and additions to existing disclosure requirements for fair value measurements. ASU 2018-13 does not change fair value measurements already required or permitted by existing standards. ASU 2018-13 is effective for financial statements issued for fiscal years beginning after December 15, 2019, and interim periods within those fiscal years, with early adoption permitted. The ASU has been adopted for the year ended December 31, 2018 and there was no material impact to the financial statements.
In August 2018, the SEC adopted amendments to certain financial statement disclosure requirements to conform them to GAAP for investment companies. These amendments made certain removals from, changes to and additions to existing disclosure requirements under Regulation S-X. The Funds’ adoption of these amendments, effective with the financial statements prepared as of December 31, 2018 had no effect on the Funds’ net assets or results of operations. As a result of adopting these amendments, the distributions to shareholders in the December 31, 2017 Statements of Changes in Net Assets presented herein have been reclassified to conform to the current year presentation, which includes all distributions to each class of shareholders, other than tax basis return of capital distributions, in one line item per share class. Adopting these amendments also eliminated the presentation of accumulated undistributed net investment income/(distributions in excess of net investment income) in the Statements of Changes in Net Assets presented herein. Prior to adoption of this amendment, the distributions to shareholders and accumulated undistributed net investment income/(distributions in excess of net investment income) in the December 31, 2017 Statements of Changes in Net Assets appeared as follows:
| | | | Net realized gains | | Accumulated undistributed net | |
| | Net investment | | from investment | | investment income/(distributions in | |
| | income | | transactions | | excess of net investment income) | |
Asset Management Fund | | $ | (5,061,492 | ) | $ | (6,837,618 | ) | $ | — | |
Equity Fund | | (1,291,316 | ) | (2,118,848 | ) | 3,532 | |
Midcap Fund | | (271,407 | ) | (3,587,314 | ) | — | |
SMID Cap Fund | | (261,257 | ) | (327,372 | ) | — | |
Small Cap Fund | | (1,854,467 | ) | (28,816,187 | ) | 188,495 | |
Walden Asset Management Fund | | (1,213,718 | ) | (940,938 | ) | — | |
Walden Equity Fund | | (1,740,760 | ) | (8,052,912 | ) | — | |
Walden Midcap Fund | | (203,517 | ) | (1,315,187 | ) | — | |
Walden SMID Cap Fund | | (234,490 | ) | (788,833 | ) | — | |
Walden Small Cap Fund | | (474,566 | ) | (4,812,342 | ) | 45,161 | |
Walden International Equity Fund | | (471,514 | ) | — | | (2,142 | ) |
| | | | | | | | | | |
3. Related Party Transactions and Other Service Arrangements:
Investment Adviser:
The Trust, with respect to the Funds, and the Adviser are parties to an Investment Advisory Agreement under which the Adviser is entitled to receive an annual fee, computed daily and paid monthly, equal to the average daily net assets of each Fund, at the following annual percentage rates before contractual waivers:
Fund | | Fee Rate | |
Asset Management Fund | | 0.75 | % |
Equity Fund | | 0.75 | % |
Midcap Fund | | 0.75 | % |
SMID Cap Fund | | 0.75 | % |
Small Cap Fund | | 0.75 | % |
Fund | | Fee Rate | |
Walden Asset Management Fund | | 0.75 | % |
Walden Equity Fund | | 0.75 | % |
Walden Midcap Fund | | 0.75 | % |
Walden SMID Cap Fund | | 0.75 | % |
Walden Small Cap Fund | | 0.75 | % |
Walden International Equity Fund | | 0.75 | % |
Additionally, two trustees of the Trust are officers of the Adviser or its affiliate, and an officer of the Trust is an officer of the Adviser. These persons are not paid directly by the Funds.
Administration and Fund Accounting:
Citi Fund Services Ohio, Inc. (“Citi”) serves the Funds as administrator. Citi provides administrative and fund accounting services for a fee that is computed daily and paid monthly, based on the aggregate daily net assets of the Trust plus certain base fees.
Certain officers of the Trust are affiliated with Citi. Such persons were paid no fees directly by the Funds for serving as Officers of the Trust. Citi makes an employee available to serve as the Trust’s Chief Compliance Officer (“CCO”) under a Compliance Service Agreement between the Funds and Citi (the “CCO Agreement”). Under the CCO Agreement, Citi also provides infrastructure and support in implementing the written policies and procedures comprising the Trust’s compliance program, including support services to the CCO. For the services provided under the CCO Agreement, the Funds paid Citi $150,000 for the year ended December 31, 2018, plus certain out of pocket expenses. Citi pays the salary and other compensation earned by the CCO as an employee of Citi.
Distribution:
Foreside Financial Services, LLC (“Foreside”), which is not affiliated with Citi or the Adviser, serves as the Funds’ distribution agent. Prior to a name change effective February 28, 2018, Foreside operated as BHIL Distributors, LLC. Fees for these services are paid monthly by the Adviser and not by the Funds.
Shareholder Services:
The Funds may enter into shareholder services agreements with investment advisers, banks, trust companies and other types of organizations (“Authorized Service Providers”), which may include affiliates of the Funds, for providing administrative services with respect to shares of the Funds attributable to or held in the name of the Authorized Service Provider for its clients or other parties with whom they have a servicing relationship. Fees paid by the Funds under shareholder services agreements may not exceed 0.25% of the average daily net assets of each Fund and are presented separately on the Statement of Operations. Affiliates of the Funds did not receive any fees during the year ended December 31, 2018.
Continued
75
Notes to Financial Statements | December 31, 2018 |
Custodian and Transfer Agency:
Boston Trust & Investment Management Company (“Boston Trust”), the parent company of the Adviser, acts as the Funds transfer agent. Under the transfer agency agreement, Boston Trust receives a fixed fee of $18,000 annually per fund, accrued daily and paid monthly for its services. Under a sub-transfer agency agreement, FIS Investor Services, LLC receives a fixed annual fee accrued daily and paid monthly, plus annual per account fees and certain out of pocket expenses for its services to the Trust. Expenses incurred under the transfer agency agreement and sub-transfer agency agreement are presented collectively as “Transfer Agency” expenses on the Statement of Operations.
Boston Trust acts as the Funds’ custodian, with the exception of the Walden International Equity Fund. Under the custody agreement, Boston Trust receives an annual asset based fee of 0.014% of the value of securities held. Citibank, N.A. receives sub-custodian fees from Boston Trust for each Fund except the Walden International Equity Fund. Under a separate custody agreement, Citibank, N.A., an affiliate of Citi, serves as custodian for the Walden International Equity Fund and receives a fee based on a percentage of assets held on behalf of the Walden International Equity Fund, transaction fees and certain out of pocket expenses for its services. Such percentages vary by the jurisdiction in which the assets are held.
Fee Reductions:
The Adviser has agreed to reduce its fees payable by the Funds to the extent necessary, exclusive of brokerage costs, interest, taxes, dividends, litigation, indemnification, expenses associated with the investments in underlying investment companies and extraordinary expenses (as determined under GAAP) of each Fund, except the SMID Cap Fund and the Walden International Equity Fund, to 1.00% of the average daily net assets. The Adviser has agreed to reduce its fees payable by the SMID Cap Fund and the Walden International Equity Fund to the extent necessary, subject to certain exclusions, to limit the aggregate annual operating expenses of the SMID Cap Fund to 0.75% of its average daily net assets and the Walden International Equity Fund to 1.15% of its average daily net assets. Any such reductions made by the Adviser in its fees or in the payment or reimbursement of expenses that are a Fund’s obligation may be subject to repayment by the Fund within three years provided the Fund receiving the reduction, payment or reimbursement is able to effect such repayment and remain in compliance with applicable expense limitations. The expense limitation agreement shall automatically renew effective May 1 of every year until the Adviser provides written notice of non-renewal to the Trust.
Pursuant to its agreement, the Adviser reimbursed, and has yet to recoup, fees in the following amounts for the year ended March 31, 2016, the nine months ended December 31, 2016, the year ended December 31, 2017 and the year ended December 31, 2018, respectively:
Fund | | Amount | | Expires | |
SMID Cap Fund | | $ | 44,650 | | 3/31/2019 | |
| | 37,894 | | 12/31/2019 | |
| | 87,452 | | 12/31/2020 | |
| | 168,823 | | 12/31/2021 | |
| | | | | |
Small Cap Fund | | 297,469 | | 3/31/2019 | |
| | 157,762 | | 12/31/2019 | |
| | 58,104 | | 12/31/2020 | |
| | 261,419 | | 12/31/2021 | |
| | | | | | |
Fund | | Amount | | Expires | |
Walden Asset Management Fund | | $ | 40,670 | | 3/31/2019 | |
| | 34,372 | | 12/31/2019 | |
| | 28,580 | | 12/31/2020 | |
| | 45,249 | | 12/31/2021 | |
| | | | | |
Walden Equity Fund | | 151,560 | | 3/31/2019 | |
| | 124,204 | | 12/31/2019 | |
| | 138,810 | | 12/31/2020 | |
| | 166,166 | | 12/31/2021 | |
| | | | | |
Walden Midcap Fund | | 16,479 | | 3/31/2019 | |
| | 12,415 | | 12/31/2019 | |
| | 4,010 | | 12/31/2020 | |
| | | | | |
Walden SMID Cap Fund | | 37,277 | | 3/31/2019 | |
| | 31,322 | | 12/31/2019 | |
| | 33,179 | | 12/31/2020 | |
| | 42,347 | | 12/31/2021 | |
| | | | | |
Walden Small Cap Fund | | 42,280 | | 3/31/2019 | |
| | 36,830 | | 12/31/2019 | |
| | 26,962 | | 12/31/2020 | |
| | 48,303 | | 12/31/2021 | |
| | | | | |
Walden International Equity Fund | | 85,178 | | 3/31/2019 | |
| | 73,099 | | 12/31/2019 | |
| | 47,374 | | 12/31/2020 | |
| | 7,070 | | 12/31/2021 | |
| | | | | | |
During the year ended December 31, 2018, the Adviser recouped $8,081 from the Midcap Fund and $1,091 from Walden Midcap Fund.
As of December 31, 2018, the Adviser may recoup amounts from the Funds as follows:
Total Potential Recoupment | | | |
Asset Management Fund | | $ | — | |
Equity Fund | | — | |
Midcap Fund | | — | |
SMID Cap Fund | | 338,819 | |
Small Cap Fund | | 774,754 | |
| | | | |
Total Potential Recoupment | | | |
Walden Asset Management Fund | | $ | 148,871 | |
Walden Equity Fund | | 580,740 | |
Walden Midcap Fund | | 32,904 | |
Walden SMID Cap Fund | | 144,125 | |
Walden Small Cap Fund | | 154,375 | |
Walden International Equity Fund | | 212,721 | |
| | | | |
During the year ended December 31, 2017, the Equity Fund delivered securities of the Fund in exchange for the redemption of shares. The total fair value of the in-kind redemptions was $5,350,555 for 231,726 shares of the Equity Fund.
During the year ended December 31, 2018, there were no in-kind transfers.
Continued
76
Notes to Financial Statements | December 31, 2018 |
Interfund Lending:
Pursuant to an Exemptive Order issued by the Securities and Exchange Commission (“SEC”), the Funds may participate in an interfund lending program (the “Program”). The Program provides an alternative credit facility under which the Funds may lend to, or borrow from, one another, consistent with each Fund’s investment objectives, limitations and organization documents. Any open loans at period end are presented under the caption “Payable” for interfund lending in the Statements of Assets and Liabilities. As of December 31, 2018, the Funds had no outstanding loans to or from another fund under the Program. The Funds’ did not have any activity in the Program during the period.
4. Purchases and Sales of Securities:
Cost of purchases and proceeds from sales and maturities of securities, excluding short-term securities and U.S. Government securities, for the Funds for the year ended December 31, 2018, totaled:
| | | | Sales and | |
Fund | | Purchases | | Maturities | |
Asset Management Fund | | $ | 6,923,032 | | $ | 39,981,749 | |
Equity Fund | | 2,247,678 | | 5,770,459 | |
Midcap Fund | | 27,570,194 | | 12,396,956 | |
SMID Cap Fund | | 34,166,121 | | 10,840,748 | |
Small Cap Fund | | 70,761,777 | | 180,655,997 | |
Walden Asset Management Fund | | 6,992,228 | | 10,372,443 | |
Walden Equity Fund | | 13,335,005 | | 13,557,457 | |
Walden Midcap Fund | | 10,179,493 | | 8,951,058 | |
Walden SMID Cap Fund | | 16,062,531 | | 9,567,450 | |
Walden Small Cap Fund | | 21,194,139 | | 29,763,254 | |
Walden International Equity Fund | | 4,426,903 | | 1,438,761 | |
| | | | | | | |
Cost of purchases and proceeds from sales and maturities of U.S. Government Securities, excluding short-term securities, for the Funds for the year ended December 31, 2018, totaled:
Fund | | Purchases | | Sales and Maturities | |
Asset Management Fund | | $ | 4,968,164 | | $ | — | |
Walden Asset Management Fund | | 6,961,719 | | 38,674 | |
| | | | | | | |
5. Federal Income Tax Information:
At December 31, 2018, the cost, gross unrealized appreciation and gross unrealized depreciation on investments, for federal income tax purposes, were as follows:
| | | | Gross Tax Unrealized | | Gross Tax Unrealized | | Net Unrealized Appreciation | |
Fund | | Tax Cost | | Appreciation | | (Depreciation) | | (Depreciation) | |
Asset Management Fund | | $ | 289,900,840 | | $ | 172,096,810 | | $ | (1,856,499 | ) | $ | 170,240,311 | |
Equity Fund | | 64,202,950 | | 61,863,175 | | (291,419 | ) | 61,571,756 | |
Midcap Fund | | 59,873,964 | | 18,357,527 | | (2,228,162 | ) | 16,129,365 | |
SMID Cap Fund | | 74,772,299 | | 5,167,485 | | (5,691,113 | ) | (523,628 | ) |
Small Cap Fund | | 197,010,681 | | 61,540,066 | | (16,075,058 | ) | 45,465,008 | |
Walden Asset Management Fund | | 88,697,659 | | 35,983,107 | | (1,191,540 | ) | 34,791,567 | |
Walden Equity Fund | | 109,206,068 | | 85,485,597 | | (2,269,080 | ) | 83,216,517 | |
Walden Midcap Fund | | 34,868,869 | | 12,434,307 | | (1,656,818 | ) | 10,777,489 | |
Walden SMID Cap Fund | | 41,605,566 | | 9,108,671 | | (2,039,477 | ) | 7,069,194 | |
Walden Small Cap Fund | | 69,801,437 | | 19,048,143 | | (5,782,053 | ) | 13,266,090 | |
Walden International Equity Fund | | 40,036,692 | | 2,899,174 | | (4,059,137 | ) | (1,159,963 | ) |
| | | | | | | | | | | | | |
The tax character of distributions paid during the fiscal year ended December 31, 2018 was as follows:
| | Distributions paid from | | | |
| | | | Net Long Term | | Total Taxable | |
Fund | | Ordinary Income | | Capital Gains | | Distributions | |
Asset Management Fund | | $ | 5,150,766 | | $ | 14,055,703 | | $ | 19,206,469 | |
Equity Fund | | 1,242,397 | | 1,000,925 | | 2,243,322 | |
Midcap Fund | | 670,067 | | 3,347,813 | | 4,017,880 | |
SMID Cap Fund | | 1,300,219 | | 120,329 | | 1,420,548 | |
Small Cap Fund | | 3,182,004 | | 31,455,328 | | 34,637,332 | |
Walden Asset Management Fund | | 1,300,957 | | 1,299,859 | | 2,600,816 | |
Walden Equity Fund | | 1,698,265 | | 2,456,934 | | 4,155,199 | |
Walden Midcap Fund | | 498,682 | | 2,565,361 | | 3,064,043 | |
Walden SMID Cap Fund | | 400,299 | | 1,722,942 | | 2,123,241 | |
Walden Small Cap Fund | | 424,979 | | 4,423,452 | | 4,848,431 | |
Walden International Equity Fund | | 649,752 | | — | | 649,752 | |
| | | | | | | | | | |
Continued
77
Notes to Financial Statements | December 31, 2018 |
The tax character of distributions paid during the fiscal year ended December 31, 2017 was as follows:
| | Distributions paid from | | | | | |
| | | | Net Long Term | | Total Taxable | | Total Distributions | |
Fund | | Ordinary Income | | Capital Gains | | Distributions | | Paid(1) | |
Asset Management Fund | | $ | 5,033,185 | | $ | 6,865,925 | | $ | 11,899,110 | | $ | 11,899,110 | |
Equity Fund | | 1,291,316 | | 2,118,848 | | 3,410,164 | | 3,410,164 | |
Midcap Fund | | 729,312 | | 3,129,409 | | 3,858,721 | | 3,858,721 | |
SMID Cap Fund | | 519,807 | | 68,822 | | 588,629 | | 588,629 | |
Small Cap Fund | | 3,371,093 | | 27,299,561 | | 30,670,654 | | 30,670,654 | |
Walden Asset Management Fund | | 1,296,570 | | 858,086 | | 2,154,656 | | 2,154,656 | |
Walden Equity Fund | | 1,932,721 | | 7,860,951 | | 9,793,672 | | 9,793,672 | |
Walden Midcap Fund | | 408,200 | | 1,110,504 | | 1,518,704 | | 1,518,704 | |
Walden SMID Cap Fund | | 594,253 | | 429,070 | | 1,023,323 | | 1,023,323 | |
Walden Small Cap Fund | | 1,118,233 | | 4,168,675 | | 5,286,908 | | 5,286,908 | |
Walden International Equity Fund | | 471,514 | | — | | 471,514 | | 471,514 | |
| | | | | | | | | | | | | |
(1) Total distributions paid may differ from the amount reported in the Statements of Changes in Net Assets because for tax purposes distributions are recognized when actually paid.
As of December 31, 2018, the components of distributable earnings (deficit) on a tax basis were as follows:
| | | | | | | | | | | | Total | |
| | Undistributed | | Undistributed | | | | Accumulated | | Unrealized | | Distributable | |
| | Ordinary | | Long-Term Capital | | Accumulated | | Capital and | | Appreciation | | Earnings | |
Fund | | Income | | Gains | | Earnings | | Other Losses | | (Depreciation)(2) | | (Deficit) | |
Asset Management Fund | | $ | 10,544 | | $ | 350,937 | | $ | 361,481 | | $ | — | | $ | 170,240,311 | | $ | 170,601,792 | |
Equity Fund | | 1,194 | | — | | 1,194 | | (281,047 | ) | 61,571,756 | | 61,291,903 | |
Midcap Fund | | 39,942 | | 919,788 | | 959,730 | | — | | 16,129,365 | | 17,089,095 | |
SMID Cap Fund | | 98,924 | | 347,593 | | 446,517 | | (1 | ) | (523,628 | ) | (77,112 | ) |
Small Cap Fund | | — | | 3,485,076 | | 3,485,076 | | — | | 45,465,008 | | 48,950,084 | |
Walden Asset Management Fund | | 1,300 | | 34,168 | | 35,468 | | — | | 34,791,567 | | 34,827,035 | |
Walden Equity Fund | | 4,333 | | 364,694 | | 369,027 | | — | | 83,216,517 | | 83,585,544 | |
Walden Midcap Fund | | 19,563 | | 550,412 | | 569,975 | | — | | 10,777,489 | | 11,347,464 | |
Walden SMID Cap Fund | | 24,297 | | 331,785 | | 356,082 | | — | | 7,069,194 | | 7,425,276 | |
Walden Small Cap Fund | | — | | 918,124 | | 918,124 | | — | | 13,266,090 | | 14,184,214 | |
Walden International Equity Fund | | — | | — | | — | | (286,282 | ) | (1,160,578 | ) | (1,446,860 | ) |
| | | | | | | | | | | | | | | | | | | |
(2) The differences between book-basis and tax-basis unrealized appreciation (depreciation) is attributable primarily to tax deferral of losses on wash sales and return of capital distributions from REIT securities and other investments.
As of the end of its tax year ended December 31, 2018, the Fund has a net capital loss carry forwards (“CLCFs”) not subject to expiration as summarized in the tables below. The Board does not intend to authorize a distribution of any realized gain for the Fund until any applicable CLCF has been offset or expires.
Fund | | Short Term | | Long Term | | Total | |
Walden International Equity Fund | | $ | 34,849 | | $ | 200,272 | | $ | 235,121 | |
| | | | | | | | | | |
Under current tax law, certain net investment losses and capital losses realized after October 31 of a Fund’s fiscal year may be deferred and treated as occurring on the first business day of the following fiscal year for tax purposes. The following Funds deferred losses as follows:
| | Late Year | | Post October | |
Fund | | Ordinary Loss | | Capital Losses | |
Equity Fund | | $ | — | | $ | 281,047 | |
Walden International Equity Fund | | 1,487 | | 49,674 | |
| | | | | | | |
Continued
78
Notes to Financial Statements | December 31, 2018 |
As of December 31, 2018, the following reclassifications have been made on the Statements of Assets and Liabilities to increase (decrease) such accounts with offsetting adjustments as indicated:
| | Total Distributable | | | |
Fund | | Earnings | | Paid in Capital | |
Asset Management Fund | | (1 | ) | $ | 1 | |
Equity Fund | | 2 | | (2 | ) |
Midcap Fund | | (63,914 | ) | 63,914 | |
SMID Cap Fund | | (25,275 | ) | 25,275 | |
Small Cap Fund | | (6,838,942 | ) | 6,838,942 | |
Walden Asset Management Fund | | 1 | | (1 | ) |
Walden Equity Fund | | (1 | ) | 1 | |
Walden Midcap Fund | | (59,220 | ) | 59,220 | |
Walden SMID Cap Fund | | (45,875 | ) | 45,875 | |
Walden Small Cap Fund | | (222,724 | ) | 222,724 | |
Walden International Equity Fund | | 1,035 | | (1,035 | ) |
| | | | | | |
These “book/tax” differences are either considered temporary or permanent in nature. To the extent these differences are permanent in nature (e.g. return of capital, distribution reclass, foreign currency reclass, and equalization), such amounts are reclassified within the composition of net assets based on their federal tax-basis treatment: temporary differences (e.g. wash sales and post October losses) do not require reclassification. To the extent dividends to shareholders exceed net investment income and net realized gains for tax purposes, they are reported as returns of capital.
6. Control Ownership and Principal Holders:
The beneficial ownership, either directly or indirectly, of more than 25% of the voting securities of a Fund creates presumptions of control of the Fund under section 2 (a)(9) of the 1940 Act. As of December 31, 2018, the Funds had individual shareholder accounts and/or omnibus shareholder accounts (comprised of a group of individual shareholders), owning more than 25% of the total shares outstanding of the Fund as detailed below.
Fund | | Control Ownership | | % of Ownership | |
Asset Management Fund | | US Bank N.A. | | 87.58 | |
Equity Fund | | US Bank N.A. | | 93.60 | |
Midcap Fund | | US Bank N.A. | | 73.01 | |
SMID Cap Fund | | National Financial Services | | 55.48 | |
Small Cap Fund | | National Financial Services | | 31.56 | |
Walden Asset Management Fund | | US Bank N.A. | | 59.73 | |
Walden Equity Fund | | US Bank N.A. | | 29.80 | |
Walden Midcap Fund | | US Bank N.A. | | 83.64 | |
Walden SMID Cap Fund | | US Bank N.A. | | 56.31 | |
Walden Small Cap Fund | | US Bank N.A. | | 45.07 | |
Walden International Equity Fund | | US Bank N.A. | | 85.79 | |
7. Subsequent Events:
Management has evaluated events and transactions through the date these financial statements were issued and concluded no subsequent events required recognition or disclosure in these financial statements.
Continued
79
Report of Independent Registered Public Accounting Firm
To the Shareholders and Board of Trustees of
The Boston Trust & Walden Funds
Opinion on the Financial Statements
We have audited the accompanying statements of assets and liabilities, including the schedules of portfolio investments, of The Boston Trust & Walden Funds, comprising the Boston Trust Asset Management Fund, Boston Trust Equity Fund, Boston Trust Midcap Fund, Boston Trust SMID Cap Fund, Boston Trust Small Cap Fund, Walden Asset Management Fund, Walden Equity Fund, Walden Midcap Fund, Walden SMID Cap Fund, Walden Small Cap Fund, and Walden International Equity Fund (the “Funds”), as of December 31, 2018, and the related statements of operations for the year then ended, the statements of changes in net assets for each of the two years in the period then ended, including the related notes, and the financial highlights for each of the periods indicated in the period then ended (collectively referred to as the “financial statements”). In our opinion, the financial statements present fairly, in all material respects, the financial position of each of the Funds as of December 31, 2018, the results of their operations for the year then ended, the changes in their net assets for each of the two years in the period then ended, and the financial highlights for each of the periods indicated in the period then ended, in conformity with accounting principles generally accepted in the United States of America.
Basis for Opinion
These financial statements are the responsibility of the Funds’ management. Our responsibility is to express an opinion on the Funds’ financial statements based on our audits. We are a public accounting firm registered with the Public Company Accounting Oversight Board (United States) (“PCAOB”) and are required to be independent with respect to the Funds in accordance with the U.S. federal securities laws and the applicable rules and regulations of the Securities and Exchange Commission and the PCAOB.
We conducted our audits in accordance with the standards of the PCAOB. Those standards require that we plan and perform the audit to obtain reasonable assurance about whether the financial statements are free of material misstatement, whether due to error or fraud.
Our audits included performing procedures to assess the risks of material misstatement of the financial statements, whether due to error or fraud, and performing procedures that respond to those risks. Such procedures included examining, on a test basis, evidence regarding the amounts and disclosures in the financial statements. Our procedures included confirmation of securities owned as of December 31, 2018, by correspondence with the custodians and brokers. Our audits also included evaluating the accounting principles used and significant estimates made by management, as well as evaluating the overall presentation of the financial statements. We believe that our audits provide a reasonable basis for our opinion.
We have served as the Funds’ auditor since 2008.
/s/ Cohen & Company, Ltd.
COHEN & COMPANY, LTD.
Cleveland, Ohio
February 26, 2019
80
Supplementary Information (Unaudited) | December 31, 2018 |
Federal Income Tax Information:
During the fiscal year ended December 31, 2018, the Funds declared long-term realized gain distributions in the following amounts:
Fund | | Long Term Capital Gain Distributions | |
Asset Management Fund | | $ | 14,055,703 | |
Equity Fund | | 1,000,925 | |
Midcap Fund | | 3,411,727 | |
SMID Cap Fund | | 145,603 | |
Small Cap Fund | | 38,429,690 | |
Walden Asset Management Fund | | 1,299,859 | |
Walden Equity Fund | | 2,456,934 | |
Walden Midcap Fund | | 2,624,581 | |
Walden SMID Cap Fund | | 1,768,817 | |
Walden Small Cap Fund | | 4,646,176 | |
| | | | |
During the fiscal year ended December 31, 2018, the Funds declared short-term realized gain distributions in the following amounts:
Fund | | Short-Term Capital Gains Distributions | |
Equity Fund | | $ | 1,682 | |
Midcap Fund | | 323,892 | |
SMID Cap Fund | | 733,654 | |
Small Cap Fund | | 2,038,506 | |
Walden Asset Management Fund | | 14,598 | |
Walden Midcap Fund | | 237,488 | |
Walden SMID Cap Fund | | 125,852 | |
| | | | |
For the fiscal year ended December 31, 2018, the following percentage of the total ordinary income distributions paid by the Funds qualify for the distributions received deduction available to corporate shareholders.
Fund | | Distribution Received Deduction | |
Asset Management Fund | | 100.00 | % |
Equity Fund | | 100.00 | % |
Midcap Fund | | 99.13 | % |
SMID Cap Fund | | 74.79 | % |
Small Cap Fund | | 100.00 | % |
Walden Asset Management Fund | | 100.00 | % |
Walden Equity Fund | | 100.00 | % |
Walden Midcap Fund | | 100.00 | % |
Walden SMID Cap Fund | | 100.00 | % |
Walden Small Cap Fund | | 100.00 | % |
Walden International Equity Fund | | 0.00 | % |
For the fiscal year ended December 31, 2018, distributions paid by the Funds may be subject to a maximum tax rate of 15%, as provided for by the Jobs and Growth Tax Relief Reconciliation Act of 2003. The Funds intend to designate the maximum amount allowable as taxed at a maximum rate of 15%. Complete information will be reported in conjunction with your 2018 Form 1099-DIV.
Fund | | Qualified Dividend Income | |
Asset Management Fund | | 100.00 | % |
Equity Fund | | 100.00 | % |
Midcap Fund | | 99.49 | % |
SMID cap Fund | | 75.72 | % |
Small Cap Fund | | 100.00 | % |
Walden Asset Management Fund | | 100.00 | % |
Walden Equity Fund | | 100.00 | % |
Walden Midcap Fund | | 100.00 | % |
Walden SMID Cap Fund | | 100.00 | % |
Walden Small Cap Fund | | 100.00 | % |
Walden International Equity Fund | | 100.00 | % |
The following Funds intend to elect to pass through to shareholders the income tax credit for taxes paid to foreign countries. Foreign source income and foreign tax expense per outstanding share on December 31, 2018 are as follows:
| | Foreign Source Income | | Foreign Tax Expense | |
Fund | | Per Share ($) | | Per Share ($) | |
Walden International Equity Fund | | 0.32 | | 0.03 | |
The pass-through of this foreign tax credit will only affect those persons who are shareholders on the dividend record date in December 2018. These shareholders will receive more detailed information along with their 2019 Form 1099-DIV.
Continued
81
Table of Shareholder Expenses:
As a shareholder of the Trust, you incur ongoing costs, including management fees, and other Fund expenses. These examples are intended to help you understand your ongoing costs (in dollars) of investing in The Boston Trust & Walden Funds and to compare these costs with the ongoing costs of investing in other mutual funds.
These examples are based on an investment of $1,000 invested at the beginning of the period and held for the entire period from July 1, 2018 through December 31, 2018.
Actual Expenses
The table below provides information about actual account values and actual expenses. You may use the information below together with the amount you invested, to estimate the expenses that you paid over the period. Simply divide your account value by $1,000 (for example, an $8,600 account value divided by $1,000 = 8.6), then multiply the result by the number in the table under the heading entitled “Expenses Paid during Period” to estimate the expenses you paid on your account during this period.
Please note that the expenses shown in the tables are meant to highlight your ongoing costs only and do not reflect the costs incurred by the Funds for buying and selling securities. The Funds do not charge transaction fees, such as redemption fees, nor do the Funds charge a sales charge (load). Therefore, the table is useful in comparing ongoing costs only, and will not help you determine the relative total costs of owning different funds.
| | | | | | | | Annualized | |
| | Beginning | | Ending | | Expenses Paid | | Expense Ratio | |
| | Account Value | | Account Value | | During Period(1) | | During Period | |
| | 7/1/18 | | 12/31/18 | | 7/1/18 - 12/31/18 | | 7/1/18 - 12/31/18 | |
Asset Management Fund | | $ | 1,000.00 | | $ | 978.30 | | $ | 4.64 | | 0.93 | % |
Equity Fund | | 1,000.00 | | 967.90 | | 4.61 | | 0.93 | % |
Midcap Fund | | 1,000.00 | | 943.50 | | 4.75 | | 0.97 | % |
SMID Cap Fund | | 1,000.00 | | 908.70 | | 3.61 | | 0.75 | % |
Small Cap Fund | | 1,000.00 | | 893.90 | | 4.77 | | 1.00 | % |
Walden Asset Management Fund | | 1,000.00 | | 973.90 | | 4.98 | | 1.00 | % |
Walden Equity Fund | | 1,000.00 | | 957.80 | | 4.93 | | 1.00 | % |
Walden Midcap Fund | | 1,000.00 | | 942.80 | | 4.90 | | 1.00 | % |
Walden SMID Cap Fund | | 1,000.00 | | 908.10 | | 4.81 | | 1.00 | % |
Walden Small Cap Fund | | 1,000.00 | | 896.50 | | 4.78 | | 1.00 | % |
Walden International Equity Fund | | 1,000.00 | | 902.30 | | 5.51 | | 1.15 | % |
| | | | | | | | | | | | |
(1) Expenses are equal to the Fund’s annualized expense ratio multiplied by the average account value over the period multiplied by 184/365 (to reflect the one-half year period).
Hypothetical Example for Comparison Purposes
The table below provides information about hypothetical account values and hypothetical expenses based on each Fund’s actual expense ratio and an assumed rate of return of 5% per year before expenses, which is not the Fund’s actual return. The hypothetical account values and expenses may not be used to estimate the actual ending account balance or expenses you paid for the period. You may use this information to compare this 5% hypothetical example with the 5% hypothetical examples that appear in the shareholder reports of other funds.
Please note that the expenses shown in the table are meant to highlight your ongoing costs only and do not reflect the costs incurred by the Funds for buying and selling securities. The Funds do not charge transaction fees, such as redemption fees, nor do the Funds charge a sales charge (load). Therefore, the table is useful in comparing ongoing costs only, and will not help you determine the relative total costs of owning different funds.
| | | | | | | | Annualized | |
| | Beginning | | Ending | | Expenses Paid | | Expense Ratio | |
| | Account Value | | Account Value | | During Period(1) | | During Period | |
| | 7/1/18 | | 12/31/18 | | 7/1/18 - 12/31/18 | | 7/1/18 - 12/31/18 | |
Asset Management Fund | | $ | 1,000.00 | | $ | 1,020.52 | | $ | 4.74 | | 0.93 | % |
Equity Fund | | 1,000.00 | | 1,020.52 | | 4.74 | | 0.93 | % |
Midcap Fund | | 1,000.00 | | 1,020.32 | | 4.94 | | 0.97 | % |
SMID Cap Fund | | 1,000.00 | | 1,021.42 | | 3.82 | | 0.75 | % |
Small Cap Fund | | 1,000.00 | | 1,020.16 | | 5.09 | | 1.00 | % |
Walden Asset Management Fund | | 1,000.00 | | 1,020.16 | | 5.09 | | 1.00 | % |
Walden Equity Fund | | 1,000.00 | | 1,020.16 | | 5.09 | | 1.00 | % |
Walden Midcap Fund | | 1,000.00 | | 1,020.16 | | 5.09 | | 1.00 | % |
Walden SMID Cap Fund | | 1,000.00 | | 1,020.16 | | 5.09 | | 1.00 | % |
Walden Small Cap Fund | | 1,000.00 | | 1,020.16 | | 5.09 | | 1.00 | % |
Walden International Equity Fund | | 1,000.00 | | 1,019.41 | | 5.85 | | 1.15 | % |
| | | | | | | | | | | | |
(1) Expenses are equal to the Fund’s annualized expense ratio multiplied by the average account value over the period multiplied by 184/365 (to reflect the one-half year period).
Continued
82
Tabular Summary of Schedules of Portfolio Investments:
The Boston Trust Funds invested, as a percentage of total net assets, in the following industries as of December 31, 2018.
Asset Management Fund | | | |
| | Percentage of Total | |
Security Allocation for the Schedule of Portfolio Investments | | Net Assets | |
U.S. Government & U.S. Government Agency Obligations | | 18.5 | % |
Information Technology | | 17.2 | % |
Financials | | 16.1 | % |
Health Care | | 12.5 | % |
Industrials | | 8.7 | % |
Consumer Staples | | 6.6 | % |
Communication Services | | 6.4 | % |
Consumer Discretionary | | 4.4 | % |
Energy | | 2.6 | % |
Materials | | 2.2 | % |
Utilities | | 1.9 | % |
Investment Companies | | 1.9 | % |
Municipal Bonds | | 0.8 | % |
Other net assets | | 0.2 | % |
Total | | 100.0 | % |
| | Percentage of Total | |
Security Allocation for the Schedule of Portfolio Investments | | Net Assets | |
Information Technology | | 20.8 | % |
Financials | | 19.5 | % |
Health Care | | 15.0 | % |
Industrials | | 12.6 | % |
Consumer Staples | | 9.1 | % |
Communication Services | | 8.5 | % |
Consumer Discretionary | | 5.2 | % |
Materials | | 3.3 | % |
Energy | | 3.3 | % |
Utilities | | 2.2 | % |
Investment Companies | | 0.4 | % |
Other net assets | | 0.1 | % |
Total | | 100.0 | % |
| | Percentage of Total | |
Security Allocation for the Schedule of Portfolio Investments | | Net Assets | |
Financials | | 15.9 | % |
Information Technology | | 15.6 | % |
Industrials | | 13.3 | % |
Consumer Discretionary | | 12.0 | % |
Health Care | | 11.5 | % |
Materials | | 7.7 | % |
Consumer Staples | | 6.6 | % |
Real Estate | | 5.9 | % |
Utilities | | 5.1 | % |
Investment Companies | | 4.1 | % |
Energy | | 2.4 | % |
Communication Services | | 1.4 | % |
Other net assets | | (1.5 | )% |
Total | | 100.0 | % |
| | Percentage of Total | |
Security Allocation for the Schedule of Portfolio Investments | | Net Assets | |
Industrials | | 16.7 | % |
Financials | | 15.0 | % |
Health Care | | 14.8 | % |
Information Technology | | 14.3 | % |
Consumer Discretionary | | 10.8 | % |
Real Estate | | 8.4 | % |
Materials | | 6.5 | % |
Consumer Staples | | 4.4 | % |
Utilities | | 3.8 | % |
Energy | | 2.7 | % |
Investment Companies | | 1.3 | % |
Communication Services | | 1.2 | % |
Other net assets | | 0.1 | % |
Total | | 100.0 | % |
| | Percentage of Total | |
Security Allocation for the Schedule of Portfolio Investments | | Net Assets | |
Health Care | | 17.6 | % |
Financials | | 16.3 | % |
Industrials | | 15.8 | % |
Information Technology | | 14.1 | % |
Consumer Discretionary | | 13.2 | % |
Real Estate | | 5.7 | % |
Utilities | | 4.9 | % |
Materials | | 4.5 | % |
Consumer Staples | | 4.3 | % |
Energy | | 2.6 | % |
Communication Services | | 0.8 | % |
Investment Companies | | 0.3 | % |
Other net assets | | (0.1 | )% |
Total | | 100.0 | % |
Continued
83
The Walden Funds invested, as a percentage of total net assets, in the following industries and countries as of December 31, 2018.
Walden Asset Management Fund | | | |
| | Percentage of Total | |
Security Allocation for the Schedule of Portfolio Investments | | Net Assets | |
U.S. Government & U.S. Government Agency Obligations | | 25.4 | % |
Information Technology | | 15.0 | % |
Financials | | 11.7 | % |
Health Care | | 11.1 | % |
Industrials | | 8.3 | % |
Consumer Staples | | 7.2 | % |
Consumer Discretionary | | 5.8 | % |
Communication Services | | 5.1 | % |
Investment Companies | | 3.4 | % |
Energy | | 2.2 | % |
Utilities | | 1.9 | % |
Materials | | 1.6 | % |
Municipal Bonds | | 0.4 | % |
Certificate of Deposit | | 0.1 | % |
Other net assets | | 0.8 | % |
Total | | 100.0 | % |
| | Percentage of Total | |
Security Allocation for the Schedule of Portfolio Investments | | Net Assets | |
Information Technology | | 19.7 | % |
Financials | | 16.1 | % |
Health Care | | 16.1 | % |
Industrials | | 11.7 | % |
Consumer Staples | | 10.2 | % |
Consumer Discretionary | | 8.8 | % |
Communication Services | | 7.3 | % |
Energy | | 3.1 | % |
Utilities | | 2.8 | % |
Materials | | 2.5 | % |
Investment Companies | | 1.6 | % |
Other net assets | | 0.1 | % |
Total | | 100.0 | % |
| | Percentage of Total | |
Security Allocation for the Schedule of Portfolio Investments | | Net Assets | |
Financials | | 16.9 | % |
Information Technology | | 15.3 | % |
Industrials | | 14.0 | % |
Consumer Discretionary | | 11.1 | % |
Health Care | | 11.0 | % |
Materials | | 8.0 | % |
Real Estate | | 6.3 | % |
Consumer Staples | | 6.3 | % |
Utilities | | 5.9 | % |
Energy | | 2.6 | % |
Communication Services | | 1.3 | % |
Investment Companies | | 0.9 | % |
Other net assets | | 0.4 | % |
Total | | 100.0 | % |
| | Percentage of Total | |
Security Allocation for the Schedule of Portfolio Investments | | Net Assets | |
Industrials | | 17.3 | % |
Financials | | 16.4 | % |
Health Care | | 15.5 | % |
Information Technology | | 15.3 | % |
Consumer Discretionary | | 9.9 | % |
Real Estate | | 8.5 | % |
Materials | | 6.7 | % |
Consumer Staples | | 4.7 | % |
Utilities | | 4.0 | % |
Energy | | 2.3 | % |
Communication Services | | 1.3 | % |
Investment Companies | | 0.3 | % |
Other net assets | | (2.2 | )% |
Total | | 100.0 | % |
| | Percentage of Total | |
Security Allocation for the Schedule of Portfolio Investments | | Net Assets | |
Financials | | 16.3 | % |
Health Care | | 16.2 | % |
Industrials | | 15.9 | % |
Information Technology | | 14.4 | % |
Consumer Discretionary | | 13.1 | % |
Real Estate | | 5.5 | % |
Utilities | | 4.9 | % |
Consumer Staples | | 4.8 | % |
Materials | | 4.6 | % |
Energy | | 2.5 | % |
Communication Services | | 0.9 | % |
Investment Companies | | 0.9 | % |
Other net assets | | 0.0 | % |
Total | | 100.0 | % |
Walden International Equity Fund | | | |
| | Percentage of Total | |
Security Allocation for the Schedule of Portfolio Investments | | Net Assets | |
Japan | | 22.6 | % |
United Kingdom | | 14.4 | % |
France | | 8.8 | % |
Canada | | 8.0 | % |
Germany | | 8.0 | % |
Switzerland | | 7.8 | % |
Australia | | 5.7 | % |
Netherlands | | 4.5 | % |
Hong Kong | | 3.3 | % |
Spain | | 2.8 | % |
Italy | | 2.4 | % |
Sweden | | 1.6 | % |
Finland | | 1.6 | % |
Ireland | | 1.5 | % |
Denmark | | 1.5 | % |
Singapore | | 1.2 | % |
Belgium | | 1.1 | % |
United States | | 1.0 | % |
Israel | | 0.6 | % |
Norway | | 0.6 | % |
Luxembourg | | 0.5 | % |
Other net assets | | 0.5 | % |
Total | | 100.0 | % |
Continued
84
Other Information:
A description of the policies and guidelines that the Funds use to determine how to vote proxies related to portfolio securities is available: (i) without charge, upon request, by calling 1-800-282-8782 ext. 7050, and (ii) on the Securities and Exchange Commission’s (the “Commission”) website at http://www.sec.gov.
Proxy voting policies and guidelines as well as information regarding how the Funds voted proxies relating to portfolio securities during the most recent 12-month period ended June 30 is available (i) without charge, upon request, by calling 1-800-282-8782 ext. 7050, (ii) on the Boston Trust & Investment Management, Inc. website at http://www.btim.com; and (iii) on the Commission’s website at http://www.sec.gov.
The Funds file complete schedules of portfolio holdings for each Fund with the Commission for the first and third quarters of each fiscal year on Form N-Q. The Funds’ Form N-Q is available on the Commission’s website at http://www.sec.gov. The Funds’ Form N-Q may be reviewed and copied at the Commission’s Public Reference Room in Washington, D.C. and information on the operation of the Public Reference Room may be obtained by calling 800-SEC-0330.
Continued
85
The annual consideration by the Board of Trustees (the “Board”) of the continuation of the investment advisory agreement between Boston Trust Investment Management, Inc., (the “Adviser”) and Boston Trust Asset Management Fund, Boston Trust Equity Fund, Boston Trust Midcap Fund, Boston Trust SMID Cap Fund, Boston Trust Small Cap Fund, Walden Asset Management Fund, Walden Equity Fund, Walden Midcap Fund, Walden SMID Cap Fund, Walden Small Cap Fund, and Walden International Equity Fund (the “Funds”).
Section 15 of the Investment Company Act of 1940 (the “1940 Act”) requires that the Investment Advisory Agreement with the Adviser be renewed annually by the Board of The Boston Trust & Walden Funds (the “Trust”), including a majority of the Board who are not “interested persons” of the Trust or of the Adviser (“Independent Trustees”). It is the duty of the Board to request as much information as is reasonably necessary to evaluate the terms of the Investment Advisory Agreement and determine whether its continuance is fair to the Funds and their shareholders. The Board considered the continuation of the Investment Advisory Agreement at an in-person meeting held on August 15, 2018. The Board requested, and the Adviser provided, information and data relating to: (i) the investment performance of each series of the Trust and the Adviser; (ii) the nature, extent and quality of the services provided by the Adviser to the Funds; (iii) the cost of the services to be provided and the profits to be realized by the Adviser and its affiliates from the relationship with the Funds; (iv) the extent to which economies of scale will be realized as the Funds grow; (v) whether the fee levels reflect these economies of scale to the benefit of Funds’ shareholders; (vi) the advisory fees paid by other comparable funds advised by the Adviser or by a different investment adviser; (vii) the Funds’ expense ratios and the expense ratios of similar funds; and (viii) the effect of any fee waivers and expense reimbursements made by the Adviser.
At the meeting on August 15, 2018, the Board engaged in a thorough review process to determine whether to continue the Investment Advisory Agreement. The Board met directly with representatives of the Adviser and reviewed the information and data listed above, as supplemented by Citi Fund Services Ohio, Inc., the Trust’s administrator. As part of its deliberations, the Board also considered and relied upon the information about the Funds and the Adviser that it had received throughout the year as part of its ongoing oversight of the Funds and their operations.
The Board gave careful consideration to the nature, extent and quality of the services provided by the Adviser. The Board discussed the organizational structure of Adviser and its investment philosophy, portfolio construction process and fixed income approach. The Board discussed the Adviser’s approach to sustainable, responsible and impact investing, including its environmental, social and governance research framework and its portfolio screening guidelines. The Board reviewed the Adviser’s experience and the capabilities of its personnel, as well as the quality of the reports and other materials received from the Adviser. The Board reviewed biographical information about the employees of the Adviser and its parent, Boston Trust & Investment Management Company (“Boston Trust”). The Board addressed the Adviser’s brokerage allocation and execution strategy, noting that the Adviser does not take into consideration sales of Fund shares in selecting brokers through which its affects Fund portfolio transactions. The Board also discussed the Adviser’s compliance program and its business continuity and disaster recovery plans. Next, the Board discussed succession planning, stating that employee ownership of Boston Trust continues to increase. Finally, taking into account the personnel involved in servicing the Funds, as well as the materials and services described above, the Board expressed satisfaction with the quality of the services received from the Adviser.
Next, the Board reviewed the performance of the Funds from inception through June 30, 2018, comparing the performance to various indices and also, in the case of the Boston Trust Asset Management Fund and the Walden Asset Management Fund, to a bond index, equity index and Treasury bills. The Board noted that as of June 30, 2018, while each Fund outperformed the index and its peer group at various times for the Year-to-Date, 1-year, 3-year, 5-year and Since Inception periods, each Fund generally underperformed or performed consistent with its peer group during the same periods. The Board noted that while the Funds generally underperformed their benchmarks at various times, performance was consistent with the long-term performance pattern of each Fund’s investment style, as they participated in rising markets and outperformed in falling markets. The Board noted that this downside protection is consistent with the Adviser’s strategy and is routinely communicated to clients and investors. The Board also noted that during a rising market lasting over a decade, the Funds have consistently adhered to a lower risk, higher quality strategy.
The Board noted that the Adviser has been operating under an Expense Limitation Agreement that requires the Adviser to waive fees and/ or reimburse expenses of a Fund to the extent total operating expenses of that Fund (other than the Walden International Equity Fund) exceed 1.00%. The expense limit for the Walden International Equity Fund is 1.15%. The actual advisory fees charged by all Funds, except the Boston Trust Equity Fund and the Walden Equity Fund, are at or below the industry and Lipper averages after expense waivers and/ or reimbursements. The actual advisory fees for the Boston Trust Equity Fund and the Walden Equity Fund are 0.04% above the industry average after expense waivers and/or reimbursements.
Continued
86
Turning to total operating expenses, the Board noted that the expense ratios for all the Funds, other than the Boston Trust Equity Fund and Walden Equity Fund, are lower than the industry average before and after expense waivers and/or reimbursements. The expense ratio for the Boston Trust Equity Fund and the Walden Equity Fund after waivers and/or reimbursements are 0.03% and 0.11% higher than the industry average, respectively. However, the expense ratios for the Boston Trust Equity Fund and the Walden Equity Fund are well below the highest expense ratios in the range of industry average both before and after waivers and/or reimbursements. After considering the comparative data as described above, and the Expense Limitation Agreement that was previously renewed by the Board at its February 27, 2018 Board meeting, the Board concluded that the advisory fees and expense ratios were reasonable.
In reviewing the costs of the services to be provided and the profits to be realized by the Adviser. The Board reviewed the Adviser’s income statement for the 12-months ended December 31, 2017 and the six-months ended June 30, 2018, as well as the gross and net profit margins realized on each Fund. The Board noted that the Adviser is a wholly-owned subsidiary of Boston Trust and the payment of direct and indirect Trust expenses is governed by an Intercompany Services Agreement between the Adviser and Boston Trust. The Board noted that the Adviser’s relationship with the Funds was profitable even though the Adviser is operating under an Expense Limitation Agreement with the Trust. The Board discussed the custody and transfer agency fees earned by the Adviser for services provided to the Funds, which are reduced by amounts paid for sub-custody and sub-transfer agency services.
87
Information about Trustees and Officers (Unaudited) | December 31, 2018 |
Overall responsibility for management of the Funds rests with the Board of Trustees. The names of the Trustees and Officers of the Funds, their addresses, ages and principal occupations during the past five years are provided in the tables below. The business address of the persons listed below is 4400 Easton Commons, Suite 200, Columbus, Ohio 43219, unless otherwise listed. Trustees who are deemed “interested persons,” as defined in the 1940 Act, are referred to as Interested Trustees. Trustees who are not interested persons are referred to as Independent Trustees. The Funds’ Statement of Additional Information includes additional information about the Funds’ Trustees and is available, without charge and upon request, by calling 1-800-282-8782 or by visiting www.btim.com.
| | | | | | | | | | Other |
| | | | | | | | Number of Funds | | Directorships |
| | Position(s) | | Term of Office* | | | | in Fund Complex | | Held by Trustee |
Name, | | Held with | | and Length of | | Principal Occupation(s) | | Overseen by | | during the past |
Date of Birth | | the Funds | | Time Served | | During Past Five Years | | Trustee | | five years |
INTERESTED TRUSTEES** | | | | | | |
| | | | | | | | | | |
Lucia B. Santini
One Beacon Street
33rd Floor
Boston, MA 02108
Year of Birth: 1958 | | Trustee and President | | Since 2011 | | President, Boston Trust Investment Management, Inc., January 2017 to present, Managing Director, February, 2001 to December 31, 2016; Managing Director and Senior Portfolio Manager, Boston Trust & Investment Management Company (bank trust company), November 1993 to present. | | 11 | | None |
| | | | | | | | | | |
Heidi Soumerai
One Beacon Street
33rd Floor
Boston, MA 02108
Year of Birth: 1957 | | Trustee | | Since 2013 | | Managing Director and Director of ESG Research, Boston Trust & Investment Management Company, August 2004 to present; Research Analyst, Boston Trust & Investment Management, January 1985 to present. | | 11 | | None |
| | | | | | | | | | |
INDEPENDENT TRUSTEES | | | | | | |
| | | | | | | | | | |
Michael M. Van Buskirk
Year of Birth: 1947 | | Trustee and Chairman of the Board | | Since 1992 | | Retired since 2014. President and Chief Executive Officer, Ohio Bankers League, May 1991 to December 2013. | | 11 | | Advisers Investment Trust (2011 to present) (Chairman of the Board) |
| | | | | | | | | | |
Diane E. Armstrong
Year of Birth: 1964 | | Trustee | | Since 2005 | | Advisor, Investment Partners (financial planning firm), January 2018 to present; President, Armstrong Financial Services (financial planning firm), November 2012 to present. | | 11 | | None |
| | | | | | | | | | |
Elizabeth E. McGeveran
Year of Birth: 1971 | | Trustee | | Since 2016 | | Director, Impact Investing, The McKnight Foundation, September 2014 to present. | | 11 | | None |
| | | | | | | | | | |
OFFICERS WHO ARE NOT TRUSTEES | | | | | | |
| | | | | | | | | | |
Jennifer Ellis
One Beacon Street
33rd Floor
Boston, MA 02108
Year of Birth: 1972 | | Treasurer | | Since 2011 | | Director of Finance/Treasurer, Boston Trust & Investment Management Company, May 2011 to present. | | N/A | | N/A |
| | | | | | | | | | |
Curtis Barnes
800 Boylston Street
24th Floor
Boston, MA 02199
Year of Birth: 1953 | | Secretary | | Since 2007 | | Senior Vice President, Citi Fund Services Ohio, Inc. (fund administrator), August 2007 to present. | | N/A | | N/A |
| | | | | | | | | | |
Amy Siefer
4400 Easton Commons
Suite 200
Columbus, OH 43219
Year of Birth: 1977 | | Chief Compliance Officer and AML Officer | | Since 2018 | | Vice President, Citi Fund Services Ohio, Inc. (fund administrator), May 2012 to present. | | N/A | | N/A |
* Trustees hold their position with the Funds until their resignation or removal. Officers hold their positions with the Funds until a successor has been duly elected and qualified.
** Ms. Santini and Ms. Soumerai are considered “interested persons” of the Trust as defined in the 1940 Act due to their employment with Boston Trust Investment Management, Inc., the Funds’ investment adviser.
88
This page intentionally left blank.
89
Investment Adviser
Boston Trust Investment Management, Inc.
One Beacon Street
Boston, MA 02108
Transfer Agent
Boston Trust & Investment Management Company
One Beacon Street
Boston, MA 02108
Administrator
Citi Fund Services Ohio, Inc.
4400 Easton Commons, Suite 200
Columbus, OH 43219
Distributor
Foreside Financial Services, LLC
Three Canal Plaza, Suite 100
Portland, ME 04101
Independent Registered Public Accounting Firm
Cohen & Company, Ltd.
1350 Euclid Avenue, Suite 800
Cleveland, OH 44115
Legal Counsel
Thompson Hine LLP
41 South High Street, Suite 1700
Columbus, OH 43215
This report is intended for the shareholders of the Funds and may not be used as sales literature unless preceded or accompanied by a current prospectus.
Past performance results shown should not be considered a representation of future performance. Share price and returns will fluctuate so that shares, when redeemed, may be worth more or less than their original cost. Statements and other information herein are dated and subject to change.
02/19
Item 2. Code of Ethics.
(a) The registrant has adopted a code of ethics that applies to the registrant’s principal executive officer, principal financial officer, principal accounting officer or controller, or persons performing similar functions. This code of ethics is included as an Exhibit.
(b) During the period covered by the report, with respect to the registrant’s code of ethics that applies to its principal executive officer, principal financial officer, principal accounting officer or controller, or persons performing similar functions; there have been no amendments to, nor any waivers granted from, a provision that relates to any element of the code of ethics definition enumerated in paragraph (b) of this Item 2.
Item 3. Audit Committee Financial Expert.
3(a)(1) The registrant’s board of directors has determined that the registrant has at least one audit committee financial expert serving on its audit committee.
3(a)(2) The audit committee financial expert is Diane Armstrong, who is “independent” for purposes of this Item 3 of Form N-CSR.
Item 4. Principal Accountant Fees and Services.
| | December 2018 | | December 2017 | |
| | | | | |
(a) Audit Fees | | $ | 114,500 | | $ | 114,500 | |
| | | | | |
(b) Audit-Related Fees | | $ | 17,250 | | $ | 17,250 | |
The fees for 2018 and 2017 relate to the consent issuance in three Form 17f-2 filings filed with the Securities and Exchange Commission (“SEC”).
| | December 2018 | | December 2017 | |
| | | | | |
(c) Tax Fees | | $ | 27,500 | | $ | 27,500 | |
| | | | | | | |
Tax fees for both 2018 and 2017 relate to the preparation of the Funds’ federal and state income tax returns, federal excise tax return review and review of capital gain and income distribution calculations.
| | December 2018 | | December 2017 | |
| | | | | |
(d) All Other Fees | | $ | 0 | | $ | 0 | |
| | | | | | | |
(e)(1) The Audit Committee may pre-approve at any regularly scheduled Audit Committee meeting audit, audit-related, tax and other non-audit services to be rendered or that may be rendered by the Auditor to the Funds and certain non-audit services to be rendered by the Auditor to the Advisor which require pre-approval by the Audit Committee. In connection with such pre-approvals, the Auditor, or a Fund officer, with the assistance of the Auditor, shall provide the Audit Committee with a report containing information about each type of service to be pre-approved at the meeting.
(e)(2) For the fiscal years ended December 31, 2018 and 2017,100% of all the fees in paragraph (b) through (d) were approved by the Audit Committee.
(f) Not applicable.
(g) For the fiscal year ended December 31, 2018, Cohen Fund Audit Services, Ltd. billed non-audit fees of $44,750.
For the fiscal year ended December 31, 2017, Cohen Fund Audit Services, Ltd. billed non-audit fees of $44,750.
(h) Not applicable.
Item 5. Audit Committee of Listed Registrants.
Not applicable.
Item 6. Investments.
(a) Included as part of the report to shareholders filed under Item 1.
(b) Not applicable.
Item 7. Disclosure of Proxy Voting Policies and Procedures for Closed-End Management Investment Companies.
Not applicable.
Item 8. Portfolio Managers of Closed-End Management Investment Companies.
Not applicable
Item 9. Purchases of Equity Securities by Closed-End Management Investment Company and Affiliated Purchasers.
Not applicable.
Item 10. Submission of Matters to a Vote of Security Holders.
Not applicable.
Item 11. Controls and Procedures.
(a) The registrant’s principal executive officer and principal financial officer have concluded, based on their evaluation of the registrant’s disclosure controls and procedures as conducted within 90 days of the filing date of this report, that these disclosure controls and procedures are adequately designed and are operating effectively to ensure that information required to be disclosed by the registrant on Form N-CSR is recorded, processed, summarized and reported within the time periods specified in the Securities and Exchange Commission’s rules and forms.
(b) There were no changes in the registrant’s internal control over financial reporting (as defined in Rule 30a-3(d) under the Act (17 CFR 270.30a-3(d)) that occurred during the second fiscal quarter of the period covered by this report that have materially affected or are reasonably likely to materially affect, the registrant’s internal control over financial reporting.
Item 12. Disclosure of Securities Lending Activities for Closed-End Management Investment Companies.
Not applicable.
Item 13. Exhibits.
(a)(1) Not applicable — Only effective for annual reports.
(a)(2) Certifications pursuant to Rule 30a-2(a) are attached hereto.
(a)(3) Not applicable.
(b) Certifications pursuant to Rule 30a-2(b) are furnished herewith
SIGNATURES
Pursuant to the requirements of the Securities Exchange Act of 1934 and the Investment Company Act of 1940, the registrant has duly caused this report to be signed on its behalf by the undersigned, thereunto duly authorized.
(Registrant) | The Boston Trust & Walden Funds | |
| | |
| | |
By (Signature and Title)* | /s/ Lucia Santini , President | |
| | |
Date | 2/27/2019 | | |
| | | | | | |
Pursuant to the requirements of the Securities Exchange Act of 1934 and the Investment Company Act of 1940, this report has been signed below by the following persons on behalf of the registrant and in the capacities and on the dates indicated.
By (Signature and Title)* | /s/ Lucia Santini , President | |
| | |
Date | 2/27/2019 | | |
| | | | |
By (Signature and Title)* | /s/ Jennifer Ellis , Treasurer | |
| | |
Date | 2/27/2019 | | |
| | | | |
