UNITED STATES
SECURITIES AND EXCHANGE COMMISSION
Washington, D.C. 20549
FORM N-CSR
CERTIFIED SHAREHOLDER REPORT OF REGISTERED
MANAGEMENT INVESTMENT COMPANIES
Investment Company Act file number | 811-06526 |
|
The Boston Trust & Walden Funds |
(Exact name of registrant as specified in charter) |
|
One Beacon Street, Boston MA | | 02108 |
(Address of principal executive offices) | | (Zip code) |
|
4400 Easton Commons, Columbus, OH 43219 |
(Name and address of agent for service) |
|
Registrant’s telephone number, including area code: | 1-800-282-8782 | |
|
Date of fiscal year end: | December 31 | |
|
Date of reporting period: | December 31, 2016 | |
| | | | | | | | |
Item 1. Reports to Stockholders.
This page intentionally left blank.
Annual Report December 31, 2016 | 
|
Table of Contents
Economic and Market Summary | 3 |
| |
Boston Trust Asset Management Fund | |
Manager Commentary | 4 |
Investment Performance | 5 |
Schedule of Portfolio Investments | 12 |
Financial Statements | 14 |
Financial Highlights | 16 |
| |
Boston Trust Equity Fund | |
Manager Commentary | 4 |
Investment Performance | 5 |
Schedule of Portfolio Investments | 17 |
Financial Statements | 18 |
Financial Highlights | 20 |
| |
Boston Trust Midcap Fund | |
Manager Commentary | 6 |
Investment Performance | 7 |
Schedule of Portfolio Investments | 21 |
Financial Statements | 22 |
Financial Highlights | 24 |
| |
Boston Trust SMID Cap Fund | |
Manager Commentary | 8 |
Investment Performance | 9 |
Schedule of Portfolio Investments | 25 |
Financial Statements | 26 |
Financial Highlights | 28 |
| |
Boston Trust Small Cap Fund | |
Manager Commentary | 10 |
Investment Performance | 11 |
Schedule of Portfolio Investments | 29 |
Financial Statements | 30 |
Financial Highlights | 32 |
| |
Environmental, Social and Governance Research and Engagement Update | 34 |
| |
Walden Asset Management Fund | |
Manager Commentary | 38 |
Investment Performance | 39 |
Schedule of Portfolio Investments | 48 |
Financial Statements | 50 |
Financial Highlights | 52 |
| |
Walden Equity Fund | |
Manager Commentary | 38 |
Investment Performance | 39 |
Schedule of Portfolio Investments | 53 |
Financial Statements | 55 |
Financial Highlights | 56 |
| |
Walden Midcap Fund | |
Manager Commentary | 40 |
Investment Performance | 41 |
Schedule of Portfolio Investments | 57 |
Financial Statements | 58 |
Financial Highlights | 60 |
| |
Walden SMID Cap Fund | |
Manager Commentary | 42 |
Investment Performance | 43 |
Schedule of Portfolio Investments | 61 |
Financial Statements | 62 |
Financial Highlights | 64 |
| |
Walden Small Cap Fund | |
Manager Commentary | 44 |
Investment Performance | 45 |
Schedule of Portfolio Investments | 65 |
Financial Statements | 66 |
Financial Highlights | 68 |
| |
Walden International Equity Fund | |
Manager Commentary | 46 |
Investment Performance | 47 |
Schedule of Portfolio Investments | 69 |
Financial Statements | 71 |
Financial Highlights | 73 |
| |
Notes to Financial Statements | 74 |
Report of Independent Public Accounting Firm | 82 |
Supplementary Information | 83 |
Investment Adviser Contract Approval | 88 |
Information About Trustees and Officers | 90 |
Boston Trust Investment Management, Inc. (BTIM), a subsidiary of Boston Trust & Investment Management Company, serves as investment adviser (the Adviser) to the Boston Trust & Walden Funds and receives a fee for its services. Walden Asset Management (Walden), a division of Boston Trust & Investment Management Company, performs shareholder advocacy, proxy voting, screening services, and other environmental, social and governance initiatives for the Adviser and is paid a fee for these services by the Adviser.
Shares of the Funds are not deposits of, obligations of, or guaranteed by BTIM or its affiliates, nor are they federally insured by the FDIC. Investments in the Funds involve investment risks, including the possible loss of principal. Funds are distributed by BHIL Distributors, LLC. Member FINRA/SIPC.
The foregoing information and opinions are for general information only. Boston Trust & Walden Funds and BTIM do not assume liability for any loss, which may result from the reliance by any person upon any such information or opinions. Such information and opinions are subject to change without notice, are for general information only, and are not intended as an offer or solicitation with respect to the purchase or sale of any security or offering individual or personalized investment advice. Portfolio composition is as of December 31, 2016 and is subject to change without notice.
The Boston Trust & Walden Funds may invest in foreign securities, which may involve risk not typically associated with U.S. investments.
To reduce expenses, we may only mail one copy of the Fund’s shareholder updates, such as prospectus, annual report, semi-annual report, to those addresses shared by two or more accounts. If you are a direct shareholder and wish to receive individual copies of these documents, please call us at 800-282-8782; 7050. If you are not a direct shareholder, please contact your financial institution to opt out of householding. We will begin sending you individual copies thirty days after receiving your request.
Photography credits:
· Cover: Bruce Field · Pages 1, 7, 41, 45 and 47: Jim Gallagher · Pages 5, 9, and 43: Rebecca Monette · Pages 11 and 39: Janet C. Dygert
1
This page intentionally left blank.
2

| The Boston Trust & Walden Funds A Registered Investment Company | 
|
Boston Trust and Walden Funds | | Domenic Colasacco, CFA |
Economic and Market Summary | | Portfolio Manager and President |
(Unaudited) | | Boston Trust Investment Management, Inc. |
For the nine month fiscal period ended December 31, 2016, the S&P 500 Index posted a total return of 10.47%; the calendar 2016 return for the Index was 11.96%. The vast majority of other domestic indices were also in positive territory for both periods, while bond and international returns (in dollar terms) were mixed, but generally lower.
When we look back at calendar 2016 stock and bond market performance a few years from now, it may be difficult to recall that the year was far more volatile than suggested by the comparatively benign final returns. Even now, it is hard to recall that the positive performance came after a volatile first quarter of calendar 2016 in which aggregate stock values fell by about 10% during the first six weeks of the year. The concern at the time was that lower commodity values would devastate many emerging economy countries dependent on raw material exports, and hurt certain financial companies that had extended too much credit to the energy sector here in the United States. Stock prices fully recovered by the end of the first quarter, though, helped by a partial rebound in oil prices. For the most part, there were few economic surprises through the balance of the year. Global gross domestic product (GDP)(1) growth advanced at an annual rate of roughly 2%, with minimal inflation in economically developed countries. Interest rates also remained at historically low levels for most of the year.
While the overall economy progressed roughly as anticipated during the last three quarters of 2016, two surprising political events each rattled investors for brief periods. The first was the so-called “Brexit” vote in Great Britain in June, which led to renewed fear about the long-term sustainability of the euro zone. Donald Trump’s victory in November was of course the other. We suspect the initial adverse stock market reaction to Trump’s win, which occurred primarily in the wee hours of November 9th as the election outcome became evident, may have been driven more by emotional political disappointment than economic analysis. That view is supported by the fact that, within days, even the most loyal, left-leaning economists conceded that Trump’s proposed core economic policies of lower personal and corporate tax rates and higher government spending are likely to benefit economic growth, at least for the next few years. Similarly, investors concluded that the policy initiatives also improved the outlook for corporate profits and thereby stock values.
We share much of this view that Keynesian economic policy will promote further gains in the economy. As investment managers, though, our key role in the year ahead will be to gain a clear understanding of the specific legislative proposals of the new Administration, and to assess whether the current investor optimism is justified or could eventually prove to be unwarranted for any number of potential reasons. The former is likely to support still higher stock values, while disappointment could easily lead to a complete retracement of recent stock price gains. At this time, we lean toward being hopeful that both GDP and corporate profit growth are likely to accelerate modestly from recent trends, without a substantial rise in inflation or interest rates. That combination should support a further rise in stock values.
In balancing risk and return considerations, we have not revised our now years-long conclusion that a diversified stock portfolio of well-situated companies with prudent business models and reasonable growth prospects remains the most attractive option among a series of lackluster investment choices.
(1) The Gross Domestic Product (“GDP”) is the value of goods and services produced in a given country in a given year.
3
Boston Trust Asset Management Fund
Boston Trust Equity Fund
December 31, 2016
Domenic Colasacco, CFA
Portfolio Manager and President
Boston Trust Investment Management, Inc.
Asset Management Fund Objective
The Fund seeks long-term capital growth and income through an actively managed portfolio of stocks, bonds and money market instruments.
Equity Fund Objective
The Fund seeks long-term capital growth through an actively managed portfolio of stocks.
Investment Concerns
Equity securities (stocks) are more volatile and carry more risk and return potential than other forms of investments, including investments in high-grade fixed income securities.
Foreign investing involves risks not typically associated with U.S. investments, including adverse political, social and economic developments and differing auditing and legal standards. These risks are magnified in emerging markets.
Small- to mid-capitalization companies typically have a higher risk of failure and historically have experienced a greater degree of volatility.
Bonds offer a relatively stable level of income, although bond prices will fluctuate, providing the potential for principal gain or loss. Intermediate-term, higher quality bonds generally offer less risk than longer-term bonds and a lower rate of return.
Cash equivalents offer low risk and low return potential.
Manager Commentary (Unaudited)
Management Discussion of Fund Performance
Stocks, as measured by the S&P 500 Index, added another 10.47% of total return during the nine month period ended December 31, 2016, extending a rally that has lasted almost eight years and amassed gains of over 250% on a total return basis. While domestic stock indices registered double-digit gains over the fiscal period, U.S. bonds, as measured by the Bloomberg Barclays U.S. Government/Credit Index, were in slightly negative territory.
In diversified investment portfolios, lower bond prices offset part of the recent gains contributed by equity holdings. Moreover, those investors holding large amounts of global stocks did even worse than domestic portfolios given the lower U.S. Dollar based returns recorded by the primary euro zone and Japanese equity indices. For example, a portfolio holding an asset allocation blend of 40% in the S&P 500 Index, 20% EAFE Index(1) and 40% in Bloomberg Barclays Gov’t/Credit bonds only generated a gain of 4.91% during the three quarter fiscal period. We are pleased to report that Boston Trust Asset Management Fund’s results exceeded those achieved by such a typical, broadly diversified investment portfolio, returning 6.19% on a net basis for the period, a return that was supported primarily by our decision to keep the equity allocation near the upper-end of the usual 40% to 80% policy range. The Boston Trust Equity Fund posted a total, after-fee return of 8.82% for the nine month period, trailing the S&P 500’s return of 10.47%. For calendar year 2016, the Equity Fund’s 12.01% total net return was slightly higher than the S&P 500’s 11.96% return.
There were few economic surprises during the final three quarters of 2016. GDP growth, both globally and here in the United States, remained in a modest growth trend, with low inflation and interest rates. The key domestic economic reports included an unemployment rate that remained below 5%, continued job gains at an annual rate of close to two million, and further evidence that wages have begun to rise, particularly at lower income levels. The latter, along with continued comparatively low energy prices, supported gains in overall consumer spending and a modest increase in the savings rate, both of which bode well for further economic progress. With the notable exception of companies hurt by low energy prices, aggregate corporate profits have also remained in a positive, albeit modest, growth trend.
While economic reports were short of extraordinary, two political events rattled investors for discrete periods this year—the June UK referendum vote to leave the euro zone, and of course, the election of Donald Trump. Both events precipitated initially significant negative market reactions, followed by recoveries as investors digested the surprise and implications. Indeed, much of the wide disparity in stock and bond returns occurred since the US election in November. In recent weeks, there has also been unusually wide divergence in the performance of different equity sectors and individual stocks. Market values of companies in more stable parts of the economy such as utilities and consumer staples are generally flat to down. The best gains have been registered by stocks of companies most likely to benefit from a combination of faster economic growth and higher interest rates. These include most industrial companies and banks. Stocks of mostly domestic companies, many of which are comparatively small, have also performed exceptionally well, perhaps due to the expectation that such companies will be helped most if Trump’s proposal to lower corporate tax rates is enacted. Larger global companies already shield a greater proportion of their profits from taxes and stand to benefit less if tax rates are reduced. By policy, we keep both Funds’ equity holdings broadly diversified, but we had significant exposure to more economically sensitive companies which contributed positively to U.S. equity segment performance in the final weeks and months of the year.
Our core investment strategy views have not changed much for a few years. At year-end, 10-year US Treasury notes and 30-year maturity Treasury bonds had yields of roughly 2.5% and 3%, respectively. Both are higher than the levels of three and six months ago, but still quite low and not particularly attractive by historical standards. Aggregate stock values are also higher, but, in our opinion, still remain a better investment option than either bonds or near-zero yielding money market instruments over the next several years. Our view incorporates the fact that current stock price-to-earnings ratios(2) are above their historical average. Provided the economic environment does not deteriorate, however, we believe stock valuations will hold and perhaps expand in the years just ahead within an economic environment of gradual GDP growth. Flat to rising valuations would allow even modest growth in corporate profits to translate into mid-to-high single digit equity returns over the next three to five years, or much higher than available returns in bonds. Accordingly, unless there is a change in the generally favorable economic environment or stock/bond valuation relationship, we are likely to keep the Asset Management Fund’s equity allocation near the upper-end of the 40% to 80% policy range.*
* Portfolio composition is subject to change.
(1) The MSCI EAFE Index is an equity index which captures large and mid cap representation across Developed Markets countries* around the world, excluding the US and Canada. With 930 constituents, the index covers approximately 85% of the free float-adjusted market capitalization in each country.
(2) The Price-to-Earnings Ratio (“P/E Ratio”) is a valuation ratio of a company’s current share price to its per-share earnings.
4
Investment Performance (Unaudited)
Boston Trust Asset Management Fund
Boston Trust Equity Fund
December 31, 2016
| | For the period ended 12/31/16 | |
| | Aggregate | | Annualized | |
| | | | | | | | | | Since | | Since | |
| | | | | | | | | | Inception | | Inception | |
| | 9 Months | | 1 Year | | 5 Years | | 10 Years | | (12/1/95) | | (10/1/03) | |
Boston Trust Asset Management Fund(1) | | 6.19 | % | 9.59 | % | 9.67 | % | 6.86 | % | 7.79 | % | — | |
Boston Trust Equity Fund(1) | | 8.82 | % | 12.01 | % | 11.71 | % | 7.08 | % | — | | 7.79 | % |
S&P 500 Index | | 10.47 | % | 11.96 | % | 14.66 | % | 6.95 | % | 8.41 | % | 8.35 | % |
Bloomberg Barclays U.S. Government/Credit Index | | -0.41 | % | 3.05 | % | 2.29 | % | 4.40 | % | 5.25 | % | — | |
Citigroup 90-Day U.S. Treasury Bill Index | | 0.22 | % | 0.27 | % | 0.09 | % | 0.73 | % | 2.35 | % | — | |
Hypothetical Growth of a $100,000 Investment
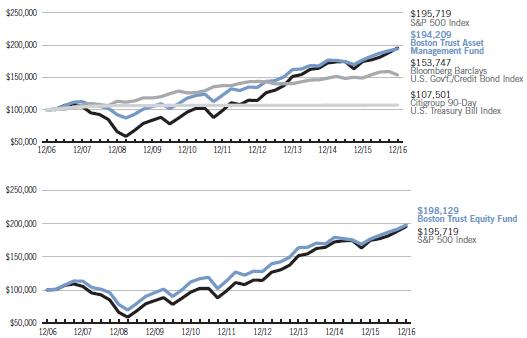
The charts represent a 10-year hypothetical $100,000 investment in the Boston Trust Asset Management Fund and the Boston Trust Equity Fund, and represent the reinvestment of dividends and capital gains in the Funds. The returns shown on the table and graphs do not reflect the deduction of taxes a shareholder would pay on Fund distributions or the redemption of Fund shares.
The Boston Trust Asset Management Fund is measured against a combination of equity and fixed income indices. The Boston Trust Equity Fund is measured against the Standard & Poor’s 500 Index (“S&P 500”), which is widely regarded as a gauge of the U.S. equities market, includes 500 leading companies in leading industries of the U.S. economy. Although the S&P 500 focuses on the large cap segment of the market, with approximately 75% coverage of U.S. equities, it is also widely viewed as a proxy for the total market. The Bloomberg Barclays U.S. Government/Credit Index includes Treasuries (i.e., public obligations of the U.S. Treasury that have remaining maturities of more than one year), government-related issues (e.g., agency, sovereign, supranational, and local authority debt), and USD Corporates. The Bloomberg Barclays U.S. Government/Credit Index is a component of the Bloomberg Barclays U.S. Aggregate Index. The Citigroup 90-Day U.S. Treasury Bill Index reflects monthly return equivalents of yield averages that are not marked to the market. The index is an average of the last three-month treasury bill issues. The three-month treasury bills are the short-term debt obligations of the U.S. Government. The indices are unmanaged and their performance does not reflect the deduction of expenses associated with a mutual fund, such as investment management and fund accounting fees. The Fund’s performance reflects the deduction of fees for these services. Investors cannot invest directly in an index.

Boston Trust Asset Management Fund
Fund Net Asset Value: | | $ | 41.33 | |
Gross Expense Ratio(1): | | 0.94 | % |
Boston Trust Equity Fund
Fund Net Asset Value: | | $ | 20.09 | |
Gross Expense Ratio(1): | | 0.96 | % |
Past performance does not guarantee future results. The performance data quoted represents past performance and current returns may be lower or higher. The investment return and principal value will fluctuate so that an investor’s shares, when redeemed may be worth more or less than the original cost. To obtain performance information current to the most recent month-end, please call 1-800-282-8782 ext. 7050.
(1) The Gross Expense Ratio is from the Fund’s most recent prospectus, dated August 1, 2016. The contractual fee limit under each Fund’s expense limitation agreement is 1.00% of each Fund’s average annual net assets, subject to certain limitations as described in each Fund’s prospectus. Please see each Fund’s most recent prospectus for details. Additional information pertaining to each Fund’s expense ratio as of December 31, 2016 can be found in the financial highlights included in this report.
5
Boston Trust Midcap Fund
December 31, 2016
Stephen J. Amyouny, CFA
Portfolio Manager
Boston Trust Investment Management, Inc.
Fund Objective
The Fund seeks long-term capital growth through an actively managed portfolio of stocks of middle capitalization (“midcap”) companies.
Investment Concerns
Equity securities (stocks) are more volatile and carry more risk and return potential than other forms of investments, including investments in high-grade fixed income securities.
Mid capitalization funds typically carry additional risks since smaller companies generally have a higher risk of failure.
Manager Commentary (Unaudited)
Management Discussion of Fund Performance
Portfolio Review
The Boston Trust Midcap Fund posted a return of 7.29% for the nine month period ended December 31, 2016, trailing the benchmark Russell Midcap® Index return of 11.30%. For calendar year 2016, the Fund returned 12.13%, compared to its benchmark’s return of 13.80% for the same period. After experiencing a sharp decline in the early weeks of 2016, equities trended higher throughout most of the year, albeit in an uneven and at times volatile pattern. In particular, equities rallied sharply following the Presidential election as investors reacted favorably to the pro-growth initiatives proposed by the Trump administration; investors anticipate that these proposals, which include increased infrastructure spending, lower taxes, and less regulation, will positively impact corporate profits if enacted.
Performance varied widely among sectors and specific industries as investors attempted to position their portfolios to benefit from expected policy changes. For example, banks, which have suffered from sluggish economic growth and low interest rates, rose sharply on expectations for stronger growth, less regulation, and rising interest rates. The portfolio also benefitted from the strong performance of certain diversified financials companies, including capital markets participants. Industrial manufacturers, especially domestically-oriented companies that export goods to international markets, and energy companies also rallied following the election. Conversely, health care stocks generally declined due to heightened concerns over drug pricing as well as the potential repeal of the Affordable Care Act (aka Obamacare). Additionally, stocks of stable companies that have above-average dividend yields came under selling pressure; rising interest rates may reduce the appeal of these income-oriented investments for which valuations have been bid up during the recent low interest rate environment. These stocks include certain companies within the utilities, consumer staples, real estate, and telecom sectors.
During this nine month period, our analysis indicates that the stocks of higher quality, more reasonably-valued companies that we favor trailed the performance of the broader market. Detracting from performance of the Fund was our underrepresentation in energy and materials companies leveraged to oil and other commodity prices. These companies, many of which have histories of volatile earnings and cash flows as well as elevated financial leverage, performed exceptionally well as oil prices nearly doubled from the trough levels reached in mid-February. Semiconductor stocks, another volatile group of companies that we have historically avoided in the past, also performed very well throughout this period. On the positive side, Fund positions within the healthcare sector performed quite well as we avoided many of the worst performing segments of health care; e.g. biotechnology, specialty pharmaceuticals, and hospitals.
Outlook
As we enter 2017, despite the powerful stock market rally in 2016, there is considerable uncertainty about the priorities of the incoming presidential administration, the path of future Federal Reserve interest rate increases, and the health of the global economy outside the U.S. Policies related to corporate taxes and global trade have the potential to most significantly impact corporate profits. Accordingly, we will be closely monitoring any developments on these issues.
The Fund remains broadly diversified among higher quality companies that we believe have sustainable business models, attractive future prospects, and reasonable valuations. Over the last year, the valuation of mid-cap stocks has expanded by 16% based on operating earnings per share, and the index price-to-earnings(1) multiple on this metric is now 25x. We believe that the valuations of many stocks reflect overly optimistic expectations for future growth and/or the projected benefits from new tax and trade policies. The Fund by contrast is trading at less than 21x operating earnings, while portfolio valuations are consistent with what they were a year ago and at a substantial discount to the market. As a result, we believe such a portfolio could produce attractive risk-adjusted performance compared to the index benchmark over full market cycles.*
* Portfolio composition is subject to change.
(1) The Price-to-Earnings Ratio (“P/E Ratio”) is a valuation ratio of a company’s current share price to its per-share earnings.
6
Investment Performance (Unaudited)
Boston Trust Midcap Fund
December 31, 2016
| | For the period ended 12/31/16 | |
| | Aggregate | | Annualized | |
| | | | | | | | Since | |
| | | | | | | | Inception | |
| | 9 Months | | 1 Year | | 5 Years | | 9/24/07 | |
Boston Trust Midcap Fund(1) | | 7.29 | % | 12.13 | % | 12.19 | % | 8.42 | % |
Russell Midcap® Index | | 11.30 | % | 13.80 | % | 14.72 | % | 7.57 | % |
Hypothetical Growth of a $100,000 Investment

The chart represents the historical performance of a hypothetical $100,000 investment in the Boston Trust Midcap Fund from September 24, 2007 to December 31, 2016, and represents the reinvestment of dividends and capital gains in the Fund. The returns shown on the table and graph do not reflect the deduction of taxes a shareholder would pay on Fund distributions or the redemption of Fund shares.
The Boston Trust Midcap Fund is measured against the Russell Midcap® Index, which is an unmanaged index that measures the performance of the mid cap segment of the U.S. equity universe. The Russell Midcap® Index is a subset of the Russell 1000® Index. It includes approximately 800 of the smallest securities based on a combination of their market capitalization and current index membership. The Russell Midcap® Index represents approximately 31% of the total market capitalization of the Russell 1000 companies. The performance of an index does not reflect the deduction of expenses associated with a mutual fund, such as investment management and fund accounting fees. The Fund’s performance reflects the deduction of fees for these services. Investors cannot invest directly in an index.

Fund Net Asset Value: | | $ | 15.34 | |
Gross Expense Ratio(1): | | 1.03 | % |
Past performance does not guarantee future results. The performance data quoted represents past performance and current returns may be lower or higher. The investment return and principal value will fluctuate so that an investor’s shares, when redeemed may be worth more or less than the original cost. To obtain performance information current to the most recent month-end, please call 1-800-282-8782 ext. 7050.
(1) The Gross Expense Ratio is from the Fund’s most recent prospectus, dated August 1, 2016. The Gross Expense Ratio excludes the impact of any contractual fee waivers, which limit the Fund’s total expenses to 1.00%, subject to certain limitations as described in the Fund’s prospectus. Please see the Fund’s most recent prospectus for details. Additional information pertaining to the Fund’s expense ratio as of December 31, 2016 can be found in the financial highlights included in this report. The investment performance may reflect fee reductions. If such fee reductions had not occurred, the quoted performance would have been lower. The expense limitation agreement shall automatically renew effective August 1 of every year until the Adviser provides written notice of non-renewal to the Trust.
7
Boston Trust SMID Cap Fund
December 31, 2016
Kenneth P. Scott, CFA
Portfolio Manager
Boston Trust Investment Management, Inc.
Fund Objective
The Fund seeks long-term capital growth through an actively managed portfolio of stocks of small to middle (“smid”) capitalization companies.
Investment Concerns
Equity securities (stocks) are more volatile and carry more risk and return potential than other forms of investments, including investments in high-grade fixed income securities.
Small- to mid-capitalization companies typically have a higher risk of failure and historically have experienced a greater degree of volatility.
Manager Commentary (Unaudited)
Management Discussion of Fund Performance
For the nine months ended December 31, 2016, the Boston Trust SMID Cap Fund returned 14.67%, trailing the 17.13% return of the Russell 2500™ Index. For calendar year 2016, the Fund returned 20.16%, outpacing the Russell 2500™ Index return of 17.59%. For longer-term periods, the Fund has provided competitive returns with less volatility than the index.
Following the volatile first quarter of calendar 2016, during which the Fund outperformed its benchmark by a wide margin, markets rebounded sharply and somewhat indiscriminately. Our analysis suggests that higher quality stocks modestly underperformed the strong market advance, which was a headwind to our style.
As evidence of the broad rally, most economic sectors appreciated more than 6% during the nine months. Performance of the real estate and health care sectors contributed most to relative performance comparisons. Materials and consumer discretionary were the biggest detractors from relative performance. Within materials the best performance came from lower quality, more commodity exposed names in the metals & mining and construction materials industries where the Fund has no exposure.
No individual stock had an outsized impact on performance during the period. Among contributors, SVB Financial, East West Bancorp, and UMB Financial are banks, which rallied broadly on investor optimism that rising interest rates and potentially less regulation would bolster profitability. Detractors included three consumer discretionary stocks, Fossil, Nordstrom, and Sally Beauty. All three are grappling with changes in consumer preferences.
Fundamental trends for the U.S. smaller cap market remain healthy. Revenue per share and earnings per share growth among Russell 2500™ companies in the third quarter of 2016 were 5% and 11%, respectively, on a year over year basis. Looking forward, we believe that continued employment gains in the U.S., coupled with modest productivity improvements, and still low interest rates, can sustain a modest pace of U.S. economic expansion, which in turn can support gains among smaller cap stocks. That said, the recent pace of smaller cap market appreciation may be difficult to sustain and any substantial improvement in the U.S. economic environment may take time to materialize. Furthermore, there is significant uncertainty around the potential ramifications of the new administration’s policies, and this may be exacerbated by higher than average index valuations.
We remain focused on constructing well-diversified portfolios of higher quality companies that can generate superior economic returns across macro-economic environments. As always, we believe valuation discipline is paramount to avoid overpaying for expectations that may prove overly optimistic. The Fund currently trades at an average operating price-to-earnings ratio(1) of 21x. This is one-third less than the Russell 2500™ operating price-to-earnings ratio of 34x and gives us confidence that the Fund has far less valuation risk than the market, especially considering the Fund’s superior quality profile.*
* Portfolio composition is subject to change.
(1) The Price-to-Earnings Ratio (“P/E Ratio”) is a valuation ratio of a company’s current share price to its per-share earnings.
8
Investment Performance (Unaudited) | Boston Trust SMID Cap Fund December 31, 2016 |
| | For the period ended 12/31/16 | |
| | Aggregate | | Annualized | |
| | | | | | | | Since | |
| | | | | | | | Inception | |
| | 9 Months | | 1 Year | | 5 Years | | 11/30/11 | |
Boston Trust SMID Cap Fund(1) | | 14.67 | % | 20.16 | % | 12.10 | % | 11.85 | % |
Russell 2500™ Index | | 17.13 | % | 17.59 | % | 14.54 | % | 14.33 | % |
Hypothetical Growth of a $100,000 Investment

The chart represents the historical performance of a hypothetical $100,000 investment in the Boston Trust SMID Cap Fund from November 30, 2011 to December 31, 2016, and represents the reinvestment of dividends and capital gains in the Fund. The returns shown on the table and graph do not reflect the deduction of taxes a shareholder would pay on Fund distributions or the redemption of Fund shares.
The Boston Trust SMID Cap Fund is measured against the Russell 2500™ Index, which is an unmanaged index that measures the performance of the small- to mid-cap segment of the U.S. equity universe, commonly referred to as “smid” cap. The Russell 2500 is a subset of the Russell 3000® Index. It includes approximately 2500 of the smallest securities based on a combination of their market cap and current index membership. The performance of an index does not reflect the deduction of expenses associated with a mutual fund, such as investment management and fund accounting fees. The Fund’s performance reflects the deduction of fees for these services. Investors cannot invest directly in an index.

Fund Net Asset Value: | | $ | 13.48 | |
Gross Expense Ratio(1): | | 1.73 | % |
Past performance does not guarantee future results. The performance data quoted represents past performance and current returns may be lower or higher. The investment return and principal value will fluctuate so that an investor’s shares, when redeemed may be worth more or less than the original cost. Returns less than one year are not annualized. To obtain performance information current to the most recent month-end, please call 1-800-282-8782 ext. 7050.
(1) The Gross Expense Ratio is from the Fund’s most recent prospectus, dated August 1, 2016. The Gross Expense Ratio excludes the impact of any contractual fee waivers, which limit the Fund’s total expenses to 0.75%, subject to certain limitations as described in the Fund’s prospectus. Please see the Fund’s most recent prospectus for details. Additional information pertaining to the Fund’s expense ratio as of December 31, 2016 can be found in the financial highlights included in this report. The investment performance may reflect fee reductions. If such fee reductions had not occurred, the quoted performance would have been lower. The contractual fee waiver continues through August 1, 2017 and may be terminated thereafter.
9
Boston Trust Small Cap Fund
December 31, 2016
Kenneth P. Scott, CFA
Portfolio Manager
Boston Trust Investment Management, Inc.
Fund Objective
The Fund seeks long-term capital growth through an actively managed portfolio of stocks of small capitalization companies.
Investment Concerns
Equity securities (stocks) are more volatile and carry more risk and return potential than other forms of investments, including investments in high-grade fixed income securities.
Small capitalization funds typically carry additional risks since smaller companies generally have a higher risk of failure, and historically, their stocks have experienced a greater degree of market volatility than stocks on average.
Manager Commentary (Unaudited)
Management Discussion of Fund Performance
For the nine month period ended December 31, 2016, the Boston Trust Small Cap Fund returned 15.94%, trailing the 23.18% return of the Russell 2000® Index. For calendar year 2016, the Fund returned 23.29%, outpacing the Russell 2000® Index return of 21.31% For longer-term periods, those that cover at least one complete market cycle, the Fund provided competitive returns with less volatility than the index.
Following the volatile first quarter of calendar 2016, during which the Fund outperformed its benchmark by a wide margin, markets rebounded sharply and somewhat indiscriminately. Our analysis suggests that higher quality, more reasonably valued stocks lagged modestly the strong market advance, a headwind to our style that favors such stocks. Additionally, despite rising interest rates during the second half of 2016, we observed that stocks of more levered companies outperformed less levered peers.
As evidence of the broad rally, every economic sector appreciated more than 10% during the nine months, except for real estate. Industrials and real estate were the only two sectors that contributed favorably to relative performance for the period. Fund positioning in other sectors detracted from relative results, most acutely within health care and consumer discretionary. In both sectors, higher quality stocks trailed the overall sector.
No individual stock had an outsized impact on performance during the period. Among contributors, Bank of Hawaii and UMB Financial benefitted from the rally in banks as investors anticipated that future interest rate increases and potentially less regulation would bolster their profitability. Another contributor was CLARCOR, a relatively large position in the Fund that agreed to be acquired for an 18% premium toward the end of 2016. Detractors from performance included several names from the consumer discretionary sector; Fossil and Sally Beauty were among the bottom five.
Fundamental trends for the U.S. small-cap market remain healthy. Revenue per share and earnings per share growth among Russell 2000® companies in the third quarter of 2016 were 5% and 12%, respectively, on a year-over-year basis. Looking forward, we believe that continued employment gains in the U.S., coupled with modest productivity improvements, and still low interest rates, can sustain a modest pace of U.S. economic expansion, which in turn can support gains among small cap stocks. That said, the recent pace of small cap market appreciation may be difficult to sustain and any substantial improvement in the U.S. economic environment may take time to materialize. Furthermore, there is significant uncertainty around the potential ramifications of the new administration’s policies, and this may be exacerbated by higher than average index valuations.
We remain focused on constructing well-diversified portfolios of higher quality companies that can generate superior economic returns across macro-economic environments. As always, we believe valuation discipline is paramount to avoid overpaying for expectations that may prove overly optimistic. The portfolio currently trades at an average operating price-to-earnings ratio(1) of 23x. This is almost half the Russell 2000® operating price-to-earnings ratio of 45x and gives us confidence that the portfolio has far less valuation risk than the market, especially considering the portfolio’s superior quality profile.*
* Portfolio composition is subject to change.
(1) The Price-to-Earnings Ratio (“P/E Ratio”) is a valuation ratio of a company’s current share price to its per-share earnings.
10
Investment Performance (Unaudited) | Boston Trust Small Cap Fund December 31, 2016 |
| | For the period ended 12/31/16 | |
| | Aggregate | | Annualized | |
| | | | | | | | | | Since | |
| | | | | | | | | | Inception | |
| | 9 Months | | 1 Year | | 5 Years | | 10 Years | | (12/31/94) | |
Boston Trust Small Cap Fund(1) | | 15.94 | % | 23.29 | % | 11.85 | % | 8.55 | % | 11.00 | % |
Russell 2000® Index | | 23.18 | % | 21.31 | % | 14.46 | % | 7.07 | % | 9.46 | % |
Hypothetical Growth of a $100,000 Investment
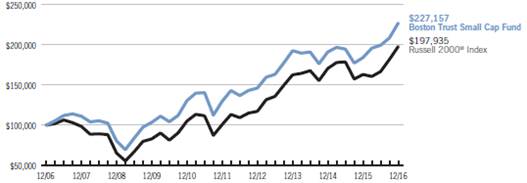
The chart represents a 10-year hypothetical $100,000 investment in the Boston Trust Small Cap Fund and represents the reinvestment of dividends and capital gains in the Fund. The returns shown on the table and graph do not reflect the deduction of taxes a shareholder would pay on Fund distributions or the redemption of Fund shares.
The Boston Trust Small Cap Fund is measured against the Russell 2000® Index, which is an unmanaged index that measures the performance of the small cap segment of the U.S. equity universe. The Russell 2000® Index is a subset of the Russell 3000® Index representing approximately 10% of the total market capitalization of that index. It includes approximately 2000 of the smallest securities based on a combination of their market cap and current index membership. The performance of an index does not reflect the deduction of expenses associated with a mutual fund, such as investment management and fund accounting fees. The Fund’s performance reflects the deduction of fees for these services. Investors cannot invest directly in an index.

Fund Net Asset Value: | | $ | 14.33 | |
Gross Expense Ratio(1): | | 1.08 | % |
Past performance does not guarantee future results. The performance data quoted represents past performance and current returns may be lower or higher. The investment return and principal value will fluctuate so that an investor’s shares, when redeemed may be worth more or less than the original cost. To obtain performance information current to the most recent month-end, please call 1-800-282-8782 ext. 7050.
(1) The Gross Expense Ratio is from the Fund’s most recent prospectus, dated August 1, 2016. The Gross Expense Ratio excludes the impact of any contractual fee waivers, which limit the Fund’s total expenses to 1.00%, subject to certain limitations as described in the Fund’s prospectus. Please see the Fund’s most recent prospectus for details. Additional information pertaining to the Fund’s expense ratio as of December 31, 2016 can be found in the financial highlights included in this report. The investment performance may reflect fee reductions. If such fee reductions had not occurred, the quoted performance would have been lower. The contractual fee waiver continues through August 1, 2017 and may be terminated thereafter.
11
Schedule of Portfolio Investments | | Boston Trust Asset Management Fund |
| | December 31, 2016 |
Security Description | | Shares | | Fair Value ($) | |
| | | | | |
COMMON STOCKS (75.7%) | | | | | |
Consumer Discretionary (8.9%) | | | | | |
Adient PLC (a) | | 2,089 | | 122,415 | |
Advance Auto Parts, Inc. | | 10,000 | | 1,691,200 | |
Autoliv, Inc. | | 25,000 | | 2,828,750 | |
Comcast Corp., Class A | | 140,000 | | 9,667,000 | |
NIKE, Inc., Class B | | 135,000 | | 6,862,050 | |
Nordstrom, Inc. | | 10,000 | | 479,300 | |
Omnicom Group, Inc. | | 75,000 | | 6,383,250 | |
Ross Stores, Inc. | | 60,000 | | 3,936,000 | |
Starbucks Corp. | | 75,000 | | 4,164,000 | |
| | | | 36,133,965 | |
Consumer Staples (8.2%) | | | | | |
Church & Dwight Co., Inc. | | 75,000 | | 3,314,250 | |
Colgate-Palmolive Co. | | 20,000 | | 1,308,800 | |
Costco Wholesale Corp. | | 37,500 | | 6,004,125 | |
CVS Health Corp. | | 15,000 | | 1,183,650 | |
Diageo PLC, Sponsored ADR | | 30,000 | | 3,118,200 | |
McCormick & Co., Inc. | | 25,000 | | 2,333,250 | |
PepsiCo, Inc. | | 40,000 | | 4,185,200 | |
Procter & Gamble Co. | | 35,000 | | 2,942,800 | |
Reckitt Benckiser Group PLC, Sponsored ADR | | 150,000 | | 2,520,000 | |
Sysco Corp. | | 35,000 | | 1,937,950 | |
The Hershey Co. | | 40,000 | | 4,137,200 | |
| | | | 32,985,425 | |
Energy (3.5%) | | | | | |
Chevron Corp. | | 17,500 | | 2,059,750 | |
ConocoPhillips | | 40,000 | | 2,005,600 | |
Exxon Mobil Corp. | | 82,500 | | 7,446,450 | |
Schlumberger Ltd. | | 30,000 | | 2,518,500 | |
| | | | 14,030,300 | |
Financials (14.9%) | | | | | |
American Express Co. | | 50,000 | | 3,704,000 | |
BB&T Corp. | | 35,000 | | 1,645,700 | |
Berkshire Hathaway, Inc., Class B (a) | | 40,000 | | 6,519,200 | |
Chubb Ltd. | | 45,000 | | 5,945,400 | |
Cincinnati Financial Corp. | | 90,000 | | 6,817,500 | |
Comerica, Inc. | | 30,000 | | 2,043,300 | |
Commerce Bancshares, Inc. | | 30,387 | | 1,756,672 | |
JPMorgan Chase & Co. | | 100,000 | | 8,629,000 | |
M&T Bank Corp. | | 10,000 | | 1,564,300 | |
Northern Trust Corp. | | 30,000 | | 2,671,500 | |
PNC Financial Services Group, Inc. | | 45,000 | | 5,263,200 | |
State Street Corp. | | 40,000 | | 3,108,800 | |
T. Rowe Price Group, Inc. | | 70,000 | | 5,268,200 | |
U.S. Bancorp | | 100,000 | | 5,137,000 | |
| | | | 60,073,772 | |
Health Care (11.1%) | | | | | |
Becton, Dickinson & Co. | | 50,000 | | 8,277,500 | |
C.R. Bard, Inc. | | 30,000 | | 6,739,800 | |
DENTSPLY SIRONA, Inc. | | 50,000 | | 2,886,500 | |
Edwards Lifesciences Corp. (a) | | 50,000 | | 4,685,000 | |
Johnson & Johnson, Inc. | | 55,000 | | 6,336,550 | |
Medtronic PLC | | 25,000 | | 1,780,750 | |
Merck & Co., Inc. | | 35,000 | | 2,060,450 | |
Mettler-Toledo International, Inc. (a) | | 7,500 | | 3,139,200 | |
Stryker Corp. | | 25,000 | | 2,995,250 | |
UnitedHealth Group, Inc. | | 25,000 | | 4,001,000 | |
Varian Medical Systems, Inc. (a) | | 20,000 | | 1,795,600 | |
| | | | 44,697,600 | |
Industrials (10.4%) | | | | | |
3M Co. | | 35,000 | | 6,249,950 | |
Donaldson Co., Inc. | | 40,000 | | 1,683,200 | |
Emerson Electric Co. | | 25,000 | | 1,393,750 | |
Hubbell, Inc. | | 40,000 | | 4,668,000 | |
Illinois Tool Works, Inc. | | 50,000 | | 6,123,000 | |
Rockwell Collins, Inc. | | 55,000 | | 5,101,800 | |
Union Pacific Corp. | | 50,000 | | 5,184,000 | |
United Parcel Service, Inc., Class B | | 50,000 | | 5,732,000 | |
W.W. Grainger, Inc. | | 25,000 | | 5,806,250 | |
| | | | 41,941,950 | |
Information Technology (14.3%) | | | | | |
Accenture PLC, Class A | | 70,000 | | 8,199,100 | |
Alphabet, Inc., Class A (a) | | 2,000 | | 1,584,900 | |
Alphabet, Inc., Class C (a) | | 11,000 | | 8,490,020 | |
Apple, Inc. | | 75,000 | | 8,686,500 | |
Automatic Data Processing, Inc. | | 70,000 | | 7,194,600 | |
Cisco Systems, Inc. | | 100,000 | | 3,022,000 | |
Dell Technologies, Inc., Class V (a) | | 4,458 | | 245,056 | |
Microsoft Corp. | | 150,000 | | 9,321,000 | |
Oracle Corp. | | 130,000 | | 4,998,500 | |
Versum Materials, Inc. (a) | | 10,000 | | 280,700 | |
Visa, Inc., Class A | | 75,000 | | 5,851,500 | |
| | | | 57,873,876 | |
Materials (2.4%) | | | | | |
Air Products & Chemicals, Inc. | | 20,000 | | 2,876,400 | |
AptarGroup, Inc. | | 30,000 | | 2,203,500 | |
PPG Industries, Inc. | | 50,000 | | 4,738,000 | |
| | | | 9,817,900 | |
Telecommunication Services (0.5%) | | | | | |
Verizon Communications, Inc. | | 35,000 | | 1,868,300 | |
| | | | 1,868,300 | |
Utilities (1.5%) | | | | | |
Consolidated Edison, Inc. | | 35,000 | | 2,578,800 | |
Eversource Energy | | 60,000 | | 3,313,800 | |
| | | | 5,892,600 | |
| | | | | |
TOTAL COMMON STOCKS (Cost $166,013,656) | | | | 305,315,688 | |
| | | | | |
| | Shares or | | | |
| | Principal | | | |
| | Amount($) | | | |
| | | | | |
CORPORATE BONDS (4.1%) | | | | | |
| | | | | |
Financials (2.5%) | | | | | |
American Express Bank FSB, 6.00%, 9/13/17, MTN | | 200,000 | | 206,204 | |
American Express Co., 2.65%, 12/2/22 | | 1,926,000 | | 1,898,943 | |
American Express Co., 7.00%, 3/19/18 | | 1,500,000 | | 1,594,505 | |
Berkshire Hathaway, Inc., 3.13%, 3/15/26, Callable 12/15/25 @ 100 | | 2,000,000 | | 1,989,376 | |
John Deere Capital Corp., 5.35%, 4/3/18, MTN | | 1,000,000 | | 1,047,826 | |
JPMorgan Chase & Co., 3.90%, 7/15/25, Callable 4/15/25 @ 100 | | 1,000,000 | | 1,029,367 | |
National Rural Utilities Cooperative Finance Corp., 10.38%, 11/1/18 | | 500,000 | | 576,761 | |
Wells Fargo & Co., 3.55%, 9/29/25, MTN | | 2,000,000 | | 1,998,918 | |
| | | | 10,341,900 | |
Health Care (0.3%) | | | | | |
Becton, Dickinson & Co., 3.13%, 11/8/21 | | 1,000,000 | | 1,026,378 | |
| | | | | |
Information Technology (1.3%) | | | | | |
Apple, Inc., 3.25%, 2/23/26, Callable | | | | | |
11/23/25 @ 100 | | 2,500,000 | | 2,504,275 | |
See Notes to Financial Statements
12
| | Shares or | | | |
| | Principal | | | |
Security Description | | Amount($) | | Fair Value ($) | |
| | | | | |
CORPORATE BONDS, CONTINUED | | | | | |
Information Technology, continued | | | | | |
Oracle Corp., 5.75%, 4/15/18 | | 750,000 | | 792,490 | |
Visa, Inc., 3.15%, 12/14/25, Callable 9/14/25 @ 100 | | 2,000,000 | | 2,011,050 | |
| | | | 5,307,815 | |
| | | | | |
TOTAL CORPORATE BONDS (Cost $16,478,126) | | | | 16,676,093 | |
| | | | | |
MUNICIPAL BONDS (1.2%) | | | | | |
| | | | | |
Illinois (0.1%): | | | | | |
Illinois State, GO, 5.00%, 4/1/24, Callable 4/1/17 @ 100 | | 500,000 | | 502,110 | |
| | | | | |
Massachusetts (0.7%): | | | | | |
Massachusetts State, Series E, 4.00%, 9/1/37, Callable 9/1/25 @ 100 | | 1,000,000 | | 1,025,740 | |
Massachusetts State Development Finance Agency Revenue, Series R-2, 5.00%, 7/1/28, Callable 7/1/20 @ 100 | | 460,000 | | 510,053 | |
Massachusetts State Health & Educational Facilities Authority Revenue, Series A, 5.00%, 12/15/26, Prerefunded 12/15/19 @ 100 | | 1,500,000 | | 1,650,659 | |
| | | | 3,186,452 | |
Washington (0.1%): | | | | | |
Washington State, Series C, GO, 5.00%, 2/1/26, Prerefunded 2/1/19 @ 100 | | 250,000 | | 268,583 | |
| | | | | |
Wisconsin (0.3%): | | | | | |
Wisconsin State, Series C, GO, 5.00%, 5/1/25, Prerefunded 5/1/18 @ 100 | | 200,000 | | 210,044 | |
Wisconsin State, Series D, GO, 5.50%, 5/1/26, Prerefunded 5/1/18 @ 100 | | 750,000 | | 792,578 | |
| | | | 1,002,622 | |
| | | | | |
TOTAL MUNICIPAL BONDS (Cost $5,024,445) | | | | 4,959,767 | |
| | | | | |
U.S. GOVERNMENT & U.S. GOVERNMENT AGENCY OBLIGATIONS (14.5%) | | | | | |
| | | | | |
Federal Farm Credit Bank | | | | | |
2.63%, 8/12/19 | | 10,000,000 | | 10,255,000 | |
2.85%, 3/2/28 | | 2,000,000 | | 1,986,682 | |
2.95%, 1/27/25 | | 2,000,000 | | 2,034,182 | |
3.14%, 12/5/29 | | 2,500,000 | | 2,534,515 | |
3.39%, 2/1/28 | | 2,000,000 | | 2,102,182 | |
3.85%, 12/26/25 | | 2,770,000 | | 2,996,439 | |
| | | | 21,909,000 | |
Federal Home Loan Bank | | | | | |
2.38%, 3/13/26 | | 6,000,000 | | 5,791,572 | |
2.50%, 12/10/27 | | 1,500,000 | | 1,425,117 | |
2.63%, 6/11/27 | | 1,500,000 | | 1,453,262 | |
2.88%, 9/13/24 | | 2,500,000 | | 2,579,010 | |
3.50%, 9/24/29 | | 2,000,000 | | 2,137,380 | |
| | | | 13,386,341 | |
U.S. Treasury Note | | | | | |
2.75%, 2/15/24 | | 22,500,000 | | 23,242,680 | |
| | | | | |
TOTAL U.S. GOVERNMENT & U.S. GOVERNMENT AGENCY OBLIGATIONS (Cost $58,211,182) | | | | 58,538,021 | |
| | | | | |
| | Shares | | | |
INVESTMENT COMPANIES (5.6%) | | | | | |
JPMorgan U.S. Government Money Market Fund, Capital Shares, 0.24%(b) | | 22,746,126 | | 22,746,126 | |
TOTAL INVESTMENT COMPANIES (Cost $22,746,126) | | | | 22,746,126 | |
| | | | | |
Total Investments (Cost $268,473,535) — 101.1%(c) | | | | 408,235,695 | |
Liabilities in excess of other assets — (1.1)% | | | | (4,267,138 | ) |
NET ASSETS — 100.0% | | | | $ | 403,968,557 | |
| | | | | | |
(a) | Non-income producing security. |
(b) | Rate disclosed is the seven day yield as of December 31, 2016. |
(c) | See Federal Tax Information listed in the Notes to the Financial Statements. |
| |
ADR | American Depositary Receipt |
FSB | Federal Savings Bank |
GO | General Obligation |
MTN | Medium Term Note |
See Notes to Financial Statements
13
Financial Statements | | Boston Trust Asset Management Fund |
STATEMENT OF ASSETS AND LIABILITIES | | | |
December 31, 2016 | | | |
| | | |
Assets: | | | |
Investments, at fair value (cost $268,473,535) | | $ | 408,235,695 | |
Interest and dividends receivable | | 1,126,381 | |
Receivable for capital shares issued | | 263,327 | |
Prepaid expenses and other assets | | 31,874 | |
Total Assets | | 409,657,277 | |
Liabilities: | | | |
Payable for investments purchased | | 5,252,272 | |
Payable for capital shares redeemed | | 55,462 | |
Accrued expenses and other liabilities: | | | |
Investment adviser | | 253,736 | |
Administration and accounting | | 37,746 | |
Chief compliance officer | | 1,483 | |
Custodian | | 4,975 | |
Shareholder servicing fees | | 251 | |
Transfer agent | | 6,490 | |
Trustee | | 107 | |
Other | | 76,198 | |
Total Liabilities | | 5,688,720 | |
Net Assets | | $ | 403,968,557 | |
Composition of Net Assets: | | | |
Capital | | $ | 262,768,738 | |
Accumulated undistributed net investment /(loss) | | 1 | |
Accumulated net realized gains from investment transactions | | 1,437,658 | |
Net unrealized appreciation from investments | | 139,762,160 | |
Net Assets | | $ | 403,968,557 | |
Shares outstanding (par value $0.01, unlimited number of shares authorized) | | 9,773,474 | |
Net Asset Value, Offering Price and Redemption price per share | | $ | 41.33 | |
STATEMENTS OF OPERATIONS | | | |
For the nine months ended December 31, 2016 | | | |
| | | |
Investment Income: | | | |
Interest | | $ | 1,776,047 | |
Dividends | | 4,258,956 | |
Less: Foreign tax withholding | | (46,555 | ) |
Total Investment Income | | 5,988,448 | |
Expenses: | | | |
Investment adviser | | 2,140,804 | |
Administration and accounting | | 296,417 | |
Chief compliance officer | | 12,105 | |
Custodian | | 39,630 | |
Shareholder servicing | | 3,538 | |
Transfer agency | | 28,168 | |
Trustee | | 23,809 | |
Other | | 161,851 | |
Total expenses | | 2,706,322 | |
Net Expenses | | 2,706,322 | |
Net Investment Income | | 3,282,126 | |
Net Realized/Unrealized Gains (Losses) from Investments: | | | |
Net realized gains from investment transactions | | 3,089,611 | |
Change in unrealized appreciation/depreciation from investments | | 16,305,132 | |
Net realized/unrealized gains (losses) from investments | | 19,394,743 | |
Change in Net Assets Resulting from Operations | | $ | 22,676,869 | |
For the year ended March 31, 2016 | | | |
| | | |
Investment Income: | | | |
Interest | | $ | 2,218,652 | |
Dividends | | 5,737,480 | |
Less: Foreign tax withholding | | (17,892 | ) |
Total Investment Income | | 7,938,240 | |
Expenses: | | | |
Investment adviser | | 2,636,952 | |
Administration and accounting | | 376,004 | |
Chief compliance officer | | 16,062 | |
Custodian | | 58,318 | |
Shareholder servicing | | 5,938 | |
Transfer agency | | 35,806 | |
Trustee | | 24,312 | |
Other | | 156,254 | |
Total expenses before fee reductions | | 3,309,646 | |
Fees voluntarily reduced by the transfer agent | | (12,034 | ) |
Net Expenses | | 3,297,612 | |
Net Investment Income | | 4,640,628 | |
Net Realized/Unrealized Gains (Losses) from Investments: | | | |
Net realized gains from investment transactions | | 16,469,857 | |
Change in unrealized appreciation/depreciation from investments | | (8,873,994 | ) |
Net realized/unrealized gains (losses) from investments | | 7,595,863 | |
Change in Net Assets Resulting from Operations | | $ | 12,236,491 | |
See Notes to Financial Statements
14
STATEMENTS OF CHANGES IN NET ASSETS
| | For the | | | | | |
| | nine months ended | | For the year ended | | For the year ended | |
| | December 31, 2016 | | March 31, 2016 | | March 31, 2015 | |
| | | | | | | |
Investment Activities: | | | | | | | |
Operations: | | | | | | | |
Net investment income | | $ | 3,282,126 | | $ | 4,640,628 | | $ | 4,117,970 | |
Net realized gains from investment transactions | | 3,089,611 | | 16,469,857 | | 19,703,977 | |
Change in unrealized appreciation/depreciation from investments | | 16,305,132 | | (8,873,994 | ) | 3,446,932 | |
Change in Net Assets Resulting from Operations | | 22,676,869 | | 12,236,491 | | 27,268,879 | |
Dividends: | | | | | | | |
Net investment income | | (4,258,937 | ) | (4,817,610 | ) | (3,866,046 | ) |
Net realized gains from investment transactions | | (15,310,863 | ) | (14,994,468 | ) | (8,430,347 | ) |
Change in Net Assets Resulting from Shareholder Dividends | | (19,569,800 | ) | (19,812,078 | ) | (12,296,393 | ) |
Capital Share Transactions: | | | | | | | |
Proceeds from shares issued | | 46,031,672 | | 24,649,358 | | 30,246,451 | |
Dividends reinvested | | 17,913,751 | | 18,479,514 | | 11,609,430 | |
Cost of shares redeemed | | (17,489,284 | ) | (34,998,804 | ) | (43,940,255 | ) |
Change in Net Assets Resulting from Capital Share Transactions | | 46,456,139 | | 8,130,068 | | (2,084,374 | ) |
Change in Net Assets | | 49,563,208 | | 554,481 | | 12,888,112 | |
Net Assets: | | | | | | | |
Beginning of period | | 354,405,349 | | 353,850,868 | | 340,962,756 | |
End of period | | $ | 403,968,557 | | $ | 354,405,349 | | $ | 353,850,868 | |
Share Transactions: | | | | | | | |
Issued | | 1,094,293 | | 599,690 | | 729,305 | |
Reinvested | | 433,013 | | 463,610 | | 280,083 | |
Redeemed | | (415,414 | ) | (866,940 | ) | (1,062,899 | ) |
Change in shares | | 1,111,892 | | 196,360 | | (53,511 | ) |
Accumulated undistributed net investment income/(distributions in excess of net investment income) | | $ | 1 | | $ | 955,245 | | $ | 1,169,040 | |
See Notes to Financial Statements
15
FINANCIAL HIGHLIGHTS
Selected data for a share outstanding throughout the periods indicated.
| | For the nine | | | | | | | | | | | |
| | months | | For the year | | For the year | | For the year | | For the year | | For the year | |
| | ended | | ended | | ended | | ended | | ended | | ended | |
| | December 31, | | March 31, | | March 31, | | March 31, | | March 31, | | March 31, | |
| | 2016 | | 2016 | | 2015 | | 2014 | | 2013 | | 2012 | |
| | | | | | | | | | | | | |
Net Asset Value, Beginning of Period | | $ | 40.92 | | $ | 41.80 | | $ | 40.03 | | $ | 36.08 | | $ | 33.71 | | $ | 31.56 | |
| | | | | | | | | | | | | |
Investment Activities: | | | | | | | | | | | | | |
Operations: | | | | | | | | | | | | | |
Net investment income | | 0.35 | | 0.55 | | 0.50 | | 0.44 | | 0.51 | | 0.43 | |
Net realized and unrealized gains from investment transactions | | 2.18 | | 0.92 | | 2.77 | | 4.28 | | 2.41 | | 2.17 | |
Total from investment activities | | 2.53 | | 1.47 | | 3.27 | | 4.72 | | 2.92 | | 2.60 | |
Dividends: | | | | | | | | | | | | | |
Net investment income | | (0.46 | ) | (0.57 | ) | (0.47 | ) | (0.44 | ) | (0.51 | ) | (0.45 | ) |
Net realized gains from investments | | (1.66 | ) | (1.78 | ) | (1.03 | ) | (0.33 | ) | (0.04 | ) | — | |
Total dividends | | (2.12 | ) | (2.35 | ) | (1.50 | ) | (0.77 | ) | (0.55 | ) | (0.45 | ) |
| | | | | | | | | | | | | |
Net Asset Value, End of Period | | $ | 41.33 | | $ | 40.92 | | $ | 41.80 | | $ | 40.03 | | $ | 36.08 | | $ | 33.71 | |
| | | | | | | | | | | | | |
Total Return | | 6.19 | %(a) | 3.65 | % | 8.21 | % | 13.13 | % | 8.77 | % | 8.36 | % |
| | | | | | | | | | | | | |
Ratios/Supplemental Data: | | | | | | | | | | | | | |
Net assets at end of period (000’s) | | $ | 403,969 | | $ | 354,405 | | $ | 353,851 | | $ | 340,963 | | $ | 288,673 | | $ | 257,031 | |
Ratio of net expenses to average net assets | | 0.95 | %(b) | 0.94 | % | 0.92 | % | 0.92 | % | 0.96 | % | 1.00 | % |
Ratio of net investment income to average net assets | | 1.15 | %(b) | 1.32 | % | 1.19 | % | 1.17 | % | 1.51 | % | 1.40 | % |
Ratio of expenses (before fee reductions or recoupment of fees previously reimbursed by the investment advisor) to average net assets | | 0.95 | %(b) | 0.94 | % | 0.93 | % | 0.93 | % | 0.96 | % | 1.07 | % |
Portfolio turnover rate | | 8.42 | %(a) | 11.64 | % | 17.74 | % | 8.94 | % | 7.43 | % | 18.70 | % |
Amounts designated as “—“ are $0 or have been rounded to $0.
(a) Not annualized for periods less than one year.
(b) Annualized for periods less than one year.
See Notes to Financial Statements
16
Schedule of Portfolio Investments | | Boston Trust Equity Fund |
| | December 31, 2016 |
Security Description | | Shares | | Fair Value ($) | |
| | | | | |
COMMON STOCKS (98.3%) | | | | | |
Consumer Discretionary (10.4%) | | | | | |
Advance Auto Parts, Inc. | | 7,500 | | 1,268,400 | |
Autoliv, Inc. | | 10,000 | | 1,131,500 | |
Comcast Corp., Class A | | 50,000 | | 3,452,500 | |
NIKE, Inc., Class B | | 32,500 | | 1,651,975 | |
Omnicom Group, Inc. | | 30,000 | | 2,553,300 | |
Ross Stores, Inc. | | 10,000 | | 656,000 | |
Starbucks Corp. | | 30,000 | | 1,665,600 | |
| | | | 12,379,275 | |
Consumer Staples (11.5%) | | | | | |
Church & Dwight Co., Inc. | | 30,000 | | 1,325,700 | |
Colgate-Palmolive Co. | | 10,000 | | 654,400 | |
Costco Wholesale Corp. | | 15,000 | | 2,401,650 | |
CVS Health Corp. | | 5,000 | | 394,550 | |
Diageo PLC, Sponsored ADR | | 5,000 | | 519,700 | |
McCormick & Co., Inc. | | 7,000 | | 653,310 | |
PepsiCo, Inc. | | 12,500 | | 1,307,875 | |
Procter & Gamble Co. | | 12,500 | | 1,051,000 | |
Reckitt Benckiser Group PLC, Sponsored ADR | | 75,000 | | 1,260,000 | |
Sysco Corp. | | 25,000 | | 1,384,250 | |
The Hershey Co. | | 15,000 | | 1,551,450 | |
Wal-Mart Stores, Inc. | | 17,500 | | 1,209,600 | |
| | | | 13,713,485 | |
Energy (4.5%) | | | | | |
Chevron Corp. | | 7,500 | | 882,750 | |
ConocoPhillips | | 15,000 | | 752,100 | |
Exxon Mobil Corp. | | 30,000 | | 2,707,800 | |
Schlumberger Ltd. | | 12,500 | | 1,049,375 | |
| | | | 5,392,025 | |
Financials (19.8%) | | | | | |
American Express Co. | | 25,000 | | 1,852,000 | |
BB&T Corp. | | 32,500 | | 1,528,150 | |
Berkshire Hathaway, Inc., Class B (a) | | 17,500 | | 2,852,150 | |
Chubb Ltd. | | 16,000 | | 2,113,920 | |
Cincinnati Financial Corp. | | 30,000 | | 2,272,500 | |
Commerce Bancshares, Inc. | | 9,115 | | 526,938 | |
JPMorgan Chase & Co. | | 35,000 | | 3,020,150 | |
M&T Bank Corp. | | 5,000 | | 782,150 | |
Northern Trust Corp. | | 12,500 | | 1,113,125 | |
PNC Financial Services Group, Inc. | | 20,000 | | 2,339,200 | |
State Street Corp. | | 20,000 | | 1,554,400 | |
T. Rowe Price Group, Inc. | | 20,000 | | 1,505,200 | |
U.S. Bancorp | | 40,000 | | 2,054,800 | |
| | | | 23,514,683 | |
Health Care (14.5%) | | | | | |
Becton, Dickinson & Co. | | 16,000 | | 2,648,800 | |
C.R. Bard, Inc. | | 12,500 | | 2,808,250 | |
DENTSPLY SIRONA, Inc. | | 25,000 | | 1,443,250 | |
Edwards Lifesciences Corp. (a) | | 7,500 | | 702,750 | |
Johnson & Johnson, Inc. | | 25,000 | | 2,880,250 | |
Medtronic PLC | | 7,500 | | 534,225 | |
Merck & Co., Inc. | | 25,000 | | 1,471,750 | |
Mettler-Toledo International, Inc. (a) | | 1,500 | | 627,840 | |
Stryker Corp. | | 12,000 | | 1,437,720 | |
UnitedHealth Group, Inc. | | 12,500 | | 2,000,500 | |
Varian Medical Systems, Inc. (a) | | 7,500 | | 673,350 | |
| | | | 17,228,685 | |
Industrials (12.6%) | | | | | |
3M Co. | | 10,000 | | 1,785,700 | |
Deere & Co. | | 5,000 | | 515,200 | |
Donaldson Co., Inc. | | 10,000 | | 420,800 | |
Hubbell, Inc. | | 12,500 | | 1,458,750 | |
Illinois Tool Works, Inc. | | 15,000 | | 1,836,900 | |
Rockwell Collins, Inc. | | 15,000 | | 1,391,400 | |
Union Pacific Corp. | | 25,000 | | 2,592,000 | |
United Parcel Service, Inc., Class B | | 20,000 | | 2,292,800 | |
W.W. Grainger, Inc. | | 11,500 | | 2,670,875 | |
| | | | 14,964,425 | |
Information Technology (18.7%) | | | | | |
Accenture PLC, Class A | | 25,000 | | 2,928,249 | |
Alphabet, Inc., Class A (a) | | 750 | | 594,338 | |
Alphabet, Inc., Class C (a) | | 4,000 | | 3,087,280 | |
Apple, Inc. | | 32,500 | | 3,764,150 | |
Automatic Data Processing, Inc. | | 20,000 | | 2,055,600 | |
Cisco Systems, Inc. | | 50,000 | | 1,511,000 | |
Dell Technologies, Inc., Class V (a) | | 1,114 | | 61,237 | |
Microsoft Corp. | | 55,000 | | 3,417,700 | |
Oracle Corp. | | 50,000 | | 1,922,500 | |
Versum Materials, Inc. (a) | | 3,500 | | 98,245 | |
Visa, Inc., Class A | | 35,000 | | 2,730,700 | |
| | | | 22,170,999 | |
Materials (3.3%) | | | | | |
Air Products & Chemicals, Inc. | | 7,000 | | 1,006,740 | |
AptarGroup, Inc. | | 10,000 | | 734,500 | |
PPG Industries, Inc. | | 22,500 | | 2,132,100 | |
| | | | 3,873,340 | |
Telecommunication Services (0.9%) | | | | | |
Verizon Communications, Inc. | | 20,000 | | 1,067,600 | |
| | | | 1,067,600 | |
Utilities (2.1%) | | | | | |
Consolidated Edison, Inc. | | 15,000 | | 1,105,200 | |
Eversource Energy | | 25,000 | | 1,380,750 | |
| | | | 2,485,950 | |
| | | | | |
TOTAL COMMON STOCKS (Cost $66,396,445) | | | | 116,790,467 | |
| | | | | |
INVESTMENT COMPANIES (1.8%) | | | | | |
| | | | | |
JPMorgan U.S. Government Money Market | | | | | |
Fund, Capital Shares, 0.24%(b) | | 2,099,046 | | 2,099,046 | |
TOTAL INVESTMENT COMPANIES (Cost $2,099,046) | | | | 2,099,046 | |
| | | | | |
Total Investments (Cost $68,495,491) — 100.1%(c) | | | | 118,889,513 | |
Liabilities in excess of other assets — (0.1)% | | | | (65,921 | ) |
NET ASSETS — 100.0% | | | | $ | 118,823,592 | |
| | | | | | |
(a) Non-income producing security.
(b) Rate disclosed is the seven day yield as of December 31, 2016.
(c) See Federal Tax Information listed in the Notes to the Financial Statements.
ADR American Depositary Receipt
See Notes to Financial Statements
17
Financial Statements | | Boston Trust Equity Fund |
STATEMENT OF ASSETS AND LIABILITIES
December 31, 2016
Assets: | | | |
Investments, at fair value (cost $68,495,491) | | $ | 118,889,513 | |
Dividends receivable | | 166,196 | |
Receivable for capital shares issued | | 31 | |
Prepaid expenses and other assets | | 5,751 | |
Total Assets | | 119,061,491 | |
Liabilities: | | | |
Payable for capital shares redeemed | | 120,540 | |
Accrued expenses and other liabilities: | | | |
Investment adviser | | 75,717 | |
Administration and accounting | | 10,469 | |
Chief compliance officer | | 439 | |
Custodian | | 1,470 | |
Shareholder servicing fees | | 697 | |
Transfer agent | | 5,807 | |
Trustee | | 30 | |
Other | | 22,730 | |
Total Liabilities | | 237,899 | |
Net Assets | | $ | 118,823,592 | |
Composition of Net Assets: | | | |
Capital | | $ | 68,699,873 | |
Accumulated undistributed net investment income/(distributions in excess of net investment income) | | — | |
Accumulated net realized losses from investment transactions | | (270,303 | ) |
Net unrealized appreciation from investments | | 50,394,022 | |
Net Assets | | $ | 118,823,592 | |
Shares outstanding (par value $0.01, unlimited number of shares authorized) | | 5,915,563 | |
Net Asset Value, Offering Price and Redemption price per share | | $ | 20.09 | |
STATEMENTS OF OPERATIONS
For the nine months ended December 31, 2016
Investment Income: | | | |
Dividends | | $ | 1,706,710 | |
Total Investment Income | | 1,706,710 | |
Expenses: | | | |
Investment adviser | | 647,553 | |
Administration and accounting | | 88,274 | |
Chief compliance officer | | 3,641 | |
Custodian | | 11,799 | |
Shareholder servicing | | 4,100 | |
Transfer agency | | 25,705 | |
Trustee | | 7,163 | |
Other | | 45,745 | |
Total expenses | | 833,980 | |
Net Expenses | | 833,980 | |
Net Investment Income | | 872,730 | |
Net Realized/Unrealized Gains (Losses) from Investments: | | | |
Net realized gains from investment transactions | | 1,255,690 | |
Change in unrealized appreciation/depreciation from investments | | 7,626,579 | |
Net realized/unrealized gains (losses) from investments | | 8,882,269 | |
Change in Net Assets Resulting from Operations | | $ | 9,754,999 | |
For the year ended March 31, 2016
Investment Income: | | | |
Dividends | | $ | 2,270,042 | |
Less: Foreign tax withholding | | (1,508 | ) |
Total Investment Income | | 2,268,534 | |
Expenses: | | | |
Investment adviser | | 815,501 | |
Administration and accounting | | 115,618 | |
Chief compliance officer | | 4,916 | |
Custodian | | 18,607 | |
Shareholder servicing | | 1,753 | |
Transfer agency | | 34,079 | |
Trustee | | 7,436 | |
Other | | 48,401 | |
Total expenses before fee reductions | | 1,046,311 | |
Fees voluntarily reduced by the transfer agent | | (12,034 | ) |
Net Expenses | | 1,034,277 | |
Net Investment Income | | 1,234,257 | |
Net Realized/Unrealized Gains (Losses) from Investments: | | | |
Net realized gains from investment transactions | | 6,530,280 | |
Change in unrealized appreciation/depreciation from investments | | (4,850,098 | ) |
Net realized/unrealized gains (losses) from investments | | 1,680,182 | |
Change in Net Assets Resulting from Operations | | $ | 2,914,439 | |
See Notes to Financial Statements
18
STATEMENTS OF CHANGES IN NET ASSETS
| | For the | | | | | |
| | nine month ended | | For the year ended | | For the year ended | |
| | December 31, 2016 | | March 31, 2016 | | March 31, 2015 | |
| | | | | | | |
Investment Activities: | | | | | | | |
Operations: | | | | | | | |
Net investment income | | $ | 872,730 | | $ | 1,234,257 | | $ | 1,013,873 | |
Net realized gains from investment transactions | | 1,255,690 | | 6,530,280 | | 7,743,467 | |
Change in unrealized appreciation/depreciation from investments | | 7,626,579 | | (4,850,098 | ) | (754,251 | ) |
Change in Net Assets Resulting from Operations | | 9,754,999 | | 2,914,439 | | 8,003,089 | |
Dividends: | | | | | | | |
Net investment income | | (1,112,873 | ) | (1,284,508 | ) | (966,299 | ) |
Net realized gains from investment transactions | | (6,430,101 | ) | (6,393,088 | ) | (2,029,175 | ) |
Change in Net Assets Resulting from Shareholder Dividends | | (7,542,974 | ) | (7,677,596 | ) | (2,995,474 | ) |
Capital Share Transactions: | | | | | | | |
Proceeds from shares issued | | 3,297,528 | | 4,569,753 | | 7,156,034 | |
Dividends reinvested | | 6,210,652 | | 7,044,804 | | 2,743,713 | |
Cost of shares redeemed | | (3,727,538 | ) | (6,684,699 | ) | (2,651,012 | ) |
Change in Net Assets Resulting from Capital Share Transactions | | 5,780,642 | | 4,929,858 | | 7,248,735 | |
Change in Net Assets | | 7,992,667 | | 166,701 | | 12,256,350 | |
Net Assets: | | | | | | | |
Beginning of period | | 110,830,925 | | 110,664,224 | | 98,407,874 | |
End of period | | $ | 118,823,592 | | $ | 110,830,925 | | $ | 110,664,224 | |
Share Transactions: | | | | | | | |
Issued | | 162,084 | | 234,638 | | 350,684 | |
Reinvested | | 308,988 | | 365,964 | | 133,125 | |
Redeemed | | (182,322 | ) | (330,644 | ) | (129,194 | ) |
Change in shares | | 288,750 | | 269,958 | | 354,615 | |
Accumulated undistributed net investment income/(distributions in excess of net investment income) | | $ | — | | $ | 236,174 | | $ | 304,834 | |
Amounts designated as “—” are $0 or have been rounded to $0.
See Notes to Financial Statements
19
FINANCIAL HIGHLIGHTS
Selected data for a share outstanding throughout the periods indicated.
| | For the nine | | | | | | | | | | | |
| | months | | For the year | | For the year | | For the year | | For the year | | For the year | |
| | ended | | ended | | ended | | ended | | ended | | ended | |
| | December 31, | | March 31, | | March 31, | | March 31, | | March 31, | | March 31, | |
| | 2016 | | 2016 | | 2015 | | 2014 | | 2013 | | 2012 | |
| | | | | | | | | | | | | |
Net Asset Value, Beginning of Period | | $ | 19.70 | | $ | 20.66 | | $ | 19.67 | | $ | 16.85 | | $ | 15.54 | | $ | 14.46 | |
| | | | | | | | | | | | | |
Investment Activities: | | | | | | | | | | | | | |
Operations: | | | | | | | | | | | | | |
Net investment income | | 0.16 | | 0.23 | | 0.19 | | 0.19 | | 0.20 | | 0.13 | |
Net realized and unrealized gains from investment transactions | | 1.58 | | 0.27 | | 1.38 | | 2.81 | | 1.30 | | 1.08 | |
Total from investment activities | | 1.74 | | 0.50 | | 1.57 | | 3.00 | | 1.50 | | 1.21 | |
Dividends: | | | | | | | | | | | | | |
Net investment income | | (0.20 | ) | (0.24 | ) | (0.19 | ) | (0.18 | ) | (0.19 | ) | (0.13 | ) |
Net realized gains from investments | | (1.15 | ) | (1.22 | ) | (0.39 | ) | — | | — | | — | |
Total dividends | | (1.35 | ) | (1.46 | ) | (0.58 | ) | (0.18 | ) | (0.19 | ) | (0.13 | ) |
| | | | | | | | | | | | | |
Net Asset Value, End of Period | | $ | 20.09 | | $ | 19.70 | | $ | 20.66 | | $ | 19.67 | | $ | 16.85 | | $ | 15.54 | |
| | | | | | | | | | | | | |
Total Return | | 8.82 | %(a) | 2.59 | % | 8.01 | % | 17.84 | % | 9.76 | % | 8.50 | % |
| | | | | | | | | | | | | |
Ratios/Supplemental Data: | | | | | | | | | | | | | |
Net assets at end of period (000’s) | | $ | 118,824 | | $ | 110,831 | | $ | 110,664 | | $ | 98,408 | | $ | 81,154 | | $ | 69,574 | |
Ratio of net expenses to average net assets | | 0.96 | %(b) | 0.95 | % | 0.94 | % | 0.94 | % | 1.00 | % | 1.00 | % |
Ratio of net investment income to average net assets | | 1.01 | %(b) | 1.14 | % | 0.96 | % | 1.05 | % | 1.28 | % | 0.96 | % |
Ratio of expenses (before fee reductions or recoupment of fees previously reimbursed by the investment advisor) to average net assets(c) | | 0.96 | %(b) | 0.96 | % | 0.95 | % | 0.96 | % | 1.01 | % | 1.07 | % |
Portfolio turnover rate | | 6.65 | %(a) | 18.04 | % | 19.49 | % | 6.29 | % | 5.69 | % | 10.80 | % |
Amounts designated as “—” are $0 or have been rounded to $0.
(a) Not annualized for periods less than one year.
(b) Annualized for periods less than one year.
(c) During the periods ending March 31, 2012 through March 31, 2016 and December 31, 2016, certain fees were reduced. If such fee reduction had not occurred, the ratio would have been as indicated.
See Notes to Financial Statements
20
Schedule of Portfolio Investments | | Boston Trust Midcap Fund |
| | December 31, 2016 |
Security Description | | Shares | | Fair Value ($) | |
| | | | | |
Common STOCKS (99.3%) | | | | | |
Consumer Discretionary (14.7%) | | | | | |
Advance Auto Parts, Inc. | | 4,250 | | 718,759 | |
Autoliv, Inc. | | 4,250 | | 480,888 | |
Dollar General Corp. | | 8,225 | | 609,226 | |
Hasbro, Inc. | | 6,175 | | 480,353 | |
LKQ Corp. (a) | | 14,000 | | 429,100 | |
Nordstrom, Inc. | | 9,000 | | 431,370 | |
Omnicom Group, Inc. | | 11,500 | | 978,765 | |
O’Reilly Automotive, Inc. (a) | | 1,775 | | 494,178 | |
Polaris Industries, Inc. | | 3,900 | | 321,321 | |
Ross Stores, Inc. | | 13,000 | | 852,799 | |
Sally Beauty Holdings, Inc. (a) | | 22,500 | | 594,450 | |
Service Corp. International | | 17,125 | | 486,350 | |
Williams Sonoma, Inc. | | 11,750 | | 568,583 | |
| | | | 7,446,142 | |
Consumer Staples (6.3%) | | | | | |
Brown-Forman Corp., Class B | | 13,400 | | 601,928 | |
Church & Dwight Co., Inc. | | 18,950 | | 837,401 | |
McCormick & Co., Inc. | | 3,675 | | 342,988 | |
Mead Johnson Nutrition Co. | | 6,925 | | 490,013 | |
The Hershey Co. | | 5,050 | | 522,321 | |
Whole Foods Market, Inc. | | 12,000 | | 369,120 | |
| | | | 3,163,771 | |
Energy (3.9%) | | | | | |
Cabot Oil & Gas Corp. | | 19,200 | | 448,512 | |
Dril-Quip, Inc. (a) | | 10,000 | | 600,500 | |
FMC Technologies, Inc. (a) | | 15,475 | | 549,827 | |
Oceaneering International, Inc. | | 13,600 | | 383,656 | |
| | | | 1,982,495 | |
Financials (14.9%) | | | | | |
American Financial Group, Inc. | | 6,575 | | 579,389 | |
Brown & Brown, Inc. | | 14,500 | | 650,469 | |
Commerce Bancshares, Inc. | | 9,184 | | 530,927 | |
Discover Financial Services | | 7,525 | | 542,477 | |
East West Bancorp, Inc. | | 9,350 | | 475,261 | |
Eaton Vance Corp. | | 11,550 | | 483,714 | |
FactSet Research Systems, Inc. | | 4,000 | | 653,720 | |
Moody’s Corp. | | 4,250 | | 400,648 | |
Northern Trust Corp. | | 11,000 | | 979,550 | |
SEI Investments Co. | | 7,300 | | 360,328 | |
Signature Bank (a) | | 5,050 | | 758,510 | |
T. Rowe Price Group, Inc. | | 7,500 | | 564,450 | |
W. R. Berkley Corp. | | 8,370 | | 556,689 | |
| | | | 7,536,132 | |
Health Care (12.8%) | | | | | |
C.R. Bard, Inc. | | 3,675 | | 825,625 | |
DENTSPLY SIRONA, Inc. | | 7,125 | | 411,326 | |
Laboratory Corp. of America Holdings (a) | | 4,000 | | 513,520 | |
MEDNAX, Inc. (a) | | 5,375 | | 358,298 | |
Mettler-Toledo International, Inc. (a) | | 1,800 | | 753,408 | |
ResMed, Inc. | | 5,400 | | 335,070 | |
STERIS PLC | | 8,475 | | 571,130 | |
The Cooper Companies, Inc. | | 3,450 | | 603,509 | |
Varian Medical Systems, Inc. (a) | | 3,800 | | 341,164 | |
VCA, Inc. (a) | | 9,200 | | 631,580 | |
Waters Corp. (a) | | 4,000 | | 537,560 | |
Zimmer Biomet Holdings, Inc. | | 5,500 | | 567,600 | |
| | | | 6,449,790 | |
Industrials (14.7%) | | | | | |
AMETEK, Inc. | | 12,100 | | 588,060 | |
C.H. Robinson Worldwide, Inc. | | 4,600 | | 336,996 | |
Donaldson Co., Inc. | | 11,775 | | 495,492 | |
Expeditors International of Washington, Inc. | | 7,125 | | 377,340 | |
Hubbell, Inc. | | 6,000 | | 700,200 | |
IDEX Corp. | | 4,050 | | 364,743 | |
Kansas City Southern | | 5,500 | | 466,675 | |
Lincoln Electric Holdings, Inc. | | 7,000 | | 536,690 | |
Nordson Corp. | | 6,000 | | 672,300 | |
Rockwell Collins, Inc. | | 8,950 | | 830,202 | |
Sensata Technologies Holding NV (a) | | 12,000 | | 467,400 | |
W.W. Grainger, Inc. | | 3,500 | | 812,875 | |
Wabtec Corp. | | 9,250 | | 767,935 | |
| | | | 7,416,908 | |
Information Technology (14.4%) | | | | | |
Amdocs Ltd. | | 11,500 | | 669,875 | |
Amphenol Corp., Class A | | 9,500 | | 638,400 | |
Aspen Technology, Inc. (a) | | 7,170 | | 392,056 | |
Check Point Software Technologies Ltd. (a) | | 6,000 | | 506,760 | |
Citrix Systems, Inc. (a) | | 6,500 | | 580,515 | |
DST Systems, Inc. | | 2,975 | | 318,771 | |
F5 Networks, Inc. (a) | | 5,400 | | 781,488 | |
Fiserv, Inc. (a) | | 3,300 | | 350,724 | |
IPG Photonics Corp. (a) | | 5,775 | | 570,050 | |
Juniper Networks, Inc. | | 20,825 | | 588,515 | |
Paychex, Inc. | | 9,650 | | 587,492 | |
TE Connectivity Ltd. | | 11,425 | | 791,524 | |
The Western Union Co. | | 22,000 | | 477,840 | |
| | | | 7,254,010 | |
Materials (5.6%) | | | | | |
AptarGroup, Inc. | | 10,500 | | 771,224 | |
Avery Dennison Corp. | | 10,525 | | 739,066 | |
Ball Corp. | | 7,250 | | 544,258 | |
International Flavors & Fragrances, Inc. | | 6,625 | | 780,624 | |
| | | | 2,835,172 | |
Real Estate (5.4%) | | | | | |
Digital Realty Trust, Inc. | | 5,500 | | 540,430 | |
Host Hotels & Resorts, Inc. | | 31,375 | | 591,105 | |
Jones Lang LaSalle, Inc. | | 5,375 | | 543,090 | |
Lamar Advertising Co., Class A | | 7,525 | | 505,981 | |
Realty Income Corp. | | 9,375 | | 538,875 | |
| | | | 2,719,481 | |
Utilities (6.6%) | | | | | |
American Water Works Co., Inc. | | 5,950 | | 430,542 | |
Consolidated Edison, Inc. | | 7,000 | | 515,760 | |
Edison International | | 9,200 | | 662,308 | |
Eversource Energy | | 13,866 | | 765,819 | |
ONE Gas, Inc. | | 8,000 | | 511,680 | |
WEC Energy Group, Inc. | | 7,500 | | 439,875 | |
| | | | 3,325,984 | |
TOTAL COMMON STOCKS (Cost $32,904,611) | | | | 50,129,885 | |
| | | | | |
INVESTMENT COMPANIES (0.3%) | | | | | |
| | | | | |
JPMorgan U.S. Government Money Market | | | | | |
Fund, Capital Shares, 0.24%(b) | | 157,181 | | 157,181 | |
TOTAL INVESTMENT COMPANIES (Cost $157,181) | | | | 157,181 | |
| | | | | |
Total Investments (Cost $33,061,792) — 99.6%(c) | | | | 50,287,066 | |
Other assets in excess of liabilities — 0.4% | | | | 208,072 | |
NET ASSETS — 100.0% | | | | $ | 50,495,138 | |
| | | | | | |
(a) Non-income producing security.
(b) Rate disclosed is the seven day yield as of December 31, 2016.
(c) See Federal Tax Information listed in the Notes to the Financial Statements.
See Notes to Financial Statements
21
Financial Statements | | Boston Trust Midcap Fund |
STATEMNET OF ASSETS AND LIABILITIES
December 31, 2016
Assets: | | | |
Investments, at fair value (cost $33,061,792) | | $ | 50,287,066 | |
Dividends receivable | | 57,975 | |
Receivable for investments sold | | 219,280 | |
Prepaid expenses and other assets | | 5,677 | |
Total Assets | | 50,569,998 | |
Liabilities: | | | |
Payable for capital shares redeemed | | 23,010 | |
Accrued expenses and other liabilities: | | | |
Investment adviser | | 30,556 | |
Administration and accounting | | 5,139 | |
Chief compliance officer | | 187 | |
Custodian | | 622 | |
Shareholder servicing fees | | 222 | |
Transfer agent | | 5,418 | |
Trustee | | 13 | |
Other | | 9,693 | |
Total Liabilities | | 74,860 | |
Net Assets | | $ | 50,495,138 | |
Composition of Net Assets: | | | |
Capital | | $ | 32,783,262 | |
Accumulated undistributed net investment income | | 6,652 | |
Accumulated net realized gains from investment transactions | | 479,950 | |
Net unrealized appreciation from investments | | 17,225,274 | |
Net Assets | | $ | 50,495,138 | |
Shares outstanding (par value $0.01, unlimited number of shares authorized) | | 3,291,166 | |
Net Asset Value, Offering Price and Redemption price per share | | $ | 15.34 | |
STATEMENTS OF OPERATIONS
For the nine months ended December 31, 2016
Investment Income: | | | |
Dividends | | $ | 741,753 | |
Total Investment Income | | 741,753 | |
Expenses: | | | |
Investment adviser | | 278,551 | |
Administration and accounting | | 38,860 | |
Chief compliance officer | | 1,515 | |
Custodian | | 4,919 | |
Shareholder servicing | | 1,696 | |
Transfer agency | | 25,776 | |
Trustee | | 2,979 | |
Other | | 24,749 | |
Total expenses before fee reductions | | 379,045 | |
Fees contractually reduced by the investment adviser | | (6,555 | ) |
Net Expenses | | 372,490 | |
Net Investment Income | | 369,263 | |
Net Realized/Unrealized Gains (Losses) from Investments: | | | |
Net realized gains from investment transactions | | 2,227,310 | |
Change in unrealized appreciation/depreciation from investments | | 924,493 | |
Net realized/unrealized gains (losses) from investments | | 3,151,803 | |
Change in Net Assets Resulting from Operations | | $ | 3,521,066 | |
For the year ended March 31, 2016
Investment Income: | | | |
Dividends | | $ | 735,408 | |
Total Investment Income | | 735,408 | |
Expenses: | | | |
Investment adviser | | 348,938 | |
Administration and accounting | | 49,804 | |
Chief compliance officer | | 2,101 | |
Custodian | | 8,518 | |
Shareholder servicing | | 4,031 | |
Transfer agency | | 35,012 | |
Trustee | | 3,179 | |
Other | | 27,042 | |
Total expenses before fee reductions | | 478,625 | |
Fees voluntarily reduced by the transfer agent | | (5,450 | ) |
Fees contractually reduced by the investment adviser | | (8,884 | ) |
Net Expenses | | 464,291 | |
Net Investment Income | | 271,117 | |
Net Realized/Unrealized Gains (Losses) from Investments: | | | |
Net realized gains from investment transactions | | 2,916,024 | |
Change in unrealized appreciation/depreciation from investments | | (2,689,050 | ) |
Net realized/unrealized gains (losses) from investments | | 226,974 | |
Change in Net Assets Resulting from Operations | | $ | 498,091 | |
See Notes to Financial Statements
22
STATEMENTS OF CHANGES IN NET ASSETS
| | For the | | | | | |
| | nine months ended | | For the year ended | | For the year ended | |
| | December 31, 2016 | | March 31, 2016 | | March 31, 2015 | |
| | | | | | | |
Investment Activities: | | | | | | | |
Operations: | | | | | | | |
Net investment income | | $ | 369,263 | | $ | 271,117 | | $ | 149,098 | |
Net realized gains from investment transactions | | 2,227,310 | | 2,916,024 | | 2,132,406 | |
Change in unrealized appreciation/depreciation from investments | | 924,493 | | (2,689,050 | ) | 2,988,513 | |
Change in Net Assets Resulting from Operations | | 3,521,066 | | 498,091 | | 5,270,017 | |
Dividends: | | | | | | | |
Net investment income | | (412,131 | ) | (248,030 | ) | (147,759 | ) |
Net realized gains from investment transactions | | (2,991,609 | ) | (2,579,926 | ) | (2,011,509 | ) |
Change in Net Assets Resulting from Shareholder Dividends | | (3,403,740 | ) | (2,827,956 | ) | (2,159,268 | ) |
Capital Share Transactions: | | | | | | | |
Proceeds from shares issued | | 1,824,768 | | 3,369,645 | | 2,772,357 | |
Dividends reinvested | | 2,967,431 | | 2,645,794 | | 1,991,145 | |
Cost of shares redeemed | | (2,355,862 | ) | (3,426,525 | ) | (1,984,811 | ) |
Change in Net Assets Resulting from Capital Share Transactions | | 2,436,337 | | 2,588,914 | | 2,778,691 | |
Change in Net Assets | | 2,553,663 | | 259,049 | | 5,889,440 | |
Net Assets: | | | | | | | |
Beginning of period | | 47,941,475 | | 47,682,426 | | 41,792,986 | |
End of period | | $ | 50,495,138 | | $ | 47,941,475 | | $ | 47,682,426 | |
Share Transactions: | | | | | | | |
Issued | | 116,182 | | 222,975 | | 177,659 | |
Reinvested | | 190,954 | | 179,742 | | 129,295 | |
Redeemed | | (152,012 | ) | (225,472 | ) | (128,644 | ) |
Change in shares | | 155,124 | | 177,245 | | 178,310 | |
Accumulated undistributed net investment income | | $ | 6,652 | | $ | 49,520 | | $ | 26,433 | |
See Notes to Financial Statements
23
FINANCIAL HIGHLIGHTS
Selected data for a share outstanding throughout the periods indicated.
| | For the nine | | | | | | | | | | | |
| | months | | For the year | | For the year | | For the year | | For the year | | For the year | |
| | ended | | ended | | ended | | ended | | ended | | ended | |
| | December 31, | | March 31, | | March 31, | | March 31, | | March 31, | | March 31, | |
| | 2016 | | 2016 | | 2015 | | 2014 | | 2013 | | 2012 | |
| | | | | | | | | | | | | |
Net Asset Value, Beginning of Period | | $ | 15.29 | | $ | 16.12 | | $ | 15.03 | | $ | 13.08 | | $ | 12.34 | | $ | 11.96 | |
| | | | | | | | | | | | | |
Investment Activities: | | | | | | | | | | | | | |
Operations: | | | | | | | | | | | | | |
Net investment income | | 0.12 | | 0.09 | | 0.05 | | 0.04 | | 0.08 | | 0.03 | |
Net realized and unrealized gains from investment transactions | | 1.01 | | 0.05 | | 1.82 | | 2.30 | | 1.01 | | 0.78 | |
Total from investment activities | | 1.13 | | 0.14 | | 1.87 | | 2.34 | | 1.09 | | 0.81 | |
Dividends: | | | | | | | | | | | | | |
Net investment income | | (0.13 | ) | (0.09 | ) | (0.05 | ) | (0.04 | ) | (0.08 | ) | (0.03 | ) |
Net realized gains from investments | | (0.95 | ) | (0.88 | ) | (0.73 | ) | (0.35 | ) | (0.27 | ) | (0.40 | ) |
Total dividends | | (1.08 | ) | (0.97 | ) | (0.78 | ) | (0.39 | ) | (0.35 | ) | (0.43 | ) |
| | | | | | | | | | | | | |
Net Asset Value, End of Period | | $ | 15.34 | | $ | 15.29 | | $ | 16.12 | | $ | 15.03 | | $ | 13.08 | | $ | 12.34 | |
| | | | | | | | | | | | | |
Total Return | | 7.29 | %(a) | 1.07 | % | 12.65 | % | 18.02 | % | 9.20 | % | 7.24 | % |
| | | | | | | | | | | | | |
Ratios/Supplemental Data: | | | | | | | | | | | | | |
Net assets at end of period (000’s) | | $ | 50,495 | | $ | 47,941 | | $ | 47,682 | | $ | 41,793 | | $ | 34,875 | | $ | 29,224 | |
Ratio of net expenses to average net assets | | 1.00 | %(b) | 1.00 | % | 1.00 | % | 1.00 | % | 1.00 | % | 1.00 | % |
Ratio of net investment income to average net assets | | 0.99 | %(b) | 0.58 | % | 0.34 | % | 0.30 | % | 0.68 | % | 0.30 | % |
Ratio of expenses (before fee reductions or recoupment of fees previously reimbursed by the investment advisor) to average net assets(c) | | 1.02 | %(b) | 1.03 | % | 1.02 | % | 1.01 | % | 1.08 | % | 1.19 | % |
Portfolio turnover rate | | 14.53 | %(a) | 21.02 | % | 15.76 | % | 16.09 | % | 16.44 | % | 19.01 | % |
(a) Not annualized for periods less than one year.
(b) Annualized for periods less than one year.
(c) During the periods ending March 31, 2012 through March 31, 2016 and December 31, 2016, certain fees were reduced. If such fee reduction had not occurred, the ratio would have been as indicated.
See Notes to Financial Statements
24
Schedule of Portfolio Investments | | Boston Trust SMID Cap Fund |
| | December 31, 2016 |
Security Description | | Shares | | Fair Value ($) | |
| | | | | |
COMMON STOCKS (99.1%) | | | | | |
Consumer Discretionary (14.1%) | | | | | |
Big Lots, Inc. | | 1,600 | | 80,336 | |
Brinker International, Inc. | | 925 | | 45,815 | |
Cheesecake Factory, Inc. | | 1,175 | | 70,359 | |
Choice Hotels International, Inc. | | 1,275 | | 71,463 | |
Dorman Products, Inc. (a) | | 1,075 | | 78,539 | |
Gentherm, Inc. (a) | | 850 | | 28,773 | |
ILG, Inc. | | 2,175 | | 39,520 | |
Nordstrom, Inc. | | 1,275 | | 61,111 | |
Polaris Industries, Inc. | | 500 | | 41,195 | |
Sally Beauty Holdings, Inc. (a) | | 1,750 | | 46,235 | |
Service Corp. International | | 3,025 | | 85,910 | |
Tenneco, Inc. (a) | | 800 | | 49,976 | |
Texas Roadhouse, Inc. | | 1,275 | | 61,506 | |
The Cato Corp., Class A | | 1,075 | | 32,336 | |
Tiffany & Co. | | 650 | | 50,330 | |
Tupperware Brands Corp. | | 400 | | 21,048 | |
Williams Sonoma, Inc. | | 1,075 | | 52,019 | |
| | | | 916,471 | |
Consumer Staples (3.4%) | | | | | |
Flowers Foods, Inc. | | 3,025 | | 60,408 | |
Sanderson Farms, Inc. | | 525 | | 49,476 | |
The Boston Beer Co., Inc., Class A (a) | | 250 | | 42,463 | |
Whole Foods Market, Inc. | | 2,156 | | 66,319 | |
| | | | 218,666 | |
Energy (3.7%) | | | | | |
Dril-quip, Inc. (a) | | 650 | | 39,033 | |
FMC Technologies, Inc. (a) | | 2,050 | | 72,836 | |
Forum Energy Technologies, Inc. (a) | | 2,925 | | 64,350 | |
Oceaneering International, Inc. | | 1,225 | | 34,557 | |
Tesoro Corp. | | 375 | | 32,794 | |
| | | | 243,570 | |
Financials (18.3%) | | | | | |
American Financial Group, Inc. | | 800 | | 70,496 | |
Artisan Partners Asset Management, Inc., | | | | | |
Class A | | 1,000 | | 29,750 | |
Bank of Hawaii Corp. | | 1,075 | | 95,342 | |
Brown & Brown, Inc. | | 1,600 | | 71,776 | |
Cohen & Steers, Inc. | | 1,475 | | 49,560 | |
Commerce Bancshares, Inc. | | 1,274 | | 73,650 | |
CVB Financial Corp. | | 2,375 | | 54,459 | |
East West Bancorp, Inc. | | 2,100 | | 106,743 | |
Eaton Vance Corp. | | 2,225 | | 93,183 | |
Everest Re Group Ltd. | | 300 | | 64,920 | |
FactSet Research Systems, Inc. | | 300 | | 49,029 | |
SEI Investments Co. | | 1,075 | | 53,062 | |
Signature Bank (a) | | 625 | | 93,875 | |
SVB Financial Group (a) | | 650 | | 111,578 | |
Texas Capital Bancshares, Inc. (a) | | 600 | | 47,040 | |
UMB Financial Corp. | | 1,000 | | 77,120 | |
W. R. Berkley Corp. | | 800 | | 53,208 | |
| | | | 1,194,791 | |
Health Care (11.5%) | | | | | |
Chemed Corp. | | 525 | | 84,215 | |
Masimo Corp. (a) | | 900 | | 60,660 | |
MEDNAX, Inc. (a) | | 900 | | 59,994 | |
Mettler-Toledo International, Inc. (a) | | 175 | | 73,248 | |
Owens & Minor, Inc. | | 1,375 | | 48,524 | |
PAREXEL International Corp. (a) | | 900 | | 59,148 | |
ResMed, Inc. | | 1,075 | | 66,703 | |
STERIS PLC | | 750 | | 50,543 | |
The Cooper Companies, Inc. | | 400 | | 69,971 | |
Varian Medical Systems, Inc. (a) | | 525 | | 47,135 | |
VCA, Inc. (a) | | 850 | | 58,353 | |
Waters Corp. (a) | | 500 | | 67,195 | |
| | | | 745,689 | |
Industrials (16.4%) | | | | | |
Applied Industrial Technologies, Inc. | | 1,050 | | 62,370 | |
C.H. Robinson Worldwide, Inc. | | 900 | | 65,934 | |
CLARCOR, Inc. | | 400 | | 32,988 | |
Donaldson Co., Inc. | | 1,850 | | 77,848 | |
Expeditors International of Washington, Inc. | | 1,150 | | 60,904 | |
Franklin Electric Co., Inc. | | 1,000 | | 38,900 | |
Hub Group, Inc., Class A (a) | | 900 | | 39,375 | |
Hubbell, Inc. | | 650 | | 75,855 | |
IDEX Corp. | | 550 | | 49,533 | |
Kansas City Southern | | 575 | | 48,789 | |
Lincoln Electric Holdings, Inc. | | 800 | | 61,336 | |
Nordson Corp. | | 800 | | 89,640 | |
Rockwell Collins, Inc. | | 700 | | 64,932 | |
Sensata Technologies Holding NV (a) | | 900 | | 35,055 | |
The Toro Co. | | 1,275 | | 71,336 | |
UniFirst Corp. | | 450 | | 64,643 | |
Valmont Industries, Inc. | | 350 | | 49,315 | |
Wabtec Corp. | | 1,000 | | 83,020 | |
| | | | 1,071,773 | |
Information Technology (15.6%) | | | | | |
Amdocs Ltd. | | 1,375 | | 80,094 | |
Aspen Technology, Inc. (a) | | 1,475 | | 80,653 | |
DST Systems, Inc. | | 800 | | 85,720 | |
F5 Networks, Inc. (a) | | 700 | | 101,304 | |
InterDigital, Inc. | | 700 | | 63,945 | |
IPG Photonics Corp. (a) | | 1,100 | | 108,581 | |
Juniper Networks, Inc. | | 2,425 | | 68,531 | |
NetApp, Inc. | | 800 | | 28,216 | |
NETGEAR, Inc. (a) | | 1,375 | | 74,731 | |
Plantronics, Inc. | | 1,075 | | 58,867 | |
Syntel, Inc. | | 1,775 | | 35,127 | |
Tech Data Corp. (a) | | 550 | | 46,574 | |
Teradata Corp. (a) | | 2,000 | | 54,340 | |
The Western Union Co. | | 2,925 | | 63,531 | |
WEX, Inc. (a) | | 575 | | 64,170 | |
| | | | 1,014,384 | |
Materials (5.2%) | | | | | |
AptarGroup, Inc. | | 900 | | 66,105 | |
Avery Dennison Corp. | | 450 | | 31,599 | |
Calgon Carbon Corp. | | 3,175 | | 53,975 | |
International Flavors & Fragrances, Inc. | | 550 | | 64,806 | |
Minerals Technologies, Inc. | | 700 | | 54,075 | |
Silgan Holdings, Inc. | | 1,375 | | 70,373 | |
| | | | 340,933 | |
Real Estate (7.8%) | | | | | |
CoreSite Realty Corp. | | 1,025 | | 81,354 | |
DuPont Fabros Technology, Inc. | | 1,100 | | 48,323 | |
Jones Lang LaSalle, Inc. | | 700 | | 70,728 | |
Lamar Advertising Co., Class A | | 675 | | 45,387 | |
LaSalle Hotel Properties | | 2,200 | | 67,034 | |
National Health Investors, Inc. | | 725 | | 53,773 | |
Ryman Hospitality Properties, Inc. | | 975 | | 61,435 | |
Tanger Factory Outlet Centers, Inc. | | 2,175 | | 77,822 | |
| | | | 505,856 | |
Utilities (3.1%) | | | | | |
American States Water Co. | | 1,100 | | 50,116 | |
New Jersey Resources Corp. | | 1,725 | | 61,238 | |
ONE Gas, Inc. | | 1,375 | | 87,945 | |
| | | | 199,299 | |
TOTAL COMMON STOCKS (Cost $5,100,899) | | | | 6,451,432 | |
| | | | | |
INVESTMENT COMPANIES (0.8%) | | | | | |
| | | | | |
JPMorgan U.S. Government Money Market Fund, Capital Shares, 0.24%(b) | | 55,149 | | 55,149 | |
TOTAL INVESTMENT COMPANIES (Cost $55,149) | | | | 55,149 | |
| | | | | |
Total Investments (Cost $5,156,048) — 99.9%(c) | | | | 6,506,581 | |
Other assets in excess of liabilities — 0.1% | | | | 3,864 | |
NET ASSETS — 100.0% | | | | $ | 6,510,445 | |
| | | | | | |
(a) Non-income producing security.
(b) Rate disclosed is the seven day yield as of December 31, 2016.
(c) See Federal Tax Information listed in the Notes to the Financial Statements.
See Notes to Financial Statements
25
Financial Statements | | Boston Trust SMID Cap Fund |
STATEMENT OF ASSETS AND LIABILITIES
December 31, 2016
Assets: | | | |
Investments, at fair value (cost $5,156,048) | | $ | 6,506,581 | |
Dividends receivable | | 7,631 | |
Receivable for capital shares issued | | 42 | |
Receivable from Adviser | | 798 | |
Prepaid expenses and other assets | | 2,361 | |
Total Assets | | 6,517,413 | |
Liabilities: | | | |
Accrued expenses and other liabilities: | | | |
Administration and accounting | | 830 | |
Chief compliance officer | | 22 | |
Custodian | | 67 | |
Shareholder servicing fees | | 4 | |
Transfer agent | | 4,905 | |
Trustee | | 2 | |
Other | | 1,138 | |
Total Liabilities | | 6,968 | |
Net Assets | | $ | 6,510,445 | |
Composition of Net Assets: | | | |
Capital | | $ | 5,168,276 | |
Accumulated undistributed net investment income | | 2,560 | |
Accumulated net realized losses from investment transactions | | (10,924 | ) |
Net unrealized appreciation from investments | | 1,350,533 | |
Net Assets | | $ | 6,510,445 | |
Shares outstanding (par value $0.01, unlimited number of shares authorized) | | 482,864 | |
Net Asset Value, Offering Price and Redemption price per share | | $ | 13.48 | |
STATEMENTS OF OPERATIONS
For the nine months ended December 31, 2016
Investment Income: | | | |
Dividends | | $ | 91,391 | |
Total Investment Income | | 91,391 | |
Expenses: | | | |
Investment adviser | | 33,089 | |
Administration and accounting | | 5,219 | |
Chief compliance officer | | 180 | |
Custodian | | 584 | |
Transfer agency | | 24,601 | |
Trustee | | 354 | |
Other | | 7,066 | |
Total expenses before fee reductions | | 71,093 | |
Fees contractually reduced by the investment adviser | | (37,894 | ) |
Net Expenses | | 33,199 | |
Net Investment Income | | 58,192 | |
Net Realized/Unrealized Gains (Losses) from Investments: | | | |
Net realized gains from investment transactions | | 156,288 | |
Change in unrealized appreciation/depreciation from investments | | 606,860 | |
Net realized/unrealized gains (losses) from investments | | 763,148 | |
Change in Net Assets Resulting from Operations | | $ | 821,340 | |
For the year ended March 31, 2016
Investment Income: | | | |
Dividends | | $ | 68,479 | |
Total Investment Income | | 68,479 | |
Expenses: | | | |
Investment adviser | | 40,124 | |
Administration and accounting | | 6,382 | |
Chief compliance officer | | 235 | |
Custodian | | 1,831 | |
Shareholder servicing | | 5 | |
Transfer agency | | 33,009 | |
Trustee | | 355 | |
Other | | 10,361 | |
Total expenses before fee reductions | | 92,302 | |
Fees voluntarily reduced by the transfer agent | | (5,450 | ) |
Fees contractually reduced by the investment adviser | | (44,650 | ) |
Net Expenses | | 42,202 | |
Net Investment Income | | 26,277 | |
Net Realized/Unrealized Gains (Losses) from Investments: | | | |
Net realized gains from investment transactions | | 390,976 | |
Change in unrealized appreciation/depreciation from investments | | (553,723 | ) |
Net realized/unrealized gains (losses) from investments | | (162,747 | ) |
Change in Net Assets Resulting from Operations | | $ | (136,470 | ) |
See Notes to Financial Statements
26
STATEMENTS OF CHANGES IN NET ASSETS
| | For the | | | | | |
| | nine months ended | | For the year ended | | For the year ended | |
| | December 31, 2016 | | March 31, 2016 | | March 31, 2015 | |
| | | | | | | |
Investment Activities: | | | | | | | |
Operations: | | | | | | | |
Net investment income | | $ | 58,192 | | $ | 26,277 | | $ | 4,140 | |
Net realized gains from investment transactions | | 156,288 | | 390,976 | | 162,582 | |
Change in unrealized appreciation/depreciation from investments | | 606,860 | | (553,723 | ) | 213,128 | |
Change in Net Assets Resulting from Operations | | 821,340 | | (136,470 | ) | 379,850 | |
Dividends: | | | | | | | |
Net investment income | | (68,960 | ) | (16,526 | ) | (1,747 | ) |
Net realized gains from investment transactions | | (321,176 | ) | (350,500 | ) | (264,517 | ) |
Change in Net Assets Resulting from Shareholder Dividends | | (390,136 | ) | (367,026 | ) | (266,264 | ) |
Capital Share Transactions: | | | | | | | |
Proceeds from shares issued | | 547,155 | | 1,339,502 | | 600,028 | |
Dividends reinvested | | 322,044 | | 294,835 | | 254,275 | |
Cost of shares redeemed | | (378,521 | ) | (928,394 | ) | (389,915 | ) |
Change in Net Assets Resulting from Capital Share Transactions | | 490,678 | | 705,943 | | 464,388 | |
Change in Net Assets | | 921,882 | | 202,447 | | 577,974 | |
Net Assets: | | | | | | | |
Beginning of period | | 5,588,563 | | 5,386,116 | | 4,808,142 | |
End of period | | $ | 6,510,445 | | $ | 5,588,563 | | $ | 5,386,116 | |
Share Transactions: | | | | | | | |
Issued | | 40,999 | | 102,400 | | 45,724 | |
Reinvested | | 23,472 | | 24,528 | | 19,850 | |
Redeemed | | (29,016 | ) | (72,027 | ) | (29,591 | ) |
Change in shares | | 35,455 | | 54,901 | | 35,983 | |
Accumulated undistributed net investment income | | $ | 2,560 | | $ | 12,819 | | $ | 3,651 | |
Amounts designated as “—” are $0 or have been rounded to $0.
See Notes to Financial Statements
27
FINANCIAL HIGHLIGHTS
Selected data for a share outstanding throughout the periods indicated.
| | | | | | | | | | | | Period | |
| | For the nine | | | | | | | | | | November 30, | |
| | months | | For the year | | For the year | | For the year | | For the year | | 2011(e) | |
| | ended | | ended | | ended | | ended | | ended | | through | |
| | December 31, | | March 31, | | March 31, | | March 31, | | March 31, | | March 31, | |
| | 2016 | | 2016 | | 2015 | | 2014 | | 2013 | | 2012 | |
| | | | | | | | | | | | | |
Net Asset Value, Beginning of Period | | $ | 12.49 | | $ | 13.72 | | $ | 13.49 | | $ | 12.05 | | $ | 11.09 | | $ | 10.00 | |
| | | | | | | | | | | | | |
Investment Activities: | | | | | | | | | | | | | |
Operations: | | | | | | | | | | | | | |
Net investment income | | 0.13 | | 0.06 | | 0.01 | | (0.01 | ) | 0.04 | | — | |
Net realized and unrealized gains (losses) from investment transactions | | 1.72 | | (0.41 | ) | 0.97 | | 2.40 | | 1.05 | | 1.09 | |
Total from investment activities | | 1.85 | | (0.35 | ) | 0.98 | | 2.39 | | 1.09 | | 1.09 | |
Dividends: | | | | | | | | | | | | | |
Net investment income | | (0.15 | ) | (0.04 | ) | — | | — | | (0.05 | ) | — | |
Net realized gains from investments | | (0.71 | ) | (0.84 | ) | (0.75 | ) | (0.95 | ) | (0.08 | ) | — | |
Total dividends | | (0.86 | ) | (0.88 | ) | (0.75 | ) | (0.95 | ) | (0.13 | ) | — | |
| | | | | | | | | | | | | |
Net Asset Value, End of Period | | $ | 13.48 | | $ | 12.49 | | $ | 13.72 | | $ | 13.49 | | $ | 12.05 | | $ | 11.09 | |
| | | | | | | | | | | | | |
Total Return | | 14.67 | %(a) | (2.34 | )% | 7.69 | % | 20.05 | % | 10.00 | % | 10.96 | %(a) |
| | | | | | | | | | | | | |
Ratios/Supplemental Data: | | | | | | | | | | | | | |
Net assets at end of period (000’s) | | $ | 6,510 | | $ | 5,589 | | $ | 5,386 | | $ | 4,808 | | $ | 4,719 | | $ | 3,605 | |
Ratio of net expenses to average net assets | | 0.75 | %(b) | 0.79 | %(d) | 1.00 | % | 1.00 | % | 1.00 | % | 1.00 | %(b) |
Ratio of net investment income to average net assets | | 1.31 | %(b) | 0.49 | % | 0.09 | % | (0.06 | )% | 0.37 | % | 0.03 | %(b) |
Ratio of expenses (before fee reductions or recoupment of fees previously reimbursed by the investment advisor) to average net assets(c) | | 1.61 | %(b) | 1.73 | % | 1.73 | % | 1.59 | % | 2.02 | % | 2.18 | %(b) |
Portfolio turnover rate | | 22.69 | %(a) | 50.15 | % | 33.07 | % | 35.97 | % | 33.83 | % | 12.14 | %(a) |
Amounts designated as “—” are $0 or have been rounded to $0.
(a) Not annualized for periods less than one year.
(b) Annualized for periods less than one year.
(c) During the periods ending March 31, 2012 through March 31, 2016 and December 31, 2016, certain fees were reduced. If such fee reduction had not occurred, the ratio would have been as indicated.
(d) The net expense ratio shown for the period represents the blended ratio of the current expense limit in effect as of June 1, 2015 and the higher expense limit in effect prior to that date.
(e) Commencement of operations on November 30, 2011.
See Notes to Financial Statements
28
Schedule of Portfolio Investments | | Boston Trust Small Cap Fund |
| | December 31, 2016 |
Security Description | | Shares | | Fair Value ($) | |
| | | | | |
COMMON STOCKS (100.0%) | | | | | |
Consumer Discretionary (14.1%) | | | | | |
Big Lots, Inc. | | 86,000 | | 4,318,060 | |
Brinker International, Inc. | | 48,000 | | 2,377,440 | |
Cheesecake Factory, Inc. | | 67,000 | | 4,011,960 | |
Choice Hotels International, Inc. | | 90,000 | | 5,044,500 | |
Dorman Products, Inc. (a) | | 70,000 | | 5,114,200 | |
Fossil Group, Inc. (a) | | 38,000 | | 982,680 | |
Gentherm, Inc. (a) | | 57,000 | | 1,929,450 | |
ILG, Inc. | | 160,000 | | 2,907,200 | |
Sally Beauty Holdings, Inc. (a) | | 139,000 | | 3,672,380 | |
Tenneco, Inc. (a) | | 55,000 | | 3,435,850 | |
Texas Roadhouse, Inc. | | 65,000 | | 3,135,600 | |
The Cato Corp., Class A | | 95,000 | | 2,857,600 | |
Tupperware Brands Corp. | | 28,000 | | 1,473,360 | |
Urban Outfitters, Inc. (a) | | 45,000 | | 1,281,600 | |
Williams Sonoma, Inc. | | 74,000 | | 3,580,860 | |
| | | | 46,122,740 | |
Consumer Staples (3.3%) | | | | | |
Flowers Foods, Inc. | | 155,000 | | 3,095,350 | |
Sanderson Farms, Inc. | | 24,000 | | 2,261,760 | |
The Boston Beer Co., Inc., Class A (a) | | 16,000 | | 2,717,600 | |
United Natural Foods, Inc. (a) | | 54,000 | | 2,576,880 | |
| | | | 10,651,590 | |
Energy (2.9%) | | | | | |
Dril-Quip, Inc. (a) | | 35,000 | | 2,101,750 | |
Forum Energy Technologies, Inc. (a) | | 154,000 | | 3,388,000 | |
Natural Gas Services Group, Inc. (a) | | 67,000 | | 2,154,050 | |
Oceaneering International, Inc. | | 66,000 | | 1,861,860 | |
| | | | 9,505,660 | |
Financials (17.5%) | | | | | |
1st Source Corp. | | 36,000 | | 1,607,760 | |
Artisan Partners Asset Management, Inc., | | | | | |
Class A | | 64,000 | | 1,904,000 | |
Bank of Hawaii Corp. | | 73,000 | | 6,474,370 | |
Cohen & Steers, Inc. | | 89,000 | | 2,990,400 | |
Commerce Bancshares, Inc. | | 76,000 | | 4,393,560 | |
CVB Financial Corp. | | 125,000 | | 2,866,250 | |
Eagle Bancorp, Inc. (a) | | 40,000 | | 2,438,000 | |
Eaton Vance Corp. | | 115,000 | | 4,816,200 | |
Horace Mann Educators Corp. | | 53,000 | | 2,268,400 | |
Independent Bank Corp. | | 57,000 | | 4,015,650 | |
Infinity Property & Casualty Corp. | | 34,000 | | 2,988,600 | |
Lakeland Financial Corp. | | 55,000 | | 2,604,800 | |
Morningstar, Inc. | | 33,000 | | 2,427,480 | |
Texas Capital Bancshares, Inc. (a) | | 38,000 | | 2,979,200 | |
Tompkins Financial Corp. | | 24,000 | | 2,268,960 | |
Trustmark Corp. | | 70,000 | | 2,495,500 | |
UMB Financial Corp. | | 60,000 | | 4,627,200 | |
Washington Federal, Inc. | | 67,000 | | 2,301,450 | |
Washington Trust BanCorp, Inc. | | 16,000 | | 896,800 | |
| | | | 57,364,580 | |
Health Care (14.3%) | | | | | |
Air Methods Corp. (a) | | 66,000 | | 2,102,100 | |
Anika Therapeutics, Inc. (a) | | 63,000 | | 3,084,480 | |
Atrion Corp. | | 4,000 | | 2,028,800 | |
Bio-Techne Corp. | | 22,000 | | 2,262,260 | |
Bruker Corp. | | 179,000 | | 3,791,220 | |
Chemed Corp. | | 32,000 | | 5,133,120 | |
CorVel Corp. (a) | | 34,000 | | 1,244,400 | |
Ensign Group, Inc. | | 115,000 | | 2,554,150 | |
Globus Medical, Inc., Class A (a) | | 89,000 | | 2,208,090 | |
Haemonetics Corp. (a) | | 71,000 | | 2,854,200 | |
Masimo Corp. (a) | | 85,000 | | 5,729,000 | |
Meridian Bioscience, Inc. | | 171,000 | | 3,026,700 | |
Owens & Minor, Inc. | | 119,000 | | 4,199,510 | |
PAREXEL International Corp. (a) | | 45,000 | | 2,957,400 | |
U.S. Physical Therapy, Inc. | | 54,000 | | 3,790,800 | |
| | | | 46,966,230 | |
Industrials (14.6%) | | | | | |
Applied Industrial Technologies, Inc. | | 86,000 | | 5,108,400 | |
Chart Industries, Inc. (a) | | 56,000 | | 2,017,120 | |
CLARCOR, Inc. | | 21,000 | | 1,731,870 | |
Donaldson Co., Inc. | | 68,000 | | 2,861,440 | |
Franklin Electric Co., Inc. | | 98,000 | | 3,812,200 | |
Genesee & Wyoming, Inc., Class A (a) | | 19,000 | | 1,318,790 | |
Herman Miller, Inc. | | 72,000 | | 2,462,400 | |
Hub Group, Inc., Class A (a) | | 70,000 | | 3,062,500 | |
Landstar System, Inc. | | 43,000 | | 3,667,900 | |
Lincoln Electric Holdings, Inc. | | 38,000 | | 2,913,460 | |
Nordson Corp. | | 23,000 | | 2,577,150 | |
Tennant Co. | | 63,000 | | 4,485,600 | |
The Toro Co. | | 63,000 | | 3,524,850 | |
UniFirst Corp. | | 35,000 | | 5,027,750 | |
Valmont Industries, Inc. | | 24,000 | | 3,381,600 | |
| | | | 47,953,030 | |
Information Technology (18.2%) | | | | | |
Aspen Technology, Inc. (a) | | 89,000 | | 4,866,520 | |
Coherent, Inc. (a) | | 29,000 | | 3,984,165 | |
DHI Group, Inc. (a) | | 281,000 | | 1,756,250 | |
DST Systems, Inc. | | 51,284 | | 5,495,080 | |
ExlService Holdings, Inc. (a) | | 57,000 | | 2,875,080 | |
InterDigital, Inc. | | 54,000 | | 4,932,900 | |
IPG Photonics Corp. (a) | | 47,000 | | 4,639,370 | |
NETGEAR, Inc. (a) | | 68,000 | | 3,695,800 | |
NIC, Inc. | | 159,000 | | 3,800,100 | |
Plantronics, Inc. | | 83,000 | | 4,545,080 | |
Power Integrations, Inc. | | 55,000 | | 3,731,750 | |
Syntel, Inc. | | 90,000 | | 1,781,100 | |
Tech Data Corp. (a) | | 38,000 | | 3,217,840 | |
Teradata Corp. (a) | | 121,000 | | 3,287,570 | |
Ubiquiti Networks, Inc. (a) | | 56,000 | | 3,236,800 | |
WEX, Inc. (a) | | 35,000 | | 3,906,000 | |
| | | | 59,751,405 | |
Materials (4.9%) | | | | | |
AptarGroup, Inc. | | 28,000 | | 2,056,600 | |
Calgon Carbon Corp. | | 125,000 | | 2,125,000 | |
Minerals Technologies, Inc. | | 65,000 | | 5,021,250 | |
Quaker Chemical Corp. | | 18,000 | | 2,302,920 | |
Silgan Holdings, Inc. | | 89,000 | | 4,555,020 | |
| | | | 16,060,790 | |
Real Estate (6.8%) | | | | | |
CoreSite Realty Corp. | | 54,000 | | 4,285,980 | |
DuPont Fabros Technology, Inc. | | 90,000 | | 3,953,700 | |
LaSalle Hotel Properties | | 112,000 | | 3,412,640 | |
National Health Investors, Inc. | | 36,000 | | 2,670,120 | |
Ryman Hospitality Properties, Inc. | | 56,000 | | 3,528,560 | |
Tanger Factory Outlet Centers, Inc. | | 120,000 | | 4,293,600 | |
| | | | 22,144,600 | |
Utilities (3.4%) | | | | | |
American States Water Co. | | 47,000 | | 2,141,320 | |
New Jersey Resources Corp. | | 87,300 | | 3,099,150 | |
ONE Gas, Inc. | | 91,000 | | 5,820,360 | |
| | | | 11,060,830 | |
TOTAL COMMON STOCKS (Cost $248,645,155) | | | | 327,581,455 | |
| | | | | |
INVESTMENT COMPANIES (1.7%) | | | | | |
JPMorgan U.S. Government Money Market Fund, Capital Shares, 0.24%(b) | | 5,562,800 | | 5,562,800 | |
TOTAL INVESTMENT COMPANIES (Cost $5,562,800) | | | | 5,562,800 | |
| | | | | |
Total Investments (Cost $254,207,955) — 101.7%(c) | | | | 333,144,255 | |
Liabilities in excess of other assets — (1.7)% | | | | (5,550,805 | ) |
NET ASSETS — 100.0% | | | | $ | 327,593,450 | |
| | | | | | |
(a) Non-income producing security.
(b) Rate disclosed is the seven day yield as of December 31, 2016.
(c) See Federal Tax Information listed in the Notes to the Financial Statements.
See Notes to Financial Statements
29
Financial Statements | | Boston Trust Small Cap Fund |
STATEMENT OF ASSETS AND LIABILITIES
December 31, 2016
Assets: | | | |
Investments, at fair value (cost $254,207,955) | | $ | 333,144,255 | |
Dividends receivable | | 434,255 | |
Receivable for investments sold | | 102,801,943 | |
Receivable for capital shares issued | | 190,327 | |
Prepaid expenses and other assets | | 19,837 | |
Total Assets | | 436,590,617 | |
Liabilities: | | | |
Payable for capital shares redeemed | | 108,581,145 | |
Accrued expenses and other liabilities: | | | |
Investment adviser | | 251,435 | |
Administration and accounting | | 40,159 | |
Chief compliance officer | | 1,504 | |
Custodian | | 4,128 | |
Shareholder servicing fees | | 34,390 | |
Transfer agent | | 5,987 | |
Trustee | | 145 | |
Other | | 78,274 | |
Total Liabilities | | 108,997,167 | |
Net Assets | | $ | 327,593,450 | |
Composition of Net Assets: | | | |
Capital | | $ | 236,066,690 | |
Accumulated undistributed net investment income | | 195,458 | |
Accumulated net realized gains from investment transactions | | 12,395,002 | |
Net unrealized appreciation from investments | | 78,936,300 | |
Net Assets | | $ | 327,593,450 | |
Shares outstanding (par value $0.01, unlimited number of shares authorized) | | 22,858,343 | |
Net Asset Value, Offering Price and Redemption price per share | | $ | 14.33 | |
STATEMENTS OF OPERATIONS
For the nine months ended December 31, 2016
Investment Income: | | | |
Dividends | | $ | 6,131,495 | |
Total Investment Income | | 6,131,495 | |
Expenses: | | | |
Investment adviser | | 2,070,534 | |
Administration and accounting | | 283,867 | |
Chief compliance officer | | 11,391 | |
Custodian | | 37,053 | |
Shareholder servicing | | 302,704 | |
Transfer agency | | 29,627 | |
Trustee | | 22,304 | |
Other | | 171,226 | |
Total expenses before fee reductions | | 2,928,706 | |
Fees contractually reduced by the investment adviser | | (157,762 | ) |
Net Expenses | | 2,770,944 | |
Net Investment Income | | 3,360,551 | |
Net Realized/Unrealized Gains (Losses) from Investments: | | | |
Net realized gains from investment transactions | | 22,122,179 | |
Change in unrealized appreciation/depreciation from investments | | 31,044,553 | |
Net realized/unrealized gains (losses) from investments | | 53,166,732 | |
Change in Net Assets Resulting from Operations | | $ | 56,527,283 | |
For the year ended March 31, 2016
Investment Income: | | | |
Dividends | | $ | 5,427,083 | |
Total Investment Income | | 5,427,083 | |
Expenses: | | | |
Investment adviser | | 2,838,811 | |
Administration and accounting | | 400,414 | |
Chief compliance officer | | 17,796 | |
Custodian | | 64,964 | |
Shareholder servicing | | 508,558 | |
Transfer agency | | 39,426 | |
Trustee | | 27,230 | |
Other | | 179,867 | |
Total expenses before fee reductions | | 4,077,066 | |
Fees voluntarily reduced by the transfer agent | | (5,450 | ) |
Fees contractually reduced by the investment adviser | | (297,469 | ) |
Net Expenses | | 3,774,147 | |
Net Investment Income | | 1,652,936 | |
Net Realized/Unrealized Gains (Losses) from Investments: | | | |
Net realized gains from investment transactions | | 35,027,795 | |
Change in unrealized appreciation/depreciation from investments | | (44,598,483 | ) |
Net realized/unrealized gains (losses) from investments | | (9,570,688 | ) |
Change in Net Assets Resulting from Operations | | $ | (7,917,752 | ) |
See Notes to Financial Statements
30
STATEMENTS OF CHANGES IN NET ASSETS
| | For the | | | | | |
| | nine months ended | | For the year ended | | For the year ended | |
| | December 31, 2016 | | March 31, 2016 | | March 31, 2015 | |
| | | | | | | |
Investment Activities: | | | | | | | |
Operations: | | | | | | | |
Net investment income | | $ | 3,360,551 | | $ | 1,652,936 | | $ | 791,676 | |
Net realized gains from investment transactions | | 22,122,179 | | 35,027,795 | | 47,957,282 | |
Change in unrealized appreciation/depreciation from investments | | 31,044,553 | | (44,598,483 | ) | (34,259,948 | ) |
Change in Net Assets Resulting from Operations | | 56,527,283 | | (7,917,752 | ) | 14,489,010 | |
Dividends: | | | | | | | |
Net investment income | | (3,993,823 | ) | (1,493,172 | ) | (386,517 | ) |
Net realized gains from investment transactions | | (9,153,927 | ) | (58,309,973 | ) | (31,345,842 | ) |
Change in Net Assets Resulting from Shareholder Dividends | | (13,147,750 | ) | (59,803,145 | ) | (31,732,359 | ) |
Capital Share Transactions: | | | | | | | |
Proceeds from shares issued | | 74,410,954 | | 20,953,558 | | 13,576,896 | |
Dividends reinvested | | 12,938,039 | | 58,903,085 | | 31,322,227 | |
Cost of shares redeemed | | (141,791,508 | ) | (113,160,602 | ) | (124,266,848 | ) |
Change in Net Assets Resulting from Capital Share Transactions | | (54,442,515 | ) | (33,303,959 | ) | (79,367,725 | ) |
Change in Net Assets | | (11,062,982 | ) | (101,024,856 | ) | (96,611,074 | ) |
Net Assets: | | | | | | | |
Beginning of period | | 338,656,432 | | 439,681,288 | | 536,292,362 | |
End of period | | $ | 327,593,450 | | $ | 338,656,432 | | $ | 439,681,288 | |
Share Transactions: | | | | | | | |
Issued | | 5,453,700 | | 1,559,272 | | 907,477 | |
Reinvested | | 884,955 | | 4,855,984 | | 2,178,180 | |
Redeemed | | (10,061,133 | ) | (8,756,963 | ) | (8,264,667 | ) |
Change in shares | | (3,722,478 | ) | (2,341,707 | ) | (5,179,010 | ) |
Accumulated undistributed net investment income | | $ | 195,458 | | $ | 621,907 | | $ | 563,027 | |
See Notes to Financial Statements
31
FINANCIAL HIGHLIGHTS
Selected data for a share outstanding throughout the periods indicated.
| | For the nine | | | | | | | | | | | |
| | months | | For the year | | For the year | | For the year | | For the year | | For the year | |
| | ended | | ended | | ended | | ended | | ended | | ended | |
| | December 31, | | March 31, | | March 31, | | March 31, | | March 31, | | March 31, | |
| | 2016 | | 2016 | | 2015 | | 2014 | | 2013 | | 2012 | |
| | | | | | | | | | | | | |
Net Asset Value, Beginning of Period | | $ | 12.74 | | $ | 15.20 | | $ | 15.73 | | $ | 14.25 | | $ | 13.24 | | $ | 14.00 | |
| | | | | | | | | | | | | |
Investment Activities: | | | | | | | | | | | | | |
Operations: | | | | | | | | | | | | | |
Net investment income | | 0.12 | | 0.06 | | 0.03 | | — | | 0.05 | | 0.01 | |
Net realized and unrealized gains (losses) from investment transactions | | 1.92 | | (0.25 | ) | 0.51 | | 2.66 | | 1.43 | | 0.20 | |
Total from investment activities | | 2.04 | | (0.19 | ) | 0.54 | | 2.66 | | 1.48 | | 0.21 | |
Dividends: | | | | | | | | | | | | | |
Net investment income | | (0.14 | ) | (0.06 | ) | (0.01 | ) | — | | (0.05 | ) | (0.01 | ) |
Net realized gains from investments | | (0.31 | ) | (2.21 | ) | (1.06 | ) | (1.18 | ) | (0.42 | ) | (0.96 | ) |
Total dividends | | (0.45 | ) | (2.27 | ) | (1.07 | ) | (1.18 | ) | (0.47 | ) | (0.97 | ) |
| | | | | | | | | | | | | |
Net Asset Value, End of Period | | $ | 14.33 | | $ | 12.74 | | $ | 15.20 | | $ | 15.73 | | $ | 14.25 | | $ | 13.24 | |
| | | | | | | | | | | | | |
Total Return | | 15.94 | %(a) | (0.52 | )% | 3.81 | % | 18.74 | % | 11.61 | % | 2.35 | % |
| | | | | | | | | | | | | |
Ratios/Supplemental Data: | | | | | | | | | | | | | |
Net assets at end of period (000’s) | | $ | 327,593 | | $ | 338,656 | | $ | 439,681 | | $ | 536,292 | | $ | 502,789 | | $ | 328,009 | |
Ratio of net expenses to average net assets | | 1.00 | %(b) | 1.00 | % | 1.00 | % | 1.00 | % | 1.00 | % | 1.00 | % |
Ratio of net investment income to average net assets | | 1.21 | %(b) | 0.44 | % | 0.17 | % | 0.02 | % | 0.38 | % | 0.05 | % |
Ratio of expenses (before fee reductions or recoupment of fees previously reimbursed by the investment advisor) to average net assets(c) | | 1.06 | %(b) | 1.08 | % | 1.05 | % | 1.07 | % | 0.99 | % | 1.09 | % |
Portfolio turnover rate | | 51.92 | %(a) | 37.42 | % | 28.62 | % | 34.50 | % | 33.34 | % | 30.99 | % |
Amounts designated as “—” are $0 or have been rounded to $0.
(a) Not annualized for periods less than one year.
(b) Annualized for periods less than one year.
(c) During the periods ending March 31, 2012 through March 31, 2016 and December 31, 2016, certain fees were reduced. If such fee reduction had not occurred, the ratio would have been as indicated.
See Notes to Financial Statements
32
This page intentionally left blank.
33
Environmental, Social and Governance Research and Engagement Update (Unaudited) | | 
|
We present below our fifth annual report on the impact of Walden’s company engagement initiatives to encourage more sustainable business policies, practices, and transparency on a range of environmental, social, and governance (ESG) topics. Our achievements continue to demonstrate that investors can have a constructive influence on corporate behavior and accountability.
Reach & Impact In 2016: The Numbers
Walden engaged approximately 44 percent of companies held in client portfolios across investment strategies in 2016* (Table 1). These initiatives include written communications, private conversations with company representatives, shareholder resolutions, outreach through ad hoc groups of investors with common holdings, and organized coalition actions that address pertinent ESG issues across sectors or industries. Topics most addressed by Walden during the year, in order of frequency, were climate change and board diversity (tied), lobbying disclosure, sustainability (or ESG) reporting, and LGBT equal employment opportunity.
Table 1 does not represent the entirety of Walden’s engagement activity as it excludes outreach to companies that are not held in Walden client portfolios. This occurs frequently when we participate in collaborative engagements spanning entire sectors. Walden may also engage directly with companies not held in client portfolios if we believe there is a compelling reason to be involved. For example, helping to convince a leading manufacturer to adopt science-based greenhouse gas (GHG) goals would provide a model for portfolio companies to act.
Our reported reach of 44 percent also obscures Walden’s frequent practice of engaging on multiple ESG issues at a single company. Furthermore, the metric does not distinguish between companies that receive one communication from those with multiple points of contact.
The number of companies we interact with provides important context, but we believe that actual outcomes matter more. In 2016, Walden achieved an impact rate of 31 percent (Table 2), which is our measure of the effectiveness of engagement. The impact rate is expressed as the percentage of companies demonstrating improvement relative to the companies reached through engagement. Table 2 also shows impact rates by primary ESG topic areas ranged from 17 to 53 percent.
Table 1: Walden’s Reach in 2016
Reach | | | |
# of Portfolio Companies Engaged | | 147 | |
Reach Rate: % of Portfolio Holdings Engaged* | | 44 | % |
Most Frequent ESG Topics (# of Companies) | | | |
Climate Change | | 41 | |
Board Diversity | | 41 | |
Lobbying Disclosure | | 21 | |
Sustainability Reporting | | 17 | |
LGBT Equal Employment Opportunity | | 16 | |
Table 2: Walden’s Impact in 2016
Impact | | | |
# of Portfolio Companies | | 45 | |
Impact Rate: % of Companies Engaged (147) | | 31 | % |
Impact Rates for Most Frequent ESG Topics | | | |
Climate Change | | 17 | % |
Board Diversity | | 29 | % |
Lobbying Disclosure | | 19 | % |
Sustainability Reporting | | 53 | % |
LGBT Equal Employment Opportunity | | 38 | % |
What constitutes improvement in ESG performance? Unlike recording and counting the numbers of companies engaged and the issues addressed, assessing impact can be a subjective process. As reported previously, we consider engagement to be successful when we observe progress toward one or more of three potential outcomes: better corporate policies (e.g., amending board nominating charters to include explicit consideration of gender and race), more sustainable business practices (e.g., adoption of science-based GHG goals), and increased transparency (e.g., initiating or substantially improving sustainability reports).
Collaborating with other investors often extends our reach when the engagement activity—typically in the form of a signatory letter— involves numerous companies. The flip side of these partnerships, which oftentimes function to build corporate awareness, is that they dilute Walden’s calculated impact rate. For example, in 2016 we joined a group that wrote S&P 100 companies asking for their support of a new Equal Employment Opportunity Commission
* The 334 companies in the universe considered for engagement include several companies that are not widely held in actively managed accounts. These include smaller positions held in Boston Trust client accounts that may not be held for Walden clients as well as low cost basis positions held in taxable accounts. Walden International Equity Fund holdings are currently excluded from the universe, pending an evaluation of the opportunities for engagement and strategy assets. This figure and the associated discussion sections include certain security holdings of The Boston Trust & Walden Funds as well security holdings within separate accounts of Boston Trust & Investment Management Company and its affiliates that utilize Walden Asset Management’s services for a fee as noted on page 1.
34
proposal to increase wage disclosure by gender, race, and job categories. We believe it is important for investors to signal their interest and support, but portfolio company follow up on this issue is a lower priority. Hence, improvement in policies, practices, or transparency is less likely at these companies.
In our 2015 annual impact report, a separate section “Limitations to the Measurement of Impact” described five primary challenges. To better understand and interpret the reported impact metrics, a summary of these challenges follows:
· The continuum of progress: Corporate progress is often incremental and can span multiple years. Walden counts milestones achieved in reporting periods as evidence of progress.
· Attribution: Observed progress may be primarily catalyzed by Walden’s engagement but also often represents the combined efforts of numerous investors and other stakeholders, as well as internal company advocates.
· Quality vs. Quantity: Improvements in policies, practices, and transparency are not all equal in terms of the time and resources required to implement them or in the magnitude of the impact; yet they are counted equally.
· Transparency: On occasion, progress may be counted in our reporting based on private conversations and commitments before we publicly report the details.
· Real World Progress vs. Corporate Change: Our current definition of ESG impact is usually at least one step removed from real world impacts such as the amount of emissions avoided, a decrease in workplace discrimination incidents, or a diminution of corporate money in politics.
EXAMPLES OF IMPACT IN 2016
Climate Change
While Walden’s approach to addressing climate change is multi-faceted, we focus engagement on two primary objectives. We encourage companies to adopt science-based GHG goals, entailing global reduction of GHG emissions by 55% by 2050 and reaching net zero emissions between 2050 and 2100. We also seek to influence companies to support effective climate-related public policy because we believe a vocal corporate constituency is crucial for continued progress.
· U.S. Bancorp set a new science-based GHG reduction goal in 2016: a 40 percent reduction in GHG emissions from operations by 2029 and 60 percent by 2044 relative to 2014 levels.
· Electronic products manufacturer Hubbell conducted a baseline study of energy efficiency in 2016 and plans to set a goal in 2017.
· ConocoPhillips increased disclosure on carbon asset risk—how it addresses physical, operational, and financial risks associated with climate change—and is now recognized as a leader in
A Closer Look: The Cheesecake Factory
Walden first purchased shares of The Cheesecake Factory (CAKE) for our clients in July of 2014; currently, their collective holdings rank among the company’s top 25 shareholders. Our initial ESG analysis identified several areas of superior performance, most notably a strong workplace culture and benefits that contributed to low employee turnover as well as recognition for the first time on Fortune magazine’s venerated “100 Best Companies to Work For” list.
Notwithstanding CAKE’s positive ESG record, our 2014 assessment also identified two areas for improvement where we believed shareholder engagement could be beneficial: board diversity and LGBT policies. CAKE’s 7-member board of directors had no women or people of color, significantly lagging its self-identified peer group. Also, in 2009 CAKE settled for $345,000 an Equal Employment Opportunity Commission lawsuit alleging same-sex sexual harassment.
Walden’s shareholder engagement with CAKE began with a September 2014 letter encouraging greater board diversity. Though we did not receive a prompt response, CAKE’s Director of Investor Relations reached out prior to its annual meeting of shareholders in May 2015 to discuss general matters of corporate governance and simultaneously committed to address our other ESG concerns. As we prepared for a follow up phone conference, Walden also sought information about CAKE’s equal employment opportunity (EEO) policy with respect to LGBT protections. An ensuing phone meeting in October 2015 marked the beginning of an ongoing, constructive conversation between Walden’s ESG and securities analysts and CAKE’s management team that included the General Counsel, CFO, and ultimately, the CEO at an in-person meeting in our office in September 2016.
From the onset, CAKE, a company founded by a woman, articulated its commitment to women in leadership roles on the board and in management as well as its goal to uphold best practices regarding nondiscrimination policies. CAKE listened to our proposals on how to make this commitment more apparent to stakeholders by fine-tuning corporate policies and posting them on the corporate website. We made the business case for being proactive in identifying diverse board candidates, encouraging long term thinking that would not be satisfied with one woman or person of color on the director slate.
Since our first interactions, we have been pleased to observe significant progress in policies, practices, and transparency consistent with our advocacy. CAKE added “gender identity” and “gender expression” to its EEO policy, which is now featured prominently on its website. Its “Corporate Governance and Nominating Committee Policies and Procedures Regarding Board of Directors Candidates” was amended in February 2016 to explicitly include gender and ethnicity as factors considered in identifying candidates. Lastly, in December 2016 CAKE appointed a woman director with 30 years of restaurant experience to its Board, where she will also serve on the Corporate Governance and Nominating Committee.
As long term investors who appreciate that ESG progress is usually incremental over time, we believe that we have developed a relationship of trust with CAKE’s management that fosters openness to our perspective and input. Certainly, before Walden’s engagement, CAKE was committed to high standards (for the third consecutive year CAKE made the 100 Best list in 2016, the only restaurant chain to make the cut). But we also believe that our interactions helped build significant momentum for positive change.
35
considering the impacts of a transition to a low-carbon global economy.
· PNC Financial Services continued to develop its portfolio environmental stress test framework to better inform its lending, financing, and investing activities and also enhanced disclosure on this initiative.
Alphabet (Google), Apple, Microsoft, and Amazon submitted an amicus brief backing the EPA’s Clean Power Plan, which limits GHG emissions from existing fossil fuel power plants and is central to the U.S. commitment to combat climate change. Having pledged to power their business operations exclusively with renewable energy, these technology companies wrote, “delaying action on climate change will be costly in economic and human terms, while accelerating the transition to a low-carbon economy will produce multiple benefits with regard to sustainable economic growth, public health, resilience to natural disasters, and the health of the global environment.” Additionally, we asked several companies to consider adding their names to a Ceres-organized, joint investor-company statement to President-elect Trump and members of the U.S. Congress to express strong support for the Paris Climate Agreement. We applaud Johnson & Johnson for endorsing the statement.
Water Risk
The supply of fresh water is increasingly stressed by climate change, water pollution, and population growth. Water scarcity is not only a threat to public health; it poses a significant risk for the highly water dependent global food and beverage value chain. Conversations addressing water stewardship at two companies continued to demonstrate progress in 2016.
· Flowers Foods used the Global Water Tool provided by the World Business Council for Sustainable Development to assess global water risk, completed the CDP water questionnaire, and set a goal to reduce water use by 10 percent per metric ton of product.
· McCormick is launching a pilot farmer support program addressing water risk (and sustainable agriculture generally) with top suppliers, and enhanced its disclosure in the annual CDP water questionnaire.
Board Diversity
Walden engages companies that have one or no women or people of color on their boards of directors. This often follows our practice of voting on the annual proxy ballot against directors serving on nominating committees. Growing pressure from major institutional investors as well as business leaders has helped change the dynamic of our conversations with companies. For example, the Business Roundtable recently made the business case for ethnic and gender diversity in its updated governance principles. For the most part, portfolio companies appear to know they need to improve board composition as part of board refreshment and they are taking appropriate steps.
· Bruker, Cabot Oil & Gas, The Cheesecake Factory, CLARCOR, Cohen & Steers, CoreSite, Discovery Communications, and IPG Photonics each added a woman director in 2016. Four of these firms had previously amended their corporate governance policies to explicitly consider gender and race in the nominating process.
· Hub Group agreed to strengthen corporate governance policies by committing to a diverse candidate pool and expanding recruitment networks.
Equal Employment Opportunity (EEO): LGBT
North Carolina’s passage of House Bill 2 (HB2) last March brought to the fore that LGBT individuals continue to lack legal protections in many areas of the country. The significant economic impact of the discriminatory law was plainly visible as businesses canceled investments (e.g., PayPal terminated a planned global center), major sports events were relocated, and entertainers boycotted North Carolina. HB2 served as a reminder to Walden of the importance of our advocacy for inclusive company EEO policies that explicitly protect employees from discrimination based on sexual orientation or gender identity and expression. Applied Industrial Technologies, Avery Dennison, Brown & Brown, Calgon Carbon, and Chart Industries adopted more inclusive EEO policies over the year and posted them to their websites. On this issue, companies appear to be leading policymakers.
Sustainability (or ESG) Reporting
In November, the Forum for Sustainable and Responsible Investment released its biennial report on trends in U.S. SRI (Sustainable, Responsible, and Impact) investing. The headline finding was that U.S. SRI assets increased 33 percent from 2014 to $8.72 trillion, representing about one out of every 5 dollars under professional management. One would think that, with this large commitment to SRI, robust, standardized, and verified ESG reporting would be commonplace, providing portfolio managers with good information to guide investment decisions. Unfortunately this is not the case, especially with respect to smaller companies.
Walden finds that many companies are responsive to requests for sustainability reports that describe how they measure, manage, and monitor their ESG risks and opportunities. BB&T published its inaugural sustainability report in the fall. After high levels of support for shareholder resolutions calling for sustainability reports at their 2016 annual meetings, CLARCOR, Emerson Electric and ESCO Technologies agreed to develop ESG reporting. Nordson also committed to produce its first report and to update it annually, and hired a consultant to start the process.
Other
The following examples of company initiatives addressing other ESG topics provide additional evidence of the impact of Walden’s engagement activity.
American Express increased lobbying disclosure, including third-party lobbying through trade associations, and detailed board and management oversight of political spending.
PPG committed to phase out the use of lead from commercial coatings, the last of its products to contain this potent neurotoxin. The company also agreed to provide an update in its 2017 sustainability report.
Embroiled in controversy following the $185 million settlement in September for “the widespread illegal practice of secretly opening unauthorized deposit and credit card accounts” (Consumer Financial Protection Bureau statement), Wells Fargo announced in December a by-law amendment to require separation of the CEO and Chair positions. This separation of responsibilities fosters independent oversight and is considered a best practice in corporate governance.
36
Public Policy Advocacy
Public policies are often an essential part of the solution to complex and systemic environmental, social, and governance (ESG) concerns. For example, encouraging companies one-by-one to adopt science-based GHG reduction goals is a worthy endeavor, but a policy mandate in support of a price on carbon is needed to level the playing field economy-wide and ensure broad based action. Walden is committed to federal and state level public policy advocacy that complements and strengthens our company engagement initiatives.
Policy advocacy takes many forms: joining investor coalitions in letters or statements to governmental entities and standard-setting organizations; responding to requests for comment on new or proposed changes to policies; and in-person visits to legislators or agencies that have direct policy-making responsibilities.
In 2016 Walden participated in over two dozen signatory letters and statements addressing an array of ESG topics. While we often provided input, these initiatives were led by a diverse group of NGOs and other stakeholders such as Ceres/INCR (Investor Network on Climate Risk), the Cotton Campaign, the Council on Institutional Investors, ICCR (Interfaith Center on Corporate Responsibility), Public Citizen, PRI (Principles for Responsible Investment network), US SIF (U.S. Forum for Sustainable and Responsible Investment), as well as large institutional investors including CalSTRS and the NYC Comptroller. As examples, investor statements this past year called for:
· Securing the Paris 2015 Climate Agreement;
· Methane emissions reductions in the oil and gas sector;
· Adherence to a set of carbon pricing principles to ensure strong standards;
· Full repeal of North Carolina’s HB2 legislation that curtailed protections for LGBT individuals;
· Ending the use of forced labor in cotton production in Uzbekistan and Turkmenistan;
· Banning the use of antibiotics important to human medicine in meat production; and
· SEC mandated disclosure of corporate political spending.
We submitted public comments to the SEC regarding Regulation S-K on corporate disclosure requirements, making the case for enhanced disclosures on political spending, pay equity, board and management diversity, and climate risk. Separately, in a letter to President Obama, we encouraged an executive order requiring political spending transparency for corporate entities receiving government contracts. Walden also provided guidance on listing requirements to the World Federation of Exchanges as well as input to the Financial Stability Board’s Task Force on Financial Related Climate Disclosure. Lastly, we provided public comments in support of the Equal Employment Opportunity Commission’s (EEOC) proposal to increase disclosure of wage data as a means to address persistent wage gaps experienced by women and people of color. Representatives of the EEOC followed up with us to explore the adequacy of different wage metrics.
As a participant in US SIF’s “Hill Day,” Walden had the opportunity to address directly many of the issues identified above with White House staff and state lawmakers. Here in Boston, we joined Ceres at a meeting with representatives of the Massachusetts Department of Environmental Protection and Office of Energy & Environmental Affairs to express support for the Regional Greenhouse Gas Initiative and urge more ambitious emissions reduction targets.
Walden does not quantify the impact of our public policy advocacy, though we report on any changes that are consistent with our positions. Still, we are convinced that investors, including Walden, are a critical constituency to hold policymakers accountable on matters of social and environmental responsibility.
We begin 2017 facing significant uncertainty about the direction of U.S. public policy related to many priorities that we share with our clients—climate change; the rights of women, people of color, and LGBT individuals; income inequality; corporate influence in politics; among them. While aspects of the current political and social discourse are profoundly unsettling, Walden believes that with encouragement from an active investor constituency, many companies are poised to ensure forward progress. We are also heartened by a new December 29 Department of Labor Interpretive Bulletin that supports the rights of investors, like Walden, to engage with companies on critical environmental and social matters. (Walden had joined US SIF in advocating for this guidance.) We are as committed as ever to doing just that.
The equities in bold-face in the above commentary were holdings of one or more of the Walden Funds as of December 31, 2016.
The information contained herein has been prepared from sources and data we believe to be reliable, but we make no guarantee as to its adequacy, accuracy, timeliness, or completeness. We cannot and do not guarantee the suitability or profitability of any particular investment. No information herein is intended as an offer or solicitation of an offer to sell or buy, or as a sponsorship of any company, security, or fund. Neither Walden nor any of its contributors makes any representations about the suitability of the information contained herein. Opinions expressed herein are subject to change without notice.
37
Walden Asset Management Fund
Walden Equity Fund
December 31, 2016
William H. Apfel, CFA
Portfolio Manager
Boston Trust Investment Management, Inc.
Asset Management Fund Objective
The Fund seeks long-term capital growth and income through an actively managed portfolio of stocks, bonds and money market instruments.
Equity Fund Objective
The Fund seeks long-term growth of capital through an actively managed portfolio of stocks.
Investment Concerns
Equity securities (stocks) are more volatile and carry more risk and return potential than other forms of investments, including investments in high-grade fixed income securities. The net asset value per share of these Funds will fluctuate as the value of the securities in the portfolio changes.
Foreign investing involves risks not typically associated with U.S. investments, including adverse political, social and economic developments and differing auditing and legal standards. These risks are magnified in emerging markets.
Small- to mid-capitalization companies typically have a higher risk of failure and historically have experienced a greater degree of volatility.
Bonds offer a relatively stable level of income, although bond prices will fluctuate, providing the potential for principal gain or loss. Intermediate term, higher quality bonds generally offer less risk than longer-term bonds and a lower rate of return.
Manager Commentary (Unaudited)
Management Discussion of Fund Performance
Stocks, as measured by the S&P 500 Index, continued their almost 8-year-old rally, posting 10.47% of total return during the nine month fiscal period ended December 31, 2016. Stocks have now achieved gains of over 250% since the market’s low in March 2009. The Walden Asset Management Fund posted a total return of 5.87% for the period, benefiting from our decision to maintain an above average allocation to equities; the bond market, as measured by the Bloomberg Barclays U.S. Government/Credit Index was slightly down with a total return of -0.41% for the same nine month fiscal period. The Walden Equity Fund posted a net total return of 8.80% for the fiscal period.
Investors will recall that markets began calendar 2016 inauspiciously as indices of large cap stocks declined approximately 10% and global oil prices dropped below $30 per barrel. However, the early gloom dissipated as forecasts of an abrupt end to years of slow but steady global growth proved too pessimistic. Markets had recouped much of their losses by the end of March, and except for the brief market decline in response to the British vote to leave the European Union in June and the modest October sell off, large cap stocks mostly increased gradually until the November election. In the wake of the victory of Donald Trump, the market rise accelerated. The sectors favored reflected a revised assessment of business opportunities. Domestically focused companies that are beneficiaries of rising interest rates and less regulation fared best. Most global business lagged, especially those that will derive the least benefit from Trump’s proposed corporate tax cuts.
While the economic context in which companies operate is a necessary consideration in making investment decisions, we have avoided making large changes in investment strategy based upon political decisions that are inherently difficult to forecast. Indeed, we suspect that the market may have already gone too far in divining actual policies from the often contradictory pronouncements being made by politicians. Actual changes in tax, spending, regulatory, and trade policies await the proposals of the new administration and the legislation process. Even once known, the ultimate investment consequences of policy changes can prove surprising. In this environment, we believe it is especially important to maintain our commitment to constructing broadly diversified portfolios comprised of reasonably valued companies with business models and financial characteristics that are likely to prosper in a wide range of market environments.
Market forecasts should always be made with humility. We might be well schooled in market history or the intricacies of corporate cash flows, but to a large degree short-term investment returns are determined by future events. These range from the myriad decisions made by small businesses to central bank policy to the vagaries of geopolitics. Given the political changes in prospect for 2017, forecasts made today are especially fraught. Nonetheless, we judge that the balance of risk and opportunity over the longer term continues to favor equities over bonds. While stocks today are moderately expensive by our measures, the balance sheets of most of the high quality companies we favor are strong, cash flows ample, and capital allocation strategies prudent. In contrast, yields offered by high quality fixed income investments remain low by historical standards and are likely to rise if many of the proposed policies are implemented. As such, we continue to maintain an above average allocation to equities in the Walden Asset Management Fund. Equity segments of both Funds will continue to be invested in the manner noted above, while bond holdings are invested in the securities of high quality issuers. We believe having the Funds’ portfolios constructed in this manner will again provide a degree of protection even in an adverse investment environment.*
* Portfolio composition is subject to change.
38
Investment Performance (Unaudited) | Walden Asset Management Fund |
| Walden Equity Fund |
| December 31, 2016 |
| | For the period ended 12/31/16 | |
| | Aggregate | | Annualized | |
| | | | | | | | | | Since Inception | |
| | 9 Months | | 1 Year | | 5 Years | | 10 Years | | (6/18/99) | |
Walden Asset Management Fund(1) | | 5.87 | % | 9.08 | % | 9.17 | % | 5.68 | % | 4.94 | % |
Walden Equity Fund(1) | | 8.80 | % | 11.80 | % | 12.10 | % | 7.14 | % | 5.70 | % |
S&P 500 Index | | 10.47 | % | 11.96 | % | 14.66 | % | 6.95 | % | 4.94 | % |
Bloomberg Barclays U.S. Government/Credit Index | | -0.41 | % | 3.05 | % | 2.29 | % | 4.40 | % | 5.15 | % |
Citigroup 90-Day U.S. Treasury Bill Index | | 0.22 | % | 0.27 | % | 0.09 | % | 0.73 | % | 1.81 | % |
Hypothetical Growth of a $100,000 Investment
The charts represent a 10-year hypothetical $100,000 investment in the Walden Asset Management Fund and Walden Equity Fund, and represents the reinvestment of dividends and capital gains in the Funds. The returns shown on the table and graph do not reflect the deduction of taxes a shareholder would pay on Fund distributions or the redemption of Fund shares.
The Walden Asset Management Fund is measured against a combination of equity and fixed income indices. The Walden Equity Fund is measured against the Standard & Poor’s 500 Index (“S&P 500”), which is widely regarded as a gauge of the U.S. equities market. This index includes 500 leading companies in leading industries of the U.S. economy. Although the S&P 500 focuses on the large cap segment of the market, with approximately 75% coverage of U.S. equities, it is also also widely viewed as a proxy for the total market. The Bloomberg Barclays U.S. Government/Credit Index includes Treasuries (i.e., public obligations of the U.S. Treasury that have remaining maturities of more than one year), government-related issues (i.e., agency, sovereign, supranational, and local authority debt), and USD Corporates. The Bloomberg Barclays U.S. Government/Credit Index is a component of the Bloomberg Barclays U.S. Aggregate Index. The Citigroup 90-Day U.S. Treasury Bill Index reflects monthly return equivalents of yield averages that are not marked to the market. The index is an average of the last three-month treasury bill issues. The three-month treasury bills are the short-term debt obligations of the U.S. Government. The indices are unmanaged and their performance does not reflect the deduction of expenses associated with a mutual fund, such as investment management and fund accounting fees. The Fund’s performance reflects the deduction of fees for these services. Investors cannot invest directly in an index.

Walden Asset Management Fund
Fund Net Asset Value: | | $ | 15.74 | |
Gross Expense Ratio(1): | | 1.06 | % |
Walden Equity Fund
Fund Net Asset Value: | | $ | 18.82 | |
Gross Expense Ratio(1): | | 1.10 | % |
Past performance does not guarantee future results. The performance data quoted represents past performance and current returns may be lower or higher. The investment return and principal value will fluctuate so that an investor’s shares, when redeemed may be worth more or less than the original cost. To obtain performance information current to the most recent month-end, please call 1-800-282-8782 ext. 7050.
(1) The Gross Expense Ratio is from each Funds’ most recent prospectus, dated August 1, 2016. The Gross Expense Ratio excludes the impact of any contractual fee waivers, which limit Fund total expenses to 1.00%, subject to certain limitations as described in each Fund’s prospectus. Please see each Fund’s most recent prospectus for details. Additional information pertaining to each Fund’s expense ratio as of December 31, 2016 can be found in the financial highlights included in this report. The investment performance may reflect fee reductions. If such fee reductions had not occurred, the quoted performance would have been lower. The contractual fee waiver continues through August 1, 2017 and may be terminated thereafter.
39
Walden Midcap Fund
December 31, 2016
Stephen J. Amyouny, CFA
Portfolio Manager
Boston Trust Investment Management, Inc.
Fund Objective
The Fund seeks long-term capital growth through an actively managed portfolio of stocks of middle capitalization (“midcap”) companies.
Investment Concerns
Equity securities (stocks) are more volatile and carry more risk and return potential than other forms of investments, including investments in high-grade fixed income securities.
Mid capitalization funds typically carry additional risks since smaller companies generally have a higher risk of failure.
Manager Commentary (Unaudited)
Management Discussion of Fund Performance
Portfolio Review
The Walden Midcap Fund posted a return of 7.36% for the nine month period ended December 31, 2016, trailing the benchmark Russell Midcap® Index return of 11.30%. After experiencing a sharp decline in the early weeks of 2016, equities trended higher throughout most of the year, albeit in an uneven and at times volatile pattern. In particular, equities rallied sharply following the Presidential election as investors reacted favorably to the pro-growth initiatives proposed by the Trump administration; investors anticipate that these proposals, which include increased infrastructure spending, lower taxes, and less regulation, will positively impact corporate profits if enacted.
Performance varied widely among sectors and specific industries as investors attempted to position their portfolios to benefit from expected policy changes. For example, banks, which have suffered from sluggish economic growth and low interest rates, rose sharply on expectations for stronger growth, less regulation, and rising interest rates. The portfolio also benefitted from the strong performance of certain diversified financials companies, including capital markets participants. Industrial manufacturers, especially domestically-oriented companies that export goods to international markets, and energy companies also rallied following the election. Conversely, health care stocks generally declined due to heightened concerns over drug pricing as well as the potential repeal of the Affordable Care Act (aka Obamacare). Additionally, stocks of stable companies that have above-average dividend yields came under selling pressure; rising interest rates may reduce the appeal of these income-oriented investments for which valuations have been bid up during the recent low interest rate environment. These stocks include certain companies within the utilities, consumer staples, real estate, and telecom sectors.
During this nine month period, our analysis indicates that the stocks of higher quality, more reasonably-valued companies that we favor trailed the performance of the broader market. Detracting from performance of the Fund was our underrepresentation in energy and materials companies leveraged to oil and other commodity prices. These companies, many of which have histories of volatile earnings and cash flows as well as elevated financial leverage, performed exceptionally well as oil prices nearly doubled from the trough levels reached in mid-February. Semiconductor stocks, another volatile group of companies that we have historically avoided in the past, also performed very well throughout this period. On the positive side, Fund positions within the health care sector performed quite well as we avoided many of the worst performing segments of health care; e.g. biotechnology, specialty pharmaceuticals, and hospitals.
Outlook
As we enter 2017, despite the powerful stock market rally in 2016, there is considerable uncertainty about the priorities of the incoming presidential administration, the path of future Federal Reserve interest rate increases, and the health of the global economy outside the U.S. Policies related to corporate taxes and global trade have the potential to most significantly impact corporate profits. Accordingly, we will be closely monitoring any developments on these issues.
The Fund remains broadly diversified among higher quality companies that we believe have sustainable business models, attractive future prospects, and reasonable valuations. Over the last year, the valuation of mid-cap stocks has expanded by 16% based on operating earnings per share, and the index price-to-earnings(1) multiple on this metric is now 25x. We believe that the valuations of many stocks reflect overly optimistic expectations for future growth and/or the projected benefits from new tax and trade policies. The Fund by contrast is trading at less than 21x operating earnings, while portfolio valuations are consistent with what they were a year ago and at a substantial discount to the market. As a result, we continue to believe such a portfolio should produce attractive risk-adjusted performance compared to the index benchmark over full market cycles.*
* Portfolio composition is subject to change.
(1) The Price-to-Earnings Ratio (“P/E Ratio”) is a valuation ratio of a company’s current share price to its per-share earnings.
40
Investment Performance (Unaudited) | | Walden Midcap Fund |
| | December 31, 2016 |
| | For the period ended 12/31/16 | |
| | Aggregate | | Annualized | |
| | | | | | | | Since | |
| | | | | | | | Inception | |
| | 9 Months | | 1 Year | | 5 Years | | 8/1/11 | |
Walden Midcap Fund(1) | | 7.36 | % | 12.13 | % | 12.13 | % | 10.82 | % |
Russell Midcap® Index | | 11.30 | % | 13.80 | % | 14.72 | % | 12.50 | % |
Hypothetical Growth of a $100,000 Investment
The chart represents the historical performance of a hypothetical $100,000 investment in the Walden Midcap Fund from August 1, 2011 to December 31, 2016, and represents the reinvestment of dividends and capital gains in the Fund. The returns shown on the table and graph do not reflect the deduction of taxes a shareholder would pay on Fund distributions or the redemption of Fund shares.
The Walden Midcap Fund is measured against the Russell Midcap® Index, which is an unmanaged index that measures the performance of the mid cap segment of the U.S. equity universe. The Russell Midcap® Index is a subset of the Russell 1000® Index. It includes approximately 800 of the smallest securities based on a combination of their market capitalization and current index membership. The Russell Midcap® Index represents approximately 31% of the total market capitalization of the Russell 1000 companies. The performance of an index does not reflect the deduction of expenses associated with a mutual fund, such as investment management and fund accounting fees. The Fund’s performance reflects the deduction of fees for these services. Investors cannot invest directly in an index.

Fund Net Asset Value: | | $ | 14.90 | |
Gross Expense Ratio(1): | | 1.07 | % |
Past performance does not guarantee future results. The performance data quoted represents past performance and current returns may be lower or higher. The investment return and principal value will fluctuate so that an investor’s shares, when redeemed may be worth more or less than the original cost. Returns less than one year are not annualized. To obtain performance information current to the most recent month-end, please call 1-800-282-8782 ext. 7050.
(1) The Gross Expense Ratio is from the Fund’s most recent prospectus, dated August 1, 2016. The Gross Expense Ratio excludes the impact of any contractual fee waivers, which limit Fund total expenses to 1.00%, subject to certain limitations as described in the Fund’s prospectus. Please see the Fund’s most recent prospectus for details. Additional information pertaining to the Fund’s expense ratio as of December 31, 2016 can be found in the financial highlights included in this report. The investment performance may reflect fee reductions. If such fee reductions had not occurred, the quoted performance would have been lower. The contractual fee waiver continues through August 1, 2017 and may be terminated thereafter.
41
Walden SMID Cap Fund
December 31, 2016
Kenneth P. Scott, CFA
Portfolio Manager
Boston Trust Investment Management, Inc.
Fund Objective
The Fund seeks long-term capital growth through an actively managed portfolio of stocks of small to middle (“smid”) capitalization companies.
Investment Concerns
Equity securities (stocks) are more volatile and carry more risk and return potential than other forms of investments, including investments in high-grade fixed income securities.
Small- to mid-capitalization companies typically have a higher risk of failure and historically have experienced a greater degree of volatility.
Manager Commentary (Unaudited)
Management Discussion of Fund Performance
For the nine months ended December 31, 2016, the Walden SMID Cap Fund returned 14.73%, trailing the 17.13% return of the Russell 2500™ Index. For calendar year 2016, the Fund returned 20.11%, outpacing the Russell 2500™ Index return of 17.59%. For longer-term periods the Fund provided competitive returns with less volatility than the index.
Following the volatile first quarter of calendar 2016, during which the Fund outperformed its benchmark by a wide margin, markets rebounded sharply and somewhat indiscriminately. Our analysis suggests that higher quality stocks modestly underperformed the strong market advance, which was a headwind to our style.
As evidence of the broad rally, most economic sectors appreciated more than 6% during the nine months. Performance of the real estate and health care sectors contributed most to relative performance comparisons. Materials and consumer discretionary were the biggest detractors from relative performance. Within materials, the best performance came from lower quality, more commodity exposed names in the metals & mining and construction materials industries where the Fund has no exposure.
No individual stock had an outsized impact on performance during the period. Among contributors, SVB Financial, East West Bancorp, and UMB Financial are banks, which rallied broadly on investor optimism that rising interest rates and potentially less regulation would bolster profitability. Detractors included three consumer discretionary stocks, Cato, Nordstrom, and Sally Beauty. All three are grappling with changes in consumer preferences.*
Fundamental trends for the U.S. smaller cap market remain healthy. Revenue per share and earnings per share growth among Russell 2500™ companies in the third quarter of 2016 were 5% and 11%, respectively, on a year-over-year basis. Looking forward, we believe that continued employment gains in the U.S., coupled with modest productivity improvements, and still low interest rates, can sustain a modest pace of U.S. economic expansion, which in turn can support gains among smaller cap stocks. That said, the recent pace of smaller-cap market appreciation may be difficult to sustain and any substantial improvement in the U.S. economic environment may take time to materialize. Furthermore, there is significant uncertainty around the potential ramifications of the new administration’s policies, and this may be exacerbated by higher than average index valuations.
We remain focused on constructing well-diversified portfolios of higher quality companies that can generate superior economic returns across macro-economic environments. As always, we believe valuation discipline is paramount to avoid overpaying for expectations that may prove overly optimistic. The Fund currently trades at an average operating price-to-earnings ratio(1) of 21x. This is one-third less than the Russell 2500™ operating price-to-earnings ratio of 34x and gives us confidence that the Fund has potential for far less valuation risk than the market, especially considering the Fund’s above-average quality profile.*
* Portfolio composition is subject to change.
(1) The Price-to-Earnings Ratio (“P/E Ratio”) is a valuation ratio of a company’s current share price to its per-share earnings.
42
Investment Performance (Unaudited) | | Walden SMID Cap Fund |
| | December 31, 2016 |
| | For the period ended 12/31/16 | |
| | Aggregate | | Annualized | |
| | | | | | Since | |
| | | | | | Inception | |
| | 9 Months | | 1 Year | | 6/28/12 | |
Walden SMID Cap Fund(1) | | 14.73 | % | 20.11 | % | 13.18 | % |
Russell 2500® Index | | 17.13 | % | 17.59 | % | 14.92 | % |
Hypothetical Growth of a $100,000 Investment
The chart represents the historical performance of a hypothetical $100,000 investment in the Walden SMID Cap Fund from June 28, 2012 to December 31, 2016, and represents the reinvestment of dividends and capital gains in the Fund. The returns shown on the table and graph do not reflect the deduction of taxes a shareholder would pay on Fund distributions or the redemption of Fund shares.
The Walden SMID Cap Fund is measured against the Russell 2500™ Index, which is an unmanaged index that measures the performance of the small- to mid-cap segment of the U.S. equity universe, commonly referred to as “smid” cap. The Russell 2500 is a subset of the Russell 3000® Index. It includes approximately 2500 of the smallest securities based on a combination of their market cap and current index membership. The performance of an index does not reflect the deduction of expenses associated with a mutual fund, such as investment management and fund accounting fees. The Fund’s performance reflects the deduction of fees for these services. Investors cannot invest directly in an index.

Fund Net Asset Value: | | $ | 14.60 | |
Gross Expense Ratio(1): | | 1.15 | % |
Past performance does not guarantee future results. The performance data quoted represents past performance and current returns may be lower or higher. The investment return and principal value will fluctuate so that an investor’s shares, when redeemed may be worth more or less than the original cost. To obtain performance information current to the most recent month-end, please call 1-800-282-8782 ext. 7050.
(1) The Gross Expense Ratio is from the Fund’s most recent prospectus, dated August 1, 2016. The Gross Expense Ratio excludes the impact of any contractual fee waivers, which limit Fund total expenses to 1.00%, subject to certain limitations as described in the Fund’s prospectus. Please see the Fund’s most recent prospectus for details. Additional information pertaining to the Fund’s expense ratio as of December 31, 2016 can be found in the financial highlights included in this report. The investment performance may reflect fee reductions. If such fee reductions had not occurred, the quoted performance would have been lower. The contractual fee waiver continues through August 1, 2017 and may be terminated thereafter.
43
Walden Small Cap Fund
December 31, 2016
Kenneth P. Scott, CFA
Portfolio Manager
Boston Trust Investment Management, Inc.
Fund Objective
The Fund seeks long-term capital growth through an actively managed portfolio of stocks of small capitalization companies.
Investment Concerns
Equity securities (stocks) are more volatile and carry more risk and return potential than other forms of investments, including investments in high-grade fixed income securities.
Small capitalization funds typically carry additional risks since smaller companies generally have a higher risk of failure, and historically, their stocks have experienced a greater degree of market volatility than stocks on average.
Manager Commentary (Unaudited)
Management Discussion of Fund Performance
For the nine months ended December 31, 2016, the Walden Small Cap Fund returned 16.57%, trailing the 23.18% return of the Russell 2000® Index. For calendar year 2016, the Fund returned 23.96%, outpacing the Russell 2000® Index return of 21.31% For longer-term periods, the Fund provided competitive returns with less volatility than the index.
Following the volatile first quarter of calendar 2016, during which the Fund outperformed its benchmark by a wide margin, markets rebounded sharply and somewhat indiscriminately. Our analysis suggests that higher quality, more reasonably valued stocks lagged modestly the strong market advance, a headwind to our style that favors such stocks. Additionally, despite rising interest rates during the second half of 2016, we observed that stocks of more levered companies outperformed less levered peers.
As evidence of the broad rally, every economic sector appreciated more than 10% during the nine months, except for real estate. Industrials and real estate were the only two sectors that contributed favorably to relative performance for the period. Fund positioning in other sectors detracted from relative results, most acutely within health care and consumer discretionary. In both sectors, higher quality stocks trailed the overall sector.
No individual stock had an outsized impact on performance during the period. Among contributors, Bank of Hawaii and UMB Financial benefitted from the rally in banks as investors anticipated that future interest rate increases and potentially less regulation would bolster their profitability. Another contributor was CLARCOR, a relatively large position in the Fund that agreed to be acquired for an 18% premium toward the end of 2016. Detractors from performance included several names from the consumer discretionary sector; Fossil and Sally Beauty were among the bottom five.
Fundamental trends for the U.S. small-cap market remain healthy. Revenue per share and earnings per share growth among Russell 2000® companies in the third quarter of 2016 were 5% and 12%, respectively, on a year-over-year basis. Looking forward, we believe that continued employment gains in the U.S., coupled with modest productivity improvements, and still low interest rates, can sustain a modest pace of U.S. economic expansion, which in turn can support gains among small cap stocks. That said, the recent pace of small cap market appreciation may be difficult to sustain and any substantial improvement in the U.S. economic environment may take time to materialize. Furthermore, there is significant uncertainty around the potential ramifications of the new administration’s policies, and this may be exacerbated by higher than average index valuations.
We remain focused on constructing well-diversified portfolios of higher quality companies that can generate superior economic returns across macro-economic environments. As always, we believe valuation discipline is paramount to avoid overpaying for expectations that may prove overly optimistic. The portfolio currently trades at an average operating price-to-earnings ratio(1) of 23x. This is almost half the Russell 2000® operating price-to-earnings ratio of 45x and gives us confidence that the portfolio has far less valuation risk than the market, especially considering the portfolio’s above-average quality profile.*
* Portfolio composition is subject to change.
(1) The Price-to-Earnings Ratio (“P/E Ratio”) is a valuation ratio of a company’s current share price to its per-share earnings.
44
Investment Performance (Unaudited) | | Walden Small Cap Fund |
| | December 31, 2016 |
| | For the period ended 12/31/16 | |
| | Aggregate | | Annualized | |
| | | | | | | | Since | |
| | | | | | | | Inception | |
| | 9 Months | | 1 Year | | 5 Years | | 10/24/08 | |
Walden Small Cap Fund(1) | | 16.57 | % | 23.96 | % | 11.94 | % | 14.52 | % |
Russell 2000® Index | | 23.18 | % | 21.31 | % | 14.46 | % | 15.42 | % |
Hypothetical Growth of a $100,000 Investment

The chart represents the historical performance of a hypothetical $100,000 investment in the Walden Small Cap Fund from October 24, 2008 to December 31, 2016, and represents the reinvestment of dividends and capital gains in the Fund. The returns shown on the table and graph do not reflect the deduction of taxes a shareholder would pay on Fund distributions or the redemption of Fund shares.
The Walden Small Cap Fund is measured against the Russell 2000® Index, which is an unmanaged index that measures the performance of the small cap segment of the U.S. equity universe. The Russell 2000® Index is a subset of the Russell 3000® Index representing approximately 10% of the total market capitalization of that index. It includes approximately 2,000 of the smallest securities based on a combination of their market cap and current index membership. The performance of an index does not reflect the deduction of expenses associated with a mutual fund, such as investment management and fund accounting fees. The Fund’s performance reflects the deduction of fees for these services. Investors cannot invest directly in an index.

Fund Net Asset Value: | | $ | 18.46 | |
Gross Expense Ratio(1): | | 1.06 | % |
Past performance does not guarantee future results. The performance data quoted represents past performance and current returns may be lower or higher. The investment return and principal value will fluctuate so that an investor’s shares, when redeemed may be worth more or less than the original cost. To obtain performance information current to the most recent month-end, please call 1-800-282-8782 ext. 7050.
(1) The Gross Expense Ratio is from the Fund’s most recent prospectus, dated August 1, 2016. The Gross Expense Ratio excludes the impact of any contractual fee waivers, which limit Fund total expenses to 1.00%, subject to certain limitations as described in the Fund’s prospectus. Please see the Fund’s most recent prospectus for details. Additional information pertaining to the Fund’s expense ratio as of December 31, 2016 can be found in the financial highlights included in this report. The investment performance may reflect fee reductions. If such fee reductions had not occurred, the quoted performance would have been lower. The contractual fee waiver continues through August 1, 2017 and may be terminated thereafter.
45
Walden International Equity Fund
December 31, 2016
William H. Apfel, CFA
Portfolio Manager
Boston Trust Investment Management, Inc.
Fund Objective
The Fund seeks long-term capital growth through an actively managed portfolio of equities of international companies.
Investment Concerns
International investing involves increased risk and volatility. An investment in international funds entails the special risks of international investing, including currency exchange fluctuation, government regulations and intervention, and the potential for political and economic instability.
Foreign investing involves risks not typically associated with U.S. investments, including adverse political, regulatory, social and economic developments and differing auditing and legal standards. These risks are magnified in emerging markets.
Equity securities (stocks) are more volatile and carry more risk and return potential than other forms of investments, including investments in high-grade fixed income securities.
Mid-capitalization funds typically carry additional risks since smaller companies generally have a higher risk of failure.
The net asset value per share of these Funds will fluctuate as the value of the securities in the portfolio changes.
Cash equivalents offer low risk and low return potential.
Manager Commentary (Unaudited)
Management Discussion of Fund Performance
For the nine month fiscal period ended December 31, 2016, the Walden International Equity Fund posted an after-fee total return of 0.62%. The Fund’s return trailed those of its primary benchmarks, the MSCI World ex-USA Index (net) and Russell Global Developed ex-US Large Cap Index, which posted gains of 4.79% and 4.82%, respectively.
The returns, which are reported in US dollars, would be materially higher if measured on a local currency basis. Still, the majority of countries represented in the global developed market did post positive U.S. dollar-denominated returns for the period. While a handful of markets that have small index weightings were in negative territory, the United Kingdom market (at roughly 15% of the Fund and its benchmarks) detracted from U.S. dollar returns for the period. When measured in British Pounds, the London-based market actually returned close to 20% for the period. However, when factoring the Dollar’s roughly 16% gain against the Pound during the period, the return for U.S. investors was markedly reduced. More than half of the Pound’s fall versus the Dollar came on the heels of the surprising “Brexit” vote in June. Leaving the euro trading zone is likely to result in higher import prices for the UK, thereby stoking inflation and further reducing the value of the Pound.
While the Fund’s absolute return was impacted by a range of regional economic and political events, the benchmark-trailing relative return can be attributed largely to headwinds for stocks of companies we view as higher than average quality, a characteristic we emphasize. In particular, those companies which we view as more stable, in regard to both the volatility and cyclicality of sales and earnings, generally failed to keep pace with broad market indices. Nonetheless, we remain committed to constructing a well-diversified portfolio comprised of companies with strong balance sheets, ample free cash flows, and sustainable business models. We believe such a portfolio offers an attractive risk-return profile over complete market cycles.*
* Portfolio composition is subject to change.
46
Investment Performance (Unaudited) | | Walden International |
| | Equity Fund |
| | December 31, 2016 |
| | For the period ended 12/31/16 | |
| | Aggregate | | Annualized | |
| | | | | | Since | |
| | | | | | Inception | |
| | 9 Months | | 1 Year | | 6/9/15 | |
Walden International Equity Fund(1) | | 0.62 | % | 0.52 | % | -2.91 | % |
MSCI World ex-USA Index (net) | | 4.79 | % | 2.75 | % | -3.50 | % |
Russell Global Developed ex-US Large Cap Index | | 4.82 | % | 3.01 | % | -3.05 | % |
Hypothetical Growth of a $100,000 Investment

The above chart represents the historical performance of a hypothetical $100,000 investment in the Walden International Equity Fund from June 9, 2015 to December 31, 2016, and includes the reinvestment of dividends and capital gains in the Fund. The returns shown on the table and within the graph do not reflect the deduction of taxes a shareholder would pay on Fund distributions or the redemption of Fund shares.
The Walden International Equity Fund is measured against the MSCI World ex-USA Index and the Russell Developed ex-US Large Cap Index. The MSCI World ex-USA Index captures large- and mid-cap representation across 22 of 23 developed markets countries, excluding the United States. The Russell Developed ex-US Large Cap Index measures the performance of the largest investable securities in developed countries globally, excluding companies assigned to the United States. The Russell Developed ex-US Index is constructed to provide a comprehensive and unbiased barometer for this market segment and is completely reconstituted annually to accurately reflect the changes in the market over time. These indices are unmanaged and the performance of an index does not reflect the deduction of expenses associated with a mutual fund, such as investment management and fund accounting fees. The Fund’s performance reflects the deduction of fees for these services. Investors cannot invest directly in an index.

Fund Net Asset Value: | | $ | 9.34 | |
Gross Expense Ratio(1): | | 2.21 | % |
Past performance does not guarantee future results. The performance data quoted represents past performance and current returns may be lower or higher. The investment return and principal value will fluctuate so that an investor’s shares, when redeemed may be worth more or less than the original cost. To obtain performance information current to the most recent month-end, please call 1-800-282-8782 ext. 7050.
(1) The Gross Expense Ratio is from the Fund’s most recent prospectus, dated August 1, 2016. The Gross Expense Ratio excludes the impact of any contractual fee waivers, which limit Fund total expenses to 1.15%, subject to certain limitations as described in the Fund’s prospectus. Please see the Fund’s most recent prospectus for details. Additional information pertaining to the Fund’s expense ratio as of December 31, 2016 can be found in the financial highlights included in this report. The investment performance may reflect fee reductions. If such fee reductions had not occurred, the quoted performance would have been lower. The expense limitation agreement shall automatically renew effective August 1 of every year until the Adviser provides written notice of non-renewal to the Trust.
47
Schedule of Portfolio Investments | | Walden Asset Management Fund |
| | December 31, 2016 |
Security Description | | Shares | | Fair Value ($) | |
| | | | | |
COMMON STOCKS (70.8%) | | | | | |
Consumer Discretionary (9.6%) | | | | | |
Advance Auto Parts, Inc. | | 3,500 | | 591,920 | |
Autoliv, Inc. | | 4,000 | | 452,600 | |
AutoZone, Inc. (a) | | 600 | | 473,874 | |
Charter Communications, Inc., Class A (a) | | 2,445 | | 703,964 | |
Comcast Corp., Class A | | 13,000 | | 897,650 | |
Dollar General Corp. | | 9,600 | | 711,072 | |
McDonald’s Corp. | | 6,000 | | 730,320 | |
NIKE, Inc., Class B | | 19,600 | | 996,268 | |
Nordstrom, Inc. | | 13,000 | | 623,090 | |
Omnicom Group, Inc. | | 15,000 | | 1,276,650 | |
Ross Stores, Inc. | | 21,000 | | 1,377,600 | |
Starbucks Corp. | | 10,000 | | 555,200 | |
The Home Depot, Inc. | | 2,000 | | 268,160 | |
| | | | 9,658,368 | |
Consumer Staples (8.3%) | | | | | |
Church & Dwight Co., Inc. | | 12,000 | | 530,280 | |
Colgate-Palmolive Co. | | 15,000 | | 981,600 | |
Costco Wholesale Corp. | | 9,200 | | 1,473,012 | |
CVS Health Corp. | | 9,000 | | 710,190 | |
General Mills, Inc. | | 17,000 | | 1,050,090 | |
PepsiCo, Inc. | | 12,500 | | 1,307,875 | |
Procter & Gamble Co. | | 10,000 | | 840,800 | |
Reckitt Benckiser Group PLC, Sponsored ADR | | 52,000 | | 873,600 | |
The Hershey Co. | | 6,000 | | 620,580 | |
| | | | 8,388,027 | |
Energy (2.8%) | | | | | |
Apache Corp. | | 11,500 | | 729,905 | |
ConocoPhillips | | 23,000 | | 1,153,220 | |
Dril-Quip, Inc. (a) | | 10,000 | | 600,500 | |
Oceaneering International, Inc. | | 13,000 | | 366,730 | |
| | | | 2,850,355 | |
Financials (12.7%) | | | | | |
American Express Co. | | 10,000 | | 740,800 | |
Chubb Ltd. | | 6,500 | | 858,780 | |
Cincinnati Financial Corp. | | 18,000 | | 1,363,500 | |
Comerica, Inc. | | 9,000 | | 612,990 | |
Commerce Bancshares, Inc. | | 12,600 | | 728,406 | |
Discover Financial Services | | 13,000 | | 937,170 | |
JPMorgan Chase & Co. | | 13,400 | | 1,156,286 | |
Northern Trust Corp. | | 11,000 | | 979,550 | |
PNC Financial Services Group, Inc. | | 10,000 | | 1,169,600 | |
State Street Corp. | | 10,500 | | 816,060 | |
SunTrust Banks, Inc. | | 18,000 | | 987,300 | |
T. Rowe Price Group, Inc. | | 12,000 | | 903,120 | |
U.S. Bancorp | | 31,500 | | 1,618,155 | |
| | | | 12,871,717 | |
Health Care (10.1%) | | | | | |
Becton, Dickinson & Co. | | 8,400 | | 1,390,620 | |
C.R. Bard, Inc. | | 5,500 | | 1,235,630 | |
Johnson & Johnson, Inc. | | 16,000 | | 1,843,360 | |
Medtronic PLC | | 12,500 | | 890,375 | |
Merck & Co., Inc. | | 15,600 | | 918,372 | |
Mettler-Toledo International, Inc. (a) | | 1,800 | | 753,408 | |
Stryker Corp. | | 9,500 | | 1,138,195 | |
UnitedHealth Group, Inc. | | 8,000 | | 1,280,320 | |
Waters Corp. (a) | | 6,000 | | 806,340 | |
| | | | 10,256,620 | |
| | Shares or | | | |
| | Principal | | | |
| | Amount($) | | | |
| | | | | |
Industrials (9.9%) | | | | | |
3M Co. | | 8,000 | | 1,428,560 | |
Deere & Co. | | 8,000 | | 824,320 | |
Donaldson Co., Inc. | | 12,000 | | 504,960 | |
Emerson Electric Co. | | 15,100 | | 841,825 | |
Hubbell, Inc. | | 7,000 | | 816,900 | |
Illinois Tool Works, Inc. | | 10,000 | | 1,224,600 | |
Lincoln Electric Holdings, Inc. | | 11,000 | | 843,370 | |
Union Pacific Corp. | | 11,000 | | 1,140,480 | |
United Parcel Service, Inc., Class B | | 10,000 | | 1,146,400 | |
W.W. Grainger, Inc. | | 5,300 | | 1,230,925 | |
| | | | 10,002,340 | |
Information Technology (13.2%) | | | | | |
Accenture PLC, Class A | | 9,500 | | 1,112,735 | |
Alphabet, Inc., Class A (a) | | 900 | | 713,205 | |
Alphabet, Inc., Class C (a) | | 1,800 | | 1,389,276 | |
Apple, Inc. | | 20,500 | | 2,374,310 | |
Automatic Data Processing, Inc. | | 13,800 | | 1,418,363 | |
Cisco Systems, Inc. | | 36,000 | | 1,087,920 | |
Cognizant Technology Solutions Corp., Class A (a) | | 10,000 | | 560,300 | |
Dell Technologies, Inc., Class V (a) | | 1,671 | | 91,855 | |
Microsoft Corp. | | 34,000 | | 2,112,760 | |
Oracle Corp. | | 32,000 | | 1,230,400 | |
QUALCOMM, Inc. | | 3,000 | | 195,600 | |
Visa, Inc., Class A | | 14,000 | | 1,092,280 | |
| | | | 13,379,004 | |
Materials (2.1%) | | | | | |
AptarGroup, Inc. | | 11,000 | | 807,950 | |
PPG Industries, Inc. | | 6,500 | | 615,940 | |
Praxair, Inc. | | 6,000 | | 703,140 | |
| | | | 2,127,030 | |
Telecommunication Services (0.7%) | | | | | |
Verizon Communications, Inc. | | 12,500 | | 667,250 | |
| | | | 667,250 | |
Utilities (1.4%) | | | | | |
Consolidated Edison, Inc. | | 10,000 | | 736,800 | |
Eversource Energy | | 13,000 | | 717,990 | |
| | | | 1,454,790 | |
| | | | | |
TOTAL COMMON STOCKS (Cost $45,662,163) | | | | 71,655,501 | |
| | | | | |
CERTIFICATE OF DEPOSIT (0.1%) | | | | | |
Certificate of Deposit (0.1%) | | | | | |
Self Help Federal Credit Union, 1.30%, 6/21/19 (b) | | 100,000 | | 99,373 | |
| | | | | |
TOTAL CERTIFICATE OF DEPOSIT (Cost $100,000) | | | | 99,373 | |
| | | | | |
CORPORATE BONDS (3.9%) | | | | | |
Consumer Discretionary (0.3%) | | | | | |
Leggett & Platt, Inc., 4.40%, 7/1/18 | | 200,000 | | 205,375 | |
Starbucks Corp., 2.45%, 6/15/26, Callable 3/15/26 @ 100 | | 100,000 | | 95,554 | |
| | | | 300,929 | |
See Notes to Financial Statements
48
| | Shares or | | | |
| | Principal | | | |
Security Description | | Amount($) | | Fair Value ($) | |
| | | | | |
CORPORATE BONDS, CONTINUED | | | | | |
Consumer Staples (0.2%) | | | | | |
Campbell Soup Co., 4.50%, 2/15/19 | | 150,000 | | 157,736 | |
| | | | | |
Financials (1.4%) | | | | | |
American Express Co., 2.65%, 12/2/22 | | 287,000 | | 282,968 | |
American Express Co., 7.00%, 3/19/18 | | 250,000 | | 265,751 | |
Calvert Social Investment Foundation, Series NOTZ, 1.00%, 10/2/17 (b) | | 75,000 | | 75,000 | |
Export-Import Bank of Korea, 1.75%, 2/27/18 | | 250,000 | | 250,106 | |
KFW, 1.88%, 11/30/20 | | 250,000 | | 249,159 | |
National Rural Utilities Cooperative Finance Corp., 10.38%, 11/1/18 | | 250,000 | | 288,381 | |
North American Development Bank, 4.38%, 2/11/20 | | 100,000 | | 106,441 | |
| | | | 1,517,806 | |
Health Care (0.5%) | | | | | |
Abbott Laboratories, 2.95%, 3/15/25, Callable 12/15/24 @ 100 | | 100,000 | | 96,446 | |
Becton, Dickinson & Co., 3.13%, 11/8/21 | | 250,000 | | 256,595 | |
Merck & Co., Inc., 3.88%, 1/15/21, Callable 10/15/20 @ 100 | | 150,000 | | 159,270 | |
| | | | 512,311 | |
Industrials (0.1%) | | | | | |
Hubbell, Inc., 3.63%, 11/15/22 | | 75,000 | | 77,016 | |
| | | | 77,016 | |
Information Technology (1.3%) | | | | | |
Apple, Inc., 2.85%, 5/6/21 | | 350,000 | | 357,479 | |
Apple, Inc., 2.85%, 2/23/23, Callable 12/23/22 @ 100 | | 150,000 | | 151,059 | |
Oracle Corp., 3.40%, 7/8/24, Callable 4/8/24 @ 100 | | 300,000 | | 305,965 | |
Oracle Corp., 5.75%, 4/15/18 | | 200,000 | | 211,331 | |
Visa, Inc., 3.15%, 12/14/25, Callable 9/14/25 @ 100 | | 275,000 | | 276,519 | |
| | | | 1,302,353 | |
Telecommunication Services (0.1%) | | | | | |
AT&T, Inc., 5.50%, 2/1/18 | | 100,000 | | 103,926 | |
| | | | | |
TOTAL CORPORATE BONDS (Cost $3,886,329) | | | | 3,972,077 | |
| | | | | |
MUNICIPAL BONDS (0.5%) | | | | | |
New York (0.2%): | | | | | |
New York St Environmental Facs, 1.89%, 7/15/22 | | 190,000 | | 184,836 | |
| | | | | |
Wisconsin (0.3%): | | | | | |
Wisconsin State, Build America Bonds, GO, 4.60%, 5/1/26, Callable 5/1/21 @ 100 | | 250,000 | | 276,560 | |
| | | | | |
TOTAL MUNICIPAL BONDS (Cost $441,128) | | | | 461,396 | |
| | | | | |
U.S. GOVERNMENT & U.S. GOVERNMENT AGENCY OBLIGATIONS (21.1%) | | | | | |
Federal Farm Credit Bank | | | | | |
2.60%, 10/6/22 | | 250,000 | | 254,228 | |
2.75%, 7/16/27 | | 250,000 | | 246,739 | |
2.85%, 3/2/28 | | 750,000 | | 745,006 | |
5.38%, 11/10/20 | | 250,000 | | 280,926 | |
| | | | 1,526,899 | |
Federal Home Loan Bank | | | | | |
1.88%, 11/29/21 | | 1,000,000 | | 994,257 | |
2.13%, 3/10/23 | | 1,000,000 | | 989,768 | |
2.50%, 3/11/22 | | 200,000 | | 204,152 | |
2.88%, 6/14/24 | | 1,000,000 | | 1,028,997 | |
2.88%, 9/13/24 | | 1,000,000 | | 1,031,604 | |
3.25%, 6/9/23 | | 850,000 | | 896,947 | |
5.25%, 12/11/20 | | 200,000 | | 225,612 | |
5.25%, 8/15/22 | | 1,000,000 | | 1,153,925 | |
5.50%, 7/15/36 | | 700,000 | | 920,005 | |
| | | | 7,445,267 | |
Federal Home Loan Mortgage Corporation | | | | | |
2.38%, 1/13/22 | | 5,750,000 | | 5,848,480 | |
| | | | | |
Federal National Mortgage Association | | | | | |
1.38%, 2/26/21 | | 500,000 | | 490,547 | |
1.50%, 6/22/20 | | 350,000 | | 348,544 | |
1.75%, 11/26/19 | | 250,000 | | 252,019 | |
2.13%, 4/24/26 | | 1,250,000 | | 1,183,595 | |
2.63%, 9/6/24 | | 2,250,000 | | 2,274,140 | |
| | | | 4,548,845 | |
Government National Mortgage Association | | | | | |
4.00%, 9/15/40 | | 56,443 | | 60,064 | |
4.00%, 9/15/41 | | 234,569 | | 250,011 | |
6.50%, 5/15/32 | | 17,337 | | 19,816 | |
| | | | 329,891 | |
Housing & Urban Development | | | | | |
2.70%, 8/1/22 | | 491,000 | | 497,440 | |
| | | | | |
U.S. Treasury Inflation Index Note | | | | | |
0.63%, 7/15/21 | | 268,120 | | 276,875 | |
1.25%, 7/15/20 | | 831,278 | | 878,358 | |
| | | | 1,155,233 | |
TOTAL U.S. GOVERNMENT & U.S. GOVERNMENT AGENCY
OBLIGATIONS (Cost $21,245,811) | | 21,352,055 | |
| | | | | |
INVESTMENT COMPANIES (2.9%) | | | | | |
JPMorgan U.S. Government Money Market Fund, Capital Shares, 0.24%(c) | | 2,912,259 | | 2,912,259 | |
TOTAL INVESTMENT COMPANIES (Cost $2,912,259) | | | | 2,912,259 | |
| | | | | |
Total Investments (Cost $74,247,690) — 99.3%(d) | | | | 100,452,661 | |
Other assets in excess of liabilities — 0.7% | | | | 673,715 | |
NET ASSETS — 100.0% | | | | $ | 101,126,376 | |
| | | | | | |
(a) Non-income producing security.
(b) These securities have been deemed illiquid and represent 0.17% of the Fund’s net assets.
(c) Rate disclosed is the seven day yield as of December 31, 2016.
(d) See Federal Tax Information listed in the Notes to the Financial Statements.
ADR American Depositary Receipt
GO General Obligation
See Notes to Financial Statements
49
Financial Statements | | Walden Asset Management Fund |
STATEMENT OF ASSETS AND LIABILITIES
December 31, 2016
Assets: | | | |
Investments, at fair value (cost $74,247,690) | | $ | 100,452,661 | |
Interest and dividends receivable | | 317,990 | |
Receivable for investments sold | | 270,812 | |
Receivable for capital shares issued | | 170,237 | |
Prepaid expenses and other assets | | 13,711 | |
Total Assets | | 101,225,411 | |
Liabilities: | | | |
Payable for capital shares redeemed | | 2,840 | |
Accrued expenses and other liabilities: | | | |
Investment adviser | | 56,489 | |
Administration and accounting | | 9,960 | |
Chief compliance officer | | 359 | |
Custodian | | 1,172 | |
Shareholder servicing fees | | 4,141 | |
Transfer agent | | 5,588 | |
Trustee | | 27 | |
Other | | 18,459 | |
Total Liabilities | | 99,035 | |
Net Assets | | $ | 101,126,376 | |
Composition of Net Assets: | | | |
Capital | | $ | 74,840,273 | |
Accumulated undistributed net investment /(distributions in excess of net investment income) | | — | |
Accumulated net realized gains from investment transactions | | 81,132 | |
Net unrealized appreciation from investments | | 26,204,971 | |
Net Assets | | $ | 101,126,376 | |
Shares outstanding (par value $0.01, unlimited number of shares authorized) | | 6,422,963 | |
Net Asset Value, Offering Price and Redemption price per share | | $ | 15.74 | |
Amounts designated as “—” are $0 or have been rounded to $0.
STATEMENTS OF OPERATIONS
For the nine months ended December 31, 2016
Investment Income: | | | |
Interest | | $ | 459,283 | |
Dividends | | 1,038,546 | |
Total Investment Income | | 1,497,829 | |
Expenses: | | | |
Investment adviser | | 525,922 | |
Administration and accounting | | 75,811 | |
Chief compliance officer | | 2,910 | |
Custodian | | 9,478 | |
Shareholder servicing | | 41,007 | |
Transfer agency | | 28,092 | |
Trustee | | 5,714 | |
Other | | 48,971 | |
Total expenses before fee reductions | | 737,905 | |
Fees contractually reduced by the investment adviser | | (34,372 | ) |
Net Expenses | | 703,533 | |
Net Investment Income | | 794,296 | |
Net Realized/Unrealized Gains (Losses) from Investments: | | | |
Net realized gains from investment transactions | | 608,726 | |
Change in unrealized appreciation/depreciation from investments | | 3,962,515 | |
Net realized/unrealized gains (losses) from investments | | 4,571,241 | |
Change in Net Assets Resulting from Operations | | $ | 5,365,537 | |
For the year ended March 31, 2016
Investment Income: | | | |
Interest | | $ | 528,825 | |
Dividends | | 1,366,460 | |
Less: Foreign tax withholding | | (856 | ) |
Total Investment Income | | 1,894,429 | |
Expenses: | | | |
Investment adviser | | 623,054 | |
Administration and accounting | | 92,326 | |
Chief compliance officer | | 3,794 | |
Custodian | | 14,507 | |
Shareholder servicing | | 49,075 | |
Transfer agency | | 34,976 | |
Trustee | | 5,748 | |
Other | | 51,741 | |
Total expenses before fee reductions | | 875,221 | |
Fees voluntarily reduced by the transfer agent | | (5,450 | ) |
Fees contractually reduced by the investment adviser | | (40,670 | ) |
Net Expenses | | 829,101 | |
Net Investment Income | | 1,065,328 | |
Net Realized/Unrealized Gains (Losses) from Investments: | | | |
Net realized gains from investment transactions | | 2,797,103 | |
Change in unrealized appreciation/depreciation from investments | | (1,198,594 | ) |
Net realized/unrealized gains (losses) from investments | | 1,598,509 | |
Change in Net Assets Resulting from Operations | | $ | 2,663,837 | |
See Notes to Financial Statements
50
STATEMENTS OF CHANGES IN NET ASSETS
| | For the | | | | | |
| | nine months ended | | For the year ended | | For the year ended | |
| | December 31, 2016 | | March 31, 2016 | | March 31, 2015 | |
| | | | | | | |
Investment Activities: | | | | | | | |
Operations: | | | | | | | |
Net investment income | | $ | 794,296 | | $ | 1,065,328 | | $ | 864,232 | |
Net realized gains from investment transactions | | 608,726 | | 2,797,103 | | 3,898,437 | |
Change in unrealized appreciation/depreciation from investments | | 3,962,515 | | (1,198,594 | ) | 751,465 | |
Change in Net Assets Resulting from Operations | | 5,365,537 | | 2,663,837 | | 5,514,134 | |
Dividends: | | | | | | | |
Net investment income | | (1,023,297 | ) | (1,064,984 | ) | (838,735 | ) |
Net realized gains from investment transactions | | (1,937,592 | ) | (4,707,813 | ) | (559,047 | ) |
Change in Net Assets Resulting from Shareholder Dividends | | (2,960,889 | ) | (5,772,797 | ) | (1,397,782 | ) |
Capital Share Transactions: | | | | | | | |
Proceeds from shares issued | | 17,594,347 | | 7,492,805 | | 4,635,811 | |
Dividends reinvested | | 2,556,856 | | 5,204,742 | | 1,252,876 | |
Cost of shares redeemed | | (8,320,463 | ) | (7,196,993 | ) | (4,673,557 | ) |
Change in Net Assets Resulting from Capital Share Transactions | | 11,830,740 | | 5,500,554 | | 1,215,130 | |
Change in Net Assets | | 14,235,388 | | 2,391,594 | | 5,331,482 | |
Net Assets: | | | | | | | |
Beginning of period | | 86,890,988 | | 84,499,394 | | 79,167,912 | |
End of period | | $ | 101,126,376 | | $ | 86,890,988 | | $ | 84,499,394 | |
Share Transactions: | | | | | | | |
Issued | | 1,115,592 | | 495,652 | | 294,956 | |
Reinvested | | 161,826 | | 348,143 | | 79,146 | |
Redeemed | | (525,988 | ) | (465,993 | ) | (298,010 | ) |
Change in shares | | 751,430 | | 377,802 | | 76,092 | |
Accumulated undistributed net investment income/(distributions in excess of net investment income) | | $ | — | | $ | 217,915 | | $ | 215,774 | |
Amounts designated as “—” are $0 or have been rounded to $0.
See Notes to Financial Statements
51
FINANCIAL HIGHLIGHTS
Selected data for a share outstanding throughout the periods indicated.
| | For the nine | | For the year | | For the year | | For the year | | For the year | | For the year | |
| | months ended | | ended | | ended | | ended | | ended | | ended | |
| | December 31, | | March 31, | | March 31, | | March 31, | | March 31, | | March 31, | |
| | 2016 | | 2016 | | 2015 | | 2014 | | 2013 | | 2012 | |
| | | | | | | | | | | | | |
Net Asset Value, Beginning of Period | | $ | 15.32 | | $ | 15.96 | | $ | 15.17 | | $ | 13.53 | | $ | 12.82 | | $ | 12.07 | |
| | | | | | | | | | | | | |
Investment Activities: | | | | | | | | | | | | | |
Operations: | | | | | | | | | | | | | |
Net investment income | | 0.13 | | 0.20 | | 0.17 | | 0.13 | | 0.15 | | 0.12 | |
Net realized and unrealized gains from investment transactions | | 0.77 | | 0.27 | | 0.89 | | 1.72 | | 0.71 | | 0.75 | |
Total from investment activities | | 0.90 | | 0.47 | | 1.06 | | 1.85 | | 0.86 | | 0.87 | |
Dividends: | | | | | | | | | | | | | |
Net investment income | | (0.17 | ) | (0.21 | ) | (0.16 | ) | (0.13 | ) | (0.15 | ) | (0.12 | ) |
Net realized gains from investments | | (0.31 | ) | (0.90 | ) | (0.11 | ) | (0.08 | ) | — | | — | |
Total dividends | | (0.48 | ) | (1.11 | ) | (0.27 | ) | (0.21 | ) | (0.15 | ) | (0.12 | ) |
| | | | | | | | | | | | | |
Net Asset Value, End of Period | | $ | 15.74 | | $ | 15.32 | | $ | 15.96 | | $ | 15.17 | | $ | 13.53 | | $ | 12.82 | |
| | | | | | | | | | | | | |
Total Return | | 5.87 | %(a) | 3.10 | % | 7.00 | % | 13.73 | % | 6.83 | % | 7.35 | % |
| | | | | | | | | | | | | |
Ratios/Supplemental Data: | | | | | | | | | | | | | |
Net assets at end of period (000’s) | | $ | 101,126 | | $ | 86,891 | | $ | 84,499 | | $ | 79,168 | | $ | 64,728 | | $ | 57,080 | |
Ratio of net expenses to average net assets | | 1.00 | %(b) | 1.00 | % | 1.00 | % | 1.00 | % | 1.00 | % | 1.00 | % |
Ratio of net investment income to average net assets | | 1.13 | %(b) | 1.29 | % | 1.06 | % | 0.95 | % | 1.25 | % | 1.04 | % |
Ratio of expenses (before fee reductions or recoupment of fees previously reimbursed by the investment advisor) to average net assets(c) | | 1.05 | %(b) | 1.06 | % | 1.04 | % | 1.05 | % | 1.10 | % | 1.13 | % |
Portfolio turnover rate | | 10.18 | %(a) | 15.56 | % | 21.62 | % | 6.50 | % | 15.93 | % | 24.56 | % |
Amounts designated as “—” are $0 or have been rounded to $0.
(a) Not annualized for periods less than one year.
(b) Annualized for periods less than one year.
(c) During the periods ending March 31, 2012 through March 31, 2016 and December 31, 2016, certain fees were reduced. If such fee reduction had not occurred, the ratio would have been as indicated.
See Notes to Financial Statements
52
Schedule of Portfolio Investments | | Walden Equity Fund |
| | December 31, 2016 |
Security Description | | Shares | | Fair Value ($) | |
| | | | | |
COMMON STOCKS (98.8%) | | | | | |
Consumer Discretionary (12.9%) | | | | | |
Advance Auto Parts, Inc. | | 9,400 | | 1,589,728 | |
Autoliv, Inc. | | 8,000 | | 905,200 | |
AutoZone, Inc. (a) | | 1,500 | | 1,184,685 | |
Charter Communications, Inc., Class A (a) | | 5,379 | | 1,548,722 | |
Comcast Corp., Class A | | 36,000 | | 2,485,800 | |
Dollar General Corp. | | 22,000 | | 1,629,540 | |
McDonald’s Corp. | | 14,500 | | 1,764,940 | |
NIKE, Inc., Class B | | 55,000 | | 2,795,650 | |
Nordstrom, Inc. | | 30,000 | | 1,437,900 | |
Omnicom Group, Inc. | | 40,000 | | 3,404,400 | |
Ross Stores, Inc. | | 46,000 | | 3,017,600 | |
Starbucks Corp. | | 28,000 | | 1,554,560 | |
The TJX Cos., Inc. | | 3,000 | | 225,390 | |
| | | | 23,544,115 | |
Consumer Staples (11.5%) | | | | | |
Church & Dwight Co., Inc. | | 32,000 | | 1,414,080 | |
Colgate-Palmolive Co. | | 36,000 | | 2,355,840 | |
Costco Wholesale Corp. | | 20,000 | | 3,202,200 | |
CVS Health Corp. | | 27,000 | | 2,130,570 | |
General Mills, Inc. | | 40,000 | | 2,470,800 | |
PepsiCo, Inc. | | 29,000 | | 3,034,270 | |
Procter & Gamble Co. | | 31,500 | | 2,648,520 | |
Reckitt Benckiser Group PLC, Sponsored ADR | | 120,000 | | 2,016,000 | |
The Hershey Co. | | 16,000 | | 1,654,880 | |
| | | | 20,927,160 | |
Energy (3.8%) | | | | | |
Apache Corp. | | 32,000 | | 2,031,040 | |
ConocoPhillips | | 56,000 | | 2,807,840 | |
Dril-Quip, Inc. (a) | | 22,000 | | 1,321,100 | |
Oceaneering International, Inc. | | 27,000 | | 761,670 | |
| | | | 6,921,650 | |
Financials (18.0%) | | | | | |
American Express Co. | | 25,000 | | 1,852,000 | |
BB&T Corp. | | 5,000 | | 235,100 | |
Chubb Ltd. | | 17,000 | | 2,246,040 | |
Cincinnati Financial Corp. | | 35,000 | | 2,651,250 | |
Comerica, Inc. | | 25,000 | | 1,702,750 | |
Discover Financial Services | | 33,000 | | 2,378,970 | |
JPMorgan Chase & Co. | | 45,000 | | 3,883,050 | |
Moody’s Corp. | | 10,000 | | 942,700 | |
Northern Trust Corp. | | 23,000 | | 2,048,150 | |
PNC Financial Services Group, Inc. | | 28,500 | | 3,333,360 | |
State Street Corp. | | 28,000 | | 2,176,160 | |
SunTrust Banks, Inc. | | 50,000 | | 2,742,500 | |
T. Rowe Price Group, Inc. | | 30,000 | | 2,257,800 | |
U.S. Bancorp | | 81,500 | | 4,186,655 | |
Wells Fargo & Co. | | 1,000 | | 55,110 | |
| | | | 32,691,595 | |
Health Care (14.5%) | | | | | |
Becton, Dickinson & Co. | | 19,000 | | 3,145,450 | |
C.R. Bard, Inc. | | 15,000 | | 3,369,900 | |
DENTSPLY SIRONA, Inc. | | 22,000 | | 1,270,060 | |
Express Scripts Holding Co. (a) | | 1,000 | | 68,790 | |
Johnson & Johnson, Inc. | | 37,000 | | 4,262,770 | |
Medtronic PLC | | 29,000 | | 2,065,670 | |
Merck & Co., Inc. | | 36,000 | | 2,119,320 | |
Mettler-Toledo International, Inc. (a) | | 4,800 | | 2,009,088 | |
Stryker Corp. | | 24,000 | | 2,875,440 | |
UnitedHealth Group, Inc. | | 21,000 | | 3,360,840 | |
Waters Corp. (a) | | 13,000 | | 1,747,070 | |
| | | | 26,294,398 | |
Industrials (13.7%) | | | | | |
3M Co. | | 18,000 | | 3,214,260 | |
Deere & Co. | | 18,000 | | 1,854,720 | |
Donaldson Co., Inc. | | 25,000 | | 1,052,000 | |
Emerson Electric Co. | | 35,000 | | 1,951,250 | |
Hubbell, Inc. | | 21,500 | | 2,509,050 | |
Illinois Tool Works, Inc. | | 23,700 | | 2,902,302 | |
Lincoln Electric Holdings, Inc. | | 28,000 | | 2,146,760 | |
Union Pacific Corp. | | 32,000 | | 3,317,760 | |
United Parcel Service, Inc., Class B | | 23,000 | | 2,636,720 | |
W.W. Grainger, Inc. | | 14,000 | | 3,251,500 | |
| | | | 24,836,322 | |
Information Technology (18.4%) | | | | | |
Accenture PLC, Class A | | 28,000 | | 3,279,640 | |
Alphabet, Inc., Class A (a) | | 2,500 | | 1,981,125 | |
Alphabet, Inc., Class C (a) | | 4,700 | | 3,627,554 | |
Apple, Inc. | | 50,000 | | 5,791,000 | |
Automatic Data Processing, Inc. | | 29,000 | | 2,980,620 | |
Cisco Systems, Inc. | | 90,000 | | 2,719,800 | |
Cognizant Technology Solutions Corp., Class A (a) | | 20,000 | | 1,120,600 | |
Dell Technologies, Inc., Class V (a) | | 4,458 | | 245,056 | |
International Business Machines Corp. | | 2,000 | | 331,980 | |
Microsoft Corp. | | 88,000 | | 5,468,320 | |
Oracle Corp. | | 72,500 | | 2,787,625 | |
QUALCOMM, Inc. | | 13,000 | | 847,600 | |
Visa, Inc., Class A | | 32,500 | | 2,535,650 | |
| | | | 33,716,570 | |
Materials (3.1%) | | | | | |
AptarGroup, Inc. | | 26,000 | | 1,909,700 | |
PPG Industries, Inc. | | 17,000 | | 1,610,920 | |
Praxair, Inc. | | 17,500 | | 2,050,825 | |
| | | | 5,571,445 | |
Telecommunication Services (1.0%) | | | | | |
Verizon Communications, Inc. | | 33,000 | | 1,761,540 | |
| | | | 1,761,540 | |
Utilities (1.9%) | | | | | |
Consolidated Edison, Inc. | | 25,000 | | 1,842,000 | |
Eversource Energy | | 30,000 | | 1,656,900 | |
| | | | 3,498,900 | |
TOTAL COMMON STOCKS (Cost $112,918,868) | | | | 179,763,695 | |
| | | | | |
INVESTMENT COMPANIES (1.0%) | | | | | |
JPMorgan U.S. Government Money Market Fund, Capital Shares, 0.24%(b) | | 1,792,896 | | 1,792,896 | |
TOTAL INVESTMENT COMPANIES (Cost $1,792,896) | | | | 1,792,896 | |
| | | | | |
Total Investments (Cost $114,711,764) — 99.8%(c) | | | | 181,556,591 | |
Other assets in excess of liabilities — 0.2% | | | | 273,467 | |
NET ASSETS — 100.0% | | | | $ | 181,830,058 | |
| | | | | | |
(a) Non-income producing security.
(b) Rate disclosed is the seven day yield as of December 31, 2016.
(c) See Federal Tax Information listed in the Notes to the Financial Statements.
ADR American Depositary Receipt
See Notes to Financial Statements
53
Financial Statements | | Walden Equity Fund |
STATEMENT OF ASSETS AND LIABILITIES
December 31, 2016
Assets: | | | |
Investments, at fair value (cost $114,711,764) | | $ | 181,556,591 | |
Dividends receivable | | 242,069 | |
Receivable for investments sold | | 656,496 | |
Receivable for capital shares issued | | 17,013 | |
Prepaid expenses and other assets | | 13,635 | |
Total Assets | | 182,485,804 | |
Liabilities: | | | |
Payable for investments purchased | | 408,951 | |
Payable for capital shares redeemed | | 69,285 | |
Accrued expenses and other liabilities: | | | |
Investment adviser | | 97,922 | |
Administration and accounting | | 16,295 | |
Chief compliance officer | | 670 | |
Custodian | | 2,224 | |
Shareholder servicing fees | | 16,953 | |
Transfer agent | | 7,164 | |
Trustee | | 47 | |
Other | | 36,235 | |
Total Liabilities | | 655,746 | |
Net Assets | | $ | 181,830,058 | |
Composition of Net Assets: | | | |
Capital | | $ | 114,604,494 | |
Accumulated undistributed net investment /(distributions in excess of net investment income) | | — | |
Accumulated net realized gains from investment transactions | | 380,737 | |
Net unrealized appreciation from investments | | 66,844,827 | |
Net Assets | | $ | 181,830,058 | |
Shares outstanding (par value $0.01, unlimited number of shares authorized) | | 9,659,650 | |
Net Asset Value, Offering Price and Redemption price per share | | $ | 18.82 | |
Amounts designated as “—” are $0 or have been rounded to $0.
STATEMENTS OF OPERATIONS
For the nine months ended December 31, 2016
Investment Income: | | | |
Dividends | | $ | 2,654,856 | |
Total Investment Income | | 2,654,856 | |
Expenses: | | | |
Investment adviser | | 990,520 | |
Administration and accounting | | 135,151 | |
Chief compliance officer | | 5,604 | |
Custodian | | 18,301 | |
Shareholder servicing | | 157,944 | |
Transfer agency | | 37,057 | |
Trustee | | 10,972 | |
Other | | 93,446 | |
Total expenses before fee reductions | | 1,448,995 | |
Fees contractually reduced by the investment adviser | | (124,204 | ) |
Net Expenses | | 1,324,791 | |
Net Investment Income | | 1,330,065 | |
Net Realized/Unrealized Gains (Losses) from Investments: | | | |
Net realized gains from investment transactions | | 1,501,606 | |
Change in unrealized appreciation/depreciation from investments | | 12,051,364 | |
Net realized/unrealized gains (losses) from investments | | 13,552,970 | |
Change in Net Assets Resulting from Operations | | $ | 14,883,035 | |
For the year ended March 31, 2016
Investment Income: | | | |
Dividends | | $ | 3,318,257 | |
Total Investment Income | | 3,318,257 | |
Expenses: | | | |
Investment adviser | | 1,129,528 | |
Administration and accounting | | 160,004 | |
Chief compliance officer | | 6,836 | |
Custodian | | 25,592 | |
Shareholder servicing | | 197,842 | |
Transfer agency | | 47,113 | |
Trustee | | 10,281 | |
Other | | 82,956 | |
Total expenses before fee reductions | | 1,660,152 | |
Fees voluntarily reduced by the transfer agent | | (5,450 | ) |
Fees contractually reduced by the investment adviser | | (151,560 | ) |
Net Expenses | | 1,503,142 | |
Net Investment Income | | 1,815,115 | |
Net Realized/Unrealized Gains (Losses) from Investments: | | | |
Net realized gains from investment transactions | | 7,214,050 | |
Change in unrealized appreciation/depreciation from investments | | (3,912,669 | ) |
Net realized/unrealized gains (losses) from investments | | 3,301,381 | |
Change in Net Assets Resulting from Operations | | $ | 5,116,496 | |
See Notes to Financial Statements
54
STATEMENTS OF CHANGES IN NET ASSETS
| | For the | | | | | |
| | nine months ended | | For the year ended | | For the year ended | |
| | December 31, 2016 | | March 31, 2016 | | March 31, 2015 | |
| | | | | | | |
Investment Activities: | | | | | | | |
Operations: | | | | | | | |
Net investment income | | $ | 1,330,065 | | $ | 1,815,115 | | $ | 1,442,315 | |
Net realized gains from investment transactions | | 1,501,606 | | 7,214,050 | | 9,300,993 | |
Change in unrealized appreciation/depreciation from investments | | 12,051,364 | | (3,912,669 | ) | 1,022,961 | |
Change in Net Assets Resulting from Operations | | 14,883,035 | | 5,116,496 | | 11,766,269 | |
Dividends: | | | | | | | |
Net investment income | | (1,666,011 | ) | (1,870,888 | ) | (1,402,464 | ) |
Net realized gains from investment transactions | | (4,339,839 | ) | (7,516,146 | ) | (7,427,363 | ) |
Change in Net Assets Resulting from Shareholder Dividends | | (6,005,850 | ) | (9,387,034 | ) | (8,829,827 | ) |
Capital Share Transactions: | | | | | | | |
Proceeds from shares issued | | 21,048,733 | | 22,257,331 | | 13,182,101 | |
Dividends reinvested | | 5,332,754 | | 8,562,564 | | 7,987,749 | |
Cost of shares redeemed | | (17,994,687 | ) | (19,482,695 | ) | (18,485,773 | ) |
Change in Net Assets Resulting from Capital Share Transactions | | 8,386,800 | | 11,337,200 | | 2,684,077 | |
Change in Net Assets | | 17,263,985 | | 7,066,662 | | 5,620,519 | |
Net Assets: | | | | | | | |
Beginning of period | | 164,566,073 | | 157,499,411 | | 151,878,892 | |
End of period | | $ | 181,830,058 | | $ | 164,566,073 | | $ | 157,499,411 | |
Share Transactions: | | | | | | | |
Issued | | 1,143,143 | | 1,287,052 | | 700,427 | |
Reinvested | | 281,858 | | 489,010 | | 434,117 | |
Redeemed | | (968,060 | ) | (1,064,374 | ) | (991,135 | ) |
Change in shares | | 456,941 | | 711,688 | | 143,409 | |
Accumulated undistributed net investment income/(distributions in excess of net investment income) | | $ | — | | $ | 333,842 | | $ | 411,165 | |
Amounts designated as “—” are $0 or have been rounded to $0.
See Notes to Financial Statements
55
FINANCIAL HIGHLIGHTS
Selected data for a share outstanding throughout the periods indicated.
| | For the nine | | | | | | | | | | | |
| | months | | For the year | | For the year | | For the year | | For the year | | For the year | |
| | ended | | ended | | ended | | ended | | ended | | ended | |
| | December 31, | | March 31, | | March 31, | | March 31, | | March 31, | | March 31, | |
| | 2016 | | 2016 | | 2015 | | 2014 | | 2013 | | 2012 | |
| | | | | | | | | | | | | |
Net Asset Value, Beginning of Period | | $ | 17.88 | | $ | 18.55 | | $ | 18.19 | | $ | 15.41 | | $ | 14.39 | | $ | 13.32 | |
| | | | | | | | | | | | | |
Investment Activities: | | | | | | | | | | | | | |
Operations: | | | | | | | | | | | | | |
Net investment income | | 0.14 | | 0.23 | | 0.18 | | 0.16 | | 0.16 | | 0.13 | |
Net realized and unrealized gains from investment transactions | | 1.44 | | 0.29 | | 1.29 | | 2.86 | | 1.01 | | 1.06 | |
Total from investment activities | | 1.58 | | 0.52 | | 1.47 | | 3.02 | | 1.17 | | 1.19 | |
Dividends: | | | | | | | | | | | | | |
Net investment income | | (0.18 | ) | (0.24 | ) | (0.18 | ) | (0.15 | ) | (0.15 | ) | (0.12 | ) |
Net realized gains from investments | | (0.46 | ) | (0.95 | ) | (0.93 | ) | (0.09 | ) | — | | — | |
Total dividends | | (0.64 | ) | (1.19 | ) | (1.11 | ) | (0.24 | ) | (0.15 | ) | (0.12 | ) |
| | | | | | | | | | | | | |
Net Asset Value, End of Period | | $ | 18.82 | | $ | 17.88 | | $ | 18.55 | | $ | 18.19 | | $ | 15.41 | | $ | 14.39 | |
Total Return | | 8.80 | %(a) | 2.92 | % | 8.13 | % | 19.66 | % | 8.27 | % | 9.06 | % |
| | | | | | | | | | | | | |
Ratios/Supplemental Data: | | | | | | | | | | | | | |
Net assets at end of period (000’s) | | $ | 181,830 | | $ | 164,566 | | $ | 157,499 | | $ | 151,879 | | $ | 130,698 | | $ | 104,206 | |
Ratio of net expenses to average net assets | | 1.00 | %(b) | 1.00 | % | 1.00 | % | 1.00 | % | 1.00 | % | 1.00 | % |
Ratio of net investment income to average net assets | | 1.00 | %(b) | 1.21 | % | 0.95 | % | 0.95 | % | 1.22 | % | 0.97 | % |
Ratio of expenses (before fee reductions or recoupment of fees previously reimbursed by the investment advisor) to average net assets(c) | | 1.09 | %(b) | 1.10 | % | 1.09 | % | 1.08 | % | 1.14 | % | 1.09 | % |
Portfolio turnover rate | | 9.94 | %(a) | 17.78 | % | 21.31 | % | 12.33 | % | 10.34 | % | 11.06 | % |
Amounts designated as “—” are $0 or have been rounded to $0.
(a) Not annualized for periods less than one year.
(b) Annualized for periods less than one year.
(c) During the periods ending March 31, 2012 through March 31, 2016 and December 31, 2016, certain fees were reduced. If such fee reduction had not occurred, the ratio would have been as indicated.
See Notes to Financial Statements
56
Schedule of Portfolio Investments | | Walden Midcap Fund |
| | December 31, 2016 |
Security Description | | Shares | | Fair Value ($) | |
| | | | | |
COMMON STOCKS (98.9%) | | | | | |
Consumer Discretionary (14.8%) | | | | | |
Advance Auto Parts, Inc. | | 3,000 | | 507,360 | |
Autoliv, Inc. | | 3,750 | | 424,313 | |
Dollar General Corp. | | 6,500 | | 481,455 | |
Hasbro, Inc. | | 4,575 | | 355,889 | |
LKQ Corp. (a) | | 11,500 | | 352,475 | |
Nordstrom, Inc. | | 7,550 | | 361,872 | |
Omnicom Group, Inc. | | 10,000 | | 851,100 | |
O’Reilly Automotive, Inc. (a) | | 1,400 | | 389,774 | |
Polaris Industries, Inc. | | 3,200 | | 263,648 | |
Ross Stores, Inc. | | 12,950 | | 849,520 | |
Sally Beauty Holdings, Inc. (a) | | 19,500 | | 515,190 | |
Williams Sonoma, Inc. | | 8,875 | | 429,461 | |
| | | | 5,782,057 | |
Consumer Staples (6.5%) | | | | | |
Church & Dwight Co., Inc. | | 14,050 | | 620,869 | |
McCormick & Co., Inc. | | 2,725 | | 254,324 | |
Mead Johnson Nutrition Co. | | 5,200 | | 367,952 | |
The Clorox Co. | | 4,500 | | 540,090 | |
The Hershey Co. | | 3,750 | | 387,863 | |
Whole Foods Market, Inc. | | 12,000 | | 369,120 | |
| | | | 2,540,218 | |
Energy (3.8%) | | | | | |
Cabot Oil & Gas Corp. | | 14,375 | | 335,800 | |
Dril-Quip, Inc. (a) | | 7,425 | | 445,871 | |
FMC Technologies, Inc. (a) | | 11,375 | | 404,154 | |
Oceaneering International, Inc. | | 10,200 | | 287,742 | |
| | | | 1,473,567 | |
Financials (15.0%) | | | | | |
American Financial Group, Inc. | | 4,875 | | 429,585 | |
Brown & Brown, Inc. | | 11,000 | | 493,460 | |
Commerce Bancshares, Inc. | | 7,757 | | 448,432 | |
Discover Financial Services | | 6,325 | | 455,969 | |
East West Bancorp, Inc. | | 7,100 | | 360,893 | |
Eaton Vance Corp. | | 9,125 | | 382,155 | |
FactSet Research Systems, Inc. | | 3,175 | | 518,890 | |
Moody’s Corp. | | 3,400 | | 320,518 | |
Northern Trust Corp. | | 9,075 | | 808,128 | |
SEI Investments Co. | | 5,425 | | 267,778 | |
Signature Bank (a) | | 3,725 | | 559,495 | |
T. Rowe Price Group, Inc. | | 5,575 | | 419,575 | |
W. R. Berkley Corp. | | 6,160 | | 409,702 | |
| | | | 5,874,580 | |
Health Care (12.9%) | | | | | |
C.R. Bard, Inc. | | 3,025 | | 679,597 | |
DENTSPLY SIRONA, Inc. | | 5,800 | | 334,834 | |
Laboratory Corp. of America Holdings (a) | | 3,500 | | 449,330 | |
MEDNAX, Inc. (a) | | 3,925 | | 261,641 | |
Mettler-Toledo International, Inc. (a) | | 1,350 | | 565,056 | |
ResMed, Inc. | | 4,425 | | 274,571 | |
STERIS PLC | | 6,300 | | 424,557 | |
The Cooper Companies, Inc. | | 2,575 | | 450,445 | |
Varian Medical Systems, Inc. (a) | | 3,650 | | 327,697 | |
VCA, Inc. (a) | | 6,825 | | 468,536 | |
Waters Corp. (a) | | 2,975 | | 399,810 | |
Zimmer Biomet Holdings, Inc. | | 4,075 | | 420,540 | |
| | | | 5,056,614 | |
Industrials (15.5%) | | | | | |
AMETEK, Inc. | | 9,000 | | 437,400 | |
C.H. Robinson Worldwide, Inc. | | 3,500 | | 256,410 | |
Donaldson Co., Inc. | | 8,875 | | 373,460 | |
Dover Corp. | | 3,875 | | 290,354 | |
Expeditors International of Washington, Inc. | | 5,250 | | 278,040 | |
Genesee & Wyoming, Inc., Class A (a) | | 4,800 | | 333,168 | |
Graco, Inc. | | 3,500 | | 290,815 | |
Hubbell, Inc. | | 5,100 | | 595,170 | |
IDEX Corp. | | 4,775 | | 430,037 | |
Lincoln Electric Holdings, Inc. | | 6,300 | | 483,021 | |
Nordson Corp. | | 5,425 | | 607,870 | |
Sensata Technologies Holding NV (a) | | 9,500 | | 370,025 | |
W.W. Grainger, Inc. | | 3,000 | | 696,750 | |
Wabtec Corp. | | 7,175 | | 595,668 | |
| | | | 6,038,188 | |
Information Technology (13.9%) | | | | | |
Amdocs Ltd. | | 9,500 | | 553,375 | |
Aspen Technology, Inc. (a) | | 6,380 | | 348,858 | |
Check Point Software Technologies Ltd. (a) | | 5,500 | | 464,530 | |
Citrix Systems, Inc. (a) | | 5,150 | | 459,947 | |
DST Systems, Inc. | | 2,775 | | 297,341 | |
F5 Networks, Inc. (a) | | 4,450 | | 644,004 | |
Fiserv, Inc. (a) | | 2,650 | | 281,642 | |
IPG Photonics Corp. (a) | | 4,475 | | 441,727 | |
Juniper Networks, Inc. | | 15,875 | | 448,628 | |
Paychex, Inc. | | 8,000 | | 487,040 | |
TE Connectivity Ltd. | | 9,000 | | 623,520 | |
The Western Union Co. | | 17,200 | | 373,584 | |
| | | | 5,424,196 | |
Materials (5.4%) | | | | | |
AptarGroup, Inc. | | 7,500 | | 550,874 | |
Avery Dennison Corp. | | 7,725 | | 542,450 | |
Ball Corp. | | 5,975 | | 448,543 | |
International Flavors & Fragrances, Inc. | | 4,750 | | 559,693 | |
| | | | 2,101,560 | |
Real Estate (5.5%) | | | | | |
Digital Realty Trust, Inc. | | 4,425 | | 434,801 | |
Host Hotels & Resorts, Inc. | | 23,350 | | 439,914 | |
Jones Lang LaSalle, Inc. | | 4,500 | | 454,680 | |
Lamar Advertising Co., Class A | | 6,000 | | 403,440 | |
Realty Income Corp. | | 7,025 | | 403,797 | |
| | | | 2,136,632 | |
Utilities (5.6%) | | | | | |
American Water Works Co., Inc. | | 4,350 | | 314,766 | |
Consolidated Edison, Inc. | | 7,450 | | 548,916 | |
Eversource Energy | | 12,333 | | 681,152 | |
ONE Gas, Inc. | | 9,900 | | 633,204 | |
| | | | 2,178,038 | |
TOTAL COMMON STOCKS (Cost $28,535,831) | | | | 38,605,650 | |
| | | | | |
INVESTMENT COMPANIES (1.1%) | | | | | |
JPMorgan U.S. Government Money Market Fund, Capital Shares, 0.24%(b) | | 449,117 | | 449,117 | |
TOTAL INVESTMENT COMPANIES (Cost $449,117) | | | | 449,117 | |
| | | | | |
Total Investments (Cost $28,984,948) — 100.0%(c) | | | | 39,054,767 | |
Other assets in excess of liabilities — 0.0% | | | | 3,784 | |
NET ASSETS — 100.0% | | | | $ | 39,058,551 | |
| | | | | | |
(a) Non-income producing security.
(b) Rate disclosed is the seven day yield as of December 31, 2016.
(c) See Federal Tax Information listed in the Notes to the Financial Statements.
See Notes to Financial Statements
57
Financial Statements | | Walden Midcap Fund |
STATEMENT OF ASSETS AND LIABILITIES
December 31, 2016
Assets: | | | |
Investments, at fair value (cost $28,984,948) | | $ | 39,054,767 | |
Dividends receivable | | 36,908 | |
Receivable for tax reclaims | | 555 | |
Prepaid expenses and other assets | | 5,687 | |
Total Assets | | 39,097,917 | |
Liabilities: | | | |
Accrued expenses and other liabilities: | | | |
Investment adviser | | 22,397 | |
Administration and accounting | | 3,705 | |
Chief compliance officer | | 140 | |
Custodian | | 456 | |
Shareholder servicing fees | | 177 | |
Transfer agent | | 5,220 | |
Trustee | | 10 | |
Other | | 7,261 | |
Total Liabilities | | 39,366 | |
Net Assets | | $ | 39,058,551 | |
Composition of Net Assets: | | | |
Capital | | $ | 29,005,988 | |
Accumulated undistributed net investment income | | 4,466 | |
Accumulated net realized losses from investment transactions | | (21,722 | ) |
Net unrealized appreciation from investments | | 10,069,819 | |
Net Assets | | $ | 39,058,551 | |
Shares outstanding (par value $0.01, unlimited number of shares authorized) | | 2,621,510 | |
Net Asset Value, Offering Price and Redemption price per share | | $ | 14.90 | |
STATEMENTS OF OPERATIONS
For the nine months ended December 31, 2016
Investment Income: | | | |
Dividends | | $ | 548,856 | |
Total Investment Income | | 548,856 | |
Expenses: | | | |
Investment adviser | | 208,488 | |
Administration and accounting | | 28,951 | |
Chief compliance officer | | 1,135 | |
Custodian | | 3,683 | |
Shareholder servicing | | 1,667 | |
Transfer agency | | 25,198 | |
Trustee | | 2,231 | |
Other | | 19,903 | |
Total expenses before fee reductions | | 291,256 | |
Fees contractually reduced by the investment adviser | | (12,415 | ) |
Net Expenses | | 278,841 | |
Net Investment Income | | 270,015 | |
Net Realized/Unrealized Gains (Losses) from Investments: | | | |
Net realized gains from investment transactions | | 1,060,526 | |
Change in unrealized appreciation/depreciation from investments | | 1,336,027 | |
Net realized/unrealized gains (losses) from investments | | 2,396,553 | |
Change in Net Assets Resulting from Operations | | $ | 2,666,568 | |
For the year ended March 31, 2016
Investment Income: | | | |
Dividends | | $ | 542,837 | |
Total Investment Income | | 542,837 | |
Expenses: | | | |
Investment adviser | | 256,751 | |
Administration and accounting | | 36,765 | |
Chief compliance officer | | 1,540 | |
Custodian | | 6,501 | |
Shareholder servicing | | 2,013 | |
Transfer agency | | 33,674 | |
Trustee | | 2,333 | |
Other | | 25,085 | |
Total expenses before fee reductions | | 364,662 | |
Fees voluntarily reduced by the transfer agent | | (5,450 | ) |
Fees contractually reduced by the investment adviser | | (17,571 | ) |
Net Expenses | | 341,641 | |
Net Investment Income | | 201,196 | |
Net Realized/Unrealized Gains (Losses) from Investments: | | | |
Net realized gains from investment transactions | | 1,695,089 | |
Change in unrealized appreciation/depreciation from investments | | (1,472,122 | ) |
Net realized/unrealized gains (losses) from investments | | 222,967 | |
Change in Net Assets Resulting from Operations | | $ | 424,163 | |
See Notes to Financial Statements
58
STATEMENTS OF CHANGES IN NET ASSETS
| | For the | | | | | |
| | nine months ended | | For the year ended | | For the year ended | |
| | December 31, 2016 | | March 31, 2016 | | March 31, 2015 | |
| | | | | | | |
Investment Activities: | | | | | | | |
Operations: | | | | | | | |
Net investment income | | $ | 270,015 | | $ | 201,196 | | $ | 110,825 | |
Net realized gains from investment transactions | | 1,060,526 | | 1,695,089 | | 1,063,803 | |
Change in unrealized appreciation/depreciation from investments | | 1,336,027 | | (1,472,122 | ) | 2,571,325 | |
Change in Net Assets Resulting from Operations | | 2,666,568 | | 424,163 | | 3,745,953 | |
Dividends: | | | | | | | |
Net investment income | | (298,358 | ) | (189,252 | ) | (111,033 | ) |
Net realized gains from investment transactions | | (1,581,320 | ) | (1,580,533 | ) | (1,141,232 | ) |
Change in Net Assets Resulting from Shareholder Dividends | | (1,879,678 | ) | (1,769,785 | ) | (1,252,265 | ) |
Capital Share Transactions: | | | | | | | |
Proceeds from shares issued | | 1,818,727 | | 1,992,838 | | 1,601,016 | |
Dividends reinvested | | 1,735,400 | | 1,713,082 | | 1,215,716 | |
Cost of shares redeemed | | (825,866 | ) | (1,775,818 | ) | (928,375 | ) |
Change in Net Assets Resulting from Capital Share Transactions | | 2,728,261 | | 1,930,102 | | 1,888,357 | |
Change in Net Assets | | 3,515,151 | | 584,480 | | 4,382,045 | |
Net Assets: | | | | | | | |
Beginning of period | | 35,543,400 | | 34,958,920 | | 30,576,875 | |
End of period | | $ | 39,058,551 | | $ | 35,543,400 | | $ | 34,958,920 | |
Share Transactions: | | | | | | | |
Issued | | 121,921 | | 136,967 | | 109,555 | |
Reinvested | | 114,775 | | 122,014 | | 83,555 | |
Redeemed | | (55,474 | ) | (121,971 | ) | (64,495 | ) |
Change in shares | | 181,222 | | 137,010 | | 128,615 | |
Accumulated undistributed net investment income | | $ | 4,466 | | $ | 32,810 | | $ | 20,866 | |
See Notes to Financial Statements
59
FINANCIAL HIGHLIGHTS
Selected data for a share outstanding throughout the periods indicated.
| | | | | | | | | | | | Period | |
| | For the nine | | | | | | | | | | August 1, | |
| | months | | For the year | | For the year | | For the year | | For the year | | 2011(d) | |
| | ended | | ended | | ended | | ended | | ended | | through | |
| | December 31, | | March 31, | | March 31, | | March 31, | | March 31, | | March 31, | |
| | 2016 | | 2016 | | 2015 | | 2014 | | 2013 | | 2012 | |
| | | | | | | | | | | | | |
Net Asset Value, Beginning of Period | | $ | 14.57 | | $ | 15.18 | | $ | 14.06 | | $ | 12.06 | | $ | 11.11 | | $ | 10.00 | |
| | | | | | | | | | | | | |
Investment Activities: | | | | | | | | | | | | | |
Operations: | | | | | | | | | | | | | |
Net investment income | | 0.11 | | 0.09 | | 0.05 | | 0.04 | | 0.06 | | 0.02 | |
Net realized and unrealized gains from investment transactions | | 0.97 | | 0.07 | | 1.65 | | 2.08 | | 0.95 | | 1.11 | |
Total from investment activities | | 1.08 | | 0.16 | | 1.70 | | 2.12 | | 1.01 | | 1.13 | |
Dividends: | | | | | | | | | | | | | |
Net investment income | | (0.12 | ) | (0.08 | ) | (0.05 | ) | (0.03 | ) | (0.06 | ) | (0.02 | ) |
Net realized gains from investments | | (0.63 | ) | (0.69 | ) | (0.53 | ) | (0.09 | ) | — | | — | |
Total dividends | | (0.75 | ) | (0.77 | ) | (0.58 | ) | (0.12 | ) | (0.06 | ) | (0.02 | ) |
| | | | | | | | | | | | | |
Net Asset Value, End of Period | | $ | 14.90 | | $ | 14.57 | | $ | 15.18 | | $ | 14.06 | | $ | 12.06 | | $ | 11.11 | |
| | | | | | | | | | | | | |
Total Return | | 7.36 | %(a) | 1.27 | % | 12.25 | % | 17.65 | % | 9.12 | % | 11.33 | %(a) |
| | | | | | | | | | | | | |
Ratios/Supplemental Data: | | | | | | | | | | | | | |
Net assets at end of period (000’s) | | $ | 39,059 | | $ | 35,543 | | $ | 34,959 | | $ | 30,577 | | $ | 24,390 | | $ | 14,213 | |
Ratio of net expenses to average net assets | | 1.00 | %(b) | 1.00 | % | 1.00 | % | 1.00 | % | 1.00 | % | 1.00 | %(b) |
Ratio of net investment income to average net assets | | 0.97 | %(b) | 0.59 | % | 0.35 | % | 0.30 | % | 0.58 | % | 0.34 | %(b) |
Ratio of expenses (before fee reductions or recoupment of fees previously reimbursed by the investment advisor) to average net assets(c) | | 1.04 | %(b) | 1.07 | % | 1.04 | % | 1.04 | % | 1.23 | % | 1.34 | %(b) |
Portfolio turnover rate | | 12.59 | %(a) | 20.10 | % | 16.06 | % | 14.86 | % | 12.32 | % | 8.43 | %(a) |
Amounts designated as “—” are $0 or have been rounded to $0.
(a) Not annualized for periods less than one year.
(b) Annualized for periods less than one year.
(c) During the periods ending March 31, 2012 through March 31, 2016 and December 31, 2016, certain fees were reduced. If such fee reduction had not occurred, the ratio would have been as indicated.
(d) Commencement of operations on August 1, 2011.
See Notes to Financial Statements
60
Schedule of Portfolio Investments | | Walden SMID Cap Fund |
| | December 31, 2016 |
Security Description | | Shares | | Fair Value ($) | |
| | | | | |
COMMON STOCKS (98.9%) | | | | | |
Consumer Discretionary (13.2%) | | | | | |
Big Lots, Inc. | | 9,900 | | 497,079 | |
Brinker International, Inc. | | 5,400 | | 267,462 | |
Cheesecake Factory, Inc. | | 6,900 | | 413,172 | |
Choice Hotels International, Inc. | | 7,400 | | 414,770 | |
Dorman Products, Inc. (a) | | 6,900 | | 504,114 | |
Gentherm, Inc. (a) | | 4,900 | | 165,865 | |
ILG, Inc. | | 12,800 | | 232,576 | |
Nordstrom, Inc. | | 7,900 | | 378,647 | |
Polaris Industries, Inc. | | 2,800 | | 230,692 | |
Sally Beauty Holdings, Inc. (a) | | 10,500 | | 277,410 | |
Tenneco, Inc. (a) | | 4,800 | | 299,856 | |
Texas Roadhouse, Inc. | | 7,500 | | 361,800 | |
The Cato Corp., Class A | | 9,000 | | 270,720 | |
Tiffany & Co. | | 3,900 | | 301,977 | |
Tupperware Brands Corp. | | 2,200 | | 115,764 | |
Williams Sonoma, Inc. | | 6,400 | | 309,696 | |
| | | | 5,041,600 | |
Consumer Staples (2.5%) | | | | | |
Flowers Foods, Inc. | | 24,800 | | 495,256 | |
Whole Foods Market, Inc. | | 15,400 | | 473,704 | |
| | | | 968,960 | |
Energy (3.2%) | | | | | |
Dril-Quip, Inc. (a) | | 3,700 | | 222,185 | |
FMC Technologies, Inc. (a) | | 12,000 | | 426,360 | |
Forum Energy Technologies, Inc. (a) | | 16,800 | | 369,600 | |
Oceaneering International, Inc. | | 7,800 | | 220,038 | |
| | | | 1,238,183 | |
Financials (18.6%) | | | | | |
American Financial Group, Inc. | | 4,700 | | 414,164 | |
Artisan Partners Asset Management, Inc., Class A | | 5,800 | | 172,550 | |
Bank of Hawaii Corp. | | 6,400 | | 567,616 | |
Brown & Brown, Inc. | | 9,400 | | 421,684 | |
Cohen & Steers, Inc. | | 8,400 | | 282,240 | |
Commerce Bancshares, Inc. | | 8,100 | | 468,261 | |
CVB Financial Corp. | | 14,600 | | 334,778 | |
East West Bancorp, Inc. | | 12,100 | | 615,043 | |
Eaton Vance Corp. | | 12,600 | | 527,688 | |
Everest Re Group Ltd. | | 1,750 | | 378,700 | |
FactSet Research Systems, Inc. | | 2,000 | | 326,860 | |
SEI Investments Co. | | 6,300 | | 310,968 | |
Signature Bank (a) | | 3,700 | | 555,740 | |
SVB Financial Group (a) | | 3,700 | | 635,142 | |
Texas Capital Bancshares, Inc. (a) | | 3,600 | | 282,240 | |
UMB Financial Corp. | | 6,200 | | 478,144 | |
W. R. Berkley Corp. | | 4,500 | | 299,295 | |
| | | | 7,071,113 | |
Health Care (12.0%) | | | | | |
Chemed Corp. | | 3,100 | | 497,271 | |
Masimo Corp. (a) | | 4,800 | | 323,520 | |
MEDNAX, Inc. (a) | | 5,300 | | 353,298 | |
Mettler-Toledo International, Inc. (a) | | 1,100 | | 460,416 | |
Owens & Minor, Inc. | | 8,700 | | 307,023 | |
PAREXEL International Corp. (a) | | 5,100 | | 335,172 | |
ResMed, Inc. | | 6,200 | | 384,710 | |
STERIS PLC | | 4,300 | | 289,777 | |
The Cooper Companies, Inc. | | 2,300 | | 402,339 | |
Varian Medical Systems, Inc. (a) | | 5,200 | | 466,856 | |
VCA, Inc. (a) | | 5,300 | | 363,845 | |
Waters Corp. (a) | | 2,800 | | 376,292 | |
| | | | 4,560,519 | |
Industrials (15.9%) | | | | | |
Applied Industrial Technologies, Inc. | | 7,450 | | 442,530 | |
C.H. Robinson Worldwide, Inc. | | 4,900 | | 358,974 | |
CLARCOR, Inc. | | 1,500 | | 123,705 | |
Donaldson Co., Inc. | | 11,000 | | 462,880 | |
Expeditors International of Washington, Inc. | | 7,100 | | 376,016 | |
Franklin Electric Co., Inc. | | 5,900 | | 229,510 | |
Genesee & Wyoming, Inc., Class A (a) | | 3,700 | | 256,817 | |
Hub Group, Inc., Class A (a) | | 4,800 | | 210,000 | |
Hubbell, Inc. | | 4,200 | | 490,140 | |
IDEX Corp. | | 3,200 | | 288,192 | |
Lincoln Electric Holdings, Inc. | | 4,600 | | 352,682 | |
Nordson Corp. | | 4,700 | | 526,635 | |
Sensata Technologies Holding NV (a) | | 5,200 | | 202,540 | |
The Toro Co. | | 7,400 | | 414,030 | |
UniFirst Corp. | | 3,600 | | 517,140 | |
Valmont Industries, Inc. | | 2,200 | | 309,980 | |
Wabtec Corp. | | 5,900 | | 489,818 | |
| | | | 6,051,589 | |
Information Technology (16.4%) | | | | | |
Amdocs Ltd. | | 8,200 | | 477,650 | |
Aspen Technology, Inc. (a) | | 9,000 | | 492,120 | |
DST Systems, Inc. | | 5,400 | | 578,610 | |
F5 Networks, Inc. (a) | | 4,000 | | 578,880 | |
InterDigital, Inc. | | 4,200 | | 383,670 | |
IPG Photonics Corp. (a) | | 6,800 | | 671,228 | |
Juniper Networks, Inc. | | 14,100 | | 398,466 | |
NetApp, Inc. | | 9,400 | | 331,538 | |
NETGEAR, Inc. (a) | | 8,400 | | 456,540 | |
Plantronics, Inc. | | 6,400 | | 350,464 | |
Syntel, Inc. | | 10,700 | | 211,753 | |
Tech Data Corp. (a) | | 3,200 | | 270,976 | |
Teradata Corp. (a) | | 11,600 | | 315,172 | |
The Western Union Co. | | 16,700 | | 362,724 | |
WEX, Inc. (a) | | 3,300 | | 368,280 | |
| | | | 6,248,071 | |
Materials (5.4%) | | | | | |
AptarGroup, Inc. | | 5,300 | | 389,285 | |
Avery Dennison Corp. | | 2,600 | | 182,572 | |
Calgon Carbon Corp. | | 21,700 | | 368,900 | |
International Flavors & Fragrances, Inc. | | 3,300 | | 388,839 | |
Minerals Technologies, Inc. | | 4,000 | | 309,000 | |
Silgan Holdings, Inc. | | 8,400 | | 429,912 | |
| | | | 2,068,508 | |
Real Estate (8.6%) | | | | | |
CoreSite Realty Corp. | | 6,100 | | 484,157 | |
DuPont Fabros Technology, Inc. | | 8,700 | | 382,191 | |
Jones Lang LaSalle, Inc. | | 4,000 | | 404,160 | |
Lamar Advertising Co., Class A | | 4,000 | | 268,960 | |
LaSalle Hotel Properties | | 17,300 | | 527,131 | |
National Health Investors, Inc. | | 4,200 | | 311,514 | |
Ryman Hospitality Properties, Inc. | | 7,300 | | 459,973 | |
Tanger Factory Outlet Centers, Inc. | | 12,700 | | 454,406 | |
| | | | 3,292,492 | |
Utilities (3.1%) | | | | | |
American States Water Co. | | 6,300 | | 287,028 | |
New Jersey Resources Corp. | | 10,000 | | 355,000 | |
ONE Gas, Inc. | | 8,500 | | 543,660 | |
| | | | 1,185,688 | |
TOTAL COMMON STOCKS (Cost $30,628,581) | | | | 37,726,723 | |
| | | | | |
INVESTMENT COMPANIES (2.6%) | | | | | |
JPMorgan U.S. Government Money Market Fund, Capital Shares, 0.24%(b) | | 985,224 | | 985,224 | |
TOTAL INVESTMENT COMPANIES (Cost $985,224) | | | | 985,224 | |
| | | | | |
Total Investments (Cost $31,613,805) — 101.5%(c) | | | | 38,711,947 | |
Liabilities in excess of other assets — (1.5)% | | | | (583,494 | ) |
NET ASSETS — 100.0% | | | | $ | 38,128,453 | |
| | | | | | |
(a) Non-income producing security.
(b) Rate disclosed is the seven day yield as of December 31, 2016.
(c) See Federal Tax Information listed in the Notes to the Financial Statements.
See Notes to Financial Statements
61
Financial Statements | | Walden SMID Cap Fund |
STATEMENT OF ASSETS AND LIABILITIES
December 31, 2016
Assets: | | | |
Investments, at fair value (cost $31,613,805) | | $ | 38,711,947 | |
Dividends receivable | | 47,902 | |
Receivable for investments sold | | 4,013 | |
Receivable for capital shares issued | | 6,000 | |
Prepaid expenses and other assets | | 7,418 | |
Total Assets | | 38,777,280 | |
Liabilities: | | | |
Payable for investments purchased | | 282,580 | |
Payable for capital shares redeemed | | 330,000 | |
Accrued expenses and other liabilities: | | | |
Investment adviser | | 18,869 | |
Administration and accounting | | 3,846 | |
Chief compliance officer | | 132 | |
Custodian | | 391 | |
Shareholder servicing fees | | 497 | |
Transfer agent | | 5,708 | |
Trustee | | 11 | |
Other | | 6,793 | |
Total Liabilities | | 648,827 | |
Net Assets | | $ | 38,128,453 | |
Composition of Net Assets: | | | |
Capital | | $ | 31,040,244 | |
Accumulated undistributed net investment income | | 14,094 | |
Accumulated net realized losses from investment transactions | | (24,027 | ) |
Net unrealized appreciation from investments | | 7,098,142 | |
Net Assets | | $ | 38,128,453 | |
Shares outstanding (par value $0.01, unlimited number of shares authorized) | | 2,612,408 | |
Net Asset Value, Offering Price and Redemption price per share | | $ | 14.60 | |
STATEMENTS OF OPERATIONS
For the nine months ended December 31, 2016
Investment Income: | | | |
Dividends | | $ | 543,631 | |
Total Investment Income | | 543,631 | |
Expenses: | | | |
Investment adviser | | 191,576 | |
Administration and accounting | | 27,001 | |
Chief compliance officer | | 1,065 | |
Custodian | | 3,452 | |
Shareholder servicing | | 6,712 | |
Transfer agency | | 27,420 | |
Trustee | | 2,081 | |
Other | | 28,318 | |
Total expenses before fee reductions | | 287,625 | |
Fees contractually reduced by the investment adviser | | (31,322 | ) |
Net Expenses | | 256,303 | |
Net Investment Income | | 287,328 | |
Net Realized/Unrealized Gains (Losses) from Investments: | | | |
Net realized gains from investment transactions | | 824,662 | |
Change in unrealized appreciation/depreciation from investments | | 3,678,759 | |
Net realized/unrealized gains (losses) from investments | | 4,503,421 | |
Change in Net Assets Resulting from Operations | | $ | 4,790,749 | |
For the year ended March 31, 2016
Investment Income: | | | |
Dividends | | $ | 370,431 | |
Total Investment Income | | 370,431 | |
Expenses: | | | |
Investment adviser | | 213,832 | |
Administration and accounting | | 30,932 | |
Chief compliance officer | | 1,264 | |
Custodian | | 5,531 | |
Shareholder servicing | | 6,787 | |
Transfer agency | | 35,400 | |
Trustee | | 1,912 | |
Registration | | 19,304 | |
Other | | 12,395 | |
Total expenses before fee reductions | | 327,357 | |
Fees voluntarily reduced by the transfer agent | | (5,450 | ) |
Fees contractually reduced by the investment adviser | | (37,277 | ) |
Net Expenses | | 284,630 | |
Net Investment Income | | 85,801 | |
Net Realized/Unrealized Gains (Losses) from Investments: | | | |
Net realized gains from investment transactions | | 2,067,072 | |
Change in unrealized appreciation/depreciation from investments | | (2,573,638 | ) |
Net realized/unrealized gains (losses) from investments | | (506,566 | ) |
Change in Net Assets Resulting from Operations | | $ | (420,765 | ) |
See Notes to Financial Statements
62
STATEMENTS OF CHANGES IN NET ASSETS
| | For the | | | | | |
| | nine months ended | | For the year ended | | For the year ended | |
| | December 31, 2016 | | March 31, 2016 | | March 31, 2015 | |
| | | | | | | |
Investment Activities: | | | | | | | |
Operations: | | | | | | | |
Net investment income | | $ | 287,328 | | $ | 85,801 | | $ | 21,855 | |
Net realized gains from investment transactions | | 824,662 | | 2,067,072 | | 647,642 | |
Change in unrealized appreciation/depreciation from investments | | 3,678,759 | | (2,573,638 | ) | 1,348,173 | |
Change in Net Assets Resulting from Operations | | 4,790,749 | | (420,765 | ) | 2,017,670 | |
Dividends: | | | | | | | |
Net investment income | | (335,455 | ) | (46,429 | ) | (9,861 | ) |
Net realized gains from investment transactions | | (1,605,637 | ) | (1,794,699 | ) | (563,783 | ) |
Change in Net Assets Resulting from Shareholder Dividends | | (1,941,092 | ) | (1,841,128 | ) | (573,644 | ) |
Capital Share Transactions: | | | | | | | |
Proceeds from shares issued | | 4,827,253 | | 7,159,481 | | 3,707,064 | |
Dividends reinvested | | 1,350,333 | | 1,419,506 | | 427,587 | |
Cost of shares redeemed | | (3,350,858 | ) | (2,234,323 | ) | (2,989,167 | ) |
Change in Net Assets Resulting from Capital Share Transactions | | 2,826,728 | | 6,344,664 | | 1,145,484 | |
Change in Net Assets | | 5,676,385 | | 4,082,771 | | 2,589,510 | |
Net Assets: | | | | | | | |
Beginning of period | | 32,452,068 | | 28,369,297 | | 25,779,787 | |
End of period | | $ | 38,128,453 | | $ | 32,452,068 | | $ | 28,369,297 | |
Share Transactions: | | | | | | | |
Issued | | 338,923 | | 543,712 | | 269,872 | |
Reinvested | | 90,687 | | 109,954 | | 31,188 | |
Redeemed | | (239,469 | ) | (161,080 | ) | (216,671 | ) |
Change in shares | | 190,141 | | 492,586 | | 84,389 | |
Accumulated undistributed net investment income | | $ | 14,094 | | $ | 53,299 | | $ | 14,876 | |
See Notes to Financial Statements
63
FINANCIAL HIGHLIGHTS
Selected data for a share outstanding throughout the periods indicated.
| | For the nine | | | | | | | | Period | |
| | months | | For the year | | For the year | | For the year | | June 28, 2012 | |
| | ended | | ended | | ended | | ended | | through | |
| | December 31, | | March 31, | | March 31, | | March 31, | | March 31, | |
| | 2016 | | 2016 | | 2015 | | 2014 | | 2013 | |
| | | | | | | | | | | |
Net Asset Value, Beginning of Period | | $ | 13.40 | | $ | 14.70 | | $ | 13.97 | | $ | 12.09 | | $ | 10.00 | |
| | | | | | | | | | | |
Investment Activities: | | | | | | | | | | | |
Operations: | | | | | | | | | | | |
Net investment income | | 0.12 | | 0.04 | | 0.01 | | (0.01 | ) | 0.03 | |
Net realized and unrealized gains (losses) from investment transactions | | 1.87 | | (0.44 | ) | 1.03 | | 2.38 | | 2.09 | |
Total from investment activities | | 1.99 | | (0.40 | ) | 1.04 | | 2.37 | | 2.12 | |
Dividends: | | | | | | | | | | | |
Net investment income | | (0.14 | ) | (0.02 | ) | (0.01 | ) | — | | (0.03 | ) |
Net realized gains from investments | | (0.65 | ) | (0.88 | ) | (0.30 | ) | (0.49 | ) | — | |
Total dividends | | (0.79 | ) | (0.90 | ) | (0.31 | ) | (0.49 | ) | (0.03 | ) |
| | | | | | | | | | | |
Net Asset Value, End of Period | | $ | 14.60 | | $ | 13.40 | | $ | 14.70 | | $ | 13.97 | | $ | 12.09 | |
| | | | | | | | | | | |
Total Return | | 14.73 | %(a) | (2.47 | )% | 7.60 | % | 19.68 | % | 21.28 | %(a) |
| | | | | | | | | | | |
Ratios/Supplemental Data: | | | | | | | | | | | |
Net assets at end of period (000’s) | | $ | 38,128 | | $ | 32,452 | | $ | 28,369 | | $ | 25,780 | | $ | 20,458 | |
Ratio of net expenses to average net assets | | 1.00 | %(b) | 1.00 | % | 1.00 | % | 1.00 | % | 1.00 | %(b) |
Ratio of net investment income to average net assets | | 1.12 | %(b) | 0.30 | % | 0.08 | % | (0.05 | )% | 0.43 | %(b) |
Ratio of expenses (before fee reductions or recoupment of fees previously reimbursed by the investment advisor) to average net assets(c) | | 1.12 | %(b) | 1.15 | % | 1.12 | % | 1.12 | % | 1.60 | %(b) |
Portfolio turnover rate | | 20.85 | %(a) | 43.24 | % | 33.61 | % | 51.57 | % | 13.31 | %(a) |
Amounts designated as “—” are $0 or have been rounded to $0.
(a) Not annualized for periods less than one year.
(b) Annualized for periods less than one year.
(c) During the periods ending March 31, 2012 through March 31, 2016 and December 31, 2016, certain fees were reduced. If such fee reduction had not occurred, the ratio would have been as indicated.
See Notes to Financial Statements
64
Schedule of Portfolio Investments | | Walden Small Cap Fund |
| | December 31, 2016 |
Security Description | | Shares | | Fair Value ($) | |
| | | | | |
COMMON STOCKS (98.9%) | | | | | |
Consumer Discretionary (13.6%) | | | | | |
Big Lots, Inc. | | 22,500 | | 1,129,725 | |
Brinker International, Inc. | | 12,200 | | 604,266 | |
Cheesecake Factory, Inc. | | 18,300 | | 1,095,804 | |
Choice Hotels International, Inc. | | 23,600 | | 1,322,779 | |
Dorman Products, Inc. (a) | | 17,975 | | 1,313,254 | |
Fossil Group, Inc. (a) | | 10,100 | | 261,186 | |
Gentherm, Inc. (a) | | 14,800 | | 500,980 | |
ILG, Inc. | | 41,800 | | 759,506 | |
Sally Beauty Holdings, Inc. (a) | | 35,700 | | 943,194 | |
Tenneco, Inc. (a) | | 13,875 | | 866,771 | |
Texas Roadhouse, Inc. | | 17,100 | | 824,904 | |
The Cato Corp., Class A | | 24,900 | | 748,992 | |
Tupperware Brands Corp. | | 6,725 | | 353,870 | |
Williams Sonoma, Inc. | | 17,000 | | 822,630 | |
| | | | 11,547,861 | |
Consumer Staples (3.0%) | | | | | |
Flowers Foods, Inc. | | 40,400 | | 806,788 | |
Tootsie Roll Industries, Inc. | | 21,700 | | 862,575 | |
United Natural Foods, Inc. (a) | | 17,775 | | 848,223 | |
| | | | 2,517,586 | |
Energy (2.9%) | | | | | |
Dril-Quip, Inc. (a) | | 9,275 | | 556,964 | |
Forum Energy Technologies, Inc. (a) | | 42,600 | | 937,200 | |
Natural Gas Services Group, Inc. (a) | | 15,100 | | 485,465 | |
Oceaneering International, Inc. | | 17,675 | | 498,612 | |
| | | | 2,478,241 | |
Financials (17.9%) | | | | | |
1st Source Corp. | | 9,400 | | 419,804 | |
Artisan Partners Asset Management, Inc., Class A | | 21,500 | | 639,625 | |
Bank of Hawaii Corp. | | 19,100 | | 1,693,979 | |
Cohen & Steers, Inc. | | 23,100 | | 776,160 | |
Commerce Bancshares, Inc. | | 20,580 | | 1,189,730 | |
CVB Financial Corp. | | 32,700 | | 749,811 | |
Eagle Bancorp, Inc. (a) | | 10,600 | | 646,070 | |
Eaton Vance Corp. | | 30,000 | | 1,256,400 | |
Horace Mann Educators Corp. | | 14,725 | | 630,230 | |
Independent Bank Corp. | | 14,600 | | 1,028,570 | |
Infinity Property & Casualty Corp. | | 8,600 | | 755,940 | |
Lakeland Financial Corp. | | 14,512 | | 687,288 | |
Morningstar, Inc. | | 8,400 | | 617,904 | |
Texas Capital Bancshares, Inc. (a) | | 9,275 | | 727,160 | |
Tompkins Financial Corp. | | 6,400 | | 605,056 | |
Trustmark Corp. | | 18,500 | | 659,525 | |
UMB Financial Corp. | | 15,450 | | 1,191,504 | |
Washington Federal, Inc. | | 20,000 | | 687,000 | |
Washington Trust BanCorp, Inc. | | 5,000 | | 280,250 | |
| | | | 15,242,006 | |
Health Care (13.9%) | | | | | |
Air Methods Corp. (a) | | 16,800 | | 535,080 | |
Anika Therapeutics, Inc. (a) | | 16,300 | | 798,048 | |
Atrion Corp. | | 1,050 | | 532,560 | |
Bio-Techne Corp. | | 5,900 | | 606,697 | |
Bruker Corp. | | 40,000 | | 847,200 | |
Chemed Corp. | | 8,100 | | 1,299,321 | |
CorVel Corp. (a) | | 8,875 | | 324,825 | |
Ensign Group, Inc. | | 30,100 | | 668,521 | |
Globus Medical, Inc., Class A (a) | | 23,400 | | 580,554 | |
Haemonetics Corp. (a) | | 18,775 | | 754,755 | |
Masimo Corp. (a) | | 19,200 | | 1,294,080 | |
Meridian Bioscience, Inc. | | 44,600 | | 789,420 | |
Owens & Minor, Inc. | | 31,200 | | 1,101,048 | |
PAREXEL International Corp. (a) | | 11,500 | | 755,780 | |
U.S. Physical Therapy, Inc. | | 13,900 | | 975,780 | |
| | | | 11,863,669 | |
Industrials (14.7%) | | | | | |
Applied Industrial Technologies, Inc. | | 22,500 | | 1,336,500 | |
Chart Industries, Inc. (a) | | 15,000 | | 540,300 | |
CLARCOR, Inc. | | 5,300 | | 437,091 | |
Donaldson Co., Inc. | | 18,000 | | 757,440 | |
Franklin Electric Co., Inc. | | 25,000 | | 972,500 | |
Genesee & Wyoming, Inc., Class A (a) | | 5,200 | | 360,932 | |
Herman Miller, Inc. | | 19,075 | | 652,365 | |
Hub Group, Inc., Class A (a) | | 18,600 | | 813,750 | |
Landstar System, Inc. | | 11,200 | | 955,360 | |
Lincoln Electric Holdings, Inc. | | 9,700 | | 743,699 | |
Nordson Corp. | | 6,100 | | 683,505 | |
Tennant Co. | | 16,500 | | 1,174,800 | |
The Toro Co. | | 17,200 | | 962,340 | |
UniFirst Corp. | | 8,800 | | 1,264,120 | |
Valmont Industries, Inc. | | 6,375 | | 898,238 | |
| | | | 12,552,940 | |
Information Technology (18.2%) | | | | | |
Aspen Technology, Inc. (a) | | 23,150 | | 1,265,842 | |
Coherent, Inc. (a) | | 7,275 | | 999,476 | |
DHI Group, Inc. (a) | | 74,250 | | 464,063 | |
DST Systems, Inc. | | 11,050 | | 1,184,007 | |
ExlService Holdings, Inc. (a) | | 14,475 | | 730,119 | |
InterDigital, Inc. | | 13,825 | | 1,262,913 | |
IPG Photonics Corp. (a) | | 11,900 | | 1,174,649 | |
NETGEAR, Inc. (a) | | 17,700 | | 961,995 | |
NIC, Inc. | | 53,500 | | 1,278,650 | |
Plantronics, Inc. | | 21,200 | | 1,160,912 | |
Power Integrations, Inc. | | 13,875 | | 941,419 | |
Syntel, Inc. | | 24,300 | | 480,897 | |
Tech Data Corp. (a) | | 9,900 | | 838,332 | |
Teradata Corp. (a) | | 31,300 | | 850,421 | |
Ubiquiti Networks, Inc. (a) | | 15,075 | | 871,335 | |
WEX, Inc. (a) | | 9,000 | | 1,004,400 | |
| | | | 15,469,430 | |
Materials (4.7%) | | | | | |
AptarGroup, Inc. | | 7,000 | | 514,150 | |
Calgon Carbon Corp. | | 33,900 | | 576,300 | |
Minerals Technologies, Inc. | | 16,475 | | 1,272,694 | |
Quaker Chemical Corp. | | 4,850 | | 620,509 | |
Silgan Holdings, Inc. | | 20,000 | | 1,023,600 | |
| | | | 4,007,253 | |
Real Estate (6.6%) | | | | | |
CoreSite Realty Corp. | | 13,650 | | 1,083,401 | |
DuPont Fabros Technology, Inc. | | 20,000 | | 878,600 | |
LaSalle Hotel Properties | | 29,800 | | 908,006 | |
National Health Investors, Inc. | | 9,475 | | 702,761 | |
Ryman Hospitality Properties, Inc. | | 14,500 | | 913,645 | |
Tanger Factory Outlet Centers, Inc. | | 31,550 | | 1,128,858 | |
| | | | 5,615,271 | |
Utilities (3.4%) | | | | | |
American States Water Co. | | 12,100 | | 551,276 | |
New Jersey Resources Corp. | | 22,700 | | 805,850 | |
ONE Gas, Inc. | | 24,550 | | 1,570,218 | |
| | | | 2,927,344 | |
TOTAL COMMON STOCKS (Cost $65,059,149) | | | | 84,221,601 | |
| | | | | |
INVESTMENT COMPANIES (1.1%) | | | | | |
JPMorgan U.S. Government Money Market Fund, Capital Shares, 0.24%(b) | | 943,357 | | 943,357 | |
TOTAL INVESTMENT COMPANIES (Cost $943,357) | | | | 943,357 | |
| | | | | |
Total Investments (Cost $66,002,506) — 100.0%(c) | | | | 85,164,958 | |
Other assets in excess of liabilities — 0.0% | | | | 33,810 | |
NET ASSETS — 100.0% | | | | $ | 85,198,768 | |
| | | | | | |
(a) Non-income producing security.
(b) Rate disclosed is the seven day yield as of December 31, 2016.
(c) See Federal Tax Information listed in the Notes to the Financial Statements.
See Notes to Financial Statements
65
Financial Statements | | Walden Small Cap Fund |
STATEMENT OF ASSETS AND LIABILITIES
December 31, 2016
Assets: | | | |
Investments, at fair value (cost $66,002,506) | | $ | 85,164,958 | |
Dividends receivable | | 104,764 | |
Receivable for capital shares issued | | 125 | |
Prepaid expenses and other assets | | 11,439 | |
Total Assets | | 85,281,286 | |
Liabilities: | | | |
Accrued expenses and other liabilities: | | | |
Investment adviser | | 47,600 | |
Administration and accounting | | 8,691 | |
Chief compliance officer | | 304 | |
Custodian | | 935 | |
Shareholder servicing fees | | 3,362 | |
Transfer agent | | 5,786 | |
Trustee | | 25 | |
Other | | 15,815 | |
Total Liabilities | | 82,518 | |
Net Assets | | $ | 85,198,768 | |
Composition of Net Assets: | | | |
Capital | | $ | 65,079,446 | |
Accumulated undistributed net investment income | | 49,717 | |
Accumulated net realized gains from investment transactions | | 907,153 | |
Net unrealized appreciation from investments | | 19,162,452 | |
Net Assets | | $ | 85,198,768 | |
Shares outstanding (par value $0.01, unlimited number of shares authorized) | | 4,615,347 | |
Net Asset Value, Offering Price and Redemption price per share | | $ | 18.46 | |
STATEMENTS OF OPERATIONS
For the nine months ended December 31, 2016
Investment Income: | | | |
Dividends | | $ | 1,230,919 | |
Total Investment Income | | 1,230,919 | |
Expenses: | | | |
Investment adviser | | 430,421 | |
Administration and accounting | | 60,059 | |
Chief compliance officer | | 2,343 | |
Custodian | | 7,677 | |
Shareholder servicing | | 34,851 | |
Transfer agency | | 27,743 | |
Trustee | | 4,587 | |
Other | | 45,040 | |
Total expenses before fee reductions | | 612,721 | |
Fees contractually reduced by the investment adviser | | (36,830 | ) |
Net Expenses | | 575,891 | |
Net Investment Income | | 655,028 | |
Net Realized/Unrealized Gains (Losses) from Investments: | | | |
Net realized gains from investment transactions | | 1,896,069 | |
Change in unrealized appreciation/depreciation from investments | | 9,644,974 | |
Net realized/unrealized gains (losses) from investments | | 11,541,043 | |
Change in Net Assets Resulting from Operations | | $ | 12,196,071 | |
For the year ended March 31, 2016
Investment Income: | | | |
Dividends | | $ | 1,097,637 | |
Total Investment Income | | 1,097,637 | |
Expenses: | | | |
Investment adviser | | 570,604 | |
Administration and accounting | | 81,085 | |
Chief compliance officer | | 3,516 | |
Custodian | | 13,570 | |
Shareholder servicing | | 44,984 | |
Transfer agency | | 38,434 | |
Trustee | | 5,375 | |
Other | | 48,838 | |
Total expenses before fee reductions | | 806,406 | |
Fees voluntarily reduced by the transfer agent | | (5,450 | ) |
Fees contractually reduced by the investment adviser | | (42,280 | ) |
Net Expenses | | 758,676 | |
Net Investment Income | | 338,961 | |
Net Realized/Unrealized Gains (Losses) from Investments: | | | |
Net realized gains from investment transactions | | 7,497,629 | |
Change in unrealized appreciation/depreciation from investments | | (9,256,458 | ) |
Net realized/unrealized gains (losses) from investments | | (1,758,829 | ) |
Change in Net Assets Resulting from Operations | | $ | (1,419,868 | ) |
See Notes to Financial Statements
66
STATEMENTS OF CHANGES IN NET ASSETS
| | For the | | | | | |
| | nine months ended | | For the year ended | | For the year ended | |
| | December 31, 2016 | | March 31, 2016 | | March 31, 2015 | |
| | | | | | | |
Investment Activities: | | | | | | | |
Operations: | | | | | | | |
Net investment income | | $ | 655,028 | | $ | 338,961 | | $ | 155,409 | |
Net realized gains from investment transactions | | 1,896,069 | | 7,497,629 | | 9,520,835 | |
Change in unrealized appreciation/depreciation from investments | | 9,644,974 | | (9,256,458 | ) | (6,724,294 | ) |
Change in Net Assets Resulting from Operations | | 12,196,071 | | (1,419,868 | ) | 2,951,950 | |
Dividends: | | | | | | | |
Net investment income | | (784,955 | ) | (296,905 | ) | (72,438 | ) |
Net realized gains from investment transactions | | (2,494,801 | ) | (11,528,479 | ) | (6,685,832 | ) |
Change in Net Assets Resulting from Shareholder Dividends | | (3,279,756 | ) | (11,825,384 | ) | (6,758,270 | ) |
Capital Share Transactions: | | | | | | | |
Proceeds from shares issued | | 6,739,873 | | 2,460,171 | | 1,632,009 | |
Proceeds from shares issued in subscription in-kind(a) | | — | | — | | 5,484,961 | |
Dividends reinvested | | 2,655,254 | | 9,605,667 | | 5,542,266 | |
Cost of shares redeemed | | (2,866,880 | ) | (16,806,854 | ) | (24,903,218 | ) |
Change in Net Assets Resulting from Capital Share Transactions | | 6,528,247 | | (4,741,016 | ) | (12,243,982 | ) |
Change in Net Assets | | 15,444,562 | | (17,986,268 | ) | (16,050,302 | ) |
Net Assets: | | | | | | | |
Beginning of period | | 69,754,206 | | 87,740,474 | | 103,790,776 | |
End of period | | $ | 85,198,768 | | $ | 69,754,206 | | $ | 87,740,474 | |
Share Transactions: | | | | | | | |
Issued | | 398,334 | | 149,403 | | 82,515 | |
Issued in subscriptions in-kind(a) | | — | | — | | 274,111 | |
Reinvested | | 141,012 | | 612,606 | | 298,292 | |
Redeemed | | (164,119 | ) | (985,635 | ) | (1,270,991 | ) |
Change in shares | | 375,227 | | (223,626 | ) | (616,073 | ) |
Accumulated undistributed net investment income | | $ | 49,717 | | $ | 140,930 | | $ | 118,440 | |
Amounts designated as “—” are $0 or have been rounded to $0.
(a) See Note 3 to Financial Statements.
See Notes to Financial Statements
67
FINANCIAL HIGHLIGHTS
Selected data for a share outstanding throughout the periods indicated.
| | For the nine | | | | | | | | | | | |
| | months | | For the year | | For the year | | For the year | | For the year | | For the year | |
| | ended | | ended | | ended | | ended | | ended | | ended | |
| | December 31, | | March 31, | | March 31, | | March 31, | | March 31, | | March 31, | |
| | 2016 | | 2016 | | 2015 | | 2014 | | 2013 | | 2012 | |
| | | | | | | | | | | | | |
Net Asset Value, Beginning of Period | | $ | 16.45 | | $ | 19.66 | | $ | 20.43 | | $ | 18.48 | | $ | 16.92 | | $ | 17.64 | |
| | | | | | | | | | | | | |
Investment Activities: | | | | | | | | | | | | | |
Operations: | | | | | | | | | | | | | |
Net investment income | | 0.16 | | 0.08 | | 0.04 | | 0.01 | | 0.07 | | 0.01 | |
Net realized and unrealized gains (losses) from investment transactions | | 2.58 | | (0.38 | ) | 0.66 | | 3.42 | | 1.93 | | 0.27 | |
Total from investment activities | | 2.74 | | (0.30 | ) | 0.70 | | 3.43 | | 2.00 | | 0.28 | |
Dividends: | | | | | | | | | | | | | |
Net investment income | | (0.17 | ) | (0.07 | ) | (0.02 | ) | — | | (0.07 | ) | (0.02 | ) |
Net realized gains from investments | | (0.56 | ) | (2.84 | ) | (1.45 | ) | (1.48 | ) | (0.37 | ) | (0.98 | ) |
Total dividends | | (0.73 | ) | (2.91 | ) | (1.47 | ) | (1.48 | ) | (0.44 | ) | (1.00 | ) |
| | | | | | | | | | | | | |
Net Asset Value, End of Period | | $ | 18.46 | | $ | 16.45 | | $ | 19.66 | | $ | 20.43 | | $ | 18.48 | | $ | 16.92 | |
| | | | | | | | | | | | | |
Total Return | | 16.57 | %(a) | (0.80 | )% | 3.86 | % | 18.58 | % | 12.05 | % | 2.28 | % |
| | | | | | | | | | | | | |
Ratios/Supplemental Data: | | | | | | | | | | | | | |
Net assets at end of period (000’s) | | $ | 85,199 | | $ | 69,754 | | $ | 87,740 | | $ | 103,791 | | $ | 95,233 | | $ | 69,544 | |
Ratio of net expenses to average net assets | | 1.00 | %(b) | 1.00 | % | 1.00 | % | 1.00 | % | 1.00 | % | 1.00 | % |
Ratio of net investment income to average net assets | | 1.14 | %(b) | 0.45 | % | 0.17 | % | 0.03 | % | 0.40 | % | 0.06 | % |
Ratio of expenses (before fee reductions or recoupment of fees previously reimbursed by the investment advisor) to average net assets(c) | | 1.06 | %(b) | 1.06 | % | 1.01 | % | 1.05 | % | 1.09 | % | 1.15 | % |
Portfolio turnover rate | | 14.71 | %(a) | 38.05 | % | 28.74 | % | 36.60 | % | 31.98 | % | 24.62 | % |
Amounts designated as “—” are $0 or have been rounded to $0.
(a) Not annualized for periods less than one year.
(b) Annualized for periods less than one year.
(c) During the periods ending March 31, 2012 through March 31, 2016 and December 31, 2016, certain fees were reduced. If such fee reduction had not occurred, the ratio would have been as indicated.
See Notes to Financial Statements
68
Schedule of Portfolio Investments | | Walden International Equity Fund |
| | December 31, 2016 |
Security Description | | Shares | | Fair Value ($) | |
| | | | | |
COMMON STOCKS (99.0%) | | | | | |
Australia (6.3%) | | | | | |
Australia & New Zealand Banking Group Ltd. | | 5,000 | | 109,433 | |
Brambles Ltd. | | 10,612 | | 94,683 | |
Commonwealth Bank of Australia | | 2,900 | | 172,004 | |
CSL Ltd. | | 1,803 | | 130,366 | |
Origin Energy Ltd. | | 24,200 | | 114,473 | |
Telstra Corp. Ltd. | | 24,807 | | 91,139 | |
Westpac Banking Corp. | | 4,734 | | 111,102 | |
Woodside Petroleum Ltd. | | 4,855 | | 108,721 | |
| | | | 931,921 | |
Belgium (0.7%) | | | | | |
Colruyt SA | | 1,991 | | 98,391 | |
| | | | 98,391 | |
Canada (8.9%) | | | | | |
Bank of Montreal | | 1,695 | | 121,926 | |
BCE, Inc. | | 2,298 | | 99,332 | |
Canadian National Railway Co. | | 1,635 | | 110,047 | |
Great-West Lifeco, Inc. | | 4,143 | | 108,536 | |
IGM Financial, Inc. | | 3,913 | | 111,342 | |
Intact Financial Corp. | | 1,398 | | 100,073 | |
Magna International, Inc. | | 2,576 | | 111,867 | |
Metro, Inc. | | 3,018 | | 90,281 | |
Rogers Communications, Inc., Class B | | 2,385 | | 92,007 | |
Royal Bank of Canada | | 2,020 | | 136,728 | |
The Bank of Nova Scotia | | 2,020 | | 112,488 | |
The Toronto-Dominion Bank | | 2,451 | | 120,898 | |
| | | | 1,315,525 | |
Denmark (1.3%) | | | | | |
Novo Nordisk A/S | | 2,430 | | 87,185 | |
Novozymes A/S | | 2,873 | | 98,884 | |
| | | | 186,069 | |
Finland (0.7%) | | | | | |
Kone OYJ | | 2,380 | | 106,332 | |
| | | | 106,332 | |
France (8.8%) | | | | | |
Air Liquide SA | | 906 | | 100,732 | |
AXA SA | | 4,979 | | 125,497 | |
Danone SA | | 1,600 | | 101,231 | |
Dassault Systemes | | 1,264 | | 96,197 | |
Essilor International SA | | 794 | | 89,573 | |
Imerys SA | | 1,464 | | 110,900 | |
Legrand SA | | 1,702 | | 96,549 | |
L’Oreal SA | | 600 | | 109,343 | |
Publicis Groupe SA | | 1,515 | | 104,375 | |
Schneider Electric SE | | 1,900 | | 131,971 | |
Suez Environnement Co. | | 6,790 | | 100,033 | |
Technip SA | | 1,760 | | 125,350 | |
| | | | 1,291,751 | |
Germany (8.4%) | | | | | |
Allianz SE | | 710 | | 117,161 | |
Beiersdorf AG | | 1,103 | | 93,419 | |
Deutsche Boerse AG | | 1,245 | | 99,878 | |
Fresenius SE & Co. KGaA | | 1,416 | | 110,447 | |
Fuchs Petrolub SE | | 2,475 | | 103,661 | |
Hannover Rueck SE | | 990 | | 106,932 | |
Henkel AG & Co. KGaA | | 1,000 | | 104,058 | |
Linde AG | | 580 | | 95,128 | |
Merck KGaA | | 1,090 | | 113,475 | |
Muenchener Rueckversicherungs-Gesellschaft AG | | 562 | | 106,134 | |
SAP AG | | 2,200 | | 190,284 | |
| | | | 1,240,577 | |
Hong Kong (2.7%) | | | | | |
Hang Lung Properties Ltd. | | 47,400 | | 99,955 | |
Hang Seng Bank Ltd. | | 5,920 | | 109,789 | |
Li & Fung Ltd. | | 198,000 | | 86,780 | |
MTR Corp. Ltd. | | 20,370 | | 98,764 | |
| | | | 395,288 | |
Ireland (0.7%) | | | | | |
Experian PLC | | 5,419 | | 104,903 | |
| | | | 104,903 | |
Israel (1.3%) | | | | | |
Check Point Software Technologies Ltd.(a) | | 1,294 | | 109,292 | |
Nice Systems, Ltd. | | 1,096 | | 75,237 | |
| | | | 184,529 | |
Italy (1.5%) | | | | | |
Luxottica Group SpA | | 2,500 | | 134,346 | |
Snam SpA | | 20,137 | | 82,809 | |
| | | | 217,155 | |
Japan (21.1%) | | | | | |
Astellas Pharma, Inc. | | 6,550 | | 90,882 | |
Benesse Holdings, Inc. | | 4,360 | | 119,806 | |
Canon, Inc. | | 3,475 | | 97,876 | |
Central Japan Railway Co. | | 615 | | 100,990 | |
Chugai Pharmaceutical Co. Ltd. | | 3,200 | | 91,801 | |
Daiwa House Industry Co. Ltd. | | 4,290 | | 117,005 | |
Denso Corp. | | 2,435 | | 105,343 | |
East Japan Railway Co. | | 1,225 | | 105,632 | |
Fast Retailing Co. Ltd. | | 305 | | 108,907 | |
INPEX Corp. | | 12,675 | | 126,713 | |
JSR Corp. | | 8,700 | | 136,959 | |
KDDI Corp. | | 4,100 | | 103,550 | |
Mitsubishi Electric Corp. | | 8,175 | | 113,722 | |
Nippon Telegraph & Telephone Corp. | | 2,380 | | 100,199 | |
Nitto Denko Corp. | | 1,900 | | 145,485 | |
Nomura Research Institute Ltd. | | 3,388 | | 102,980 | |
NTT DOCOMO, Inc. | | 4,410 | | 100,320 | |
Oracle Corporation Japan | | 1,800 | | 90,559 | |
Oriental Land Co. Ltd. | | 1,725 | | 97,374 | |
Secom Co. Ltd. | | 1,435 | | 104,860 | |
Sumitomo Mitsui Financial Group, Inc. | | 2,450 | | 93,315 | |
Terumo Corp. | | 2,800 | | 103,236 | |
The Chiba Bank Ltd. | | 20,245 | | 124,121 | |
The Hachijuni Bank Ltd. | | 21,240 | | 122,918 | |
The Shizuoka Bank Ltd. | | 14,180 | | 119,022 | |
Tokio Marine Holdings, Inc. | | 2,650 | | 108,513 | |
Toyota Motor Corp. | | 1,700 | | 99,681 | |
Yahoo Japan Corp. | | 24,535 | | 93,980 | |
Yamato Holdings Co. Ltd. | | 4,675 | | 94,779 | |
| | | | 3,120,528 | |
Luxembourg (1.0%) | | | | | |
Tenaris SA | | 8,480 | | 151,351 | |
| | | | 151,351 | |
Netherlands (3.7%) | | | | | |
Akzo Nobel NV | | 1,787 | | 111,648 | |
Koninklijke Ahold Delhaize NV | | 8,228 | | 173,281 | |
Koninklijke Vopak NV | | 2,166 | | 102,177 | |
Wolters Kluwer NV | | 4,171 | | 150,840 | |
| | | | 537,946 | |
Norway (0.8%) | | | | | |
Statoil ASA | | 6,461 | | 118,005 | |
| | | | 118,005 | |
See Notes to Financial Statements
69
Security Description | | Shares | | Fair Value ($) | |
| | | | | |
COMMON STOCKS, CONTINUED | | | | | |
Singapore (1.2%) | | | | | |
ComfortDelGro Corp. Ltd. | | 48,150 | | 81,840 | |
Singapore Exchange Ltd. | | 18,680 | | 92,137 | |
| | | | 173,977 | |
Spain (3.1%) | | | | | |
Banco Bilbao Vizcaya Argentaria SA | | 16,788 | | 113,117 | |
Bankinter SA | | 14,004 | | 108,284 | |
Gas Natural SDG SA | | 4,843 | | 91,100 | |
Inditex SA | | 4,067 | | 138,526 | |
| | | | 451,027 | |
Sweden (3.0%) | | | | | |
ASSA Abloy AB | | 4,656 | | 86,191 | |
Atlas Copco AB | | 4,000 | | 121,400 | |
Nordea Bank AB | | 10,703 | | 118,648 | |
Svenska Handelsbanken AB | | 8,480 | | 117,503 | |
| | | | 443,742 | |
Switzerland (8.2%) | | | | | |
ABB Ltd. | | 4,575 | | 96,294 | |
Cie Financiere Richemont SA | | 1,663 | | 109,941 | |
Givaudan SA | | 51 | | 93,366 | |
Nestle SA | | 4,529 | | 324,543 | |
Novartis AG | | 2,900 | | 210,960 | |
Roche Holding AG | | 1,170 | | 266,784 | |
SGS SA | | 48 | | 97,553 | |
| | | | 1,199,441 | |
United Kingdom (15.6%) | | | | | |
Aberdeen Asset Management PLC | | 26,761 | | 84,599 | |
Admiral Group PLC | | 4,075 | | 91,628 | |
Burberry Group PLC | | 5,795 | | 106,778 | |
Compass Group PLC | | 5,409 | | 99,950 | |
Croda International PLC | | 2,719 | | 106,919 | |
Investec PLC | | 16,474 | | 108,028 | |
ITV PLC | | 37,902 | | 96,217 | |
J Sainsbury PLC | | 31,672 | | 97,326 | |
Johnson Matthey PLC | | 2,547 | | 99,641 | |
Marks & Spencer Group PLC | | 22,170 | | 95,485 | |
National Grid PLC | | 13,835 | | 161,618 | |
Next PLC | | 1,386 | | 85,011 | |
Petrofac Ltd. | | 8,827 | | 94,447 | |
Reckitt Benckiser Group PLC | | 1,921 | | 162,697 | |
RELX PLC | | 5,597 | | 99,725 | |
Schroders PLC | | 3,143 | | 115,416 | |
Severn Trent PLC | | 3,168 | | 86,563 | |
Smith & Nephew PLC | | 6,383 | | 95,788 | |
Smiths Group PLC | | 6,000 | | 104,425 | |
Unilever PLC | | 5,044 | | 203,945 | |
WPP PLC | | 4,299 | | 95,652 | |
| | | | 2,291,858 | |
TOTAL COMMON STOCKS (Cost $15,294,587) | | | | 14,560,316 | |
| | | | | |
INVESTMENT COMPANIES (0.4%) | | | | | |
JPMorgan U.S. Government Money Market Fund, Capital Shares, 0.24%(b) | | 57,908 | | 57,908 | |
TOTAL INVESTMENT COMPANIES (Cost $57,908) | | | | 57,908 | |
| | | | | |
Total Investments (Cost $15,352,495) — 99.4%(c) | | | | 14,618,224 | |
Other assets in excess of liabilities — 0.6% | | | | 94,518 | |
NET ASSETS — 100.0% | | | | $ | 14,712,742 | |
| | | | | | |
(a) Non-income producing security.
(b) Rate disclosed is the seven day yield as of December 31, 2016.
(c) See Federal Tax Information listed in the Notes to the Financial Statements.
The Fund invested, as a percentage of net assets at value, in the following industries as of December 31, 2016:
| | Percentage of Total | |
Industry | | Net Assets | |
Financials | | 23.0 | % |
Industrials | | 14.2 | % |
Consumer Discretionary | | 12.2 | % |
Consumer Staples | | 10.6 | % |
Health Care | | 9.5 | % |
Materials | | 8.2 | % |
Energy | | 7.0 | % |
Information Technology | | 5.8 | % |
Telecommunication Services | | 4.0 | % |
Utilities | | 3.0 | % |
Real Estate | | 1.5 | % |
Investment Companies | | 0.4 | % |
Other net assets | | 0.6 | % |
Total | | 100.0 | % |
See Notes to Financial Statements
70
Financial Statements | | Walden International Equity Fund |
STATEMENT OF ASSETS AND LIABILITIES
December 31, 2016
Assets: | | | |
Investments, at fair value (cost $15,352,495) | | $ | 14,618,224 | |
Cash | | 76,884 | |
Dividends receivable | | 20,798 | |
Receivable for tax reclaims | | 10,453 | |
Receivable from Adviser | | 593 | |
Prepaid expenses and other assets | | 3,141 | |
Total Assets | | 14,730,093 | |
Liabilities: | | | |
Accrued expenses and other liabilities: | | | |
Administration and accounting | | 6,603 | |
Chief compliance officer | | 48 | |
Custodian | | 4,248 | |
Transfer agent | | 3,984 | |
Trustee | | 4 | |
Other | | 2,464 | |
Total Liabilities | | 17,351 | |
Net Assets | | $ | 14,712,742 | |
Composition of Net Assets: | | | |
Capital | | $ | 15,576,276 | |
Accumulated undistributed net investment income/(distributions in excess of net investment income) | | (10,510 | ) |
Accumulated net realized losses from investment transactions | | (118,009 | ) |
Net unrealized appreciation from investments | | (735,015 | ) |
Net Assets | | $ | 14,712,742 | |
Shares outstanding (par value $0.01, unlimited number of shares authorized) | | 1,574,542 | |
Net Asset Value, Offering Price and Redemption price per share | | $ | 9.34 | |
STATEMENTS OF OPERATIONS
For the nine months ended December 31, 2016
Investment Income: | | | |
Dividends | | $ | 352,852 | |
Less: Foreign tax withholding | | (42,320 | ) |
Total Investment Income | | 310,532 | |
Expenses: | | | |
Investment adviser | | 76,968 | |
Administration and accounting | | 41,553 | |
Chief compliance officer | | 439 | |
Custodian | | 41,550 | |
Transfer agency | | 21,302 | |
Trustee | | 862 | |
Other | | 8,826 | |
Total expenses before fee reductions | | 191,500 | |
Fees contractually reduced by the investment adviser | | (73,099 | ) |
Net Expenses | | 118,401 | |
Net Investment Income | | 192,131 | |
Net Realized/Unrealized Gains (Losses) from Investments: | | | |
Net realized losses from investment transactions | | (73,089 | ) |
Change in unrealized appreciation/depreciation from investments | | (67,327 | ) |
Net realized/unrealized gains (losses) from investments | | (140,416 | ) |
Change in Net Assets Resulting from Operations | | $ | 51,715 | |
For the period June 9, 2015(a) through March 31, 2016
Investment Income: | | | |
Dividends | | $ | 217,720 | |
Less: Foreign tax withholding | | (28,048 | ) |
Total Investment Income | | 189,672 | |
Expenses: | | | |
Investment adviser | | 59,958 | |
Administration and accounting | | 39,041 | |
Chief compliance officer | | 347 | |
Custodian | | 42,961 | |
Transfer agency | | 17,127 | |
Trustee | | 482 | |
Printing | | 10,636 | |
Other | | 6,792 | |
Total expenses before fee reductions | | 177,344 | |
Fees contractually reduced by the investment adviser | | (85,178 | ) |
Net Expenses | | 92,166 | |
Net Investment Income | | 97,506 | |
Net Realized/Unrealized Gains (Losses) from Investments: | | | |
Net realized losses from investment transactions | | (41,713 | ) |
Change in unrealized appreciation/depreciation from investments | | (667,688 | ) |
Net realized/unrealized (losses) from investments | | (709,401 | ) |
Change in Net Assets Resulting from Operations | | $ | (611,895 | ) |
(a) Commencement of operations June 9, 2015.
See Notes to Financial Statements
71
STATEMENTS OF CHANGES IN NET ASSETS
| | | | For the period | |
| | For the | | Jun. 9, 2015(a) | |
| | nine months ended | | through | |
| | December 31, 2016 | | March 31, 2016 | |
| | | | | |
Investment Activities: | | | | | |
Operations: | | | | | |
Net investment income | | $ | 192,131 | | $ | 97,506 | |
Net realized losses from investment transactions | | (73,089 | ) | (41,713 | ) |
Change in unrealized appreciation/depreciation from investments | | (67,327 | ) | (667,688 | ) |
Change in Net Assets Resulting from Operations | | 51,715 | | (611,895 | ) |
Dividends: | | | | | |
Net investment income | | (259,568 | ) | (39,886 | ) |
Net realized gains from investment transactions | | — | | (4,339 | ) |
Change in Net Assets Resulting from Shareholder Dividends | | (259,568 | ) | (44,225 | ) |
Capital Share Transactions: | | | | | |
Proceeds from shares issued | | 1,896,830 | | 13,146,620 | |
Proceeds from shares issued in subscription in-kind(b) | | — | | 251,381 | |
Dividends reinvested | | 237,659 | | 44,225 | |
Change in Net Assets Resulting from Capital Share Transactions | | 2,134,489 | | 13,442,226 | |
Change in Net Assets | | 1,926,636 | | 12,786,106 | |
Net Assets: | | | | | |
Beginning of period | | 12,786,106 | | — | |
End of period | | $ | 14,712,742 | | $ | 12,786,106 | |
Share Transactions: | | | | | |
Issued | | 196,549 | | 1,322,610 | |
Issued in subscriptions in-kind(b) | | — | | 25,138 | |
Reinvested | | 25,555 | | 4,690 | |
Change in shares | | 222,104 | | 1,352,438 | |
Accumulated undistributed net investment income/(distributions in excess of net investment income) | | $ | (10,510 | ) | $ | 62,697 | |
Amounts designated as “—” are $0 or have been rounded to $0.
(a) Commencement of operations on June 9, 2015.
(b) See Note 3 to Financial Statements.
See Notes to Financial Statements
72
FINANCIAL HIGHLIGHTS
Selected data for a share outstanding throughout the periods indicated.
| | | | For the period | |
| | For the | | June 9, 2015(a) | |
| | nine months ended | | through | |
| | December 31, 2016 | | March 31, 2016 | |
| | | | | |
Net Asset Value, Beginning of Period | | $ | 9.45 | | $ | 10.00 | |
| | | | | |
Investment Activities: | | | | | |
Operations: | | | | | |
Net investment income | | 0.12 | | 0.08 | |
Net realized and unrealized (losses) from investment transactions | | (0.06 | ) | (0.59 | ) |
Total from investment activities | | 0.06 | | (0.51 | ) |
Dividends: | | | | | |
Net investment income | | (0.17 | ) | (0.04 | ) |
Net realized gains from investments | | — | | — | |
Total dividends | | (0.17 | ) | (0.04 | ) |
| | | | | |
Net Asset Value, End of Period | | $ | 9.34 | | $ | 9.45 | |
| | | | | |
Total Return | | 0.62 | %(b) | (5.09 | )%(b) |
| | | | | |
Ratios/Supplemental Data: | | | | | |
Net assets at end of period (000’s) | | $ | 14,713 | | $ | 12,786 | |
Ratio of net expenses to average net assets | | 1.15 | %(c) | 1.15 | %(c) |
Ratio of net investment income to average net assets | | 1.87 | %(c) | 1.22 | %(c) |
Ratio of expenses (before fee reductions or recoupment of fees previously reimbursed by the investment advisor) to average net assets(d) | | 1.86 | %(c) | 2.21 | %(c) |
Portfolio turnover rate | | 4.90 | %(b) | 5.11 | %(b) |
Amounts designated as “—” are $0 or have been rounded to $0.
(a) Commencement of operations on June 9, 2015.
(b) Not annualized for periods less than one year.
(c) Annualized for periods less than one year.
(d) During the periods ending March 31, 2016 and December 31, 2016, certain fees were reduced. If such fee reduction had not occurred, the ratio would have been as indicated.
See Notes to Financial Statements
73
Notes to Financial Statements | | December 31, 2016 |
1. Organization:
The Boston Trust & Walden Funds (the “Trust”) was organized on January 8, 1992 as a Massachusetts business trust and is registered under the Investment Company Act of 1940, as amended (the “1940 Act”), as an open-end management investment company. The Trust contains the following funds (individually a “Fund”, collectively the “Funds”), each of which are registered as a diversified Fund under the 1940 Act:
Fund | | Short Name |
Boston Trust Asset Management Fund | | Asset Management Fund |
Boston Trust Equity Fund | | Equity Fund |
Boston Trust Midcap Fund | | Midcap Fund |
Boston Trust SMID Cap Fund | | SMID Cap Fund |
Boston Trust Small Cap Fund | | Small Cap Fund |
| | |
Walden Asset Management Fund | | Walden Asset Management Fund |
Walden Equity Fund | | Walden Equity Fund |
Walden Midcap Fund | | Walden Midcap Fund |
Walden SMID Cap Fund (formerly Walden SMID Cap Innovations Fund) | | Walden SMID Cap Fund |
Walden Small Cap Fund (formerly Walden Small Cap Innovations Fund) | | Walden Small Cap Fund |
Walden International Equity Fund | | Walden International Equity Fund |
The investment objective of each of the Asset Management Fund and Walden Asset Management Fund is to seek long-term capital growth and income through an actively managed portfolio of stocks, bonds and money market instruments. The investment objective of each of the Equity Fund and Walden Equity Fund is to seek long-term capital growth through an actively managed portfolio of stocks. The investment objective of each of the Midcap Fund and Walden Midcap Fund is to seek long-term capital growth through an actively managed portfolio of stocks of middle capitalization companies. The investment objective of each of the SMID Cap Fund and Walden SMID Cap Fund is to seek long-term capital growth through an actively managed portfolio of stocks of small to middle capitalization companies. The investment objective of each of the Small Cap Fund and Walden Small Cap Fund is to seek long-term capital growth through an actively managed portfolio of stocks of small capitalization companies. The investment objective of the Walden International Equity Fund is to seek long-term capital growth through an actively managed portfolio of equities of international companies.
Under the Trust’s organizational documents, its officers and trustees are indemnified against certain liabilities arising out of the performance of their duties to the Trust. In addition, in the normal course of business, the Trust may enter into contracts with its vendors and others that provide for general indemnifications. Each Fund’s maximum exposure under these arrangements is unknown, as this would involve future claims that may be made against the Funds. However, based on experience, the Funds expect risk of loss to be remote.
The Trust’s Board of Trustees (the “Board”), upon recommendation from the Boston Trust Investment Management, Inc. (the “Adviser”), approved a change to the Trust’s fiscal year end from March 31 to December 31. As a result, the fiscal period ended December 31, 2016 is a nine month reporting period.
2. Significant Accounting Policies:
The following is a summary of significant accounting policies followed by the Funds in the preparation of their financial statements. The policies are in conformity with accounting principles generally accepted in the United States of America (“GAAP”).
The preparation of financial statements in conformity with GAAP requires management to make estimates and assumptions that affect the reported amounts of assets and liabilities, the disclosure of contingent assets and liabilities at the date of the financial statements and the reported amounts of increases and decreases in net assets from operations during the reporting period. Actual results may differ from those estimates.
The Funds are investment companies and accordingly follow the investment company accounting and reporting guidance of the Financial Accounting Standards Board (FASB) Accounting Standards Codification Topic 946 Financial Services - Investment Companies.
Security Valuation:
The Funds record their investments at fair value. Fair value is defined as the price that would be received to sell an asset or paid to transfer a liability in an orderly transaction between market participants at the measurement date. The valuation techniques used to determine fair value are further described below.
The value of each equity security, including common stocks, is based either on the last sale price on a national securities exchange, or in the absence of recorded sales, at the closing bid prices on such exchanges, or at the quoted bid price in the over-the-counter market. Equity securities traded on the NASDAQ stock market are valued at the NASDAQ official closing price. The prices for foreign securities are reported in local currency and converted to U.S dollars using currency exchange rates. Prices for most securities held in the Funds are provided daily by a recognized independent pricing service.
Bonds and other fixed income securities (other than short-term obligations but including listed issues) are provided by an independent pricing service, the use of which has been approved by the Board. In making such valuations, the pricing service utilizes both dealer-supplied valuations and electronic data processing techniques that take into account appropriate factors such as institutional-size trading in similar groups of securities, yield, quality, coupon rate, maturity, type of issue, and trading characteristics other than market data and without exclusive reliance upon quoted prices or exchanges or over-the-counter prices, since such valuations are believed to reflect more accurately the fair value of such securities. All debt portfolio securities with a remaining maturity of 60 days or less may be valued at amortized cost, which approximates fair value. Under the amortized cost method, discount or premium, if any, is accreted or amortized, respectively, on a constant (straight-line) basis to the maturity of the security.
The Trust may use a pricing service to value certain portfolio securities where the prices provided are believed to reflect the fair value of such securities. If market prices are not readily available or, in the opinion of the Adviser, market prices do not reflect fair value, or if an event occurs after the close of trading on the exchange or market on which the security is principally traded (but prior to the time the NAV is calculated) that materially affects fair value, the Adviser will value the Funds’ assets at their fair value according to policies approved by the Board. The Adviser believes that foreign security values may be affected by volatility that occurs in global markets on a trading day after the close of any given foreign securities markets. The fair valuation procedures, therefore, include a procedure whereby foreign security prices may be “fair valued” by an independent pricing service through the use of factors which take such volatility into account.
Investments in investment companies and money market funds are valued at net asset value per share.
Continued
74
Notes to Financial Statements | | December 31, 2016 |
Fair Value Measurements:
The valuation techniques employed by the Funds, as described above in Security Valuation, maximize the use of observable inputs and minimize the use of unobservable inputs in determining fair value. The inputs used for valuing the Funds’ investments are summarized in the three broad levels listed below:
Level 1 — quoted prices in active markets for identical assets
Level 2 — other significant observable inputs (including quoted prices for similar securities, interest rates, prepayment speeds, credit risk, etc.)
Level 3 — significant unobservable inputs (including the Funds’ own assumptions in determining the fair value of investments)
The inputs or methodology used to value investments are not necessarily an indication of the risk associated with investing in those investments.
Pursuant to the valuation techniques described above in Security Valuation, equity securities are generally categorized as Level 1 securities in the fair value hierarchy (unless there is a fair valuation event, in which case affected securities are generally categorized as Level 2 securities). Debt securities, including those with a remaining maturity of 60 days or less, are generally categorized as Level 2 securities in the fair value hierarchy. Open-end investment companies and money market funds are generally categorized as Level 1 securities in the fair value hierarchy.
Investments for which there are no such quotations, or for which quotations do not appear reliable, are valued at fair value as determined in good faith by the Adviser under the direction of the Board. These valuations are typically categorized as Level 2 or Level 3 in the fair value hierarchy.
The following is a summary of the valuation inputs used as of December 31, 2016 in valuing the Funds’ investments based on the three levels defined above:
| | | | Level 2 | | | |
| | Level 1 | | Other Significant | | Total Investments | |
Fund Name | | Quoted Prices | | Observable Inputs | | in Securities | |
Asset Management Fund | | | | | | | |
Common Stocks(1) | | $ | 305,315,688 | | $ | — | | $ | 305,315,688 | |
Corporate Bonds(1) | | — | | 16,676,093 | | 16,676,093 | |
Municipal Bonds(2) | | — | | 4,959,767 | | 4,959,767 | |
U.S. Government & U.S. Government Agency Obligations | | — | | 58,538,021 | | 58,538,021 | |
Investment Companies | | 22,746,126 | | — | | 22,746,126 | |
Total | | 328,061,814 | | 80,173,881 | | 408,235,695 | |
Equity Fund | | | | | | | |
Common Stocks(1) | | 116,790,467 | | — | | 116,790,467 | |
Investment Companies | | 2,099,046 | | — | | 2,099,046 | |
Total | | 118,889,513 | | — | | 118,889,513 | |
Midcap Fund | | | | | | | |
Common Stocks(1) | | 50,129,885 | | — | | 50,129,885 | |
Investment Companies | | 157,181 | | — | | 157,181 | |
Total | | 50,287,066 | | — | | 50,287,066 | |
SMID Cap Fund | | | | | | | |
Common Stocks(1) | | 6,451,432 | | — | | 6,451,432 | |
Investment Companies | | 55,149 | | — | | 55,149 | |
Total | | 6,506,581 | | — | | 6,506,581 | |
Small Cap Fund | | | | | | | |
Common Stocks(1) | | 327,581,455 | | — | | 327,581,455 | |
Investment Companies | | 5,562,800 | | — | | 5,562,800 | |
Total | | 333,144,255 | | — | | 333,144,255 | |
Walden Asset Management Fund | | | | | | | |
Common Stocks(1) | | 71,655,501 | | — | | 71,655,501 | |
Corporate Bonds(1) | | — | | 3,972,077 | | 3,972,077 | |
Municipal Bonds(2) | | — | | 461,396 | | 461,396 | |
U.S. Government & U.S. Government Agency Obligations | | — | | 21,352,055 | | 21,352,055 | |
Investment Companies | | 2,912,259 | | — | | 2,912,259 | |
Certificate of Deposit | | — | | 99,373 | | 99,373 | |
Total | | 74,567,760 | | 25,884,901 | | 100,452,661 | |
Walden Equity Fund | | | | | | | |
Common Stocks(1) | | 179,763,695 | | — | | 179,763,695 | |
Investment Companies | | 1,792,896 | | — | | 1,792,896 | |
Total | | 181,556,591 | | — | | 181,556,591 | |
Walden Midcap Fund | | | | | | | |
Common Stocks(1) | | 38,605,650 | | — | | 38,605,650 | |
Investment Companies | | 449,117 | | — | | 449,117 | |
Total | | 39,054,767 | | — | | 39,054,767 | |
Walden SMID Cap Fund | | | | | | | |
Common Stocks(1) | | 37,726,723 | | — | | 37,726,723 | |
Investment Companies | | 985,224 | | — | | 985,224 | |
Total | | 38,711,947 | | — | | 38,711,947 | |
Walden Small Cap Fund | | | | | | | |
Common Stocks(1) | | 84,221,601 | | — | | 84,221,601 | |
Investment Companies | | 943,357 | | — | | 943,357 | |
Total | | 85,164,958 | | — | | 85,164,958 | |
| | | | | | | | | | |
Continued
75
Notes to Financial Statements | | December 31, 2016 |
| | | | Level 2 | | | |
| | Level 1 | | Other Significant | | Total Investments | |
Fund Name | | Quoted Prices | | Observable Inputs | | in Securities | |
Walden International Equity Fund | | | | | | | |
Common Stocks(3) | | | | | | | |
Auto Components | | $ | 111,867 | | $ | 105,343 | | $ | 217,210 | |
Banks | | 492,040 | | 1,419,256 | | 1,911,296 | |
Capital Markets | | 111,342 | | 500,058 | | 611,400 | |
Diversified Telecommunication Services | | 99,332 | | 191,338 | | 290,670 | |
Food & Staples Retailing | | 90,281 | | 368,998 | | 459,279 | |
Insurance | | 208,609 | | 655,865 | | 864,474 | |
Road & Rail | | 110,047 | | 387,226 | | 497,273 | |
Software | | 109,292 | | 452,277 | | 561,569 | |
Wireless Telecommunication Services | | 92,007 | | 203,870 | | 295,877 | |
Other Common Stocks | | — | | 8,851,268 | | 8,851,268 | |
Investment Companies | | 57,908 | | — | | 57,908 | |
Total | | 1,482,725 | | 13,135,499 | | 14,618,224 | |
| | | | | | | | | | |
(1) For detailed industry descriptions, see the accompanying Schedules of Portfolio Investments.
(2) For detailed State classifications, see the accompanying Schedules of Portfolio Investments.
(3) For detailed Country classifications, see the accompanying Schedules of Portfolio Investments.
The Funds recognize transfers, if any, between fair value hierarchy levels at the reporting period end. There were no transfers between levels as of December 31, 2016, from the valuation input levels used on March 31, 2016. The Funds did not hold any Level 3 securities during the period ended December 31, 2016.
Security Transactions and Related Income:
Security transactions are recorded no later than one business day after trade date. For financial reporting purposes, security transactions are recorded on trade date on the last business day of the reporting period recognized on effective yield on yield to maturity basis. Interest income is recognized on the accrual basis and includes, where applicable, the amortization of premium or accretion of discount method. Dividend income is recorded on the ex-dividend date. Gains or losses realized on sales of securities are determined by comparing the identified cost of the security lot sold with the net sales proceeds.
Real Estate Investment Trusts:
The Funds may own shares of real estate investment trusts (“REITs”), which report information on the source of their distribution annually. Certain distributions received from REITs during the year, which are known to be return of capital, are recorded as a reduction to the cost of the individual REIT.
Expenses:
Expenses directly attributable to a Fund are charged directly to that Fund. Expenses relating to the Trust are allocated proportionately to each Fund within the Trust according to the relative net assets of each Fund or on another reasonable basis.
Dividends to Shareholders:
Dividends to shareholders are recorded on the ex-dividend date. Dividends to shareholders from net investment income, if any, are declared and paid annually by the Funds. Dividends to shareholders from net realized gains, if any, are declared and distributed at least annually by the Funds.
Federal Income Taxes:
Each Fund intends to continue to qualify as a regulated investment company by complying with the provisions available to certain investment companies, as defined in Subchapter M of the Internal Revenue Code, and to make distributions from net investment income and from net realized capital gains sufficient to relieve it from all, or substantially all, federal income and excise taxes. Therefore, no federal income tax provision is required.
Management has reviewed tax positions taken in tax years that remain subject to examination by all major tax jurisdictions, including Federal (i.e., the last four tax year ends and the interim tax period since then, as applicable) and believes that there is no tax liability resulting from unrecognized tax benefits related to uncertain tax positions taken as of and during the nine months ended December 31, 2016. The Funds recognize interest and penalties, if any, related to unrecognized tax benefits, as income tax expense in the Statement of Operations as incurred.
Foreign Currency Transactions:
The accounting records of the Funds are maintained in U.S. dollars denominated amounts are translated into U.S. dollars as follows, with the resultant exchange gains and losses recorded in the Statements of Operations:
i) value of investment securities and other assets and liabilities at the exchange rate on the valuation date; and
ii) purchases and sales of Investment securities and income and expenses at the exchange rate prevailing on the respective date of such transactions.
The Funds do not isolate realized and unrealized gains and losses attributable to changes in the exchange rates from gains and losses that arise from changes in the value of investments. Such fluctuations are included with net realized and unrealized gain or loss on investments.
Investment income from non-U.S. sources received by a Fund is generally subject to non-U.S. withholding taxes at rates ranging up to 30%. Such withholding taxes may be reduced or eliminated under the terms of applicable U.S. income tax treaties. The Funds may be subject to foreign taxes on gains in investments or currency repatriation. The Funds accrue such taxes, as applicable, based on their current interpretation of tax rules in the foreign markets in which they invest.
Continued
76
Notes to Financial Statements | | December 31, 2016 |
New Accounting Pronouncements:
In October 2016, the Securities and Exchange Commission (SEC) released its Final Rules on Investment Company Reporting Modernization (the “Rules”). The Rules which introduce two new regulatory reporting forms for investment companies — Form N-PORT and Form N-CEN — also contains amendments to Regulation S-X which require standardized, enhanced disclosures about derivatives in investment company financial statements, as well as other amendments. The amendments are effective for filings made with the SEC after August 1, 2017. Management is currently evaluating the impact of the amendments on the fund’s financial statements. The adoption will have no effect on the Funds’ net assets or results of operations.
3. Related Party Transactions and Other Service Arrangements:
Investment Adviser:
The Trust, with respect to the Funds, and the Adviser are parties to an Investment Advisory Agreement under which the Adviser is entitled to receive an annual fee, computed daily and paid monthly, equal to the average daily net assets of each Fund, at the following annual percentage rates before contractual waivers:
Fund | | Fee Rate | |
Asset Management Fund | | 0.75 | % |
Equity Fund | | 0.75 | % |
Midcap Fund | | 0.75 | % |
SMID Cap Fund | | 0.75 | % |
Small Cap Fund | | 0.75 | % |
Fund | | Fee Rate | |
Walden Asset Management Fund | | 0.75 | % |
Walden Equity Fund | | 0.75 | % |
Walden Midcap Fund | | 0.75 | % |
Walden SMID Cap Fund | | 0.75 | % |
Walden Small Cap Fund | | 0.75 | % |
Walden International Equity Fund | | 0.75 | % |
Additionally, two trustees of the Trust are officers of the Adviser or its affiliate, and an officer of the Trust is an officer of the Adviser. These persons are not paid directly by the Funds.
Administration and Fund Accounting:
Citi Fund Services Ohio, Inc. (“Citi”) serves the Funds as administrator. Citi provides administrative and fund accounting services for a fee that is computed daily and paid monthly, based on the aggregate daily net assets of the Trust plus certain base fees.
Certain officers of the Trust are affiliated with Citi. Such persons were paid no fees directly by the Funds for serving as Officers of the Trust. Citi makes an employee available to serve as the Funds’ Chief Compliance Officer (“CCO”) under a Compliance Service Agreement between the Funds and Citi (the “CCO Agreement”). Under the CCO Agreement, Citi also provides infrastructure and support in implementing the written policies and procedures comprising the Funds’ compliance program, including support services to the CCO. For the services provided under the CCO Agreement, the Funds paid Citi $89,376 for the nine months ended December 31, 2016, plus certain out of pocket expenses. Citi pays the salary and other compensation earned by the CCO as an employee of Citi.
Distribution:
BHIL Distributors, LLC, (“BHIL”), a wholly-owned subsidiary of Foreside Distribution Services, L.P., (“Foreside”) serves as the Funds’ distribution agent. The distribution agreement provides for payment of a fixed annual fee of $35,000 for review of sales literature and dealer set-up efforts, and reimbursement of out-of-pocket expenses. These amounts are paid monthly to BHIL from the Advisor and not by the Funds. BHIL is not affiliated with Citi or the Adviser. Effective February 7, 2017, Lovell Minnick Partners, LLC agreed to acquire a majority stake in Foreside parent, Foreside Financial Corp. The transaction is expected to close second quarter 2017.
Shareholder Services:
The Funds may enter into shareholder services agreements with investment advisers, banks, trust companies and other types of organizations (“Authorized Service Providers”), which may include affiliates of the Funds, for providing administrative services with respect to shares of the Funds attributable to or held in the name of the Authorized Service Provider for its clients or other parties with whom they have a servicing relationship. Affiliates of the Funds did not receive any fees during the nine months ended December 31, 2016.
Custodian and Transfer Agency:
Boston Trust & Investment Management Company (“Boston Trust”), the parent company of the Adviser, acts as the Fund’s transfer agent. Under the transfer agency agreement, Boston Trust receives a fixed fee of $18,000 annually per fund, accrued daily and paid monthly for its services. Under a sub-transfer agency agreement assigned from Citi, FIS Investor Services, LLC receives a fixed annual fee accrued daily and paid monthly, plus annual per account fees and certain out of pocket expenses for its services to the Trust.
Boston Trust acts as the Funds’ custodian, with the exception of the Walden International Equity Fund. Under the custody agreement, Boston Trust receives an annual asset based fee of 0.014% of the value of securities held. Citibank, N.A. receives sub-custodian fees from Boston Trust for each Fund except the Walden International Equity Fund. Under a separate custody agreement, Citibank, N.A., an affiliate of Citi, serves as custodian for the Walden International Equity Fund and receives a fee based on a percentage of assets held on behalf of the Walden International Equity Fund, transaction fees and certain out of pocket expenses for its services. Such percentages vary by the jurisdiction in which the assets are held.
Fee Reductions:
The Adviser has agreed to reduce its fees payable by the Funds to the extent necessary, exclusive of brokerage costs, interest, taxes, dividends, litigation, indemnification, expenses associated with the investments in underlying investment companies and extraordinary expenses (as determined under generally accepted accounting principles) of each Fund, except the SMID Cap Fund and the Walden International Equity Fund, to 1.00% of the average daily net assets. The Adviser has agreed to reduce its fees payable by the SMID Cap Fund and the Walden International Equity Fund to the extent necessary, subject to certain exclusions, to limit the aggregate annual operating expenses of the SMID Cap Fund to 0.75% of its average daily net assets and the Walden International Equity Fund to 1.15% of its average daily net assets. Any such reductions made by the Adviser in its fees or in the payment or reimbursement of expenses that are a Fund’s obligation may be subject to repayment by the Fund within three years provided the Fund receiving the reduction, payment or reimbursement is able to effect such repayment and remain in compliance with applicable expense limitations. The expense limitation agreement shall automatically renew effective August 1 of every year until the Adviser provides written notice of non-renewal to the Trust.
Continued
77
Notes to Financial Statements | | December 31, 2016 |
Pursuant to its agreement, for the years ended March 31, 2014, 2015 and 2016, and the period ended December 31, 2016, the Adviser reimbursed, and has yet to recoup, fees in the following amounts:
Fund | | | | Amount | | Expires | |
Midcap Fund | | | | $ | 4 | | 3/31/2017 | |
| | | | 1,824 | | 3/31/2018 | |
| | | | 8,884 | | 3/31/2019 | |
| | | | 6,555 | | 12/31/2019 | |
| | | | | | | |
SMID Cap Fund | | | | 23,931 | | 3/31/2017 | |
| | | | 29,670 | | 3/31/2018 | |
| | | | 44,650 | | 3/31/2019 | |
| | | | 37,894 | | 12/31/2019 | |
| | | | | | | |
Small Cap Fund | | | | 355,171 | | 3/31/2017 | |
| | | | 213,139 | | 3/31/2018 | |
| | | | 297,469 | | 3/31/2019 | |
| | | | 157,762 | | 12/31/2019 | |
| | | | | | | | |
Fund | | | | Amount | | Expires | |
Walden Asset Management Fund | | | | $ | 28,632 | | 3/31/2017 | |
| | | | 25,881 | | 3/31/2018 | |
| | | | 40,670 | | 3/31/2019 | |
| | | | 34,372 | | 12/31/2019 | |
| | | | | | | |
Walden Equity Fund | | | | 113,975 | | 3/31/2017 | |
| | | | 124,593 | | 3/31/2018 | |
| | | | 151,560 | | 3/31/2019 | |
| | | | 124,204 | | 12/31/2019 | |
| | | | | | | |
Walden Midcap Fund | | | | 7,143 | | 3/31/2017 | |
| | | | 7,376 | | 3/31/2018 | |
| | | | 17,571 | | 3/31/2019 | |
| | | | 12,415 | | 12/31/2019 | |
| | | | | | | |
Walden SMID Cap Fund | | | | 23,699 | | 3/31/2017 | |
| | | | 25,541 | | 3/31/2018 | |
| | | | 37,277 | | 3/31/2019 | |
| | | | 31,322 | | 12/31/2019 | |
| | | | | | | |
Walden Small Cap Fund | | | | 49,312 | | 3/31/2017 | |
| | | | 2,313 | | 3/31/2018 | |
| | | | 42,280 | | 3/31/2019 | |
| | | | 36,830 | | 12/31/2019 | |
| | | | | | | |
Walden International Equity Fund | | | | 85,178 | | 3/31/2019 | |
| | | | 73,099 | | 12/31/2019 | |
| | | | | | | | |
As of December 31, 2016, the Adviser may recoup amounts from the Funds as follows:
Total Potential Recoupment | | | |
Asset Management Fund | | $ | — | |
Equity Fund | | — | |
Midcap Fund | | 17,267 | |
SMID Cap Fund | | 136,145 | |
Small Cap Fund | | 1,023,541 | |
| | | | |
Total Potential Recoupment | | | |
Walden Asset Management Fund | | $ | 129,555 | |
Walden Equity Fund | | 514,332 | |
Walden Midcap Fund | | 44,505 | |
Walden SMID Cap Fund | | 117,839 | |
Walden Small Cap Fund | | 130,735 | |
Walden International Equity Fund | | 158,277 | |
| | | | |
During the year ended March 31, 2016, certain securities of an affiliated separately managed account were exchanged, at fair value, as in-kind transfers of the Walden International Equity Fund. The total fair value of the in-kind transfers was $251,381 for 25,138 shares of the Walden International Equity Fund in exchange for securities of an affiliated separately managed account.
During the year ended March 31, 2015, certain securities of an affiliated separately managed account were exchanged, at fair value, as in-kind transfers of the Walden Small Cap Fund. The total fair value of the in-kind transfers was $5,484,961 for 274,111 shares of the Walden Small Cap Fund in exchange for securities of an affiliated separately managed account.
4. Purchases and Sales of Securities:
Cost of purchases and proceeds from sales and maturities of securities, excluding short-term securities and U.S. Government securities, for the Funds for the nine months ended December 31, 2016, totaled:
Fund | | Purchases | | Sales and Maturities | |
Asset Management Fund | | $ | 37,783,503 | | $ | 20,033,821 | |
Equity Fund | | 7,545,136 | | 8,624,472 | |
Midcap Fund | | 7,114,352 | | 7,532,247 | |
SMID Cap Fund | | 1,473,673 | | 1,322,305 | |
Small Cap Fund | | 184,011,261 | | 245,283,954 | |
Walden Asset Management Fund | | 9,701,798 | | 7,608,784 | |
Walden Equity Fund | | 21,377,476 | | 17,159,795 | |
Walden Midcap Fund | | 5,656,412 | | 4,599,305 | |
Walden SMID Cap Fund | | 8,675,713 | | 7,020,497 | |
Walden Small Cap Fund | | 14,609,185 | | 11,121,633 | |
Walden International Equity Fund | | 2,794,525 | | 666,652 | |
| | | | | | | |
Cost of purchases and proceeds from sales and maturities of U.S. Government Securities, excluding short-term securities, for the Funds for the nine months ended December 31, 2016, totaled:
Fund | | Purchases | | Sales and Maturities | |
Asset Management Fund | | $ | 8,685,074 | | $ | 10,992,857 | |
Walden Asset Management Fund | | 6,998,992 | | 1,646,312 | |
| | | | | | | |
Continued
78
Notes to Financial Statements | | December 31, 2016 |
5. Federal Income Tax Information:
At December 31, 2016, the cost, gross unrealized appreciation and gross unrealized depreciation on securities, for federal income tax purposes, were as follows:
| | | | Gross Tax Unrealized | | Gross Tax Unrealized | | Net Unrealized Appreciation | |
Fund | | Tax Cost | | Appreciation | | (Depreciation) | | (Depreciation) | |
Asset Management Fund | | $ | 268,515,903 | | $ | 141,996,573 | | $ | (2,276,781 | ) | $ | 139,719,792 | |
Equity Fund | | 68,585,483 | | 50,847,913 | | (543,883 | ) | 50,304,030 | |
Midcap Fund | | 33,061,792 | | 18,165,538 | | (940,264 | ) | 17,225,274 | |
SMID Cap Fund | | 5,155,846 | | 1,514,265 | | (163,530 | ) | 1,350,735 | |
Small Cap Fund | | 254,239,100 | | 93,207,541 | | (14,302,386 | ) | 78,905,155 | |
Walden Asset Management Fund | | 74,274,619 | | 27,837,783 | | (1,659,741 | ) | 26,178,042 | |
Walden Equity Fund | | 114,686,581 | | 69,519,188 | | (2,649,178 | ) | 66,870,010 | |
Walden Midcap Fund | | 28,986,383 | | 10,877,421 | | (809,037 | ) | 10,068,384 | |
Walden SMID Cap Fund | | 31,610,613 | | 8,067,732 | | (966,398 | ) | 7,101,334 | |
Walden Small Cap Fund | | 66,004,834 | | 22,551,232 | | (3,391,108 | ) | 19,160,124 | |
Walden International Equity Fund | | 15,362,711 | | 474,840 | | (1,219,327 | ) | (744,487 | ) |
| | | | | | | | | | | | | |
The tax character of distributions paid during the nine month fiscal period ended December 31, 2016 was as follows:
| | Distributions paid from | | | | | | | |
| | | | Net Long Term | | Total Taxable | | Tax Return of | | Total Distributions | |
Fund | | Ordinary Income | | Capital Gains | | Distributions | | Capital | | Paid(1) | |
Asset Management Fund | | $ | 4,223,815 | | $ | 15,345,985 | | $ | 19,569,800 | | $ | — | | $ | 19,569,800 | |
Equity Fund | | 1,112,876 | | 6,430,098 | | 7,542,974 | | — | | 7,542,974 | |
Midcap Fund | | 659,104 | | 2,744,636 | | 3,403,740 | | — | | 3,403,740 | |
SMID Cap Fund | | 118,839 | | 271,297 | | 390,136 | | — | | 390,136 | |
Small Cap Fund | | 3,993,823 | | 9,153,927 | | 13,147,750 | | — | | 13,147,750 | |
Walden Asset Management Fund | | 1,044,552 | | 1,916,337 | | 2,960,889 | | — | | 2,960,889 | |
Walden Equity Fund | | 1,714,128 | | 4,291,722 | | 6,005,850 | | — | | 6,005,850 | |
Walden Midcap Fund | | 464,829 | | 1,414,849 | | 1,879,678 | | — | | 1,879,678 | |
Walden SMID Cap Fund | | 792,165 | | 1,148,927 | | 1,941,092 | | — | | 1,941,092 | |
Walden Small Cap Fund | | 732,553 | | 2,547,203 | | 3,279,756 | | — | | 3,279,756 | |
Walden International Equity Fund | | 259,568 | | — | | 259,568 | | — | | 259,568 | |
| | | | | | | | | | | | | | | | |
(1) Total distributions paid may differ from the amount reported in the Statements of Changes in Net Assets because for tax purposes distributions are recognized when actually paid.
The tax character of distributions paid during the fiscal year ended March 31, 2016 was as follows:
| | Distributions paid from | | | | | | | |
| | | | Net Long Term | | Total Taxable | | Tax Return of | | Total Distributions | |
Fund | | Ordinary Income | | Capital Gains | | Distributions | | Capital | | Paid(1) | |
Asset Management Fund | | $ | 4,817,610 | | $ | 14,994,468 | | $ | 19,812,078 | | $ | — | | $ | 19,812,078 | |
Equity Fund | | 1,334,295 | | 6,343,300 | | 7,677,595 | | — | | 7,677,595 | |
Midcap Fund | | 402,244 | | 2,425,712 | | 2,827,956 | | — | | 2,827,956 | |
SMID Cap Fund | | 42,783 | | 324,242 | | 367,025 | | — | | 367,025 | |
Small Cap Fund | | 2,611,157 | | 57,191,988 | | 59,803,145 | | — | | 59,803,145 | |
Walden Asset Management Fund | | 1,069,344 | | 4,703,453 | | 5,772,797 | | — | | 5,772,797 | |
Walden Equity Fund | | 1,870,888 | | 7,516,146 | | 9,387,034 | | — | | 9,387,034 | |
Walden Midcap Fund | | 341,785 | | 1,428,000 | | 1,769,785 | | — | | 1,769,785 | |
Walden SMID Cap Fund | | 246,894 | | 1,594,235 | | 1,841,129 | | — | | 1,841,129 | |
Walden Small Cap Fund | | 428,898 | | 11,396,486 | | 11,825,384 | | — | | 11,825,384 | |
Walden International Equity Fund | | 44,225 | | — | | 44,225 | | — | | 44,225 | |
| | | | | | | | | | | | | | | | |
(1) Total distributions paid may differ from the amount reported in the Statements of Changes in Net Assets because for tax purposes distributions are recognized when actually paid.
The tax character of distributions paid during the fiscal year ended March 31, 2015 was as follows:
| | Distributions paid from | | | | | | | |
| | | | Net Long Term | | Total Taxable | | Tax Return of | | Total Distributions | |
| | Ordinary Income | | Capital Gains | | Distributions | | Capital | | Paid(1) | |
Asset Management Fund | | $ | 4,816,117 | | $ | 7,480,276 | | $ | 12,296,393 | | $ | — | | $ | 12,296,393 | |
Equity Fund | | 966,299 | | 2,029,175 | | 2,995,474 | | — | | 2,995,474 | |
Midcap Fund | | 394,184 | | 1,765,084 | | 2,159,268 | | — | | 2,159,268 | |
SMID Cap Fund | | 42,588 | | 223,676 | | 266,264 | | — | | 266,264 | |
Small Cap Fund | | 5,843,060 | | 25,889,299 | | 31,732,359 | | — | | 31,732,359 | |
Walden Asset Management Fund | | 877,816 | | 519,966 | | 1,397,782 | | — | | 1,397,782 | |
Walden Equity Fund | | 2,227,112 | | 6,602,715 | | 8,829,827 | | — | | 8,829,827 | |
Walden Midcap Fund | | 345,118 | | 907,147 | | 1,252,265 | | — | | 1,252,265 | |
Walden SMID Cap Fund | | 440,304 | | 133,340 | | 573,644 | | — | | 573,644 | |
Walden Small Cap Fund | | 599,334 | | 6,158,936 | | 6,758,270 | | — | | 6,758,270 | |
| | | | | | | | | | | | | | | | |
(1) Total distributions paid may differ from the amount reported in the Statements of Changes in Net Assets because for tax purposes distributions are recognized when actually paid.
Continued
79
Notes to Financial Statements | | December 31, 2016 |
As of December 31, 2016, the components of accumulated earnings on a tax basis were as follows:
| | Undistributed | | Undistributed | | | | Accumulated | | Unrealized | | | |
| | Ordinary | | Long-Term Capital | | Accumulated | | Capital and Other | | Appreciation | | Total Accumulated | |
Fund | | Income | | Gains | | Earnings | | Losses | | (Depreciation)(2) | | Earnings (Deficit) | |
Asset Management Fund | | $ | — | | $ | 1,480,027 | | $ | 1,480,027 | | $ | — | | $ | 139,719,792 | | $ | 141,199,819 | |
Equity Fund | | — | | — | | — | | (180,311 | ) | 50,304,030 | | 50,123,719 | |
Midcap Fund | | 41,658 | | 444,945 | | 486,603 | | — | | 17,225,274 | | 17,711,877 | |
SMID Cap Fund | | — | | — | | — | | (8,566 | ) | 1,350,735 | | 1,342,169 | |
Small Cap Fund | | 869,522 | | 11,752,083 | | 12,621,605 | | — | | 78,905,155 | | 91,526,760 | |
Walden Asset Management Fund | | — | | 108,061 | | 108,061 | | — | | 26,178,042 | | 26,286,103 | |
Walden Equity Fund | | — | | 361,944 | | 361,944 | | (6,390 | ) | 66,870,010 | | 67,225,564 | |
Walden Midcap Fund | | 4,465 | | — | | 4,465 | | (20,285 | ) | 10,068,384 | | 10,052,564 | |
Walden SMID Cap Fund | | — | | — | | — | | (13,126 | ) | 7,101,334 | | 7,088,208 | |
Walden Small Cap Fund | | — | | 959,198 | | 959,198 | | — | | 19,160,124 | | 20,119,322 | |
Walden International Equity Fund | | 3,060 | | — | | 3,060 | | (121,364 | ) | (745,231 | ) | (863,535 | ) |
| | | | | | | | | | | | | | | | | | | |
(2) The differences between book-basis and tax-basis unrealized appreciation (depreciation) is attributable primarily to tax deferral of losses on wash sales.
As of the end of its tax year ended December 31, 2016, the Fund has net capital loss carry forwards (“CLCFs”) not subject to expiration as summarized in the tables below. The Board does not intend to authorize a distribution of any realized gain for the Fund until any applicable CLCF has been offset or expires.
Fund | | Short Term | | Long Term | | Total | |
Walden International Equity Fund | | $ | 62,403 | | $ | 53,582 | | $ | 115,985 | |
| | | | | | | | | | |
Under current tax law, net investment losses and capital losses realized after October 31 of a Fund’s fiscal year may be deferred and treated as occurring on the first business day of the following fiscal year for tax purposes. The following Funds deferred losses as follows:
| | Late Year | | Post October | |
Fund | | Ordinary Loss | | Capital Losses | |
Equity Fund | | $ | — | | $ | 180,311 | |
SMID Cap Fund | | — | | 8,566 | |
Walden Equity Fund | | — | | 6,390 | |
Walden Midcap Fund | | — | | 20,285 | |
Walden SMID Cap Fund | | — | | 13,125 | |
Walden International Equity Fund | | 3,820 | | 1,558 | |
| | | | | | | |
As of December 31, 2016, the following reclassifications have been made to increase (decrease) such accounts with offsetting adjustments as indicated:
| | Accumulated Net | | Accumulated Net | | | |
Fund | | Investment Income | | Realized Gains | | Paid in Capital | |
Asset Management Fund | | $ | 21,567 | | $ | (21,568 | ) | $ | 1 | |
Equity Fund | | 3,969 | | 6,780 | | (10,749 | ) |
Midcap Fund | | — | | (1 | ) | 1 | |
SMID Cap Fund | | 509 | | 604 | | (1,113 | ) |
Small Cap Fund | | 206,823 | | (6,746,481 | ) | 6,539,658 | |
Walden Asset Management Fund | | 11,086 | | (11,086 | ) | — | |
Walden Equity Fund | | 2,104 | | (2,101 | ) | (3 | ) |
Walden Midcap Fund | | (1 | ) | — | | 1 | |
Walden SMID Cap Fund | | 8,922 | | (111 | ) | (8,811 | ) |
Walden Small Cap Fund | | 38,714 | | (38,714 | ) | — | |
Walden International Equity Fund | | (5,770 | ) | 5,773 | | (3 | ) |
| | | | | | | | | | |
The amounts of dividends to shareholders from net investment income and of distributions from net realized gains are determined in accordance with federal income tax regulations, which may differ from GAAP. These “book/tax” differences are either considered temporary or permanent in nature. To the extent these differences are permanent in nature (e.g. return of capital, net operating loss, reclassification of certain market discounts, gain/ loss on paydowns, and distributions), such amounts are reclassified within the composition of net assets based on their federal tax-basis treatment; temporary differences (e.g. wash sales and post October losses) do not require reclassification. To the extent dividends to shareholders exceed net investment income and net realized gains for tax purposes, they are reported as distributions of capital.
Continued
80
Notes to Financial Statements | | December 31, 2016 |
6. Control Ownership and Principal Holders:
The beneficial ownership, either directly or indirectly, of more than 25% of the voting securities of a Fund creates presumptions of control of the Fund, under section 2 (a)(9) of the 1940 Act. As of December 31, 2016, the Funds had individual shareholder accounts and/or omnibus shareholder accounts (comprised of a group of individual shareholders), owning more than 25% of the total shares outstanding of the Fund as detailed below.
Fund | | Control Ownership | | % of Ownership | |
Asset Management Fund | | US Bank N.A. | | 90.2 | |
Equity Fund | | US Bank N.A. | | 93.3 | |
Midcap Fund | | US Bank N.A. | | 94.2 | |
SMID Cap Fund | | US Bank N.A. | | 68.3 | |
Walden Asset Management Fund | | US Bank N.A. | | 63.5 | |
Walden Equity Fund | | US Bank N.A. | | 27.6 | |
Walden Midcap Fund | | US Bank N.A. | | 95.9 | |
Walden SMID Cap Fund | | US Bank N.A. | | 50.1 | |
Walden Small Cap Fund | | US Bank N.A. | | 42.8 | |
Walden International Equity Fund | | US Bank N.A. | | 93.6 | |
7. Subsequent Events:
Management has evaluated events and transactions through the date these financial statements were issued and concluded no subsequent events required recognition or disclosure in these financial statements.
Continued
81
Report of Independent Registered Public Accounting Firm
To the Shareholders and Board of Trustees of
The Boston Trust & Walden Funds
We have audited the accompanying statements of assets and liabilities, including the schedules of portfolio investments, of The Boston Trust & Walden Funds, comprising the Boston Trust Asset Management Fund, Boston Trust Equity Fund, Boston Trust Midcap Fund, Boston Trust SMID Cap Fund, Boston Trust Small Cap Fund, Walden Asset Management Fund, Walden Equity Fund, Walden Midcap Fund, Walden SMID Cap Fund (formerly Walden SMID Cap Innovations Fund), Walden Small Cap Fund (formerly Walden Small Cap Innovations Fund) and Walden International Equity Fund (the “Funds”), as of December 31, 2016, and the related statements of operations and changes in net assets and financial highlights for each of the periods presented. These financial statements and financial highlights are the responsibility of the Funds’ management. Our responsibility is to express an opinion on these financial statements and financial highlights based on our audits.
We conducted our audits in accordance with the standards of the Public Company Accounting Oversight Board (United States). Those standards require that we plan and perform the audit to obtain reasonable assurance about whether the financial statements and financial highlights are free of material misstatement. An audit includes examining, on a test basis, evidence supporting the amounts and disclosures in the financial statements. Our procedures included confirmation of securities owned as of December 31, 2016, by correspondence with the custodian and brokers or by other appropriate auditing procedures where replies from brokers were not received. An audit also includes assessing the accounting principles used and significant estimates made by management, as well as evaluating the overall financial statement presentation. We believe that our audits provide a reasonable basis for our opinion.
In our opinion, the financial statements and financial highlights referred to above present fairly, in all material respects, the financial position of each of the Funds constituting The Boston Trust & Walden Funds as of December 31, 2016, the results of their operations, the changes in their net assets, and the financial highlights for each of the periods presented, in conformity with accounting principles generally accepted in the United States of America.
/s/ Cohen & Company, Ltd.
COHEN & COMPANY, LTD.
Cleveland, Ohio
February 27, 2017
82
Supplementary Information (Unaudited) | | December 31, 2016 |
Federal Income Tax Information:
During the fiscal period ended December 31, 2016, the Funds declared long-term realized gain distributions in the following amounts:
Fund | | 15% Capital Gains | |
Asset Management Fund | | $ | 15,345,985 | |
Equity Fund | | 6,430,098 | |
Midcap Fund | | 2,744,636 | |
SMID Cap Fund | | 271,297 | |
Small Cap Fund | | 13,554,295 | |
Walden Asset Management Fund | | 1,916,337 | |
Walden Equity Fund | | 4,291,721 | |
Walden Midcap Fund | | 1,414,849 | |
Walden SMID Cap Fund | | 1,148,927 | |
Walden Small Cap Fund | | 2,547,203 | |
| | | | |
During the fiscal period ended December 31, 2016, the Funds declared short-term realized gain distributions in the following amounts:
Fund | | Short-Term Capital Gains | |
Midcap Fund | | $ | 246,974 | |
SMID Cap Fund | | 50,203 | |
Small Cap Fund | | 621,559 | |
Walden Asset Management Fund | | 28,010 | |
Walden Equity Fund | | 56,998 | |
Walden Midcap Fund | | 166,470 | |
Walden SMID Cap Fund | | 459,212 | |
Walden Small Cap Fund | | 440 | |
| | | | |
For the fiscal period ended December 31, 2016, the following percentage of the total ordinary income distributions paid by the Funds qualify for the distributions received deduction available to corporate shareholders.
Fund | | Distribution Received Deduction | |
Asset Management Fund | | 100.00 | % |
Equity Fund | | 100.00 | % |
Midcap Fund | | 100.00 | % |
SMID Cap Fund | | 94.91 | % |
Small Cap Fund | | 100.00 | % |
Walden Asset Management Fund | | 100.00 | % |
Walden Equity Fund | | 100.00 | % |
Walden Midcap Fund | | 100.00 | % |
Walden SMID Cap Fund | | 82.56 | % |
Walden Small Cap Fund | | 100.00 | % |
For the fiscal period ended December 31, 2016, distributions paid by the Funds may be subject to a maximum tax rate of 15%, as provided for by the Jobs and Growth Tax Relief Reconciliation Act of 2003. The Funds intend to designate the maximum amount allowable as taxed at a maximum rate of 15%. Complete information will be reported in conjunction with your 2013 Form 1099-DIV.
Fund | | Qualified Dividend Income | |
Asset Management Fund | | 100.00 | % |
Equity Fund | | 100.00 | % |
Midcap Fund | | 100.00 | % |
SMID cap Fund | | 100.00 | % |
Small Cap Fund | | 100.00 | % |
Walden Asset Management Fund | | 100.00 | % |
Walden Equity Fund | | 100.00 | % |
Walden Midcap Fund | | 100.00 | % |
Walden SMID Cap Fund | | 85.37 | % |
Walden Small Cap Fund | | 100.00 | % |
Walden International Equity Fund | | 79.16 | % |
Continued
83
Table of Shareholder Expenses:
As a shareholder of the Trust, you incur ongoing costs, including management fees, and other Fund expenses. These examples are intended to help you understand your ongoing costs (in dollars) of investing in the Boston Trust & Walden Funds and to compare these costs with the ongoing costs of investing in other mutual funds.
These examples are based on an investment of $1,000 invested at the beginning of the period and held for the entire period from July 1, 2016 through December 31, 2016.
Actual Expenses
The table below provides information about actual account values and actual expenses. You may use the information below together with the amount you invested, to estimate the expenses that you paid over the period. Simply divide your account value by $1,000 (for example, an $8,600 account value divided by $1,000 = 8.6), then multiply the result by the number in the table under the heading entitled “Expenses Paid during Period” to estimate the expenses you paid on your account during this period.
Please note that the expenses shown in the tables are meant to highlight your ongoing costs only and do not reflect the costs incurred by the Funds for buying and selling securities. The Funds do not charge transaction fees, such as redemption fees, nor do the Funds charge a sales charge (load). Therefore, the table is useful in comparing ongoing costs only, and will not help you determine the relative total costs of owning different funds.
| | | | | | | | Annualized | |
| | Beginning | | Ending | | Expenses Paid | | Expense Ratio | |
| | Account Value | | Account Value | | During Period(1) | | During Period | |
| | 7/1/16 | | 12/31/16 | | 7/1/16 - 12/31/16 | | 7/1/16 - 12/31/16 | |
Asset Management Fund | | $ | 1,000.00 | | $ | 1,034.30 | | $ | 4.87 | | 0.95 | % |
Equity Fund | | 1,000.00 | | 1,058.20 | | 5.03 | | 0.97 | % |
Midcap Fund | | 1,000.00 | | 1,047.50 | | 5.16 | | 1.00 | % |
SMID Cap Fund | | 1,000.00 | | 1,129.50 | | 4.03 | | 0.75 | % |
Small Cap Fund | | 1,000.00 | | 1,137.90 | | 5.39 | | 1.00 | % |
Walden Asset Management Fund | | 1,000.00 | | 1,039.10 | | 5.14 | | 1.00 | % |
Walden Equity Fund | | 1,000.00 | | 1,067.10 | | 5.21 | | 1.00 | % |
Walden Midcap Fund | | 1,000.00 | | 1,049.10 | | 5.16 | | 1.00 | % |
Walden SMID Cap Fund | | 1,000.00 | | 1,132.10 | | 5.37 | | 1.00 | % |
Walden Small Cap Fund | | 1,000.00 | | 1,140.10 | | 5.39 | | 1.00 | % |
Walden International Equity Fund | | 1,000.00 | | 1,012.60 | | 5.83 | | 1.15 | % |
| | | | | | | | | | | | |
(1) Expenses are equal to the Fund’s annualized expense ratio multiplied by the average account value over the period multiplied by 184/365 (to reflect the one-half year period).
Hypothetical Example for Comparison Purposes
The table below provides information about hypothetical account values and hypothetical expenses based on each Fund’s actual expense ratio and an assumed rate of return of 5% per year before expenses, which is not the Fund’s actual return. The hypothetical account values and expenses may not be used to estimate the actual ending account balance or expenses you paid for the period. You may use this information to compare this 5% hypothetical example with the 5% hypothetical examples that appear in the shareholder reports of other funds.
Please note that the expenses shown in the table are meant to highlight your ongoing costs only and do not reflect the costs incurred by the Funds for buying and selling securities. The Funds do not charge transaction fees, such as redemption fees, nor do the Funds charge a sales charge (load). Therefore, the table is useful in comparing ongoing costs only, and will not help you determine the relative total costs of owning different funds.
| | | | | | | | Annualized | |
| | Beginning | | Ending | | Expenses Paid | | Expense Ratio | |
| | Account Value | | Account Value | | During Period(1) | | During Period | |
| | 7/1/16 | | 12/31/16 | | 7/1/16 - 12/31/16 | | 7/1/16 - 12/31/16 | |
Asset Management Fund | | $ | 1,000.00 | | $ | 1,020.42 | | $ | 4.84 | | 0.95 | % |
Equity Fund | | 1,000.00 | | 1,020.32 | | 4.94 | | 0.97 | % |
Midcap Fund | | 1,000.00 | | 1,020.16 | | 5.09 | | 1.00 | % |
SMID Cap Fund | | 1,000.00 | | 1,021.42 | | 3.82 | | 0.75 | % |
Small Cap Fund | | 1,000.00 | | 1,020.16 | | 5.09 | | 1.00 | % |
Walden Asset Management Fund | | 1,000.00 | | 1,020.16 | | 5.09 | | 1.00 | % |
Walden Equity Fund | | 1,000.00 | | 1,020.16 | | 5.09 | | 1.00 | % |
Walden Midcap Fund | | 1,000.00 | | 1,020.16 | | 5.09 | | 1.00 | % |
Walden SMID Cap Fund | | 1,000.00 | | 1,020.16 | | 5.09 | | 1.00 | % |
Walden Small Cap Fund | | 1,000.00 | | 1,020.16 | | 5.09 | | 1.00 | % |
Walden International Equity Fund | | 1,000.00 | | 1,019.41 | | 5.85 | | 1.15 | % |
| | | | | | | | | | | | |
(1) Expenses are equal to the Fund’s annualized expense ratio multiplied by the average account value over the period multiplied by 184/365 (to reflect the one-half year period).
Continued
84
Tabular Summary of Schedules of Portfolio Investments:
The Boston Trust Funds invested, as a percentage of total net assets, in the following industries as of December 31, 2016.
Asset Management Fund
| | Percentage of Total | |
Security Allocation for the Schedule of Portfolio Investments | | Net Assets | |
Financials | | 17.4 | % |
Information Technology | | 15.6 | % |
U.S. Government & U.S. Government Agency Obligations | | 14.5 | % |
Health Care | | 11.4 | % |
Industrials | | 10.4 | % |
Consumer Discretionary | | 8.9 | % |
Consumer Staples | | 8.2 | % |
Investment Companies | | 5.6 | % |
Energy | | 3.5 | % |
Materials | | 2.4 | % |
Utilities | | 1.5 | % |
Municipal Bonds | | 1.2 | % |
Telecommunication Services | | 0.5 | % |
Liabilities in excess of other net assets | | -1.1 | % |
Total | | 100.0 | % |
Equity Fund
| | Percentage of Total | |
Security Allocation for the Schedule of Portfolio Investments | | Net Assets | |
Financials | | 19.8 | % |
Information Technology | | 18.7 | % |
Health Care | | 14.5 | % |
Industrials | | 12.6 | % |
Consumer Staples | | 11.5 | % |
Consumer Discretionary | | 10.4 | % |
Energy | | 4.5 | % |
Materials | | 3.3 | % |
Utilities | | 2.1 | % |
Investment Companies | | 1.8 | % |
Telecommunication Services | | 0.9 | % |
Liabilities in excess of other net assets | | -0.1 | % |
Total | | 100.0 | % |
Midcap Fund
| | Percentage of Total | |
Security Allocation for the Schedule of Portfolio Investments | | Net Assets | |
Financials | | 14.9 | % |
Industrials | | 14.7 | % |
Consumer Discretionary | | 14.7 | % |
Information Technology | | 14.4 | % |
Health Care | | 12.8 | % |
Utilities | | 6.6 | % |
Consumer Staples | | 6.3 | % |
Materials | | 5.6 | % |
Real Estate | | 5.4 | % |
Energy | | 3.9 | % |
Investment Companies | | 0.3 | % |
Other net assets | | 0.4 | % |
Total | | 100.0 | % |
SMID Cap Fund
| | Percentage of Total | |
Security Allocation for the Schedule of Portfolio Investments | | Net Assets | |
Financials | | 18.3 | % |
Industrials | | 16.4 | % |
Information Technology | | 15.6 | % |
Consumer Discretionary | | 14.1 | % |
Health Care | | 11.5 | % |
Real Estate | | 7.8 | % |
Materials | | 5.2 | % |
Energy | | 3.7 | % |
Consumer Staples | | 3.4 | % |
Utilities | | 3.1 | % |
Investment Companies | | 0.8 | % |
Other net assets | | 0.1 | % |
Total | | 100.0 | % |
Small Cap Fund
| | Percentage of Total | |
Security Allocation for the Schedule of Portfolio Investments | | Net Assets | |
Information Technology | | 18.2 | % |
Financials | | 17.5 | % |
Industrials | | 14.6 | % |
Health Care | | 14.3 | % |
Consumer Discretionary | | 14.1 | % |
Real Estate | | 6.8 | % |
Materials | | 4.9 | % |
Utilities | | 3.4 | % |
Consumer Staples | | 3.3 | % |
Energy | | 2.9 | % |
Investment Companies | | 1.7 | % |
Liabilities in excess of other net assets | | -1.7 | % |
Total | | 100.0 | % |
Continued
85
The Walden Funds invested, as a percentage of total net assets, in the following industries and countries as of December 31, 2016.
Walden Asset Management Fund
| | Percentage of Total | |
Security Allocation for the Schedule of Portfolio Investments | | Net Assets | |
U.S. Government & U.S. Government Agency Obligations | | 21.1 | % |
Information Technology | | 14.5 | % |
Financials | | 14.1 | % |
Health Care | | 10.6 | % |
Industrials | | 10.0 | % |
Consumer Discretionary | | 9.9 | % |
Consumer Staples | | 8.5 | % |
Investment Companies | | 2.9 | % |
Energy | | 2.8 | % |
Materials | | 2.1 | % |
Utilities | | 1.4 | % |
Telecommunication Services | | 0.8 | % |
Municipal Bonds | | 0.5 | % |
Certificate of Deposit | | 0.1 | % |
Other net assets | | 0.7 | % |
Total | | 100.0 | % |
Walden Equity Fund
| | Percentage of Total | |
Security Allocation for the Schedule of Portfolio Investments | | Net Assets | |
Information Technology | | 18.4 | % |
Financials | | 18.0 | % |
Health Care | | 14.5 | % |
Industrials | | 13.7 | % |
Consumer Discretionary | | 12.9 | % |
Consumer Staples | | 11.5 | % |
Energy | | 3.8 | % |
Materials | | 3.1 | % |
Utilities | | 1.9 | % |
Telecommunication Services | | 1.0 | % |
Investment Companies | | 1.0 | % |
Other net assets | | 0.2 | % |
Total | | 100.0 | % |
Walden Midcap Fund
| | Percentage of Total | |
Security Allocation for the Schedule of Portfolio Investments | | Net Assets | |
Industrials | | 15.5 | % |
Financials | | 15.0 | % |
Consumer Discretionary | | 14.8 | % |
Information Technology | | 13.9 | % |
Health Care | | 12.9 | % |
Consumer Staples | | 6.5 | % |
Utilities | | 5.6 | % |
Real Estate | | 5.5 | % |
Materials | | 5.4 | % |
Energy | | 3.8 | % |
Investment Companies | | 1.1 | % |
Total | | 100.0 | % |
Walden SMID Cap Fund
| | Percentage of Total | |
Security Allocation for the Schedule of Portfolio Investments | | Net Assets | |
Financials | | 18.6 | % |
Information Technology | | 16.4 | % |
Industrials | | 15.9 | % |
Consumer Discretionary | | 13.2 | % |
Health Care | | 12.0 | % |
Real Estate | | 8.6 | % |
Materials | | 5.4 | % |
Energy | | 3.2 | % |
Utilities | | 3.1 | % |
Investment Companies | | 2.6 | % |
Consumer Staples | | 2.5 | % |
Liabilities in excess of other net assets | | -1.5 | % |
Total | | 100.0 | % |
Walden Small Cap Fund
| | Percentage of Total | |
Security Allocation for the Schedule of Portfolio Investments | | Net Assets | |
Information Technology | | 18.2 | % |
Financials | | 17.9 | % |
Industrials | | 14.7 | % |
Health Care | | 13.9 | % |
Consumer Discretionary | | 13.6 | % |
Real Estate | | 6.6 | % |
Materials | | 4.7 | % |
Utilities | | 3.4 | % |
Consumer Staples | | 3.0 | % |
Energy | | 2.9 | % |
Investment Companies | | 1.1 | % |
Total | | 100.0 | % |
Walden International Equity Fund
| | Percentage of Total | |
Security Allocation for the Schedule of Portfolio Investments | | Net Assets | |
Japan | | 21.1 | % |
United Kingdom | | 15.6 | % |
Canada | | 8.9 | % |
France | | 8.8 | % |
Germany | | 8.4 | % |
Switzerland | | 8.2 | % |
Australia | | 6.3 | % |
Netherlands | | 3.7 | % |
Spain | | 3.1 | % |
Sweden | | 3.0 | % |
Hong Kong | | 2.7 | % |
Italy | | 1.5 | % |
Israel | | 1.3 | % |
Denmark | | 1.3 | % |
Singapore | | 1.2 | % |
Luxembourg | | 1.0 | % |
Norway | | 0.8 | % |
Ireland | | 0.7 | % |
Belgium | | 0.7 | % |
Finland | | 0.7 | % |
United States | | 0.4 | % |
Other net assets | | 0.6 | % |
Total | | 100.0 | % |
Continued
86
Other Information:
A description of the policies and guidelines that the Funds use to determine how to vote proxies related to portfolio securities is available: (i) without charge, upon request, by calling 1-800-282-8782 ext. 7050, and (ii) on the Securities and Exchange Commission’s (the “Commission”) website at http://www.sec.gov.
Proxy voting policies and guidelines as well as information regarding how the Funds voted proxies relating to portfolio securities during the most recent 12-month period ended June 30 is available (i) without charge, upon request, by calling 1-800-282-8782 ext. 7050, (ii) on the Boston Trust & Investment Management, Inc. website at http://www.btim.com; and (iii) on the Commission’s website at http://www.sec.gov.
The Funds file complete schedules of portfolio holdings for each Fund with the Commission for the first and third quarters of each fiscal year on Form N-Q. The Funds’ Form N-Q is available on the Commission’s website at http://www.sec.gov. The Funds’ Form N-Q may be reviewed and copied at the Commission’s Public Reference Room in Washington, D.C. and information on the operation of the Public Reference Room may be obtained by calling 800-SEC-0330.
Continued
87
The annual consideration by the Board of Trustees (the “Board”) of the continuation of the investment advisory agreement between Boston Trust Investment Management, Inc., (the “Adviser”) and Boston Trust Asset Management Fund, Boston Trust Equity Fund, Boston Trust Midcap Fund, Boston Trust SMID Cap Fund, Boston Trust Small Cap Fund, Walden Asset Management Fund, Walden Equity Fund, Walden Midcap Fund, Walden SMID Cap Fund, Walden Small Cap Fund, and Walden International Equity Fund (the “Funds”).
Section 15 of the Investment Company Act of 1940 (the “1940 Act”) requires that the Investment Advisory Agreement with Boston Trust Investment Management, Inc. (the “Adviser”) be renewed annually by the Board of Trustees of The Boston Trust & Walden Funds (the “Trust”), including a majority of the Board who are not “interested persons” of the Trust or of the Adviser (“Independent Trustees”). It is the duty of the Board to request as much information as is reasonably necessary to evaluate the terms of the Investment Advisory Agreement and determine whether its continuance is fair to the Funds and their shareholders. The Board considered the continuation of the Investment Advisory Agreement at an in-person meeting held on August 11, 2016. The Board requested, and the Adviser provided, information and data relating to: (i) the investment performance of each series of the Trust (the “Funds”) and the Adviser; (ii) the nature, extent and quality of the services provided by the Adviser to the Funds; (iii) the cost of the services to be provided and the profits to be realized by the Adviser and its affiliates from the relationship with the Funds; (iv) the extent to which economies of scale will be realized as the Funds grow; (v) whether the fee levels reflect these economies of scale to the benefit of Funds’ shareholders; (vi) the advisory fees paid by other comparable funds advised by the Adviser or by a different investment adviser; (vii) the Funds’ expense ratios and the expense ratios of similar funds; and (viii) the effect of any fee waivers and expense reimbursements made by the Adviser.
At the meeting on August 11, 2016, the Board engaged in a thorough review process to determine whether to continue the Investment Advisory Agreement. The Board met directly with representatives of the Adviser and reviewed the information and data listed above, as supplemented by Citi Fund Services Ohio, Inc. (“Citi”), the Trust’s administrator. As part of its deliberations, the Board also considered and relied upon the information about the Funds and the Adviser that it had received throughout the year as part of its ongoing oversight of the Funds and their operations.
The Board gave careful consideration to the nature, extent and quality of the services provided by the Adviser. The Trustees reviewed the organizational structure of the Adviser and Boston Trust & Investment Management Company (“Boston Trust”), the Adviser’s parent; the Adviser’s investment philosophy: its portfolio construction process and its fixed income approach. The Board discussed the Adviser’s up-capture and down-capture performance, demonstrating the Adviser’s investment philosophy. The Board discussed Walden Asset Management’s approach to sustainable, responsible and impact investing, including its ESG research framework and its portfolio screening guidelines. The Board reviewed the Adviser’s experience and the capabilities of its personnel, as well as the quality of the reports and other materials received from the Adviser. The Board reviewed biographical information about the employees of Boston Trust. The Board discussed the Adviser’s brokerage allocation and execution strategy, noting that the Adviser does not take into consideration sales of Fund shares in selecting brokers through which its affects Fund portfolio transactions. The Board also discussed the Adviser’s compliance program and its business continuity and disaster recovery plans. Finally, the Board discussed succession planning, noting Boston Trust’s objective of transitioning equity from the original five principals to a larger number of employees and highlighting the key areas of focus under the plan. The Board acknowledged that non-founder employees now own 43% of the company. Taking into account the personnel involved in servicing the Funds, as well as the materials and services described above, the Board expressed satisfaction with the quality of the services received from the Adviser.
The Board reviewed the performance of the Funds from inception through December 31, 2015 and June 30, 2016, comparing the performance to various indices and also, in the case of the Boston Trust Asset Management Fund and the Walden Asset Management Fund, to a bond index, equity index and Treasury bills. The Adviser also compared each Fund, other than the Boston Trust Equity Fund and Walden Equity Fund, to competitor funds. The Boston Trust Equity Fund and Walden Equity Fund were compared to the Morningstar Larger Blend Average and the Lipper Large Cap Core Average. The Trustees and the Adviser discussed the methodology used to select the competitor funds and whether to revise the methodology going forward. The Board noted that as of December 31, 2015, all of the Funds except the Boston Trust Asset Management Fund, Boston Trust Equity Fund, Walden Asset Management Fund, and Walden Equity Fund outperformed their respective indices for the one-year period and all of the Funds underperformed their respective indices for the three-year and five-year periods, except the Boston Trust SMID Cap Fund, Walden SMID Cap Fund, and Walden Midcap Fund, which do not have five-year track records, and the Walden International Equity Fund, which does not have a three-year and five-year track record. For the 10-year period, the Boston Trust Small Cap Fund outperformed its index, while the Boston Trust Asset Management Fund, Boston Trust Equity Fund, Walden Asset Management Fund, and Walden Equity Fund underperformed their indices. The Trustees noted that the Boston Trust Midcap Fund, Boston Trust SMID Cap Fund, Walden Midcap Fund, Walden SMID Cap Fund, Walden Small Cap Fund, and Walden International Equity Fund do not have a 10-year performance record. Looking at since inception information, the Trustees noted that the Boston Trust Asset Management Fund, Boston Trust Equity Fund, Boston Trust SMID Cap Fund, Walden Midcap Fund, Walden SMID Cap Fund and Walden Small Cap Fund each underperformed their respective indices, while the Boston Trust Midcap Fund, Boston Trust Small Cap Fund, Walden Asset Management Fund, Walden Equity Fund, and Walden International Equity Fund each outperformed their respective indices for the same period. Reviewing performance information as of June 30, 2016, the Board noted that each Fund outperformed their respective index for the year-to-date and one-year periods. The Funds also performed well in comparison to competitor
Continued
88
funds. A representative of the Adviser noted that while the Funds generally underperformed their benchmarks, they participated in the rising market and outperformed their benchmarks in falling markets. A representative of the Adviser noted that this downside protection is consistent with the Adviser’s strategy and is routinely communicated to clients and investors.
The Board also reviewed the range of advisory fees paid by the Funds to the Adviser and the total operating expenses of each Fund. The Board reviewed materials provided by the Adviser and Citi that compare the investment advisory fees assessed the Funds, both before and after expense waivers and/or reimbursements, with the industry average and the appropriate Lipper and Morningstar averages (the “Peer Group”). The Adviser also provided the Board with the Adviser’s separate account and pooled investment fund fee schedules. The Board considered that separate accounts and other pooled investment funds tend to require fewer services than the Funds and, therefore, tend to be charged lower fees. The Board noted that, with the exception of the Boston Trust Asset Management Fund, Walden Asset Management Fund, Boston Trust Equity Fund and Walden Equity Fund, each Fund has contractual advisory fees below the Peer Group average. The contractual advisory fees for the Boston Trust Asset Management Fund and Walden Asset Management Fund are well below 0.90% and 1.10%, the highest fees in the Lipper and Morningstar ranges, respectively. The contractual advisory fees charged by the Boston Trust Equity Fund and the Walden Equity Fund are well below 1.01%, and 1.49%, the highest fees in the appropriate Lipper and Morningstar ranges, respectively.
The Board noted that the Adviser has been operating under an Expense Limitation Agreement that requires the Adviser to waive fees and/ or reimburse expenses to the extent total operating expenses of any Fund (other than the Walden International Equity Fund) exceed 1.00%. The expense limit for the Walden International Equity Fund is 1.15%. The actual advisory fees charged by all of the Funds, except the Boston Trust Asset Management Fund and Boston Trust Equity Fund, are at or below the Peer Group average after expense waivers and/or reimbursements. The actual advisory fees for the Boston Trust Asset Management Fund and Boston Trust Equity Fund are slightly above the Peer Group average after expense waivers and/or reimbursements.
The Board noted that the expense ratios for all the Funds, other than the Boston Trust SMID Cap Fund, Walden Equity Fund, and Walden International Equity Fund, are equal to or lower than the industry average before and after expense waivers and/or reimbursements. The expense ratios for the Boston Trust SMID Cap Fund and Walden International Equity Fund are lower than the industry average after waivers and reimbursements, and the expense ratio for the Walden Equity Fund after waivers and/or reimbursements is 0.02% higher than the Peer Group. However, the Walden Equity Fund’s expense ratio is 0.50% lower than the highest expense ratio in the Peer Group before waivers and/or reimbursements and 0.60% lower than the highest expense ratio in the Peer Group after waivers and/or reimbursements. After considering the comparative data as described above, and the proposed renewal of the Expense Limitation Agreement, the Board concluded that the advisory fees and expense ratios were reasonable.
In reviewing the costs of the services to be provided and the profits to be realized by the Adviser, the Board reviewed the Adviser’s income statement for the six-months ending June 30, 2016 and the 12-months ending December 31, 2015, as well as the gross and net profit margins realized on each Fund. The Board considered that the Adviser is a wholly-owned subsidiary of Boston Trust and the payment of direct and indirect Trust expenses is governed by an Intercompany Services Agreement between the Adviser and Boston Trust. The Board considered that direct expenses are paid by the Adviser and indirect expenses are allocated between the Adviser and Boston Trust based on percentage of revenue. The Board reviewed a report comparing the Adviser’s EBITDA, operating and pre-tax margins to industry peers. The Board noted that the Adviser’s relationship with the Funds was profitable even though the Adviser is operating under an Expense Limitation Agreement with the Trust. The Board and the Adviser then discussed advisory fee breakpoints and whether and at what levels breakpoints would be appropriate.
The Board also discussed the custody and transfer agency fees earned by Boston Trust for services provided to the Funds. With respect to custody, the Board considered that fees earned by Boston Trust are largely passed through to the sub-custodian, with a small amount retained by Boston Trust to compensate it for monitoring and overseeing the sub-custodian, reporting and reconciling securities and cash movement and oversight of corporate actions and class action settlements. The Board noted that the transfer agency fees earned by Boston Trust reflect its service to the Funds’ direct shareholders and for oversight of the Trust’s intermediary relationships, including oversight and coordination of trading and settlement issues for all shareholders.
The Independent Trustees met in executive session with fund counsel. The Board determined that the Investment Advisory Agreement was fair and reasonable, that the Adviser’s fees are reasonable in light of the services provided to the Boston Trust and Walden Funds and the benefits received by the Adviser, and that renewal of the Investment Advisory Agreement would be in the best interests of the Funds.
89
Information about Trustees and Officers (Unaudited) | | December 31, 2016 |
Overall responsibility for management of the Funds rests with the Board of Trustees. The names of the Trustees and Officers of the Funds, their addresses, ages and principal occupations during the past five years are provided in the tables below. The business address of the persons listed below is 4400 Easton Commons, Suite 200, Columbus, Ohio 43219, unless otherwise listed. Trustees who are deemed “interested persons,” as defined in the Investment Company Act of 1940, are referred to as Interested Trustees. Trustees who are not interested persons are referred to as Independent Trustees. The Funds’ Statement of Additional Information includes additional information about the Funds’ Trustees and is available, without charge and upon request, by calling 1-800-282-8782 or by visiting www.btim.com.
| | | | | | | | | | Other |
| | | | | | | | Number of Funds | | Directorships |
| | Position(s) | | Term of Office* | | | | in Fund Complex | | Held by Trustee |
Name, | | Held with | | and Length of | | Principal Occupation(s) | | Overseen by | | during the past |
Date of Birth | | the Funds | | Time Served | | During Past Five Years | | Trustee | | five years |
INTERESTED TRUSTEES | | | | | | | | | | |
| | | | | | | | | | |
Lucia B. Santini
One Beacon Street
33rd Floor
Boston, MA 02108
Year of Birth: 1958 | | Trustee and President | | Since 2011 | | Managing Director, Boston Trust Investment Management, Inc., February 2001 to present. | | 11 | | None |
| | | | | | | | | | |
Heidi Soumerai
One Beacon Street
33rd Floor
Boston, MA 02108
Year of Birth: 1957 | | Trustee | | Since 2013 | | Managing Director and Director of ESG Research, Boston Trust & Investment Management Company, August 2004 to present; Research Analyst, Boston Trust & Investment Management, January 1985 to present. | | 11 | | None |
| | | | | | | | | | |
INDEPENDENT TRUSTEES | | | | | | | | | | |
| | | | | | | | | | |
Michael M. Van Buskirk
Year of Birth: 1947 | | Trustee and Chairman of the Board | | Since 1992 | | Retired since December 2013. President and Chief Executive Officer, Ohio Bankers League, May 1991 to December 2013. | | 11 | | Advisers |
| | | | | Investment Trust |
| | | | | | | | | | |
Diane E. Armstrong
Year of Birth: 1964 | | Trustee | | Since 2004 | | President, Armstrong Financial Services (financial planning firm), November 2012 to present; Managing Director of Financial Planning Services, WealthStone (financial planning firm), July 2008 to November 2012. | | 11 | | None |
| | | | | | | | |
| | | | | | | | | |
| | | | | | | | | |
| | | | | | | | | |
| | | | | | | | | | |
Elizabeth Elliott McGeveran
Year of Birth: 1971 | | Trustee | | Since 2016 | | Director, Impact Investing, The McKnight Foundation, September 2014 to present; Senior Vice President, Governance and Sustainable Investment, F&C Asset Management, October 1999 to April 2013. | | 11 | | None |
| | | | | | | | |
| | | | | | | | | |
| | | | | | | | | |
| | | | | | | | | |
| | | | | | | | | | |
OFFICERS WHO ARE NOT TRUSTEES | | | | | | | | | | |
| | | | | | | | | | |
Jennifer Ellis
One Beacon Street
33rd Floor
Boston, MA 02108
Year of Birth: 1972 | | Treasurer | | Since 2011 | | Director of Finance/Treasurer, Boston Trust & Investment Management Company, May 2011 to present; Finance Director, Bain Capital, June 2008 to May 2010. | | N/A | | N/A |
| | | | | | | | |
| | | | | | | | |
| | | | | | | | |
| | | | | | | | | |
| | | | | | | | | | |
Curtis Barnes
Citi Fund Services
800 Boylston Street
24th Floor
Boston, MA 02199
Year of Birth: 1953 | | Secretary | | Since 2007 | | Senior Vice President, Citi Fund Services Ohio, Inc. (fund administrator), May 1995 to present. | | N/A | | N/A |
| | | | | | | | |
| | | | | | | | | | |
Charles Booth
4400 Easton commons
Suite 200
Columbus, OH 43219
Year of Birth: 1960 | | Chief Compliance Officer | | Since 2015 | | Director, Citi Fund Services Ohio, Inc. (fund administrator), May 2007 to present. | | N/A | | N/A |
| | | | | | | |
| | | | | | | | | |
* Trustees hold their position with the Funds until their resignation or removal. Officers hold their positions with the Funds until a successor has been duly elected and qualified.
Ms. Santini and Ms. Soumerai are considered “interested persons” of the Trust as defined in the 1940 Act due to their employment with Boston Trust Investment Management, Inc., the Funds’ Investment Adviser.
90
This page intentionally left blank.
91
This page intentionally left blank.
92
This page intentionally left blank.
93
Investment Adviser
Boston Trust Investment Management, Inc.
One Beacon Street
Boston, MA 02108
Custodian and Transfer Agent
Boston Trust & Investment Management Company
One Beacon Street
Boston, MA 02108
Administrator
Citi Fund Services Ohio, Inc.
4400 Easton Commons, Suite 200
Columbus, OH 43219
Distributor
BHIL Distributors, LLC
Three Canal Plaza, Suite 100
Portland, ME 04101
Independent Registered Public Accounting Firm
Cohen & Company, Ltd.
1350 Euclid Avenue, Suite 800
Cleveland, OH 44115
Legal Counsel
Thompson Hine LLP
41 South High Street, Suite 1700
Columbus, OH 43215
This report is intended for the shareholders of the Funds and may not be used as sales literature unless preceded or accompanied by a current prospectus.
Past performance results shown should not be considered a representation of future performance. Share price and returns will fluctuate so that shares, when redeemed, may be worth more or less than their original cost. Statements and other information herein are dated and subject to change.
02/17
Item 2. Code of Ethics.
(a) The registrant has adopted a code of ethics that applies to the registrant’s principal executive officer, principal financial officer, principal accounting officer or controller, or persons performing similar functions. This code of ethics is included as an Exhibit.
(b) During the period covered by the report, with respect to the registrant’s code of ethics that applies to its principal executive officer, principal financial officer, principal accounting officer or controller, or persons performing similar functions; there have been no amendments to, nor any waivers granted from, a provision that relates to any element of the code of ethics definition enumerated in paragraph (b) of this Item 2.
Item 3. Audit Committee Financial Expert.
3(a)(1) The registrant’s board of directors has determined that the registrant has at least one audit committee financial expert serving on its audit committee.
3(a)(2) The audit committee financial expert is Diane Armstrong, who is “independent” for purposes of this Item 3 of Form N-CSR.
Item 4. Principal Accountant Fees and Services.
| | December 2016 | | March 2016 | | March 2015 | |
(a) Audit Fees | | $ | 106,500 | | $ | 98,500 | | $ | 97,500 | |
| | | | | | | |
(b) Audit-Related Fees | | $ | 17,250 | | $ | 17,250 | | $ | 15,000 | |
The fees for 2015 relate to the consent issuance in three Form 17f-2 filings filed with the Securities and Exchange Commission (“SEC”).
The fees for 2016 relate to the consent issuance in three Form 17f-2 filings filed with the SEC.
| | December 2016 | | March 2016 | | March 2015 | |
(c) Tax Fees | | $ | 27,500 | | $ | 27,500 | | $ | 25,000 | |
| | | | | | | | | | |
Tax fees for both years related to the preparation of the Funds’ federal and state income tax returns, federal excise tax return review and review of capital gain and income distribution calculations.
| | December 2016 | | March 2016 | | March 2015 | |
(d) All Other Fees | | $ | 0 | | $ | 0 | | $ | 0 | |
| | | | | | | | | | |
(e)(1) The Audit Committee may pre-approve at any regularly scheduled Audit Committee meeting audit, audit-related, tax and other non-audit services to be rendered or that may be rendered by the Auditor to the Funds and certain non-audit services to be rendered by the Auditor to the Advisor which require pre-approval by the Audit Committee. In connection with such pre-approvals, the Auditor, or a Fund officer, with the assistance of the Auditor, shall provide the Audit Committee with a report containing information about each type of service to be pre-approved at the meeting.
(e)(2) For the fiscal years ended December 31, 2016, March 31, 2016 and 2015, 100% of all the fees in paragraph (b) through (d) were approved by the Audit Committee.
(f) Not applicable.
(g) For the fiscal year ended December 31, 2016, Cohen Fund Audit Services, Ltd. billed non-audit fees of $44,750.
For the fiscal year ended March 31, 2016, Cohen Fund Audit Services, Ltd. billed non-audit fees of $44,750.
For the fiscal year ended March 31, 2015, Cohen Fund Audit Services, Ltd. billed non-audit fees of $40,000.
(f) Not applicable.
Item 5. Audit Committee of Listed Registrants.
Not applicable.
Item 6. Investments.
(a) Included as part of the report to shareholders filed under Item 1.
(b) Not applicable.
Item 7. Disclosure of Proxy Voting Policies and Procedures for Closed-End Management Investment Companies.
Not applicable.
Item 8. Portfolio Managers of Closed-End Management Investment Companies.
Not applicable
Item 9. Purchases of Equity Securities by Closed-End Management Investment Company and Affiliated Purchasers.
Not applicable.
Item 10. Submission of Matters to a Vote of Security Holders.
Not applicable.
Item 11. Controls and Procedures.
(a) The registrant’s principal executive officer and principal financial officer have concluded, based on their evaluation of the registrant’s disclosure controls and procedures as conducted within 90 days of the filing date of this report, that these disclosure controls and procedures are adequately designed and are operating effectively to ensure that information required to be disclosed by the registrant on Form N-CSR is recorded, processed, summarized and reported within the time periods specified in the Securities and Exchange Commission’s rules and forms.
(b) There were no changes in the registrant’s internal control over financial reporting (as defined in Rule 30a-3(d) under the Act (17 CFR 270.30a-3(d)) that occurred during the second fiscal quarter of the period covered by this report that have materially affected or are reasonably likely to materially affect, the registrant’s internal control over financial reporting.
Item 12. Exhibits.
(a)(1) The code of ethics that is the subject of the disclosure required by Item 2 is attached hereto.
(a)(2) Certifications pursuant to Rule 30a-2(a) are attached hereto.
(a)(3) Not applicable.
(b) Certifications pursuant to Rule 30a-2(b) are furnished herewith
SIGNATURES
Pursuant to the requirements of the Securities Exchange Act of 1934 and the Investment Company Act of 1940, the registrant has duly caused this report to be signed on its behalf by the undersigned, thereunto duly authorized.
(Registrant) | The Boston Trust & Walden Funds |
| |
By (Signature and Title)* | /s/ Lucia Santini, President |
| |
Date | February 22, 2017 | | |
| | | | | |
Pursuant to the requirements of the Securities Exchange Act of 1934 and the Investment Company Act of 1940, this report has been signed below by the following persons on behalf of the registrant and in the capacities and on the dates indicated.
By (Signature and Title)* | /s/ Lucia Santini, President | |
| | | |
Date | February 22, 2017 | | |
| | | |
By (Signature and Title)* | /s/ Jennifer Ellis, Treasurer | |
| | | |
Date | February 22, 2017 | | | | |
| | | | | | | | | |