UNITED STATES
SECURITIES AND EXCHANGE COMMISSION
Washington, D.C. 20549
FORM N-CSR
CERTIFIED SHAREHOLDER REPORT OF REGISTERED
MANAGEMENT INVESTMENT COMPANIES
Investment Company Act file number | 811-06526 |
|
Boston Trust Walden Funds |
(Exact name of registrant as specified in charter) |
|
One Beacon Street, Boston MA | | 02108 |
(Address of principal executive offices) | | (Zip code) |
|
4400 Easton Commons, Columbus, OH 43219 |
(Name and address of agent for service) |
|
Registrant’s telephone number, including area code: | 1-800-282-8782 | |
|
Date of fiscal year end: | December 31 | |
|
Date of reporting period: | December 31, 2019 | |
| | | | | | | | |
| Item 1. | Reports to Stockholders. |
Annual Report
December 31, 2019

 Boston Trust Walden Funds
| Boston Trust Asset Management Fund | Walden Balanced Fund |
| Boston Trust Equity Fund | (formerly known as the Walden Asset Management Fund) |
| Boston Trust Midcap Fund | Walden Equity Fund |
| Boston Trust SMID Cap Fund | Walden Midcap Fund |
| Boston Trust Small Cap Fund | Walden SMID Cap Fund |
| | Walden Small Cap Fund |
| Walden International Equity Fund |
This page intentionally left blank.
| Table of Contents | Annual Report |
| | December 31, 2019 |
| Boston Trust Walden Funds Economic and Market Summary | 3 |
| | |
| Boston Trust Asset Management Fund | |
| Manager Commentary | 4 |
| Investment Performance | 5 |
| Schedule of Portfolio Investments | 12 |
| Financial Statements | 14 |
| Financial Highlights | 16 |
| | |
| Boston Trust Equity Fund | |
| Manager Commentary | 4 |
| Investment Performance | 5 |
| Schedule of Portfolio Investments | 17 |
| Financial Statements | 18 |
| Financial Highlights | 20 |
| | |
| Boston Trust Midcap Fund | |
| Manager Commentary | 6 |
| Investment Performance | 7 |
| Schedule of Portfolio Investments | 21 |
| Financial Statements | 22 |
| Financial Highlights | 24 |
| | |
| Boston Trust SMID Cap Fund | |
| Manager Commentary | 8 |
| Investment Performance | 9 |
| Schedule of Portfolio Investments | 25 |
| Financial Statements | 26 |
| Financial Highlights | 28 |
| | |
| Boston Trust Small Cap Fund | |
| Manager Commentary | 10 |
| Investment Performance | 11 |
| Schedule of Portfolio Investments | 29 |
| Financial Statements | 30 |
| Financial Highlights | 32 |
| | |
| Annual ESG Impact Report | 34 |
| Walden Balanced Fund | |
| Manager Commentary | 36 |
| Investment Performance | 37 |
| Schedule of Portfolio Investments | 46 |
| Financial Statements | 48 |
| Financial Highlights | 50 |
| | |
| Walden Equity Fund | |
| Manager Commentary | 36 |
| Investment Performance | 37 |
| Schedule of Portfolio Investments | 51 |
| Financial Statements | 52 |
| Financial Highlights | 54 |
| | |
| Walden Midcap Fund | |
| Manager Commentary | 38 |
| Investment Performance | 39 |
| Schedule of Portfolio Investments | 55 |
| Financial Statements | 56 |
| Financial Highlights | 58 |
| | |
| Walden SMID Cap Fund | |
| Manager Commentary | 40 |
| Investment Performance | 41 |
| Schedule of Portfolio Investments | 59 |
| Financial Statements | 60 |
| Financial Highlights | 62 |
| | |
| Walden Small Cap Fund | |
| Manager Commentary | 42 |
| Investment Performance | 43 |
| Schedule of Portfolio Investments | 63 |
| Financial Statements | 64 |
| Financial Highlights | 66 |
| | |
| Walden International Equity Fund | |
| Manager Commentary | 44 |
| Investment Performance | 45 |
| Schedule of Portfolio Investments | 67 |
| Financial Statements | 69 |
| Financial Highlights | 71 |
| | |
| Notes to Financial Statements | 72 |
| Report of Independent Registered Public Accounting Firm | 80 |
| Supplementary Information | 81 |
| Investment Adviser Contract Approval | 86 |
| Information About Trustees and Officers | 88 |
Boston Trust Walden Inc., a subsidiary of Boston Trust Walden Company, serves as investment adviser (the “Adviser”) to the Boston Trust Walden Funds and receives a fee for its services. Boston Trust Walden Company provides certain administrative, operational, and investment support functions for the Adviser and is paid a fee for these services by the Adviser.
Shares of the Funds are not deposits of, obligations of, or guaranteed by Boston Trust Walden Company or its affiliates, nor are they federally insured by the FDIC. Investments in the Funds involve investment risks, including the possible loss of principal. Funds are distributed by Foreside Financial Services, LLC.
The foregoing information and opinions are for general information only. The Boston Trust Walden Funds and Boston Trust Walden Company do not assume liability for any loss, which may result from the reliance by any person upon any such information or opinions. Such information and opinions are subject to change without notice, are for general information only, and are not intended as an offer or solicitation with respect to the purchase or sale of any security or offering individual or personalized investment advice. Portfolio composition is as of December 31, 2019 and is subject to change without notice.
The Boston Trust Walden Funds may invest in foreign securities, which may involve risk not typically associated with U.S. investments.
To reduce expenses, we may only mail one copy of the Funds’ shareholder updates, such as their prospectus, annual report, and semi-annual report, to those addresses shared by two or more accounts. If you are a direct shareholder and wish to receive individual copies of these documents, please call us at 1-800-282-8782 x7050. If you are not a direct shareholder, please contact your financial institution to opt out of householding. We will begin sending you individual copies thirty days after receiving your request.
Important Notice: The Securities and Exchange Commission will permit funds to deliver shareholder reports electronically beginning January 1, 2021. At that time, the Boston Trust Walden Funds will send a notice, either by mail or email, each time your fund’s updated report is available on our website (www.bostontrustwalden.com). Investors enrolled in electronic delivery will receive the notice by email with links to the updated report. Investors who are not enrolled in electronic delivery by January 1, 2021 will receive the notice in the mail. All investors who prefer to receive shareholder reports in paper may, at any time, choose that option free of charge by calling 1-800-282-8782 x7050.
This page intentionally left blank.
| Boston Trust Walden Funds |
| Boston Trust Walden Funds | Domenic Colasacco, CFA |
| Economic and Market Summary | Portfolio Manager |
| (Unaudited) | Boston Trust Walden Inc. |
The expression “what a difference a year makes” has been an apt summary of the stock market environment on many occasions during my now 50-year career as a money manager. In only a handful of times, however, has investor perception about the stock market outlook changed as much as it did over the past twelve months. Last year, as I sat down to write the year-end 2018 edition of this report, we had just endured a 20% drop in the S&P 500 Index1. At the time, media headlines were filled with predictions that the long-awaited economic recession would finally arrive in 2019, fostered by a combination of weaker global economies, growing trade tensions, and what many investors viewed as a misguided rising interest rate policy by the Federal Reserve Board (the Fed).
With the benefit of hindsight, we know now that the recession forecasts were incorrect. Stock prices began to recover early in 2019, soon after Fed Chairman Powell announced a revised interest rate policy. By April, the prior 20% price drop had been entirely recouped. Stock prices continued to rise at a comparatively steady pace over the summer and fall months, supported by a series of economic reports that eased investors’ recession fears. At year-end, the S&P 500 Index closed near a record level, posting a total return of 31.49% for the calendar year. The gain computes to an even more dramatic 40.25% if measured from the lowest point of the fourth quarter 2018 price decline, which occurred on December 24, 2018.
Historically, large changes in stock values—up or down—over comparatively short time periods usually have been accompanied by significant economic or political events. Given the minimal changes in domestic and global economies, that was not the case in 2019. Rather, the past year was a classic example of the importance of investor perception about the business outlook, and what can happen when widely accepted perceptions prove to be incorrect.
Shareholders may recall that we did not share the economic pessimism that became widespread a year ago. That view led us to keep the equity allocations in both the Boston Trust Asset Management Fund and Walden Balanced Fund near the upper-end of their specified policy ranges throughout 2019. In all of our Funds, we also retained broad exposure to individual companies that we believed were well positioned to benefit comparatively from the modest GDP1 growth, low interest rate environment we have enjoyed during the past decade. These core investment decisions allowed our Funds to participate in last year’s outstanding stock market advance.
Writing these economic updates has been a pleasant exercise for much of the past decade. Despite intermittent forecasts by many economists and stock market pundits that a recession was looming, core economic trends have not changed appreciably since 2010. Throughout this period, here in the United States we have enjoyed real GDP growth of about 2% to 3% per annum. Employment, personal income and corporate profits have also expanded, all without any substantive spikes in either inflation or interest rates. Internationally, Japan and the Eurozone have only muddled through, but many emerging economies, especially China and other key Asian countries, performed well, leading to an overall global GDP growth rate slightly above our own.
As we begin both a new year and new decade, the type of economic factors that ordinarily lead to a recession and longer-lasting bear market are still not apparent to us. Unless economic conditions deteriorate, we expect to continue to retain equity allocations in our two stock/bond blended funds near the upper-end of their policy ranges.
| 1 | TheStandard & Poor’s 500 Index (S&P 500) is widely regarded as a gauge of the U.S. equities market and includes 500 of the largest publicly traded U.S. companies. TheGross Domestic Product (GDP) is the value of goods and services produced in a given country in a given year. |
Boston Trust Asset Management Fund
Boston Trust Equity Fund
December 31, 2019
Domenic Colasacco, CFA
Lead Portfolio Manager
Amy Crandall Kaser, CFP®
Portfolio Manager
Jason T. O’Connell, CFA, CAIA, CFP®
Portfolio Manager
Boston Trust Walden Inc.
Asset Management Fund Objective
The Fund seeks long-term capital growth and income through an actively managed portfolio of stocks, bonds, and money market instruments.
Equity Fund Objective
The Fund seeks long-term capital growth through an actively managed portfolio of stocks.
Investment Concerns
Equity securities (stocks) are more volatile and carry more risk and return potential than other forms of investments, including investments in high-grade fixed income securities.
Foreign investing involves risks not typically associated with U.S. investments, including adverse political, social and economic developments and differing auditing and legal standards. These risks are magnified in emerging markets.
Small- to mid-capitalization companies typically have a higher risk of failure and historically have experienced a greater degree of volatility.
Bonds offer a relatively stable level of income, although bond prices will fluctuate, providing the potential for principal gain or loss. Intermediate-term, higher quality bonds generally offer less risk than longer-term bonds and a lower rate of return.
Cash equivalents offer low risk and low return potential.
Manager Commentary (Unaudited)
Management Discussion of Fund Performance
Stocks, as measured by the S&P 500 Index, rose by 31.49% in 2019. Bond indices were also well into positive territory, with the Bloomberg Barclays U.S. Government/Credit Bond Index posting a 9.71% total return for the year. 2019 marked the best simultaneous year for stocks and bonds since 1998. The Boston Trust Asset Management Fund and the Boston Trust Equity Fund both fully participated. The Boston Trust Asset Management Fund’s 2019 total return of 25.81%† was among the best calendar year gains since the Fund’s inception in 1995, while the Boston Trust Equity Fund’s 31.74%† total return was, in fact, its best year since that Fund’s inception in 2003.
As pleasant as it is to report an attractive absolute and relative calendar year return, our recent discussions with shareholders suggest that there is widespread concern about the sustainability of the past year’s stock market gain. We agree that a decline in stock prices is possible at any time. In thinking about how best to position the Boston Trust Asset Management Fund in an always-uncertain world, over the years we have found that it is helpful to try to discern the likely catalysts of a potential future stock market decline. One possibility is a repeat of the year ago experience, which was driven mostly by a change in investor perception about near-term business prospects rather than a substantial deterioration in economic conditions. These types of declines occur frequently and can be significant and scary. Yet they are virtually impossible to time correctly and are best considered part of the cost of being a successful long-term investor.
The other potential reason for the next substantial stock market decline will be a deterioration in key economic segments that leads to an actual recession. These types of declines occur less frequently but are usually longer lasting and more severe. We did not have a recession during the past ten years. There were two recessions during the prior decade, however, and in each case aggregate stock values dropped by close to 50%. Unfortunately, in their initial stages, the two types of stock market declines are difficult to distinguish. In managing the Boston Trust Asset Management Fund, our usual approach has been to wait until there is clear evidence an economic decline is inevitable before moving to a more defensive investment position. The last time we took such a step was during 2007 and 2008, before the depths of the financial crisis. This approach accepts greater initial downside risk, nevertheless avoids being whipsawed by the more frequent, perception driven stock market declines. It is worth noting that in both Funds, regardless of where we are in the economic cycle, we remain committed to our approach of investing in companies with sustainable business models and strong financial underpinnings. Emphasis in a diversified portfolio of such higher-quality stocks has allowed the Funds’ equity portfolios to participate in rising markets yet hold up comparatively well during the intermittent periods of stock market downturns we have endured since 2010.*
In addition to a potential recession, a few shareholders have expressed concern that current stock valuations are too high. There is no question that stocks generally are more expensive today than they were a year ago, primarily because corporate profits did not increase much during 2019. Specifically, the oft-referenced price-to-earnings ratio1 for the S&P 500 is now close to 20x, compared to 16x or so at the end of 2018. Lower starting valuations almost always give us more confidence about future stock market returns. Nonetheless, we are inclined to view 2018 year-end valuations, which were driven down by recession fears, as the outlier. The price-to-earnings ratio of the S&P 500 has been close to 20x for most of the time since 2013, the last calendar year the S&P 500 increased by close to 30%. The S&P 500 total return has still managed to average about 12% per annum since then, though, helped by the sharp increase in corporate profits over the past six years. We expect profit growth to moderate over the next several years, then again, in our opinion, even modest profit increases should allow stock returns to exceed the low 1% to 3% interest rates available in bonds and money market instruments, provided a favorable economic environment should continue.
| † | The recent appreciation in the stock market has helped to produce short-term returns that are not typical and may not continue in the future. Because of ongoing market volatility, fund performance may be subject to substantial short-term changes. |
| | |
| * | Portfolio composition is subject to change. |
| | |
| 1 | The price-to-earnings ratio (P/E Ratio) is a valuation ratio of a company’s current share price to its per-share earnings. |
| Investment Performance (Unaudited) | Boston Trust Asset Management Fund |
| | Boston Trust Equity Fund |
| | December 31, 2019 |
| | | For the periods ended 12/31/19 | |
| | | Average Annual Total Returns | |
| | | | | | | | | | | | | | | | | | | | | Since | | | Since | |
| | | | | | | | | | | | | | | | | | | | | Inception | | | Inception | |
| | | 1 Year | | | 3 Years | | | 5 Years | | | 10 Years | | | 15 Years | | | 20 Years | | | (12/1/95) | | | (10/1/03) | |
| Boston Trust Asset Management Fund | | | 25.81 | %† | | | 12.89 | % | | | 9.60 | % | | | 10.28 | % | | | 7.78 | % | | | 6.92 | % | | | 8.41 | % | | | — | |
| Boston Trust Equity Fund | | | 31.74 | %† | | | 15.71 | % | | | 11.35 | % | | | 12.32 | % | | | 8.59 | % | | | — | | | | — | | | | 9.21 | % |
| S&P 500 Index | | | 31.49 | % | | | 15.27 | % | | | 11.70 | % | | | 13.56 | % | | | 9.00 | % | | | 6.06 | % | | | 9.25 | % | | | 9.59 | % |
| Bloomberg Barclays U.S. Government/Credit Bond Index | | | 9.71 | % | | | 4.35 | % | | | 3.23 | % | | | 3.96 | % | | | 4.21 | % | | | 5.14 | % | | | 5.14 | % | | | 4.14 | % |
| FTSE 3 Month US T-Bill Index | | | 2.25 | % | | | 1.65 | % | | | 1.05 | % | | | 0.56 | % | | | 1.33 | % | | | 1.69 | % | | | 2.26 | % | | | 1.31 | % |
Hypothetical Growth of a $100,000 Investment


Boston Trust Asset Management Fund
| Fund Net Asset Value: | | $ | 55.17 | |
| Gross Expense Ratio1: | | | 0.93 | % |
Boston Trust Equity Fund
| Fund Net Asset Value: | | $ | 29.55 | |
| Gross Expense Ratio1: | | | 0.92 | % |
Past performance does not guarantee future results. The performance data quoted represents past performance and current returns may be lower or higher. The investment return and principal value will fluctuate so that an investor’s shares, when redeemed may be worth more or less than the original cost. To obtain performance information current to the most recent month-end, please call 1-800-282-8782 ext. 7050.
| 1 | The Gross Expense Ratio is from each Fund’s most recent prospectus, dated May 1, 2019. Additional information pertaining to each Fund’s expense ratio as of December 31, 2019 can be found in the financial highlights included in this report. |
| † | The recent appreciation in the stock market has helped to produce short-term returns that are not typical and may not continue in the future. Because of ongoing market volatility, fund performance may be subject to substantial short-term changes. |
The above charts represent a 10-year hypothetical $100,000 investment in the Boston Trust Asset Management Fund and the Boston Trust Equity Fund, and includes the reinvestment of dividends and capital gains in the Funds. The returns shown on the table and the graphs do not reflect the deduction of taxes a shareholder would pay on Fund distributions or the redemption of Fund shares.
The Boston Trust Asset Management Fund is measured against a combination of equity and fixed income indices. The Boston Trust Equity Fund is measured against the Standard & Poor’s 500 Index (“S&P 500”), which is widely regarded as a gauge of the U.S. equities market, includes 500 leading companies in leading industries of the U.S. economy. Although the S&P 500 focuses on the large-cap segment of the market, with approximately 75% coverage of U.S. equities, it is also widely viewed as a proxy for the total market. The Bloomberg Barclays U.S. Government/Credit Index includes Treasuries (i.e., public obligations of the U.S. Treasury that have remaining maturities of more than one year), government-related issues (e.g., agency, sovereign, supranational, and local authority debt), and USD Corporates. The Bloomberg Barclays U.S. Government/Credit Bond Index is a component of the Bloomberg Barclays U.S. Aggregate Bond Index. The FTSE 3 Month US T-Bill Index reflects monthly return equivalents of yield averages that are not marked to the market. The index is an average of the last three-month treasury bill issues. The three-month treasury bills are the short-term debt obligations of the U.S. Government. The indexes are unmanaged and their performance does not reflect the deduction of expenses associated with a mutual fund, such as investment management and fund accounting fees. The Funds’ performance reflects the deduction of fees for these services. Investors cannot invest directly in an index.
Boston Trust Midcap Fund
December 31, 2019
Stephen J. Amyouny, CFA
Lead Portfolio Manager
Belinda Cavazos, CFA
Portfolio Manager
Richard Q. Williams, CFA
Portfolio Manager
Boston Trust Walden Inc.
Fund Objective
The Fund seeks long-term capital growth through an actively managed portfolio of stocks of middle capitalization (“mid cap”) companies.
Investment Concerns
Equity securities (stocks) are more volatile and carry more risk and return potential than other forms of investments, including investments in high-grade fixed income securities.
Mid cap funds typically carry additional risks since smaller companies generally have a higher risk of failure.
Manager Commentary (Unaudited)
Management Discussion of Fund Performance
The Russell Midcap® Index rose 30.54% in 2019, a strong rebound after the prior year’s -9.06% return. The Boston Trust Midcap Fund participated in the market’s strong rise but the 28.59%† total return underperformed the index modestly for the year. For the trailing three-, five-, and ten-year periods, the Fund is ahead of the index, with less volatility.†
Our analysis of 2019 suggests there were crosscurrents affecting our performance. The higher-quality stocks we favor outperformed the index, but our valuation discipline was a headwind, as more reasonably valued stocks underperformed for the year. At the sector level, information technology drove relative underperformance, while energy and health care were the top relative contributors in 2019. Underperformance in information technology was driven by our underweight to semiconductors, as well as unfavorable security selection. Within energy, relative performance was aided by our underweight to the sector and positive security selection in energy equipment and services.*
Outlook
The underlying fundamentals of the U.S. economy remain solid. Furthermore, recent interest rate cuts by the U.S. Federal Reserve Board have decreased the risk of a severe domestic slowdown, and the economies of key trading partners appear to be stabilizing. There has also been progress on the trade front with the recent signing of a new trade agreement with Canada and Mexico, and positive steps towards resolution of ongoing disputes with China. The upcoming U.S. election is one area likely to generate uncertainty in 2020, and there is the obvious risk of unforeseen geopolitical events affecting markets. Our base case outlook is that fundamentals for the U.S. equity market will remain favorable, although the recent pace of strong market appreciation may be difficult to sustain.
We see multiple paths for the Boston Trust Midcap Fund to continue to add value, including superior company fundamentals and the portfolio’s reasonable valuation profile relative to the index. We remain focused on constructing a well-diversified portfolio of higher quality; reasonably valued companies that we believe can generate greater economic returns across a full market cycle. This combination of superior fundamentals and reasonable valuation relative to the index gives us confidence the Fund is well positioned for the future.
| † | The recent appreciation in the stock market has helped to produce short-term returns that are not typical and may not continue in the future. Because of ongoing market volatility, fund performance may be subject to substantial short-term changes. |
| | |
| * | Portfolio composition is subject to change. |
| Investment Performance (Unaudited) | Boston Trust Midcap Fund |
| | December 31, 2019 |
| | | For the periods ended 12/31/19 | |
| | | Average Annual Total Returns | |
| | | | | | | | | | | | | | | Since | |
| | | | | | | | | | | | | | | Inception | |
| | | 1 Year | | | 3 Years | | | 5 Years | | | 10 Years | | | (9/24/07) | |
| Boston Trust Midcap Fund | | | 28.59 | %† | | | 14.25 | % | | | 10.77 | % | | | 13.38 | % | | | 9.82 | % |
| Russell Midcap® Index | | | 30.54 | % | | | 12.06 | % | | | 9.33 | % | | | 13.19 | % | | | 8.65 | % |
Hypothetical Growth of a $100,000 Investment

| † | The recent appreciation in the stock market has helped to produce short-term returns that are not typical and may not continue in the future. Because of ongoing market volatility, fund performance may be subject to substantial short-term changes. |
The above chart represents a 10-year hypothetical $100,000 investment in the Boston Trust Midcap Fund, and includes the reinvestment of dividends and capital gains in the Fund. The returns shown on the table and the graph do not reflect the deduction of taxes a shareholder would pay on Fund distributions or the redemption of Fund shares.
The Boston Trust Midcap Fund is measured against the Russell Midcap® Index, which is an unmanaged index that tracks the performance of the mid-cap segment of the U.S. equity universe. The Russell Midcap® Index is a subset of the Russell 1000® Index. It includes approximately 800 of the smallest securities based on a combination of their market capitalization and current index membership. The Russell Midcap® Index represents approximately 31% of the total market capitalization of the Russell 1000 companies. The performance of an index does not reflect the deduction of expenses associated with a mutual fund, such as investment management and fund accounting fees. The Fund’s performance reflects the deduction of fees for these services. Investors cannot invest directly in an index.
| Fund Net Asset Value: | | $ | 19.55 | |
| Gross Expense Ratio1: | | | 0.98 | % |
Past performance does not guarantee future results. The performance data quoted represents past performance and current returns may be lower or higher. The investment return and principal value will fluctuate so that an investor’s shares, when redeemed may be worth more or less than the original cost. To obtain performance information current to the most recent month-end, please call 1-800-282-8782 ext. 7050.
| 1 | The Gross Expense Ratio is from the Fund’s most recent prospectus, dated May 1, 2019. Additional information pertaining to the Fund’s expense ratio as of December 31, 2019 can be found in the financial highlights included in this report. |
| Boston Trust SMID Cap Fund |
| December 31, 2019 |
Kenneth P. Scott, CFA
Lead Portfolio Manager
Belinda Cavazos, CFA
Portfolio Manager
Richard Q. Williams, CFA
Portfolio Manager
Boston Trust Walden Inc.
Fund Objective
The Fund seeks long-term capital growth through an actively managed portfolio of stocks of small to middle capitalization (“smid cap”) companies.
Investment Concerns
Equity securities (stocks) are more volatile and carry more risk and return potential than other forms of investments, including investments in high-grade fixed income securities.
Smid cap companies typically have a higher risk of failure and historically have experienced a greater degree of volatility.
Manager Commentary (Unaudited)
Management Discussion of Fund Performance
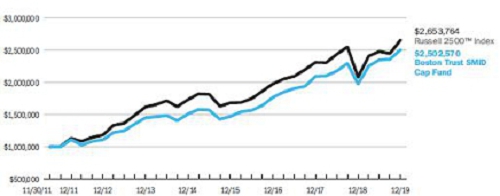
For the full year, the Russell 2500™ Index returned 27.77%, a strong rebound from 2018’s -10.00% decline. The Boston Trust SMID Cap Fund returned 26.74%†, modestly trailing the index. The Fund has outperformed the index for the trailing three- and five-year periods, with less risk.
Higher-quality stocks generally performed in line with the index for the year, which explains the Fund’s ability to participate in the strong market. Relative performance was most favorable in the financials sector, due to the Fund’s overweight to and performance of its capital markets stocks. Information technology was the leading detractor from relative results for the year due to a combination of style headwinds and unfavorable security selection.*
Outlook
The underlying fundamentals of the U.S. economy remain solid. Furthermore, recent interest rate cuts by the U.S. Federal Reserve Board have decreased the risk of a severe domestic slowdown, and the economies of key trading partners appear to be stabilizing. There has also been progress on the trade front with the recent signing of a new trade agreement with Canada and Mexico, and positive steps towards resolution of ongoing disputes with China. The upcoming U.S. election is one area likely to generate uncertainty in 2020, and there is the ongoing risk of unforeseen geopolitical events affecting markets. Our base case outlook is that fundamentals for the U.S. equity market will remain favorable, although the recent pace of strong market appreciation may be difficult to sustain, especially given the earnings growth deceleration we observed throughout 2019.
We see multiple paths for the Boston Trust SMID Cap Fund to continue to add value, including superior company fundamentals and the Fund’s valuation discount to the index. We remain focused on constructing a well-diversified fund of higher quality; reasonably valued companies that we believe can generate greater economic returns across a full market cycle. Compared to the index, the Fund is invested in companies with higher and more stable returns on invested capital, stronger balance sheets, and sustainable growth. Despite this higher-quality financial profile, valuation for the Fund currently stands at an average operating price/earnings ratio (P/E ratio)1 of 24x, a discount to the Russell 2500™ operating P/E of 32x. We believe the combination of superior fundamentals and more reasonable valuation relative to the index provides confidence that the Fund is well positioned for the future.
| † | The recent appreciation in the stock market has helped to produce short-term returns that are not typical and may not continue in the future. Because of ongoing market volatility, fund performance may be subject to substantial short-term changes. |
| | |
| * | Portfolio composition is subject to change. |
| | |
| 1 | The price-to-earnings ratio (P/E Ratio) is a valuation ratio of a company’s current share price to its per-share earnings. |
| Investment Performance (Unaudited) | Boston Trust SMID Cap Fund |
| December 31, 2019 |
| | | For the periods ended 12/31/19 | |
| | | Average Annual Total Returns | |
| | | | | | | | | | | | Since | |
| | | | | | | | | | | | Inception | |
| | | 1 Year | | | 3 Years | | | 5 Years | | | (11/30/11) | |
| Boston Trust SMID Cap Fund1 | | | 26.74 | %† | | | 12.30 | % | | | 10.66 | % | | | 12.01 | % |
| Russell 2500™ Index | | | 27.77 | % | | | 10.33 | % | | | 8.93 | % | | | 12.83 | % |
Hypothetical Growth of a $1,000,000 Investment
| † | The recent appreciation in the stock market has helped to produce short-term returns that are not typical and may not continue in the future. Because of ongoing market volatility, fund performance may be subject to substantial short-term changes. |
The above chart represents a hypothetical $1,000,000 investment in the Boston Trust SMID Cap Fund from November 30, 2011 to December 31, 2019, and includes the reinvestment of dividends and capital gains in the Fund. The returns shown on the table and the graph do not reflect the deduction of taxes a shareholder would pay on Fund distributions or the redemption of Fund shares.
The Boston Trust SMID Cap Fund is measured against the Russell 2500™ Index, which is an unmanaged index that tracks the performance of the small- to mid-cap segment of the U.S. equity universe, commonly referred to as “smid” cap. The Russell 2500™ Index is a subset of the Russell 3000® Index. It includes approximately 2500 of the smallest securities based on a combination of their market cap and current index membership. Russell Investment Group is the source and owner of the trademarks, service marks and copyrights related to the Russell Indexes. Russell® is a trademark of Russell Investment Group. The performance of an index does not reflect the deduction of expenses associated with a mutual fund, such as investment management and fund accounting fees. The Fund’s performance reflects the deduction of fees for these services. Investors cannot invest directly in an index.
| Fund Net Asset Value: | | $ | 17.90 | |
| Gross Expense Ratio1: | | | 0.98 | % |
Past performance does not guarantee future results. The performance data quoted represents past performance and current returns may be lower or higher. The investment return and principal value will fluctuate so that an investor’s shares, when redeemed may be worth more or less than the original cost. Returns less than one year are not annualized. To obtain performance information current to the most recent month-end, please call 1-800-282-8782 ext. 7050.
| 1 | The Gross Expense Ratio is from the Fund’s most recent prospectus, dated May 1, 2019. The contractual fee limit under the Fund’s expense limitation agreement is 0.75% of the Fund’s average annual net assets, subject to certain limitations as described in the Fund’s prospectus. Please see the Fund’s most recent prospectus for details. Additional information pertaining to the Fund’s expense ratio as of December 31, 2019 can be found in the financial highlights included in this report. The investment performance may reflect fee reductions. If such fee reductions had not occurred, the quoted performance would have been lower. The contractual fee waiver continues through May 1, 2020 and may be renewed thereafter. |
| Boston Trust Small Cap Fund |
| December 31, 2019 |
Kenneth P. Scott, CFA
Lead Portfolio Manager
Belinda Cavazos, CFA
Portfolio Manager
Richard Q. Williams, CFA
Portfolio Manager
Boston Trust Walden Inc.
Fund Objective
The Fund seeks long-term capital growth through an actively managed portfolio of stocks of small capitalization (“small cap”) companies.
Investment Concerns
Equity securities (stocks) are more volatile and carry more risk and return potential than other forms of investments, including investments in high-grade fixed income securities.
Small cap funds typically carry additional risks since smaller companies generally have a higher risk of failure, and historically, their stocks have experienced a greater degree of market volatility than stocks on average.
Manager Commentary (Unaudited)
Management Discussion of Fund Performance
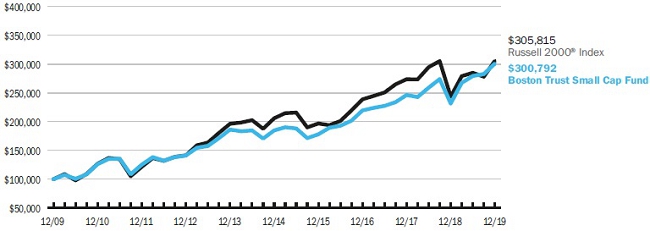
For the full year, the Russell 2000® returned 25.52%, a strong rebound from 2018’s -11.01% decline. Despite the Fund’s underperformance in the fourth quarter, the Boston Trust Small Cap Fund outperformed the index by a wide margin with a total return of 29.88%† for the year 2019. The Fund has also outperformed the index for the trailing three-, and five-year periods, with less risk.
The strong relative performance in 2019 was driven primarily by favorable stock selection, as higher-quality stocks lagged the index. Relative performance was favorable across most sectors and only stocks in the consumer discretionary and utilities sectors detracted from results. The headwind to quality was particularly evident in those two lagging sectors.*
Outlook
The underlying fundamentals of the U.S. economy remain solid. Furthermore, recent interest rate cuts by the U.S. Federal Reserve Board have decreased the risk of a severe domestic slowdown, and the economies of key trading partners appear to be stabilizing. There has also been progress on the trade front with the recent signing of a new trade agreement with Canada and Mexico, and positive steps towards resolution of ongoing disputes with China. The upcoming U.S. election is one area likely to generate uncertainty in 2020, and there is the ongoing risk of unforeseen geopolitical events affecting markets. Our base case outlook is that fundamentals for the U.S. equity market will remain favorable, although the recent pace of strong market appreciation may be difficult to sustain, especially given the earnings growth deceleration we observed throughout 2019.
We see multiple paths for the Boston Trust Small Cap Fund to continue to add value, including superior company fundamentals and the Fund’s valuation discount to the index. We remain focused on constructing a well-diversified portfolio of higher quality, reasonably valued companies that we believe can generate greater economic returns across a full market cycle. Compared to the index, the Fund is invested in companies with higher and more stable returns on invested capital, stronger balance sheets, and sustainable growth. Despite this higher quality financial profile, valuation for the Fund currently stands at an average operating price/earnings ratio (P/E ratio)1 of 24x, half the Russell 2000® operating P/E of 48x. We believe the combination of superior fundamentals and more reasonable valuation relative to the index provides confidence that the Fund is well positioned for the future.
| † | The recent appreciation in the stock market has helped to produce short-term returns that are not typical and may not continue in the future. Because of ongoing market volatility, fund performance may be subject to substantial short-term changes. |
| | |
| * | Portfolio composition is subject to change. |
| | |
| 1 | The price-to-earnings ratio (P/E Ratio) is a valuation ratio of a company’s current share price to its per-share earnings. |
| Investment Performance (Unaudited) | Boston Trust Small Cap Fund |
| December 31, 2019 |
| | | For the periods ended 12/31/19 | |
| | | Average Annual Total Returns | |
| | | | | | | | | | | | | | | | | | | | | Since | |
| | | | | | | | | | | | | | | | | | | | | Inception | |
| | | 1 Year | | | 3 Years | | | 5 Years | | | 10 Years | | | 15 Years | | | 20 Years | | | (12/31/94) | |
| Boston Trust Small Cap Fund1 | | | 29.88 | %† | | | 11.08 | % | | | 10.23 | % | | | 11.64 | % | | | 9.07 | % | | | 10.58 | % | | | 11.01 | % |
| Russell 2000® Index | | | 25.52 | % | | | 8.59 | % | | | 8.23 | % | | | 11.83 | % | | | 7.92 | % | | | 7.59 | % | | | 9.35 | % |
Hypothetical Growth of a $100,000 Investment
| † | The recent appreciation in the stock market has helped to produce short-term returns that are not typical and may not continue in the future. Because of ongoing market volatility, fund performance may be subject to substantial short-term changes. |
The above chart represents a 10-year hypothetical $100,000 investment in the Boston Trust Small Cap Fund and includes the reinvestment of dividends and capital gains in the Fund. The returns shown on the table and the graph do not reflect the deduction of taxes a shareholder would pay on Fund distributions or the redemption of Fund shares.
The Boston Trust Small Cap Fund is measured against the Russell 2000® Index, which is an unmanaged index that tracks the performance of the small-cap segment of the U.S. equity universe. The Russell 2000® Index is a subset of the Russell 3000® Index representing approximately 10% of the total market capitalization of that index. It includes approximately 2000 of the smallest securities based on a combination of their market cap and current index membership. Russell Investment Group is the source and owner of the trademarks, service marks and copyrights related to the Russell Indexes. Russell® is a trademark of Russell Investment Group. The performance of an index does not reflect the deduction of expenses associated with a mutual fund, such as investment management and fund accounting fees. The Fund’s performance reflects the deduction of fees for these services. Investors cannot invest directly in an index.
| Fund Net Asset Value: | | $ | 14.62 | |
| Gross Expense Ratio1: | | | 1.09 | % |
Past performance does not guarantee future results. The performance data quoted represents past performance and current returns may be lower or higher. The investment return and principal value will fluctuate so that an investor’s shares, when redeemed may be worth more or less than the original cost. To obtain performance information current to the most recent month-end, please call 1-800-282-8782 ext. 7050.
| 1 | The Gross Expense Ratio is from the Fund’s most recent prospectus, dated May 1, 2019. The contractual fee limit under the Fund’s expense limitation agreement is 1.00% of the Fund’s average annual net assets, subject to certain limitations as described in the Fund’s prospectus. Please see the Fund’s most recent prospectus for details. Additional information pertaining to the Fund’s expense ratio as of December 31, 2019 can be found in the financial highlights included in this report. The investment performance may reflect fee reductions. If such fee reductions had not occurred, the quoted performance would have been lower. The contractual fee waiver continues through May 1, 2020 and may be renewed thereafter. |
| Schedule of Portfolio Investments | | Boston Trust Asset Management Fund
December 31, 2019 |
| Security Description | | Shares | | | Fair Value ($) | |
| Common Stocks (79.8%) | | | | | | | | |
| Communication Services (7.2%) | | | | | | | | |
| Alphabet, Inc., Class A (a) | | | 2,000 | | | | 2,678,780 | |
| Alphabet, Inc., Class C (a) | | | 16,500 | | | | 22,060,830 | |
| Charter Communications, Inc., Class A (a) | | | 1,000 | | | | 485,080 | |
| Comcast Corp., Class A | | | 230,000 | | | | 10,343,100 | |
| Omnicom Group, Inc. | | | 40,000 | | | | 3,240,800 | |
| Verizon Communications, Inc. | | | 101,000 | | | | 6,201,400 | |
| | | | | | | | 45,009,990 | |
| Consumer Discretionary (4.9%) | | | | | | | | |
| Autoliv, Inc. | | | 37,000 | | | | 3,123,170 | |
| Nike, Inc., Class B | | | 127,500 | | | | 12,917,025 | |
| Ross Stores, Inc. | | | 30,000 | | | | 3,492,600 | |
| Starbucks Corp. | | | 115,000 | | | | 10,110,800 | |
| The Tjx Cos., Inc. | | | 10,000 | | | | 610,600 | |
| | | | | | | | 30,254,195 | |
| Consumer Staples (7.1%) | | | | | | | | |
| Church & Dwight Co., Inc. | | | 70,000 | | | | 4,923,800 | |
| Costco Wholesale Corp. | | | 52,000 | | | | 15,283,840 | |
| Diageo Plc, Sponsored Adr | | | 27,500 | | | | 4,631,550 | |
| Mccormick & Co., Inc. | | | 29,500 | | | | 5,007,035 | |
| Pepsico, Inc. | | | 32,500 | | | | 4,441,775 | |
| Procter & Gamble Co. | | | 25,000 | | | | 3,122,500 | |
| Sysco Corp. | | | 60,000 | | | | 5,132,400 | |
| The Hershey Co. | | | 10,000 | | | | 1,469,800 | |
| | | | | | | | 44,012,700 | |
| Energy (1.9%) | | | | | | | | |
| Chevron Corp. | | | 25,000 | | | | 3,012,750 | |
| Conocophillips | | | 54,000 | | | | 3,511,620 | |
| Exxon Mobil Corp. | | | 80,000 | | | | 5,582,400 | |
| | | | | | | | 12,106,770 | |
| Financials (14.7%) | | | | | | | | |
| American Express Co. | | | 59,000 | | | | 7,344,910 | |
| Berkshire Hathaway, Inc., Class B (a) | | | 62,500 | | | | 14,156,250 | |
| Chubb Ltd. | | | 37,000 | | | | 5,759,420 | |
| Cincinnati Financial Corp. | | | 69,000 | | | | 7,255,350 | |
| Comerica, Inc. | | | 37,500 | | | | 2,690,625 | |
| Commerce Bancshares, Inc. | | | 35,176 | | | | 2,389,857 | |
| Jpmorgan Chase & Co. | | | 110,000 | | | | 15,334,000 | |
| M&T Bank Corp. | | | 17,500 | | | | 2,970,625 | |
| Northern Trust Corp. | | | 54,000 | | | | 5,736,960 | |
| Pnc Financial Services Group, Inc. | | | 50,000 | | | | 7,981,500 | |
| State Street Corp. | | | 20,000 | | | | 1,582,000 | |
| T. Rowe Price Group, Inc. | | | 50,000 | | | | 6,092,000 | |
| Truist Financial Corp. | | | 100,000 | | | | 5,632,000 | |
| U.s. Bancorp | | | 110,000 | | | | 6,521,900 | |
| | | | | | | | 91,447,397 | |
| Health Care (11.5%) | | | | | | | | |
| Becton, Dickinson & Co. | | | 55,000 | | | | 14,958,350 | |
| Dentsply Sirona, Inc. | | | 56,000 | | | | 3,169,040 | |
| Edwards Lifesciences Corp. (a) | | | 45,000 | | | | 10,498,050 | |
| Henry Schein, Inc. (a) | | | 54,000 | | | | 3,602,880 | |
| Johnson & Johnson, Inc. | | | 50,000 | | | | 7,293,500 | |
| Medtronic Plc | | | 20,000 | | | | 2,269,000 | |
| Merck & Co., Inc. | | | 44,000 | | | | 4,001,800 | |
| Mettler-Toledo International, Inc. (a) | | | 8,500 | | | | 6,742,880 | |
| Stryker Corp. | | | 25,000 | | | | 5,248,500 | |
| Unitedhealth Group, Inc. | | | 35,000 | | | | 10,289,300 | |
| Varian Medical Systems, Inc. (a) | | | 22,500 | | | | 3,195,225 | |
| Waters Corp. (a) | | | 2,000 | | | | 467,300 | |
| | | | | | | | 71,735,825 | |
| | | Shares or | | | | |
| | | Principal | | | | |
| | | Amount ($) | | | | |
| Industrials (8.9%) | | | | | | | | |
| 3M Co. | | | 44,000 | | | | 7,762,480 | |
| Donaldson Co., Inc. | | | 81,000 | | | | 4,667,220 | |
| Emerson Electric Co. | | | 1,000 | | | | 76,260 | |
| Expeditors International Of Washington, Inc. | | | 37,500 | | | | 2,925,750 | |
| Honeywell International, Inc. | | | 25,000 | | | | 4,425,000 | |
| Hubbell, Inc. | | | 40,000 | | | | 5,912,800 | |
| Illinois Tool Works, Inc. | | | 42,500 | | | | 7,634,275 | |
| Union Pacific Corp. | | | 53,500 | | | | 9,672,265 | |
| United Parcel Service, Inc., Class B | | | 54,000 | | | | 6,321,240 | |
| W.w. Grainger, Inc. | | | 17,500 | | | | 5,924,100 | |
| | | | | | | | 55,321,390 | |
| Information Technology (19.4%) | | | | | | | | |
| Accenture Plc, Class A | | | 75,000 | | | | 15,792,751 | |
| Apple, Inc. | | | 109,000 | | | | 32,007,850 | |
| Automatic Data Processing, Inc. | | | 81,000 | | | | 13,810,500 | |
| Cisco Systems, Inc. | | | 180,000 | | | | 8,632,800 | |
| Microsoft Corp. | | | 170,000 | | | | 26,809,000 | |
| Oracle Corp. | | | 150,000 | | | | 7,947,000 | |
| Visa, Inc., Class A | | | 82,000 | | | | 15,407,800 | |
| | | | | | | | 120,407,701 | |
| Materials (2.3%) | | | | | | | | |
| Air Products & Chemicals, Inc. | | | 21,000 | | | | 4,934,790 | |
| Aptargroup, Inc. | | | 37,500 | | | | 4,335,750 | |
| Ppg Industries, Inc. | | | 40,000 | | | | 5,339,600 | |
| | | | | | | | 14,610,140 | |
| Utilities (1.9%) | | | | | | | | |
| Consolidated Edison, Inc. | | | 52,500 | | | | 4,749,675 | |
| Eversource Energy | | | 82,000 | | | | 6,975,740 | |
| | | | | | | | 11,725,415 | |
| | | | | | | | | |
| TOTAL COMMON STOCKS (Cost $194,100,930) | | | | | | | 496,631,523 | |
| | | | | | | | | |
| Corporate Bonds (2.5%) | | | | | | | | |
| | | | | | | | | |
| Communication Services (0.2%) | | | | | | | | |
| Comcast Corp., 4.25%, 10/15/30, Callable 7/15/30 @ 100 | | | 900,000 | | | | 1,030,320 | |
| | | | | | | | | |
| Financials (1.2%) | | | | | | | | |
| American Express Co., 2.65%, 12/2/22 | | | 1,926,000 | | | | 1,964,295 | |
| Berkshire Hathaway, Inc., 3.13%, 3/15/26, Callable 12/15/25 @ 100 | | | 2,000,000 | | | | 2,109,624 | |
| Cincinnati Financial Corp., 6.92%, 5/15/28 | | | 500,000 | | | | 647,314 | |
| Jpmorgan Chase & Co., 3.90%, 7/15/25, Callable 4/15/25 @ 100 | | | 1,000,000 | | | | 1,080,853 | |
| Wells Fargo & Co., 3.55%, 9/29/25, Mtn | | | 2,000,000 | | | | 2,119,476 | |
| | | | | | | | 7,921,562 | |
| | | | | | | | | |
| Health Care (0.2%) | | | | | | | | |
| Becton, Dickinson & Co., 3.13%, 11/8/21 | | | 1,000,000 | | | | 1,019,703 | |
| | | | | | | | | |
| Industrials (0.2%) | | | | | | | | |
| Hubbell, Inc., 3.50%, 2/15/28, Callable 11/15/27 @ 100 | | | 1,000,000 | | | | 1,028,638 | |
| | | | | | | | | |
| Information Technology (0.7%) | | | | | | | | |
| Apple, Inc., 3.25%, 2/23/26, Callable 11/23/25 @ 100 | | | 2,500,000 | | | | 2,649,678 | |
| Visa, Inc., 3.15%, 12/14/25, Callable 9/14/25 @ 100 | | | 2,000,000 | | | | 2,116,075 | |
| | | | | | | | 4,765,753 | |
| | | | | | | | | |
| TOTAL CORPORATE BONDS (Cost $15,177,842) | | | | | | | 15,765,976 | |
See Notes to Financial Statements
| Schedule of Portfolio Investments (cont.) | | Boston Trust Asset Management Fund
December 31, 2019 |
| | | | | | |
| | | Principal | | | | |
| Security Description | | Amount ($) | | | Fair Value ($) | |
| Municipal Bonds (3.5%) | | | | | | | | |
| Massachusetts (3.5%): | | | | | | | | |
| Commonwealth of Massachusetts Transportation Fund Revenue, Series A, 4.00%, 6/1/36, Callable 12/1/27 @ 100 | | | 500,000 | | | | 570,775 | |
| Commonwealth of Massachusetts, Go, Series B, 5.25%, 9/1/20, Agm | | | 150,000 | | | | 154,169 | |
| Commonwealth of Massachusetts, Go, Series C, 5.50%, 12/1/22, Agm | | | 600,000 | | | | 676,500 | |
| Commonwealth of Massachusetts, Go, Series C, 4.00%, 7/1/31, Callable 7/1/22 @ 100 | | | 1,000,000 | | | | 1,059,820 | |
| Commonwealth of Massachusetts, Go, Series A, 5.00%, 3/1/32, Callable 3/1/24 @ 100 | | | 200,000 | | | | 229,324 | |
| Commonwealth of Massachusetts, Go, Series D, 3.00%, 5/1/35, Callable 5/1/29 @ 100 (b) | | | 7,550,000 | | | | 7,939,655 | |
| Commonwealth of Massachusetts, Go, Series D, 3.00%, 5/1/36, Callable 5/1/29 @ 100 (b) | | | 5,000,000 | | | | 5,219,849 | |
| Commonwealth of Massachusetts, Go, Series B, 5.00%, 4/1/37, Callable 4/1/27 @ 100 | | | 250,000 | | | | 303,378 | |
| Commonwealth of Massachusetts, Go, Series E, 4.00%, 9/1/37, Callable 9/1/25 @ 100 | | | 1,600,000 | | | | 1,766,704 | |
| Commonwealth of Massachusetts, Go, Series B, 5.00%, 7/1/38, Callable 7/1/26 @ 100 | | | 260,000 | | | | 310,474 | |
| Commonwealth of Massachusetts, Go, Series A, 5.00%, 1/1/43, Callable 1/1/28 @ 100 | | | 250,000 | | | | 301,740 | |
| Commonwealth of Massachusetts, Go, Series C, 5.00%, 5/1/46, Callable 5/1/29 @ 100 | | | 2,000,000 | | | | 2,459,500 | |
| Massachusetts State Development Finance Agency Revenue, Series R-2, 5.00%, 7/1/28, Callable 7/1/20 @ 100 | | | 460,000 | | | | 468,593 | |
| | | | | | | | 21,460,481 | |
| Washington (0.0%): | | | | | | | | |
| State of Washington, Series A, 5.00%, 8/1/35, Callable 8/1/23 @ 100 | | | 250,000 | | | | 281,130 | |
| | | | | | | | | |
| TOTAL MUNICIPAL BONDS (Cost $21,457,891) | | | | | | | 21,741,611 | |
| | | | | | | | | |
| U.S. Government & U.S. Government Agency Obligations (12.2%) | | | | | | | | |
| | | | | | | | | |
| Federal Farm Credit Bank (2.0%) | | | | | | | | |
| 2.85%, 3/2/28 | | | 2,400,000 | | | | 2,544,926 | |
| 2.95%, 1/27/25 | | | 2,000,000 | | | | 2,112,663 | |
| 3.14%, 12/5/29 | | | 2,500,000 | | | | 2,722,781 | |
| 3.39%, 2/1/28 | | | 2,000,000 | | | | 2,200,454 | |
| 3.85%, 12/26/25 | | | 2,770,000 | | | | 3,082,429 | |
| | | | | | | | 12,663,253 | |
| Federal Home Loan Bank (2.3%) | | | | | | | | |
| 2.38%, 3/13/26 | | | 6,000,000 | | | | 6,154,441 | |
| 2.50%, 12/10/27 | | | 1,500,000 | | | | 1,539,935 | |
| 2.63%, 6/11/27 | | | 1,500,000 | | | | 1,561,996 | |
| 2.88%, 9/13/24 | | | 2,500,000 | | | | 2,631,982 | |
| 3.50%, 9/24/29 | | | 2,000,000 | | | | 2,216,048 | |
| | | | | | | | 14,104,402 | |
| | | Shares or | | | | |
| | | Principal | | | | |
| | | Amount ($) | | | | |
| U.S. Treasury Bill (0.0%) | | | | | | | | |
| 1.36%, 1/30/20 | | | 300,000 | | | | 299,662 | |
| | | | | | | | | |
| U.S. Treasury Note (7.9%) | | | | | | | | |
| 1.63%, 8/15/29 | | | 12,000,000 | | | | 11,701,875 | |
| 2.00%, 10/31/22 | | | 1,000,000 | | | | 1,011,172 | |
| 2.75%, 2/15/24 | | | 35,000,000 | | | | 36,516,210 | |
| | | | | | | | 49,229,257 | |
| TOTAL U.S. GOVERNMENT & U.S. GOVERNMENT AGENCY OBLIGATIONS (Cost $74,002,871) | | | | | | | 76,296,574 | |
| | | | | | | | | |
| Investment Companies (1.9%) | | | | | | | | |
| JPMorgan U.S. Government Money Market Fund, Capital Shares, 1.49% (c) | | | 12,086,947 | | | | 12,086,947 | |
| TOTAL INVESTMENT COMPANIES (Cost $12,086,947) | | | | | | | 12,086,947 | |
| | | | | | | | | |
| Total Investments (Cost $316,826,481) — 99.9%(d) | | | | | | | 622,522,631 | |
| Other Assets in Excess of Liabilities — 0.1% | | | | | | | 628,591 | |
| NET ASSETS — 100.0% | | | | | | $ | 623,151,222 | |
| (a) | Non-income producing security. |
| (b) | These securities have been deemed illiquid and represent 2.11% of the Fund’s net assets. |
| (c) | Rate disclosed is the seven day yield as of December 31, 2019. |
| (d) | See Federal Tax Information listed in the Notes to the Financial Statements. |
| ADR | American Depositary Receipt |
| AGM | Assured Guaranty Municipal Corporation |
| GO | General Obligation |
| MTN | Medium Term Note |
| PLC | Public Limited Company |
See Notes to Financial Statements
| Financial Statements | | Boston Trust Asset Management Fund |
| Statement of Assets and Liabilities | | | |
| December 31, 2019 | | | |
| | | | |
| Assets: | | | | |
| Investments, at fair value (cost $316,826,481) | | $ | 622,522,631 | |
| Interest and dividends receivable | | | 1,406,929 | |
| Receivable for capital shares issued | | | 53,272 | |
| Prepaid expenses | | | 26,301 | |
| Total Assets | | | 624,009,133 | |
| Liabilities: | | | | |
| Payable for capital shares redeemed | | | 386,395 | |
| Accrued expenses and other liabilities: | | | | |
| Investment adviser | | | 367,506 | |
| Administration and accounting | | | 12,107 | |
| Custodian | | | 5,453 | |
| Shareholder servicing fees | | | 13,458 | |
| Transfer agent | | | 4,988 | |
| Trustee | | | 639 | |
| Other | | | 67,365 | |
| Total Liabilities | | | 857,911 | |
| Net Assets | | $ | 623,151,222 | |
| Composition of Net Assets: | | | | |
| Paid in capital | | $ | 316,282,290 | |
| Total distributable earnings/(loss) | | | 306,868,932 | |
| Net Assets | | $ | 623,151,222 | |
| Shares outstanding (par value $0.01, unlimited number of shares authorized) | | | 11,295,932 | |
| Net Asset Value, Offering Price and Redemption price per share | | $ | 55.17 | |
| Statement of Operations | | | |
| For the year ended December 31, 2019 | | | |
| | | | |
| Investment Income: | | | | |
| Interest | | $ | 2,618,902 | |
| Dividends | | | 7,581,948 | |
| Total Investment Income | | | 10,200,850 | |
| Expenses: | | | | |
| Investment adviser | | | 3,889,577 | |
| Administration and accounting | | | 356,953 | |
| Chief compliance officer | | | 44,399 | |
| Custodian | | | 72,137 | |
| Shareholder servicing | | | 158,013 | |
| Transfer agency | | | 40,160 | |
| Trustee | | | 33,878 | |
| Other | | | 199,896 | |
| Total expenses | | | 4,795,013 | |
| Net Expenses | | | 4,795,013 | |
| Net Investment Income | | | 5,405,837 | |
| Net Realized/Unrealized Gains (Losses) from Investments: | | | | |
| Net realized gains from investment transactions | | | 1,195,012 | |
| Net realized gains from redemptions in-kind (a) | | | 5,029,044 | |
| Change in unrealized appreciation/depreciation from investments | | | 107,980,131 | |
| Net realized/unrealized gains (losses) from investments | | | 114,204,187 | |
| Change in Net Assets Resulting from Operations | | $ | 119,610,024 | |
(a) See Note 3 in Notes to Financial Statements
See Notes to Financial Statements
| Financial Statements | | Boston Trust Asset Management Fund |
| Statements of Changes in Net Assets | | | | | | |
| | | For the year | | | For the year | |
| | | ended | | | ended | |
| | | December 31, | | | December 31, | |
| | | 2019 | | | 2018 | |
| Investment Activities: | | | | | | | | |
| Operations: | | | | | | | | |
| Net investment income | | $ | 5,405,837 | | | $ | 5,161,310 | |
| Net realized gains from investment transactions | | | 6,224,056 | | | | 7,439,455 | |
| Change in unrealized appreciation/depreciation from investments | | | 107,980,131 | | | | (19,626,925 | ) |
| Change in Net Assets Resulting from Operations | | | 119,610,024 | | | | (7,026,160 | ) |
| Distributions to shareholders: | | | | | | | | |
| Total Distributions | | | (5,742,144 | ) | | | (19,206,469 | ) |
| Change in Net Assets Resulting from distributions to shareholders | | | (5,742,144 | ) | | | (19,206,469 | ) |
| Capital Share Transactions: | | | | | | | | |
| Proceeds from shares issued | | | 50,601,734 | | | | 34,500,765 | |
| Proceeds from in-kind shares issued (a) | | | 43,771,772 | | | | — | |
| Dividends reinvested | | | 2,889,950 | | | | 16,531,889 | |
| Cost of shares redeemed | | | (43,328,375 | ) | | | (60,384,310 | ) |
| Cost of in-kind shares redeemed (a) | | | (5,777,713 | ) | | | — | |
| Change in Net Assets Resulting from Capital Share Transactions | | | 48,157,368 | | | | (9,351,656 | ) |
| Change in Net Assets | | | 162,025,248 | | | | (35,584,285 | ) |
| Net Assets: | | | | | | | | |
| Beginning of period | | | 461,125,974 | | | | 496,710,259 | |
| End of period | | $ | 623,151,222 | | | $ | 461,125,974 | |
| Share Transactions: | | | | | | | | |
| Issued | | | 1,000,119 | | | | 733,719 | |
| Issued in-kind (a) | | | 808,358 | | | | — | |
| Reinvested | | | 53,597 | | | | 359,858 | |
| Redeemed | | | (863,743 | ) | | | (1,272,289 | ) |
| Redeemed in-kind (a) | | | (118,834 | ) | | | — | |
| Change in shares | | | 879,497 | | | | (178,712 | ) |
Amounts designated as “—” are $0 or have been rounded to $0.
(a) See Note 3 in Notes to Financial Statements.
See Notes to Financial Statements
| Financial Statements | | Boston Trust Asset Management Fund |
| Financial Highlights |
| Selected data for a share outstanding throughout the periods indicated. |
| | | | | | | | | | | | For the nine | | | | | | | |
| | | For the year | | | For the year | | | For the year | | | months | | | For the year | | | For the year | |
| | | ended | | | ended | | | ended | | | ended | | | ended | | | ended | |
| | | December 31, | | | December 31, | | | December 31, | | | December 31, | | | March 31, | | | March 31, | |
| | | | 2019 | | | | 2018 | | | | 2017 | | | | 2016 | | | | 2016 | | | | 2015 | |
| Net Asset Value, Beginning of Period | | $ | 44.27 | | | $ | 46.88 | | | $ | 41.33 | | | $ | 40.92 | | | $ | 41.80 | | | $ | 40.03 | |
| | | | | | | | | | | | | | | | | | | | | | | | | |
| Investment Activities: | | | | | | | | | | | | | | | | | | | | | | | | |
| Operations: | | | | | | | | | | | | | | | | | | | | | | | | |
| Net investment income | | | 0.48 | | | | 0.52 | | | | 0.49 | | | | 0.35 | | | | 0.55 | | | | 0.50 | |
| Net realized/unrealized gains (losses) from investments | | | 10.93 | | | | (1.20 | ) | | | 6.22 | | | | 2.18 | | | | 0.92 | | | | 2.77 | |
| Total from investment activities | | | 11.41 | | | | (0.68 | ) | | | 6.71 | | | | 2.53 | | | | 1.47 | | | | 3.27 | |
| Dividends: | | | | | | | | | | | | | | | | | | | | | | | | |
| Net investment income | | | (0.48 | ) | | | (0.52 | ) | | | (0.49 | ) | | | (0.46 | ) | | | (0.57 | ) | | | (0.47 | ) |
| Net realized gains from investment transactions | | | (0.03 | ) | | | (1.41 | ) | | �� | (0.67 | ) | | | (1.66 | ) | | | (1.78 | ) | | | (1.03 | ) |
| Total dividends | | | (0.51 | ) | | | (1.93 | ) | | | (1.16 | ) | | | (2.12 | ) | | | (2.35 | ) | | | (1.50 | ) |
| | | | | | | | | | | | | | | | | | | | | | | | | |
| Net Asset Value, End of Period | | $ | 55.17 | | | $ | 44.27 | | | $ | 46.88 | | | $ | 41.33 | | | $ | 40.92 | | | $ | 41.80 | |
| | | | | | | | | | | | | | | | | | | | | | | | | |
| Total Return | | | 25.81 | % | | | (1.61 | )% | | | 16.23 | % | | | 6.19 | % | (a) | | 3.65 | % | | | 8.21 | % |
| | | | | | | | | | | | | | | | | | | | | | | | | |
| Ratios/Supplemental Data: | | | | | | | | | | | | | | | | | | | | | | | | |
| Net assets at end of period (000’s) | | $ | 623,151 | | | $ | 461,126 | | | $ | 496,710 | | | $ | 403,969 | | | $ | 354,405 | | | $ | 353,851 | |
| Ratio of net expenses to average net assets | | | 0.90 | % | | | 0.93 | % | | | 0.92 | % | | | 0.95 | % | (b) | | 0.94 | % | | | 0.92 | % |
| Ratio of net investment income to average net assets | | | 1.02 | % | | | 1.05 | % | | | 1.13 | % | | | 1.15 | % | (b) | | 1.32 | % | | | 1.19 | % |
| Ratio of expenses (before fee reductions or recoupment of fees previously reimbursed by the investment adviser) to average net assets(c) | | | 0.90 | % | | | 0.93 | % | | | 0.92 | % | | | 0.95 | % | (b) | | 0.94 | % | | | 0.93 | % |
| Portfolio turnover rate | | | 5.76 | % | (d) | | 2.53 | % | | | 6.96 | % | | | 8.42 | % | (a) | | 11.64 | % | | | 17.74 | % |
| (a) | Not annualized for periods less than one year. |
| (b) | Annualized for periods less than one year. |
| (c) | During the period ending March 31, 2015, certain fees were reduced. If such fee reduction had not occurred, the ratio would have been as indicated. |
| (d) | Excludes impact of in-kind transactions. |
See Notes to Financial Statements
| Boston Trust Equity Fund |
| Schedule of Portfolio Investments | December 31, 2019 |
| Security Description | | Shares | | | Fair Value ($) | |
| Common Stocks (99.5%) | | | | | | | | |
| Communication Services (8.3%) | | | | | | | | |
| Alphabet, Inc., Class A (a) | | | 750 | | | | 1,004,543 | |
| Alphabet, Inc., Class C (a) | | | 5,250 | | | | 7,019,355 | |
| Comcast Corp., Class A | | | 70,000 | | | | 3,147,900 | |
| Omnicom Group, Inc. | | | 15,000 | | | | 1,215,300 | |
| Verizon Communications, Inc. | | | 15,000 | | | | 921,000 | |
| | | | | | | | 13,308,098 | |
| Consumer Discretionary (5.7%) | | | | | | | | |
| Autoliv, Inc. | | | 12,500 | | | | 1,055,125 | |
| NIKE, Inc., Class B | | | 30,000 | | | | 3,039,300 | |
| Ross Stores, Inc. | | | 12,500 | | | | 1,455,250 | |
| Starbucks Corp. | | | 40,000 | | | | 3,516,800 | |
| | | | | | | | 9,066,475 | |
| Consumer Staples (9.1%) | | | | | | | | |
| Church & Dwight Co., Inc. | | | 20,000 | | | | 1,406,800 | |
| Colgate-Palmolive Co. | | | 2,000 | | | | 137,680 | |
| Costco Wholesale Corp. | | | 17,000 | | | | 4,996,640 | |
| Diageo PLC, Sponsored ADR | | | 7,500 | | | | 1,263,150 | |
| McCormick & Co., Inc. | | | 7,000 | | | | 1,188,110 | |
| PepsiCo, Inc. | | | 10,000 | | | | 1,366,700 | |
| Procter & Gamble Co. | | | 10,000 | | | | 1,249,000 | |
| Sysco Corp. | | | 25,000 | | | | 2,138,500 | |
| The Hershey Co. | | | 5,000 | | | | 734,900 | |
| | | | | | | | 14,481,480 | |
| Energy (1.9%) | | | | | | | | |
| Chevron Corp. | | | 10,000 | | | | 1,205,100 | |
| ConocoPhillips | | | 7,500 | | | | 487,725 | |
| Exxon Mobil Corp. | | | 20,000 | | | | 1,395,600 | |
| | | | | | | | 3,088,425 | |
| Financials (18.8%) | | | | | | | | |
| American Express Co. | | | 25,000 | | | | 3,112,250 | |
| Berkshire Hathaway, Inc., Class B (a) | | | 20,000 | | | | 4,530,000 | |
| Chubb Ltd. | | | 12,500 | | | | 1,945,750 | |
| Cincinnati Financial Corp. | | | 25,000 | | | | 2,628,750 | |
| Commerce Bancshares, Inc. | | | 10,550 | | | | 716,767 | |
| JPMorgan Chase & Co. | | | 35,000 | | | | 4,879,000 | |
| M&T Bank Corp. | | | 5,000 | | | | 848,750 | |
| Northern Trust Corp. | | | 15,000 | | | | 1,593,600 | |
| PNC Financial Services Group, Inc. | | | 20,000 | | | | 3,192,600 | |
| State Street Corp. | | | 5,000 | | | | 395,500 | |
| T. Rowe Price Group, Inc. | | | 17,500 | | | | 2,132,200 | |
| Truist Financial Corp. | | | 30,000 | | | | 1,689,600 | |
| U.S. Bancorp | | | 40,000 | | | | 2,371,600 | |
| | | | | | | | 30,036,367 | |
| Health Care (14.2%) | | | | | | | | |
| Becton, Dickinson & Co. | | | 16,000 | | | | 4,351,520 | |
| Dentsply Sirona, Inc. | | | 25,000 | | | | 1,414,750 | |
| Edwards Lifesciences Corp. (a) | | | 7,500 | | | | 1,749,675 | |
| Henry Schein, Inc. (a) | | | 17,500 | | | | 1,167,600 | |
| Johnson & Johnson, Inc. | | | 17,500 | | | | 2,552,725 | |
| Medtronic PLC | | | 10,000 | | | | 1,134,500 | |
| Merck & Co., Inc. | | | 15,000 | | | | 1,364,250 | |
| Mettler-Toledo International, Inc. (a) | | | 1,500 | | | | 1,189,920 | |
| Stryker Corp. | | | 12,000 | | | | 2,519,280 | |
| UnitedHealth Group, Inc. | | | 14,000 | | | | 4,115,720 | |
| Varian Medical Systems, Inc. (a) | | | 7,500 | | | | 1,065,075 | |
| | | | | | | | 22,625,015 | |
| Industrials (13.3%) | | | | | | | | |
| 3M Co. | | | 14,500 | | | | 2,558,090 | |
| Deere & Co. | | | 7,500 | | | | 1,299,450 | |
| Donaldson Co., Inc. | | | 22,500 | | | | 1,296,450 | |
| Expeditors International of Washington, Inc. | | | 15,000 | | | | 1,170,300 | |
| Honeywell International, Inc. | | | 10,000 | | | | 1,770,000 | |
| Hubbell, Inc. | | | 15,000 | | | | 2,217,300 | |
| Illinois Tool Works, Inc. | | | 15,000 | | | | 2,694,450 | |
| Union Pacific Corp. | | | 22,500 | | | | 4,067,775 | |
| United Parcel Service, Inc., Class B | | | 15,000 | | | | 1,755,900 | |
| W.W. Grainger, Inc. | | | 7,000 | | | | 2,369,640 | |
| | | | | | | | 21,199,355 | |
| Information Technology (22.9%) | | | | | | | | |
| Accenture PLC, Class A | | | 25,000 | | | | 5,264,250 | |
| Apple, Inc. | | | 30,000 | | | | 8,809,500 | |
| Automatic Data Processing, Inc. | | | 20,000 | | | | 3,410,000 | |
| Cisco Systems, Inc. | | | 45,000 | | | | 2,158,200 | |
| Microsoft Corp. | | | 55,000 | | | | 8,673,500 | |
| Oracle Corp. | | | 40,000 | | | | 2,119,200 | |
| Visa, Inc., Class A | | | 32,500 | | | | 6,106,750 | |
| | | | | | | | 36,541,400 | |
| Materials (3.1%) | | | | | | | | |
| Air Products & Chemicals, Inc. | | | 5,000 | | | | 1,174,950 | |
| AptarGroup, Inc. | | | 10,000 | | | | 1,156,200 | |
| PPG Industries, Inc. | | | 20,000 | | | | 2,669,800 | |
| | | | | | | | 5,000,950 | |
| Utilities (2.2%) | | | | | | | | |
| Consolidated Edison, Inc. | | | 15,000 | | | | 1,357,050 | |
| Eversource Energy | | | 25,000 | | | | 2,126,750 | |
| | | | | | | | 3,483,800 | |
| | | | | | | | | |
| TOTAL COMMON STOCKS (Cost $60,586,372) | | | | | | | 158,831,365 | |
| | | | | | | | | |
| Investment Companies (0.5%) | | | | | | |
| JPMorgan U.S. Government Money Market Fund, Capital Shares, 1.49% (b) | | | 786,177 | | | | 786,177 | |
| TOTAL INVESTMENT COMPANIES (Cost $786,177) | | | | | | | 786,177 | |
| | | | | | | | | |
| Total Investments (Cost $61,372,549) — 100.0%(c) | | | | | | | 159,617,542 | |
| Other assets in excess of liabilities — 0.0% | | | | | | | 33,405 | |
| NET ASSETS — 100.0% | | | | | | $ | 159,650,947 | |
(a) Non-income producing security.
(b) Rate disclosed is the seven day yield as of December 31, 2019.
(c) See Federal Tax Information listed in the Notes to the Financial Statements.
ADR American Depositary Receipt
PLC Public Limited Company
See Notes to Financial Statements
| Financial Statements | Boston Trust Equity Fund |
| Statement of Assets and Liabilities | | | |
| December 31, 2019 | | | |
| | | | |
| Assets: | | | | |
| Investments, at fair value (cost $61,372,549) | | $ | 159,617,542 | |
| Dividends receivable | | | 154,987 | |
| Receivable for capital shares issued | | | 295 | |
| Prepaid expenses | | | 6,645 | |
| Total Assets | | | 159,779,469 | |
| Liabilities: | | | | |
| Accrued expenses and other liabilities: | | | | |
| Investment adviser | | | 100,160 | |
| Administration and accounting | | | 3,249 | |
| Custodian | | | 1,633 | |
| Shareholder servicing fees | | | 324 | |
| Transfer agent | | | 4,329 | |
| Trustee | | | 191 | |
| Other | | | 18,636 | |
| Total Liabilities | | | 128,522 | |
| Net Assets | | $ | 159,650,947 | |
| Composition of Net Assets: | | | | |
| Paid in capital | | $ | 60,608,266 | |
| Total distributable earnings/(loss) | | | 99,042,681 | |
| Net Assets | | $ | 159,650,947 | |
| Shares outstanding (par value $0.01, unlimited number of shares authorized) | | | 5,402,762 | |
| Net Asset Value, Offering Price and Redemption price per share | | $ | 29.55 | |
| Statement of Operations | | | |
| For the year ended December 31, 2019 | | | |
| | | | |
| Investment Income: | | | | |
| Dividends | | $ | 2,598,264 | |
| Total Investment Income | | | 2,598,264 | |
| Expenses: | | | | |
| Investment adviser | | | 1,085,055 | |
| Administration and accounting | | | 97,937 | |
| Chief compliance officer | | | 12,274 | |
| Custodian | | | 19,931 | |
| Shareholder servicing | | | 3,574 | |
| Transfer agency | | | 34,819 | |
| Trustee | | | 9,393 | |
| Other | | | 54,879 | |
| Total expenses | | | 1,317,862 | |
| Net Expenses | | | 1,317,862 | |
| Net Investment Income | | | 1,280,402 | |
| Net Realized/Unrealized Gains (Losses) from Investments: | | | | |
| Net realized gains from investment transactions | | | 1,332,110 | |
| Change in unrealized appreciation/depreciation from investments | | | 36,580,729 | |
| Net realized/unrealized gains (losses) from investments | | | 37,912,839 | |
| Change in Net Assets Resulting from Operations | | $ | 39,193,241 | |
See Notes to Financial Statements
| Financial Statements | | Boston Trust Equity Fund |
| Statements of Changes in Net Assets | | | | | | |
| | | For the year ended | | | For the year ended | |
| | | December 31, 2019 | | | December 31, 2018 | |
| | | | | | | |
| Investment Activities: | | | | | | | | |
| Operations: | | | | | | | | |
| Net investment income | | $ | 1,280,402 | | | $ | 1,238,377 | |
| Net realized gains from investment transactions | | | 1,332,110 | | | | 177,204 | |
| Change in unrealized appreciation/depreciation from investments | | | 36,580,729 | | | | (4,627,270 | ) |
| Change in Net Assets Resulting from Operations | | | 39,193,241 | | | | (3,211,689 | ) |
| Distributions to shareholders: | | | | | | | | |
| Total Distributions | | | (1,442,463 | ) | | | (2,243,322 | ) |
| Change in Net Assets Resulting from distributions to shareholders | | | (1,442,463 | ) | | | (2,243,322 | ) |
| Capital Share Transactions: | | | | | | | | |
| Proceeds from shares issued | | | 1,613,063 | | | | 1,327,119 | |
| Dividends reinvested | | | 651,454 | | | | 1,559,628 | |
| Cost of shares redeemed | | | (6,208,577 | ) | | | (5,593,745 | ) |
| Change in Net Assets Resulting from Capital Share Transactions | | | (3,944,060 | ) | | | (2,706,998 | ) |
| Change in Net Assets | | | 33,806,718 | | | | (8,162,009 | ) |
| Net Assets: | | | | | | | | |
| Beginning of period | | | 125,844,229 | | | | 134,006,238 | |
| End of period | | $ | 159,650,947 | | | $ | 125,844,229 | |
| Share Transactions: | | | | | | | | |
| Issued | | | 58,549 | | | | 53,942 | |
| Reinvested | | | 22,675 | | | | 65,586 | |
| Redeemed | | | (237,992 | ) | | | (231,373 | ) |
| Change in shares | | | (156,768 | ) | | | (111,845 | ) |
See Notes to Financial Statements
| Financial Statements | | Boston Trust Equity Fund |
| Financial Highlights | | | | | | | | | | | | | | | | | | |
| Selected data for a share outstanding throughout the periods indicated. | | | | | | | | | | | | | | |
| | | | | | | | | | | | | | | | | | | | | | | | | |
| | | | | | | | | | | | | | | | For the nine | | | | | | | | | |
| | | | For the year | | | | For the year | | | | For the year | | | | months | | | | For the year | | | | For the year | |
| | | | ended | | | | ended | | | | ended | | | | ended | | | | ended | | | | ended | |
| | | | December 31, | | | | December 31, | | | | December 31, | | | | December 31, | | | | March 31, | | | | March 31, | |
| | | | 2019 | | | | 2018 | | | | 2017 | | | | 2016 | | | | 2016 | | | | 2015 | |
| Net Asset Value, Beginning of Period | | $ | 22.64 | | | $ | 23.63 | | | $ | 20.09 | | | $ | 19.70 | | | $ | 20.66 | | | $ | 19.67 | |
| | | | | | | | | | | | | | | | | | | | | | | | | |
| Investment Activities: | | | | | | | | | | | | | | | | | | | | | | | | |
| Operations: | | | | | | | | | | | | | | | | | | | | | | | | |
| Net investment income | | | 0.24 | | | | 0.22 | | | | 0.23 | | | | 0.16 | | | | 0.23 | | | | 0.19 | |
| Net realized/unrealized gains (losses) from investments | | | 6.94 | | | | (0.80 | ) | | | 3.92 | | | | 1.58 | | | | 0.27 | | | | 1.38 | |
| Total from investment activities | | | 7.18 | | | | (0.58 | ) | | | 4.15 | | | | 1.74 | | | | 0.50 | | | | 1.57 | |
| Dividends: | | | | | | | | | | | | | | | | | | | | | | | | |
| Net investment income | | | (0.24 | ) | | | (0.23 | ) | | | (0.23 | ) | | | (0.20 | ) | | | (0.24 | ) | | | (0.19 | ) |
| Net realized gains from investment transactions | | | (0.03 | ) | | | (0.18 | ) | | | (0.38 | ) | | | (1.15 | ) | | | (1.22 | ) | | | (0.39 | ) |
| Total dividends | | | (0.27 | ) | | | (0.41 | ) | | | (0.61 | ) | | | (1.35 | ) | | | (1.46 | ) | | | (0.58 | ) |
| | | | | | | | | | | | | | | | | | | | | | | | | |
| Net Asset Value, End of Period | | $ | 29.55 | | | $ | 22.64 | | | $ | 23.63 | | | $ | 20.09 | | | $ | 19.70 | | | $ | 20.66 | |
| | | | | | | | | | | | | | | | | | | | | | | | | |
| Total Return | | | 31.74 | % | | | (2.55 | )% | | | 20.67 | % | | | 8.82 | %(a) | | | 2.59 | % | | | 8.01 | % |
| | | | | | | | | | | | | | | | | | | | | | | | | |
| Ratios/Supplemental Data: | | | | | | | | | | | | | | | | | | | | | | | | |
| Net assets at end of period (000’s) | | $ | 159,651 | | | $ | 125,844 | | | $ | 134,006 | | | $ | 118,824 | | | $ | 110,831 | | | $ | 110,664 | |
| Ratio of net expenses to average net assets | | | 0.91 | % | | | 0.92 | % | | | 0.93 | % | | | 0.96 | %(b) | | | 0.95 | % | | | 0.94 | % |
| Ratio of net investment income to average net assets | | | 0.88 | % | | | 0.91 | % | | | 1.02 | % | | | 1.01 | %(b) | | | 1.14 | % | | | 0.96 | % |
| Ratio of expenses (before fee reductions or recoupment of fees previously reimbursed by the investment adviser) to average net assets(c) | | | 0.91 | % | | | 0.92 | % | | | 0.93 | % | | | 0.96 | %(b) | | | 0.96 | % | | | 0.95 | % |
| Portfolio turnover rate | | | 2.61 | % | | | 1.67 | % | | | 9.00 | % | | | 6.65 | %(a) | | | 18.04 | % | | | 19.49 | % |
| (a) | Not annualized for periods less than one year. |
| (b) | Annualized for periods less than one year. |
| (c) | During the periods ending March 31, 2015 through December 31, 2016, certain fees were reduced. If such fee reduction had not occurred, the ratio would have been as indicated. |
See Notes to Financial Statements
| Schedule of Portfolio Investments | | Boston Trust Midcap Fund |
December 31, 2019
| Security Description | | Shares | | | Fair Value ($) | |
| Common Stocks (98.8%) | | | | | | | | |
| Communication Services (1.2%) | | | | | | | | |
| Omnicom Group, Inc. | | | 21,175 | | | | 1,715,599 | |
| | | | | | | | 1,715,599 | |
| Consumer Discretionary (11.8%) | | | | | | | | |
| Dollar General Corp. | | | 10,075 | | | | 1,571,498 | |
| Dunkin’ Brands Group, Inc. | | | 19,575 | | | | 1,478,696 | |
| eBay, Inc. | | | 41,050 | | | | 1,482,315 | |
| Expedia Group, Inc. | | | 11,175 | | | | 1,208,465 | |
| Hyatt Hotels Corp., Class A | | | 27,675 | | | | 2,482,724 | |
| Nordstrom, Inc. | | | 33,750 | | | | 1,381,388 | |
| O’Reilly Automotive, Inc. (a) | | | 4,525 | | | | 1,983,126 | |
| Polaris, Inc. | | | 14,675 | | | | 1,492,448 | |
| Ross Stores, Inc. | | | 22,225 | | | | 2,587,434 | |
| Service Corporation International | | | 31,150 | | | | 1,433,835 | |
| | | | | | | | 17,101,929 | |
| Consumer Staples (6.7%) | | | | | | | | |
| Brown-Forman Corp., Class B | | | 24,175 | | | | 1,634,230 | |
| Church & Dwight Co., Inc. | | | 17,700 | | | | 1,245,018 | |
| McCormick & Co., Inc. | | | 5,800 | | | | 984,434 | |
| Sysco Corp. | | | 20,250 | | | | 1,732,185 | |
| The Clorox Co. | | | 11,875 | | | | 1,823,288 | |
| The Hershey Co. | | | 8,325 | | | | 1,223,608 | |
| The JM Smucker Co. | | | 10,330 | | | | 1,075,663 | |
| | | | | | | | 9,718,426 | |
| Energy (2.7%) | | | | | | | | |
| Apache Corp. | | | 54,250 | | | | 1,388,258 | |
| Dril-Quip, Inc. (a) | | | 26,150 | | | | 1,226,697 | |
| Helmerich & Payne, Inc. | | | 29,875 | | | | 1,357,220 | |
| | | | | | | | 3,972,175 | |
| Financials (15.3%) | | | | | | | | |
| Brown & Brown, Inc. | | | 27,575 | | | | 1,088,661 | |
| Commerce Bancshares, Inc. | | | 30,393 | | | | 2,064,900 | |
| Discover Financial Services | | | 24,050 | | | | 2,039,921 | |
| East West Bancorp, Inc. | | | 32,275 | | | | 1,571,793 | |
| Eaton Vance Corp. | | | 29,175 | | | | 1,362,181 | |
| FactSet Research Systems, Inc. | | | 10,425 | | | | 2,797,027 | |
| M&T Bank Corp. | | | 13,075 | | | | 2,219,481 | |
| Northern Trust Corp. | | | 21,775 | | | | 2,313,376 | |
| SEI Investments Co. | | | 25,375 | | | | 1,661,555 | |
| Signature Bank | | | 10,600 | | | | 1,448,066 | |
| State Street Corp. | | | 25,125 | | | | 1,987,388 | |
| T. Rowe Price Group, Inc. | | | 13,175 | | | | 1,605,242 | |
| | | | | | | | 22,159,591 | |
| Health Care (11.8%) | | | | | | | | |
| Agilent Technologies, Inc. | | | 18,475 | | | | 1,576,102 | |
| Cerner Corp. | | | 20,700 | | | | 1,519,173 | |
| Henry Schein, Inc. (a) | | | 21,175 | | | | 1,412,796 | |
| Hill-Rom Holdings, Inc. | | | 12,675 | | | | 1,438,993 | |
| Laboratory Corp. of America Holdings (a) | | | 7,100 | | | | 1,201,107 | |
| Mettler-Toledo International, Inc. (a) | | | 1,900 | | | | 1,507,232 | |
| Steris PLC | | | 10,825 | | | | 1,649,947 | |
| The Cooper Companies, Inc. | | | 5,525 | | | | 1,775,127 | |
| Varian Medical Systems, Inc. (a) | | | 13,225 | | | | 1,878,082 | |
| Waters Corp. (a) | | | 6,350 | | | | 1,483,678 | |
| Zimmer Biomet Holdings, Inc. | | | 10,975 | | | | 1,642,738 | |
| | | | | | | | 17,084,975 | |
| Industrials (15.6%) | | | | | | | | |
| AMETEK, Inc. | | | 21,875 | | | | 2,181,812 | |
| AO Smith Corp. | | | 36,500 | | | | 1,738,859 | |
| Cummins, Inc. | | | 8,250 | | | | 1,476,420 | |
| Donaldson Co., Inc. | | | 41,000 | | | | 2,362,419 | |
| Expeditors International of Washington, Inc. | | | 20,475 | | | | 1,597,460 | |
| Hubbell, Inc. | | | 12,475 | | | | 1,844,054 | |
| IDEX Corp. | | | 5,825 | | | | 1,001,900 | |
| Lincoln Electric Holdings, Inc. | | | 13,325 | | | | 1,288,927 | |
| Masco Corp. | | | 34,025 | | | | 1,632,860 | |
| Nordson Corp. | | | 10,600 | | | | 1,726,104 | |
| Roper Technologies, Inc. | | | 5,550 | | | | 1,965,977 | |
| Sensata Technologies Holding PLC (a) | | | 26,825 | | | | 1,445,063 | |
| The Middleby Corp. (a) | | | 10,425 | | | | 1,141,746 | |
| Verisk Analytics, Inc. | | | 8,275 | | | | 1,235,789 | |
| | | | | | | | 22,639,390 | |
| Information Technology (15.1%) | | | | | | | | |
| Akamai Technologies, Inc. (a) | | | 15,700 | | | | 1,356,166 | |
| Amdocs Ltd. | | | 22,050 | | | | 1,591,790 | |
| Amphenol Corp., Class A | | | 17,500 | | | | 1,894,025 | |
| ANSYS, Inc. (a) | | | 4,175 | | | | 1,074,687 | |
| Aspen Technology, Inc. (a) | | | 11,275 | | | | 1,363,486 | |
| CDK Global, Inc. | | | 27,500 | | | | 1,503,700 | |
| Check Point Software Technologies Ltd. (a) | | | 13,575 | | | | 1,506,281 | |
| Citrix Systems, Inc. | | | 15,675 | | | | 1,738,357 | |
| F5 Networks, Inc. (a) | | | 12,525 | | | | 1,749,117 | |
| IPG Photonics Corp. (a) | | | 9,975 | | | | 1,445,577 | |
| Juniper Networks, Inc. | | | 58,575 | | | | 1,442,702 | |
| Paychex, Inc. | | | 38,600 | | | | 3,283,316 | |
| TE Connectivity Ltd. | | | 21,300 | | | | 2,041,392 | |
| | | | | | | | 21,990,596 | |
| Materials (5.7%) | | | | | | | | |
| AptarGroup, Inc. | | | 15,475 | | | | 1,789,220 | |
| Avery Dennison Corp. | | | 17,750 | | | | 2,322,054 | |
| Packaging Corporation of America | | | 16,325 | | | | 1,828,237 | |
| RPM International, Inc. | | | 29,900 | | | | 2,295,124 | |
| | | | | | | | 8,234,635 | |
| Real Estate (7.6%) | | | | | | | | |
| Alexandria Real Estate Equities, Inc. | | | 10,400 | | | | 1,680,432 | |
| AvalonBay Communities, Inc. | | | 5,900 | | | | 1,237,230 | |
| Digital Realty Trust, Inc. | | | 10,200 | | | | 1,221,348 | |
| Host Hotels & Resorts, Inc. | | | 99,900 | | | | 1,853,145 | |
| Jones Lang LaSalle, Inc. | | | 10,175 | | | | 1,771,366 | |
| Lamar Advertising Co., Class A | | | 15,250 | | | | 1,361,215 | |
| Realty Income Corp. | | | 26,825 | | | | 1,975,125 | |
| | | | | | | | 11,099,861 | |
| Utilities (5.3%) | | | | | | | | |
| American Water Works Co., Inc. | | | 9,625 | | | | 1,182,431 | |
| Consolidated Edison, Inc. | | | 19,600 | | | | 1,773,212 | |
| Eversource Energy | | | 40,050 | | | | 3,407,054 | |
| ONE Gas, Inc. | | | 14,725 | | | | 1,377,818 | |
| | | | | | | | 7,740,515 | |
| | | | | | | | | |
| TOTAL COMMON STOCKS (Cost $106,386,647) | | | | | | | 143,457,692 | |
| | | | | | | | | |
| Investment Companies (1.5%) | | | | | | | | |
| | | | | | | | | |
| JPMorgan U.S. Government Money Market Fund, Capital Shares, 1.49% (b) | | | 2,224,127 | | | | 2,224,127 | |
| TOTAL INVESTMENT COMPANIES (Cost $2,224,127) | | | | | | | 2,224,127 | |
| | | | | | | | | |
| Total Investments (Cost $108,610,774) — 100.3%(c) | | | | | | | 145,681,819 | |
| Liabilities in excess of other assets — (0.3)% | | | | | | | (377,144 | ) |
| NET ASSETS — 100.0% | | | | | | $ | 145,304,675 | |
(a) Non-income producing security.
(b) Rate disclosed is the seven day yield as of December 31, 2019.
(c) See Federal Tax Information listed in the Notes to the Financial Statements.
PLC Public Limited Company
See Notes to Financial Statements
| Financial Statements | Boston Trust Midcap Fund |
| Statement of Assets and Liabilities | | | |
| December 31, 2019 | | | |
| Assets: | | | |
| Investments, at fair value (cost $108,610,774) | | $ | 145,681,819 | |
| Dividends receivable | | | 166,584 | |
| Receivable for capital shares issued | | | 175,568 | |
| Prepaid expenses | | | 16,195 | |
| Total Assets | | | 146,040,166 | |
| Liabilities: | | | | |
| Payable for investments purchased | | | 580,712 | |
| Payable for capital shares redeemed | | | 42,249 | |
| Accrued expenses and other liabilities: | | | | |
| Investment adviser | | | 77,959 | |
| Administration and accounting | | | 2,775 | |
| Custodian | | | 1,040 | |
| Shareholder servicing fees | | | 10,357 | |
| Transfer agent | | | 4,936 | |
| Trustee | | | 158 | |
| Other | | | 15,305 | |
| Total Liabilities | | | 735,491 | |
| Net Assets | | $ | 145,304,675 | |
| Composition of Net Assets: | | | | |
| Paid in capital | | $ | 107,859,865 | |
| Total distributable earnings/(loss) | | | 37,444,810 | |
| Net Assets | | $ | 145,304,675 | |
| Shares outstanding (par value $0.01, unlimited number of shares authorized) | | | 7,432,554 | |
| Net Asset Value, Offering Price and Redemption price per share | | $ | 19.55 | |
| Statement of Operations | | | |
| For the year ended December 31, 2019 | | | |
| Investment Income: | | | | |
| Dividends | | $ | 1,855,437 | |
| Total Investment Income | | | 1,855,437 | |
| Expenses: | | | | |
| Investment adviser | | | 835,158 | |
| Administration and accounting | | | 72,857 | |
| Chief compliance officer | | | 8,959 | |
| Custodian | | | 15,186 | |
| Shareholder servicing | | | 105,919 | |
| Transfer agency | | | 41,088 | |
| Trustee | | | 6,661 | |
| Other | | | 71,312 | |
| Total expenses before fee reductions | | | 1,157,140 | |
| Fees contractually reduced by the investment adviser | | | (42,703 | ) |
| Net Expenses | | | 1,114,437 | |
| Net Investment Income | | | 741,000 | |
| Net Realized/Unrealized Gains (Losses) from Investments: | | | | |
| Net realized gains from investment transactions | | | 3,967,963 | |
| Change in unrealized appreciation/depreciation from investments | | | 20,892,329 | |
| Net realized/unrealized gains (losses) from investments | | | 24,860,292 | |
| Change in Net Assets Resulting from Operations | | $ | 25,601,292 | |
See Notes to Financial Statements
| Financial Statements | Boston Trust Midcap Fund |
Statements of Changes in Net Assets
| | | For the year ended | | | For the year ended | |
| | | December 31, 2019 | | | December 31, 2018 | |
| Investment Activities: | | | | | | | | |
| Operations: | | | | | | | | |
| Net investment income | | $ | 741,000 | | | $ | 346,175 | |
| Net realized gains from investment transactions | | | 3,967,963 | | | | 3,814,615 | |
| Change in unrealized appreciation/depreciation from investments | | | 20,892,329 | | | | (7,142,288 | ) |
| Change in Net Assets Resulting from Operations | | | 25,601,292 | | | | (2,981,498 | ) |
| Distributions to shareholders: | | | | | | | | |
| Total Distributions | | | (5,145,785 | ) | | | (4,017,880 | ) |
| Change in Net Assets Resulting from distributions to shareholders | | | (5,145,785 | ) | | | (4,017,880 | ) |
| Capital Share Transactions: | | | | | | | | |
| Proceeds from shares issued | | | 60,147,066 | | | | 21,747,824 | |
| Dividends reinvested | | | 4,094,485 | | | | 3,308,277 | |
| Cost of shares redeemed | | | (14,255,219 | ) | | | (4,741,801 | ) |
| Change in Net Assets Resulting from Capital Share Transactions | | | 49,986,332 | | | | 20,314,300 | |
| Change in Net Assets | | | 70,441,839 | | | | 13,314,922 | |
| Net Assets: | | | | | | | | |
| Beginning of period | | | 74,862,836 | | | | 61,547,914 | |
| End of period | | $ | 145,304,675 | | | $ | 74,862,836 | |
| Share Transactions: | | | | | | | | |
| Issued | | | 3,233,471 | | | | 1,245,052 | |
| Reinvested | | | 214,483 | | | | 200,623 | |
| Redeemed | | | (759,976 | ) | | | (267,350 | ) |
| Change in shares | | | 2,687,978 | | | | 1,178,325 | |
See Notes to Financial Statements
| Financial Statements | Boston Trust Midcap Fund |
Financial Highlights
Selected data for a share outstanding throughout the periods indicated.
| | | | | | | | | | | | For the nine | | | | | | | |
| | | For the year | | | For the year | | | For the year | | | months | | | For the year | | | For the year | |
| | | ended | | | ended | | | ended | | | ended | | | ended | | | ended | |
| | | December 31, | | | December 31, | | | December 31, | | | December 31, | | | March 31, | | | March 31, | |
| | | 2019 | | | 2018 | | | 2017 | | | 2016 | | | 2016 | | | 2015 | |
| Net Asset Value, Beginning of Period | | $ | 15.78 | | | $ | 17.26 | | | $ | 15.34 | | | $ | 15.29 | | | $ | 16.12 | | | $ | 15.03 | |
| | | | | | | | | | | | | | | | | | | | | | | | | |
| Investment Activities: | | | | | | | | | | | | | | | | | | | | | | | | |
| Operations: | | | | | | | | | | | | | | | | | | | | | | | | |
| Net investment income | | | 0.10 | | | | 0.08 | | | | 0.08 | | | | 0.12 | | | | 0.09 | | | | 0.05 | |
| Net realized/unrealized gains (losses) from investments | | | 4.39 | | | | (0.62 | ) | | | 2.98 | | | | 1.01 | | | | 0.05 | | | | 1.82 | |
| Total from investment activities | | | 4.49 | | | | (0.54 | ) | | | 3.06 | | | | 1.13 | | | | 0.14 | | | | 1.87 | |
| Dividends: | | | | | | | | | | | | | | | | | | | | | | | | |
| Net investment income | | | (0.09 | ) | | | (0.08 | ) | | | (0.08 | ) | | | (0.13 | ) | | | (0.09 | ) | | | (0.05 | ) |
| Net realized gains from investment transactions | | | (0.63 | ) | | | (0.86 | ) | | | (1.06 | ) | | | (0.95 | ) | | | (0.88 | ) | | | (0.73 | ) |
| Total dividends | | | (0.72 | ) | | | (0.94 | ) | | | (1.14 | ) | | | (1.08 | ) | | | (0.97 | ) | | | (0.78 | ) |
| | | | | | | | | | | | | | | | | | | | | | | | | |
| Net Asset Value, End of Period | | $ | 19.55 | | | $ | 15.78 | | | $ | 17.26 | | | $ | 15.34 | | | $ | 15.29 | | | $ | 16.12 | |
| | | | | | | | | | | | | | | | | | | | | | | | | |
| Total Return | | | 28.59 | % | | | (3.36 | )% | | | 20.01 | % | | | 7.29 | %(a) | | | 1.07 | % | | | 12.65 | % |
| | | | | | | | | | | | | | | | | | | | | | | | | |
| Ratios/Supplemental Data: | | | | | | | | | | | | | | | | | | | | | | | | |
| Net assets at end of period (000’s) | | $ | 145,305 | | | $ | 74,863 | | | $ | 61,548 | | | $ | 50,495 | | | $ | 47,941 | | | $ | 47,682 | |
| Ratio of net expenses to average net assets | | | 1.00 | % | | | 0.98 | % | | | 1.00 | % | | | 1.00 | %(b) | | | 1.00 | % | | | 1.00 | % |
| Ratio of net investment income to average net assets | | | 0.66 | % | | | 0.54 | % | | | 0.46 | % | | | 0.99 | %(b) | | | 0.58 | % | | | 0.34 | % |
| Ratio of expenses (before fee reductions or recoupment of fees previously reimbursed by the investment adviser) to average net assets(c) | | | 1.04 | % | | | 0.98 | % | | | 0.98 | % | | | 1.02 | %(b) | | | 1.03 | % | | | 1.02 | % |
| Portfolio turnover rate | | | 18.46 | % | | | 19.34 | % | | | 23.22 | % | | | 14.53 | %(a) | | | 21.02 | % | | | 15.76 | % |
| (a) | Not annualized for periods less than one year. |
| (b) | Annualized for periods less than one year. |
| (c) | During the periods, certain fees were reduced or recouped by the investment adviser. If such fee reductions/recoupments had not occurred, the ratio would have been as indicated. |
See Notes to Financial Statements
| Schedule of Portfolio Investments | Boston Trust SMID Cap Fund |
| | December 31, 2019 |
| Security Description | | Shares | | | Fair Value ($) | |
| Common Stocks (98.6%) | | | | | | | | |
| Communication Services (1.4%) | | | | | | | | |
| Interpublic Group of Cos., Inc. | | | 74,300 | | | | 1,716,330 | |
| | | | | | | | 1,716,330 | |
| Consumer Discretionary (10.6%) | | | | | | | | |
| Cheesecake Factory, Inc. | | | 23,975 | | | | 931,669 | |
| Choice Hotels International, Inc. | | | 16,900 | | | | 1,747,966 | |
| Dorman Products, Inc. (a) | | | 15,000 | | | | 1,135,800 | |
| Dunkin’ Brands Group, Inc. | | | 20,900 | | | | 1,578,786 | |
| Nordstrom, Inc. | | | 39,700 | | | | 1,624,921 | |
| Polaris, Inc. | | | 10,400 | | | | 1,057,680 | |
| Service Corporation International | | | 40,825 | | | | 1,879,175 | |
| Texas Roadhouse, Inc. | | | 17,000 | | | | 957,440 | |
| Tiffany & Co. | | | 7,175 | | | | 958,939 | |
| Williams Sonoma, Inc. | | | 19,950 | | | | 1,465,128 | |
| | | | | | | | 13,337,504 | |
| Consumer Staples (3.5%) | | | | | | | | |
| Flowers Foods, Inc. | | | 54,000 | | | | 1,173,959 | |
| Lancaster Colony Corp. | | | 5,925 | | | | 948,593 | |
| Performance Food Group Co. (a) | | | 22,625 | | | | 1,164,735 | |
| The JM Smucker Co. | | | 10,875 | | | | 1,132,414 | |
| | | | | | | | 4,419,701 | |
| Energy (3.1%) | | | | | | | | |
| Apache Corp. | | | 22,900 | | | | 586,011 | |
| Dril-Quip, Inc. (a) | | | 19,100 | | | | 895,981 | |
| Helmerich & Payne, Inc. | | | 31,700 | | | | 1,440,131 | |
| National Oilwell Varco, Inc. | | | 41,700 | | | | 1,044,585 | |
| | | | | | | | 3,966,708 | |
| Financials (16.2%) | | | | | | | | |
| American Financial Group, Inc. | | | 7,925 | | | | 868,976 | |
| Bank of Hawaii Corp. | | | 14,450 | | | | 1,375,062 | |
| Brown & Brown, Inc. | | | 43,300 | | | | 1,709,484 | |
| Cohen & Steers, Inc. | | | 19,000 | | | | 1,192,440 | |
| Comerica, Inc. | | | 12,975 | | | | 930,956 | |
| Commerce Bancshares, Inc. | | | 19,970 | | | | 1,356,762 | |
| East West Bancorp, Inc. | | | 29,100 | | | | 1,417,170 | |
| Eaton Vance Corp. | | | 34,875 | | | | 1,628,314 | |
| FactSet Research Systems, Inc. | | | 8,300 | | | | 2,226,890 | |
| First Hawaiian, Inc. | | | 30,700 | | | | 885,695 | |
| SEI Investments Co. | | | 32,200 | | | | 2,108,456 | |
| Signature Bank | | | 13,000 | | | | 1,775,930 | |
| SVB Financial Group (a) | | | 7,300 | | | | 1,832,592 | |
| UMB Financial Corp. | | | 17,000 | | | | 1,166,880 | |
| | | | | | | | 20,475,607 | |
| Health Care (13.3%) | | | | | | | | |
| Chemed Corp. | | | 4,300 | | | | 1,888,818 | |
| Dentsply Sirona, Inc. | | | 26,625 | | | | 1,506,709 | |
| Henry Schein, Inc. (a) | | | 18,800 | | | | 1,254,336 | |
| Masimo Corp. (a) | | | 15,000 | | | | 2,370,900 | |
| PerkinElmer, Inc. | | | 18,100 | | | | 1,757,510 | |
| Steris PLC | | | 14,100 | | | | 2,149,122 | |
| The Cooper Companies, Inc. | | | 5,425 | | | | 1,742,998 | |
| Varian Medical Systems, Inc. (a) | | | 15,400 | | | | 2,186,954 | |
| Waters Corp. (a) | | | 8,200 | | | | 1,915,930 | |
| | | | | | | | 16,773,277 | |
| Industrials (16.7%) | | | | | | | | |
| AO Smith Corp. | | | 24,600 | | | | 1,171,944 | |
| Applied Industrial Technologies, Inc. | | | 21,050 | | | | 1,403,825 | |
| C.H. Robinson Worldwide, Inc. | | | 11,225 | | | | 877,795 | |
| Donaldson Co., Inc. | | | 36,675 | | | | 2,113,213 | |
| Expeditors International of Washington, Inc. | | | 22,200 | | | | 1,732,044 | |
| Hexcel Corp. | | | 17,700 | | | | 1,297,587 | |
| Hubbell, Inc. | | | 14,800 | | | | 2,187,736 | |
| IDEX Corp. | | | 7,325 | | | | 1,259,900 | |
| Lincoln Electric Holdings, Inc. | | | 14,700 | | | | 1,421,931 | |
| Masco Corp. | | | 29,700 | | | | 1,425,303 | |
| Nordson Corp. | | | 12,525 | | | | 2,039,571 | |
| Sensata Technologies Holding PLC (a) | | | 22,700 | | | | 1,222,849 | |
| The Middleby Corp. (a) | | | 10,700 | | | | 1,171,864 | |
| UniFirst Corp. | | | 9,200 | | | | 1,858,216 | |
| | | | | | | | 21,183,778 | |
| Information Technology (15.0%) | | | | | | | | |
| Akamai Technologies, Inc. (a) | | | 19,400 | | | | 1,675,772 | |
| Amdocs Ltd. | | | 13,300 | | | | 960,127 | |
| Aspen Technology, Inc. (a) | | | 17,025 | | | | 2,058,833 | |
| CDK Global, Inc. | | | 24,200 | | | | 1,323,256 | |
| Citrix Systems, Inc. | | | 10,850 | | | | 1,203,265 | |
| Coherent, Inc. (a) | | | 6,800 | | | | 1,131,180 | |
| F5 Networks, Inc. (a) | | | 10,600 | | | | 1,480,290 | |
| IPG Photonics Corp. (a) | | | 11,100 | | | | 1,608,612 | |
| Jack Henry & Associates, Inc. | | | 9,325 | | | | 1,358,373 | |
| Juniper Networks, Inc. | | | 47,700 | | | | 1,174,851 | |
| Manhattan Associates, Inc. (a) | | | 20,400 | | | | 1,626,900 | |
| NetApp, Inc. | | | 20,200 | | | | 1,257,450 | |
| NETGEAR, Inc. (a) | | | 28,250 | | | | 692,408 | |
| Progress Software Corp. | | | 22,700 | | | | 943,185 | |
| Tech Data Corp. (a) | | | 3,500 | | | | 502,600 | |
| | | | | | | | 18,997,102 | |
| Materials (6.1%) | | | | | | | | |
| AptarGroup, Inc. | | | 14,200 | | | | 1,641,804 | |
| Avery Dennison Corp. | | | 13,700 | | | | 1,792,234 | |
| Packaging Corporation of America | | | 11,800 | | | | 1,321,482 | |
| RPM International, Inc. | | | 26,600 | | | | 2,041,816 | |
| Silgan Holdings, Inc. | | | 29,650 | | | | 921,522 | |
| | | | | | | | 7,718,858 | |
| Real Estate (8.8%) | | | | | | | | |
| American Campus Communities, Inc. | | | 18,700 | | | | 879,461 | |
| Camden Property Trust | | | 14,850 | | | | 1,575,585 | |
| CoreSite Realty Corp. | | | 14,000 | | | | 1,569,680 | |
| CubeSmart | | | 29,700 | | | | 934,956 | |
| Highwoods Properties, Inc. | | | 26,300 | | | | 1,286,333 | |
| Host Hotels & Resorts, Inc. | | | 87,900 | | | | 1,630,545 | |
| Jones Lang LaSalle, Inc. | | | 10,025 | | | | 1,745,252 | |
| Lamar Advertising Co., Class A | | | 16,525 | | | | 1,475,022 | |
| | | | | | | | 11,096,834 | |
| Utilities (3.9%) | | | | | | | | |
| Atmos Energy Corp. | | | 16,000 | | | | 1,789,760 | |
| New Jersey Resources Corp. | | | 30,600 | | | | 1,363,842 | |
| ONE Gas, Inc. | | | 18,400 | | | | 1,721,688 | |
| | | | | | | | 4,875,290 | |
| TOTAL COMMON STOCKS (Cost $108,186,938) | | | | | | | 124,560,989 | |
| | | | | | | | | |
| Investment Companies (1.3%) | | | | | | | | |
| | | | | | | | | |
| JPMorgan U.S. Government Money Market Fund, Capital Shares, 1.49% (b) | | | 1,691,214 | | | | 1,691,214 | |
| TOTAL INVESTMENT COMPANIES (Cost $1,691,214) | | | | | | | 1,691,214 | |
| | | | | | | | | |
| Total Investments (Cost $109,878,152) — 99.9%(c) | | | | | | | 126,252,203 | |
| Other assets in excess of liabilities — 0.1% | | | | | | | 123,486 | |
| NET ASSETS — 100.0% | | | | | | $ | 126,375,689 | |
| (a) | Non-income producing security. |
| (b) | Rate disclosed is the seven day yield as of December 31, 2019. |
| (c) | See Federal Tax Information listed in the Notes to the Financial Statements. |
| PLC | Public Limited Company |
See Notes to Financial Statements
| Financial Statements | Boston Trust SMID Cap Fund |
Statement of Assets and Liabilities
December 31, 2019
| Assets: | | | |
| Investments, at fair value (cost $109,878,152) | | $ | 126,252,203 | |
| Dividends receivable | | | 116,672 | |
| Receivable for capital shares issued | | | 64,213 | |
| Prepaid expenses | | | 12,428 | |
| Total Assets | | | 126,445,516 | |
| Liabilities: | | | | |
| Payable for capital shares redeemed | | | 270 | |
| Accrued expenses and other liabilities: | | | | |
| Investment adviser | | | 50,616 | |
| Administration and accounting | | | 2,081 | |
| Custodian | | | 895 | |
| Transfer agent | | | 4,152 | |
| Trustee | | | 93 | |
| Other | | | 11,720 | |
| Total Liabilities | | | 69,827 | |
| Net Assets | | $ | 126,375,689 | |
| Composition of Net Assets: | | | | |
| Paid in capital | | $ | 109,946,898 | |
| Total distributable earnings/(loss) | | | 16,428,791 | |
| Net Assets | | $ | 126,375,689 | |
| Shares outstanding (par value $0.01, unlimited number of shares authorized) | | | 7,059,197 | |
| Net Asset Value, Offering Price and Redemption price per share | | $ | 17.90 | |
Statement of Operations
For the year ended December 31, 2019
| Investment Income: | | | |
| Dividends | | $ | 1,399,784 | |
| Total Investment Income | | | 1,399,784 | |
| Expenses: | | | | |
| Investment adviser | | | 655,634 | |
| Administration and accounting | | | 59,507 | |
| Chief compliance officer | | | 7,435 | |
| Custodian | | | 12,060 | |
| Transfer agency | | | 34,487 | |
| Trustee | | | 5,679 | |
| Interest fees | | | 97 | |
| Other | | | 51,680 | |
| Total expenses before fee reductions | | | 826,579 | |
| Fees contractually reduced by the investment adviser | | | (170,506 | ) |
| Net Expenses | | | 656,073 | |
| Net Investment Income | | | 743,711 | |
| Net Realized/Unrealized Gains (Losses) from Investments: | | | | |
| Net realized gains from investment transactions | | | 2,407,151 | |
| Change in unrealized appreciation/depreciation from investments | | | 16,700,103 | |
| Net realized/unrealized gains (losses) from investments | | | 19,107,254 | |
| Change in Net Assets Resulting from Operations | | $ | 19,850,965 | |
See Notes to Financial Statements
| Financial Statements | Boston Trust SMID Cap Fund |
Statements of Changes in Net Assets
| | | For the year ended | | | For the year ended | |
| | | December 31, 2019 | | | December 31, 2018 | |
| Investment Activities: | | | | | | | | |
| Operations: | | | | | | | | |
| Net investment income | | $ | 743,711 | | | $ | 566,565 | |
| Net realized gains from investment transactions | | | 2,407,151 | | | | 960,363 | |
| Change in unrealized appreciation/depreciation from investments | | | 16,700,103 | | | | (6,823,876 | ) |
| Change in Net Assets Resulting from Operations | | | 19,850,965 | | | | (5,296,948 | ) |
| Distributions to shareholders: | | | | | | | | |
| Total Distributions | | | (3,234,772 | ) | | | (1,420,548 | ) |
| Change in Net Assets Resulting from distributions to shareholders | | | (3,234,772 | ) | | | (1,420,548 | ) |
| Capital Share Transactions: | | | | | | | | |
| Proceeds from shares issued | | | 43,659,409 | | | | 28,631,006 | |
| Dividends reinvested | | | 3,166,407 | | | | 1,390,368 | |
| Cost of shares redeemed | | | (11,365,725 | ) | | | (5,447,086 | ) |
| Change in Net Assets Resulting from Capital Share Transactions | | | 35,460,091 | | | | 24,574,288 | |
| Change in Net Assets | | | 52,076,284 | | | | 17,856,792 | |
| Net Assets: | | | | | | | | |
| Beginning of period | | | 74,299,405 | | | | 56,442,613 | |
| End of period | | $ | 126,375,689 | | | $ | 74,299,405 | |
| Share Transactions: | | | | | | | | |
| Issued | | | 2,472,566 | | | | 1,748,779 | |
| Reinvested | | | 181,041 | | | | 90,696 | |
| Redeemed | | | (672,234 | ) | | | (336,839 | ) |
| Change in shares | | | 1,981,373 | | | | 1,502,636 | |
See Notes to Financial Statements
| Financial Statements | Boston Trust SMID Cap Fund |
Financial Highlights
Selected data for a share outstanding throughout the periods indicated.
| | | | | | | | | | | | For the nine | | | | | | | |
| | | For the year | | | For the year | | | For the year | | | months | | | For the year | | | For the year | |
| | | ended | | | ended | | | ended | | | ended | | | ended | | | ended | |
| | | December 31, | | | December 31, | | | December 31, | | | December 31, | | | March 31, | | | March 31, | |
| | | 2019 | | | 2018 | | | 2017 | | | 2016 | | | 2016 | | | 2015 | |
| Net Asset Value, Beginning of Period | | $ | 14.63 | | | $ | 15.79 | | | $ | 13.48 | | | $ | 12.49 | | | $ | 13.72 | | | $ | 13.49 | |
| | | | | | | | | | | | | | | | | | | | | | | | | |
| Investment Activities: | | | | | | | | | | | | | | | | | | | | | | | | |
| Operations: | | | | | | | | | | | | | | | | | | | | | | | | |
| Net investment income | | | 0.14 | | | | 0.11 | | | | 0.07 | | | | 0.13 | | | | 0.06 | | | | 0.01 | |
| Net realized/unrealized gains (losses) from investments | | | 3.76 | | | | (0.98 | ) | | | 2.41 | | | | 1.72 | | | | (0.41 | ) | | | 0.97 | |
| Total from investment activities | | | 3.90 | | | | (0.87 | ) | | | 2.48 | | | | 1.85 | | | | (0.35 | ) | | | 0.98 | |
| Dividends: | | | | | | | | | | | | | | | | | | | | | | | | |
| Net investment income | | | (0.12 | ) | | | (0.12 | ) | | | (0.08 | ) | | | (0.15 | ) | | | (0.04 | ) | | | — | |
| Net realized gains from investment transactions | | | (0.51 | ) | | | (0.17 | ) | | | (0.09 | ) | | | (0.71 | ) | | | (0.84 | ) | | | (0.75 | ) |
| Total dividends | | | (0.63 | ) | | | (0.29 | ) | | | (0.17 | ) | | | (0.86 | ) | | | (0.88 | ) | | | (0.75 | ) |
| | | | | | | | | | | | | | | | | | | | | | | | | |
| Net Asset Value, End of Period | | $ | 17.90 | | | $ | 14.63 | | | $ | 15.79 | | | $ | 13.48 | | | $ | 12.49 | | | $ | 13.72 | |
| | | | | | | | | | | | | | | | | | | | | | | | | |
| Total Return | | | 26.74 | % | | | (5.62 | )% | | | 18.39 | % | | | 14.67 | %(a) | | | (2.34 | )% | | | 7.69 | % |
| | | | | | | | | | | | | | | | | | | | | | | | | |
| Ratios/Supplemental Data: | | | | | | | | | | | | | | | | | | | | | | | | |
| Net assets at end of period (000’s) | | $ | 126,376 | | | $ | 74,299 | | | $ | 56,443 | | | $ | 6,510 | | | $ | 5,589 | | | $ | 5,386 | |
| Ratio of net expenses to average net assets | | | 0.75 | % | | | 0.75 | % | | | 0.75 | % | | | 0.75 | %(b) | | | 0.79 | %(c) | | | 1.00 | % |
| Ratio of net investment income to average net assets | | | 0.85 | % | | | 0.77 | % | | | 0.85 | % | | | 1.31 | %(b) | | | 0.49 | % | | | 0.09 | % |
| Ratio of expenses (before fee reductions or recoupment of fees previously reimbursed by the investment adviser) to average net assets(d) | | | 0.95 | % | | | 0.98 | % | | | 1.04 | % | | | 1.61 | %(b) | | | 1.73 | % | | | 1.73 | % |
| Portfolio turnover rate | | | 24.08 | % | | | 14.98 | % | | | 37.44 | % | | | 22.69 | %(a) | | | 50.15 | % | | | 33.07 | % |
Amounts designated as “—” are $0 or have been rounded to $0.
| (a) | Not annualized for periods less than one year. |
| (b) | Annualized for periods less than one year. |
| (c) | The net expense ratio shown for the period presented represents the blended ratio of the current expense limit in effect as of June 1, 2015 and the higher expense limit in effect prior to that date. |
| (d) | During the periods, certain fees were reduced. If such fee reduction had not occurred, the ratio would have been as indicated. |
See Notes to Financial Statements
| Schedule of Portfolio Investments | Boston Trust Small Cap Fund |
| | December 31, 2019 |
| Security Description | | Shares | | | Fair Value ($) | |
| Common Stocks (98.4%) | | | | | | | | |
| Consumer Discretionary (12.4%) | | | | | | | | |
| Carter’s, Inc. | | | 20,500 | | | | 2,241,470 | |
| Cheesecake Factory, Inc. | | | 55,200 | | | | 2,145,072 | |
| Choice Hotels International, Inc. | | | 44,800 | | | | 4,633,664 | |
| Dorman Products, Inc. (a) | | | 27,900 | | | | 2,112,588 | |
| Dunkin’ Brands Group, Inc. | | | 50,300 | | | | 3,799,662 | |
| Gentherm, Inc. (a) | | | 37,701 | | | | 1,673,547 | |
| Monro, Inc. | | | 35,700 | | | | 2,791,740 | |
| Nordstrom, Inc. | | | 78,400 | | | | 3,208,912 | |
| Texas Roadhouse, Inc. | | | 60,100 | | | | 3,384,832 | |
| Williams Sonoma, Inc. | | | 44,100 | | | | 3,238,704 | |
| | | | | | | | 29,230,191 | |
| Consumer Staples (4.6%) | | | | | | | | |
| Flowers Foods, Inc. | | | 128,000 | | | | 2,782,719 | |
| Lancaster Colony Corp. | | | 14,300 | | | | 2,289,430 | |
| Performance Food Group Co. (a) | | | 41,008 | | | | 2,111,092 | |
| The Boston Beer Co., Inc., Class A (a) | | | 6,370 | | | | 2,406,905 | |
| Tootsie Roll Industries, Inc. | | | 36,464 | | | | 1,244,881 | |
| | | | | | | | 10,835,027 | |
| Energy (2.5%) | | | | | | | | |
| Dril-Quip, Inc. (a) | | | 44,573 | | | | 2,090,919 | |
| Helmerich & Payne, Inc. | | | 59,400 | | | | 2,698,542 | |
| Newpark Resources, Inc. (a) | | | 158,058 | | | | 991,024 | |
| | | | | | | | 5,780,485 | |
| Financials (17.0%) | | | | | | | | |
| 1st Source Corp. | | | 35,800 | | | | 1,857,304 | |
| Bank of Hawaii Corp. | | | 36,700 | | | | 3,492,373 | |
| Bank of Marin BanCorp | | | 14,558 | | | | 655,838 | |
| Bridge BanCorp, Inc. | | | 27,189 | | | | 911,647 | |
| Bryn Mawr Bank Corp. | | | 33,093 | | | | 1,364,755 | |
| Camden National Corp. | | | 26,180 | | | | 1,205,851 | |
| Cohen & Steers, Inc. | | | 54,500 | | | | 3,420,420 | |
| Commerce Bancshares, Inc. | | | 43,700 | | | | 2,968,978 | |
| CVB Financial Corp. | | | 91,700 | | | | 1,978,886 | |
| Eaton Vance Corp. | | | 76,300 | | | | 3,562,447 | |
| First Hawaiian, Inc. | | | 78,500 | | | | 2,264,725 | |
| German American BanCorp | | | 27,220 | | | | 969,576 | |
| Independent Bank Corp. | | | 18,600 | | | | 1,548,450 | |
| Lakeland Financial Corp. | | | 54,300 | | | | 2,656,899 | |
| Morningstar, Inc. | | | 20,100 | | | | 3,041,331 | |
| Tompkins Financial Corp. | | | 23,700 | | | | 2,168,550 | |
| UMB Financial Corp. | | | 37,000 | | | | 2,539,680 | |
| Washington Federal, Inc. | | | 48,610 | | | | 1,781,557 | |
| Washington Trust BanCorp, Inc. | | | 32,300 | | | | 1,737,417 | |
| | | | | | | | 40,126,684 | |
| Health Care (16.5%) | | | | | | | | |
| Anika Therapeutics, Inc. (a) | | | 31,475 | | | | 1,631,979 | |
| Atrion Corp. | | | 2,732 | | | | 2,053,098 | |
| Bruker Corp. | | | 75,000 | | | | 3,822,750 | |
| Cantel Medical Corp. | | | 46,700 | | | | 3,311,030 | |
| Charles River Laboratories International, Inc. (a) | | | 25,677 | | | | 3,922,419 | |
| Chemed Corp. | | | 11,800 | | | | 5,183,268 | |
| CorVel Corp. (a) | | | 31,110 | | | | 2,717,770 | |
| Ensign Group, Inc. | | | 39,808 | | | | 1,806,089 | |
| Globus Medical, Inc., Class A (a) | | | 62,600 | | | | 3,685,888 | |
| Haemonetics Corp. (a) | | | 17,900 | | | | 2,056,710 | |
| Hill-Rom Holdings, Inc. | | | 37,000 | | | | 4,200,609 | |
| Premier, Inc. (a) | | | 63,100 | | | | 2,390,228 | |
| U.S. Physical Therapy, Inc. | | | 17,266 | | | | 1,974,367 | |
| | | | | | | | 38,756,205 | |
| Industrials (17.4%) | | | | | | | | |
| Applied Industrial Technologies, Inc. | | | 42,400 | | | | 2,827,656 | |
| Donaldson Co., Inc. | | | 74,400 | | | | 4,286,929 | |
| Forward Air Corp. | | | 45,400 | | | | 3,175,730 | |
| Franklin Electric Co., Inc. | | | 64,900 | | | | 3,720,068 | |
| Herman Miller, Inc. | | | 35,697 | | | | 1,486,780 | |
| Hub Group, Inc., Class A (a) | | | 59,500 | | | | 3,051,755 | |
| Kadant, Inc. | | | 19,100 | | | | 2,011,994 | |
| Korn Ferry | | | 43,887 | | | | 1,860,809 | |
| Landstar System, Inc. | | | 30,100 | | | | 3,427,487 | |
| Lincoln Electric Holdings, Inc. | | | 38,900 | | | | 3,762,797 | |
| Tennant Co. | | | 21,300 | | | | 1,659,696 | |
| UniFirst Corp. | | | 21,100 | | | | 4,261,778 | |
| Valmont Industries, Inc. | | | 15,180 | | | | 2,273,660 | |
| Watts Water Technologies, Inc., Class A | | | 33,100 | | | | 3,302,056 | |
| | | | | | | | 41,109,195 | |
| Information Technology (13.3%) | | | | | | | | |
| Badger Meter, Inc. | | | 30,600 | | | | 1,986,858 | |
| Coherent, Inc. (a) | | | 18,400 | | | | 3,060,840 | |
| CSG Systems International, Inc. | | | 50,300 | | | | 2,604,534 | |
| ExlService Holdings, Inc. (a) | | | 37,400 | | | | 2,597,804 | |
| InterDigital, Inc. | | | 34,600 | | | | 1,885,354 | |
| Manhattan Associates, Inc. (a) | | | 47,900 | | | | 3,820,025 | |
| NETGEAR, Inc. (a) | | | 54,148 | | | | 1,327,167 | |
| NIC, Inc. | | | 170,300 | | | | 3,806,205 | |
| Power Integrations, Inc. | | | 26,800 | | | | 2,650,788 | |
| Progress Software Corp. | | | 81,900 | | | | 3,402,945 | |
| Tech Data Corp. (a) | | | 12,100 | | | | 1,737,560 | |
| Teradata Corp. (a) | | | 92,500 | | | | 2,476,225 | |
| | | | | | | | 31,356,305 | |
| Materials (3.9%) | | | | | | | | |
| Minerals Technologies, Inc. | | | 45,600 | | | | 2,627,928 | |
| Sensient Technologies Corp. | | | 48,900 | | | | 3,231,801 | |
| Silgan Holdings, Inc. | | | 108,100 | | | | 3,359,748 | |
| | | | | | | | 9,219,477 | |
| Real Estate (5.8%) | | | | | | | | |
| American Campus Communities, Inc. | | | 37,072 | | | | 1,743,496 | |
| CoreSite Realty Corp. | | | 32,400 | | | | 3,632,688 | |
| CubeSmart | | | 69,000 | | | | 2,172,120 | |
| Highwoods Properties, Inc. | | | 77,800 | | | | 3,805,198 | |
| Ryman Hospitality Properties, Inc. | | | 25,500 | | | | 2,209,830 | |
| | | | | | | | 13,563,332 | |
| Utilities (5.0%) | | | | | | | | |
| Chesapeake Utilities Corp. | | | 31,000 | | | | 2,970,730 | |
| Hawaiian Electric Industries, Inc. | | | 49,455 | | | | 2,317,461 | |
| New Jersey Resources Corp. | | | 67,200 | | | | 2,995,104 | |
| ONE Gas, Inc. | | | 37,000 | | | | 3,462,090 | |
| | | | | | | | 11,745,385 | |
| | | | | | | | | |
| TOTAL COMMON STOCKS (Cost $176,140,452) | | | | | | | 231,722,286 | |
| | | | | | | | | |
| Investment Companies (1.5%) | | | | | | | | |
| | | | | | | | | |
| JPMorgan U.S. Government Money Market Fund, Capital Shares, 1.49% (b) | | | 3,445,871 | | | | 3,445,871 | |
| TOTAL INVESTMENT COMPANIES (Cost $3,445,871) | | | | | | | 3,445,871 | |
| | | | | | | | | |
| Total Investments (Cost $179,586,323) — 99.9%(c) | | | | | | | 235,168,157 | |
| Other assets in excess of liabilities — 0.1% | | | | | | | 300,642 | |
| NET ASSETS — 100.0% | | | | | | $ | 235,468,799 | |
| (a) | Non-income producing security. |
| (b) | Rate disclosed is the seven day yield as of December 31, 2019. |
| (c) | See Federal Tax Information listed in the Notes to the Financial Statements. |
See Notes to Financial Statements
| Financial Statements | Boston Trust Small Cap Fund |
| Statement of Assets and Liabilities | | | |
| December 31, 2019 | | | |
| | | | |
| Assets: | | | | |
| Investments, at fair value (cost $179,586,323) | | $ | 235,168,157 | |
| Dividends receivable | | | 214,100 | |
| Receivable for capital shares issued | | | 290,589 | |
| Prepaid expenses | | | 20,516 | |
| Total Assets | | | 235,693,362 | |
| Liabilities: | | | | |
| Payable for capital shares redeemed | | | 13,973 | |
| Accrued expenses and other liabilities: | | | | |
| Investment adviser | | | 139,300 | |
| Administration and accounting | | | 5,194 | |
| Custodian | | | 2,096 | |
| Shareholder servicing fees | | | 27,463 | |
| Transfer agent | | | 6,532 | |
| Trustee | | | 402 | |
| Other | | | 29,603 | |
| Total Liabilities | | | 224,563 | |
| Net Assets | | $ | 235,468,799 | |
| Composition of Net Assets: | | | | |
| Paid in capital | | $ | 178,228,296 | |
| Total distributable earnings/(loss) | | | 57,240,503 | |
| Net Assets | | $ | 235,468,799 | |
| Shares outstanding (par value $0.01, unlimited number of shares authorized) | | | 16,103,719 | |
| Net Asset Value, Offering Price and Redemption price per share | | $ | 14.62 | |
| | | | | |
| Statement of Operations | | | | |
| For the year ended December 31, 2019 | | | | |
| | | | | |
| Investment Income: | | | | |
| Dividends | | $ | 3,841,915 | |
| Total Investment Income | | | 3,841,915 | |
| Expenses: | | | | |
| Investment adviser | | | 1,825,866 | |
| Administration and accounting | | | 164,425 | |
| Chief compliance officer | | | 20,622 | |
| Custodian | | | 32,642 | |
| Shareholder servicing | | | 374,268 | |
| Transfer agency | | | 48,445 | |
| Trustee | | | 16,120 | |
| Other | | | 121,078 | |
| Total expenses before fee reductions | | | 2,603,466 | |
| Fees contractually reduced by the investment adviser | | | (168,952 | ) |
| Net Expenses | | | 2,434,514 | |
| Net Investment Income | | | 1,407,401 | |
| Net Realized/Unrealized Gains (Losses) from Investments: | | | | |
| Net realized gains from investment transactions | | | 12,876,513 | |
| Net realized gains from redemptions in-kind (a) | | | 42,132,134 | |
| Change in unrealized appreciation/depreciation from investments | | | 9,542,517 | |
| Net realized/unrealized gains (losses) from investments | | | 64,551,164 | |
| Change in Net Assets Resulting from Operations | | $ | 65,958,565 | |
(a) See Note 3 in Notes to Financial Statements.
See Notes to Financial Statements
| Financial Statements | Boston Trust Small Cap Fund |
Statements of Changes in Net Assets
| | | For the year ended | | | For the year ended | |
| | | December 31, 2019 | | | December 31, 2018 | |
| Investment Activities: | | | | | | | | |
| Operations: | | | | | | | | |
| Net investment income | | $ | 1,407,401 | | | $ | 1,143,498 | |
| Net realized gains from investment transactions | | | 55,008,647 | | | | 43,824,649 | |
| Change in unrealized appreciation/depreciation from investments | | | 9,542,517 | | | | (55,806,560 | ) |
| Change in Net Assets Resulting from Operations | | | 65,958,565 | | | | (10,838,413 | ) |
| Distributions to shareholders: | | | | | | | | |
| Total Distributions | | | (15,569,783 | ) | | | (34,637,332 | ) |
| Change in Net Assets Resulting from distributions to shareholders | | | (15,569,783 | ) | | | (34,637,332 | ) |
| Capital Share Transactions: | | | | | | | | |
| Proceeds from shares issued | | | 80,119,024 | | | | 30,104,415 | |
| Dividends reinvested | | | 14,461,506 | | | | 32,559,881 | |
| Cost of shares redeemed | | | (31,775,419 | ) | | | (141,125,269 | ) |
| Cost of in-kind shares redeemed (a) | | | (119,901,316 | ) | | | — | |
| Change in Net Assets Resulting from Capital Share Transactions | | | (57,096,205 | ) | | | (78,460,973 | ) |
| Change in Net Assets | | | (6,707,423 | ) | | | (123,936,718 | ) |
| Net Assets: | | | | | | | | |
| Beginning of period | | | 242,176,222 | | | | 366,112,940 | |
| End of period | | $ | 235,468,799 | | | $ | 242,176,222 | |
| Share Transactions: | | | | | | | | |
| Issued | | | 5,601,029 | | | | 1,948,859 | |
| Reinvested | | | 1,010,587 | | | | 2,577,979 | |
| Redeemed | | | (2,272,358 | ) | | | (9,208,620 | ) |
| Redeemed in-kind (a) | | | (8,413,292 | ) | | | — | |
| Change in shares | | | (4,074,034 | ) | | | (4,681,782 | ) |
Amounts designated as “—” are $0 or have been rounded to $0.
(a) See Note 3 in Notes to Financial Statements.
See Notes to Financial Statements
| Financial Statements | Boston Trust Small Cap Fund |
Financial Highlights
Selected data for a share outstanding throughout the periods indicated.
| | | | | | | | | | | | For the nine | | | | | | | |
| | | For the year | | | For the year | | | For the year | | | months | | | For the year | | | For the year | |
| | | ended | | | ended | | | ended | | | ended | | | ended | | | ended | |
| | | December 31, | | | December 31, | | | December 31, | | | December 31, | | | March 31, | | | March 31, | |
| | | 2019 | | | 2018 | | | 2017 | | | 2016 | | | 2016 | | | 2015 | |
| Net Asset Value, Beginning of Period | | $ | 12.00 | | | $ | 14.73 | | | $ | 14.33 | | | $ | 12.74 | | | $ | 15.20 | | | $ | 15.73 | |
| | | | | | | | | | | | | | | | | | | | | | | | | |
| Investment Activities: | | | | | | | | | | | | | | | | | | | | | | | | |
| Operations: | | | | | | | | | | | | | | | | | | | | | | | | |
| Net investment income | | | 0.09 | | | | 0.07 | | | | 0.07 | | | | 0.12 | | | | 0.06 | | | | 0.03 | |
| Net realized/unrealized gains (losses) from investments | | | 3.47 | | | | (0.86 | ) | | | 1.67 | | | | 1.92 | | | | (0.25 | ) | | | 0.51 | |
| Total from investment activities | | | 3.56 | | | | (0.79 | ) | | | 1.74 | | | | 2.04 | | | | (0.19 | ) | | | 0.54 | |
| Dividends: | | | | | | | | | | | | | | | | | | | | | | | | |
| Net investment income | | | (0.06 | ) | | | (0.07 | ) | | | (0.08 | ) | | | (0.14 | ) | | | (0.06 | ) | | | (0.01 | ) |
| Net realized gains from investment transactions | | | (0.88 | ) | | | (1.87 | ) | | | (1.26 | ) | | | (0.31 | ) | | | (2.21 | ) | | | (1.06 | ) |
| Total dividends | | | (0.94 | ) | | | (1.94 | ) | | | (1.34 | ) | | | (0.45 | ) | | | (2.27 | ) | | | (1.07 | ) |
| | | | | | | | | | | | | | | | | | | | | | | | | |
| Net Asset Value, End of Period | | $ | 14.62 | | | $ | 12.00 | | | $ | 14.73 | | | $ | 14.33 | | | $ | 12.74 | | | $ | 15.20 | |
| | | | | | | | | | | | | | | | | | | | | | | | | |
| Total Return | | | 29.88 | % | | | (6.00 | )% | | | 12.26 | % | | | 15.94 | %(a) | | | (0.52 | )% | | | 3.81 | % |
| | | | | | | | | | | | | | | | | | | | | | | | | |
| Ratios/Supplemental Data: | | | | | | | | | | | | | | | | | | | | | | | | |
| Net assets at end of period (000’s) | | $ | 235,469 | | | $ | 242,176 | | | $ | 366,113 | | | $ | 327,593 | | | $ | 338,656 | | | $ | 439,681 | |
| Ratio of net expenses to average net assets | | | 1.00 | % | | | 1.00 | % | | | 1.00 | % | | | 1.00 | %(b) | | | 1.00 | % | | | 1.00 | % |
| Ratio of net investment income to average net assets | | | 0.58 | % | | | 0.39 | % | | | 0.46 | % | | | 1.21 | %(b) | | | 0.44 | % | | | 0.17 | % |
| Ratio of expenses (before fee reductions or recoupment of fees previously reimbursed by the investment adviser) to average net assets (c) | | | 1.07 | % | | | 1.09 | % | | | 1.02 | % | | | 1.06 | %(b) | | | 1.08 | % | | | 1.05 | % |
| Portfolio turnover rate | | �� | 23.23 | %(d) | | | 24.60 | % | | | 23.78 | % | | | 51.92 | %(a) | | | 37.42 | % | | | 28.62 | % |
| (a) | Not annualized for periods less than one year. |
| (b) | Annualized for periods less than one year. |
| (c) | During the periods, certain fees were reduced or recouped by the investment adviser. If such fee reductions/recoupments had not occurred, the ratio would have been as indicated. |
| (d) | Excludes impact of in-kind transactions. |
See Notes to Financial Statements
This page intentionally left blank.

Read our 2019 Annual ESG Impact Report online
We invite you to read our Annual ESG Impact Report online, which provides an in-depth view of the ways in which Boston Trust Walden Company promotes business sustainability and achieve impact on behalf of clients.
The report can be found at:www.bostontrustwalden.com/insights/annual-esg-impact-report-2019/
Included in this report:

This page intentionally left blank.
Walden Balanced Fund
(formerly known as the Walden Asset Management Fund)
Walden Equity Fund
December 31, 2019
William H. Apfel, CFA
Portfolio Manager
Boston Trust Walden Inc.
Balanced Fund Objective
The Fund seeks long-term capital growth and income through an actively managed portfolio of stocks, bonds and money market instruments.
Equity Fund Objective
The Fund seeks long-term growth of capital through an actively managed portfolio of stocks.
Investment Concerns
Equity securities (stocks) are more volatile and carry more risk and return potential than other forms of investments, including investments in high-grade fixed income securities. The net asset value per share of these Funds will fluctuate as the value of the securities in the portfolio changes.
Foreign investing involves risks not typically associated with U.S. investments, including adverse political, social and economic developments and differing auditing and legal standards. These risks are magnified in emerging markets.
Small- to mid-capitalization companies typically have a higher risk of failure and historically have experienced a greater degree of volatility.
Bonds offer a relatively stable level of income, although bond prices will fluctuate, providing the potential for principal gain or loss. Intermediate term, higher quality bonds generally offer less risk than longer-term bonds and a lower rate of return.
Manager Commentary (Unaudited)
Management Discussion of Fund Performance
The Walden Balanced Fund and Walden Equity Fund returned 23.70%† and 32.30%†, respectively, for the 12-month period ended December 31, 2019. The results compared favorably to the relevant market indices, including the S&P 500 Index and the Bloomberg Barclays U.S. Government/Credit Bond Index, which rose by 31.49% and 9.71%, respectively, for the year. Both Funds’ equity segments outperformed the S&P 500 Index benchmark, while the Walden Balanced Fund also benefitted from our decision to keep the equity allocation at the upper-end of the policy range.*
The stock market’s gains in 2019 represented a strong rebound following a challenging 2018 that was marked by a nearly 20% drop during the latter months of the year. In stark contrast to the litany of risks that were cited as the cause for the market decline in the fourth quarter of last year, 2019 brought with it a renewed sense of optimism that the long-awaited economic recession had not quite arrived. That the Funds outperformed the broad market over the course of 2019 was a particularly favorable outcome when considering that it came on the heels of relative downside protection in 2018.
Our analysis of the year’s returns indicated that the stocks of what we deemed to be more financially sound and well-run companies significantly outperformed those that did not meet our quality criteria. Specifically, we noted that stable growers, those businesses that are less subject to economic cycles and have delivered a sustained or improving rate of organic growth, were rewarded by investors. Until the fourth quarter, we saw little evidence that valuation was at the forefront of investors’ minds. Our valuation discipline, which is predicated on the idea that the avoidance of overpaying for securities is an important risk management tool, acted as a headwind, albeit one that we believe will prove transitory.
At the sector level, decisions in healthcare, financials, and the consumer sectors propelled relative performance. Results in the industrials and communications services sectors were challenging, though the underperformance was attributable almost exclusively to just two stocks. Within industrials, the holding of 3M Company (1.01% of net assets) was the largest detractor. Weakness in the stock was due to cyclical end market challenges as well as concerns regarding the outcome of pending litigation. The decision to not own Facebook held back the comparative gain from communications services, as this large capitalization stock rebounded sharply despite well-publicized issues regarding data privacy.
Outlook
The underlying fundamentals that have supported the current economic expansion, including a strong labor market, growth in personal income, and healthy corporate cash flows, remain largely intact. Importantly, those factors have improved while inflation remains modest. Therefore, absent an unanticipated deterioration in the economic climate or renewed controversies regarding global trade, our outlook for corporate earnings is positive. Meanwhile, market valuations reside at reasonable levels in the context of low inflation, low interest rates, and solid corporate earnings. This is also true relative to fixed income alternatives as it relates to the Walden Balanced Fund. Nevertheless, investors should be forewarned; short-term market moves are largely dictated by changes in investor sentiment, not earnings. In addition, 2020, a presidential election year, is likely to be filled with wide swings in sentiment. If recent headlines are any guide, geopolitical risks are also mounting. Thus, we anticipate heightened market volatility. Our base case outlook is that fundamentals for U.S. equities remain favorable, although the recent pace of appreciation may be difficult to sustain. While it is our discipline to avoid adjusting our investment strategy in response to every market turn, we believe that our long-held emphasis on financially strong companies, reasonable valuations, and prudent diversification will allow the Funds to earn attractive returns in a range of market outcomes.
| † | The recent appreciation in the stock market has helped to produce short-term returns that are not typical and may not continue in the future. Because of ongoing market volatility, fund performance may be subject to substantial short-term changes. |
| | |
| * | Portfolio composition is subject to change. |
| Investment Performance (Unaudited) | Walden Balanced Fund |
| | Walden Equity Fund |
| | December 31, 2019 |
| | | For the periods ended 12/31/19 | |
| | | Average Annual Total Returns | |
| | | | | | | | | | | | | | | | | | | | | | | | | | | | Since | |
| | | | | | | | | | | | | | | | | | | | | | | | | | | | Inception | |
| | | | 1 Year | | | | 3 years | | | | 5 Years | | | | 10 Years | | | | 15 Years | | | | 20 Years | | | | (6/18/99) | |
| Walden Balanced Fund1 | | | 23.70 | %† | | | 11.71 | % | | | 8.71 | % | | | 9.42 | % | | | 6.65 | % | | | 5.89 | % | | | 5.90 | % |
| Walden Equity Fund1 | | | 32.30 | %† | | | 15.91 | % | | | 11.62 | % | | | 12.55 | % | | | 8.51 | % | | | 7.17 | % | | | 7.13 | % |
| S&P 500 Index | | | 31.49 | % | | | 15.27 | % | | | 11.70 | % | | | 13.56 | % | | | 9.00 | % | | | 6.06 | % | | | 6.40 | % |
| Bloomberg Barclays U.S. Government/Credit Bond Index | | | 9.71 | % | | | 4.35 | % | | | 3.23 | % | | | 3.96 | % | | | 4.21 | % | | | 5.14 | % | | | 5.03 | % |
| FTSE 3 Month US T-Bill Index | | | 2.25 | % | | | 1.65 | % | | | 1.05 | % | | | 0.56 | % | | | 1.33 | % | | | 1.69 | % | | | 1.78 | % |
Hypothetical Growth of a $100,000 Investment

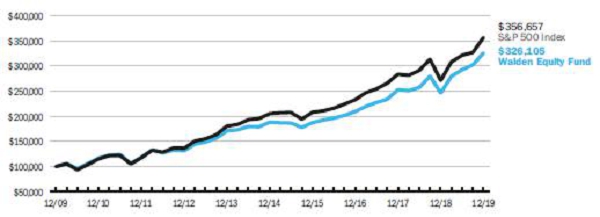
| † | The recent appreciation in the stock market has helped to produce short-term returns that are not typical and may not continue in the future. Because of ongoing market volatility, fund performance may be subject to substantial short-term changes. |
The above charts represent a 10-year hypothetical $100,000 investment in the Walden Balanced Fund and Walden Equity Fund, and includes the reinvestment of dividends and capital gains in the Funds. The returns shown on the table and the graphs do not reflect the deduction of taxes a shareholder would pay on Fund distributions or the redemption of Fund shares.
The Walden Balanced Fund is measured against a combination of equity and fixed income indices. The Walden Equity Fund is measured against the Standard & Poor’s 500 Index (“S&P 500”), which is widely regarded as a gauge of the U.S. equities market. This index includes 500 leading companies in leading industries of the U.S. economy. Although the S&P 500 focuses on the large-cap segment of the market, with approximately 75% coverage of U.S. equities, it is also also widely viewed as a proxy for the total market. The Bloomberg Barclays U.S. Government/Credit Bond Index includes Treasuries (i.e., public obligations of the U.S. Treasury that have remaining maturities of more than one year), government-related issues (i.e., agency, sovereign, supranational, and local authority debt), and USD Corporates. The Bloomberg Barclays U.S. Government/Credit Bond Index is a component of the Bloomberg Barclays U.S. Aggregate Bond Index. The FTSE 3 Month US T-Bill Index reflects monthly return equivalents of yield averages that are not marked to the market. The index is an average of the last three-month treasury bill issues. The three-month treasury bills are the short-term debt obligations of the U.S. Government. The indexes are unmanaged and their performance does not reflect the deduction of expenses associated with a mutual fund, such as investment management and fund accounting fees. The Funds’ performance reflects the deduction of fees for these services. Investors cannot invest directly in an index.
| Walden Balanced Fund | | | |
| Fund Net Asset Value: | | $ | 20.76 | |
| Gross Expense Ratio1: | | | 1.04 | % |
| | | | | |
| Walden Equity Fund | | | | |
| Fund Net Asset Value: | | $ | 26.47 | |
| Gross Expense Ratio1: | | | 1.08 | % |
Past performance does not guarantee future results. The performance data quoted represents past performance and current returns may be lower or higher. The investment return and principal value will fluctuate so that an investor’s shares, when redeemed may be worth more or less than the original cost. To obtain performance information current to the most recent month-end, please call 1-800-282-8782 ext. 7050.
| 1 | The Gross Expense Ratio is from each Fund’s most recent prospectus, dated May 1, 2019. The contractual fee limit under each Fund’s expense limitation agreement is 1.00% of each Fund’s average annual net assets, subject to certain limitations as described in each Fund’s prospectus. Please see each Fund’s most recent prospectus for details. Additional information pertaining to each Fund’s expense ratio as of December 31, 2019 can be found in the financial highlights included in this report. The investment performance may reflect fee reductions. If such fee reductions had not occurred, the quoted performance would have been lower. The contractual fee waiver continues through May 1, 2020 and may be renewed thereafter. |
Walden Midcap Fund
December 31, 2019
Stephen J. Amyouny, CFA
Lead Portfolio Manager
Belinda Cavazos, CFA
Portfolio Manager
Richard Q. Williams, CFA
Portfolio Manager
Boston Trust Walden Inc.
Fund Objective
The Fund seeks long-term capital growth through an actively managed portfolio of stocks of middle capitalization (“mid cap”) companies.
Investment Concerns
Equity securities (stocks) are more volatile and carry more risk and return potential than other forms of investments, including investments in high-grade fixed income securities.
Mid cap funds typically carry additional risks since smaller companies generally have a higher risk of failure.
Manager Commentary (Unaudited)
Management Discussion of Fund Performance
The Russell Midcap® Index rose 30.54% in 2019, a strong rebound after the prior year’s -9.06% return. The Walden Midcap Fund participated in the market’s strong rise but modestly underperformed the index with a 28.38%† total return for the year. For the trailing three- and five–year periods, the Fund is ahead of the index, with less volatility.
Our analysis of 2019 suggests there were crosscurrents impacting our performance. The higher-quality stocks we favor outperformed the index; however, our valuation discipline was a headwind, as more reasonably valued stocks underperformed for the year. At the sector level, information technology drove relative underperformance, while energy and consumer discretionary were the top relative contributors in 2019. Underperformance in information technology was driven by our underweight to semiconductors, as well as unfavorable security selection. Within energy, relative performance was aided by our underweight to the sector and positive security selection in energy equipment and services.*
Outlook
The underlying fundamentals of the U.S. economy remain solid. Furthermore, recent interest rate cuts by the U.S. Federal Reserve Board have decreased the risk of a severe domestic slowdown, and the economies of key trading partners appear to be stabilizing. There has also been progress on the trade front with the recent signing of a new trade agreement with Canada and Mexico, and positive steps towards resolution of ongoing disputes with China. The upcoming U.S. election is one area likely to generate uncertainty in 2020, and there is the obvious risk of unforeseen geopolitical events affecting markets. Our base case outlook is that fundamentals for the U.S. equity market will remain favorable, although the recent pace of strong market appreciation may be difficult to sustain.
We see multiple paths for the Walden Midcap Fund to continue to add value, including superior company fundamentals and the portfolio’s reasonable valuation profile relative to the index. We remain focused on constructing a well-diversified portfolio of higher-quality reasonably valued companies that we believe can generate greater economic returns across a full market cycle. We believe this combination of superior fundamentals and reasonable valuation relative to the index gives us confidence the Fund is well positioned for the future.
| † | The recent appreciation in the stock market has helped to produce short-term returns that are not typical and may not continue in the future. Because of ongoing market volatility, fund performance may be subject to substantial short-term changes. |
| | |
| * | Portfolio composition is subject to change. |
| InvestmentPerformance (Unaudited) | Walden Midcap Fund |
December 31, 2019
| | | For the periods ended 12/31/19 | |
| | | Average Annual Total Returns | |
| | | | | | | | | | | | Since | |
| | | | | | | | | | | | Inception | |
| | | 1 Year | | | 3 Years | | | 5 Years | | | (8/1/11) | |
| Walden Midcap Fund1 | | | 28.38 | %† | | | 13.98 | % | | | 10.58 | % | | | 11.93 | % |
| Russell Midcap® Index | | | 30.54 | % | | | 12.06 | % | | | 9.33 | % | | | 12.34 | % |
Hypothetical Growth of a $100,000 Investment
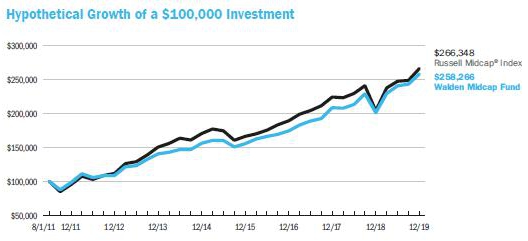
| † | The recent appreciation in the stock market has helped to produce short-term returns that are not typical and may not continue in the future. Because of ongoing market volatility, fund performance may be subject to substantial short-term changes. |
The above chart represents a hypothetical $100,000 investment in the Walden Midcap Fund from August 1, 2011 to December 31, 2019, and includes the reinvestment of dividends and capital gains in the Fund. The returns shown on the table and graph do not reflect the deduction of taxes a shareholder would pay on Fund distributions or the redemption of Fund shares.
The Walden Midcap Fund is measured against the Russell Midcap® Index, which is an unmanaged index that tracks the performance of the mid-cap segment of the U.S. equity universe. The Russell Midcap® Index is a subset of the Russell 1000® Index. It includes approximately 800 of the smallest securities based on a combination of their market capitalization and current index membership. The Russell Midcap® Index represents approximately 31% of the total market capitalization of the Russell 1000 companies. Russell Investment Group is the source and owner of the trademarks, service marks and copyrights related to the Russell Indexes. Russell® is a trademark of Russell Investment Group. The performance of an index does not reflect the deduction of expenses associated with a mutual fund, such as investment management and fund accounting fees. The Fund’s performance reflects the deduction of fees for these services. Investors cannot invest directly in an index.
| Fund Net Asset Value: | | $ | 18.71 | |
| Gross Expense Ratio1: | | | 1.00 | % |
Past performance does not guarantee future results. The performance data quoted represents past performance and current returns may be lower or higher. The investment return and principal value will fluctuate so that an investor’s shares, when redeemed may be worth more or less than the original cost. Returns less than one year are not annualized. To obtain performance information current to the most recent month-end, please call 1-800-282-8782 ext. 7050.
| 1 | The Gross Expense Ratio is from the Fund’s most recent prospectus, dated May 1, 2019. Additional information pertaining to the Fund’s expense ratio as of December 31, 2019 can be found in the financial highlights included in this report. The investment performance may reflect fee reductions. If such fee reductions had not occurred, the quoted performance would have been lower. The contractual fee waiver continues through May 1, 2020 and may be renewed thereafter. |
Walden SMID Cap Fund
December 31, 2019
Kenneth P. Scott, CFA
Lead Portfolio Manager
Belinda Cavazos, CFA
Portfolio Manager
Richard Q. Williams, CFA
Portfolio Manager
Boston Trust Walden Inc.
Fund Objective
The Fund seeks long-term capital growth through an actively managed portfolio of stocks of small and middle capitalization (“smid cap”) companies.
Investment Concerns
Equity securities (stocks) are more volatile and carry more risk and return potential than other forms of investments, including investments in high-grade fixed income securities.
Smid cap companies typically have a higher risk of failure and historically have experienced a greater degree of volatility.
Manager Commentary (Unaudited)
Management Discussion of Fund Performance
For the full year, the Russell 2500™ Index returned 27.77%, a strong rebound from 2018’s -10.00% decline. The Walden SMID Cap Fund returned 26.12%†, modestly trailing the index. The Fund has outperformed the index for the trailing three- and five-year periods, with less risk.
Higher-quality stocks generally performed in line with the index for the year, which explains the Fund’s ability to participate in the strong market. Relative performance was most favorable in the financials sector, due to the Fund’s overweight to and performance of its capital markets stocks. Information technology was the leading detractor from relative results for the year due to a combination of style headwinds and unfavorable security selection.*
Outlook
The underlying fundamentals of the U.S. economy remain solid. Furthermore, recent interest rate cuts by the U.S. Federal Reserve Board have decreased the risk of a severe domestic slowdown, and the economies of key trading partners appear to be stabilizing. There has also been progress on the trade front with the recent signing of a new trade agreement with Canada and Mexico, and positive steps towards resolution of ongoing disputes with China. The upcoming U.S. election is one area likely to generate uncertainty in 2020, and there is the ongoing risk of unforeseen geopolitical events affecting markets. Our base case outlook is that fundamentals for the U.S. equity market will remain favorable, although the recent pace of strong market appreciation may be difficult to sustain, especially given the earnings growth deceleration we observed throughout 2019. We see multiple paths for the Walden SMID Cap Fund to continue to add value, including superior company fundamentals and the Fund’s valuation discount to the index. We remain focused on constructing a well-diversified Fund of higher-quality reasonably valued companies that we believe can generate superior economic returns across a full market cycle. Compared to the index, the Fund is invested in companies with higher and more stable returns on invested capital, stronger balance sheets, and sustainable growth. Despite this higher quality financial profile, valuation for the Fund currently stands at an average operating price/earnings ratio (P/E ratio)1 of 22x, a discount to the Russell 2500™ operating P/E of 32x. We believe the combination of superior fundamentals and more reasonable valuation relative to the index provides confidence that the Fund is well positioned for the future.
| † | The recent appreciation in the stock market has helped to produce short-term returns that are not typical and may not continue in the future. Because of ongoing market volatility, fund performance may be subject to substantial short-term changes. |
| | |
| * | Portfolio composition is subject to change. |
| | |
| 1 | The price-to-earnings ratio (P/E Ratio) is a valuation ratio of a company’s current share price to its per-share earnings. |
| InvestmentPerformance (Unaudited) | Walden SMID Cap Fund |
December 31, 2019
| | | For the periods ended 12/31/19 | |
| | | Average Annual Total Returns | |
| | | | | | | | | | | | Since | |
| | | | | | | | | | | | Inception | |
| | | 1 Year | | | 3 Years | | | 5 Years | | | (6/28/12) | |
| Walden SMID Cap Fund1 | | | 26.12 | %† | | | 11.67 | % | | | 10.28 | % | | | 12.57 | % |
| Russell 2500™ Index | | | 27.77 | % | | | 10.33 | % | | | 8.93 | % | | | 13.07 | % |
Hypothetical Growth of a $100,000 Investment

| † | The recent appreciation in the stock market has helped to produce short-term returns that are not typical and may not continue in the future. Because of ongoing market volatility, fund performance may be subject to substantial short-term changes. |
The above chart represents a hypothetical $100,000 investment in the Walden SMID Cap Fund from June 28, 2012 to December 31, 2019, and includes the reinvestment of dividends and capital gains in the Fund. The returns shown on the table and the graph do not reflect the deduction of taxes a shareholder would pay on Fund distributions or the redemption of Fund shares.
The Walden SMID Cap Fund is measured against the Russell 2500™ Index, which is an unmanaged index that tracks the performance of the small- to mid-cap segment of the U.S. equity universe, commonly referred to as “smid” cap. The Russell 2500™ is a subset of the Russell 3000® Index. It includes approximately 2500 of the smallest securities based on a combination of their market cap and current index membership. Russell Investment Group is the source and owner of the trademarks, service marks and copyrights related to the Russell Indexes. Russell® is a trademark of Russell Investment Group. The performance of an index does not reflect the deduction of expenses associated with a mutual fund, such as investment management and fund accounting fees. The Fund’s performance reflects the deduction of fees for these services. Investors cannot invest directly in an index.
| Fund Net Asset Value: | | $ | 18.10 | |
| Gross Expense Ratio1: | | | 1.08 | % |
Past performance does not guarantee future results. The performance data quoted represents past performance and current returns may be lower or higher. The investment return and principal value will fluctuate so that an investor’s shares, when redeemed may be worth more or less than the original cost. To obtain performance information current to the most recent month-end, please call 1-800-282-8782 ext. 7050.
| 1 | The Gross Expense Ratio is from the Fund’s most recent prospectus, dated May 1, 2019. The contractual fee limit under the Fund’s expense limitation agreement is 1.00% of the Fund’s average annual net assets, subject to certain limitations as described in the Fund’s prospectus. Please see the Fund’s most recent prospectus for details. Additional information pertaining to the Fund’s expense ratio as of December 31, 2019 can be found in the financial highlights included in this report. The investment performance may reflect fee reductions. If such fee reductions had not occurred, the quoted performance would have been lower. The contractual fee waiver continues through May 1, 2020 and may be renewed thereafter. |
Walden Small Cap Fund
December 31, 2019
Kenneth P. Scott, CFA
Lead Portfolio Manager
Belinda Cavazos, CFA
Portfolio Manager
Richard Q. Williams, CFA
Portfolio Manager
Boston Trust Walden Inc.
Fund Objective
The Fund seeks long-term capital growth through an actively managed portfolio of stocks of small capitalization (“small cap”) companies.
Investment Concerns
Equity securities (stocks) are more volatile and carry more risk and return potential than other forms of investments, including investments in high-grade fixed income securities.
Small cap funds typically carry additional risks since smaller companies generally have a higher risk of failure, and historically, their stocks have experienced a greater degree of market volatility than stocks on average.
Manager Commentary (Unaudited)
Management Discussion of Fund Performance
For the full year, the Russell 2000® Index returned 25.52%, a strong rebound from 2018’s -11.01% decline. Despite the Fund’s underperformance in the fourth quarter, the 29.15%†total return for the Walden Small Cap Fund outperformed the index by a wide margin in 2019. The Fund has also outperformed the index for the trailing three-, and five-year periods, with less risk.
The strong relative performance in 2019 was driven primarily by favorable stock selection, as higher-quality stocks lagged the index. Relative performance was favorable across most sectors and only stocks in the consumer discretionary, consumer staples and utilities sectors detracted from results. The headwind to quality was particularly evident in consumer discretionary and utilities, while unfavorable stock selection led to underperformance within consumer staples.*
Outlook
The underlying fundamentals of the U.S. economy remain solid. Furthermore, recent interest rate cuts by the U.S. Federal Reserve Board have decreased the risk of a severe domestic slowdown, and the economies of key trading partners appear to be stabilizing. There has also been progress on the trade front with the recent signing of a new trade agreement with Canada and Mexico, and positive steps towards resolution of ongoing disputes with China. The upcoming U.S. election is one area likely to generate uncertainty in 2020, and there is the ongoing risk of unforeseen geopolitical events affecting markets. Our base case outlook is that fundamentals for the U.S. equity market will remain favorable, although the recent pace of strong market appreciation may be difficult to sustain, especially given the earnings growth deceleration we observed throughout 2019.
We see multiple paths for the Walden Small Cap Fund to continue to add value, including superior company fundamentals and the Fund’s valuation discount to the index. We remain focused on constructing a well-diversified portfolio of higher-quality reasonably valued companies that we believe can generate greater economic returns across a full market cycle. Compared to the index, the Fund is invested in companies with higher and more stable returns on invested capital, stronger balance sheets, and sustainable growth. Despite this higher quality financial profile, valuation for the Fund currently stands at an average operating price/earnings ratio (P/E ratio)1 of 24x, half the Russell 2000® operating P/E of 48x. We believe the combination of superior fundamentals and more reasonable valuation relative to the index provides confidence that the Fund is well positioned for the future.
| † | The recent appreciation in the stock market has helped to produce short-term returns that are not typical and may not continue in the future. Because of ongoing market volatility, fund performance may be subject to substantial short-term changes. |
| | |
| * | Portfolio composition is subject to change. |
| | |
| 1 | The price-to-earnings ratio (P/E Ratio) is a valuation ratio of a company’s current share price to its per-share earnings. |
| Investment Performance (Unaudited) | Walden Small Cap Fund December 31, 2019 |
| | | For the periods ended 12/31/19 | |
| | | Average Annual Total Returns | |
| | | | | | | | | | | | | | | Since | |
| | | | | | | | | | | | | | | Inception | |
| | | 1 Year | | | 3 Years | | | 5 Years | | | 10 Years | | | (10/24/08) | |
| Walden Small Cap Fund1 | | | 29.15 | %† | | | 10.60 | % | | | 10.03 | % | | | 11.48 | % | | | 13.46 | % |
| Russell 2000® Index | | | 25.52 | % | | | 8.59 | % | | | 8.23 | % | | | 11.83 | % | | | 13.55 | % |
Hypothetical Growth of a $100,000 Investment
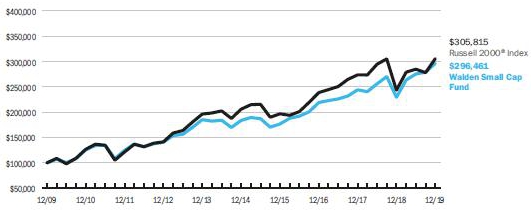
| † | The recent appreciation in the stock market has helped to produce short-term returns that are not typical and may not continue in the future. Because of ongoing market volatility, fund performance may be subject to substantial short-term changes. |
The above chart represents a 10-year hypothetical $100,000 investment in the Walden Small Cap Fund and includes the reinvestment of dividends and capital gains in the Fund. The returns shown on the table and graph do not reflect the deduction of taxes a shareholder would pay on Fund distributions or the redemption of Fund shares.
The Walden Small Cap Fund is measured against the Russell 2000® Index, which is an unmanaged index that tracks the performance of the small-cap segment of the U.S. equity universe. The Russell 2000® Index is a subset of the Russell 3000® Index representing approximately 10% of the total market capitalization of that index. It includes approximately 2,000 of the smallest securities based on a combination of their market cap and current index membership. Russell Investment Group is the source and owner of the trademarks, service marks and copyrights related to the Russell Indexes. Russell® is a trademark of Russell Investment Group. The performance of an index does not reflect the deduction of expenses associated with a mutual fund, such as investment management and fund accounting fees. The Fund’s performance reflects the deduction of fees for these services. Investors cannot invest directly in an index.
| Fund Net Asset Value: | | $ | 21.18 | |
| Gross Expense Ratio1: | | | 1.05 | % |
Past performance does not guarantee future results. The performance data quoted represents past performance and current returns may be lower or higher. The investment return and principal value will fluctuate so that an investor’s shares, when redeemed may be worth more or less than the original cost. To obtain performance information current to the most recent month-end, please call 1-800-282-8782 ext. 7050.
| 1 | The Gross Expense Ratio is from the Fund’s most recent prospectus, dated May 1, 2019. The contractual fee limit under the Fund’s expense limitation agreement is 1.00% of the Fund’s average annual net assets, subject to certain limitations as described in the Fund’s prospectus. Please see the Fund’s most recent prospectus for details. Additional information pertaining to the Fund’s expense ratio as of December 31, 2019 can be found in the financial highlights included in this report. The investment performance may reflect fee reductions. If such fee reductions had not occurred, the quoted performance would have been lower. The contractual fee waiver continues through May 1, 2020 and may be renewed thereafter. |
Walden International Equity Fund
December 31, 2019
William H. Apfel, CFA
Lead Portfolio Manager
Nathaniel J. Riley, CFA
Portfolio Manager
David A. Sandell, CFA
Portfolio Manager
Boston Trust Walden Inc.
Fund Objective
The Fund seeks long-term capital growth through an actively managed portfolio of equities of international companies.
Investment Concerns
Foreign investing involves risks not typically associated with U.S. investments, including adverse political, regulatory, social and economic developments and differing auditing and legal standards. These risks are magnified in emerging markets.
Equity securities (stocks) are more volatile and carry more risk and return potential than other forms of investments, including investments in high-grade fixed income securities.
Mid-capitalization funds typically carry additional risks since smaller companies generally have a higher risk of failure.
The net asset value per share of these Funds will fluctuate as the value of the securities in the portfolio changes.
Cash equivalents offer low risk and low return potential.
Manager Commentary (Unaudited)
Management Discussion of Fund Performance
For the 12-month period ended December 31, 2019, the Walden International Equity Fund posted a total return of 20.62%†. The Fund’s return trailed that of its primary benchmark, the MSCI World ex-USA Index (net), which posted a return of 22.49% for the year.
Every country represented in the MSCI World ex-USA Index achieved a positive return for 2019. Global markets bounced back quickly in the first quarter of 2019, after swooning through the fourth quarter of 2019, and provided further gains later in the year as the economic picture proved better than expected. Global growth slowed slightly, and economic indicators such as the Purchasing Managers’ Index1 did generally decline through the year, but most developed countries did not fare as poorly as feared at the end of 2018. Global central banks continued to provide liquidity, supporting economic activity and asset prices. Global trade disruptions stemming from the Trump administration’s policies have eased somewhat, affecting international developed markets both directly and indirectly: The USMCA1 agreement appears likely to be ratified as the successor to NAFTA1, and the U.S. and China have agreed to reduce bilateral tariffs and address certain trade concerns, though tariffs have escalated between the U.S. and Europe.
During the year our quality style roughly kept pace with the benchmark, which is somewhat unusual during strong up markets. Our underperformance can be attributed in part to our avoidance of industries and companies with superficially strong financial characteristics, but which carry higher-than-average business model risk. Semiconductors are one such industry, and were the greatest detractor to our relative performance as it rallied strongly in 2019.*
| † | The recent appreciation in the stock market has helped to produce short-term returns that are not typical and may not continue in the future. Because of ongoing market volatility, fund performance may be subject to substantial short-term changes. |
| 1 | Purchasing Managers’ Index (PMI) is an indicator of the economic health of the manufacturing sector. The PMI is based on five major indicators: new orders, inventory levels, production, supplier deliveries, and the employment environment. The United States-Mexico-Canada Agreement, or “USMCA,” will replace the current North America Free Trade Agreement “NAFTA,” which governs trade in North America. The trade agreement has been negotiated by the governments of The United States, Mexico, and Canada, but still must be ratified be certain groups within these governments. |
| * | Portfolio composition is subject to change. |
| Investment Performance (Unaudited) | Walden International |
| | Equity Fund |
| | December 31, 2019 |
| |
| | | For the periods ended 12/31/19 | |
| | | Average Annual Total Returns | |
| | | | | | | | | Since | |
| | | | | | | | | Inception | |
| | | 1 Year | | | 3 Years | | | (6/9/15) | |
| Walden International Equity Fund1 | | | 20.62 | %† | | | 9.12 | % | | | 4.84 | % |
| MSCI World ex-USA Index (net) | | | 22.49 | % | | | 9.34 | % | | | 4.76 | % |
Hypothetical Growth of a $1,000,000 Investment

| † | The recent appreciation in the stock market has helped to produce short-term returns that are not typical and may not continue in the future. Because of ongoing market volatility, fund performance may be subject to substantial short-term changes. |
The above chart represents a hypothetical $1,000,000 investment in the Walden International Equity Fund from June 9, 2015 to December 31, 2019, and includes the reinvestment of dividends and capital gains in the Fund. The returns shown on the table and the graph do not reflect the deduction of taxes a shareholder would pay on Fund distributions or the redemption of Fund shares.
The Walden International Equity Fund is measured against the MSCI World ex-USA Index. The MSCI World ex-USA Index captures large- and mid-cap representation of developed markets countries, excluding the United States. This index is unmanaged and the performance of an index does not reflect the deduction of expenses associated with a mutual fund, such as investment management and fund accounting fees. The Fund’s performance reflects the deduction of fees for these services. Investors cannot invest directly in an index.
| Fund Net Asset Value: | | $ | 11.60 | |
| Gross Expense Ratio1: | | | 1.17 | % |
Past performance does not guarantee future results. The performance data quoted represents past performance and current returns may be lower or higher. The investment return and principal value will fluctuate so that an investor’s shares, when redeemed may be worth more or less than the original cost. To obtain performance information current to the most recent month-end, please call 1-800-282-8782 ext. 7050.
| 1 | The Gross Expense Ratio is from the Fund’s most recent prospectus, dated May 1, 2019. The contractual fee limit under the Fund’s expense limitation agreement is 1.10% of the Fund’s average annual net assets, subject to certain limitations as described in the Fund’s prospectus. Please see the Fund’s most recent prospectus for details. Additional information pertaining to the Fund’s expense ratio as of December 31, 2019 can be found in the financial highlights included in this report. The investment performance may reflect fee reductions. If such fee reductions had not occurred, the quoted performance would have been lower. The contractual fee waiver continues through May 1, 2020 and may be renewed thereafter. |
| Schedule of Portfolio Investments | Walden Balanced Fund |
December 31, 2019
| Security Description | | Shares | | | Fair Value ($) | |
| Common Stocks (73.9%) | | | | | | | | |
| Communication Services (6.2%) | | | | | | | | |
| Alphabet, Inc., Class A (a) | | | 1,000 | | | | 1,339,390 | |
| Alphabet, Inc., Class C (a) | | | 2,800 | | | | 3,743,656 | |
| Charter Communications, Inc., Class A (a) | | | 2,445 | | | | 1,186,021 | |
| Comcast Corp., Class A | | | 33,000 | | | | 1,484,010 | |
| Omnicom Group, Inc. | | | 13,000 | | | | 1,053,260 | |
| Verizon Communications, Inc. | | | 16,000 | | | | 982,400 | |
| | | | | | | | 9,788,737 | |
| Consumer Discretionary (5.9%) | | | | | | | | |
| Advance Auto Parts, Inc. | | | 2,500 | | | | 400,400 | |
| Autoliv, Inc. | | | 3,000 | | | | 253,230 | |
| Booking Holdings, Inc. (a) | | | 475 | | | | 975,522 | |
| Dollar General Corp. | | | 10,000 | | | | 1,559,800 | |
| McDonald’s Corp. | | | 2,000 | | | | 395,220 | |
| NIKE, Inc., Class B | | | 18,000 | | | | 1,823,580 | |
| Ross Stores, Inc. | | | 14,500 | | | | 1,688,090 | |
| Starbucks Corp. | | | 19,500 | | | | 1,714,440 | |
| The Home Depot, Inc. | | | 2,000 | | | | 436,760 | |
| | | | | | | | 9,247,042 | |
| Consumer Staples (7.5%) | | | | | | | | |
| Church & Dwight Co., Inc. | | | 13,000 | | | | 914,420 | |
| Colgate-Palmolive Co. | | | 16,000 | | | | 1,101,440 | |
| Costco Wholesale Corp. | | | 8,600 | | | | 2,527,712 | |
| Estee Lauder Cos., Inc., Class A | | | 7,000 | | | | 1,445,780 | |
| PepsiCo, Inc. | | | 14,500 | | | | 1,981,715 | |
| Sysco Corp. | | | 17,000 | | | | 1,454,180 | |
| The Clorox Co. | | | 8,000 | | | | 1,228,320 | |
| The Hershey Co. | | | 8,000 | | | | 1,175,840 | |
| | | | | | | | 11,829,407 | |
| Energy (1.9%) | | | | | | | | |
| Apache Corp. | | | 24,000 | | | | 614,160 | |
| ConocoPhillips | | | 37,000 | | | | 2,406,110 | |
| | | | | | | | 3,020,270 | |
| Financials (12.2%) | | | | | | | | |
| American Express Co. | | | 11,000 | | | | 1,369,390 | |
| Cincinnati Financial Corp. | | | 15,000 | | | | 1,577,250 | |
| Comerica, Inc. | | | 9,000 | | | | 645,750 | |
| Commerce Bancshares, Inc. | | | 14,585 | | | | 990,905 | |
| Discover Financial Services | | | 14,000 | | | | 1,187,480 | |
| JPMorgan Chase & Co. | | | 22,000 | | | | 3,066,800 | |
| M&T Bank Corp. | | | 4,000 | | | | 679,000 | |
| Northern Trust Corp. | | | 15,000 | | | | 1,593,600 | |
| PNC Financial Services Group, Inc. | | | 11,500 | | | | 1,835,745 | |
| State Street Corp. | | | 14,500 | | | | 1,146,950 | |
| T. Rowe Price Group, Inc. | | | 10,000 | | | | 1,218,400 | |
| Truist Financial Corp. | | | 36,000 | | | | 2,027,520 | |
| U.S. Bancorp | | | 31,500 | | | | 1,867,635 | |
| | | | | | | | 19,206,425 | |
| Health Care (11.6%) | | | | | | | | |
| Becton, Dickinson & Co. | | | 9,600 | | | | 2,610,912 | |
| Danaher Corp. | | | 11,000 | | | | 1,688,280 | |
| Henry Schein, Inc. (a) | | | 16,000 | | | | 1,067,520 | |
| Johnson & Johnson, Inc. | | | 13,000 | | | | 1,896,310 | |
| Medtronic PLC | | | 11,500 | | | | 1,304,675 | |
| Merck & Co., Inc. | | | 17,600 | | | | 1,600,720 | |
| Mettler-Toledo International, Inc. (a) | | | 1,700 | | | | 1,348,576 | |
| Stryker Corp. | | | 8,500 | | | | 1,784,490 | |
| UnitedHealth Group, Inc. | | | 9,000 | | | | 2,645,820 | |
| Varian Medical Systems, Inc. (a) | | | 7,000 | | | | 994,070 | |
| Waters Corp. (a) | | | 5,800 | | | | 1,355,170 | |
| | | | | | | | 18,296,543 | |
| | | Shares or
Principal | | | | |
| | | Amount ($) | | | | |
| Industrials (8.5%) | | | | | | | | |
| 3M Co. | | | 9,000 | | | | 1,587,780 | |
| Cummins, Inc. | | | 5,000 | | | | 894,800 | |
| Deere & Co. | | | 6,000 | | | | 1,039,560 | |
| Donaldson Co., Inc. | | | 20,000 | | | | 1,152,400 | |
| Emerson Electric Co. | | | 11,000 | | | | 838,860 | |
| Hubbell, Inc. | | | 8,500 | | | | 1,256,470 | |
| Illinois Tool Works, Inc. | | | 8,000 | | | | 1,437,040 | |
| Lincoln Electric Holdings, Inc. | | | 7,000 | | | | 677,110 | |
| Union Pacific Corp. | | | 12,500 | | | | 2,259,875 | |
| United Parcel Service, Inc., Class B | | | 10,500 | | | | 1,229,130 | |
| W.W. Grainger, Inc. | | | 3,000 | | | | 1,015,560 | |
| | | | | | | | 13,388,585 | |
| Information Technology (15.6%) | | | | | | | | |
| Accenture PLC, Class A | | | 13,000 | | | | 2,737,410 | |
| Apple, Inc. | | | 21,500 | | | | 6,313,475 | |
| Automatic Data Processing, Inc. | | | 13,000 | | | | 2,216,500 | |
| Cisco Systems, Inc. | | | 30,000 | | | | 1,438,800 | |
| Microsoft Corp. | | | 37,000 | | | | 5,834,899 | |
| Oracle Corp. | | | 42,500 | | | | 2,251,650 | |
| TE Connectivity Ltd. | | | 10,000 | | | | 958,400 | |
| Visa, Inc., Class A | | | 15,000 | | | | 2,818,500 | |
| | | | | | | | 24,569,634 | |
| Materials (2.5%) | | | | | | |
| Air Products & Chemicals, Inc. | | | 5,000 | | | | 1,174,950 | |
| AptarGroup, Inc. | | | 12,500 | | | | 1,445,250 | |
| PPG Industries, Inc. | | | 10,000 | | | | 1,334,900 | |
| | | | | | | | 3,955,100 | |
| Utilities (2.0%) | | | | | | | | |
| Consolidated Edison, Inc. | | | 15,500 | | | | 1,402,285 | |
| Eversource Energy | | | 21,000 | | | | 1,786,470 | |
| | | | | | | | 3,188,755 | |
| | | | | | | | | |
| TOTAL COMMON STOCKS (Cost $55,698,642) | | | | | | | 116,490,498 | |
| | | | | | | | | |
| Certificate of Deposit (0.1%) | | | | | | | | |
| | | | | | | | | |
| Certificate of Deposit (0.1%) | | | | | | | | |
| Self-Help Federal Credit Union, 1.90%,12/20/21 (b) | | | 200,000 | | | | 200,796 | |
| | | | | | | | | |
| TOTAL CERTIFICATE OF DEPOSIT (Cost $200,000) | | | | | | | 200,796 | |
| | | | | | | | | |
| Corporate Bonds (2.7%) | | | | | | | | |
| | | | | | | | | |
| Consumer Discretionary (0.2%) | | | | | | | | |
| Starbucks Corp., 2.45%, 6/15/26, Callable 3/15/26 @ 100 | | | 350,000 | | | | 355,326 | |
| | | | | | | | | |
| Financials (0.8%) | | | | | | | | |
| American Express Co., 2.65%, 12/2/22 | | | 287,000 | | | | 292,707 | |
| John Deere Capital Corp., 2.80%, 7/18/29 | | | 350,000 | | | | 359,765 | |
| KFW, 1.88%, 11/30/20 | | | 250,000 | | | | 250,367 | |
| North American Development Bank, 4.38%,2/11/20 | | | 100,000 | | | | 100,281 | |
| The Toronto-Dominion Bank, 3.50%, 7/19/23,MTN | | | 350,000 | | | | 368,636 | |
| | | | | | | | 1,371,756 | |
See Notes to Financial Statements
| Schedule of Portfolio Investments (Cont.) | | Walden Balanced Fund |
December 31, 2019
Corporate Bonds, Continued
| | | Shares or | | | | |
| | | Principal | | | | |
| Security Description | | Amount ($) | | | Fair Value ($) | |
| Health Care (0.3%) | | | | | | | | |
| Abbott Laboratories, 2.95%, 3/15/25, Callable 12/15/24 @ 100 | | | 100,000 | | | | 104,158 | |
| Kaiser Foundation Hospitals, 3.15%, 5/1/27, Callable 2/1/27 @ 100 | | | 250,000 | | | | 261,374 | |
| Merck & Co., Inc., 3.88%, 1/15/21, Callable 10/15/20 @ 100 | | | 150,000 | | | | 152,862 | |
| | | | | | | | 518,394 | |
| Industrials (0.4%) | | | | | | | | |
| Emerson Electric Co., 2.63%, 2/15/23, Callable 11/15/22 @ 100 | | | 200,000 | | | | 205,388 | |
| Hubbell, Inc., 3.35%, 3/1/26, Callable 12/1/25 @ 100 | | | 145,000 | | | | 148,304 | |
| Hubbell, Inc., 3.50%, 2/15/28, Callable 11/15/27 @ 100 | | | 150,000 | | | | 154,296 | |
| Hubbell, Inc., 3.63%, 11/15/22 | | | 75,000 | | | | 77,935 | |
| | | | | | | | 585,923 | |
| Information Technology (0.9%) | | | | | | | | |
| Apple, Inc., 2.20%, 9/11/29, Callable 6/11/29 @ 100 | | | 350,000 | | | | 343,876 | |
| Apple, Inc., 2.85%, 2/23/23, Callable 12/23/22 @ 100 | | | 150,000 | | | | 154,378 | |
| Apple, Inc., 3.00%, 6/20/27, Callable 3/20/27 @ 100 | | | 200,000 | | | | 209,834 | |
| Oracle Corp., 3.40%, 7/8/24, Callable 4/8/24 @ 100 | | | 300,000 | | | | 316,894 | |
| Visa, Inc., 3.15%, 12/14/25, Callable 9/14/25 @ 100 | | | 275,000 | | | | 290,960 | |
| | | | | | | | 1,315,942 | |
| Utilities (0.1%) | | | | | | | | |
| Midamerican Energy Co., 3.10%, 5/1/27, Callable 2/1/27 @ 100 | | | 200,000 | | | | 208,743 | |
| | | | | | | | | |
| TOTAL CORPORATE BONDS (Cost $4,227,207) | | | | | | | 4,356,084 | |
| | | | | | | | | |
| Municipal Bonds (2.0%) | | | | | | | | |
| | | | | | | | | |
| Massachusetts (1.7%): | | | | | | | | |
| Commonwealth of Massachusetts, GO, Series D, 3.00%, 5/1/35, Callable 5/1/29 @ 100 (b) | | | 1,150,000 | | | | 1,209,352 | |
| Commonwealth of Massachusetts, GO, Series D, 3.00%, 5/1/36, Callable 5/1/29 @ 100 (b) | | | 1,500,000 | | | | 1,565,955 | |
| | | | | | | | 2,775,307 | |
| New York (0.1%): | | | | | | | | |
| New York State Environmental Facilities Corp., Series C, 1.89%, 7/15/22 | | | 190,000 | | | | 190,200 | |
| | | | | | | | | |
| Wisconsin (0.2%): | | | | | | | | |
| Wisconsin State, Build America Bonds, GO, 4.60%, 5/1/26, Callable 5/1/21 @ 100 | | | 250,000 | | | | 258,072 | |
| | | | | | | | | |
| TOTAL MUNICIPAL BONDS (Cost $3,180,225) | | | | | | | 3,223,579 | |
| | | | | | | | | |
| U.S. Government & U.S. Government Agency Obligations (19.5%) | | | | | | |
| | | | | | | |
| Federal Farm Credit Bank (0.9%) | | | | | | |
| 2.60%, 10/6/22 | | | 250,000 | | | | 256,729 | |
| 2.75%, 7/16/27 | | | 250,000 | | | | 262,966 | |
| 2.85%, 3/2/28 | | | 750,000 | | | | 795,289 | |
| | | | | | | | 1,314,984 | |
| Federal Home Loan Bank (4.0%) | | | | | | | | |
| 2.13%, 3/10/23 | | | 1,000,000 | | | | 1,017,243 | |
| 2.50%, 3/11/22 | | | 200,000 | | | | 203,798 | |
| 2.88%, 6/14/24 | | | 1,000,000 | | | | 1,050,393 | |
| 2.88%, 9/13/24 | | | 1,000,000 | | | | 1,052,793 | |
| 3.25%, 6/9/23 | | | 850,000 | | | | 895,882 | |
| 5.25%, 8/15/22 | | | 1,000,000 | | | | 1,092,675 | |
| 5.50%, 7/15/36 | | | 700,000 | | | | 985,134 | |
| | | | | | | | 6,297,918 | |
| Federal National Mortgage Association (3.5%) | | | | | | | | |
| 1.88%, 9/24/26 | | | 1,000,000 | | | | 998,838 | |
| 2.13%, 4/24/26 | | | 1,250,000 | | | | 1,269,666 | |
| 2.63%, 9/6/24 | | | 3,250,000 | | | | 3,384,958 | |
| | | | | | | | 5,653,462 | |
| Government National Mortgage Association (0.1%) | | | | | | | | |
| 4.00%, 9/15/40 | | | 29,305 | | | | 31,213 | |
| 4.00%, 9/15/41 | | | 131,000 | | | | 139,483 | |
| 6.50%, 5/15/32 | | | 3,502 | | | | 3,864 | |
| | | | | | | | 174,560 | |
| Housing & Urban Development (0.3%) | | | | | | | | |
| 2.70%, 8/1/22 | | | 491,000 | | | | 497,159 | |
| | | | | | | | | |
| U.S. Treasury Inflation Index Note (1.2%) | | | | | | | | |
| 0.25%, 7/15/29 | | | 1,005,990 | | | | 1,016,192 | |
| 0.50%, 1/15/28 | | | 521,610 | | | | 535,288 | |
| 0.75%, 7/15/28 | | | 512,570 | | | | 539,443 | |
| | | | | | | | 2,090,923 | |
| | | | | | | | | |
| U.S. Treasury Note (9.5%) | | | | | | | | |
| 1.63%, 8/15/29 | | | 5,000,000 | | | | 4,875,782 | |
| 1.88%, 1/31/22 | | | 250,000 | | | | 251,519 | |
| 2.50%, 2/28/26 | | | 750,000 | | | | 781,758 | |
| 2.63%, 12/31/23 | | | 1,000,000 | | | | 1,037,500 | |
| 2.75%, 8/31/23 | | | 1,500,000 | | | | 1,558,975 | |
| 2.75%, 11/15/23 | | | 1,500,000 | | | | 1,561,611 | |
| 2.75%, 2/28/25 | | | 3,500,000 | | | | 3,681,699 | |
| 2.88%, 9/30/23 | | | 1,000,000 | | | | 1,044,629 | |
| | | | | | | | 14,793,473 | |
| TOTAL U.S. GOVERNMENT & U.S. GOVERNMENT AGENCY OBLIGATIONS (Cost $29,910,410) | | | | | | | 30,822,479 | |
| | | | | | | | | |
| Investment Companies (1.6%) | | | | | | | | |
| | | | | | | | | |
| JPMorgan U.S. Government Money Market Fund, Capital Shares, 1.49% (c) | | | 2,521,206 | | | | 2,521,206 | |
| TOTAL INVESTMENT COMPANIES (Cost $2,521,206) | | | | | | | 2,521,206 | |
| | | | | | | | | |
| Total Investments (Cost $95,737,690) — 99.8%(d) | | | | | | | 157,614,642 | |
| Other assets in excess of liabilities — 0.2% | | | | | | | 277,222 | |
| NET ASSETS — 100.0% | | | | | | $ | 157,891,864 | |
| (a) | Non-income producing security. |
| (b) | These securities have been deemed illiquid and represent 1.88% of the Fund’s net assets. |
| (c) | Rate disclosed is the seven day yield as of December 31, 2019. |
| (d) | See Federal Tax Information listed in the Notes to the Financial Statements. |
| PLC | Public Limited Company |
See Notes to Financial Statements
| Financial Statements | | Walden Balanced Fund |
| Statement of Assets and Liabilities | | | |
| December 31, 2019 | | | |
| | | | |
| Assets: | | | | |
| Investments, at fair value (cost $95,737,690) | | $ | 157,614,642 | |
| Interest and dividends receivable | | | 399,520 | |
| Receivable for capital shares issued | | | 47,883 | |
| Prepaid expenses | | | 14,808 | |
| Total Assets | | | 158,076,853 | |
| Liabilities: | | | | |
| Payable for capital shares redeemed | | | 49,324 | |
| Accrued expenses and other liabilities: | | | | |
| Investment adviser | | | 95,958 | |
| Administration and accounting | | | 3,594 | |
| Custodian | | | 1,497 | |
| Shareholder servicing fees | | | 12,188 | |
| Transfer agent | | | 4,697 | |
| Trustee | | | 163 | |
| Other | | | 17,568 | |
| Total Liabilities | | | 184,989 | |
| Net Assets | | $ | 157,891,864 | |
| Composition of Net Assets: | | | | |
| Paid in capital | | $ | 95,628,835 | |
| Total distributable earnings/(loss) | | | 62,263,029 | |
| Net Assets | | $ | 157,891,864 | |
| Shares outstanding (par value $0.01, unlimited number of shares authorized) | | | 7,607,176 | |
| Net Asset Value, Offering Price and Redemption price per share | | $ | 20.76 | |
| Statement of Operations | | | |
| For the year ended December 31, 2019 | | | |
| | | | |
| Investment Income: | | | | |
| Interest | | $ | 962,930 | |
| Dividends | | | 1,926,920 | |
| Total Investment Income | | | 2,889,850 | |
| Expenses: | | | | |
| Investment adviser | | | 1,076,334 | |
| Administration and accounting | | | 101,094 | |
| Chief compliance officer | | | 12,050 | |
| Custodian | | | 19,704 | |
| Shareholder servicing | | | 143,035 | |
| Transfer agency | | | 38,087 | |
| Trustee | | | 9,139 | |
| Other | | | 71,426 | |
| Total expenses before fee reductions | | | 1,470,869 | |
| Fees contractually reduced by the investment adviser | | | (34,853 | ) |
| Net Expenses | | | 1,436,016 | |
| Net Investment Income | | | 1,453,834 | |
| Net Realized/Unrealized Gains (Losses) from Investments: | | | |
| Net realized gains from investment transactions | | | 1,420,529 | |
| Change in unrealized appreciation/depreciation from investments | | | 27,075,874 | |
| Net realized/unrealized gains (losses) from investments | | | 28,496,403 | |
| Change in Net Assets Resulting from Operations | | $ | 29,950,237 | |
See Notes to Financial Statements
| Financial Statements | Walden Balanced Fund |
| | |
Statements of Changes in Net Assets
| | | For the year ended | | | For the year ended | |
| | | December 31, 2019 | | | December 31, 2018 | |
| Investment Activities: | | | | | | | | |
| Operations: | | | | | | | | |
| Net investment income | | $ | 1,453,834 | | | $ | 1,287,659 | |
| Net realized gains from investment transactions | | | 1,420,529 | | | | 1,472,942 | |
| Change in unrealized appreciation/depreciation from investments | | | 27,075,874 | | | | (4,974,428 | ) |
| Change in Net Assets Resulting from Operations | | | 29,950,237 | | | | (2,213,827 | ) |
| Distributions to shareholders: | | | | | | | | |
| Total Distributions | | | (2,514,243 | ) | | | (2,600,816 | ) |
| Change in Net Assets Resulting from distributions to shareholders | | | (2,514,243 | ) | | | (2,600,816 | ) |
| Capital Share Transactions: | | | | | | | | |
| Proceeds from shares issued | | | 17,881,885 | | | | 15,978,645 | |
| Dividends reinvested | | | 2,015,907 | | | | 2,139,780 | |
| Cost of shares redeemed | | | (13,937,371 | ) | | | (10,164,112 | ) |
| Change in Net Assets Resulting from Capital Share Transactions | | | 5,960,421 | | | | 7,954,313 | |
| Change in Net Assets | | | 33,396,415 | | | | 3,139,670 | |
| Net Assets: | | | | | | | | |
| Beginning of period | | | 124,495,449 | | | | 121,355,779 | |
| End of period | | $ | 157,891,864 | | | $ | 124,495,449 | |
| Share Transactions: | | | | | | | | |
| Issued | | | 943,180 | | | | 900,825 | |
| Reinvested | | | 99,208 | | | | 121,371 | |
| Redeemed | | | (732,434 | ) | | | (559,444 | ) |
| Change in shares | | | 309,954 | | | | 462,752 | |
See Notes to Financial Statements
| Financial Statements | | Walden Balanced Fund |
Financial Highlights
Selected data for a share outstanding throughout the periods indicated.
| | | | | | | | | | | | For the nine | | | | | | | |
| | | For the year | | | For the year | | | For the year | | | months | | | For the year | | | For the year | |
| | | ended | | | ended | | | ended | | | ended | | | ended | | | ended | |
| | | December 31, | | | December 31, | | | December 31, | | | December 31, | | | March 31, | | | March 31, | |
| | | 2019 | | | 2018 | | | 2017 | | | 2016 | | | 2016 | | | 2015 | |
| Net Asset Value, Beginning of Period | | $ | 17.06 | | | $ | 17.76 | | | $ | 15.74 | | | $ | 15.32 | | | $ | 15.96 | | | $ | 15.17 | |
| | | | | | | | | | | | | | | | | | | | | | | | | |
| Investment Activities: | | | | | | | | | | | | | | | | | | | | | | | | |
| Operations: | | | | | | | | | | | | | | | | | | | | | | | | |
| Net investment income | | | 0.19 | | | | 0.19 | | | | 0.18 | | | | 0.13 | | | | 0.20 | | | | 0.17 | |
| Net realized/unrealized gains (losses) from investments | | | 3.85 | | | | (0.52 | ) | | | 2.16 | | | | 0.77 | | | | 0.27 | | | | 0.89 | |
| Total from investment activities | | | 4.04 | | | | (0.33 | ) | | | 2.34 | | | | 0.90 | | | | 0.47 | | | | 1.06 | |
| Dividends: | | | | | | | | | | | | | | | | | | | | | | | | |
| Net investment income | | | (0.20 | ) | | | (0.18 | ) | | | (0.18 | ) | | | (0.17 | ) | | | (0.21 | ) | | | (0.16 | ) |
| Net realized gains from investment transactions | | | (0.14 | ) | | | (0.19 | ) | | | (0.14 | ) | | | (0.31 | ) | | | (0.90 | ) | | | (0.11 | ) |
| Total dividends | | | (0.34 | ) | | | (0.37 | ) | | | (0.32 | ) | | | (0.48 | ) | | | (1.11 | ) | | | (0.27 | ) |
| | | | | | | | | | | | | | | | | | | | | | | | | |
| Net Asset Value, End of Period | | $ | 20.76 | | | $ | 17.06 | | | $ | 17.76 | | | $ | 15.74 | | | $ | 15.32 | | | $ | 15.96 | |
| | | | | | | | | | | | | | | | | | | | | | | | | |
| Total Return | | | 23.70 | % | | | (1.90 | )% | | | 14.88 | % | | | 5.87 | %(a) | | | 3.10 | % | | | 7.00 | % |
| | | | | | | | | | | | | | | | | | | | | | | | | |
| Ratios/Supplemental Data: | | | | | | | | | | | | | | | | | | | | | | | | |
| Net assets at end of period (000’s) | | $ | 157,892 | | | $ | 124,495 | | | $ | 121,356 | | | $ | 101,126 | | | $ | 86,891 | | | $ | 84,499 | |
| Ratio of net expenses to average net assets | | | 1.00 | % | | | 1.00 | % | | | 1.00 | % | | | 1.00 | %(b) | | | 1.00 | % | | | 1.00 | % |
| Ratio of net investment income to average net assets | | | 1.01 | % | | | 1.02 | % | | | 1.08 | % | | | 1.13 | %(b) | | | 1.29 | % | | | 1.06 | % |
| Ratio of expenses (before fee reductions or recoupment of fees previously reimbursed by the investment adviser) to average net assets (c) | | | 1.02 | % | | | 1.04 | % | | | 1.03 | % | | | 1.05 | %(b) | | | 1.06 | % | | | 1.04 | % |
| Portfolio turnover rate | | | 12.99 | % | | | 8.47 | % | | | 8.40 | % | | | 10.18 | %(a) | | | 15.56 | % | | | 21.62 | % |
| (a) | Not annualized for periods less than one year. |
| (b) | Annualized for periods less than one year. |
| (c) | During the periods, certain fees were reduced. If such fee reduction had not occurred, the ratio would have been as indicated. |
See Notes to Financial Statements
| Schedule of Portfolio Investments | Walden Equity Fund |
December 31, 2019
| Security Description | | Shares | | | Fair Value ($) | |
| Common Stocks (99.1%) | | | | | | | | |
| Communication Services (8.1%) | | | | | | | | |
| Alphabet, Inc., Class A (a) | | | 2,700 | | | | 3,616,353 | |
| Alphabet, Inc., Class C (a) | | | 5,050 | | | | 6,751,951 | |
| Charter Communications, Inc., Class A (a) | | | 4,879 | | | | 2,366,705 | |
| Comcast Corp., Class A | | | 69,725 | | | | 3,135,534 | |
| Omnicom Group, Inc. | | | 26,000 | | | | 2,106,520 | |
| Verizon Communications, Inc. | | | 35,000 | | | | 2,149,000 | |
| | | | | | | | 20,126,063 | |
| Consumer Discretionary (8.2%) | | | | | | | | |
| Booking Holdings, Inc. (a) | | | 1,200 | | | | 2,464,476 | |
| Dollar General Corp. | | | 20,475 | | | | 3,193,691 | |
| McDonald’s Corp. | | | 10,250 | | | | 2,025,503 | |
| NIKE, Inc., Class B | | | 43,500 | | | | 4,406,985 | |
| Ross Stores, Inc. | | | 39,500 | | | | 4,598,590 | |
| Starbucks Corp. | | | 39,000 | | | | 3,428,879 | |
| The TJX Cos., Inc. | | | 6,000 | | | | 366,360 | |
| | | | | | | | 20,484,484 | |
| Consumer Staples (10.1%) | | | | | | | | |
| Church & Dwight Co., Inc. | | | 28,000 | | | | 1,969,520 | |
| Colgate-Palmolive Co. | | | 30,000 | | | | 2,065,200 | |
| Costco Wholesale Corp. | | | 18,725 | | | | 5,503,652 | |
| Estee Lauder Cos., Inc., Class A | | | 15,000 | | | | 3,098,100 | |
| PepsiCo, Inc. | | | 31,000 | | | | 4,236,770 | |
| Procter & Gamble Co. | | | 5,000 | | | | 624,500 | |
| Sysco Corp. | | | 34,800 | | | | 2,976,792 | |
| The Clorox Co. | | | 15,000 | | | | 2,303,100 | |
| The Hershey Co. | | | 15,000 | | | | 2,204,700 | |
| | | | | | | | 24,982,334 | |
| Energy (2.3%) | | | | | | | | |
| Apache Corp. | | | 39,000 | | | | 998,010 | |
| ConocoPhillips | | | 74,000 | | | | 4,812,220 | |
| | | | | | | | 5,810,230 | |
| Financials (16.3%) | | | | | | | | |
| American Express Co. | | | 24,375 | | | | 3,034,443 | |
| Cincinnati Financial Corp. | | | 17,550 | | | | 1,845,383 | |
| Comerica, Inc. | | | 22,425 | | | | 1,608,994 | |
| Discover Financial Services | | | 32,175 | | | | 2,729,084 | |
| JPMorgan Chase & Co. | | | 51,000 | | | | 7,109,400 | |
| M&T Bank Corp. | | | 12,000 | | | | 2,037,000 | |
| Northern Trust Corp. | | | 27,300 | | | | 2,900,352 | |
| PNC Financial Services Group, Inc. | | | 29,500 | | | | 4,709,085 | |
| State Street Corp. | | | 25,350 | | | | 2,005,185 | |
| T. Rowe Price Group, Inc. | | | 21,500 | | | | 2,619,560 | |
| Truist Financial Corp. | | | 92,000 | | | | 5,181,440 | |
| U.S. Bancorp | | | 78,025 | | | | 4,626,102 | |
| | | | | | | | 40,406,028 | |
| Health Care (15.3%) | | | | | | | | |
| Becton, Dickinson & Co. | | | 18,500 | | | | 5,031,445 | |
| Danaher Corp. | | | 21,450 | | | | 3,292,146 | |
| Dentsply Sirona, Inc. | | | 17,000 | | | | 962,030 | |
| Henry Schein, Inc. (a) | | | 32,500 | | | | 2,168,400 | |
| Johnson & Johnson, Inc. | | | 20,000 | | | | 2,917,400 | |
| Medtronic PLC | | | 27,000 | | | | 3,063,150 | |
| Merck & Co., Inc. | | | 34,000 | | | | 3,092,300 | |
| Mettler-Toledo International, Inc. (a) | | | 3,750 | | | | 2,974,800 | |
| Stryker Corp. | | | 20,000 | | | | 4,198,800 | |
| UnitedHealth Group, Inc. | | | 17,500 | | | | 5,144,650 | |
| Varian Medical Systems, Inc. (a) | | | 17,000 | | | | 2,414,170 | |
| Waters Corp. (a) | | | 12,200 | | | | 2,850,530 | |
| | | | | | | | 38,109,821 | |
| Industrials (11.3%) | | | | | | | | |
| 3M Co. | | | 19,500 | | | | 3,440,190 | |
| Cummins, Inc. | | | 13,000 | | | | 2,326,480 | |
| Deere & Co. | | | 13,650 | | | | 2,364,999 | |
| Donaldson Co., Inc. | | | 41,450 | | | | 2,388,349 | |
| Emerson Electric Co. | | | 15,000 | | | | 1,143,900 | |
| Hubbell, Inc. | | | 20,475 | | | | 3,026,615 | |
| Illinois Tool Works, Inc. | | | 17,550 | | | | 3,152,506 | |
| Union Pacific Corp. | | | 29,000 | | | | 5,242,910 | |
| United Parcel Service, Inc., Class B | | | 23,400 | | | | 2,739,204 | |
| W.W. Grainger, Inc. | | | 7,000 | | | | 2,369,640 | |
| | | | | | | | 28,194,793 | |
| Information Technology (20.9%) | | | | | | | | |
| Accenture PLC, Class A | | | 28,500 | | | | 6,001,244 | |
| Analog Devices, Inc. | | | 17,075 | | | | 2,029,193 | |
| Apple, Inc. | | | 43,000 | | | | 12,626,950 | |
| Automatic Data Processing, Inc. | | | 25,850 | | | | 4,407,425 | |
| Cisco Systems, Inc. | | | 59,475 | | | | 2,852,421 | |
| Microsoft Corp. | | | 76,000 | | | | 11,985,200 | |
| Oracle Corp. | | | 80,000 | | | | 4,238,400 | |
| TE Connectivity Ltd. | | | 18,525 | | | | 1,775,436 | |
| Visa, Inc., Class A | | | 31,000 | | | | 5,824,900 | |
| | | | | | | | 51,741,169 | |
| Materials (3.6%) | | | | | | | | |
| Air Products & Chemicals, Inc. | | | 8,000 | | | | 1,879,920 | |
| AptarGroup, Inc. | | | 26,000 | | | | 3,006,120 | |
| Avery Dennison Corp. | | | 12,000 | | | | 1,569,840 | |
| PPG Industries, Inc. | | | 19,500 | | | | 2,603,055 | |
| | | | | | | | 9,058,935 | |
| Utilities (3.0%) | | | | | | | | |
| Consolidated Edison, Inc. | | | 34,500 | | | | 3,121,215 | |
| Eversource Energy | | | 51,200 | | | | 4,355,584 | |
| | | | | | | | 7,476,799 | |
| | | | | | | | | |
| TOTAL COMMON STOCKS (Cost $110,912,491) | | | | | | | 246,390,656 | |
| | | | | | | | | |
| Investment Companies (0.7%) | | | | | | | | |
| | | | | | | | | |
| JPMorgan U.S. Government Money Market Fund, Capital Shares, 1.49% (b) | | | 1,713,352 | | | | 1,713,352 | |
| TOTAL INVESTMENT COMPANIES (Cost $1,713,352) | | | | | | | 1,713,352 | |
| | | | | | | | | |
| Total Investments (Cost $112,625,843) — 99.8%(c) | | | | | | | 248,104,008 | |
| Other assets in excess of liabilities — 0.2% | | | | | | | 425,444 | |
| NET ASSETS — 100.0% | | | | | | $ | 248,529,452 | |
| (a) | Non-income producing security. |
| (b) | Rate disclosed is the seven day yield as of December 31, 2019. |
| (c) | See Federal Tax Information listed in the Notes to the Financial Statements. |
| PLC | Public Limited Company |
See Notes to Financial Statements
| Financial Statements | Walden Equity Fund |
Statement of Assets and Liabilities
December 31, 2019
| Assets: | | | |
| Investments, at fair value (cost $112,625,843) | | $ | 248,104,008 | |
| Dividends receivable | | | 263,064 | |
| Receivable for capital shares issued | | | 423,170 | |
| Prepaid expenses | | | 15,880 | |
| Total Assets | | | 248,806,122 | |
| Liabilities: | | | | |
| Payable for capital shares redeemed | | | 62,894 | |
| Accrued expenses and other liabilities: | | | | |
| Investment adviser | | | 142,070 | |
| Administration and accounting | | | 4,879 | |
| Custodian | | | 2,297 | |
| Shareholder servicing fees | | | 30,514 | |
| Transfer agent | | | 5,201 | |
| Trustee | | | 282 | |
| Other | | | 28,533 | |
| Total Liabilities | | | 276,670 | |
| Net Assets | | $ | 248,529,452 | |
| Composition of Net Assets: | | | | |
| Paid in capital | | $ | 110,624,795 | |
| Total distributable earnings/(loss) | | | 137,904,657 | |
| Net Assets | | $ | 248,529,452 | |
| Shares outstanding (par value $0.01, unlimited number of shares authorized) | | | 9,387,408 | |
| Net Asset Value, Offering Price and Redemption price per share | | $ | 26.47 | |
Statement of Operations
For the year ended December 31, 2019
| Investment Income: | | | |
| Dividends | | $ | 4,115,495 | |
| Total Investment Income | | | 4,115,495 | |
| Expenses: | | | | |
| Investment adviser | | | 1,685,108 | |
| Administration and accounting | | | 151,033 | |
| Chief compliance officer | | | 18,906 | |
| Custodian | | | 30,788 | |
| Shareholder servicing | | | 364,411 | |
| Transfer agency | | | 40,953 | |
| Trustee | | | 14,467 | |
| Interest fees | | | 453 | |
| Other | | | 100,948 | |
| Total expenses before fee reductions | | | 2,407,067 | |
| Fees contractually reduced by the investment adviser | | | (158,316 | ) |
| Net Expenses | | | 2,248,751 | |
| Net Investment Income | | | 1,866,744 | |
| Net Realized/Unrealized Gains (Losses) from Investments: | | | | |
| Net realized gains from investment transactions | | | 7,908,081 | |
| Change in unrealized appreciation/depreciation from investments | | | 51,904,859 | |
| Net realized/unrealized gains (losses) from investments | | | 59,812,940 | |
| Change in Net Assets Resulting from Operations | | $ | 61,679,684 | |
See Notes to Financial Statements
| Financial Statements | Walden Equity Fund |
Statements of Changes in Net Assets
| | | For the year ended | | | For the year ended | |
| | | December 31, 2019 | | | December 31, 2018 | |
| Investment Activities: | | | | | | | | |
| Operations: | | | | | | | | |
| Net investment income | | $ | 1,866,744 | | | $ | 1,702,598 | |
| Net realized gains from investment transactions | | | 7,908,081 | | | | 2,964,658 | |
| Change in unrealized appreciation/depreciation from investments | | | 51,904,859 | | | | (9,554,393 | ) |
| Change in Net Assets Resulting from Operations | | | 61,679,684 | | | | (4,887,137 | ) |
| Distributions to shareholders: | | | | | | | | |
| Total Distributions | | | (7,360,570 | ) | | | (4,155,199 | ) |
| Change in Net Assets Resulting from distributions to shareholders | | | (7,360,570 | ) | | | (4,155,199 | ) |
| Capital Share Transactions: | | | | | | | | |
| Proceeds from shares issued | | | 32,110,753 | | | | 26,392,394 | |
| Dividends reinvested | | | 6,014,991 | | | | 3,440,593 | |
| Cost of shares redeemed | | | (36,513,094 | ) | | | (25,632,176 | ) |
| Change in Net Assets Resulting from Capital Share Transactions | | | 1,612,650 | | | | 4,200,811 | |
| Change in Net Assets | | | 55,931,764 | | | | (4,841,525 | ) |
| Net Assets: | | | | | | | | |
| Beginning of period | | | 192,597,688 | | | | 197,439,213 | |
| End of period | | $ | 248,529,452 | | | $ | 192,597,688 | |
| Share Transactions: | | | | | | | | |
| Issued | | | 1,327,796 | | | | 1,181,162 | |
| Reinvested | | | 233,773 | | | | 158,632 | |
| Redeemed | | | (1,509,693 | ) | | | (1,139,738 | ) |
| Change in shares | | | 51,876 | | | | 200,056 | |
See Notes to Financial Statements
| Financial Statements | Walden Equity Fund |
Financial Highlights
Selected data for a share outstanding throughout the periods indicated.
| | | | | | | | | | | | For the nine | | | | | | | |
| | | For the year | | | For the year | | | For the year | | | months | | | For the year | | | For the year | |
| | | ended | | | ended | | | ended | | | ended | | | ended | | | ended | |
| | | December 31, | | | December 31, | | | December 31, | | | December 31, | | | March 31, | | | March 31, | |
| | | 2019 | | | 2018 | | | 2017 | | | 2016 | | | 2016 | | | 2015 | |
| Net Asset Value, Beginning of Period | | $ | 20.63 | | | $ | 21.61 | | | $ | 18.82 | | | $ | 17.88 | | | $ | 18.55 | | | $ | 18.19 | |
| | | | | | | | | | | | | | | | | | | | | | | | | |
| Investment Activities: | | | | | | | | | | | | | | | | | | | | | | | | |
| Operations: | | | | | | | | | | | | | | | | | | | | | | | | |
| Net investment income | | | 0.20 | | | | 0.19 | | | | 0.20 | | | | 0.14 | | | | 0.23 | | | | 0.18 | |
| Net realized/unrealized gains (losses) from investments | | | 6.44 | | | | (0.72 | ) | | | 3.70 | | | | 1.44 | | | | 0.29 | | | | 1.29 | |
| Total from investment activities | | | 6.64 | | | | (0.53 | ) | | | 3.90 | | | | 1.58 | | | | 0.52 | | | | 1.47 | |
| Dividends: | | | | | | | | | | | | | | | | | | | | | | | | |
| Net investment income | | | (0.20 | ) | | | (0.18 | ) | | | (0.20 | ) | | | (0.18 | ) | | | (0.24 | ) | | | (0.18 | ) |
| Net realized gains from investment transactions | | | (0.60 | ) | | | (0.27 | ) | | | (0.91 | ) | | | (0.46 | ) | | | (0.95 | ) | | | (0.93 | ) |
| Total dividends | | | (0.80 | ) | | | (0.45 | ) | | | (1.11 | ) | | | (0.64 | ) | | | (1.19 | ) | | | (1.11 | ) |
| | | | | | | | | | | | | | | | | | | | | | | | | |
| Net Asset Value, End of Period | | $ | 26.47 | | | $ | 20.63 | | | $ | 21.61 | | | $ | 18.82 | | | $ | 17.88 | | | $ | 18.55 | |
| | | | | | | | | | | | | | | | | | | | | | | | | |
| Total Return | | | 32.30 | % | | | (2.54 | )% | | | 20.77 | % | | | 8.80 | %(a) | | | 2.92 | % | | | 8.13 | % |
| | | | | | | | | | | | | | | | | | | | | | | | | |
| Ratios/Supplemental Data: | | | | | | | | | | | | | | | | | | | | | | | | |
| Net assets at end of period (000’s) | | $ | 248,529 | | | $ | 192,598 | | | $ | 197,439 | | | $ | 181,830 | | | $ | 164,566 | | | $ | 157,499 | |
| Ratio of net expenses to average net assets | | | 1.00 | % | | | 1.00 | % | | | 1.00 | % | | | 1.00 | %(b) | | | 1.00 | % | | | 1.00 | % |
| Ratio of net investment income to average net assets | | | 0.83 | % | | | 0.82 | % | | | 0.93 | % | | | 1.00 | %(b) | | | 1.21 | % | | | 0.95 | % |
| Ratio of expenses (before fee reductions or recoupment of fees previously reimbursed by the investment adviser) to average net assets (c) | | | 1.07 | % | | | 1.08 | % | | | 1.07 | % | | | 1.09 | %(b) | | | 1.10 | % | | | 1.09 | % |
| Portfolio turnover rate | | | 10.57 | % | | | 6.51 | % | | | 9.88 | % | | | 9.94 | %(a) | | | 17.78 | % | | | 21.31 | % |
| (a) | Not annualized for periods less than one year. |
| (b) | Annualized for periods less than one year. |
| (c) | During the periods, certain fees were reduced. If such fee reduction had not occurred, the ratio would have been as indicated. |
See Notes to Financial Statements
Schedule of Portfolio Investments | Walden Midcap Fund |
December 31, 2019
| Security Description | | Shares | | | Fair Value ($) | |
| Common Stocks (98.3%) | | | | | | | | |
| Communication Services (1.2%) | | | | | | | | |
| Omnicom Group, Inc. | | | 9,550 | | | | 773,741 | |
| | | | | | | | 773,741 | |
| Consumer Discretionary (11.1%) | | | | | | | | |
| Dollar General Corp. | | | 3,875 | | | | 604,422 | |
| Dunkin’ Brands Group, Inc. | | | 8,375 | | | | 632,648 | |
| eBay, Inc. | | | 17,775 | | | | 641,855 | |
| Expedia Group, Inc. | | | 4,875 | | | | 527,183 | |
| Hyatt Hotels Corp., Class A | | | 12,550 | | | | 1,125,860 | |
| Nordstrom, Inc. | | | 14,450 | | | | 591,439 | |
| O’Reilly Automotive, Inc. (a) | | | 1,950 | | | | 854,607 | |
| Polaris, Inc. | | | 6,975 | | | | 709,358 | |
| Ross Stores, Inc. | | | 10,525 | | | | 1,225,320 | |
| | | | | | | | 6,912,692 | |
| Consumer Staples (5.8%) | | | | | | | | |
| Church & Dwight Co., Inc. | | | 7,050 | | | | 495,897 | |
| McCormick & Co., Inc. | | | 3,425 | | | | 581,325 | |
| Sysco Corp. | | | 9,475 | | | | 810,492 | |
| The Clorox Co. | | | 5,100 | | | | 783,054 | |
| The Hershey Co. | | | 3,650 | | | | 536,477 | |
| The JM Smucker Co. | | | 4,075 | | | | 424,330 | |
| | | | | | | | 3,631,575 | |
| Energy (2.8%) | | | | | | | | |
| Apache Corp. | | | 23,275 | | | | 595,607 | |
| Dril-Quip, Inc. (a) | | | 11,650 | | | | 546,502 | |
| Helmerich & Payne, Inc. | | | 12,800 | | | | 581,504 | |
| | | | | | | | 1,723,613 | |
| Financials (16.1%) | | | | | | | | |
| Brown & Brown, Inc. | | | 12,125 | | | | 478,695 | |
| Commerce Bancshares, Inc. | | | 14,259 | | | | 968,756 | |
| Discover Financial Services | | | 10,500 | | | | 890,610 | |
| East West Bancorp, Inc. | | | 13,900 | | | | 676,930 | |
| Eaton Vance Corp. | | | 14,100 | | | | 658,329 | |
| FactSet Research Systems, Inc. | | | 4,875 | | | | 1,307,962 | |
| M&T Bank Corp. | | | 5,725 | | | | 971,819 | |
| Northern Trust Corp. | | | 9,900 | | | | 1,051,776 | |
| SEI Investments Co. | | | 11,675 | | | | 764,479 | |
| Signature Bank | | | 4,625 | | | | 631,821 | |
| State Street Corp. | | | 11,150 | | | | 881,965 | |
| T. Rowe Price Group, Inc. | | | 6,425 | | | | 782,822 | |
| | | | | | | | 10,065,964 | |
| Health Care (11.4%) | | | | | | | | |
| Agilent Technologies, Inc. | | | 7,825 | | | | 667,551 | |
| Cerner Corp. | | | 9,125 | | | | 669,684 | |
| Henry Schein, Inc. (a) | | | 9,550 | | | | 637,176 | |
| Hill-Rom Holdings, Inc. | | | 5,425 | | | | 615,900 | |
| Mettler-Toledo International, Inc. (a) | | | 825 | | | | 654,456 | |
| Steris PLC | | | 5,175 | | | | 788,774 | |
| The Cooper Companies, Inc. | | | 2,600 | | | | 835,353 | |
| Varian Medical Systems, Inc. (a) | | | 5,875 | | | | 834,309 | |
| Waters Corp. (a) | | | 2,775 | | | | 648,379 | |
| Zimmer Biomet Holdings, Inc. | | | 5,125 | | | | 767,110 | |
| | | | | | | | 7,118,692 | |
| Industrials (16.1%) | | | | | | | | |
| AMETEK, Inc. | | | 10,300 | | | | 1,027,321 | |
| AO Smith Corp. | | | 15,625 | | | | 744,375 | |
| Cummins, Inc. | | | 3,600 | | | | 644,256 | |
| Donaldson Co., Inc. | | | 17,250 | | | | 993,944 | |
| Expeditors International of Washington, Inc. | | | 9,225 | | | | 719,735 | |
| Hubbell, Inc. | | | 5,525 | | | | 816,706 | |
| IDEX Corp. | | | 2,600 | | | | 447,200 | |
| Lincoln Electric Holdings, Inc. | | | 7,325 | | | | 708,547 | |
| Masco Corp. | | | 15,625 | | | | 749,843 | |
| Nordson Corp. | | | 4,575 | | | | 744,993 | |
| Roper Technologies, Inc. | | | 2,350 | | | | 832,441 | |
| Sensata Technologies Holding PLC (a) | | | 12,075 | | | | 650,480 | |
| The Middleby Corp. (a) | | | 4,425 | | | | 484,626 | |
| Verisk Analytics, Inc. | | | 3,425 | | | | 511,490 | |
| | | | | | | | 10,075,957 | |
| Information Technology (14.4%) | | | | | | | | |
| Akamai Technologies, Inc. (a) | | | 6,850 | | | | 591,703 | |
| Amdocs Ltd. | | | 9,750 | | | | 703,853 | |
| ANSYS, Inc. (a) | | | 1,825 | | | | 469,773 | |
| Aspen Technology, Inc. (a) | | | 5,400 | | | | 653,022 | |
| CDK Global, Inc. | | | 12,025 | | | | 657,527 | |
| Check Point Software Technologies Ltd. (a) | | | 6,300 | | | | 699,048 | |
| Citrix Systems, Inc. | | | 6,975 | | | | 773,528 | |
| F5 Networks, Inc. (a) | | | 5,700 | | | | 796,005 | |
| IPG Photonics Corp. (a) | | | 4,800 | | | | 695,616 | |
| Juniper Networks, Inc. | | | 26,825 | | | | 660,700 | |
| Paychex, Inc. | | | 16,675 | | | | 1,418,375 | |
| TE Connectivity Ltd. | | | 9,550 | | | | 915,272 | |
| | | | | | | | 9,034,422 | |
| Materials (5.9%) | | | | | | |
| AptarGroup, Inc. | | | 7,000 | | | | 809,340 | |
| Avery Dennison Corp. | | | 7,725 | | | | 1,010,584 | |
| Packaging Corporation of America | | | 7,350 | | | | 823,127 | |
| RPM International, Inc. | | | 13,725 | | | | 1,053,531 | |
| | | | | | | | 3,696,582 | |
| Real Estate (7.5%) | | | | | | | | |
| Alexandria Real Estate Equities, Inc. | | | 4,025 | | | | 650,360 | |
| AvalonBay Communities, Inc. | | | 2,550 | | | | 534,735 | |
| Digital Realty Trust, Inc. | | | 4,475 | | | | 535,837 | |
| Host Hotels & Resorts, Inc. | | | 41,225 | | | | 764,724 | |
| Jones Lang LaSalle, Inc. | | | 4,225 | | | | 735,530 | |
| Lamar Advertising Co., Class A | | | 6,550 | | | | 584,653 | |
| Realty Income Corp. | | | 12,325 | | | | 907,489 | |
| | | | | | | | 4,713,328 | |
| Utilities (6.0%) | | | | | | | | |
| American Water Works Co., Inc. | | | 5,350 | | | | 657,248 | |
| Consolidated Edison, Inc. | | | 8,925 | | | | 807,445 | |
| Eversource Energy | | | 18,880 | | | | 1,606,121 | |
| ONE Gas, Inc. | | | 7,200 | | | | 673,704 | |
| | | | | | | | 3,744,518 | |
| TOTAL COMMON STOCKS (Cost $41,346,773) | | | | | | | 61,491,084 | |
| | | | | | | | | |
| Investment Companies (1.4%) | | | | | | | | |
| | | | | | | | | |
| JPMorgan U.S. Government Money Market Fund, Capital Shares, 1.49% (b) | | | 867,497 | | | | 867,497 | |
| TOTAL INVESTMENT COMPANIES (Cost $867,497) | | | | | | | 867,497 | |
| | | | | | | | | |
| Total Investments (Cost $42,214,270) — 99.7%(c) | | | | | | | 62,358,581 | |
| Other assets in excess of liabilities — 0.3% | | | | | | | 179,352 | |
| NET ASSETS — 100.0% | | | | | | $ | 62,537,933 | |
| (a) | Non-income producing security. |
| (b) | Rate disclosed is the seven day yield as of December 31, 2019. |
| (c) | See Federal Tax Information listed in the Notes to the Financial Statements. |
| PLC | Public Limited Company |
See Notes to Financial Statements
| Financial Statements | Walden Midcap Fund |
Statement of Assets and Liabilities
December 31, 2019
| Assets: | | | |
| Investments, at fair value (cost $42,214,270) | | $ | 62,358,581 | |
| Dividends receivable | | | 70,768 | |
| Receivable for capital shares issued | | | 150,619 | |
| Prepaid expenses | | | 9,708 | |
| Total Assets | | | 62,589,676 | |
| Liabilities: | | | | |
| Payable for capital shares redeemed | | | 42 | |
| Accrued expenses and other liabilities: | | | | |
| Investment adviser | | | 37,444 | |
| Administration and accounting | | | 1,253 | |
| Custodian | | | 542 | |
| Shareholder servicing fees | | | 1,461 | |
| Transfer agent | | | 4,111 | |
| Trustee | | | 70 | |
| Other | | | 6,820 | |
| Total Liabilities | | | 51,743 | |
| Net Assets | | $ | 62,537,933 | |
| Composition of Net Assets: | | | | |
| Paid in capital | | $ | 41,900,670 | |
| Total distributable earnings/(loss) | | | 20,637,263 | |
| Net Assets | | $ | 62,537,933 | |
| Shares outstanding (par value $0.01, unlimited number of shares authorized) | | | 3,343,218 | |
| Net Asset Value, Offering Price and Redemption price per share | | $ | 18.71 | |
Statement of Operations
For the year ended December 31, 2019
| Investment Income: | | | |
| Dividends | | $ | 916,412 | |
| Total Investment Income | | | 916,412 | |
| Expenses: | | | | |
| Investment adviser | | | 409,401 | |
| Administration and accounting | | | 36,627 | |
| Chief compliance officer | | | 4,531 | |
| Custodian | | | 7,430 | |
| Shareholder servicing | | | 16,172 | |
| Transfer agency | | | 34,612 | |
| Trustee | | | 3,466 | |
| Other | | | 33,249 | |
| Gross expense before recoupment | | | 545,488 | |
| Recoupment of prior expenses reimbursed by the investment adviser | | | 569 | |
| Total expenses | | | 546,057 | |
| Net Expenses | | | 546,057 | |
| Net Investment Income | | | 370,355 | |
| Net Realized/Unrealized Gains (Losses) from Investments: | | | | |
| Net realized gains from investment transactions | | | 3,543,017 | |
| Change in unrealized appreciation/depreciation from investments | | | 9,362,398 | |
| Net realized/unrealized gains (losses) from investments | | | 12,905,415 | |
| Change in Net Assets Resulting from Operations | | $ | 13,275,770 | |
See Notes to Financial Statements
| Financial Statements | Walden Midcap Fund |
Statements of Changes in Net Assets
| | | For the year ended | | | For the year ended | |
| | | December 31, 2019 | | | December 31, 2018 | |
| Investment Activities: | | | | | | | | |
| Operations: | | | | | | | | |
| Net investment income | | $ | 370,355 | | | $ | 261,195 | |
| Net realized gains from investment transactions | | | 3,543,017 | | | | 2,611,419 | |
| Change in unrealized appreciation/depreciation from investments | | | 9,362,398 | | | | (4,638,576 | ) |
| Change in Net Assets Resulting from Operations | | | 13,275,770 | | | | (1,765,962 | ) |
| Distributions to shareholders: | | | | | | | | |
| Total Distributions | | | (3,932,964 | ) | | | (3,064,044 | ) |
| Change in Net Assets Resulting from distributions to shareholders | | | (3,932,964 | ) | | | (3,064,044 | ) |
| Capital Share Transactions: | | | | | | | | |
| Proceeds from shares issued | | | 10,311,717 | | | | 5,213,428 | |
| Dividends reinvested | | | 3,313,873 | | | | 2,641,329 | |
| Cost of shares redeemed | | | (6,249,705 | ) | | | (3,767,045 | ) |
| Change in Net Assets Resulting from Capital Share Transactions | | | 7,375,885 | | | | 4,087,712 | |
| Change in Net Assets | | | 16,718,691 | | | | (742,294 | ) |
| Net Assets: | | | | | | | | |
| Beginning of period | | | 45,819,242 | | | | 46,561,536 | |
| End of period | | $ | 62,537,933 | | | $ | 45,819,242 | |
| Share Transactions: | | | | | | | | |
| Issued | | | 567,958 | | | | 294,070 | |
| Reinvested | | | 181,284 | | | | 161,945 | |
| Redeemed | | | (349,003 | ) | | | (213,991 | ) |
| Change in shares | | | 400,239 | | | | 242,024 | |
See Notes to Financial Statements
| Financial Statements | Walden Midcap Fund |
Financial Highlights
Selected data for a share outstanding throughout the periods indicated.
| | | | | | | | | | | | For the nine | | | | | | | |
| | | For the year | | | For the year | | | For the year | | | months | | | For the year | | | For the year | |
| | | ended | | | ended | | | ended | | | ended | | | ended | | | ended | |
| | | December 31, | | | December 31, | | | December 31, | | | December 31, | | | March 31, | | | March 31, | |
| | | 2019 | | | 2018 | | | 2017 | | | 2016 | | | 2016 | | | 2015 | |
| Net Asset Value, Beginning of Period | | $ | 15.57 | | | $ | 17.24 | | | $ | 14.90 | | | $ | 14.57 | | | $ | 15.18 | | | $ | 14.06 | |
| | | | | | | | | | | | | | | | | | | | | | | | | |
| Investment Activities: | | | | | | | | | | | | | | | | | | | | | | | | |
| Operations: | | | | | | | | | | | | | | | | | | | | | | | | |
| Net investment income | | | 0.12 | | | | 0.09 | | | | 0.07 | | | | 0.11 | | | | 0.09 | | | | 0.05 | |
| Net realized/unrealized gains (losses) from investments | | | 4.27 | | | | (0.66 | ) | | | 2.85 | | | | 0.97 | | | | 0.07 | | | | 1.65 | |
| Total from investment activities | | | 4.39 | | | | (0.57 | ) | | | 2.92 | | | | 1.08 | | | | 0.16 | | | | 1.70 | |
| Dividends: | | | | | | | | | | | | | | | | | | | | | | | | |
| Net investment income | | | (0.10 | ) | | | (0.09 | ) | | | (0.08 | ) | | | (0.12 | ) | | | (0.08 | ) | | | (0.05 | ) |
| Net realized gains from investment transactions | | | (1.15 | ) | | | (1.01 | ) | | | (0.50 | ) | | | (0.63 | ) | | | (0.69 | ) | | | (0.53 | ) |
| Total dividends | | | (1.25 | ) | | | (1.10 | ) | | | (0.58 | ) | | | (0.75 | ) | | | (0.77 | ) | | | (0.58 | ) |
| | | | | | | | | | | | | | | | | | | | | | | | | |
| Net Asset Value, End of Period | | $ | 18.71 | | | $ | 15.57 | | | $ | 17.24 | | | $ | 14.90 | | | $ | 14.57 | | | $ | 15.18 | |
| | | | | | | | | | | | | | | | | | | | | | | | | |
| Total Return | | | 28.38 | % | | | (3.58 | )% | | | 19.62 | % | | | 7.36 | %(a) | | | 1.27 | % | | | 12.25 | % |
| | | | | | | | | | | | | | | | | | | | | | | | | |
| Ratios/Supplemental Data: | | | | | | | | | | | | | | | | | | | | | | | | |
| Net assets at end of period (000’s) | | $ | 62,538 | | | $ | 45,819 | | | $ | 46,562 | | | $ | 39,059 | | | $ | 35,543 | | | $ | 34,959 | |
| Ratio of net expenses to average net assets | | | 1.00 | % | | | 1.00 | % | | | 1.00 | % | | | 1.00 | %(b) | | | 1.00 | % | | | 1.00 | % |
| Ratio of net investment income to average net assets | | | 0.68 | % | | | 0.54 | % | | | 0.45 | % | | | 0.97 | %(b) | | | 0.59 | % | | | 0.35 | % |
| Ratio of expenses (before fee reductions or recoupment of fees previously reimbursed by the investment adviser) to average net assets (c) | | | 1.00 | % | | | 1.00 | % | | | 1.01 | % | | | 1.04 | %(b) | | | 1.07 | % | | | 1.04 | % |
| Portfolio turnover rate | | | 23.17 | % | | | 18.66 | % | | | 24.85 | % | | | 12.59 | %(a) | | | 20.10 | % | | | 16.06 | % |
| (a) | Not annualized for periods less than one year. |
| (b) | Annualized for periods less than one year. |
| (c) | During the periods, certain fees were reduced or recouped by the investment adviser. If such fee reductions/recoupments had not occurred, the ratio would have been as indicated. |
See Notes to Financial Statements
| Schedule of Portfolio Investments | Walden SMID Cap Fund |
December 31, 2019
| Security Description | | Shares | | | Fair Value ($) | |
| Common Stocks (99.0%) | | | | | | | | |
| Communication Services (1.4%) | | | | | | | | |
| Interpublic Group of Cos., Inc. | | | 36,475 | | | | 842,573 | |
| | | | | | | | 842,573 | |
| Consumer Discretionary (10.4%) | | | | | | | | |
| Cheesecake Factory, Inc. | | | 16,100 | | | | 625,646 | |
| Choice Hotels International, Inc. | | | 8,325 | | | | 861,054 | |
| Dorman Products, Inc. (a) | | | 9,275 | | | | 702,303 | |
| Dunkin’ Brands Group, Inc. | | | 10,950 | | | | 827,163 | |
| Nordstrom, Inc. | | | 19,550 | | | | 800,182 | |
| Polaris, Inc. | | | 4,925 | | | | 500,873 | |
| Texas Roadhouse, Inc. | | | 13,275 | | | | 747,648 | |
| Tiffany & Co. | | | 4,550 | | | | 608,108 | |
| Williams Sonoma, Inc. | | | 9,775 | | | | 717,875 | |
| | | | | | | | 6,390,852 | |
| Consumer Staples (2.7%) | | | | | | | | |
| Flowers Foods, Inc. | | | 27,900 | | | | 606,546 | |
| Lancaster Colony Corp. | | | 2,925 | | | | 468,293 | |
| The JM Smucker Co. | | | 5,400 | | | | 562,302 | |
| | | | | | | | 1,637,141 | |
| Energy (2.3%) | | | | | | | | |
| Apache Corp. | | | 11,325 | | | | 289,807 | |
| Dril-Quip, Inc. (a) | | | 8,600 | | | | 403,426 | |
| Helmerich & Payne, Inc. | | | 15,625 | | | | 709,844 | |
| | | | | | | | 1,403,077 | |
| Financials (16.6%) | | | | | | | | |
| American Financial Group, Inc. | | | 5,375 | | | | 589,369 | |
| Bank of Hawaii Corp. | | | 7,200 | | | | 685,152 | |
| Brown & Brown, Inc. | | | 21,175 | | | | 835,989 | |
| Cohen & Steers, Inc. | | | 9,475 | | | | 594,651 | |
| Comerica, Inc. | | | 6,425 | | | | 460,994 | |
| Commerce Bancshares, Inc. | | | 10,497 | | | | 713,166 | |
| East West Bancorp, Inc. | | | 14,250 | | | | 693,975 | |
| Eaton Vance Corp. | | | 17,050 | | | | 796,065 | |
| FactSet Research Systems, Inc. | | | 4,050 | | | | 1,086,615 | |
| First Hawaiian, Inc. | | | 15,450 | | | | 445,733 | |
| SEI Investments Co. | | | 15,775 | | | | 1,032,947 | |
| Signature Bank | | | 6,275 | | | | 857,227 | |
| SVB Financial Group (a) | | | 3,600 | | | | 903,743 | |
| UMB Financial Corp. | | | 8,325 | | | | 571,428 | |
| | | | | | | | 10,267,054 | |
| Health Care (14.2%) | | | | | | | | |
| Chemed Corp. | | | 2,150 | | | | 944,409 | |
| Dentsply Sirona, Inc. | | | 15,975 | | | | 904,025 | |
| Henry Schein, Inc. (a) | | | 9,275 | | | | 618,828 | |
| Masimo Corp. (a) | | | 7,825 | | | | 1,236,819 | |
| PerkinElmer, Inc. | | | 10,175 | | | | 987,993 | |
| Steris PLC | | | 7,000 | | | | 1,066,940 | |
| The Cooper Companies, Inc. | | | 2,525 | | | | 811,257 | |
| Varian Medical Systems, Inc. (a) | | | 7,475 | | | | 1,061,525 | |
| Waters Corp. (a) | | | 4,700 | | | | 1,098,155 | |
| | | | | | | | 8,729,951 | |
| Industrials (17.0%) | | | | | | | | |
| AO Smith Corp. | | | 12,075 | | | | 575,253 | |
| Applied Industrial Technologies, Inc. | | | 10,300 | | | | 686,907 | |
| C.H. Robinson Worldwide, Inc. | | | 5,475 | | | | 428,145 | |
| Donaldson Co., Inc. | | | 17,800 | | | | 1,025,635 | |
| Expeditors International of Washington, Inc. | | | 10,900 | | | | 850,418 | |
| Hexcel Corp. | | | 8,800 | | | | 645,128 | |
| Hubbell, Inc. | | | 7,100 | | | | 1,049,521 | |
| IDEX Corp. | | | 3,625 | | | | 623,500 | |
| Lincoln Electric Holdings, Inc. | | | 7,200 | | | | 696,456 | |
| Masco Corp. | | | 14,700 | | | | 705,453 | |
| Nordson Corp. | | | 6,025 | | | | 981,111 | |
| Sensata Technologies Holding PLC (a) | | | 11,225 | | | | 604,691 | |
| The Middleby Corp. (a) | | | 5,375 | | | | 588,670 | |
| UniFirst Corp. | | | 5,275 | | | | 1,065,445 | |
| | | | | | | | 10,526,333 | |
| Information Technology (15.4%) | | | | | | | | |
| Akamai Technologies, Inc. (a) | | | 9,475 | | | | 818,451 | |
| Amdocs Ltd. | | | 6,575 | | | | 474,649 | |
| Aspen Technology, Inc. (a) | | | 8,325 | | | | 1,006,741 | |
| CDK Global, Inc. | | | 11,900 | | | | 650,692 | |
| Citrix Systems, Inc. | | | 5,325 | | | | 590,543 | |
| Coherent, Inc. (a) | | | 3,300 | | | | 548,955 | |
| F5 Networks, Inc. (a) | | | 5,900 | | | | 823,934 | |
| IPG Photonics Corp. (a) | | | 5,375 | | | | 778,945 | |
| Jack Henry & Associates, Inc. | | | 4,700 | | | | 684,649 | |
| Juniper Networks, Inc. | | | 23,750 | | | | 584,963 | |
| Manhattan Associates, Inc. (a) | | | 10,100 | | | | 805,475 | |
| NetApp, Inc. | | | 10,075 | | | | 627,169 | |
| NETGEAR, Inc. (a) | | | 14,050 | | | | 344,366 | |
| Progress Software Corp. | | | 11,050 | | | | 459,128 | |
| Tech Data Corp. (a) | | | 2,250 | | | | 323,100 | |
| | | | | | | | 9,521,760 | |
| Materials (6.2%) | | | | | | |
| AptarGroup, Inc. | | | 6,875 | | | | 794,888 | |
| Avery Dennison Corp. | | | 6,700 | | | | 876,494 | |
| Packaging Corporation of America | | | 5,800 | | | | 649,542 | |
| RPM International, Inc. | | | 12,925 | | | | 992,123 | |
| Silgan Holdings, Inc. | | | 15,575 | | | | 484,071 | |
| | | | | | | | 3,797,118 | |
| Real Estate (8.8%) | | | | | | | | |
| American Campus Communities, Inc. | | | 9,375 | | | | 440,906 | |
| Camden Property Trust | | | 7,100 | | | | 753,310 | |
| CoreSite Realty Corp. | | | 6,875 | | | | 770,825 | |
| CubeSmart | | | 14,700 | | | | 462,756 | |
| Highwoods Properties, Inc. | | | 12,775 | | | | 624,825 | |
| Host Hotels & Resorts, Inc. | | | 42,700 | | | | 792,085 | |
| Jones Lang LaSalle, Inc. | | | 4,925 | | | | 857,393 | |
| Lamar Advertising Co., Class A | | | 8,125 | | | | 725,238 | |
| | | | | | | | 5,427,338 | |
| Utilities (4.0%) | | | | | | | | |
| Atmos Energy Corp. | | | 7,775 | | | | 869,712 | |
| New Jersey Resources Corp. | | | 15,000 | | | | 668,550 | |
| ONE Gas, Inc. | | | 9,575 | | | | 895,932 | |
| | | | | | | | 2,434,194 | |
| | | | | | | | | |
| TOTAL COMMON STOCKS (Cost $44,350,715) | | | | | | | 60,977,391 | |
| | | | | | | | | |
| Investment Companies (0.9%) | | | | | | | | |
| | | | | | | | | |
| JPMorgan U.S. Government Money Market Fund, Capital Shares, 1.49% (b) | | | 566,745 | | | | 566,745 | |
| TOTAL INVESTMENT COMPANIES (Cost $566,745) | | | | | | | 566,745 | |
| | | | | | | | | |
| Total Investments (Cost $44,917,460) — 99.9%(c) | | | | | | | 61,544,136 | |
| Other assets in excess of liabilities — 0.1% | | | | | | | 37,813 | |
| NET ASSETS — 100.0% | | | | | | $ | 61,581,949 | |
| (a) | Non-income producing security. |
| (b) | Rate disclosed is the seven day yield as of December 31, 2019. |
| (c) | See Federal Tax Information listed in the Notes to the Financial Statements. |
| PLC | Public Limited Company |
See Notes to Financial Statements
| Financial Statements | Walden SMID Cap Fund |
Statement of Assets and Liabilities
December 31, 2019
| Assets: | | | |
| Investments, at fair value (cost $44,917,460) | | $ | 61,544,136 | |
| Dividends receivable | | | 61,734 | |
| Receivable for capital shares issued | | | 27,665 | |
| Prepaid expenses | | | 9,152 | |
| Total Assets | | | 61,642,687 | |
| Liabilities: | | | | |
| Payable for capital shares redeemed | | | 6,509 | |
| Accrued expenses and other liabilities: | | | | |
| Investment adviser | | | 36,970 | |
| Administration and accounting | | | 1,289 | |
| Custodian | | | 566 | |
| Shareholder servicing fees | | | 3,737 | |
| Transfer agent | | | 4,442 | |
| Trustee | | | 70 | |
| Other | | | 7,155 | |
| Total Liabilities | | | 60,738 | |
| Net Assets | | $ | 61,581,949 | |
| Composition of Net Assets: | | | | |
| Paid in capital | | $ | 44,778,780 | |
| Total distributable earnings/(loss) | | | 16,803,169 | |
| Net Assets | | $ | 61,581,949 | |
| Shares outstanding (par value $0.01, unlimited number of shares authorized) | | | 3,402,315 | |
| Net Asset Value, Offering Price and Redemption price per share | | $ | 18.10 | |
Statement of Operations
For the year ended December 31, 2019
| Investment Income: | | | |
| Dividends | | $ | 894,580 | |
| Total Investment Income | | | 894,580 | |
| Expenses: | | | | |
| Investment adviser | | | 416,756 | |
| Administration and accounting | | | 37,933 | |
| Chief compliance officer | | | 4,721 | |
| Custodian | | | 7,650 | |
| Shareholder servicing | | | 45,611 | |
| Transfer agency | | | 36,047 | |
| Trustee | | | 3,620 | |
| Other | | | 39,868 | |
| Total expenses before fee reductions | | | 592,206 | |
| Fees contractually reduced by the investment adviser | | | (36,311 | ) |
| Net Expenses | | | 555,895 | |
| Net Investment Income | | | 338,685 | |
| Net Realized/Unrealized Gains (Losses) from Investments: | | | | |
| Net realized gains from investment transactions | | | 2,742,242 | |
| Change in unrealized appreciation/depreciation from investments | | | 9,402,172 | |
| Net realized/unrealized gains (losses) from investments | | | 12,144,414 | |
| Change in Net Assets Resulting from Operations | | $ | 12,483,099 | |
See Notes to Financial Statements
| Financial Statements | Walden SMID Cap Fund |
Statements of Changes in Net Assets
| | | For the year ended | | | For the year ended | |
| | | December 31, 2019 | | | December 31, 2018 | |
| Investment Activities: | | | | | | | | |
| Operations: | | | | | | | | |
| Net investment income | | $ | 338,685 | | | $ | 274,446 | |
| Net realized gains from investment transactions | | | 2,742,242 | | | | 1,583,837 | |
| Change in unrealized appreciation/depreciation from investments | | | 9,402,172 | | | | (4,903,119 | ) |
| Change in Net Assets Resulting from Operations | | | 12,483,099 | | | | (3,044,836 | ) |
| Distributions to shareholders: | | | | | | | | |
| Total Distributions | | | (3,068,662 | ) | | | (2,123,241 | ) |
| Change in Net Assets Resulting from distributions to shareholders | | | (3,068,662 | ) | | | (2,123,241 | ) |
| Capital Share Transactions: | | | | | | | | |
| Proceeds from shares issued | | | 8,038,546 | | | | 13,129,291 | |
| Dividends reinvested | | | 2,312,967 | | | | 1,610,869 | |
| Cost of shares redeemed | | | (5,804,826 | ) | | | (7,583,025 | ) |
| Change in Net Assets Resulting from Capital Share Transactions | | | 4,546,687 | | | | 7,157,135 | |
| Change in Net Assets | | | 13,961,124 | | | | 1,989,058 | |
| Net Assets: | | | | | | | | |
| Beginning of period | | | 47,620,825 | | | | 45,631,767 | |
| End of period | | $ | 61,581,949 | | | $ | 47,620,825 | |
| Share Transactions: | | | | | | | | |
| Issued | | | 459,149 | | | | 772,168 | |
| Reinvested | | | 130,529 | | | | 101,825 | |
| Redeemed | | | (337,040 | ) | | | (458,240 | ) |
| Change in shares | | | 252,638 | | | | 415,753 | |
See Notes to Financial Statements
| Financial Statements | Walden SMID Cap Fund |
Financial Highlights
Selected data for a share outstanding throughout the periods indicated.
| | | | | | | | | | | | For the nine | | | | | | | |
| | | For the year | | | For the year | | | For the year | | | months | | | For the year | | | For the year | |
| | | ended | | | ended | | | ended | | | ended | | | ended | | | ended | |
| | | December 31, | | | December 31, | | | December 31, | | | December 31, | | | March 31, | | | March 31, | |
| | | 2019 | | | 2018 | | | 2017 | | | 2016 | | | 2016 | | | 2015 | |
| Net Asset Value, Beginning of Period | | $ | 15.12 | | | $ | 16.69 | | | $ | 14.60 | | | $ | 13.40 | | | $ | 14.70 | | | $ | 13.97 | |
| | | | | | | | | | | | | | | | | | | | | | | | | |
| Investment Activities: | | | | | | | | | | | | | | | | | | | | | | | | |
| Operations: | | | | | | | | | | | | | | | | | | | | | | | | |
| Net investment income | | | 0.10 | | | | 0.09 | | | | 0.07 | | | | 0.12 | | | | 0.04 | | | | 0.01 | |
| Net realized/unrealized gains (losses) from investments | | | 3.83 | | | | (0.99 | ) | | | 2.40 | | | | 1.87 | | | | (0.44 | ) | | | 1.03 | |
| Total from investment activities | | | 3.93 | | | | (0.90 | ) | | | 2.47 | | | | 1.99 | | | | (0.40 | ) | | | 1.04 | |
| Dividends: | | | | | | | | | | | | | | | | | | | | | | | | |
| Net investment income | | | (0.10 | ) | | | (0.09 | ) | | | (0.09 | ) | | | (0.14 | ) | | | (0.02 | ) | | | (0.01 | ) |
| Net realized gains from investment transactions | | | (0.85 | ) | | | (0.58 | ) | | | (0.29 | ) | | | (0.65 | ) | | | (0.88 | ) | | | (0.30 | ) |
| Total dividends | | | (0.95 | ) | | | (0.67 | ) | | | (0.38 | ) | | | (0.79 | ) | | | (0.90 | ) | | | (0.31 | ) |
| | | | | | | | | | | | | | | | | | | | | | | | | |
| Net Asset Value, End of Period | | $ | 18.10 | | | $ | 15.12 | | | $ | 16.69 | | | $ | 14.60 | | | $ | 13.40 | | | $ | 14.70 | |
| | | | | | | | | | | | | | | | | | | | | | | | | |
| Total Return | | | 26.12 | % | | | (5.59 | )% | | | 16.94 | % | | | 14.73 | %(a) | | | (2.47 | )% | | | 7.60 | % |
| | | | | | | | | | | | | | | | | | | | | | | | | |
| Ratios/Supplemental Data: | | | | | | | | | | | | | | | | | | | | | | | | |
| Net assets at end of period (000’s) | | $ | 61,582 | | | $ | 47,621 | | | $ | 45,632 | | | $ | 38,128 | | | $ | 32,452 | | | $ | 28,369 | |
| Ratio of net expenses to average net assets | | | 1.00 | % | | | 1.00 | % | | | 1.00 | % | | | 1.00 | %(b) | | | 1.00 | % | | | 1.00 | % |
| Ratio of net investment income to average net assets | | | 0.61 | % | | | 0.52 | % | | | 0.48 | % | | | 1.12 | %(b) | | | 0.30 | % | | | 0.08 | % |
| Ratio of expenses (before fee reductions or recoupment of fees previously reimbursed by the investment adviser) to average net assets(c) | | | 1.07 | % | | | 1.08 | % | | | 1.08 | % | | | 1.12 | %(b) | | | 1.15 | % | | | 1.12 | % |
| Portfolio turnover rate | | | 29.75 | % | | | 18.61 | % | | | 31.92 | % | | | 20.85 | %(a) | | | 43.24 | % | | | 33.61 | % |
| (a) | Not annualized for periods less than one year. |
| (b) | Annualized for periods less than one year. |
| (c) | During the periods, certain fees were reduced. If such fee reduction had not occurred, the ratio would have been as indicated. |
See Notes to Financial Statements
| Schedule of Portfolio Investments | Walden Small Cap Fund |
December 31, 2019
| Security Description | | Shares | | | Fair Value ($) | |
| Common Stocks (97.9%) | | | | | | | | |
| Consumer Discretionary (12.4%) | | | | | | | | |
| Carter’s, Inc. | | | 11,200 | | | | 1,224,608 | |
| Cheesecake Factory, Inc. | | | 29,675 | | | | 1,153,171 | |
| Choice Hotels International, Inc. | | | 24,700 | | | | 2,554,720 | |
| Dorman Products, Inc. (a) | | | 15,200 | | | | 1,150,944 | |
| Dunkin’ Brands Group, Inc. | | | 27,200 | | | | 2,054,688 | |
| Gentherm, Inc. (a) | | | 20,525 | | | | 911,105 | |
| Monro, Inc. | | | 19,900 | | | | 1,556,180 | |
| Nordstrom, Inc. | | | 42,300 | | | | 1,731,339 | |
| Texas Roadhouse, Inc. | | | 32,500 | | | | 1,830,400 | |
| Williams Sonoma, Inc. | | | 23,950 | | | | 1,758,888 | |
| | | | | | | | 15,926,043 | |
| Consumer Staples (3.6%) | | | | | | | | |
| Flowers Foods, Inc. | | | 83,900 | | | | 1,823,986 | |
| Lancaster Colony Corp. | | | 9,800 | | | | 1,568,980 | |
| Tootsie Roll Industries, Inc. | | | 34,400 | | | | 1,174,416 | |
| | | | | | | | 4,567,382 | |
| Energy (2.5%) | | | | | | | | |
| Dril-Quip, Inc. (a) | | | 23,925 | | | | 1,122,322 | |
| Helmerich & Payne, Inc. | | | 32,500 | | | | 1,476,475 | |
| Newpark Resources, Inc. (a) | | | 87,000 | | | | 545,490 | |
| | | | | | | | 3,144,287 | |
| Financials (17.2%) | | | | | | | | |
| 1st Source Corp. | | | 20,000 | | | | 1,037,600 | |
| Bank of Hawaii Corp. | | | 20,100 | | | | 1,912,715 | |
| Bank of Marin BanCorp | | | 8,000 | | | | 360,400 | |
| Bridge BanCorp, Inc. | | | 15,225 | | | | 510,494 | |
| Bryn Mawr Bank Corp. | | | 18,025 | | | | 743,351 | |
| Camden National Corp. | | | 14,875 | | | | 685,143 | |
| Cohen & Steers, Inc. | | | 29,600 | | | | 1,857,696 | |
| Commerce Bancshares, Inc. | | | 25,100 | | | | 1,705,293 | |
| CVB Financial Corp. | | | 48,125 | | | | 1,038,538 | |
| Eaton Vance Corp. | | | 41,500 | | | | 1,937,635 | |
| First Hawaiian, Inc. | | | 42,700 | | | | 1,231,895 | |
| German American BanCorp | | | 15,375 | | | | 547,658 | |
| Independent Bank Corp. | | | 10,300 | | | | 857,475 | |
| Lakeland Financial Corp. | | | 29,625 | | | | 1,449,551 | |
| Morningstar, Inc. | | | 10,900 | | | | 1,649,279 | |
| Tompkins Financial Corp. | | | 13,000 | | | | 1,189,500 | |
| UMB Financial Corp. | | | 20,300 | | | | 1,393,392 | |
| Washington Federal, Inc. | | | 26,625 | | | | 975,806 | |
| Washington Trust BanCorp, Inc. | | | 17,650 | | | | 949,394 | |
| | | | | | | | 22,032,815 | |
| Health Care (15.2%) | | | | | | | | |
| Anika Therapeutics, Inc. (a) | | | 17,175 | | | | 890,524 | |
| Atrion Corp. | | | 1,450 | | | | 1,089,675 | |
| Bruker Corp. | | | 40,700 | | | | 2,074,479 | |
| Cantel Medical Corp. | | | 29,600 | | | | 2,098,640 | |
| Chemed Corp. | | | 6,375 | | | | 2,800,282 | |
| CorVel Corp. (a) | | | 20,550 | | | | 1,795,248 | |
| Ensign Group, Inc. | | | 21,675 | | | | 983,395 | |
| Globus Medical, Inc., Class A (a) | | | 34,100 | | | | 2,007,808 | |
| Haemonetics Corp. (a) | | | 9,675 | | | | 1,111,658 | |
| Hill-Rom Holdings, Inc. | | | 20,100 | | | | 2,281,953 | |
| Premier, Inc. (a) | | | 34,400 | | | | 1,303,072 | |
| U.S. Physical Therapy, Inc. | | | 9,400 | | | | 1,074,890 | |
| | | | | | | | 19,511,624 | |
| Industrials (18.1%) | | | | | | | | |
| Applied Industrial Technologies, Inc. | | | 23,500 | | | | 1,567,215 | |
| Donaldson Co., Inc. | | | 41,000 | | | | 2,362,419 | |
| Forward Air Corp. | | | 24,600 | | | | 1,720,770 | |
| Franklin Electric Co., Inc. | | | 36,200 | | | | 2,074,984 | |
| Herman Miller, Inc. | | | 19,525 | | | | 813,216 | |
| Hub Group, Inc., Class A (a) | | | 32,600 | | | | 1,672,054 | |
| Kadant, Inc. | | | 10,600 | | | | 1,116,604 | |
| Korn Ferry | | | 23,950 | | | | 1,015,480 | |
| Landstar System, Inc. | | | 16,400 | | | | 1,867,468 | |
| Lincoln Electric Holdings, Inc. | | | 21,200 | | | | 2,050,676 | |
| Tennant Co. | | | 17,500 | | | | 1,363,600 | |
| UniFirst Corp. | | | 12,100 | | | | 2,443,958 | |
| Valmont Industries, Inc. | | | 8,125 | | | | 1,216,963 | |
| Watts Water Technologies, Inc., Class A | | | 18,150 | | | | 1,810,644 | |
| | | | | | | | 23,096,051 | |
| Information Technology (14.0%) | | | | | | | | |
| Badger Meter, Inc. | | | 16,700 | | | | 1,084,331 | |
| Coherent, Inc. (a) | | | 9,975 | | | | 1,659,341 | |
| CSG Systems International, Inc. | | | 27,325 | | | | 1,414,889 | |
| ExlService Holdings, Inc. (a) | | | 20,200 | | | | 1,403,092 | |
| InterDigital, Inc. | | | 18,100 | | | | 986,269 | |
| Manhattan Associates, Inc. (a) | | | 26,000 | | | | 2,073,500 | |
| NETGEAR, Inc. (a) | | | 29,525 | | | | 723,658 | |
| NIC, Inc. | | | 94,600 | | | | 2,114,310 | |
| Power Integrations, Inc. | | | 20,400 | | | | 2,017,764 | |
| Progress Software Corp. | | | 44,400 | | | | 1,844,820 | |
| Tech Data Corp. (a) | | | 9,000 | | | | 1,292,400 | |
| Teradata Corp. (a) | | | 50,000 | | | | 1,338,500 | |
| | | | | | | | 17,952,874 | |
| Materials (4.1%) | | | | | | | | |
| Minerals Technologies, Inc. | | | 30,600 | | | | 1,763,478 | |
| Sensient Technologies Corp. | | | 26,600 | | | | 1,757,994 | |
| Silgan Holdings, Inc. | | | 56,400 | | | | 1,752,912 | |
| | | | | | | | 5,274,384 | |
| Real Estate (5.8%) | | | | | | | | |
| American Campus Communities, Inc. | | | 20,250 | | | | 952,358 | |
| CoreSite Realty Corp. | | | 17,600 | | | | 1,973,312 | |
| CubeSmart | | | 39,200 | | | | 1,234,016 | |
| Highwoods Properties, Inc. | | | 42,300 | | | | 2,068,893 | |
| Ryman Hospitality Properties, Inc. | | | 13,800 | | | | 1,195,908 | |
| | | | | | | | 7,424,487 | |
| | | | | | | | | |
| Utilities (5.0%) | | | | | | | | |
| Chesapeake Utilities Corp. | | | 16,900 | | | | 1,619,527 | |
| Hawaiian Electric Industries, Inc. | | | 27,500 | | | | 1,288,650 | |
| New Jersey Resources Corp. | | | 36,600 | | | | 1,631,262 | |
| ONE Gas, Inc. | | | 20,200 | | | | 1,890,114 | |
| | | | | | | | 6,429,553 | |
| | | | | | | | | |
| TOTAL COMMON STOCKS (Cost $92,477,302) | | | | | | | 125,359,500 | |
| | | | | | | | | |
| Investment Companies (1.7%) | | | | | | | | |
| | | | | | | | | |
| JPMorgan U.S. Government Money Market Fund, Capital Shares, 1.49% (b) | | | 2,144,929 | | | | 2,144,929 | |
| TOTAL INVESTMENT COMPANIES (Cost $2,144,929) | | | �� | | | | 2,144,929 | |
| | | | | | | | | |
| Total Investments (Cost $94,622,231) — 99.6%(c) | | | | | | | 127,504,429 | |
| Other assets in excess of liabilities — 0.4% | | | | | | | 466,559 | |
| NET ASSETS — 100.0% | | | | | | $ | 127,970,988 | |
| (a) | Non-income producing security. |
| (b) | Rate disclosed is the seven day yield as of December 31, 2019. |
| (c) | See Federal Tax Information listed in the Notes to the Financial Statements. |
See Notes to Financial Statements
| Financial Statements | Walden Small Cap Fund |
Statement of Assets and Liabilities
December 31, 2019
| Assets: | | | |
| Investments, at fair value (cost $94,622,231) | | $ | 127,504,429 | |
| Dividends receivable | | | 116,384 | |
| Receivable for capital shares issued | | | 475,077 | |
| Prepaid expenses | | | 15,132 | |
| Total Assets | | | 128,111,022 | |
| Liabilities: | | | | |
| Payable for capital shares redeemed | | | 36,622 | |
| Accrued expenses and other liabilities: | | | | |
| Investment adviser | | | 71,933 | |
| Administration and accounting | | | 2,522 | |
| Custodian | | | 979 | |
| Shareholder servicing fees | | | 10,086 | |
| Transfer agent | | | 4,544 | |
| Trustee | | | 175 | |
| Other | | | 13,173 | |
| Total Liabilities | | | 140,034 | |
| Net Assets | | $ | 127,970,988 | |
| Composition of Net Assets: | | | | |
| Paid in capital | | $ | 94,322,193 | |
| Total distributable earnings/(loss) | | | 33,648,795 | |
| Net Assets | | $ | 127,970,988 | |
| Shares outstanding (par value $0.01, unlimited number of shares authorized) | | | 6,041,038 | |
| Net Asset Value, Offering Price and Redemption price per share | | $ | 21.18 | |
Statement of Operations
For the year ended December 31, 2019
| Investment Income: | | | |
| Dividends | | $ | 1,719,527 | |
| Total Investment Income | | | 1,719,527 | |
| Expenses: | | | | |
| Investment adviser | | | 786,934 | |
| Administration and accounting | | | 69,176 | |
| Chief compliance officer | | | 8,545 | |
| Custodian | | | 14,116 | |
| Shareholder servicing | | | 117,152 | |
| Transfer agency | | | 36,922 | |
| Trustee | | | 6,520 | |
| Other | | | 57,345 | |
| Total expenses before fee reductions | | | 1,096,710 | |
| Fees contractually reduced by the investment adviser | | | (46,849 | ) |
| Net Expenses | | | 1,049,861 | |
| Net Investment Income | | | 669,666 | |
| Net Realized/Unrealized Gains (Losses) from Investments: | | | | |
| Net realized gains from investment transactions | | | 5,482,240 | |
| Change in unrealized appreciation/depreciation from investments | | | 19,428,565 | |
| Net realized/unrealized gains (losses) from investments | | | 24,910,805 | |
| Change in Net Assets Resulting from Operations | | $ | 25,580,471 | |
See Notes to Financial Statements
| Financial Statements | Walden Small Cap Fund |
Statements of Changes in Net Assets
| | | For the year ended | | | For the year ended | |
| | | December 31, 2019 | | | December 31, 2018 | |
| Investment Activities: | | | | | | | | |
| Operations: | | | | | | | | |
| Net investment income | | $ | 669,666 | | | $ | 424,979 | |
| Net realized gains from investment transactions | | | 5,482,240 | | | | 5,465,977 | |
| Change in unrealized appreciation/depreciation from investments | | | 19,428,565 | | | | (11,223,623 | ) |
| Change in Net Assets Resulting from Operations | | | 25,580,471 | | | | (5,332,667 | ) |
| Distributions to shareholders: | | | | | | | | |
| Total Distributions | | | (5,983,053 | ) | | | (4,848,431 | ) |
| Change in Net Assets Resulting from distributions to shareholders | | | (5,983,053 | ) | | | (4,848,431 | ) |
| Capital Share Transactions: | | | | | | | | |
| Proceeds from shares issued | | | 32,367,481 | | | | 8,254,682 | |
| Dividends reinvested | | | 5,089,564 | | | | 4,120,461 | |
| Cost of shares redeemed | | | (12,160,013 | ) | | | (17,260,949 | ) |
| Change in Net Assets Resulting from Capital Share Transactions | | | 25,297,032 | | | | (4,885,806 | ) |
| Change in Net Assets | | | 44,894,450 | | | | (15,066,904 | ) |
| Net Assets: | | | | | | | | |
| Beginning of period | | | 83,076,538 | | | | 98,143,442 | |
| End of period | | $ | 127,970,988 | | | $ | 83,076,538 | |
| Share Transactions: | | | | | | | | |
| Issued | | | 1,572,261 | | | | 407,232 | |
| Reinvested | | | 245,280 | | | | 227,650 | |
| Redeemed | | | (594,242 | ) | | | (873,346 | ) |
| Change in shares | | | 1,223,299 | | | | (238,464 | ) |
See Notes to Financial Statements
| Financial Statements | Walden Small Cap Fund |
Financial Highlights
Selected data for a share outstanding throughout the periods indicated.
| | | | | | | | | | | | For the nine | | | | | | | |
| | | For the year | | | For the year | | | For the year | | | months | | | For the year | | | For the year | |
| | | ended | | | ended | | | ended | | | ended | | | ended | | | ended | |
| | | December 31, | | | December 31, | | | December 31, | | | December 31, | | | March 31, | | | March 31, | |
| | | 2019 | | | 2018 | | | 2017 | | | 2016 | | | 2016 | | | 2015 | |
| Net Asset Value, Beginning of Period | | $ | 17.24 | | | $ | 19.41 | | | $ | 18.46 | | | $ | 16.45 | | | $ | 19.66 | | | $ | 20.43 | |
| | | | | | | | | | | | | | | | | | | | | | | | | |
| Investment Activities: | | | | | | | | | | | | | | | | | | | | | | | | |
| Operations: | | | | | | | | | | | | | | | | | | | | | | | | |
| Net investment income | | | 0.11 | | | | 0.09 | | | | 0.09 | | | | 0.16 | | | | 0.08 | | | | 0.04 | |
| Net realized/unrealized gains (losses) from investments | | | 4.89 | | | | (1.21 | ) | | | 2.02 | | | | 2.58 | | | | (0.38 | ) | | | 0.66 | |
| Total from investment activities | | | 5.00 | | | | (1.12 | ) | | | 2.11 | | | | 2.74 | | | | (0.30 | ) | | | 0.70 | |
| Dividends: | | | | | | | | | | | | | | | | | | | | | | | | |
| Net investment income | | | (0.09 | ) | | | (0.10 | ) | | | (0.10 | ) | | | (0.17 | ) | | | (0.07 | ) | | | (0.02 | ) |
| Net realized gains from investment transactions | | | (0.97 | ) | | | (0.95 | ) | | | (1.06 | ) | | | (0.56 | ) | | | (2.84 | ) | | | (1.45 | ) |
| Total dividends | | | (1.06 | ) | | | (1.05 | ) | | | (1.16 | ) | | | (0.73 | ) | | | (2.91 | ) | | | (1.47 | ) |
| | | | | | | | | | | | | | | | | | | | | | | | | |
| Net Asset Value, End of Period | | $ | 21.18 | | | $ | 17.24 | | | $ | 19.41 | | | $ | 18.46 | | | $ | 16.45 | | | $ | 19.66 | |
| | | | | | | | | | | | | | | | | | | | | | | | | |
| Total Return | | | 29.15 | % | | | (6.05 | )% | | | 11.50 | % | | | 16.57 | %(a) | | | (0.80 | )% | | | 3.86 | % |
| | | | | | | | | | | | | | | | | | | | | | | | | |
| Ratios/Supplemental Data: | | | | | | | | | | | | | | | | | | | | | | | | |
| Net assets at end of period (000’s) | | $ | 127,971 | | | $ | 83,077 | | | $ | 98,143 | | | $ | 85,199 | | | $ | 69,754 | | | $ | 87,740 | |
| Ratio of net expenses to average net assets | | | 1.00 | % | | | 1.00 | % | | | 1.00 | % | | | 1.00 | %(b) | | | 1.00 | % | | | 1.00 | % |
| Ratio of net investment income to average net assets | | | 0.64 | % | | | 0.44 | % | | | 0.47 | % | | | 1.14 | %(b) | | | 0.45 | % | | | 0.17 | % |
| Ratio of expenses (before fee reductions or recoupment of fees previously reimbursed by the investment adviser) to average net assets(c) | | | 1.04 | % | | | 1.05 | % | | | 1.03 | % | | | 1.06 | %(b) | | | 1.06 | % | | | 1.01 | % |
| Portfolio turnover rate | | | 22.88 | % | | | 22.47 | % | | | 27.16 | % | | | 14.71 | %(a) | | | 38.05 | % | | | 28.74 | % |
| (a) | Not annualized for periods less than one year. |
| (b) | Annualized for periods less than one year. |
| (c) | During the periods, certain fees were reduced. If such fee reduction had not occurred, the ratio would have been as indicated. |
See Notes to Financial Statements
| Schedule of Portfolio Investments | Walden International Equity Fund |
December 31, 2019
| Security Description | | Shares | | | Fair Value ($) | |
| Common Stocks (99.2%) | | | | | | | | |
| Australia (6.7%) | | | | | | | | |
| Australia & New Zealand Banking Group Ltd. | | | 27,299 | | | | 472,843 | |
| Brambles Ltd. | | | 34,113 | | | | 281,119 | |
| Commonwealth Bank of Australia | | | 8,745 | | | | 491,529 | |
| CSL Ltd. | | | 4,058 | | | | 787,374 | |
| Origin Energy Ltd. | | | 76,481 | | | | 454,522 | |
| Telstra Corp. Ltd. | | | 186,700 | | | | 465,028 | |
| Westpac Banking Corp. | | | 24,925 | | | | 424,661 | |
| Woodside Petroleum Ltd. | | | 19,197 | | | | 464,151 | |
| | | | | | | | 3,841,227 | |
| Belgium (0.5%) | | | | | | | | |
| Colruyt SA | | | 5,856 | | | | 305,644 | |
| | | | | | | | 305,644 | |
| Canada (8.5%) | | | | | | | | |
| Bank of Montreal | | | 6,130 | | | | 475,141 | |
| BCE, Inc. | | | 11,100 | | | | 514,307 | |
| Canadian National Railway Co. | | | 5,074 | | | | 459,059 | |
| Great-West Lifeco, Inc. | | | 12,649 | | | | 324,019 | |
| Intact Financial Corp. | | | 4,300 | | | | 465,038 | |
| Magna International, Inc. | | | 8,900 | | | | 488,047 | |
| Metro, Inc. | | | 13,400 | | | | 553,070 | |
| Royal Bank of Canada | | | 6,484 | | | | 513,117 | |
| The Bank of Nova Scotia | | | 8,900 | | | | 502,784 | |
| The Toronto-Dominion Bank | | | 9,285 | | | | 520,816 | |
| | | | | | | | 4,815,398 | |
| Denmark (1.8%) | | | | | | | | |
| Novo Nordisk A/S | | | 9,858 | | | | 571,842 | |
| Novozymes A/S | | | 9,400 | | | | 460,290 | |
| | | | | | | | 1,032,132 | |
| Finland (1.5%) | | | | | | | | |
| Kone OYJ | | | 7,661 | | | | 500,805 | |
| Nordea Bank AB | | | 47,200 | | | | 381,932 | |
| | | | | | | | 882,737 | |
| France (9.7%) | | | | | | | | |
| Air Liquide SA | | | 5,290 | | | | 751,786 | |
| Danone SA | | | 8,300 | | | | 688,871 | |
| Dassault Systemes | | | 2,927 | | | | 482,754 | |
| Essilor International SA | | | 2,907 | | | | 444,029 | |
| Imerys SA | | | 9,983 | | | | 423,025 | |
| Legrand SA | | | 6,214 | | | | 506,977 | |
| L’Oreal SA | | | 2,400 | | | | 712,677 | |
| Publicis Groupe SA | | | 9,053 | | | | 409,873 | |
| Schneider Electric SE | | | 6,500 | | | | 668,585 | |
| Societe BIC SA | | | 6,100 | | | | 424,769 | |
| | | | | | | | 5,513,346 | |
| Germany (8.7%) | | | | | | | | |
| Allianz SE | | | 1,845 | | | | 452,375 | |
| Beiersdorf AG | | | 2,649 | | | | 316,948 | |
| Deutsche Boerse AG | | | 3,056 | | | | 480,571 | |
| Fresenius SE & Co. KGaA | | | 7,758 | | | | 437,872 | |
| Fuchs Petrolub SE | | | 5,992 | | | | 298,085 | |
| Hannover Rueck SE | | | 2,400 | | | | 463,975 | |
| Henkel AG & Co. KGaA | | | 4,900 | | | | 461,353 | |
| Hugo Boss AG | | | 6,200 | | | | 300,808 | |
| Merck KGaA | | | 3,586 | | | | 424,319 | |
| Muenchener Rueckversicherungs-Gesellschaft AG | | | 1,600 | | | | 471,982 | |
| SAP AG | | | 6,310 | | | | 850,325 | |
| | | | | | | | 4,958,613 | |
| Hong Kong (3.4%) | | | | | | | | |
| Hang Lung Properties Ltd. | | | 155,400 | | | | 339,748 | |
| Hang Seng Bank Ltd. | | | 17,220 | | | | 356,370 | |
| Hysan Development Co. Ltd. | | | 86,000 | | | | 338,397 | |
| MTR Corp. Ltd. | | | 83,900 | | | | 497,370 | |
| Sino Land Co., Ltd. | | | 268,000 | | | | 390,500 | |
| | | | | | | | 1,922,385 | |
| Ireland (0.8%) | | | | | | | | |
| Experian PLC | | | 14,071 | | | | 475,846 | |
| | | | | | | | 475,846 | |
| Israel (0.8%) | | | | | | | | |
| Nice Systems Ltd.(a) | | | 3,100 | | | | 480,748 | |
| | | | | | | | 480,748 | |
| Italy (1.5%) | | | | | | | | |
| Snam SpA | | | 78,869 | | | | 415,530 | |
| Terna Rete Elettrica Nazionale SpA | | | 62,748 | | | | 419,810 | |
| | | | | | | | 835,340 | |
| Japan (22.2%) | | | | | | | | |
| Astellas Pharma, Inc. | | | 27,300 | | | | 466,401 | |
| Benesse Holdings, Inc. | | | 12,560 | | | | 330,302 | |
| Canon, Inc. | | | 16,175 | | | | 441,170 | |
| Central Japan Railway Co. | | | 2,115 | | | | 425,073 | |
| Chugai Pharmaceutical Co. Ltd. | | | 5,300 | | | | 488,218 | |
| Daiwa House Industry Co. Ltd. | | | 16,190 | | | | 501,660 | |
| Denso Corp. | | | 7,000 | | | | 315,808 | |
| East Japan Railway Co. | | | 4,200 | | | | 379,161 | |
| Fast Retailing Co. Ltd. | | | 805 | | | | 477,220 | |
| INPEX Corp. | | | 49,200 | | | | 513,298 | |
| JSR Corp. | | | 17,200 | | | | 314,414 | |
| Kao Corp. | | | 5,200 | | | | 428,945 | |
| Kurita Water Industries Ltd. | | | 10,900 | | | | 322,984 | |
| Mitsubishi Estate Co. Ltd. | | | 25,500 | | | | 487,556 | |
| Nippon Telegraph & Telephone Corp. | | | 22,800 | | | | 577,600 | |
| Nitto Denko Corp. | | | 7,200 | | | | 404,012 | |
| Nomura Research Institute Ltd. | | | 23,364 | | | | 502,763 | |
| NTT DOCOMO, Inc. | | | 14,310 | | | | 399,953 | |
| Oracle Corporation Japan | | | 3,700 | | | | 336,431 | |
| Oriental Land Co. Ltd. | | | 3,765 | | | | 513,924 | |
| Sumitomo Mitsui Financial Group, Inc. | | | 14,850 | | | | 546,736 | |
| Sysmex Corp. | | | 5,900 | | | | 401,087 | |
| Terumo Corp. | | | 13,600 | | | | 480,548 | |
| The Chiba Bank Ltd. | | | 70,900 | | | | 407,717 | |
| The Hachijuni Bank Ltd. | | | 89,800 | | | | 391,102 | |
| Tokio Marine Holdings, Inc. | | | 7,000 | | | | 390,905 | |
| Toyota Motor Corp. | | | 9,340 | | | | 657,718 | |
| Trend Micro, Inc.(a) | | | 7,400 | | | | 378,734 | |
| Yamato Holdings Co. Ltd. | | | 19,500 | | | | 333,518 | |
| | | | | | | | 12,614,958 | |
| Luxembourg (0.6%) | | | | | | | | |
| Tenaris SA | | | 32,476 | | | | 367,245 | |
| | | | | | | | 367,245 | |
| Netherlands (2.7%) | | | | | | | | |
| Koninklijke Ahold Delhaize NV | | | 23,600 | | | | 591,410 | |
| Koninklijke Vopak NV | | | 8,600 | | | | 466,846 | |
| Wolters Kluwer NV | | | 6,754 | | | | 493,629 | |
| | | | | | | | 1,551,885 | |
| Norway (0.8%) | | | | | | | | |
| Statoil ASA | | | 23,542 | | | | 470,966 | |
| | | | | | | | 470,966 | |
| Singapore (1.4%) | | | | | | | | |
| ComfortDelGro Corp. Ltd. | | | 209,350 | | | | 370,902 | |
| Singapore Exchange Ltd. | | | 67,500 | | | | 445,385 | |
| | | | | | | | 816,287 | |
See Notes to Financial Statements
| Schedule of Portfolio Investments (Cont.) | Walden International Equity Fund |
December 31, 2019
| Security Description | | Shares | | | Fair Value ($) | |
| Common Stocks, Continued | | | | | | | | |
| Spain (2.4%) | | | | | | | | |
| Enagas SA | | | 13,235 | | | | 338,076 | |
| Gas Natural SDG SA | | | 18,400 | | | | 463,164 | |
| Inditex SA | | | 15,243 | | | | 539,905 | |
| | | | | | | | 1,341,145 | |
| Sweden (2.3%) | | | | | | | | |
| Atlas Copco AB, Class A | | | 10,300 | | | | 410,714 | |
| Hennes & Mauritz AB | | | 19,766 | | | | 401,925 | |
| Svenska Handelsbanken AB | | | 44,986 | | | | 484,531 | |
| | | | | | | | 1,297,170 | |
| Switzerland (8.6%) | | | | | | | | |
| ABB Ltd. | | | 18,018 | | | | 435,060 | |
| Cie Financiere Richemont SA | | | 5,400 | | | | 423,974 | |
| Givaudan SA | | | 181 | | | | 566,597 | |
| Nestle SA | | | 8,100 | | | | 877,707 | |
| Roche Holding AG | | | 3,698 | | | | 1,199,355 | |
| SGS SA | | | 175 | | | | 479,153 | |
| Sonova Holding AG-REG | | | 1,830 | | | | 418,765 | |
| Zurich Insurance Group AG | | | 1,200 | | | | 492,270 | |
| | | | | | | | 4,892,881 | |
| United Kingdom (14.3%) | | | | | | | | |
| Admiral Group PLC | | | 13,700 | | | | 419,491 | |
| Compass Group PLC | | | 25,000 | | | | 626,176 | |
| Croda International PLC | | | 5,575 | | | | 378,590 | |
| Investec PLC | | | 60,916 | | | | 358,679 | |
| ITV PLC | | | 155,179 | | | | 311,423 | |
| Johnson Matthey PLC | | | 11,400 | | | | 453,520 | |
| London Stock Exchange Group PLC | | | 6,576 | | | | 679,145 | |
| Marks & Spencer Group PLC | | | 141,600 | | | | 401,501 | |
| National Grid PLC | | | 47,157 | | | | 592,529 | |
| Next PLC | | | 4,590 | | | | 427,313 | |
| Reckitt Benckiser Group PLC | | | 5,600 | | | | 454,684 | |
| RELX PLC | | | 19,100 | | | | 481,766 | |
| Sage Group PLC | | | 41,182 | | | | 409,139 | |
| Schroders PLC | | | 6,790 | | | | 301,905 | |
| Smith & Nephew PLC | | | 22,159 | | | | 535,204 | |
| Smiths Group PLC | | | 18,900 | | | | 422,489 | |
| Unilever PLC | | | 9,200 | | | | 526,613 | |
| WPP PLC | | | 22,392 | | | | 315,085 | |
| | | | | | | | 8,095,252 | |
| | | | | | | | | |
| TOTAL COMMON STOCKS (Cost $49,912,752) | | | | | | | 56,511,205 | |
| | | | | | | | | |
| Investment Companies (1.1%) | | | | | | | | |
| | | | | | | | | |
| JPMorgan U.S. Government Money Market Fund, Capital Shares, 1.49% (b) | | | 614,788 | | | | 614,788 | |
| TOTAL INVESTMENT COMPANIES (Cost $614,788) | | | | | | | 614,788 | |
| | | | | | | | | |
| Total Investments (Cost $50,527,540) — 100.3% (c) | | | | | | | 57,125,993 | |
| Liabilities in excess of other assets — (0.3)% | | | | | | | (166,318 | ) |
| NET ASSETS — 100.0% | | | | | | $ | 56,959,675 | |
| (a) | Non-income producing security. |
| (b) | Rate disclosed is the seven day yield as of December 31, 2019. |
| (c) | See Federal Tax Information listed in the Notes to the Financial Statements. |
| PLC | Public Limited Company |
The Fund invested, as a percentage of net assets at value, in the following industries as of December 31, 2019:
| | | Percentage of Total | |
| Industry | | Net Assets | |
| Financials | | | 20.6 | % |
| Industrials | | | 14.7 | |
| Health Care | | | 11.7 | |
| Consumer Discretionary | | | 10.5 | |
| Consumer Staples | | | 10.4 | |
| Materials | | | 7.2 | |
| Information Technology | | | 6.8 | |
| Energy | | | 6.0 | |
| Communication Services | | | 5.2 | |
| Real Estate | | | 3.5 | |
| Utilities | | | 2.6 | |
| Investment Companies | | | 1.1 | |
| Other net assets | | | (0.3 | ) |
| Total | | | 100.0 | % |
See Notes to Financial Statements
| Financial Statements | Walden International Equity Fund |
Statement of Assets and Liabilities
December 31, 2019
| Assets: | | | |
| Investments, at fair value (cost $50,527,540) | | $ | 57,125,993 | |
| Foreign currency, at fair value (cost $8,739) | | | 8,796 | |
| Dividends receivable | | | 52,400 | |
| Receivable for capital shares issued | | | 30,600 | |
| Receivable for tax reclaims | | | 82,044 | |
| Prepaid expenses | | | 3,156 | |
| Total Assets | | | 57,302,989 | |
| Liabilities: | | | | |
| Payable for investments purchased | | | 290,928 | |
| Accrued expenses and other liabilities: | | | | |
| Investment adviser | | | 35,638 | |
| Administration and accounting | | | 4,669 | |
| Custodian | | | 1,695 | |
| Transfer agent | | | 3,326 | |
| Trustee | | | 74 | |
| Other | | | 6,984 | |
| Total Liabilities | | | 343,314 | |
| Net Assets | | $ | 56,959,675 | |
| Composition of Net Assets: | | | | |
| Paid in capital | | $ | 50,469,516 | |
| Total distributable earnings/(loss) | | | 6,490,159 | |
| Net Assets | | $ | 56,959,675 | |
| Shares outstanding (par value $0.01, unlimited number of shares authorized) | | | 4,908,326 | |
| Net Asset Value, Offering Price and Redemption price per share | | $ | 11.60 | |
Statement of Operations
For the year ended December 31, 2019
| Investment Income: | | | |
| Dividends | | $ | 1,617,385 | |
| Less: Foreign tax withholding | | | (153,196 | ) |
| Total Investment Income | | | 1,464,189 | |
| Expenses: | | | | |
| Investment adviser | | | 370,316 | |
| Administration and accounting | | | 53,739 | |
| Chief compliance officer | | | 4,181 | |
| Custodian | | | 23,510 | |
| Transfer agency | | | 28,575 | |
| Trustee | | | 3,166 | |
| Other | | | 21,164 | |
| Gross expense before recoupment | | | 504,651 | |
| Recoupment of prior expenses reimbursed by the investment adviser | | | 7,793 | |
| Total expenses | | | 512,444 | |
| Net Expenses | | | 512,444 | |
| Net Investment Income | | | 951,745 | |
| Net Realized/Unrealized Gains (Losses) from Investments: | | | | |
| Net realized gains from investment securities and foreign currency transactions | | | 156,236 | |
| Change in unrealized appreciation/depreciation from investment securities and foreign currency transactions | | | 7,758,251 | |
| Net realized/unrealized gains (losses) from investments | | | 7,914,487 | |
| Change in Net Assets Resulting from Operations | | $ | 8,866,232 | |
See Notes to Financial Statements
| Financial Statements | Walden International Equity Fund |
Statements of Changes in Net Assets
| | | For the year ended | | | For the year ended | |
| | | December 31, 2019 | | | December 31, 2018 | |
| Investment Activities: | | | | | | | | |
| Operations: | | | | | | | | |
| Net investment income | | $ | 951,745 | | | $ | 665,831 | |
| Net realized gains (losses) from investment transactions | | | 156,236 | | | | (80,636 | ) |
| Change in unrealized appreciation/depreciation from investments | | | 7,758,251 | | | | (5,048,658 | ) |
| Change in Net Assets Resulting from Operations | | | 8,866,232 | | | | (4,463,463 | ) |
| Distributions to shareholders: | | | | | | | | |
| Total Distributions | | | (929,213 | ) | | | (649,752 | ) |
| Change in Net Assets Resulting from distributions to shareholders | | | (929,213 | ) | | | (649,752 | ) |
| Capital Share Transactions: | | | | | | | | |
| Proceeds from shares issued | | | 10,921,617 | | | | 3,925,039 | |
| Dividends reinvested | | | 611,610 | | | | 416,559 | |
| Cost of shares redeemed | | | (1,566,941 | ) | | | (1,406,297 | ) |
| Change in Net Assets Resulting from Capital Share Transactions | | | 9,966,286 | | | | 2,935,301 | |
| Change in Net Assets | | | 17,903,305 | | | | (2,177,914 | ) |
| Net Assets: | | | | | | | | |
| Beginning of period | | | 39,056,370 | | | | 41,234,284 | |
| End of period | | $ | 56,959,675 | | | $ | 39,056,370 | |
| Share Transactions: | | | | | | | | |
| Issued | | | 1,010,684 | | | | 361,674 | |
| Reinvested | | | 54,029 | | | | 42,077 | |
| Redeemed | | | (148,651 | ) | | | (136,574 | ) |
| Change in shares | | | 916,062 | | | | 267,177 | |
See Notes to Financial Statements
| Financial Statements | Walden International Equity Fund |
Financial Highlights
Selected data for a share outstanding throughout the periods indicated.
| | | | | | | | | | | | For the nine | | | Period | |
| | | For the year | | | For the year | | | For the year | | | months | | | June 9, 2015 | |
| | | ended | | | ended | | | ended | | | ended | | | through | |
| | | December 31, | | | December 31, | | | December 31, | | | December 31, | | | March 31, | |
| | | | 2019 | | | | 2018 | | | | 2017 | | | | 2016 | | | | 2016(a) | |
| Net Asset Value, Beginning of Period | | $ | 9.78 | | | $ | 11.07 | | | $ | 9.34 | | | $ | 9.45 | | | $ | 10.00 | |
| | | | | | | | | | | | | | | | | | | | | |
| Investment Activities: | | | | | | | | | | | | | | | | | | | | |
| Operations: | | | | | | | | | | | | | | | | | | | | |
| Net investment income | | | 0.20 | | | | 0.17 | | | | 0.13 | | | | 0.12 | | | | 0.08 | |
| Net realized/unrealized gains (losses) from investments | | | 1.81 | | | | (1.29 | ) | | | 1.73 | | | | (0.06 | ) | | | (0.59 | ) |
| Total from investment activities | | | 2.01 | | | | (1.12 | ) | | | 1.86 | | | | 0.06 | | | | (0.51 | ) |
| Dividends: | | | | | | | | | | | | | | | | | | | | |
| Net investment income | | | (0.19 | ) | | | (0.17 | ) | | | (0.13 | ) | | | (0.17 | ) | | | (0.04 | ) |
| Net realized gains from investment transactions | | | — | | | | — | | | | — | | | | — | | | | — | |
| Total dividends | | | (0.19 | ) | | | (0.17 | ) | | | (0.13 | ) | | | (0.17 | ) | | | (0.04 | ) |
| | | | | | | | | | | | | | | | | | | | | |
| Net Asset Value, End of Period | | $ | 11.60 | | | $ | 9.78 | | | $ | 11.07 | | | $ | 9.34 | | | $ | 9.45 | |
| | | | | | | | | | | | | | | | | | | | | |
| Total Return | | | 20.62 | % | | | (10.18 | )% | | | 19.92 | % | | | 0.62 | %(b) | | | (5.09 | )%(b) |
| | | | | | | | | | | | | | | | | | | | | |
| Ratios/Supplemental Data: | | | | | | | | | | | | | | | | | | | | |
| Net assets at end of period (000’s) | | $ | 56,960 | | | $ | 39,056 | | | $ | 41,234 | | | $ | 14,713 | | | $ | 12,786 | |
| Ratio of net expenses to average net assets | | | 1.04 | % | | | 1.15 | % | | | 1.15 | % | | | 1.15 | %(c) | | | 1.15 | %(c) |
| Ratio of net investment income to average net assets | | | 1.93 | % | | | 1.57 | % | | | 1.57 | % | | | 1.87 | %(c) | | | 1.22 | %(c) |
| Ratio of expenses (before fee reductions or recoupment of fees previously reimbursed by the investment adviser) to average net assets(d) | | | 1.02 | % | | | 1.17 | % | | | 1.31 | % | | | 1.86 | %(c) | | | 2.21 | %(c) |
| Portfolio turnover rate | | | 10.70 | % | | | 3.44 | % | | | 10.16 | % | | | 4.90 | %(b) | | | 5.11 | %(b) |
Amounts designated as “—” are $0 or have been rounded to $0.
| (a) | Commencement of operations on June 9, 2015. |
| (b) | Not annualized for periods less than one year. |
| (c) | Annualized for periods less than one year. |
| (d) | During the periods, certain fees were reduced or recouped by the investment adviser. If such fee reductions/recoupments had not occurred, the ratio would have been as indicated. |
See Notes to Financial Statements
| Notes to Financial Statements | December 31, 2019 |
The Boston Trust Walden Funds (formerly The Boston Trust & Walden Funds) (the “Trust”) was organized on January 8, 1992 as a Massachusetts business trust and is registered under the Investment Company Act of 1940, as amended (the “1940 Act”), as an open-end management investment company. The Trust contains the following funds (individually a “Fund”, collectively the “Funds”), each of which are registered as a diversified Fund under the 1940 Act:
| Fund | | Short Name |
| Boston Trust Asset Management Fund | | Asset Management Fund |
| Boston Trust Equity Fund | | Equity Fund |
| Boston Trust Midcap Fund | | Midcap Fund |
| Boston Trust SMID Cap Fund | | SMID Cap Fund |
| Boston Trust Small Cap Fund | | Small Cap Fund |
| Walden Balanced Fund (formerly Walden Asset Management Fund)* | | Walden Balanced Fund |
| Walden Equity Fund | | Walden Equity Fund |
| Walden Midcap Fund | | Walden Midcap Fund |
| Walden SMID Cap Fund | | Walden SMID Cap Fund |
| Walden Small Cap Fund | | Walden Small Cap Fund |
| Walden International Equity Fund | | Walden International Equity Fund |
| * | The Fund changed its name effective September 4, 2019. |
The investment objective of the Asset Management Fund and Walden Balanced Fund is to seek long-term capital growth and income through an actively managed portfolio of stocks, bonds and money market instruments. The investment objective of the Equity Fund and Walden Equity Fund is to seek long-term capital growth through an actively managed portfolio of stocks. The investment objective of the Midcap Fund and Walden Midcap Fund is to seek long-term capital growth through an actively managed portfolio of stocks of middle capitalization companies. The investment objective of the SMID Cap Fund and Walden SMID Cap Fund is to seek long-term capital growth through an actively managed portfolio of stocks of small to middle capitalization companies. The investment objective of the Small Cap Fund and Walden Small Cap Fund is to seek long-term capital growth through an actively managed portfolio of stocks of small capitalization companies. The investment objective of the Walden International Equity Fund is to seek long-term capital growth through an actively managed portfolio of equities of international companies.
Under the Trust’s organizational documents, its officers and trustees are indemnified against certain liabilities arising out of the performance of their duties to the Trust. In addition, in the normal course of business, the Trust may enter into contracts with its vendors and others that provide for general indemnifications. Each Fund’s maximum exposure under these arrangements is unknown, as this would involve future claims that may be made against the Funds. However, based on experience, the Funds expect risk of loss to be remote.
| 2. | Significant Accounting Policies: |
The following is a summary of significant accounting policies followed by the Funds in the preparation of their financial statements. The policies are in conformity with accounting principles generally accepted in the United States of America (“GAAP”).
The preparation of financial statements in conformity with GAAP requires management to make estimates and assumptions that affect the reported amounts of assets and liabilities, the disclosure of contingent assets and liabilities at the date of the financial statements and the reported amounts of increases and decreases in net assets from operations during the reporting period. Actual results may differ from those estimates.
The Funds are investment companies and accordingly follow the investment company accounting and reporting guidance of the Financial Accounting Standards Board (FASB) Accounting Standards Codification Topic 946,“Financial Services - Investment Companies”.
Security Valuation:
The Funds record their investments at fair value. Fair value is defined as the price that would be received to sell an asset or paid to transfer a liability in an orderly transaction between market participants at the measurement date. The valuation techniques used to determine fair value are further described below.
The value of each equity security, including common stocks, is based either on the last sale price on a national securities exchange, or in the absence of recorded sales, at the closing bid price on such exchanges, or at the quoted bid price in the over-the-counter market. Equity securities traded on the NASDAQ stock market are valued at the NASDAQ official closing price. The prices for foreign securities are reported in local currency and converted to U.S dollars using currency exchange rates. Prices for most securities held in the Funds are provided daily by a recognized independent pricing service.
Bonds and other fixed income securities (other than short-term obligations but including listed issues) are provided by an independent pricing service, the use of which has been approved by the Board of Trustees (“Board”). In making such valuations, the pricing service utilizes both dealer-supplied valuations and electronic data processing techniques that take into account appropriate factors such as institutional-size trading in similar groups of securities, yield, quality, coupon rate, maturity, type of issue, and trading characteristics other than market data and without exclusive reliance upon quoted prices or exchanges or over-the-counter prices, since such valuations are believed to reflect more accurately the fair value of such securities. All debt portfolio securities with a remaining maturity of 60 days or less may be valued at amortized cost, which approximates fair value.
The Trust may use a pricing service to value certain portfolio securities where the prices provided are believed to reflect the fair value of such securities. If market prices are not readily available or, in the opinion of the Adviser, market prices do not reflect fair value, or if an event occurs after the close of trading on the exchange or market on which the security is principally traded (but prior to the time the NAV is calculated) that materially affects fair value, the Adviser will value the Funds’ assets at their fair value according to policies approved by the Board. The Adviser believes that foreign security values may be affected by volatility that occurs in global markets on a trading day after the close of any given foreign securities markets. The fair valuation procedures, therefore, include a procedure whereby foreign security prices may be “fair valued” by an independent pricing service through the use of factors which take such volatility into account.
Investments in investment companies and money market funds are valued at NAV per share.
Continued
| Notes to Financial Statements | December 31, 2019 |
Fair Value Measurements:
The valuation techniques employed by the Funds, as described above in Security Valuation, maximize the use of observable inputs and minimize the use of unobservable inputs in determining fair value. The inputs used for valuing the Funds’ investments are summarized in the three broad levels listed below:
Level 1 — Quoted prices in active markets for identical assets
Level 2 — Other significant observable inputs (including quoted prices for similar securities, interest rates, prepayment speeds, credit risk, etc.)
Level 3 — Significant unobservable inputs (including the Funds’ own assumptions in determining the fair value of investments)
The inputs or methodology used to value investments are not necessarily an indication of the risk associated with investing in those investments.
Pursuant to the valuation techniques described above in Security Valuation, equity securities are generally categorized as Level 1 securities in the fair value hierarchy (unless there is a fair valuation event, in which case affected securities are generally categorized as Level 2 securities). Fixed income securities, including those with a remaining maturity of 60 days or less, are generally categorized as Level 2 securities in the fair value hierarchy. Open-ended investment companies and money market funds are generally categorized as Level 1 securities in the fair value hierarchy.
Investments for which there are no quotations available, or for which quotations do not appear reliable, are valued at fair value as determined in good faith by the Adviser under the direction of the Board. These valuations are typically categorized as Level 2 or Level 3 in the fair value hierarchy.
The following is a summary of the valuation inputs used as of December 31, 2019 in valuing the Funds’ investments based on the three levels defined above:
| | | | | | Level 2 | | | Total | |
| | | Level 1 | | | Other Significant | | | Investments | |
| Fund Name | | Quoted Prices | | | Observable Inputs | | | in Securities | |
| Asset Management Fund | | | | | | | | | | | | |
| Common Stocks1 | | $ | 496,631,523 | | | $ | — | | | $ | 496,631,523 | |
| Corporate Bonds1 | | | — | | | | 15,765,976 | | | | 15,765,976 | |
| Municipal Bonds2 | | | — | | | | 21,741,611 | | | | 21,741,611 | |
| U.S. Government & U.S. Government Agency Obligations | | | — | | | | 76,296,574 | | | | 76,296,574 | |
| Investment Companies | | | 12,086,947 | | | | — | | | | 12,086,947 | |
| Total | | | 508,718,470 | | | | 113,804,161 | | | | 622,522,631 | |
| | | | | | | | | | | | | |
| Equity Fund | | | | | | | | | | | | |
| Common Stocks1 | | | 158,831,365 | | | | — | | | | 158,831,365 | |
| Investment Companies | | | 786,177 | | | | — | | | | 786,177 | |
| Total | | | 159,617,542 | | | | — | | | | 159,617,542 | |
| | | | | | | | | | | | | |
| Midcap Fund | | | | | | | | | | | | |
| Common Stocks1 | | | 143,457,692 | | | | — | | | | 143,457,692 | |
| Investment Companies | | | 2,224,127 | | | | — | | | | 2,224,127 | |
| Total | | | 145,681,819 | | | | — | | | | 145,681,819 | |
| | | | | | | | | | | | | |
| SMID Cap Fund | | | | | | | | | | | | |
| Common Stocks1 | | | 124,560,989 | | | | — | | | | 124,560,989 | |
| Investment Companies | | | 1,691,214 | | | | — | | | | 1,691,214 | |
| Total | | | 126,252,203 | | | | — | | | | 126,252,203 | |
| | | | | | | | | | | | | |
| Small Cap Fund | | | | | | | | | | | | |
| Common Stocks1 | | | 231,722,286 | | | | — | | | | 231,722,286 | |
| Investment Companies | | | 3,445,871 | | | | — | | | | 3,445,871 | |
| Total | | | 235,168,157 | | | | — | | | | 235,168,157 | |
| | | | | | | | | | | | | |
| Walden Balanced Fund | | | | | | | | | | | | |
| Common Stocks1 | | | 116,490,498 | | | | — | | | | 116,490,498 | |
| Certificate of Deposit | | | — | | | | 200,796 | | | | 200,796 | |
| Corporate Bonds1 | | | — | | | | 4,356,084 | | | | 4,356,084 | |
| Municipal Bonds2 | | | — | | | | 3,223,579 | | | | 3,223,579 | |
| U.S. Government & U.S. Government Agency Obligations | | | — | | | | 30,822,479 | | | | 30,822,479 | |
| Investment Companies | | | 2,521,206 | | | | — | | | | 2,521,206 | |
| Total | | | 119,011,704 | | | | 38,602,938 | | | | 157,614,642 | |
| | | | | | | | | | | | | |
| Walden Equity Fund | | | | | | | | | | | | |
| Common Stocks1 | | | 246,390,656 | | | | — | | | | 246,390,656 | |
| Investment Companies | | | 1,713,352 | | | | — | | | | 1,713,352 | |
| Total | | | 248,104,008 | | | | — | | | | 248,104,008 | |
| | | | | | | | | | | | | |
| Walden Midcap Fund | | | | | | | | | | | | |
| Common Stocks1 | | | 61,491,084 | | | | — | | | | 61,491,084 | |
| Investment Companies | | | 867,497 | | | | — | | | | 867,497 | |
| Total | | | 62,358,581 | | | | — | | | | 62,358,581 | |
Continued
| Notes to Financial Statements | December 31, 2019 |
| | | | | | Level 2 | | | Total | |
| | | Level 1 | | | Other Significant | | | Investments | |
| Fund Name | | Quoted Prices | | | Observable Inputs | | | in Securities | |
| Walden SMID Cap Fund | | | | | | | | | | | | |
| Common Stocks1 | | $ | 60,977,391 | | | $ | — | | | $ | 60,977,391 | |
| Investment Companies | | | 566,745 | | | | — | | | | 566,745 | |
| Total | | | 61,544,136 | | | | — | | | | 61,544,136 | |
| | | | | | | | | | | | | |
| Walden Small Cap Fund | | | | | | | | | | | | |
| Common Stocks1 | | | 125,359,500 | | | | — | | | | 125,359,500 | |
| Investment Companies | | | 2,144,929 | | | | — | | | | 2,144,929 | |
| Total | | | 127,504,429 | | | | — | | | | 127,504,429 | |
| | | | | | | | | | | | | |
| Walden International Equity Fund | | | | | | | | | | | | |
| Common Stocks3 | | | | | | | | | | | | |
| Auto Components | | | 488,047 | | | | 315,808 | | | | 803,855 | |
| Banks | | | 2,011,858 | | | | 3,957,421 | | | | 5,969,279 | |
| Diversified Telecommunication Services | | | 514,307 | | | | 1,042,628 | | | | 1,556,935 | |
| Food & Staples Retailing | | | 553,070 | | | | 897,054 | | | | 1,450,124 | |
| Insurance | | | 789,057 | | | | 2,690,998 | | | | 3,480,055 | |
| Road & Rail | | | 459,059 | | | | 1,672,506 | | | | 2,131,565 | |
| Other Common Stocks | | | — | | | | 41,119,392 | | | | 41,119,392 | |
| Investment Companies | | | 614,788 | | | | — | | | | 614,788 | |
| Total | | | 5,430,186 | | | | 51,695,807 | | | | 57,125,993 | |
1 For detailed industry classifications, see the accompanying Schedules of Portfolio Investments.
2 For detailed State descriptions, see the accompanying Schedules of Portfolio Investments.
3 For detailed Country classifications, see the accompanying Schedules of Portfolio Investments.
Investment Transactions and Related Income:
Investment transactions are accounted for no later than one business day after trade date. However, for financial reporting purposes, investment transactions are accounted for on trade date. Investment gains and losses are calculated on an identified cost basis. Interest income is recognized on an accrual basis and includes, where applicable, the amortization or accretion of premium or discount based on effective yield. Dividend income is recorded on the ex-dividend date except in the case of certain foreign securities, in which case dividends are recorded as soon as such information becomes available.
Real Estate Investment Trusts:
The Funds may own shares of real estate investment trusts (“REITs”), which report information on the source of their distribution annually. Certain distributions received from REITs during the year, which are known to be return of capital, are recorded as a reduction to the cost of the individual REIT.
Expenses:
Expenses directly attributable to a Fund are charged directly to that Fund. Expenses relating to the Trust are allocated proportionately to each Fund within the Trust according to the relative net assets of each Fund or on another reasonable basis.
Distributions to Shareholders:
Distributions to shareholders are recorded on the ex-dividend date. Dividends to shareholders from net investment income, if any, are declared and paid annually by the Funds. Dividends to shareholders from net realized gains, if any, are declared and distributed at least annually by the Funds. The amounts of distributions to shareholders from net investment income and of distributions from net realized gains are determined in accordance with federal income tax regulations, which may differ from GAAP.
Federal Income Taxes:
Each Fund qualifies and intends to continue to qualify as a regulated investment company by complying with the provisions available to certain investment companies, as defined in Subchapter M of the Internal Revenue Code, and to make distributions from net investment income and from net realized capital gains sufficient to relieve it from all, or substantially all, federal income and excise taxes. Therefore, no federal income tax provision is required.
Management has reviewed tax positions taken in tax years that remain subject to examination by all major tax jurisdictions, including U.S. Federal (i.e., the last four tax year ends and the interim tax period since then, as applicable) and believes that there is no tax liability resulting from unrecognized tax benefits related to uncertain tax positions taken as of and during the year ended December 31, 2019. The Funds recognize interest and penalties, if any, related to unrecognized tax benefits, as income tax expense in the Statements of Operations as incurred. There is no income tax noted as due for the year ended December 31, 2019.
Foreign Currency Transactions:
The accounting records of the Funds are maintained in U.S. dollars. Non-U.S. dollar denominated amounts are translated into U.S. dollars as follows, with the resultant exchange gains and losses recorded in the Statements of Operations:
i) Value of investment securities and other assets and liabilities at the exchange rate on the valuation date; and
ii) Purchases and sales of Investment securities and income and expenses at the exchange rate prevailing on the respective date of such transactions.
The Funds do not isolate realized and unrealized gains and losses attributable to changes in the exchange rates from gains and losses that arise from changes in the value of investments. Such fluctuations are included with net realized and unrealized gain or loss from investments.
Investment income from non-U.S. sources received by a Fund is generally subject to non-U.S. withholding taxes at rates ranging up to 30%. Such withholding taxes may be reduced or eliminated under the terms of applicable U.S. income tax treaties. The Funds may be subject to foreign taxes on gains in investments or currency repatriation. The Funds accrue such taxes, as applicable, based on their current interpretation of tax rules in the foreign markets in which they invest.
Continued
| Notes to Financial Statements | December 31, 2019 |
New Accounting Pronouncements:
In March 2017, FASB issued Accounting Standards Update No. 2017-08 “Premium Amortization on Purchased Callable Debt Securities” (“ASU 2017-08”), which shortens the premium amortization period for purchased non-contingently callable debt securities. ASU 2017-08 specifies that the premium amortization period ends at the earliest call date for purchased non-contingently callable debt securities. ASU 2017-08 is effective for fiscal years, and interim periods within those fiscal years, beginning after December 15, 2018. The Funds have adopted ASU 2017-08 on a modified retrospective basis as of January 1, 2019. The adoption of ASU 2017-08 did not have a significant impact on the amortized cost of investments as of January 1, 2019, and had no impact on beginning net assets, the current period results from operations, or any prior period information presented in the financial statements.
| 3. | Related Party Transactions and Other Service Arrangements: |
Investment Adviser:
The Trust, with respect to the Funds, and the Adviser are parties to an Investment Advisory Agreement under which the Adviser is entitled to receive an annual fee, computed daily and paid monthly, equal to the average daily net assets of each Fund, at the following annual percentage rates before contractual waivers:
| Fund | | Fee Rate | |
| Asset Management Fund | | | 0.73 | %* |
| Equity Fund | | | 0.75 | % |
| Midcap Fund | | | 0.75 | % |
| SMID Cap Fund | | | 0.75 | % |
| Small Cap Fund | | | 0.75 | % |
| Fund | | Fee Rate | |
| Walden Balanced Fund | | | 0.75 | % |
| Walden Equity Fund | | | 0.75 | % |
| Walden Midcap Fund | | | 0.75 | % |
| Walden SMID Cap Fund | | | 0.75 | % |
| Walden Small Cap Fund | | | 0.75 | % |
| Walden International Equity Fund | | | 0.75 | % |
| * | Effective rate for the year ended December 31, 2019. The Asset Management Fund has an Investment Management Agreement with the Adviser under which the Fund pays: (a) 0.75% of the first $500 million of average daily net assets; (b) 0.50% of average daily net assets in excess of $500 million. |
Additionally, two trustees of the Trust are officers of the Adviser or its affiliate, and an officer of the Trust is an officer of the Adviser. These persons are not paid directly by the Funds.
Administration and Fund Accounting:
Citi Fund Services Ohio, Inc. (“Citi”) serves the Funds as administrator. Citi provides administrative and fund accounting services for a fee that is computed daily and paid monthly, based on the aggregate daily net assets of the Trust plus certain base fees.
Certain officers of the Trust are affiliated with Citi. Such persons were paid no fees directly by the Funds for serving as Officers of the Trust. Citi makes an employee available to serve as the Trust’s Chief Compliance Officer (“CCO”) under a Compliance Service Agreement between the Funds and Citi (the “CCO Agreement”). Under the CCO Agreement, Citi also provides infrastructure and support in implementing the written policies and procedures comprising the Trust’s compliance program, including support services to the CCO. For the services provided under the CCO Agreement, the Funds paid Citi $150,000 for the year ended December 31, 2019, plus certain out of pocket expenses. Citi pays the salary and other compensation earned by the CCO as an employee of Citi.
Distribution:
Foreside Financial Services, LLC (“Foreside”), which is not affiliated with Citi or the Adviser, serves as the Funds’ distribution agent. Fees for these services are paid monthly by the Adviser and not by the Funds.
Shareholder Services:
The Funds may enter into shareholder services agreements with investment advisers, banks, trust companies and other types of organizations (“Authorized Service Providers”), which may include affiliates of the Funds, for providing administrative services with respect to shares of the Funds attributable to or held in the name of the Authorized Service Provider for its clients or other parties with whom they have a servicing relationship. Fees paid by the Funds under shareholder services agreements may not exceed 0.25% of the average daily net assets of each Fund and are presented separately on the Statements of Operations. Affiliates of the Funds did not receive any fees during the year ended December 31, 2019.
Custodian and Transfer Agency:
Boston Trust Walden Company (formally Boston Trust & Investment Management Company) (“Boston Trust”), the parent company of the Adviser, acts as the Funds’ transfer agent. Under the transfer agency agreement, Boston Trust receives a fixed fee of $18,000 annually per fund, accrued daily and paid monthly for its services. Under a sub-transfer agency agreement, FIS Investor Services, LLC receives a fixed annual fee accrued daily and paid monthly, plus annual per account fees and certain out of pocket expenses for its services to the Trust. Expenses incurred under the transfer agency agreement and sub-transfer agency agreement are presented collectively as “Transfer Agency” expenses on the Statements of Operations.
Boston Trust acts as the Funds’ custodian, with the exception of the Walden International Equity Fund. Under the custody agreement, Boston Trust receives an annual asset based fee of 0.014% of the value of securities held. Citibank, N.A. receives sub-custodian fees from Boston Trust for each Fund except the Walden International Equity Fund. Under a separate custody agreement, Citibank, N.A., an affiliate of Citi, serves as custodian for the Walden International Equity Fund and receives a fee based on a percentage of assets held on behalf of the Walden International Equity Fund, transaction fees and certain out of pocket expenses for its services. Such percentages vary by the jurisdiction in which the assets are held.
Fee Reductions:
The Adviser has agreed to reduce its fees payable by the Funds to the extent necessary, exclusive of brokerage costs, interest, taxes, dividends, litigation, indemnification, expenses associated with the investments in underlying investment companies and extraordinary expenses (as determined under GAAP) of each Fund, except the SMID Cap Fund and the Walden International Equity Fund, to 1.00% of the average daily net assets. The Adviser has agreed to reduce its fees payable by the SMID Cap Fund and the Walden International Equity Fund to the extent necessary, subject to certain exclusions, to limit the aggregate annual operating expenses of the SMID Cap Fund to 0.75% of its average daily net assets and the Walden International Equity Fund to 1.10% of its average daily net assets. Prior to May 1, 2019, the contractual expense limitation for the Walden International Equity Fund was 1.15%. Any such reductions made by the Adviser in its fees or in the payment or reimbursement of expenses that are a Fund’s obligation may be subject to repayment by the Fund within three years provided the Fund receiving the reduction, payment or reimbursement is able to effect such repayment and remain in compliance with applicable expense limitations. The expense limitation agreement shall automatically renew effective May 1 of every year until the Adviser provides written notice of non-renewal to the Trust.
Continued
| Notes to Financial Statements | December 31, 2019 |
Pursuant to its agreement, the Adviser reimbursed, and has yet to recoup, fees in the following amounts for the years ended December 31, 2017 (expiring 12/31/2020), December 31, 2018 (expiring 12/31/2021) and December 31, 2019 (expiring 12/31/2022):
| Fund | | Amount | | | Expires |
| Midcap Fund | | $ | 42,703 | | | 12/31/2022 |
| | | | | | | |
| SMID Cap Fund | | | 87,452 | | | 12/31/2020 |
| | | | 168,823 | | | 12/31/2021 |
| | | | 170,506 | | | 12/31/2022 |
| | | | | | | |
| Small Cap Fund | | | 58,104 | | | 12/31/2020 |
| | | | 261,419 | | | 12/31/2021 |
| | | | 168,952 | | | 12/31/2022 |
| Fund | | Amount | | | Expires |
| Walden Balanced Fund | | $ | 28,580 | | | 12/31/2020 |
| | | | 45,249 | | | 12/31/2021 |
| | | | 34,853 | | | 12/31/2022 |
| | | | | | | |
| Walden Equity Fund | | | 138,810 | | | 12/31/2020 |
| | | | 166,166 | | | 12/31/2021 |
| | | | 158,316 | | | 12/31/2022 |
| | | | | | | |
| Walden Midcap Fund | | | 4,010 | | | 12/31/2020 |
| | | | | | | |
| Walden SMID Cap Fund | | | 33,179 | | | 12/31/2020 |
| | | | 42,347 | | | 12/31/2021 |
| | | | 36,311 | | | 12/31/2022 |
| | | | | | | |
| Walden Small Cap Fund | | | 26,962 | | | 12/31/2020 |
| | | | 48,303 | | | 12/31/2021 |
| | | | 46,849 | | | 12/31/2022 |
| | | | | | | |
| Walden International Equity Fund | | | 47,374 | | | 12/31/2020 |
| | | | 7,070 | | | 12/31/2021 |
During the year ended December 31, 2019, the Adviser recouped $569 and $7,793 from the Walden Midcap Fund and Walden International Equity Fund, respectively.
As of December 31, 2019, the Adviser may recoup amounts from the Funds as follows:
| Total Potential Recoupment | | | |
| Asset Management Fund | | $ | — | |
| Equity Fund | | | — | |
| Midcap Fund | | | 42,703 | |
| SMID Cap Fund | | | 426,781 | |
| Small Cap Fund | | | 488,475 | |
| Total Potential Recoupment | | | |
| Walden Balanced Fund | | $ | 108,682 | |
| Walden Equity Fund | | | 463,292 | |
| Walden Midcap Fund | | | 4,010 | |
| Walden SMID Cap Fund | | | 111,837 | |
| Walden Small Cap Fund | | | 122,114 | |
| Walden International Equity Fund | | | 54,444 | |
In-Kind Subscriptions and Redemptions:
During the year ended December 31, 2019, the Asset Management Fund acquired securities and other assets from a common trust fund managed by the Adviser, the Boston Trust Managed Growth Fund. The subscription proceeds were accomplished through an in-kind contribution of investments and other assets. The contribution was not a taxable event under the provisions of Section 584 of the Internal Revenue Code, and therefore the historical cost basis of those investments was carried forward. The Asset Management Fund issued 808,358 shares to the holders of Boston Trust Managed Growth Fund in exchange for investments and other assets valued at $43,771,772. The value and historical cost of the contributed investments was $43,613,987 and $16,186,943, respectively, which was carried forward to align the ongoing reporting of realized and unrealized gains and losses for tax purposes.
During the year ended December 31, 2019, the Funds delivered securities in exchange for the redemption of shares (redemptions in-kind) as follows:
| | | | | | Fund Shares | | | Realized | |
| Fund | | Fair Value | | | Redeemed | | | Gain/(Loss) | |
| Asset Management Fund | | $ | 5,777,713 | | | | 118,834 | | | $ | 5,029,044 | |
| Small Cap Fund | | | 119,901,316 | | | | 8,413,292 | | | | 42,132,134 | |
During the year ended December 31, 2018, there were no in-kind subscriptions or redemptions.
Interfund Lending:
Pursuant to an Exemptive Order issued by the Securities and Exchange Commission (“SEC”), the Funds may participate in an interfund lending program (the “Program”). The Program provides an alternative credit facility under which the Funds may lend to, or borrow from, one another, consistent with each Fund’s investment objectives, limitations and organization documents. The Program provides a borrowing Fund with a source of liquidity at a rate lower than the bank borrowing rate at times when the cash position of the Fund is insufficient to meet temporary cash requirements. In addition, Funds making short-term cash loans directly to other Funds would earn interest at a rate higher than they otherwise could obtain from investing their cash in repurchase agreements or certain other short-term money market instruments. Interfund loans have a maximum duration of seven days and may be called on one business day’s notice. Any open loans at period end are presented under the caption “Payable” for interfund lending in the Statements of Assets and Liabilities. As of December 31, 2019, the Funds had no outstanding loans to or from another fund under the Program. The Funds’ activity in the Program during the period for which loans were outstanding was as follows:
| | | Borrower or | | Weighted
Average
Loan | | | Days | | | Weighted
Average
Annualized | | | Interest
Income | |
| Fund | | Lender | | Balance | | | Outstanding | | | Interest Rate | | | (Expense) | |
| Asset Management Fund | | Lender | | $ | 1,032,360 | | | | 5 | | | | 3.63 | % | | $ | 550 | |
| SMID Cap Fund | | Borrower | | | 243,855 | | | | 4 | | | | 3.56 | | | | (97 | ) |
| Walden Equity Fund | | Borrower | | | 4,186,378 | | | | 1 | | | | 3.90 | | | | (453 | ) |
Continued
| Notes to Financial Statements | December 31, 2019 |
| 4. | Purchases and Sales of Securities: |
Cost of purchases and proceeds from sales and maturities of securities, excluding in-kinds, short-term securities and U.S. Government securities, for the Funds for the year ended December 31, 2019, totaled:
| | | | | | Sales and | |
| Fund | | Purchases | | | Maturities | |
| Asset Management Fund | | $ | 35,346,517 | | | $ | 14,360,972 | |
| Equity Fund | | | 3,752,516 | | | | 8,058,262 | |
| Midcap Fund | | | 65,803,156 | | | | 20,142,389 | |
| SMID Cap Fund | | | 53,440,200 | | | | 21,188,497 | |
| Small Cap Fund | | | 101,134,749 | | | | 56,083,334 | |
| Walden Balanced Fund | | | 16,883,315 | | | | 7,670,294 | |
| Walden Equity Fund | | | 23,511,858 | | | | 26,275,089 | |
| Walden Midcap Fund | | | 15,807,190 | | | | 12,442,124 | |
| Walden SMID Cap Fund | | | 16,664,734 | | | | 16,328,055 | |
| Walden Small Cap Fund | | | 42,325,042 | | | | 23,742,917 | |
| Walden International Equity Fund | | | 15,221,960 | | | | 5,170,845 | |
Cost of purchases and proceeds from sales and maturities of U.S. Government Securities, excluding short-term securities, for the Funds for the year ended December 31, 2019, totaled:
| | | | | | Sales and | |
| Fund | | Purchases | | | Maturities | |
| Asset Management Fund | | $ | 16,960,605 | | | $ | 15,229,492 | |
| Walden Balanced Fund | | | 8,749,446 | | | | 10,704,277 | |
| 5. | Federal Income Tax Information: |
At December 31, 2019, the cost, gross unrealized appreciation and gross unrealized depreciation on investments, for federal income tax purposes, were as follows:
| | | | | | | | | | | | Net Unrealized | |
| | | | | | Gross Tax Unrealized | | | Gross Tax Unrealized | | | Appreciation | |
| Fund | | Tax Cost | | | Appreciation | | | (Depreciation) | | | (Depreciation) | |
| Asset Management Fund | | $ | 316,873,885 | | | $ | 305,854,880 | | | $ | (206,134 | ) | | $ | 305,648,746 | |
| Equity Fund | | | 61,465,057 | | | | 98,244,993 | | | | (92,508 | ) | | | 98,152,485 | |
| Midcap Fund | | | 108,760,795 | | | | 38,569,814 | | | | (1,648,790 | ) | | | 36,921,024 | |
| SMID Cap Fund | | | 110,053,903 | | | | 17,716,364 | | | | (1,518,064 | ) | | | 16,198,300 | |
| Small Cap Fund | | | 180,047,048 | | | | 58,735,966 | | | | (3,614,857 | ) | | | 55,121,109 | |
| Walden Balanced Fund | | | 95,781,580 | | | | 62,333,817 | | | | (500,755 | ) | | | 61,833,062 | |
| Walden Equity Fund | | | 112,799,891 | | | | 136,289,638 | | | | (985,521 | ) | | | 135,304,117 | |
| Walden Midcap Fund | | | 42,270,239 | | | | 21,161,100 | | | | (1,072,758 | ) | | | 20,088,342 | |
| Walden SMID Cap Fund | | | 45,119,099 | | | | 17,256,013 | | | | (830,976 | ) | | | 16,425,037 | |
| Walden Small Cap Fund | | | 94,879,295 | | | | 34,164,047 | | | | (1,538,913 | ) | | | 32,625,134 | |
| Walden International Equity Fund | | | 50,527,563 | | | | 8,888,348 | | | | (2,289,918 | ) | | | 6,598,430 | |
| | | | | | | | | | | | | | | | | |
The tax character of distributions paid during the fiscal year ended December 31, 2019 was as follows:
| | | | Distributions paid from | | | | | |
| | | | | | | | Net Long Term | | | | Total Taxable | |
| Fund | | | Ordinary Income | | | | Capital Gains | | | | Distributions | |
| Asset Management Fund | | $ | 5,391,202 | | | $ | 350,942 | | | $ | 5,742,144 | |
| Equity Fund | | | 1,281,596 | | | | 160,867 | | | | 1,442,463 | |
| Midcap Fund | | | 1,776,041 | | | | 3,369,743 | | | | 5,145,784 | |
| SMID Cap Fund | | | 1,290,766 | | | | 1,944,006 | | | | 3,234,772 | |
| Small Cap Fund | | | 1,133,540 | | | | 14,436,243 | | | | 15,569,783 | |
| Walden Balanced Fund | | | 1,608,080 | | | | 906,163 | | | | 2,514,243 | |
| Walden Equity Fund | | | 2,122,863 | | | | 5,237,707 | | | | 7,360,570 | |
| Walden Midcap Fund | | | 559,523 | | | | 3,373,441 | | | | 3,932,964 | |
| Walden SMID Cap Fund | | | 462,200 | | | | 2,606,462 | | | | 3,068,662 | |
| Walden Small Cap Fund | | | 526,851 | | | | 5,456,202 | | | | 5,983,053 | |
| Walden International Equity Fund | | | 929,213 | | | | — | | | | 929,213 | |
Continued
| Notes to Financial Statements | December 31, 2019 |
The tax character of distributions paid during the fiscal year ended December 31, 2018 was as follows:
| | | | Distributions paid from | | | | | |
| | | | | | | | Net Long Term | | | | Total Taxable | |
| Fund | | | Ordinary Income | | | | Capital Gains | | | | Distributions | |
| Asset Management Fund | | $ | 5,150,766 | | | $ | 14,055,703 | | | $ | 19,206,469 | |
| Equity Fund | | | 1,242,397 | | | | 1,000,925 | | | | 2,243,322 | |
| Midcap Fund | | | 670,067 | | | | 3,347,813 | | | | 4,017,880 | |
| SMID Cap Fund | | | 1,300,219 | | | | 120,329 | | | | 1,420,548 | |
| Small Cap Fund | | | 3,182,004 | | | | 31,455,328 | | | | 34,637,332 | |
| Walden Balanced Fund | | | 1,300,957 | | | | 1,299,859 | | | | 2,600,816 | |
| Walden Equity Fund | | | 1,698,265 | | | | 2,456,934 | | | | 4,155,199 | |
| Walden Midcap Fund | | | 498,682 | | | | 2,565,361 | | | | 3,064,043 | |
| Walden SMID Cap Fund | | | 400,299 | | | | 1,722,942 | | | | 2,123,241 | |
| Walden Small Cap Fund | | | 424,979 | | | | 4,423,452 | | | | 4,848,431 | |
| Walden International Equity Fund | | | 649,752 | | | | — | | | | 649,752 | |
As of December 31, 2019, the components of distributable earnings (deficit) on a tax basis were as follows:
| | | | | | Undistributed | | | | | | | | | | | | Total | |
| | | Undistributed | | | Long-Term | | | | | | Accumulated | | | Unrealized | | | Distributable | |
| | | Ordinary | | | Capital | | | Accumulated | | | Capital and | | | Appreciation | | | Earnings | |
| Fund | | Income | | | Gains | | | Earnings | | | Other Losses | | | (Depreciation)1 | | | (Deficit) | |
| Asset Management Fund | | $ | 38,055 | | | $ | 1,182,131 | | | $ | 1,220,186 | | | $ | — | | | $ | 305,648,746 | | | $ | 306,868,932 | |
| Equity Fund | | | — | | | | 890,196 | | | | 890,196 | | | | — | | | | 98,152,485 | | | | 99,042,681 | |
| Midcap Fund | | | 156,456 | | | | 367,330 | | | | 523,786 | | | | — | | | | 36,921,024 | | | | 37,444,810 | |
| SMID Cap Fund | | | — | | | | 281,448 | | | | 281,448 | | | | (50,957 | ) | | | 16,198,300 | | | | 16,428,791 | |
| Small Cap Fund | | | 344,160 | | | | 1,775,234 | | | | 2,119,394 | | | | — | | | | 55,121,109 | | | | 57,240,503 | |
| Walden Balanced Fund | | | 162,256 | | | | 267,711 | | | | 429,967 | | | | — | | | | 61,833,062 | | | | 62,263,029 | |
| Walden Equity Fund | | | 134,292 | | | | 2,466,248 | | | | 2,600,540 | | | | — | | | | 135,304,117 | | | | 137,904,657 | |
| Walden Midcap Fund | | | 54,166 | | | | 494,755 | | | | 548,921 | | | | — | | | | 20,088,342 | | | | 20,637,263 | |
| Walden SMID Cap Fund | | | 18,518 | | | | 359,614 | | | | 378,132 | | | | — | | | | 16,425,037 | | | | 16,803,169 | |
| Walden Small Cap Fund | | | 65,530 | | | | 958,131 | | | | 1,023,661 | | | | — | | | | 32,625,134 | | | | 33,648,795 | |
| Walden International Equity Fund | | | 6,819 | | | | — | | | | 6,819 | | | | (114,689 | ) | | | 6,598,029 | | | | 6,490,159 | |
| 1 | The differences between book-basis and tax-basis unrealized appreciation (depreciation) is attributable primarily to tax deferral of losses on wash sales and return of capital distributions from REIT securities and other investments. |
As of the end of its tax year ended December 31, 2019, the following Funds have a net capital loss carry forwards (“CLCFs”) not subject to expiration as summarized in the tables below. The Board does not intend to authorize a distribution of any realized gain for the Fund until any applicable CLCF has been offset or expires.
| Fund | | Long Term Amount | | | Total | |
| Walden International Equity Fund | | $ | 114,689 | | | $ | 114,689 | |
During the year ended December 31, 2019, the following Funds utilized capital loss carry forwards to offset realized capital gains:
| Fund | | Total | |
| Walden International Equity Fund | | $ | 120,432 | |
Under current tax law, certain net investment losses and capital losses realized after October 31 of a Fund’s fiscal year may be deferred and treated as occurring on the first business day of the following fiscal year for tax purposes. The following Funds deferred losses as follows:
| | | Post October | |
| Fund | | Capital Losses | |
| SMID Cap Fund | | $ | 50,957 | |
As of December 31, 2019, the following reclassifications have been made on the Statements of Assets and Liabilities to increase (decrease) such accounts with offsetting adjustments as indicated:
| | | Total Distributable | | | | |
| Fund | | Earnings | | | Paid in Capital | |
| Asset Management Fund | | $ | (5,029,044 | ) | | $ | 5,029,044 | |
| Midcap Fund | | | (99,792 | ) | | | 99,792 | |
| SMID Cap Fund | | | (110,290 | ) | | | 110,290 | |
| Small Cap Fund | | | (42,098,363 | ) | | | 42,098,363 | |
| Walden Equity Fund | | | (1 | ) | | | 1 | |
| Walden Midcap | | | (53,007 | ) | | | 53,007 | |
| Walden SMID Cap Fund | | | (36,544 | ) | | | 36,544 | |
| Walden Small Cap Fund | | | (132,837 | ) | | | 132,837 | |
These “book/tax” differences are either considered temporary or permanent in nature. To the extent these differences are permanent in nature (e.g. return of capital, distribution reclass, foreign currency reclass, and equalization), such amounts are reclassified within the composition of net assets based on their federal tax-basis treatment; temporary differences (e.g. wash sales and post October losses) do not require reclassification. To the extent dividends to shareholders exceed net investment income and net realized gains for tax purposes, they are reported as returns of capital.
Continued
| Notes to Financial Statements | December 31, 2019 |
| 6. | Control Ownership and Principal Holders: |
The beneficial ownership, either directly or indirectly, of more than 25% of the voting securities of a Fund creates presumptions of control of the Fund under section 2 (a)(9) of the 1940 Act. As of December 31, 2019, the Funds had individual shareholder accounts and/or omnibus shareholder accounts (comprised of a group of individual shareholders), owning more than 25% of the total shares outstanding of the Fund as detailed below.
| | | | | Percentage of | |
| Fund | | Control Ownership | | Ownership | |
| Asset Management Fund | | US Bank N.A. | | | 87.37 | % |
| Equity Fund | | US Bank N.A. | | | 94.34 | |
| Midcap Fund | | US Bank N.A. | | | 48.33 | |
| SMID Cap Fund | | National Financial Services | | | 63.51 | |
| Walden Balanced Fund | | US Bank N.A. | | | 56.73 | |
| Walden Equity Fund | | US Bank N.A. | | | 29.19 | |
| Walden Midcap Fund | | US Bank N.A. | | | 75.15 | |
| Walden SMID Cap Fund | | US Bank N.A. | | | 52.77 | |
| Walden Small Cap Fund | | US Bank N.A. | | | 36.68 | |
| Walden International Equity Fund | | US Bank N.A. | | | 86.52 | |
Effective February 4, 2020, the Boston Trust Small Cap Fund changed its name to the Boston Trust Walden Small Cap Fund.
Management has evaluated events and transactions through the date these financial statements were issued and concluded no additional subsequent events required recognition or disclosure in these financial statements.
Report of Independent Registered Public Accounting Firm
To the Shareholders and Board of Trustees of
Boston Trust Walden Funds
Opinion on the Financial Statements
We have audited the accompanying statements of assets and liabilities, including the schedules of portfolio investments, of Boston Trust Walden Funds comprising the funds listed below (the “Funds”) as of December 31, 2019, the related statements of operations, the statements of changes in net assets, and the financial highlights for each of the periods indicated below, including the related notes (collectively referred to as the “financial statements”). In our opinion, the financial statements present fairly, in all material respects, the financial position of each of the Funds as of December 31, 2019, the results of their operations, the changes in their net assets, and the financial highlights for each of the periods indicated below in conformity with accounting principles generally accepted in the United States of America.
| | | | Statements of | | | | Statements of Changes | | | | Financial | |
| Fund Name | | | Operations | | | | in Net Assets | | | | Highlights | |
| Boston Trust Asset Management Fund | | | For the year ended December 31, 2019 | | | | For the two years ended December 31, 2019 and 2018 | | | | For the years ended December 31, 2019, 2018 and 2017, for the period ended December 31, 2016 and for the years ended March 31, 2016 and 2015 | |
| Boston Trust Equity Fund | | |
| Boston Trust Midcap Fund | | |
| Boston Trust SMID Cap Fund | | |
| Boston Trust Small Cap Fund | | |
| Walden Balanced Fund | | | | | | | | | | | | |
| Walden Equity Fund | | | | | | | | | | | | |
| Walden Midcap Fund | | | | | | | | | | | | |
| Walden SMID Cap Fund | | | | | | | | | | | | |
| Walden Small Cap Fund | | | | | | | | | | | | |
| Walden International Equity Fund | | | For the year ended December 31, 2019 | | | | For the two years ended December 31, 2019 and 2018 | | | | For the years ended December 31, 2019, 2018 and 2017, for the period ended December 31, 2016 and for the period ended March 31, 2016 | |
Basis for Opinion
These financial statements are the responsibility of the Funds’ management. Our responsibility is to express an opinion on the Funds’ financial statements based on our audits. We are a public accounting firm registered with the Public Company Accounting Oversight Board (United States) (“PCAOB”) and are required to be independent with respect to the Funds in accordance with the U.S. federal securities laws and the applicable rules and regulations of the Securities and Exchange Commission and the PCAOB.
We conducted our audits in accordance with the standards of the PCAOB. Those standards require that we plan and perform the audit to obtain reasonable assurance about whether the financial statements are free of material misstatement whether due to error or fraud.
Our audits included performing procedures to assess the risks of material misstatement of the financial statements, whether due to error or fraud, and performing procedures that respond to those risks. Such procedures included examining, on a test basis, evidence regarding the amounts and disclosures in the financial statements. Our procedures included confirmation of securities owned as of December 31, 2019, by correspondence with the custodian and brokers. Our audits also included evaluating the accounting principles used and significant estimates made by management, as well as evaluating the overall presentation of the financial statements. We believe that our audits provide a reasonable basis for our opinion.
We have served as the Funds’ auditor since 2008.

COHEN & COMPANY, LTD.
Cleveland, Ohio
February 21, 2020
| Supplementary Information (Unaudited) | December 31, 2019 |
Federal Income Tax Information:
During the fiscal year ended December 31, 2019, the Funds declared long-term realized gain distributions in the following amounts:
| Fund | | Long-Term Capital Gain Distributions | |
| Asset Management Fund | | $ | 350,942 | |
| Equity Fund | | | 160,867 | |
| Midcap Fund | | | 3,369,743 | |
| SMID Cap Fund | | | 1,944,006 | |
| Small Cap Fund | | | 14,436,243 | |
| Walden Balanced Fund | | | 906,163 | |
| Walden Equity Fund | | | 5,237,707 | |
| Walden Midcap Fund | | | 3,373,441 | |
| Walden SMID Cap Fund | | | 2,606,462 | |
| Walden Small Cap Fund | | | 5,456,202 | |
During the fiscal year ended December 31, 2019, the Funds declared short-term realized gain distributions in the following amounts:
| Fund | | Short-Term Capital Gains Distributions | |
| Midcap Fund | | $ | 1,136,363 | |
| SMID Cap Fund | | | 661,414 | |
| Small Cap Fund | | | 30,527 | |
| Walden Balanced Fund | | | 152,946 | |
| Walden Equity Fund | | | 251,786 | |
| Walden Midcap Fund | | | 243,862 | |
| Walden SMID Cap Fund | | | 151,337 | |
For the fiscal year ended December 31, 2019, the following percentage of the total ordinary income distributions paid by the Funds qualify for the distributions received deduction available to corporate shareholders.
| Fund | | Distribution Received Deduction | |
| Asset Management Fund | | | 100.00 | % |
| Equity Fund | | | 100.00 | |
| Midcap Fund | | | 79.11 | |
| SMID Cap Fund | | | 84.00 | |
| Small Cap Fund | | | 100.00 | |
| Walden Balanced Fund | | | 100.00 | |
| Walden Equity Fund | | | 100.00 | |
| Walden Midcap Fund | | | 100.00 | |
| Walden SMID Cap Fund | | | 100.00 | |
| Walden Small Cap Fund | | | 100.00 | |
For the fiscal year ended December 31, 2019, distributions paid by the Funds may be subject to a maximum tax rate of 15%, as provided for by the Jobs and Growth Tax Relief Reconciliation Act of 2003. The Funds intend to designate the maximum amount allowable as taxed at a maximum rate of 15%. Complete information will be reported in conjunction with your 2019 Form 1099-DIV.
| Fund | | Qualified Dividend Income | |
| Asset Management Fund | | | 100.00 | % |
| Equity Fund | | | 100.00 | |
| Midcap Fund | | | 82.52 | |
| SMID cap Fund | | | 85.83 | |
| Small Cap Fund | | | 100.00 | |
| Walden Balanced Fund | | | 100.00 | |
| Walden Equity Fund | | | 100.00 | |
| Walden Midcap Fund | | | 100.00 | |
| Walden SMID Cap Fund | | | 100.00 | |
| Walden Small Cap Fund | | | 100.00 | |
| Walden International Equity Fund | | | 100.00 | |
The following Funds intend to elect to pass through to shareholders the income tax credit for taxes paid to foreign countries. Foreign source income and foreign tax expense per outstanding share on December 31, 2019 are as follows:
| | | Foreign Source Income | | | Foreign Tax Expense | |
| Fund | | Per Share | | | Per Share | |
| Walden International Equity Fund | | $ | 0.33 | | | $ | 0.03 | |
The pass-through of this foreign tax credit will only affect those persons who are shareholders on the dividend record date in December 2019. These shareholders will receive more detailed information along with their 2019 Form 1099-DIV.
Continued
| Supplementary Information (Unaudited) | | December 31, 2019 |
Table of Shareholder Expenses:
As a shareholder of the Trust, you incur ongoing costs, including management fees, and other Fund expenses. These examples are intended to help you understand your ongoing costs (in dollars) of investing in the Boston Trust Walden Funds and to compare these costs with the ongoing costs of investing in other mutual funds.
These examples are based on an investment of $1,000 invested at the beginning of the period and held for the entire period from July 1, 2019 through December 31, 2019.
Actual Expenses
The table below provides information about actual account values and actual expenses. You may use the information below together with the amount you invested, to estimate the expenses that you paid over the period. Simply divide your account value by $1,000 (for example, an $8,600 account value divided by $1,000 = 8.6), then multiply the result by the number in the table under the heading entitled “Expenses Paid During Period” to estimate the expenses you paid on your account during this period.
Please note that the expenses shown in the tables are meant to highlight your ongoing costs only and do not reflect the costs incurred by the Funds for buying and selling securities. The Funds do not charge transaction fees, such as redemption fees, nor do the Funds charge a sales charge (load). Therefore, the table is useful in comparing ongoing costs only, and will not help you determine the relative total costs of owning different funds.
| | | | | | | | | | | | Annualized | |
| | | Beginning | | | Ending | | | Expenses Paid | | | Expense Ratio | |
| | | Account Value | | | Account Value | | | During Period1 | | | During Period | |
| | | 7/1/19 | | | 12/31/19 | | | 7/1/19 - 12/31/19 | | | 7/1/19 - 12/31/19 | |
| Asset Management Fund | | $ | 1,000.00 | | | $ | 1,093.80 | | | $ | 4.70 | | | | 0.89 | % |
| Equity Fund | | | 1,000.00 | | | | 1,113.70 | | | | 4.85 | | | | 0.91 | |
| Midcap Fund | | | 1,000.00 | | | | 1,073.60 | | | | 5.23 | | | | 1.00 | |
| SMID Cap Fund | | | 1,000.00 | | | | 1,066.30 | | | | 3.91 | | | | 0.75 | |
| Small Cap Fund | | | 1,000.00 | | | | 1,077.10 | | | | 5.24 | | | | 1.00 | |
| Walden Balanced Fund | | | 1,000.00 | | | | 1,087.80 | | | | 5.26 | | | | 1.00 | |
| Walden Equity Fund | | | 1,000.00 | | | | 1,114.90 | | | | 5.33 | | | | 1.00 | |
| Walden Midcap Fund | | | 1,000.00 | | | | 1,072.40 | | | | 5.22 | | | | 1.00 | |
| Walden SMID Cap Fund | | | 1,000.00 | | | | 1,061.80 | | | | 5.20 | | | | 1.00 | |
| Walden Small Cap Fund | | | 1,000.00 | | | | 1,076.20 | | | | 5.23 | | | | 1.00 | |
| Walden International Equity Fund | | | 1,000.00 | | | | 1,067.60 | | | | 5.16 | | | | 0.99 | |
1 Expenses are equal to the Fund’s annualized expense ratio multiplied by the average account value over the period multiplied by 184/365 (to reflect the one-half year period).
Hypothetical Example for Comparison Purposes
The table below provides information about hypothetical account values and hypothetical expenses based on each Fund’s actual expense ratio and an assumed rate of return of 5% per year before expenses, which is not the Fund’s actual return. The hypothetical account values and expenses may not be used to estimate the actual ending account balance or expenses you paid for the period. You may use this information to compare this 5% hypothetical example with the 5% hypothetical examples that appear in the shareholder reports of other funds.
Please note that the expenses shown in the table are meant to highlight your ongoing costs only and do not reflect the costs incurred by the Funds for buying and selling securities. The Funds do not charge transaction fees, such as redemption fees, nor do the Funds charge a sales charge (load). Therefore, the table is useful in comparing ongoing costs only, and will not help you determine the relative total costs of owning different funds.
| | | | | | | | | | | | Annualized | |
| | | Beginning | | | Ending | | | Expenses Paid | | | Expense Ratio | |
| | | Account Value | | | Account Value | | | During Period1 | | | During Period | |
| | | 7/1/19 | | | 12/31/19 | | | 7/1/19 - 12/31/19 | | | 7/1/19 - 12/31/19 | |
| Asset Management Fund | | $ | 1,000.00 | | | $ | 1,020.72 | | | $ | 4.53 | | | | 0.89 | % |
| Equity Fund | | | 1,000.00 | | | | 1,020.62 | | | | 4.63 | | | | 0.91 | |
| Midcap Fund | | | 1,000.00 | | | | 1,020.16 | | | | 5.09 | | | | 1.00 | |
| SMID Cap Fund | | | 1,000.00 | | | | 1,021.42 | | | | 3.82 | | | | 0.75 | |
| Small Cap Fund | | | 1,000.00 | | | | 1,020.16 | | | | 5.09 | | | | 1.00 | |
| Walden Balanced Fund | | | 1,000.00 | | | | 1,020.16 | | | | 5.09 | | | | 1.00 | |
| Walden Equity Fund | | | 1,000.00 | | | | 1,020.16 | | | | 5.09 | | | | 1.00 | |
| Walden Midcap Fund | | | 1,000.00 | | | | 1,020.16 | | | | 5.09 | | | | 1.00 | |
| Walden SMID Cap Fund | | | 1,000.00 | | | | 1,020.16 | | | | 5.09 | | | | 1.00 | |
| Walden Small Cap Fund | | | 1,000.00 | | | | 1,020.16 | | | | 5.09 | | | | 1.00 | |
| Walden International Equity Fund | | | 1,000.00 | | | | 1,020.21 | | | | 5.04 | | | | 0.99 | |
| 1 | Expenses are equal to the Fund’s annualized expense ratio multiplied by the average account value over the period multiplied by 184/365 (to reflect the one-half year period). |
Continued
| Supplementary Information (Unaudited) | December 31, 2019 |
Tabular Summary of Schedules of Portfolio Investments:
The Boston Trust Walden Funds invested, as a percentage of total net assets, in the following industries and countries as of December 31, 2019.
| | | Percentage of Total | |
| Security Allocation for the Schedule of Portfolio Investments | | Net Assets | |
| Information Technology | | | 20.1 | % |
| Financials | | | 15.9 | |
| U.S. Government & U.S. Government Agency Obligations | | | 12.2 | |
| Health Care | | | 11.7 | |
| Industrials | | | 9.1 | |
| Communication Services | | | 7. 4 | |
| Consumer Staples | | | 7. 1 | |
| Consumer Discretionary | | | 4.9 | |
| Municipal Bonds | | | 3.5 | |
| Materials | | | 2.3 | |
| Energy | | | 1.9 | |
| Investment Companies | | | 1.9 | |
| Utilities | | | 1.9 | |
| Other net assets | | | 0.1 | |
| Total | | | 100.0 | % |
| | | | | |
Equity Fund
| | | Percentage of Total | |
| Security Allocation for the Schedule of Portfolio Investments | | Net Assets | |
| Information Technology | | | 22.9 | % |
| Financials | | | 18.8 | |
| Health Care | | | 14.2 | |
| Industrials | | | 13.3 | |
| Consumer Staples | | | 9.1 | |
| Communication Services | | | 8.3 | |
| Consumer Discretionary | | | 5.7 | |
| Materials | | | 3.1 | |
| Utilities | | | 2.2 | |
| Energy | | | 1.9 | |
| Investment Companies | | | 0.5 | |
| Other net assets | | | 0.0 | |
| Total | | | 100.0 | % |
Midcap Fund
| | | Percentage of Total | |
| Security Allocation for the Schedule of Portfolio Investments | | Net Assets | |
| Industrials | | | 15.6 | % |
| Financials | | | 15.3 | |
| Information Technology | | | 15.1 | |
| Consumer Discretionary | | | 11.8 | |
| Health Care | | | 11.8 | |
| Real Estate | | | 7.6 | |
| Consumer Staples | | | 6.7 | |
| Materials | | | 5.7 | |
| Utilities | | | 5.3 | |
| Energy | | | 2.7 | |
| Investment Companies | | | 1.5 | |
| Communication Services | | | 1.2 | |
| Other net assets | | | (0.3 | ) |
| Total | | | 100.0 | % |
SMID Cap Fund
| | | Percentage of Total | |
| Security Allocation for the Schedule of Portfolio Investments | | Net Assets | |
| Industrials | | | 16.7 | % |
| Financials | | | 16.2 | |
| Information Technology | | | 15.0 | |
| Health Care | | | 13.3 | |
| Consumer Discretionary | | | 10.6 | |
| Real Estate | | | 8.8 | |
| Materials | | | 6.1 | |
| Utilities | | | 3.9 | |
| Consumer Staples | | | 3.5 | |
| Energy | | | 3.1 | |
| Communication Services | | | 1.4 | |
| Investment Companies | | | 1.3 | |
| Other net assets | | | 0.1 | |
| Total | | | 100.0 | % |
Small Cap Fund
| | | Percentage of Total | |
| Security Allocation for the Schedule of Portfolio Investments | | Net Assets | |
| Industrials | | | 17.4 | % |
| Financials | | | 17.0 | |
| Health Care | | | 16.5 | |
| Information Technology | | | 13.3 | |
| Consumer Discretionary | | | 12.4 | |
| Real Estate | | | 5.8 | |
| Utilities | | | 5.0 | |
| Consumer Staples | | | 4.6 | |
| Materials | | | 3.9 | |
| Energy | | | 2.5 | |
| Investment Companies | | | 1.5 | |
| Other net assets | | | 0.1 | |
| Total | | | 100.0 | % |
Continued
| Supplementary Information (Unaudited) | | December 31, 2019 |
Tabular Summary of Schedules of Portfolio Investments (cont.):
Walden Balanced Fund
| | | Percentage of Total | |
| Security Allocation for the Schedule of Portfolio Investments | | Net Assets | |
| U.S. Government & U.S. Government Agency Obligations | | | 19.5 | % |
| Information Technology | | | 16.5 | |
| Financials | | | 13.0 | |
| Health Care | | | 11.9 | |
| Industrials | | | 8.9 | |
| Consumer Staples | | | 7.5 | |
| Communication Services | | | 6.2 | |
| Consumer Discretionary | | | 6.1 | |
| Materials | | | 2.5 | |
| Utilities | | | 2.1 | |
| Municipal Bonds | | | 2.0 | |
| Energy | | | 1.9 | |
| Investment Companies | | | 1.6 | |
| Certificate of Deposit | | | 0.1 | |
| Other net assets | | | 0.2 | |
| Total | | | 100.0 | % |
| | | Percentage of Total | |
| Security Allocation for the Schedule of Portfolio Investments | | Net Assets | |
| Information Technology | | | 20.9 | % |
| Financials | | | 16.3 | |
| Health Care | | | 15.3 | |
| Industrials | | | 11.3 | |
| Consumer Staples | | | 10.1 | |
| Consumer Discretionary | | | 8.2 | |
| Communication Services | | | 8.1 | |
| Materials | | | 3.6 | |
| Utilities | | | 3.0 | |
| Energy | | | 2.3 | |
| Investment Companies | | | 0.7 | |
| Other net assets | | | 0.2 | |
| Total | | | 100.0 | % |
| | | Percentage of Total | |
| Security Allocation for the Schedule of Portfolio Investments | | Net Assets | |
| Financials | | | 16.1 | % |
| Industrials | | | 16.1 | |
| Information Technology | | | 14.4 | |
| Health Care | | | 11.4 | |
| Consumer Discretionary | | | 11.1 | |
| Real Estate | | | 7.5 | |
| Utilities | | | 6.0 | |
| Materials | | | 5.9 | |
| Consumer Staples | | | 5.8 | |
| Energy | | | 2.8 | |
| Investment Companies | | | 1.4 | |
| Communication Services | | | 1.2 | |
| Other net assets | | | 0.3 | |
| Total | | | 100.0 | % |
| | | Percentage of Total | |
| Security Allocation for the Schedule of Portfolio Investments | | Net Assets | |
| Industrials | | | 17.0 | % |
| Financials | | | 16.6 | |
| Information Technology | | | 15.4 | |
| Health Care | | | 14.2 | |
| Consumer Discretionary | | | 10.4 | |
| Real Estate | | | 8.8 | |
| Materials | | | 6.2 | |
| Utilities | | | 4.0 | |
| Consumer Staples | | | 2.7 | |
| Energy | | | 2.3 | |
| Communication Services | | | 1.4 | |
| Investment Companies | | | 0.9 | |
| Other net assets | | | 0.1 | |
| Total | | | 100.0 | % |
Walden Small Cap Fund
| | | Percentage of Total | |
| Security Allocation for the Schedule of Portfolio Investments | | Net Assets | |
| Industrials | | | 18.1 | % |
| Financials | | | 17.2 | |
| Health Care | | | 15.2 | |
| Information Technology | | | 14.0 | |
| Consumer Discretionary | | | 12.4 | |
| Real Estate | | | 5.8 | |
| Utilities | | | 5.0 | |
| Materials | | | 4.1 | |
| Consumer Staples | | | 3.6 | |
| Energy | | | 2.5 | |
| Investment Companies | | | 1.7 | |
| Other net assets | | | 0.4 | |
| Total | | | 100.0 | % |
Walden International Equity Fund
| | | | Percentage of Total | |
| Security Allocation for the Schedule of Portfolio Investments | | | Net Assets | |
| Japan | | | 22.2 | % |
| United Kingdom | | | 14.3 | |
| France | | | 9.7 | |
| Germany | | | 8.7 | |
| Switzerland | | | 8.6 | |
| Canada | | | 8.5 | |
| Australia | | | 6.7 | |
| Hong Kong | | | 3.4 | |
| Netherlands | | | 2.7 | |
| Spain | | | 2.4 | |
| Sweden | | | 2.3 | |
| Denmark | | | 1.8 | |
| Italy | | | 1.5 | |
| Finland | | | 1.5 | |
| Singapore | | | 1.4 | |
| United States | | | 1.1 | |
| Ireland | | | 0.8 | |
| Israel | | | 0.8 | |
| Norway | | | 0.8 | |
| Luxembourg | | | 0.6 | |
| Belgium | | | 0.5 | |
| Other net assets | | | (0.3 | ) |
| Total | | | 100.0 | % |
Continued
| Supplementary Information (Unaudited) | | | December 31, 2019 |
Other Information:
A description of the policies and guidelines that the Funds use to determine how to vote proxies related to portfolio securities is available: (i) without charge, upon request, by calling 1-800-282-8782 ext. 7050, and (ii) on the Securities and Exchange Commission’s (the “Commission”) website at http://www.sec.gov.
Proxy voting policies and guidelines as well as information regarding how the Funds voted proxies relating to portfolio securities during the most recent 12-month period ended June 30 is available (i) without charge, upon request, by calling 1-800-282-8782 ext. 7050, (ii) online at https://www.bostontrustwalden.com/ investment-services/mutual-funds/; and (iii) on the Commission’s website at http://www.sec.gov.
The Funds file their portfolio holdings information for each month in a fiscal quarter within 60 days after the end of the relevant fiscal quarter with the SEC on Form N-PORT. Portfolio holdings information for the third month of each fiscal quarter is available on the SEC’s website at http://www.sec.gov. The Funds’ Schedules of Portfolio Investments will be available no later than 60 days after each period end, without charge, online at https://www.bostontrustwalden.com/investment-services/mutual-funds/.
Leanne Moore became a portfolio manager responsible for the daily management of the Boston Trust SMID Cap Fund, Walden SMID Cap Fund, Boston Trust Small Cap Fund, and Walden Small Cap Fund effective February 4, 2020. Mark Zagata became a portfolio manager responsible for the daily management of the Boston Trust Midcap Fund and Walden Midcap Fund effective February 4, 2020. Belinda Cavazos was removed as a portfolio manager responsible for the daily management for the Boston Trust Walden Funds effective February 4, 2020. In all Funds, there has been no change to the Lead Portfolio Manager.
Continued
| Investment Adviser Contract Approval (Unaudited) | December 31, 2019 |
The annual consideration by the Board of Trustees (the “Board”) of the continuation of the investment advisory agreement between Boston Trust Walden Inc., (the “Adviser”) and Boston Trust Asset Management Fund, Boston Trust Equity Fund, Boston Trust Midcap Fund, Boston Trust SMID Cap Fund, Boston Trust Walden Small Cap Fund, Walden Balanced Fund, Walden Equity Fund, Walden Midcap Fund, Walden SMID Cap Fund, Walden Small Cap Fund, and Walden International Equity Fund (the “Funds”).
Section 15 of the Investment Company Act of 1940 (the “1940 Act”) requires that the Investment Advisory Agreement with Boston Trust Walden Inc. (the “Adviser”) be renewed annually by the Board of Trustees of Boston Trust Walden Funds (the “Trust”), including a majority of the Board who are not “interested persons” of the Trust or of the Adviser. It is the duty of the Board to request as much information as is reasonably necessary to evaluate the terms of the Investment Advisory Agreement and determine whether its continuance is fair to the Funds and their shareholders. The Board considered the continuation of the Investment Advisory Agreement at an in-person meeting held on August 14, 2019. The Board requested, and the Adviser provided, information and data relating to: (i) the investment performance of each series of the Trust (the “Funds”) and the Adviser; (ii) the nature, extent and quality of the services provided by the Adviser to the Funds; (iii) the cost of the services to be provided and the profits to be realized by the Adviser and its affiliates from the relationship with the Funds; (iv) the extent to which economies of scale will be realized as the Funds grow; (v) whether the fee levels reflect these economies of scale to the benefit of Funds’ shareholders; (vi) the advisory fees paid by other comparable funds advised by the Adviser or by a different investment adviser; (vii) the Funds’ expense ratios and the expense ratios of similar funds; and (viii) the effect of any fee waivers and expense reimbursements made by the Adviser.
At the meeting on August 14, 2019, the Board engaged in a thorough review process to determine whether to continue the Investment Advisory Agreement. The Board met directly with representatives of the Adviser and reviewed the information and data listed above, as supplemented by Citi Fund Services Ohio, Inc., the Trust’s administrator. As part of its deliberations, the Board also considered and relied upon the information about the Funds and the Adviser that it had received throughout the year as part of its ongoing oversight of the Funds and their operations.
The Board carefully considered the nature, extent and quality of the services provided by the Adviser. The Board discussed the organizational structure of Adviser and its investment philosophy, portfolio construction process and fixed income approach. The Board discussed the Adviser’s approach to sustainable, responsible and impact investing, including its environmental, social and governance research framework and its portfolio screening guidelines. The Board reviewed the Adviser’s experience and the capabilities of its personnel, as well as the quality of the reports and other materials received from the Adviser. The Board reviewed biographical information about the employees of the Adviser and its parent, Boston Trust Walden Company (“Boston Trust”). The Board addressed the Adviser’s brokerage allocation and execution strategy, noting that the Adviser does not take into consideration sales of Fund shares in selecting brokers through which its affects Fund portfolio transactions. The Board also discussed the Adviser’s compliance program, business continuity and disaster recovery plans, succession planning and employee ownership. Considering the personnel involved in servicing the Funds, as well as the materials and services described above, the Board expressed satisfaction with the quality of the services received from the Adviser.
Next, the Board reviewed the performance of the Funds from inception through June 30, 2019, comparing the performance to various indices and, in the case of the Boston Trust Asset Management Fund and the Walden Balanced Fund, to a bond index, equity index and Treasury bills. The Board noted that as of June 30, 2019, while each Fund outperformed the index and its peer group at various times for the Year-to-Date, 1-year, 3-year, 5-year and Since Inception periods, each Fund generally performed in line with its peer group during the same periods. The Board noted that while the Funds outperformed their benchmarks at various times, performance was consistent with the long-term performance pattern of each Fund’s investment style, as they participated in rising markets and outperformed in falling markets. The Board noted that this downside protection is consistent with the Adviser’s strategy and is routinely communicated to clients and investors. The Board also noted that during a rising market lasting over a decade, the Funds have consistently adhered to a lower risk, higher quality strategy.
The Board noted that the advisory fees for each Fund are within the range of their peer groups. The Board noted that the Adviser has been operating under an Expense Limitation Agreement that requires the Adviser to waive fees and/or reimburse expenses to the extent total operating expenses exceed 0.75% for the Boston Trust SMID Cap Fund, 1.10% for the Walden International Equity Fund and 1.00% for all the other Funds.
Continued
| Investment Adviser Contract Approval (Unaudited) | December 31, 2019 |
Turning to total operating expenses, the Board discussed the components of the Funds’ expense ratios and the services and value shareholders receive in exchange for the fees paid and expense borne by the Funds. The Board noted that the expense ratios for all the Funds were within the range of total operating expenses of the funds in the peer groups. After considering the comparative data as described above, and the Expense Limitation Agreement that was previously renewed by the Board at its February 26, 2019 meeting, the Board concluded that the advisory fees and expense ratios were reasonable.
In reviewing the costs of the services to be provided and the profits to be realized by the Adviser, the Board reviewed the Adviser’s income statement for the 12-months ended December 31, 2018 and the six-months ended June 30, 2019, as well as the gross and net profit margins realized on each Fund. The Board noted that the Adviser is a wholly-owned subsidiary of Boston Trust and the payment of direct and indirect Trust expenses is governed by an Intercompany Services Agreement between the Adviser and Boston Trust. The Board noted that the Adviser’s relationship with the Funds was profitable even though the Adviser is operating under an Expense Limitation Agreement with the Trust. The Board discussed the custody and transfer agency fees earned by the Adviser for services provided to the Funds, which are reduced by amounts paid for sub-custody and sub-transfer agency services.
| Information about Trustees and Officers (Unaudited) | December 31, 2019 |
Overall responsibility for management of the Funds rests with the Board of Trustees. The names of the Trustees and Officers of the Funds, their addresses, ages and principal occupations during the past five years are provided in the tables below. Trustees who are deemed “interested persons,” as defined in the 1940 Act, are referred to as Interested Trustees. Trustees who are not interested persons are referred to as Independent Trustees. The Funds’ Statement of Additional Information includes additional information about the Funds’ Trustees and is available, without charge and upon request, by calling 1-800-282-8782 or by visiting www.bostontrustwalden.com.
| | | | | | | | | | | Other |
| | | | | | | | | Number of Funds | | Directorships |
| | | Position(s) | | Term of Office* | | | | in Fund Complex | | Held by Trustee |
| Name, Address, | | Held with | | and Length of | | Principal Occupation(s) | | Overseen by | | during the past |
| and Year of Birth | | the Funds | | Time Served | | During Past Five Years | | Trustee*** | | five years |
| INTERESTED TRUSTEES** | | | | | | |
| | | | | | | |
Lucia B. Santini
One Beacon Street
Boston, MA 02108
Year of Birth: 1958
| | Trustee and
President
| | Since 2011
| | President, Boston Trust Walden Inc., January 2017 to present, Managing Director, February, 2001 to December 31, 2016; Managing Director and Senior Portfolio Manager, Boston Trust Walden Company (bank trust company), November 1993 to present. | | 11
| | None
|
Heidi Soumerai
One Beacon Street
Boston, MA 02108
Year of Birth: 1957 | | Trustee
| | Since 2013
| | Managing Director and Director of ESG Research, Boston Trust Walden Company, August 2004 to present; Research Analyst, Boston Trust Walden Company, January 1985 to present. | | 11
| | None
|
| | | | | | | | | | | |
| INDEPENDENT TRUSTEES | | | | | | |
Diane E. Armstrong
One Beacon Street
Boston, MA 02108
Year of Birth: 1964 | | Trustee
| | Since 2005
| | Advisor, Investment Partners (financial planning firm), January 2018 to present; President, Armstrong Financial Services (financial planning firm), November 2012 to present. | | 11
| | None
|
| | | | | | | | | | | |
Elizabeth E. McGeveran
One Beacon Street
Boston, MA 02108
Year of Birth: 1971 | | Trustee
| | Since 2016
| | Head of Investments, The McKnight Foundation, September 2014 to present.
| | 11
| | None
|
| | | | | | | | | | | |
| Michael M. Van Buskirk | | Trustee and | | Since 1992; | | Retired since 2014. | | 11 | | Advisers |
| One Beacon Street | | Chairman of | | Chairman Since | | | | | | Investment Trust |
| Boston, MA 02108 | | the Board | | 2006 | | | | | | (2011 to present) |
| Year of Birth: 1947 | | | | | | | | | | (Chairman of the |
| | | | | | | | | | | Board) |
| OFFICERS WHO ARE NOT TRUSTEES | | | | | | |
Jennifer Ellis
One Beacon Street
Boston, MA 02108
Year of Birth: 1972 | | Treasurer
| | Since 2011
| | Director of Finance/Treasurer, Boston Trust Walden Company, May 2011 to present.
| | N/A
| | N/A
|
| | | | | | | | | | | |
Curtis Barnes 800 Boylston Street 24th Floor Boston, MA 02199 Year of Birth: 1953 | | Secretary
| | Since 2007
| | Senior Vice President, Citi Fund Services Ohio, Inc. (fund administrator), August 2007 to present.
| | N/A
| | N/A
|
| | | | | | | | | | | | | | | | | |
| | | | | | | | | | | | | | | | | |
| Amy E. Siefer | | Chief | | | Since 2018 | | | Vice President, Citi Fund Services Ohio, Inc. (fund administrator), May 2012 to present. | | | N/A | | | | N/A | |
| 4400 Easton Commons | | Compliance | | | | | | | | | | | | | |
| Suite 200 | | Officer and AML | | | | | | | | | | | | | |
| Columbus, OH 43219 | | Officer | | | | | | | | | | | | | |
| Year of Birth: 1977 | | | | | | | | | | | | | | | | |
* Trustees and officers hold their position until resignation or removal.
** Ms. Santini and Ms. Soumerai are considered “interested persons” of the Trust as defined in the 1940 Act due to their employment with Boston Trust Walden Inc., the Funds’ investment adviser.
*** The “Fund Complex” consists of the Boston Trust Walden Funds.
The page intentionally left blanck.
Investment Adviser
Boston Trust Walden Inc.
One Beacon Street
Boston, MA 02108
Transfer Agent
Boston Trust Walden Company
One Beacon Street
Boston, MA 02108
Administrator
Citi Fund Services Ohio, Inc.
4400 Easton Commons, Suite 200
Columbus, OH 43219
Distributor
Foreside Financial Services, LLC
Three Canal Plaza, Suite 100
Portland, ME 04101
Independent Registered Public Accounting Firm
Cohen & Company, Ltd.
1350 Euclid Avenue, Suite 800
Cleveland, OH 44115
Legal Counsel
Thompson Hine LLP
41 South High Street, Suite 1700
Columbus, OH 43215
This report is intended for the shareholders of the Funds and may not be used as sales literature unless preceded or accompanied by a current prospectus.
Past performance results shown should not be considered a representation of future performance.
Share price and returns will fluctuate so that shares, when redeemed, may be worth more or less than their original cost.
Statements and other information herein are dated and subject to change.
02/20
(a) The registrant has adopted a code of ethics that applies to the registrant’s principal executive officer, principal financial officer, principal accounting officer or controller, or persons performing similar functions. This code of ethics is included as an Exhibit.
(b) During the period covered by the report, with respect to the registrant's code of ethics that applies to its principal executive officer, principal financial officer, principal accounting officer or controller, or persons performing similar functions; there have been no amendments to, nor any waivers granted from, a provision that relates to any element of the code of ethics definition enumerated in paragraph (b) of this Item 2.
| Item 3. | Audit Committee Financial Expert. |
3(a)(1) The registrant’s board of directors has determined that the registrant has at least one audit committee financial expert serving on its audit committee.
3(a)(2) The audit committee financial expert is Diane Armstrong, who is “independent” for purposes of this Item 3 of Form N-CSR.
| Item 4. | Principal Accountant Fees and Services. |
| | | | | December2019 | | | December2018 | |
| (a) | | Audit Fees | | $ | 114,500 | | | $ | 114,500 | |
| | | | | | | | | | | |
| (b) | | Audit-Related Fees | | $ | 17,250 | | | $ | 17,250 | |
The fees for 2018 and 2019 relate to the consent issuance in three Form 17f-2 filings filed with the Securities and Exchange Commission (“SEC”).
| | | | | December2019 | | | December2018 | |
| (c) | | Tax Fees | | $ | 27,500 | | | $ | 27,500 | |
Tax fees for both 2018 and 2019 relate to the preparation of the Funds’ federal and state income tax returns, federal excise tax return review and review of capital gain and income distribution calculations.
| | | | | December2019 | | | December2018 | |
| (d) | | All Other Fees | | $ | 0 | | | $ | 0 | |
| (e)(1) | The Audit Committee may pre-approve at any regularly scheduled Audit Committee meeting audit, audit-related, tax and other non-audit services to be rendered or that may be rendered by the Auditor to the Funds and certain non-audit services to be rendered by the Auditor to the Advisor which require pre-approval by the Audit Committee. In connection with such pre-approvals, the Auditor, or a Fund officer, with the assistance of the Auditor, shall provide the Audit Committee with a report containing information about each type of service to be pre-approved at the meeting. |
| (e)(2) | For the fiscal years ended December 31, 2019 and 2018, 100% of all the fees in paragraph (b) through (d) were approved by the Audit Committee. |
| (g) | For the fiscal year ended December 31, 2019, Cohen Fund Audit Services, Ltd. billed non-audit fees of $44,750. For the fiscal year ended December 31, 2018, Cohen Fund Audit Services, Ltd. billed non-audit fees of $44,750. |
(h) | Not applicable. |
| Item 5. | Audit Committee of Listed Registrants. |
Not applicable.
(a) Included as part of the report to shareholders filed under Item 1.
(b) Not applicable.
| Item 7. | Disclosure of Proxy Voting Policies and Procedures for Closed-End Management Investment Companies. |
Not applicable.
| Item 8. | Portfolio Managers of Closed-End Management Investment Companies. |
Not applicable
| Item 9. | Purchases of Equity Securities by Closed-End Management Investment Company and Affiliated Purchasers. |
Not applicable.
| Item 10. | Submission of Matters to a Vote of Security Holders. |
Not applicable.
| Item 11. | Controls and Procedures. |
(a)The registrant’s principal executive officer and principal financial officer have concluded, based on their evaluation of the registrant's disclosure controls and procedures as conducted within 90 days of the filing date of this report, that these disclosure controls and procedures are adequately designed and are operating effectively to ensure that information required to be disclosed by the registrant on Form N-CSR is recorded, processed, summarized and reported within the time periods specified in the Securities and Exchange Commission's rules and forms.
(b)There were no changes in the registrant’s internal control over financial reporting (as defined in Rule 30a-3(d) under the Act (17 CFR 270.30a-3(d)) that occurred during the period covered by this report that have materially affected or are reasonably likely to materially affect, the registrant’s internal control over financial reporting.
| Item 12. | Disclosure of Securities Lending Activities for Closed-End Management Investment Companies. |
Not applicable.
(a)(1) The code of ethics that is the subject of the disclosure required by Item 2 is attached hereto.
(a)(2) Certifications pursuant to Rule 30a-2(a) are attached hereto.
(a)(3) Not applicable.
(b) Certifications pursuant to Rule 30a-2(b) are furnished herewith.
SIGNATURES
Pursuant to the requirements of the Securities Exchange Act of 1934 and the Investment Company Act of 1940, the registrant has duly caused this report to be signed on its behalf by the undersigned, thereunto duly authorized.
| (Registrant) | Boston Trust Walden Funds |
| By (Signature and Title)* | /s/ Lucia Santini, President |
Pursuant to the requirements of the Securities Exchange Act of 1934 and the Investment Company Act of 1940, this report has been signed below by the following persons on behalf of the registrant and in the capacities and on the dates indicated.
| By (Signature and Title)* | /s/ Lucia Santini, President |
| By (Signature and Title)* | /s/ Jennifer Ellis, Treasurer |