UNITED STATES
SECURITIES AND EXCHANGE COMMISSION
Washington, D.C. 20549
FORM N-CSR
CERTIFIED SHAREHOLDER REPORT OF REGISTERED
MANAGEMENT INVESTMENT COMPANIES
Investment Company Act file number | 811-06526 |
|
The Boston Trust & Walden Funds |
(Exact name of registrant as specified in charter) |
|
One Beacon Street, Boston MA | | 02108 |
(Address of principal executive offices) | | (Zip code) |
|
3435 Stelzer Rd. Columbus, OH 43219 |
(Name and address of agent for service) |
|
Registrant’s telephone number, including area code: | 1-800-282-8782 | |
|
Date of fiscal year end: | March 31 | |
|
Date of reporting period: | March 31, 2015 | |
| | | | | | | | |
Item 1. Reports to Stockholders.
This page intentionally left blank.
Annual Report
March 31, 2015
| | 
|
Table of Contents
Economic and Market Summary | 3 |
| |
Boston Trust Asset Management Fund | |
Manager Commentary | 4 |
Investment Performance | 5 |
Schedule of Portfolio Investments | 12 |
Financial Statements | 14 |
Financial Highlights | 16 |
| |
Boston Trust Equity Fund | |
Manager Commentary | 4 |
Investment Performance | 5 |
Schedule of Portfolio Investments | 17 |
Financial Statements | 18 |
Financial Highlights | 20 |
| |
Boston Trust Midcap Fund | |
Manager Commentary | 6 |
Investment Performance | 7 |
Schedule of Portfolio Investments | 21 |
Financial Statements | 22 |
Financial Highlights | 24 |
| |
Boston Trust SMID Cap Fund | |
Manager Commentary | 8 |
Investment Performance | 9 |
Schedule of Portfolio Investments | 25 |
Financial Statements | 26 |
Financial Highlights | 28 |
| |
Boston Trust Small Cap Fund | |
Manager Commentary | 10 |
Investment Performance | 11 |
Schedule of Portfolio Investments | 29 |
Financial Statements | 30 |
Financial Highlights | 32 |
| |
Environmental, Social and Governance Research and Action Update | 34 |
| |
Walden Asset Management Fund | |
Manager Commentary | 36 |
Investment Performance | 37 |
Schedule of Portfolio Investments | 44 |
Financial Statements | 46 |
Financial Highlights | 48 |
| |
Walden Equity Fund | |
Manager Commentary | 36 |
Investment Performance | 37 |
Schedule of Portfolio Investments | 49 |
Financial Statements | 50 |
Financial Highlights | 52 |
| |
Walden Midcap Fund | |
Manager Commentary | 38 |
Investment Performance | 39 |
Schedule of Portfolio Investments | 53 |
Financial Statements | 54 |
Financial Highlights | 56 |
| |
Walden SMID Cap Innovations Fund | |
Manager Commentary | 40 |
Investment Performance | 41 |
Schedule of Portfolio Investments | 57 |
Financial Statements | 58 |
Financial Highlights | 60 |
| |
Walden Small Cap Innovations Fund | |
Manager Commentary | 42 |
Investment Performance | 43 |
Schedule of Portfolio Investments | 61 |
Financial Statements | 62 |
Financial Highlights | 64 |
| |
Notes to Financial Statements | 65 |
Report of Independent Public Accounting Firm | 71 |
Supplementary Information | 72 |
Investment Adviser Contract Approval | 76 |
Information About Trustees and Officers | 78 |
Boston Trust Investment Management, Inc. (BTIM), a subsidiary of Boston Trust & Investment Management Company and an affiliate of Walden Asset Management (Walden), serves as investment adviser (the Adviser) to the Boston Trust & Walden Funds and receives a fee for its services. Walden, a division of Boston Trust & Investment Management Company, performs shareholder advocacy, proxy voting, screening services, and other environmental, social and governance initiatives for the Adviser and is paid a fee for these services by the Adviser.
Shares of the Funds are not deposits of, obligations of, or guaranteed by BTIM or its affiliates, nor are they federally insured by the FDIC. Investments in the Funds involve investment risks, including the possible loss of principal. Funds are distributed by BHIL Distributors, Inc. Member FINRA.
The foregoing information and opinions are for general information only. Boston Trust & Walden Funds and BTIM do not assume liability for any loss, which may result from the reliance by any person upon any such information or opinions. Such information and opinions are subject to change without notice, are for general information only, and are not intended as an offer or solicitation with respect to the purchase or sale of any security or offering individual or personalized investment advice.
The Boston Trust & Walden Funds may invest in foreign securities, which may involve risk not typically associated with U.S. investments.
Photography credits:
· Cover: Bruce Field
· Pages 1, 7, 39 and 43: Jim Gallagher
· Pages 5, 9, and 41: Rebecca Monette
· Pages 11 and 37: Janet C. Dygert
1
This page intentionally left blank.
2
| 
| The Boston Trust & Walden Funds
A Registered Investment Company | 
| |
Boston Trust and Walden Funds | Domenic Colasacco, CFA |
Economic and Market Summary | Portfolio Manager and President |
(Unaudited) | Boston Trust Investment Management, Inc. |
For the 12 months ended March 31, 2015, the S&P 500 posted a total return of 12.73%—a double digit gain for the third consecutive year. Most other domestic indices staged similar rallies, while major international indices were marginally in negative territory for the 12 month period. We are now over six years removed from the depths of the financial crisis, and while investments in large capitalization stocks have more than tripled over that time on a total return basis, in the aggregate, equities are still not excessively valued by most of the usual historical metrics.
Our Economic Outlook
Global economic trends have proceeded close to consensus expectations over the last year with the notable exception of the steep decline of energy prices during the autumn of 2014. Among the larger developed economies, Gross Domestic Product(1) growth was best here in the United States, where a combination of employment and income gains led to steady increases in consumer spending. Business capital expenditures have been mixed, with energy related investment slowing in recent months in reaction to the sharp drop in oil and natural gas prices; a weakness widely anticipated after oil prices were roughly halved through the second half of the calendar year. While sectors that benefit from lower energy prices have yet to fill the void, we see no reason to doubt that, in time, lower energy costs will aid rather than hinder overall economic activity in economic regions that import oil and gas.
Among the reasons global economic growth has been modest in recent years is that neither Japan nor the euro zone has come close to the economic gains achieved here in the United States. Despite aggressive monetary policies, including additional stimulus in recent quarters, both regions have struggled to simply avoid slipping back into recessions. In recent months, there has been renewed hope that weakness in their respective currencies relative to the dollar will lead to better export driven economic gains and some beneficial inflation. Improvement would be welcomed by all concerned, particularly investors who have bid-up stocks in these financial markets since year-end. Conditions in the key emerging economies of Brazil, Russia, India and China (the so-called BRIC countries) began to diverge about a year ago, when both Brazil and Russia were hurt by a combination of weak commodity prices and internal political decisions. China and India have continued to post comparatively strong growth, though, which has led most economic forecasters to retain global real GDP expectations in the vicinity of 2.5% for 2015, in line with calendar 2014’s pace. Such an economic environment usually supports at least benign, if not positive, trends in financial markets.
Investment Strategy
As we begin the spring months, investment circumstances are consistent with those that have prevailed in recent quarters. Specifically, safe, low risk investment options that provide an attractive return are not available. Indeed, interest rates are a bit lower today than they were a few months ago. Stocks, after three straight years of double-digit gains, are no longer undervalued; in fact, they are even less so because the continuing strength in the dollar suggests that 2015 corporate profits are likely to be weaker than previously anticipated for U.S. based companies with extensive international activities. Yet our now long held view that stocks continue to offer better return prospects than low yielding fixed-income investments over the next several years has not changed.
As we have repeatedly stated in past reports, the allocation between stocks and bonds is often more important than the individual securities selected. Since the end of 2009, after we concluded that the likelihood of falling back into an economic recession was low, we have kept the Asset Management Funds’ equity allocations at a comparatively high level. Through most of this period, the stock/bond allocation decision was facilitated by exceptionally low interest rates (which made bonds unattractive) and stock valuations that were below average. As stock prices have increased over the past few years, most equity valuation metrics have moved from bargain levels to slightly above long-term medians. Accordingly, compared to a few years ago, today our continuing preference for stocks has far less margin for error if either corporate profits or economic trends fail to meet current positive investor expectations.
Looking out a few years, our analysis and judgment still lead us to favor stocks rather than bonds and other types of investment assets. In a low interest rate, low inflation environment, even modest growth in corporate sales, profits and cash flows should result in equity returns that are above other investment options over the next three to five years. Unless these views change, we expect to retain the Asset Management Funds’ equity allocations in the vicinity of 75% to 80% of total assets in the months ahead. Among individual stocks investments within all of our Funds, emphasis remains on companies across a broad range of sectors with above-average financial strength, lower than average business model risk, and reasonable valuations, a combination that often reduces downside stock price risk if financial market trends weaken unexpectedly.
(1) The Gross Domestic Product (“GDP”) is the value of goods and services produced in a given country in a given year.
3
Boston Trust Asset Management Fund
Boston Trust Equity Fund
March 31, 2015
Domenic Colasacco, CFA
Portfolio Manager and President Boston Trust Investment Management, Inc.
Asset Management Fund Objective
The Fund seeks long-term capital growth and income through an actively managed portfolio of stocks, bonds and money market instruments.
Equity Fund Objective
The Fund seeks long-term capital growth through an actively managed portfolio of stocks.
Investment Concerns
Equity securities (stocks) are more volatile and carry more risk and return potential than other forms of investments, including investments in high-grade fixed income securities.
Bonds offer a relatively stable level of income, although bond prices will fluctuate, providing the potential for principal gain or loss. Intermediate-term, higher quality bonds generally offer less risk than longer-term bonds and a lower rate of return.
Cash equivalents offer low risk and low return potential.
Manager Commentary (Unaudited)
Management Discussion of Fund Performance
Portfolio Review
Stocks, as measured by the S&P 500 Index, added another 12.73% of total return to their now over six-year-old rally, during the fiscal year ended March 31, 2015. Over the past six years, the Index has registered gains of over 200% on a total return basis; this historic period of market performance was produced in the context of an American economy, and likewise corporate profits, returning to solid underpinnings from the brink of depression, and valuation expansion reflecting increasing investor confidence in the endurance of this financial strength.
The overall return of the Boston Trust Asset Management Fund was competitive, posting a total return of 8.21%. The Fund’s equity segment, however, trailed the 12.73% total return of the S&P 500 Index for the fiscal year ended March 31, 2015, as did the return of the Boston Trust Equity Fund, which posted a gain of 8.01% for the period. As has often been the case in past periods of sharply rising markets, our high-quality discipline, which seeks to identify companies with long histories of financial success, limited results as equity markets reached new highs.
Our investment approach has three primary decision points: asset allocation, sector/style emphasis and individual security selection. Since the end of 2009, after we concluded the likelihood of falling back into an economic recession was low, we have kept the Asset Management Fund’s equity allocation at a comparatively high level. Through most of this period the stock/bond allocation decision was facilitated by exceptionally low interest rates (which made bonds unattractive) and stock valuations that were below average on multiple metrics. As stock prices have increased over the past few years, most valuation metrics have moved from bargain levels to slightly above long-term medians. Accordingly, compared to a few years ago, today our continuing preference for stocks has far less margin for error if either corporate profits or economic trends fail to meet current investor expectations. Looking out a few years, though, our analysis and judgment still lead us to favor stocks rather than bonds and other types of assets. Even modest growth in corporate sales, profits and cash flows should result in equity returns that are above alternative investment options over the next three- to five-years.
A comparatively high-equity allocation usually implies above average price volatility for a portfolio. Yet the Boston Trust Asset Management Fund has had below average volatility compared to the typical balanced fund since 2009. The reason reflects our decision to focus on stocks of companies that have higher quality financial characteristics and less intrinsic business model risk. This preference and performance pattern is also reflected in the Boston Trust Equity Fund. While our overall equity returns have trailed the returns of many equity indices in recent periods, we have seen pockets of performance within sectors that exemplify the benefits of our approach. For example, in the energy sector, the Funds’ largest holdings have been ExxonMobil and Chevron rather than smaller, financially leveraged firms that need high oil and gas prices to remain profitable. This equity style often trails general market indices when industry conditions are favorable, as they were in the energy sector over the past few years. In the second half of calendar 2014, though, ExxonMobil and Chevron stock values dropped modestly, while more leveraged energy company equities fell by 25% to 50% as oil prices contracted. This is one example of style emphasis that can help the Funds’ comparative equity returns during adverse periods. We wish we had the foresight to anticipate when to move from higher quality stocks to more aggressive issues. Sadly, we have not found a group of analytical tools that allow us to execute such a strategy with consistency. To our knowledge, neither has anyone else. We take comfort in the fact that over full market cycles a higher quality investment style has produced competitive returns with less risk and price volatility. We see no reason to expect future long-term trends to be any different.*
* Portfolio composition is subject to change.
4
Investment Performance (Unaudited) | Boston Trust Asset Management Fund Boston Trust Equity Fund March 31, 2015 |
| | For the year ended 3/31/15 | |
| | Annualized | |
| | 1 Year | | 5 Years | | 10 Years | |
Boston Trust Asset Management Fund(1) | | 8.21 | % | 10.01 | % | 7.11 | % |
Boston Trust Equity Fund(1) | | 8.01 | % | 11.85 | % | 7.36 | % |
S&P 500 Index | | 12.73 | % | 14.47 | % | 8.01 | % |
Barclays U.S. Government/Credit Bond Index | | 5.86 | % | 4.75 | % | 4.96 | % |
Citigroup 90-Day U.S. Treasury Bill Index | | 0.03 | % | 0.07 | % | 1.41 | % |
Morningstar U.S. Open-End Moderate Allocation Funds Average | | 5.89 | % | 8.47 | % | 5.75 | % |
Hypothetical Growth of a $100,000 Investment
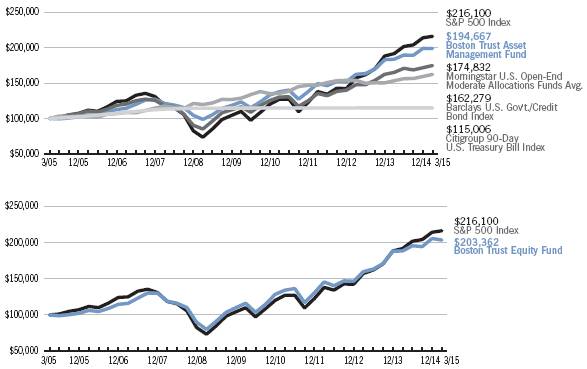
The charts represent a 10-year hypothetical $100,000 investment in the Boston Trust Asset Management Fund and the Boston Trust Equity Fund, and represent the reinvestment of dividends and capital gains in the Funds. The returns shown on the table and graphs do not reflect the deduction of taxes a shareholder would pay on Fund distributions or the redemption of Fund shares.
The Boston Trust Asset Management Fund is measured against a combination of equity and fixed income indices. The Boston Trust Equity Fund is measured against the Standard & Poor’s 500 Index (“S&P 500”), which is widely regarded as a gauge of the U.S. equities market. This index includes 500 leading companies in leading industries of the U.S. economy. Although the S&P 500 focuses on the large cap segment of the market, with approximately 75% coverage of U.S. equities, it is also widely viewed as a proxy for the total market. The Barclays U.S. Government/Credit Bond Index is a component of the Barclays U.S. Aggregate Index. The Barclays U.S. Government/Credit Bond Index includes Treasuries (i.e., public obligations of the U.S. Treasury that have remaining maturities of more than one year), Government-Related issues (e.g., agency, sovereign, supranational, and local authority debt), and USD Corporates. The Citigroup 90-Day U.S. Treasury Bill Index reflects monthly return equivalents of yield averages that are not marked to the market. The Index is an average of the last three-month Treasury bill issues. The three-month Treasury bills are the short-term debt obligations of the U.S. Government. The indices are unmanaged and their performance does not reflect the deduction of expenses associated with a mutual fund, such as investment management and fund accounting fees. The Funds’ performance reflects the deduction of fees for these services. The Morningstar U.S. Open-End Moderate Allocation Funds Average represents performance of portfolios that seek to provide both capital appreciation and income by investing in three major areas: stocks, bonds, and cash. These portfolios tend to hold larger positions in stocks than conservative-allocation portfolios. These portfolios typically have 50% to 70% of assets in equities, and the remainder in fixed income and cash. Investors cannot invest directly in an average or an index.

Boston Trust Asset Management Fund
Fund Net Asset Value: | | $ | 41.80 | |
Gross Expense Ratio(1): | | 0.93 | % |
Boston Trust Equity Fund
Fund Net Asset Value: | | $ | 20.66 | |
Gross Expense Ratio(1): | | 0.96 | % |
Past performance does not guarantee future results. The performance data quoted represents past performance and current returns may be lower or higher. The investment return and principal value will fluctuate so that an investor’s shares, when redeemed may be worth more or less than the original cost. To obtain performance information current to the most recent month-end, please call 1-800-282-8782 ext. 7050.
(1) The Funds’ Gross Expense Ratio is from the most recent prospectus, dated August 1, 2014. The Gross Expense Ratio for the Boston Trust Equity Fund includes the impact of repayment of fees and expenses which were previously reimbursed under the terms of the Fund’s contractual expense limitation agreement, which continues through August 1, 2015, and may be terminated thereafter. The contractual fee limit under the agreement is 1.00% of each Fund’s average annual net assets. Please see each Fund’s most recent prospectus for details. Additional information pertaining to each Fund’s expense ratio as of March 31, 2015, can be found in the financial highlights. The investment performance may reflect fee reductions. If such fee reductions had not occurred, the quoted performance would have been lower.
5
Boston Trust Midcap Fund
March 31, 2015
Stephen J. Amyouny, CFA
Portfolio Manager
Boston Trust Investment Management, Inc.
Fund Objective
The Fund seeks long-term capital growth through an actively managed portfolio of stocks of middle capitalization (“midcap”) companies.
Investment Concerns
Equity securities (stocks) are more volatile and carry more risk and return potential than other forms of investments, including investments in high-grade fixed income securities.
Mid-capitalization funds typically carry additional risks since smaller companies generally have a higher risk of failure.
Manager Commentary (Unaudited)
Management Discussion of Fund Performance
Portfolio Review
The Boston Trust Midcap Fund posted a total return of 12.65% for the 12-month period ended March 31, 2015, trailing the 13.68% return for the Russell Midcap® Index return. All sectors posted positive returns with one glaring exception: energy. Energy stocks fell sharply in response to the substantial decline (approximately 50%) in oil prices following their peak in mid-2014. Although the sell-off among energy stocks detracted from overall market (and Fund) results, the decline in energy prices was a clear positive for many corporations (lower fuel/energy costs) and consumers (higher discretionary income). Several companies within the Consumer Discretionary sector benefited from this trend. These companies included Hasbro, Ross Stores, O’Reilly Automotive, Autoliv, and Sally Beauty.*
Recent economic data has confirmed that the U.S. economy continues to improve with solid GDP† growth, unemployment at a post-recession low rate of 5.5%, and rising consumer confidence. In addition to this economic progress, interest rates remain historically low, inflation is well contained, and energy prices remain depressed—the last of which has contributed to increasing discretionary spending among consumers. Perhaps most importantly, however, this economic landscape has shown no signs of rapid acceleration, thus allowing the Federal Reserve Board (the Fed) to maintain its highly accommodative monetary policy. Thus, because of the confluence of these factors—modest economic growth, low interest rates, contained wage costs, and depressed energy prices—it remains a very positive environment for corporations. As such, corporate profits have continued to grow at a pace sufficient to support higher equity prices.
Portfolio Strategy
Although corporate profits have improved substantially from the depths of the financial crisis approximately six years ago and equity prices have considerably appreciated in response, equity valuations have expanded even more rapidly and now stand at a post-recession high. In light of present interest rates and inflation, we do not find these valuations excessive or even unreasonable; however, we cannot count on, nor do we expect valuations to expand further from current levels. Thus, corporate profits must continue to rise in order to drive equity prices higher. Accordingly, we remain focused on identifying and investing in reasonably valued, higher quality companies with attractive long-term growth prospects.
In particular, we continue to find good value within the financial services, industrial, energy, and information technology sectors. Within financials, the Fund owns several regional banks with strong customer franchises, solid financials, and reasonable valuations. Although banks have broadly improved their capital bases and reduced their financial leverage in recent years, the low interest rate environment has pressured their profit margins and returns on equity. We believe that banks will benefit from rising interest rates and continued economic growth. They also have minimal direct exposure to some of the aforementioned international issues and currency headwinds. On the other hand, industrial and energy companies have underperformed the broader market due to global economic concerns, the strengthening of the U.S. dollar, and general malaise within the energy markets. As a result, valuations reflect only modest growth expectations, thereby presenting opportunities for patient, long-term investors. Within the technology sector, investors have been attracted to the higher growth prospects of innovative young companies in emerging segments of the market (e.g. social media, internet, and cloud computing) with less-than-certain future prospects. Our investment approach remains focused on technology companies with solid financials, ample free cash flow generation, and more visible growth prospects.*
Within healthcare, we continue to avoid the more speculative segments of the sector, including biotechnology and specialty pharmaceuticals. These stocks are among the most egregiously valued within the entire stock market as investors have seemingly blindly invested in many companies with limited historical track records of success yet very lofty expectations and uncertain future growth prospects. Our Fund holdings remain concentrated in healthcare segments such as medical devices and equipment, life sciences tools, healthcare services, and diagnostics.*
Lastly, we will be closely monitoring all actions taken by the Fed as well as economic conditions overseas, geopolitical risks, and corporate profit growth. After six years of strong market returns, we understand it is paramount to remain true to our investment discipline of identifying higher quality companies with reasonable valuations.
† The Gross Domestic Product (“GDP”) is the measure of the market value of the goods and services produced by labor and property in the United States..
* Portfolio composition is subject to change.
6
Investment Performance (Unaudited) | Boston Trust Midcap Fund March 31, 2015 |
| | For the year ended 3/31/15 | |
| | Annualized | |
| | | | | | Since Inception | |
| | 1 Year | | 5 Years | | 9/24/07 | |
Boston Trust Midcap Fund(1) | | 12.65 | % | 15.02 | % | 9.30 | % |
Russell Midcap® Index | | 13.68 | % | 16.16 | % | 8.46 | % |
Hypothetical Growth of a $100,000 Investment
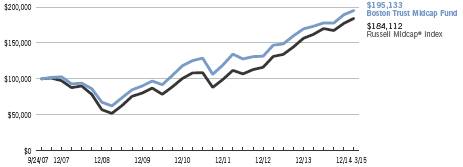
The chart represents the historical performance of a hypothetical $100,000 investment in the Boston Trust Midcap Fund from September 24, 2007 to March 31, 2015, and represents the reinvestment of dividends and capital gains in the Fund. The returns shown on the table and graph do not reflect the deduction of taxes a shareholder would pay on Fund distributions or the redemption of Fund shares.
The Boston Trust Midcap Fund is measured against the Russell Midcap® Index, which is an unmanaged index that measures the performance of the mid-cap segment of the U.S. equity universe. The Russell Midcap® Index is a subset of the Russell 1000® Index. It includes approximately 800 of the smallest securities based on a combination of their market capitalization and current index membership. The Russell Midcap® Index represents approximately 31% of the total market capitalization of the Russell 1000 companies. The performance of an index does not reflect the deduction of expenses associated with a mutual fund, such as investment management and fund accounting fees. The Fund’s performance reflects the deduction of fees for these services. Investors cannot invest directly in an index.

Fund Net Asset Value: | | $ | 16.12 | |
Gross Expense Ratio(1): | | 1.01 | % |
Past performance does not guarantee future results. The performance data quoted represents past performance and current returns may be lower or higher. The investment return and principal value will fluctuate so that an investor’s shares, when redeemed may be worth more or less than the original cost. To obtain performance information current to the most recent month-end, please call 1-800-282-8782 ext. 7050.
(1) The Gross Expense Ratio is from the Fund’s most recent prospectus, dated August 1, 2014. The Gross Expense Ratio excludes the impact of any contractual fee waivers. After giving effect to such fee waivers, the Fund’s Net Expense Ratio would be 1.00%, including the indirect expenses of investing in acquired funds. Please see the Fund’s most recent prospectus for details. Additional information pertaining to the Fund’s expense ratio as of March 31, 2015 can be found in the financial highlights. The investment performance may reflect fee reductions. If such fee reductions had not occurred, the quoted performance would have been lower. The contractual fee waiver continues through August 1, 2015 and may be terminated thereafter.
7
Boston Trust SMID Cap Fund
March 31, 2015
Kenneth P. Scott, CFA
Stephen C. Franco, CFA
Heidi H. Vanni, CFA
Portfolio Managers
Boston Trust Investment Management, Inc.
Fund Objective
The Fund seeks long-term capital growth through an actively managed portfolio of stocks of small to middle (“mid”) capitalization companies.
Investment Concerns
Equity securities (stocks) are more volatile and carry more risk and return potential than other forms of investments, including investments in high-grade fixed income securities.
Small- to mid-capitalization companies typically have a higher risk of failure and historically have experienced a greater degree of volatility.
Manager Commentary (Unaudited)
Management Discussion of Fund Performance
Portfolio Review
The U.S. SMID cap equity markets rose in the fiscal year ended March 31, 2015, with the benchmark Russell 2500TM Index returning 10.07%. The Boston Trust SMID Cap Fund, which invests in the stocks of higher quality, more reasonably valued companies, posted a return of 7.69%.
U.S. stocks reached new highs in early 2015, extending the bull market that began in the spring of 2009. Economic growth has remained positive, while markets appear to have inferred that the U.S. Federal Reserve’s monetary policy will remain accommodative in the near term.
During this period of economic recovery and strong stock market performance, returns of the Boston Trust SMID Cap Fund, for the one- and three- year period ended March 31, have trailed those of the Russell 2500TM. Boston Trust continues to believe that the Fund may achieve its goal of outperforming the Russell 2500TM with less volatility for periods that cover at least one full market cycle.
Portfolio Strategy
The Fund’s investment style favors reasonably valued stocks of higher quality companies, i.e. growing firms with persistently strong profitability. Our analysis suggests that stocks of higher quality companies performed well during the fiscal year. However, the Fund was under-represented in several industries that experienced above average stock price returns within their sectors. These included airlines, biotechnology (biotech) and pharmaceutical (pharma), construction materials, energy producers and REITs†, all of which our investment style generally avoids or underweights due to their lower quality or greater financial leverage.
The biotech and pharma industries have experienced particularly strong performance recently, with SMID cap biotech firms climbing 49% and SMID cap pharma firms climbing 48% in the fiscal year. This has affected industry and market valuations, as discussed further below. We do not expect these trends to persist long term. The biotech and pharma industries collectively now comprise 6% of the Russell 2500TM, compared to 0% in the Boston Trust SMID Cap Fund.
There are other indications that this bull market is maturing. For instance, NYSE margin debt is at an all-time high. As Furey Research Partners noted, the percent of IPOs that are loss making has climbed to long-term peak levels above 70%. That said, we cannot predict when investor preference will fade for investments we consider more speculative.
The top individual stock contributors to client portfolio performance this fiscal year were real estate management firm Jones Lang LaSalle (JLL), Medicaid managed care firm Centene (CNC), electronic bond trading platform provider MarketAxess (MKTX), digital market services firm Sapient (SAPE), and pharmaceutical packaging firm West Pharmaceutical Services (WST). We continue to own these stocks in the Fund but have reduced some position sizes and sold Sapient due to its pending acquisition by another firm.*
Laggards this year were energy services firms Carbo Ceramics (CRR) and Geospace Technologies (GEOS), energy producer Denbury Resources (DNR), online auction firm Liquidity Services (LQDT), and heat exchange manufacturer Chart Industries (GTLS). Carbo, Chart, Denbury, and Geospace declined at least in part due to the steep decline in energy prices. We have maintained Chart Industries (GTLS) in the portfolio, given our view that its fundamentals remain sound. We sold Carbo, Denbury, and Geospace, and replaced them with other energy stocks that we view as higher quality.*
Boston Trust SMID Cap Fund holdings in aggregate posted continued improvement in underlying fundamentals, with growth in sales and profits outpacing the SMID cap market. We view long-term fundamental performance as an important barometer of the likely path of future Fund performance, as we believe stock returns ultimately reflect underlying company fundamental performance.*
The Fund seeks to maintain portfolio sector weights comparable to those of the index in order to ensure broad diversification. Marginal differences in portfolio sector weights had minimal impact on returns relative to the index.
† | REITs (real estate investment trusts) are publicly traded entities that invest in office buildings, apartment complexes, industrial facilities, shopping centers and other real estate properties. Most REITs trade on major stock exchanges or over the counter. Investments in the Fund are subject to risks related to a direct investment in real estate such as regulatory risk, concentration risk, and diversification risk. By itself the Fund does not constitute a complete investment plan and should be considered a long-term investment for investors who can afford to weather changes in the value of their investments. |
| |
* | Portfolio composition is subject to change. |
8
Investment Performance (Unaudited) | Boston Trust SMID Cap Fund March 31, 2015 |
| | For the year ended 3/31/15 | |
| | Annualized | |
| | | | Since Inception | |
| | 1 Year | | 11/30/11 | |
Boston Trust SMID Cap Fund(1) | | 7.69 | % | 14.66 | % |
Russell 2500™ Index | | 10.07 | % | 19.68 | % |
Hypothetical Growth of a $100,000 Investment

The chart represents the historical performance of a hypothetical $100,000 investment in the Boston Trust SMID Cap Fund from November 30, 2011 to March 31, 2015, and represents the reinvestment of dividends and capital gains in the Fund. The returns shown on the table and graph do not reflect the deduction of taxes a shareholder would pay on Fund distributions or the redemption of Fund shares.
The Boston Trust SMID Cap Fund is measured against the Russell 2500™ Index, which is an unmanaged index that measures the performance of the small- to mid-cap segment of the U.S. equity universe, commonly referred to as “smid” cap. The Russell 2500 is a subset of the Russell 3000® Index. It includes approximately 2500 of the smallest securities based on a combination of their market cap and current index membership. The performance of an index does not reflect the deduction of expenses associated with a mutual fund, such as investment management and fund accounting fees. The Fund’s performance reflects the deduction of fees for these services. Investors cannot invest directly in an index.

Fund Net Asset Value: | | $ | 13.72 | |
Gross Expense Ratio(1): | | 1.59 | % |
Past performance does not guarantee future results. The performance data quoted represents past performance and current returns may be lower or higher. The investment return and principal value will fluctuate so that an investor’s shares, when redeemed may be worth more or less than the original cost. Returns less than one year are not annualized. To obtain performance information current to the most recent month-end, please call 1-800-282-8782 ext. 7050.
(1) The Gross Expense Ratio is from the Fund’s most recent prospectus, dated August 1, 2014. The Gross Expense Ratio excludes the impact of any contractual fee waivers. After giving effect to such fee waivers, the Fund’s Net Expense Ratio would be 1.00%, including the indirect expenses of investing in acquired funds. Please see the Fund’s most recent prospectus for details. Additional information pertaining to the Fund’s expense ratio as of March 31, 2015 can be found in the financial highlights. The investment performance may reflect fee reductions. If such fee reductions had not occurred, the quoted performance would have been lower. The contractual fee waiver continues through August 1, 2015 and may be terminated thereafter.
9
Boston Trust Small Cap Fund
March 31, 2015
Kenneth P. Scott, CFA
Portfolio Manager
Boston Trust Investment Management, Inc.
Fund Objective
The Fund is to seeks long-term capital growth through an actively managed portfolio of stocks of small capitalization companies.
Investment Concerns
Equity securities (stocks) are more volatile and carry more risk and return potential than other forms of investments, including investments in high-grade fixed income securities.
Small-capitalization funds typically carry additional risks since smaller companies generally have a higher risk of failure, and historically, their stocks have experienced a greater degree of market volatility than stocks on average.
Manager Commentary (Unaudited)
Management Discussion of Fund Performance
Portfolio Review
U.S. small cap equity markets rose in the fiscal year ended March 31, 2015, with the benchmark Russell 2000® Index returning 8.21%. The Boston Trust Small Cap Fund, which invests in the stocks of higher quality, more reasonably valued companies, posted a return of 3.81%.
U.S. stocks reached new highs in early 2015, extending the bull market that began in the spring of 2009. Economic growth has remained positive, while markets appear to have inferred that the U.S. Federal Reserve’s monetary policy will remain accommodative in the near term.
During this period of economic recovery and strong stock market performance, returns of the Boston Trust Small Cap Fund, for the 1- and 5-year periods ended March 31, have trailed the Russell 2000®. However, for the 10- and 15-year periods, i.e. those that cover at least one full market cycle, the Boston Trust Small Cap Fund has achieved its goal of outperforming the Russell 2000® with less volatility.
Portfolio Strategy
The Fund’s investment style favors reasonably valued stocks of higher quality companies, i.e. growing firms with persistently strong profitability. Our analysis suggests that stocks of higher quality companies performed well during the fiscal year. However, the Fund was under-represented in several industries that experienced above average stock price increases within their sectors. These included airlines, biotechnology (biotech) and pharmaceutical (pharma), construction materials, energy producers, and REITs† all of which our investment style generally avoids or underweights due to their lower quality or greater financial leverage.
The biotech and pharma industries have experienced particularly strong performance recently, with small-cap biotech and pharma firms climbing 40% in the fiscal year. This has affected industry and market valuations, as discussed further below. We do not expect these trends to persist long term. The biotech and pharma industries collectively now comprise 8% of the Russell 2000®, compared to 0% in the Boston Trust Small Cap Fund.*
There are other indications that this bull market is maturing. For instance, NYSE margin debt is at an all-time high. As Furey Research Partners noted, the percent of IPOs that are loss making has climbed to long-term peak levels above 70%. That said, we cannot predict when investor preference will fade for investments we consider more speculative.
The Fund holdings in aggregate posted continued improvement in underlying fundamentals, with growth in sales and profits outpacing the small-cap market. We view long-term fundamental performance as an important barometer of the likely path of future Fund performance, as we believe stock returns ultimately reflect underlying company fundamental performance.
The Fund seeks to maintain portfolio sector weights comparable to those of the index in order to ensure broad diversification. Marginal differences in portfolio sector weights had minimal impact on returns relative to the index.*
Given that interest rates have remained low for several years, while valuations have expanded, and volatility has generally been below average, some clients ask, what changes in the economic or market environment would favor the Fund. In addition to our typical pattern of striving to provide protection in down markets, we believe the Fund’s relative performance will benefit from a return to normal market volatility, more reasonable small-cap market valuations, higher interest rates, or any combination thereof. We believe that this disconnect of valuation from fundamentals is unsustainable in the mid- to long-term, and that the Fund is well positioned for a closer alignment between stock valuations and company fundamentals, even if the timing of such is unfortunately not predictable. Nevertheless, even if there were no change in small-cap market volatility, interest rates, or valuations from current levels, we believe that the strong fundamentals of higher quality firms will ultimately provide better, long-term stock returns relative to firms with inferior fundamentals.*
† REITs (real estate investment trusts) are publicly traded entities that invest in office buildings, apartment complexes, industrial facilities, shopping centers and other real estate properties. Most REITs trade on major stock exchanges or over the counter. Investments in the Fund are subject to risks related to a direct investment in real estate such as regulatory risk, concentration risk, and diversification risk. By itself the Fund does not constitute a complete investment plan and should be considered a long-term investment for investors who can afford to weather changes in the value of their investments.
* Portfolio composition is subject to change.
10
Investment Performance (Unaudited) | Boston Trust Small Cap Fund March 31, 2015 |
| | For the year ended 3/31/15 | |
| | Annualized | |
| | 1 Year | | 5 Years | | 10 Years | | 15 Years | |
Boston Trust Small Cap Fund(1),(2) | | 3.81 | % | 12.11 | % | 9.03 | % | 9.97 | % |
Russell 2000® Index | | 8.21 | % | 14.57 | % | 8.82 | % | 7.19 | % |
Hypothetical Growth of a $100,000 Investment
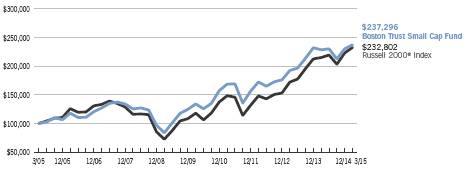
The chart represents a 10-year hypothetical $100,000 investment in the Boston Trust Small Cap Fund and represents the reinvestment of dividends and capital gains in the Fund. The returns shown on the table and graph do not reflect the deduction of taxes a shareholder would pay on Fund distributions or the redemption of Fund shares.
(2) The quoted performance for the Fund reflects the performance of a collective investment fund that was previously managed with full investment authority by the parent company of the Fund’s Adviser prior to the establishment of the Fund on December 16, 2005. The performance of the collective investment fund has been restated to reflect the net expenses of the Fund after all expenses at an annual rate of 1.25%, the Adviser’s expense limitation for its initial year of investment operations. The collective investment fund was not registered with the Securities and Exchange Commission and, therefore, was not subject to the investment restrictions imposed by law on registered mutual funds. If the collective investment fund had been registered, the collective investment fund’s performance may have been adversely affected.
The Boston Trust Small Cap Fund is measured against the Russell 2000® Index, which is an unmanaged index that measures the performance of the small-cap segment of the U.S. equity universe. The Russell 2000® Index is a subset of the Russell 3000® Index representing approximately 10% of the total market capitalization of that index. It includes approximately 2000 of the smallest securities based on a combination of their market cap and current index membership. The performance of an index does not reflect the deduction of expenses associated with a mutual fund, such as investment management and fund accounting fees. The Fund’s performance reflects the deduction of fees for these services. Investors cannot invest directly in an index.

Fund Net Asset Value: | | $ | 15.20 | |
Gross Expense Ratio(1): | | 1.07 | % |
Past performance does not guarantee future results. The performance data quoted represents past performance and current returns may be lower or higher. The investment return and principal value will fluctuate so that an investor’s shares, when redeemed may be worth more or less than the original cost. To obtain performance information current to the most recent month-end, please call 1-800-282-8782 ext. 7050.
(1) The Gross Expense Ratio is from the Fund’s most recent prospectus, dated August 1, 2014. The Gross Expense Ratio excludes the impact of any contractual fee waivers. After giving effect to such fee waivers, the Fund’s Net Expense Ratio would be 1.00%, including the indirect expenses of investing in acquired funds. Please see the Fund’s most recent prospectus for details. Additional information pertaining to the Fund’s expense ratio as of March 31, 2015 can be found in the financial highlights. The investment performance may reflect fee reductions. If such fee reductions had not occurred, the quoted performance would have been lower. The contractual fee waiver continues through August 1, 2015 and may be terminated thereafter.
11
Schedule of Portfolio Investments | Boston Trust Asset Management Fund March 31, 2015 |
Security Description | | Shares | | Fair Value ($) | |
| | | | | |
COMMON STOCKS (77.3%) | | | | | |
Consumer Discretionary (10.0%) | | | | | |
Advance Auto Parts, Inc. | | 2,500 | | 374,225 | |
Autoliv, Inc. | | 30,000 | | 3,533,100 | |
Comcast Corp., Class A | | 110,000 | | 6,211,700 | |
DIRECTV (a) | | 35,000 | | 2,978,500 | |
Johnson Controls, Inc. | | 25,000 | | 1,261,000 | |
NIKE, Inc., Class B | | 70,000 | | 7,023,100 | |
Nordstrom, Inc. | | 50,000 | | 4,016,000 | |
Omnicom Group, Inc. | | 75,000 | | 5,848,500 | |
Ross Stores, Inc. | | 40,000 | | 4,214,400 | |
| | | | 35,460,525 | |
| | | | | |
Consumer Staples (9.4%) | | | | | |
Church & Dwight Co., Inc. | | 35,000 | | 2,989,700 | |
Colgate-Palmolive Co. | | 30,000 | | 2,080,200 | |
Costco Wholesale Corp. | | 35,000 | | 5,302,325 | |
Diageo PLC, Sponsored ADR | | 30,000 | | 3,317,100 | |
McCormick & Co., Inc. | | 25,000 | | 1,927,750 | |
Nestle SA, Sponsored ADR | | 40,000 | | 3,008,822 | |
PepsiCo, Inc. | | 40,000 | | 3,824,800 | |
Procter & Gamble Co. | | 35,000 | | 2,867,900 | |
Reckitt Benckiser Group PLC, Sponsored ADR | | 150,000 | | 2,566,500 | |
SYSCO Corp. | | 35,000 | | 1,320,550 | |
Wal-Mart Stores, Inc. | | 50,000 | | 4,112,500 | |
| | | | 33,318,147 | |
| | | | | |
Energy (4.9%) | | | | | |
Chevron Corp. | | 40,000 | | 4,199,200 | |
ConocoPhillips | | 40,000 | | 2,490,400 | |
Exxon Mobil Corp. | | 90,002 | | 7,650,170 | |
Schlumberger Ltd. | | 35,000 | | 2,920,400 | |
| | | | 17,260,170 | |
Financials (12.6%) | | | | | |
American Express Co. | | 50,000 | | 3,906,000 | |
BB&T Corp. | | 25,000 | | 974,750 | |
Chubb Corp. | | 70,000 | | 7,077,000 | |
Cincinnati Financial Corp. | | 100,000 | | 5,328,000 | |
Comerica, Inc. | | 50,000 | | 2,256,500 | |
Commerce Bancshares, Inc. | | 27,562 | | 1,166,424 | |
JPMorgan Chase & Co. | | 100,000 | | 6,058,000 | |
M&T Bank Corp. | | 10,000 | | 1,270,000 | |
Northern Trust Corp. | | 22,500 | | 1,567,125 | |
PNC Financial Services Group, Inc. | | 40,000 | | 3,729,600 | |
State Street Corp. | | 25,000 | | 1,838,250 | |
T. Rowe Price Group, Inc. | | 75,000 | | 6,073,500 | |
US Bancorp | | 75,000 | | 3,275,250 | |
| | | | 44,520,399 | |
Health Care (12.3%) | | | | | |
Becton, Dickinson & Co. | | 50,000 | | 7,179,500 | |
C.R. Bard, Inc. | | 35,000 | | 5,857,250 | |
DENTSPLY International, Inc. | | 50,000 | | 2,544,500 | |
Edwards Lifesciences Corp. (a) | | 25,000 | | 3,561,500 | |
Express Scripts Holding Co. (a) | | 75,000 | | 6,507,750 | |
Johnson & Johnson, Inc. | | 60,000 | | 6,036,000 | |
Medtronic PLC | | 50,000 | | 3,899,500 | |
Mettler-Toledo International, Inc. (a) | | 7,500 | | 2,464,875 | |
St. Jude Medical, Inc. | | 20,000 | | 1,308,000 | |
Stryker Corp. | | 25,000 | | 2,306,250 | |
Varian Medical Systems, Inc. (a) | | 20,000 | | 1,881,800 | |
| | | | 43,546,925 | |
| | Shares or | | | |
| | Principal | | | |
| | Amount ($) | | | |
| | | | | |
Industrials (13.0%) | | | | | |
3M Co. | | 35,000 | | 5,773,250 | |
Deere & Co. | | 5,000 | | 438,450 | |
Donaldson Co., Inc. | | 75,000 | | 2,828,250 | |
Emerson Electric Co. | | 50,000 | | 2,831,000 | |
Hubbell, Inc., Class B | | 40,000 | | 4,384,800 | |
Illinois Tool Works, Inc. | | 50,000 | | 4,857,000 | |
Precision Castparts Corp. | | 30,000 | | 6,300,000 | |
Rockwell Collins, Inc. | | 55,000 | | 5,310,250 | |
Union Pacific Corp. | | 25,000 | | 2,707,750 | |
United Parcel Service, Inc., Class B | | 50,000 | | 4,847,000 | |
W.W. Grainger, Inc. | | 25,000 | | 5,895,250 | |
| | | | 46,173,000 | |
| | | | | |
Information Technology (13.4%) | | | | | |
Accenture PLC, Class A | | 70,000 | | 6,558,300 | |
Apple, Inc. | | 75,000 | | 9,332,250 | |
Automatic Data Processing, Inc. | | 70,000 | | 5,994,800 | |
CDK Global, Inc. | | 10,000 | | 467,600 | |
EMC Corp. | | 100,000 | | 2,556,000 | |
Google, Inc., Class A (a) | | 2,000 | | 1,109,400 | |
Google, Inc., Class C (a) | | 5,000 | | 2,740,000 | |
Intel Corp. | | 25,000 | | 781,750 | |
Microsoft Corp. | | 140,000 | | 5,691,700 | |
Oracle Corp. | | 125,000 | | 5,393,750 | |
QUALCOMM, Inc. | | 25,000 | | 1,733,500 | |
Visa, Inc. | | 70,000 | | 4,578,700 | |
| | | | 46,937,750 | |
| | | | | |
Materials (1.7%) | | | | | |
Air Products & Chemicals, Inc. | | 22,500 | | 3,403,800 | |
AptarGroup, Inc. | | 30,000 | | 1,905,600 | |
PPG Industries, Inc. | | 2,500 | | 563,850 | |
| | | | 5,873,250 | |
TOTAL COMMON STOCKS (Cost $144,333,852) | | | | 273,090,166 | |
| | | | | |
CORPORATE BONDS (2.8%) | | | | | |
Consumer Staples (0.2%) | | | | | |
Diageo Capital PLC, 5.50%, 9/30/16 | | 500,000 | | 535,044 | |
| | | | | |
Financials (2.0%) | | | | | |
American Express Bank FSB, 6.00%, 9/13/17, MTN | | 200,000 | | 221,810 | |
American Express Co., 2.65%, 12/2/22 | | 1,926,000 | | 1,918,126 | |
American Express Co., 7.00%, 3/19/18 | | 1,500,000 | | 1,734,158 | |
John Deere Capital Corp., 5.35%, 4/3/18, MTN | | 1,000,000 | | 1,117,996 | |
JPMorgan Chase & Co., 3.15%, 7/5/16 | | 1,500,000 | | 1,539,215 | |
National Rural Utilities Cooperative | | | | | |
Finance Corp., 10.38%, 11/1/18 | | 500,000 | | 648,321 | |
| | | | 7,179,626 | |
| | | | | |
Health Care (0.3%) | | | | | |
Becton, Dickinson & Co., 3.13%, 11/8/21 | | 1,000,000 | | 1,028,728 | |
| | | | | |
Industrials (0.1%) | | | | | |
Emerson Electric Co., 5.13%, 12/1/16 | | 300,000 | | 320,863 | |
| | | | | |
Information Technology (0.2%) | | | | | |
Oracle Corp., 5.75%, 4/15/18 | | 750,000 | | 847,995 | |
TOTAL CORPORATE BONDS (Cost $8,999,751) | | | | 9,912,256 | |
See Notes to Financial Statements
12
| | Shares or | | | |
| | Principal | | | |
Security Description | | Amount ($) | | Fair Value ($) | |
| | | | | |
MUNICIPAL BONDS (1.7%) | | | | | |
Florida (0.2%): | | | | | |
Florida State Board of Education, Series D, GO, 5.00%, 6/1/21, Callable 6/1/17 @ 101 | | 1,000,000 | | 1,099,280 | |
| | | | | |
Illinois (0.5%): | | | | | |
Illinois State, Series A, GO, 5.00%, 3/1/22, Callable 5/7/15 @ 100 | | 600,000 | | 601,920 | |
Illinois State, GO, 5.00%, 4/1/24, Callable 4/1/17 @ 100 | | 500,000 | | 536,245 | |
Illinois State, Series A, GO, 5.00%, 6/1/29, Callable 12/1/16 @ 100 | | 250,000 | | 260,630 | |
| | | | 1,398,795 | |
| | | | | |
Massachusetts (0.6%): | | | | | |
Massachusetts State Development Finance Agency Revenue, Series R-2, 5.00%, 7/1/28, Callable 7/1/20 @ 100 | | 460,000 | | 535,343 | |
Massachusetts State Health & Educational Facilities Authority Revenue, Series A, 5.00%, 12/15/26, Callable 12/15/19 @ 100 | | 1,500,000 | | 1,767,975 | |
| | | | 2,303,318 | |
| | | | | |
Washington (0.1%): | | | | | |
Washington State, Series C, GO, 5.00%, 2/1/26, Callable 2/1/19 @ 100 | | 250,000 | | 284,253 | |
| | | | | |
Wisconsin (0.3%): | | | | | |
Wisconsin State, Series C, GO, 5.00%, 5/1/25, Callable 5/1/18 @ 100, Prerefunded 5/1/18 @ 100 | | 200,000 | | 224,704 | |
Wisconsin State, Series D, GO, 5.50%, 5/1/26, Callable 5/1/18 @ 100, Prerefunded 5/1/18 @ 100 | | 750,000 | | 853,995 | |
| | | | 1,078,699 | |
TOTAL MUNICIPAL BONDS (Cost $5,827,419) | | | | 6,164,345 | |
| | | | | |
U.S. GOVERNMENT & U.S. GOVERNMENT AGENCY OBLIGATIONS (17.0%) | | | | | |
Federal Farm Credit Bank | | | | | |
2.63%, 8/12/19 | | 11,500,000 | | 12,083,337 | |
2.85%, 3/2/28 | | 2,000,000 | | 2,010,858 | |
2.95%, 1/27/25 | | 2,000,000 | | 2,122,610 | |
3.14%, 12/5/29 | | 2,500,000 | | 2,573,670 | |
3.39%, 2/1/28 | | 2,000,000 | | 2,130,260 | |
3.85%, 12/26/25 | | 2,770,000 | | 3,109,164 | |
| | | | 24,029,899 | |
Federal Home Loan Bank | | | | | |
2.50%, 12/10/27 | | 1,500,000 | | 1,475,480 | |
2.63%, 6/11/27 | | 1,500,000 | | 1,496,994 | |
2.88%, 9/13/24 | | 2,500,000 | | 2,625,228 | |
3.50%, 9/24/29 | | 2,000,000 | | 2,180,738 | |
4.13%, 12/13/19 | | 2,000,000 | | 2,240,426 | |
| | | | 10,018,866 | |
U.S. Treasury Note | | | | | |
2.38%, 6/30/18 | | 7,000,000 | | 7,308,987 | |
2.75%, 2/15/24 | | 17,500,000 | | 18,756,447 | |
| | | | 26,065,434 | |
TOTAL U.S. GOVERNMENT & U.S. GOVERNMENT AGENCY OBLIGATIONS (Cost $57,788,922) | | | | 60,114,199 | |
| | Shares | | | |
| | | | | |
INVESTMENT COMPANIES (1.1%) | | | | | |
State Street Institutional U.S. Government | | | | | |
Money Market Fund, Investor Shares, 0.00% (b) | | 4,050,575 | | 4,050,575 | |
TOTAL INVESTMENT COMPANIES (Cost $4,050,575) | | | | 4,050,575 | |
| | | | | |
Total Investments (Cost $221,000,519) (c) — 99.9% | | | | 353,331,541 | |
Other assets in excess of liabilities — 0.1% | | | | 519,327 | |
NET ASSETS — 100.0% | | | | $ | 353,850,868 | |
| | | | | | |
(a) Non-income producing security.
(b) Rate disclosed is the seven day yield as of March 31, 2015.
(c) See Federal Tax Information listed in the Notes to the Financial Statements.
ADR American Depositary Receipt
FSB Federal Savings Bank
GO General Obligation
MTN Medium Term Note
PLC Public Limited Company
See Notes to Financial Statements
13
Financial Statements | Boston Trust Asset Management Fund |
STATEMENT OF ASSETS AND LIABILITIES
March 31, 2015
Assets: | | | |
Investments, at fair value (cost $221,000,519) | | $ | 353,331,541 | |
Interest and dividends receivable | | 919,936 | |
Receivable for capital shares issued | | 324 | |
Receivable for tax reclaims | | 50,789 | |
Prepaid expenses and other assets | | 13,421 | |
Total Assets | | 354,316,011 | |
Liabilities: | | | |
Payable for capital shares redeemed | | 175,076 | |
Accrued expenses and other liabilities: | | | |
Investment adviser | | 225,743 | |
Administration and accounting | | 7,170 | |
Custodian | | 4,822 | |
Transfer agent | | 2,012 | |
Trustee | | 442 | |
Other | | 49,878 | |
Total Liabilities | | 465,143 | |
Net Assets | | $ | 353,850,868 | |
Composition of Net Assets: | | | |
Capital | | $ | 208,182,530 | |
Accumulated undistributed net investment income | | 1,169,040 | |
Accumulated net realized gains from investment transactions | | 12,168,276 | |
Net unrealized appreciation from investments | | 132,331,022 | |
Net Assets | | $ | 353,850,868 | |
Shares outstanding (par value $0.01, unlimited number of shares authorized) | | 8,465,222 | |
Net Asset Value, Offering and Redemption price per share | | $ | 41.80 | |
STATEMENT OF OPERATIONS
For the year ended March 31, 2015
Investment Income: | | | |
Interest | | $ | 1,966,462 | |
Dividends | | 5,350,888 | |
Total Investment Income | | 7,317,350 | |
Expenses: | | | |
Investment adviser | | 2,600,904 | |
Administration and accounting | | 355,735 | |
Chief compliance officer | | 14,505 | |
Custodian | | 57,207 | |
Shareholder servicing | | 4,698 | |
Transfer agency | | 35,968 | |
Trustee | | 18,738 | |
Other | | 123,625 | |
Total expenses before fee reductions | | 3,211,380 | |
Fees voluntarily reduced by the transfer agent | | (12,000 | ) |
Net Expenses | | 3,199,380 | |
Net Investment Income | | 4,117,970 | |
Net Realized/Unrealized Gains from Investments: | | | |
Net realized gains from investment transactions | | 19,703,977 | |
Change in unrealized appreciation from investments | | 3,446,932 | |
Net realized/unrealized gains from investments | | 23,150,909 | |
Change in Net Assets Resulting from Operations | | $ | 27,268,879 | |
See Notes to Financial Statements
14
STATEMENTS OF CHANGES IN NET ASSETS
| | For the year ended | | For the year ended | |
| | March 31, 2015 | | March 31, 2014 | |
| | | | | |
Investment Activities: | | | | | |
Operations: | | | | | |
Net investment income | | $ | 4,117,970 | | $ | 3,664,185 | |
Net realized gains from investment transactions | | 19,703,977 | | 2,636,487 | |
Change in unrealized appreciation/depreciation from investments | | 3,446,932 | | 31,971,140 | |
Change in Net Assets Resulting from Operations | | 27,268,879 | | 38,271,812 | |
Dividends: | | | | | |
Net investment income | | (3,866,046 | ) | (3,579,729 | ) |
Net realized gains from investment transactions | | (8,430,347 | ) | (2,709,038 | ) |
Change in Net Assets Resulting from Shareholder Dividends | | (12,296,393 | ) | (6,288,767 | ) |
Capital Share Transactions: | | | | | |
Proceeds from shares issued | | 30,246,451 | | 32,397,914 | |
Dividends reinvested | | 11,609,430 | | 5,926,238 | |
Cost of shares redeemed | | (43,940,255 | ) | (18,017,576 | ) |
Change in Net Assets Resulting from Capital Share Transactions | | (2,084,374 | ) | 20,306,576 | |
Change in Net Assets | | 12,888,112 | | 52,289,621 | |
Net Assets: | | | | | |
Beginning of period | | 340,962,756 | | 288,673,135 | |
End of period | | $ | 353,850,868 | | $ | 340,962,756 | |
Share Transactions: | | | | | |
Issued | | 729,305 | | 834,562 | |
Reinvested | | 280,083 | | 151,488 | |
Redeemed | | (1,062,899 | ) | (467,491 | ) |
Change in shares | | (53,511 | ) | 518,559 | |
Accumulated undistributed net investment income | | $ | 1,169,040 | | $ | 907,383 | |
See Notes to Financial Statements
15
FINANCIAL HIGHLIGHTS
Selected data for a share outstanding throughout the years indicated.
| | For the year | | For the year | | For the year | | For the year | | For the year | |
| | ended | | ended | | ended | | ended | | ended | |
| | March 31, | | March 31, | | March 31, | | March 31, | | March 31, | |
| | 2015 | | 2014 | | 2013 | | 2012 | | 2011 | |
| | | | | | | | | | | |
Net Asset Value, Beginning of Period | | $ | 40.03 | | $ | 36.08 | | $ | 33.71 | | $ | 31.56 | | $ | 28.69 | |
| | | | | | | | | | | |
Investment Activities: | | | | | | | | | | | |
Net investment income | | 0.50 | | 0.44 | | 0.51 | | 0.43 | | 0.44 | |
Net realized and unrealized gains from investment transactions | | 2.77 | | 4.28 | | 2.41 | | 2.17 | | 2.88 | |
Total from investment activities | | 3.27 | | 4.72 | | 2.92 | | 2.60 | | 3.32 | |
| | | | | | | | | | | |
Dividends: | | | | | | | | | | | |
Net investment income | | (0.47 | ) | (0.44 | ) | (0.51 | ) | (0.45 | ) | (0.45 | ) |
Net realized gains from investments | | (1.03 | ) | (0.33 | ) | (0.04 | ) | — | | — | |
Total dividends | | (1.50 | ) | (0.77 | ) | (0.55 | ) | (0.45 | ) | (0.45 | ) |
| | | | | | | | | | | |
Net Asset Value, End of Period | | $ | 41.80 | | $ | 40.03 | | $ | 36.08 | | $ | 33.71 | | $ | 31.56 | |
Total Return | | 8.21 | % | 13.13 | % | 8.77 | % | 8.36 | % | 11.65 | % |
| | | | | | | | | | | |
Ratios/Supplemental Data: | | | | | | | | | | | |
Net assets at end of period (000’s) | | $ | 353,851 | | $ | 340,963 | | $ | 288,673 | | $ | 257,031 | | $ | 233,228 | |
Ratio of net expenses to average net assets | | 0.92 | % | 0.92 | % | 0.96 | % | 1.00 | % | 1.00 | % |
Ratio of net investment income to average net assets | | 1.19 | % | 1.17 | % | 1.51 | % | 1.40 | % | 1.50 | % |
Ratio of expenses (before fee reductions or recoupment of fees previously reimbursed by the investment adviser) to average net assets (a) | | 0.93 | % | 0.93 | % | 0.96 | % | 1.07 | % | 1.07 | % |
Portfolio turnover rate | | 17.74 | % | 8.94 | % | 7.43 | % | 18.70 | % | 15.76 | % |
Amounts designated as “—” are $0 or have been rounded to $0.
(a) During the period, certain fees were reduced. If such fee reductions had not occurred, the ratio would have been as indicated.
See Notes to Financial Statements
16
Schedule of Portfolio Investments | Boston Trust Equity Fund |
| March 31, 2015 |
Security Description | | Shares | | Fair Value ($) | |
| | | | | |
COMMON STOCKS (97.7%) | | | | | |
| | | | | |
Consumer Discretionary (12.3%) | | | | | |
Advance Auto Parts, Inc. | | 6,000 | | 898,140 | |
Autoliv, Inc. | | 15,000 | | 1,766,550 | |
Comcast Corp., Class A | | 50,000 | | 2,823,500 | |
DIRECTV (a) | | 14,000 | | 1,191,400 | |
Johnson Controls, Inc. | | 10,000 | | 504,400 | |
NIKE, Inc., Class B | | 15,000 | | 1,504,950 | |
Nordstrom, Inc. | | 25,000 | | 2,008,000 | |
Omnicom Group, Inc. | | 30,000 | | 2,339,400 | |
Ross Stores, Inc. | | 5,000 | | 526,800 | |
| | | | 13,563,140 | |
Consumer Staples (12.3%) | | | | | |
Church & Dwight Co., Inc. | | 15,000 | | 1,281,300 | |
Colgate-Palmolive Co. | | 15,000 | | 1,040,100 | |
Costco Wholesale Corp. | | 15,000 | | 2,272,425 | |
CVS Health Corp. | | 5,000 | | 516,050 | |
Diageo PLC, Sponsored ADR | | 12,500 | | 1,382,125 | |
McCormick & Co., Inc. | | 7,000 | | 539,770 | |
PepsiCo, Inc. | | 12,500 | | 1,195,250 | |
Procter & Gamble Co. | | 12,500 | | 1,024,250 | |
Reckitt Benckiser Group PLC, Sponsored ADR | | 80,000 | | 1,368,800 | |
SYSCO Corp. | | 25,000 | | 943,250 | |
Wal-Mart Stores, Inc. | | 25,000 | | 2,056,250 | |
| | | | 13,619,570 | |
Energy (5.8%) | | | | | |
Chevron Corp. | | 12,500 | | 1,312,250 | |
ConocoPhillips | | 15,000 | | 933,900 | |
Exxon Mobil Corp. | | 35,000 | | 2,975,000 | |
Schlumberger Ltd. | | 15,000 | | 1,251,600 | |
| | | | 6,472,750 | |
Financials (16.7%) | | | | | |
American Express Co. | | 22,500 | | 1,757,700 | |
BB&T Corp. | | 20,000 | | 779,800 | |
Berkshire Hathaway, Inc. (a) | | 5,000 | | 721,600 | |
Chubb Corp. | | 25,000 | | 2,527,500 | |
Cincinnati Financial Corp. | | 30,000 | | 1,598,400 | |
Comerica, Inc. | | 15,000 | | 676,950 | |
Commerce Bancshares, Inc. | | 8,268 | | 349,902 | |
JPMorgan Chase & Co. | | 35,000 | | 2,120,300 | |
M&T Bank Corp. | | 5,000 | | 635,000 | |
Northern Trust Corp. | | 10,000 | | 696,500 | |
PNC Financial Services Group, Inc. | | 20,000 | | 1,864,800 | |
State Street Corp. | | 15,000 | | 1,102,950 | |
T. Rowe Price Group, Inc. | | 30,000 | | 2,429,400 | |
US Bancorp | | 30,000 | | 1,310,100 | |
| | | | 18,570,902 | |
Health Care (16.1%) | | | | | |
Becton, Dickinson & Co. | | 17,000 | | 2,441,030 | |
C.R. Bard, Inc. | | 14,000 | | 2,342,900 | |
DENTSPLY International, Inc. | | 25,000 | | 1,272,250 | |
Edwards Lifesciences Corp. (a) | | 5,000 | | 712,300 | |
Express Scripts Holding Co. (a) | | 32,500 | | 2,820,025 | |
Johnson & Johnson, Inc. | | 30,000 | | 3,018,000 | |
Medtronic PLC | | 25,000 | | 1,949,750 | |
Merck & Co., Inc. | | 10,000 | | 574,800 | |
Mettler-Toledo International, Inc. (a) | | 1,500 | | 492,975 | |
St. Jude Medical, Inc. | | 5,000 | | 327,000 | |
Stryker Corp. | | 12,000 | | 1,107,000 | |
Varian Medical Systems, Inc. (a) | | 7,500 | | 705,675 | |
| | | | 17,763,705 | |
Industrials (15.9%) | | | | | |
3M Co. | | 7,500 | | 1,237,125 | |
Deere & Co. | | 5,000 | | 438,450 | |
Donaldson Co., Inc. | | 40,000 | | 1,508,400 | |
Emerson Electric Co. | | 25,000 | | 1,415,500 | |
Hubbell, Inc., Class B | | 10,000 | | 1,096,200 | |
Illinois Tool Works, Inc. | | 20,000 | | 1,942,800 | |
Precision Castparts Corp. | | 14,000 | | 2,940,000 | |
Rockwell Collins, Inc. | | 15,000 | | 1,448,250 | |
Union Pacific Corp. | | 15,000 | | 1,624,650 | |
United Parcel Service, Inc., Class B | | 12,500 | | 1,211,750 | |
W.W. Grainger, Inc. | | 11,500 | | 2,711,815 | |
| | | | 17,574,940 | |
Information Technology (16.3%) | | | | | |
Accenture PLC, Class A | | 25,000 | | 2,342,250 | |
Apple, Inc. | | 32,500 | | 4,043,975 | |
Automatic Data Processing, Inc. | | 20,000 | | 1,712,800 | |
CDK Global, Inc. | | 6,666 | | 311,702 | |
EMC Corp. | | 30,000 | | 766,800 | |
Google, Inc., Class A (a) | | 750 | | 416,025 | |
Google, Inc., Class C (a) | | 3,000 | | 1,644,000 | |
Microsoft Corp. | | 50,000 | | 2,032,750 | |
Oracle Corp. | | 45,000 | | 1,941,750 | |
QUALCOMM, Inc. | | 10,000 | | 693,400 | |
Visa, Inc. | | 32,000 | | 2,093,120 | |
| | | | 17,998,572 | |
Materials (2.0%) | | | | | |
Air Products & Chemicals, Inc. | | 7,500 | | 1,134,600 | |
AptarGroup, Inc. | | 10,000 | | 635,200 | |
PPG Industries, Inc. | | 2,000 | | 451,080 | |
| | | | 2,220,880 | |
Utilities (0.3%) | | | | | |
Consolidated Edison, Inc. | | 5,000 | | 305,000 | |
| | | | 305,000 | |
TOTAL COMMON STOCKS (Cost $60,471,918) | | | | 108,089,459 | |
| | | | | |
INVESTMENT COMPANIES (2.5%) | | | | | |
| | | | | |
State Street Institutional U.S. Government | | �� | | | |
Money Market Fund, Investor Shares, 0.00% (b) | | 2,806,057 | | 2,806,057 | |
TOTAL INVESTMENT COMPANIES (Cost $2,806,057) | | | | 2,806,057 | |
| | | | | |
Total Investments (Cost $63,277,975) (c) — 100.2% | | | | 110,895,516 | |
Liabilities in excess of other assets — (0.2)% | | | | (231,292 | ) |
NET ASSETS — 100.0% | | | | $ | 110,664,224 | |
| | | | | | |
(a) Non-income producing security.
(b) Rate disclosed is the seven day yield as of March 31, 2015.
(c) See Federal Tax Information listed in the Notes to the Financial Statements.
ADR American Depositary Receipt
PLC Public Limited Company
See Notes to Financial Statements
17
Financial Statements | Boston Trust Equity Fund |
STATEMENT OF ASSETS AND LIABILITIES
March 31, 2015
Assets: | | | |
Investments, at fair value (cost $63,277,975) | | $ | 110,895,516 | |
Dividends receivable | | 177,275 | |
Receivable for investments sold | | 1,333,915 | |
Prepaid expenses and other assets | | 3,675 | |
Total Assets | | 112,410,381 | |
Liabilities: | | | |
Payable for investments purchased | | 1,636,875 | |
Payable for capital shares redeemed | | 17,269 | |
Accrued expenses and other liabilities: | | | |
Investment adviser | | 70,884 | |
Administration and accounting | | 2,177 | |
Custodian | | 1,537 | |
Shareholder servicing fees | | 14 | |
Transfer agent | | 1,835 | |
Trustee | | 137 | |
Other | | 15,429 | |
Total Liabilities | | 1,746,157 | |
Net Assets | | $ | 110,664,224 | |
Composition of Net Assets: | | | |
Capital | | $ | 58,000,122 | |
Accumulated undistributed net investment income | | 304,834 | |
Accumulated net realized gains from investment transactions | | 4,741,727 | |
Net unrealized appreciation from investments | | 47,617,541 | |
Net Assets | | $ | 110,664,224 | |
Shares outstanding (par value $0.01, unlimited number of shares authorized) | | 5,356,855 | |
Net Asset Value, Offering and Redemption price per share | | $ | 20.66 | |
STATEMENT OF OPERATIONS
For the year ended March 31, 2015
Investment Income: | | | |
Dividends | | $ | 2,003,135 | |
Total Investment Income | | 2,003,135 | |
Expenses: | | | |
Investment adviser | | 791,354 | |
Administration and accounting | | 107,672 | |
Chief compliance officer | | 4,358 | |
Custodian | | 18,044 | |
Shareholder servicing | | 1,146 | |
Transfer agency | | 34,230 | |
Trustee | | 5,629 | |
Other | | 38,829 | |
Total expenses before fee reductions | | 1,001,262 | |
Fees voluntarily reduced by the transfer agent | | (12,000 | ) |
Net Expenses | | 989,262 | |
Net Investment Income | | 1,013,873 | |
Net Realized/Unrealized Gains (Losses) from Investments: | | | |
Net realized gains from investment transactions | | 7,743,467 | |
Change in unrealized appreciation/depreciation from investments | | (754,251 | ) |
Net realized/unrealized gains (losses) from investments | | 6,989,216 | |
Change in Net Assets Resulting from Operations | | $ | 8,003,089 | |
See Notes to Financial Statements
18
STATEMENTS OF CHANGES IN NET ASSETS
| | For the year ended | | For the year ended | |
| | March 31, 2015 | | March 31, 2014 | |
| | | | | |
Investment Activities: | | | | | |
Operations: | | | | | |
Net investment income | | $ | 1,013,873 | | $ | 943,229 | |
Net realized gains from investment transactions | | 7,743,467 | | 687,667 | |
Change in unrealized appreciation/depreciation from investments | | (754,251 | ) | 13,074,426 | |
Change in Net Assets Resulting from Operations | | 8,003,089 | | 14,705,322 | |
Dividends: | | | | | |
Net investment income | | (966,299 | ) | (881,548 | ) |
Net realized gains from investment transactions | | (2,029,175 | ) | — | |
Change in Net Assets Resulting from Shareholder Dividends | | (2,995,474 | ) | (881,548 | ) |
Capital Share Transactions: | | | | | |
Proceeds from shares issued | | 7,156,034 | | 7,505,747 | |
Dividends reinvested | | 2,743,713 | | 745,746 | |
Cost of shares redeemed | | (2,651,012 | ) | (4,820,953 | ) |
Change in Net Assets Resulting from Capital Share Transactions | | 7,248,735 | | 3,430,540 | |
Change in Net Assets | | 12,256,350 | | 17,254,314 | |
Net Assets: | | | | | |
Beginning of period | | 98,407,874 | | 81,153,560 | |
End of period | | $ | 110,664,224 | | $ | 98,407,874 | |
Share Transactions: | | | | | |
Issued | | 350,684 | | 409,509 | |
Reinvested | | 133,125 | | 38,943 | |
Redeemed | | (129,194 | ) | (262,391 | ) |
Change in shares | | 354,615 | | 186,061 | |
Accumulated undistributed net investment income | | $ | 304,834 | | $ | 257,260 | |
Amounts designated as “—” are $0 or have been rounded to $0.
See Notes to Financial Statements
19
FINANCIAL HIGHLIGHTS
Selected data for a share outstanding throughout the years indicated.
| | For the year | | For the year | | For the year | | For the year | | For the year | |
| | ended | | ended | | ended | | ended | | ended | |
| | March 31, | | March 31, | | March 31, | | March 31, | | March 31, | |
| | 2015 | | 2014 | | 2013 | | 2012 | | 2011 | |
Net Asset Value, Beginning of Period | | $ | 19.67 | | $ | 16.85 | | $ | 15.54 | | $ | 14.46 | | $ | 12.62 | |
| | | | | | | | | | | |
Investment Activities: | | | | | | | | | | | |
Net investment income | | 0.19 | | 0.19 | | 0.20 | | 0.13 | | 0.11 | |
Net realized and unrealized gains from investment transactions | | 1.38 | | 2.81 | | 1.30 | | 1.08 | | 1.84 | |
Total from investment activities | | 1.57 | | 3.00 | | 1.50 | | 1.21 | | 1.95 | |
| | | | | | | | | | | |
Dividends: | | | | | | | | | | | |
Net investment income | | (0.19 | ) | (0.18 | ) | (0.19 | ) | (0.13 | ) | (0.11 | ) |
Net realized gains from investments | | (0.39 | ) | — | | — | | — | | — | |
Total dividends | | (0.58 | ) | (0.18 | ) | (0.19 | ) | (0.13 | ) | (0.11 | ) |
| | | | | | | | | | | |
Net Asset Value, End of Period | | $ | 20.66 | | $ | 19.67 | | $ | 16.85 | | $ | 15.54 | | $ | 14.46 | |
Total Return | | 8.01 | % | 17.84 | % | 9.76 | % | 8.50 | % | 15.48 | % |
| | | | | | | | | | | |
Ratios/Supplemental Data: | | | | | | | | | | | |
Net assets at end of period (000’s) | | $ | 110,664 | | $ | 98,408 | | $ | 81,154 | | $ | 69,574 | | $ | 63,463 | |
Ratio of net expenses to average net assets | | 0.94 | % | 0.94 | % | 1.00 | % | 1.00 | % | 1.00 | % |
Ratio of net investment income to average net assets | | 0.96 | % | 1.05 | % | 1.28 | % | 0.96 | % | 0.85 | % |
Ratio of expenses (before fee reductions or recoupment of fees previously reimbursed by the investment adviser) to average net assets (a) | | 0.95 | % | 0.96 | % | 1.01 | % | 1.07 | % | 1.09 | % |
Portfolio turnover rate | | 19.49 | % | 6.29 | % | 5.69 | % | 10.80 | % | 14.31 | % |
Amounts designated as “—” are $0 or have been rounded to $0.
(a) During the period, certain fees were reduced. If such fee reductions had not occurred, the ratio would have been as indicated.
See Notes to Financial Statements
20
Schedule of Portfolio Investments | Boston Trust Midcap Fund |
| March 31, 2015 |
Security Description | | Shares | | Fair Value ($) | |
| | | | | |
COMMON STOCKS (98.1%) | | | | | |
| | | | | |
Consumer Discretionary (15.8%) | | | | | |
Advance Auto Parts, Inc. | | 4,250 | | 636,183 | |
Autoliv, Inc. | | 4,500 | | 529,965 | |
Hasbro, Inc. | | 11,650 | | 736,746 | |
LKQ Corp. (a) | | 14,000 | | 357,840 | |
Nordstrom, Inc. | | 10,500 | | 843,360 | |
Omnicom Group, Inc. | | 13,175 | | 1,027,387 | |
O’Reilly Automotive, Inc. (a) | | 3,700 | | 800,087 | |
Ross Stores, Inc. | | 8,250 | | 869,219 | |
Sally Beauty Holdings, Inc. (a) | | 16,000 | | 549,920 | |
Service Corp. International | | 28,000 | | 729,400 | |
Williams Sonoma, Inc. | | 5,450 | | 434,420 | |
| | | | 7,514,527 | |
Consumer Staples (7.9%) | | | | | |
Brown-Forman Corp., Class B | | 8,000 | | 722,800 | |
Campbell Soup Co. | | 11,925 | | 555,109 | |
Church & Dwight Co., Inc. | | 13,925 | | 1,189,474 | |
McCormick & Co., Inc. | | 8,750 | | 674,712 | |
Whole Foods Market, Inc. | | 12,000 | | 624,960 | |
| | | | 3,767,055 | |
Energy (3.9%) | | | | | |
Cabot Oil & Gas Corp. | | 9,250 | | 273,153 | |
Dril-Quip, Inc. (a) | | 6,500 | | 444,535 | |
Energen Corp. | | 5,000 | | 330,000 | |
FMC Technologies, Inc. (a) | | 9,800 | | 362,698 | |
Oceaneering International, Inc. | | 8,675 | | 467,842 | |
| | | | 1,878,228 | |
Financials (17.9%) | | | | | |
Bank of Hawaii Corp. | | 4,550 | | 278,506 | |
BOK Financial Corp. | | 5,425 | | 332,119 | |
Brown & Brown, Inc. | | 12,575 | | 416,358 | |
Chubb Corp. | | 4,200 | | 424,620 | |
Cincinnati Financial Corp. | | 14,500 | | 772,560 | |
Comerica, Inc. | | 10,000 | | 451,299 | |
Commerce Bancshares, Inc. | | 8,331 | | 352,568 | |
Cullen/Frost Bankers, Inc. | | 6,450 | | 445,566 | |
East West Bancorp, Inc. | | 12,450 | | 503,726 | |
Eaton Vance Corp. | | 11,550 | | 480,942 | |
HCC Insurance Holdings | | 8,300 | | 470,361 | |
Jones Lang LaSalle, Inc. | | 4,025 | | 685,860 | |
M&T Bank Corp. | | 3,450 | | 438,150 | |
Northern Trust Corp. | | 11,000 | | 766,150 | |
SEI Investments Co. | | 11,825 | | 521,364 | |
Signature Bank (a) | | 2,600 | | 336,908 | |
T. Rowe Price Group, Inc. | | 10,825 | | 876,609 | |
| | | | 8,553,666 | |
Health Care (14.9%) | | | | | |
C.R. Bard, Inc. | | 5,000 | | 836,750 | |
DENTSPLY International, Inc. | | 11,900 | | 605,591 | |
Laboratory Corp. of America Holdings (a) | | 4,250 | | 535,883 | |
MEDNAX, Inc. (a) | | 7,500 | | 543,825 | |
Mettler-Toledo International, Inc. (a) | | 2,425 | | 796,976 | |
Quintiles Transnational Holdings, Inc. (a) | | 8,000 | | 535,760 | |
ResMed, Inc. | | 5,400 | | 387,612 | |
St. Jude Medical, Inc. | | 12,300 | | 804,420 | |
The Cooper Companies, Inc. | | 4,500 | | 843,390 | |
Varian Medical Systems, Inc. (a) | | 4,925 | | 463,393 | |
Waters Corp. (a) | | 5,950 | | 739,704 | |
| | | | 7,093,304 | |
Industrials (15.0%) | | | | | |
AMETEK, Inc. | | 12,100 | | 635,734 | |
C.H. Robinson Worldwide, Inc. | | 3,200 | | 234,304 | |
CLARCOR, Inc. | | 6,000 | | 396,360 | |
Donaldson Co., Inc. | | 17,550 | | 661,810 | |
Hubbell, Inc., Class B | | 6,000 | | 657,720 | |
IDEX Corp. | | 6,350 | | 481,521 | |
Lincoln Electric Holdings, Inc. | | 8,425 | | 550,911 | |
Nordson Corp. | | 6,500 | | 509,210 | |
Rockwell Collins, Inc. | | 5,500 | | 531,025 | |
Sensata Technologies Holding NV (a) | | 8,950 | | 514,178 | |
W.W. Grainger, Inc. | | 3,750 | | 884,288 | |
Wabtec Corp. | | 11,700 | | 1,111,616 | |
| | | | 7,168,677 | |
Information Technology (12.6%) | | | | | |
Amphenol Corp., Class A | | 9,800 | | 577,514 | |
Check Point Software Technologies Ltd. (a) | | 8,150 | | 668,055 | |
Citrix Systems, Inc. (a) | | 8,950 | | 571,637 | |
F5 Networks, Inc. (a) | | 5,000 | | 574,700 | |
FactSet Research Systems, Inc. | | 4,500 | | 716,400 | |
Fiserv, Inc. (a) | | 6,950 | | 551,829 | |
IPG Photonics Corp. (a) | | 4,225 | | 391,658 | |
NetApp, Inc. | | 10,525 | | 373,217 | |
Paychex, Inc. | | 9,650 | | 478,785 | |
Syntel, Inc. (a) | | 12,050 | | 623,346 | |
Teradata Corp. (a) | | 11,025 | | 486,644 | |
| | | | 6,013,785 | |
Materials (4.4%) | | | | | |
AptarGroup, Inc. | | 13,000 | | 825,760 | |
Ball Corp. | | 7,000 | | 494,480 | |
International Flavors & Fragrances, Inc. | | 6,625 | | 777,775 | |
| | | | 2,098,015 | |
Real Estate Investment Trusts (1.7%) | | | | | |
BioMed Realty Trust, Inc. | | 19,000 | | 430,540 | |
Digital Realty Trust, Inc. | | 5,500 | | 362,780 | |
| | | | 793,320 | |
Utilities (4.0%) | | | | | |
AGL Resources, Inc. | | 5,725 | | 284,246 | |
Eversource Energy | | 9,391 | | 474,433 | |
ONE Gas, Inc. | | 8,425 | | 364,213 | |
Questar Corp. | | 17,575 | | 419,340 | |
Wisconsin Energy Corp. | | 7,500 | | 371,250 | |
| | | | 1,913,482 | |
TOTAL COMMON STOCKS (Cost $27,804,228) | | | | 46,794,059 | |
| | | | | |
INVESTMENT COMPANIES (2.4%) | | | | | |
| | | | | |
State Street Institutional U.S. Government | | | | | |
Money Market Fund, Investor Shares, 0.00% (b) | | 1,142,232 | | 1,142,232 | |
TOTAL INVESTMENT COMPANIES (Cost $1,142,232) | | | | 1,142,232 | |
| | | | | |
Total Investments (Cost $28,946,460) (c) — 100.5% | | | | 47,936,291 | |
Liabilities in excess of other assets — (0.5)% | | | | (253,865 | ) |
NET ASSETS — 100.0% | | | | $ | 47,682,426 | |
| | | | | | |
(a) Non-income producing security.
(b) Rate disclosed is the seven day yield as of March 31, 2015.
(c) See Federal Tax Information listed in the Notes to the Financial Statements.
See Notes to Financial Statements
21
STATEMENT OF ASSETS AND LIABILITIES | | | | | |
March 31, 2015 | | | | | |
Assets: | | | | | |
Investments, at fair value (cost $28,946,460) | | | | $ | 47,936,291 | |
Dividends receivable | | | | 42,267 | |
Prepaid expenses and other assets | | | | 3,170 | |
Total Assets | | | | 47,981,728 | |
Liabilities: | | | | | |
Payable for investments purchased | | | | 258,549 | |
Accrued expenses and other liabilities: | | | | | |
Investment adviser | | | | 29,953 | |
Administration and accounting | | | | 963 | |
Custodian | | | | 692 | |
Shareholder servicing fees | | | | 13 | |
Transfer agent | | | | 2,498 | |
Trustee | | | | 58 | |
Other | | | | 6,576 | |
Total Liabilities | | | | 299,302 | |
Net Assets | | | | $ | 47,682,426 | |
Composition of Net Assets: | | | | | |
Capital | | | | $ | 27,758,011 | |
Accumulated undistributed net investment income | | | | 26,433 | |
Accumulated net realized gains from investment transactions | | | | 908,151 | |
Net unrealized appreciation from investments | | | | 18,989,831 | |
Net Assets | | | | $ | 47,682,426 | |
Shares outstanding (par value $0.01, unlimited number of shares authorized) | | | | 2,958,797 | |
Net Asset Value, Offering and Redemption price per share | | | | $ | 16.12 | |
STATEMENT OF OPERATIONS | | | | | |
For the year ended March 31, 2015 | | | | | |
| | | | | |
Investment Income: | | | | | |
Dividends | | | | $ | 587,459 | |
Less:Foreign tax withholding | | | | (838 | ) |
Total Investment Income | | | | 586,621 | |
Expenses: | | | | | |
Investment adviser | | | | 328,016 | |
Administration and accounting | | | | 44,926 | |
Chief compliance officer | | | | 1,774 | |
Custodian | | | | 7,921 | |
Shareholder servicing | | | | 3,132 | |
Transfer agency | | | | 35,039 | |
Trustee | | | | 2,293 | |
Other | | | | 21,682 | |
Total expenses before fee reductions | | | | 444,783 | |
Fees voluntarily reduced by the transfer agent | | | | (5,436 | ) |
Fees contractually reduced by the investment adviser | | | | (1,824 | ) |
Net Expenses | | | | 437,523 | |
Net Investment Income | | | | 149,098 | |
Net Realized/Unrealized Gains from Investments: | | | | | |
Net realized gains from investment transactions | | | | 2,132,406 | |
Change in unrealized appreciation from investments | | | | 2,988,513 | |
Net realized/unrealized gains from investments | | | | 5,120,919 | |
Change in Net Assets Resulting from Operations | | | | $ | 5,270,017 | |
See Notes to Financial Statements
22
STATEMENTS OF CHANGES IN NET ASSETS
| | For the year ended | | For the year ended | |
| | March 31, 2015 | | March 31, 2014 | |
| | | | | |
Investment Activities: | | | | | |
Operations: | | | | | |
Net investment income | | $ | 149,098 | | $ | 118,280 | |
Net realized gains from investment transactions | | 2,132,406 | | 1,520,619 | |
Change in unrealized appreciation/depreciation from investments | | 2,988,513 | | 4,838,544 | |
Change in Net Assets Resulting from Operations | | 5,270,017 | | 6,477,443 | |
Dividends: | | | | | |
Net investment income | | (147,759 | ) | (96,861 | ) |
Net realized gains from investment transactions | | (2,011,509 | ) | (985,115 | ) |
Change in Net Assets Resulting from Shareholder Dividends | | (2,159,268 | ) | (1,081,976 | ) |
Capital Share Transactions: | | | | | |
Proceeds from shares issued | | 2,772,357 | | 3,133,532 | |
Dividends reinvested | | 1,991,145 | | 1,004,501 | |
Cost of shares redeemed | | (1,984,811 | ) | (2,615,671 | ) |
Change in Net Assets Resulting from Capital Share Transactions | | 2,778,691 | | 1,522,362 | |
Change in Net Assets | | 5,889,440 | | 6,917,829 | |
Net Assets: | | | | | |
Beginning of period | | 41,792,986 | | 34,875,157 | |
End of period | | $ | 47,682,426 | | $ | 41,792,986 | |
Share Transactions: | | | | | |
Issued | | 177,659 | | 228,524 | |
Reinvested | | 129,295 | | 69,420 | |
Redeemed | | (128,644 | ) | (184,340 | ) |
Change in shares | | 178,310 | | 113,604 | |
Accumulated undistributed net investment income | | $ | 26,433 | | $ | 25,094 | |
See Notes to Financial Statements
23
FINANCIAL HIGHLIGHTS
Selected data for a share outstanding throughout the years indicated.
| | For the year | | For the year | | For the year | | For the year | | For the year | |
| | ended | | ended | | ended | | ended | | ended | |
| | March 31, | | March 31, | | March 31, | | March 31, | | March 31, | |
| | 2015 | | 2014 | | 2013 | | 2012 | | 2011 | |
| | | | | | | | | | | |
Net Asset Value, Beginning of Period | | $ | 15.03 | | $ | 13.08 | | $ | 12.34 | | $ | 11.96 | | $ | 9.44 | |
| | | | | | | | | | | |
Investment Activities: | | | | | | | | | | | |
Net investment income | | 0.05 | | 0.04 | | 0.08 | | 0.03 | | 0.02 | |
Net realized and unrealized gains from investment transactions | | 1.82 | | 2.30 | | 1.01 | | 0.78 | | 2.73 | |
Total from investment activities | | 1.87 | | 2.34 | | 1.09 | | 0.81 | | 2.75 | |
| | | | | | | | | | | |
Dividends: | | | | | | | | | | | |
Net investment income | | (0.05 | ) | (0.04 | ) | (0.08 | ) | (0.03 | ) | (0.02 | ) |
Net realized gains from investments | | (0.73 | ) | (0.35 | ) | (0.27 | ) | (0.40 | ) | (0.21 | ) |
Total dividends | | (0.78 | ) | (0.39 | ) | (0.35 | ) | (0.43 | ) | (0.23 | ) |
| | | | | | | | | | | |
Net Asset Value, End of Period | | $ | 16.12 | | $ | 15.03 | | $ | 13.08 | | $ | 12.34 | | $ | 11.96 | |
Total Return | | 12.65 | % | 18.02 | % | 9.20 | % | 7.24 | % | 29.32 | % |
| | | | | | | | | | | |
Ratios/Supplemental Data: | | | | | | | | | | | |
Net assets at end of period (000’s) | | $ | 47,682 | | $ | 41,793 | | $ | 34,875 | | $ | 29,224 | | $ | 27,276 | |
Ratio of net expenses to average net assets | | 1.00 | % | 1.00 | % | 1.00 | % | 1.00 | % | 1.00 | % |
Ratio of net investment income to average net assets | | 0.34 | % | 0.30 | % | 0.68 | % | 0.30 | % | 0.25 | % |
Ratio of expenses (before fee reductions or recoupment of fees previously reimbursed by the investment adviser) to average net assets (a) | | 1.02 | % | 1.01 | % | 1.08 | % | 1.19 | % | 1.20 | % |
Portfolio turnover rate | | 15.76 | % | 16.09 | % | 16.44 | % | 19.01 | % | 18.58 | % |
(a) During the period, certain fees were reduced. If such fee reductions had not occurred, the ratio would have been as indicated.
See Notes to Financial Statements
24
Schedule of Portfolio Investments | Boston Trust SMID Cap Fund |
| March 31, 2015 |
Security Description | | Shares | | Fair Value ($) | |
| | | | | |
COMMON STOCKS (98.2%) | | | | | |
| | | | | |
Consumer Discretionary (14.3%) | | | | | |
Bright Horizons Family Solutions, Inc. (a) | | 725 | | 37,171 | |
Cheesecake Factory, Inc. | | 1,100 | | 54,263 | |
Choice Hotels International, Inc. | | 925 | | 59,264 | |
Dorman Products, Inc. (a) | | 1,050 | | 52,237 | |
DSW, Inc., Class A | | 1,375 | | 50,710 | |
Gentherm, Inc. (a) | | 950 | | 47,985 | |
Interval Leisure Group | | 1,175 | | 30,797 | |
Service Corp. International | | 3,175 | | 82,709 | |
Sotheby’s | | 600 | | 25,356 | |
Tenneco, Inc. (a) | | 750 | | 43,065 | |
Texas Roadhouse, Inc. | | 1,850 | | 67,395 | |
Tumi Holdings, Inc. (a) | | 2,050 | | 50,143 | |
Tupperware Brands Corp. | | 350 | | 24,157 | |
Vitamin Shoppe, Inc. (a) | | 1,200 | | 49,428 | |
Williams Sonoma, Inc. | | 450 | | 35,870 | |
Wolverine World Wide, Inc. | | 1,750 | | 58,538 | |
| | | | 769,088 | |
Consumer Staples (2.8%) | | | | | |
Flowers Foods, Inc. | | 2,625 | | 59,692 | |
United Natural Foods, Inc. (a) | | 825 | | 63,558 | |
WhiteWave Food Co., Class A (a) | | 625 | | 27,713 | |
| | | | 150,963 | |
Energy (2.5%) | | | | | |
Dril-Quip, Inc. (a) | | 350 | | 23,937 | |
Forum Energy Technologies, Inc. (a) | | 2,100 | | 41,160 | |
Oceaneering International, Inc. | | 825 | | 44,491 | |
RPC, Inc. | | 2,150 | | 27,542 | |
| | | | 137,130 | |
Financials (18.5%) | | | | | |
Artisan Partners Asset Management, Inc. | | 950 | | 43,187 | |
Bank of Hawaii Corp. | | 1,000 | | 61,210 | |
BOK Financial Corp. | | 325 | | 19,897 | |
Brown & Brown, Inc. | | 1,225 | | 40,560 | |
Cohen & Steers, Inc. | | 775 | | 31,736 | |
Commerce Bancshares, Inc. | | 1,017 | | 43,039 | |
Cullen/Frost Bankers, Inc. | | 350 | | 24,178 | |
East West Bancorp, Inc. | | 2,075 | | 83,954 | |
Eaton Vance Corp. | | 1,250 | | 52,050 | |
Encore Capital Group, Inc. (a) | | 1,450 | | 60,306 | |
HCC Insurance Holdings | | 1,100 | | 62,337 | |
Jones Lang LaSalle, Inc. | | 625 | | 106,500 | |
LPL Financial Holdings, Inc. | | 575 | | 25,220 | |
MarketAxess Holdings, Inc. | | 900 | | 74,610 | |
SEI Investments Co. | | 1,625 | | 71,645 | |
Signature Bank (a) | | 550 | | 71,268 | |
SVB Financial Group (a) | | 550 | | 69,872 | |
Texas Capital Bancshares, Inc. (a) | | 575 | | 27,974 | |
UMB Financial Corp. | | 450 | | 23,801 | |
| | | | 993,344 | |
Health Care (14.5%) | | | | | |
Air Methods Corp. (a) | | 875 | | 40,766 | |
Anika Therapeutics, Inc. (a) | | 950 | | 39,112 | |
Bio-Reference Labs, Inc. (a) | | 1,525 | | 53,741 | |
Bruker Corp. (a) | | 2,250 | | 41,558 | |
Centene Corp. (a) | | 775 | | 54,785 | |
Cyberonics, Inc. (a) | | 350 | | 22,722 | |
DENTSPLY International, Inc. | | 1,000 | | 50,890 | |
Haemonetics Corp. (a) | | 800 | | 35,936 | �� |
MEDNAX, Inc. (a) | | 825 | | 59,821 | |
Mettler-Toledo International, Inc. (a) | | 225 | | 73,946 | |
Quintiles Transnational Holdings, Inc. (a) | | 600 | | 40,182 | |
STERIS Corp. | | 1,025 | | 72,027 | |
The Cooper Companies, Inc. | | 400 | | 74,967 | |
Thoratec Corp. (a) | | 1,200 | | 50,268 | |
West Pharmaceutical Services, Inc. | | 1,175 | | 70,747 | |
| | | | 781,468 | |
Industrials (15.7%) | | | | | |
Applied Industrial Technologies | | 900 | | 40,806 | |
Chart Industries, Inc. (a) | | 725 | | 25,429 | |
CLARCOR, Inc. | | 750 | | 49,545 | |
Donaldson Co., Inc. | | 1,450 | | 54,680 | |
Franklin Electric Co., Inc. | | 1,000 | | 38,140 | |
Genesee & Wyoming, Inc., Class A (a) | | 550 | | 53,042 | |
Hub Group, Inc., Class A (a) | | 800 | | 31,432 | |
Hubbell, Inc., Class B | | 400 | | 43,848 | |
IDEX Corp. | | 525 | | 39,811 | |
Lincoln Electric Holdings, Inc. | | 675 | | 44,138 | |
Lindsay Manufacturing Co. | | 325 | | 24,781 | |
Middleby Corp. (a) | | 625 | | 64,156 | |
Nordson Corp. | | 800 | | 62,672 | |
Sensata Technologies Holding NV (a) | | 1,100 | | 63,195 | |
UniFirst Corp. | | 500 | | 58,845 | |
Valmont Industries, Inc. | | 325 | | 39,936 | |
Wabtec Corp. | | 950 | | 90,260 | |
Watts Water Technologies, Inc., Class A | | 399 | | 21,957 | |
| | | | 846,673 | |
Information Technology (15.6%) | | | | | |
Blackbaud, Inc. | | 625 | | 29,613 | |
Coherent, Inc. (a) | | 375 | | 24,360 | |
CommVault Systems, Inc. (a) | | 725 | | 31,683 | |
F5 Networks, Inc. (a) | | 400 | | 45,976 | |
FactSet Research Systems, Inc. | | 375 | | 59,699 | |
InterDigital, Inc. | | 725 | | 36,787 | |
IPG Photonics Corp. (a) | | 1,000 | | 92,700 | |
Mellanox Technologies Ltd. (a) | | 875 | | 39,673 | |
Plantronics, Inc. | | 975 | | 51,626 | |
Polycom, Inc. (a) | | 2,650 | | 35,510 | |
Power Integrations, Inc. | | 475 | | 24,738 | |
SolarWinds, Inc. (a) | | 950 | | 48,678 | |
Solera Holdings, Inc. | | 475 | | 24,539 | |
Synaptics, Inc. (a) | | 400 | | 32,522 | |
Syntel, Inc. (a) | | 1,725 | | 89,234 | |
Teradata Corp. (a) | | 1,150 | | 50,761 | |
Ubiquiti Networks, Inc. | | 2,150 | | 63,532 | |
WEX, Inc. (a) | | 550 | | 59,048 | |
| | | | 840,679 | |
Materials (6.2%) | | | | | |
AptarGroup, Inc. | | 975 | | 61,932 | |
Calgon Carbon Corp. | | 2,725 | | 57,416 | |
Commercial Metals Co. | | 1,850 | | 29,952 | |
International Flavors & Fragrances, Inc. | | 625 | | 73,374 | |
Minerals Technologies, Inc. | | 950 | | 69,445 | |
Silgan Holdings, Inc. | | 675 | | 39,238 | |
| | | | 331,357 | |
Real Estate Investment Trusts (3.6%) | | | | | |
BioMed Realty Trust, Inc. | | 1,725 | | 39,089 | |
CoreSite Realty Corp. | | 700 | | 34,076 | |
Digital Realty Trust, Inc. | | 850 | | 56,066 | |
Tanger Factory Outlet Centers, Inc. | | 1,900 | | 66,822 | |
| | | | 196,053 | |
Utilities (4.5%) | | | | | |
AGL Resources, Inc. | | 900 | | 44,685 | |
American States Water Co. | | 1,200 | | 47,868 | |
New Jersey Resources Corp. | | 900 | | 27,954 | |
ONE Gas, Inc. | | 1,375 | | 59,441 | |
Questar Corp. | | 2,600 | | 62,036 | |
| | | | 241,984 | |
TOTAL COMMON STOCKS (Cost $3,991,343) | | | | 5,288,739 | |
| | | | | |
INVESTMENT COMPANIES (1.8%) | | | | | |
| | | | | |
State Street Institutional U.S. Government Money | | | | | |
Market Fund, Investor Shares, 0.00% (b) | | 95,058 | | 95,058 | |
TOTAL INVESTMENT COMPANIES (Cost $95,058) | | | | 95,058 | |
| | | | | |
Total Investments (Cost $4,086,401) (c) — 100.0% | | | | 5,383,797 | |
Other assets in excess of liabilities — 0.0% | | | | 2,319 | |
NET ASSETS — 100.0% | | | | $ | 5,386,116 | |
| | | | | | |
(a) Non-income producing security.
(b) Rate disclosed is the seven day yield as of March 31, 2015.
(c) See Federal Tax Information listed in the Notes to the Financial Statements.
See Notes to Financial Statements
25
Financial Statements | Boston Trust SMID Cap Fund |
STATEMENT OF ASSETS AND LIABILITIES
March 31, 2015
Assets: | | | |
Investments, at fair value (cost $4,086,401) | | $ | 5,383,797 | |
Dividends receivable | | 2,916 | |
Receivable from the investment adviser | | 846 | |
Prepaid expenses and other assets | | 1,935 | |
Total Assets | | 5,389,494 | |
Liabilities: | | | |
Accrued expenses and other liabilities: | | | |
Administration and accounting | | 158 | |
Custodian | | 149 | |
Transfer agent | | 2,319 | |
Trustee | | 7 | |
Other | | 745 | |
Total Liabilities | | 3,378 | |
Net Assets | | $ | 5,386,116 | |
Composition of Net Assets: | | | |
Capital | | $ | 3,972,768 | |
Accumulated undistributed net investment income | | 3,651 | |
Accumulated net realized gains from investment transactions | | 112,301 | |
Net unrealized appreciation from investments | | 1,297,396 | |
Net Assets | | $ | 5,386,116 | |
Shares outstanding (par value $0.01, unlimited number of shares authorized) | | 392,508 | |
Net Asset Value, Offering and Redemption price per share | | $ | 13.72 | |
STATEMENT OF OPERATIONS
For the year ended March 31, 2015
Investment Income: | | | |
Dividends | | $ | 52,417 | |
Total Investment Income | | 52,417 | |
Expenses: | | | |
Investment adviser | | 36,195 | |
Administration and accounting | | 5,541 | |
Chief compliance officer | | 199 | |
Custodian | | 1,773 | |
Transfer agency | | 33,359 | |
Trustee | | 258 | |
Other | | 6,058 | |
Total expenses before fee reductions | | 83,383 | |
Fees voluntarily reduced by the transfer agent | | (5,436 | ) |
Fees contractually reduced by the investment adviser | | (29,670 | ) |
Net Expenses | | 48,277 | |
Net Investment Income | | 4,140 | |
Net Realized/Unrealized Gains from Investments: | | | |
Net realized gains from investment transactions | | 162,582 | |
Change in unrealized appreciation from investments | | 213,128 | |
Net realized/unrealized gains from investments | | 375,710 | |
Change in Net Assets Resulting from Operations | | $ | 379,850 | |
See Notes to Financial Statements
26
STATEMENTS OF CHANGES IN NET ASSETS
| | For the year | | For the year | |
| | ended | | ended | |
| | March 31, 2015 | | March 31, 2014 | |
| | | | | |
Investment Activities: | | | | | |
Operations: | | | | | |
Net investment income (loss) | | $ | 4,140 | | $ | (3,177 | ) |
Net realized gains from investment transactions | | 162,582 | | 563,030 | |
Change in unrealized appreciation/depreciation from investments | | 213,128 | | 363,670 | |
Change in Net Assets Resulting from Operations | | 379,850 | | 923,523 | |
Dividends: | | | | | |
Net investment income | | (1,747 | ) | — | |
Net realized gains from investment transactions | | (264,517 | ) | (324,784 | ) |
Change in Net Assets Resulting from Shareholder Dividends | | (266,264 | ) | (324,784 | ) |
Capital Share Transactions: | | | | | |
Proceeds from shares issued | | 600,028 | | 446,894 | |
Dividends reinvested | | 254,275 | | 309,697 | |
Cost of shares redeemed | | (389,915 | ) | (1,266,203 | ) |
Change in Net Assets Resulting from Capital Share Transactions | | 464,388 | | (509,612 | ) |
Change in Net Assets | | 577,974 | | 89,127 | |
Net Assets: | | | | | |
Beginning of period | | 4,808,142 | | 4,719,015 | |
End of period | | $ | 5,386,116 | | $ | 4,808,142 | |
Share Transactions: | | | | | |
Issued | | 45,724 | | 35,059 | |
Reinvested | | 19,850 | | 23,623 | |
Redeemed | | (29,591 | ) | (93,739 | ) |
Change in shares | | 35,983 | | (35,057 | ) |
Accumulated undistributed net investment income | | $ | 3,651 | | $ | 1,487 | |
Amounts designated as “—” are $0 or have been rounded to $0.
See Notes to Financial Statements
27
FINANCIAL HIGHLIGHTS
Selected data for a share outstanding throughout the periods indicated.
| | For the year | | For the year | | For the year | | For the | |
| | ended | | ended | | ended | | period ended | |
| | March 31, | | March 31, | | March 31, | | March 31, | |
| | 2015 | | 2014 | | 2013 | | 2012 (a) | |
| | | | | | | | | |
Net Asset Value, Beginning of Period | | $ | 13.49 | | $ | 12.05 | | $ | 11.09 | | $ | 10.00 | |
| | | | | | | | | |
Investment Activities: | | | | | | | | | |
Net investment income (loss) | | 0.01 | | (0.01 | ) | 0.04 | | — | |
Net realized and unrealized gains from investment transactions | | 0.97 | | 2.40 | | 1.05 | | 1.09 | |
Total from investment activities | | 0.98 | | 2.39 | | 1.09 | | 1.09 | |
| | | | | | | | | |
Dividends: | | | | | | | | | |
Net investment income | | — | | — | | (0.05 | ) | — | |
Net realized gains from investments | | (0.75 | ) | (0.95 | ) | (0.08 | ) | — | |
Total dividends | | (0.75 | ) | (0.95 | ) | (0.13 | ) | — | |
| | | | | | | | | |
Net Asset Value, End of Period | | $ | 13.72 | | $ | 13.49 | | $ | 12.05 | | $ | 11.09 | |
Total Return | | 7.69 | % | 20.05 | % | 10.00 | % | 10.96 | %(b) |
| | | | | | | | | |
Ratios/Supplemental Data: | | | | | | | | | |
Net assets at end of period (000’s) | | $ | 5,386 | | $ | 4,808 | | $ | 4,719 | | $ | 3,605 | |
Ratio of net expenses to average net assets | | 1.00 | % | 1.00 | % | 1.00 | % | 1.00 | %(c) |
Ratio of net investment income to average net assets | | 0.09 | % | (0.06 | )% | 0.37 | % | 0.03 | %(c) |
Ratio of expenses (before fee reductions or recoupment of fees previously reimbursed by the investment adviser) to average net assets (d) | | 1.73 | % | 1.59 | % | 2.02 | % | 2.18 | %(c) |
Portfolio turnover rate | | 33.07 | % | 35.97 | % | 33.83 | % | 12.14 | %(b) |
Amounts designated as “—” are $0 or have been rounded to $0.
(a) Commencement of operations on November 30, 2011.
(b) Not annualized for periods less than one year.
(c) Annualized for periods less than one year.
(d) During the period, certain fees were reduced. If such fee reductions had not occurred, the ratio would have been as indicated.
See Notes to Financial Statements
28
Schedule of Portfolio Investments | Boston Trust Small Cap Fund |
| March 31, 2015 |
Security Description | | Shares | | Fair Value ($) | |
| | | | | |
COMMON STOCKS (99.1%) | | | | | |
| | | | | |
Consumer Discretionary (14.6%) | | | | | |
Bright Horizons Family Solutions, Inc. (a) | | 60,000 | | 3,076,200 | |
Cheesecake Factory, Inc. | | 102,000 | | 5,031,660 | |
Choice Hotels International, Inc. | | 80,000 | | 5,125,600 | |
Dorman Products, Inc. (a) | | 105,000 | | 5,223,750 | |
DSW, Inc., Class A | | 140,000 | | 5,163,200 | |
Gentherm, Inc. (a) | | 114,000 | | 5,758,140 | |
Hibbett Sports, Inc. (a) | | 60,000 | | 2,943,600 | |
Interval Leisure Group | | 154,000 | | 4,036,340 | |
Sotheby’s | | 60,000 | | 2,535,600 | |
Tenneco, Inc. (a) | | 82,000 | | 4,708,440 | |
Texas Roadhouse, Inc. | | 127,000 | | 4,626,610 | |
Tumi Holdings, Inc. (a) | | 189,000 | | 4,622,940 | |
Tupperware Brands Corp. | | 42,000 | | 2,898,840 | |
Vitamin Shoppe, Inc. (a) | | 90,000 | | 3,707,100 | |
Wolverine World Wide, Inc. | | 142,000 | | 4,749,900 | |
| | | | 64,207,920 | |
Consumer Staples (3.5%) | | | | | |
Darling International, Inc. (a) | | 114,000 | | 1,597,140 | |
Flowers Foods, Inc. | | 210,000 | | 4,775,400 | |
The Chefs’ Warehouse, Inc. (a) | | 119,000 | | 2,669,170 | |
United Natural Foods, Inc. (a) | | 80,000 | | 6,163,200 | |
| | | | 15,204,910 | |
Energy (3.1%) | | | | | |
Dril-Quip, Inc. (a) | | 47,000 | | 3,214,330 | |
Forum Energy Technologies, Inc. (a) | | 249,000 | | 4,880,400 | |
Geospace Technologies Corp. (a) | | 79,000 | | 1,304,290 | |
Natural Gas Services Group, Inc. (a) | | 95,000 | | 1,825,900 | |
RPC, Inc. | | 185,000 | | 2,369,850 | |
| | | | 13,594,770 | |
Financials (16.6%) | | | | | |
Artisan Partners Asset Management, Inc. | | 94,000 | | 4,273,240 | |
Bank of Hawaii Corp. | | 146,000 | | 8,936,660 | |
BBCN Bancorp, Inc. | | 308,000 | | 4,456,760 | |
Cohen & Steers, Inc. | | 128,000 | | 5,241,600 | |
Commerce Bancshares, Inc. | | 104,000 | | 4,401,280 | |
Dime Community Bancshares, Inc. | | 129,000 | | 2,076,900 | |
Eagle Bancorp, Inc. (a) | | 70,000 | | 2,688,000 | |
Encore Capital Group, Inc. (a) | | 159,000 | | 6,612,810 | |
First NBC Bank Holding Co. (a) | | 87,000 | | 2,869,260 | |
HFF, Inc., Class A | | 123,000 | | 4,617,420 | |
Independent Bank Corp. | | 85,000 | | 3,728,950 | |
Infinity Property & Casualty Corp. | | 24,834 | | 2,037,630 | |
MarketAxess Holdings, Inc. | | 87,000 | | 7,212,300 | |
Texas Capital Bancshares, Inc. (a) | | 56,000 | | 2,724,400 | |
Tompkins Financial Corp. | | 28,000 | | 1,507,800 | |
Trustmark Corp. | | 105,000 | | 2,549,400 | |
UMB Financial Corp. | | 67,000 | | 3,543,630 | |
Umpqua Holdings Corp. | | 221,000 | | 3,796,780 | |
| | | | 73,274,820 | |
Health Care (14.5%) | | | | | |
Air Methods Corp. (a) | | 97,000 | | 4,519,230 | |
Anika Therapeutics, Inc. (a) | | 95,000 | | 3,911,150 | |
Bio-Reference Labs, Inc. (a) | | 176,000 | | 6,202,240 | |
Bio-Techne Corp. | | 22,000 | | 2,206,380 | |
Bruker Corp. (a) | | 218,000 | | 4,026,460 | |
Cantel Medical Corp. | | 68,000 | | 3,230,000 | |
Computer Programs & Systems, Inc. | | 77,000 | | 4,178,020 | |
CorVel Corp. (a) | | 36,000 | | 1,238,760 | |
Cyberonics, Inc. (a) | | 45,000 | | 2,921,400 | |
Haemonetics Corp. (a) | | 108,000 | | 4,851,360 | |
ICU Medical, Inc. (a) | | 24,000 | | 2,235,360 | |
IPC The Hospitalist Co. (a) | | 68,000 | | 3,171,520 | |
STERIS Corp. | | 91,000 | | 6,394,570 | |
Thoratec Corp. (a) | | 127,000 | | 5,320,030 | |
West Pharmaceutical Services, Inc. | | 155,000 | | 9,332,550 | |
| | | | 63,739,030 | |
Industrials (14.2%) | | | | | |
Applied Industrial Technologies | | 105,000 | | 4,760,700 | |
Chart Industries, Inc. (a) | | 91,000 | | 3,191,825 | |
CLARCOR, Inc. | | 120,000 | | 7,927,200 | |
ESCO Technologies, Inc. | | 90,000 | | 3,508,200 | |
Franklin Electric Co., Inc. | | 151,000 | | 5,759,140 | |
Herman Miller, Inc. | | 152,000 | | 4,219,520 | |
Hub Group, Inc., Class A (a) | | 138,000 | | 5,422,020 | |
Lindsay Manufacturing Co. | | 41,000 | | 3,126,250 | |
Team, Inc. (a) | | 99,000 | | 3,859,020 | |
Tennant Co. | | 95,000 | | 6,210,150 | |
UniFirst Corp. | | 64,000 | | 7,532,160 | |
Valmont Industries, Inc. | | 27,000 | | 3,317,760 | |
Watts Water Technologies, Inc., Class A | | 64,000 | | 3,521,920 | |
| | | | 62,355,865 | |
Information Technology (17.1%) | | | | | |
Blackbaud, Inc. | | 92,000 | | 4,358,960 | |
Coherent, Inc. (a) | | 42,000 | | 2,728,320 | |
CommVault Systems, Inc. (a) | | 82,000 | | 3,583,400 | |
InterDigital, Inc. | | 62,000 | | 3,145,880 | |
IPG Photonics Corp. (a) | | 60,000 | | 5,562,000 | |
Mellanox Technologies Ltd. (a) | | 130,000 | | 5,894,200 | |
Plantronics, Inc. | | 128,000 | | 6,777,600 | |
Polycom, Inc. (a) | | 303,000 | | 4,060,200 | |
Power Integrations, Inc. | | 84,000 | | 4,374,720 | |
SolarWinds, Inc. (a) | | 128,000 | | 6,558,720 | |
Solera Holdings, Inc. | | 64,000 | | 3,306,240 | |
Synaptics, Inc. (a) | | 55,000 | | 4,471,775 | |
Syntel, Inc. (a) | | 170,000 | | 8,794,100 | |
Ubiquiti Networks, Inc. | | 180,000 | | 5,319,000 | |
WEX, Inc. (a) | | 60,000 | | 6,441,600 | |
| | | | 75,376,715 | |
Materials (5.9%) | | | | | |
AptarGroup, Inc. | | 67,000 | | 4,255,840 | |
Calgon Carbon Corp. | | 190,000 | | 4,003,300 | |
Commercial Metals Co. | | 150,000 | | 2,428,500 | |
Minerals Technologies, Inc. | | 75,000 | | 5,482,500 | |
Quaker Chemical Corp. | | 69,000 | | 5,909,160 | |
Silgan Holdings, Inc. | | 65,000 | | 3,778,450 | |
| | | | 25,857,750 | |
Real Estate Investment Trusts (5.1%) | | | | | |
BioMed Realty Trust, Inc. | | 147,000 | | 3,331,020 | |
CoreSite Realty Corp. | | 129,000 | | 6,279,720 | |
DuPont Fabros Technology, Inc. | | 204,000 | | 6,666,720 | |
Tanger Factory Outlet Centers, Inc. | | 170,000 | | 5,978,900 | |
| | | | 22,256,360 | |
Utilities (4.5%) | | | | | |
American States Water Co. | | 100,000 | | 3,989,000 | |
New Jersey Resources Corp. | | 106,000 | | 3,292,360 | |
ONE Gas, Inc. | | 150,000 | | 6,484,500 | |
Questar Corp. | | 245,000 | | 5,845,700 | |
| | | | 19,611,560 | |
TOTAL COMMON STOCKS (Cost $342,989,470) | | | | 435,479,700 | |
| | | | | |
INVESTMENT COMPANIES (0.6%) | | | | | |
| | | | | |
State Street Institutional U.S. Government | | | | | |
Money Market Fund, Investor Shares, 0.00% (b) | | 2,840,430 | | 2,840,430 | |
TOTAL INVESTMENT COMPANIES (Cost $2,840,430) | | | | 2,840,430 | |
| | | | | |
Total Investments (Cost $345,829,900) (c) — 99.7% | | | | 438,320,130 | |
Other assets in excess of liabilities — 0.3% | | | | 1,361,158 | |
NET ASSETS — 100.0% | | | | $ | 439,681,288 | |
| | | | | | |
(a) Non-income producing security.
(b) Rate disclosed is the seven day yield as of March 31, 2015.
(c) See Federal Tax Information listed in the Notes to the Financial Statements.
See Notes to Financial Statements
29
Financial Statements | Boston Trust Small Cap Fund |
STATEMENT OF ASSETS AND LIABILITIES |
March 31, 2015 |
Assets: | | | |
Investments, at fair value (cost $345,829,900) | | $ | 438,320,130 | |
Dividends receivable | | 386,685 | |
Receivable for investments sold | | 1,403,272 | |
Receivable for capital shares issued | | 46,919 | |
Prepaid expenses and other assets | | 18,132 | |
Total Assets | | 440,175,138 | |
Liabilities: | | | |
Payable for investments purchased | | 31,509 | |
Payable for capital shares redeemed | | 57,871 | |
Accrued expenses and other liabilities: | | | |
Investment adviser | | 273,432 | |
Administration and accounting | | 8,423 | |
Custodian | | 6,198 | |
Shareholder servicing fees | | 48,788 | |
Transfer agent | | 2,953 | |
Trustee | | 547 | |
Other | | 64,129 | |
Total Liabilities | | 493,850 | |
Net Assets | | $ | 439,681,288 | |
Composition of Net Assets: | | | |
Capital | | $ | 317,273,506 | |
Accumulated undistributed net investment income | | 563,027 | |
Accumulated net realized gains from investment transactions | | 29,354,525 | |
Net unrealized appreciation from investments | | 92,490,230 | |
Net Assets | | $ | 439,681,288 | |
Shares outstanding (par value $0.01, unlimited number of shares authorized) | | 28,922,528 | |
Net Asset Value, Offering and Redemption price per share | | $ | 15.20 | |
STATEMENT OF OPERATIONS |
For the year ended March 31, 2015 |
Investment Income: | | | |
Dividends | | $ | 5,543,730 | |
Total Investment Income | | 5,543,730 | |
Expenses: | | | |
Investment adviser | | 3,565,992 | |
Administration and accounting | | 483,963 | |
Chief compliance officer | | 20,247 | |
Custodian | | 77,595 | |
Shareholder servicing | | 578,259 | |
Transfer agency | | 41,951 | |
Trustee | | 26,446 | |
Other | | 176,176 | |
Total expenses before fee reductions | | 4,970,629 | |
Fees voluntarily reduced by the transfer agent | | (5,436 | ) |
Fees contractually reduced by the investment adviser | | (213,139 | ) |
Net Expenses | | 4,752,054 | |
Net Investment Income | | 791,676 | |
Net Realized/Unrealized Gains (Losses) from Investments: | | | |
Net realized gains from investment transactions | | 47,957,282 | |
Change in unrealized appreciation/depreciation from investments | | (34,259,948 | ) |
Net realized/unrealized gains (losses) from investments | | 13,697,334 | |
Change in Net Assets Resulting from Operations | | $ | 14,489,010 | |
See Notes to Financial Statements
30
STATEMENTS OF CHANGES IN NET ASSETS
| | | | For the year | |
| | For the year | | ended | |
| | ended | | March 31, | |
| | March 31, 2015 | | 2014 (a) | |
| | | | | |
Investment Activities: | | | | | |
Operations: | | | | | |
Net investment income | | $ | 791,676 | | $ | 82,430 | |
Net realized gains from investment transactions | | 47,957,282 | | 44,722,535 | |
Change in unrealized appreciation/depreciation from investments | | (34,259,948 | ) | 44,209,598 | |
Change in Net Assets Resulting from Operations | | 14,489,010 | | 89,014,563 | |
Dividends: | | | | | |
Net investment income | | (386,517 | ) | (7,906 | ) |
Net realized gains from investment transactions | | (31,345,842 | ) | (37,756,330 | ) |
Change in Net Assets Resulting from Shareholder Dividends | | (31,732,359 | ) | (37,764,236 | ) |
Capital Share Transactions: | | | | | |
Proceeds from shares issued | | 13,576,896 | | 18,075,410 | |
Proceeds from shares issued in subscription in-kind (a) | | — | | 7,967,662 | |
Dividends reinvested | | 31,322,227 | | 36,480,688 | |
Cost of shares redeemed | | (124,266,848 | ) | (79,799,529 | ) |
Cost of shares redeemed in redemption in-kind (a) | | — | | (471,351 | ) |
Change in Net Assets Resulting from Capital Share Transactions | | (79,367,725 | ) | (17,747,120 | ) |
Change in Net Assets | | (96,611,074 | ) | 33,503,207 | |
Net Assets: | | | | | |
Beginning of period | | 536,292,362 | | 502,789,155 | |
End of period | | $ | 439,681,288 | | $ | 536,292,362 | |
Share Transactions: | | | | | |
Issued | | 907,477 | | 1,173,966 | |
Issued in subscriptions in-kind (a) | | — | | 507,818 | |
Reinvested | | 2,178,180 | | 2,329,546 | |
Redeemed | | (8,264,667 | ) | (5,162,578 | ) |
Redeemed in redemption in-kind (a) | | — | | (28,515 | ) |
Change in shares | | (5,179,010 | ) | (1,179,763 | ) |
Accumulated undistributed net investment income | | $ | 563,027 | | $ | 245,887 | |
Amounts designated as “—” are $0 or have been rounded to $0.
(a) See Note 3 in Notes to Financial Statements.
See Notes to Financial Statements
31
FINANCIAL HIGHLIGHTS
Selected data for a share outstanding throughout the years indicated.
| | For the year | | For the year | | For the year | | For the year | | For the year | |
| | ended | | ended | | ended | | ended | | ended | |
| | March 31, | | March 31, | | March 31, | | March 31, | | March 31, | |
| | 2015 | | 2014 | | 2013 | | 2012 | | 2011 | |
| | | | | | | | | | | |
Net Asset Value, Beginning of Period | | $ | 15.73 | | $ | 14.25 | | $ | 13.24 | | $ | 14.00 | | $ | 11.52 | |
| | | | | | | | | | | |
Investment Activities: | | | | | | | | | | | |
Net investment income | | 0.03 | | — | | 0.05 | | 0.01 | | 0.02 | |
Net realized and unrealized gains from investment transactions | | 0.51 | | 2.66 | | 1.43 | | 0.20 | | 2.91 | |
Total from investment activities | | 0.54 | | 2.66 | | 1.48 | | 0.21 | | 2.93 | |
| | | | | | | | | | | |
Dividends: | | | | | | | | | | | |
Net investment income | | (0.01 | ) | — | | (0.05 | ) | (0.01 | ) | (0.03 | ) |
Net realized gains from investments | | (1.06 | ) | (1.18 | ) | (0.42 | ) | (0.96 | ) | (0.42 | ) |
Total dividends | | (1.07 | ) | (1.18 | ) | (0.47 | ) | (0.97 | ) | (0.45 | ) |
| | | | | | | | | | | |
Net Asset Value, End of Period | | $ | 15.20 | | $ | 15.73 | | $ | 14.25 | | $ | 13.24 | | $ | 14.00 | |
Total Return | | 3.81 | % | 18.74 | % | 11.61 | % | 2.35 | % | 25.78 | % |
| | | | | | | | | | | |
Ratios/Supplemental Data: | | | | | | | | | | | |
Net assets at end of period (000’s) | | $ | 439,681 | | $ | 536,292 | | $ | 502,789 | | $ | 328,009 | | $ | 268,237 | |
Ratio of net expenses to average net assets | | 1.00 | % | 1.00 | % | 1.00 | % | 1.00 | % | 1.00 | % |
Ratio of net investment income to average net assets | | 0.17 | % | 0.02 | % | 0.38 | % | 0.05 | % | 0.15 | % |
Ratio of expenses (before fee reductions or recoupment of fees previously reimbursed by the investment adviser) to average net assets (a) | | 1.05 | % | 1.07 | % | 0.99 | % | 1.09 | % | 1.12 | % |
Portfolio turnover rate | | 28.62 | % | 34.50 | % | 33.34 | % | 30.99 | % | 35.54 | % |
Amounts designated as “—” are $0 or have been rounded to $0.
(a) During the period, certain fees were reduced. If such fee reductions had not occurred, the ratio would have been as indicated.
See Notes to Financial Statements
32
This page intentionally left blank.
33
Environmental, Social and Governance Research and
Action Update (Unaudited) | 
|
Calling climate change the “defining challenge of our generation,” Secretary of State John Kerry announced on March 31st the submission of the United States’ Intended Nationally Determined Contribution (INDC) to the United Nations Framework Convention on Climate Change—a pledge to cut greenhouse gas (GHG) emissions 26-28% below 2005 levels by 2025. This commitment is consistent with the U.S. reaching reductions of 80% by 2050, the contribution needed to help keep global temperature rise below 2 degrees Celsius and avoid the most devastating consequences of climate change. Beginning November 30th, the UN Climate Conference will meet in Paris with the objective of establishing a climate agreement with global and country-specific GHG reduction targets.
Climate Change Engagement
Businesses must embrace and support the political commitments through GHG emissions reduction targets that are similarly based in climate science. Walden’s shareholder engagement encouraging robust corporate responses to climate change remains a top priority. We are pleased to report ongoing progress at a number of client portfolio companies, often through collaboration with other investors and the efforts of focused NGO (non-governmental organization) campaigns.
Financial services company BB&T agreed to publish a sustainability report beginning in 2016 that will describe its energy efficiency initiatives and alternative energy financing. BB&T plans to utilize the CDP climate questionnaire to guide reporting and gather data for consideration in future goal-setting and progress measurement. CDP is an NGO that works with institutional investors and companies to encourage strong and transparent corporate responses to climate change. Retailer Costco committed to resume CDP climate change disclosure, include climate science context in its energy use reporting, and keep GHG emissions growth below sales growth over the next 5 years. Walden and a small group of investors met with CEO Craig Jelinek and other executives at Costco’s headquarters, where we introduced a representative of Rocky Mountain Institute and discussed opportunities for the company to expand energy efficiency measures and renewable energy procurement. Lincoln Electric reported that progress on data collection has it on track to include long-term GHG goals on its website by year-end. PepsiCo told Walden that its next generation GHG goals would be science-based as well as more explicit about climate change impacts and opportunities throughout the supply chain.
Advances by International Flavors & Fragrances (IFF) and Sysco toward sustainable palm oil procurement will help prevent the destruction of carbon absorbing forests and peatlands in Indonesia and Malaysia, which until recently was standard practice in the industry. After having mapped its supply chain, IFF is in the final stages of developing a sourcing policy that will require 100% certification of palm oil by 2020 and annual reporting of progress. Sysco similarly traced part of its supply chain, and with assistance from The Forest Trust, an expert NGO, is on track to announce its palm oil procurement policy and implementation plans in the coming months.
Corporate Governance Engagement
Lobbying Transparency: For several years, AFSCME and Walden have coordinated an investor campaign to strengthen disclosure and oversight of corporate lobbying practices, including indirect activity through trade associations or tax-exempt organizations that promote model legislation. Enhanced accountability helps investors assess the consistency of companies’ expressed policies with their public policy advocacy to determine if lobbying activities are in the long-term best interests of shareholders or a source of potential business risk (e.g. reputational risk). According to AFSCME, approximately 35 companies have improved their lobbying disclosure. In the current proxy season, 65 investors, including state and city pension funds, have filed lobbying disclosure resolutions at more than 50 companies. Voting support of 39.8% on a resolution at portfolio company Emerson Electric is testimony of broad interest in improved lobbying disclosure.
Sustainability Reporting: Comprehensive sustainability reporting that includes meaningful environmental, social, and governance (ESG) metrics and goals helps investors and other stakeholders understand how companies manage and measure ESG risks and opportunities. When company outreach and dialogues prove ineffective, Walden may file shareholder resolutions to encourage greater accountability on ESG management and performance. To date, ESG reporting resolutions for 2015 annual general meetings have received unusually strong voting support: Clarcor; if abstentions are included, a majority did not support management); Commercial Metals; Emerson Electric; and ESCO Technologies. With this strong backing from investors, Walden hopes future conversations with these companies will be more fruitful.
The equities of the companies in bold-face above were holdings of one or more of the Walden Funds as of March 31, 2015, or have since been acquired by the Fund(s).
34
Other Corporate Governance: In January, Apache told Walden of its plan to split the CEO and Board Chair positions after recently retired CEO Steve Farris leaves the Chairman role in May. Walden has long advocated for separating the two roles at portfolio companies to foster independent board oversight of management. Cohen & Steers amended its corporate governance guidelines and nominating charter to add gender, race, and ethnicity as factors considered in director nominations.
Over our 40-year history as engaged investors, we have worked to forge constructive partnerships with companies that bring meaning to Walden’s tagline and goal of “advancing sustainable business practices.” We were delighted to receive personal 40th anniversary congratulations and affirmation from PepsiCo CEO Indra Nooyi, who told us: “We greatly appreciate your support and partnership over the years and have benefitted from your valuable insights on political spending, lobbying disclosure, Board leadership disclosure, and sustainability matters. The feedback we have received from you and other stakeholders has informed our decisions and strategy.”
Walden continues to aim for significant positive impact and we are pleased that early results in 2015 presage another productive year.
Business Leads the Way on LGBT Equality
Arkansas headquartered Wal-Mart, a beacon of controversy for critics who denounce poverty level wages, has recently become a beacon of another sort. Speaking via Twitter against the state’s Religious Freedom Restoration Act that would have enabled discrimination against lesbian, gay, bisexual, and transgender (LGBT) citizens, CEO Doug McMillon said the bill “threatens to undermine the spirit of inclusion present through the state of Arkansas and does not reflect the values we proudly uphold.” McMillon further stated, “Every day, in our stores, we see firsthand the benefits diversity and inclusion have on our associates, customers and communities we serve…For these reasons, we are asking Governor Hutchinson to veto this legislation.” Walden applauds Wal-Mart’s exemplary public stand.
While a broad-based public backlash against a similar law enacted in Indiana helped pave the way for Governor Hutchinson to send the bill back to state legislators for a fix earlier this month, the consensus view is that when business speaks, politicians listen. In the case of LGBT rights, companies have often been more proactive than legislators, and Walden has worked hard to encourage positive corporate practices that can serve as role models for reluctant politicians.
Since 2000, Walden has written letters, engaged in dialogues, or filed shareholder proposals with over 100 companies regarding workplace equality for LGBT individuals. A substantive number of these companies ultimately improved their equal employment opportunity (EEO) policies by making them more publicly accessible or expanding policies to explicitly include protective language for sexual orientation and gender identity. In the past three years alone, Walden has engaged with 35 companies and 32 of them made the desired improvements. Walden’s ultimate goal is for all client portfolio companies to have inclusive non-discrimination policies that are easily accessible to current and prospective employees.
In 2014 and early 2015, Walden has seen continued progress even while most of the companies engaged have been located in states that are typically less supportive of LGBT equality. InterDigital, MarketAxess, and UMB Financial have published their EEO policies to their websites, and Texas Capital Bancshares added sexual orientation and gender identity to its policy. Franklin Electric increased the transparency of its EEO policy and also amended its medical benefits plan to offer spousal and dependent coverage to employees in state recognized same-sex unions. Moreover, resolutions filed for 2015 annual meetings at Cullen/Frost Bankers, Expeditors International, First NBC Bank, IDEX Corporation, and Syntel have been withdrawn upon the companies agreeing to improve the inclusivity and visibility of their non-discrimination policies.
Walden is also pleased to partner with and support the efforts of clients working to make a positive impact on this issue. Pride Foundation, a regional community foundation focused on advancing equality for the LGBT community in the Northwest, led resolutions at nine companies for the 2015 proxy season and has seen similar success.
LGBT rights are a matter of social justice and good business. We believe companies that ensure a respectful and supportive atmosphere for all employees enhance long-term shareholder value. Employment discrimination on the basis of sexual orientation and gender identity diminishes employee morale and productivity. Further, inclusive and public EEO policies help companies avoid costly discrimination litigation and reputation damage, all while enabling the company to attract employees from the broadest possible talent pool.
Kudos to Wal-Mart and other companies such as Apple, EMC, and many more that are publicly making the case for equality. Their voices help galvanize needed changes in public policy.
The information contained herein has been prepared from sources and data we believe to be reliable, but we make no guarantee as to its adequacy, accuracy, timeliness, or completeness. We cannot and do not guarantee the suitability or profitability of any particular investment. No information herein is intended as an offer or solicitation of an offer to sell or buy, or as a sponsorship of any company, security, or fund. Neither Walden nor any of its contributors makes any representations about the suitability of the information contained herein. Opinions expressed herein are subject to change without notice.
The equities of the companies in bold-face above were holdings of one or more of the Walden Funds as of March 31, 2015, or have since been acquired by the Fund(s).
35
Walden Asset Management Fund
Walden Equity Fund
March 31, 2015
William H. Apfel, CFA
Portfolio Manager
Boston Trust Investment Management, Inc.
Asset Management Fund Objective
The investment objective of the Walden Asset Management Fund is to seek long-term capital growth and income through an actively managed portfolio of stocks, bonds and money market instruments.
Equity Fund Objective
The investment objective of the Walden Equity Fund is to seek long-term growth of capital through an actively managed portfolio of stocks.
Investment Concerns
Equity securities (stocks) are more volatile and carry more risk and return potential than other forms of investments, including investments in high-grade fixed income securities. The net asset value per share of these Funds will fluctuate as the value of the securities in the portfolio changes.
Bonds offer a relatively stable level of income, although bond prices will fluctuate, providing the potential for principal gain or loss. Intermediate term, higher quality bonds generally offer less risk than longer-term bonds and a lower rate of return.
Cash equivalents offer low risk and low return potential.
Manager Commentary (Unaudited)
Management Discussion of Fund Performance
Portfolio Review
The Walden Asset Management Fund returned 7.00% for the year ended March 31, 2015, once again benefitting from a high allocation to equities. Equity segment results, like the total return of the Walden Equity Fund, fell short of the 12.73% gain registered by the S&P 500 Index. For the 12-month period, the Walden Equity Fund had a total return of 8.13%.
As we experienced during the past fiscal year, and at various times in periods prior, good financial metrics for companies do not always assure strong equity market returns. Valuations matter. We believe that for some companies and market segments, valuations have reached unsustainable levels. At about 18x trailing earnings for the S&P 500, the market in aggregate is also no longer cheap. Rising valuations are thus unlikely to contribute much to future returns. We believe that over the long term, stock prices will track earnings growth, and investor returns will be supplemented by any dividends paid. In a world of low inflation and skimpy interest rates, this is still a satisfying prospect. In contrast, high-quality bonds are an appropriate component of a balanced fund primarily because they offer a measure of protection against the most adverse equity market outcomes.
As has been the case for much of the past three years, healthcare stocks posted the strongest returns for the year. Both Funds hold a full market weight in this sector, but our selections lagged the sector average. Several of the best performing healthcare stocks could be found among biotechnology and pharmaceutical companies to which we have little direct exposure. While many of these companies have produced extraordinary new medicines and promise to deliver therapies for devastating diseases, most are speculatively valued and dependent on future clinical successes that are difficult to predict. Taken as a whole, we expect investors will ultimately be disappointed as the financial returns these companies produce fail to justify their valuations. Our discipline requires us to avoid such investments despite the inevitable periods when investor enthusiasm drives their stock prices higher. Meanwhile, we continue to find ample investment opportunities in this sector that meet our financial criteria and that we judge to be fairly valued. Among these are companies that provide support to the drug discovery industry in the form of research tools and clinical testing expertise.*
Decisions regarding energy sector allocation and stock selection were critical in determining investment results for the year, as well. While both Funds were underweighted in this sector, portfolio holdings fell more than the sector index, offsetting the allocation advantage. This outcome is certainly disappointing given our intention to maintain lower than market exposure to commodity price risks as well as our expectation that carbon pricing will ultimately challenge the business models of those producers less inclined to plan for the risks associated with climate change. However, the quick drop in oil prices during the second half of calendar 2014 inevitably favored the stocks of the largest, most diversified, and most financially secure energy companies. Most prominent among these are ExxonMobil and Chevron, neither of which is held in either Fund.*
Outlook & Strategy
March 2015 marks the six year anniversary of the bull market. Indices of large-cap stocks have roughly tripled in that time. With the memory of the financial crisis now distant, investor appetite for risk has sharply increased. Given today’s low level of interest rates and inflation, we do not believe aggregate valuations are excessive. Clearly, however, the share of stocks that are speculatively valued is rising. Despite the temptation to follow the trend, we are staying true to our valuation discipline and our focus on companies with solid financial underpinnings. If equity markets rise rapidly in the short run, widely outpacing earnings growth, equity segment returns are likely to trail market averages. We believe, however, that our investment discipline will prove rewarding over the long term and could provide a measure of protection when investors turn their attention to the risks inherent in equity investing.
Within the Walden Asset Management Fund, bonds present a very different investment challenge. We have held the view that at recent low yields, high-quality bonds should be treated like an insurance policy against a poor outcome for stocks, rather than as an attractive, standalone investment category. In fact, bond yields have declined as stocks have risen. This reflects, in our judgment, the paltry yields available for global fixed income investors due to weak growth and near zero inflation in most non-U.S. developed markets. While we expect this economic environment to persist, fixed income investments remain unappealing in all but the most adverse market scenarios. Accordingly, the bond allocation remains close to its lower limit. Shareholders should therefore anticipate that overall portfolio risk has also increased and fluctuations in value may be greater than in past periods.*
* Portfolio composition is subject to change.
36
Investment Performance (Unaudited) | Walden Asset Management Fund |
| Walden Equity Fund |
| March 31, 2015 |
| | For the year ended 3/31/15 | |
| | Annualized | |
| | 1 Year | | 5 Years | | 10 Years | |
Walden Asset Management Fund(1) | | 7.00 | % | 9.21 | % | 5.84 | % |
Walden Equity Fund(1) | | 8.13 | % | 12.08 | % | 7.27 | % |
S&P 500 Index | | 12.73 | % | 14.47 | % | 8.01 | % |
Barclays U.S. Government/Credit Bond Index | | 5.86 | % | 4.75 | % | 4.96 | % |
Citigroup 90-Day U.S. Treasury Bill Index | | 0.03 | % | 0.07 | % | 1.41 | % |
Morningstar U.S. Open-End Moderate Allocation Funds Average | | 5.89 | % | 8.47 | % | 5.75 | % |
Hypothetical Growth of a $100,000 Investment
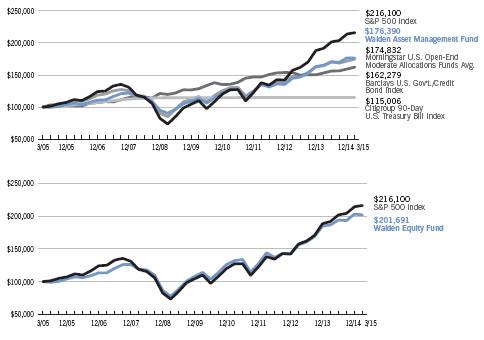
The charts represent a 10-year hypothetical $100,000 investment in the Walden Asset Management Fund and Walden Equity Fund, and represents the reinvestment of dividends and capital gains in the Funds. The returns shown on the table and graph do not reflect the deduction of taxes a shareholder would pay on Fund distributions or the redemption of Fund shares.
The Walden Asset Management Fund is measured against a combination of equity and fixed income indices. The Walden Equity Fund is measured against the Standard & Poor’s 500 Index (“S&P 500”), which is widely regarded as a gauge of the U.S. equities market. This index includes 500 leading companies in leading industries of the U.S. economy. Although the S&P 500 focuses on the large-cap segment of the market, with approximately 75% coverage of U.S. equities, it is also widely viewed as a proxy for the total market. The Barclays U.S. Government/Credit Bond Index is a component of the Barclays U.S. Aggregate Index. The Barclays U.S. Government/Credit Bond Index includes Treasuries (i.e., public obligations of the U.S. Treasury that have remaining maturities of more than one year), Government-Related issues (i.e., agency, sovereign, supranational, and local authority debt), and USD Corporates. The Citigroup 90-Day U.S. Treasury Bill Index reflects monthly return equivalents of yield averages that are not marked to the market. The Index is an average of the last three-month treasury bill issues. The three-month treasury bills are the short-term debt obligations of the U.S. Government. The Morningstar U.S. Open-End Moderate Allocation Funds Average represents performance of portfolios that seek to provide both capital appreciation and income by investing in three major areas: stocks, bonds, and cash. These portfolios tend to hold larger positions in stocks than conservative-allocation portfolios. These portfolios typically have 50% to 70% of assets in equities and the remainder in fixed income and cash. The indices are unmanaged and their performance does not reflect the deduction of expenses associated with a mutual fund, such as investment management and fund accounting fees. The Funds’ performance reflects the deduction of fees for these services. Investors cannot invest directly in an index or an average.

Walden Asset Management Fund
Fund Net Asset Value: | | $ | 15.96 | |
Gross Expense Ratio(1): | | 1.05 | % |
Walden Equity Fund
Fund Net Asset Value: | | $ | 18.55 | |
Gross Expense Ratio(1): | | 1.08 | % |
Past performance does not guarantee future results. The performance data quoted represents past performance and current returns may be lower or higher. The investment return and principal value will fluctuate so that an investor’s shares, when redeemed may be worth more or less than the original cost. To obtain performance information current to the most recent month-end, please call 1-800-282-8782 ext. 7050.
(1) The Funds’ Gross Expense Ratio is from the most recent prospectus, dated August 1, 2014. The Gross Expense Ratio excludes the impact of any contractual fee waivers. After giving effect to such fee waivers, the Walden Asset Management Fund’s and the Walden Equity Fund’s Net Expense Ratio would be 1.00%, including the indirect expenses of investing in acquired funds. Please see each Fund’s most recent prospectus for details. Additional information pertaining to each Fund’s expense ratio as of March 31, 2015 can be found in the financial highlights. The investment performance may reflect fee reductions. If such fee reductions had not occurred, the quoted performance would have been lower. The contractual fee waiver continues through August 1, 2015 and may be terminated thereafter.
37
Walden Midcap Fund
March 31, 2015
Stephen J. Amyouny, CFA
Portfolio Manager
Boston Trust Investment Management, Inc.
Fund Objective
The Fund seeks long-term capital growth through an actively managed portfolio of stocks of middle capitalization (“midcap”) companies.
Investment Concerns
Equity securities (stocks) are more volatile and carry more risk and return potential than other forms of investments, including investments in high-grade fixed income securities.
Mid-capitalization funds typically carry additional risks since smaller companies generally have a higher risk of failure.
Manager Commentary (Unaudited)
Management Discussion of Fund Performance
Portfolio Review
The Walden Midcap Fund posted a total return of 12.25% for the year ended March 31, 2015, trailing the total return of 13.68% for the Russell Midcap® Index return. All sectors posted positive returns with one glaring exception: energy. Energy stocks fell sharply in response to the substantial decline (approximately 50%) in oil prices following their peak in mid-2014. Although the selloff among energy stocks detracted from overall market (and Fund) results, the decline in energy prices was a clear positive for many corporations (lower fuel/energy costs) and consumers (higher discretionary income). Several companies within the Consumer Discretionary sector benefited from this trend. These companies included Hasbro, Ross Stores, O’Reilly Automotive, Autoliv, and Sally Beauty.*
Recent economic data has confirmed that the U.S. economy continues to improve with solid GDP† growth, unemployment at a post-recession low rate of 5.5%, and rising consumer confidence. In addition to this economic progress, interest rates remain historically low, inflation is well contained, and energy prices remain depressed— the last of which has contributed to increasing discretionary spending among consumers. Perhaps most importantly, however, this economic landscape has shown no signs of rapid acceleration, thus allowing the Fed to maintain its highly accommodative monetary policy. Thus, as a result of the confluence of these factors—modest economic growth, low interest rates, contained wage costs, and depressed energy prices—it remains a very positive environment for corporations. As such, corporate profits have continued to grow at a pace sufficient to support higher equity prices.
Portfolio Strategy
Although corporate profits have improved substantially from the depths of the financial crisis approximately six years ago and equity prices have considerably appreciated in response, equity valuations have expanded even more rapidly and now stand at a post-recession high. In light of present interest rates and inflation, we do not find these valuations excessive or even unreasonable; however, we cannot count on, nor do we expect valuations to expand further from current levels. Thus, corporate profits must continue to rise in order to drive equity prices higher. Accordingly, we remain focused on identifying and investing in reasonably valued, higher quality companies with attractive long-term growth prospects.
In particular, we continue to find good value within the financial services, industrial, energy, and information technology sectors. Within financials, the Fund owns several regional banks with strong customer franchises, solid financials, and reasonable valuations. Although banks have broadly improved their capital bases and reduced their financial leverage in recent years, the low interest rate environment has pressured their profit margins and returns on equity. We believe that banks will benefit from rising interest rates and continued economic growth. They also have minimal direct exposure to some of the aforementioned international issues and currency headwinds. On the other hand, industrial and energy companies have underperformed the broader market due to global economic concerns, the strengthening of the U.S. dollar, and general malaise within the energy markets. As a result, valuations reflect only modest growth expectations, thereby presenting opportunities for patient, long-term investors. Within the technology sector, investors have been attracted to the higher growth prospects of innovative young companies in emerging segments of the market (e.g. social media, internet, and cloud computing) with less-than-certain future prospects. Our investment approach remains focused on technology companies with solid financials, ample free cash flow generation, and more visible growth prospects.
Within healthcare, we continue to avoid the more speculative segments of the sector, including biotechnology and specialty pharmaceuticals. These stocks are among the most egregiously valued within the entire stock market as investors have seemingly blindly invested in many companies with limited historical track records of success yet very lofty expectations and uncertain future growth prospects. Our Fund holdings remain concentrated in healthcare segments such as medical devices and equipment, life sciences tools, healthcare services, and diagnostics.*
Lastly, we will be closely monitoring any and all actions taken by the Fed as well as economic conditions overseas, geopolitical risks, and corporate profit growth. After six years of strong market returns, we understand it is paramount to remain true to our investment discipline of identifying higher quality companies with reasonable valuations.
† The Gross Domestic Product (“GDP”) is the measure of the market value of the goods and services produced by labor and property in the United States.
* Portfolio composition is subject to change.
38
Investment Performance (Unaudited) | Walden Midcap Fund |
| March 31, 2015 |
| | For the year ended 3/31/15 | |
| | Annualized | |
| | | | Since Inception | |
| | 1 Year | | 8/1/11 | |
Walden Midcap Fund(1) | | 12.25 | % | 13.76 | % |
Russell Midcap® Index | | 13.68 | % | 16.91 | % |
Hypothetical Growth of a $100,000 Investment
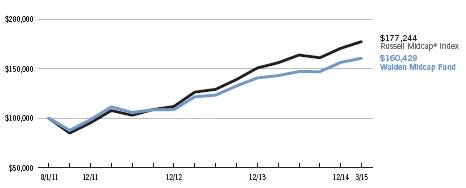
The chart represents the historical performance of a hypothetical $100,000 investment in the Walden Midcap Fund from August 1, 2011 to March 31, 2015, and represents the reinvestment of dividends and capital gains in the Fund. The returns shown on the table and graph do not reflect the deduction of taxes a shareholder would pay on Fund distributions or the redemption of Fund shares.
The Walden Midcap Fund is measured against the Russell Midcap® Index, which is an unmanaged index that measures the performance of the mid-cap segment of the U.S. equity universe. The Russell Midcap® Index is a subset of the Russell 1000® Index. It includes approximately 800 of the smallest securities based on a combination of their market capitalization and current index membership. The Russell Midcap® Index represents approximately 31% of the total market capitalization of the Russell 1000 companies. The performance of an index does not reflect the deduction of expenses associated with a mutual fund, such as investment management and fund accounting fees. The Fund’s performance reflects the deduction of fees for these services. Investors cannot invest directly in an index.

Fund Net Asset Value: | | $ | 15.18 | |
Gross Expense Ratio(1): | | 1.04 | % |
Past performance does not guarantee future results. The performance data quoted represents past performance and current returns may be lower or higher. The investment return and principal value will fluctuate so that an investor’s shares, when redeemed may be worth more or less than the original cost. Returns less than one year are not annualized. To obtain performance information current to the most recent month-end, please call 1-800-282-8782 ext. 7050.
(1) The Gross Expense Ratio is from the Fund’s most recent prospectus, dated August 1, 2014. The Gross Expense Ratio excludes the impact of any contractual fee waivers. After giving effect to such fee waivers, the Fund’s Net Expense Ratio would be 1.00%, including the indirect expenses of investing in acquired funds. Please see the Fund’s most recent prospectus for details. Additional information pertaining to the Fund’s expense ratio as of March 31, 2015 can be found in the financial highlights. The investment performance may reflect fee reductions. If such fee reductions had not occurred, the quoted performance would have been lower. The contractual fee waiver continues through August 1, 2015 and may be terminated thereafter.
39
Walden SMID Cap
Innovations Fund
March 31, 2015
Kenneth P. Scott, CFA
Stephen C. Franco, CFA
Heidi H. Vanni, CFA
Portfolio Managers
Boston Trust Investment Management, Inc.
Fund Objective
The investment objective of the Walden SMID Cap Innovations Fund is to seek long-term capital growth through an actively managed portfolio of stocks of small to middle (“mid”) capitalization companies.
Investment Concerns
Equity securities (stocks) are more volatile and carry more risk and return potential than other forms of investments, including investments in high-grade fixed income securities.
Small-capitalization funds typically carry additional risks since smaller companies generally have a higher risk of failure, and historically, their stocks have experienced a greater degree of market volatility than stocks on average.
Manager Commentary (Unaudited)
Management Discussion of Fund Performance
Portfolio Review
The U.S. SMID cap equity markets rose in the fiscal year ended March 31, 2015, with the benchmark Russell 2500TM Index returning 10.07%. The Walden SMID Cap Innovations Fund, which invests in the stocks of higher quality, more reasonably valued companies, posted a return of 7.60%.
U.S. stocks reached new highs in early 2015, extending the bull market that began in the spring of 2009. Economic growth has remained positive, while markets appear to have inferred that the U.S. Federal Reserve’s monetary policy will remain accommodative in the near term.
During this period of economic recovery and strong stock market performance, returns of the Walden SMID Cap Innovations Fund, for the one-year period ended March 31, has trailed those of the Russell 2500TM. Boston Trust continues to believe that the Fund may achieve its goal of outperforming the Russell 2500TM with less volatility for periods that cover at least one full market cycle.
Portfolio Strategy
The Fund’s investment style favors reasonably valued stocks of higher quality companies, i.e. growing firms with persistently strong profitability. Our analysis suggests that stocks of higher quality companies performed well during the fiscal year. However, the Fund was under-represented in several industries that experienced above average stock price returns within their sectors. These included airlines, biotechnology (biotech) and pharmaceutical (pharma), construction materials, energy producers and REITs†, all of which our investment style generally avoids or underweights due to their lower quality or greater financial leverage.
The biotech and pharma industries have experienced particularly strong performance recently, with SMID cap biotech firms climbing 49% and SMID cap pharma firms climbing 48% in the fiscal year. This has affected industry and market valuations, as discussed further below. We do not expect these trends to persist long term. The biotech and pharma industries collectively now comprise 6% of the Russell 2500TM, compared to 0% in the Walden SMID Cap Innovations Fund.
There are other indications that this bull market is maturing. For instance, NYSE margin debt is at an all-time high. As Furey Research Partners noted, the percent of IPOs that are loss making has climbed to long-term peak levels above 70%. That said, we cannot predict when investor preference will fade for investments we consider more speculative.
The top individual stock contributors to client portfolio performance this fiscal year were real estate management firm Jones Lang LaSalle (JLL), Medicaid managed care firm Centene (CNC), electronic bond trading platform provider MarketAxess (MKTX), digital market services firm Sapient (SAPE), and pharmaceutical packaging firm West Pharmaceutical Services (WST). We continue to own these stocks in the Fund but have reduced some position sizes and sold Sapient due to its pending acquisition by another firm.*
Laggards this year were energy services firms Carbo Ceramics (CRR) and Geospace Technologies (GEOS), energy producer Denbury Resources (DNR), online auction firm Liquidity Services (LQDT), and heat exchange manufacturer Chart Industries (GTLS). Carbo, Chart, Denbury, and Geospace declined at least in part due to the steep decline in energy prices. We have maintained Chart Industries (GTLS) in the portfolio, given our view that its fundamentals remain sound. We sold Carbo, Denbury, and Geospace, and replaced them with other energy stocks that we view as higher quality.*
Walden SMID Cap Innovations Fund holdings in aggregate posted continued improvement in underlying fundamentals, with growth in sales and profits outpacing the SMID cap market. We view long-term fundamental performance as an important barometer of the likely path of future Fund performance, as we believe stock returns ultimately reflect underlying company fundamental performance.*
The Fund seeks to maintain portfolio sector weights comparable to those of the index in order to ensure broad diversification. Marginal differences in portfolio sector weights had minimal impact on returns relative to the index.
† REITs (real estate investment trusts) are publicly traded entities that invest in office buildings, apartment complexes, industrial facilities, shopping centers and other real estate properties. Most REITs trade on major stock exchanges or over the counter. Investments in the Fund are subject to risks related to a direct investment in real estate such as regulatory risk, concentration risk, and diversification risk. By itself the Fund does not constitute a complete investment plan and should be considered a long-term investment for investors who can afford to weather changes in the value of their investments.
* Portfolio composition is subject to change.
40
Investment Performance (Unaudited) | Walden SMID Cap |
| Innovations Fund |
| March 31, 2015 |
| | For the year ended 3/31/15 | |
| | Annualized | |
| | | | Since Inception | |
| | 1 Year | | 6/28/12 | |
Walden SMID Cap Innovations Fund(1) | | 7.60 | % | 17.56 | % |
Russell 2500® Index | | 10.07 | % | 21.86 | % |
Hypothetical Growth of a $100,000 Investment
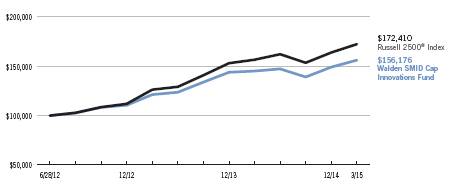
The chart represents the historical performance of a hypothetical $100,000 investment in the Walden SMID Cap Innovations Fund from June 28, 2012 to March 31, 2015, and represents the reinvestment of dividends and capital gains in the Fund. The returns shown on the table and graph do not reflect the deduction of taxes a shareholder would pay on Fund distributions or the redemption of Fund shares.
The Walden SMID Cap Innovations Fund is measured against the Russell 2500™ Index, which is an unmanaged index that measures the performance of the small- to mid-cap segment of the U.S. equity universe, commonly referred to as “smid” cap. The Russell 2500 is a subset of the Russell 3000® Index. It includes approximately 2500 of the smallest securities based on a combination of their market cap and current index membership. The performance of an index does not reflect the deduction of expenses associated with a mutual fund, such as investment management and fund accounting fees. The Fund’s performance reflects the deduction of fees for these services. Investors cannot invest directly in an index.

Fund Net Asset Value: | | $ | 14.70 | |
Gross Expense Ratio(1): | | 1.12 | % |
Past performance does not guarantee future results. The performance data quoted represents past performance and current returns may be lower or higher. The investment return and principal value will fluctuate so that an investor’s shares, when redeemed may be worth more or less than the original cost. To obtain performance information current to the most recent month-end, please call 1-800-282-8782 ext. 7050.
(1) The Gross Expense Ratio is from the Fund’s most recent prospectus, dated August 1, 2014. The Gross Expense Ratio excludes the impact of any contractual fee waivers. After giving effect to such fee waivers, the Fund’s Net Expense Ratio would be 1.00%, including the indirect expenses of investing in acquired funds. Please see the Fund’s most recent prospectus for details. Additional information pertaining to the Fund’s expense ratio as of March 31, 2015 can be found in the financial highlights. The investment performance may reflect fee reductions. If such fee reductions had not occurred, the quoted performance would have been lower. The contractual fee waiver continues through August 1, 2015 and may be terminated thereafter.
41
Walden Small Cap
Innovations Fund
March 31, 2015
Kenneth P. Scott, CFA
Portfolio Manager
Boston Trust Investment Management, Inc.
Fund Objective
The investment objective of the Walden Small Cap Innovations Fund is to seek long-term capital growth through an actively managed portfolio of stocks of small capitalization companies.
Investment Concerns
Equity securities (stocks) are more volatile and carry more risk and return potential than other forms of investments, including investments in high-grade fixed income securities.
Small-capitalization funds typically carry additional risks since smaller companies generally have a higher risk of failure, and historically, their stocks have experienced a greater degree of market volatility than stocks on average.
Manager Commentary (Unaudited)
Management Discussion of Fund Performance
Portfolio Review
U.S. small cap equity markets rose in the fiscal year ended March 31, 2015, with the benchmark Russell 2000® Index returning 8.21%. The Walden Small Cap Innovations Fund, which invests in the stocks of higher quality, more reasonably valued companies, posted a return of 3.86%.
U.S. stocks reached new highs in early 2015, extending the bull market that began in the spring of 2009. Economic growth has remained positive, while markets appear to have inferred that the U.S. Federal Reserve’s monetary policy will remain accommodative in the near term.
During this period of economic recovery and strong stock market performance, returns of the Walden Small Cap Innovations Fund, for the 1- and 5-year periods ended March 31, have trailed the Russell 2000®. Boston Trust continues to believe that the Fund may achieve its goal of outperforming the Russell 2000TM with less volatility for periods that cover at least one full market cycle.
Portfolio Strategy
The Fund’s investment style favors reasonably valued stocks of higher quality companies, i.e. growing firms with persistently strong profitability. Our analysis suggests that stocks of higher quality companies performed well during the fiscal year. However, the Fund was under-represented in several industries that experienced above average stock price increases within their sectors. These included airlines, biotechnology (biotech) and pharmaceutical (pharma), construction materials, energy producers, and REITs† all of which our investment style generally avoids or underweights due to their lower quality or greater financial leverage.
The biotech and pharma industries have experienced particularly strong performance recently, with small-cap biotech and pharma firms climbing 40% in the fiscal year. This has affected industry and market valuations, as discussed further below. We do not expect these trends to persist long term. The biotech and pharma industries collectively now comprise 8% of the Russell 2000®, compared to 0% in the Walden Small Cap Innovations Fund.*
There are other indications that this bull market is maturing. For instance, NYSE margin debt is at an all-time high. As Furey Research Partners noted, the percent of IPOs that are loss making has climbed to long-term peak levels above 70%. That said, we cannot predict when investor preference will fade for investments we consider more speculative.
The Fund holdings in aggregate posted continued improvement in underlying fundamentals, with growth in sales and profits outpacing the small-cap market. We view long-term fundamental performance as an important barometer of the likely path of future Fund performance, as we believe stock returns ultimately reflect underlying company fundamental performance.
The Fund seeks to maintain portfolio sector weights comparable to those of the index in order to ensure broad diversification. Marginal differences in portfolio sector weights had minimal impact on returns relative to the index.*
Given that interest rates have remained low for several years, while valuations have expanded, and volatility has generally been below average, some clients ask, what changes in the economic or market environment would favor the Fund. In addition to our typical pattern of striving to provide protection in down markets, we believe the Fund’s relative performance will benefit from a return to normal market volatility, more reasonable small-cap market valuations, higher interest rates, or any combination thereof. We believe that this disconnect of valuation from fundamentals is unsustainable in the mid- to long-term, and that the Fund is well positioned for a closer alignment between stock valuations and company fundamentals, even if the timing of such is unfortunately not predictable. Nevertheless, even if there were no change in small-cap market volatility, interest rates, or valuations from current levels, we believe that the strong fundamentals of higher quality firms will ultimately provide better, long-term stock returns relative to firms with inferior fundamentals.*
† REITs (real estate investment trusts) are publicly traded entities that invest in office buildings, apartment complexes, industrial facilities, shopping centers and other real estate properties. Most REITs trade on major stock exchanges or over the counter. Investments in the Fund are subject to risks related to a direct investment in real estate such as regulatory risk, concentration risk, and diversification risk. By itself the Fund does not constitute a complete investment plan and should be considered a long-term investment for investors who can afford to weather changes in the value of their investments.
* Portfolio composition is subject to change.
42
Investment Performance (Unaudited) | Walden Small Cap |
| Innovations Fund |
| March 31, 2015 |
| | For the year ended 3/31/15 | |
| | Annualized | |
| | | | | | Since Inception | |
| | 1 Year | | 5 Years | | 10/24/08 | |
Walden Small Cap Innovations Fund(1) | | 3.86 | % | 12.05 | % | 16.18 | % |
Russell 2000® Index | | 8.21 | % | 14.57 | % | 18.05 | % |
Hypothetical Growth of a $100,000 Investment
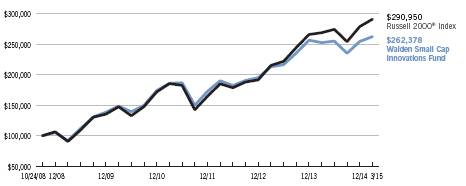
The chart represents the historical performance of a hypothetical $100,000 investment in the Walden Small Cap Innovations Fund from October 24, 2008 to March 31, 2015, and represents the reinvestment of dividends and capital gains in the Fund. The returns shown on the table and graph do not reflect the deduction of taxes a shareholder would pay on Fund distributions or the redemption of Fund shares.
The Walden Small Cap Innovations Fund is measured against the Russell 2000® Index, which is an unmanaged index that measures the performance of the small-cap segment of the U.S. equity universe. The Russell 2000® Index is a subset of the Russell 3000® Index representing approximately 10% of the total market capitalization of that index. It includes approximately 2,000 of the smallest securities based on a combination of their market cap and current index membership. The performance of an index does not reflect the deduction of expenses associated with a mutual fund, such as investment management and fund accounting fees. The Fund’s performance reflects the deduction of fees for these services. Investors cannot invest directly in an index.

Fund Net Asset Value: | | $ | 19.66 | |
Gross Expense Ratio(1): | | 1.05 | % |
Past performance does not guarantee future results. The performance data quoted represents past performance and current returns may be lower or higher. The investment return and principal value will fluctuate so that an investor’s shares, when redeemed may be worth more or less than the original cost. To obtain performance information current to the most recent month-end, please call 1-800-282-8782 ext. 7050.
(1) The Gross Expense Ratio is from the Fund’s most recent prospectus, dated August 1, 2014. The Gross Expense Ratio excludes the impact of any contractual fee waivers. After giving effect to such fee waivers, the Fund’s Net Expense Ratio would be 1.00%, including the indirect expenses of investing in acquired funds. Please see the Fund’s most recent prospectus for details. Additional information pertaining to the Fund’s expense ratio as of March 31, 2015 can be found in the financial highlights. The investment performance may reflect fee reductions. If such fee reductions had not occurred, the quoted performance would have been lower. The contractual fee waiver continues through August 1, 2015 and may be terminated thereafter.
43
Schedule of Portfolio Investments | Walden Asset Management Fund |
| March 31, 2015 |
Security Description | | Shares | | Fair Value ($) | |
| | | | | |
COMMON STOCKS (74.5%) | | | | | |
Consumer Discretionary (10.1%) | | | | | |
Advance Auto Parts, Inc. | | 5,500 | | 823,295 | |
Autoliv, Inc. | | 4,000 | | 471,080 | |
DIRECTV (a) | | 7,800 | | 663,780 | |
McDonald’s Corp. | | 7,000 | | 682,080 | |
NIKE, Inc., Class B | | 14,000 | | 1,404,620 | |
Nordstrom, Inc. | | 9,500 | | 763,040 | |
Omnicom Group, Inc. | | 13,000 | | 1,013,740 | |
Ross Stores, Inc. | | 11,500 | | 1,211,640 | |
The Home Depot, Inc. | | 2,000 | | 227,220 | |
Time Warner Cable, Inc. | | 8,500 | | 1,273,980 | |
| | | | 8,534,475 | |
Consumer Staples (9.1%) | | | | | |
Colgate-Palmolive Co. | | 15,700 | | 1,088,638 | |
Costco Wholesale Corp. | | 9,200 | | 1,393,754 | |
CVS Health Corp. | | 7,500 | | 774,075 | |
General Mills, Inc. | | 19,000 | | 1,075,400 | |
PepsiCo, Inc. | | 12,500 | | 1,195,250 | |
Procter & Gamble Co. | | 14,000 | | 1,147,160 | |
Reckitt Benckiser Group PLC, Sponsored ADR | | 57,000 | | 975,270 | |
| | | | 7,649,547 | |
Energy (3.8%) | | | | | |
Apache Corp. | | 13,000 | | 784,290 | |
BG Group PLC, Sponsored ADR | | 45,000 | | 555,975 | |
ConocoPhillips | | 22,500 | | 1,400,850 | |
Oceaneering International, Inc. | | 9,000 | | 485,370 | |
| | | | 3,226,485 | |
Financials (11.9%) | | | | | |
American Express Co. | | 10,000 | | 781,200 | |
Chubb Corp. | | 11,000 | | 1,112,100 | |
Cincinnati Financial Corp. | | 21,000 | | 1,118,880 | |
Comerica, Inc. | | 17,000 | | 767,210 | |
Commerce Bancshares, Inc. | | 14,000 | | 592,480 | |
JPMorgan Chase & Co. | | 13,000 | | 787,540 | |
PNC Financial Services Group, Inc. | | 12,000 | | 1,118,880 | |
State Street Corp. | | 10,000 | | 735,300 | |
T. Rowe Price Group, Inc. | | 17,000 | | 1,376,660 | |
US Bancorp | | 20,000 | | 873,400 | |
Wells Fargo & Co. | | 15,000 | | 816,000 | |
| | | | 10,079,650 | |
Health Care (11.9%) | | | | | |
Abbott Laboratories | | 20,000 | | 926,600 | |
Becton, Dickinson & Co. | | 8,000 | | 1,148,720 | |
C.R. Bard, Inc. | | 5,500 | | 920,425 | |
DENTSPLY International, Inc. | | 14,000 | | 712,460 | |
Express Scripts Holding Co. (a) | | 11,000 | | 954,470 | |
Johnson & Johnson, Inc. | | 12,000 | | 1,207,200 | |
Medtronic PLC | | 12,500 | | 974,875 | |
Mettler-Toledo International, Inc. (a) | | 2,700 | | 887,355 | |
Quintiles Transnational Holdings, Inc. (a) | | 10,000 | | 669,700 | |
Stryker Corp. | | 9,500 | | 876,375 | |
Waters Corp. (a) | | 6,000 | | 745,920 | |
| | | | 10,024,100 | |
Industrials (10.4%) | | | | | |
3M Co. | | 8,500 | | 1,402,075 | |
Deere & Co. | | 9,000 | | 789,210 | |
Donaldson Co., Inc. | | 19,000 | | 716,490 | |
Emerson Electric Co. | | 14,000 | | 792,680 | |
Illinois Tool Works, Inc. | | 11,000 | | 1,068,540 | |
Lincoln Electric Holdings, Inc. | | 9,500 | | 621,205 | |
| | Shares or | | | |
| | Principal | | | |
| | Amount ($) | | | |
| | | | | |
Sensata Technologies Holding NV (a) | | 11,000 | | 631,950 | |
Union Pacific Corp. | | 7,600 | | 823,156 | |
United Parcel Service, Inc., Class B | | 9,000 | | 872,460 | |
W.W. Grainger, Inc. | | 4,650 | | 1,096,517 | |
| | | | 8,814,283 | |
Information Technology (13.1%) | | | | | |
Accenture PLC, Class A | | 12,500 | | 1,171,124 | |
Apple, Inc. | | 15,500 | | 1,928,665 | |
Automatic Data Processing, Inc. | | 12,000 | | 1,027,680 | |
Cisco Systems, Inc. | | 37,000 | | 1,018,425 | |
EMC Corp. | | 30,000 | | 766,800 | |
Google, Inc., Class A (a) | | 900 | | 499,230 | |
Google, Inc., Class C (a) | | 900 | | 493,200 | |
International Business Machines Corp. | | 3,500 | | 561,750 | |
Microsoft Corp. | | 31,000 | | 1,260,305 | |
Oracle Corp. | | 22,000 | | 949,300 | |
QUALCOMM, Inc. | | 9,000 | | 624,060 | |
Visa, Inc. | | 12,000 | | 784,920 | |
| | | | 11,085,459 | |
Materials (2.8%) | | | | | |
AptarGroup, Inc. | | 12,000 | | 762,240 | |
PPG Industries, Inc. | | 3,300 | | 744,282 | |
Praxair, Inc. | | 7,000 | | 845,180 | |
| | | | 2,351,702 | |
Utilities (1.4%) | | | | | |
Consolidated Edison, Inc. | | 10,000 | | 610,000 | |
Eversource Energy | | 12,000 | | 606,240 | |
| | | | 1,216,240 | |
TOTAL COMMON STOCKS (Cost $40,461,521) | | | | 62,981,941 | |
| | | | | |
CORPORATE BONDS (4.8%) | | | | | |
| | | | | |
Consumer Discretionary (0.3%) | | | | | |
Leggett & Platt, Inc., 4.40%, 7/1/18 | | 200,000 | | 214,708 | |
| | | | | |
Consumer Staples (0.2%) | | | | | |
Campbell Soup Co., 4.50%, 2/15/19 | | 150,000 | | 163,508 | |
| | | | | |
Financials (2.3%) | | | | | |
American Express Co., 2.65%, 12/2/22 | | 287,000 | | 285,827 | |
American Express Co., 7.00%, 3/19/18 | | 250,000 | | 289,026 | |
Calvert Social Investment Foundation, | | | | | |
Series NOTZ, 1.00%, 10/2/17, MTN (b) | | 75,000 | | 75,000 | |
Export-Import Bank of Korea, 1.75%, 2/27/18 | | 250,000 | | 250,259 | |
International Finance Corp., 0.63%, 11/15/16 | | 250,000 | | 250,016 | |
JPMorgan Chase & Co., 3.15%, 7/5/16 | | 250,000 | | 256,535 | |
National Rural Utilities Cooperative Finance | | | | | |
Corp., 10.38%, 11/1/18 | | 250,000 | | 324,161 | |
North American Development Bank, | | | | | |
4.38%, 2/11/20 | | 100,000 | | 110,940 | |
Wachovia Corp., 5.75%, 6/15/17 | | 100,000 | | 110,045 | |
| | | | 1,951,809 | |
Health Care (0.5%) | | | | | |
Becton, Dickinson & Co., 3.13%, 11/8/21 | | 250,000 | | 257,182 | |
Merck & Co., Inc., 3.88%, 1/15/21, | | | | | |
Callable 10/15/20 @ 100 | | 150,000 | | 164,262 | |
| | | | 421,444 | |
See Notes to Financial Statements
44
| | Shares or | | | |
| | Principal | | | |
Security Description | | Amount ($) | | Fair Value ($) | |
| | | | | |
Industrials (0.1%) | | | | | |
Hubbell, Inc., 3.63%, 11/15/22 | | 75,000 | | 78,822 | |
| | | | | |
Information Technology (1.1%) | | | | | |
Apple, Inc., 2.85%, 5/6/21 | | 350,000 | | 364,980 | |
Oracle Corp., 3.40%, 7/8/24, Callable | | | | | |
4/8/24 @ 100 | | 300,000 | | 315,724 | |
Oracle Corp., 5.75%, 4/15/18 | | 200,000 | | 226,132 | |
| | | | 906,836 | |
Materials (0.2%) | | | | | |
Sigma-Aldrich Corp., 3.38%, 11/1/20, | | | | | |
Callable 8/1/20 @ 100 | | 200,000 | | 209,402 | |
| | | | | |
Telecommunication Services (0.1%) | | | | | |
AT&T, Inc., 5.50%, 2/1/18 | | 100,000 | | 110,157 | |
TOTAL CORPORATE BONDS (Cost $3,843,113) | | | | 4,056,686 | |
| | | | | |
MUNICIPAL BONDS (0.7%) | | | | | |
| | | | | |
Illinois (0.2%): | | | | | |
Illinois State, GO, 5.00%, 6/1/27, NATL-RE | | | | | |
FGIC, Callable 2/20/15 @ 100 | | 200,000 | | 200,700 | |
| | | | | |
Ohio (0.2%): | | | | | |
Ohio State, Series D, GO, 4.50%, 9/15/22, | | | | | |
NATL-RE, Callable 3/15/16 @ 100, | | | | | |
Prerefunded 3/15/16 @ 100 | | 150,000 | | 156,060 | |
| | | | | |
Wisconsin (0.3%): | | | | | |
Wisconsin State, Build America Bonds, GO, | | | | | |
4.60%, 5/1/26, Callable 5/1/21 @ 100 | | 250,000 | | 276,718 | |
TOTAL MUNICIPAL BONDS (Cost $601,199) | | | | 633,478 | |
| | | | | |
U.S. GOVERNMENT & U.S. GOVERNMENT AGENCY OBLIGATIONS (18.4%) | | | | | |
| | | | | |
Federal Farm Credit Bank | | | | | |
2.60%, 10/6/22 | | 250,000 | | 257,997 | |
2.75%, 7/16/27 | | 250,000 | | 254,335 | |
2.85%, 3/2/28 | | 750,000 | | 754,072 | |
5.38%, 11/10/20 | | 250,000 | | 296,319 | |
| | | | 1,562,723 | |
Federal Home Loan Bank | | | | | |
0.63%, 12/28/16 | | 1,000,000 | | 1,001,480 | |
2.50%, 3/11/22 | | 200,000 | | 206,639 | |
2.88%, 6/14/24 | | 1,000,000 | | 1,047,917 | |
2.88%, 9/13/24 | | 1,000,000 | | 1,050,091 | |
3.25%, 6/9/23 | | 850,000 | | 919,138 | |
5.25%, 12/11/20 | | 200,000 | | 239,331 | |
5.25%, 8/15/22 | | 1,000,000 | | 1,218,421 | |
5.50%, 7/15/36 | | 700,000 | | 983,527 | |
| | | | 6,666,544 | |
Federal Home Loan Mortgage Corporation | | | | | |
1.00%, 3/8/17 | | 1,000,000 | | 1,007,288 | |
2.38%, 1/13/22 | | 2,400,000 | | 2,483,388 | |
| | | | 3,490,676 | |
Federal National Mortgage Association | | | | | |
0.88%, 12/20/17 | | 1,000,000 | | 1,000,330 | |
1.75%, 11/26/19 | | 500,000 | | 507,700 | |
| | | | 1,508,030 | |
Government National Mortgage Association | | | | | |
4.00%, 9/15/40 | | 101,956 | | 109,739 | |
4.00%, 9/15/41 | | 401,589 | | 432,262 | |
6.50%, 5/15/32 | | 22,065 | | 25,284 | |
| | | | 567,285 | |
U.S. Treasury Inflation Index Note | | | | | |
0.63%, 7/15/21 | | 259,273 | | 272,012 | |
1.25%, 7/15/20 | | 1,339,738 | | 1,453,712 | |
| | | | 1,725,724 | |
TOTAL U.S. GOVERNMENT & U.S. GOVERNMENT AGENCY OBLIGATIONS (Cost $14,846,204) | | | | 15,520,982 | |
| | | | | |
INVESTMENT COMPANIES (1.4%) | | | | | |
| | | | | |
State Street Institutional U.S. Government | | | | | |
Money Market Fund, Investor Shares, 0.00% (c) | | 1,162,827 | | 1,162,827 | |
TOTAL INVESTMENT COMPANIES (Cost $1,162,827) | | | | 1,162,827 | |
| | | | | |
Total Investments (Cost $60,914,864) (d) — 99.8% | | | | 84,355,914 | |
Other assets in excess of liabilities — 0.2% | | | | 143,480 | |
NET ASSETS — 100.0% | | | | $ | 84,499,394 | |
| | | | | | |
(a) Non-income producing security.
(b) Illiquid Security.
(c) Rate disclosed is the seven day yield as of March 31, 2015.
(d) See Federal Tax Information listed in the Notes to the Financial Statements.
ADR | American Depositary Receipt |
FGIC | Financial Guaranty Insurance Company |
GO | General Obligation |
MTN | Medium Term Note |
NATL-RE | Reinsured by National Public Finance Guarantee Corporation |
PLC | Public Limited Company |
See Notes to Financial Statements
45
Financial Statements | Walden Asset Management Fund |
STATEMENT OF ASSETS AND LIABILITIES
March 31, 2015
Assets: | | | |
Investments, at fair value (cost $60,914,864) | | $ | 84,355,914 | |
Interest and dividends receivable | | 211,583 | |
Prepaid expenses and other assets | | 6,664 | |
Total Assets | | 84,574,161 | |
Liabilities: | | | |
Payable for capital shares redeemed | | 3,899 | |
Accrued expenses and other liabilities: | | | |
Investment adviser | | 49,537 | |
Administration and accounting | | 1,962 | |
Custodian | | 1,155 | |
Shareholder servicing fees | | 4,365 | |
Transfer agent | | 2,357 | |
Trustee | | 101 | |
Other | | 11,391 | |
Total Liabilities | | 74,767 | |
Net Assets | | $ | 84,499,394 | |
Composition of Net Assets: | | | |
Capital | | $ | 57,508,980 | |
Accumulated undistributed net investment income | | 215,774 | |
Accumulated net realized gains from investment transactions | | 3,333,590 | |
Net unrealized appreciation from investments | | 23,441,050 | |
Net Assets | | $ | 84,499,394 | |
Shares outstanding (par value $0.01, unlimited number of shares authorized) | | 5,293,731 | |
Net Asset Value, Offering and Redemption price per share | | $ | 15.96 | |
STATEMENT OF OPERATIONS |
For the year ended March 31, 2015 |
Investment Income: | | | |
Interest | | $ | 420,278 | |
Dividends | | 1,264,313 | |
Less:Foreign tax withholding | | (1,476 | ) |
Total Investment Income | | 1,683,115 | |
Expenses: | | | |
Investment adviser | | 614,044 | |
Administration and accounting | | 87,095 | |
Chief compliance officer | | 3,403 | |
Custodian | | 14,235 | |
Shareholder servicing | | 49,042 | |
Transfer agency | | 35,072 | |
Trustee | | 4,397 | |
Other | | 42,912 | |
Total expenses before fee reductions | | 850,200 | |
Fees voluntarily reduced by the transfer agent | | (5,436 | ) |
Fees contractually reduced by the investment adviser | | (25,881 | ) |
Net Expenses | | 818,883 | |
Net Investment Income | | 864,232 | |
Net Realized/Unrealized Gains from Investments: | | | |
Net realized gains from investment transactions | | 3,898,437 | |
Change in unrealized appreciation from investments | | 751,465 | |
Net realized/unrealized gains from investments | | 4,649,902 | |
Change in Net Assets Resulting from Operations | | $ | 5,514,134 | |
See Notes to Financial Statements
46
STATEMENTS OF CHANGES IN NET ASSETS
| | For the year | | For the year | |
| | ended | | ended | |
| | March 31, 2015 | | March 31, 2014 | |
| | | | | |
Investment Activities: | | | | | |
Operations: | | | | | |
Net investment income | | $ | 864,232 | | $ | 683,714 | |
Net realized gains from investment transactions | | 3,898,437 | | 481,944 | |
Change in unrealized appreciation/depreciation from investments | | 751,465 | | 8,019,460 | |
Change in Net Assets Resulting from Operations | | 5,514,134 | | 9,185,118 | |
Dividends: | | | | | |
Net investment income | | (838,735 | ) | (655,425 | ) |
Net realized gains from investment transactions | | (559,047 | ) | (427,528 | ) |
Change in Net Assets Resulting from Shareholder Dividends | | (1,397,782 | ) | (1,082,953 | ) |
Capital Share Transactions: | | | | | |
Proceeds from shares issued | | 4,635,811 | | 8,589,407 | |
Dividends reinvested | | 1,252,876 | | 977,922 | |
Cost of shares redeemed | | (4,673,557 | ) | (3,229,189 | ) |
Change in Net Assets Resulting from Capital Share Transactions | | 1,215,130 | | 6,338,140 | |
Change in Net Assets | | 5,331,482 | | 14,440,305 | |
Net Assets: | | | | | |
Beginning of period | | 79,167,912 | | 64,727,607 | |
End of period | | $ | 84,499,394 | | $ | 79,167,912 | |
Share Transactions: | | | | | |
Issued | | 294,956 | | 591,985 | |
Reinvested | | 79,146 | | 66,076 | |
Redeemed | | (298,010 | ) | (224,028 | ) |
Change in shares | | 76,092 | | 434,033 | |
Accumulated undistributed net investment income | | $ | 215,774 | | $ | 185,693 | |
See Notes to Financial Statements
47
FINANCIAL HIGHLIGHTS
Selected data for a share outstanding throughout the years indicated.
| | For the year | | For the year | | For the year | | For the year | | For the year | |
| | ended | | ended | | ended | | ended | | ended | |
| | March 31, | | March 31, | | March 31, | | March 31, | | March 31, | |
| | 2015 | | 2014 | | 2013 | | 2012 | | 2011 | |
| | | | | | | | | | | |
Net Asset Value, Beginning of Period | | $ | 15.17 | | $ | 13.53 | | $ | 12.82 | | $ | 12.07 | | $ | 10.98 | |
| | | | | | | | | | | |
Investment Activities: | | | | | | | | | | | |
Net investment income | | 0.17 | | 0.13 | | 0.15 | | 0.12 | | 0.15 | |
Net realized and unrealized gains from investment transactions | | 0.89 | | 1.72 | | 0.71 | | 0.75 | | 1.09 | |
Total from investment activities | | 1.06 | | 1.85 | | 0.86 | | 0.87 | | 1.24 | |
| | | | | | | | | | | |
Dividends: | | | | | | | | | | | |
Net investment income | | (0.16 | ) | (0.13 | ) | (0.15 | ) | (0.12 | ) | (0.15 | ) |
Net realized gains from investments | �� | (0.11 | ) | (0.08 | ) | — | | — | | — | |
Total dividends | | (0.27 | ) | (0.21 | ) | (0.15 | ) | (0.12 | ) | (0.15 | ) |
| | | | | | | | | | | |
Net Asset Value, End of Period | | $ | 15.96 | | $ | 15.17 | | $ | 13.53 | | $ | 12.82 | | $ | 12.07 | |
Total Return | | 7.00 | % | 13.73 | % | 6.83 | % | 7.35 | % | 11.32 | % |
| | | | | | | | | | | |
Ratios/Supplemental Data: | | | | | | | | | | | |
Net assets at end of period (000’s) | | $ | 84,499 | | $ | 79,168 | | $ | 64,728 | | $ | 57,080 | | $ | 48,044 | |
Ratio of net expenses to average net assets | | 1.00 | % | 1.00 | % | 1.00 | % | 1.00 | % | 1.00 | % |
Ratio of net investment income to average net assets | | 1.06 | % | 0.95 | % | 1.25 | % | 1.04 | % | 1.30 | % |
Ratio of expenses (before fee reductions or recoupment of fees previously reimbursed by the investment adviser) to average net assets (a) | | 1.04 | % | 1.05 | % | 1.10 | % | 1.13 | % | 1.14 | % |
Portfolio turnover rate | | 21.62 | % | 6.50 | % | 15.93 | % | 24.56 | % | 31.03 | % |
Amounts designated as “—” are $0 or have been rounded to $0.
(a) During the period, certain fees were reduced. If such fee reductions had not occurred, the ratio would have been as indicated.
See Notes to Financial Statements
48
Schedule of Portfolio Investments | Walden Equity Fund March 31, 2015 |
Security Description | | Shares | | Fair Value ($) | |
| | | | | |
COMMON STOCKS (99.2%) | | | | | |
| | | | | |
Consumer Discretionary (14.1%) | | | | | |
Advance Auto Parts, Inc. | | 12,000 | | 1,796,280 | |
Autoliv, Inc. | | 10,000 | | 1,177,700 | |
DIRECTV (a) | | 18,000 | | 1,531,800 | |
McDonald’s Corp. | | 22,000 | | 2,143,680 | |
NIKE, Inc., Class B | | 41,000 | | 4,113,530 | |
Nordstrom, Inc. | | 30,000 | | 2,409,600 | |
Omnicom Group, Inc. | | 37,500 | | 2,924,250 | |
Ross Stores, Inc. | | 29,000 | | 3,055,440 | |
The TJX Cos., Inc. | | 3,000 | | 210,150 | |
Time Warner Cable, Inc. | | 19,000 | | 2,847,720 | |
| | | | 22,210,150 | |
Consumer Staples (11.9%) | | | | | |
Colgate-Palmolive Co. | | 40,000 | | 2,773,600 | |
Costco Wholesale Corp. | | 20,000 | | 3,029,900 | |
CVS Health Corp. | | 18,800 | | 1,940,348 | |
General Mills, Inc. | | 45,000 | | 2,547,000 | |
PepsiCo, Inc. | | 35,000 | | 3,346,700 | |
Procter & Gamble Co. | | 36,000 | | 2,949,840 | |
Reckitt Benckiser Group PLC, Sponsored ADR | | 130,000 | | 2,224,300 | |
| | | | 18,811,688 | |
Energy (4.8%) | | | | | |
Apache Corp. | | 30,000 | | 1,809,900 | |
BG Group PLC, Sponsored ADR | | 105,000 | | 1,297,275 | |
ConocoPhillips | | 51,000 | | 3,175,260 | |
Oceaneering International, Inc. | | 25,000 | | 1,348,250 | |
| | | | 7,630,685 | |
Financials (15.9%) | | | | | |
American Express Co. | | 20,000 | | 1,562,400 | |
BB&T Corp. | | 40,000 | | 1,559,600 | |
Chubb Corp. | | 21,000 | | 2,123,100 | |
Cincinnati Financial Corp. | | 50,000 | | 2,664,000 | |
Comerica, Inc. | | 41,000 | | 1,850,330 | |
Commerce Bancshares, Inc. | | 30,870 | | 1,306,418 | |
JPMorgan Chase & Co. | | 30,000 | | 1,817,400 | |
Northern Trust Corp. | | 15,000 | | 1,044,750 | |
PNC Financial Services Group, Inc. | | 22,000 | | 2,051,280 | |
State Street Corp. | | 22,000 | | 1,617,660 | |
T. Rowe Price Group, Inc. | | 43,000 | | 3,482,140 | |
US Bancorp | | 50,000 | | 2,183,500 | |
Wells Fargo & Co. | | 30,000 | | 1,632,000 | |
| | | | 24,894,578 | |
Health Care (15.3%) | | | | | |
Abbott Laboratories | | 30,000 | | 1,389,900 | |
Becton, Dickinson & Co. | | 25,000 | | 3,589,750 | |
C.R. Bard, Inc. | | 13,000 | | 2,175,550 | |
DENTSPLY International, Inc. | | 31,000 | | 1,577,590 | |
Express Scripts Holding Co. (a) | | 32,000 | | 2,776,640 | |
Indivior PLC, Sponsored ADR (a) | | 1 | | 14 | |
Johnson & Johnson, Inc. | | 28,000 | | 2,816,800 | |
Medtronic PLC | | 30,000 | | 2,339,700 | |
Mettler-Toledo International, Inc. (a) | | 6,000 | | 1,971,900 | |
Quintiles Transnational Holdings, Inc. (a) | | 23,000 | | 1,540,310 | |
Stryker Corp. | | 22,500 | | 2,075,625 | |
Waters Corp. (a) | | 15,000 | | 1,864,800 | |
| | | | 24,118,579 | |
Industrials (14.6%) | | | | | |
3M Co. | | 18,000 | | 2,969,100 | |
Deere & Co. | | 18,000 | | 1,578,420 | |
Donaldson Co., Inc. | | 42,000 | | 1,583,820 | |
Emerson Electric Co. | | 42,000 | | 2,378,040 | |
Hubbell, Inc., Class B | | 10,000 | | 1,096,200 | |
Illinois Tool Works, Inc. | | 24,000 | | 2,331,360 | |
Lincoln Electric Holdings, Inc. | | 28,000 | | 1,830,920 | |
Sensata Technologies Holding NV (a) | | 28,000 | | 1,608,600 | |
Union Pacific Corp. | | 27,000 | | 2,924,370 | |
United Parcel Service, Inc., Class B | | 20,000 | | 1,938,800 | |
W.W. Grainger, Inc. | | 12,000 | | 2,829,720 | |
| | | | 23,069,350 | |
Information Technology (17.2%) | | | | | |
Accenture PLC, Class A | | 35,000 | | 3,279,150 | |
Apple, Inc. | | 37,000 | | 4,603,910 | |
Automatic Data Processing, Inc. | | 25,000 | | 2,141,000 | |
Cisco Systems, Inc. | | 85,000 | | 2,339,625 | |
EMC Corp. | | 85,000 | | 2,172,600 | |
Google, Inc., Class A (a) | | 2,600 | | 1,442,220 | |
Google, Inc., Class C (a) | | 2,800 | | 1,534,400 | |
International Business Machines Corp. | | 2,000 | | 321,000 | |
Microsoft Corp. | | 77,000 | | 3,130,435 | |
Oracle Corp. | | 60,000 | | 2,589,000 | |
QUALCOMM, Inc. | | 25,000 | | 1,733,500 | |
Visa, Inc. | | 26,000 | | 1,700,660 | |
| | | | 26,987,500 | |
Materials (3.5%) | | | | | |
AptarGroup, Inc. | | 27,000 | | 1,715,040 | |
PPG Industries, Inc. | | 8,000 | | 1,804,320 | |
Praxair, Inc. | | 16,000 | | 1,931,840 | |
| | | | 5,451,200 | |
Utilities (1.9%) | | | | | |
Consolidated Edison, Inc. | | 25,000 | | 1,525,000 | |
Eversource Energy | | 30,000 | | 1,515,600 | |
| | | | 3,040,600 | |
TOTAL COMMON STOCKS (Cost $97,508,198) | | | | 156,214,330 | |
INVESTMENT COMPANIES (0.6%) | | | | | |
| | | | | |
State Street Institutional U.S. Government Money Market Fund, Investor Shares, 0.00% (b) | | 930,968 | | 930,968 | |
TOTAL INVESTMENT COMPANIES (Cost $930,968) | | | | 930,968 | |
| | | | | |
Total Investments (Cost $98,439,166) (c) — 99.8% | | | | 157,145,298 | |
Other assets in excess of liabilities — 0.2% | | | | 354,113 | |
NET ASSETS — 100.0% | | | | $ | 157,499,411 | |
| | | | | | |
(a) | Non-income producing security. |
(b) | Rate disclosed is the seven day yield as of March 31, 2015. |
(c) | See Federal Tax Information listed in the Notes to the Financial Statements. |
| | |
ADR | American Depositary Receipt |
PLC | Public Limited Company |
See Notes to Financial Statements
49
Financial Statements | Walden Equity Fund |
STATEMENT OF ASSETS AND LIABILITIES
March 31, 2015
Assets: | | | |
Investments, at fair value (cost $98,439,166) | | $ | 157,145,298 | |
Dividends receivable | | 206,965 | |
Receivable for capital shares issued | | 269,235 | |
Prepaid expenses and other assets | | 10,837 | |
Total Assets | | 157,632,335 | |
Liabilities: | | | |
Accrued expenses and other liabilities: | | | |
Investment adviser | | 82,938 | |
Administration and accounting | | 3,081 | |
Custodian | | 2,136 | |
Shareholder servicing fees | | 17,632 | |
Transfer agent | | 3,670 | |
Trustee | | 193 | |
Other | | 23,274 | |
Total Liabilities | | 132,924 | |
Net Assets | | $ | 157,499,411 | |
Composition of Net Assets: | | | |
Capital | | $ | 94,880,496 | |
Accumulated undistributed net investment income | | 411,165 | |
Accumulated net realized gains from investment transactions | | 3,501,618 | |
Net unrealized appreciation from investments | | 58,706,132 | |
Net Assets | | $ | 157,499,411 | |
Shares outstanding (par value $0.01, unlimited number of shares authorized) | | 8,491,021 | |
Net Asset Value, Offering and Redemption price per share | | $ | 18.55 | |
STATEMENT OF OPERATIONS
For the year ended March 31, 2015
Investment Income: | | | |
Dividends | | $ | 2,966,787 | |
Less:Foreign tax withholding | | (3,848 | ) |
Total Investment Income | | 2,962,939 | |
Expenses: | | | |
Investment adviser | | 1,140,337 | |
Administration and accounting | | 154,958 | |
Chief compliance officer | | 6,495 | |
Custodian | | 26,166 | |
Shareholder servicing | | 190,064 | |
Transfer agency | | 50,940 | |
Trustee | | 8,405 | |
Other | | 73,288 | |
Total expenses before fee reductions | | 1,650,653 | |
Fees voluntarily reduced by the transfer agent | | (5,436 | ) |
Fees contractually reduced by the investment adviser | | (124,593 | ) |
Net Expenses | | 1,520,624 | |
Net Investment Income | | 1,442,315 | |
Net Realized/Unrealized Gains from Investments: | | | |
Net realized gains from investment transactions | | 9,300,993 | |
Change in unrealized appreciation from investments | | 1,022,961 | |
Net realized/unrealized gains from investments | | 10,323,954 | |
Change in Net Assets Resulting from Operations | | $ | 11,766,269 | |
See Notes to Financial Statements
50
STATEMENTS OF CHANGES IN NET ASSETS
| | For the year | | For the year | |
| | ended | | ended | |
| | March 31, 2015 | | March 31, 2014 | |
| | | | | |
Investment Activities: | | | | | |
Operations: | | | | | |
Net investment income | | $ | 1,442,315 | | $ | 1,352,252 | |
Net realized gains from investment transactions | | 9,300,993 | | 3,507,905 | |
Change in unrealized appreciation/depreciation from investments | | 1,022,961 | | 20,486,265 | |
Change in Net Assets Resulting from Operations | | 11,766,269 | | 25,346,422 | |
Dividends: | | | | | |
Net investment income | | (1,402,464 | ) | (1,279,080 | ) |
Net realized gains from investment transactions | | (7,427,363 | ) | (719,069 | ) |
Change in Net Assets Resulting from Shareholder Dividends | | (8,829,827 | ) | (1,998,149 | ) |
Capital Share Transactions: | | | | | |
Proceeds from shares issued | | 13,182,101 | | 14,219,200 | |
Dividends reinvested | | 7,987,749 | | 1,799,548 | |
Cost of shares redeemed | | (18,485,773 | ) | (18,185,795 | ) |
Change in Net Assets Resulting from Capital Share Transactions | | 2,684,077 | | (2,167,047 | ) |
Change in Net Assets | | 5,620,519 | | 21,181,226 | |
Net Assets: | | | | | |
Beginning of period | | 151,878,892 | | 130,697,666 | |
End of period | | $ | 157,499,411 | | $ | 151,878,892 | |
Share Transactions: | | | | | |
Issued | | 700,427 | | 848,849 | |
Reinvested | | 434,117 | | 102,299 | |
Redeemed | | (991,135 | ) | (1,086,262 | ) |
Change in shares | | 143,409 | | (135,114 | ) |
Accumulated undistributed net investment income | | $ | 411,165 | | $ | 371,318 | |
See Notes to Financial Statements
51
FINANCIAL HIGHLIGHTS
Selected data for a share outstanding throughout the years indicated.
| | For the year | | For the year | | For the year | | For the year | | For the year | |
| | ended | | ended | | ended | | ended | | ended | |
| | March 31, | | March 31, | | March 31, | | March 31, | | March 31, | |
| | 2015 | | 2014 | | 2013 | | 2012 | | 2011 | |
| | | | | | | | | | | |
Net Asset Value, Beginning of Period | | $ | 18.19 | | $ | 15.41 | | $ | 14.39 | | $ | 13.32 | | $ | 11.61 | |
| | | | | | | | | | | |
Investment Activities: | | | | | | | | | | | |
Net investment income | | 0.18 | | 0.16 | | 0.16 | | 0.13 | | 0.11 | |
Net realized and unrealized gains from investment transactions | | 1.29 | | 2.86 | | 1.01 | | 1.06 | | 1.71 | |
Total from investment activities | | 1.47 | | 3.02 | | 1.17 | | 1.19 | | 1.82 | |
| | | | | | | | | | | |
Dividends: | | | | | | | | | | | |
Net investment income | | (0.18 | ) | (0.15 | ) | (0.15 | ) | (0.12 | ) | (0.11 | ) |
Net realized gains from investments | | (0.93 | ) | (0.09 | ) | — | | — | | — | |
Total dividends | | (1.11 | ) | (0.24 | ) | (0.15 | ) | (0.12 | ) | (0.11 | ) |
| | | | | | | | | | | |
Net Asset Value, End of Period | | $ | 18.55 | | $ | 18.19 | | $ | 15.41 | | $ | 14.39 | | $ | 13.32 | |
Total Return | | 8.13 | % | 19.66 | % | 8.27 | % | 9.06 | % | 15.77 | % |
| | | | | | | | | | | |
Ratios/Supplemental Data: | | | | | | | | | | | |
Net assets at end of period (000’s) | | $ | 157,499 | | $ | 151,879 | | $ | 130,698 | | $ | 104,206 | | $ | 92,221 | |
Ratio of net expenses to average net assets | | 1.00 | % | 1.00 | % | 1.00 | % | 1.00 | % | 1.00 | % |
Ratio of net investment income to average net assets | | 0.95 | % | 0.95 | % | 1.22 | % | 0.97 | % | 0.93 | % |
Ratio of expenses (before fee reductions or recoupment of fees previously reimbursed by the investment adviser) to average net assets (a) | | 1.09 | % | 1.08 | % | 1.14 | % | 1.09 | % | 1.13 | % |
Portfolio turnover rate | | 21.31 | % | 12.33 | % | 10.34 | % | 11.06 | % | 13.07 | % |
Amounts designated as “—” are $0 or have been rounded to $0.
(a) During the period, certain fees were reduced. If such fee reductions had not occurred, the ratio would have been as indicated.
See Notes to Financial Statements
52
Schedule of Portfolio Investments | Walden Midcap Fund |
| March 31, 2015 |
Security Description | | Shares | | Fair Value ($) | |
| | | | | |
COMMON STOCKS (97.6%) | | | | | |
| | | | | |
Consumer Discretionary (14.8%) | | | | | |
Advance Auto Parts, Inc. | | 3,100 | | 464,039 | |
Autoliv, Inc. | | 3,500 | | 412,195 | |
Hasbro, Inc. | | 9,100 | | 575,484 | |
LKQ Corp. (a) | | 11,000 | | 281,160 | |
Nordstrom, Inc. | | 8,550 | | 686,736 | |
Omnicom Group, Inc. | | 9,575 | | 746,659 | |
O’Reilly Automotive, Inc. (a) | | 2,700 | | 583,848 | |
Ross Stores, Inc. | | 6,075 | | 640,062 | |
Sally Beauty Holdings, Inc. (a) | | 12,000 | | 412,440 | |
Williams Sonoma, Inc. | | 4,500 | | 358,695 | |
| | | | 5,161,318 | |
Consumer Staples (8.3%) | | | | | |
Campbell Soup Co. | | 8,700 | | 404,985 | |
Church & Dwight Co., Inc. | | 10,000 | | 854,200 | |
McCormick & Co., Inc. | | 6,650 | | 512,782 | |
The Clorox Co. | | 5,875 | | 648,541 | |
Whole Foods Market, Inc. | | 9,300 | | 484,344 | |
| | | | 2,904,852 | |
Energy (4.2%) | | | | | |
Cabot Oil & Gas Corp. | | 6,250 | | 184,563 | |
Dril-Quip, Inc. (a) | | 5,000 | | 341,950 | |
Energen Corp. | | 4,400 | | 290,400 | |
FMC Technologies, Inc. (a) | | 7,950 | | 294,230 | |
Oceaneering International, Inc. | | 6,400 | | 345,151 | |
| | | | 1,456,294 | |
Financials (17.2%) | | | | | |
Bank of Hawaii Corp. | | 3,725 | | 228,007 | |
BOK Financial Corp. | | 4,925 | | 301,509 | |
Brown & Brown, Inc. | | 9,350 | | 309,579 | |
Chubb Corp. | | 3,050 | | 308,355 | |
Cincinnati Financial Corp. | | 10,100 | | 538,128 | |
Comerica, Inc. | | 6,900 | | 311,397 | |
Commerce Bancshares, Inc. | | 7,037 | | 297,806 | |
Cullen/Frost Bankers, Inc. | | 4,400 | | 303,952 | |
East West Bancorp, Inc. | | 7,875 | | 318,622 | |
Eaton Vance Corp. | | 9,125 | | 379,965 | |
HCC Insurance Holdings | | 6,100 | | 345,687 | |
Jones Lang LaSalle, Inc. | | 2,850 | | 485,640 | |
Northern Trust Corp. | | 9,375 | | 652,968 | |
SEI Investments Co. | | 8,725 | | 384,685 | |
Signature Bank (a) | | 1,800 | | 233,244 | |
T. Rowe Price Group, Inc. | | 7,750 | | 627,595 | |
| | | | 6,027,139 | |
Health Care (15.2%) | | | | | |
C.R. Bard, Inc. | | 4,425 | | 740,523 | |
DENTSPLY International, Inc. | | 8,625 | | 438,926 | |
Laboratory Corp. of America Holdings (a) | | 3,000 | | 378,270 | |
MEDNAX, Inc. (a) | | 5,075 | | 367,988 | |
Mettler-Toledo International, Inc. (a) | | 1,825 | | 599,786 | |
Quintiles Transnational Holdings, Inc. (a) | | 5,675 | | 380,055 | |
ResMed, Inc. | | 4,425 | | 317,627 | |
St. Jude Medical, Inc. | | 9,025 | | 590,235 | |
The Cooper Companies, Inc. | | 3,200 | | 599,744 | |
Varian Medical Systems, Inc. (a) | | 3,650 | | 343,429 | |
Waters Corp. (a) | | 4,450 | | 553,224 | |
| | | | 5,309,807 | |
Industrials (15.2%) | | | | | |
AMETEK, Inc. | | 9,000 | | 472,860 | |
CLARCOR, Inc. | | 5,175 | | 341,861 | |
Donaldson Co., Inc. | | 12,775 | | 481,745 | |
Dover Corp. | | 3,175 | | 219,456 | |
Graco, Inc. | | 3,000 | | 216,480 | |
Hubbell, Inc., Class B | | 5,100 | | 559,062 | |
IDEX Corp. | | 4,275 | | 324,173 | |
Lincoln Electric Holdings, Inc. | | 6,300 | | 411,957 | |
Nordson Corp. | | 5,425 | | 424,995 | |
Sensata Technologies Holding NV (a) | | 6,500 | | 373,425 | |
W.W. Grainger, Inc. | | 2,850 | | 672,059 | |
Wabtec Corp. | | 8,500 | | 807,584 | |
| | | | 5,305,657 | |
Information Technology (12.7%) | | | | | |
Check Point Software Technologies Ltd. (a) | | 6,000 | | 491,820 | |
Citrix Systems, Inc. (a) | | 7,575 | | 483,815 | |
F5 Networks, Inc. (a) | | 4,450 | | 511,483 | |
FactSet Research Systems, Inc. | | 4,150 | | 660,680 | |
Fiserv, Inc. (a) | | 6,350 | | 504,190 | |
IPG Photonics Corp. (a) | | 3,100 | | 287,370 | |
NetApp, Inc. | | 7,750 | | 274,815 | |
Paychex, Inc. | | 7,875 | | 390,718 | |
Syntel, Inc. (a) | | 8,850 | | 457,811 | |
Teradata Corp. (a) | | 8,650 | | 381,811 | |
| | | | 4,444,513 | |
Materials (4.5%) | | | | | |
AptarGroup, Inc. | | 9,075 | | 576,444 | |
Ball Corp. | | 5,000 | | 353,200 | |
International Flavors & Fragrances, Inc. | | 5,425 | | 636,895 | |
| | | | 1,566,539 | |
Real Estate Investment Trusts (1.8%) | | | | | |
BioMed Realty Trust, Inc. REIT | | 15,000 | | 339,900 | |
Digital Realty Trust, Inc. REIT | | 4,425 | | 291,873 | |
| | | | 631,773 | |
Utilities (3.7%) | | | | | |
AGL Resources, Inc. | | 4,200 | | 208,530 | |
Eversource Energy | | 7,833 | | 395,723 | |
ONE Gas, Inc. | | 8,000 | | 345,840 | |
Questar Corp. | | 15,000 | | 357,900 | |
| | | | 1,307,993 | |
TOTAL COMMON STOCKS (Cost $23,909,971) | | | | 34,115,885 | |
| | | | | |
INVESTMENT COMPANIES (2.4%) | | | | | |
| | | | | |
State Street Institutional U.S. Government Money Market Fund, Investor Shares, 0.00% (b) | | 831,304 | | 831,304 | |
TOTAL INVESTMENT COMPANIES (Cost $831,304) | | | | 831,304 | |
| | | | | |
Total Investments (Cost $24,741,275) (c) — 100.0% | | | | 34,947,189 | |
Other assets in excess of liabilities — 0.0% | | | | 11,731 | |
NET ASSETS — 100.0% | | | | $ | 34,958,920 | |
| | | | | | |
(a) Non-income producing security.
(b) Rate disclosed is the seven day yield as of March 31, 2015.
(c) See Federal Tax Information listed in the Notes to the Financial Statements.
REIT Real Estate Investment Trust
See Notes to Financial Statements
53
Financial Statements | Walden Midcap Fund |
STATEMENT OF ASSETS AND LIABILITIES
March 31, 2015
Assets: | | | |
Investments, at fair value (cost $24,741,275) | | $ | 34,947,189 | |
Dividends receivable | | 29,151 | |
Receivable for capital shares issued | | 6,300 | |
Prepaid expenses and other assets | | 4,244 | |
Total Assets | | 34,986,884 | |
Liabilities: | | | |
Accrued expenses and other liabilities: | | | |
Investment adviser | | 19,508 | |
Administration and accounting | | 716 | |
Custodian | | 530 | |
Shareholder servicing fees | | 114 | |
Transfer agent | | 2,352 | |
Trustee | | 43 | |
Other | | 4,701 | |
Total Liabilities | | 27,964 | |
Net Assets | | $ | 34,958,920 | |
Composition of Net Assets: | | | |
Capital | | $ | 24,347,624 | |
Accumulated undistributed net investment income | | 20,866 | |
Accumulated net realized gains from investment transactions | | 384,516 | |
Net unrealized appreciation from investments | | 10,205,914 | |
Net Assets | | $ | 34,958,920 | |
Shares outstanding (par value $0.01, unlimited number of shares authorized) | | 2,303,278 | |
Net Asset Value, Offering and Redemption price per share | | $ | 15.18 | |
STATEMENT OF OPERATIONS
For the year ended March 31, 2015
Investment Income: | | | |
Dividends | | $ | 431,819 | |
Less: Foreign tax withholding | | (615 | ) |
Total Investment Income | | 431,204 | |
Expenses: | | | |
Investment adviser | | 240,191 | |
Administration and accounting | | 33,013 | |
Chief compliance officer | | 1,319 | |
Custodian | | 6,146 | |
Shareholder servicing | | 115 | |
Transfer agency | | 33,672 | |
Trustee | | 1,701 | |
Other | | 17,034 | |
Total expenses before fee reductions | | 333,191 | |
Fees voluntarily reduced by the transfer agent | | (5,436 | ) |
Fees contractually reduced by the investment adviser | | (7,376 | ) |
Net Expenses | | 320,379 | |
Net Investment Income | | 110,825 | |
Net Realized/Unrealized Gains from Investments: | | | |
Net realized gains from investment transactions | | 1,063,803 | |
Change in unrealized appreciation from investments | | 2,571,325 | |
Net realized/unrealized gains from investments | | 3,635,128 | |
Change in Net Assets Resulting from Operations | | $ | 3,745,953 | |
See Notes to Financial Statements
54
STATEMENTS OF CHANGES IN NET ASSETS
| | For the year | | For the year | |
| | ended | | ended | |
| | March 31, 2015 | | March 31, 2014 | |
| | | | | |
Investment Activities: | | | | | |
Operations: | | | | | |
Net investment income | | $ | 110,825 | | $ | 84,201 | |
Net realized gains from investment transactions | | 1,063,803 | | 830,251 | |
Change in unrealized appreciation from investments | | 2,571,325 | | 3,660,139 | |
Change in Net Assets Resulting from Operations | | 3,745,953 | | 4,574,591 | |
Dividends: | | | | | |
Net investment income | | (111,033 | ) | (66,025 | ) |
Net realized gains from investment transactions | | (1,141,232 | ) | (205,678 | ) |
Change in Net Assets Resulting from Shareholder Dividends | | (1,252,265 | ) | (271,703 | ) |
Capital Share Transactions: | | | | | |
Proceeds from shares issued | | 1,601,016 | | 3,105,556 | |
Dividends reinvested | | 1,215,716 | | 263,420 | |
Cost of shares redeemed | | (928,375 | ) | (1,485,143 | ) |
Change in Net Assets Resulting from Capital Share Transactions | | 1,888,357 | | 1,883,833 | |
Change in Net Assets | | 4,382,045 | | 6,186,721 | |
Net Assets: | | | | | |
Beginning of period | | 30,576,875 | | 24,390,154 | |
End of period | | $ | 34,958,920 | | $ | 30,576,875 | |
Share Transactions: | | | | | |
Issued | | 109,555 | | 243,088 | |
Reinvested | | 83,555 | | 19,348 | |
Redeemed | | (64,495 | ) | (110,895 | ) |
Change in shares | | 128,615 | | 151,541 | |
Accumulated undistributed net investment income | | $ | 20,866 | | $ | 21,074 | |
See Notes to Financial Statements
55
FINANCIAL HIGHLIGHTS
Selected data for a share outstanding throughout the periods indicated.
| | For the year | | For the year | | For the year | | For the period | |
| | ended | | ended | | ended | | ended | |
| | March 31, | | March 31, | | March 31, | | March 31, | |
| | 2015 | | 2014 | | 2013 | | 2012 (a) | |
| | | | | | | | | |
Net Asset Value, Beginning of Period | | $ | 14.06 | | $ | 12.06 | | $ | 11.11 | | $ | 10.00 | |
| | | | | | | | | |
Investment Activities: | | | | | | | | | |
Net investment income | | 0.05 | | 0.04 | | 0.06 | | 0.02 | |
Net realized and unrealized gains from investment transactions | | 1.65 | | 2.08 | | 0.95 | | 1.11 | |
Total from investment activities | | 1.70 | | 2.12 | | 1.01 | | 1.13 | |
| | | | | | | | | |
Dividends: | | | | | | | | | |
Net investment income | | (0.05 | ) | (0.03 | ) | (0.06 | ) | (0.02 | ) |
Net realized gains from investments | | (0.53 | ) | (0.09 | ) | — | | — | |
Total dividends | | (0.58 | ) | (0.12 | ) | (0.06 | ) | (0.02 | ) |
| | | | | | | | | |
Net Asset Value, End of Period | | $ | 15.18 | | $ | 14.06 | | $ | 12.06 | | $ | 11.11 | |
Total Return | | 12.25 | % | 17.65 | % | 9.12 | % | 11.33 | %(b) |
| | | | | | | | | |
Ratios/Supplemental Data: | | | | | | | | | |
Net assets at end of period (000’s) | | $ | 34,959 | | $ | 30,577 | | $ | 24,390 | | $ | 14,213 | |
Ratio of net expenses to average net assets | | 1.00 | % | 1.00 | % | 1.00 | % | 1.00 | %(c) |
Ratio of net investment income to average net assets | | 0.35 | % | 0.30 | % | 0.58 | % | 0.34 | %(c) |
Ratio of expenses (before fee reductions or recoupment of fees previously reimbursed by the investment adviser) to average net assets (d) | | 1.04 | % | 1.04 | % | 1.23 | % | 1.34 | %(c) |
Portfolio turnover rate | | 16.06 | % | 14.86 | % | 12.32 | % | 8.43 | %(b) |
Amounts designated as “—” are $0 or have been rounded to $0.
(a) Commencement of operations on August 1, 2011.
(b) Not annualized for periods less than one year.
(c) Annualized for periods less than one year.
(d) During the period, certain fees were reduced. If such fee reductions had not occurred, the ratio would have been as indicated.
See Notes to Financial Statements
56
| Walden SMID Cap Innovations Fund |
Schedule of Portfolio Investments | March 31, 2015 |
Security Description | | Shares | | Fair Value ($) | |
| | | | | |
COMMON STOCKS (99.2%) | | | | | |
| | | | | |
Consumer Discretionary (14.5%) | | | | | |
Bright Horizons Family Solutions, Inc. (a) | | 6,325 | | 324,283 | |
Cheesecake Factory, Inc. | | 5,825 | | 287,347 | |
Choice Hotels International, Inc. | | 4,750 | | 304,333 | |
Dorman Products, Inc. (a) | | 5,650 | | 281,088 | |
DSW, Inc., Class A | | 7,125 | | 262,770 | |
Gentherm, Inc. (a) | | 7,250 | | 366,197 | |
Interval Leisure Group | | 6,200 | | 162,502 | |
Sotheby’s | | 3,150 | | 133,119 | |
Tenneco, Inc. (a) | | 3,975 | | 228,245 | |
Texas Roadhouse, Inc. | | 10,300 | | 375,228 | |
Tumi Holdings, Inc. (a) | | 11,800 | | 288,628 | |
Tupperware Brands Corp. | | 1,750 | | 120,785 | |
Vitamin Shoppe, Inc. (a) | | 7,150 | | 294,509 | |
Williams Sonoma, Inc. | | 4,650 | | 370,651 | |
Wolverine World Wide, Inc. | | 9,175 | | 306,904 | |
| | | | 4,106,589 | |
Consumer Staples (2.7%) | | | | | |
Flowers Foods, Inc. | | 14,100 | | 320,634 | |
United Natural Foods, Inc. (a) | | 4,200 | | 323,568 | |
WhiteWave Food Co., Class A (a) | | 3,050 | | 135,237 | |
| | | | 779,439 | |
Energy (2.5%) | | | | | |
Dril-Quip, Inc. (a) | | 1,725 | | 117,973 | |
Forum Energy Technologies, Inc. (a) | | 11,225 | | 220,010 | |
Oceaneering International, Inc. | | 4,325 | | 233,247 | |
RPC, Inc. | | 11,500 | | 147,315 | |
| | | | 718,545 | |
Financials (18.9%) | | | | | |
Artisan Partners Asset Management, Inc. | | 4,800 | | 218,208 | |
Bank of Hawaii Corp. | | 5,475 | | 335,125 | |
BOK Financial Corp. | | 1,875 | | 114,788 | |
Brown & Brown, Inc. | | 6,525 | | 216,043 | |
Cohen & Steers, Inc. | | 4,525 | | 185,299 | |
Commerce Bancshares, Inc. | | 5,643 | | 238,812 | |
Cullen/Frost Bankers, Inc. | | 1,750 | | 120,890 | |
East West Bancorp, Inc. | | 10,950 | | 443,036 | |
Eaton Vance Corp. | | 6,900 | | 287,316 | |
Encore Capital Group, Inc. (a) | | 8,000 | | 332,720 | |
HCC Insurance Holdings | | 6,250 | | 354,187 | |
Jones Lang LaSalle, Inc. | | 3,350 | | 570,840 | |
LPL Financial Holdings, Inc. | | 2,925 | | 128,291 | |
MarketAxess Holdings, Inc. | | 4,800 | | 397,920 | |
SEI Investments Co. | | 8,525 | | 375,867 | |
Signature Bank (a) | | 2,900 | | 375,782 | |
SVB Financial Group (a) | | 2,950 | | 374,768 | |
Texas Capital Bancshares, Inc. (a) | | 3,275 | | 159,329 | |
UMB Financial Corp. | | 2,325 | | 122,969 | |
| | | | 5,352,190 | |
Health Care (14.5%) | | | | | |
Air Methods Corp. (a) | | 3,125 | | 145,594 | |
Anika Therapeutics, Inc. (a) | | 5,050 | | 207,909 | |
Bio-Reference Labs, Inc. (a) | | 8,925 | | 314,517 | |
Bruker Corp. (a) | | 13,050 | | 241,034 | |
Centene Corp. (a) | | 4,050 | | 286,295 | |
Cyberonics, Inc. (a) | | 1,650 | | 107,118 | |
DENTSPLY International, Inc. | | 5,475 | | 278,623 | |
Haemonetics Corp. (a) | | 4,100 | | 184,172 | |
MEDNAX, Inc. (a) | | 4,300 | | 311,793 | |
Mettler-Toledo International, Inc. (a) | | 1,225 | | 402,596 | |
Quintiles Transnational Holdings, Inc. (a) | | 3,175 | | 212,630 | |
STERIS Corp. | | 5,300 | | 372,430 | |
The Cooper Companies, Inc. | | 2,225 | | 417,009 | |
Thoratec Corp. (a) | | 6,150 | | 257,624 | |
West Pharmaceutical Services, Inc. | | 6,275 | | 377,817 | |
| | | | 4,117,161 | |
Industrials (15.9%) | | | | | |
Applied Industrial Technologies | | 4,750 | | 215,365 | |
Chart Industries, Inc. (a) | | 3,775 | | 132,408 | |
CLARCOR, Inc. | | 3,825 | | 252,680 | |
Donaldson Co., Inc. | | 8,675 | | 327,134 | |
Franklin Electric Co., Inc. | | 5,350 | | 204,049 | |
Genesee & Wyoming, Inc., Class A (a) | | 2,950 | | 284,498 | |
Hub Group, Inc., Class A (a) | | 4,870 | | 191,342 | |
Hubbell, Inc., Class B | | 1,950 | | 213,759 | |
IDEX Corp. | | 2,475 | | 187,679 | |
Lincoln Electric Holdings, Inc. | | 3,875 | | 253,386 | |
Lindsay Manufacturing Co. | | 1,750 | | 133,438 | |
Middleby Corp. (a) | | 3,500 | | 359,275 | |
Nordson Corp. | | 4,175 | | 327,070 | |
Sensata Technologies Holding NV (a) | | 5,675 | | 326,029 | |
UniFirst Corp. | | 2,625 | | 308,936 | |
Valmont Industries, Inc. | | 1,700 | | 208,896 | |
Wabtec Corp. | | 4,950 | | 470,299 | |
Watts Water Technologies, Inc., Class A | | 2,075 | | 114,187 | |
| | | | 4,510,430 | |
Information Technology (15.6%) | | | | | |
Blackbaud, Inc. | | 3,025 | | 143,325 | |
Coherent, Inc. (a) | | 1,875 | | 121,800 | |
CommVault Systems, Inc. (a) | | 3,050 | | 133,285 | |
F5 Networks, Inc. (a) | | 1,550 | | 178,157 | |
FactSet Research Systems, Inc. | | 2,525 | | 401,980 | |
InterDigital, Inc. | | 3,300 | | 167,442 | |
IPG Photonics Corp. (a) | | 5,275 | | 488,993 | |
Mellanox Technologies Ltd. (a) | | 4,550 | | 206,297 | |
Plantronics, Inc. | | 5,075 | | 268,721 | |
Polycom, Inc. (a) | | 15,800 | | 211,720 | |
Power Integrations, Inc. | | 2,550 | | 132,804 | |
SolarWinds, Inc. (a) | | 5,175 | | 265,167 | |
Solera Holdings, Inc. | | 2,550 | | 131,733 | |
Synaptics, Inc. (a) | | 2,225 | | 180,904 | |
Syntel, Inc. (a) | | 9,075 | | 469,449 | |
Teradata Corp. (a) | | 6,175 | | 272,565 | |
Ubiquiti Networks, Inc. | | 11,400 | | 336,869 | |
WEX, Inc. (a) | | 2,825 | | 303,292 | |
| | | | 4,414,503 | |
Materials (6.1%) | | | | | |
AptarGroup, Inc. | | 5,050 | | 320,776 | |
Calgon Carbon Corp. | | 14,050 | | 296,034 | |
Commercial Metals Co. | | 10,225 | | 165,543 | |
International Flavors & Fragrances, Inc. | | 3,350 | | 393,289 | |
Minerals Technologies, Inc. | | 4,525 | | 330,778 | |
Silgan Holdings, Inc. | | 3,875 | | 225,254 | |
| | | | 1,731,674 | |
Real Estate Investment Trusts (4.0%) | | | | | |
BioMed Realty Trust, Inc. REIT | | 9,800 | | 222,068 | |
CoreSite Realty Corp. | | 4,900 | | 238,532 | |
Digital Realty Trust, Inc. REIT | | 4,600 | | 303,416 | |
Tanger Factory Outlet Centers, Inc. | | 10,225 | | 359,613 | |
| | | | 1,123,629 | |
Utilities (4.5%) | | | | | |
AGL Resources, Inc. | | 4,875 | | 242,044 | |
American States Water Co. | | 6,450 | | 257,291 | |
New Jersey Resources Corp. | | 4,775 | | 148,312 | |
ONE Gas, Inc. | | 6,900 | | 298,286 | |
Questar Corp. | | 13,725 | | 327,478 | |
| | | | 1,273,411 | |
TOTAL COMMON STOCKS (Cost $22,134,550) | | | | 28,127,571 | |
| | | | | |
INVESTMENT COMPANIES (0.8%) | | | | | |
| | | | | |
State Street Institutional U.S. Government Money Market Fund, Investor Shares, 0.00% (b) | | 235,534 | | 235,534 | |
TOTAL INVESTMENT COMPANIES (Cost $235,534) | | | | 235,534 | |
| | | | | |
Total Investments (Cost $22,370,084) (c) — 100.0% | | | | 28,363,105 | |
Other assets in excess of liabilities — 0.0% | | | | 6,192 | |
NET ASSETS — 100.0% | | | | $ | 28,369,297 | |
| | | | | | |
(a) Non-income producing security.
(b) Rate disclosed is the seven day yield as of March 31, 2015.
(c) See Federal Tax Information listed in the Notes to the Financial Statements.
REIT Real Estate Investment Trust
See Notes to Financial Statements
57
Financial Statements | Walden SMID Cap Innovations Fund |
STATEMENT OF ASSETS AND LIABILITIES
March 31, 2015
Assets: | | | |
Investments, at fair value (cost $22,370,084) | | $ | 28,363,105 | |
Dividends receivable | | 16,451 | |
Prepaid expenses and other assets | | 10,063 | |
Total Assets | | 28,389,619 | |
Liabilities: | | | |
Accrued expenses and other liabilities: | | | |
Investment adviser | | 12,732 | |
Administration and accounting | | 608 | |
Custodian | | 450 | |
Shareholder servicing fees | | 4 | |
Transfer agent | | 2,503 | |
Trustee | | 35 | |
Other | | 3,990 | |
Total Liabilities | | 20,322 | |
Net Assets | | $ | 28,369,297 | |
Composition of Net Assets: | | | |
Capital | | $ | 21,877,663 | |
Accumulated undistributed net investment income | | 14,876 | |
Accumulated net realized gains from investment transactions | | 483,737 | |
Net unrealized appreciation from investments | | 5,993,021 | |
Net Assets | | $ | 28,369,297 | |
Shares outstanding (par value $0.01, unlimited number of shares authorized) | | 1,929,681 | |
Net Asset Value, Offering and Redemption price per share | | $ | 14.70 | |
STATEMENT OF OPERATIONS
For the year ended March 31, 2015
Investment Income: | | | |
Dividends | | $ | 284,446 | |
Total Investment Income | | 284,446 | |
Expenses: | | | |
Investment adviser | | 196,889 | |
Administration and accounting | | 27,343 | |
Chief compliance officer | | 1,088 | |
Custodian | | 5,225 | |
Shareholder servicing | | 3,139 | |
Transfer agency | | 35,421 | |
Trustee | | 1,408 | |
Other | | 23,055 | |
Total expenses before fee reductions | | 293,568 | |
Fees voluntarily reduced by the transfer agent | | (5,436 | ) |
Fees contractually reduced by the investment adviser | | (25,541 | ) |
Net Expenses | | 262,591 | |
Net Investment Income | | 21,855 | |
Net Realized/Unrealized Gains from Investments: | | | |
Net realized gains from investment transactions | | 647,642 | |
Change in unrealized appreciation from investments | | 1,348,173 | |
Net realized/unrealized gains from investments | | 1,995,815 | |
Change in Net Assets Resulting from Operations | | $ | 2,017,670 | |
See Notes to Financial Statements
58
STATEMENTS OF CHANGES IN NET ASSETS
| | For the year | | For the year | |
| | ended | | ended | |
| | March 31, 2015 | | March 31, 2014 | |
| | | | | |
Investment Activities: | | | | | |
Operations: | | | | | |
Net investment income (loss) | | $ | 21,855 | | $ | (11,339 | ) |
Net realized gains from investment transactions | | 647,642 | | 1,357,970 | |
Change in unrealized appreciation/depreciation from investments | | 1,348,173 | | 3,038,858 | |
Change in Net Assets Resulting from Operations | | 2,017,670 | | 4,385,489 | |
Dividends: | | | | | |
Net investment income | | (9,861 | ) | — | |
Net realized gains from investment transactions | | (563,783 | ) | (937,000 | ) |
Change in Net Assets Resulting from Shareholder Dividends | | (573,644 | ) | (937,000 | ) |
Capital Share Transactions: | | | | | |
Proceeds from shares issued | | 3,707,064 | | 6,609,780 | |
Proceeds from shares issued in subscription in-kind (a) | | — | | 716,178 | |
Dividends reinvested | | 427,587 | | 731,364 | |
Cost of shares redeemed | | (2,989,167 | ) | (6,183,874 | ) |
Change in Net Assets Resulting from Capital Share Transactions | | 1,145,484 | | 1,873,448 | |
Change in Net Assets | | 2,589,510 | | 5,321,937 | |
Net Assets: | | | | | |
Beginning of period | | 25,779,787 | | 20,457,850 | |
End of period | | $ | 28,369,297 | | $ | 25,779,787 | |
Share Transactions: | | | | | |
Issued | | 269,872 | | 512,420 | |
Issued in subscriptions in-kind (a) | | — | | 54,545 | |
Reinvested | | 31,188 | | 53,698 | |
Redeemed | | (216,671 | ) | (467,291 | ) |
Change in shares | | 84,389 | | 153,372 | |
Accumulated undistributed net investment income | | $ | 14,876 | | $ | 2,882 | |
Amounts designated as “—” are $0 or have been rounded to $0.
(a) See Note 3 in Notes to Financial Statements.
See Notes to Financial Statements
59
FINANCIAL HIGHLIGHTS
Selected data for a share outstanding throughout the periods indicated.
| | For the year | | For the year | | For the period | |
| | ended | | ended | | ended | |
| | March 31, | | March 31, | | March 31, | |
| | 2015 | | 2014 | | 2013 (a) | |
| | | | | | | |
Net Asset Value, Beginning of Period | | $ | 13.97 | | $ | 12.09 | | $ | 10.00 | |
| | | | | | | |
Investment Activities: | | | | | | | |
Net investment income (loss) | | 0.01 | | (0.01 | ) | 0.03 | |
Net realized and unrealized gains from investment transactions | | 1.03 | | 2.38 | | 2.09 | |
Total from investment activities | | 1.04 | | 2.37 | | 2.12 | |
| | | | | | | |
Dividends: | | | | | | | |
Net investment income | | (0.01 | ) | — | | (0.03 | ) |
Net realized gains from investments | | (0.30 | ) | (0.49 | ) | — | |
Total dividends | | (0.31 | ) | (0.49 | ) | (0.03 | ) |
| | | | | | | |
Net Asset Value, End of Period | | $ | 14.70 | | $ | 13.97 | | $ | 12.09 | |
Total Return | | 7.60 | % | 19.68 | % | 21.28 | %(b) |
| | | | | | | |
Ratios/Supplemental Data: | | | | | | | |
Net assets at end of period (000’s) | | $ | 28,369 | | $ | 25,780 | | $ | 20,458 | |
Ratio of net expenses to average net assets | | 1.00 | % | 1.00 | % | 1.00 | %(c) |
Ratio of net investment income to average net assets | | 0.08 | % | (0.05 | )% | 0.43 | %(c) |
Ratio of expenses (before fee reductions or recoupment of fees previously reimbursed by the investment adviser) to average net assets (d) | | 1.12 | % | 1.12 | % | 1.60 | %(c) |
Portfolio turnover rate | | 33.61 | % | 51.57 | % | 13.31 | %(b) |
Amounts designated as “—” are $0 or have been rounded to $0.
(a) Commencement of operations on June 28, 2012.
(b) Not annualized for periods less than one year.
(c) Annualized for periods less than one year.
(d) During the period, certain fees were reduced. If such fee reductions had not occurred, the ratio would have been as indicated.
See Notes to Financial Statements
60
Schedule of Portfolio Investments | Walden Small Cap Innovations Fund March 31, 2015 |
Security Description | | Shares | | Fair Value ($) | |
| | | | | |
COMMON STOCKS (99.3%) | | | | | |
| | | | | |
Consumer Discretionary (14.8%) | | | | | |
Bright Horizons Family Solutions, Inc. (a) | | 12,050 | | 617,804 | |
Cheesecake Factory, Inc. | | 19,000 | | 937,270 | |
Choice Hotels International, Inc. | | 15,300 | | 980,271 | |
Dorman Products, Inc. (a) | | 20,900 | | 1,039,775 | |
DSW, Inc., Class A | | 28,000 | | 1,032,640 | |
Gentherm, Inc. (a) | | 22,700 | | 1,146,577 | |
Hibbett Sports, Inc. (a) | | 13,800 | | 677,028 | |
Interval Leisure Group | | 29,600 | | 775,816 | |
Sotheby’s | | 13,300 | | 562,058 | |
Tenneco, Inc. (a) | | 16,500 | | 947,430 | |
Texas Roadhouse, Inc. | | 25,400 | | 925,322 | |
Tumi Holdings, Inc. (a) | | 39,100 | | 956,386 | |
Tupperware Brands Corp. | | 8,600 | | 593,572 | |
Vitamin Shoppe, Inc. (a) | | 19,400 | | 799,086 | |
Wolverine World Wide, Inc. | | 28,500 | | 953,325 | |
| | | | 12,944,360 | |
Consumer Staples (3.7%) | | | | | |
Darling International, Inc. (a) | | 23,600 | | 330,636 | |
Flowers Foods, Inc. | | 44,700 | | 1,016,478 | |
The Chefs’ Warehouse, Inc. (a) | | 23,300 | | 522,619 | |
United Natural Foods, Inc. (a) | | 17,500 | | 1,348,200 | |
| | | | 3,217,933 | |
Energy (3.0%) | | | | | |
Dril-Quip, Inc. (a) | | 8,800 | | 601,832 | |
Forum Energy Technologies, Inc. (a) | | 49,900 | | 978,040 | |
Geospace Technologies Corp. (a) | | 16,000 | | 264,160 | |
Natural Gas Services Group, Inc. (a) | | 17,100 | | 328,662 | |
RPC, Inc. | | 36,100 | | 462,441 | |
| | | | 2,635,135 | |
Financials (16.6%) | | | | | |
Artisan Partners Asset Management, Inc. | | 18,800 | | 854,648 | |
Bank of Hawaii Corp. | | 28,500 | | 1,744,485 | |
BBCN Bancorp, Inc. | | 60,700 | | 878,329 | |
Cohen & Steers, Inc. | | 26,600 | | 1,089,270 | |
Commerce Bancshares, Inc. | | 20,400 | | 863,328 | |
Dime Community Bancshares, Inc. | | 24,700 | | 397,670 | |
Eagle Bancorp, Inc. (a) | | 13,800 | | 529,920 | |
Encore Capital Group, Inc. (a) | | 31,600 | | 1,314,244 | |
First NBC Bank Holding Co. (a) | | 17,100 | | 563,958 | |
HFF, Inc., Class A | | 23,800 | | 893,452 | |
Independent Bank Corp. | | 17,100 | | 750,177 | |
Infinity Property & Casualty Corp. | | 4,900 | | 402,045 | |
MarketAxess Holdings, Inc. | | 17,400 | | 1,442,460 | |
Texas Capital Bancshares, Inc. (a) | | 11,700 | | 569,205 | |
Tompkins Financial Corp. | | 5,300 | | 285,405 | |
Trustmark Corp. | | 21,900 | | 531,732 | |
UMB Financial Corp. | | 13,800 | | 729,882 | |
Umpqua Holdings Corp. | | 46,100 | | 791,998 | |
| | | | 14,632,208 | |
Health Care (14.7%) | | | | | |
Air Methods Corp. (a) | | 19,075 | | 888,704 | |
Anika Therapeutics, Inc. (a) | | 19,700 | | 811,049 | |
Bio-Reference Labs, Inc. (a) | | 35,500 | | 1,251,020 | |
Bio-Techne Corp. | | 4,800 | | 481,392 | |
Bruker Corp. (a) | | 43,500 | | 803,445 | |
Cantel Medical Corp. | | 14,404 | | 684,190 | |
Computer Programs & Systems, Inc. | | 16,400 | | 889,864 | |
CorVel Corp. (a) | | 7,200 | | 247,752 | |
Cyberonics, Inc. (a) | | 8,900 | | 577,788 | |
Haemonetics Corp. (a) | | 21,500 | | 965,780 | |
ICU Medical, Inc. (a) | | 4,900 | | 456,386 | |
IPC The Hospitalist Co. (a) | | 13,800 | | 643,632 | |
STERIS Corp. | | 17,800 | | 1,250,806 | |
Thoratec Corp. (a) | | 24,950 | | 1,045,156 | |
West Pharmaceutical Services, Inc. | | 30,900 | | 1,860,489 | |
| | | | 12,857,453 | |
Industrials (14.2%) | | | | | |
Applied Industrial Technologies | | 20,000 | | 906,800 | |
Chart Industries, Inc. (a) | | 18,100 | | 634,858 | |
CLARCOR, Inc. | | 24,200 | | 1,598,652 | |
ESCO Technologies, Inc. | | 18,200 | | 709,436 | |
Franklin Electric Co., Inc. | | 30,000 | | 1,144,200 | |
Herman Miller, Inc. | | 29,000 | | 805,040 | |
Hub Group, Inc., Class A (a) | | 27,600 | | 1,084,404 | |
Lindsay Manufacturing Co. | | 8,100 | | 617,625 | |
Team, Inc. (a) | | 20,400 | | 795,192 | |
Tennant Co. | | 19,000 | | 1,242,030 | |
UniFirst Corp. | | 12,600 | | 1,482,894 | |
Valmont Industries, Inc. | | 5,600 | | 688,128 | |
Watts Water Technologies, Inc., Class A | | 13,500 | | 742,905 | |
| | | | 12,452,164 | |
Information Technology (16.9%) | | | | | |
Blackbaud, Inc. | | 18,200 | | 862,316 | |
Coherent, Inc. (a) | | 8,289 | | 538,453 | |
CommVault Systems, Inc. (a) | | 11,800 | | 515,660 | |
InterDigital, Inc. | | 12,200 | | 619,028 | |
IPG Photonics Corp. (a) | | 13,200 | | 1,223,640 | |
Mellanox Technologies Ltd. (a) | | 26,200 | | 1,187,908 | |
Plantronics, Inc. | | 24,900 | | 1,318,455 | |
Polycom, Inc. (a) | | 59,600 | | 798,640 | |
Power Integrations, Inc. | | 16,400 | | 854,112 | |
SolarWinds, Inc. (a) | | 25,600 | | 1,311,744 | |
Solera Holdings, Inc. | | 12,600 | | 650,916 | |
Synaptics, Inc. (a) | | 10,200 | | 829,311 | |
Syntel, Inc. (a) | | 34,100 | | 1,763,993 | |
Ubiquiti Networks, Inc. | | 36,600 | | 1,081,530 | |
WEX, Inc. (a) | | 12,700 | | 1,363,472 | |
| | | | 14,919,178 | |
Materials (6.0%) | | | | | |
AptarGroup, Inc. | | 13,300 | | 844,816 | |
Calgon Carbon Corp. | | 38,800 | | 817,516 | |
Commercial Metals Co. | | 31,500 | | 509,985 | |
Minerals Technologies, Inc. | | 15,600 | | 1,140,360 | |
Quaker Chemical Corp. | | 14,500 | | 1,241,780 | |
Silgan Holdings, Inc. | | 12,200 | | 709,186 | |
| | | | 5,263,643 | |
Real Estate Investment Trusts (5.0%) | | | | | |
BioMed Realty Trust, Inc. REIT | | 29,000 | | 657,140 | |
CoreSite Realty Corp. | | 25,900 | | 1,260,812 | |
DuPont Fabros Technology, Inc. | | 40,800 | | 1,333,344 | |
Tanger Factory Outlet Centers, Inc. | | 31,900 | | 1,121,923 | |
| | | | 4,373,219 | |
Utilities (4.4%) | | | | | |
American States Water Co. | | 20,400 | | 813,756 | |
New Jersey Resources Corp. | | 21,900 | | 680,214 | |
ONE Gas, Inc. | | 28,500 | | 1,232,055 | |
Questar Corp. | | 47,300 | | 1,128,578 | |
| | | | 3,854,603 | |
TOTAL COMMON STOCKS (Cost $68,375,960) | | | | 87,149,896 | |
| | | | | |
INVESTMENT COMPANIES (0.4%) | | | | | |
| | | | | |
State Street Institutional U.S. Government Money Market Fund, Investor Shares, 0.00% (b) | | 360,495 | | 360,495 | |
TOTAL INVESTMENT COMPANIES (Cost $360,495) | | | | 360,495 | |
| | | | | |
Total Investments (Cost $68,736,455) (c) — 99.7% | | | | 87,510,391 | |
Other assets in excess of liabilities — 0.3% | | | | 230,083 | |
NET ASSETS — 100.0% | | | | $ | 87,740,474 | |
| | | | | | |
(a) | Non-income producing security. |
(b) | Rate disclosed is the seven day yield as of March 31, 2015. |
(c) | See Federal Tax Information listed in the Notes to the Financial Statements. |
| | |
REIT | Real Estate Investment Trust |
See Notes to Financial Statements
61
Financial Statements | Walden Small Cap Innovations Fund |
STATEMENT OF ASSETS AND LIABILITIES
March 31, 2015
Assets: | | | |
Investments, at fair value (cost $68,736,455) | | $ | 87,510,391 | |
Dividends receivable | | 78,133 | |
Receivable for investments sold | | 238,186 | |
Prepaid expenses and other assets | | 8,776 | |
Total Assets | | 87,835,486 | |
Liabilities: | | | |
Payable for investments purchased | | 8,140 | |
Payable for capital shares redeemed | | 8,000 | |
Accrued expenses and other liabilities: | | | |
Investment adviser | | 58,276 | |
Administration and accounting | | 1,725 | |
Custodian | | 1,290 | |
Shareholder servicing fees | | 1,671 | |
Transfer agent | | 2,939 | |
Trustee | | 110 | |
Other | | 12,861 | |
Total Liabilities | | 95,012 | |
Net Assets | | $ | 87,740,474 | |
Composition of Net Assets: | | | |
Capital | | $ | 63,292,215 | |
Accumulated undistributed net investment income | | 118,440 | |
Accumulated net realized gains from investment transactions | | 5,555,883 | |
Net unrealized appreciation from investments | | 18,773,936 | |
Net Assets | | $ | 87,740,474 | |
Shares outstanding (par value $0.01, unlimited number of shares authorized) | | 4,463,746 | |
Net Asset Value, Offering and Redemption price per share | | $ | 19.66 | |
STATEMENT OF OPERATIONS
For the year ended March 31, 2015
Investment Income: | | | |
Dividends | | $ | 1,087,665 | |
Total Investment Income | | 1,087,665 | |
Expenses: | | | |
Investment adviser | | 699,514 | |
Administration and accounting | | 95,337 | |
Chief compliance officer | | 3,933 | |
Custodian | | 15,932 | |
Shareholder servicing | | 36,321 | |
Transfer agency | | 40,728 | |
Trustee | | 5,126 | |
Other | | 43,114 | |
Total expenses before fee reductions | | 940,005 | |
Fees voluntarily reduced by the transfer agent | | (5,436 | ) |
Fees contractually reduced by the investment adviser | | (2,313 | ) |
Net Expenses | | 932,256 | |
Net Investment Income | | 155,409 | |
Net Realized/Unrealized Gains (Losses) from Investments: | | | |
Net realized gains from investment transactions | | 9,520,835 | |
Change in unrealized appreciation/depreciation from investments | | (6,724,294 | ) |
Net realized/unrealized gains (losses) from investments | | 2,796,541 | |
Change in Net Assets Resulting from Operations | | $ | 2,951,950 | |
See Notes to Financial Statements
62
STATEMENTS OF CHANGES IN NET ASSETS
| | For the year | | For the year | |
| | ended | | ended | |
| | March 31, 2015 | | March 31, 2014 | |
| | | | | |
Investment Activities: | | | | | |
Operations: | | | | | |
Net investment income | | $ | 155,409 | | $ | 30,394 | |
Net realized gains from investment transactions | | 9,520,835 | | 8,796,070 | |
Change in unrealized appreciation/depreciation from investments | | (6,724,294 | ) | 8,525,526 | |
Change in Net Assets Resulting from Operations | | 2,951,950 | | 17,351,990 | |
Dividends: | | | | | |
Net investment income | | (72,438 | ) | (13,979 | ) |
Net realized gains from investment transactions | | (6,685,832 | ) | (7,309,801 | ) |
Change in Net Assets Resulting from Shareholder Dividends | | (6,758,270 | ) | (7,323,780 | ) |
Capital Share Transactions: | | | | | |
Proceeds from shares issued | | 1,632,009 | | 6,163,589 | |
Proceeds from shares issued in subscription in-kind (a) | | 5,484,961 | | 471,351 | |
Dividends reinvested | | 5,542,266 | | 6,716,084 | |
Cost of shares redeemed | | (24,903,218 | ) | (14,821,198 | ) |
Change in Net Assets Resulting from Capital Share Transactions | | (12,243,982 | ) | (1,470,174 | ) |
Change in Net Assets | | (16,050,302 | ) | 8,558,036 | |
Net Assets: | | | | | |
Beginning of period | | 103,790,776 | | 95,232,740 | |
End of period | | $ | 87,740,474 | | $ | 103,790,776 | |
Share Transactions: | | | | | |
Issued | | 82,515 | | 312,145 | |
Issued in subscriptions in-kind (a) | | 274,111 | | 22,057 | |
Reinvested | | 298,292 | | 330,353 | |
Redeemed | | (1,270,991 | ) | (739,624 | ) |
Change in shares | | (616,073 | ) | (75,069 | ) |
Accumulated undistributed net investment income | | $ | 118,440 | | $ | 49,805 | |
(a) See Note 3 in Notes to Financial Statements.
See Notes to Financial Statements
63
FINANCIAL HIGHLIGHTS
Selected data for a share outstanding throughout the years indicated.
| | For the year | | For the year | | For the year | | For the year | | For the year | |
| | ended | | ended | | ended | | ended | | ended | |
| | March 31, | | March 31, | | March 31, | | March 31, | | March 31, | |
| | 2015 | | 2014 | | 2013 | | 2012 | | 2011 | |
| | | | | | | | | | | |
Net Asset Value, Beginning of Period | | $ | 20.43 | | $ | 18.48 | | $ | 16.92 | | $ | 17.64 | | $ | 14.57 | |
| | | | | | | | | | | |
Investment Activities: | | | | | | | | | | | |
Net investment income | | 0.04 | | 0.01 | | 0.07 | | 0.01 | | 0.02 | |
Net realized and unrealized gains from investment transactions | | 0.66 | | 3.42 | | 1.93 | | 0.27 | | 3.59 | |
Total from investment activities | | 0.70 | | 3.43 | | 2.00 | | 0.28 | | 3.61 | |
| | | | | | | | | | | |
Dividends: | | | | | | | | | | | |
Net investment income | | (0.02 | ) | — | | (0.07 | ) | (0.02 | ) | (0.03 | ) |
Net realized gains from investments | | (1.45 | ) | (1.48 | ) | (0.37 | ) | (0.98 | ) | (0.51 | ) |
Total dividends | | (1.47 | ) | (1.48 | ) | (0.44 | ) | (1.00 | ) | (0.54 | ) |
| | | | | | | | | | | |
Net Asset Value, End of Period | | $ | 19.66 | | $ | 20.43 | | $ | 18.48 | | $ | 16.92 | | $ | 17.64 | |
Total Return | | 3.86 | % | 18.58 | % | 12.05 | % | 2.28 | % | 25.13 | % |
| | | | | | | | | | | |
Ratios/Supplemental Data: | | | | | | | | | | | |
Net assets at end of period (000’s) | | $ | 87,740 | | $ | 103,791 | | $ | 95,233 | | $ | 69,544 | | $ | 46,488 | |
Ratio of net expenses to average net assets | | 1.00 | % | 1.00 | % | 1.00 | % | 1.00 | % | 1.00 | % |
Ratio of net investment income to average net assets | | 0.17 | % | 0.03 | % | 0.40 | % | 0.06 | % | 0.14 | % |
Ratio of expenses (before fee reductions or recoupment of fees previously reimbursed by the investment adviser) to average net assets (a) | | 1.01 | % | 1.05 | % | 1.09 | % | 1.15 | % | 1.27 | % |
Portfolio turnover rate | | 28.74 | % | 36.60 | % | 31.98 | % | 24.62 | % | 36.01 | % |
Amounts designated as “—” are $0 or have been rounded to $0.
(a) During the period, certain fees were reduced. If such fee reductions had not occurred, the ratio would have been as indicated.
See Notes to Financial Statements
64
Notes to Financial Statements | March 31, 2015 |
1. Organization:
The Boston Trust & Walden Funds (the “Trust”) was organized on January 8, 1992 as a Massachusetts business trust and is registered under the Investment Company Act of 1940, as amended (the “1940 Act”), as an open-end management investment company. The Trust contains the following funds (individually a “Fund”, collectively the “Funds”), each of which are registered as a diversified Fund under the 1940 Act:
Fund | | Short Name |
Boston Trust Asset Management Fund | | Asset Management Fund |
Boston Trust Equity Fund | | Equity Fund |
Boston Trust Midcap Fund | | Midcap Fund |
Boston Trust SMID Cap Fund | | SMID Cap Fund |
Boston Trust Small Cap Fund | | Small Cap Fund |
| | |
Walden Asset Management Fund | | Walden Asset Management Fund |
Walden Equity Fund | | Walden Equity Fund |
Walden Midcap Fund | | Walden Midcap Fund |
Walden SMID Cap Innovations Fund | | Walden SMID Cap Fund |
Walden Small Cap Innovations Fund | | Walden Small Cap Fund |
The investment objective of the Asset Management Fund and Walden Asset Management Fund is to seek long-term capital growth and income through an actively managed portfolio of stocks, bonds and money market instruments. The investment objective of the Equity Fund and Walden Equity Fund is to seek long-term capital growth through an actively managed portfolio of stocks. The investment objective of the Midcap Fund and Walden Midcap Fund is to seek long-term capital growth through an actively managed portfolio of stocks of middle capitalization companies. The investment objective of the SMID Cap Fund and Walden SMID Cap Fund is to seek long-term capital growth through an actively managed portfolio of stocks of small to middle capitalization companies. The investment objective of the Small Cap Fund and Walden Small Cap Fund is to seek long-term capital growth through an actively managed portfolio of stocks of small capitalization companies.
Under the Trust’s organizational documents, its officers and trustees are indemnified against certain liabilities arising out of the performance of their duties to the Trust. In addition, in the normal course of business, the Trust may enter into contracts with its vendors and others that provide for general indemnifications. Each Fund’s maximum exposure under these arrangements is unknown, as this would involve future claims that may be made against the Funds. However, based on experience, the Funds expect risk of loss to be remote.
2. Significant Accounting Policies:
The following is a summary of significant accounting policies followed by the Funds in the preparation of their financial statements. The policies are in conformity with accounting principles generally accepted in the United States of America (“GAAP”).
The preparation of financial statements in conformity with GAAP requires management to make estimates and assumptions that affect the reported amounts of assets and liabilities, the disclosure of contingent assets and liabilities at the date of the financial statements and the reported amounts of increases and decreases in net assets from operations during the reporting period. Actual results may differ from those estimates.
Security Valuation:
The Funds record their investments at fair value. Fair value is defined as the price that would be received to sell an asset or paid to transfer a liability in an orderly transaction between market participants at the measurement date. The valuation techniques used to determine fair value are further described below.
The value of each equity security, including common stocks, is based either on the last sale price on a national securities exchange, or in the absence of recorded sales, at the closing bid prices on such exchanges, or at the quoted bid price in the over-the-counter market. Equity securities traded on the NASDAQ stock market are valued at the NASDAQ official closing price.
Bonds and other fixed income securities (other than short-term obligations but including listed issues) are provided by an independent pricing service, the use of which has been approved by the Trust’s Board of Trustees (the “Board”). In making such valuations, the pricing service utilizes both dealer-supplied valuations and electronic data processing techniques that take into account appropriate factors such as institutional-size trading in similar groups of securities, yield, quality, coupon rate, maturity, type of issue, and trading characteristics other than market data and without exclusive reliance upon quoted prices or exchanges or over-the-counter prices, since such valuations are believed to reflect more accurately the fair value of such securities. All debt portfolio securities with a remaining maturity of 60 days or less may be valued at amortized cost, which approximates fair value. Under the amortized cost method, discount or premium, if any, is accreted or amortized, respectively, on a constant (straight-line) basis to the maturity of the security.
The Trust may use a pricing service to value certain portfolio securities where the prices provided are believed to reflect the fair market value of such securities. If market prices are not readily available or, in the opinion of Boston Trust Investment Management, Inc. (the “Adviser”), market prices do not reflect fair value, or if an event occurs after the close of trading on the exchange or market on which the security is principally traded (but prior to the time the NAV is calculated) that materially affects fair value, the Adviser will value the Funds’ assets at their fair value according to policies approved by the Board.
Investments in investment companies and money market funds are valued at net asset value per share.
Fair Value Measurements:
The valuation techniques employed by the Funds, as described above in Security Valuation, maximize the use of observable inputs and minimize the use of unobservable inputs in determining fair value. The inputs used for valuing the Funds’ investments are summarized in the three broad levels listed below:
Level 1 — quoted prices in active markets for identical assets
Level 2 — other significant observable inputs (including quoted prices for similar securities, interest rates, prepayment speeds, credit risk, etc.)
Level 3 — significant unobservable inputs (including the Funds’ own assumptions in determining the fair value of investments)
The inputs or methodology used to value investments are not necessarily an indication of the risk associated with investing in those investments.
Continued
65
Notes to Financial Statements | March 31, 2015 |
Pursuant to the valuation techniques described above in Security Valuation, equity securities are generally categorized as Level 1 securities in the fair value hierarchy (unless there is a fair valuation event, in which case affected securities are generally categorized as Level 2 securities). Debt securities, including those with a remaining maturity of 60 days or less, are generally categorized as Level 2 securities in the fair value hierarchy. Open-end investment companies and money market funds are generally categorized as Level 1 securities in the fair value hierarchy.
Investments for which there are no such quotations, or for which quotations do not appear reliable, are valued at fair value as determined in good faith by the Adviser under the direction of the Board. These valuations are typically categorized as Level 2 or Level 3 in the fair value hierarchy.
The following is a summary of the valuation inputs used as of March 31, 2015 in valuing the Funds’ investments based on the three levels defined above:
| | | | Level 2 | | | |
| | Level 1 | | Other Significant | | Total Investments | |
Fund Name | | Quoted Prices | | Observable Inputs | | in Securities | |
Asset Management Fund | | | | | | | |
Common Stocks(1) | | $ | 273,090,166 | | $ | — | | $ | 273,090,166 | |
Corporate Bonds(1) | | — | | 9,912,256 | | 9,912,256 | |
Municipal Bonds(2) | | — | | 6,164,345 | | 6,164,345 | |
U.S. Government & U.S. Government Agency Obligations | | — | | 60,114,199 | | 60,114,199 | |
Investment Companies | | 4,050,575 | | — | | 4,050,575 | |
Total | | 277,140,741 | | 76,190,800 | | 353,331,541 | |
Equity Fund | | | | | | | |
Common Stocks(1) | | 108,089,459 | | — | | 108,089,459 | |
Investment Companies | | 2,806,057 | | — | | 2,806,057 | |
Total | | 110,895,516 | | — | | 110,895,516 | |
Midcap Fund | | | | | | | |
Common Stocks(1) | | 46,794,059 | | — | | 46,794,059 | |
Investment Companies | | 1,142,232 | | — | | 1,142,232 | |
Total | | 47,936,291 | | — | | 47,936,291 | |
SMID Cap Fund | | | | | | | |
Common Stocks(1) | | 5,288,739 | | — | | 5,288,739 | |
Investment Companies | | 95,058 | | — | | 95,058 | |
Total | | 5,383,797 | | — | | 5,383,797 | |
Small Cap Fund | | | | | | | |
Common Stocks(1) | | 435,479,700 | | — | | 435,479,700 | |
Investment Companies | | 2,840,430 | | — | | 2,840,430 | |
Total | | 438,320,130 | | — | | 438,320,130 | |
Walden Asset Management Fund | | | | | | | |
Common Stocks(1) | | 62,981,941 | | — | | 62,981,941 | |
Corporate Bonds(1) | | — | | 4,056,686 | | 4,056,686 | |
Municipal Bonds(2) | | — | | 633,478 | | 633,478 | |
U.S. Government & U.S. Government Agency Obligations | | — | | 15,520,982 | | 15,520,982 | |
Investment Companies | | 1,162,827 | | — | | 1,162,827 | |
Total | | 64,144,768 | | 20,211,146 | | 84,355,914 | |
Walden Equity Fund | | | | | | | |
Common Stocks(1) | | 156,214,330 | | — | | 156,214,330 | |
Investment Companies | | 930,968 | | — | | 930,968 | |
Total | | 157,145,298 | | — | | 157,145,298 | |
Walden Midcap Fund | | | | | | | |
Common Stocks(1) | | 34,115,885 | | — | | 34,115,885 | |
Investment Companies | | 831,304 | | — | | 831,304 | |
Total | | 34,947,189 | | — | | 34,947,189 | |
Walden SMID Cap Fund | | | | | | | |
Common Stocks(1) | | 28,127,571 | | — | | 28,127,571 | |
Investment Companies | | 235,534 | | — | | 235,534 | |
Total | | 28,363,105 | | — | | 28,363,105 | |
Walden Small Cap Fund | | | | | | | |
Common Stocks(1) | | 87,149,896 | | — | | 87,149,896 | |
Investment Companies | | 360,495 | | — | | 360,495 | |
Total | | 87,510,391 | | — | | 87,510,391 | |
| | | | | | | | | | |
(1) For detailed industry descriptions, see the accompanying Schedules of Portfolio Investments.
(2) For detailed State classifications, see the accompanying Schedules of Portfolio Investments.
The Funds recognize transfers, if any, between fair value hierarchy levels at the reporting period end. There were no transfers between levels as of March 31, 2015, from the valuation input levels used on March 31, 2014. The Funds did not hold any Level 3 securities during the year ended March 31, 2015.
Continued
66
Notes to Financial Statements | March 31, 2015 |
Security Transactions and Related Income:
Security transactions are recorded no later than one business day after trade date. For financial reporting purposes, security transactions are recorded on trade date on the last business day of the reporting period. Interest income is recognized on the accrual basis and includes, where applicable, the amortization of premium or discount. Dividend income and withholding taxes on foreign dividends are recorded on the ex-dividend date. Gains or losses realized on sales of securities are determined by comparing the identified cost of the security lot sold with the net sales proceeds.
Real Estate Investment Trusts:
The Funds may own shares of real estate investment trusts (“REITs”), which report information on the source of their distribution annually. Certain distributions received from REITs during the year, which are known to be return of capital, are recorded as a reduction to the cost of the individual REIT.
Expenses:
Expenses directly attributable to a Fund are charged directly to that Fund. Expenses relating to the Trust are allocated proportionately to each Fund within the Trust according to the relative net assets of each Fund or on another reasonable basis.
Dividends to Shareholders:
Dividends to shareholders are recorded on the ex-dividend date. Dividends to shareholders from net investment income, if any, are declared and paid annually by the Funds. Dividends to shareholders from net realized gains, if any, are declared and distributed at least annually by the Funds.
The amounts of dividends to shareholders from net investment income and of distributions from net realized gains are determined in accordance with federal income tax regulations, which may differ from GAAP. These “book/tax” differences are either considered temporary or permanent in nature. To the extent these differences are permanent in nature (e.g. return of capital, net operating loss, reclassification of certain market discounts, gain/ loss, paydowns, and distributions), such amounts are reclassified within the composition of net assets based on their federal tax-basis treatment; temporary differences (e.g. wash sales and post October losses) do not require reclassification. To the extent dividends to shareholders exceed net investment income and net realized gains for tax purposes, they are reported as distributions of capital.
Federal Income Taxes:
Each Fund intends to continue to qualify as a regulated investment company by complying with the provisions available to certain investment companies, as defined in Subchapter M of the Internal Revenue Code, and to make distributions from net investment income and from net realized capital gains sufficient to relieve it from all, or substantially all, federal income and excise taxes. Therefore, no federal income tax provision is required.
Management has reviewed tax positions taken in tax years that remain subject to examination by all major tax jurisdictions, including Federal (i.e., the last four tax year ends and the interim tax period since then, as applicable). The Funds recognize interest and penalties, if any, related to unrecognized tax benefits, as income tax expense in the Statement of Operations. Management believes that there is no tax liability resulting from unrecognized tax benefits related to uncertain tax positions taken as of and during the year ended March 31, 2015.
New Accounting Pronouncement:
In June 2014, the Financial Accounting Standards Board issued Accounting Standards Update No. 2014-11 “Transfers and Servicing (Topic 860)” (“ASU 2014-11”), which requires repurchase-to-maturity transactions to be accounted for as secured borrowing rather than sales with a forward commitment. In addition, for repurchase financing agreements, separate secured borrowing accounting is required for the components (i.e., transfer of a financial asset contemporaneous with a repurchase agreement with the same counterparty). Management has determined the guidance in ASU 2014-11, which is effective for interim and annual periods beginning after December 15, 2014, will not impact the Funds’ financial statements.
3. Related Party Transactions and Other Service Arrangements:
Investment Adviser:
The Trust, with respect to the Funds, and the Adviser are parties to an Investment Advisory Agreement under which the Adviser is entitled to receive an annual fee, computed daily and paid monthly, equal to the average daily net assets of each Fund, at the following annual percentage rates before contractual waivers:
Fund | | Fee Rate | |
Asset Management Fund | | 0.75 | % |
Equity Fund | | 0.75 | % |
Midcap Fund | | 0.75 | % |
SMID Cap Fund | | 0.75 | % |
Small Cap Fund | | 0.75 | % |
Walden Asset Management Fund | | 0.75 | % |
Walden Equity Fund | | 0.75 | % |
Walden Midcap Fund | | 0.75 | % |
Walden SMID Cap Fund | | 0.75 | % |
Walden Small Cap Fund | | 0.75 | % |
Additionally, two trustees of the Trust are officers of the Adviser or its affiliate, and an officer of the Trust is an officer of the Adviser. These persons are not paid directly by the Funds.
Administration and Fund Accounting:
Citi Fund Services Ohio, Inc. (“Citi”) serves the Funds as administrator. Citi provides administrative and fund accounting services for a fee that is computed daily and paid monthly, based on the aggregate daily net assets of the Trust.
Certain officers of the Trust are affiliated with Citi. Such persons were paid no fees directly by the Funds for serving as Officers of the Trust. Citi makes an employee available to serve as the Funds’ Chief Compliance Officer (“CCO”) under a Compliance Service Agreement between the Funds and Citi (the “CCO Agreement”). Under the CCO Agreement, Citi also provides infrastructure and support in implementing the written policies and procedures comprising the Funds’ compliance program, including support services to the CCO. For the services provided under the CCO Agreement, the Funds paid Citi $56,751 for the year ended March 31, 2015, plus certain out of pocket expenses. Citi pays the salary and other compensation earned by the CCO as an employee of Citi.
Distribution:
BHIL Distributors, Inc., (“BHIL”), a wholly-owned subsidiary of Beacon Hill Fund Services, Inc., serves as the Funds’ distribution agent. The distribution agreement provides for payment of a fixed annual fee of $28,000 for review of sales literature and dealer set-up efforts, and reimbursement of out-of-pocket expenses. These amounts are paid monthly to BHIL from the Advisor and not by the Funds. BHIL is not affiliated with Citi or the Adviser.
Continued
67
Notes to Financial Statements | March 31, 2015 |
Shareholder Services:
The Funds may enter into shareholder services agreements with investment advisers, banks, trust companies and other types of organizations (“Authorized Service Providers”), which may include affiliates of the Funds, for providing administrative services with respect to shares of the Funds attributable to or held in the name of the Authorized Service Provider for its clients or other parties with whom they have a servicing relationship.
Each Fund is authorized to pay non-distribution related shareholder services fees up to 0.25% of its average annual net assets with respect to shares of the Funds serviced by an Authorized Service Provider.
Custodian and Transfer Agency:
Boston Trust & Investment Management Company (“Boston Trust”), the parent company of the Adviser, acts as the Funds’ custodian and transfer agent. Under the custody agreement, Boston Trust receives $1,000 annually per Fund plus an annual asset based fee of 0.016% of the fair value of securities held. Under the transfer agency agreement, Boston Trust receives a fixed fee of $18,000 annually per fund, accrued daily and paid monthly for its services. Under a sub-transfer agency agreement, Citi received a fixed annual fee, accrued daily and paid monthly, plus annual per account fees and certain out of pocket expenses for its services to the Trust through March 31, 2015. Effective April 1, 2015, the sub-transfer agency agreement was assigned to SunGard Investor Services LLC (SIS). The sub-transfer agency services, and fees charged for such services, are unchanged as a result of the assignment to SIS.
Fee Reductions:
The Adviser has agreed to reduce its fees payable by the Funds to the extent necessary, subject to certain exclusions, to limit each Fund’s aggregate annual operating expenses to 1.00% of the average daily net assets. Any such reductions made by the Adviser in its fees or in the payment or reimbursement of expenses that are a Fund’s obligation may be subject to repayment by the Fund within three years of the date the payment is made or the obligation is incurred provided the Fund receiving the reduction, payment or reimbursement is able to effect such repayment and remain in compliance with applicable expense limitations. The expense limitation agreement shall automatically renew effective August 1 of every year until the Adviser provides written notice of non-renewal to the Trust.
Pursuant to its agreement, for the years ended March 31, 2013, 2014 and 2015, the Adviser reimbursed, and has yet to recoup, fees in the following amounts:
Fund | | Amount | | Expires | |
Midcap Fund | | $ | 16,993 | | 2016 | |
| | 4 | | 2017 | |
| | 1,824 | | 2018 | |
| | | | | |
SMID Cap Fund | | 33,947 | | 2016 | |
| | 23,931 | | 2017 | |
| | 29,670 | | 2018 | |
| | | | | |
Small Cap Fund | | 355,171 | | 2017 | |
| | 213,139 | | 2018 | |
Walden Asset Management Fund | | | 49,992 | | 2016 | |
| | 28,632 | | 2017 | |
| | 25,881 | | 2018 | |
| | | | | |
Walden Equity Fund | | 151,960 | | 2016 | |
| | 113,975 | | 2017 | |
| | 124,593 | | 2018 | |
| | | | | |
Walden Midcap Fund | | 34,176 | | 2016 | |
| | 7,143 | | 2017 | |
| | 7,376 | | 2018 | |
| | | | | |
Walden SMID Cap Fund | | 30,124 | | 2016 | |
| | 23,699 | | 2017 | |
| | 25,541 | | 2018 | |
| | | | | |
Walden Small Cap Fund | | 64,888 | | 2016 | |
| | 49,312 | | 2017 | |
| | 2,313 | | 2018 | |
As of March 31, 2015, the Adviser may recoup amounts from the Funds as follows:
Total Potential Recoupment | | | |
Asset Management Fund | | $ | — | |
Equity Fund | | — | |
Midcap Fund | | 18,821 | |
SMID Cap Fund | | 87,548 | |
Small Cap Fund | | 568,310 | |
Walden Asset Management Fund | | 104,505 | |
Walden Equity Fund | | 390,528 | |
Walden Midcap Fund | | 48,695 | |
Walden SMID Cap Fund | | 79,364 | |
Walden Small Cap Fund | | 116,513 | |
| | | | |
During the year ended March 31, 2015, the transfer agent voluntarily reduced a portion of the transfer agent fees otherwise payable by the Funds, as indicated on each Fund’s Statement of Operations. These voluntary reductions are not subject to recoupment in future years.
During the year ended March 31, 2015, certain securities of an affiliated separately managed account were exchanged, at fair value, as in-kind transfers of shares of the Walden Small Cap Fund. The total fair value of the in-kind transfers was $5,484,961 for 274,111 shares of the Walden Small Cap Fund in exchange for securities of an affiliated separately managed account.
During the year ended March 31, 2014, net assets of certain Funds were exchanged as in-kind transfers. The total fair value of the in-kind transfers was $471,351 for 22,057 shares of the Walden Small Cap Fund in exchange for 28,515 shares of the Small Cap Fund, $716,178 for 54,545 shares of the Walden SMID Cap Fund in exchange for shares of an affiliated separately managed account, and $7,967,662 for 507,818 shares of the Small Cap Fund in exchange for securities of an affiliated separately managed account.
Continued
68
Notes to Financial Statements | March 31, 2015 |
4. Purchases and Sales of Securities:
Cost of purchases and proceeds from sales and maturities of securities, excluding short-term securities and U.S. Government securities, for the Funds for the year ended March 31, 2015, totaled:
Fund | | Purchases | | Sales and Maturities | |
Asset Management Fund | | $ | 34,797,411 | | $ | 58,784,831 | |
Equity Fund | | 23,557,362 | | 20,223,222 | |
Midcap Fund | | 7,144,806 | | 6,803,313 | |
SMID Cap Fund | | 1,737,191 | | 1,586,184 | |
Small Cap Fund | | 135,329,321 | | 245,107,826 | |
| | | | | |
Walden Asset Management Fund | | 12,591,439 | | 13,085,351 | |
Walden Equity Fund | | 32,172,713 | | 37,001,106 | |
Walden Midcap Fund | | 5,400,050 | | 5,067,285 | |
Walden SMID Cap Fund | | 9,524,867 | | 8,728,867 | |
Walden Small Cap Fund | | 26,667,275 | | 50,202,867 | |
| | | | | | | |
Cost of purchases and proceeds from sales and maturities of U.S. Government Securities, excluding short-term securities, for the Funds for the year ended March 31, 2015, totaled:
Fund | | Purchases | | Sales and Maturities | |
Asset Management Fund | | $ | 26,848,832 | | $ | 1,210,348 | |
Walden Asset Management Fund | | 6,674,517 | | 4,322,364 | |
| | | | | | | |
5. Federal Income Tax Information:
At March 31, 2015, the cost, gross unrealized appreciation and gross unrealized depreciation on securities, for federal income tax purposes, were as follows:
| | | | Gross Tax Unrealized | | Gross Tax Unrealized | | Net Unrealized Appreciation | |
| | Tax Cost | | Appreciation | | (Depreciation) | | (Depreciation) | |
Asset Management Fund | | $ | 221,068,070 | | $ | 132,661,220 | | $ | (397,749 | ) | $ | 132,263,471 | |
Equity Fund | | 63,357,450 | | 47,761,173 | | (223,107 | ) | 47,538,066 | |
Midcap Fund | | 28,946,666 | | 19,115,686 | | (126,061 | ) | 18,989,625 | |
SMID Cap Fund | | 4,084,830 | | 1,401,762 | | (102,795 | ) | 1,298,967 | |
Small Cap Fund | | 345,850,175 | | 111,856,230 | | (19,386,275 | ) | 92,469,955 | |
| | | | | | | | | |
Walden Asset Management Fund | | 60,937,622 | | 24,063,916 | | (645,624 | ) | 23,418,292 | |
Walden Equity Fund | | 98,446,069 | | 59,398,939 | | (699,710 | ) | 58,699,229 | |
Walden Midcap Fund | | 24,743,055 | | 10,451,158 | | (247,024 | ) | 10,204,134 | |
Walden SMID Cap Fund | | 22,375,299 | | 6,575,611 | | (587,805 | ) | 5,987,806 | |
Walden Small Cap Fund | | 68,727,706 | | 22,398,660 | | (3,615,975 | ) | 18,782,685 | |
| | | | | | | | | | | | | |
The tax character of distributions paid during the fiscal year ended March 31, 2015 was as follows:
| | Distributions paid from | | | | | | | |
| | | | Net Long Term | | Total Taxable | | Tax Return of | | Total Distributions | |
| | Ordinary Income | | Capital Gains | | Distributions | | Capital | | Paid(1) | |
Asset Management Fund | | $ | 4,816,117 | | $ | 7,480,276 | | $ | 12,296,393 | | $ | — | | $ | 12,296,393 | |
Equity Fund | | 966,299 | | 2,029,175 | | 2,995,474 | | — | | 2,995,474 | |
Midcap Fund | | 394,184 | | 1,765,084 | | 2,159,268 | | — | | 2,159,268 | |
SMID Cap Fund | | 42,588 | | 223,676 | | 266,264 | | — | | 266,264 | |
Small Cap Fund | | 5,843,060 | | 25,889,299 | | 31,732,359 | | — | | 31,732,359 | |
| | | | | | | | | | | |
Walden Asset Management Fund | | 877,816 | | 519,966 | | 1,397,782 | | — | | 1,397,782 | |
Walden Equity Fund | | 2,227,112 | | 6,602,715 | | 8,829,827 | | — | | 8,829,827 | |
Walden Midcap Fund | | 345,118 | | 907,147 | | 1,252,265 | | — | | 1,252,265 | |
Walden SMID Cap Fund | | 440,304 | | 133,340 | | 573,644 | | — | | 573,644 | |
Walden Small Cap Fund | | 599,334 | | 6,158,936 | | 6,758,270 | | — | | 6,758,270 | |
| | | | | | | | | | | | | | | | |
The tax character of distributions paid during the fiscal year ended March 31, 2014 was as follows:
| | Distributions paid from | | | | | | | |
| | | | Net Long Term | | Total Taxable | | Tax Return of | | Total Distributions | |
| | Ordinary Income | | Capital Gains | | Distributions | | Capital | | Paid(1) | |
Asset Management Fund | | $ | 3,591,713 | | $ | 2,697,054 | | $ | 6,288,767 | | $ | — | | $ | 6,288,767 | |
Equity Fund | | 881,548 | | — | | 881,548 | | — | | 881,548 | |
Midcap Fund | | 320,948 | | 761,028 | | 1,081,976 | | — | | 1,081,976 | |
SMID Cap Fund | | 44,236 | | 280,548 | | 324,784 | | — | | 324,784 | |
Small Cap Fund | | 12,357,796 | | 25,406,440 | | 37,764,236 | | — | | 37,764,236 | |
| | | | | | | | | | | |
Walden Asset Management Fund | | 715,155 | | 367,798 | | 1,082,953 | | — | | 1,082,953 | |
Walden Equity Fund | | 1,279,080 | | 719,069 | | 1,998,149 | | — | | 1,998,149 | |
Walden Midcap Fund | | 66,025 | | 205,678 | | 271,703 | | — | | 271,703 | |
Walden SMID Cap Fund | | 699,079 | | 237,921 | | 937,000 | | — | | 937,000 | |
Walden Small Cap Fund | | 1,852,143 | | 5,471,637 | | 7,323,780 | | — | | 7,323,780 | |
| | | | | | | | | | | | | | | | |
(1) Total distributions paid may differ from the amount reported in the Statements of Changes in Net Assets because for tax purposes distributions are recognized when actually paid.
Continued
69
Notes to Financial Statements | March 31, 2015 |
As of March 31, 2015, the components of accumulated earnings on a tax basis were as follows:
| | Undistributed | | Undistributed | | | | Accumulated | | Unrealized | | Total | |
| | Ordinary | | Long-Term Capital | | Accumulated | | Capital and Other | | Appreciation | | Accumulated | |
| | Income | | Gains | | Earnings | | Losses | | (Depreciation)(2) | | Earnings (Deficit) | |
Asset Management Fund | | $ | 1,169,040 | | $ | 12,307,365 | | $ | 13,476,405 | | $ | (71,538 | ) | $ | 132,263,471 | | $ | 145,668,338 | |
Equity Fund | | 354,619 | | 4,771,417 | | 5,126,036 | | — | | 47,538,066 | | 52,664,102 | |
Midcap Fund | | 31,929 | | 902,861 | | 934,790 | | — | | 18,989,625 | | 19,924,415 | |
SMID Cap Fund | | 15,655 | | 98,726 | | 114,381 | | — | | 1,298,967 | | 1,413,348 | |
Small Cap Fund | | 1,314,901 | | 28,622,926 | | 29,937,827 | | — | | 92,469,955 | | 122,407,782 | |
| | | | | | | | | | | | | |
Walden Asset Management Fund | | 215,774 | | 3,359,933 | | 3,575,707 | | (3,585 | ) | 23,418,292 | | 26,990,414 | |
Walden Equity Fund | | 411,165 | | 3,660,964 | | 4,072,129 | | (152,443 | ) | 58,699,229 | | 62,618,915 | |
Walden Midcap Fund | | 48,018 | | 359,144 | | 407,162 | | — | | 10,204,134 | | 10,611,296 | |
Walden SMID Cap Fund | | 79,565 | | 425,025 | | 504,590 | | (762 | ) | 5,987,806 | | 6,491,634 | |
Walden Small Cap Fund | | 124,518 | | 5,541,056 | | 5,665,574 | | — | | 18,782,685 | | 24,448,259 | |
| | | | | | | | | | | | | | | | | | | |
(2) The differences between book-basis and tax-basis unrealized appreciation (depreciation) is attributable primarily to tax deferral of losses on wash sales.
As of the end of the tax year ended March 31, 2015, the Funds do not have any capital loss carry forwards (“CLCFs”). During the year ended March 31, 2015, the following Funds utilized CLCFs to offset realized capital gains:
Fund | | Amount | |
Equity Fund | | $ | 868,689 | |
| | | | |
Under current tax law, net investment losses and capital losses realized after October 31 of a Fund’s fiscal year may be deferred and treated as occurring on the first business day of the following fiscal year for tax purposes. The following Funds deferred losses as follows:
| | Late Year | | Post-October | |
Fund | | Ordinary Loss | | Capital Losses | |
Asset Management Fund | | $ | — | | $ | 71,538 | |
Walden Asset Management Fund | | — | | 3,585 | |
Walden Equity Fund | | — | | 152,443 | |
Walden SMID Cap Fund | | 762 | | — | |
| | | | | | | |
As of March 31, 2015, the following reclassifications have been made to increase (decrease) such accounts with offsetting adjustments as indicated:
| | Accumulated Net | | Accumulated Net | | | |
Fund | | Investment Income | | Realized Gains | | Paid in Capital | |
Asset Management Fund | | $ | 9,733 | | $ | (9,733 | ) | $ | — | |
Equity Fund | | — | | (1 | ) | 1 | |
SMID Cap Fund | | (229 | ) | 229 | | — | |
Small Cap Fund | | (88,019 | ) | 88,019 | | — | |
| | | | | | | |
Walden Asset Management Fund | | 4,584 | | (4,584 | ) | — | |
Walden Equity Fund | | (4 | ) | 7 | | (3 | ) |
Walden Midcap Fund | | — | | 1 | | (1 | ) |
Walden Small Cap Fund | | (14,336 | ) | 14,335 | | 1 | |
| | | | | | | | | | |
6. Control Ownership and Principal Holders:
The beneficial ownership, either directly or indirectly, of more than 25% of the voting securities of a Fund creates presumptions of control of the Fund, under section 2 (a)(9) of the 1940 Act. As of March 31, 2015, the Funds had individual shareholder accounts and/or omnibus shareholder accounts (comprised of a group of individual shareholders), owning more than 25% of the total shares outstanding of the Fund as detailed below.
Fund | | Control Ownership | | % of Ownership | |
Asset Management Fund | | Boston Trust & Investment Management Company | | 96.4 | |
Equity Fund | | Boston Trust & Investment Management Company | | 98.1 | |
Midcap Fund | | Boston Trust & Investment Management Company | | 90.7 | |
SMID Cap Fund | | Boston Trust & Investment Management Company | | 69.8 | |
Walden Asset Management Fund | | Boston Trust & Investment Management Company | | 72.7 | |
Walden Equity Fund | | Boston Trust & Investment Management Company | | 29.4 | |
Walden Midcap Fund | | Boston Trust & Investment Management Company | | 96.5 | |
Walden SMID Cap Fund | | Boston Trust & Investment Management Company | | 58.5 | |
Walden Small Cap Fund | | Boston Trust & Investment Management Company | | 44.4 | |
7. Subsequent Events:
On May 20, 2015, the Board approved a change in the limit to the SMID Cap Fund’s aggregate annual operating expenses. Effective June 1, 2015, the expense limit applicable to the SMID Cap Fund is reduced to 0.75% (formerly 1.00%) of that Fund’s average daily net assets. The Board also approved a change to the Trust’s shareholder servicing agreement to exclude the SMID Cap Fund from the agreement. The remaining Funds are unaffected by this change.
Continued
70
Report of Independent Registered Public Accounting Firm
To the Shareholders and Board of Trustees of
The Boston Trust & Walden Funds
We have audited the accompanying statements of assets and liabilities, including the schedules of portfolio investments, of The Boston Trust & Walden Funds comprising the Boston Trust Asset Management Fund, Boston Trust Equity Fund, Boston Trust Midcap Fund, Boston Trust SMID Cap Fund, Boston Trust Small Cap Fund, Walden Asset Management Fund, Walden Equity Fund, Walden Midcap Fund, Walden SMID Cap Innovations Fund and Walden Small Cap Innovations Fund (the “Funds”) as of March 31, 2015, and the related statements of operations for the year then ended, the statements of changes in net assets for each of the two years in the period then ended, and the financial highlights for each of the five years in the period then ended for Boston Trust Asset Management Fund, Boston Trust Equity Fund, Boston Trust Midcap Fund, Boston Trust Small Cap Fund, Walden Asset Management Fund, Walden Equity Fund and Walden Small Cap Innovations Fund, the related statements of operations for the year then ended, statements of changes in net assets for each of the two years in the period then ended, and the financial highlights for each of the four periods in the period then ended for the Boston Trust SMID Cap Fund and Walden Midcap Fund, and the related statement of operations for the year then ended, statements of changes in net assets for each of the two years in the period then ended, and financial highlights for each of the three periods in the period then ended for the Walden SMID Cap Innovations Fund. These financial statements and financial highlights are the responsibility of the Funds’ management. Our responsibility is to express an opinion on these financial statements and financial highlights based on our audits.
We conducted our audits in accordance with the standards of the Public Company Accounting Oversight Board (United States). Those standards require that we plan and perform the audit to obtain reasonable assurance about whether the financial statements and financial highlights are free of material misstatement. An audit includes examining, on a test basis, evidence supporting the amounts and disclosures in the financial statements. Our procedures included confirmation of securities owned as of March 31, 2015, by correspondence with the custodian and brokers or by other appropriate auditing procedures where replies from brokers were not received. An audit also includes assessing the accounting principles used and significant estimates made by management, as well as evaluating the overall financial statement presentation. We believe that our audits provide a reasonable basis for our opinion.
In our opinion, the financial statements and financial highlights referred to above present fairly, in all material respects, the financial position of each of the Funds constituting The Boston Trust & Walden Funds as of March 31, 2015, the results of their operations, the changes in their net assets, and the financial highlights for the periods indicated above, in conformity with accounting principles generally accepted in the United States of America.

COHEN FUND AUDIT SERVICES, LTD.
Cleveland, Ohio
May 26, 2015
71
Supplementary Information (Unaudited) | March 31, 2015 |
Federal Income Tax Information:
During the fiscal year ended March 31, 2015, the Funds declared long-term realized gain distributions in the following amounts:
| | 15% Capital Gains | |
Asset Management Fund | | $ | 7,480,276 | |
Equity Fund | | 2,029,175 | |
Midcap Fund | | 1,765,084 | |
SMID Cap Fund | | 223,676 | |
Small Cap Fund | | 25,889,299 | |
Walden Asset Management Fund | | 519,966 | |
Walden Equity Fund | | 6,602,715 | |
Walden Midcap Fund | | 907,147 | |
Walden SMID Cap Fund | | 133,340 | |
Walden Small Cap Fund | | 6,158,936 | |
| | | | |
During the fiscal year ended March 31, 2015, the Funds declared short-term realized gain distributions in the following amounts:
| | Short-Term Capital Gains | |
Asset Management Fund | | $ | 950,063 | |
Midcap Fund | | 246,424 | |
SMID Cap Fund | | 40,841 | |
Small Cap Fund | | 5,456,543 | |
Walden Asset Management Fund | | 39,077 | |
Walden Equity Fund | | 824,644 | |
Walden Midcap Fund | | 234,085 | |
Walden SMID Cap Fund | | 430,443 | |
Walden Small Cap Fund | | 526,896 | |
| | | | |
For the fiscal year ended March 31, 2015, the following percentage of the total ordinary income distributions paid by the Funds qualify for the distributions received deduction available to corporate shareholders.
| | Distributions Received Deduction | |
Asset Management Fund | | 97.02 | % |
Equity Fund | | 100.00 | % |
Midcap Fund | | 97.42 | % |
SMID Cap Fund | | 72.24 | % |
Small Cap Fund | | 46.49 | % |
Walden Asset Management Fund | | 100.00 | % |
Walden Equity Fund | | 100.00 | % |
Walden Midcap Fund | | 100.00 | % |
Walden SMID Cap Fund | | 39.65 | % |
Walden Small Cap Fund | | 61.66 | % |
For the fiscal year ended March 31, 2015, distributions paid by the Funds may be subject to a maximum tax rate of 15%, as provided for by the Jobs and Growth Tax Relief Reconciliation Act of 2003. The Funds intend to designate the maximum amount allowable as taxed at a maximum rate of 15%. Complete information will be reported in conjunction with your 2014 Form 1099-DIV.
| | Qualified Dividend Income | |
Asset Management Fund | | 100.00 | % |
Equity Fund | | 100.00 | % |
Midcap Fund | | 98.08 | % |
SMID Cap Fund | | 72.30 | % |
Small Cap Fund | | 46.37 | % |
Walden Asset Management Fund | | 100.00 | % |
Walden Equity Fund | | 100.00 | % |
Walden Midcap Fund | | 100.00 | % |
Walden SMID Cap Fund | | 39.64 | % |
Walden Small Cap Fund | | 61.65 | % |
Continued
72
Table of Shareholder Expenses:
As a shareholder of the Trust, you incur ongoing costs, including management fees, and other Fund expenses. These examples are intended to help you understand your ongoing costs (in dollars) of investing in the Boston Trust Funds & Walden Funds and to compare these costs with the ongoing costs of investing in other mutual funds.
These examples are based on an investment of $1,000 invested at the beginning of the period and held for the entire period from October 1, 2014, through March 31, 2015.
Actual Expenses
The table below provides information about actual account values and actual expenses. You may use the information below together with the amount you invested, to estimate the expenses that you paid over the period. Simply divide your account value by $1,000 (for example, an $8,600 account value divided by $1,000 = 8.6), then multiply the result by the number in the table under the heading entitled “Expenses Paid During Period” to estimate the expenses you paid on your account during this period.
Please note that the expenses shown in the table are meant to highlight your ongoing costs only and do not reflect the costs incurred by the Funds for buying and selling securities. The Funds do not charge transaction fees, such as redemption fees, nor do the Funds charge a sales charge (load). Therefore, the table is useful in comparing ongoing costs only, and will not help you determine the relative total costs of owning different funds.
| | | | | | | | Annualized | |
| | | | | | Expenses Paid | | Expense Ratio | |
| | Beginning Account Value | | Ending Account Value | | During Period(1) | | During Period | |
| | 10/1/14 | | 3/31/15 | | 10/1/14 - 3/31/15 | | 10/1/14 - 3/31/15 | |
Asset Management Fund | | $ | 1,000.00 | | $ | 1,050.40 | | $ | 4.75 | | 0.93 | % |
Equity Fund | | 1,000.00 | | 1,047.10 | | 4.90 | | 0.96 | % |
Midcap Fund | | 1,000.00 | | 1,098.80 | | 5.23 | | 1.00 | % |
SMID Cap Fund | | 1,000.00 | | 1,124.40 | | 5.30 | | 1.00 | % |
Small Cap Fund | | 1,000.00 | | 1,115.40 | | 5.27 | | 1.00 | % |
Walden Asset Management Fund | | 1,000.00 | | 1,038.60 | | 5.08 | | 1.00 | % |
Walden Equity Fund | | 1,000.00 | | 1,044.50 | | 5.10 | | 1.00 | % |
Walden Midcap Fund | | 1,000.00 | | 1,092.20 | | 5.22 | | 1.00 | % |
Walden SMID Cap Fund | | 1,000.00 | | 1,122.60 | | 5.29 | | 1.00 | % |
Walden Small Cap Fund | | 1,000.00 | | 1,115.60 | | 5.28 | | 1.00 | % |
| | | | | | | | | | | | |
(1) Expenses are equal to the Fund’s annualized expense ratio multipled by the average account value over the period multiplied by 182/365 (to reflect the one-half year period).
Hypothetical Example for Comparison Purposes
The table below provides information about hypothetical account values and hypothetical expenses based on each Fund’s actual expense ratio and an assumed rate of return of 5% per year before expenses, which is not the Fund’s actual return. The hypothetical account values and expenses may not be used to estimate the actual ending account balance or expenses you paid for the period. You may use this information to compare this 5% hypothetical example with the 5% hypothetical examples that appear in the shareholder reports of other funds.
Please note that the expenses shown in the table are meant to highlight your ongoing costs only and do not reflect the costs incurred by the Funds for buying and selling securities. The Funds do not charge transaction fees, such as redemption fees, nor do the Funds charge a sales charge (load). Therefore, the table is useful in comparing ongoing costs only, and will not help you determine the relative total costs of owning different funds.
| | | | | | | | Annualized | |
| | | | | | Expenses Paid | | Expense Ratio | |
| | Beginning Account Value | | Ending Account Value | | During Period(1) | | During Period | |
| | 10/1/14 | | 3/31/15 | | 10/1/14 - 3/31/15 | | 10/1/14 - 3/31/15 | |
Asset Management Fund | | $ | 1,000.00 | | $ | 1,020.29 | | $ | 4.68 | | 0.93 | % |
Equity Fund | | 1,000.00 | | 1,020.14 | | 4.84 | | 0.96 | % |
Midcap Fund | | 1,000.00 | | 1,019.95 | | 5.04 | | 1.00 | % |
SMID Cap Fund | | 1,000.00 | | 1,019.95 | | 5.04 | | 1.00 | % |
Small Cap Fund | | 1,000.00 | | 1,019.95 | | 5.04 | | 1.00 | % |
Walden Asset Management Fund | | 1,000.00 | | 1,019.95 | | 5.04 | | 1.00 | % |
Walden Equity Fund | | 1,000.00 | | 1,019.95 | | 5.04 | | 1.00 | % |
Walden Midcap Fund | | 1,000.00 | | 1,019.95 | | 5.04 | | 1.00 | % |
Walden SMID Cap Fund | | 1,000.00 | | 1,019.95 | | 5.04 | | 1.00 | % |
Walden Small Cap Fund | | 1,000.00 | | 1,019.95 | | 5.04 | | 1.00 | % |
| | | | | | | | | | | | |
(1) Expenses are equal to the Fund’s annualized expense ratio multipled by the average account value over the period multiplied by 182/365 (to reflect the one-half year period).
Continued
73
Tabular Summary of Schedules of Portfolio Investments:
The Boston Trust Funds invested, as a percentage of total net assets, in the following industries as of March 31, 2015.
Asset Management Fund
| | Percentage of Total | |
Security Allocation for the Schedule of Portfolio Investments | | Net Assets | |
U.S. Government & U.S. Government Agency Obligations | | 17.0 | % |
Financials | | 14.6 | % |
Information Technology | | 13.6 | % |
Industrials | | 13.1 | % |
Health Care | | 12.6 | % |
Consumer Discretionary | | 10.0 | % |
Consumer Staples | | 9.6 | % |
Energy | | 4.9 | % |
Municipal Bonds | | 1.7 | % |
Materials | | 1.7 | % |
Investment Companies | | 1.1 | % |
Other net assets | | 0.1 | % |
Total | | 100.0 | % |
Equity Fund
| | Percentage of Total | |
Security Allocation for the Schedule of Portfolio Investments | | Net Assets | |
Financials | | 16.7 | % |
Information Technology | | 16.3 | % |
Health Care | | 16.1 | % |
Industrials | | 15.9 | % |
Consumer Staples | | 12.3 | % |
Consumer Discretionary | | 12.3 | % |
Energy | | 5.8 | % |
Investment Companies | | 2.5 | % |
Materials | | 2.0 | % |
Utilities | | 0.3 | % |
Other net assets | | -0.2 | % |
Total | | 100.0 | % |
Midcap Fund
| | Percentage of Total | |
Security Allocation for the Schedule of Portfolio Investments | | Net Assets | |
Financials | | 17.9 | % |
Consumer Discretionary | | 15.8 | % |
Industrials | | 15.0 | % |
Health Care | | 14.9 | % |
Information Technology | | 12.6 | % |
Consumer Staples | | 7.9 | % |
Materials | | 4.4 | % |
Utilities | | 4.0 | % |
Energy | | 3.9 | % |
Investment Companies | | 2.4 | % |
Real Estate Investment Trusts | | 1.7 | % |
Other net assets | | -0.5 | % |
Total | | 100.0 | % |
SMID Cap Fund
| | Percentage of Total | |
Security Allocation for the Schedule of Portfolio Investments | | Net Assets | |
Financials | | 18.5 | % |
Industrials | | 15.7 | % |
Information Technology | | 15.6 | % |
Health Care | | 14.5 | % |
Consumer Discretionary | | 14.3 | % |
Materials | | 6.2 | % |
Utilities | | 4.5 | % |
Real Estate Investment Trusts | | 3.6 | % |
Consumer Staples | | 2.8 | % |
Energy | | 2.5 | % |
Investment Companies | | 1.8 | % |
Other net assets | | 0.0 | % |
Total | | 100.0 | % |
Small Cap Fund
| | Percentage of Total | |
Security Allocation for the Schedule of Portfolio Investments | | Net Assets | |
Information Technology | | 17.1 | % |
Financials | | 16.6 | % |
Consumer Discretionary | | 14.6 | % |
Health Care | | 14.5 | % |
Industrials | | 14.2 | % |
Materials | | 5.9 | % |
Real Estate Investment Trusts | | 5.1 | % |
Utilities | | 4.5 | % |
Consumer Staples | | 3.5 | % |
Energy | | 3.1 | % |
Investment Companies | | 0.6 | % |
Other net assets | | 0.3 | % |
Total | | 100.0 | % |
Continued
74
The Walden Funds invested, as a percentage of total net assets, in the following industries as of March 31, 2015.
Walden Asset Management Fund
| | Percentage of Total | |
Security Allocation for the Schedule of Portfolio Investments | | Net Assets | |
U.S. Government & U.S. Government Agency Obligations | | 18.4 | % |
Financials | | 14.2 | % |
Information Technology | | 14.2 | % |
Health Care | | 12.4 | % |
Industrials | | 10.5 | % |
Consumer Discretionary | | 10.4 | % |
Consumer Staples | | 9.3 | % |
Energy | | 3.8 | % |
Materials | | 3.0 | % |
Investment Companies | | 1.4 | % |
Utilities | | 1.4 | % |
Municipal Bonds | | 0.7 | % |
Telecommunication Services | | 0.1 | % |
Other net assets | | 0.2 | % |
Total | | 100.0 | % |
Walden Equity Fund
| | Percentage of Total | |
Security Allocation for the Schedule of Portfolio Investments | | Net Assets | |
Information Technology | | 17.2 | % |
Financials | | 15.9 | % |
Health Care | | 15.3 | % |
Industrials | | 14.6 | % |
Consumer Discretionary | | 14.1 | % |
Consumer Staples | | 11.9 | % |
Energy | | 4.8 | % |
Materials | | 3.5 | % |
Utilities | | 1.9 | % |
Investment Companies | | 0.6 | % |
Other net assets | | 0.2 | % |
Total | | 100.0 | % |
Walden Midcap Fund
| | Percentage of Total | |
Security Allocation for the Schedule of Portfolio Investments | | Net Assets | |
Financials | | 17.2 | % |
Industrials | | 15.2 | % |
Health Care | | 15.2 | % |
Consumer Discretionary | | 14.8 | % |
Information Technology | | 12.7 | % |
Consumer Staples | | 8.3 | % |
Materials | | 4.5 | % |
Energy | | 4.2 | % |
Utilities | | 3.7 | % |
Investment Companies | | 2.4 | % |
Real Estate Investment Trusts | | 1.8 | % |
Other net assets | | 0.0 | % |
Total | | 100.0 | % |
Walden SMID Cap Innovations Fund
| | Percentage of Total | |
Security Allocation for the Schedule of Portfolio Investments | | Net Assets | |
Financials | | 18.9 | % |
Industrials | | 15.9 | % |
Information Technology | | 15.6 | % |
Health Care | | 14.5 | % |
Consumer Discretionary | | 14.5 | % |
Materials | | 6.1 | % |
Utilities | | 4.5 | % |
Real Estate Investment Trusts | | 4.0 | % |
Consumer Staples | | 2.7 | % |
Energy | | 2.5 | % |
Investment Companies | | 0.8 | % |
Other net assets | | 0.0 | % |
Total | | 100.0 | % |
Walden Small Cap Innovations Fund
| | Percentage of Total | |
Security Allocation for the Schedule of Portfolio Investments | | Net Assets | |
Information Technology | | 16.9 | % |
Financials | | 16.6 | % |
Consumer Discretionary | | 14.8 | % |
Health Care | | 14.7 | % |
Industrials | | 14.2 | % |
Materials | | 6.0 | % |
Real Estate Investment Trusts | | 5.0 | % |
Utilities | | 4.4 | % |
Consumer Staples | | 3.7 | % |
Energy | | 3.0 | % |
Investment Companies | | 0.4 | % |
Other net assets | | 0.3 | % |
Total | | 100.0 | % |
Other Information:
A description of the policies and guidelines that the Funds use to determine how to vote proxies related to portfolio securities is available: (i) without charge, upon request, by calling 1-800-282-8782 ext. 7050, and (ii) on the Securities and Exchange Commission’s (the “Commission”) website at http://www.sec.gov.
Proxy voting policies and guidelines as well as information regarding how the Funds voted proxies relating to portfolio securities during the most recent 12-month period ended June 30 is available (i) without charge, upon request, by calling 1-800-282-8782 ext. 7050, (ii) on the Boston Trust & Investment Management, Inc. website at http://www.btim.com; and (iii) on the Commission’s website at http://www.sec.gov.
The Funds file complete schedules of portfolio holdings for each Fund with the Commission for the first and third quarters of each fiscal year on Form N-Q. The Funds’ Form N-Q is available on the Commission’s website at http://www.sec.gov. The Funds’ Form N-Q may be reviewed and copied at the Commission’s Public Reference Room in Washington, D.C. and information on the operation of the Public Reference Room may be obtained by calling 800-SEC-0330.
Continued
75
The annual consideration by the Board of Trustees (the “Board”) of the continuation of the investment advisory agreement between Boston Trust Investment Management, Inc., (the “Adviser”) and Boston Trust Asset Management Fund, Boston Trust Equity Fund, Boston Trust Midcap Fund, Boston Trust SMID Cap Fund, Boston Trust Small Cap Fund, Walden Asset Management Fund, Walden Equity Fund, Walden Midcap Fund, Walden SMID Cap Innovations Fund and Walden Small Cap Innovations Fund (the “Funds”).
Section 15 of the Investment Company Act of 1940 (the “1940 Act”) requires that the Investment Advisory Agreement with the Boston Trust Investment Management, Inc. (the “Adviser”) be renewed annually by the Board, including a majority of the Board of Trustees of The Boston Trust & Walden Funds (the “Trust”) who are not “interested persons” of the Trust or of the Adviser (“Independent Trustees”). It is the duty of the Board to request as much information as is reasonably necessary to evaluate the terms of the Investment Advisory Agreement and determine whether its continuance is fair to the Funds and their shareholders. The Board considered the continuation of the Investment Advisory Agreement at an in-person meeting held on February 27, 2015. The Board requested, and the Adviser provided, information and data relating to: (i) the investment performance of each series of the Trust (the “Funds”) and the Adviser; (ii) the nature, extent and quality of the services provided by the Adviser to the Funds; (iii) the cost of the services to be provided and the profits to be realized by the Adviser and its affiliates from the relationship with the Funds; (iv) the extent to which economies of scale will be realized as the Funds grow; (v) whether the fee levels reflect these economies of scale to the benefit of Funds’ shareholders; (vi) the advisory fees paid by other comparable funds advised by the Adviser or by a different investment adviser; (vii) the Funds’ expense ratios and the expense ratios of similar funds; and (viii) the effect of any fee waivers and expense reimbursements made by the Adviser.
At the meeting on February 27, 2015, the Board engaged in a thorough review process to determine whether to continue the Investment Advisory Agreement. The Board met directly with representatives of the Adviser and reviewed the information and data listed above, as supplemented by Citi Fund Services Ohio, Inc., the Trust’s administrator. As part of its deliberations, the Board also considered and relied upon the information about the Funds and the Adviser that it had received throughout the year as part of its ongoing oversight of the Funds and their operations. The Board reviewed the performance of the Boston Trust Funds and the Walden Funds from inception through December 31, 2014, comparing the performance to various indices and also, in the case of the Boston Trust Asset Management Fund and the Walden Asset Management Fund, to a bond index, equity index and Treasury bills. The Board noted that as of all of the Funds except the Walden Mid Cap Fund underperformed their respective indices for the one-year period and all of the Funds underperformed their respective indices for the three-year and five-year periods. For the 10-year period, all of the Funds except the Boston Trust Small Cap Fund underperformed their respective indices. The Boston Trust Equity Fund, the Boston Trust SMID Cap Fund, the Walden Midcap Fund, the Walden SMID Cap Innovations Fund and the Walden Small Cap Innovations Fund each also underperformed their respective indices for the since inception period, while the Boston Trust Midcap Fund, Boston Trust Small Cap and the Walden Equity Fund outperformed their respective indices for the same period. While the Boston Trust Asset Management Fund underperformed the S&P 500 Index for all periods, it outperformed the 90 Day US Treasury Bills and the Barclays Capital G/C Bond Index for all periods. The Walden Asset Management Fund underperformed the S&P 500 Index for all periods other than the since inception period, and outperformed the 90 Day US Treasury Bills for all periods. The Walden Asset Management Fund outperformed the Barclays Capital G/C Bond Index for all periods other than the since inception period. The Board noted the Adviser’s statements that while the Funds underperformed their benchmarks, they participated in the rising market and outperformed their benchmarks in falling markets. The information also demonstrated the downside protection that is part of the Adviser’s strategy that is routinely communicated to clients and investors.
The Board then turned to a review of the range of advisory fees paid by the Boston Trust Funds and Walden Funds to the Adviser and the total operating expenses of each Fund. The Board noted that, with the exception of the Boston Trust Asset Management Fund, Walden Asset Management Fund, Boston Trust Equity and the Walden Equity Fund, each Boston Trust Fund and Walden Fund has contractual advisory fees below the peer group average. The contractual advisory fees for the Boston Trust Asset Management Fund and Walden Asset Management Fund are 0.03% above the median fees for the peer group and 0.25% below the highest fees in the peer group. The contractual advisory fees charged by the Boston Trust Equity Fund and the Walden Equity Fund are 0.06% above the median fees for the peer group and 0.25% below the highest fees in the peer group.
The Board noted that BTIM has been operating under an Expense Limitation Agreement that requires BTIM to waive fees and/or reimburse expenses to the extent total operating expenses of any Fund (other than the Walden International Equity Fund) exceeds 1.00%. The expense limit for the Walden International Equity Fund is 1.15%. The actual advisory fees charged by all the Boston Trust and Walden Funds, except the Boston Trust Asset Management Fund, the Boston Trust Equity Fund and the Walden Asset Management Fund, are below the peer group average after expense waivers and/or reimbursements. The actual advisory fees for the Boston Trust Asset Management Fund is 0.03% above the average for the peer group, while the actual advisory fees for the Boston Trust Equity Fund is 0.06% above the peer group average. The actual advisory fees for the Walden Asset Management Fund is equal to the average for the peer group. However, after waivers and reimbursements, the Boston Trust Asset Management Fund, the Walden Asset Management Fund and the Boston Trust Equity Fund were all well below the peer group’s highest fee of 1.00%.
Continued
76
Turning to total operating expenses, the Board noted that the expense ratios for all the Boston Trust Funds and Walden Funds, other than the Boston Trust SMID Cap Fund and the Walden Equity Fund, are equal to or lower than the industry average before and after expense waivers and/or reimbursements. The expense ratio for the Boston SMID Cap Fund before waivers and/or reimbursements is 0.34% higher than the peer group average, but 0.15% lower than the highest expense ratio in the peer group and 0.21% lower than the average expense ratio for the peer group after waivers and/or reimbursements. The expense ratio for the Walden Equity Fund before waivers and/or reimbursements is 0.10% higher than the peer group average and 0.03% higher after waivers and/or reimbursements. However, the Walden Equity Fund’s expense ratio is 0.52% lower than the highest expense ratio in the peer group before waivers and/or reimbursements and 0.59% lower than the a highest expense ratio in the peer group after waivers and/or reimbursements. After considering the comparative data as described above, and the proposed renewal of the Expense Limitation Agreement, the Board concluded that the advisory fees and expense ratios were reasonable.
The Board then gave careful consideration to the nature, extent and quality of the services provided by the Adviser. The Trustees reviewed the Adviser’s organizational structure and the investment philosophy, portfolio construction process, fixed income approach and brokerage policies of the Adviser and its parent, Boston Trust & Investment Management Company (“Boston Trust”). The Board considered the Adviser’s up-capture and down-capture performance and the portfolio management’s approach to sustainable, responsible impact investing, including its ESG research framework and its portfolio screening guidelines. The Board reviewed the Adviser’s experience and the capabilities of its personnel, as well as the quality of the reports and other materials received from the Adviser. The Board reviewed biographical information about the employees of the Adviser and Boston Trust and discussed the Adviser’s succession planning and compliance program. Taking into account the personnel involved in servicing the Funds, as well as the materials and services described above, the Board expressed satisfaction with the quality of the services received from the Adviser.
Next, in reviewing the costs of the services to be provided and the profits to be realized by the Adviser, the Board reviewed the Adviser’s income statements for calendar years 2013 and 2014 and the gross and net profit margins realized on each Fund. The Board noted that the adviser’s relationship with the Funds was profitable even though the Adviser was operating under an Expense Limitation Agreement with the Trust. The Board discussed the custody and transfer agency fees earned by Boston Trust for services provided to the Funds, which are reduced by amounts paid for sub-custody services.
In reaching its conclusions with respect to the continuation of the Investment Advisory Agreement, the Board did not identify any single controlling factor. Rather, the Board noted that a combination of factors influenced their decision making process. The Board did, however, identify the commitment of the Adviser to the successful operation of the Funds and the level of Fund expenses as being important elements of their consideration. The Board took notice of the fact that the Adviser has maintained an Expense Limitation Agreement with respect to each of the Funds since the inception of each Fund pursuant to which total operating expenses for each of the Funds is limited, which the Board noted benefits shareholders in each of the Funds. The Board took further notice of the fact that the Adviser has agreed to continue the Expense Limitation Agreement for each of the Funds. Based upon their review and consideration of these factors and other matters deemed relevant by the Board in reaching an informed business judgment, a majority of the Board, including a majority of the Independent Trustees, concluded that the terms of the Investment Advisory Agreement are fair and reasonable and the Board voted to renew the Investment Advisory Agreement for an additional one-year period.
77
Information about Trustees and Officers (Unaudited) | March 31, 2015 |
Overall responsibility for management of the Funds rests with the Board of Trustees. The names of the Trustees and Officers of the Funds, their addresses, ages and principal occupations during the past five years are provided in the tables below. The business address of the persons listed below is 3435 Stelzer Road, Columbus, Ohio 43219-3035, unless otherwise listed. Trustees who are deemed “interested persons,” as defined in the Investment Company Act of 1940, are referred to as Interested Trustees. Trustees who are not interested persons are referred to as Independent Trustees. The Funds’ Statement of Additional Information includes additional information about the Funds’ Trustees and is available, without charge and upon request, by calling 1-800-282-8782 or by visiting www.btim.com.
| | | | | | | | | | Other |
| | | | | | | | Number of Funds | | Directorships |
| | Position(s) | | Term of Office* | | | | in Fund Complex | | Held by Trustee |
Name, | | Held with | | and Length of | | Principal Occupation(s) | | Overseen by | | during the past |
Date of Birth | | the Funds | | Time Served | | During Past Five Years | | Trustee | | five years |
INTERESTED TRUSTEES | | | | | | | | | | |
| | | | | | | | | | |
Lucia B. Santini One Beacon Street 33rd Floor Boston, MA 02108 Date of Birth: 10/2/1958 | | Trustee and President | | Since 2011 | | Managing Director, Boston Trust Investment Management, Inc., February 2001 to present. | | 10 | | None |
| | | | | | | | | | |
Heidi Soumerai One Beacon Street 33rd Floor Boston, MA 02108 Date of Birth: 9/14/1957 | | Trustee | | Since 2013 | | Senior Vice President and Director of ESG Research, Boston Trust & Investment Management Company, August 2004 to present; Research Analyst, Boston Trust & Investment Management, January 1985 to present. | | 10 | | None |
| | | | | | | | | | |
INDEPENDENT TRUSTEES | | | | | | | | | | |
| | | | | | | | | | |
Michael M. Van Buskirk Date of Birth: 2/22/1947 | | Trustee and Chairman of the Board | | Since 1992 | | President and Chief Executive Officer, Ohio Bankers League, May 1991 to December 2013. | | 10 | | Advisers Investment Trust |
| | | | | | | | | | |
Diane E. Armstrong Date of Birth: 7/2/1964 | | Trustee | | Since 2004 | | President, Armstrong Financial Services (financial planning firm), November 2012 to present; Managing Director of Financial Planning Services, WealthStone (financial planning firm), July 2008 to November 2012. | | 10 | | None |
| | | | | | | | | | |
Dr. James H. Woodward Date of Birth: 11/24/1939 | | Trustee | | Since 2006 | | Chancellor Emeritus, University of North Carolina at Charlotte, August 2005 to present. Chancellor, North Carolina State University, June 2009 to April 2010. | | 10 | | None |
| | | | | | | | | | |
OFFICERS WHO ARE NOT TRUSTEES | | | | | | | | |
| | | | | | | | | | |
Jennifer Ellis One Beacon Street 33rd Floor Boston, MA 02108 Date of Birth: 7/29/1972 | | Treasurer | | Since 2011 | | Chief Financial Officer/Treasurer, Boston Trust & Investment Management Company, May 2011 to present; Finance Director, Bain Capital, June 2008 to May 2010. | | N/A | | N/A |
| | | | | | | | | | |
Curtis Barnes 100 Summer Street Boston, MA 02110 Date of Birth: 9/24/1953 | | Secretary | | Since 2007 | | Senior Vice President, Citi Fund Services Ohio, Inc. (fund administrator), May 1995 to present. | | N/A | | N/A |
| | | | | | | | | | |
Charles Booth** Date of Birth: 4/4/1960 | | Chief Compliance Officer | | Since 2015 | | Director, Citi Fund Services Ohio, Inc. (fund administrator), May 2007 to present. | | N/A | | N/A |
* Trustees hold their position with the Funds until their resignation or removal. Officers hold their positions with the Funds until a successor has been duly elected and qualified.
** Frederick Schmidt resigned as the Chief Compliance Officer effective May 1, 2015 and was replaced by Charles Booth. Mr. Booth serves as Chief Compliance Officer. His compensation is reviewed and approved by the Board of Trustees and paid by Citi pursuant to a Compliance Services Agreement between Citi and the Trust. The fee paid pursuant to the Compliance Services Agreement by the Fund is not indicative of the total compensation received by Mr. Booth.
Ms. Santini and Ms. Soumerai are considered “interested persons” of the Trust as defined in the 1940 Act due to their employment with Boston Trust Investment Management, Inc., the Funds’ Investment Adviser.
78
This page intentionally left blank.
79
This page intentionally left blank.
80
This page intentionally left blank.
81
Investment Adviser
Boston Trust Investment Management, Inc.
One Beacon Street
Boston, MA 02108
Custodian and Transfer Agent
Boston Trust & Investment Management Company
One Beacon Street
Boston, MA 02108
Administrator
Citi Fund Services Ohio, Inc.
3435 Stelzer Road
Columbus, OH 43219
Distributor
BHIL Distributors, Inc.
4041 N. High Street, Suite 402
Columbus, OH 43214
Independent Registered Public Accounting Firm
Cohen Fund Audit Services, Ltd.
1350 Euclid Avenue, Suite 800
Cleveland, OH 44115
Legal Counsel
Thompson Hine LLP
41 South High Street, Suite 1700
Columbus, OH 43215
This report is intended for the shareholders of the Funds and may not be used as sales literature unless preceded or accompanied by a current prospectus.
Past performance results shown should not be considered a representation of future performance. Share price and returns will fluctuate so that shares, when redeemed, may be worth more or less than their original cost. Statements and other information herein are dated and subject to change.
05/15
Item 2. Code of Ethics.
(a) The registrant has adopted a code of ethics that applies to the registrant’s principal executive officer, principal financial officer, principal accounting officer or controller, or persons performing similar functions. This code of ethics is included as an Exhibit.
(b) During the period covered by the report, with respect to the registrant’s code of ethics that applies to its principal executive officer, principal financial officer, principal accounting officer or controller, or persons performing similar functions; there have been no amendments to, nor any waivers granted from, a provision that relates to any element of the code of ethics definition enumerated in paragraph (b) of this Item 2.
Item 3. Audit Committee Financial Expert.
3(a)(1) The registrant’s board of directors has determined that the registrant has at least one audit committee financial expert serving on its audit committee.
3(a)(2) The audit committee financial expert is Diane Armstrong, who is “independent” for purposes of this Item 3 of Form N-CSR.
Item 4. Principal Accountant Fees and Services.
| | | | 2015 | | 2014 | |
(a) | | Audit Fees | | $ | 97,500 | | $ | 95,000 | |
| | | | | | | |
(b) | | Audit-Related Fees | | $ | 15,000 | | $ | 15,000 | |
The fees for 2014 relate to the consent issuance in three Form 17f-2 filings filed with the Securities and Exchange Commission (“SEC”).
The fees for 2015 relate to the consent issuance in three Form 17f-2 filings filed with the SEC.
| | | | 2015 | | 2014 | |
(c) | | Tax Fees | | $ | 25,000 | | $ | 25,000 | |
| | | | | | | | | |
Tax fees for both years related to the preparation of the Funds’ federal and state income tax returns, federal excise tax return review and review of capital gain and income distribution calculations.
| | | | 2015 | | 2014 | |
(d) | | All Other Fees | | $ | 0 | | $ | 0 | |
| | | | | | | | | |
Item 5. Audit Committee of Listed Registrants.
Not applicable.
Item 6. Investments.
(a) Included as part of the report to shareholders filed under Item 1.
(b) Not applicable.
Item 7. Disclosure of Proxy Voting Policies and Procedures for Closed-End Management Investment Companies.
Not applicable.
Item 8. Portfolio Managers of Closed-End Management Investment Companies.
Not applicable
Item 9. Purchases of Equity Securities by Closed-End Management Investment Company and Affiliated Purchasers.
Not applicable.
Item 10. Submission of Matters to a Vote of Security Holders.
Not applicable.
Item 11. Controls and Procedures.
(a) The registrant’s principal executive officer and principal financial officer have concluded, based on their evaluation of the registrant’s disclosure controls and procedures as conducted within 90 days of the filing date of this report, that these disclosure controls and procedures are adequately designed and are operating effectively to ensure that information required to be disclosed by the registrant on Form N-CSR is recorded, processed, summarized and reported within the time periods specified in the Securities and Exchange Commission’s rules and forms.
(b) There were no changes in the registrant’s internal control over financial reporting (as defined in Rule 30a-3(d) under the Act (17 CFR 270.30a-3(d)) that occurred during the second fiscal quarter of the period covered by this report that have materially affected or are reasonably likely to materially affect, the registrant’s internal control over financial reporting.
Item 12. Exhibits.
(a)(1) The code of ethics that is the subject of the disclosure required by Item 2 is attached hereto.
(a)(2) Certifications pursuant to Rule 30a-2(a) are attached hereto.
(a)(3) Not applicable.
(b) Certifications pursuant to Rule 30a-2(b) are furnished herewith
SIGNATURES
Pursuant to the requirements of the Securities Exchange Act of 1934 and the Investment Company Act of 1940, the registrant has duly caused this report to be signed on its behalf by the undersigned, thereunto duly authorized.
(Registrant) | The Boston Trust & Walden Funds | | |
| | | |
| | | |
By (Signature and Title)* | /s/ Lucia Santini, President | | |
| | | |
| | | |
Date | May 26, 2015 | | |
| | | | | | |
Pursuant to the requirements of the Securities Exchange Act of 1934 and the Investment Company Act of 1940, this report has been signed below by the following persons on behalf of the registrant and in the capacities and on the dates indicated.
By (Signature and Title)* | /s/ Lucia Santini, President | | |
| | | |
| | | |
Date | May 26, 2015 | | |
| | | |
| | | |
By (Signature and Title)* | /s/ Jennifer Ellis, Treasurer | | |
| | | |
| | | |
Date | May 26, 2015 | | |
| | | | | |
