UNITED STATES
SECURITIES AND EXCHANGE COMMISSION
Washington, D.C. 20549
FORM N-CSR
CERTIFIED SHAREHOLDER REPORT OF REGISTERED
MANAGEMENT INVESTMENT COMPANIES
| | | | |
| Investment Company Act file number | 811-06526 | | |
| The Boston Trust & Walden Funds | |
| (Exact name of registrant as specified in charter) | |
| One Beacon Street, Boston, MA | 02108 | |
| (Address of principal executive offices) | (Zip code) | |
| 3435 Stelzer Rd. Columbus, OH | 43219 | |
| (Name and address of agent for service) | |
| | |
| Registrant’s telephone number, including area code: 1-800-282-8782 | |
| | |
| Date of fiscal year end: March 31 | |
| Date of reporting period: March 31, 2013 | |
Item 1. Reports to Stockholders.
| | Annual Report
March 31, 2013 | |  |
Table of Contents | | | | |
| Economic and Market Summary | | 3 | | |
| | | | | |
| Boston Trust Asset Management Fund | | | | |
Manager Commentary | | 4 | | |
Investment Performance | | 5 | | |
Schedule of Portfolio Investments | | 12 | | |
Financial Statements | | 14 | | |
Financial Highlights | | 16 | | |
| | | | | |
| Boston Trust Equity Fund | | | | |
Manager Commentary | | 4 | | |
Investment Performance | | 5 | | |
Schedule of Portfolio Investments | | 17 | | |
Financial Statements | | 18 | | |
Financial Highlights | | 20 | | |
| | | | | |
| Boston Trust Midcap Fund | | | | |
Manager Commentary | | 6 | | |
Investment Performance | | 7 | | |
Schedule of Portfolio Investments | | 21 | | |
Financial Statements | | 22 | | |
Financial Highlights | | 24 | | |
| | | | | |
| Boston Trust SMID Cap Fund | | | | |
Manager Commentary | | 8 | | |
Investment Performance | | 9 | | |
Schedule of Portfolio Investments | | 25 | | |
Financial Statements | | 26 | | |
Financial Highlights | | 28 | | |
| | | | | |
| Boston Trust Small Cap Fund | | | | |
Manager Commentary | | 10 | | |
Investment Performance | | 11 | | |
Schedule of Portfolio Investments | | 29 | | |
Financial Statements | | 30 | | |
Financial Highlights | | 32 | | |
| Environmental, Social and Governance Research and Action Update | | 34 | | |
| | | | | |
| Walden Asset Management Fund | | | | |
Manager Commentary | | 36 | | |
Investment Performance | | 37 | | |
Schedule of Portfolio Investments | | 44 | | |
Financial Statements | | 46 | | |
Financial Highlights | | 48 | | |
| | | | | |
| Walden Equity Fund | | | | |
Manager Commentary | | 36 | | |
Investment Performance | | 37 | | |
Schedule of Portfolio Investments | | 49 | | |
Financial Statements | | 50 | | |
Financial Highlights | | 52 | | |
| | | | | |
| Walden Midcap Fund | | | | |
Manager Commentary | | 38 | | |
Investment Performance | | 39 | | |
Schedule of Portfolio Investments | | 53 | | |
Financial Statements | | 54 | | |
Financial Highlights | | 56 | | |
| | | | | |
| Walden SMID Cap Innovations Fund | | | | |
Manager Commentary | | 40 | | |
Investment Performance | | 41 | | |
Schedule of Portfolio Investments | | 57 | | |
Financial Statements | | 58 | | |
Financial Highlights | | 60 | | |
| | | | | |
| Walden Small Cap Innovations Fund | | | | |
Manager Commentary | | 42 | | |
Investment Performance | | 43 | | |
Schedule of Portfolio Investments | | 61 | | |
Financial Statements | | 62 | | |
Financial Highlights | | 64 | | |
| | | | | |
| Notes to Financial Statements | | 65 | | |
| Report of Independent Public Accounting Firm | | 72 | | |
| Supplementary Information | | 73 | | |
| Investment Adviser Contract Approval | | 77 | | |
| Information About Trustees and Officers | | 79 | | |
Boston Trust Investment Management, Inc. (BTIM), a subsidiary of Boston Trust & Investment Management Company and an affiliate of Walden Asset Management (Walden), serves as investment adviser (the Adviser) to the Boston Trust & Walden Funds and receives a fee for its services. Walden, a division of BTIM, performs shareholder advocacy, proxy voting, screening services, and other environmental, social and governance initiatives for the Adviser and is paid a fee for these services by the Adviser.
Shares of the Funds are not deposits of, obligations of, or guaranteed by BTIM or its affiliates, nor are they federally insured by the FDIC. Investments in the Funds involve investment risks, including the possible loss of principal. Funds are distributed by BHIL Distributors, Inc. Member FINRA.
The foregoing information and opinions are for general information only. Boston Trust & Walden Funds and BTIM do not assume liability for any loss, which may result from the reliance by any person upon any such information or opinions. Such information and opinions are subject to change without notice, are for general information only, and are not intended as an offer or solicitation with respect to the purchase or sale of any security or offering individual or personalized investment advice.
The Boston Trust & Walden Funds may invest in foreign securities, which may involve risk not typically associated with U.S. investments.
The recent appreciation in the stock market has helped to produce short-term returns that are not typical and may not continue in the future. Because of ongoing market volatility, fund performance may be subject to substantial short-term changes.
| Photography credits: |
| • | Cover: Bruce Field |
| • | Pages 1, 7, 39 and 43: Jim Gallagher |
| • | Pages 5, 9 and 41: Rebecca Monette |
| • | Pages 11 and 37: Janet C. Dygert |
1
This page intentionally left blank.
2
| |  | The Boston Trust & Walden Funds
A Registered Investment Company |  | |
Boston Trust and Walden Funds
Economic and Market Summary
(Unaudited) | | Domenic Colasacco, CFA
Portfolio Manager and President
Boston Trust Investment Management, Inc. |
Stock prices advanced sharply during the 12 months ended March 31, 2013, with the S&P 500 Index closing the fiscal period just above record levels reached in October 2007. Higher equity prices were supported by what are now familiar factors. These include greater investor confidence about the domestic economic outlook, continuation of the Federal Reserve’s aggressive monetary policy and, with the primary exception of the euro zone, evidence that global business trends remain positive. We suspect investors were also pleased about the comparative lack of political drama in Washington in recent months. Congress and the President remain far apart on core fiscal policy issues; however both parties now appear more willing to compromise sufficiently to avoid a repeat of the tax, budget, and debt ceiling battles of recent years that fostered widespread concern about the economy.
Our Economic Outlook
Our economic views today are similar to those outlined in our 2012 mid-year report. At that time, we expected the domestic economy to expand through 2013, albeit modestly. Our confidence reflected positive trends in the key automotive and housing sectors, as well as the economic boost provided by the rapid development of domestic oil and gas shale deposits. We also assumed that the Federal Reserve would maintain an expansionary monetary policy, with near zero interest rates and high financial system liquidity, for the next several years. Globally, we did not expect much improvement within the euro zone or Japan; however, the economies of many emerging market countries had begun to strengthen. Taken together, we concluded that 2013 global economic growth would be close to 3%, a level that is sufficient to support continued gains in corporate profits and cash flows.
Recent economic reports have supported these general expectations. We are particularly pleased with domestic employment, which has continued to rebound at a rate of about 200,000 net new jobs per month. Job growth has helped to sustain a positive trend in consumer spending and lifted overall consumer confidence. Inflation has remained modest, in large part due to still high levels of unused labor and capital resources. Stock values usually trend higher within an environment of rising profits, low inflation and even modest economic growth, a combination we believe is likely to remain in place over at least the next year or two.
At the end of March 2013, the S&P 500 closed just above levels first reached in March 2000 and more recently in October 2007. The S&P 500 may be at a similar level, but there are few other similarities among the three peak value periods. In 2000, driven by the price bubble in the technology sector, valuations of corporate sales, profits and cash flows were roughly twice the historic average and close to the highest valuations on record. We were also about to enter an economic recession led by a drop in technology capital spending after the required Y2K expenditures ended. In 2007 equity valuations were not extreme, but a different economic bubble of far greater importance — housing — was about to burst. The value of an enormous amount of mortgage debt related to inflated house prices held on bank balance sheets dropped suddenly in 2008 and led to the worst financial debacle since the 1930’s. We suspect memories of the recent crisis are still vivid and will not list the varied consequences.
The future is as uncertain and as difficult to predict today as ever. Fundamental investment circumstances, however, are not near the respective valuation and economic extremes of 2000 or 2007. Starting with valuation, stock prices have risen sharply in recent years, but so have corporate financial results. Taken together, stocks currently sell at only average, not inflated multiples of corporate sales, profits, and free cash flows. Prevailing economic risks range from structural currency/sovereign debt problems in the euro zone to stagnation in Japan, while here in the United States we face the prospect of an entitlement-spending imbalance caused by the aging baby boomer generation. These and other difficult challenges will not go away anytime soon.
3
Manager Commentary (Unaudited)
| | | |
| | | |
| | Boston Trust Asset Management Fund | |
| | | |
| | Boston Trust Equity Fund | |
| | March 31, 2013 | |
| | | |
| | Domenic Colasacco, CFA | |
| | | |
| | Portfolio Manager and President Boston Trust Investment Management, Inc. | |
| | | |
| | Asset Management Fund Objective | |
| | The Fund seeks long-term capital growth and income through an actively managed portfolio of stocks, bonds and money market instruments. | |
| | | |
| | Equity Fund Objective | |
| | The Fund seeks long-term capital growth through an actively managed portfolio of stocks. | |
| | | |
| | Investment Concerns | |
| | Equity securities (stocks) are more volatile and carry more risk and return potential than other forms of investments, including investments in high-grade fixed income securities. | |
| | | |
| | Bonds offer a relatively stable level of income, although bond prices will fluctuate, providing the potential for principal gain or loss. Intermediate-term, higher quality bonds generally offer less risk than longer-term bonds and a lower rate of return. | |
| | | |
| | Cash equivalents offer low risk and low return potential. | |
| | | |
| | | |
Management Discussion of Fund Performance |
| |
Portfolio Review |
| For the 12-month period ended March 31, 2013, Boston Trust Equity Fund posted a total return of 9.76%, an underperformance compared to the 13.96% return for the S&P 500 Index. The shortfall in the Fund’s return relative to the S&P 500 benchmark was primarily due to the results of our equity selections, described in more detail below. As has often been the case in past periods of sharply rising markets, our “high quality” discipline, which seeks to identify companies with long histories of financial success, limited results as equity markets approached new highs. |
| |
| The Boston Trust Asset Management Fund was well positioned to participate in the broad stock market uptrend. Most importantly, the Fund’s equity allocation began the period near 75% of total assets, or at the upper end of the traditional 45% to 75% range. We did not reduce the equity allocation as stock prices increased, taking full advantage of the upward price trend. In hindsight, as was the case with the Boston Trust Equity Fund, we should have been more aggressive in our individual stock selections. The aggregate investment stance, however, still enabled the Fund to post an attractive gain of 8.77% for the 12-month period. The gain was particularly attractive compared to the near zero rates available in money market investments and nominal overall bond returns. We were especially pleased that the Boston Trust Asset Management Fund’s return compared well with those of balanced mutual funds tracked by the leading firms that rank mutual fund performance.* |
| |
| In recent weeks, Fund shareholders have begun to ask us if the time has come to assume a more conservative investment position. After all, most stock indices have increased by close to 40% in just the past 18 months and more than doubled since the lows reached at the height of the financial crisis in March 2009. We would not be surprised if the pace of stock price gains moderates in the months ahead. Neither would an actual, temporary price drop surprise us, especially if economic reports suggest that global business trends have begun to soften, as has occurred at some point during each of the past three calendar years. Yet stocks continue to provide far better longer-term intrinsic value than either bonds or money market instruments and we believe are likely to rise further in the years ahead, provided we are correct that the economy, both here and globally, will continue to improve. |
* Portfolio composition is subject to change.
4
| Investment Performance (Unaudited) | | Boston Trust Asset Management Fund
Boston Trust Equity Fund
March 31, 2013 |
| | | Annualized |
| | |
|
| | | 1 Year Ended | | 5 Years Ended | | 10 Years Ended | | Since Inception |
| | | 3/31/13 | | 3/31/13 | | 3/31/13 | | 10/1/03 |
| Boston Trust Asset Management Fund1 | | | 8.77 | % | | | 6.00 | % | | | 7.39 | % | | | — | |
| Boston Trust Equity Fund1 | | | 9.76 | % | | | 6.07 | % | | | — | | | | 7.00 | % |
| S&P 500 Index | | | 13.96 | % | | | 5.81 | % | | | 8.53 | % | | | 6.83 | % |
|
| Barclays Capital U.S. Government/Credit Bond Index | | | 4.56 | % | | | 5.50 | % | | | 5.06 | % | | | — | |
|
| Citigroup 90-Day U.S. Treasury Bill Index | | | 0.08 | % | | | 0.31 | % | | | 1.66 | % | | | — | |
|
| Morningstar U.S. Open-End Moderate Allocation Funds Avg. | | | 9.35 | % | | | 4.53 | % | | | 6.82 | % | | | — | |
|
| | | | | | | | | | | | | | | | | |
| Hypothetical Growth of a $10,000 Investment |
| |
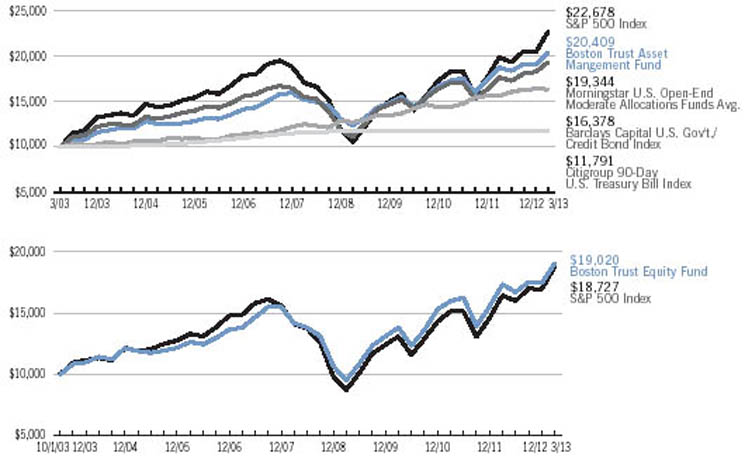 |
| The above charts represent an historical hypothetical $10,000 investment in the Boston Trust Asset Management Fund and the Boston Trust Equity Fund. The top chart signifies a 10-year performance period for the Boston Trust Asset Management Fund. The bottom chart represents an investment from October 1, 2003 (Fund inception) to March 31, 2013. Both charts represent the reinvestment of dividends and capital gains in the Funds. The returns shown on the table and graphs do not reflect the deduction of taxes a shareholder would pay on Fund distributions or the redemption of Fund shares. |
| |
The Boston Trust Asset Management Fund is measured against a combination of equity and fixed income indices. The Boston Trust Equity Fund is measured against the Standard & Poor’s 500 Index (“S&P 500”), which is widely regarded as a gauge of the U.S. equities market. This index includes 500 leading companies in leading industries of the U.S. economy. Although the S&P 500 focuses on the large cap segment of the market, with approximately 75% coverage of U.S. equities, it is also widely viewed as a proxy for the total market. The Barclays Capital U.S. Government/Credit Bond Index is a component of the Barclays U.S. Aggregate Index. The Barclays Capital U.S. Government/ Credit Bond Index includes Treasuries (i.e., public obligations of the U.S. Treasury that have remaining maturities of more than one year), Government-Related issues (e.g., agency, sovereign, supranational, and local authority debt), and USD Corporates. The Citigroup 90-Day U.S. Treasury Bill Index reflects monthly return equivalents of yield averages that are not marked to the market. The Index is an average of the last three-month Treasury bill issues. The three-month Treasury bills are the short-term debt obligations of the U.S. Government. The Morningstar U.S. Open-End Moderate Allocation Funds Average represents performance of portfolios that seek to provide both capital appreciation and income by investing in three major areas: stocks, bonds, and cash. These portfolios tend to hold larger positions in stocks than conservative-allocation portfolios. These portfolios typically have 50% to 70% of assets in equities, and the remainder in fixed income and cash. The indices are unmanaged and their performance does not reflect the deduction of expenses associated with a mutual fund, such as investment management and fund accounting fees. The Funds’ performance reflects the deduction of fees for these services. Investors cannot invest directly in an index. |

Boston Trust Asset Management Fund
| Fund Net Asset Value: | $36.08 |
| Gross Expense Ratio1: | 1.00% |
Boston Trust Equity Fund
| Fund Net Asset Value: | $16.85 |
| Gross Expense Ratio1: | 1.00% |
Past performance does not guarantee future results. The performance data quoted represents past performance and current returns may be lower or higher. The investment return and principal value will fluctuate so that an investor’s shares, when redeemed may be worth more or less than the original cost. To obtain performance information current to the most recent month-end, please call 1-800-282-8782 ext. 7050. |
| | |
| 1 | The Gross Expense Ratio is from the Fund’s most recent prospectus, dated August 1, 2012. The Gross Expense Ratio includes the impact of repayment of fees and expenses which were previously reimbursed under the terms of each Fund’s contractual expense limitation agreement, which continues through August 1, 2013 and may be terminated thereafter. The contractual fee limit under the agreement is 1.00% of each Fund’s average annual net assets. Please see each Fund’s most recent prospectus for details. Additional information pertaining to each Fund’s expense ratio as of March 31, 2013 can be found in the financial highlights. The investment performance may reflect fee reductions. If such fee reductions had not occurred, the quoted performance would have been lower. |
5
Manager Commentary (Unaudited)
| | | |
| | | |
| | Boston Trust Midcap Fund | |
| | March 31, 2013 | |
| | | |
| | Stephen J. Amyouny, CFA | |
| | | |
| | Portfolio Manager | |
| | Boston Trust Investment | |
| | Management, Inc. | |
| | | |
| | Fund Objective | |
| | The Fund seeks long-term capital growth through an actively managed portfolio of stocks of middle capitalization (“midcap”) companies. | |
| | | |
| | Investment Concerns | |
| | Equity securities (stocks) are more volatile and carry more risk and return potential than other forms of investments, including investments in high-grade fixed income securities. | |
| | | |
| | Mid-capitalization funds typically carry additional risks since smaller companies generally have a higher risk of failure. | |
| | | |
| | | |
Management Discussion of Fund Performance |
| |
Portfolio Review |
The Boston Trust Midcap Fund posted a total return of 9.20% for the 12-month period ended March 31, 2013 – a disappointing result in comparison to the benchmark Russell Midcap® Index, which returned 17.30%. Two primary factors contributed to the Fund’s weak performance relative to the benchmark: 1) the strong performance of lower-quality stocks versus high-quality stocks, and 2) security selection. Over the last 12 months, investors reacted positively to the aggressive monetary policies of the Fed and other central banks across the globe. As a result, investors increased their exposures to riskier assets, including stocks in lower quality companies that stand to benefit the most from a reacceleration in global economic activity. This trend presented a headwind to our investment approach, which focuses on higher-quality companies with more stable businesses, greater financial strength, and high levels of profitability. The Fund also experienced disappointing results relative to the benchmark index in two specific sectors, information technology and consumer discretionary. Within information technology, the Fund’s exposure to companies in the enterprise corporate IT markets detracted from results. This technology segment has recently experienced a softening in demand, which adversely affected the performance of several of the Fund’s holdings; however, we continue to believe that it is an attractive segment within the technology sector with solid growth prospects. In the consumer discretionary sector, many highly cyclical stocks with exposure to residential housing performed exceptionally well. This group included homebuilders, producers of household durables, and home retailers as well as companies in the materials sector that supply building and construction materials and paints.* |
| |
| One sector of the market that performed very well and bucked the aforementioned trend of lower-quality companies was consumer staples. The Fund’s holdings in that sector performed exceptionally well, thanks in part to investors’ gravitation toward companies with relatively stable businesses and high dividend yields that offer an alternative to low yielding fixed income instruments.* |
| |
Portfolio Strategy |
In recent years, corporations have generally grown earnings per share1 (“EPS”) from a combination of revenue growth, margin expansion, and share repurchases. We believe that revenue growth in aggregate among our portfolio companies is likely to approximate global Gross Domestic Product2 growth with perhaps a 1% to 2% additional benefit from expected acquisition activity. Based on strong free cash flow generation and very healthy balance sheets, share repurchases are also likely to contribute to future EPS growth. The wildcard in this formula remains the ability of our companies to continue to expand margins. Over the last few years, companies have benefited from operating leverage, rising productivity, low wage cost inflation, improving supply chain logistics, global sourcing, and lower interest expenses. We anticipate that future margin expansion should be modest, in comparison to current levels, and thus will contribute less to EPS growth over the next few years; although, based on present valuations that are quite reasonable, we believe that EPS growth will be sufficient to drive stock prices higher. |
| |
As always, the Fund will continue to hold a diversified portfolio of high-quality companies with strong balance sheets, sustainable business models, and attractive growth prospects that sell at reasonable valuations. The last point – reasonable valuations – is worth emphasizing. Thanks in large part to the sharp price appreciation of equities over the last few years many stocks now sell at valuations that imply unreasonably high future growth expectations. We continue to monitor the valuations of our Fund holdings and remain disciplined in all facets of our investment approach. In fact, despite the superior financial characteristics of our companies, the Fund presently sells at a Price-to-Earnings Ratio3 on trailing GAAP EPS that is approximately 15% below that of the Russell Midcap Index. We remain confident that our long-term investment approach and discipline will produce attractive future returns. |
| 1 | The Earnings per Share ("EPS") Growth indicates the portion of a company's profit allocated to each outstanding share of common stock. Earnings per share serves as an indicator of a company's profitability. |
| | |
| 2 | The Gross Domestic Product (“GDP”) is the measure of the market value of the goods and services produced by labor and property in the United States. |
| | |
| 3 | The Price-to-Earnings Ratio (“P/E Ratio”) is a valuation ratio of a company’s current share price to its per-share earnings. A high P/E means high projected earnings in the future. |
| | |
| * | Portfolio composition is subject to change. |
6
| Investment Performance (Unaudited) | | Boston Trust Midcap Fund
March 31, 2013 |
| | | Annualized |
| | |
|
| | | 1 Year Ended | | 5 Year Ended | | Since Inception |
| | | 3/31/13 | | 3/31/13 | | 9/24/07 |
| Boston Trust Midcap Fund1 | | | 9.20 | % | | | 9.56 | % | | | 7.20 | % |
| Russell Midcap® Index | | | 17.30 | % | | | 8.37 | % | | | 5.03 | % |
|
| | | | | | | | | | | | | |
| Hypothetical Growth of a $10,000 Investment |
| |
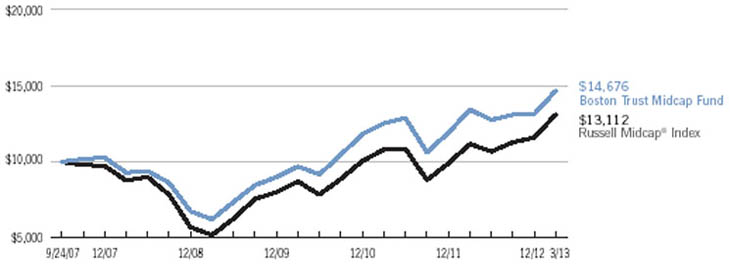 |
| The chart represents the historical performance of a hypothetical $10,000 investment in the Boston Trust Midcap Fund from September 24, 2007 to March 31, 2013, and represents the reinvestment of dividends and capital gains in the Fund. The returns shown on the table and graph do not reflect the deduction of taxes a shareholder would pay on Fund distributions or the redemption of Fund shares. |
| |
The Boston Trust Midcap Fund is measured against the Russell Midcap® Index, which is an unmanaged index that measures the performance of the mid-cap segment of the U.S. equity universe. The Russell Midcap® Index is a subset of the Russell 1000® Index. It includes approximately 800 of the smallest securities based on a combination of their market capitalization and current index membership. The Russell Midcap® Index represents approximately 31% of the total market capitalization of the Russell 1000 companies. The performance of an index does not reflect the deduction of expenses associated with a mutual fund, such as investment management and fund accounting fees. The Fund’s performance reflects the deduction of fees for these services. Investors cannot invest directly in an index. |

| Fund Net Asset Value: | $13.08 |
| Gross Expense Ratio1: | 1.13% |
Past performance does not guarantee future results. The performance data quoted represents past performance and current returns may be lower or higher. The investment return and principal value will fluctuate so that an investor’s shares, when redeemed may be worth more or less than the original cost. To obtain performance information current to the most recent month-end, please call 1-800-282-8782 ext. 7050. |
| | |
| 1 | The Gross Expense Ratio is from the Fund’s most recent prospectus, dated August 1, 2012. The Gross Expense Ratio excludes the impact of any contractual fee waivers. After giving effect to such fee waivers, the Fund’s Net Expense Ratio would be 1.00%, including the indirect expenses of investing in acquired funds. Please see the Fund’s most recent prospectus for details. Additional information pertaining to the Fund’s expense ratio as of March 31, 2013 can be found in the financial highlights. The investment performance may reflect fee reductions. If such fee reductions had not occurred, the quoted performance would have been lower. The contractual fee waiver continues through August 1, 2013 and may be terminated thereafter. |
7
Manager Commentary (Unaudited)
| | | |
| | | |
| | Boston Trust SMID Cap Fund | |
| | March 31, 2013 | |
| | | |
| | Kenneth P. Scott, CFA | |
| | Stephen C. Franco, CFA | |
| | Heidi H. Vanni, CFA | |
| | | |
| | Portfolio Managers | |
| | Boston Trust Investment | |
| | Management, Inc. | |
| | | |
| | Fund Objective | |
| | The Fund seeks long-term capital growth through an actively managed portfolio of stocks of small to middle capitalization companies. | |
| | | |
| | Investment Concerns | |
| | Equity securities (stocks) are more volatile and carry more risk and return potential than other forms of investments, including investments in high-grade fixed income securities. | |
| | | |
| | Small- to mid-capitalization companies typically have a higher risk of failure and historically have experienced a greater degree of volatility. | |
| | | |
| | | |
Management Discussion of Fund Performance |
| |
Portfolio Review |
U.S. equity markets rose sharply for the 12-month period, with the value of the Fund’s benchmark, the Russell 2500® Index increasing 17.73%. The U.S. market welcomed continued improvement in economic fundamentals, and appeared unaffected by the ongoing fiscal challenges of the U.S. and Europe. The Boston Trust SMID Cap portfolios, which focus on higher quality, more innovative companies, posted strong gains of 10.00%, although, disappointingly, underperformed the benchmark returns by over 7.7 percentage points for the year ended March 31, 2013. |
| |
| Generally, stocks of higher-quality companies underperform when share prices rise sharply and when expectations for volatility are low and falling. This is consistent with the view that stock values, and those of riskier companies in particular, appreciate as investors demonstrate increased appetite for risk. |
| |
| On a key measure of quality–financial leverage–stocks with lower-quality profiles outperformed in the year ended March 31, 2013. We believe this is due not only to the typical performance patterns associated with lower-quality stocks in a strong bull market, but also to historically low interest rates. The most indebted firms currently face fewer burdens than they would in a normal interest rate environment. On other measures of quality, such as profitability, the performance impact is less clear. |
| |
Portfolio Strategy |
| The top individual stock contributors to performance this year were mortgage-servicing firm Ocwen Financial (OCN), short haul railroad firm Genesee & Wyoming (GWR), commercial kitchen equipment maker Middleby (MIDD), railroad equipment supplier Wabtec (WAB) and network storage vendor CommVault Systems (CVLT). Laggards this year were premium mattress manufacturers Tempur-Pedic (TPX) and Select Comfort (SCSS), health care software firm Quality Systems (QSII), prepaid debit card firm Green Dot (GDOT) and videoconferencing vendor Polycom (PLCM). Tempur-Pedic and Green Dot were sold due to concerns about the long-term sustainability of their business models.* |
| |
| Boston Trust aims to maintain SMID-cap portfolio sector weights comparable to those of the overall SMID-cap market. Slight differences in sector weights had no significant impact on relative performance. However, at the subsector level there were differences that affected performance. For example, our focus on higher-quality companies resulted in underweights in certain lower-quality industries, (e.g. airlines, biotechnology, building products, and media) which performed quite well over the previous 12 months.* |
| |
| U.S. economic activity continued to improve in early 2013, with ongoing contributions from consumers, a housing recovery, business investment, and healthy exports, complemented by low inflation and the Federal Reserve maintaining its efforts to hold interest rates at historically low levels. Thus, in spite of several, global economic challenges, the opportunity for continued, positive equity performance, including SMIDcap equity performance, remains in place. |
| |
That said, with a Price-to-Earnings Ratio1 of 26 times trailing earnings at March 31, 2013, the valuation of the Russell 2500® implies continued strong growth in overall SMID-cap company earnings. Wall Street analysts expect the Russell 2500® companies, in aggregate, to post approximately 20% growth in earnings in 2013. Such earnings growth can be achieved either through strong sales growth, which may be challenging for this large group of companies if the economic recovery remains modest, or through expansion of profit margins, which are already above their historical average. A shortfall in SMID-cap firms’ earnings may prove disappointing at current valuations. However, we continue to believe that investing in reasonably priced shares of a distinct subset of more innovative, higher-quality companies, whose businesses are leveraged to more sustainable elements of growth, will continue to provide substantial value to client portfolios over time. |
| 1 | The Price-to-Earnings Ratio (“P/E Ratio”) is a valuation ratio of a company’s current share price to its per-share earnings. A high P/E means high projected earnings in the future. |
| | |
| * | Portfolio composition is subject to change. |
8
| Investment Performance (Unaudited) | | Boston Trust SMID Cap Fund
March 31, 2013 |
| | | Annualized |
| | |
|
| | | 1 Year Ended | | Since Inception |
| | | 3/31/13 | | 11/30/11 |
| Boston Trust SMID Cap Fund1 | | | 10.00 | % | | | 16.11 | % |
| Russell 2500TM Index | | | 17.73 | % | | | 24.07 | % |
|
| | | | | | | | | |
| Hypothetical Growth of a $10,000 Investment | | | | | | | | |
| |
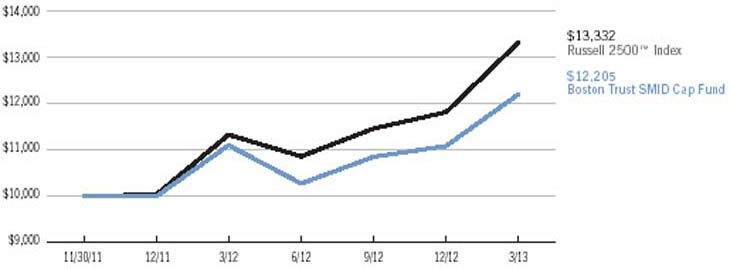 |
| The chart represents the historical performance of a hypothetical $10,000 investment in the Boston Trust SMID Cap Fund from November 30, 2011 to March 31, 2013, and represents the reinvestment of dividends and capital gains in the Fund. The returns shown on the table and graph do not reflect the deduction of taxes a shareholder would pay on Fund distributions or the redemption of Fund shares. |
| |
The Boston Trust SMID Cap Fund is measured against the Russell 2500TM Index, which is an unmanaged index that measures the performance of the small- to mid-cap segment of the U.S. equity universe, commonly referred to as “smid” cap. The Russell 2500 is a subset of the Russell 3000® Index. It includes approximately 2500 of the smallest securities based on a combination of their market cap and current index membership. The performance of an index does not reflect the deduction of expenses associated with a mutual fund, such as investment management and fund accounting fees. The Fund’s performance reflects the deduction of fees for these services. Investors cannot invest directly in an index. |

| Fund Net Asset Value: | $12.05 |
| Gross Expense Ratio1: | 2.18% |
Past performance does not guarantee future results. The performance data quoted represents past performance and current returns may be lower or higher. The investment return and principal value will fluctuate so that an investor’s shares, when redeemed may be worth more or less than the original cost. Returns less than one year are not annualized. To obtain performance information current to the most recent month-end, please call 1-800-282-8782 ext. 7050. |
| | |
| 1 | The Gross Expense Ratio is from the Fund’s most recent prospectus, dated August 1, 2012. The Gross Expense Ratio excludes the impact of any contractual fee waivers. After giving effect to such fee waivers, the Fund’s Net Expense Ratio would be 1.00%, including the indirect expenses of investing in acquired funds. Please see the Fund’s most recent prospectus for details. Additional information pertaining to the Fund’s expense ratio as of March 31, 2013 can be found in the financial highlights. The investment performance may reflect fee reductions. If such fee reductions had not occurred, the quoted performance would have been lower. The contractual fee waiver continues through August 1, 2013 and may be terminated thereafter. |
9
Manager Commentary (Unaudited)
| | | |
| | | |
| | Boston Trust Small Cap Fund | |
| | March 31, 2013 | |
| | | |
| | Kenneth P. Scott, CFA | |
| | | |
| | Portfolio Manager | |
| | Boston Trust Investment | |
| | Management, Inc. | |
| | | |
| | Fund Objective | |
| | The Fund is to seeks long-term capital growth through an actively managed portfolio of stocks of small capitalization companies. | |
| | | |
| | Investment Concerns | |
| | Equity securities (stocks) are more volatile and carry more risk and return potential than other forms of investments, including investments in high-grade fixed income securities. | |
| | | |
| | Small-capitalization funds typically carry additional risks since smaller companies generally have a higher risk of failure, and historically, their stocks have experienced a greater degree of market volatility than stocks on average. | |
| | | |
| | | |
Management Discussion of Fund Performance |
| |
Portfolio Review |
U.S. equity markets rose sharply for the 12-month period ended March 31, 2013, with the value of the Russell 2000® Index increasing 16.30%. The U.S. market welcomed continued improvement in economic fundamentals, and appeared unaffected by the ongoing fiscal challenges of the U.S. and Europe. The Boston Trust Small Cap Fund, which focuses on higher quality, more innovative companies, posted a strong gain of 11.61% for the 12-month period, although, disappointingly, underperforming the benchmark return for the fiscal period. For the 5-year, 10-year, and 15-year periods ended March 31, 2013, the Boston Trust Small Cap Fund outperformed the Russell 2000® while demonstrating lower volatility. |
| |
| Generally, stocks of higher-quality companies underperform when share prices rise sharply and when expectations for volatility are low and falling. This is consistent with the view that stock values, and those of riskier companies in particular, appreciate as investors demonstrate increased appetite for risk. |
| |
| On a key measure of quality–financial leverage–stocks with lower-quality profiles outperformed in the year ended March 31, 2013. We believe this is due not only to the typical performance patterns associated with lower-quality stocks in a strong bull market, but also to historically low interest rates. The most indebted firms currently face fewer burdens than they would in a normal interest rate environment. On other measures of quality, such as profitability, the performance impact is less clear. |
| |
Portfolio Strategy |
| The top individual stock contributors to performance this year were mortgage servicing company Ocwen Financial (OCN), short haul railroad firm Genesee & Wyoming (GWR), pharmaceutical packaging company West Pharmaceutical (WST), architectural glass manufacturer Apogee Enterprises (APOG), and commercial kitchen equipment maker Middleby (MIDD). Laggards this year were premium mattress manufacturer Select Comfort (SCSS), health care software firm Quality Systems (QSII), prepaid debit card firm Green Dot (GDOT), alternative fuel vehicle equipment maker Fuel Systems Solutions (FSYS), and business-to-business auction firm Liquidity Services (LQDT. We sold Ocwen Financial and Genesee & Wyoming from the Fund due to market capitalization considerations, and sold Green Dot and Fuel Systems due to concerns about the long-term sustainability of their business models.* |
| |
| Boston Trust aims to maintain small cap portfolio sector weights comparable to those of the overall small cap market. Slight differences in sector weights had no significant impact on relative performance. However, at the subsector level there were differences that affected performance. For example, our focus on higher-quality companies resulted in under weights in certain lower-quality industries (e.g. airlines, biotechnology, building products, and construction materials) that fared particularly well during the 12-month period. |
| |
| U.S. economic activity continued to improve in early 2013, with ongoing contributions from consumers, a housing recovery, business investment, and healthy exports, complemented by low inflation and the U.S. Federal Reserve maintaining its efforts to hold interest rates at historically low levels. Thus, in spite of several, global economic challenges, the opportunity for continued, positive equity performance, including small-cap equity performance, remains in place. |
| |
That said, with a Price-to-Earnings Ratio1 of 34 times trailing earnings at March 31, 2013, the valuation of the Russell 2000® implies continued strong growth in overall small-cap company earnings. Wall Street analysts expect the Russell 2000® companies, in aggregate, to post approximately 20% growth in earnings in 2013. Such earnings growth can be achieved either through strong sales growth, which may be challenging for this large group of companies if the economic recovery remains modest, or through expansion of profit margins, which are already above their historical average. A shortfall in small-cap firms’ earnings may prove disappointing at current valuations. However, we continue to believe that investing in reasonably priced shares of a distinct subset of more innovative, higher-quality companies, whose businesses are leveraged to more sustainable elements of growth, will continue to provide substantial value to Fund holders’ overall portfolios over time.* |
| 1 | The Price-to-Earnings Ratio (“P/E Ratio”) is a valuation ratio of a company’s current share price to its per-share earnings. A high P/E means high current earnings. |
| | |
| * | Portfolio composition is subject to change. |
10
| Investment Performance (Unaudited) | | Boston Trust Small Cap Fund
March 31, 2013 |
| | | Annualized |
| | |
|
| | | 1 Year Ended | | 5 Years Ended | | 10 Years Ended |
| | | 3/31/13 | | 3/31/13 | | 3/31/13 |
| Boston Trust Small Cap Fund1,* | | | 11.61 | % | | | 8.95 | % | | | 12.48 | % |
| Russell 2000® Index | | | 16.30 | % | | | 8.24 | % | | | 11.52 | % |
|
| | | | | | | | | | | | | |
| Hypothetical Growth of a $10,000 Investment |
| |
 |
| The chart represents a 10-year hypothetical $10,000 investment in the Boston Trust Small Cap Fund and represents the reinvestment of dividends and capital gains in the Fund. The returns shown on the table and graph do not reflect the deduction of taxes a shareholder would pay on Fund distributions or the redemption of Fund shares. |
| | |
| * | The quoted performance for the Fund reflects the performance of a collective investment fund that was previously managed with full investment authority by the parent company of the Fund’s Adviser prior to the establishment of the Fund on December 16, 2005. The performance of the collective investment fund has been restated to reflect the net expenses of the Fund after all expenses at an annual rate of 1.25%, the Adviser’s expense limitation for its initial year of investment operations. The collective investment fund was not registered with the Securities and Exchange Commission and, therefore, was not subject to the investment restrictions imposed by law on registered mutual funds. If the collective investment fund had been registered, the collective investment fund’s performance may have been adversely affected. |
| | |
The Boston Trust Small Cap Fund is measured against the Russell 2000® Index, which is an unmanaged index that measures the performance of the small-cap segment of the U.S. equity universe. The Russell 2000® Index is a subset of the Russell 3000® Index representing approximately 10% of the total market capitalization of that index. It includes approximately 2000 of the smallest securities based on a combination of their market cap and current index membership. The performance of an index does not reflect the deduction of expenses associated with a mutual fund, such as investment management and fund accounting fees. The Fund’s performance reflects the deduction of fees for these services. Investors cannot invest directly in an index. |

| Fund Net Asset Value: | $14.25 |
| Gross Expense Ratio1: | 1.06% |
Past performance does not guarantee future results. The performance data quoted represents past performance and current returns may be lower or higher. The investment return and principal value will fluctuate so that an investor’s shares, when redeemed may be worth more or less than the original cost. To obtain performance information current to the most recent month-end, please call 1-800-282-8782 ext. 7050. |
| | |
| 1 | The Gross Expense Ratio is from the Fund’s most recent prospectus, dated August 1, 2012. The Gross Expense Ratio excludes the impact of any contractual fee waivers. After giving effect to such fee waivers, the Fund’s Net Expense Ratio would be 1.00%, including the indirect expenses of investing in acquired funds. Please see the Fund’s most recent prospectus for details. Additional information pertaining to the Fund’s expense ratio as of March 31, 2013 can be found in the financial highlights. The investment performance may reflect fee reductions. If such fee reductions had not occurred, the quoted performance would have been lower. The contractual fee waiver continues through August 1, 2013 and may be terminated thereafter. |
11
Schedule of Portfolio Investments | | Boston Trust Asset Management Fund |
| | | March 31, 2013 |
| | | |
| COMMON STOCKS (74.4%) | | | | | | | | |
| Security Description | | Shares | | | Fair Value ($) | |
| | | | | | | |
| Consumer Discretionary (8.2%) | | | | | | | | |
| Advance Auto Parts, Inc. | | | 7,500 | | | | 619,875 | |
| Autoliv, Inc. | | | 25,000 | | | | 1,728,500 | |
| Comcast Corp., Class A | | | 100,000 | | | | 4,201,000 | |
| Johnson Controls, Inc. | | | 40,000 | | | | 1,402,800 | |
| McDonald’s Corp. | | | 32,500 | | | | 3,239,925 | |
| NIKE, Inc., Class B | | | 80,000 | | | | 4,720,800 | |
| Omnicom Group, Inc. | | | 60,000 | | | | 3,534,000 | |
| Ross Stores, Inc. | | | 60,000 | | | | 3,637,200 | |
| Target Corp. | | | 10,000 | | | | 684,500 | |
| | | | | | | | |
| | | | | | | | 23,768,600 | |
| | | | | | | | |
| Consumer Staples (8.8%) | | | | | | | | |
| Church & Dwight Co., Inc. | | | 25,000 | | | | 1,615,750 | |
| Colgate-Palmolive Co. | | | 12,500 | | | | 1,475,375 | |
| Costco Wholesale Corp. | | | 35,000 | | | | 3,713,850 | |
| Diageo PLC, Sponsored ADR | | | 30,000 | | | | 3,775,200 | |
| McCormick & Co., Inc. | | | 32,500 | | | | 2,390,375 | |
| Nestle SA, Sponsored ADR | | | 40,000 | | | | 2,898,800 | |
| PepsiCo, Inc. | | | 40,000 | | | | 3,164,400 | |
| Procter & Gamble Co. | | | 35,000 | | | | 2,697,100 | |
| SYSCO Corp. | | | 100,000 | | | | 3,517,000 | |
| | | | | | | | |
| | | | | | | | 25,247,850 | |
| | | | | | | | |
| Energy (9.3%) | | | | | | | | |
| Apache Corp. | | | 25,000 | | | | 1,929,000 | |
| Chevron Corp. | | | 50,000 | | | | 5,941,000 | |
| ConocoPhillips | | | 50,000 | | | | 3,005,000 | |
| Devon Energy Corp. | | | 15,000 | | | | 846,300 | |
| Exxon Mobil Corp. | | | 105,000 | | | | 9,461,550 | |
| Phillips 66 | | | 25,000 | | | | 1,749,250 | |
| Schlumberger Ltd. | | | 50,000 | | | | 3,744,500 | |
| | | | | | | | |
| | | | | | | | 26,676,600 | |
| | | | | | | | |
| Financials (11.0%) | | | | | | | | |
| BB&T Corp. | | | 20,000 | | | | 627,800 | |
| Chubb Corp. | | | 70,000 | | | | 6,127,100 | |
| Cincinnati Financial Corp. | | | 125,000 | | | | 5,898,750 | |
| Comerica, Inc. | | | 60,000 | | | | 2,157,000 | |
| Commerce Bancshares, Inc. | | | 25,000 | | | | 1,020,750 | |
| JPMorgan Chase & Co. | | | 100,000 | | | | 4,746,000 | |
| M&T Bank Corp. | | | 12,500 | | | | 1,289,500 | |
| Northern Trust Corp. | | | 22,500 | | | | 1,227,600 | |
| PNC Financial Services Group, Inc. | | | 35,000 | | | | 2,327,500 | |
| State Street Corp. | | | 25,000 | | | | 1,477,250 | |
| T. Rowe Price Group, Inc. | | | 65,000 | | | | 4,866,550 | |
| | | | | | | | |
| | | | | | | | 31,765,800 | |
| | | | | | | | |
| Health Care (6.8%) | | | | | | | | |
| Becton, Dickinson & Co. | | | 50,000 | | | | 4,780,500 | |
| C.R. Bard, Inc. | | | 32,500 | | | | 3,275,350 | |
| DENTSPLY International, Inc. | | | 55,000 | | | | 2,333,100 | |
| Johnson & Johnson, Inc. | | | 20,000 | | | | 1,630,600 | |
| Medtronic, Inc. | | | 20,000 | | | | 939,200 | |
| Mettler-Toledo International, Inc.(a) | | | 5,000 | | | | 1,066,100 | |
| Roche Holding AG, Sponsored ADR | | | 30,000 | | | | 1,758,000 | |
| Saint Jude Medical, Inc. | | | 20,000 | | | | 808,800 | |
| Stryker Corp. | | | 20,000 | | | | 1,304,800 | |
| Varian Medical Systems, Inc.(a) | | | 25,000 | | | | 1,800,000 | |
| | | | | | | | |
| | | | | | | | 19,696,450 | |
| | | | | | | | |
| Industrials (14.3%) | | | | | | | | |
| 3M Co. | | | 35,000 | | | | 3,720,850 | |
| Donaldson Co., Inc. | | | 150,000 | | | | 5,428,500 | |
| Emerson Electric Co. | | | 75,000 | | | | 4,190,250 | |
| Expeditors International of Washington, Inc. | | | 25,000 | | | | 892,750 | |
| Hubbell, Inc., Class B | | | 42,500 | | | | 4,127,175 | |
| Illinois Tool Works, Inc. | | | 75,000 | | | | 4,570,500 | |
| | | Shares or | | | | |
| | | Principal | | | | |
| Security Description | | | Amount ($) | | Fair Value ($) |
| | | | | | | |
| Industrials, continued | | | | | | | | |
| Precision Castparts Corp. | | | 30,000 | | | | 5,688,600 | |
| Rockwell Collins, Inc. | | | 45,000 | | | | 2,840,400 | |
| United Parcel Service, Inc., Class B | | | 50,000 | | | | 4,295,000 | |
| W.W. Grainger, Inc. | | | 25,000 | | | | 5,624,500 | |
| | | | | | | | |
| | | | | | | | 41,378,525 | |
| | | | | | | | |
| Information Technology (12.9%) | | | | | | | | |
| Accenture PLC, Class A | | | 70,000 | | | | 5,317,900 | |
| Apple, Inc. | | | 10,000 | | | | 4,426,300 | |
| Automatic Data Processing, Inc. | | | 70,000 | | | | 4,551,400 | |
| EMC Corp.(a) | | | 150,000 | | | | 3,583,500 | |
| Intel Corp. | | | 10,000 | | | | 218,500 | |
| International Business Machines Corp. | | | 30,000 | | | | 6,399,000 | |
| Microsoft Corp. | | | 120,000 | | | | 3,433,200 | |
| Oracle Corp. | | | 125,000 | | | | 4,042,500 | |
| QUALCOMM, Inc. | | | 40,000 | | | | 2,678,000 | |
| Wal-Mart Stores, Inc. | | | 35,000 | | | | 2,619,050 | |
| | | | | | | | |
| | | | | | | | 37,269,350 | |
| | | | | | | | |
| Materials (3.1%) | | | | | | | | |
| Air Products & Chemicals, Inc. | | | 20,000 | | | | 1,742,400 | |
| AptarGroup, Inc. | | | 30,000 | | | | 1,720,500 | |
| Ecolab, Inc. | | | 25,000 | | | | 2,004,500 | |
| Sigma-Aldrich Corp. | | | 45,000 | | | | 3,495,600 | |
| | | | | | | | |
| | | | | | | | 8,963,000 | |
| | | | | | | | |
| TOTAL COMMON STOCKS (Cost $122,811,901) | | | | | | | 214,766,175 | |
| | | | | | | | |
| CORPORATE BONDS (4.1%) | | | | | | | | |
| Consumer Staples (0.2%) | | | | | | | | |
| Diageo Capital PLC, 5.50%, 9/30/16 | | | 500,000 | | | | 574,619 | |
| | | | | | | | |
| Financials (3.3%) | | | | | | | | |
| American Express Bank FSB, BKNT, 6.00%, 9/13/17 | | | 200,000 | | | | 239,030 | |
| American Express Co., 2.65%, 12/2/22 | | | 1,926,000 | | | | 1,891,380 | |
| American Express Co., 7.00%, 3/19/18 | | | 1,500,000 | | | | 1,875,064 | |
| John Deere Capital Corp., Series D, 5.35%, 4/3/18 | | | 1,000,000 | | | | 1,189,572 | |
| JPMorgan Chase & Co., 3.15%, 7/5/16 | | | 1,500,000 | | | | 1,591,663 | |
| National Rural Utilities Cooperative Finance Corp., 10.38%, 11/1/18 | | | 500,000 | | | | 730,543 | |
| Wells Fargo & Co., 2.63%, 12/15/16 | | | 1,500,000 | | | | 1,577,730 | |
| Weyerhaeuser Co., 7.25%, 7/1/13 | | | 300,000 | | | | 304,384 | |
| | | | | | | | |
| | | | | | | | 9,399,366 | |
| | | | | | | | |
| Industrials (0.1%) | | | | | | | | |
| Emerson Electric Co., 5.13%, 12/1/16 | | | 300,000 | | | | 344,970 | |
| | | | | | | | |
| Information Technology (0.3%) | | | | | | | | |
| Oracle Corp., 5.75%, 4/15/18 | | | 750,000 | | | | 905,994 | |
| | | | | | | | |
| Telecommunication Services (0.2%) | | | | | | | | |
| AT&T, Inc., 5.63%, 6/15/16 | | | 500,000 | | | | 571,297 | |
| | | | | | | | |
| TOTAL CORPORATE BONDS (Cost $10,292,870) | | | | | | | 11,796,246 | |
| | | | | | | | |
| MUNICIPAL BONDS (2.4%) | | | | | | | | |
| Florida (0.4%) | | | | | | | | |
| Florida State Board of Education, Series D, GO, 5.00%, 6/1/21, Callable 6/1/17 @ 101 | | | 1,000,000 | | | | 1,165,510 | |
| | | | | | | | |
| Illinois (0.5%) | | | | | | | | |
| Illinois State, GO, 5.00%, 4/1/24, Callable 4/1/17 @ 100 | | | 500,000 | | | | 551,610 | |
| Illinois State, Series A, GO, 5.00%, 3/1/22, Callable 3/1/14 @ 100 | | | 600,000 | | | | 620,706 | |
| 12 | | See Notes to Financial Statements |
Schedule of Portfolio Investments | | Boston Trust Asset Management Fund |
| | | March 31, 2013 |
| | | |
| MUNICIPAL BONDS, CONTINUED | | | | | | | | |
| | | Shares or | | | | |
| | | Principal | | | | |
| Security Description | | | Amount ($) | | Fair Value ($) | |
| | | | | | | |
| Illinois, continued | | | | | | | | |
| Illinois State, Series A, GO, 5.00%, 3/1/22, Prerefunded 3/1/14 @ 100 | | | 150,000 | | | | 156,423 | |
| Illinois State, Series A, GO, 5.00%, 6/1/29, Callable 12/1/16 @ 100 | | | 250,000 | | | | 266,487 | |
| | | | | | | | |
| | | | | | | | 1,595,226 | |
| | | | | | | | |
| Massachusetts (0.8%) | | | | | | | | |
| Massachusetts State Development Finance Agency Revenue, Series R-2, 5.00%, 7/1/28, Callable 7/1/20 @ 100 | | | 460,000 | | | | 531,139 | |
| Massachusetts State Health & Educational Facilities Authority Revenue, Series A, 5.00%, 12/15/26, GO of Institution, Callable 12/15/19 @ 100 | | | 1,500,000 | | | | 1,786,005 | |
| | | | | | | | |
| | | | | | | | 2,317,144 | |
| | | | | | | | |
| Ohio (0.2%) | | | | | | | | |
| Ohio State, Series D, GO, 4.50%, 9/15/22, NATL-RE, Callable 3/15/16 @ 100 | | | 500,000 | | | | 547,525 | |
| | | | | | | | |
| Washington (0.1%) | | | | | | | | |
| Washington State, Series C, GO, 5.00%, 2/1/26, Callable 2/1/19 @ 100 | | | 250,000 | | | | 294,218 | |
| | | | | | | | |
| Wisconsin (0.4%) | | | | | | | | |
| Wisconsin State, Series C, GO, 5.00%, 5/1/25, Callable 5/1/18 @ 100 | | | 200,000 | | | | 235,492 | |
| Wisconsin State, Series D, GO, 5.50%, 5/1/26, Callable 5/1/18 @ 100 | | | 750,000 | | | | 904,702 | |
| | | | | | | | |
| | | | | | | | 1,140,194 | |
| | | | | | | | |
| TOTAL MUNICIPAL BONDS (Cost $6,524,587) | | | | | | | 7,059,817 | |
| | | | | | | | |
| U.S. GOVERNMENT & U.S. GOVERNMENT AGENCY OBLIGATIONS (13.8%) |
| Federal Farm Credit Bank | | | | | | | | |
2.63%, 8/12/19 | | | 11,500,000 | | | | 12,423,335 | |
3.39%, 2/1/28 | | | 2,000,000 | | | | 2,118,096 | |
| | | | | | | | |
| | | | | | | | 14,541,431 | |
| | | | | | | | |
| Federal Home Loan Bank | | | | | | | | |
4.13%, 12/13/19 | | | 2,000,000 | | | | 2,354,082 | |
5.25%, 9/13/13 | | | 5,000,000 | | | | 5,116,300 | |
5.25%, 12/9/22 | | | 1,000,000 | | | | 1,278,391 | |
| | | | | | | | |
| | | | | | | | 8,748,773 | |
| | | | | | | | |
| Government National Mortgage Association | | | | | | | | |
4.00%, 9/15/40 | | | 821,131 | | | | 900,582 | |
| U.S. Treasury Bond | | | | | | | | |
5.25%, 2/15/29 | | | 750,000 | | | | 1,017,539 | |
| U.S. Treasury Inflation Protected Bond | | | | | | | | |
1.25%, 7/15/20 | | | 6,334,920 | | | | 7,573,424 | |
| U.S. Treasury Note | | | | | | | | |
2.38%, 6/30/18 | | | 6,500,000 | | | | 7,018,986 | |
| | | | | | | | |
TOTAL U.S. GOVERNMENT & U.S. GOVERNMENT
AGENCY OBLIGATIONS (Cost $36,880,665) | | | | | | | 39,800,735 | |
| | | | | | | | |
| INVESTMENT COMPANIES (5.4%) | | | | | | | | |
| State Street Institutional U.S. Government Money Market Fund, Investor Shares, 0.01%(b) | | | 15,654,911 | | | | 15,654,911 | |
| | | | | | | | |
| TOTAL INVESTMENT COMPANIES (Cost $15,654,911) | | | | | | | 15,654,911 | |
| | | | | | | | |
| Total Investments (Cost $192,164,934)(c) — 100.1% | | | | | | | 289,077,884 | |
| Liabilities in excess of other assets — (0.1)% | | | | | | | (404,749 | ) |
| | | | | | | | |
| NET ASSETS — 100.0% | | | | | | $ | 288,673,135 | |
| | | | | | | | |
| |
| (a) | | Non-income producing security. |
| (b) | | Rate disclosed is the seven day yield as of March 31, 2013. |
| (c) | | See Federal Tax Information listed in the Notes to the Financial Statements. |
| ADR | | American Depositary Receipt |
| BKNT | | Bank Note |
| FSB | | Federal Savings Bank |
| GO | | General Obligation |
| NATL-RE | | Reinsured by National Public Finance Guarantee Corporation |
| PLC | | Public Limited Company |
| See Notes to Financial Statements | | 13 |
Financial Statements | | Boston Trust Asset Management Fund |
| | | |
| STATEMENT OF ASSETS AND LIABILITIES | | | | |
| March 31, 2013 | | | | |
| | | | | |
| Assets: | | | | |
| Investments, at fair value (cost $192,164,934) | | $ | 289,077,884 | |
| Cash | | | 82,950 | |
| Interest and dividends receivable | | | 750,927 | |
| Receivable for investments sold | | | 322,847 | |
| Receivable for capital shares issued | | | 22,834 | |
| Prepaid expenses and other assets | | | 14,398 | |
| | | | |
Total Assets | | | 290,271,840 | |
| | | | |
| Liabilities: | | | | |
| Payable for investments purchased | | | 1,241,450 | |
| Payable for capital shares redeemed | | | 102,900 | |
| Accrued expenses and other liabilities: | | | | |
Investment adviser | | | 180,769 | |
Chief compliance officer | | | 2,025 | |
Administration and accounting | | | 9,902 | |
Custodian | | | 6,968 | |
Transfer agent | | | 9,972 | |
Trustee | | | 795 | |
Other | | | 43,924 | |
| | | | |
Total Liabilities | | | 1,598,705 | |
| | | | |
| Net Assets | | $ | 288,673,135 | |
| | | | |
| Composition of Net Assets: | | | | |
| Capital | | $ | 189,960,328 | |
| Accumulated net investment income | | | 810,566 | |
| Accumulated net realized gains from investment transactions | | | 989,291 | |
| Net unrealized appreciation from investments | | | 96,912,950 | |
| | | | |
| Net Assets | | $ | 288,673,135 | |
| | | | |
| Shares outstanding (par value $0.01, unlimited number of shares authorized) | | | 8,000,174 | |
| | | | |
| Net Asset Value, Offering Price and Redemption Price per share | | $ | 36.08 | |
| | | | |
| STATEMENT OF OPERATIONS | | | | |
| For the year ended March 31, 2013 | | | | |
| | | | | |
| Investment Income: | | | | |
| Interest | | $ | 2,018,541 | |
| Dividends | | | 4,459,146 | |
| | | | |
Total Investment Income | | | 6,477,687 | |
| | | | |
| Expenses: | | | | |
Investment adviser | | | 1,962,274 | |
Administration and accounting | | | 318,327 | |
Shareholder servicing | | | 473 | |
Trustee | | | 11,524 | |
Custodian | | | 42,520 | |
Transfer agency | | | 35,738 | |
Chief compliance officer | | | 10,284 | |
Recoupment of prior expenses reimbursed by the investment adviser | | | 4,171 | |
Other | | | 126,977 | |
| | | | |
Total expenses before fee reductions | | | 2,512,288 | |
Fees voluntarily reduced by transfer agent | | | (7,500 | ) |
| | | | |
| Net Expenses | | | 2,504,788 | |
| | | | |
| Net Investment Income | | | 3,972,899 | |
| | | | |
| Net Realized/Unrealized Gains from Investments: | | | | |
Net realized gains from investment transactions | | | 2,435,392 | |
Change in unrealized appreciation from investments | | | 16,395,428 | |
| | | | |
| Net realized/unrealized gains from investments | | | 18,830,820 | |
| | | | |
| Change in Net Assets Resulting from Operations | | $ | 22,803,719 | |
| | | | |
| 14 | | See Notes to Financial Statements |
Financial Statements | | Boston Trust Asset Management Fund |
| | | |
| STATEMENTS OF CHANGES IN NET ASSETS | | | | | | | | |
| | | For the year ended | | For the year ended |
| | | March 31, | | March 31, |
| | | 2013 | | 2012 |
| | | | | |
| | | | | | | | | |
| Investment Activities: | | | | | | | | |
| Operations: | | | | | | | | |
Net investment income | | $ | 3,972,899 | | | $ | 3,300,658 | |
Net realized gains from investment transactions | | | 2,435,392 | | | | 1,166,056 | |
Change in unrealized appreciation/depreciation from investments | | | 16,395,428 | | | | 15,325,800 | |
| | | | | | | |
| Change in Net Assets Resulting from Operations | | | 22,803,719 | | | | 19,792,514 | |
| | | | | | | |
| Dividends: | | | | | | | | |
Net investment income | | | (3,899,407 | ) | | | (3,373,655 | ) |
Net realized gains from investment transactions | | | (305,946 | ) | | | — | |
| | | | | | | |
| Change in Net Assets Resulting from Shareholder Dividends | | | (4,205,353 | ) | | | (3,373,655 | ) |
| | | | | | | |
| Capital Share Transactions: | | | | | | | | |
Proceeds from shares issued | | | 32,322,210 | | | | 12,966,581 | |
Proceeds from shares issued in subscription in-kind(a) | | | — | | | | 6,858,946 | |
Dividends reinvested | | | 3,883,401 | | | | 3,093,298 | |
Cost of shares redeemed | | | (23,162,238 | ) | | | (15,534,449 | ) |
| | | | | | | |
| Change in Net Assets Resulting from Capital Share Transactions | | | 13,043,373 | | | | 7,384,376 | |
| | | | | | | |
| Change in Net Assets | | | 31,641,739 | | | | 23,803,235 | |
| Net Assets: | | | | | | | | |
Beginning of period | | | 257,031,396 | | | | 233,228,161 | |
| | | | | | | |
End of period | | $ | 288,673,135 | | | $ | 257,031,396 | |
| | | | | | | |
| Share Transactions: | | | | | | | | |
Issued | | | 946,104 | | | | 410,393 | |
Issued in subscriptions in-kind(a) | | | — | | | | 223,273 | |
Reinvested | | | 114,593 | | | | 100,172 | |
Redeemed | | | (685,885 | ) | | | (499,341 | ) |
| | | | | | | |
| Change in Shares | | | 374,812 | | | | 234,497 | |
| | | | | | | |
| Accumulated net investment income | | $ | 810,566 | | | $ | 724,083 | |
| | | | | | | |
| |
| Amounts designated as “—” are $0 or have been rounded to $0. |
| (a) | | See Note 3 in Notes to Financial Statements. |
| See Notes to Financial Statements | | 15 |
Financial Statements | | Boston Trust Asset Management Fund |
| | | |
| FINANCIAL HIGHLIGHTS | | | | | | | | | | | | | | | | | | | | |
| Selected data for a share outstanding throughout the years indicated. |
| | | | | | | | | | | | | | | | | | | | | |
| | | For the year | | For the year | | For the year | | For the year | | For the year |
| | | ended | | ended | | ended | | ended | | ended |
| | | March 31, | | March 31, | | March 31, | | March 31, | | March 31, |
| | | 2013 | | 2012 | | 2011 | | 2010 | | 2009 |
| | | | | | | | | | | |
| | | | | | | | | | | | | | | | | | | | | |
| Net Asset Value, Beginning of Period | | $ | 33.71 | | | $ | 31.56 | | | $ | 28.69 | | | $ | 23.33 | | | $ | 30.31 | |
| | | | | | | | | | | | | | | | |
| Investment Activities: | | | | | | | | | | | | | | | | | | | | |
Net investment income | | | 0.51 | | | | 0.43 | | | | 0.44 | | | | 0.47 | | | | 0.49 | (a) |
Net realized and unrealized gains (losses) from investment transactions | | | 2.41 | | | | 2.17 | | | | 2.88 | | | | 5.36 | | | | (6.11 | ) |
| | | | | | | | | | | | | | | | |
| Total from investment activities | | | 2.92 | | | | 2.60 | | | | 3.32 | | | | 5.83 | | | | (5.62 | ) |
| | | | | | | | | | | | | | | | |
| Dividends: | | | | | | | | | | | | | | | | | | | | |
Net investment income | | | (0.51 | ) | | | (0.45 | ) | | | (0.45 | ) | | | (0.47 | ) | | | (0.52 | ) |
Net realized gains from investments | | | (0.04 | ) | | | — | | | | — | | | | — | | | | (0.84 | ) |
| | | | | | | | | | | | | | | | |
| Total dividends | | | (0.55 | ) | | | (0.45 | ) | | | (0.45 | ) | | | (0.47 | ) | | | (1.36 | ) |
| | | | | | | | | | | | | | | | |
| Net Asset Value, End of Period | | $ | 36.08 | | | $ | 33.71 | | | $ | 31.56 | | | $ | 28.69 | | | $ | 23.33 | |
| | | | | | | | | | | | | | | | |
| Total Return | | | 8.77% | | | | 8.36% | | | | 11.65% | | | | 25.08% | | | | (18.68)% | |
| | | | | | | | | | | | | | | | |
| Ratios/Supplemental Data: | | | | | | | | | | | | | | | | | | | | |
| Net Assets at end of period (000’s) | | $ | 288,673 | | | $ | 257,031 | | | $ | 233,228 | | | $ | 200,312 | | | $ | 148,401 | |
| Ratio of net expenses to average net assets | | | 0.96% | | | | 1.00% | | | | 1.00% | | | | 1.00% | | | | 1.00% | |
| Ratio of net investment income to average net assets | | | 1.51% | | | | 1.40% | | | | 1.50% | | | | 1.84% | | | | 1.80% | |
Ratio of expenses (before fee reductions or recoupment of fees previously reimbursed by the investment advisor) to average net assets(b) | | | 0.96% | | | | 1.07% | | | | 1.07% | | | | 1.08% | | | | 1.08% | |
| Portfolio turnover rate | | | 7.43% | | | | 18.70% | | | | 15.76% | | | | 12.90% | | | | 21.30% | |
| |
| Amounts designated as “—” are $0 or have been rounded to $0. |
| (a) | | Calculated using the average shares method. |
| (b) | | During the period, certain fees were reduced. If such fee reductions had not occurred, the ratio would have been as indicated. |
| 16 | | See Notes to Financial Statements |
Schedule of Portfolio Investments | | Boston Trust Equity Fund |
| | | March 31, 2013 |
| | | |
| COMMON STOCKS (98.8%) | | | | | | | | |
| Security Description | | | Shares | | Fair Value ($) |
| | | | | | | |
| Consumer Discretionary (11.2%) | | | | | | | | |
| Advance Auto Parts, Inc. | | | 5,000 | | | | 413,250 | |
| Autoliv, Inc. | | | 15,000 | | | | 1,037,100 | |
| Comcast Corp., Class A | | | 50,000 | | | | 2,100,500 | |
| Johnson Controls, Inc. | | | 10,000 | | | | 350,700 | |
| McDonald’s Corp. | | | 17,500 | | | | 1,744,575 | |
| NIKE, Inc., Class B | | | 16,000 | | | | 944,160 | |
| Omnicom Group, Inc. | | | 30,000 | | | | 1,767,000 | |
| Ross Stores, Inc. | | | 12,500 | | | | 757,750 | |
| | | | | | | | |
| | | | | | | | 9,115,035 | |
| | | | | | | | |
| Consumer Staples (12.0%) | | | | | | | | |
| Church & Dwight Co., Inc. | | | 10,000 | | | | 646,300 | |
| Colgate-Palmolive Co. | | | 6,000 | | | | 708,180 | |
| Costco Wholesale Corp. | | | 15,000 | | | | 1,591,650 | |
| Diageo PLC, Sponsored ADR | | | 14,000 | | | | 1,761,760 | |
| McCormick & Co., Inc. | | | 7,000 | | | | 514,850 | |
| Nestle SA, Sponsored ADR | | | 15,000 | | | | 1,087,050 | |
| PepsiCo, Inc. | | | 12,500 | | | | 988,875 | |
| Procter & Gamble Co. | | | 10,000 | | | | 770,600 | |
| Reckitt Benckiser Group PLC, Sponsored ADR | | | 20,000 | | | | 288,600 | |
| SYSCO Corp. | | | 40,000 | | | | 1,406,800 | |
| | | | | | | | |
| | | | | | | | 9,764,665 | |
| | | | | | | | |
| Energy (11.4%) | | | | | | | | |
| Apache Corp. | | | 7,000 | | | | 540,120 | |
| Chevron Corp. | | | 16,000 | | | | 1,901,120 | |
| ConocoPhillips | | | 15,000 | | | | 901,500 | |
| Devon Energy Corp. | | | 5,000 | | | | 282,100 | |
| Exxon Mobil Corp. | | | 40,000 | | | | 3,604,400 | |
| Phillips 66 | | | 7,500 | | | | 524,775 | |
| Schlumberger Ltd. | | | 20,000 | | | | 1,497,800 | |
| | | | | | | | |
| | | | | | | | 9,251,815 | |
| | | | | | | | |
| Financials (15.3%) | | | | | | | | |
| BB&T Corp. | | | 20,000 | | | | 627,800 | |
| Chubb Corp. | | | 25,000 | | | | 2,188,250 | |
| Cincinnati Financial Corp. | | | 50,000 | | | | 2,359,500 | |
| Comerica, Inc. | | | 15,000 | | | | 539,250 | |
| Commerce Bancshares, Inc. | | | 5,000 | | | | 204,150 | |
| JPMorgan Chase & Co. | | | 35,000 | | | | 1,661,100 | |
| M&T Bank Corp. | | | 5,000 | | | | 515,800 | |
| Northern Trust Corp. | | | 7,500 | | | | 409,200 | |
| PNC Financial Services Group, Inc. | | | 15,000 | | | | 997,500 | |
| State Street Corp. | | | 12,000 | | | | 709,080 | |
| T. Rowe Price Group, Inc. | | | 30,000 | | | | 2,246,100 | |
| | | | | | | | |
| | | | | | | | 12,457,730 | |
| | | | | | | | |
| Health Care (9.1%) | | | | | | | | |
| Becton, Dickinson & Co. | | | 17,000 | | | | 1,625,370 | |
| C.R. Bard, Inc. | | | 12,500 | | | | 1,259,750 | |
| DENTSPLY International, Inc. | | | 25,000 | | | | 1,060,500 | |
| Johnson & Johnson, Inc. | | | 2,000 | | | | 163,060 | |
| Medtronic, Inc. | | | 10,000 | | | | 469,600 | |
| Mettler-Toledo International, Inc.(a) | | | 1,500 | | | | 319,830 | |
| Roche Holdings Ltd., Sponsored ADR | | | 15,000 | | | | 879,000 | |
| Saint Jude Medical, Inc. | | | 5,000 | | | | 202,200 | |
| Stryker Corp. | | | 10,000 | | | | 652,400 | |
| Varian Medical Systems, Inc.(a) | | | 10,000 | | | | 720,000 | |
| | | | | | | | |
| | | | | | | | 7,351,710 | |
| | | | | | | | |
| Industrials (18.6%) | | | | | | | | |
| 3M Co. | | | 7,500 | | | | 797,325 | |
| Donaldson Co., Inc. | | | 50,000 | | | | 1,809,500 | |
| Emerson Electric Co. | | | 35,000 | | | | 1,955,450 | |
| Expeditors International of Washington, Inc. | | | 5,000 | | | | 178,550 | |
| Hubbell, Inc., Class B | | | 10,000 | | | | 971,100 | |
| Illinois Tool Works, Inc. | | | 30,000 | | | | 1,828,200 | |
| Precision Castparts Corp. | | | 15,000 | | | | 2,844,300 | |
| Rockwell Collins, Inc. | | | 15,000 | | | | 946,800 | |
| United Parcel Service, Inc., Class B | | | 14,000 | | | | 1,202,600 | |
| W.W. Grainger, Inc. | | | 11,500 | | | | 2,587,270 | |
| | | | | | | | |
| | | | | | | | 15,121,095 | |
| | | | | | | | |
| Information Technology (16.8%) | | | | | | | | |
| Accenture PLC, Class A | | | 25,000 | | | | 1,899,250 | |
| Apple, Inc. | | | 4,000 | | | | 1,770,520 | |
| Automatic Data Processing, Inc. | | | 20,000 | | | | 1,300,400 | |
| EMC Corp.(a) | | | 65,000 | | | | 1,552,850 | |
| Intel Corp. | | | 5,000 | | | | 109,250 | |
| International Business Machines Corp. | | | 10,000 | | | | 2,133,000 | |
| Microsoft Corp. | | | 50,000 | | | | 1,430,500 | |
| Oracle Corp. | | | 45,000 | | | | 1,455,300 | |
| QUALCOMM, Inc. | | | 12,500 | | | | 836,875 | |
| Wal-Mart Stores, Inc. | | | 15,000 | | | | 1,122,450 | |
| | | | | | | | |
| | | | | | | | 13,610,395 | |
| | | | | | | | |
| Materials (4.4%) | | | | | | | | |
| Air Products & Chemicals, Inc. | | | 5,000 | | | | 435,600 | |
| AptarGroup, Inc. | | | 7,500 | | | | 430,125 | |
| Ecolab, Inc. | | | 14,000 | | | | 1,122,520 | |
| Sigma-Aldrich Corp. | | | 20,000 | | | | 1,553,600 | |
| | | | | | | | |
| | | | | | | | 3,541,845 | |
| | | | | | | | |
| TOTAL COMMON STOCKS (Cost $44,916,924) | | | | | | | 80,214,290 | |
| | | | | | | | |
| INVESTMENT COMPANIES (1.8%) | | | | | | | | |
| State Street Institutional U.S. Government Money Market Fund, Investor Shares, 0.01%(b) | | | 1,437,072 | | | | 1,437,072 | |
| | | | | | | | |
| TOTAL INVESTMENT COMPANIES (Cost $1,437,072) | | | | | | | 1,437,072 | |
| | | | | | | | |
| Total Investments (Cost $46,353,996)(c) — 100.6% | | | | | | | 81,651,362 | |
| Liabilities in excess of other assets — (0.6)% | | | | | | | (497,802 | ) |
| | | | | | | | |
| NET ASSETS — 100.0% | | | | | | $ | 81,153,560 | |
| | | | | | | | |
| |
| (a) | | Non-income producing security. |
| (b) | | Rate disclosed is the seven day yield as of March 31, 2013. |
| (c) | | See Federal Tax Information listed in the Notes to the Financial Statements. |
| ADR | | American Depositary Receipt |
| PLC | | Public Limited Company |
| See Notes to Financial Statements | | 17 |
Financial Statements | | Boston Trust Equity Fund |
| | | |
| STATEMENT OF ASSETS AND LIABILITIES | | | | |
| March 31, 2013 | | | | |
| | | | | |
| Assets: | | | | |
| Investments, at fair value (cost $46,353,996) | | $ | 81,651,362 | |
| Cash | | | 21,759 | |
| Dividends receivable | | | 142,137 | |
| Prepaid expenses and other assets | | | 2,730 | |
| | | | |
Total Assets | | | 81,817,988 | |
| | | | |
| Liabilities: | | | | |
| Payable for investments purchased | | | 582,738 | |
| Payable for capital shares redeemed | | | 3,800 | |
| Accrued expenses and other liabilities: | | | | |
Investment adviser | | | 50,731 | |
Chief compliance officer | | | 539 | |
Administration and accounting | | | 2,889 | |
Custodian | | | 1,938 | |
Transfer agent | | | 9,316 | |
Trustee | | | 212 | |
Other | | | 12,265 | |
| | | | |
Total Liabilities | | | 664,428 | |
| | | | |
| Net Assets | | $ | 81,153,560 | |
| | | | |
| Composition of Net Assets: | | | | |
| Capital | | $ | 47,320,846 | |
| Accumulated net investment income | | | 195,579 | |
| Accumulated net realized losses from investment transactions | | | (1,660,231 | ) |
| Net unrealized appreciation from investments | | | 35,297,366 | |
| | | | |
| Net Assets | | $ | 81,153,560 | |
| | | | |
| Shares outstanding (par value $0.01, unlimited number of shares authorized) | | | 4,816,179 | |
| | | | |
| Net Asset Value, Offering Price and Redemption Price per share | | $ | 16.85 | |
| | | | |
| STATEMENT OF OPERATIONS | | | | |
| For the year ended March 31, 2013 | | | | |
| | | | | |
| Investment Income: | | | | |
| Dividends | | $ | 1,624,034 | |
| | | | |
Total Investment Income | | | 1,624,034 | |
| | | | |
| Expenses: | | | | |
Investment adviser | | | 532,984 | |
Administration and accounting | | | 87,832 | |
Trustee | | | 3,058 | |
Custodian | | | 11,984 | |
Transfer agency | | | 32,852 | |
Chief compliance officer | | | 2,733 | |
Recoupment of prior expenses reimbursed by the investment adviser | | | 8,013 | |
Other | | | 39,917 | |
| | | | |
Total expenses before fee reductions | | | 719,373 | |
Fees voluntarily reduced by transfer agent | | | (7,500 | ) |
| | | | |
| Net Expenses | | | 711,873 | |
| | | | |
| Net Investment Income | | | 912,161 | |
| | | | |
| Net Realized/Unrealized Gains from Investments: | | | | |
Net realized gains from investment transactions | | | 1,142,942 | |
Change in unrealized appreciation from investments | | | 5,023,429 | |
| | | | |
| Net realized/unrealized gains from investments | | | 6,166,371 | |
| | | | |
| Change in Net Assets Resulting from Operations | | $ | 7,078,532 | |
| | | | |
| 18 | | See Notes to Financial Statements |
Financial Statements | | Boston Trust Equity Fund |
| | | |
| STATEMENTS OF CHANGES IN NET ASSETS | | | | | | | | |
| | | For the year ended | | For the year ended |
| | | March 31, | | March 31, |
| | | 2013 | | 2012 |
| | | | | |
| | | | | | | | | |
| Investment Activities: | | | | | | | | |
| Operations: | | | | | | | | |
Net investment income | | $ | 912,161 | | | $ | 602,627 | |
Net realized gains from investment transactions | | | 1,142,942 | | | | 245,312 | |
Change in unrealized appreciation from investments | | | 5,023,429 | | | | 4,546,914 | |
| | | | | | | |
| Change in Net Assets Resulting from Operations | | | 7,078,532 | | | | 5,394,853 | |
| | | | | | | |
| Dividends: | | | | | | | | |
Net investment income | | | (861,329 | ) | | | (589,650 | ) |
| | | | | | | |
| Change in Net Assets Resulting from Shareholder Dividends | | | (861,329 | ) | | | (589,650 | ) |
| | | | | | | |
| Capital Share Transactions: | | | | | | | | |
Proceeds from shares issued | | | 11,499,576 | | | | 4,647,257 | |
Dividends reinvested | | | 779,539 | | | | 507,274 | |
Cost of shares redeemed | | | (6,916,458 | ) | | | (3,849,474 | ) |
| | | | | | | |
| Change in Net Assets Resulting from Capital Share Transactions | | | 5,362,657 | | | | 1,305,057 | |
| | | | | | | |
| Change in Net Assets | | | 11,579,860 | | | | 6,110,260 | |
| Net Assets: | | | | | | | | |
Beginning of period | | | 69,573,700 | | | | 63,463,440 | |
| | | | | | | |
End of period | | $ | 81,153,560 | | | $ | 69,573,700 | |
| | | | | | | |
| Share Transactions: | | | | | | | | |
Issued | | | 738,195 | | | | 327,501 | |
Reinvested | | | 50,238 | | | | 36,786 | |
Redeemed | | | (449,589 | ) | | | (275,060 | ) |
| | | | | | | |
| Change in Shares | | | 338,844 | | | | 89,227 | |
| | | | | | | |
| Accumulated net investment income | | $ | 195,579 | | | $ | 144,747 | |
| | | | | | | |
| See Notes to Financial Statements | | 19 |
Financial Statements | | Boston Trust Equity Fund |
| | | |
| FINANCIAL HIGHLIGHTS | | | | | | | | | | | | | | | | | | | | |
| Selected data for a share outstanding throughout the years indicated. |
| | | For the year | | For the year | | For the year | | For the year | | For the year |
| | | ended | | ended | | ended | | ended | | ended |
| | | March 31, | | March 31, | | March 31, | | March 31, | | March 31, |
| | | 2013 | | 2012 | | 2011 | | 2010 | | 2009 |
| | | | | | | | | | | |
| | | | | | | | | | | | | | | | | | | | | |
| Net Asset Value, Beginning of Period | | $ | 15.54 | | | $ | 14.46 | | | $ | 12.62 | | | $ | 8.77 | | | $ | 13.17 | |
| | | | | | | | | | | | | | | | |
| Investment Activities: | | | | | | | | | | | | | | | | | | | | |
Net investment income | | | 0.20 | | | | 0.13 | | | | 0.11 | | | | 0.10 | | | | 0.10 | (a) |
Net realized and unrealized gains (losses) from investment transactions | | | 1.30 | | | | 1.08 | | | | 1.84 | | | | 3.85 | | | | (4.40 | ) |
| | | | | | | | | | | | | | | | |
| Total from investment activities | | | 1.50 | | | | 1.21 | | | | 1.95 | | | | 3.95 | | | | (4.30 | ) |
| | | | | | | | | | | | | | | | |
| Dividends: | | | | | | | | | | | | | | | | | | | | |
Net investment income | | | (0.19 | ) | | | (0.13 | ) | | | (0.11 | ) | | | (0.10 | ) | | | (0.10 | ) |
| | | | | | | | | | | | | | | | |
| Total dividends | | | (0.19 | ) | | | (0.13 | ) | | | (0.11 | ) | | | (0.10 | ) | | | (0.10 | ) |
| | | | | | | | | | | | | | | | |
| Net Asset Value, End of Period | | $ | 16.85 | | | $ | 15.54 | | | $ | 14.46 | | | $ | 12.62 | | | $ | 8.77 | |
| | | | | | | | | | | | | | | | |
| Total Return | | | 9.76% | | | | 8.50% | | | | 15.48% | | | | 45.13% | | | | (32.73)% | |
| | | | | | | | | | | | | | | | |
| Ratios/Supplemental Data: | | | | | | | | | | | | | | | | | | | | |
| | | | | | | | | | | | | | | | | | | | | |
| Net Assets at end of period (000’s) | | $ | 81,154 | | | $ | 69,574 | | | $ | 63,463 | | | $ | 53,583 | | | $ | 38,699 | |
| Ratio of net expenses to average net assets | | | 1.00% | | | | 1.00% | | | | 1.00% | | | | 1.00% | | | | 1.00% | |
| Ratio of net investment income to average net assets | | | 1.28% | | | | 0.96% | | | | 0.85% | | | | 0.92% | | | | 0.86% | |
Ratio of expenses (before fee reductions or recoupment of fees previously reimbursed by the investment advisor) to average net assets(b) | | | 1.01% | | | | 1.07% | | | | 1.09% | | | | 1.11% | | | | 1.10% | |
| Portfolio turnover rate | | | 5.69% | | | | 10.80% | | | | 14.31% | | | | 19.90% | | | | 28.85% | |
| |
| (a) | | Calculated using the average shares method. |
| (b) | | During the period, certain fees were reduced. If such fee reductions had not occurred, the ratio would have been as indicated. |
| 20 | | See Notes to Financial Statements |
Schedule of Portfolio Investments | | Boston Trust Midcap Fund |
| | | March 31, 2013 |
| | | |
| COMMON STOCKS (98.1%) | | | | | | | | |
| Security Description | | | Shares | | Fair Value ($) |
| | | | | | | |
| Consumer Discretionary (14.1%) | | | | | | | | |
| Advance Auto Parts, Inc. | | | 6,500 | | | | 537,225 | |
| Autoliv, Inc. | | | 9,280 | | | | 641,619 | |
| Family Dollar Stores, Inc. | | | 9,500 | | | | 560,975 | |
| Hasbro, Inc. | | | 15,000 | | | | 659,100 | |
| LKQ Corp.(a) | | | 14,750 | | | | 320,960 | |
| O’Reilly Automotive, Inc.(a) | | | 5,700 | | | | 584,535 | |
| Omnicom Group, Inc. | | | 11,000 | | | | 647,900 | |
| Ross Stores, Inc. | | | 11,500 | | | | 697,130 | |
| Tractor Supply Co. | | | 2,725 | | | | 283,755 | |
| | | | | | | | |
| | | | | | | | 4,933,199 | |
| | | | | | | | |
| Consumer Staples (6.9%) | | | | | | | | |
| Brown-Forman Corp., Class B | | | 7,000 | | | | 499,800 | |
| Campbell Soup Co. | | | 12,000 | | | | 544,320 | |
| Church & Dwight Co., Inc. | | | 12,400 | | | | 801,412 | |
| McCormick & Co., Inc. | | | 7,525 | | | | 553,464 | |
| | | | | | | | |
| | | | | | | | 2,398,996 | |
| | | | | | | | |
| Energy (8.8%) | | | | | | | | |
| Cabot Oil & Gas Corp. | | | 6,000 | | | | 405,660 | |
| Core Laboratories NV | | | 5,750 | | | | 793,040 | |
| Denbury Resources, Inc.(a) | | | 26,425 | | | | 492,826 | |
| Energen Corp. | | | 5,000 | | | | 260,050 | |
| FMC Technologies, Inc.(a) | | | 7,800 | | | | 424,242 | |
| Murphy Oil Corp. | | | 5,500 | | | | 350,515 | |
| Oceaneering International, Inc. | | | 5,000 | | | | 332,050 | |
| | | | | | | | |
| | | | | | | | 3,058,383 | |
| | | | | | | | |
| Financials (17.5%) | | | | | | | | |
| Bank of Hawaii Corp. | | | 6,950 | | | | 353,129 | |
| BioMed Realty Trust, Inc. | | | 11,325 | | | | 244,620 | |
| BOK Financial Corp. | | | 3,975 | | | | 247,643 | |
| Cincinnati Financial Corp. | | | 15,005 | | | | 708,086 | |
| Comerica, Inc. | | | 11,025 | | | | 396,349 | |
| Commerce Bancshares, Inc. | | | 7,598 | | | | 310,226 | |
| Cullen/Frost Bankers, Inc. | | | 6,500 | | | | 406,445 | |
| Digital Realty Trust, Inc. | | | 3,800 | | | | 254,258 | |
| East West Bancorp, Inc. | | | 12,500 | | | | 320,875 | |
| Eaton Vance Corp. | | | 8,700 | | | | 363,921 | |
| IntercontinentalExchange, Inc.(a) | | | 2,025 | | | | 330,217 | |
| Jones Lang LaSalle, Inc. | | | 3,675 | | | | 365,332 | |
| M&T Bank Corp. | | | 2,850 | | | | 294,006 | |
| Northern Trust Corp. | | | 10,000 | | | | 545,600 | |
| SEI Investments Co. | | | 12,400 | | | | 357,740 | |
| T. Rowe Price Group, Inc. | | | 7,900 | | | | 591,473 | |
| | | | | | | | |
| | | | | | | | 6,089,920 | |
| | | | | | | | |
| Health Care (11.4%) | | | | | | | | |
| C.R. Bard, Inc. | | | 5,850 | | | | 589,563 | |
| DENTSPLY International, Inc. | | | 11,750 | | | | 498,435 | |
| Laboratory Corp. of America Holdings(a) | | | 4,000 | | | | 360,800 | |
| MEDNAX, Inc.(a) | | | 2,775 | | | | 248,723 | |
| Mettler-Toledo International, Inc.(a) | | | 3,500 | | | | 746,270 | |
| ResMed, Inc. | | | 5,400 | | | | 250,344 | |
| Techne Corp. | | | 3,700 | | | | 251,045 | |
| Varian Medical Systems, Inc.(a) | | | 6,700 | | | | 482,400 | |
| Waters Corp.(a) | | | 6,000 | | | | 563,460 | |
| | | | | | | | |
| | | | | | | | 3,991,040 | |
| | | | | | | | |
| Industrials (15.8%) | | | | | | | | |
| AMETEK, Inc. | | | 11,675 | | | | 506,228 | |
| C.H. Robinson Worldwide, Inc. | | | 4,150 | | | | 246,759 | |
| CLARCOR, Inc. | | | 6,950 | | | | 364,041 | |
| Donaldson Co., Inc. | | | 21,000 | | | | 759,990 | |
| Expeditors International of Washington, Inc. | | | 6,700 | | | | 239,257 | |
| Hubbell, Inc., Class B | | | 5,300 | | | | 514,683 | |
| IDEX Corp. | | | 6,000 | | | | 320,520 | |
| Lincoln Electric Holdings, Inc. | | | 10,475 | | | | 567,535 | |
| Nordson Corp. | | | 4,950 | | | | 326,453 | |
| Rockwell Collins, Inc. | | | 5,250 | | | | 331,380 | |
| W.W. Grainger, Inc. | | | 3,250 | | | | 731,185 | |
| Wabtec Corp. | | | 5,800 | | | | 592,238 | |
| | | | | | | | |
| | | | | | | | 5,500,269 | |
| | | | | | | | |
| Information Technology (14.9%) | | | | | | | | |
| BMC Software, Inc.(a) | | | 14,500 | | | | 671,785 | |
| Check Point Software Technologies Ltd.(a) | | | 11,000 | | | | 516,890 | |
| Citrix Systems, Inc.(a) | | | 9,000 | | | | 649,440 | |
| F5 Networks, Inc.(a) | | | 3,000 | | | | 267,240 | |
| Factset Research Systems, Inc. | | | 4,000 | | | | 370,400 | |
| Fiserv, Inc.(a) | | | 3,500 | | | | 307,405 | |
| NetApp, Inc.(a) | | | 16,775 | | | | 573,034 | |
| Paychex, Inc. | | | 9,500 | | | | 333,165 | |
| Riverbed Technology, Inc.(a) | | | 13,400 | | | | 199,794 | |
| Syntel, Inc. | | | 5,025 | | | | 339,288 | |
| Teradata Corp.(a) | | | 11,125 | | | | 650,924 | |
| TIBCO Software, Inc.(a) | | | 15,000 | | | | 303,300 | |
| | | | | | | | |
| | | | | | | | 5,182,665 | |
| | | | | | | | |
| Materials (4.9%) | | | | | | | | |
| AptarGroup, Inc. | | | 12,500 | | | | 716,875 | |
| International Flavors & Fragrances, Inc. | | | 3,675 | | | | 281,762 | |
| Sigma-Aldrich Corp. | | | 9,400 | | | | 730,192 | |
| | | | | | | | |
| | | | | | | | 1,728,829 | |
| | | | | | | | |
| Utilities (3.8%) | | | | | | | | |
| AGL Resources, Inc. | | | 7,150 | | | | 299,943 | |
| Northeast Utilities | | | 8,466 | | | | 367,932 | |
| Questar Corp. | | | 26,725 | | | | 650,219 | |
| | | | | | | | |
| | | | | | | | 1,318,094 | |
| | | | | | | | |
| TOTAL COMMON STOCKS (Cost $23,038,621) | | | | | | | 34,201,395 | |
| | | | | | | | |
| INVESTMENT COMPANIES (2.0%) | | | | | | | | |
| State Street Institutional U.S. Government Money Market Fund, Investor Shares, 0.01%(b) | | | 703,557 | | | | 703,557 | |
| | | | | | | | |
| TOTAL INVESTMENT COMPANIES (Cost $703,557) | | | | | | | 703,557 | |
| | | | | | | | |
| Total Investments (Cost $23,742,178)(c) — 100.1% | | | | | | | 34,904,952 | |
| Liabilities in excess of other assets — (0.1)% | | | | | | | (29,795 | ) |
| | | | | | | | |
| NET ASSETS — 100.0% | | | | | | $ | 34,875,157 | |
| | | | | | | | |
| |
| (a) | | Non-income producing security. |
| (b) | | Rate disclosed is the seven day yield as of March 31, 2013. |
| (c) | | See Federal Tax Information listed in the Notes to the Financial Statements. |
| See Notes to Financial Statements | | 21 |
Financial Statements | | Boston Trust Midcap Fund |
| | | |
| STATEMENT OF ASSETS AND LIABILITIES | | | | |
| March 31, 2013 | | | | |
| |
| Assets: | | | | |
| Investments, at fair value (cost $23,742,178) | | $ | 34,904,952 | |
| Cash | | | 8,367 | |
| Dividends receivable | | | 26,434 | |
| Receivable for capital shares issued | | | 109,640 | |
| Prepaid expenses and other assets | | | 2,197 | |
| | | | |
Total Assets | | | 35,051,590 | |
| | | | |
| Liabilities: | | | | |
| Payable for investments purchased | | | 142,499 | |
| Accrued expenses and other liabilities: | | | | |
Investment adviser | | | 17,299 | |
Chief compliance officer | | | 224 | |
Administration and accounting | | | 1,373 | |
Custodian | | | 875 | |
Transfer agent | | | 8,980 | |
Trustee | | | 88 | |
Other | | | 5,095 | |
| | | | |
Total Liabilities | | | 176,433 | |
| | | | |
| Net Assets | | $ | 34,875,157 | |
| | | | |
| Composition of Net Assets: | | | | |
| Capital | | $ | 23,456,958 | |
| Accumulated net investment income | | | 3,675 | |
| Accumulated net realized gains from investment transactions | | | 251,750 | |
| Net unrealized appreciation from investments | | | 11,162,774 | |
| | | | |
| Net Assets | | $ | 34,875,157 | |
| | | | |
| Shares outstanding (par value $0.01, unlimited number of shares authorized) | | | 2,666,883 | |
| | | | |
| Net Asset Value, Offering Price and Redemption Price per share | | $ | 13.08 | |
| | | | |
| STATEMENT OF OPERATIONS | | | | |
| For the year ended March 31, 2013 | | | | |
| |
| Investment Income: | | | | |
| Dividends | | $ | 495,141 | |
| Less: Foreign tax withholding | | | (780 | ) |
| | | | |
Total Investment Income | | | 494,361 | |
| | | | |
| Expenses: | | | | |
Investment adviser | | | 220,142 | |
Administration and accounting | | | 38,059 | |
Shareholder servicing | | | 81 | |
Trustee | | | 1,231 | |
Custodian | | | 5,375 | |
Transfer agency | | | 31,873 | |
Chief compliance officer | | | 1,108 | |
Other | | | 18,817 | |
| | | | |
Total expenses before fee reductions | | | 316,686 | |
| | | | |
Fees voluntarily reduced by transfer agent | | | (5,437 | ) |
Fees contractually reduced by the investment adviser | | | (16,993 | ) |
| | | | |
| Net Expenses | | | 294,256 | |
| | | | |
| Net Investment Income | | | 200,105 | |
| | | | |
| Net Realized/Unrealized Gains from Investments: | | | | |
Net realized gains from investment transactions | | | 747,973 | |
Change in unrealized appreciation from investments | | | 2,036,667 | |
| | | | |
| Net realized/unrealized gains from investments | | | 2,784,640 | |
| | | | |
| Change in Net Assets Resulting from Operations | | $ | 2,984,745 | |
| | | | |
| 22 | | See Notes to Financial Statements |
Financial Statements | | Boston Trust Midcap Fund |
| | | |
| STATEMENTS OF CHANGES IN NET ASSETS | | | | | | | | |
| | | For the year ended | | For the year ended |
| | | March 31, | | March 31, |
| | | 2013 | | 2012 |
| | | | | |
| | | | | | | | | |
| Investment Activities: | | | | | | | | |
| Operations: | | | | | | | | |
Net investment income | | $ | 200,105 | | | $ | 78,677 | |
Net realized gains from investment transactions | | | 747,973 | | | | 569,650 | |
Change in unrealized appreciation from investments | | | 2,036,667 | | | | 1,268,521 | |
| | | | | | | |
| Change in Net Assets Resulting from Operations | | | 2,984,745 | | | | 1,916,848 | |
| | | | | | | |
| Dividends: | | | | | | | | |
Net investment income | | | (207,695 | ) | | | (77,741 | ) |
Net realized gains from investment transactions | | | (662,925 | ) | | | (889,781 | ) |
| | | | | | | |
| Change in Net Assets Resulting from Shareholder Dividends | | | (870,620 | ) | | | (967,522 | ) |
| | | | | | | |
| Capital Share Transactions: | | | | | | | | |
Proceeds from shares issued | | | 5,383,464 | | | | 2,852,941 | |
Dividends reinvested | | | 755,140 | | | | 828,947 | |
Cost of shares redeemed | | | (2,601,641 | ) | | | (2,682,664 | ) |
| | | | | | | |
| Change in Net Assets Resulting from Capital Share Transactions | | | 3,536,963 | | | | 999,224 | |
| | | | | | | |
| Change in Net Assets | | | 5,651,088 | | | | 1,948,550 | |
| Net Assets: | | | | | | | | |
Beginning of period | | | 29,224,069 | | | | 27,275,519 | |
| | | | | | | |
End of period | | $ | 34,875,157 | | | $ | 29,224,069 | |
| | | | | | | |
| Share Transactions: | | | | | | | | |
Issued | | | 452,973 | | | | 250,003 | |
Reinvested | | | 64,331 | | | | 76,613 | |
Redeemed | | | (219,490 | ) | | | (237,172 | ) |
| | | | | | | |
| Change in Shares | | | 297,814 | | | | 89,444 | |
| | | | | | | |
| Accumulated net investment income | | $ | 3,675 | | | $ | 11,266 | |
| | | | | | | |
| See Notes to Financial Statements | | 23 |
Financial Statements | | Boston Trust Midcap Fund |
| | | |
| FINANCIAL HIGHLIGHTS | | | | | | | | | | | | | | | | | | | | |
| Selected data for a share outstanding throughout the periods indicated. |
| | | | | | | | | | | | | | | | | | | | | |
| | | For the year | | For the year | | For the year | | For the year | | For the year |
| | | ended | | ended | | ended | | ended | | ended |
| | | March 31, | | March 31, | | March 31, | | March 31, | | March 31, |
| | | 2013 | | 2012 | | 2011 | | 2010 | | 2009 |
| | | | | | | | | | | |
| | | | | | | | | | | | | | | | | | | | | |
| Net Asset Value, Beginning of Period | | $ | 12.34 | | | $ | 11.96 | | | $ | 9.44 | | | $ | 6.08 | | | $ | 9.23 | |
| | | | | | | | | | | | | | | | |
| Investment Activities: | | | | | | | | | | | | | | | | | | | | |
Net investment income | | | 0.08 | | | | 0.03 | | | | 0.02 | | | | 0.02 | | | | 0.02 | (a) |
Net realized and unrealized gains (losses) from investment transactions | | | 1.01 | | | | 0.78 | | | | 2.73 | | | | 3.36 | | | | (3.07 | ) |
| | | | | | | | | | | | | | | | |
| Total from investment activities | | | 1.09 | | | | 0.81 | | | | 2.75 | | | | 3.38 | | | | (3.05 | ) |
| | | | | | | | | | | | | | | | |
| Dividends: | | | | | | | | | | | | | | | | | | | | |
Net investment income | | | (0.08 | ) | | | (0.03 | ) | | | (0.02 | ) | | | (0.02 | ) | | | (0.02 | ) |
Net realized gains from investments | | | (0.27 | ) | | | (0.40 | ) | | | (0.21 | ) | | | — | | | | (0.08 | ) |
| | | | | | | | | | | | | | | | |
| Total dividends | | | (0.35 | ) | | | (0.43 | ) | | | (0.23 | ) | | | (0.02 | ) | | | (0.10 | ) |
| | | | | | | | | | | | | | | | |
| Net Asset Value, End of Period | | $ | 13.08 | | | $ | 12.34 | | | $ | 11.96 | | | $ | 9.44 | | | $ | 6.08 | |
| | | | | | | | | | | | | | | | |
| Total Return | | | 9.20% | | | | 7.24% | | | | 29.32% | | | | 55.68% | | | | (33.03)% | |
| | | | | | | | | | | | | | | | |
| Ratios/Supplemental Data: | | | | | | | | | | | | | | | | | | | | |
| Net Assets at end of period (000’s) | | $ | 34,875 | | | $ | 29,224 | | | $ | 27,276 | | | $ | 16,309 | | | $ | 8,019 | |
| Ratio of net expenses to average net assets | | | 1.00% | | | | 1.00% | | | | 1.00% | | | | 1.00% | | | | 1.00% | |
| Ratio of net investment income to average net assets | | | 0.68% | | | | 0.30% | | | | 0.25% | | | | 0.26% | | | | 0.24% | |
| Ratio of expenses (before fee reductions) to average net assets(b) | | | 1.08% | | | | 1.19% | | | | 1.20% | | | | 1.32% | | | | 1.48% | |
| Portfolio turnover rate | | | 16.44% | | | | 19.01% | | | | 18.58% | | | | 26.44% | | | | 22.93% | |
| |
| Amounts designated as “—” are $0 or have been rounded to $0. |
| (a) | | Calculated using the average shares method. |
| (b) | | During the period, certain fees were reduced. If such fee reductions had not occurred, the ratio would have been as indicated. |
| 24 | | See Notes to Financial Statements |
Schedule of Portfolio Investments | | Boston Trust SMID Cap Fund |
| | | March 31, 2013 |
| | | |
| COMMON STOCKS (98.9%) | | | | | | | | |
| Security Description | | | Shares | | Fair Value ($) |
| | | | | | | |
| Consumer Discretionary (13.8%) | | | | | | | | |
| Autoliv, Inc. | | | 825 | | | | 57,040 | |
| Columbia Sportswear Co. | | | 550 | | | | 31,834 | |
| Dorman Products, Inc. | | | 950 | | | | 35,350 | |
| DSW, Inc., Class A | | | 700 | | | | 44,660 | |
| Hibbett Sports, Inc.(a) | | | 674 | | | | 37,926 | |
| iRobot Corp.(a) | | | 1,450 | | | | 37,207 | |
| Life Time Fitness, Inc.(a) | | | 725 | | | | 31,016 | |
| LKQ Corp.(a) | | | 2,950 | | | | 64,192 | |
| Select Comfort Corp.(a) | | | 2,325 | | | | 45,965 | |
| SodaStream International Ltd.(a) | | | 1,302 | | | | 64,631 | |
| The Men’s Wearhouse, Inc. | | | 900 | | | | 30,078 | |
| Tractor Supply Co. | | | 375 | | | | 39,049 | |
| Vitamin Shoppe, Inc.(a) | | | 775 | | | | 37,859 | |
| Weight Watchers International, Inc. | | | 800 | | | | 33,688 | |
| Wolverine World Wide, Inc. | | | 1,350 | | | | 59,899 | |
| | | | | | | | |
| | | | | | | | 650,394 | |
| | | | | | | | |
| Consumer Staples (2.4%) | | | | | | | | |
| Darling International, Inc.(a) | | | 1,300 | | | | 23,348 | |
| Hain Celestial Group, Inc.(a) | | | 350 | | | | 21,378 | |
| The Fresh Market, Inc.(a) | | | 600 | | | | 25,662 | |
| United Natural Foods, Inc.(a) | | | 900 | | | | 44,280 | |
| | | | | | | | |
| | | | | | | | 114,668 | |
| | | | | | | | |
| Energy (6.4%) | | | | | | | | |
| CARBO Ceramics, Inc. | | | 725 | | | | 66,026 | |
| Core Laboratories NV | | | 175 | | | | 24,136 | |
| Denbury Resources, Inc.(a) | | | 3,100 | | | | 57,815 | |
| Geospace Technologies Corp.(a) | | | 300 | | | | 32,376 | |
| Lufkin Industries, Inc. | | | 750 | | | | 49,792 | |
| Oceaneering International, Inc. | | | 750 | | | | 49,807 | |
| RPC, Inc. | | | 1,550 | | | | 23,514 | |
| | | | | | | | |
| | | | | | | | 303,466 | |
| | | | | | | | |
| Financials (22.9%) | | | | | | | | |
| Bank of Hawaii Corp. | | | 1,456 | | | | 73,979 | |
| BioMed Realty Trust, Inc. | | | 1,125 | | | | 24,300 | |
| BOK Financial Corp. | | | 425 | | | | 26,478 | |
| Cohen & Steers, Inc. | | | 1,425 | | | | 51,400 | |
| Commerce Bancshares, Inc. | | | 1,365 | | | | 55,733 | |
| Coresite Realty Corp. | | | 800 | | | | 27,984 | |
| Cullen/Frost Bankers, Inc. | | | 550 | | | | 34,392 | |
| DuPont Fabros Technology, Inc. | | | 2,176 | | | | 52,812 | |
| East West Bancorp, Inc. | | | 3,075 | | | | 78,935 | |
| Eaton Vance Corp. | | | 1,425 | | | | 59,608 | |
| Financial Engines, Inc. | | | 1,425 | | | | 51,613 | |
| Jones Lang LaSalle, Inc. | | | 950 | | | | 94,439 | |
| MarketAxess Holdings, Inc. | | | 1,400 | | | | 52,220 | |
| Ocwen Financial Corp.(a) | | | 2,225 | | | | 84,372 | |
| SEI Investments Co. | | | 1,900 | | | | 54,815 | |
| Signature Bank(a) | | | 1,000 | | | | 78,760 | |
| SVB Financial Group(a) | | | 1,225 | | | | 86,901 | |
| Texas Capital Bancshares, Inc.(a) | | | 672 | | | | 27,182 | |
| UMB Financial Corp. | | | 725 | | | | 35,576 | |
| Umpqua Holdings Corp. | | | 2,125 | | | | 28,178 | |
| | | | | | | | |
| | | | | | | | 1,079,677 | |
| | | | | | | | |
| Health Care (11.2%) | | | | | | | | |
| Bruker Corp.(a) | | | 2,775 | | | | 53,002 | |
| Covance, Inc.(a) | | | 350 | | | | 26,012 | |
| DENTSPLY International, Inc. | | | 525 | | | | 22,271 | |
| Haemonetics Corp.(a) | | | 575 | | | | 23,954 | |
| ICU Medical, Inc.(a) | | | 750 | | | | 44,212 | |
| MEDNAX, Inc.(a) | | | 425 | | | | 38,093 | |
| Meridian Bioscience, Inc. | | | 1,050 | | | | 23,961 | |
| Mettler-Toledo International, Inc.(a) | | | 182 | | | | 38,806 | |
| Myriad Genetics, Inc.(a) | | | 1,525 | | | | 38,735 | |
| Neogen Corp.(a) | | | 452 | | | | 22,406 | |
| Quality Systems, Inc. | | | 2,200 | | | | 40,216 | |
| ResMed, Inc. | | | 975 | | | | 45,201 | |
| Techne Corp. | | | 341 | | | | 23,137 | |
| Thoratec Corp.(a) | | | 1,300 | | | | 48,750 | |
| West Pharmaceutical Services, Inc. | | | 600 | | | | 38,964 | |
| | | | | | | | |
| | | | | | | | 527,720 | |
| | | | | | | | |
| Industrials (16.4%) | | | | | | | | |
| Chart Industries, Inc.(a) | | | 500 | | | | 40,005 | |
| CLARCOR, Inc. | | | 1,125 | | | | 58,928 | |
| Donaldson Co., Inc. | | | 2,200 | | | | 79,618 | |
| ESCO Technologies, Inc. | | | 550 | | | | 22,473 | |
| Franklin Electric Co., Inc. | | | 1,000 | | | | 33,570 | |
| Genesee & Wyoming, Inc., Class A(a) | | | 652 | | | | 60,708 | |
| Hub Group, Inc., Class A(a) | | | 975 | | | | 37,499 | |
| Hubbell, Inc., Class B | | | 493 | | | | 47,875 | |
| IDEX Corp. | | | 595 | | | | 31,785 | |
| II-VI, Inc.(a) | | | 1,150 | | | | 19,596 | |
| Lincoln Electric Holdings, Inc. | | | 850 | | | | 46,053 | |
| Lindsay Manufacturing Co. | | | 552 | | | | 48,675 | |
| Middleby Corp.(a) | | | 422 | | | | 64,207 | |
| Nordson Corp. | | | 615 | | | | 40,559 | |
| Wabtec Corp. | | | 850 | | | | 86,793 | |
| Watts Water Technologies, Inc., Class A | | | 1,149 | | | | 55,141 | |
| | | | | | | | |
| | | | | | | | 773,485 | |
| | | | | | | | |
| Information Technology (14.2%) | | | | | | | | |
| Blackbaud, Inc. | | | 800 | | | | 23,704 | |
| Bottomline Technologies, Inc.(a) | | | 800 | | | | 22,808 | |
| Coherent, Inc. | | | 375 | | | | 21,278 | |
| CommVault Systems, Inc.(a) | | | 450 | | | | 36,891 | |
| Factset Research Systems, Inc. | | | 375 | | | | 34,725 | |
| InterDigital, Inc. | | | 875 | | | | 41,851 | |
| IPG Photonics Corp. | | | 925 | | | | 61,429 | |
| Liquidity Services, Inc.(a) | | | 800 | | | | 23,848 | |
| Mellanox Technologies Ltd.(a) | | | 425 | | | | 23,592 | |
| MicroStrategy, Inc., Class A(a) | | | 222 | | | | 22,440 | |
| NIC, Inc. | | | 1,600 | | | | 30,656 | |
| Plantronics, Inc. | | | 1,175 | | | | 51,923 | |
| Polycom, Inc.(a) | | | 2,800 | | | | 31,024 | |
| Power Integrations, Inc. | | | 950 | | | | 41,240 | |
| Riverbed Technology, Inc.(a) | | | 2,375 | | | | 35,411 | |
| Sapient Corp.(a) | | | 3,700 | | | | 45,103 | |
| Syntel, Inc. | | | 350 | | | | 23,632 | |
| TIBCO Software, Inc.(a) | | | 2,000 | | | | 40,440 | |
| WEX, Inc.(a) | | | 750 | | | | 58,875 | |
| | | | | | | | |
| | | | | | | | 670,870 | |
| | | | | | | | |
| Materials (6.6%) | | | | | | | | |
| AptarGroup, Inc. | | | 1,300 | | | | 74,555 | |
| Calgon Carbon Corp.(a) | | | 3,325 | | | | 60,182 | |
| Commercial Metals Co. | | | 3,100 | | | | 49,135 | |
| International Flavors & Fragrances, Inc. | | | 450 | | | | 34,502 | |
| Kraton Performance Polymers, Inc.(a) | | | 1,650 | | | | 38,610 | |
| Minerals Technologies, Inc. | | | 1,400 | | | | 58,114 | |
| | | | | | | | |
| | | | | | | | 315,098 | |
| | | | | | | | |
| Utilities (5.0%) | | | | | | | | |
| AGL Resources, Inc. | | | 1,050 | | | | 44,048 | |
| American States Water Co. | | | 1,106 | | | | 63,672 | |
| New Jersey Resources Corp. | | | 750 | | | | 33,638 | |
| Questar Corp. | | | 3,850 | | | | 93,670 | |
| | | | | | | | |
| | | | | | | | 235,028 | |
| | | | | | | | |
| TOTAL COMMON STOCKS (Cost $3,949,808) | | | | | | | 4,670,406 | |
| | | | | | | | |
| INVESTMENT COMPANIES (1.2%) | | | | | | | | |
| State Street Institutional U.S. Government Money Market Fund, Investor Shares, 0.01%(b) | | | 55,076 | | | | 55,076 | |
| | | | | | | | |
| TOTAL INVESTMENT COMPANIES (Cost $55,076)(c) | | | | | | | 55,076 | |
| | | | | | | | |
| Total Investments (Cost $4,004,884) — 100.1% | | | | | | | 4,725,482 | |
| Liabilities in excess of other assets — (0.1)% | | | | | | | (6,467 | ) |
| | | | | | | | |
| NET ASSETS — 100.0% | | | | | | $ | 4,719,015 | |
| | | | | | | | |
| |
| (a) | | Non-income producing security. |
| (b) | | Rate disclosed is the seven day yield as of March 31, 2013. |
| (c) | | See Federal Tax Information listed in the Notes to the Financial Statements. |
| See Notes to Financial Statements | | 25 |
Financial Statements | | Boston Trust SMID Cap Fund |
| | | |
| STATEMENT OF ASSETS AND LIABILITIES | | | | |
| March 31, 2013 | | | | |
| |
| Assets: | | | | |
| Investments, at fair value (cost $4,004,884) | | $ | 4,725,482 | |
| Cash | | | 238 | |
| Dividends receivable | | | 2,548 | |
| Receivable from adviser | | | 1,208 | |
| Prepaid expenses and other assets | | | 125 | |
| | | | |
Total Assets | | | 4,729,601 | |
| | | | |
| Liabilities: | | | | |
| Accrued expenses and other liabilities: | | | | |
Chief compliance officer | | | 31 | |
Administration and accounting | | | 408 | |
Custodian | | | 247 | |
Transfer agent | | | 8,965 | |
Trustee | | | 12 | |
Other | | | 923 | |
| | | | |
Total Liabilities | | | 10,586 | |
| | | | |
| Net Assets | | $ | 4,719,015 | |
| | | | |
| Composition of Net Assets: | | | | |
| Capital | | $ | 4,017,992 | |
| Accumulated net investment income/(loss) | | | 847 | |
| Accumulated net realized losses from investment transactions | | | (20,422 | ) |
| Net unrealized appreciation from investments | | | 720,598 | |
| | | | |
| Net Assets | | $ | 4,719,015 | |
| | | | |
| Shares outstanding (par value $0.01, unlimited number of shares authorized) | | | 391,582 | |
| | | | |
| Net Asset Value, Offering Price and Redemption Price per share | | $ | 12.05 | |
| | | | |
| STATEMENT OF OPERATIONS | | | | |
| For the year ended March 31, 2013 | | | | |
| |
| Investment Income: | | | | |
| Dividends | | $ | 52,804 | |
| Less: Foreign tax withholding | | | (72 | ) |
| | | | |
Total Investment Income | | | 52,732 | |
| | | | |
| Expenses: | | | | |
Investment adviser | | | 28,883 | |
Administration and accounting | | | 7,980 | |
Trustee | | | 168 | |
Custodian | | | 1,602 | |
Transfer agency | | | 32,844 | |
Chief compliance officer | | | 152 | |
Other | | | 6,371 | |
| | | | |
Total expenses before fee reductions | | | 78,000 | |
Fees voluntarily reduced by transfer agent | | | (5,437 | ) |
Fees contractually reduced by the investment adviser | | | (33,947 | ) |
| | | | |
| Net Expenses | | | 38,616 | |
| | | | |
| Net Investment Income | | | 14,116 | |
| | | | |
| Net Realized/Unrealized Gains (Losses) from Investments: | | | | |
Net realized losses from investment transactions | | | (21,455 | ) |
Change in unrealized appreciation from investments | | | 421,345 | |
| | | | |
| Net realized/unrealized gains from investments | | | 399,890 | |
| | | | |
| Change in Net Assets Resulting from Operations | | $ | 414,006 | |
| | | | |
| 26 | | See Notes to Financial Statements |
Financial Statements | | Boston Trust SMID Cap Fund |
| | | |
| STATEMENT OF CHANGES IN NET ASSETS | | | | | | | | |
| | | For the year ended | | For the period ended |
| | | March 31, | | March 31, |
| | | 2013 | | 2012(a) |
| | | | | |
| | | | | | | | | |
| Investment Activities: | | | | | | | | |
| Operations: | | | | | | | | |
Net investment income | | $ | 14,116 | | | $ | 286 | |
Net realized gains (losses) from investment transactions | | | (21,455 | ) | | | 30,511 | |
Change in unrealized appreciation from investments | | | 421,345 | | | | 299,253 | |
| | | | | | | |
| Change in Net Assets Resulting from Operations | | | 414,006 | | | | 330,050 | |
| | | | | | | |
| Dividends: | | | | | | | | |
Net investment income | | | (18,180 | ) | | | (898 | ) |
Net realized losses from investment transactions | | | (30,511 | ) | | | — | |
| | | | | | | |
| Change in Net Assets Resulting from Shareholder Dividends | | | (48,691 | ) | | | (898 | ) |
| | | | | | | |
| Capital Share Transactions: | | | | | | | | |
Proceeds from shares issued | | | 1,270,515 | | | | 2,949,757 | |
Proceeds from shares issued in subscription in-kind(b) | | | — | | | | 325,000 | |
Dividends reinvested | | | 43,101 | | | | 775 | |
Cost of shares redeemed | | | (239,762 | ) | | | — | |
Cost of shares redeemed in redemption in-kind(b) | | | (324,838 | ) | | | — | |
| | | | | | | |
| Change in Net Assets Resulting from Capital Share Transactions | | | 749,016 | | | | 3,275,532 | |
| | | | | | | |
| Change in Net Assets | | | 1,114,331 | | | | 3,604,684 | |
| Net Assets: | | | | | | | | |
Beginning of period | | | 3,604,684 | | | | — | |
| | | | | | | |
End of period | | $ | 4,719,015 | | | $ | 3,604,684 | |
| | | | | | | |
| Share Transactions: | | | | | | | | |
Issued | | | 117,966 | | | | 292,427 | |
Issued in subscriptions in-kind(b) | | | — | | | | 32,500 | |
Reinvested | | | 3,972 | | | | 79 | |
Redeemed | | | (22,846 | ) | | | — | |
Redeemed in redemption in-kind(b) | | | (32,516 | ) | | | — | |
| | | | | | | |
| Change in Shares | | | 66,576 | | | | 325,006 | |
| | | | | | | |
| Accumulated net investment income (loss) | | $ | 847 | | | $ | 2,071 | |
| | | | | | | |
| |
| Amounts designated as “—” are $0 or have been rounded to $0. |
| (a) | | Commenced operations on November 30, 2011. |
| (b) | | See Note 3 in Notes to Financial Statements. |
| See Notes to Financial Statements | | 27 |
Financial Statements | | Boston Trust SMID Cap Fund |
| | | |
| FINANCIAL HIGHLIGHTS | | | | | | | | |
| Selected data for a share outstanding throughout the period indicated. |
| | | | | | | | | |
| | | For the year | | For the period |
| | | ended | | ended |
| | | March 31, | | March 31, |
| | | 2013 | | 2012(a) |
| | | | | |
| | | | | | | | | |
| Net Asset Value, Beginning of Period | | $ | 11.09 | | | $ | 10.00 | |
| | | | | | | |
| Investment Activities: | | | | | | | | |
Net investment income | | | 0.04 | | | | — | |
Net realized and unrealized gains from investment transactions | | | 1.05 | | | | 1.09 | |
| | | | | | | |
| Total from investment activities | | | 1.09 | | | | 1.09 | |
| | | | | | | |
| Dividends: | | | | | | | | |
Net investment income | | | (0.05 | ) | | | — | |
Net realized gains from investments | | | (0.08 | ) | | | — | |
| | | | | | | |
| Total dividends | | | (0.13 | ) | | | — | |
| | | | | | | |
| Net Asset Value, End of Period | | $ | 12.05 | | | $ | 11.09 | |
| | | | | | | |
| Total Return | | | 10.00% | | | | 10.96% | (b) |
| | | | | | | |
| Ratios/Supplemental Data: | | | | | | | | |
| Net Assets at end of period (000’s) | | $ | 4,719 | | | $ | 3,605 | |
| Ratio of net expenses to average net assets | | | 1.00% | | | | 1.00% | (c) |
| Ratio of net investment income to average net assets | | | 0.37% | | | | 0.03% | (c) |
| Ratio of expenses (before fee reductions) to average net assets(d) | | | 2.02% | | | | 2.18% | (c) |
| Portfolio turnover rate | | | 33.83% | | | | 12.14% | (b) |
| |
| Amounts designated as “—” are $0 or have been rounded $0. |
| (a) | | Commenced operations on November 30, 2011. |
| (b) | | Not annualized for periods less than one year. |
| (c) | | Annualized for periods less than one year. |
| (d) | | During the period, certain fees were reduced. If such fee reductions had not occurred, the ratio would have been as indicated |
| 28 | | See Notes to Financial Statements |
Schedule of Portfolio Investments | | Boston Trust Small Cap Fund |
| | | March 31, 2013 |
| | | |
| COMMON STOCKS (99.5%) | | | | | | | | |
| Security Description | | | Shares | | Fair Value ($) |
| | | | | | | |
| Consumer Discretionary (12.9%) | | | | | | | | |
| Columbia Sportswear Co. | | | 91,000 | | | | 5,267,080 | |
| Dorman Products, Inc. | | | 133,000 | | | | 4,948,930 | |
| DSW, Inc., Class A | | | 75,900 | | | | 4,842,420 | |
| Hibbett Sports, Inc.(a) | | | 98,000 | | | | 5,514,460 | |
| iRobot Corp.(a) | | | 203,000 | | | | 5,208,980 | |
| Life Time Fitness, Inc.(a) | | | 89,000 | | | | 3,807,420 | |
| Select Comfort Corp.(a) | | | 271,000 | | | | 5,357,670 | |
| SodaStream International Ltd.(a) | | | 146,000 | | | | 7,247,440 | |
| The Men’s Wearhouse, Inc. | | | 167,000 | | | | 5,581,140 | |
| Vitamin Shoppe, Inc.(a) | | | 118,000 | | | | 5,764,300 | |
| Weight Watchers International, Inc. | | | 86,000 | | | | 3,621,460 | |
| Wolverine World Wide, Inc. | | | 176,000 | | | | 7,809,120 | |
| | | | | | | | |
| | | | | | | | 64,970,420 | |
| | | | | | | | |
| Consumer Staples (3.0%) | | | | | | | | |
| Darling International, Inc.(a) | | | 203,000 | | | | 3,645,880 | |
| Hain Celestial Group, Inc.(a) | | | 35,000 | | | | 2,137,800 | |
| The Fresh Market, Inc.(a) | | | 76,000 | | | | 3,250,520 | |
| United Natural Foods, Inc.(a) | | | 119,000 | | | | 5,854,800 | |
| | | | | | | | |
| | | | | | | | 14,889,000 | |
| | | | | | | | |
| Energy (6.7%) | | | | | | | | |
| CARBO Ceramics, Inc. | | | 98,000 | | | | 8,924,860 | |
| Geospace Technologies Corp.(a) | | | 75,000 | | | | 8,094,000 | |
| Lufkin Industries, Inc. | | | 155,000 | | | | 10,290,450 | |
| Natural Gas Services Group, Inc.(a) | | | 102,525 | | | | 1,974,631 | |
| RPC, Inc. | | | 281,000 | | | | 4,262,770 | |
| | | | | | | | |
| | | | | | | | 33,546,711 | |
| | | | | | | | |
| Financials (21.3%) | | | | | | | | |
| Bank of Hawaii Corp. | | | 202,000 | | | | 10,263,620 | |
| BioMed Realty Trust, Inc. | | | 121,000 | | | | 2,613,600 | |
| City National Corp. | | | 70,000 | | | | 4,123,700 | |
| Cohen & Steers, Inc. | | | 182,000 | | | | 6,564,740 | |
| Coresite Realty Corp. | | | 177,000 | | | | 6,191,460 | |
| Corporate Office Properties Trust | | | 92,000 | | | | 2,454,560 | |
| Dime Community Bancshares, Inc. | | | 176,050 | | | | 2,528,078 | |
| DuPont Fabros Technology, Inc. | | | 307,000 | | | | 7,450,890 | |
| East West Bancorp, Inc. | | | 197,000 | | | | 5,056,990 | |
| Financial Engines, Inc. | | | 191,000 | | | | 6,918,020 | |
| First Financial Bankshares, Inc. | | | 87,000 | | | | 4,228,200 | |
| Independent Bank Corp. | | | 117,000 | | | | 3,813,030 | |
| MarketAxess Holdings, Inc. | | | 219,000 | | | | 8,168,700 | |
| Signature Bank(a) | | | 65,000 | | | | 5,119,400 | |
| SVB Financial Group(a) | | | 155,000 | | | | 10,995,700 | |
| Texas Capital Bancshares, Inc.(a) | | | 137,000 | | | | 5,541,650 | |
| UMB Financial Corp. | | | 151,000 | | | | 7,409,570 | |
| Umpqua Holdings Corp. | | | 560,000 | | | | 7,425,600 | |
| | | | | | | | |
| | | | | | | | 106,867,508 | |
| | | | | | | | |
| Health Care (13.4%) | | | | | | | | |
| Bruker Corp.(a) | | | 428,000 | | | | 8,174,800 | |
| Cantel Medical Corp. | | | 152,000 | | | | 4,569,120 | |
| Computer Programs & Systems, Inc. | | | 80,000 | | | | 4,328,800 | |
| Haemonetics Corp.(a) | | | 62,000 | | | | 2,582,920 | |
| ICU Medical, Inc.(a) | | | 106,000 | | | | 6,248,700 | |
| Landauer, Inc. | | | 37,000 | | | | 2,086,060 | |
| Meridian Bioscience, Inc. | | | 220,000 | | | | 5,020,400 | |
| Myriad Genetics, Inc.(a) | | | 199,000 | | | | 5,054,600 | |
| Neogen Corp.(a) | | | 50,000 | | | | 2,478,500 | |
| Quality Systems, Inc. | | | 250,000 | | | | 4,570,000 | |
| Techne Corp. | | | 73,000 | | | | 4,953,050 | |
| Thoratec Corp.(a) | | | 175,000 | | | | 6,562,500 | |
| West Pharmaceutical Services, Inc. | | | 162,000 | | | | 10,520,280 | |
| | | | | | | | |
| | | | | | | | 67,149,730 | |
| | | | | | | | |
| Industrials (16.1%) | | | | | | | | |
| American Science & Engineering, Inc. | | | 61,000 | | | | 3,720,390 | |
| Apogee Enterprises, Inc. | | | 206,000 | | | | 5,963,700 | |
| Chart Industries, Inc.(a) | | | 57,000 | | | | 4,560,570 | |
| CLARCOR, Inc. | | | 175,000 | | | | 9,166,500 | |
| ESCO Technologies, Inc. | | | 120,000 | | | | 4,903,200 | |
| Franklin Electric Co., Inc. | | | 186,000 | | | | 6,244,020 | |
| Gentherm, Inc.(a) | | | 210,000 | | | | 3,439,800 | |
| Herman Miller, Inc. | | | 86,000 | | | | 2,379,620 | |
| Hub Group, Inc., Class A(a) | | | 166,000 | | | | 6,384,360 | |
| II-VI, Inc.(a) | | | 195,000 | | | | 3,322,800 | |
| Lindsay Manufacturing Co. | | | 80,000 | | | | 7,054,400 | |
| Middleby Corp.(a) | | | 56,000 | | | | 8,520,400 | |
| Simpson Manufacturing Co., Inc. | | | 111,000 | | | | 3,397,710 | |
| Team, Inc.(a) | | | 136,000 | | | | 5,585,520 | |
| Watts Water Technologies, Inc., Class A | | | 133,000 | | | | 6,382,670 | |
| | | | | | | | |
| | | | | | | | 81,025,660 | |
| | | | | | | | |
| Information Technology (17.9%) | | | | | | | | |
| Blackbaud, Inc. | | | 150,000 | | | | 4,444,500 | |
| Bottomline Technologies, Inc.(a) | | | 164,000 | | | | 4,675,640 | |
| Coherent, Inc. | | | 88,000 | | | | 4,993,120 | |
| InterDigital, Inc. | | | 104,000 | | | | 4,974,320 | |
| IPG Photonics Corp. | | | 75,175 | | | | 4,992,372 | |
| Liquidity Services, Inc.(a) | | | 120,000 | | | | 3,577,200 | |
| Mellanox Technologies Ltd.(a) | | | 95,000 | | | | 5,273,450 | |
| MicroStrategy, Inc., Class A(a) | | | 36,000 | | | | 3,638,880 | |
| NIC, Inc. | | | 235,000 | | | | 4,502,600 | |
| Plantronics, Inc. | | | 241,000 | | | | 10,649,790 | |
| Polycom, Inc.(a) | | | 560,000 | | | | 6,204,800 | |
| Power Integrations, Inc. | | | 195,000 | | | | 8,464,950 | |
| Riverbed Technology, Inc.(a) | | | 241,000 | | | | 3,593,310 | |
| Sapient Corp.(a) | | | 575,000 | | | | 7,009,250 | |
| Syntel, Inc. | | | 57,000 | | | | 3,848,640 | |
| WEX, Inc.(a) | | | 119,000 | | | | 9,341,500 | |
| | | | | | | | |
| | | | | | | | 90,184,322 | |
| | | | | | | | |
| Materials (5.0%) | | | | | | | | |
| Calgon Carbon Corp.(a) | | | 270,000 | | | | 4,887,000 | |
| Commercial Metals Co. | | | 340,000 | | | | 5,389,000 | |
| Kraton Performance Polymers, Inc.(a) | | | 86,000 | | | | 2,012,400 | |
| Minerals Technologies, Inc. | | | 139,000 | | | | 5,769,890 | |
| Quaker Chemical Corp. | | | 117,000 | | | | 6,905,340 | |
| | | | | | | | |
| | | | | | | | 24,963,630 | |
| | | | | | | | |
| Utilities (3.2%) | | | | | | | | |
| American States Water Co. | | | 71,000 | | | | 4,087,470 | |
| New Jersey Resources Corp. | | | 166,000 | | | | 7,445,100 | |
| South Jersey Industries, Inc. | | | 85,000 | | | | 4,725,150 | |
| | | | | | | | |
| | | | | | | | 16,257,720 | |
| | | | | | | | |
| TOTAL COMMON STOCKS (Cost $417,314,121) | | | | | | | 499,854,701 | |
| | | | | | | | |
| INVESTMENT COMPANIES (0.6%) | | | | | | | | |
| State Street Institutional U.S. Government Money Market Fund, Investor Shares, 0.01%(b) | | | 3,210,238 | | | | 3,210,238 | |
| | | | | | | | |
| TOTAL INVESTMENT COMPANIES (Cost $3,210,238) | | | | | | | 3,210,238 | |
| | | | | | | | |
| Total Investments (Cost $420,524,359)(c) — 100.1% | | | | | | | 503,064,939 | |
| Liabilities in excess of other assets — (0.1)% | | | | | | | (275,784 | ) |
| | | | | | | | |
| NET ASSETS — 100.0% | | | | | | $ | 502,789,155 | |
| | | | | | | | |
| |
| (a) | | Non-income producing security. |
| (b) | | Rate disclosed is the seven day yield as of March 31, 2013. |
| (c) | | See Federal Tax Information listed in the Notes to the Financial Statements. |
| See Notes to Financial Statements | | 29 |
Financial Statements | | Boston Trust Small Cap Fund |
| | | |
| STATEMENT OF ASSETS AND LIABILITIES | | | | |
| March 31, 2013 | | | | |
| |
| Assets: | | | | |
| Investments, at fair value (cost $420,524,359) | | $ | 503,064,939 | |
| Cash | | | 43,220 | |
| Dividends receivable | | | 496,198 | |
| Receivable for capital shares issued | | | 39,639 | |
| Prepaid expenses and other assets | | | 22,236 | |
| | | | |
Total Assets | | | 503,666,232 | |
| | | | |
| Liabilities: | | | | |
| Payable for investments purchased | | | 396,165 | |
| Payable for capital shares redeemed | | | 41,664 | |
| Accrued expenses and other liabilities: | | | | |
Investment adviser | | | 312,313 | |
Chief compliance officer | | | 2,777 | |
Administration and accounting | | | 16,445 | |
Custodian | | | 9,027 | |
Transfer agent | | | 10,116 | |
Trustee | | | 1,091 | |
Shareholder servicing | | | 14,589 | |
Other | | | 72,890 | |
| | | | |
Total Liabilities | | | 877,077 | |
| | | | |
| Net Assets | | $ | 502,789,155 | |
| | | | |
| Composition of Net Assets: | | | | |
| Capital | | $ | 414,332,112 | |
| Accumulated net investment income (loss) | | | 196,993 | |
| Accumulated net realized gains from investment transactions | | | 5,719,470 | |
| Net unrealized appreciation from investments | | | 82,540,580 | |
| | | | |
| Net Assets | | $ | 502,789,155 | |
| | | | |
| Shares outstanding (par value $0.01, unlimited number of shares authorized) | | | 35,281,301 | |
| | | | |
| Net Asset Value, Offering Price and Redemption Price per share | | $ | 14.25 | |
| | | | |
| STATEMENT OF OPERATIONS | | | | |
| For the year ended March 31, 2013 | | | | |
| |
| Investment Income: | | | | |
| Dividends | | $ | 4,929,838 | |
| | | | |
Total Investment Income | | | 4,929,838 | |
| | | | |
| Expenses: | | | | |
Investment adviser | | | 2,679,568 | |
Administration and accounting | | | 428,065 | |
Shareholder servicing | | | 143,826 | |
Trustee | | | 14,412 | |
Custodian | | | 54,121 | |
Transfer agency | | | 44,894 | |
Chief compliance officer | | | 13,219 | |
Recoupment of prior expenses reimbursed by the investment adviser | | | 21,275 | |
Other | | | 189,936 | |
| | | | |
Total expenses before fee reductions | | | 3,589,316 | |
Fees voluntarily reduced by Transfer agent | | | (5,437 | ) |
| | | | |
| Net Expenses | | | 3,583,879 | |
| | | | |
| Net Investment Income | | | 1,345,959 | |
| | | | |
| Net Realized/Unrealized Gains from Investments: | | | | |
Net realized gains from investment transactions | | | 17,943,293 | |
Change in unrealized appreciation from investments | | | 27,309,103 | |
| | | | |
| Net realized/unrealized gains from investments | | | 45,252,396 | |
| | | | |
| Change in Net Assets Resulting from Operations | | $ | 46,598,355 | |
| | | | |
| 30 | | See Notes to Financial Statements |
Financial Statements | | Boston Trust Small Cap Fund |
| | | |
| STATEMENTS OF CHANGES IN NET ASSETS | | | | | | | | |
| | | For the year ended | | For the year ended |
| | | March 31, | | March 31, |
| | | 2013 | | 2012 |
| | | | | |
| | | | | | | | | |
| Investment Activities: | | | | | | | | |
| Operations: | | | | | | | | |
Net investment income | | $ | 1,345,959 | | | $ | 133,968 | |
Net realized gains from investment transactions | | | 17,943,293 | | | | 2,564,171 | |
Change in unrealized appreciation from investments | | | 27,309,103 | | | | 6,975,434 | |
| | | | | | | |
| Change in Net Assets Resulting from Operations | | | 46,598,355 | | | | 9,673,573 | |
| | | | | | | |
| Dividends: | | | | | | | | |
Net investment income | | | (1,470,783 | ) | | | (258,044 | ) |
Net realized gains from investment transactions | | | (11,612,948 | ) | | | (19,639,829 | ) |
| | | | | | | |
| Change in Net Assets Resulting from Shareholder Dividends | | | (13,083,731 | ) | | | (19,897,873 | ) |
| | | | | | | |
| Capital Share Transactions: | | | | | | | | |
Proceeds from shares issued | | | 163,526,538 | | | | 96,089,797 | |
Dividends reinvested | | | 12,261,159 | | | | 18,302,949 | |
Cost of shares redeemed | | | (34,019,044 | ) | | | (44,396,879 | ) |
Cost of shares redeemed in redemption in-kind(a) | | | (503,078 | ) | | | — | |
| | | | | | | |
| Change in Net Assets Resulting from Capital Share Transactions | | | 141,265,575 | | | | 69,995,867 | |
| | | | | | | |
| Change in Net Assets | | | 174,780,199 | | | | 59,771,567 | |
| Net Assets: | | | | | | | | |
Beginning of period | | | 328,008,956 | | | | 268,237,389 | |
| | | | | | | |
End of period | | $ | 502,789,155 | | | $ | 328,008,956 | |
| | | | | | | |
| Share Transactions: | | | | | | | | |
Issued | | | 12,160,205 | | | | 7,662,068 | |
Reinvested | | | 950,581 | | | | 1,557,698 | |
Redeemed | | | (2,568,914 | ) | | | (3,601,785 | ) |
Redeemed in redemption in-kind(a) | | | (40,571 | ) | | | — | |
| | | | | | | |
| Change in Shares | | | 10,501,301 | | | | 5,617,981 | |
| | | | | | | |
| Accumulated net investment income (loss) | | $ | 196,993 | | | $ | — | |
| | | | | | | |
| |
| Amounts designated as “—” are $0 or have been rounded $0. |
| (a) | | See Note 3 in Notes to Financial Statements. |
| See Notes to Financial Statements | | 31 |
| | |
Boston Trust Small Cap Fund |
| | | |
| FINANCIAL HIGHLIGHTS |
| Selected data for a share outstanding throughout the periods indicated. |
| | | For the year | | | For the year | | | For the year | | | For the year | | | For the year | |
| | | ended | | | ended | | | ended | | | ended | | | ended | |
| | | March 31, | | | March 31, | | | March 31, | | | March 31, | | | March 31, | |
| | | 2013 | | | 2012 | | | 2011 | | | 2010 | | | 2009 | |
| | | | | | | | | | | | | | | | |
| Net Asset Value, Beginning of Period | | $ | 13.24 | | | $ | 14.00 | | | $ | 11.52 | | | $ | 7.21 | | | $ | 10.92 | |
| | | | | | | | | | | | | | | | |
| Investment Activities: | | | | | | | | | | | | | | | | | | | | |
Net investment income | | | 0.05 | | | | 0.01 | | | | 0.02 | | | | 0.02 | | | | 0.02 | (a) |
Net realized and unrealized gains (losses) from investment transactions | | | 1.43 | | | | 0.20 | | | | 2.91 | | | | 4.31 | | | | (3.64) | |
| | | | | | | | | | | | | | | | |
| Total from investment activities | | | 1.48 | | | | 0.21 | | | | 2.93 | | | | 4.33 | | | | (3.62) | |
| | | | | | | | | | | | | | | | |
| Dividends: | | | | | | | | | | | | | | | | | | | | |
Net investment income | | | (0.05) | | | | (0.01) | | | | (0.03) | | | | (0.02) | | | | (0.02) | |
Net realized gains from investments | | | (0.42) | | | | (0.96) | | | | (0.42) | | | | — | | | | (0.07) | |
| | | | | | | | | | | | | | | | |
| Total dividends | | | (0.47) | | | | (0.97) | | | | (0.45) | | | | (0.02) | | | | (0.09) | |
| | | | | | | | | | | | | | | | |
| Net Asset Value, End of Period | | $ | 14.25 | | | $ | 13.24 | | | $ | 14.00 | | | $ | 11.52 | | | $ | 7.21 | |
| | | | | | | | | | | | | | | | |
| Total Return | | | 11.61% | | | | 2.35% | | | | 25.78% | | | | 60.01% | | | | (33.24)% | |
| | | | | | | | | | | | | | | | |
| Ratios/Supplemental Data: | | | | | | | | | | | | | | | | | | | | |
| Net Assets at end of period (000’s) | | $ | 502,789 | | | $ | 328,009 | | | $ | 268,237 | | | $ | 133,511 | | | $ | 25,504 | |
| Ratio of net expenses to average net assets | | | 1.00% | | | | 1.00% | | | | 1.00% | | | | 1.00% | | | | 1.10% | |
| Ratio of net investment income to average net assets | | | 0.38% | | | | 0.05% | | | | 0.15% | | | | 0.26% | | | | 0.21% | |
Ratio of expenses (before fee reductions or recoupment of fees previously reimbursed by the investment advisor) to average net assets(b) | | | 0.99% | | | | 1.09% | | | | 1.12% | | | | 1.14% | | | | 1.18% | |
| Portfolio turnover rate | | | 33.34% | | | | 30.99% | | | | 35.54% | | | | 26.68% | | | | 21.28% | |
| |
| Amounts designated as “—” are $0 or have been rounded to $0. |
| (a) | | Calculated using the average shares method. |
| (b) | | During the period, certain fees were reduced. If such fee reductions had not occurred, the ratio would have been as indicated. |
| 32 | | See Notes to Financial Statements |
This page intentionally left blank.
Environmental, Social and
Governance Research and
Action Update (Unaudited) |  |
Walden is pleased to begin 2013 with a report of substantial progress in fostering improved corporate environmental, social and governance (ESG) performance, a tribute to the positive impact of shareholder engagement.
Political Spending & Lobbying
As a leading investor advocate for full disclosure of corporate funds used in the political sphere, Walden is encouraged that the Securities and Exchange Commission (SEC) is considering mandating disclosure of political contributions by publicly traded companies. While the U.S. Chamber of Commerce and other organizations gear up to block such a rule, we have seen a number of portfolio companies step up. We withdrew a resolution at PepsiCo, led by the New York State Common Retirement Fund, when it agreed to disclose direct lobbying and contributions made to trade associations, as well as funds paid to grassroots lobbying and tax exempt groups that write and endorse model legislation. Similarly, Walden’s resolution at 3M was withdrawn with a commitment to detailed disclosure of lobbying activities and expenditures to trade associations. Another resolution at JPMorgan Chase, led by Domini Social Investments and co-filed by Walden, was withdrawn after successful negotiations led to the disclosure of new policies that ensure corporate funds cannot be used for electoral purposes.
Environmental Impacts
After productive discussions with Stryker, we withdrew our shareholder proposal requesting a comprehensive greenhouse gas (GHG) emissions management plan. The company committed to fully assess its facilities, establish GHG goals and targets, and complete the annual questionnaire of the Carbon Disclosure Project, the main repository of corporate responses to climate change. Walden also co-filed a resolution at PNC Financial, led by Boston Common Asset Management, requesting an assessment of GHG emissions in its lending portfolio and exposure to climate change risk in its lending, investing and financing activities. Prompted by PNC’s funding of mountaintop removal coal mining, the SEC denied the bank’s attempt to omit the resolution from its proxy ballot. Additionally, Walden was among the dozen investors who joined Ceres in a letter to the National Federation of Municipal Analysts seeking improved disclosure from water utilities on water supply risk analysis and climate change impacts.
Equality
The debate on the Defense of Marriage Act (DOMA) continues to intensify as the U.S. Supreme Court deliberates its fate. DOMA prevents the federal government from recognizing marriages between same-sex couples considered legally married in their home state. The business community has joined the wave of support for what many believe will be DOMA’s invalidation in June. Walden wrote to twelve portfolio companies commending their decision to join hundreds of others that signed a friend of the court brief to the Supreme Court that essentially called the law bad for business. The companies are: Apple, Cisco Systems, Diageo, EMC, Google, Intel, Johnson & Johnson, Microsoft, Nike, Oracle, Qualcomm, and State Street. Additionally, Walden recently encouraged Denbury Resources to make its inclusive nondiscrimination policy more accessible via the Equal Employment section of its corporate website.
ESG Disclosure
Walden continues to emphasize shareholder initiatives calling for transparency around ESG practices, goals and results. Comprehensive reporting equips investors with information to assess more fully ESG risks and opportunities, and importantly, heightens corporate accountability, which can be an important precursor to more sustainable business conduct. We withdrew a resolution at Wabtec upon its commitment to publish a sustainability report by year-end that will reference the best practice GRI (Global Reporting Initiative) guidelines. Along with Calvert Investments, we have provided detailed feedback on McCormick’s outline for its first sustainability report. Our resolution at Emerson Electric attained shareholder support of 38 percent (up from 35 percent last year), sending a strong message to management that reporting on ESG impacts and results matters to investors.
We close this quarter’s update with words we appreciated from PepsiCo’s CEO, Indra Nooyi, who some Wall Street analysts criticize for her championing of Performance with Purpose, the company’s sustainability strategy. Along with Ceres and Calvert Investments, we let Ms. Nooyi and the Board know that we believe this focus positions the company for long-term business success. Ms. Nooyi reached out personally to thank us for our continued engagement over the years, noting: “Your feedback informs our thinking as we shape the company’s approaches to address the issues that are so important to all of us.”
34
| Environmental, Social and Governance Research and Action Update (Unaudited) (continued) |
Women on Boards: Too Long in Coming
Facts and forces are coalescing to bring attention to the lack of gender diversity in U.S. corporate boardrooms.
First the facts. Women remain woefully underrepresented among corporate directors despite modest advances in recent years. According to Ernst & Young1, women hold just 14 percent of S&P 1500 company board seats. The larger companies in the S&P 500 fare slightly better with a total of 17 percent. Fully one-quarter of S&P 1500 companies have no female representation at all. And, according to the nonprofit Catalyst, women of color hold just 3 percent of director positions. These numbers are particularly disappointing since women make up nearly half of the U.S. workforce (47 percent) and they are attaining educational credentials at record levels (e.g., U.S. Census Bureau data shows women now account for about six of ten advanced degree holders among the 26-29 year age group).
More facts. Evidence is mounting of a positive relationship between company performance and the presence of women on boards. For example, recent research by Credit Suisse2 (not peer reviewed) found that boards with gender diversity had higher return on equity, lower leverage and better than average growth. Moreover, superior stock price performance was observed for companies with one or more women on boards. The authors posited several reasons for their findings: positive signaling of good governance, stronger efforts board-wide, better mix of leadership skills, access to a wider pool of talent, better representation of consumers, gender differences in risk-aversion, and improved corporate governance.
Forces putting the spotlight on board diversity include women’s organizations and networks, business leaders, media, and importantly, major institutional investors who believe gender diversity is an essential aspect of good corporate governance. With a representative of CalSTRS (California State Teachers Retirement System), Walden’s Tim Smith co-chairs the Investor Committee of the Thirty Percent Coalition—a network of corporate governance experts, corporations, senior business executives, state-wide elected officials, national women’s organizations, and institutional investors—which aims to encourage gender diversity in boardrooms through outreach to companies and other initiatives. Signatories to recent letters to companies lacking women directors have included the Comptrollers of New York State and New York City; the Treasurers of the States of Connecticut, Maryland, Massachusetts, Pennsylvania, Washington State, and California; representatives of CalSTRS, CalPERS and AFL-CIO; and various foundations, religious investors, mutual funds, and investment managers.
Walden is also ramping up engagement on board diversity at selected portfolio companies (American Science & Engineering, CARBO Ceramics, City National, IPG Photonics, NetApp, ResMed, Riverbed Technology, and Sapient), seeking stronger nominating policies and implementation plans to increase the representation of women and people of color. Specifically, Walden recommends companies have a public statement expressing the value of board diversity, nominating charter language that explicitly identifies gender and race as factors considered, and a commitment to a diverse candidate pool. We also often seek to have a conversation with the chairperson of a board’s nominating committee.
Walden is pleased with the early results of this outreach. Riverbed informed us of its new appointment of two directors that added both racial and gender diversity to its Board. Sapient told us it will consider our recommendations during the annual review of corporate governance documents in the coming months. CARBO Ceramics agreed to bring our message to its nominating committee for discussion. NetApp, where we filed a resolution, is exploring steps that may result in the withdrawal of the proposal.
We were particularly impressed with a technology company response to the Thirty Percent Coalition that described gender diversity as a “critical need at the most fundamental level.” The Chair of the Nominating and Governance Committee further stated: “[we] have opened our recruiting process so that we are constantly looking for qualified women candidates, even in the absence of an open seat. So when we do find a woman candidate, we will expand the size of the board to make room for her.”
While progress is always slower to come than we all want, there is reason for optimism.
|
| 1 | Getting on Board: Women join boards at higher rates, though progress comes slowly; Ernst & Young, December 2012. |
| | |
| 2 | Gender diversity and corporate performance; Research Institute, Thought leadership from Credit Suisse Research, August 2012. |
35
| Manager Commentary (Unaudited) |
| |
| | Walden Asset Management Fund | |
| | Walden Equity Fund | |
| | March 31, 2013 | |
| | | |
| | | |
| | William H. Apfel, CFA | |
| | | |
| | Portfolio Manager | |
| | Boston Trust Investment | |
| | Management, Inc. | |
| | | |
| | Asset Management Fund Objective | |
| | The investment objective of the Walden Asset Management Fund is to seek long-term capital growth and income through an actively managed portfolio of stocks, bonds and money market instruments. | |
| | | |
| | Equity Fund Objective | |
| | The investment objective of the Walden Equity Fund is to seek long-term growth of capital through an actively managed portfolio of stocks. | |
| | | |
| | Investment Concerns | |
| | Equity securities (stocks) are more volatile and carry more risk and return potential than other forms of investments, including investments in high-grade fixed income securities. The net asset value per share of these Funds will fluctuate as the value of the securities in the portfolio changes. | |
| | | |
| | Bonds offer a relatively stable level of income, although bond prices will fluctuate, providing the potential for principal gain or loss. Intermediate term, higher quality bonds generally offer less risk than longer-term bonds and a lower rate of return. | |
| | | |
| | Cash equivalents offer low risk and low return potential. | |
| | | |
| | | |
| |
| Management Discussion of Fund Performance |
| |
| Portfolio Review |
The Walden Asset Management Fund (formerly the Walden Balanced Fund) returned 6.83% for the 12-month period, compared to 9.35% for its Morningstar peer group average. The Walden Equity Fund returned 8.27% for the 12-month period, compared to 13.96% for the S&P 500 Index. The shortfall in the Funds’ returns relative to these respective benchmarks was primarily due to the results for our equity selections, described in more detail below. As has often been the case in past periods of sharply rising markets, our “high quality” discipline, which seeks to identify companies with long histories of financial success, limited results as equity markets approached new highs. While trailing the Morningstar peer group, the Walden Asset Management Fund benefited from the equity market’s strong advance. Most importantly, the Fund’s equity allocation began the period near 75% to total assets, or at the upper end of the traditional 45% to 75% range. We did not reduce the equity allocation as stock prices increased, taking full advantage of the upward price trend. |
| |
As always, equity segment results for the Walden Asset Management Fund, and the entirety of the Walden Equity Fund, were affected by the composition of market returns. In particular, sectors less dependent upon economic growth fared better, as the healthcare and consumer products sectors posted especially strong returns. In contrast, commodity price-dependent materials companies lagged as did the technology sector. Meanwhile, low-quality stocks, as defined by Standard & Poor’s, continued their recent strong returns as investors sought weaker companies whose fortunes might be lifted by a rising market. The latter two trends limited both Funds relative results. |
| |
Our selections in the finance sector performed well relative to the sector index. Holdings in this sector include two high-quality property-casualty insurance companies. These benefitted from mounting indications that insurance pricing is now rising after years of weakness. While banks continued to lead the market higher, the more domestically oriented regional lenders were particularly good performers. In most instances, we prefer the beneficiaries of a healing domestic economy to the more global and diversified money center institutions. Toward the end of the fiscal year, the latter group suffered as the collapse of Cypriot banks once again called attention to the risks inherent in complex financial institutions.* |
| |
Fund industrial sector holdings lagged the sector index. Our industrial sector selections have fared well during the four-year market rise, as we emphasized capital goods producers that serve expanding global markets. Despite the slow growing economy, many of these companies have succeeded in strengthening their profitability through improved efficiencies in manufacturing and distribution. In contrast, the best performers in this sector during the past 12-month period were highly cyclical airlines and stocks leveraged to a rebound in construction. While we anticipate that construction activity will gain momentum, we find the valuation of many companies in this industry entails a high degree of speculation.* |
| |
Finally, the fixed income segment of the Walden Asset Management Fund performed in line with market benchmarks over the past year. In the current environment, we view the role of fixed income in a diversified portfolio as a matter of risk control and diversification. Our expected return forecasts for this segment in the most likely scenarios average near zero. |
| |
Portfolio Strategy |
Four years after stock prices dropped by more than half in the wake of the financial crisis, market indices have fully recovered. Further market advances will depend upon continued profit growth. With profit margins near historical peaks, only those reasonably valued companies that continue to generate rising sales, increased efficiencies, and steady cash flows, may reward investors. |
| |
We believe our current equity investment strategy is well suited to this environment. While Fund sector weights are similar to those of the S&P 500 Index, and Price-to-Earnings Ratio1 valuations are close to index levels, individual holdings are focused on companies with substantial free cash flows relative to earnings and businesses we consider well placed to generate steady sales and earnings growth. As always, portfolio companies have long histories of attractive profitability, strong balance sheets, and business models we judge to be sustainable far into the future. |
| |
With all the risks that equities entail, we view them as easily a better option than fixed income alternatives. At today’s valuations, we believe only equities offer the likelihood of attractive long-term returns. Fund equity allocation therefore remains high relative to historical averages. Fixed income holdings are of the highest quality. Average fixed income segment maturities are shorter than appropriate benchmark comparisons, reflecting our expectation that over time interest rates are more likely to rise than fall. |
| | |
| 1 | The Price-to-Earnings Ratio (“P/E Ratio”) is a valuation ratio of a company’s current share price to its per-share earnings. A high P/E means high projected earnings in the future. |
| * | Portfolio composition is subject to change. |
36
| Investment Performance (Unaudited) | Walden Asset Management Fund
Walden Equity Fund
March 31, 2013 |
| | | Annualized |
| | | |
| | | 1 Year Ended | | 5 Years Ended | | 10 Years Ended |
| | | 3/31/13 | | 3/31/13 | | 3/31/13 |
| Walden Asset Management Fund1 | | | 6.83 | % | | | 4.36 | % | | | 6.07 | % |
| Walden Equity Fund1 | | | 8.27 | % | | | 5.54 | % | | | 8.04 | % |
| S&P 500 Index | | | 13.96 | % | | | 5.81 | % | | | 8.53 | % |
| |
| Barclays Capital U.S. Government/Credit Bond Index | | | 4.56 | % | | | 5.50 | % | | | 5.06 | % |
| |
| Citigroup 90-Day U.S. Treasury Bill Index | | | 0.08 | % | | | 0.31 | % | | | 1.66 | % |
| |
| Morningstar U.S. Open-End Moderate Allocation Funds Average | | | 9.35 | % | | | 4.53 | % | | | 6.82 | % |
| |
Hypothetical Growth of a $10,000 Investment

The above charts represent a 10-year hypothetical $10,000 investment in the Walden Asset Management Fund and Walden Equity Fund, and represents the reinvestment of dividends and capital gains in the Funds. The returns shown on the table and graph do not reflect the deduction of taxes a shareholder would pay on Fund distributions or the redemption of Fund shares.
The Walden Asset Management Fund is measured against a combination of equity and fixed income indices. The Walden Equity Fund is measured against the Standard & Poor’s 500 Index (“S&P 500”) which is widely regarded as a gauge of the U.S. equities market. This index includes 500 leading companies in leading industries of the U.S. economy. Although the S&P 500 focuses on the large cap segment of the market, with approximately 75% coverage of U.S. equities, it is also widely viewed as a proxy for the total market. The Barclays Capital U.S. Government/Credit Bond Index is a component of the Barclays U.S. Aggregate Index. The Barclays Capital U.S. Government/Credit Bond Index includes Treasuries (i.e., public obligations of the U.S. Treasury that have remaining maturities of more than one year), Government-Related issues (i.e., agency, sovereign, supranational, and local authority debt), and USD Corporates. The Citigroup 90-Day U.S. Treasury Bill Index reflects monthly return equivalents of yield averages that are not marked to the market. The Index is an average of the last three-month treasury bill issues. The three-month treasury bills are the short-term debt obligations of the U.S. Government. The Morningstar U.S. Open-End Moderate Allocation Funds Average represents performance of portfolios that seek to provide both capital appreciation and income by investing in three major areas: stocks, bonds, and cash. These portfolios tend to hold larger positions in stocks than conservative-allocation portfolios. These portfolios typically have 50% to 70% of assets in equities and the remainder in fixed income and cash. The indices are unmanaged and their performance does not reflect the deduction of expenses associated with a mutual fund, such as investment management and fund accounting fees. The Funds’ performance reflects the deduction of fees for these services. Investors cannot invest directly in an index.

Walden Asset Management Fund
| Fund Net Asset Value: | $13.53 |
| Gross Expense Ratio1: | 1.13% |
Walden Equity Fund
| Fund Net Asset Value: | $15.41 |
| Gross Expense Ratio1: | 1.16% |
Past performance does not guarantee future results. The performance data quoted represents past performance and current returns may be lower or higher. The investment return and principal value will fluctuate so that an investor’s shares, when redeemed may be worth more or less than the original cost. To obtain performance information current to the most recent month-end, please call 1-800-282-8782 ext. 7050.
| 1 | The Gross Expense Ratio is from each Fund’s most recent prospectus, dated August 1, 2012. The Gross Expense Ratio excludes the impact of contractual fee waivers. After giving effect to such fee waivers, the Asset Management Fund’s Net Expense Ratio would be 1.00%, including the indirect expenses of investing in acquired funds. Please see each Fund’s most recent prospectus for details. Additional information pertaining to each Fund’s expense ratio as of March 31, 2013 can be found in the financial highlights. The investment performance may reflect fee reductions. If such fee reductions had not occurred, the quoted performance would have been lower. The contractual fee waiver continues through August 1, 2013 and may be terminated thereafter. |
37
| Manager Commentary (Unaudited) |
| |
| | Walden Midcap Fund | |
| | March 31, 2013 | |
| | | |
| | | |
| | Stephen J. Amyouny, CFA | |
| | | |
| | Portfolio Manager | |
| | Boston Trust Investment | |
| | Management, Inc. | |
| | | |
| | Fund Objective | |
| | The Fund seeks long-term capital growth through an actively managed portfolio of stocks of middle capitalization (“midcap”) companies. | |
| | | |
| | Investment Concerns | |
| | Equity securities (stocks) are more volatile and carry more risk and return potential than other forms of investments, including investments in high-grade fixed income securities. | |
| | | |
| | Mid-capitalization funds typically carry additional risks since smaller companies generally have a higher risk of failure. | |
| | | |
| | | |
| |
| Management Discussion of Fund Performance |
| |
| Portfolio Review |
The Walden Midcap Fund posted a total return of 9.12% for the 12-month period ended March 31, 2013—a disappointing result in comparison to the benchmark Russell Midcap® Index, which returned 17.30%. Two primary factors contributed to the Fund’s weak performance relative to the benchmark: 1) the strong performance of lower quality stocks versus high-quality stocks, and 2) security selection. Over the last 12 months, investors reacted positively to the aggressive monetary policies of the Fed and other central banks across the globe. As a result, investors increased their exposures to riskier assets, including stocks in lower quality companies, which stand to benefit the most from a reacceleration in global economic activity. This trend presented a headwind to our investment approach, which focuses on higher-quality companies with more stable businesses, greater financial strength, and high levels of profitability. The Fund also experienced disappointing results relative to the benchmark index in two specific sectors: information technology and consumer discretionary. Within information technology, the Fund’s exposure to companies in the enterprise corporate IT markets detracted from results. This technology segment has recently experienced a softening in demand, which adversely affected the performance of several of the Fund’s holdings; however, we continue to believe that it is an attractive segment within the technology sector with solid growth prospects. In the consumer discretionary sector, many highly cyclical stocks with exposure to residential housing performed exceptionally well. This group included homebuilders, producers of household durables, and home retailers as well as companies in the materials sector that supply building and construction materials and paints.* |
| |
One sector of the market that performed very well and bucked the afore-mentioned trend of lower-quality companies was consumer staples. The Fund’s holdings in this sector performed exceptionally well, thanks in part to investors’ gravitation toward companies with relatively stable businesses and high dividend yields that offer an alternative to low yielding fixed income instruments.* |
| |
Portfolio Strategy |
In recent years, corporations have generally grown earnings per share1 (EPS) from a combination of revenue growth, margin expansion, and share repurchases. We believe that revenue growth in aggregate among our portfolio companies is likely to approximate global gross domestic product2 growth with perhaps a 1% to 2% additional benefit from expected acquisition activity. Based on strong free cash flow generation and very healthy balance sheets, share repurchases are also likely to contribute to future EPS growth. The wildcard in this formula remains the ability of our companies to continue to expand margins. Over the last few years, companies have benefited from operating leverage, rising productivity, low wage cost inflation, improving supply chain logistics, global sourcing, and lower interest expenses. We anticipate that future margin expansion should be modest, in comparison to current levels, and thus will contribute less to EPS growth over the next few years; although, based on present valuations that are quite reasonable, we believe that EPS growth will be sufficient to drive stock prices higher. |
| |
As always, the Fund will continue to hold a diversified portfolio of high-quality companies with strong balance sheets, sustainable business models, and attractive growth prospects that sell at reasonable valuations. The last point – reasonable valuations – is worth emphasizing. Thanks in large part to the sharp price appreciation of equities over the last few years many stocks now sell at valuations that imply unreasonably high future growth expectations. We continue to monitor the valuations of our Fund holdings and remain disciplined in all facets of our investment approach. In fact, despite the superior financial characteristics of our companies, the Fund holdings presently sells at a Price-to-Earnings Ratio3 on trailing GAAP EPS that is approximately 15% below that of the Russell Midcap Index. We remain confident that our long-term investment approach and discipline will produce attractive future returns. |
| | |
| 1 | The Earnings per Share (“EPS”) Growth indicates the portion of a company’s profit allocated to each outstanding share of common stock. Earnings per share serves as an indicator of a company’s profitability. |
| | |
| 2 | The Gross Domestic Product (“GDP”) is the measure of the market value of the goods and services produced by labor and property in the United States. |
| | |
| 3 | The Price-to-Earnings Ratio (“P/E Ratio”) is a valuation ratio of a company’s current share price to its per-share earnings. A high P/E means high projected earnings in the future. |
| | |
| * | Portfolio composition is subject to change. |
38
| Investment Performance (Unaudited) | Walden Midcap Fund
March 31, 2013 |
| | | Annualized |
| | | |
| | | 1 Year Ended | | | | Since Inception |
| | | 3/31/13 | | | | 8/1/11 |
| Walden Midcap Fund1 | | | 9.12 | % | | | | | | | 12.39 | % |
| |
| Russell Midcap® Index | | | 17.30 | % | | | | | | | 15.03 | % |
| |
Hypothetical Growth of a $10,000 Investment
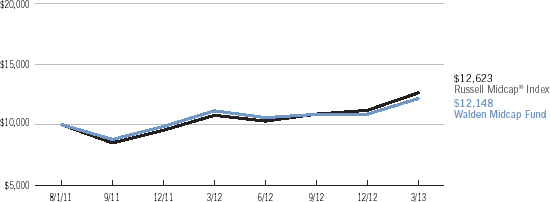
The chart represents the historical performance of a hypothetical $10,000 investment in the Walden Midcap Fund from August 1, 2011 to March 31, 2013, and represents the reinvestment of dividends and capital gains in the Fund. The returns shown on the table and graph do not reflect the deduction of taxes a shareholder would pay on Fund distributions or the redemption of Fund shares.
The Walden Midcap Fund is measured against the Russell Midcap® Index, which is an unmanaged index that measures the performance of the mid-cap segment of the U.S. equity universe. The Russell Midcap® Index is a subset of the Russell 1000® Index. It includes approximately 800 of the smallest securities based on a combination of their market capitalization and current index membership. The Russell Midcap® Index represents approximately 31% of the total market capitalization of the Russell 1000 companies. The performance of an index does not reflect the deduction of expenses associated with a mutual fund, such as investment management and fund accounting fees. The Fund’s performance reflects the deduction of fees for these services. Investors cannot invest directly in an index.

| Fund Net Asset Value: | $12.06 |
| Gross Expense Ratio1: | 1.28% |
Past performance does not guarantee future results. The performance data quoted represents past performance and current returns may be lower or higher. The investment return and principal value will fluctuate so that an investor’s shares, when redeemed may be worth more or less than the original cost. Returns less than one year are not annualized. To obtain performance information current to the most recent month-end, please call 1-800-282-8782 ext. 7050.
| 1 | The Gross Expense Ratio is from the Fund’s most recent prospectus, dated August 1, 2012. The Gross Expense Ratio excludes the impact of any contractual fee waivers. After giving effect to such fee waivers, the Fund’s Net Expense Ratio would be 1.01%, including the indirect expenses of investing in acquired funds. Please see the Fund’s most recent prospectus for details. Additional information pertaining to the Fund’s expense ratio as of March 31, 2013 can be found in the financial highlights. The investment performance may reflect fee reductions. If such fee reductions had not occurred, the quoted performance would have been lower. The contractual fee waiver continues through August 1, 2013 and may be terminated thereafter. |
39
| Manager Commentary (Unaudited) |
| |
| | Walden SMID Cap | |
| | Innovations Fund | |
| | March 31, 2013 | |
| | | |
| | | |
| | Kenneth P. Scott, CFA | |
| | Stephen C. Franco, CFA | |
| | Heidi H. Vanni, CFA | |
| | | |
| | Portfolio Managers | |
| | Boston Trust Investment | |
| | Management, Inc. | |
| | | |
| | Fund Objective | |
| | The investment objective of the Walden SMID Cap Innovations Fund is to seek long-term capital growth through an actively managed portfolio of stocks of small- to mid-capitalization companies. | |
| | | |
| | Investment Concerns | |
| | Equity securities (stocks) are more volatile and carry more risk and return potential than other forms of investments, including investments in high-grade fixed income securities. | |
| | | |
| | Small-capitalization funds typically carry additional risks since smaller companies generally have a higher risk of failure, and historically, their stocks have experienced a greater degree of market volatility than stocks on average. | |
| | | |
| | | |
| |
| Management Discussion of Fund Performance |
| |
| Portfolio Review |
U.S. equity markets rose sharply for the 12-month period, with the value of the Fund’s benchmark, the Russell 2500® Index increasing 17.73%. The U.S. market welcomed continued improvement in economic fundamentals, and appeared unaffected by the ongoing fiscal challenges of the U.S. and Europe. The Walden SMID Cap Innovations Fund, which focuses on higher quality, more innovative companies, posted strong gains of 21.28% for the period from its inception on June 28, 2012 to the period ended March 31, 2013, although, disappointingly, underperformed the benchmark returns by approximately 4.9 percentage points for the period ending March 31, 2013. |
| |
Generally, stocks of higher-quality companies underperform when share prices rise sharply and when expectations for volatility are low and falling. This is consistent with the view that stock values, and those of riskier companies in particular, appreciate as investors demonstrate increased appetite for risk. |
| |
On a key measure of quality–financial leverage–stocks with lower-quality profiles outperformed in the year ended March 31, 2013. We believe this is due not only to the typical performance patterns associated with lower-quality stocks in a strong bull market, but also to historically low interest rates. The most indebted firms currently face fewer burdens than they would in a normal interest rate environment. On other measures of quality, such as profitability, the performance impact is less clear. |
| |
Portfolio Strategy |
The top individual stock contributors to performance this year were mortgage-servicing firm Ocwen Financial (OCN), short haul railroad firm Genesee & Wyoming (GWR), commercial kitchen equipment maker Middleby (MIDD), railroad equipment supplier Wabtec (WAB) and network storage vendor CommVault Systems (CVLT). Laggards this year were premium mattress manufacturers Tempur-Pedic (TPX) and Select Comfort (SCSS), health care software firm Quality Systems (QSII), prepaid debit card firm Green Dot (GDOT) and videoconferencing vendor Polycom (PLCM). Tempur-Pedic and Green Dot were sold due to concerns about the long-term sustainability of their business models.* |
| |
Walden aims to maintain SMID-cap portfolio sector weights comparable to those of the overall SMID-cap market. Slight differences in sector weights had no significant impact on relative performance. However, at the subsector level there were differences that affected performance. For example, our focus on higher-quality companies results in under weights in certain lower-quality industries, (e.g. airlines, biotechnology, building products, and media) which performed quite well over the previous 12 months.* |
| |
U.S. economic activity continued to improve in early 2013, with ongoing contributions from consumers, a housing recovery, business investment, and healthy exports, complemented by low inflation and the Federal Reserve maintaining its efforts to hold interest rates at historically low levels. Thus, in spite of several, global economic challenges, the opportunity for continued, positive equity performance, including SMIDcap equity performance, remains in place. |
| |
That said, with a Price-to-Earnings Ratio1 of 26 times trailing earnings at March 31, 2013, the valuation of the Russell 2500® implies continued strong growth in overall SMID-cap company earnings. Wall Street analysts expect the Russell 2500® companies, in aggregate, to post approximately 20% growth in earnings in 2013. Such earnings growth can be achieved either through strong sales growth, which may be challenging for this large group of companies if the economic recovery remains modest, or through expansion of profit margins, which are already above their historical average. A shortfall in SMID-cap firms’ earnings may prove disappointing at current valuations. However, we continue to believe that investing in reasonably priced shares of a distinct subset of more innovative, higher-quality companies, whose businesses are leveraged to more sustainable elements of growth, will continue to provide substantial value to client portfolios over time. |
| | |
| 1 | The Price-to-Earnings Ratio (“P/E Ratio”) is a valuation ratio of a company’s current share price to its per-share earnings. A high P/E means high projected earnings in the future. |
| | |
| * | Portfolio composition is subject to change. |
40
| Investment Performance (Unaudited) | Walden SMID Cap
Innovations Fund
March 31, 2013 |
| | | 6 Months Ended | | | | Since Inception |
| | | 3/31/13 | | | | 6/28/12 |
| Walden SMID Cap Innovations Fund1 | | | 11.88 | % | | | | | | | 21.28 | % |
| |
| Russell 2500® Index | | | 16.35 | % | | | | | | | 26.31 | % |
| |
Hypothetical Growth of a $10,000 Investment

The chart represents the historical performance of a hypothetical $10,000 investment in the Walden SMID Cap Innovations Fund from June 28, 2012 to March 31, 2013, and represents the reinvestment of dividends and capital gains in the Fund. The returns shown on the table and graph do not reflect the deduction of taxes a shareholder would pay on Fund distributions or the redemption of Fund shares.
The Walden SMID Cap Innovations Fund is measured against the Russell 2500TM Index, which is an unmanaged index that measures the performance of the small- to mid-cap segment of the U.S. equity universe, commonly referred to as “smid” cap. The Russell 2500 is a subset of the Russell 3000® Index. It includes approximately 2500 of the smallest securities based on a combination of their market cap and current index membership. The performance of an index does not reflect the deduction of expenses associated with a mutual fund, such as investment management and fund accounting fees. The Fund’s performance reflects the deduction of fees for these services. Investors cannot invest directly in an index.

| Fund Net Asset Value: | $12.09 |
| Gross Expense Ratio1: | 1.19% |
Past performance does not guarantee future results. The performance data quoted represents past performance and current returns may be lower or higher. The investment return and principal value will fluctuate so that an investor’s shares, when redeemed may be worth more or less than the original cost. To obtain performance information current to the most recent month-end, please call 1-800-282-8782 ext. 7050.
| 1 | The Gross Expense Ratio is from the Fund’s most recent prospectus, dated August 1, 2012. The Gross Expense Ratio excludes the impact of any contractual fee waivers. After giving effect to such fee waivers, the SMID Cap Innovations Fund’s Net Expense Ratio would be 1.01%, including the indirect expenses of investing in acquired funds. Please see the Fund’s most recent prospectus for details. Additional information pertaining to the Fund’s expense ratio as of March 31, 2013 can be found in the financial highlights. The investment performance may reflect fee reductions. If such fee reductions had not occurred, the quoted performance would have been lower. The contractual fee waiver continues through August 1, 2013 and may be terminated thereafter. |
41
| Manager Commentary (Unaudited) |
| |
| | Walden Small Cap | |
| | Innovations Fund | |
| | March 31, 2013 | |
| | | |
| | | |
| | Kenneth P. Scott, CFA | |
| | | |
| | Portfolio Manager | |
| | Boston Trust Investment | |
| | Management, Inc. | |
| | | |
| | Fund Objective | |
| | The investment objective of the Walden Small Cap Innovations Fund is to seek long-term capital growth through an actively managed portfolio of stocks of small capitalization companies. | |
| | | |
| | Investment Concerns | |
| | Equity securities (stocks) are more volatile and carry more risk and return potential than other forms of investments, including investments in high-grade fixed income securities. | |
| | | |
| | Small-capitalization funds typically carry additional risks since smaller companies generally have a higher risk of failure, and historically, their stocks have experienced a greater degree of market volatility than stocks on average. | |
| | | |
| | | |
| |
| Management Discussion of Fund Performance |
| |
| Portfolio Review |
U.S. equity markets rose sharply for the 12-month period ended March 31, 2013, with the value of the benchmark Russell 2000® Index increasing 16.30%. The U.S. market welcomed continued improvement in economic fundamentals, and appeared unaffected by the ongoing fiscal challenges of the U.S. and Europe. The Walden Small Cap Innovations Fund, which focuses on higher quality, more innovative companies, posted a strong gain of 12.05% for the 12-month period, nevertheless, disappointingly, underperformed the benchmark return for period. For the 3-year period, and since inception, the Fund underperformed the strong performance of the Russell 2000® by less than 1% annualized, albeit while demonstrating lower volatility. |
| |
Generally, stocks of higher-quality companies underperform when share prices rise sharply and when expectations for volatility are low and falling. This is consistent with the view that stock values, and those of riskier companies in particular, appreciate as investors demonstrate increased appetite for risk. |
| |
On a key measure of quality–financial leverage–stocks with lower quality profiles outperformed in the year ended March 31, 2013. We believe this is due not only to the typical performance patterns associated with lower-quality stocks in a strong bull market, but also to historically low interest rates. The most indebted firms currently face fewer burdens than they would in a normal interest rate environment. On other measures of quality, such as profitability, the performance impact is less clear. |
| |
Performance Attribution Commentary |
The top individual stock contributors to performance this year were mortgage servicing company Ocwen Financial (OCN), short haul railroad firm Genesee & Wyoming (GWR), pharmaceutical packaging company West Pharmaceutical (WST), architectural glass manufacturer Apogee Enterprises (APOG), and commercial kitchen equipment maker Middleby (MIDD). Laggards this year were premium mattress manufacturer Select Comfort (SCSS), health care software firm Quality Systems (QSII), prepaid debit card firm Green Dot (GDOT), alternative fuel vehicle equipment maker Fuel Systems Solutions (FSYS), and business-to-business auction firm Liquidity Services (LQDT). We sold Ocwen Financial and Genesee & Wyoming from the Fund due to market capitalization considerations, and sold Green Dot and Fuel Systems due to concerns about the long-term sustainability of their business models.* |
| |
Walden aims to maintain small-cap portfolio sector weights comparable to those of the overall small-cap market. Slight differences in sector weights had no significant impact on relative performance. However, at the subsector level there were differences that affected performance. For example, our focus on higher-quality companies resulted in under weights in certain lower-quality industries, (e.g. airlines, biotechnology, building products, and construction materials) that fared particularly well during this past year. |
| |
U.S. economic activity continued to improve in early 2013, with ongoing contributions from consumers, a housing recovery, business investment, and healthy exports, complemented by low inflation and the U.S. Federal Reserve maintaining its efforts to hold interest rates at historically low levels. Thus, in spite of several, global economic challenges, the opportunity for continued, positive equity performance, including small cap equity performance, remains in place. |
| |
That said, with a Price-to-Earnings Ratio1 of 34 times trailing earnings at March 31, 2013, the valuation of the Russell 2000® implies continued, strong growth in overall small-cap company earnings. Wall Street analysts expect the Russell 2000® companies, in aggregate, to post approximately 20% growth in earnings in 2013. Such earnings growth can be achieved either through strong sales growth, which may be challenging for this large group of companies if the economic recovery remains modest, or through expansion of profit margins, which are already above their historical average. A shortfall in small-cap firms’ earnings may prove disappointing at current valuations. However, we continue to believe that investing in reasonably priced shares of a distinct subset of more innovative, higher-quality companies, whose businesses are leveraged to more sustainable elements of growth, will continue to provide substantial value to Fund holders’ overall portfolios over time.* |
| | |
| 1 | The Price-to-Earnings Ratio (“P/E Ratio”) is a valuation ratio of a company’s current share price to its per-share earnings. A high P/E means high projected earnings in the future. |
| | |
| * | Portfolio composition is subject to change. |
42
| Investment Performance (Unaudited) | Walden Small Cap
Innovations Fund
March 31, 2013 |
| | | Annualized |
| | | |
| | | 1 Year Ended | | | | Since Inception |
| | | 3/31/13 | | | | 10/24/08 |
| Walden Small Cap Innovations Fund1 | | | 12.05 | % | | | | | | | 18.60 | % |
| |
| Russell 2000® Index | | | 16.30 | % | | | | | | | 18.87 | % |
| |
Hypothetical Growth of a $10,000 Investment

The chart represents the historical performance of a hypothetical $10,000 investment in the Walden Small Cap Innovations Fund from October 24, 2008 to March 31, 2013, and represents the reinvestment of dividends and capital gains in the Fund. The returns shown on the table and graph do not reflect the deduction of taxes a shareholder would pay on Fund distributions or the redemption of Fund shares.
The Walden Small Cap Innovations Fund is measured against the Russell 2000® Index, which is an unmanaged index that measures the performance of the small-cap segment of the U.S. equity universe. The Russell 2000® Index is a subset of the Russell 3000® Index representing approximately 10% of the total market capitalization of that index. It includes approximately 2,000 of the smallest securities based on a combination of their market cap and current index membership. The performance of an index does not reflect the deduction of expenses associated with a mutual fund, such as investment management and fund accounting fees. The Fund’s performance reflects the deduction of fees for these services. Investors cannot invest directly in an index.

| Fund Net Asset Value: | $18.48 |
| Gross Expense Ratio1: | 1.16% |
Past performance does not guarantee future results. The performance data quoted represents past performance and current returns may be lower or higher. The investment return and principal value will fluctuate so that an investor’s shares, when redeemed may be worth more or less than the original cost. To obtain performance information current to the most recent month-end, please call 1-800-282-8782 ext. 7050.
| 1 | The Gross Expense Ratio is from the Fund’s most recent prospectus, dated August 1, 2012. The Gross Expense Ratio excludes the impact of any contractual fee waivers. After giving effect to such fee waivers, the Small Cap Innovations Fund’s Net Expense Ratio would be 1.01%, including the indirect expenses of investing in acquired funds. Please see the Fund’s most recent prospectus for details. Additional information pertaining to the Fund’s expense ratio as of March 31, 2013 can be found in the financial highlights. The investment performance may reflect fee reductions. If such fee reductions had not occurred, the quoted performance would have been lower. The contractual fee waiver continues through August 1, 2013 and may be terminated thereafter. |
43
Schedule of Portfolio Investments | |
Walden Asset Management Fund
March 31, 2013 |
| | | |
| COMMON STOCKS (74.3%) | | | | | | | |
| Security Description | | | | Shares | | | Fair Value ($) |
| | | | | | | | |
| Consumer Discretionary (8.4%) | | | | | | | |
| Advance Auto Parts, Inc. | | | 6,000 | | | | 495,900 |
| Autoliv, Inc. | | | 7,000 | | | | 483,980 |
| McDonald’s Corp. | | | 8,500 | | | | 847,365 |
| NIKE, Inc., Class B | | | 18,000 | | | | 1,062,180 |
| Omnicom Group, Inc. | | | 12,000 | | | | 706,800 |
| Ross Stores, Inc. | | | 12,000 | | | | 727,440 |
| The Home Depot, Inc. | | | 2,000 | | | | 139,560 |
| Time Warner Cable, Inc. | | | 10,000 | | | | 960,600 |
| | | | | | | | |
| | | | | | | | 5,423,825 |
| | | | | | | | |
| Consumer Staples (10.2%) | | | | | | | |
| Colgate-Palmolive Co. | | | 7,850 | | | | 926,535 |
| Costco Wholesale Corp. | | | 9,200 | | | | 976,212 |
| McCormick & Co., Inc. | | | 3,000 | | | | 220,650 |
| Nestle SA, Sponsored ADR | | | 13,000 | | | | 942,110 |
| PepsiCo, Inc. | | | 12,600 | | | | 996,786 |
| Procter & Gamble Co. | | | 14,000 | | | | 1,078,840 |
| Reckitt Benckiser Group PLC, Sponsored ADR | | | 41,000 | | | | 591,630 |
| SYSCO Corp. | | | 24,000 | | | | 844,080 |
| | | | | | | | |
| | | | | | | | 6,576,843 |
| | | | | | | | |
| Energy (7.8%) | | | | | | | |
| Apache Corp. | | | 9,000 | | | | 694,440 |
| BG Group PLC, Sponsored ADR | | | 36,000 | | | | 617,400 |
| ConocoPhillips | | | 18,500 | | | | 1,111,850 |
| Core Laboratories NV | | | 6,000 | | | | 827,520 |
| Denbury Resources, Inc.(a) | | | 25,000 | | | | 466,250 |
| Devon Energy Corp. | | | 14,500 | | | | 818,090 |
| Phillips 66 | | | 7,000 | | | | 489,790 |
| | | | | | | | |
| | | | | | | | 5,025,340 |
| | | | | | | | |
| Financials (10.7%) | | | | | | | |
| American Express Co. | | | 8,000 | | | | 539,680 |
| BB&T Corp. | | | 15,000 | | | | 470,850 |
| Chubb Corp. | | | 9,500 | | | | 831,535 |
| Cincinnati Financial Corp. | | | 21,000 | | | | 990,990 |
| Comerica, Inc. | | | 17,000 | | | | 611,150 |
| Commerce Bancshares, Inc. | | | 10,500 | | | | 428,715 |
| JPMorgan Chase & Co. | | | 15,000 | | | | 711,900 |
| PNC Financial Services Group, Inc. | | | 10,000 | | | | 665,000 |
| State Street Corp. | | | 10,000 | | | | 590,900 |
| T. Rowe Price Group, Inc. | | | 15,000 | | | | 1,123,050 |
| | | | | | | | |
| | | | | | | | 6,963,770 |
| | | | | | | | |
| Health Care (9.3%) | | | | | | | |
| Becton, Dickinson & Co. | | | 9,000 | | | | 860,490 |
| C.R. Bard, Inc. | | | 7,000 | | | | 705,460 |
| DENTSPLY International, Inc. | | | 18,000 | | | | 763,560 |
| Johnson & Johnson, Inc. | | | 9,000 | | | | 733,770 |
| Medtronic, Inc. | | | 12,000 | | | | 563,520 |
| Mettler-Toledo International, Inc.(a) | | | 3,100 | | | | 660,982 |
| Roche Holding AG, Sponsored ADR | | | 10,000 | | | | 586,000 |
| Stryker Corp. | | | 9,500 | | | | 619,780 |
| Waters Corp.(a) | | | 6,000 | | | | 563,460 |
| | | | | | | | |
| | | | | | | | 6,057,022 |
| | | | | | | | |
| Industrials (11.3%) | | | | | | | |
| 3M Co. | �� | | 7,500 | | | | 797,325 |
| Deere & Co. | | | 9,500 | | | | 816,810 |
| Donaldson Co., Inc. | | | 24,000 | | | | 868,560 |
| Emerson Electric Co. | | | 18,000 | | | | 1,005,660 |
| Expeditors International of Washington, Inc. | | | 9,500 | | | | 339,245 |
| Illinois Tool Works, Inc. | | | 16,000 | | | | 975,040 |
| Lincoln Electric Holdings, Inc. | | | 11,500 | | | | 623,070 |
| United Parcel Service, Inc., Class B | | | 9,500 | | | | 816,050 |
| W.W. Grainger, Inc. | | | 4,650 | | | | 1,046,157 |
| | | | | | | | |
| | | | | | | | 7,287,917 |
| | | | | | | | |
| | | | | | | | | |
| | | | | Shares or | | | | |
| | | | | Principal | | | | |
| Security Description | | | | Amount ($) | | | | Fair Value ($) |
| | | | | | | | |
| Information Technology (13.3%) | | | | | | | |
| Accenture PLC, Class A | | | 10,500 | | | | 797,685 |
| Apple, Inc. | | | 2,300 | | | | 1,018,049 |
| Automatic Data Processing, Inc. | | | 11,000 | | | | 715,220 |
| Cisco Systems, Inc. | | | 33,000 | | | | 690,030 |
| EMC Corp.(a) | | | 26,000 | | | | 621,140 |
| Google, Inc., Class A(a) | | | 900 | | | | 714,627 |
| Intel Corp. | | | 20,000 | | | | 437,000 |
| International Business Machines Corp. | | | 4,500 | | | | 959,850 |
| Microsoft Corp. | | | 31,000 | | | | 886,910 |
| NetApp, Inc.(a) | | | 10,000 | | | | 341,600 |
| Oracle Corp. | | | 25,000 | | | | 808,500 |
| QUALCOMM, Inc. | | | 9,500 | | | | 636,025 |
| | | | | | | | |
| | | | | | | | 8,626,636 |
| | | | | | | | |
| Materials (3.3%) | | | | | | | |
| AptarGroup, Inc. | | | 12,000 | | | | 688,200 |
| Praxair, Inc. | | | 6,700 | | | | 747,318 |
| Sigma-Aldrich Corp. | | | 9,000 | | | | 699,120 |
| | | | | | | | |
| | | | | | | | 2,134,638 |
| | | | | | | | |
| TOTAL COMMON STOCKS (Cost $34,379,438) | | | | | | | 48,095,991 |
| | | | | | | | |
| CORPORATE BONDS (3.7%) | | | | | | | |
| Consumer Staples (0.3%) | | | | | | | |
| Campbell Soup Co., 4.50%, 2/15/19 | | | 150,000 | | | | 169,947 |
| | | | | | | | |
| Financials (2.7%) | | | | | | | |
| American Express Co., 2.65%, 12/2/22 | | | 287,000 | | | | 281,841 |
| American Express Co., 7.00%, 3/19/18 | | | 250,000 | | | | 312,511 |
| Calvert Social Investment Foundation, Series NOTZ, 0.75%, 8/31/14, MTN(b) | | | 75,000 | | | | 75,000 |
| Export-Import Bank of Korea, 1.75%, 2/27/18 | | | 250,000 | | | | 249,865 |
| JPMorgan Chase & Co., 3.15%, 7/5/16 | | | 250,000 | | | | 265,277 |
| National Rural Utilities Cooperative Finance Corp., 10.38%, 11/1/18 | | | 250,000 | | | | 365,271 |
| North American Development Bank, 4.38%, 2/1/20 | | | 100,000 | | | | 111,136 |
| Wachovia Corp., 5.75%, 6/15/17 | | | 100,000 | | | | 117,636 |
| | | | | | | | |
| | | | | | | | 1,778,537 |
| | | | | | | | |
| Industrials (0.1%) | | | | | | | |
| Hubbell, Inc., 3.63%, 11/15/22 | | | 75,000 | | | | 79,962 |
| | | | | | | | |
| |
| Information Technology (0.4%) | | | | | | | |
| Oracle Corp., 5.75%, 4/15/18 | | | 200,000 | | | | 241,598 |
| | | | | | | | |
| |
| Telecommunication Services (0.2%) | | | | | | | |
| AT&T, Inc., 5.50%, 2/1/18 | | | 100,000 | | | | 117,691 |
| | | | | | | | |
| TOTAL CORPORATE BONDS (Cost $2,127,595) | | | | | | | 2,387,735 |
| | | | | | | | |
| MUNICIPAL BONDS (1.1%) | | | | | | | |
| Illinois (0.3%) | | | | | | | |
| Illinois State, GO, 5.00%, 6/1/27, NATL-RE FGIC, Callable 6/1/13 @ 100 | | | 200,000 | | | | 201,206 |
| | | | | | | | |
| Ohio (0.2%) | | | | | | | |
| Ohio State, Series D, GO, 4.50%, 9/15/22, NATL-RE, Callable 3/15/16 @ 100 | | | 150,000 | | | | 164,258 |
| | | | | | | | |
| Oregon (0.2%) | | | | | | | |
| Oregon State, Series A, GO, 5.00%, 10/1/14 | | | 100,000 | | | | 105,996 |
| | | | | | | | |
| Wisconsin (0.4%) | | | | | | | |
| Wisconsin State, Build America Bonds, GO, 4.60%, 5/1/26, Callable 5/1/21 @ 100 | | | 250,000 | | | | 285,627 |
| | | | | | | | |
| TOTAL MUNICIPAL BONDS (Cost $703,216) | | | | | | | 757,087 |
| | | | | | | | |
| 44 | | See Notes to Financial Statements |
Schedule of Portfolio Investments (cont.) | |
Walden Asset Management Fund
March 31, 2013 |
| | | |
| U.S. GOVERNMENT & U.S. GOVERNMENT AGENCY OBLIGATIONS (16.8%) | | | | | | | |
| | | | | Shares or | | | | |
| | | | | Principal | | | | |
| Security Description | | | | Amount ($) | | | Fair Value ($) |
| | | | | | | | |
| Federal Farm Credit Bank | | | | | | | |
5.38%, 11/10/20 | | | 250,000 | | | | 313,890 |
| | | | | | | | | |
| Federal Home Loan Bank | | | | | | | |
0.88%, 12/12/14 | | | 1,500,000 | | | | 1,515,811 |
1.38%, 5/28/14 | | | 500,000 | | | | 506,895 |
2.50%, 3/11/22 | | | 200,000 | | | | 210,092 |
3.13%, 12/13/13 | | | 1,000,000 | | | | 1,021,006 |
3.63%, 10/18/13 | | | 500,000 | | | | 509,599 |
5.25%, 12/11/20 | | | 200,000 | | | | 251,712 |
5.25%, 8/15/22 | | | 1,000,000 | | | | 1,272,406 |
5.50%, 7/15/36 | | | 700,000 | | | | 940,918 |
| | | | | | | | |
| | | | | | | | 6,228,439 |
| | | | | | | | |
| Federal National Mortgage Association | | | | | | | |
0.88%, 8/28/14 | | | 1,000,000 | | | | 1,009,191 |
1.13%, 6/27/14 | | | 500,000 | | | | 505,872 |
| | | | | | | | |
| | | | | | | | 1,515,063 |
| | | | | | | | |
| Government National Mortgage Association | | | | | | | |
4.00%, 9/15/40 | | | 164,227 | | | | 180,117 |
4.00%, 9/15/41 | | | 557,393 | | | | 608,190 |
6.50%, 5/15/32 | | | 34,216 | | | | 39,145 |
| | | | | | | | |
| | | | | | | | 827,452 |
| | | | | | | | |
| The Financing Corporation | | | | | | | |
2.92%, 4/5/13(c) | | | 100,000 | | | | 99,993 |
| | | | | | | | |
| U.S. Treasury Inflation Index Note | | | | | | | |
0.63%, 7/15/21 | | | 255,408 | | | | 292,388 |
| | | | | | | | |
| U.S. Treasury Inflation Protected Bond | | | | | | | |
1.25%, 7/15/20 | | | 1,319,775 | | | | 1,577,797 |
| | | | | | | | |
| TOTAL U.S. GOVERNMENT & U.S. GOVERNMENT | | | | | | | |
| | | | | | | | |
| AGENCY OBLIGATIONS (Cost $10,215,461) | | | | | | | 10,855,022 |
| | | | | | | | |
| INVESTMENT COMPANIES (4.0%) | | | | | | | |
| State Street Institutional U.S. Government Money Market Fund, Investor Shares, 0.01%(d) | | | 2,574,260 | | | | 2,574,260 |
| | | | | | | | |
| TOTAL INVESTMENT COMPANIES (Cost $2,574,260) | | | | | | | 2,574,260 |
| | | | | | | | |
| Total Investments (Cost $49,999,970)(e) — 99.9% | | | | | | | 64,670,095 |
| Other assets in excess of liabilities — 0.1% | | | | | | | 57,512 |
| | | | | | | | |
| NET ASSETS — 100.0% | | | | | | $ | 64,727,607 |
| | | | | | | | |
| (a) | | Non-income producing security. |
| (b) | | Illiquid Security. |
| (c) | | Rate represents the effective yield at purchase. |
| (d) | | Rate disclosed is the seven day yield as of March 31, 2013. |
| (e) | | See Federal Tax Information listed in the Notes to the Financial Statements. |
| ADR | | American Depositary Receipt |
| FGIC | | Insured by Financial Guaranty Insurance Company |
| GO | | General Obligation |
| MTN | | Medium Term Note |
| NATL-RE | | Reinsured by National Public Finance Guarantee Corporation |
| NV | | Naamloze Vennootschap |
| PLC | | Public Limited Company |
| See Notes to Financial Statements | | 45 |
Financial Statements | |
Walden Asset Management Fund |
| | | |
| STATEMENT OF ASSETS AND LIABILITIES | | | | | |
| March 31, 2013 | | | | | |
| | | | | | |
| Assets: | | | | | |
| Investments, at fair value (cost $49,999,970) | | | $ | 64,670,095 | |
| Cash | | | | 16,006 | |
| Interest and dividends receivable | | | | 167,788 | |
| Prepaid expenses and other assets | | | | 6,497 | |
| | | | | |
Total Assets | | | | 64,860,386 | |
| | | | | |
| Liabilities: | | | | | |
| Payable for capital shares redeemed | | | | 70,001 | |
| Accrued expenses and other liabilities: | | | | | |
Investment adviser | | | | 29,892 | |
Chief compliance officer | | | | 420 | |
Administration and accounting | | | | 2,549 | |
Custodian | | | | 1,546 | |
Transfer agent | | | | 8,973 | |
Trustee | | | | 165 | |
Shareholder servicing | | | | 9,938 | |
Other | | | | 9,295 | |
| | | | | |
Total Liabilities | | | | 132,779 | |
| | | | | |
| Net Assets | | | $ | 64,727,607 | |
| | | | | |
| Composition of Net Assets: | | | | | |
| Capital | | | $ | 49,955,710 | |
| Accumulated net investment income | | | | 145,977 | |
| Accumulated net realized losses from investment transactions | | | | (44,205 | ) |
| Net unrealized appreciation from investments | | | | 14,670,125 | |
| | | | | |
| Net Assets | | | $ | 64,727,607 | |
| | | | | |
Shares outstanding (par value $0.01, unlimited number of shares authorized) | | | | 4,783,606 | |
| | | | | |
Net Asset Value, Offering Price and Redemption Price per share | | | $ | 13.53 | |
| | | | | |
| STATEMENT OF OPERATIONS | | | | | |
| For the year ended March 31, 2013 | | | | | |
| | | | | | |
| Investment Income: | | | | | |
| Interest | | | $ | 341,646 | |
| Dividends | | | | 969,142 | |
| Less: Foreign tax withholding | | | | (1,131 | ) |
| | | | | |
Total Investment Income | | | | 1,309,657 | |
| | | | | |
| Expenses: | | | | | |
Investment adviser | | | | 435,530 | |
Administration and accounting | | | | 74,983 | |
Shareholder servicing | | | | 36,337 | |
Trustee | | | | 2,514 | |
Custodian | | | | 10,047 | |
Transfer agency | | | | 33,226 | |
Chief compliance officer | | | | 2,250 | |
Other | | | | 42,629 | |
| | | | | |
Total expenses before fee reductions | | | | 637,516 | |
Fees voluntarily reduced by the transfer agent | | | | (5,437 | ) |
Fees contractually reduced by investment advisor | | | | (49,992 | ) |
| | | | | |
| Net Expenses | | | | 582,087 | |
| | | | | |
| Net Investment Income | | | | 727,570 | |
| | | | | |
| Net Realized/Unrealized Gains from Investments: | | | | | |
Net realized gains from investment transactions | | | | 460,562 | |
Change in unrealized appreciation from investments | | | | 2,939,385 | |
| | | | | |
| Net realized/unrealized gains from investments | | | | 3,399,947 | |
| | | | | |
| Change in Net Assets Resulting from Operations | | | $ | 4,127,517 | |
| | | | | |
| 46 | | See Notes to Financial Statements |
Financial Statements | |
Walden Asset Management Fund |
| | | |
| STATEMENTS OF CHANGES IN NET ASSETS | | | | | | | | | | |
| | | | For the year ended | | | | For the year ended | |
| | | | March 31, | | | | March 31, | |
| | | | 2013 | | | | 2012 | |
| | | | | | | | | |
| | | | | | | | | | | |
| Investment Activities: | | | | | | | | | | |
| Operations: | | | | | | | | | | |
Net investment income | | | $ | 727,570 | | | | $ | 527,632 | |
Net realized gains from investment transactions | | | | 460,562 | | | | | 649,156 | |
Change in unrealized appreciation/depreciation from investments | | | | 2,939,385 | | | | | 3,335,936 | |
| | | | | | | | | |
| Change in Net Assets Resulting from Operations | | | | 4,127,517 | | | | | 4,512,724 | |
| | | | | | | | | |
| Dividends: | | | | | | | | | | |
Net investment income | | | | (710,488 | ) | | | | (550,502 | ) |
| | | | | | | | | |
| Change in Net Assets Resulting from Shareholder Dividends | | | | (710,488 | ) | | | | (550,502 | ) |
| | | | | | | | | |
| Capital Share Transactions: | | | | | | | | | | |
Proceeds from shares issued | | | | 7,258,486 | | | | | 5,722,485 | |
Proceeds from shares issued in subscription in-kind(a) | | | | — | | | | | 5,098,275 | |
Dividends reinvested | | | | 524,576 | | | | | 294,548 | |
Cost of shares redeemed | | | | (3,552,189 | ) | | | | (6,041,401 | ) |
| | | | | | | | | |
| Change in Net Assets Resulting from Capital Share Transactions | | | | 4,230,873 | | | | | 5,073,907 | |
| | | | | | | | | |
| Change in Net Assets | | | | 7,647,902 | | | | | 9,036,129 | |
| Net Assets: | | | | | | | | | | |
Beginning of period | | | | 57,079,705 | | | | | 48,043,576 | |
| | | | | | | | | |
End of period | | | $ | 64,727,607 | | | | $ | 57,079,705 | |
| | | | | | | | | |
| Share Transactions: | | | | | | | | | | |
Issued | | | | 568,831 | | | | | 480,206 | |
Issued in subscriptions in-kind(a) | | | | — | | | | | 463,901 | |
Reinvested | | | | 41,417 | | | | | 25,261 | |
Redeemed | | | | (279,084 | ) | | | | (497,437 | ) |
| | | | | | | | | |
| Change in Shares | | | | 331,164 | | | | | 471,931 | |
| | | | | | | | | |
| Accumulated net investment income | | | $ | 145,977 | | | | $ | 112,702 | |
| | | | | | | | | |
| |
| Amounts designated as “—” are $0 or have been rounded to $0. |
| (a) | | See Note 3 in Notes to Financial Statements. |
| See Notes to Financial Statements | | 47 |
Financial Statements | |
Walden Asset Management Fund |
| | | |
| FINANCIAL HIGHLIGHTS |
| Selected data for a share outstanding throughout the years indicated. |
| | | | For the year | | | | For the year | | | | For the year | | | | For the year | | | | For the year | |
| | | | ended | | | | ended | | | | ended | | | | ended | | | | ended | |
| | | | March 31, | | | | March 31, | | | | March 31, | | | | March 31, | | | | March 31, | |
| | | | 2013 | | | | 2012 | | | | 2011 | | | | 2010 | | | | 2009 | |
| | | | | | | | | | | | | | | | | | | | | |
| | | | | | | | | | | | | | | | | | | | | | | | | | |
Net Asset Value, Beginning of Period | | | $ | 12.82 | | | | $ | 12.07 | | | | $ | 10.98 | | | | $ | 8.84 | | | | $ | 11.90 | |
| | | | | | | | | | | | | | | | | | | | | |
| Investment Activities: | | | | | | | | | | | | | | | | | | | | | | | | | |
Net investment income | | | | 0.15 | | | | | 0.12 | | | | | 0.15 | | | | | 0.16 | | | | | 0.16 | (a) |
Net realized and unrealized gains (losses) from investment transactions | | | | 0.71 | | | | | 0.75 | | | | | 1.09 | | | | | 2.11 | | | | | (2.88 | ) |
| | | | | | | | | | | | | | | | | | | | | |
| Total from investment activities | | | | 0.86 | | | | | 0.87 | | | | | 1.24 | | | | | 2.27 | | | | | (2.72 | ) |
| | | | | | | | | | | | | | | | | | | | | |
| Dividends: | | | | | | | | | | | | | | | | | | | | | | | | | |
Net investment income | | | | (0.15 | ) | | | | (0.12 | ) | | | | (0.15 | ) | | | | (0.13 | ) | | | | (0.21 | ) |
Net realized gains from investments | | | | — | | | | | — | | | | | — | | | | | — | | | | | (0.13 | ) |
| | | | | | | | | | | | | | | | | | | | | |
| Total dividends | | | | (0.15 | ) | | | | (0.12 | ) | | | | (0.15 | ) | | | | (0.13 | ) | | | | (0.34 | ) |
| | | | | | | | | | | | | | | | | | | | | |
| Net Asset Value, End of Period | | | $ | 13.53 | | | | $ | 12.82 | | | | $ | 12.07 | | | | $ | 10.98 | | | | $ | 8.84 | |
| | | | | | | | | | | | | | | | | | | | | |
| Total Return | | | | 6.83% | | | | | 7.35% | | | | | 11.32% | | | | | 25.78% | | | | | (22.91)% | |
| | | | | | | | | | | | | | | | | | | | | |
| Ratios/Supplemental Data: | | | | | | | | | | | | | | | | | | | | | | | | | |
| Net Assets at end of period (000’s) | | | $ | 64,728 | | | | $ | 57,080 | | | | $ | 48,044 | | | | $ | 41,500 | | | | $ | 29,005 | |
| Ratio of net expenses to average net assets | | | | 1.00% | | | | | 1.00% | | | | | 1.00% | | | | | 1.00% | | | | | 1.00% | |
Ratio of net investment income to average net assets | | | | 1.25% | | | | | 1.04% | | | | | 1.30% | | | | | 1.59% | | | | | 1.55% | |
Ratio of expenses (before fee reductions) to average net assets(b) | | | | 1.10% | | | | | 1.13% | | | | | 1.14% | | | | | 1.17% | | | | | 1.19% | |
| Portfolio turnover rate | | | | 15.93% | | | | | 24.56% | | | | | 31.03% | | | | | 27.02% | | | | | 71.27% | |
| Amounts designated as “—” are $0 or have been rounded to $0. |
| (a) | | Calculated using the average shares method. |
| (b) | | During the period, certain fees were reduced. If such fee reductions had not occurred, the ratio would have been as indicated. |
| 48 | | See Notes to Financial Statements |
Schedule of Portfolio Investments | |
Walden Equity Fund
March 31, 2013 |
| | | |
| COMMON STOCKS (98.7%) | | | | | | | |
| Security Description | | | | Shares | | | | Fair Value ($) |
| | | | | | | | |
| Consumer Discretionary (10.8%) | | | | | | | |
| Advance Auto Parts, Inc. | | | 16,500 | | | | 1,363,725 |
| Autoliv, Inc. | | | 20,500 | | | | 1,417,370 |
| McDonald’s Corp. | | | 21,500 | | | | 2,143,335 |
| NIKE, Inc., Class B | | | 46,500 | | | | 2,743,965 |
| Omnicom Group, Inc. | | | 30,500 | | | | 1,796,450 |
| Ross Stores, Inc. | | | 29,000 | | | | 1,757,980 |
| The TJX Cos., Inc. | | | 8,000 | | | | 374,000 |
| Time Warner Cable, Inc. | | | 26,000 | | | | 2,497,560 |
| | | | | | | | |
| | | | | | | | 14,094,385 |
| | | | | | | | |
| Consumer Staples (13.2%) | | | | | | | |
| Colgate-Palmolive Co. | | | 23,000 | | | | 2,714,690 |
| Costco Wholesale Corp. | | | 21,000 | | | | 2,228,310 |
| McCormick & Co., Inc. | | | 10,000 | | | | 735,500 |
| Nestle SA, Sponsored ADR | | | 35,000 | | | | 2,536,450 |
| PepsiCo, Inc. | | | 35,000 | | | | 2,768,850 |
| Procter & Gamble Co. | | | 36,000 | | | | 2,774,160 |
| Reckitt Benckiser Group PLC, Sponsored ADR | | | 115,000 | | | | 1,659,450 |
| SYSCO Corp. | | | 50,000 | | | | 1,758,500 |
| | | | | | | | |
| | | | | | | | 17,175,910 |
| | | | | | | | |
| Energy (10.2%) | | | | | | | |
| Apache Corp. | | | 26,000 | | | | 2,006,160 |
| BG Group PLC, Sponsored ADR | | | 95,000 | | | | 1,629,250 |
| ConocoPhillips | | | 49,000 | | | | 2,944,900 |
| Core Laboratories NV | | | 15,000 | | | | 2,068,800 |
| Denbury Resources, Inc.(a) | | | 58,000 | | | | 1,081,700 |
| Devon Energy Corp. | | | 37,000 | | | | 2,087,540 |
| Phillips 66 | | | 22,000 | | | | 1,539,340 |
| | | | | | | | |
| | | | | | | | 13,357,690 |
| | | | | | | | |
| Financials (14.4%) | | | | | | | |
| American Express Co. | | | 23,000 | | | | 1,551,580 |
| BB&T Corp. | | | 38,000 | | | | 1,192,820 |
| Chubb Corp. | | | 28,000 | | | | 2,450,840 |
| Cincinnati Financial Corp. | | | 60,000 | | | | 2,831,400 |
| Comerica, Inc. | | | 48,000 | | | | 1,725,600 |
| Commerce Bancshares, Inc. | | | 23,000 | | | | 939,090 |
| JPMorgan Chase & Co. | | | 40,000 | | | | 1,898,400 |
| PNC Financial Services Group, Inc. | | | 25,000 | | | | 1,662,500 |
| State Street Corp. | | | 26,000 | | | | 1,536,340 |
| T. Rowe Price Group, Inc. | | | 40,000 | | | | 2,994,800 |
| | | | | | | | |
| | | | | | | | 18,783,370 |
| | | | | | | | |
| Health Care (12.7%) | | | | | | | |
| Becton, Dickinson & Co. | | | 25,000 | | | | 2,390,250 |
| C.R. Bard, Inc. | | | 20,000 | | | | 2,015,600 |
| DENTSPLY International, Inc. | | | 46,000 | | | | 1,951,320 |
| Johnson & Johnson, Inc. | | | 25,000 | | | | 2,038,250 |
| Medtronic, Inc. | | | 30,000 | | | | 1,408,800 |
| Mettler-Toledo International, Inc.(a) | | | 8,500 | | | | 1,812,370 |
| Roche Holding AG, Sponsored ADR | | | 25,000 | | | | 1,465,000 |
| Saint Jude Medical, Inc. | | | 10,000 | | | | 404,400 |
| Stryker Corp. | | | 25,000 | | | | 1,631,000 |
| Waters Corp.(a) | | | 16,000 | | | | 1,502,560 |
| | | | | | | | |
| | | | | | | | 16,619,550 |
| | | | | | | | |
| Industrials (15.2%) | | | | | | | |
| 3M Co. | | | 20,000 | | | | 2,126,200 |
| Deere & Co. | | | 23,000 | | | | 1,977,540 |
| Donaldson Co., Inc. | | | 63,000 | | | | 2,279,970 |
| Emerson Electric Co. | | | 49,000 | | | | 2,737,630 |
| Expeditors International of Washington, Inc. | | | 23,000 | | | | 821,330 |
| Hubbell, Inc., Class B | | | 10,000 | | | | 971,100 |
| Illinois Tool Works, Inc. | | | 42,000 | | | | 2,559,480 |
| Lincoln Electric Holdings, Inc. | | | 28,000 | | | | 1,517,040 |
| United Parcel Service, Inc., Class B | | | 25,000 | | | | 2,147,500 |
| W.W. Grainger, Inc. | | | 12,000 | | | | 2,699,760 |
| | | | | | | | |
| | | | | | | | 19,837,550 |
| | | | | | | | |
| Information Technology (17.9%) | | | | | | | |
| Accenture PLC, Class A | | | 30,000 | | | | 2,279,100 |
| Apple, Inc. | | | 6,400 | | | | 2,832,832 |
| Automatic Data Processing, Inc. | | | 32,000 | | | | 2,080,640 |
| Cisco Systems, Inc. | | | 94,500 | | | | 1,975,995 |
| EMC Corp.(a) | | | 74,000 | | | | 1,767,860 |
| Google, Inc., Class A(a) | | | 2,600 | | | | 2,064,478 |
| Intel Corp. | | | 60,000 | | | | 1,311,000 |
| International Business Machines Corp. | | | 11,000 | | | | 2,346,300 |
| Microsoft Corp. | | | 78,000 | | | | 2,231,580 |
| NetApp, Inc.(a) | | | 24,000 | | | | 819,840 |
| Oracle Corp. | | | 65,000 | | | | 2,102,100 |
| QUALCOMM, Inc. | | | 23,000 | | | | 1,539,850 |
| | | | | | | | |
| | | | | | | | 23,351,575 |
| | | | | | | | |
| Materials (4.3%) | | | | | | | |
| AptarGroup, Inc. | | | 30,000 | | | | 1,720,500 |
| Praxair, Inc. | | | 18,000 | | | | 2,007,720 |
| Sigma-Aldrich Corp. | | | 25,000 | | | | 1,942,000 |
| | | | | | | | |
| | | | | | | | 5,670,220 |
| | | | | | | | |
| TOTAL COMMON STOCKS (Cost $91,693,344) | | | | | | | 128,890,250 |
| | | | | | | | |
| INVESTMENT COMPANIES (1.2%) | | | | | | | |
| State Street Institutional U.S. Government Money Market Fund, Investor Shares, 0.01%(b) | | | 1,624,857 | | | | 1,624,857 |
| | | | | | | | |
| TOTAL INVESTMENT COMPANIES (Cost $1,624,857) | | | | | | | 1,624,857 |
| | | | | | | | |
| Total Investments (Cost $93,318,201)(c) — 99.9% | | | | | | | 130,515,107 |
| Other assets in excess of liabilities — 0.1% | | | | | | | 182,559 |
| | | | | | | | |
| NET ASSETS — 100.0% | | | | | | $ | 130,697,666 |
| | | | | | | | |
| (a) | | Non-income producing security. |
| (b) | | Rate disclosed is the seven day yield as of March 31, 2013. |
| (c) | | See Federal Tax Information listed in the Notes to the Financial Statements. |
| ADR | | American Depositary Receipt |
| AG | | Aktiengesellschaft (German Stock Company) |
| PLC | | Public Limited Company |
| See Notes to Financial Statements | | 49 |
Financial Statements | |
Walden Equity Fund |
| | | |
| STATEMENT OF ASSETS AND LIABILITIES | | | | | |
| March 31, 2013 | | | | | |
| | | | | | |
| Assets: | | | | | |
| Investments, at fair value (cost $93,318,201) | | | $ | 130,515,107 | |
| Cash | | | | 41,578 | |
| Dividends receivable | | | | 197,261 | |
| Receivable for capital shares issued | | | | 102,774 | |
| Prepaid expenses and other assets | | | | 13,486 | |
| | | | | |
Total Assets | | | | 130,870,206 | |
| | | | | |
| Liabilities: | | | | | |
| Payable for investments purchased | | | | 36,309 | |
| Accrued expenses and other liabilities: | | | | | |
Investment adviser | | | | 48,507 | |
Chief compliance officer | | | | 802 | |
Administration and accounting | | | | 4,491 | |
Custodian | | | | 2,781 | |
Transfer agent | | | | 9,814 | |
Trustee | | | | 315 | |
Shareholder servicing | | | | 48,996 | |
Other | | | | 20,525 | |
| | | | | |
Total Liabilities | | | | 172,540 | |
| | | | | |
| Net Assets | | | $ | 130,697,666 | |
| | | | | |
| Composition of Net Assets: | | | | | |
| Capital | | | $ | 94,363,469 | |
Accumulated net investment income | | | | 298,146 | |
Accumulated net realized losses from investment transactions | | | | (1,160,855 | ) |
Net unrealized appreciation from investments | | | | 37,196,906 | |
| | | | | |
Net Assets | | | $ | 130,697,666 | |
| | | | | |
Shares outstanding (par value $0.01, unlimited number of shares authorized) | | | | 8,482,726 | |
| | | | | |
Net Asset Value, Offering Price and Redemption Price per share | | | $ | 15.41 | |
| | | | | |
| STATEMENT OF OPERATIONS | | | | | |
| For the year ended March 31, 2013 | | | | | |
| | | | | | |
| Investment Income: | | | | | |
| Dividends | | | $ | 2,415,317 | |
| Less: Foreign tax withholding | | | | (3,000 | ) |
| | | | | |
Total Investment Income | | | | 2,412,317 | |
| | | | | |
| Expenses: | | | | | |
Investment adviser | | | | 812,878 | |
Administration and accounting | | | | 132,257 | |
Shareholder servicing | | | | 161,968 | |
Trustee | | | | 4,681 | |
Custodian | | | | 18,124 | |
Transfer agency | | | | 38,897 | |
Chief compliance officer | | | | 4,251 | |
Other | | | | 71,037 | |
| | | | | |
Total expenses before fee reductions | | | | 1,244,093 | |
Fees voluntarily reduced by transfer agent | | | | (5,437 | ) |
Fees contractually reduced by the investment adviser | | | | (151,960 | ) |
| | | | | |
| Net Expenses | | | | 1,086,696 | |
| | | | | |
| Net Investment Income | | | | 1,325,621 | |
| | | | | |
| Net Realized/Unrealized Gains from Investments: | | | | | |
Net realized gains from investment transactions | | | | 1,573,805 | |
Change in unrealized appreciation from investments | | | | 7,120,222 | |
| | | | | |
| Net realized/unrealized gains from investments | | | | 8,694,027 | |
| | | | | |
| Change in Net Assets Resulting from Operations | | | $ | 10,019,648 | |
| | | | | |
| 50 | | See Notes to Financial Statements |
Financial Statements | |
Walden Equity Fund |
| | | |
| STATEMENTS OF CHANGES IN NET ASSETS | | | | | | | | | | |
| | | | For the year ended | | | | For the year ended | |
| | | | March 31, | | | | March 31, | |
| | | | 2013 | | | | 2012 | |
| | | | | | | | | |
| | | | | | | | | | | |
| Investment Activities: | | | | | | | | | | |
| Operations: | | | | | | | | | | |
Net investment income | | | $ | 1,325,621 | | | | $ | 906,589 | |
Net realized gains from investment transactions | | | | 1,573,805 | | | | | 1,575,647 | |
Change in unrealized appreciation from investments | | | | 7,120,222 | | | | | 6,155,388 | |
| | | | | | | | | |
| Change in Net Assets Resulting from Operations | | | | 10,019,648 | | | | | 8,637,624 | |
| | | | | | | | | |
| Dividends: | | | | | | | | | | |
Net investment income | | | | (1,235,398 | ) | | | | (866,803 | ) |
| | | | | | | | | |
| Change in Net Assets Resulting from Shareholder Dividends | | | | (1,235,398 | ) | | | | (866,803 | ) |
| | | | | | | | | |
| Capital Share Transactions: | | | | | | | | | | |
Proceeds from shares issued | | | | 26,075,858 | | | | | 13,201,221 | |
Dividends reinvested | | | | 1,012,431 | | | | | 703,063 | |
Cost of shares redeemed | | | | (9,380,879 | ) | | | | (9,690,517 | ) |
| | | | | | | | | |
| Change in Net Assets Resulting from Capital Share Transactions | | | | 17,707,410 | | | | | 4,213,767 | |
| | | | | | | | | |
| Change in Net Assets | | | | 26,491,660 | | | | | 11,984,588 | |
| Net Assets: | | | | | | | | | | |
Beginning of period | | | | 104,206,006 | | | | | 92,221,418 | |
| | | | | | | | | |
End of period | | | $ | 130,697,666 | | | | $ | 104,206,006 | |
| | | | | | | | | |
| Share Transactions: | | | | | | | | | | |
Issued | | | | 1,828,723 | | | | | 1,008,761 | |
Reinvested | | | | 72,127 | | | | | 55,534 | |
Redeemed | | | | (661,573 | ) | | | | (742,325 | ) |
| | | | | | | | | |
| Change in Shares | | | | 1,239,277 | | | | | 321,970 | |
| | | | | | | | | |
| Accumulated net investment income | | | $ | 298,146 | | | | $ | 207,923 | |
| | | | | | | | | |
| See Notes to Financial Statements | | 51 |
Financial Statements | |
Walden Equity Fund |
| | | |
| FINANCIAL HIGHLIGHTS |
| Selected data for a share outstanding throughout the years indicated. |
| | | | For the year | | | | For the year | | | | For the year | | | | For the year | | | | For the year | |
| | | | ended | | | | ended | | | | ended | | | | ended | | | | ended | |
| | | | March 31, | | | | March 31, | | | | March 31, | | | | March 31, | | | | March 31, | |
| | | | 2013 | | | | 2012 | | | | 2011 | | | | 2010 | | | | 2009 | |
| | | | | | | | | | | | | | | | | | | | | |
| | | | | | | | | | | | | | | | | | | | | | | | | | |
| Net Asset Value, Beginning of Period | | | $ | 14.39 | | | | $ | 13.32 | | | | $ | 11.61 | | | | $ | 8.01 | | | | $ | 12.54 | |
| | | | | | | | | | | | | | | | | | | | | |
| Investment Activities: | | | | | | | | | | | | | | | | | | | | | | | | | |
Net investment income | | | | 0.16 | | | | | 0.13 | | | | | 0.11 | | | | | 0.11 | | | | | 0.14 | (a) |
Net realized and unrealized gains (losses) from investment transactions | | | | 1.01 | | | | | 1.06 | | | | | 1.71 | | | | | 3.63 | | | | | (4.48 | ) |
| | | | | | | | | | | | | | | | | | | | | |
| Total from investment activities | | | | 1.17 | | | | | 1.19 | | | | | 1.82 | | | | | 3.74 | | | | | (4.34 | ) |
| | | | | | | | | | | | | | | | | | | | | |
| Dividends: | | | | | | | | | | | | | | | | | | | | | | | | | |
Net investment income | | | | (0.15 | ) | | | | (0.12 | ) | | | | (0.11 | ) | | | | (0.14 | ) | | | | (0.10 | ) |
Net realized gains from investments | | | | — | | | | | — | | | | | — | | | | | — | | | | | (0.09 | ) |
| | | | | | | | | | | | | | | | | | | | | |
| Total dividends | | | | (0.15 | ) | | | | (0.12 | ) | | | | (0.11 | ) | | | | (0.14 | ) | | | | (0.19 | ) |
| | | | | | | | | | | | | | | | | | | | | |
| Net Asset Value, End of Period | | | $ | 15.41 | | | | $ | 14.39 | | | | $ | 13.32 | | | | $ | 11.61 | | | | $ | 8.01 | |
| | | | | | | | | | | | | | | | | | | | | |
| Total Return | | | | 8.27% | | | | | 9.06% | | | | | 15.77% | | | | | 46.79% | | | | | (34.74)% | |
| | | | | | | | | | | | | | | | | | | | | |
| Ratios/Supplemental Data: | | | | | | | | | | | | | | | | | | | | | | | | | |
Net Assets at end of period (000’s) | | | $ | 130,698 | | | | $ | 104,206 | | | | $ | 92,221 | | | | $ | 72,087 | | | | $ | 43,280 | |
Ratio of net expenses to average net assets | | | | 1.00% | | | | | 1.00% | | | | | 1.00% | | | | | 1.00% | | | | | 1.00% | |
Ratio of net investment income to average net assets | | | | 1.22% | | | | | 0.97% | | | | | 0.93% | | | | | 1.18% | | | | | 1.36% | |
Ratio of expenses (before fee reductions) to average net assets(b) | | | | 1.14% | | | | | 1.09% | | | | | 1.13% | | | | | 1.16% | | | | | 1.19% | |
Portfolio turnover rate | | | | 10.34% | | | | | 11.06% | | | | | 13.07% | | | | | 25.16% | | | | | 40.07% | |
| Amounts designated as “—” are $0 or have been rounded to $0. |
| (a) | | Calculated using the average shares method. |
| (b) | | During the period, certain fees were reduced. If such fee reductions had not occurred, the ratio would have been as indicated. |
| 52 | | See Notes to Financial Statements |
Schedule of Portfolio Investments | |
Walden Midcap Fund
March 31, 2013 |
| | | |
| COMMON STOCKS (97.3%) | | | | | | | |
| Security Description | | | | Shares | | | | Fair Value ($) | |
| | | | | | | | |
| Consumer Discretionary (14.1%) | | | | | | | | |
| Advance Auto Parts, Inc. | | | 4,300 | | | | 355,395 | |
| Autoliv, Inc. | | | 6,350 | | | | 439,039 | |
| Family Dollar Stores, Inc. | | | 6,775 | | | | 400,064 | |
| Hasbro, Inc. | | | 9,500 | | | | 417,430 | |
| LKQ Corp.(a) | | | 10,075 | | | | 219,232 | |
| O’Reilly Automotive, Inc.(a) | | | 4,600 | | | | 471,730 | |
| Omnicom Group, Inc. | | | 8,000 | | | | 471,200 | |
| Ross Stores, Inc. | | | 7,650 | | | | 463,743 | |
| Tractor Supply Co. | | | 1,950 | | | | 203,053 | |
| | | | | | | | | |
| | | | | | | | 3,440,886 | |
| | | | | | | | | |
| Consumer Staples (7.1%) | | | | | | | | |
| Campbell Soup Co. | | | 8,600 | | | | 390,096 | |
| Church & Dwight Co., Inc. | | | 8,425 | | | | 544,508 | |
| McCormick & Co., Inc. | | | 5,575 | | | | 410,041 | |
| The Clorox Co. | | | 4,425 | | | | 391,745 | |
| | | | | | | | | |
| | | | | | | | 1,736,390 | |
| | | | | | | | | |
| Energy (8.3%) | | | | | | | | |
| Cabot Oil & Gas Corp. | | | 3,875 | | | | 261,989 | |
| Core Laboratories NV | | | 4,100 | | | | 565,472 | |
| Denbury Resources, Inc.(a) | | | 21,775 | | | | 406,104 | |
| Energen Corp. | | | 4,750 | | | | 247,047 | |
| FMC Technologies, Inc.(a) | | | 6,125 | | | | 333,139 | |
| Oceaneering International, Inc. | | | 3,025 | | | | 200,890 | |
| | | | | | | | | |
| | | | | | | | 2,014,641 | |
| | | | | | | | | |
| Financials (17.3%) | | | | | | | | |
| Bank of Hawaii Corp. | | | 5,925 | | | | 301,049 | |
| BioMed Realty Trust, Inc. | | | 7,800 | | | | 168,480 | |
| BOK Financial Corp. | | | 2,750 | | | | 171,325 | |
| Cincinnati Financial Corp. | | | 9,800 | | | | 462,462 | |
| Comerica, Inc. | | | 7,250 | | | | 260,637 | |
| Commerce Bancshares, Inc. | | | 5,879 | | | | 240,040 | |
| Cullen/Frost Bankers, Inc. | | | 4,350 | | | | 272,005 | |
| Digital Realty Trust, Inc. | | | 3,325 | | | | 222,476 | |
| East West Bancorp, Inc. | | | 7,500 | | | | 192,525 | |
| Eaton Vance Corp. | | | 6,525 | | | | 272,941 | |
| IntercontinentalExchange, Inc.(a) | | | 1,425 | | | | 232,375 | |
| Jones Lang LaSalle, Inc. | | | 2,475 | | | | 246,040 | |
| Northern Trust Corp. | | | 8,475 | | | | 462,396 | |
| SEI Investments Co. | | | 10,675 | | | | 307,974 | |
| T. Rowe Price Group, Inc. | | | 5,450 | | | | 408,041 | |
| | | | | | | | | |
| | | | | | | | 4,220,766 | |
| | | | | | | | | |
| Health Care (11.2%) | | | | | | | | |
| C.R. Bard, Inc. | | | 4,500 | | | | 453,510 | |
| DENTSPLY International, Inc. | | | 7,975 | | | | 338,299 | |
| Laboratory Corp. of America Holdings(a) | | | 2,600 | | | | 234,520 | |
| MEDNAX, Inc.(a) | | | 1,925 | | | | 172,538 | |
| Mettler-Toledo International, Inc.(a) | | | 2,200 | | | | 469,084 | |
| ResMed, Inc. | | | 3,700 | | | | 171,532 | |
| Techne Corp. | | | 2,525 | | | | 171,321 | |
| Varian Medical Systems, Inc.(a) | | | 4,800 | | | | 345,600 | |
| Waters Corp.(a) | | | 3,925 | | | | 368,597 | |
| | | | | | | | | |
| | | | | | | | 2,725,001 | |
| | | | | | | | | |
| Industrials (15.8%) | | | | | | | | |
| AMETEK, Inc. | | | 8,025 | | | | 347,964 | |
| CLARCOR, Inc. | | | 5,100 | | | | 267,138 | |
| Donaldson Co., Inc. | | | 14,175 | | | | 512,993 | |
| Dover Corp. | | | 3,000 | | | | 218,640 | |
| Expeditors International of Washington, Inc. | | | 6,250 | | | | 223,188 | |
| Graco, Inc. | | | 3,175 | | | | 184,245 | |
| Hubbell, Inc., Class B | | | 3,700 | | | | 359,307 | |
| IDEX Corp. | | | 3,975 | | | | 212,345 | |
| Lincoln Electric Holdings, Inc. | | | 7,200 | | | | 390,096 | |
| Nordson Corp. | | | 3,400 | | | | 224,230 | |
| W.W. Grainger, Inc. | | | 2,250 | | | | 506,205 | |
| Wabtec Corp. | | | 4,075 | | | | 416,098 | |
| | | | | | | | | |
| | | | | | | | 3,862,449 | |
| | | | | | | | | |
| Information Technology (14.9%) | | | | | | | | |
| BMC Software, Inc.(a) | | | 10,625 | | | | 492,256 | |
| Check Point Software Technologies Ltd.(a) | | | 7,875 | | | | 370,046 | |
| Citrix Systems, Inc.(a) | | | 5,725 | | | | 413,116 | |
| F5 Networks, Inc.(a) | | | 2,050 | | | | 182,614 | |
| Factset Research Systems, Inc. | | | 2,400 | | | | 222,240 | |
| Fiserv, Inc.(a) | | | 2,650 | | | | 232,749 | |
| NetApp, Inc.(a) | | | 11,600 | | | | 396,256 | |
| Paychex, Inc. | | | 6,950 | | | | 243,736 | |
| Riverbed Technology, Inc.(a) | | | 9,450 | | | | 140,900 | |
| Syntel, Inc. | | | 3,675 | | | | 248,136 | |
| Teradata Corp.(a) | | | 7,825 | | | | 457,841 | |
| TIBCO Software, Inc.(a) | | | 11,375 | | | | 230,003 | |
| | | | | | | | | |
| | | | | | | | 3,629,893 | |
| | | | | | | | | |
| Materials (4.7%) | | | | | | | | |
| AptarGroup, Inc. | | | 8,350 | | | | 478,873 | |
| International Flavors & Fragrances, Inc. | | | 2,475 | | | | 189,758 | |
| Sigma-Aldrich Corp. | | | 6,125 | | | | 475,790 | |
| | | | | | | | | |
| | | | | | | | 1,144,421 | |
| | | | | | | | | |
| Utilities (3.9%) | | | | | | | | |
| AGL Resources, Inc. | | | 5,050 | | | | 211,848 | |
| Northeast Utilities | | | 6,233 | | | | 270,886 | |
| Questar Corp. | | | 19,225 | | | | 467,744 | |
| | | | | | | | | |
| | | | | | | | 950,478 | |
| | | | | | | | | |
| TOTAL COMMON STOCKS (Cost $19,750,475) | | | | | | | 23,724,925 | |
| | | | | | | | | |
| INVESTMENT COMPANIES (3.2%) | | | | | | | |
| State Street Institutional U.S. Government Money Market Fund, Investor Shares, 0.01%(b) | | | 784,720 | | | | 784,720 | |
| | | | | | | | | |
| TOTAL INVESTMENT COMPANIES (Cost $784,720) | | | | | | | 784,720 | |
| | | | | | | | | |
| Total Investments (Cost $20,535,195)(c) — 100.5% | | | | | | | 24,509,645 | |
| Liabilities in excess of other assets — (0.5)% | | | | | | | (119,491 | ) |
| | | | | | | | | |
| NET ASSETS — 100.0% | | | | | | $ | 24,390,154 | |
| | | | | | | | | |
| (a) | | Non-income producing security. |
| (b) | | Rate disclosed is the seven day yield as of March 31, 2013. |
| (c) | | See Federal Tax Information listed in the Notes to the Financial Statements. |
| See Notes to Financial Statements | | 53 |
Financial Statements | |
Walden Midcap Fund |
| | | |
| STATEMENT OF ASSETS AND LIABILITIES | | | | | |
| March 31, 2013 | | | | | |
| | | | | | |
| Assets: | | | | | |
| Investments, at fair value (cost $20,535,195) | | | $ | 24,509,645 | |
| Cash | | | | 3,699 | |
| Dividends receivable | | | | 17,372 | |
| Receivable for capital shares issued | | | | 84,420 | |
| Prepaid expenses and other assets | | | | 1,560 | |
| | | | | |
Total Assets | | | | 24,616,696 | |
| | | | | |
| Liabilities: | | | | | |
| Payable for investments purchased | | | | 203,603 | |
| Accrued expenses and other liabilities: | | | | | |
Investment adviser | | | | 7,921 | |
Chief compliance officer | | | | 154 | |
Administration and accounting | | | | 1,026 | |
Custodian | | | | 644 | |
Transfer agent | | | | 8,976 | |
Trustee | | | | 61 | |
Other | | | | 4,157 | |
| | | | | |
Total Liabilities | | | | 226,542 | |
| | | | | |
| Net Assets | | | $ | 24,390,154 | |
| | | | | |
| Composition of Net Assets: | | | | | |
| Capital | | | $ | 20,575,435 | |
| Accumulated net investment income/(loss) | | | | 2,898 | |
| Accumulated net realized losses from investment transactions | | | | (162,629 | ) |
| Net unrealized appreciation from investments | | | | 3,974,450 | |
| | | | | |
| Net Assets | | | $ | 24,390,154 | |
| | | | | |
| Shares outstanding (par value $0.01, unlimited number of shares authorized) | | | | 2,023,122 | |
| | | | | |
| Net Asset Value, Offering Price and Redemption Price per share | | | $ | 12.06 | |
| | | | | |
| STATEMENT OF OPERATIONS | | | | | |
| For the year ended March 31, 2013 | | | | | |
| | | | | | |
| Investment Income: | | | | | |
| Dividends | | | $ | 277,064 | |
| Less: Foreign tax withholding | | | | (522 | ) |
| | | | | |
Total Investment Income | | | | 276,542 | |
| | | | | |
| Expenses: | | | | | |
Investment adviser | | | | 130,323 | |
Administration and accounting | | | | 23,926 | |
Shareholder servicing | | | | 220 | |
Trustee | | | | 734 | |
Custodian | | | | 3,811 | |
Transfer agency | | | | 33,354 | |
Chief compliance officer | | | | 692 | |
Other | | | | 20,917 | |
| | | | | |
Total expenses before fee reductions | | | | 213,977 | |
Fees voluntarily reduced by Transfer agent | | | | (5,437 | ) |
Fees contractually reduced by the investment adviser | | | | (34,176 | ) |
| | | | | |
| Net Expenses | | | | 174,364 | |
| | | | | |
| Net Investment Income | | | | 102,178 | |
| | | | | |
| Net Realized/Unrealized Gains (Losses) from Investments: | | | | | |
Net realized losses from investment transactions | | | | (107,396 | ) |
Change in unrealized appreciation from investments | | | | 2,223,917 | |
| | | | | |
| Net realized/unrealized gains from investments | | | | 2,116,521 | |
| | | | | |
| Change in Net Assets Resulting from Operations | | | $ | 2,218,699 | |
| | | | | |
| 54 | | See Notes to Financial Statements |
Financial Statements | |
Walden Midcap Fund |
| | | |
| STATEMENTS OF CHANGES IN NET ASSETS | | | | | | | | | | |
| | | | For the year ended | | | | For the period ended | |
| | | | March 31, | | | | March 31, | |
| | | | 2013 | | | | 2012(a) | |
| | | | | | | | | |
| | | | | | | | | | | |
| Investment Activities: | | | | | | | | | | |
| Operations: | | | | | | | | | | |
Net investment income | | | $ | 102,178 | | | | $ | 22,004 | |
Net realized losses from investment transactions | | | | (107,396 | ) | | | | (55,233 | ) |
Change in unrealized appreciation from investments | | | | 2,223,917 | | | | | 1,750,533 | |
| | | | | | | | | |
| Change in Net Assets Resulting from Operations | | | | 2,218,699 | | | | | 1,717,304 | |
| | | | | | | | | |
| Dividends: | | | | | | | | | | |
Net investment income | | | | (105,039 | ) | | | | (19,338 | ) |
| | | | | | | | | |
| Change in Net Assets Resulting from Shareholder Dividends | | | | (105,039 | ) | | | | (19,338 | ) |
| | | | | | | | | |
| Capital Share Transactions: | | | | | | | | | | |
Proceeds from shares issued | | | | 8,036,654 | | | | | 12,510,643 | |
Dividends reinvested | | | | 64,219 | | | | | 9,369 | |
Cost of shares redeemed | | | | (37,847 | ) | | | | (4,510 | ) |
| | | | | | | | | |
| Change in Net Assets Resulting from Capital Share Transactions | | | | 8,063,026 | | | | | 12,515,502 | |
| | | | | | | | | |
| Change in Net Assets | | | | 10,176,686 | | | | | 14,213,468 | |
| Net Assets: | | | | | | | | | | |
Beginning of period | | | | 14,213,468 | | | | | — | |
| | | | | | | | | |
End of period | | | $ | 24,390,154 | | | | $ | 14,213,468 | |
| | | | | | | | | |
| Share Transactions: | | | | | | | | | | |
Issued | | | | 741,285 | | | | | 1,278,825 | |
Reinvested | | | | 5,954 | | | | | 963 | |
Redeemed | | | | (3,405 | ) | | | | (500 | ) |
| | | | | | | | | |
| Change in Shares | | | | 743,834 | | | | | 1,279,288 | |
| | | | | | | | | |
| Accumulated net investment income | | | $ | 2,898 | | | | $ | 5,759 | |
| | | | | | | | | |
| Amounts designated as “—” are $0 or have been rounded to $0. |
| (a) Commenced operations on August 1, 2011 |
| See Notes to Financial Statements | | 55 |
Financial Statements | |
Walden Midcap Fund |
| | | |
| FINANCIAL HIGHLIGHTS |
| Selected data for a share outstanding throughout the period indicated. |
| | | | For the year | | | | For the period | |
| | | | ended | | | | ended | |
| | | | March 31, | | | | March 31, | |
| | | | 2013 | | | | 2012(a) | |
| | | | | | | | | |
| | | | | | | | | | | |
| Net Asset Value, Beginning of Period | | | $ | 11.11 | | | | $ | 10.00 | |
| | | | | | | | | |
| Investment Activities: | | | | | | | | | | |
Net investment income | | | | 0.06 | | | | | 0.02 | |
Net realized and unrealized gains from investment transactions | | | | 0.95 | | | | | 1.11 | |
| | | | | | | | | |
| Total from investment activities | | | | 1.01 | | | | | 1.13 | |
| | | | | | | | | |
| Dividends: | | | | | | | | | | |
Net investment income | | | | (0.06 | ) | | | | (0.02 | ) |
| | | | | | | | | |
| Total dividends | | | | (0.06 | ) | | | | (0.02 | ) |
| | | | | | | | | |
| Net Asset Value, End of Period | | | $ | 12.06 | | | | $ | 11.11 | |
| | | | | | | | | |
| Total Return | | | | 9.12% | | | | | 11.33% | (b) |
| | | | | | | | | |
| Ratios/Supplemental Data: | | | | | | | | | | |
| Net Assets at end of period (000’s) | | | $ | 24,390 | | | | $ | 14,213 | |
| Ratio of net expenses to average net assets | | | | 1.00% | | | | | 1.00% | (c) |
| Ratio of net investment income to average net assets | | | | 0.58% | | | | | 0.34% | (c) |
| Ratio of expenses (before fee reductions) to average net assets(d) | | | | 1.23% | | | | | 1.34% | (c) |
| Portfolio turnover rate | | | | 12.32% | | | | | 8.43% | (b) |
| (a) | | Commenced operations on August 1, 2011. |
| (b) | | Not annualized for periods less than one year. |
| (c) | | Annualized for periods less than one year. |
| (d) | | During the period, certain fees were reduced. If such fee reductions had not occurred, the ratio would have been as indicated. |
| 56 | | See Notes to Financial Statements |
Schedule of Portfolio Investments | |
Walden SMID Cap Innovations Fund
March 31, 2013 |
| | | |
| COMMON STOCKS (95.7%) | | | | | | | |
| Security Description | | | | Shares | | | Fair Value ($) |
| | | | | | | | |
| Consumer Discretionary (13.1%) | | | | | | | |
| Autoliv, Inc. | | | 3,700 | | | | 255,818 |
| Columbia Sportswear Co. | | | 2,600 | | | | 150,488 |
| Dorman Products, Inc. | | | 3,900 | | | | 145,119 |
| DSW, Inc., Class A | | | 2,300 | | | | 146,740 |
| Hibbett Sports, Inc.(a) | | | 3,100 | | | | 174,437 |
| Life Time Fitness, Inc.(a) | | | 3,850 | | | | 164,703 |
| LKQ Corp.(a) | | | 13,200 | | | | 287,232 |
| Select Comfort Corp.(a) | | | 10,800 | | | | 213,516 |
| SodaStream International Ltd.(a) | | | 4,900 | | | | 243,236 |
| The Men’s Wearhouse, Inc. | | | 4,800 | | | | 160,416 |
| Tractor Supply Co. | | | 1,900 | | | | 197,847 |
| Vitamin Shoppe, Inc.(a) | | | 3,500 | | | | 170,975 |
| Weight Watchers International, Inc. | | | 4,100 | | | | 172,651 |
| Wolverine World Wide, Inc. | | | 4,500 | | | | 199,665 |
| | | | | | | | |
| | | | | | | | 2,682,843 |
| | | | | | | | |
| Consumer Staples (2.7%) | | | | | | | |
| Darling International, Inc.(a) | | | 7,000 | | | | 125,720 |
| Hain Celestial Group, Inc.(a) | | | 1,200 | | | | 73,296 |
| The Fresh Market, Inc.(a) | | | 2,850 | | | | 121,895 |
| United Natural Foods, Inc.(a) | | | 4,450 | | | | 218,940 |
| | | | | | | | |
| | | | | | | | 539,851 |
| | | | | | | | |
| Energy (6.0%) | | | | | | | |
| CARBO Ceramics, Inc. | | | 2,500 | | | | 227,675 |
| Core Laboratories NV | | | 725 | | | | 99,992 |
| Denbury Resources, Inc.(a) | | | 12,400 | | | | 231,260 |
| Geospace Technologies Corp.(a) | | | 1,400 | | | | 151,088 |
| Lufkin Industries, Inc. | | | 3,150 | | | | 209,128 |
| Oceaneering International, Inc. | | | 3,100 | | | | 205,871 |
| RPC, Inc. | | | 6,550 | | | | 99,364 |
| | | | | | | | |
| | | | | | | | 1,224,378 |
| | | | | | | | |
| Financials (22.5%) | | | | | | | |
| Bank of Hawaii Corp. | | | 6,550 | | | | 332,805 |
| BioMed Realty Trust, Inc. | | | 5,000 | | | | 108,000 |
| BOK Financial Corp. | | | 2,200 | | | | 137,060 |
| Cohen & Steers, Inc. | | | 6,050 | | | | 218,224 |
| Commerce Bancshares, Inc. | | | 5,400 | | | | 220,482 |
| Coresite Realty Corp. | | | 3,800 | | | | 132,924 |
| Cullen/Frost Bankers, Inc. | | | 2,500 | | | | 156,325 |
| DuPont Fabros Technology, Inc. | | | 9,600 | | | | 232,992 |
| East West Bancorp, Inc. | | | 13,500 | | | | 346,545 |
| Eaton Vance Corp. | | | 6,300 | | | | 263,529 |
| Financial Engines, Inc. | | | 5,500 | | | | 199,210 |
| Jones Lang LaSalle, Inc. | | | 3,900 | | | | 387,699 |
| MarketAxess Holdings, Inc. | | | 5,300 | | | | 197,690 |
| Ocwen Financial Corp.(a) | | | 9,300 | | | | 352,656 |
| SEI Investments Co. | | | 8,150 | | | | 235,127 |
| Signature Bank(a) | | | 4,000 | | | | 315,040 |
| SVB Financial Group(a) | | | 5,300 | | | | 375,982 |
| Texas Capital Bancshares, Inc.(a) | | | 3,300 | | | | 133,485 |
| UMB Financial Corp. | | | 2,900 | | | | 142,303 |
| Umpqua Holdings Corp. | | | 9,000 | | | | 119,340 |
| | | | | | | | |
| | | | | | | | 4,607,418 |
| | | | | | | | |
| Health Care (10.6%) | | | | | | | |
| Bruker Corp.(a) | | | 12,050 | | | | 230,155 |
| DENTSPLY International, Inc. | | | 2,600 | | | | 110,292 |
| Haemonetics Corp.(a) | | | 2,450 | | | | 102,067 |
| ICU Medical, Inc.(a) | | | 3,000 | | | | 176,850 |
| MEDNAX, Inc.(a) | | | 1,550 | | | | 138,927 |
| Meridian Bioscience, Inc. | | | 8,000 | | | | 182,560 |
| Mettler-Toledo International, Inc.(a) | | | 600 | | | | 127,932 |
| Myriad Genetics, Inc.(a) | | | 6,900 | | | | 175,260 |
| Neogen Corp.(a) | | | 2,000 | | | | 99,140 |
| Quality Systems, Inc. | | | 10,150 | | | | 185,542 |
| ResMed, Inc. | | | 4,000 | | | | 185,440 |
| Techne Corp. | | | 1,400 | | | | 94,990 |
| Thoratec Corp.(a) | | | 5,150 | | | | 193,125 |
| West Pharmaceutical Services, Inc. | | | 2,600 | | | | 168,844 |
| | | | | | | | |
| | | | | | | | 2,171,124 |
| | | | | | | | |
| Industrials (15.9%) | | | | | | | |
| Chart Industries, Inc.(a) | | | 2,200 | | | | 176,022 |
| CLARCOR, Inc. | | | 4,600 | | | | 240,948 |
| Donaldson Co., Inc. | | | 9,900 | | | | 358,281 |
| ESCO Technologies, Inc. | | | 2,250 | | | | 91,935 |
| Franklin Electric Co., Inc. | | | 4,800 | | | | 161,136 |
| Genesee & Wyoming, Inc., Class A(a) | | | 2,800 | | | | 260,708 |
| Hub Group, Inc., Class A(a) | | | 4,400 | | | | 169,224 |
| Hubbell, Inc., Class B | | | 2,200 | | | | 213,642 |
| IDEX Corp. | | | 2,400 | | | | 128,208 |
| Lincoln Electric Holdings, Inc. | | | 3,700 | | | | 200,466 |
| Lindsay Manufacturing Co. | | | 2,400 | | | | 211,632 |
| Middleby Corp.(a) | | | 1,700 | | | | 258,655 |
| Nordson Corp. | | | 3,200 | | | | 211,040 |
| Wabtec Corp. | | | 3,600 | | | | 367,596 |
| Watts Water Technologies, Inc., Class A | | | 4,300 | | | | 206,357 |
| | | | | | | | |
| | | | | | | | 3,255,850 |
| | | | | | | | |
| Information Technology (13.8%) | | | | | | | |
| Blackbaud, Inc. | | | 3,500 | | | | 103,705 |
| Bottomline Technologies, Inc.(a) | | | 3,200 | | | | 91,232 |
| Coherent, Inc. | | | 2,000 | | | | 113,480 |
| CommVault Systems, Inc.(a) | | | 1,900 | | | | 155,762 |
| Factset Research Systems, Inc. | | | 2,000 | | | | 185,200 |
| InterDigital, Inc. | | | 3,700 | | | | 176,971 |
| IPG Photonics Corp. | | | 3,650 | | | | 242,396 |
| Liquidity Services, Inc.(a) | | | 4,300 | | | | 128,183 |
| Mellanox Technologies Ltd.(a) | | | 2,100 | | | | 116,571 |
| MicroStrategy, Inc., Class A(a) | | | 1,000 | | | | 101,080 |
| NIC, Inc. | | | 5,350 | | | | 102,506 |
| Plantronics, Inc. | | | 4,900 | | | | 216,531 |
| Polycom, Inc.(a) | | | 14,000 | | | | 155,120 |
| Power Integrations, Inc. | | | 4,100 | | | | 177,981 |
| Riverbed Technology, Inc.(a) | | | 7,500 | | | | 111,825 |
| Sapient Corp.(a) | | | 15,400 | | | | 187,726 |
| Syntel, Inc. | | | 1,450 | | | | 97,904 |
| TIBCO Software, Inc.(a) | | | 6,500 | | | | 131,430 |
| WEX, Inc.(a) | | | 2,950 | | | | 231,575 |
| | | | | | | | |
| | | | | | | | 2,827,178 |
| | | | | | | | |
| Materials (6.4%) | | | | | | | |
| AptarGroup, Inc. | | | 5,400 | | | | 309,690 |
| Calgon Carbon Corp.(a) | | | 13,300 | | | | 240,730 |
| Commercial Metals Co. | | | 13,500 | | | | 213,975 |
| International Flavors & Fragrances, Inc. | | | 1,900 | | | | 145,673 |
| Kraton Performance Polymers, Inc.(a) | | | 7,050 | | | | 164,970 |
| Minerals Technologies, Inc. | | | 5,700 | | | | 236,607 |
| | | | | | | | |
| | | | | | | | 1,311,645 |
| | | | | | | | |
| Utilities (4.7%) | | | | | | | |
| AGL Resources, Inc. | | | 4,150 | | | | 174,093 |
| American States Water Co. | | | 4,350 | | | | 250,429 |
| New Jersey Resources Corp. | | | 3,700 | | | | 165,945 |
| Questar Corp. | | | 15,500 | | | | 377,115 |
| | | | | | | | |
| | | | | | | | 967,582 |
| | | | | | | | |
| TOTAL COMMON STOCKS (Cost $17,981,879) | | | | | | | 19,587,869 |
| | | | | | | | |
| INVESTMENT COMPANIES (2.6%) | | | | | | | |
State Street Institutional U.S. Government Money Market Fund, Investor Shares, 0.01%(b) | | | 525,308 | | | | 525,308 |
| | | | | | | | |
TOTAL INVESTMENT COMPANIES (Cost $525,308) | | | | | | | 525,308 |
| | | | | | | | |
Total Investments (Cost $18,507,187)(c) — 98.3% | | | | | | | 20,113,177 |
Other assets in excess of liabilities — 1.7% | | | | | | | 344,673 |
| | | | | | | | |
NET ASSETS — 100.0% | | | | | | $ | 20,457,850 |
| | | | | | | | |
| (a) | | Non-income producing security. |
| (b) | | Rate disclosed is the seven day yield as of March 31, 2013. |
| (c) | | See Federal Tax Information listed in the Notes to the Financial Statements. |
| See Notes to Financial Statements | | 57 |
Financial Statements | |
Walden SMID Cap Innovations Fund |
| | | |
| STATEMENT OF ASSETS AND LIABILITIES | | | | | |
| March 31, 2013 | | | | | |
| | | | | | |
| Assets: | | | | | |
| Investments, at fair value (cost $18,507,187) | | | $ | 20,113,177 | |
| Cash | | | | 927 | |
| Dividends receivable | | | | 10,351 | |
| Receivable for capital shares issued | | | | 500,000 | |
| Prepaid expenses and other assets | | | | 3,008 | |
| | | | | |
Total Assets | | | | 20,627,463 | |
| | | | | |
| Liabilities: | | | | | |
| Payable for investments purchased | | | | 151,308 | |
| Accrued expenses and other liabilities: | | | | | |
Investment adviser | | | | 3,987 | |
Chief compliance officer | | | | 95 | |
Administration and accounting | | | | 885 | |
Custodian | | | | 390 | |
Transfer agent | | | | 9,152 | |
Trustee | | | | 37 | |
Distribution and service fees | | | | 81 | |
Other | | | | 3,678 | |
| | | | | |
Total Liabilities | | | | 169,613 | |
| | | | | |
| Net Assets | | | $ | 20,457,850 | |
| | | | | |
| Composition of Net Assets: | | | | | |
Capital | | | $ | 18,858,731 | |
Accumulated net investment income/(loss) | | | | 1,993 | |
Accumulated net realized losses from investment transactions | | | | (8,864 | ) |
Net unrealized appreciation from investments | | | | 1,605,990 | |
| | | | | |
Net Assets | | | $ | 20,457,850 | |
| | | | | |
Shares outstanding (par value $0.01, unlimited number of shares authorized) | | | | 1,691,920 | |
| | | | | |
Net Asset Value, Offering Price and Redemption Price per share | | | $ | 12.09 | |
| | | | | |
| STATEMENT OF OPERATIONS | | | | | |
| For the period ended March 31, 2013(a) | | | | | |
| | | | | | |
| Investment Income: | | | | | |
| Dividends | | | $ | 85,796 | |
| Less: Foreign tax withholding | | | | (83 | ) |
| | | | | |
Total Investment Income | | | | 85,713 | |
| | | | | |
| Expenses: | | | | | |
Investment adviser | | | | 44,648 | |
Administration and accounting | | | | 9,410 | |
Shareholder servicing | | | | 133 | |
Trustee | | | | 191 | |
Custodian | | | | 1,633 | |
Transfer agency | | | | 25,242 | |
Chief compliance officer | | | | 233 | |
Other | | | | 14,214 | |
| | | | | |
Total expenses before fee reductions | | | | 95,704 | |
Fees voluntarily reduced by Transfer agent | | | | (5,437 | ) |
Fees contractually reduced by the investment adviser | | | | (30,124 | ) |
| | | | | |
| Net Expenses | | | | 60,143 | |
| | | | | |
| Net Investment Income | | | | 25,570 | |
| | | | | |
| Net Realized/Unrealized Gains (Losses) from Investments: | | | | | |
Net realized losses from investment transactions | | | | (8,864 | ) |
Change in unrealized appreciation from investments | | | | 1,605,990 | |
| | | | | |
| Net realized/unrealized gains from investments | | | | 1,597,126 | |
| | | | | |
| Change in Net Assets Resulting from Operations | | | $ | 1,622,696 | |
| | | | | |
| (a) Commenced operations on June 29, 2012. |
| 58 | | See Notes to Financial Statements |
Financial Statements | |
Walden SMID Cap Innovations Fund |
| | | |
| STATEMENTS OF CHANGES IN NET ASSETS | | | | | |
| | | | For the period ended | |
| | | | March 31, | |
| | | | 2013(a) | |
| | | | | |
| | | | | | |
| Investment Activities: | | | | | |
| Operations: | | | | | |
Net investment income | | | $ | 25,570 | |
Net realized losses from investment transactions | | | | (8,864 | ) |
Change in unrealized appreciation/depreciation from investments | | | | 1,605,990 | |
| | | | | |
| Change in Net Assets Resulting from Operations | | | | 1,622,696 | |
| | | | | |
| Dividends: | | | | | |
Net investment income | | | | (28,882 | ) |
| | | | | |
| Change in Net Assets Resulting from Shareholder Dividends | | | | (28,882 | ) |
| | | | | |
| Capital Share Transactions: | | | | | |
Proceeds from shares issued | | | | 18,517,915 | |
Proceeds from shares issued in subscription in-kind(b) | | | | 324,838 | |
Dividends reinvested | | | | 22,377 | |
Cost of shares redeemed | | | | (1,094 | ) |
| | | | | |
| Change in Net Assets Resulting from Capital Share Transactions | | | | 18,864,036 | |
| | | | | |
| Change in Net Assets | | | | 20,457,850 | |
| Net Assets: | | | | | |
Beginning of period | | | | — | |
| | | | | |
End of period | | | $ | 20,457,850 | |
| | | | | |
| Share Transactions: | | | | | |
Issued | | | | 1,657,497 | |
Issued in subscriptions in-kind(b) | | | | 32,484 | |
Reinvested | | | | 2,039 | |
Redeemed | | | | (100 | ) |
| | | | | |
| Change in Shares | | | | 1,691,920 | |
| | | | | |
| Accumulated net investment income (loss) | | | $ | 1,993 | |
| | | | | |
| Amounts designated as “—” are $0 or have been rounded to $0. |
| (a) Commenced operations on June 29, 2012. |
| (b) See Note 3 in Notes to Financial Statements. |
| See Notes to Financial Statements | | 59 |
Financial Statements | |
Walden SMID Cap Innovations Fund |
| | | |
| FINANCIAL HIGHLIGHTS |
| Selected data for a share outstanding throughout the period indicated. |
| | | | | | |
| | | | For the period | |
| | | | ended | |
| | | | March 31, | |
| | | | 2013(a) | |
| | | | | |
| | | | | | |
| Net Asset Value, Beginning of Period | | | $ | 10.00 | |
| | | | | |
| Investment Activities: | | | | | |
Net investment income | | | | 0.03 | |
Net realized and unrealized gains from investment transactions | | | | 2.09 | |
| | | | | |
| Total from investment activities | | | | 2.12 | |
| | | | | |
| Dividends: | | | | | |
Net investment income | | | | (0.03 | ) |
| | | | | |
| Total dividends | | | | (0.03 | ) |
| | | | | |
| Net Asset Value, End of Period | | | $ | 12.09 | |
| | | | | |
| Total Return | | | | 21.28% | (b) |
| | | | | |
| Ratios/Supplemental Data: | | | | | |
| Net Assets at end of period (000’s) | | | $ | 20,458 | |
| Ratio of net expenses to average net assets | | | | 1.00% | (c) |
| Ratio of net investment income to average net assets | | | | 0.43% | (c) |
| Ratio of expenses (before fee reductions) to average net assets(d) | | | | 1.60% | (c) |
| Portfolio turnover rate | | | | 13.31% | (b) |
| (a) | | Commenced operations on June 29, 2012. |
| (b) | | Not annualized for periods less than one year. |
| (c) | | Annualized for periods less than one year. |
| (d) | | During the period, certain fees were reduced. If such fee reductions had not occurred, the ratio would have been as indicated. |
| 60 | | See Notes to Financial Statements |
Schedule of Portfolio Investments | |
Walden Small Cap Innovations Fund
March 31, 2013 |
| | | |
| COMMON STOCKS (98.1%) | | | | | | | |
| Security Description | | | | Shares | | | Fair Value ($) | |
| | | | | | | | |
| Consumer Discretionary (12.3%) | | | | | | | | |
| Columbia Sportswear Co. | | | 21,050 | | | | 1,218,374 | |
| Dorman Products, Inc. | | | 24,700 | | | | 919,087 | |
| DSW, Inc., Class A | | | 14,300 | | | | 912,340 | |
| Gentex Corp. | | | 300 | | | | 6,003 | |
| Hibbett Sports, Inc.(a) | | | 18,700 | | | | 1,052,249 | |
| Life Time Fitness, Inc.(a) | | | 17,200 | | | | 735,816 | |
| Select Comfort Corp.(a) | | | 50,000 | | | | 988,500 | |
| SodaStream International Ltd.(a) | | | 27,400 | | | | 1,360,136 | |
| The Men’s Wearhouse, Inc. | | | 32,000 | | | | 1,069,440 | |
| Vitamin Shoppe, Inc.(a) | | | 26,500 | | | | 1,294,525 | |
| Weight Watchers International, Inc. | | | 16,000 | | | | 673,760 | |
| Wolverine World Wide, Inc. | | | 32,500 | | | | 1,442,025 | |
| | | | | | | | | |
| | | | | | | | 11,672,255 | |
| | | | | | | | | |
| Consumer Staples (2.9%) | | | | | | | | |
| Darling International, Inc.(a) | | | 37,775 | | | | 678,439 | |
| Hain Celestial Group, Inc.(a) | | | 6,600 | | | | 403,128 | |
| The Fresh Market, Inc.(a) | | | 14,600 | | | | 624,442 | |
| United Natural Foods, Inc.(a) | | | 22,000 | | | | 1,082,400 | |
| | | | | | | | | |
| | | | | | | | 2,788,409 | |
| | | | | | | | | |
| Energy (6.8%) | | | | | | | | |
| CARBO Ceramics, Inc. | | | 18,800 | | | | 1,712,116 | |
| Geospace Technologies Corp.(a) | | | 13,200 | | | | 1,424,544 | |
| Lufkin Industries, Inc. | | | 31,200 | | | | 2,071,368 | |
| Natural Gas Services Group, Inc.(a) | | | 21,900 | | | | 421,794 | |
| RPC, Inc. | | | 54,475 | | | | 826,386 | |
| | | | | | | | | |
| | | | | | | | 6,456,208 | |
| | | | | | | | | |
| Financials (21.0%) | | | | | | | | |
| Bank of Hawaii Corp. | | | 37,900 | | | | 1,925,699 | |
| BioMed Realty Trust, Inc. | | | 22,400 | | | | 483,840 | |
| City National Corp. | | | 12,800 | | | | 754,048 | |
| Cohen & Steers, Inc. | | | 34,050 | | | | 1,228,183 | |
| Coresite Realty Corp. | | | 33,000 | | | | 1,154,340 | |
| Corporate Office Properties Trust | | | 17,300 | | | | 461,564 | |
| Dime Community Bancshares, Inc. | | | 33,050 | | | | 474,598 | |
| DuPont Fabros Technology, Inc. | | | 57,800 | | | | 1,402,806 | |
| East West Bancorp, Inc. | | | 37,000 | | | | 949,790 | |
| Financial Engines, Inc. | | | 36,400 | | | | 1,318,408 | |
| First Financial Bankshares, Inc. | | | 16,100 | | | | 782,460 | |
| Independent Bank Corp. | | | 21,800 | | | | 710,462 | |
| MarketAxess Holdings, Inc. | | | 40,500 | | | | 1,510,650 | |
| Signature Bank(a) | | | 12,300 | | | | 968,748 | |
| SVB Financial Group(a) | | | 28,900 | | | | 2,050,166 | |
| Texas Capital Bancshares, Inc.(a) | | | 25,700 | | | | 1,039,565 | |
| UMB Financial Corp. | | | 28,400 | | | | 1,393,588 | |
| Umpqua Holdings Corp. | | | 105,800 | | | | 1,402,908 | |
| | | | | | | | | |
| | | | | | | | 20,011,823 | |
| | | | | | | | | |
| Health Care (13.4%) | | | | | | | | |
| Bruker Corp.(a) | | | 80,900 | | | | 1,545,190 | |
| Cantel Medical Corp. | | | 29,200 | | | | 877,752 | |
| Computer Programs & Systems, Inc. | | | 15,500 | | | | 838,705 | |
| Haemonetics Corp.(a) | | | 11,600 | | | | 483,256 | |
| ICU Medical, Inc.(a) | | | 20,000 | | | | 1,179,000 | |
| Landauer, Inc. | | | 9,200 | | | | 518,696 | |
| Meridian Bioscience, Inc. | | | 40,625 | | | | 927,063 | |
| Myriad Genetics, Inc.(a) | | | 38,000 | | | | 965,200 | |
| Neogen Corp.(a) | | | 9,500 | | | | 470,915 | |
| Quality Systems, Inc. | | | 47,200 | | | | 862,816 | |
| Techne Corp. | | | 13,100 | | | | 888,835 | |
| Thoratec Corp.(a) | | | 32,900 | | | | 1,233,750 | |
| West Pharmaceutical Services, Inc. | | | 30,500 | | | | 1,980,670 | |
| | | | | | | | | |
| | | | | | | | 12,771,848 | |
| | | | | | | | | |
| Industrials (15.7%) | | | | | | | | |
| American Science & Engineering, Inc. | | | 14,000 | | | | 853,860 | |
| Apogee Enterprises, Inc. | | | 38,600 | | | | 1,117,470 | |
| Chart Industries, Inc.(a) | | | 10,500 | | | | 840,105 | |
| CLARCOR, Inc. | | | 34,000 | | | | 1,780,920 | |
| ESCO Technologies, Inc. | | | 22,700 | | | | 927,522 | |
| Franklin Electric Co., Inc. | | | 34,600 | | | | 1,161,522 | |
| Gentherm, Inc.(a) | | | 40,400 | | | | 661,752 | |
| Herman Miller, Inc. | | | 15,900 | | | | 439,953 | |
| Hub Group, Inc., Class A(a) | | | 30,800 | | | | 1,184,568 | |
| Lindsay Manufacturing Co. | | | 16,700 | | | | 1,472,606 | |
| Middleby Corp.(a) | | | 10,150 | | | | 1,544,322 | |
| Simpson Manufacturing Co., Inc. | | | 21,400 | | | | 655,054 | |
| Team, Inc.(a) | | | 26,350 | | | | 1,082,195 | |
| Watts Water Technologies, Inc., Class A | | | 25,800 | | | | 1,238,142 | |
| | | | | | | | | |
| | | | | | | | 14,959,991 | |
| | | | | | | | | |
| Information Technology (17.8%) | | | | | | | | |
| Blackbaud, Inc. | | | 28,200 | | | | 835,566 | |
| Bottomline Technologies, Inc.(a) | | | 31,200 | | | | 889,512 | |
| Coherent, Inc. | | | 16,100 | | | | 913,514 | |
| InterDigital, Inc. | | | 19,300 | | | | 923,119 | |
| IPG Photonics Corp. | | | 14,250 | | | | 946,343 | |
| Liquidity Services, Inc.(a) | | | 22,800 | | | | 679,668 | |
| Mellanox Technologies Ltd.(a) | | | 17,650 | | | | 979,751 | |
| MicroStrategy, Inc., Class A(a) | | | 6,600 | | | | 667,128 | |
| NIC, Inc. | | | 44,400 | | | | 850,704 | |
| Plantronics, Inc. | | | 45,900 | | | | 2,028,321 | |
| Polycom, Inc.(a) | | | 105,000 | | | | 1,163,400 | |
| Power Integrations, Inc. | | | 36,800 | | | | 1,597,488 | |
| Riverbed Technology, Inc.(a) | | | 43,825 | | | | 653,431 | |
| Sapient Corp.(a) | | | 109,400 | | | | 1,333,586 | |
| Syntel, Inc. | | | 10,500 | | | | 708,960 | |
| WEX, Inc.(a) | | | 23,000 | | | | 1,805,500 | |
| | | | | | | | | |
| | | | | | | | 16,975,991 | |
| | | | | | | | | |
| Materials (4.9%) | | | | | | | | |
| Calgon Carbon Corp.(a) | | | 51,200 | | | | 926,720 | |
| Commercial Metals Co. | | | 63,400 | | | | 1,004,890 | |
| Kraton Performance Polymers, Inc.(a) | | | 15,600 | | | | 365,040 | |
| Minerals Technologies, Inc. | | | 25,800 | | | | 1,070,958 | |
| Quaker Chemical Corp. | | | 22,300 | | | | 1,316,146 | |
| | | | | | | | | |
| | | | | | | | 4,683,754 | |
| | | | | | | | | |
| Utilities (3.3%) | | | | | | | | |
| American States Water Co. | | | 13,800 | | | | 794,466 | |
| New Jersey Resources Corp. | | | 31,600 | | | | 1,417,260 | |
| South Jersey Industries, Inc. | | | 15,900 | | | | 883,881 | |
| | | | | | | | | |
| | | | | | | | 3,095,607 | |
| | | | | | | | | |
| TOTAL COMMON STOCKS (Cost $76,443,182) | | | | | | | 93,415,886 | |
| | | | | | | | | |
| INVESTMENT COMPANIES (1.9%) | | | | | | | |
State Street Institutional U.S. Government Money Market Fund, Investor Shares, 0.01%(b) | | | 1,829,464 | | | | 1,829,464 | |
| | | | | | | | | |
TOTAL INVESTMENT COMPANIES (Cost $1,829,464) | | | | | | | 1,829,464 | |
| | | | | | | | | |
Total Investments (Cost $78,272,646)(c) — 100.0% | | | | | | | 95,245,350 | |
Liabilities in excess of other assets — 0.0% | | | | | | | (12,610 | ) |
| | | | | | | | | |
| NET ASSETS — 100.0% | | | | | | $ | 95,232,740 | |
| | | | | | | | | |
| (a) | | Non-income producing security. |
| (b) | | Rate disclosed is the seven day yield as of March 31, 2013. |
| (c) | | See Federal Tax Information listed in the Notes to the Financial Statements. |
| See Notes to Financial Statements | | 61 |
Financial Statements | |
Walden Small Cap Innovations Fund |
| | | |
| STATEMENT OF ASSETS AND LIABILITIES | | | | |
| March 31, 2013 | | | | |
| | | | | |
| Assets: | | | | |
| Investments, at fair value (cost $78,272,646) | | | $ | 95,245,350 |
| Cash | | | | 8,704 |
| Dividends receivable | | | | 94,752 |
| Receivable for capital shares issued | | | | 32,272 |
| Prepaid expenses and other assets | | | | 10,544 |
| | | | |
Total Assets | | | | 95,391,622 |
| | | | |
| Liabilities: | | | | |
| Payable for investments purchased | | | | 72,630 |
| Accrued expenses and other liabilities: | | | | |
Investment adviser | | | | 38,814 |
Chief compliance officer | | | | 615 |
Administration and accounting | | | | 3,377 |
Custodian | | | | 2,210 |
Transfer agent | | | | 9,689 |
Trustee | | | | 242 |
Distribution and service fees | | | | 16,199 |
Other | | | | 15,106 |
| | | | |
Total Liabilities | | | | 158,882 |
| | | | |
| Net Assets | | | $ | 95,232,740 |
| | | | |
| Composition of Net Assets: | | | | |
| Capital | | | $ | 77,006,370 |
Accumulated net investment income (loss) | | | | 42,856 |
Accumulated net realized gains from investment transactions | | | | 1,210,810 |
Net unrealized appreciation from investments | | | | 16,972,704 |
| | | | |
Net Assets | | | $ | 95,232,740 |
| | | | |
Shares outstanding (par value $0.01, unlimited number of shares authorized) | | | | 5,154,888 |
| | | | |
Net Asset Value, Offering Price and Redemption Price Per Share* | | | $ | 18.48 |
| | | | |
| STATEMENT OF OPERATIONS | | | | | |
| For the year ended March 31, 2013 | | | | | |
| | | | | | |
| Investment Income: | | | | | |
| Dividends | | | $ | 1,139,362 | |
| | | | | |
Total Investment Income | | | | 1,139,362 | |
| | | | | |
| Expenses: | | | | | |
Investment adviser | | | | 611,300 | |
Administration and accounting | | | | 100,434 | |
Shareholder servicing | | | | 63,690 | |
Trustee | | | | 3,425 | |
Custodian | | | | 13,854 | |
Transfer agency | | | | 37,272 | |
Chief compliance officer | | | | 3,141 | |
Other | | | | 54,588 | |
| | | | | |
Total expenses before fee reductions | | | | 887,704 | |
Fees voluntarily reduced by Transfer agent | | | | (5,437 | ) |
Fees contractually reduced by the investment adviser | | | | (64,888 | ) |
| | | | | |
| Net Expenses | | | | 817,379 | |
| | | | | |
| Net Investment Income | | | | 321,983 | |
| | | | | |
| Net Realized/Unrealized Gains from Investments: | | | | | |
Net realized gains from investment transactions | | | | 3,321,577 | |
Change in unrealized appreciation from investments | | | | 7,311,466 | |
| | | | | |
| Net realized/unrealized gains from investments | | | | 10,633,043 | |
| | | | | |
| Change in Net Assets Resulting from Operations | | | $ | 10,955,026 | |
| | | | | |
| * | | The Net Asset Value (NAV) per share represents the final traded NAV per share calculated during the reporting period (determined as of March 28, 2013) and does not reflect the rounding effect of certain adjustments recorded for financial reporting purposes. The rounded NAV per share as of March 31, 2013, considering the effect of these financial reporting adjustments, is $18.47. |
| 62 | | See Notes to Financial Statements |
Financial Statements | |
Walden Small Cap Innovations Fund |
| | | |
| STATEMENTS OF CHANGES IN NET ASSETS | | | | | | | | | | |
| | | | For the year ended | | | | For the year ended | |
| | | | March 31, | | | | March 31, | |
| | | | 2013 | | | | 2012 | |
| | | | | | | | | |
| | | | | | | | | | | |
| Investment Activities: | | | | | | | | | | |
| Operations: | | | | | | | | | | |
Net investment income | | | $ | 321,983 | | | | $ | 31,553 | |
Net realized gains from investment transactions | | | | 3,321,577 | | | | | 261,025 | |
Change in unrealized appreciation from investments | | | | 7,311,466 | | | | | 1,299,094 | |
| | | | | | | | | |
| Change in Net Assets Resulting from Operations | | | | 10,955,026 | | | | | 1,591,672 | |
| | | | | | | | | |
| Dividends: | | | | | | | | | | |
Net investment income | | | | (331,453 | ) | | | | (59,243 | ) |
Net realized gains from investment transactions | | | | (1,863,888 | ) | | | | (3,327,935 | ) |
| | | | | | | | | |
| Change in Net Assets Resulting from Shareholder Dividends | | | | (2,195,341 | ) | | | | (3,387,178 | ) |
| | | | | | | | | |
| Capital Share Transactions: | | | | | | | | | | |
Proceeds from shares issued | | | | 20,056,167 | | | | | 25,475,054 | |
Proceeds from shares issued in subscription in-kind(a) | | | | 503,078 | | | | | 1,691,789 | |
Dividends reinvested | | | | 1,709,944 | | | | | 2,157,735 | |
Cost of shares redeemed | | | | (5,340,602 | ) | | | | (4,472,977 | ) |
| | | | | | | | | |
| Change in Net Assets Resulting from Capital Share Transactions | | | | 16,928,587 | | | | | 24,851,601 | |
| | | | | | | | | |
| Change in Net Assets | | | | 25,688,272 | | | | | 23,056,095 | |
| Net Assets: | | | | | | | | | | |
Beginning of period | | | | 69,544,468 | | | | | 46,488,373 | |
| | | | | | | | | |
End of period | | | $ | 95,232,740 | | | | $ | 69,544,468 | |
| | | | | | �� | | | |
| Share Transactions: | | | | | | | | | | |
Issued | | | | 1,225,851 | | | | | 1,513,736 | |
Issued in subscriptions in-kind(a) | | | | 31,680 | | | | | 100,047 | |
Reinvested | | | | 102,176 | | | | | 143,466 | |
Redeemed | | | | (315,804 | ) | | | | (281,200 | ) |
| | | | | | | | | |
| Change in Shares | | | | 1,043,903 | | | | | 1,476,049 | |
| | | | | | | | | |
| Accumulated net investment income/(loss) | | | $ | 42,856 | | | | $ | (27,691 | ) |
| | | | | | | | | |
| Amounts designated as “—” are $0 or have been rounded to $0. |
| (a) See Note 3 in the Notes to Financial Statements. |
| See Notes to Financial Statements | | 63 |
Financial Statements | |
Walden Small Cap Innovations Fund |
| | | |
| FINANCIAL HIGHLIGHTS |
| Selected data for a share outstanding throughout the periods indicated. |
| | | | | | | | | | | | | | | | | | | | | | | | | | |
| | | | For the year | | | | For the year | | | | For the year | | | | For the year | | | | For the period | |
| | | | ended | | | | ended | | | | ended | | | | ended | | | | ended | |
| | | | March 31, | | | | March 31, | | | | March 31, | | | | March 31, | | | | March 31, | |
| | | | 2013 | | | | 2012 | | | | 2011 | | | | 2010 | | | | 2009(a) | |
| | | | | | | | | | | | | | | | | | | | | |
| | | | | | | | | | | | | | | | | | | | | | | | | | |
| Net Asset Value, Beginning of Period | | | $ | 16.92 | | | | $ | 17.64 | | | | $ | 14.57 | | | | $ | 9.19 | | | | $ | 10.00 | |
| | | | | | | | | | | | | | | | | | | | | |
| Investment Activities: | | | | | | | | | | | | | | | | | | | | | | | | | |
Net investment income | | | | 0.07 | | | | | 0.01 | | | | | 0.02 | | | | | 0.02 | | | | | 0.03 | (b) |
Net realized and unrealized gains (losses) from investment transactions | | | | 1.93 | | | | | 0.27 | | | | | 3.59 | | | | | 5.60 | | | | | (0.83 | ) |
| | | | | | | | | | | | | | | | | | | | | |
| Total from investment activities | | | | 2.00 | | | | | 0.28 | | | | | 3.61 | | | | | 5.62 | | | | | (0.80 | ) |
| | | | | | | | | | | | | | | | | | | | | |
| Dividends: | | | | | | | | | | | | | | | | | | | | | | | | | |
Net investment income | | | | (0.07 | ) | | | | (0.02 | ) | | | | (0.03 | ) | | | | (0.02 | ) | | | | (0.01 | ) |
Net realized gains from investments | | | | (0.37 | ) | | | | (0.98 | ) | | | | (0.51 | ) | | | | (0.22 | ) | | | | — | |
| | | | | | | | | | | | | | | | | | | | | |
| Total dividends | | | | (0.44 | ) | | | | (1.00 | ) | | | | (0.54 | ) | | | | (0.24 | ) | | | | (0.01 | ) |
| | | | | | | | | | | | | | | | | | | | | |
| Net Asset Value, End of Period | | | $ | 18.48 | | | | $ | 16.92 | | | | $ | 17.64 | | | | $ | 14.57 | | | | $ | 9.19 | |
| | | | | | | | | | | | | | | | | | | | | |
| Total Return | | | | 12.05% | | | | | 2.28% | | | | | 25.13% | | | | | 61.45% | | | | | (7.98)% | (c) |
| | | | | | | | | | | | | | | | | | | | | |
| Ratios/Supplemental Data: | | | | | | | | | | | | | | | | | | | | | | | | | |
Net Assets at end of period (000’s) | | | $ | 95,233 | | | | $ | 69,544 | | | | $ | 46,488 | | | | $ | 22,057 | | | | $ | 2,340 | |
Ratio of net expenses to average net assets | | | | 1.00% | | | | | 1.00% | | | | | 1.00% | | | | | 1.00% | | | | | 1.16% | (d) |
Ratio of net investment income to average net assets | | | | 0.40% | | | | | 0.06% | | | | | 0.14% | | | | | 0.26% | | | | | 0.63% | (d) |
Ratio of expenses (before fee reductions) to average net assets(e) | | | | 1.09 | % | | | | 1.15% | | | | | 1.27% | | | | | 1.68% | | | | | 9.61% | (d) |
Portfolio turnover rate | | | | 31.98 | % | | | | 24.62% | | | | | 36.01% | | | | | 23.07% | | | | | 4.37% | (c) |
| Amounts designated as “—” are $0 or have been rounded $0. |
| (a) | | Commenced operations on October 24, 2008. |
| (b) | | Calculated using the average shares method. |
| (c) | | Not annualized for periods less than one year. |
| (d) | | Annualized for periods less than one year. |
| (e) | | During the period, certain fees were reduced. If such fee reductions had not occurred, the ratio would have been as indicated. |
| 64 | | See Notes to Financial Statements |
| Notes to Financial Statements | |
March 31, 2013 |
| | | |
1. | Organization: |
| | The Boston Trust & Walden Funds (the “Trust”) was organized on January 8, 1992 as a Massachusetts business trust and is registered under the Investment Company Act of 1940, as amended (the “1940 Act”), as an open-end management investment company. The Trust contains the following ten operational funds (individually a “Fund”, collectively the “Funds”): |
| | Fund | | | Short Name |
| | |
| | Boston Trust Asset Management Fund (formerly known as Boston Trust Balanced Fund) | | | Asset Management Fund |
| | Boston Trust Equity Fund | | | Equity Fund |
| | Boston Trust Midcap Fund | | | Midcap Fund |
| | Boston Trust SMID Cap Fund | | | SMID Cap Fund |
| | Boston Trust Small Cap Fund | | | Small Cap Fund |
| | | | | |
| | Walden Asset Management Fund (formerly known as Walden Balanced Fund) | | | Walden Asset Management Fund |
| | Walden Equity Fund | | | Walden Equity Fund |
| | Walden Midcap Fund | | | Walden Midcap Fund |
| | Walden SMID Cap Innovations Fund | | | Walden SMID Cap Fund |
| | Walden Small Cap Innovations Fund | | | Walden Small Cap Fund |
| | |
| | The investment objective of the Asset Management Fund and Walden Asset Management Fund is to seek long-term capital growth and income through an actively managed portfolio of stocks, bonds and money market instruments. The investment objective of the Equity Fund and Walden Equity Fund is to seek long-term capital growth through an actively managed portfolio of stocks. The investment objective of the Midcap Fund and Walden Midcap Fund is to seek long-term capital growth through an actively managed portfolio of stocks of middle capitalization companies. The investment objective of the Small Cap Fund and Walden Small Cap Fund is to seek long-term capital growth through an actively managed portfolio of stocks of small capitalization companies. The investment objective of the SMID Cap Fund and Walden SMID Cap Fund is to seek long-term capital growth through an actively managed portfolio of stocks of small to middle capitalization companies. |
| | |
| | Under the Trust’s organizational documents, its officers and trustees are indemnified against certain liabilities arising out of the performance of their duties to the Trust. In addition, in the normal course of business, the Trust may enter into contracts with its vendors and others that provide for general indemnifications. Each Fund’s maximum exposure under these arrangements is unknown, as this would involve future claims that may be made against the Funds. However, based on experience, the Funds expect that risk of loss to be remote. |
| | |
2. | Significant Accounting Policies: |
| | The following is a summary of significant accounting policies followed by the Funds in the preparation of their financial statements. The policies are in conformity with accounting principles generally accepted in the United States of America (“GAAP”). |
| | |
| | The preparation of financial statements in conformity with GAAP requires management to make estimates and assumptions that affect the reported amounts of assets and liabilities, the disclosure of contingent assets and liabilities at the date of the financial statements and the reported amounts of increases and decreases in net assets from operations during the reporting period. Actual results may differ from those estimates. |
| | |
| | Security Valuation: |
| | The Funds record their investments at fair value. Fair value is defined as the price that would be received to sell an asset or paid to transfer a liability in an orderly transaction between market participants at the measurement date. The valuation techniques used to determine fair value are further described below. |
| | |
| | The value of each equity security, including common stocks, is based either on the last sale price on a national securities exchange, or in the absence of recorded sales, at the closing bid prices on such exchanges, or at the quoted bid price in the over-the-counter market. Equity securities traded on the NASDAQ stock market are valued at the NASDAQ official closing price. |
| | |
| | Bonds and other fixed income securities (other than short-term obligations but including listed issues) are provided by an independent pricing service, the use of which has been approved by the Trust’s Board of Trustees (the “Board”). In making such valuations, the pricing service utilizes both dealer-supplied valuations and electronic data processing techniques that take into account appropriate factors such as institutional-size trading in similar groups of securities, yield, quality, coupon rate, maturity, type of issue, and trading characteristics other than market data and without exclusive reliance upon quoted prices or exchanges or over-the-counter prices, since such valuations are believed to reflect more accurately the fair value of such securities. All debt portfolio securities with a remaining maturity of 60 days or less are valued at amortized cost, which approximates fair value. Under the amortized cost method, discount or premium, if any, is accreted or amortized, respectively, on a constant (straight-line) basis to the maturity of the security. |
| | |
| | The Trust may use a pricing service to value certain portfolio securities where the prices provided are believed to reflect the fair market value of such securities. If market prices are not readily available or, in Boston Trust Investment Management, Inc.’s (the “Adviser”) opinion, market prices do not reflect fair value, or if an event occurs after the close of trading on the exchange or market on which the security is principally traded (but prior to the time the NAV is calculated) that materially affects fair value, the Adviser will value the Funds’ assets at their fair value according to policies approved by the Board.
Investments in investment companies and money market funds are valued at net asset value per share. |
| | |
| | Fair Value Measurements: |
| | The valuation techniques employed by the Funds, as described above in Security Valuation, maximize the use of observable inputs and minimize the use of unobservable inputs in determining fair value. The inputs used for valuing the Funds’ investments are summarized in the three broad levels listed below: |
| | |
| | Level 1 — quoted prices in active markets for identical assets |
| | Level 2 — other significant observable inputs (including quoted prices for similar securities, interest rates, prepayment speeds, credit risk, etc.) |
| | Level 3 — significant unobservable inputs (including the Funds’ own assumptions in determining the fair value of investments) |
| | |
| | The inputs or methodology used to value investments are not necessarily an indication of the risk associated with investing in those investments. |
| Notes to Financial Statements | |
March 31, 2013 |
| | | |
| | Pursuant to the valuation techniques described above in Security Valuation, equity securities are generally categorized as Level 1 securities in the fair value hierarchy (unless there is a fair valuation event, in which case affected securities are generally categorized as Level 2 securities). Debt securities, including those with a remaining maturity of 60 days or less are generally categorized as Level 2 securities in the fair value hierarchy. Open-end investment companies and money market funds are generally categorized as Level 1 securities in the fair value hierarchy. |
| | |
| | Investments for which there are no such quotations, or for which quotations do not appear reliable, are valued at fair value as determined in good faith by the Pricing Committee under the direction of the Board. These valuations are typically categorized as Level 2 or Level 3 in the fair value hierarchy. |
| | |
| | The following is a summary of the valuation inputs used as of March 31, 2013 in valuing the Funds’ investments based on the three levels defined above: |
| | | | | | | Level 2 | | |
| | | | Level 1 | | | Other Significant | | Total Investments |
| | Fund Name | | Quoted Prices | | | Observable Inputs | | in Securities |
| | |
| | Asset Management Fund | | | | | | | | | | | | |
| | Common Stocks1 | | $ | 214,766,175 | | | $ | — | | | $ | 214,766,175 | |
| | Corporate Bonds1 | | | — | | | | 11,796,246 | | | | 11,796,246 | |
| | Municipal Bonds2 | | | — | | | | 7,059,817 | | | | 7,059,817 | |
| | U.S. Government & U.S. Government Agency Obligations | | | — | | | | 39,800,735 | | | | 39,800,735 | |
| | Investment Companies | | | 15,654,911 | | | | — | | | | 15,654,911 | |
| | | | | | | | | | | |
| | Total | | | 230,421,086 | | | | 58,656,798 | | | | 289,077,884 | |
| | | | | | | | | | | | | | |
| | Equity Fund | | | | | | | | | | | | |
| | Common Stocks1 | | | 80,214,290 | | | | — | | | | 80,214,290 | |
| | Investment Companies | | | 1,437,072 | | | | — | | | | 1,437,072 | |
| | | | | | | | | | | |
| | Total | | | 81,651,362 | | | | — | | | | 81,651,362 | |
| | | | | | | | | | | | | | |
| | Midcap Fund | | | | | | | | | | | | |
| | Common Stocks1 | | | 34,201,395 | | | | — | | | | 34,201,395 | |
| | Investment Companies | | | 703,557 | | | | — | | | | 703,557 | |
| | | | | | | | | | | |
| | Total | | | 34,904,952 | | | | — | | | | 34,904,952 | |
| | | | | | | | | | | | | | |
| | SMID Cap Fund | | | | | | | | | | | | |
| | Common Stocks1 | | | 4,670,406 | | | | — | | | | 4,670,406 | |
| | Investment Companies | | | 55,076 | | | | — | | | | 55,076 | |
| | | | | | | | | | | |
| | Total | | | 4,725,482 | | | | — | | | | 4,725,482 | |
| | | | | | | | | | | | | | |
| | Small Cap Fund | | | | | | | | | | | | |
| | Common Stocks1 | | | 499,854,701 | | | | — | | | | 499,854,701 | |
| | Investment Companies | | | 3,210,238 | | | | — | | | | 3,210,238 | |
| | | | | | | | | | | |
| | Total | | | 503,064,939 | | | | — | | | | 503,064,939 | |
| | |
| | Walden Asset Management Fund | | | | | | | | | | | | |
| | Common Stocks1 | | | 48,095,991 | | | | — | | | | 48,095,991 | |
| | Corporate Bonds1 | | | — | | | | 2,387,735 | | | | 2,387,735 | |
| | Municipal Bonds2 | | | — | | | | 757,087 | | | | 757,087 | |
| | U.S. Government & U.S. Government Agency Obligations | | | — | | | | 10,855,022 | | | | 10,855,022 | |
| | Investment Companies | | | 2,574,260 | | | | — | | | | 2,574,260 | |
| | | | | | | | | | | |
| | Total | | | 50,670,251 | | | | 13,999,844 | | | | 64,670,095 | |
| | | | | | | | | | | | | | |
| | Walden Equity Fund | | | | | | | | | | | | |
| | Common Stocks1 | | | 128,890,250 | | | | — | | | | 128,890,250 | |
| | Investment Companies | | | 1,624,857 | | | | — | | | | 1,624,857 | |
| | | | | | | | | | | |
| | Total | | | 130,515,107 | | | | — | | | | 130,515,107 | |
| | | | | | | | | | | | | | |
| | Walden Midcap Fund | | | | | | | | | | | | |
| | Common Stocks1 | | | 23,724,925 | | | | — | | | | 23,724,925 | |
| | Investment Companies | | | 784,720 | | | | — | | | | 784,720 | |
| | | | | | | | | | | |
| | Total | | | 24,509,645 | | | | — | | | | 24,509,645 | |
| | | | | | | | | | | | | | |
| | Walden SMID Cap Fund | | | | | | | | | | | | |
| | Common Stocks1 | | | 19,587,869 | | | | — | | | | 19,587,869 | |
| | Investment Companies | | | 525,308 | | | | — | | | | 525,308 | |
| | | | | | | | | | | |
| | Total | | | 20,113,177 | | | | — | | | | 20,113,177 | |
| | | | | | | | | | | | | | |
| | Walden Small Cap Fund | | | | | | | | | | | | |
| | Common Stocks1 | | | 93,415,886 | | | | — | | | | 93,415,886 | |
| | Investment Companies | | | 1,829,464 | | | | — | | | | 1,829,464 | |
| | | | | | | | | | | |
| | Total | | | 95,245,350 | | | | — | | | | 95,245,350 | |
| | |
| | 1 | For detailed industry descriptions, see the accompanying Schedules of Portfolio Investments. |
| | 2 | For detailed State classifications, see the accompanying Schedules of Portfolio Investments. |
| | The Funds recognize transfers, if any, between fair value hierarchy levels at the reporting period end. There were no transfers between levels as of March 31, 2013 from the valuation input levels used on March 31, 2012. The Funds did not hold any Level 3 securities during the period ended March 31, 2013. |
| Notes to Financial Statements | |
March 31, 2013 |
| | | |
| | Security Transactions and Related Income: |
| | Security transactions are recorded no later than one business day after trade date. For financial reporting purposes, security transactions are recorded on trade date on the last business day of the reporting period. Interest income is recognized on the accrual basis and includes, where applicable, the amortization of premium or discount. Dividend income is recorded on the ex-dividend date. Gains or losses realized on sales of securities are determined by comparing the identified cost of the security lot sold with the net sales proceeds. |
| | |
| | Expenses: |
| | Expenses directly attributable to a Fund are charged directly to that Fund. Expenses relating to the Trust are allocated proportionately to each Fund within the Trust according to the relative net assets of each Fund or on another reasonable basis. |
| | |
| | Dividends to Shareholders: |
| | Dividends to shareholders are recorded on the ex-dividend date. Dividends to shareholders from net investment income, if any, are declared and paid annually by the Funds. Dividends to shareholders from net realized gains, if any, are declared and distributed at least annually by the Funds. |
| | |
| | The amounts of dividends to shareholders from net investment income and of distributions from net realized gains are determined in accordance with federal income tax regulations, which may differ from GAAP. These “book/tax” differences are either considered temporary or permanent in nature. To the extent these differences are permanent in nature (e.g. return of capital, net operating loss, reclassification of certain market discounts, gain/loss, paydowns, and distributions), such amounts are reclassified within the composition of net assets based on their federal tax-basis treatment; temporary differences (e.g. wash sales and post October losses) do not require reclassification. To the extent dividends to shareholders exceed net investment income and net realized gains for tax purposes, they are reported as distributions of capital. |
| | |
| | Federal Income Taxes: |
| | Each Fund intends to continue to qualify as a regulated investment company by complying with the provisions available to certain investment companies, as defined in Subchapter M of the Internal Revenue Code, and to make distributions from net investment income and from net realized capital gains sufficient to relieve it from all, or substantially all, federal income and excise taxes. Therefore, no federal income tax provision is required. |
| | |
| | Management has reviewed tax positions taken in tax years that remain subject to examination by all major tax jurisdictions, including federal (i.e., the last four tax year ends and the interim tax period since then, as applicable). The Funds recognize interest and penalties, if any, related to unrecognized tax benefits, as income tax expense in the Statement of Operations. Management believes that there is no tax liability resulting from unrecognized tax benefits related to uncertain tax positions taken as of and during the year ended March 31, 2013. |
| | |
| | New Accounting Pronouncement: |
| | In January 2013, the Financial Accounting Standards Board issued ASU No. 2013-01 “Clarifying the Scope of Disclosures about Offsetting Assets and Liabilities (“ASU 2013-01’) which amended ASC Subtopic 210-20, Balance Sheet Offsetting. ASU 2013-01 clarified the scope of ASU No. 2011-11 “Disclosures about Offsetting Assets and Liabilities (“ASU 2011-11”). ASU 2011-11 requires an entity to disclose information about offsetting and related arrangements to enable users of that entity’s financial statements to understand the effect of those arrangements on its financial position. ASU 2013-01 clarifies the scope of ASU 2011-11 as applying to derivatives accounted for in accordance with Topic 815, Derivatives and Hedging, including bifurcated embedded derivatives, repurchase agreements and reverse repurchase agreements, and securities borrowing and securities lending transactions that are offset either in accordance with other requirements of GAAP or subject to an enforceable master netting arrangement or similar agreement. The guidance in ASU 2013-01 and ASU 2011-11 is effective for interim and annual periods beginning on or after January 1, 2013. Management is evaluating any impact ASU 2013-01 and ASU 2011-11 may have on the Funds’ financial statements. |
| | |
3. | Related Party Transactions and Other Service Arrangements: |
| | Investment Adviser: |
| | The Funds and the Adviser are parties to an Investment Advisory Agreement under which the Adviser is entitled to receive an annual fee, computed daily and paid monthly, equal to the average daily net assets of each Fund, at the following annual percentage rates before contractual waivers: |
| | Fund | | | Fee Rate | |
| | | |
| | Asset Management Fund | | | 0.75 | % | |
| | Equity Fund | | | 0.75 | % | |
| | Midcap Fund | | | 0.75 | % | |
| | SMID Cap Fund | | | 0.75 | % | |
| | Small Cap Fund | | | 0.75 | % | |
| | Walden Asset Management Fund | | | 0.75 | % | |
| | Walden Equity Fund | | | 0.75 | % | |
| | Walden Midcap Fund | | | 0.75 | % | |
| | Walden SMID Cap Fund | | | 0.75 | % | |
| | Walden Small Cap Fund | | | 0.75 | % | |
| | Additionally, one Trustee of the Trust is Managing Director of the Adviser and an officer of the Trust is an officer of the Adviser. The persons are not paid directly by the Funds. |
| | |
| | Administration and Fund Accounting: |
| | Citi Fund Services Ohio, Inc. (“Citi”) serves the Funds as administrator. Citi provides administrative and fund accounting services for a fee that is computed daily and paid monthly, based on the aggregate daily net assets of the Trust. |
| |
| | Certain officers of the Trust are affiliated with Citi. Such persons were paid no fees directly by the Funds for serving as Officers of the Trust. Citi makes an employee available to service as the Funds’ Chief Compliance Officer (“CCO”) under a Compliance Service Agreement between the Funds and Citi (the “CCO Agreement”). Under the CCO Agreement, Citi also provides infrastructure and support in implementing the written policies and procedures comprising the Funds’ compliance program, including support services to the CCO. For the services provided under the CCO Agreement, the Funds paid Citi $39,123 for the year ended March 31, 2013, plus certain out of pocket expenses. Citi pays the salary and other compensation earned by the CCO as an employee of Citi. |
| | |
| | Distribution: |
| | Effective August 1, 2012, BHIL Distributors, Inc., (“BHIL”), a wholly-owned subsidiary of Beacon Hill Fund Services, Inc., serves as the Funds’ distribution agent. The distribution agreement provides for payment of a fixed annual fee of $17,500, fees for review of sales literature and dealer set-up efforts, and reimbursement of out-of-pocket expenses. These amounts are paid monthly to BHIL from the Advisor and not by the Funds. BHIL is not affiliated with Citi or the Adviser. Prior to August 1, 2012, Foreside Distributing Services, L.P., an indirect, wholly-owned subsidiary of Foreside Financial Group, LLC, served as the Funds’ distribution agent. |
| Notes to Financial Statements | |
March 31, 2013 |
| | | |
| | Shareholder Services: |
| | The Funds may enter into shareholder services agreements with investment advisers, banks, trust companies and other types of organizations (“Authorized Service Providers”), which may include affiliates of the Funds, for providing administrative services with respect to shares of the Funds attributable to or held in the name of the Authorized Service Provider for its clients or other parties with whom they have a servicing relationship. Each Fund is authorized to pay non-distribution related shareholder services fees up to 0.25% of the average annual net assets with respect to shares of the Funds serviced by an Authorized Service Provider. |
| | |
| | Custodian and Transfer Agency: |
| | Boston Trust & Investment Management Company (“Boston Trust”), the parent company of the Adviser, acts as the Funds’ custodian and transfer agent. Under the custody agreement, Boston Trust receives $1,000 annually per Fund plus an annual asset based fee of 0.016% of the value of securities held. Under the transfer agency agreement, Boston Trust receives a fixed fee of $18,000 annually per fund, accrued daily and paid monthly for its services. Under a sub-transfer agency agreement, Citi receives a fixed annual fee from the Funds that use Citi as sub-transfer agent, accrued daily and paid monthly, plus annual per account fees and certain out of pocket expenses for its services to the Trust. |
| | |
| | Fee Reductions: |
| | The Adviser has agreed to reduce its fees payable by the Funds to the extent necessary to limit each Fund’s aggregate annual operating expenses to 1.00% of the average daily net assets. Any such reductions made by the Adviser in its fees or in the payment or reimbursement of expenses that are a Fund’s obligation may be subject to repayment by the Fund within three years provided the Fund receiving the reduction, payment or reimbursement is able to effect such repayment and remain in compliance with applicable expense limitations. The expense limitation agreement shall automatically renew effective August 1 of every year until the Adviser provides written notice of non-renewal to the Trust. |
| | |
| | Pursuant to its agreement, for the periods ended March 31, 2011, 2012 and 2013, the Adviser reimbursed, and has yet to recoup, fees in the following amounts: |
| | Fund | | Amount | | Expires | |
| | | |
| | Equity Fund | | $ | 13,866 | | | 2014 | |
| | | | | | | | | |
| | Midcap Fund | | | 27,687 | | | 2014 | |
| | | | | 33,899 | | | 2015 | |
| | | | | 16,993 | | | 2016 | |
| | | | | | | | | |
| | SMID Cap Fund | | | 11,533 | | | 2015 | |
| | | | | 33,947 | | | 2016 | |
| | | | | | | | | |
| | Small Cap Fund | | | 105,195 | | | 2014 | |
| | | | | 60,584 | | | 2015 | |
| | | | | | | | | |
| | Walden Asset Management Fund | | | 32,028 | | | 2014 | |
| | | | | 33,900 | | | 2015 | |
| | | | | 49,992 | | | 2016 | |
| | | | | | | | | |
| | Walden Equity Fund | | | 51,177 | | | 2014 | |
| | | | | 26,043 | | | 2015 | |
| | | | | 151,960 | | | 2016 | |
| | | | | | | | | |
| | Walden Midcap Fund | | | 18,288 | | | 2015 | |
| | | | | 34,176 | | | 2016 | |
| | | | | | | | | |
| | Walden SMID Cap Fund | | | 30,124 | | | 2016 | |
| | | | | | | | | |
| | Walden Small Cap Fund | | | 61,924 | | | 2014 | |
| | | | | 45,712 | | | 2015 | |
| | | | | 64,888 | | | 2016 | |
| | |
| | During the year ended March 31, 2013, the Adviser recouped amounts from the following Funds: |
| | | |
| | Asset Management Fund | | | $ | 4,171 | |
| | Equity Fund | | | | 8,013 | |
| | Small Cap Fund | | | | 21,275 | |
| | | |
| | As of March 31, 2013, the Adviser may recoup amounts from the Funds as follows: |
| | Total Potential Recoupment | |
| | | |
| | Asset Management Fund | | | $ | — | |
| | Equity Fund | | | | 13,866 | |
| | Midcap Fund | | | | 78,579 | |
| | SMID Cap Fund | | | | 45,480 | |
| | Small Cap Fund | | | | 165,779 | |
| | Walden Asset Management Fund | | | $ | 115,920 | |
| | Walden Equity Fund | | | | 229,180 | |
| | Walden Midcap Fund | | | | 52,464 | |
| | Walden SMID Cap Fund | | | | 30,124 | |
| | Walden Small Cap Fund | | | | 172,524 | |
| | | |
| | During the year ended March 31, 2013, the transfer agent voluntarily reduced a portion of the transfer agent fees otherwise payable by the Funds, as indicated on each Fund’s Statement of Operations. These voluntary reductions are not subject to recoupment in future years. |
| |
Other Affiliated Transactions: |
| During the year ended March 31, 2013, net assets of certain Funds (the “Redeeming Funds”) were exchanged as in-kind transfers for shares of other Funds (the “Subscribing Funds”) within the Trust. Fund shares of the Subscribing Funds, issued in connection with the exchanges, were used to pay for securities, at fair value, transferred from the Redeeming Funds. The total fair value of the in-kind transfers was $324,838 for 32,484 shares of the Walden SMID Cap Fund in exchange for 32,516 shares of the SMID Cap Fund and $503,078 for 31,680 shares of the Walden Small Cap Fund in exchange for 40,571 shares of the Small Cap Fund. |
| |
| During the year ended March 31, 2012, certain net assets of common trust funds, managed by the Advisor, were exchanged as in-kind transfers for shares of certain Funds of the Trust. Fund shares issued in connection with the exchange were used to pay for securities transferred from the common trust funds to certain Funds at fair value. The total fair value of the in-kind transfers was $6,858,946 for 223,273 shares of the Asset Management Fund, $325,000 for 32,500 shares of the SMID Cap Fund, $5,098,275 for 463,901 shares of the Walden Asset Management Fund and $1,691,789 for 100,047 shares of the Walden Small Cap Fund. |
| Notes to Financial Statements | |
March 31, 2013 |
| | | |
4. | Purchases and Sales of Securities: |
| | Cost of purchases and proceeds from sales and maturities of securities, excluding short-term securities and U.S. Government securities, for the Funds for the period ended March 31, 2013, totaled: |
| | Fund | | | Purchases | | | | Sales and Maturities | |
| | | |
| | Asset Management Fund | | | $ | 19,107,716 | | | | $ | 12,194,503 | | |
| | Equity Fund | | | | 8,624,684 | | | | | 3,981,923 | | |
| | Midcap Fund | | | | 7,624,849 | | | | | 4,763,074 | | |
| | SMID Cap Fund | | | | 2,002,714 | | | | | 1,286,693 | | |
| | Small Cap Fund | | | | 247,861,643 | | | | | 119,000,680 | | |
| | | |
| | Walden Asset Management Fund | | | | 6,238,544 | | | | | 1,748,984 | | |
| | Walden Equity Fund | | | | 28,155,593 | | | | | 11,172,312 | | |
| | Walden Midcap Fund | | | | 9,828,212 | | | | | 2,106,750 | | |
| | Walden SMID Cap Fund | | | | 19,053,194 | | | | | 1,062,017 | | |
| | Walden Small Cap Fund | | | | 40,393,904 | | | | | 25,556,983 | | |
| | | |
| | Cost of purchases and proceeds from sales and maturities of U.S. Government Securities, excluding short-term securities, for the Funds for the year ended March 31, 2013, totaled: |
| | Fund | | Purchases | | Sales and Maturities | |
| | | |
| | Asset Management Fund | | $ | 0 | | $ | 7,765,182 | | |
| | Walden Asset Management Fund | | | 5,555,978 | | | 7,212,610 | | |
| | | |
5. | Federal Income Tax Information: |
| | At March 31, 2013, the cost, gross unrealized appreciation and gross unrealized depreciation on securities, for federal income tax purposes, were as follows: |
| | | | | | | | | Gross Tax Unrealized | | Gross Tax Unrealized | | Net Unrealized Appreciation |
| | | | Tax Cost | | Appreciation | | (Depreciation) | | (Depreciation) |
| | |
| | Asset Management Fund | | | $ | 192,265,346 | | | | $ | 97,645,755 | | | | $ | (833,217 | ) | | | $ | 96,812,538 | |
| | Equity Fund | | | | 46,444,492 | | | | | 35,557,646 | | | | | (350,776 | ) | | | | 35,206,870 | |
| | Midcap Fund | | | | 23,742,178 | | | | | 11,407,360 | | | | | (244,586 | ) | | | | 11,162,774 | |
| | SMID Cap Fund | | | | 4,002,845 | | | | | 837,696 | | | | | (115,059 | ) | | | | 722,637 | |
| | Small Cap Fund | | | | 420,420,215 | | | | | 89,147,554 | | | | | (6,502,830 | ) | | | | 82,644,724 | |
| | |
| | Walden Asset Management Fund | | | | 50,029,682 | | | | | 15,140,937 | | | | | (500,524 | ) | | | | 14,640,413 | |
| | Walden Equity Fund | | | | 93,328,042 | | | | | 38,304,047 | | | | | (1,116,982 | ) | | | | 37,187,065 | |
| | Walden Midcap Fund | | | | 20,535,966 | | | | | 4,183,365 | | | | | (209,686 | ) | | | | 3,973,679 | |
| | Walden SMID Cap Fund | | | | 18,505,369 | | | | | 1,875,094 | | | | | (267,286 | ) | | | | 1,607,808 | |
| | Walden Small Cap Fund | | | | 78,249,094 | | | | | 18,427,611 | | | | | (1,431,355 | ) | | | | 16,996,256 | |
| | |
| | The tax character of distributions paid during the fiscal year ended March 31, 2013 was as follows: |
| | | | Distributions paid from | | | | | | | | | | | | | | | |
| | | | | | | | | | |
| | | | | | | | | Net Long Term | | Total Taxable | | Tax Return of | | Total Distributions |
| | | | Ordinary Income | | Capital Gains | | Distributions | | Capital | | Paid1 |
| | |
| | Asset Management Fund | | | $ | 3,899,407 | | | | $ | 305,946 | | | | $ | 4,205,353 | | | | $ | — | | | | $ | 4,205,353 | |
| | Equity Fund | | | | 861,329 | | | | | — | | | | | 861,329 | | | | | — | | | | | 861,329 | |
| | Midcap Fund | | | | 207,695 | | | | | 662,925 | | | | | 870,620 | | | | | — | | | | | 870,620 | |
| | SMID Cap Fund | | | | 45,812 | | | | | 29 | | | | | 45,841 | | | | | 2,850 | | | | | 48,691 | |
| | Small Cap Fund | | | | 6,375,133 | | | | | 6,708,598 | | | | | 13,083,731 | | | | | — | | | | | 13,083,731 | |
| | |
| | Walden Asset Management Fund | | | | 710,488 | | | | | — | | | | | 710,488 | | | | | — | | | | | 710,488 | |
| | Walden Equity Fund | | | | 1,235,398 | | | | | — | | | | | 1,235,398 | | | | | — | | | | | 1,235,398 | |
| | Walden Midcap Fund | | | | 105,039 | | | | | — | | | | | 105,039 | | | | | — | | | | | 105,039 | |
| | Walden SMID Cap Fund | | | | 23,799 | | | | | — | | | | | 23,799 | | | | | 5,083 | | | | | 28,882 | |
| | Walden Small Cap Fund | | | | 915,641 | | | | | 1,279,700 | | | | | 2,195,341 | | | | | — | | | | | 2,195,341 | |
| | |
| | The tax character of distributions paid during the fiscal year ended March 31, 2012 was as follows: |
| | | | Distributions paid from | | | | | | | | | | | | | | | |
| | | | | | | | | | |
| | | | | | | | | Net Long Term | | Total Taxable | | Tax Return of | | Total Distributions |
| | | | Ordinary Income | | Capital Gains | | Distributions | | Capital | | Paid1 |
| | |
| | Asset Management Fund | | | $ | 3,373,655 | | | | $ | — | | | | $ | 3,373,655 | | | | $ | — | | | | $ | 3,373,655 | |
| | Equity Fund | | | | 589,650 | | | | | — | | | | | 589,650 | | | | | — | | | | | 589,650 | |
| | Midcap Fund | | | | 302,768 | | | | | 664,754 | | | | | 967,522 | | | | | — | | | | | 967,522 | |
| | SMID Cap Fund | | | | 898 | | | | | — | | | | | 898 | | | | | — | | | | | 898 | |
| | Small Cap Fund | | | | 5,265,166 | | | | | 14,632,707 | | | | | 19,897,873 | | | | | — | | | | | 19,897,873 | |
| | |
| | Walden Asset Management Fund | | | | 550,502 | | | | | — | | | | | 550,502 | | | | | — | | | | | 550,502 | |
| | Walden Equity Fund | | | | 866,803 | | | | | — | | | | | 866,803 | | | | | — | | | | | 866,803 | |
| | Walden Midcap Fund | | | | 19,338 | | | | | — | | | | | 19,338 | | | | | — | | | | | 19,338 | |
| | Walden Small Cap Fund | | | | 995,830 | | | | | 2,391,348 | | | | | 3,387,178 | | | | | — | | | | | 3,387,178 | |
| | |
| | 1 | Total distributions paid may differ from the amount reported in the Statements of Changes in Net Assets because for tax purposes distributions are recognized when actually paid. |
| Notes to Financial Statements | |
March 31, 2013 |
| | | |
As of March 31, 2013, the components of accumulated earnings on a tax basis were as follows:
| | | | Undistributed | | Undistributed | | | | | | Accumulated | | Unrealized | | Total |
| | | | Ordinary | | Long-Term Capital | | Accumulated | | Capital and Other | | Appreciation | | Accumulated |
| | | | Income | | Gains | | Earnings | | Losses | | (Depreciation)2 | | Earnings (Deficit) |
| | |
| | Asset Management Fund | | $ | 810,566 | | | $ | 1,089,703 | | | $ | 1,900,269 | | | $ | — | | | $ | 96,812,538 | | | $ | 98,712,807 | |
| | Equity Fund | | | 195,579 | | | | — | | | | 195,579 | | | | (1,569,735 | ) | | | 35,206,870 | | | | 33,832,714 | |
| | Midcap Fund | | | 3,675 | | | | 287,428 | | | | 291,103 | | | | (35,678 | ) | | | 11,162,774 | | | | 11,418,199 | |
| | SMID Cap Fund | | | — | | | | — | | | | — | | | | (21,614 | ) | | | 722,637 | | | | 701,023 | |
| | Small Cap Fund | | | 1,086,062 | | | | 4,775,622 | | | | 5,861,684 | | | | (49,366 | ) | | | 82,644,724 | | | | 88,457,042 | |
| | |
| | Walden Asset Management Fund | | | 145,977 | | | | — | | | | 145,977 | | | | (14,493 | ) | | | 14,640,413 | | | | 14,771,897 | |
| | Walden Equity Fund | | | 298,146 | | | | — | | | | 298,146 | | | | (1,151,013 | ) | | | 37,187,064 | | | | 36,334,197 | |
| | Walden Midcap Fund | | | 2,898 | | | | — | | | | 2,898 | | | | (161,858 | ) | | | 3,973,679 | | | | 3,814,719 | |
| | Walden SMID Cap Fund | | | — | | | | — | | | | — | | | | (8,689 | ) | | | 1,607,808 | | | | 1,599,119 | |
| | Walden Small Cap Fund | | | 481,517 | | | | 764,090 | | | | 1,245,607 | | | | (15,492 | ) | | | 16,996,256 | | | | 18,226,371 | |
| | |
| | 2 | The differences between book-basis and tax-basis unrealized appreciation (depreciation) is attributable primarily to tax deferral of losses on wash sales. |
The Regulated Investment Company Modernization Act of 2010 (the “Act”) was enacted on December 22, 2010. The Act makes changes to several tax rules impacting the Funds. In general, the provisions of the Act will be effective for the Funds’ fiscal year ended March 31, 2013. Although the Act provides several benefits, including the unlimited carryforward of future capital losses, there may be a greater likelihood that all or a portion of each Fund’s pre-enactment capital loss carryforwards, if any, may expire without being utilized due to the fact that post-enactment capital losses get utilized before pre-enactment capital loss carryforwards.
As of March 31, 2013, the following Funds had net capital loss carryforwards, which are available to offset future realized gains. To the extent these carryforwards are used to offset future gains, it is probable that the amounts offset will not be distributed to shareholders.
Pre-enactment capital loss carryforwards subject to expiration:
| | Fund | Amount | | Expires | |
| | | |
| | Equity Fund | $ | 1,549,884 | | 2018 | |
| | | |
| | Walden Asset Management Fund | | 14,493 | | 2018 | |
| | Walden Equity Fund | | 1,151,013 | | 2018 | |
| | | |
Post-enactment capital loss carryforwards not subject to expiration:
| | Fund | | Short Term Amount | | Long Term Amount | |
| | | |
| | SMID Cap Fund | | $ | 20,244 | | | — | |
| | | |
| | Walden Midcap Fund | | | 152,377 | | | — | |
| | Walden SMID Cap Fund | | | 4,658 | | | — | |
| | | |
During the year ended March 31, 2013, the following Funds utilized capital loss carryforwards to offset realized capital gains:
| | Fund | | Amount | | |
| | | |
| | Asset Management Fund | | $ | 1,026,751 | | |
| | Equity Fund | | | 1,107,491 | | |
| | | |
| | Walden Asset Management Fund | | | 444,371 | | |
| | Walden Equity Fund | | | 1,576,712 | | |
| | | |
Under current tax law, net investment losses and capital losses realized after October 31 of a Fund’s fiscal year may be deferred and treated as occurring on the first business day of the following fiscal year for tax purposes. The following Funds deferred losses as follows:
| | | | Late Year | | Post-October | |
| | Fund | | Ordinary Loss | | Capital Losses | |
| | | |
| | Equity Fund | | $ | — | | | $ | 19,851 | | |
| | Midcap Fund | | | — | | | | 35,678 | | |
| | SMID Cap Fund | | | 1,370 | | | | — | | |
| | Small Cap Fund | | | 49,366 | | | | — | | |
| | | |
| | Walden Midcap Fund | | | — | | | | 9,481 | | |
| | Walden SMID Cap Fund | | | 1,540 | | | | 2,491 | | |
| | Walden Small Cap Fund | | | 15,492 | | | | — | | |
| | | |
| Notes to Financial Statements | |
March 31, 2013 |
| | | |
As of March 31, 2013, the following reclassifications have been made to increase (decrease) such accounts with offsetting adjustments as indicated:
| | | | Accumulated Net | | Accumulated Net | | | | | |
| | Fund | | Investment Income | | Realized Gains | | Paid in Capital | |
| | | |
| | Asset Management Fund | | $ | 12,991 | | | $ | (12,991 | ) | | $ | — | | |
| | Midcap Fund | | | (1 | ) | | | 2 | | | | (1 | ) | |
| | SMID Cap Fund | | | 2,840 | | | | 1,033 | | | | (3,873 | ) | |
| | Small Cap Fund | | | 321,817 | | | | (321,445 | ) | | | (372 | ) | |
| | | |
| | Walden Asset Management Fund | | | 16,193 | | | | (16,192 | ) | | | (1 | ) | |
| | Walden Equity Fund | | | — | | | | (1 | ) | | | 1 | | |
| | Walden SMID Cap Fund | | | 5,305 | | | | — | | | | (5,305 | ) | |
| | Walden Small Cap Fund | | | 80,017 | | | | (80,019 | ) | | | 2 | | |
| | | |
| 6. | | Control Ownership and Principal Holders: |
| | | The beneficial ownership, either directly or indirectly, of more than 25% of the voting securities of a Fund creates presumptions of control of the Fund, under section 2 (a)(9) of the 1940 Act. As of March 31, 2013, the Funds had individual shareholder accounts and/or omnibus shareholder accounts (comprised of a group of individual shareholders), owning more than 25% of the total shares outstanding of the Fund as detailed below. |
| | Fund | | Control Ownership | | % of Ownership |
| | |
| | Asset Management Fund | | Boston Trust & Investment Management Company | | | 93.3 | |
| | Equity Fund | | Boston Trust & Investment Management Company | | | 99.1 | |
| | Midcap Fund | | Boston Trust & Investment Management Company | | | 92.3 | |
| | SMID Cap Fund | | Boston Trust & Investment Management Company | | | 62.1 | |
| | Walden Asset Management Fund | | Boston Trust & Investment Management Company | | | 72.0 | |
| | Walden Equity Fund | | Boston Trust & Investment Management Company | | | 28.8 | |
| | Walden Midcap Fund | | Boston Trust & Investment Management Company | | | 98.1 | |
| | Walden SMID Cap Fund | | Boston Trust & Investment Management Company | | | 56.6 | |
| | Walden Small Cap Fund | | Boston Trust & Investment Management Company | | | 33.2 | |
| | |
| 7. | | Subsequent Events: |
| | | Management evaluated subsequent events through the date these financial statements were issued and concluded no subsequent events required recognition or disclosure in these financial statements. |
Report of Independent Registered Public Accounting Firm
To the Shareholders and Board of Trustees
The Boston Trust & Walden Funds
We have audited the accompanying statements of assets and liabilities, including the schedules of portfolio investments of The Boston Trust & Walden Funds, comprising the Boston Trust Asset Management Fund (formerly, the Boston Trust Balanced Fund), Boston Trust Equity Fund, Boston Trust Midcap Fund, Boston Trust SMID Cap Fund, Boston Trust Small Cap Fund, Walden Asset Management Fund (formerly, the Walden Balanced Fund), Walden Equity Fund, Walden Midcap Fund, Walden SMID Cap Innovations Fund and Walden Small Cap Innovations Fund (the “Funds”), as of March 31, 2013, and the related statement of operations for the year then ended, the statements of changes in net assets for each of the two years in the period then ended, and the financial highlights for each of the five periods in the period then ended for the Boston Trust Asset Management Fund, Boston Trust Equity Fund, Boston Trust Midcap Fund, Boston Trust Small Cap Fund, Walden Asset Management Fund, Walden Equity Fund and Walden Small Cap Innovations Fund, the related statements of operations for the year then ended, statement of changes in net assets for each of the two periods in the period then ended, and the financials highlights for each of the two periods in the period then ended for the Boston Trust SMID Cap Fund and Walden Midcap Fund, and the related statements of operations and changes in net assets and the financial highlights for the period June 29, 2012 (commencement of operations) through March 31, 2013, for the Walden SMID Cap Innovations Fund. These financial statements and financial highlights are the responsibility of the Funds’ management. Our responsibility is to express an opinion on these financial statements and financial highlights based on our audits.
We conducted our audits in accordance with the standards of the Public Company Accounting Oversight Board (United States). Those standards require that we plan and perform the audit to obtain reasonable assurance about whether the financial statements and financial highlights are free of material misstatement. An audit includes examining, on a test basis, evidence supporting the amounts and disclosures in the financial statements. Our procedures included confirmation of securities owned as of March 31, 2013, by correspondence with the custodian and brokers. An audit also includes assessing the accounting principles used and significant estimates made by management, as well as evaluating the overall financial statement presentation. We believe that our audits provide a reasonable basis for our opinion.
In our opinion, the financial statements and financial highlights referred to above present fairly, in all material respects, the financial position of each of the Funds constituting The Boston Trust & Walden Funds as of March 31, 2013, and the results of their operations, the changes in their net assets and their financial highlights for the periods indicated above, in conformity with accounting principles generally accepted in the United States of America.

COHEN FUND AUDIT SERVICES, LTD.
Cleveland, Ohio
May 29, 2013
72
| Supplementary Information (Unaudited) | |
March 31, 2013 |
| | | |
Federal Income Tax Information:
During the fiscal year ended March 31, 2013, the Funds declared long-term realized gain distributions in the following amounts:
| | | 15% Capital Gains | |
| | | | |
| Asset Management Fund | | $ | 305,946 | | |
| Midcap Fund | | | 662,925 | | |
| SMID Cap Fund | | | 29 | | |
| Small Cap Fund | | | 6,708,598 | | |
| Walden Small Cap Fund | | | 1,279,700 | | |
During the fiscal year ended March 31, 2013, the Funds declared short-term realized gain distributions in the following amounts:
| | | Short-Term Capital Gains | |
| | | | |
| SMID Cap Fund | | $ | 30,482 | | |
| Small Cap Fund | | | 5,226,344 | | |
| Walden Small Cap Fund | | | 664,206 | | |
For the fiscal year ended March 31, 2013, the following percentage of the total ordinary income distributions paid by the Funds qualify for the distributions received deduction available to corporate shareholders.
| | | Distributions Received Deduction | |
| | | | |
| Asset Management Fund | | | 99.45 | % | |
| Equity Fund | | | 100.00 | % | |
| Midcap Fund | | | 100.00 | % | |
| SMID Cap Fund | | | 47.47 | % | |
| Small Cap Fund | | | 64.62 | % | |
| Walden Asset Management Fund | | | 100.00 | % | |
| Walden Equity Fund | | | 100.00 | % | |
| Walden Midcap Fund | | | 100.00 | % | |
| Walden SMID Cap Fund | | | 100.00 | % | |
| Walden Small Cap Fund | | | 73.29 | % | |
For the fiscal year ended March 31, 2013, distributions paid by the Funds may be subject to a maximum tax rate of 15%, as provided for by the Jobs and Growth Tax Relief Reconciliation Act of 2003. The Funds intend to designate the maximum amount allowable as taxed at a maximum rate of 15%. Complete information will be reported in conjunction with your 2012 Form 1099-DIV.
| | | Qualified Dividend Income |
| | | |
| Asset Management Fund | | | 100.00 | % |
| Equity Fund | | | 100.00 | % |
| Midcap Fund | | | 100.00 | % |
| SMID Cap Fund | | | 46.61 | % |
| Small Cap Fund | | | 63.50 | % |
| Walden Asset Management Fund | | | 100.00 | % |
| Walden Equity Fund | | | 100.00 | % |
| Walden Midcap Fund | | | 100.00 | % |
| Walden SMID Cap Fund | | | 100.00 | % |
| Walden Small Cap Fund | | | 71.92 | % |
| Supplementary Information (Unaudited) | |
March 31, 2013 |
| | | |
Table of Shareholder Expenses:
As a shareholder of the Trust, you incur ongoing costs, including management fees, and other Fund expenses. These examples are intended to help you understand your ongoing costs (in dollars) of investing in the Boston Trust Funds and Walden Funds and to compare these costs with the ongoing costs of investing in other mutual funds.
These examples are based on an investment of $1,000 invested at the beginning of the period and held for the entire period from October 1, 2012, through March 31, 2013.
Actual Expenses
The table below provides information about actual account values and actual expenses. You may use the information below together with the amount you invested, to estimate the expenses that you paid over the period. Simply divide your account value by $1,000 (for example, an $8,600 account value divided by $1,000 = 8.6), then multiply the result by the number in the table under the heading entitled “Expenses Paid During Period” to estimate the expenses you paid on your account during this period.
Please note that the expenses shown in the table are meant to highlight your ongoing costs only and do not reflect the costs incurred by the Funds for buying and selling securities. The Funds do not charge transaction fees, such as redemption fees, nor do the Funds charge a sales charge (load). Therefore, the table is useful in comparing ongoing costs only, and will not help you determine the relative total costs of owning different funds.
| | | | | | | | | | | | | | | Annualized |
| | | | | | | | | | | Expenses Paid | | Expense Ratio |
| | | Beginning Account Value | | Ending Account Value | | During Period1 | | During Period |
| | | 10/1/12 | | 3/31/13 | | 10/1/12 - 3/31/13 | | 10/1/12 - 3/31/13 |
| |
| Asset Management Fund | | $ | 1,000.00 | | | $ | 1,065.90 | | | $ | 4.94 | | | | 0.96 | % |
| Equity Fund | | | 1,000.00 | | | | 1,086.40 | | | | 5.20 | | | | 1.00 | % |
| Midcap Fund | | | 1,000.00 | | | | 1,121.00 | | | | 5.29 | | | | 1.00 | % |
| SMID Cap Fund | | | 1,000.00 | | | | 1,125.40 | | | | 5.30 | | | | 1.00 | % |
| Small Cap Fund | | | 1,000.00 | | | | 1,115.20 | | | | 5.27 | | | | 1.00 | % |
| |
| Walden Asset Management Fund | | | 1,000.00 | | | | 1,064.10 | | | | 5.15 | | | | 1.00 | % |
| Walden Equity Fund | | | 1,000.00 | | | | 1,089.50 | | | | 5.21 | | | | 1.00 | % |
| Walden Midcap Fund | | | 1,000.00 | | | | 1,120.50 | | | | 5.29 | | | | 1.00 | % |
| Walden SMID Cap Fund | | | 1,000.00 | | | | 1,118.80 | | | | 5.28 | | | | 1.00 | % |
| Walden Small Cap Fund | | | 1,000.00 | | | | 1,117.80 | | | | 5.28 | | | | 1.00 | % |
| |
| 1 | | Expenses are equal to the average account value times a Fund’s annualized expense ratio, multiplied by the number of days in the most recent fiscal half-year, divided by the number of days in the fiscal year. |
Hypothetical Example for Comparison Purposes
The table below provides information about hypothetical account values and hypothetical expenses based on each Boston Trust Fund’s and Walden Fund’s actual expense ratio and an assumed rate of return of 5% per year before expenses, which is not the Fund’s actual return. The hypothetical account values and expenses may not be used to estimate the actual ending account balance or expenses you paid for the period. You may use this information to compare this 5% hypothetical example with the 5% hypothetical examples that appear in the shareholder reports of other funds.
Please note that the expenses shown in the table are meant to highlight your ongoing costs only and do not reflect the costs incurred by the Funds for buying and selling securities. The Funds do not charge transaction fees, such as redemption fees, nor do the Funds charge a sales charge (load). Therefore, the table is useful in comparing ongoing costs only, and will not help you determine the relative total costs of owning different funds.
| | | | | | | | | | | | | | | Annualized |
| | | | | | | | | | | Expenses Paid | | Expense Ratio |
| | | Beginning Account Value | | Ending Account Value | | During Period1 | | During Period |
| | | 10/1/12 | | 3/31/13 | | 10/1/12 - 3/31/13 | | 10/1/12 - 3/31/13 |
| |
| Asset Management Fund | | $ | 1,000.00 | | | $ | 1,020.19 | | | $ | 4.84 | | | | 0.96 | % |
| Equity Fund | | | 1,000.00 | | | | 1,019.95 | | | | 5.04 | | | | 1.00 | % |
| Midcap Fund | | | 1,000.00 | | | | 1,019.95 | | | | 5.04 | | | | 1.00 | % |
| SMID Cap Fund | | | 1,000.00 | | | | 1,019.95 | | | | 5.04 | | | | 1.00 | % |
| Small Cap Fund | | | 1,000.00 | | | | 1,019.95 | | | | 5.04 | | | | 1.00 | % |
| |
| Walden Asset Management Fund | | | 1,000.00 | | | | 1,019.95 | | | | 5.04 | | | | 1.00 | % |
| Walden Equity Fund | | | 1,000.00 | | | | 1,019.95 | | | | 5.04 | | | | 1.00 | % |
| Walden Midcap Fund | | | 1,000.00 | | | | 1,019.95 | | | | 5.04 | | | | 1.00 | % |
| Walden SMID Cap Fund | | | 1,000.00 | | | | 1,019.95 | | | | 5.04 | | | | 1.00 | % |
| Walden Small Cap Fund | | | 1,000.00 | | | | 1,019.95 | | | | 5.04 | | | | 1.00 | % |
| |
| 1 | | Expenses are equal to the average account value times a Fund’s annualized expense ratio, multiplied by the number of days in the most recent fiscal half-year, divided by the number of days in the fiscal year. |
| Supplementary Information (Unaudited) | |
March 31, 2013 |
| | | |
Tabular Summary of Schedules of Portfolio Investments:
The Boston Trust Funds invested, as a percentage of total net assets, in the following industries as of March 31, 2013.
| Boston Trust Asset Management Fund | | | | |
| | | Percentage of Total |
| Security Allocation for the Schedule of Portfolio Investments | | Net Assets |
| |
| Industrials | | | 14.4 | % |
| Financials | | | 14.3 | % |
| U.S. Government & U.S. Government Agency Obligations | | | 13.8 | % |
| Information Technology | | | 13.2 | % |
| Energy | | | 9.3 | % |
| Consumer Staples | | | 9.0 | % |
| Consumer Discretionary | | | 8.2 | % |
| Health Care | | | 6.8 | % |
| Investment Companies | | | 5.4 | % |
| Materials | | | 3.1 | % |
| Municipal Bonds | | | 2.4 | % |
| Telecommunication Services | | | 0.2 | % |
| Liabilities in excess of other assets | | | -0.1 | % |
| |
| Total | | | 100.0 | % |
| |
| Boston Trust Equity Fund | | | | |
| | | Percentage of Total |
| Security Allocation for the Schedule of Portfolio Investments | | Net Assets |
| |
| Industrials | | | 18.6 | % |
| Information Technology | | | 16.8 | % |
| Financials | | | 15.3 | % |
| Consumer Staples | | | 12.0 | % |
| Energy | | | 11.4 | % |
| Consumer Discretionary | | | 11.2 | % |
| Health Care | | | 9.1 | % |
| Materials | | | 4.4 | % |
| Investment Companies | | | 1.8 | % |
| Liabilities in excess of other assets | | | -0.6 | % |
| |
| Total | | | 100.0 | % |
| |
| Boston Trust Midcap Fund | | | | |
| | | Percentage of Total |
| Security Allocation for the Schedule of Portfolio Investments | | Net Assets |
| |
| Financials | | | 17.5 | % |
| Industrials | | | 15.8 | % |
| Information Technology | | | 14.9 | % |
| Consumer Discretionary | | | 14.1 | % |
| Health Care | | | 11.4 | % |
| Energy | | | 8.8 | % |
| Consumer Staples | | | 6.9 | % |
| Materials | | | 4.9 | % |
| Utilities | | | 3.8 | % |
| Investment Companies | | | 2.0 | % |
| Liabilities in excess of other assets | | | -0.1 | % |
| |
| Total | | | 100.0 | % |
| |
| Boston Trust SMID Cap Fund | | | | |
| | | Percentage of Total |
| Security Allocation for the Schedule of Portfolio Investments | | Net Assets |
| |
| Financials | | | 22.9 | % |
| Industrials | | | 16.4 | % |
| Information Technology | | | 14.2 | % |
| Consumer Discretionary | | | 13.8 | % |
| Health Care | | | 11.2 | % |
| Materials | | | 6.6 | % |
| Energy | | | 6.4 | % |
| Utilities | | | 5.0 | % |
| Consumer Staples | | | 2.4 | % |
| Investment Companies | | | 1.2 | % |
| Liabilities in excess of other assets | | | -0.1 | % |
| |
| Total | | | 100.0 | % |
| |
| Boston Trust Small Cap Fund | | | | |
| | | Percentage of Total |
| Security Allocation for the Schedule of Portfolio Investments | | Net Assets |
| |
| Financials | | | 21.3 | % |
| Information Technology | | | 17.9 | % |
| Industrials | | | 16.1 | % |
| Health Care | | | 13.4 | % |
| Consumer Discretionary | | | 12.9 | % |
| Energy | | | 6.7 | % |
| Materials | | | 5.0 | % |
| Utilities | | | 3.2 | % |
| Consumer Staples | | | 3.0 | % |
| Investment Companies | | | 0.6 | % |
| Liabilities in excess of other assets | | | -0.1 | % |
| |
| Total | | | 100.0 | % |
| |
| Supplementary Information (Unaudited) | |
March 31, 2013 |
| | | |
The Walden Funds invested, as a percentage of total net assets, in the following industries as of March 31, 2013.
| Walden Asset Management Fund | | | | |
| | | Percentage of Total |
| Security Allocation for the Schedule of Portfolio Investments | | Net Assets |
| |
| U.S. Government & U.S. Government Agency Obligations | | | 16.8 | % |
| Information Technology | | | 13.7 | % |
| Financials | | | 13.4 | % |
| Industrials | | | 11.4 | % |
| Consumer Staples | | | 10.5 | % |
| Health Care | | | 9.3 | % |
| Consumer Discretionary | | | 8.4 | % |
| Energy | | | 7.8 | % |
| Investment Companies | | | 4.0 | % |
| Materials | | | 3.3 | % |
| Municipal Bonds | | | 1.1 | % |
| Telecommunication Services | | | 0.2 | % |
| Other assets in excess of liabilities | | | 0.1 | % |
| |
| Total | | | 100.0 | % |
| |
| Walden Equity Fund | | | | |
| | | Percentage of Total |
| Security Allocation for the Schedule of Portfolio Investments | | Net Assets |
| |
| Information Technology | | | 17.9 | % |
| Industrials | | | 15.2 | % |
| Financials | | | 14.4 | % |
| Consumer Staples | | | 13.2 | % |
| Health Care | | | 12.7 | % |
| Consumer Discretionary | | | 10.8 | % |
| Energy | | | 10.2 | % |
| Materials | | | 4.3 | % |
| Investment Companies | | | 1.2 | % |
| Other assets in excess of liabilities | | | 0.1 | % |
| |
| Total | | | 100.0 | % |
| |
| Walden Midcap Fund | | | | |
| | | Percentage of Total |
| Security Allocation for the Schedule of Portfolio Investments | | Net Assets |
| |
| Financials | | | 17.3 | % |
| Industrials | | | 15.8 | % |
| Information Technology | | | 14.9 | % |
| Consumer Discretionary | | | 14.1 | % |
| Health Care | | | 11.2 | % |
| Energy | | | 8.3 | % |
| Consumer Staples | | | 7.1 | % |
| Materials | | | 4.7 | % |
| Utilities | | | 3.9 | % |
| Investment Companies | | | 3.2 | % |
| Liabilities in excess of other assets | | | -0.5 | % |
| |
| Total | | | 100.0 | % |
| |
| Walden SMID Cap Fund | | | | |
| | | Percentage of Total |
| Security Allocation for the Schedule of Portfolio Investments | | Net Assets |
| |
| Financials | | | 22.5 | % |
| Industrials | | | 15.9 | % |
| Information Technology | | | 13.8 | % |
| Consumer Discretionary | | | 13.1 | % |
| Health Care | | | 10.6 | % |
| Materials | | | 6.4 | % |
| Energy | | | 6.0 | % |
| Utilities | | | 4.7 | % |
| Consumer Staples | | | 2.7 | % |
| Investment Companies | | | 2.6 | % |
| Other assets in excess of liabilities | | | 1.7 | % |
| |
| Total | | | 100.0 | % |
| |
| Walden Small Cap Fund | | | | |
| | | Percentage of Total |
| Security Allocation for the Schedule of Portfolio Investments | | Net Assets |
| |
| Financials | | | 21.0 | % |
| Information Technology | | | 17.8 | % |
| Industrials | | | 15.7 | % |
| Health Care | | | 13.4 | % |
| Consumer Discretionary | | | 12.3 | % |
| Energy | | | 6.8 | % |
| Materials | | | 4.9 | % |
| Utilities | | | 3.3 | % |
| Consumer Staples | | | 2.9 | % |
| Investment Companies | | | 1.9 | % |
| Liabilities in excess of other assets | | | 0.0 | % |
| |
| Total | | | 100.0 | % |
| |
Other Information:
A description of the policies and procedures that the Funds use to determine how to vote proxies related to portfolio securities is available (i) without charge, upon request, by calling 1-800-282-8782 ext. 7050, and (ii) on the Securities and Exchange Commission’s (the “Commission”) website at http://www.sec.gov.
Information regarding how the Funds voted proxies relating to portfolio securities during the most recent 12-month period ended June 30 is available (i) without charge, upon request, by calling 1-800-282-8782 ext. 7050, (ii) on the Boston Trust & Investment Management, Inc. website at http://www.btim.com; and (iii) on the Commission’s website at http://www.sec.gov.
The Funds file complete schedules of portfolio holdings for each Fund with the Commission for the first and third quarters of each fiscal year on Form N-Q. The Funds’ Form N-Q is available on the Commission’s website at http://www.sec.gov. The Funds’ Form N-Q may be reviewed and copied at the Commission’s Public Reference Room in Washington, D.C. and information on the operation of the Public Reference Room may be obtained by calling 1-800-SEC-0330.
| Supplementary Information (Unaudited) | |
March 31, 2013 |
| | | |
The annual consideration by the Board of Trustees (the “Board”) of the continuation of the investment advisory agreement between Boston Trust Investment Management, Inc., (the “Adviser”) and Boston Trust Asset Management Fund, Boston Trust Equity Fund, Boston Trust Midcap Fund, Boston Trust SMID Cap Fund, Boston Trust Small Cap Fund, Walden Asset Management Fund, Walden Equity Fund, Walden Midcap Fund, Walden SMID Cap Innovations Fund and Walden Small Cap Innovations Fund (the “Funds”).
Section 15 of the Investment Company Act of 1940 (the “1940 Act”) requires that the Investment Advisory Agreement with the Boston Trust Investment Management, Inc. (the “Adviser”) be renewed annually by the Board, including a majority of the Board of Trustees of The Boston Trust & Walden Funds (the “Trust”) who are not “interested persons” of the Trust or of the Adviser (“Independent Trustees”). It is the duty of the Board to request as much information as is reasonably necessary to evaluate the terms of the Investment Advisory Agreement and determine whether its continuance is fair to the Funds and their shareholders. The Board considered the continuation of the Investment Advisory Agreement at an in-person meeting held on March 1, 2013. The Board requested, and the Adviser provided, information and data relating to: (i) the investment performance of each series of the Trust (the “Funds”) and the Adviser; (ii) the nature, extent and quality of the services provided by the Adviser to the Funds; (iii) the cost of the services to be provided and the profits to be realized by the Adviser and its affiliates from the relationship with the Funds; (iv) the extent to which economies of scale will be realized as the Funds grow; (v) whether the fee levels refleect these economies of scale to the benefit of Funds’ shareholders; (vi) the advisory fees paid by other comparable funds advised by the Adviser or by a different investment adviser; (vii) the Funds’ expense ratios and the expense ratios of similar funds; and (viii) the effect of any fee waivers and expense reimbursements made by the Adviser.
At the meeting on March 1, 2013, the Board engaged in a thorough review process to determine whether to continue the Investment Advisory Agreement. The Board met directly with representatives of the Adviser and reviewed the information and data listed above, as supplemented by Citi Fund Services Ohio, Inc., the Trust’s administrator. As part of its deliberations, the Board also considered and relied upon the information about the Funds and the Adviser that it had received throughout the year as part of its ongoing oversight of the Funds and their operations. The Board reviewed the performance of the Boston Trust Funds and the Walden Funds from inception through December 31, 2012, comparing the performance to various indices and also, in the case of the Boston Trust Asset Management Fund and the Walden Asset Management Fund, to a bond index, equity index and Treasury bills. The Board noted that as of December 31, 2012, all of the Funds except the Boston Trust SMID Cap Fund underperformed their respective indices for the one-year period, but each outperformed its benchmark index for the five-year period and all but the Boston Trust SMID Cap Fund, the Walden Midcap Fund and the Walden SMID Cap Innovations Fund, which are very new Funds with little operating history, outperformed its benchmark index for the since inception period. While the Boston Trust Asset Management Fund and the Walden Asset Management Fund outperformed the S&P 500 Index and the 90 Day US Treasury Bills for the five-year period, it underperformed the Barclays Capital G/C Bond Index for that time period.
The Board then turned to a review of the range of advisory fees paid by the Boston Trust Funds and Walden Funds to BTIM and the total operating expenses of each Fund. The Board noted that, with the exception of the Boston Trust Asset Management Fund, Walden Asset Management Fund, Boston Trust Equity and the Walden Equity Fund, each Boston Trust Fund and Walden Fund had a contractual advisory fee that was at or below the peer group average. The contractual advisory fees for the Boston Trust Asset Management Fund and the Walden Asset Management Fund were equal to the median fees for the peer group and only 0.04% above the average for the peer group and well the below the peer group’s highest fee of 1.00%. The contractual advisory fees for the Boston Equity Fund and the Walden Equity Fund were only 0.04% above the average for the peer group and well the below the peer group’s highest fee of 1.00%.
The Board noted that BTIM has been operating under an Expense Limitation Agreement that requires BTIM to waive fees and/or reimburse expenses to the extent total operation expenses of all any Fund exceeds 1.00%. The actual advisory fees charged by all the Boston Trust and Walden Funds, except Boston Trust Asset Management Fund, Walden Asset Management Fund, Boston Trust Equity and the Walden Equity Fund, are below the peer group average after expense waivers and/or reimbursements. Actual advisory fees for the Walden Equity Fund were 0.02% above the average for the peer group, while the actual advisory fees for the Boston Trust Equity Fund were 0.15% above the peer group and well below the peer group’s highest fee of 1.00%. The actual advisory fees for the Walden Asset Management Fund were 0.04% above the average for the peer group, while the actual advisory fees for the Boston Trust Asset Management Fund were 0.13% above the average for the peer group. The actual advisory fees for both Funds were well below the peer group’s highest fee of 1.00%. The Board noted that BTIM would conduct a breakpoint analysis and consider advisory fee breakpoints in the future.
Turning to total operating expenses, the Board noted that the expense ratios for all the Boston Trust Funds and Walden Funds, other than the Boston Trust Equity and the Walden Equity Fund, are lower than the industry average after expense waivers and/or reimbursements. The expense ratios for the Boston Trust Equity and the Walden Equity Fund are 0.01% above the peer group and equal to the median for the peer group. After considering the comparative data as described above, and the proposed renewal of the Expense Limitation Agreement, the Board concluded that the advisory fees and expense ratios were reasonable.
| Supplementary Information (Unaudited) | |
March 31, 2013 |
| | | |
The Board then gave careful consideration to the nature, extent and quality of the services provided by BTIM. The Trustees reviewed the organizational structure of BTIM and Boston Trust, BTIM’s investment philosophy, its portfolio construction process, its fixed income approach and its brokerage policies. The Board reviewed the adviser’s experience and the capabilities of its personnel, as well as the quality of the reports and other materials received from BTIM. Taking into account the personnel involved in servicing the Funds, as well as the materials and services described above, the Board expressed satisfaction with the quality of the services received from BTIM.
Next, in reviewing the costs of the services to be provided and the profits to be realized by BTIM, the Board reviewed the adviser’s audited balance sheets for calendar years 2011 and 2012 and the gross and net profit margins realized on each Fund. The Board noted that the adviser’s relationship with the Funds was profitable even though BTIM was operating under an Expense Limitation Agreement with the Trust. The Board discussed the custody and transfer agency fees earned by Boston Trust for services provided to the Funds, which are reduced by amounts paid for sub-custody services.
In reaching its conclusions with respect to the continuation of the Investment Advisory Agreement, the Board did not identify any single controlling factor. Rather, the Board noted that a combination of factors influenced their decision making process. The Board did, however, identify the commitment of the Adviser to the successful operation of the Funds and the level of Fund expenses as being important elements of their consideration. The Board took notice of the fact that the Adviser has maintained an Expense Limitation Agreement with respect to each of the Funds since the inception of each Fund pursuant to which total operating expenses for each of the Funds is limited, which the Board noted benefits shareholders in each of the Funds. The Board took further notice of the fact that the Adviser has agreed to continue the Expense Limitation Agreement for each of the Funds. Based upon their review and consideration of these factors and other matters deemed relevant by the Board in reaching an informed business judgment, a majority of the Board, including a majority of the Independent Trustees, concluded that the terms of the Investment Advisory Agreement are fair and reasonable and the Board voted to renew the Investment Advisory Agreement for an additional one-year period.
| Information about Trustees and Officers (Unaudited) | |
March 31, 2013 |
| | | |
Overall responsibility for management of the Funds rests with the Board of Trustees. The names of the Trustees and Officers of the Funds, their addresses, ages and principal occupations during the past five years are provided in the tables below. The business address of the persons listed below is 3435 Stelzer Road, Columbus, Ohio 43219-3035, unless otherwise listed. Trustees who are deemed “interested persons,” as defined in the Investment Company Act of 1940, are referred to as Interested Trustees. Trustees who are not interested persons are referred to as Independent Trustees. The Funds do not have any Interested Trustees. The Funds’ Statement of Additional Information includes additional information about the Funds’ Trustees and is available, without charge and upon request, by calling 1-800-282-8782 or by visiting www.btim.com.
| |
| | | | | | | | | Number of Funds | | Other Directorships |
| | | Positions(s) | | Term of Office* | | | | in Fund Complex | | Held by Trustee |
| | | Held with | | and Length of | | Principal Occupation(s) | | Overseen by | | during the past |
| Name, Date of Birth | | the Funds | | Time Served | | During Past Five Years | | Trustee | | five years |
| |
| INTERESTED TRUSTEES | | | | | | |
| |
Lucia B. Santini
One Beacon Street,
33rd Floor
Boston, MA 02108
Date of Birth: 10/2/1958 | | Trustee and
President | | Since 2011 | | Managing Director, Boston Trust Investment Management, Inc., February, 2001 to present; Senior Vice President and Senior Portfolio Manager, Boston Trust & Investment Management Company (bank trust company), November 1993 to present. | | 10 | | None |
| |
| INDEPENDENT TRUSTEES | | | | | | |
| |
Michael M. Van Buskirk
Date of Birth: 2/22/1947 | | Trustee and
Chairman of the
Board | | Since 1992 | | President and Chief Executive Officer, Ohio Bankers League, May 1991 to present. | | 10 | | The Coventry Funds Trust; Advisers Investment Trust |
| |
Diane E. Armstrong
Date of Birth: 7/2/1964 | | Trustee | | Since 2004 | | President, Armstrong Financial Services (financial planning firm), November 2012 to present; Managing Director of Financial Planning Services, WealthStone (financial planning firm), July 2008 to present. Principal of King, Dodson Armstrong Financial Advisors, Inc., August 2003 to July 2008. Director of Financial Planning, Hamilton Capital Management, April 2000 to August 2003. | | 10 | | The Coventry Funds Trust |
| |
Dr. James H. Woodward
Date of Birth: 11/24/1939 | | Trustee | | Since 2006 | | Chancellor Emeritus, University of North Carolina at Charlotte, August 2005 to present. Chancellor, North Carolina State University, June 2009 to April 2010. Chancellor, University of North Carolina at Charlotte, July 1989 to July 2005. | | 10 | | The Coventry Funds Trust |
| |
| OFFICERS WHO ARE NOT TRUSTEES |
| |
Jennifer Ellis
One Beacon Street,
33rd Floor
Boston, MA 02108
Date of Birth: 7/29/1972 | | Treasurer | | Since 2011 | | Chief Financial Officer/Treasurer, Boston Trust & Investment Management Company, May 2011 to present; Finance Director, Bain Capital, June 2008 to May 2010; Vice-President of Finance, Vesbridge Partners, June 2004 to June 2008. | | | | |
| | | | | | | | | | | |
Curtis Barnes
100 Summer Street
Boston, MA 02110
Date of Birth: 9/24/1953 | | Secretary | | Since 2007 | | Senior Vice President-Regulatory Administration Citi Fund Services Ohio, Inc. (fund administrator), May 1995 to present. | | | | |
| | | | | | | | | | | |
Eric B. Phipps **
Date of Birth: 6/20/1971 | | Chief Compliance
Officer | | Since 2006 | | Vice President, Citi Fund Services Ohio, Inc. (fund administrator), June 2006 to present. Staff Accountant, United States Securities and Exchange Commission, October 2004 to May 2006. | | | | |
| |
| * | | Trustees hold their position with the Funds until their resignation or removal. Officers hold their positions with the Funds until a successor has been duly elected and qualified. |
| ** | | Mr. Phipps serves as Chief Compliance Officer. His compensation is reviewed and approved by the Board of Trustees and paid by Citi pursuant to a Compliance Services Agreement between Citi and the Trust. The fee paid pursuant to the Compliance Services Agreement by the Fund is not indicative of the total compensation received by Mr. Phipps. |
79
This page intentionally left blank.
80
This page intentionally left blank.
81
| | | |
| | | |
| | | Investment Adviser |
| | | Boston Trust Investment Management, Inc. |
| | | One Beacon Street |
| | | Boston, MA 02108 |
| | | |
| | | |
| | | Custodian and Transfer Agent |
| | | Boston Trust & Investment Management Company |
| | | One Beacon Street |
| | | Boston, MA 02108 |
| | | |
| | | |
| | | Administrator |
| | | Citi Fund Services Ohio, Inc. |
| | | 3435 Stelzer Road |
| | | Columbus, OH 43219 |
| | | |
| | | |
| | | Distributor |
| | | BHIL Distributors, Inc. |
| | | 4041 N. High Street, Suite 402 |
| | | Columbus, OH 43214 |
| | | |
| | | |
| | | Independent Registered Public Accounting Firm |
| | | Cohen Fund Audit Services, Ltd. |
| | | 1350 Euclid Avenue, Suite 800 |
| | | Cleveland, OH 44145 |
| | | |
| | | Legal Counsel |
| | | Thompson Hine LLP |
| | | 41 South High Street, Suite 1700 |
| | | Columbus, OH 43215 |
| | | |
| | | |
| | | |
| | | |
| | | |
| | | |
| | | |
| | | This report is intended for the shareholders of the Funds and may not be used as sales literature unless preceded or accompanied by a current prospectus. |
| | | |
| | | |
| | | Past performance results shown should not be considered a representation of future performance. Share price and returns will fluctuate so that shares, when redeemed, may be worth more or less than their original cost. Statements and other information herein are dated and subject to change. |
| | | |
| | | |
| | | |
| | | |
| | | |
| | | |
| | | 05/13 |
| | | |
| | | |
Item 2. Code of Ethics.
| | (a) The registrant has adopted a code of ethics that applies to the registrant’s principal executive officer, principal financial officer, principal accounting officer or controller, or persons performing similar functions. This code of ethics is included as an Exhibit. |
| | |
| | (b) During the period covered by the report, with respect to the registrant’s code of ethics that applies to its principal executive officer, principal financial officer, principal accounting officer or controller, or persons performing similar functions; there have been no amendments to, nor any waivers granted from, a provision that relates to any element of the code of ethics definition enumerated in paragraph (b) of this Item 2. |
Item 3. Audit Committee Financial Expert.
3(a)(1) The registrant’s board of directors has determined that the registrant has at least one audit committee financial expert serving on its audit committee.
3(a)(2) The audit committee financial expert is Diane Armstrong, who is “independent” for purposes of this Item 3 of Form N-CSR.
Item 4. Principal Accountant Fees and Services.
| | | | | | | | | |
| | | | | 2013 | | 2012 |
| (a) | | Audit Fees | | $ | 87,750 | | $ | 87,750 |
| | | | | | | | | |
| | | | | | | | | |
| (b) | | Audit-Related Fees | | $ | 13,500 | | $ | 12,000 |
The fees for 2011 relate to the consent issuance in three Form 17f-2 filings filed with the Securities and Exchange Commission (“SEC”).
The fees for 2012 relate to the consent issuance in three Form 17f-2 filings filed with the SEC.
| | | | | 2013 | | 2011 |
| (c) | | Tax Fees | | $ | 22,500 | | $ | 22,500 |
Tax fees for both years related to the preparation of the Funds’ federal and state income tax returns, federal excise tax return review and review of capital gain and income distribution calculations.
| (d) | | 2013 | | 2011 |
| All Other Fees | | $ | 0 | | $ | 0 |
Item 5. Audit Committee of Listed Registrants.
Not applicable.
Item 6. Investments.
(a) Included as part of the report to shareholders filed under Item 1.
(b) Not applicable.
Item 7. Disclosure of Proxy Voting Policies and Procedures for Closed-End Management Investment Companies.
Not applicable.
Item 8. Portfolio Managers of Closed-End Management Investment Companies.
Not applicable.
Item 9. Purchases of Equity Securities by Closed-End Management Investment Company and Affiliated Purchasers.
Not applicable.
Item 10. Submission of Matters to a Vote of Security Holders.
Not applicable.
Item 11. Controls and Procedures.
(a) The registrant’s principal executive officer and principal financial officer have concluded, based on their evaluation of the registrant’s disclosure controls and procedures as conducted within 90 days of the filing date of this report, that these disclosure controls and procedures are adequately designed and are operating effectively to ensure that information required to be disclosed by the registrant on Form N-CSR is recorded, processed, summarized and reported within the time periods specified in the Securities and Exchange Commission’s rules and forms.
(b) There were no changes in the registrant’s internal control over financial reporting (as defined in Rule 30a-3(d) under the Act (17 CFR 270.30a-3(d)) that occurred during the second fiscal quarter of the period covered by this report that have materially affected or are reasonably likely to materially affect, the registrant’s internal control over financial reporting.
Item 12. Exhibits.
(a)(1) The code of ethics that is the subject of the disclosure required by Item 2 is attached hereto.
(a)(2) Certifications pursuant to Rule 30a-2(a) are attached hereto.
(a)(3) Not applicable.
(b) Certifications pursuant to Rule 30a-2(b) are furnished herewith.
SIGNATURES
Pursuant to the requirements of the Securities Exchange Act of 1934 and the Investment Company Act of 1940, the registrant has duly caused this report to be signed on its behalf by the undersigned, thereunto duly authorized.
| (Registrant) | The Boston Trust & Walden Funds |
| By (Signature and Title)* | /s/ Lucia Santini, President |
Pursuant to the requirements of the Securities Exchange Act of 1934 and the Investment Company Act of 1940, this report has been signed below by the following persons on behalf of the registrant and in the capacities and on the dates indicated.
| By (Signature and Title)* | /s/ Lucia Santini, President |
| By (Signature and Title)* | /s/ Jennifer Ellis, Treasurer |
| | |