UNITED STATES
SECURITIES AND EXCHANGE COMMISSION
Washington, D.C. 20549
FORM N-CSR
CERTIFIED SHAREHOLDER REPORT OF REGISTERED
MANAGEMENT INVESTMENT COMPANIES
| Investment Company Act file number | 811-06526 | | |
| | | The Coventry Group | | |
| | | | (Exact name of registrant as specified in charter) | | |
| | | | | | |
| 3435 Stelzer Rd. | | Columbus, OH | | 43219 |
| | | | (Address of principal executive offices) | | (Zip code) |
| | | | | | |
| 3435 Stelzer Rd. | | Columbus, OH | | 43219 |
| | | | (Name and address of agent for service) | | |
| Registrant’s telephone number, including area code: | 1-800-282-8782 | | |
| | | | | | |
| Date of fiscal year end: | | March 31 | | |
| | | | | | |
| Date of reporting period: | | March 31, 2011 | | |
Item 1. Reports to Stockholders.

Annual Report
March 31, 2011
Boston Trust Investment Management, Inc., a subsidiary of Boston Trust & Investment Management Company (BTIM) and an affiliate of Walden Asset Management (Walden) serves as investment adviser (the Adviser) to the Boston Trust and Walden Funds and receives a fee for its services. Walden, a division of BTIM, performs shareholder advocacy, proxy voting, screening services, and other environmental, social and governance initiatives for the Adviser and is paid a fee for these services by the Adviser.
Shares of the Funds are not deposits of, obligations of, or guaranteed by Boston Trust & Investment Management Company or its affiliates, nor are they federally insured by the FDIC. Investments in the Funds involve investment risks, including the possible loss of principal. Funds are distributed by Foreside Distribution Services, L.P., Portland, ME.
The foregoing information and opinions are for general information only. Boston Trust Funds and Boston Trust Investment Management, Inc. do not assume liability for any loss, which may result from the reliance by any person upon any such information or opinions. Such information and opinions are subject to change without notice, are for general information only, and are not intended as an offer or solicitation with respect to the purchase or sale of any security or offering individual or personalized investment advice.
The recent appreciation in the stock market has helped to produce short-term returns that are not typical and may not continue in the future. Because of ongoing market volatility, fund performance may be subject to substantial short-term changes.

| Photography credits: |
| • | Cover: Bruce Field |
| • | Pages 1 and 7: Jim Gallagher |
| • | Pages 5 and 33: Rebecca Monette |
| • | Pages 9 and 31: Janet C. Dygert |
1
This page intentionally left blank.
2
Economic and Market
Summary (Unaudited) |  |
Domenic Colasacco, CFA
Portfolio Manager and President
Boston Trust Investment Management, Inc.
Stock prices, over longer time-periods, reflect economic conditions generally and trends in corporate profits in particular. Shorter-term price movements, however, are driven most often by the perceived impact that political and business related events will have on longer-term economic health. Through the first few months of 2011, investors had to assess a series of political revolutions in the Middle East and the devastating earthquake in Japan. Neither of these has yet to be fully resolved. In the Middle East, revolutions could spread and threaten additional key oil producing regions; while in Japan the full extent of radiation damage—particularly its impact on the world’s third largest economy—remains subject to conflicting reports and opinions.
Initially, investors reacted negatively to both news reports, depressing equity markets around the globe. In the United States, the S&P 500 Index1 fell by roughly 7% during the latter weeks of February and the first part of March. By quarter end, though, nearly all of the price declines had been recouped. Indeed, the S&P 500 ended the first quarter of 2011 roughly 15% above levels of a year ago and about 30% higher than the market lows reached last summer. At least for the moment, investors have concluded that neither the turmoil in the Middle East nor the catastrophe in Japan is likely to pose a meaningful threat to the gradual, yet widespread, business recovery that is underway in most developed and emerging economies. Yet, for prices to continue upward, we believe it is imperative that key economic metrics such as employment, total income, capital spending and corporate profits continue to improve.
Our Economic Outlook
We expect 2011 to be another year of modest growth in Gross Domestic Product2, with comparatively low reported inflation and further gains in corporate profits. Stock prices tend to rise in such an environment far more often than not. While most of the headline news in recent months was ominous, nearly all of the key economic reports have been at the better end of expectations, in particular the key employment statistics. Our economy added roughly 600,000 new private sector jobs in the first quarter of 2011, the best period since the financial crisis began. Recent gains were sufficient to bring the unemployment rate below 9% for the first time in nearly two years.
Paradoxically, despite all the political rhetoric, the divergent views of Democrats and Republicans led to a more stimulative budget for this fiscal year than we were likely to receive exclusively from either side. Democrats held firm for more spending, while Republicans demanded lower taxes. The creative, breakthrough compromise for the fiscal 2011 budget was to do both.
Lower taxes with more government spending, however, is not a sustainable option. At some point, our trade and budget deficits need to be reduced, as must those in other developed economies. In managing the Fund, we will seek to balance such longer-term domestic and global economic challenges with what still currently remains an equity friendly investment environment.
|
| 1 | The Standard & Poor’s 500 Index (“S&P 500”), an unmanaged index that is widely regarded as a gauge of the U.S. equities market.This index includes 500 leading companies in leading industries of the U.S. economy. Although the S&P 500 focuses on the large cap segment of the market, with approximately 75% coverage of U.S. equities, it is also an ideal proxy for the total market. |
| | |
| 2 | The Gross Domestic Product (“GDP”) is the measure of the market value of the goods and services produced by labor and property in the United States. |
3
| |
Boston Trust Balanced Fund
Boston Trust Equity Fund | |
| | March 31, 2011 | |
| |
Domenic Colasacco, CFA | |
| | Portfolio Manager and President Boston Trust Investment Management, Inc. | |
| |
Balanced Fund Objective | |
| | The Fund seeks long-term capital growth and income through an actively managed portfolio of stocks, bonds and money market instruments. | |
| |
Equity Fund Objective | |
| | The Fund seeks long-term capital growth through an actively managed portfolio of stocks. | |
| |
Investment Concerns | |
| | Equity securities (stocks) are more volatile and carry more risk and return potential than other forms of investments, including investments in high-grade fixed income securities.
Bonds offer a relatively stable level of income, although bond prices will fluctuate, providing the potential for principal gain or loss. Intermediate-term, higher quality bonds generally offer less risk than longer-term bonds and a lower rate of return.
Cash equivalents offer low risk and low return potential. | |
| | | |
| | | |
Manager Commentary (Unaudited)
Management Discussion of Fund Performance
Portfolio Review
The Boston Trust Balanced Fund was well positioned to participate in the favorable stock market trend over the past twelve months. Our constructive views about the sustainability of the current economic recovery—despite the frequent ominous headlines—led us to retain the Fund’s equity allocation near 70% for most of the past year. While the Fund’s performance benefited from the above average equity exposure (the usual range is 45% to 75%), the Fund’s performance modestly trailed its Morningstar peer group average for the 12-month period. We are pleased that during this period of sharply rising markets the Fund’s emphasis on high quality, lower risk equity investments did not significantly constrain results. In contrast, the Fund’s bond segment performance fell short of the Barclays Capital U.S. Government/Credit Bond Index as longer maturity, and lower credit quality issues led the market higher. Given today’s low starting yields, we believe total returns for the fixed income segment in the year ahead are likely to be modest, and that the risks of extending maturities or increasing credit risk are substantial. We therefore have focused our efforts to achieve attractive total returns on the equity segment. As outlined on the performance chart on page 5, however, the Fund’s long term results remain attractive.
The Boston Trust Equity Fund returned 15.48% for 12-month period ended March 31, 2011 compared to the 15.65% for the S&P 500 Index. The very modest underperformance of the Fund resulted from the comparison to an unmanaged benchmark that reflects no deduction for fees and expenses; the Funds’ expense ratio is 1%. We are pleased to report strong, absolute returns during a period when more volatile, riskier stocks such as those of commodities and energy companies were in favor. As is the case with the Balanced Fund, performance is above average for longer term periods that include a complete market and economic cycle.
Our Investment Strategy
In our view, stocks remain fairly priced by past standards, and are attractive compared to the low yields available in both money market instruments and bonds. Unless there is a significant change in the economic trend or a sharp rise in prices, we expect to keep the Balanced Fund’s equity exposure at the upper end of the range in the months ahead. We believe equity values will continue to be supported by a combination of the ample corporate cash flow and the continued profit growth we anticipate for the remainder of 2011 and into 2012.*
Within the Balanced Fund’s equity segment, and in the Boston Trust Equity Fund, we have emphasized stocks of companies that we believe will benefit comparatively from the broad global economic recovery that is underway. These include stocks in the industrial, energy, and financial industries. We also continued to emphasize stocks of higher quality companies. In our view higher quality stocks are not likely to decline as much as stocks generally if the pace of economic recovery decelerates unexpectedly. We also believe they remain attractively priced compared to equity securities of most risky, less proven companies.*
Our investment position within the fixed income segment is also unchanged; the Boston Trust Balanced Fund continues to prefer investment-grade issues with comparatively short maturities. From a total return perspective, the incremental yield available in longer-maturity or higher credit risk bonds is insufficient in our view to compensate for the potential loss in principal value if interest rates rise or credit conditions deteriorate.*
* Portfolio composition is subject to change.
4
| Investment Performance (Unaudited) | Boston Trust Balanced Fund
Boston Trust Equity Fund
March 31, 2011 |
| | | Annualized |
| | | 1 Year | | 5 Years | | 10 Years | | Since |
| | | Ended | | Ended | | Ended | | Inception |
| | | 3/31/11 | | 3/31/11 | | 3/31/11 | | 10/1/03 |
| Boston Trust Balanced Fund1 | | 11.65 | % | | 5.59 | % | | 5.78 | % | | — | |
| Boston Trust Equity Fund11 | | 15.48 | % | | 4.78 | % | | — | | | 6.44 | % |
| S&P 500 Index | | 15.65 | % | | 2.62 | % | | 3.29 | % | | 5.69 | % |
|
| Barclays Capital U.S. Government/Credit Bond Index | | 5.26 | % | | 5.83 | % | | 5.53 | % | | — | |
|
| Citigroup 90-Day U.S. Treasury Bill Index | | 0.15 | % | | 2.10 | % | | 2.12 | % | | — | |
|
| Morningstar U.S. Open-End Moderate Allocation Funds Avg. | | 11.97 | % | | 3.55 | % | | 4.36 | % | | — | |
|
Hypothetical Growth of a $10,000 Investment
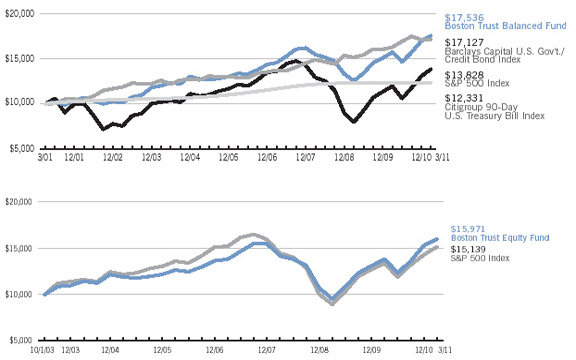
The top chart represents historical 10-year performance of a hypothetical investment of $10,000 in the Boston Trust Balanced Fund. The bottom chart represents historical performance of a hypothetical investment of $10,000 in the Boston Trust Equity Fund from October 1, 2003 to March 31, 2011. Both charts represent the reinvestment of dividends and capital gains in the Fund. The returns shown on the table and graphs do not reflect the deduction of taxes a shareholder would pay on Fund distributions or the redemption of Fund shares.
The Boston Trust Balanced Fund is measured against a combination of equity and fixed income indices. The Boston Trust Equity Fund is measured against the Standard & Poor’s 500 Index (“S&P 500”) which is widely regarded as a gauge of the U.S. equities market. This index includes 500 leading companies in leading industries of the U.S. economy. Although the S&P 500 focuses on the large cap segment of the market, with approximately 75% coverage of U.S. equities, it is also widely viewed as a proxy for the total market. The Barclays Capital U.S. Government/Credit Bond Index is a component of the Barclays U.S. Aggregate Index. The Barclays Capital U.S. Government/Credit Bond Index includes Treasuries (i.e., public obligations of the U.S. Treasury that have remaining maturities of more than one year), Government-Related issues (i.e., agency, sovereign, supranational, and local authority debt), and USD Corporates. The Citigroup 90-Day U.S. Treasury Bill Index reflects monthly return equivalents of yield averages that are not marked to the market. The Index is an average of the last three-month treasury bill issues. The three-month treasury bills are the short-term debt obligations of the U.S. Government. The Morningstar U.S. Open-End Moderate Allocation Funds Average represents performance of portfolios that seek to provide both capital appreciation and income by investing in three major areas: stocks, bonds, and cash. These portfolios tend to hold larger positions in stocks than conservative-allocation portfolios. These portfolios typically have 50% to 70% of assets in equities and the remainder in fixed income and cash. The indices are unmanaged and their performance does not reflect the deduction of expenses associated with a mutual fund, such as investment management and fund accounting fees. The Fund’s performance reflects the deduction of fees for these services. Investors cannot invest directly in an index.

Balanced Fund
| Fund Net Asset Value: | $31.56 |
| Gross Expense Ratio1: | 1.09% |
Equity Fund
| Fund Net Asset Value: | $14.46 |
| Gross Expense Ratio1: | 1.12% |
Past performance does not guarantee future results. The performance data quoted represents past performance and current returns may be lower or higher. The investment return and principal value will fluctuate so that an investor’s shares, when redeemed may be worth more or less than the original cost. To obtain performance information current to the most recent month-end, please call 1-800-282-8782 ext. 7050.
| 1 | The Gross Expense Ratio is from the Fund’s most recent prospectus, dated August 1, 2010. The Gross Expense Ratio excludes the impact of any voluntary or contractual fee waivers. After giving effect to such fee waivers, the Balanced Fund’s Net Expense Ratio would be 1.01%, and the Equity Fund’s Net Expense Ratio would be 1.00%, including the indirect expenses of investing in acquired funds. Please see the Fund’s most recent prospectus for details. Additional information pertaining to the Fund’s expense ratio as of March 31, 2011 can be found in the financial highlights. The investment performance reflects voluntary and contractual fee waivers. If such fee reductions had not occurred, the quoted performance would have been lower. The voluntary fee waivers may be discontinued at any time. The contractual fee waiver continues through August 1, 2012 and may be terminated thereafter. |
5
| |
Boston Trust Midcap Fund | |
| | March 31, 2011 | |
| |
Stephen J. Amyouny, CFA | |
| | Portfolio Manager Boston Trust Investment Management, Inc. | |
| |
Fund Objective | |
| | The Fund seeks long-term capital growth through an actively managed portfolio of stocks of middle capitalization (“midcap”) companies. | |
| |
Investment Concerns | |
| | Equity securities (stocks) are more volatile and carry more risk and return potential than other forms investments, including investments in high-grade fixed income securities.
Mid-capitalization funds typically carry additional risks since smaller companies generally have a higher risk of failure. | |
| | | |
| | | |
Manager Commentary (Unaudited)
Management Discussion of Fund Performance
Portfolio Review
The Boston Trust Midcap Fund posted a return of 29.32% for the year ended March 31, 2011. Although performance among sectors was broad-based and generally quite good, the Fund achieved particularly strong results within its more economically-sensitive industries, such as the industrial products & services, information technology, and consumer discretionary sectors. Security selection within the information technology sector also contributed significantly to performance as several of the Fund’s larger positions within this sector appreciated sharply during this period. Additionally, energy stocks benefited from the sharp increase in oil prices. Fund holdings within the more defensive, less economically-sensitive sectors, such as utilities and telecommunications, generally performed poorly relative to the broader market.
During the most recent quarter, two distinct and visible trends proved a headwind to the Fund: 1) investors’ appetite for risk was evident by the strong performance of stocks with high betas1 (i.e. volatility); and 2) the stocks of companies with significant leverage to commodity prices, especially within the energy and materials sectors, performed very well. With the exception of the brief period in which stocks came under selling pressure—primarily related to the Libyan uprising and the Japanese tsunami—investors rewarded the riskier stocks in the market. The Fund, which contains high-quality companies that favor steady and predictable earnings, did not benefit from these trends. Partially offsetting this headwind was our sector allocation decisions, which had a modestly positive impact. Although our portfolios are well-diversified with representation across all sectors, our modest overweight in healthcare and our underweight in financials provided positive contributions.*
Portfolio Strategy:
Equities have rebounded substantially from the market bottom reached approximately two years ago, yet we believe that further gains are likely if corporate earnings and healthy free cash flows materialize as expected. Should these gains continue we believe that our high quality investment discipline is well positioned to reap these benefits. Providing some level of support to equity prices is the substantial cash balances and financial strength of our companies. Measures of balance sheet strength look remarkably robust and bode well for future capital growth, rising acquisition activity, and greater shareholder returns.*
The Fund remains well-diversified with an emphasis on multi-national companies with significant growth opportunities in developing regions of the world (e.g. technology and industrial product companies). This tilt toward economically-sensitive global industries and companies has provided positive benefits over the last 18 months; yet, we continue to assess the risk and reward potential of each Fund holding. If an external event disrupts the favorable trends that we anticipate, we believe the quality of our selections may, as in the past, provide a measure of protection.
| 1 | Beta is a means of measuring the volatility of a security or portfolio of securities in comparison with the market as a whole. A Beta of 1 indicates that the security will move with the market, greater than 1 indicates that it’s more volatile than the market, and less than 1 indicates that it’s less volatile than the market. |
| * | Portfolio composition is subject to change. |
6
| Investment Performance (Unaudited) | Boston Trust Midcap Fund
March 31, 2011 |
| | | Annualized |
| | | 1 Year | | Since |
| | | Ended | | Inception |
| | | 3/31/11 | | 9/24/07 |
| Boston Trust Midcap Fund1 | | 29.32 | % | | 6.63 | % |
| Russell Midcap® Index | | 24.27 | % | | 2.27 | % |
|
Hypothetical Growth of a $10,000 Investment
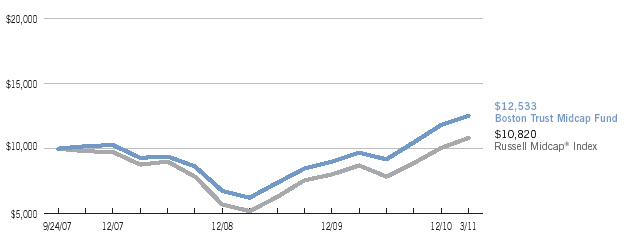
The chart represents historical performance of a hypothetical investment of $10,000 in the Boston Trust Midcap Fund from September 24, 2007 to March 31, 2011, and represents the reinvestment of dividends and capital gains in the Fund. The returns shown on the table and graph do not reflect the deduction of taxes a shareholder would pay on Fund distributions or the redemption of Fund shares.
The Boston Trust Midcap Fund is measured against the Russell Midcap® Index, which is an unmanaged index that measures the performance of the mid-cap segment of the U.S. equity universe. The Russell Midcap® Index is a subset of the Russell 1000® Index. It includes approximately 800 of the smallest securities based on a combination of their market capitalization and current index membership. The Russell Midcap® Index represents approximately 27% of the total market capitalization of the Russell 1000 companies. The performance of an index does not reflect the deduction of expenses associated with a mutual fund, such as investment management and fund accounting fees. The Fund’s performance reflects the deduction of fees for these services. Investors cannot invest directly in an index.

| Fund Net Asset Value: | $11.96 |
| Gross Expense Ratio1: | 1.33% |
Past performance does not guarantee future results. The performance data quoted represents past performance and current returns may be lower or higher. The investment return and principal value will fluctuate so that an investor’s shares, when redeemed may be worth more or less than the original cost. To obtain performance information current to the most recent month-end, please call 1-800-282-8782 ext. 7050.
| 1 | The Gross Expense Ratio is from the Fund’s most recent prospectus, dated August 1, 2010. The Gross Expense Ratio excludes the impact of any voluntary or contractual fee waivers. After giving effect to such fee waivers, the Fund’s Net Expense Ratio would be 1.01%, including the indirect expenses of investing in acquired funds. Please see the Fund’s most recent prospectus for details. Additional information pertaining to the Fund’s expense ratio as of March 31, 2011 can be found in the financial highlights. The investment performance reflects voluntary and contractual fee waivers. If such fee reductions had not occurred, the quoted performance would have been lower. The voluntary fee waivers may be discontinued at any time. The contractual fee waiver continues through August 1, 2012 and may be terminated thereafter. |
7
| |
Boston Trust Small Cap Fund | |
| | March 31, 2011 | |
| |
Kenneth P. Scott, CFA | |
| | Portfolio Manager Boston Trust Investment Management, Inc. | |
| |
Fund Objective | |
| | The Fund is to seeks long-term capital growth through an actively managed portfolio of stocks of small capitalization companies. | |
| |
Investment Concerns | |
| | Equity securities (stocks) are more volatile and carry more risk and return potential than other forms of investments, including investments in high-grade fixed income securities.
Small-capitalization funds typically carry additional risks since smaller companies generally have a higher risk of failure, and historically, their stocks have experienced a greater degree of market volatility than stocks on average. | |
| | | |
| | | |
Manager Commentary (Unaudited)
Management Discussion of Fund Performance
Portfolio Review
The Boston Trust Small Cap Fund, which focuses on higher quality, innovative companies, rose 25.78% for the year ended March 31, 2011, in-line with the robust performance of the Russell 2000® Index. For the trailing three-year, five-year, and ten-year periods ended March 31, 2011, the Fund outperformed the benchmark with less volatility.
Contributors and Detractors to Performance
Overall, the Fund participated, albeit not fully, in the strong market rise of most quarters this fiscal year, while avoiding some of the downturn last spring. This performance pattern is consistent, in our view, with the Fund’s focus on higher quality, innovative companies. Generally speaking, higher quality firms underperform in a period of sharply rising stock prices. And, by certain measures of financial quality, such as returns on capital, and the stability of profitability, it appears that higher quality small cap firms did modestly underperform the small cap market during the past year, especially during the summer months. The Fund’s higher quality profile benefited from the market’s volatility this past year, in our view, while the acquisition of four Fund holdings in late 2010 also contributed positively. As noted previously, we aim to maintain Fund sector weights comparable to those of the overall market. Thus, our sector composition generally has no significant impact on overall performance.*
The best-performing Fund holdings through the full year period were CARBO Ceramics, Inc. (CRR), which represented 3.13% of the Fund at March 31, 2011, Hain Celestial Group, Inc. (HAIN)(0.61%), Lindsay Manufacturing Co. (LNN)(1.23%), and Under Armour, Inc. (UA)(1.71%). Conversely, the Fund laggards for the full year period were eHealth, Inc. (EHTH)(0.88%), Itron, Inc. (ITRI)(0.30%), Net 1 UEPS Technologies, Inc. (UEPS)(0.46%), and NutriSystem, Inc. (NTRI)(0.32%).*
Changes in Fund Positions
We sold the entire position of 17 small-cap stocks during the year. Five firms, including Lululemon Athletica (LULU), grew over Boston Trust’s upper market cap threshold. Four firms, including Baldor Electric (BEZ), were acquired. We sold 8 firms from the Fund due to concerns about the sustainability of future profitability or deteriorating fundamentals. These included Pre-Paid Legal Services (PPD) and Timberland (TBL).*
Conversely, we established new positions in 27 higher quality, innovative small cap company stocks during the fiscal year. Examples include East West Bancorp, Inc. (EWBC) (1.58%), Hub Group, Inc. (HUBG)(0.48%), InterDigital, Inc. (IDCC)(1.06%), NIC, Inc. (EGOV)(0.64%), and OYO Geospace Corp. (OYOG)(0.49%).
Fund Manager Outlook
With a trailing Price-to-Earnings1 ratio of 39x at March 31, 2011, the valuation of the Russell 2000® implies a continued, strong recovery in small cap company earnings. The market may have an overly optimistic outlook for small cap firms overall, and a shortfall in sales and earnings may prove disappointing. However, if the economy continues to improve, and small cap stocks live up to market expectations for growth, then these stocks may continue to perform well. In either case, we continue to believe that our focus on innovative, higher quality, more reasonably valued stocks leveraged to more sustainable elements of economic growth, may continue to provide value to clients’ overall portfolios over time.
| 1 | The Price-to-Earnings Ratio (“P/E Ratio”) is a valuation ratio of a company’s current share price to its per-share earnings. A high P/E means high projected earnings in the future. |
| * | Portfolio composition is subject to change. |
8
| Investment Performance (Unaudited) | Boston Trust Small Cap Fund
March 31, 2011 |
| | | Annualized |
| | | 1 Year | | 5 Years | | 10 Years |
| | | Ended | | Ended | | Ended |
| | | 3/31/11 | | 3/31/11 | | 3/31/11 |
| Boston Trust Small Cap Fund1,* | | 25.78 | % | | 7.42 | % | | 10.43 | % |
| Russell 2000® Index | | 25.79 | % | | 3.35 | % | | 7.87 | % |
|
Hypothetical Growth of a $10,000 Investment
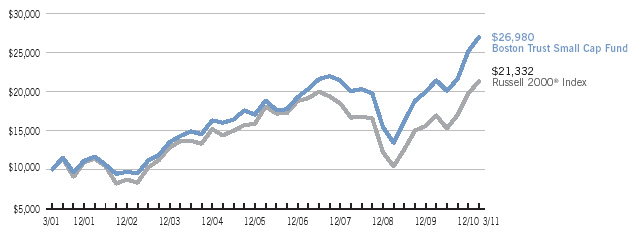
The chart represents historical 10-year performance of a hypothetical investment of $10,000 in the Boston Trust Small Cap Fund and represents the reinvestment of dividends and capital gains in the Fund. The returns shown on the table and graph do not reflect the deduction of taxes a shareholder would pay on Fund distributions or the redemption of Fund shares.
| * | The quoted performance for the Fund reflects the performance of a collective investment fund that was previously managed with full investment authority by the parent company of the Fund’s Adviser prior to the establishment of the Fund on December 16, 2005. The performance of the collective investment fund has been restated to reflect the net expenses of the Fund after all expenses at an annual rate of 1.25%, the Adviser’s expense limitation for its initial year of investment operations. The performance of the collective investment fund was restated to reflect the expenses associated with the mutual fund. The collective investment fund was not registered with the Securities and Exchange Commission and, therefore, was not subject to the investment restrictions imposed by law on registered mutual funds. If the collective investment fund had been registered, the collective investment fund’s performance may have been adversely affected. |
The Boston Trust Small Cap Fund is measured against the Russell 2000® Index, which is an unmanaged index that measures the performance of the small-cap segment of the U.S. equity universe. The Russell 2000® Index is a subset of the Russell 3000® Index representing approximately 8% of the total market capitalization of that index. It includes approximately 2000 of the smallest securities based on a combination of their market cap and current index membership. The performance of an index does not reflect the deduction of expenses associated with a mutual fund, such as investment management and fund accounting fees. The Fund’s performance reflects the deduction of fees for these services. Investors cannot invest directly in an index.

| Fund Net Asset Value: | $14.00 |
| Gross Expense Ratio1: | 1.16% |
Past performance does not guarantee future results. The performance data quoted represents past performance and current returns may be lower or higher. The investment return and principal value will fluctuate so that an investor’s shares, when redeemed may be worth more or less than the original cost. To obtain performance information current to the most recent month-end, please call 1-800-282-8782 ext. 7050.
| 1 | The Gross Expense Ratio is from the Fund’s most recent prospectus, dated August 1, 2010. The Gross Expense Ratio excludes the impact of any voluntary or contractual fee waivers. After giving effect to such fee waivers, the Fund’s Net Expense Ratio would be 1.02%, including the indirect expenses of investing in acquired funds. Please see the Fund’s most recent prospectus for details. Additional information pertaining to the Fund’s expense ratio as of March 31, 2011 can be found in the financial highlights. The investment performance reflects voluntary and contractual fee waivers. If such fee reductions had not occurred, the quoted performance would have been lower. The voluntary fee waivers may be discontinued at any time. The contractual fee waiver continues through August 1, 2012 and may be terminated thereafter. |
9
| |
| |
| Schedule of Portfolio Investments | | Boston Trust Balanced Fund
March 31, 2011 |
|
| COMMON STOCKS (72.6%) | | | | | | |
| Security Description | | | | Shares | | | Fair Value ($) |
| |
| Consumer Discretionary (5.8%) | | | | | | |
| Comcast Corp., Class A | | | 100,000 | | | 2,472,000 |
| Johnson Controls, Inc. | | | 30,000 | | | 1,247,100 |
| NIKE, Inc., Class B | | | 40,000 | | | 3,028,000 |
| Omnicom Group, Inc. | | | 50,000 | | | 2,453,000 |
| Ross Stores, Inc. | | | 50,000 | | | 3,556,000 |
| Target Corp. | | | 15,000 | | | 750,150 |
| | | | | | | | 13,506,250 |
| Consumer Products (10.0%) | | | | | | |
| Church & Dwight Co., Inc. | | | 15,000 | | | 1,190,100 |
| Costco Wholesale Corp. | | | 35,000 | | | 2,566,200 |
| Diageo PLC, Sponsored ADR | | | 25,000 | | | 1,905,500 |
| Kellogg Co. | | | 25,000 | | | 1,349,500 |
| McCormick & Co., Inc. | | | 60,000 | | | 2,869,800 |
| McDonald’s Corp. | | | 12,500 | | | 951,125 |
| Nestle SA, Sponsored ADR | | | 15,000 | | | 862,200 |
| PepsiCo, Inc. | | | 40,000 | | | 2,576,400 |
| Procter & Gamble Co. | | | 40,000 | | | 2,464,000 |
| SYSCO Corp. | | | 125,000 | | | 3,462,500 |
| Walgreen Co. | | | 80,000 | | | 3,211,200 |
| | | | | | | | 23,408,525 |
| Energy (11.9%) | | | | | | |
| Apache Corp. | | | 25,000 | | | 3,273,000 |
| Chevron Corp. | | | 50,000 | | | 5,371,500 |
| ConocoPhillips | | | 50,000 | | | 3,993,000 |
| Denbury Resources, Inc.(a) | | | 40,000 | | | 976,000 |
| Devon Energy Corp. | | | 10,000 | | | 917,700 |
| Exxon Mobil Corp. | | | 100,000 | | | 8,413,000 |
| Schlumberger Ltd. | | | 50,000 | | | 4,663,000 |
| | | | | | | | 27,607,200 |
| Financial Services (9.1%) | | | | | | |
| BB&T Corp. | | | 25,000 | | | 686,250 |
| Chubb Corp. | | | 60,000 | | | 3,678,600 |
| Cincinnati Financial Corp. | | | 125,000 | | | 4,100,000 |
| Comerica, Inc. | | | 45,000 | | | 1,652,400 |
| JPMorgan Chase & Co. | | | 35,000 | | | 1,613,500 |
| M&T Bank Corp. | | | 10,000 | | | 884,700 |
| Northern Trust Corp. | | | 25,000 | | | 1,268,750 |
| PNC Financial Services Group, Inc. | | | 25,000 | | | 1,574,750 |
| State Street Corp. | | | 25,000 | | | 1,123,500 |
| SunTrust Banks, Inc. | | | 25,000 | | | 721,000 |
| T. Rowe Price Group, Inc. | | | 60,000 | | | 3,985,200 |
| | | | | | | | 21,288,650 |
| Health Care (7.2%) | | | | | | |
| Becton, Dickinson & Co. | | | 40,000 | | | 3,184,800 |
| C.R. Bard, Inc. | | | 32,500 | | | 3,227,575 |
| DENTSPLY International, Inc. | | | 60,000 | | | 2,219,400 |
| Johnson & Johnson, Inc. | | | 25,000 | | | 1,481,250 |
| Medtronic, Inc. | | | 40,000 | | | 1,574,000 |
| Saint Jude Medical, Inc. | | | 35,000 | | | 1,794,100 |
| Stryker Corp. | | | 25,000 | | | 1,520,000 |
| Varian Medical Systems, Inc.(a) | | | 25,000 | | | 1,691,000 |
| | | | | | | | 16,692,125 |
| Industrial Materials (3.3%) | | | | | | |
| Air Products & Chemicals, Inc. | | | 25,000 | | | 2,254,500 |
| AptarGroup, Inc. | | | 40,000 | | | 2,005,200 |
| Ecolab, Inc. | | | 25,000 | | | 1,275,500 |
| Sigma-Aldrich Corp. | | | 35,000 | | | 2,227,400 |
| | | | | | | | 7,762,600 |
| | | | | | | |
| | | | | Shares or | | | |
| | | | | Principal | | | |
| Security Description | | | | Amount ($) | | | Fair Value ($) |
| |
| Industrial Products & Services (13.4%) | | | | | | |
| 3M Co. | | | 20,000 | | | 1,870,000 |
| Donaldson Co., Inc. | | | 75,000 | | | 4,596,750 |
| Emerson Electric Co. | | | 75,000 | | | 4,382,250 |
| Hubbell, Inc., Class B | | | 40,000 | | | 2,841,200 |
| Illinois Tool Works, Inc. | | | 65,000 | | | 3,491,800 |
| Precision Castparts Corp. | | | 30,000 | | | 4,415,400 |
| Rockwell Collins, Inc. | | | 50,000 | | | 3,241,500 |
| United Parcel Service, Inc., Class B | | | 40,000 | | | 2,972,800 |
| W.W. Grainger, Inc. | | | 25,000 | | | 3,442,000 |
| | | | | | | | 31,253,700 |
| Information Technology (11.9%) | | | | | | |
| Accenture PLC, Class A | | | 75,000 | | | 4,122,750 |
| Apple, Inc.(a) | | | 5,000 | | | 1,742,250 |
| Automatic Data Processing, Inc. | | | 75,000 | | | 3,848,250 |
| Cisco Systems, Inc. | | | 25,000 | | | 428,750 |
| EMC Corp.(a) | | | 150,000 | | | 3,982,500 |
| Hewlett-Packard Co. | | | 5,000 | | | 204,850 |
| Intel Corp. | | | 50,000 | | | 1,008,500 |
| International Business Machines Corp. | | | 27,500 | | | 4,484,425 |
| Microsoft Corp. | | | 125,000 | | | 3,170,000 |
| Oracle Corp. | | | 140,000 | | | 4,671,800 |
| | | | | | | | 27,664,075 |
| TOTAL COMMON STOCKS (Cost $106,590,194) | | | | | | 169,183,125 |
| |
| CORPORATE BONDS (3.6%) | | | | | | |
| Basic Materials (0.1%) | | | | | | |
| Weyerhaeuser Co., 7.25%, 7/1/13 | | | 300,000 | | | 314,862 |
| Consumer Products (0.2%) | | | | | | |
| Diageo Capital PLC, 5.50%, 9/30/16 | | | 500,000 | | | 557,541 |
| Financial Services (2.5%) | | | | | | |
| American Express Bank FSB, BKNT, 6.00%, | | | | | | |
9/13/17 | | | | 200,000 | | | 221,905 |
| American Express Co. | | | | | | |
7.00%, 3/19/18 | | | | 1,500,000 | | | 1,755,553 |
8.13%, 5/20/19 | | | | 1,675,000 | | | 2,093,097 |
| John Deere Capital Corp., Series D, 5.35%, | | | | | | |
4/3/18 | | | | 1,000,000 | | | 1,102,891 |
| National Rural Utilities Cooperative Finance Corp., | | | | | | |
10.38%, 11/1/18 | | | | 500,000 | | | 683,650 |
| | | | | | | | 5,857,096 |
| Industrial Products & Services (0.2%) | | | | | | |
| Emerson Electric Co., 5.13%, 12/1/16 | | | 300,000 | | | 334,618 |
| Information Technology (0.4%) | | | | | | |
| Oracle Corp., 5.75%, 4/15/18 | | | 750,000 | | | 841,066 |
| Telecommunications (0.2%) | | | | | | |
| AT&T, Inc., 5.63%, 6/15/16 | | | 500,000 | | | 559,965 |
| TOTAL CORPORATE BONDS (Cost $7,355,600) | | | | | | 8,465,148 |
| 10 | | See Notes to Financial Statements |
| |
| |
| Schedule of Portfolio Investments (cont.) | | Boston Trust Balanced Fund
March 31, 2011 |
|
| MUNICIPAL BONDS (2.9%) | | | | | | |
| | | | | Shares or | | | |
| | | | | Principal | | | |
| Security Description | | | | Amount ($) | | | Fair Value ($) |
| |
| Florida (0.6%) | | | | | | |
| Florida State Board of Education, Series A, GO, | | | | | | |
4.75%, 1/1/20, Callable 1/1/12 @ 101 | | | 300,000 | | | 312,747 |
| Florida State Board of Education, Series D, GO, | | | | | | |
5.00%, 6/1/21, Callable 6/1/17 @ 101 | | | 1,000,000 | | | 1,088,130 |
| | | | | | | | 1,400,877 |
| Illinois (0.6%) | | | | | | |
| Illinois State, GO, 5.00%, 4/1/24, Callable 4/1/17 | | | | | | |
@ 100 | | | | 500,000 | | | 478,110 |
| Illinois State, Series A | | | | | | |
5.00%, 3/1/22, Callable 3/1/14 @ 100 | | | 750,000 | | | 731,505 |
5.00%, 6/1/29, Callable 12/1/16 @ 100 | | | 250,000 | | | 228,105 |
| | | | | | | | 1,437,720 |
| Massachusetts (0.9%) | | | | | | |
| Massachusetts State Development Finance Agency | | | | | | |
Revenue, Series R-2, 5.00%, 7/1/28, Callable | | | | | | |
7/1/20 @ 100 | | | | 460,000 | | | 475,442 |
| Massachusetts State Health & Educational | | | | | | |
Facilities Authority Revenue, Series A, 5.00%, | | | | | | |
12/15/26, GO of Institution, Callable 12/15/19 | | | | | | |
@ 100 | | | | 1,500,000 | | | 1,619,445 |
| | | | | | | | 2,094,887 |
| Ohio (0.2%) | | | | | | |
| Ohio State, Series D, GO, 4.50%, 9/15/22, | | | | | | |
NATL-RE, Callable 3/15/16 @ 100 | | | 500,000 | | | 512,005 |
| Washington (0.1%) | | | | | | |
| Washington State, Series C, GO, 5.00%, 2/1/26, | | | | | | |
Callable 2/1/19 @ 100 | | | 250,000 | | | 262,183 |
| Wisconsin (0.5%) | | | | | | |
| Wisconsin State, Series C, GO, 5.00%, 5/1/25, | | | | | | |
Callable 5/1/18 @ 100 | | | 200,000 | | | 210,572 |
| Wisconsin State, Series D, GO, 5.50%, 5/1/26, | | | | | | |
Callable 5/1/18 @ 100 | | | 750,000 | | | 816,757 |
| | | | | | | | 1,027,329 |
| TOTAL MUNICIPAL BONDS (Cost $6,888,054) | | | | | | 6,735,001 |
| | | | | | | | |
| U.S. GOVERNMENT & U.S. GOVERNMENT AGENCY OBLIGATIONS (19.3%) | | | | | | |
| | | | | Shares or | | | |
| | | | | Principal | | | |
| Security Description | | | | Amount ($) | | | Fair Value ($) |
| |
| Federal Home Loan Bank | | | | | | |
2.25%, 4/13/12 | | | 7,500,000 | | | 7,645,650 |
4.88%, 12/14/12 | | | 12,000,000 | | | 12,830,172 |
5.25%, 9/13/13 | | | 5,000,000 | | | 5,490,620 |
5.25%, 12/9/22 | | | 1,000,000 | | | 1,099,905 |
5.38%, 6/8/12 | | | 5,000,000 | | | 5,291,055 |
| Government National Mortgage Association | | | | | | |
6.00%, 10/15/36 | | | 1,222,236 | | | 1,346,434 |
| U.S. Treasury Bills(a)(b) | | | | | | |
0.11%, 6/9/11 | | | 1,500,000 | | | 1,499,827 |
0.13%, 4/21/11 | | | 3,500,000 | | | 3,499,864 |
| U.S. Treasury Inflation Protected Bonds | | | | | | |
1.25%, 7/15/20 | | | 6,057,900 | | | 6,265,653 |
| TOTAL U.S. GOVERNMENT & U.S. GOVERNMENT AGENCY | | | | | | |
OBLIGATIONS (Cost $43,326,884) | | | | | | 44,969,180 |
| | | | | | | | |
| INVESTMENT COMPANIES (1.6%) | | | | | | |
| Victory Federal Money Market, Investor Shares, | | | | | | |
0.01% (c) | | | 3,818,329 | | | 3,818,329 |
| Total Investment Companies (Cost $3,818,329) | | | | | | 3,818,329 |
| Total Investments (Cost $167,979,061) (d) — 100.0% | | | | | | 233,170,783 |
| Other assets in excess of liabilities — 0.0% | | | | | | 57,378 |
| NET ASSETS — 100.0% | | | | | $ | 233,228,161 |
|
| (a) | | Non-income producing security. |
| (b) | | Rate represents the effective yield at purchase. |
| (c) | | Rate disclosed is the seven day yield as of March 31, 2011. |
| (d) | | See Federal Tax Information listed in the Notes to Financial Statements. |
| ADR | | American Depositary Receipt |
| BKNT | | Bank Note |
| FSB | | Federal Savings Bank |
| GO | | General Obligation |
| NATL-RE | | Reinsured by National Public Finance Guarantee Corporation |
| PLC | | Public Limited Company |
| | See Notes to Financial Statements | 11 |
| |
| |
| Financial Statements | | Boston Trust Balanced Fund |
| |
| STATEMENT OF ASSETS AND LIABILITIES | | | | |
| March 31, 2011 | | | | |
| | | | | |
| Assets: | | | | |
| Investments, at fair value (cost $167,979,061) | | $ | 233,170,783 | |
| Interest and dividends receivable | | | 915,289 | |
| Receivable for investments sold | | | 934,249 | |
| Receivable for capital shares issued | | | 84 | |
| Prepaid expenses and other assets | | 18,668 | |
Total Assets | | 235,039,073 | |
| Liabilities: | | | | |
| Payable for investments purchased | | | 1,562,734 | |
| Payable for capital shares redeemed | | | 23,600 | |
| Accrued expenses and other liabilities: | | | | |
Investment adviser | | | 162,938 | |
Administration and accounting | | | 5,809 | |
Custodian | | | 4,173 | |
Transfer agent | | | 1,861 | |
Trustee | | | 738 | |
Other | | 49,059 | |
Total Liabilities | | 1,810,912 | |
| Net Assets | | $ | 233,228,161 | |
| Composition of Net Assets: | | | | |
| Capital | | $ | 169,532,580 | |
| Accumulated net investment income | | | 792,716 | |
| Accumulated net realized losses from investment transactions | | | (2,288,857 | ) |
| Net unrealized appreciation from investments | | 65,191,722 | |
| Net Assets | | $ | 233,228,161 | |
Shares Outstanding (par value $0.01, unlimited number of shares authorized) | | 7,390,865 | |
Net Asset Value, Offering Price and Redemption Price per share | | $ | 31.56 | |
| STATEMENT OF OPERATIONS | | | | |
| For the year ended March 31, 2011 | | | | |
| | | | | |
| Investment Income: | | | | |
| Interest | | $ | 2,331,457 | |
| Dividends | | 2,857,910 | |
Total Investment Income | | 5,189,367 | |
| Expenses: | | | | |
Investment adviser | | | 1,558,874 | |
Administration and accounting | | | 422,609 | |
Trustee | | | 14,925 | |
Custodian | | | 40,977 | |
Transfer agency | | | 19,541 | |
Chief compliance officer | | | 11,148 | |
Recoupment of prior expenses reimbursed by the investment adviser | | | 17,016 | |
Other | | 130,871 | |
Total expenses before fee reductions | | | 2,215,961 | |
Fees voluntarily reduced by the administrator | | (136,554 | ) |
| Net Expenses | | 2,079,407 | |
| Net Investment Income | | 3,109,960 | |
| Net Realized/Unrealized Gains from Investments: | | | | |
Net realized gains from investment transactions | | | 286,430 | |
Change in unrealized appreciation from investments | | 20,040,206 | |
| Net realized/unrealized gains from investments | | 20,326,636 | |
| Change in Net Assets Resulting from Operations | | $ | 23,436,596 | |
| 12 | | See Notes to Financial Statements |
| |
| |
| Financial Statements | | Boston Trust Balanced Fund |
| |
| STATEMENTS OF CHANGES IN NET ASSETS | | | | | | | | |
| | | For the year ended | | For the year ended |
| | | March 31, | | March 31, |
| | | 2011 | | 2010 |
| | | | | | | | | |
| | | | | | | | | |
| Investment Activities: | | | | | | | | |
| Operations: | | | | | | | | |
Net investment income | | $ | 3,109,960 | | | $ | 3,221,977 | |
Net realized gains from investment transactions | | | 286,430 | | | | 946,272 | |
Change in unrealized appreciation/depreciation from investments | | 20,040,206 | | | 34,043,468 | |
| Change in Net Assets Resulting from Operations | | 23,436,596 | | | 38,211,717 | |
| Dividends: | | | | | | | | |
Net investment income | | (3,144,788) | | | (3,153,684) | |
| Change in Net Assets Resulting from Shareholder Dividends | | (3,144,788) | | | (3,153,684) | |
| Capital Share Transactions: | | | | | | | | |
Proceeds from shares issued | | | 26,295,763 | | | | 26,227,435 | |
Dividends reinvested | | | 2,969,891 | | | | 3,011,645 | |
Cost of shares redeemed | | (16,640,819) | | | (12,386,127) | |
| Change in Net Assets Resulting from Capital Share Transactions | | 12,624,835 | | | 16,852,953 | |
| Change in Net Assets | | | 32,916,643 | | | | 51,910,986 | |
| Net Assets: | | | | | | | | |
Beginning of period | | 200,311,518 | | | 148,400,532 | |
End of period | | $ | 233,228,161 | | | $ | 200,311,518 | |
| Share Transactions: | | | | | | | | |
Issued | | | 877,206 | | | | 973,787 | |
Reinvested | | | 99,062 | | | | 109,834 | |
Redeemed | | (568,537) | | | (461,327) | |
| Change in Shares | | | 407,731 | | | | 622,294 | |
Accumulated net investment income | | $ | 792,716 | | | $ | 827,544 | |
See Notes to Financial Statements | | 13 |
| |
| |
| Financial Highlights | | Boston Trust Balanced Fund |
| |
| FINANCIAL HIGHLIGHTS | | | | | | | | | | | | | | | | | | | | |
| Selected data for a share outstanding throughout the years indicated. | |
| | | | | | | | | | | | | | | | | | | | | |
| | | For the year | | | For the year | | | For the year | | | For the year | | | For the year | |
| | | ended | | | ended | | | ended | | | ended | | | ended | |
| | | March 31, | | | March 31, | | | March 31, | | | March 31, | | | March 31, | |
| | | 2011 | | | 2010 | | | 2009 | | | 2008 | | | 2007 | |
| | | | | | | | | | | | | | | | | | | | | |
| Net Asset Value, Beginning of Period | | $ | 28.69 | | | $ | 23.33 | | | $ | 30.31 | | | $ | 29.87 | | | $ | 29.11 | |
| | | | | | | | | | | | | | | | | | | | | |
| Investment Activities: | | | | | | | | | | | | | | | | | | | | |
Net investment income | | | 0.44 | | | | 0.47 | | | | 0.49(a) | | | | 0.46 | | | | 0.46 | |
Net realized and unrealized gains (losses) from investment transactions | | 2.88 | | | 5.36 | | | (6.11) | | | 1.42 | | | 2.13 | |
| Total from Investment Activities | | 3.32 | | | 5.83 | | | (5.62) | | | 1.88 | | | 2.59 | |
| | | | | | | | | | | | | | | | | | | | | |
| Dividends: | | | | | | | | | | | | | | | | | | | | |
Net investment income | | (0.45) | | | (0.47) | | | (0.52) | | | (0.45) | | | (0.43) | |
Net realized gains from investments | | — | | | — | | | (0.84) | | | (0.99) | | | (1.40) | |
| Total Dividends | | (0.45) | | | (0.47) | | | (1.36) | | | (1.44) | | | (1.83) | |
| | | | | | | | | | | | | | | | | | | | | |
| Net Asset Value, End of Period | | $ | 31.56 | | | $ | 28.69 | | | $ | 23.33 | | | $ | 30.31 | | | $ | 29.87 | |
| Total Return | | 11.65% | | | 25.08% | | | (18.68)% | | | 6.06% | | | 8.98% | |
| | | | | | | | | | | | | | | | | | | | | |
| Ratios/Supplemental Data: | | | | | | | | | | | | | | | | | | | | |
| Net Assets at end of period (000’s) | | $ | 233,228 | | | $ | 200,312 | | | $ | 148,401 | | | $ | 183,314 | | | $ | 170,307 | |
| Ratio of net expenses to average net assets | | | 1.00% | | | | 1.00% | | | | 1.00% | | | | 1.00% | | | | 1.00% | |
Ratio of net investment income to average net assets | | | 1.50% | | | | 1.84% | | | | 1.80% | | | | 1.46% | | | | 1.50% | |
Ratio of expenses (before fee reductions) to average net assets(b) | | | 1.07% | | | | 1.08% | | | | 1.08% | | | | 1.08% | | | | 1.07% | |
| Portfolio Turnover Rate | | | 15.76% | | | | 12.90% | | | | 21.30% | | | | 33.49% | | | | 37.24% | |
|
| (a) | | Calculated using the average shares method. |
| (b) | | During the period, certain fees were reduced. If such fee reductions had not occurred, the ratio would have been as indicated. |
| 14 | | See Notes to Financial Statements |
| |
| |
| Schedule of Portfolio Investments | | Boston Trust Equity Fund
March 31, 2011 |
|
| COMMON STOCKS (99.6%) |
| Security Description | | | | Shares | | | Fair Value ($) |
| | | | | | | | |
| Consumer Discretionary (7.4%) | | | | | | | |
| Comcast Corp., Class A | | | 40,000 | | | | 988,800 |
| Johnson Controls, Inc. | | | 18,000 | | | | 748,260 |
| NIKE, Inc., Class B | | | 7,500 | | | | 567,750 |
| Omnicom Group, Inc. | | | 25,000 | | | | 1,226,500 |
| Ross Stores, Inc. | | | 12,500 | | | | 889,000 |
| Target Corp. | | | 5,000 | | | | 250,050 |
| | | | | | | | 4,670,360 |
| Consumer Products (12.2%) | | | | | | | |
| Church & Dwight Co., Inc. | | | 7,500 | | | | 595,050 |
| Costco Wholesale Corp. | | | 15,000 | | | | 1,099,800 |
| Diageo PLC, Sponsored ADR | | | 12,500 | | | | 952,750 |
| Kellogg Co. | | | 5,000 | | | | 269,900 |
| McCormick & Co., Inc. | | | 15,000 | | | | 717,450 |
| McDonald’s Corp. | | | 2,500 | | | | 190,225 |
| PepsiCo, Inc. | | | 12,500 | | | | 805,125 |
| Procter & Gamble Co. | | | 12,500 | | | | 770,000 |
| SYSCO Corp. | | | 40,000 | | | | 1,108,000 |
| Walgreen Co. | | | 30,000 | | | | 1,204,200 |
| | | | | | | | 7,712,500 |
| Energy (16.4%) | | | | | | | |
| Apache Corp. | | | 12,000 | | | | 1,571,040 |
| Chevron Corp. | | | 16,000 | | | | 1,718,880 |
| ConocoPhillips | | | 20,000 | | | | 1,597,200 |
| Denbury Resources, Inc.(a) | | | 10,000 | | | | 244,000 |
| Devon Energy Corp. | | | 5,000 | | | | 458,850 |
| Exxon Mobil Corp. | | | 35,000 | | | | 2,944,550 |
| Schlumberger Ltd. | | | 20,000 | | | | 1,865,200 |
| | | | | | | | 10,399,720 |
| Financial Services (12.9%) | | | | | | | |
| Chubb Corp. | | | 22,000 | | | | 1,348,820 |
| Cincinnati Financial Corp. | | | 40,000 | | | | 1,312,000 |
| Comerica, Inc. | | | 17,500 | | | | 642,600 |
| JPMorgan Chase & Co. | | | 10,000 | | | | 461,000 |
| M&T Bank Corp. | | | 5,000 | | | | 442,350 |
| Northern Trust Corp. | | | 7,500 | | | | 380,625 |
| PNC Financial Services Group, Inc. | | | 12,500 | | | | 787,375 |
| State Street Corp. | | | 12,500 | | | | 561,750 |
| SunTrust Banks, Inc. | | | 10,000 | | | | 288,400 |
| T. Rowe Price Group, Inc. | | | 30,000 | | | | 1,992,600 |
| | | | | | | | 8,217,520 |
| Health Care (10.2%) | | | | | | | |
| Becton, Dickinson & Co. | | | 15,000 | | | | 1,194,300 |
| C.R. Bard, Inc. | | | 12,500 | | | | 1,241,375 |
| DENTSPLY International, Inc. | | | 30,000 | | | | 1,109,700 |
| Johnson & Johnson, Inc. | | | 3,500 | | | | 207,375 |
| Medtronic, Inc. | | | 20,000 | | | | 787,000 |
| Saint Jude Medical, Inc. | | | 10,000 | | | | 512,600 |
| Stryker Corp. | | | 12,500 | | | | 760,000 |
| Varian Medical Systems, Inc.(a) | | | 10,000 | | | | 676,400 |
| | | | | | | | 6,488,750 |
| Industrial Materials (5.8%) | | | | | | | |
| Air Products & Chemicals, Inc. | | | 10,000 | | | | 901,800 |
| AptarGroup, Inc. | | | 15,000 | | | | 751,950 |
| Ecolab, Inc. | | | 15,000 | | | | 765,300 |
| Sigma-Aldrich Corp. | | | 20,000 | | | | 1,272,800 |
| | | | | | | | 3,691,850 |
| Industrial Products & Services (18.2%) | | | | | | | |
| 3M Co. | | | 5,000 | | | | 467,500 |
| Donaldson Co., Inc. | | | 25,000 | | | | 1,532,250 |
| Emerson Electric Co. | | | 35,000 | | | | 2,045,050 |
| Hubbell, Inc., Class B | | | 10,000 | | | | 710,300 |
| Illinois Tool Works, Inc. | | | 25,000 | | | | 1,343,000 |
| Precision Castparts Corp. | | | 15,000 | | | | 2,207,700 |
| Rockwell Collins, Inc. | | | 15,000 | | | | 972,450 |
| United Parcel Service, Inc., Class B | | | 9,000 | | | | 668,880 |
| W.W. Grainger, Inc. | | | 11,500 | | | | 1,583,320 |
| | | | | | | | 11,530,450 |
| Information Technology (16.5%) | | | | | | | |
| Accenture PLC, Class A | | | 25,000 | | | | 1,374,250 |
| Apple, Inc.(a) | | | 1,250 | | | | 435,563 |
| Automatic Data Processing, Inc. | | | 25,000 | | | | 1,282,750 |
| Cisco Systems, Inc. | | | 17,500 | | | | 300,125 |
| EMC Corp.(a) | | | 65,000 | | | | 1,725,750 |
| Hewlett-Packard Co. | | | 5,000 | | | | 204,850 |
| Intel Corp. | | | 20,000 | | | | 403,400 |
| International Business Machines Corp. | | | 10,000 | | | | 1,630,700 |
| Microsoft Corp. | | | 50,000 | | | | 1,268,000 |
| Oracle Corp. | | | 55,000 | | | | 1,835,350 |
| | | | | | | | 10,460,738 |
| TOTAL COMMON STOCKS (Cost $37,444,865) | | | | | | | 63,171,888 |
| | |
| INVESTMENT COMPANIES (0.3%) | |
Victory Federal Money Market, Investor Shares,
0.01% (b) | | | 214,061 | | | | 214,061 |
| Total Investment Companies (Cost $214,061) | | | | | | | 214,061 |
| Total Investments (Cost $37,658,926) (c) — 99.9% | | | | | | | 63,385,949 |
| Other assets in excess of liabilities — 0.1% | | | | | | | 77,491 |
| | | | | | | | |
| NET ASSETS — 100.0% | | | | | | $ | 63,463,440 |
|
| (a) | | Non-income producing security. |
| (b) | | Rate disclosed is the seven day yield as of March 31, 2011. |
| (c) | | See Federal Tax Information listed in the Notes to Financial Statements. |
| ADR | | American Depositary Receipt |
| PLC | | Public Limited Company |
See Notes to Financial Statements | | 15 |
| |
| |
| Financial Statements | | Boston Trust Equity Fund |
| |
| STATEMENT OF ASSETS AND LIABILITIES |
| March 31, 2011 | | | | | |
| | | | | | |
| Assets: | | | | | |
| Investments, at fair value (cost $37,658,926) | | | $ | 63,385,949 | |
| Dividends receivable | | | | 108,110 | |
| Receivable for investments sold | | | | 483,878 | |
| Prepaid expenses and other assets | | | | 4,678 | |
Total Assets | | | | 63,982,615 | |
| Liabilities: | | | | | |
| Payable for investments purchased | | | | 459,304 | |
| Accrued expenses and other liabilities: | | | | | |
Investment adviser | | | | 39,558 | |
Administration and accounting | | | | 1,595 | |
Custodian | | | | 1,578 | |
Transfer agent | | | | 2,066 | |
Trustee | | | | 227 | |
Other | | | | 14,847 | |
Total Liabilities | | | | 519,175 | |
| Net Assets | | | $ | 63,463,440 | |
| Composition of Net Assets: | | | | | |
| Capital | | | $ | 40,653,132 | |
| Accumulated net investment income | | | | 131,770 | |
| Accumulated net realized losses from investment transactions | | | | (3,048,485) | |
| Net unrealized appreciation from investments | | | | 25,727,023 | |
| Net Assets | | | $ | 63,463,440 | |
Shares Outstanding (par value $0.01, unlimited number of shares authorized) | | | | 4,388,108 | |
Net Asset Value, Offering Price and Redemption Price per share | | | $ | 14.46 | |
| STATEMENT OF OPERATIONS |
| For the year ended March 31, 2011 | | | | | |
| | | | | | |
| Investment Income: | | | | | |
| Dividends | | | $ | 1,026,926 | |
Total Investment Income | | | | 1,026,926 | |
| Expenses: | | | | | |
Investment adviser | | | | 415,918 | |
Administration and accounting | | | | 115,179 | |
Trustee | | | | 3,986 | |
Custodian | | | | 12,966 | |
Transfer agency | | | | 19,563 | |
Chief compliance officer | | | | 2,966 | |
Other | | | | 34,579 | |
Total expenses before fee reductions | | | | 605,157 | |
Fees voluntarily reduced by the administrator | | | | (36,462) | |
Fees contractually reduced by the investment adviser | | | | (13,866) | |
| Net Expenses | | | | 554,829 | |
| Net Investment Income | | | | 472,097 | |
| Net Realized/Unrealized Gains from Investments: | | | | | |
Net realized gains from investment transactions | | | | 242,815 | |
Change in unrealized appreciation from investments | | | | 7,726,327 | |
| Net realized/unrealized gains from investments | | | | 7,969,142 | |
| Change in Net Assets Resulting from Operations | | | $ | 8,441,239 | |
| 16 | | See Notes to Financial Statements |
| |
| |
| Financial Statements | | Boston Trust Equity Fund |
| |
| STATEMENTS OF CHANGES IN NET ASSETS |
| | | | For the year ended | | | | For the year ended | |
| | | | March 31, | | | | March 31, | |
| | | | 2011 | | | | 2010 | |
| | | | | | | | | | | |
| Investment Activities: | | | | | | | | | | |
| Operations: | | | | | | | | | | |
Net investment income | | | $ | 472,097 | | | | $ | 440,449 | |
Net realized gains from investment transactions | | | | 242,815 | | | | | 774,817 | |
Change in unrealized appreciation from investments | | | | 7,726,327 | | | | | 16,019,763 | |
| Change in Net Assets Resulting from Operations | | | | 8,441,239 | | | | | 17,235,029 | |
| Dividends: | | | | | | | | | | |
Net investment income | | | | (457,037) | | | | | (435,641) | |
| Change in Net Assets Resulting from Shareholder Dividends | | | | (457,037) | | | | | (435,641) | |
| Capital Share Transactions: | | | | | | | | | | |
Proceeds from shares issued | | | | 3,647,169 | | | | | 2,198,669 | |
Dividends reinvested | | | | 404,313 | | | | | 393,025 | |
Cost of shares redeemed | | | | (2,155,592) | | | | | (4,506,458) | |
| Change in Net Assets Resulting from Capital Share Transactions | | | | 1,895,890 | | | | | (1,914,764) | |
| Change in Net Assets | | | | 9,880,092 | | | | | 14,884,624 | |
| Net Assets: | | | | | | | | | | |
Beginning of period | | | | 53,583,348 | | | | | 38,698,724 | |
End of period | | | $ | 63,463,440 | | | | $ | 53,583,348 | |
| Share Transactions: | | | | | | | | | | |
Issued | | | | 282,284 | | | | | 200,783 | |
Reinvested | | | | 29,971 | | | | | 33,279 | |
Redeemed | | | | (168,962) | | | | | (401,965) | |
| Change in Shares | | | | 143,293 | | | | | (167,903) | |
| Accumulated net investment income | | | $ | 131,770 | | | | $ | 116,710 | |
See Notes to Financial Statements | | 17 |
| |
| |
| Financial Statements | | Boston Trust Equity Fund |
| |
| FINANCIAL HIGHLIGHTS |
| Selected data for a share outstanding throughout the years indicated. |
| | | | | | | | | | | | | | | | | | | | | | |
| | | | For the year | | | For the year | | | For the year | | | For the year | | | For the year | |
| | | | ended | | | ended | | | ended | | | ended | | | ended | |
| | | | March 31, | | | March 31, | | | March 31, | | | March 31, | | | March 31, | |
| | | | 2011 | | | 2010 | | | 2009 | | | 2008 | | | 2007 | |
| | | | | | | | | | | | | | | | | | | | | | |
| Net Asset Value, Beginning of Period | | | $ | 12.62 | | | $ | 8.77 | | | $ | 13.17 | | | $ | 13.17 | | | $ | 12.39 | |
| Investment Activities: | | | | | | | | | | | | | | | | | | | | | |
Net investment income | | | | 0.11 | | | | 0.10 | | | | 0.10(a) | | | | 0.08 | | | | 0.09 | |
Net realized and unrealized gains (losses) from investment transactions | | | | 1.84 | | | | 3.85 | | | | (4.40) | | | | 0.30 | | | | 1.04 | |
| Total from Investment Activities | | | | 1.95 | | | | 3.95 | | | | (4.30) | | | | 0.38 | | | | 1.13 | |
| Dividends: | | | | | | | | | | | | | | | | | | | | | |
Net investment income | | | | (0.11) | | | | (0.10) | | | | (0.10) | | | | (0.08) | | | | (0.08) | |
Net realized gains from investments | | | | — | | | | — | | | | — | | | | (0.30) | | | | (0.27) | |
| Total Dividends | | | | (0.11) | | | | (0.10) | | | | (0.10) | | | | (0.38) | | | | (0.35) | |
| Net Asset Value, End of Period | | | $ | 14.46 | | | $ | 12.62 | | | $ | 8.77 | | | $ | 13.17 | | | $ | 13.17 | |
| Total Return | | | | 15.48% | | | | 45.13% | | | | (32.73)% | | | | 2.59% | | | | 9.20% | |
| Ratios/Supplemental Data: | | | | | | | | | | | | | | | | | | | | | |
| Net Assets at end of period (000’s) | | | $ | 63,463 | | | $ | 53,583 | | | $ | 38,699 | | | $ | 65,050 | | | $ | 59,884 | |
| Ratio of net expenses to average net assets | | | | 1.00% | | | | 1.00% | | | | 1.00% | | | | 1.00% | | | | 1.00% | |
| Ratio of net investment income to average net assets | | | | 0.85% | | | | 0.92% | | | | 0.86% | | | | 0.55% | | | | 0.71% | |
Ratio of expenses (before fee reductions) to average net assets(b) | | | | 1.09% | | | | 1.11% | | | | 1.10% | | | | 1.10% | | | | 1.11% | |
| Portfolio Turnover Rate | | | | 14.31% | | | | 19.90% | | | | 28.85% | | | | 23.53% | | | | 21.48% | |
| |
| (a) | | Calculated using the average shares method. |
| (b) | | During the period, certain fees were reduced. If such fee reductions had not occurred, the ratio would have been as indicated. |
| 18 | | See Notes to Financial Statements |
| |
| |
| Schedule of Portfolio Investments | | Boston Trust Midcap Fund
March 31, 2011 |
|
| COMMON STOCKS (97.5%) |
| Security Description | | | | Shares | | | Fair Value ($) |
| Consumer Discretionary (12.9%) | | | | | | | | |
| Advance Auto Parts, Inc. | | | | 4,850 | | | | 318,257 |
| Autoliv, Inc. | | | | 5,830 | | | | 432,761 |
| Cablevision Systems Corp., Class A | | | | 10,500 | | | | 363,405 |
| Family Dollar Stores, Inc. | | | | 6,000 | | | | 307,920 |
| Gentex Corp. | | | | 9,050 | | | | 273,762 |
| Guess?, Inc. | | | | 7,500 | | | | 295,125 |
| John Wiley & Sons, Inc., Class A | | | | 2,600 | | | | 132,184 |
| O’Reilly Automotive, Inc.(a) | | | | 6,700 | | | | 384,982 |
| Omnicom Group, Inc. | | | | 7,750 | | | | 380,215 |
| Ross Stores, Inc. | | | | 8,700 | | | | 618,744 |
| | | | | | | | | 3,507,355 |
| Consumer Products (8.0%) | | | | | | | | |
| Brown-Forman Corp., Class B | | | | 6,375 | | | | 435,413 |
| Church & Dwight Co., Inc. | | | | 8,250 | | | | 654,555 |
| Clorox Co. | | | | 3,000 | | | | 210,210 |
| Hasbro, Inc. | | | | 7,250 | | | | 339,590 |
| McCormick & Co., Inc. | | | | 11,300 | | | | 540,479 |
| | | | | | | | | 2,180,247 |
| Energy (9.2%) | | | | | | | | |
| Cabot Oil & Gas Corp. | | | | 7,500 | | | | 397,275 |
| Core Laboratories NV | | | | 4,000 | | | | 408,680 |
| Denbury Resources, Inc.(a) | | | | 21,425 | | | | 522,770 |
| FMC Technologies, Inc.(a) | | | | 5,325 | | | | 503,106 |
| Murphy Oil Corp. | | | | 6,500 | | | | 477,230 |
| QEP Resources, Inc. | | | | 4,750 | | | | 192,565 |
| | | | | | | | | 2,501,626 |
| Financial Services (15.2%) | | | | | | | | |
| Bank of Hawaii Corp. | | | | 4,200 | | | | 200,844 |
| Cincinnati Financial Corp. | | | | 14,905 | | | | 488,884 |
| Comerica, Inc. | | | | 10,275 | | | | 377,298 |
| Commerce Bancshares, Inc. | | | | 6,893 | | | | 278,753 |
| Corporate Office Properties Trust | | | | 6,500 | | | | 234,910 |
| Digital Realty Trust, Inc. | | | | 4,300 | | | | 250,002 |
| East West Bancorp, Inc. | | | | 10,000 | | | | 219,600 |
| IntercontinentalExchange, Inc.(a) | | | | 2,500 | | | | 308,850 |
| Jones Lang LaSalle, Inc. | | | | 1,675 | | | | 167,065 |
| M&T Bank Corp. | | | | 3,650 | | | | 322,915 |
| Morningstar, Inc. | | | | 5,875 | | | | 342,982 |
| SEI Investments Co. | | | | 14,000 | | | | 334,320 |
| T. Rowe Price Group, Inc. | | | | 6,000 | | | | 398,520 |
| TD Ameritrade Holding Corp. | | | | 10,025 | | | | 209,222 |
| | | | | | | | | 4,134,165 |
| Health Care (11.2%) | | | | | | | | |
| C.R. Bard, Inc. | | | | 5,850 | | | | 580,963 |
| DENTSPLY International, Inc. | | | | 11,500 | | | | 425,385 |
| Gen-Probe, Inc.(a) | | | | 4,200 | | | | 278,670 |
| IDEXX Laboratories, Inc.(a) | | | | 2,650 | | | | 204,633 |
| Patterson Cos., Inc. | | | | 7,650 | | | | 246,254 |
| Pharmaceutical Product Development, Inc. | | | | 5,875 | | | | 162,796 |
| ResMed, Inc.(a) | | | | 8,100 | | | | 243,000 |
| Techne Corp. | | | | 2,700 | | | | 193,320 |
| Varian Medical Systems, Inc.(a) | | | | 4,200 | | | | 284,088 |
| Waters Corp.(a) | | | | 5,000 | | | | 434,500 |
| | | | | | | | | 3,053,609 |
| Industrial Materials (5.1%) | | | | | | | | |
| AptarGroup, Inc. | | | | 9,600 | | | | 481,248 |
| Ecolab, Inc. | | | | 6,225 | | | | 317,600 |
| Sigma-Aldrich Corp. | | | | 9,275 | | | | 590,261 |
| | | | | | | | | 1,389,109 |
| | | | | | | | | |
| Industrial Products & Services (16.1%) | | | | | | | | |
| AMETEK, Inc. | | | | 11,750 | | | | 515,472 |
| C.H. Robinson Worldwide, Inc. | | | | 4,150 | | | | 307,640 |
| CLARCOR, Inc. | | | | 6,950 | | | | 312,263 |
| Donaldson Co., Inc. | | | | 9,000 | | | | 551,610 |
| Expeditors International of Washington, Inc. | | | | 5,200 | | | | 260,728 |
| L-3 Communications Holdings, Inc. | | | | 3,000 | | | | 234,930 |
| Lincoln Electric Holdings, Inc. | | | | 7,500 | | | | 569,400 |
| Mettler-Toledo International, Inc.(a) | | | | 2,800 | | | | 481,600 |
| Rockwell Collins, Inc. | | | | 9,000 | | | | 583,470 |
| W.W. Grainger, Inc. | | | | 4,225 | | | | 581,698 |
| | | | | | | | | 4,398,811 |
| Information Technology (15.1%) | | | | | | | | |
| Amdocs Ltd.(a) | | | | 12,000 | | | | 346,200 |
| BMC Software, Inc.(a) | | | | 12,200 | | | | 606,828 |
| Check Point Software Technologies Ltd.(a) | | | | 10,900 | | | | 556,445 |
| Citrix Systems, Inc.(a) | | | | 5,225 | | | | 383,828 |
| F5 Networks, Inc.(a) | | | | 3,200 | | | | 328,224 |
| FactSet Research Systems, Inc. | | | | 2,600 | | | | 272,298 |
| Fiserv, Inc.(a) | | | | 3,250 | | | | 203,840 |
| Paychex, Inc. | | | | 5,700 | | | | 178,752 |
| Polycom, Inc.(a) | | | | 5,500 | | | | 285,175 |
| Skyworks Solutions, Inc.(a) | | | | 9,250 | | | | 299,885 |
| Teradata Corp.(a) | | | | 13,000 | | | | 659,100 |
| | | | | | | | | 4,120,575 |
| Telecommunications (1.2%) | | | | | | | | |
| NII Holdings, Inc.(a) | | | | 8,050 | | | | 335,444 |
| | | | | | | | | |
| Utilities (3.5%) | | | | | | | | |
| AGL Resources, Inc. | | | | 5,150 | | | | 205,176 |
| Energen Corp. | | | | 4,500 | | | | 284,040 |
| NSTAR | | | | 4,700 | | | | 217,469 |
| Questar Corp. | | | | 15,000 | | | | 261,750 |
| | | | | | | | | 968,435 |
| TOTAL COMMON STOCKS (Cost $18,731,790) | | | | | | | | 26,589,376 |
| | | | | | | | | | |
| INVESTMENT COMPANIES (2.4%) |
Victory Federal Money Market, Investor Shares,
0.01% (b) | | | | 665,515 | | | | 665,515 |
| Total Investment Companies (Cost $665,515) | | | | | | | | 665,515 |
| Total Investments (Cost $19,397,305) (c) — 99.9% | | | | | | | | 27,254,891 |
| Other assets in excess of liabilities — 0.1% | | | | | | | | 20,628 |
| NET ASSETS — 100.0% | | | | | | | $ | 27,275,519 |
| |
| (a) | | Non-income producing security. |
| (b) | | Rate disclosed is the seven day yield as of March 31, 2011. |
| (c) | | See Federal Tax Information listed in the Notes to Financial Statements. |
See Notes to Financial Statements | | 19 |
| |
| |
| Financial Statements | | Boston Trust Midcap Fund |
| |
| STATEMENT OF ASSETS AND LIABILITIES |
| March 31, 2011 | | | | | |
| Assets: | | | | | |
| Investments, at fair value (cost $19,397,305) | | | $ | 27,254,891 | |
| Dividends receivable | | | | 21,841 | |
| Receivable for capital shares issued | | | | 17,940 | |
| Prepaid expenses and other assets | | | | 3,365 | |
Total Assets | | | | 27,298,037 | |
| Liabilities: | | | | | |
| Accrued expenses and other liabilities: | | | | | |
Investment adviser | | | | 15,909 | |
Administration and accounting | | | | 673 | |
Custodian | | | | 584 | |
Transfer agent | | | | 2,006 | |
Trustee | | | | 45 | |
Other | | | | 3,301 | |
Total Liabilities | | | | 22,518 | |
| Net Assets | | | $ | 27,275,519 | |
| Composition of Net Assets: | | | | | |
| Capital | | | $ | 18,920,771 | |
| Accumulated net investment income | | | | 10,330 | |
| Accumulated net realized gains from investment transactions | | | | 486,832 | |
| Net unrealized appreciation from investments | | | | 7,857,586 | |
| Net Assets | | | $ | 27,275,519 | |
| Shares Outstanding (par value $0.01, unlimited number of shares authorized) | | | | 2,279,625 | |
| Net Asset Value, Offering Price and Redemption Price per share | | | $ | 11.96 | |
| STATEMENT OF OPERATIONS | | | | | |
| For the year ended March 31, 2011 | | | | | |
| Investment Income: | | | | | |
| Dividends | | | $ | 252,939 | |
| Less: Foreign tax withholding | | | | (421) | |
Total Investment Income | | | | 252,518 | |
| Expenses: | | | | | |
Investment adviser | | | | 151,132 | |
Administration and accounting | | | | 44,410 | |
Trustee | | | | 1,280 | |
Custodian | | | | 8,410 | |
Transfer agency | | | | 20,080 | |
Chief compliance officer | | | | 927 | |
Other | | | | 16,560 | |
Total expenses before fee reductions | | | | 242,799 | |
Fees voluntarily reduced by the administrator | | | | (13,302) | |
Fees contractually reduced by the investment adviser | | | | (27,687) | |
| Net Expenses | | | | 201,810 | |
| Net Investment Income | | | | 50,708 | |
| Net Realized/Unrealized Gains from Investments: | | | | | |
Net realized gains from investment transactions | | | | 1,174,341 | |
Change in unrealized appreciation from investments | | | | 4,206,917 | |
| Net realized/unrealized gains from investments | | | | 5,381,258 | |
| Change in Net Assets Resulting from Operations | | | $ | 5,431,966 | |
| 20 | | See Notes to Financial Statements |
| |
| |
| Financial Statements | | Boston Trust Midcap Fund |
| |
| STATEMENTS OF CHANGES IN NET ASSETS |
| | | | For the year ended | | | | For the year ended | |
| | | | March 31, | | | | March 31, | |
| | | | 2011 | | | | 2010 | |
| Investment Activities: | | | | | | | | | | |
| Operations: | | | | | | | | | | |
Net investment income | | | $ | 50,708 | | | | $ | 29,258 | |
Net realized gains from investment transactions | | | | 1,174,341 | | | | | 74,712 | |
Change in unrealized appreciation from investments | | | | 4,206,917 | | | | | 4,650,605 | |
| Change in Net Assets Resulting from Operations | | | | 5,431,966 | | | | | 4,754,575 | |
| Dividends: | | | | | | | | | | |
Net investment income | | | | (43,671) | | | | | (33,641) | |
Net realized gains from investment transactions | | | | (407,930) | | | | | — | |
| Change in Net Assets Resulting from Shareholder Dividends | | | | (451,601) | | | | | (33,641) | |
| Capital Share Transactions: | | | | | | | | | | |
Proceeds from shares issued | | | | 5,926,173 | | | | | 4,098,321 | |
Dividends reinvested | | | | 394,901 | | | | | 31,914 | |
Cost of shares redeemed | | | | (334,592) | | | | | (561,325) | |
| Change in Net Assets Resulting from Capital Share Transactions | | | | 5,986,482 | | | | | 3,568,910 | |
| Change in Net Assets | | | | 10,966,847 | | | | | 8,289,844 | |
| Net Assets: | | | | | | | | | | |
Beginning of period | | | | 16,308,672 | | | | | 8,018,828 | |
End of period | | | $ | 27,275,519 | | | | $ | 16,308,672 | |
| Share Transactions: | | | | | | | | | | |
Issued | | | | 549,194 | | | | | 474,162 | |
Reinvested | | | | 35,545 | | | | | 3,714 | |
Redeemed | | | | (32,572) | | | | | (69,958) | |
| Change in Shares | | | | 552,167 | | | | | 407,918 | |
| Accumulated net investment income | | | $ | 10,330 | | | | $ | 3,293 | |
See Notes to Financial Statements | | 21 |
| |
| |
| Financial Highlights | | Boston Trust Midcap Fund |
| |
| FINANCIAL HIGHLIGHTS |
| Selected data for a share outstanding throughout the periods indicated. |
| | | For the year | | | For the year | | | For the year | | | For the period | |
| | | ended | | | ended | | | ended | | | ended | |
| | | March 31, | | | March 31, | | | March 31, | | | March 31, | |
| | | 2011 | | | 2010 | | | 2009 | | | 2008(a) | |
| Net Asset Value, Beginning of Period | | $ | 9.44 | | | $ | 6.08 | | | $ | 9.23 | | | $ | 10.00 | |
| Investment Activities: | | | | | | | | | | | | | | | | |
Net investment income | | | 0.02 | | | | 0.02 | | | | 0.02(b) | | | | 0.01 | |
Net realized and unrealized gains (losses) from investment transactions | | | 2.73 | | | | 3.36 | | | | (3.07) | | | | (0.71) | |
| Total from Investment Activities | | | 2.75 | | | | 3.38 | | | | (3.05) | | | | (0.70) | |
| Dividends: | | | | | | | | | | | | | | | | |
Net investment income | | | (0.02) | | | | (0.02) | | | | (0.02) | | | | —(c) | |
Net realized gains from investments | | | (0.21) | | | | — | | | | (0.08) | | | | (0.07) | |
| Total Dividends | | | (0.23) | | | | (0.02) | | | | (0.10) | | | | (0.07) | |
| Net Asset Value, End of Period | | $ | 11.96 | | | $ | 9.44 | | | $ | 6.08 | | | $ | 9.23 | |
| Total Return(d) | | | 29.32% | | | | 55.68% | | | | (33.03)% | | | | (7.05)% | |
| Ratios/Supplemental Data: | | | | | | | | | | | | | | | | |
| Net Assets at end of period (000’s) | | $ | 27,276 | | | $ | 16,309 | | | $ | 8,019 | | | $ | 13,433 | |
| Ratio of net expenses to average net assets(e) | | | 1.00% | | | | 1.00% | | | | 1.00% | | | | 1.00% | |
| Ratio of net investment income to average net assets(e) | | | 0.25% | | | | 0.26% | | | | 0.24% | | | | 0.29% | |
| Ratio of expenses (before fee reductions) to average net assets(e)(f) | | | 1.20% | | | | 1.32% | | | | 1.48% | | | | 1.58% | |
| Portfolio Turnover Rate(d) | | | 18.58% | | | | 26.44% | | | | 22.93% | | | | 17.87% | |
| |
| (a) | | Commenced operations on September 24, 2007. |
| (b) | | Calculated using the average shares method. |
| (c) | | Less than $0.005 per share. |
| (d) | | Not annualized for periods less than one year. |
| (e) | | Annualized for periods less than one year. |
| (f) | | During the period, certain fees were reduced. If such fee reductions had not occurred, the ratio would have been as indicated. |
| 22 | | See Notes to Financial Statements |
| |
| |
| Schedule of Portfolio Investments | | Boston Trust Small Cap Fund
March 31, 2011 |
| |
| COMMON STOCKS (99.5%) |
| Security Description | | | Shares | | Fair Value ($) |
| Consumer Discretionary (12.5%) | | | | | | |
| Ambassadors Group, Inc. | | | 55,000 | | | 602,250 |
| Amerigon, Inc.(a) | | | 89,700 | | | 1,369,719 |
| Capella Education Co.(a) | | | 48,500 | | | 2,414,815 |
| Fuel Systems Solutions, Inc.(a) | | | 76,400 | | | 2,305,752 |
| Hibbett Sports, Inc.(a) | | | 78,300 | | | 2,803,923 |
| John Wiley & Sons, Inc., Class A | | | 112,200 | | | 5,704,248 |
| K12, Inc.(a) | | | 57,550 | | | 1,939,435 |
| LKQ Corp.(a) | | | 155,000 | | | 3,735,500 |
| NutriSystem, Inc. | | | 59,500 | | | 862,155 |
| Select Comfort Corp.(a) | | | 114,100 | | | 1,376,046 |
| Tempur-Pedic International, Inc.(a) | | | 65,300 | | | 3,308,098 |
| The Men’s Wearhouse, Inc. | | | 49,385 | | | 1,336,358 |
| Under Armour, Inc., Class A(a) | | | 67,300 | | | 4,579,765 |
| Universal Technical Institute, Inc. | | | 64,300 | | | 1,250,635 |
| | | | | | | 33,588,699 |
| Consumer Products (3.1%) | | | | | | |
| Darling International, Inc.(a) | | | 90,400 | | | 1,389,448 |
| Hain Celestial Group, Inc.(a) | | | 50,400 | | | 1,626,912 |
| Lifeway Foods, Inc.(a) | | | 61,500 | | | 640,830 |
| United Natural Foods, Inc.(a) | | | 103,100 | | | 4,620,942 |
| | | | | | | 8,278,132 |
| Energy (6.4%) | | | | | | |
| CARBO Ceramics, Inc. | | | 59,500 | | | 8,396,640 |
| Dawson Geophysical Co.(a) | | | 23,700 | | | 1,039,956 |
| Lufkin Industries, Inc. | | | 36,800 | | | 3,439,696 |
| Natural Gas Services Group, Inc.(a) | | | 70,950 | | | 1,260,072 |
| OYO Geospace Corp.(a) | | | 13,300 | | | 1,311,114 |
| Tesco Corp.(a) | | | 74,000 | | | 1,624,300 |
| | | | | | | 17,071,778 |
| Financial Services (18.6%) | | | | | | |
| Bank of Hawaii Corp. | | | 97,100 | | | 4,643,322 |
| Corporate Office Properties Trust | | | 79,500 | | | 2,873,130 |
| Dime Community Bancshares | | | 178,850 | | | 2,639,826 |
| DuPont Fabros Technology, Inc. | | | 120,100 | | | 2,912,425 |
| East West Bancorp, Inc. | | | 192,900 | | | 4,236,084 |
| eHealth, Inc.(a) | | | 177,800 | | | 2,364,740 |
| Green Dot Corp., Class A(a) | | | 49,800 | | | 2,136,918 |
| Horace Mann Educators Corp. | | | 150,500 | | | 2,528,400 |
| Independent Bank Corp. | | | 83,700 | | | 2,260,737 |
| Investment Technology Group, Inc.(a) | | | 133,500 | | | 2,428,365 |
| Ocwen Financial Corp.(a) | | | 163,800 | | | 1,805,076 |
| Orrstown Financial Services, Inc. | | | 43,100 | | | 1,206,800 |
| Parkway Properties, Inc. | | | 66,100 | | | 1,123,700 |
| Signature Bank(a) | | | 79,500 | | | 4,483,800 |
| Southside Bancshares, Inc. | | | 73,175 | | | 1,565,945 |
| TCF Financial Corp. | | | 211,100 | | | 3,348,046 |
| Texas Capital Bancshares, Inc.(a) | | | 46,075 | | | 1,197,489 |
| UMB Financial Corp. | | | 100,700 | | | 3,761,649 |
| Umpqua Holdings Corp. | | | 218,400 | | | 2,498,496 |
| | | | | | | 50,014,948 |
| Health Care (14.3%) | | | | | | |
| American Medical Systems Holdings, Inc.(a) | | | 101,900 | | | 2,205,116 |
| Bruker Corp.(a) | | | 222,700 | | | 4,643,295 |
| Cantel Medical Corp. | | | 50,400 | | | 1,297,800 |
| Computer Programs & Systems, Inc. | | | 22,400 | | | 1,439,872 |
| Gen-Probe, Inc.(a) | | | 29,975 | | | 1,988,841 |
| ICU Medical, Inc.(a) | | | 48,500 | | | 2,123,330 |
| Landauer, Inc. | | | 55,272 | | | 3,400,334 |
| Meridian Bioscience, Inc. | | | 167,500 | | | 4,018,325 |
| Neogen Corp.(a) | | | 109,200 | | | 4,518,696 |
| Nutraceutical International Corp.(a) | | | 38,100 | | | 570,738 |
| Quality Systems, Inc. | | | 58,900 | | | 4,908,726 |
| West Pharmaceutical Services, Inc. | | | 94,000 | | | 4,208,380 |
| Wright Medical Group, Inc.(a) | | | 62,500 | | | 1,063,125 |
| ZOLL Medical Corp.(a) | | | 44,900 | | | 2,011,969 |
| | | | | | | 38,398,547 |
| Industrial Materials (4.0%) | | | | | | |
| Commercial Metals Co. | | | 154,100 | | | 2,661,307 |
| Minerals Technologies, Inc. | | | 58,900 | | | 4,035,828 |
| Quaker Chemical Corp. | | | 68,000 | | | 2,731,560 |
| STR Holdings, Inc.(a) | | | 69,200 | | | 1,327,256 |
| | | | | | | 10,755,951 |
| Industrial Products & Services (18.1%) | | | | | | |
| American Science & Engineering, Inc. | | | 45,500 | | | 4,202,380 |
| Apogee Enterprises, Inc. | | | 120,700 | | | 1,592,033 |
| Calgon Carbon Corp.(a) | | | 85,800 | | | 1,362,504 |
| CLARCOR, Inc. | | | 121,300 | | | 5,450,009 |
| ESCO Technologies, Inc. | | | 36,400 | | | 1,388,660 |
| Fuel-Tech, Inc.(a) | | | 148,000 | | | 1,317,200 |
| Genesee & Wyoming, Inc., Class A(a) | | | 108,000 | | | 6,285,600 |
| Herman Miller, Inc. | | | 44,900 | | | 1,234,301 |
| Hub Group, Inc., Class A(a) | | | 35,800 | | | 1,295,602 |
| Layne Christensen Co.(a) | | | 31,500 | | | 1,086,750 |
| Lindsay Manufacturing Co. | | | 41,900 | | | 3,310,938 |
| Met-Pro Corp. | | | 50,900 | | | 605,710 |
| Middleby Corp.(a) | | | 37,600 | | | 3,505,072 |
| Simpson Manufacturing Co., Inc. | | | 85,500 | | | 2,518,830 |
| Team, Inc.(a) | | | 173,500 | | | 4,556,110 |
| Wabtec Corp. | | | 88,700 | | | 6,016,521 |
| Watts Water Technologies, Inc., Class A | | | 77,100 | | | 2,944,449 |
| | | | | | | 48,672,669 |
| Information Technology (19.0%) | | | | | | |
| Blackbaud, Inc. | | | 85,500 | | | 2,329,020 |
| Blackboard, Inc.(a) | | | 44,900 | | | 1,627,176 |
| Blue Coat Systems, Inc.(a) | | | 107,400 | | | 3,024,384 |
| Bottomline Technologies, Inc.(a) | | | 74,200 | | | 1,865,388 |
| Ceragon Networks Ltd.(a) | | | 157,700 | | | 1,905,016 |
| Coherent, Inc.(a) | | | 38,200 | | | 2,219,802 |
| CommVault Systems, Inc.(a) | | | 77,700 | | | 3,098,676 |
| InterDigital, Inc. | | | 59,400 | | | 2,833,974 |
| Itron, Inc.(a) | | | 14,200 | | | 801,448 |
| J2 Global Communications, Inc.(a) | | | 147,400 | | | 4,349,774 |
| Liquidity Services, Inc.(a) | | | 131,700 | | | 2,352,162 |
| National Instruments Corp. | | | 121,550 | | | 3,983,193 |
| Net 1 UEPS Technologies, Inc.(a) | | | 142,600 | | | 1,226,360 |
| NIC, Inc. | | | 138,300 | | | 1,723,218 |
| Plantronics, Inc. | | | 158,400 | | | 5,800,608 |
| Power Integrations, Inc. | | | 112,900 | | | 4,327,457 |
| Renaissance Learning, Inc. | | | 75,800 | | | 890,650 |
| Sapient Corp.(a) | | | 334,900 | | | 3,834,605 |
| SunPower Corp., Class B(a) | | | 25,200 | | | 420,084 |
| Wright Express Corp.(a) | | | 38,100 | | | 1,975,104 |
| | | | | | | 50,588,099 |
| Utilities (3.5%) | | | | | | |
| American States Water Co. | | | 30,300 | | | 1,086,558 |
| New Jersey Resources Corp. | | | 96,500 | | | 4,144,675 |
| Ormat Technologies, Inc. | | | 20,500 | | | 519,265 |
| South Jersey Industries, Inc. | | | 67,300 | | | 3,766,781 |
| | | | | | | 9,517,279 |
| TOTAL COMMON STOCKS (Cost $218,630,059) | | | | | | 266,886,102 |
| |
| INVESTMENT COMPANIES (0.3%) |
Victory Federal Money Market, Investor Shares,
0.01% (b) | | | 791,795 | | | 791,795 |
| Total Investment Companies (Cost $791,795) | | | | | | 791,795 |
| Total Investments (Cost $219,421,854) (c) — 99.8% | | | | | | 267,677,897 |
| Other assets in excess of liabilities — 0.2% | | | | | | 559,492 |
| NET ASSETS — 100.0% | | | | | $ | 268,237,389 |
| |
| (a) | | Non-income producing security. |
| (b) | | Rate disclosed is the seven day yield as of March 31, 2011. |
| (c) | | See Federal Tax Information listed in the Notes to the Financial Statements. |
| See Notes to Financial Statements | | 23 |
| |
| |
| Financial Statements | | Boston Trust Small Cap Fund |
| |
| STATEMENT OF ASSETS AND LIABILITIES |
| March 31, 2011 |
| | | | |
| Assets: | | | |
| Investments, at fair value (cost $219,421,854) | | $ | 267,677,897 |
| Dividends receivable | | | 239,964 |
| Receivable for investments sold | | | 1,759,697 |
| Receivable for capital shares issued | | | 418,296 |
| Prepaid expenses and other assets | | | 24,539 |
Total Assets | | | 270,120,393 |
| Liabilities: | | | |
| Payable for investments purchased | | | 1,669,661 |
| Payable for capital shares redeemed | | | 2,634 |
| Accrued expenses and other liabilities: | | | |
Investment adviser | | | 146,119 |
Administration and accounting | | | 6,418 |
Custodian | | | 4,050 |
Transfer agent | | | 13,705 |
Trustee | | | 498 |
Other | | | 39,919 |
Total Liabilities | | | 1,883,004 |
| Net Assets | | $ | 268,237,389 |
| Composition of Net Assets: | | | |
| Capital | | $ | 203,071,043 |
| Accumulated net investment income | | | — |
| Accumulated net realized gains from investment transactions | | | 16,910,303 |
| Net unrealized appreciation from investments | | | 48,256,043 |
| Net Assets | | $ | 268,237,389 |
| Shares Outstanding (par value $0.01, unlimited number of shares authorized) | | | 19,162,019 |
| Net Asset Value, Offering Price and Redemption Price per share | | $ | 14.00 |
| STATEMENT OF OPERATIONS |
| For the year ended March 31, 2011 |
| | | | |
| Investment Income: | | | |
| Dividends | | $ | 2,129,967 |
Total Investment Income | | | 2,129,967 |
| Expenses: | | | |
Investment adviser | | | 1,381,352 |
Administration and accounting | | | 373,124 |
Trustee | | | 12,218 |
Custodian | | | 49,199 |
Transfer agency | | | 104,560 |
Chief compliance officer | | | 8,740 |
Other | | | 143,224 |
Total expenses before fee reductions | | | 2,072,417 |
Fees voluntarily reduced by the administrator | | | (121,777) |
Fees contractually reduced by the investment adviser | | | (105,195) |
| Net Expenses | | | 1,845,445 |
| Net Investment Income | | | 284,522 |
| Net Realized/Unrealized Gains from Investments: | | | |
Net realized gains from investment transactions | | | 21,136,670 |
Change in unrealized appreciation from investments | | | 26,567,497 |
| Net realized/unrealized gains from investments | | | 47,704,167 |
| Change in Net Assets Resulting from Operations | | $ | 47,988,689 |
| 24 | | See Notes to Financial Statements |
| |
| |
| Financial Statements | | Boston Trust Small Cap Fund |
| |
| STATEMENTS OF CHANGES IN NET ASSETS | | | | | | | | |
| |
| | | For the year ended | | | For the year ended | |
| | | March 31, | | | March 31, | |
| | | 2011 | | | 2010 | |
| Investment Activities: | | | | | | | | |
| Operations: | | | | | | | | |
Net investment income | | $ | 284,522 | | | $ | 226,806 | |
Net realized gains from investment transactions | | | 21,136,670 | | | | 5,571,322 | |
Change in unrealized appreciation from investments | | | 26,567,497 | | | | 28,303,344 | |
| Change in Net Assets Resulting from Operations | | | 47,988,689 | | | | 34,101,472 | |
| Dividends: | | | | | | | | |
Net investment income | | | (443,395) | | | | (147,516) | |
Net realized gains from investment transactions | | | (6,460,550) | | | | — | |
| Change in Net Assets Resulting from Shareholder Dividends | | | (6,903,945) | | | | (147,516) | |
| Capital Share Transactions: | | | | | | | | |
Proceeds from shares issued | | | 105,562,125 | | | | 83,648,260 | |
Dividends reinvested | | | 6,342,014 | | | | 125,768 | |
Cost of shares redeemed | | | (18,262,910) | | | | (6,524,057) | |
Cost of shares redeemed in-kind(a) | | | — | | | | (3,196,449) | |
| Change in Net Assets Resulting from Capital Share Transactions | | | 93,641,229 | | | | 74,053,522 | |
| Change in Net Assets | | | 134,725,973 | | | | 108,007,478 | |
| Net Assets: | | | | | | | | |
Beginning of period | | | 133,511,416 | | | | 25,503,938 | |
End of period | | $ | 268,237,389 | | | $ | 133,511,416 | |
| Share Transactions: | | | | | | | | |
Issued | | | 8,594,889 | | | | 8,971,228 | |
Reinvested | | | 495,857 | | | | 12,282 | |
Redeemed | | | (1,517,825) | | | | (650,734) | |
Redeemed in-kind(a) | | | — | | | | (278,774) | |
| Change in Shares | | | 7,572,921 | | | | 8,054,002 | |
| Accumulated net investment income | | $ | — | | | $ | 104,399 | |
| |
| (a) | | See Note 3 in Notes to Financial Statements. |
| See Notes to Financial Statements | | 25 |
| |
| |
| Financial Highlights | | Boston Trust Small Cap Fund |
| |
| FINANCIAL HIGHLIGHTS |
| Selected data for a share outstanding throughout the periods indicated. |
| | | For the year | | | For the year | | | For the year | | | For the year | | | For the year | |
| | | ended | | | ended | | | ended | | | ended | | | ended | |
| | | March 31, | | | March 31, | | | March 31, | | | March 31, | | | March 31, | |
| | | 2011 | | | 2010 | | | 2009 | | | 2008 | | | 2007 | |
| Net Asset Value, Beginning of Period | | $ | 11.52 | | | $ | 7.21 | | | $ | 10.92 | | | $ | 11.55 | | | $ | 10.94 | |
| Investment Activities: | | | | | | | | | | | | | | | | | | | | |
Net investment income (loss) | | | 0.02 | | | | 0.02 | | | | 0.02(a) | | | | 0.03 | | | | (0.01) | |
| Net realized and unrealized gains (losses) from investment transactions | | | 2.91 | | | | 4.31 | | | | (3.64) | | | | (0.14) | | | | 0.85 | |
| Total from Investment Activities | | | 2.93 | | | | 4.33 | | | | (3.62) | | | | (0.11) | | | | 0.84 | |
| Dividends: | | | | | | | | | | | | | | | | | | | | |
Net investment income | | | (0.03) | | | | (0.02) | | | | (0.02) | | | | (0.02) | | | | — | |
Net realized gains from investments | | | (0.42) | | | | — | | | | (0.07) | | | | (0.50) | | | | (0.23) | |
| Total Dividends | | | (0.45) | | | | (0.02) | | | | (0.09) | | | | (0.52) | | | | (0.23) | |
| Net Asset Value, End of Period | | $ | 14.00 | | | $ | 11.52 | | | $ | 7.21 | | | $ | 10.92 | | | $ | 11.55 | |
| Total Return | | | 25.78% | | | | 60.01% | | | | (33.24)% | | | | (1.21)% | | | | 7.75% | |
| Ratios/Supplemental Data: | | | | | | | | | | | | | | | | | | | | |
| Net Assets at end of period (000’s) | | $ | 268,237 | | | $ | 133,511 | | | $ | 25,504 | | | $ | 30,423 | | | $ | 20,679 | |
| Ratio of net expenses to average net assets | | | 1.00% | | | | 1.00% | | | | 1.10% | | | | 1.08% | | | | 1.25% | |
| Ratio of net investment income (loss) to | | | | | | | | | | | | | | | | | | | | |
average net assets | | | 0.15% | | | | 0.26% | | | | 0.21% | | | | 0.25% | | | | (0.13)% | |
| Ratio of expenses (before fee reductions) to | | | | | | | | | | | | | | | | | | | | |
average net assets(b) | | | 1.12% | | | | 1.14% | | | | 1.18% | | | | 1.14% | | | | 1.43% | |
| Portfolio Turnover Rate | | | 35.54% | | | | 26.68% | | | | 21.28% | | | | 19.53% | | | | 10.18% | |
| |
| (a) | | Calculated using the average shares method. |
| (b) | | During the period, certain fees were reduced. If such fee reductions had not occurred, the ratio would have been as indicated. |
| 26 | | See Notes to Financial Statements |
This page intentionally left blank.
27
Environmental, Social and
Governance Research and
Action Update (Unaudited) | |  |
Shareholder resolutions are front and center during the spring season of company annual meetings. Engaged investors eagerly await voting results that signal the strength of shareholder support for environmental, social or corporate governance (ESG) related ballot initiatives they champion. Headlines are made when shareholder resolutions garner majority support or exceed expectations.
Less visible are the shareholder resolutions that never appear on company proxy statements because management and investors have negotiated withdrawals. Yet these quiet dialogues are more often than not the avenue for meaningful progress on ESG goals. With two recent company agreements, Walden has now withdrawn 60 percent (11 of 18) of the resolutions we led (or co-led) for 2011 annual meetings.
Walden withdrew our resolution at Target requesting a comprehensive Board review of political contributions, including criteria for donations to candidates and procedures to assess associated risks. Target had unleashed nationwide controversy in 2010 for its contributions to MN Forward, a political group working to elect a gubernatorial candidate known for his opposition to lesbian and gay civil rights. In January, Target’s Board completed a review of policies, oversight and reporting on political spending, and adopted a new policy that is posted on its website. Though the policy does not prohibit spending in future elections, new checks and balances assure greater due diligence and sensitivity to potential risks.
St. Jude Medical’s commitment to produce an inaugural Corporate Social Responsibility (CSR) report, based on input from internal and external stakeholders including Walden, led us to withdraw our resolution seeking comprehensive ESG disclosure. While the CSR report will not meet best practice GRI (Global Reporting Initiative) standards, it will be informed by GRI guidelines and more detailed reporting is expected to be developed over time as the company seeks “continuous improvement.” We commend St. Jude Medical for placing an announcement in its proxy informing shareholders of the CSR report and Walden’s withdrawal. In another sign of responsiveness to shareholders, St. Jude Medical did not include a “statement of opposition” on a client-led resolution requesting annual election of directors in lieu of three year terms. Instead, the company asked to hear from shareholders without biasing the results.
Our first voting result in 2011 is in—just over one-third of votes cast supported our ESG reporting resolution at Emerson Electric. To date our interactions have focused on the environmental and energy efficiency benefits of many of its products, but Emerson has not been convinced of the value of comprehensive ESG disclosure. We hope to leverage this relatively strong investor backing in ongoing discussions with the company.
Continuing Focus: Chamber Board Membership
Our last update described multiple strategies Walden is pursuing to challenge companies’ use of firm resources to enable the U.S. Chamber of Commerce (the Chamber) to advance positions that appear to contradict their own policies and actions on issues such as climate change. A case in point is the Chamber’s lawsuit against the Environmental Protection Agency (EPA) in which it challenges the basis of EPA’s power to regulate greenhouse gases. Focusing on companies with Board representation on the Chamber, Walden is leading dialogues, an investor open letter and shareholder resolutions on this topic.
We have also begun utilizing an investor tool that is new to us, raising resolutions from the “floor” of annual meetings. Floor resolutions cannot be expected to garner significant shareholder support compared to traditional proxy resolutions, but they allow for a direct exploration of an issue while also providing a public record of the action. This strategy is prompting serious discussions about political spending policies and Chamber Board membership at a number of companies, including where Walden is leading the effort at 3M, ConocoPhillips, JPMorgan Chase and Pfizer. The floor resolution at Pfizer was withdrawn when the company adopted a new policy prohibiting the use of company funds for any political campaigns and placed a senior environmental executive on the Chamber’s environmental committee to strengthen representation of its positions.
Meanwhile James Rogers, CEO of Duke Energy, was most responsive to the investor open letter encouraging a review of
Environmental, Social and Governance Research and Action Update (Unaudited) (continued)
involvement in the Chamber. The company is reviewing formally its policy to determine the appropriate path—engagement or withdrawal—including whether “constructive engagement can bring the organization’s policy positions into better alignment with those of Duke Energy.”
Other Recent and Emerging Initiatives
In January Walden co-led a group of 39 institutional investors representing over $800 billion in assets calling for companies to support an annual advisory vote on executive compensation in their spring proxy statements and for investors to vote for annual “Say on Pay.” The Dodd-Frank reform bill called for mandatory Say on Pay, along with a vote on the frequency these should occur every one, two or three years. As of early April, annual votes are the clear favorite at over three-quarters of companies voted. Four companies failed to receive majority support for the advisory vote, including Hewlett-Packard.
We are co-leading a collaboration of Principles for Responsible Investment (PRI) and CDP Water Disclosure, a project of Climate Disclosure Project (CDP) that began last year, to encourage a response from companies with high exposure to water-related risks that did not complete its questionnaire on water management and conservation policies, practices and goals. The initial response rate among companies was impressive, with 50 percent of 302 companies completing the questionnaire.
Walden is concerned about growing challenges to limit EPA’s authority to regulate greenhouse gases, particularly in light of diminished hopes for passage of a sound climate change policy in the U.S. Congress. Walden joined 44 investors with over $500 billion in assets urging House and Senate leaders to allow the EPA to press ahead with greenhouse gas regulations and to oppose constraints on EPA’s authority to do so. We were relieved, at least temporarily, to see the EPA rider removed from recent contentious budget negotiations.
Immigration Reform: An Emerging Investor Concern
While calls for civility in public discourse may be cliché, the very uncivil tone of discussions on U.S. immigration policy has helped push immigration reform into a political dead zone. Yet a sound U.S. immigration policy—one that includes a pathway for currently unauthorized immigrants to earn legal status—is a business and human rights imperative. That’s why Walden is co-leading an investor initiative, representing approximately $145 billion in assets, to encourage business leaders to speak out for comprehensive immigration reform.
The historic and ongoing importance of immigrants in creating a prosperous U.S. economy is well documented. In March, for example, the annual Kauffman Index of Entrepreneurial Activity, a leading indicator of new business creation in the U.S., concluded: “A growing immigrant population and rising entrepreneurship rate contributed to a rise in the share of new entrepreneurs that are immigrant, from 13.4 percent in 1996 to 29.5 percent in 2010.” Meanwhile, many U.S. industries depend on immigrants, including undocumented workers, to operate their businesses. The Pew Hispanic Center estimates the share of employment occupied by unauthorized workers, who in 2008 totaled over 8 million, was 14 percent in construction, 13 percent in agriculture and 10 percent in leisure and hospitality. The bottom line: To be a successful global competitor, U.S. business must attract and retain the most talented and highly motivated people across the job-skill spectrum.
Lack of progress on federal immigration reform along with several draconian legislative efforts by individual states increasingly threatens the human rights of immigrants, some of whom face growing discrimination and violence. At least 5 million children of undocumented immigrants, the vast majority of whom were born in the U.S., endure an uncertain future that imperils their families. Moreover, fear of exposure keeps undocumented workers, who are disproportionately represented in low-wage occupations, vulnerable to unscrupulous employers who can violate wage, safety and discrimination laws with impunity.
To help end the legislative impasse, our coalition of faith-based investors, investment firms, unions and the New York City Comptroller wrote to over 150 CEOs to ask for their public support of comprehensive immigration reform that includes a pathway for currently undocumented workers. We cited the Partnership for a New American Economy (the Partnership), a bipartisan coalition of mayors and business leaders who are making the case for sensible immigration reform. Thus far 17 companies have responded, many sharing common concerns but none expressing willingness to take a public stand, including Apache, Colgate-Palmolive, Devon Energy, Emerson Electric, IBM and Merck. Plans to follow up on a targeted basis are in the works. We praise corporate leaders who are already speaking out through the Partnership, including co-Chairs Microsoft and Walt Disney, as well as Adobe Systems, JPMorgan Chase, Quest Diagnostics, and Time Warner Cable. Their support could help foster the political will necessary to make progress.
The equities of the companies in bold-face in the above commentary were holdings of the Funds as of March 31, 2011.
| | | |
| | | |
| | | |
| Walden Social Balanced Fund
Walden Social Equity Fund
March 31, 2011
Stephen K. Moody
Portfolio Manager
Walden Social Balanced Fund
Boston Trust Investment
Management, Inc.
Social Balanced Fund Objective
The investment objective of the Walden Social Balanced Fund is to seek long-term capital growth and income through an actively managed portfolio of stocks, bonds and money market instruments.
William H. Apfel, CFA
Portfolio Manager
Walden Social Equity Fund
Boston Trust Investment
Management, Inc.
Social Equity Fund Objective
The investment objective of the Walden Social Equity Fund is to seek long-term growth of capital.
Investment Concerns
Equity securities (stocks) are more volatile and carry more risk and return potential than other forms of investments, including investments in high-grade fixed income securities. The net asset value per share of this Fund will fluctuate as the value of the securities in the portfolio changes.
Bonds offer a relatively stable level of income, although bond prices will fluctuate, providing the potential for principal gain or loss. Intermediate-term, higher quality bonds generally offer less risk than longer-term bonds and a lower rate of return.
Cash equivalents offer low risk and low return potential. | | | | | |
| | | |
| | | |
| | | |
| | | |
| | | |
| | | |
| | | |
ManagerCommentary (Unaudited)
Management Discussion of Fund Performance
Portfolio Review
The Walden Social Balanced Fund was well positioned to participate in the favorable stock market trend over the past twelve months. Our constructive views about the sustainability of the current economic recovery—despite the ominous headlines—led us to retain the Fund’s equity allocation near 70% for most of the past year. While the Fund’s performance benefited from the above average equity exposure (the usual range is 45% to 75%), the Fund’s performance modestly trailed its Morningstar peer group average for the 12-month period. We are pleased that during this period of sharply rising markets the Fund’s emphasis on high quality, lower risk equity investments did not significantly constrain results. In contrast, the Fund’s bond segment performance fell short of the Barclays Capital U.S. Government/Credit Bond Index as longer maturity, and lower credit quality issues led the market higher. Given today’s low starting yields, we believe total returns for the fixed income segment in the year ahead are likely to be modest, and that the risks of extending maturities or increasing credit risk are substantial. We therefore have focused our efforts to achieve attractive total returns on the equity segment. As outlined on the performance chart on page 31, however, the Fund’s long-term results remain competitive.
The Walden Social Equity Fund returned 15.77% for 12-month period ended March 31, 2011 compared to the 15.65% for the S&P 500 Index. We are pleased to report strong, absolute returns during a period when more volatile, riskier stocks such as those of commodities and energy companies were in favor. We continue to emphasize dominant businesses well-placed to benefit from a global recovery.
Our Investment Strategy
In our view, stocks remain fairly priced by past standards, and are attractive compared to the low yields available in both money market instruments and bonds. Unless there is a significant change in the economic trend or a sharp rise in prices, we expect to keep the Balanced Fund’s equity exposure at the upper end of the range in the months ahead. We believe equity values will continue to be supported by a combination of the ample corporate cash flow and the continued profit growth we anticipate for the remainder of 2011 and into 2012.*
Within the Fund’s equity segment, and the Walden Social Equity Fund, we have emphasized stocks of companies that we believe will benefit comparatively from the broad global economic recovery that is underway. These include stocks in the industrial and technology industries. We also continue to emphasize stocks of higher quality companies. In our view higher quality stocks are not likely to decline as much as stocks generally if the pace of economic recovery decelerates unexpectedly. We also believe they remain attractively priced compared to equity securities of most risky, less proven companies.*
Our investment position within the fixed income segment of the Balanced Fund is also unchanged; we continue to prefer investment-grade issues with comparatively short maturities. From a total return perspective, the incremental yield available in longer-maturity or higher credit risk bonds is insufficient, in our view to compensate for the potential loss in principal value if interest rates rise or credit conditions deteriorate.*
* Portfolio composition is subject to change. |
30
| Investment Performance (Unaudited) | Walden Social Balanced Fund
Walden Social Equity Fund
March 31, 2011 |
| | | Annualized |
| | | 1 Year | | 5 Years | | 10 Years |
| | | Ended | | Ended | | Ended |
| | | 3/31/11 | | 3/31/11 | | 3/31/11 |
| Walden Social Balanced Fund1 | | 11.32 | % | | 3.57 | % | | 4.15 | % |
| Walden Social Equity Fund1 | | 15.77 | % | | 4.23 | % | | 4.85 | % |
| S&P 500 Index | | 15.65 | % | | 2.62 | % | | 3.29 | % |
|
| Barclays Capital U.S. Government/Credit Bond Index | | 5.26 | % | | 5.83 | % | | 5.53 | % |
|
| Citigroup 90-Day U.S. Treasury Bill Index | | 0.15 | % | | 2.10 | % | | 2.12 | % |
|
| Morningstar U.S. Open-End Moderate Allocation Funds Average | | 11.97 | % | | 3.55 | % | | 4.36 | % |
|
Hypothetical Growth of a $10,000 Investment
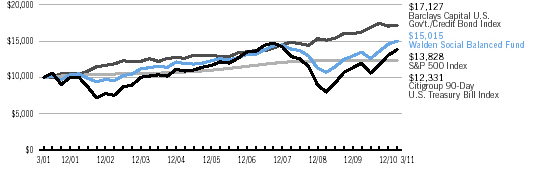
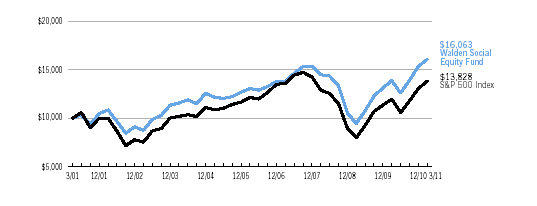
The charts represent historical 10-year performance of a hypothetical investment of $10,000 in the Walden Social Balanced Fund and Walden Social Equity Fund, respectively, and represents the reinvestment of dividends and capital gains in the Fund. The returns shown on the table and graph do not reflect the deduction of taxes a shareholder would pay on Fund distributions or the redemption of Fund shares.
The Walden Social Balanced Fund is measured against a combination of equity and fixed income indices. The Walden Social Equity Fund is measured against the Standard & Poor’s 500 Index (“S&P 500”) which is widely regarded as a gauge of the U.S. equities market. This index includes 500 leading companies in leading industries of the U.S. economy. Although the S&P 500 focuses on the large cap segment of the market, with approximately 75% coverage of U.S. equities, it is also also widely viewed as a proxy for the total market. The Barclays Capital U.S. Government/Credit Bond Index is a component of the Barclays U.S. Aggregate Index. The Barclays Capital U.S. Government/Credit Bond Index includes Treasuries (i.e., public obligations of the U.S. Treasury that have remaining maturities of more than one year), Government-Related issues (i.e., agency, sovereign, supranational, and local authority debt), and USD Corporates. The Citigroup 90-Day U.S. Treasury Bill Index reflects monthly return equivalents of yield averages that are not marked to the market. The Index is an average of the last three-month treasury bill issues. The three-month treasury bills are the short-term debt obligations of the U.S. Government. The Morningstar U.S. Open-End Moderate Allocation Funds Average represents performance of portfolios that seek to provide both capital appreciation and income by investing in three major areas: stocks, bonds, and cash. These portfolios tend to hold larger positions in stocks than conservative-allocation portfolios. These portfolios typically have 50% to 70% of assets in equities and the remainder in fixed income and cash. The indices are unmanaged and their performance does not reflect the deduction of expenses associated with a mutual fund, such as investment management and fund accounting fees. The Fund’s performance reflects the deduction of fees for these services. Investors cannot invest directly in an index.

Social Balanced Fund
| Fund Net Asset Value: | $12.07 |
| Gross Expense Ratio1: | 1.18% |
Social Equity Fund
| Fund Net Asset Value: | $13.32 |
| Gross Expense Ratio1: | 1.17% |
Past performance does not guarantee future results. The performance data quoted represents past performance and current returns may be lower or higher. The investment return and principal value will fluctuate so that an investor’s shares, when redeemed may be worth more or less than the original cost. To obtain performance information current to the most recent month-end, please call 1-800-282-8782 ext. 7050.
| 1 | The Gross Expense Ratio is from the Fund’s most recent prospectus, dated August 1, 2010. The Gross Expense Ratio excludes the impact of any voluntary or contractual fee waivers. After giving effect to such fee waivers, the Social Balanced Fund’s Net Expense Ratio would be 1.01% and the Social Equity Fund’s Net Expense Ratio would be 1.01%, including the indirect expenses of investing in acquired funds. Please see the Fund’s most recent prospectus for details. Additional information pertaining to the Fund’s expense ratio as of March 31, 2011 can be found in the financial highlights. The investment performance reflects voluntary and contractual fee waivers. If such fee reductions had not occurred, the quoted performance would have been lower. The voluntary fee waivers may be discontinued at any time. The contractual fee waiver continues through August 1, 2012 and may be terminated thereafter. |
31
| |
Walden Small Cap Innovations Fund | |
| | March 31, 2011 | |
| |
Kenneth P. Scott, CFA | |
| | Portfolio Manager and Boston Trust Investment Management, Inc. | |
| |
Fund Objective | |
| | The investment objective of the Walden Small Cap Innovations Fund is to seek long-term capital growth through an actively managed portfolio of stocks of small capitalization companies. | |
| |
Investment Concerns | |
| | Equity securities (stocks) are more volatile and carry more risk and return potential than other forms of investments, including investments in high-grade fixed income securities.
Small-capitalization funds typically carry additional risks since smaller companies generally have a higher risk of failure, and historically, their stocks have experienced a greater degree of market volatility than stocks on average. | |
| | | |
| | | |
| | | |
| | | |
| | | |
| | | |
| | | |
| | | |
| | | |
| | | |
Manager Commentary (Unaudited)
Management Discussion of Fund Performance
Portfolio Review
The Walden Small Cap Innovations Fund, which focuses on higher quality, innovative companies, rose 25.13% for the year ended March 31, 2011, in-line with the robust performance of the Russell 2000® Index. For the trailing since inception period ended March 31, 2011, the Fund performed in-line with the benchmark.
Contributors and Detractors to Performance
Overall, the Fund participated, albeit not fully, in the strong market rise of most quarters this fiscal year, while avoiding some of the downturn last spring. This performance pattern is consistent, in our view, with the Fund’s focus on higher quality, innovative companies. Generally speaking, higher quality firms underperform in a period of sharply rising stock prices. And, by certain measures of financial quality, such as returns on capital, and the stability of profitability, it appears that higher quality small cap firms did modestly underperform the small cap market during the past year, especially during the summer months. The Fund’s higher quality profile benefited from the market’s volatility this past year, in our view, while the acquisition of four Fund holdings in late 2010 also contributed positively. As noted previously, we aim to maintain Fund sector weights comparable to those of the overall market. Thus, our sector composition generally has no significant impact on overall performance.
The best-performing Fund holdings through the full year period were CARBO Ceramics, Inc. (CRR), which represents 2.73% of the Fund at March 31, 2011, Hain Celestial Group, Inc. (HAIN)(0.59%), Lindsay Manufacturing Co. (LNN)(1.21%), and Under Armour, Inc. (UA) (1.67%). Conversely, the Fund laggards for the full year period were eHealth, Inc. (EHTH) (0.86%), Itron, Inc. (ITRI)(0.30%), Net 1 UEPS Technologies, Inc. (UEPS)(0.45%), and NutriSystem, Inc. (NTRI)(0.31%).*
Changes in Fund Positions
We sold the entire position of 17 small-cap stocks during the year. Five firms, including Lululemon Athletica (LULU), grew over Boston Trust’s upper market cap threshold. Four firms, including Baldor Electric (BEZ), were acquired. We sold 8 firms from the Fund due to concerns about the sustainability of future profitability or deteriorating fundamentals. These included Pre-Paid Legal Services (PPD) and Timberland (TBL).*
Conversely, we established new positions in 27 higher quality, innovative small cap company stocks during the fiscal year. Examples include East West Bancorp, Inc. (EWBC) (1.58%), Hub Group, Inc. (HUBG)(0.47%), InterDigital, Inc. (IDCC)(1.03%), NIC, Inc. (EGOV)(0.63%), and OYO Geospace Corp. (OYOG)(0.49%).
Fund Manager Outlook
With a trailing Price-to-Earnings1 ratio of 39x at March 31, 2011, the valuation of the Russell 2000® implies a continued, strong recovery in small cap company earnings. The market may have an overly optimistic outlook for small cap firms overall, and a shortfall in sales and earnings may prove disappointing. However, if the economy continues to improve, and small cap stocks live up to market expectations for growth, then these stocks may continue to perform well. In either case, we continue to believe that our focus on innovative, higher quality, more reasonably valued stocks leveraged to more sustainable elements of economic growth, may continue to provide value to clients’ overall portfolios over time.
| 1 | The Price-to-Earnings Ratio (“P/E Ratio”) is a valuation ratio of a company’s current share price to its per-share earnings. A high P/E means high projected earnings in the future. |
| * | Portfolio composition is subject to change. |
32
| Investment Performance (Unaudited) | Walden Small Cap Innovations Fund
March 31, 2011 |
| | | Annualized |
| | | 1 Year | | Since |
| | | Ended | | Inception |
| | | 3/31/11 | | 10/24/08 |
| Walden Small Cap Innovations Fund1 | | 25.13 | % | | 29.02 | % |
| Russell 2000® Index | | 25.79 | % | | 28.86 | % |
|
Hypothetical Growth of a $10,000 Investment
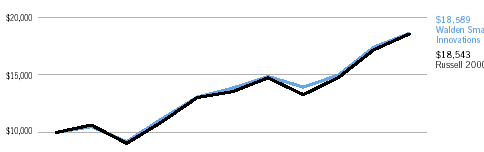
The chart represents historical performance of a hypothetical investment of $10,000 in the Walden Small Cap Innovations Fund from October 24, 2008 to March 31, 2011, and represents the reinvestment of dividends and capital gains in the Fund. The returns shown on the table and graph do not reflect the deduction of taxes a shareholder would pay on Fund distributions or the redemption of Fund shares.
The Walden Small Cap Innovations Fund is measured against the Russell 2000® Index, which is an unmanaged index that measures the performance of the small-cap segment of the U.S. equity universe. The Russell 2000® Index is a subset of the Russell 3000® Index representing approximately 8% of the total market capitalization of that index. It includes approximately 2,000 of the smallest securities based on a combination of their market cap and current index membership. The performance of an index does not reflect the deduction of expenses associated with a mutual fund, such as investment management and fund accounting fees. The Fund’s performance reflects the deduction of fees for these services. Investors cannot invest directly in an index.

| Fund Net Asset Value: | $17.64 |
| Gross Expense Ratio1: | 1.70% |
Past performance does not guarantee future results. The performance data quoted represents past performance and current returns may be lower or higher. The investment return and principal value will fluctuate so that an investor’s shares, when redeemed may be worth more or less than the original cost. To obtain performance information current to the most recent month-end, please call 1-800-282-8782 ext. 7050.
| 1 | The Gross Expense Ratio is from the Fund’s most recent prospectus, dated August 1, 2010. The Gross Expense Ratio excludes the impact of any voluntary or contractual fee waivers. After giving effect to such fee waivers, the Fund’s Net Expense Ratio would be 1.02%, including the indirect expenses of investing in acquired funds. Please see the Fund’s most recent prospectus for details. Additional information pertaining to the Fund’s expense ratio as of March 31, 2011 can be found in the financial highlights. The investment performance reflects voluntary and contractual fee waivers. If such fee reductions had not occurred, the quoted performance would have been lower. The voluntary fee waivers may be discontinued at any time. The contractual fee waiver continues through August 1, 2012 and may be terminated thereafter. |
33
| |
| |
| Schedule of Portfolio Investments | | Walden Social Balanced Fund
March 31, 2011 |
| |
| Security Description | | | | Shares | | | Fair Value ($) |
| | | | | | | | |
| Consumer Discretionary (7.5%) | | | | | | |
| Johnson Controls, Inc. | | | 12,000 | | | 498,840 |
| NIKE, Inc., Class B | | | 8,000 | | | 605,600 |
| Omnicom Group, Inc. | | | 14,000 | | | 686,840 |
| Ross Stores, Inc. | | | 7,000 | | | 497,840 |
| Target Corp. | | | 11,000 | | | 550,110 |
| The Home Depot, Inc. | | | 5,000 | | | 185,300 |
| Time Warner Cable, Inc. | | | 7,966 | | | 568,295 |
| | | | | | | | 3,592,825 |
| | | | | | | | |
| Consumer Products (7.9%) | | | | | | |
| Colgate-Palmolive Co. | | | 5,000 | | | 403,800 |
| Costco Wholesale Corp. | | | 9,500 | | | 696,540 |
| Kellogg Co. | | | 5,000 | | | 269,900 |
| Nestle SA, Sponsored ADR | | | 6,000 | | | 344,880 |
| PepsiCo, Inc. | | | 9,600 | | | 618,336 |
| Procter & Gamble Co. | | | 9,300 | | | 572,880 |
| SYSCO Corp. | | | 17,700 | | | 490,290 |
| Walgreen Co. | | | 10,000 | | | 401,400 |
| | | | | | | | 3,798,026 |
| | | | | | | | |
| Energy (10.4%) | | | | | | |
| Apache Corp. | | | 7,500 | | | 981,900 |
| BG Group PLC, Sponsored ADR | | | 6,500 | | | 811,850 |
| ConocoPhillips | | | 15,000 | | | 1,197,900 |
| Core Laboratories NV | | | 6,000 | | | 613,020 |
| Denbury Resources, Inc.(a) | | | 22,000 | | | 536,800 |
| Devon Energy Corp. | | | 9,500 | | | 871,815 |
| | | | | | | | 5,013,285 |
| | | | | | | | |
| Financial Services (8.5%) | | | | | | |
| BB&T Corp. | | | 11,000 | | | 301,950 |
| Chubb Corp. | | | 10,000 | | | 613,100 |
| Cincinnati Financial Corp. | | | 20,000 | | | 656,000 |
| Comerica, Inc. | | | 8,000 | | | 293,760 |
| Commerce Bancshares, Inc. | | | 4,000 | | | 161,760 |
| JPMorgan Chase & Co. | | | 6,000 | | | 276,600 |
| Northern Trust Corp. | | | 5,800 | | | 294,350 |
| PNC Financial Services Group, Inc. | | | 5,000 | | | 314,950 |
| State Street Corp. | | | 8,000 | | | 359,520 |
| T. Rowe Price Group, Inc. | | | 12,000 | | | 797,040 |
| | | | | | | | 4,069,030 |
| Health Care (7.8%) | | | | | | |
| Becton, Dickinson & Co. | | | 7,800 | | | 621,036 |
| C.R. Bard, Inc. | | | 7,000 | | | 695,170 |
| DENTSPLY International, Inc. | | | 18,000 | | | 665,820 |
| Johnson & Johnson, Inc. | | | 6,000 | | | 355,500 |
| Medtronic, Inc. | | | 7,000 | | | 275,450 |
| Saint Jude Medical, Inc. | | | 7,500 | | | 384,450 |
| Stryker Corp. | | | 6,000 | | | 364,800 |
| Waters Corp.(a) | | | 4,400 | | | 382,360 |
| | | | | | | | 3,744,586 |
| Industrial Materials (4.1%) | | | | | | |
| AptarGroup, Inc. | | | 10,000 | | | 501,300 |
| Ecolab, Inc. | | | 5,000 | | | 255,100 |
| Praxair, Inc. | | | 5,000 | | | 508,000 |
| Sigma-Aldrich Corp. | | | 11,000 | | | 700,040 |
| | | | | | | | 1,964,440 |
| | | | | Shares or | | |
| | | | | Principal | | |
| Security Description | | | | Amount ($) | | Fair Value ($) |
| | | | | | | |
| Industrial Products & Services (11.7%) | | | | | |
| 3M Co. | | | 7,600 | | 710,600 |
| Deere & Co. | | | 7,000 | | 678,230 |
| Donaldson Co., Inc. | | | 11,000 | | 674,190 |
| Emerson Electric Co. | | | 15,000 | | 876,450 |
| Illinois Tool Works, Inc. | | | 16,000 | | 859,520 |
| Lincoln Electric Holdings, Inc. | | | 6,000 | | 455,520 |
| United Parcel Service, Inc., Class B | | | 9,000 | | 668,880 |
| W.W. Grainger, Inc. | | | 5,000 | | 688,400 |
| | | | | | | 5,611,790 |
| Information Technology (13.6%) | | | | | |
| Accenture PLC, Class A | | | 14,000 | | 769,580 |
| Apple, Inc.(a) | | | 1,460 | | 508,737 |
| Automatic Data Processing, Inc. | | | 10,000 | | 513,100 |
| Check Point Software Technologies Ltd.(a) | | | 9,000 | | 459,450 |
| Cisco Systems, Inc. | | | 24,000 | | 411,600 |
| EMC Corp.(a) | | | 26,000 | | 690,300 |
| Google, Inc., Class A(a) | | | 600 | | 351,726 |
| Hewlett-Packard Co. | | | 8,000 | | 327,760 |
| Intel Corp. | | | 18,000 | | 363,060 |
| International Business Machines Corp. | | | 4,000 | | 652,280 |
| Microsoft Corp. | | | 20,000 | | 507,200 |
| Oracle Corp. | | | 12,000 | | 400,440 |
| QUALCOMM, Inc. | | | 11,000 | | 603,130 |
| | | | | | | 6,558,363 |
| | | | | | | |
| Utilities (0.7%) | | | | | |
| Questar Corp. | | | 20,000 | | 349,000 |
| TOTAL COMMON STOCKS (Cost $26,617,315) | | | | | 34,701,345 |
| CORPORATE BONDS (5.9%) | | | | | | |
| Financial Services (4.6%) | | | | | |
| American Express Co. | | | | | |
| 7.00%, 3/19/18 | | | 250,000 | | 292,592 |
| 8.13%, 5/20/19 | | | 250,000 | | 312,403 |
| Calvert Social Investment Foundation | | | | | |
| 3.00%, 12/31/11 | | | 175,000 | | 175,000 |
| 3.00%, 8/15/12 | | | 75,000 | | 75,000 |
| National Rural Utilities Cooperative Finance Corp., | | | | | |
| 10.38%, 11/1/18 | | | 250,000 | | 341,825 |
| Wells Fargo & Co., 3.00%, 12/9/11 | | | 1,000,000 | | 1,018,881 |
| | | | | | | 2,215,701 |
| | | | | | | |
| Health Care (0.6%) | | | | | |
| Abbott Laboratories, 5.60%, 5/15/11 | | | 300,000 | | 301,946 |
| | | | | | | |
| Information Technology (0.5%) | | | | | |
| Oracle Corp., 5.75%, 4/15/18 | | | 200,000 | | 224,284 |
| | | | | | | |
| Telecommunications (0.2%) | | | | | |
| AT&T, Inc., 5.50%, 2/1/18 | | | 100,000 | | 109,316 |
| TOTAL CORPORATE BONDS (Cost $2,665,892) | | | | | 2,851,247 |
| 34 | | See Notes to Financial Statements |
| |
| |
| Schedule of Portfolio Investments (cont.) | | Walden Social Balanced Fund
March 31, 2011 |
| |
| | | | | | | |
| | | | | Principal | | |
| Security Description | | | | Amount ($) | | Fair Value ($) |
| | | | | | | |
| California (0.6%) | | | | | |
| California State, GO, 4.50%, 8/1/28, AMBAC, | | | | | |
Callable 2/1/17 @ 100 | | | 310,000 | | 275,274 |
| | | | | | | |
| Illinois (0.4%) | | | | | |
| Illinois State, GO, 5.00%, 6/1/27, NATL-RE FGIC, | | | | | |
Callable 6/1/13 @ 100 | | | 200,000 | | 185,914 |
| | | | | | | |
| Ohio (0.3%) | | | | | |
| Ohio State, Series D, GO, 4.50%, 9/15/22, | | | | | |
NATL-RE, Callable 3/15/16 @ 100 | | | 150,000 | | 153,602 |
| | | | | | | |
| Oregon (0.2%) | | | | | |
| Oregon State, Series A, GO, 5.00%, 10/1/14 | | | 100,000 | | 107,816 |
| | | | | | | |
| Wisconsin (0.5%) | | | | | |
| Wisconsin State, GO, 4.60%, 5/1/26, Callable | | | | | |
5/1/21 @ 100 | | | 250,000 | | 235,697 |
| TOTAL MUNICIPAL BONDS (Cost $982,892) | | | | | 958,303 |
| | | | | | |
| U.S. GOVERNMENT & U.S. GOVERNMENT AGENCY OBLIGATIONS (18.6%) |
| Federal Farm Credit Bank | | | | | |
2.00%, 1/17/12 | | | 200,000 | | 202,701 |
2.13%, 6/18/12 | | | 250,000 | | 254,962 |
5.38%, 11/10/20 | | | 250,000 | | 283,002 |
| Federal Home Loan Bank | | | | | |
1.00%, 12/28/11 | | | 500,000 | | 502,649 |
1.13%, 3/9/12 | | | 3,500,000 | | 3,526,026 |
2.25%, 4/13/12 | | | 300,000 | | 305,826 |
5.25%, 12/11/20 | | | 500,000 | | 553,599 |
5.25%, 8/15/22 | | | 1,000,000 | | 1,113,626 |
| Federal National Mortgage Association, | | | | | |
1.25%, 6/22/12 | | | 500,000 | | 504,764 |
| Financing Corp., 2.92%, 4/5/13(a)(b) | | | 100,000 | | 97,618 |
| Government National Mortgage Association | | | | | |
6.00%, 7/15/34 | | | 88,097 | | 97,049 |
6.50%, 5/15/32 | | | 62,548 | | 70,845 |
| Housing and Urban Development, Series 00-A, | | | | | |
7.50%, 8/1/11, Callable 5/9/11 @ 100 | | | 90,000 | | 90,537 |
| U.S. Treasury Inflation Protected Bonds, | | | | | |
1.25%, 7/15/20 | | | 1,262,062 | | 1,305,344 |
| | | | | | | |
| TOTAL U.S. GOVERNMENT & U.S. GOVERNMENT AGENCY OBLIGATIONS (Cost $8,758,540) | | | | | 8,908,548 |
| INVESTMENT COMPANIES (0.8%) |
| | | | | Shares or | | | |
| | | | | Principal | | | |
| Security Description | | | | Amount ($) | | | Fair Value ($) |
| | | | | | | | |
Victory Federal Money Market, Investor Shares,
0.01% (c) | | | 363,395 | | | 363,395 |
| Total Investment Companies (Cost $363,395) | | | | | | 363,395 |
| Total Investments (Cost $39,388,034) (d) — 99.5% | | | | | | 47,782,838 |
| Other assets in excess of liabilities — 0.5% | | | | | | 260,738 |
| NET ASSETS — 100.0% | | | | | $ | 48,043,576 |
|
| (a) | | Non-income producing security. |
| (b) | | Rate represents the effective yield at purchase. |
| (c) | | Rate disclosed is the seven day yield as of March 31, 2011. |
| (d) | | See Federal Tax Information listed in the Notes to Financial Statements. |
| ADR | | American Depositary Receipt |
| AMBAC | | Insured by American Municipal Bond Assurance Corporation |
| FGIC | | Insured by Financial Guaranty Insurance Company |
| GO | | General Obligation |
| NATL-RE | | Reinsured by National Public Finance Guarantee Corporation |
| PLC | | Public Limited Company |
See Notes to Financial Statements | | 35 |
| | | |
| | | |
| Financial Statements | | Walden Social Balanced Fund |
| | | |
| STATEMENT OF ASSETS AND LIABILITIES | | | | |
| March 31, 2011 | | | | |
| | | | | |
| Assets: | | | | |
| Investments, at fair value (cost $39,388,034) | | $ | 47,782,838 | |
| Interest and dividends receivable | | | 145,869 | |
| Receivable for investments sold | | | 624,455 | |
| Receivable for capital shares issued | | | 765 | |
| Prepaid expenses and other assets | | | 11,974 | |
Total Assets | | | 48,565,901 | |
| Liabilities: | | | | |
| Payable for investments purchased | | | 481,058 | |
| Payable for capital shares redeemed | | | 1,226 | |
| Accrued expenses and other liabilities: | | | | |
Investment adviser | | | 27,342 | |
Administration and accounting | | | 1,201 | |
Custodian | | | 703 | |
Transfer agent | | | 2,951 | |
Trustee | | | 102 | |
Other | | | 7,742 | |
Total Liabilities | | | 522,325 | |
| Net Assets | | $ | 48,043,576 | |
| Composition of Net Assets: | | | | |
| Capital | | $ | 40,650,932 | |
| Accumulated net investment income | | | 134,162 | |
| Accumulated net realized losses from investment transactions | | | (1,136,322) | |
| Net unrealized appreciation from investments | | | 8,394,804 | |
| Net Assets | | $ | 48,043,576 | |
| Shares Outstanding (par value $0.01, unlimited number of shares authorized) | | | 3,980,511 | |
| Net Asset Value, Offering Price and Redemption Price per share | | $ | 12.07 | |
| STATEMENT OF OPERATIONS | | | | |
| For the year ended March 31, 2011 | | | | |
| | | | | |
| Investment Income: | | | | |
| Interest | | $ | 434,399 | |
| Dividends | | | 567,174 | |
| Less: Foreign tax withholding | | | (1,957) | |
Total Investment Income | | | 999,616 | |
| Expenses: | | | | |
Investment adviser | | | 326,088 | |
Administration and accounting | | | 93,388 | |
Trustee | | | 2,847 | |
Custodian | | | 9,349 | |
Transfer agency | | | 23,701 | |
Chief compliance officer | | | 2,126 | |
Other | | | 38,055 | |
Total expenses before fee reductions | | | 495,554 | |
Fees voluntarily reduced by the administrator | | | (28,564) | |
Fees contractually reduced by the investment adviser | | | (32,028) | |
| Net Expenses | | | 434,962 | |
| Net Investment Income | | | 564,654 | |
| Net Realized/Unrealized Gains from Investments: | | | | |
Net realized gains from investment transactions | | | 938,535 | |
Change in unrealized appreciation from investments | | | 3,310,833 | |
| Net realized/unrealized gains from investments | | | 4,249,368 | |
| Change in Net Assets Resulting from Operations | | $ | 4,814,022 | |
| 36 | | See Notes to Financial Statements |
| | | |
| | | |
| Financial Statements | | Walden Social Balanced Fund |
| | | |
| STATEMENTS OF CHANGES IN NET ASSETS |
| | | | | | | | | |
| | | For the year ended | | | For the year ended | |
| | | March 31, | | | March 31, | |
| | | 2011 | | | 2010 | |
| Investment Activities: | | | | | | | | |
| Operations: | | | | | | | | |
Net investment income | | $ | 564,654 | | | $ | 555,747 | |
Net realized gains from investment transactions | | | 938,535 | | | | 290,665 | |
Change in unrealized appreciation from investments | | | 3,310,833 | | | | 6,965,282 | |
| Change in Net Assets Resulting from Operations | | | 4,814,022 | | | | 7,811,694 | |
| Dividends: | | | | | | | | |
Net investment income | | | (566,820) | | | | (460,378) | |
| Change in Net Assets Resulting from Shareholder Dividends | | | (566,820) | | | | (460,378) | |
| Capital Share Transactions: | | | | | | | | |
Proceeds from shares issued | | | 4,143,187 | | | | 7,682,862 | |
Dividends reinvested | | | 428,084 | | | | 335,149 | |
Cost of shares redeemed | | | (2,274,798) | | | | (2,874,682) | |
| Change in Net Assets Resulting from Capital Share Transactions | | | 2,296,473 | | | | 5,143,329 | |
| Change in Net Assets | | | 6,543,675 | | | | 12,494,645 | |
| Net Assets: | | | | | | | | |
Beginning of period | | | 41,499,901 | | | | 29,005,256 | |
End of period | | $ | 48,043,576 | | | $ | 41,499,901 | |
| Share Transactions: | | | | | | | | |
Issued | | | 365,154 | | | | 752,440 | |
Reinvested | | | 37,064 | | | | 32,072 | |
Redeemed | | | (201,345) | | | | (285,804) | |
| Change in Shares | | | 200,873 | | | | 498,708 | |
| Accumulated net investment income | | $ | 134,162 | | | $ | 136,327 | |
See Notes to Financial Statements | | 37 |
| | | |
| | | |
| Financial Statements | | Walden Social Balanced Fund |
| | | |
| FINANCIAL HIGHLIGHTS |
| Selected data for a share outstanding throughout the years indicated. |
| | | | | | | | | | | | | | | | | | | | | |
| | | For the year | | | For the year | | | For the year | | | For the year | | | For the year | |
| | | ended | | | ended | | | ended | | | ended | | | ended | |
| | | March 31, | | | March 31, | | | March 31, | | | March 31, | | | March 31, | |
| | | 2011 | | | 2010 | | | 2009 | | | 2008 | | | 2007 | |
| Net Asset Value, Beginning of Period | | $ | 10.98 | | | $ | 8.84 | | | $ | 11.90 | | | $ | 11.83 | | | $ | 11.58 | |
| Investment Activities: | | | | | | | | | | | | | | | | | | | | |
Net investment income | | | 0.15 | | | | 0.16 | | | | 0.16(a) | | | | 0.19 | | | | 0.18 | |
Net realized and unrealized gains (losses) from investment transactions | | | 1.09 | | | | 2.11 | | | | (2.88) | | | | 0.46 | | | | 0.38 | |
| Total from Investment Activities | | | 1.24 | | | | 2.27 | | | | (2.72) | | | | 0.65 | | | | 0.56 | |
| Dividends: | | | | | | | | | | | | | | | | | | | | |
Net investment income | | | (0.15) | | | | (0.13) | | | | (0.21) | | | | (0.17) | | | | (0.17) | |
Net realized gains from investments | | | — | | | | — | | | | (0.13) | | | | (0.41) | | | | (0.14) | |
| Total Dividends | | | (0.15) | | | | (0.13) | | | | (0.34) | | | | (0.58) | | | | (0.31) | |
| Net Asset Value, End of Period | | $ | 12.07 | | | $ | 10.98 | | | $ | 8.84 | | | $ | 11.90 | | | $ | 11.83 | |
| Total Return | | | 11.32% | | | | 25.78% | | | | (22.91)% | | | | 5.30% | | | | 4.85% | |
| Ratios/Supplemental Data: | | | | | | | | | | | | | | | | | | | | |
| Net Assets at end of period (000’s) | | $ | 48,044 | | | $ | 41,500 | | | $ | 29,005 | | | $ | 33,182 | | | $ | 29,644 | |
| Ratio of net expenses to average net assets | | | 1.00% | | | | 1.00% | | | | 1.00% | | | | 1.00% | | | | 1.00% | |
| Ratio of net investment income to average net assets | | | 1.30% | | | | 1.59% | | | | 1.55% | | | | 1.52% | | | | 1.52% | |
| Ratio of expenses (before fee reductions) to average net assets(b) | | | 1.14% | | | | 1.17% | | | | 1.19% | | | | 1.16% | | | | 1.17% | |
| Portfolio Turnover Rate | | | 31.03% | | | | 27.02% | | | | 71.27% | | | | 38.99% | | | | 28.57% | |
|
| (a) | | Calculated using the average shares method. |
| (b) | | During the period, certain fees were reduced. If such fee reductions had not occurred, the ratio would have been as indicated. |
| 38 | | See Notes to Financial Statements |
| |
| |
| Schedule ofPortfolio Investments | | Walden Social Equity Fund
March 31, 2011 |
| | | |
| COMMON STOCKS (98.3%) | | | | | |
| Security Description | | | | Shares | | Fair Value ($) |
| | | | | | | |
| Consumer Discretionary (9.3%) | | | | | |
| Johnson Controls, Inc. | | | 22,000 | | 914,540 |
| Lowe’s Cos., Inc. | | | 35,000 | | 925,050 |
| NIKE, Inc., Class B | | | 18,000 | | 1,362,600 |
| Omnicom Group, Inc. | | | 18,000 | | 883,080 |
| Ross Stores, Inc. | | | 16,000 | | 1,137,920 |
| The TJX Cos., Inc. | | | 20,000 | | 994,600 |
| The Walt Disney Co. | | | 20,000 | | 861,800 |
| Time Warner Cable, Inc. | | | 21,332 | | 1,521,825 |
| | | | | | | 8,601,415 |
| | | | | | | |
| Consumer Products (14.9%) | | | | | |
| Colgate-Palmolive Co. | | | 17,000 | | 1,372,920 |
| Costco Wholesale Corp. | | | 18,000 | | 1,319,760 |
| General Mills, Inc. | | | 30,000 | | 1,096,500 |
| Kellogg Co. | | | 20,000 | | 1,079,600 |
| McCormick & Co., Inc. | | | 20,000 | | 956,600 |
| McDonald’s Corp. | | | 20,000 | | 1,521,800 |
| Nestle SA, Sponsored ADR | | | 22,000 | | 1,264,560 |
| PepsiCo, Inc. | | | 20,000 | | 1,288,200 |
| Procter & Gamble Co. | | | 20,000 | | 1,232,000 |
| SYSCO Corp. | | | 43,000 | | 1,191,100 |
| Walgreen Co. | | | 35,000 | | 1,404,900 |
| | | | | | | 13,727,940 |
| | | | | | | |
| Energy (13.5%) | | | | | |
| Apache Corp. | | | 20,000 | | 2,618,400 |
| BG Group PLC, Sponsored ADR | | | 14,000 | | 1,748,600 |
| ConocoPhillips | | | 40,000 | | 3,194,400 |
| Core Laboratories NV | | | 18,000 | | 1,839,060 |
| Denbury Resources, Inc.(a) | | | 40,900 | | 997,960 |
| Devon Energy Corp. | | | 22,000 | | 2,018,940 |
| | | | | | | 12,417,360 |
| | | | | | | |
| Financial Services (11.2%) | | | | | |
| BB&T Corp. | | | 26,000 | | 713,700 |
| Chubb Corp. | | | 30,000 | | 1,839,300 |
| Cincinnati Financial Corp. | | | 50,000 | | 1,640,000 |
| Comerica, Inc. | | | 22,000 | | 807,840 |
| JPMorgan Chase & Co. | | | 21,000 | | 968,100 |
| Northern Trust Corp. | | | 17,000 | | 862,750 |
| PNC Financial Services Group, Inc. | | | 14,000 | | 881,860 |
| SunTrust Banks, Inc. | | | 23,000 | | 663,320 |
| T. Rowe Price Group, Inc. | | | 30,030 | | 1,994,592 |
| | | | | | | 10,371,462 |
| | | | | | | |
| Health Care (11.6%) | | | | | |
| Amgen, Inc.(a) | | | 13,000 | | 694,850 |
| Becton, Dickinson & Co. | | | 20,000 | | 1,592,400 |
| C.R. Bard, Inc. | | | 14,000 | | 1,390,340 |
| DENTSPLY International, Inc. | | | 36,000 | | 1,331,640 |
| Johnson & Johnson, Inc. | | | 17,000 | | 1,007,250 |
| Medtronic, Inc. | | | 35,000 | | 1,377,250 |
| Saint Jude Medical, Inc. | | | 22,000 | | 1,127,720 |
| Stryker Corp. | | | 18,000 | | 1,094,400 |
| Waters Corp.(a) | | | 13,000 | | 1,129,700 |
| | | | | | | 10,745,550 |
| | | | | | | |
| Industrial Materials (4.8%) | | | | | |
| AptarGroup, Inc. | | | 30,000 | | 1,503,900 |
| Praxair, Inc. | | | 15,000 | | 1,524,000 |
| Sigma-Aldrich Corp. | | | 22,000 | | 1,400,080 |
| | | | | | | 4,427,980 |
| Industrial Products & Services (15.0%) | | | | | |
| 3M Co. | | | 10,000 | | 935,000 |
| Deere & Co. | | | 19,000 | | 1,840,910 |
| Donaldson Co., Inc. | | | 25,000 | | 1,532,250 |
| Emerson Electric Co. | | | 32,000 | | 1,869,760 |
| Expeditors International of Washington, Inc. | | | 15,000 | | 752,100 |
| Hubbell, Inc., Class B | | | 13,000 | | 923,390 |
| Illinois Tool Works, Inc. | | | 30,000 | | 1,611,600 |
| Lincoln Electric Holdings, Inc. | | | 20,000 | | 1,518,400 |
| United Parcel Service, Inc., Class B | | | 20,000 | | 1,486,400 |
| W.W. Grainger, Inc. | | | 10,000 | | 1,376,800 |
| | | | | | | 13,846,610 |
| | | | | | | |
| Information Technology (17.6%) | | | | | |
| Accenture PLC, Class A | | | 30,000 | | 1,649,100 |
| Apple, Inc.(a) | | | 2,000 | | 696,900 |
| Automatic Data Processing, Inc. | | | 29,000 | | 1,487,990 |
| Cisco Systems, Inc. | | | 84,000 | | 1,440,600 |
| EMC Corp.(a) | | | 65,000 | | 1,725,750 |
| Hewlett-Packard Co. | | | 30,000 | | 1,229,100 |
| Intel Corp. | | | 70,000 | | 1,411,900 |
| International Business Machines Corp. | | | 11,000 | | 1,793,770 |
| Microsoft Corp. | | | 75,000 | | 1,902,000 |
| Oracle Corp. | | | 55,000 | | 1,835,350 |
| QUALCOMM, Inc. | | | 19,000 | | 1,041,770 |
| | | | | | | 16,214,230 |
| | | | | | | |
| Utilities (0.4%) | | | | | |
| Questar Corp. | | | 20,000 | | 349,000 |
| TOTAL COMMON STOCKS (Cost $66,780,251) | | | | | 90,701,547 |
| | | | | | | |
| INVESTMENT COMPANIES (1.6%) | | | | | |
Victory Federal Money Market, Investor Shares,
0.01% (b) | | | 1,462,078 | | 1,462,078 |
| Total Investment Companies (Cost $1,462,078) | | | | | 1,462,078 |
| Total Investments (Cost $68,242,329) (c) — 99.9% | | | | | 92,163,625 |
| Other assets in excess of liabilities — 0.1% | | | | | 57,793 |
| NET ASSETS — 100.0% | | | | | $ 92,221,418 |
|
| (a) | | Non-income producing security. |
| (b) | | Rate disclosed is the seven day yield as of March 31, 2011. |
| (c) | | See Federal Tax Information listed in the Notes to Financial Statements. |
| ADR | | American Depositary Receipt |
| PLC | | Public Limited Company |
See Notes to Financial Statements | | 39 |
| | | |
| | | |
| Financial Highlights | | Walden Social Equity Fund |
| | | |
| STATEMENT OF ASSETS AND LIABILITIES | | | | |
| March 31, 2011 | | | | |
| | | | | |
| Assets: | | | | |
| Investments, at fair value (cost $68,242,329) | | $ | 92,163,625 | |
| Interest and dividends receivable | | | 118,970 | |
| Receivable for capital shares issued | | | 10,041 | |
| Prepaid expenses and other assets | | | 17,308 | |
Total Assets | | | 92,309,944 | |
| Liabilities: | | | | |
| Payable for capital shares redeemed | | | 3,132 | |
| Accrued expenses and other liabilities: | | | | |
Investment adviser | | | 56,009 | |
Administration and accounting | | | 2,312 | |
Custodian | | | 1,603 | |
Transfer agent | | | 4,278 | |
Trustee | | | 250 | |
Shareholder services | | | 922 | |
Other | | | 20,020 | |
Total Liabilities | | | 88,526 | |
| Net Assets | | $ | 92,221,418 | |
| Composition of Net Assets: | | | | |
| Capital | | $ | 72,442,294 | |
| Accumulated net investment income | | | 168,137 | |
| Accumulated net realized losses from investment transactions | | | (4,310,309) | |
| Net unrealized appreciation from investments | | | 23,921,296 | |
| Net Assets | | $ | 92,221,418 | |
| Shares Outstanding (par value $0.01, unlimited number of shares authorized) | | | 6,921,479 | |
| Net Asset Value, Offering Price and Redemption Price per share | | $ | 13.32 | |
| STATEMENT OF OPERATIONS | | | | |
| For the year ended March 31, 2011 | | | | |
| | | | | |
| Investment Income: | | | | |
| Interest | | $ | 455 | |
| Dividends | | | 1,513,993 | |
| Less: Foreign tax withholding | | | (12,168) | |
Total Investment Income | | | 1,502,280 | |
| Expenses: | | | | |
Investment adviser | | | 584,290 | |
Administration and accounting | | | 160,000 | |
Shareholder services | | | 9,350 | |
Trustee | | | 5,305 | |
Custodian | | | 16,782 | |
Transfer agency | | | 33,085 | |
Chief compliance officer | | | 3,925 | |
Other | | | 69,312 | |
Total expenses before fee reductions | | | 882,049 | |
Fees voluntarily reduced by the administrator | | | (51,264) | |
Fees contractually reduced by the investment adviser | | | (51,177) | |
| Net Expenses | | | 779,608 | |
| Net Investment Income | | | 722,672 | |
| Net Realized/Unrealized Gains from Investments: | | | | |
Net realized gains from investment transactions | | | 702,216 | |
Change in unrealized appreciation from investments | | | 10,844,878 | |
| Net realized/unrealized gains from investments | | | 11,547,094 | |
| Change in Net Assets Resulting from Operations | | $ | 12,269,766 | |
| 40 | | See Notes to Financial Statements |
| | | |
| | | |
| Financial Statements | | Walden Social Equity Fund |
| | | |
| STATEMENTS OF CHANGES IN NET ASSETS | | | | | | | | |
| | | For the year ended | | | For the year ended | |
| | | March 31, | | | March 31, | |
| | | 2011 | | | 2010 | |
| Investment Activities: | | | | | | | | |
| Operations: | | | | | | | | |
Net investment income | | $ | 722,672 | | | $ | 720,642 | |
Net realized gains from investment transactions | | | 702,216 | | | | 189,768 | |
Change in unrealized appreciation from investments | | | 10,844,878 | | | | 21,354,847 | |
| Change in Net Assets Resulting from Operations | | | 12,269,766 | | | | 22,265,257 | |
| Dividends: | | | | | | | | |
Net investment income | | | (751,640) | | | | (834,615) | |
| Change in Net Assets Resulting from Shareholder Dividends | | | (751,640) | | | | (834,615) | |
| Capital Share Transactions: | | | | | | | | |
Proceeds from shares issued | | | 12,894,252 | | | | 13,452,300 | |
Dividends reinvested | | | 656,460 | | | | 682,616 | |
Cost of shares redeemed | | | (4,934,188) | | | | (6,758,378) | |
| Change in Net Assets Resulting from Capital Share Transactions | | | 8,616,524 | | | | 7,376,538 | |
| Change in Net Assets | | | 20,134,650 | | | | 28,807,180 | |
| Net Assets: | | | | | | | | |
Beginning of period | | | 72,086,768 | | | | 43,279,588 | |
End of period | | $ | 92,221,418 | | | $ | 72,086,768 | |
| Share Transactions: | | | | | | | | |
Issued | | | 1,070,417 | | | | 1,398,576 | |
Reinvested | | | 52,643 | | | | 63,147 | |
Redeemed | | | (411,508) | | | | (657,388) | |
| Change in Shares | | | 711,552 | | | | 804,335 | |
| Accumulated net investment income | | $ | 168,137 | | | $ | 197,105 | |
See Notes to Financial Statements | | 41 |
| | | |
| | | |
| Financial Highlights | | Walden Social Equity Fund |
| | | |
| FINANCIAL HIGHLIGHTS | | | | | | | | | | | | | | | | | | | | |
| Selected data for a share outstanding throughout the years indicated. | | | | | | | | | | | | | | | | | | | | |
| | | | | | | | | | | | | | | | | | | | | |
| | | For the year | | | For the year | | | For the year | | | For the year | | | For the year | |
| | | ended | | | ended | | | ended | | | ended | | | ended | |
| | | March 31, | | | March 31, | | | March 31, | | | March 31, | | | March 31, | |
| | | 2011 | | | 2010 | | | 2009 | | | 2008 | | | 2007 | |
| Net Asset Value, Beginning of Period | | $ | 11.61 | | | $ | 8.01 | | | $ | 12.54 | | | $ | 12.31 | | | $ | 12.09 | |
| Investment Activities: | | | | | | | | | | | | | | | | | | | | |
Net investment income | | | 0.11 | | | | 0.11 | | | | 0.14(a) | | | | 0.08 | | | | 0.07 | |
Net realized and unrealized gains (losses) from investment transactions | | | 1.71 | | | | 3.63 | | | | (4.48) | | | | 0.57 | | | | 0.61 | |
| Total from Investment Activities | | | 1.82 | | | | 3.74 | | | | (4.34) | | | | 0.65 | | | | 0.68 | |
| Dividends: | | | | | | | | | | | | | | | | | | | | |
Net investment income | | | (0.11) | | | | (0.14) | | | | (0.10) | | | | (0.08) | | | | (0.08) | |
Net realized gains from investments | | | — | | | | — | | | | (0.09) | | | | (0.34) | | | | (0.38) | |
| Total Dividends | | | (0.11) | | | | (0.14) | | | | (0.19) | | | | (0.42) | | | | (0.46) | |
| Net Asset Value, End of Period | | $ | 13.32 | | | $ | 11.61 | | | $ | 8.01 | | | $ | 12.54 | | | $ | 12.31 | |
| Total Return | | | 15.77% | | | | 46.79% | | | | (34.74)% | | | | 5.01% | | | | 5.62% | |
| Ratios/Supplemental Data: | | | | | | | | | | | | | | | | | | | | |
| Net Assets at end of period (000’s) | | $ | 92,221 | | | $ | 72,087 | | | $ | 43,280 | | | $ | 51,903 | | | $ | 49,873 | |
| Ratio of net expenses to average net assets | | | 1.00% | | | | 1.00% | | | | 1.00% | | | | 1.00% | | | | 1.00% | |
| Ratio of net investment income to average net assets | | | 0.93% | | | | 1.18% | | | | 1.36% | | | | 0.59% | | | | 0.68% | |
| Ratio of expenses (before fee reductions) to average net assets(b) | | | 1.13% | | | | 1.16% | | | | 1.19% | | | | 1.18% | | | | 1.15% | |
| Portfolio Turnover Rate | | | 13.07% | | | | 25.16% | | | | 40.07% | | | | 44.67% | | | | 25.50% | |
|
| (a) | | Calculated using the average shares method. |
| (b) | | During the period, certain fees were reduced. If such fee reductions had not occurred, the ratio would have been as indicated. |
| 42 | | See Notes to Financial Statements |
| |
| |
| Schedule of Portfolio Investments | | Walden Small Cap Innovations Fund
March 31, 2011 |
| | | |
| COMMON STOCKS (96.3%) | | | | | |
| Security Description | | | | Shares | | Fair Value ($) |
| | | | | | | |
| Consumer Discretionary (12.2%) | | | | | |
| Ambassadors Group, Inc. | | | 9,400 | | 102,930 |
| Amerigon, Inc.(a) | | | 15,950 | | 243,556 |
| Capella Education Co.(a) | | | 8,200 | | 408,278 |
| Fuel Systems Solutions, Inc.(a) | | | 12,900 | | 389,322 |
| Hibbett Sports, Inc.(a) | | | 13,200 | | 472,692 |
| John Wiley & Sons, Inc., Class A | | | 18,900 | | 960,876 |
| K12, Inc.(a) | | | 9,690 | | 326,553 |
| LKQ Corp.(a) | | | 25,100 | | 604,910 |
| NutriSystem, Inc. | | | 10,000 | | 144,900 |
| Select Comfort Corp.(a) | | | 19,300 | | 232,758 |
| Tempur-Pedic International, Inc.(a) | | | 11,100 | | 562,326 |
| The Men’s Wearhouse, Inc. | | | 8,325 | | 225,275 |
| Under Armour, Inc., Class A(a) | | | 11,400 | | 775,770 |
| Universal Technical Institute, Inc. | | | 10,900 | | 212,005 |
| | | | | | | 5,662,151 |
| Consumer Products (3.0%) | | | | | |
| Darling International, Inc.(a) | | | 15,000 | | 230,550 |
| Hain Celestial Group, Inc.(a) | | | 8,500 | | 274,380 |
| Lifeway Foods, Inc.(a) | | | 10,515 | | 109,566 |
| United Natural Foods, Inc.(a) | | | 17,400 | | 779,868 |
| | | | | | | 1,394,364 |
| Energy (5.9%) | | | | | |
| CARBO Ceramics, Inc. | | | 9,000 | | 1,270,080 |
| Dawson Geophysical Co.(a) | | | 3,900 | | 171,132 |
| Lufkin Industries, Inc. | | | 6,200 | | 579,514 |
| Natural Gas Services Group, Inc.(a) | | | 12,000 | | 213,120 |
| OYO Geospace Corp.(a) | | | 2,300 | | 226,734 |
| Tesco Corp.(a) | | | 12,525 | | 274,924 |
| | | | | | | 2,735,504 |
| Financial Services (18.2%) | | | | | |
| Bank of Hawaii Corp. | | | 16,400 | | 784,248 |
| Corporate Office Properties Trust | | | 13,400 | | 484,276 |
| Dime Community Bancshares | | | 30,200 | | 445,752 |
| DuPont Fabros Technology, Inc. | | | 20,300 | | 492,275 |
| East West Bancorp, Inc. | | | 32,600 | | 715,896 |
| eHealth, Inc.(a) | | | 30,000 | | 399,000 |
| Green Dot Corp., Class A(a) | | | 8,400 | | 360,444 |
| Horace Mann Educators Corp. | | | 25,400 | | 426,720 |
| Independent Bank Corp. | | | 14,100 | | 380,841 |
| Investment Technology Group, Inc.(a) | | | 22,500 | | 409,275 |
| Ocwen Financial Corp.(a) | | | 27,700 | | 305,254 |
| Orrstown Financial Services, Inc. | | | 7,300 | | 204,400 |
| Parkway Properties, Inc. | | | 11,200 | | 190,400 |
| Signature Bank(a) | | | 13,400 | | 755,760 |
| Southside Bancshares, Inc. | | | 12,025 | | 257,335 |
| TCF Financial Corp. | | | 35,600 | | 564,616 |
| Texas Capital Bancshares, Inc.(a) | | | 7,900 | | 205,321 |
| UMB Financial Corp. | | | 17,000 | | 635,035 |
| Umpqua Holdings Corp. | | | 36,900 | | 422,136 |
| | | | | | | 8,438,984 |
| Health Care (13.9%) | | | | | |
| American Medical Systems Holdings, Inc.(a) | | | 17,200 | | 372,208 |
| Bruker Corp.(a) | | | 37,600 | | 783,960 |
| Cantel Medical Corp. | | | 8,500 | | 218,875 |
| Computer Programs & Systems, Inc. | | | 3,800 | | 244,264 |
| Gen-Probe, Inc.(a) | | | 5,050 | | 335,068 |
| ICU Medical, Inc.(a) | | | 8,200 | | 358,996 |
| Landauer, Inc. | | | 9,150 | | 562,908 |
| Meridian Bioscience, Inc. | | | 28,300 | | 678,917 |
| Neogen Corp.(a) | | | 18,400 | | 761,392 |
| Nutraceutical International Corp.(a) | | | 6,400 | | 95,872 |
| Quality Systems, Inc. | | | 9,900 | | 825,066 |
| West Pharmaceutical Services, Inc. | | | 15,900 | | 711,843 |
| Wright Medical Group, Inc.(a) | | | 10,500 | | 178,605 |
| ZOLL Medical Corp.(a) | | | 7,600 | | 340,556 |
| | | | | | | 6,468,530 |
| Industrial Materials (3.9%) | | | | | |
| Commercial Metals Co. | | | 26,000 | | 449,020 |
| Minerals Technologies, Inc. | | | 9,900 | | 678,348 |
| Quaker Chemical Corp. | | | 11,500 | | 461,955 |
| STR Holdings, Inc.(a) | | | 11,700 | | 224,406 |
| | | | | | | 1,813,729 |
| Industrial Products & Services (17.4%) | | | | | |
| American Science & Engineering, Inc. | | | 7,700 | | 711,172 |
| Apogee Enterprises, Inc. | | | 20,400 | | 269,076 |
| Calgon Carbon Corp.(a) | | | 14,600 | | 231,848 |
| CLARCOR, Inc. | | | 20,500 | | 921,065 |
| ESCO Technologies, Inc. | | | 6,125 | | 233,669 |
| Fuel-Tech, Inc.(a) | | | 24,500 | | 218,050 |
| Genesee & Wyoming, Inc., Class A(a) | | | 17,800 | | 1,035,960 |
| Herman Miller, Inc. | | | 7,600 | | 208,924 |
| Hub Group, Inc., Class A(a) | | | 6,000 | | 217,140 |
| Layne Christensen Co.(a) | | | 5,300 | | 182,850 |
| Lindsay Manufacturing Co. | | | 7,100 | | 561,042 |
| Met-Pro Corp. | | | 8,600 | | 102,340 |
| Middleby Corp.(a) | | | 6,400 | | 596,608 |
| Simpson Manufacturing Co., Inc. | | | 14,400 | | 424,224 |
| Team, Inc.(a) | | | 26,300 | | 690,638 |
| Wabtec Corp. | | | 14,650 | | 993,710 |
| Watts Water Technologies, Inc., Class A | | | 13,000 | | 496,470 |
| | | | | | | 8,094,786 |
| Information Technology (18.3%) | | | | | |
| Blackbaud, Inc. | | | 14,400 | | 392,256 |
| Blackboard, Inc.(a) | | | 7,600 | | 275,424 |
| Blue Coat Systems, Inc.(a) | | | 18,100 | | 509,696 |
| Bottomline Technologies, Inc.(a) | | | 12,350 | | 310,479 |
| Ceragon Networks Ltd.(a) | | | 26,600 | | 321,328 |
| Coherent, Inc.(a) | | | 6,500 | | 377,715 |
| CommVault Systems, Inc.(a) | | | 13,100 | | 522,428 |
| InterDigital, Inc. | | | 10,000 | | 477,100 |
| Itron, Inc.(a) | | | 2,450 | | 138,278 |
| J2 Global Communications, Inc.(a) | | | 24,900 | | 734,799 |
| Liquidity Services, Inc.(a) | | | 22,200 | | 396,492 |
| National Instruments Corp. | | | 21,350 | | 699,639 |
| Net 1 UEPS Technologies, Inc.(a) | | | 24,100 | | 207,260 |
| NIC, Inc. | | | 23,400 | | 291,564 |
| Plantronics, Inc. | | | 26,700 | | 977,754 |
| Power Integrations, Inc. | | | 18,700 | | 716,771 |
| Renaissance Learning, Inc. | | | 12,800 | | 150,400 |
| Sapient Corp.(a) | | | 56,500 | | 646,925 |
| SunPower Corp., Class B(a) | | | 4,275 | | 71,264 |
| Wright Express Corp.(a) | | | 6,500 | | 336,960 |
| | | | | | | 8,554,532 |
| Utilities (3.5%) | | | | | |
| American States Water Co. | | | 5,100 | | 182,886 |
| New Jersey Resources Corp. | | | 16,300 | | 700,085 |
| Ormat Technologies, Inc. | | | 3,500 | | 88,655 |
| South Jersey Industries, Inc. | | | 11,400 | | 638,058 |
| | | | | | | 1,609,684 |
| TOTAL COMMON STOCKS (Cost $36,410,120) | | | | | 44,772,264 |
| | | | | | | |
| INVESTMENT COMPANIES (4.8%) | | | | | |
Victory Federal Money Market, Investor Shares,
0.01% (b) | | | 2,244,939 | | 2,244,939 |
| Total Investment Companies (Cost $2,244,939) | | | | | 2,244,939 |
| Total Investments (Cost $38,655,059) (c) — 101.1% | | | | | 47,017,203 |
| Liabilities in excess of other assets — (1.1)% | | | | | (528,830) |
| NET ASSETS — 100.0% | | | | | $ 46,488,373 |
|
| (a) | | Represents non-income producing security |
| (b) | | Rate disclosed is the seven day yield as of March 31, 2011. |
| (c) | | See Federal Tax Information listed in the Notes to Financial Statements. |
See Notes to Financial Statements | | 43 |
| | | |
| | | |
| Financial Statements | | Walden Small Cap Innovations Fund |
| | | |
| STATEMENT OF ASSETS AND LIABILITIES | | | |
| March 31, 2011 | | | |
| | | | |
| Assets: | | | |
| Investments, at fair value (cost $38,655,059) | | $ | 47,017,203 |
| Dividends receivable | | | 40,354 |
| Receivable for investments sold | | | 301,193 |
| Receivable for capital shares issued | | | 261,379 |
| Prepaid expenses and other assets | | | 12,174 |
Total Assets | | | 47,632,303 |
| Liabilities: | | | |
| Payable for investments purchased | | | 1,108,109 |
| Accrued expenses and other liabilities: | | | |
Investment adviser | | | 17,653 |
Administration and accounting | | | 1,073 |
Custodian | | | 2,235 |
Transfer agent | | | 4,406 |
Trustee | | | 124 |
Other | | | 10,330 |
Total Liabilities | | | 1,143,930 |
| Net Assets | | $ | 46,488,373 |
| Composition of Net Assets: | | | |
| Capital | | $ | 35,226,181 |
| Accumulated net investment income | | | — |
| Accumulated net realized gains from investment transactions | | | 2,900,048 |
| Net unrealized appreciation from investments | | | 8,362,144 |
| Net Assets | | $ | 46,488,373 |
| Shares Outstanding (par value $0.01, unlimited number of shares authorized) | | | 2,634,936 |
| Net Asset Value, Offering Price and Redemption Price per share | | $ | 17.64 |
| STATEMENT OF OPERATIONS | | | |
| For the year ended March 31, 2011 | | | |
| | | | |
| Investment Income: | | | |
| Dividends | | $ | 346,950 |
Total Investment Income | | | 346,950 |
| Expenses: | | | |
Investment adviser | | | 228,601 |
Administration and accounting | | | 65,793 |
Trustee | | | 2,085 |
Custodian | | | 24,076 |
Transfer agency | | | 32,763 |
Chief compliance officer | | | 1,450 |
Other | | | 32,806 |
Total expenses before fee reductions | | | 387,574 |
Fees voluntarily reduced by the administrator | | | (20,187) |
Fees contractually reduced by the investment adviser | | | (61,924) |
| Net Expenses | | | 305,463 |
| Net Investment Income | | | 41,487 |
| Net Realized/Unrealized Gains from Investments: | | | |
Net realized gains from investment transactions | | | 3,540,130 |
Change in unrealized appreciation from investments | | | 4,488,197 |
| Net realized/unrealized gains from investments | | | 8,028,327 |
| Change in Net Assets Resulting from Operations | | $ | 8,069,814 |
| 44 | | See Notes to Financial Statements |
| | | |
| | | |
| Financial Statements | | Walden Small Cap Innovations Fund |
| | | |
| STATEMENTS OF CHANGES IN NET ASSETS | | | | | | | | | |
| | | For the year ended | | | For the year ended | |
| | | March 31, | | | March 31, | |
| | | 2011 | | 2010 |
| Investment Activities: | | | | | | | | | |
| Operations: | | | | | | | | | |
Net investment income | | $ | 41,487 | | | $ | 31,441 | |
Net realized gains from investment transactions | | | 3,540,130 | | | | 760,908 | | |
Change in unrealized appreciation/depreciation from investments | | | 4,488,197 | | | | 3,930,123 | | |
| Change in Net Assets Resulting from Operations | | | 8,069,814 | | | | 4,722,472 | | |
| Dividends: | | | | | | | | | |
Net investment income | | | (61,121) | | | | (27,286) | |
Net realized gains from investment transactions | | | (1,120,030) | | | | (255,693) | |
| Change in Net Assets Resulting from Shareholder Dividends | | | (1,181,151) | | | | (282,979) | |
| Capital Share Transactions: | | | | | | | | | |
Proceeds from shares issued | | | 17,622,443 | | | | 11,604,131 | | |
Proceeds from shares issued in subscription in-kind (a) | | | — | | | | 4,083,411 | | |
Dividends reinvested | | | 820,114 | | | | 134,996 | | |
Cost of shares redeemed | | | (899,498) | | | | (545,628) | |
| Change in Net Assets Resulting from Capital Share Transactions | | | 17,543,059 | | | | 15,276,910 | | |
| Change in Net Assets | | | 24,431,722 | | | | 19,716,403 | | |
| Net Assets: | | | | | | | | | |
Beginning of period | | | 22,056,651 | | | | 2,340,248 | | |
End of period | | $ | 46,488,373 | | | $ | 22,056,651 | | |
| Share Transactions: | | | | | | | | | |
Issued | | | 1,129,578 | | | | 1,000,056 | | |
Issued in subscription in-kind (a) | | | — | | | | 289,822 | | |
Reinvested | | | 50,750 | | | | 10,317 | | |
Redeemed | | | (58,814) | | | | (41,475) | |
| Change in Shares | | | 1,121,514 | | | | 1,258,720 | | |
| Accumulated net investment income | | $ | — | | | $ | 6,164 | | |
|
| (a) | | See Note 3 in Notes to Financial Statements. |
See Notes to Financial Statements | | 45 |
| | | |
| | | |
| Financial Highlights | | Walden Small Cap Innovations Fund |
| | | |
| FINANCIAL HIGHLIGHTS |
| Selected data for a share outstanding throughout the periods indicated. |
| | | | | | | | | | | | | |
| | | For the year | | | For the year | | | For the period | |
| | | ended | | | ended | | | ended | |
| | | March 31, | | | March 31, | | | March 31, | |
| | | 2011 | | | 2010 | | | 2009(a) | |
| Net Asset Value, Beginning of Period | | $ | 14.57 | | | $ | 9.19 | | | $ | 10.00 | |
| Investment Activities: | | | | | | | | | | | | |
Net investment income | | | 0.02 | | | | 0.02 | | | | 0.03(b) | |
Net realized and unrealized gains (losses) from investment transactions | | | 3.59 | | | | 5.60 | | | | (0.83) | |
| Total from Investment Activities | | | 3.61 | | | | 5.62 | | | | (0.80) | |
| Dividends: | | | | | | | | | | | | |
Net investment income | | | (0.03) | | | | (0.02) | | | | (0.01) | |
Net realized gains from investments | | | (0.51) | | | | (0.22) | | | | — | |
| Total Dividends | | | (0.54) | | | | (0.24) | | | | (0.01) | |
| Net Asset Value, End of Period | | $ | 17.64 | | | $ | 14.57 | | | $ | 9.19 | |
| Total Return(c) | | | 25.13% | | | | 61.45% | | | | (7.98)% | |
| Ratios/Supplemental Data: | | | | | | | | | | | | |
| Net Assets at end of period (000’s) | | $ | 46,488 | | | $ | 22,057 | | | $ | 2,340 | |
| Ratio of net expenses to average net assets(d) | | | 1.00% | | | | 1.00% | | | | 1.16% | |
| Ratio of net investment income to average net assets(d) | | | 0.14% | | | | 0.26% | | | | 0.63% | |
| Ratio of expenses (before fee reductions) to average net assets(d)(e) | | | 1.27% | | | | 1.68% | | | | 9.61% | |
| Portfolio Turnover Rate(c) | | | 36.01% | | | | 23.07% | | | | 4.37% | |
|
| (a) | | Commenced operations on October 24, 2008. |
| (b) | | Calculated using the average shares method. |
| (c) | | Not annualized for periods less than one year. |
| (d) | | Annualized for periods less than one year. |
| (e) | | During the period, certain fees were reduced. If such fee reductions had not occurred, the ratio would have been as indicated. |
| 46 | | See Notes to Financial Statements |
| | | |
| | | |
| Notes to Financial Statements | | March 31, 2011 |
| | | |
| 1. | | Organization: |
| | | The Coventry Group (the “Group”) was organized on January 8, 1992 as a Massachusetts business trust and is registered under the Investment Company Act of 1940, as amended (the “1940 Act”), as an open-end management investment company. The Group contains the following Boston Trust Funds and Walden Funds (individually a “Fund”, collectively the “Funds”): |
| | | |
| | | Fund | | | Short Name | | |
| | | Boston Trust Balanced Fund | | Balanced Fund | |
| | | Boston Trust Equity Fund | | Equity Fund | |
| | | Boston Trust Midcap Fund | | Midcap Fund | |
| | | Boston Trust Small Cap Fund | | Small Cap Fund | |
| | | Walden Social Balanced Fund | | Social Balanced Fund | |
| | | Walden Social Equity Fund | | Social Equity Fund | |
| | | Walden Small Cap Innovations Fund | | Small Cap Innovations Fund | |
| | | | | | | | |
| | | The investment objective of the Balanced Fund and Social Balanced Fund is to seek long-term capital growth and income through an actively managed portfolio of stocks, bonds and money market instruments. The investment objective of the Equity Fund and Social Equity Fund is to seek long-term capital growth through an actively managed portfolio of stocks. The investment objective of the Midcap Fund is to seek long-term capital growth through an actively managed portfolio of stocks of middle capitalization companies. The investment objective of the Small Cap Fund and Small Cap Innovations Fund is to seek long-term capital growth through an actively managed portfolio of stocks of small capitalization companies. |
| | | |
| | | Under the Group’s organizational documents, its officers and trustees are indemnified against certain liabilities arising out of the performance of their duties to the Group. In addition, in the normal course of business, the Group may enter into contracts with its vendors and others that provide for general indemnifications. Each Fund’s maximum exposure under these arrangements is unknown, as this would involve future claims that may be made against the Funds. However, based on experience, the Funds expect that risk of loss to be remote. |
| | | |
| 2. | | Significant Accounting Policies: |
| | | The following is a summary of significant accounting policies followed by the Funds in the preparation of their financial statements. The policies are in conformity with accounting principles generally accepted in the United States of America (“GAAP”). |
| | | |
| | | The preparation of financial statements in conformity with GAAP requires management to make estimates and assumptions that affect the reported amounts of assets and liabilities, the disclosure of contingent assets and liabilities at the date of the financial statements and the reported amounts of increases and decreases in net assets from operations during the reporting period. Actual results may differ from those estimates. |
| | | |
| | | Security Valuation: |
| | | The Funds record their investments at fair value. Fair value is defined as the price that would be received to sell an asset or paid to transfer a liability in an orderly transaction between market participants at the measurement date. The valuation techniques used to determine fair value are further described below. |
| | | |
| | | The value of each equity security is based either on the last sale price on a national securities exchange, or in the absence of recorded sales, at the closing bid prices on such exchanges, or at the quoted bid price in the over-the-counter market. Equity securities traded on the NASDAQ stock market are valued at the NASDAQ official closing price. |
| | | |
| | | Bonds and other fixed income securities (other than short-term obligations but including listed issues) are provided by an independent pricing service, the use of which has been approved by the Group’s Board of Trustees (the “Board”). In making such valuations, the pricing service utilizes both dealer-supplied valuations and electronic data processing techniques that take into account appropriate factors such as institutional-size trading in similar groups of securities, yield, quality, coupon rate, maturity, type of issue, and trading characteristics other than market data and without exclusive reliance upon quoted prices or exchanges or over-the-counter prices, since such valuations are believed to reflect more accurately the fair value of such securities. All debt portfolio securities with a remaining maturity of 60 days or less are valued at amortized cost, which approximates fair value. Under the amortized cost method, discount or premium, if any, is accreted or amortized, respectively, on a constant (straight-line) basis to the maturity of the security. |
| | | |
| | | The Group may use a pricing service to value certain portfolio securities where the prices provided are believed to reflect the fair market value of such securities. If market prices are not readily available or, in Boston Trust Investment Management, Inc.’s (the “Adviser”) opinion, market prices do not reflect fair value, or if an event occurs after the close of trading on the exchange or market on which the security is principally traded (but prior to the time the NAV is calculated) that materially affects fair value, the Adviser will value the Funds’ assets at their fair value according to policies approved by the Board. |
| | | |
| | | Investments in investment companies and money market funds are valued at net asset value per share. Certificates of deposit are valued at acquisition cost. |
| | | |
| | | Fair Value Measurements: |
| | | The valuation techniques employed by the Funds, as described above in Security Valuation, maximize the use of observable inputs and minimize the use of unobservable inputs in determining fair value. The inputs used for valuing the Funds’ investments are summarized in the three broad levels listed below: |
| | | |
| | | Level 1 — quoted prices in active markets for identical assets |
| | | Level 2 — other significant observable inputs (including quoted prices for similar securities, interest rates, prepayment speeds, credit risk, etc.) |
| | | Level 3 — significant unobservable inputs (including the Funds’ own assumptions in determining the fair value of investments) |
| | | |
| | | The inputs or methodology used to value investments are not necessarily an indication of the risk associated with investing in those investments. |
| | | |
| | | |
| | | |
| Notes to Financial Statements | | March 31, 2011 |
| | | |
| | | Pursuant to the valuation techniques described above in Security Valuation, equity securities are generally categorized as Level 1 securities in the fair value hierarchy (unless there is a fair valuation event, in which case affected securities are generally categorized as Level 2 securities). Debt securities, including those with a remaining maturity of 60 days or less, and certificates of deposit are generally categorized as Level 2 securities in the fair value hierarchy. Open-end investment companies and money market funds are generally categorized as Level 1 securities in the fair value hierarchy. |
| | | |
| | | Investments for which there are no such quotations, or for which quotations do not appear reliable, are valued at fair value as determined in good faith by the Pricing Committee under the direction of the Board. These valuations are typically categorized as Level 2 or Level 3 in the fair value hierarchy. |
| | | |
| | | The following is a summary of the valuation inputs used as of March 31, 2011 in valuing the Funds’ investments based on the three levels defined above. |
| | | |
| | | | | | | | | | LEVEL 2 | | | | |
| | | | | | LEVEL I | | Other Significant | | Total Investments in |
| | | Fund Name | | | Quoted Prices | | Observable Inputs | | Securities |
| | | Balanced Fund | | | | | | | | | | | | | |
| | | Common Stocks1 | | | | $169,183,125 | | | $ | — | | | | $169,183,125 | |
| | | Corporate Bonds1 | | | | — | | | | 8,465,148 | | | | 8,465,148 | |
| | | Municipal Bonds2 | | | | — | | | | 6,735,001 | | | | 6,735,001 | |
| | | U.S. Government & U.S. Government Agency Obligations | | | | — | | | | 44,969,180 | | | | 44,969,180 | |
| | | Investment Companies | | | | 3,818,329 | | | | — | | | | 3,818,329 | |
| | | Total | | | | 173,001,454 | | | | 60,169,329 | | | | 233,170,783 | |
| | | | | | | | | | | | | | | | |
| | | Equity Fund | | | | | | | | | | | | | |
| | | Common Stocks1 | | | | 63,171,888 | | | | — | | | | 63,171,888 | |
| | | Investment Companies | | | | 214,061 | | | | — | | | | 214,061 | |
| | | Total | | | | 63,385,949 | | | | — | | | | 63,385,949 | |
| | | | | | | | | | | | | | | | |
| | | Midcap Fund | | | | | | | | | | | | | |
| | | Common Stocks1 | | | | 26,589,376 | | | | — | | | | 26,589,376 | |
| | | Investment Companies | | | | 665,515 | | | | — | | | | 665,515 | |
| | | Total | | | | 27,254,891 | | | | — | | | | 27,254,891 | |
| | | | | | | | | | | | | | | | |
| | | Small Cap Fund | | | | | | | | | | | | | |
| | | Common Stocks1 | | | | 266,886,102 | | | | — | | | | 266,886,102 | |
| | | Investment Companies | | | | 791,795 | | | | — | | | | 791,795 | |
| | | Total | | | | 267,677,897 | | | | — | | | | 267,677,897 | |
| | | | | | | | | | | | | | | | |
| | | Social Balanced Fund | | | | | | | | | | | | | |
| | | Common Stocks1 | | | | 34,701,345 | | | | — | | | | 34,701,345 | |
| | | Corporate Bonds1 | | | | — | | | | 2,851,247 | | | | 2,851,247 | |
| | | Municipal Bonds2 | | | | — | | | | 958,303 | | | | 958,303 | |
| | | U.S. Government & U.S. Government Agency Obligations | | | | — | | | | 8,908,548 | | | | 8,908,548 | |
| | | Investment Companies | | | | 363,395 | | | | — | | | | 363,395 | |
| | | Total | | | | 35,064,740 | | | | 12,718,098 | | | | 47,782,838 | |
| | | | | | | | | | | | | | | | |
| | | Social Equity | | | | | | | | | | | | | |
| | | Common Stocks1 | | | | 90,701,547 | | | | — | | | | 90,701,547 | |
| | | Investment Companies | | | | 1,462,078 | | | | — | | | | 1,462,078 | |
| | | Total | | | | 92,163,625 | | | | — | | | | 92,163,625 | |
| | | | | | | | | | | | | | | | |
| | Small Cap Innovations Fund | | | | | | | | | | | | | |
| | | Common Stocks1 | | | | 44,772,264 | | | | — | | | | 44,772,264 | |
| | | Investment Companies | | | | 2,244,939 | | | | — | | | | 2,244,939 | |
| | | Total | | | | 47,017,203 | | | | — | | | | 47,017,203 | |
| | | | | | | | | | | | | | | | |
| | | 1 For detailed industry descriptions, see the accompanying Schedules of Portfolio Investments. |
| | | 2 For detailed State classifications, see the accompanying Schedules of Portfolio Investments. |
| | | |
| | | The Funds recognize significant transfers, if any, between fair value hierarchy levels at the reporting period end. There were no significant transfers between Levels 1, 2 or 3 as of March 31, 2011 from the valuation input levels used on March 31, 2010. The Funds did not hold any Level 3 securities for the year ended March 31, 2011. |
| | | |
| | | |
| | | |
| Notes to Financial Statements | | March 31, 2011 |
| | | |
| | | Security Transactions and Related Income: |
| | | Security transactions are recorded no later than one business day after trade date. For financial reporting purposes, security transactions are recorded on trade date on the last business day of the reporting period. Interest income is recognized on the accrual basis and includes, where applicable, the amortization of premium or discount. Dividend income is recorded on the ex-dividend date. Gains or losses realized on sales of securities are determined by comparing the identified cost of the security lot sold with the net sales proceeds. |
| | | |
| | | Expenses: |
| | | Expenses directly attributable to a Fund are charged directly to that Fund. Expenses relating to the Group are allocated proportionately to each Fund within the Group according to the relative net assets of each Fund or on another reasonable basis. |
| | | |
| | | Dividends to Shareholders: |
| | | Dividends are recorded on the ex-dividend date. Dividends to shareholders from net investment income, if any, are declared and paid annually by the Funds. Dividends to shareholders from net realized gains, if any, are declared and distributed at least annually by the Funds. |
| | | |
| | | The amounts of dividends to shareholders from net investment income and of distributions from net realized gains are determined in accordance with federal income tax regulations, which may differ from GAAP. These “book/tax” differences are either considered temporary or permanent in nature. To the extent these differences are permanent in nature (e.g. return of capital, net operating loss, reclassification of certain market discounts, gain/loss, paydowns, and distributions), such amounts are reclassified within the composition of net assets based on their federal tax-basis treatment; temporary differences (e.g. wash sales and post October losses) do not require reclassification. To the extent dividends to shareholders exceed net investment income and net realized gains for tax purposes, they are reported as distributions of capital. |
| | | |
| | | Federal Income Taxes: |
| | | Each Fund intends to continue to qualify as a regulated investment company by complying with the provisions available to certain investment companies, as defined in Subchapter M of the Internal Revenue Code, and to make distributions from net investment income and from net realized capital gains sufficient to relieve it from all, or substantially all, federal income and excise taxes. Therefore, no federal income tax provision is required. |
| | | |
| | | Management of the Funds has reviewed tax positions taken in tax years that remain subject to examination by all major tax jurisdictions, including federal (i.e., the last four tax year ends and the interim tax period since then, as applicable). The Funds recognize interest and penalties, if any, related to unrecognized tax benefits, as income tax expense in the Statement of Operations. Management believes that there is no tax liability resulting from unrecognized tax benefits related to uncertain tax positions taken as of and during the year ended March 31, 2011. |
| | | |
| 3. | | Related Party Transactions: |
| | | Investment Adviser: |
| | | The Funds and the Adviser are parties to an Investment Advisory Agreement under which the Adviser is entitled to receive an annual fee, computed daily and paid monthly, equal to the average daily net assets of each Fund, at the following annual percentage rates before contractual waivers: |
| | | |
| | | Fund | | Fee Rate | |
| | | Balanced Fund | | | 0.75 | % | |
| | | Equity Fund | | | 0.75 | % | |
| | | Midcap Fund | | | 0.75 | % | |
| | | Small Cap Fund | | | 0.75 | % | |
| | | Social Balanced Fund | | | 0.75 | % | |
| | | Social Equity Fund | | | 0.75 | % | |
| | | Small Cap Innovations Fund | | | 0.75 | % | |
| | | | | | | | |
| | | Administration and Fund Accounting: |
| | | Citi Fund Services Ohio, Inc. (“Citi”) serves the Funds as administrator. Citi, as the Funds’ administrator, provides administrative and fund accounting services for a fee that is computed daily and paid monthly at an annual rate of up to 0.20% of the average daily net assets of each Fund. Certain officers of the Group are affiliated with Citi. Such persons were paid no fees directly by the Funds for serving as officers of the Group, except the Chief Compliance Officer (the “CCO”). The CCO is not paid directly by the Funds. Rather, the Funds pay Citi for CCO services, which include the services of the CCO. |
| | | |
| | | Under a Compliance Services Agreement between the Funds and Citi (the “CCO Agreement”), Citi makes an employee available to serve as the Funds’ CCO. Under the CCO Agreement, Citi also provides infrastructure and support in implementing the written policies and procedures comprising the Funds’ compliance program, including support services to the CCO. For the year ended March 31, 2011, the Funds paid Citi $31,282, plus certain out of pocket expenses, for the services provided under the CCO Agreement. Citi pays the salary and other compensation earned by the CCO as an employee of Citi. |
| | | |
| | | Distribution: |
| | | Foreside Distribution Services, L.P., (“Foreside”), an indirect, wholly owned subsidiary of Foreside Financial Group, LLC, serves as the Funds’ distribution agent. Under the distribution agreement, Foreside receives a fixed fee of $15,000 per year, paid monthly by the Adviser from its profits and not by the Funds, for its services. Foreside is not affiliated with Citi or the Adviser. |
| | | |
| | | Custodian and Transfer Agency: |
| | | Boston Trust & Investment Management Company (“Boston Trust”), the parent company of the Adviser, acts as the Funds’ custodian and transfer agent. Under the custody agreement, Boston Trust receives an asset-based fee of 0.02% of the average daily net assets for the first $100 million and 0.015% of the average daily net assets above $100 million, plus per transaction fees. Under the transfer agency agreement, Boston Trust receives a fixed fee of $18,000 annually, accrued daily and paid monthly for its services. Under a sub-transfer agency agreement, Citi receives a fixed fee of $50,000 annually accrued daily and paid monthly, plus certain out of pocket expenses for its services to the Group. At March 31, 2011, each Fund, except the Balanced Fund and the Equity Fund is party to the sub-transfer agency agreement. |
| | | |
| | | |
| Notes to Financial Statements | | March 31, 2011 |
| | | |
| | | Fee Reductions: |
| | | The Adviser has agreed to reduce its fees payable by the Funds to the extent necessary to limit each Fund’s aggregate annual operating expenses to 1.00% of the average daily net assets. Any such reductions made by the Adviser in its fees or in the payment or reimbursement of expenses that are a Fund’s obligation may be subject to repayment by the Fund within three years provided the Fund receiving the reduction, payment or reimbursement is able to effect such repayment and remain in compliance with applicable expense limitations. The expense limitation agreement shall automatically renew effective August 1 of every year until the Adviser provides written notice of non-renewal to the Group. |
| | | |
| | | Pursuant to its agreement, for the periods ended March 31, 2009, 2010 and 2011, the Adviser reimbursed fees in the following amounts: |
| | | |
| | | Fund | | Amount | | | Expires | | Fund | | Amount | | | Expires |
| | | Balanced Fund | | | $39,648 | | | 2012 | | Social Balanced Fund | | | $39,013 | | | 2012 |
| | | | | | 44,935 | | | 2013 | | | | | 38,125 | | | 2013 |
| | | | | | — | | | 2014 | | | | | 32,028 | | | 2014 |
| | | Equity Fund | | | 23,578 | | | 2012 | | Social Equity Fund | | | 69,183 | | | 2012 |
| | | | | | 26,106 | | | 2013 | | | | | 63,210 | | | 2013 |
| | | | | | 13,866 | | | 2014 | | | | | 51,177 | | | 2014 |
| | | Midcap Fund | | | 48,745 | | | 2012 | | Small Cap Innovations Fund | | | 39,182 | | | 2012 |
| | | | | | 29,358 | | | 2013 | | | | | 75,530 | | | 2013 |
| | | | | | 27,687 | | | 2014 | | | | | 61,924 | | | 2014 |
| | | Small Cap Fund | | | 6,931 | | | 2012 | | | | | | | | |
| | | | | | 72,080 | | | 2013 | | | | | | | | |
| | | | | | 105,195 | | | 2014 | | | | | | | | |
| | | | | | | | | | | | | | | | | |
| | | As of March 31, 2011, the Adviser may recoup amounts from the Funds as follows: |
| | | | | |
| | | Total Potential Recoupment |
| | | Balanced Fund | $84,583 | |
| | | Equity Fund | 63,550 | |
| | | Midcap Fund | 105,790 | |
| | | Small Cap Fund | 184,206 | |
| | | Social Balanced Fund | 109,166 | |
| | | Social Equity Fund | 183,570 | |
| | | Small Cap Innovations Fund | 176,636 | |
| | | | | |
| | | During the year ended March 31, 2011, the Balanced Fund recouped $17,016. |
| | | | | |
| | | Citi has voluntarily agreed to reduce its administrative fees. For the year ended March 31, 2011, Citi voluntarily waived fees as shown on each Fund’s Statement of Operations. |
| | | | | |
| | | Other Affiliated Transactions: |
| | | During the fiscal year ended March 31, 2010, certain securities of separately managed accounts managed by Boston Trust & Investment Management Company, an affiliate of the Adviser, were exchanged, at fair value, as in-kind transfers for shares of the Small Cap Innovations Fund. The total fair value of the securities involved in the in-kind transfers was $886,962, in exchange for 69,511 Shares of the Small Cap Innovations Fund. |
| | | | | |
| | | On March 11, 2010, the Small Cap Innovations Fund issued capital shares to certain shareholders of the Small Cap Fund, in exchange for securities received from the Small Cap Fund in accordance with procedures adopted by the Board of Trustees pursuant to Rule 17a-7 exemption provided under the 1940 Act as follows: |
| | | | | |
| | | | | Capital Shares | | Value of Securities | | | |
| | | Fund | | Received/(Transferred) | | Received/(Transferred) | | | Realized Gain/(Loss) |
| | | Small Cap Fund | | | (278,774 | ) | | $ | (3,196,449 | ) | | | $50,886 |
| | | Small Cap Innovations Fund | | | 220,311 | | | | 3,196,449 | | | | N/A |
| 4. | | Purchases and Sales of Securities: |
| | | Cost of purchases and proceeds from sales and maturities of securities, excluding short-term securities and U.S. Government securities, for the Funds for the year ended March 31, 2011, totaled: |
| | | |
| | | Fund | | Purchases | | Sales and Maturities | |
| | | Balanced Fund | | | $33,493,049 | | | | $18,620,587 | | |
| | | Equity Fund | | | 9,655,003 | | | | 7,877,133 | | |
| | | Midcap Fund | | | 9,100,976 | | | | 3,641,529 | | |
| | | Small Cap Fund | | | 152,539,474 | | | | 64,202,538 | | |
| | | Social Balanced Fund | | | 10,846,287 | | | | 8,108,169 | | |
| | | Social Equity Fund | | | 18,241,370 | | | | 10,024,054 | | |
| | | Small Cap Innovations Fund | | | 26,079,003 | | | | 10,747,176 | | |
| | | | | | | | | | | | |
| | | |
| | | |
| Notes to Financial Statements | | March 31, 2011 |
| | | |
| | | Cost of purchases and proceeds from sales and maturities of U.S. Government Securities, excluding short-term securities, for the Funds for the year ended March 31, 2011, totaled: |
| | | | | | | | | | | | |
| | | Fund | | Purchases | | Sales and Maturities | |
| | | Balanced Fund | | | $6,215,954 | | | | $13,292,988 | | |
| | | Social Balanced Fund | | | 2,292,389 | | | | 5,999,931 | | |
| | | |
| 5. | | Federal Income Tax Information: |
| | | At March 31, 2011, the cost, gross unrealized appreciation and gross unrealized depreciation on securities, for federal income tax purposes, were as follows: |
| | | | | | | | | Gross Tax | | Gross Tax | | Net Unrealized |
| | | | | | | | | Unrealized | | Unrealized | | Appreciation |
| | | | | Tax Cost | | Appreciation | | (Depreciation) | | (Depreciation) |
| | | Balanced Fund | | $ | 168,011,923 | | | $ | 65,986,616 | | | | $(827,756 | ) | | $ | 65,158,860 | |
| | | Equity Fund | | | 37,759,569 | | | | 26,109,342 | | | | (482,962 | ) | | | 25,626,380 | |
| | | Midcap Fund | | | 19,397,305 | | | | 7,907,073 | | | | (49,487 | ) | | | 7,857,586 | |
| | | Small Cap Fund | | | 219,441,211 | | | | 53,598,627 | | | | (5,361,941 | ) | | | 48,236,686 | |
| | | Social Balanced Fund | | | 39,416,758 | | | | 8,849,112 | | | | (483,032 | ) | | | 8,366,080 | |
| | | Social Equity Fund | | | 68,249,266 | | | | 25,239,767 | | | | (1,325,408 | ) | | | 23,914,359 | |
| | | Small Cap Innovations Fund | | | 38,656,357 | | | | 9,057,689 | | | | (696,843 | ) | | | 8,360,846 | |
| | | The tax character of distributions paid during the fiscal year ended March 31, 2011 was as follows: |
| | | | | | | | | | | | | | | | | | | | | | | |
| | | | | Distributions paid from | | | | | | | | | | | | |
| | | | | | | | | Net Long Term | | Total Taxable | | Tax Return of | | Total Distributions |
| | | | | Ordinary Income | | Capital Gains | | Distributions | | Capital | | Paid1 |
| | | Balanced Fund | | $ | 3,144,788 | | | | $— | | | $ | 3,144,788 | | | $ | — | | | $ | 3,144,788 | |
| | | Equity Fund | | | 457,037 | | | | — | | | | 457,037 | | | | — | | | | 457,037 | |
| | | Midcap Fund | | | 43,671 | | | | 407,930 | | | | 451,601 | | | | — | | | | 451,601 | |
| | | Small Cap Fund | | | 5,481,798 | | | | 1,422,147 | | | | 6,903,945 | | | | — | | | | 6,903,945 | |
| | | Social Balanced Fund | | | 566,820 | | | | — | | | | 566,820 | | | | — | | | | 566,820 | |
| | | Social Equity Fund | | | 751,640 | | | | — | | | | 751,640 | | | | — | | | | 751,640 | |
| | | Small Cap Innovations Fund | | | 957,455 | | | | 223,696 | | | | 1,181,151 | | | | — | | | | 1,181,151 | |
| | | The tax character of distributions paid during the fiscal year ended March 31, 2010 was as follows: |
| | | | | | | | | | | | | | | | | | | | | | | |
| | | | | Distributions paid from | | | | | | | | | | | | |
| | | | | | | | | Net Long Term | | Total Taxable | | Tax Return of | | Total Distributions |
| | | | | Ordinary Income | | Capital Gains | | Distributions | | Capital | | Paid1 |
| | | Balanced Fund | | $ | 3,153,684 | | | $ | — | | | $ | 3,153,684 | | | $ | — | | | $ | 3,153,684 | |
| | | Equity Fund | | | 435,641 | | | | — | | | | 435,641 | | | | — | | | | 435,641 | |
| | | Midcap Fund | | | 33,641 | | | | — | | | | 33,641 | | | | — | | | | 33,641 | |
| | | Small Cap Fund | | | 147,516 | | | | — | | | | 147,516 | | | | — | | | | 147,516 | |
| | | Social Balanced Fund | | | 460,378 | | | | — | | | | 460,378 | | | | — | | | | 460,378 | |
| | | Social Equity Fund | | | 834,615 | | | | — | | | | 834,615 | | | | — | | | | 834,615 | |
| | | Small Cap Innovations Fund | | | 282,970 | | | | 9 | | | | 282,979 | | | | — | | | | 282,979 | |
| | | 1 Total distributions paid may differ from the amount reported in the Statements of Changes in Net Assets because for tax purposes distributions are recognized when actually paid. |
| | | |
| | | As of March 31, 2011, the components of accumulated earnings on a tax basis were as follows: |
| | | |
| | | | | Undistributed | | Undistributed | | | | | | Accumulated | | Unrealized | | Total |
| | | | | Ordinary | | Long-Term Capital | | Accumulated | | Capital and Other | | Appreciation | | Accumulated |
| | | | | Income | | Gains | | Earnings | | Losses | | (Depreciation)2 | | Earnings (Deficit) |
| | | Balanced Fund | | $ | 792,718 | | | | $— | | | $ | 792,718 | | | $ | (2,255,997 | ) | | $ | 65,158,860 | | | $ | 63,695,581 | |
| | | Equity Fund | | | 131,770 | | | | — | | | | 131,770 | | | | (2,947,842 | ) | | | 25,626,380 | | | | 22,810,308 | |
| | | Midcap Fund | | | 154,434 | | | | 342,728 | | | | 497,162 | | | | — | | | | 7,857,586 | | | | 8,354,748 | |
| | | Small Cap Fund | | | 4,493,900 | | | | 12,435,760 | | | | 16,929,660 | | | | — | | | | 48,236,686 | | | | 65,166,346 | |
| | | Social Balanced Fund | | | 134,162 | | | | — | | | | 134,162 | | | | (1,107,598 | ) | | | 8,366,080 | | | | 7,392,644 | |
| | | Social Equity Fund | | | 168,137 | | | | — | | | | 168,137 | | | | (4,303,372 | ) | | | 23,914,359 | | | | 19,779,124 | |
| | | Small Cap Innovations Fund | | | 897,007 | | | | 2,004,339 | | | | 2,901,346 | | | | — | | | | 8,360,846 | | | | 11,262,192 | |
| | | 2 The differences between book-basis and tax-basis unrealized appreciation (depreciation) is attributable primarily to tax deferral of losses on wash sales. |
| | | |
| | | |
| | | |
| Notes to Financial Statements | | March 31, 2011 |
| | | |
Under current tax law, capital losses realized after October 31 of a Fund’s fiscal year may be deferred and treated as occurring on the first business day of the following fiscal year for tax purposes. The Funds did not have any post October losses for the year ended March 31, 2011.
The Regulated Investment Company Modernization Act of 2010 (the “Act”) was enacted on December 22, 2010. The Act makes changes to several tax rules impacting the Funds. In general, the provisions of the Act will be effective for the Funds’ fiscal year ending March 31, 2012. Although the Act provides several benefits, including the unlimited carryforward of future capital losses, there may be a greater likelihood that all or a portion of each Fund’s pre-enactment capital loss carryforwards, if any, may expire without being utilized due to the fact that post-enactment capital losses get utilized before pre-enactment capital loss carryforwards.
Relevant information regarding the impact of the Act on the Funds, if any, will be contained within the “Federal Income Taxes” section of the financial statement notes for the fiscal year ending March 31, 2012.
As of March 31, 2011, the following Funds had net capital loss carryforwards, which are available to offset future realized gains. To the extent these carryforwards are used to offset future gains, it is probable that the amounts offset will not be distributed to shareholders.
| | Fund | | Amount | | Expires | |
| | Balanced Fund | | $ | 2,255,997 | | 2018 | | |
| | Equity Fund | | | 506,202 | | 2017 | | |
| | Equity Fund | | | 2,441,640 | | 2018 | | |
| | Social Balanced Fund | | | 1,107,598 | | 2018 | | |
| | Social Equity Fund | | | 212,103 | | 2017 | | |
| | Social Equity Fund | | | 4,091,269 | | 2018 | | |
During the year ended March 31, 2011, the following Funds utilized capital loss carryforwards to offset realized capital gains:
| | Fund | | Amount | |
| | Balanced Fund | | $ | 286,429 | |
| | Equity Fund | | | 252,961 | |
| | Midcap Fund | | | 244,417 | |
| | Social Balanced Fund | | | 837,767 | |
| | Social Equity Fund | | | 699,549 | |
As of March 31, 2011, the following reclassifications have been made to increase (decrease) such accounts with offsetting adjustments as indicated:
| | | | Accumulated Net | | Accumulated Net | | | | |
| | | | Investment Income | | Realized Gains | | Paid in Capital |
| | Small Cap Fund | | $ | 54,474 | | | $ | (54,475 | ) | | $ | 1 | |
| | Social Balanced Fund | | | 1 | | | | 1 | | | | (2 | ) |
| | Small Cap Innovations Fund | | | 13,470 | | | | (13,470 | ) | | | — | |
6. Control Ownership and Principal Holders:
The beneficial ownership, either directly or indirectly, of more than 25% of the voting securities of a Fund creates presumptions of control of the Fund, under section 2 (a)(9) of the 1940 Act. As of March 31, 2011, the Funds had individual shareholder accounts and/or omnibus shareholder accounts (comprised of a group of individual shareholders), owning more than 25% of the total shares outstanding of the Fund as detailed below:
| | Fund | | Control Ownership | | % of Ownership |
| | Balanced Fund | | Boston Trust & Investment Management Company | | 95.7 |
| | Equity Fund | | Boston Trust & Investment Management Company | | 98.9 |
| | Midcap Fund | | Boston Trust & Investment Management Company | | 95.0 |
| | Social Balanced Fund | | Boston Trust & Investment Management Company | | 67.2 |
| | | | TIAA-CREF | | 27.8 |
| | Social Equity Fund | | Boston Trust & Investment Management Company | | 26.8 |
| | | | Charles Schwab & Co. | | 27.1 |
| | | | TIAA-CREF | | 30.7 |
| | Small Cap Innovations Fund | | Boston Trust & Investment Management Company | | 56.8 |
7. Subsequent Events:
On May 19, 2011, the Board of Trustees of the Group approved a name change for the Group to Boston Trust & Walden Funds. This name change will become effective August 1, 2011.
Report of Independent Registered Public Accounting Firm
To the Shareholders and Board of Trustees of The Coventry Group:
We have audited the accompanying statements of assets and liabilities, including the schedules of portfolio investments, of The Coventry Group, comprising the Boston Trust Balanced Fund, Boston Trust Equity Fund, Boston Trust Midcap Fund, Boston Trust Small Cap Fund, Walden Social Balanced Fund, Walden Social Equity Fund, and Walden Small Cap Innovations Fund (the “Funds”) as of March 31, 2011, and the related statement of operations for the year then ended, the statements of changes in net assets for each of the two years in the period then ended, and the financial highlights for each of the three periods in the period then ended. These financial statements and financial highlights are the responsibility of Fund management. Our responsibility is to express an opinion on these financial statements and financial highlights based on our audits. The financial highlights for the periods indicated prior to the period ended March 31, 2009 were audited by another independent registered public accounting firm, who expressed an unqualified opinion on those financial statements and financial highlights.
We conducted our audits in accordance with the standards of the Public Company Accounting Oversight Board (United States). Those standards require that we plan and perform the audit to obtain reasonable assurance about whether the financial statements and financial highlights are free of material misstatement. An audit includes examining, on a test basis, evidence supporting the amounts and disclosures in the financial statements. Our procedures included confirmation of securities owned as of March 31, 2011 by correspondence with the custodian and brokers. An audit also includes assessing the accounting principles used and significant estimates made by management, as well as evaluating the overall financial statement presentation. We believe that our audits provide a reasonable basis for our opinion.
In our opinion, the financial statements and financial highlights referred to above present fairly, in all material respects, the financial position of each of the Funds constituting The Coventry Group as of March 31, 2011, the results of its operations for the year then ended, the changes in its net assets for each of the two years in the period then ended, and the financial highlights for each of the three periods in the period then ended, in conformity with accounting principles generally accepted in the United States of America.

COHEN FUND AUDIT SERVICES, LTD.
Westlake, Ohio
May 25, 2011
| | | |
| | | |
| Supplementary Information (Unaudited) | | March 31, 2011 |
| | | |
Federal Income Tax Information:
During the fiscal year ended March 31, 2011, the Funds declared long-term realized gain distributions in the following amounts:
| | | | 15% Capital Gains |
| | Midcap Fund | | $ | 407,930 | |
| | Small Cap Fund | | | 1,422,147 | |
| | Small Cap Innovations Fund | | | 223,696 | |
During the fiscal year ended March 31, 2011, the Funds declared short-term realized gain distributions in the following amounts:
| | | | Short-Term Capital Gains |
| | Small Cap Fund | | $ | 5,092,877 | |
| | Small Cap Innovations Fund | | | 909,804 | |
For the fiscal year ended March 31, 2011, the following percentage of the total ordinary income distributions paid by the Funds qualify for the distributions received deduction available to corporate shareholders.
| | | | Distributions Received Deduction |
| | Balanced Fund | | 79.58 | % |
| | Equity Fund | | 100.00 | % |
| | Midcap Fund | | 100.00 | % |
| | Small Cap Fund | | 31.81 | % |
| | Social Balanced Fund | | 87.76 | % |
| | Social Equity Fund | | 100.00 | % |
| | Small Cap Innovations Fund | | 21.20 | % |
For the fiscal year ended March 31, 2011, distributions paid by the Funds may be subject to a maximum tax rate of 15%, as provided for by the Jobs and Growth Tax Relief Reconciliation Act of 2003. The Funds intend to designate the maximum amount allowable as taxed at a maximum rate of 15%. Complete information will be reported in conjunction with your 2011 Form 1099-DIV.
| | | | Qualified Dividend Income |
| | Balanced Fund | | 84.32 | % |
| | Equity Fund | | 100.00 | % |
| | Midcap Fund | | 100.00 | % |
| | Small Cap Fund | | 31.99 | % |
| | Social Balanced Fund | | 93.49 | % |
| | Social Equity Fund | | 100.00 | % |
| | Small Cap Innovations Fund | | 21.28 | % |
| | | |
| | | |
| Supplementary Information (Unaudited) | | March 31, 2011 |
| | | |
Table of Shareholder Expenses:
As a shareholder of the Boston Trust Funds and Walden Funds, you incur ongoing costs, including management fees, and other Fund expenses. These examples are intended to help you understand your ongoing costs (in dollars) of investing in the Boston Trust Funds and Walden Funds and to compare these costs with the ongoing costs of investing in other mutual funds.
These examples are based on an investment of $1,000 invested at the beginning of the period and held for the entire period from October 1, 2010, through March 31, 2011.
Actual Expenses
The table below provides information about actual account values and actual expenses. You may use the information below together with the amount you invested, to estimate the expenses that you paid over the period. Simply divide your account value by $1,000 (for example, an $8,600 account value divided by $1,000 = 8.6), then multiply the result by the number in the table under the heading entitled “Expenses Paid During Period” to estimate the expenses you paid on your account during this period.
Please note that the expenses shown in the table are meant to highlight your ongoing costs only and do not reflect the costs incurred by the Funds for buying and selling securities. The Funds do not charge transaction fees, such as redemption fees, nor do the Funds charge a sales charge (load). Therefore, the table is useful in comparing ongoing costs only, and will not help you determine the relative total costs of owning different funds.
| | | | | | | | | | | | | | | | | Annualized |
| | | | | | | | | | | | Expenses Paid | | | Expense Ratio |
| | | | Beginning Account Value | | Ending Account Value | | During Period1 | | | During Period |
| | | | 10/1/10 | | 3/31/11 | | 10/1/10 - 3/31/11 | | | 10/1/10 - 3/31/11 |
| | Balanced Fund | | $ | 1,000.00 | | | $ | 1,116.50 | | | $ | 5.28 | | | | 1.00 | % |
| | Equity Fund | | | 1,000.00 | | | | 1,172.50 | | | | 5.42 | | | | 1.00 | % |
| | Midcap Fund | | | 1,000.00 | | | | 1,195.60 | | | | 5.47 | | | | 1.00 | % |
| | Small Cap Fund | | | 1,000.00 | | | | 1,247.00 | | | | 5.60 | | | | 1.00 | % |
| | Social Balanced Fund | | | 1,000.00 | | | | 1,103.10 | | | | 5.24 | | | | 1.00 | % |
| | Social Equity Fund | | | 1,000.00 | | | | 1,155.70 | | | | 5.37 | | | | 1.00 | % |
| | Small Cap Innovations Fund | | | 1,000.00 | | | | 1,241.10 | | | | 5.59 | | | | 1.00 | % |
| | 1 | Expenses are equal to the average account value times the Fund’s annualized expense ratio multiplied by the number of days in the most recent fiscal half-year divided by the number of days in the fiscal year. |
Hypothetical Example for Comparison Purposes
The table below provides information about hypothetical account values and hypothetical expenses based on each Boston Trust Fund’s and Walden Fund’s actual expense ratio and an assumed rate of return of 5% per year before expenses, which is not the Fund’s actual return. The hypothetical account values and expenses may not be used to estimate the actual ending account balance or expenses you paid for the period. You may use this information to compare this 5% hypothetical example with the 5% hypothetical examples that appear in the shareholder reports of other funds.
Please note that the expenses shown in the table are meant to highlight your ongoing costs only and do not reflect the costs incurred by the Funds for buying and selling securities. The Funds do not charge transaction fees, such as redemption fees, nor do the Funds charge a sales charge (load). Therefore, the table is useful in comparing ongoing costs only, and will not help you determine the relative total costs of owning different funds.
| | | | | | | | | | | | | | | | Annualized |
| | | | | | | | | | | | Expenses Paid | | Expense Ratio |
| | | | Beginning Account Value | | Ending Account Value | | During Period1 | | During Period |
| | | | 10/1/10 | | 3/31/11 | | 10/1/10 - 3/31/11 | | 10/1/10 - 3/31/11 |
| | Balanced Fund | | $ | 1,000.00 | | | $ | 1,019.95 | | | $ | 5.04 | | | | 1.00 | % |
| | Equity Fund | | | 1,000.00 | | | | 1,019.95 | | | | 5.04 | | | | 1.00 | % |
| | Midcap Fund | | | 1,000.00 | | | | 1,019.95 | | | | 5.04 | | | | 1.00 | % |
| | Small Cap Fund | | | 1,000.00 | | | | 1,019.95 | | | | 5.04 | | | | 1.00 | % |
| | Social Balanced Fund | | | 1,000.00 | | | | 1,019.95 | | | | 5.04 | | | | 1.00 | % |
| | Social Equity Fund | | | 1,000.00 | | | | 1,019.95 | | | | 5.04 | | | | 1.00 | % |
| | Small Cap Innovations Fund | | | 1,000.00 | | | | 1,019.95 | | | | 5.04 | | | | 1.00 | % |
| | 1 | Expenses are equal to the average account value times the Fund’s annualized expense ratio multiplied by the number of days in the most recent fiscal half-year divided by the number of days in the fiscal year. |
| | | |
| | | |
| Supplementary Information (Unaudited) | | March 31, 2011 |
| | | |
Tabular Summary of Schedules of Portfolio Investments:
The Boston Trust Funds invested, as a percentage of total portfolio investments, in the following industries as of March 31, 2011.
| | Boston Trust Balanced Fund | | Boston Trust Equity Fund | | Boston Trust Midcap Fund | | Boston Trust Small Cap Fund |
| | | | | | | | | | | | | | | | | | | | |
| | Security Allocation | | Percentage of | | Security Allocation | | Percentage of | | Security Allocation | | Percentage of | | Security Allocation | | Percentage of |
| | for the Schedule of | | Total Portfolio | | for the Schedule of | | Total Portfolio | | for the Schedule of | | Total Portfolio | | for the Schedule of | | Total Portfolio |
| | Portfolio Investments | | Investments | | Portfolio Investments | | Investments | | Portfolio Investments | | Investments | | Portfolio Investments | | Investments |
| | U.S. Gov’t. Obligations | | 19.4 | % | | Industrial Prods & Svcs | | 18.2 | % | | Industrial Prods & Svcs | | 16.1 | % | | Information Technology | | 18.9 | % |
| | Industrial Prods & Svcs | | 13.6 | % | | Information Technology | | 16.5 | % | | Financial Services | | 15.2 | % | | Financial Services | | 18.7 | % |
| | Information Technology | | 12.2 | % | | Energy | | 16.4 | % | | Information Technology | | 15.1 | % | | Industrial Prods & Svcs | | 18.2 | % |
| | Energy | | 11.8 | % | | Financial Services | | 13.0 | % | | Consumer Discretionary | | 12.9 | % | | Health Care | | 14.3 | % |
| | Financial Services | | 11.6 | % | | Consumer Products | | 12.2 | % | | Health Care | | 11.2 | % | | Consumer Discretionary | | 12.5 | % |
| | Consumer Products | | 10.3 | % | | Health Care | | 10.2 | % | | Energy | | 9.2 | % | | Energy | | 6.4 | % |
| | Health Care | | 7.2 | % | | Consumer Discretionary | | 7.4 | % | | Consumer Products | | 8.0 | % | | Industrial Materials | | 4.0 | % |
| | Consumer Discretionary | | 5.8 | % | | Industrial Materials | | 5.8 | % | | Industrial Materials | | 5.1 | % | | Utilities | | 3.6 | % |
| | Industrial Materials | | 3.3 | % | | Investment Companies | | 0.3 | % | | Utilities | | 3.6 | % | | Consumer Products | | 3.1 | % |
| | Municipal Bonds | | 2.9 | % | | Total | | 100.0 | % | | Investment Companies | | 2.4 | % | | Investment Companies | | 0.3 | % |
| | Investment Companies | | 1.6 | % | | | | | | | Telecommunications | | 1.2 | % | | Total | | 100.0 | % |
| | Telecommunications | | 0.2 | % | | | | | | | Total | | 100.0 | % | | | | | |
| | Basic Materials | | 0.1 | % | | | | | | | | | | | | | | | |
| | Total | | 100.0 | % | | | | | | | | | | | | | | | |
The Walden Funds invested, as a percentage of total portfolio investments, in the following industries as of March 31, 2011.
| | Walden Social Balanced Fund | | Walden Social Equity Fund | | Walden Small Cap Innovations Fund |
| | | | | | | | | | | | | | | |
| | | | Percentage of | | | | Percentage of | | | | Percentage of |
| | Security Allocation for the | | Total Portfolio | | Security Allocation for the | | Total Portfolio | | Security Allocation for the | | Total Portfolio |
| | Schedule of Portfolio Investments | | Investments | | Schedule of Portfolio Investments | | Investments | | Schedule of Portfolio Investments | | Investments |
| | U.S. Gov’t. Obligations | | 18.7 | % | | Information Technology | | 17.6 | % | | Information Technology | | 18.2 | % |
| | Information Technology | | 14.2 | % | | Industrial Prods & Svcs | | 15.0 | % | | Financial Services | | 17.9 | % |
| | Financial Services | | 13.2 | % | | Consumer Products | | 14.9 | % | | Industrial Prods & Svcs | | 17.2 | % |
| | Industrial Prods & Svcs | | 11.7 | % | | Energy | | 13.5 | % | | Health Care | | 13.8 | % |
| | Energy | | 10.5 | % | | Health Care | | 11.7 | % | | Consumer Discretionary | | 12.0 | % |
| | Health Care | | 8.5 | % | | Financial Services | | 11.2 | % | | Energy | | 5.8 | % |
| | Consumer Products | | 7.9 | % | | Consumer Discretionary | | 9.3 | % | | Investment Companies | | 4.8 | % |
| | Consumer Discretionary | | 7.5 | % | | Industrial Materials | | 4.8 | % | | Industrial Materials | | 3.9 | % |
| | Industrial Materials | | 4.1 | % | | Investment Companies | | 1.6 | % | | Utilities | | 3.4 | % |
| | Municipal Bonds | | 2.0 | % | | Utilities | | 0.4 | % | | Consumer Products | | 3.0 | % |
| | Investment Companies | | 0.8 | % | | Total | | 100.0 | % | | Total | | 100.0 | % |
| | Utilities | | 0.7 | % | | | | | | | | | | |
| | Telecommunications | | 0.2 | % | | | | | | | | | | |
| | Total | | 100.0 | % | | | | | | | | | | |
Other Information:
A description of the policies and procedures that the Funds use to determine how to vote proxies related to portfolio securities is available (i) without charge,upon request, by calling 1-800-282-8782 ext. 7050, and (ii) on the Securities and Exchange Commission’s (the “Commission”) website at http://www.sec.gov.
Information regarding how the Funds’ voted proxies relating to portfolio securities during the most recent 12-month period ended June 30 is available (i) without charge, upon request, by calling 1-800-282-8782 ext. 7050, (ii) on the Boston Trust & Investment Management, Inc. website at http://www.btim.com; and (iii) on the Commission’s website at http://www.sec.gov.
The Funds file complete schedules of portfolio holdings for each Fund with the Commission for the first and third quarters of each fiscal year on Form N-Q. The Funds’ Form N-Q is available on the Commission’s website at http://www.sec.gov. The Funds’ Form N-Q may be reviewed and copied at the Commission’s Public Reference Room in Washington, D.C. and information on the operation of the Public Reference Room may be obtained by calling 1-800-SEC-0330.
| | | |
| | | |
| Supplementary Information (Unaudited) | | March 31, 2011 |
| | | |
The annual consideration by the Board of Trustees (the “Board”) of the continuation of the investment advisory agreement between Boston Trust Investment Management, Inc., (the “Adviser”) and Boston Trust Balanced Fund, Boston Trust Equity Fund, Boston Trust Midcap Fund, Boston Trust Small Cap Fund, Walden Social Balanced Fund, Walden Social Equity Fund and Walden Small Cap Innovations Fund (the “Funds”).
Section 15 of the Investment Company Act of 1940 (the “1940 Act”) requires that the Investment Advisory Agreement with the Adviser be renewed annually by the Board, including a majority of the Trustees who are not “interested persons” of the Funds or of the Adviser (“Independent Trustees”). It is the duty of the Board to request as much information as is reasonably necessary to evaluate the terms of the Investment Advisory Agreement and determine whether its continuance is fair to the Funds and their shareholders. The Board considered the continuation of the Investment Advisory Agreement at an in-person meeting held on February 25, 2011. The Board requested, and the Adviser provided, information and data relating to: (i) the investment performance of the Funds and the Adviser; (ii) the nature, extent and quality of the services provided by the Adviser to the Funds; (iii) the cost of the services to be provided and the profits to be realized by the Adviser and its affiliates from the relationship with the Funds; (iv) the extent to which economies of scale will be realized as the Funds grow; (v) whether the fee levels reflect these economies of scale to the benefit of Funds’ shareholders; (vi) the advisory fees paid by other comparable funds advised by the Adviser or by a different investment adviser; (vii) the Funds’ expense ratios and the expense ratios of similar funds; and (viii) the effect of any fee waivers and expense reimbursements made by the Adviser.
At the meeting on February 25, 2011, the Board engaged in a thorough review process to determine whether to continue the Investment Advisory Agreement. The Board met directly with representatives of the Adviser and reviewed the information and data listed above. As part of its deliberations, the Board also considered and relied upon the information about the Funds and the Adviser that it had received throughout the year as part of its ongoing oversight of the Funds and their operations. The Board reviewed the performance of the Funds from inception through December 31, 2010, comparing the performance to various indices and, in the case of the Boston Trust Balanced Fund and the Walden Social Balanced Fund, to a composite index comprised of stocks, bond and money market indices. The Boston Trust Equity Fund, Boston Trust Midcap Fund and Walden Social Equity Fund outperformed their respective indices for the one year, five-year and since inception periods ended December 31, 2010. The Boston Trust Balanced Fund outperformed the composite return and the S&P 500 Index for all periods, but lagged the Barclays Capital Government/Credit Bond Index for the five-year period ended December 31, 2010. The Walden Social Balanced Fund underperformed the S&P 500 for the one-year period, the composite return for the five-year period and the Barclays Capital Government/Credit Bond Index for the five-year and since inception periods. The Boston Trust Small Cap and the Walden Small Cap Innovations Fund outperformed the Russell Midcap Index and the Russell 2000 Index, respectively, for all periods other than the one-year period ended December 31, 2010.
Turning to the level of the advisory fees paid by the Funds, the Board reviewed a comparative analysis of advisory fees and expense ratios based on publicly available data for comparable funds. The Board noted that, with the exception of the Boston Trust Balanced Fund, Boston Trust Equity Fund, Walden Social Balanced Fund and Walden Social Equity Fund, each Fund has a contractual advisory fee that is at or below the average fee for the peer group. The contractual advisory fees for the Boston Trust Equity Fund and Walden Social Equity Fund, meanwhile, were near the median for the peer group, while the contractual advisory fees for the Boston Trust Balanced Fund and Walden Social Balanced Fund were above the median for the peer group average, but below the highest fees in the peer group. The Board noted that the Adviser has been operating under an Expense Limitation Agreement that requires BTIM to waive fees and/or reimburse expenses to the extent total operation expenses of all any Fund exceeds 1.00%. The actual advisory fees charged by all the Boston Trust and Walden Funds, except the Boston Trust Balanced Fund, are below the peer group average after expense waivers and/or reimbursements. Actual advisory fees for the Boston Trust Balanced Fund are above the peer group average, but well below the highest fees paid by funds in the peer group. Turning to total operating expenses, the Board noted that the expense ratios for all the Boston Trust Funds and Walden Funds, other than the Boston Trust Equity Fund and the Walden Social Equity Fund, are lower than the industry average after expense waivers and/or reimbursements. The expense ratios, after expense waivers and/or reimbursements, for the Boston Trust Equity Fund and the Walden Social Equity Fund are one basis point above the industry average and in the middle of the range of expense ratios for the peer group. After considering the comparative data as described above, and the proposed renewal of the Expense Limitation Agreement, the Board concluded that the advisory fees and expense ratios were reasonable.
The Board gave careful consideration to the nature, extent and quality of the services provided by the Adviser to the Funds. The Board reviewed the Adviser’s organizational structure, investment philosophy, portfolio construction process, fixed income approach and brokerage policies. The Board noted the experience and the capabilities of the Adviser’s personnel, as well as the quality of the reports and other materials received from the Adviser. Taking into account the personnel involved in servicing the Funds, as well as the materials and services described above, the Board expressed satisfaction with the quality of the services received from the Adviser.
| | | |
| | | |
| Supplementary Information (Unaudited) | | March 31, 2011 |
| | | |
The Board then reviewed financial information collected from the income statements of the Adviser concerning the cost to the Adviser of providing services to the Funds and the overall profitability to the Adviser of its relationship with the Funds. The Board noted that the Adviser’s relationship with the Funds was profitable in spite of the revenue reducing efforts of an Expense Limitation Agreement with the Funds. The Board also reviewed the fees received by the Adviser and its affiliates under the Transfer Agency and Custody Agreements.
In reaching its conclusions with respect to the continuation of the Investment Advisory Agreement, the Board did not identify any single controlling factor. Rather, the Board noted that a combination of factors influenced their decision making process. The Board did, however, identify the commitment of the Adviser to the successful operation of the Funds and the level of Fund expenses as being important elements of their consideration. The Board took notice of the fact that the Adviser has maintained an Expense Limitation Agreement with respect to each of the Funds since the inception of each Fund pursuant to which total operating expenses for each of the Funds is limited, which the Board noted benefits shareholders in each of the Funds. The Board took further notice of the fact that the Adviser has agreed to continue the Expense Limitation Agreement for each of the Funds. Based upon their review and consideration of these factors and other matters deemed relevant by the Board in reaching an informed business judgment, a majority of the Board, including a majority of the Independent Trustees, concluded that the terms of the Investment Advisory Agreement are fair and reasonable and the Board voted to renew the Investment Advisory Agreement for an additional one-year period.
58
| | | |
| | | |
| Information about Trustees and Officers (Unaudited) | | March 31, 2011 |
| | | |
Overall responsibility for management of the Funds rests with the Board of Trustees. The names of the Trustees and Officers of the Funds, their addresses, ages and principal occupations during the past five years are provided in the tables below. The business address of the persons listed below is 3435 Stelzer Road, Columbus, Ohio 43219-3035, unless otherwise listed. Trustees who are deemed “interested persons,” as defined in the Investment Company Act of 1940, are referred to as Interested Trustees. Trustees who are not interested persons are referred to as Independent Trustees. The Funds do not have any Interested Trustees. The Funds’ Statement of Additional Information includes additional information about the Funds’ Trustees and is available, without charge and upon request, by calling 1-800-282-8782 or by visiting www.btim.com.
|
| | | | | | | | | | | Other |
| | | | | | | | | Number of Funds | | Directorships |
| | | Positions(s) | | Term of Office* | | | | in Fund Complex | | Held by Trustee |
| | | Held with | | and Length of | | Principal Occupation(s) | | Overseen by | | during the past |
| Name, Date of Birth | | the Funds | | Time Served | | During Past Five Years | | Trustee | | five years |
|
| INDEPENDENT TRUSTEES |
|
| |
Michael M. Van Buskirk
Date of Birth: 2/22/1947 | | Trustee and Chairman of the Board | | Since 1992 | | President and Chief Executive Officer, Ohio Bankers League, May 1991 to present. | | 7 | | None |
| | | | | | | | | | | |
Diane Armstrong
Date of Birth: 7/2/1964 | | Trustee | | Since 2004 | | Managing Director of Financial Planning Services, WealthStone (financial planning firm), July 2008 to present. Principal of King, Dodson Armstrong Financial Advisors, Inc., August 2003 to July 2008. Director of Financial Planning, Hamilton Capital Management, April 2000 to August 2003. | | 7 | | None |
| | | | | | | | | | | |
Dr. James Woodward
Date of Birth: 11/24/1939 | | Trustee | | Since 1997 | | Chancellor Emeritus, University of North Carolina at Charlotte, August 2005 to present. Chancellor, North Carolina State University, June 2009 to April 2010. Chancellor, University of North Carolina at Charlotte, July 1989 to July 2005. | | 7 | | None |
|
| OFFICERS WHO ARE NOT TRUSTEES |
|
| |
John Danko
Date of Birth: 4/17/1967 | | President | | Since 2008 | | Director, Client Executive, Citi Fund Services Ohio, Inc. (fund administrator), May 1997 to present. | | | | |
| | | | | | | | | | | |
Joel B. Engle
Date of Birth: 10/31/1965 | | Treasurer | | Since 2010 | | Senior Vice President, Citi Fund Services Ohio, Inc. (fund administrator), December 2007 to present. Vice President, Financial Reporting, Spectrum Global Fund Administration, March 2007 to December 2007. Vice President, Fund Administration, Citi Fund Services Ohio, Inc., February 2006 to March 2007. | | | | |
| | | | | | | | | | | |
Curtis Barnes
100 Summer Street
Boston, MA 02110
Date of Birth: 9/24/1953 | | Secretary | | Since 2007 | | Senior Vice President, Regulatory Administration, Citi Fund Services Ohio, Inc. (fund administrator), May 1995 to present. | | | | |
| | | | | | | | | | | |
Eric B. Phipps **
Date of Birth: 6/20/1971 | | Chief Compliance Officer | | Since 2006 | | Vice President, Citi Fund Services Ohio, Inc. (fund administrator), June 2006 to present. Staff Accountant, United States Securities and Exchange Commission, October 2004 to May 2006. | | | | |
|
| * | | Trustees hold their position with the Funds until their resignation or removal. Officers hold their positions with the Funds until a successor has been duly elected and qualified. |
| ** | | Mr. Phipps serves as Chief Compliance Officer. His compensation is reviewed and approved by the Board of Trustees and paid by Citi pursuant to a Compliance Services Agreement between Citi and the Trust. The fee paid pursuant to the Compliance Services Agreement by the Fund is not indicative of the total compensation received by Mr. Phipps. |
59
This page intentionally left blank.
60
This page intentionally left blank.
61
| | | |
| | | |
| | | Investment Adviser |
| | | Boston Trust Investment Management, Inc. |
| | | One Beacon Street |
| | | Boston, MA 02108 |
| | | |
| | | |
| | | Custodian and Transfer Agent |
| | | Boston Trust & Investment Management Company |
| | | One Beacon Street |
| | | Boston, MA 02108 |
| | | |
| | | |
| | | Administrator |
| | | Citi Fund Services Ohio, Inc. |
| | | 3435 Stelzer Road |
| | | Columbus, OH 43219 |
| | | |
| | | |
| | | Distributor |
| | | Foreside Distribution Services, L.P. |
| | | 3 Canal Plaza, Suite 100 |
| | | Portland, ME 04101 |
| | | |
| | | |
| | | Independent Registered Public Accounting Firm |
| | | Cohen Fund Audit Services, Ltd. |
| | | 800 Westpoint Parkway, Suite 1100 |
| | | Westlake, OH 44145 |
| | | |
| | | |
| | | Legal Counsel |
| | | Thompson Hine LLP |
| | | 41 South High Street, Suite 1700 |
| | | Columbus, OH 43215 |
| | | |
| | | |
| | | |
| | | |
| | | |
| | | |
| | | |
| | | This report is intended for the shareholders of the Funds and may not be used as sales literature unless preceded or accompanied by a current prospectus. |
| | | |
| | | |
| | | Past performance results shown should not be considered a representation of future performance. Share price and returns will fluctuate so that shares, when redeemed, may be worth more or less than their original cost. Statements and other information herein are dated and subject to change. |
| | | |
| | | |
| | | |
| | | |
| | | |
| | | |
| | | 05/11 |
| | | |
| | | |
Item 2. Code of Ethics.
| | |
| | (a) The registrant has adopted a code of ethics that applies to the registrant’s principal executive officer, principal financial officer, principal accounting officer or controller, or persons performing similar functions. This code of ethics is included as an Exhibit. |
| | |
| | (b) During the period covered by the report, with respect to the registrant’s code of ethics that applies to its principal executive officer, principal financial officer, principal accounting officer or controller, or persons performing similar functions; there have been no amendments to, nor any waivers granted from, a provision that relates to any element of the code of ethics definition enumerated in paragraph (b) of this Item 2. |
Item 3. Audit Committee Financial Expert.
3(a)(1) The registrant’s board of directors has determined that the registrant has at least one audit committee financial expert serving on its audit committee.
3(a)(2) The audit committee financial expert is Diane Armstrong, who is “independent” for purposes of this Item 3 of Form N-CSR.
Item 4. Principal Accountant Fees and Services.
| | | | | | | |
| | | | | 2011 | | 2010 |
| (a) | | Audit Fees | | $70,000 | | $70,000 |
| | | | | | | |
| (b) | | Audit-Related Fees | | $12,000 | | $12,000 |
The fees for 2010 relate to the consent issuance in three Form 17f-2 filings filed with the Securities and Exchange Commission (“SEC”).
The fees for 2011 relate to the consent issuance in three Form 17f-2 filings filed with the SEC.
| | | | | 2011 | | 2010 |
| (c) | | Tax Fees | | $14,000 | | $14,000 |
Tax fees for both years related to the preparation of the Funds’ federal and state income tax returns, federal excise tax return review and review of capital gain and income distribution calculations.
| (d) | | 2011 | | 2010 |
| All Other Fees | | $0 | | $0 |
| | | | | |
Item 5. Audit Committee of Listed Registrants.
Not applicable.
Item 6. Investments.
(a) Included as part of the report to shareholders filed under Item 1.
(b) Not applicable.
Item 7. Disclosure of Proxy Voting Policies and Procedures for Closed-End Management Investment Companies.
Not applicable.
Item 8. Portfolio Managers of Closed-End Management Investment Companies.
Not applicable
Item 9. Purchases of Equity Securities by Closed-End Management Investment Company and Affiliated Purchasers.
Not applicable.
Item 10. Submission of Matters to a Vote of Security Holders.
Not applicable.
Item 11. Controls and Procedures.
(a) The registrant’s principal executive officer and principal financial officer have concluded, based on their evaluation of the registrant’s disclosure controls and procedures as conducted within 90 days of the filing date of this report, that these disclosure controls and procedures are adequately designed and are operating effectively to ensure that information required to be disclosed by the registrant on Form N-CSR is recorded, processed, summarized and reported within the time periods specified in the Securities and Exchange Commission’s rules and forms.
(b) There were no changes in the registrant’s internal control over financial reporting (as defined in Rule 30a-3(d) under the Act (17 CFR 270.30a-3(d)) that occurred during the second fiscal quarter of the period covered by this report that have materially affected or are reasonably likely to materially affect, the registrant’s internal control over financial reporting.
Item 12. Exhibits.
(a)(1) The code of ethics that is the subject of the disclosure required by Item 2 is attached hereto.
(a)(2) Certifications pursuant to Rule 30a-2(a) are attached hereto.
(a)(3) Not applicable.
(b) Certifications pursuant to Rule 30a-2(b) are furnished herewith
SIGNATURES
Pursuant to the requirements of the Securities Exchange Act of 1934 and the Investment Company Act of 1940, the registrant has duly caused this report to be signed on its behalf by the undersigned, thereunto duly authorized.
| (Registrant) | The Coventry Group |
| | | | |
| | |
| By (Signature and Title)* | /s/ John Danko, President |
| | |
| | |
| Date | May 23, 2011 | |
Pursuant to the requirements of the Securities Exchange Act of 1934 and the Investment Company Act of 1940, this report has been signed below by the following persons on behalf of the registrant and in the capacities and on the dates indicated.
| | |
| By (Signature and Title)* | /s/ John Danko, President |
| | |
| | |
| Date | May 23, 2011 | |
| | |
| By (Signature and Title)* | /s/ Joel Engle, Treasurer |
| | |
| | |
| Date | May 23, 2011 | |
| | | | |
*Print the name and title of each signing officer under his or her signature.