UNITED STATES
SECURITIES AND EXCHANGE COMMISSION
Washington, D.C. 20549
FORM N-CSR
CERTIFIED SHAREHOLDER REPORT OF REGISTERED
MANAGEMENT INVESTMENT COMPANIES
| Investment Company Act file number | 811-06526 | | |
| | |
| | |
| | | The Coventry Group | | |
|
| | | | (Exact name of registrant as specified in charter) | | |
| | | | | | |
| 3435 Stelzer Road | | Columbus, OH | | 43219 |
|
| | | | (Address of principal executive offices) | | (Zip code) |
| | | | | | |
| 3435 Stelzer Road | | Columbus, OH | | 43219 |
|
| | | | (Name and address of agent for service) | | |
| Registrant’s telephone number, including area code: | 1-800-282-8782 | | |
| | |
| | |
| | | | | | |
| Date of fiscal year end: | | March 31, 2009 | | |
| | |
| | |
| | | | | | |
| Date of reporting period: | | March 31, 2009 | | |
| | |
| | |
| | | |
| Item 1. | | Reports to Stockholders. |
| | | |
| | | |
| |
| |
| |
| |
 |
| |
| Boston Trust Balanced Fund |
| Boston Trust Equity Fund |
| Boston Trust Small Cap Fund |
| Boston Trust Midcap Fund |
| |
| Walden Social Balanced Fund |
| Walden Social Equity Fund |
| Walden Small Cap Innovations Fund |
| |
| |
 |
| |
| |
| |
| |
| |
| |
| | ANNUAL REPORT |
| |
| | March 31, 2009 |
| |
| |
| |
| |
Boston Trust Investment Management, Inc., a subsidiary of Boston Trust & Investment Management Company (BTIM) and an affiliate of Walden Asset Management (Walden) serves as investment adviser (the Adviser) to the Boston Trust and Walden Funds and receives a fee for its services. Walden, a division of BTIM, performs shareholder advocacy, proxy voting, screening services, and other social initiatives for the Adviser and is paid a fee for these services by the Adviser.
Shares of the Funds are not deposits of, obligations of, or guaranteed by Boston Trust & Investment Management Company or its affiliates, nor are they federally insured by the FDIC. Investments in the Funds involve investment risks, including the possible loss of principal. Funds are distributed by Foreside Distribution Services, L.P., Columbus, Ohio.
The foregoing information and opinions are for general information only. Boston Trust Funds and Boston Trust Investment Management, Inc. do not assume liability for any loss, which may result from the reliance by any person upon any such information or opinions. Such information and opinions are subject to change without notice, are for general information only, and are not intended as an offer or solicitation with respect to the purchase or sale of any security or offering individual or personalized investment advice.
Economic and Market
Summary (unaudited) | Boston Trust Balanced Fund
Boston Trust Equity Fund
Manager Commentary by Domenic Colasacco |
|
Investment Concerns:
Equity securities (stocks) are more volatile and carry more risk than other forms of investments, including investments in high-grade fixed income securities. The net asset value per share of these Funds will fluctuate as the value of the securities in the portfolio changes. Common stocks, and funds investing in common stocks, generally provide greater return potential when compared with other types of investments. Bonds offer a relatively stable level of income, although bond prices will fluctuate providing the potential for principal gain or loss. Intermediate-term, higher-quality bonds generally offer less risk than longer-term bonds and a lower rate of return.
Past performance does not guarantee future results. The performance data quoted represents past performance and current returns may be lower or higher. Total return figures include change in share price, reinvestment of dividends and capital gains. The investment return and principal value will fluctuate so that an investor’s shares, when redeemed, may be worth more or less than the original cost. To obtain performance information current to the most recent month end, please call us at 1.800.282.8782 ext. 7050.
Market and Performance Summary
Sadly, actual events during the first quarter of 2009 only confirmed widespread, broadly pessimistic near-term economic views. Early in January, it became clear that the sharp decline in Gross Domestic Product1 that began last September would persist through the winter months, with continued steep drops in consumer spending for durable goods such as automobiles, furniture and appliances. Business capital expenditures across a broad range of industries also fell. Not surprisingly, employment trends were especially weak, as businesses struggled to reduce expenses given the sudden fall in revenue. In just three months, roughly two million jobs were lost, and the unemployment rate jumped to 8.5%, the highest level in nearly 30 years. Economic news from Japan and across key European countries was also at the low end of negative forecasts.
One had to look hard for positive economic news during the past few months, but there was good progress on several fronts. Most importantly, the variety of programs initiated by the Federal Reserve (the “Fed”) since last fall to help stabilize credit markets began to be effective. On the fiscal side, the new Obama administration quickly passed an economic stimulus bill, and in March, the Treasury Department finally detailed a long-awaited plan to remove some problem, or so-called toxic, assets from bank balance sheets. Even though we suspect both of these fiscal programs will have to be enhanced and revised in the months ahead, they are essential, positive steps that help fill the economic void left by broad declines in private sector activity. Independent of these new government programs, toward quarter-end a few economic reports suggested that the rate of decline in consumer spending had begun to moderate. Positive news, however minor, is always welcome amid the deluge of adverse reports.
Despite our lack of confidence at year-end 2008 for an early resolution of the economic mess, we thought there was a reasonable prospect that the decline in aggregate stock prices already seen fully reflected the further deterioration in business conditions we anticipated. After all, from the peak reached in October 2007, the S&P 500 Index2 had already declined more than 40%. That prospect did not prove to be the case. From the first week of January through early March, the S&P 500 declined another 25%. About one-half of this fresh drop was recouped through the final few weeks of the first quarter of 2009. High day-to-day volatility and price advances that last for months (false starts that are called, in Wall Street parlance, bear market rallies) are typical in extended bear markets. Not until well after stock prices trough and economic activity improves is it possible to have full confidence that the worst has passed.
Economic Summary & Outlook
We generally dislike periods when the economy captures newspaper headlines or becomes the lead story in broadcast news. For economic events to rise to such levels of general interest has usually required dire developments. That has certainly been the case since last fall when Federal Reserve and Treasury Department intervention was required to prevent an implosion of our financial system. We will not repeat how we
|
| 1 | The Gross Domestic Product (GDP) is the measure of the market value of the goods and services produced by labor and property in the United States. |
| 2 | The Standard & Poor’s 500 Index (“S&P 500”) is an unmanaged index that is regarded as a gauge of the U.S. equities market, this index includes 500 leading companies in leading industries of the U.S. economy. Although the S&P 500 focuses on the large cap segment of the market, with approximately 75% coverage of U.S. equities, it is also an ideal proxy for the total market. |
|
1
Economic and Market
Summary (unaudited)(cont.) | Boston Trust Balanced Fund
Boston Trust Equity Fund
Manager Commentary by Domenic Colasacco |
|
came to that point. Suffice to note that we are now in the midst of a severe global recession unlike any we have experienced since World War II. The essential difference from prior recessionary periods, in our view, is the near collapse of our largest financials institutions and the consequent sharp and deep drop in private sector economic activity. These developments required government intervention unprecedented in scale. We share the view that without such support, more banks would have failed and the current economic decline would be much worse.
Will these massive levels of monetary and fiscal stimulus succeed? Recent surveys have confirmed that most economic forecasters expect GDP trends to stabilize by summer and begin to rise prior to year-end 2009. Other economists are not as sanguine and have expressed concern that more government support will be required to effect a positive turn in GDP. Frankly, all economic forecasts in the current fragile financial environment come with a high degree of risk. Which (if any) prove prescient as time passes no one knows for sure. We do know that we are not yet in the type of sustainable, balanced economic environment that supported attractive investment returns through most of the 1980’s and 1990’s. Until we get there, financial markets will remain volatile. Stated differently, the transition toward a revised financial order, with more government involvement, is unlikely to be smooth.
Investment Strategy
For the 12-month period ended March 31, 2009, the Boston Trust Balanced Fund returned -18.68%, and the Boston Trust Equity Fund returned -32.73%. For the same period, the S&P 500 Index1, the Barclays Capital U.S. Government/Credit Index2 and the Citigroup 90-day U.S. Treasury Bill Index3 posted a -38.09%, 1.78% and 1.13% total return, respectively.
The Boston Trust Balanced Fund’s net asset value fell by 5.55% during the first quarter of 2009. That is clearly not pleasant in absolute terms but, as was the case in 2008, above the returns posted by most balanced mutual funds. Our decision to reduce the Fund’s equity allocation over the past 18 months from above 70% to just below 50% at year-end helped cushion the first quarter decline. At fiscal period end, stocks comprised roughly 45% of the Fund’s total value, the lowest level in over a decade.
We decided to reduce equity exposure further over the past few months in light of the lack of clarity in both the timing and strength of an economic recovery. Where does the Fund go from here? And when will this excruciating bear market end? Our thoughts on these questions are summarized below.†
Asset Allocation: Our policy and practice has been to keep the Balanced Fund’s equity allocation within an approximate range of 45% to 75% of total assets.† Two primary factors drive our allocation decision process: comparative equity valuations and prospective economic conditions. When both are favorable, we tend to keep stock exposure near maximum, while the opposite is true during periods of high stock prices and weak economics. Gradations in either or both factors lead us to some middle ground.†
At roughly 45%, the Balanced Fund’s current equity allocation is at the low end of its usual range. On the surface, such a low allocation implies that we have a bearish outlook for stocks. Yet that is not the reason we have chosen to de-emphasize equities at this time. By nearly all traditional valuation metrics stocks, in the aggregate, are now either fairly priced or simply bargains. If the more bullish economists prove correct, we would not be surprised to see the primary stock indices rise by 25% or so in just a few months. In that environment, we would look back with regret at not having purchased more stocks at today’s levels.†
Our continued cautious equity allocation primarily reflects the unusually high level of economic uncertainty. Stocks could just as easily decline 25% in the second quarter, rather than rise, if the economy fails to respond positively in the months ahead to recent government stimulus programs. We have always preferred to invest when economic trends are more settled and definitive. Among the things we would like to see prior to increasing significantly the Fund’s equity allocation are more evidence of a trough in home values, a moderation in job losses, lower credit spreads in fixed income markets and more confidence that the worst is behind us with respect to the health of our major banks and insurance companies. Stock prices may very well move higher as these issues clarify, but investment risks will be lower. We believe there will be many opportunities to generate attractive returns (with less risk) within an already improved economic environment.
|
| 1 | The Standard & Poor’s 500 Index (“S&P 500”) is an unmanaged index that is regarded as a gauge of the U.S. equities market, this index includes 500 leading companies in leading industries of the U.S. economy. Although the S&P 500 focuses on the large cap segment of the market, with approximately 75% coverage of U.S. equities, it is also an ideal proxy for the total market. |
| 2 | The Barclays Capital U.S. Government/Credit Bond Index is a non-securitized component of the Barclays U.S. Aggregate Index and was the first macro index launched by Lehman Brothers. The U.S. Government/Credit Index includes Treasuries (i.e., public obligations of the U.S. Treasury that have remaining maturities of more than one year), Government-Related issues (i.e., agency, sovereign, supranational, and local authority debt), and USD Corporates. |
| 3 | The Citigroup 90-Day U.S. Treasury Bills are represented by the U.S. Treasury Bill Total Return Index. Treasury bills are government guaranteed and offer a fixed rate of return. Return and principal of stocks and bonds will vary with market conditions. |
| † | Portfolio composition is subject to change. |
|
2
Economic and Market
Summary (unaudited)(cont.) | Boston Trust Balanced Fund
Boston Trust Equity Fund
Manager Commentary by Domenic Colasacco |
|
On behalf of all of us at Boston Trust & Investment Management Company, we thank you for your continued confidence in our services. Please feel free to contact us at (617) 726-7252 should you have any questions about our investment views or your account.
Domenic Colasacco
Portfolio Manager and President
Boston Trust Investment Management, Inc.
3
| Investment Performance (unaudited) | Boston Trust Balanced Fund
March 31, 2009 |
|
| Fund Net Asset Value: $23.33 | | | | | | | | | | | | |
| Gross Expense Ratio1: 1.09% | | Annualized |
| | |
|
| | | 1 Year Ended | | 5 Years Ended | | 10 Years Ended |
| | | 3/31/09 | | 3/31/09 | | 3/31/09 |
Boston Trust Balanced Fund | | | -18.68% | | | | 0.89% | | | | 2.24% | |
Lipper Mixed-Asset Target Allocation Growth Funds Average | | | -29.69% | | | | -2.45% | | | | 0.01% | |
S&P 500 Index | | | -38.09% | | | | -4.76% | | | | -3.00% | |
Barclays Capital U.S. Government/Credit Bond Index | | | 1.78% | | | | 3.74% | | | | 5.64% | |
Citigroup 90-Day U.S. Treasury Bill | | | 1.13% | | | | 3.06% | | | | 3.19% | |
Past performance does not guarantee future results. The performance data quoted represents past performance and current returns may be lower or higher. The investment return and principal value will fluctuate so that an investor’s shares, when redeemed may be worth more or less than the original cost. To obtain performance information current to the most recent month-end, please call 1-800-282-8782 ext. 7050.
| 1 | The above Gross Expense ratio is from the Fund’s prospectus dated August 1, 2008. Additional information pertaining to the Fund’s expense ratios as of March 31, 2009 can be found in the financial highlights. The investment performance reflects voluntary fee waivers which may be discontinued at any time and a contractual fee waiver which shall continue in effect from year to year only upon mutual agreement of the Fund and the Adviser. The performance above reflects any fee reductions during the applicable periods. If such fee reductions had not occured, the quoted performance would have been lower. Based on the Fund’s prospectus dated August 1, 2008, the Total Fund Operating Expenses would be 1.08% and the Net Fund Operating Expenses would be 1.00% excluding the indirect costs of investing in Acquired Funds. |

The chart represents historical 10-year performance of a hypothetical investment of $10,000 in the Boston Trust Balanced Fund and represents the reinvestment of dividends and capital gains in the Fund. The returns shown on the table and graph do not reflect the deduction of taxes a shareholder would pay on fund distributions or the redemption of Fund shares.
The Boston Trust Balanced Fund is measured against the Standard & Poor’s 500 Index (“S&P 500”), which is regarded as a gauge of the U.S. equities market. This index includes 500 leading companies in leading industries of the U.S. economy. Although the S&P 500 focuses on the large cap segment of the market, with approximately 75% coverage of U.S. equities, it is also an ideal proxy for the total market. The Barclays Capital U.S. Government/Credit Bond Index is a non-securitized component of the Barclays U.S. Aggregate Index and was the first macro index launched by Lehman Brothers. The U.S. Government/Credit Index includes Treasuries (i.e., public obligations of the U.S. Treasury that have remaining maturities of more than one year), Government-Related issues (i.e., agency, sovereign, supranational, and local authority debt), and USD Corporates. The Citigroup 90-Day U.S. Treasury Bills are represented by the U.S. Treasury Bill Total Return Index. Treasury bills are government guaranteed and offer a fixed rate of return. Return and principal of stocks and bonds will vary with market conditions. The indices’ performance is unmanaged and does not reflect the deduction of expenses associated with a mutual fund, such as investment management and fund accounting fees. The Fund’s performance reflects the deduction of fees for these services. The Lipper Average is an equally weighted index of the largest managed mutual funds within their respective investment objectives, adjusted for the reinvestment of capital gains distributions and income dividends. Investors cannot invest directly in an index.
The Lipper Mixed-Asset Target Allocation Growth Funds Average is an average of managed mutual funds whose primary objective is to maintain a mix of between 60%-80% equity securities with the remainder invested in bonds, cash and cash equivalents.
4
| Investment Performance (unaudited) | Boston Trust Equity Fund
March 31, 2009 |
|
| Fund Net Asset Value: $8.77 | | | | | | | | | | | | | | | | |
| Gross Expense Ratio1: 1.10% | | Annualized |
| | |
|
| | | 1 Year Ended | | 3 Years Ended | | 5 Years Ended | | Since Inception |
| | | 3/31/09 | | 3/31/09 | | 3/31/09 | | 10/1/03 |
Boston Trust Equity Fund | | | -32.73% | | | | -9.00% | | | | -2.81% | | | | -0.87% | |
S&P 500 Index | | | -38.09% | | | | -13.06% | | | | -4.76% | | | | -2.42% | |
Past performance does not guarantee future results. The performance data quoted represents past performance and current returns may be lower or higher. The investment return and principal value will fluctuate so that an investor’s shares, when redeemed may be worth more or less than the original cost. To obtain performance information current to the most recent month-end, please call 1-800-282-8782 ext. 7050.
| 1 | The above Gross Expense ratio is from the Fund’s prospectus dated August 1, 2008. Additional information pertaining to the Fund’s expense ratios as of March 31, 2009 can be found in the financial highlights. The investment performance reflects voluntary fee waivers which may be discontinued at any time and a contractual fee waiver which shall continue in effect from year to year only upon mutual agreement of the Fund and the Adviser. The performance above reflects any fee reductions during the applicable periods. If such fee reductions had not occured, the quoted performance would have been lower. Based on the Fund’s prospectus dated August 1, 2008, the Total Fund Operating Expenses would be 1.10% and the Net Fund Operating Expenses would be 1.00% excluding the indirect costs of investing in Acquired Funds. |

The chart represents historical performance of a hypothetical investment of $10,000 in the Boston Trust Equity Fund from October 1, 2003 to March 31, 2009, and represents the reinvestment of dividends and capital gains in the Fund. The returns shown on the table and graph do not reflect the deduction of taxes a shareholder would pay on fund distributions or the redemption of Fund shares.
The Boston Trust Equity Fund is measured against the Standard & Poor’s 500 Index (“S&P 500”), which is an unmanaged index that is regarded as a gauge of the U.S. equities market. This index includes 500 leading companies in leading industries of the U.S. economy. Although the S&P 500 focuses on the large cap segment of the market, with approximately 75% coverage of U.S. equities, it is also an ideal proxy for the total market. The performance of an index does not reflect the deduction of expenses associated with a mutual fund, such as investment management and fund accounting fees. The Fund’s performance reflects the deduction of fees for these services. Investors cannot invest directly in an index.
5
Economic and Market
Summary (unaudited) | Boston Trust Small Cap Fund
Manager Commentary by Kenneth P. Scott |
|
Investment Concerns:
Equity securities (stocks) are more volatile and carry more risk than other forms of investments, including investments in high-grade fixed income securities. The net asset value per share of this Fund will fluctuate as the value of the securities in the portfolio changes. Common stocks, and funds investing in common stocks, generally provide greater return potential when compared with other types of investments. Small-capitalization stocks typically carry additional risk, since smaller companies generally have higher risk of failure and, historically, their stocks have experienced a greater degree of volatility.
Past performance does not guarantee future results. The performance data quoted represents past performance and current returns may be lower or higher. Total return figures include change in share price, reinvestment of dividends and capital gains. The investment return and principal value will fluctuate so that an investor’s shares, when redeemed, may be worth more or less than the original cost. To obtain performance information current to the most recent month end, please call us at 1.800.282.8782 ext. 7050.
Economic and Market Summary
In the first quarter 2009, when equity markets continued to decline, the Boston Trust Small Cap Fund outperformed the Russell 2000® Index1 by approximately one and a half percent. For the trailing one, three, five, and 10 year periods ended March 31, 2009, the Boston Trust Small Cap Fund has outperformed the benchmark, while experiencing less volatility.
We focus our small cap research analysis on companies we judge to be more innovative, of higher quality and leveraged to investment themes offering significant benefits to their customers and the potential for long-term growth. During our period under review, firms with superior profitability, as indicated by returns on invested capital, performed comparatively well. Similarly, our investment in faster growing firms with less financial leverage also contributed to better relative small cap performance.
While we continue to aim for sector and market cap comparability, our underweight in stocks with market capitalizations below $100 million contributed positively to performance during the quarter. If small cap market indices remain at depressed levels, we believe this is likely to increase the benchmark tracking error of the Fund. In the current environment, identifying higher quality financial services firms remains a challenge. Still we narrowed our modest underweight in this sector, which had a small positive performance impact in the last three calendar months of the Fund’s fiscal period.†
We established new positions in four stocks in the Boston Trust Small Cap Fund during the period under review. Commerce Bancshares (1.07%) is a Midwest bank with a less stressed balance sheet and lower exposure to real estate. Another new holding, Computer Programs & Systems (0.52%), designs electronic medical record systems, which are expected to see continued growth, driven in part by regulatory reform efforts aiming to reduce medical errors. Gen-Probe (1.02%) makes human blood analysis equipment that detects disease, such as infectious microorganisms, TB, strep, pneumonia and fungal infections. Investment Technology Group (0.90%) manages the POSIT investment trading platform, which allows buyers and sellers to post, anonymously, large blocks to be matched on a periodic basis.†
Conversely, we sold the full positions of six stocks from the Fund during the period under review: Gaiam, Healthways, Interface, Kadant, School Specialty and SunOpta. We believe these firms are more likely than peers to experience continued deterioration in their fundamental performance; some of these firms, in our judgment, have near-term liquidity issues relative to existing debt obligations. The net result of this portfolio management and securities research activity was a turnover rate in line with our historical average.†
We recognize that strong relative returns may be cold comfort when the overall equity markets have declined so severely. Extraordinary market volatility is likely to linger, and significant risks and challenges remain, in small cap as well as large cap funds. However, the current valuation of small cap stocks is below historical averages leading us to expect better than average returns as the economy recovers, particularly for shares of companies whose growth prospects are uniquely leveraged to the fastest growing segments of the economy. In the meantime, we expect that the market’s lower appetite for risk will support demand for the shares of higher quality companies, especially when they are more reasonably valued than their peers. Our efforts to identify higher quality, innovative small cap companies at attractive prices continue.
The equities of the companies in bold-face in the commentary were holdings of the Boston Trust Small Cap Fund as of March 31, 2009.
Kenneth P. Scott, CFA
Portfolio Manager
Boston Trust Investment Management, Inc.
|
| 1 | The Russell 2000® Index measures the performance of the small-cap segment of the U.S. equity universe. The Russell 2000® Index is a subset of the Russell 3000® Index representing approximately 10% of the total market capitalization of that index. It includes approximately 2000 of the smallest securities based on a combination of their market cap and current index membership. |
| † | Portfolio composition is subject to change. |
|
6
| Investment Performance (unaudited) | Boston Trust Small Cap Fund
March 31, 2009 |
|
| Fund Net Asset Value: $7.21 | | | | | | | | | | | | |
| Gross Expense Ratio1: 1.15% | | Annualized |
| | |
|
| | | 1 Year Ended | | 5 Years Ended | | 10 Years Ended |
| | | 3/31/09 | | 3/31/09 | | 3/31/09 |
Boston Trust Small Cap Fund* | | | -33.24% | | | | -1.28% | | | | 6.62% | |
Russell 2000® Index | | | -37.50% | | | | -5.24% | | | | 1.93% | |
Past performance does not guarantee future results. The performance data quoted represents past performance and current returns may be lower or higher. The investment return and principal value will fluctuate so that an investor’s shares, when redeemed may be worth more or less than the original cost. To obtain performance information current to the most recent month-end, please call 1-800-282-8782 ext. 7050.
| * | The quoted performance for the Fund reflects the performance of a collective investment fund that was previously managed with full investment authority by the parent company of the Fund’s Adviser prior to the establishment of the Fund on December 16, 2005. The performance of the collective fund has been restated to reflect the net expenses of the Fund after all expenses at an annual rate of 1.25%, the Adviser’s expense limitation, for its initial year of investment operations. The performance of the collective investment fund was restated to reflect the expenses associated with the Mutual Fund. The collective investment fund was not registered with the Securities and Exchange Commission and, therefore, was not subject to the investment restrictions imposed by law on registered mutual funds. If the collective investment fund had been registered, the collective investment fund’s performance may have been adversely affected. |
| | |
| 1 | The above Gross Expense ratio is from the Fund’s prospectus dated August 1, 2008. Additional information pertaining to the Fund’s expense ratios as of March 31, 2009 can be found in the financial highlights. The investment performance reflects voluntary fee waivers which may be discontinued at any time and a contractual fee waiver which shall continue in effect from year to year only upon mutual agreement of the Fund and the Adviser. The performance above reflects any fee reductions during the applicable periods. If such fee reductions had not occured, the quoted performance would have been lower. Based on the Fund’s prospectus dated August 1, 2008, the Total Fund Operating Expenses would be 1.14% and the Net Fund Operating Expenses would be 1.14% excluding the indirect costs of investing in Acquired Funds. |
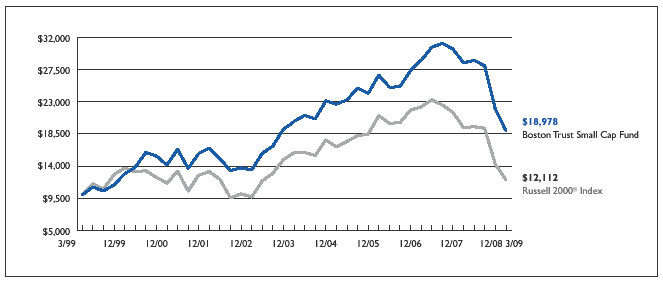
The chart represents historical 10-year performance of a hypothetical investment of $10,000 in the Boston Trust Small Cap Fund and represents the reinvestment of dividends and capital gains in the Fund. The returns shown on the table and graph do not reflect the deduction of taxes a shareholder would pay on fund distributions or the redemption of Fund shares.
The Boston Trust Small Cap Fund is measured against the Russell 2000® Index, which is an unmanaged index that measures the performance of the small-cap segment of the U.S. equity universe. The Russell 2000® Index is a subset of the Russell 3000® Index representing approximately 10% of the total market capitalization of that index. It includes approximately 2000 of the smallest securities based on a combination of their market cap and current index membership. The performance of an index does not reflect the deduction of expenses associated with a mutual fund, such as investment management and fund accounting fees. The Fund’s performance reflects the deduction of fees for these services. Investors cannot invest directly in an index.
7
Economic and Market
Summary (unaudited) | Boston Trust Midcap Fund
Manager Commentary by Stephen J. Amyouny |
|
Investment Concerns:
Equity securities (stocks) are more volatile and carry more risk than other forms of investments, including investments in high-grade fixed income securities. The net asset value per share of this Fund will fluctuate as the value of the securities in the portfolio changes. Common stocks, and funds investing in common stocks, generally provide greater return potential when compared with other types of investments. Small-capitalization stocks typically carry additional risk, since smaller companies generally have higher risk of failure and, historically, their stocks have experienced a greater degree of volatility.
Past performance does not guarantee future results. The performance data quoted represents past performance and current returns may be lower or higher. Total return figures include change in share price, reinvestment of dividends and capital gains. The investment return and principal value will fluctuate so that an investor’s shares, when redeemed, may be worth more or less than the original cost. To obtain performance information current to the most recent month end, please call us at 1.800.282.8782 ext. 7050.
Market Summary
In the first quarter of 2009, investors were harshly reminded of the long road to financial and economic recovery ahead. The historic election of President Obama initially brought widespread hope that a new administration would aggressively address the economic issues that continue to plague the nation. However, this hope quickly dissolved as investors once again began to recognize and fear the deep troubles affecting our financial system. As a result, stocks sold off sharply in January and February, extending a stock market decline that began in October of 2007. High volatility remained prevalent in the first quarter as investors continued to evaluate the short term and long term outlook for the global economy. Yet, March brought renewed optimism that the economy might be nearing a bottom. For the first time in several months, there were bits of encouraging economic news that investors hoped might signal the beginning stages of a recovery. It is too early to tell if we have indeed reached a bottom, both in terms of the economy and the financial markets, but we remain optimistic that the massive fiscal and monetary stimuli that have been placed in motion will eventually put the economy back on track.
Portfolio Review
The Boston Trust Midcap Fund returned -33.03% for the year ended March 31, 2009 versus the benchmark Russell Midcap® Index1 return of -40.81%. Once again, stocks within the financial sector led the decline due to continued concerns over the health of the global financial system. Although the government continues to enact programs aimed at stabilizing the financial system and enhancing the flow of credit, investors remain skeptical of the uncertain future for financial companies. Fortunately, the Fund’s limited exposure to financial services companies helped to moderate the impact of this sector’s sharp sell-off. However, the Fund was not so fortunate in its positioning within the Industrial Products and Services sector, which also performed quite poorly during the period. As economic conditions continue to deteriorate across the globe, demand for industrial products and services has fallen sharply. Industrial companies with exposure to global infrastructure, autos, trucks, residential construction, and transportation services were among the hardest hit. Despite these short-term losses, we expect the Fund’s industrial product holdings to perform very well when economic activity begins to reaccelerate. On a positive note, the Fund’s technology holdings collectively posted a positive return while losses within the healthcare and energy sectors were quite modest.†
During the period, the Fund established new positions in Gen-Probe (1.0%), a diagnostic test manufacturer with a pristine balance sheet, solid growth prospects, and an attractive valuation, and Time Warner Cable (1.5%). We also decided to liquidate the Fund’s positions in IMS Health, Investment Technology Group, Terex, Northern Trust, Wilmington Trust, Lincoln Electric, and Cablevision. These stocks were generally sold in order to reduce our exposure to financial companies or due to increased uncertainty regarding their growth outlook or financial stability.†
Portfolio Strategy
Over the last 12 months, the Fund has benefited from our relatively defensive portfolio composition. During this period, we have maintained an above-average allocation to companies in defensive sectors, e.g. healthcare and consumer staples, and a below-average allocation to the financial services and consumer discretionary sectors. The uncertain outlook for financial companies and our continued concerns over the financial health of consumers will most likely keep us on the defensive in these areas. In fact, we believe that unemployment
|
| 1 | The Russell Midcap® Index measures the performance of the mid-cap segment of the U.S. equity universe. The Russell Midcap® Index is a subset of the Russell 1000® Index. It includes approximately 800 of the smallest securities based on a combination of their market cap and current index membership. The Russell Midcap® Index represents approximately 31% of the total market capitalization of the Russell 1000 companies. |
| † | Portfolio composition is subject to change. |
|
8
Economic and Market
Summary (unaudited)(cont.) | Boston Trust Midcap Fund
Manager Commentary by Stephen J. Amyouny |
|
will continue to rise, bankruptcies will continue to escalate, the housing market has not yet reached bottom, and consumer confidence will remain at low levels over the next few months—all of which will continue to negatively impact discretionary spending among consumers. Yet, we are also optimistic that the massive amounts of monetary and fiscal stimuli provided by the government will stabilize the economy and position it for a reacceleration of growth over the next 12 to 18 months. As such, we continue to maintain a healthy exposure to industrial products and technology companies that stand to benefit from the eventual recovery in economic activity. Once we have increased confidence that a sustainable economic recovery is under way, we are likely to reduce our exposure in the more defensive sectors; however, at this time, the Fund maintains a delicate balance between defensive and economically sensitive sectors.†
Lastly, we should note that our research team remains focused on the balance sheets and general financial health of each of the Fund’s companies. Our long-standing approach of investing in higher-quality companies with sustainable business models and attractive growth prospects has served us well over the years. In this environment, it has paid to own these higher-quality companies with below-average financial leverage and solid free cash flow generation. We have also identified a number of potential portfolio candidates that have strong financial profiles, attractive growth prospects, and now sell at reasonable valuations, and we are likely to invest in several of these companies over the remainder of the year.†
The equities of the companies in bold-face in the commentary were holdings of the Boston Trust Midcap Fund as of March 31, 2009.
Stephen J. Amyouny, CFA
Portfolio Manager
Boston Trust Investment Management, Inc.
|
| † | Portfolio composition is subject to change. |
|
9
| Investment Performance (unaudited) | Boston Trust Midcap Fund
March 31, 2009 |
|
| Fund Net Asset Value: $6.08 | | | | | | | | |
| Gross Expense Ratio1: 1.58% | | Annualized |
| | |
|
| | | 1 Year Ended | | Since Inception |
| | | 3/31/09 | | 9/24/07 |
Boston Trust Midcap Fund | | | -33.03% | | | | -26.82% | |
Russell Midcap® Index | | | -40.81% | | | | -35.09% | |
Past performance does not guarantee future results. The performance data quoted represents past performance and current returns may be lower or higher. The investment return and principal value will fluctuate so that an investor’s shares, when redeemed may be worth more or less than the original cost. To obtain performance information current to the most recent month-end, please call 1-800-282-8782 ext. 7050.
| 1 | The above Gross Expense ratio is from the Fund’s prospectus dated August 1, 2008. Additional information pertaining to the Fund’s expense ratios as of March 31, 2009 can be found in the financial highlights. The investment performance reflects voluntary fee waivers which may be discontinued at any time and a contractual fee waiver which shall continue in effect from year to year only upon mutual agreement of the Fund and the Adviser. The performance above reflects any fee reductions during the applicable periods. If such fee reductions had not occured, the quoted performance would have been lower. Based on the Fund’s prospectus dated August 1, 2008, the Total Fund Operating Expenses would be 1.58% and the Net Fund Operating Expenses would be 1.00% excluding the indirect costs of investing in Acquired Funds. |
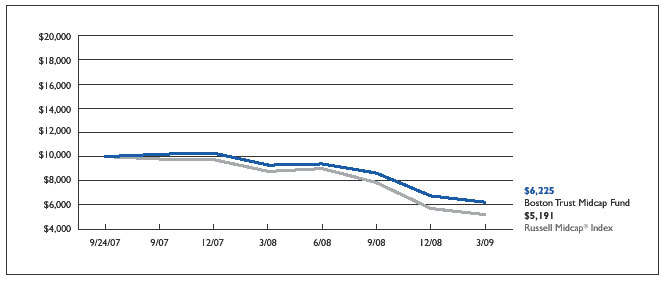
The chart represents historical performance of a hypothetical investment of $10,000 in the Boston Trust Midcap Fund from September 24, 2007 to March 31, 2009, and represents the reinvestment of dividends and capital gains in the Fund. The returns shown on the table and graph do not reflect the deduction of taxes a shareholder would pay on fund distributions or the redemption of Fund shares.
The Boston Trust Midcap Fund is measured against the Russell Midcap® Index, which is an unmanaged index that measures the performance of the mid-cap segment of the U.S. equity universe. The Russell Midcap® Index is a subset of the Russell 1000® Index. It includes approximately 800 of the smallest securities based on a combination of their market capitalization and current index membership. The Russell Midcap® Index represents approximately 31% of the total market capitalization of the Russell 1000 companies. The performance of an index does not reflect the deduction of expenses associated with a mutual fund, such as investment management and fund accounting fees. The Fund’s performance reflects the deduction of fees for these services. Investors cannot invest directly in an index.
10
| Schedule of Portfolio Investments | | Boston Trust Balanced Fund
March 31, 2009 |
|
| | | | | | |
COMMON STOCkS (42.7%) | | | | | |
| Security Description | | Shares | | Value ($) |
| |
| |
|
| Consumer Discretionary (3.8%) | | | | | |
| Comcast Corp., Class A | | 70,000 | | | 954,800 |
| Johnson Controls, Inc. | | 40,000 | | | 480,000 |
| NIKE, Inc., Class B | | 17,000 | | | 797,130 |
| Omnicom Group, Inc. | | 50,000 | | | 1,170,000 |
| Staples, Inc. | | 50,000 | | | 905,500 |
| Target Corp. | | 40,000 | | | 1,375,600 |
| | | | |
|
| | | | | | 5,683,030 |
| | | | |
|
| Consumer Products (5.4%) | | | | | |
| Costco Wholesale Corp. | | 30,000 | | | 1,389,600 |
| Diageo PLC, ADR | | 25,000 | | | 1,118,750 |
| PepsiCo, Inc. | | 25,000 | | | 1,287,000 |
| Procter & Gamble Co. | | 60,000 | | | 2,825,400 |
| Sysco Corp. | | 60,000 | | | 1,368,000 |
| | | | |
|
| | | | | | 7,988,750 |
| | | | |
|
| Energy (6.3%) | | | | | |
| Apache Corp. | | 20,000 | | | 1,281,800 |
| Chevron Corp. | | 28,000 | | | 1,882,720 |
| Exxon Mobil Corp. | | 65,000 | | | 4,426,500 |
| Schlumberger Ltd. | | 15,000 | | | 609,300 |
| XTO Energy, Inc. | | 35,000 | | | 1,071,700 |
| | | | |
|
| | | | | | 9,272,020 |
| | | | |
|
| Financial Services (3.1%) | | | | | |
| Chubb Corp. | | 30,000 | | | 1,269,600 |
| Cincinnati Financial Corp. | | 50,000 | | | 1,143,500 |
| State Street Corp. | | 15,000 | | | 461,700 |
| T. Rowe Price Group, Inc. | | 60,000 | | | 1,731,600 |
| | | | |
|
| | | | | | 4,606,400 |
| | | | |
|
| Health Care (7.5%) | | | | | |
| Becton, Dickinson & Co. | | 35,000 | | | 2,353,400 |
| C.R. Bard, Inc. | | 25,000 | | | 1,993,000 |
| DENTSPLY International, Inc. | | 60,000 | | | 1,611,000 |
| Johnson & Johnson, Inc. | | 30,000 | | | 1,578,000 |
| Medtronic, Inc. | | 30,000 | | | 884,100 |
| Saint Jude Medical, Inc.(a) | | 35,000 | | | 1,271,550 |
| Stryker Corp. | | 30,000 | | | 1,021,200 |
| Varian Medical Systems, Inc.(a) | | 15,000 | | | 456,600 |
| | | | |
|
| | | | | | 11,168,850 |
| | | | |
|
| Industrial Materials (2.3%) | | | | | |
| Air Products & Chemicals, Inc. | | 15,000 | | | 843,750 |
| AptarGroup, Inc. | | 17,500 | | | 544,950 |
| Ecolab, Inc. | | 25,000 | | | 868,250 |
| Sigma-Aldrich Corp. | | 30,000 | | | 1,133,700 |
| | | | |
|
| | | | | | 3,390,650 |
| | | | |
|
| Industrial Products & Services (7.6%) | | | | | |
| Donaldson Co., Inc. | | 75,000 | | | 2,013,000 |
| Emerson Electric Co. | | 60,000 | | | 1,714,800 |
| Illinois Tool Works, Inc. | | 60,000 | | | 1,851,000 |
| Parker Hannifin Corp. | | 20,000 | | | 679,600 |
| Precision Castparts Corp. | | 30,000 | | | 1,797,000 |
| United Parcel Service, Inc., Class B | | 30,000 | | | 1,476,600 |
| W.W. Grainger, Inc. | | 25,000 | | | 1,754,500 |
| | | | |
|
| | | | | | 11,286,500 |
| | | | |
|
| Information Technology (6.7%) | | | | | |
| Accenture Ltd., Class A | | 35,000 | | | 962,150 |
| Automatic Data Processing, Inc. | | 20,000 | | | 703,200 |
| Cisco Systems, Inc.(a) | | 100,000 | | | 1,677,000 |
| EMC Corp.(a) | | 100,000 | | | 1,140,000 |
| International Business Machines Corp. | | 10,000 | | | 968,900 |
| Microsoft Corp. | | 125,000 | | | 2,296,250 |
| Oracle Corp.(a) | | 120,000 | | | 2,168,400 |
| | | | |
|
| | | | | | 9,915,900 |
| | | | |
|
| TOTAL COMMON STOCKS (Cost $55,202,821) | | | | | 63,312,100 |
| | | | |
|
CORPORATE BONDS (3.2%) | | | | | |
| | | Principal | | | |
| Security Description | | Amount ($) | | | Value ($) |
| |
| |
|
| Basic Materials (0.2%) | | | | | |
| Weyerhaeuser Co., 7.25%, 7/1/13 | | 300,000 | | | 277,365 |
| | | | |
|
| Communication Services (0.3%) | | | | | |
| AT&T, Inc., 5.63%, 6/15/16 | | 500,000 | | | 501,831 |
| | | | |
|
| Consumer Products (0.4%) | | | | | |
| Diageo Capital PLC, 5.50%, 9/30/16 | | 500,000 | | | 506,397 |
| | | | |
|
| Financial Services (1.5%) | | | | | |
| American Express Co., 7.00%, 3/19/18 | | 250,000 | | | 220,887 |
| American Express Credit Co., | | | | | |
Series C, 5.88%, 5/2/13 | | 600,000 | | | 527,246 |
| John Deere Capital Corp., | | | | | |
Series D, 5.35%, 4/3/18 | | 1,000,000 | | | 929,289 |
| National Rural Utilities Cooperative | | | | | |
Finance Corp., 10.38%, 11/1/18 | | 500,000 | | | 579,765 |
| | | | |
|
| | | | | | 2,257,187 |
| | | | |
|
| Industrial Products & Services (0.3%) | | | | | |
| Emerson Electric Co., 5.13%, 12/1/16 | | 300,000 | | | 309,205 |
| Weyerhaeuser Co., 6.75%, 3/15/12 | | 100,000 | | | 96,252 |
| | | | |
|
| | | | | | 405,457 |
| | | | |
|
| Information Technology (0.5%) | | | | | |
| Oracle Corp., 5.75%, 4/15/18 | | 750,000 | | | 784,093 |
| | | | |
|
| TOTAL CORPORATE BONDS (Cost $4,897,253) | | | | | 4,732,330 |
| | | | |
|
MUNICIPAL BONDS (5.8%) | | | | | |
| Connecticut (0.7%) | | | | | |
| Connecticut State, Series E, GO, 5.00%, | | | | | |
12/15/20, Callable 12/15/16 @ 100 | | 1,000,000 | | | 1,103,270 |
| | | | |
|
| Florida (0.7%) | | | | | |
| Florida State Board of Education, Series D, | | | | | |
GO, 5.00%, 6/1/21, Callable 6/1/17 @ 101 | | 1,000,000 | | | 1,061,040 |
| | | | |
|
| Georgia (0.2%) | | | | | |
| Georgia State, Series B, GO, 5.00%, 3/1/20, | | | | | |
Callable 3/1/16 @ 100 | | 300,000 | | | 330,888 |
| | | | |
|
| Illinois (1.0%) | | | | | |
| Illinois State, Series A, GO, 5.00%, 3/1/22, | | | | | |
Callable 3/1/14 @ 100 | | 750,000 | | | 777,360 |
| Illinois State, GO, 5.00%, 4/1/24, | | | | | |
Callable 4/1/17 @ 100 | | 500,000 | | | 516,290 |
| Illinois State, Series A, GO, 5.00%, 6/1/29, | | | | | |
Callable 12/1/16 @ 100 | | 250,000 | | | 247,790 |
| | | | |
|
| | | | | | 1,541,440 |
| | | | |
|
| Massachusetts (1.2%) | | | | | |
| Massachusetts State, Series A, GO, 5.25%, 8/1/20 | | 500,000 | | | 572,155 |
| Massachusetts State, Series C, GO, | | | | | |
5.50%, 12/1/22, FSA | | 1,000,000 | | | 1,160,080 |
| | | | |
|
| | | | | | 1,732,235 |
| | | | |
|
| Ohio (0.4%) | | | | | |
| Ohio State, Series D, GO, 4.50%, 9/15/22, MBIA, | | | | | |
Callable 3/15/16 @ 100 | | 500,000 | | | 512,585 |
| | | | |
|
| Washington (0.9%) | | | | | |
| Washington State, Series A, GO, 5.00%, 7/1/20, | | | | | |
FSA, Callable 7/1/14 @ 100 | | 1,000,000 | | | 1,062,380 |
| Washington State, Series C, GO, 5.00%, 2/1/26, | | | | | |
Callable 2/1/19 @ 100 | | 250,000 | | | 257,222 |
| | | | |
|
| | | | | | 1,319,602 |
| | | | |
|
| See Notes to Financial Statements |
|
| |
| 11 |
| Schedule of Portfolio Investments (cont.) | | Boston Trust Balanced Fund
March 31, 2009 |
|
MUNICIPAL BONDS, CONTINUED | | | | | |
| | | | | | |
| | | Shares or | | | |
| | | Principal | | | |
| Security Description | | Amount ($) | | Value ($) |
| |
| |
|
| Wisconsin (0.7%) | | | | | |
| Wisconsin State, Series C, GO, 5.00%, 5/1/25, | | | | | |
Callable 5/1/18 @ 100 | | 200,000 | | | 206,624 |
| Wisconsin State, Series D, GO, 5.50%, 5/1/26, | | | | | |
Callable 5/1/18 @ 100 | | 750,000 | | | 799,605 |
| | | | |
|
| | | | | | 1,006,229 |
| | | | |
|
| TOTAL MUNICIPAL BONDS (Cost $8,414,483) | | | | | 8,607,289 |
| | | | |
|
U.S. GOVERNMENT & U.S. GOVERNMENT AGENCY OBLIGATIONS (45.5%) | | | | | |
| Federal Farm Credit Bank | | | | | |
4.75%, 12/7/09 | | 5,000,000 | | | 5,130,700 |
6.30%, 12/20/10 | | 1,500,000 | | | 1,627,874 |
| Federal Home Loan Bank | | | | | |
2.25%, 4/13/12 | | 7,500,000 | | | 7,557,262 |
4.88%, 12/14/12 | | 13,000,000 | | | 14,259,414 |
5.00%, 10/13/11 | | 3,000,000 | | | 3,242,682 |
5.25%, 9/11/09 | | 5,000,000 | | | 5,099,525 |
5.25%, 6/11/10 | | 5,000,000 | | | 5,249,195 |
5.25%, 6/10/11 | | 3,000,000 | | | 3,238,938 |
5.25%, 9/13/13 | | 5,000,000 | | | 5,595,225 |
5.38%, 6/8/12 | | 5,000,000 | | | 5,517,520 |
| Government National Mortgage Association, | | | | | |
6.00%, 10/15/36 | | 2,708,732 | | | 2,834,306 |
U.S. Treasury Bills, 0.87%, 11/19/09(b) | | 5,000,000 | | | 4,984,210 |
| U.S. Treasury Inflation Protected Bonds, | | | | | |
3.50%, 1/15/11 | | 3,032,450 | | | 3,185,771 |
| | | | |
|
| TOTAL U.S. GOVERNMENT & U.S. GOVERNMENT | | | | | |
AGENCY OBLIGATIONS (Cost $64,551,736) | | | | | 67,522,622 |
| | | | |
|
INVESTMENT COMPANIES (7.5%) | | | | | |
| Cavanal Hill U.S. Treasury Fund, 0.01%(c) | | 3,746,542 | | | 3,746,542 |
| Victory Federal Money Market, | | | | | |
Investor Shares, 0.45%(c) | | 7,417,756 | | | 7,417,756 |
| | | | |
|
| TOTAL INVESTMENT COMPANIES | | | | | |
(Cost $11,164,298) | | | | | 11,164,298 |
| | | | |
|
| Total Investments (Cost $144,230,591) — 104.7% | | | | | 155,338,639 |
| Liabilities in excess of other assets — (4.7)% | | | | | (6,938,107) |
| | | | |
|
| NET ASSETS — 100.0% | | | | $ | 148,400,532 |
| | | | |
|
|
| (a) | | Non-income producing security. |
| (b) | | Rate represents the effective yield at purchase. |
| (c) | | Rate disclosed is the seven day yield as of March 31, 2009. |
| ADR | | American Depositary Receipt |
| FSA | | Insured by Financial Security Assurance |
| GO | | General Obligation |
| MBIA | | Insured by Municipal Bond Insurance Association |
| PLC | | Public Limited Company |
| See Notes to Financial Statements |
|
| |
| 12 |
| Financial Statements | | Boston Trust Balanced Fund |
|
STATEMENT OF ASSETS AND LIABILITIES | | | |
| March 31, 2009 | | | |
| | | | |
| Assets: | | | |
| Investments, at value (cost $144,230,591) | | $ | 155,338,639 |
| Interest and dividends receivable | | | 976,218 |
| Receivable for capital shares issued | | | 18,060 |
| Prepaid expenses and other assets | | | 27,656 |
| | |
|
Total Assets | | | 156,360,573 |
| | |
|
| Liabilities: | | | |
| Payable for investments purchased | | | 7,774,728 |
| Payable for capital shares redeemed | | | 9,687 |
| Accrued expenses and other liabilities: | | | |
Investment adviser | | | 93,979 |
Chief compliance officer | | | 1,127 |
Administration and accounting | | | 4,174 |
Custodian | | | 5,241 |
Transfer agent | | | 2,946 |
Other | | | 68,159 |
| | |
|
Total Liabilities | | | 7,960,041 |
| | |
|
| | | | |
| Net Assets | | $ | 148,400,532 |
| | |
|
| | | | |
| Composition of Net Assets: | | | |
| Capital | | $ | 140,054,792 |
| Accumulated net investment income | | | 759,251 |
| Accumulated net realized losses from | | | |
investment transactions | | | (3,521,559) |
| Net unrealized appreciation from investments | | | 11,108,048 |
| | |
|
| | | | |
| Net Assets | | $ | 148,400,532 |
| | |
|
| | | | |
| Shares outstanding (par value $0.01, unlimited number of shares authorized) | | | 6,360,840 |
| | |
|
| Net Asset Value, Offering Price and Redemption Price per share | | $ | 23.33 |
| | |
|
STATEMENT OF OPERATIONS | | | |
| For the year ended March 31, 2009 | | | |
| | | | |
| Investment Income: | | | |
| Interest | | $ | 2,942,711 |
| Dividends | | | 1,738,754 |
| Less: Foreign tax withholding | | | (3,129) |
| | |
|
Total Investment Income | | | 4,678,336 |
| | |
|
| Expenses: | | | |
Investment adviser | | | 1,250,601 |
Administration and accounting | | | 338,602 |
Trustee | | | 18,653 |
Custodian | | | 32,404 |
Transfer agency | | | 17,946 |
Chief compliance officer | | | 13,775 |
Other | | | 130,653 |
| | |
|
Total expenses before fee reductions | | | 1,802,634 |
Fees voluntarily reduced by the administrator | | | (92,923) |
Fees contractually reduced by the investment adviser | | | (39,648) |
| | |
|
| Net Expenses | | | 1,670,063 |
| | |
|
| | | | |
| Net Investment Income | | | 3,008,273 |
| | |
|
| | | | |
| Net Realized/Unrealized Losses from Investments: | | | |
| Net realized losses from investment transactions | | | (2,892,802) |
| Change in unrealized appreciation/depreciation from investments | | | (34,137,628) |
| | |
|
| Net realized/unrealized losses from investments | | | (37,030,430) |
| | |
|
| | | | |
| Change in Net Assets Resulting from Operations | | $ | (34,022,157) |
| | |
|
| See Notes to Financial Statements |
|
| |
| 13 |
| Financial Statements | | Boston Trust Balanced Fund |
|
STATEMENTS OF CHANGES IN NET ASSETS | | | | | | | |
| | | | | | | | |
| | | | | | | | |
| | | For the year ended | | | For the year ended |
| | | March 31, 2009 | | | March 31, 2008 |
| | |
| | |
|
| Investment Activities: | | | | | | | |
| Operations: | | | | | | | |
Net investment income | | $ | 3,008,273 | | | $ | 2,671,776 |
Net realized gains (losses) from investment transactions | | | (2,892,802) | | | | 7,314,461 |
Change in unrealized appreciation/depreciation from investments | | | (34,137,628) | | | | 332,647 |
| | |
| | |
|
| Change in net assets resulting from operations | | | (34,022,157) | | | | 10,318,884 |
| | |
| | |
|
| Dividends: | | | | | | | |
Net investment income | | | (3,026,472) | | | | (2,580,508) |
Net realized gains from investment transactions | | | (4,856,029) | | | | (5,624,715) |
| | |
| | |
|
| Change in net assets from shareholder dividends | | | (7,882,501) | | | | (8,205,223) |
| | |
| | |
|
| Capital Share Transactions: | | | | | | | |
Proceeds from shares issued | | | 20,285,450 | | | | 16,074,101 |
Dividends reinvested | | | 7,558,953 | | | | 7,856,581 |
Cost of shares redeemed | | | (20,852,763) | | | | (13,037,872) |
| | |
| | |
|
| Change in net assets from capital share transactions | | | 6,991,640 | | | | 10,892,810 |
| | |
| | |
|
| | | | | | | | |
| Change in net assets | | | (34,913,018) | | | | 13,006,471 |
| | | | | | | | |
| Net Assets: | | | | | | | |
Beginning of period | | | 183,313,550 | | | | 170,307,079 |
| | |
| | |
|
End of period | | $ | 148,400,532 | | | $ | 183,313,550 |
| | |
| | |
|
| Share Transactions: | | | | | | | |
Issued | | | 795,051 | | | | 510,696 |
Reinvested | | | 313,910 | | | | 246,829 |
Redeemed | | | (795,578) | | | | (411,351) |
| | |
| | |
|
| Change in shares | | | 313,383 | | | | 346,174 |
| | |
| | |
|
| Accumulated net investment income | | $ | 759,251 | | | $ | 777,451 |
| | |
| | |
|
| See Notes to Financial Statements |
|
| |
| 14 |
| Financial Statements | | Boston Trust Balanced Fund |
|
FINANCIAL HIGHLIGHTS | | | | | | | | | | | | | | | | | | | |
| Selected data for a share outstanding throughout the years indicated. |
| | | | | | | | | | | | | | | | | | | | |
| | | | | | | | | | | | | | | | | | | | |
| | | For the year | | | For the year | | | For the year | | | For the year | | | For the year |
| | | ended | | | ended | | | ended | | | ended | | | ended |
| | | March 31, | | | March 31, | | | March 31, | | | March 31, | | | March 31, |
| | | 2009 | | | 2008 | | | 2007 | | | 2006 | | | 2005 |
| | |
| | |
| | |
| | |
| | |
|
| Net Asset Value, Beginning of Period | | $ | 30.31 | | | $ | 29.87 | | | $ | 29.11 | | | $ | 28.77 | | | $ | 27.63 |
| | |
| | | |
| | |
| | |
| | |
|
| Investment Activities: | | | | | | | | | | | | | | | | | | | |
Net investment income | | | 0.49 | (a) | | | 0.46 | | | | 0.46 | | | | 0.53 | | | | 0.50 |
Net realized and unrealized gains (losses) from | | | | | | | | | | | | | | | | | | | |
investment transactions | | | (6.11) | | | | 1.42 | | | | 2.13 | | | | 0.88 | | | | 1.15 |
| | |
| | | |
| | |
| | |
| | |
|
| Total from investment activities | | | (5.62) | | | | 1.88 | | | | 2.59 | | | | 1.41 | | | | 1.65 |
| | |
| | | |
| | |
| | |
| | |
|
| Dividends: | | | | | | | | | | | | | | | | | | | |
Net investment income | | | (0.52) | | | | (0.45) | | | | (0.43) | | | | (0.52) | | | | (0.50) |
Net realized gains from investments | | | (0.84) | | | | (0.99) | | | | (1.40) | | | | (0.55) | | | | (0.01) |
| | |
| | | |
| | |
| | |
| | |
|
| Total dividends | | | (1.36) | | | | (1.44) | | | | (1.83) | | | | (1.07) | | | | (0.51) |
| | |
| | | |
| | |
| | |
| | |
|
| | | | | | | | | | | | | | | | | | | | |
| Net Asset Value, End of Period | | $ | 23.33 | | | $ | 30.31 | | | $ | 29.87 | | | $ | 29.11 | | | $ | 28.77 |
| | |
| | | |
| | |
| | |
| | |
|
| | | | | | | | | | | | | | | | | | | | |
| Total Return | | | (18.68)% | | | | 6.06% | | | | 8.98% | | | | 4.97% | | | | 5.96% |
| | |
| | | |
| | |
| | |
| | |
|
| Ratios/Supplemental Data: | | | | | | | | | | | | | | | | | | | |
| Net Assets at end of period (000’s) | | $ | 148,401 | | | $ | 183,314 | | | $ | 170,307 | | | $ | 164,475 | | | $ | 172,218 |
| Ratio of net expenses to average net assets | | | 1.00% | | | | 1.00% | | | | 1.00% | | | | 1.00% | | | | 1.00% |
| Ratio of net investment income to average net assets | | | 1.80% | | | | 1.46% | | | | 1.50% | | | | 1.76% | | | | 1.75% |
| Ratio of expenses (before fee reductions) to average | | | | | | | | | | | | | | | | | | | |
net assets(b) | | | 1.08% | | | | 1.08% | | | | 1.07% | | | | 1.08% | | | | 1.09% |
| Portfolio turnover | | | 21.30% | | | | 33.49% | | | | 37.24% | | | | 29.77% | | | | 10.38% |
|
| (a) | | Calculated using the average shares method. |
| (b) | | During the period, certain fees were reduced and total fund expenses are capped at 1.00%. If such expense caps had not been in place, the ratio would have been as indicated. |
| See Notes to Financial Statements |
|
| |
| 15 |
| Schedule of Portfolio Investments | | Boston Trust Equity Fund
March 31, 2009 |
|
COMMON STOCKS (94.5%) | | | | | |
| Security Description | | Shares | | Value ($) |
| |
| |
|
| Consumer Discretionary (10.4%) | | | | | |
| Comcast Corp., Class A | | 60,000 | | | 818,400 |
| Johnson Controls, Inc. | | 25,000 | | | 300,000 |
| NIKE, Inc., Class B | | 10,000 | | | 468,900 |
| Omnicom Group, Inc. | | 40,000 | | | 936,000 |
| Staples, Inc. | | 25,000 | | | 452,750 |
| Target Corp. | | 30,000 | | | 1,031,700 |
| | | | |
|
| | | | | | 4,007,750 |
| | | | |
|
| Consumer Products (10.9%) | | | | | |
| Costco Wholesale Corp. | | 15,000 | | | 694,800 |
| Diageo PLC, ADR | | 17,500 | | | 783,125 |
| PepsiCo, Inc. | | 15,000 | | | 772,200 |
| Procter & Gamble Co. | | 20,000 | | | 941,800 |
| Sysco Corp. | | 45,000 | | | 1,026,000 |
| | | | |
|
| | | | | | 4,217,925 |
| | | | |
|
| Energy (12.8%) | | | | | |
| Apache Corp. | | 12,000 | | | 769,080 |
| Chevron Corp. | | 15,000 | | | 1,008,600 |
| Exxon Mobil Corp. | | 30,000 | | | 2,043,000 |
| Schlumberger Ltd. | | 15,000 | | | 609,300 |
| XTO Energy, Inc. | | 17,000 | | | 520,540 |
| | | | |
|
| | | | | | 4,950,520 |
| | | | |
|
| Financial Services (8.2%) | | | | | |
| Chubb Corp. | | 25,000 | | | 1,058,000 |
| Cincinnati Financial Corp. | | 35,000 | | | 800,450 |
| State Street Corp. | | 10,000 | | | 307,800 |
| T. Rowe Price Group, Inc. | | 35,000 | | | 1,010,100 |
| | | | |
|
| | | | | | 3,176,350 |
| | | | |
|
| Health Care (14.5%) | | | | | |
| Becton, Dickinson & Co. | | 17,500 | | | 1,176,700 |
| C.R. Bard, Inc. | | 12,500 | | | 996,500 |
| DENTSPLY International, Inc. | | 30,000 | | | 805,500 |
| Johnson & Johnson, Inc. | | 12,000 | | | 631,200 |
| Medtronic, Inc. | | 25,000 | | | 736,750 |
| Saint Jude Medical, Inc.(a) | | 15,000 | | | 544,950 |
| Stryker Corp. | | 12,500 | | | 425,500 |
| Varian Medical Systems, Inc.(a) | | 10,000 | | | 304,400 |
| | | | |
|
| | | | | | 5,621,500 |
| | | | |
|
| Industrial Materials (6.3%) | | | | | |
| Air Products & Chemicals, Inc. | | 14,000 | | | 787,500 |
| AptarGroup, Inc. | | 12,500 | | | 389,250 |
| Ecolab, Inc. | | 15,000 | | | 520,950 |
| Sigma-Aldrich Corp. | | 20,000 | | | 755,800 |
| | | | |
|
| | | | | | 2,453,500 |
| | | | |
|
| Industrial Products & Services (17.9%) | | | | | |
| Donaldson Co., Inc. | | 30,000 | | | 805,200 |
| Emerson Electric Co. | | 37,500 | | | 1,071,750 |
| Illinois Tool Works, Inc. | | 35,000 | | | 1,079,750 |
| Parker Hannifin Corp. | | 15,000 | | | 509,700 |
| Precision Castparts Corp. | | 22,500 | | | 1,347,750 |
| Rockwell Collins, Inc. | | 10,000 | | | 326,400 |
| United Parcel Service, Inc., Class B | | 15,000 | | | 738,300 |
| W.W. Grainger, Inc. | | 15,000 | | | 1,052,700 |
| | | | |
|
| | | | | | 6,931,550 |
| | | | |
|
| Information Technology (13.5%) | | | | | |
| Accenture Ltd., Class A | | 25,000 | | | 687,250 |
| Automatic Data Processing, Inc. | | 20,000 | | | 703,200 |
| Cisco Systems, Inc.(a) | | 55,000 | | | 922,350 |
| EMC Corp.(a) | | 70,000 | | | 798,000 |
| Microsoft Corp. | | 65,000 | | | 1,194,050 |
| Oracle Corp.(a) | | 50,000 | | | 903,500 |
| | | | |
|
| | | | | | 5,208,350 |
| | | | |
|
| TOTAL COMMON STOCKS (Cost $34,586,512) | | | | | 36,567,445 |
| | | | |
|
INVESTMENT COMPANIES (5.7%) | | | | | |
| | | | | | |
| Cavanal Hill U.S. Treasury Fund, 0.01%(b) | | 254,024 | | | 254,024 |
| Victory Federal Money Market, Investor | | | | | |
Shares, 0.45%(b) | | 1,935,879 | | | 1,935,879 |
| | | | |
|
| TOTAL INVESTMENT COMPANIES | | | | | |
(Cost $2,189,903) | | | | | 2,189,903 |
| | | | |
|
| Total Investments (Cost $36,776,415) — 100.2% | | | | | 38,757,348 |
| Liabilities in excess of other assets — (0.2)% | | | | | (58,624) |
| | | | |
|
| NET ASSETS — 100.0% | | | | $ | 38,698,724 |
| | | | |
|
|
| (a) | | Non-income producing security. |
| (b) | | Rate disclosed is the seven day yield as of March 31, 2009. |
| ADR | | American Depositary Receipt |
| PLC | | Public Limited Company |
| See Notes to Financial Statements |
|
| |
| 16 |
| Financial Statements | | Boston Trust Equity Fund |
|
| STATEMENT OF ASSETS AND LIABILITIES |
| March 31, 2009 |
| Assets: | | | | |
| Investments, at value (cost $36,776,415) | | $ | 38,757,348 | |
| Interest and dividends receivable | | | 93,928 | |
| Prepaid expenses and other assets | | | 7,333 | |
| | |
| |
Total Assets | | | 38,858,609 | |
| | |
| |
| | | | | |
| Liabilities: | | | | |
| Payable for capital shares redeemed | | | 108,233 | |
| Accrued expenses and other liabilities: | | | | |
Investment adviser | | | 25,286 | |
Chief compliance officer | | | 329 | |
Administration and accounting | | | 1,194 | |
Custodian | | | 2,120 | |
Transfer agent | | | 2,946 | |
Other | | | 19,777 | |
| | |
| |
Total Liabilities | | | 159,885 | |
| | |
| |
| | | | | |
| Net Assets | | $ | 38,698,724 | |
| | |
| |
| | | | | |
| Composition of Net Assets: | | | | |
| Capital | | $ | 40,672,418 | |
| Accumulated net investment income | | | 111,490 | |
| Accumulated net realized losses from | | | | |
investment transactions | | | (4,066,117) | |
| Net unrealized appreciation from investments | | | 1,980,933 | |
| | |
| |
| | | | | |
| Net Assets | | $ | 38,698,724 | |
| | |
| |
| | | | | |
| Shares outstanding (par value $0.01, unlimited number of | | | | |
shares authorized) | | | 4,412,718 | |
| | |
| |
| | | | | |
| Net Asset Value, Offering Price and Redemption Price per | | | | |
share | | $ | 8.77 | |
| | |
| |
| For the year ended March 31, 2009 | | �� | | |
| | | | | |
| Investment Income: | | | | |
| Interest | | $ | 5 | |
| Dividends | | | 1,028,842 | |
| Less: Foreign tax withholding | | | (2,503) | |
| | |
| |
Total Investment Income | | | 1,026,344 | |
| | |
| |
| | | | | |
| Expenses: | | | | |
Investment adviser | | | 413,488 | |
Administration and accounting | | | 113,309 | |
Trustee | | | 3,758 | |
Custodian | | | 12,620 | |
Transfer agency | | | 17,946 | |
Chief compliance officer | | | 4,146 | |
Other | | | 40,812 | |
| | |
| |
Total expenses before fee reductions | | | 606,079 | |
Fees voluntarily reduced by the administrator | | | (30,688) | |
Fees contractually reduced by the investment adviser | | | (23,578) | |
| | |
| |
| Net Expenses | | | 551,813 | |
| | |
| |
| | | | | |
| Net Investment Income | | | 474,531 | |
| | |
| |
| | | | | |
| Net Realized/Unrealized Losses from Investments: | | | | |
| Net realized losses from investment transactions | | | (4,042,987) | |
| Change in unrealized appreciation/depreciation from | | | | |
investments | | | (17,791,854) | |
| | |
| |
| Net realized/unrealized losses from investments | | | (21,834,841) | |
| | |
| |
| | | | | |
| Change in Net Assets Resulting from Operations | | $ | (21,360,310) | |
| | |
| |
See Notes to Financial Statements
17
| Financial Statements | | Boston Trust Equity Fund |
|
| STATEMENTS OF CHANGES IN NET ASSETS |
| | For the year ended | | For the year ended |
| | March 31, 2009 | | March 31, 2008 |
| |
| |
|
| Investment Activities: | | | | | | | | | |
| Operations: | | | | | | | | | |
| Net investment income | | $ | 474,531 | | | | $ | 365,451 | |
| Net realized gains (losses) from investment transactions | | | (4,042,987) | | | | | 727,583 | |
| Change in unrealized appreciation/depreciation from investments | | | (17,791,854) | | | | | 474,087 | |
| | |
| | | |
| |
| Change in net assets resulting from operations | | | (21,360,310) | | | | | 1,567,121 | |
| | |
| | | |
| |
| Dividends: | | | | | | | | | |
Net investment income | | | (482,096) | | | | | (369,648) | |
Net realized gains from investment transactions | | | — | | | | | (1,405,851) | |
| | |
| | | |
| |
| Change in net assets from shareholder dividends | | | (482,096) | | | | | (1,775,499) | |
| | |
| | | |
| |
| Capital Share Transactions: | | | | | | | | | |
Proceeds from shares issued | | | 4,500,020 | | | | | 6,359,787 | |
Dividends reinvested | | | 437,230 | | | | | 1,650,276 | |
Cost of shares redeemed | | | (9,445,789) | | | | | (2,636,040) | |
| | |
| | | |
| |
| Change in net assets from capital share transactions | | | (4,508,539) | | | | | 5,374,023 | |
| | |
| | | |
| |
| | | | | | | | | | |
| Change in net assets | | | (26,350,945) | | | | | 5,165,645 | |
Net Assets: | | | | | | | | | |
Beginning of period | | | 65,049,669 | | | | | 59,884,024 | |
| | |
| | | |
| |
End of period | | $ | 38,698,724 | | | | $ | 65,049,669 | |
| | |
| | | |
| |
| | | | | | | | | | |
| Share Transactions: | | | | | | | | | |
Issued | | | 389,563 | | | | | 464,496 | |
Reinvested | | | 45,892 | | | | | 113,812 | |
Redeemed | | | (960,879) | | | | | (187,820) | |
| | |
| | | |
| |
| Change in shares | | | (525,424) | | | | | 390,488 | |
| | |
| | | |
| |
| | | | | | | | | | |
| Accumulated net investment income | | $ | 111,490 | | | | $ | 119,054 | |
| | |
| | | |
| |
See Notes to Financial Statements
18
| Financial Statements | | Boston Trust Equity Fund |
|
Selected data for a share outstanding throughout the years indicated.
| | | | For the year | | | | For the year | | | | For the year | | | | For the year | | | | For the year | |
| | | | ended | | | | ended | | | | ended | | | | ended | | | | ended | |
| | | | March 31, | | | | March 31, | | | | March 31, | | | | March 31, | | | | March 31, | |
| | | | 2009 | | | | 2008 | | | | 2007 | | | | 2006 | | | | 2005 | |
| | |
| | |
| | |
| | |
| | |
| |
| Net Asset Value, Beginning of Period | | $ | 13.17 | | | $ | 13.17 | | | $ | 12.39 | | | $ | 11.86 | | | $ | 11.19 | |
| | |
| | |
| | |
| | |
| | |
| |
| | | | | | | | | | | | | | | | | | | | | |
| Investment Activities: | | | | | | | | | | | | | | | | | | | | |
Net investment income | | | 0.10 | (a) | | | 0.08 | | | | 0.09 | | | | 0.09 | | | | 0.10 | |
Net realized and unrealized gains (losses) from | | | | | | | | | | | | | | | | | | | | |
investment transactions | | | (4.40) | | | | 0.30 | | | | 1.04 | | | | 0.65 | | | | 0.84 | |
| | |
| | |
| | |
| | |
| | |
| |
| Total from investment activities | | | (4.30) | | | | 0.38 | | | | 1.13 | | | | 0.74 | | | | 0.94 | |
| | |
| | |
| | |
| | |
| | |
| |
| Dividends: | | | | | | | | | | | | | | | | | | | | |
Net investment income | | | (0.10) | | | | (0.08) | | | | (0.08) | | | | (0.09) | | | | (0.09) | |
Net realized gains from investments | | | — | | | | (0.30) | | | | (0.27) | | | | (0.12) | | | | (0.18) | |
| | |
| | |
| | |
| | |
| | |
| |
| Total dividends | | | (0.10) | | | | (0.38) | | | | (0.35) | | | | (0.21) | | | | (0.27) | |
| | |
| | |
| | |
| | |
| | |
| |
| | | | | | | | | | | | | | | | | | | | | |
| Net Asset Value, End of Period | | $ | 8.77 | | | $ | 13.17 | | | $ | 13.17 | | | $ | 12.39 | | | $ | 11.86 | |
| | |
| | |
| | |
| | |
| | |
| |
| | | | | | | | | | | | | | | | | | | | | |
| Total Return | | | (32.73)% | | | | 2.59% | | | | 9.20% | | | | 6.23% | | | | 8.34% | |
| | |
| | |
| | |
| | |
| | |
| |
| | | | | | | | | | | | | | | | | | | | | |
| Ratios/Supplemental Data: | | | | | | | | | | | | | | | | | | | | |
| Net Assets at end of period (000’s) | | $ | 38,699 | | | $ | 65,050 | | | $ | 59,884 | | | $ | 48,574 | | | $ | 41,175 | |
| Ratio of net expenses to average net assets | | | 1.00% | | | | 1.00% | | | | 1.00% | | | | 1.00% | | | | 1.00% | |
| Ratio of net investment income to average net assets | | | 0.86% | | | | 0.55% | | | | 0.71% | | | | 0.73% | | | | 0.84% | |
| Ratio of expenses (before fee reductions) to average | | | | | | | | | | | | | | | | | | | | |
net assets(b) | | | 1.10% | | | | 1.10% | | | | 1.11% | | | | 1.11% | | | | 1.14% | |
| Portfolio turnover | | | 28.85% | | | | 23.53% | | | | 21.48% | | | | 20.44% | | | | 12.05% | |
|
| (a) | | Calculated using the average shares method. |
| (b) | | During the period, certain fees were reduced and total fund expenses are capped at 1.00%. If such expense caps had not been in place, the ratio would have been as indicated. |
See Notes to Financial Statements
19
| Schedule of Portfolio Investments | | Boston Trust Small Cap Fund
March 31, 2009 |
|
| Security Description | | Shares | | | Value ($) | |
| |
| | |
| |
| Consumer Discretionary (12.0%) | | | | | | | | |
| Ambassadors Group, Inc. | | | 7,300 | | | | 59,276 | |
| Capella Education Co.(a) | | | 5,050 | | | | 267,650 | |
| Gentex Corp. | | | 48,000 | | | | 478,080 | |
| Hibbett Sports, Inc.(a) | | | 8,600 | | | | 165,292 | |
| John Wiley & Sons, Inc., Class A | | | 16,600 | | | | 494,348 | |
| LKQ Corp.(a) | | | 29,000 | | | | 413,830 | |
| Pre-Paid Legal Services, Inc.(a) | | | 3,800 | | | | 110,314 | |
| Scholastic Corp. | | | 7,500 | | | | 113,025 | |
| Strayer Education, Inc. | | | 3,850 | | | | 692,499 | |
| Timberland Co., Class A(a) | | | 13,000 | | | | 155,220 | |
| Under Armour, Inc., Class A(a) | | | 6,500 | | | | 106,795 | |
| | | | | | |
| |
| | | | | | | | 3,056,329 | |
| | | | | | |
| |
| Consumer Products (6.6%) | | | | | | | | |
| Diamond Foods, Inc. | | | 13,500 | | | | 377,055 | |
| Green Mountain Coffee Roasters, Inc.(a) | | | 8,600 | | | | 412,800 | |
| Hain Celestial Group, Inc.(a) | | | 12,000 | | | | 170,880 | |
| Lifeway Foods, Inc.(a) | | | 20,000 | | | | 160,000 | |
| United Natural Foods, Inc.(a) | | | 16,000 | | | | 303,520 | |
| Whole Foods Market, Inc. | | | 15,200 | | | | 255,360 | |
| | | | | | |
| |
| | | | | | | | 1,679,615 | |
| | | | | | |
| |
| Energy (3.9%) | | | | | | | | |
| CARBO Ceramics, Inc. | | | 10,000 | | | | 284,400 | |
| CREDO Petroleum Corp.(a) | | | 12,400 | | | | 92,628 | |
| Dawson Geophysical Co.(a) | | | 5,200 | | | | 70,200 | |
| Encore Acquisition Co.(a) | | | 19,000 | | | | 442,130 | |
| NATCO Group, Inc., Class A(a) | | | 6,000 | | | | 113,580 | |
| | | | | | |
| |
| | | | | | | | 1,002,938 | |
| | | | | | |
| |
| Financial Services (16.6%) | | | | | | | | |
| Assured Guaranty Ltd. | | | 45,525 | | | | 308,204 | |
| Bank of Hawaii Corp. | | | 14,500 | | | | 478,210 | |
| Commerce Bancshares, Inc. | | | 7,500 | | | | 272,250 | |
| Corporate Office Properties | | | 14,500 | | | | 360,035 | |
| Digital Realty Trust, Inc. | | | 14,100 | | | | 467,838 | |
| Dime Community Bancshares | | | 55,225 | | | | 518,010 | |
| eHealth, Inc.(a) | | | 25,000 | | | | 400,250 | |
| Independent Bank Corp. | | | 10,200 | | | | 150,450 | |
| Investment Technology Group, Inc.(a) | | | 9,000 | | | | 229,680 | |
| Jones Lang LaSalle, Inc. | | | 11,000 | | | | 255,860 | |
| Parkway Properties, Inc. | | | 10,125 | | | | 104,288 | |
| Southside Bancshares, Inc. | | | 9,200 | | | | 173,880 | |
| Umpqua Holdings Corp. | | | 15,500 | | | | 140,430 | |
| Wainwright Bank & Trust Co. | | | 17,495 | | | | 117,042 | |
| Wilmington Trust Corp. | | | 26,000 | | | | 251,940 | |
| | | | | | |
| |
| | | | | | | | 4,228,367 | |
| | | | | | |
| |
| Health Care (15.2%) | | | | | | | | |
| Dionex Corp.(a) | | | 11,100 | | | | 524,475 | |
| Gen-Probe, Inc.(a) | | | 5,700 | | | | 259,806 | |
| ICU Medical, Inc.(a) | | | 9,000 | | | | 289,080 | |
| IDEXX Laboratories, Inc.(a) | | | 17,400 | | | | 601,692 | |
| Immucor, Inc.(a) | | | 4,975 | | | | 125,121 | |
| Landauer, Inc. | | | 11,825 | | | | 599,291 | |
| Meridian Bioscience, Inc. | | | 29,400 | | | | 532,728 | |
| Neogen Corp.(a) | | | 9,000 | | | | 196,470 | |
| ResMed, Inc.(a) | | | 8,500 | | | | 300,390 | |
| West Pharmaceutical Services, Inc. | | | 14,000 | | | | 459,340 | |
| | | | | | |
| |
| | | | | | | | 3,888,393 | |
| | | | | | |
| |
| Industrial Materials (2.3%) | | | | | | | | |
| Commercial Metals Co. | | | 15,500 | | | | 179,025 | |
| Minerals Technologies, Inc. | | | 10,000 | | | | 320,500 | |
| Quaker Chemical Corp. | | | 12,250 | | | | 97,265 | |
| | | | | | |
| |
| | | | | | | | 596,790 | |
| | | | | | |
| |
| Industrial Products & Services (15.0%) | | | | | | | | |
| Apogee Enterprises, Inc. | | | 13,000 | | | | 142,740 | |
| Baldor Electric Co. | | | 24,500 | | | | 355,005 | |
| CLARCOR, Inc. | | | 20,300 | | | | 511,357 | |
| ESCO Technologies, Inc.(a) | | | 7,000 | | | | 270,900 | |
| Fuel-Tech, Inc.(a) | | | 6,075 | | | | 63,545 | |
| Genesee & Wyoming, Inc., Class A(a) | | | 23,000 | | | | 488,750 | |
| Herman Miller, Inc. | | | 8,050 | | | | 85,813 | |
| Layne Christensen Co.(a) | | | 5,400 | | | | 86,778 | |
| Lindsay Manufacturing Co. | | | 9,000 | | | | 243,000 | |
| Met-Pro Corp. | | | 12,699 | | | | 103,497 | |
| Middleby Corp.(a) | | | 4,600 | | | | 149,178 | |
| Simpson Manufacturing Co., Inc. | | | 18,325 | | | | 330,216 | |
| SunPower Corp., Class B(a) | | | 4,600 | | | | 91,080 | |
| Team, Inc.(a) | | | 14,500 | | | | 169,940 | |
| Wabtec Corp. | | | 17,500 | | | | 461,650 | |
| Watts Water Technologies, Inc., Class A | | | 14,000 | | | | 273,840 | |
| | | | | | |
| |
| | | | | | | | 3,827,289 | |
| | | | | | |
| |
| Information Technology (18.2%) | | | | | | | | |
| Alvarion Ltd.(a) | | | 20,900 | | | | 69,179 | |
| Blackbaud, Inc. | | | 17,000 | | | | 197,370 | |
| Coherent, Inc.(a) | | | 7,175 | | | | 123,769 | |
| Computer Programs & Systems, Inc. | | | 4,000 | | | | 133,080 | |
| F5 Networks, Inc.(a) | | | 12,000 | | | | 251,400 | |
| Itron, Inc.(a) | | | 9,000 | | | | 426,150 | |
| J2 Global Communications, Inc.(a) | | | 27,500 | | | | 601,975 | |
| National Instruments Corp. | | | 8,000 | | | | 149,200 | |
| Net 1 UEPS Technologies, Inc.(a) | | | 26,000 | | | | 395,460 | |
| Plantronics, Inc. | | | 32,000 | | | | 386,240 | |
| Polycom, Inc.(a) | | | 32,000 | | | | 492,480 | |
| Power Integrations, Inc. | | | 28,500 | | | | 490,200 | |
| Quality Systems, Inc. | | | 13,000 | | | | 588,250 | |
| RADVision Ltd.(a) | | | 30,000 | | | | 149,700 | |
| Renaissance Learning, Inc. | | | 20,700 | | | | 185,679 | |
| | | | | | |
| |
| | | | | | | | 4,640,132 | |
| | | | | | |
| |
| Telecommunications (0.5%) | | | | | | | | |
| NII Holdings, Inc.(a) | | | 8,300 | | | | 124,500 | |
| | | | | | |
| |
| | | | | | | | | |
| Utilities (6.3%) | | | | | | | | |
| American States Water Co. | | | 3,500 | | | | 127,120 | |
| New Jersey Resources Corp. | | | 20,650 | | | | 701,687 | |
| Ormat Technologies, Inc. | | | 4,000 | | | | 109,840 | |
| South Jersey Industries, Inc. | | | 18,725 | | | | 655,375 | |
| | | | | | |
| |
| | | | | | | | 1,594,022 | |
| | | | | | |
| |
| TOTAL COMMON STOCKS (Cost $31,253,173) | | | | | | | 24,638,375 | |
| | | | | | |
| |
| | | | | | | | | |
| INVESTMENT COMPANY (3.3%) | | | | | | | | |
| Victory Federal Money Market, Investor Shares, | | | | | | | | |
0.45% (Cost $840,982)(b) | | | 840,982 | | | | 840,982 | |
| | | | | | |
| |
| Total Investments (Cost $32,094,155) — 99.9% | | | | | | | 25,479,357 | |
| Other assets in excess of liabilities — 0.1% | | | | | | | 24,581 | |
| | | | | | |
| |
| NET ASSETS — 100.0% | | | | | | $ | 25,503,938 | |
| | | | | | |
| |
|
| (a) | | Non-income producing security. |
| (b) | | Rate disclosed is the seven day yield as of March 31, 2009. |
See Notes to Financial Statements
20
| Financial Statements | | Boston Trust Small Cap Fund |
| STATEMENT OF ASSETS AND LIABILITIES |
| March 31, 2009 |
| Assets: | | | | |
| Investments, at value (cost $32,094,155) | | $ | 25,479,357 | |
| Interest and dividends receivable | | | 33,637 | |
| Receivable for investments sold | | | 12,927 | |
| Prepaid expenses and other assets | | | 6,340 | |
| | |
| |
Total Assets | | | 25,532,261 | |
| | |
| |
| Liabilities: | | | | |
| Accrued expenses and other liabilities: | | | | |
Investment adviser | | | 8,297 | |
Chief compliance officer | | | 196 | |
Administration and accounting | | | 739 | |
Custodian | | | 1,600 | |
Transfer agent | | | 5,346 | |
Other | | | 12,145 | |
| | |
| |
Total Liabilities | | | 28,323 | |
| | |
| |
| | | | | |
| Net Assets | | $ | 25,503,938 | |
| | |
| |
| Composition of Net Assets: | | | | |
| Capital | | $ | 35,325,406 | |
| Accumulated net investment income | | | 25,109 | |
| Accumulated net realized losses from | | | | |
investment transactions | | | (3,231,779) | |
| Net unrealized depreciation from investments | | | (6,614,798) | |
| | |
| |
| Net Assets | | $ | 25,503,938 | |
| | |
| |
| | | | | |
| Shares outstanding (par value $0.01, unlimited number of | | | | |
shares authorized) | | | 3,535,096 | |
| | |
| |
| | | | | |
| Net Asset Value, Offering Price and Redemption Price per | | | | |
share(a) | | $ | 7.21 | |
| | |
| |
|
| (a) | | A redemption fee is imposed upon shares redeemed within 60 days. See Note 2 to financial statements. |
| For the year ended March 31, 2009 | | | | |
| | | | | |
| Investment Income: | | | | |
| Interest | | $ | 32 | |
| Dividends | | | 390,075 | |
| | |
| |
Total Investment Income | | | 390,107 | |
| | |
| |
| Expenses: | | | | |
Investment adviser | | | 222,800 | |
Administration and accounting | | | 63,177 | |
Trustee | | | 3,331 | |
Custodian | | | 9,184 | |
Transfer agency | | | 22,422 | |
Chief compliance officer | | | 2,470 | |
Other | | | 26,445 | |
| | |
| |
Total expenses before fee reductions | | | 349,829 | |
Fees voluntarily reduced by the administrator | | | (16,534) | |
Fees contractually reduced by the investment adviser | | | (6,931) | |
| | |
| |
| Net Expenses | | | 326,364 | |
| | |
| |
| Net Investment Income | | | 63,743 | |
| | |
| |
| Net Realized/Unrealized Losses from Investments: | | | | |
| Net realized losses from investment transactions | | | (3,231,779) | |
| Change in unrealized appreciation/depreciation from | | | | |
investments | | | (8,313,989) | |
| | |
| |
| Net realized/unrealized losses from investments | | | (11,545,768) | |
| | |
| |
| Change in Net Assets Resulting from Operations | | $ | (11,482,025) | |
| | |
| |
See Notes to Financial Statements
21
| Financial Statements | | Boston Trust Small Cap Fund |
|
| STATEMENTS OF CHANGES IN NET ASSETS |
| | For the year ended | | For the year ended |
| | March 31, 2009 | | March 31, 2008 |
| |
| |
|
| Investment Activities: | | | | | | | | | |
| Operations: | | | | | | | | | |
Net investment income | | $ | 63,743 | | | | $ | 75,855 | |
Net realized gains (losses) from investment transactions | | | (3,231,779) | | | | | 1,378,034 | |
Change in unrealized appreciation/depreciation from investments | | | (8,313,989) | | | | | (2,208,473) | |
| | |
| | | |
| |
| Change in net assets resulting from operations | | | (11,482,025) | | | | | (754,584) | |
| | |
| | | |
| |
| Dividends: | | | | | | | | | |
Net investment income | | | (50,862) | | | | | (42,957) | |
Net realized gains from investment transactions | | | (252,171) | | | | | (1,321,469) | |
| | |
| | | |
| |
| Change in net assets from shareholder dividends | | | (303,033) | | | | | (1,364,426) | |
| | |
| | | |
| |
| Capital Share Transactions: | | | | | | | | | |
Proceeds from shares issued | | | 10,208,948 | | | | | 11,967,031 | |
Dividends reinvested | | | 284,550 | | | | | 1,093,930 | |
Cost of shares redeemed | | | (3,627,892) | | | | | (1,197,907) | |
| | |
| | | |
| |
| Change in net assets from capital share transactions | | | 6,865,606 | | | | | 11,863,054 | |
| | |
| | | |
| |
| | | | | | | | | | |
| Change in net assets | | | (4,919,452) | | | | | 9,744,044 | |
| | | | | | | | | | |
| Net Assets: | | | | | | | | | |
Beginning of period | | | 30,423,390 | | | | | 20,679,346 | |
| | |
| | | |
| |
End of period | | $ | 25,503,938 | | | | $ | 30,423,390 | |
| | |
| | | |
| |
| Share Transactions: | | | | | | | | | |
Issued | | | 1,132,080 | | | | | 1,003,636 | |
Reinvested | | | 36,434 | | | | | 94,223 | |
Redeemed | | | (419,063) | | | | | (102,989) | |
| | |
| | | |
| |
| Change in shares | | | 749,451 | | | | | 994,870 | |
| | |
| | | |
| |
| Accumulated net investment income | | $ | 25,109 | | | | $ | 12,228 | |
| | |
| | | |
| |
See Notes to Financial Statements
22
| Financial Statements | | Boston Trust Small Cap Fund |
|
Selected data for a share outstanding throughout the periods indicated.
| | | | For the year | | | | For the year | | | | For the year | | | | For the | |
| | | | ended | | | | ended | | | | ended | | | | period ended | |
| | | | March 31, | | | | March 31, | | | | March 31, | | | | March 31, | |
| | | | 2009 | | | | 2008 | | | | 2007 | | | | 2006(a) | |
| | |
| | |
| | |
| | |
| |
| Net Asset Value, Beginning of Period | | $ | 10.92 | | | $ | 11.55 | | | $ | 10.94 | | | $ | 10.00 | |
| | |
| | |
| | |
| | |
| |
| | | | | | | | | | | | | | | | | |
| Investment Activities: | | | | | | | | | | | | | | | | |
Net investment income (loss) | | | 0.02 | (b) | | | 0.03 | | | | (0.01) | | | | — | |
Net realized and unrealized gains (losses) from investment transactions | | | (3.64 | ) | | | (0.14) | | | | 0.85 | | | | 0.94 | |
| | |
| | |
| | |
| | |
| |
| Total from investment activities | | | (3.62 | ) | | | (0.11) | | | | 0.84 | | | | 0.94 | |
| | |
| | |
| | |
| | |
| |
| | | | | | | | | | | | | | | | | |
| Dividends: | | | | | | | | | | | | | | | | |
Net investment income | | | (0.02 | ) | | | (0.02) | | | | — | | | | — | |
Net realized gains from investments | | | (0.07 | ) | | | (0.50) | | | | (0.23) | | | | — | |
| | |
| | |
| | |
| | |
| |
| Total dividends | | | (0.09 | ) | | | (0.52) | | | | (0.23) | | | | — | |
| | |
| | |
| | |
| | |
| |
| Net Asset Value, End of Period | | $ | 7.21 | | | $ | 10.92 | | | $ | 11.55 | | | $ | 10.94 | |
| | |
| | |
| | |
| | |
| |
| | | | | | | | | | | | | | | | | |
| Total Return | | | (33.24)% | | | | (1.21)% | | | | 7.75% | | | | 9.40% | (c) |
| | |
| | |
| | |
| | |
| |
| Ratios/Supplemental Data: | | | | | | | | | | | | | | | | |
| Net Assets at end of period (000’s) | | $ | 25,504 | | | $ | 30,423 | | | $ | 20,679 | | | $ | 10,938 | |
| Ratio of net expenses to average net assets | | | 1.10% | | | | 1.08% | | | | 1.25% | | | | 1.23% | (d) |
| Ratio of net investment income (loss) to average net assets | | | 0.21% | | | | 0.25% | | | | (0.13)% | | | | (0.02)% | (d) |
| Ratio of expenses (before fee reductions) to average net assets(e) | | | 1.18% | | | | 1.14% | | | | 1.43% | | | | 1.52% | (d) |
| Portfolio turnover | | | 21.28% | | | | 19.53% | | | | 10.18% | | | | 3.62% | (c) |
|
| (a) | | Commenced operations on December 16, 2005. |
| (b) | | Calculated using the average shares method. |
| (c) | | Not annualized for periods less than one year. |
| (d) | | Annualized for periods less than one year. |
| (e) | | During the period, certain fees were reduced and total fund expenses were capped at 1.25% through March 13, 2009 and at 1.00% thereafter. If such expense caps had not been in place, the ratio would have been as indicated. |
See Notes to Financial Statements
23
| Schedule of Portfolio Investments | | Boston Trust Midcap Fund
March 31, 2009 |
|
COMMON STOCKS (95.7%) | | | | | |
| Security Description | | Shares | | Value ($) |
| |
| |
|
| Consumer Discretionary (8.7%) | | | | | |
| Abercrombie & Fitch Co., Class A | | 2,500 | | | 59,500 |
| Autoliv, Inc. | | 4,650 | | | 86,351 |
| Coach, Inc.(a) | | 5,750 | | | 96,025 |
| John Wiley & Sons, Inc., Class A | | 2,500 | | | 74,450 |
| Nordstrom, Inc. | | 5,000 | | | 83,750 |
| Omnicom Group, Inc. | | 6,500 | | | 152,100 |
| Ross Stores, Inc. | | 4,000 | | | 143,520 |
| | | | |
|
| | | | | | 695,696 |
| | | | |
|
| Consumer Products (11.8%) | | | | | |
| Alberto-Culver Co. | | 9,000 | | | 203,490 |
| Brown-Forman Corp., Class B | | 4,250 | | | 165,027 |
| Church & Dwight Co., Inc. | | 2,000 | | | 104,460 |
| Clorox Co. | | 1,400 | | | 72,072 |
| Energizer Holdings, Inc.(a) | | 3,500 | | | 173,915 |
| Hormel Foods Corp. | | 2,000 | | | 63,420 |
| McCormick & Co., Inc. | | 5,500 | | | 162,635 |
| | | | |
|
| | | | | | 945,019 |
| | | | |
|
| Energy (5.8%) | | | | | |
| Cabot Oil & Gas Corp. | | 6,000 | | | 141,420 |
| Murphy Oil Corp. | | 6,000 | | | 268,620 |
| Smith International, Inc. | | 2,500 | | | 53,700 |
| | | | |
|
| | | | | | 463,740 |
| | | | |
|
| Financial Services (5.4%) | | | | | |
| Cincinnati Financial Corp. | | 5,130 | | | 117,323 |
| Digital Realty Trust, Inc. | | 1,500 | | | 49,770 |
| SEI Investments Co. | | 9,000 | | | 109,890 |
| T. Rowe Price Group, Inc. | | 5,500 | | | 158,730 |
| | | | |
|
| | | | | | 435,713 |
| | | | |
|
| Health Care (17.8%) | | | | | |
| C.R. Bard, Inc. | | 3,000 | | | 239,160 |
| DENTSPLY International, Inc. | | 8,500 | | | 228,225 |
| Gen-Probe, Inc.(a) | | 1,700 | | | 77,486 |
| Hologic, Inc.(a) | | 6,000 | | | 78,540 |
| Laboratory Corp. of America Holdings(a) | | 1,200 | | | 70,188 |
| PerkinElmer, Inc. | | 6,500 | | | 83,005 |
| Saint Jude Medical, Inc.(a) | | 5,000 | | | 181,650 |
| Smith & Nephew PLC, Sponsored ADR | | 2,500 | | | 78,125 |
| Techne Corp. | | 2,250 | | | 123,097 |
| Varian Medical Systems, Inc.(a) | | 4,000 | | | 121,760 |
| Waters Corp.(a) | | 4,000 | | | 147,800 |
| | | | |
|
| | | | | | 1,429,036 |
| | | | |
|
| Industrial Materials (8.7%) | | | | | |
| Airgas, Inc. | | 2,750 | | | 92,978 |
| AptarGroup, Inc. | | 7,000 | | | 217,980 |
| Ecolab, Inc. | | 4,000 | | | 138,920 |
| Sigma-Aldrich Corp. | | 6,500 | | | 245,635 |
| | | | |
|
| | | | | | 695,513 |
| | | | |
|
| Industrial Products & Services (17.5%) | | | | | |
| AMETEK, Inc. | | 3,250 | | | 101,627 |
| C.H. Robinson Worldwide, Inc. | | 4,000 | | | 182,440 |
| CLARCOR, Inc. | | 3,600 | | | 90,684 |
| Donaldson Co., Inc. | | 8,000 | | | 214,720 |
| Expeditors International of Washington, Inc. | | 4,500 | | | 127,305 |
| L-3 Communications Holdings, Inc. | | 1,500 | | | 101,700 |
| Mettler-Toledo International, Inc.(a) | | 1,800 | | | 92,394 |
| Precision Castparts Corp. | | 3,200 | | | 191,680 |
| Rockwell Collins, Inc. | | 3,750 | | | 122,400 |
| W.W. Grainger, Inc. | | 2,500 | | | 175,450 |
| | | | |
|
| | | | | | 1,400,400 |
| | | | |
|
| Information Technology (14.2%) | | | | | |
| Adobe Systems, Inc.(a) | | 4,400 | | | 94,116 |
| Amdocs Ltd.(a) | | 6,250 | | | 115,750 |
| Citrix Systems, Inc.(a) | | 6,500 | | | 147,160 |
| Cognizant Technology Solutions Corp. Class A(a) | | 4,000 | | | 83,160 |
| FactSet Research Systems, Inc. | | 3,500 | | | 174,965 |
| Fiserv, Inc.(a) | | 2,150 | | | 78,389 |
| Intuit, Inc.(a) | | 4,000 | | | 108,000 |
| Juniper Networks, Inc.(a) | | 5,000 | | | 75,300 |
| NetApp, Inc.(a) | | 7,000 | | | 103,880 |
| Paychex, Inc. | | 4,000 | | | 102,680 |
| Total System Services, Inc. | | 4,000 | | | 55,240 |
| | | | |
|
| | | | | | 1,138,640 |
| | | | |
|
| Telecommunications (2.1%) | | | | | |
| NII Holdings, Inc.(a) | | 3,000 | | | 45,000 |
| Time Warner Cable, Inc. | | 4,925 | | | 122,140 |
| | | | |
|
| | | | | | 167,140 |
| | | | |
|
| Utilities (3.7%) | | | | | |
| Energen Corp. | | 3,200 | | | 93,216 |
| New Jersey Resources Corp. | | 3,750 | | | 127,425 |
| Questar Corp. | | 2,650 | | | 77,990 |
| | | | |
|
| | | | | | 298,631 |
| | | | |
|
| TOTAL COMMON STOCKS (Cost $8,669,464) | | | | | 7,669,528 |
| | | | |
|
INVESTMENT COMPANY (4.9%) | | | | | |
| Victory Federal Money Market, Investor Shares, | | | | | |
0.45% (Cost $396,067)(b) | | 396,067 | | | 396,067 |
| | | | |
|
| Total Investments (Cost $9,065,531) — 100.6% | | | | | 8,065,595 |
| Liabilities in excess of other assets — (0.6)% | | | | | (46,767) |
| | | | |
|
| NET ASSETS — 100.0% | | | | $ | 8,018,828 |
| | | | |
|
|
| (a) | | Non-income producing security. |
| (b) | | Rate disclosed is the seven day yield as of March 31, 2009. |
| ADR | | American Depositary Receipt |
| PLC | | Public Limited Company |
| See Notes to Financial Statements |
|
| |
| 24 |
| Financial Statements | | Boston Trust Midcap Fund |
|
STATEMENT OF ASSETS AND LIABILITIES | | | |
| March 31, 2009 | | | |
| | | | |
| Assets: | | | |
| Investments, at value (cost $9,065,531) | | $ | 8,065,595 |
| Interest and dividends receivable | | | 8,269 |
| Receivable for investments sold | | | 74,484 |
| Receivable from adviser | | | 9,007 |
| Prepaid expenses and other assets | | | 3,179 |
| | |
|
Total Assets | | | 8,160,534 |
| | |
|
| Liabilities: | | | |
| Payable for investments purchased | | | 133,210 |
| Accrued expenses and other liabilities: | | | |
Chief compliance officer | | | 66 |
Administration and accounting | | | 267 |
Custodian | | | 908 |
Transfer agent | | | 2,946 |
Other | | | 4,309 |
| | |
|
Total Liabilities | | | 141,706 |
| | |
|
| | | | |
| Net Assets | | $ | 8,018,828 |
| | |
|
| | | | |
| Composition of Net Assets: | | | |
| Capital | | $ | 9,365,379 |
| Accumulated net investment income | | | 7,676 |
| Accumulated net realized losses from | | | |
investment transactions | | | (354,291) |
| Net unrealized depreciation from investments | | | (999,936) |
| | |
|
| | | | |
| Net Assets | | $ | 8,018,828 |
| | |
|
| | | | |
| Shares outstanding (par value $0.01, unlimited number of | | | |
shares authorized) | | | 1,319,540 |
| | |
|
| Net Asset Value, Offering Price and Redemption Price per | | | |
share(a) | | $ | 6.08 |
| | |
|
|
| (a) | A redemption fee is imposed upon shares redeemed within 60 days. See Note 2 to financial statements. |
STATEMENT OF OPERATIONS | | | |
| For the year ended March 31, 2009 | | | |
| | | | |
| Investment Income: | | | |
| Dividends | | $ | 142,870 |
| | |
|
Total Investment Income | | | 142,870 |
| | |
|
| Expenses: | | | |
Investment adviser | | | 86,401 |
Administration and accounting | | | 26,324 |
Trustee | | | 6,152 |
Offering | | | 10,746 |
Custodian | | | 5,459 |
Transfer agency | | | 17,946 |
Chief compliance officer | | | 947 |
Other | | | 16,511 |
| | |
|
Total expenses before fee reductions | | | 170,486 |
Fees voluntarily reduced by the administrator | | | (6,430) |
Fees contractually reduced by the investment adviser | | | (48,745) |
| | |
|
| Net Expenses | | | 115,311 |
| | |
|
| | | | |
| Net Investment Income | | | 27,559 |
| | |
|
| | | | |
| Net Realized/Unrealized Losses from Investments: | | | |
| Net realized losses from investment transactions | | | (131,105) |
| Change in unrealized appreciation/depreciation from | | | |
investments | | | (4,448,003) |
| | |
|
| Net realized/unrealized losses from investments | | | (4,579,108) |
| | |
|
| Change in Net Assets Resulting from Operations | | $ | (4,551,549) |
| | |
|
| See Notes to Financial Statements |
|
| |
| 25 |
| Financial Statements | | Boston Trust Midcap Fund |
|
STATEMENTS OF CHANGES IN NET ASSETS | | | | | | | |
| | | | | | | | |
| | | | | | | | |
| | | For the year ended | | | For the period ended |
| | | March 31, 2009 | | | March 31, 2008(a) |
| | |
| | |
|
| Investment Activities: | | | | | | | |
| Operations: | | | | | | | |
Net investment income | | $ | 27,559 | | | $ | 20,960 |
Net realized losses from investment transactions | | | (131,105) | | | | (18,226) |
Change in unrealized appreciation/depreciation from investments | | | (4,448,003) | | | | 3,448,067 |
| | |
| | |
|
| Change in net assets resulting from operations | | | (4,551,549) | | | | 3,450,801 |
| | |
| | |
|
| Dividends: | | | | | | | |
Net investment income | | | (34,699) | | | | (6,592) |
Net realized gains from investment transactions | | | (112,776) | | | | (92,184) |
| | |
| | |
|
| Change in net assets from shareholder dividends | | | (147,475) | | | | (98,776) |
| | |
| | |
|
| Capital Share Transactions: | | | | | | | |
Proceeds from shares issued | | | 1,084,006 | | | | 1,612,101 |
Proceeds from shares issued in connection with common trust fund conversion (b) | | | — | | | | 8,831,794 |
Dividends reinvested | | | 146,568 | | | | 98,604 |
Cost of shares redeemed | | | (1,945,927) | | | | (461,319) |
| | |
| | |
|
| Change in net assets from capital share transactions | | | (715,353) | | | | 10,081,180 |
| | |
| | |
|
| | | | | | | | |
| Change in net assets | | | (5,414,377) | | | | 13,433,205 |
| | | | | | | | |
| Net Assets: | | | | | | | |
Beginning of period | | | 13,433,205 | | | | — |
| | |
| | |
|
End of period | | $ | 8,018,828 | | | $ | 13,433,205 |
| | |
| | |
|
| Share Transactions: | | | | | | | |
Issued | | | 127,461 | | | | 162,062 |
Issued in connection with common trust fund conversion (b) | | | — | | | | 1,330,441 |
Reinvested | | | 23,456 | | | | 9,677 |
Redeemed | | | (287,450) | | | | (46,107) |
| | |
| | |
|
| Change in shares | | | (136,533) | | | | 1,456,073 |
| | |
| | |
|
| Accumulated net investment income | | $ | 7,676 | | | $ | 14,816 |
| | |
| | |
|
|
| (a) | | Commenced operations on September 24, 2007. |
| (b) | | See Note 4 to financial statements. |
| See Notes to Financial Statements |
|
| |
| 26 |
| Financial Statements | | Boston Trust Midcap Fund |
|
FINANCIAL HIGHLIGHTS | | | | | | | | |
| Selected data for a share outstanding throughout the periods indicated. | | | | | | | | |
| | | | | | | | | |
| | | | | | | | | |
| | | | | | | For the | |
| | | For the | | | period ended | |
| | | year ended | | | March 31, | |
| | | March 31, 2009 | | | 2008(a) | |
| | |
| | |
| |
| Net Asset Value, Beginning of Period | | $ | 9.23 | | | $ | 10.00 | |
| | |
| | |
| |
| Investment Activities: | | | | | | | | |
Net investment income | | | 0.02 | (b) | | | 0.01 | |
Net realized and unrealized losses from investment transactions | | | (3.07) | | | | (0.71) | |
| | |
| | |
| |
| Total from investment activities | | | (3.05) | | | | (0.70) | |
| | |
| | |
| |
| Dividends: | | | | | | | | |
Net investment income | | | (0.02) | | | | — | (c) |
Net realized gains from investments | | | (0.08) | | | | (0.07) | |
| | |
| | |
| |
| Total dividends | | | (0.10) | | | | (0.07) | |
| | |
| | |
| |
| | | | | | | | | |
| Net Asset Value, End of Period | | $ | 6.08 | | | $ | 9.23 | |
| | |
| | |
| |
| Total Return | | | (33.03)% | | | | (7.05)% | (d) |
| | |
| | |
| |
| Ratios/Supplemental Data: | | | | | | | | |
Net Assets at end of period (000’s) | | $ | 8,019 | | | $ | 13,433 | |
Ratio of net expenses to average net assets | | | 1.00% | | | | 1.00% | (e) |
Ratio of net investment income (loss) to average net assets | | | 0.24% | | | | 0.29% | (e) |
Ratio of expenses (before fee reductions) to average net assets (f) | | | 1.48% | | | | 1.58% | (e) |
Portfolio turnover | | | 22.93% | | | | 17.87% | (d) |
|
| (a) | | Commenced operations on September 24, 2007. |
| (b) | | Calculated using the average shares method. |
| (c) | | Less than $0.005 per share. |
| (d) | | Not annualized for less than one year. |
| (e) | | Annualized for periods of less than one year. |
| (f) | | During the period, certain fees were reduced and total fund expenses are capped at 1.00%. If such expense caps had not been in place, the ratio would have been as indicated. |
| See Notes to Financial Statements |
|
| |
| 27 |
| Social Research and Action Update (unaudited) | | March 31, 2009 |
| The Walden Social Balanced and Walden Social Equity portfolios employ a multi-faceted approach to meeting the Funds’ social objectives. Proxy voting, social research, company engagement, public policy, and community development investing are all important components of the corporate change process. The Walden Funds are active in each of these social investment strategies. The Funds also seek to invest in companies that the Adviser believes are above average in their industry for environmental performance, employment practices, community relations, and product quality. The Funds avoid investing in companies that, to the Adviser’s knowledge earn significant revenues from tobacco, or gaming activities; earn significant revenues from the manufacture or sale of military weapons systems or firearms; have critical, direct involvement in nuclear power production; or significantly support human rights abuses. |
| |
| Proxy Voting |
| |
| Walden’s goal is to vote proxies of portfolio companies in the best long-term interest of mutual fund investors – an important fiduciary responsibility we take very seriously. Both the social and financial mandates of the portfolios are carefully considered in voting the proxies of Walden Fund companies. As examples, Walden generally votes in favor of proposals that request increased board independence on auditing and nominating committees, as well as those that request management to develop or strengthen a human rights policy. Walden’s Comprehensive Social Proxy Voting Guidelines, along with the annual proxy voting reports for the 12 months ended June 30, 2008, are available at http://www.waldenassetmgmt.com/social/proxyvoting.html. |
| |
| Social Research and Activism |
| |
| Though hopes for a new spirit of bipartisanship in Washington may be fading, at least one issue continues to bring together people on the left, right and center—fury over lavish pay received by some executives at bailed-out financial institutions on the brink of collapse. This set the stage in February for a new mandate directed at hundreds of Troubled Asset Relief Program (TARP) fund recipients, giving shareholders an advisory vote on executive compensation, popularly known as “Say on Pay.” |
| |
| The shareholder advisory vote, for several years a major focus of Walden’s company and public policy advocacy, helps strengthen director and management accountability on executive compensation. Mandated Say on Pay among TARP recipients is a promising first step, and we believe future legislation could extend the requirement to all publicly traded companies. |
| From Concept to Reality |
| |
So far in 2009, Walden has withdrawn three of our seven Say on Pay resolutions after the companies committed to grant shareholders the advisory vote. As a beneficiary of TARP funds, Goldman Sachs was required to do so, but other companies took a leadership stance. Intel is implementing the Say on Pay vote this proxy season, and Hewlett-Packard (0.56%) will seek shareholder approval in 2010 for the advisory vote in the following year. |
| |
Early tallies of shareholder support for Say on Pay resolutions are also encouraging. Among the highest votes on this issue, 62 percent of shares were voted in favor of the advisory vote at Hain Celestial, a substantial majority. A history of controversy over executive compensation practices at Walt Disney (0.69%) may have contributed to a 42 percent vote in favor of Say on Pay—not quite passing but nonetheless a strong signal of shareholder support. The annual meetings are pending for the remaining two companies at which Walden co-filed, IBM (0.91%) and General Electric. |
| |
Perhaps not surprisingly, given the global reach of the economic crisis, the call for greater executive pay accountability extends beyond U.S. shores. At the February annual meeting of Novartis (0.66%), 31 percent of shareholders, including Walden, approved a resolution calling for the annual advisory vote. According to RiskMetrics, a leading proxy advisor, this is “nearly unprecedented support for a management-opposed resolution in Switzerland,” and reflects intense criticism over the lack of compensation transparency for the highest paid CEO in that country. |
| |
| Focus on Disclosure |
| |
| Certainly the stock market upheaval over the last year underscores the importance of comprehensive disclosure of business operations, risks and opportunities in order to accurately assess long-term business prospects. This is equally true in researching and analyzing environmental, social and governance (ESG) performance. Walden continues to have success making the case for ESG, or sustainability, reporting at a wide range of companies. |
| |
Since the last portfolio management memorandum, Walden has withdrawn three sustainability reporting resolutions. DENTSPLY (1.02%), Kadant, and Middleby each agreed to prepare a first-time report. DENTSPLY’s CEO visited our office to solicit input on a rough draft prepared with the help of an outside ESG (environmental, social and government) consultant. Now available on the company website, DENTSPLY is committed to building an increasingly robust reporting framework. Walden is also providing input to Kadant and Middleby as they begin the process. |
28
| Social Research and Action Update (unaudited)(cont.) | | March 31, 2009 |
| Walden provides feedback outside of the resolution process as well. In the last calendar quarter of 2008 we worked with Parkway Properties to suggest ways to improve ESG reporting as the company prepares its second annual document. We offered our perspective to Timberland as part of a formal stakeholder dialogue organized by Ceres, a network of investors and environmental organizations. Walt Disney, which just released its first comprehensive corporate responsibility report, created its own stakeholder review team and invited Walden to join. In each case, the dialogue process was constructive and productive. |
| |
| Joining Forces |
| |
| We frequently collaborate with like-minded investors to boost our influence and effectiveness in company dialogues. In the last calendar quarter of 2008, the objectives of two cooperative actions were met and Walden joined two new initiatives. |
| |
| With the Sudan Divestment Task Force (SDTF) and a small group of Walden led investors, we had urged the Swiss company ABB to take substantial remedial action in order to qualify for removal from SDTF’s “Highest Offender” list. According to a recent update from the Task Force, ABB has made significant contributions to internationally recognized humanitarian organizations and submitted to a third party audit of these actions, thereby removing the company from the list as it winds down its operations in Sudan. Costco was asked to disclose comprehensive diversity statistics. The company provided us with detailed workforce composition data by race and gender, and described plans to ramp up web based reporting. |
| |
The new actions include Walden’s participation in a sign-on letter to Google (0.36%) requesting the preparation of a comprehensive sustainability report. We also joined an existing investor dialogue focusing on Cisco Systems’ (1.05%) response to human rights concerns around internet-related freedom of association and privacy in countries, such as China, with a record of serious human rights violations. |
| |
| Positive Company Developments |
| |
| Several companies held in many client portfolios announced noteworthy initiatives: |
| • | Recognizing that access to affordable clean water is a human right, PepsiCo (1.36%) established guidelines to reduce water consumption across all operations, including its supply chain. Consistent with United Nations principles, PepsiCo’s water policy addresses safety, sufficiency, acceptability, physical accessibility and affordability. The company is also decreasing its environmental footprint through a 20 percent reduction in plastic content in its bottled water containers. Walden and other investors continue to encourage PepsiCo to set goals for beverage container recovery and recycling. |
| • | Procter & Gamble (1.52%) published 2012 sustainability goals that extend well beyond previous targets for sales of environmentally preferable products. The company also increased short-term per unit reduction goals for greenhouse gases, energy and water consumption and disposed waste that would result in a 50 percent overall decrease in one decade. |
| • | A new Renewable Energy Division was created at 3M (0.72%), using existing and adapted technologies to focus on energy generation and energy management. For example, 3M films help concentrate light in solar panels and specialty tapes protect wind turbine blades. |
| Public Policy Initiatives |
| |
| The arrival of the new Administration is a fresh opportunity to advocate for responsible and responsive environmental, social and corporate governance policies. Under the leadership of OMB Watch*, Walden encouraged a restoration of strict Toxics Release Inventory reporting rules that were weakened under the Bush administration. In early March, President Obama did just that, and as a result, communities can more easily assess toxic pollution from facilities in their neighborhoods. |
| |
| We twice joined the Investor Network on Climate Risk as it reached out to Democratic and Republican congressional leadership. In January we called for a focus on clean energy, energy efficiency and public transportation investment as part of the economic recovery bill. In February, we followed up to urge new legislation on energy, transportation, and climate change to promote private investment in energy efficiency and renewable energy and reduce greenhouse gas emissions. We are optimistic that growing public support for these and similar initiatives will help create the political will to make meaningful progress. |
| |
| If you have any questions, comments, or changes in your financial objectives, please feel free to contact us at (617) 726-7250. |
| |
The equities of the companies in bold-face in the above commentary were holdings of the Walden Funds as of March 31, 2009. |
| * | | OMB Watch, a nongovernmental, nonprofit research and advocacy organization, was formed in 1983 to promote and protect increased government transparency and accountability, sound and equitable regulatory and budgetary processes and policies, and active citizen participation in democracy. |
29
Economic and Market
Summary (unaudited) | | Walden Social Balanced Fund
Manager Commentary by Stephen Moody
Walden Social Equity Fund
Manager Commentary by Robert Lincoln |
|
| Investment Concerns: |
Equity securities (stocks) are more volatile and carry more risk than other forms of investments, including investments in high-grade fixed income securities. The net asset value per share of these Funds will fluctuate as the value of the securities in the portfolio changes. Common stocks, and funds investing in common stocks, generally provide greater return potential when compared with other types of investments. Bonds offer a relatively stable level of income, although bond prices will fluctuate providing the potential for principal gain or loss. Intermediate-term, higher-quality bonds generally offer less risk than longer-term bonds and a lower rate of return. |
| |
Past performance does not guarantee future results. The performance data quoted represents past performance and current returns may be lower or higher. Total return figures include change in share price, reinvestment of dividends and capital gains. The investment return and principal value will fluctuate so that an investor’s shares, when redeemed, may be worth more or less than the original cost. To obtain performance information current to the most recent month end, please call us at 1.800.282.8782 ext. 7050. |
| |
| Economic Summary & Outlook |
| |
| Our prior quarterly reports for the close of 2008 and the beginning of 2009 covered the extraordinary events of those periods in some detail, and there was abundant coverage and analysis in the media. We will not recount the details once again for you. Suffice to note that we are now in the midst of a severe global recession unlike any we have experienced since World War II. The essential difference from prior recessionary periods, in our view, is the near collapse of our largest financials institutions and the consequent sharp and deep drop in private sector economic activity. These developments required a government intervention unprecedented in scale. We share the view that without such support more banks would have failed and the current economic decline would be much worse. |
| |
Will these massive levels of monetary and fiscal stimulus succeed? Recent surveys have confirmed that most economic forecasters expect GDP1 trends to stabilize by summer and begin to rise prior to calendar year-end 2009. Other economists are not as sanguine and have expressed concern that more government support will be required to effect a positive turn in GDP. Frankly, all economic forecasts in the current fragile financial environment come with a high degree of risk. Which (if any) prove prescient as time passes no one knows for sure. We do know that we are not yet in the type of sustainable, balanced economic environment that supported attractive investment returns through most of the 1980’s and 1990’s. Until we get there, financial markets will remain volatile. Stated differently, we believe the transition toward a revised financial order, with more government involvement, is unlikely to be smooth. |
| |
| Financial Markets and Fund Performance |
| |
| The Walden Social Balanced Fund returned -22.91% for the year ended March 31. That is clearly not pleasant in absolute terms but, as was the case in 2008, was above the returns posted by most balanced mutual funds. Our decision to reduce the Fund’s equity allocation over the past 18 months from over 70% to just below 50% at fiscal year-end helped cushion the first quarter of 2009 decline. At year-end, stocks comprised roughly 45% of the Fund’s total value, the lowest level in over a decade. The operative question remains, when will this excruciating bear market end? |
| |
The Walden Social Equity Fund was somewhat less volatile than the S&P 5002 and for the 12-month period ended March 31, 2009, the Fund finished with a total return of -34.74% compared to the -38.09% total return for the S&P 500. |
| |
| Early in January, it became clear that the sharp decline in GDP that began last September would persist through the winter months, with continued steep drops in consumer spending for durable goods such as automobiles, furniture, and appliances. Business capital expenditures across a broad range of industries also fell. Not surprisingly, employment trends were especially weak, as businesses struggled to reduce expenses given the sudden fall in revenue. In just three months, roughly two million jobs were lost, and the unemployment rate jumped to 8.5%, the highest level in nearly 30 years. Economic news from Japan and across key European countries was also at the low end of negative forecasts. |
| |
| One had to look hard for positive economic news during the past year, but there was good progress on several fronts. Most importantly, the variety of programs initiated by the Federal Reserve (the “Fed”) since last fall to help stabilize credit markets began to be effective. On the fiscal side, the new Obama administration quickly passed an economic stimulus bill, and in March the Treasury Department finally detailed a long-awaited plan to remove some problem, or so-called toxic, assets from bank balance sheets. Even though we suspect both of these fiscal |
| 1 | The Gross Domestic Product (GDP) is the measure of the market value of the goods and services produced by labor and property in the United States. |
| 2 | The Standard & Poor’s 500 Index (“S&P 500”) is an unmanaged index that is regarded as a gauge of the U.S. equities market, this index includes 500 leading companies in leading industries of the U.S. economy. Although the S&P 500 focuses on the large cap segment of the market, with approximately 75% coverage of U.S. equities, it is also an ideal proxy for the total market. |
30
Economic and Market
Summary (unaudited)(cont.) | | Walden Social Balanced Fund
Manager Commentary by Stephen Moody
Walden Social Equity Fund
Manager Commentary by Robert Lincoln |
|
| programs will be enhanced and revised in the months ahead, they are essential, positive steps that help fill the economic void left by broad declines in private sector activity. Independent of these new government programs, toward the fiscal period-end a few economic reports suggested that the rate of decline in consumer spending had begun to moderate. Markets were also buoyed by a surge in home refinancing, which may portend stabilization in the housing market, and a better than expected durable goods orders report. |
| |
| Despite our lack of confidence at period-end for an early resolution of the economic mess, we thought there was a reasonable prospect that the steep decline in aggregate stock prices fully reflected the further deterioration in business conditions we anticipated. After all, from the peak reached in October 2007, the S&P 500 had already declined more than 40%. However, from the first week of January 2009 through early March, the S&P 500 declined another 25%. About one-half of this fresh drop was recouped through the final few weeks of the first quarter of 2009. High day to day volatility and price advances that last for months are typical in extended bear markets. Not until well after stock prices trough and economic activity improves is it possible to have full confidence that the worst has passed. |
| |
| Our Investment Strategy for the Walden Social Balanced Fund |
| |
At roughly 45%, the Fund’s current equity allocation is close to the low end of its usual range. On the surface, such a low allocation implies that we have a bearish or negative outlook for stocks. Yet that is not the reason we have chosen to reduce equities now. By nearly any traditional measure of value stocks, in the aggregate, are now either fairly priced or simply bargains. If the more bullish economists prove correct, we would not be surprised to see the primary stock indices rise by 25% or so in just a few months, just as it has between March 9 and March 31. In that environment, we would look back with regret at not having purchased more stocks at today’s levels.† |
| |
Instead, our continued cautious equity allocation primarily reflects the unusually high level of economic uncertainty and the possibility of a deflationary spiral. Stocks could almost as easily decline 25% again in the second quarter, rather than rise, if the economy fails to respond positively in the months ahead to recent government stimulus programs. We have always preferred to increase ownership of equities when economic trends are more definitive. The signs we would like to see now prior to increasing the portfolio equity allocation significantly are more evidence of a trough in home values, a moderation in job losses, a continued broad lowering of interest rates, relative to risk free securities, in fixed income markets and more progress and confidence that the worst is behind us with respect to the health of our major banks and insurance companies. Stock prices may very well move higher as these issues clarify, but there will be ample opportunity to generate attractive returns (with less risk) within an already improved economic environment.† |
| |
For the fiscal period end, the rate of return of both the Fund’s equity and fixed-income holdings was slightly better than those of broad-based indices. In bonds, our decision to keep the portfolio concentrated in issues with comparatively short maturities aided performance, as did the holdings in high-quality bonds issued by various states. The equity portfolio had two characteristics of quality which aided it this quarter and for longer recent periods. Though broadly diversified, the equity portfolio had a very low exposure to companies with unhealthy balance sheets, especially of financial companies, and in particular stocks of large banks and life insurers. The second is our typical avoidance of companies with higher debt and greater responsiveness to economic cyclicality compared to their industry peers. That is revenue and earnings of the companies in the portfolio are typically less volatile and vulnerable to the ups and downs of the economy. Both of these characteristics of our investment style, which we have been especially attentive to in this last business cycle, have contributed to the superior return posted by the equity segment for the past several years. Note that equity segment results, however, are likely to trail stock index returns if the economic recovery proceeds smoothly or swiftly in the months ahead. A rising tide does help lift all boats and recent poor stock performance will be especially well rewarded if the issuing company is likely to survive as something other than a zombie. As for financials, consistent with our views about the Fund’s overall equity allocation, we prefer to await actual fundamental improvement prior to buying shares in banks and other credit sensitive companies. This is hard to determine, as financial earnings are especially easy to manage.† |
| |
| Our Investment Strategy for the Walden Social Equity Fund |
| |
Throughout most of the past two years we have underweighted financial companies and overweighted industrial ones. During the last quarter of the fiscal period, the former strategy once again proved beneficial. Even with the massive declines in the stocks of financial companies, we believe that the risk of further losses is greater than the opportunities posed by low prices. The painful process of debt liquidation is, in our view, certain to continue for some time. By some reckonings the losses many banks must take in this process are well in excess of their equity capital. Even if government actions maintain bank solvency, as we expect they will, there is no reason to believe that these programs will allow common shareholders, who represent the most leveraged tier of the capital structure, to prosper. Our few holdings in this sector are comprised primarily of a mutual fund company and two property and casualty insurers companies. We believe the balance sheets of these companies remain sound.† |
| † | Portfolio composition is subject to change. |
31
Economic and Market
Summary (unaudited)(cont.) | | Walden Social Balanced Fund
Manager Commentary by Stephen Moody
Walden Social Equity Fund
Manager Commentary by Robert Lincoln |
|
In contrast, our decision to maintain a large exposure to industrial companies modestly detracted from results as most economic reports pointed to a deepening recession. Losses were limited, however, by our focus on companies with strong balance sheets and niche market positions. During the last quarter of the period, we also increased holdings of technology companies. We are well aware that individual company performance is highly unpredictable in this sector. Moreover, like industrial companies most technology companies face large cyclical headwinds. Nonetheless, many technology companies are today available at unprecedented valuations. Among them we find many with the rock solid financial structures we favor and business models we believe are likely to still produce sustainable, long term growth.† |
| |
While the combination of these strategies enabled the portfolios we manage to avoid some of the devastation that transpired from January 1 through early March, we were not able to avoid substantial losses. The market recovery during the last few weeks of March can only be said to have reduced these losses.† |
| |
 |
| Boston Trust Investment Management, Inc. |
| |
 |
| Portfolio Manager |
| Boston Trust Investment Management, Inc. |
| † | Portfolio composition is subject to change. |
32
| Investment Performance (unaudited) | | Walden Social Balanced Fund
March 31, 2009 |
Fund Net Asset Value: $8.84
| Gross Expense Ratio1: 1.17% | | Annualized |
| | |
|
| | | 1 Year Ended | | 5 Years Ended | | Since Inception |
| | | 3/31/09 | | 3/31/09 | | 6/20/99 |
Walden Social Balanced Fund | | | -22.91 | % | | | -1.14 | % | | | 0.90 | % |
|
S&P 500 Index* | | | -38.09 | % | | | -4.76 | % | | | -3.52 | % |
|
Barclays Capital U.S. Government/Credit Bond Index* | | | 1.78 | % | | | 3.74 | % | | | 5.92 | % |
|
Citigroup 90-Day U.S. Treasury Bills** | | | 1.13 | % | | | 3.06 | % | | | 3.15 | % |
|
Lipper Mixed-Asset Target Allocation Growth Funds Average*** | | | -29.69 | % | | | -2.45 | % | | | -0.35 | % |
Past performance does not guarantee future results. The performance data quoted represents past performance and current returns may be lower or higher. The investment return and principal value will fluctuate so that an investor’s shares, when redeemed may be worth more or less than the original cost. To obtain performance information current to the most recent month-end, please call 1-800-282-8782 ext. 7050. |
| |
| *The since inception performance data is calculated from June 18, 1999. |
| **The since inception performance data is calculated from June 30, 1999. |
| ***The since inception performance data is calculated from June 17, 1999. |
| 1 | The above Gross Expense ratio is from the Fund’s prospectus dated August 1, 2008. Additional information pertaining to the Fund’s expense ratios as of March 31, 2009 can be found in the financial highlights. The investment performance reflects voluntary fee waivers which may be discontinued at any time and a contractual fee waiver which shall continue in effect from year to year only upon mutual agreement of the Fund and the Adviser. The performance above reflects any fee reductions during the applicable periods. If such fee reductions had not occured, the quoted performance would have been lower. Based on the Fund’s prospectus dated August 1, 2008, the Total Fund Operating Expenses would be 1.16% and the Net Fund Operating Expenses would be 1.00% excluding the indirect costs of investing in Acquired Funds. |
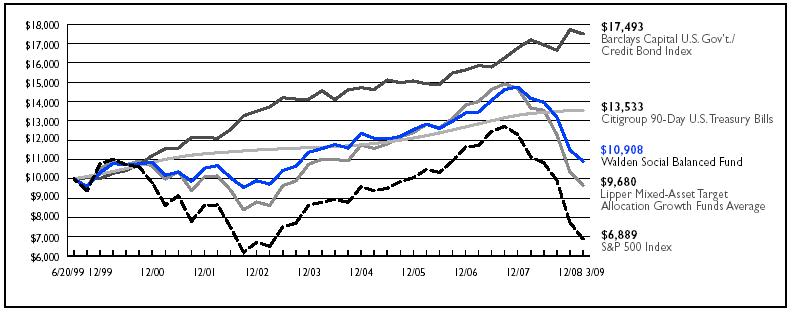
The chart represents historical performance of a hypothetical investment of $10,000 in the Walden Social Balanced Fund from June 20, 1999 to March 31, 2009, and represents the reinvestment of dividends and capital gains in the Fund. The returns shown on the table and graph do not reflect the deduction of taxes a shareholder would pay on fund distributions or the redemption of Fund shares. |
| |
The Walden Social Balanced Fund is measured against the Standard & Poor’s 500 Index (“S&P 500”), which is regarded as a gauge of the U.S. equities market. This index includes 500 leading companies in leading industries of the U.S. economy. Although the S&P 500 focuses on the large cap segment of the market, with approximately 75% coverage of U.S. equities, it is also an ideal proxy for the total market. The Barclays Capital U.S. Government/Credit Bond Index is a non-securitized component of the Barclays U.S. Aggregate Index and was the first macro index launched by Lehman Brothers. The U.S. Government/Credit Index includes Treasuries (i.e., public obligations of the U.S. Treasury that have remaining maturities of more than one year), Government-Related issues (i.e., agency, sovereign, supranational, and local authority debt), and USD Corporates. The Citigroup 90-Day U.S. Treasury Bills are represented by the U.S. Treasury Bill Total Return Index. Treasury bills are government guaranteed and offer a fixed rate of return. Return and principal of stocks and bonds will vary with market conditions. The indices’ performance is unmanaged and does not reflect the deduction of expenses associated with a mutual fund, such as investment management and fund accounting fees. The Fund’s performance reflects the deduction of fees for these services. The Lipper Average is an equally weighted index of the largest managed mutual funds within their respective investment objectives, adjusted for the reinvestment of capital gains distributions and income dividends. Investors cannot invest directly in an index. |
| |
The Lipper Mixed-Asset Target Allocation Growth Funds Average is an average of managed mutual funds whose primary objective is to maintain a mix of between 60%-80%equity securities with the remainder invested in bonds, cash and cash equivalents. |
33
| Investment Performance (unaudited) | | Walden Social Equity Fund
March 31, 2009 |
Fund Net Asset Value: $8.01
| Gross Expense Ratio1: 1.18% | | Annualized |
| | |
|
| | | 1 Year Ended | | 5 Years Ended | | Since Inception |
| | | 3/31/09 | | 3/31/09 | | 6/20/99 |
Walden Social Equity Fund | | | -34.74 | % | | | -3.96 | % | | | -0.98 | % |
|
S&P 500 Index* | | | -38.09 | % | | | -4.76 | % | | | -3.52 | % |
| Past performance does not guarantee future results. The performance data quoted represents past performance and current returns may be lower or higher. The investment return and principal value will fluctuate so that an investor’s shares, when redeemed may be worth more or less than the original cost. To obtain performance information current to the most recent month-end, please call 1-800-282-8782 ext. 7050. |
| 1 | The above Gross Expense ratio is from the Fund’s prospectus dated August 1, 2008. Additional information pertaining to the Fund’s expense ratios as of March 31, 2009 can be found in the financial highlights. The investment performance reflects voluntary fee waivers which may be discontinued at any time and a contractual fee waiver which shall continue in effect from year to year only upon mutual agreement of the Fund and the Adviser. The performance above reflects any fee reductions during the applicable periods. If such fee reductions had not occured, the quoted performance would have been lower. Based on the Fund’s prospectus dated August 1, 2008, the Total Fund Operating Expenses would be 1.18% and the Net Fund Operating Expenses would be 1.00% excluding the indirect costs of investing in Acquired Funds. |
| |
| * | The performance data being shown for the S&P 500 is calculated from June 18, 1999. |
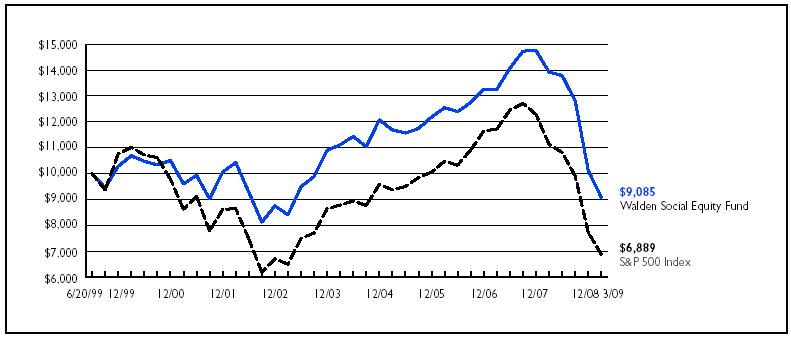
The chart represents historical performance of a hypothetical investment of $10,000 in the Walden Social Equity Fund from June 20, 1999 to March 31, 2009, and represents the reinvestment of dividends and capital gains in the Fund. The returns shown on the table and graph do not reflect the deduction of taxes a shareholder would pay on fund distributions or the redemption of Fund shares. |
| |
The Fund’s performance is measured against the Standard & Poor’s 500 Index (“S&P 500”), which is an unmanaged index that is regarded as a gauge of the U.S. equities market. This index includes 500 leading companies in leading industries of the U.S. economy. Although the S&P 500 focuses on the large cap segment of the market, with approximately 75% coverage of U.S. equities, it is also an ideal proxy for the total market. The index does not reflect the deduction of expenses associated with a mutual fund, such as investment management and fund accounting fees. The Fund’s performance reflects the deduction of fees for these services. Investors cannot invest directly in an index. |
34
| Schedule of Portfolio Investments | Walden Social Balanced Fund
March 31, 2009 |
|
| Security Description | | Shares | | | Value ($) |
| |
| | |
|
| | | | | | |
| Consumer Discretionary (4.9%) | | | | | |
| Johnson Controls, Inc. | | 11,000 | | | 132,000 |
| Lowe’s Cos., Inc. | | 8,000 | | | 146,000 |
| NIKE, Inc., Class B | | 7,500 | | | 351,675 |
| Omnicom Group, Inc. | | 8,000 | | | 187,200 |
| Target Corp. | | 5,000 | | | 171,950 |
| The Home Depot, Inc. | | 5,000 | | | 117,800 |
| The TJX Cos., Inc. | | 4,000 | | | 102,560 |
| The Walt Disney Co. | | 11,000 | | | 199,760 |
| | | | | |
|
| | | | | | 1,408,945 |
| | | | | |
|
| Consumer Products (7.7%) | | | | | |
| Colgate-Palmolive Co. | | 8,000 | | | 471,840 |
| Costco Wholesale Corp. | | 8,500 | | | 393,720 |
| General Mills, Inc. | | 4,000 | | | 199,520 |
| PepsiCo, Inc. | | 7,600 | | | 391,248 |
| Procter & Gamble Co. | | 9,500 | | | 447,355 |
| Sysco Corp. | | 15,000 | | | 342,000 |
| | | | | |
|
| | | | | | 2,245,683 |
| | | | | |
|
| Energy (5.5%) | | | | | |
| Apache Corp. | | 5,500 | | | 352,495 |
| BG Group PLC, ADR | | 4,000 | | | 301,160 |
| BP PLC, ADR | | 13,000 | | | 521,300 |
| ConocoPhillips | | 11,000 | | | 430,760 |
| | | | | |
|
| | | | | | 1,605,715 |
| | | | | |
|
| Financial Services (2.6%) | | | | | |
| Chubb Corp. | | 4,000 | | | 169,280 |
| Cincinnati Financial Corp. | | 5,700 | | | 130,359 |
| T. Rowe Price Group, Inc. | | 11,500 | | | 331,890 |
| Visa, Inc., Class A | | 2,000 | | | 111,200 |
| | | | | |
|
| | | | | | 742,729 |
| | | | | |
|
| Health Care (8.1%) | | | | | |
| Becton, Dickinson & Co. | | 4,000 | | | 268,960 |
| C.R. Bard, Inc. | | 3,500 | | | 279,020 |
| DENTSPLY International, Inc. | | 11,000 | | | 295,350 |
| Johnson & Johnson, Inc. | | 8,500 | | | 447,100 |
| Medtronic, Inc. | | 3,000 | | | 88,410 |
| Novartis AG, ADR | | 5,000 | | | 189,150 |
| Saint Jude Medical, Inc.(a) | | 5,000 | | | 181,650 |
| Stryker Corp. | | 5,000 | | | 170,200 |
| Teva Pharmaceutical Industries Ltd., Sponsored ADR | | 4,000 | | | 180,200 |
| Varian Medical Systems, Inc.(a) | | 4,200 | | | 127,848 |
| Waters Corp.(a) | | 3,000 | | | 110,850 |
| | | | | |
|
| | | | | | 2,338,738 |
| | | | | |
|
| Industrial Materials (2.6%) | | | | | |
| AptarGroup, Inc. | | 8,000 | | | 249,120 |
| Praxair, Inc. | | 3,000 | | | 201,870 |
| Sigma-Aldrich Corp. | | 8,000 | | | 302,320 |
| | | | | |
|
| | | | | | 753,310 |
| | | | | |
|
| Industrial Products & Services (5.6%) | | | | | |
| 3M Co. | | 4,200 | | | 208,824 |
| Donaldson Co., Inc. | | 9,500 | | | 254,980 |
| Emerson Electric Co. | | 13,000 | | | 371,540 |
| Illinois Tool Works, Inc. | | 10,500 | | | 323,925 |
| United Parcel Service, Inc., Class B | | 4,000 | | | 196,880 |
| W.W. Grainger, Inc. | | 4,000 | | | 280,720 |
| | | | | |
|
| | | | | | 1,636,869 |
| | | | | |
|
| | | | | | |
| | | Shares or
Principal
Amount ($) | | | |
| | |
| | | |
| Information Technology (7.4%) | | | | | |
| Accenture Ltd., Class A | | 7,000 | | | 192,430 |
| Adobe Systems, Inc.(a) | | 8,000 | | | 171,120 |
| Cisco Systems, Inc.(a) | | 18,000 | | | 301,860 |
| EMC Corp.(a) | | 15,000 | | | 171,000 |
| Google, Inc., Class A(a) | | 300 | | | 104,418 |
| Hewlett-Packard Co. | | 5,000 | | | 160,300 |
| International Business Machines Corp. | | 2,700 | | | 261,603 |
| Microsoft Corp. | | 11,000 | | | 202,070 |
| Nokia Corp., ADR | | 11,000 | | | 128,370 |
| Oracle Corp.(a) | | 8,000 | | | 144,560 |
| Paychex, Inc. | | 6,000 | | | 154,020 |
| SAP AG, ADR | | 4,000 | | | 141,160 |
| | | | | |
|
| | | | | | 2,132,911 |
| | | | | |
|
| Telecommunications (0.2%) | | | | | |
| Time Warner Cable, Inc. | | 2,466 | | | 61,157 |
| | | | | |
|
| TOTAL COMMON STOCKS (Cost $15,081,006) | | | | | 12,926,057 |
| | | | | |
|
| Financial Services (7.8%) | | | | | |
| American Express Co., 7.00%, 3/19/18 | | 250,000 | | | 220,887 |
| BP Capital Markets PLC, 5.25%, 11/7/13 | | 500,000 | | | 535,720 |
| Calvert Social Investment Foundation, 3.00%, 12/31/11 | | 175,000 | | | 175,219 |
| National Rural Utilities Cooperative Finance Corp., 10.38%, 11/1/18 | | 250,000 | | | 289,882 |
| Wells Fargo & Co., 3.00%, 12/9/11 | | 1,000,000 | | | 1,034,562 |
| | | | | |
|
| | | | | | 2,256,270 |
| | | | | |
|
| Health Care (1.1%) | | | | | |
| Abbott Laboratories, 5.60%, 5/15/11 | | 300,000 | | | 321,834 |
| | | | | |
|
| Information Technology (0.7%) | | | | | |
| Oracle Corp., 5.75%, 4/15/18 | | 200,000 | | | 209,091 |
| | | | | |
|
| Telecommunications (0.3%) | | | | | |
| AT&T, Inc., 5.50%, 2/1/18 | | 100,000 | | | 96,862 |
| | | | | |
|
| TOTAL CORPORATE BONDS (Cost $2,824,944) | | | | | 2,884,057 |
| | | | | |
|
| Delaware (0.7%) | | | | | |
| Delaware State, Series 2009A, GO, | | | | | |
4.13%, 1/1/25, Callable 1/1/17 @ 100 | | 200,000 | | | 196,914 |
| | | | | |
|
| Florida (0.8%) | | | | | |
| Florida State Board of Education, Series B, GO, | | | | | |
4.75%, 6/1/26, Callable 6/1/14 @ 101 | | 250,000 | | | 247,383 |
| | | | | |
|
| Illinois (0.7%) | | | | | |
| Illinois State, GO, 5.00%, 6/1/27, FGIC, | | | | | |
Callable 6/1/13 @ 100 | | 200,000 | | | 200,956 |
| | | | | |
|
| Massachusetts (0.9%) | | | | | |
| Massachusetts State, Series A, GO, 5.00%, 8/1/26, | | | | | |
Callable 8/1/18 @ 100 | | 250,000 | | | 257,690 |
| | | | | |
|
| Ohio (0.5%) | | | | | |
| Ohio State, Series D, GO, 4.50%, 9/15/22, MBIA, | | | | | |
Callable 3/15/16 @ 100 | | 150,000 | | | 153,776 |
| | | | | |
|
| Texas (1.3%) | | | | | |
| Texas State, GO, 5.00%, 10/1/26, | | | | | |
Callable 10/1/17 @ 100 | | 350,000 | | | 363,492 |
| | | | | |
|
| Washington (0.9%) | | | | | |
| Washington State, Series C, GO, 5.00%, 2/1/26, | | | | | |
Callable 2/1/19 @ 100 | | 250,000 | | | 257,222 |
| | | | | |
|
| TOTAL MUNICIPAL BONDS (Cost $1,664,543) | | | | | 1,677,433 |
| | | | | |
|
See Notes to Financial Statements
35
| Schedule of Portfolio Investments | Walden Social Balanced Fund
March 31, 2009 |
|
| U.S. GOVERNMENT & U.S. GOVERNMENT AGENCY OBLIGATIONS (32.1%) |
| | | Shares or | | | |
| | | Principal | | | |
| Security Description | | Amount ($) | | | Value ($) |
| |
| | |
|
| Federal Farm Credit Bank, 6.00%, 3/7/11 | | 500,000 | | | 543,511 |
| Federal Home Loan Bank | | | | | |
1.63%, 3/16/11 | | 4,000,000 | | | 4,016,216 |
3.75%, 8/18/09 | | 200,000 | | | 202,487 |
4.63%, 2/18/11 | | 500,000 | | | 530,027 |
5.00%, 12/21/15 | | 300,000 | | | 335,343 |
5.25%, 6/12/09 | | 900,000 | | | 908,418 |
| Government National Mortgage Association | | | | | |
6.00%, 7/15/34 | | 141,080 | | | 147,621 |
6.00%, 10/15/36 | | 180,988 | | | 189,378 |
6.50%, 2/15/32 | | 7,654 | | | 8,141 |
6.50%, 5/15/32 | | 92,927 | | | 98,843 |
| Housing and Urban Development, 7.50%, 8/1/11 | | 200,000 | | | 204,203 |
| U.S. Treasury Inflation Protected Bonds | | | | | |
1.88%, 7/15/15 | | 651,216 | | | 672,689 |
2.00%, 4/15/12 | | 1,040,370 | | | 1,074,420 |
3.00%, 7/15/12 | | 352,248 | | | 377,250 |
| | | | | |
|
| TOTAL U.S. GOVERNMENT & U.S. GOVERNMENT | | | | | |
AGENCY OBLIGATIONS (Cost $9,106,912) | | | | | 9,308,547 |
| | | | | |
|
| | | | | | |
| CERTIFICATES OF DEPOSIT (0.3%) |
| Shorebank Pacific Bank, 2.50%, 5/10/09(b) | | 50,000 | | | 50,000 |
| Vermont Development Credit Union, | | | | | |
3.75%, 7/13/09(b) | | 50,000 | | | 50,000 |
| | | | | |
|
| TOTAL CERTIFICATES OF DEPOSIT | | | | | |
(Cost $100,000) | | | | | 100,000 |
| | | | | |
|
| | | | | | |
| INVESTMENT COMPANIES (6.8%) |
| Cavanal Hill U.S. Treasury Fund, 0.01%(c) | | 521,243 | | | 521,243 |
| Victory Federal Money Market, Investor Shares, | | | | | |
0.45%(c) | | 1,441,236 | | | 1,441,236 |
| | | | | |
|
| TOTAL INVESTMENT COMPANIES | | | | | |
(Cost $1,962,479) | | | | | 1,962,479 |
| | | | | |
|
| Total Investments (Cost $30,739,884) — 99.5% | | | | | 28,858,573 |
| Other assets in excess of liabilities — 0.5% | | | | | 146,683 |
| | | | | |
|
| NET ASSETS — 100.0% | | | | | $29,005,256 |
| | | | | |
|
|
| (a) | | Non-income producing security. |
| (b) | | Fair Valued Security. These securities represent 0.3% of the net assets as of March 31, 2009. |
| (c) | | Rate disclosed is the seven day yield as of March 31, 2009. |
| ADR | | American Depositary Receipt |
| AG | | Aktiengesellschaft (German Stock Company) |
| FGIC | | Insured by Financial Guaranty Insurance Company |
| GO | | General Obligation |
| MBIA | | Insured by Municipal Bond Insurance Association |
| PLC | | Public Limited Company |
See Notes to Financial Statements
36
| Financial Statements | Walden Social Balanced Fund |
|
| STATEMENT OF ASSETS AND LIABILITIES |
| March 31, 2009 | | | | |
| | | | | |
| Assets: | | | | |
| Investments, at value (cost $30,739,884) | | $ | 28,858,573 | |
| Interest and dividends receivable | | | 132,585 | |
| Receivable for capital shares issued | | | 562 | |
| Receivable for investments sold | | | 166,858 | |
| Prepaid expenses and other assets | | | 9,775 | |
| | |
| |
Total Assets | | | 29,168,353 | |
| | |
| |
| Liabilities: | | | | |
| Payable for investments purchased | | | 129,475 | |
| Payable for capital shares redeemed | | | 500 | |
| Accrued expenses and other liabilities: | | | | |
Investment adviser | | | 14,025 | |
Chief compliance officer | | | 215 | |
Administration and accounting | | | 752 | |
Custodian | | | 1,219 | |
Transfer agent | | | 2,946 | |
Other | | | 13,965 | |
| | |
| |
Total Liabilities | | | 163,097 | |
| | |
| |
| | | | | |
| Net Assets | | $ | 29,005,256 | |
| | |
| |
| Composition of Net Assets: | | | | |
| Capital | | $ | 33,211,132 | |
| Accumulated net investment income | | | 23,531 | |
| Accumulated net realized losses from | | | | |
investment transactions | | | (2,348,096) | |
| Net unrealized depreciation from investments | | | (1,881,311) | |
| | |
| |
| | | | | |
| Net Assets | | $ | 29,005,256 | |
| | |
| |
| Shares outstanding (par value $0.01, unlimited number of shares authorized) | | | 3,280,930 | |
| | |
| |
| Net Asset Value, Offering Price and Redemption Price per share | | $ | 8.84 | |
| | |
| |
| For the year ended March 31, 2009 | | | | |
| | | | | |
| Investment Income: | | | | |
| Interest | | $ | 389,542 | |
| Dividends | | | 381,607 | |
| Less: Foreign tax withholding | | | (6,269) | |
| | |
| |
Total Investment Income | | | 764,880 | |
| | |
| |
| Expenses: | | | | |
Investment adviser | | | 224,714 | |
Administration and accounting | | | 64,939 | |
Trustee | | | 3,374 | |
Custodian | | | 7,450 | |
Transfer agency | | | 17,946 | |
Chief compliance officer | | | 2,471 | |
Other | | | 34,942 | |
| | |
| |
Total expenses before fee reductions | | | 355,836 | |
Fees voluntarily reduced by the administrator | | | (16,689) | |
Fees contractually reduced by the investment adviser | | | (39,013) | |
| | |
| |
Net Expenses | | | 300,134 | |
| | |
| |
| | | | | |
| Net Investment Income | | | 464,746 | |
| | |
| |
| Net Realized/Unrealized Losses from Investments: | | | | |
| Net realized losses from investment transactions | | | (2,309,330) | |
| Change in unrealized appreciation/depreciation from investments | | | (5,794,229) | |
| | |
| |
| Net realized/unrealized losses from investments | | | (8,103,559) | |
| | |
| |
| Change in Net Assets Resulting from Operations | | $ | (7,638,813) | |
| | |
| |
See Notes to Financial Statements
37
| Financial Statements | Walden Social Balanced Fund |
|
| STATEMENTS OF CHANGES IN NET ASSETS |
| | | | | | | | | |
| | | | For the year ended | | | | For the year ended | |
| | | | March 31, 2009 | | | | March 31, 2008 | |
| | |
| |
|
| Investment Activities: | | | | | | | | |
| Operations: | | | | | | | | |
Net investment income | | $ | 464,746 | | | $ | 492,333 | |
Net realized gains (losses) from investment transactions | | | (2,309,330) | | | | 908,914 | |
Change in unrealized appreciation/depreciation from investments | | | (5,794,229) | | | | 122,348 | |
| | |
| | |
| |
| Change in net assets resulting from operations | | | (7,638,813) | | | | 1,523,595 | |
| | |
| | |
| |
| Dividends: | | | | | | | | |
Net investment income | | | (591,854) | | | | (463,640) | |
Net realized gains from investment transactions | | | (355,217) | | | | (1,085,395) | |
| | |
| | |
| |
| Change in net assets from shareholder dividends | | | (947,071) | | | | (1,549,035) | |
| | |
| | |
| |
| Capital Share Transactions: | | | | | | | | |
Proceeds from shares issued | | | 7,074,197 | | | | 4,179,191 | |
Dividends reinvested | | | 940,321 | | | | 1,540,486 | |
Cost of shares redeemed | | | (3,605,235) | | | | (2,156,665) | |
| | |
| | |
| |
| Change in net assets from capital share transactions | | | 4,409,283 | | | | 3,563,012 | |
| | |
| | |
| |
| Change in net assets | | | (4,176,601) | | | | 3,537,572 | |
| | | | | | | |
| Net Assets: | | | | | | | | |
Beginning of period | | | 33,181,857 | | | | 29,644,285 | |
| | |
| | |
| |
End of period | | $ | 29,005,256 | | | $ | 33,181,857 | |
| | |
| | |
| |
| Share Transactions: | | | | | | | | |
Issued | | | 748,371 | | | | 335,669 | |
Reinvested | | | 104,364 | | | | 123,436 | |
Redeemed | | | (361,325) | | | | (174,513) | |
| | |
| | |
| |
| Change in shares | | | 491,410 | | | | 284,592 | |
| | |
| | |
| |
| Accumulated net investment income | | $ | 23,531 | | | $ | 150,639 | |
| | |
| | |
| |
See Notes to Financial Statements
38
| Financial Statements | Walden Social Balanced Fund |
|
| Selected data for a share outstanding throughout the years indicated. |
| | | | | | | | | | | | | | | | | | | | | |
| | | For the year | | For the year | | For the year | | For the year | | For the year |
| | | ended | | ended | | ended | | ended | | ended |
| | | March 31, | | March 31, | | March 31, | | March 31, | | March 31, |
| | | 2009 | | 2008 | | 2007 | | 2006 | | 2005 |
| | |
| |
| |
| |
| |
|
| Net Asset Value, Beginning of Period | | $ | 11.90 | | | $ | 11.83 | | | $ | 11.58 | | | $ | 11.08 | | | $ | 10.71 | |
| | |
| | |
| | |
| | |
| | |
| |
| Investment Activities: | | | | | | | | | | | | | | | | | | | | |
Net investment income | | | 0.16 | (a) | | | 0.19 | | | | 0.18 | | | | 0.18 | | | | 0.13 | |
Net realized and unrealized gains (losses) from | | | | | | | | | | | | | | | | | | | | |
investment transactions | | | (2.88) | | | | 0.46 | | | | 0.38 | | | | 0.49 | | | | 0.37 | |
| | |
| | |
| | |
| | |
| | |
| |
| Total from investment activities | | | (2.72) | | | | 0.65 | | | | 0.56 | | | | 0.67 | | | | 0.50 | |
| | |
| | |
| | |
| | |
| | |
| |
| Dividends: | | | | | | | | | | | | | | | | | | | | |
Net investment income | | | (0.21) | | | | (0.17) | | | | (0.17) | | | | (0.17) | | | | (0.13) | |
Net realized gains from investments | | | (0.13) | | | | (0.41) | | | | (0.14) | | | | — | | | | — | |
| | |
| | |
| | |
| | |
| | |
| |
| Total dividends | | | (0.34) | | | | (0.58) | | | | (0.31) | | | | (0.17) | | | | (0.13) | |
| | |
| | |
| | |
| | |
| | |
| |
| Net Asset Value, End of Period | | $ | 8.84 | | | $ | 11.90 | | | $ | 11.83 | | | $ | 11.58 | | | $ | 11.08 | |
| | |
| | |
| | |
| | |
| | |
| |
| Total Return | | | (22.91)% | | | | 5.30% | | | | 4.85% | | | | 6.06% | | | | 4.62% | |
| | |
| | |
| | |
| | |
| | |
| |
| Ratios/Supplemental Data: | | | | | | | | | | | | | | | | | | | | |
| Net Assets at end of period (000’s) | | $ | 29,005 | | | $ | 33,182 | | | $ | 29,644 | | | $ | 29,722 | | | $ | 28,121 | |
| Ratio of net expenses to average net assets | | | 1.00% | | | | 1.00% | | | | 1.00% | | | | 1.00% | | | | 1.00% | |
| Ratio of net investment income to average net assets | | | 1.55% | | | | 1.52% | | | | 1.52% | | | | 1.49% | | | | 1.26% | |
| Ratio of expenses (before fee reductions) to average net assets(b) | | | 1.19% | | | | 1.16% | | | | 1.17% | | | | 1.18% | | | | 1.26% | |
| Portfolio turnover | | | 71.27% | | | | 38.99% | | | | 28.57% | | | | 41.14% | | | | 21.15% | |
|
| (a) | | Calculated using the average shares method. |
| (b) | | During the period, certain fees were reduced and total fund expenses are capped at 1.00%. If such expense caps had not been in place, the ratio would have been as indicated. |
See Notes to Financial Statements
39
| Schedule of Portfolio Investments | Walden Social Equity Fund
March 31, 2009 |
|
| Security Description | | Shares | | | Value ($) |
| |
| | |
|
| | | | | | |
| Consumer Discretionary (7.5%) | | | | | |
| Lowe’s Cos., Inc. | | 35,000 | | | 638,750 |
| NIKE, Inc., Class B | | 20,000 | | | 937,800 |
| Omnicom Group, Inc. | | 30,000 | | | 702,000 |
| The TJX Cos., Inc. | | 20,000 | | | 512,800 |
| The Walt Disney Co. | | 25,000 | | | 454,000 |
| | | | | |
|
| | | | | | 3,245,350 |
| | | | | |
|
| Consumer Products (12.9%) | | | | | |
| Colgate-Palmolive Co. | | 12,000 | | | 707,760 |
| Costco Wholesale Corp. | | 18,000 | | | 833,760 |
| General Mills, Inc. | | 15,000 | | | 748,200 |
| McCormick & Co., Inc. | | 23,000 | | | 680,110 |
| PepsiCo, Inc. | | 17,000 | | | 875,160 |
| Procter & Gamble Co. | | 18,000 | | | 847,620 |
| Sysco Corp. | | 38,000 | | | 866,400 |
| | | | | |
|
| | | | | | 5,559,010 |
| | | | | |
|
| Energy (15.0%) | | | | | |
| Apache Corp. | | 25,000 | | | 1,602,250 |
| BG Group PLC, ADR | | 12,000 | | | 903,480 |
| BP PLC, ADR | | 40,000 | | | 1,604,000 |
| ConocoPhillips | | 40,000 | | | 1,566,400 |
| Weatherford International Ltd.(a) | | 20,000 | | | 221,400 |
| XTO Energy, Inc. | | 20,000 | | | 612,400 |
| | | | | |
|
| | | | | | 6,509,930 |
| | | | | |
|
| Financial Services (5.9%) | | | | | |
| Chubb Corp. | | 20,000 | | | 846,400 |
| Cincinnati Financial Corp. | | 33,000 | | | 754,710 |
| T. Rowe Price Group, Inc. | | 33,030 | | | 953,246 |
| | | | | |
|
| | | | | | 2,554,356 |
| | | | | |
|
| Health Care (13.8%) | | | | | |
| Becton, Dickinson & Co. | | 12,000 | | | 806,880 |
| C.R. Bard, Inc. | | 7,000 | | | 558,040 |
| DENTSPLY International, Inc. | | 30,000 | | | 805,500 |
| Johnson & Johnson, Inc. | | 17,000 | | | 894,200 |
| Medtronic, Inc. | | 29,000 | | | 854,630 |
| Roche Holdings Ltd. | | 14,000 | | | 481,600 |
| Saint Jude Medical, Inc.(a) | | 20,000 | | | 726,600 |
| Stryker Corp. | | 20,000 | | | 680,800 |
| Varian Medical Systems, Inc.(a) | | 6,000 | | | 182,640 |
| | | | | |
|
| | | | | | 5,990,890 |
| | | | | |
|
| Industrial Materials (7.2%) | | | | | |
| Air Products & Chemicals, Inc. | | 16,000 | | | 900,000 |
| AptarGroup, Inc. | | 25,000 | | | 778,500 |
| Praxair, Inc. | | 10,000 | | | 672,900 |
| Sigma-Aldrich Corp. | | 20,000 | | | 755,800 |
| | | | | |
|
| | | | | | 3,107,200 |
| | | | | |
|
| Industrial Products & Services (14.4%) | | | | | |
| 3M Co. | | 20,000 | | | 994,400 |
| Donaldson Co., Inc. | | 25,000 | | | 671,000 |
| Emerson Electric Co. | | 36,000 | | | 1,028,880 |
| Expeditors International of Washington, Inc. | | 18,000 | | | 509,220 |
| Illinois Tool Works, Inc. | | 36,000 | | | 1,110,600 |
| United Parcel Service, Inc., Class B | | 20,000 | | | 984,400 |
| W.W. Grainger, Inc. | | 13,000 | | | 912,340 |
| | | | | |
|
| | | | | | 6,210,840 |
| | | | | |
|
| Information Technology (18.4%) | | | | | |
| Accenture Ltd., Class A | | 25,000 | | | 687,250 |
| Automatic Data Processing, Inc. | | 25,000 | | | 879,000 |
| Cisco Systems, Inc.(a) | | 40,000 | | | 670,800 |
| Dell, Inc.(a) | | 60,000 | | | 568,800 |
| EMC Corp.(a) | | 50,000 | | | 570,000 |
| Hewlett-Packard Co. | | 15,000 | | | 480,900 |
| Intel Corp. | | 50,000 | | | 752,500 |
| International Business Machines Corp. | | 7,000 | | | 678,230 |
| Microsoft Corp. | | 44,000 | | | 808,280 |
| Nokia Corp., ADR | | 40,000 | | | 466,800 |
| Oracle Corp.(a) | | 40,000 | | | 722,800 |
| Paychex, Inc. | | 27,000 | | | 693,090 |
| | | | | |
|
| | | | | | 7,978,450 |
| | | | | |
|
| Telecommunications (3.1%) | | | | | |
| AT&T, Inc. | | 35,000 | | | 882,000 |
| Time Warner Cable, Inc. | | 18,333 | | | 454,667 |
| | | | | |
|
| | | | | | 1,336,667 |
| | | | | |
|
| TOTAL COMMON STOCKS (Cost $50,771,122) | | | | | 42,492,693 |
| | | | | |
|
| | | | | | |
| INVESTMENT COMPANY (0.7%) |
| Victory Federal Money Market, Investor Shares, 0.45% (Cost $314,526)(b) | | 314,526 | | | 314,526 |
| | | | | |
|
| Total Investments (Cost $51,085,648) — 98.9% | | | | | 42,807,219 |
| Other assets in excess of liabilities — 1.1% | | | | | 472,369 |
| | | | | |
|
| NET ASSETS — 100.0% | | | | | $43,279,588 |
| | | | | |
|
|
| (a) | | Non-income producing security. |
| (b) | | Rate disclosed is the seven day yield as of March 31, 2009. |
| ADR | | American Depositary Receipt |
| PLC | | Public Limited Company |
See Notes to Financial Statements
40
| Financial Statements | Walden Social Equity Fund |
|
| STATEMENT OF ASSETS AND LIABILITIES |
| March 31, 2009 | | | | |
| | | | | |
| Assets: | | | | |
| Investments, at value (cost $51,085,648) | | $ | 42,807,219 | |
| Interest and dividends receivable | | | 96,455 | |
| Receivable for capital shares issued | | | 417,131 | |
| Receivable for investments sold | | | 317,076 | |
| Prepaid expenses and other assets | | | 12,819 | |
| | |
| |
Total Assets | | | 43,650,700 | |
| | |
| |
| Liabilities: | | | | |
| Payable for investments purchased | | | 305,448 | |
| Payable for capital shares redeemed | | | 11,100 | |
| Accrued expenses and other liabilities: | | | | |
Investment adviser | | | 22,273 | |
Chief compliance officer | | | 335 | |
Administration and accounting | | | 1,222 | |
Custodian | | | 2,400 | |
Transfer agent | | | 6,600 | |
Shareholder service | | | 468 | |
Other | | | 21,266 | |
| | |
| |
Total Liabilities | | | 371,112 | |
| | |
| |
| Net Assets | | $ | 43,279,588 | |
| | |
| |
| Composition of Net Assets: | | | | |
| Capital | | $ | 56,449,232 | |
| Accumulated net investment income | | | 311,078 | |
| Accumulated net realized losses from investment transactions | | | (5,202,293) | |
| Net unrealized depreciation from investments | | | (8,278,429) | |
| | |
| |
| Net Assets | | $ | 43,279,588 | |
| | |
| |
| Shares outstanding (par value $0.01, unlimited number of shares authorized) | | | 5,405,592 | |
| | |
| |
| Net Asset Value, Offering Price and Redemption Price per share | | $ | 8.01 | |
| | |
| |
| For the year ended March 31, 2009 | | | | |
| | | | | |
| Investment Income: | | | | |
| Interest | | $ | 11 | |
| Dividends | | | 1,256,377 | |
| Less: Foreign tax withholding | | | (13,015) | |
| | |
| |
Total Investment Income | | | 1,243,373 | |
| | |
| |
| Expenses: | | | | |
Investment adviser | | | 395,237 | |
Administration and accounting | | | 108,539 | |
Shareholder servicing fees | | | 6,325 | |
Trustee | | | 5,776 | |
Custodian | | | 14,258 | |
Transfer agency | | | 39,230 | |
Chief compliance officer | | | 4,361 | |
Other | | | 52,610 | |
| | |
| |
Total expenses before fee reductions | | | 626,336 | |
Fees voluntarily reduced by the administrator | | | (29,283) | |
Fees contractually reduced by the investment adviser | | | (69,183) | |
| | |
| |
| Net Expenses | | | 527,870 | |
| | |
| |
| Net Investment Income | | | 715,503 | |
| | |
| |
| Net Realized/Unrealized Losses from Investments: | | | | |
| Net realized losses from investment transactions | | | (5,196,246) | |
| Change in unrealized appreciation/depreciation from investments | | | (18,436,056) | |
| | |
| |
| Net realized/unrealized losses from investments | | | (23,632,302) | |
| | |
| |
| Change in Net Assets Resulting from Operations | | $ | (22,916,799) | |
| | |
| |
See Notes to Financial Statements
41
| Financial Statements | Walden Social Equity Fund |
|
| STATEMENTS OF CHANGES IN NET ASSETS |
| | | For the year ended | | For the year ended |
| | | March 31, 2009 | | March 31, 2008 |
| | |
| |
|
| Investment Activities: | | | | | | | | |
| Operations: | | | | | | | | |
Net investment income | | $ | 715,503 | | | $ | 308,596 | |
Net realized gains (losses) from investment transactions | | | (5,196,246) | | | | 1,534,792 | |
Change in unrealized appreciation/depreciation from investments | | | (18,436,056) | | | | 553,617 | |
| | |
| | |
| |
| Change in net assets resulting from operations | | | (22,916,799) | | | | 2,397,005 | |
| | |
| | |
| |
| Dividends: | | | | | | | | |
Net investment income | | | (515,574) | | | | (297,927) | |
Net realized gains from investment transactions | | | (485,655) | | | | (1,341,018) | |
| | |
| | |
| |
| Change in net assets from shareholder dividends | | | (1,001,229) | | | | (1,638,945) | |
| | |
| | |
| |
| Capital Share Transactions: | | | | | | | | |
Proceeds from shares issued | | | 28,492,125 | | | | 8,249,608 | |
Dividends reinvested | | | 963,408 | | | | 1,599,563 | |
Cost of shares redeemed | | | (14,161,336) | | | | (8,576,512) | |
| | |
| | |
| |
| Change in net assets from capital share transactions | | | 15,294,197 | | | | 1,272,659 | |
| | |
| | |
| |
| Change in net assets | | | (8,623,831) | | | | 2,030,719 | |
| | | | | | | | | |
| Net Assets: | | | | | | | | |
Beginning of period | | | 51,903,419 | | | | 49,872,700 | |
| | |
| | |
| |
End of period | | $ | 43,279,588 | | | $ | 51,903,419 | |
| | |
| | |
| |
| Share Transactions: | | | | | | | | |
Issued | | | 2,648,123 | | | | 640,227 | |
Reinvested | | | 112,548 | | | | 119,015 | |
Redeemed | | | (1,495,648) | | | | (670,383) | |
| | |
| | |
| |
| Change in shares | | | 1,265,023 | | | | 88,859 | |
| | |
| | |
| |
| Accumulated net investment income | | $ | 311,078 | | | $ | 111,149 | |
| | |
| | |
| |
See Notes to Financial Statements
42
| Financial Statements | Walden Social Equity Fund |
|
Selected data for a share outstanding throughout the years indicated.
| | | For the year | | | For the year | | | For the year | | | For the year | | | For the year | |
| | | ended | | | ended | | | ended | | | ended | | | ended | |
| | | March 31, | | | March 31, | | | March 31, | | | March 31, | | | March 31, | |
| | | 2009 | | | 2008 | | | 2007 | | | 2006 | | | 2005 | |
| | |
| | |
| | |
| | |
| | |
| |
| Net Asset Value, Beginning of Period | | $ | 12.54 | | | $ | 12.31 | | | $ | 12.09 | | | $ | 11.34 | | | $ | 10.85 | |
| | |
| | |
| | |
| | |
| | |
| |
| Investment Activities: | | | | | | | | | | | | | | | | | | | | |
Net investment income | | | 0.14 | (a) | | | 0.08 | | | | 0.07 | | | | 0.09 | | | | 0.08 | |
Net realized and unrealized gains (losses) from investment transactions | | | (4.48) | | | | 0.57 | | | | 0.61 | | | | 0.74 | | | | 0.48 | |
| | |
| | |
| | |
| | |
| | |
| |
| Total from investment activities | | | (4.34) | | | | 0.65 | | | | 0.68 | | | | 0.83 | | | | 0.56 | |
| | |
| | |
| | |
| | |
| | |
| |
| Dividends: | | | | | | | | | | | | | | | | | | | | |
Net investment income | | | (0.10) | | | | (0.08) | | | | (0.08) | | | | (0.08) | | | | (0.07) | |
Net realized gains from investments | | | (0.09) | | | | (0.34) | | | | (0.38) | | | | — | | | | — | |
| | |
| | |
| | |
| | |
| | |
| |
| Total dividends | | | (0.19) | | | | (0.42) | | | | (0.46) | | | | (0.08) | | | | (0.07) | |
| | |
| | |
| | |
| | |
| | |
| |
| | | | | | | | | | | | | | | | | | | | | |
| Net Asset Value, End of Period | | $ | 8.01 | | | $ | 12.54 | | | $ | 12.31 | | | $ | 12.09 | | | $ | 11.34 | |
| | |
| | |
| | |
| | |
| | |
| |
| | | | | | | | | | | | | | | | | | | | | |
| Total Return | | | (34.74)% | | | | 5.01% | | | | 5.62% | | | | 7.32% | | | | 5.18% | |
| | |
| | |
| | |
| | |
| | |
| |
| Ratios/Supplemental Data: | | | | | | | | | | | | | | | | | | | | |
| Net Assets at end of period (000’s) | | $ | 43,280 | | | $ | 51,903 | | | $ | 49,873 | | | $ | 48,712 | | | $ | 45,287 | |
| Ratio of net expenses to average net assets | | | 1.00% | | | | 1.00% | | | | 1.00% | | | | 1.00% | | | | 1.00% | |
| Ratio of net investment income to average net assets | | | 1.36% | | | | 0.59% | | | | 0.68% | | | | 0.70% | | | | 0.75% | |
Ratio of expenses (before fee reductions) to average net assets(b) | | | 1.19% | | | | 1.18% | | | | 1.15% | | | | 1.12% | | | | 1.15% | |
| Portfolio turnover | | | 40.07% | | | | 44.67% | | | | 25.50% | | | | 29.11% | | | | 15.89% | |
|
| (a) | | Calculated using the average shares method. |
| (b) | | During the period, certain fees were reduced and total fund expenses are capped at 1.00%. If such expense caps had not been in place, the ratio would have been as indicated. |
See Notes to Financial Statements
43
| Schedule of Portfolio Investments | Walden Small Cap Innovations Fund
March 31, 2009 |
|
| Security Description | | Shares | | Value ($) | |
| |
| |
| |
| Consumer Discretionary (10.9%) | | | | | | |
| Ambassadors Group, Inc. | | 650 | | | 5,278 | |
| Capella Education Co.(a) | | 475 | | | 25,175 | |
| Gentex Corp. | | 3,950 | | | 39,342 | |
| Hibbett Sports, Inc.(a) | | 750 | | | 14,415 | |
| John Wiley & Sons, Inc., Class A | | 1,500 | | | 44,670 | |
| LKQ Corp.(a) | | 2,725 | | | 38,886 | |
| Pre-Paid Legal Services, Inc.(a) | | 275 | | | 7,983 | |
| Scholastic Corp. | | 575 | | | 8,665 | |
| Strayer Education, Inc. | | 275 | | | 49,465 | |
| Timberland Co., Class A(a) | | 1,150 | | | 13,731 | |
| Under Armour, Inc., Class A(a) | | 475 | | | 7,804 | |
| | | | |
| |
| | | | | | 255,414 | |
| | | | |
| |
| Consumer Products (6.8%) | | | | | | |
| Diamond Foods, Inc. | | 1,225 | | | 34,214 | |
| Green Mountain Coffee Roasters, Inc.(a) | | 825 | | | 39,600 | |
| Hain Celestial Group, Inc.(a) | | 1,200 | | | 17,088 | |
| Lifeway Foods, Inc.(a) | | 1,975 | | | 15,800 | |
| United Natural Foods, Inc.(a) | | 1,400 | | | 26,558 | |
| Whole Foods Market, Inc. | | 1,575 | | | 26,460 | |
| | | | |
| |
| | | | | | 159,720 | |
| | | | |
| |
| Energy (4.1%) | | | | | | |
| CARBO Ceramics, Inc. | | 925 | | | 26,307 | |
| CREDO Petroleum Corp.(a) | | 1,225 | | | 9,151 | |
| Dawson Geophysical Co.(a) | | 400 | | | 5,400 | |
| Encore Acquisition Co.(a) | | 1,800 | | | 41,886 | |
| NATCO Group, Inc., Class A(a) | | 625 | | | 11,831 | |
| | | | |
| |
| | | | | | 94,575 | |
| | | | |
| |
| Financial Services (15.9%) | | | | | | |
| Assured Guaranty Ltd. | | 1,325 | | | 8,970 | |
| Bank of Hawaii Corp. | | 1,500 | | | 49,470 | |
| Commerce Bancshares, Inc. | | 750 | | | 27,225 | |
| Corporate Office Properties | | 1,350 | | | 33,520 | |
| Digital Realty Trust, Inc. | | 1,350 | | | 44,793 | |
| Dime Community Bancshares | | 4,875 | | | 45,727 | |
| eHealth, Inc.(a) | | 2,325 | | | 37,223 | |
| Independent Bank Corp. | | 675 | | | 9,956 | |
| Investment Technology Group, Inc.(a) | | 975 | | | 24,882 | |
| Jones Lang LaSalle, Inc. | | 1,025 | | | 23,842 | |
| Parkway Properties, Inc. | | 1,200 | | | 12,360 | |
| Southside Bancshares, Inc. | | 825 | | | 15,593 | |
| Umpqua Holdings Corp. | | 1,525 | | | 13,817 | |
| Wilmington Trust Corp. | | 2,600 | | | 25,194 | |
| | | | |
| |
| | | | | | 372,572 | |
| | | | |
| |
| Health Care (14.8%) | | | | | | |
| Dionex Corp.(a) | | 1,050 | | | 49,612 | |
| Gen-Probe, Inc.(a) | | 250 | | | 11,395 | |
| ICU Medical, Inc.(a) | | 850 | | | 27,302 | |
| IDEXX Laboratories, Inc.(a) | | 1,650 | | | 57,057 | |
| Immucor, Inc.(a) | | 475 | | | 11,946 | |
| Landauer, Inc. | | 975 | | | 49,413 | |
| Meridian Bioscience, Inc. | | 2,625 | | | 47,565 | |
| Neogen Corp.(a) | | 975 | | | 21,284 | |
| ResMed, Inc.(a) | | 750 | | | 26,505 | |
| West Pharmaceutical Services, Inc. | | 1,350 | | | 44,294 | |
| | | | |
| |
| | | | | | 346,373 | |
| | | | |
| |
| Industrial Materials (2.5%) | | | | | | |
| Commercial Metals Co. | | 1,575 | | | 18,191 | |
| Minerals Technologies, Inc. | | 925 | | | 29,647 | |
| Quaker Chemical Corp. | | 1,300 | | | 10,322 | |
| | | | |
| |
| | | | | | 58,160 | |
| | | | |
| |
| Industrial Products & Services (14.4%) | | | | | | |
| Apogee Enterprises, Inc. | | 1,350 | | | 14,823 | |
| Baldor Electric Co. | | 2,300 | | | 33,327 | |
| CLARCOR, Inc. | | 1,800 | | | 45,342 | |
| Fuel-Tech, Inc.(a) | | 475 | | | 4,969 | |
| Genesee & Wyoming, Inc., Class A(a) | | 2,250 | | | 47,812 | |
| Herman Miller, Inc. | | 725 | | | 7,729 | |
| Layne Christensen Co.(a) | | 575 | | | 9,240 | |
| Lindsay Manufacturing Co. | | 825 | | | 22,275 | |
| Met-Pro Corp. | | 1,200 | | | 9,780 | |
| Middleby Corp.(a) | | 450 | | | 14,594 | |
| Simpson Manufacturing Co., Inc. | | 1,650 | | | 29,733 | |
| SunPower Corp., Class B(a) | | 475 | | | 9,405 | |
| Team, Inc.(a) | | 1,400 | | | 16,408 | |
| Wabtec Corp. | | 1,725 | | | 45,505 | |
| Watts Water Technologies, Inc., Class A | | 1,325 | | | 25,917 | |
| | | | |
| |
| | | | | | 336,859 | |
| | | | |
| |
| Information Technology (18.1%) | | | | | | |
| Alvarion Ltd.(a) | | 2,150 | | | 7,117 | |
| Blackbaud, Inc. | | 1,575 | | | 18,286 | |
| Coherent, Inc.(a) | | 625 | | | 10,781 | |
| Computer Programs & Systems, Inc. | | 350 | | | 11,645 | |
| F5 Networks, Inc.(a) | | 1,050 | | | 21,997 | |
| Itron, Inc.(a) | | 850 | | | 40,247 | |
| J2 Global Communications, Inc.(a) | | 2,500 | | | 54,725 | |
| National Instruments Corp. | | 750 | | | 13,988 | |
| Net 1 UEPS Technologies, Inc.(a) | | 2,525 | | | 38,405 | |
| Plantronics, Inc. | | 2,875 | | | 34,701 | |
| Polycom, Inc.(a) | | 3,025 | | | 46,555 | |
| Power Integrations, Inc. | | 2,625 | | | 45,150 | |
| Quality Systems, Inc. | | 1,225 | | | 55,431 | |
| RADVision Ltd.(a) | | 2,825 | | | 14,097 | |
| Renaissance Learning, Inc. | | 1,025 | | | 9,194 | |
| | | | |
| |
| | | | | | 422,319 | |
| | | | |
| |
| Telecommunications (0.5%) | | | | | | |
| NII Holdings, Inc.(a) | | 850 | | | 12,750 | |
| | | | |
| |
| Utilities (4.9%) | | | | | | |
| American States Water Co. | | 350 | | | 12,712 | |
| New Jersey Resources Corp. | | 1,500 | | | 50,970 | |
| Ormat Technologies, Inc. | | 475 | | | 13,043 | |
| South Jersey Industries, Inc. | | 1,075 | | | 37,625 | |
| | | | |
| |
| | | | | | 114,350 | |
| | | | |
| |
| TOTAL COMMON STOCKS (Cost $2,229,268) | | | | | 2,173,092 | |
| | | | |
| |
| INVESTMENT COMPANIES (6.0%) |
| Cavanal Hill U.S. Treasury Fund, 0.01%(b) | | 28,637 | | | 28,637 | |
| Victory Federal Money Market, Investor Shares, 0.45%(b) | | 111,604 | | | 111,604 | |
| | | | |
| |
| TOTAL INVESTMENT COMPANIES (Cost $140,241) | | | | | 140,241 | |
| | | | |
| |
| Total Investments (Cost $2,369,509) — 98.9% | | | | | 2,313,333 | |
| Other assets in excess of liabilities — 1.1% | | | | | 26,915 | |
| | | | |
| |
| NET ASSETS — 100.0% | | | | $ | 2,340,248 | |
| | | | |
| |
|
| (a) | | Non-income producing security. |
| (b) | | Rate disclosed is the seven day yield as of March 31, 2009. |
See Notes to Financial Statements
44
| Financial Statements | Walden Small Cap Innovations Fund |
|
| STATEMENT OF ASSETS AND LIABILITIES |
March 31, 2009
| Assets: | | | | |
| Investments, at value (cost $2,369,509) | | $ | 2,313,333 | |
| Interest and dividends receivable | | | 2,047 | |
| Receivable for capital shares issued | | | 258 | |
| Receivable for investments sold | | | 867 | |
| Receivable from adviser | | | 14,458 | |
| Prepaid offering | | | 10,994 | |
| Prepaid expenses and other assets | | | 6,923 | |
| | |
| |
Total Assets | | | 2,348,880 | |
| | |
| |
| Liabilities: | | | | |
| Accrued expenses and other liabilities: | | | | |
Chief compliance officer | | | 11 | |
Administration and accounting | | | 40 | |
Custodian | | | 2,000 | |
Transfer agent | | | 5,650 | |
Other | | | 931 | |
| | |
| |
Total Liabilities | | | 8,632 | |
| | |
| |
| Net Assets | | $ | 2,340,248 | |
| | |
| |
| Composition of Net Assets: | | | | |
| Capital | | $ | 2,406,212 | |
| Accumulated net investment income | | | 2,000 | |
| Accumulated net realized losses from | | | | |
investment transactions | | | (11,788) | |
| Net unrealized depreciation from investments | | | (56,176) | |
| | |
| |
| Net Assets | | $ | 2,340,248 | |
| | |
| |
| Shares outstanding (par value $0.01, unlimited number of shares authorized) | | | 254,702 | |
| | |
| |
| Net Asset Value, Offering Price and Redemption Price per share(a) | | $ | 9.19 | |
| | |
| |
|
| (a) | | A redemption fee is imposed upon shares redeemed within 60 days. See Note 2 to financial statements. |
For the period ended March 31, 2009 (a)
| Investment Income: | | | | |
| Dividends | | $ | 8,364 | |
| | |
| |
Total Investment Income | | | 8,364 | |
| | |
| |
| Expenses: | | | | |
Investment adviser | | | 3,462 | |
Administration and accounting | | | 2,360 | |
Trustee | | | 71 | |
Organizational | | | 4,430 | |
Offering | | | 8,392 | |
Custodian | | | 7,507 | |
Transfer agency | | | 14,636 | |
Chief compliance officer | | | 36 | |
Other | | | 3,971 | |
| | |
| |
Total expenses before fee reductions | | | 44,865 | |
Fees voluntarily reduced by the administrator | | | (252) | |
Fees contractually reduced by the investment adviser | | | (39,182) | |
| | |
| |
| Net Expenses | | | 5,431 | |
| | |
| |
| | | | | |
| Net Investment Income | | | 2,933 | |
| | |
| |
| Net Realized/Unrealized Losses from Investments: | | | | |
| Net realized losses from investment transactions | | | (11,788) | |
| Change in unrealized appreciation/depreciation from investments | | | (56,176) | |
| | |
| |
| Net realized/unrealized losses from investments | | | (67,964) | |
| | |
| |
| Change in Net Assets Resulting from Operations | | $ | (65,031) | |
| | |
| |
|
| (a) | | Commenced operations on October 24, 2008. |
See Notes to Financial Statements
45
| Financial Statements | Walden Small Cap Innovations Fund |
|
| STATEMENT OF CHANGES IN NET ASSETS |
| | | | | |
| | | For the period ended | |
| | | March 31, 2009(a) | |
| �� | |
| |
| Investment Activities: | | | | |
| Operations: | | | | |
Net investment income | | $ | 2,933 | |
Net realized losses from investment transactions | | | (11,788) | |
Change in unrealized appreciation/depreciation from investments | | | (56,176) | |
| | |
| |
| Change in net assets resulting from operations | | | (65,031) | |
| | |
| |
| Dividends: | | | | |
Net investment income | | | (1,149) | |
| | |
| |
| Change in net assets from shareholder dividends | | | (1,149) | |
| | |
| |
| Capital Share Transactions: | | | | |
Proceeds from shares issued | | | 2,405,279 | |
Dividends reinvested | | | 1,149 | |
| | |
| |
| Change in net assets from capital share transactions | | | 2,406,428 | |
| | |
| |
| Change in net assets | | | 2,340,248 | |
| | |
| |
| Net Assets: | | | | |
End of period | | $ | 2,340,248 | |
| | |
| |
| Share Transactions: | | | | |
Issued | | | 254,587 | |
Reinvested | | | 115 | |
| | |
| |
| Change in shares | | | 254,702 | |
| | |
| |
| Accumulated net investment income | | $ | 2,000 | |
| | |
| |
|
| (a) | | Commenced operations on October 24, 2008. |
See Notes to Financial Statements
46
| Financial Statements | | Walden Small Cap Innovations Fund |
|
FINANCIAL HIGHLIGHTS | | | | |
| Selected data for a share outstanding throughout the period indicated. | | | | |
| | | | | |
| | | | | |
| | | For the | |
| | | period ended | |
| | | March 31, | |
| | | 2009(a) | |
| | |
| |
| Net Asset Value, Beginning of Period | | $ | 10.00 | |
| | |
| |
| Investment Activities: | | | | |
Net investment income | | | 0.03 | (b) |
Net realized and unrealized losses from investment transactions | | | (0.83) | |
| | |
| |
| Total from investment activities | | | (0.80) | |
| | |
| |
| Dividends: | | | | |
Net investment income | | | (0.01) | |
| | |
| |
| Total dividends | | | (0.01) | |
| | |
| |
| | | | | |
| Net Asset Value, End of Period | | $ | 9.19 | |
| | |
| |
| Total Return | | | (7.98)% | (c) |
| | |
| |
| Ratios/Supplemental Data: | | | | |
| Net Assets at end of period (000’s) | | $ | 2,340 | |
| Ratio of net expenses to average net assets | | | 1.16% | (d) |
| Ratio of net investment income to average net assets | | | 0.63% | (d) |
| Ratio of expenses (before fee reductions) to average net assets(e) | | | 9.61% | (d) |
| Portfolio turnover | | | 4.37% | (c) |
|
| (a) | | Commenced operations on October 24, 2008. |
| (b) | | Calculated using the average shares method. |
| (c) | | Not annualized for periods less than one year. |
| (d) | | Annualized for periods less than one year. |
| (e) | | During the period, certain fees were reduced and total fund expenses were capped at 1.25% through March 13, 2009 and at 1.00% thereafter. If such expense caps had not been in place, the ratio would have been as indicated. |
| See Notes to Financial Statements |
|
| |
| 47 |
| Notes to Financial Statements | | March 31, 2009 |
|
| 1. | | Organization: |
| | | The Coventry Group (the “Group”) was organized on January 8, 1992 as a Massachusetts business trust and is registered under the Investment Company Act of 1940, as amended (the “1940 Act”), as an open-end management investment company. The Group contains the following Boston Trust Funds and Walden Funds (individually a “Fund”, collectively the “Funds”): |
| | | Fund | | Short Name |
| | | Boston Trust Balanced Fund | | Balanced Fund |
| | | Boston Trust Equity Fund | | Equity Fund |
| | | Boston Trust Small Cap Fund | | Small Cap Fund |
| | | Boston Trust Midcap Fund | | Midcap Fund |
| | | Walden Social Balanced Fund | | Social Balanced Fund |
| | | Walden Social Equity Fund | | Social Equity Fund |
| | | Walden Small Cap Innovations Fund | | Small Cap Innovations Fund |
| | | The Small Cap Innovations Fund commenced operations on October 24, 2008. |
| | | |
| | | The investment objective of the Balanced Fund and Social Balanced Fund is to seek long-term capital growth and income through an actively managed portfolio of stocks, bonds and money market instruments. The investment objective of the Equity Fund and Social Equity Fund is to seek long-term capital growth through an actively managed portfolio of stocks. The investment objective of the Small Cap Fund and Small Cap Innovations Fund is to seek long-term capital growth through an actively managed portfolio of stocks of small capitalization companies. The investment objective of the Midcap Fund is to seek long-term capital growth through an actively managed portfolio of stocks of middle capitalization companies. |
| | | |
| | | Under the Group’s organizational documents, its officers and trustees are indemnified against certain liabilities arising out of the performance of their duties to the Group. In addition, in the normal course of business, the Group may enter into contracts with its vendors and others that provide for general indemnifications. Each Fund’s maximum exposure under these arrangements is unknown, as this would involve future claims that may be made against the Funds. However, based on experience, the Funds expect that risk of loss to be remote. |
| | | |
| 2. | | Significant Accounting Policies: |
| | | The following is a summary of significant accounting policies followed by the Funds in the preparation of their financial statements. The policies are in conformity with accounting principles generally accepted in the United States of America (“GAAP”). |
| | | |
| | | Security Valuation: |
| | | The value of each equity security is based either on the last sale price on a national securities exchange, or in the absence of recorded sales, at the closing bid prices on such exchanges, or at the quoted bid price in the over-the-counter market. Equity securities traded on the NASDAQ stock market are valued at the NASDAQ official closing price. Securities or other assets for which market quotations are not readily available (e.g., an approved pricing service does not provide a price, a furnished price is in error, certain stale prices, or an event occurs that materially affects the furnished price) are valued at fair value as determined in good faith by or at the direction of the Group’s Board of Trustees (the “Board”). |
| | | |
| | | Bonds and other fixed income securities (other than short-term obligations but including listed issues) are valued on the basis of valuations furnished by a pricing service, the use of which has been approved by the Board. In making such valuations, the pricing service utilizes both dealer-supplied valuations and electronic data processing techniques which take into account appropriate factors such as institutional-size trading in similar groups of securities, yield, quality, coupon rate, maturity, type of issue, and trading characteristics other than market data and without exclusive reliance upon quoted prices or exchanges or over-the-counter prices, since such valuations are believed to reflect more accurately the fair value of such securities. All debt portfolio securities with a remaining maturity of 60 days or less are valued at amortized cost, which approximates fair value. Under the amortized cost method, discount or premium, if any, is accreted or amortized, respectively, on a constant (straight-line) basis to the maturity of the security. |
| | | |
| | | The Group may use a pricing service to value certain portfolio securities where the prices provided are believed to reflect the fair market value of such securities. If market prices are not available or, in Boston Trust Investment Management, Inc.’s (the “Adviser”) opinion, market prices do not reflect fair value, or if an event occurs after the close of trading on the exchange or market on which the security is principally traded (but prior to the time the NAV is calculated) that materially affects fair value, the Adviser will value the Fund’s assets at their fair value according to policies approved by the Board. |
| | | |
| | | Investments in money market funds are valued at net asset value per share. |
| | | |
| | | Fair Value Measurements: |
| | | Effective April 1, 2008, the Funds adopted Statement of Financial Accounting Standards No. 157, “Fair Value Measurements” (“SFAS 157”). This standard establishes a single authoritative definition of fair value, sets out a framework for measuring fair value based on inputs used to value the Funds’ investments, and requires additional disclosures about fair value measurements. SFAS 157 applies to fair value measurements already required or permitted by existing standards. |
| | | |
| | | One key component of the implementation of SFAS 157 includes the development of a three-tier fair value hierarchy. The basis of the tiers is dependent upon the various “inputs” used to determine the value of the Funds’ investments. These inputs are summarized in the three broad levels listed below: |
| | | |
| | | Level 1 - quoted prices in active markets for identical assets. |
| | | Level 2 - other significant observable inputs (including quoted prices for similar securities, interest rates, prepayment speeds, credit risk, etc.). |
| | | Level 3 - significant unobservable inputs (including the Fund Management’s own assumptions in determining the fair value of investments). |
| | | |
| | | The inputs or methodology used to value securities are not necessarily an indication of the risk associated with investing in those securities. |
| Notes to Financial Statements | | March 31, 2009 |
| | The following is a summary categorization, as of March 31, 2009, of each Fund’s investments based on the level of inputs utilized in determining the value of such investments: |
| | | | | | | LEVEL 2 | | LEVEL 3 | | | |
| | | | LEVEL 1 | | Other Significant | | Significant | | | |
| | | | Quoted Prices | | Observable Inputs | | Unobservable Inputs | | | |
| | | |
| |
| |
| | | |
| | | | Investments in | | Investments in | | Investments in | | Total Investments in |
| | Fund | | Securities($) | | Securities($) | | Securities($) | | Securities($) |
| |
|
| | Balanced Fund | | 74,476,398 | | | | 80,862,241 | | | | — | | | 155,338,639 | |
| | Equity Fund | | 38,757,348 | | | | — | | | | — | | | 38,757,348 | |
| | Small Cap Fund | | 25,479,357 | | | | — | | | | — | | | 25,479,357 | |
| | Midcap Fund | | 8,065,595 | | | | — | | | | — | | | 8,065,595 | |
| |
|
| | Social Balanced Fund | | 14,888,536 | | | | 13,870,037 | | | | 100,000 | | | 28,858,573 | |
| | Social Equity Fund | | 42,807,219 | | | | — | | | | — | | | 42,807,219 | |
| | Small Cap Innovations Fund | | 2,313,333 | | | | — | | | | — | | | 2,313,333 | |
| |
|
| | For each Level 3 investment, the value of certificates of deposit at maturity was the input used to determine fair value.
The following is a reconciliation of Level 3 investments for which significant unobservable inputs were used to determine fair value: |
| | | | Social Balanced Fund | |
| | | | Investments in Securities | |
| | | |
| |
| | Balance as of 4/1/08 | | | $200,000 | | |
| | Accrued Accretion (Amortization) | | | — | | |
| | Net Realized Gain (Loss) | | | — | | |
| | Change in Unrealized Appreciation (Depreciation) | | | — | | |
| | Net Purchase (Sales) | | | (100,000) | | |
| | Transfers In (Out) of Level 3 | | | — | | |
| | | |
| |
| | Balance as of 3/31/09 | | | $100,000 | | |
| | | |
| |
| | Security Transactions and Related Income:
Changes in holdings of portfolio securities shall be reflected no later than in the first calculation on the first business day following the trade date. However, for financial reporting purposes, portfolio security transactions are reported on trade date. Interest income is recognized on the accrual basis and includes, where applicable, the amortization of premium or discount. Dividend income is recorded on the ex-dividend date. Gains or losses realized on sales of securities are determined by comparing the identified cost of the security lot sold with the net sales proceeds.
Expenses:
Expenses directly attributable to a Fund are charged directly to the Fund. Expenses relating to the Group are allocated proportionately to each Fund within the Group according to the relative net assets of each Fund or on another reasonable basis.
Use of Estimates:
The preparation of financial statements in conformity with GAAP requires management to make estimates and assumptions that affect the reported amounts of assets and liabilities and disclosure of contingent assets and liabilities at the date of the financial statements and the reported amounts of increases and decreases in net assets from operations during the reporting period. Actual results may differ from those estimates.
Dividends to Shareholders:
Dividends are recorded on the ex-dividend date. Dividends from net investment income, if any, are declared and paid annually by the Funds. Dividends from net realized gains, if any, are declared and distributed at least annually by the Funds.
The amounts of dividends from net investment income and of distributions from net realized gains are determined in accordance with federal income tax regulations, which may differ from GAAP. These “book/tax” differences are either considered temporary or permanent in nature. To the extent these differences are permanent in nature, such amounts are reclassified within the composition of net assets based on their federal tax-basis treatment; temporary differences do not require reclassification. To the extent dividends exceed net investment income and net realized gains for tax purposes, they are reported as distributions of capital.
Redemption Fees:
The Small Cap Fund, Small Cap Innovations Fund and Midcap Fund reserve the right to assess a redemption fee for shares redeemed within 60 days of purchase. The shareholder will be charged a fee equal to 1.00% of the value of the shares redeemed for the Small Cap Fund and Small Cap Innovations Fund and 0.75% for the Midcap Fund, unless an exception applies as disclosed in the Funds’ Prospectus. The redemption fee is intended to offset excess brokerage commissions and other costs associated with fluctuations in asset levels and cash flows caused by frequent trading by shareholders. The applicability of the redemption fee will be calculated using a first-in first-out method, which means the oldest shares will be redeemed first, followed by the redemption of more recently acquired shares.
Federal Income Taxes:
Each Fund intends to continue to qualify as a regulated investment company by complying with the provisions available to certain investment companies, as defined in Subchapter M of the Internal Revenue Code, and to make distributions from net investment income and from net realized capital gains sufficient to relieve it from all, or substantially all, federal income and excise taxes. Therefore, no federal income tax provision is required. |
Continued
49
| Notes to Financial Statements | | March 31, 2009 |
| | As of and during the year ended March 31, 2009, the Funds did not have a liability for any unrecognized tax benefits. The Funds recognize interest and penalties, if any, related to unrecognized tax benefits as income tax expense in the statements of operations. During the year, the Funds did not incur any interest or penalties. The statute of limitations on the Funds’ tax returns remains open for the years ended March 31, 2006 through March 31, 2009. |
| 3. | | Related Party Transactions: |
| | Investment Adviser:
The Funds and the Adviser are parties to an Investment Advisory Agreement under which the Adviser is entitled to receive an annual fee, computed daily and paid monthly, equal to the average daily net assets of each Fund, at the following annual percentage rates before contractual waivers: |
| | | | | | |
| | Fund | | Fee Rate | |
| |
| |
| |
| | Balanced Fund | | 0.75 | % | |
| | Equity Fund | | 0.75 | % | |
| | Small Cap Fund | | 0.75 | % | |
| | Midcap Fund | | 0.75 | % | |
| | Social Balanced Fund | | 0.75 | % | |
| | Social Equity Fund | | 0.75 | % | |
| | Small Cap Innovations Fund | | 0.75 | % | |
| | Administration and Fund Accounting:
Citi Fund Services Ohio, Inc. (“Citi”) serves the Funds as administrator. Citi, as the Funds administrator, provides administrative and fund accounting services for a fee that is computed daily and paid monthly at an annual rate of up to 0.20% of the average daily net assets of each Fund. Certain officers of the Group are affiliated with Citi. Such persons were paid no fees directly by the Funds for serving as officers of the Group, except the Chief Compliance Officer (the “CCO”).
Under a Compliance Services Agreement between the Funds and Citi (the “CCO Agreement”), Citi makes an employee available to serve as the Funds’ CCO. Under the CCO Agreement, Citi also provides infrastructure and support in implementing the written policies and procedures comprising the Funds’ compliance program, including support services to the CCO. For the services provided under the CCO Agreement, the Funds paid Citi $27,327 for the year ended March 31, 2009, plus certain out of pocket expenses. Citi pays the salary and other compensation earned by any such individuals as employees of Citi.
Distribution:
Foreside Distribution Services, L.P., (“Foreside”), an indirect wholly owned subsidiary of Foreside Financial Group, LLC, serves as the Funds’ distribution agent. Under the distribution agreement, Foreside receives a fixed fee of $15,000 per year and paid monthly, by the Adviser, for its services. Foreside is not affiliated with Citi or the Adviser.
Custodian and Transfer Agency:
Boston Trust & Investment Management Company, the parent Company of the Adviser, acts as the Funds’ custodian and transfer agent. Under the custody agreement, Boston Trust & Investment Management Company receives an asset-based fee of 0.02% of the average daily net assets for the first $100 million and 0.015% of the average daily net assets above $100 million, plus per transaction fees. Under the transfer agency agreement, Boston Trust & Investment Management Company receives a fixed fee of $18,000 annually per Fund, accrued daily and paid monthly for its services. Under the sub-transfer agency agreement, Citi receives a fixed fee of $12,000 annually per Fund, for the Social Equity Fund, the Small Cap Fund, and the Small Cap Innovations Fund, accrued daily and paid monthly by the Funds plus certain out of pocket expenses for its services.
Fee Reductions:
The Adviser has agreed to reduce its fees payable by the Funds to the extent necessary to limit each Fund’s aggregate annual operating expenses to 1.00% (1.25% for the Small Cap Fund and 1.25% for the Small Cap Innovations Fund until March 13, 2009, thereafter 1.00%) of the average daily net assets. Any such reductions made by the Adviser in its fees or in the payment or reimbursement of expenses that are a Fund’s obligation may be subject to repayment by the Fund within three years provided the Fund receiving the reduction, payment or reimbursement is able to effect such repayment and remain in compliance with applicable limitations. Pursuant to its agreement, for the year ended March 31, 2009, the Adviser reimbursed fees in the amount of $39,648, $23,578, $6,931, $48,745, $39,013, $69,183 and $39,182 for the Balanced Fund, Equity Fund, Small Cap Fund, Midcap Fund, Social Balanced Fund, Social Equity Fund, and Small Cap Innovations Fund, respectively. As of March 31, 2009, the Adviser may recoup $97,438, $82,095, $26,606, $86,791, $108,570, $179,558, and $39,182 from the Funds as follows: |
| | Fund | | Amount | | Expires | | Funds | | Amount | | Expires | |
| |
| |
| |
| |
| |
| |
| |
| | Balanced Fund | | $ | 19,700 | | 2010 | | | Social Balanced Fund | | $ | 34,656 | | 2010 | | |
| | | | | 38,090 | | 2011 | | | | | | 34,901 | | 2011 | | |
| | | | | 39,648 | | 2012 | | | | | | 39,013 | | 2012 | | |
| | Equity Fund | | | 28,636 | | 2010 | | | Social Equity Fund | | | 45,669 | | 2010 | | |
| | | | | 29,881 | | 2011 | | | | | | 64,706 | | 2011 | | |
| | | | | 23,578 | | 2012 | | | | | | 69,183 | | 2012 | | |
| | Small Cap Fund | | | 19,675 | | 2010 | | | Small Cap Innovations Fund | | | 39,182 | | 2012 | | |
| | | | | 6,931 | | 2012 | | | | | | | | | | |
| | Midcap Fund | | | 38,046 | | 2011 | | | | | | | | | | |
| | | | | 48,745 | | 2012 | | | | | | | | | | |
| | Citi has voluntarily agreed to reduce its administrative fees. For the year ended March 31, 2009, Citi voluntarily waived fees in the amount of $92,923, $30,688, $16,534, $6,430, $16,689, $29,283 and $252 for the Balanced Fund, Equity Fund, Small Cap Fund, Midcap Fund, Social Balanced Fund, Social Equity Fund, and Small Cap Innovations Fund, respectively.
Other Affiliated Transactions:
During the fiscal year ended March 31, 2009, certain net assets of Common Trust funds, managed by Boston Trust Investment Management, Inc., were exchanged as in-kind transfers for shares of the Boston Trust Funds and Walden Social Funds. Proceeds from the sale of shares issued in connection with the exchange were used to pay for securities from the Common Trust funds to the Boston Trust Funds and Walden Social Funds at fair market value. The total fair market value of the in-kind transfers was $670,711 and $5,625,605 for the Small Cap Fund and Social Equity Fund, respectively. |
Continued
50
| Notes to Financial Statements | | March 31, 2009 |
| 4. | | Conversion of Common Trust Fund:
On September 24, 2007, net assets of a Common Trust Fund managed by Boston Trust Investment Management, Inc. were exchanged in a tax-free conversion for shares of the corresponding Boston Trust Fund. The following is a summary of shares issued, net assets converted, net asset value per share issued and unrealized appreciation of assets acquired as of the conversion date: |
| | | | | | | | | | Net Asset | | | | | | | Common Trust | | Shares | | Net Assets | | Value Per | | Unrealized |
| | Fund | | Fund Shares | | Issued | | Converted | | Share Issued | | Appreciation |
| |
| |
| |
| |
| |
| |
|
| | Midcap Fund | | 378,154 | | | 1,330,441 | | | $ | 13,304,459 | | | | $10.00 | | | | $4,472,664 | |
| 5. | | Purchases and Sales of Securities: |
| | | Purchases of and proceeds from sales and maturities of securities, excluding short-term securities and U.S. Government securities, for the Funds for the year ended March 31, 2009, totaled: |
| | Fund | | Purchases | | | Sales and Maturities | |
| |
| |
| | |
| |
| | Balanced Fund | | $ | 26,515,031 | | | $ | 34,944,441 | | |
| | Equity Fund | | | 15,155,676 | | | | 20,385,953 | | |
| | Small Cap Fund | | | 13,698,034 | | | | 6,061,046 | | |
| | Midcap Fund | | | 2,548,421 | | | | 3,144,164 | | |
| |
| |
| | Social Balanced Fund | | | 15,041,577 | | | | 11,334,836 | | |
| | Social Equity Fund | | | 36,264,823 | | | | 20,740,531 | | |
| | Small Cap Innovations Fund | | | 2,288,338 | | | | 47,272 | | |
| | Purchases of and proceeds from sales and maturities of U.S. Government securities, excluding short-term securities, for the Funds for the year ended March 31, 2009, totaled: |
| | Fund | | Purchases | | | Sales and Maturities | |
| |
| |
| | |
| |
| | Balanced Fund | | $ | 7,565,025 | | | $ | 2,333,938 | | |
| | Social Balanced Fund | | | 10,109,220 | | | | 9,307,639 | | |
| 6. | | Federal Income Tax Information: |
| | | At March 31, 2009, the cost, gross unrealized appreciation and gross unrealized depreciation on securities, for federal income tax purposes, were as follows: |
| | | | | | | Gross Tax | | Gross Tax | | Net Unrealized |
| | | | | | | Unrealized | | Unrealized | | Appreciation |
| | | | Tax Cost | | Appreciation | | (Depreciation) | | (Depreciation) |
| |
|
| | Balanced Fund | | $ | 144,263,453 | | $ | 18,821,376 | | $ | (7,746,190) | | | $ | 11,075,186 | |
| | Equity Fund | | | 36,886,708 | | | 7,654,558 | | | (5,783,918) | | | | 1,870,640 | |
| | Small Cap Fund | | | 32,094,155 | | | 1,138,693 | | | (7,753,491) | | | | (6,614,798) | |
| | Midcap Fund | | | 9,065,531 | | | 1,285,213 | | | (2,285,149) | | | | (999,936) | |
| |
|
| | Social Balanced Fund | | | 30,819,768 | | | 1,124,860 | | | (3,086,055) | | | | (1,961,195) | |
| | Social Equity Fund | | | 51,111,816 | | | 2,276,516 | | | (10,581,113) | | | | (8,304,597) | |
| | Small Cap Innovations Fund | | | 2,369,571 | | | 92,798 | | | (149,036) | | | | (56,238) | |
| |
|
| | The tax character of distributions paid during the fiscal year ended March 31, 2009 was as follows: |
| | | | Distributions paid from | | | | | | | | | | | |
| | | |
| | | | | | | | | | | |
| | | | | | | | Net Long Term | | Total Taxable | | Tax Return of | | Total Distributions |
| | | | Ordinary Income | | Capital Gains | | Distributions | | Capital | | Paid1 |
| |
|
| | Balanced Fund | | $ | 3,118,906 | | | $ | 4,763,595 | | | $ | 7,882,501 | | | $ | — | | $ | 7,882,501 | |
| | Equity Fund | | | 482,096 | | | | — | | | | 482,096 | | | | — | | | 482,096 | |
| | Small Cap Fund | | | 50,862 | | | | 252,171 | | | | 303,033 | | | | — | | | 303,033 | |
| | Midcap Fund | | | 34,699 | | | | 112,776 | | | | 147,475 | | | | — | | | 147,475 | |
| |
|
| | Social Balanced Fund | | | 605,006 | | | | 342,065 | | | | 947,071 | | | | — | | | 947,071 | |
| | Social Equity Fund | | | 515,574 | | | | 485,655 | | | | 1,001,229 | | | | — | | | 1,001,229 | |
| | Small Cap Innovations Fund | | | 1,149 | | | | — | | | | 1,149 | | | | — | | | 1,149 | |
| |
|
Continued
51
| Notes to Financial Statements | | March 31, 2009 |
| | The tax character of distributions paid during the fiscal year ended March 31, 2008 was as follows: |
| | | | Distributions paid from | | | | | | | | | | | | |
| | | |
| | | | | | | |
| | | | | | | | Net Long Term | | Total Taxable | | Tax Return of | | Total Distributions |
| | | | Ordinary Income | | Capital Gains | | Distributions | | Capital | | Paid1 |
| |
|
| | Balanced Fund | | $ | 2,580,508 | | | $ | 5,624,715 | | | $ | 8,205,223 | | | $ | — | | | $ | 8,205,223 | |
| | Equity Fund | | | 392,184 | | | | 1,383,315 | | | | 1,775,499 | | | | — | | | | 1,775,499 | |
| | Small Cap Fund | | | 493,692 | | | | 870,734 | | | | 1,364,426 | | | | — | | | | 1,364,426 | |
| | Midcap Fund | | | 6,592 | | | | 92,184 | | | | 98,776 | | | | — | | | | 98,776 | |
| |
|
| | Social Balanced Fund | | | 463,640 | | | | 1,085,395 | | | | 1,549,035 | | | | — | | | | 1,549,035 | |
| | Social Equity Fund | | | 306,240 | | | | 1,332,705 | | | | 1,638,945 | | | | — | | | | 1,638,945 | |
| |
|
| | 1 Total distributions paid may differ from the amount reported in the Statements of Changes in Net Assets because for tax purposes distributions are recognized when actually paid.
As of March 31, 2009, the components of accumulated earnings on a tax basis were as follows: |
| | | | | | | | Undistributed | | | | | | | Accumulated | | Unrealized | | | | |
| | | | Undistributed | | Long-Term Capital | | Accumulated | | | Capital and Other | | Appreciation | | Total Accumulated |
| | | | Ordinary Income | | Gains | | Earnings | | | Losses | | (Depreciation)1 | | Earnings (Deficit) |
| |
|
| | Balanced Fund | | $ | 759,251 | | | $ | — | | | $ | 759,251 | | | | $ | (3,488,697) | | | $ | 11,075,186 | | | $ | 8,345,740 | |
| | Equity Fund | | | 111,490 | | | | — | | | | 111,490 | | | | | (3,955,824) | | | | 1,870,640 | | | | (1,973,694) | |
| | Small Cap Fund | | | 25,109 | | | | — | | | | 25,109 | | | | | (3,231,779) | | | | (6,614,798) | | | | (9,821,468) | |
| | Midcap Fund | | | 7,676 | | | | — | | | | 7,676 | | | | | (354,291) | | | | (999,936) | | | | (1,346,551) | |
| |
|
| | Social Balanced Fund | | | 58,396 | | | | — | | | | 58,396 | | | | | (2,303,077) | | | | (1,961,195) | | | | (4,205,876) | |
| | Social Equity Fund | | | 311,078 | | | | — | | | | 311,078 | | | | | (5,176,125) | | | | (8,304,597) | | | | (13,169,644) | |
| | Small Cap Innovations Fund | | | 2,000 | | | | — | | | | 2,000 | | | | | (11,726) | | | | (56,238) | | | | (65,964) | |
| |
|
| | 1 The differences between book-basis and tax-basis unrealized appreciation (depreciation) is attributable primarily to: tax deferral of losses on wash sales.
Under current tax law, capital losses realized after October 31 of a Fund’s fiscal year may be deferred and treated as occurring on the first business day of the following fiscal year for tax purposes. The following Funds had deferred post October capital losses, which will be treated as arising on the first business day of the Funds’ next taxable year. |
| | | | Post-October Loss | |
| | | |
| |
| | Balanced Fund | | $ | 3,488,697 | | |
| | Equity Fund | | | 3,196,661 | | |
| | Small Cap Fund | | | 2,651,329 | | |
| | Midcap Fund | | | 354,291 | | |
| | Social Balanced Fund | | | 1,941,339 | | |
| | Social Equity Fund | | | 4,264,473 | | |
| | Small Cap Innovations Fund | | | 11,726 | | |
| | As of March 31, 2009, the following reclassifications have been made to increase (decrease) such accounts with offsetting adjustments to capital: |
| | | Accumulated Net | | | | | | | |
| | | Investment | | Accumulated Net | | | | | |
| | | Income (loss) | | Realized Gains | | Paid in Capital | |
| |
| |
| | Balanced Fund | | $(1 | ) | | $1 | | | $— | | |
| | Equity Fund | | 1 | | | — | | | (1 | ) | |
| |
| |
| | Social Balanced Fund | | — | | | (1) | | | 1 | | |
| | Small Cap Innovations Fund | | 216 | | | — | | | (216 | ) | |
| |
| |
| | As of March 31, 2009, the following Funds had net capital loss carryforwards, which are available to offset future realized gains. To the extent these carryforwards are used to offset future gains, it is probable that the amounts offset will not be distributed to shareholders. |
| | Fund | Amount | | Expires | |
| |
| |
| | Equity Fund | $ | 759,163 | | 2017 | |
| | Small Cap Fund | | 580,450 | | 2017 | |
| |
| |
| | Social Balanced Fund | | 361,738 | | 2017 | |
| | Social Equity Fund | | 911,652 | | 2017 | |
| |
| |
Continued
52
| Notes to Financial Statements | March 31, 2009 |
|
| 7. | | Control Ownership and Principal Holders: |
| | | The beneficial ownership, either directly or indirectly, of more than 25% of the voting securities of a Fund creates presumptions of control of the Fund, under section 2 (a)(9) of the 1940 Act. As of March 31, 2009, the Funds had individual shareholder accounts and/or omnibus shareholder accounts (comprised of a group of individual shareholders), owning more than 25% of the total shares outstanding of the Fund as detailed below. |
| | | | | | % of | |
| | Fund | | Control Ownership | | Ownership | |
| |
| |
| |
| |
| | Balanced Fund | | Boston Trust & Investment Management Company | | 93.8% | |
| | Equity Fund | | Boston Trust & Investment Management Company | | 99.9% | |
| | Small Cap Fund | | Boston Trust & Investment Management Company | | 67.9% | |
| | Midcap Fund | | Boston Trust & Investment Management Company | | 100.0% | |
| | Social Balanced Fund | | Boston Trust & Investment Management Company | | 61.7% | |
| | | | Fidelity Investment Services | | 32.2% | |
| | Social Equity Fund | | Boston Trust & Investment Management Company | | 31.6% | |
| | | | Fidelity Investment Services | | 37.6% | |
| | Small Cap Innovations Fund | | Boston Trust & Investment Management Company | | 69.5% | |
| | | | Mac & Company (nominee for BNY Mellon) | | 26.0% | |
| 8. | | Change in Independent Registered Public Accounting Firm: |
| | | At a meeting on May 14, 2008, the Coventry Group Audit Committee (consisting of Independent Trustees) selected and approved Cohen Fund Audit Services, Ltd. as the Independent Registered Public Accounting Firm for the Funds, replacing Ernst & Young LLP. |
53
Report of Independent Registered Public Accounting Firm
To the Shareholders and Board of Trustees of The Coventry Group:
We have audited the accompanying statements of assets and liabilities, including the schedules of portfolio investments, of The Coventry Group, comprising the Boston Trust Balanced Fund, Boston Trust Equity Fund, Boston Trust Small Cap Fund, Boston Trust Midcap Fund, Walden Social Balanced Fund,Walden Social Equity Fund, and Walden Small Cap Innovations Fund (the “Funds”) as of March 31, 2009, and the related statements of operations and changes in net assets and the financial highlights for the period then ended. These financial statements and financial highlights are the responsibility of Fund management. Our responsibility is to express an opinion on these financial statements and financial highlights based on our audit. The financial statements and the financial highlights for the periods indicated prior to the period ended March 31, 2009 were audited by other independent registered public accounting firms, who expressed unqualified opinions on those financial statements and financial highlights.
We conducted our audit in accordance with the standards of the Public Company Accounting Oversight Board (United States). Those standards require that we plan and perform the audit to obtain reasonable assurance about whether the financial statements and financial highlights are free of material misstatement. An audit includes examining, on a test basis, evidence supporting the amounts and disclosures in the financial statements. Our procedures included confirmation of securities owned as of March 31, 2009 by correspondence with the custodian and brokers or by other appropriate auditing procedures where replies from brokers were not received. An audit also includes assessing the accounting principles used and significant estimates made by management, as well as evaluating the overall financial statement presentation. We believe that our audit provides a reasonable basis for our opinion.
In our opinion, the financial statements and financial highlights referred to above present fairly, in all material respects, the financial position of each of the Funds as of March 31, 2009, and the results of their operations, changes in their net assets and their financial highlights for the period then ended, in conformity with accounting principles generally accepted in the United States of America.

COHEN FUND AUDIT SERVICES, LTD.
Westlake, Ohio
May 20, 2009
54
| Supplementary Information (unaudited) | March 31, 2009 |
|
Federal Income Tax Information:
During the fiscal year ended March 31, 2009, the Funds declared long-term realized gain distributions in the following amounts:
| | | 15% Capital Gains |
| Balanced Fund | | $4,763,595 | |
| Small Cap Fund | | 252,171 | |
| Midcap Fund | | 112,776 | |
| Social Balanced Fund | | 342,065 | |
| Social Equity Fund | | 485,655 | |
For the fiscal year ended March 31, 2009, the following percentage of the total ordinary income distributions paid by the Funds qualify for the distributions received deduction available to corporate shareholders.
| | | Distributions Received Deduction |
| Balanced Fund | | 56.17% | |
| Equity Fund | | 100.00% | |
| Small Cap Fund | | 94.91% | |
| Midcap Fund | | 100.00% | |
| Social Balanced Fund | | 67.50% | |
| Social Equity Fund | | 100.00% | |
| Small Cap Innovations Fund | | 100.00% | |
For the fiscal year ended March 31, 2009, distributions paid by the Funds may be subject to a maximum tax rate of 15%, as provided for by the Jobs and Growth Tax Relief Reconciliation Act of 2003. The Funds intend to designate the maximum amount allowable as taxed at a maximum rate of 15%. Complete information will be reported in conjunction with your 2009 Form 1099-DIV.
| | | Qualified Dividend Income |
| Balanced Fund | | 58.12% | |
| Equity Fund | | 100.00% | |
| Small Cap Fund | | 94.86% | |
| Midcap Fund | | 100.00% | |
| Social Balanced Fund | | 77.45% | |
| Social Equity Fund | | 100.00% | |
| Small Cap Innovations Fund | | 100.00% | |
| | | | |
Table of Shareholder Expenses:
As a shareholder of the Boston Trust Funds and Walden Funds, you incur the following costs: ongoing costs, including management fees, and other Fund expenses. This example is intended to help you understand your ongoing costs (in dollars) of investing in the Boston Trust Funds and Walden Funds and to compare these costs with the ongoing costs of investing in other mutual funds.
The example is based on an investment of $1,000 invested at the beginning of the period and held for the entire period from October 1, 2008 through March 31, 2009.
Actual Expenses
The table below provides information about actual account values and actual expenses. You may use the information below, together with the amount you invested, to estimate the expenses that you paid over the period. Simply divide your account value by $1,000 (for example, an $8,600 account value divided by $1,000 = 8.6), then multiply the result by the number in the table under the heading entitled “Expenses Paid During Period” to estimate the expenses you paid on your account during this period.
Please note that the expenses shown in the table are meant to highlight your ongoing costs only and do not reflect any transactional costs, such as sales charges (loads). Therefore, the table is useful in comparing ongoing costs only, and will not help you determine the relative total costs of owning different funds. In addition, if these transactional costs were included, your costs would have been higher.
| | | | | | | | | | | | | | | | | |
| | | Beginning Account Value | | Ending Account Value | | Expense Paid During Period1 | | Expense Ratio During Period |
| | | 10/1/08 | | 3/31/09 | | 10/1/08 - 3/31/09 | | 10/1/08 - 3/31/09 |
|
| Balanced Fund | | $ | 1,000.00 | | | $ | 853.70 | | | | $4.62 | | | | 1.00% | |
| Equity Fund | | | 1,000.00 | | | | 726.20 | | | | 4.30 | | | | 1.00% | |
| Small Cap Fund | | | 1,000.00 | | | | 677.60 | | | | 4.73 | | | | 1.13% | |
| Midcap Fund | | | 1,000.00 | | | | 721.30 | | | | 4.29 | | | | 1.00% | |
|
| Social Balanced Fund | | | 1,000.00 | | | | 828.00 | | | | 4.56 | | | | 1.00% | |
| Social Equity Fund | | | 1,000.00 | | | | 708.60 | | | | 4.26 | | | | 1.00% | |
| Small Cap Innovations Fund2 | | | 1,000.00 | | | | 920.20 | | | | 4.85 | | | | 1.16% | |
|
| 1 | | Expenses are equal to the average account value times the Fund’s annualized expense ratio multiplied by the number of days in the most recent fiscal half-year divided by the number of days in the fiscal year. |
| | | |
| 2 | | Information shown reflects values using the expense ratios and rates of return for the period from October 24, 2008 (commencement of operations) to March 31, 2009. |
Continued
55
| Supplementary Information (unaudited) | March 31, 2009 |
|
Hypothetical Example for Comparison Purposes
The table below provides information about hypothetical account values and hypothetical expenses based on each Boston Trust Funds’ and Walden Funds’ actual expense ratio and an assumed rate of return of 5% per year before expenses, which is not the Fund’s actual return. The hypothetical account values and expenses may not be used to estimate the actual ending account balance or expenses you paid for the period. You may use this information to compare this 5% hypothetical example with the 5% hypothetical examples that appear in the shareholder reports of other funds.
Please note that the expenses shown in the table are meant to highlight your ongoing costs only and do not reflect any transactional costs, such as sales charges (loads). Therefore, the table is useful in comparing ongoing costs only, and will not help you determine the relative total costs of owning different funds. In addition, if these transactional costs were included, your costs would have been higher.
| | | Beginning Account Value | | Ending Account Value | | Expense Paid During Period1 | | Expense Ratio During Period |
| | | 10/1/08 | | 3/31/09 | | 10/1/08 - 3/31/09 | | 10/1/08 - 3/31/09 |
|
| Balanced Fund | | $ | 1,000.00 | | | $ | 1,019.95 | | | | $5.04 | | | | 1.00% | |
| Equity Fund | | | 1,000.00 | | | | 1,019.95 | | | | 5.04 | | | | 1.00% | |
| Small Cap Fund | | | 1,000.00 | | | | 1,019.30 | | | | 5.69 | | | | 1.13% | |
| Midcap Fund | | | 1,000.00 | | | | 1,019.95 | | | | 5.04 | | | | 1.00% | |
|
| Social Balanced Fund | | | 1,000.00 | | | | 1,019.95 | | | | 5.04 | | | | 1.00% | |
| Social Equity Fund | | | 1,000.00 | | | | 1,019.95 | | | | 5.04 | | | | 1.00% | |
| Small Cap Innovations Fund2 | | | 1,000.00 | | | | 1,019.15 | | | | 5.84 | | | | 1.16% | |
|
| 1 | | Expenses are equal to the average account value times the Fund’s annualized expense ratio multiplied by the number of days in the most recent fiscal half-year divided by the number of days in the fiscal year. |
| | | |
| 2 | | Information shown reflects values using the expense ratios for the period from October 24, 2008 (commencement of operations) to March 31, 2009 and has been adjusted to reflect the values for the period from October 1, 2008 to March 31, 2009. |
Continued
56
| Supplementary Information (unaudited) | March 31, 2009 |
|
Tabular Summary of Schedules of Investments:
The Boston Trust Funds invested, as a percentage of total portfolio investments, in the following industries as of March 31, 2009.
| Boston Trust Balanced Fund | | Boston Trust Equity Fund | | Boston Trust Small Cap Fund | | Boston Trust Midcap Fund |
| | | | | | | | | | | | | | | | | | | |
| Security Allocation | | Percentage of | | Security Allocation | | Percentage of | | Security Allocation | | Percentage of | | Security Allocation | | Percentage of |
| for the Schedule of | | Total Portfolio | | for the Schedule of | | Total Portfolio | | for the Schedule of | | Total Portfolio | | for the Schedule of | | Total Portfolio |
| Portfolio Investments | | Investments | | Portfolio Investments | | Investments | | Portfolio Investments | | Investments | | Portfolio Investments | | Investments |
| |
| |
| |
|
| U.S. Gov’t. Obligations | | 43.5 | % | | Industrial Prods & Svcs | | 17.9 | % | | Information Technology | | 18.2 | % | | Health Care | | 17.7 | % |
| Industrial Prods & Svcs | | 7.3 | % | | Health Care | | 14.5 | % | | Financial Services | | 16.6 | % | | Industrial Prods & Svcs | | 17.4 | % |
| Health Care | | 7.2 | % | | Information Technology | | 13.4 | % | | Health Care | | 15.3 | % | | Information Technology | | 14.1 | % |
| Investment Companies | | 7.2 | % | | Energy | | 12.8 | % | | Industrial Prods & Svcs | | 15.0 | % | | Consumer Products | | 11.7 | % |
| Information Technology | | 6.4 | % | | Consumer Products | | 10.9 | % | | Consumer Discretionary | | 12.0 | % | | Industrial Materials | | 8.6 | % |
| Energy | | 6.0 | % | | Consumer Discretionary | | 10.3 | % | | Consumer Products | | 6.6 | % | | Consumer Discretionary | | 8.6 | % |
| Municipal Bonds | | 5.5 | % | | Financial Services | | 8.2 | % | | Utilities | | 6.3 | % | | Energy | | 5.8 | % |
| Consumer Products | | 5.1 | % | | Industrial Materials | | 6.3 | % | | Energy | | 3.9 | % | | Financial Services | | 5.4 | % |
| Consumer Discretionary | | 3.6 | % | | Investment Companies | | 5.7 | % | | Investment Companies | | 3.3 | % | | Investment Companies | | 4.9 | % |
| Financial Services | | 3.0 | % | |
| | Industrial Materials | | 2.3 | % | | Utilities | | 3.7 | % |
| Corporate Bonds | | 3.0 | % | | Total | | 100.0 | % | | Telecommunications | | 0.5 | % | | Telecommunications | | 2.1 | % |
| Industrial Materials | | 2.2 | % | |
| |
| |
|
| | | | | | | Total | | 100.0 | % | | Total | | 100.0 | % |
| Total | | 100.0 | % | | | | | | |
| |
|
| | | | | | | | | | | | | | | |
The Boston Trust (Walden) Funds invested, as a percentage of total portfolio investments, in the following industries as of March 31, 2009.
| Walden Social Balanced Fund | | Walden Social Equity Fund | | Walden Small Cap Innovations Fund |
| | | | | | | | | | | | | | |
| | | Percentage of | | | | Percentage of | | | | Percentage of |
| Security Allocation for the | | Total Portfolio | | Security Allocation for the | | Total Portfolio | | Security Allocation for the | | Total Portfolio |
| Schedule of Portfolio Investments | | Investments | | Schedule of Portfolio Investments | | Investments | | Schedule of Portfolio Investments | | Investments |
| |
| |
|
| U.S. Gov’t. Obligations | | 32.3 | % | | Information Technology | | 18.6 | % | | Information Technology | | 18.3 | % |
| Corporate Bonds | | 10.0 | % | | Energy | | 15.2 | % | | Financial Services | | 16.1 | % |
| Health Care | | 8.1 | % | | Industrial Prods & Svcs | | 14.5 | % | | Health Care | | 15.0 | % |
| Consumer Products | | 7.8 | % | | Health Care | | 14.0 | % | | Industrial Prods & Svcs | | 14.6 | % |
| Information Technology | | 7.4 | % | | Consumer Products | | 13.0 | % | | Consumer Discretionary | | 11.0 | % |
| Investment Companies | | 6.8 | % | | Consumer Discretionary | | 7.6 | % | | Consumer Products | | 6.9 | % |
| Municipal Bonds | | 5.8 | % | | Industrial Materials | | 7.3 | % | | Investment Companies | | 6.1 | % |
| Industrial Prods & Svcs | | 5.7 | % | | Financial Services | | 6.0 | % | | Utilities | | 4.9 | % |
| Energy | | 5.5 | % | | Telecommunications | | 3.1 | % | | Energy | | 4.1 | % |
| Consumer Discretionary | | 4.9 | % | | Investment Companies | | 0.7 | % | | Industrial Materials | | 2.5 | % |
| Industrial Materials | | 2.6 | % | |
| | Telecommunications | | 0.5 | % |
| Financial Services | | 2.6 | % | | Total | | 100.0 | % | |
|
| Certificates of Deposit | | 0.3 | % | |
| | Total | | 100.0 | % |
| Telecommunications | | 0.2 | % | | | | | | |
|
| | | | | | | | | | |
| Total | | 100.0 | % | | | | | | | | | | |
| | | | | | | | | | |
| | | | | | | | | | | | | | |
Other Information:
A description of the policies and procedures that the Funds use to determine how to vote proxies related to portfolio securities is available (i) without charge, upon request, by calling 1-800-282-8782 ext. 7050, (ii) on the Boston Trust & Investment Management (the “BTIM”) website at http://www.btim.com, and (iii) on the Securities and Exchange Commission’s (the “Commission”) website at http://www.sec.gov.
Information regarding how the Funds’ voted proxies relating to portfolio securities during the most recent 12-month period ended June 30 is available (i) without charge, upon request, by calling 1-800-282-8782 ext. 7050, (ii) on the BTIM website at http://www.btim.com, and (iii) on the Commission’s website at http://www.sec.gov.
The Funds file complete schedules of portfolio holdings for each Fund with the Commission for the first and third quarters of each fiscal year on Form N-Q. The Funds’ Form N-Q is available on the Commission’s website at http://www.sec.gov. The Funds’ Form N-Q may be reviewed and copied at the Commission’s Public Reference Room in Washington, D.C. and information on the operation of the Public Reference Room may be obtained by calling 800-SEC-0330.
Continued
57
| Supplementary Information (unaudited) | March 31, 2009 |
|
The annual consideration by the Board of Trustees (the “Board”) of the continuation of the investment advisory agreement between Boston Trust Investment Management, Inc., (the “Adviser”) and Boston Trust Balanced Fund, Boston Trust Equity Fund, Boston Trust Small Cap Fund, Boston Trust Midcap Fund, Walden Social Balanced Fund, Walden Social Equity Fund and Walden Small Cap Innovations Fund (the “Funds”).
Section 15 of the Investment Company Act of 1940 (the “1940 Act”) requires that the Investment Advisory Agreement with the Adviser be renewed annually by the Board, including a majority of the Trustees who are not “interested persons” of the Funds or of the Adviser (“Independent Trustees”). It is the duty of the Board to request as much information as is reasonably necessary to evaluate the terms of the Investment Advisory Agreement and determine whether its continuance is fair to the Funds and their shareholders. The Board considered the continuation of the Investment Advisory Agreement at an in-person meeting held on February 26, 2009. The Board requested, and the Adviser provided, information and data relating to: (i) the investment performance of the Funds and the Adviser; (ii) the nature, extent and quality of the services provided by the Adviser to the Funds; (iii) the cost of the services to be provided and the profits to be realized by the Adviser and its affiliates from the relationship with the Funds; (iv) the extent to which economies of scale will be realized as the Funds grow; (v) whether the fee levels reflect these economies of scale to the benefit of Funds’ shareholders; (vi) the advisory fees paid by other comparable funds advised by the Adviser or by a different investment adviser; (vii) the Funds’ expense ratios and the expense ratios of similar funds; and (viii) the effect of any fee waivers and expense reimbursements made by the Adviser.
At the meeting on February 26, 2009, the Board engaged in a thorough review process to determine whether to continue the Investment Advisory Agreement. The Board met directly with representatives of the Adviser and reviewed the information and data listed above. As part of its deliberations, the Board also considered and relied upon the information about the Funds and the Adviser that it had received throughout the year as part of its ongoing oversight of the Funds and their operations. The Board reviewed the performance of the Funds from inception through December 31, 2008, comparing the performance to various indices and, in the case of the Boston Trust Balanced Fund and the Walden Social Balanced Fund, a composite index comprised of stocks, bond and money market indices. The Boston Trust Funds and the Walden Funds, other than the Walden Social Balanced Fund and the Walden Small Cap Innovations Fund outperformed their respective composites and indexes for the one-year, five-year and since inception periods ended December 31, 2008. The Walden Social Balanced Fund underperformed its composite index for the one-year, five-year and since inception periods ended December 31, 2008. With respect to certain indexes comprising the composite index, both the Boston Trust Balanced Fund and the Walden Social Balanced Fund outperformed the S&P 500 Index in all periods, but generally lagged the Barclays Capital U.S. Government/Credit Bond Index. While the Walden Small Cap Innovations Fund underperformed its index for its since inception period ended December 31, 2008, the Board also observed that the Fund’s since inception performance is a short-term measure because it commenced operations as a mutual fund October 24, 2008. The Board also took note of the relationship between the Adviser and the Funds and the efforts that have been undertaken by the Adviser to foster the growth and development of the Funds, as well as plans for the continued growth of each Fund. Based upon the short-term and long-term performance of the Funds, the Board concluded that performance of the Funds was within range of reasonable expectations.
Turning to the level of the advisory fees paid by the Funds, the Board reviewed a comparative analysis of advisory fees and expense ratios based on publicly available data for comparable funds. The Board noted that, with the exception of the Boston Trust Balanced Fund and the Walden Social Balanced Fund, the advisory fee for each Fund, both before and after expense waivers and/or reimbursements, compared favorably with the industry average for comparable funds. The advisory fee for the Walden Social Balanced Fund was below the industry average after expense waivers and/or reimbursements. The advisory fee for the Boston Trust Balanced Fund was only slightly above the industry average but within the range of fees paid by comparable funds. The Board also noted that the total operating expenses for each of the Funds were lower than the industry average after expense waivers and/or reimbursements. In addition the total operating expenses of the Boston Trust Small Cap Fund, Boston Trust Midcap Fund, Boston Trust Equity Fund and the Walden Social Equity Fund were lower than the industry average before expense waivers and/or reimbursements. The Board noted that the Adviser would consider advisory fee breakpoints in the future, but did not think that, based on current Fund sizes, that the current economics made fee breaks possible at this time. Having considered the above factors in assessing Fund advisory fees and expense ratios, the Board concluded that fee and expense levels were reasonable.
The Board gave careful consideration to the range of investment advisory services provided by the Adviser to the Funds and the level and quality of these services. The Board reviewed the Adviser’s organizational structure for its twelve person staff, the Adviser’s investment philosophy and portfolio construction process, its fixed income approach and its brokerage policies. The Board noted the experience and the capabilities of the Adviser’s personnel, as well as the quality of the reports and other materials received from the Adviser. In addition, with respect to the Walden Social Balanced Fund and the Walden Social Equity Fund, the Board noted the manner in which the Adviser utilizes the services of its affiliate, Walden Asset Management, to assist the Adviser with socially responsible investment strategies that it employs in these two Funds. Such services include shareholder advocacy, proxy voting and other social initiatives. The Board also reviewed the manner in which the Adviser compensates its affiliate from its own resources for such services. Further, the Board considered the use of Boston Trust & Investment Management Company as custodian for the Funds and the benefit to the Funds and the Adviser resulting from such use.
Continued
58
| Supplementary Information (unaudited) | March 31, 2009 |
|
The Board then reviewed financial information collected from the income statements of the Adviser concerning the cost to the Adviser of providing services to the Funds and the overall profitability to the Adviser of its relationship with the Funds. The Board noted that the Adviser’s relationship with the Funds was profitable in spite of the revenue reducing efforts of both an Expense Limitation Agreement with the Funds and the waiver of a portion of the advisory fee attributable to investments in the Funds by bank trust accounts.
In reaching its conclusions with respect to the continuation of the Investment Advisory Agreement, the Board did not identify any single controlling factor. Rather, the Board noted that a combination of factors influenced their decision making process. The Board did, however, identify the commitment of the Adviser to the successful operation of the Funds and the level of Fund expenses as being important elements of their consideration. The Board took notice of the fact that the Adviser has maintained an Expense Limitation Agreement with respect to each of the Funds since the inception of each Fund pursuant to which total operating expenses for each of the Funds is limited, which the Board noted benefits shareholders in each of the Funds. The Board took further notice of the fact that the Adviser has agreed to continue the Expense Limitation Agreement for each of the Funds, including a new reduced Expense Limitation Agreement for the Boston Trust Small Cap Fund and the Walden Small Cap Innovations Fund, for the current fiscal year. Based upon their review and consideration of these factors and other matters deemed relevant by the Board in reaching an informed business judgment, a majority of the Board, including a majority of the Independent Trustees, concluded that the terms of the Investment Advisory Agreement are fair and reasonable and the Board voted to renew the Investment Advisory Agreement for an additional one-year period.
59
| Information about Trustees and Officers (unaudited) | March 31, 2009 |
|
Overall responsibility for management of the Funds rests with the Board of Trustees. The names of the Trustees and Officers of the Funds, their addresses, ages and principal occupations during the past five years are provided in the tables below. The business address of the persons listed below is 3435 Stelzer Road, Columbus, Ohio 43219-3035, unless otherwise listed. Trustees who are deemed “interested persons,” as defined in the Investment Company Act of 1940, are Interested Trustees. Trustees who are not interested persons are referred to as Independent Trustees. The Funds’ Statement of Additional Information includes additional information about the Funds’ Trustees and is available, without charge and upon request by calling 1-800-282-8782.
| | | | | | | | | Number of Funds | | Other |
| | | Positions(s) | | Term of Office* | | | | in Fund Complex | | Directorships |
| | | Held with | | and Length of | | Principal Occupation(s) | | Overseen by | | Held by |
| Name, Age | | the Funds | | Time Served | | During Past Five Years | | Trustee | | Trustee |
|
| INDEPENDENT TRUSTEES | | | | | | | | | |
|
Michael M. Van Buskirk
Date of Birth: 2/22/1947 | | Trustee | | Since 1992 | | President and Chief Executive Officer, Ohio Bankers League, May, 1991 to present. | | 7 | | The Coventry Funds Trust |
| | | | | | | | | | | |
Diane Armstrong
Date of Birth: 7/2/1964 | | Trustee | | Since 2004 | | Director of Financial Planning, WealthStone, July, 2008 to present; Principal of King, Dodson Armstrong Financial Advisors, Inc. August, 2003 to July, 2008; Director of Financial Planning, Hamilton Capital Management, April, 2000 to August, 2003. | | 7 | | The Coventry Funds Trust |
| | | | | | | | | | | |
Dr. James Woodward
Date of Birth: 11/24/1939 | | Trustee | | Since 1997 | | Chancellor Emeritus, University of North Carolina at Charlotte, August, 2005 to present; Chancellor, University of North Carolina at Charlotte. July, 1989 to July, 2005. | | 7 | | The Coventry Funds Trust |
|
| OFFICERS WHO ARE NOT TRUSTEES | | | | | | | | |
|
John Danko
Date of Birth: 4/17/1967 | | President | | Since 2008 | | Senior Vice President, Relationship Management, Citi Fund Services Ohio, Inc., May, 1997 to present. | | | | |
| | | | | | | | | | | |
Robert W. Silva
Date of Birth: 8/15/1966 | | Treasurer | | Since 2008 | | Senior Vice President, Fund Administration, Citi Fund Services Ohio, Inc., September, 2007 to present; Assistant Vice President, Citizens Advisers, Inc., May, 2002 to August, 2007. | | | | |
| | | | | | | | | | | |
| | | | | | | | | | | |
Curtis Barnes
Date of Birth: 9/24/1953 | | Secretary | | Since 2007 | | Senior Vice President, Regulatory Administration, Citi Fund Services Ohio, Inc., May, 1995 to present. | | | | |
| | | | | | | | | | | |
Eric B. Phipps **
Date of Birth: 6/20/1971 | | Chief Compliance Officer | Since 2006 | | Vice President Citi Fund Services Ohio, Inc., June, 2006 to present. Staff Accountant, United States Securities and Exchange Commission October, 2004 to May, 2006. Director of Compliance BISYS Fund Services Ohio, Inc. December, 1995 to October, 2004. | | | | |
|
| * | | Trustees hold their position with the Funds until their resignation or removal. Officers hold their positions with the Funds until a successor has been duly elected and qualified. |
| ** | | Mr. Phipps serves as Chief Compliance Officer. His compensation is reviewed and approved by the Board of Trustees and paid by Citi pursuant to a Compliance Services Agreement between Citi and the Trust. The Fee paid pursuant to the Compliance Services Agreement by the Fund is not indicative of the total compensation received by Mr. Phipps. |
60
| | |
| | |
| Investment Adviser | |
| Boston Trust Investment Management, Inc. | |
| One Beacon Street | |
| Boston, MA 02108 | |
| | |
| | |
| Custodian and Transfer Agent | |
| Boston Trust & Investment Management Company | |
| One Beacon Street | |
| Boston, MA 02108 | |
| | |
| | |
| Administrator | |
| Citi Fund Services Ohio, Inc. | |
| 3435 Stelzer Road | |
| Columbus, OH 43219 | |
| | |
| | |
| Distributor | |
| Foreside Distribution Services, L.P. | |
| 10 High Street | |
| Boston, MA 02110 | |
| | |
| | |
| Independent Registered Public Accounting Firm | |
| Cohen Fund Audit Services, Ltd. | |
| 800 Westpoint Parkway, Suite 1100 | |
| Westlake, Ohio 44145 | |
| | |
| | |
| Legal Counsel | |
| Thompson Hine LLP | |
| 41 South High Street, Suite 1700 | |
| Columbus, OH 43215 | |
| | |
| | |
| | |
| | |
| | |
| | |
| | |
| This report is intended for the shareholders of the Funds and may not be used as sales literature unless preceded or accompanied by a current prospectus. | |
| | |
| | |
| Past performance results shown should not be considered a representation of future performance. Share price and returns will fluctuate so that shares, when redeemed, may be worth more or less than their original cost. Statements and other information herein are dated and subject to change. | |
| | |
| | |
| | |
| | |
| | |
| | |
| 05/09 | |
| | |
| | |
| Item 2. | | Code of Ethics. |
| | | |
| (a) | | The registrant has adopted a code of ethics that applies to the registrant’s principal executive officer, principal financial officer, principal accounting officer or controller, or persons performing similar functions. This code of ethics is included as an Exhibit. |
| | | |
| (b) | | During the period covered by the report, with respect to the registrant’s code of ethics that applies to its principal executive officer, principal financial officer, principal accounting officer or controller, or persons performing similar functions; there have been no amendments to, nor any waivers granted from, a provision that relates to any element of the code of ethics definition enumerated in paragraph (b) of this Item 2. |
| | | |
| Item 3. | | Audit Committee Financial Expert. |
| | | |
| 3(a)(1) | | The registrant’s board of directors has determined that the registrant has at least one audit committee financial expert serving on its audit committee. |
| | | |
| 3(a)(2) | | The audit committee financial expert is Diane Armstrong, who is “independent” for purposes of this Item 3 of Form N-CSR. |
| | | |
| Item 4. | | Principal Accountant Fees and Services. |
| | | |
| (a) | | Audit Fees |
| | | For the year ended March 31, 2009, Cohen billed Audit Fees to the Boston Trust Funds of $70,000. For the fiscal year ended March 31, 2008, Ernst & Young billed Audit Fees to the Boston Trust Funds of $79,770. |
| | | |
| (b) | | Audit Related Fees |
| | | For the period ended March 31, 2009 there were no fees for audit-related services for the Boston Trust Funds. |
| | | |
| (c) | | Tax Fees |
| | | For the year ended March 31, 2009, Cohen billed Tax Fees to the Boston Trust Funds of $14,000. For the fiscal year ended March 31, 2008, Ernst & Young billed Tax Fees to the Boston Trust Funds of $18,000. These fees relate to tax compliance services. |
| | | |
| (d) | | All Other Fees |
| | | There were no fees for all other services to the Boston Trust Funds not included above. |
| | | The audit committee reviews all matters involving the Coventry Group’s independent accountants, including engagement letters and accountant presentations addressing the scope of an audit. Audit related matters are presented to the Board of Trustees for consideration, with a recommendation from the audit committee. All services provided to the Coventry Group by independent accountants are pre-approved by the audit committee. |
| | | |
| (e) | | Not applicable. |
| | | |
| (f) | | Not applicable. |
| | | |
| (g) | | Not applicable. |
| | | |
| (h) | | Not applicable. |
| | | |
| Item 5. Audit Committee of Listed Registrants. |
| | | |
| Not applicable. |
| | | |
| Item 6. Schedule of Investments. |
| | | |
| (a) | | Not applicable. |
| (b) | | Not applicable. |
| | | |
| Item 7. Disclosure of Proxy Voting Policies and Procedures for Closed-End Management Investment Companies. |
| | | |
| Not applicable. |
| | | |
| Item 8. Portfolio Managers of Closed-End Management Investment Companies. |
| | | |
| Not applicable. |
| | | |
| Item 9. Purchases of Equity Securities by Closed-End Management Investment Company and Affiliated Purchasers. |
| | | |
| Not applicable. |
| | | |
| Item 10. Submission of Matters to a Vote of Security Holders. |
| | | |
| Not applicable. |
| | | |
| Item 11. Controls and Procedures. |
| | | |
| (a) | | The registrant’s principal executive officer and principal financial officer have concluded, based on their evaluation of the registrant’s disclosure controls and procedures as conducted within 90 days of the filing date of this report, that these disclosure controls and procedures are adequately designed and are operating effectively to ensure that information required to be disclosed by the registrant on Form N-CSR is recorded, processed, summarized and reported within the time periods specified in the Securities and Exchange Commission’s rules and forms. |
| | | |
| (b) | | There were no changes in the registrant’s internal control over financial reporting (as defined in Rule 30a-3(d) under the Act (17 CFR 270.30a-3(d)) that occurred during the second fiscal quarter of the period covered by this report that have materially affected or are reasonably likely to materially affect, the registrant’s internal control over financial reporting. |
| | | |
| | | |
| Item 12. Exhibits. |
| | | |
| (a)(1) | | The code of ethics that is the subject of the disclosure required by Item 2 is attached hereto. |
| | | |
| (a)(2) | | Certifications pursuant to Rule 30a-2(a) are attached hereto. |
| | | |
| (a)(3) | | Not applicable. |
| | | |
| (b) | | Certifications pursuant to Rule 30a-2(b) are furnished herewith. |
SIGNATURES
Pursuant to the requirements of the Securities Exchange Act of 1934 and the Investment Company Act of 1940, the registrant has duly caused this report to be signed on its behalf by the undersigned, thereunto duly authorized.
| (Registrant) | The Coventry Group |
| | | | |
| | |
| By (Signature and Title) | /s/ John Danko |
| | John Danko, President |
| | |
| Date: | June 2, 2009 | |
Pursuant to the requirements of the Securities Exchange Act of 1934 and the Investment Company Act of 1940, this report has been signed below by the following persons on behalf of the registrant and in the capacities and on the dates indicated.
| | |
| By (Signature and Title) | /s/ John Danko |
| | John Danko, President |
| | |
| Date: | June 2, 2009 | |
| | |
| By (Signature and Title) | /s/ Robert Silva |
| | Robert Silva, Treasurer |
| | |
| Date: | June 2, 2009 | |
| | | | |