UNITED STATES
SECURITIES AND EXCHANGE COMMISSION
Washington, D.C. 20549
FORM N-CSR
CERTIFIED SHAREHOLDER REPORT OF REGISTERED
MANAGEMENT INVESTMENT COMPANIES
| Investment Company Act file number | 811-06526 | | |
| | | The Coventry Group | | |
| | | | (Exact name of registrant as specified in charter) | | |
| | | | | | |
| 3435 Stelzer Rd. | | Columbus, OH | | 43219 |
| | | | (Address of principal executive offices) | | (Zip code) |
| | | | | | |
| 3435 Stelzer Rd. | | Columbus, OH | | 43219 |
| | | | (Name and address of agent for service) | | |
| Registrant’s telephone number, including area code: | 1-800-282-8782 | | |
| | | | | | |
| Date of fiscal year end: | | March 31 | | |
| | | | | | |
| Date of reporting period: | | March 31, 2010 | | |
Item 1. Reports to Stockholders.
| | | |
| |
| |
| |
| |
 |
| |
| Boston Trust Balanced Fund |
| Boston Trust Equity Fund |
| Boston Trust Midcap Fund |
| Boston Trust Small Cap Fund |
| |
| Walden Social Balanced Fund |
| Walden Social Equity Fund |
| Walden Small Cap Innovations Fund |
| |
| |
 |
| |
| |
| |
| |
| |
| |
| | ANNUAL REPORT |
| |
| | March 31, 2010 |
| |
| |
| |
| |
Boston Trust Investment Management, Inc., a subsidiary of Boston Trust & Investment Management Company (BTIM) and an affiliate of Walden Asset Management (Walden) serves as investment adviser (the Adviser) to the Boston Trust and Walden Funds and receives a fee for its services. Walden, a division of BTIM, performs shareholder advocacy, proxy voting, screening services, and other social initiatives for the Adviser and is paid a fee for these services by the Adviser.
Shares of the Funds are not deposits of, obligations of, or guaranteed by Boston Trust & Investment Management Company or its affiliates, nor are they federally insured by the FDIC. Investments in the Funds involve investment risks, including the possible loss of principal. Funds are distributed by Foreside Distribution Services, L.P., Gahanna, OH.
The foregoing information and opinions are for general information only. Boston Trust Funds and Boston Trust Investment Management, Inc. do not assume liability for any loss, which may result from the reliance by any person upon any such information or opinions. Such information and opinions are subject to change without notice, are for general information only, and are not intended as an offer or solicitation with respect to the purchase or sale of any security or offering individual or personalized investment advice.

Economic and Market
Summary (unaudited) | Boston Trust Balanced Fund
Boston Trust Equity Fund
Manager Commentary by Domenic Colasacco |
|
Investment Concerns:
Equity securities (stocks) are more volatile and carry more risk than other forms of investments, including investments in high-grade fixed income securities. The net asset value per share of these Funds will fluctuate as the value of the securities in the portfolio changes. Common stocks, and funds investing in common stocks, generally provide greater return potential when compared with other types of investments. Bonds offer a relatively stable level of income, although bond prices will fluctuate providing the potential for principal gain or loss. Intermediate-term, higher-quality bonds generally offer less risk than longer-term bonds and a lower rate of return.
The recent growth rate in the stock market has helped to produce short-term returns that are not typical and may not continue in the future. Because of ongoing market volatility, Fund performance may be subject to substantial short-term changes.
Past performance does not guarantee future results. The performance data quoted represents past performance and current returns may be lower or higher. Total return figures include change in share price, reinvestment of dividends and capital gains. The investment return and principal value will fluctuate so that an investor’s shares, when redeemed, may be worth more or less than the original cost. To obtain performance information current to the most recent month end, please call us at 1.800.282.8782 ext. 7050.
Many of the primary stock indices reached new recovery highs during the final quarter of the Funds’ fiscal year. As a welcome change, price gains were achieved without the volatility and fanfare that accompanied financial market trends over the past several years. Nearly all the media headlines were captured by the historic political battle in Washington over health care legislation and the equally contentious struggle in Europe to address Greece’s severe debt and budget problems. The latter, which has yet to be fully resolved, brought to light the inherent structural weaknesses in the European monetary union. Stock investors mostly looked past these headlines and were pleased with reports of further progress toward economic stabilization and recovery. Not only have consumer spending and business capital investment continued to improve, but corporate profits and cash flows have been at the upper end of expectations, particularly for non-financial companies. Additionally, a few nascent signs emerged that a modest reversal in the severe employment downturn is underway. Indeed, just after quarter-end, the Labor Department reported the first substantive monthly increase in private sector jobs since the financial crisis began.
As outlined in the statistical table, the Boston Trust Balanced Fund’s return for the past 12 months was slightly below the composite benchmark. The shortfall primarily reflects the underperformance of the Fund’s equity segment during a period of sharply rising stock prices - the S&P 500 Index1 was up by nearly 50% in the past year. Such relative price trends are typical given the equity segments’ focus on stocks of companies that have comparatively stable business models, with less financial and operating leverage. Performance is above average over all longer-term periods. The Boston Trust Equity Fund returned 45.13% for the 12-month period ended March 31, 2010 compared to 49.77% for the S&P 500. As with the Boston Trust Balanced Fund, the shortfall reflects the focus on stocks of companies with comparatively stable business models, and with less financial and operating leverage.†
We are especially pleased that an investment in the Fund is now within 3% of the record, quarter-end high that was reached on December 31, 2007. By comparison, a portfolio invested entirely in the S&P 500 would have to rise by another 25% or so to return to peak 2007 values. Will the Fund recoup the balance of the loss in the months ahead? Or have stock prices risen too far (up roughly 50% in just one year), too fast in light of the improved yet still problematic economic environment? The future is never certain, but we think the current upward trend will continue. Our views in this regard are summarized in more detail in the Economic Outlook and Investment Strategy.†
Economic Summary & Outlook
Current economic conditions are far from ideal. The list of problem areas remain long and include the following: a structural trade imbalance; budget deficits and debt levels, at all levels of government, that are at their highest ratios to gross domestic product since World War II; the highest unemployment in nearly 30 years; impaired household balance sheets; an energy policy, which still relies on imported oil; and wages, after inflation adjustments,
|
| 1 | The Standard & Poor’s 500 Index (“S&P 500”), an unmanaged index that is widely regarded as a gauge of the U.S. equities market. This index includes 500 leading companies in leading industries of the U.S. economy. Although the S&P 500 focuses on the large cap segment of the market, with approximately 75% coverage of U.S. equities, it is also an ideal proxy for the total market. |
| † | Portfolio composition is subject to change. |
|
1
Economic and Market
Summary (unaudited)(cont.) | Boston Trust Balanced Fund
Boston Trust Equity Fund
Manager Commentary by Domenic Colasacco |
|
wages that in over a decade have made little progress. Moreover, economic conditions in Japan and most of Europe are not much better than our own. Little wonder that consumer confidence is close to the lowest level in several generations.
Yet these economic problems are not new. As we have seen over both the past quarter and year, an increase in stock prices is not dependent on an ideal economic environment. That is especially true in times, such as now, when stock valuations relative to sales, earnings, cash flows and prevailing interest rates are reasonable. In our view, the essential ingredient needed to sustain an upward trend in stock prices going forward is further aggregate improvement, however modest, in the myriad of economic problems that exist. There is little question that, as bad as the economic situation may appear today, matters were worse 3, 6 and especially 12 months ago. Last spring, much of our financial system was in crisis, we were shedding hundreds of thousands of jobs every month, and house prices, along with corporate profits and cash flows, were in a virtual free-fall. None of these is the case today. The government’s monetary and fiscal policy initiatives merit much of the credit for the recent economic improvement. Such policies remain firmly in place and, in our opinion, are likely to lead to further gains in business activity-and stock prices-in the year ahead. We believe stock market returns may become especially attractive if, as intended, the policy initiatives lead to more substantive increases in private sector confidence and spending.
Asset Allocation: Our policy and practice has been to keep the Boston Trust Balanced Fund’s equity allocation within an approximate range of 45% to 75% of total assets. Two primary factors drive our equity allocation decision process: comparative stock/bond valuations and prospective economic conditions. When both are favorable, we tend to keep stock exposure near maximum, while the opposite is true during periods of high stock prices and weak economics. Gradations in either or both factors lead us to some middle ground.†
At fiscal year-end, the Boston Trust Balanced Fund’s equity allocation was nearly 70% of total assets. That compares with just under 65% at 12/31/09 and 53% at 6/30/09. As outlined in my prior reports, we have been of the opinion that stocks became attractively priced relative to most valuation metrics over a year ago. Our typical conservatism, however, led us to increase stock exposure only as our confidence in the economic foundation strengthened. We expect to follow a similar path in the months ahead and may increase the Fund’s equity allocation by several additional percentage points, provided the economic news, on the margin, remains positive. There is also no question that our preference for stocks is influenced by the close to zero return available in money market instruments and the low absolute yield levels of longer term bonds. Stock prices do not have to rise much in the year ahead to perform better than fixed income instruments generally.†
Equity and Fixed Income Component: Equity performance in the Boston Trust Equity Fund and the equity component of the Boston Trust Balanced Fund was aided by the steps we took beginning in late summer of 2009 to increase exposure to stocks in cyclical sectors that would benefit comparatively from improvement in economic activity. These included a number of industrial capital equipment companies, as well as those firms that manufacture and sell discretionary products directly to consumers. In addition, our decision to purchase stocks in a handful of well-positioned regional banks and insurance companies also contributed significantly to recent positive equity results.†
Given current low absolute bond yields, and our view that interest rates are more likely to rise than fall in the months ahead, we do not expect to revise our year-long decision to emphasize shorter term bonds. For more detail on Fund holdings, please refer to the Fund’s financial statements.†
Thank you for your continued confidence in our services. Please feel free to contact us directly at 617-726-7250 should you have any questions about our investment views or your account.

Domenic Colasacco
Portfolio Manager and President
Boston Trust Investment Management, Inc.
|
| † | Portfolio composition is subject to change. |
|
2
| Investment Performance (unaudited) | Boston Trust Balanced Fund
March 31, 2010 |
|
| Fund Net Asset Value: $28.69 | | |
| Gross Expense Ratio1: 1.09% | | |
| | | Annualized | |
| |
|
| | | 1 Year | | | 5 Years | | | 10 Years | |
| | | Ended | | | Ended | | | Ended | |
| | | 3/31/10 | | | 3/31/10 | | | 3/31/10 | |
| Boston Trust Balanced Fund | | 25.08 | % | | | 4.30 | % | | | 4.08 | % | |
| Lipper Mixed-Asset Target Allocation Growth Funds Average | | 40.02 | % | | | 2.96 | % | | | 1.92 | % | |
| S&P 500 Index | | 49.77 | % | | | 1.92 | % | | | -0.65 | % | |
| Barclays Capital U.S. Government/Credit Bond Index | | 7.51 | % | | | 5.17 | % | | | 6.22 | % | |
| Citigroup 90-Day U.S. Treasury Bill Index | | 0.13 | % | | | 2.76 | % | | | 2.70 | % | |
Past performance does not guarantee future results. The performance data quoted represents past performance and current returns may be lower or higher. The investment return and principal value will fluctuate so that an investor’s shares, when redeemed may be worth more or less than the original cost. To obtain performance information current to the most recent month-end, please call 1-800-282-8782 ext. 7050.
| 1 | The above Gross Expense ratio is from the Fund’s prospectus dated August 1, 2009. Additional information pertaining to the Fund’s expense ratios as of March 31, 2010 can be found in the financial highlights. The investment performance reflects voluntary fee waivers which may be discontinued at any time and a contractual fee waiver which shall continue in effect from year to year only upon mutual agreement of the Fund and the Adviser. The performance above reflects any fee reductions during the applicable periods. If such fee reductions had not occurred, the quoted performance would have been lower. Based on the Fund’s prospectus dated August 1, 2009, the Total Fund Operating Expenses would be 1.08% and the Net Fund Operating Expenses would be 1.00% excluding the indirect costs of investing in Acquired Funds. |
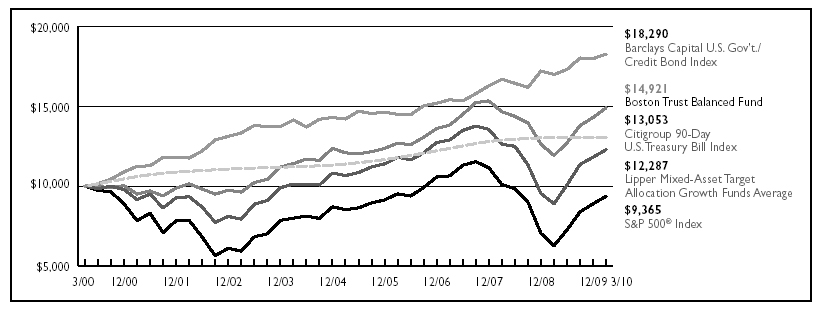
The chart represents historical 10-year performance of a hypothetical investment of $10,000 in the Boston Trust Balanced Fund and represents the reinvestment of dividends and capital gains in the Fund. The returns shown on the table and graph do not reflect the deduction of taxes a shareholder would pay on Fund distributions or the redemption of Fund shares.
The Boston Trust Balanced Fund is measured against the Standard & Poor’s 500 Index (“S&P 500”), which is an unmanaged index that is widely regarded as a gauge of the U.S. equities market. This index includes 500 leading companies in leading industries of the U.S. economy. Although the S&P 500 focuses on the large cap segment of the market, with approximately 75% coverage of U.S. equities, it is also an ideal proxy for the total market. The Barclays Capital U.S. Government/Credit Bond Index is a non-securitized component of the Barclays U.S. Aggregate Index and was the first macro index launched by Lehman Brothers. The Barclays Capital U.S. Government/Credit Bond Index includes Treasuries (i.e., public obligations of the U.S. Treasury that have remaining maturities of more than one year), Government-Related issues (i.e., agency, sovereign, supranational, and local authority debt), and USD Corporates. The Citigroup 90-Day U.S. Treasury Bill Index reflects monthly return equivalents of yield averages that are not marked to the market. The Index is an average of the last three-month treasury bill issues. The three-month treasury bills are the short-term debt obligations of the U.S. Government. The indices’ performance is unmanaged and does not reflect the deduction of expenses associated with a mutual fund, such as investment management and fund accounting fees. The Fund’s performance reflects the deduction of fees for these services.
The Lipper Mixed-Asset Target Allocation Growth Funds Average (“Lipper Average”) is an average of managed mutual funds whose primary objective is to maintain a mix of between 60%-80% equity securities with the remainder invested in bonds, cash and cash equivalents. The Lipper Average is an equally weighted index of the largest managed mutual funds within their respective investment objectives, adjusted for the reinvestment of capital gains distributions and income dividends and net of all fund expenses. Investors cannot invest directly in an index.
The recent growth rate in the stock market has helped to produce short-term returns that are not typical and may not continue in the future. Because of ongoing market volatility, fund performance may be subject to substantial short-term changes.
3
| Investment Performance (unaudited) | Boston Trust Equity Fund
March 31, 2010 |
|
| Fund Net Asset Value: $12.62 | | |
| Gross Expense Ratio1: 1.12% | | |
| | Annualized | |
| |
|
| | | 1 Year | | | 5 Years | | | Since | |
| | | Ended | | | Ended | | | Inception | |
| | | 3/31/10 | | | 3/31/10 | | | 10/1/03 | |
| Boston Trust Equity Fund | | 45.13 | % | | | 3.05 | % | | | 5.12 | % | |
| S&P 500 Index | | 49.77 | % | | | 1.92 | % | | | 4.23 | % | |
Past performance does not guarantee future results. The performance data quoted represents past performance and current returns may be lower or higher. The investment return and principal value will fluctuate so that an investor’s shares, when redeemed may be worth more or less than the original cost. To obtain performance information current to the most recent month-end, please call 1-800-282-8782 ext. 7050.
| 1 | The above Gross Expense ratio is from the Fund’s prospectus dated August 1, 2009. Additional information pertaining to the Fund’s expense ratios as of March 31, 2010 can be found in the financial highlights. The investment performance reflects voluntary fee waivers which may be discontinued at any time and a contractual fee waiver which shall continue in effect from year to year only upon mutual agreement of the Fund and the Adviser. The performance above reflects any fee reductions during the applicable periods. If such fee reductions had not occurred, the quoted performance would have been lower. Based on the Fund’s prospectus dated August 1, 2009, the Total Fund Operating Expenses would be 1.10% and the Net Fund Operating Expenses would be 1.00% excluding the indirect costs of investing in Acquired Funds. |
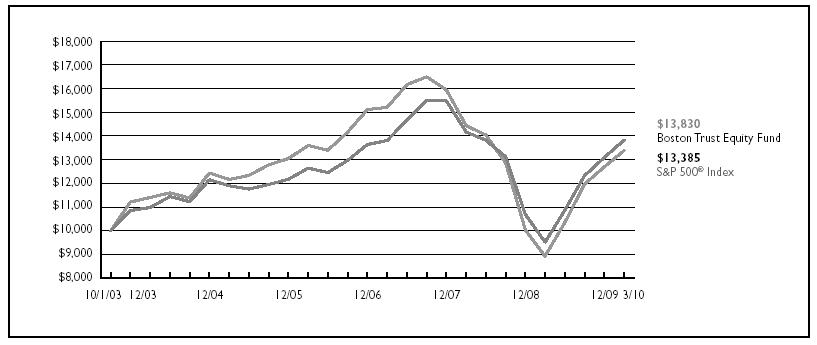
The chart represents historical performance of a hypothetical investment of $10,000 in the Boston Trust Equity Fund from October 1, 2003 to March 31, 2010, and represents the reinvestment of dividends and capital gains in the Fund. The returns shown on the table and graph do not reflect the deduction of taxes a shareholder would pay on Fund distributions or the redemption of Fund shares.
The Boston Trust Equity Fund is measured against the Standard & Poor’s 500 Index (“S&P 500”), which is an unmanaged index that is widely regarded as a gauge of the U.S. equities market. This index includes 500 leading companies in leading industries of the U.S. economy. Although the S&P 500 focuses on the large cap segment of the market, with approximately 75% coverage of U.S. equities, it is also an ideal proxy for the total market. The performance of an index does not reflect the deduction of expenses associated with a mutual fund, such as investment management and fund accounting fees. The Fund’s performance reflects the deduction of fees for these services. Investors cannot invest directly in an index.
The recent growth rate in the stock market has helped to produce short-term returns that are not typical and may not continue in the future. Because of ongoing market volatility, fund performance may be subject to substantial short-term changes.
4
Economic and Market
Summary (unaudited) | Boston Trust Midcap Fund
Manager Commentary by Stephen J. Amyouny |
|
Investment Concerns:
Equity securities (stocks) are more volatile and carry more risk than other forms of investments, including investments in high-grade fixed income securities. The net asset value per share of this Fund will fluctuate as the value of the securities in the portfolio changes. Common stocks, and funds investing in common stocks, generally provide greater return potential when compared with other types of investments. Mid-capitalization stocks typically carry additional risk, since smaller companies companies generally have higher risk of failure and, historically, their stocks have experienced a greater degree of volatility.
The recent growth rate in the stock market has helped to produce short-term returns that are not typical and may not continue in the future. Because of ongoing market volatility, Fund performance may be subject to substantial short-term changes.
Past performance does not guarantee future results. The performance data quoted represents past performance and current returns may be lower or higher. Total return figures include change in share price, reinvestment of dividends and capital gains. The investment return and principal value will fluctuate so that an investor’s shares, when redeemed, may be worth more or less than the original cost. To obtain performance information current to the most recent month end, please call us at 1.800.282.8782 ext. 7050.
Market Summary
The equity markets continued their upward rise during the first quarter of 2010 as economic activity gained momentum and further signs of financial stabilization appeared. Price gains were achieved without the significant volatility that has been prevalent over the last few years. Not only have consumer spending and business capital investment continued to improve, but corporate profits and cash flows have been at the upper end of expectations, particularly for non-financial companies. Credit markets have stabilized substantially as evidenced by the significant reduction in corporate bond yield spreads relative to U.S. treasuries. This improvement has provided companies with increased access to capital, lower costs of capital, and enhanced liquidity, which are critical components to future growth. Additionally, a few nascent signs emerged that a modest reversal in the severe employment downturn is underway. Indeed, just after quarter-end, the Labor Department reported the first substantive monthly increase in private sector jobs since the financial crisis began.
Midcap stocks, as measured by the benchmark Russell Midcap® Index1, posted strong results for the quarter (8.67%) and exceptionally strong results over the last 12 months (67.71%). Despite this incredible price recovery, the Russell Midcap® Index remains approximately 10% below its price at the beginning of 2008.
Portfolio Review
The Boston Trust Midcap Fund posted a return of 55.68% over the most recent 12 months. Although performance among sectors was broad-based and generally quite good, the Fund achieved particularly strong results within its more economically sensitive industries, such as the Industrial Products & Services, Financial Services, and Consumer Discretionary sectors. Within these groups, retailers Abercrombie & Fitch (0.7%) and Ross Stores (2.4%), auto supplier Autoliv (1.5%), regional banks Comerica (1.8%) and M&T Bank (1.8%), and aerospace suppliers Precision Castparts (1.6%) and Rockwell Collins (1.9%), posted strong performances for the period ended March 31, 2010. Solid gains were achieved among many technology, industrial materials, and energy companies. Fund holdings within the more defensive, less economically-sensitive sectors, such as utilities and consumer staples, generally performed poorly relative to the broader market.†
Over the last 12 months, lower quality stocks performed exceptionally well relative to stocks of higher quality companies. These lower quality stocks, which generally possess below average financial strength, higher than average financial leverage, and poor sales and earnings consistency, recovered sharply following their dismal performance in 2008 and early 2009. For this reason, the performance of the Fund, which concentrates its investments in the securities of higher quality companies, has trailed the benchmark over the last year; however, the Fund still posted an exceptionally high absolute return for the 12 months ended March 31, 2010, and the Fund’s annualized return since inception remains superior to the index.
We established new positions in several companies, including Teradata (1.2%), Check Point Software (1.1%), FMC Technologies (1.7%), Strayer Education (0.9%), and Morningstar (1.0%). We also liquidated positions in Energizer, GameStop, Nordstrom, Juniper Networks, Airgas, and Smith International—the latter two positions due to acquisitions by larger companies.†
| 1 | | The Russell Midcap® Index measures the performance of the mid-cap segment of the U.S. equity universe. The Russell Midcap® Index is a subset of the Russell 1000® Index. It includes approximately 800 of the smallest securities based on a combination of their market cap and current index membership. The Russell Midcap® Index represents approximately 27% of the total market capitalization of the Russell 1000 companies. |
| | | |
| † | | Portfolio composition is subject to change. |
5
Economic and Market
Summary (unaudited)(cont.) | Boston Trust Midcap Fund
Manager Commentary by Stephen J. Amyouny |
|
Portfolio Strategy
We believe that the Fund remains very well diversified with broad-based exposure across economic sectors and a wide range of industries. We will continue to increase, selectively, the Fund’s portfolio allocation to allow exposure to economically sensitive industries, such as industrial products and technology companies that stand to benefit from accelerating global economic activity. Many of the companies held in the Fund have significant exposure to developing regions of the world, such as Brazil, China and India, where economic growth could very likely be robust in comparison to developed regions.†
We also remain acutely aware of the rising earnings expectations for most companies and the related potential for disappointments if earnings growth does not materialize as investors anticipate. For this reason, we continue to look to reduce or eliminate Fund positions in those companies where earnings expectations appear overly optimistic relative to our internal projections. Companies have generally reduced costs aggressively during the downcycle and are now positioned to achieve significant profit margin expansion over the next few quarters. We believe the combination of accelerating sales growth and margin expansion should lead to higher earnings for most companies this year. Our Fund’s long-term focus on high-quality companies with sustainable business models, attractive growth prospects, and reasonable valuations may produce attractive investment returns in this type of economic environment.†
The equities of the companies in bold-face in the commentary were holdings of the Boston Trust Midcap Fund as of March 31, 2010.

Stephen J. Amyouny, CFA
Portfolio Manager
Boston Trust Investment Management, Inc.
† Portfolio composition is subject to change.
6
| Investment Performance (unaudited) | Boston Trust Midcap Fund
March 31, 2010 |
|
| Fund Net Asset Value: $9.44 | | |
| Gross Expense Ratio1: 1.50% | | |
| | | Annualized | |
| |
|
| | | 1 Year | | | Since | |
| | | Ended | | | Inception | |
| | | 3/31/10 | | | 9/24/07 | |
| Boston Trust Midcap Fund | | 55.68 | % | | | -1.24 | % | |
| Russell Midcap® Index | | 67.71 | % | | | -5.35 | % | |
Past performance does not guarantee future results. The performance data quoted represents past performance and current returns may be lower or higher. The investment return and principal value will fluctuate so that an investor’s shares, when redeemed may be worth more or less than the original cost. To obtain performance information current to the most recent month-end, please call 1-800-282-8782 ext. 7050.
| 1 | The above Gross Expense ratio is from the Fund’s prospectus dated August 1, 2009. Additional information pertaining to the Fund’s expense ratios as of March 31, 2010 can be found in the financial highlights. The investment performance reflects voluntary fee waivers which may be discontinued at any time and a contractual fee waiver which shall continue in effect from year to year only upon mutual agreement of the Fund and the Adviser. The performance above reflects any fee reductions during the applicable periods. If such fee reductions had not occurred, the quoted performance would have been lower. Based on the Fund’s prospectus dated August 1, 2009, the Total Fund Operating Expenses would be 1.48% and the Net Fund Operating Expenses would be 1.00% excluding the indirect costs of investing in Acquired Funds. |
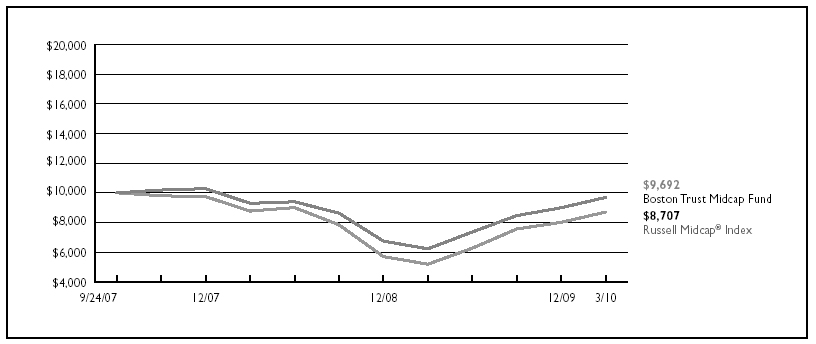
The chart represents historical performance of a hypothetical investment of $10,000 in the Boston Trust Midcap Fund from September 24, 2007 to March 31, 2010, and represents the reinvestment of dividends and capital gains in the Fund. The returns shown on the table and graph do not reflect the deduction of taxes a shareholder would pay on Fund distributions or the redemption of Fund shares.
The Boston Trust Midcap Fund is measured against the Russell Midcap® Index, which is an unmanaged index that measures the performance of the mid-cap segment of the U.S. equity universe. The Russell Midcap® Index is a subset of the Russell 1000® Index. It includes approximately 800 of the smallest securities based on a combination of their market capitalization and current index membership. The Russell Midcap® Index represents approximately 27% of the total market capitalization of the Russell 1000 companies. The performance of an index does not reflect the deduction of expenses associated with a mutual fund, such as investment management and fund accounting fees. The Fund’s performance reflects the deduction of fees for these services. Investors cannot invest directly in an index.
The recent growth rate in the stock market has helped to produce short-term returns that are not typical and may not continue in the future. Because of ongoing market volatility, fund performance may be subject to substantial short-term changes.
7
Economic and Market
Summary (unaudited) | Boston Trust Small Cap Fund
Manager Commentary by Kenneth P. Scott |
|
Investment Concerns:
Equity securities (stocks) are more volatile and carry more risk than other forms of investments, including investments in high-grade fixed income securities. The net asset value per share of this Fund will fluctuate as the value of the securities in the portfolio changes. Common stocks, and funds investing in common stocks, generally provide greater return potential when compared with other types of investments. Small-capitalization stocks typically carry additional risk, since smaller companies generally have higher risk of failure and, historically, their stocks have experienced a greater degree of volatility.
The recent growth rate in the stock market has helped to produce short-term returns that are not typical and may not continue in the future. Because of ongoing market volatility, Fund performance may be subject to substantial short-term changes.
Past performance does not guarantee future results. The performance data quoted represents past performance and current returns may be lower or higher. Total return figures include change in share price, reinvestment of dividends and capital gains. The investment return and principal value will fluctuate so that an investor’s shares, when redeemed, may be worth more or less than the original cost. To obtain performance information current to the most recent month end, please call us at 1.800.282.8782 ext. 7050.
Market Summary
Generally speaking, a sharp rebound in stock prices, like the one we have experienced over the past quarter, and year, favors lower quality companies—those less equipped to withstand economic hardship—whose share price suffered most during the preceding bear market. This can create a headwind for managers investing in higher quality companies. This appears to have been the case in the first quarter of 2010 and over the past year. While the Boston Trust Small Cap Fund’s absolute performance was positive, two key elements related to quality appear to be associated with lower relative returns for the quarter: firms with higher returns on invested capital, and those with more consistent returns on invested capital—both factors we favor—underperformed their less profitable and more volatile peers during the quarter.
Portfolio Review
After a market hiccup in January, small cap equity prices continued their rebound, as most economic fundamentals continued to improve during the first quarter of 2010. Boston Trust Small Cap Fund, which focuses on higher quality, innovative companies, underperformed the strong absolute performance of the Russell 2000® Index1 by more than one percent for the calendar quarter and for the one-year period ended March 31, 2010. For the five-year and ten-year periods ended March 31, 2010, the Boston Trust Small Cap Fund has outperformed the benchmark, with less volatility.†
As noted previously, we aim to maintain Fund sector weights comparable to those of the overall market. Thus, our sector composition generally has no significant impact on overall performance. That said, our stock performance within sectors generally reflects our high-quality bias. For example, our consumer discretionary picks did not keep up fully with the exceptional, double-digit performance of the small cap consumer discretionary sector, while our tech selections outperformed this market-lagging sector. Individually, Baldor Electric (2.3%), Lululemon (2.1%) and Polycom (2.4%) contributed most to first quarter performance, while Nutrisystem (0.5%), Investment Technology Group (1.0%) and Carbo Ceramics (1.5%) detracted most.†
During the first quarter 2010, we established new positions in Cantel Medical (CMN) (0.5%) which is a leading provider of infection prevention and control products in the healthcare market. Nutraceutical International (NUTR) (0.3%) is a leading manufacturer of branded nutritional supplements and natural products. Orrstown Financial (ORRF) (0.5%) and UMB Financial (UMBF) (0.5%) are community banks with conservative lending standards operating primarily in two areas less affected by the housing crisis—south-central Pennsylvania and Kansas City, Missouri, respectively. We sold stakes in Commerce Bancshares, Green Mountain Coffee Roasters and Idexx Laboratories from the Fund during the quarter because stock price appreciation moved them outside small cap market capitalization range. We also completed the sale of Encore Acquisition from the Fund, given its acquisition by Denbury Resources.†
Portfolio Strategy
We continue to believe that our focus on innovative, higher quality, more reasonably valued stocks leveraged to more sustainable elements of economic growth will continue to provide substantial value to client portfolios over time. We appreciate your continued confidence in our services.
The equities of the companies in bold-face in the commentary were holdings of the Boston Trust Small Cap Fund as of March 31, 2010.

Kenneth P. Scott, CFA
Portfolio Manager
Boston Trust Investment Management, Inc.
| 1 | | The Russell 2000® Index measures the performance of the small-cap segment of the U.S. equity universe. The Russell 2000® Index is a subset of the Russell 3000® Index representing approximately 8% of the total market capitalization of that index. It includes approximately 2000 of the smallest securities based on a combination of their market cap and current index membership. |
| † | | Portfolio composition is subject to change. |
8
| Investment Performance (unaudited) | Boston Trust Small Cap Fund
March 31, 2010 |
|
| Fund Net Asset Value: $11.52 | | |
| Gross Expense Ratio1: 1.20% | | |
| | | Annualized | |
| |
|
| | | 1 Year | | | 5 Years | | | 10 Years | |
| | | Ended | | | Ended | | | Ended | |
| | | 3/31/10 | | | 3/31/10 | | | 3/31/10 | |
| Boston Trust Small Cap Fund* | | 60.01 | % | | | 6.03 | % | | | 8.92 | % | |
| Russell 2000® Index | | 62.76 | % | | | 3.36 | % | | | 3.68 | % | |
Past performance does not guarantee future results. The performance data quoted represents past performance and current returns may be lower or higher. The investment return and principal value will fluctuate so that an investor’s shares, when redeemed may be worth more or less than the original cost. To obtain performance information current to the most recent month-end, please call 1-800-282-8782 ext. 7050.
| 1 | | The above Gross Expense ratio is from the Fund’s prospectus dated August 1, 2009. Additional information pertaining to the Fund’s expense ratios as of March 31, 2010 can be found in the financial highlights. The investment performance reflects voluntary fee waivers which may be discontinued at any time and a contractual fee waiver which shall continue in effect from year to year only upon mutual agreement of the Fund and the Adviser. The performance above reflects any fee reductions during the applicable periods. If such fee reductions had not occurred, the quoted performance would have been lower. Based on the Fund’s prospectus dated August 1, 2009, the Total Fund Operating Expenses would be 1.18% and the Net Fund Operating Expenses would be 1.00% excluding the indirect costs of investing in Acquired Funds. |
| |
| * | | The quoted performance for the Fund reflects the performance of a collective investment fund that was previously managed with full investment authority by the parent company of the Fund’s Adviser prior to the establishment of the Fund on December 16, 2005. The performance of the collective investment fund has been restated to reflect the net expenses of the Fund after all expenses at an annual rate of 1.25%, the Adviser’s expense limitation for its initial year of investment operations. The performance of the collective investment fund was restated to reflect the expenses associated with the mutual fund. The collective investment fund was not registered with the Securities and Exchange Commission and, therefore, was not subject to the investment restrictions imposed by law on registered mutual funds. If the collective investment fund had been registered, the collective investment fund’s performance may have been adversely affected. |
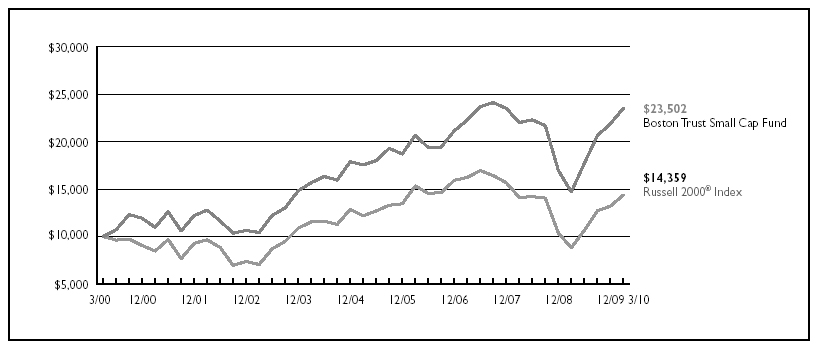
The chart represents historical 10-year performance of a hypothetical investment of $10,000 in the Boston Trust Small Cap Fund and represents the reinvestment of dividends and capital gains in the Fund. The returns shown on the table and graph do not reflect the deduction of taxes a shareholder would pay on Fund distributions or the redemption of Fund shares.
The Boston Trust Small Cap Fund is measured against the Russell 2000® Index, which is an unmanaged index that measures the performance of the small-cap segment of the U.S. equity universe. The Russell 2000® Index is a subset of the Russell 3000® Index representing approximately 8% of the total market capitalization of that index. It includes approximately 2000 of the smallest securities based on a combination of their market cap and current index membership. The performance of an index does not reflect the deduction of expenses associated with a mutual fund, such as investment management and fund accounting fees. The Fund’s performance reflects the deduction of fees for these services. Investors cannot invest directly in an index.
The recent growth rate in the stock market has helped to produce short-term returns that are not typical and may not continue in the future. Because of ongoing market volatility, fund performance may be subject to substantial short-term changes.
9
|
| Schedule of Portfolio Investments | | Boston Trust Balanced Fund
March 31, 2010 |
| COMMON STOCKS (67.9%) | | | | | | | |
| Security Description | | | | | Shares | | | Value ($) |
| |
| Consumer Discretionary (6.1%) | | | | | | | |
| Comcast Corp., Class A | | | | 80,000 | | | 1,505,600 |
| Johnson Controls, Inc. | | | | 30,000 | | | 989,700 |
| NIKE, Inc., Class B | | | | 25,000 | | | 1,837,500 |
| Omnicom Group, Inc. | | | | 60,000 | | | 2,328,600 |
| Ross Stores, Inc. | | | | 25,000 | | | 1,336,750 |
| Staples, Inc. | | | | 65,000 | | | 1,520,350 |
| Target Corp. | | | | 50,000 | | | 2,630,000 |
| | | | | | | | 12,148,500 |
| Consumer Products (9.9%) | | | | | | | |
| Costco Wholesale Corp. | | | | 35,000 | | | 2,089,850 |
| Diageo PLC, Sponsored ADR | | | | 35,000 | | | 2,360,750 |
| Kellogg Co. | | | | 50,000 | | | 2,671,500 |
| McCormick & Co., Inc. | | | | 75,000 | | | 2,877,000 |
| PepsiCo, Inc. | | | | 35,000 | | | 2,315,600 |
| Procter & Gamble Co. | | | | 60,000 | | | 3,796,200 |
| SYSCO Corp. | | | | 125,000 | | | 3,687,500 |
| | | | | | | | 19,798,400 |
| Energy (8.1%) | | | | | | | |
| Apache Corp. | | | | 20,000 | | | 2,030,000 |
| Chevron Corp. | | | | 40,000 | | | 3,033,200 |
| ConocoPhillips | | | | 45,000 | | | 2,302,650 |
| Exxon Mobil Corp. | | | | 65,000 | | | 4,353,700 |
| Schlumberger Ltd. | | | | 45,000 | | | 2,855,700 |
| XTO Energy, Inc. | | | | 35,000 | | | 1,651,300 |
| | | | | | | | 16,226,550 |
| Financial Services (9.9%) | | | | | | | |
| Bank of America Corp. | | | | 80,000 | | | 1,428,000 |
| Chubb Corp. | | | | 50,000 | | | 2,592,500 |
| Cincinnati Financial Corp. | | | | 125,000 | | | 3,612,500 |
| Comerica, Inc. | | | | 50,000 | | | 1,902,000 |
| JPMorgan Chase & Co. | | | | 25,000 | | | 1,118,750 |
| M&T Bank Corp. | | | | 20,000 | | | 1,587,600 |
| PNC Financial Services Group, Inc. | | | | 25,000 | | | 1,492,500 |
| State Street Corp. | | | | 30,000 | | | 1,354,200 |
| SunTrust Banks, Inc. | | | | 55,000 | | | 1,473,450 |
| T. Rowe Price Group, Inc. | | | | 60,000 | | | 3,295,800 |
| | | | | | | | 19,857,300 |
| Health Care (8.1%) | | | | | | | |
| Becton, Dickinson & Co. | | | | 35,000 | | | 2,755,550 |
| C.R. Bard, Inc. | | | | 30,000 | | | 2,598,600 |
| DENTSPLY International, Inc. | | | | 60,000 | | | 2,091,000 |
| Johnson & Johnson, Inc. | | | | 30,000 | | | 1,956,000 |
| Medtronic, Inc. | | | | 40,000 | | | 1,801,200 |
| Saint Jude Medical, Inc.(a) | | | | 35,000 | | | 1,436,750 |
| Stryker Corp. | | | | 30,000 | | | 1,716,600 |
| Varian Medical Systems, Inc.(a) | | | | 35,000 | | | 1,936,550 |
| | | | | | | | 16,292,250 |
| Industrial Materials (3.2%) | | | | | | | |
| Air Products & Chemicals, Inc. | | | | 25,000 | | | 1,848,750 |
| AptarGroup, Inc. | | | | 40,000 | | | 1,574,000 |
| Ecolab, Inc. | | | | 30,000 | | | 1,318,500 |
| Sigma-Aldrich Corp. | | | | 30,000 | | | 1,609,800 |
| | | | | | | | 6,351,050 |
| Industrial Products & Services (11.9%) | | | | | | | |
| ABB Ltd., Sponsored ADR(a) | | | | 75,000 | | | 1,638,000 |
| Donaldson Co., Inc. | | | | 75,000 | | | 3,384,000 |
| Emerson Electric Co. | | | | 85,000 | | | 4,278,900 |
| Hubbell, Inc., Class B | | | | 15,000 | | | 756,450 |
| Illinois Tool Works, Inc. | | | | 60,000 | | | 2,841,600 |
| Precision Castparts Corp. | | | | 30,000 | | | 3,801,300 |
| | | | |
Shares or
Principal
Amount ($) | | | Value ($) |
| Rockwell Collins, Inc. | | | | 40,000 | | | 2,503,600 |
| United Parcel Service, Inc., Class B | | | | 30,000 | | | 1,932,300 |
| W.W. Grainger, Inc. | | | | 25,000 | | | 2,703,000 |
| | | | | | | | 23,839,150 |
| Information Technology (10.7%) | | | | | | | |
| Accenture PLC, Class A | | | | 60,000 | | | 2,517,000 |
| Automatic Data Processing, Inc. | | | | 65,000 | | | 2,890,550 |
| Cisco Systems, Inc.(a) | | | | 120,000 | | | 3,123,600 |
| EMC Corp.(a) | | | | 160,000 | | | 2,886,400 |
| International Business Machines Corp. | | | | 20,000 | | | 2,565,000 |
| Microsoft Corp. | | | | 125,000 | | | 3,658,750 |
| Nokia Corp., Sponsored ADR | | | | 50,000 | | | 777,000 |
| Oracle Corp. | | | | 120,000 | | | 3,082,800 |
| | | | | | | | 21,501,100 |
| TOTAL COMMON STOCKS (Cost $94,103,631) | | | | | | | 136,014,300 |
| |
| CORPORATE BONDS (4.2%) | | | | | | | |
| Basic Materials (0.2%) | | | | | | | |
| Weyerhaeuser Co. | | | | | | | |
6.75%, 3/15/12 | | | | 100,000 | | | 106,697 |
7.25%, 7/1/13 | | | | 300,000 | | | 322,511 |
| | | | | | | | 429,208 |
| Consumer Products (0.3%) | | | | | | | |
| Diageo Capital PLC, 5.50%, 9/30/16 | | | | 500,000 | | | 543,620 |
| |
| Financial Services (2.8%) | | | | | | | |
| American Express Bank FSB, BKNT, | | | | | | | |
6.00%, 9/13/17 | | | | 200,000 | | | 214,973 |
| American Express Co., | | | | | | | |
7.00%, 3/19/18 | | | | 1,500,000 | | | 1,706,331 |
8.13%, 5/20/19 | | | | 1,675,000 | | | 2,032,159 |
| John Deere Capital Corp., Series D, | | | | | | | |
5.35%, 4/3/18 | | | | 1,000,000 | | | 1,065,817 |
National Rural Utilities Cooperative Finance Corp., 10.38%, 11/1/18 | | | | 500,000 | | | 666,048 |
| | | | | | | | 5,685,328 |
| Industrial Products & Services (0.2%) | | | | | | | |
| Emerson Electric Co., 5.13%, 12/1/16 | | | | 300,000 | | | 322,669 |
| |
| Information Technology (0.4%) | | | | | | | |
| Oracle Corp., 5.75%, 4/15/18 | | | | 750,000 | | | 823,940 |
| |
| Telecommunications (0.3%) | | | | | | | |
| AT&T, Inc., 5.63%, 6/15/16 | | | | 500,000 | | | 548,882 |
| TOTAL CORPORATE BONDS (Cost $7,460,767) | | | | | | | 8,353,647 |
| |
| MUNICIPAL BONDS (2.2%) | | | | | | | |
| Florida (0.5%) | | | | | | | |
| Florida State Board of Education, Series D, GO, | | | | | | | |
5.00%, 6/1/21, Callable 6/1/17 @ 101 | | | | 1,000,000 | | | 1,093,970 |
| |
| Illinois (0.8%) | | | | | | | |
| Illinois State, GO, 5.00%, 4/1/24, Callable 4/1/17 @ 100 | | | | 500,000 | | | 512,130 |
| Illinois State, Series A, | | | | | | | |
5.00%, 3/1/22, Callable 3/1/14 @ 100 | | | | 750,000 | | | 773,812 |
5.00%, 6/1/29, Callable 3/1/14 @ 100 | | | | 250,000 | | | 252,378 |
| | | | | | | | 1,538,320 |
| See Notes to Financial Statements |
|
| |
| 10 |
|
| Schedule of Portfolio Investments | Boston Trust Balanced Fund
March 31, 2010 |
| MUNICIPAL BONDS, CONTINUED | | | | | | | |
| Security Description | | | | | Shares or
Principal
Amount ($) | | | Value ($) |
| Ohio (0.3%) | | | | | | | |
Ohio State, Series D, GO, 4.50%, 9/15/22, NATL-RE, Callable 3/15/16 @ 100 | | | | 500,000 | | | 519,255 |
| |
| Washington (0.1%) | | | | | | | |
Washington State, Series C, GO, 5.00%, 2/1/26, Callable 2/1/19 @ 100 | | | | 250,000 | | | 270,343 |
| |
| Wisconsin (0.5%) | | | | | | | |
Wisconsin State, Series C, GO, 5.00%, 5/1/25, Callable 5/1/18 @ 100 | | | | 200,000 | | | 215,100 |
Wisconsin State, Series D, GO, 5.50%, 5/1/26, Callable 5/1/18 @ 100 | | | | 750,000 | | | 835,117 |
| | | | | | | | 1,050,217 |
| TOTAL MUNICIPAL BONDS (Cost $4,342,749) | | | | | | | 4,472,105 |
| |
U.S. GOVERNMENT & U.S. GOVERNMENT AGENCY OBLIGATIONS (23.7%) | | | | | | | |
| Federal Home Loan Bank | | | | | | | |
2.25%, 4/13/12 | | | | 7,500,000 | | | 7,662,367 |
4.88%, 12/14/12 | | | | 13,000,000 | | | 14,120,119 |
5.00%, 10/13/11 | | | | 1,500,000 | | | 1,594,454 |
5.25%, 6/11/10 | | | | 5,000,000 | | | 5,048,800 |
5.25%, 6/10/11 | | | | 2,000,000 | | | 2,104,252 |
5.25%, 9/13/13 | | | | 5,000,000 | | | 5,531,715 |
5.25%, 12/9/22 | | | | 1,000,000 | | | 1,055,550 |
5.38%, 6/8/12 | | | | 5,000,000 | | | 5,440,980 |
| Government National Mortgage Association, | | | | | | | |
6.00%, 10/15/36 | | | | 1,634,339 | | | 1,748,602 |
| U.S. Treasury Inflation Protected Bonds, | | | | | | | |
3.50%, 1/15/11 | | | | 3,112,500 | | | 3,224,600 |
TOTAL U.S. GOVERNMENT & U.S. GOVERNMENT AGENCY OBLIGATIONS (Cost $45,312,828) | | | | | | | 47,531,439 |
| |
| INVESTMENT COMPANIES (1.6%) | | | | | | | |
Victory Federal Money Market, Investor Shares, 0.01% (b) (Cost $3,120,208) | | | | 3,120,208 | | | 3,120,208 |
| Total Investments (Cost $154,340,183) — 99.6% | | | | | | | 199,491,699 |
| Other assets in excess of liabilities — 0.4% | | | | | | | 819,819 |
| |
| NET ASSETS — 100.0% | | | | | | | $200,311,518 |
|
| (a) | | Non-income producing security. |
| (b) | | Rate disclosed is the seven day yield as of March 31, 2010. |
| ADR | | American Depositary Receipt |
| BKNT | | Bank Note |
| FSB | | Federal Savings Bank |
| GO | | General Obligation |
| NATL-RE | | Reinsured by National Public Finance Guarantee Corporation |
| PLC | | Public Limited Company |
| See Notes to Financial Statements |
|
| |
| 11 |
| Financial Statements | | Boston Trust Balanced Fund |
| STATEMENT OF ASSETS AND LIABILITIES | | | | |
| March 31, 2010 | | | | |
| | | | | |
| Assets: | | | | |
| Investments, at value (cost $154,340,183) | | $ | 199,491,699 | |
| Interest and dividends receivable | | | 1,003,432 | |
| Receivable for capital shares issued | | | 22,000 | |
| Prepaid expenses and other assets | | | 3,504 | |
Total Assets | | | 200,520,635 | |
| | | | | |
| Liabilities: | | | | |
| Payable for capital shares redeemed | | | 14,000 | |
| Accrued expenses and other liabilities: | | | | |
Investment adviser | | | 123,186 | |
Chief compliance officer | | | 862 | |
Administration and accounting | | | 5,999 | |
Custodian | | | 8,059 | |
Transfer agent | | | 4,245 | |
Trustee | | | 3,920 | |
Other | | | 48,846 | |
Total Liabilities | | | 209,117 | |
| | | | | |
| Net Assets | | $ | 200,311,518 | |
| | | | | |
| Composition of Net Assets: | | | | |
| Capital | | $ | 156,907,745 | |
| Accumulated net investment income | | | 827,544 | |
| Accumulated net realized losses from investment transactions | | | (2,575,287 | ) |
| Net unrealized appreciation from investments | | | 45,151,516 | |
| | | | | |
| Net Assets | | $ | 200,311,518 | |
| | | | | |
| Shares outstanding (par value $0.01, unlimited number of shares authorized) | | | 6,983,134 | |
| | | | | |
| Net Asset Value, Offering Price and Redemption Price per share | | $ | 28.69 | |
| | | | | |
| STATEMENT OF OPERATIONS | | | | |
| For the year ended March 31, 2010 | | | | |
| | | | | |
| Investment Income: | | | | |
| Interest | | $ | 2,875,717 | |
| Dividends | | | 2,101,424 | |
Total Investment Income | | | 4,977,141 | |
| Expenses: | | | | |
Investment adviser | | | 1,315,294 | |
Administration and accounting | | | 357,090 | |
Trustee | | | 17,597 | |
Custodian | | | 33,394 | |
Transfer agency | | | 17,971 | |
Chief compliance officer | | | 12,510 | |
Printing | | | 29,081 | |
Professional | | | 74,224 | |
Other | | | 45,032 | |
Total expenses before fee reductions | | | 1,902,193 | |
Fees voluntarily reduced by the administrator | | | (102,094) | |
Fees contractually reduced by the investment adviser | | | (44,935) | |
| Net Expenses | | | 1,755,164 | |
| | | | | |
| Net Investment Income | | | 3,221,977 | |
| Net Realized/Unrealized Gains from Investments: | | | | |
| Net realized gains from investment transactions | | | 946,272 | |
| Change in unrealized appreciation/depreciation from investments | | | 34,043,468 | |
| Net realized/unrealized gains from investments | | | 34,989,740 | |
| | | | | |
| Change in Net Assets Resulting from Operations | | $ | 38,211,717 | |
| See Notes to Financial Statements |
|
| |
| 12 |
| Financial Statements | | Boston Trust Balanced Fund |
| STATEMENTS OF CHANGES IN NET ASSETS | | | | | | | | | | |
| | | | | | | | | | | |
| | | | For the year ended | | | | For the year ended | |
| | | | March 31, 2010 | | | | March 31, 2009 | |
| Investment Activities: | | | | | | | | | | |
| Operations: | | | | | | | | | | |
Net investment income | | | $ | 3,221,977 | | | | $ | 3,008,273 | |
Net realized gains (losses) from investment transactions | | | | 946,272 | | | | | (2,892,802) | |
Change in unrealized appreciation/depreciation from investments | | | | 34,043,468 | | | | | (34,137,628) | |
| Change in net assets resulting from operations | | | | 38,211,717 | | | | | (34,022,157) | |
| | | | | | | | | | | |
| Dividends: | | | | | | | | | | |
Net investment income | | | | (3,153,684) | | | | | (3,026,472) | |
Net realized gains from investment transactions | | | | — | | | | | (4,856,029) | |
| Change in net assets resulting from shareholder dividends | | | | (3,153,684) | | | | | (7,882,501) | |
| | | | | | | | | | | |
| Capital Share Transactions: | | | | | | | | | | |
Proceeds from shares issued | | | | 26,227,435 | | | | | 20,285,450 | |
Dividends reinvested | | | | 3,011,645 | | | | | 7,558,953 | |
Cost of shares redeemed | | | | (12,386,127) | | | | | (20,852,763) | |
| Change in net assets resulting from capital share transactions | | | | 16,852,953 | | | | | 6,991,640 | |
| | | | | | | | | | | |
| Change in net assets | | | | 51,910,986 | | | | | (34,913,018) | |
| | | | | | | | | | | |
| Net Assets: | | | | | | | | | | |
Beginning of period | | | | 148,400,532 | | | | | 183,313,550 | |
End of period | | | $ | 200,311,518 | | | | $ | 148,400,532 | |
| | | | | | | | | | | |
| Share Transactions: | | | | | | | | | | |
Issued | | | | 973,787 | | | | | 795,051 | |
Reinvested | | | | 109,834 | | | | | 313,910 | |
Redeemed | | | | (461,327) | | | | | (795,578) | |
| Change in shares | | | | 622,294 | | | | | 313,383 | |
| | | | | | | | | | | |
| Accumulated net investment income | | | $ | 827,544 | | | | $ | 759,251 | |
| See Notes to Financial Statements |
|
| |
| 13 |
| Financial Statements | | Boston Trust Balanced Fund |
| FINANCIAL HIGHLIGHTS | | | | | | | | | | | | | | | | | | | | | |
| Selected data for a share outstanding throughout the years indicated. | |
| | | | | | | | | | | | | | | | | | | | | | |
| | | | For the year | | | For the year | | | For the year | | | For the year | | | For the year | |
| | | | ended | | | ended | | | ended | | | ended | | | ended | |
| | | | March 31, | | | March 31, | | | March 31, | | | March 31, | | | March 31, | |
| | | | 2010 | | | 2009 | | | 2008 | | | 2007 | | | 2006 | |
| Net Asset Value, Beginning of Period | | | $ | 23.33 | | | $ | 30.31 | | | $ | 29.87 | | | $ | 29.11 | | | $ | 28.77 | |
| | | | | | | | | | | | | | | | | | | | | | |
| Investment Activities: | | | | | | | | | | | | | | | | | | | | | |
Net investment income | | | | 0.47 | | | | 0.49 | (a) | | | 0.46 | | | | 0.46 | | | | 0.53 | |
Net realized and unrealized gains (losses) from investment transactions | | | | 5.36 | | | | (6.11) | | | | 1.42 | | | | 2.13 | | | | 0.88 | |
| Total from investment activities | | | | 5.83 | | | | (5.62) | | | | 1.88 | | | | 2.59 | | | | 1.41 | |
| | | | | | | | | | | | | | | | | | | | | | |
| Dividends: | | | | | | | | | | | | | | | | | | | | | |
Net investment income | | | | (0.47) | | | | (0.52) | | | | (0.45) | | | | (0.43) | | | | (0.52) | |
Net realized gains from investments | | | | — | | | | (0.84) | | | | (0.99) | | | | (1.40) | | | | (0.55) | |
| Total dividends | | | | (0.47) | | | | 1.36) | | | | (1.44) | | | | (1.83) | | | | (1.07) | |
| | | | | | | | | | | | | | | | | | | | | | |
| Net Asset Value, End of Period | | | $ | 28.69 | | | $ | 23.33 | | | $ | 30.31 | | | $ | 29.87 | | | $ | 29.11 | |
| | | | | | | | | | | | | | | | | | | | | | |
| Total Return | | | | 25.08% | | | | (18.68)% | | | | 6.06% | | | | 8.98% | | | | 4.97% | |
| | | | | | | | | | | | | | | | | | | | | | |
| Ratios/Supplemental Data: | | | | | | | | | | | | | | | | | | | | | |
| Net Assets at end of period (000’s) | | | $ | 200,312 | | | $ | 148,401 | | | $ | 183,314 | | | $ | 170,307 | | | $ | 164,475 | |
| Ratio of net expenses to average net assets | | | | 1.00% | | | | 1.00% | | | | 1.00% | | | | 1.00% | | | | 1.00% | |
| Ratio of net investment income to average net assets | | | | 1.84% | | | | 1.80% | | | | 1.46% | | | | 1.50% | | | | 1.76% | |
Ratio of expenses (before fee reductions) to average net assets(b) | | | | 1.08% | | | | 1.08% | | | | 1.08% | | | | 1.07% | | | | 1.08% | |
| Portfolio turnover rate | | | | 12.90% | | | | 21.30% | | | | 33.49% | | | | 37.24% | | | | 29.77% | |
|
| (a) | | Calculated using the average shares method. |
| (b) | | During the period, certain fees were reduced and total fund expenses were capped at 1.00%. If such expense caps had not been in place, the ratio would have been as indicated. |
| See Notes to Financial Statements |
|
| |
| 14 |
| Schedule of Portfolio Investments | | Boston Trust Equity Fund
March 31, 2010 |
|
| COMMON STOCKS (99.7%) | | | | | | | | |
| Security Description | | | | | | | Shares | | Value ($) |
| |
| Consumer Discretionary (7.7%) | | | | | | | | |
| Comcast Corp., Class A | | | | | | 35,000 | | 658,700 |
| Johnson Controls, Inc. | | | | | | 18,000 | | 593,820 |
| NIKE, Inc., Class B | | | | | | 5,000 | | 367,500 |
| Omnicom Group, Inc. | | | | | | 25,000 | | 970,250 |
| Ross Stores, Inc. | | | | | | 1,000 | | 53,470 |
| Staples, Inc. | | | | | | 30,000 | | 701,700 |
| Target Corp. | | | | | | 15,000 | | 789,000 |
| | | | | | | | | 4,134,440 |
| Consumer Products (12.5%) | | | | | | | | |
| Costco Wholesale Corp. | | | | | | 15,000 | | 895,650 |
| Diageo PLC, Sponsored ADR | | | | | | 15,000 | | 1,011,750 |
| Kellogg Co. | | | | | | 7,500 | | 400,725 |
| McCormick & Co., Inc. | | | | | | 25,000 | | 959,000 |
| PepsiCo, Inc. | | | | | | 15,000 | | 992,400 |
| Procter & Gamble Co. | | | | | | 15,000 | | 949,050 |
| SYSCO Corp. | | | | | | 50,000 | | 1,475,000 |
| | | | | | | | | 6,683,575 |
| Energy (11.4%) | | | | | | | | |
| Apache Corp. | | | | | | 12,000 | | 1,218,000 |
| Chevron Corp. | | | | | | 12,500 | | 947,875 |
| ConocoPhillips | | | | | | 10,000 | | 511,700 |
| Exxon Mobil Corp. | | | | | | 32,500 | | 2,176,850 |
| Schlumberger Ltd. | | | | | | 20,000 | | 1,269,200 |
| | | | | | | | | 6,123,625 |
| Financial Services (16.3%) | | | | | | | | |
| Bank of America Corp. | | | | | | 35,000 | | 624,750 |
| Chubb Corp. | | | | | | 20,000 | | 1,037,000 |
| Cincinnati Financial Corp. | | | | | | 45,000 | | 1,300,500 |
| Comerica, Inc. | | | | | | 20,000 | | 760,800 |
| JPMorgan Chase & Co. | | | | | | 10,000 | | 447,500 |
| M&T Bank Corp. | | | | | | 10,000 | | 793,800 |
| PNC Financial Services Group, Inc. | | | | | | 12,500 | | 746,250 |
| State Street Corp. | | | | | | 15,000 | | 677,100 |
| SunTrust Banks, Inc. | | | | | | 25,000 | | 669,750 |
| T. Rowe Price Group, Inc. | | | | | | 30,000 | | 1,647,900 |
| | | | | | | | | 8,705,350 |
| Health Care (13.3%) | | | | | | | | |
| Becton, Dickinson & Co. | | | | | | 15,000 | | 1,180,950 |
| C.R. Bard, Inc. | | | | | | 12,500 | | 1,082,750 |
| DENTSPLY International, Inc. | | | | | | 30,000 | | 1,045,500 |
| Johnson & Johnson, Inc. | | | | | | 10,000 | | 652,000 |
| Medtronic, Inc. | | | | | | 25,000 | | 1,125,750 |
| Merck & Co., Inc. | | | | | | 2,500 | | 93,375 |
| Saint Jude Medical, Inc.(a) | | | | | | 10,000 | | 410,500 |
| Stryker Corp. | | | | | | 12,500 | | 715,250 |
| Varian Medical Systems, Inc.(a) | | | | | | 15,000 | | 829,950 |
| | | | | | | | | 7,136,025 |
| Industrial Materials (5.7%) | | | | | | | | |
| Air Products & Chemicals, Inc. | | | | | | 10,000 | | 739,500 |
| AptarGroup, Inc. | | | | | | 15,000 | | 590,250 |
| Ecolab, Inc. | | | | | | 15,000 | | 659,250 |
| Sigma-Aldrich Corp. | | | | | | 20,000 | | 1,073,200 |
| | | | | | | | | 3,062,200 |
| Industrial Products & Services (17.1%) | | | | | | | | |
| ABB Ltd., Sponsored ADR | | | | | | 35,000 | | 764,400 |
| Donaldson Co., Inc. | | | | | | 25,000 | | 1,128,000 |
| Emerson Electric Co. | | | | | | 37,500 | | 1,887,750 |
| Illinois Tool Works, Inc. | | | | | | 25,000 | | 1,184,000 |
| Precision Castparts Corp. | | | | | | 15,000 | | 1,900,650 |
| Rockwell Collins, Inc. | | | | | | 15,000 | | 938,850 |
| W.W. Grainger, Inc. | | | | | | 12,500 | | 1,351,500 |
| | | | | | | | | 9,155,150 |
| Information Technology (15.7%) | | | | | | | | |
| Accenture PLC, Class A | | | | | | 25,000 | | 1,048,750 |
| Automatic Data Processing, Inc. | | | | | | 25,000 | | 1,111,750 |
| Cisco Systems, Inc.(a) | | | | | | 55,000 | | 1,431,650 |
| EMC Corp.(a) | | | | | | 80,000 | | 1,443,200 |
| International Business Machines Corp. | | | | | | 5,000 | | 641,250 |
| Microsoft Corp. | | | | | | 50,000 | | 1,463,500 |
| Oracle Corp. | | | | | | 50,000 | | 1,284,500 |
| | | | | | | | | 8,424,600 |
| TOTAL COMMON STOCKS (Cost $35,424,269) | | | | | | | | 53,424,965 |
| |
| INVESTMENT COMPANIES (0.2%) | | | | | | | | |
Victory Federal Money Market, Investor Shares, 0.01% (b) (Cost $117,678) | | | | | | 117,678 | | 117,678 |
| Total Investments (Cost $35,541,947) — 99.9% | | | | | | | | 53,542,643 |
| Other assets in excess of liabilities — 0.1% | | | | | | | | 40,705 |
| NET ASSETS — 100.0% | | | | | | | | $53,583,348 |
|
| (a) | | Non-income producing security. |
| (b) | | Rate disclosed is the seven day yield as of March 31, 2010. |
| ADR | | American Depositary Receipt |
| PLC | | Public Limited Company |
See Notes to Financial Statements
15
| Financial Statements | | Boston Trust Equity Fund |
|
| STATEMENT OF ASSETS AND LIABILITIES | | | |
| March 31, 2010 | | | |
| | | | |
| Assets: | | | |
| Investments, at value (cost $35,541,947) | | $ | 53,542,643 |
| Dividends receivable | | | 95,957 |
| Prepaid expenses and other assets | | | 106 |
Total Assets | | | 53,638,706 |
| Liabilities: | | | |
| Accrued expenses and other liabilities: | | | |
Investment adviser | | | 32,203 |
Chief compliance officer | | | 237 |
Administration and accounting | | | 1,776 |
Custodian | | | 2,584 |
Transfer agent | | | 4,370 |
Trustee | | | 1,080 |
Other | | | 13,108 |
Total Liabilities | | | 55,358 |
| | | | |
| Net Assets | | $ | 53,583,348 |
| Composition of Net Assets: | | | |
| Capital | | $ | 38,757,242 |
| Accumulated net investment income | | | 116,710 |
| Accumulated net realized losses from investment transactions | | | (3,291,300) |
| Net unrealized appreciation from investments | | | 18,000,696 |
| | | | |
| Net Assets | | $ | 53,583,348 |
| | | | |
| Shares outstanding (par value $0.01, unlimited number of shares authorized) | | | 4,244,815 |
| | | | |
| Net Asset Value, Offering Price and Redemption Price per share | | $ | 12.62 |
| | | | |
| STATEMENT OF OPERATIONS | | | |
| For the year ended March 31, 2010 | | | |
| | | | |
| Investment Income: | | | |
| Dividends | | $ | 920,931 |
Total Investment Income | | | 920,931 |
| Expenses: | | | |
Investment adviser | | | 360,054 |
Administration and accounting | | | 99,456 |
Trustee | | | 4,683 |
Custodian | | | 10,467 |
Transfer agency | | | 17,507 |
Chief compliance officer | | | 3,382 |
Printing | | | 7,659 |
Professional | | | 19,662 |
Other | | | 11,723 |
Total expenses before fee reductions | | | 534,593 |
Fees voluntarily reduced by the administrator | | | (28,005) |
Fees contractually reduced by the investment adviser | | | (26,106) |
| Net Expenses | | | 480,482 |
| | | | |
| Net Investment Income | | | 440,449 |
| Net Realized/Unrealized Gains from Investments: | | | |
| Net realized gains from investment transactions | | | 774,817 |
| Change in unrealized appreciation/depreciation from investments | | | 16,019,763 |
| Net realized/unrealized gains from investments | | | 16,794,580 |
| | | | |
| Change in Net Assets Resulting from Operations | | $ | 17,235,029 |
See Notes to Financial Statements
16
| Financial Statements | | Boston Trust Equity Fund |
| STATEMENTS OF CHANGES IN NET ASSETS | | | | | | | | | | |
| | | | | | | | | | | |
| | | | For the year ended | | | | For the year ended | |
| | | | March 31, 2010 | | | | March 31, 2009 | |
| Investment Activities: | | | | | | | | | | |
| Operations: | | | | | | | | | | |
Net investment income | | | $ | 440,449 | | | | $ | 474,531 | |
Net realized gains (losses) from investment transactions | | | | 774,817 | | | | | (4,042,987) | |
Change in unrealized appreciation/depreciation from investments | | | | 16,019,763 | | | | | (17,791,854) | |
| Change in net assets resulting from operations | | | | 17,235,029 | | | | | (21,360,310) | |
| | | | | | | | | | | |
| Dividends: | | | | | | | | | | |
Net investment income | | | | (435,641) | | | | | (482,096) | |
| Change in net assets resulting from shareholder dividends | | | | (435,641) | | | | | (482,096) | |
| | | | | | | | | | | |
| Capital Share Transactions: | | | | | | | | | | |
Proceeds from shares issued | | | | 2,198,669 | | | | | 4,500,020 | |
Dividends reinvested | | | | 393,025 | | | | | 437,230 | |
Cost of shares redeemed | | | | (4,506,458) | | | | | (9,445,789) | |
| Change in net assets resulting from capital share transactions | | | | (1,914,764) | | | | | (4,508,539) | |
| | | | | | | | | | | |
| Change in net assets | | | | 14,884,624 | | | | | (26,350,945) | |
| | | | | | | | | | | |
| Net Assets: | | | | | | | | | | |
Beginning of period | | | | 38,698,724 | | | | | 65,049,669 | |
End of period | | | $ | 53,583,348 | | | | $ | 38,698,724 | |
| | | | | | | | | | | |
| Share Transactions: | | | | | | | | | | |
Issued | | | | 200,783 | | | | | 389,563 | |
Reinvested | | | | 33,279 | | | | | 45,892 | |
Redeemed | | | | (401,965) | | | | | (960,879) | |
| Change in shares | | | | 167,903) | | | | | (525,424) | |
| | | | | | | | | | | |
| Accumulated net investment income | | | $ | 116,710 | | | | $ | 111,490 | |
See Notes to Financial Statements
17
| Financial Statements | | Boston Trust Equity Fund |
|
| |
| FINANCIAL HIGHLIGHTS |
| Selected data for a share outstanding throughout the years indicated. | | | | | | | | | | | | | | | | | | | | | |
| | | | | | | | | | | | | | | | | | | | | | |
| | | | For the year | | | For the year | | | For the year | | | For the year | | | For the year | |
| | | | ended | | | ended | | | ended | | | ended | | | ended | |
| | | | March 31, | | | March 31, | | | March 31, | | | March 31, | | | March 31, | |
| | | | 2010 | | | 2009 | | | 2008 | | | 2007 | | | 2006 | |
| | | | | | | | | | | | | | | | | | | | | | |
| Net Asset Value, Beginning of Period | | | $ | 8.77 | | | $ | 13.17 | | | $ | 13.17 | | | $ | 12.39 | | | $ | 11.86 | |
| | | | | | | | | | | | | | | | | | | | | | |
| Investment Activities: | | | | | | | | | | | | | | | | | | | | | |
Net investment income | | | | 0.10 | | | | 0.10 | (a) | | | 0.08 | | | | 0.09 | | | | 0.09 | |
Net realized and unrealized gains (losses) from investment transactions | | | | 3.85 | | | | (4.40) | | | | 0.30 | | | | 1.04 | | | | 0.65 | |
| Total from investment activities | | | | 3.95 | | | | (4.30) | | | | 0.38 | | | | 1.13 | | | | 0.74 | |
| | | | | | | | | | | | | | | | | | | | | | |
| Dividends: | | | | | | | | | | | | | | | | | | | | | |
Net investment income | | | | (0.10) | | | | (0.10) | | | | (0.08) | | | | (0.08) | | | | (0.09) | |
Net realized gains from investments | | | | — | | | | — | | | | (0.30) | | | | (0.27) | | | | (0.12) | |
| Total dividends | | | | (0.10) | | | | (0.10) | | | | (0.38) | | | | (0.35) | | | | (0.21) | |
| | | | | | | | | | | | | | | | | | | | | | |
| Net Asset Value, End of Period | | | $ | 12.62 | | | $ | 8.77 | | | $ | 13.17 | | | $ | 13.17 | | | $ | 12.39 | |
| | | | | | | | | | | | | | | | | | | | | | |
| Total Return | | | | 45.13% | | | | (32.73)% | | | | 2.59% | | | | 9.20% | | | | 6.23% | |
| | | | | | | | | | | | | | | | | | | | | | |
| Ratios/Supplemental Data: | | | | | | | | | | | | | | | | | | | | | |
| Net Assets at end of period (000’s) | | | $ | 53,583 | | | $ | 38,699 | | | $ | 65,050 | | | $ | 59,884 | | | $ | 48,574 | |
| Ratio of net expenses to average net assets | | | | 1.00% | | | | 1.00% | | | | 1.00% | | | | 1.00% | | | | 1.00% | |
| Ratio of net investment income to average net assets | | | | 0.92% | | | | 0.86% | | | | 0.55% | | | | 0.71% | | | | 0.73% | |
| Ratio of expenses (before fee reductions) to average net assets(b) | | | | 1.11% | | | | 1.10% | | | | 1.10% | | | | 1.11% | | | | 1.11% | |
| Portfolio turnover rate | | | | 19.90% | | | | 28.85% | | | | 23.53% | | | | 21.48% | | | | 20.44% | |
|
| (a) | | Calculated using the average shares method. |
| (b) | | During the period, certain fees were reduced and total fund expenses were capped at 1.00%. If such expense caps had not been in place, the ratio would have been as indicated. |
See Notes to Financial Statements
18
| Schedule of Portfolio Investments | | Boston Trust Midcap Fund
March 31, 2010 |
|
COMMON STOCkS (96.6%) | | | | | |
| Security Description | | | Shares | | | Value ($) |
| |
| Consumer Discretionary (13.1%) | | | | | |
| Abercrombie & Fitch Co., Class A | | 2,600 | | | 118,664 |
| Advance Auto Parts, Inc. | | 4,500 | | | 188,640 |
| Autoliv, Inc.(a) | | 4,830 | | | 248,890 |
| Coach, Inc. | | 4,500 | | | 177,840 |
| Guess?, Inc. | | 4,150 | | | 194,967 |
| John Wiley & Sons, Inc., Class A | | 2,600 | | | 112,528 |
| O’Reilly Automotive, Inc.(a) | | 6,200 | | | 258,602 |
| Omnicom Group, Inc. | | 7,750 | | | 300,777 |
| Ross Stores, Inc. | | 7,300 | | | 390,331 |
| Strayer Education, Inc. | | 575 | | | 140,024 |
| | | | | | 2,131,263 |
| Consumer Products (6.8%) | | | | | |
| Alberto-Culver Co. | | 10,000 | | | 261,500 |
| Brown-Forman Corp., Class B | | 3,125 | | | 185,781 |
| Church & Dwight Co., Inc. | | 3,500 | | | 234,325 |
| Clorox Co. | | 2,500 | | | 160,350 |
| McCormick & Co., Inc. | | 7,050 | | | 270,438 |
| | | | | | 1,112,394 |
| Energy (6.3%) | | | | | |
| Cabot Oil & Gas Corp. | | 8,200 | | | 301,760 |
| Core Laboratories NV | | 1,300 | | | 170,040 |
| FMC Technologies, Inc.(a) | | 4,325 | | | 279,525 |
| Murphy Oil Corp. | | 5,000 | | | 280,950 |
| | | | | | 1,032,275 |
| Financial Services (16.3%) | | | | | |
| Bank of Hawaii Corp. | | 3,900 | | | 175,305 |
| Cincinnati Financial Corp. | | 10,405 | | | 300,704 |
| Comerica, Inc. | | 7,525 | | | 286,251 |
| Commerce Bancshares, Inc. | | 4,375 | | | 179,988 |
| Digital Realty Trust, Inc. | | 2,600 | | | 140,920 |
| IntercontinentalExchange, Inc.(a) | | 975 | | | 109,376 |
| Jones Lang LaSalle, Inc. | | 1,675 | | | 122,091 |
| M&T Bank Corp. | | 3,650 | | | 289,737 |
| Morningstar, Inc.(a) | | 3,325 | | | 159,899 |
| SEI Investments Co. | | 11,250 | | | 247,162 |
| T. Rowe Price Group, Inc. | | 6,750 | | | 370,777 |
| TD Ameritrade Holding Corp.(a) | | 8,525 | | | 162,487 |
| The NASDAQ OMX Group, Inc.(a) | | 5,400 | | | 114,048 |
| | | | | | 2,658,745 |
| Health Care (12.2%) | | | | | |
| C.R. Bard, Inc. | | 3,650 | | | 316,163 |
| DENTSPLY International, Inc. | | 7,275 | | | 253,534 |
| Gen-Probe, Inc.(a) | | 3,950 | | | 197,500 |
| IDEXX Laboratories, Inc.(a) | | 2,650 | | | 152,508 |
| Patterson Cos., Inc. | | 5,650 | | | 175,432 |
| Pharmaceutical Product Development, Inc. | | 5,875 | | | 139,531 |
| ResMed, Inc.(a) | | 2,300 | | | 146,395 |
| Techne Corp. | | 1,900 | | | 121,011 |
| Varian Medical Systems, Inc.(a) | | 4,200 | | | 232,386 |
| Waters Corp.(a) | | 3,700 | | | 249,898 |
| | | | | | 1,984,358 |
| Industrial Materials (5.6%) | | | | | |
| AptarGroup, Inc. | | 7,300 | | | 287,255 |
| Ecolab, Inc. | | 5,725 | | | 251,614 |
| Sigma-Aldrich Corp. | | 7,025 | | | 376,961 |
| | | | | | 915,830 |
| Industrial Products & Services (15.6%) | | | | | |
| AMETEK, Inc. | | 6,500 | | | 269,490 |
| C.H. Robinson Worldwide, Inc. | | 4,150 | | | 231,777 |
| CLARCOR, Inc. | | 4,950 | | | 170,726 |
| Donaldson Co., Inc. | | 7,800 | | | 351,936 |
| Expeditors International of Washington, Inc. | | 5,200 | | | 191,984 |
| L-3 Communications Holdings, Inc. | | 1,250 | | | 114,538 |
| Mettler-Toledo International, Inc.(a) | | 2,800 | | | 305,760 |
| Precision Castparts Corp. | | 2,100 | | | 266,091 |
| Rockwell Collins, Inc. | | 4,950 | | | 309,820 |
| W.W. Grainger, Inc. | | 3,125 | | | 337,875 |
| | | | | | 2,549,997 |
| Information Technology (15.9%) | | | | | |
| Amdocs Ltd.(a) | | 7,000 | | | 210,770 |
| BMC Software, Inc.(a) | | 6,000 | | | 228,000 |
| Check Point Software Technologies Ltd.(a) | | 5,250 | | | 184,065 |
| Citrix Systems, Inc.(a) | | 7,350 | | | 348,904 |
| Cognizant Technology Solutions Corp. Class A(a) | | 4,500 | | | 229,410 |
| F5 Networks, Inc.(a) | | 2,600 | | | 159,926 |
| FactSet Research Systems, Inc. | | 3,650 | | | 267,800 |
| Fiserv, Inc.(a) | | 2,250 | | | 114,210 |
| Intuit, Inc.(a) | | 4,750 | | | 163,115 |
| NetApp, Inc.(a) | | 10,400 | | | 338,624 |
| Paychex, Inc. | | 4,700 | | | 144,290 |
| Teradata Corp.(a) | | 6,750 | | | 195,008 |
| | | | | | 2,584,122 |
| Telecommunications (0.8%) | | | | | |
| NII Holdings, Inc.(a) | | 3,150 | | | 131,229 |
| | | | | | |
| Utilities (4.0%) | | | | | |
| AGL Resources, Inc. | | 2,650 | | | 102,423 |
| Energen Corp. | | 3,500 | | | 162,855 |
| NSTAR | | 3,200 | | | 113,344 |
| Questar Corp. | | 6,250 | | | 270,000 |
| | | | | | 648,622 |
| TOTAL COMMON STOCKS (Cost $12,098,166) | | | | | 15,748,835 |
| | | | | | |
| INVESTMENT COMPANIES (3.1%) | | | | | |
| Victory Federal Money Market, Investor Shares, 0.01%(b) (Cost $503,577) | | 503,577 | | | 503,577 |
| Total Investments (Cost $12,601,743) — 99.7% | | | | | 16,252,412 |
| Other assets in excess of liabilities — 0.3% | | | | | 56,260 |
| NET ASSETS — 100.0% | | | | $ | 16,308,672 |
|
| (a) | Non-income producing security. |
| (b) | Rate disclosed is the seven day yield as of March 31, 2010. |
| NV | Naamloze Venootschap (Dutch Corporation) |
See Notes to Financial Statements
19
| Financial Statements | | Boston Trust Midcap Fund |
|
| STATEMENT OF ASSETS AND LIABILITIES | | | |
| March 31, 2010 | | | |
| | | | |
| Assets: | | | |
| Investments, at value (cost $12,601,743) | | $ | 16,252,412 |
| Dividends receivable | | | 10,834 |
| Receivable for capital shares issued | | | 61,000 |
| Prepaid expenses and other assets | | | 1,110 |
Total Assets | | | 16,325,356 |
| | | | |
| Liabilities: | | | |
| Accrued expenses and other liabilities: | | | |
Investment adviser | | | 6,467 |
Chief compliance officer | | | 65 |
Administration and accounting | | | 742 |
Custodian | | | 1,384 |
Transfer agent | | | 4,015 |
Trustee | | | 296 |
Other | | | 3,715 |
Total Liabilities | | | 16,684 |
| | | | |
| Net Assets | | $ | 16,308,672 |
| | | | |
| Composition of Net Assets: | | | |
| Capital | | $ | 12,934,289 |
| Accumulated net investment income | | | 3,293 |
Accumulated net realized losses from investment transactions | | | (279,579) |
Net unrealized appreciation from investments | | | 3,650,669 |
| | | | |
Net Assets | | $ | 16,308,672 |
| | | | |
Shares outstanding (par value $0.01, unlimited number of shares authorized) | | | 1,727,458 |
Net Asset Value, Offering Price and Redemption Price per share | | $ | 9.44 |
| STATEMENT OF OPERATIONS | | | | |
| For the year ended March 31, 2010 | | | | |
| | | | | |
| Investment Income: | | | | |
| Dividends | | | $ | 143,739 |
| Less: Foreign tax withholding | | | | (36) |
Total Investment Income | | | | 143,703 |
| | | | | |
| Expenses: | | | | |
Investment adviser | | | | 85,663 |
Administration and accounting | | | | 26,472 |
Trustee | | | | 1,116 |
Custodian | | | | 5,475 |
Transfer agency | | | | 17,132 |
Chief compliance officer | | | | 746 |
Printing | | | | 1,978 |
Professional | | | | 5,060 |
Other | | | | 6,854 |
Total expenses before fee reductions | | | | 150,496 |
Fees voluntarily reduced by the administrator | | | | (6,693) |
Fees contractually reduced by the investment adviser | | | | (29,358) |
| Net Expenses | | | | 114,445 |
| | | | | |
| Net Investment Income | | | | 29,258 |
| | | | | |
| Net Realized/Unrealized Gains from Investments: | | | | |
| Net realized gains from investment transactions | | | | 74,712 |
Change in unrealized appreciation/depreciation from investments | | | | 4,650,605 |
| Net realized/unrealized gains from investments | | | | 4,725,317 |
| | | | | |
| Change in Net Assets Resulting from Operations | | | $ | 4,754,575 |
See Notes to Financial Statements
20
| Financial Statements | | Boston Trust Midcap Fund |
|
| STATEMENTS OF CHANGES IN NET ASSETS | | | | | | | | |
| | | | | | | | | |
| | | For the year ended | | | For the year ended | |
| | | March 31, 2010 | | | March 31, 2009 | |
| | | | | | | | | |
| Investment Activities: | | | | | | | | |
| Operations: | | | | | | | | |
Net investment income | | $ | 29,258 | | | $ | 27,559 | |
Net realized gains (losses) from investment transactions | | | 74,712 | | | | (131,105) | |
Change in unrealized appreciation/depreciation from investments | | | 4,650,605 | | | | (4,448,003) | |
| Change in net assets resulting from operations | | | 4,754,575 | | | | (4,551,549) | |
| | | | | | | | | |
| Dividends: | | | | | | | | |
Net investment income | | | (33,641) | | | | (34,699) | |
Net realized gains from investment transactions | | | — | | | | (112,776) | |
| Change in net assets resulting from shareholder dividends | | | (33,641) | | | | (147,475) | |
| | | | | | | | | |
| Capital Share Transactions: | | | | | | | | |
Proceeds from shares issued | | | 4,098,321 | | | | 1,084,006 | |
Dividends reinvested | | | 31,914 | | | | 146,568 | |
Cost of shares redeemed | | | (561,325) | | | | (1,945,927) | |
| Change in net assets resulting from capital share transactions | | | 3,568,910 | | | | (715,353) | |
| | | | | | | | | |
| Change in net assets | | | 8,289,844 | | | | (5,414,377) | |
| | | | | | | | | |
| Net Assets: | | | | | | | | |
Beginning of period | | | 8,018,828 | | | | 13,433,205 | |
End of period | | $ | 16,308,672 | | | $ | 8,018,828 | |
| | | | | | | | | |
| Share Transactions: | | | | | | | | |
Issued | | | 474,162 | | | | 127,461 | |
Reinvested | | | 3,714 | | | | 23,456 | |
Redeemed | | | (69,958) | | | | (287,450) | |
| Change in shares | | | 407,918 | | | | (136,533) | |
| | | | | | | | | |
| Accumulated net investment income | | $ | 3,293 | | | $ | 7,676 | |
See Notes to Financial Statements
21
| Financial Statements | | Boston Trust Midcap Fund |
|
| | | |
| FINANCIAL HIGHLIGHTS |
| Selected data for a share outstanding throughout the periods indicated. |
| | | | | | | For the | | | For the | |
| | | For the | | | year ended | | | period ended | |
| | | year ended | | | March 31, | | | March 31, | |
| | | March 31, 2010 | | | 2009 | | | 2008 (a) | |
| | | | | | | | | | | | | |
| Net Asset Value, Beginning of Period | | $ | 6.08 | | | $ | 9.23 | | | $ | 10.00 | |
| | | | | | | | | | | | | |
| Investment Activities: | | | | | | | | | | | | |
Net investment income | | | 0.02 | | | | 0.02 | (b) | | | 0.01 | |
Net realized and unrealized gains (losses) from investment transactions | | | 3.36 | | | | (3.07) | | | | (0.71) | |
| Total from investment activities | | | 3.38 | | | | (3.05) | | | | (0.70) | |
| | | | | | | | | | | | | |
| Dividends: | | | | | | | | | | | | |
Net investment income | | | (0.02) | | | | (0.02) | | | | — | (c) |
Net realized gains from investments | | | — | | | | (0.08) | | | | (0.07) | |
| Total dividends | | | (0.02) | | | | (0.10) | | | | (0.07) | |
| | | | | | | | | | | | | |
| Net Asset Value, End of Period | | $ | 9.44 | | | $ | 6.08 | | | $ | 9.23 | |
| | | | | | | | | | | | | |
| Total Return | | | 55.68% | | | | (33.03)% | | | | (7.05)% | (d) |
| | | | | | | | | | | | | |
| Ratios/Supplemental Data: | | | | | | | | | | | | |
| Net Assets at end of period (000’s) | | $ | 16,309 | | | $ | 8,019 | | | $ | 13,433 | |
| Ratio of net expenses to average net assets | | | 1.00% | | | | 1.00% | | | | 1.00% | (e) |
| Ratio of net investment income to average net assets | | | 0.26% | | | | 0.24% | | | | 0.29% | (e) |
| Ratio of expenses (before fee reductions) to average net assets (f) | | | 1.32% | | | | 1.48% | | | | 1.58% | (e) |
| Portfolio turnover | | | 26.44% | | | | 22.93% | | | | 17.87% | (d) |
|
| (a) | Commenced operations on September 24, 2007. |
| (b) | Calculated using the average shares method. |
| (c) | Less than $0.005 per share. |
| (d) | Not annualized for periods less than one year. |
| (e) | Annualized for periods less than one year. |
| (f) | During the period, certain fees were reduced and total fund expenses were capped at 1.00%. If such expense caps had not been in place, the ratio would have been as indicated. |
See Notes to Financial Statements
22
| Schedule of Portfolio Investments | | Boston Trust Small Cap Fund
March 31, 2010 |
|
COMMON STOCkS (98.0%) | | | | | |
| Security Description | | | Shares | | | Value ($) |
| |
| Consumer Discretionary (16.0%) | | | | | |
| Ambassadors Group, Inc. | | 23,825 | | | 263,266 |
| Capella Education Co.(a) | | 27,950 | | | 2,594,878 |
| Gentex Corp. | | 158,650 | | | 3,080,983 |
| Hibbett Sports, Inc.(a) | | 47,150 | | | 1,206,097 |
| John Wiley & Sons, Inc., Class A | | 57,300 | | | 2,479,944 |
| LKQ Corp.(a) | | 98,425 | | | 1,998,028 |
| Lululemon Athletica, Inc.(a) | | 66,750 | | | 2,770,125 |
| NutriSystem, Inc. | | 38,000 | | | 676,780 |
| Pre-Paid Legal Services, Inc.(a) | | 12,350 | | | 467,448 |
| Strayer Education, Inc. | | 6,075 | | | 1,479,384 |
| Tempur-Pedic International, Inc.(a) | | 61,625 | | | 1,858,610 |
| Timberland Co., Class A(a) | | 57,300 | | | 1,222,782 |
| Under Armour, Inc., Class A(a) | | 21,325 | | | 627,168 |
| Universal Technical Institute, Inc.(a) | | 27,950 | | | 637,819 |
| | | | | | 21,363,312 |
| Consumer Products (2.9%) | | | | | |
| Diamond Foods, Inc. | | 23,725 | | | 997,399 |
| Hain Celestial Group, Inc.(a) | | 29,750 | | | 516,163 |
| Lifeway Foods, Inc.(a) | | 69,275 | | | 822,294 |
| United Natural Foods, Inc.(a) | | 53,975 | | | 1,518,317 |
| | | | | | 3,854,173 |
| Energy (3.2%) | | | | | |
| Boots & Coots, Inc.(a) | | 180,850 | | | 439,466 |
| CARBO Ceramics, Inc. | | 32,975 | | | 2,055,661 |
| CREDO Petroleum Corp.(a) | | 57,300 | | | 566,697 |
| Dawson Geophysical Co.(a) | | 15,675 | | | 458,337 |
| T-3 Energy Services, Inc.(a) | | 33,575 | | | 824,602 |
| | | | | | 4,344,763 |
| Financial Services (19.6%) | | | | | |
| Bank of Hawaii Corp. | | 58,800 | | | 2,643,060 |
| Corporate Office Properties | | 48,050 | | | 1,928,247 |
| Dime Community Bancshares | | 186,275 | | | 2,352,653 |
| eHealth, Inc.(a) | | 82,425 | | | 1,298,194 |
| Horace Mann Educators Corp. | | 39,900 | | | 600,894 |
| Independent Bank Corp. | | 50,575 | | | 1,247,180 |
| Investment Technology Group, Inc.(a) | | 80,925 | | | 1,350,638 |
| Jones Lang LaSalle, Inc. | | 44,425 | | | 3,238,138 |
| Orrstown Financial Services, Inc. | | 27,682 | | | 702,292 |
| Parkway Properties, Inc. | | 58,800 | | | 1,104,264 |
| Signature Bank(a) | | 41,325 | | | 1,531,091 |
| Southside Bancshares, Inc. | | 52,375 | | | 1,129,729 |
| TCF Financial Corp. | | 128,475 | | | 2,047,891 |
| UMB Financial Corp. | | 16,600 | | | 673,960 |
| Umpqua Holdings Corp. | | 100,125 | | | 1,327,658 |
| Wainwright Bank & Trust Co. | | 17,095 | | | 166,163 |
| Wilmington Trust Corp. | | 92,900 | | | 1,539,353 |
| Wilshire Bancorp, Inc. | | 120,500 | | | 1,329,115 |
| | | | | | 26,210,520 |
| Health Care (12.4%) | | | | | |
| Cantel Medical Corp. | | 30,450 | | | 604,433 |
| Computer Programs & Systems, Inc. | | 13,775 | | | 538,327 |
| Dionex Corp.(a) | | 38,225 | | | 2,858,465 |
| Gen-Probe, Inc.(a) | | 19,500 | | | 975,000 |
| ICU Medical, Inc.(a) | | 29,650 | | | 1,021,443 |
| Immucor, Inc.(a) | | 16,375 | | | 366,636 |
| Landauer, Inc. | | 40,525 | | | 2,643,040 |
| Martek Biosciences Corp.(a) | | 51,375 | | | 1,156,451 |
| Meridian Bioscience, Inc. | | 101,025 | | | 2,057,879 |
| Neogen Corp.(a) | | 44,525 | | | 1,117,578 |
| Nutraceutical International Corp.(a) | | 23,275 | | | 347,729 |
| West Pharmaceutical Services, Inc. | | 49,875 | | | 2,092,256 |
| ZOLL Medical Corp.(a) | | 27,450 | | | 723,582 |
| | | | | | 16,502,819 |
| Industrial Materials (2.9%) | | | | | |
| Commercial Metals Co. | | 73,025 | | | 1,099,756 |
| Minerals Technologies, Inc. | | 32,075 | | | 1,662,768 |
| Quaker Chemical Corp. | | 41,125 | | | 1,114,899 |
| | | | | | 3,877,423 |
| Industrial Products & Services (15.2%) | | | | | |
| American Science & Engineering, Inc. | | 7,650 | | | 573,138 |
| Apogee Enterprises, Inc. | | 43,825 | | | 692,873 |
| Baldor Electric Co. | | 82,025 | | | 3,067,735 |
| CLARCOR, Inc. | | 72,575 | | | 2,503,112 |
| ESCO Technologies, Inc. | | 22,725 | | | 722,882 |
| Fuel-Tech, Inc.(a) | | 40,325 | | | 323,407 |
| Genesee & Wyoming, Inc., Class A(a) | | 68,575 | | | 2,339,779 |
| Herman Miller, Inc. | | 27,450 | | | 495,747 |
| Layne Christensen Co.(a) | | 19,000 | | | 507,490 |
| Lindsay Manufacturing Co. | | 26,150 | | | 1,082,871 |
| Met-Pro Corp. | | 31,075 | | | 304,224 |
| Middleby Corp.(a) | | 15,975 | | | 920,000 |
| Simpson Manufacturing Co., Inc. | | 62,025 | | | 1,721,814 |
| SunPower Corp., Class B(a) | | 15,800 | | | 264,492 |
| Team, Inc.(a) | | 48,250 | | | 800,468 |
| Wabtec Corp. | | 60,325 | | | 2,540,889 |
| Watts Water Technologies, Inc., Class A | | 47,550 | | | 1,476,903 |
| | | | | | 20,337,824 |
| Information Technology (21.3%) | | | | | |
| Alvarion Ltd.(a) | | 162,505 | | | 643,520 |
| Blackbaud, Inc. | | 55,900 | | | 1,408,121 |
| Blackboard, Inc.(a) | | 27,000 | | | 1,124,820 |
| Blue Coat Systems, Inc.(a) | | 31,075 | | | 964,568 |
| Coherent, Inc.(a) | | 23,925 | | | 764,643 |
| Itron, Inc.(a) | | 30,775 | | | 2,233,342 |
| J2 Global Communications, Inc.(a) | | 91,775 | | | 2,147,535 |
| Liquidity Services, Inc.(a) | | 58,200 | | | 671,628 |
| National Instruments Corp. | | 51,075 | | | 1,703,351 |
| Net 1 UEPS Technologies, Inc.(a) | | 85,950 | | | 1,580,620 |
| Plantronics, Inc. | | 100,525 | | | 3,144,422 |
| Polycom, Inc.(a) | | 103,550 | | | 3,166,559 |
| Power Integrations, Inc. | | 70,675 | | | 2,911,810 |
| Quality Systems, Inc. | | 42,225 | | | 2,594,304 |
| Renaissance Learning, Inc. | | 45,550 | | | 739,277 |
| Riverbed Technology, Inc.(a) | | 41,275 | | | 1,172,210 |
| Skyworks Solutions, Inc.(a) | | 90,675 | | | 1,414,530 |
| | | | | | 28,385,260 |
| Utilities (4.5%) | | | | | |
| American States Water Co. | | 10,350 | | | 359,145 |
| New Jersey Resources Corp. | | 70,075 | | | 2,632,017 |
| Ormat Technologies, Inc. | | 13,675 | | | 384,814 |
| South Jersey Industries, Inc. | | 62,025 | | | 2,604,430 |
| | | | | | 5,980,406 |
| TOTAL COMMON STOCKS (Cost $109,167,954) | | | | | 130,856,500 |
| | | | | | |
| INVESTMENT COMPANIES (2.4%) | | | | | |
Victory Federal Money Market, Investor Shares, 0.01%(b) (Cost $3,214,539) | | 3,214,539 | | | 3,214,539 |
| | | | | | |
| Total Investments (Cost $112,382,493) — 100.4% | | | | | 134,071,039 |
| Liabilities in excess of other assets — (0.4)% | | | | | (559,623) |
| NET ASSETS — 100.0% | | | | $ | 133,511,416 |
| | |
| (a) | Non-income producing security. |
| (b) | Rate disclosed is the seven day yield as of March 31, 2010. |
See Notes to Financial Statements
23
| Financial Statements | | Boston Trust Small Cap Fund |
|
| STATEMENT OF ASSETS AND LIABILITIES | | | |
| March 31, 2010 | | | |
| | | | |
| Assets: | | | |
| Investments, at value (cost $112,382,493) | | $ | 134,071,039 |
| Dividends receivable | | | 151,660 |
| Receivable for capital shares issued | | | 92,155 |
| Prepaid expenses and other assets | | | 9,982 |
Total Assets | | | 134,324,836 |
| | | | |
| Liabilities: | | | |
| Payable for investments purchased | | | 698,811 |
| Accrued expenses and other liabilities: | | | |
Investment adviser | | | 60,895 |
Chief compliance officer | | | 511 |
Administration and accounting | | | 3,961 |
Custodian | | | 5,915 |
Transfer agent | | | 8,557 |
Trustee | | | 2,322 |
Other | | | 32,448 |
Total Liabilities | | | 813,420 |
| | | | |
| Net Assets | | $ | 133,511,416 |
| | | | |
| Composition of Net Assets: | | | |
| Capital | | $ | 109,429,813 |
| Accumulated net investment income | | | 104,399 |
| Accumulated net realized gains from investment transactions | | | 2,288,658 |
| Net unrealized appreciation from investments | | | 21,688,546 |
| | | | |
| Net Assets | | $ | 133,511,416 |
| | | | |
| Shares outstanding (par value $0.01, unlimited number of shares authorized) | | | 11,589,098 |
| | | | |
| Net Asset Value, Offering Price and Redemption Price per share | | $ | 11.52 |
| | | | |
| STATEMENT OF OPERATIONS | | | |
| For the year ended March 31, 2010 | | | |
| | | | |
| Investment Income: | | | |
| Dividends | | $ | 1,086,545 |
Total Investment Income | | | 1,086,545 |
| | | | |
| Expenses: | | | |
Investment adviser | | | 642,565 |
Administration and accounting | | | 175,409 |
Trustee | | | 8,144 |
Custodian | | | 26,860 |
Transfer agency | | | 41,846 |
Chief compliance officer | | | 4,852 |
Printing | | | 18,736 |
Professional | | | 37,224 |
Other | | | 26,448 |
Total expenses before fee reductions | | | 982,084 |
Fees voluntarily reduced by the administrator | | | (50,265) |
Fees contractually reduced by the investment adviser | | | (72,080) |
| Net Expenses | | | 859,739 |
| | | | |
| Net Investment Income | | | 226,806 |
| | | | |
| Net Realized/Unrealized Gains from Investments: | | | |
| Net realized gains from investment transactions | | | 5,520,436 |
| Net realized gains from redemptions in-kind | | | 50,886 |
| Change in unrealized appreciation/depreciation from investments | | | 28,303,344 |
| Net realized/unrealized gains from investments | | | 33,874,666 |
| | | | |
| Change in Net Assets Resulting from Operations | | $ | 34,101,472 |
See Notes to Financial Statements
24
| Financial Statements | | Boston Trust Small Cap Fund |
|
| STATEMENTS OF CHANGES IN NET ASSETS | | | | | | | |
| | | | | | | | |
| | | For the year ended | | | For the year ended |
| | | March 31, 2010 | | | March 31, 2009 |
| | | | | | | | |
| Investment Activities: | | | | | | | |
| Operations: | | | | | | | |
Net investment income | | $ | 226,806 | | | $ | 63,743 |
Net realized gains (losses) from investment transactions | | | 5,571,322 | | | | (3,231,779) |
Change in unrealized appreciation/depreciation from investments | | | 28,303,344 | | | | (8,313,989) |
| Change in net assets resulting from operations | | | 34,101,472 | | | | (11,482,025) |
| | | | | | | | |
| Dividends: | | | | | | | |
Net investment income | | | (147,516) | | | | (50,862) |
Net realized gains from investment transactions | | | — | | | | (252,171) |
| Change in net assets resulting from shareholder dividends | | | (147,516) | | | | (303,033) |
| | | | | | | | |
| Capital Share Transactions: | | | | | | | |
Proceeds from shares issued | | | 83,648,260 | | | | 10,208,948 |
Dividends reinvested | | | 125,768 | | | | 284,550 |
Cost of shares redeemed | | | (6,524,057) | | | | (3,627,892) |
Cost of shares redeemed in-kind (a) | | | (3,196,449) | | | | — |
| Change in net assets resulting from capital share transactions | | | 74,053,522 | | | | 6,865,606 |
| | | | | | | | |
| Change in net assets | | | 108,007,478 | | | | (4,919,452) |
| | | | | | | | |
| Net Assets: | | | | | | | |
Beginning of period | | | 25,503,938 | | | | 30,423,390 |
End of period | | $ | 133,511,416 | | | $ | 25,503,938 |
| | | | | | | | |
| Share Transactions: | | | | | | | |
Issued | | | 8,971,228 | | | | 1,132,080 |
Reinvested | | | 12,282 | | | | 36,434 |
Redeemed | | | (650,734) | | | | (419,063) |
Redeemed in-kind (a) | | | (278,774) | | | | — |
| Change in shares | | | 8,054,002 | | | | 749,451 |
| | | | | | | | |
| Accumulated net investment income | | $ | 104,399 | | | $ | 25,109 |
| |
| (a) See Note 3 in Notes to Financial Statements. |
See Notes to Financial Statements
25
| Financial Statements | | Boston Trust Small Cap Fund |
|
| FINANCIAL HIGHLIGHTS |
| Selected data for a share outstanding throughout the periods indicated. |
| | | For the year | | | For the year | | | For the year | | | For the year | | | For the period | |
| | | ended | | | ended | | | ended | | | ended | | | ended | |
| | | March 31, | | | March 31, | | | March 31, | | | March 31, | | | March 31, | |
| | | 2010 | | | 2009 | | | 2008 | | | 2007 | | | 2006 (a) | |
| | | | | | | | | | | | | | | | | | | | | |
| Net Asset Value, Beginning of Period | | $ | 7.21 | | | $ | 10.92 | | | $ | 11.55 | | | $ | 10.94 | | | $ | 10.00 | |
| | | | | | | | | | | | | | | | | | | | | |
| Investment Activities: | | | | | | | | | | | | | | | | | | | | |
Net investment income (loss) | | | 0.02 | | | | 0.02 | (b) | | | 0.03 | | | | (0.01) | | | | — | |
Net realized and unrealized gains (losses) from investment transactions | | | 4.31 | | | | (3.64) | | | | (0.14) | | | | 0.85 | | | | 0.94 | |
| Total from investment activities | | | 4.33 | | | | (3.62) | | | | (0.11) | | | | 0.84 | | | | 0.94 | |
| | | | | | | | | | | | | | | | | | | | | |
| Dividends: | | | | | | | | | | | | | | | | | | | | |
Net investment income | | | (0.02) | | | | (0.02) | | | | (0.02) | | | | — | | | | — | |
Net realized gains from investments | | | — | | | | (0.07) | | | | (0.50) | | | | (0.23) | | | | — | |
| Total dividends | | | (0.02) | | | | (0.09) | | | | (0.52) | | | | (0.23) | | | | — | |
| | | | | | | | | | | | | | | | | | | | | |
| Net Asset Value, End of Period | | $ | 11.52 | | | $ | 7.21 | | | $ | 10.92 | | | $ | 11.55 | | | $ | 10.94 | |
| | | | | | | | | | | | | | | | | | | | | |
| Total Return | | | 60.01% | | | | (33.24)% | | | | (1.21)% | | | | 7.75% | | | | 9.40% | (c) |
| | | | | | | | | | | | | | | | | | | | | |
| Ratios/Supplemental Data: | | | | | | | | | | | | | | | | | | | | |
| Net Assets at end of period (000’s) | | $ | 133,511 | | | $ | 25,504 | | | $ | 30,423 | | | $ | 20,679 | | | $ | 10,938 | |
Ratio of net expenses to average net assets | | | 1.00% | | | | 1.10% | | | | 1.08% | | | | 1.25% | | | | 1.23% | (d) |
Ratio of net investment income (loss) to average net assets | | | 0.26% | | | | 0.21% | | | | 0.25% | | | | (0.13)% | | | | (0.02)% | (d) |
Ratio of expenses (before fee reductions) to average
net assets(e) | | | 1.14% | | | | 1.18% | | | | 1.14% | | | | 1.43% | | | | 1.52% | (d) |
| Portfolio turnover rate | | | 26.68% | | | | 21.28% | | | | 19.53% | | | | 10.18% | | | | 3.62% | (c) |
| | |
| (a) | Commenced operations on December 16, 2005. |
| (b) | Calculated using the average shares method. |
| (c) | Not annualized for periods less than one year. |
| (d) | Annualized for periods less than one year. |
| (e) | During the period, certain fees were reduced and total fund expenses were capped at 1.25% through March 31, 2009 and at 1.00% there after. If such expense caps had not been in place, the ratio would have been as indicated. |
See Notes to Financial Statements
26

| Social Research and Action Update (unaudited) | March 31, 2010 |
The Walden Social Balanced, Walden Social Equity and Walden Small Cap Innovations portfolios employ a multi-faceted approach to meeting the Funds’ environmental, social and governance (ESG) objectives. Proxy voting, ESG research, company engagement, public policy advocacy, and community development investing are all important components of the corporate change process. The Walden Funds are active in each of these strategies. The Funds seek to invest in companies that the Adviser believes are above average in their industry for environmental performance, employment practices, community impact, and product quality. The Funds avoid investing in companies that, to the Adviser’s knowledge earn significant revenues from tobacco, or gaming activities; earn significant revenues from the manufacture or sale of military weapons systems or firearms; have critical, direct involvement in nuclear power production; or significantly support human rights abuses. |
| |
| Proxy Voting |
| |
Walden’s goal is to vote proxies of portfolio companies in the best long-term interest of mutual fund investors—an important fiduciary responsibility we take very seriously. Both the ESG and financial mandates of the portfolios are carefully considered in voting the proxies of Walden Fund companies. As examples, Walden generally votes in favor of proposals that request increased board independence on auditing and nominating committees, as well as those that request management to develop or strengthen a human rights policy. Walden’s Comprehensive Social Proxy Voting Guidelines, along with the annual proxy voting reports for the 12 months ended June 30, are available at http://www.btim.com. |
| |
| ESG Research and Action |
| |
Company negotiations with shareholders who have submitted proposals for the next annual meeting ramp up noticeably in the first quarter of any given year. In this “desperately seeking withdrawals” period, even less responsive companies have been known to become quite engaged as deadlines approach for printing proxy statements before annual meetings. Companies are often more open to constructive dialogue. And negotiations for withdrawal can yield meaningful progress. This is, unequivocally, a good outcome of the shareholder resolution process, preferable even to achieving a high level of voting support at the annual meeting. This positive outcome is exemplified in Walden’s eight withdrawal agreements this season in 2010. |
| |
| 2010 Resolutions Withdrawn |
| |
With As You Sow Foundation and other investors, Walden has for many years pressed PepsiCo and other U.S. beverage companies for stronger beverage container recycling initiatives, most recently with a focus on industry-wide container recovery goals (for PET plastic, glass and aluminum containers). PepsiCo announced a substantial new step in March, stating publicly its intention to boost U.S. beverage container recycling rates to 50% by 2018 from 32% today through various industry partnerships, consumer programs and other initiatives with U.S. bottlers, suppliers, communities, governmental entities and nongovernmental organizations. Along with its previous pledge to use 10% recycled content in PET bottles in the U.S., PepsiCo’s actions and goals demonstrate a fresh and authentic commitment to industry leadership on recycling; hence, our resolution was withdrawn. |
| |
A resolution asking Colgate-Palmolive to provide an opportunity for shareholders to have an advisory vote on executive compensation, popularly known as Say on Pay, was withdrawn after the company agreed to implement this advisory vote at its 2010 annual meeting in May. In its press release, Colgate included a quotation from Walden and acknowledged explicitly the importance of a “constructive dialogue” with Walden and its client, The Needmor Fund, in reaching its decision, an unusually transparent and positive expression of the engagement process. PepsiCo also agreed to the implement Say on Pay in 2010 in response to a client-sponsored resolution that was withdrawn. |
| |
Walden also withdrew a resolution at Expeditors International, co-filed with the United Methodist Church Foundation, addressing the lack of diversity among board members. Expeditors agreed to amend and expand its “Director Nomination Process” that describes how the Nominating and Governance Committee considers racial and gender diversity when filling board vacancies. |
| |
Similar to Expeditors, Watts Water Technologies amended its Corporate Governance Guidelines and Nominating and Corporate Governance Committee Charter to address explicitly diversity considerations in the director selection process. Baldor Electric, Credo Petroleum and Time Warner Cable agreed to initiate or expand ESG reporting as well. |
| |
Apart from these eight withdrawals, Walden participated actively in negotiations with ExxonMobil on a first-of-its-kind resolution requesting a report on the financial risks associated with climate change. With our client and lead filer Christopher Reynolds Foundation, we developed a new proposal building on a recent Securities and Exchange Commission (SEC) decision allowing shareholders to address risk directly. This previously would have been considered “ordinary business” and therefore sufficient reason to omit the resolution from the proxy statement. The resolution was withdrawn after ExxonMobil outlined how climate risk is managed and monitored and agreed to additional reporting, including financial implications of climate change. This new focus |
27
| Social Research and Action Update (unaudited)(cont.) | March 31, 2010 |
on risk may result in increasing evidence that environmental and social considerations can have material long term financial consequences for companies. |
| |
Resolutions in Proxy Statements |
| |
Just one vote result is in at the time of this writing but we hope it starts a trend. Walden’s Say on Pay resolution at Walt Disney was supported by a majority 51% of votes cast, reflecting continuing public demand for greater accountability on executive compensation. Votes on similar Walden resolutions at GE, Johnson & Johnson and IBM are forthcoming, the latter co-filed with Boston Common Asset Management. GE and IBM attempted for a second time to receive permission from the SEC to omit their proposals, but Walden prevailed again. We also await a vote on sustainability (or ESG) reporting proposals at C.R. Bard, Gentex, Layne Christensen, and St. Jude Medical. |
| |
Action through Dialogue |
| |
While proxy resolutions are an important tool for shareholders to draw attention to important ESG concerns, Walden has always believed that corporate dialogues can be equally effective in encouraging sustainable business policies and practices. This is particularly true when institutional investors work in coalition. In January, over two dozen investors joined Walden – including large pension funds such as TIAA-CREF, public retirement systems of California and Connecticut and AFSCME; faith-based investors; mutual fund companies and investment firms – in an open letter to 18 major financial firms asking them to voluntarily provide shareholders with an advisory vote on executive compensation. Some companies are required to implement Say on Pay because they have not paid back Troubled Asset Relief Program (TARP) funds. Still, 12 companies responded thoughtfully and 16 are implementing the advisory vote. |
| |
There are numerous recent examples of the positive impact of ongoing dialogue, sometimes building on resolutions that were submitted in previous years: |
| • | | ConocoPhillips – With other investors led by Boston Common Asset Management, and stakeholders including Amazon Watch, we met with management to discuss indigenous rights policies related to energy exploration and production. ConocoPhillips is moving closer to the best practice policy of “free, prior and informed consent” in its Peruvian operations. |
| • | | EMC – For a decade Walden has encouraged the data storage technology leader to strengthen comprehensive ESG performance and reporting and the company continues to make impressive progress. In February, we were pleased to learn that EMC joined Ceres, a network of investors, environmental organizations and other public interest groups that work with companies committed to ESG transparency and continuous improvement. |
| • | | General Mills – Agreed to implement Say-on-Pay at its 2010 annual meeting after a majority of shareholders supported Walden’s advisory vote resolution in 2009. |
| • | | Microsoft – Joined several other major companies taking a public stand in opposition to the U.S. Chamber of Commerce’s lobbying against proposed climate change legislation. In conversations with Walden, Microsoft reported exploring avenues to differentiate itself from the Chamber, and recently requested that the trade association avoid using company dues to lobby against climate change regulations. |
| • | | State Street – State Street Global Advisors (SSgA) has implemented and will post publicly new proxy voting policies that will result in more thoughtful voting practices and the support of some shareholder resolutions addressing environmental and social factors. Previously, SSgA routinely voted against all such proposals. Walden’s 2009 resolution addressing proxy voting was deemed a matter of ordinary business by the SEC and omitted from the proxy statement, but our conversation continued, with SSgA and other investors. |
Public Policy Advocacy |
| |
Walden wrote Senator Dodd, chair of the Banking Committee, offering comments in support of key financial reform provisions proposed in the “Restoring American Financial Stability Act.” These included greater industry regulation and oversight, the creation of a systemic risk regulator, credit rating agency reform, stronger consumer protections, mandatory Say on Pay votes for shareholders and ESG disclosure, among other corporate governance reforms. |
| |
We also joined investors commending the SEC’s recent disclosure guidance on climate risk, a major victory for investors who increasingly believe climate change poses material risks to companies. The guidance asks companies to consider regulatory, legislative and financial risk associated with climate change, as well as the possibility of physical impacts from severe weather, water availability, rising sea levels and other climate-related threats. |
| |
Sale of BP – In February 2010 BP was sold from Walden Social Balanced and Walden Social Equity, consistent with the Walden Funds guideline to avoid companies with a pattern of violating health and safety regulations. |
| |
For many years Walden had been monitoring BP’s ESG record, particularly following the fatal explosion in March 2005 at its Texas refinery that killed 15 people. In the fall of 2009, the U.S. Occupational Safety and Health Administration (OSHA) concluded a months-long investigation of BP’s compliance with commitments made as part of the settlement related to the Texas City refinery tragedy. BP was fined $87 million – the largest ever for OSHA – for failing to correct many of the problems associated with the 2005 explosion. |
| |
If you have any questions, comments, or changes in your financial objectives, please feel free to contact us at (617) 726-7250. |
| |
The equities of the companies in bold-face in the above commentary were holdings of the Funds as of March 31, 2010. |
28
| | | Walden Social Balanced Fund |
| | | Manager Commentary by Stephen K. Moody |
| Economic and Market | | Walden Social Equity Fund |
| Summary (unaudited)(cont.) | | Manager Commentary by Robert A. Lincoln |
|
| Investment Concerns: |
Equity securities (stocks) are more volatile and carry more risk than other forms of investments, including investments in high-grade fixed income securities. The net asset value per share of these Funds will fluctuate as the value of the securities in the portfolio changes. Common stocks, and funds investing in common stocks, generally provide greater return potential when compared with other types of investments. Bonds offer a relatively stable level of income, although bond prices will fluctuate providing the potential for principal gain or loss. Intermediate-term, higher-quality bonds generally offer less risk than longer-term bonds and a lower rate of return. |
| |
The recent growth rate in the stock market has helped to produce short-term returns that are not typical and may not continue in the future. Because of ongoing market volatility, Fund performance may be subject to substantial short-term changes. |
| |
Past performance does not guarantee future results. The performance data quoted represents past performance and current returns may be lower or higher. Total return figures include change in share price, reinvestment of dividends and capital gains. The investment return and principal value will fluctuate so that an investor’s shares, when redeemed, may be worth more or less than the original cost. To obtain performance information current to the most recent month end, please call us at 1.800.282.8782 ext. 7050. |
| |
Our Economic Outlook |
| |
Current economic conditions in the United States are far from ideal. The list of problem areas are long and their solution difficult: a structural trade imbalance; budget deficits and fiscal debt, at all levels of government, at their highest ratios to Gross Domestic Product1 growth since World War II (though nowhere near as high as then, if one ignores future social security and healthcare benefit liabilities); unemployment, the highest it has been in nearly 30 years; household balance sheets severely overhung with debt; a profligate and dependent energy policy; and an inequality in the distribution of wages and income that is as extreme as it has been in a hundred years, with all that that portends for political paralysis and the consequent difficulty in investing in human capital, the source of all long-term economic growth; and an accompanying stagnation in the absolute levels of inflation-adjusted wage growth that has persisted for well over a decade. Moreover, economic conditions in Japan and most of Europe are not much better than in the U.S. Little wonder that consumer confidence is close to its lowest level in several generations. |
Yet these economic problems are not new. As we have seen over both the past calendar quarter and year, an increase in stock prices is not dependent on an ideal economic environment. That is especially true in times, such as now, when the prices of stocks relative to sales, prospective earnings, cash flows, and prevailing interest rates are reasonable. In our view, the key ingredient needed to sustain an upward trend in stock prices going forward is further aggregate improvement, however modest, in the myriad of these economic problems. Moreover, there is little question that, as bad as the economic situation may appear today, matters were worse three, six and especially twelve months ago. Last spring, we were shedding seven hundred thousand jobs every month, and house prices, along with corporate profits and cash flows, were in a virtual free-fall. None of this is the case today. The government’s monetary and fiscal policy initiatives, as we have noted, merit most of the credit for the recent economic improvement. Such policies remain firmly in place and, in our view, are likely to lead to further gains in economic growth, business activity, and stock prices—in the year ahead. Stock market returns should be especially attractive if, as intended, the policy initiatives continue to lead to more substantial increases in private sector confidence and spending. |
| |
The Financial Markets and Fund Performance |
| |
A mere thirteen months ago, reeling from the near-total collapse of the global financial system, the U.S. stock market was in free fall, having declined over 58% from its high in October of 2007. A year later, the stock market is up almost 50%. However, it needs to climb over 33% more to get back to its all time high. The economy, in almost every respect, has turned a corner and begun to rebuild out of the ashes of that debacle. It is the underlying economy, not corporate profits alone, which will be the underpinning of the financial markets, both domestically and globally. The reasons for the turnabout are no miracle. There is no doubt about what saved the day: massive governmental intervention across the globe, the actions of some of the same government actors who were blind sided by the collapse. For all of the controversy surrounding the bailout, nothing is more incontrovertible than the notion that without it, we would have entered a spiraling deflation, known more colloquially as a depression. Liquidity was returned to the system. Normal transactions resumed. In addition, by March of last year even the stock market, in all its panic, turned the corner and began to climb out of its nadir. |
| |
The stock market rise for the first quarter of 2010 has been without the extreme volatility and publicity that accompanied financial market trends over the past several years. The headlines were replete with the historic political battle in Washington over health care legislation and the equally contentious struggle in Europe to address its financial underbelly: most publicly |
|
| 1 | TheGross Domestic Product (GDP) is the measure of the market value of the goods and services produced by labor and property in the United States. |
|
29
| | | Walden Social Balanced Fund |
| | | Manager Commentary by Stephen K. Moody |
| Economic and Market | | Walden Social Equity Fund |
| Summary (unaudited)(cont.) | | Manager Commentary by Robert A. Lincoln |
|
Greece’s severe debt and budget problems. Greece brought out the inherent structural weaknesses in the European monetary union, whereby the monetary policy (the Euro) is divorced from the fiscal policy, along with both taxation and spending, of the member states. The MSCI EAFE Index2 underperformed the S&P 500 Index3 by over four percentage points, due to the Euro-zone crisis. Stock investors, especially in the United States, looked past these headlines for the most part and were pleased with reports of further progress toward economic stabilization and recovery. Not only did the world’s rapid growth maven, China, turn a corner early, but U.S. consumer spending and business capital investment continued to improve, and corporate profits and cash flows have been at the upper end of expectations, particularly for non-financial companies. Most importantly for the sustainability of the recovery, signs emerged that a modest reversal in the severe employment downturn is underway. Indeed, the Labor Department reported that we experienced in March the first substantive increase in private sector jobs since the financial crisis began. |
| |
Our Investment Strategy for the Walden Social Balanced Fund |
| |
The Walden Social Balanced Fund returned 25.78% for the year ended March 31, 2010 and as is clear from the performance table, the Fund’s longer term performance also remains competitive. In the past three years, the Fund portfolio has risen 0.7% per annum, compared with the market’s decline of 4.2% per year. |
| |
As we have noted before, while stocks became attractively priced relative to most measures of valuation over a year ago, our concerns about the extreme risks remaining in the economy, as well as our own careful approach to investing, led us to increase stock exposure only as our confidence in the economic foundation strengthened For this reason, the under-allocation to equities at the beginning of the year, the portfolio underperformed the Composite for the past twelve months. Still, we would likely follow a similar path in the months ahead and may increase the Fund’s equity allocation slowly by several additional percentage points, provided the economic news, on the margin, remains positive. There is also no question that our preference for stocks is influenced by the close to zero return available in money market instruments and the low absolute yields of longer term bonds. Stock prices do not have to rise much in the year ahead to perform better than their immediate competition, fixed income instruments. |
| Our Investment Strategy for the Social Equity Fund |
| |
For the last 12 months Walden Social Equity Fund returned 46.79% compared with 49.77% for the Standard & Poor’s 500. This slight underperformance in an extremely strong market is not surprising given the lower risk profile and higher quality of the stocks held in the Fund. Longer term performance remains competitive. We are pleased that, although a portfolio invested entirely in the S&P 500 Index would have to rise by another 25% or so to return to year end 2007 values, the Fund is within 15% of regaining its losses since year end 2007. For the three- and five-year periods the Fund is also ahead of the S&P 500. |
| |
Equity returns in U.S. markets during the first quarter of 2010 failed to follow the standard script for a period of improving economic prospects and investor confidence. True, the overall result was a substantial rise in the S&P 500 and other broad-based indices. In addition, two sectors—industrials and consumer discretionary—did rise sharply as the economy recovered. However, stocks in commodity related industries generally trailed the market. The extreme case was the energy sector, which failed to rebound even as the price of oil continued its rise. Similarly surprising, technology stocks, which stand to benefit from a resumption of global growth, only inched forward, continuing a recent uncharacteristically steady pattern of return. In some respects, the financial sector gained the most from the crosscurrents of the first quarter. Despite the very modest progress on the housing, mortgage and foreclosure front, and few gains in employment, reports indicated that the bottom in the deterioration of bank balance sheets had been reached. Furthermore, we believe the Federal Reserve’s aggressive decision to keep short-term interest rates near zero will allow banks to benefit from their lending business, even as demand for loans remains disappointing. Finally, the largest banks are reporting huge profits in their trading operations. While we hardly think this latter factor is sustainable, investors in financial stocks have certainly had the wind at their backs. |
| |
In this environment, we are pleased that the Walden Social Equity Fund produced competitive returns. Several factors contributed. While our quality approach was a modest disadvantage, our sector policy, which leaned toward more cyclical sectors, especially a substantial overweight in the top performing industrial sector, aided results. Moreover, amidst the Congressional battle over healthcare legislation, our selections in this sector once again |
|
| 2 | The Morgan Stanley Capital International Europe, Australasia and Far East (“MSCI EAFE”) Index is a free float-adjusted market capitalization index that is designed to measure the equity market performance of developed markets, excluding the U.S. & Canada. |
| 3 | The Standard & Poor’s 500 Index (“S&P 500”), an unmanaged index that is widely regarded as a gauge of the U.S. equities market. this Index includes 500 leading companies in leading industries of the U.S. economy. Although the S&P 500 focuses on the large cap segment of the market, with approximately 75% coverage of U.S. equities, it is also an ideal proxy for the total market. |
| † | Portfolio composition is subject to change. |
|
30
| | | Walden Social Balanced Fund |
| | | Manager Commentary by Stephen K. Moody |
| Economic and Market | | Walden Social Equity Fund |
| Summary (unaudited)(cont.) | | Manager Commentary by Robert A. Lincoln |
|
performed well. Our approach to the financial sector produced mixed results. Given our concerns regarding the quality of many financial institutions and the uncertainty regarding the shape and impact of financial reform, we have chosen to modestly underweight this sector. However, within financials we have held a significant share of regional banks. These, we believe, will be significant beneficiaries of low short-term interest rates and improving credit quality while entailing less exposure to trading and tightening of regulation of financial innovation. Regional banks were among the best performing investments during the quarter. Looking ahead, we believe the portfolios remain structured to benefit from a continuation of the economic recovery while we seek to avoid investments that entail excessive risk.† |
| |
Will we achieve future gains in the months ahead? Or have stock prices risen too far, up roughly 50% in just one year, too fast in light of the improved yet still problematic economic environment? The future is never certain, but we think the current upward trend will continue. |

Stephen K. Moody
Portfolio Manager
Boston Trust Investment Management, Inc.

Robert A. Lincoln
Portfolio Manager
Boston Trust Investment Management, Inc.
|
| † Portfolio composition is subject to change. |
|
31
| | | | | Walden Social Balanced Fund |
| Investment Performance (unaudited) | | | | March 31, 2010 |
|
| | | | | |
| Fund Net Asset Value: $10.98 | | | | |
| Gross Expense Ratio1: 1.20% | | | | |
| | | Annualized |
| | | 1 Year | | 5 Years | | 10 Years |
| | | Ended | | Ended | | Ended |
| | | 3/31/10 | | 3/31/10 | | 3/31/10 |
| Walden Social Balanced Fund | | 25.78% | | 2.57% | | 2.45% |
| Lipper Mixed-Asset Target Allocation Growth Funds Average | | 40.02% | | 2.96% | | 1.92% |
| S&P 500 Index | | 49.77% | | 1.92% | | -0.65% |
| Barclays Capital U.S. Government/Credit Bond Index | | 7.51% | | 5.17% | | 6.22% |
| Citigroup 90-Day U.S. Treasury Bill Index | | 0.13% | | 2.76% | | 2.70% |
Past performance does not guarantee future results. The performance data quoted represents past performance and current returns may be lower or higher. The investment return and principal value will fluctuate so that an investor’s shares, when redeemed may be worth more or less than the original cost. To obtain performance information current to the most recent month-end, please call 1-800-282-8782 ext. 7050. |
| | |
| 1 | The above Gross Expense ratio is from the Fund’s prospectus dated August 1, 2009. Additional information pertaining to the Fund’s expense ratios as of March 31, 2010 can be found in the financial highlights. The investment performance reflects voluntary fee waivers which may be discontinued at any time and a contractual fee waiver which shall continue in effect from year to year only upon mutual agreement of the Fund and the Adviser. The performance above reflects any fee reductions during the applicable periods. If such fee reductions had not occurred, the quoted performance would have been lower. Based on the Fund’s prospectus dated August 1, 2009, the Total Fund Operating Expenses would be 1.19% and the Net Fund Operating Expenses would be 1.00% excluding the indirect costs of investing in Acquired Funds. |
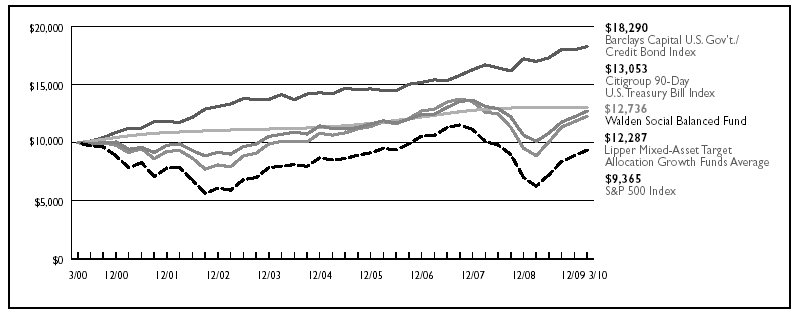
The chart represents historical 10-year performance of a hypothetical investment of $10,000 in the Walden Social Balanced Fund and represents the reinvestment of dividends and capital gains in the Fund. The returns shown on the table and graph do not reflect the deduction of taxes a shareholder would pay on Fund distributions or the redemption of Fund shares. |
| |
The Walden Social Balanced Fund is measured against the Standard & Poor’s 500 Index (“S&P 500”), which is an unmanaged index that is widely regarded as a gauge of the U.S. equities market. This index includes 500 leading companies in leading industries of the U.S. economy. Although the S&P 500 focuses on the large cap segment of the market, with approximately 75% coverage of U.S. equities, it is also an ideal proxy for the total market. The Barclays Capital U.S. Government/Credit Bond Index is a non-securitized component of the Barclays U.S. Aggregate Index and was the first macro index launched by Lehman Brothers. The Barclays Capital U.S. Government/Credit Bond Index includes Treasuries (i.e., public obligations of the U.S. Treasury that have remaining maturities of more than one year), Government-Related issues (i.e., agency, sovereign, supranational, and local authority debt), and USD Corporates. The Citigroup 90-Day U.S. Treasury Bill Index reflects monthly return equivalents of yield averages that are not marked to the market. The Index is an average of the last three-month treasury bill issues. The three-month treasury bills are the short-term debt obligations of the U.S. Government. The indices’ performance is unmanaged and does not reflect the deduction of expenses associated with a mutual fund, such as investment management and fund accounting fees. The Fund’s performance reflects the deduction of fees for these services. |
| |
The Lipper Mixed-Asset Target Allocation Growth Funds Average (“Lipper Average”) is an average of managed mutual funds whose primary objective is to maintain a mix of between 60%-80% equity securities with the remainder invested in bonds, cash and cash equivalents. The Lipper Average is an equally weighted index of the largest managed mutual funds within their respective investment objectives, adjusted for the reinvestment of capital gains distributions and income dividends and net of all fund expenses. Investors cannot invest directly in an index. |
| |
The recent growth rate in the stock market has helped to produce short-term returns that are not typical and may not continue in the future. Because of ongoing market volatility, fund performance may be subject to substantial short-term changes. |
32
| | | | | Walden Social Balanced Fund |
| Investment Performance (unaudited) | | | | March 31, 2010 |
|
| | | | | |
| Fund Net Asset Value: $11.61 | | | | |
| Gross Expense Ratio1: 1.20% | | | | |
| | | Annualized |
| | | 1 Year | | 5 Years | | 10 Years |
| | | Ended | | Ended | | Ended |
| | | 3/31/10 | | 3/31/10 | | 3/31/10 |
| Walden Social Equity Fund | | 46.79% | | 2.66% | | 2.23% |
| S&P 500 Index | | 49.77% | | 1.92% | | -0.65% |
Past performance does not guarantee future results. The performance data quoted represents past performance and current returns may be lower or higher. The investment return and principal value will fluctuate so that an investor’s shares, when redeemed may be worth more or less than the original cost. To obtain performance information current to the most recent month-end, please call 1-800-282-8782 ext. 7050. |
| | |
| 1 | The above Gross Expense ratio is from the Fund’s prospectus dated August 1, 2009. Additional information pertaining to the Fund’s expense ratios as of March 31, 2010 can be found in the financial highlights. The investment performance reflects voluntary fee waivers which may be discontinued at any time and a contractual fee waiver which shall continue in effect from year to year only upon mutual agreement of the Fund and the Adviser. The performance above reflects any fee reductions during the applicable periods. If such fee reductions had not occurred, the quoted performance would have been lower. Based on the Fund’s prospectus dated August 1, 2009, the Total Fund Operating Expenses would be 1.19% and the Net Fund Operating Expenses would be 1.00% excluding the indirect costs of investing in Acquired Funds. |
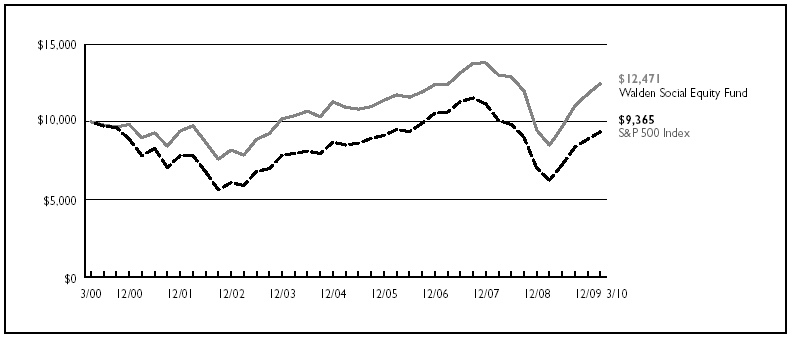
The chart represents historical 10-year performance of a hypothetical investment of $10,000 in the Walden Social Equity Fund and represents the reinvestment of dividends and capital gains in the Fund. The returns shown on the table and graph do not reflect the deduction of taxes a shareholder would pay on Fund distributions or the redemption of Fund shares. |
| |
The Walden Social Equity Fund is measured against the Standard & Poor’s 500 Index (“S&P 500”), which is an unmanaged index that is widely regarded as a gauge of the U.S. equities market. This index includes 500 leading companies in leading industries of the U.S. economy. Although the S&P 500 focuses on the large cap segment of the market, with approximately 75% coverage of U.S. equities, it is also an ideal proxy for the total market. The performance of an index does not reflect the deduction of expenses associated with a mutual fund, such as investment management and fund accounting fees. The Fund’s performance reflects the deduction of fees for these services. Investors cannot invest directly in an index. |
| |
The recent growth rate in the stock market has helped to produce short-term returns that are not typical and may not continue in the future. Because of ongoing market volatility, fund performance may be subject to substantial short-term changes. |
33
| Economic and Market | | Walden Small Cap Innovations Fund |
| Summary (unaudited) | | Manager Commentary by Kenneth P. Scott |
|
| Investment Concerns: |
Equity securities (stocks) are more volatile and carry more risk than other forms of investments, including investments in high-grade fixed income securities. The net asset value per share of these Funds will fluctuate as the value of the securities in the portfolio changes. Common stocks, and funds investing in common stocks, generally provide greater return potential when compared with other types of investments. Small-capitalization stocks typically carry additional risk, since smaller companies generally have higher risk of failure and, historically, their stocks have experienced a greater degree of volatility. |
| |
The recent growth rate in the stock market has helped to produce short-term returns that are not typical and may not continue in the future. Because of ongoing market volatility, fund performance may be subject to substantial short-term changes. |
| |
Past performance does not guarantee future results. The performance data quoted represents past performance and current returns may be lower or higher. Total return figures include change in share price, reinvestment of dividends and capital gains. The investment return and principal value will fluctuate so that an investor’s shares, when redeemed, may be worth more or less than the original cost. To obtain performance information current to the most recent month end, please call us at 1.800.282.8782 ext. 7050. |
| |
Small Cap Market Review |
| |
Generally speaking, a sharp rebound in stock prices, like the one we have experienced over the past quarter, and year, favors lower quality companies—those less equipped to withstand economic hardship—whose share price suffered most during the preceding bear market. This can create a headwind for managers investing in higher quality companies. This appears to have been the case in the first quarter of 2010. While Walden Small Cap Innovations Fund’s absolute performance was positive, two key elements related to quality appear to be correlated to lower relative returns for the period: firms with higher returns on invested capital, and those with more consistent returns on invested capital—both factors we favor—underperformed their less profitable and more volatile peers during the quarter. |
| |
Walden Small Cap Innovations Fund Performance |
| |
After a market hiccup in January, small cap equity prices continued their rebound, as most economic fundamentals continued to improve. However, the Walden Small Cap Innovations Fund, which focuses on higher quality, innovative companies, underperformed the strong absolute performance of the Russell 2000® Index1 for the trailing one-year period. |
As noted previously, we aim to maintain Fund sector weights comparable to those of the overall market. Thus, our sector composition generally has no significant impact on overall performance. That said, our stock performance within sectors generally reflects our high quality bias. For example, our consumer discretionary picks did not keep up fully with the exceptional, double-digit performance of the small cap consumer discretionary sector, while our tech selections outperformed this market-lagging sector. Individually, Baldor Electric (2.3%), lululemon (2.1%) and Polycom (2.4%) contributed most to first quarter performance, while Nutrisystem (0.5%), Investment Technology Group (1.0%) and Carbo Ceramics (1.5%) detracted most. |
| |
Purchases and Sales |
| |
We established new positions in the Fund during the period: Cantel Medical (CMN) (0.5%) is a leading provider of infection prevention and control products in the healthcare market. Nutraceutical International (NUTR) (0.3%) is a leading manufacturer of branded nutritional supplements and natural products. Orrstown Financial (ORRF) (0.5%) and UMB Financial (UMBF) (0.5%) are community banks with conservative lending standards operating primarily in two areas less affected by the housing crisis—south-central Pennsylvania and Kansas City, Missouri, respectively. We sold stakes in Commerce Bancshares, Green Mountain Coffee Roasters and Idexx Laboratories from the Fund during the quarter because stock price appreciation moved them outside small cap market capitalization range. We also completed the sale of Encore Acquisition from the Fund, given that Denbury Resources was acquiring that firm. |
| |
Small Cap Outlook |
| |
We continue to believe that our focus on innovative, higher quality, more reasonably valued stocks leveraged to more sustainable elements of economic growth will continue to provide substantial value to client portfolios over time. We appreciate your continued confidence in our services. |
| |
The equities of the companies in bold-face in the above commentary were holdings of the Walden Small Cap Innovations Fund as of March 31, 2010. |
Kenneth P. Scott, CFA
Portfolio Manager
Boston Trust Investment Management, Inc.
|
| 1 | The Russell 2000® Index measures the performance of the small-cap segment of the U.S. equity universe. The Russell 2000® Index is a subset of the Russell 3000® Index representing approximately 8% of the total market capitalization of that index. It includes approximately 2000 of the smallest securities based on a combination of their market cap and current index membership. |
| † | Portfolio composition is subject to change. |
|
34
| | Walden Small Cap Innovations Fund |
| Investment Performance (unaudited) | March 31, 2010 |
|
| | |
| Fund Net Asset Value: $14.57 | |
| Gross Expense Ratio1: 1.44% | |
| | | Annualized |
| | | 1 Year | | Since |
| | | Ended | | Inception |
| | | 3/31/10 | | 10/24/08 |
| Walden Small Cap Innovations Fund | | 61.45% | | 31.81% |
| Russell 2000® Index | | 62.76% | | 31.04% |
Past performance does not guarantee future results. The performance data quoted represents past performance and current returns may be lower or higher. The investment return and principal value will fluctuate so that an investor’s shares, when redeemed may be worth more or less than the original cost. To obtain performance information current to the most recent month-end, please call 1-800-282-8782 ext. 7050. |
| | |
| 1 | The above Gross Expense ratio is from the Fund’s prospectus dated August 1, 2009. Additional information pertaining to the Fund’s expense ratios as of March 31, 2010 can be found in the financial highlights. The investment performance reflects voluntary fee waivers which may be discontinued at any time and a contractual fee waiver which shall continue in effect from year to year only upon mutual agreement of the Fund and the Adviser. The performance above reflects any fee reductions during the applicable periods. If such fee reductions had not occurred, the quoted performance would have been lower. Based on the Fund’s prospectus dated August 1, 2009, the Total Fund Operating Expenses would be 1.43% and the Net Fund Operating Expenses would be 1.00% excluding the indirect costs of investing in Acquired Funds. |

The chart represents historical performance of a hypothetical investment of $10,000 in the Walden Small Cap Innovations Fund from October 24, 2008 to March 31, 2010, and represents the reinvestment of dividends and capital gains in the Fund. The returns shown on the table and graph do not reflect the deduction of taxes a shareholder would pay on Fund distributions or the redemption of Fund shares. |
| |
The Walden Small Cap Innovations Fund is measured against the Russell 2000® Index, which is an unmanaged index that measures the performance of the small-cap segment of the U.S. equity universe. The Russell 2000® Index is a subset of the Russell 3000® Index representing approximately 8% of the total market capitalization of that index. It includes approximately 2000 of the smallest securities based on a combination of their market cap and current index membership. The performance of an index does not reflect the deduction of expenses associated with a mutual fund, such as investment management and fund accounting fees. The Fund’s performance reflects the deduction of fees for these services. Investors cannot invest directly in an index. |
| |
The recent growth rate in the stock market has helped to produce short-term returns that are not typical and may not continue in the future. Because of ongoing market volatility, fund performance may be subject to substantial short-term changes. |
35
| Schedule of Portfolio Investments | | Walden Social Balanced Fund
March 31, 2010 |
|
| COMMON STOCKS (65.3%) |
| |
| Security Description | | | | Shares | | | Value ($) |
| Consumer Discretionary (6.0%) | | | | | | |
| Bed Bath & Beyond, Inc.(a) | | | 5,000 | | | 218,800 |
| Johnson Controls, Inc. | | | 8,500 | | | 280,415 |
| Lowe’s Cos., Inc. | | | 10,000 | | | 242,400 |
| NIKE, Inc., Class B | | | 7,500 | | | 551,250 |
| Omnicom Group, Inc. | | | 6,500 | | | 252,265 |
| Ross Stores, Inc. | | | 5,000 | | | 267,350 |
| Target Corp. | | | 6,000 | | | 315,600 |
| The Home Depot, Inc. | | | 11,000 | | | 355,850 |
| | | | | | | 2,483,930 |
| Consumer Products (10.1%) | | | | | | |
| Colgate-Palmolive Co. | | | 5,000 | | | 426,300 |
| Costco Wholesale Corp. | | | 9,500 | | | 567,245 |
| General Mills, Inc. | | | 3,300 | | | 233,607 |
| Kellogg Co. | | | 5,000 | | | 267,150 |
| McCormick & Co., Inc. | | | 10,000 | | | 383,600 |
| Nestle SA, Sponsored ADR | | | 5,000 | | | 256,000 |
| PepsiCo, Inc. | | | 11,000 | | | 727,760 |
| Procter & Gamble Co. | | | 12,500 | | | 790,875 |
| SYSCO Corp. | | | 17,700 | | | 522,150 |
| | | | | | | 4,174,687 |
| Energy (6.5%) | | | | | | |
| Apache Corp. | | | 6,500 | | | 659,750 |
| BG Group PLC, Sponsored ADR | | | 7,000 | | | 607,250 |
| ConocoPhillips | | | 13,500 | | | 690,795 |
| Core Laboratories NV | | | 3,000 | | | 392,400 |
| Devon Energy Corp. | | | 5,200 | | | 335,036 |
| | | | | | | 2,685,231 |
| Financial Services (8.7%) | | | | | | |
| Bank of America Corp. | | | 12,000 | | | 214,200 |
| Chubb Corp. | | | 9,000 | | | 466,650 |
| Cincinnati Financial Corp. | | | 24,000 | | | 693,600 |
| Comerica, Inc. | | | 6,000 | | | 228,240 |
| JPMorgan Chase & Co. | | | 4,600 | | | 205,850 |
| M&T Bank Corp. | | | 1,600 | | | 127,008 |
| PNC Financial Services Group, Inc. | | | 3,000 | | | 179,100 |
| State Street Corp. | | | 5,000 | | | 225,700 |
| SunTrust Banks, Inc. | | | 5,000 | | | 133,950 |
| T. Rowe Price Group, Inc. | | | 13,200 | | | 725,076 |
| Visa, Inc., Class A | | | 4,600 | | | 418,738 |
| | | | | | | 3,618,112 |
| Health Care (9.7%) | | | | | | |
| Becton, Dickinson & Co. | | | 6,000 | | | 472,380 |
| C.R. Bard, Inc. | | | 4,500 | | | 389,790 |
| DENTSPLY International, Inc. | | | 10,000 | | | 348,500 |
| Johnson & Johnson, Inc. | | | 12,000 | | | 782,400 |
| Medtronic, Inc. | | | 5,000 | | | 225,150 |
| Merck & Co., Inc. | | | 6,000 | | | 224,100 |
| Patterson Cos., Inc. | | | 8,000 | | | 248,400 |
| Saint Jude Medical, Inc.(a) | | | 6,000 | | | 246,300 |
| Stryker Corp. | | | 5,000 | | | 286,100 |
| Teva Pharmaceutical Industries Ltd., Sponsored ADR | | | 4,000 | | | 252,320 |
| Varian Medical Systems, Inc.(a) | | | 5,000 | | | 276,650 |
| Waters Corp.(a) | | | 4,000 | | | 270,160 |
| | | | | | | 4,022,250 |
| Industrial Materials (3.2%) | | | | | | |
| AptarGroup, Inc. | | | 8,000 | | | 314,800 |
| Ecolab, Inc. | | | 5,000 | | | 219,750 |
| | | Shares or | | | |
| | | | Principal | | | |
| Security Description | | | | Amount ($) | | | |
| Industrial Materials, continued | | | | | | |
| Praxair, Inc. | | | 5,000 | | | 415,000 |
| Sigma-Aldrich Corp. | | | 7,500 | | | 402,450 |
| | | | | | | 1,352,000 |
| Industrial Products & Services (9.9%) | | | | | | |
| 3M Co. | | | 2,700 | | | 225,639 |
| ABB Ltd., Sponsored ADR(a) | | | 14,500 | | | 316,680 |
| Deere & Co. | | | 6,000 | | | 356,760 |
| Donaldson Co., Inc. | | | 9,500 | | | 428,640 |
| Emerson Electric Co. | | | 17,000 | | | 855,780 |
| Expeditors International of Washington, Inc. | | | 9,000 | | | 332,280 |
| Illinois Tool Works, Inc. | | | 13,000 | | | 615,680 |
| United Parcel Service, Inc., Class B | | | 7,000 | | | 450,870 |
| W.W. Grainger, Inc. | | | 5,000 | | | 540,600 |
| | | | | | | 4,122,929 |
| Information Technology (9.1%) | | | | | | |
| Accenture PLC, Class A | | | 7,000 | | | 293,650 |
| Automatic Data Processing, Inc. | | | 10,000 | | | 444,700 |
| Cisco Systems, Inc.(a) | | | 22,000 | | | 572,660 |
| Google, Inc., Class A(a) | | | 500 | | | 283,505 |
| Hewlett-Packard Co. | | | 5,000 | | | 265,750 |
| Intel Corp. | | | 11,000 | | | 244,860 |
| International Business Machines Corp. | | | 3,000 | | | 384,750 |
| Microsoft Corp. | | | 16,000 | | | 468,320 |
| Nokia Corp., Sponsored ADR | | | 18,000 | | | 279,720 |
| Oracle Corp. | | | 10,000 | | | 256,900 |
| SAP AG, Sponsored ADR | | | 6,000 | | | 289,020 |
| | | | | | | 3,783,835 |
| Telecommunications (1.3%) | | | | | | |
| QUALCOMM, Inc. | | | 5,200 | | | 218,348 |
| Time Warner Cable, Inc. | | | 5,866 | | | 312,716 |
| | | | | | | 531,064 |
| Utility (0.8%) | | | | | | |
| Questar Corp. | | | 8,000 | | | 345,600 |
| TOTAL COMMON STOCKS (Cost $22,491,969) | | | | | | 27,119,638 |
| | | | | | | | |
| CORPORATE BONDS (8.2%) | | | | | | |
| Financial Services (6.6%) | | | | | | |
| American Express Co. | | | | | | |
7.00%, 3/19/18 | | | 250,000 | | | 284,389 |
8.13%, 5/20/19 | | | 250,000 | | | 303,307 |
| BP Capital Markets PLC, 5.25%, 11/7/13 | | | 500,000 | | | 550,666 |
| Calvert Social Investment Foundation | | | | | | |
3.00%, 12/31/11 | | | 175,000 | | | 175,000 |
3.00%, 8/15/12 | | | 75,000 | | | 75,000 |
| National Rural Utilities Cooperative Finance | | | | | | |
Corp., 10.38%, 11/1/18 | | | 250,000 | | | 333,024 |
| Wells Fargo & Co., 3.00%, 12/9/11 | | | 1,000,000 | | | 1,032,971 |
| | | | | | | 2,754,357 |
| Health Care (0.8%) | | | | | | |
| Abbott Laboratories, 5.60%, 5/15/11 | | | 300,000 | | | 315,362 |
| | | | | | | | |
| Information Technology (0.5%) | | | | | | |
| Oracle Corp., 5.75%, 4/15/18 | | | 200,000 | | | 219,717 |
| | | | | | | | |
| Telecommunications (0.3%) | | | | | | |
| AT&T, Inc., 5.50%, 2/1/18 | | | 100,000 | | | 106,334 |
| TOTAL CORPORATE BONDS (Cost $3,177,177) | | | | | | 3,395,770 |
See Notes to Financial Statements
36
| Schedule of Portfolio Investments | | Walden Social Balanced Fund
March 31, 2010 |
|
| MUNICIPAL BONDS (2.4%) | | | | | | |
| Security Description | | | | Principal
Amount ($) | | | Value ($) |
| |
| California (0.7%) | | | | | | |
| California State, GO, 4.50%, 8/1/28, AMBAC, | | | | | | |
Callable 2/1/17 @ 100 | | | 310,000 | | | 276,656 |
| Illinois (0.5%) | | | | | | |
| Illinois State, GO, 5.00%, 6/1/27, NATL-RE FGIC, | | | | | | |
Callable 6/1/13 @ 100 | | | 200,000 | | | 201,960 |
| Massachusetts (0.6%) | | | | | | |
| Massachusetts State, Series A, GO, 5.00%, 8/1/26, | | | | | | |
Callable 8/1/18 @ 100 | | | 250,000 | | | 271,027 |
| Ohio (0.4%) | | | | | | |
| Ohio State, Series D, GO, 4.50%, 9/15/22, NATL-RE, | | | | | | |
Callable 3/15/16 @ 100 | | | 150,000 | | | 155,777 |
| Oregon (0.2%) | | | | | | |
| Oregon State, Series A, GO, 5.00%, 10/1/14 | | | 100,000 | | | 106,648 |
| TOTAL MUNICIPAL BONDS (Cost $984,010) | | | | | | 1,012,068 |
| | | | | | | | |
| U.S. GOVERNMENT & U.S. GOVERNMENT AGENCY OBLIGATIONS (21.3%) | | | | | | |
| Federal Farm Credit Bank | | | | | | |
2.13%, 6/18/12 | | | 250,000 | | | 254,396 |
5.38%, 11/10/20 | | | 250,000 | | | 272,119 |
6.00%, 3/7/11 | | | 500,000 | | | 525,307 |
| Federal Home Loan Bank | | | | | | |
1.63%, 3/16/11 | | | 3,225,000 | | | 3,257,934 |
2.25%, 4/13/12 | | | 300,000 | | | 306,495 |
4.63%, 2/18/11 | | | 200,000 | | | 207,139 |
5.00%, 12/21/15 | | | 300,000 | | | 329,702 |
5.25%, 12/11/20 | | | 500,000 | | | 536,002 |
5.25%, 8/15/22 | | | 1,000,000 | | | 1,047,986 |
| Financing Corp., 2.92%, 4/5/13(b) | | | 100,000 | | | 93,023 |
| Government National Mortgage Association | | | | | | |
6.00%, 7/15/34 | | | 107,728 | | | 115,259 |
6.00%, 10/15/36 | | | 97,541 | | | 104,360 |
6.50%, 5/15/32 | | | 76,525 | | | 83,721 |
| Housing and Urban Development, 7.50%, 8/1/11, | | | | | | |
Callable 4/30/10 @ 100 | | | 190,000 | | | 191,092 |
| U.S. Treasury Inflation Protected Bonds | | | | | | |
2.00%, 4/15/12 | | | 1,065,000 | | | 1,116,253 |
3.00%, 7/15/12 | | | 361,548 | | | 389,738 |
| TOTAL U.S. GOVERNMENT & U.S. GOVERNMENT | | | | | | |
AGENCY OBLIGATIONS (Cost $8,620,875) | | | | | | 8,830,526 |
| | | | | | | | |
| CERTIFICATE OF DEPOSIT (0.1%) | | | | | | |
| | | | | Shares or | | | |
| | | | | Principal | | | |
| | | | | Amount ($) | | | |
| Shorebank Pacific Bank, 3.38%, 5/10/14 | | | | | | |
(Cost $50,000) | | | 50,000 | | | 50,000 |
| INVESTMENT COMPANIES (2.4%) | | | | | | |
| Victory Federal Money Market, Investor Shares, | | | | | | |
0.01%(c) (Cost $976,185) | | | 976,185 | | | 976,185 |
| Total Investments (Cost $36,300,216) — 99.7% | | | | | | 41,384,187 |
| Other assets in excess of liabilities — 0.3% | | | | | | 115,714 |
| NET ASSETS — 100.0% | | | | | | $41,499,901 |
|
| (a) | | Non-income producing security. |
| (b) | | Rate represents the effective yield at purchase. |
| (c) | | Rate disclosed is the seven day yield as of March 31, 2010. |
| ADR | | American Depositary Receipt |
| AG | | Aktiengesellschaft (German Stock Company) |
| AMBAC | | Insured by American Municipal Bond Assurance Corporation |
| FGIC | | Insured by Financial Guaranty Insurance Company |
| GO | | General Obligation |
| NATL-RE | | Reinsured by National Public Finance Guarantee Corporation |
| NV | | Naamloze Venootschap (Dutch Corporation) |
| PLC | | Public Limited Company |
See Notes to Financial Statements
37
| Financial Statements | | Walden Social Balanced Fund
March 31, 2010 |
|
| STATEMENT OF ASSETS AND LIABILITIES | | | | | |
| March 31, 2010 | | | | | |
| | | | | | |
| Assets: | | | | | |
| Investments, at value (cost $36,300,216) | | | $ | 41,384,187 | |
| Interest and dividends receivable | | | | 152,631 | |
| Receivable for capital shares issued | | | | 985 | |
| Prepaid expenses and other assets | | | | 2,616 | |
Total Assets | | | | 41,540,419 | |
| | | | | | |
| Liabilities: | | | | | |
| Accrued expenses and other liabilities: | | | | | |
Investment adviser | | | | 22,009 | |
Chief compliance officer | | | | 170 | |
Administration and accounting | | | | 1,610 | |
Custodian | | | | 1,859 | |
Transfer agent | | | | 4,018 | |
Trustee | | | | 772 | |
Other | | | | 10,080 | |
Total Liabilities | | | | 40,518 | |
| | | | | | |
| Net Assets | | | $ | 41,499,901 | |
| | | | | | |
| Composition of Net Assets: | | | | | |
| Capital | | | $ | 38,354,461 | |
| Accumulated net investment income | | | | 136,327 | |
Accumulated net realized losses from investment transactions | | | | (2,074,858) | |
| Net unrealized appreciation from investments | | | | 5,083,971 | |
| | | | | | |
| Net Assets | | | $ | 41,499,901 | |
| | | | | | |
| Shares outstanding (par value $0.01, unlimited number of shares authorized) | | | | 3,779,638 | |
| | | | | | |
| Net Asset Value, Offering Price and Redemption Price per share | | | $ | 10.98 | |
| | | | | | |
| STATEMENT OF OPERATIONS | | | | | |
| For the year ended March 31, 2010 | | | | | |
| Investment Income: | | | | | |
| Interest | | | $ | 489,123 | |
| Dividends | | | | 416,059 | |
| Less: Foreign tax withholding | | | | (69) | |
Total Investment Income | | | | 905,113 | |
| | | | | | |
| Expenses: | | | | | |
Investment adviser | | | | 261,765 | |
Administration and accounting | | | | 76,293 | |
Trustee | | | | 3,449 | |
Custodian | | | | 7,950 | |
Transfer agency | | | | 17,646 | |
Chief compliance officer | | | | 2,417 | |
Printing | | | | 7,090 | |
Professional | | | | 14,737 | |
Other | | | | 16,463 | |
Total expenses before fee reductions | | | | 407,810 | |
Fees voluntarily reduced by the administrator | | | | (20,319) | |
Fees contractually reduced by the investment adviser | | | | (38,125) | |
| Net Expenses | | | | 349,366 | |
| | | | | | |
| Net Investment Income | | | | 555,747 | |
| | | | | | |
| Net Realized/Unrealized Gains from Investments: | | | | | |
| Net realized gains from investment transactions | | | | 290,665 | |
| Change in unrealized appreciation/depreciation from investments | | | | 6,965,282 | |
| Net realized/unrealized gains from investments | | | | 7,255,947 | |
| | | | | | |
| Change in Net Assets Resulting from Operations | | | $ | 7,811,694 | |
See Notes to Financial Statements
38
| Financial Statements | | Walden Social Balanced Fund
March 31, 2010 |
|
| STATEMENTS OF CHANGES IN NET ASSETS |
| | | | | | | | | | | |
| | | | For the year ended | | | | For the year ended | |
| | | | March 31, 2010 | | | | March 31, 2009 | |
| | | | | | | | | | | |
| Investment Activities: | | | | | | | | | | |
| Operations: | | | | | | | | | | |
Net investment income | | | $ | 555,747 | | | | $ | 464,746 | |
Net realized gains (losses) from investment transactions | | | | 290,665 | | | | | (2,309,330) | |
Change in unrealized appreciation/depreciation from investments | | | | 6,965,282 | | | | | (5,794,229) | |
| Change in net assets resulting from operations | | | | 7,811,694 | | | | | (7,638,813) | |
| | | | | | | | | | | |
| Dividends: | | | | | | | | | | |
Net investment income | | | | (460,378) | | | | | (591,854) | |
Net realized gains from investment transactions | | | | — | | | | | (355,217) | |
| Change in net assets resulting from shareholder dividends | | | | (460,378) | | | | | (947,071) | |
| | | | | | | | | | | |
| Capital Share Transactions: | | | | | | | | | | |
Proceeds from shares issued | | | | 7,682,862 | | | | | 7,074,197 | |
Dividends reinvested | | | | 335,149 | | | | | 940,321 | |
Cost of shares redeemed | | | | (2,874,682) | | | | | (3,605,235) | |
| Change in net assets resulting from capital share transactions | | | | 5,143,329 | | | | | 4,409,283 | |
| | | | | | | | | | | |
| Change in net assets | | | | 12,494,645 | | | | | (4,176,601) | |
| | | | | | | | | | | |
| Net Assets: | | | | | | | | | | |
Beginning of period | | | | 29,005,256 | | | | | 33,181,857 | |
End of period | | | $ | 41,499,901 | | | | $ | 29,005,256 | |
| | | | | | | | | | | |
| Share Transactions: | | | | | | | | | | |
Issued | | | | 752,440 | | | | | 748,371 | |
Reinvested | | | | 32,072 | | | | | 104,364 | |
Redeemed | | | | (285,804) | | | | | (361,325) | |
| Change in shares | | | | 498,708 | | | | | 491,410 | |
| | | | | | | | | | | |
| Accumulated net investment income | | | $ | 136,327 | | | | $ | 23,531 | |
| | | | | | | | | | | |
See Notes to Financial Statements
39
| Financial Statements | | Walden Social Balanced Fund
March 31, 2010 |
|
| FINANCIAL HIGHLIGHTS | | | | | | | | | | | | | | | | | | | | | |
| Selected data for a share outstanding throughout the years indicated. | | | | | | | | | | |
| | | | | | | | | | | | | | | | | | | | | | |
| | | | For the year | | | For the year | | | For the year | | | For the year | | | For the year | |
| | | | ended | | | ended | | | ended | | | ended | | | ended | |
| | | | March 31, | | | March 31, | | | March 31, | | | March 31, | | | March 31, | |
| | | | 2010 | | | 2009 | | | 2008 | | | 2007 | | | 2006 | |
| | | | | | | | | | | | | | | | | | | | | | |
| Net Asset Value, Beginning of Period | | | $ | 8.84 | | | $ | 11.90 | | | $ | 11.83 | | | $ | 11.58 | | | $ | 11.08 | |
| | | | | | | | | | | | | | | | | | | | | | |
| Investment Activities: | | | | | | | | | | | | | | | | | | | | | |
Net investment income | | | | 0.16 | | | | 0.16 | (a) | | | 0.19 | | | | 0.18 | | | | 0.18 | |
Net realized and unrealized gains (losses) from investment transactions | | | | 2.11 | | | | (2.88) | | | | 0.46 | | | | 0.38 | | | | 0.49 | |
| Total from investment activities | | | | 2.27 | | | | (2.72) | | | | 0.65 | | | | 0.56 | | | | 0.67 | |
| | | | | | | | | | | | | | | | | | | | | | |
| Dividends: | | | | | | | | | | | | | | | | | | | | | |
Net investment income | | | | (0.13) | | | | (0.21) | | | | (0.17) | | | | (0.17) | | | | (0.17) | |
Net realized gains from investments | | | | — | | | | (0.13) | | | | (0.41) | | | | (0.14) | | | | — | |
| Total dividends | | | | (0.13) | | | | (0.34) | | | | (0.58) | | | | (0.31) | | | | (0.17) | |
| | | | | | | | | | | | | | | | | | | | | | |
| Net Asset Value, End of Period | | | $ | 10.98 | | | $ | 8.84 | | | $ | 11.90 | | | $ | 11.83 | | | $ | 11.58 | |
| | | | | | | | | | | | | | | | | | | | | | |
| Total Return | | | | 25.78% | | | | (22.91)% | | | | 5.30% | | | | 4.85% | | | | 6.06% | |
| | | | | | | | | | | | | | | | | | | | | | |
| Ratios/Supplemental Data: | | | | | | | | | | | | | | | | | | | | | |
| Net Assets at end of period (000’s) | | | $ | 41,500 | | | $ | 29,005 | | | $ | 33,182 | | | $ | 29,644 | | | $ | 29,722 | |
| Ratio of net expenses to average net assets | | | | 1.00% | | | | 1.00% | | | | 1.00% | | | | 1.00% | | | | 1.00% | |
| Ratio of net investment income to average net assets | | | | 1.59% | | | | 1.55% | | | | 1.52% | | | | 1.52% | | | | 1.49% | |
| Ratio of expenses (before fee reductions) to average net assets(b) | | | | 1.17% | | | | 1.19% | | | | 1.16% | | | | 1.17% | | | | 1.18% | |
| Portfolio turnover rate | | | | 27.02% | | | | 71.27% | | | | 38.99% | | | | 28.57% | | | | 41.14% | |
|
| (a) | Calculated using the average shares method. |
| (b) | During the period, certain fees were reduced and total fund expenses were capped at 1.00%. If such expense caps had not been in place, the ratio would have been as indicated. |
See Notes to Financial Statements
40
| Schedule of Portfolio Investments | | Walden Social Equity Fund
March 31, 2010 |
|
| COMMON STOCKS (98.4%) | | | | | | |
| Security Description | | | | Shares | | | Value ($) |
| Consumer Discretionary (6.9%) | | | | | | |
| Lowe’s Cos., Inc. | | | 35,000 | | | 848,400 |
| NIKE, Inc., Class B | | | 18,000 | | | 1,323,000 |
| Omnicom Group, Inc. | | | 15,000 | | | 582,150 |
| The TJX Cos., Inc. | | | 27,000 | | | 1,148,040 |
| The Walt Disney Co. | | | 30,000 | | | 1,047,300 |
| | | | | | | 4,948,890 |
| Consumer Products (15.4%) | | | | | | |
| Colgate-Palmolive Co. | | | 12,000 | | | 1,023,120 |
| Costco Wholesale Corp. | | | 18,000 | | | 1,074,780 |
| General Mills, Inc. | | | 15,000 | | | 1,061,850 |
| Kellogg Co. | | | 20,000 | | | 1,068,600 |
| McCormick & Co., Inc. | | | 20,000 | | | 767,200 |
| McDonald’s Corp. | | | 20,000 | | | 1,334,400 |
| Nestle SA, Sponsored ADR | | | 22,000 | | | 1,126,400 |
| PepsiCo, Inc. | | | 16,000 | | | 1,058,560 |
| Procter & Gamble Co. | | | 20,000 | | | 1,265,400 |
| SYSCO Corp. | | | 45,000 | | | 1,327,500 |
| | | | | | | 11,107,810 |
| Energy (10.4%) | | | | | | |
| Apache Corp. | | | 20,000 | | | 2,030,000 |
| BG Group PLC, Sponsored ADR | | | 13,000 | | | 1,127,750 |
| ConocoPhillips | | | 40,000 | | | 2,046,800 |
| Core Laboratories NV | | | 9,000 | | | 1,177,200 |
| Devon Energy Corp. | | | 18,000 | | | 1,159,740 |
| | | | | | | 7,541,490 |
| Financial Services (14.0%) | | | | | | |
| Bank of America Corp. | | | 40,000 | | | 714,000 |
| BB&T Corp. | | | 24,000 | | | 777,360 |
| Chubb Corp. | | | 30,000 | | | 1,555,500 |
| Cincinnati Financial Corp. | | | 50,000 | | | 1,445,000 |
| Comerica, Inc. | | | 22,000 | | | 836,880 |
| JPMorgan Chase & Co. | | | 16,000 | | | 716,000 |
| PNC Financial Services Group, Inc. | | | 14,000 | | | 835,800 |
| SunTrust Banks, Inc. | | | 30,000 | | | 803,700 |
| T. Rowe Price Group, Inc. | | | 33,030 | | | 1,814,338 |
| The Charles Schwab Corp. | | | 33,000 | | | 616,770 |
| | | | | | | 10,115,348 |
| Health Care (14.5%) | | | | | | |
| Amgen, Inc.(a) | | | 13,000 | | | 776,880 |
| Becton, Dickinson & Co. | | | 10,000 | | | 787,300 |
| C.R. Bard, Inc. | | | 8,000 | | | 692,960 |
| DENTSPLY International, Inc. | | | 20,000 | | | 697,000 |
| Johnson & Johnson, Inc. | | | 17,000 | | | 1,108,400 |
| Medtronic, Inc. | | | 25,000 | | | 1,125,750 |
| Merck & Co., Inc. | | | 30,000 | | | 1,120,500 |
| Roche Holdings Ltd. Sponsored ADR | | | 16,000 | | | 648,320 |
| Saint Jude Medical, Inc.(a) | | | 20,000 | | | 821,000 |
| Stryker Corp. | | | 18,000 | | | 1,029,960 |
| Varian Medical Systems, Inc.(a) | | | 15,000 | | | 829,950 |
| Waters Corp.(a) | | | 12,000 | | | 810,480 |
| | | | | | | 10,448,500 |
| Industrial Materials (4.6%) | | | | | | |
| AptarGroup, Inc. | | | 30,000 | | | 1,180,500 |
| Praxair, Inc. | | | 13,000 | | | 1,079,000 |
| Sigma-Aldrich Corp. | | | 20,000 | | | 1,073,200 |
| | | | | | | 3,332,700 |
| Industrial Products & Services (14.7%) | | | | | | |
| 3M Co. | | | 12,000 | | | 1,002,840 |
| Deere & Co. | | | 22,000 | | | 1,308,120 |
| Donaldson Co., Inc. | | | 25,000 | | | 1,128,000 |
| Emerson Electric Co. | | | 25,000 | | | 1,258,500 |
| Expeditors International of Washington, Inc. | | | 25,000 | | | 923,000 |
| Hubbell, Inc., Class B | | | 25,000 | | | 1,260,750 |
| Illinois Tool Works, Inc. | | | 28,000 | | | 1,326,080 |
| United Parcel Service, Inc., Class B | | | 20,000 | | | 1,288,200 |
| W.W. Grainger, Inc. | | | 10,000 | | | 1,081,200 |
| | | | | | | 10,576,690 |
| Information Technology (14.8%) | | | | | | |
| Accenture PLC, Class A | | | 20,000 | | | 839,000 |
| Automatic Data Processing, Inc. | | | 30,000 | | | 1,334,100 |
| Cisco Systems, Inc.(a) | | | 50,000 | | | 1,301,500 |
| EMC Corp.(a) | | | 50,000 | | | 902,000 |
| Hewlett-Packard Co. | | | 15,000 | | | 797,250 |
| Intel Corp. | | | 50,000 | | | 1,113,000 |
| International Business Machines Corp. | | | 9,000 | | | 1,154,250 |
| Microsoft Corp. | | | 40,000 | | | 1,170,800 |
| Nokia Corp., Sponsored ADR | | | 65,000 | | | 1,010,100 |
| Oracle Corp. | | | 40,000 | | | 1,027,600 |
| | | | | | | 10,649,600 |
| Telecommunications (1.6%) | | | | | | |
| Time Warner Cable, Inc. | | | 21,332 | | | 1,137,209 |
| | | | | | | |
| Utility (1.5%) | | | | | | |
| Questar Corp. | | | 25,000 | | | 1,080,000 |
| TOTAL COMMON STOCKS (Cost $57,861,819) | | | | | | 70,938,237 |
| INVESTMENT COMPANIES (1.5%) | | | | | | |
| Victory Federal Money Market, Investor Shares, | | | | | | |
| 0.01%(b) (Cost $1,087,796) | | | 1,087,796 | | | 1,087,796 |
| Total Investments (Cost $58,949,615) — 99.9% | | | | | | 72,026,033 |
| Other assets in excess of liabilities — 0.1% | | | | | | 60,735 |
| NET ASSETS — 100.0% | | | | | | $72,086,768 |
| | | |
| (a) | | Non-income producing security. |
| (b) | | Rate disclosed is the seven day yield as of March 31, 2010. |
| ADR | | American Depositary Receipt |
| NV | | Naamloze Venootschap (Dutch Corporation) |
| PLC | | Public Limited Company |
See Notes to Financial Statements
41
| Financial Statements | | Walden Social Equity Fund |
|
| STATEMENT OF ASSETS AND LIABILITIES | | | | | |
| March 31, 2010 | | | | | |
| | | | | | |
| Assets: | | | | | |
| Investments, at value (cost $58,949,615) | | | $ | 72,026,033 | |
| Dividends receivable | | | | 121,736 | |
| Receivable for capital shares issued | | | | 2,427 | |
| Prepaid expenses and other assets | | | | 5,913 | |
Total Assets | | | | 72,156,109 | |
| Liabilities: | | | | | |
| Payable for capital shares redeemed | | | | 453 | |
| Accrued expenses and other liabilities: | | | | | |
Investment adviser | | | | 35,386 | |
Chief compliance officer | | | | 295 | |
Administration and accounting | | | | 2,283 | |
Custodian | | | | 3,300 | |
Transfer agent | | | | 7,548 | |
Trustee | | | | 1,341 | |
Shareholder service | | | | 721 | |
Other | | | | 18,014 | |
Total Liabilities | | | | 69,341 | |
| | | | | | |
| Net Assets | | | $ | 72,086,768 | |
| Composition of Net Assets: | | | | | |
| Capital | | | $ | 63,825,770 | |
| Accumulated net investment income | | | | 197,105 | |
| Accumulated net realized losses from | | | | | |
| investment transactions | | | | (5,012,525) | |
| Net unrealized appreciation from investments | | | | 13,076,418 | |
| | | | | | |
| Net Assets | | | $ | 72,086,768 | |
| Shares outstanding (par value $0.01, unlimited number of shares authorized) | | | | 6,209,927 | |
| Net Asset Value, Offering Price and Redemption Price per share | | | $ | 11.61 | |
| STATEMENT OF OPERATIONS | | | | | |
| For the year ended March 31, 2010 | | | | | |
| |
| Investment Income: | | | | | |
| Dividends | | | $ | 1,331,759 | |
| Less: Foreign tax withholding | | | | (261) | |
Total Investment Income | | | | 1,331,498 | |
| Expenses: | | | | | |
Investment adviser | | | | 457,536 | |
Administration and accounting | | | | 125,690 | |
Shareholder service | | | | 7,321 | |
Trustee | | | | 5,961 | |
Custodian | | | | 13,857 | |
Transfer agency | | | | 34,379 | |
Chief compliance officer | | | | 4,155 | |
Printing | | | | 14,082 | |
Professional | | | | 25,286 | |
Other | | | | 21,324 | |
Total expenses before fee reductions | | | | 709,591 | |
Fees voluntarily reduced by the administrator | | | | (35,525) | |
Fees contractually reduced by the investment adviser | | | | (63,210) | |
| Net Expenses | | | | 610,856 | |
| | | | | | |
| Net Investment Income | | | | 720,642 | |
| Net Realized/Unrealized Gains from Investments: | | | | | |
| Net realized gains from investment transactions | | | | 189,768 | |
| | | | | | |
| Change in unrealized appreciation/depreciation from investments | | | | 21,354,847 | |
| Net realized/unrealized gains from investments | | | | 21,544,615 | |
| | | | | | |
| Change in Net Assets Resulting from Operations | | | $ | 22,265,257 | |
See Notes to Financial Statements
42
| Financial Statements | | Walden Social Equity Fund |
|
| STATEMENTS OF CHANGES IN NET ASSETS |
| | | | | | | | | | |
| | | | For the year ended | | | For the year ended | |
| | | | March 31, 2010 | | | March 31, 2009 | |
| | | | | | | | | | |
| Investment Activities: | | | | | | | | | |
| Operations: | | | | | | | | | |
Net investment income | | | $ | 720,642 | | | $ | 715,503 | |
Net realized gains (losses) from investment transactions | | | | 189,768 | | | | (5,196,246) | |
Change in unrealized appreciation/depreciation from investments | | | | 21,354,847 | | | | (18,436,056) | |
| Change in net assets resulting from operations | | | | 22,265,257 | | | | (22,916,799) | |
| | | | | | | | | | |
| Dividends: | | | | | | | | | |
Net investment income | | | | (834,615) | | | | (515,574) | |
Net realized gains from investment transactions | | | | — | | | | (485,655) | |
| Change in net assets resulting from shareholder dividends | | | | (834,615) | | | | (1,001,229) | |
| | | | | | | | | | |
| Capital Share Transactions: | | | | | | | | | |
Proceeds from shares issued | | | | 13,452,300 | | | | 28,492,125 | |
Dividends reinvested | | | | 682,616 | | | | 963,408 | |
Cost of shares redeemed | | | | (6,758,378) | | | | (14,161,336) | |
| | | | | | | | | | |
| Change in net assets resulting from capital share transactions | | | | 7,376,538 | | | | 15,294,197 | |
| | | | | | | | | | |
| Change in net assets | | | | 28,807,180 | | | | (8,623,831) | |
| | | | | | | | | | |
| Net Assets: | | | | | | | | | |
Beginning of period | | | | 43,279,588 | | | | 51,903,419 | |
End of period | | | $ | 72,086,768 | | | $ | 43,279,588 | |
| | | | | | | | | | |
| Share Transactions: | | | | | | | | | |
Issued | | | | 1,398,576 | | | | 2,648,123 | |
Reinvested | | | | 63,147 | | | | 112,548 | |
Redeemed | | | | (657,388) | | | | (1,495,648) | |
| Change in shares | | | | 804,335 | | | | 1,265,023 | |
| | | | | | | | | | |
| Accumulated net investment income | | | $ | 197,105 | | | $ | 311,078 | |
See Notes to Financial Statements
43
| Financial Statements | | Walden Social Equity Fund |
|
| FINANCIAL HIGHLIGHTS | | | | | | | | | | | | | | | | | | | | | |
| Selected data for a share outstanding throughout the years indicated. |
| | | | | | | | | | | | | | | | | | | | | | |
| | | | | | | | | | | | | | | | | | | | | | |
| | | | For the year | | For the year | | For the year | | For the year | | For the year |
| | | | ended | | ended | | ended | | ended | | ended |
| | | | March 31, | | March 31, | | March 31, | | March 31, | | March 31, |
| | | | 2010 | | 2009 | | 2008 | | 2007 | | 2006 |
| | | | | | | | | | | | | | | | | | | | | | |
| Net Asset Value, Beginning of Period | | | $ | 8.01 | | | $ | 12.54 | | | $ | 12.31 | | | $ | 12.09 | | | $ | 11.34 | |
| Investment Activities: | | | | | | | | | | | | | | | | | | | | | |
Net investment income | | | | 0.11 | | | | 0.14 | (a) | | | 0.08 | | | | 0.07 | | | | 0.09 | |
Net realized and unrealized gains (losses) from investment transactions | | | | 3.63 | | | | (4.48) | | | | 0.57 | | | | 0.61 | | | | 0.74 | |
| Total from investment activities | | | | 3.74 | | | | (4.34) | | | | 0.65 | | | | 0.68 | | | | 0.83 | |
| | | | | | | | | | | | | | | | | | | | | | |
| Dividends: | | | | | | | | | | | | | | | | | | | | | |
Net investment income | | | | (0.14) | | | | (0.10) | | | | (0.08) | | | | (0.08) | | | | (0.08) | |
Net realized gains from investments | | | | — | | | | (0.09) | | | | (0.34) | | | | (0.38) | | | | — | |
| Total dividends | | | | (0.14) | | | | (0.19) | | | | (0.42) | | | | (0.46) | | | | (0.08) | |
| | | | | | | | | | | | | | | | | | | | | | |
| Net Asset Value, End of Period | | | $ | 11.61 | | | $ | 8.01 | | | $ | 12.54 | | | $ | 12.31 | | | $ | 12.09 | |
| | | | | | | | | | | | | | | | | | | | | | |
| Total Return | | | | 46.79% | | | | (34.74)% | | | | 5.01% | | | | 5.62% | | | | 7.32% | |
| | | | | | | | | | | | | | | | | | | | | | |
| Ratios/Supplemental Data: | | | | | | | | | | | | | | | | | | | | | |
| Net Assets at end of period (000’s) | | | $ | 72,087 | | | $ | 43,280 | | | $ | 51,903 | | | $ | 49,873 | | | $ | 48,712 | |
| Ratio of net expenses to average net assets | | | | 1.00% | | | | 1.00% | | | | 1.00% | | | | 1.00% | | | | 1.00% | |
| Ratio of net investment income to average net assets | | | | 1.18% | | | | 1.36% | | | | 0.59% | | | | 0.68% | | | | 0.70% | |
Ratio of expenses (before fee reductions) to average net assets(b) | | | | 1.16% | | | | 1.19% | | | | 1.18% | | | | 1.15% | | | | 1.12% | |
| Portfolio turnover rate | | | | 25.16% | | | | 40.07% | | | | 44.67% | | | | 25.50% | | | | 29.11% | |
| | |
| (a) | Calculated using the average shares method. |
| (b) | During the period, certain fees were reduced and total fund expenses were capped at 1.00%. If such expense caps had not been in place, the ratio would have been as indicated. |
See Notes to Financial Statements
44
| Schedule of Portfolio Investments | | Walden Small Cap Innovations Fund
March 31, 2010 |
|
| COMMON STOCKS (97.1%) | | | | | | |
| Security Description | | | | Shares | | | Value ($) |
| Consumer Discretionary (16.0%) | | | | | | |
| Ambassadors Group, Inc. | | | 3,975 | | | 43,924 |
| Capella Education Co.(a) | | | 4,500 | | | 417,780 |
| Gentex Corp. | | | 24,975 | | | 485,014 |
| Hibbett Sports, Inc.(a) | | | 7,725 | | | 197,606 |
| John Wiley & Sons, Inc., Class A | | | 9,275 | | | 401,422 |
| LKQ Corp.(a) | | | 16,025 | | | 325,307 |
| Lululemon Athletica, Inc.(a) | | | 11,000 | | | 456,500 |
| NutriSystem, Inc. | | | 6,300 | | | 112,203 |
| Pre-Paid Legal Services, Inc.(a) | | | 2,125 | | | 80,431 |
| Strayer Education, Inc. | | | 1,175 | | | 286,136 |
| Tempur-Pedic International, Inc.(a) | | | 10,300 | | | 310,648 |
| Timberland Co., Class A(a) | | | 9,325 | | | 198,995 |
| Under Armour, Inc., Class A(a) | | | 3,450 | | | 101,465 |
| Universal Technical Institute, Inc.(a) | | | 4,675 | | | 106,684 |
| | | | | | | 3,524,115 |
| Consumer Products (2.9%) | | | | | | |
| Diamond Foods, Inc. | | | 3,875 | | | 162,905 |
| Hain Celestial Group, Inc.(a) | | | 4,975 | | | 86,316 |
| Lifeway Foods, Inc.(a) | | | 11,650 | | | 138,286 |
| United Natural Foods, Inc.(a) | | | 8,700 | | | 244,731 |
| | | | | | | 632,238 |
| Energy (3.3%) | | | | | | |
| Boots & Coots, Inc.(a) | | | 30,300 | | | 73,629 |
| CARBO Ceramics, Inc. | | | 5,400 | | | 336,636 |
| CREDO Petroleum Corp.(a) | | | 9,325 | | | 92,224 |
| Dawson Geophysical Co.(a) | | | 2,875 | | | 84,065 |
| T-3 Energy Services, Inc.(a) | | | 5,475 | | | 134,466 |
| | | | | | | 721,020 |
| Financial Services (19.4%) | | | | | | |
| Bank of Hawaii Corp. | | | 9,725 | | | 437,139 |
| Corporate Office Properties | | | 8,000 | | | 321,040 |
| Dime Community Bancshares | | | 30,775 | | | 388,688 |
| eHealth, Inc.(a) | | | 13,700 | | | 215,775 |
| Horace Mann Educators Corp. | | | 6,450 | | | 97,137 |
| Independent Bank Corp. | | | 8,375 | | | 206,527 |
| Investment Technology Group, Inc.(a) | | | 13,125 | | | 219,056 |
| Jones Lang LaSalle, Inc. | | | 7,250 | | | 528,452 |
| Orrstown Financial Services, Inc. | | | 4,603 | | | 116,778 |
| Parkway Properties, Inc. | | | 9,500 | | | 178,410 |
| Signature Bank(a) | | | 6,800 | | | 251,940 |
| Southside Bancshares, Inc. | | | 8,487 | | | 183,065 |
| TCF Financial Corp. | | | 21,100 | | | 336,334 |
| UMB Financial Corp. | | | 2,700 | | | 109,620 |
| Umpqua Holdings Corp. | | | 16,400 | | | 217,464 |
| Wainwright Bank & Trust Co. | | | 1,405 | | | 13,657 |
| Wilmington Trust Corp. | | | 15,000 | | | 248,550 |
| Wilshire Bancorp, Inc. | | | 19,825 | | | 218,670 |
| | | | | | | 4,288,302 |
| Health Care (12.2%) | | | | | | |
| Cantel Medical Corp. | | | 5,000 | | | 99,250 |
| Computer Programs & Systems, Inc. | | | 2,350 | | | 91,838 |
| Dionex Corp.(a) | | | 6,350 | | | 474,853 |
| Gen-Probe, Inc.(a) | | | 3,150 | | | 157,500 |
| ICU Medical, Inc.(a) | | | 4,700 | | | 161,915 |
| Immucor, Inc.(a) | | | 2,800 | | | 62,692 |
| Landauer, Inc. | | | 6,575 | | | 428,822 |
| Martek Biosciences Corp.(a) | | | 8,475 | | | 190,772 |
| Meridian Bioscience, Inc. | | | 16,725 | | | 340,688 |
| Neogen Corp. (a) | | | 7,200 | | | 180,720 |
| Nutraceutical International Corp.(a) | | | 3,775 | | | 56,399 |
| West Pharmaceutical Services, Inc. | | | 8,000 | | | 335,600 |
| ZOLL Medical Corp.(a) | | | 4,450 | | | 117,302 |
| | | | | | | 2,698,351 |
| Industrial Materials (2.9%) | | | | | | |
| Commercial Metals Co. | | | 12,100 | | | 182,226 |
| Minerals Technologies, Inc. | | | 5,300 | | | 274,752 |
| Quaker Chemical Corp. | | | 6,775 | | | 183,670 |
| | | | | | | 640,648 |
| Industrial Products & Services (15.0%) | | | | | | |
| American Science & Engineering, Inc. | | | 1,200 | | | 89,904 |
| Apogee Enterprises, Inc. | | | 6,975 | | | 110,275 |
| Baldor Electric Co. | | | 13,400 | | | 501,160 |
| CLARCOR, Inc. | | | 12,000 | | | 413,880 |
| ESCO Technologies, Inc. | | | 3,600 | | | 114,516 |
| Fuel-Tech, Inc.(a) | | | 6,600 | | | 52,932 |
| Genesee & Wyoming, Inc., Class A(a) | | | 11,325 | | | 386,409 |
| Herman Miller, Inc. | | | 4,450 | | | 80,367 |
| Layne Christensen Co.(a) | | | 3,025 | | | 80,798 |
| Lindsay Manufacturing Co. | | | 4,150 | | | 171,851 |
| Met-Pro Corp. | | | 5,275 | | | 51,642 |
| Middleby Corp.(a) | | | 2,700 | | | 155,493 |
| Simpson Manufacturing Co., Inc. | | | 9,925 | | | 275,518 |
| SunPower Corp., Class B(a) | | | 2,725 | | | 45,617 |
| Team, Inc.(a) | | | 7,675 | | | 127,328 |
| Wabtec Corp. | | | 9,825 | | | 413,829 |
| Watts Water Technologies, Inc., Class A | | | 7,600 | | | 236,056 |
| | | | | | | 3,307,575 |
| Information Technology (21.0%) | | | | | | |
| Alvarion Ltd.(a) | | | 26,690 | | | 105,692 |
| Blackbaud, Inc. | | | 8,500 | | | 214,115 |
| Blackboard, Inc.(a) | | | 4,375 | | | 182,263 |
| Blue Coat Systems, Inc.(a) | | | 5,275 | | | 163,736 |
| Coherent, Inc.(a) | | | 3,800 | | | 121,448 |
| Itron, Inc.(a) | | | 5,150 | | | 373,735 |
| J2 Global Communications, Inc.(a) | | | 14,800 | | | 346,320 |
| Liquidity Services, Inc.(a) | | | 8,775 | | | 101,264 |
| National Instruments Corp. | | | 8,425 | | | 280,974 |
| Net l UEPS Technologies, Inc.(a) | | | 14,300 | | | 262,977 |
| Plantronics, Inc. | | | 16,100 | | | 503,608 |
| Polycom, Inc.(a) | | | 17,000 | | | 519,860 |
| Power Integrations, Inc. | | | 11,500 | | | 473,800 |
| Quality Systems, Inc. | | | 7,000 | | | 430,080 |
| Renaissance Learning, Inc. | | | 7,475 | | | 121,319 |
| Riverbed Technology, Inc.(a) | | | 6,900 | | | 195,960 |
| Skyworks Solutions, Inc.(a) | | | 14,700 | | | 229,320 |
| | | | | | | 4,626,471 |
| Utilities (4.4%) | | | | | | |
| American States Water Co. | | | 1,725 | | | 59,857 |
| New Jersey Resources Corp. | | | 11,600 | | | 435,696 |
| Ormat Technologies, Inc. | | | 2,125 | | | 59,798 |
| South Jersey Industries, Inc. | | | 10,000 | | | 419,900 |
| | | | | | | 975,251 |
| TOTAL COMMON STOCKS (Cost $17,540,024) | | | | | | 21,413,971 |
| | | | | | | |
| INVESTMENT COMPANIES (1.8%) | | | | | | |
| Victory Federal Money Market, Investor Shares, | | | | | | |
| 0.01% (b) (Cost $410,651) | | | 410,651 | | | 410,651 |
| | | | | | | |
| Total Investments (Cost $17,950,675) — 98.9% | | | | | | 21,824,622 |
| Other assets in excess of liabilities — 1.1% | | | | | | 232,029 |
| NET ASSETS — 100.0% | | | | | | $ 22,056,651 |
| | | |
| (a) | | Represents non-income producing security |
| (b) | | Rate disclosed is the seven day yield as of March 31, 2010. |
See Notes to Financial Statements
45
| Financial Statements | | Walden Small Cap Innovations Fund |
|
| STATEMENT OF ASSETS AND LIABILITIES | | | | | |
| March 31, 2010 | | | | | |
| Assets: | | | | | |
| Investments, at value (cost $17,950,675) | | | $ | 21,824,622 | |
| Dividends receivable | | | | 22,660 | |
| Receivable for capital shares issued | | | | 230,379 | |
| Prepaid expenses and other assets | | | | 3,058 | |
Total Assets | | | | 22,080,719 | |
| | | | | | |
| Liabilities: | | | | | |
| Accrued expenses and other liabilities: | | | | | |
Investment adviser | | | | 7,667 | |
Chief compliance officer | | | | 81 | |
Administration and accounting | | | | 915 | |
Custodian | | | | 2,991 | |
Transfer agent | | | | 6,985 | |
Trustee | | | | 370 | |
Other | | | | 5,059 | |
Total Liabilities | | | | 24,068 | |
| | | | | | |
| Net Assets | | | $ | 22,056,651 | |
| | | | | | |
| Composition of Net Assets: | | | | | |
| Capital | | | $ | 17,683,122 | |
| Accumulated net investment income | | | | 6,164 | |
| Accumulated net realized gains from investment transactions | | | | 493,418 | |
| Net unrealized appreciation from investments | | | | 3,873,947 | |
| | | | | | |
| Net Assets | | | $ | 22,056,651 | |
| Shares outstanding (par value $0.01, unlimited number of shares authorized) | | | | 1,513,422 | |
| Net Asset Value, Offering Price and Redemption Price per share | | | $ | 14.57 | |
| | | | | | |
| | | | | | |
| STATEMENT OF OPERATIONS | | | | | |
| For the year ended March 31, 2010 | | | | | |
| | | | | | |
| Investment Income: | | | | | |
| Dividends | | | $ | 153,643 | |
Total Investment Income | | | | 153,643 | |
| Expenses: | | | | | |
Investment adviser | | | | 91,255 | |
Administration and accounting | | | | 28,578 | |
Trustee | | | | 1,226 | |
Custodian | | | | 18,015 | |
Transfer agency | | | | 33,277 | |
Chief compliance officer | | | | 692 | |
Offering | | | | 10,994 | |
Printing | | | | 2,450 | |
Professional | | | | 5,882 | |
Other | | | | 12,504 | |
Total expenses before fee reductions | | | | 204,873 | |
Fees voluntarily reduced by the administrator | | | | (7,141) | |
Fees contractually reduced by the investment adviser | | | | (75,530) | |
| Net Expenses | | | | 122,202 | |
| | | | | | |
| Net Investment Income | | | | 31,441 | |
| Net Realized/Unrealized Gains from Investments: | | | | | |
| Net realized gains from investment transactions | | | | 760,908 | |
| Change in unrealized appreciation/depreciation from investments | | | | 3,930,123 | |
| Net realized/unrealized gains from investments | | | | 4,691,031 | |
| | | | | | |
| Change in Net Assets Resulting from Operations | | | $ | 4,722,472 | |
| | | | | | |
| | | | | | |
See Notes to Financial Statements
46
| Financial Statements | | Walden Small Cap Innovations Fund |
|
| STATEMENTS OF CHANGES IN NET ASSETS | | | | | | | | | |
| | | | | | | | | | |
| | | | For the year ended | | | For the period ended | |
| | | | March 31, 2010 | | | March 31, 2009(a) | |
| | | | | | | | | | |
| Investment Activities: | | | | | | | | | |
| Operations: | | | | | | | | | |
Net investment income | | | $ | 31,441 | | | $ | 2,933 | |
Net realized gains (losses) from investment transactions | | | | 760,908 | | | | (11,788) | |
Change in unrealized appreciation/depreciation from investments | | | | 3,930,123 | | | | (56,176) | |
| Change in net assets resulting from operations | | | | 4,722,472 | | | | (65,031) | |
| | | | | | | | | | |
| Dividends: | | | | | | | | | |
Net investment income | | | | (27,286) | | | | (1,149) | |
Net realized gains from investment transactions | | | | (255,693) | | | | — | |
| Change in net assets resulting from shareholder dividends | | | | (282,979) | | | | (1,149) | |
| | | | | | | | | | |
| Capital Share Transactions: | | | | | | | | | |
Proceeds from shares issued | | | | 11,604,131 | | | | 2,405,279 | |
Proceeds from shares issued in subscription in-kind (b) | | | | 4,083,411 | | | | — | |
Dividends reinvested | | | | 134,996 | | | | 1,149 | |
Cost of shares redeemed | | | | (545,628) | | | | — | |
| Change in net assets resulting from capital share transactions | | | | 15,276,910 | | | | 2,406,428 | |
| | | | | | | | | | |
| Change in net assets | | | | 19,716,403 | | | | 2,340,248 | |
| | | | | | | | | | |
| Net Assets: | | | | | | | | | |
Beginning of period | | | | 2,340,248 | | | | — | |
End of period | | | $ | 22,056,651 | | | $ | 2,340,248 | |
| | | | | | | | | | |
| Share Transactions: | | | | | | | | | |
Issued | | | | 1,000,056 | | | | 254,587 | |
Issued in subscription in-kind (b) | | | | 289,822 | | | | — | |
Reinvested | | | | 10,317 | | | | 115 | |
Redeemed | | | | (41,475) | | | | — | |
| Change in shares | | | | 1,258,720 | | | | 254,702 | |
| | | | | | | | | | |
| Accumulated net investment income | | | $ | 6,164 | | | $ | 2,000 | |
| | | |
| (a) | | Commenced operations on October 24, 2008. |
| (b) | | See Note 3 in Notes to Financial Statements. |
See Notes to Financial Statements
47
| Financial Statements | | Walden Small Cap Innovations Fund |
|
| FINANCIAL HIGHLIGHTS | | | | | | | | | |
| Selected data for a share outstanding throughout the periods indicated. |
| | | | | | | | | | |
| | | | | | | | | | |
| | | | For the year | | | For the | |
| | | | ended | | | period ended | |
| | | | March 31, | | | March 31, | |
| | | | 2010 | | | 2009 (a) | |
| | | | | | | | | | |
| | | | | | | | | | |
| Net Asset Value, Beginning of Period | | | $ | 9.19 | | | $ | 10.00 | |
| Investment Activities: | | | | | | | | | |
Net investment income | | | | 0.02 | | | | 0.03 | (b) |
Net realized and unrealized gains (losses) from investment transactions | | | | 5.60 | | | | (0.83) | |
| Total from investment activities | | | | 5.62 | | | | (0.80) | |
| | | | | | | | | | |
| Dividends: | | | | | | | | | |
Net investment income | | | | (0.02) | | | | (0.01) | |
Net realized gains from investments | | | | (0.22) | | | | — | |
| Total dividends | | | | (0.24) | | | | (0.01) | |
| | | | | | | | | | |
| Net Asset Value, End of Period | | | $ | 14.57 | | | $ | 9.19 | |
| | | | | | | | | | |
| Total Return | | | | 61.45% | | | | (7.98)% | (c) |
| | | | | | | | | | |
| Ratios/Supplemental Data: | | | | | | | | | |
| Net Assets at end of period (000’s) | | | $ | 22,057 | | | $ | 2,340 | |
| Ratio of net expenses to average net assets | | | | 1.00% | | | | 1.16% | (d) |
| Ratio of net investment income to average net assets | | | | 0.26% | | | | 0.63% | (d) |
| Ratio of expenses (before fee reductions) to average net assets(e) | | | | 1.68% | | | | 9.61% | (d) |
| Portfolio turnover rate | | | | 23.07% | | | | 4.37% | (c) |
| | | |
| (a) | | Commenced operations on October 24, 2008. |
| (b) | | Calculated using the average shares method. |
| (c) | | Not annualized for periods less than one year. |
| (d) | | Annualized for periods less than one year. |
| (e) | | During the period, certain fees were reduced and total fund expenses were capped at 1.25% through March 31, 2009 and at 1.00% there after. If such expense caps had not been in place, the ratio would have been as indicated. |
| | | |
See Notes to Financial Statements
48
| Notes to Financial Statements | | March 31, 2010 |
|
| 1. | | Organization: |
| | | The Coventry Group (the “Group”) was organized on January 8, 1992 as a Massachusetts business trust and is registered under the Investment Company Act of 1940, as amended (the “1940 Act”), as an open-end management investment company. The Group contains the following Boston Trust Funds and Walden Funds (individually a “Fund”, collectively the “Funds”): |
| | | |
| | | Fund | | | Short Name | | |
| | | Boston Trust Balanced Fund | | Balanced Fund | |
| | | Boston Trust Equity Fund | | Equity Fund | |
| | | Boston Trust Midcap Fund | | Midcap Fund | |
| | | Boston Trust Small Cap Fund | | Small Cap Fund | |
| | | Walden Social Balanced Fund | | Social Balanced Fund | |
| | | Walden Social Equity Fund | | Social Equity Fund | |
| | | Walden Small Cap Innovations Fund | | Small Cap Innovations Fund | |
| | | |
| | | The investment objective of the Balanced Fund and Social Balanced Fund is to seek long-term capital growth and income through an actively managed portfolio of stocks, bonds and money market instruments. The investment objective of the Equity Fund and Social Equity Fund is to seek long-term capital growth through an actively managed portfolio of stocks. The investment objective of the Midcap Fund is to seek long-term capital growth through an actively managed portfolio of stocks of middle capitalization companies. The investment objective of the Small Cap Fund and Small Cap Innovations Fund is to seek long-term capital growth through an actively managed portfolio of stocks of small capitalization companies. |
| | | |
| | | Under the Group’s organizational documents, its officers and trustees are indemnified against certain liabilities arising out of the performance of their duties to the Group. In addition, in the normal course of business, the Group may enter into contracts with its vendors and others that provide for general indemnifications. Each Fund’s maximum exposure under these arrangements is unknown, as this would involve future claims that may be made against the Funds. However, based on experience, the Funds expect that risk of loss to be remote. |
| | | |
| 2. | | Significant Accounting Policies: |
| | | The following is a summary of significant accounting policies followed by the Funds in the preparation of their financial statements. The policies are in conformity with accounting principles generally accepted in the United States of America (“GAAP”). |
| | | |
| | | Security Valuation: |
| | | The Funds record their investments at fair value. Fair value is defined as the price that would be received to sell an asset or paid to transfer a liability in an orderly transaction between market participants at the measurement date. The valuation techniques used to determine fair value are further described below. |
| | | |
| | | The value of each equity security is based either on the last sale price on a national securities exchange, or in the absence of recorded sales, at the closing bid prices on such exchanges, or at the quoted bid price in the over-the-counter market. Equity securities traded on the NASDAQ stock market are valued at the NASDAQ official closing price. |
| | | |
| | | Bonds and other fixed income securities (other than short-term obligations but including listed issues) are valued on the basis of valuations furnished by a pricing service, the use of which has been approved by the Group’s Board of Trustees (the “Board”). In making such valuations, the pricing service utilizes both dealer-supplied valuations and electronic data processing techniques which take into account appropriate factors such as institutional-size trading in similar groups of securities, yield, quality, coupon rate, maturity, type of issue, and trading characteristics other than market data and without exclusive reliance upon quoted prices or exchanges or over-the-counter prices, since such valuations are believed to reflect more accurately the fair value of such securities. All debt portfolio securities with a remaining maturity of 60 days or less are valued at amortized cost, which approximates fair value. Under the amortized cost method, discount or premium, if any, is accreted or amortized, respectively, on a constant (straight-line) basis to the maturity of the security. |
| | | |
| | | The Group may use a pricing service to value certain portfolio securities where the prices provided are believed to reflect the fair market value of such securities. If market prices are not readily available or, in Boston Trust Investment Management, Inc.’s (the “Adviser”) opinion, market prices do not reflect fair value, or if an event occurs after the close of trading on the exchange or market on which the security is principally traded (but prior to the time the NAV is calculated) that materially affects fair value, the Adviser will value the Funds’ assets at their fair value according to policies approved by the Board. |
| | | |
| | | Investments in investment companies and money market funds are valued at net asset value per share. Certificates of deposit are valued at acquisition cost. |
| | | |
| | | Fair Value Measurements: |
| | | The valuation techniques employed by the Funds’, as described above in Security Valuation, maximize the use of observable inputs and minimize the use of unobservable inputs in determining fair value. The inputs used for valuing the Funds’ investments are summarized in the three broad levels listed below: |
| | | |
| | | Level 1 - quoted prices in active markets for identical assets. |
| | | Level 2 - other significant observable inputs (including quoted prices for similar securities, interest rates, prepayment speeds, credit risk, etc.). |
| | | Level 3 - significant unobservable inputs (including Fund Management’s own assumptions in determining the fair value of investments). |
| | | |
| | | The inputs or methodology used to value securities are not necessarily an indication of the risk associated with investing in those securities. |
Continued
49
| Notes to Financial Statements | | March 31, 2010 |
|
| | The following is a summary of the valuation inputs used as of March 31, 2010 in valuing the Funds’ investments based upon three levels defined above: |
| | | | | | | | | LEVEL 2 | | LEVEL 3 | | |
| | | | | LEVEL I | | Other Significant | | Significant | | Total Investments in |
| | Fund Name | | | Quoted Prices | | Observable Inputs | | Unobservable Inputs | | Securities |
| | Balanced Fund | | | | | | | | | | | | | | | | | |
| | Common Stocks† | | | $ | 136,014,300 | | | $ | — | | | $ | — | | | $ | 136,014,300 | |
| | Corporate Bonds | | | | — | | | | 8,353,647 | | | | — | | | | 8,353,647 | |
| | Municipal Bonds | | | | — | | | | 4,472,105 | | | | — | | | | 4,472,105 | |
| | U.S. Government & U.S. Government | | | | | | | | | | | | | | | | | |
| | Agency Obligations | | | | — | | | | 47,531,439 | | | | — | | | | 47,531,439 | |
| | Investment Companies | | | | 3,120,208 | | | | — | | | | — | | | | 3,120,208 | |
| | Total | | | | 139,134,508 | | | | 60,357,191 | | | | — | | | | 199,491,699 | |
| |
| | Equity Fund | | | | | | | | | | | | | | | | | |
| | Common Stocks† | | | | 53,424,965 | | | | — | | | | — | | | | 53,424,965 | |
| | Investment Companies | | | | 117,678 | | | | — | | | | — | | | | 117,678 | |
| | Total | | | | 53,542,643 | | | | — | | | | — | | | | 53,542,643 | |
| |
| | Midcap Fund | | | | | | | | | | | | | | | | | |
| | Common Stocks† | | | | 15,748,835 | | | | — | | | | — | | | | 15,748,835 | |
| | Investment Companies | | | | 503,577 | | | | — | | | | — | | | | 503,577 | |
| | Total | | | | 16,252,412 | | | | — | | | | — | | | | 16,252,412 | |
| |
| | Small Cap Fund | | | | | | | | | | | | | | | | | |
| | Common Stocks† | | | | 130,856,500 | | | | — | | | | — | | | | 130,856,500 | |
| | Investment Companies | | | | 3,214,539 | | | | — | | | | — | | | | 3,214,539 | |
| | Total | | | | 134,071,039 | | | | — | | | | — | | | | 134,071,039 | |
| | | | | | | | | | | | | | | | | | | |
| | Social Balanced Fund | | | | | | | | | | | | | | | | | |
| | Common Stocks† | | | $ | 27,119,638 | | | | — | | | | — | | | | 27,119,638 | |
| | Corporate Bonds | | | | — | | | | 3,395,770 | | | | — | | | | 3,395,770 | |
| | Municipal Bonds | | | | — | | | | 1,012,068 | | | | — | | | | 1,012,068 | |
| | U.S. Government & U.S. Government | | | | | | | | | | | | | | | | | |
| | Agency Obligations | | | | — | | | | 8,830,526 | | | | — | | | | 8,830,526 | |
| | Certificates of Deposit | | | | — | | | | 50,000 | | | | — | | | | 50,000 | |
| | Investment Companies | | | | 976,185 | | | | — | | | | — | | | | 976,185 | |
| | Total | | | | 28,095,823 | | | | 13,288,364 | | | | — | | | | 41,384,187 | |
| |
| | Social Equity | | | | | | | | | | | | | | | | | |
| | Common Stocks† | | | | 70,938,237 | | | | — | | | | — | | | | 70,938,237 | |
| | Investment Companies | | | | 1,087,796 | | | | — | | | | — | | | | 1,087,796 | |
| | Total | | | | 72,026,033 | | | | — | | | | — | | | | 72,026,033 | |
| |
| | Small Cap Innovations Fund | | | | | | | | | | | | | | | | | |
| | Common Stocks† | | | | 21,413,971 | | | | — | | | | — | | | | 21,413,971 | |
| | Investment Companies | | | | 410,651 | | | | — | | | | — | | | | 410,651 | |
| | Total | | | | 21,824,622 | | | | — | | | | — | | | | 21,824,622 | |
| | † For detailed industry descriptions, see the accompanying Schedules of Portfolio Investments. |
| | | | | | | | | | | | | | | | | | | |
| | Following is a reconciliation of Level 3 investments (certificates of deposit) for which significant unobservable inputs were used to determine fair value: | |
| | | | | | | | | |
| | | | | | Investment Securities | |
| | | Social Balanced Fund | | | (Certificates of Deposit) | |
| | | | | | | | | |
| | | Balance as of March 31, 2009 | | | | $100,000 | | |
| | | Realized gain/(loss) | | | | — | | |
| | | Change in unrealized appreciation/(depreciation) | | | | — | | |
| | | Net purchases/(sales) | | | | (100,000) | | |
| | | Transfers in (out) of Level 3 | | | | — | | |
| | | Balance as of March 31, 2010 | | | | $— | | |
Continued
50
| Notes to Financial Statements | | March 31, 2010 |
|
| | | Security Transactions and Related Income: |
| | | Security transactions are recorded no later than one business day after trade date. For financial reporting purposes, security transactions are recorded on trade date on the last business day of the reporting period. Interest income is recognized on the accrual basis and includes, where applicable, the amortization of premium or discount. Dividend income is recorded on the ex-dividend date. Gains or losses realized on sales of securities are determined by comparing the identified cost of the security lot sold with the net sales proceeds. |
| | | |
| | | Expenses: |
| | | Expenses directly attributable to a Fund are charged directly to that Fund. Expenses relating to the Group are allocated proportionately to each Fund within the Group according to the relative net assets of each Fund or on another reasonable basis. |
| | | |
| | | Use of Estimates: |
| | | The preparation of financial statements in conformity with GAAP requires management to make estimates and assumptions that affect the reported amounts of assets and liabilities, the disclosure of contingent assets and liabilities at the date of the financial statements and the reported amounts of increases and decreases in net assets from operations during the reporting period. Actual results may differ from those estimates. |
| | | |
| | | Dividends to Shareholders: |
| | | Dividends are recorded on the ex-dividend date. Dividends to shareholders from net investment income, if any, are declared and paid annually by the Funds. Dividends to shareholders from net realized gains, if any, are declared and distributed at least annually by the Funds. |
| | | |
| | | The amounts of dividends to shareholders from net investment income and of distributions from net realized gains are determined in accordance with federal income tax regulations, which may differ from GAAP. These “book/tax” differences are either considered temporary or permanent in nature. To the extent these differences are permanent in nature (e.g. return of capital, net operating loss, reclassification of certain market discounts, gain/loss, paydowns, and distributions), such amounts are reclassified within the composition of net assets based on their federal tax-basis treatment; temporary differences (e.g. wash sales and post October losses) do not require reclassification. To the extent dividends to shareholders exceed net investment income and net realized gains for tax purposes, they are reported as distributions of capital. |
| | | |
| | | Redemption Fees: |
| | | Prior to December 4, 2009, the Midcap Fund, Small Cap Fund and Small Cap Innovations Fund reserved the right to assess a redemption fee for shares redeemed within 60 days of purchase. The shareholder could be charged a fee equal to 0.75% of the value of the shares redeemed for the Mid Cap Fund and 1.00% for the Small Cap Fund and Small Cap Innovations Fund, unless an exception applies as was disclosed in the Funds’ Prospectus. The redemption fee was intended to offset excess brokerage commissions and other costs associated with fluctuations in asset levels and cash flows caused by frequent trading by shareholders. The applicability of the redemption fee was calculated using a first-in first-out method, which means the oldest shares were redeemed first, followed by the redemption of more recently acquired shares. Effective December 4, 2009, the Board eliminated the redemption fee for the Midcap Fund, Small Cap Fund and Small Cap Innovations Fund. |
| | | |
| | | Federal Income Taxes: |
| | | Each Fund intends to continue to qualify as a regulated investment company by complying with the provisions available to certain investment companies, as defined in Subchapter M of the Internal Revenue Code, and to make distributions from net investment income and from net realized capital gains sufficient to relieve it from all, or substantially all, federal income and excise taxes. Therefore, no federal income tax provision is required. |
| | | |
| | | Management of the Funds has reviewed tax positions taken in tax years that remain subject to examination by all major tax jurisdictions, including federal (i.e., the last four tax year ends and the interim tax period since then, as applicable). The Funds recognize interest and penalties, if any, related to unrecognized tax benefits, as income tax expense in the Statement of Operations. Management believes that there is no tax liability resulting from unrecognized tax benefits related to uncertain tax positions taken. |
| | | |
| | | Recently Issued Accounting Pronouncements: |
| | | In January 2010, the Financial Accounting Standards Board issued an Accounting Standards Update, “Improving Disclosures about Fair Value Measurements.” New disclosures and clarifications of existing disclosures are effective for interim and annual reporting periods beginning after December 15, 2009, while disclosures about purchases, sales, issuances, and settlements in the Level 3 roll forward of activity in fair value measurements is effective for interim and fiscal periods beginning after December 15, 2010. Management is currently evaluating the impact the adoption of this update will have on the Funds’ financial statements and related disclosures. |
| | | |
| 3. | | Related Party Transactions: |
| | | Investment Adviser: |
| | | The Funds and the Adviser are parties to an Investment Advisory Agreement under which the Adviser is entitled to receive an annual fee, computed daily and paid monthly, equal to the average daily net assets of each Fund, at the following annual percentage rates before contractual waivers: |
| | | Fund | | | Fee Rate |
| | | Balanced Fund | | | 0.75 | % | |
| | | Equity Fund | | | 0.75 | % | |
| | | Midcap Fund | | | 0.75 | % | |
| | | Small Cap Fund | | | 0.75 | % | |
| | | Social Balanced Fund | | | 0.75 | % | |
| | | Social Equity Fund | | | 0.75 | % | |
| | | Small Cap Innovations Fund | | | 0.75 | % | |
| | | | | | | | | |
| | | Administration and Fund Accounting: |
| | | Citi Fund Services Ohio, Inc. (“Citi”) serves the Funds as administrator. Citi, as the Funds’ administrator, provides administrative and fund accounting services for a fee that is computed daily and paid monthly at an annual rate of up to 0.20% of the average daily net assets of each Fund. Certain officers of the Group are affiliated with Citi. Such persons were paid no fees directly by the Funds for serving as officers of the Group, except the Chief Compliance Officer (the “CCO”). |
Continued
51
| Notes to Financial Statements | | March 31, 2010 |
|
| | | Under a Compliance Services Agreement between the Funds and Citi (the “CCO Agreement”), Citi makes an employee available to serve as the Funds’ CCO. Under the CCO Agreement, Citi also provides infrastructure and support in implementing the written policies and procedures comprising the Funds’ compliance program, including support services to the CCO. For the services provided under the CCO Agreement, the Funds paid Citi $28,754 for the year ended March 31, 2010, plus certain out of pocket expenses. Citi pays the salary and other compensation earned by the CCO as an employee of Citi. |
| | | |
| | | Distribution: |
| | | Foreside Distribution Services, L.P., (“Foreside”), an indirect, wholly owned subsidiary of Foreside Financial Group, LLC, serves as the Funds’ distribution agent. Under the distribution agreement, Foreside receives a fixed fee of $15,000 per year, paid monthly by the Adviser from its profits and not by the Funds’, for its services. Foreside is not affiliated with Citi or the Adviser. |
| | | |
| | | Custodian and Transfer Agency: |
| | | Boston Trust & Investment Management Company (“Boston Trust”), the parent company of the Adviser, acts as the Funds’ custodian and transfer agent. Under the custody agreement, Boston Trust receives an asset-based fee of 0.02% of the average daily net assets for the first $100 million and 0.015% of the average daily net assets above $100 million, plus per transaction fees. Under the transfer agency agreement, Boston Trust receives a fixed fee of $18,000 annually per fund, accrued daily and paid monthly for its services. Under a sub-transfer agency agreement, Citi receives a fixed fee of $12,000 annually per Fund for the Social Equity Fund, the Small Cap Fund, and the Small Cap Innovations Fund, accrued daily and paid monthly plus certain out of pocket expenses for its services. |
| | | |
| | | Fee Reductions: |
| | | The Adviser has agreed to reduce its fees payable by the Funds to the extent necessary to limit each Fund’s aggregate annual operating expenses to 1.00% of the average daily net assets. Any such reductions made by the Adviser in its fees or in the payment or reimbursement of expenses that are a Fund’s obligation may be subject to repayment by the Fund within three years provided the Fund receiving the reduction, payment or reimbursement is able to effect such repayment and remain in compliance with applicable expense limitations. Pursuant to its agreement, for the year ended March 31, 2010, the Adviser reimbursed fees in the amount of $44,935, $26,106, $29,358, $72,080, $38,125, $63,210 and $75,530 for the Balanced Fund, Equity Fund, Midcap Fund, Small Cap Fund, Social Balanced Fund, Social Equity Fund, and Small Cap Innovations Fund, respectively. As of March 31, 2010, the Adviser may recoup $122,673, $79,565, $116,149, $79,011, $112,039, $197,099, and $114,712 from the Funds as follows: |
| | | | | | | | | | | | | | | | | | | |
| | | Fund | | | Amount | | | Expires | | Fund | | | Amount | | | Expire |
| | | Balanced Fund | | $ | 38,090 | | | 2011 | | Social Balanced Fund | | $ | 34,901 | | | 2011 |
| | | | | | $ | 39,648 | | | 2012 | | | | | $ | 39,013 | | | 2012 |
| | | | | | $ | 44,935 | | | 2013 | | | | | $ | 38,125 | | | 2013 |
| | | Equity Fund | | $ | 29,881 | | | 2011 | | Social Equity Fund | | $ | 64,706 | | | 2011 |
| | | | | | $ | 23,578 | | | 2012 | | | | | $ | 69,183 | | | 2012 |
| | | | | | $ | 26,106 | | | 2013 | | | | | $ | 63,210 | | | 2013 |
| | | Midcap Fund | | $ | 38,046 | | | 2011 | | Small Cap Innovations Fund | | $ | 39,182 | | | 2012 |
| | | | | | $ | 48,745 | | | 2012 | | | | | $ | 75,530 | | | 2013 |
| | | | | | $ | 29,358 | | | 2013 | | | | | | | | | |
| | | Small Cap Fund | | $ | 6,931 | | | 2012 | | | | | | | | | |
| | | | | | $ | 72,080 | | | 2013 | | | | | | | | | |
| | | |
| | | Citi has voluntarily agreed to reduce its administrative fees. For the year ended March 31, 2010, Citi voluntarily waived fees in the amount of $102,094, $28,005, $6,693, $50,265, $20,319, $35,525 and $7,141 for the Balanced Fund, Equity Fund, Midcap Fund, Small Cap Fund, Social Balanced Fund, Social Equity Fund, and Small Cap Innovations Fund, respectively. |
| | | |
| | | Other Affiliated Transactions: |
| | | During the fiscal year ended March 31, 2010, certain securities of separately managed accounts managed by Boston Trust & Investment Management Company, an affiliate of the Adviser, were exchanged, at fair market value, as in-kind transfers for shares of the Small Cap Innovations Fund. The total fair market value of the securities involved in the in-kind transfers was $886,962, in exchange for 69,511 Shares of the Small Cap Innovations Fund. |
| | | |
| | | On March 11, 2010, the Small Cap Innovations Fund issued capital shares to certain shareholders of the Small Cap Fund, in exchange for securities received from the Small Cap Fund in accordance with procedures adopted by the Board of Trustees pusuant to Rule 17a-7 exemption provided under the 1940 Act as follows: |
| | | | | | Capital Shares Received/ | | Value of Securities Received/ | | | | |
| | | Fund | | | (Transferred) | | (Transferred) | | | Realized Gain/(Loss) |
| | | Small Cap Fund | | | | (278,774 | ) | | $ | (3,196,449 | ) | | | $50,886 | |
| | | Small Cap Innovations Fund | | | | 220,311 | | | | 3,196,449 | | | | N/A | |
| | | | | | | | | | | | | | | | |
| 4. | | Purchases and Sales of Securities: | | | | | | | | | | | | | | | |
| | | Cost of purchases and proceeds from sales and maturities of securities, excluding short-term securities and U.S. Government securities, for the Funds for the year ended March 31, 2010, totaled: |
| | | | | | | | | | | | | | | | | | |
| | | Fund | | | Purchases | | Sales and Maturities |
| | | Balanced Fund | | $ | 43,411,101 | | | $ | 6,581,274 | |
| | | Equity Fund | | | 9,424,069 | | | | 9,355,281 | |
| | | Midcap Fund | | | 6,269,005 | | | | 2,915,014 | |
| | | Small Cap Fund | | | 94,457,471 | | | | 22,114,012 | |
| | | Social Balanced Fund | | | 12,319,507 | | | | 5,616,107 | |
| | | Social Equity Fund | | | 21,629,305 | | | | 14,957,895 | |
| | | Small Cap Innovations Fund | | | 17,243,084 | | | | 2,693,237 | |
Continued
52
| Notes to Financial Statements | | March 31, 2010 |
|
| | | Cost of purchases and proceeds from sales and maturities of U.S. Government Securities, excluding short-term securities, for the Funds for the year ended March 31, 2010, totaled: |
| | | Fund | | | Purchases | | Sales and Maturities |
| | | Balanced Fund | | $ | 1,047,845 | | | $ | 15,454,398 | |
| | | Social Balanced Fund | | | 2,993,741 | | | | 3,512,915 | |
| | | |
| 5. | | Federal Income Tax Information: |
| | | At March 31, 2010, the cost, gross unrealized appreciation and gross unrealized depreciation on securities, for federal income tax purposes, were as follows: |
| | | | | | | | | Gross Tax | | Gross Tax | | Net Unrealized |
| | | | | | | | | Unrealized | | Unrealized | | Appreciation |
| | | | | Tax Cost | | Appreciation | | (Depreciation) | | (Depreciation) |
| | | Balanced Fund | | $ | 154,373,045 | | | $ | 45,711,134 | | | $ | (592,480 | ) | | $ | 45,118,654 | |
| | | Equity Fund | | | 35,632,444 | | | | 18,413,961 | | | | (503,762 | ) | | | 17,910,199 | |
| | | Midcap Fund | | | 12,601,743 | | | | 3,811,780 | | | | (161,111 | ) | | | 3,650,669 | |
| | | Small Cap Fund | | | 112,393,693 | | | | 23,728,988 | | | | (2,051,642 | ) | | | 21,677,346 | |
| | | Social Balanced Fund | | | 36,429,710 | | | | 5,260,231 | | | | (305,754 | ) | | | 4,954,477 | |
| | | Social Equity Fund | | | 58,959,219 | | | | 14,391,710 | | | | (1,324,896 | ) | | | 13,066,814 | |
| | | Small Cap Innovations Fund | | | 17,950,765 | | | | 4,035,533 | | | | (161,676 | ) | | | 3,873,857 | |
| | | |
| | | The tax character of distributions paid during the fiscal year ended March 31, 2010 was as follows: |
| | | | | Distributions paid from | | | | | | | | | | | | |
| | | | | | | | | Net Long Term | | Total Taxable | | Tax Return of | | Total Distributions |
| | | | | Ordinary Income | | Capital Gains | | Distributions | | Capital | | Paid1 |
| | | Balanced Fund | | $ | 3,153,684 | | | $ | — | | | $ | 3,153,684 | | | $ | — | | | $ | 3,153,684 | |
| | | Equity Fund | | | 435,641 | | | | — | | | | 435,641 | | | | — | | | | 435,641 | |
| | | Midcap Fund | | | 33,641 | | | | — | | | | 33,641 | | | | — | | | | 33,641 | |
| | | Small Cap Fund | | | 147,516 | | | | — | | | | 147,516 | | | | — | | | | 147,516 | |
| | | Social Balanced Fund | | | 460,378 | | | | — | | | | 460,378 | | | | — | | | | 460,378 | |
| | | Social Equity Fund | | | 834,615 | | | | — | | | | 834,615 | | | | — | | | | 834,615 | |
| | | Small Cap Innovations Fund | | | 282,970 | | | | 9 | | | | 282,979 | | | | — | | | | 282,979 | |
| | | The tax character of distributions paid during the fiscal year ended March 31, 2009 was as follows: |
| | | | | Distributions paid from | | | | | | | | | | | | |
| | | | | | | | | Net Long Term | | Total Taxable | | Tax Return of | | Total Distributions |
| | | | | Ordinary Income | | Capital Gains | | Distributions | | Capital | | Paid1 |
| | | Balanced Fund | | $ | 3,118,906 | | | $ | 4,763,595 | | | $ | 7,882,501 | | | $ | — | | | $ | 7,882,501 | |
| | | Equity Fund | | | 482,096 | | | | — | | | | 482,096 | | | | — | | | | 482,096 | |
| | | Midcap Fund | | | 34,699 | | | | 112,776 | | | | 147,475 | | | | — | | | | 147,475 | |
| | | Small Cap Fund | | | 50,862 | | | | 252,171 | | | | 303,033 | | | | — | | | | 303,033 | |
| | | Social Balanced Fund | | | 605,006 | | | | 342,065 | | | | 947,071 | | | | — | | | | 947,071 | |
| | | Social Equity Fund | | | 515,574 | | | | 485,655 | | | | 1,001,229 | | | | — | | | | 1,001,229 | |
| | | Small Cap Innovations Fund | | | 1,149 | | | | — | | | | 1,149 | | | | — | | | | 1,149 | |
| | | |
| | | 1 Total distributions paid may differ from the amount reported in the Statements of Changes in Net Assets because for tax purposes distributions are recognized when actually paid. |
| | | |
| | | As of March 31, 2010, the components of accumulated earnings on a tax basis were as follows: |
| | | | | | | | | Undistributed | | | | | | Accumulated | | Unrealized | | | | |
| | | | | Undistributed | | Long-Term Capital | | Accumulated | | Capital and Other | | Appreciation | | Total Accumulated |
| | | | | Ordinary Income | | Gains | | Earnings | | Losses | | (Depreciation)2 | | Earnings (Deficit) |
| | | Balanced Fund | | $ | 827,545 | | | $ | — | | | $ | 827,545 | | | $ | (2,542,426 | ) | | $ | 45,118,654 | | | $ | 43,403,773 | |
| | | Equity Fund | | | 116,710 | | | | — | | | | 116,710 | | | | (3,200,803 | ) | | | 17,910,199 | | | | 14,826,106 | |
| | | Midcap Fund | | | 3,293 | | | | — | | | | 3,293 | | | | (279,579 | ) | | | 3,650,669 | | | | 3,374,383 | |
| | | Small Cap Fund | | | 2,404,257 | | | | — | | | | 2,404,257 | | | | — | | | | 21,677,346 | | | | 24,081,603 | |
| | | Social Balanced Fund | | | 136,327 | | | | — | | | | 136,327 | | | | (1,945,364 | ) | | | 4,954,477 | | | | 3,145,440 | |
| | | Social Equity Fund | | | 197,105 | | | | — | | | | 197,105 | | | | (5,002,921 | ) | | | 13,066,814 | | | | 8,260,998 | |
| | | Small Cap Innovations Fund | | | 420,294 | | | | 79,378 | | | | 499,672 | | | | — | | | | 3,873,857 | | | | 4,373,529 | |
| | | |
| | | 2 The differences between book-basis and tax-basis unrealized appreciation (depreciation) is attributable primarily to: tax deferral of losses on wash sales. |
Continued
53
| Notes to Financial Statements | | March 31, 2010 |
|
| | | Under current tax law, capital losses realized after October 31 of a Fund’s fiscal year may be deferred and treated as occurring on the first business day of the following fiscal year for tax purposes. The following Funds had deferred post-October capital losses, which will be treated as arising on the first business day of the Funds’ next taxable year. |
| | | | | Post-October Loss | |
| | | Midcap Fund | | $ | 35,162 | | |
| | | |
| | | As of March 31, 2010, the following Funds had net capital loss carryforwards, which are available to offset future realized gains. To the extent these carryforwards are used to offset future gains, it is probable that the amounts offset will not be distributed to shareholders. |
| | | Fund | | | Amount | | Expires | |
| | | Balanced Fund | | $ | 2,542,426 | | | | 2018 | | |
| | | Equity Fund | | | 759,163 | | | | 2017 | | |
| | | Equity Fund | | | 2,441,640 | | | | 2018 | | |
| | | Midcap Fund | | | 244,417 | | | | 2018 | | |
| | | Social Balanced Fund | | | 361,738 | | | | 2017 | | |
| | | Social Balanced Fund | | | 1,583,626 | | | | 2018 | | |
| | | Social Equity Fund | | | 911,652 | | | | 2017 | | |
| | | Social Equity Fund | | | 4,091,269 | | | | 2018 | | |
| | | During the year ended March 31, 2010, the following Funds utilized capital loss carryforwards to offset capital gains realized: |
| | | Fund | | | Amount | |
| | | Small Cap Fund | | $ | 580,450 | | |
| | | As of March 31, 2010, the following reclassifications have been made to increase (decrease) such accounts with offsetting adjustments as indicated: |
| | | | | Accumulated Net Investment | | Accumulated Net | | | | | |
| | | | | Income (loss) | | Realized Gains | | Paid in Capital | |
| | | Equity Fund | | $ | 412 | | | $ | — | | | $ | (412 | ) | |
| | | Small Cap Fund | | | — | | | | (50,886 | ) | | | 50,886 | | |
| | | Social Balanced Fund | | | 17,427 | | | | (17,427 | ) | | | — | | |
| | | Small Cap Innovations Fund | | | 9 | | | | (9 | ) | | | — | | |
| | | |
| 6. | | Control Ownership and Principal Holders: |
| | | The beneficial ownership, either directly or indirectly, of more than 25% of the voting securities of a Fund creates presumptions of control of the Fund, under section 2 (a)(9) of the 1940 Act. As of March 31, 2010, the Funds had individual shareholder accounts and/or omnibus shareholder accounts (comprised of a group of individual shareholders), owning more than 25% of the total shares outstanding of the Fund as detailed below. |
| | | | | | | | | % of |
| | | Fund | | | Control Ownership | | | Ownership |
| | | Balanced Fund | | Boston Trust & Investment Management Company | | | 94.6 | % |
| | | Equity Fund | | Boston Trust & Investment Management Company | | | 99.9 | % |
| | | Midcap Fund | | Boston Trust & Investment Management Company | | | 99.8 | % |
| | | Social Balanced Fund | | Boston Trust & Investment Management Company | | | 66.9 | % |
| | | | | | Fidelity Investment Services | | | 28.1 | % |
| | | Social Equity Fund | | Boston Trust & Investment Management Company | | | 28.7 | % |
| | | | | | Fidelity Investment Services | | | 35.6 | % |
| | | Small Cap Innovations Fund | | Boston Trust & Investment Management Company | | | 76.5 | % |
| | | |
| 7. | | Subsequent Events: |
| | | Management evaluated subsequent events through the date these financial statements were issued and concluded no subsequent events required recognition or disclosure in these financial statements. |
Continued
54
Report of Independent Registered Public Accounting Firm
To the Shareholders and Board of Trustees of The Coventry Group:
We have audited the accompanying statements of assets and liabilities, including the schedules of portfolio investments, of The Coventry Group, comprising the Boston Trust Balanced Fund, Boston Trust Equity Fund, Boston Trust Small Cap Fund, Boston Trust Midcap Fund, Walden Social Balanced Fund, Walden Social Equity Fund, and Walden Small Cap Innovations Fund (the “Funds”) as of March 31, 2010, and the related statements of operations for the year then ended, and the statements of changes in net assets and the financial highlights for the two years in the period then ended. These financial statements and financial highlights are the responsibility of Fund management. Our responsibility is to express an opinion on these financial statements and financial highlights based on our audits. The financial highlights for the periods indicated prior to the period ended March 31, 2009 were audited by other independent registered public accounting firms, who expressed unqualified opinions on those financial statements and financial highlights.
We conducted our audits in accordance with the standards of the Public Company Accounting Oversight Board (United States). Those standards require that we plan and perform the audit to obtain reasonable assurance about whether the financial statements and financial highlights are free of material misstatement. An audit includes examining, on a test basis, evidence supporting the amounts and disclosures in the financial statements. Our procedures included confirmation of securities owned as of March 31, 2010 by correspondence with the custodian and broker. An audit also includes assessing the accounting principles used and significant estimates made by management, as well as evaluating the overall financial statement presentation. We believe that our audits provide a reasonable basis for our opinion.
In our opinion, the financial statements and financial highlights referred to above present fairly, in all material respects, the financial position of each of the Funds as of March 31, 2010, the results of their operations for the year then ended, and the changes in their net assets and their financial highlights for each of the two years in the period then ended, in conformity with accounting principles generally accepted in the United States of America.

COHEN FUND AUDIT SERVICES, LTD.
Westlake, Ohio
May 21, 2010
55
| Supplementary Information (unaudited) | | March 31, 2010 |
|
Federal Income Tax Information:
During the fiscal year ended March 31, 2010, the Funds declared long-term realized gain distributions in the following amounts:
| | 15% Capital Gains | |
| Small Cap Innovations Fund | $9 | |
During the fiscal year ended March 31, 2010, the Funds declared short-term realized gain distributions in the following amounts:
| | Short-Term Capital Gains | |
| Small Cap Innovations Fund | $255,693 | |
For the fiscal year ended March 31, 2010, the following percentage of the total ordinary income distributions paid by the Funds qualify for the distributions received deduction available to corporate shareholders.
| | Distributions Received Deduction | |
| Balanced Fund | 58.03 | % | |
| Equity Fund | 100.00 | % | |
| Midcap Fund | 100.00 | % | |
| Small Cap Fund | 49.17 | % | |
| Social Balanced Fund | 65.96 | % | |
| Social Equity Fund | 100.00 | % | |
| Small Cap Innovations Fund | 19.83 | % | |
For the fiscal year ended March 31, 2010, distributions paid by the Funds may be subject to a maximum tax rate of 15%, as provided for by the Jobs and Growth Tax Relief Reconciliation Act of 2003. The Funds intend to designate the maximum amount allowable as taxed at a maximum rate of 15%. Complete information will be reported in conjunction with your 2010 Form 1099-DIV.
| | Qualified Dividend Income | |
| Balanced Fund | 62.11 | % | |
| Equity Fund | 100.00 | % | |
| Midcap Fund | 100.00 | % | |
| Small Cap Fund | 49.65 | % | |
| Social Balanced Fund | 75.48 | % | |
| Social Equity Fund | 100.00 | % | |
| Small Cap Innovations Fund | 20.27 | % | |
Continued
56
| Supplementary Information (unaudited) | | March 31, 2010 |
|
Table of Shareholder Expenses:
As a shareholder of the Boston Trust Funds and Walden Funds, you incur ongoing costs, including management fees, and other Fund expenses. These examples are intended to help you understand your ongoing costs (in dollars) of investing in the Boston Trust Funds and Walden Funds and to compare these costs with the ongoing costs of investing in other mutual funds.
These examples are based on an investment of $1,000 invested at the beginning of the period and held of the entire period from October 1, 2009 through March 31, 2010.
Actual Expenses
The table below provides information about actual account values and actual expenses. You may use the information below; together with the amount you invested, to estimate the expenses that you paid over the period. Simply divide your account value by $1,000 (for example, an $8,600 account value divided by $1,000 = 8.6), then multiply the result by the number in the table under the heading entitled “Expenses Paid During Period” estimate the expenses you paid on your account during this period.
Please note that the expenses shown in the table are meant to highlight your ongoing costs only and do not reflect any transactional costs, such as sales charges (loads). Therefore, the table is useful in comparing ongoing costs only, and will not help you determine the relative total costs of owning different funds. In addition, if these transactional costs were included, your costs would have been higher.
| | | | | | | | | | | Annualized |
| | | | | | | | Expenses Paid | Expense Ratio |
| | Beginning Account Value | Ending Account Value | During Period1 | During Period |
| | 10/1/09 | 3/31/10 | 10/1/09 - 3/31/10 | 10/1/09 - 3/31/10 |
| Balanced Fund | $ | 1,000.00 | | $ | 1,080.80 | | $ | 5.19 | | 1.00 | % |
| Equity Fund | | 1,000.00 | | | 1,121.40 | | | 5.29 | | 1.00 | % |
| Midcap Fund | | 1,000.00 | | | 1,144.60 | | | 5.35 | | 1.00 | % |
| Small Cap Fund | | 1,000.00 | | | 1,140.00 | | | 5.34 | | 1.00 | % |
| Social Balanced Fund | | 1,000.00 | | | 1,080.60 | | | 5.19 | | 1.00 | % |
| Social Equity Fund | | 1,000.00 | | | 1,129.50 | | | 5.31 | | 1.00 | % |
| Small Cap Innovations Fund | | 1,000.00 | | | 1,136.90 | | | 5.33 | | 1.00 | % |
| 1 | Expenses are equal to the average account value times the Fund’s annualized expense ratio multiplied by the number of days in the most recent fiscal half-year divided by the number of days in the fiscal year. |
Hypothetical Example for Comparison Purposes
The table below provides information about hypothetical account values and hypothetical expenses based on each Boston Trust Fund’s and Walden Fund’s actual expense ratio and an assumed rate of return of 5% per year before expenses, which is not the Fund’s actual return. The hypothetical account values and expenses may not be used to estimate the actual ending account balance or expenses you paid for the period. You may use this information to compare this 5% hypothetical example with the 5% hypothetical examples that appear in the shareholder reports of other funds.
Please note that the expenses shown in the table are meant to highlight your ongoing costs only and do not reflect any transactional costs, such as sales charges (loads). Therefore, the table is useful in comparing ongoing costs only, and will not help you determine the relative costs of owning different funds. In addition, if these transactional costs were included, your costs would have been higher.
| | | | | | | | | | | | Annualized |
| | | | | | | | | Expenses Paid | Expense Ratio |
| | | Beginning Account Value | Ending Account Value | During Period1 | During Period |
| | | 10/1/09 | 3/31/10 | 10/1/09 - 3/31/10 | 10/1/09 - 3/31/10 |
| Balanced Fund | | $ | 1,000.00 | | $ | 1,019.95 | | $ | 5.04 | | 1.00 | % |
| Equity Fund | | | 1,000.00 | | | 1,019.95 | | | 5.04 | | 1.00 | % |
| Midcap Fund | | | 1,000.00 | | | 1,019.95 | | | 5.04 | | 1.00 | % |
| Small Cap Fund | | | 1,000.00 | | | 1,019.95 | | | 5.04 | | 1.00 | % |
| Social Balanced Fund | | | 1,000.00 | | | 1,019.95 | | | 5.04 | | 1.00 | % |
| Social Equity Fund | | | 1,000.00 | | | 1,019.95 | | | 5.04 | | 1.00 | % |
| Small Cap Innovations Fund | | | 1,000.00 | | | 1,019.95 | | | 5.04 | | 1.00 | % |
| 1 | Expenses are equal to the average account value times the Fund’s annualized expense ratio multiplied by the number of days in the most recent fiscal half-year divided by the number of days in the fiscal year. |
Continued
57
| Supplementary Information (unaudited) | | March 31, 2010 |
|
Tabular Summary of Schedules of Investments:
The Boston Trust Funds invested, as a percentage of total portfolio investments, in the following industries as of March 31, 2010.
| Boston Trust Balanced Fund | | | | | Boston Trust Equity Fund | | | | | Boston Trust Midcap Fund | | | | | Boston Trust Small Cap Fund | | | |
| | | | | | | | | | | | | | | | | | | |
| Security Allocation | | Percentage of | | Security Allocation | | Percentage of | | Security Allocation | | Percentage of | | Security Allocation | | Percentage of |
| for the Schedule of | | Total Portfolio | | for the Schedule of | | Total Portfolio | | for the Schedule of | | Total Portfolio | | for the Schedule of | | Total Portfolio |
| Portfolio Investments | | Investments | | Portfolio Investments | | Investments | | Portfolio Investments | | Investments | | Portfolio Investments | | Investments |
| U.S. Gov’t. Obligations | | 23.8 | % | | Industrial Prods & Svcs | | 17.2 | % | | Financial Services | | 16.4 | % | | Information Technology | | 21.2 | % |
| Financial Services | | 12.8 | % | | Financial Services | | 16.3 | % | | Information Technology | | 15.9 | % | | Financial Services | | 19.5 | % |
| Industrial Prods & Svcs | | 12.1 | % | | Information Technology | | 15.7 | % | | Industrial Prods & Svcs | | 15.7 | % | | Consumer Discretionary | | 15.9 | % |
| Information Technology | | 11.2 | % | | Health Care | | 13.3 | % | | Consumer Discretionary | | 13.1 | % | | Industrial Prods & Svcs | | 15.2 | % |
| Consumer Products | | 10.2 | % | | Consumer Products | | 12.5 | % | | Health Care | | 12.2 | % | | Health Care | | 12.3 | % |
| Health Care | | 8.2 | % | | Energy | | 11.4 | % | | Consumer Products | | 6.8 | % | | Utilities | | 4.5 | % |
| Energy | | 8.1 | % | | Consumer Discretionary | | 7.7 | % | | Energy | | 6.4 | % | | Energy | | 3.2 | % |
| Consumer Discretionary | | 6.1 | % | | Industrial Materials | | 5.7 | % | | Industrial Materials | | 5.6 | % | | Consumer Products | | 2.9 | % |
| Industrial Materials | | 3.2 | % | | Investment Companies | | 0.2 | % | | Utilities | | 4.0 | % | | Industrial Materials | | 2.9 | % |
| Municipal Bonds | | 2.2 | % | | Total | | 100.0 | % | | Investment Companies | | 3.1 | % | | Investment Companies | | 2.4 | % |
| Investment Companies | | 1.6 | % | | | | | | | Telecommunications | | 0.8 | % | | Total | | 100.0 | % |
| Telecommunications | | 0.3 | % | | | | | | | Total | | 100.0 | % | | | | | |
| Basic Materials | | 0.2 | % | | | | | | | | | | | | | | | |
| Total | | 100.0 | % | | | | | | | | | | | | | | | |
The Walden Funds invested, as a percentage of total portfolio investments, in the following industries as of March 31, 2010.
| Walden Social Balanced Fund | | | | | Walden Social Equity Fund | | | | | Walden Small Cap Innovations Fund | | | |
| | | Percentage of | | | | Percentage of | | | | Percentage of |
| Security Allocation for the | | Total Portfolio | | Security Allocation for the | | Total Portfolio | | Security Allocation for the | | Total Portfolio |
| Schedule of Portfolio Investments | | Investments | | Schedule of Portfolio Investments | | Investments | | Schedule of Portfolio Investments | | Investments |
| U.S. Gov’t. Obligations | | 21.3 | % | | Consumer Products | | 15.4 | % | | Information Technology | | 21.2 | % |
| Financial Services | | 15.4 | % | | Information Technology | | 14.8 | % | | Financial Services | | 19.6 | % |
| Health Care | | 10.5 | % | | Industrial Prods & Svcs | | 14.7 | % | | Consumer Discretionary | | 16.1 | % |
| Consumer Products | | 10.1 | % | | Health Care | | 14.5 | % | | Industrial Prods & Svcs | | 15.2 | % |
| Industrial Prods & Svcs | | 10.0 | % | | Financial Services | | 14.0 | % | | Health Care | | 12.4 | % |
| Information Technology | | 9.7 | % | | Energy | | 10.5 | % | | Utilities | | 4.5 | % |
| Energy | | 6.5 | % | | Consumer Discretionary | | 6.9 | % | | Energy | | 3.3 | % |
| Consumer Discretionary | | 6.0 | % | | Industrial Materials | | 4.6 | % | | Consumer Products | | 2.9 | % |
| Industrial Materials | | 3.3 | % | | Telecommunications | | 1.6 | % | | Industrial Materials | | 2.9 | % |
| Investment Companies | | 2.4 | % | | Investment Companies | | 1.5 | % | | Investment Companies | | 1.9 | % |
| Municipal Bonds | | 2.4 | % | | Utility | | 1.5 | % | | Total | | 100.0 | % |
| Telecommunications | | 1.5 | % | | Total | | 100.0 | % | | | | | |
| Utility | | 0.8 | % | | | | | | | | | | |
| Certificate of Deposit | | 0.1 | % | | | | | | | | | | |
| Total | | 100.0 | % | | | | | | | | | | |
Other Information:
A description of the policies and procedures that the Funds use to determine how to vote proxies related to portfolio securities is available (i) without charge, upon request, by calling 1-800-282-8782 ext. 7050, and (ii) on the Securities and Exchange Commission’s (the “Commission”) website at http://www.sec.gov.
Information regarding how the Funds’ voted proxies relating to portfolio securities during the most recent 12-month period ended June 30 is available (i) without charge, upon request, by calling 1-800-282-8782 ext. 7050, (ii) on the Boston Trust & Investment Management, Inc. website at http://www.btim.com; and (iii) on the Commission’s website at http://www.sec.gov.
The Funds file complete schedules of portfolio holdings for each Fund with the Commission for the first and third quarters of each fiscal year on Form N-Q. The Funds’ Form N-Q is available on the Commission’s website at http://www.sec.gov. The Funds’ Form N-Q may be reviewed and copied at the Commission’s Public Reference Room in Washington, D.C. and information on the operation of the Public Reference Room may be obtained by calling 800-SEC-0330.
Continued
58
| Supplementary Information (unaudited) | | March 31, 2010 |
|
The annual consideration by the Board of Trustees (the “Board”) of the continuation of the investment advisory agreement between Boston Trust Investment Management, Inc., (the “Adviser”) and Boston Trust Balanced Fund, Boston Trust Equity Fund, Boston Trust Midcap Fund, Boston Trust Small Cap Fund, Walden Social Balanced Fund, Walden Social Equity Fund and Walden Small Cap Innovations Fund (the “Funds”).
Section 15 of the Investment Company Act of 1940 (the “1940 Act”) requires that the Investment Advisory Agreement with the Adviser be renewed annually by the Board, including a majority of the Trustees who are not “interested persons” of the Funds or of the Adviser (“Independent Trustees”). It is the duty of the Board to request as much information as is reasonably necessary to evaluate the terms of the Investment Advisory Agreement and determine whether its continuance is fair to the Funds and their shareholders. The Board considered the continuation of the Investment Advisory Agreement at an in-person meeting held on February 24, 2010. The Board requested, and the Adviser provided, information and data relating to: (i) the investment performance of the Funds and the Adviser; (ii) the nature, extent and quality of the services provided by the Adviser to the Funds; (iii) the cost of the services to be provided and the profits to be realized by the Adviser and its affiliates from the relationship with the Funds; (iv) the extent to which economies of scale will be realized as the Funds grow; (v) whether the fee levels reflect these economies of scale to the benefit of Funds’ shareholders; (vi) the advisory fees paid by other comparable funds advised by the Adviser or by a different investment adviser; (vii) the Funds’ expense ratios and the expense ratios of similar funds; and (viii) the effect of any fee waivers and expense reimbursements made by the Adviser.
At the meeting on February 24, 2010, the Board engaged in a thorough review process to determine whether to continue the Investment Advisory Agreement. The Board met directly with representatives of the Adviser and reviewed the information and data listed above. As part of its deliberations, the Board also considered and relied upon the information about the Funds and the Adviser that it had received throughout the year as part of its ongoing oversight of the Funds and their operations. The Board reviewed the performance of the Funds from inception through December 31, 2009, comparing the performance to various indices and, in the case of the Boston Trust Balanced Fund and the Walden Social Balanced Fund, a composite index comprised of stocks, bond and money market indices. The Boston Trust Funds and the Walden Funds, other than the Walden Social Equity Fund, the Boston Trust Balanced Fund, and the Walden Social Balanced Fund, outperformed their respective indices for the one year, five-year and since inception periods ended December 31, 2009. The Walden Social Equity Fund outperformed its index for all periods other than the one-year period ended December 31, 2009. The Boston Trust Balanced Fund outperformed the composite return, the S&P 500 Index and the Barclays Capital Government/Credit Bond Index for the since inception period, but lagged the Barclays Capital Government/Credit Bond Index for the five-year period and the composite return and S&P 500 Index for the one-year period. The Walden Social Balanced Fund underperformed the composite return for the one-year and five-year periods ended December 31, 2009, the Barclays Capital Government/Credit Bond Index for the five-year period, the S&P 500 Index for the one-year period, and all indices from inception to December 31, 2009.
Turning to the level of the advisory fees paid by the Funds, the Board reviewed a comparative analysis of advisory fees and expense ratios based on publicly available data for comparable funds. The Board noted that, with the exception of the Boston Trust Balanced Fund, Walden Social Equity and the Boston Trust Equity Fund, each Fund has a contractual advisory fee that is at or below the average fee for the peer group. The contractual advisory fees for the Boston Trust Equity Fund and Walden Social Equity Fund were at the median for the peer group, while the contractual advisory fee for the Boston Trust Balanced Fund was above the median for the peer group, but well below the highest fees for the peer group. The Adviser has been operating under an Expense Limitation Agreement that requires the Adviser to waive fees and/or reimburse expenses to the extent total operating expenses of any Fund exceeds 1.00%. The actual advisory fees charged by the Funds, except the Boston Trust Balanced Fund, Walden Social Balanced Fund, Walden Social Equity Fund and the Boston Trust Equity Fund, are below the peer group averages after expense waivers and/or reimbursements. The actual advisory fees paid by the excepted Funds are above the peer group average, but below the highest level of actual advisory fees for the peer groups.
The Board also noted that the total operating expenses for each of the Funds were lower than the industry average after expense waivers and/or reimbursements. Having considered the above factors in assessing Fund advisory fees and expense ratios, the Board concluded that fee and expense levels were reasonable.
The Board gave careful consideration to the nature, extent and quality of the services provided by the Adviser to the Funds. The Board reviewed the Adviser’s organizational structure, investment philosophy, portfolio construction process, fixed income approach and brokerage policies. The Board noted the experience and the capabilities of the Adviser’s personnel, as well as the quality of the reports and other materials received from the Adviser. Taking into account the personnel involved in servicing the Funds, as well as the materials and services described above, the Board expressed satisfaction with the quality of the services received from the Adviser.
Continued
59
| Supplementary Information (unaudited) | | March 31, 2010 |
|
The Board then reviewed financial information collected from the income statements of the Adviser concerning the cost to the Adviser of providing services to the Funds and the overall profitability to the Adviser of its relationship with the Funds. The Board noted that the Adviser was no longer rebating a portion of its fee to bank trust accounts that are invested in the Funds. As a result of this change, the Adviser’s financial information appears to show increased profitability; however, the Bank, parent company to the Adviser, is now bearing such expenses, which impacts the parent company’s profit margin. The Board noted that the Adviser’s relationship with the Funds was profitable in spite of the revenue reducing efforts of an Expense Limitation Agreement with the Funds.
In reaching its conclusions with respect to the continuation of the Investment Advisory Agreement, the Board did not identify any single controlling factor. Rather, the Board noted that a combination of factors influenced their decision making process. The Board did, however, identify the commitment of the Adviser to the successful operation of the Funds and the level of Fund expenses as being important elements of their consideration. The Board took notice of the fact that the Adviser has maintained an Expense Limitation Agreement with respect to each of the Funds since the inception of each Fund pursuant to which total operating expenses for each of the Funds is limited, which the Board noted benefits shareholders in each of the Funds. The Board took further notice of the fact that the Adviser has agreed to continue the Expense Limitation Agreement for each of the Funds. Based upon their review and consideration of these factors and other matters deemed relevant by the Board in reaching an informed business judgment, a majority of the Board, including a majority of the Independent Trustees, concluded that the terms of the Investment Advisory Agreement are fair and reasonable and the Board voted to renew the Investment Advisory Agreement for an additional one-year period.
60
| Information about Trustees and Officers (unaudited) | | March 31, 2010 |
|
Overall responsibility for management of the Funds rests with the Board of Trustees. The names of the Trustees and Officers of the Funds, their addresses, ages and principal occupations during the past five years are provided in the tables below. The business address of the persons listed below is 3435 Stelzer Road, Columbus, Ohio 43219-3035, unless otherwise listed. Trustees who are deemed “interested persons,” as defined in the Investment Company Act of 1940, are referred to as Interested Trustees. Trustees who are not interested persons are referred to as Independent Trustees. The Funds do not have any Interested Trustees. The Funds’ Statement of Additional Information includes additional information about the Funds’ Trustees and is available, without charge and upon request, by calling 1-800-282-8782 or by visiting www.btim.com.
| | | | | | | | | | | | Other |
| | | | | | | | | | Number of Funds | | Directorships |
| | | Positions(s) | | Term of Office* | | | | | in Fund Complex | | Held by Trustee |
| | | Held with | | and Length of | | Principal Occupation(s) | | | Overseen by | | during the past |
| Name, Date of Birth | | the Funds | | Time Served | | During Past Five Years | | | Trustee | | five years |
| INDEPENDENT TRUSTEES | | | | | | | | | | | |
Michael M. Van Buskirk
Date of Birth: 2/22/1947 | | Trustee and
Chairman of the
Board | | Since 1992 | | President and Chief Executive Officer, Ohio Bankers League, May, 1991 to present. | | | 7 | | None |
| |
Diane Armstrong
Date of Birth: 7/2/1964 | | Trustee | | Since 2004 | | Managing Director of Financial Planning Services, Wealthstone (financial planning firm), July 2008 to present. Principal of King, Dodson Armstrong Financial Advisors, Inc. August 2003 to July 2008. Director of Financial Planning, Hamilton Capital Management, April 2000 to August 2003. | | | 7 | | None |
| |
Dr. James Woodward
Date of Birth: 11/24/1939 | | Trustee | | Since 1997 | | Chancellor, North Carolina State University, June 2009 to April 2010. Chancellor Emeritus, University of North Carolina at Charlotte. August 2005 to present. Chancellor, University of North Carolina at Charlotte. July 1989 to July 2005. | | | 7 | | None |
| OFFICERS WHO ARE NOT TRUSTEES | | | | | | | | | | | |
John Danko
Date of Birth: 4/17/1967 | | President | | Since 2008 | | Senior Vice President, Relationship Management, Citi Fund Services Ohio, Inc., May, 1997 to present. | | | | | |
| |
Joel B. Engle
Date of Birth: 10/31/1965 | | Treasurer | | Since 2010 | | Senior Vice President, Citi Fund Services Ohio, Inc. (fund administrator), December 2007 to present; Vice President, Financial Reporting, Spectrum Global Fund Administration (March 2007 to December 2007); Vice President, Fund Administration, Citi Fund Services Ohio, Inc. (February 2006 to March 2007); and Self- employed, retail business owner (April 2003 to February 2006). | | | | | |
| |
Curtis Barnes
100 Summer Street
Boston, MA 02110
Date of Birth: 9/24/1953 | | Secretary | | Since 2007 | | Senior Vice President-Regulatory Administration Citi Fund Services Ohio, Inc. (fund administrator), May 1995 to present. | | | | | |
| |
Eric B. Phipps **
Date of Birth: 6/20/1971 | | Chief Compliance Officer | | Since 2006 | | Vice President, Citi Fund Services Ohio, Inc. (fund administrator), June 2006 to present. Staff Accountant United States Securities and Exchange Commission October 2004 to May 2006. | | | | | |
| * | Trustees hold their position with the Funds until their resignation or removal. Officers hold their positions with the Funds until a successor has been duly elected and qualified. |
| ** | Mr. Phipps serves as Chief Compliance Officer. His compensation is reviewed and approved by the Board of Trustees and paid by Citi pursuant to a Compliance Services Agreement between Citi and the Trust. The fee paid pursuant to the Compliance Services Agreement by the Fund is not indicative of the total compensation received by Mr. Phipps. |
61
This page intentionally left blank.
62
This page intentionally left blank.
63
This page intentionally left blank.
64
| | | |
| | | |
| Investment Adviser | | |
| | | |
| Boston Trust Investment Management, Inc. | | |
| | | |
| One Beacon Street | | |
| | | |
| Boston, MA 02108 | | |
| | | |
| | | |
| Custodian and Transfer Agent | | |
| | | |
| Boston Trust & Investment Management Company | | |
| | | |
| One Beacon Street | | |
| | | |
| Boston, MA 02108 | | |
| | | |
| | | |
| Administrator | | |
| | | |
| Citi Fund Services Ohio, Inc. | | |
| | | |
| 3435 Stelzer Road | | |
| | | |
| Columbus, OH 43219 | | |
| | | |
| | | |
| Distributor | | |
| | | |
| Foreside Distribution Services, L.P. | | |
| | | |
| 690 Taylor Road, Suite 150 | | |
| | | |
| Gahanna, Ohio 43230 | | |
| | | |
| | | |
| Independent Registered Public Accounting Firm | | |
| | | |
| Cohen Fund Audit Services, Ltd. | | |
| | | |
| 800 Westpoint Parkway, Suite 1100 | | |
| | | |
| Westlake, Ohio 44145 | | |
| | | |
| | | |
| Legal Counsel | | |
| | | |
| Thompson Hine LLP | | |
| | | |
| 41 South High Street, Suite 1700 | | |
| | | |
| Columbus, OH 43215 | | |
| | | |
| | | |
| | | |
| | | |
| | | |
| | | |
| | | |
| This report is intended for the shareholders of the Funds and may not be used as sales literature unless preceded or accompanied by a current prospectus. | | |
| | | |
| | | |
| Past performance results shown should not be considered a representation of future performance. Share price and returns will fluctuate so that shares, when redeemed, may be worth more or less than their original cost. Statements and other information herein are dated and subject to change. | | |
| | | |
| | | |
| | | |
| | | |
| | | |
| | | |
| 05/10 | | |
| | | |
| | | |
Item 2. Code of Ethics.
| | |
| | |
| | |
| | (a) The registrant has adopted a code of ethics that applies to the registrant’s principal executive officer, principal financial officer, principal accounting officer or controller, or persons performing similar functions. This code of ethics is included as an Exhibit. |
| | |
| | (b) During the period covered by the report, with respect to the registrant’s code of ethics that applies to its principal executive officer, principal financial officer, principal accounting officer or controller, or persons performing similar functions; there have been no amendments to, nor any waivers granted from, a provision that relates to any element of the code of ethics definition enumerated in paragraph (b) of this Item 2. |
Item 3. Audit Committee Financial Expert.
3(a)(1) The registrant’s board of directors has determined that the registrant has at least one audit committee financial expert serving on its audit committee.
3(a)(2) The audit committee financial expert is Diane Armstrong, who is “independent” for purposes of this Item 3 of Form N-CSR.
Item 4. Principal Accountant Fees and Services.
| | | | | | | |
| | | | | 2009 | | 2008 |
| (a) | | Audit Fees | | $70,000 | | $70,000 |
| | | | | | | |
| (b) | | Audit-Related Fees | | $12,000 | | $12,000 |
| | | | | | | |
The fees for 2008 relate to the consent issuance in three Form 17f-2 filings filed with the Securities and Exchange Commission (“SEC”).
The fees for 2009 relate to the consent issuance in three Form 17f-2 filings filed with the SEC.
| | | | | 2009 | | 2008 |
| | | | | | | |
| (c) | | Tax Fees | | $14,000 | | $14,000 |
Tax fees for both years related to the preparation of the Funds’ federal and state income tax returns, federal excise tax return review and review of capital gain and income distribution calculations.
| (d) | | 2009 | | 2008 |
| All Other Fees | | $26,000 | | $26,000 |
| | | | | |
Item 5. Audit Committee of Listed Registrants.
Not applicable.
Item 6. Investments.
(a) Included as part of the report to shareholders filed under Item 1.
(b) Not applicable.
Item 7. Disclosure of Proxy Voting Policies and Procedures for Closed-End Management Investment Companies.
Not applicable.
Item 8. Portfolio Managers of Closed-End Management Investment Companies.
Not applicable.
Item 9. Purchases of Equity Securities by Closed-End Management Investment Company and Affiliated Purchasers.
Not applicable.
Item 10. Submission of Matters to a Vote of Security Holders.
Not applicable.
Item 11. Controls and Procedures.
(a) The registrant’s principal executive officer and principal financial officer have concluded, based on their evaluation of the registrant’s disclosure controls and procedures as conducted within 90 days of the filing date of this report, that these disclosure controls and procedures are adequately designed and are operating effectively to ensure that information required to be disclosed by the registrant on Form N-CSR is recorded, processed, summarized and reported within the time periods specified in the Securities and Exchange Commission’s rules and forms.
(b) There were no changes in the registrant’s internal control over financial reporting (as defined in Rule 30a-3(d) under the Act (17 CFR 270.30a-3(d)) that occurred during the second fiscal quarter of the period covered by this report that have materially affected or are reasonably likely to materially affect, the registrant’s internal control over financial reporting.
Item 12. Exhibits.
(a)(1) The code of ethics that is the subject of the disclosure required by Item 2 is attached hereto.
(a)(2) Certifications pursuant to Rule 30a-2(a) are attached hereto.
(a)(3) Not applicable.
(b) Certifications pursuant to Rule 30a-2(b) are furnished herewith.
SIGNATURES
Pursuant to the requirements of the Securities Exchange Act of 1934 and the Investment Company Act of 1940, the registrant has duly caused this report to be signed on its behalf by the undersigned, thereunto duly authorized.
| (Registrant) | The Coventry Group |
| | | | |
| | |
| By (Signature and Title)* | /s/ John Danko |
| | John Danko, President |
| | |
| Date: | May 21, 2010 | |
Pursuant to the requirements of the Securities Exchange Act of 1934 and the Investment Company Act of 1940, this report has been signed below by the following persons on behalf of the registrant and in the capacities and on the dates indicated.
| | |
| By (Signature and Title)* | /s/ John Danko |
| | John Danko, President |
| | |
| Date: | May 21, 2010 | |
| | |
| By (Signature and Title)* | /s/ Joel Engle |
| | Joel Engle, Treasurer |
| | |
| Date: | May 21, 2010 | |
| | | | |
*Print the name and title of each signing officer under his or her signature.