UNITED STATES SECURITIES AND EXCHANGE COMMISSION
Washington, D.C. 20549
FORM N-CSR
CERTIFIED SHAREHOLDER REPORT OF REGISTERED MANAGEMENT
INVESTMENT COMPANIES
| Investment Company Act file number: | 811-06569 |
| | |
| Exact name of registrant as specified in charter: | Ivy Funds |
| | |
| Address of principal executive offices: | 610 Market Street Philadelphia, PA 19106 |
| | |
| Name and address of agent for service: | David F. Connor, Esq. 610 Market Street Philadelphia, PA 19106 |
| | |
| Registrant’s telephone number, including area code: | (800) 523-1918 |
| | |
| Date of fiscal year end: | March 31 |
| | |
| Date of reporting period: | March 31, 2023 |
Item 1. Reports to Stockholders
Annual report
Equity funds
Delaware Ivy Core Equity Fund
Delaware Ivy Large Cap Growth Fund
Delaware Ivy Mid Cap Growth Fund
Delaware Ivy Mid Cap Income Opportunities Fund
Delaware Ivy Small Cap Growth Fund
Delaware Ivy Smid Cap Core Fund
(formerly, Delaware Ivy Small Cap Core Fund)
Delaware Ivy Value Fund
Fixed income funds
Delaware Ivy Core Bond Fund
(formerly, Delaware Ivy Securian Core Bond Fund)
Delaware Ivy Global Bond Fund
Delaware Ivy High Income Fund
Delaware Ivy Limited-Term Bond Fund
Delaware Ivy Municipal Bond Fund
Delaware Ivy Municipal High Income Fund
Global / international equity funds
Delaware Global Value Equity Fund
(formerly, Delaware Ivy Global Equity Income Fund)
Delaware Ivy Global Growth Fund
Delaware Ivy International Core Equity Fund
Delaware Ivy International Value Fund
Delaware Ivy Systematic Emerging Markets Equity Fund
(formerly, Ivy Emerging Markets Equity Fund)
Multi-asset fund
Delaware Ivy Managed International Opportunities Fund
March 31, 2023
Carefully consider the Funds' investment objectives, risk factors, charges, and expenses before investing. This and other information can be found in the Funds' prospectus and their summary prospectuses, which may be obtained by visiting delawarefunds.com/literature or calling 800 523-1918. Investors should read the prospectus and the summary prospectus carefully before investing.
You can obtain shareholder reports and prospectuses online instead of in the mail.
Visit delawarefunds.com/edelivery.
Table of contents
Experience Delaware Funds by Macquarie®
Macquarie Asset Management (MAM) is a global asset manager that aims to deliver positive impact for everyone. MAM Public Investments traces its roots to 1929 and partners with institutional and individual clients to deliver specialist active investment capabilities across global equities, fixed income, and multi-asset solutions using a conviction-based, long-term approach to investing. In the US, retail investors recognize our Delaware Funds by Macquarie family of funds as one of the oldest mutual fund families.
If you are interested in learning more about creating an investment plan, contact your financial advisor.
You can learn more about Delaware Funds or obtain a prospectus for the Funds at delawarefunds.com/literature.
Manage your account online
· Check your account balance and transactions
· View statements and tax forms
· Make purchases and redemptions
Visit delawarefunds.com/account-access.
Macquarie Asset Management (MAM) is the asset management division of Macquarie Group. MAM is a full-service asset manager offering a diverse range of products across public and private markets including fixed income, equities, multi-asset solutions, private credit, infrastructure, renewables, natural assets, real estate, and asset finance. The Public Investments business is a part of MAM and includes the following investment advisers: Macquarie Investment Management Business Trust (MIMBT), Macquarie Funds Management Hong Kong Limited, Macquarie Investment Management Austria Kapitalanlage AG, Macquarie Investment Management Global Limited, Macquarie Investment Management Europe Limited, and Macquarie Investment Management Europe S.A.
The Funds are distributed by Delaware Distributors, L.P. (DDLP), an affiliate of MIMBT and Macquarie Group Limited.
Other than Macquarie Bank Limited ABN 46 008 583 542 ("Macquarie Bank"), any Macquarie Group entity noted in this document is not an authorized deposit-taking institution for the purposes of the Banking Act 1959 (Commonwealth of Australia). The obligations of these other Macquarie Group entities do not represent deposits or other liabilities of Macquarie Bank. Macquarie Bank does not guarantee or otherwise provide assurance in respect of the obligations of these other Macquarie Group entities. In addition, if this document relates to an investment, (a) the investor is subject to investment risk including possible delays in repayment and loss of income and principal invested and (b) none of Macquarie Bank or any other Macquarie Group entity guarantees any particular rate of return on or the performance of the investment, nor do they guarantee repayment of capital in respect of the investment.
The Funds are governed by US laws and regulations.
This annual report is for the information of Delaware Global Value Equity Fund, Delaware Ivy Core Equity Fund, Delaware Ivy Core Bond Fund, Delaware Ivy Global Bond Fund, Delaware Ivy Global Growth Fund, Delaware Ivy High Income Fund, Delaware Ivy International Core Equity Fund, Delaware Ivy International Value Fund, Delaware Ivy Large Cap Growth Fund, Delaware Ivy Limited-Term Bond Fund, Delaware Ivy Managed International Opportunities Fund, Delaware Ivy Mid Cap Growth Fund, Delaware Ivy Mid Cap Income Opportunities Fund, Delaware Ivy Municipal Bond Fund, Delaware Ivy Municipal High Income Fund, Delaware Ivy Small Cap Growth Fund, Delaware Ivy Smid Cap Core Fund, Delaware Ivy Systematic Emerging Markets Equity Fund, and Delaware Ivy Value Fund shareholders, but it may be used with prospective investors when preceded or accompanied by the Delaware Fund fact sheet for the most recently completed calendar quarter. These documents are available at delawarefunds.com/literature.
Unless otherwise noted, views expressed herein are current as of March 31, 2023, and subject to change for events occurring after such date.
The Funds are not FDIC insured and are not guaranteed. It is possible to lose the principal amount invested.
Advisory services provided by Delaware Management Company, a series of MIMBT, a US registered investment advisor. All third-party marks cited are the property of their respective owners.
© 2023 Macquarie Management Holdings, Inc.
| Portfolio management reviews |
| Delaware Global Value Equity Fund | March 31, 2023 (Unaudited) |
| Performance preview (for the year ended March 31, 2023) | | |
| Delaware Global Value Equity Fund (Class I shares) | 1-year return | +5.99% |
| Delaware Global Value Equity Fund (Class A shares) | 1-year return | +5.75% |
| MSCI World Index (net) (benchmark) | 1-year return | -7.02% |
| MSCI World Index (gross) (benchmark) | 1-year return | -6.54% |
Past performance does not guarantee future results.
For complete, annualized performance for Delaware Global Value Equity Fund, please see the table on page 44.
Class I shares are not subject to a sales charge and are offered for sale exclusively to certain eligible investors. In addition, Class I shares pay no distribution and service fee. The performance of Class A shares excludes the applicable sales charge. The performance of both Class I shares and Class A shares reflects the reinvestment of all distributions. Please see page 46 for a description of the index. Index performance returns do not reflect any management fees, transaction costs, or expenses. Indices are unmanaged and one cannot invest directly in an index.
Investment objective
The Fund seeks to provide total return through a combination of current income and capital appreciation.
Significant Fund event
At a meeting on July 19, 2022, the shareholders of Delaware Global Value Equity Fund (formerly, Delaware Ivy Global Equity Income Fund) approved an amendment to its fundamental investment restriction related to industry concentration and a change in its diversification status. These changes went into effect on July 29, 2022.
Market review
Central bank rhetoric started to change as of late 2021. Nervousness spread across markets as inflation, liquidity crunches, and higher interest rates, combined with geopolitical tensions and Russia's invasion of Ukraine in February 2022, raised investor concerns. Several times during 2022, however, the stock market breathed a sigh of relief as hopes rose that the US central bank would soon start to lower interest rates.
Strongly rising inflation resulted in large interest rate increases, particularly in the US, but also in Europe, from historically low levels. Bonds have returned as a viable alternative to stocks. At the same time, interest rate increases mean that price-to-equity (P/E) multiples in the stock market fell during 2022. This was also reflected in the pricing of certain parts of the stock market, which brought back memories of the bursting of the dot-com bubble at the start of this millennium.
But gravity always strikes, and 2022 brought about a solid wake-up call for global investors.
Despite significant uncertainties, the stock market found support during the first quarter of 2023, as the global economy seemed to hold up better than expected, at least for the time. The reopening of China after its zero-COVID policy was lifted also added to optimism.
Furthermore, lower oil prices eased inflationary pressure and provided hope that the cycle of interest rate hikes would soon come to an end.
Source: Bloomberg, unless noted otherwise.
Within the Fund
For the fiscal year ended March 31, 2023, Delaware Global Value Equity Fund posted a positive return and outperformed its benchmark, the MSCI World Index. The Fund’s Class I shares gained 5.99%. The Fund’s Class A shares advanced 5.75% at net asset value (NAV) and declined 0.36% at maximum offer price. These figures reflect all distributions reinvested. During the same period, the Fund’s benchmark fell 7.02% (net). For complete, annualized performance of Delaware Global Value Equity Fund, please see the table on page 44.
The bottom-up approach the investment manager follows seeks to identify what are viewed as undervalued quality companies that have the potential to provide solid relative capital in challenging times. With the difficult market environment during the year, this worked well for the portfolio. The defensive and high-quality characteristics of the companies in the Fund shielded investors to a large extent against the market’s havoc.
The annual outperformance resulted from both sector allocation and security selection. The Fund’s overweight position in the consumer staples sector and solid stock selection in both the consumer staples and consumer discretionary sectors contributed to relative returns. Not investing in the energy sector was a drag on relative performance.
Among individual holdings, two of the largest contributors to performance were the French caterer and on-site food-service solution provider Sodexo, and Merck & Co. Inc., an American multinational pharmaceutical company.
Sodexo finally regained the business it had lost as a result of COVID-19, a great relief for investors. In 2022, revenues grew by
Portfolio management reviews
Delaware Global Value Equity Fund
double digits organically and profit margins improved, signifying positive developments. Sodexo is focusing on developing its food service to improve working conditions for employees, a nod to the ongoing labor shortage. Additionally, the company plans to be more selective and limit its activity to 50 countries. Going forward, Sodexo expects margins to be higher than they were pre-COVID-19.
Merck & Co. has surprised the stock market positively several times during 2022. The latest news from the company shows successful trials treating pulmonary hypertension, a type of high blood pressure that affects the arteries in the lungs and the right side of the heart.
Conversely, two of the largest detractors from performance during the fiscal year were Fresenius Medical Care AG & Co., a German healthcare company that provides kidney dialysis services, and adidas AG, a world leader in the design, manufacturing, and marketing of sports equipment and articles.
We believe the world's leading kidney dialysis company, Fresenius Medical Care, was in a perfect storm together with its competitors. COVID-19 has reduced the patient population, slowed clinic traffic, and increased patient costs. The industry works on a contract basis, and the final payors and prices for dialysis services have yet to be adjusted higher to reflect inflation. In essence, Fresenius Medical Care must absorb these higher costs until prices are renegotiated.
A challenging trading environment in China, caused by COVID-19 restrictions and industry-wide supply chain disruptions, hurt adidas's shares. In 2022, the company lowered its outlook a few times. China is a major driver behind the company’s growth challenges, as China is a profitable market for adidas as well as an important sourcing market. In effect, the zero-COVID policy in China has significantly affected adidas and overshadowed the company’s positive attributes. Despite the current challenges, we are still confident that adidas will remain a very strong brand and will be able to restore profitability relatively fast.
We believe the long-term investment case and return potential is still intact for both companies. Therefore, we continue to hold them in the Fund.
During the fiscal year, the Fund used foreign exchange currency contracts to secure the US dollar value of securities between trade date and settlement date. These did not have a material impact on performance (that is, more than 0.50 percentage points).
| Portfolio management reviews |
| Delaware Ivy Core Bond Fund | March 31, 2023 (Unaudited) |
| Performance preview (for the year ended March 31, 2023) | | |
| Delaware Ivy Core Bond Fund (Class I shares) | 1-year return | -4.61% |
| Delaware Ivy Core Bond Fund (Class A shares) | 1-year return | -4.91% |
| Bloomberg US Aggregate Index (benchmark) | 1-year return | -4.78% |
Past performance does not guarantee future results.
For complete, annualized performance for Delaware Ivy Core Bond Fund, please see the table on page 47.
Class I shares are not subject to a sales charge and are offered for sale exclusively to certain eligible investors. In addition, Class I shares pay no distribution and service fee. The performance of Class A shares excludes the applicable sales charge. The performance of both Class I shares and Class A shares reflects the reinvestment of all distributions. Please see page 49 for a description of the index. Index performance returns do not reflect any management fees, transaction costs, or expenses. Indices are unmanaged and one cannot invest directly in an index.
Investment objective
The Fund seeks to provide current income consistent with preservation of capital.
Significant Fund event
On March 3, 2022, the Board of Trustees of the Ivy Funds (“Board”) approved the termination of the Sub-Advisory Agreement between Delaware Management Company (the “Manager” or “DMC”), and Securian Asset Management, Inc. as it relates to the Fund. In addition, the Board approved the appointment of affiliated sub-advisors of the Manager, Macquarie Investment Management Europe Limited (“MIMEL”), Macquarie Investment Management Austria Kapitalanlage AG (“MIMAK”), and Macquarie Investment Management Global Limited (“MIMGL”) to provide portfolio management and trading services, as well as to share investment research and recommendations, to the Fund. Further, the Board approved changes to certain of the Fund’s investment policies, and approved a name change, with all such changes to take effect on or about July 31, 2022 (the “Effective Date”). Please see the prospectus for more information.
Market review
The fiscal year ended March 31, 2023, saw a dizzying number of geopolitical, monetary policy, financial, and economic events. The period started with the backdrop of Russia’s invasion of Ukraine, the launch of unconventional economic weapons by the West, and a second shock to supply chains via agricultural and energy routes. To complicate things, on the journey to managing escalating inflation not seen since the early 1980s era of US Federal Reserve Chair Paul Volcker, the Federal Open Market Committee (FOMC) delivered the second-steepest rate-hiking cycle in recent history, removing liquidity and ultimately playing a role in the banking system tremors of March 2023. While it may be too early to say inflation is in the past, metrics like the inverted yield curve and leading indicators are flashing red for recession risk for calendar 2023, indicating a handoff of risks from inflation to recession.
Policymakers, like investors, are often visited by ghosts of crises past. Events in March 2023 were a reminder that the Fed’s misstep during the time of Chair Volcker is not the only memory to fear. For many, the global financial crisis of 2008 came back into view, as did other unusual phenomena, such as the Long-Term Capital Management (LTCM) crisis of 1998 or the 1987 insurance crash. Regardless of the preferred history book example, the importance of confidence in the financial system came back into focus.
In March, Silicon Valley Bank, a little-known regional bank with an idiosyncratic depositor base and long history of high-quality lending, succumbed to depositor crowd behavior and was taken into receivership by the Federal Deposit Insurance Corporation (FDIC). The event spooked depositors and markets, opening the door to the possibility of a run on banks. At record speed, the Fed put into place a lending facility for US banks to borrow against Treasury and agency mortgage-backed securities (MBS) at par, effectively insuring deposits. Additionally, in Europe, the Swiss regulator engineered an arrangement between UBS and Credit Suisse to prevent a confidence crisis at Credit Suisse from becoming a systemic issue.
Despite the temporary market disruption, central banks remained focused on fighting inflation. Even with the backdrop of a bank confidence crisis, the European Central Bank (ECB) opted to raise interest rates by 0.50 percentage points to 3.50%, and the FOMC increased rates by another 0.25 percentage points in March to a range of 4.75% to 5.00%, pursuing a tightrope walk of remaining both focused on inflation and committed to financial stability. So far, markets have seemed willing to accept that the worst has been averted. Even as interest rate volatility remains near all-time highs, the compensation for credit risk, with few exceptions, still fails, in our view, to fully reflect the likelihood of a recession.
With a backdrop of unhinged inflation and resilient labor markets, all but one of the interest rate hikes during this cycle took place during this fiscal year – the US federal funds rate increased from near zero to a range of 4.75% to 5.00% by fiscal year end. While the yield curve inverted somewhat predictably, with long-term interest rates rising less than short-term rates, the fiscal year saw a significant
Portfolio management reviews
Delaware Ivy Core Bond Fund
decline in bond market returns and drastically higher consumer lending rates, including for auto loans and mortgages.
The US dollar maintained its strength for most of the year, while the euro fluctuated around parity with the dollar. Despite crowded calls that the dollar may have seen its peak strength, the shift from rate cycle beneficiary to safe-haven asset by March 2023 averted the shift in the dollar era.
Against this highly volatile backdrop, credit markets behaved reasonably well in 2022, albeit while sustaining broad losses largely owing to the increase in interest rates. However, higher yields were viewed as an opportunity for many fixed income investors and may have provided important technical support at a time when central banks across most of the developed world were raising short-term rates. Indeed, even despite the Silicon Valley Bank default and banking sector concerns, credit premiums have yet to match the highs seen during other stress periods. Looking forward, the silver lining for fixed income investors may be manifest in the higher yields that offer an income buffer to further price volatility.
Source: Bloomberg, unless noted otherwise.
Within the Fund
For the fiscal year ended March 31, 2023, Delaware Ivy Core Bond Fund posted a negative return but slightly outperformed its benchmark, the Bloomberg US Aggregate Index which also declined. The Fund’s Class I shares declined 4.61%. The Fund’s Class A shares fell 4.91% at net asset value and fell 9.21% at maximum offer price. These figures reflect all distributions reinvested. For the same period, the Fund’s benchmark declined 4.78%. Complete annualized performance for Delaware Ivy Core Bond Fund is shown in the table on page 47.
Following is a discussion of the Fund’s performance during the period from April 1, 2022, to July 31, 2022, when Securian Asset Management, Inc. was the Fund’s sub-advisor.
Security selection in non-agency collateralized mortgage obligations (CMOs), industrials, commercial mortgage-backed securities (CMBS), financials, and asset-backed securities (ABS) were the main performance detractors. In particular, the Fund’s positions in Enterprise Products Partners LP performed poorly, despite the overall strength in energy prices. Other notable underperforming positions were Viatris Inc. and International Ltd. The Fund’s overweight positions in utilities, financials, and ABS also detracted from performance. Conversely, the Fund benefited from its interest rate exposure, which averaged less than that of the benchmark during the period. The Fund also benefited from its overweight positions in the industrials sector, as well as in cash, and positive security selection in the utilities sector.
We continued to sell credit positions during the period on concerns about rising market volatility and in response to steady outflows from the Fund. The Fund’s exposure to corporate bonds ended the period at about 41.4% on July 31, 2022, down about 1.4 percentage points from the beginning of the fiscal year, compared with the index weighting of 24%. The Fund’s largest overweight positions by market weight were in electric utilities, transportation, energy, banks, and insurance. The Fund’s energy exposure remained in midstream pipeline companies and refiners, with no direct exposure to volatile energy prices. The largest underweight positions from a market-weight perspective in the corporate space were in information technology, capital goods, basic industry, and communications.
The Fund was overweight non-agency MBS, ABS, and CMBS, and underweight agency MBS. We remained comfortable with the Fund’s overweight positions in the consumer-facing sectors of ABS, such as in the single-family rental space, and non-agency MBS as we believe a healthy home-equity cushion as well as a healthy borrowing base should continue to support these structures.
The Fund’s overall exposure to interest rates in terms of duration changed little during the period. As of July 29, 2022, we thought the Fund remained positioned to potentially benefit from rising rates relative to its benchmark. The Fund utilized Treasury futures contracts to help hedge interest rate exposures across the curve. The use of these futures contributed very little to the Fund’s performance during the period, however.
Following is a discussion about performance during the period from August 1, 2022, when the firm’s current portfolio management team began serving as the investment manager for the Fund, to March 31, 2023.
Investors widely expected that the Fed would be active throughout most of the fiscal year. That expectation became reality when the Fed began raising rates in March 2022, just prior to the beginning of this fiscal period, and continued through March 2023 when the federal funds rate reached a range of 4.75% to 5.00%. As cumulative rate hikes rose, investors slowly shifted their focus from inflation risk to recession risk and any unexpected consequences of the rapid liquidity withdrawal.
In managing the Fund, we try to provide, rather than take, liquidity. Liquidity enables us to take advantage of periods of uncertainty. It provides us with the investment flexibility to take advantage of market opportunities as they arise.
Throughout the volatility period of the fiscal year, we increased the Fund’s allocation to dislocated sectors, such as investment grade corporates and MBS, when risk premiums increased amid investor fears. Conversely, we reduced allocations to credit-related securities such as investment grade, high yield, and emerging markets debt,
when liquidity improved, and risk premiums tightened excessively compared to expectations of higher recession risk.
To manage interest rate risk, we positioned the Fund’s portfolio with a short duration for most of the fiscal year, then shifted to a neutral and long position once 10-year Treasury rates reached 4%. This risk-management approach aided performance during the period that we managed the Fund, along with positioning exposure to maturities that benefited from yield curve flattening.
In addition, our disciplined reduction of the starting underweight to agency MBS as valuations became more attractive contributed to performance, as did our preference for up-in-coupon more recent securities within the sector. The allocation to floating-rate non-agency MBS benefited returns as well since price volatility was absorbed by the significantly higher yields.
Lastly our decision to add to investment grade credit as spreads widened in mid-2022 helped performance for the period the team managed the Fund, as the sector benefited from the lower inflation fears by the start of 2023. Higher-quality industrial securities in particular outperformed as economic strength continued to bolster returns. Airlines such as United Airlines Inc., which we continue to hold, benefited in the environment.
Among performance detractors, the bank sector tremors in the first quarter of 2023 negatively affected the Fund’s modest overweight to certain regional banks. In particular, the exposure to Silicon Valley Bank, which unexpectedly suffered a depositor run and was taken under conservatorship by the FDIC in record time, was the key detractor from performance. We have retained exposure to Silicon Valley Bank securities, as we expect a more beneficial recovery outcome post-bankruptcy than by selling securities at distressed market prices. The high-quality assets available to the holding company offer multiple paths to stronger-than-priced recovery scenarios. In addition, Fund holdings in certain other banks that were caught in the headlines detracted from performance. The Fund’s exposure to senior securities of Citizens Bank N.A., a regional bank, and Credit Suisse AG, eventually taken over by UBS, detracted from performance. Although we reduced the Fund’s exposure in both issuers, we continue to hold positions.
The heightened volatility in risk assets during the period resulted in indiscriminate underperformance for higher-quality securitized issues. As a result, the Fund’s overweight to CMBS detracted from Fund performance for the period that we managed the Fund. The focus on senior structures with ample subordination and fundamentally sound collateral is expected to benefit from an eventual stabilization in volatility, and we continue to hold the overweight with an expectation of opportunistically increasing exposure if weakness persists.
Key risks and opportunities
Investors face complex considerations going forward, from the remaining stress on smaller regional banks to pressure in commercial real estate markets, the possibility of lingering inflation, and the high risk of recession. However, we suggest the landscape may be simplified to something more straightforward: We are in the middle of a risk handoff from inflation to recession after a secular repricing in interest rates, with relatively simple implications.
First, with yields returning to where they were before quantitative easing (QE) monetary policy took hold, bonds seem to be acting like bonds again, featuring historically compelling yields and a return to their inverse correlation with equities, which manifested clearly in the first quarter.
Second, history suggests it may be better to be early than late at turning points in tightening cycles, as yield curve inversions and rising recession risks mean the outlook for longer-term interest rates is quite bright, in our view.
Lastly, transitions don’t usually go smoothly. In our opinion, volatility is likely to remain high; credit spreads, while more attractive than before the tightening cycle, may need to increase further as recession risks take center stage; and market movements may happen rapidly.
We think this is a compelling time for agile active management and bottom-up (bond by bond) security selection as dispersion increases. Value has emerged in certain areas of the market, such as agency MBS and high-quality securitized debt, far from the eye of the storm. Meanwhile, the high-income feature of credit and emerging markets debt, coupled with volatility, may create opportunities down the road. Bonds are bonds again, in our view, and exposure to the asset class is as attractive as we’ve seen in decades. We believe agility and security selection will remain key to navigating the uncertainty.
Portfolio management reviews
Delaware Ivy Core Bond Fund
During the fiscal year, the Fund used a variety of derivatives, including Treasury futures, options, and credit default swaps. Treasury futures and options were primarily used to manage interest rate risk. Credit default swaps and currency hedges were used to manage credit and foreign exchange (FX) risk through the cycle.
The use of derivatives detracted modestly from the Fund’s performance for the fiscal year.
| Portfolio management reviews |
| Delaware Ivy Core Equity Fund | March 31, 2023 (Unaudited) |
| Performance preview (for the year ended March 31, 2023) | | |
| Delaware Ivy Core Equity Fund (Class I shares) | 1-year return | -6.46% |
| Delaware Ivy Core Equity Fund (Class A shares) | 1-year return | -6.71% |
| S&P 500® Index (benchmark) | 1-year return | -7.73% |
Past performance does not guarantee future results.
For complete, annualized performance for Delaware Ivy Core Equity Fund, please see the table on page 50.
Class I shares are not subject to a sales charge and are offered for sale exclusively to certain eligible investors. In addition, Class I shares pay no distribution and service fee. The performance of Class A shares excludes the applicable sales charge. The performance of both Class I shares and Class A shares reflects the reinvestment of all distributions. Please see page 52 for a description of the index. Index performance returns do not reflect any management fees, transaction costs, or expenses. Indices are unmanaged and one cannot invest directly in an index.
Investment objective
The Fund seeks to provide capital growth and appreciation.
Market review
For the fiscal year ended March 31, 2023, equity markets as measured by the S&P 500 Index declined 7.73%. The worst-performing sectors during the period included real estate, consumer discretionary, and communication services. Energy and consumer staples were the only sectors that appreciated during the period though energy weakened notably in early 2023. Consumer staples provided defensive ballast when investors grew concerned with slowing growth.
The period was characterized by strong, albeit slowing, economic growth and persistent inflation that pushed the US Federal Reserve to continue an aggressive series of rate increases that began in March 2022. During this past fiscal year, growth took on a far different flavor versus the prior period, as consumer spending on goods slowed meaningfully while spending on consumer services like travel and hospitality accelerated following the end of pandemic-related safety measures. Consumer expenditures on technology goods and through online channels were especially weak.
Industrial activity accelerated through much of the period, buoyed by historic tax incentives enacted to encourage onshore semiconductor manufacturing and investments in decarbonization and green energy. The Infrastructure and Jobs Act passed in late 2021 also gave rise to investors’ optimism about industrials.
Equity markets marked a bottom in October 2022 as evidence emerged that inflationary pressures were easing. While September core inflation (excluding food and energy) rose to 6.6%, the October reading dropped to 6.3% and continued to moderate into 2023, ending the fiscal period at 5.5%. Investors took this as a sign that the Fed was near the end of its rate-hike campaign, though inflation remained well above the Fed’s long-term 2% target.
A broader look back at events that transpired during the fiscal year suggests that signs of excessive risk taking by participants returned with vigor, despite every effort by the Fed to slow US economic growth and global policy makers taking similar steps overseas. Bitcoin's strong rally in the first three months of 2023, in conjunction with the aforementioned moves in more growth-oriented information technology consumer discretionary shares (Tesla Inc., NVIDIA Corp., and Meta Platforms Inc.), is indicative of a market that is story driven and somewhat valuation insensitive. The trade higher in the market’s largest companies was also noteworthy during the first quarter of 2023 with the top 10 companies by market capitalization driving approximately 80% of the S&P 500’s gain in the first three months of 2023. The concentration of market returns to just a handful of large companies is even more perplexing when considering that some of these companies have seen significant reductions in near-term earnings growth rates. Tesla, one example, has reduced prices across its product lineup and is now expected to earn far less in 2023 than previously anticipated. Even with the product price reductions, the stock advanced significantly for the first quarter of 2023.
Signs of increased “animal spirits” and the desire to pile-on risk in the equity market are even more perplexing when we consider other events that transpired during the first calendar quarter of 2023, notably failure of two high-profile financial institutions, Silicon Valley Bank and Signature Bank. We have previously written about the most rapid increase in the federal funds rate in any cycle. The period from 2004 to 2006 was somewhat similar as the Fed raised short-term rates by 4.25 percentage points, though it did so over the course of two years as opposed to 4.75 percentage points in one year so far in this tightening cycle.
This affects growth by making durable goods purchases more expensive and by draining liquidity from the banking system. It is the second mechanism that appeared to rapidly take hold. Deposit outflows from US banks are down about $1 trillion from the peak levels reached in April of 2022 (Federal Reserve). The record deposit outflows, even from levels that were elevated from pre-pandemic levels, will likely increase the risk of a more rapid slowdown in economic growth as banks slow lending in response to fewer low-cost deposits.
Portfolio management reviews
Delaware Ivy Core Equity Fund
We believe that a more rapid slowdown in growth catalyzed by lower bank-lending is something the Fed welcomes to snuff out inflation across the economy.
Source: Bloomberg, unless noted otherwise.
Within the Fund
For the fiscal year ended March 31, 2023, Delaware Ivy Core Equity Fund declined, although it outperformed its benchmark, the S&P 500 Index, which also declined. The Fund’s Class I shares fell 6.46%. The Fund’s Class A shares declined 6.71% at net asset value and declined 12.06% at maximum offer price. These figures reflect all distributions reinvested. During the same period, the Fund’s benchmark declined 7.73%. For complete annualized performance of Delaware Ivy Core Equity Fund, please see the table on page 50.
The Fund outperformed the benchmark on a relative basis during the fiscal year. Active return (outperformance) was strongest within the consumer discretionary sector where the Fund’s meaningful underweight compared to the benchmark contributed to relative performance. Stock selection within the healthcare sector also contributed. Somewhat offsetting these benefits, however, was the Fund’s underweight allocation to the top-performing energy sector and its underweight allocation to the consumer staples sector.
Leading contributors to Fund performance during the period included United Rentals Inc., an equipment rental company that benefited from higher rental rates and a robust recovery in non-residential construction activity. The Progressive Corp. also added strongly to performance. Progressive led the insurance industry in recapturing pricing following the loss of profitability during the pandemic when used-car prices and associated repair costs rapidly inflated. Eli Lilly & Co. also contributed significantly on expectations that it will achieve blockbuster status for a new diabetes drug that has ancillary weight-loss benefits.
Blackstone Inc. and Union Pacific Corp. were two of the weakest-performing investments during the period as tighter monetary conditions and reduced freight activity, respectively, weighed on the share price. CME Group Inc. also declined as investors priced in peak financial and interest rate volatility. Given the decline in the overall market, our modest cash holdings were beneficial.
The Fund’s current positioning increasingly reflects more caution with respect to the ultimate impact of a rapid decrease in banks’ willingness to extend credit. We have recently moderated our position sizes and holdings in more economically sensitive equities that do not appear to us to reflect further weakness in growth. We have reduced our weighting of the financial sector several points with sales of The Charles Schwab Corp., Discover Financial Services, Bank of America Corp., and reduced weightings in our alternative investment positions, Blackstone and KKR & Co. Inc. We have also reduced positions in two industrials, Deere & Co. and United Rentals Inc., that we think appear at risk to short-term tightness in lending standards.
Finally, we have reduced our weight in semiconductors, which continues to benefit from easing supply chain pressures but could be susceptible to reductions in demand if critical industrial end markets weaken. At the same time, we have increased position sizes in more defensive companies like hospital HCA Healthcare Inc., auto parts retailer AutoZone Inc., and in consumer staples. One cyclical area where we retain high conviction is in commercial aerospace associated holdings. While recessionary conditions appear more likely in some sectors, commercial aerospace has been in a deep recession with the inability to supply the world’s airlines with planes ordered many years ago. Additionally, safety issues interrupted production of The Boeing Co.’s 737 and 787. Airbus SE and Raytheon Technologies Corp. remain our preferred ways to play increased aircraft production over the next four to five years.
| Portfolio management reviews |
| Delaware Ivy Global Bond Fund | March 31, 2023 (Unaudited) |
| Performance preview (for the year ended March 31, 2023) | | |
| Delaware Ivy Global Bond Fund (Class I shares) | 1-year return | -1.76% |
| Delaware Ivy Global Bond Fund (Class A shares) | 1-year return | -2.00% |
| Bloomberg 1-10 Year Global Aggregate Index Hedged USD (benchmark) | 1-year return | -1.59% |
Past performance does not guarantee future results.
For complete, annualized performance for Delaware Ivy Global Bond Fund, please see the table on page 53.
Class I shares are not subject to a sales charge and are offered for sale exclusively to certain eligible investors. In addition, Class I shares pay no distribution and service fee. The performance of Class A shares excludes the applicable sales charge. The performance of both Class I shares and Class A shares reflects the reinvestment of all distributions. Please see page 55 for a description of the index. Index performance returns do not reflect any management fees, transaction costs, or expenses. Indices are unmanaged and one cannot invest directly in an index.
Investment objective
The Fund seeks to provide a combination of current income and capital appreciation.
Market review
Fixed income markets were highly volatile and overall produced poor performance for the year ended March 31, 2023. Over the 12 months, the widely followed Bloomberg Global Aggregate Index Hedged USD returned -3.86%, a vast improvement over the low of -12.1% for the 12 months ended September 30, 2022, but still the worst 12-month return period since the index’s inception outside of the 2022-2023 period. Inflation was the key driver of weakness in the bond market (and broader risk market). Year-over-year US Consumer Price Index (CPI) results continued to accelerate through the second quarter of 2022, peaking at more than 9% in June. In reaction, central banks remained in significant tightening mode, with the US Federal Reserve increasing rates at the fastest pace since the early 1980s. The retreat in inflation in most developed markets (though still highly elevated) in the fourth quarter of 2022 and first quarter of 2023 was fuel for a rebound in both bond and risk-market pricing. Russia’s war in Ukraine continued to have financial market effects for much of the year, most notably through summer 2022 as investors feared the impact of energy shortages on European and global growth. Financial issuers came under severe pressure in March 2023 after the failure of Silicon Valley Bank and the forced takeover of Credit Suisse by UBS, though by month end the immediate market panic had subsided, replaced with expectations of medium-term tightening in lending conditions, impacting the broader economy.
Inflation was the single largest factor influencing market sentiment over the past year, with progress in the fight against price increases the key determinant of performance. US headline CPI reached a peak of 9.1% in June 2022, before falling back to 5% year over year by March 2023. The drivers of inflation have broadened materially, from initially in used cars, semiconductors, and so on, to a broad-based impact on goods, services, and rents. But markets have taken significant solace from the clear improvement, with expectations that inflation can continue to gradually decline (albeit likely in a volatile manner). Central bank tightening in reaction to inflation was aggressive: the Fed increased rates by 4.50 percentage points during the year ended March 2023, and the European Central Bank increased rates by 3.50 percentage points (moving away from negative rate settings for the first time since 2014). The Bank of Japan was the only major developed central bank to barely budge on monetary policy, with no rate hikes and only a modest widening of its yield curve control corridor for 10-year Japanese government bonds. Rate hikes and inflation wreaked havoc on government bond yields. Yields on the 10-year US Treasury rose from 2.34% on March 31, 2022, to a peak of 4.24% in October before rebounding to 3.47% by the end of March 2023. The calendar year 2022 made history for having the worst government bond returns in at least the last 100 years.
Credit markets were highly volatile, reflecting many of the same concerns. The average credit spread on US investment grade corporates traded above 1.60% on three separate occasions and had three full round trips of more than 0.3 percentage points from peak to trough each time – exceptional volatility for a high-quality asset class. Much of 2022’s volatility centered on inflation and the perceived need for a significant economic slowdown to cool prices.
The lingering financial market impacts of Russia’s ongoing war in Ukraine also affected markets. Fears of a severe energy shortage in Europe drove significant underperformance in that region’s assets in the second and third quarters of 2022. The euro fell more than 13% versus the US dollar, and European investment grade corporates widened versus their US counterparts. But with a relatively mild winter, and significant scrambling for seaborne liquefied natural gas (LNG) supplies, much of the underperformance reversed in the second half of the year.
Financial industry turmoil was the key development late in the 12-month period, initially with the sudden collapse of Silicon Valley Bank in the US. That was followed a week later by the rescue deal in which UBS agreed to purchase rival Credit Suisse, and the unprecedented write-down of Credit Suisse’s additional tier 1 (AT1) securities to zero – without a bankruptcy or full equity write-down. This turbulence drove broad market weakness, but particularly in
Portfolio management reviews
Delaware Ivy Global Bond Fund
financials, with European banks and US regional banks performing poorly. The broader market impact had mostly faded by month end, with the lingering effects most likely to be lower lending and general tightening of financial conditions for bank borrowers in the medium term.
Source: Bloomberg, unless noted otherwise.
Within the Fund
For the fiscal year ended March 31, 2023, Delaware Ivy Global Bond Fund declined and underperformed its benchmark, the Bloomberg 1-10 Year Global Aggregate Index Hedged USD, which also declined. The Fund’s Class I shares fell 1.76%. The Fund’s Class A shares declined 2.00% at net asset value and declined 6.40% at maximum offer price. These figures reflect all distributions reinvested. During the same period, the Fund’s benchmark fell 1.59%. For complete, annualized performance of Delaware Ivy Global Bond Fund, please see the table on page 53.
A mix of factors drove the underperformance: outright duration overweights early in the 12-month period were a key detractor, as were modest non-US-dollar currency positions and security selection within investment grade credit due to an overweight to US regional banks. This was mostly offset by duration curve positioning (favoring longer-dated versus short-maturity exposures), underweight positions in agency mortgage-backed securities (MBS), which materially underperformed most other sectors, and security selection within emerging markets.
Fund positioning
We added duration in the Fund’s portfolio throughout the year, from a low of just under 4 years in early 2022 to a peak of more than 5.75 years in mid-March 2023. We viewed increasingly higher yields as attractive against a backdrop of peaking price pressures in the fourth quarter of 2022 and the first quarter of 2023, and a more difficult economic outlook. The Fund’s duration was weighted to US dollar and Australian dollar bonds, but European duration was also added as yields in that market rose well above zero. The US dollar and Australian dollar positions are aligned with our view these markets offer the most compelling outlook: higher yields, but also expectations that these economies will cool relatively faster – particularly in Australia, where most mortgages are floating rate and so interest rate increases flow through very quickly to consumer incomes.
The Fund gradually added to holdings of investment grade corporate credit through the second and third quarters of 2022, with volatile and wide credit spreads offering attractive entry points for increasing exposure. The Fund used spread widening in the fourth quarter of 2022 and early first quarter of 2023 to reduce some exposure and add credit hedges to the portfolio, which had the benefit of reducing volatility and adding to returns in the March volatility. We added back some of the Fund’s investment grade allocations in late March, reflecting overall wider spreads.
The Fund’s currency exposures remain heavily weighted to the US dollar, as we judge the US economy to be stronger than most global peers, and the US dollar is likely to benefit both from safe-haven flows in a risk-off environment or from relatively higher yields in a scenario of stickier-than-expected inflation.
During the fiscal year, the Fund’s use of swaps, futures, foreign exchange currency positions, and options had a limited effect. Overall, derivatives were immaterial to the Fund’s performance during the fiscal year.
Our overall stance of gradually increasing duration and finding pockets of value in credit markets to add to the portfolio is in line with our expectation for continued volatility in fixed income markets and an increasing focus on global growth. The Fund has significant ability to increase its credit holdings, and we will look to do so as potential opportunities emerge.
| Portfolio management reviews |
| Delaware Ivy Global Growth Fund | March 31, 2023 (Unaudited) |
| Performance preview (for the year ended March 31, 2023) | | |
| Delaware Ivy Global Growth Fund (Class I shares) | 1-year return | -4.24%* |
| Delaware Ivy Global Growth Fund (Class A shares) | 1-year return | -4.48% |
| MSCI ACWI Index (net) (benchmark) | 1-year return | -7.44% |
| MSCI ACWI Index (gross) (benchmark) | 1-year return | -6.96% |
Past performance does not guarantee future results.
*Total return for the report period presented in the table differs from the return in “Financial highlights.” The total return presented in the above table is calculated based on the net asset value (NAV) at which shareholder transactions were processed. The total return presented in “Financial highlights” is calculated in the same manner but also takes into account certain adjustments that are necessary under US generally accepted accounting principles required in the annual report.
For complete, annualized performance for Delaware Ivy Global Growth Fund, please see the table on page 57.
Class I shares are not subject to a sales charge and are offered for sale exclusively to certain eligible investors. In addition, Class I shares pay no distribution and service fee. The performance of Class A shares excludes the applicable sales charge. The performance of both Class I shares and Class A shares reflects the reinvestment of all distributions. Please see page 59 for a description of the index. Index performance returns do not reflect any management fees, transaction costs, or expenses. Indices are unmanaged and one cannot invest directly in an index.
Investment objective
The Fund seeks to provide growth of capital.
Market review
Fiscal 2023 marked one of the great paradigm shifts for global markets and economies in recent history. A confluence of events, including fallout from pandemic spending and loose monetary policy, catalyzed what had been years in the making.
Major central bank policy shifts, inflation, changes to global supply chains, the end of inexpensive Russian energy for Europe, and labor shortages created broad-based asset price declines with few exceptions. Equities fell along with bond markets, which typically provide protection, as investors scrambled to face what we believe will be a new reality.
Years of lower interest rates and quantitative easing finally came to roost in the form of inflation. Perpetuating inflationary pressure, the war in Ukraine drove increases to energy and food prices, particularly in Europe. As a result of Russia’s actions, Western nations implemented sanctions against Russia. This all but cut off Russia’s ability to supply natural gas, oil, wheat, and other commodities to most of the world. In addition, rising home prices and rapid wage growth became concerning. Home affordability was historically low and labor shortages along with demographic shifts created a difficult task for central banks.
In response, the US Federal Reserve took action through a series of interest rate hikes. Central banks around the world soon followed. The Fed and the European Central Bank increased rates throughout the year. Europe abandoned negative rate policy after nearly a decade. With higher rates, market valuations quickly declined. Extremely high valuations, afforded by longer-duration growth companies in a low-rate environment, were hit particularly hard. US regional banks were caught with liability mismatches and mark-to-market losses in their Treasury holdings, all stemming from the rapid rate increases. This caused a run on several banks and turmoil in the system. At the same time, one of the oldest Swiss financial institutions, Credit Suisse, had to be rescued in a coordinated effort between UBS and Swiss central bank.
China maintained its zero-COVID policy throughout most of calendar year 2022 before finally reopening in December when the pressure from its population and weakening economy became too great. With the easing of this overhang, economic activity accelerated.
Source: Bloomberg, unless noted otherwise.
Within the Fund
For the fiscal year ended March 31, 2023, Delaware Ivy Global Growth Fund declined, although it outperformed its benchmark, the MSCI All Country World Index, which also declined. The Fund’s Class I shares fell 4.24%. The Fund’s Class A shares declined 4.48% at net asset value and declined 9.97% at maximum offer price. These figures reflect all distributions reinvested. During the same period, the Fund’s benchmark declined 7.44% (net). For complete annualized performance of Delaware Ivy Global Growth Fund, please see the table on page 57.
The Fund posted a negative return for the fiscal year but outperformed its benchmark. The largest contribution to relative performance came from stock selection in the consumer discretionary, communication services, and healthcare sectors while stock selection in the consumer staples sector was the largest detractor. Geographically, stock selection in the US and India contributed most while selection in Japan and Germany was a drag
Portfolio management reviews
Delaware Ivy Global Growth Fund
on performance. Sector and country exposure is primarily a result of our bottom-up (stock-by-stock) process.
On an individual stock basis, Deutsche Telekom AG, a large German telecommunications company, and Darden Restaurants Inc., a US restaurant operator best known for its Olive Garden franchise, were the leading contributors. Deutsche Telekom has continued to execute and benefit from the strength of its US subsidiary, T-Mobile US Inc. Deutsche Telekom appears to be ahead of schedule in bringing its ownership stake in T-Mobile to more than 50%. This should help enable the firm to generate additional cash, which it plans to return to shareholders through dividends. T-Mobile is gaining share in a competitive US wireless environment and German operations are growing. Darden has grown significantly post the COVID reopening, as diners were eager to eat out again. It has also been able to pass on inflationary pressures and maintain profit margins in the face of labor cost increases and higher raw material expenses.
The largest detractors from performance were First Republic Bank, a US-based regional bank, and Alphabet Inc., the US-based internet company and parent of Google. First Republic was swept up in a broad run on regional bank deposits. Historically, it has been a well-managed bank but was quickly put under pressure after several peers in similar geographies showed signs of collapsing. While we believe First Republic had a different risk profile, many depositors withdrew their money, and we were no longer able to handicap the risk of owning. We exited the position after the initial pullback, but before the major selloff in shares. Alphabet fell under pressure when advertising spending, a major source of revenue, slowed across the industry as advertising is highly sensitive to economic cycles. The stock also fell along with other large benchmark growth names sensitive to higher interest rates. We exited our position.
During the fiscal year, the Fund’s use of foreign exchange (FX) currency positions had a limited effect. Overall, derivatives were immaterial to the Fund’s performance during the fiscal year.
| Portfolio management reviews |
| Delaware Ivy High Income Fund | March 31, 2023 (Unaudited) |
| Performance preview (for the year ended March 31, 2023) | | |
| Delaware Ivy High Income Fund (Class I shares) | 1-year return | -5.79% |
| Delaware Ivy High Income Fund (Class A shares) | 1-year return | -6.02% |
| ICE BofA US High Yield Constrained Index (benchmark) | 1-year return | -3.58% |
Past performance does not guarantee future results.
For complete, annualized performance for Delaware Ivy High Income Fund, please see the table on page 60.
Class I shares are not subject to a sales charge and are offered for sale exclusively to certain eligible investors. In addition, Class I shares pay no distribution and service fee. The performance of Class A shares excludes the applicable sales charge. The performance of both Class I shares and Class A shares reflects the reinvestment of all distributions. Please see page 62 for a description of the index. Index performance returns do not reflect any management fees, transaction costs, or expenses. Indices are unmanaged and one cannot invest directly in an index.
Investment objective
The Fund seeks to provide total return through a combination of high current income and capital appreciation.
Market review
Throughout the fiscal year ended March 31, 2023, high yield bond markets were volatile as investors responded to the US Federal Reserve and its efforts to contain inflation via an aggressive series of rate hikes that began March 17, 2022, just prior to the start of the Fund’s12-month fiscal period.
Even though the Fed’s first increase was small, just 0.25 percentage points, it was the first increase in more than three years, and it seemed to set investors on edge. Coming on the heels of the Russian invasion of Ukraine the month before, consumer sentiment declined and investors worried about growth profiles going forward as speculation about a forthcoming recession, its depth and length, dominated financial discussions. At the same time, inflation, apparently unaffected by the Fed’s action, continued to rise. Through the first three months of the fiscal period, high yield markets declined 10.0%, setting the stage for a difficult 12 months.
Volatility set in as summer began. Sentiment picked up in July. By that time, the Fed had hiked rates in both May and June, by 0.50 and 0.75 percentage points, respectively. Investors, clinging to the belief that further hikes would be lower and slower, pushed Treasury yields lower by 80 basis points (one basis point is a hundredth of a percentage point). High yield markets advanced 6%. The Fed operated from a different playbook, however, and continued to raise rates another 0.75 percentage points in both late July and September. The high yield market sold off, ending up essentially unchanged for the second fiscal quarter.
High yield markets see-sawed for much of the remainder of the 12-month period, advancing in October and November before declining in December. High yield bonds posted strong gains in January 2023 before receding somewhat in February. Virtually all the markets’ movements were attributable to the Fed’s actions and inflation data, which began to improve, showing signs of easing as 2023 began. Only in March, the final month of the fiscal year, did the narrative shift, when two US regional banks – Silicon Valley Bank and Signature Bank – failed due to rising interest rates that had adversely affected its balance sheet. The banks’ failure set off a small panic that rippled through the banking system. Equity markets responded as expected, shedding earlier gains, but the high yield market rallied, gaining 1.1% in March. The gains were uneven, however, with BB-rated credits significantly outperforming B-rated credits, up about 0.5%, and CCC-rated credits, which declined as investors sought quality.
Overall, the high-yield market struggled throughout the fiscal year to overcome its opening-month loss. Though the market made progress, it finished the period with an overall decline of 3.58%.
During the fiscal year, the broadcasting, telecommunications, and cable sectors were the leading underperformers in the Fund’s benchmark, the ICE BofA US High Yield Constrained Index. Investors’ concern with the onset of a recession weighed heavily on the broadcasting sector, which suffers slow growth and a loss of advertising revenue in such a scenario. Additionally, these three sectors typically have longer-dated securities with some duration. So, with the upward move in rates, fundamentals softened and bond prices declined. Recession fears also led to a decline in the retail sector as investors became concerned that consumer spending would slow.
Energy, paper and packaging, and diversified media all outperformed within the benchmark during the fiscal year. Oil prices spiked following Russia’s invasion of Ukraine and natural gas prices were fairly strong during the period. Paper and packaging, running the gamut from paper to plastic bags, is diversified and resilient, and its operators typically have strong balance sheets. Compared with broadcasting, diversified media has relatively little advertising exposure, and has the potential to perform well in a recessionary environment.
Source: Bloomberg, unless noted otherwise.
Portfolio management reviews
Delaware Ivy High Income Fund
Within the Fund
For the fiscal year ended March 31, 2023, Delaware Ivy High Income Fund declined, underperforming its benchmark, the ICE BofA US High Yield Constrained Index, which also declined. The Fund’s Class I shares declined 5.79%. The Fund’s Class A shares fell 6.02% at net asset value and fell 10.28% at maximum offer price. These figures reflect all distributions reinvested. During the same period, the Fund’s benchmark declined 3.58%. For complete annualized performance of Delaware Ivy High Income Fund, please see the table on page 60.
The health services sector was the most significant detractor from the Fund’s relative performance during the fiscal year, principally due to its position in dialysis provider U.S. Renal Care Inc. The company underwent a leveraged buyout in 2019 and has since had a highly leveraged balance sheet. The business suffered during the pandemic and has not bounced back. On top of that, labor costs have risen dramatically. The company is in trouble, and we think it is likely headed for a restructuring. We continue to hold it in the Fund.
Wesco International Inc. is an aerospace defense contractor that detracted from the Fund’s performance during the fiscal year. The company provides distribution services for the defense industry. It has a highly levered balance sheet and sits at the bottom of the capital structure. With one balance sheet restructuring already behind it, Wesco is generating insufficient cash flow and its maturity date is next year. With a refinancing unlikely due to poor fundamentals, Wesco is another company facing a likely restructuring.
Similarly, satellite telecommunications company Ligado Networks LLC also appears to be running out of cash. Ligado owns satellite spectrum assets that the FCC approved but the Defense Department subsequently blocked due to potential interference with global positioning satellite (GPS) systems. With no resolution in sight, the company is unable to profit from its assets and it, too, appears headed for restructuring.
On the positive side of the ledger, the Fund outperformed in the retail sector, on the strength of both security selection and an underweight relative to the benchmark. The Fund has a bias toward high-quality retailers, which performed better in a difficult environment.
The Fund also performed well in the leisure sector. New Cotai LLC owns a gaming property in Macau called Studio City. During the pandemic, the company restructured its balance sheet, resulting in the Fund owning some equity and equity-linked securities. With the reopening of China, allowing people to resume travel and gaming, those securities significantly outperformed. Other leisure companies that performed well include cruise line Royal Caribbean Cruises Ltd.
In the technology sector, Entegris Inc. significantly contributed to performance during the fiscal period. The company provides critical components used in the manufacturing of semiconductors. Although it has solid fundamentals, it nonetheless traded down during the pandemic and through subsequent supply chain issues. Entegris has a strong balance sheet and is rated BB. We purchased the credits at a favorable price and, with the reopening of China and the easing of the supply chain bottleneck, the bonds have performed well. Overall, we did well in the technology sector as we generally favor software services, which are less susceptible to cyclical swings than hardware.
Throughout the fiscal year, we migrated the Fund to higher-quality credits. We took the Fund’s CCC-rated exposure down from 26% to 16% of the portfolio. We reduced the Fund’s B-rated exposure from about 52% down to 44% and increased the Fund’s BB-rated exposure from about 10% up to 25% of the portfolio. We believe that with these changes we have a more balanced credit-risk profile that has the potential to be less volatile than the portfolio has been in the past. At the same time, we are mindful of the importance of income in a high yield portfolio. Over the long term, income, rather than price appreciation, is the primary source of return.
Similarly, we made changes to the Fund’s sector positioning. We increased energy from about 10% to 13% of the Fund’s portfolio; basic industry from less than 2% to more than 6%; healthcare from 6% to 9%; technology from 5.4% to 7%; and leisure from 4.5% to 7.5%. We cut the Fund’s retail exposure in half from 9% to 4.5%. Services was reduced from about 16% to 6.5% and telecommunications from about 13.5% to about 7%. Also of note, we reduced the Fund’s exposure to bank loans from about 24% down to 13%.
| Portfolio management reviews |
| Delaware Ivy International Core Equity Fund | March 31, 2023 (Unaudited) |
| Performance preview (for the year ended March 31, 2023) | | |
| Delaware Ivy International Core Equity Fund (Class I shares) | 1-year return | -0.17% |
| Delaware Ivy International Core Equity Fund (Class A shares) | 1-year return | -0.55% |
| MSCI ACWI ex USA Index (net) (benchmark) | 1-year return | -5.07% |
| MSCI ACWI ex USA Index (gross) (benchmark) | 1-year return | -4.57% |
Past performance does not guarantee future results.
For complete, annualized performance for Delaware Ivy International Core Equity Fund, please see the table on page 63.
Class I shares are not subject to a sales charge and are offered for sale exclusively to certain eligible investors. In addition, Class I shares pay no distribution and service fee. The performance of Class A shares excludes the applicable sales charge. The performance of both Class I shares and Class A shares reflects the reinvestment of all distributions. Please see page 65 for a description of the index. Index performance returns do not reflect any management fees, transaction costs, or expenses. Indices are unmanaged and one cannot invest directly in an index.
Investment objective
The Fund seeks to provide capital growth and appreciation.
Market review
Fiscal 2023 marked one of the great paradigm shifts for global markets and economies in recent history. A confluence of events, including fallout from pandemic spending and loose monetary policy, catalyzed what had been years in the making.
Major central bank policy shifts, inflation, changes to global supply chains, the end of inexpensive Russian energy for Europe, and labor shortages created broad-based asset price declines with few exceptions. Equities fell along with bond markets, which typically provide protection, as investors scrambled to face what we believe will be a new reality.
Years of lower interest rates and quantitative easing finally came to roost in the form of inflation. Perpetuating inflationary pressure, the war in Ukraine drove increases to energy and food prices, particularly in Europe. As a result of Russia’s actions, Western nations implemented sanctions against Russia. This all but cut off Russia’s ability to supply natural gas, oil, wheat, and other commodities to most of the world. In addition, rising home prices and rapid wage growth became concerning. Home affordability was historically low and labor shortages along with demographic shifts created a difficult task for central banks.
In response, the US Federal Reserve took action through a series of interest rate hikes. Central banks around the world soon followed. The Fed and the European Central Bank increased rates throughout the year. Europe abandoned negative rate policy after nearly a decade. With higher rates, market valuations quickly declined. Extremely high valuations, afforded by longer-duration growth companies in a low-rate environment, were hit particularly hard. Regional banks in the US were caught with liability mismatches and mark-to-market losses in their Treasury holdings, all stemming from the rapid rate increases. This caused a run on several banks and turmoil in the system. At the same time, one of the oldest Swiss financial institutions, Credit Suisse, had to be rescued in a coordinated effort between UBS and Swiss central bank.
China maintained its zero-COVID policy throughout most of calendar year 2022 before finally reopening in December when the pressure from its population and weakening economy became too great. With the easing of this overhang, economic activity accelerated.
Source: Bloomberg, unless noted otherwise.
Within the Fund
For the fiscal year ended March 31, 2023, Delaware Ivy International Core Equity Fund declined, although it outperformed its benchmark, the MSCI ACWI (All Country World Index) ex USA Index, which also declined. The Fund’s Class I shares fell 0.17%. The Fund’s Class A shares declined 0.55% at net asset value and declined 6.24% at maximum offer price. These figures reflect all distributions reinvested. During the same period, the Fund’s benchmark declined 5.07% (net). For complete annualized performance of Delaware Ivy International Core Equity Fund, please see the table on page 63.
The Fund posted a slight negative return for the year, but outperformed its benchmark, the MSCI ACWI ex USA Index. The largest contribution to relative performance came from stock selection in the financials, energy, and information technology sectors while stock selection in the consumer staples sector was the largest detractor. From a country perspective, stock selection in Canada was a key contributor, primarily due to energy exposure. Sector and country exposure is largely a result of our bottom-up (stock-by-stock) process.
On an individual stock basis, H World Group Ltd., a China-based hotel operator, and Renesas Electronics Corp., a Japanese semiconductor company, were the leading contributors. H World Group stock had been under pressure due to continued COVID-19
Portfolio management reviews
Delaware Ivy International Core Equity Fund
lockdowns and travel bans in China. We took the opportunity to buy the stock when it was weak, and expectations were low. Ultimately, when China abandoned its zero-COVID policy, the stock recovered in anticipation of a rebound in travel. Renesas Electronics was up after it reported its fourth-quarter results. It saw major gains in autos and the internet of things, both viewed as long-term structural growth opportunities, and announced a significant share buyback program.
The largest detractors from performance were HelloFresh SE, a German food delivery service popular in the US and overseas, and Adidas AG, a German athletic company. HelloFresh had benefited from the pandemic as more people opted for food delivery, but despite continued sales growth, the company has since had to spend more on customer acquisition and marketing expenses. Also, as interest rates climbed, higher growth and higher valuation stocks, including HelloFresh, pulled back more than the market. We continue to own HelloFresh as we believe the company will successfully convert customers into its subscription model and return to positive cash flow. Adidas fell under pressure when economic instability led to a slowdown in discretionary goods purchasing. Adidas has significant Chinese exposure, which continued to weigh on sales as a result of lockdowns. Heightened inventory likewise put the company at risk of discounting and margin pressure. We sold the stock in anticipation of better opportunities.
During the fiscal year, the Fund’s use of foreign exchange (FX) currency positions had a limited effect. Overall, derivatives were immaterial to the Fund’s performance during the fiscal year.
| Portfolio management reviews |
| Delaware Ivy International Value Fund | March 31, 2023 (Unaudited) |
| Performance preview (for the year ended March 31, 2023) | | |
| Delaware Ivy International Value Fund (Class I shares) | 1-year return | +0.58% |
| Delaware Ivy International Value Fund (Class A shares) | 1-year return | +0.23% |
| MSCI EAFE (Europe, Australasia, Far East) Index (net) (benchmark) | 1-year return | -1.38% |
| MSCI EAFE (Europe, Australasia, Far East) Index (gross) (benchmark) | 1-year return | -0.86% |
Past performance does not guarantee future results.
For complete, annualized performance for Delaware Ivy International Value Fund, please see the table on page 66.
Class I shares are not subject to a sales charge and are offered for sale exclusively to certain eligible investors. In addition, Class I shares pay no distribution and service fee. The performance of Class A shares excludes the applicable sales charge. The performance of both Class I shares and Class A shares reflects the reinvestment of all distributions. Please see page 68 for a description of the index. Index performance returns do not reflect any management fees, transaction costs, or expenses. Indices are unmanaged and one cannot invest directly in an index.
Investment objective
The Fund seeks to provide capital appreciation.
Market review
Central bank rhetoric started to change as of late 2021. Nervousness spread across markets as inflation, liquidity crunches, and higher interest rates, combined with geopolitical tensions and Russia's invasion of Ukraine in February 2022, raised investor concerns. Several times during 2022, however, the stock market breathed a sigh of relief as hopes rose that the US central bank would soon start to lower interest rates.
Strongly rising inflation resulted in large interest rate increases, particularly in the US, but also in Europe, from historically low levels. Bonds have returned as a viable alternative to stocks. At the same time, interest rate increases mean that price-to-earnings (P/E) multiples in the stock market fell during 2022. This was also reflected in the pricing of certain parts of the stock market, which brought back memories of the bursting of the dot-com bubble at the start of this millennium.
But gravity always strikes, and 2022 brought about a solid wake-up call for global investors. Despite significant uncertainties, the stock market found support during the first quarter of 2023, as the global economy seemed to hold up better than expected, at least for the time. The reopening of China after its zero-COVID policy was lifted also added to optimism. Furthermore, lower oil prices eased inflationary pressure and provided hope that the cycle of interest rate hikes would soon come to an end.
Source: Bloomberg, unless noted otherwise.
Within the Fund
For the fiscal year ended March 31, 2023, Delaware Ivy International Value Fund posted a slight gain, outperforming its benchmark, the MSCI EAFE (Europe, Australasia, Far East) Index, which declined. The Fund’s Class I shares gained 0.58%. The Fund’s Class A shares advanced 0.23% at net asset value (NAV) and declined 5.53% at maximum offer price. These figures reflect all distributions reinvested. During the same period, the Fund’s benchmark declined 1.38% (net). For complete, annualized performance of Delaware Ivy International Value Fund, please see the table on page 66.
The bottom-up approach of the investment manager seeks to identify what are viewed as undervalued quality companies that have the potential to provide solid relative capital protection in challenging times. With the difficult market environment during the year, this worked well for the portfolio. The defensive and high-quality characteristics of the companies in the Fund partly shielded investors against the market’s havoc.
The annual outperformance resulted from sector and security selection. The Fund’s overweight position in the consumer staples sector and its stock selection in communication services and information technology contributed to relative returns. Security selection within healthcare and industrials was a drag on relative performance.
Among individual holdings, two of the largest contributors to performance were the French caterer and on-site food-service solution provider Sodexo and Danish Novo Nordisk, a world-leading diabetes care company.
Novo Nordisk posted strong performance and raised its guidance three times in 2022, growing both sales and earnings by double-digit rates, including some tailwind from a strong US dollar. The company’s key franchises, diabetes (GLP-1) and obesity care show strong growth rates and offer a very attractive combination of large and expanding addressable markets. Novo Nordisk is a leader in both. Novo expanded its leading position in the GLP-1 space with a dominant market share. Obesity care is a big opportunity; globally, more than 760 million people are obese, but today very few are treated.
Portfolio management reviews
Delaware Ivy International Value Fund
Sodexo finally regained the business it had lost as a result of COVID-19, a great relief for investors. In 2022, revenues grew by double digits organically and profit margins improved, signifying positive developments. Sodexo is focusing on developing its food service to improve working conditions for employees, a nod to the ongoing labor shortage. Additionally, the company plans to be more selective and limit its activity to 50 countries. Going forward, Sodexo expects margins to be higher than they were pre-COVID-19.
Conversely, two of the largest detractors from performance during the fiscal year were Fresenius Medical Care AG & Co., a German healthcare company that provides kidney dialysis services, and adidas AG, a world leader in the design, manufacturing, and marketing of sports equipment and articles.
We believe the world's leading kidney dialysis company, Fresenius Medical Care, was in a perfect storm together with its competitors. COVID-19 has reduced the patient population, slowed clinic traffic, and increased patient costs. The industry works on a contract basis, and the final payors and prices for dialysis services have yet to be adjusted higher to reflect inflation. In essence, Fresenius Medical Care must absorb these higher costs until prices are renegotiated.
A challenging trading environment in China, caused by COVID-19 restrictions and industry-wide supply chain disruptions, hurt adidas's shares. In 2022, the company lowered its outlook a few times. China is a major driver behind the company’s growth challenges, as China is a profitable market for adidas as well as an important sourcing market. In effect, the zero-COVID policy in China significantly affected adidas and overshadowed the company’s positive attributes. Despite the current challenges, we are still confident that adidas will remain a very strong brand and has the potential to restore profitability relatively fast.
We believe the long-term investment case and return potential is still intact for both companies. Therefore, we continue to hold them in the Fund.
During the fiscal year, the Fund used foreign exchange currency contracts to secure the US dollar value of securities between trade date and settlement date. These did not have a material impact on performance.
| Portfolio management reviews |
| Delaware Ivy Large Cap Growth Fund | March 31, 2023 (Unaudited) |
| Performance preview (for the year ended March 31, 2023) | | |
| Delaware Ivy Large Cap Growth Fund (Class I shares) | 1-year return | -8.99% |
| Delaware Ivy Large Cap Growth Fund (Class A shares) | 1-year return | -9.24% |
| Russell 1000® Growth Index (benchmark) | 1-year return | -10.90% |
Past performance does not guarantee future results.
For complete, annualized performance for Delaware Ivy Large Cap Growth Fund, please see the table on page 69.
Class I shares are not subject to a sales charge and are offered for sale exclusively to certain eligible investors. In addition, Class I shares pay no distribution and service fee. The performance of Class A shares excludes the applicable sales charge. The performance of both Class I shares and Class A shares reflects the reinvestment of all distributions. Please see page 71 for a description of the index. Index performance returns do not reflect any management fees, transaction costs, or expenses. Indices are unmanaged and one cannot invest directly in an index.
Investment objective
The Fund seeks to provide growth of capital.
Market review
After posting solid gains of 62.7% and 15.0% during the Fund’s 2021 and 2022 fiscal years, the Russell 1000 Growth Index declined 10.9% in the fiscal year ended March 31, 2023. The measurement period finished on an up note, however, as the index returned 14.4% in the period’s final quarter, the first calendar quarter of 2023. Despite the overall decline and growing uncertainty that characterized the fiscal period, it is important to keep things in perspective. Over the past five years the Russell 1000 Growth Index generated annualized gains of 13.7%, strong performance considering the recent drawdown. Over the past ten years the index posted annualized gains of 14.6%.
While value styles shined during the trailing 12-month period, there were also moments of clarity where investors were drawn back to business quality – profitability, cash flow, and competitive advantage – as a necessary consideration. The market’s hunt for the next “thematic” trade, whether that be peak interest rates, lower inflation, or a US Federal Reserve policy pivot, was not a sustainable and repeatable investment strategy. It is not surprising that in a period when the relative growth of many “hyper-growth” companies disappointed, investors returned to a theme with lasting power – business quality. The gains realized during fiscal 2020 and early fiscal 2021 in many low-quality, hyper-growth companies were based on unsustainable growth expectations, which led to disappointment in these stocks during fiscal 2023.
There were some key events that occurred during fiscal 2023 that will shape the outlook for the coming year. Particularly notable was the aggressive increase of interest rates. The Fed raised rates an aggregate 4.25 percentage points from a starting point near zero in March 2022. This has been one of the most aggressive upward rate trajectories in history. Additionally, starting in June 2022 the Fed initiated quantitative tightening by reducing its balance sheet by $80 to $90 billion per month. The inversion of the yield curve provided support for those arguing a recession is on the horizon.
The Fed confirmed the greatest enemy remains inflationary pressure and reiterated its desire to maintain tight policy that it sees as necessary to extinguish inflationary risk. Policy remained hawkish despite several signals of increasing uncertainty regarding the future pace of economic growth. The pace of growth in the US already appeared to be slowing with the Institute for Supply Management (ISM) Manufacturing Index and Services Purchasing Managers’ Index (PMI) both weakening during the period. Orders are slowing and inventories have normalized. Particularly notable were the second- and third-largest bank failures in recent history, events that the market interpreted as a mere inconvenience but will likely produce sustained financial tightening effects.
Source: Bloomberg, unless noted otherwise.
Within the Fund
For the fiscal year ended March 31, 2023, Delaware Ivy Large Cap Growth Fund declined, although it outperformed its benchmark, the Russell 1000 Growth Index, which also declined. The Fund’s Class I shares fell 8.99%. The Fund’s Class A shares declined 9.24% at net asset value and declined 14.46% at maximum offer price. These figures reflect all distributions reinvested. During the same period, the Fund’s benchmark declined 10.90%. For complete annualized performance of Delaware Ivy Large Cap Growth Fund, please see the table on page 69.
Our strategy is anchored in our beliefs, supported by empirical evidence, that business quality is more persistent than growth, that the market structurally undervalues quality businesses, and that wide-moat growth companies with attractive risk-reward profiles are the soundest vehicles for long-term compounding of wealth. As such, we continue to populate the Fund with what we consider to be high-quality, wide-moat companies supported by secular growth tailwinds and reasonable valuations.
From a sector perspective, strong stock selection in the consumer discretionary, information technology (IT), and communication
Portfolio management reviews
Delaware Ivy Large Cap Growth Fund
services sectors was the largest contributor to relative outperformance. A sector overweight in industrials and an underweight in financials sectors also contributed. Stock selection in industrials and health care was a large detractor, along with an overweight position in communication services.
The consumer discretionary sector was the largest contributor to the Fund’s outperformance. Lack of exposure to Tesla Inc. accounted for most of the outperformance in the sector. We continue to believe that economics in the automotive industry will be competed away over time and that Tesla is overpriced relative to its realizable future earnings. Additional contributors, but of lesser magnitude, included positions in Ferrari NV and LVMH Moet Hennessy Louis Vuitton SE.
Positive relative performance in IT was helped by outperformance from the Fund’s significant overweight position in Motorola Solutions Inc. The company posted strong results throughout the year while maintaining a healthy backlog of future revenue. VeriSign Inc., NVIDIA Corp., and Microsoft Corp. also contributed to relative outperformance.
Electronic Arts Inc. drove the Fund’s relative outperformance within the communications services sector. Despite some recent choppiness in the company’s mobile business, Electronic Arts has sustained its post-pandemic growth because of its subscription-like video game franchises. Lack of exposure to Netflix Inc. and Match Group Inc., which we consider to be lower-quality businesses, also drove outperformance.
The relative underperformance within the industrials sector was driven by weakness in TransUnion. Poorly received acquisitions and exposure to cyclical consumer credit volumes were causes of TransUnion’s relative underperformance. Machinery stocks such as Caterpillar Inc., which we did not own, saw strong relative performance as investors favored relative value. A notable positive offset to the headwind in industrials was relative strength from the Fund’s overweight position in CoStar Group Inc.
The healthcare sector negatively affected performance during the year since the Fund lacked exposure to the biopharmaceuticals group. We believe this group benefited from the market’s flight-to-stability. While there were certain notable company-specific events during the year, no companies in the group have what we think are attractive idiosyncratic investment theses.
We anticipate that an environment defined by elevated volatility will persist as market participants guess and wait for the effect of financial tightening to manifest. A volatile environment may result in risky markets that are temporarily driven by emotion rather than fundamental business analysis. For example, investors’ preference for “low price” stocks at the start of calendar 2023, igniting one of the most powerful low-price rallies of the last 30 years, confirms, in our view, the persistence of value-destructive behavioral tendencies. This reference dependence (the desire to buy something that was at a higher price 12 months ago) is another example of emotions and behavioral tendencies guiding the market rather than fundamental business model analysis. Although we are prepared to be temporarily wrong in such markets, we are confident in our belief that this is not a sustainable investment strategy.
In contrast, quality-first investing is a sustainable investment strategy that has been empirically proven to generate excess returns over time. We believe the market environment is ripe for quality to outperform given relatively attractive valuations in high-quality stocks and mounting risks to corporate profitability that create potential downside risk for the growthy and cyclical tails of the market. We still see unrealistic growth expectations for the growthy tail of the market even though prices and, in some cases, valuations have become more attractive.
In terms of the economic environment, inflationary pressures are cooling but remain relatively high. Unfortunately, the policy environment has become complicated for the Fed, tasked with maintaining financial stability and constraining inflation. The Fed is possibly caught between a rock and a hard place. Do they acknowledge the recent risk to financial stability and set aside the fight on inflation or do they continue to fight inflation at the risk of causing further instability? We detail this unattractive decision tree facing the Fed not to create fear but simply to highlight that businesses relying on improving economic activity to drive growth could struggle in the coming quarters and years. The eventual “Fed pivot” to lower rates is unlikely to be perceived as positively as it has been in the recent past, and bad news is likely to be interpreted simply as bad news.
If the economic environment does in fact become choppy over the next 12 to 18 months, we think our high-quality growth companies should experience a below-average level of earnings volatility due to the critical nature of their products and services and their unique competitive positions. These advantages should minimize price competition, churn, trade-down, and other forces that erode growth and profitability. Furthermore, we believe these companies will be rewarded with a higher relative valuation such that they will potentially generate outperformance from relative growth, earnings stability (fewer negative revisions), and higher relative valuations.
Finally, we remain optimistic that active stock picking is on the verge of once again proving its value. We believe it is unlikely that we will return to a zero-interest rate environment and with that regime change comes a different set of standards. Higher valuation levels and access to capital will have to be earned through consistent growth, strong cash generation, strong profitability, and disciplined
capital management. That is even more true post the recent disruption in the financial sector. The days of free money and an “everyone wins” mentality are likely behind us, and, in our opinion, enhanced discretion on the part of investors will reward durable, high-quality growth companies.
| Portfolio management reviews |
| Delaware Ivy Limited-Term Bond Fund | March 31, 2023 (Unaudited) |
| Performance preview (for the year ended March 31, 2023) | | |
| Delaware Ivy Limited-Term Bond Fund (Class I shares) | 1-year return | +0.07% |
| Delaware Ivy Limited-Term Bond Fund (Class A shares) | 1-year return | -0.17% |
| Bloomberg 1-3 Year US Government/Credit Index (benchmark) | 1-year return | +0.26% |
Past performance does not guarantee future results.
For complete, annualized performance for Delaware Ivy Limited-Term Bond Fund, please see the table on page 73.
Class I shares are not subject to a sales charge and are offered for sale exclusively to certain eligible investors. In addition, Class I shares pay no distribution and service fee. The performance of Class A shares excludes the applicable sales charge. The performance of both Class I shares and Class A shares reflects the reinvestment of all distributions. Please see page 76 for a description of the index. Index performance returns do not reflect any management fees, transaction costs, or expenses. Indices are unmanaged and one cannot invest directly in an index.
Investment objective
The Fund seeks to provide current income consistent with preservation of capital.
Market review
The fiscal year ended March 31, 2023, saw a dizzying number of geopolitical, monetary policy, financial, and economic events. The period started with the backdrop of Russia’s invasion of Ukraine, the launch of unconventional economic weapons by the West, and a second shock to supply chains via agricultural and energy routes. To complicate things, on the journey to managing escalating inflation not seen since the early 1980s era of US Federal Reserve Chair Paul Volcker, the Federal Open Market Committee (FOMC) delivered the second-steepest rate-hiking cycle in recent history, removing liquidity and ultimately playing a role in the banking system tremors of March 2023. While it may be too early to say inflation is in the past, metrics like the inverted yield curve and leading indicators are flashing red for recession risk for calendar 2023, indicating a handoff of risks from inflation to recession.
Policymakers, like investors, are often visited by ghosts of crises past. Events in March 2023 were a reminder that the Fed’s misstep during the time of Chair Volcker is not the only memory to fear. For many, the global financial crisis of 2008 came back into view, as did other unusual phenomena, such as the Long-Term Capital Management (LTCM) crisis of 1998 or the 1987 insurance crash. Regardless of the preferred history book example, the importance of confidence in the financial system came back into focus.
In March, Silicon Valley Bank, a little-known regional bank with an idiosyncratic depositor base and long history of high-quality lending, succumbed to depositor crowd behavior and was taken into receivership by the Federal Deposit Insurance Corporation (FDIC). The event spooked depositors and markets, opening the door to the possibility of a run on banks. At record speed, the Fed put into place a lending facility for US banks to borrow against Treasury and agency mortgage-backed securities (MBS) at par, effectively insuring deposits. Additionally, in Europe, the Swiss regulator engineered an arrangement between UBS and Credit Suisse to prevent a confidence crisis at Credit Suisse from becoming a systemic issue.
Despite the temporary market disruption, central banks remained focused on fighting inflation. Even with the backdrop of a bank confidence crisis, the European Central Bank (ECB) opted to raise interest rates by 0.50 percentage points to 3.50%, and the FOMC increased rates by another 0.25 percentage points in March to a range of 4.75% to 5.00%, pursuing a tightrope walk of remaining both focused on inflation and committed to financial stability. So far, markets have seemed willing to accept that the worst has been averted. Even as interest rate volatility remains near all-time highs, the compensation for credit risk, with few exceptions, still fails, in our view, to fully reflect the likelihood of a recession.
With a backdrop of unhinged inflation and resilient labor markets, all but one of the interest rate hikes during this cycle took place during this fiscal year – the US federal funds rate increased from near zero to a range of 4.75% to 5.00% by fiscal year end. While the yield curve inverted somewhat predictably, with long-term interest rates rising less than short-term rates, the fiscal year saw a significant decline in bond market returns and drastically higher consumer lending rates, including for auto loans and mortgages.
The US dollar maintained its strength for most of the year, while the euro fluctuated around parity with the dollar. Despite crowded calls that the dollar may have seen its peak strength, the shift from rate cycle beneficiary to safe-haven asset by March 2023 averted the shift in the dollar era.
Against this highly volatile backdrop, credit markets behaved reasonably well in 2022, albeit while sustaining broad losses largely owing to the increase in interest rates. However, higher yields were viewed as an opportunity for many fixed income investors and may have provided important technical support at a time when central banks across most of the developed world were raising short-term rates. Indeed, even despite the Silicon Valley Bank default and banking sector concerns, credit premiums have yet to match the highs seen during other stress periods. Looking forward, the silver
lining for fixed income investors may be manifest in the higher yields that potentially offer an income buffer to further price volatility.
Source: Bloomberg, unless noted otherwise.
Within the Fund
For the fiscal year ended March 31, 2023, Delaware Ivy Limited-Term Bond Fund underperformed its benchmark, the Bloomberg 1-3 Year US Government/Credit Index. The Fund’s Class I shares gained 0.07%. The Fund’s Class A shares declined 0.17% at net asset value and declined 2.92% at maximum offer price. These figures reflect all distributions reinvested. For the same period, the Fund’s benchmark gained 0.26%. Complete, annualized performance for Delaware Ivy Limited-Term Bond Fund is shown in the table on page 73.
Investors widely expected that the Fed would be active throughout most of the fiscal year. That expectation became reality when the Fed began raising rates in March 2022, just prior to the beginning of this fiscal period, and continued through March 2023 when the federal funds rates reached a range of 4.75% to 5.00%. As cumulative rate hikes rose, investors slowly shifted their focus from inflation risk to recession risk and any unexpected consequences of the rapid liquidity withdrawal.
In managing the Fund, we try to provide, rather than take, liquidity. Liquidity enables us to take advantage of periods of uncertainty. It provides us with the investment flexibility to take advantage of market opportunities as they arise.
The Fund entered the fiscal year with an overweight allocation to investment grade corporate credit, which neither detracted nor added to relative performance. However, an overweight to BBB-rated industrials was a leading driver of performance, as higher yields started to benefit total returns during a volatile period. The Fund’s higher relative allocation to industrials than financials limited its exposure to the March 2023 spread widening. Meanwhile, we maintained the Fund’s overweight to investment grade corporate credit but reduced it modestly in early 2023 as investors’ exuberance for continued economic growth despite increased interest rates took risk premiums too low, based on our assessments.
The Fund’s out-of-benchmark allocation to commercial mortgage-backed securities (CMBS) contributed to performance, as the higher spreads in the sector helped absorb the price volatility, while the Fund remains focused predominantly on AAA-rated securities.
Lastly, the Fund’s modest allocation to high yield securities was beneficial, as the higher income helped buffer price volatility. Specific examples included MGM Resorts International, which benefited from the global economic reopening, and Sensata Technologies BV, a hardware company that benefited from improved supply chain operations. We continue to hold both issuers in the Fund.
Yield curve management detracted from performance. We maintained a modestly greater interest rate sensitivity during the fiscal year, which detracted from returns as short-term interest rates rose.
Out-of-benchmark exposure to collateralized loan obligations (CLOs) detracted from performance as well, as spreads widened on the heels of greater volatility. We believe the Fund’s exposure to high-quality AAA-rated securities should benefit from the higher yields as volatility stabilizes.
Lastly, the heightened volatility in the banking sector in March 2023 resulted in underperformance for several of the Fund’s bank holdings. In particular, the Fund’s allocation to Credit Suisse AG senior securities detracted from performance as spreads widened ahead of the company’s arranged acquisition by UBS. Similarly, an allocation to Citizens Bank N.A. senior securities detracted from performance as markets repriced risk premiums on regional bank securities over concerns of fleeing depositors. We continue to hold both of these issuers in the Fund, as we believe fundamentals remain supportive of recovery.
Key risks and opportunities
Investors face complex considerations going forward, from the remaining stress on smaller regional banks to pressure in commercial real estate markets, the possibility of lingering inflation, and the high risk of recession. However, we suggest the landscape may be simplified to something more straightforward: We are in the middle of a risk handoff from inflation to recession after a secular repricing in interest rates, with relatively simple implications.
First, with yields returning to where they were before quantitative easing (QE) monetary policy took hold, bonds seem to be acting like bonds again, featuring historically compelling yields and a return to their inverse correlation with equities, which manifested clearly in the first quarter.
Second, history suggests it may be better to be early than late at turning points in tightening cycles, as yield curve inversions and rising recession risks mean the outlook for longer-term interest rates is quite bright, in our view.
Lastly, transitions don’t usually go smoothly. In our opinion, volatility is likely to remain high; credit spreads, while more attractive than before the tightening cycle, may need to increase further as recession risks take center stage; and market movements may happen rapidly.
We think this is a compelling time for agile active management and bottom-up (bond by bond) security selection as dispersion increases. Value has emerged in certain areas of the market, such as agency mortgage-backed securities (MBS) and high-quality securitized debt,
Portfolio management reviews
Delaware Ivy Limited-Term Bond Fund
far from the eye of the storm. Meanwhile, the high-income feature of credit and emerging markets debt, coupled with volatility, may create opportunities down the road. Bonds are bonds again, in our view, and exposure to the asset class is as attractive as we’ve seen in decades. We believe agility and security selection will remain key to navigating the uncertainty.
During the fiscal year, the Fund used derivatives, including interest rate futures and high yield credit default swaps (CDX) to tactically gain access to the high yield asset class. Derivatives detracted from performance by less than 50 basis points.
| Portfolio management reviews |
| Delaware Ivy Managed International Opportunities Fund | March 31, 2023 (Unaudited) |
| Performance preview (for the year ended March 31, 2023) | | |
| Delaware Ivy Managed International Opportunities Fund (Class I shares) | 1-year return | -3.50% |
| Delaware Ivy Managed International Opportunities Fund (Class A shares) | 1-year return | -3.79% |
| MSCI ACWI (All Country World Index) ex USA Index (net) (benchmark) | 1-year return | -5.07% |
| MSCI ACWI (All Country World Index) ex USA Index (gross) (benchmark) | 1-year return | -4.57% |
Past performance does not guarantee future results.
For complete, annualized performance for Delaware Ivy Managed International Opportunities Fund, please see the table on page 77.
Class I shares are not subject to a sales charge and are offered for sale exclusively to certain eligible investors. In addition, Class I shares pay no distribution and service fee. The performance of Class A shares excludes the applicable sales charge. The performance of both Class I shares and Class A shares reflects the reinvestment of all distributions. Please see page 79 for a description of the index. Index performance returns do not reflect any management fees, transaction costs, or expenses. Indices are unmanaged and one cannot invest directly in an index.
Investment objective
The Fund seeks to provide capital growth and appreciation.
Market review
At the start of the Fund’s fiscal year on March 31, 2022, persistently high inflation led to tighter central bank monetary policy, with the US Federal Reserve leading the way in raising interest rates. This increase in rates was the Fed’s aggressive attempt to try to bring inflation under control. Other central banks, including the Bank of England and the European Central Bank (ECB), also took repeated steps to tighten monetary policy in their jurisdictions. Meanwhile, equities and bonds posted poor performance in the face of brutal headwinds and unrelenting negative news. This included soaring inflation, consequent aggressive monetary tightening, ongoing supply chain problems, China’s zero-COVID policy-related lockdowns, the Russia-Ukraine war, and soaring energy prices. The higher prices and disruptions within the supply of oil and gas hit Europe hardest as Russia cut off gas to several European Union (EU) countries. In turn, the Group of Seven (G7) nations and later the EU implemented an oil embargo.
Markets rallied briefly in July 2022, when a near-term turnaround in inflation seemed possible. Despite investors’ concerns about the slowing of economic growth, stocks appreciated along with other risk asset classes, including corporate, high yield, convertible, and emerging market bonds. A key reason for this appreciation was the decline in yields on US and euro-zone government bonds, leading to significant price gains. However, the tide turned again in mid-August and the bear market returned for most asset classes when hopes for a slowdown in inflation were dashed. Central banks then reaffirmed their intentions to continue aggressively tightening monetary policy. Recession fears mounted and the energy crisis worsened as Russia announced it was shutting down a gas pipeline for maintenance. German yields rose sharply, and the euro fell below parity with the US dollar for the first time in 20 years.
The fourth quarter of 2022, like the third quarter, had a friendly start. Most equities advanced, and the US and European broad indices posted substantial gains. Continued high inflation and interest rate hikes by numerous central banks characterized the market environment in October, and, by November, it appeared that markets were in recovery mode. After the Fed’s expected 0.75-percentage-point interest rate hike at the beginning of October, poorer economic data and slightly declining inflation rates fueled hopes of slower interest rate hikes in the near future. Instead of a year-end rally, however, equities and bonds suffered significant losses in December. Global inflation rates fell slightly, and as expected, the major central banks raised key interest rates but by less than before (for example, the Fed and the ECB each raised rates by 0.50 percentage points).
The positive reversal of trends from the challenges and large drawdowns that had occurred for most of calendar year 2022 continued as the new year began. The equity and bond markets started 2023 strong on the heels of China’s reopening and hopes of falling inflation. Although headline inflation rates fell due to declining energy prices, core inflation fluctuated. This caused the ECB and the Fed to again emphasize their intention to remain restrictive for longer. GDP growth for the fourth quarter of 2022 was better than expected in the US and in China, but slightly negative in Germany and other European countries.
In February 2023, inflation and interest rate hike expectations rose once again as did bond yields. In the US in particular, the January inflation rate was surprisingly high, the labor market remained strong, and globally, indicators pointed to high demand in the services sector. Fed and ECB spokespersons again stressed that they would remain hawkish. In this environment, government and corporate bonds fell in unison. In the equity markets, North America and emerging markets lost ground while Europe and Japan gained. Commodities fell sharply in some cases, partly because demand from China was weaker than
Portfolio management reviews
Delaware Ivy Managed International Opportunities Fund
expected. The US dollar broke out of a four-month downtrend and strengthened against the euro.
The collapse of three US regional banks and Switzerland's Credit Suisse caused severe turbulence in March. Bank share prices plummeted, and stock markets in general fell quite sharply. Government bonds and gold rallied, risk premiums on corporate bonds widened, and the US dollar lost ground against the euro. Since one contributory factor was the sharp interest rate hikes, central banks sought to perform a balancing act between maintaining financial stability and fighting inflation. While the ECB and Fed guaranteed massive liquidity for the banking system, it also raised key interest rates due to continued high core inflation. Markets then calmed down, and broad equity indices turned positive again.
Source: Bloomberg, unless noted otherwise.
Within the Fund
For the fiscal year ended March 31, 2023, Delaware Ivy Managed International Opportunities Fund declined, although it outperformed its benchmark, the MSCI ACWI ex USA Index, which also declined. The Fund’s Class I shares declined 3.50%. The Fund’s Class A shares fell 3.79% at net asset value and fell 9.32% at maximum offer price. These figures reflect all distributions reinvested. For the same period, the benchmark declined 5.07% (net). For complete, annualized performance of Delaware Ivy Managed International Opportunities Fund, please see the table on page 77.
The recent environment for international equities has been a challenging one, and, as a result, the Fund’s performance declined for the fiscal year. Despite the challenging backdrop, however, the Fund managed to outperform its benchmark. Fund performance reflected the mix of returns in the underlying funds and their allocation weightings. The most significant contributors to both absolute performance and performance relative to the Fund’s benchmark over the past year were Delaware Ivy International Value Fund, Delaware Global Value Equity Fund, Delaware Ivy International Core Equity Fund, and a modest allocation to cash during the period. Conversely, the most significant detractors to both absolute and relative fund performance were Delaware Ivy Systematic Emerging Markets Equity Fund and Delaware Ivy International Small Cap Fund.
The unprecedented hiking cycle in the US and the euro zone has already begun to affect the economy’s largest stakeholders, in our view. One year after the Fed’s initial rate hike of 0.25 percentage points, the current financial market environment seems staged for a binary outcome, in our opinion. We believe much depends on how confidence in the banking sector develops and whether more pain appears on the horizon. Central banks in the US and the euro zone face a dilemma as the targets of both price and financial market stability seem to us hard to achieve simultaneously. Even though the situation is fluid, we believe that unlike 2022, there are more asset classes that could offer intrinsic diversification. Our focus remains then on risk management while we seek what we consider to be the most attractive investment opportunities in the context of carefully constructed, well-diversified portfolios.
| Portfolio management reviews |
| Delaware Ivy Mid Cap Growth Fund | March 31, 2023 (Unaudited) |
| Performance preview (for the year ended March 31, 2023) | | |
| Delaware Ivy Mid Cap Growth Fund (Class I shares) | 1-year return | -9.80% |
| Delaware Ivy Mid Cap Growth Fund (Class A shares) | 1-year return | -10.07% |
| Russell Midcap® Growth Index (benchmark) | 1-year return | -8.52% |
Past performance does not guarantee future results.
For complete, annualized performance for Delaware Ivy Mid Cap Growth Fund, please see the table on page 80.
Class I shares are not subject to a sales charge and are offered for sale exclusively to certain eligible investors. In addition, Class I shares pay no distribution and service fee. The performance of Class A shares excludes the applicable sales charge. The performance of both Class I shares and Class A shares reflects the reinvestment of all distributions. Please see page 82 for a description of the index. Index performance returns do not reflect any management fees, transaction costs, or expenses. Indices are unmanaged and one cannot invest directly in an index.
Investment objective
The Fund seeks to provide growth of capital.
Market review
Though the overwhelming trend was to the downside, there was significant volatility throughout the trailing 12-month period as the markets tried to understand and price peak inflation and the corresponding aggressive US Federal Reserve moves juxtaposed against stubborn employment, wage, and manufacturing data. Continued strength in these later measures led the Fed to reiterate its higher-and-hold interest rate policy instead of pivoting to a more dovish stance. As labor markets remained tight, the talk of peak inflation continued to be offset by the growing concern of a hard landing due to the stress of tighter financial conditions.
With interest rates continuing to move higher, housing affordability rolled over as mortgage rates more than doubled from their lows, causing affordability to sink precipitously. The downdraft continued as focus shifted from the macro concerns to corporate earnings degradation and the ultimate impact on how earnings and earnings growth should be appropriately priced, given the new higher interest rate environment. The final volatility-inducing event of the 12-month period occurred early in March 2023 as the banking sector came under intense scrutiny, particularly at regional banks due to mismatches in assets and liabilities caused by the Fed’s aggressive tightening cycle. Though there were only two bank casualties in the US, a contagion was averted when the Fed stepped in announcing a new emergency liquidity facility while protecting the uninsured deposits at those institutions that were in need. All of this changed the narrative to the expectation of an aggressive Fed pivot, which provided a significant tailwind once again to the equity markets, particularly larger capitalization growth stocks.
The Russell Midcap Growth Index (the Fund’s benchmark) declined for the trailing year. All sectors within the index turned in negative performance except for the energy, utilities, and consumer staples sectors. The Russell Midcap Growth Index outperformed both the large- and small-cap growth indexes as well as the Russell Midcap® Value Index for the period, with lower debt, lower price-to-earnings (P/E) and sales growth, higher gross margins, and higher earnings per share growth outperforming within the index.
Source: FactSet, unless noted otherwise.
Within the Fund
For the fiscal period ending March 31, 2023, Delaware Ivy Mid Cap Growth Fund declined, underperforming its benchmark, the Russell Midcap Growth Index, which also declined. The Fund’s Class I shares declined 9.80%. The Fund’s Class A shares fell 10.07% at net asset value and fell 15.23% at maximum offer price. These figures reflect all distributions reinvested. During the same period, the Fund’s benchmark declined 8.52%. For complete, annualized performance of Delaware Ivy Mid Cap Growth Fund, please see the table on page 80.
Both stock selection and asset allocation negatively affected relative performance in the period. With the litany of uncertainties presented in the macroeconomic environment, we remain vigilant in our fundamental research, maintaining a concentrated portfolio of profitable, lower-debt companies that we think can grow throughout a market and economic cycle. Sector overweight and underweight positions are primarily a by-product of bottom-up (stock-by-stock) selection, with notable overweight positions in information technology (IT), healthcare, and communication services, while significant underweights are in materials, real estate, consumer staples, and industrials. The lack of exposure to the energy sector over the period was the main contributor to the Fund’s relative underperformance, while our underweight to materials provided the largest positive relative sector contribution to performance.
Healthcare, the second largest sector allocation in the benchmark and an overweight in the Fund, was a significant relative contributor to performance, with both the overweight allocation to the sector as well as strong stock selection contributing. West Pharmaceutical Services Inc. is a leading manufacturer in the design and production of technologically advanced, high-quality, integrated containment and delivery systems for injectable medicines. We have researched and
Portfolio management reviews
Delaware Ivy Mid Cap Growth Fund
followed the company for several years but were not comfortable with the risk-reward potential given the valuation of the stock over time. The market pullback in 2022 gave us the valuation opportunity that we had patiently waited to initiate a position in the Fund’s portfolio. In our opinion, West has deftly navigated the stepdown from the accelerated demand for its products due to COVID-19, while increasing production capacity and maintaining focus on product development that suits the needs of the new biologic therapies coming to market.
The consumer discretionary sector produced the second-highest relative contribution for the period, with stock selection driving the outperformance over the index. BorgWarner Inc., the second-highest stock contributor to performance for the trailing year, engages in the provision of technology solutions for combustion, hybrid, and electric vehicles. Management announced a spinoff of much of its legacy internal combustion business late in 2022. The company’s message over the past four years has been one of transition: winning business in new powertrain technology, specifically hybrid and electric vehicles. With this spinoff, the company is executing on its goal of being 1/3 Electric Vehicle Revenue by mid-decade. We have held BorgWarner for a long time, and, we think, our patience – coupled with the fruits of their labors – is beginning to pay off.
The industrials sector, a market-weight position in the Fund’s portfolio, was the largest detractor to relative performance for the year with negative stock selection driving underperformance. CoStar Group Inc., a real estate data, analytics, and online marketplace, was a bright spot in the industrials sector for the period and, remains the second largest position in the Fund. There is always a bit of handwringing when CoStar announces guidance for the upcoming year, and 2023 was no different. The company guided well below consensus expectations due to the investments they made to expand their revenue model into the residential real estate market with the launch of Homes.com, which is expected to roll out mid-year. We believe strongly that management can navigate into the residential real estate market with the same, if not better, success as their launch of Apartments.com, which in the fourth quarter of 2022 announced net new bookings growth of more than 170% year over year.
The financial sector came under tremendous pressure in the first quarter of 2023 as news of Silicon Valley Bank’s (SVB’s) tenuous capital situation came into focus with unexpected and alarming rapidity. Fears of contagion and potential bank runs became widespread in a short period of time, bringing the entirety of the financial sector down as bank capital structures were fully scrutinized. While we didn’t own SVB, we did have exposure to two regional banks that suffered at the hands of the market. Of note is First Republic Bank, which we had held in the Fund’s portfolio for more than a decade. Though the bank’s capital situation was much different than that of SVB, the market treated the stock in a similar fashion, selling off more than 80% in the first quarter, making First Republic the largest single relative detractor to performance within the portfolio for the period. We sold the name as judiciously as possible, as we believe the landscape for regional banks has elevated scrutiny, increased the potential for unknown risks, and raised the likelihood for increased regulation.
Information technology, the largest overweight position to the largest sector in the index, was a slight drag on performance for the period coupled with negative relative returns from stock selection. While the energy sector is a small allocation compared to the benchmark, and we continue to have no exposure in this sector, it was responsible for the highest negative relative sector allocation performance for the Fund during the performance period. We remain wary of the business models within the energy sector, where companies, in our view, have tended to spend with reckless cyclical abandon, and not for the longer-term viability and profile of their businesses. Recently however, we noted an interesting change in that dynamic, as shareholders have spoken, and managements have listened to the desire for more capital discipline. We continue to research potential names for the portfolio but have yet to enter any positions of note.
Finally, a slight overweight to communication services had a negative effect on relative performance. Strong stock selection, however, returned a positive overall relative contribution to the Fund within this sector. While an underweight to the materials and consumer staples sectors provided a positive contribution to relative returns, stock selection in both sectors offset any gains from the weightings. No exposure to the underperforming real estate sector added to relative outperformance while our cash position detracted.
The top five individual holdings that were relative contributors to the Fund’s performance for the reporting period were MarketAxess Holdings Inc., BorgWarner Inc., Seagen Inc., Abiomed Inc., and Horizon Therapeutics. Abiomed and Horizon Therapeutics are no longer held in the Fund.
The bottom five individual holdings that were relative detractors to the Fund’s performance for the reporting period were First Republic Bank, Coherent Corp., Marvell Technology Inc., National Vision Holdings Inc., and Generac Holdings Inc.
The Fund’s use of options had a limited effect. Overall, derivatives were immaterial to the Fund’s performance during the fiscal year.
| Portfolio management reviews |
| Delaware Ivy Mid Cap Income Opportunities Fund | March 31, 2023 (Unaudited) |
| Performance preview (for the year ended March 31, 2023) | | |
| Delaware Ivy Mid Cap Income Opportunities Fund (Class I shares) | 1-year return | -4.42% |
| Delaware Ivy Mid Cap Income Opportunities Fund (Class A shares) | 1-year return | -4.73% |
| Russell Midcap® Index (benchmark) | 1-year return | -8.78% |
Past performance does not guarantee future results.
For complete, annualized performance for Delaware Ivy Mid Cap Income Opportunities Fund, please see the table on page 83.
Class I shares are not subject to a sales charge and are offered for sale exclusively to certain eligible investors. In addition, Class I shares pay no distribution and service fee. The performance of Class A shares excludes the applicable sales charge. The performance of both Class I shares and Class A shares reflects the reinvestment of all distributions. Please see page 85 for a description of the index. Index performance returns do not reflect any management fees, transaction costs, or expenses. Indices are unmanaged and one cannot invest directly in an index.
Investment objective
The Fund seeks to provide total return through a combination of current income and capital appreciation.
Market review
Investors were filled with optimism as they entered calendar year 2022. Expectations for an emergence from the COVID-19 pandemic, strong economic demand, robust company and consumer balance sheets, extremely low interest rates, and expansionary fiscal spending combined to push equity valuations to very high levels. As the year unfolded, however, it was these exact bullish ingredients that brought the unwanted outcome of high inflation. The US Federal Reserve concluded that the inflation was largely transitory and would recede throughout the year. This assessment proved to be misguided as the inflationary environment continued to gain steam, inevitability forcing the Fed’s hand. In March 2022, the Fed began aggressively raising interest rates to combat inflation, a policy that continued through the first calendar quarter of 2023.
Prevailing wisdom suggests that during a tightening cycle, the Fed will increase interest rates until something breaks. In the first calendar quarter of 2023, some banks broke. Bank customers moved deposits from lower-yielding accounts to Treasurys and other institutions where they could earn higher levels of interest, forcing banks to raise deposit rates to maintain their level of deposits. Silicon Valley Bank (SVB) experienced an effective failure in the quarter. This caused significant anxiety across the banking industry as customers grew concerned about the safety of their deposits. Signature Bank experienced the same outcome as SVB. Customers of First Republic Bank, whose high-net-worth customer base maintained deposits in excess of the FDIC insurance level, made massive withdrawals over a short period, pressuring its balance sheet. Despite these events, the Fed has remained resolute with its focus on continuing its rate tightening cycle.
Beyond the banking issues, the overall economy surprised to the upside with stronger growth and continued robust employment growth. Cash flows were negatively pressured when many companies experienced a significant build in working capital, particularly inventory levels. This occurred as firms attempted to mitigate the supply chain pressures from the preceding two years. We expect this pressure to ease in the new fiscal year, improving free cash flow generation.
The Russell Midcap Index declined in fiscal 2023. Two sectors, energy and industrials, produced positive performance. The consumer staples, utility, healthcare, and consumer discretionary sectors delivered negative total returns but outperformed relative to the benchmark. The communications and real estate sectors had the worst relative performance, both declining greater than 20%. The financials sector underperformed, particularly late in the period. The information technology (IT) sector extended its period of multiple compression, driving underperformance. Materials produced benchmark-like returns for the quarter.
Overall, the investment environment was broadly positive for our investment process. Dividend-paying companies outperformed their non-dividend-paying brethren.
Source: Bloomberg, unless noted otherwise.
Within the Fund
For the fiscal period ended March 31, 2023, Delaware Ivy Mid Cap Income Opportunities Fund declined, although it outperformed its benchmark, the Russell Midcap Index. The Fund’s Class I shares declined 4.42%. The Fund’s Class A shares fell 4.73% at net asset value and fell 10.22% at maximum offer price. These figures reflect all distributions reinvested. During the same period, the Fund’s benchmark declined 8.78%. For complete, annualized performance of Delaware Ivy Mid Cap Income Opportunities Fund, please see the table on page 83.
Dividend income nicely contributed to relative overall performance in a contracting equity market environment.
Sector allocation and stock selection contributed equally. Within sector allocation, the Fund’s underweight position to the poorly performing real estate and communications services sectors, and its
Portfolio management reviews
Delaware Ivy Mid Cap Income Opportunities Fund
overweight allocation to the strongly performing industrial and the consumer discretionary sectors, were the main contributors. Slightly offsetting these positive allocation decisions were underweight positions in the energy and utilities sectors. Although stock selection was positive within the materials, financials, real estate, and consumer staples sectors, these gains were slightly offset within the industrials and consumer discretionary sectors.
The real estate sector produced the strongest relative return for the Fund, which was significantly underweight this underperforming sector. American Campus Communities was the only holding during the year. The company was acquired early in the period by private equity for a premium given the arbitrage of private market valuation rates versus the public value of ACC.
Strong stock selection within the materials sector also contributed greatly to relative outperformance as most of our holdings generated positive returns in a down equity market. RPM International Inc. produced better-than-expected results as pricing initiatives finally surpassed costs increases, allowing for margin expansion in the second half of the year. Avery Dennison Corp. continued to benefit from greater adoption of radio frequency identification (RFID) technology across multiple industries, driving better-than-expected results. This product carries higher margins than its base business, thus driving secular margin expansion.
Stock selection also drove outperformance within the financials sector. A large portion of this was the avoidance of the troubled banks. The Fund did experience weakness in its regional bank holdings, Columbia Banking System Inc. and Glacier Bancorp Inc., which was more than offset by strong performance in our non-bank financial exposure. Arthur J. Gallagher & Co. experienced stronger than expected organic growth throughout the year with solid pricing and economic growth supporting results. Ares Management LLC continued to produce strong results leading to a significant increase in the company’s dividend.
The Fund’s outperformance in the consumer staples sector was split evenly between our overweight to the outperforming sector and stock selection. The Clorox Co. performed strongly in the period. After a difficult cost inflation period for the company, Clorox passed through significant price increases and has begun its margin recovery journey. Sysco Corp. demonstrated market share gains and, like Clorox, began margin recovery following periods of significant inflation.
The consumer discretionary and industrials sectors were both areas of relative weakness driven by negative stock selection. Results for Hasbro Inc. were pressured as retailers found themselves over-inventoried and made significant adjustments to orders, particularly within the toy category. This led to negative revenue and earnings revisions. We sold our position in the stock. Stanley Black & Decker Inc., experienced significant margin and cash flow contraction as underlying demand first exploded to the upside, then quickly slowed, leading to a significant build in inventory coupled with raw material and logistics cost increases. We continue to own Stanley Black & Decker, believing we have reached the free cash flow generation inflection.
We keep watch on several key variables to determine Fund positioning. These variables (domestic economic growth, change in interest rates, change in commodity prices, and foreign economic growth) have remained consistent since the Fund’s inception and continue to be monitored.
Domestic economic growth: Most market participants have forecasted that 2023 will usher in a recession as the Fed is focused on combating US inflation. We believe this is a reasonable expectation, with the main debate the depth and duration of the recession. We find ourselves in the short and shallow crowd, believing the probability of a severe recession is low. Banks are likely to tighten lending standards following recent events, which could further impede growth. Company and consumer balance sheets, while deteriorating, are currently at robust levels, providing the backdrop for stronger spending than normally experienced in an economic contraction. Significant fiscal infrastructure spending is scheduled to occur in 2023 and projected to grow again in 2024. While we think the rate of layoffs will increase this year, the recent difficultly of hiring experienced skilled workers will likely keep employment levels higher than those seen in previous recessionary periods. As we closely monitor this situation, we remain constructive on the financial markets as valuations have compressed and expectations for corporate earnings have begun their negative revisions.
Change in interest rates: The short- and long-term segments of the interest rate curve indicated dramatically different environments. The short end has continued to march higher with each Fed increase. Inflation has remained persistently high; however, there are indicators of moderation forthcoming in multiple areas. We continue to believe the Fed will err on the side of too many rate increases to ensure that inflation eases. The medium to long-end of the interest rate curve suggests the Fed will quickly pivot to rate cuts after the ensuing recession and moderating inflation. The fly in the ointment remains employment and wage pressure. We do worry about its relative stickiness, as overall unemployment remains low, and companies want to hold on to their skilled labor in preparation for the next expansionary cycle. Our expectation is we are in the very late innings of the interest rate increases cycle and anticipate the Fed pausing in the near term and potentially cutting interest rates as economic growth slows and inflation eases.
Change in commodity prices: Strong demand, challenging production, and supply chain issues have been supportive of higher commodity prices since 2020. We now have easing in all three of these components, which is driving a moderation in many industrial commodities. The Russian invasion of Ukraine added another level of uncertainty, particularly within the energy and agriculture markets. Should a resolution be found, we would expect commodity prices to ease further, but visibility to such a resolution remains opaque. A closely watched survey from the Institute for Supply Management has shown significant moderation in its ISM® Manufacturing Prices Index throughout the most recent quarter, indicating that less cost pass-through appears to be forthcoming.
Foreign economic growth: It appears China has loosened its stance regarding COVID-19, providing an environment that supports global economic growth. A resolution to the Russian-Ukrainian conflict has the potential to ease pressures in the region and could also support economic growth but remains difficult to predict. The anticipated European energy crisis was largely averted with a warmer than normal winter. We think this result should produce better than previously forecasted growth in the region.
| Portfolio management reviews |
| Delaware Ivy Municipal Bond Fund | March 31, 2023 (Unaudited) |
| Performance preview (for the year ended March 31, 2023) | | |
| Delaware Ivy Municipal Bond Fund (Class I shares) | 1-year return | -3.62% |
| Delaware Ivy Municipal Bond Fund (Class A shares) | 1-year return | -3.83% |
| Bloomberg Municipal Bond Index (benchmark) | 1-year return | +0.26% |
Past performance does not guarantee future results.
For complete, annualized performance for Delaware Ivy Municipal Bond Fund, please see the table on page 86.
Class I shares are not subject to a sales charge and are offered for sale exclusively to certain eligible investors. In addition, Class I shares pay no distribution and service fee. The performance of Class A shares excludes the applicable sales charge. The performance of both Class I shares and Class A shares reflects the reinvestment of all distributions. Please see page 88 for a description of the index. Index performance returns do not reflect any management fees, transaction costs, or expenses. Indices are unmanaged and one cannot invest directly in an index.
Investment objective
The Fund seeks to provide the level of current income consistent with preservation of capital and that is not subject to federal income tax.
Market review
For the fiscal year ended March 31, 2023, and especially in its first half, inflation in the US remained a major concern for policymakers and investors. Higher energy costs, worsened by Russia’s invasion of Ukraine in February 2022, and disruptions in the supply chain, primarily drove the rise in prices. In June 2022, the US Consumer Price Index (CPI) peaked at an annual increase of 9.1%, the fastest rise in more than 40 years. However, this trend meaningfully slowed during the final three quarters of this fiscal year. By March 2023, the annual CPI increase had dropped to 5.0% – still historically high but the lowest rate of inflation in more than a year, as interest rate hikes by the US Federal Reserve appeared to have their desired impact.
The US central bank took decisive action by raising short-term interest rates when inflation became a growing concern for the Fed. Throughout the fiscal year, the Fed increased rates frequently and rapidly, raising the federal funds rate eight times from 0.25% at the start of the fiscal year to 4.75% by the end of March 2023. Although the Fed was expected to continue raising rates in 2023, most analysts believed that the rate-hiking cycle would soon come to an end as concerns about a recession grew. Concern about the economic backdrop grew further in the final month of the fiscal year amid worries about the banking industry, precipitated by the collapse of US lenders Silicon Valley Bank and Signature Bank, and Europe’s Credit Suisse.
Amid rising inflation and interest rates, the US economy began the fiscal year on a downturn. In the first half of 2022, the country’s gross domestic product (GDP) – a measure of national economic output – decreased by an annualized 1.6% and 0.6%, in the first and second quarter, respectively. However, in the third quarter, US GDP grew by an annualized 3.2%. The economy continued its expansion in the fourth quarter, growing at an estimated annual rate of 2.6% during that three-month period, driven primarily by inventory adjustments and consumer spending.
Despite the challenging economic conditions, the US jobs market remained robust throughout the fiscal year. The unemployment rate began the period at an historically low 3.6%, which was a significant improvement from the pandemic peak of 14.7% in April 2020. In February 2023, the jobless rate reached a 53-year low of 3.4% before ticking back up to 3.5% the following month.
In an often-volatile environment for fixed-income investors, the municipal bond market, as measured by the Bloomberg Municipal Bond Index, gained 0.26% for the fiscal year ended March 31, 2023.
Investors in municipal bonds encountered two very different sets of market conditions during the Fund’s fiscal year. Market conditions were highly challenging for fixed-income investors in its first half, as an unfavorable supply and demand backdrop hurt the municipal bond market.
Despite generally healthy credit quality among municipal issuers, rising interest rates and concerns that higher inflation would lead to even more rate hikes by the Fed led to significant outflows from municipal bond funds, causing a decrease in bond values.
In the second half of the fiscal year, however, investors’ concern about inflation eased and expectations that the Fed would soon end its rate-hike cycle grew as the odds of recession increased. Outflows from the municipal bond market slowed and demand for municipal securities increased, helping the market recover the value it had lost earlier in the fiscal year.
In this market environment, the weakest performers by far were longest-dated bonds, hampered by their increased sensitivity to higher rates. Meanwhile, shorter term and especially intermediate-term bonds fared the best. Additionally, bonds with lower credit ratings were more likely to lag their higher-rated counterparts during the fiscal year.
Source: Bloomberg, unless noted otherwise.
These tables show municipal bond returns by maturity length and by credit quality for the fiscal year ended March 31, 2023.
| Returns by maturity | |
| 1 year | +1.55% |
| 3 years | +1.52% |
| 5 years | +1.75% |
| 10 years | +2.38% |
| 22+ years | -3.64% |
| | |
| Returns by credit rating | |
| AAA | +0.55% |
| AA | +0.58% |
| A | -0.04% |
| BBB | -1.32% |
Source: Bloomberg.
Within the Fund
For the fiscal year ended March 31, 2023, Delaware Ivy Municipal Bond Fund posted negative returns and underperformed its benchmark, the Bloomberg Municipal Bond Index. The Fund’s Class I shares fell 3.62%. The Fund’s Class A shares declined 3.83% at net asset value (NAV) and declined 8.18% at maximum offer price. These figures reflect all distributions reinvested. During the same period, the Fund’s benchmark gained 0.26%. For complete, annualized performance of Delaware Ivy Municipal Bond Fund, please see the table on page 86.
Regardless of the market backdrop, we regularly maintain a consistent management approach throughout the fiscal year. Our bottom-up investment strategy relies on deep credit research to select municipal securities on an issuer-by-issuer basis. We prioritize tax-exempt bonds that we believe offer a favorable balance between risk and return potential for our shareholders.
We have high confidence in our team’s credit research capabilities. Therefore, when looking for new investments to add to the Fund’s portfolio, we give priority to lower-rated, higher-yielding bonds with strong credit fundamentals. We believe these types of securities provide greater opportunities for us to add value for the Fund’s shareholders.
During the fiscal year, against a highly volatile backdrop for the municipal bond market and the Fund, we encountered a high degree of investment outflows as shareholders redeemed shares. When we made bond sales and, less often, purchases during this fiscal year, we were mindful of keeping the Fund’s duration, credit quality, and sector allocations relatively consistent, as we liked how the Fund was positioned coming into the fiscal period.
To generate the proceeds needed to meet shareholders’ redemptions, we were active sellers of bonds during the 12-month time frame. We prioritized selling bonds with lower book yields, which allowed us to realize increased tax losses that we may be able to apply against future gains. Also, to a lesser extent, we engaged in tax-loss swaps to take advantage of higher yields available in the marketplace. With this strategy, we exchanged bonds with lower yields for those providing similar risk characteristics but with better coupons. This approach allowed us to improve the Fund’s income profile. Meanwhile, we were careful to avoid selling securities we believed would perform relatively well in the future, once market conditions begin to heal.
The top individual performer for the Fund was a general obligation bond issue for Palomar Health, a California healthcare district. These zero-coupon bonds, rated AA by Standard & Poor’s and maturing in 2033, gained 4% for this fiscal year, benefiting from their favorable structure and yield curve positioning.
Our next-strongest-performing investment, nonrated New York tobacco-securitization bonds maturing in 2060, rose 4%. These securities benefited from their high yield, which was desirable to investors and was sufficient to offset the negative price movement to a greater extent than many other bonds in the Fund’s portfolio. They also benefited from their recovery off a lower valuation to start this fiscal year.
On the negative side, we saw underperformance from a couple of issuers of debt for senior housing facilities. These included nonrated bonds issued for Sanctuary LTC LLC, which owns various senior healthcare facilities in Texas and Oklahoma, and Tapestry Senior Living in Wickliffe, Ohio. These securities returned -20% and -13%, respectively, for the fiscal year. In an environment in which bonds of lower credit quality tended to underperform, the senior-living sector, which primarily features lower-rated issuers, disproportionately struggled.
| Portfolio management reviews |
| Delaware Ivy Municipal High Income Fund | March 31, 2023 (Unaudited) |
| Performance preview (for the year ended March 31, 2023) | | |
| Delaware Ivy Municipal High Income Fund (Class I shares) | 1-year return | -6.53% |
| Delaware Ivy Municipal High Income Fund (Class A shares) | 1-year return | -6.78% |
| Bloomberg Municipal Bond Index (benchmark) | 1-year return | +0.26% |
Past performance does not guarantee future results.
For complete, annualized performance for Delaware Ivy Municipal High Income Fund, please see the table on page 89.
Class I shares are not subject to a sales charge and are offered for sale exclusively to certain eligible investors. In addition, Class I shares pay no distribution and service fee. The performance of Class A shares excludes the applicable sales charge. The performance of both Class I shares and Class A shares reflects the reinvestment of all distributions. Please see page 91 for a description of the index. Index performance returns do not reflect any management fees, transaction costs, or expenses. Indices are unmanaged and one cannot invest directly in an index.
Investment objective
The Fund seeks to provide a high level of current income that is not subject to federal income tax.
Market review
For the fiscal year ended March 31, 2023, and especially in its first half, inflation in the US remained a major concern for policymakers and investors. Higher energy costs, worsened by Russia’s invasion of Ukraine in February 2022, and disruptions in the supply chain, primarily drove the rise in prices. In June 2022, the US Consumer Price Index (CPI) peaked at an annual increase of 9.1%, the fastest rise in more than 40 years. However, this trend meaningfully slowed during the final three quarters of this fiscal year. By March 2023, the annual CPI increase had dropped to 5.0% – still historically high but the lowest rate of inflation in more than a year, as interest rate hikes by the US Federal Reserve appeared to have their desired impact.
The US central bank took decisive action by raising short-term interest rates when inflation became a growing concern for the Fed. Throughout the fiscal year, the Fed increased rates frequently and rapidly, raising the federal funds rate eight times from 0.25% at the start of the fiscal year to 4.75% by the end of March 2023. Although the Fed was expected to continue raising rates in 2023, most analysts believed that the rate-hiking cycle would soon come to an end as concerns about a recession grew. Concern about the economic backdrop grew further in the final month of the fiscal year amid worries about the banking industry, precipitated by the collapse of US lenders Silicon Valley Bank and Signature Bank, and Europe’s Credit Suisse.
Amid rising inflation and interest rates, the US economy began the fiscal year on a downturn. In the first half of 2022, the country’s gross domestic product (GDP) – a measure of national economic output – decreased by an annualized 1.6% and 0.6%, in the first and second quarter, respectively. However, in the third quarter, US GDP grew by an annualized 3.2%. The economy continued its expansion in the fourth quarter, growing at an estimated annual rate of 2.6% during that three-month period, driven primarily by inventory adjustments and consumer spending.
Despite the challenging economic conditions, the US jobs market remained robust throughout the fiscal year. The unemployment rate began the period at a historically low 3.6%, which was a significant improvement from the pandemic peak of 14.7% in April 2020. In February 2023, the jobless rate reached a 53-year low of 3.4% before ticking back up to 3.5% the following month.
In an often-volatile environment for fixed-income investors, the municipal bond market, as measured by the Bloomberg Municipal Bond Index, gained 0.26% for the fiscal year ended March 31, 2023.
Investors in municipal bonds encountered two very different sets of market conditions during the Fund’s fiscal year. Market conditions were highly challenging for fixed-income investors in its first half, as an unfavorable supply and demand backdrop hurt the municipal bond market. Despite generally healthy credit quality among municipal issuers, rising interest rates and concerns that higher inflation would lead to even more rate hikes by the Fed led to significant outflows from municipal bond funds, causing a decrease in bond values.
In the second half of the fiscal year, however, investors’ concerns about inflation eased and expectations that the Fed would soon end its rate-hike cycle grew as the odds of recession increased. Outflows from the municipal bond market slowed and demand for municipal securities increased, helping the market recover the value it had lost earlier in the fiscal year.
In this market environment, the weakest performers by far were longer-dated bonds hampered by their increased sensitivity to higher rates. Meanwhile, shorter-term, and especially intermediate-term bonds fared the best. Additionally, bonds with lower credit ratings were more likely to lag their higher-rated counterparts during the fiscal year.
Source: Bloomberg, unless noted otherwise.
These tables show municipal bond returns by maturity length and by credit quality for the fiscal year ended March 31, 2023.
| Returns by credit rating | |
| AAA | 0.55% |
| AA | 0.58% |
| A | -0.04% |
| BBB | -1.32% |
| | |
| Returns by maturity | |
| 1 year | 1.55% |
| 3 years | 1.52% |
| 5 years | 1.75% |
| 10 years | 2.38% |
| 22+ years | -3.64% |
Source: Bloomberg.
Within the Fund
For the fiscal year ended March 31, 2023, Delaware Ivy Municipal High Income Fund posted negative returns and underperformed its benchmark, the Bloomberg Municipal Bond Index. The Fund’s Class I shares fell 6.53%. The Fund’s Class A shares declined 6.78% at net asset value (NAV) and declined 11.04% at maximum offer price. These figures reflect all distributions reinvested. During the same period, the Fund’s benchmark gained 0.26%. For complete, annualized performance of Delaware Ivy Municipal High Income Fund, please see the table on page 89.
Regardless of the market backdrop, we regularly maintain a consistent management approach throughout the fiscal year. Our bottom-up investment strategy relies on deep credit research to select municipal securities on an issuer-by-issuer basis. We prioritize tax-exempt bonds that we believe offer a favorable balance between risk and return potential for our shareholders.
We have high confidence in our team’s credit research capabilities. Therefore, when looking for new investments to add to the Fund’s portfolio, we give priority to lower-rated, higher-yielding bonds with strong credit fundamentals. We believe these types of securities provide greater opportunities for us to add value for the Fund’s shareholders.
During the fiscal year, against a highly volatile backdrop for the municipal bond market and the Fund, we encountered a high degree of investment outflows as shareholders redeemed shares. When we made bond sales and, less often, purchases during this fiscal year, we were mindful of keeping the Fund’s duration, credit quality, and sector allocations relatively consistent, as we liked how the Fund was positioned coming into the fiscal period.
To generate the proceeds needed to meet shareholders’ redemptions, we were active sellers of bonds during the 12-month time frame. We prioritized selling bonds with lower book yields, which allowed us to realize increased tax losses that we may be able to apply against future gains. Also, to a lesser extent, we engaged in tax-loss swaps to take advantage of higher yields available in the marketplace. With this strategy, we exchanged bonds with lower yields for those providing similar risk characteristics but with better coupons. This approach allowed us to improve the Fund’s income profile. Meanwhile, we were careful to avoid selling securities we believed would perform relatively well in the future, once market conditions begin to heal.
The top individual performer for the Fund was a nonrated Washington, D.C., tobacco-securitization bond issue maturing in 2055. These securities, which gained about 17%, benefited from their high yield, which was desirable to investors and was sufficient to offset the negative price movement to a greater extent than many other bonds in the Fund’s portfolio. They also benefited from their recovery off a lower valuation to start this fiscal year.
Another contributor to the Fund’s performance was a general obligation (GO) bond issue of Riverdale, Illinois. These nonrated bonds maturing in 2036 gained 8% for this fiscal year, benefiting from their favorable structure and yield curve positioning.
On the negative side, we saw underperformance from a couple of issuers of debt for senior housing facilities. These included bonds issued for Church Homes, a retirement community in Hartford, Connecticut, and the Harborside senior living community in Port Washington, New York. These securities returned -36% and -15%, respectively, for the fiscal year. In an environment in which bonds of lower credit quality tended to underperform, the senior-living sector, which primarily features lower-rated issuers, disproportionately struggled.
The Fund’s nonrated bonds for the Legacy Cares athletic complex project in Mesa, Arizona also hampered performance. These securities returned -33%, meaningfully detracting from the Fund’s performance as the issuer experienced credit challenges during the fiscal year.
| Portfolio management reviews |
| Delaware Ivy Small Cap Growth Fund | March 31, 2023 (Unaudited) |
| Performance preview (for the year ended March 31, 2023) | | |
| Delaware Ivy Small Cap Growth Fund (Class I shares) | 1-year return | -14.68% |
| Delaware Ivy Small Cap Growth Fund (Class A shares) | 1-year return | -14.90% |
| Russell 2000® Growth Index (benchmark) | 1-year return | -10.60% |
Past performance does not guarantee future results.
For complete, annualized performance for Delaware Ivy Small Cap Growth Fund, please see the table on page 92.
Class I shares are not subject to a sales charge and are offered for sale exclusively to certain eligible investors. In addition, Class I shares pay no distribution and service fee. The performance of Class A shares excludes the applicable sales charge. The performance of both Class I shares and Class A shares reflects the reinvestment of all distributions. Please see page 94 for a description of the index. Index performance returns do not reflect any management fees, transaction costs, or expenses. Indices are unmanaged and one cannot invest directly in an index.
Investment objective
The Fund seeks to provide growth of capital.
Market review
The fiscal year ended March 31, 2023 was not favorable for small-cap growth stocks. The Russell 2000 Growth Index declined more than 10% for the period despite rallying in the last three months. Calendar year 2022 for small-cap growth stocks was the third worst in more than 25 years, eclipsed only by the recession of 2008-2009 and the 2002 “tech bubble.” Through the first nine months of the period, rising interest rates impacted valuations while economic disruption and recession affected earnings estimates. The 10-year Treasury yield, in a downtrend since the great financial crisis, was near zero percent for almost a year following the onset of the COVID-19 pandemic. Responding to significant fiscal and monetary stimulus in 2021, earnings growth surged for most of the major sectors of the market and growth stocks thrived. In 2022, however, rapidly growing consumer demand led to shortages and supply chain snarls that fed inflation, taking a toll on equity markets.
Small-cap growth stocks had been a major beneficiary of the low interest-rate, healthy economic environment that prevailed in 2021 and were thus highly vulnerable when conditions changed. During the fiscal year the 10-year Treasury yield rose from 2.3% to more than 4.2% in the fall of 2022 before settling back to 3.5% by year-end. The yield curve inverted midway through the year. High-yield spreads rose more than 2.5 percentage points by midyear, signaling increased concern about a potential recession. Higher interest rates crushed small-cap growth stocks by the end of the first fiscal quarter. A brief attempt at a late summer rally was thwarted until 2023 when a modest rebound took hold. The Russell 2000 Growth Index benchmark lagged the mid-cap and large-cap indexes for the fiscal year. Growth stocks, however, outperformed small value stocks for the period.
Source: Bloomberg, unless noted otherwise.
Within the Fund
For the fiscal period ending March 31, 2023, Delaware Ivy Small Cap Growth Fund declined, underperforming its benchmark, the Russell 2000 Growth Index, which also declined. The Fund’s Class I shares declined 14.68%. The Fund’s Class A shares fell 14.90% at net asset value and fell 19.78% at maximum offer price. These figures reflect all distributions reinvested. During the same period, the Fund’s benchmark declined 10.60%. For complete, annualized performance of Delaware Ivy Small Cap Growth Fund, please see the table on page 92.
The Fund lagged the benchmark for the year principally due to pressure on our two largest sectors, healthcare, and information technology (IT). The healthcare sector was a significant detractor from relative performance, primarily attributable to poor stock selection. Several previously strong performers drastically reversed course due to high valuations, underwhelming profitability, weakness in procedure volumes, and disappointing sales as potential customers were constrained by persistent inflation. The overall healthcare sector underperformed the broader index, a departure from typical down years. More specifically, small-cap healthcare did not perform like a defensive sector. The repercussions of COVID-19 on the healthcare system lasted well beyond expectations. Many companies with new products or services faced challenges getting in front of decision makers or obtaining budget signoffs. Additionally, some potential customers were unable to hire the personnel necessary to accept, install, and implement new product platforms.
In many cases we felt the new product or service was superior and would gain traction in the marketplace, but that scenario was rarely realized. For example, Omnicell Inc. has what we view as a best-in-class solution for medication management that successfully gained share in past years. It hit a significant wall this period, however, due to budget constraints and facilities’ inability to implement new platforms while labor is scarce. As a result, previously
consistent revenues and bookings dried up for several quarters, visibility was lost, and we decided to sell the Fund’s position.
We decided to maintain our positions in some healthcare companies where we felt confident that competitive advantages remained compelling. In other instances, we exited our positions and moved on. We may renew those positions if and when sales visibility better matches our investment horizon. Through this environment, we still maintained our long-term philosophy of owning names with novel offerings that make healthcare more efficient and value based.
The IT sector has historically been a large driver of alpha (excess return relative to the benchmark) for the Fund, and we expect it to continue to be the most-favored sector from a fundamental growth perspective. Last year, however, was a correction year reflecting the macro factors mentioned above. We reduced our large overweight versus the index throughout the year as we exited less-seasoned companies and favored a higher-quality and more-profitable group of stocks. The result was performance that lagged the benchmark for the year, largely due to an overweight in software stocks and a disappointing earnings outlook for one of our communication stocks, Viavi Solutions Inc. The Fund benefited from several take-outs as private equity firms took advantage of lower stock prices to make strategic acquisitions. SailPoint Technologies Inc., ForgeRock Inc., and Switch Inc. were among the companies acquired but the gains were insufficient to offset several poorly performing software stocks including Domo Inc., Five9 Inc., and Varonis Systems Inc. However, semiconductors, led by Allegro MicroSystems Inc., positively contributed. The IT sector rallied strongly in the last quarter of the fiscal year, but that was not enough to offset the shortfall from the previous nine months.
The consumer discretionary, financials, communications, and industrials sectors were all positive for the fiscal year. Led by the consumer discretionary sector, strong stock gains from Fox Factory Holding Corp., Visteon Corp., and Texas Roadhouse Inc. drove a healthy gain for the Fund for the fiscal year. Consumer spending remained resilient throughout the year and the Fund positioned itself in a diversified group of high-quality leaders like those mentioned above. Kinsale Capital Group Inc. and Shift4 Payments Inc. were strong performers in the financials sector while Iridium Communications Inc. contributed in the communication services sector. The industrials sector contributed positively during the period, benefiting from advantageous stock selection. The industrials sector outperformed the market as a whole and our stock selection outperformed the sector. We had exposure to alternative energy, resource management, and electrification, which we think have plenty of demand and visibility going forward. While reducing the Fund’s exposure to areas only growing via cyclical inflation did not significantly contribute to performance, we believe that has the potential to benefit the portfolio as the economic cycle weakens.
| Portfolio management reviews |
| Delaware Ivy Smid Cap Core Fund | March 31, 2023 (Unaudited) |
| Performance preview (for the year ended March 31, 2023) | | |
| Delaware Ivy Smid Cap Core Fund (Class I shares) | 1-year return | -6.69% |
| Delaware Ivy Smid Cap Core Fund (Class A shares) | 1-year return | -7.02% |
| Russell 2500TM Index (benchmark) | 1-year return | -10.39% |
Past performance does not guarantee future results.
For complete, annualized performance for Delaware Ivy Smid Cap Core Fund, please see the table on page 95.
Class I shares are not subject to a sales charge and are offered for sale exclusively to certain eligible investors. In addition, Class I shares pay no distribution and service fee. The performance of Class A shares excludes the applicable sales charge. The performance of both Class I shares and Class A shares reflects the reinvestment of all distributions. Please see page 98 for a description of the index. Index performance returns do not reflect any management fees, transaction costs, or expenses. Indices are unmanaged and one cannot invest directly in an index.
Investment objective
The Fund seeks to provide capital appreciation.
Market review
Equity markets declined during the fiscal year ended March 31, 2023. During the fiscal year, small-cap stocks declined on average, underperforming mid-cap and large-cap stocks. The smaller-cap Russell 2000® Index declined 11.61% during the fiscal year and the Fund’s benchmark, the Russell 2500 Index declined 10.39%. The Russell Midcap® Index declined 8.78%, and the large-cap Russell 1000® Index was the strongest size segment, with a return of -8.39%. Small- to mid-cap value stocks performed roughly in line with small-to mid-cap growth stocks, as the Russell 2500TM Value Index declined 10.53% and the Russell 2500TM Growth Index declined 10.35%.
Sector-level performance within the Russell 2500 Index was mostly negative as only two sectors, capital goods and consumer staples advanced, and the other 14 declined. Companies in the real estate investment trust (REIT), media, technology, finance, and healthcare sectors performed the weakest for the year as each fell by more than 15%. The credit cyclicals, consumer services, business services, energy, transportation, consumer discretionary, basic materials, communications services, and utilities sectors in the benchmark declined for the year by less than 10%.
Real gross domestic product (GDP) increased 2.1% in 2022, compared with an increase of 5.9% in 2021. The FactSet economic consensus estimate for 2023 Real GDP is 1.0%, reflecting the potential for a recession during the year.
With respect to labor, the US unemployment rate ended March 2023 at 3.5%, which is not far from where it was at the start of the fiscal year, 3.6%, for March 2022. The National Federation of Independent Business (NFIB) Small Business Optimism Index, a composite of ten seasonally adjusted components that provides an indication of the health of small businesses in the US, has been below its 49-year average of 98 for 15 consecutive months, with a reading of 90.1 in March 2023. The Conference Board Consumer Confidence Index® which reflects prevailing business conditions and likely developments for the months ahead, decreased during the fiscal year, from a March 2022 reading of 107.6 to 104.2 in March 2023. The March Purchasing Manager’s Index (PMI) registered 46.3%, which indicated the manufacturing sector contracted for the fifth consecutive month, following a 28-month period of growth. Readings below 50% indicate contraction. For the 12 months ended March 31, 2023, the US Consumer Price Index (CPI) increased 5.0%, the smallest 12-month increase since the period ended May 31, 2021, as inflation cooled.
Source: Bloomberg, unless noted otherwise.
Within the Fund
For the fiscal year ended March 31, 2023, Delaware Ivy Smid Cap Core Fund declined, although it outperformed the Fund’s benchmark, the Russell 2500 Index which also declined. The Fund’s Class I shares declined 6.69%. The Fund’s Class A shares at net asset value (NAV) declined 7.02% and declined 12.35% at maximum offer price. These figures reflect all distributions reinvested. During the same period, the Fund’s benchmark declined 10.39%. For complete, annualized performance of Delaware Ivy Smid Cap Core Fund, please see the table on page 95.
Positive stock selection contributed to relative outperformance during the fiscal year. The Fund’s holdings in the consumer discretionary and credit cyclicals sectors advanced on average while those in the benchmark declined. The Fund’s holdings in the technology and healthcare sectors declined by less than those in the benchmark for the year. Stock selection detracted from performance in two sectors: capital goods and consumer staples.
In the energy sector, shares of Diamondback Energy Inc. outperformed as the company continued to improve its earnings and free cash flow profile. During the fiscal year, Diamondback increased its dividend and declared an additional variable cash dividend. Diamondback is committed to returning 75% of free cash flow to shareholders, using various methods including dividends, share repurchases, and debt paydowns. We maintained the Fund’s position in Diamondback as the company is a leader in low-cost operations,
has a high free cash flow yield, and management is committed to maximizing returns for shareholders.
Specialty contractor Quanta Services, Inc. was a top contributor for the fiscal year as the company delivered financial strength across its electric power, renewable energy, and underground utility infrastructure solutions business segments. Quanta’s fiscal year 2022 revenues and earnings were the company’s highest on record and management guided to fiscal 2023 growth. We maintained the Fund’s position in Quanta Services as we believe that the company offers attractive opportunities for investors to gain exposure to long-term secular growth trends.
The Fund’s positions in the consumer discretionary sector outperformed those in the benchmark for the fiscal year. Discount retailer Five Below, Inc. outperformed, as the company navigated the retail industry’s inventory issues well with minimal impact to its gross margins and continued strength in sales. Five Below sells high-quality toys, accessories, and electronics, with a focus on tweens and teens, with most items priced between $1 and $5. We maintained the Fund’s position in Five Below as the company sells high-quality items at a favorable price point while maintaining strong store economics.
In the software industry, shares of cyber-security analytics company Rapid7 Inc. underperformed during the fiscal year. Since we purchased Rapid7, it diversified its offerings to become a multi-pillar platform covering threat detection and response, cloud security, and vulnerability risk. Most of the decline in Rapid7’s share price occurred in May 2022, following the company’s fiscal first-quarter financial report, as management reduced its annualized recurring revenue (ARR) growth guidance on softening economic conditions. We continue to view Rapid7 as attractive, due to our positive view of its market opportunity and the traction in its broadening suite of what we view as best-in-class offerings.
In the medical products industry, shares of contract development and manufacturing company Catalent Inc. underperformed. Catalent’s fiscal fourth-quarter 2022 and first-quarter 2023 financial results were weaker than expected and its stock price reacted negatively to the reports. While the stock was pressured, Catalent’s guidance is conservative and reflects lower biologics revenue from its production of Moderna’s COVID-19 vaccine. We maintained the Fund’s position in Catalent as we think it has an impressive suite of products, is trading at a discounted valuation, and management has taken steps to position the company for organic growth.
The failures of Silicon Valley Bank and Signature Bank in March 2023 illustrated how quickly deposit outflows could result in a liquidity event. Consumers and corporations recognized the risk of having uninsured deposits, which created deposit outflows at certain banks. Western Alliance Bancorp was one of the banks which came under pressure as it was associated with Silicon Valley Bank due to Western Alliance Bancorp’s technology and innovation group. We exited the Fund’s position in Western Alliance Bancorp prior to the end of the fiscal year on increased risk.
At the end of the fiscal year, the Fund remained overweight the transportation, consumer discretionary, credit cyclicals, business services, and healthcare sectors. The Fund was overweight the finance, capital goods, and communications services sectors at the start of the fiscal year, and we reduced weight in those sectors ending the fiscal year underweight relative to the benchmark. The Fund remained underweight the utilities, technology, consumer services, and basic materials sectors.
We believe that the current market and economic environment should continue to support active management. In our opinion, we can take advantage of market conditions that have created valuation disconnects. We continue to maintain our strategy of investing in companies that we believe have strong balance sheets and cash flow, sustainable competitive advantages, and high-quality management teams with the potential to deliver value to shareholders. We appreciate your confidence and look forward to serving your investment needs in the next fiscal year.
| Portfolio management reviews |
| Delaware Ivy Systematic Emerging Markets Equity Fund | March 31, 2023 (Unaudited) |
| Performance preview (for the year ended March 31, 2023) | | |
| Delaware Ivy Systematic Emerging Markets Equity Fund (Class I shares) | 1-year return | -11.08% |
| Delaware Ivy Systematic Emerging Markets Equity Fund (Class A shares) | 1-year return | -11.42% |
| MSCI Emerging Markets Index (net) (benchmark) | 1-year return | -10.70% |
| MSCI Emerging Markets Index (gross) (benchmark) | 1-year return | -10.30% |
Past performance does not guarantee future results.
For complete, annualized performance for Delaware Ivy Systematic Emerging Markets Equity Fund, please see the table on page 99.
Class I shares are not subject to a sales charge and are offered for sale exclusively to certain eligible investors. In addition, Class I shares pay no distribution and service fee. The performance of Class A shares excludes the applicable sales charge. The performance of both Class I shares and Class A shares reflects the reinvestment of all distributions. Please see page 101 for a description of the index. Index performance returns do not reflect any management fees, transaction costs, or expenses. Indices are unmanaged and one cannot invest directly in an index.
Investment objective
The Fund seeks to provide growth of capital.
Market review
The MSCI Emerging Markets Index (net) declined 10.7% during the Fund’s fiscal year ended March 31, 2023, lagging the developed markets MSCI World Index (net), which fell 7.0% for the period.
Emerging market equities declined significantly in the first half of the fiscal year for three reasons. The ongoing conflict in Ukraine led to significant reductions of Russian oil and gas supplied to Europe, raising investors’ concern about economic growth in the region. China maintained its stringent stance on COVID-19, continuing lockdowns in major metropolitan areas and further dampening the region’s economic outlook. Monetary tightening by the US Federal Reserve showed no sign of abating, contributing to rising US bond yields and a strengthening US dollar.
Emerging markets reversed course in the second half of the period as China ended its zero-COVID policy, fueling investors’ optimism for an economic rebound. Performance in 2023 benefited from a weakening US dollar. The rally reversed in February as the Fed continued to express concern about high inflation, suggesting that interest rates might rise further. Additional factors denting investor sentiment included a dearth of stimulus measures at China’s “Two Sessions” meeting, escalating geopolitical tensions between China and the US, and unforeseen turmoil in the US and European banking sectors.
Source: Bloomberg, unless noted otherwise.
Within the Fund
For the fiscal year ended March 31, 2023, Delaware Ivy Systematic Emerging Markets Equity Fund Class I shares fell, underperforming the Fund’s benchmark, the MSCI Emerging Markets Index, which also fell. The Fund’s Class I shares declined 11.08%. The Fund’s Class A shares declined 11.42% at net asset value (NAV) and fell 16.53% at maximum offer price. These figures reflect all distributions reinvested. During the same period, the Fund’s benchmark fell 10.70% (net). For complete, annualized performance of Delaware Ivy Systematic Emerging Markets Equity Fund, please see the table on page 99.
Strong stock selection in Brazil, India, and South Korea contributed to the Fund’s relative performance for the fiscal year. Shares of Petróleo Brasileiro SA (Petrobras), AmBev SA, and Banco do Brasil SA outperformed in sympathy with improving sentiment for the Brazilian economy. In South Korea, shares of car companies Kia Corp. and Hyundai Motor Co. added to performance as the market focused on the companies’ improving product mix and stronger position in key markets. Both have strong and growing exposure to the Indian market, which surpassed 3.8 million vehicles in calendar year 2022.
The technology sector was the primary source of the Fund’s underperformance during the fiscal year. Amid growing evidence of softening demand for consumer electronics and some pullbacks in enterprise technology spending, several stocks in the Fund corrected significantly. The share prices of semiconductor-chip manufacturers, including Taiwan Semiconductor Manufacturing Co. Ltd., SK hynix Inc., and Samsung Electronics Co. Ltd., declined as investors anticipated weaker earnings.
During the fiscal year, the Fund’s use of foreign exchange (FX) currency positions had a limited effect. Overall, derivatives were immaterial to the Fund’s performance.
In our view, the near-term outlook remains clouded by a host of issues including US monetary policy, concern about global economic growth, and escalating geopolitical tension. As such, we believe market conditions are likely to remain volatile. Nonetheless, we do not believe that these uncertainties have derailed long-term growth opportunities underpinned by secular trends such as digitalization and consumption premiumization (consumers’ preference for high-quality, healthy, and premium products). Furthermore, we believe that
equity valuations across several pockets of the emerging markets universe appear attractive.
In this environment, we think a strategy that focuses on identifying what we view as high-quality companies, with positive operating momentum, at reasonable valuations, and without being captive to one specific style such as value or growth, should hold up better and potentially contribute to stronger long-term performance.
| Portfolio management reviews |
| Delaware Ivy Value Fund | March 31, 2023 (Unaudited) |
| Performance preview (for the year ended March 31, 2023) | | |
| Delaware Ivy Value Fund (Class I shares) | 1-year return | -6.25% |
| Delaware Ivy Value Fund (Class A shares) | 1-year return | -6.47% |
| Russell 1000® Value Index (benchmark) | 1-year return | -5.91% |
Past performance does not guarantee future results.
For complete, annualized performance for Delaware Ivy Value Fund, please see the table on page 102.
Class I shares are not subject to a sales charge and are offered for sale exclusively to certain eligible investors. In addition, Class I shares pay no distribution and service fee. The performance of Class A shares excludes the applicable sales charge. The performance of both Class I shares and Class A shares reflects the reinvestment of all distributions. Please see page 104 for a description of the index. Index performance returns do not reflect any management fees, transaction costs, or expenses. Indices are unmanaged and one cannot invest directly in an index.
Investment objective
The Fund seeks to provide capital appreciation.
Significant Fund event
The portfolio management team for the Fund changed effective December 5, 2022. Please read the latest prospectus, including the supplement dated December 5, 2022, for more information concerning this event.
Market review
US stocks were under pressure for much of the Fund’s fiscal year. There were several strong rallies during the 12-month period, but the stock market trend was broadly lower. Rising inflation, high interest rates, and their potential effect on consumer spending and economic growth appeared to unnerve investors. The war in Ukraine along with sanctions imposed by Western democracies against Russia created further disruption, straining energy markets and interfering with the post-pandemic global economic recovery. Toward the end of the Fund’s fiscal year, the failures of Silicon Valley Bank and Signature Bank added to an already volatile period. Investors’ fear about broader systemic risks and potential contagion in the US banking system caused a selloff in bank stocks, especially smaller and mid-sized institutions. In response, the US Federal Reserve created an emergency lending facility, the Bank Term Funding Program (BTFP), and guaranteed all deposits (insured and uninsured) at both banks to quell investors’ concern and minimize deposit risk elsewhere. As part of its program to combat inflation, the Fed raised the federal funds rate eight times during the fiscal year to a range between 4.75% and 5.00%.
As the end of the Fund’s fiscal year approached, inflation readings moderated, according to data from the Bureau of Economic Analysis. The Personal Consumption Expenditures Price Index (PCE) rose 5.0% in February from a year earlier, down from a high of 7.0% in June. The Core Personal Consumption Expenditures Price Index (Core PCE), the Fed’s preferred inflation gauge, which excludes food and energy prices, increased 4.6% in February year over year, down from highs of 5.4% in both February and March.
Source: Bloomberg, unless noted otherwise.
Within the Fund
For the fiscal year ended March 31, 2023, Delaware Ivy Value Fund underperformed its benchmark, the Russell 1000 Value Index, which also declined. The Fund’s Class I shares fell 6.25%. The Fund’s Class A shares declined 6.47% at net asset value (NAV) and declined 11.87% at maximum offer price.These figures reflect all distributions reinvested. During the same period, the Fund’s benchmark fell 5.91%. For complete, annualized performance of Delaware Ivy Value Fund, please see the table on page 102.
Following is a discussion about performance during the period from December 5, 2022, when the firm’s current portfolio management team began serving as the investment manager for the Fund, to March 31, 2023.
The Fund’s financials sector holdings were significant detractors during the period that the team managed the Fund. In March, the Fund’s two regional bank holdings, Truist Financial Corp. and US Bancorp, came under significant pressure following the failures of Silicon Valley Bank and Signature Bank. Our intent is to have a more defensive and less credit-sensitive positioning in financials as well as an underweight allocation compared with the benchmark. Despite being among the 10 largest banks in the US, Truist and US Bancorp sold off along with much of the group, reflecting investors’ concerns about net interest margins, potential deposit flight, and lingering fears of contagion. We believe the selloff was overdone. Both banks have solid fundamentals with diversified loan portfolios and deposit bases as well as strong capital positions. Looking ahead, we think credit conditions will become more challenging for banks and other credit-sensitive financials. Part of our rationale for holding Truist and US Bancorp is that they have historically been conservative loan underwriters and have diversified business models.
Information technology (IT) services provider Fidelity National Information Services Inc. was another significant detractor. In February 2023, the company announced that it would spin off its Merchant Solutions business (retail transaction processing) later this year as it seeks to unlock value by strengthening the strategic and operational focus across each of its business segments. Merchant Solutions represents about 30% of total revenue; the balance is in its Banking and Capital Markets business (Fidelity National Information Services processes data for financial institutions). We view the Banking and Capital Markets segment as an attractive business. It has high recurring revenue (more than 80%) and high client retention rates. The company has approximately 1,200 banking customers and no relationship represents more than 3% of revenue. In March 2023, the company’s shares came under pressure, trading down with regional banks following the government takeovers of Silicon Valley Bank and Signature Bank. The selloff appeared overdone to us. Fidelity National Information Services is not a bank and does not have credit or loan exposure. The handful of regional banks deemed “at risk” represented less than 1% of the company’s revenue and it is still getting paid on those contracts. Its stock currently trades at an all-time low price-to-earnings (P/E) ratio, and we believe the shares offer an attractive trade-off between potential upside and downside over our three- to five-year investment horizon.
Investments in the IT sector made the largest contribution to relative returns during the period that the team managed the Fund. Motorola Solutions Inc., a provider of mission-critical communication systems and analytics, including land mobile radios, command-center software, and video security equipment, was a leading contributor. In February, the company reported fourth-quarter 2022 revenue and earnings per share (EPS) that were ahead of expectations and issued guidance for the current quarter that was above consensus estimates. The environment for public-safety spending remains supportive and should hold up relatively well even in an economic downturn, in our view. Broadcom Inc., a provider of semiconductor and enterprise software solutions, was a strong contributor. The company reported solid results for the most-recent quarter. Revenue was in line with expectations, while EPS was ahead. Broadcom’s guidance for revenue and earnings in the coming quarter was modestly above consensus estimates. Broadcom continues to see steady demand for its products and highlighted artificial intelligence (AI) networking and the recovery in China as areas of strength.
Dover Corp., a diversified industrial products maker and solutions provider, was another notable contributor. Investors reacted positively to the company’s 2023 guidance presented during an earnings call in late January. Dover’s guidance for full-year EPS was ahead of Wall Street analysts’ consensus estimate, driven by stronger-than-expected organic growth along with positive pricing and cost inputs on the margin front. In addition, Dover called out a positive inflection in orders for biopharma connectors (a product used by biopharmaceutical manufacturers, and one of Dover’s highest margin businesses) after multiple quarters of sequential declines.
The Fund’s recent underperformance was largely attributable to our financial sector holdings, which experienced steep declines despite their strong capital positions, diversified business models, and comparably sound investment portfolios.
We think our focus on valuation and quality is especially appropriate right now. We don’t believe that last year’s bear market is over. The full effects of the Fed’s aggressive rate hikes on both the economy and corporate profits still lie ahead, in our view. Leading indicators such as housing, purchasing managers indexes (PMIs), and an inverted yield curve suggest that economic and market conditions will become more challenging. Banks are tightening lending standards, and consensus estimates for corporate earnings, while trending lower, still seem too optimistic to us. In the past, meaningful declines in earnings have presaged a bear market. In addition, the stock market has historically experienced significant declines during Fed easing cycles following the first rate cut. This doesn’t appear to be on most investors’ radar, in our view.
Performance summaries
| Delaware Global Value Equity Fund | March 31, 2023 (Unaudited) |
The performance quoted represents past performance and does not guarantee future results. Investment return and principal value of an investment will fluctuate so that shares, when redeemed, may be worth more or less than their original cost. Current performance may be lower or higher than the performance quoted. Performance data current to the most recent month end may be obtained by calling 800 523-1918 or visiting delawarefunds.com/performance.
| Fund and benchmark performance1,2 | Average annual total returns through March 31, 2023 |
| | 1 year | 5 year | 10 year | Lifetime |
| Class A (Est. June 4, 2012) | | | | |
| Excluding sales charge | +5.75% | +5.67% | +6.73% | — |
| Including sales charge | -0.36% | +4.43% | +6.10% | — |
| Class C (Est. June 4, 2012) | | | | |
| Excluding sales charge | +4.84% | +4.84% | +6.15% | — |
| Including sales charge | +4.21% | +4.84% | +6.15% | — |
| Class I (Est. June 4, 2012) | | | | |
| Excluding sales charge | +5.99% | +5.98% | +7.07% | — |
| Including sales charge | +5.99% | +5.98% | +7.07% | — |
| Class R (Est. December 19, 2012) | | | | |
| Excluding sales charge | +5.37% | +5.34% | +6.41% | — |
| Including sales charge | +5.37% | +5.34% | +6.41% | — |
| Class R6 (Est. July 31, 2014) | | | | |
| Excluding sales charge | +6.09% | +6.12% | — | +6.05% |
| Including sales charge | +6.09% | +6.12% | — | +6.05% |
| Class Y (Est. June 4, 2012) | | | | |
| Excluding sales charge | +5.74% | +5.69% | +6.80% | — |
| Including sales charge | +5.74% | +5.69% | +6.80% | — |
| MSCI World Index (net) | -7.02% | +8.01% | +8.85% | — |
| MSCI World Index (gross) | -6.54% | +8.57% | +9.44% | — |
1Returns reflect the reinvestment of all distributions and are presented both with and without the applicable sales charges described below. Returns do not reflect the deduction of taxes the shareholder would pay on Fund distributions or redemptions of Fund shares.
Expense limitations were in effect for certain classes during some or all of the periods shown in the “Fund and benchmark performance” table. Expenses for each class are listed in the “Fund expense ratios” table on page 45. Performance would have been lower had expense limitations not been in effect.
Class A shares are sold with a maximum front-end sales charge of 5.75%, and have an annual distribution and service (12b-1) fee of 0.25% of average daily net assets. Performance for Class A shares, excluding sales charges, assumes that no front-end sales charge applied.
Class C shares are sold with a contingent deferred sales charge (CDSC) of 1.00% if redeemed during the first 12 months. They are also subject to an annual 12b-1 fee of 1.00% of average daily net assets. Performance for Class C shares, excluding sales charges, assumes either that CDSCs did not apply or that the investment was not redeemed.
Class I shares are not subject to a sales charge and are offered for sale exclusively to certain eligible investors. In addition, Class I shares pay no 12b-1 fee.
Effective July 1, 2021, Class N shares were renamed Class R6 shares. Class R6 shares are available only to certain investors. In addition, Class R6 shares do not pay any service fees, sub-accounting fees, and/or sub-transfer agency fees to any brokers, dealers, or other financial intermediaries. Class R6 shares pay no 12b-1 fee.
Class R shares are available only for certain retirement plan products. They are sold without a sales charge and have an annual 12b-1 fee of 0.50% of average daily net assets.
Class Y shares are available only to certain investors. Class Y shares have an annual 12b-1 fee of 0.25% of average daily net assets.
International investments entail risks including fluctuation in currency values, differences in accounting principles, or economic or political instability. Investing in emerging markets can be riskier than investing in established foreign markets due to increased volatility, lower trading volume, and higher risk of market closures. In many emerging markets, there is substantially less publicly available information and the available information may be incomplete or misleading. Legal claims are generally more difficult to pursue.
The disruptions caused by natural disasters, pandemics, or similar events could prevent the Fund from executing advantageous investment decisions in a timely manner and could negatively impact the Fund’s ability to achieve its investment objective and the value of the Fund’s investments.
2The Fund’s expense ratios, as described in the most recent prospectus, are disclosed in the following “Fund expense ratios” table. The expense ratios below may differ from the expense ratios in the “Financial highlights” since they are based on different time periods and the expense ratios in the prospectus include acquired fund fees and expenses, if any. See Note 2 in “Notes to financial statements” for additional details. Please see the “Financial highlights” section in this report for the most recent expense ratios.
Fund expense
ratios | Class A | Class C | Class I | Class R | Class R6 | Class Y |
| Total annual operating expenses (without fee waivers) | 1.25% | 2.04% | 0.94% | 1.54% | 0.79% | 1.18% |
| Net expenses (including fee waivers, if any) | 1.17% | 1.92% | 0.92% | 1.42% | 0.79% | 1.17% |
| |
| Type of waiver | Contractual | Contractual | Contractual | Contractual | n/a | Contractual |
Performance summaries
Delaware Global Value Equity Fund
Performance of a $10,000 investment1
For the period March 31, 2013 through March 31, 2023

| | | | |
| | | Starting value | Ending value |
 | MSCI World Index (gross) | $10,000 | $24,641 |
 | MSCI World Index (net) | $10,000 | $23,357 |
 | Delaware Global Value Equity Fund - Class I shares | $10,000 | $19,809 |
 | Delaware Global Value Equity Fund - Class A shares | $ 9,425 | $18,072 |
1The “Performance of a $10,000 investment” graph assumes $10,000 invested in Class I and Class A shares of the Fund on March 31, 2013, and includes the effect of a 5.75% front-end sales charge (for Class A shares) and the reinvestment of all distributions. The graph does not reflect the deduction of taxes the shareholders would pay on Fund distributions or redemptions of Fund shares. Expense limitations may have been in effect for some or all of the periods shown. Performance would have been lower had expense limitations not been in effect. Expenses are listed in the “Fund expense ratios” table on page 45. Please note additional details on pages 44 through 46.
The graph also assumes $10,000 invested in the MSCI World Index as of March 31, 2013. The MSCI World Index represents large- and mid-cap stocks across 23 developed market countries worldwide. The index covers approximately 85% of the free float-adjusted market capitalization in each country. Index “net” return approximates the minimum possible dividend reinvestment, after deduction of withholding tax at the highest possible rate. Index “gross” return approximates the maximum possible dividend reinvestment.
Index performance returns do not reflect any management fees, transaction costs, or expenses. Indices are unmanaged and one cannot invest directly in an index. Past performance does not guarantee future results.
Performance of other Fund classes will vary due to different charges and expenses.
| | Nasdaq
symbols | | CUSIPs | |
| Class A | IBIAX | | 465899631 | |
| Class C | IBICX | | 465899615 | |
| Class I | IBIIX | | 465899599 | |
| Class R | IYGEX | | 465899458 | |
| Class R6 | IICNX | | 46600A864 | |
| Class Y | IBIYX | | 465899581 | |
Performance summaries
| Delaware Ivy Core Bond Fund | March 31, 2023 (Unaudited) |
The performance quoted represents past performance and does not guarantee future results. Investment return and principal value of an investment will fluctuate so that shares, when redeemed, may be worth more or less than their original cost. Current performance may be lower or higher than the performance quoted. Performance data current to the most recent month end may be obtained by calling 800 523-1918 or visiting delawarefunds.com/performance.
| Fund and benchmark performance1,2 | Average annual total returns through March 31, 2023 |
| | 1 year | 5 year | 10 year | Lifetime |
| Class A (Est. August 14, 1987) | | | | |
| Excluding sales charge | -4.91% | +0.73% | +1.54% | — |
| Including sales charge | -9.21% | -0.45% | +0.94% | — |
| Class C (Est. December 8, 2003) | | | | |
| Excluding sales charge | -5.69% | -0.03% | +0.93% | — |
| Including sales charge | -6.61% | -0.03% | +0.93% | — |
| Class I (Est. April 2, 2007) | | | | |
| Excluding sales charge | -4.61% | +1.16% | +1.93% | — |
| Including sales charge | -4.61% | +1.16% | +1.93% | — |
| Class R (Est. December 19, 2012) | | | | |
| Excluding sales charge | -5.17% | +0.43% | +1.24% | — |
| Including sales charge | -5.17% | +0.43% | +1.24% | — |
| Class R6 (Est. July 31, 2014) | | | | |
| Excluding sales charge | -4.60% | +1.16% | — | +1.93% |
| Including sales charge | -4.60% | +1.16% | — | +1.93% |
| Class Y (Est. December 8, 2003) | | | | |
| Excluding sales charge | -4.90% | +0.76% | +1.58% | — |
| Including sales charge | -4.90% | +0.76% | +1.58% | — |
| Bloomberg US Aggregate Index | -4.78% | +0.91% | +1.36% | — |
1Returns reflect the reinvestment of all distributions and are presented both with and without the applicable sales charges described below. Returns do not reflect the deduction of taxes the shareholder would pay on Fund distributions or redemptions of Fund shares.
Expense limitations were in effect for certain classes during some or all of the periods shown in the “Fund and benchmark performance” table. Expenses for each class are listed on the “Fund expense ratios” table on page 48. Performance would have been lower had expense limitations not been in effect.
Class A shares are sold with a maximum front-end sales charge of 4.50%, and have an annual distribution and service (12b-1) fee of 0.25% of average daily net assets. Performance for Class A shares, excluding sales charges, assumes that no front-end sales charge applied. Effective July 1, 2021, the maximum front-end sales charge imposed on purchases for Class A shares changed from 5.75% to 4.50%.
Class C shares are sold with a contingent deferred sales charge (CDSC) of 1.00% if redeemed during the first 12 months. They are also subject to an annual 12b-1 fee of 1.00% of average daily net assets. Performance for Class C shares, excluding sales charges, assumes either that CDSCs did not apply or that the investment was not redeemed.
Class I shares are not subject to a sales charge and are offered for sale exclusively to certain eligible investors. In addition, Class I shares pay no 12b-1 fee.
Effective July 1, 2021, Class N shares were renamed Class R6 shares. Class R6 shares are available only to certain investors. In addition, Class R6 shares do not pay any service fees, sub-accounting fees, and/or sub-transfer agency fees to any brokers, dealers, or other financial intermediaries. Class R6 shares pay no 12b-1 fee.
Performance summaries
Delaware Ivy Core Bond Fund
Class R shares are available only for certain retirement plan products. They are sold without a sales charge and have an annual 12b-1 fee of 0.50% of average daily net assets.
Class Y shares are available only to certain investors. Class Y shares have an annual 12b-1 fee of 0.25% of average daily net assets.
Fixed income securities and bond funds can lose value, and investors can lose principal, as interest rates rise. They also may be affected by economic conditions that hinder an issuer’s ability to make interest and principal payments on its debt. This includes prepayment risk, the risk that the principal of a bond that is held by a portfolio will be prepaid prior to maturity, at the time when interest rates are lower than what the bond was paying. A portfolio may then have to reinvest that money at a lower interest rate.
High yielding, non-investment-grade bonds (junk bonds) involve higher risk than investment grade bonds. The high yield secondary market is particularly susceptible to liquidity problems when institutional investors, such as mutual funds and certain other financial institutions, temporarily stop buying bonds for regulatory, financial, or other reasons. In addition, a less liquid secondary market makes it more difficult to obtain precise valuations of the high yield securities.
The disruptions caused by natural disasters, pandemics, or similar events could prevent the Fund from executing advantageous investment decisions in a timely manner and could negatively impact the Fund’s ability to achieve its investment objective and the value of the Fund’s investments.
IBOR risk is the risk that changes related to the use of the London interbank offered rate (LIBOR) or similar rates (such as EONIA) could have adverse impacts on financial instruments that reference these rates. The abandonment of these rates and transition to alternative rates could affect the value and liquidity of instruments that reference them and could affect investment strategy performance.
2The Fund’s expense ratios, as described in the most recent prospectus, are disclosed in the following “Fund expense ratios” table. The expense ratios below may differ from the expense ratios in the “Financial highlights” since they are based on different time periods and the expense ratios in the prospectus include acquired fund fees and expenses, if any. See Note 2 in “Notes to financial statements” for additional details. Please see the “Financial highlights” section in this report for the most recent expense ratios.
Fund expense
ratios | Class A | Class C | Class I | Class R | Class R6 | Class Y |
| Total annual operating expenses (without fee waivers) | 0.98% | 1.76% | 0.71% | 1.34% | 0.58% | 0.99% |
| Net expenses (including fee waivers, if any) | 0.70% | 1.45% | 0.45% | 0.95% | 0.45% | 0.70% |
| |
| Type of waiver | Contractual | Contractual | Contractual | Contractual | Contractual | Contractual |
Performance of a $10,000 investment1
For the period March 31, 2013 through March 31, 2023
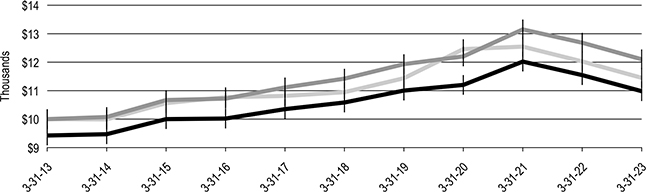
| | | | |
| | | Starting value | Ending value |
| Delaware Ivy Core Bond Fund - Class I shares | $10,000 | $12,102 |
| Bloomberg US Aggregate Index | $10,000 | $11,451 |
| Delaware Ivy Core Bond Fund - Class A shares | $ 9,425 | $10,981 |
1The “Performance of a $10,000 investment” graph assumes $10,000 invested in Class I and Class A shares of the Fund on March 31, 2013, and includes the effect of a 5.75% front-end sales charge (for Class A shares) and the reinvestment of all distributions. Effective July 1, 2021, the maximum front-end sales charge imposed on purchases for Class A shares changed from 5.75% to 4.50%. The graph does not reflect the deduction of taxes the shareholders would pay on Fund distributions or redemptions of Fund shares. Expense limitations may have been in effect for some or all of the periods shown. Performance would have been lower had expense limitations not been in effect. Expenses are listed in the “Fund expense ratios” table on page 48. Please note additional details on pages 47 through 49.
The graph also assumes $10,000 invested in the Bloomberg US Aggregate Index as of March 31, 2013. The Bloomberg US Aggregate Index is a broad-based benchmark that measures the investment grade, US dollar-denominated, fixed-rate taxable bond market.
Index performance returns do not reflect any management fees, transaction costs, or expenses. Indices are unmanaged and one cannot invest directly in an index. Past performance does not guarantee future results.
Performance of other Fund classes will vary due to different charges and expenses.
| | Nasdaq
symbols | | CUSIPs | |
| Class A | IBOAX | | 465898344 | |
| Class C | IBOCX | | 465898328 | |
| Class I | IVBIX | | 465897775 | |
| Class R | IYBDX | | 465899524 | |
| Class R6 | IBNDX | | 46600A302 | |
| Class Y | IBOYX | | 465898575 | |
Performance summaries
| Delaware Ivy Core Equity Fund | March 31, 2023 (Unaudited) |
The performance quoted represents past performance and does not guarantee future results. Investment return and principal value of an investment will fluctuate so that shares, when redeemed, may be worth more or less than their original cost. Current performance may be lower or higher than the performance quoted. Performance data current to the most recent month end may be obtained by calling 800 523-1918 or visiting delawarefunds.com/performance.
| Fund and benchmark performance1,2 | Average annual total returns through March 31, 2023 |
| | 1 year | 5 year | 10 year | Lifetime |
| Class A (Est. July 3, 2000) | | | | |
| Excluding sales charge | -6.71% | +11.25% | +10.95% | — |
| Including sales charge | -12.06% | +9.94% | +10.30% | — |
| Class C (Est. September 21, 1992) | | | | |
| Excluding sales charge | -7.48% | +10.31% | +10.24% | — |
| Including sales charge | -8.26% | +10.31% | +10.24% | — |
| Class I (Est. April 2, 2007) | | | | |
| Excluding sales charge | -6.46% | +11.48% | +11.23% | — |
| Including sales charge | -6.46% | +11.48% | +11.23% | — |
| Class R (Est. December 19, 2012) | | | | |
| Excluding sales charge | -6.98% | +10.84% | +10.55% | — |
| Including sales charge | -6.98% | +10.84% | +10.55% | — |
| Class R6 (Est. July 31, 2014) | | | | |
| Excluding sales charge | -6.44% | +11.64% | — | +10.18% |
| Including sales charge | -6.44% | +11.64% | — | +10.18% |
| Class Y (Est. December 29, 1995) | | | | |
| Excluding sales charge | -6.63% | +11.41% | +11.20% | — |
| Including sales charge | -6.63% | +11.41% | +11.20% | — |
| S&P 500 Index | -7.73% | +11.19% | +12.24% | — |
1Returns reflect the reinvestment of all distributions and are presented both with and without the applicable sales charges described below. Returns do not reflect the deduction of taxes the shareholder would pay on Fund distributions or redemptions of Fund shares.
Expense limitations were in effect for certain classes during some or all of the periods shown in the “Fund and benchmark performance” table. Expenses for each class are listed in the “Fund expense ratios” table on page 51. Performance would have been lower had expense limitations not been in effect.
Class A shares are sold with a maximum front-end sales charge of 5.75%, and have an annual distribution and service (12b-1) fee of 0.25% of average daily net assets. Performance for Class A shares, excluding sales charges, assumes that no front-end sales charge applied.
Class C shares are sold with a contingent deferred sales charge (CDSC) of 1.00% if redeemed during the first 12 months. They are also subject to an annual 12b-1 fee of 1.00% of average daily net assets. Performance for Class C shares, excluding sales charges, assumes either that CDSCs did not apply or that the investment was not redeemed.
Class I shares are not subject to a sales charge and are offered for sale exclusively to certain eligible investors. In addition, Class I shares pay no 12b-1 fee.
Effective July 1, 2021, Class N shares were renamed Class R6 shares. Class R6 shares are available only to certain investors. In addition, Class R6 shares do not pay any service fees, sub-accounting fees, and/or sub-transfer agency fees to any brokers, dealers, or other financial intermediaries. Class R6 shares pay no 12b-1 fee.
Class R shares are available only for certain retirement plan products. They are sold without a sales charge and have an annual 12b-1 fee of 0.50% of average daily net assets.
Class Y shares are available only to certain investors. Class Y shares have an annual 12b-1 fee of 0.25% of average daily net assets.
Risk is increased in a concentrated portfolio since it holds a limited number of securities with each investment having a greater effect on the overall performance.
The disruptions caused by natural disasters, pandemics, or similar events could prevent the Fund from executing advantageous investment decisions in a timely manner and could negatively impact the Fund’s ability to achieve its investment objective and the value of the Fund’s investments.
2The Fund’s expense ratios, as described in the most recent prospectus, are disclosed in the following “Fund expense ratios” table. The expense ratios below may differ from the expense ratios in the “Financial highlights” since they are based on different time periods and the expense ratios in the prospectus include acquired fund fees and expenses, if any. See Note 2 in “Notes to financial statements” for additional details. Please see the “Financial highlights” section in this report for the most recent expense ratios.
| | | | | | | |
Fund expense
ratios | Class A | Class C | Class I | Class R | Class R6 | Class Y |
| Total annual operating expenses (without fee waivers) | 0.97% | 1.85% | 0.79% | 1.39% | 0.64% | 1.04% |
| Net expenses (including fee waivers, if any) | 0.97% | 1.75% | 0.75% | 1.25% | 0.64% | 1.00% |
| |
| Type of waiver | Contractual | Contractual | Contractual | Contractual | Contractual | Contractual |
Performance summaries
Delaware Ivy Core Equity Fund
Performance of a $10,000 investment1
For the period March 31, 2013 through March 31, 2023

| | | | |
| | | Starting value | Ending value |
| S&P 500 Index | $10,000 | $31,736 |
| Delaware Ivy Core Equity Fund - Class I shares | $10,000 | $28,992 |
| Delaware Ivy Core Equity Fund - Class A shares | $ 9,425 | $26,646 |
1The “Performance of a $10,000 investment” graph assumes $10,000 invested in Class I and Class A shares of the Fund on March 31, 2013, and includes the effect of a 5.75% front-end sales charge (for Class A shares) and the reinvestment of all distributions. The graph does not reflect the deduction of taxes the shareholders would pay on Fund distributions or redemptions of Fund shares. Expense limitations may have been in effect for some or all of the periods shown. Performance would have been lower had expense limitations not been in effect. Expenses are listed in the “Fund expense ratios” table on page 51. Please note additional details on pages 50 through 52.
The graph also assumes $10,000 invested in the S&P 500 Index as of March 31, 2013. The S&P 500 Index measures the performance of 500 mostly large-cap stocks weighted by market value, and is often used to represent performance of the US stock market.
Index performance returns do not reflect any management fees, transaction costs, or expenses. Indices are unmanaged and one cannot invest directly in an index. Past performance does not guarantee future results.
Performance of other Fund classes will vary due to different charges and expenses.
| | Nasdaq
symbols | | CUSIPs | |
| Class A | WCEAX | | 466000106 | |
| Class C | WTRCX | | 466000304 | |
| Class I | ICIEX | | 466000163 | |
| Class R | IYCEX | | 465899573 | |
| Class R6 | ICEQX | | 46600A401 | |
| Class Y | WCEYX | | 466000403 | |
Performance summaries
| Delaware Ivy Global Bond Fund | March 31, 2023 (Unaudited) |
The performance quoted represents past performance and does not guarantee future results. Investment return and principal value of an investment will fluctuate so that shares, when redeemed, may be worth more or less than their original cost. Current performance may be lower or higher than the performance quoted. Performance data current to the most recent month end may be obtained by calling 800 523-1918 or visiting delawarefunds.com/performance.
| Fund and benchmark performance1,2 | Average annual total returns through March 31, 2023 |
| | 1 year | 5 year | 10 year | Lifetime |
| Class A (Est. April 4, 2008) | | | | |
| Excluding sales charge | -2.00% | +1.42% | +1.54% | — |
| Including sales charge | -6.40% | +0.23% | +0.94% | — |
| Class C (Est. April 4, 2008) | | | | |
| Excluding sales charge | -2.68% | +0.68% | +0.92% | — |
| Including sales charge | -3.63% | +0.68% | +0.92% | — |
| Class I (Est. April 4, 2008) | | | | |
| Excluding sales charge | -1.76% | +1.66% | +1.79% | — |
| Including sales charge | -1.76% | +1.66% | +1.79% | — |
| Class R (Est. December 19, 2012) | | | | |
| Excluding sales charge | -2.31% | +0.95% | +1.06% | — |
| Including sales charge | -2.31% | +0.95% | +1.06% | — |
| Class R6 (Est. July 31, 2014) | | | | |
| Excluding sales charge | -1.75% | +1.69% | — | +1.62% |
| Including sales charge | -1.75% | +1.69% | — | +1.62% |
| Class Y (Est. April 4, 2008) | | | | |
| Excluding sales charge | -2.06% | +1.41% | +1.53% | — |
| Including sales charge | -2.06% | +1.41% | +1.53% | — |
| Bloomberg 1-10 Year Global Aggregate Index Hedged USD | -1.59% | +1.20% | +1.66% | — |
1Returns reflect the reinvestment of all distributions and are presented both with and without the applicable sales charges described below. Returns do not reflect the deduction of taxes the shareholder would pay on Fund distributions or redemptions of Fund shares.
Expense limitations were in effect for certain classes during some or all of the periods shown in the “Fund and benchmark performance” table. Expenses for each class are listed in the “Fund expense ratios” table on page 54. Performance would have been lower had expense limitations not been in effect.
Class A shares are sold with a maximum front-end sales charge of 4.50%, and have an annual distribution and service (12b-1) fee of 0.25% of average daily net assets. Performance for Class A shares, excluding sales charges, assumes that no front-end sales charge applied. Effective July 1, 2021, the maximum sales charge imposed on purchases for Class A shares changed from 5.75% to 4.50%.
Class C shares are sold with a contingent deferred sales charge (CDSC) of 1.00% if redeemed during the first 12 months. They are also subject to an annual 12b-1 fee of 1.00% of average daily net assets. Performance for Class C shares, excluding sales charges, assumes either that CDSCs did not apply or that the investment was not redeemed.
Class I shares are not subject to a sales charge and are offered for sale exclusively to certain eligible investors. In addition, Class I shares pay no 12b-1 fee.
Effective July 1, 2021, Class N shares were renamed Class R6 shares. Class R6 shares are available only to certain investors. In addition, Class R6 shares do not pay any service fees, sub-accounting fees, and/or sub-transfer agency fees to any brokers, dealers, or other financial intermediaries. Class R6 shares pay no 12b-1 fee.
Performance summaries
Delaware Ivy Global Bond Fund
Class R shares are available only for certain retirement plan products. They are sold without a sales charge and have an annual 12b-1 fee of 0.50% of average daily net assets.
Class Y shares are available only to certain investors. Class Y shares have an annual 12b-1 fee of 0.25% of average daily net assets.
Fixed income securities and bond funds can lose value, and investors can lose principal, as interest rates rise. They also may be affected by economic conditions that hinder an issuer’s ability to make interest and principal payments on its debt. This includes prepayment risk, the risk that the principal of a bond that is held by a portfolio will be prepaid prior to maturity, at the time when interest rates are lower than what the bond was paying. A portfolio may then have to reinvest that money at a lower interest rate.
High yielding, non-investment-grade bonds (junk bonds) involve higher risk than investment grade bonds. The high yield secondary market is particularly susceptible to liquidity problems when institutional investors, such as mutual funds and certain other financial institutions, temporarily stop buying bonds for regulatory, financial, or other reasons. In addition, a less liquid secondary market makes it more difficult to obtain precise valuations of the high yield securities.
International investments entail risks including fluctuation in currency values, differences in accounting principles, or economic or political instability. Investing in emerging markets can be riskier than investing in established foreign markets due to increased volatility, lower trading volume, and higher risk of market closures. In many emerging markets, there is substantially less publicly available information and the available information may be incomplete or misleading. Legal claims are generally more difficult to pursue.
IBOR risk is the risk that changes related to the use of the London interbank offered rate (LIBOR) or similar rates (such as EONIA) could have adverse impacts on financial instruments that reference these rates. The abandonment of these rates and transition to alternative rates could affect the value and liquidity of instruments that reference them and could affect investment strategy performance.
The disruptions caused by natural disasters, pandemics, or similar events could prevent the Fund from executing advantageous investment decisions in a timely manner and could negatively impact the Fund’s ability to achieve its investment objective and the value of the Fund’s investments.
2The Fund’s expense ratios, as described in the most recent prospectus, are disclosed in the following “Fund expense ratios” table. The expense ratios below may differ from the expense ratios in the “Financial highlights” since they are based on different time periods and the expense ratios in the prospectus include acquired fund fees and expenses, if any. See Note 2 in “Notes to financial statements” for additional details. Please see the “Financial highlights” section in this report for the most recent expense ratios.
Fund expense
ratios | Class A | Class C | Class I | Class R | Class R6 | Class Y |
| Total annual operating expenses (without fee waivers) | 1.19% | 1.97% | 0.86% | 1.45% | 0.70% | 1.11% |
| Net expenses (including fee waivers, if any) | 0.96% | 1.71% | 0.71% | 1.21% | 0.70% | 0.96% |
| |
| Type of waiver | Contractual | Contractual | Contractual | Contractual | Contractual | Contractual |
Performance of a $10,000 investment1
For the period March 31, 2013 through March 31, 2023
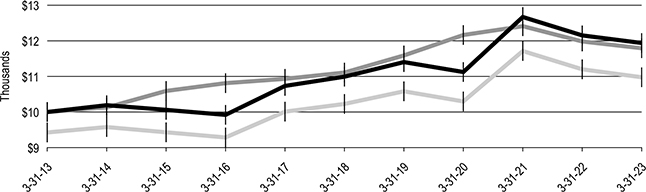
| | | | |
| | | Starting value | Ending value |
| Delaware Ivy Global Bond Fund - Class I shares | $10,000 | $11,939 |
| Bloomberg 1-10 Year Global Aggregate Index Hedged USD | $10,000 | $11,793 |
| Delaware Ivy Global Bond Fund - Class A shares | $ 9,425 | $10,977 |
1The “Performance of a $10,000 investment” graph assumes $10,000 invested in Class I and Class A shares of the Fund on March 31, 2013, and includes the effect of a 5.75% front-end sales charge (for Class A shares) and the reinvestment of all distributions. Effective July 1, 2021, the maximum sales charge imposed on purchases for Class A shares changed from 5.75% to 4.50%. The graph does not reflect the deduction of taxes the shareholders would pay on Fund distributions or redemptions of Fund shares. Expense limitations may have been in effect for some or all of the periods shown. Performance would have been lower had expense limitations not been in effect. Expenses are listed in the “Fund expense ratios” table on page 54. Please note additional details on pages 53 through 56.
The graph also assumes $10,000 invested in the Bloomberg 1-10 Year Global Aggregate Index Hedged USD Index as of March 31, 2013. The Bloomberg 1-10 Year Global Aggregate Index Hedged USD provides a broad-based measure of the global investment grade fixed-rate debt market with a maturity of greater than 1 year and less than 10 years. Index returns are currency-hedged, and adjustments are made to the par amount outstanding of bonds for holdings of central governments that are publicly available.
The Bloomberg Global Aggregate Index Hedged USD, mentioned on page 9, provides a broad-based measure of global investment grade fixed-rate debt markets. Index returns are currency-hedged, and adjustments are made to the par amount outstanding of bonds for holdings of central governments that are publicly available.
The US Consumer Price Index (CPI), mentioned on page 9, is a measure of inflation that is calculated by the US Department of Labor, representing changes in prices of all goods and services purchased for consumption by urban households.
Index performance returns do not reflect any management fees, transaction costs, or expenses. Indices are unmanaged and one cannot invest directly in an index. Past performance does not guarantee future results.
Performance of other Fund classes will vary due to different charges and expenses.
Performance summaries
Delaware Ivy Global Bond Fund
| | Nasdaq
symbols | | CUSIPs | |
| Class A | IVSAX | | 465899748 | |
| Class C | IVSCX | | 465899722 | |
| Class I | IVSIX | | 465899714 | |
| Class R | IYGOX | | 465899516 | |
| Class R6 | IVBDX | | 46600A872 | |
| Class Y | IVSYX | | 465899698 | |
Performance summaries
| Delaware Ivy Global Growth Fund | March 31, 2023 (Unaudited) |
The performance quoted represents past performance and does not guarantee future results. Investment return and principal value of an investment will fluctuate so that shares, when redeemed, may be worth more or less than their original cost. Current performance may be lower or higher than the performance quoted. Performance data current to the most recent month end may be obtained by calling 800 523-1918 or visiting delawarefunds.com/performance.
| Fund and benchmark performance1,2 | Average annual total returns through March 31, 2023 |
| | 1 year | 5 year | 10 year | Lifetime |
| Class A (Est. April 30, 1986) | | | | |
| Excluding sales charge | -4.48% | +7.16% | +7.70% | — |
| Including sales charge | -9.97% | +5.90% | +7.07% | — |
| Class C (Est. April 30, 1996) | | | | |
| Excluding sales charge | -5.30% | +6.23% | +7.02% | — |
| Including sales charge | -5.72% | +6.23% | +7.02% | — |
| Class I (Est. April 2, 2007) | | | | |
| Excluding sales charge | -4.24%* | +7.45% | +8.04% | — |
| Including sales charge | -4.24% | +7.45% | +8.04% | — |
| Class R (Est. December 19, 2012) | | | | |
| Excluding sales charge | -4.74% | +6.82% | +7.40% | — |
| Including sales charge | -4.74% | +6.82% | +7.40% | — |
| Class R6 (Est. July 31, 2014) | | | | |
| Excluding sales charge | -4.18%* | +7.58% | — | +7.15% |
| Including sales charge | -4.18% | +7.58% | — | +7.15% |
| Class Y (Est. July 24, 2003) | | | | |
| Excluding sales charge | -4.50% | +7.17% | +7.76% | — |
| Including sales charge | -4.50% | +7.17% | +7.76% | — |
| MSCI ACWI Index (net) | -7.44% | +6.93% | +8.06% | — |
| MSCI ACWI Index (gross) | -6.96% | +7.46% | +8.62% | — |
*Total returns for the report period presented in the table differs from the return in “Financial highlights.” The total returns presented in the above table are calculated based on the net asset value (NAV) at which shareholder transactions were processed. The total returns presented in “Financial highlights” are calculated in the same manner, but also takes into account certain adjustments that are necessary under US generally accepted accounting principles required in the annual report.
1Returns reflect the reinvestment of all distributions and are presented both with and without the applicable sales charges described below. Returns do not reflect the deduction of taxes the shareholder would pay on Fund distributions or redemptions of Fund shares.
Expense limitations were in effect for certain classes during some or all of the periods shown in the “Fund and benchmark performance” table. Expenses for each class are listed in the “Fund expense ratios” table on page 58. Performance would have been lower had expense limitations not been in effect.
Class A shares are sold with a maximum front-end sales charge of 5.75%, and have an annual distribution and service (12b-1) fee of 0.25% of average daily net assets. Performance for Class A shares, excluding sales charges, assumes that no front-end sales charge applied.
Class C shares are sold with a contingent deferred sales charge (CDSC) of 1.00% if redeemed during the first 12 months. They are also subject to an annual 12b-1 fee of 1.00% of average daily net assets. Performance for Class C shares, excluding sales charges, assumes either that CDSCs did not apply or that the investment was not redeemed.
Class I shares are not subject to a sales charge and are offered for sale exclusively to certain eligible investors. In addition, Class I shares pay no 12b-1 fee.
Performance summaries
Delaware Ivy Global Growth Fund
Effective July 1, 2021, Class N shares were renamed Class R6 shares. Class R6 shares are available only to certain investors. In addition, Class R6 shares do not pay any service fees, sub-accounting fees, and/or sub-transfer agency fees to any brokers, dealers, or other financial intermediaries. Class R6 shares pay no 12b-1 fee.
Class R shares are available only for certain retirement plan products. They are sold without a sales charge and have an annual 12b-1 fee of 0.50% of average daily net assets.
Class Y shares are available only to certain investors. Class Y shares have an annual 12b-1 fee of 0.25% of average daily net assets.
International investments entail risks including fluctuation in currency values, differences in accounting principles, or economic or political instability. Investing in emerging markets can be riskier than investing in established foreign markets due to increased volatility, lower trading volume, and higher risk of market closures. In many emerging markets, there is substantially less publicly available information and the available information may be incomplete or misleading. Legal claims are generally more difficult to pursue.
Risk is increased in a concentrated portfolio since it holds a limited number of securities with each investment having a greater effect on the overall performance.
The disruptions caused by natural disasters, pandemics, or similar events could prevent the Fund from executing advantageous investment decisions in a timely manner and could negatively impact the Fund’s ability to achieve its investment objective and the value of the Fund’s investments.
2The Fund’s expense ratios, as described in the most recent prospectus, are disclosed in the following “Fund expense ratios” table. The expense ratios below may differ from the expense ratios in the “Financial highlights” since they are based on different time periods and the expense ratios in the prospectus include acquired fund fees and expenses, if any. See Note 2 in “Notes to financial statements” for additional details. Please see the “Financial highlights” section in this report for the most recent expense ratios.
Fund expense
ratios | Class A | Class C | Class I | Class R | Class R6 | Class Y |
| Total annual operating expenses (without fee waivers) | 1.27% | 2.22% | 1.07% | 1.66% | 0.91% | 1.32% |
| Net expenses (including fee waivers, if any) | 1.21% | 1.97% | 0.97% | 1.47% | 0.91% | 1.22% |
| |
| Type of waiver | Contractual | Contractual | Contractual | Contractual | Contractual | Contractual |
Performance of a $10,000 investment1
For the period March 31, 2013 through March 31, 2023

| | | | |
| | | Starting value | Ending value |
| MSCI ACWI Index (gross) | $10,000 | $22,859 |
| MSCI ACWI Index (net) | $10,000 | $21,708 |
| Delaware Ivy Global Growth Fund - Class I shares | $10,000 | $21,677 |
| Delaware Ivy Global Growth Fund - Class A shares | $ 9,425 | $19,796 |
1The “Performance of a $10,000 investment” graph assumes $10,000 invested in Class I and Class A shares of the Fund on March 31, 2013, and includes the effect of a 5.75% front-end sales charge (for Class A shares) and the reinvestment of all distributions. The graph does not reflect the deduction of taxes the shareholders would pay on Fund distributions or redemptions of Fund shares. Expense limitations may have been in effect for some or all of the periods shown. Performance would have been lower had expense limitations not been in effect. Expenses are listed in the “Fund expense ratios” table on page 58. Please note additional details on pages 57 through 59.
The graph also assumes $10,000 invested in the MSCI ACWI Index as of March 31, 2013. The MSCI ACWI (All Country World Index) represents large- and mid-cap stocks across developed and emerging markets worldwide. The index covers approximately 85% of the global investable equity opportunity set. Index “net” return approximates the minimum possible dividend reinvestment, after deduction of withholding tax at the highest possible rate. Index “gross” return approximates the maximum possible dividend reinvestment.
Index performance returns do not reflect any management fees, transaction costs, or expenses. Indices are unmanaged and one cannot invest directly in an index. Past performance does not guarantee future results.
Performance of other Fund classes will vary due to different charges and expenses.
| | Nasdaq
symbols | | CUSIPs | |
| Class A | IVINX | | 465897502 | |
| Class C | IVNCX | | 465897585 | |
| Class I | IGIIX | | 465898724 | |
| Class R | IYIGX | | 465899425 | |
| Class R6 | ITGRX | | 46600A815 | |
| Class Y | IVIYX | | 465897114 | |
Performance summaries
| Delaware Ivy High Income Fund | March 31, 2023 (Unaudited) |
The performance quoted represents past performance and does not guarantee future results. Investment return and principal value of an investment will fluctuate so that shares, when redeemed, may be worth more or less than their original cost. Current performance may be lower or higher than the performance quoted. Performance data current to the most recent month end may be obtained by calling 800 523-1918 or visiting delawarefunds.com/performance.
| Fund and benchmark performance1,2 | Average annual total returns through March 31, 2023 |
| | 1 year | 5 year | 10 year | Lifetime |
| Class A (Est. July 3, 2000) | | | | |
| Excluding sales charge | -6.02% | +1.97% | +3.38% | — |
| Including sales charge | -10.28% | +0.76% | +2.77% | — |
| Class C (Est. July 31, 1997) | | | | |
| Excluding sales charge | -6.70% | +1.25% | +2.80% | — |
| Including sales charge | -7.57% | +1.25% | +2.80% | — |
| Class I (Est. April 2, 2007) | | | | |
| Excluding sales charge | -5.79% | +2.21% | +3.63% | — |
| Including sales charge | -5.79% | +2.21% | +3.63% | — |
| Class R (Est. December 19, 2012) | | | | |
| Excluding sales charge | -6.29% | +1.61% | +3.02% | — |
| Including sales charge | -6.29% | +1.61% | +3.02% | — |
| Class R6 (Est. July 31, 2014) | | | | |
| Excluding sales charge | -5.68% | +2.35% | — | +3.18% |
| Including sales charge | -5.68% | +2.35% | — | +3.18% |
| Class Y (Est. December 30, 1998) | | | | |
| Excluding sales charge | -6.02% | +1.98% | +3.38% | — |
| Including sales charge | -6.02% | +1.98% | +3.38% | — |
| ICE BofA US High Yield Constrained Index | -3.58% | +3.04% | +4.02% | — |
1Returns reflect the reinvestment of all distributions and are presented both with and without the applicable sales charges described below. Returns do not reflect the deduction of taxes the shareholder would pay on Fund distributions or redemptions of Fund shares.
Expense limitations were in effect for certain classes during some or all of the periods shown in the “Fund and benchmark performance” table. Expenses for each class are listed in the “Fund expense ratios” table on page 61. Performance would have been lower had expense limitations not been in effect.
Class A shares are sold with a maximum front-end sales charge of 4.50%, and have an annual distribution and service (12b-1) fee of 0.25% of average daily net assets. Performance for Class A shares, excluding sales charges, assumes that no front-end sales charge applied. Effective July 1, 2021, the maximum front-end sales charge imposed on purchases for Class A shares changed from 5.75% to 4.50%.
Class C shares are sold with a contingent deferred sales charge (CDSC) of 1.00% if redeemed during the first 12 months. They are also subject to an annual 12b-1 fee of 1.00% of average daily net assets. Performance for Class C shares, excluding sales charges, assumes either that CDSCs did not apply or that the investment was not redeemed.
Class I shares are not subject to a sales charge and are offered for sale exclusively to certain eligible investors. In addition, Class I shares pay no 12b-1 fee.
Effective July 1, 2021, Class N shares were renamed Class R6 shares. Class R6 shares are available only to certain investors. In addition, Class R6 shares do not pay any service fees, sub-accounting fees, and/or sub-transfer agency fees to any brokers, dealers, or other financial intermediaries. Class R6 shares pay no 12b-1 fee.
Class R shares are available only for certain retirement plan products. They are sold without a sales charge and have an annual 12b-1 fee of 0.50% of average daily net assets.
Class Y shares are available only to certain investors. Class Y shares have an annual 12b-1 fee of 0.25% of average daily net assets.
Fixed income securities and bond funds can lose value, and investors can lose principal, as interest rates rise. They also may be affected by economic conditions that hinder an issuer’s ability to make interest and principal payments on its debt. This includes prepayment risk, the risk that the principal of a bond that is held by a portfolio will be prepaid prior to maturity, at the time when interest rates are lower than what the bond was paying. A portfolio may then have to reinvest that money at a lower interest rate.
High yielding, non-investment-grade bonds (junk bonds) involve higher risk than investment grade bonds. The high yield secondary market is particularly susceptible to liquidity problems when institutional investors, such as mutual funds and certain other financial institutions, temporarily stop buying bonds for regulatory, financial, or other reasons. In addition, a less liquid secondary market makes it more difficult to obtain precise valuations of the high yield securities.
The Fund may invest in derivatives, which may involve additional expenses and are subject to risk, including the risk that an underlying security or securities index moves in the opposite direction from what the portfolio manager anticipated. A derivatives transaction depends upon the counterparties’ ability to fulfill their contractual obligations.
International investments entail risks including fluctuation in currency values, differences in accounting principles, or economic or political instability. Investing in emerging markets can be riskier than investing in established foreign markets due to increased volatility, lower trading volume, and higher risk of market closures. In many emerging markets, there is substantially less publicly available information and the available information may be incomplete or misleading. Legal claims are generally more difficult to pursue.
IBOR risk is the risk that changes related to the use of the London interbank offered rate (LIBOR) or similar rates (such as EONIA) could have adverse impacts on financial instruments that reference these rates. The abandonment of these rates and transition to alternative rates could affect the value and liquidity of instruments that reference them and could affect investment strategy performance.
The disruptions caused by natural disasters, pandemics, or similar events could prevent the Fund from executing advantageous investment decisions in a timely manner and could negatively impact the Fund’s ability to achieve its investment objective and the value of the Fund’s investments.
2The Fund’s expense ratios, as described in the most recent prospectus, are disclosed in the following “Fund expense ratios” table. The expense ratios below may differ from the expense ratios in the “Financial highlights” since they are based on different time periods and the expense ratios in the prospectus include acquired fund fees and expenses, if any. See Note 2 in “Notes to financial statements” for additional details. Please see the “Financial highlights” section in this report for the most recent expense ratios.
Fund expense
ratios | Class A | Class C | Class I | Class R | Class R6 | Class Y |
| Total annual operating expenses (without fee waivers) | 0.95% | 1.70% | 0.74% | 1.34% | 0.60% | 0.99% |
| Net expenses (including fee waivers, if any) | 0.95% | 1.70% | 0.74% | 1.25% | 0.60% | 0.99% |
| |
| Type of waiver | Contractual | Contractual | Contractual | Contractual | Contractual | Contractual |
Performance summaries
Delaware Ivy High Income Fund
Performance of a $10,000 investment1
For the period March 31, 2013 through March 31, 2023
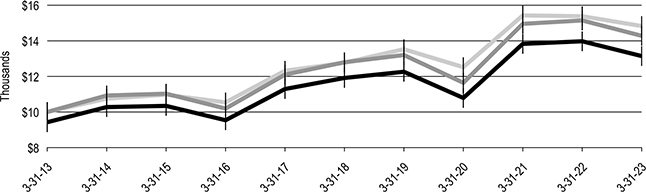
| | | | |
| | | Starting value | Ending value |
| ICE BofA US High Yield Constrained Index | $10,000 | $14,832 |
| Delaware Ivy High Income Fund - Class I shares | $10,000 | $14,282 |
| Delaware Ivy High Income Fund - Class A shares | $ 9,425 | $13,144 |
1The “Performance of a $10,000 investment” graph assumes $10,000 invested in Class I and Class A shares of the Fund on March 31, 2013, and includes the effect of a 5.75% front-end sales charge (for Class A shares) and the reinvestment of all distributions. Effective July 1, 2021, the maximum front-end sales charge imposed on purchases for Class A shares changed from 5.75% to 4.50%. The graph does not reflect the deduction of taxes the shareholders would pay on Fund distributions or redemptions of Fund shares. Expense limitations may have been in effect for some or all of the periods shown. Performance would have been lower had expense limitations not been in effect. Expenses are listed in the “Fund expense ratios” table on page 61. Please note additional details on pages 60 through 62.
The graph also assumes $10,000 invested in the ICE BofA US High Yield Constrained Index as of March 31, 2013. The ICE BofA US High Yield Constrained Index tracks the performance of US dollar-denominated high yield corporate debt publicly issued in the US domestic market, but caps individual issuer exposure at 2% of the benchmark.
Index performance returns do not reflect any management fees, transaction costs, or expenses. Indices are unmanaged and one cannot invest directly in an index. Past performance does not guarantee future results.
Performance of other Fund classes will vary due to different charges and expenses.
| | Nasdaq
symbols | | CUSIPs | |
| Class A | WHIAX | | 466000668 | |
| Class C | WRHIX | | 466000643 | |
| Class I | IVHIX | | 466000122 | |
| Class R | IYHIX | | 465899490 | |
| Class R6 | IHIFX | | 46600A831 | |
| Class Y | WHIYX | | 466000635 | |
Performance summaries
| Delaware Ivy International Core Equity Fund | March 31, 2023 (Unaudited) |
The performance quoted represents past performance and does not guarantee future results. Investment return and principal value of an investment will fluctuate so that shares, when redeemed, may be worth more or less than their original cost. Current performance may be lower or higher than the performance quoted. Performance data current to the most recent month end may be obtained by calling 800 523-1918 or visiting delawarefunds.com/performance.
| Fund and benchmark performance1,2 | Average annual total returns through March 31, 2023 |
| | 1 year | 5 year | 10 year | Lifetime |
| Class A (Est. May 13, 1997) | | | | |
| Excluding sales charge | -0.55% | +1.91% | +4.94% | — |
| Including sales charge | -6.24% | +0.71% | +4.32% | — |
| Class C (Est. May 13, 1997) | | | | |
| Excluding sales charge | -1.23% | +1.22% | +4.38% | — |
| Including sales charge | -2.21% | +1.22% | +4.38% | — |
| Class I (Est. April 2, 2007) | | | | |
| Excluding sales charge | -0.17% | +2.34% | +5.34% | — |
| Including sales charge | -0.17% | +2.34% | +5.34% | — |
| Class R (Est. December 19, 2012) | | | | |
| Excluding sales charge | -0.78% | +1.62% | +4.66% | — |
| Including sales charge | -0.78% | +1.62% | +4.66% | — |
| Class R6 (Est. July 31, 2014) | | | | |
| Excluding sales charge | -0.22% | +2.35% | — | +3.28% |
| Including sales charge | -0.22% | +2.35% | — | +3.28% |
| Class Y (Est. July 24, 2003) | | | | |
| Excluding sales charge | -0.46% | +1.97% | +5.02% | — |
| Including sales charge | -0.46% | +1.97% | +5.02% | — |
| MSCI ACWI ex USA Index (net) | -5.07% | +2.47% | +4.17% | — |
| MSCI ACWI ex USA Index (gross) | -4.57% | +2.97% | +4.65% | — |
1Returns reflect the reinvestment of all distributions and are presented both with and without the applicable sales charges described below. Returns do not reflect the deduction of taxes the shareholder would pay on Fund distributions or redemptions of Fund shares.
Expense limitations were in effect for certain classes during some or all of the periods shown in the “Fund and benchmark performance” table. Expenses for each class are listed in the “Fund expense ratios” table on page 64. Performance would have been lower had expense limitations not been in effect.
Class A shares are sold with a maximum front-end sales charge of 5.75%, and have an annual distribution and service (12b-1) fee of 0.25% of average daily net assets. Performance for Class A shares, excluding sales charges, assumes that no front-end sales charge applied.
Class C shares are sold with a contingent deferred sales charge (CDSC) of 1.00% if redeemed during the first 12 months. They are also subject to an annual 12b-1 fee of 1.00% of average daily net assets. Performance for Class C shares, excluding sales charges, assumes either that CDSCs did not apply or that the investment was not redeemed.
Class I shares are not subject to a sales charge and are offered for sale exclusively to certain eligible investors. In addition, Class I shares pay no 12b-1 fee.
Effective July 1, 2021, Class N shares were renamed Class R6 shares. Class R6 shares are available only to certain investors. In addition, Class R6 shares do not pay any service fees, sub-accounting fees, and/or sub-transfer agency fees to any brokers, dealers, or other financial intermediaries. Class R6 shares pay no 12b-1 fee.
Performance summaries
Delaware Ivy International Core Equity Fund
Class R shares are available only for certain retirement plan products. They are sold without a sales charge and have an annual 12b-1 fee of 0.50% of average daily net assets.
Class Y shares are available only to certain investors. Class Y shares have an annual 12b-1 fee of 0.25% of average daily net assets.
International investments entail risks including fluctuation in currency values, differences in accounting principles, or economic or political instability. Investing in emerging markets can be riskier than investing in established foreign markets due to increased volatility, lower trading volume, and higher risk of market closures. In many emerging markets, there is substantially less publicly available information and the available information may be incomplete or misleading. Legal claims are generally more difficult to pursue.
To the extent the Fund invests a significant portion of its assets in a particular geographical region or country, economic, political, social and environmental conditions in that region or country will have a greater effect on Fund performance than they would in a more geographically diversified equity fund and the Fund’s performance may be more volatile than the performance of a more geographically diversified fund.
The disruptions caused by natural disasters, pandemics, or similar events could prevent the Fund from executing advantageous investment decisions in a timely manner and could negatively impact the Fund’s ability to achieve its investment objective and the value of the Fund’s investments.
2The Fund’s expense ratios, as described in the most recent prospectus, are disclosed in the following “Fund expense ratios” table. The expense ratios below may differ from the expense ratios in the “Financial highlights” since they are based on different time periods and the expense ratios in the prospectus include acquired fund fees and expenses, if any. See Note 2 in “Notes to financial statements” for additional details. Please see the “Financial highlights” section in this report for the most recent expense ratios.
Fund expense
ratios | Class A | Class C | Class I | Class R | Class R6 | Class Y |
| Total annual operating expenses (without fee waivers) | 1.36% | 2.06% | 1.02% | 1.63% | 0.88% | 1.28% |
| Net expenses (including fee waivers, if any) | 1.04% | 1.79% | 0.79% | 1.29% | 0.79% | 1.04% |
| |
| Type of waiver | Contractual | Contractual | Contractual | Contractual | Contractual | Contractual |
Performance of a $10,000 investment1
For the period March 31, 2013 through March 31, 2023
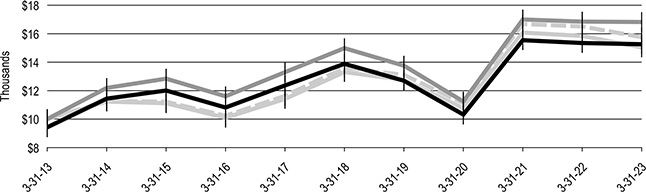
| | | | |
| | | Starting value | Ending value |
| Delaware Ivy International Core Equity Fund - Class I shares | $10,000 | $16,823 |
 | MSCI ACWI ex USA Index (gross) | $10,000 | $15,759 |
| Delaware Ivy International Core Equity Fund - Class A shares | $10,000 | $15,263 |
| MSCI ACWI ex USA Index (net) | $ 9,425 | $15,040 |
1The “Performance of a $10,000 investment” graph assumes $10,000 invested in Class I and Class A shares of the Fund on March 31, 2013, and includes the effect of a 5.75% front-end sales charge (for Class A shares) and the reinvestment of all distributions. The graph does not reflect the deduction of taxes the shareholders would pay on Fund distributions or redemptions of Fund shares. Expense limitations may have been in effect for some or all of the periods shown. Performance would have been lower had expense limitations not been in effect. Expenses are listed in the “Fund expense ratios” table on page 64. Please note additional details on pages 63 through 65.
The graph also assumes $10,000 invested in the MSCI ACWI ex USA Index as of March 31, 2013. The MSCI ACWI (All Country World Index) ex USA Index represents large- and mid-cap stocks across developed and emerging markets worldwide, excluding the United States. The index covers approximately 85% of the global investable equity opportunity set outside the United States. Index “net” return approximates the minimum possible dividend reinvestment, after deduction of withholding tax at the highest possible rate. Index “gross” return approximates the maximum possible dividend reinvestment.
Index performance returns do not reflect any management fees, transaction costs, or expenses. Indices are unmanaged and one cannot invest directly in an index. Past performance does not guarantee future results.
Performance of other Fund classes will vary due to different charges and expenses.
| | Nasdaq
symbols | | CUSIPs | |
| Class A | IVIAX | | 465897353 | |
| Class C | IVIFX | | 465897338 | |
| Class I | ICEIX | | 465899706 | |
| Class R | IYITX | | 465899433 | |
| Class R6 | IINCX | | 46600A823 | |
| Class Y | IVVYX | | 465898682 | |
Performance summaries
| Delaware Ivy International Value Fund | March 31, 2023 (Unaudited) |
The performance quoted represents past performance and does not guarantee future results. Investment return and principal value of an investment will fluctuate so that shares, when redeemed, may be worth more or less than their original cost. Current performance may be lower or higher than the performance quoted. Performance data current to the most recent month end may be obtained by calling 800 523-1918 or visiting delawarefunds.com/performance.
| Fund and benchmark performance1,2 | Average annual total returns through March 31, 2023 |
| | 1 year | 5 year | 10 year | Lifetime |
| Class A (Est. September 4, 2001) | | | | |
| Excluding sales charge | +0.23% | +2.02% | +3.35% | — |
| Including sales charge | -5.53% | +0.82% | +2.73% | — |
| Class C (Est. October 19, 2001) | | | | |
| Excluding sales charge | -0.49%* | +1.29% | +2.84% | — |
| Including sales charge | -1.38% | +1.29% | +2.84% | — |
| Class I (Est. April 2, 2007) | | | | |
| Excluding sales charge | +0.58% | +2.44% | +3.80% | — |
| Including sales charge | +0.58% | +2.44% | +3.80% | — |
| Class R (Est. December 19, 2012) | | | | |
| Excluding sales charge | +0.10% | +1.86% | +3.20% | — |
| Including sales charge | +0.10% | +1.86% | +3.20% | — |
| Class R6 (Est. July 31, 2014) | | | | |
| Excluding sales charge | +0.58% | +2.57% | — | +1.92% |
| Including sales charge | +0.58% | +2.57% | — | +1.92% |
| Class Y (Est. July 24, 2003) | | | | |
| Excluding sales charge | +0.35%* | +2.17% | +3.54% | — |
| Including sales charge | +0.35% | +2.17% | +3.54% | — |
| MSCI EAFE Index (net) | -1.38% | +3.52% | +5.00% | — |
| MSCI EAFE Index (gross) | -0.86% | +4.03% | +5.50% | — |
*Total returns for the report period presented in the table differs from the return in “Financial highlights.” The total returns presented in the above table are calculated based on the net asset value (NAV) at which shareholder transactions were processed. The total returns presented in “Financial highlights” are calculated in the same manner, but also takes into account certain adjustments that are necessary under US generally accepted accounting principles required in the annual report.
1Returns reflect the reinvestment of all distributions and are presented both with and without the applicable sales charges described below. Returns do not reflect the deduction of taxes the shareholder would pay on Fund distributions or redemptions of Fund shares.
Expense limitations were in effect for certain classes during some or all of the periods shown in the “Fund and benchmark performance” table. Expenses for each class are listed in the “Fund expense ratios” table on page 67. Performance would have been lower had expense limitations not been in effect.
Class A shares are sold with a maximum front-end sales charge of 5.75%, and have an annual distribution and service (12b-1) fee of 0.25% of average daily net assets. Performance for Class A shares, excluding sales charges, assumes that no front-end sales charge applied.
Class C shares are sold with a contingent deferred sales charge (CDSC) of 1.00% if redeemed during the first 12 months. They are also subject to an annual 12b-1 fee of 1.00% of average daily net assets. Performance for Class C shares, excluding sales charges, assumes either that CDSCs did not apply or that the investment was not redeemed.
Class I shares are not subject to a sales charge and are offered for sale exclusively to certain eligible investors. In addition, Class I shares pay no 12b-1 fee.
Effective July 1, 2021, Class N shares were renamed Class R6 shares. Class R6 shares are available only to certain investors. In addition, Class R6 shares do not pay any service fees, sub-accounting fees, and/or sub-transfer agency fees to any brokers, dealers, or other financial intermediaries. Class R6 shares pay no 12b-1 fee.
Class R shares are available only for certain retirement plan products. They are sold without a sales charge and have an annual 12b-1 fee of 0.50% of average daily net assets.
Class Y shares are available only to certain investors. Class Y shares have an annual 12b-1 fee of 0.25% of average daily net assets.
International investments entail risks including fluctuation in currency values, differences in accounting principles, or economic or political instability. Investing in emerging markets can be riskier than investing in established foreign markets due to increased volatility, lower trading volume, and higher risk of market closures. In many emerging markets, there is substantially less publicly available information and the available information may be incomplete or misleading. Legal claims are generally more difficult to pursue.
The disruptions caused by natural disasters, pandemics, or similar events could prevent the Fund from executing advantageous investment decisions in a timely manner and could negatively impact the Fund’s ability to achieve its investment objective and the value of the Fund’s investments.
2The Fund’s expense ratios, as described in the most recent prospectus, are disclosed in the following “Fund expense ratios” table. The expense ratios below may differ from the expense ratios in the “Financial highlights” since they are based on different time periods and the expense ratios in the prospectus include acquired fund fees and expenses, if any. See Note 2 in “Notes to financial statements” for additional details. Please see the “Financial highlights” section in this report for the most recent expense ratios.
Fund expense
ratios | Class A | Class C | Class I | Class R | Class R6 | Class Y |
| Total annual operating expenses (without fee waivers) | 1.45% | 2.28% | 1.08% | 1.75% | 0.92% | 1.34% |
| Net expenses (including fee waivers, if any) | 1.20% | 1.95% | 0.95% | 1.45% | 0.92% | 1.20% |
| |
| Type of waiver | Contractual | Contractual | Contractual | Contractual | Contractual | Contractual |
Performance summaries
Delaware Ivy International Value Fund
Performance of a $10,000 investment1
For the period March 31, 2013 through March 31, 2023

| | | | |
| | | Starting value | Ending value |
| MSCI EAFE Index (gross) | $10,000 | $17,076 |
| MSCI EAFE Index (net) | $10,000 | $16,288 |
| Delaware Ivy International Value Fund - Class I shares | $10,000 | $14,513 |
| Delaware Ivy International Value Fund - Class A shares | $ 9,425 | $13,096 |
1The “Performance of a $10,000 investment” graph assumes $10,000 invested in Class I and Class A shares of the Fund on March 31, 2013, and includes the effect of a 5.75% front-end sales charge (for Class A shares) and the reinvestment of all distributions. The graph does not reflect the deduction of taxes the shareholders would pay on Fund distributions or redemptions of Fund shares. Expense limitations may have been in effect for some or all of the periods shown. Performance would have been lower had expense limitations not been in effect. Expenses are listed in the “Fund expense ratios” table on page 67. Please note additional details on pages 66 through 68.
The graph also assumes $10,000 invested in the MSCI EAFE Index as of March 31, 2013. The MSCI EAFE (Europe, Australasia, Far East) Index represents large- and mid-cap stocks across 21 developed markets, excluding the United States and Canada. The index covers approximately 85% of the free float-adjusted market capitalization in each country. Index “net” return approximates the minimum possible dividend reinvestment, after deduction of withholding tax at the highest possible rate. Index “gross” return approximates the maximum possible dividend reinvestment.
Index performance returns do not reflect any management fees, transaction costs, or expenses. Indices are unmanaged and one cannot invest directly in an index. Past performance does not guarantee future results.
Performance of other Fund classes will vary due to different charges and expenses.
| | Nasdaq
symbols | | CUSIPs | |
| Class A | ICDAX | | 465898880 | |
| Class C | ICDCX | | 465898781 | |
| Class I | ICVIX | | 465898112 | |
| Class R | IYCUX | | 465899474 | |
| Class R6 | ICNGX | | 46600A500 | |
| Class Y | ICDYX | | 465897148 | |
Performance summaries
| Delaware Ivy Large Cap Growth Fund | March 31, 2023 (Unaudited) |
The performance quoted represents past performance and does not guarantee future results. Investment return and principal value of an investment will fluctuate so that shares, when redeemed, may be worth more or less than their original cost. Current performance may be lower or higher than the performance quoted. Performance data current to the most recent month end may be obtained by calling 800 523-1918 or visiting delawarefunds.com/performance.
| Fund and benchmark performance1,2 | Average annual total returns through March 31, 2023 |
| | 1 year | 5 year | 10 year | Lifetime |
| Class A (Est. June 30, 2000) | | | | |
| Excluding sales charge | -9.24% | +13.41% | +14.21% | — |
| Including sales charge | -14.46% | +12.08% | +13.53% | — |
| Class C (Est. July 3, 2000) | | | | |
| Excluding sales charge | -9.97% | +12.49% | +13.52% | — |
| Including sales charge | -10.74% | +12.49% | +13.52% | — |
| Class I (Est. April 2, 2007) | | | | |
| Excluding sales charge | -8.99% | +13.75% | +14.53% | — |
| Including sales charge | -8.99% | +13.75% | +14.53% | — |
| Class R (Est. December 29, 2005) | | | | |
| Excluding sales charge | -9.55% | +12.98% | +13.81% | — |
| Including sales charge | -9.55% | +12.98% | +13.81% | — |
| Class R6 (Est. July 31, 2014) | | | | |
| Excluding sales charge | -9.01% | +13.78% | — | +13.59% |
| Including sales charge | -9.01% | +13.78% | — | +13.59% |
| Class Y (Est. July 6, 2000) | | | | |
| Excluding sales charge | -9.28% | +13.40% | +14.26% | — |
| Including sales charge | -9.28% | +13.40% | +14.26% | — |
| Russell 1000 Growth Index | -10.90% | +13.66% | +14.59% | — |
1Returns reflect the reinvestment of all distributions and are presented both with and without the applicable sales charges described below. Returns do not reflect the deduction of taxes the shareholder would pay on Fund distributions or redemptions of Fund shares.
Expense limitations were in effect for certain classes during some or all of the periods shown in the “Fund and benchmark performance” table. Expenses for each class are listed in the “Fund expense ratios” table on page 70. Performance would have been lower had expense limitations not been in effect.
Class A shares are sold with a maximum front-end sales charge of 5.75%, and have an annual distribution and service (12b-1) fee of 0.25% of average daily net assets. Performance for Class A shares, excluding sales charges, assumes that no front-end sales charge applied.
Class C shares are sold with a contingent deferred sales charge (CDSC) of 1.00% if redeemed during the first 12 months. They are also subject to an annual 12b-1 fee of 1.00% of average daily net assets. Performance for Class C shares, excluding sales charges, assumes either that CDSCs did not apply or that the investment was not redeemed.
Class I shares are not subject to a sales charge and are offered for sale exclusively to certain eligible investors. In addition, Class I shares pay no 12b-1 fee.
Effective July 1, 2021, Class N shares were renamed Class R6 shares. Class R6 shares are available only to certain investors. In addition, Class R6 shares do not pay any service fees, sub-accounting fees, and/or sub-transfer agency fees to any brokers, dealers, or other financial intermediaries. Class R6 shares pay no 12b-1 fee.
Class R shares are available only for certain retirement plan products. They are sold without a sales charge and have an annual 12b-1 fee of 0.50% of average daily net assets.
Performance summaries
Delaware Ivy Large Cap Growth Fund
Class Y shares are available only to certain investors. Class Y shares have an annual 12b-1 fee of 0.25% of average daily net assets.
“Non-diversified” investments may allocate more of their net assets to investments in single securities than “diversified” investments. Resulting adverse effects may subject these investments to greater risks and volatility.
Risk is increased in a concentrated portfolio since it holds a limited number of securities with each investment having a greater effect on overall performance.
The disruptions caused by natural disasters, pandemics, or similar events could prevent the Fund from executing advantageous investment decisions in a timely manner and could negatively impact the Fund’s ability to achieve its investment objective and the value of the Fund’s investments.
2The Fund’s expense ratios, as described in the most recent prospectus, are disclosed in the following “Fund expense ratios” table. The expense ratios below may differ from the expense ratios in the “Financial highlights” since they are based on different time periods and the expense ratios in the prospectus include acquired fund fees and expenses, if any. See Note 2 in “Notes to financial statements” for additional details. Please see the “Financial highlights” section in this report for the most recent expense ratios.
Fund expense
ratios | Class A | Class C | Class I | Class R | Class R6 | Class Y |
| Total annual operating expenses (without fee waivers) | 0.94% | 1.80% | 0.77% | 1.37% | 0.64% | 1.02% |
| Net expenses (including fee waivers, if any) | 0.89% | 1.64% | 0.64% | 1.14% | 0.64% | 0.89% |
| |
| Type of waiver | Contractual | Contractual | Contractual | Contractual | Contractual | Contractual |
Performance of a $10,000 investment1
For the period March 31, 2013 through March 31, 2023

| | | | |
| | | Starting value | Ending value |
| Russell 1000 Growth Index | $10,000 | $39,043 |
| Delaware Ivy Large Cap Growth Fund - Class I shares | $10,000 | $38,842 |
| Delaware Ivy Large Cap Growth Fund - Class A shares | $ 9,425 | $35,586 |
1The “Performance of a $10,000 investment” graph assumes $10,000 invested in Class I and Class A shares of the Fund on March 31, 2013, and includes the effect of a 5.75% front-end sales charge (for Class A shares) and the reinvestment of all distributions. The graph does not reflect the deduction of taxes the shareholders would pay on Fund distributions or redemptions of Fund shares. Expense limitations may have been in effect for some or all of the periods shown. Performance would have been lower had expense limitations not been in effect. Expenses are listed in the “Fund expense ratios” table on page 70. Please note additional details on pages 69 through 72.
The graph also assumes $10,000 invested in the Russell 1000 Growth Index as of March 31, 2013. The Russell 1000 Growth Index measures the performance of the large-cap growth segment of the US equity universe. It includes those Russell 1000 companies with higher price-to-book ratios and higher forecasted growth values.
Frank Russell Company is the source and owner of the trademarks, service marks, and copyrights related to the Russell Indexes. Russell® is a trademark of Frank Russell Company.
The S&P 500 Index, mentioned on page 19, measures the performance of 500 mostly large-cap stocks weighted by market value and is often used to represent performance of the US stock market.
The Institute for Supply Management (ISM) Manufacturing and Non-Manufacturing New Orders Index, mentioned on page 19, monitors new order volume based on the ISM’s surveys of manufacturing and non-manufacturing firms.
The Purchasing Managers’ Index (PMI), mentioned on page 19, is an indicator of the economic health of the manufacturing sector. A PMI reading above 50% indicates that the manufacturing economy is generally expanding; below 50% indicates that it is generally contracting.
Index performance returns do not reflect any management fees, transaction costs, or expenses. Indices are unmanaged and one cannot invest directly in an index. Past performance does not guarantee future results.
Performance of other Fund classes will vary due to different charges and expenses.
Performance summaries
Delaware Ivy Large Cap Growth Fund
| | Nasdaq
symbols | | CUSIPs | |
| Class A | WLGAX | | 466000627 | |
| Class C | WLGCX | | 466000593 | |
| Class I | IYGIX | | 466001203 | |
| Class R | WLGRX | | 466000429 | |
| Class R6 | ILGRX | | 46600A799 | |
| Class Y | WLGYX | | 466000585 | |
Performance summaries
| Delaware Ivy Limited-Term Bond Fund | March 31, 2023 (Unaudited) |
The performance quoted represents past performance and does not guarantee future results. Investment return and principal value of an investment will fluctuate so that shares, when redeemed, may be worth more or less than their original cost. Current performance may be lower or higher than the performance quoted. Performance data current to the most recent month end may be obtained by calling 800 523-1918 or visiting delawarefunds.com/performance.
| Fund and benchmark performance1,2 | Average annual total returns through March 31, 2023 |
| | 1 year | 5 year | 10 year | Lifetime |
| Class A (Est. August 17, 2000) | | | | |
| Excluding sales charge | -0.17% | +1.16% | +0.89% | — |
| Including sales charge | -2.92% | +0.66% | +0.63% | — |
| Class C (Est. September 21, 1992) | | | | |
| Excluding sales charge | -0.95% | +0.40% | +0.28% | — |
| Including sales charge | -1.93% | +0.40% | +0.28% | — |
| Class I (Est. April 2, 2007) | | | | |
| Excluding sales charge | +0.07% | +1.39% | +1.12% | — |
| Including sales charge | +0.07% | +1.39% | +1.12% | — |
| Class R (Est. December 19, 2012) | | | | |
| Excluding sales charge | -0.46% | +0.80% | +0.53% | — |
| Including sales charge | -0.46% | +0.80% | +0.53% | — |
| Class R6 (Est. July 31, 2014) | | | | |
| Excluding sales charge | +0.11% | +1.53% | — | +1.42% |
| Including sales charge | +0.11% | +1.53% | — | +1.42% |
| Class Y (Est. December 29, 1995) | | | | |
| Excluding sales charge | -0.18% | +1.16% | +0.88% | — |
| Including sales charge | -0.18% | +1.16% | +0.88% | — |
| Bloomberg 1-3 Year US Government/Credit Index | +0.26% | +1.27% | +1.01% | — |
1Returns reflect the reinvestment of all distributions and are presented both with and without the applicable sales charges described below. Returns do not reflect the deduction of taxes the shareholder would pay on Fund distributions or redemptions of Fund shares.
Expense limitations were in effect for certain classes during some or all of the periods shown in the “Fund and benchmark performance” table. Expenses for each class are listed in the “Fund expense ratios” table on page 75. Performance would have been lower had expense limitations not been in effect.
Class A shares are sold with a maximum front-end sales charge of 2.75%, and have an annual distribution and service (12b-1) fee of 0.25% of average daily net assets. Performance for Class A shares, excluding sales charges, assumes that no front-end sales charge applied. Effective July 1, 2021, the maximum front-end sales charge imposed on purchases for Class A shares changed from 2.50% to 2.75%.
Class C shares are sold with a contingent deferred sales charge (CDSC) of 1.00% if redeemed during the first 12 months. They are also subject to an annual 12b-1 fee of 1.00% of average daily net assets. Performance for Class C shares, excluding sales charges, assumes either that CDSCs did not apply or that the investment was not redeemed.
Class I shares are not subject to a sales charge and are offered for sale exclusively to certain eligible investors. In addition, Class I shares pay no 12b-1 fee.
Effective July 1, 2021, Class N shares were renamed Class R6 shares. Class R6 shares are available only to certain investors. In addition, Class R6 shares do not pay any service fees, sub-accounting fees, and/or sub-transfer agency fees to any brokers, dealers, or other financial intermediaries. Class R6 shares pay no 12b-1 fee.
Performance summaries
Delaware Ivy Limited-Term Bond Fund
Class R shares are available only for certain retirement plan products. They are sold without a sales charge and have an annual 12b-1 fee of 0.50% of average daily net assets.
Class Y shares are available only to certain investors. Class Y shares have an annual 12b-1 fee of 0.25% of average daily net assets.
Fixed income securities and bond funds can lose value, and investors can lose principal, as interest rates rise. They also may be affected by economic conditions that hinder an issuer’s ability to make interest and principal payments on its debt. This includes prepayment risk, the risk that the principal of a bond that is held by a portfolio will be prepaid prior to maturity, at the time when interest rates are lower than what the bond was paying. A portfolio may then have to reinvest that money at a lower interest rate.
High yielding, non-investment-grade bonds (junk bonds) involve higher risk than investment grade bonds. The high yield secondary market is particularly susceptible to liquidity problems when institutional investors, such as mutual funds and certain other financial institutions, temporarily stop buying bonds for regulatory, financial, or other reasons. In addition, a less liquid secondary market makes it more difficult to obtain precise valuations of the high yield securities.
The Fund may invest in derivatives, which may involve additional expenses and are subject to risk, including the risk that an underlying security or securities index moves in the opposite direction from what the portfolio manager anticipated. A derivatives transaction depends upon the counterparties’ ability to fulfill their contractual obligations.
International investments entail risks including fluctuation in currency values, differences in accounting principles, or economic or political instability. Investing in emerging markets can be riskier than investing in established foreign markets due to increased volatility, lower trading volume, and higher risk of market closures. In many emerging markets, there is substantially less publicly available information and the available information may be incomplete or misleading. Legal claims are generally more difficult to pursue.
If and when the Fund invests in forward foreign currency contracts or uses other investments to hedge against currency risks, the Fund will be subject to special risks, including counterparty risk.
IBOR risk is the risk that changes related to the use of the London interbank offered rate (LIBOR) or similar rates (such as EONIA) could have adverse impacts on financial instruments that reference these rates. The abandonment of these rates and transition to alternative rates could affect the value and liquidity of instruments that reference them and could affect investment strategy performance.
The disruptions caused by natural disasters, pandemics, or similar events could prevent the Fund from executing advantageous investment decisions in a timely manner and could negatively impact the Fund’s ability to achieve its investment objective and the value of the Fund’s investments.
2The Fund’s expense ratios, as described in the most recent prospectus, are disclosed in the following “Fund expense ratios” table. The expense ratios below may differ from the expense ratios in the “Financial highlights” since they are based on different time periods and the expense ratios in the prospectus include acquired fund fees and expenses, if any. See Note 2 in “Notes to financial statements” for additional details. Please see the “Financial highlights” section in this report for the most recent expense ratios.
Fund expense
ratios | Class A | Class C | Class I | Class R | Class R6 | Class Y |
| Total annual operating expenses (without fee waivers) | 0.89% | 1.67% | 0.68% | 1.29% | 0.53% | 0.93% |
| Net expenses (including fee waivers, if any) | 0.78% | 1.53% | 0.53% | 1.03% | 0.53% | 0.78% |
| |
| Type of waiver | Contractual | Contractual | Contractual | Contractual | Contractual | Contractual |
Performance summaries
Delaware Ivy Limited-Term Bond Fund
Performance of a $10,000 investment1
For the period March 31, 2013 through March 31, 2023

| | | | |
| | | Starting value | Ending value |
| Delaware Ivy Limited-Term Bond Fund - Class I shares | $10,000 | $11,180 |
| Bloomberg 1-3 Year US Government/Credit Index | $10,000 | $11,059 |
| Delaware Ivy Limited-Term Bond Fund - Class A shares | $ 9,750 | $10,646 |
1The “Performance of a $10,000 investment” graph assumes $10,000 invested in Class I and Class A shares of the Fund on March 31, 2013, and includes the effect of a 2.50% front-end sales charge (for Class A shares) and the reinvestment of all distributions. Effective July 1, 2021, the maximum front-end sales charge imposed on purchases for Class A shares changed from 2.50% to 2.75%. The graph does not reflect the deduction of taxes the shareholders would pay on Fund distributions or redemptions of Fund shares. Expense limitations may have been in effect for some or all of the periods shown. Performance would have been lower had expense limitations not been in effect. Expenses are listed in the “Fund expense ratios” table on page 75. Please note additional details on pages 73 through 76.
The graph also assumes $10,000 invested in the Bloomberg 1-3 Year US Government/Credit Index as of March 31, 2013. The Bloomberg 1-3 Year US Government/Credit Index is a market value-weighted index of government fixed-rate debt securities and investment grade US and foreign fixed-rate debt securities with average maturities of one to three years.
Index performance returns do not reflect any management fees, transaction costs, or expenses. Indices are unmanaged and one cannot invest directly in an index. Past performance does not guarantee future results.
Performance of other Fund classes will vary due to different charges and expenses.
| | Nasdaq
symbols | | CUSIPs | |
| Class A | WLTAX | | 466000882 | |
| Class C | WLBCX | | 466000866 | |
| Class I | ILTIX | | 466001401 | |
| Class R | IYLTX | | 465899482 | |
| Class R6 | ILMDX | | 46600A781 | |
| Class Y | WLTYX | | 466000858 | |
| Performance summaries | |
| Delaware Ivy Managed International Opportunities Fund | March 31, 2023 (Unaudited) |
The performance quoted represents past performance and does not guarantee future results. Investment return and principal value of an investment will fluctuate so that shares, when redeemed, may be worth more or less than their original cost. Current performance may be lower or higher than the performance quoted. Performance data current to the most recent month end may be obtained by calling 800 523-1918 or visiting delawarefunds.com/performance.
| Fund and benchmark performance1,2 | Average annual total returns through March 31, 2023 |
| | 1 year | 5 year | 10 year | Lifetime |
| Class A (Est. April 2, 2007) | | | | |
| Excluding sales charge | -3.79% | +1.78% | +4.45% | — |
| Including sales charge | -9.32% | +0.59% | +3.83% | — |
| Class C (Est. April 2, 2007) | | | | |
| Excluding sales charge | -4.57% | +1.07% | +3.90% | — |
| Including sales charge | -5.39% | +1.07% | +3.90% | — |
| Class I (Est. April 2, 2007) | | | | |
| Excluding sales charge | -3.50% | +2.06% | +4.73% | — |
| Including sales charge | -3.50% | +2.06% | +4.73% | — |
| Class R (Est. December 19, 2012) | | | | |
| Excluding sales charge | -4.01% | +1.60% | +4.28% | — |
| Including sales charge | -4.01% | +1.60% | +4.28% | — |
| Class R6 (Est. July 5, 2017) | | | | |
| Excluding sales charge | -3.48% | +2.06% | — | +3.44% |
| Including sales charge | -3.48% | +2.06% | — | +3.44% |
| Class Y (Est. April 2, 2007) | | | | |
| Excluding sales charge | -3.70% | +1.87% | +4.54% | — |
| Including sales charge | -3.70% | +1.87% | +4.54% | — |
| MSCI ACWI ex USA Index (net) | -5.07% | +2.47% | +4.17% | — |
| MSCI ACWI ex USA Index (gross) | -4.57% | +2.97% | +4.65% | — |
1Returns reflect the reinvestment of all distributions and are presented both with and without the applicable sales charges described below. Returns do not reflect the deduction of taxes the shareholder would pay on Fund distributions or redemptions of Fund shares.
Expense limitations may have been in effect for certain classes during some or all of the periods shown in the “Fund and benchmark performance” table. Expenses for each class are listed in the “Fund expense ratios” table on page 78. If applicable, performance would have been lower had expense limitations not been in effect.
Class A shares are sold with a maximum front-end sales charge of 5.75%, and have an annual distribution and service (12b-1) fee of 0.25% of average daily net assets. Performance for Class A shares, excluding sales charges, assumes that no front-end sales charge applied.
Class C shares are sold with a contingent deferred sales charge (CDSC) of 1.00% if redeemed during the first 12 months. They are also subject to an annual 12b-1 fee of 1.00% of average daily net assets. Performance for Class C shares, excluding sales charges, assumes either that CDSCs did not apply or that the investment was not redeemed.
Class I shares are not subject to a sales charge and are offered for sale exclusively to certain eligible investors. In addition, Class I shares pay no 12b-1 fee.
Effective July 1, 2021, Class N shares were renamed Class R6 shares. Class R6 shares are available only to certain investors. In addition, Class R6 shares do not pay any service fees, sub-accounting fees, and/or sub-transfer agency fees to any brokers, dealers, or other financial intermediaries. Class R6 shares pay no 12b-1 fee.
Performance summaries
Delaware Ivy Managed International Opportunities Fund
Class R shares are available only for certain retirement plan products. They are sold without a sales charge and have an annual 12b-1 fee of 0.50% of average daily net assets.
Class Y shares are available only to certain investors. Class Y shares have an annual 12b-1 fee of 0.25% of average daily net assets.
International investments entail risks including fluctuation in currency values, differences in accounting principles, or economic or political instability. Investing in emerging markets can be riskier than investing in established foreign markets due to increased volatility, lower trading volume, and higher risk of market closures. In many emerging markets, there is substantially less publicly available information and the available information may be incomplete or misleading. Legal claims are generally more difficult to pursue.
The disruptions caused by natural disasters, pandemics, or similar events could prevent the Fund from executing advantageous investment decisions in a timely manner and could negatively impact the Fund’s ability to achieve its investment objective and the value of the Fund’s investments.
2The Fund’s expense ratios, as described in the most recent prospectus, are disclosed in the following “Fund expense ratios” table. The expense ratios below may differ from the expense ratios in the “Financial highlights” since they are based on different time periods and the expense ratios in the prospectus include acquired fund fees and expenses, if any. See Note 2 in “Notes to financial statements” for additional details. Please see the “Financial highlights” section in this report for the most recent expense ratios.
Fund expense
ratios | Class A | Class C | Class I | Class R | Class R6 | Class Y |
| Total annual operating expenses (without fee waivers) | 1.43% | 2.32% | 1.04% | 1.54% | 1.04% | 1.32% |
| Net expenses (including fee waivers, if any) | 1.43% | 2.32% | 1.04% | 1.54% | 1.04% | 1.32% |
| | | | | | | |
| Type of waiver | n/a | n/a | n/a | n/a | n/a | n/a |
Performance of a $10,000 investment1
For the period March 31, 2013 through March 31, 2023

| | | Starting value | Ending value |
| Delaware Ivy Managed International Opportunities Fund - Class I shares | $10,000 | $15,867 |
| MSCI ACWI ex USA Index (gross) | $10,000 | $15,759 |
| MSCI ACWI ex USA Index (net) | $10,000 | $15,040 |
| Delaware Ivy Managed International Opportunities Fund - Class A shares | $ 9,425 | $14,561 |
1The “Performance of a $10,000 investment” graph assumes $10,000 invested in Class I and Class A shares of the Fund on March 31, 2013, and includes the effect of a 5.75% front-end sales charge (for Class A shares) and the reinvestment of all distributions. The graph does not reflect the deduction of taxes the shareholders would pay on Fund distributions or redemptions of Fund shares. Expense limitations may have been in effect for some or all of the periods shown. Performance would have been lower had expense limitations not been in effect. Expenses are listed in the “Fund expense ratios” table on page 78. Please note additional details on pages 77 through 79.
The graph also assumes $10,000 invested in the MSCI ACWI ex USA Index as of March 31, 2013. The MSCI ACWI (All Country World Index) ex USA Index represents large- and mid-cap stocks across developed and emerging markets worldwide, excluding the United States. The index covers approximately 85% of the global investable equity opportunity set outside the United States. Index “net” return approximates the minimum possible dividend reinvestment, after deduction of withholding tax at the highest possible rate. Index “gross” return approximates the maximum possible dividend reinvestment.
Index performance returns do not reflect any management fees, transaction costs, or expenses. Indices are unmanaged and one cannot invest directly in an index. Past performance does not guarantee future results.
Performance of other Fund classes will vary due to different charges and expenses.
| | Nasdaq
symbols | | CUSIPs | |
| Class A | IVTAX | | 465898229 | |
| Class C | IVTCX | | 465898195 | |
| Class I | IVTIX | | 465898179 | |
| Class R | IYMGX | | 465899391 | |
| Class R6 | IVTNX | | 46600A229 | |
| Class Y | IVTYX | | 465898161 | |
| Performance summaries | |
| Delaware Ivy Mid Cap Growth Fund | March 31, 2023 (Unaudited) |
The performance quoted represents past performance and does not guarantee future results. Investment return and principal value of an investment will fluctuate so that shares, when redeemed, may be worth more or less than their original cost. Current performance may be lower or higher than the performance quoted. Performance data current to the most recent month end may be obtained by calling 800 523-1918 or visiting delawarefunds.com/performance.
| Fund and benchmark performance1,2 | Average annual total returns through March 31, 2023 |
| | 1 year | 5 year | 10 year | Lifetime |
| Class A (Est. June 30, 2000) | | | | |
| Excluding sales charge | -10.07% | +11.92% | +11.52% | — |
| Including sales charge | -15.23% | +10.61% | +10.86% | — |
| Class C (Est. July 3, 2000) | | | | |
| Excluding sales charge | -10.79% | +11.07% | +10.88% | — |
| Including sales charge | -11.57% | +11.07% | +10.88% | — |
| Class I (Est. April 2, 2007) | | | | |
| Excluding sales charge | -9.80% | +12.33% | +11.89% | — |
| Including sales charge | -9.80% | +12.33% | +11.89% | — |
| Class R (Est. December 29, 2005) | | | | |
| Excluding sales charge | -10.34% | +11.52% | +11.16% | — |
| Including sales charge | -10.34% | +11.52% | +11.16% | — |
| Class R6 (Est. July 31, 2014) | | | | |
| Excluding sales charge | -9.80% | +12.34% | — | +11.62% |
| Including sales charge | -9.80% | +12.34% | — | +11.62% |
| Class Y (Est. July 10, 2000) | | | | |
| Excluding sales charge | -10.09% | +11.93% | +11.56% | — |
| Including sales charge | -10.09% | +11.93% | +11.56% | — |
| Russell Midcap Growth Index | -8.52% | +9.07% | +11.17% | — |
1Returns reflect the reinvestment of all distributions and are presented both with and without the applicable sales charges described below. Returns do not reflect the deduction of taxes the shareholder would pay on Fund distributions or redemptions of Fund shares.
Expense limitations were in effect for certain classes during some or all of the periods shown in the “Fund and benchmark performance” table. Expenses for each class are listed in the “Fund expense ratios” table on page 81. Performance would have been lower had expense limitations not been in effect.
Class A shares are sold with a maximum front-end sales charge of 5.75%, and have an annual distribution and service (12b-1) fee of 0.25% of average daily net assets. Performance for Class A shares, excluding sales charges, assumes that no front-end sales charge applied.
Class C shares are sold with a contingent deferred sales charge (CDSC) of 1.00% if redeemed during the first 12 months. They are also subject to an annual 12b-1 fee of 1.00% of average daily net assets. Performance for Class C shares, excluding sales charges, assumes either that CDSCs did not apply or that the investment was not redeemed.
Class I shares are not subject to a sales charge and are offered for sale exclusively to certain eligible investors. In addition, Class I shares pay no 12b-1 fee.
Effective July 1, 2021, Class N shares were renamed Class R6 shares. Class R6 shares are available only to certain investors. In addition, Class R6 shares do not pay any service fees, sub-accounting fees, and/or sub-transfer agency fees to any brokers, dealers, or other financial intermediaries. Class R6 shares pay no 12b-1 fee.
Class R shares are available only for certain retirement plan products. They are sold without a sales charge and have an annual 12b-1 fee of 0.50% of average daily net assets.
Class Y shares are available only to certain investors. Class Y shares have an annual 12b-1 fee of 0.25% of average daily net assets.
Investments in small and/or medium-sized companies typically exhibit greater risk and higher volatility than larger, more established companies.
The disruptions caused by natural disasters, pandemics, or similar events could prevent the Fund from executing advantageous investment decisions in a timely manner and could negatively impact the Fund’s ability to achieve its investment objective and the value of the Fund’s investments.
2The Fund’s expense ratios, as described in the most recent prospectus, are disclosed in the following “Fund expense ratios” table. The expense ratios below may differ from the expense ratios in the “Financial highlights” since they are based on different time periods and the expense ratios in the prospectus include acquired fund fees and expenses, if any. See Note 2 in “Notes to financial statements” for additional details. Please see the “Financial highlights” section in this report for the most recent expense ratios.
Fund expense
ratios | Class A | Class C | Class I | Class R | Class R6 | Class Y |
| Total annual operating expenses (without fee waivers) | 1.12% | 1.93% | 0.95% | 1.55% | 0.80% | 1.19% |
| Net expenses (including fee waivers, if any) | 1.04% | 1.79% | 0.79% | 1.29% | 0.79% | 1.04% |
| | | | | | | |
| Type of waiver | Contractual | Contractual | Contractual | Contractual | Contractual | Contractual |
Performance summaries
Delaware Ivy Mid Cap Growth Fund
Performance of a $10,000 investment1
For the period March 31, 2013 through March 31, 2023

| | | Starting value | Ending value |
| Delaware Ivy Mid Cap Growth Fund - Class I shares | $10,000 | $30,760 |
| Russell Midcap Growth Index | $10,000 | $28,830 |
| Delaware Ivy Mid Cap Growth Fund - Class A shares | $ 9,425 | $28,051 |
1The “Performance of a $10,000 investment” graph assumes $10,000 invested in Class I and Class A shares of the Fund on March 31, 2013, and includes the effect of a 5.75% front-end sales charge (for Class A shares) and the reinvestment of all distributions. The graph does not reflect the deduction of taxes the shareholders would pay on Fund distributions or redemptions of Fund shares. Expense limitations may have been in effect for some or all of the periods shown. Performance would have been lower had expense limitations not been in effect. Expenses are listed in the “Fund expense ratios” table on page 81. Please note additional details on pages 80 through 82.
The graph also assumes $10,000 invested in the Russell Midcap Growth Index as of March 31, 2013. The Russell Midcap Growth Index measures the performance of the mid-cap growth segment of the US equity universe. It includes those Russell Midcap Index companies with higher price-to-book ratios and higher forecasted growth values.
The Russell Midcap Value Index, mentioned on page 27, measures the performance of the mid-cap value segment of the US equity universe. It includes those Russell Midcap Index companies with lower price-to-book ratios and lower forecasted growth values.
Frank Russell Company is the source and owner of the trademarks, service marks, and copyrights related to the Russell Indexes. Russell® is a trademark of the Frank Russell Company.
Index performance returns do not reflect any management fees, transaction costs, or expenses. Indices are unmanaged and one cannot invest directly in an index. Past performance does not guarantee future results.
Performance of other Fund classes will vary due to different charges and expenses.
| | Nasdaq | | | |
| | symbols | | CUSIPs | |
| Class A | WMGAX | | 466000577 | |
| Class C | WMGCX | | 466000551 | |
| Class I | IYMIX | | 466001609 | |
| Class R | WMGRX | | 466000411 | |
| Class R6 | IGRFX | | 46600A765 | |
| Class Y | WMGYX | | 466000544 | |
| Performance summaries | |
| Delaware Ivy Mid Cap Income Opportunities Fund | March 31, 2023 (Unaudited) |
The performance quoted represents past performance and does not guarantee future results. Investment return and principal value of an investment will fluctuate so that shares, when redeemed, may be worth more or less than their original cost. Current performance may be lower or higher than the performance quoted. Performance data current to the most recent month end may be obtained by calling 800 523-1918 or visiting delawarefunds.com/performance.
| Fund and benchmark performance1,2 | Average annual total returns through March 31, 2023 |
| | 1 year | 5 year | 10 year | Lifetime |
| Class A (Est. October 1, 2014) | | | | |
| Excluding sales charge | -4.73% | +7.62% | — | +8.97% |
| Including sales charge | -10.22% | +6.35% | — | +8.21% |
| Class C (Est. October 1, 2014) | | | | |
| Excluding sales charge | -5.42% | +6.81% | — | +8.22% |
| Including sales charge | -6.34% | +6.81% | — | +8.22% |
| Class I (Est. October 1, 2014) | | | | |
| Excluding sales charge | -4.42% | +8.02% | — | +9.35% |
| Including sales charge | -4.42% | +8.02% | — | +9.35% |
| Class R (Est. October 1, 2014) | | | | |
| Excluding sales charge | -4.99% | +7.26% | — | +8.59% |
| Including sales charge | -4.99% | +7.26% | — | +8.59% |
| Class R6 (Est. October 1, 2014) | | | | |
| Excluding sales charge | -4.37% | +8.05% | — | +9.39% |
| Including sales charge | -4.37% | +8.05% | — | +9.39% |
| Class Y (Est. October 1, 2014) | | | | |
| Excluding sales charge | -4.68% | +7.63% | — | +8.98% |
| Including sales charge | -4.68% | +7.63% | — | +8.98% |
| Russell Midcap Index | -8.78% | +8.05% | — | +8.95%* |
*The benchmark lifetime return is calculated using the Fund’s inception date.
1Returns reflect the reinvestment of all distributions and are presented both with and without the applicable sales charges described below. Returns do not reflect the deduction of taxes the shareholder would pay on Fund distributions or redemptions of Fund shares.
Expense limitations were in effect for certain classes during some or all of the periods shown in the “Fund and benchmark performance” table. Expenses for each class are listed in the “Fund expense ratios” table on page 84. Performance would have been lower had expense limitations not been in effect.
Class A shares are sold with a maximum front-end sales charge of 5.75%, and have an annual distribution and service (12b-1) fee of 0.25% of average daily net assets. Performance for Class A shares, excluding sales charges, assumes that no front-end sales charge applied.
Class C shares are sold with a contingent deferred sales charge (CDSC) of 1.00% if redeemed during the first 12 months. They are also subject to an annual 12b-1 fee of 1.00% of average daily net assets. Performance for Class C shares, excluding sales charges, assumes either that CDSCs did not apply or that the investment was not redeemed.
Class I shares are not subject to a sales charge and are offered for sale exclusively to certain eligible investors. In addition, Class I shares pay no 12b-1 fee.
Effective July 1, 2021, Class N shares were renamed Class R6 shares. Class R6 shares are available only to certain investors. In addition, Class R6 shares do not pay any service fees, sub-accounting fees, and/or sub-transfer agency fees to any brokers, dealers, or other financial intermediaries. Class R6 shares pay no 12b-1 fee.
Performance summaries
Delaware Ivy Mid Cap Income Opportunities Fund
Class R shares are available only for certain retirement plan products. They are sold without a sales charge and have an annual 12b-1 fee of 0.50% of average daily net assets.
Class Y shares are available only to certain investors. Class Y shares have an annual 12b-1 fee of 0.25% of average daily net assets.
Investments in small and/or medium-sized companies typically exhibit greater risk and higher volatility than larger, more established companies.
There is no guarantee that dividend-paying stocks will continue to pay dividends.
Risk is increased in a concentrated portfolio since it holds a limited number of securities with each investment having a greater effect on the overall performance.
The disruptions caused by natural disasters, pandemics, or similar events could prevent the Fund from executing advantageous investment decisions in a timely manner and could negatively impact the Fund’s ability to achieve its investment objective and the value of the Fund’s investments.
2The Fund’s expense ratios, as described in the most recent prospectus, are disclosed in the following “Fund expense ratios” table. The expense ratios below may differ from the expense ratios in the “Financial highlights” since they are based on different time periods and the expense ratios in the prospectus include acquired fund fees and expenses, if any. See Note 2 in “Notes to financial statements” for additional details. Please see the “Financial highlights” section in this report for the most recent expense ratios.
Fund expense
ratios | Class A | Class C | Class I | Class R | Class R6 | Class Y |
| Total annual operating expenses (without fee waivers) | 1.26% | 2.01% | 1.07% | 1.63% | 0.89% | 1.30% |
| Net expenses (including fee waivers, if any) | 1.08% | 1.83% | 0.83% | 1.33% | 0.83% | 1.08% |
| | | | | | | |
| Type of waiver | Contractual | Contractual | Contractual | Contractual | Contractual | Contractual |
Performance of a $10,000 investment1
For the period October 1, 2014 (Fund's inception) through March 31, 2023

| | | Starting value | Ending value |
| Delaware Ivy Mid Cap Income Opportunities Fund - Class I shares | $10,000 | $21,367 |
| Russell Midcap Index | $10,000 | $20,728 |
| Delaware Ivy Mid Cap Income Opportunities Fund - Class A shares | $ 9,425 | $19,557 |
1The “Performance of a $10,000 investment” graph assumes $10,000 invested in Class I and Class A shares of the Fund on October 1, 2014, and includes the effect of a 5.75% front-end sales charge (for Class A shares) and the reinvestment of all distributions. The graph does not reflect the deduction of taxes the shareholders would pay on Fund distributions or redemptions of Fund shares. Expense limitations may have been in effect for some or all of the periods shown. Performance would have been lower had expense limitations not been in effect. Expenses are listed in the “Fund expense ratios” table on page 84. Please note additional details on pages 83 through 85.
The graph also assumes $10,000 invested in the Russell Midcap Index as of October 1, 2014. The Russell Midcap Index measures the performance of the mid-cap segment of the US equity universe. The Russell Midcap Index is a subset of the Russell 1000® Index.
The Institute for Supply Management (ISM) Manufacturing Prices Index, mentioned on page 31, monitors pricing trends based on the ISM’s surveys of manufacturing firms.
Frank Russell Company is the source and owner of the trademarks, service marks, and copyrights related to the Russell Indexes. Russell® is a trademark of the Frank Russell Company.
Index performance returns do not reflect any management fees, transaction costs, or expenses. Indices are unmanaged and one cannot invest directly in an index. Past performance does not guarantee future results.
Performance of other Fund classes will vary due to different charges and expenses.
| | Nasdaq | | | |
| | symbols | | CUSIPs | |
| Class A | IVOAX | | 46600B102 | |
| Class C | IVOCX | | 46600B201 | |
| Class I | IVOIX | | 46600B409 | |
| Class R | IVORX | | 46600B508 | |
| Class R6 | IVOSX | | 46600B607 | |
| Class Y | IVOYX | | 46600B706 | |
| Performance summaries | |
| Delaware Ivy Municipal Bond Fund | March 31, 2023 (Unaudited) |
The performance quoted represents past performance and does not guarantee future results. Investment return and principal value of an investment will fluctuate so that shares, when redeemed, may be worth more or less than their original cost. Current performance may be lower or higher than the performance quoted. Performance data current to the most recent month end may be obtained by calling 800 523-1918 or visiting delawarefunds.com/performance.
| Fund and benchmark performance1,2 | Average annual total returns through March 31, 2023 |
| | 1 year | 5 year | 10 year | Lifetime |
| Class A (Est. September 15, 2000) | | | | |
| Excluding sales charge | -3.83% | +0.15% | +1.01% | — |
| Including sales charge | -8.18% | -0.72% | +0.58% | — |
| Class C (Est. September 21, 1992) | | | | |
| Excluding sales charge | -4.65% | -0.69% | +0.37% | — |
| Including sales charge | -5.58% | -0.69% | +0.37% | — |
| Class I (Est. November 4, 2009) | | | | |
| Excluding sales charge | -3.62% | +0.32% | +1.19% | — |
| Including sales charge | -3.62% | +0.32% | +1.19% | — |
| Class R6 (Est. July 5, 2017) | | | | |
| Excluding sales charge | -3.60% | +0.41% | — | +0.55% |
| Including sales charge | -3.60% | +0.41% | — | +0.55% |
| Bloomberg Municipal Bond Index | +0.26% | +2.03% | +2.38% | — |
1Returns reflect the reinvestment of all distributions and are presented both with and without the applicable sales charges described below. Returns do not reflect the deduction of taxes the shareholder would pay on Fund distributions or redemptions of Fund shares.
Expense limitations were in effect for certain classes during some or all of the periods shown in the “Fund and benchmark performance” table. Expenses for each class are listed in the “Fund expense ratios” table on page 87. Performance would have been lower had expense limitations not been in effect.
Class A shares are sold with a maximum front-end sales charge of 4.50%, and have an annual distribution and service (12b-1) fee of 0.25% of average daily net assets. Performance for Class A shares, excluding sales charges, assumes that no front-end sales charge applied. Effective July 1, 2021, the maximum front-end sales charge imposed on purchases for Class A shares changed from 4.25% to 4.50%.
Class C shares are sold with a contingent deferred sales charge (CDSC) of 1.00% if redeemed during the first 12 months. They are also subject to an annual 12b-1 fee of 1.00% of average daily net assets. Performance for Class C shares, excluding sales charges, assumes either that CDSCs did not apply or that the investment was not redeemed.
Class I shares are not subject to a sales charge and are offered for sale exclusively to certain eligible investors. In addition, Class I shares pay no 12b-1 fee.
Effective July 1, 2021, Class N shares were renamed Class R6 shares. Class R6 shares are available only to certain types of investors. In addition, Class R6 shares do not pay any service fees, sub-accounting fees, and/or sub-transfer agency fees to any brokers, dealers, or other financial intermediaries. Class R6 shares pay no 12b-1 fee.
Fixed income securities and bond funds can lose value, and investors can lose principal, as interest rates rise. They also may be affected by economic conditions that hinder an issuer’s ability to make interest and principal payments on its debt. This includes prepayment risk, the risk that the principal of a bond that is held by a portfolio will be prepaid prior to maturity, at the time when interest rates are lower than what the bond was paying. A portfolio may then have to reinvest that money at a lower interest rate.
High yielding, non-investment-grade bonds (junk bonds) involve higher risk than investment grade bonds. The high yield secondary market is particularly susceptible to liquidity problems when institutional investors, such as mutual funds and certain other financial institutions,
temporarily stop buying bonds for regulatory, financial, or other reasons. In addition, a less liquid secondary market makes it more difficult to obtain precise valuations of the high yield securities.
Substantially all dividend income derived from tax-free funds is exempt from federal income tax. Some income may be subject to state or local and/or the federal alternative minimum tax (AMT) that applies to certain investors. Capital gains, if any, are taxable.
Duration number will change as market conditions change. Therefore, duration should not be solely relied upon to indicate a municipal bond fund’s potential volatility.
IBOR risk is the risk that changes related to the use of the London interbank offered rate (LIBOR) or similar rates (such as EONIA) could have adverse impacts on financial instruments that reference these rates. The abandonment of these rates and transition to alternative rates could affect the value and liquidity of instruments that reference them and could affect investment strategy performance.
The disruptions caused by natural disasters, pandemics, or similar events could prevent the Fund from executing advantageous investment decisions in a timely manner and could negatively impact the Fund’s ability to achieve its investment objective and the value of the Fund’s investments.
2The Fund’s expense ratios, as described in the most recent prospectus, are disclosed in the following “Fund expense ratios” table. The expense ratios below may differ from the expense ratios in the “Financial highlights” since they are based on different time periods and the expense ratios in the prospectus include acquired fund fees and expenses, if any. See Note 2 in “Notes to financial statements” for additional details. Please see the “Financial highlights” section in this report for the most recent expense ratios.
| Fund expense ratios | Class A | Class C | Class I | Class R6 |
| Total annual operating expenses (without fee waivers) | 0.87% | 1.67% | 0.72% | 0.58% |
| Net expenses (including fee waivers, if any) | 0.80% | 1.55% | 0.55% | 0.55% |
| | | | | |
| Type of waiver | Contractual | Contractual | Contractual | Contractual |
Performance summaries
Delaware Ivy Municipal Bond Fund
Performance of a $10,000 investment1
For the period March 31, 2013 through March 31, 2023

| | | Starting value | Ending value |
| Bloomberg Municipal Bond Index | $10,000 | $12,655 |
| Delaware Ivy Municipal Bond Fund - Class I shares | $10,000 | $11,256 |
| Delaware Ivy Municipal Bond Fund - Class A shares | $ 9,575 | $10,591 |
1The “Performance of a $10,000 investment” graph assumes $10,000 invested in Class I and Class A shares of the Fund on March 31, 2013, and includes the effect of a 4.25% front-end sales charge (for Class A shares) and the reinvestment of all distributions. Effective July 1, 2021, the maximum front-end sales charge imposed on purchases for Class A shares changed from 4.25% to 4.50%. The graph does not reflect the deduction of taxes the shareholders would pay on Fund distributions or redemptions of Fund shares. Expense limitations may have been in effect for some or all of the periods shown. Performance would have been lower had expense limitations not been in effect. Expenses are listed in the “Fund expense ratios” table on page 87. Please note additional details on pages 86 through 88.
The graph also assumes $10,000 invested in the Bloomberg Municipal Bond Index as of March 31, 2013. The Bloomberg Municipal Bond Index measures the total return performance of the long-term, investment grade tax-exempt bond market.
The US Consumer Price Index (CPI), mentioned on page 32, is a measure of inflation that is calculated by the US Department of Labor, representing changes in prices of all goods and services purchased for consumption by urban households.
Index performance returns do not reflect any management fees, transaction costs, or expenses. Indices are unmanaged and one cannot invest directly in an index. Past performance does not guarantee future results.
Performance of other Fund classes will vary due to different charges and expenses.
| | Nasdaq | | | |
| | symbols | | CUSIPs | |
| Class A | WMBAX | | 466000841 | |
| Class C | WMBCX | | 466000825 | |
| Class I | IMBIX | | 46601B101 | |
| Class R6 | IMBNX | | 46600A211 | |
| Performance summaries | |
| Delaware Ivy Municipal High Income Fund | March 31, 2023 (Unaudited) |
The performance quoted represents past performance and does not guarantee future results. Investment return and principal value of an investment will fluctuate so that shares, when redeemed, may be worth more or less than their original cost. Current performance may be lower or higher than the performance quoted. Performance data current to the most recent month end may be obtained by calling 800 523-1918 or visiting delawarefunds.com/performance.
| Fund and benchmark performance1,2 | Average annual total returns through March 31, 2023 |
| | 1 year | 5 year | 10 year | Lifetime |
| Class A (Est. May 18, 2009) | | | | |
| Excluding sales charge | -6.78% | +0.57% | +1.69% | — |
| Including sales charge | -11.04% | -0.29% | +1.25% | — |
| Class C (Est. May 18, 2009) | | | | |
| Excluding sales charge | -7.44% | -0.13% | +1.11% | — |
| Including sales charge | -8.33% | -0.13% | +1.11% | — |
| Class I (Est. December 30, 1998) | | | | |
| Excluding sales charge | -6.53% | +0.84% | +1.92% | — |
| Including sales charge | -6.53% | +0.84% | +1.92% | — |
| Class R6 (Est. July 5, 2017) | | | | |
| Excluding sales charge | -6.55% | +0.87% | — | +1.11% |
| Including sales charge | -6.55% | +0.87% | — | +1.11% |
| Class Y (Est. May 18, 2009) | | | | |
| Excluding sales charge | -6.79% | +0.57% | +1.69% | — |
| Including sales charge | -6.79% | +0.57% | +1.69% | — |
| Bloomberg Municipal Bond Index | +0.26% | +2.03% | +2.38% | — |
1Returns reflect the reinvestment of all distributions and are presented both with and without the applicable sales charges described below. Returns do not reflect the deduction of taxes the shareholder would pay on Fund distributions or redemptions of Fund shares.
Expense limitations were in effect for certain classes during some or all of the periods shown in the “Fund and benchmark performance” table. Expenses for each class are listed in the “Fund expense ratios” table on page 90. Performance would have been lower had expense limitations not been in effect.
Class A shares are sold with a maximum front-end sales charge of 4.50%, and have an annual distribution and service (12b-1) fee of 0.25% of average daily net assets. Performance for Class A shares, excluding sales charges, assumes that no front-end sales charge applied. Effective July 1, 2021, the maximum front-end sales charge imposed on purchases for Class A shares changed from 4.25% to 4.50%.
Class C shares are sold with a contingent deferred sales charge (CDSC) of 1.00% if redeemed during the first 12 months. They are also subject to an annual 12b-1 fee of 1.00% of average daily net assets. Performance for Class C shares, excluding sales charges, assumes either that CDSCs did not apply or that the investment was not redeemed.
Class I shares are not subject to a sales charge and are offered for sale exclusively to certain eligible investors. In addition, Class I shares pay no 12b-1 fee.
Effective July 1, 2021, Class N shares were renamed Class R6 shares. Class R6 shares are available only to certain types of investors. In addition, Class R6 shares do not pay any service fees, sub-accounting fees, and/or sub-transfer agency fees to any brokers, dealers, or other financial intermediaries. Class R6 shares pay no 12b-1 fee.
Class Y shares are available only to certain investors. Class Y shares have an annual 12b-1 fee of 0.25% of average daily net assets.
Fixed income securities and bond funds can lose value, and investors can lose principal, as interest rates rise. They also may be affected by economic conditions that hinder an issuer’s ability to make interest and principal payments on its debt. This includes prepayment risk, the risk
Performance summaries
Delaware Ivy Municipal High Income Fund
that the principal of a bond that is held by a portfolio will be prepaid prior to maturity, at the time when interest rates are lower than what the bond was paying. A portfolio may then have to reinvest that money at a lower interest rate.
High yielding, non-investment-grade bonds (junk bonds) involve higher risk than investment grade bonds. The high yield secondary market is particularly susceptible to liquidity problems when institutional investors, such as mutual funds and certain other financial institutions, temporarily stop buying bonds for regulatory, financial, or other reasons. In addition, a less liquid secondary market makes it more difficult to obtain precise valuations of the high yield securities.
Substantially all dividend income derived from tax-free funds is exempt from federal income tax. Some income may be subject to state or local and/or the federal alternative minimum tax (AMT) that applies to certain investors. Capital gains, if any, are taxable.
Duration measures a bond’s sensitivity to interest rates, by indicating the approximate percentage of change in a bond or bond fund’s price given a 1% change in interest rates.
IBOR risk is the risk that changes related to the use of the London interbank offered rate (LIBOR) or similar rates (such as EONIA) could have adverse impacts on financial instruments that reference these rates. The abandonment of these rates and transition to alternative rates could affect the value and liquidity of instruments that reference them and could affect investment strategy performance.
The disruptions caused by natural disasters, pandemics, or similar events could prevent the Fund from executing advantageous investment decisions in a timely manner and could negatively impact the Fund’s ability to achieve its investment objective and the value of the Fund’s investments.
2The Fund’s expense ratios, as described in the most recent prospectus, are disclosed in the following “Fund expense ratios” table. The expense ratios below may differ from the expense ratios in the “Financial highlights” since they are based on different time periods and the expense ratios in the prospectus include acquired fund fees and expenses, if any. See Note 2 in “Notes to financial statements” for additional details. Please see the “Financial highlights” section in this report for the most recent expense ratios.
| Fund expense ratios | Class A | Class C | Class I | Class R6 | Class Y |
| Total annual operating expenses (without fee waivers) | 0.89% | 1.71% | 0.75% | 0.60% | 1.00% |
| Net expenses (including fee waivers, if any) | 0.86% | 1.58% | 0.61% | 0.60% | 0.86% |
| | | | | | |
| Type of waiver | Contractual | Contractual | Contractual | Contractual | Contractual |
Performance of a $10,000 investment1
For the period March 31, 2013 through March 31, 2023

| | | Starting value | Ending value |
| Bloomberg Municipal Bond Index | $10,000 | $12,655 |
| Delaware Ivy Municipal High Income Fund - Class I shares | $10,000 | $12,098 |
| Delaware Ivy Municipal High Income Fund - Class A shares | $ 9,575 | $11,326 |
1The “Performance of a $10,000 investment” graph assumes $10,000 invested in Class I and Class A shares of the Fund on March 31, 2013, and includes the effect of a 4.25% front-end sales charge (for Class A shares) and the reinvestment of all distributions. Effective July 1, 2021, the maximum front-end sales charge imposed on purchases for Class A shares changed from 4.25% to 4.50%. The graph does not reflect the deduction of taxes the shareholders would pay on Fund distributions or redemptions of Fund shares. Expense limitations may have been in effect for some or all of the periods shown. Performance would have been lower had expense limitations not been in effect. Expenses are listed in the “Fund expense ratios” table on page 90. Please note additional details on pages 89 through 91.
The graph also assumes $10,000 invested in the Bloomberg Municipal Bond Index as of March 31, 2013. The Bloomberg Municipal Bond Index measures the total return performance of the long-term, investment grade tax-exempt bond market.
The US Consumer Price Index (CPI), mentioned on page 38, is a measure of inflation that is calculated by the US Department of Labor, representing changes in prices of all goods and services purchased for consumption by urban household.
Index performance returns do not reflect any management fees, transaction costs, or expenses. Indices are unmanaged and one cannot invest directly in an index. Past performance does not guarantee future results.
Performance of other Fund classes will vary due to different charges and expenses.
| | Nasdaq | | | |
| | symbols | | CUSIPs | |
| Class A | IYIAX | | 466001849 | |
| Class C | IYICX | | 466001765 | |
| Class I | WYMHX | | 466001757 | |
| Class R6 | IYINX | | 46600A195 | |
| Class Y | IYIYX | | 466001740 | |
| Performance summaries | |
| Delaware Ivy Small Cap Growth Fund | March 31, 2023 (Unaudited) |
The performance quoted represents past performance and does not guarantee future results. Investment return and principal value of an investment will fluctuate so that shares, when redeemed, may be worth more or less than their original cost. Current performance may be lower or higher than the performance quoted. Performance data current to the most recent month end may be obtained by calling 800 523-1918 or visiting delawarefunds.com/performance.
| Fund and benchmark performance1,2 | Average annual total returns through March 31, 2023 |
| | 1 year | 5 year | 10 year | Lifetime |
| Class A (Est. July 3, 2000) | | | | |
| Excluding sales charge | -14.90% | +5.10% | +8.87% | — |
| Including sales charge | -19.78% | +3.86% | +8.22% | — |
| Class C (Est. September 21, 1992) | | | | |
| Excluding sales charge | -15.56% | +4.31% | +8.26% | — |
| Including sales charge | -16.33% | +4.31% | +8.26% | — |
| Class I (Est. April 2, 2007) | | | | |
| Excluding sales charge | -14.68% | +5.47% | +9.25% | — |
| Including sales charge | -14.68% | +5.47% | +9.25% | — |
| Class R (Est. December 29, 2005) | | | | |
| Excluding sales charge | -15.18% | +4.75% | +8.55% | — |
| Including sales charge | -15.18% | +4.75% | +8.55% | — |
| Class R6 (Est. July 31, 2014) | | | | |
| Excluding sales charge | -14.67% | +5.49% | — | +8.75% |
| Including sales charge | -14.67% | +5.49% | — | +8.75% |
| Class Y (Est. December 29, 1995) | | | | |
| Excluding sales charge | -14.91% | +5.11% | +8.93% | — |
| Including sales charge | -14.91% | +5.11% | +8.93% | — |
| Russell 2000 Growth Index | -10.60% | +4.26% | +8.49% | — |
1Returns reflect the reinvestment of all distributions and are presented both with and without the applicable sales charges described below. Returns do not reflect the deduction of taxes the shareholder would pay on Fund distributions or redemptions of Fund shares.
Expense limitations were in effect for certain classes during some or all of the periods shown in the “Fund and benchmark performance” table. Expenses for each class are listed in the “Fund expense ratios” table on page 93. Performance would have been lower had expense limitations not been in effect.
Class A shares are sold with a maximum front-end sales charge of 5.75%, and have an annual distribution and service (12b-1) fee of 0.25% of average daily net assets. Performance for Class A shares, excluding sales charges, assumes that no front-end sales charge applied.
Class C shares are sold with a contingent deferred sales charge (CDSC) of 1.00% if redeemed during the first 12 months. They are also subject to an annual 12b-1 fee of 1.00% of average daily net assets. Performance for Class C shares, excluding sales charges, assumes either that CDSCs did not apply or that the investment was not redeemed.
Class I shares are not subject to a sales charge and are offered for sale exclusively to certain eligible investors. In addition, Class I shares pay no 12b-1 fee.
Effective July 1, 2021, Class N shares were renamed Class R6 shares. Class R6 shares are available only to certain investors. In addition, Class R6 shares do not pay any service fees, sub-accounting fees, and/or sub-transfer agency fees to any brokers, dealers, or other financial intermediaries. Class R6 shares pay no 12b-1 fee.
Class R shares are available only for certain retirement plan products. They are sold without a sales charge and have an annual 12b-1 fee of 0.50% of average daily net assets.
Class Y shares are available only to certain investors. Class Y shares have an annual 12b-1 fee of 0.25% of average daily net assets.
Investing in small and/or medium-sized companies typically exhibit greater risk and higher volatility than larger, more established companies.
The Fund may invest in initial public offerings (IPOs), which can have a significant positive impact on the Fund’s performance that may not be replicated in the future.
The disruptions caused by natural disasters, pandemics, or similar events could prevent the Fund from executing advantageous investment decisions in a timely manner and could negatively impact the Fund’s ability to achieve its investment objective and the value of the Fund’s investments.
2The Fund’s expense ratios, as described in the most recent prospectus, are disclosed in the following “Fund expense ratios” table. The expense ratios below may differ from the expense ratios in the “Financial highlights” since they are based on different time periods and the expense ratios in the prospectus include acquired fund fees and expenses, if any. See Note 2 in “Notes to financial statements” for additional details. Please see the “Financial highlights” section in this report for the most recent expense ratios.
Fund expense
ratios | Class A | Class C | Class I | Class R | Class R6 | Class Y |
| Total annual operating expenses (without fee waivers) | 1.24% | 2.11% | 1.02% | 1.61% | 0.87% | 1.26% |
| Net expenses (including fee waivers, if any) | 1.14% | 1.89% | 0.89% | 1.39% | 0.87% | 1.14% |
| | | | | | | |
| Type of waiver | Contractual | Contractual | Contractual | Contractual | Contractual | Contractual |
Performance summaries
Delaware Ivy Small Cap Growth Fund
Performance of a $10,000 investment1
For the period March 31, 2013 through March 31, 2023

| | | Starting value | Ending value |
| Delaware Ivy Small Cap Growth Fund - Class I shares | $10,000 | $24,232 |
| Russell 2000 Growth Index | $10,000 | $22,592 |
| Delaware Ivy Small Cap Growth Fund - Class A shares | $ 9,425 | $22,036 |
1The “Performance of a $10,000 investment” graph assumes $10,000 invested in Class I and Class A shares of the Fund on March 31, 2013, and includes the effect of a 5.75% front-end sales charge (for Class A shares) and the reinvestment of all distributions. The graph does not reflect the deduction of taxes the shareholders would pay on Fund distributions or redemptions of Fund shares. Expense limitations may have been in effect for some or all of the periods shown. Performance would have been lower had expense limitations not been in effect. Expenses are listed in the “Fund expense ratios” table on page 93. Please note additional details on pages 92 through 94.
The graph also assumes $10,000 invested in the Russell 2000 Growth Index as of March 31, 2013. The Russell 2000 Growth Index measures the performance of the small-cap growth segment of the US equity universe. It includes those Russell 2000 companies with higher price-to-book ratios and higher forecasted growth values.
Frank Russell Company is the source and owner of the trademarks, service marks, and copyrights related to the Russell Indexes. Russell® is a trademark of Frank Russell Company.
Index performance returns do not reflect any management fees, transaction costs, or expenses. Indices are unmanaged and one cannot invest directly in an index. Past performance does not guarantee future results.
Performance of other Fund classes will vary due to different charges and expenses.
| | Nasdaq | | | |
| | symbols | | CUSIPs | |
| Class A | WSGAX | | 466000502 | |
| Class C | WRGCX | | 466000700 | |
| Class I | IYSIX | | 466001872 | |
| Class R | WSGRX | | 466000445 | |
| Class R6 | IRGFX | | 46600A732 | |
| Class Y | WSCYX | | 466000809 | |
| Performance summaries | |
| Delaware Ivy Smid Cap Core Fund | March 31, 2023 (Unaudited) |
The performance quoted represents past performance and does not guarantee future results. Investment return and principal value of an investment will fluctuate so that shares, when redeemed, may be worth more or less than their original cost. Current performance may be lower or higher than the performance quoted. Performance data current to the most recent month end may be obtained by calling 800 523-1918 or visiting delawarefunds.com/performance.
| Fund and benchmark performance1,2 | Average annual total returns through March 31, 2023 |
| | 1 year | 5 year | 10 year | Lifetime |
| Class A (Est. January 31, 1997) | | | | |
| Excluding sales charge | -7.02% | +5.50% | +8.02% | — |
| Including sales charge | -12.35% | +4.25% | +7.38% | — |
| Class C (Est. December 8, 2003) | | | | |
| Excluding sales charge | -7.71% | +4.75% | +7.43% | — |
| Including sales charge | -8.37% | +4.75% | +7.43% | — |
| Class I (Est. April 2, 2007) | | | | |
| Excluding sales charge | -6.69% | +5.98% | +8.48% | — |
| Including sales charge | -6.69% | +5.98% | +8.48% | — |
| Class R (Est. December 19, 2012) | | | | |
| Excluding sales charge | -7.21% | +5.23% | +7.78% | — |
| Including sales charge | -7.21% | +5.23% | +7.78% | — |
| Class R6 (Est. July 31, 2014) | | | | |
| Excluding sales charge | -6.73% | +5.98% | — | +7.69% |
| Including sales charge | -6.73% | +5.98% | — | +7.69% |
| Class Y (Est. December 8, 2003) | | | | |
| Excluding sales charge | -7.00% | +5.57% | +8.14% | — |
| Including sales charge | -7.00% | +5.57% | +8.14% | — |
| Russell 2500 Index | -10.39% | +6.65% | +9.07% | — |
1Returns reflect the reinvestment of all distributions and are presented both with and without the applicable sales charges described below. Returns do not reflect the deduction of taxes the shareholder would pay on Fund distributions or redemptions of Fund shares.
Expense limitations were in effect for certain classes during some or all of the periods shown in the “Fund and benchmark performance” table. Expenses for each class are listed on the “Fund expense ratios” table on page 96. Performance would have been lower had expense limitations not been in effect.
Class A shares are sold with a maximum front-end sales charge of 5.75%, and have an annual distribution and service (12b-1) fee of 0.25% of average daily net assets. Performance for Class A shares, excluding sales charges, assumes that no front-end sales charge applied.
Class C shares are sold with a contingent deferred sales charge (CDSC) of 1.00% if redeemed during the first 12 months. They are also subject to an annual 12b-1 fee of 1.00% of average daily net assets. Performance for Class C shares, excluding sales charges, assumes either that CDSCs did not apply or that the investment was not redeemed.
Class I shares are not subject to a sales charge and are offered for sale exclusively to certain eligible investors. In addition, Class I shares pay no 12b-1 fee.
Effective July 1, 2021, Class N shares were renamed Class R6 shares. Class R6 shares are available only to certain investors. Class R6 shares are available only to certain investors. In addition, Class R6 shares do not pay any service fees, sub-accounting fees, and/or sub-transfer agency fees to any brokers, dealers, or other financial intermediaries. Class R6 shares pay no 12b-1 fee.
Class R shares are available only for certain retirement plan products. They are sold without a sales charge and have an annual 12b-1 fee of 0.50% of average daily net assets.
Performance summaries
Delaware Ivy Smid Cap Core Fund
Class Y shares are available only to certain investors. Class Y shares have an annual 12b-1 fee of 0.25% of average daily net assets.
Investments in small and/or medium-sized companies typically exhibit greater risk and higher volatility than larger, more established companies.
Risk is increased in a concentrated portfolio since it holds a limited number of securities with each investment having a greater effect on the overall performance.
The disruptions caused by natural disasters, pandemics, or similar events could prevent the Fund from executing advantageous investment decisions in a timely manner and could negatively impact the Fund’s ability to achieve its investment objective and the value of the Fund’s investments.
2The Fund’s expense ratios, as described in the most recent prospectus, are disclosed in the following “Fund expense ratios” table. The expense ratios below may differ from the expense ratios in the “Financial highlights” since they are based on different time periods and the expense ratios in the prospectus include acquired fund fees and expenses, if any. See Note 2 in “Notes to financial statements” for additional details. Please see the “Financial highlights” section in this report for the most recent expense ratios.
| Fund expense | | | | | | |
| ratios | Class A | Class C | Class I | Class R | Class R6 | Class Y |
| Total annual operating expenses (without fee waivers) | 1.36% | 2.10% | 1.07% | 1.67% | 0.94% | 1.33% |
| Net expenses (including fee waivers, if any) | 1.14% | 1.89% | 0.89% | 1.39% | 0.89% | 1.14% |
| | | | | | | |
| Type of waiver | Contractual | Contractual | Contractual | Contractual | Contractual | Contractual |
Performance of a $10,000 investment1
For the period March 31, 2013 through March 31, 2023

| | | Starting value | Ending value |
| Russell 2500 Index | $10,000 | $23,823 |
| Delaware Ivy Smid Cap Core Fund - Class I shares | $10,000 | $22,577 |
| Delaware Ivy Smid Cap Core Fund - Class A shares | $ 9,425 | $20,386 |
1The “Performance of a $10,000 investment” graph assumes $10,000 invested in Class I and Class A shares of the Fund on March 31, 2013, and includes the effect of a 5.75% front-end sales charge (for Class A shares) and the reinvestment of all distributions. The graph does not reflect the deduction of taxes the shareholders would pay on Fund distributions or redemptions of Fund shares. Expense limitations may have been in effect for some or all of the periods shown. Performance would have been lower had expense limitations not been in effect. Expenses are listed in the “Fund expense ratios” table on page 96. Please note additional details on pages 95 through 98.
The graph also assumes $10,000 invested in the Russell 2500 Index as of March 31, 2013. The Russell 2500 Index measures the performance of the small- to mid-cap segment of the US equity universe. The Russell 2500 Index is a subset of the Russell 3000® Index, representing approximately 2,500 of the smallest securities based on a combination of their market cap and current index membership.
The Russell Midcap Index, mentioned on page 38, measures the performance of the mid-cap segment of the US equity universe. The Russell Midcap Index is a subset of the Russell 1000® Index.
The Russell 1000 Index, mentioned on page 38, measures the performance of the large-cap segment of the US equity universe.
The Russell 2000 Index, mentioned on page 38, measures the performance of the small-cap segment of the US equity universe.
The Russell 2500 Growth Index, mentioned on page 38, measures the performance of the small- to mid-cap growth segment of the US equity universe. It includes those Russell 2500 companies with higher price-to-book ratios and higher forecasted growth values.
The Russell 2500 Value Index, mentioned on page 38, measures the performance of the small- to mid-cap value segment of the US equity universe. It includes those Russell 2500 companies with lower price-to-book ratios and lower forecasted growth values.
The Conference Board Consumer Confidence Index®, mentioned on page 38, is a barometer of the health of the US economy from the perspective of the consumer. The index is based on consumers’ perceptions of current business and employment conditions, as well as their expectations for six months hence regarding business conditions, employment, and income. The resulting relative value is then used as an "index value" and compared against each respective monthly value for 1985. In that year, the result of the index was arbitrarily set at 100, representing it as the index benchmark.
The NFIB Small Business Optimism Index, mentioned on page 38, is a survey asking small business owners a battery of questions related to their expectations for the future and their plans to hire, build inventory, borrow, and expand.
Performance summaries
Delaware Ivy Smid Cap Core Fund
The Purchasing Managers’ Index (PMI), mentioned on page 38, is an indicator of the economic health of the manufacturing sector. A PMI reading above 50% indicates that the manufacturing economy is generally expanding; below 50% indicates that it is generally contracting.
The US Consumer Price Index (CPI), mentioned on page 38, is a measure of inflation that is calculated by the US Department of Labor, representing changes in prices of all goods and services purchased for consumption by urban households.
Frank Russell Company is the source and owner of the trademarks, service marks and copyrights related to the Russell Indexes. Russell® is a trademark of Frank Russell Company.
Index performance returns do not reflect any management fees, transaction costs, or expenses. Indices are unmanaged and one cannot invest directly in an index. Past performance does not guarantee future results.
Performance of other Fund classes will vary due to different charges and expenses.
| | Nasdaq | | | |
| | symbols | | CUSIPs | |
| Class A | IYSAX | | 465898435 | |
| Class C | IYSCX | | 465898419 | |
| Class I | IVVIX | | 465899813 | |
| Class R | IYSMX | | 465899540 | |
| Class R6 | ISPVX | | 46600A724 | |
| Class Y | IYSYX | | 465898393 | |
| Performance summaries | |
| Delaware Ivy Systematic Emerging Markets Equity Fund | March 31, 2023 (Unaudited) |
The performance quoted represents past performance and does not guarantee future results. Investment return and principal value of an investment will fluctuate so that shares, when redeemed, may be worth more or less than their original cost. Current performance may be lower or higher than the performance quoted. Performance data current to the most recent month end may be obtained by calling 800 523-1918 or visiting delawarefunds.com/performance.
| Fund and benchmark performance1,2 | Average annual total returns through March 31, 2023 |
| | 1 year | 5 year | 10 year | Lifetime |
| Class A (Est. October 25, 1993) | | | | |
| Excluding sales charge | -11.42% | -1.02% | +4.22% | — |
| Including sales charge | -16.53% | -2.19% | +3.60% | — |
| Class C (Est. April 30, 1996) | | | | |
| Excluding sales charge | -12.02% | -1.70% | +3.59% | — |
| Including sales charge | -12.76% | -1.70% | +3.59% | — |
| Class I (Est. April 2, 2007) | | | | |
| Excluding sales charge | -11.08% | -0.60% | +4.63% | — |
| Including sales charge | -11.08% | -0.60% | +4.63% | — |
| Class R (Est. December 19, 2012) | | | | |
| Excluding sales charge | -11.57% | -1.28% | +3.94% | — |
| Including sales charge | -11.57% | -1.28% | +3.94% | — |
| Class R6 (Est. July 31, 2014) | | | | |
| Excluding sales charge | -11.06% | -0.57% | — | +3.60% |
| Including sales charge | -11.06% | -0.57% | — | +3.60% |
| Class Y (Est. July 24, 2003) | | | | |
| Excluding sales charge | -11.38% | -0.95% | +4.29% | — |
| Including sales charge | -11.38% | -0.95% | +4.29% | — |
| MSCI Emerging Markets Index (net) | -10.70% | -0.91% | +2.00% | — |
| MSCI Emerging Markets Index (gross) | -10.30% | -0.53% | +2.37% | — |
1Returns reflect the reinvestment of all distributions and are presented both with and without the applicable sales charges described below. Returns do not reflect the deduction of taxes the shareholder would pay on Fund distributions or redemptions of Fund shares.
Expense limitations were in effect for certain classes during some or all of the periods shown in the “Fund and benchmark performance” table. Expenses for each class are listed in the “Fund expense ratios” table on page 100. Performance would have been lower had expense limitations not been in effect.
Class A shares are sold with a maximum front-end sales charge of 5.75%, and have an annual distribution and service (12b-1) fee of 0.25% of average daily net assets. Performance for Class A shares, excluding sales charges, assumes that no front-end sales charge applied.
Class C shares are sold with a contingent deferred sales charge (CDSC) of 1.00% if redeemed during the first 12 months. They are also subject to an annual 12b-1 fee of 1.00% of average daily net assets. Performance for Class C shares, excluding sales charges, assumes either that CDSCs did not apply or that the investment was not redeemed.
Class I shares are not subject to a sales charge and are offered for sale exclusively to certain eligible investors. In addition, Class I shares pay no 12b-1 fee.
Effective July 1, 2021, Class N shares were renamed Class R6 shares. Class R6 shares are available only to certain investors. Class R6 shares are available only to certain investors. In addition, Class R6 shares do not pay any service fees, sub-accounting fees, and/or sub-transfer agency fees to any brokers, dealers, or other financial intermediaries. Class R6 shares pay no 12b-1 fee.
Performance summaries
Delaware Ivy Systematic Emerging Markets Equity Fund
Class R shares are available only for certain retirement plan products. They are sold without a sales charge and have an annual 12b-1 fee of 0.50% of average daily net assets.
Class Y shares are available only to certain investors. Class Y shares have an annual 12b-1 fee of 0.25% of average daily net assets.
International investments entail risks including fluctuation in currency values, differences in accounting principles, or economic or political instability. Investing in emerging markets can be riskier than investing in established foreign markets due to increased volatility, lower trading volume, and higher risk of market closures. In many emerging markets, there is substantially less publicly available information and the available information may be incomplete or misleading. Legal claims are generally more difficult to pursue.
The disruptions caused by natural disasters, pandemics, or similar events could prevent the Fund from executing advantageous investment decisions in a timely manner and could negatively impact the Fund’s ability to achieve its investment objective and the value of the Fund’s investments.
2The Fund’s expense ratios, as described in the most recent prospectus, are disclosed in the following “Fund expense ratios” table. The expense ratios below may differ from the expense ratios in the “Financial highlights” since they are based on different time periods and the expense ratios in the prospectus include acquired fund fees and expenses, if any. See Note 2 in “Notes to financial statements” for additional details. Please see the “Financial highlights” section in this report for the most recent expense ratios.
| Fund expense | | | | | | |
| ratios | Class A | Class C | Class I | Class R | Class R6 | Class Y |
| Total annual operating expenses (without fee waivers) | 1.37% | 2.09% | 1.08% | 1.68% | 0.93% | 1.32% |
| Net expenses (including fee waivers, if any) | 1.15% | 1.80% | 0.80% | 1.30% | 0.76% | 1.15% |
| | | | | | | |
| Type of waiver | Contractual | Contractual | Contractual | Contractual | Contractual | Contractual |
Performance of a $10,000 investment1
For the period March 31, 2013 through March 31, 2023

| | | Starting value | Ending value |
| Delaware Ivy Systematic Emerging Markets Equity Fund - Class I shares | $10,000 | $15,728 |
| Delaware Ivy Systematic Emerging Markets Equity Fund - Class A shares | $ 9,425 | $14,249 |
| MSCI Emerging Markets Index (gross) | $10,000 | $12,644 |
| MSCI Emerging Markets Index (net) | $10,000 | $12,186 |
1The “Performance of a $10,000 investment” graph assumes $10,000 invested in Class I and Class A shares of the Fund on March 31, 2013, and includes the effect of a 5.75% front-end sales charge (for Class A shares) and the reinvestment of all distributions. The graph does not reflect the deduction of taxes the shareholders would pay on Fund distributions or redemptions of Fund shares. Expense limitations may have been in effect for some or all of the periods shown. Performance would have been lower had expense limitations not been in effect. Expenses are listed in the “Fund expense ratios” table on page 100. Please note additional details on pages 99 through 101.
The graph also assumes $10,000 invested in the MSCI Emerging Markets Index as of March 31, 2013. The MSCI Emerging Markets Index represents large- and mid-cap stocks across emerging market countries worldwide. The index covers approximately 85% of the free float-adjusted market capitalization in each country. Index “net” return approximates the minimum possible dividend reinvestment, after deduction of withholding tax at the highest possible rate. Index “gross” return approximates the maximum possible dividend reinvestment.
The MSCI World Index, mentioned on page 40, represents large- and mid-cap stocks across 23 developed market countries worldwide. The index covers approximately 85% of the free float-adjusted market capitalization in each country. Index “net” return approximates the minimum possible dividend reinvestment, after deduction of withholding tax at the highest possible rate.
Index performance returns do not reflect any management fees, transaction costs, or expenses. Indices are unmanaged and one cannot invest directly in an index. Past performance does not guarantee future results.
Performance of other Fund classes will vary due to different charges and expenses.
| | Nasdaq | | | |
| | symbols | | CUSIPs | |
| Class A | IPOAX | | 465897866 | |
| Class C | IPOCX | | 465897643 | |
| Class I | IPOIX | | 465899854 | |
| Class R | IYPCX | | 465899383 | |
| Class R6 | IMEGX | | 46600A708 | |
| Class Y | IPOYX | | 465898674 | |
| Performance summaries | |
| Delaware Ivy Value Fund | March 31, 2023 (Unaudited) |
The performance quoted represents past performance and does not guarantee future results. Investment return and principal value of an investment will fluctuate so that shares, when redeemed, may be worth more or less than their original cost. Current performance may be lower or higher than the performance quoted. Performance data current to the most recent month end may be obtained by calling 800 523-1918 or visiting delawarefunds.com/performance.
| Fund and benchmark performance1,2 | Average annual total returns through March 31, 2023 |
| | 1 year | 5 year | 10 year | Lifetime |
| Class A (Est. September 16, 1994) | | | | |
| Excluding sales charge | -6.47% | +8.34% | +8.70% | — |
| Including sales charge | -11.87% | +7.06% | +8.06% | — |
| Class C (Est. December 8, 2003) | | | | |
| Excluding sales charge | -7.24% | +7.47% | +8.09% | — |
| Including sales charge | -7.99% | +7.47% | +8.09% | — |
| Class I (Est. April 2, 2007) | | | | |
| Excluding sales charge | -6.25% | +8.62% | +9.03% | — |
| Including sales charge | -6.25% | +8.62% | +9.03% | — |
| Class R (Est. December 19, 2012) | | | | |
| Excluding sales charge | -6.95% | +7.93% | +8.36% | — |
| Including sales charge | -6.95% | +7.93% | +8.36% | — |
| Class R6 (Est. July 31, 2014) | | | | |
| Excluding sales charge | -6.18% | +8.78% | — | +7.52% |
| Including sales charge | -6.18% | +8.78% | — | +7.52% |
| Class Y (Est. December 8, 2003) | | | | |
| Excluding sales charge | -6.49% | +8.28% | +8.71% | — |
| Including sales charge | -6.49% | +8.28% | +8.71% | — |
| Russell 1000 Value Index | -5.91% | +7.50% | +9.13% | — |
1Returns reflect the reinvestment of all distributions and are presented both with and without the applicable sales charges described below. Returns do not reflect the deduction of taxes the shareholder would pay on Fund distributions or redemptions of Fund shares.
Expense limitations were in effect for certain classes during some or all of the periods shown in the “Fund and benchmark performance” table. Expenses for each class are listed in the “Fund expense ratios” table on page 103. Performance would have been lower had expense limitations not been in effect.
Class A shares are sold with a maximum front-end sales charge of 5.75%, and have an annual distribution and service (12b-1) fee of 0.25% of average daily net assets. Performance for Class A shares, excluding sales charges, assumes that no front-end sales charge applied.
Class C shares are sold with a contingent deferred sales charge (CDSC) of 1.00% if redeemed during the first 12 months. They are also subject to an annual 12b-1 fee of 1.00% of average daily net assets. Performance for Class C shares, excluding sales charges, assumes either that CDSCs did not apply or that the investment was not redeemed.
Class I shares are not subject to a sales charge and are offered for sale exclusively to certain eligible investors. In addition, Class I shares pay no 12b-1 fee.
Effective July 1, 2021, Class N shares were renamed Class R6 shares. Class R6 shares are available only to certain investors. In addition, Class R6 shares do not pay any service fees, sub-accounting fees, and/or sub-transfer agency fees to any brokers, dealers, or other financial intermediaries. Class R6 shares pay no 12b-1 fee.
Class R shares are available only for certain retirement plan products. They are sold without a sales charge and have an annual 12b-1 fee of 0.50% of average daily net assets.
Class Y shares are available only to certain investors. Class Y shares have an annual 12b-1 fee of 0.25% of average daily net assets.
Risk is increased in a concentrated portfolio since it holds a limited number of securities with each investment having a greater effect on the overall performance.
The disruptions caused by natural disasters, pandemics, or similar events could prevent the Fund from executing advantageous investment decisions in a timely manner and could negatively impact the Fund’s ability to achieve its investment objective and the value of the Fund’s investments.
2The Fund’s expense ratios, as described in the most recent prospectus, are disclosed in the following “Fund expense ratios” table. The expense ratios below may differ from the expense ratios in the “Financial highlights” since they are based on different time periods and the expense ratios in the prospectus include acquired fund fees and expenses, if any. See Note 2 in “Notes to financial statements” for additional details. Please see the “Financial highlights” section in this report for the most recent expense ratios.
| Fund expense | | | | | | |
| ratios | Class A | Class C | Class I | Class R | Class R6 | Class Y |
| Total annual operating expenses (without fee waivers) | 1.09% | 1.97% | 0.88% | 1.53% | 0.72% | 1.14% |
| Net expenses (including fee waivers, if any) | 1.08% | 1.83% | 0.83% | 1.33% | 0.72% | 1.08% |
| | | | | | | |
| Type of waiver | Contractual | Contractual | Contractual | Contractual | Contractual | Contractual |
Performance summaries
Delaware Ivy Value Fund
Performance of a $10,000 investment1
For the period March 31, 2013 through March 31, 2023

| | | Starting value | Ending value |
| Russell 1000 Value Index | $10,000 | $23,952 |
| Delaware Ivy Value Fund - Class I shares | $10,000 | $23,734 |
| Delaware Ivy Value Fund - Class A shares | $ 9,425 | $21,704 |
1The “Performance of a $10,000 investment” graph assumes $10,000 invested in Class I and Class A shares of the Fund on March 31, 2013, and includes the effect of a 5.75% front-end sales charge (for Class A shares) and the reinvestment of all distributions. The graph does not reflect the deduction of taxes the shareholders would pay on Fund distributions or redemptions of Fund shares. Expense limitations may have been in effect for some or all of the periods shown. Performance would have been lower had expense limitations not been in effect. Expenses are listed in the “Fund expense ratios” table on page 103. Please note additional details on pages 102 through 104.
The graph also assumes $10,000 invested in the Russell 1000 Value Index as of March 31, 2013. The Russell 1000 Value Index measures the performance of the large-cap value segment of the US equity universe. It includes those Russell 1000 companies with lower price-to-book ratios and lower forecasted growth values.
Frank Russell Company is the source and owner of the trademarks, service marks, and copyrights related to the Russell Indexes. Russell® is a trademark of Frank Russell Company.
Index performance returns do not reflect any management fees, transaction costs, or expenses. Indices are unmanaged and one cannot invest directly in an index. Past performance does not guarantee future results.
Performance of other Fund classes will vary due to different charges and expenses.
| | Nasdaq | | | |
| | symbols | | CUSIPs | |
| Class A | IYVAX | | 465898385 | |
| Class C | IYVCX | | 465898369 | |
| Class I | IYAIX | | 465899789 | |
| Class R | IYVLX | | 465899532 | |
| Class R6 | IVALX | | 46600A716 | |
| Class Y | IYVYX | | 465898351 | |
Disclosure of Fund expenses
For the six-month period from October 1, 2022 to March 31, 2023 (Unaudited)
As a shareholder of a Fund, you incur two types of costs: (1) transaction costs, including sales charges (loads) on purchase payments, reinvested dividends, or other distributions; redemption fees; and exchange fees; and (2) ongoing costs, including management fees; distribution and service (12b-1) fees; and other Fund expenses. The following examples are intended to help you understand your ongoing costs (in dollars) of investing in a Fund and to compare these costs with the ongoing costs of investing in other mutual funds.
The examples are based on an investment of $1,000 invested at the beginning of the period and held for the entire six-month period from October 1, 2022 to March 31, 2023.
Actual expenses
The first section of the tables shown, “Actual Fund return,” provides information about actual account values and actual expenses. You may use the information in this section of the table, together with the amount you invested, to estimate the expenses that you paid over the period. Simply divide your account value by $1,000 (for example, an $8,600 account value divided by $1,000 = 8.6), then multiply the result by the number in the first section under the heading entitled “Expenses Paid During Period” to estimate the expenses you paid on your account during this period.
Hypothetical example for comparison purposes
The second section of the tables shown, “Hypothetical 5% return,” provides information about hypothetical account values and hypothetical expenses based on a Fund’s actual expense ratios and an assumed rate of return of 5% per year before expenses, which is not the Funds' actual return. The hypothetical account values and expenses may not be used to estimate the actual ending account balance or expenses you paid for the period. You may use this information to compare the ongoing costs of investing in each Fund and other funds. To do so, compare this 5% hypothetical example with the 5% hypothetical examples that appear in the shareholder reports of the other funds.
Please note that the expenses shown in the tables are meant to highlight your ongoing costs only and do not reflect any transactional costs, such as sales charges (loads), redemption fees, or exchange fees. Therefore, the second section of each table is useful in comparing ongoing costs only, and will not help you determine the relative total costs of owning different funds. In addition, if these transactional costs were included, your costs would have been higher. The Funds' expenses shown in the tables reflect fee waivers in effect and assume reinvestment of all dividends and distributions.
Delaware Global Value Equity Fund
Expense analysis of an investment of $1,000
| | | | | | | | | Expenses |
| | | | | | | | | Paid |
| | | Beginning | | Ending | | | | During |
| | | Account | | Account | | Annualized | | Period |
| | | Value | | Value | | Expense | | 10/1/22 to |
| | | 10/1/22 | | 3/31/23 | | Ratio | | 3/31/23* |
| Actual Fund return† | | | | | | | | | | | | | | |
| Class A | | $ | 1,000.00 | | | $ | 1,287.00 | | | 1.18% | | $ | 6.73 | |
| Class C | | | 1,000.00 | | | | 1,282.30 | | | 1.96% | | | 11.15 | |
| Class I | | | 1,000.00 | | | | 1,287.80 | | | 0.92% | | | 5.25 | |
| Class R | | | 1,000.00 | | | | 1,285.00 | | | 1.42% | | | 8.09 | |
| Class R6 | | | 1,000.00 | | | | 1,289.00 | | | 0.84% | | | 4.79 | |
| Class Y | | | 1,000.00 | | | | 1,287.00 | | | 1.18% | | | 6.73 | |
| Hypothetical 5% return (5% return before expenses) | | | | | | | | | | | | | | |
| Class A | | $ | 1,000.00 | | | $ | 1,019.05 | | | 1.18% | | $ | 5.94 | |
| Class C | | | 1,000.00 | | | | 1,015.16 | | | 1.96% | | | 9.85 | |
| Class I | | | 1,000.00 | | | | 1,020.34 | | | 0.92% | | | 4.63 | |
| Class R | | | 1,000.00 | | | | 1,017.85 | | | 1.42% | | | 7.14 | |
| Class R6 | | | 1,000.00 | | | | 1,020.74 | | | 0.84% | | | 4.23 | |
| Class Y | | | 1,000.00 | | | | 1,019.05 | | | 1.18% | | | 5.94 | |
Delaware Ivy Core Bond Fund
Expense analysis of an investment of $1,000
| | | | | | | | | Expenses |
| | | | | | | | | Paid |
| | | Beginning | | Ending | | | | During |
| | | Account | | Account | | Annualized | | Period |
| | | Value | | Value | | Expense | | 10/1/22 to |
| | | 10/1/22 | | 3/31/23 | | Ratio | | 3/31/23* |
| Actual Fund return† | | | | | | | | | | | | | | |
| Class A | | $ | 1,000.00 | | | $ | 1,052.00 | | | 0.70% | | $ | 3.58 | |
| Class C | | | 1,000.00 | | | | 1,049.20 | | | 1.48% | | | 7.56 | |
| Class I | | | 1,000.00 | | | | 1,053.30 | | | 0.45% | | | 2.30 | |
| Class R | | | 1,000.00 | | | | 1,050.60 | | | 0.95% | | | 4.86 | |
| Class R6 | | | 1,000.00 | | | | 1,054.40 | | | 0.45% | | | 2.30 | |
| Class Y | | | 1,000.00 | | | | 1,052.00 | | | 0.70% | | | 3.58 | |
| Hypothetical 5% return (5% return before expenses) | | | | | | | | | | | | | | |
| Class A | | $ | 1,000.00 | | | $ | 1,021.44 | | | 0.70% | | $ | 3.53 | |
| Class C | | | 1,000.00 | | | | 1,017.55 | | | 1.48% | | | 7.44 | |
| Class I | | | 1,000.00 | | | | 1,022.69 | | | 0.45% | | | 2.27 | |
| Class R | | | 1,000.00 | | | | 1,020.19 | | | 0.95% | | | 4.78 | |
| Class R6 | | | 1,000.00 | | | | 1,022.69 | | | 0.45% | | | 2.27 | |
| Class Y | | | 1,000.00 | | | | 1,021.44 | | | 0.70% | | | 3.53 | |
Disclosure of Fund expenses
Delaware Ivy Core Equity Fund
Expense analysis of an investment of $1,000
| | | | | | | | | Expenses |
| | | | | | | | | Paid |
| | | Beginning | | Ending | | | | During |
| | | Account | | Account | | Annualized | | Period |
| | | Value | | Value | | Expense | | 10/1/22 to |
| | | 10/1/22 | | 3/31/23 | | Ratio | | 3/31/23* |
| Actual Fund return† | | | | | | | | | | | | | | |
| Class A | | $ | 1,000.00 | | | $ | 1,145.50 | | | 0.99% | | $ | 5.30 | |
| Class C | | | 1,000.00 | | | | 1,141.10 | | | 1.77% | | | 9.45 | |
| Class I | | | 1,000.00 | | | | 1,147.20 | | | 0.76% | | | 4.07 | |
| Class R | | | 1,000.00 | | | | 1,144.70 | | | 1.25% | | | 6.68 | |
| Class R6 | | | 1,000.00 | | | | 1,147.20 | | | 0.71% | | | 3.80 | |
| Class Y | | | 1,000.00 | | | | 1,145.60 | | | 0.99% | | | 5.30 | |
| Hypothetical 5% return (5% return before expenses) | | | | | | | | | | | | | | |
| Class A | | $ | 1,000.00 | | | $ | 1,020.00 | | | 0.99% | | $ | 4.99 | |
| Class C | | | 1,000.00 | | | | 1,016.11 | | | 1.77% | | | 8.90 | |
| Class I | | | 1,000.00 | | | | 1,021.14 | | | 0.76% | | | 3.83 | |
| Class R | | | 1,000.00 | | | | 1,018.70 | | | 1.25% | | | 6.29 | |
| Class R6 | | | 1,000.00 | | | | 1,021.39 | | | 0.71% | | | 3.58 | |
| Class Y | | | 1,000.00 | | | | 1,020.00 | | | 0.99% | | | 4.99 | |
Delaware Ivy Global Bond Fund
Expense analysis of an investment of $1,000
| | | | | | | | | Expenses |
| | | | | | | | | Paid |
| | | Beginning | | Ending | | | | During |
| | | Account | | Account | | Annualized | | Period |
| | | Value | | Value | | Expense | | 10/1/22 to |
| | | 10/1/22 | | 3/31/23 | | Ratio | | 3/31/23* |
| Actual Fund return† | | | | | | | | | | | | | | |
| Class A | | $ | 1,000.00 | | | $ | 1,060.10 | | | 0.96% | | $ | 4.93 | |
| Class C | | | 1,000.00 | | | | 1,056.40 | | | 1.70% | | | 8.72 | |
| Class I | | | 1,000.00 | | | | 1,061.60 | | | 0.71% | | | 3.65 | |
| Class R | | | 1,000.00 | | | | 1,058.90 | | | 1.20% | | | 6.16 | |
| Class R6 | | | 1,000.00 | | | | 1,061.50 | | | 0.74% | | | 3.80 | |
| Class Y | | | 1,000.00 | | | | 1,059.20 | | | 0.96% | | | 4.93 | |
| Hypothetical 5% return (5% return before expenses) | | | | | | | | | | | | | | |
| Class A | | $ | 1,000.00 | | | $ | 1,020.14 | | | 0.96% | | $ | 4.84 | |
| Class C | | | 1,000.00 | | | | 1,016.45 | | | 1.70% | | | 8.55 | |
| Class I | | | 1,000.00 | | | | 1,021.39 | | | 0.71% | | | 3.58 | |
| Class R | | | 1,000.00 | | | | 1,018.95 | | | 1.20% | | | 6.04 | |
| Class R6 | | | 1,000.00 | | | | 1,021.24 | | | 0.74% | | | 3.73 | |
| Class Y | | | 1,000.00 | | | | 1,020.14 | | | 0.96% | | | 4.84 | |
Delaware Ivy Global Growth Fund
Expense analysis of an investment of $1,000
| | | | | | | | | Expenses |
| | | | | | | | | Paid |
| | | Beginning | | Ending | | | | During |
| | | Account | | Account | | Annualized | | Period |
| | | Value | | Value | | Expense | | 10/1/22 to |
| | | 10/1/22 | | 3/31/23 | | Ratio | | 3/31/23* |
| Actual Fund return† | | | | | | | | | | | | | | |
| Class A | | $ | 1,000.00 | | | $ | 1,202.00 | | | 1.23% | | $ | 6.75 | |
| Class C | | | 1,000.00 | | | | 1,197.90 | | | 2.01% | | | 11.01 | |
| Class I | | | 1,000.00 | | | | 1,203.50 | | | 0.99% | | | 5.44 | |
| Class R | | | 1,000.00 | | | | 1,200.80 | | | 1.47% | | | 8.07 | |
| Class R6 | | | 1,000.00 | | | | 1,203.60 | | | 0.99% | | | 5.44 | |
| Class Y | | | 1,000.00 | | | | 1,202.20 | | | 1.23% | | | 6.75 | |
| Hypothetical 5% return (5% return before expenses) | | | | | | | | | | | | | | |
| Class A | | $ | 1,000.00 | | | $ | 1,018.80 | | | 1.23% | | $ | 6.19 | |
| Class C | | | 1,000.00 | | | | 1,014.91 | | | 2.01% | | | 10.10 | |
| Class I | | | 1,000.00 | | | | 1,020.00 | | | 0.99% | | | 4.99 | |
| Class R | | | 1,000.00 | | | | 1,017.60 | | | 1.47% | | | 7.39 | |
| Class R6 | | | 1,000.00 | | | | 1,020.00 | | | 0.99% | | | 4.99 | |
| Class Y | | | 1,000.00 | | | | 1,018.80 | | | 1.23% | | | 6.19 | |
Delaware Ivy High Income Fund
Expense analysis of an investment of $1,000
| | | | | | | | | Expenses |
| | | | | | | | | Paid |
| | | Beginning | | Ending | | | | During |
| | | Account | | Account | | Annualized | | Period |
| | | Value | | Value | | Expense | | 10/1/22 to |
| | | 10/1/22 | | 3/31/23 | | Ratio | | 3/31/23* |
| Actual Fund return† | | | | | | | | | | | | | | |
| Class A | | $ | 1,000.00 | | | $ | 1,091.80 | | | 0.99% | | $ | 5.16 | |
| Class C | | | 1,000.00 | | | | 1,087.80 | | | 1.73% | | | 9.00 | |
| Class I | | | 1,000.00 | | | | 1,093.10 | | | 0.73% | | | 3.81 | |
| Class R | | | 1,000.00 | | | | 1,090.50 | | | 1.23% | | | 6.41 | |
| Class R6 | | | 1,000.00 | | | | 1,093.60 | | | 0.65% | | | 3.39 | |
| Class Y | | | 1,000.00 | | | | 1,091.80 | | | 0.98% | | | 5.11 | |
| Hypothetical 5% return (5% return before expenses) | | | | | | | | | | | | | | |
| Class A | | $ | 1,000.00 | | | $ | 1,020.00 | | | 0.99% | | $ | 4.99 | |
| Class C | | | 1,000.00 | | | | 1,016.31 | | | 1.73% | | | 8.70 | |
| Class I | | | 1,000.00 | | | | 1,021.29 | | | 0.73% | | | 3.68 | |
| Class R | | | 1,000.00 | | | | 1,018.80 | | | 1.23% | | | 6.19 | |
| Class R6 | | | 1,000.00 | | | | 1,021.69 | | | 0.65% | | | 3.28 | |
| Class Y | | | 1,000.00 | | | | 1,020.04 | | | 0.98% | | | 4.94 | |
Delaware Ivy International Core Equity Fund
Expense analysis of an investment of $1,000
| | | | | | | | | Expenses |
| | | | | | | | | Paid |
| | | Beginning | | Ending | | | | During |
| | | Account | | Account | | Annualized | | Period |
| | | Value | | Value | | Expense | | 10/1/22 to |
| | | 10/1/22 | | 3/31/23 | | Ratio | | 3/31/23* |
| Actual Fund return† | | | | | | | | | | | | | | |
| Class A | | $ | 1,000.00 | | | $ | 1,278.50 | | | 1.05% | | $ | 5.96 | |
| Class C | | | 1,000.00 | | | | 1,274.60 | | | 1.80% | | | 10.21 | |
| Class I | | | 1,000.00 | | | | 1,280.50 | | | 0.79% | | | 4.49 | |
| Class R | | | 1,000.00 | | | | 1,277.70 | | | 1.28% | | | 7.27 | |
| Class R6 | | | 1,000.00 | | | | 1,280.40 | | | 0.79% | | | 4.49 | |
| Class Y | | | 1,000.00 | | | | 1,279.30 | | | 1.04% | | | 5.91 | |
| Hypothetical 5% return (5% return before expenses) | | | | | | | | | | | | | | |
| Class A | | $ | 1,000.00 | | | $ | 1,019.70 | | | 1.05% | | $ | 5.29 | |
| Class C | | | 1,000.00 | | | | 1,015.96 | | | 1.80% | | | 9.05 | |
| Class I | | | 1,000.00 | | | | 1,020.99 | | | 0.79% | | | 3.98 | |
| Class R | | | 1,000.00 | | | | 1,018.55 | | | 1.28% | | | 6.44 | |
| Class R6 | | | 1,000.00 | | | | 1,020.99 | | | 0.79% | | | 3.98 | |
| Class Y | | | 1,000.00 | | | | 1,019.75 | | | 1.04% | | | 5.24 | |
Delaware Ivy International Value Fund
Expense analysis of an investment of $1,000
| | | | | | | | | Expenses |
| | | | | | | | | Paid |
| | | Beginning | | Ending | | | | During |
| | | Account | | Account | | Annualized | | Period |
| | | Value | | Value | | Expense | | 10/1/22 to |
| | | 10/1/22 | | 3/31/23 | | Ratio | | 3/31/23* |
| Actual Fund return† | | | | | | | | | | | | | | |
| Class A | | $ | 1,000.00 | | | $ | 1,303.70 | | | 1.22% | | $ | 7.01 | |
| Class C | | | 1,000.00 | | | | 1,299.10 | | | 1.99% | | | 11.41 | |
| Class I | | | 1,000.00 | | | | 1,305.60 | | | 0.99% | | | 5.69 | |
| Class R | | | 1,000.00 | | | | 1,302.10 | | | 1.28% | | | 7.35 | |
| Class R6 | | | 1,000.00 | | | | 1,304.30 | | | 1.07% | | | 6.15 | |
| Class Y | | | 1,000.00 | | | | 1,304.50 | | | 1.21% | | | 6.95 | |
| Hypothetical 5% return (5% return before expenses) | | | | | | | | | | | | | | |
| Class A | | $ | 1,000.00 | | | $ | 1,018.85 | | | 1.22% | | $ | 6.14 | |
| Class C | | | 1,000.00 | | | | 1,015.01 | | | 1.99% | | | 10.00 | |
| Class I | | | 1,000.00 | | | | 1,020.00 | | | 0.99% | | | 4.99 | |
| Class R | | | 1,000.00 | | | | 1,018.55 | | | 1.28% | | | 6.44 | |
| Class R6 | | | 1,000.00 | | | | 1,019.60 | | | 1.07% | | | 5.39 | |
| Class Y | | | 1,000.00 | | | | 1,018.90 | | | 1.21% | | | 6.09 | |
Delaware Ivy Large Cap Growth Fund
Expense analysis of an investment of $1,000
| | | | | | | | | Expenses |
| | | | | | | | | Paid |
| | | Beginning | | Ending | | | | During |
| | | Account | | Account | | Annualized | | Period |
| | | Value | | Value | | Expense | | 10/1/22 to |
| | | 10/1/22 | | 3/31/23 | | Ratio | | 3/31/23* |
| Actual Fund return† | | | | | | | | | | | | | | |
| Class A | | $ | 1,000.00 | | | $ | 1,186.40 | | | 0.90% | | $ | 4.91 | |
| Class C | | | 1,000.00 | | | | 1,182.10 | | | 1.65% | | | 8.98 | |
| Class I | | | 1,000.00 | | | | 1,187.90 | | | 0.64% | | | 3.49 | |
| Class R | | | 1,000.00 | | | | 1,184.80 | | | 1.16% | | | 6.32 | |
| Class R6 | | | 1,000.00 | | | | 1,187.90 | | | 0.64% | | | 3.49 | |
| Class Y | | | 1,000.00 | | | | 1,186.50 | | | 0.90% | | | 4.91 | |
| Hypothetical 5% return (5% return before expenses) | | | | | | | | | | | | | | |
| Class A | | $ | 1,000.00 | | | $ | 1,020.44 | | | 0.90% | | $ | 4.53 | |
| Class C | | | 1,000.00 | | | | 1,016.70 | | | 1.65% | | | 8.30 | |
| Class I | | | 1,000.00 | | | | 1,021.74 | | | 0.64% | | | 3.23 | |
| Class R | | | 1,000.00 | | | | 1,019.15 | | | 1.16% | | | 5.84 | |
| Class R6 | | | 1,000.00 | | | | 1,021.74 | | | 0.64% | | | 3.23 | |
| Class Y | | | 1,000.00 | | | | 1,020.44 | | | 0.90% | | | 4.53 | |
Delaware Ivy Limited-Term Bond Fund
Expense analysis of an investment of $1,000
| | | | | | | | | Expenses |
| | | | | | | | | Paid |
| | | Beginning | | Ending | | | | During |
| | | Account | | Account | | Annualized | | Period |
| | | Value | | Value | | Expense | | 10/1/22 to |
| | | 10/1/22 | | 3/31/23 | | Ratio | | 3/31/23* |
| Actual Fund return† | | | | | | | | | | | | | | |
| Class A | | $ | 1,000.00 | | | $ | 1,026.80 | | | 0.79% | | $ | 3.99 | |
| Class C | | | 1,000.00 | | | | 1,023.00 | | | 1.56% | | | 7.87 | |
| Class I | | | 1,000.00 | | | | 1,028.10 | | | 0.54% | | | 2.73 | |
| Class R | | | 1,000.00 | | | | 1,025.60 | | | 1.04% | | | 5.25 | |
| Class R6 | | | 1,000.00 | | | | 1,028.00 | | | 0.54% | | | 2.73 | |
| Class Y | | | 1,000.00 | | | | 1,026.80 | | | 0.79% | | | 3.99 | |
| Hypothetical 5% return (5% return before expenses) | | | | | | | | | | | | | | |
| Class A | | $ | 1,000.00 | | | $ | 1,020.99 | | | 0.79% | | $ | 3.98 | |
| Class C | | | 1,000.00 | | | | 1,017.15 | | | 1.56% | | | 7.85 | |
| Class I | | | 1,000.00 | | | | 1,022.24 | | | 0.54% | | | 2.72 | |
| Class R | | | 1,000.00 | | | | 1,019.75 | | | 1.04% | | | 5.24 | |
| Class R6 | | | 1,000.00 | | | | 1,022.24 | | | 0.54% | | | 2.72 | |
| Class Y | | | 1,000.00 | | | | 1,020.99 | | | 0.79% | | | 3.98 | |
Disclosure of Fund expenses
Delaware Ivy Managed International Opportunities Fund
Expense analysis of an investment of $1,000
| | | | | | | | | Expenses |
| | | | | | | | | Paid |
| | | Beginning | | Ending | | | | During |
| | | Account | | Account | | Annualized | | Period |
| | | Value | | Value | | Expense | | 10/1/22 to |
| | | 10/1/22 | | 3/31/23 | | Ratio | | 3/31/23* |
| Actual Fund return† | | | | | | | | | | | | | | |
| Class A | | $ | 1,000.00 | | | $ | 1,236.50 | | | 0.85% | | $ | 4.74 | |
| Class C | | | 1,000.00 | | | | 1,230.90 | | | 1.77% | | | 9.84 | |
| Class I | | | 1,000.00 | | | | 1,237.50 | | | 0.48% | | | 2.68 | |
| Class R | | | 1,000.00 | | | | 1,234.10 | | | 1.10% | | | 6.13 | |
| Class R6 | | | 1,000.00 | | | | 1,238.80 | | | 0.57% | | | 3.18 | |
| Class Y | | | 1,000.00 | | | | 1,235.90 | | | 0.79% | | | 4.40 | |
| Hypothetical 5% return (5% return before expenses) | | | | | | | | | | | | | | |
| Class A | | $ | 1,000.00 | | | $ | 1,020.69 | | | 0.85% | | $ | 4.28 | |
| Class C | | | 1,000.00 | | | | 1,016.11 | | | 1.77% | | | 8.90 | |
| Class I | | | 1,000.00 | | | | 1,022.54 | | | 0.48% | | | 2.42 | |
| Class R | | | 1,000.00 | | | | 1,019.45 | | | 1.10% | | | 5.54 | |
| Class R6 | | | 1,000.00 | | | | 1,022.09 | | | 0.57% | | | 2.87 | |
| Class Y | | | 1,000.00 | | | | 1,020.99 | | | 0.79% | | | 3.98 | |
Delaware Ivy Mid Cap Growth Fund
Expense analysis of an investment of $1,000
| | | | | | | | | Expenses |
| | | | | | | | | Paid |
| | | Beginning | | Ending | | | | During |
| | | Account | | Account | | Annualized | | Period |
| | | Value | | Value | | Expense | | 10/1/22 to |
| | | 10/1/22 | | 3/31/23 | | Ratio | | 3/31/23* |
| Actual Fund return† | | | | | | | | | | | | | | |
| Class A | | $ | 1,000.00 | | | $ | 1,179.30 | | | 1.05% | | $ | 5.70 | |
| Class C | | | 1,000.00 | | | | 1,175.20 | | | 1.81% | | | 9.82 | |
| Class I | | | 1,000.00 | | | | 1,181.00 | | | 0.79% | | | 4.30 | |
| Class R | | | 1,000.00 | | | | 1,178.00 | | | 1.30% | | | 7.06 | |
| Class R6 | | | 1,000.00 | | | | 1,181.10 | | | 0.79% | | | 4.30 | |
| Class Y | | | 1,000.00 | | | | 1,179.30 | | | 1.04% | | | 5.65 | |
| Hypothetical 5% return (5% return before expenses) | | | | | | | | | | | | | | |
| Class A | | $ | 1,000.00 | | | $ | 1,019.70 | | | 1.05% | | $ | 5.29 | |
| Class C | | | 1,000.00 | | | | 1,015.91 | | | 1.81% | | | 9.10 | |
| Class I | | | 1,000.00 | | | | 1,020.99 | | | 0.79% | | | 3.98 | |
| Class R | | | 1,000.00 | | | | 1,018.45 | | | 1.30% | | | 6.54 | |
| Class R6 | | | 1,000.00 | | | | 1,020.99 | | | 0.79% | | | 3.98 | |
| Class Y | | | 1,000.00 | | | | 1,019.75 | | | 1.04% | | | 5.24 | |
Delaware Ivy Mid Cap Income Opportunities Fund
Expense analysis of an investment of $1,000
| | | | | | | | | Expenses |
| | | | | | | | | Paid |
| | | Beginning | | Ending | | | | During |
| | | Account | | Account | | Annualized | | Period |
| | | Value | | Value | | Expense | | 10/1/22 to |
| | | 10/1/22 | | 3/31/23 | | Ratio | | 3/31/23* |
| Actual Fund return† | | | | | | | | | | | | | | |
| Class A | | $ | 1,000.00 | | | $ | 1,138.00 | | | 1.06% | | $ | 5.65 | |
| Class C | | | 1,000.00 | | | | 1,134.30 | | | 1.83% | | | 9.74 | |
| Class I | | | 1,000.00 | | | | 1,140.30 | | | 0.83% | | | 4.43 | |
| Class R | | | 1,000.00 | | | | 1,136.90 | | | 1.32% | �� | | 7.03 | |
| Class R6 | | | 1,000.00 | | | | 1,140.30 | | | 0.83% | | | 4.43 | |
| Class Y | | | 1,000.00 | | | | 1,138.80 | | | 1.10% | | | 5.87 | |
| Hypothetical 5% return (5% return before expenses) | | | | | | | | | | | | | | |
| Class A | | $ | 1,000.00 | | | $ | 1,019.65 | | | 1.06% | | $ | 5.34 | |
| Class C | | | 1,000.00 | | | | 1,015.81 | | | 1.83% | | | 9.20 | |
| Class I | | | 1,000.00 | | | | 1,020.79 | | | 0.83% | | | 4.18 | |
| Class R | | | 1,000.00 | | | | 1,018.35 | | | 1.32% | | | 6.64 | |
| Class R6 | | | 1,000.00 | | | | 1,020.79 | | | 0.83% | | | 4.18 | |
| Class Y | | | 1,000.00 | | | | 1,019.45 | | | 1.10% | | | 5.54 | |
Delaware Ivy Municipal Bond Fund
Expense analysis of an investment of $1,000
| | | | | | | | | Expenses |
| | | | | | | | | Paid |
| | | Beginning | | Ending | | | | During |
| | | Account | | Account | | Annualized | | Period |
| | | Value | | Value | | Expense | | 10/1/22 to |
| | | 10/1/22 | | 3/31/23 | | Ratio | | 3/31/23* |
| Actual Fund return† | | | | | | | | | | | | | | |
| Class A | | $ | 1,000.00 | | | $ | 1,060.80 | | | 0.80% | | $ | 4.11 | |
| Class C | | | 1,000.00 | | | | 1,056.80 | | | 1.56% | | | 8.00 | |
| Class I | | | 1,000.00 | | | | 1,062.10 | | | 0.58% | | | 2.98 | |
| Class R6 | | | 1,000.00 | | | | 1,062.10 | | | 0.56% | | | 2.88 | |
| Hypothetical 5% return (5% return before expenses) | | | | | | | | | | | | | | |
| Class A | | $ | 1,000.00 | | | $ | 1,020.94 | | | 0.80% | | $ | 4.03 | |
| Class C | | | 1,000.00 | | | | 1,017.15 | | | 1.56% | | | 7.85 | |
| Class I | | | 1,000.00 | | | | 1,022.04 | | | 0.58% | | | 2.92 | |
| Class R6 | | | 1,000.00 | | | | 1,022.14 | | | 0.56% | | | 2.82 | |
Delaware Ivy Municipal High Income Fund
Expense analysis of an investment of $1,000
| | | | | | | | | Expenses |
| | | | | | | | | Paid |
| | | Beginning | | Ending | | | | During |
| | | Account | | Account | | Annualized | | Period |
| | | Value | | Value | | Expense | | 10/1/22 to |
| | | 10/1/22 | | 3/31/23 | | Ratio | | 3/31/23* |
| Actual Fund return† | | | | | | | | | | | | | | |
| Class A | | $ | 1,000.00 | | | $ | 1,049.80 | | | 0.86% | | $ | 4.39 | |
| Class C | | | 1,000.00 | | | | 1,046.00 | | | 1.58% | | | 8.06 | |
| Class I | | | 1,000.00 | | | | 1,051.20 | | | 0.61% | | | 3.12 | |
| Class R6 | | | 1,000.00 | | | | 1,051.00 | | | 0.66% | | | 3.37 | |
| Class Y | | | 1,000.00 | | | | 1,049.80 | | | 0.86% | | | 4.39 | |
| Hypothetical 5% return (5% return before expenses) | | | | | | | | | | | | | | |
| Class A | | $ | 1,000.00 | | | $ | 1,020.64 | | | 0.86% | | $ | 4.33 | |
| Class C | | | 1,000.00 | | | | 1,017.05 | | | 1.58% | | | 7.95 | |
| Class I | | | 1,000.00 | | | | 1,021.89 | | | 0.61% | | | 3.07 | |
| Class R6 | | | 1,000.00 | | | | 1,021.64 | | | 0.66% | | | 3.33 | |
| Class Y | | | 1,000.00 | | | | 1,020.64 | | | 0.86% | | | 4.33 | |
Delaware Ivy Small Cap Growth Fund
Expense analysis of an investment of $1,000
| | | | | | | | | Expenses |
| | | | | | | | | Paid |
| | | Beginning | | Ending | | | | During |
| | | Account | | Account | | Annualized | | Period |
| | | Value | | Value | | Expense | | 10/1/22 to |
| | | 10/1/22 | | 3/31/23 | | Ratio | | 3/31/23* |
| Actual Fund return† | | | | | | | | | | | | | | |
| Class A | | $ | 1,000.00 | | | $ | 1,093.60 | | | 1.15% | | $ | 6.00 | |
| Class C | | | 1,000.00 | | | | 1,089.80 | | | 1.91% | | | 9.95 | |
| Class I | | | 1,000.00 | | | | 1,094.20 | | | 0.89% | | | 4.65 | |
| Class R | | | 1,000.00 | | | | 1,091.00 | | | 1.40% | | | 7.30 | |
| Class R6 | | | 1,000.00 | | | | 1,094.40 | | | 0.89% | | | 4.65 | |
| Class Y | | | 1,000.00 | | | | 1,093.40 | | | 1.14% | | | 5.95 | |
| Hypothetical 5% return (5% return before expenses) | | | | | | | | | | | | | | |
| Class A | | $ | 1,000.00 | | | $ | 1,019.20 | | | 1.15% | | $ | 5.79 | |
| Class C | | | 1,000.00 | | | | 1,015.41 | | | 1.91% | | | 9.60 | |
| Class I | | | 1,000.00 | | | | 1,020.49 | | | 0.89% | | | 4.48 | |
| Class R | | | 1,000.00 | | | | 1,017.95 | | | 1.40% | | | 7.04 | |
| Class R6 | | | 1,000.00 | | | | 1,020.49 | | | 0.89% | | | 4.48 | |
| Class Y | | | 1,000.00 | | | | 1,019.25 | | | 1.14% | | | 5.74 | |
Delaware Ivy Smid Cap Core Fund
Expense analysis of an investment of $1,000
| | | | | | | | | Expenses |
| | | | | | | | | Paid |
| | | Beginning | | Ending | | | | During |
| | | Account | | Account | | Annualized | | Period |
| | | Value | | Value | | Expense | | 10/1/22 to |
| | | 10/1/22 | | 3/31/23 | | Ratio | | 3/31/23* |
| Actual Fund return† | | | | | | | | | | | | | | |
| Class A | | $ | 1,000.00 | | | $ | 1,122.90 | | | 1.15% | | $ | 6.09 | |
| Class C | | | 1,000.00 | | | | 1,118.40 | | | 1.90% | | | 10.03 | |
| Class I | | | 1,000.00 | | | | 1,124.50 | | | 0.89% | | | 4.71 | |
| Class R | | | 1,000.00 | | | | 1,121.80 | | | 1.40% | | | 7.41 | |
| Class R6 | | | 1,000.00 | | | | 1,123.90 | | | 0.89% | | | 4.71 | |
| Class Y | | | 1,000.00 | | | | 1,122.80 | | | 1.14% | | | 6.03 | |
| Hypothetical 5% return (5% return before expenses) | | | | | | | | | | | | | | |
| Class A | | $ | 1,000.00 | | | $ | 1,019.20 | | | 1.15% | | $ | 5.79 | |
| Class C | | | 1,000.00 | | | | 1,015.46 | | | 1.90% | | | 9.55 | |
| Class I | | | 1,000.00 | | | | 1,020.49 | | | 0.89% | | | 4.48 | |
| Class R | | | 1,000.00 | | | | 1,017.95 | | | 1.40% | | | 7.04 | |
| Class R6 | | | 1,000.00 | | | | 1,020.49 | | | 0.89% | | | 4.48 | |
| Class Y | | | 1,000.00 | | | | 1,019.25 | | | 1.14% | | | 5.74 | |
Delaware Ivy Systematic Emerging Markets Equity Fund
Expense analysis of an investment of $1,000
| | | | | | | | | Expenses |
| | | | | | | | | Paid |
| | | Beginning | | Ending | | | | During |
| | | Account | | Account | | Annualized | | Period |
| | | Value | | Value | | Expense | | 10/1/22 to |
| | | 10/1/22 | | 3/31/23 | | Ratio | | 3/31/23* |
| Actual Fund return† | | | | | | | | | | | | | | |
| Class A | | $ | 1,000.00 | | | $ | 1,140.30 | | | 1.18% | | $ | 6.30 | |
| Class C | | | 1,000.00 | | | | 1,136.80 | | | 1.80% | | | 9.59 | |
| Class I | | | 1,000.00 | | | | 1,143.00 | | | 0.81% | | | 4.33 | |
| Class R | | | 1,000.00 | | | | 1,139.90 | | | 1.31% | | | 6.99 | |
| Class R6 | | | 1,000.00 | | | | 1,142.70 | | | 0.75% | | | 4.01 | |
| Class Y | | | 1,000.00 | | | | 1,140.40 | | | 1.14% | | | 6.08 | |
| Hypothetical 5% return (5% return before expenses) | | | | | | | | | | | | | | |
| Class A | | $ | 1,000.00 | | | $ | 1,019.05 | | | 1.18% | | $ | 5.94 | |
| Class C | | | 1,000.00 | | | | 1,015.96 | | | 1.80% | | | 9.05 | |
| Class I | | | 1,000.00 | | | | 1,020.89 | | | 0.81% | | | 4.08 | |
| Class R | | | 1,000.00 | | | | 1,018.40 | | | 1.31% | | | 6.59 | |
| Class R6 | | | 1,000.00 | | | | 1,021.19 | | | 0.75% | | | 3.78 | |
| Class Y | | | 1,000.00 | | | | 1,019.25 | | | 1.14% | | | 5.74 | |
Disclosure of Fund expenses
Delaware Ivy Value Fund
Expense analysis of an investment of $1,000
| | | | | | | | | Expenses |
| | | | | | | | | Paid |
| | | Beginning | | Ending | | | | During |
| | | Account | | Account | | Annualized | | Period |
| | | Value | | Value | | Expense | | 10/1/22 to |
| | | 10/1/22 | | 3/31/23 | | Ratio | | 3/31/23* |
| Actual Fund return† | | | | | | | | | | | | | | |
| Class A | | $ | 1,000.00 | | | $ | 1,109.20 | | | 1.09% | | $ | 5.73 | |
| Class C | | | 1,000.00 | | | | 1,104.70 | | | 1.83% | | | 9.60 | |
| Class I | | | 1,000.00 | | | | 1,110.90 | | | 0.84% | | | 4.42 | |
| Class R | | | 1,000.00 | | | | 1,107.40 | | | 1.32% | | | 6.94 | |
| Class R6 | | | 1,000.00 | | | | 1,110.80 | | | 0.74% | | | 3.89 | |
| Class Y | | | 1,000.00 | | | | 1,109.00 | | | 1.09% | | | 5.73 | |
| Hypothetical 5% return (5% return before expenses) | | | | | | | | | | | | | | |
| Class A | | $ | 1,000.00 | | | $ | 1,019.50 | | | 1.09% | | $ | 5.49 | |
| Class C | | | 1,000.00 | | | | 1,015.81 | | | 1.83% | | | 9.20 | |
| Class I | | | 1,000.00 | | | | 1,020.74 | | | 0.84% | | | 4.23 | |
| Class R | | | 1,000.00 | | | | 1,018.35 | | | 1.32% | | | 6.64 | |
| Class R6 | | | 1,000.00 | | | | 1,021.24 | | | 0.74% | | | 3.73 | |
| Class Y | | | 1,000.00 | | | | 1,019.50 | | | 1.09% | | | 5.49 | |
*“Expenses Paid During Period” are equal to the relevant Fund's annualized expense ratio, multiplied by the average account value over the period, multiplied by 182/365 (to reflect the one-half year period).
†Because actual returns reflect only the most recent six-month period, the returns shown may differ significantly from fiscal year returns.
In addition to the Funds’ expenses reflected on the previous pages, each Fund also indirectly bears its portion of the fees and expenses of any investment companies (Underlying Funds), including exchange-traded funds in which it invests. The tables above and on the previous pages do not reflect the expenses of any applicable Underlying Funds.
| Security type / country and sector allocations | |
| Delaware Global Value Equity Fund | As of March 31, 2023 (Unaudited) |
Sector designations may be different from the sector designations presented in other Fund materials. The sector designations may represent the investment manager’s internal sector classifications, which may result in the sector designations for one fund being different from another fund's sector designations.
| | | Percentage |
| Security type / country | | of net assets |
| Common Stocks by Country | | | 98.58 | % |
| Denmark | | | 2.34 | % |
| France | | | 14.08 | % |
| Germany | | | 10.94 | % |
| Japan | | | 4.60 | % |
| Netherlands | | | 5.34 | % |
| Spain | | | 4.45 | % |
| Sweden | | | 8.05 | % |
| Switzerland | | | 10.01 | % |
| United Kingdom | | | 12.93 | % |
| United States | | | 25.84 | % |
| Exchange-Traded Fund | | | 1.08 | % |
| Total Value of Securities | | | 99.66 | % |
| Receivables and Other Assets Net of Liabilities | | | 0.34 | % |
| Total Net Assets | | | 100.00 | % |
| | | Percentage |
| Common stocks and preferred stocks by sector | | of net assets |
| Communication Services | | | 2.33 | % |
| Consumer Discretionary | | | 16.22 | % |
| Consumer Staples* | | | 41.76 | % |
| Healthcare | | | 19.02 | % |
| Industrials | | | 9.16 | % |
| Information Technology | | | 6.15 | % |
| Materials | | | 3.94 | % |
| Total | | | 98.58 | % |
*To monitor compliance with the Fund’s concentration guidelines as described in the Fund’s Prospectus and Statement of Additional Information, the Consumer Staples sector (as disclosed herein for financial reporting purposes) is subdivided into a variety of “industries” (in accordance with the requirements of the Investment Company Act of 1940, as amended). The Consumer Staples sector consisted of Beverages, Cosmetics/Personal Care, Food, and Household Products/Wares. As of March 31, 2023, such amounts, as a percentage of total net assets were 4.86%, 8.80%, 20.96%, and 7.14%, respectively. The percentage in any such single industry will comply with the Fund’s concentration policy even if the percentage in the Consumer Staples sector for financial reporting purposes may exceed 25%.
| Security type / sector allocations | |
| Delaware Ivy Core Bond Fund | As of March 31, 2023 (Unaudited) |
Sector designations may be different from the sector designations presented in other Fund materials. The sector designations may represent the investment manager’s internal sector classifications, which may result in the sector designations for one fund being different from another fund's sector designations.
| | | Percentage |
| Security type / sector | | of net assets |
| Agency Collateralized Mortgage Obligations | | | 0.15 | % |
| Agency Mortgage-Backed Securities | | | 27.16 | % |
| Collateralized Debt Obligations | | | 1.94 | % |
| Corporate Bonds | | | 38.09 | % |
| Banking | | | 7.71 | % |
| Basic Industry | | | 1.45 | % |
| Basic Materials | | | 0.20 | % |
| Brokerage | | | 0.39 | % |
| Capital Goods | | | 1.27 | % |
| Communications | | | 3.24 | % |
| Consumer Cyclical | | | 1.82 | % |
| Consumer Non-Cyclical | | | 4.57 | % |
| Electric | | | 4.60 | % |
| Energy | | | 4.95 | % |
| Finance Companies | | | 1.89 | % |
| Industrials | | | 0.19 | % |
| Insurance | | | 2.95 | % |
| Natural Gas | | | 0.24 | % |
| Real Estate Investment Trusts | | | 0.24 | % |
| Technology | | | 1.68 | % |
| Transportation | | | 0.70 | % |
| Municipal Bonds | | | 2.52 | % |
| Non-Agency Asset-Backed Securities | | | 3.93 | % |
| Non-Agency Collateralized Mortgage Obligations | | | 7.31 | % |
| Non-Agency Commercial Mortgage-Backed Securities | | | 8.86 | % |
| Sovereign Bonds | | | 2.22 | % |
| US Treasury Obligations | | | 4.01 | % |
| Preferred Stock | | | 0.79 | % |
| Short-Term Investments | | | 4.18 | % |
| Total Value of Securities | | | 101.16 | % |
| Liabilities Net of Receivables and Other Assets | | | (1.16 | )% |
| Total Net Assets | | | 100.00 | % |
Security type / sector allocations and top 10 equity holdings
| Delaware Ivy Core Equity Fund | As of March 31, 2023 (Unaudited) |
Sector designations may be different from the sector designations presented in other Fund materials. The sector designations may represent the investment manager’s internal sector classifications, which may result in the sector designations for one fund being different from another fund's sector designations.
| | | Percentage |
| Security type / sector | | of net assets |
| Common Stocks | | | 95.03 | % |
| Communication Services | | | 5.33 | % |
| Consumer Discretionary | | | 8.12 | % |
| Consumer Staples | | | 3.57 | % |
| Energy | | | 2.54 | % |
| Financials | | | 14.86 | % |
| Healthcare | | | 12.39 | % |
| Industrials | | | 9.30 | % |
| Information Technology* | | | 31.61 | % |
| Materials | | | 4.32 | % |
| Utilities | | | 2.99 | % |
| Short-Term Investments | | | 5.59 | % |
| Total Value of Securities | | | 100.62 | % |
| Liabilities Net of Receivables and Other Assets | | | (0.62 | )% |
| Total Net Assets | | | 100.00 | % |
*To monitor compliance with the Fund’s concentration guidelines as described in the Fund’s Prospectus and Statement of Additional Information, the Information Technology sector (as disclosed herein for financial reporting purposes) is subdivided into a variety of “industries” (in accordance with the requirements of the Investment Company Act of 1940, as amended). The Information Technology sector consisted of Computers, Diversified Financial Services, Electronics, Internet, Office/Business Equipment, Semiconductors, and Software. As of March 31, 2023, such amounts, as a percentage of total net assets were 5.47%, 1.79%, 3.13%, 2.29%, 1.32%, 5.21%, and 12.40%, respectively. The percentage in any such single industry will comply with the Fund’s concentration policy even if the percentage in the Information Technology sector for financial reporting purposes may exceed 25%.
Holdings are for informational purposes only and are subject to change at any time. They are not a recommendation to buy, sell, or hold any security.
| | | Percentage |
| Top 10 equity holdings | | of net assets |
| Microsoft | | | 7.57 | % |
| UnitedHealth Group | | | 4.95 | % |
| Apple | | | 4.18 | % |
| Alphabet Class A | | | 3.50 | % |
| TE Connectivity | | | 3.13 | % |
| HCA Healthcare | | | 3.07 | % |
| Microchip Technology | | | 3.04 | % |
| NextEra Energy | | | 2.99 | % |
| Amazon.com | | | 2.88 | % |
| AutoZone | | | 2.75 | % |
Security type / country and sector allocations
| Delaware Ivy Global Bond Fund | As of March 31, 2023 (Unaudited) |
Sector designations may be different from the sector designations presented in other Fund materials. The sector designations may represent the investment manager’s internal sector classifications, which may result in the sector designations for one fund being different from another fund's sector designations.
| | | Percentage |
| Security type / country | | of net assets |
| Agency Mortgage-Backed Securities | | | 7.21 | % |
| Corporate Bonds | | | 43.47 | % |
| Australia | | | 0.13 | % |
| Brazil | | | 0.37 | % |
| Canada | | | 0.39 | % |
| Chile | | | 0.43 | % |
| China | | | 0.46 | % |
| Colombia | | | 0.32 | % |
| Czech Republic | | | 0.14 | % |
| France | | | 2.27 | % |
| Georgia | | | 0.15 | % |
| Germany | | | 0.73 | % |
| Guatemala | | | 0.44 | % |
| India | | | 0.50 | % |
| Indonesia | | | 1.37 | % |
| Israel | | | 0.24 | % |
| Italy | | | 0.22 | % |
| Japan | | | 0.62 | % |
| Kazakhstan | | | 0.99 | % |
| Kuwait | | | 1.25 | % |
| Malaysia | | | 0.14 | % |
| Mexico | | | 1.42 | % |
| Netherlands | | | 1.97 | % |
| Paraguay | | | 0.36 | % |
| Peru | | | 0.93 | % |
| Republic of Korea | | | 0.14 | % |
| Singapore | | | 0.56 | % |
| South Africa | | | 0.17 | % |
| Spain | | | 0.11 | % |
| Switzerland | | | 0.93 | % |
| Tanzania | | | 0.30 | % |
| Thailand | | | 0.16 | % |
| Turkey | | | 0.16 | % |
| Ukraine | | | 0.36 | % |
| United Arab Emirates | | | 0.52 | % |
| United Kingdom | | | 0.39 | % |
| United States | | | 23.64 | % |
| Uzbekistan | | | 0.19 | % |
| Sovereign Bonds | | | 25.13 | % |
| Albania | | | 0.19 | % |
| Angola | | | 0.50 | % |
| Armenia | | | 0.18 | % |
| Bermuda | | | 0.86 | % |
| Brazil | | | 0.31 | % |
| Chile | | | 1.29 | % |
| Colombia | | | 1.68 | % |
| Denmark | | | 2.64 | % |
| Dominican Republic | | | 1.20 | % |
| Egypt | | | 0.29 | % |
| Finland | | | 1.81 | % |
| Georgia | | | 0.18 | % |
| Germany | | | 0.94 | % |
| Indonesia | | | 0.64 | % |
| Italy | | | 0.72 | % |
| Ivory Coast | | | 1.17 | % |
| Morocco | | | 0.66 | % |
| Netherlands | | | 1.69 | % |
| New Zealand | | | 2.21 | % |
| Paraguay | | | 2.02 | % |
| Republic of North Macedonia | | | 0.36 | % |
| Senegal | | | 0.39 | % |
| South Africa | | | 1.17 | % |
| Spain | | | 0.95 | % |
| Uzbekistan | | | 1.08 | % |
| Supranational Banks | | | 2.38 | % |
| US Treasury Obligations | | | 16.38 | % |
| Options Purchased | | | 0.18 | % |
| Short-Term Investments | | | 3.81 | % |
| Options Written | | | (0.13 | )% |
| Total Value of Securities | | | 98.43 | % |
| Receivables and Other Assets Net of Liabilities | | | 1.57 | % |
| Total Net Assets | | | 100.00 | % |
| | | Percentage |
| Corporate bonds by sector | | of net assets |
| Banking | | | 17.14 | % |
| Basic Industry | | | 1.20 | % |
| Capital Goods | | | 1.43 | % |
| Communications | | | 0.74 | % |
| Consumer Cyclical | | | 1.17 | % |
| Consumer Non-Cyclical | | | 3.57 | % |
| Electric | | | 3.06 | % |
| Energy | | | 4.74 | % |
| Finance Companies | | | 1.32 | % |
| Financial Services | | | 0.50 | % |
| Industrials | | | 0.32 | % |
| Insurance | | | 2.98 | % |
| Natural Gas | | | 0.39 | % |
| Technology | | | 1.78 | % |
| Transportation | | | 1.47 | % |
| Utilities | | | 1.66 | % |
| Total | | | 43.47 | % |
Security type / sector and country allocations
| Delaware Ivy Global Growth Fund | As of March 31, 2023 (Unaudited) |
Sector designations may be different from the sector designations presented in other Fund materials. The sector designations may represent the investment manager’s internal sector classifications, which may result in the sector designations for one fund being different from another fund's sector designations.
| | | Percentage |
| Security type / country | | of net assets |
| Common Stocks by Country | | | 99.78 | % |
| Canada | | | 3.19 | % |
| China | | | 1.52 | % |
| China/Hong Kong | | | 3.42 | % |
| Denmark | | | 1.83 | % |
| France | | | 8.68 | % |
| Germany | | | 5.23 | % |
| Hong Kong | | | 1.46 | % |
| India | | | 4.70 | % |
| Israel | | | 1.87 | % |
| Italy | | | 1.57 | % |
| Japan | | | 3.54 | % |
| Netherlands | | | 0.79 | % |
| Taiwan | | | 1.93 | % |
| United Kingdom | | | 3.74 | % |
| United States | | | 56.31 | % |
| Short-Term Investments | | | 0.51 | % |
| Total Value of Securities | | | 100.29 | % |
| Liabilities Net of Receivables and Other Assets | | | (0.29 | )% |
| Total Net Assets | | | 100.00 | % |
| | | Percentage |
| Common stocks by sector | | of net assets |
| Communication Services | | | 6.66 | % |
| Consumer Discretionary | | | 11.84 | % |
| Consumer Staples | | | 7.92 | % |
| Energy | | | 6.20 | % |
| Financials | | | 11.37 | % |
| Healthcare | | | 16.58 | % |
| Industrials | | | 12.40 | % |
| Information Technology | | | 23.53 | % |
| Materials | | | 0.93 | % |
| Utilities | | | 2.35 | % |
| Total | | | 99.78 | % |
Security type / sector allocations
| Delaware Ivy High Income Fund | As of March 31, 2023 (Unaudited) |
Sector designations may be different from the sector designations presented in other Fund materials. The sector designations may represent the investment manager’s internal sector classifications, which may result in the sector designations for one fund being different from another fund's sector designations.
| | | Percentage |
| Security type / sector | | of net assets |
| Convertible Bonds | | | 2.47 | % |
| Corporate Bonds | | | 77.02 | % |
| Automotive | | | 1.13 | % |
| Basic Industry | | | 3.37 | % |
| Capital Goods | | | 3.86 | % |
| Communications | | | 8.38 | % |
| Consumer Goods | | | 1.61 | % |
| Electric | | | 2.79 | % |
| Energy | | | 13.22 | % |
| Financial Services | | | 2.51 | % |
| Healthcare | | | 7.45 | % |
| Insurance | | | 3.72 | % |
| Leisure | | | 6.67 | % |
| Media | | | 10.19 | % |
| Retail | | | 4.07 | % |
| Services | | | 3.49 | % |
| Technology & Electronics | | | 3.14 | % |
| Transportation | | | 1.42 | % |
| Municipal Bonds | | | 0.55 | % |
| Loan Agreements | | | 12.66 | % |
| Common Stocks | | | 3.88 | % |
| Basic Industry | | | 0.76 | % |
| Consumer Goods | | | 0.00 | % |
| Energy | | | 0.44 | % |
| Financial Services | | | 0.81 | % |
| Leisure | | | 1.60 | % |
| Media | | | 0.00 | % |
| Retail | | | 0.26 | % |
| Utilities | | | 0.01 | % |
| Preferred Stock | | | 0.08 | % |
| Warrants | | | 0.01 | % |
| Short-Term Investments | | | 1.23 | % |
| Total Value of Securities | | | 97.90 | % |
| Receivables and Other Assets Net of Liabilities | | | 2.10 | % |
| Total Net Assets | | | 100.00 | % |
(continues)
Security type / sector and country allocations
| Delaware Ivy International Core Equity Fund | As of March 31, 2023 (Unaudited) |
Sector designations may be different from the sector designations presented in other Fund materials. The sector designations may represent the investment manager’s internal sector classifications, which may result in the sector designations for one fund being different from another fund's sector designations.
| | | Percentage |
| Security type / country | | of net assets |
| Common Stocks by Country | | | 97.96 | % |
| Australia | | | 1.81 | % |
| Austria | | | 0.90 | % |
| Brazil | | | 4.88 | % |
| Canada | | | 5.31 | % |
| China | | | 9.62 | % |
| China/Hong Kong | | | 0.04 | % |
| Denmark | | | 4.83 | % |
| France | | | 13.85 | % |
| Germany | | | 11.16 | % |
| Hong Kong | | | 1.83 | % |
| India | | | 5.46 | % |
| Japan | | | 12.51 | % |
| Netherlands | | | 5.15 | % |
| Republic of Korea | | | 3.80 | % |
| Spain | | | 1.35 | % |
| Switzerland | | | 1.53 | % |
| Taiwan | | | 2.20 | % |
| United Kingdom | | | 7.43 | % |
| United States | | | 4.30 | % |
| Short-Term Investments | | | 0.57 | % |
| Total Value of Securities | | | 98.53 | % |
| Receivables and Other Assets Net of Liabilities | | | 1.47 | % |
| Total Net Assets | | | 100.00 | % |
| | | Percentage |
| Common stocks by sector | | of net assets |
| Communication Services | | | 5.54 | % |
| Consumer Discretionary | | | 14.65 | % |
| Consumer Staples | | | 10.40 | % |
| Energy | | | 7.54 | % |
| Financials | | | 17.16 | % |
| Healthcare | | | 10.85 | % |
| Industrials | | | 11.85 | % |
| Information Technology | | | 12.21 | % |
| Materials | | | 4.24 | % |
| Utilities | | | 3.52 | % |
| Total | | | 97.96 | % |
Security type / sector and country allocations
| Delaware Ivy International Value Fund | As of March 31, 2023 (Unaudited) |
Sector designations may be different from the sector designations presented in other Fund materials. The sector designations may represent the investment manager’s internal sector classifications, which may result in the sector designations for one fund being different from another fund's sector designations.
| | | Percentage |
| Security type / country | | of net assets |
| Common Stocks by Country | | | 97.26 | % |
| Denmark | | | 2.61 | % |
| Finland | | | 0.01 | % |
| France | | | 20.05 | % |
| Germany | | | 13.52 | % |
| Hong Kong | | | 0.01 | % |
| Japan | | | 9.46 | % |
| Netherlands | | | 6.63 | % |
| Spain | | | 4.80 | % |
| Sweden | | | 10.37 | % |
| Switzerland | | | 12.47 | % |
| United Kingdom | | | 17.33 | % |
| Exchange-Traded Funds | | | 1.18 | % |
| Short-Term Investments | | | 3.88 | % |
| Total Value of Securities | | | 102.32 | % |
| Liabilities Net of Receivables and Other Assets | | | (2.32 | )% |
| Total Net Assets | | | 100.00 | % |
| | | Percentage |
| Common stocks by sector | | of net assets |
| Communication Services | | | 5.51 | % |
| Consumer Discretionary | | | 20.61 | % |
| Consumer Staples* | | | 36.64 | % |
| Energy | | | 0.04 | % |
| Financials | | | 0.03 | % |
| Healthcare | | | 13.13 | % |
| Industrials | | | 11.95 | % |
| Information Technology | | | 4.66 | % |
| Materials | | | 4.69 | % |
| Total | | | 97.26 | % |
*To monitor compliance with the Fund’s concentration guidelines as described in the Fund’s Prospectus and Statement of Additional Information, the Consumer Staples sector (as disclosed herein for financial reporting purposes) is subdivided into a variety of “industries” (in accordance with the requirements of the Investment Company Act of 1940, as amended). The Consumer Staples sector consisted of Beverages, Cosmetics/Personal Care, Food, and Retail. As of March 31, 2023, such amounts, as a percentage of total net assets were 6.37%, 11.62%, 18.64%, and 0.01%, respectively. The percentage in any such single industry will comply with the Fund’s concentration policy even if the percentage in the Consumer Staples sector for financial reporting purposes may exceed 25%.
(continues)
Security type / sector allocations and top 10 equity holdings
| Delaware Ivy Large Cap Growth Fund | As of March 31, 2023 (Unaudited) |
Sector designations may be different from the sector designations presented in other Fund materials. The sector designations may represent the investment manager’s internal sector classifications, which may result in the sector designations for one fund being different from another fund's sector designations.
| | | Percentage |
| Security type / sector | | of net assets |
| Common Stocks | | | 99.18 | % |
| Communication Services | | | 8.51 | % |
| Consumer Discretionary | | | 13.15 | % |
| Consumer Staples | | | 3.13 | % |
| Financials | | | 4.71 | % |
| Healthcare | | | 11.47 | % |
| Industrials | | | 8.99 | % |
| Information Technology* | | | 49.22 | % |
| Total Value of Securities | | | 99.18 | % |
| Receivables and Other Assets Net of Liabilities | | | 0.82 | % |
| Total Net Assets | | | 100.00 | % |
*To monitor compliance with the Fund’s concentration guidelines as described in the Fund’s Prospectus and Statement of Additional Information, the Information Technology sector (as disclosed herein for financial reporting purposes) is subdivided into a variety of “industries” (in accordance with the requirements of the Investment Company Act of 1940, as amended). The Information Technology sector consisted of Computers, Diversified Financial Services, Internet, Semiconductors, Software, and Telecommunications. As of March 31, 2023, such amounts, as a percentage of total net assets were 8.28%, 6.15%, 4.43%, 4.11%, 21.91%, and 4.34%, respectively. The percentage in any such single industry will comply with the Fund’s concentration policy even if the percentage in the Information Technology sector for financial reporting purposes may exceed 25%.
Holdings are for informational purposes only and are subject to change at any time. They are not a recommendation to buy, sell, or hold any security.
| | | Percentage |
| Top 10 equity holdings | | of net assets |
| Microsoft | | | 13.21 | % |
| Apple | | | 8.28 | % |
| Visa Class A | | | 6.15 | % |
| Amazon.com | | | 5.12 | % |
| Alphabet Class A | | | 5.02 | % |
| VeriSign | | | 4.42 | % |
| Motorola Solutions | | | 4.34 | % |
| NVIDIA | | | 4.11 | % |
| UnitedHealth Group | | | 4.09 | % |
| CoStar Group | | | 3.31 | % |
Security type / sector allocations
| Delaware Ivy Limited-Term Bond Fund | As of March 31, 2023 (Unaudited) |
Sector designations may be different from the sector designations presented in other Fund materials. The sector designations may represent the investment manager’s internal sector classifications, which may result in the sector designations for one fund being different from another fund's sector designations.
| | | Percentage |
| Security type / sector | | of net assets |
| Agency Collateralized Mortgage Obligations | | | 0.41 | % |
| Agency Commercial Mortgage-Backed Securities | | | 8.47 | % |
| Agency Obligation | | | 0.52 | % |
| Collateralized Debt Obligations | | | 11.12 | % |
| Corporate Bonds | | | 56.79 | % |
| Banking | | | 14.52 | % |
| Basic Industry | | | 1.29 | % |
| Capital Goods | | | 4.74 | % |
| Communications | | | 7.04 | % |
| Consumer Cyclical | | | 3.81 | % |
| Consumer Non-Cyclical | | | 5.28 | % |
| Electric | | | 3.22 | % |
| Energy | | | 4.84 | % |
| Finance Companies | | | 1.42 | % |
| Insurance | | | 4.94 | % |
| Natural Gas | | | 0.54 | % |
| Technology | | | 4.56 | % |
| Transportation | | | 0.59 | % |
| Non-Agency Asset-Backed Securities | | | 7.80 | % |
| Supranational Bank | | | 0.27 | % |
| US Treasury Obligations | | | 13.58 | % |
| Short-Term Investments | | | 0.57 | % |
| Total Value of Securities | | | 99.53 | % |
| Receivables and Other Assets Net of Liabilities | | | 0.47 | % |
| Total Net Assets | | | 100.00 | % |
(continues)
Security type
| Delaware Ivy Managed International Opportunities Fund | As of March 31, 2023 (Unaudited) |
| | | Percentage |
| Security type / sector | | of net assets |
| Affiliated Mutual Funds | | | 99.60 | % |
| Short-Term Investments | | | 0.49 | % |
| Total Value of Securities | | | 100.09 | % |
| Liabilities Net of Receivables and Other Assets | | | (0.09 | )% |
| Total Net Assets | | | 100.00 | % |
Security type / sector allocations and top 10 equity holdings
| Delaware Ivy Mid Cap Growth Fund | As of March 31, 2023 (Unaudited) |
Sector designations may be different from the sector designations presented in other Fund materials. The sector designations may represent the investment manager’s internal sector classifications, which may result in the sector designations for one fund being different from another fund's sector designations.
| | | Percentage |
| Security type / sector | | of net assets |
| Common Stocks | | | 97.51 | % |
| Communication Services | | | 6.79 | % |
| Consumer Discretionary | | | 13.99 | % |
| Consumer Staples | | | 1.25 | % |
| Financials | | | 4.97 | % |
| Healthcare | | | 18.29 | % |
| Industrials | | | 17.43 | % |
| Information Technology* | | | 33.75 | % |
| Materials | | | 1.04 | % |
| Short-Term Investments | | | 2.70 | % |
| Total Value of Securities | | | 100.21 | % |
| Liabilities Net of Receivables and Other Assets | | | (0.21 | )% |
| Total Net Assets | | | 100.00 | % |
*To monitor compliance with the Fund’s concentration guidelines as described in the Fund’s Prospectus and Statement of Additional Information, the Information Technology sector (as disclosed herein for financial reporting purposes) is subdivided into a variety of “industries” (in accordance with the requirements of the Investment Company Act of 1940, as amended). The Information Technology sector consisted of Computers, Electrical Components & Equipment, Electronics, Office/Business Equipment, Semiconductors, Software, and Telecommunications. As of March 31, 2023, such amounts, as a percentage of total net assets were 1.59%, 4.35%, 4.77%, 0.94%, 9.97%, 9.94%, and 2.19% respectively. The percentage in any such single industry will comply with the Fund’s concentration policy even if the percentage in the Information Technology sector for financial reporting purposes may exceed 25%.
Holdings are for informational purposes only and are subject to change at any time. They are not a recommendation to buy, sell, or hold any security.
| | | Percentage |
| Top 10 equity holdings | | of net assets |
| MarketAxess Holdings | | | 3.91 | % |
| CoStar Group | | | 3.78 | % |
| Dexcom | | | 3.45 | % |
| Monolithic Power Systems | | | 3.20 | % |
| Pinterest Class A | | | 2.73 | % |
| BorgWarner | | | 2.52 | % |
| Microchip Technology | | | 2.47 | % |
| Teradyne | | | 2.37 | % |
| HEICO Class A | | | 2.24 | % |
| Arista Networks | | | 2.18 | % |
(continues)
Security type / sector allocations and top 10 equity holdings
| Delaware Ivy Mid Cap Income Opportunities Fund | As of March 31, 2023 (Unaudited) |
Sector designations may be different from the sector designations presented in other Fund materials. The sector designations may represent the investment manager’s internal sector classifications, which may result in the sector designations for one fund being different from another fund's sector designations.
| | | Percentage |
| Security type / sector | | of net assets |
| Common Stocks | | | 99.09 | % |
| Consumer Discretionary | | | 22.67 | % |
| Consumer Staples | | | 8.44 | % |
| Financials | | | 16.89 | % |
| Healthcare | | | 2.85 | % |
| Industrials | | | 19.69 | % |
| Information Technology | | | 14.31 | % |
| Materials | | | 14.24 | % |
| Short-Term Investments | | | 0.11 | % |
| Total Value of Securities | | | 99.20 | % |
| Receivables and Other Assets Net of Liabilities | | | 0.80 | % |
| Total Net Assets | | | 100.00 | % |
Holdings are for informational purposes only and are subject to change at any time. They are not a recommendation to buy, sell, or hold any security.
| | | Percentage |
| Top 10 equity holdings | | of net assets |
| PPG Industries | | | 2.89 | % |
| Vail Resorts | | | 2.89 | % |
| Travel + Leisure | | | 2.88 | % |
| Seagate Technology Holdings | | | 2.88 | % |
| Microchip Technology | | | 2.87 | % |
| Stanley Black & Decker | | | 2.87 | % |
| Avery Dennison | | | 2.87 | % |
| First American Financial | | | 2.86 | % |
| TE Connectivity | | | 2.86 | % |
| NetApp | | | 2.86 | % |
Security type / sector / state / territory allocations
| Delaware Ivy Municipal Bond Fund | As of March 31, 2023 (Unaudited) |
Sector designations may be different from the sector designations presented in other Fund materials.
| | | Percentage |
| Security type / sector | | of net assets |
| Municipal Bonds* | | | 98.74 | % |
| Education Revenue Bonds | | | 6.00 | % |
| Electric Revenue Bonds | | | 6.60 | % |
| Healthcare Revenue Bonds | | | 15.36 | % |
| Housing Revenue Bonds | | | 1.23 | % |
| Industrial Development Revenue/Pollution Control Revenue Bonds | | | 12.55 | % |
| Lease Revenue Bonds | | | 8.62 | % |
| Local General Obligation Bonds | | | 3.85 | % |
| Pre-Refunded/Escrowed to Maturity Bonds | | | 2.60 | % |
| Special Tax Revenue Bonds | | | 19.08 | % |
| State General Obligation Bonds | | | 3.18 | % |
| Transportation Revenue Bonds | | | 16.20 | % |
| Water & Sewer Revenue Bonds | | | 3.47 | % |
| Short-Term Investments | | | 0.56 | % |
| Total Value of Securities | | | 99.30 | % |
| Receivables and Other Assets Net of Liabilities | | | 0.70 | % |
| Total Net Assets | | | 100.00 | % |
*As of the date of this report, Delaware Ivy Municipal Bond Fund held bonds issued by or on behalf of territories and the states of the US as follows:
| | | Percentage |
| State / territory | | of net assets |
| Arizona | | | 4.41 | % |
| California | | | 10.08 | % |
| Colorado | | | 1.66 | % |
| District of Columbia | | | 2.25 | % |
| Florida | | | 4.40 | % |
| Georgia | | | 0.98 | % |
| Hawaii | | | 0.15 | % |
| Illinois | | | 8.33 | % |
| Indiana | | | 0.55 | % |
| Iowa | | | 0.59 | % |
| Kentucky | | | 0.42 | % |
| Michigan | | | 0.89 | % |
| Missouri | | | 2.62 | % |
| Nebraska | | | 0.62 | % |
| New Jersey | | | 2.88 | % |
| New York | | | 13.66 | % |
| North Carolina | | | 2.16 | % |
| Ohio | | | 4.40 | % |
| Oregon | | | 1.68 | % |
| Pennsylvania | | | 2.02 | % |
| Puerto Rico | | | 17.27 | % |
| Texas | | | 12.59 | % |
| US Virgin Islands | | | 0.87 | % |
| Utah | | | 1.26 | % |
| Washington | | | 2.00 | % |
| Total Value of Securities | | | 98.74 | % |
(continues)
Security type / sector / state / territory allocations
| Delaware Ivy Municipal High Income Fund | As of March 31, 2023 (Unaudited) |
Sector designations may be different from the sector designations presented in other Fund materials.
| | | Percentage |
| Security type / sector | | of net assets |
| Municipal Bonds* | | | 97.05 | % |
| Education Revenue Bonds | | | 14.81 | % |
| Electric Revenue Bonds | | | 4.31 | % |
| Healthcare Revenue Bonds | | | 14.14 | % |
| Housing Revenue Bond | | | 0.10 | % |
| Industrial Development Revenue/Pollution Control Revenue Bonds | | | 22.74 | % |
| Lease Revenue Bonds | | | 1.73 | % |
| Local General Obligation Bonds | | | 3.48 | % |
| Pre-Refunded/Escrowed to Maturity Bonds | | | 5.83 | % |
| Special Tax Revenue Bonds | | | 18.20 | % |
| State General Obligation Bonds | | | 2.54 | % |
| Transportation Revenue Bonds | | | 9.17 | % |
| Short-Term Investments | | | 0.98 | % |
| Total Value of Securities | | | 98.03 | % |
| Receivables and Other Assets Net of Liabilities | | | 1.97 | % |
| Total Net Assets | | | 100.00 | % |
*As of the date of this report, Delaware Ivy Municipal High Income Fund held bonds issued by or on behalf of territories and the states of the US as follows:
| | | Percentage |
| State / territory | | of net assets |
| Alabama | | | 4.27 | % |
| Arizona | | | 1.97 | % |
| California | | | 11.35 | % |
| Colorado | | | 3.70 | % |
| Connecticut | | | 0.42 | % |
| District of Columbia | | | 1.33 | % |
| Florida | | | 4.05 | % |
| Georgia | | | 2.55 | % |
| Guam | | | 0.32 | % |
| Illinois | | | 3.43 | % |
| Indiana | | | 1.16 | % |
| Iowa | | | 0.43 | % |
| Kansas | | | 1.00 | % |
| Louisiana | | | 0.00 | % |
| Maine | | | 0.19 | % |
| Massachusetts | | | 0.71 | % |
| Michigan | | | 2.45 | % |
| Missouri | | | 2.40 | % |
| Nevada | | | 0.54 | % |
| New York | | | 8.17 | % |
| North Carolina | | | 0.50 | % |
| Ohio | | | 2.53 | % |
| Oklahoma | | | 0.56 | % |
| Oregon | | | 0.34 | % |
| Pennsylvania | | | 5.26 | % |
| Puerto Rico | | | 20.33 | % |
| Rhode Island | | | 0.95 | % |
| Texas | | | 8.30 | % |
| US Virgin Islands | | | 0.24 | % |
| Utah | | | 0.73 | % |
| Vermont | | | 0.19 | % |
| Virginia | | | 2.56 | % |
| Washington | | | 1.00 | % |
| Wisconsin | | | 3.12 | % |
| Total Value of Securities | | | 97.05 | % |
Security type / sector allocations and top 10 equity holdings
| Delaware Ivy Small Cap Growth Fund | As of March 31, 2023 (Unaudited) |
Sector designations may be different from the sector designations presented in other Fund materials. The sector designations may represent the investment manager’s internal sector classifications, which may result in the sector designations for one fund being different from another fund's sector designations.
| | | Percentage |
| Security type / sector | | of net assets |
| Common Stocks | | | 98.73 | % |
| Communication Services | | | 1.55 | % |
| Consumer Discretionary | | | 15.61 | % |
| Consumer Staples | | | 4.14 | % |
| Energy | | | 4.63 | % |
| Financials | | | 4.62 | % |
| Healthcare | | | 20.83 | % |
| Industrials | | | 18.44 | % |
| Information Technology* | | | 26.19 | % |
| Materials | | | 1.94 | % |
| Real Estate | | | 0.78 | % |
| Short-Term Investments | | | 1.25 | % |
| Total Value of Securities | | | 99.98 | % |
| Receivables and Other Assets Net of Liabilities | | | 0.02 | % |
| Total Net Assets | | | 100.00 | % |
*To monitor compliance with the Fund’s concentration guidelines as described in the Fund’s Prospectus and Statement of Additional Information, the Information Technology sector (as disclosed herein for financial reporting purposes) is subdivided into a variety of “industries” (in accordance with the requirements of the Investment Company Act of 1940, as amended). The Information Technology sector consisted of Commercial Services, Computers, Electronic Component & Equipment, Semiconductors, Software, and Telecommunications. As of March 31, 2023, such amounts, as a percentage of total net assets were 2.02%, 4.58%, 0.98%, 6.23%, 11.37%, and 1.01% respectively. The percentage in any such single industry will comply with the Fund’s concentration policy even if the percentage in the Information Technology sector for financial reporting purposes may exceed 25%.
Holdings are for informational purposes only and are subject to change at any time. They are not a recommendation to buy, sell, or hold any security.
| | | Percentage |
| Top 10 equity holdings | | of net assets |
| Allegro MicroSystems | | | 3.65 | % |
| Red Rock Resorts Class A | | | 2.57 | % |
| Kinsale Capital Group | | | 2.41 | % |
| Texas Roadhouse | | | 2.29 | % |
| CyberArk Software | | | 2.29 | % |
| Clean Harbors | | | 2.27 | % |
| DoubleVerify Holdings | | | 2.23 | % |
| Fox Factory Holding | | | 2.23 | % |
| BJ's Wholesale Club Holdings | | | 2.16 | % |
| Paycor HCM | | | 2.14 | % |
(continues)
Security type / sector allocations and top 10 equity holdings
| Delaware Ivy Smid Cap Core Fund | As of March 31, 2023 (Unaudited) |
Sector designations may be different from the sector designations presented in other Fund materials. The sector designations may represent the investment manager’s internal sector classifications, which may result in the sector designations for one fund being different from another fund's sector designations.
| | | Percentage |
| Security type / sector | | of net assets |
| Common Stocks | | | 98.65 | % |
| Basic Materials | | | 8.19 | % |
| Business Services | | | 5.28 | % |
| Capital Goods | | | 11.68 | % |
| Consumer Discretionary | | | 6.26 | % |
| Consumer Services | | | 2.39 | % |
| Consumer Staples | | | 3.10 | % |
| Credit Cyclicals | | | 3.67 | % |
| Energy | | | 4.08 | % |
| Financials | | | 13.09 | % |
| Healthcare | | | 12.51 | % |
| Media | | | 2.10 | % |
| Real Estate Investment Trusts | | | 7.17 | % |
| Technology | | | 13.85 | % |
| Transportation | | | 3.47 | % |
| Utilities | | | 1.81 | % |
| Short-Term Investments | | | 1.54 | % |
| Total Value of Securities | | | 100.19 | % |
| Liabilities Net of Receivables and Other Assets | | | (0.19 | )% |
| Total Net Assets | | | 100.00 | % |
Holdings are for informational purposes only and are subject to change at any time. They are not a recommendation to buy, sell, or hold any security.
| | | Percentage |
| Top 10 equity holdings | | of net assets |
| Reliance Steel & Aluminum | | | 1.94 | % |
| Quanta Services | | | 1.69 | % |
| Liberty Energy | | | 1.69 | % |
| Primerica | | | 1.67 | % |
| Dick's Sporting Goods | | | 1.49 | % |
| Huntsman | | | 1.41 | % |
| Chesapeake Energy | | | 1.41 | % |
| Life Storage | | | 1.40 | % |
| ExlService Holdings | | | 1.37 | % |
| Casey's General Stores | | | 1.36 | % |
Security type / sector allocations and top 10 equity holdings
| Delaware Ivy Systematic Emerging Markets Equity Fund | As of March 31, 2023 (Unaudited) |
Sector designations may be different from the sector designations presented in other Fund materials. The sector designations may represent the investment manager’s internal sector classifications, which may result in the sector designations for one fund being different from another fund's sector designations.
| | | Percentage |
| Security type / sector | | of net assets |
| Common Stocks | | | 98.98 | % |
| Communication Services | | | 11.56 | % |
| Consumer Discretionary | | | 13.33 | % |
| Consumer Staples | | | 8.17 | % |
| Energy | | | 5.74 | % |
| Financials | | | 22.50 | % |
| Healthcare | | | 2.29 | % |
| Industrials | | | 5.21 | % |
| Information Technology | | | 23.34 | % |
| Materials | | | 5.15 | % |
| Real Estate | | | 1.37 | % |
| Utilities | | | 0.32 | % |
| Preferred Stocks | | | 0.56 | % |
| Short-Term Investments | | | 0.18 | % |
| Total Value of Securities | | | 99.72 | % |
| Receivables and Other Assets Net of Liabilities | | | 0.28 | % |
| Total Net Assets | | | 100.00 | % |
Holdings are for informational purposes only and are subject to change at any time. They are not a recommendation to buy, sell, or hold any security.
| | | Percentage |
| Top 10 equity holdings | | of net assets |
| Taiwan Semiconductor Manufacturing | | | 7.47 | % |
| Tencent Holdings | | | 5.33 | % |
| Samsung Electronics | | | 4.92 | % |
| ICICI Bank | | | 2.70 | % |
| Larsen & Toubro | | | 2.13 | % |
| Infosys | | | 2.06 | % |
| Alibaba Group Holding | | | 1.92 | % |
| Bharti Airtel | | | 1.83 | % |
| Bank Central Asia | | | 1.79 | % |
| Bank Rakyat Indonesia Persero | | | 1.67 | % |
(continues)
Security type / sector allocations and top 10 equity holdings
| Delaware Ivy Value Fund | As of March 31, 2023 (Unaudited) |
Sector designations may be different from the sector designations presented in other Fund materials. The sector designations may represent the investment manager’s internal sector classifications, which may result in the sector designations for one fund being different from another fund's sector designations.
| | | Percentage |
| Security type / sector | | of net assets |
| Common Stocks | | | 98.89 | % |
| Communication Services | | | 9.00 | % |
| Consumer Discretionary | | | 6.30 | % |
| Consumer Staples | | | 12.11 | % |
| Energy | | | 2.90 | % |
| Financials | | | 11.66 | % |
| Healthcare | | | 17.39 | % |
| Industrials | | | 12.72 | % |
| Information Technology | | | 17.37 | % |
| Materials | | | 3.28 | % |
| Real Estate | | | 2.77 | % |
| Utilities | | | 3.39 | % |
| Short-Term Investments | | | 0.58 | % |
| Total Value of Securities | | | 99.47 | % |
| Receivables and Other Assets Net of Liabilities | | | 0.53 | % |
| Total Net Assets | | | 100.00 | % |
Holdings are for informational purposes only and are subject to change at any time. They are not a recommendation to buy, sell, or hold any security.
| | | Percentage |
| Top 10 equity holdings | | of net assets |
| Motorola Solutions | | | 3.78 | % |
| Cisco Systems | | | 3.67 | % |
| Broadcom | | | 3.65 | % |
| Raytheon Technologies | | | 3.42 | % |
| Edison International | | | 3.39 | % |
| DuPont de Nemours | | | 3.28 | % |
| Dover | | | 3.22 | % |
| Walt Disney | | | 3.22 | % |
| Lowe's | | | 3.19 | % |
| Oracle | | | 3.16 | % |
Schedules of investments
| Delaware Global Value Equity Fund | March 31, 2023 |
| | | Number of | | | | |
| | | shares | | | Value (US $) | |
| Common Stocks – 98.58%∆ | | | | | | | | |
| Denmark – 2.34% | | | | | | | | |
| Novo Nordisk Class B | | | 47,310 | | | $ | 7,513,840 | |
| | | | | | | | 7,513,840 | |
| France – 14.08% | | | | | | | | |
| Air Liquide | | | 75,380 | | | | 12,617,763 | |
| Danone | | | 212,260 | | | | 13,207,586 | |
| Kering | | | 5,020 | | | | 3,275,189 | |
| Orange | | | 629,650 | | | | 7,480,353 | |
| Sodexo | | | 87,780 | | | | 8,573,528 | |
| | | | | | | | 45,154,419 | |
| Germany – 10.94% | | | | | | | | |
| adidas AG | | | 58,350 | | | | 10,343,852 | |
| Fresenius Medical Care AG & Co. | | | 138,310 | | | | 5,870,463 | |
| Knorr-Bremse | | | 91,520 | | | | 6,096,235 | |
| SAP | | | 101,180 | | | | 12,776,053 | |
| | | | | | | | 35,086,603 | |
| Japan – 4.60% | | | | | | | | |
| Asahi Group Holdings | | | 92,900 | | | | 3,457,556 | |
| Kao | | | 168,300 | | | | 6,551,125 | |
| Makita | | | 190,000 | | | | 4,731,926 | |
| | | | | | | | 14,740,607 | |
| Netherlands – 5.34% | | | | | | | | |
| Koninklijke Ahold Delhaize | | | 501,160 | | | | 17,122,196 | |
| | | | | | | | 17,122,196 | |
| Spain – 4.45% | | | | | | | | |
| Amadeus IT Group † | | | 212,390 | | | | 14,247,877 | |
| | | | | | | | 14,247,877 | |
| Sweden – 8.05% | | | | | | | | |
| Essity Class B | | | 325,050 | | | | 9,284,696 | |
| H & M Hennes & Mauritz Class B | | | 504,100 | | | | 7,207,390 | |
| Securitas Class B | | | 1,047,920 | | | | 9,321,922 | |
| | | | | | | | 25,814,008 | |
| Switzerland – 10.01% | | | | | | | | |
| Nestle | | | 144,640 | | | | 17,636,037 | |
| Roche Holding | | | 21,400 | | | | 6,114,891 | |
| Swatch Group | | | 24,230 | | | | 8,344,589 | |
| | | | | | | | 32,095,517 | |
| United Kingdom – 12.93% | | | | | | | | |
| Diageo | | | 271,600 | | | | 12,121,420 | |
| Intertek Group | | | 118,690 | | | | 5,944,556 | |
| Smith & Nephew | | | 791,610 | | | | 11,003,809 | |
| Unilever | | | 239,270 | | | | 12,398,740 | |
| | | | | | | | 41,468,525 | |
| United States – 25.84% | | | | | | | | |
| Clorox | | | 78,180 | | | | 12,371,203 | |
| Conagra Brands | | | 93,800 | | | | 3,523,128 | |
| Henry Schein † | | | 148,900 | | | | 12,141,306 | |
| Ingredion | | | 92,610 | | | | 9,421,215 | |
| Kimberly-Clark | | | 78,300 | | | | 10,509,426 | |
| Lamb Weston Holdings | | | 60,180 | | | | 6,290,014 | |
| Merck & Co. | | | 104,520 | | | | 11,119,883 | |
| Otis Worldwide | | | 38,890 | | | | 3,282,316 | |
| Pfizer | | | 176,536 | | | | 7,202,669 | |
| Visa Class A | | | 30,920 | | | | 6,971,223 | |
| | | | | | | | 82,832,383 | |
Total Common Stocks
(cost $307,337,112) | | | | | | | 316,075,975 | |
| | | | | | | | | |
| Exchange-Traded Fund – 1.08% | | | | | | | | |
| Vanguard S&P 500 ETF | | | 9,230 | | | | 3,471,126 | |
| Total Exchange–Traded Fund | | | | | | | | |
| (cost $3,304,587) | | | | | | | 3,471,126 | |
| Total Value of Securities–99.66% | | | | | | | | |
| (cost $310,641,699) | | | | | | $ | 319,547,101 | |
| ∆ | Securities have been classified by country of risk. Aggregate classification by business sector has been presented on page 111 in “Security type / country and sector allocations.” |
| † | Non-income producing security. |
Summary of abbreviations:
AG – Aktiengesellschaft
ETF – Exchange-Traded Fund
S&P – Standard & Poor’s Financial Services LLC
See accompanying notes, which are an integral part of the financial statements.
Schedules of investments
| Delaware Ivy Core Bond Fund | March 31, 2023 |
| | | Principal | | | | |
| | | amount° | | | Value (US $) | |
| Agency Collateralized Mortgage Obligations — 0.15% | | | | | | | | |
Freddie Mac REMICs
Series 2557 HL 5.30% 1/15/33 | | | 20,805 | | | $ | 21,150 | |
Freddie Mac Whole Loan
Securities Trust
Series 2015-SC01 1A 3.50%
5/25/45 | | | 566,519 | | | | 509,973 | |
Series 2016-SC02 1A 3.00%
10/25/46 | | | 179,451 | | | | 158,780 | |
GNMA
Series 2005-23 IO 1.00%
6/17/45 • | | | 59,901 | | | | 4 | |
Total Agency Collateralized Mortgage Obligations (cost $783,197) | | | | | | | 689,907 | |
| | | | | | | | | |
| Agency Mortgage-Backed Securities — 27.16% | | | | | | | | |
| Fannie Mae | | | | | | | | |
| 2.50% 11/1/27 | | | 177,887 | | | | 168,291 | |
| Fannie Mae S.F. 15 yr | | | | | | | | |
| 3.50% 11/1/25 | | | 33,529 | | | | 32,934 | |
| 3.50% 6/1/26 | | | 81,459 | | | | 79,907 | |
| 4.50% 4/1/25 | | | 11,559 | | | | 11,583 | |
| 6.00% 8/1/23 | | | 2,011 | | | | 2,003 | |
| Fannie Mae S.F. 20 yr | | | | | | | | |
| 2.00% 9/1/41 | | | 2,202,746 | | | | 1,893,209 | |
| 3.50% 12/1/32 | | | 452,665 | | | | 440,871 | |
| 4.00% 8/1/42 | | | 575,409 | | | | 555,684 | |
| 4.00% 9/1/42 | | | 2,713,200 | | | | 2,620,192 | |
| 5.00% 7/1/23 | | | 838 | | | | 838 | |
| 5.50% 2/1/24 | | | 1,498 | | | | 1,514 | |
| Fannie Mae S.F. 30 yr | | | | | | | | |
| 2.00% 3/1/51 | | | 4,493,680 | | | | 3,725,980 | |
| 2.00% 4/1/51 | | | 4,023,055 | | | | 3,335,130 | |
| 2.50% 4/1/51 | | | 780,629 | | | | 672,993 | |
| 2.50% 11/1/51 | | | 1,809,768 | | | | 1,561,240 | |
| 2.50% 2/1/52 | | | 3,118,724 | | | | 2,701,062 | |
| 3.00% 9/1/42 | | | 713,362 | | | | 657,925 | |
| 3.00% 5/1/43 | | | 1,023,741 | | | | 944,159 | |
| 3.00% 1/1/46 | | | 472,105 | | | | 429,110 | |
| 3.00% 12/1/51 | | | 1,652,443 | | | | 1,495,331 | |
| 3.00% 2/1/52 | | | 1,106,831 | | | | 997,316 | |
| 3.50% 8/1/50 | | | 4,242,141 | | | | 4,003,902 | |
| 3.50% 6/1/52 | | | 13,996,239 | | | | 13,006,188 | |
| 4.00% 12/1/40 | | | 196,575 | | | | 191,590 | |
| 4.00% 4/1/41 | | | 405,048 | | | | 397,878 | |
| 4.00% 8/1/41 | | | 183,812 | | | | 179,895 | |
| 4.00% 9/1/41 | | | 224,345 | | | | 220,101 | |
| 4.00% 10/1/41 | | | 355,374 | | | | 349,038 | |
| 4.00% 1/1/44 | | | 413,599 | | | | 411,866 | |
| 4.00% 4/1/44 | | | 790,435 | | | | 772,604 | |
| 4.00% 2/1/47 | | | 180,989 | | | | 176,612 | |
| 4.50% 5/1/35 | | | 49,990 | | | | 50,150 | |
| 4.50% 7/1/35 | | | 62,526 | | | | 62,469 | |
| 4.50% 6/1/39 | | | 40,218 | | | | 40,446 | |
| 4.50% 10/1/40 | | | 195,503 | | | | 196,615 | |
| 4.50% 4/1/41 | | | 553,686 | | | | 556,835 | |
| 4.50% 7/1/41 | | | 230,523 | | | | 231,642 | |
| 4.50% 10/1/52 | | | 4,757,793 | | | | 4,661,335 | |
| 5.00% 3/1/34 | | | 3,927 | | | | 4,010 | |
| 5.00% 5/1/34 | | | 2,870 | | | | 2,893 | |
| 5.00% 12/1/34 | | | 99,223 | | | | 101,329 | |
| 5.00% 7/1/35 | | | 137,044 | | | | 139,810 | |
| 5.00% 2/1/36 | | | 9,918 | | | | 10,129 | |
| 5.00% 4/1/38 | | | 66,227 | | | | 67,484 | |
| 5.00% 12/1/39 | | | 112,625 | | | �� | 115,377 | |
| 5.00% 3/1/40 | | | 225,258 | | | | 229,517 | |
| 5.00% 4/1/41 | | | 68,755 | | | | 70,223 | |
| 5.00% 9/1/52 | | | 5,506,085 | | | | 5,490,912 | |
| 5.00% 10/1/52 | | | 4,443,512 | | | | 4,431,267 | |
| 5.50% 8/1/52 | | | 5,046,662 | | | | 5,115,681 | |
| 5.50% 10/1/52 | | | 3,322,733 | | | | 3,356,143 | |
| 5.50% 3/1/53 | | | 4,778,323 | | | | 4,826,369 | |
| 6.00% 8/1/29 | | | 6,136 | | | | 6,265 | |
| 6.00% 9/1/32 | | | 6,249 | | | | 6,531 | |
| 6.00% 10/1/32 | | | 100,126 | | | | 103,678 | |
| 6.00% 11/1/32 | | | 102,690 | | | | 107,291 | |
| 6.00% 3/1/33 | | | 85,769 | | | | 89,168 | |
| 6.00% 6/1/33 | | | 18,505 | | | | 18,889 | |
| 6.00% 10/1/33 | | | 14,639 | | | | 14,942 | |
| 6.00% 12/1/33 | | | 30,382 | | | | 31,430 | |
| 6.00% 1/1/34 | | | 11,539 | | | | 11,997 | |
| 6.00% 8/1/34 | | | 10,702 | | | | 10,924 | |
| 6.00% 9/1/34 | | | 25,504 | | | | 26,518 | |
| 6.00% 11/1/34 | | | 32,994 | | | | 33,687 | |
| 6.00% 11/1/36 | | | 13,320 | | | | 13,904 | |
| 6.00% 1/1/37 | | | 14,903 | | | | 15,569 | |
| 6.00% 5/1/37 | | | 32,915 | | | | 34,530 | |
| 6.00% 8/1/37 | | | 18,456 | | | | 19,184 | |
| 6.00% 10/1/38 | | | 37,853 | | | | 39,442 | |
| 6.50% 12/1/31 | | | 2,183 | | | | 2,287 | |
| 6.50% 2/1/32 | | | 34,584 | | | | 36,515 | |
| 6.50% 4/1/32 | | | 4,654 | | | | 4,882 | |
| 6.50% 5/1/32 | | | 7,856 | | | | 8,106 | |
| 6.50% 7/1/32 | | | 2,651 | | | | 2,771 | |
| 6.50% 8/1/32 | | | 5,465 | | | | 5,699 | |
| 6.50% 9/1/32 | | | 13,109 | | | | 13,608 | |
| 6.50% 10/1/32 | | | 10,610 | | | | 11,048 | |
| 6.50% 8/1/33 | | | 6,562 | | | | 6,772 | |
| 6.50% 9/1/34 | | | 22,067 | | | | 22,767 | |
| 6.50% 11/1/34 | | | 2,073 | | | | 2,179 | |
| 6.50% 3/1/35 | | | 45,542 | | | | 47,586 | |
| | | Principal | | | | |
| | | amount° | | | Value (US $) | |
| Agency Mortgage-Backed Securities (continued) | | | | | | | | |
| Fannie Mae S.F. 30 yr | | | | | | | | |
| 7.00% 9/1/31 | | | 1,789 | | | $ | 1,817 | |
| 7.00% 11/1/31 | | | 25,028 | | | | 25,520 | |
| 7.00% 2/1/32 | | | 17,192 | | | | 17,997 | |
| 7.00% 3/1/32 | | | 26,840 | | | | 28,373 | |
| 7.50% 5/1/31 | | | 4,454 | | | | 4,448 | |
| Freddie Mac S.F. 15 yr | | | | | | | | |
| 2.50% 4/1/28 | | | 110,381 | | | | 106,094 | |
| 3.50% 8/1/26 | | | 65,826 | | | | 64,561 | |
| 5.00% 4/1/23 | | | 275 | | | | 277 | |
| Freddie Mac S.F. 20 yr | | | | | | | | |
| 2.50% 2/1/42 | | | 2,303,718 | | | | 2,040,945 | |
| 3.00% 3/1/37 | | | 1,891,886 | | | | 1,773,111 | |
| 3.50% 5/1/32 | | | 294,786 | | | | 290,010 | |
| 5.00% 5/1/29 | | | 10,130 | | | | 10,300 | |
| Freddie Mac S.F. 30 yr | | | | | | | | |
| 2.50% 11/1/51 | | | 3,158,641 | | | | 2,762,077 | |
| 2.50% 2/1/52 | | | 4,305,569 | | | | 3,714,220 | |
| 2.50% 5/1/52 | | | 680,942 | | | | 587,309 | |
| 3.00% 8/1/42 | | | 437,432 | | | | 403,439 | |
| 3.00% 1/1/43 | | | 595,783 | | | | 549,472 | |
| 3.00% 2/1/43 | | | 758,209 | | | | 699,277 | |
| 3.00% 12/1/46 | | | 244,229 | | | | 223,491 | |
| 3.00% 1/1/47 | | | 653,494 | | | | 598,004 | |
| 3.00% 7/1/50 | | | 1,181,085 | | | | 1,076,015 | |
| 3.00% 8/1/52 | | | 5,443,851 | | | | 4,926,444 | |
| 4.00% 10/1/40 | | | 102,087 | | | | 100,023 | |
| 4.00% 11/1/40 | | | 192,229 | | | | 190,973 | |
| 4.00% 2/1/41 | | | 453,885 | | | | 444,603 | |
| 4.00% 3/1/41 | | | 140,451 | | | �� | 138,225 | |
| 4.00% 6/1/41 | | | 168,154 | | | | 165,661 | |
| 4.00% 8/1/41 | | | 71,596 | | | | 70,070 | |
| 4.00% 11/1/41 | | | 895,298 | | | | 876,208 | |
| 4.00% 8/1/52 | | | 1,365,275 | | | | 1,313,349 | |
| 4.00% 9/1/52 | | | 5,235,903 | | | | 5,040,454 | |
| 4.50% 1/1/41 | | | 142,199 | | | | 142,639 | |
| 4.50% 3/1/41 | | | 90,007 | | | | 90,286 | |
| 4.50% 4/1/41 | | | 277,238 | | | | 278,198 | |
| 4.50% 9/1/52 | | | 7,150,027 | | | | 7,012,526 | |
| 5.00% 9/1/34 | | | 195 | | | | 196 | |
| 5.00% 8/1/35 | | | 12,108 | | | | 12,365 | |
| 5.00% 11/1/35 | | | 30,800 | | | | 31,322 | |
| 5.00% 12/1/35 | | | 7,568 | | | | 7,710 | |
| 5.00% 11/1/39 | | | 32,348 | | | | 33,018 | |
| 5.00% 1/1/40 | | | 264,740 | | | | 270,391 | |
| 5.00% 4/1/40 | | | 49,978 | | | | 51,044 | |
| 5.00% 8/1/40 | | | 47,546 | | | | 48,446 | |
| 5.00% 7/1/52 | | | 1,365,944 | | | | 1,364,182 | |
| 5.50% 9/1/52 | | | 4,014,093 | | | | 4,150,483 | |
| 5.50% 10/1/52 | | | 2,971,940 | | | | 3,001,822 | |
| 5.50% 3/1/53 | | | 1,063,000 | | | | 1,087,405 | |
| 6.00% 11/1/33 | | | 13,215 | | | | 13,770 | |
| 6.00% 12/1/52 | | | 2,091,700 | | | | 2,137,008 | |
| 6.50% 9/1/32 | | | 9,399 | | | | 9,925 | |
| 6.50% 5/1/34 | | | 51,013 | | | | 54,028 | |
| 6.50% 7/1/36 | | | 5,486 | | | | 5,659 | |
| 7.00% 12/1/37 | | | 12,484 | | | | 12,565 | |
| GNMA I | | | | | | | | |
| 6.25% 7/15/24 | | | 7,598 | | | | 7,263 | |
| GNMA I S.F. 30 yr | | | | | | | | |
| 3.00% 3/15/45 | | | 1,026,996 | | | | 946,989 | |
| 4.00% 1/15/41 | | | 170,574 | | | | 165,184 | |
| 4.00% 10/15/41 | | | 100,755 | | | | 97,021 | |
| 4.50% 6/15/40 | | | 138,984 | | | | 140,359 | |
| 5.00% 7/15/33 | | | 34,762 | | | | 35,857 | |
| 5.00% 7/15/34 | | | 23,557 | | | | 24,230 | |
| 5.00% 1/15/35 | | | 45,406 | | | | 46,962 | |
| 5.00% 12/15/35 | | | 74,159 | | | | 75,438 | |
| 5.00% 12/15/39 | | | 44,555 | | | | 45,910 | |
| 5.00% 1/15/40 | | | 212,492 | | | | 219,045 | |
| 5.00% 7/15/40 | | | 40,714 | | | | 41,564 | |
| 5.50% 10/15/42 | | | 877,769 | | | | 918,910 | |
| GNMA II | | | | | | | | |
| 3.25% 11/20/35 | | | 327,782 | | | | 309,551 | |
| 4.00% 8/20/31 | | | 254,669 | | | | 253,971 | |
| 4.00% 6/20/36 | | | 398,080 | | | | 388,185 | |
| GNMA II S.F. 30 yr | | | | | | | | |
| 3.00% 12/20/51 | | | 1,484,143 | | | | 1,354,452 | |
| 4.00% 12/20/40 | | | 187,559 | | | | 184,056 | |
| 4.00% 12/20/44 | | | 129,672 | | | | 127,634 | |
| 5.50% 6/20/49 | | | 1,634,296 | | | | 1,674,998 | |
| Vendee Mortgage Trust | | | | | | | | |
| 5.638% 2/15/25• | | | 11,815 | | | | 11,765 | |
| 7.793% 2/15/25 | | | 875 | | | | 879 | |
Total Agency Mortgage-Backed Securities (cost $128,995,536) | | | | | | | 127,673,729 | |
| | | | | | | | | |
| Collateralized Debt Obligations — 1.94% | | | | | | | | |
Ares LXIV CLO
Series 2022-64A A1 144A
6.098% (TSFR3M + 1.44%,
Floor 1.44%) 4/15/35 #, • | | | 3,000,000 | | | | 2,970,744 | |
BlueMountain CLO XXX
Series 2020-30A AR 144A
6.028% (TSFR03M + 1.37%,
Floor 1.37%) 4/15/35 #, • | | | 3,300,000 | | | | 3,214,893 | |
Schedules of investments
Delaware Ivy Core Bond Fund
| | | Principal | | | | |
| | | amount° | | | Value (US $) | |
| Collateralized Debt Obligations (continued) | | | | | | | | |
CIFC Funding
Series 2022-3A A 144A 6.063%
(TSFR3M + 1.41%, Floor
1.41%) 4/21/35 #, • | | | 3,000,000 | | | $ | 2,925,750 | |
Total Collateralized Debt Obligations
(cost $9,059,783) | | | | | | | 9,111,387 | |
| | | | | | | | | |
| Corporate Bonds — 38.09% | | | �� | | | | | |
| Banking — 7.71% | | | | | | | | |
| Bank of America 2.482% 9/21/36 µ | | | 1,820,000 | | | | 1,383,452 | |
| Bank of New York Mellon | | | | | | | | |
| 4.70% 9/20/25 µ, Ψ | | | 1,430,000 | | | | 1,356,740 | |
| 5.802% 10/25/28µ | | | 255,000 | | | | 265,887 | |
| Barclays | | | | | | | | |
| 5.501% 8/9/28µ | | | 250,000 | | | | 246,731 | |
| 7.325% 11/2/26µ | | | 535,000 | | | | 548,395 | |
| BBVA Bancomer 144A 5.875% 9/13/34 #, µ | | | 1,000,000 | | | | 874,200 | |
| BPCE 144A 5.125% 1/18/28 # | | | 450,000 | | | | 446,248 | |
| Citigroup 5.61% 9/29/26 µ | | | 1,670,000 | | | | 1,683,584 | |
| Citizens Bank 6.064% 10/24/25 µ | | | 900,000 | | | | 847,493 | |
| Credit Agricole 144A 5.301% 7/12/28 # | | | 360,000 | | | | 365,237 | |
| Credit Suisse | | | | | | | | |
| 1.00% 5/5/23 | | | 1,430,000 | | | | 1,417,488 | |
| 7.95% 1/9/25 | | | 255,000 | | | | 259,529 | |
| Deutsche Bank | | | | | | | | |
| 3.729% 1/14/32µ | | | 612,000 | | | | 456,935 | |
| 3.742% 1/7/33µ | | | 301,000 | | | | 218,040 | |
| 6.72% 1/18/29µ | | | 434,000 | | | | 431,316 | |
| Fifth Third Bank 5.852% 10/27/25 µ | | | 665,000 | | | | 655,939 | |
| JPMorgan Chase & Co. 1.764% 11/19/31 µ | | | 2,540,000 | | | | 2,017,601 | |
| KeyBank 5.00% 1/26/33 | | | 930,000 | | | | 864,895 | |
| KeyCorp 4.789% 6/1/33 µ | | | 265,000 | | | | 237,508 | |
| Morgan Stanley | | | | | | | | |
| 6.138% 10/16/26µ | | | 370,000 | | | | 377,314 | |
| 6.296% 10/18/28µ | | | 450,000 | | | | 473,585 | |
| 6.342% 10/18/33µ | | | 305,000 | | | | 333,385 | |
| NBK SPC 144A 1.625% 9/15/27 #, µ | | | 1,000,000 | | | | 890,340 | |
| PNC Financial Services Group 5.671% 10/28/25 µ | | | 525,000 | | | | 525,652 | |
| Popular 7.25% 3/13/28 | | | 325,000 | | | | 321,828 | |
| State Street | | | | | | | | |
| 2.20% 3/3/31 | | | 1,947,000 | | | | 1,591,126 | |
| 5.751% 11/4/26µ | | | 115,000 | | | | 117,289 | |
| 5.82% 11/4/28µ | | | 80,000 | | | | 83,515 | |
| SVB Financial Group 4.57% 4/29/33 µ, ‡ | | | 1,127,000 | | | | 654,674 | |
| Toronto-Dominion Bank 4.108% 6/8/27 | | | 1,415,000 | | | | 1,371,351 | |
| Truist Financial | | | | | | | | |
| 4.95% 9/1/25 µ, Ψ | | | 3,000,000 | | | | 2,780,345 | |
| 6.123% 10/28/33µ | | | 445,000 | | | | 467,293 | |
| 7.968% 12/15/24 µ, Ψ | | | 2,165,000 | | | | 2,064,544 | |
| US Bancorp | | | | | | | | |
| 2.491% 11/3/36µ | | | 1,415,000 | | | | 1,093,256 | |
| 3.00% 7/30/29 | | | 2,700,000 | | | | 2,352,875 | |
| 4.653 % 2/1/29µ | | | 271,000 | | | | 265,103 | |
| 4.839% 2/1/34µ | | | 300,000 | | | | 291,271 | |
| 5.727% 10/21/26µ | | | 375,000 | | | | 376,973 | |
| Wells Fargo & Co. | | | | | | | | |
| 2.393% 6/2/28µ | | | 4,250,000 | | | | 3,829,792 | |
| 3.00% 10/23/26 | | | 1,500,000 | | | | 1,404,471 | |
| | | | | | | | 36,243,200 | |
| Basic Industry — 1.45% | | | | | | |
| Braskem Netherlands Finance 144A 4.50% 1/31/30 # | | | 1,000,000 | | | | 850,261 | |
| Celanese US Holdings 6.05% 3/15/25 | | | 1,075,000 | | | | 1,081,919 | |
| Methanex 5.25% 12/15/29 | | | 1,645,000 | | | | 1,539,802 | |
| Newmont 2.60% 7/15/32 | | | 1,720,000 | | | | 1,440,554 | |
| Novelis 144A 4.75% 1/30/30 # | | | 745,000 | | | | 685,400 | |
| Nutrien 4.90% 3/27/28 | | | 180,000 | | | | 180,083 | |
| Sherwin-Williams 3.30% 5/15/50 | | | 1,450,000 | | | | 1,027,294 | |
| | | | | | | | 6,805,313 | |
| Basic Materials — 0.20% | | | | | | | | |
| Freeport Indonesia 144A 5.315% 4/14/32 # | | | 1,000,000 | | | | 936,091 | |
| | | | | | | | 936,091 | |
| Brokerage — 0.39% | | | | | | | | |
| Charles Schwab 5.375% 6/1/25 µ, Ψ | | | 665,000 | | | | 633,413 | |
| Jefferies Financial Group 6.50% 1/20/43 | | | 1,150,000 | | | | 1,181,735 | |
| | | | | | | | 1,815,148 | |
| Capital Goods — 1.27% | | | | | | | | |
| Ardagh Metal Packaging Finance USA 144A 3.25% 9/1/28 # | | | 1,330,000 | | | | 1,146,131 | |
| Boeing 3.75% 2/1/50 | | | 2,075,000 | | | | 1,574,424 | |
| Mauser Packaging Solutions Holding 144A 7.875% 8/15/26 # | | | 700,000 | | | | 700,634 | |
| Standard Industries 144A 3.375% 1/15/31 # | | | 1,150,000 | | | | 925,542 | |
| Turkiye Sise ve Cam Fabrikalari 144A 6.95% 3/14/26 # | | | 1,000,000 | | | | 983,870 | |
| | | Principal | | | | |
| | | amount° | | | Value (US $) | |
| Corporate Bonds (continued) | | | | | | | | |
| Capital Goods (continued) | | | | | | | | |
| United Rentals North America 3.875% 2/15/31 | | | 705,000 | | | $ | 622,938 | |
| | | | | | | | 5,953,539 | |
| Communications — 3.24% | | | | | | | | |
| AT&T | | | | | | | | |
| 3.50% 9/15/53 | | | 1,645,000 | | | | 1,196,406 | |
| 3.55% 9/15/55 | | | 3,343,000 | | | | 2,403,866 | |
| 3.65% 6/1/51 | | | 1,100,000 | | | | 834,437 | |
| CCO Holdings 144A 4.25% 1/15/34 # | | | 2,000,000 | | | | 1,566,370 | |
| Charter Communications | | | | | | | | |
| Operating 3.85% 4/1/61 | | | 3,175,000 | | | | 1,983,607 | |
| Crown Castle | | | | | | | | |
| 1.05% 7/15/26 | | | 775,000 | | | | 683,342 | |
| 2.10% 4/1/31 | | | 1,765,000 | | | | 1,443,181 | |
| Directv Financing 144A 5.875% 8/15/27 # | | | 800,000 | | | | 725,328 | |
| Discovery Communications 4.00% 9/15/55 | | | 2,205,000 | | | | 1,465,270 | |
| Frontier Communications Holdings 144A 5.00% 5/1/28 # | | | 800,000 | | | | 695,104 | |
| IHS Holding 144A 5.625% 11/29/26 # | | | 500,000 | | | | 422,400 | |
| Summit Digitel Infrastructure 144A 2.875% 8/12/31 # | | | 1,000,000 | | | | 781,597 | |
| Vmed O2 UK Financing I 144A 4.25% 1/31/31 # | | | 1,215,000 | | | | 1,035,180 | |
| | | | | | | | 15,236,088 | |
| Consumer Cyclical — 1.82% | | | | | | | | |
| Alsea 144A 7.75% 12/14/26 # | | | 1,000,000 | | | | 977,705 | |
| Amazon.com 2.50% 6/3/50 | | | 2,555,000 | | | | 1,733,958 | |
| Aptiv 3.10% 12/1/51 | | | 2,375,000 | | | | 1,508,333 | |
| Carnival 144A 4.00% 8/1/28 # | | | 665,000 | | | | 573,147 | |
| Ford Motor Credit 2.90% 2/10/29 | | | 1,775,000 | | | | 1,471,822 | |
| Kia 144A 2.75% 2/14/27 # | | | 1,000,000 | | | | 919,781 | |
| VICI Properties 4.95% 2/15/30 | | | 1,485,000 | | | | 1,394,975 | |
| | | | | | | | 8,579,721 | |
| Consumer Non-Cyclical — 4.57% | | | | | | | | |
| Amgen | | | | | | | | |
| 5.15% 3/2/28 | | | 220,000 | | | | 224,742 | |
| 5.25% 3/2/30 | | | 270,000 | | | | 276,245 | |
| 5.25% 3/2/33 | | | 521,000 | | | | 535,560 | |
| 5.65% 3/2/53 | | | 195,000 | | | | 203,135 | |
| Bunge Finance 1.63% 8/17/25 | | | 1,192,000 | | | | 1,103,480 | |
| Bunge Limited Finance 2.75% 5/14/31 | | | 1,750,000 | | | | 1,489,534 | |
| Central American Bottling 144A 5.25% 4/27/29 # | | | 1,000,000 | | | | 930,415 | |
| CVS Health 2.70% 8/21/40 | | | 2,035,000 | | | | 1,457,425 | |
| DaVita | | | | | | | | |
| 144A 3.75% 2/15/31 # | | | 315,000 | | | | 248,762 | |
| 144A 4.625% 6/1/30 # | | | 570,000 | | | | 487,065 | |
| GE HealthCare Technologies | | | | | | | | |
| 144A 5.60% 11/15/25 # | | | 300,000 | | | | 303,796 | |
| 144A 5.65% 11/15/27 # | | | 300,000 | | | | 310,258 | |
| HCA 3.50% 7/15/51 | | | 889,000 | | | | 615,073 | |
| New York and Presbyterian Hospital | | | | | | | | |
| 2.256% 8/1/40 | | | 4,150,000 | | | | 2,856,799 | |
| 2.606% 8/1/60 | | | 1,600,000 | | | | 940,586 | |
| NYU Langone Hospitals | | | | | | | | |
| 3.38% 7/1/55 | | | 4,900,000 | | | | 3,553,841 | |
| 4.428% 7/1/42 | | | 1,775,000 | | | | 1,604,062 | |
| Royalty Pharma 3.35% 9/2/51 | | | 3,531,000 | | | | 2,330,360 | |
| Tenet Healthcare 4.25% 6/1/29 | | | 2,015,000 | | | | 1,824,804 | |
| Zoetis 5.40% 11/14/25 | | | 175,000 | | | | 178,047 | |
| | | | | | | | 21,473,989 | |
| Electric — 4.60% | | | | | | | | |
| AEP Transmission 5.40% 3/15/53 | | | 130,000 | | | | 135,619 | |
| Alfa Desarrollo 144A 4.55% 9/27/51 # | | | 995,070 | | | | 730,526 | |
| Appalachian Power 4.50% 8/1/32 | | | 1,450,000 | | | | 1,393,027 | |
| Berkshire Hathaway Energy 2.85% 5/15/51 | | | 1,820,000 | | | | 1,253,617 | |
| Duke Energy Carolinas 4.95% 1/15/33 | | | 295,000 | | | | 303,346 | |
| Entergy Mississippi 3.25% 12/1/27 | | | 2,400,000 | | | | 2,263,216 | |
| Entergy Texas 3.45% 12/1/27 | | | 3,600,000 | | | | 3,343,617 | |
| Exelon 4.05% 4/15/30 | | | 2,500,000 | | | | 2,388,075 | |
| Florida Power & Light 2.45% 2/3/32 | | | 2,400,000 | | | | 2,051,121 | |
| Indianapolis Power & Light 144A 5.65% 12/1/32 # | | | 450,000 | | | | 473,213 | |
| JSW Hydro Energy 144A 4.125% 5/18/31 # | | | 885,000 | | | | 735,131 | |
| Oglethorpe Power 144A 4.50% 4/1/47 # | | | 1,725,000 | | | | 1,471,065 | |
| Pacific Gas & Electric 3.30% 8/1/40 | | | 2,900,000 | | | | 2,061,554 | |
| PG&E 5.25% 7/1/30 | | | 1,000,000 | | | | 929,575 | |
| Public Service of Colorado 5.25% 4/1/53 | | | 290,000 | | | | 295,843 | |
| Vistra 144A 7.00% 12/15/26 #, µ, Ψ | | | 535,000 | | | | 471,354 | |
| Vistra Operations 144A 5.125% 5/13/25 # | | | 1,375,000 | | | | 1,341,595 | |
| | | | | | | | 21,641,494 | |
Schedules of investments
Delaware Ivy Core Bond Fund
| | | Principal
amount° | | | Value (US $) | |
| Corporate Bonds (continued) | | | | | | |
| Energy — 4.95% | | | | | | | | |
| BP Capital Markets 4.875% 3/22/30 µ, Ψ | | | 1,575,000 | | | $ | 1,436,203 | |
| BP Capital Markets America 4.812% 2/13/33 | | | 255,000 | | | | 259,018 | |
| Diamondback Energy 4.25% 3/15/52 | | | 534,000 | | | | 419,846 | |
| El Paso Natural Gas 8.375% 6/15/32 | | | 2,000,000 | | | | 2,336,373 | |
| Enbridge 5.70% 3/8/33 | | | 175,000 | | | | 182,130 | |
| Energean Israel Finance 144A 4.875% 3/30/26 # | | | 1,000,000 | | | | 928,750 | |
| Energy Transfer | | | | | | | | |
| 5.75% 2/15/33 | | | 98,000 | | | | 100,474 | |
| 6.25% 4/15/49 | | | 1,470,000 | | | | 1,459,133 | |
| 6.85% 2/15/40 | | | 1,265,000 | | | | 1,306,228 | |
| Enterprise Products Operating | | | | | | | | |
| 3.30% 2/15/53 | | | 3,270,000 | | | | 2,371,568 | |
| 5.35% 1/31/33 | | | 110,000 | | | | 114,059 | |
| 7.74% 6/1/67 µ | | | 2,875,000 | | | | 2,490,603 | |
| Geopark 144A 5.50% 1/17/27 # | | | 1,000,000 | | | | 840,000 | |
| Guara Norte 144A 5.198% 6/15/34 # | | | 910,570 | | | | 784,861 | |
| Kinder Morgan 5.20% 6/1/33 | | | 380,000 | | | | 377,817 | |
| NuStar Logistics 6.375% 10/1/30 | | | 1,530,000 | | | | 1,469,733 | |
| Saudi Arabian Oil 144A 4.25% 4/16/39 # | | | 1,000,000 | | | | 898,373 | |
| Targa Resources Partners 5.00% 1/15/28 | | | 1,185,000 | | | | 1,146,926 | |
| Tennessee Gas Pipeline 8.375% 6/15/32 | | | 3,200,000 | | | | 3,748,874 | |
| Valero Energy 3.65% 12/1/51 | | | 822,000 | | | | 598,215 | |
| | | | | | | | 23,269,184 | |
| Finance Companies — 1.89% | | | | | | | | |
| AerCap Ireland Capital DAC 3.00% 10/29/28 | | | 2,085,000 | | | | 1,821,770 | |
| Air Lease | | | | | | | | |
| 2.875% 1/15/32 | | | 1,430,000 | | | | 1,182,515 | |
| 4.625% 10/1/28 | | | 1,805,000 | | | | 1,714,794 | |
| 5.85% 12/15/27 | | | 295,000 | | | | 296,816 | |
| Aviation Capital Group | | | | | | | | |
| 144A 3.50% 11/1/27 # | | | 1,330,000 | | | | 1,189,048 | |
| 144A 6.25% 4/15/28 # | | | 115,000 | | | | 115,178 | |
| Huarong Finance 2017 4.25% 11/7/27 | | | 1,000,000 | | | | 773,750 | |
| Inversiones La Construccion 144A 4.75% 2/7/32 # | | | 1,000,000 | | | | 796,173 | |
| MAF Global Securities 7.875% 6/30/27 µ, Ψ | | | 1,000,000 | | | | 1,010,370 | |
| | | | | | | | 8,900,414 | |
| Industrials — 0.19% | | | | | | | | |
| Bidvest Group UK 144A 3.625% 9/23/26 # | | | 1,000,000 | | | | 908,420 | |
| | | | | | | | 908,420 | |
| Insurance — 2.95% | | | | | | | | |
| American International Group 5.125% 3/27/33 | | | 850,000 | | | | 845,422 | |
| Aon 2.90% 8/23/51 | | | 2,155,000 | | | | 1,441,115 | |
| Athene Holding | | | | | | | | |
| 3.45% 5/15/52 | | | 1,040,000 | | | | 659,351 | |
| 3.95% 5/25/51 | | | 460,000 | | | | 317,362 | |
| Brighthouse Financial 3.85% 12/22/51 | | | 1,793,000 | | | | 1,163,883 | |
| Humana 5.75% 3/1/28 | | | 40,000 | | | | 41,573 | |
| MetLife 3.85% 9/15/25 µ, Ψ | | | 915,000 | | | | 808,451 | |
| Security Benefit Global Funding 144A 1.25% 5/17/24 # | | | 5,450,000 | | | | 5,171,339 | |
| UnitedHealth Group | | | | | | | | |
| 4.50% 4/15/33 | | | 1,740,000 | | | | 1,730,763 | |
| 5.05% 4/15/53 | | | 1,655,000 | | | | 1,675,085 | |
| | | | | | | | 13,854,344 | |
| Natural Gas — 0.24% | | | | | | | | |
| Atmos Energy 2.85% 2/15/52 | | | 405,000 | | | | 275,750 | |
| ENN Energy Holdings 144A 2.625% 9/17/30 # | | | 1,000,000 | | | | 842,677 | |
| | | | | | | | 1,118,427 | |
| Real Estate Investment Trusts — 0.24% | | | | | | | | |
| American Homes 4 Rent 3.625% 4/15/32 | | | 1,310,000 | | | | 1,136,203 | |
| | | | | | | | 1,136,203 | |
| Technology — 1.68% | | | | | | | | |
| Autodesk 2.40% 12/15/31 | | | 1,760,000 | | | | 1,464,797 | |
| Broadcom 144A 3.469% 4/15/34 # | | | 2,380,000 | | | | 1,956,489 | |
| CDW 3.276% 12/1/28 | | | 1,640,000 | | | | 1,447,751 | |
| Iron Mountain Information Management Services 144A 5.00% 7/15/32 # | | | 1,660,000 | | | | 1,427,071 | |
| Micron Technology 6.75% 11/1/29 | | | 125,000 | | | | 132,853 | |
| NCR | | | | | | | | |
| 144A 5.00% 10/1/28 # | | | 135,000 | | | | 118,800 | |
| 144A 5.125% 4/15/29 # | | | 190,000 | | | | 164,587 | |
| Oracle | | | | | | | | |
| 4.65% 5/6/30 | | | 170,000 | | | | 165,586 | |
| 5.55% 2/6/53 | | | 770,000 | | | | 734,042 | |
| 6.15% 11/9/29 | | | 250,000 | | | | 266,400 | |
| | | | | | | | 7,878,376 | |
| Transportation — 0.70% | | | | | | | | |
| American Airlines 144A 5.50% 4/20/26 # | | | 163,010 | | | | 160,621 | |
| | | Principal
amount° | | | Value (US $) | |
| Corporate Bonds (continued) | | | | | | | | |
| Transportation (continued) | | | | | | | | |
| British Airways 2020-1 Class A Pass Through Trust 144A 4.25% 11/15/32 #, t | | | 884,325 | | | $ | 826,124 | |
| Lima Metro Line 2 Finance 144A 4.35% 4/5/36 # | | | 913,906 | | | | 798,631 | |
| United Airlines 144A 4.625% 4/15/29 # | | | 1,680,000 | | | | 1,521,780 | |
| | | | | | | | 3,307,156 | |
| Total Corporate Bonds | | | | | | | | |
| (cost $186,085,486) | | | | | | | 179,057,107 | |
| | | | | | | | | |
| Municipal Bonds — 2.52% | | | | | | | | |
| Douglas County, Washington Public Utility District No. 1 (Taxable) Series A 5.45% 9/1/40 | | | 1,205,000 | | | | 1,268,516 | |
| GDB Debt Recovery Authority of Puerto Rico (Taxable) 7.50% 8/20/40 | | | 1,910,000 | | | | 1,585,300 | |
| Municipal Electric Authority of Georgia (Build America Bonds Plant Vogtle Units 3 & 4 Project) 6.655% 4/1/57 | | | 2,500,000 | | | | 2,771,950 | |
| Port Authority of New York & New Jersey | | | | | | | | |
| 4.458% 10/1/62 | | | 3,710,000 | | | | 3,477,383 | |
| 4.926% 10/1/51 | | | 2,690,000 | | | | 2,738,823 | |
| Total Municipal Bonds | | | | | | | | |
| (cost $12,256,268) | | | | | | | 11,841,972 | |
| | | | | | | | | |
| Non-Agency Asset-Backed Securities — 3.93% | | | | | | | | |
| FirstKey Homes Trust | | | | | | | | |
| Series 2021-SFR1 B 144A 1.788% 8/17/38 # | | | 4,800,000 | | | | 4,217,775 | |
| Series 2021-SFR2 D 144A 2.058% 9/17/38 # | | | 4,400,000 | | | | 3,801,815 | |
| Home Partners of America Trust | | | | | | | | |
| Series 2021-1 A 144A 1.698% 9/17/41 # | | | 3,927,231 | | | | 3,378,043 | |
| Series 2021-3 B 144A 2.649% 1/17/41 # | | | 4,790,417 | | | | 4,172,406 | |
| Progress Residential Trust | | | | | | | | |
| Series 2021-SFR7 D 144A 2.341% 8/17/40 # | | | 3,450,000 | | | | 2,901,338 | |
| Total Non-Agency Asset-Backed Securities | | | | | | | | |
| (cost $21,367,092) | | | | | | | 18,471,377 | |
| | | | | | | | | |
| Non-Agency Collateralized Mortgage Obligations — 7.31% | | | | | | | | |
| Agate Bay Mortgage Trust | | | | | | | | |
| Series 2013-1 B4 144A 3.556% 7/25/43 #, • | | | 1,482,562 | | | | 1,091,225 | |
| Series 2016-1 B1 144A 3.658% 12/25/45 #, • | | | 3,741,460 | | | | 3,490,102 | |
| Bear Stearns Mortgage Securities 8.00% 11/25/29 | | | 16,309 | | | | 8,192 | |
| CHL Mortgage Pass Through Trust 5.25% 5/25/34 t | | | 15,808 | | | | 14,427 | |
| Citigroup Global Markets Mortgage Securities VII | | | | | | | | |
| Series 1997-HUD1 B2 3.071% 12/25/30 • | | | 704,427 | | | | 145,971 | |
| Citigroup Mortgage Loan Trust | | | | | | | | |
| Series 2013-J1 B4 144A 3.479% 10/25/43 #, • | | | 834,463 | | | | 629,434 | |
| CSMC Trust | | | | | | | | |
| Series 2013-7 B4 144A 3.532% 8/25/43 #, • | | | 1,311,439 | | | | 1,074,262 | |
| Series 2017-HL1 A12 144A 3.50% 6/25/47 #, • | | | 1,763,801 | | | | 1,590,438 | |
| Eagle RE | | | | | | | | |
| | | | | | | | | |
| Series 2020-1 M1B 144A 6.295% (LIBOR01M + 1.45%) 1/25/30 #, • | | | 454,681 | | | | 453,917 | |
| JP Morgan Mortgage Trust | | | | | | | | |
| Series 2004-A3 4A2 3.633% 7/25/34 • | | | 2,905 | | | | 2,757 | |
| Series 2017-4 A13 144A 3.50% 11/25/48 #, • | | | 6,160,924 | | | | 5,345,181 | |
| Series 2021-4 A5 144A 2.50% 8/25/51 #, • | | | 6,000,000 | | | | 4,090,191 | |
| MRFC Mortgage Pass Through Trust | | | | | | | | |
| Series 1998-2 B1 6.75% 6/25/28 t | | | 460 | | | | 442 | |
| PMT Credit Risk Transfer Trust | | | | | | | | |
| Series 21-1R A 144A 7.752% (LIBOR01M + 2.90%, Floor 2.90%) 2/27/24 #, • | | | 3,324,894 | | | | 3,218,795 | |
| Prudential Home Mortgage Securities | | | | | | | | |
| Series 1994-A 5B 144A 6.73% 4/28/24 #, • | | | 19 | | | | 18 | |
| Radnor RE | | | | | | | | |
| Series 2020-1 M1B 144A 6.295% (LIBOR01M + 1.45%, Floor 1.45%) 1/25/30 #, • | | | 4,471,401 | | | | 4,449,169 | |
| Seasoned Credit Risk Transfer Trust | | | | | | | | |
| Series 2017-3 M1 4.00% 7/25/56 • | | | 2,802,333 | | | | 2,752,136 | |
Schedules of investments
Delaware Ivy Core Bond Fund
| | | Principal
amount° | | | Value (US $) | |
| Non-Agency Collateralized Mortgage Obligations (continued) | | | | | | | | |
| Sequoia Mortgage Trust | | | | | | | | |
| Series 2015-3 B1 144A 3.722% 7/25/45 #, • | | | 1,689,362 | | | $ | 1,596,560 | |
| Shellpoint -Originator Trust | | | | | | | | |
| Series 2015-1 B3 144A 3.784% 8/25/45 #, • | | | 0 | | | | 0 | |
| Sofi Mortgage Trust | | | | | | | | |
| Series 2016-1A B2 144A 3.093% 11/25/46 #, • | | | 1,384,913 | | | | 1,265,245 | |
| Structured Asset Mortgage Investments | | | | | | | | |
| Series 1998-2 B 6.75% 5/2/30 • | | | 3,265 | | | | 102 | |
| Series 1998-2 C 6.75% 5/2/30 • | | | 1,482 | | | | 37 | |
| WinWater Mortgage Loan Trust | | | | | | | | |
| Series 2015-5 B1 144A 3.756% 8/20/45 #, • | | | 3,420,915 | | | | 3,150,727 | |
| Total Non-Agency Collateralized Mortgage Obligations | | | | | | | | |
| (cost $39,731,410) | | | | | | | 34,369,328 | |
| | | | | | | | | |
| Non-Agency Commercial Mortgage-Backed Securities — 8.86% | | | | | | | | |
| BAMLL Commercial Mortgage Securities Trust | | | | | | | | |
| Series 2014-520M A 144A 4.185% 8/15/46 #, • | | | 4,130,000 | | | | 3,368,022 | |
| BBCMS Mortgage Trust | | | | | | | | |
| Series 2020-C7 A5 2.037% 4/15/53 | | | 2,000,000 | | | | 1,635,956 | |
| Benchmark Mortgage Trust | | | | | | | | |
| Series 2020-B18 A5 1.925% 7/15/53 | | | 3,000,000 | | | | 2,401,447 | |
| Series 2021-B24 A5 2.584% 3/15/54 | | | 5,000,000 | | | | 4,116,250 | |
| Series 2021-B25 A5 2.577% 4/15/54 | | | 5,000,000 | | | | 4,128,522 | |
| Citigroup Commercial Mortgage Trust | | | | | | | | |
| Series 2018-TBR A 144A 5.639% (LIBOR01M + 0.83%, | | | | | | | | |
| Floor 0.83%) 12/15/36 #, • | | | 10,000,000 | | | | 9,799,122 | |
| GS Mortgage Securities Trust | | | | | | | | |
| Series 2012-BWTR C 144A 3.329% 11/5/34 #, • | | | 1,000,000 | | | | 649,912 | |
| Series 2020-GC47 A5 2.377% 5/12/53 | | | 3,128,000 | | | | 2,589,814 | |
| JPMCC Commercial Mortgage Securities Trust | | | | | | | | |
| Series 2017-JP5 A5 3.723% 3/15/50 | | | 1,500,000 | | | | 1,409,471 | |
| KKR Industrial Portfolio Trust | | | | | | | | |
| Series 2021-KDIP B 144A 5.742% (LIBOR01M + 0.80%, Floor 0.80%) 12/15/37 #, • | | | 2,250,000 | | | | 2,158,764 | |
| One Market Plaza Trust | | | | | | | | |
| Series 2017-1MKT A 144A 3.614% 2/10/32 # | | | 4,000,000 | | | | 3,667,943 | |
| UBS Commercial Mortgage Trust | | | | | | | | |
| Series 2017-C1 AS 3.724% 6/15/50 | | | 4,000,000 | | | | 3,627,382 | |
| Series 2017-C7 AS 4.061% 12/15/50 • | | | 2,300,000 | | | | 2,115,864 | |
| Total Non-Agency Commercial Mortgage- Backed Securities | | | | | | | | |
| (cost $44,956,512) | | | | | | | 41,668,469 | |
| | | | | | | | | |
| Sovereign Bonds — 2.22%∆ | | | | | | | | |
| Azerbaijan — 0.15% | | | | | | | | |
| Republic of Azerbaijan International Bond 144A 3.50% 9/1/32 # | | | 850,000 | | | | 726,844 | |
| | | | | | | | 726,844 | |
| Colombia — 0.21% | | | | | | | | |
| Colombia Government International Bond 3.25% 4/22/32 | | | 1,321,000 | | | | 986,294 | |
| | | | | | | | 986,294 | |
| Dominican Republic — 0.22% | | | | | | | | |
| Dominican Republic International Bonds 144A 4.875% 9/23/32 # | | | 1,189,000 | | | | 1,012,592 | |
| | | | | | | | 1,012,592 | |
| Ivory Coast — 0.21% | | | | | | | | |
| Ivory Coast Government International Bond 144A 6.125% 6/15/33 # | | | 1,147,000 | | | | 996,112 | |
| | | | | | | | 996,112 | |
| Mexico — 0.18% | | | | | | | | |
| Mexico Government International Bond 3.50% 2/12/34 | | | 1,000,000 | | | | 850,310 | |
| | | | | | | | 850,310 | |
| Oman — 0.22% | | | | | | | | |
| Oman Government International Bond 144A 6.75% 1/17/48 # | | | 1,110,000 | | | | 1,052,385 | |
| | | | | | | | 1,052,385 | |
| | | Principal
amount° | | | Value (US $) | |
| Sovereign Bonds Δ(continued) | | | | | | | | |
| Paraguay — 0.18% | | | | | | | | |
| Paraguay Government International Bond | | | | | | | | |
| 144A 5.40% 3/30/50 # | | | 1,000,000 | | | $ | 864,725 | |
| | | | | | | | 864,725 | |
| Peru — 0.21% | | | | | | | | |
| Peruvian Government International Bond | | | | | | | | |
| 2.844% 6/20/30 | | | 1,140,000 | | | | 998,993 | |
| | | | | | | | 998,993 | |
| Qatar — 0.21% | | | | | | | | |
| Qatar Government International Bond | | | | | | | | |
| 144A 4.00% 3/14/29 # | | | 973,000 | | | | 968,198 | |
| | | | | | | | 968,198 | |
| Saudi Arabia — 0.21% | | | | | | | | |
| Saudi Government International Bond | | | | | | | | |
| 144A 3.625% 3/4/28 # | | | 1,012,000 | | | | 974,803 | |
| | | | | | | | 974,803 | |
| Uzbekistan — 0.22% | | | | | | | | |
| Republic of Uzbekistan International Bond | | | | | | | | |
| 144A 5.375% 2/20/29 # | | | 1,104,000 | | | | 1,012,953 | |
| | | | | | | | 1,012,953 | |
| Total Sovereign Bonds | | | | | | | | |
| (cost $10,459,283) | | | | | | | 10,444,209 | |
| | | | | | | | | |
| US Treasury Obligations — 4.01% | | | | | | | | |
| US Treasury Bonds | | | | | | | | |
| 3.625% 2/15/53 | | | 4,650,000 | | | | 4,617,668 | |
| 3.875% 2/15/43 | | | 4,730,000 | | | | 4,773,235 | |
| US Treasury Notes | | | | | | | | |
| 3.50% 2/15/33 | | | 850,000 | | | | 851,395 | |
| 3.625% 3/31/28 | | | 7,275,000 | | | | 7,287,504 | |
| 3.625% 3/31/30 | | | 120,000 | | | | 120,581 | |
| 4.25% 10/15/25 | | | 775,000 | | | | 781,146 | |
| 4.625% 2/28/25 | | | 290,000 | | | | 292,843 | |
| 4.625% 3/15/26 | | | 105,000 | | | | 107,399 | |
| Total US Treasury Obligations | | | | | | | | |
| (cost $18,630,225) | | | | | | | 18,831,771 | |
| | | Number of
shares | | | Value (US $) | |
| Preferred Stock — 0.79% | | | | | | | | |
| Brookfield Infrastructure Partners 5.00% ω | | | 200,000 | | | $ | 3,716,000 | |
| Total Preferred Stock | | | | | | | | |
| (cost $5,000,000) | | | | | | | 3,716,000 | |
| | | | | | | | | |
| Short-Term Investments — 4.18% | | | | | | | | |
| Money Market Mutual Funds — 4.18% | | | | | | | | |
| BlackRock Liquidity FedFund – Institutional Shares (seven-day effective yield 4.72%) | | | 4,919,396 | | | | 4,919,396 | |
| Fidelity Investments Money Market Government Portfolio – Class I (seven-day effective yield 4.72%) | | | 4,919,396 | | | | 4,919,396 | |
| Goldman Sachs Financial Square Government Fund – Institutional Shares (seven-day effective yield 4.84%) | | | 4,919,396 | | | | 4,919,396 | |
| Morgan Stanley Institutional Liquidity Funds Government Portfolio – Institutional Class (seven-day effective yield 4.73%) | | | 4,919,396 | | | | 4,919,396 | |
| Total Short-Term Investments | | | | | | | | |
| (cost $19,677,584) | | | | | | | 19,677,584 | |
| Total Value of Securities—101.16% | | | | | | | | |
| (cost $497,002,376) | | | | | | $ | 475,552,840 | |
| ° | Principal amount shown is stated in USD unless noted that the security is denominated in another currency. |
| • | Variable rate investment. Rates reset periodically. Rate shown reflects the rate in effect at March 31, 2023. For securities based on a published reference rate and spread, the reference rate and spread are indicated in their descriptions. The reference rate descriptions (i.e. LIBOR03M, LIBOR06M, etc.) used in this report are identical for different securities, but the underlying reference rates may differ due to the timing of the reset period. Certain variable rate securities are not based on a published reference rate and spread but are determined by the issuer or agent and are based on current market conditions, or for mortgage-backed securities, are impacted by the individual mortgages which are paying off over time. These securities do not indicate a reference rate and spread in their descriptions. |
| # | Security exempt from registration under Rule 144A of the Securities Act of 1933, as amended. At March 31, 2023, the aggregate value of Rule 144A securities was $129,733,071, which represents 27.60% of the Fund's net assets. See Note 13 in “Notes to financial statements." |
| µ | Fixed to variable rate investment. The rate shown reflects the fixed rate in effect at March 31, 2023. Rate will reset at a future date. |
| Ψ | Perpetual security. Maturity date represents next call date. |
Schedules of investments
Delaware Ivy Core Bond Fund
| ‡ | Non-income producing security. Security is currently in default. |
| t | Pass Through Agreement. Security represents the contractual right to receive a proportionate amount of underlying payments due to the counterparty pursuant to various agreements related to the rescheduling of obligations and the exchange of certain notes. |
| ∆ | Securities have been classified by country of risk. |
| ω | Perpetual security with no stated maturity date. |
The following futures contracts and swap contracts were outstanding at March 31, 2023:1
Futures Contracts
Exchange-Traded
| Contracts to Buy (Sell) | | Notional
Amount | | | Notional
Cost
(Proceeds) | | | Expiration
Date | | Value/
Unrealized
Appreciation | | | Variation
Margin
Due from
(Due to)
Brokers | |
| 328 | | US Treasury 5 yr Notes | | $ | 35,918,562 | | | $ | 35,164,074 | | | 6/30/23 | | $ | 754,488 | | | $ | 74,311 | |
| 196 | | US Treasury 10 yr Notes | | | 22,524,689 | | | | 21,838,703 | | | 6/21/23 | | | 685,986 | | | | 67,375 | |
| 10 | | US Treasury 10 yr Ultra Notes | | | 1,211,406 | | | | 1,168,619 | | | 6/21/23 | | | 42,787 | | | | 5,469 | |
| Total Futures Contracts | | | | | | $ | 58,171,396 | | | | | $ | 1,483,261 | | | $ | 147,155 | |
Swap Contracts
CDS Contracts2
Counterparty/
Reference Obligation/
Termination Date/
Payment Frequency | | Notional
Amount3 | | | Annual Protection
Payments | | | Value | | | Upfront
Payments
Paid
(Received) | | | Unrealized
Appreciation4 | | | Variation Margin
Due from
(Due to) Brokers | |
| Centrally Cleared: | | | | | | | | | | | | | | | | | | | | | | | | |
| Protection Sold/Moody's Ratings: | | | | | | | | | | | | | | | | | | | | | | | | |
| CDX.NA.HY.39.V15 | | | | | | | | | | | | | | | | | | | | | | | | |
| 12/20/27- Quarterly | | | 4,700,000 | | | | 5.000 | % | | $ | 54,994 | | | $ | (55,618 | ) | | $ | 110,612 | | | $ | 35,552 | |
| Total CDS Contracts | | | | | | | | | | $ | 54,994 | | | $ | (55,618 | ) | | $ | 110,612 | | | $ | 35,552 | |
The use of futures contracts and swap contracts involves elements of market risk and risks in excess of the amounts disclosed in the financial statements. The notional amounts presented above represent the Fund's total exposure in such contracts, whereas only the variation margin is reflected in the Fund's net assets.
| 1 | See Note 10 in “Notes to financial statements.” |
| 2 | A CDS contract is a risk-transfer instrument through which one party (purchaser of protection) transfers to another party (seller of protection) the financial risk of a credit event (as defined in the CDS agreement), as it relates to a particular reference security or basket of securities (such as an index). Periodic payments (receipts) on such contracts are accrued daily and recorded as unrealized losses (gains) on swap contracts. Upon payment (receipt), such amounts are recorded as realized losses (gains) on swap contracts. Upfront payments made or received in connection with CDS contracts are amortized over the expected life of the CDS contracts as unrealized losses (gains) on swap contracts. The change in value of CDS contracts is recorded daily as unrealized appreciation or depreciation. A realized gain or loss is recorded upon a credit event (as defined in the CDS agreement) or the maturity or termination of the CDS agreement. |
| 3 | Notional amount shown is stated in USD unless noted that the swap is denominated in another currency. |
| 4 | Unrealized appreciation (depreciation) does not include periodic interest (payments) receipt on swap contracts accrued daily in the amount of $(3,270). |
| 5 | Markit’s North America High Yield CDX Index, or the CDX.NA.HY Index, is composed of 100 liquid North American entities with high yield credit ratings that trade in the CDS market. |
Summary of abbreviations:
CLO – Collateralized Loan Obligation
DAC – Designated Activity Company
GNMA – Government National Mortgage Association
GS – Goldman Sachs
ICE – Intercontinental Exchange, Inc.
LIBOR – London Interbank Offered Rate
LIBOR01M – ICE LIBOR USD 1 Month
LIBOR03M – ICE LIBOR USD 3 Month
LIBOR06M – ICE LIBOR USD 6 Month
S.F. – Single Family
TSFR03M – 3 Month Term Secured Overnight Financing Rate
yr – Year
USD – US Dollar
See accompanying notes, which are an integral part of the financial statements.
Schedules of investments
| Delaware Ivy Core Equity Fund | March 31, 2023 |
| | | Number of
shares | | | Value (US $) | |
| Common Stocks — 95.03% t | | | | | | | | |
| Communication Services — 5.33% | | | | | | | | |
| Alphabet Class A † | | | 1,151,641 | | | $ | 119,459,721 | |
| Take-Two Interactive Software † | | | 523,542 | | | | 62,458,561 | |
| | | | | | | | 181,918,282 | |
| Consumer Discretionary — 8.12% | | | | | | | | |
| Amazon.com † | | | 950,010 | | | | 98,126,533 | |
| Aptiv † | | | 757,414 | | | | 84,974,277 | |
| AutoZone † | | | 38,094 | | | | 93,640,766 | |
| | | | | | | | 276,741,576 | |
| Consumer Staples — 3.57% | | | | | | | | |
| Costco Wholesale | | | 170,824 | | | | 84,877,321 | |
| General Mills | | | 40,677 | | | | 3,476,256 | |
| Sysco | | | 432,587 | | | | 33,408,694 | |
| | | | | | | | 121,762,271 | |
| Energy — 2.54% | | | | | | | | |
| ConocoPhillips | | | 519,560 | | | | 51,545,548 | |
| Schlumberger | | | 716,095 | | | | 35,160,264 | |
| | | | | | | | 86,705,812 | |
| Financials — 14.86% | | | | | | | | |
| American Express | | | 303,799 | | | | 50,111,645 | |
| Aon Class A | | | 211,582 | | | | 66,709,689 | |
| Artisan Partners Asset Management Class A | | | 1,099,926 | | | | 35,175,633 | |
| Blackstone | | | 404,773 | | | | 35,555,260 | |
| Capital One Financial | | | 190,717 | | | | 18,339,347 | |
| Intercontinental Exchange | | | 357,345 | | | | 37,267,510 | |
| JPMorgan Chase & Co. | | | 246,538 | | | | 32,126,367 | |
| KKR & Co. | | | 1,398,154 | | | | 73,431,048 | |
| Morgan Stanley | | | 946,236 | | | | 83,079,521 | |
| Progressive | | | 525,404 | | | | 75,164,296 | |
| | | | | | | | 506,960,316 | |
| Healthcare — 12.39% | | | | | | | | |
| Danaher | | | 224,515 | | | | 56,586,761 | |
| HCA Healthcare | | | 397,264 | | | | 104,750,571 | |
| UnitedHealth Group | | | 357,008 | | | | 168,718,411 | |
| Vertex Pharmaceuticals † | | | 153,499 | | | | 48,362,930 | |
| Zoetis | | | 265,485 | | | | 44,187,323 | |
| | | | | | | | 422,605,996 | |
| Industrials — 9.30% | | | | | | | | |
| Airbus ADR | | | 2,736,585 | | | | 91,620,866 | |
| Deere & Co. | | | 125,079 | | | | 51,642,618 | |
| Equifax | | | 310,600 | | | | 63,002,104 | |
| Raytheon Technologies | | | 439,456 | | | | 43,035,926 | |
| United Rentals | | | 171,365 | | | | 67,819,412 | |
| | | | | | | | 317,120,926 | |
| Information Technology — 31.61% | | | | | | | | |
| Apple | | | 864,019 | | | | 142,476,733 | |
| Applied Materials | | | 602,263 | | | | 73,975,964 | |
| Fiserv † | | | 456,465 | | | | 51,594,240 | |
| Intuit | | | 142,418 | | | | 63,494,217 | |
| Mastercard Class A | | | 168,053 | | | | 61,072,141 | |
| Microchip Technology | | | 1,239,437 | | | | 103,840,032 | |
| Microsoft | | | 896,131 | | | | 258,354,567 | |
| Salesforce † | | | 246,301 | | | | 49,206,014 | |
| Seagate Technology Holdings | | | 667,285 | | | | 44,120,884 | |
| TE Connectivity | | | 814,645 | | | | 106,840,692 | |
| VeriSign † | | | 368,795 | | | | 77,937,447 | |
| Zebra Technologies Class A † | | | 141,828 | | | | 45,101,304 | |
| | | | | | | | 1,078,014,235 | |
| Materials — 4.32% | | | | | | | | |
| Linde | | | 244,885 | | | | 87,041,924 | |
| Sherwin-Williams | | | 268,653 | | | | 60,385,135 | |
| | | | | | | | 147,427,059 | |
| Utilities — 2.99% | | | | | | | | |
| NextEra Energy | | | 1,323,276 | | | | 101,998,114 | |
| | | | | | | | 101,998,114 | |
| Total Common Stocks | | | | | | | | |
| (cost $2,067,949,010) | | | | | | | 3,241,254,587 | |
| | | | | | | | | |
| Short-Term Investments — 5.59% | | | | | | | | |
| Money Market Mutual Funds — 5.59% | | | | | | | | |
| BlackRock Liquidity FedFund – Institutional Shares (seven-day effective yield 4.72%) | | | 47,679,418 | | | | 47,679,418 | |
| Fidelity Investments Money Market Government Portfolio – Class I (seven-day effective yield 4.72%) | | | 47,679,418 | | | | 47,679,418 | |
| Goldman Sachs Financial Square Government Fund – Institutional Shares (seven-day effective yield 4.84%) | | | 47,679,419 | | | | 47,679,419 | |
| Morgan Stanley Institutional Liquidity Funds Government Portfolio – Institutional Class (seven-day effective yield 4.73%) | | | 47,679,418 | | | | 47,679,418 | |
| Total Short-Term Investments | | | | | | | | |
| (cost $190,717,673) | | | | | | | 190,717,673 | |
| Total Value of Securities—100.62% | | | | | | | | |
| (cost $2,258,666,683) | | | | | | $ | 3,431,972,260 | |
| t | Narrow industries are utilized for compliance purposes for concentration whereas broad sectors are used for financial reporting. |
| † | Non-income producing security. |
Summary of abbreviations:
ADR – American Depositary Receipt
See accompanying notes, which are an integral part of the financial statements.
Schedules of investments
| Delaware Ivy Global Bond Fund | March 31, 2023 |
| | | Principal
amount° | | | Value (US $) | |
| Agency Mortgage-Backed Securities – 7.21% | | | | | | | | |
| Fannie Mae S.F. 20 yr | | | | | | | | |
| 4.00% 8/1/42 | | | 496,906 | | | $ | 479,873 | |
| Fannie Mae S.F. 30 yr | | | | | | | | |
| 2.50% 4/1/51 | | | 1,722,415 | | | | 1,484,923 | |
| 3.50% 1/1/52 | | | 2,153,295 | | | | 2,001,082 | |
| 3.50% 6/1/52 | | | 3,873,445 | | | | 3,599,449 | |
| 4.00% 5/1/51 | | | 1,119,812 | | | | 1,083,474 | |
| 4.50% 9/1/49 | | | 914,179 | | | | 911,214 | |
| 5.00% 9/1/52 | | | 2,742,907 | | | | 2,735,348 | |
| 5.00% 10/1/52 | | | 671,412 | | | | 669,562 | |
| 5.50% 10/1/52 | | | 2,101,103 | | | | 2,122,229 | |
| 5.50% 3/1/53 | | | 4,266,538 | | | | 4,309,437 | |
| Freddie Mac S.F. 15 yr | | | | | | | | |
| 4.50% 9/1/37 | | | 796,625 | | | | 795,012 | |
| Freddie Mac S.F. 30 yr | | | | | | | | |
| 2.50% 5/1/52 | | | 866,295 | | | | 747,176 | |
| 3.00% 12/1/46 | | | 1,558,949 | | | | 1,426,574 | |
| 3.00% 7/1/50 | | | 2,465,033 | | | | 2,245,742 | |
| 4.00% 8/1/52 | | | 1,341,085 | | | | 1,290,079 | |
| 4.50% 10/1/35 | | | 116,334 | | | | 116,976 | |
| 4.50% 9/1/52 | | | 1,383,133 | | | | 1,356,794 | |
| 5.00% 7/1/52 | | | 1,648,890 | | | | 1,646,763 | |
| 6.00% 12/1/52 | | | 855,299 | | | | 873,825 | |
| GNMA II S.F. 30 yr 3.00% | | | | | | | | |
| 12/20/51 | | | 1,059,363 | | | | 966,791 | |
Total Agency Mortgage-Backed Securities
(cost $30,848,250) |
|
|
|
|
|
|
30,862,323 |
|
| | | | | | | | | |
| Corporate Bonds – 43.47%∆ | | | | | | | | |
| Australia – 0.13% | | | | | | | | |
| WestConnex Finance Pty 3.15% 3/31/31 | | AUD | 1,000,000 | | | | 557,738 | |
| | | | | | | | 557,738 | |
| Brazil – 0.37% | | | | | | | | |
| Itau Unibanco Holding 144A 3.25% 1/24/25 # | | | 1,230,000 | | | | 1,185,646 | |
| Rumo Luxembourg 144A 5.25% 1/10/28 # | | | 435,000 | | | | 401,288 | |
| | | | | | | | 1,586,934 | |
| Canada – 0.39% | | | | | | | | |
| Enbridge 5.70% 3/8/33 | | | 1,455,000 | | | | 1,514,281 | |
| Nutrien 4.90% 3/27/28 | | | 160,000 | | | | 160,073 | |
| | | | | | | | 1,674,354 | |
| Chile – 0.43% | | | | | | | | |
| Saci Falabella 3.75% 4/30/23 | | | 1,850,000 | | | | 1,846,744 | |
| | | | | | | | 1,846,744 | |
| China – 0.46% | | | | | | | | |
| ENN Energy Holdings 144A 2.625% 9/17/30 # | | | 2,000,000 | | | | 1,685,354 | |
| RKPF Overseas 2020 5.125% 7/26/26 | | | 425,000 | | | | 292,604 | |
| | | | | | | | 1,977,958 | |
| Colombia – 0.32% | | | | | | | | |
| Geopark 144A 5.50% 1/17/27 # | | | 1,635,000 | | | | 1,373,400 | |
| | | | | | | | 1,373,400 | |
| Czech Republic – 0.14% | | | | | | | | |
| Energo-Pro 144A 8.50% 2/4/27 # | | | 600,000 | | | | 578,250 | |
| | | | | | | | 578,250 | |
| France – 2.27% | | | | | | | | |
| AXA 5.125% 7/4/43 µ | | EUR | 1,700,000 | | | | 1,843,567 | |
| BPCE 144A 5.125% 1/18/28 # | | | 3,465,000 | | | | 3,436,113 | |
| Credit Agricole 144A 5.301% 7/12/28 # | | | 2,795,000 | | | | 2,835,662 | |
| TotalEnergies 2.708% 5/5/23 µ, Ψ | | EUR | 1,500,000 | | | | 1,623,890 | |
| | | | | | | | 9,739,232 | |
| Georgia – 0.15% | | | | | | | | |
| Georgian Railway JSC 4.00% 6/17/28 | | | 760,000 | | | | 655,150 | |
| | | | | | | | 655,150 | |
| Germany – 0.73% | | | | | | | | |
| Aroundtown 1.625% 1/31/28 | | EUR | 1,700,000 | | | | 1,216,984 | |
| Deutsche Bank | | | | | | | | |
| 5.625% 5/19/31 µ | | EUR | 800,000 | | | | 824,917 | |
| 6.72% 1/18/29 µ | | | 1,100,000 | | | | 1,093,198 | |
| | | | | | | | 3,135,099 | |
| Guatemala – 0.44% | | | | | | | | |
| Central American Bottling 144A 5.25% 4/27/29 # | | | 1,500,000 | | | | 1,395,622 | |
| CT Trust 144A 5.125% 2/3/32 # | | | 600,000 | | | | 502,500 | |
| | | | | | | | 1,898,122 | |
| India – 0.50% | | | | | | | | |
| Greenko Power II 144A 4.30% 12/13/28 # | | | 382,000 | | | | 330,907 | |
| Summit Digitel Infrastructure 144A 2.875% 8/12/31 # | | | 2,300,000 | | | | 1,797,674 | |
| | | | | | | | 2,128,581 | |
| | | Principal
amount° | | | Value (US $) | |
| Corporate Bonds∆ (continued) | | | | | | | | |
| Indonesia – 1.37% | | | | | | | | |
| Perusahaan Perseroan Persero Perusahaan Listrik Negara | | | | | | | | |
| 144A 5.375% 1/25/29 # | | | 4,800,000 | | | $ | 4,773,665 | |
| 144A 5.45% 5/21/28 # | | | 1,100,000 | | | | 1,097,002 | |
| | | | | | | | 5,870,667 | |
| Israel – 0.24% | | | | | | | | |
| Energean Israel Finance 144A 4.875% 3/30/26 # | | | 1,100,000 | | | | 1,021,625 | |
| | | | | | | | 1,021,625 | |
| Italy – 0.22% | | | | | | | | |
| Autostrade per l'Italia 2.00% 12/4/28 | | EUR | 1,000,000 | | | | 940,680 | |
| | | | | | | | 940,680 | |
| Japan – 0.62% | | | | | | | | |
| Sumitomo Mitsui Financial Group 3.748% 7/19/23 | | | 2,650,000 | | | | 2,634,575 | |
| | | | | | | | 2,634,575 | |
| Kazakhstan – 0.99% | | | | | | | | |
| Development Bank of Kazakhstan JSC | | | | | | | | |
| 144A 5.75% 5/12/25 # | | | 2,000,000 | | | | 2,010,000 | |
| 144A 10.95% 5/6/26 # | | KZT | 429,000,000 | | | | 782,141 | |
| KazTransGas JSC 144A | | | | | | | | |
| 4.375% 9/26/27 # | | | 1,588,000 | | | | 1,427,636 | |
| | | | | | | | 4,219,777 | |
| Kuwait – 1.25% | | | | | | | | |
| NBK SPC 144A 1.625% 9/15/27 #, µ | | | 6,000,000 | | | | 5,342,040 | |
| | | | | | | | 5,342,040 | |
| Malaysia – 0.14% | | | | | | | | |
| Petronas Capital 144A 3.50% 4/21/30 # | | | 650,000 | | | | 607,127 | |
| | | | | | | | 607,127 | |
| Mexico – 1.42% | | | | | | | | |
| Banco Santander Mexico | | | | | | | | |
| 144A 5.375% 4/17/25 # | | | 1,150,000 | | | | 1,144,537 | |
| 144A 5.95% 10/1/28 #, µ | | | 850,000 | | | | 832,132 | |
| BBVA Bancomer | | | | | | | | |
| 144A 1.875% 9/18/25 # | | | 1,400,000 | | | | 1,278,907 | |
| 144A 5.875% 9/13/34 #, µ | | | 1,700,000 | | | | 1,486,140 | |
| Cemex | | | | | | | | |
| 144A 7.375% 6/5/27 # | | | 650,000 | | | | 673,010 | |
| 144A 9.125% 3/14/28 #, µ, Ψ | | | 660,000 | | | | 661,784 | |
| | | | | | | | 6,076,510 | |
| Netherlands – 1.97% | | | | | | | | |
| ING Groep 3.00% 4/11/28 µ | | EUR | 7,800,000 | | | | 8,452,265 | |
| | | | | | | | 8,452,265 | |
| Paraguay – 0.36% | | | | | | | | |
| Rutas 2 and 7 Finance 144A 4.551% 9/30/36 #, ^ 2,445,333 1,547,591 | | | | | | | 1,547,591 | |
| Peru – 0.93% | | | | | | | | |
| Banco Internacional del Peru 144A 3.25% 10/4/26 # | | | 800,000 | | | | 729,426 | |
| Corp. Financiera de Desarrollo 144A 2.40% 9/28/27 # | | | 1,300,000 | | | | 1,122,511 | |
| SAN Miguel Industrias 144A 3.50% 8/2/28 # | | | 2,550,000 | | | | 2,150,190 | |
| | | | | | | | 4,002,127 | |
| Republic of Korea – 0.14% | | | | | | | | |
| SK Hynix 144A 6.50% 1/17/33 # | | | 600,000 | | | | 596,164 | |
| | | | | | | | 596,164 | |
| Singapore – 0.56% | | | | | | | | |
| DBS Group Holdings 1.50% 4/11/28 µ | | EUR | 2,200,000 | | | | 2,382,918 | |
| | | | | | | | 2,382,918 | |
| South Africa – 0.17% | | | | | | | | |
| Bidvest Group UK 144A 3.625% 9/23/26 # | | | 822,000 | | | | 746,721 | |
| | | | | | | | 746,721 | |
| Spain – 0.11% | | | | | | | | |
| Abertis Infraestructuras Finance 3.248% 11/24/25 µ, Ψ | | EUR | 500,000 | | | | 484,609 | |
| | | | | | | | 484,609 | |
| Switzerland – 0.93% | | | | | | | | |
| Credit Suisse 7.95% 1/9/25 | | | 1,945,000 | | | | 1,979,543 | |
| Holcim Finance Luxembourg 0.50% 4/23/31 | | EUR | 1,500,000 | | | | 1,215,294 | |
| UBS Group 144A 4.751% 5/12/28 #, µ | | | 800,000 | | | | 768,186 | |
| | | | | | | | 3,963,023 | |
| Tanzania – 0.30% | | | | | | | | |
| AngloGold Ashanti Holdings 3.75% 10/1/30 | | | 1,450,000 | | | | 1,269,555 | |
| | | | | | | | 1,269,555 | |
Schedules of investments
Delaware Ivy Global Bond Fund
| | | Principal
amount° | | | Value (US $) | |
| Corporate Bonds∆ (continued) | | | | | | | | |
| Thailand – 0.16% | | | | | | | | |
| Thaioil Treasury Center 144A 2.50% 6/18/30 # | | | 850,000 | | | $ | 685,156 | |
| | | | | | | | 685,156 | |
| Turkey – 0.16% | | | | | | | | |
| Akbank TAS 144A 6.80% 2/6/26 # | | | 690,000 | | | | 669,232 | |
| | | | | | | | 669,232 | |
| Ukraine – 0.36% | | | | | | | | |
| Metinvest 8.50% 4/23/26 | | | 1,280,000 | | | | 793,152 | |
| MHP Lux 6.95% 4/3/26 | | | 1,445,000 | | | | 733,020 | |
| | | | | | | | 1,526,172 | |
| United Arab Emirates – 0.52% | | | | | | | | |
| Galaxy Pipeline Assets Bidco 144A 1.75% 9/30/27 # | | | 1,705,179 | | | | 1,589,966 | |
| MAF Global Securities 7.875% 6/30/27 µ, Ψ | | | 625,000 | | | | 631,481 | |
| | | | | | | | 2,221,447 | |
| United Kingdom – 0.39% | | | | | | | | |
| Babcock International Group 1.375% 9/13/27 | | EUR | 1,450,000 | | | | 1,382,486 | |
| Barclays 7.385% 11/2/28 µ | | | 285,000 | | | | 302,340 | |
| | | | | | | | 1,684,826 | |
| United States – 23.64% | | | | | | | | |
| Air Lease | | | | | | | | |
| 2.875% 1/15/32 | | | 1,765,000 | | | | 1,459,538 | |
| 5.85% 12/15/27 | | | 2,230,000 | | | | 2,243,728 | |
| American International Group 5.125% 3/27/33 | | | 2,335,000 | | | | 2,322,423 | |
| Amgen | | | | | | | | |
| 5.25% 3/2/33 | | | 3,005,000 | | | | 3,088,977 | |
| 5.65% 3/2/53 | | | 1,630,000 | | | | 1,697,998 | |
| Aon 5.00% 9/12/32 | | | 1,025,000 | | | | 1,030,389 | |
| Appalachian Power 4.50% 8/1/32 | | | 1,135,000 | | | | 1,090,404 | |
| Autodesk 2.40% 12/15/31 | | | 695,000 | | | | 578,428 | |
| Aviation Capital Group | | | | | | | | |
| 144A 3.50% 11/1/27 # | | | 1,080,000 | | | | 965,543 | |
| 144A 6.25% 4/15/28 # | | | 970,000 | | | | 971,497 | |
| Bank of America | | | | | | | | |
| 3.648% 3/31/29 µ | | EUR | 1,500,000 | | | | 1,591,450 | |
| 6.204% 11/10/28 µ | | | 2,160,000 | | | | 2,259,960 | |
| Bank of New York Mellon | | | | | | | | |
| 5.802% 10/25/28 µ | | | 310,000 | | | | 323,235 | |
| BP Capital Markets America 4.812% 2/13/33 | | | 2,125,000 | | | | 2,158,481 | |
| CDW 3.276% 12/1/28 | | | 760,000 | | | | 670,909 | |
| Celanese US Holdings | | | | | | | | |
| 6.05% 3/15/25 | | | 990,000 | | | | 996,372 | |
| 6.165% 7/15/27 | | | 485,000 | | | | 488,455 | |
| Charter Communications Operating 3.85% 4/1/61 | | | 400,000 | | | | 249,903 | |
| Citigroup 5.61% 9/29/26 µ | | | 2,190,000 | | | | 2,207,813 | |
| Citizens Bank 6.064% 10/24/25 µ | | | 2,120,000 | | | | 1,996,317 | |
| Discovery Communications 4.00% 9/15/55 | | | 900,000 | | | | 598,069 | |
| Duke Energy | | | | | | | | |
| 2.55% 6/15/31 | | | 261,000 | | | | 218,649 | |
| 3.10% 6/15/28 | | EUR | 1,200,000 | | | | 1,241,054 | |
| Duke Energy Carolinas 4.95% 1/15/33 | | | 1,625,000 | | | | 1,670,975 | |
| Elevance Health 5.125% 2/15/53 | | | 1,065,000 | | | | 1,061,903 | |
| Energy Transfer 5.75% 2/15/33 | | | 743,000 | | | | 761,761 | |
| Entegris Escrow 144A 4.75% 4/15/29 # | | | 1,660,000 | | | | 1,570,879 | |
| Enterprise Products Operating 5.35% 1/31/33 | | | 845,000 | | | | 876,180 | |
| Exelon 5.30% 3/15/33 | | | 2,020,000 | | | | 2,057,042 | |
| Fifth Third Bancorp 6.361% 10/27/28 µ | | | 998,000 | | | | 1,005,516 | |
| Ford Motor Credit | | | | | | | | |
| 2.30% 2/10/25 | | | 475,000 | | | | 440,904 | |
| 2.90% 2/10/29 | | | 695,000 | | | | 576,291 | |
| GE HealthCare Technologies | | | | | | | | |
| 144A 5.60% 11/15/25 # | | | 2,265,000 | | | | 2,293,663 | |
| 144A 5.65% 11/15/27 # | | | 2,265,000 | | | | 2,342,448 | |
| Honeywell International 4.125% 11/2/34 | | EUR | 1,300,000 | | | | 1,432,728 | |
| Huntington National Bank 5.65% 1/10/30 | | | 2,620,000 | | | | 2,512,721 | |
| Indianapolis Power & Light 144A 5.65% 12/1/32 # | | | 3,390,000 | | | | 3,564,871 | |
| JBS USA LUX 144A 3.625% 1/15/32 # | | | 2,865,000 | | | | 2,377,148 | |
| JPMorgan Chase & Co. 3.54% 5/1/28 µ | | | 2,132,000 | | | | 2,017,868 | |
| KeyCorp 4.789% 6/1/33 µ | | | 176,000 | | | | 157,741 | |
| Kinder Morgan 5.20% 6/1/33 | | | 2,980,000 | | | | 2,962,883 | |
| Mileage Plus Holdings 144A 6.50% 6/20/27 # | | | 1,032,750 | | | | 1,030,442 | |
| | | Principal
amount° | | | Value (US $) | |
| Corporate Bonds∆ (continued) | | | | | | | | |
| United States (continued) | | | | | | | | |
| Morgan Stanley | | | | | | | | |
| 2.95% 5/7/32 µ | | EUR | 2,200,000 | | | $ | 2,173,376 | |
| 6.138% 10/16/26 µ | | | 2,665,000 | | | | 2,717,677 | |
| 6.296% 10/18/28 µ | | | 3,010,000 | | | | 3,167,758 | |
| Oracle | | | | | | | | |
| 4.65% 5/6/30 | | | 1,335,000 | | | | 1,300,333 | |
| 5.55% 2/6/53 | | | 885,000 | | | | 843,671 | |
| 6.15% 11/9/29 | | | 1,885,000 | | | | 2,008,657 | |
| PPG Industries 2.75% 6/1/29 | | EUR | 1,400,000 | | | | 1,416,475 | |
| Public Service of Colorado 5.25% 4/1/53 | | | 2,440,000 | | | | 2,489,163 | |
| Sagicor Financial 144A 5.30% 5/13/28 # | | | 725,000 | | | | 686,633 | |
| SVB Financial Group 4.57% 4/29/33 ‡ | | | 1,123,000 | | | | 652,351 | |
| Targa Resources Partners 5.00% 1/15/28 | | | 1,745,000 | | | | 1,688,933 | |
| Truist Financial 6.123% 10/28/33 µ | | | 2,041,000 | | | | 2,143,248 | |
| UnitedHealth Group 4.50% 4/15/33 | | | 5,840,000 | | | | 5,808,998 | |
| US Bancorp | | | | | | | | |
| 4.653% 2/1/29 µ | | | 2,119,000 | | | | 2,072,892 | |
| 4.839% 2/1/34 µ | | | 2,360,000 | | | | 2,291,335 | |
| 5.727% 10/21/26 µ | | | 2,735,000 | | | | 2,749,392 | |
| Valero Energy 3.65% 12/1/51 | | | 434,000 | | | | 315,846 | |
| VICI Properties 4.95% 2/15/30 | | | 2,310,000 | | | | 2,169,961 | |
| Vistra Operations 144A 5.125% 5/13/25 # | | | 2,105,000 | | | | 2,053,860 | |
| Zoetis 5.40% 11/14/25 | | | 1,310,000 | | | | 1,332,812 | |
| | | | | | | | 101,246,927 | |
| Uzbekistan - 0.19% | | | | | | | | |
| Uzbekneftegaz 4.75% 11/16/28 | | | 1,000,000 | | | | 795,115 | |
| | | | | | | | 795,115 | |
| Total Corporate Bonds (cost $192,760,617) | | | | | | | 186,138,411 | |
| | | | | | | | | |
| Sovereign Bonds – 25.13%∆ | | | | | | | | |
| Albania – 0.19% | | | | | | | | |
| Albania Government International Bond 144A 3.50% 11/23/31 # | | EUR | 896,000 | | | | 808,464 | |
| | | | | | | | 808,464 | |
| Angola – 0.50% | | | | | | | | |
| Angolan Government International Bonds 144A 8.75% 4/14/32 # | | | 2,200,000 | | | | 1,864,500 | |
| Angolan Government International Bonds 8.75% 4/14/32 | | | 345,000 | | | | 292,387 | |
| | | | | | | | 2,156,887 | |
| Armenia – 0.18% | | | | | | | | |
| Republic of Armenia International Bond 144A 3.60% 2/2/31 # | | | 993,000 | | | | 768,789 | |
| | | | | | | | 768,789 | |
| Bermuda – 0.86% | | | | | | | | |
| Bermuda Government International Bonds | | | | | | | | |
| 144A 2.375% 8/20/30 # | | | 1,688,000 | | | | 1,448,081 | |
| 144A 5.00% 7/15/32 # | | | 800,000 | | | | 804,351 | |
| 5.00% 7/15/32 | | | 1,405,000 | | | | 1,412,642 | |
| | | | | | | | 3,665,074 | |
| Brazil – 0.31% | | | | | | | | |
| Brazil Notas do Tesouro Nacional Serie F 10.00% 1/1/33 | | BRL | 8,000,000 | | | | 1,344,932 | |
| | | | | | | | 1,344,932 | |
| Chile – 1.29% | | | | | | | | |
| Chile Government International Bonds | | | | | | | | |
| 3.10% 5/7/41 | | | 1,914,000 | | | | 1,441,391 | |
| 2.55% 7/27/33 | | | 3,000,000 | | | | 2,473,910 | |
| 4.34% 3/7/42 | | | 1,800,000 | | | | 1,595,179 | |
| | | | | | | | 5,510,480 | |
| Colombia – 1.68% | | | | | | | | |
| Colombia Government International Bonds | | | | | | | | |
| 3.00% 1/30/30 | | | 2,300,000 | | | | 1,809,732 | |
| 3.125% 4/15/31 | | | 5,089,000 | | | | 3,894,632 | |
| 4.125% 2/22/42 | | | 2,268,000 | | | | 1,475,717 | |
| | | | | | | | 7,180,081 | |
| Denmark – 2.64% | | | | | | | | |
| Denmark Government Bond 144A 2.25% 11/15/33 # | | DKK | 79,800,000 | | | | 11,324,424 | |
| | | | | | | | 11,324,424 | |
| Dominican Republic – 1.20% | | | | | | | | |
| Dominican Republic International Bonds | | | | | | | | |
| 144A 4.875% 9/23/32 # | | | 3,577,000 | | | | 3,046,292 | |
| 144A 5.50% 2/22/29 # | | | 1,800,000 | | | | 1,699,791 | |
| 144A 7.05% 2/3/31 # | | | 400,000 | | | | 407,140 | |
| | | | | | | | 5,153,223 | |
Schedules of investments
Delaware Ivy Global Bond Fund
| | | Principal
amount° | | | Value (US $) | |
| Sovereign Bonds∆ (continued) | | | | | | | | |
| Egypt – 0.29% | | | | | | | | |
| Egypt Government International Bond 5.25% 10/6/25 | | | 1,543,000 | | | $ | 1,222,210 | |
| | | | | | | | 1,222,210 | |
| Finland – 1.81% | | | | | | | | |
| Finland Government Bond 144A 1.375% 4/15/27 # | | EUR | 7,500,000 | | | | 7,737,096 | |
| | | | | | | | 7,737,096 | |
| Georgia – 0.18% | | | | | | | | |
| Georgia Government International Bond 144A 2.75% 4/22/26 # | | | 854,000 | | | | 764,451 | |
| | | | | | | | 764,451 | |
| Germany – 0.94% | | | | | | | | |
| Bundesobligation 1.30% 10/15/27 | | EUR | 1,000,000 | | | | 1,035,966 | |
| Bundesrepublik Deutschland Bundesanleihe | | | | | | | | |
| 1.29% 2/15/32 | | EUR | 1,500,000 | | | | 1,335,173 | |
| 1.80% 8/15/53 | | EUR | 1,740,000 | | | | 1,655,422 | |
| | | | | | | | 4,026,561 | |
| Indonesia – 0.64% | | | | | | | | |
| Indonesia Government International Bond 3.85% 10/15/30 | | | 700,000 | | | | 667,982 | |
| Perusahaan Penerbit SBSN Indonesia III 4.70% 6/6/32 | | | 2,083,000 | | | | 2,082,091 | |
| | | | | | | | 2,750,073 | |
| Italy – 0.72% | | | | | | | | |
| Italy Buoni Poliennali Del Tesoro | | | | | | | | |
| 144A 4.00% 4/30/35 # | | EUR | 2,500,000 | | | | 2,651,684 | |
| 2.50% 12/1/32 | | EUR | 450,000 | | | | 429,953 | |
| | | | | | | | 3,081,637 | |
| Ivory Coast – 1.17% | | | | | | | | |
| Ivory Coast Government International Bond 144A 6.125% 6/15/33 # | | | 5,768,000 | | | | 5,009,220 | |
| | | | | | | | 5,009,220 | |
| Morocco – 0.66% | | | | | | | | |
| Morocco Government International Bonds | | | | | | | | |
| 5.50% 12/11/42 | | | 700,000 | | | | 606,638 | |
| 144A 2.375% 12/15/27 # | | | 2,500,000 | | | | 2,206,693 | |
| | | | | | | | 2,813,331 | |
| Netherlands – 1.69% | | | | | | | | |
| Netherlands Government Bonds | | | | | | | | |
| 144A 0.50% 7/15/32 # | | EUR | 2,690,000 | | | | 2,418,621 | |
| 144A 2.50% 7/15/33 # | | EUR | 4,500,000 | | | | 4,834,815 | |
| | | | | | | | 7,253,436 | |
| New Zealand – 2.21% | | | | | | | | |
| New Zealand Government Bond 4.25% 5/15/34 | | NZD | 15,100,000 | | | | 9,464,505 | |
| | | | | | | | 9,464,505 | |
| Paraguay – 2.02% | | | | | | | | |
| Paraguay Government International Bonds | | | | | | | | |
| 5.60% 3/13/48 | | | 1,693,000 | | | | 1,509,260 | |
| 144A 4.95% 4/28/31 # | | | 5,767,000 | | | | 5,607,599 | |
| 144A 2.739% 1/29/33 # | | | 1,887,000 | | | | 1,538,129 | |
| | | | | | | | 8,654,988 | |
| Republic of North Macedonia – 0.36% | | | | | | | | |
| North Macedonia Government International Bond 144A 1.625% 3/10/28 # | | EUR | 1,777,000 | | | | 1,532,509 | |
| | | | | | | | 1,532,509 | |
| Senegal – 0.39% | | | | | | | | |
| Senegal Government International Bond 144A 6.25% 5/23/33 # | | | 2,122,000 | | | | 1,693,135 | |
| | | | | | | | 1,693,135 | |
| South Africa – 1.17% | | | | | | | | |
| Republic of South Africa Government International Bonds | | | | | | | | |
| 5.65% 9/27/47 | | | 4,756,000 | | | | 3,525,861 | |
| 5.75% 9/30/49 | | | 1,995,000 | | | | 1,470,225 | |
| | | | | | | | 4,996,086 | |
| Spain – 0.95% | | | | | | | | |
| Spain Government Bond 144A 1.85% 7/30/35 # | | EUR | 4,470,000 | | | | 4,075,601 | |
| | | | | | | | 4,075,601 | |
| Uzbekistan – 1.08% | | | | | | | | |
| Republic of Uzbekistan International Bonds | | | | | | | | |
| 144A 5.375% 2/20/29 # | | | 3,481,000 | | | | 3,193,922 | |
| 144A 4.75% 2/20/24 # | | | 750,000 | | | | 739,066 | |
| 144A 14.00% 7/19/24 # | | UZS | 7,800,000,000 | | | | 672,849 | |
| | | | | | | | 4,605,837 | |
| Total Sovereign Bonds (cost $108,323,047) | | | | | | | 107,593,030 | |
| | | | | Principal
amount° | | Value (US $) |
| Supranational Banks – 2.38% | | | | | | | | | | | | |
| Banco Latinoamericano de Comercio Exterior 2.375% 9/14/25 # | | | | | | | 2,000,000 | | | $ | 1,841,985 | |
| Banque Ouest Africaine de Developpement 5.000% 7/27/27 | | | | | | | 1,800,000 | | | $ | 1,660,212 | |
| Central American Bank for Economic Integration 1.140% 2/9/26 # | | | | | | | 2,000,000 | | | $ | 1,814,585 | |
| Corp Andina de Fomento | | | | | | | | | | | | |
| 2.375% 5/12/23 | | | | | | | 650,000 | | | $ | 647,901 | |
| 5.25% 11/21/25 | | | | | | | 1,100,000 | | | | 1,112,858 | |
| European Union 1.000% 7/6/32 | | | EUR | | | | 3,420,000 | | | $ | 3,123,307 | |
Total Supranational Banks
(cost $10,674,171) | | | | | | | | | | | 10,200,848 | |
| | | | | | | | | | | | | |
| US Treasury Obligations – 16.38% | | | | | | | | | | | | |
| US Treasury Notes | | | | | | | | | | | | |
| 0.375% 9/30/27 | | | | | | | 4,600,000 | | | | 3,979,000 | |
| 1.25% 4/30/28 | | | | | | | 8,680,000 | | | | 7,731,133 | |
| 2.375% 5/15/27 | | | | | | | 8,525,000 | | | | 8,100,249 | |
| 2.375% 3/31/29 | | | | | | | 17,585,000 | | | | 16,421,712 | |
| 2.875% 4/30/29 | | | | | | | 9,000,000 | | | | 8,643,340 | |
| 3.625% 3/31/28 | | | | | | | 14,040,000 | | | | 14,064,132 | |
| 4.00% 10/31/29 | | | | | | | 3,365,000 | | | | 3,447,022 | |
| 4.25% 10/15/25 | | | | | | | 7,700,000 | | | | 7,761,059 | |
Total US Treasury Obligations
(cost $72,857,291) | | | | | | | | | | | 70,147,647 | |
| | | | | | | | | | | | | |
| | | | | | | | Number of
contracts | | | | | |
| Options Purchased – 0.18% | | | | | | | | | | | | |
| Foreign Currency Call Options – 0.00% | | | | | | | | | | | | |
| GBP vs USD strike price 1.04 GBP, expiration date 4/12/23, notional amount GBP 6,983,881 (JPMCB) | | | | | | | 6,715,270 | | | | 0 | |
| USD vs CNH strike price $7.30, expiration date 4/13/23, notional amount $126,484,180 (JPMCB) | | | | | | | 17,326,600 | | | | 148 | |
| | | | | | | | | | | | 148 | |
| | | | | | | | | | | | | |
| Foreign Currency Put Options – 0.00% | | | | | | | | | | | | |
| EUR vs JPY strike price 128 EUR, expiration date 5/23/23, notional amount EUR 1,168,000,000 (JPMCB) | | | | | | | 9,125,000 | | | | 10,586 | |
| EUR vs USD strike price 0.70 EUR, expiration date 4/14/23, notional amount EUR 2,819,394 (JPMCB) | | | | | | | 4,027,705 | | | | 0 | |
| EUR vs USD strike price 0.94 EUR, expiration date 4/12/23, notional amount EUR 7,572,085 (JPMCB) | | | | | | | 8,055,410 | | | | 0 | |
| GBP vs USD strike price 0.74 GBP, expiration date 4/12/23, notional amount GBP 2,484,650 (JPMCB) | | | | | | | 3,357,635 | | | | 0 | |
| | | | | | | | | | | | 10,586 | |
| | | | | | | | | | | | | |
| | | | | | | | Notional amount* | | | | | |
| Put Swaptions — 0.18% | | | | | | | | | | | | |
| CDX.NA.HY.39.V1 5yr strike price $101.50, expiration date 5/17/23 | | | | | | | 44,000,000 | | | | 767,848 | |
| | | | | | | | | | | | 767,848 | |
Total Options Purchased
(cost $1,450,602) | | | | | | | | | | | 778,582 | |
Schedules of investments
Delaware Ivy Global Bond Fund
| | | Number of
shares | | Value (US $) | |
| Short-Term Investments – 3.81% | | | | | | | | |
| Money Market Mutual Funds – 3.81% | | | | | | | | |
| BlackRock Liquidity FedFund – Institutional Shares (seven-day effective yield 4.72%) | | | 4,076,358 | | | $ | 4,076,358 | |
| Fidelity Investments Money Market Government Portfolio – Class I (seven-day effective yield 4.72%) | | | 4,076,358 | | | | 4,076,358 | |
| Goldman Sachs Financial Square Government Fund – Institutional Shares (seven-day effective yield 4.84%) | | | 4,076,358 | | | | 4,076,358 | |
| Morgan Stanley Institutional Liquidity Funds Government Portfolio – Institutional Class (seven-day effective yield 4.73%) | | | 4,076,358 | | | | 4,076,358 | |
Total Short-Term Investments
(cost $16,305,432) | | | | | | | 16,305,432 | |
Total Value of Securities-98.56%
(cost $433,219,410) | | | | | | | 422,026,273 | |
| | | | | | | | | |
| | | | Number of contracts | | | | | |
| Options Written – (0.13%) | | | | | | | | |
| Foreign Currency Call Options – (0.00%) | | | | | | | | |
| GBP vs USD strike price 0.94 GBP, expiration date 4/12/23, notional amount GBP (9,468,531) (JPMCB) | | | (10,072,905 | ) | | | 0 | |
| USD vs CNH strike price $7.50, expiration date 4/13/23, notional amount $(129,949,500) (JPMCB) | | | (17,326,600 | ) | | | (14 | ) |
| | | | | | | | (14 | ) |
| Foreign Currency Put Options – (0.00%) | | | | | | | | |
| EUR vs JPY strike price 118 EUR, expiration date 5/23/23, notional amount EUR (1,076,750,000) (JPMCB) | | | (9,125,000 | ) | | | (1,772 | ) |
| EUR vs USD strike price 0.86 EUR, expiration date 4/12/23, notional amount EUR (10,391,479) (JPMCB) | | | (12,083,115 | ) | | | 0 | |
| | | | | | | | (1,772 | ) |
| | | | | | | | | |
| | | | Notional amount* | | | | | |
| Put Swaptions — (0.13%) | | | | | | | | |
| CDX.NA.HY.39.V1 5yr strike price $97.50, expiration date 5/17/23 | | | (44,000,000 | ) | | | (233,215 | ) |
| CDX.NA.HY.39.V1 5yr strike price $99.50, expiration date 5/17/23 | | | (33,000,000 | ) | | | (313,092 | ) |
| | | | | | | | (546,307 | ) |
Total Options Written
(premium received $990,335) | | | | | | | (548,093 | ) |
| ° | | Principal amount shown is stated in USD unless noted that the security is denominated in another currency. |
| D | | Securities have been classified by country of risk. |
| # | | Security exempt from registration under Rule 144A of the Securities Act of 1933, as amended. At March 31, 2023, the aggregate value of Rule 144A securities was $137,626,081, which represents 32.14% of the Fund's net assets. See Note 13 in “Notes to financial statements." |
| µ | | Fixed to variable rate investment. The rate shown reflects the fixed rate in effect at March 31, 2023. Rate will reset at a future date. |
| ψ | | Perpetual security. Maturity date represents next call date. |
| ^ | | Zero-coupon security. The rate shown is the effective yield at the time of purchase. |
| ‡ | | Non-income producing security. Security is currently in default. |
| * | | Notional amount shown is stated in USD unless noted that the swap is denominated in another currency. |
The following foreign currency exchange contracts and futures contracts were outstanding at March 31, 2023:1
Foreign Currency Exchange Contracts
| Counterparty | | Currency to
Receive (Deliver) | | In Exchange For | | Settlement
Date | | Unrealized
Appreciation | | Unrealized
Depreciation |
| JPMCB | | CZK | | | | 58,501,140 | | | USD | | | | (2,634,000 | ) | | 4/28/23 | | $ | 65,367 | | $ | — | |
| JPMCB | | EUR | | | | 14,150,000 | | | USD | | | | (15,243,624 | ) | | 4/21/23 | | | 120,040 | | | — | |
| JPMCB | | EUR | | | | (2,168,000 | ) | | USD | | | | 2,370,099 | | | 4/28/23 | | | 15,216 | | | — | |
| JPMCB | | GBP | | | | 480,000 | | | USD | | | | (589,171 | ) | | 4/21/23 | | | 3,215 | | | — | |
| JPMCB | | IDR | | | | 40,559,219,074 | | | USD | | | | (2,638,000 | ) | | 4/28/23 | | | 72,180 | | | — | |
| JPMCB | | INR | | | | 217,542,059 | | | USD | | | | (2,634,000 | ) | | 4/28/23 | | | 9,266 | | | — | |
| JPMCB | | JPY | | | | 925,000,000 | | | USD | | | | (7,299,097 | ) | | 4/21/23 | | | — | | | (308,883 | ) |
| JPMCB | | KRW | | | | 3,454,420,644 | | | USD | | | | (2,655,000 | ) | | 4/28/23 | | | — | | | (6,470 | ) |
| JPMCB | | KZT | | | | 1,214,862,026 | | | USD | | | | (2,607,000 | ) | | 4/28/23 | | | 16,449 | | | — | |
| JPMCB | | NZD | | | | (15,100,000 | ) | | USD | | | | 9,777,117 | | | 4/21/23 | | | 334,689 | | | — | |
| TD | | AUD | | | | 4,850,786 | | | USD | | | | (3,410,772 | ) | | 4/21/23 | | | — | | | (165,831 | ) |
| TD | | DKK | | | | (77,960,000 | ) | | USD | | | | 11,408,480 | | | 4/21/23 | | | 43,966 | | | — | |
| TD | | EUR | | | | (78,756,803 | ) | | USD | | | | 85,900,045 | | | 4/21/23 | | | 388,158 | | | — | |
| Total Foreign Currency Exchange Contracts | | | $ | 1,068,546 | | $ | (481,184 | ) |
Schedules of investments
Delaware Ivy Global Bond Fund
Futures Contracts
Exchange-Traded
| | | Contracts to Buy (Sell) | | Notional
Amount | | Notional
Cost
(Proceeds) | | Expiration
Date | | Value/
Unrealized
Appreciation | | Value/
Unrealized
Depreciation | | Variation
Margin
Due from
(Due to)
Brokers | |
| | | Australian 10-Year | | | | | | | | | | | | | | | |
| 264 | | Treasury Bond | | $ | 21,685,866 | | | $ | 21,028,661 | | | 6/15/23 | | $ | 657,205 | | | $ | — | | | $ | 98,965 | | |
| (3) | | Euro-Bobl | | | (383,522 | ) | | | (374,764 | ) | | 6/8/23 | | | — | | | | (8,758 | ) | | | (931 | ) | |
| (31) | | Euro-BTP | | | (3,878,010 | ) | | | (3,733,381 | ) | | 6/8/23 | | | — | | | | (144,629 | ) | | | (25,879 | ) | |
| (110) | | Euro-Bund | | | (16,205,033 | ) | | | (16,229,084 | ) | | 6/8/23 | | | 24,051 | | | | — | | | | (74,528 | ) | |
| (21) | | Euro-Buxl | | | (3,208,016 | ) | | | (3,005,735 | ) | | 6/8/23 | | | — | | | | (202,281 | ) | | | (24,031 | ) | |
| (314) | | Euro-EURIBOR | | | (82,119,533 | ) | | | (82,361,734 | ) | | 12/18/23 | | | 242,201 | | | | — | | | | (1,396 | ) | |
| 314 | | Euro-EURIBOR | | | 82,587,757 | | | | 82,984,064 | | | 12/16/24 | | | — | | | | (396,307 | ) | | | 23,681 | | |
| 19 | | Euro-OAT | | | 2,683,455 | | | | 2,588,915 | | | 6/8/23 | | | 94,540 | | | | — | | | | 13,133 | | |
| 47 | | Euro-Schatz | | | 5,387,433 | | | | 5,336,411 | | | 6/8/23 | | | 51,022 | | | | — | | | | 2,013 | | |
| 83 | | Long 10 yr Gilt | | | 10,581,882 | | | | 10,424,621 | | | 6/28/23 | | | 157,261 | | | | — | | | | (4,808 | ) | |
| 294 | | US Treasury 2 yr Notes | | | 60,697,219 | | | | 60,031,463 | | | 6/30/23 | | | 665,756 | | | | — | | | | 41,344 | | |
| 393 | | US Treasury 5 yr Notes | | | 43,036,569 | | | | 43,142,165 | | | 6/30/23 | | | — | | | | (105,596 | ) | | | 89,038 | | |
| 168 | | US Treasury 10 yr Notes | | | 19,306,876 | | | | 18,943,985 | | | 6/21/23 | | | 362,891 | | | | — | | | | 57,750 | | |
| (61) | | US Treasury 10 yr Ultra Notes | | | (7,389,578 | ) | | | (7,421,998 | ) | | 6/21/23 | | | 32,420 | | | | — | | | | (33,360 | ) | |
| (58) | | US Treasury Long Bonds | | | (7,607,062 | ) | | | (7,262,990 | ) | | 6/21/23 | | | — | | | | (344,072 | ) | | | (58,000 | ) | |
| (6) | | US Treasury Long Bonds | | | (787,500 | ) | | | (778,297 | ) | | 9/20/23 | | | — | | | | (9,203 | ) | | | (6,000 | ) | |
| (31) | | US Treasury Ultra Bonds | | | (4,374,875 | ) | | | (4,162,727 | ) | | 6/21/23 | | | — | | | | (212,148 | ) | | | (41,656 | ) | |
| Total Futures Contracts | | | | $ | 119,149,575 | | | | | $ | 2,287,347 | | | $ | (1,422,994 | ) | | $ | 55,335 | | |
The use of foreign currency exchange contracts and futures contracts involves elements of market risk and risks in excess of the amounts disclosed in the financial statements. The foreign currency exchange contracts and notional amounts presented above represent the Fund's total exposure in such contracts, whereas only the net unrealized appreciation (depreciation) and variation margin are reflected in the Fund's net assets.
1 See Note 10 in “Notes to financial statements.”
Summary of abbreviations:
BTP – Buoni del Tesoro Poliennali
CDX.NA.HY – Credit Default Swap Index North America High Yield
EURIBOR – Euro interbank offered rate
GNMA – Government National Mortgage Association
JPMCB – JPMorgan Chase Bank
JSC – Joint Stock Company
OAT – Obligations Assimilables du Tresor
S.F. – Single Family
TD – TD Bank
yr – Year
Summary of currencies:
AUD – Australian Dollar
BRL – Brazilian Real
CZK – Czech Koruna
DKK – Danish Krone
EUR – European Monetary Unit
GBP – British Pound Sterling
IDR – Indonesian Rupiah
INR – Indian Rupee
JPY – Japanese Yen
KRW – South Korean Won
KZT – Kazakhstani Tenge
NZD – New Zealand Dollar
Summary of currencies: (continued)
USD – US Dollar
UZS – Uzbekistan Som
See accompanying notes, which are an integral part of the financial statements.
Schedules of investments
| Delaware Ivy Global Growth Fund | March 31, 2023 |
| | | Number of shares | | Value (US $) |
| Common Stocks – 99.78%D | | | | | | | | |
| Canada - 3.19% | | | | | | | | |
| Barrick Gold | | | 269,249 | | | $ | 4,999,954 | |
| Canadian Natural Resources | | | 218,828 | | | | 12,112,130 | |
| | | | | | | | 17,112,084 | |
| China - 1.52% | | | | | | | | |
| H World Group ADR † | | | 166,308 | | | | 8,145,766 | |
| | | | | | | | 8,145,766 | |
| China/Hong Kong - 3.42% | | | | | | | | |
| China Mengniu Dairy | | | 2,213,000 | | | | 9,072,078 | |
| Meituan Class B 144A #, † | | | 15,990 | | | | 290,094 | |
| Tencent Holdings | | | 183,800 | | | | 8,982,182 | |
| | | | | | | | 18,344,354 | |
| Denmark - 1.83% | | | | | | | | |
| Genmab † | | | 25,938 | | | | 9,804,702 | |
| | | | | | | | 9,804,702 | |
| France - 8.68% | | | | | | | | |
| Airbus | | | 87,139 | | | | 11,638,941 | |
| BNP Paribas | | | 148,610 | | | | 8,874,631 | |
| LVMH Moet Hennessy Louis Vuitton | | | 6,968 | | | | 6,395,987 | |
| Thales | | | 56,271 | | | | 8,319,490 | |
| TotalEnergies | | | 69,977 | | | | 4,126,104 | |
| Vinci | | | 63,366 | | | | 7,264,433 | |
| | | | | | | | 46,619,586 | |
| Germany - 5.23% | | | | | | | | |
| Bayer | | | 138,721 | | | | 8,861,721 | |
| Deutsche Telekom | | | 503,311 | | | | 12,196,381 | |
| RWE | | | 162,723 | | | | 7,001,708 | |
| | | | | | | | 28,059,810 | |
| Hong Kong - 1.46% | | | | | | | | |
| Prudential | | | 573,890 | | | | 7,857,493 | |
| | | | | | | | 7,857,493 | |
| India - 4.70% | | | | | | | | |
| ICICI Bank | | | 535,908 | | | | 5,726,951 | |
| Larsen & Toubro | | | 320,110 | | | | 8,449,723 | |
| NTPC | | | 2,623,669 | | | | 5,601,386 | |
| State Bank of India | | | 857,683 | | | | 5,482,775 | |
| | | | | | | | 25,260,835 | |
| Israel - 1.87% | | | | | | | | |
| Check Point Software Technologies † | | | 77,184 | | | | 10,033,920 | |
| | | | | | | | 10,033,920 | |
| Italy - 1.57% | | | | | | | | |
| Ferrari | | | 31,121 | | | | 8,433,287 | |
| | | | | | | | 8,433,287 | |
| | | | | | | | | |
| Japan - 3.54% | | | | | | | | |
| Asahi Group Holdings | | | 175,100 | | | | 6,516,878 | |
| Mitsubishi UFJ Financial Group | | | 1,167,400 | | | | 7,481,480 | |
| ORIX | | | 303,200 | | | | 4,999,167 | |
| | | | | | | | 18,997,525 | |
| Netherlands - 0.79% | | | | | | | | |
| Shell | | | 148,800 | | | | 4,263,281 | |
| | | | | | | | 4,263,281 | |
| Taiwan - 1.93% | | | | | | | | |
| Taiwan Semiconductor Manufacturing | | | 591,000 | | | | 10,357,051 | |
| | | | | | | | 10,357,051 | |
| United Kingdom - 3.74% | | | | | | | | |
| AstraZeneca | | | 65,303 | | | | 9,048,015 | |
| Reckitt Benckiser Group | | | 145,325 | | | | 11,055,967 | |
| | | | | | | | 20,103,982 | |
| United States - 56.31% | | | | | | | | |
| Abbott Laboratories | | | 64,563 | | | | 6,537,649 | |
| AGNC Investment | | | 706,179 | | | | 7,118,284 | |
| Amazon.com † | | | 85,604 | | | | 8,842,037 | |
| Ambarella † | | | 64,786 | | | | 5,015,732 | |
| Apple | | | 44,137 | | | | 7,278,191 | |
| Aptiv † | | | 83,525 | | | | 9,370,670 | |
| Autodesk † | | | 31,235 | | | | 6,501,878 | |
| Burlington Stores † | | | 34,343 | | | | 6,940,720 | |
| Casey's General Stores | | | 22,610 | | | | 4,894,161 | |
| ConocoPhillips | | | 103,893 | | | | 10,307,225 | |
| Danaher | | | 30,950 | | | | 7,800,638 | |
| Darden Restaurants | | | 55,593 | | | | 8,625,810 | |
| Eli Lilly & Co. | | | 20,502 | | | | 7,040,797 | |
| Generac Holdings † | | | 46,537 | | | | 5,026,461 | |
| Ingersoll Rand | | | 131,970 | | | | 7,678,015 | |
| Intercontinental Exchange | | | 57,077 | | | | 5,952,560 | |
| Intuit | | | 23,446 | | | | 10,452,930 | |
| KLA | | | 12,200 | | | | 4,869,874 | |
| Mastercard Class A | | | 35,909 | | | | 13,049,690 | |
| Microchip Technology | | | 70,814 | | | | 5,932,797 | |
| Microsoft | | | 66,089 | | | | 19,053,459 | |
| Morgan Stanley | | | 86,414 | | | | 7,587,149 | |
| NVIDIA | | | 28,871 | | | | 8,019,498 | |
| PayPal Holdings † | | | 96,575 | | | | 7,333,906 | |
| Pinterest Class A † | | | 325,841 | | | | 8,885,684 | |
| Procter & Gamble | | | 73,697 | | | | 10,958,007 | |
| Raytheon Technologies | | | 105,641 | | | | 10,345,423 | |
| Regeneron Pharmaceuticals † | | | 13,629 | | | | 11,198,540 | |
| Schlumberger | | | 50,224 | | | | 2,465,998 | |
| Seagate Technology Holdings | | | 144,096 | | | | 9,527,628 | |
| Skechers USA Class A † | | | 135,768 | | | | 6,451,695 | |
| Thermo Fisher Scientific | | | 11,158 | | | | 6,431,136 | |
| | | Number of shares | | Value (US $) |
| Common StocksD (continued) | | | | | | | | |
| United States (continued) | | | | | | | | |
| T-Mobile US † | | | 39,472 | | | $ | 5,717,125 | |
| Union Pacific | | | 39,030 | | | | 7,855,178 | |
| UnitedHealth Group | | | 24,648 | | | | 11,648,398 | |
| VeriSign † | | | 42,195 | | | | 8,917,069 | |
| Vertex Pharmaceuticals † | | | 33,806 | | | | 10,651,256 | |
| | | | | | | | 302,283,268 | |
Total Common Stocks
(cost $431,636,355) | | | | | | | 535,676,944 | |
| | | | | | | | | |
|
| Short-Term Investments – 0.51% | | | | | | | | |
| Money Market Mutual Funds – 0.51% | | | | | | | | |
| BlackRock Liquidity FedFund – Institutional Shares (seven-day effective yield 4.72%) | | | 681,882 | | | | 681,882 | |
| Fidelity Investments Money Market Government Portfolio – Class I (seven-day effective yield 4.72%) | | | 681,882 | | | | 681,882 | |
| Goldman Sachs Financial Square Government Fund – Institutional Shares (seven-day effective yield 4.84%) | | | 681,882 | | | | 681,882 | |
| Morgan Stanley Institutional Liquidity Funds Government Portfolio – Institutional Class (seven-day effective yield 4.73%) | | | 681,882 | | | | 681,882 | |
Total Short-Term Investments
(cost $2,727,528) | | | | | | | 2,727,528 | |
Total Value of Securities-100.29%
(cost $434,363,883) | | | | | | $ | 538,404,472 | |
| D | | Securities have been classified by country of risk. Aggregate classification by business sector has been presented on page 116 in “Security type / country and sector allocations.” |
| † | | Non-income producing security. |
| # | | Security exempt from registration under Rule 144A of the Securities Act of 1933, as amended. At March 31, 2023, the aggregate value of Rule 144A securities was $290,094, which represents 0.05% of the Fund's net assets. See Note 13 in “Notes to financial statements." |
Summary of abbreviations:
ADR – American Depositary Receipt
See accompanying notes, which are an integral part of the financial statements.
Schedules of investments
| Delaware Ivy High Income Fund | March 31, 2023 |
| | | Principal amount° | | Value (US $) |
| Convertible Bonds — 2.47% | | | | | | | | |
| New Cotai 5.00% exercise price $100.00, maturity date 2/2/27 = | | | 23,041,685 | | | $ | 58,691,628 | |
| Spirit Airlines 1.00% exercise price $42.88, maturity date 5/15/26 | | | 4,857,000 | | | | 3,936,599 | |
Total Convertible Bonds
(cost $26,638,183) | | | | | | | 62,628,227 | |
| | | | | | | | | |
| Corporate Bonds — 77.02% | | | | | | | | |
| Automotive — 1.13% | | | | | | | | |
| Ford Motor 4.75% 1/15/43 | | | 9,515,000 | | | | 7,309,613 | |
| Ford Motor Credit 7.35% 3/6/30 | | | 4,855,000 | | | | 4,993,368 | |
| Goodyear Tire & Rubber 5.25% 7/15/31 | | | 18,975,000 | | | | 16,410,718 | |
| | | | | | | | 28,713,699 | |
| Basic Industry — 3.37% | | | | | | | | |
| Chemours 144A 5.75% 11/15/28 # | | | 18,340,000 | | | | 16,394,579 | |
| CP Atlas Buyer 144A 7.00% 12/1/28 # | | | 5,339,000 | | | | 3,971,175 | |
| First Quantum Minerals 144A 6.875% 10/15/27 # | | | 10,294,000 | | | | 9,933,212 | |
| FMG Resources August 2006 | | | | | | | | |
| 144A 5.875% 4/15/30 # | | | 13,205,000 | | | | 12,674,016 | |
| 144A 6.125% 4/15/32 # | | | 5,955,000 | | | | 5,739,995 | |
| Novelis 144A 4.75% 1/30/30 # | | | 24,909,000 | | | | 22,916,280 | |
| Vibrantz Technologies 144A 9.00% 2/15/30 # | | | 18,063,000 | | | | 13,890,095 | |
| | | | | | | | 85,519,352 | |
| Capital Goods — 3.86% | | | | | | | | |
| ARD Finance 144A PIK 6.50% 6/30/27 #, > | | | 8,075,311 | | | | 6,187,303 | |
| Ardagh Metal Packaging Finance USA | | | | | | | | |
| 144A 3.25% 9/1/28 # | | | 6,896,000 | | | | 5,942,643 | |
| 144A 4.00% 9/1/29 # | | | 8,080,000 | | | | 6,330,316 | |
| Bombardier | | | | | | | | |
| 144A 6.00% 2/15/28 # | | | 7,463,000 | | | | 7,276,425 | |
| 144A 7.50% 2/1/29 # | | | 4,440,000 | | | | 4,539,900 | |
| Clydesdale Acquisition Holdings | | | | | | | | |
| 144A 6.625% 4/15/29 # | | | 3,010,000 | | | | 2,899,834 | |
| 144A 8.75% 4/15/30 # | | | 8,380,000 | | | | 7,625,213 | |
| Mauser Packaging Solutions Holding 144A 7.875% 8/15/26 # | | | 18,385,000 | | | | 18,401,639 | |
| Mauser Packaging Solutions Holding 144A 9.25% 4/15/27 # | | | 6,690,000 | | | | 6,188,250 | |
| Sealed Air 144A 5.00% 4/15/29 # | | | 8,655,000 | | | | 8,143,858 | |
| TransDigm 5.50% 11/15/27 | | | 23,552,000 | | | | 22,233,156 | |
| Wesco Aircraft Holdings 144A 8.50% 11/15/24 # | | | 27,345,000 | | | | 2,050,875 | |
| | | | | | | | 97,819,412 | |
| Communications — 8.38% | | | | | | | | |
| Altice France | | | | | | | | |
| 144A 5.125% 7/15/29 # | | | 11,143,000 | | | | 8,395,693 | |
| 144A 5.50% 10/15/29 # | | | 5,739,000 | | | | 4,393,525 | |
| Altice France Holding 144A 6.00% 2/15/28 # | | | 33,946,000 | | | | 21,694,889 | |
| Connect Finco 144A 6.75% 10/1/26 # | | | 24,994,000 | | | | 23,516,855 | |
| Consolidated Communications | | | | | | | | |
| 144A 5.00% 10/1/28 # | | | 6,188,000 | | | | 4,209,593 | |
| 144A 6.50% 10/1/28 # | | | 24,641,000 | | | | 17,921,370 | |
| Digicel International Finance 144A 8.75% 5/25/24 # | | | 15,719,000 | | | | 14,148,719 | |
| Frontier Communications Holdings | | | | | | | | |
| 144A 5.00% 5/1/28 # | | | 2,665,000 | | | | 2,315,565 | |
| 144A 5.875% 10/15/27 # | | | 10,030,000 | | | | 9,127,300 | |
| 5.875% 11/1/29 | | | 5,789,667 | | | | 4,420,787 | |
| 144A 6.00% 1/15/30 # | | | 3,564,000 | | | | 2,714,556 | |
| 144A 6.75% 5/1/29 # | | | 15,295,000 | | | | 12,136,124 | |
| 144A 8.75% 5/15/30 # | | | 4,190,000 | | | | 4,177,786 | |
| Ligado Networks 144A PIK 15.50% 11/1/23 #, >> | | | 42,158,728 | | | | 12,963,809 | |
| Northwest Fiber 144A 4.75% 4/30/27 # | | | 21,305,000 | | | | 18,222,192 | |
| Sable International Finance 144A 5.75% 9/7/27 # | | | 13,610,000 | | | | 12,692,286 | |
| Telesat Canada | | | | | | | | |
| 144A 5.625% 12/6/26 # | | | 29,713,000 | | | | 15,360,144 | |
| 144A 6.50% 10/15/27 # | | | 5,107,000 | | | | 1,634,240 | |
| Vmed O2 UK Financing I 144A 4.75% 7/15/31 # | | | 15,225,000 | | | | 13,069,216 | |
| VZ Secured Financing 144A 5.00% 1/15/32 # | | | 11,580,000 | | | | 9,459,413 | |
| | | | | | | | 212,574,062 | |
| Consumer Goods — 1.61% | | | | | | | | |
| Cerdia Finanz 144A 10.50% 2/15/27 # | | | 12,495,000 | | | | 11,492,676 | |
| | | Principal amount° | | Value (US $) |
| Corporate Bonds (continued) | | | | | | | | |
| Consumer Goods (continued) | | | | | | | | |
| MajorDrive Holdings IV 144A 6.375% 6/1/29 # | | | 29,962,000 | | | $ | 22,224,592 | |
| Pilgrim's Pride 4.25% 4/15/31 | | | 7,458,000 | | | | 6,585,228 | |
| Scotts Miracle-Gro 4.00% 4/1/31 | | | 595,000 | | | | 475,187 | |
| | | | | | | | 40,777,683 | |
| Electric — 2.79% | | | | | | | | |
| Calpine | | | | | | | | |
| 144A 4.625% 2/1/29 # | | | 13,165,000 | | | | 11,384,942 | |
| 144A 5.00% 2/1/31 # | | | 1,495,000 | | | | 1,267,166 | |
| 144A 5.125% 3/15/28 # | | | 21,855,000 | | | | 20,039,074 | |
| Vistra | | | | | | | | |
| 144A 7.00% 12/15/26 #, µ, Ψ | | | 27,505,000 | | | | 24,232,868 | |
| 144A 8.00% 10/15/26 #, µ, Ψ | | | 14,795,000 | | | | 13,839,551 | |
| | | | | | | | 70,763,601 | |
| Energy — 13.22% | | | | | | | | |
| Ascent Resources Utica Holdings | | | | | | | | |
| 144A 5.875% 6/30/29 # | | | 16,875,000 | | | | 14,908,978 | |
| 144A 7.00% 11/1/26 # | | | 8,882,000 | | | | 8,594,046 | |
| Bellatrix Exploration | | | | | | | | |
| 8.50% 9/11/23 = | | | 6,693,000 | | | | 0 | |
| 12.50% 12/15/23 = | | | 7,293,000 | | | | 0 | |
| Callon Petroleum | | | | | | | | |
| 144A 7.50% 6/15/30 # | | | 9,930,000 | | | | 9,343,782 | |
| 144A 8.00% 8/1/28 # | | | 16,270,000 | | | | 16,133,332 | |
| CNX Midstream Partners 144A 4.75% 4/15/30 # | | | 7,785,000 | | | | 6,705,220 | |
| CNX Resources 144A 6.00% 1/15/29 # | | | 18,345,000 | | | | 17,174,589 | |
| Crestwood Midstream Partners | | | | | | | | |
| 144A 5.625% 5/1/27 # | | | 7,419,000 | | | | 7,156,516 | |
| 144A 6.00% 2/1/29 # | | | 3,421,000 | | | | 3,261,051 | |
| 144A 7.375% 2/1/31 # | | | 9,615,000 | | | | 9,624,278 | |
| EQM Midstream Partners 144A 4.75% 1/15/31 # | | | 33,599,000 | | | | 27,933,873 | |
| Genesis Energy | | | | | | | | |
| 7.75% 2/1/28 | | | 14,335,000 | | | | 13,916,111 | |
| 8.00% 1/15/27 | | | 22,288,000 | | | | 22,060,885 | |
| Hilcorp Energy I | | | | | | | | |
| 144A 6.00% 4/15/30 # | | | 20,775,000 | | | | 19,183,633 | |
| 144A 6.00% 2/1/31 # | | | 1,905,000 | | | | 1,761,151 | |
| 144A 6.25% 4/15/32 # | | | 8,530,000 | | | | 7,899,974 | |
| Mesquite Energy 144A 7.25% 2/15/24 #, ‡ | | | 3,888,000 | | | | 34,020 | |
| Murphy Oil 6.375% 7/15/28 | | | 27,202,000 | | | | 26,828,465 | |
| NuStar Logistics | | | | | | | | |
| 6.00% 6/1/26 | | | 10,678,000 | | | | 10,480,190 | |
| 6.375% 10/1/30 | | | 10,860,000 | | | | 10,432,225 | |
| Occidental Petroleum | | | | | | | | |
| 4.20% 3/15/48 | | | 955,000 | | | | 741,591 | |
| 4.40% 4/15/46 | | | 3,873,000 | | | | 3,075,298 | |
| 4.40% 8/15/49 | | | 7,410,000 | | | | 5,796,584 | |
| 4.50% 7/15/44 | | | 3,985,000 | | | | 3,204,558 | |
| 6.60% 3/15/46 | | | 5,880,000 | | | | 6,188,700 | |
| Southwestern Energy | | | | | | | | |
| 5.375% 2/1/29 | | | 2,990,000 | | | | 2,821,528 | |
| 5.375% 3/15/30 | | | 21,650,000 | | | | 20,379,578 | |
| USA Compression Partners | | | | | | | | |
| 6.875% 4/1/26 | | | 9,395,000 | | | | 9,140,694 | |
| 6.875% 9/1/27 | | | 17,405,000 | | | | 16,648,840 | |
| Vital Energy 10.125% 1/15/28 | | | 15,088,000 | | | | 14,502,435 | |
| Weatherford International 144A 8.625% 4/30/30 # | | | 18,925,000 | | | | 19,378,443 | |
| | | | | | | | 335,310,568 | |
| Financial Services — 2.51% | | | | | | | | |
| AerCap Holdings 5.875% 10/10/79 µ | | | 22,025,000 | | | | 20,090,106 | |
| Air Lease 4.65% 6/15/26 µ, Ψ | | | 14,260,000 | | | | 11,878,061 | |
| Castlelake Aviation Finance DAC 144A 5.00% 4/15/27 # | | | 18,084,000 | | | | 16,054,176 | |
| Highlands Holdings Bond Issuer 144A PIK 7.625% 10/15/25 #, > | | | 7,278,982 | | | | 6,740,216 | |
| Midcap Financial Issuer Trust 144A 6.50% 5/1/28 # | | | 10,541,000 | | | | 8,976,610 | |
| | | | | | | | 63,739,169 | |
| Healthcare — 7.45% | | | | | | | | |
| AthenaHealth Group 144A 6.50% 2/15/30 # | | | 9,500,000 | | | | 7,711,715 | |
| Avantor Funding 144A 3.875% 11/1/29 # | | | 14,785,000 | | | | 13,246,177 | |
| Bausch Health 144A 6.125% 2/1/27 # | | | 12,880,000 | | | | 8,349,074 | |
| Cheplapharm Arzneimittel 144A 5.50% 1/15/28 # | | | 18,185,000 | | | | 16,210,654 | |
| CHS 144A 4.75% 2/15/31 # | | | 12,020,000 | | | | 8,886,386 | |
Schedules of investments
Delaware Ivy High Income Fund
| | | Principal amount° | | Value (US $) |
| Corporate Bonds (continued) | | | | | | | | |
| Healthcare (continued) | | | | | | | | |
| CHS 144A 5.25% 5/15/30 # | | | 6,560,000 | | | $ | 5,151,896 | |
| Consensus Cloud Solutions | | | | | | | | |
| 144A 6.00% 10/15/26 # | | | 6,252,000 | | | | 5,437,133 | |
| 144A 6.50% 10/15/28 # | | | 6,080,000 | | | | 5,047,610 | |
| DaVita | | | | | | | | |
| 144A 3.75% 2/15/31 # | | | 8,365,000 | | | | 6,606,008 | |
| 144A 4.625% 6/1/30 # | | | 5,075,000 | | | | 4,336,587 | |
| Hadrian Merger Sub 144A 8.50% 5/1/26 # | | | 8,941,000 | | | | 7,344,137 | |
| Medline Borrower 144A 3.875% 4/1/29 # | | | 14,286,000 | | | | 12,409,677 | |
| ModivCare Escrow Issuer 144A 5.00% 10/1/29 # | | | 18,383,000 | | | | 15,627,488 | |
| Organon & Co. 144A 5.125% 4/30/31 # | | | 21,025,000 | | | | 18,682,342 | |
| Par Pharmaceutical 144A 7.50% 4/1/27 #, ‡ | | | 16,977,000 | | | | 12,645,388 | |
| Tenet Healthcare | | | | | | | | |
| 4.375% 1/15/30 | | | 16,530,000 | | | | 14,850,552 | |
| 6.125% 10/1/28 | | | 16,925,000 | | | | 16,236,914 | |
| US Renal Care 144A 10.625% 7/15/27 # | | | 38,595,000 | | | | 10,195,900 | |
| | | | | | | | 188,975,638 | |
| Insurance — 3.72% | | | | | | | | |
| Ardonagh Midco 2 144A PIK 11.50% 1/15/27 #, >>>>> | | | 37,892,402 | | | | 34,671,548 | |
| HUB International 144A 5.625% 12/1/29 # | | | 2,920,000 | | | | 2,547,700 | |
| Jones Deslauriers Insurance Management | | | | | | | | |
| 144A 8.50% 3/15/30 # | | | 17,390,000 | | | | 18,042,038 | |
| 144A 10.50% 12/15/30 # | | | 9,340,000 | | | | 9,419,041 | |
| NFP | | | | | | | | |
| 144A 6.875% 8/15/28 # | | | 27,031,000 | | | | 23,221,521 | |
| 144A 7.50% 10/1/30 # | | | 6,740,000 | | | | 6,519,501 | |
| | | | | | | | 94,421,349 | |
| Leisure — 6.67% | | | | | | | | |
| Boyd Gaming 144A 4.75% 6/15/31 # | | | 31,070,000 | | | | 28,245,737 | |
| Caesars Entertainment 144A 8.125% 7/1/27 # | | | 15,379,000 | | | | 15,700,421 | |
| Carnival | | | | | | | | |
| 144A 5.75% 3/1/27 # | | | 24,678,000 | | | | 20,270,879 | |
| 144A 6.00% 5/1/29 # | | | 21,160,000 | | | | 16,846,534 | |
| 144A 7.625% 3/1/26 # | | | 8,613,000 | | | | 7,867,803 | |
| Royal Caribbean Cruises 144A 5.375% 7/15/27 # | | | 10,993,000 | | | | 9,804,382 | |
| Royal Caribbean Cruises | | | | | | | | |
| 144A 5.50% 8/31/26 # | | | 1,750,000 | | | | 1,639,234 | |
| 144A 5.50% 4/1/28 # | | | 36,986,000 | | | | 32,695,624 | |
| Scientific Games Holdings 144A 6.625% 3/1/30 # | | | 22,110,000 | | | | 19,559,258 | |
| Scientific Games International 144A 7.25% 11/15/29 # | | | 16,450,000 | | | | 16,496,718 | |
| | | | | | | | 169,126,590 | |
| Media — 10.19% | | | | | | | | |
| Advantage Sales & Marketing 144A 6.50% 11/15/28 # | | | 27,779,000 | | | | 21,190,516 | |
| AMC Networks 4.25% 2/15/29 | | | 16,881,000 | | | | 10,396,923 | |
| Arches Buyer 144A 6.125% 12/1/28 # | | | 18,049,000 | | | | 14,910,730 | |
| CCO Holdings | | | | | | | | |
| 144A 4.50% 8/15/30 # | | | 10,995,000 | | | | 9,303,254 | |
| 144A 4.75% 2/1/32 # | | | 13,515,000 | | | | 11,367,568 | |
| 144A 6.375% 9/1/29 # | | | 24,785,000 | | | | 23,691,981 | |
| CMG Media 144A 8.875% 12/15/27 # | | | 24,397,000 | | | | 18,468,285 | |
| CSC Holdings | | | | | | | | |
| 144A 4.625% 12/1/30 # | | | 37,266,000 | | | | 18,411,267 | |
| 144A 5.00% 11/15/31 # | | | 11,141,000 | | | | 5,655,060 | |
| 144A 5.75% 1/15/30 # | | | 12,893,000 | | | | 6,801,058 | |
| Cumulus Media New Holdings 144A 6.75% 7/1/26 # | | | 16,035,000 | | | | 12,206,002 | |
| Directv Financing 144A 5.875% 8/15/27 # | | | 26,815,000 | | | | 24,312,088 | |
| DISH DBS 144A 5.75% 12/1/28 # | | | 23,485,000 | | | | 17,569,716 | |
| Gray Escrow II 144A 5.375% 11/15/31 # | | | 14,975,000 | | | | 9,960,397 | |
| Gray Television 144A 4.75% 10/15/30 # | | | 17,600,000 | | | | 11,704,000 | |
| Nexstar Media 144A 4.75% 11/1/28 # | | | 15,495,000 | | | | 13,798,917 | |
| Sirius XM Radio 144A 4.125% 7/1/30 # | | | 24,060,000 | | | | 19,696,238 | |
| VTR Comunicaciones 144A 4.375% 4/15/29 # | | | 14,811,000 | | | | 9,006,888 | |
| | | | | | | | 258,450,888 | |
| Retail — 4.07% | | | | | | | | |
| Asbury Automotive Group | | | | | | | | |
| 4.50% 3/1/28 | | | 12,172,650 | | | | 11,093,788 | |
| 144A 4.625% 11/15/29 # | | | 366,000 | | | | 328,068 | |
| 4.75% 3/1/30 | | | 12,623,650 | | | | 11,313,126 | |
| | | Principal amount° | | Value (US $) |
| Corporate Bonds (continued) | | | | | | | | |
| Retail (continued) | | | | | | | | |
| Asbury Automotive Group 144A 5.00% 2/15/32 # | | | 366,000 | | | $ | 321,128 | |
| Bath & Body Works 6.875% 11/1/35 | | | 15,465,000 | | | | 13,955,407 | |
| LSF9 Atlantis Holdings 144A 7.75% 2/15/26 # | | | 22,964,000 | | | | 20,882,906 | |
| Michaels | | | | | | | | |
| 144A 5.25% 5/1/28 # | | | 13,002,000 | | | | 10,849,779 | |
| 144A 7.875% 5/1/29 # | | | 10,143,000 | | | | 7,109,685 | |
| Murphy Oil USA 4.75% 9/15/29 | | | 3,385,000 | | | | 3,087,798 | |
| PetSmart 144A 7.75% 2/15/29 # | | | 24,727,000 | | | | 24,298,728 | |
| | | | | | | | 103,240,413 | |
| Services — 3.49% | | | | | | | | |
| Adtalem Global Education 144A 5.50% 3/1/28 # | | | 14,497,000 | | | | 13,770,555 | |
| CDW 3.569% 12/1/31 | | | 23,215,000 | | | | 19,988,812 | |
| NESCO Holdings II 144A 5.50% 4/15/29 # | | | 7,120,000 | | | | 6,448,549 | |
| Staples | | | | | | | | |
| 144A 7.50% 4/15/26 # | | | 20,062,000 | | | | 17,596,380 | |
| 144A 10.75% 4/15/27 # | | | 8,151,000 | | | | 5,920,275 | |
| White Cap Buyer 144A 6.875% 10/15/28 # | | | 17,234,000 | | | | 14,965,290 | |
| White Cap Parent 144A PIK 8.25% 3/15/26 #, > | | | 10,700,000 | | | | 9,745,345 | |
| | | | | | | | 88,435,206 | |
| Technology & Electronics — 3.14% | | | | | | | | |
| Clarios Global 144A 8.50% 5/15/27 # | | | 12,920,000 | | | | 12,992,675 | |
| CommScope 144A 8.25% 3/1/27 # | | | 4,185,000 | | | | 3,431,700 | |
| CommScope Technologies 144A 6.00% 6/15/25 # | | | 3,906,000 | | | | 3,682,326 | |
| Entegris Escrow 144A 5.95% 6/15/30 # | | | 21,920,000 | | | | 21,267,661 | |
| NCR | | | | | | | | |
| 144A 5.00% 10/1/28 # | | | 11,115,000 | | | | 9,781,200 | |
| 144A 5.125% 4/15/29 # | | | 8,775,000 | | | | 7,601,331 | |
| 144A 5.25% 10/1/30 # | | | 3,706,000 | | | | 3,028,839 | |
| 144A 6.125% 9/1/29 # | | | 5,323,000 | | | | 5,255,238 | |
| Sensata Technologies 144A 4.00% 4/15/29 # | | | 13,855,000 | | | | 12,530,116 | |
| | | | | | | | 79,571,086 | |
| Transportation — 1.42% | | | | | | | | |
| Air Canada 144A 3.875% 8/15/26 # | | | 14,170,000 | | | | 12,881,402 | |
| American Airlines 144A 5.75% 4/20/29 # | | | 9,964,172 | | | | 9,568,603 | |
| Grupo Aeromexico 144A 8.50% 3/17/27 # | | | 15,550,000 | | | | 13,694,221 | |
| | | | | | | | 36,144,226 | |
Total Corporate Bonds
(cost $2,253,509,336) | | | | | | | 1,953,582,942 | |
| | | | | | | | | |
| Municipal Bonds — 0.55% | | | | | | | | |
| GDB Debt Recovery Authority of Puerto Rico (Taxable) 7.50% 8/20/40 | | | 16,836,224 | | | | 13,974,066 | |
Total Municipal Bonds
(cost $15,955,596) | | | | | | | 13,974,066 | |
| | | | | | | | | |
| Loan Agreements — 12.66% | | | | | | | | |
| Advantage Sales & Marketing Tranche B- 1 9.288% (LIBOR03M + 4.50%) 10/28/27 • | | | 6,431,670 | | | | 5,551,336 | |
| Air Canada 8.369% (LIBOR03M + 3.50%) 8/11/28 • | | | 6,566,917 | | | | 6,552,844 | |
| Amynta Agency Borrower 9.99% (SOFR03M + 5.00%) 2/28/28 • | | | 25,485,000 | | | | 24,577,097 | |
| Applied Systems 2nd Lien 11.489% (SOFR03M + 6.75%) 9/17/27 • | | | 19,167,465 | | | | 19,239,343 | |
| Ascent Resources Utica Holdings 2nd Lien 13.815% (LIBOR03M + 9.00%) 11/1/25 • | | | 5,650,000 | | | | 5,999,594 | |
| CNT Holdings I 2nd Lien 11.375% (SOFR03M + 6.75%) 11/6/28 • | | | 9,822,000 | | | | 9,306,345 | |
| CP Atlas Buyer Tranche B 8.407% (SOFR01M + 3.50%) 11/23/27 • | | | 13,060,031 | | | | 11,648,816 | |
| Foresight Energy Operating Tranche A 13.159% (LIBOR03M + 8.00%) 6/30/27 • | | | 7,589,105 | | | | 7,399,377 | |
| Form Technologies Tranche B 9.458% (LIBOR03M + 4.50%) 7/22/25 • | | | 55,026,063 | | | | 50,348,847 | |
| Guardian US Holdco 8.676% (SOFR03M + 3.00%) 1/31/30 • | | | 10,437,000 | | | | 10,251,096 | |
| Heartland Dental 9.807% (SOFR01M + 5.00%) 4/30/25 • | | | 7,175,775 | | | | 6,852,865 | |
Schedules of investments
Delaware Ivy High Income Fund
| | | | | Principal amount° | | Value (US $) | |
| Loan Agreements (continued) | | | | | | | | | | | | |
| Hexion Holdings 2nd Lien 12.297% (SOFR01M + 7.54%) 3/15/30 • | | | | | | | 14,490,000 | | | $ | 12,135,375 | |
| Hunter Douglas Holding Tranche B-1 8.373% (SOFR03M + 3.50%) 2/26/29 • | | | | | | | 7,145,358 | | | | 6,461,190 | |
| INDICOR 9.398% (SOFR03M + 3.50%) 11/22/29 • | | | | | | | 23,389,000 | | | | 23,248,666 | |
| Jones DesLauriers Insurance Management 1st Lien | | | | | | | | | | | | |
| 9.27% (CDOR03M + 4.25%) 3/27/28 • | | | CAD | | | | 9,580,973 | | | | 7,035,972 | |
| 9.27% (CDOR03M + 4.25%) 3/27/28 • | | | CAD | | | | 2,182,227 | | | | 1,602,560 | |
| MLN US HoldCo 1st Lien 11.54% (SOFR03M + 6.70%) 10/18/27 • | | | | | | | 32,191,651 | | | | 18,510,199 | |
| MLN US HoldCo Tranche B 13.704% (SOFR03M + 9.25%) 10/18/27 • | | | | | | | 13,596,147 | | | | 4,690,671 | |
| Northwest Fiber Tranche B-24/30/27 X, • | | | | | | | 2,573,754 | | | | 2,499,759 | |
| Pre Paid Legal Services 2nd Lien 11.84% (LIBOR01M + 7.00%) 12/14/29 • | | | | | | | 9,410,000 | | | | 8,233,750 | |
| SPX Flow 9.407% (SOFR01M + 4.60%) 4/5/29 • | | | | | | | 16,451,407 | | | | 15,772,786 | |
| Swf Holdings I 8.753% (LIBOR03M + 4.00%) 10/6/28 • | | | | | | | 16,321,436 | | | | 13,852,819 | |
| UKG 2nd Lien 10.032% (LIBOR03M + 5.25%) 5/3/27 • | | | | | | | 24,051,000 | | | | 23,209,215 | |
| Vantage Specialty Chemicals 1st Lien 9.597% (SOFR01M + 4.75%) 10/26/26 • | | | | | | | 26,932,500 | | | | 26,001,093 | |
Total Loan Agreements
(cost $351,702,529) | | | | | | | | | | | 320,981,615 | |
| | | | | | | | | | | | | |
| | | | | | | | Number of shares | | | | | |
| Common Stocks — 3.88% | | | | | | | | | | | | |
| Basic Industry — 0.76% | | | | | | | | | | | | |
| BIS Industries Holdings =, † | | | | | | | 19,682,813 | | | | 0 | |
| Foresight Energy =, † | | | | | | | 1,117,414 | | | | 19,096,599 | |
| Westmoreland Coal =, † | | | | | | | 211,917 | | | | 95,363 | |
| | | | | | | | | | | | 19,191,962 | |
| Consumer Goods — 0.00% | | | | | | | | | | | | |
| ASG Warrant =, † | | | | | | | 19,688 | | | | 0 | |
| | | | | | | | | | | | 0 | |
| Energy — 0.44% | | | | | | | | | | | | |
| KCA Deutag International =, † | | | | | | | 123,933 | | | | 7,482,455 | |
| Maritime Finance =, † | | | | | | | 1,750,000 | | | | 3,585,521 | |
| Sabine Oil & Gas Holdings =, † | | | | | | | 5,385 | | | | 6,671 | |
| | | | | | | | | | | | 11,074,647 | |
| Financial Services — 0.81% | | | | | | | | | | | | |
| New Cotai =, † | | | | | | | 20,316,462 | | | | 20,699,983 | |
| | | | | | | | | | | | 20,699,983 | |
| Leisure — 1.60% | | | | | | | | | | | | |
| Studio City International Holdings † | | | | | | | 3,843,131 | | | | 25,582,186 | |
| Studio City International Holdings ADR † | | | | | | | 2,267,875 | | | | 15,096,336 | |
| | | | | | | | | | | | 40,678,522 | |
| Media — 0.00% | | | | | | | | | | | | |
| Cumulus Media Class A † | | | | | | | 115 | | | | 424 | |
| | | | | | | | | | | | 424 | |
| Retail — 0.26% | | | | | | | | | | | | |
| True Religion Apparel = | | | | | | | 395 | | | | 6,549,308 | |
| | | | | | | | | | | | 6,549,308 | |
| Utilities — 0.01% | | | | | | | | | | | | |
| Larchmont Resources =, † | | | | | | | 18,338 | | | | 213,461 | |
| | | | | | | | | | | | 213,461 | |
Total Common Stocks
(cost $316,390,718) | | | | | | | | | | | 98,408,307 | |
| | | | | | | | | | | | | |
| Preferred Stock — 0.08% | | | | | | | | | | | | |
| True Religion Apparel 0.000% =, ω | | | | | | | 410 | | | | 2,050,430 | |
Total Preferred Stock
(cost $6,748,583) | | | | | | | | | | | 2,050,430 | |
| | | | | | | | | | | | | |
| Warrants — 0.01% | | | | | | | | | | | | |
| California Resources † | | | | | | | 40,269 | | | | 342,287 | |
Total Warrants
(cost $3,503,208) | | | | | | | | | | | 342,287 | |
| | | Number of shares | | Value (US $) |
| Short-Term Investments — 1.23% | | | | | | | | |
| Money Market Mutual Funds — 1.23% | | | | | | | | |
| BlackRock Liquidity FedFund – Institutional Shares (seven-day effective yield 4.72%) | | | 7,845,640 | | | $ | 7,845,640 | |
| Fidelity Investments Money Market Government Portfolio – Class I (seven-day effective yield 4.72%) | | | 7,845,641 | | | | 7,845,641 | |
| Goldman Sachs Financial Square Government Fund – Institutional Shares (seven-day effective yield 4.84%) | | | 7,845,641 | | | | 7,845,641 | |
| Morgan Stanley Institutional Liquidity Funds Government Portfolio – Institutional Class (seven-day effective yield 4.73%) | | | 7,845,641 | | | | 7,845,641 | |
Total Short-Term Investments
(cost $31,382,563) | | | | | | | 31,382,563 | |
Total Value of Securities—97.90%
(cost $3,005,830,716) | | | | | | $ | 2,483,350,437 | |
| ° | | Principal amount shown is stated in USD unless noted that the security is denominated in another currency. |
| = | | The value of this security was determined using significant unobservable inputs and is reported as a Level 3 security in the disclosure table located in Note 3 in “Notes to financial statements.” |
| # | | Security exempt from registration under Rule 144A of the Securities Act of 1933, as amended. At March 31, 2023, the aggregate value of Rule 144A securities was $1,592,045,716, which represents 62.77% of the Fund's net assets. See Note 13 in “Notes to financial statements." |
| > | | PIK. 100% of the income received was in the form of cash. |
| >> | | PIK. 100% of the income received was in the form of principal. |
| µ | | Fixed to variable rate investment. The rate shown reflects the fixed rate in effect at March 31, 2023. Rate will reset at a future date. |
| ψ | | Perpetual security. Maturity date represents next call date. |
| ‡ | | Non-income producing security. Security is currently in default. |
| >>>>> | | PIK. 52% of the income received was in cash and 48% was in principal. |
| • | | Variable rate investment. Rates reset periodically. Rate shown reflects the rate in effect at March 31, 2023. For securities based on a published reference rate and spread, the reference rate and spread are indicated in their descriptions. The reference rate descriptions (i.e. LIBOR03M, LIBOR06M, etc.) used in this report are identical for different securities, but the underlying reference rates may differ due to the timing of the reset period. Certain variable rate securities are not based on a published reference rate and spread but are determined by the issuer or agent and are based on current market conditions, or for mortgage-backed securities, are impacted by the individual mortgages which are paying off over time. These securities do not indicate a reference rate and spread in their descriptions. |
| X | | This loan will settle after March 31, 2023, at which time the interest rate, based on the LIBOR and the agreed upon spread on trade date, will be reflected. |
| † | | Non-income producing security. |
| ω | | Perpetual security with no stated maturity date. |
The following foreign currency exchange contracts were outstanding at March 31, 2023:1
Foreign Currency Exchange Contracts
| Counterparty | | Currency to
Receive (Deliver) | | In Exchange For | | Settlement
Date | | Unrealized
Appreciation |
| TD | | | CAD | (8,205,000) | | USD | 6,133,394 | | 4/21/23 | | $ | 60,529 | |
The use of foreign currency exchange contracts involves elements of market risk and risks in excess of the amounts disclosed in the financial statements. The foreign currency exchange contracts presented above represent the Fund's total exposure in such contracts, whereas only the net unrealized appreciation (depreciation) is reflected in the Fund's net assets.
1 See Note 10 in “Notes to financial statements.”
Schedules of investments
Delaware Ivy High Income Fund
Summary of abbreviations:
ADR – American Depositary Receipt
CDOR03M – 3 Month Canadian Dollar Offered Rate
DAC – Designated Activity Company
ICE – Intercontinental Exchange, Inc.
LIBOR – London Interbank Offered Rate
LIBOR01M – ICE LIBOR USD 1 Month
LIBOR03M – ICE LIBOR USD 3 Month
LIBOR06M – ICE LIBOR USD 6 Month
PIK – Payment-in-kind
SOFR01M – Secured Overnight Financing Rate 1 Month
SOFR03M – Secured Overnight Financing Rate 3 Month
TD – TD Bank
Summary of currencies:
CAD – Canadian Dollar
USD – US Dollar
See accompanying notes, which are an integral part of the financial statements.
| Delaware Ivy International Core Equity Fund | March 31, 2023 |
| | | Number of shares | | Value (US $) | |
| Common Stocks – 97.96%D | | | | | | | | |
| Australia - 1.81% | | | | | | | | |
| Newcrest Mining | | | 1,379,658 | | | $ | 24,627,453 | |
| | | | | | | | 24,627,453 | |
| Austria - 0.90% | | | | | | | | |
| Mondi | | | 769,497 | | | | 12,217,322 | |
| | | | | | | | 12,217,322 | |
| Brazil - 4.88% | | | | | | | | |
| Banco do Brasil | | | 3,380,869 | | | | 26,108,024 | |
| MercadoLibre † | | | 30,455 | | | | 40,141,517 | |
| | | | | | | | 66,249,541 | |
| Canada - 5.31% | | | | | | | | |
| Canadian Pacific Railway | | | 337,381 | | | | 25,979,460 | |
| Dollarama | | | 453,301 | | | | 27,090,730 | |
| Suncor Energy | | | 611,740 | | | | 18,992,683 | |
| | | | | | | | 72,062,873 | |
| China - 9.62% | | | | | | | | |
| Budweiser Brewing APAC # | | | 2,134,300 | | | | 6,495,375 | |
| China Mengniu Dairy | | | 5,221,000 | | | | 21,403,217 | |
| H World Group ADR † | | | 759,575 | | | | 37,203,984 | |
| JD.com ADR | | | 174,340 | | | | 7,651,783 | |
| Li Ning | | | 2,109,500 | | | | 16,588,928 | |
| Prosus † | | | 255,103 | | | | 19,975,602 | |
| SITC International Holdings | | | 3,465,000 | | | | 7,446,839 | |
| Tencent Holdings | | | 282,200 | | | | 13,790,923 | |
| | | | | | | | 130,556,651 | |
| China/Hong Kong - 0.04% | | | | | | | | |
| Meituan Class B 144A #, † | | | 28,880 | | | | 523,947 | |
| | | | | | | | 523,947 | |
| Denmark - 4.83% | | | | | | | | |
| Ambu Class B † | | | 1,057,850 | | | | 15,907,038 | |
| AP Moller - Maersk Class A | | | 3,069 | | | | 5,444,547 | |
| AP Moller - Maersk Class B | | | 5,482 | | | | 9,964,685 | |
| Genmab † | | | 90,474 | | | | 34,199,652 | |
| | | | | | | | 65,515,922 | |
| France - 13.85% | | | | | | | | |
| Airbus | | | 229,173 | | | | 30,610,071 | |
| BNP Paribas | | | 342,250 | | | | 20,438,344 | |
| Capgemini | | | 71,900 | | | | 13,361,575 | |
| L'Oreal | | | 18,892 | | | | 8,441,753 | |
| LVMH Moet Hennessy Louis Vuitton | | | 36,059 | | | | 33,098,865 | |
| Thales | | | 197,901 | | | | 29,259,040 | |
| TotalEnergies | | | 409,949 | | | | 24,172,120 | |
| Vinci | | | 248,546 | | | | 28,493,919 | |
| | | | | | | | 187,875,687 | |
| Germany - 11.16% | | | | | | | | |
| Bayer | | | 574,036 | | | | 36,670,344 | |
| Deutsche Telekom | | | 1,444,646 | | | | 35,007,091 | |
| HeidelbergCement | | | 284,771 | | | | 20,793,184 | |
| HelloFresh † | | | 688,975 | | | | 16,430,205 | |
| RWE | | | 636,882 | | | | 27,404,005 | |
| SAP | | | 119,405 | | | | 15,077,333 | |
| | | | | | | | 151,382,162 | |
| Hong Kong - 1.83% | | | | | | | | |
| Prudential | | | 1,813,248 | | | | 24,826,332 | |
| | | | | | | | 24,826,332 | |
| India - 5.46% | | | | | | | | |
| Axis Bank | | | 2,444,699 | | | | 25,612,542 | |
| Bharti Airtel | | | 1,487,857 | | | | 13,568,519 | |
| ICICI Bank | | | 1,364,143 | | | | 14,577,839 | |
| NTPC | | | 9,498,727 | | | | 20,279,248 | |
| | | | | | | | 74,038,148 | |
| Japan - 12.51% | | | | | | | | |
| Asahi Group Holdings | | | 566,500 | | | | 21,084,018 | |
| Inpex | | | 1,473,900 | | | | 15,597,584 | |
| Mitsubishi UFJ Financial Group | | | 2,920,900 | | | | 18,719,080 | |
| Nippon Telegraph & Telephone | | | 429,700 | | | | 12,840,613 | |
| ORIX | | | 1,075,209 | | | | 17,728,064 | |
| Renesas Electronics † | | | 2,175,500 | | | | 31,503,009 | |
| Seven & i Holdings | | | 553,000 | | | | 24,981,298 | |
| Tokio Marine Holdings | | | 1,422,053 | | | | 27,367,349 | |
| | | | | | | | 169,821,015 | |
| Netherlands - 5.15% | | | | | | | | |
| Adyen #, † | | | 4,189 | | | | 6,674,873 | |
| ASML Holding | | | 29,374 | | | | 20,016,858 | |
| ING Groep | | | 1,708,000 | | | | 20,283,092 | |
| Shell | | | 799,783 | | | | 22,914,649 | |
| | | | | | | | 69,889,472 | |
| Republic of Korea - 3.80% | | | | | | | | |
| LG | | | 368,302 | | | | 23,452,090 | |
| Samsung Electronics | | | 568,509 | | | | 28,113,317 | |
| | | | | | | | 51,565,407 | |
| Spain - 1.35% | | | | | | | | |
| Banco Bilbao Vizcaya Argentaria | | | 2,567,514 | | | | 18,356,085 | |
| | | | | | | | 18,356,085 | |
| Switzerland - 1.53% | | | | | | | | |
| Alcon | | | 293,517 | | | | 20,704,689 | |
| | | | | | | | 20,704,689 | |
| Taiwan - 2.20% | | | | | | | | |
| Taiwan Semiconductor Manufacturing | | | 1,702,000 | | | | 29,826,906 | |
| | | | | | | | 29,826,906 | |
Schedules of investments
Delaware Ivy International Core Equity Fund
| | | Number of shares | | Value (US $) |
| Common StocksD (continued) | | | | | | | | |
| United Kingdom - 7.43% | | | | | | | | |
| AstraZeneca | | | 108,324 | | | $ | 15,008,761 | |
| AstraZeneca ADR | | | 354,445 | | | | 24,602,028 | |
| Haleon | | | 3,763,229 | | | | 14,949,192 | |
| HSBC Holdings | | | 2,778,983 | | | | 18,887,370 | |
| Reckitt Benckiser Group | | | 360,459 | | | | 27,422,831 | |
| | | | | | | | 100,870,182 | |
| United States - 4.30% | | | | | | | | |
| Schlumberger | | | 420,541 | | | | 20,648,563 | |
| Seagate Technology Holdings | | | 320,557 | | | | 21,195,229 | |
| Stellantis | | | 906,093 | | | | 16,466,127 | |
| | | | | | | | 58,309,919 | |
Total Common Stocks
(cost $1,179,721,238) | | | | | | | 1,329,219,713 | |
| | | | | | | | | |
| Short-Term Investments – 0.57% | | | | | | | | |
| Money Market Mutual Funds – 0.57% | | | | | | | | |
| BlackRock Liquidity FedFund – Institutional Shares (seven-day effective yield 4.72%) | | | 1,916,458 | | | | 1,916,458 | |
| Fidelity Investments Money Market Government Portfolio – Class I (seven-day effective yield 4.72%) | | | 1,916,459 | | | | 1,916,459 | |
| Goldman Sachs Financial Square Government Fund – Institutional Shares (seven-day effective yield 4.84%) | | | 1,916,459 | | | | 1,916,459 | |
| Morgan Stanley Institutional Liquidity Funds Government Portfolio – Institutional Class (seven-day effective yield 4.73%) | | | 1,916,458 | | | | 1,916,458 | |
Total Short-Term Investments
(cost $7,665,834) | | | | | | | 7,665,834 | |
Total Value of Securities–98.53%
(cost $1,187,387,072) | | | | | | $ | 1,336,885,547 | |
| D | | Securities have been classified by country of risk. Aggregate classification by business sector has been presented on page 118 in “Security type / country and sector allocations.” |
| † | | Non-income producing security. |
| # | | Security exempt from registration under Rule 144A of the Securities Act of 1933, as amended. At March 31, 2023, the aggregate value of Rule 144A securities was $13,694,195, which represents 1.01% of the Fund's net assets. See Note 13 in “Notes to financial statements." |
Summary of abbreviations:
ADR – American Depositary Receipt
See accompanying notes, which are an integral part of the financial statements.
| Delaware Ivy International Value Fund | March 31, 2023 |
| | | Number of shares | | Value (US $) |
| Common Stocks – 97.26%D | | | | | | | | |
| Denmark - 2.61% | | | | | | | | |
| Novo Nordisk Class B | | | 20,995 | | | $ | 3,334,455 | |
| | | | | | | | 3,334,455 | |
| Finland - 0.01% | | | | | | | | |
| Nokia | | | 3,500 | | | | 17,181 | |
| | | | | | | | 17,181 | |
| France - 20.05% | | | | | | | | |
| Air Liquide | | | 35,710 | | | | 5,977,452 | |
| Amundi 144A # | | | 250 | | | | 15,752 | |
| Bouygues | | | 400 | | | | 13,490 | |
| Danone | | | 108,940 | | | | 6,778,641 | |
| Euroapi † | | | 9 | | | | 103 | |
| Kering | | | 3,020 | | | | 1,970,333 | |
| Orange | | | 279,020 | | | | 3,314,807 | |
| Publicis Groupe | | | 26,040 | | | | 2,032,677 | |
| Rexel | | | 610 | | | | 14,503 | |
| Sanofi | | | 100 | | | | 10,848 | |
| Schneider Electric | | | 100 | | | | 16,712 | |
| Sodexo | | | 56,140 | | | | 5,483,229 | |
| Technip Energies ADR | | | 1,000 | | | | 21,170 | |
| | | | | | | | 25,649,717 | |
| Germany - 13.52% | | | | | | | | |
| adidas AG | | | 31,650 | | | | 5,610,675 | |
| BASF | | | 310 | | | | 16,275 | |
| Covestro 144A # | | | 200 | | | | 8,283 | |
| Fresenius Medical Care AG & Co. | | | 69,930 | | | | 2,968,126 | |
| Knorr-Bremse | | | 40,880 | | | | 2,723,056 | |
| SAP | | | 47,085 | | | | 5,945,448 | |
| Siemens | | | 130 | | | | 21,060 | |
| | | | | | | | 17,292,923 | |
| Hong Kong - 0.01% | | | | | | | | |
| Galaxy Entertainment Group † | | | 2,000 | | | | 13,378 | |
| | | | | | | | 13,378 | |
| Japan - 9.46% | | | | | | | | |
| Asahi Group Holdings | | | 34,100 | | | | 1,269,135 | |
| Bridgestone | | | 232 | | | | 9,424 | |
| Fukuoka Financial Group | | | 700 | | | | 13,469 | |
| Honda Motor | | | 600 | | | | 15,871 | |
| Iida Group Holdings | | | 900 | | | | 14,694 | |
| Isuzu Motors | | | 600 | | | | 7,171 | |
| Kao | | | 99,500 | | | | 3,873,066 | |
| KDDI | | | 54,800 | | | | 1,689,910 | |
| Komatsu | | | 300 | | | | 7,447 | |
| Lawson | | | 200 | | | | 8,468 | |
| Makita | | | 142,800 | | | | 3,556,416 | |
| Mitsui & Co. | | | 400 | | | | 12,468 | |
| Panasonic Holdings | | | 1,000 | | | | 8,947 | |
| Seven & i Holdings | | | 35,300 | | | | 1,594,647 | |
| Sumitomo Mitsui Financial Group | | | 400 | | | | 16,007 | |
| Suzuki Motor | | | 200 | | | | 7,283 | |
| | | | | | | | 12,104,423 | |
| Netherlands - 6.63% | | | | | | | | |
| Koninklijke Ahold Delhaize | | | 247,980 | | | | 8,472,269 | |
| | | | | | | | 8,472,269 | |
| Spain - 4.80% | | | | | | | | |
| Amadeus IT Group † | | | 91,580 | | | | 6,143,512 | |
| | | | | | | | 6,143,512 | |
| Sweden - 10.37% | | | | | | | | |
| Essity Class B | | | 179,970 | | | | 5,140,645 | |
| H & M Hennes & Mauritz Class B | | | 180,600 | | | | 2,582,136 | |
| Securitas Class B | | | 622,750 | | | | 5,539,762 | |
| | | | | | | | 13,262,543 | |
| Switzerland - 12.47% | | | | | | | | |
| Nestle | | | 57,070 | | | | 6,958,577 | |
| Novartis | | | 200 | | | | 18,364 | |
| Roche Holding | | | 15,630 | | | | 4,466,157 | |
| Swatch Group | | | 13,080 | | | | 4,504,631 | |
| | | | | | | | 15,947,729 | |
| United Kingdom - 17.33% | | | | | | | | |
| Diageo | | | 154,000 | | | | 6,872,970 | |
| Intertek Group | | | 67,540 | | | | 3,382,722 | |
| J Sainsbury | | | 5,790 | | | | 19,924 | |
| John Wood Group † | | | 8,270 | | | | 20,476 | |
| Smith & Nephew | | | 430,520 | | | | 5,984,462 | |
| Tesco | | | 5,630 | | | | 18,458 | |
| Travis Perkins | | | 1,020 | | | | 12,076 | |
| Unilever | | | 112,720 | | | | 5,841,042 | |
| Vodafone Group | | | 8,750 | | | | 9,652 | |
| | | | | | | | 22,161,782 | |
Total Common Stocks
(cost $127,336,883) | | | | | | | 124,399,912 | |
| | | | | | | | | |
| Exchange-Traded Funds – 1.18% | | | | | | | | |
| iShares Trust iShares ESG Aware | | | | | | | | |
| MSCI EAFE ETF | | | 16,640 | | | | 1,195,418 | |
| Vanguard FTSE Developed | | | | | | | | |
| Markets ETF | | | 7,100 | | | | 320,707 | |
Total Exchange-Traded Funds
(cost $1,433,063) | | | | | | | 1,516,125 | |
| | | | | | | | | |
| Short-Term Investments – 3.88% | | | | | | | | |
| Money Market Mutual Funds – 3.88% | | | | | | | | |
| BlackRock Liquidity FedFund – Institutional Shares (seven-day effective yield 4.72%) | | | 1,240,753 | | | | 1,240,753 | |
Schedules of investments
Delaware Ivy International Value Fund
| | | Number of
shares | |
Value (US $) |
| Short-Term Investments (continued) | | | | | | | | |
| Money Market Mutual Funds (continued) | | | | | | | | |
| Fidelity Investments Money Market Government Portfolio – Class I (seven-day effective yield 4.72%) | | | 1,240,753 | | | $ | 1,240,753 | |
| Goldman Sachs Financial Square Government Fund – Institutional Shares (seven-day effective yield 4.84%) | | | 1,240,753 | | | | 1,240,753 | |
| Morgan Stanley Institutional Liquidity Funds Government Portfolio – Institutional Class (seven-day effective yield 4.73%) | | | 1,240,753 | | | | 1,240,753 | |
Total Short-Term Investments
(cost $4,963,012) | | | | | | | 4,963,012 | |
Total Value of Securities—102.32%
(cost $133,732,958) | | | | | | $ | 130,879,049 | |
| D | | Securities have been classified by country of risk. Aggregate classification by business sector has been presented on page 119 in “Security type / country and sector allocations.” |
| # | | Security exempt from registration under Rule 144A of the Securities Act of 1933, as amended. At March 31, 2023, the aggregate value of Rule 144A securities was $24,035, which represents 0.02% of the Fund's net assets. See Note 13 in “Notes to financial statements." |
| † | | Non-income producing security. |
Summary of abbreviations:
ADR – American Depositary Receipt
AG – Aktiengesellschaft
EAFE – Europe, Australasia, and Far East
ESG – Environmental, Social, and Governance
ETF – Exchange-Traded Fund
FTSE – Financial Times Stock Exchange
MSCI – Morgan Stanley Capital International
See accompanying notes, which are an integral part of the financial statements.
Delaware Ivy Large Cap Growth Fund | March 31, 2023 |
| | | Number of | | |
| | | shares | | Value (US $) | |
| Common Stocks — 99.18%t | | | | | | | | |
| Communication Services — 8.51% | | | | | | | | |
| Alphabet Class A † | | | 2,474,490 | | | $ | 256,678,848 | |
| Alphabet Class C † | | | 416,721 | | | | 43,338,984 | |
| Electronic Arts | | | 1,125,192 | | | | 135,529,376 | |
| | | | | | | | 435,547,208 | |
| Consumer Discretionary — 13.15% | | | | | | | | |
| Amazon.com † | | | 2,534,120 | | | | 261,749,255 | |
| Booking Holdings † | | | 27,027 | | | | 71,686,685 | |
| Ferrari | | | 458,352 | | | | 124,185,891 | |
| Home Depot | | | 122,021 | | | | 36,010,838 | |
| LVMH Moet Hennessy Louis Vuitton ADR | | | 492,913 | | | | 90,562,905 | |
| NIKE Class B | | | 721,612 | | | | 88,498,496 | |
| | | | | | | | 672,694,070 | |
| Consumer Staples — 3.13% | | | | | | | | |
| Coca-Cola | | | 2,422,921 | | | | 150,293,789 | |
| Estee Lauder Class A | | | 39,247 | | | | 9,672,816 | |
| | | | | | | | 159,966,605 | |
| Financials — 4.71% | | | | | | | | |
| Intercontinental Exchange | | | 1,176,912 | | | | 122,740,152 | |
| S&P Global | | | 342,867 | | | | 118,210,256 | |
| | | | | | | | 240,950,408 | |
| Healthcare — 11.47% | | | | | | | | |
| Cooper | | | 276,169 | | | | 103,110,458 | |
| Danaher | | | 470,988 | | | | 118,707,816 | |
| Intuitive Surgical † | | | 264,433 | | | | 67,554,698 | |
| UnitedHealth Group | | | 442,334 | | | | 209,042,625 | |
| Veeva Systems Class A † | | | 201,079 | | | | 36,956,309 | |
| Zoetis | | | 309,302 | | | | 51,480,225 | |
| | | | | | | | 586,852,131 | |
| Industrials — 8.99% | | | | | | | | |
| CoStar Group † | | | 2,460,463 | | | | 169,402,877 | |
| Equifax | | | 428,117 | | | | 86,839,252 | |
| JB Hunt Transport Services | | | 493,286 | | | | 86,551,962 | |
| TransUnion | | | 725,197 | | | | 45,063,742 | |
| Union Pacific | | | 154,306 | | | | 31,055,626 | |
| Verisk Analytics | | | 215,005 | | | | 41,250,859 | |
| | | | | | | | 460,164,318 | |
| Information Technology — 49.22% | | | | | | | | |
| Adobe † | | | 236,048 | | | | 90,965,818 | |
| Apple | | | 2,568,998 | | | | 423,627,770 | |
| Autodesk † | | | 297,150 | | | | 61,854,744 | |
| Broadridge Financial Solutions | | | 616,798 | | | | 90,404,083 | |
| Intuit | | | 270,325 | | | | 120,518,995 | |
| Microsoft | | | 2,343,841 | | | | 675,729,360 | |
| Motorola Solutions | | | 776,709 | | | | 222,239,746 | |
| NVIDIA | | | 757,613 | | | | 210,442,163 | |
| Salesforce † | | | 407,197 | | | | 81,349,816 | |
| VeriSign † | | | 1,071,024 | | | | 226,339,502 | |
| Visa Class A | | | 1,395,608 | | | | 314,653,780 | |
| | | | | | | | 2,518,125,777 | |
Total Common Stocks
(cost $2,509,132,708) | | | | | | | 5,074,300,517 | |
Total Value of Securities—99.18%
(cost $2,509,132,708) | | | | | | $ | 5,074,300,517 | |
| ♦ | Narrow industries are utilized for compliance purposes for concentration whereas broad sectors are used for financial reporting. |
| † | Non-income producing security. |
Summary of abbreviations:
ADR – American Depositary Receipt
S&P – Standard & Poor’s Financial Services LLC
See accompanying notes, which are an integral part of the financial statements.
Schedules of investments
Delaware Ivy Limited-Term Bond Fund | March 31, 2023 |
| | | Principal | | |
| | | amount° | | Value (US $) | |
| Agency Collateralized Mortgage Obligations — 0.41% |
| GNMA | | | | | | | | |
| Series 2012-39 PA 2.00% 3/16/42 | | | 1,648,605 | | | $ | 1,520,109 | |
| Series 2015-151 KC 3.50% 4/20/34 | | | 775,991 | | | | 755,867 | |
Total Agency Collateralized Mortgage Obligations
(cost $2,446,469) | | | | | | | 2,275,976 | |
| |
| Agency Commercial Mortgage-Backed Securities — 8.47% |
| FREMF Mortgage Trust | | | | | | | | |
| Series 2013-K30 C 144A | | | | | | | | |
| 3.775% 6/25/45 #, • | | | 1,000,000 | | | | 994,114 | |
| Series 2013-K31 C 144A | | | | | | | | |
| 3.63% 7/25/46 #, • | | | 3,000,000 | | | | 2,984,765 | |
| Series 2013-K33 B 144A | | | | | | | | |
| 3.496% 8/25/46 #, • | | | 3,000,000 | | | | 2,970,544 | |
| Series 2013-K33 C 144A | | | | | | | | |
| 3.496% 8/25/46 #, • | | | 3,750,000 | | | | 3,709,733 | |
| Series 2015-K47 B 144A | | | | | | | | |
| 3.587% 6/25/48 #, • | | | 2,500,000 | | | | 2,414,887 | |
| Series 2015-KF12 B 144A | | | | | | | | |
| 11.769% (LIBOR01M + 7.10%, Floor 7.10%) 9/25/22 #, • | | | 2,361,500 | | | | 2,357,272 | |
| Series 2016-K723 C 144A | | | | | | | | |
| 3.566% 11/25/23 #, • | | | 4,899,000 | | | | 4,815,100 | |
| Series 2017-K724 C 144A | | | | | | | | |
| 3.498% 12/25/49 #, • | | | 1,500,000 | | | | 1,469,441 | |
| Series 2017-K728 C 144A | | | | | | | | |
| 3.651% 11/25/50 #, • | | | 910,000 | | | | 879,184 | |
| Series 2017-KF33 B 144A | | | | | | | | |
| 7.219% (LIBOR01M + 2.55%, Floor 2.55%) 6/25/27 #, • | | | 968,036 | | | | 950,443 | |
| Series 2017-KF39 B 144A | | | | | | | | |
| 7.169% (LIBOR01M + 2.50%, Floor 2.50%) 11/25/24 #, • | | | 1,852,558 | | | | 1,825,889 | |
| Series 2017-KF40 B 144A | | | | | | | | |
| 7.369% (LIBOR01M + 2.70%, Floor 2.70%) 11/25/27 #, • | | | 1,447,006 | | | | 1,402,626 | |
| Series 2018-K732 B 144A | | | | | | | | |
| 4.053% 5/25/25 #, • | | | 985,000 | | | | 953,963 | |
| Series 2018-KF46 B 144A | | | | | | | | |
| 6.619% (LIBOR01M + 1.95%, Floor 1.95%) 3/25/28 #, • | | | 1,423,361 | | | | 1,314,418 | |
| Series 2018-KF47 B 144A | | | | | | | | |
| 6.669% (LIBOR01M + 2.00%, Floor 2.00%) 5/25/25 #, • | | | 989,299 | | | | 969,630 | |
| Series 2018-KF48 B 144A | | | | | | | | |
| 6.719% (LIBOR01M + 2.05%, Floor 2.05%) 6/25/28 #, • | | | 798,325 | | | | 752,416 | |
| Series 2018-KF49 B 144A | | | | | | | | |
| 6.569% (LIBOR01M + 1.90%, Floor 1.90%) 6/25/25 #, • | | | 838,402 | | | | 804,332 | |
| Series 2018-KF51 B 144A | | | | | | | | |
| 6.519% (LIBOR01M + 1.85%, Floor 1.85%) 8/25/25 #, • | | | 2,421,495 | | | | 2,364,394 | |
| Series 2019-KF60 B 144A | | | | | | | | |
| 7.019% (LIBOR01M + 2.35%, Floor 2.35%) 2/25/26 #, • | | | 3,048,284 | | | | 2,966,878 | |
| Series 2019-KF61 B 144A | | | | | | | | |
| 6.869% (LIBOR01M + 2.20%, Floor 2.20%) 4/25/29 #, • | | | 967,931 | | | | 914,718 | |
| Series 2019-KF68 B 144A | | | | | | | | |
| 6.869% (LIBOR01M + 2.20%, Floor 2.20%) 7/25/26 #, • | | | 2,145,934 | | | | 2,008,531 | |
| Series 2019-KF69 B 144A | | | | | | | | |
| 6.969% (LIBOR01M + 2.30%, Floor 2.30%) 8/25/29 #, • | | | 1,480,894 | | | | 1,393,848 | |
| Series 2019-KF70 B 144A | | | | | | | | |
| 6.969% (LIBOR01M + 2.30%, Floor 2.30%) 9/25/29 #, • | | | 1,126,244 | | | | 1,090,121 | |
| Series 2019-KF73 B 144A | | | | | | | | |
| 7.119% (LIBOR01M + 2.45%, Floor 2.45%) 11/25/29 #, • | | | 2,660,520 | | | | 2,574,006 | |
| Series 2020-KF74 B 144A | | | | | | | | |
| 6.819% (LIBOR01M + 2.15%, Floor 2.15%) 1/25/27 #, • | | | 1,117,136 | | | | 1,090,041 | |
| Series 2020-KF75 B 144A | | | | | | | | |
| 6.919% (LIBOR01M + 2.25%, Floor 2.25%) 12/25/29 #, • | | | 1,302,582 | | | | 1,219,077 | |
Total Agency Commercial Mortgage-Backed Securities
(cost $48,883,740) | | | | | | | 47,190,371 | |
| |
| Agency Obligation — 0.52% | | | | | | | | |
| Federal Home Loan Mortgage | | | | | | | | |
| 5.82% 3/20/25 | | | 2,895,000 | | | | 2,902,324 | |
Total Agency Obligation
(cost $2,895,000) | | | | | | | 2,902,324 | |
| |
| Collateralized Debt Obligations — 11.12% | | | | | | | | |
| Benefit Street Partners CLO XX | | | | | | | | |
| Series 2020-20A AR 144A | | | | | | | | |
| 5.962% (LIBOR03M + 1.17%, Floor 1.17%) 7/15/34 #, • | | | 5,000,000 | | | | 4,891,620 | |
| BlueMountain CLO XXX | | | | | | | | |
| Series 2020-30A AR 144A | | | | | | | | |
| 6.028% (TSFR03M + 1.37%, Floor 1.37%) 4/15/35 #, • | | | 3,000,000 | | | | 2,922,630 | |
| Canyon CLO | | | | | | | | |
| Series 2020-1A AR 144A | | | | | | | | |
| 5.972% (LIBOR03M + 1.18%, Floor 1.18%) 7/15/34 #, • | | | 4,600,000 | | | | 4,503,731 | |
| | | Principal | | |
| | | amount° | | Value (US $) | |
| Collateralized Debt Obligations (continued) | | | | | | | | |
| CIFC Funding | | | | | | | | |
| Series 2022-2A A1 144A | | | | | | | | |
| 5.953% (TSFR03M + 1.32%, Floor 1.32%) 4/19/35 #, • | | | 5,000,000 | | | $ | 4,884,200 | |
| Dryden 77 CLO | | | | | | | | |
| Series 2020-77A AR 144A | | | | | | | | |
| 6.035% (LIBOR03M + 1.12%, Floor 1.12%) 5/20/34 #, • | | | 2,600,000 | | | | 2,539,410 | |
| Galaxy XXI CLO | | | | | | | | |
| Series 2015-21A AR 144A | | | | | | | | |
| 5.828% (LIBOR03M + 1.02%) 4/20/31 #, • | | | 4,900,000 | | | | 4,811,530 | |
| Golub Capital Partners CLO 50B-R | | | | | | | | |
| Series 2020-50A A1R 144A | | | | | | | | |
| 6.009% (TSFR03M + 1.37%, Floor 1.37%) 4/20/35 #, • | | | 5,000,000 | | | | 4,847,795 | |
| KKR CLO 41 | | | | | | | | |
| Series 2022-41A A1 144A | | | | | | | | |
| 5.962% (TSFR03M + 1.33%, Floor 1.33%) 4/15/35 #, • | | | 5,000,000 | | | | 4,840,075 | |
| Neuberger Berman CLO XX | | | | | | | | |
| Series 2015-20A ARR 144A | | | | | | | | |
| 5.952% (LIBOR03M + 1.16%, Floor 1.16%) 7/15/34 #, • | | | 2,000,000 | | | | 1,950,582 | |
| Octagon Investment Partners 48 | | | | | | | | |
| Series 2020-3A AR 144A | | | | | | | | |
| 5.958% (LIBOR03M + 1.15%, Floor 1.15%) 10/20/34 #, • | | | 5,000,000 | | | | 4,892,335 | |
| PPM CLO 3 | | | | | | | | |
| Series 2019-3A AR 144A | | | | | | | | |
| 5.882% (LIBOR03M + 1.09%, Floor 1.09%) 4/17/34 #, • | | | 3,750,000 | | | | 3,632,108 | |
| Regatta XIX Funding | | | | | | | | |
| Series 2022-1A A1 144A | | | | | | | | |
| 5.959% (TSFR03M + 1.32%, Floor 1.32%) 4/20/35 #, • | | | 5,000,000 | | | | 4,857,850 | |
| Sound Point CLO XXV | | | | | | | | |
| Series 2019-4A A1R 144A | | | | | | | | |
| 5.939% (TSFR03M + 1.28%, Floor 1.28%) 4/25/33 #, • | | | 5,000,000 | | | | 4,898,050 | |
| Voya CLO | | | | | | | | |
| Series 2020-3A AR 144A | | | | | | | | |
| 5.958% (LIBOR03M + 1.15%, Floor 1.15%) 10/20/34 #, • | | | 3,000,000 | | | | 2,944,617 | |
| Wind River CLO | | | | | | | | |
| Series 2021-3A A 144A 5.958% | | | | | | | | |
| (LIBOR03M + 1.15%, Floor 1.15%) 7/20/33 #, • | | | 4,700,000 | | | | 4,552,979 | |
Total Collateralized Debt Obligations
(cost $63,271,015) | | | | | | | 61,969,512 | |
| | | | | |
| Corporate Bonds — 56.79% | | | | | | | | |
| Banking — 14.52% | | | | | | | | |
| Bank of America | | | | | | | | |
| 0.523% 6/14/24 µ | | | 2,175,000 | | | | 2,153,295 | |
| 4.125% 1/22/24 | | | 3,000,000 | | | | 2,977,111 | |
| 4.20% 8/26/24 | | | 3,675,000 | | | | 3,612,851 | |
| Bank of New York Mellon 5.802% 10/25/28 µ | | | 1,264,000 | | | | 1,317,964 | |
| Barclays 7.385% 11/2/28 µ | | | 305,000 | | | | 323,557 | |
| Citigroup | | | | | | | | |
| 5.50% 9/13/25 | | | 1,900,000 | | | | 1,898,433 | |
| 5.61% 9/29/26 µ | | | 385,000 | | | | 388,132 | |
| Citizens Bank | | | | | | | | |
| 4.119% 5/23/25 µ | | | 3,925,000 | | | | 3,707,320 | |
| 6.064% 10/24/25 µ | | | 1,185,000 | | | | 1,115,866 | |
| Credit Agricole 144A 5.301% 7/12/28 # | | | 480,000 | | | | 486,983 | |
| Credit Suisse 7.95% 1/9/25 | | | 350,000 | | | | 356,216 | |
| Deutsche Bank 6.72% 1/18/29 µ | | | 514,000 | | | | 510,822 | |
| Fifth Third Bank 5.852% 10/27/25 µ | | | 1,935,000 | | | | 1,908,635 | |
| Goldman Sachs Group | | | | | | | | |
| 3.85% 7/8/24 | | | 3,190,000 | | | | 3,127,901 | |
| 4.25% 10/21/25 | | | 3,234,000 | | | | 3,140,824 | |
| 5.599% 12/9/26 • | | | 3,700,000 | | | | 3,604,555 | |
| Huntington National Bank | | | | | | | | |
| 4.008% 5/16/25 µ | | | 2,230,000 | | | | 2,136,700 | |
| 5.65% 1/10/30 | | | 460,000 | | | | 441,165 | |
| JPMorgan Chase & Co. | | | | | | | | |
| 0.653% 9/16/24 µ | | | 3,000,000 | | | | 2,933,401 | |
| 3.875% 9/10/24 | | | 2,542,000 | | | | 2,499,817 | |
| 4.08% 4/26/26 µ | | | 6,515,000 | | | | 6,400,134 | |
| KeyBank | | | | | | | | |
| 4.15% 8/8/25 | | | 1,880,000 | | | | 1,779,157 | |
| 5.85% 11/15/27 | | | 285,000 | | | | 280,487 | |
| KeyCorp 3.878% 5/23/25 µ | | | 1,910,000 | | | | 1,842,045 | |
| Morgan Stanley | | | | | | | | |
| 6.053% (LIBOR03M + 0.79%) | | | | | | | | |
| 5/31/23 • | | | 1,700,000 | | | | 1,701,335 | |
| 6.138% 10/16/26 µ | | | 6,170,000 | | | | 6,291,957 | |
| 6.296% 10/18/28 µ | | | 987,000 | | | | 1,038,730 | |
| PNC Financial Services Group 5.671% 10/28/25 µ | | | 700,000 | | | | 700,869 | |
| Popular 7.25% 3/13/28 | | | 395,000 | | | | 391,145 | |
| SBA Tower Trust | | | | | | | | |
| 144A 1.884% 7/15/50 # | | | 3,222,000 | | | | 2,910,841 | |
| 144A 2.836% 1/15/50 # | | | 5,840,000 | | | | 5,532,083 | |
| State Street | | | | | | | | |
| 5.751% 11/4/26 µ | | | 155,000 | | | | 158,086 | |
| 5.82% 11/4/28 µ | | | 105,000 | | | | 109,614 | |
| Toronto-Dominion Bank 4.108% 6/8/27 | | | 5,795,000 | | | | 5,616,238 | |
Schedules of investments
Delaware Ivy Limited-Term Bond Fund
| | | Principal | | |
| | | amount° | | Value (US $) | |
| Corporate Bonds (continued) | | | | | | | | |
| Banking (continued) | | | | | | | | |
| US Bancorp | | | | | | | | |
| 4.653% 2/1/29 µ | | | 349,000 | | | $ | 341,406 | |
| 5.727% 10/21/26 µ | | | 490,000 | | | | 492,578 | |
| Wells Fargo & Co. 3.908% 4/25/26 µ | | | 6,870,000 | | | | 6,673,192 | |
| | | | | | | | 80,901,445 | |
| Basic Industry — 1.29% | | | | | | | | |
| Celanese US Holdings | | | | | | | | |
| 6.05% 3/15/25 | | | 330,000 | | | | 332,124 | |
| 6.165% 7/15/27 | | | 1,185,000 | | | | 1,193,442 | |
| Graphic Packaging International 144A 0.821% 4/15/24 # | | | 3,650,000 | | | | 3,479,063 | |
| Nutrien | | | | | | | | |
| 4.90% 3/27/28 | | | 210,000 | | | | 210,096 | |
| 5.95% 11/7/25 | | | 1,920,000 | | | | 1,975,727 | |
| | | | | | | | 7,190,452 | |
| Capital Goods — 4.74% | | | | | | | | |
| General Electric 5.012% 1/1/24 | | | 1,059,067 | | | | 1,057,895 | |
| Huntington Ingalls Industries 0.67% 8/16/23 | | | 5,000,000 | | | | 4,917,385 | |
| Lennox International 1.35% 8/1/25 | | | 3,925,000 | | | | 3,598,305 | |
| Martin Marietta Materials 0.65% 7/15/23 | | | 1,800,000 | | | | 1,774,070 | |
| Mauser Packaging Solutions Holding 144A 7.875% 8/15/26 # | | | 2,820,000 | | | | 2,822,552 | |
| Parker-Hannifin | | | | | | | | |
| 3.65% 6/15/24 | | | 3,315,000 | | | | 3,266,215 | |
| 4.25% 9/15/27 | | | 2,440,000 | | | | 2,395,914 | |
| Republic Services 0.875% 11/15/25 | | | 2,200,000 | | | | 1,986,482 | |
| Waste Management 0.75% 11/15/25 | | | 5,045,000 | | | | 4,592,039 | |
| | | | | | | | 26,410,857 | |
| Communications — 7.04% | | | | | | | | |
| AT&T | | | | | | | | |
| 1.70% 3/25/26 | | | 3,650,000 | | | | 3,359,720 | |
| 2.95% 7/15/26 | | | 3,750,000 | | | | 3,537,015 | |
| Charter Communications Operating 4.908% 7/23/25 | | | 4,015,000 | | | | 3,976,551 | |
| Crown Castle 3.15% 7/15/23 | | | 1,195,000 | | | | 1,187,719 | |
| Crown Castle Towers 144A 3.663% 5/15/45 # | | | 2,050,000 | | | | 1,969,426 | |
| Netflix 5.875% 2/15/25 | | | 3,750,000 | | | | 3,828,694 | |
| SBA Tower Trust 144A 3.869% 10/15/49 #, • | | | 6,500,000 | | | | 6,312,311 | |
| Sprint 7.875% 9/15/23 | | | 5,130,000 | | | | 5,172,548 | |
| T-Mobile USA 3.75% 4/15/27 | | | 3,500,000 | | | | 3,366,688 | |
| Verizon Communications 1.45% 3/20/26 | | | 2,200,000 | | | | 2,025,137 | |
| Warnermedia Holdings | | | | | | | | |
| 144A 3.638% 3/15/25 # | | | 3,890,000 | | | | 3,760,119 | |
| 6.412% 3/15/26 | | | 730,000 | | | | 733,907 | |
| | | | | | | | 39,229,835 | |
| Consumer Cyclical — 3.81% | | | | | | | | |
| Aptiv 2.396% 2/18/25 | | | 2,805,000 | | | | 2,673,465 | |
| Ford Motor Credit | | | | | | | | |
| 2.30% 2/10/25 | | | 235,000 | | | | 218,132 | |
| 2.70% 8/10/26 | | | 1,700,000 | | | | 1,515,125 | |
| 3.375% 11/13/25 | | | 3,095,000 | | | | 2,905,013 | |
| Hyundai Capital America 144A 1.25% 9/18/23 # | | | 2,200,000 | | | | 2,154,766 | |
| MGM Resorts International 5.75% 6/15/25 | | | 4,825,000 | | | | 4,817,894 | |
| Nordstrom 2.30% 4/8/24 | | | 730,000 | | | | 698,113 | |
| VICI Properties 4.95% 2/15/30 | | | 1,310,000 | | | | 1,230,584 | |
| Volkswagen Group of America Finance 144A 0.875% 11/22/23 # | | | 5,150,000 | | | | 5,009,398 | |
| | | | | | | | 21,222,490 | |
| Consumer Non-Cyclical — 5.28% | | | | | | | | |
| Amgen 5.15% 3/2/28 | | | 280,000 | | | | 286,035 | |
| Astrazeneca Finance 4.875% 3/3/28 | | | 665,000 | | | | 684,553 | |
| Becton Dickinson 3.734% 12/15/24 | | | 998,000 | | | | 976,243 | |
| Cigna Group 5.685% 3/15/26 | | | 1,155,000 | | | | 1,162,532 | |
| Darling Ingredients 144A 5.25% 4/15/27 # | | | 4,355,000 | | | | 4,250,110 | |
| Eli Lilly & Co. 5.00% 2/27/26 | | | 510,000 | | | | 514,739 | |
| GE HealthCare Technologies | | | | | | | | |
| 144A 5.60% 11/15/25 # | | | 400,000 | | | | 405,062 | |
| 144A 5.65% 11/15/27 # | | | 400,000 | | | | 413,677 | |
| Keurig Dr Pepper 0.75% 3/15/24 | | | 1,820,000 | | | | 1,743,640 | |
| McCormick & Co. | | | | | | | | |
| 0.90% 2/15/26 | | | 2,975,000 | | | | 2,667,280 | |
| 3.50% 9/1/23 | | | 1,320,000 | | | | 1,307,659 | |
| Medtronic Global Holdings SCA 4.25% 3/30/28 | | | 1,020,000 | | | | 1,018,751 | |
| Novartis Capital 3.00% 11/20/25 | | | 3,750,000 | | | | 3,633,877 | |
| Royalty Pharma | | | | | | | | |
| 0.75% 9/2/23 | | | 5,200,000 | | | | 5,071,153 | |
| 1.20% 9/2/25 | | | 3,940,000 | | | | 3,574,262 | |
| Tenet Healthcare 4.875% 1/1/26 | | | 1,475,000 | | | | 1,447,646 | |
| Zoetis 5.40% 11/14/25 | | | 230,000 | | | | 234,005 | |
| | | | | | | | 29,391,224 | |
| Electric — 3.22% | | | | | | | | |
| Duke Energy Carolinas 3.95% 11/15/28 | | | 2,545,000 | | | | 2,498,251 | |
| | | Principal | | |
| | | amount° | | Value (US $) | |
| Corporate Bonds (continued) | | | | | | | | |
| Electric (continued) | | | | | | | | |
| Edison International 3.55% 11/15/24 | | | 3,700,000 | | | $ | 3,597,115 | |
| Enel Finance International 144A 4.25% 6/15/25 # | | | 680,000 | | | | 666,398 | |
| Metropolitan Edison 144A 5.20% 4/1/28 # | | | 1,045,000 | | | | 1,056,324 | |
| MidAmerican Energy 3.70% 9/15/23 | | | 3,000,000 | | | | 2,975,718 | |
| National Rural Utilities Cooperative Finance | | | | | | | | |
| 1.875% 2/7/25 | | | 3,685,000 | | | | 3,496,899 | |
| 4.45% 3/13/26 | | | 1,080,000 | | | | 1,078,845 | |
| 4.80% 3/15/28 | | | 830,000 | | | | 838,672 | |
| NextEra Energy Capital Holdings 6.051% 3/1/25 | | | 760,000 | | | | 773,544 | |
| Vistra Operations 144A 5.125% 5/13/25 # | | | 985,000 | | | | 961,070 | |
| | | | | | | | 17,942,836 | |
| Energy — 4.84% | | | | | | | | |
| ConocoPhillips 2.40% 3/7/25 | | | 2,855,000 | | | | 2,742,063 | |
| Eastern Energy Gas Holdings 3.55% 11/1/23 | | | 3,765,000 | | | | 3,727,700 | |
| Enbridge 2.50% 2/14/25 | | | 2,200,000 | | | | 2,107,950 | |
| Energy Transfer | | | | | | | | |
| 4.25% 4/1/24 | | | 3,200,000 | | | | 3,159,955 | |
| 5.55% 2/15/28 | | | 2,700,000 | | | | 2,744,361 | |
| Galaxy Pipeline Assets Bidco 144A 1.75% 9/30/27 # | | | 3,410,358 | | | | 3,179,932 | |
| Harvest Operations 144A 1.00% 4/26/24 # | | | 3,600,000 | | | | 3,452,730 | |
| Occidental Petroleum 5.875% 9/1/25 | | | 4,560,000 | | | | 4,599,861 | |
| Targa Resources Partners 5.00% 1/15/28 | | | 1,275,000 | | | | 1,234,034 | |
| | | | | | | | 26,948,586 | |
| Finance Companies — 1.42% | | | | | | | | |
| AerCap Ireland Capital DAC 1.65% 10/29/24 | | | 2,795,000 | | | | 2,616,416 | |
| Air Lease 5.85% 12/15/27 | | | 380,000 | | | | 382,339 | |
| Aviation Capital Group 144A 4.375% 1/30/24 # | | | 3,000,000 | | | | 2,918,108 | |
| USAA Capital 144A 1.50% 5/1/23 # | | | 2,000,000 | | | | 1,994,380 | |
| | | | | | | | 7,911,243 | |
| Insurance — 4.94% | | | | | | | | |
| Athene Global Funding | | | | | | | | |
| 144A 0.914% 8/19/24 # | | | 2,150,000 | | | | 2,005,036 | |
| 144A 0.95% 1/8/24 # | | | 3,000,000 | | | | 2,872,577 | |
| Humana 5.75% 3/1/28 | | | 285,000 | | | | 296,204 | |
| MassMutual Global Funding II 144A 0.60% 4/12/24 # | | | 5,100,000 | | | | 4,872,813 | |
| Met Tower Global Funding 144A 3.70% 6/13/25 # | | | 2,100,000 | | | | 2,048,835 | |
| Metropolitan Life Global Funding I 144A 0.90% 6/8/23 # | | | 3,750,000 | | | | 3,717,277 | |
| New York Life Global Funding 144A 0.85% 1/15/26 # | | | 5,000,000 | | | | 4,509,206 | |
| Principal Life Global Funding II 144A 0.75% 4/12/24 # | | | 2,200,000 | | | | 2,103,752 | |
| Protective Life Global Funding 144A 0.631% 10/13/23 # | | | 2,250,000 | | | | 2,193,321 | |
| UnitedHealth Group 4.25% 1/15/29 | | | 2,900,000 | | | | 2,880,235 | |
| | | | | | | | 27,499,256 | |
| Natural Gas — 0.54% | | | | | | | | |
| Sempra Energy 3.30% 4/1/25 | | | 3,110,000 | | | | 3,011,915 | |
| | | | | | | | 3,011,915 | |
| Technology — 4.56% | | | | | | | | |
| Baidu 1.72% 4/9/26 | | | 1,050,000 | | | | 949,878 | |
| Micron Technology 6.75% 11/1/29 | | | 149,000 | | | | 158,361 | |
| Oracle 5.80% 11/10/25 | | | 1,355,000 | | | | 1,389,453 | |
| PayPal Holdings 1.65% 6/1/25 | | | 7,907,000 | | | | 7,425,884 | |
| Roper Technologies 1.00% 9/15/25 | | | 3,600,000 | | | | 3,293,821 | |
| S&P Global 2.45% 3/1/27 | | | 2,005,000 | | | | 1,881,650 | |
| Seagate HDD Cayman 4.75% 6/1/23 | | | 1,950,000 | | | | 1,942,804 | |
| Sensata Technologies | | | | | | | | |
| 144A 5.00% 10/1/25 # | | | 3,720,000 | | | | 3,696,564 | |
| 144A 5.625% 11/1/24 # | | | 950,000 | | | | 948,099 | |
| Thomson Reuters 4.30% 11/23/23 | | | 3,630,000 | | | | 3,600,346 | |
| Workday 3.50% 4/1/27 | | | 130,000 | | | | 124,467 | |
| | | | | | | | 25,411,327 | |
| Transportation — 0.59% | | | | | | | | |
| American Airlines 144A 5.50% 4/20/26 # | | | 328,283 | | | | 323,471 | |
| Penske Truck Leasing 144A 4.40% 7/1/27 # | | | 3,055,000 | | | | 2,933,345 | |
| | | | | | | | 3,256,816 | |
Total Corporate Bonds
(cost $329,015,257) | | | | | | | 316,328,282 | |
| |
| Non-Agency Asset-Backed Securities — 7.80% | | | | | | | | |
| BMW Vehicle Lease Trust | | | | | | | | |
| Series 2022-1 A3 1.10% 3/25/25 | | | 4,770,000 | | | | 4,650,908 | |
Schedules of investments
Delaware Ivy Limited-Term Bond Fund
| | | Principal | | |
| | | amount° | | Value (US $) | |
| Non-Agency Asset-Backed Securities (continued) | | | | | | | | |
| Discover Card Execution Note Trust | | | | | | | | |
| Series 2022-A4 A 5.03% 10/15/27 | | | 5,750,000 | | | $ | 5,824,388 | |
| Enterprise Fleet Financing | | | | | | | | |
| Series 2022-2 A2 144A 4.65% 5/21/29 # | | | 1,850,233 | | | | 1,830,983 | |
| Ford Credit Auto Owner Trust | | | | | | | | |
| Series 2022-A B 1.91% 7/15/27 | | | 3,550,000 | | | | 3,294,149 | |
| Ford Credit Floorplan Master Owner Trust A | | | | | | | | |
| Series 2020-2 A 1.06% 9/15/27 | | | 7,600,000 | | | | 6,937,211 | |
| GM Financial Automobile Leasing Trust | | | | | | | | |
| Series 2022-1 B 2.23% 2/20/26 | | | 4,150,000 | | | | 3,971,653 | |
| Hyundai Auto Lease Securitization Trust | | | | | | | | |
| Series 2023-A A3 144A 5.05% 1/15/26 # | | | 2,500,000 | | | | 2,502,500 | |
| Toyota Lease Owner Trust | | | | | | | | |
| Series 2021-B A3 144A 0.42% 10/21/24 # | | | 4,698,780 | | | | 4,612,670 | |
| Verizon Master Trust | | | | | | | | |
| Series 2022-2 A 1.53% 7/20/28 | | | 3,000,000 | | | | 2,830,162 | |
| Series 2022-2 B 1.83% 7/20/28 | | | 3,550,000 | | | | 3,345,426 | |
| Volkswagen Auto Lease Trust | | | | | | | | |
| Series 2022-A A3 3.44% 7/21/25 | | | 3,750,000 | | | | 3,675,650 | |
Total Non-Agency Asset-Backed Securities
(cost $44,391,780) | | | | | | | 43,475,700 | |
| |
| Supranational Bank — 0.27% | | | | | | | | |
| Corp Andina de Fomento 2.375% 5/12/23 | | | 1,500,000 | | | | 1,495,156 | |
Total Supranational Bank
(cost $1,499,869) | | | | | | | 1,495,156 | |
| |
| US Treasury Obligations — 13.58% | | | | | | | | |
| US Treasury Notes | | | | | | | | |
| 3.625% 3/31/30 | | | 145,000 | | | | 145,702 | |
| 3.875% 1/15/26 | | | 49,265,000 | | | | 49,286,169 | |
| 4.00% 2/15/26 | | | 21,415,000 | | | | 21,506,181 | |
| 4.25% 10/15/25 | | | 4,645,000 | | | | 4,681,834 | |
Total US Treasury Obligations
(cost $75,118,413) | | | | | | | 75,619,886 | |
| | | | | |
| Short-Term Investments — 0.57% | | | | |
| Money Market Mutual Funds — 0.57% | | | | | | | | |
| BlackRock Liquidity FedFund – | | | | | | | | |
| Institutional Shares (seven-day effective yield 4.72%) | | | 799,606 | $ | | | 799,606 | |
| Fidelity Investments Money | | | | | | | | |
| Market Government Portfolio – Class I (seven-day effective yield 4.72%) | | | 799,606 | | | | 799,606 | |
| Goldman Sachs Financial Square | | | | | | | | |
| Government Fund – Institutional Shares (seven-day effective yield 4.84%) | | | 799,606 | | | | 799,606 | |
| Morgan Stanley Institutional | | | | | | | | |
| Liquidity Funds Government Portfolio – Institutional Class (seven-day effective yield 4.73%) | | | 799,607 | | | | 799,607 | |
| Total Short-Term Investments | | | | | | | | |
| (cost $3,198,425) | | | | | | | 3,198,425 | |
| Total Value of Securities—99.53% | | | | | | | | |
| (cost $570,719,968) | | | | | | $ | 554,455,632 | |
| ° | Principal amount shown is stated in USD unless noted that the security is denominated in another currency. |
| # | Security exempt from registration under Rule 144A of the Securities Act of 1933, as amended. At March 31, 2023, the aggregate value of Rule 144A securities was $204,065,665, which represents 36.63% of the Fund’s net assets. See Note 13 in “Notes to financial statements.” |
| • | Variable rate investment. Rates reset periodically. Rate shown reflects the rate in effect at March 31, 2023. For securities based on a published reference rate and spread, the reference rate and spread are indicated in their descriptions. The reference rate descriptions (i.e. LIBOR03M, LIBOR06M, etc.) used in this report are identical for different securities, but the underlying reference rates may differ due to the timing of the reset period. Certain variable rate securities are not based on a published reference rate and spread but are determined by the issuer or agent and are based on current market conditions, or for mortgage-backed securities, are impacted by the individual mortgages which are paying off over time. These securities do not indicate a reference rate and spread in their descriptions. |
| µ | Fixed to variable rate investment. The rate shown reflects the fixed rate in effect at March 31, 2023. Rate will reset at a future date. |
The following futures contracts were outstanding at March 31, 2023:1
Futures Contracts
Exchange-Traded
| | | | | | | | | | | | | | | | | | | Variation | |
| | | | | | | | | | | | | | | | | | | Margin | |
| | | | | | | | Notional | | | | | Value/ | | | Value/ | | | Due from | |
| | | | | Notional | | | Cost | | | Expiration | | Unrealized | | | Unrealized | | | (Due to) | |
| Contracts to Buy (Sell) | | Amount | | | (Proceeds) | | | Date | | Appreciation | | | Depreciation | | | Brokers | |
| 337 | | US Treasury 2 yr Notes | | $ | 69,574,702 | | | $ | 68,811,574 | | | 6/30/23 | | $ | 763,128 | | | $ | — | | | $ | 47,391 | |
| (24) | | US Treasury 5 yr Notes | | | (2,628,187 | ) | | | (2,573,943 | ) | | 6/30/23 | | | — | | | | (54,244 | ) | | | — | |
| Total Futures Contracts | | | | | | $ | 66,237,631 | | | | | $ | 763,128 | | | $ | (54,244 | ) | | $ | 47,391 | |
The use of futures contracts involves elements of market risk and risks in excess of the amounts disclosed in the financial statements. The notional amounts presented above represent the Fund’s total exposure in such contracts, whereas only the variation margin is reflected in the Fund’s net assets.
| 1 | See Note 10 in “Notes to financial statements.” |
Summary of abbreviations:
CLO – Collateralized Loan Obligation
DAC – Designated Activity Company
FREMF – Freddie Mac Multifamily
GNMA – Government National Mortgage Association
ICE – Intercontinental Exchange, Inc.
LIBOR – London Interbank Offered Rate
LIBOR01M – ICE LIBOR USD 1 Month
LIBOR03M – ICE LIBOR USD 3 Month
LIBOR06M – ICE LIBOR USD 6 Month
S&P – Standard & Poor’s Financial Services LLC
TSFR03M – 3 Month Term Secured Overnight Financing Rate
USD – US Dollar
yr – Year
See accompanying notes, which are an integral part of the financial statements.
Schedules of investments
| Delaware Ivy Managed International Opportunities Fund | | March 31, 2023 |
| | | Number of | | | | |
| | | shares | | | Value (US $) | |
| Affiliated Mutual Funds — 99.60% | | | | | | | | |
| Global / International Equity Funds — 99.60% | | | | | | | | |
| Delaware Ivy International Core Equity Fund Class R6 << | | | 2,022,718 | | | $ | 38,532,783 | |
| Delaware Ivy International Small Cap Fund Class R6 << | | | 417,339 | | | | 3,785,266 | |
| Delaware Ivy International Value Fund Class R6 << | | | 1,045,373 | | | | 16,182,372 | |
| Delaware Ivy Systematic Emerging Markets Equity Fund Class R6 << | | | 1,066,643 | | | | 19,434,227 | |
| Total Affiliated Mutual Funds (cost $64,304,504) | | | | | | | 77,934,648 | |
| |
| Short-Term Investments — 0.49% | | | | | | | | |
| Money Market Mutual Funds — 0.49% | | | | | | | | |
| BlackRock Liquidity FedFund – Institutional Shares (seven-day effective yield 4.72%) | | | 96,986 | | | | 96,986 | |
| Fidelity Investments Money Market Government Portfolio – Class I (seven-day effective yield 4.72%) | | | 96,986 | | | | 96,986 | |
| Goldman Sachs Financial Square Government Fund – Institutional Shares (seven-day effective yield 4.84%) | | | 96,986 | | | | 96,986 | |
| Morgan Stanley Institutional Liquidity Funds Government Portfolio – Institutional Class (seven-day effective yield 4.73%) | | | 96,986 | | | | 96,986 | |
Total Short-Term Investments
(cost $387,944) | | | | | | | 387,944 | |
Total Value of Securities—100.09%
(cost $64,692,448) | | | | | | $ | 78,322,592 | |
<< Affiliated company. See Note 2 in “Notes to financial statements.”
See accompanying notes, which are an integral part of the financial statements.
Delaware Ivy Mid Cap Growth Fund | March 31, 2023 |
| | | Number of | | | | |
| | | shares | | | Value (US $) | |
| Common Stocks — 97.51%t | | | | | | | | |
| Communication Services — 6.79% | | | | | | | | |
| Pinterest Class A † | | | 5,882,114 | | | $ | 160,405,249 | |
| Shutterstock | | | 1,004,097 | | | | 72,897,442 | |
| Trade Desk Class A † | | | 1,831,708 | | | | 111,569,334 | |
| ZoomInfo Technologies † | | | 2,197,913 | | | | 54,310,430 | |
| | | | | | | | 399,182,455 | |
| Consumer Discretionary — 13.99% | | | | | | | | |
| BorgWarner | | | 3,017,625 | | | | 148,195,564 | |
| Floor & Decor Holdings Class A † | | | 946,280 | | | | 92,943,622 | |
| Foot Locker | | | 1,634,237 | | | | 64,862,866 | |
| Levi Strauss & Co. Class A | | | 3,799,049 | | | | 69,256,663 | |
| Lululemon Athletica † | | | 247,618 | | | | 90,179,999 | |
| National Vision Holdings † | | | 2,012,320 | | | | 37,912,109 | |
| On Holding Class A † | | | 2,985,758 | | | | 92,648,071 | |
| Petco Health & Wellness † | | | 3,662,026 | | | | 32,958,234 | |
| Pool | | | 301,569 | | | | 103,269,288 | |
| Vail Resorts | | | 384,492 | | | | 89,848,091 | |
| | | | | | | | 822,074,507 | |
| Consumer Staples — 1.25% | | | | | | | | |
| Brown-Forman Class B | | | 1,148,440 | | | | 73,810,239 | |
| | | | | | | | 73,810,239 | |
| Financials — 4.97% | | | | | | | | |
| Kinsale Capital Group | | | 207,339 | | | | 62,232,801 | |
| MarketAxess Holdings | | | 587,074 | | | | 229,716,185 | |
| | | | | | | | 291,948,986 | |
| Healthcare — 18.29% | | | | | | | | |
| Agilent Technologies | | | 575,948 | | | | 79,676,646 | |
| Bio-Techne | | | 1,130,016 | | | | 83,835,887 | |
| Cooper | | | 82,475 | | | | 30,792,866 | |
| Dexcom ~, † | | | 1,743,061 | | | | 202,508,827 | |
| Edwards Lifesciences † | | | 928,181 | | | | 76,788,414 | |
| Envista Holdings † | | | 2,636,711 | | | | 107,788,746 | |
| Genmab ADR † | | | 2,297,882 | | | | 86,768,025 | |
| Intuitive Surgical † | | | 404,144 | | | | 103,246,668 | |
| Repligen † | | | 648,342 | | | | 109,154,859 | |
| Seagen † | | | 542,062 | | | | 109,751,293 | |
| West Pharmaceutical Services | | | 245,411 | | | | 85,027,549 | |
| | | | | | | | 1,075,339,780 | |
| Industrials — 17.43% | | | | | | | | |
| A O Smith | | | 1,276,004 | | | | 88,235,677 | |
| Clarivate † | | | 4,499,259 | | | | 42,248,042 | |
| Copart † | | | 1,011,018 | | | | 76,038,664 | |
| CoStar Group ~, † | | | 3,225,114 | | | | 222,049,099 | |
| Fastenal ~ | | | 1,674,307 | | | | 90,312,120 | |
| Generac Holdings † | | | 637,235 | | | | 68,827,752 | |
| HEICO Class A | | | 968,430 | | | | 131,609,637 | |
| Howmet Aerospace | | | 976,088 | | | | 41,356,848 | |
| IDEX | | | 344,081 | | | | 79,493,033 | |
| Lincoln Electric Holdings | | | 374,507 | | | | 63,329,134 | |
| Trex † | | | 1,859,071 | | | | 90,480,986 | |
| WillScot Mobile Mini Holdings † | | | 647,580 | | | | 30,358,550 | |
| | | | | | | | 1,024,339,542 | |
| Information Technology — 33.75% | | | | | | | | |
| Arista Networks † | | | 764,947 | | | | 128,404,003 | |
| Coherent † | | | 2,290,558 | | | | 87,224,449 | |
| Crowdstrike Holdings Class A † | | | 680,165 | | | | 93,359,448 | |
| DocuSign † | | | 1,480,689 | | | | 86,324,169 | |
| DoubleVerify Holdings † | | | 647,881 | | | | 19,533,612 | |
| EngageSmart † | | | 1,449,717 | | | | 27,907,052 | |
| HubSpot † | | | 144,402 | | | | 61,912,358 | |
| Keysight Technologies † | | | 654,344 | | | | 105,663,469 | |
| Littelfuse | | | 271,434 | | | | 72,768,741 | |
| Marvell Technology | | | 2,610,063 | | | | 113,015,728 | |
| Microchip Technology | | | 1,735,924 | | | | 145,435,713 | |
| Monolithic Power Systems | | | 375,926 | | | | 188,166,000 | |
| Novanta † | | | 489,253 | | | | 77,835,260 | |
| Paycom Software † | | | 366,027 | | | | 111,275,868 | |
| Teradyne | | | 1,296,162 | | | | 139,350,377 | |
| Trimble † | | | 1,667,935 | | | | 87,433,153 | |
| Tyler Technologies † | | | 328,886 | | | | 116,636,131 | |
| Universal Display | | | 676,250 | | | | 104,906,662 | |
| Workday Class A † | | | 375,748 | | | | 77,606,992 | |
| Workiva † | | | 812,396 | | | | 83,197,474 | |
| Zebra Technologies Class A † | | | 174,437 | | | | 55,470,966 | |
| | | | | | | | 1,983,427,625 | |
| Materials — 1.04% | | | | | | | | |
| Martin Marietta Materials | | | 171,670 | | | | 60,953,150 | |
| | | | | | | | 60,953,150 | |
Total Common Stocks
(cost $4,423,486,355) | | | | | | | 5,731,076,284 | |
| |
| Short-Term Investments — 2.70% | | | | | | | | |
| Money Market Mutual Funds — 2.70% | | | | | | | | |
| BlackRock Liquidity FedFund – Institutional Shares (seven-day effective yield 4.72%) | | | 39,660,643 | | | | 39,660,643 | |
| Fidelity Investments Money Market Government Portfolio – Class I (seven-day effective yield 4.72%) | | | 39,660,643 | | | | 39,660,643 | |
| Goldman Sachs Financial Square Government Fund – Institutional Shares (seven-day effective yield 4.84%) | | | 39,660,643 | | | | 39,660,643 | |
Schedules of investments
Delaware Ivy Mid Cap Growth Fund
| | | Number of | | | | |
| | | shares | | | Value (US $) | |
| Short-Term Investments (continued) | | | | | | | | |
| Money Market Mutual Funds (continued) | | | | | | | | |
| Morgan Stanley Institutional Liquidity Funds Government Portfolio – Institutional Class (seven-day effective yield 4.73%) | | | 39,660,642 | | | $ | 39,660,642 | |
Total Short-Term Investments
(cost $158,642,571) | | | | | | | 158,642,571 | |
Total Value of Securities—100.21%
(cost $4,582,128,926) | | | | | | $ | 5,889,718,855 | |
| t | Narrow industries are utilized for compliance purposes for concentration whereas broad sectors are used for financial reporting. |
| † | Non-income producing security. |
| ~ | All or portion of the security has been pledged as collateral with outstanding options written. |
Summary of abbreviations:
ADR – American Depositary Receipt
See accompanying notes, which are an integral part of the financial statements.
| Delaware Ivy Mid Cap Income Opportunities Fund | | March 31, 2023 |
| | | Number of | | | | |
| | | shares | | | Value (US $) | |
| Common Stocks — 99.09% | | | | | | | | |
| Consumer Discretionary — 22.67% | | | | | | | | |
| Darden Restaurants | | | 231,467 | | | $ | 35,914,420 | |
| Foot Locker | | | 895,472 | | | | 35,541,284 | |
| Garmin | | | 363,646 | | | | 36,699,154 | |
| Polaris | | | 331,399 | | | | 36,662,671 | |
| Service Corp. International | | | 532,673 | | | | 36,637,249 | |
| Tractor Supply | | | 155,359 | | | | 36,515,579 | |
| Travel + Leisure | | | 949,376 | | | | 37,215,539 | |
| Vail Resorts | | | 159,491 | | | | 37,269,857 | |
| | | | | | | | 292,455,753 | |
| Consumer Staples — 8.44% | | | | | | | | |
| Clorox | | | 230,231 | | | | 36,431,753 | |
| McCormick & Co. | | | 440,899 | | | | 36,687,206 | |
| Sysco | | | 462,605 | | | | 35,726,984 | |
| | | | | | | | 108,845,943 | |
| Financials — 16.89% | | | | | | | | |
| Ares Management Class A | | | 439,816 | | | | 36,698,247 | |
| Arthur J. Gallagher & Co. | | | 189,423 | | | | 36,238,514 | |
| Columbia Banking System | | | 1,704,809 | | | | 36,517,009 | |
| Discover Financial Services | | | 366,513 | | | | 36,226,145 | |
| First American Financial | | | 664,088 | | | | 36,963,138 | |
| Glacier Bancorp | | | 837,254 | | | | 35,173,041 | |
| | | | | | | | 217,816,094 | |
| Healthcare — 2.85% | | | | | | | | |
| Encompass Health | | | 680,498 | | | | 36,814,942 | |
| | | | | | | | 36,814,942 | |
| Industrials — 19.69% | | | | | | | | |
| Fastenal | | | 675,873 | | | | 36,456,590 | |
| L3Harris Technologies | | | 183,934 | | | | 36,095,208 | |
| nVent Electric | | | 849,976 | | | | 36,497,969 | |
| Paychex | | | 308,549 | | | | 35,356,630 | |
| Snap-on | | | 148,214 | | | | 36,592,554 | |
| Stanley Black & Decker | | | 459,517 | | | | 37,027,880 | |
| Watsco | | | 113,080 | | | | 35,977,533 | |
| | | | | | | | 254,004,364 | |
| Information Technology — 14.31% | | | | | | | | |
| Broadridge Financial Solutions | | | 250,392 | | | | 36,699,955 | |
| Microchip Technology | | | 442,698 | | | | 37,089,238 | |
| NetApp | | | 576,970 | | | | 36,839,535 | |
| Seagate Technology Holdings | | | 561,232 | | | | 37,108,660 | |
| TE Connectivity | | | 281,101 | | | | 36,866,396 | |
| | | | | | | | 184,603,784 | |
| Materials — 14.24% | | | | | | | | |
| Avery Dennison | | | 206,727 | | | | 36,989,662 | |
| Packaging Corp. of America | | | 261,952 | | | | 36,366,796 | |
| PPG Industries | | | 279,172 | | | | 37,291,796 | |
| RPM International | | | 417,553 | | | | 36,427,324 | |
| Sonoco Products | | | 599,481 | | | | 36,568,341 | |
| | | | | | | | 183,643,919 | |
Total Common Stocks
(cost $1,016,505,870) | | | | | | | 1,278,184,799 | |
| |
| Short-Term Investments — 0.11% | | | | | | | | |
| Money Market Mutual Funds — 0.11% | | | | | | | | |
| BlackRock Liquidity FedFund – Institutional Shares (seven- day effective yield 4.72%) | | | 355,965 | | | | 355,965 | |
| Fidelity Investments Money Market Government Portfolio – Class I (seven-day effective yield 4.72%) | | | 355,964 | | | | 355,964 | |
| Goldman Sachs Financial Square Government Fund – Institutional Shares (seven-day effective yield 4.84%) | | | 355,965 | | | | 355,965 | |
| Morgan Stanley Institutional Liquidity Funds Government Portfolio – Institutional Class (seven-day effective yield 4.73%) | | | 355,965 | | | | 355,965 | |
Total Short-Term Investments
(cost $1,423,859) | | | | | | | 1,423,859 | |
Total Value of Securities—99.20%
(cost $1,017,929,729) | | | | | | $ | 1,279,608,658 | |
See accompanying notes, which are an integral part of the financial statements.
Schedules of investments
| Delaware Ivy Municipal Bond Fund | March 31, 2023 |
| | | Principal | | | | |
| | | amount° | | | Value (US $) | |
| Municipal Bonds — 98.74% | | | | | | | | |
| Education Revenue Bonds — 6.00% | | | | | | | | |
| Arizona Industrial Development Authority Revenue | | | | | | | | |
| (Leman Academy of Excellence of Projects) | | | | | | | | |
| Series A 4.50% 7/1/54 | | | 1,320,000 | | | $ | 1,185,043 | |
| California Educational Facilities Authority | | | | | | | | |
| (Stanford University) | | | | | | | | |
| Series U-7 5.00% 6/1/46 | | | 6,500,000 | | | | 7,751,575 | |
| Series V-1 5.00% 5/1/49 | | | 3,100,000 | | | | 3,671,950 | |
| Chicago, Illinois Board of Education | | | | | | | | |
| ICE 5.75% 4/1/48 (BAM) | | | 4,075,000 | | | | 4,540,284 | |
| Clifton Higher Education Finance Revenue | | | | | | | | |
| Series A 4.25% 12/1/34 | | | 3,000,000 | | | | 3,006,270 | |
| Utah Charter School Finance Authority | | | | | | | | |
| (Syracuse Arts Academy Project) | | | | | | | | |
| 5.00% 4/15/37 | | | 1,000,000 | | | | 1,030,440 | |
| | | | | | | | 21,185,562 | |
| Electric Revenue Bonds — 6.60% | | | | | | | | |
| Illinois Municipal Electric Agency | | | | | | | | |
| Series A 5.00% 2/1/32 | | | 3,695,000 | | | | 3,855,104 | |
| Missouri Joint Municipal Electric Utility Commission | | | | | | | | |
| Series A 5.00% 12/1/36 | | | 5,650,000 | | | | 5,817,297 | |
| Series A 5.00% 12/1/37 | | | 1,000,000 | | | | 1,028,350 | |
| Modesto Irrigation District | | | | | | | | |
| Series A 5.00% 10/1/36 | | | 4,270,000 | | | | 4,498,957 | |
| Puerto Rico Electric Power Authority Revenue | | | | | | | | |
| Series AAA 5.25% 7/1/25 ‡ | | | 225,000 | | | | 160,875 | |
| Series WW 5.00% 7/1/28 ‡ | | | 510,000 | | | | 363,375 | |
| Series XX 4.75% 7/1/26 ‡ | | | 185,000 | | | | 131,812 | |
| Series ZZ 4.75% 7/1/27 ‡ | | | 145,000 | | | | 103,313 | |
| Series ZZ 5.25% 7/1/24 ‡ | | | 315,000 | | | | 225,225 | |
| Salt River, Arizona Project Agricultural Improvement & Power District Electric System Revenue | | | | | | | | |
| Series A 5.00% 1/1/50 | | | 5,000,000 | | | | 5,593,550 | |
| Utility Debt Securitization Authority | | | | | | | | |
| Series TE 5.00% 12/15/31 | | | 1,500,000 | | | | 1,524,855 | |
| | | | | | | | 23,302,713 | |
| Healthcare Revenue Bonds — 15.36% | | | | | | | | |
| Arizona Industrial Development Authority Hospital Revenue | | | | | | | | |
| (Phoenix Children’s Hospital) | | | | | | | | |
| Series A 4.00% 2/1/50 | | | 4,000,000 | | | | 3,768,920 | |
| Brookhaven Development Authority | | | | | | | | |
| Series A 4.00% 7/1/44 | | | 1,000,000 | | | | 997,920 | |
| Colorado Health Facilities Authority Revenue | | | | | | | | |
| (AdventHealth Obligated Group) | | | | | | | | |
| Series A 3.00% 11/15/51 | | | 1,500,000 | | | | 1,133,820 | |
| Series A 4.00% 11/15/50 | | | 2,500,000 | | | | 2,334,375 | |
| Series A-2 4.00% 8/1/49 | | | 1,015,000 | | | | 906,872 | |
| Hamilton County Ohio Hospital Facilities Revenue | | | | | | | | |
| (Cincinnati Children’s Hospital Project) | | | | | | | | |
| Series CC 5.00% 11/15/49 | | | 6,460,000 | | | | 7,150,639 | |
| Hawaii Department of Budget & Finance Special Purpose Revenue | | | | | | | | |
| Series A 5.00% 7/1/35 | | | 500,000 | | | | 520,170 | |
| Hillsborough County Industrial Development Authority Revenue | | | | | | | | |
| Series A 3.50% 8/1/55 | | | 5,000,000 | | | | 3,941,500 | |
| Illinois Finance Authority | | | | | | | | |
| (NorthShore - Edward- Elmhurst Health Credit Group) | | | | | | | | |
| Series A 5.00% 8/15/51 | | | 3,985,000 | | | | 4,202,979 | |
| Lake County Port & Economic Development Authority | | | | | | | | |
| Series A 144A 6.75% 12/1/52 #, ‡ | | | 1,300,000 | | | | 377,000 | |
| Maricopa County Industrial Development Authority | | | | | | | | |
| Series A 4.00% 1/1/38 | | | 5,000,000 | | | | 5,034,900 | |
| Missouri Health & Educational Facilities Revenue | | | | | | | | |
| (Mercy Health) | | | | | | | | |
| 4.00% 6/1/53 (BAM) | | | 2,440,000 | | | | 2,388,711 | |
| New Hope Cultural Education Facilities Finance Texas Senior Living Revenue | | | | | | | | |
| Series A-1 5.50% 1/1/57 | | | 3,500,000 | | | | 2,539,180 | |
| Series A-2 6.50% 1/1/31 | | | 9,865,000 | | | | 8,978,038 | |
| | | Principal | | | | |
| | | amount° | | | Value (US $) | |
| Municipal Bonds (continued) | | | | | | | | |
| Healthcare Revenue Bonds (continued) | | | | | | | | |
| Pennsylvania Economic Development Financing Authority First Mortgage Revenue | | | | | | | | |
| (Tapestry Moon Senior Housing Project) | | | | | | | | |
| Series A | | | | | | | | |
| 144A 6.50% 12/1/38 #, ‡ | | | 3,285,000 | | | $ | 1,252,406 | |
| Series A | | | | | | | | |
| 144A 6.75% 12/1/53 #, ‡ | | | 3,765,000 | | | | 1,435,407 | |
| Union County, Oregon Hospital Facility Authority Revenue | | | | | | | | |
| (Grande Ronde Hospital Project) | | | | | | | | |
| 5.00% 7/1/40 | | | 1,000,000 | | | | 1,039,950 | |
| 5.00% 7/1/42 | | | 1,185,000 | | | | 1,223,939 | |
| Washington Health Care Facilities Authority | | | | | | | | |
| Series D 5.00% 10/1/38 | | | 5,000,000 | | | | 5,009,450 | |
| | | | | | | | 54,236,176 | |
| Housing Revenue Bonds — 1.23% | | | | | | | | |
| Nebraska Investment Finance Authority | | | | | | | | |
| Series A 2.35% 9/1/35 | | | 2,500,000 | | | | 2,197,825 | |
| New York City Housing Development Multifamily Revenue | | | | | | | | |
| Series A-1-B 2.05% 11/1/31 | | | 520,000 | | | | 467,137 | |
| Series A-1-B 2.15% 11/1/32 | | | 970,000 | | | | 859,963 | |
| North Carolina Housing Finance Agency | | | | | | | | |
| Series 44 2.55% 7/1/35 | | | 905,000 | | | | 804,047 | |
| | | | | | | | 4,328,972 | |
| Industrial Development Revenue/Pollution Control | | | | | | | | |
| Revenue Bonds — 12.55% | | | | | | | | |
| Buckeye, Ohio Tobacco Settlement Financing Authority | | | | | | | | |
| Series A-2 3.00% 6/1/48 | | | 6,110,000 | | | | 4,477,164 | |
| Series A-2 4.00% 6/1/48 | | | 4,010,000 | | | | 3,544,078 | |
| Florida Development Finance Revenue | | | | | | | | |
| (Brightline Florida Passenger Rail Expansion Project) | | | | | | | | |
| Series A 144A 7.50% 7/1/57 (AMT) #, • | | | 1,000,000 | | | | 987,580 | |
| Florida Development Finance Surface Transportation Facilities Revenue | | | | | | | | |
| (Brightline Passenger Rail Project - Green Bonds) | | | | | | | | |
| Series B 144A 7.375% 1/1/49 (AMT) # | | | 4,360,000 | | | | 4,028,771 | |
| George L Smith II Congress Center Authority | | | | | | | | |
| Series A 2.375% 1/1/31 | | | 1,000,000 | | | | 877,200 | |
| Series A 4.00% 1/1/54 | | | 2,000,000 | | | | 1,586,620 | |
| Golden State, California Tobacco Securitization Settlement Revenue | | | | | | | | |
| (Capital Appreciation) | | | | | | | | |
| Subordinate Series B- 2 0.913% 6/1/66 ^ | | | 15,425,000 | | | | 1,566,717 | |
| Indiana Finance Authority Exempt Facility Revenue | | | | | | | | |
| (Polyflow Indiana Project - Green Bond) | | | | | | | | |
| 144A 7.00% 3/1/39 (AMT) # | | | 2,580,000 | | | | 1,948,003 | |
| Iowa Finance Authority Midwestern Disaster Area Revenue 5.00% 12/1/50 | | | 2,140,000 | | | | 2,086,628 | |
| New York City Industrial Development Agency | | | | | | | | |
| 0.009% 3/1/27 ^ | | | 3,000,000 | | | | 2,618,070 | |
| 0.011% 3/1/26 ^ | | | 3,185,000 | | | | 2,877,711 | |
| 0.014% 3/1/25 ^ | | | 3,175,000 | | | | 2,964,593 | |
| New York Counties Tobacco Trust V | | | | | | | | |
| Series 4B 144A 0.242% 6/1/60 #, ^ | | | 402,200,000 | | | | 14,764,762 | |
| | | | | | | | 44,327,897 | |
| Lease Revenue Bonds — 8.62% | | | | | | | | |
| Fayette County School District Finance | | | | | | | | |
| 5.00% 6/1/47 (BAM) | | | 1,370,000 | | | | 1,479,984 | |
| Metropolitan Pier & Exposition Authority Illinois Revenue | | | | | | | | |
| Series B 4.178% 12/15/54 (BAM) ^ | | | 25,445,000 | | | | 5,447,774 | |
Schedules of investments
Delaware Ivy Municipal Bond Fund
| | | Principal | | | | |
| | | amount° | | | Value (US $) | |
| Municipal Bonds (continued) | | | | | | | | |
| Lease Revenue Bonds (continued) | | | | | | | | |
| Michigan State Building Authority | | | | | | | | |
| Series I 5.00% 4/15/34 | | | 2,500,000 | | | $ | 2,620,350 | |
| New Jersey State Transportation Trust Fund Authority Revenue | | | | | | | | |
| (Transportation System) | | | | | | | | |
| Series A 5.50% 12/15/39 ^ | | | 12,890,000 | | | | 6,115,273 | |
| Series AA 4.00% 6/15/50 (BAM) | | | 4,210,000 | | | | 4,042,779 | |
| New York City Transitional Finance Authority Building Aid Revenue | | | | | | | | |
| Series S-3A 5.00% 7/15/36 | | | 2,000,000 | | | | 2,197,860 | |
| New York Liberty Development Revenue | | | | | | | | |
| (Green Bonds) | | | | | | | | |
| Series A 2.875% 11/15/46 (BAM) | | | 9,425,000 | | | | 7,066,394 | |
| Regional Transportation District 5.00% 6/1/35 | | | 1,435,000 | | | | 1,488,081 | |
| | | | | | | | 30,458,495 | |
| Local General Obligation Bonds — 3.85% | | | | | | | | |
| Lincoln Consolidated School District | | | | | | | | |
| Series A 5.00% 5/1/35 (AGM) | | | 500,000 | | | | 533,210 | |
| Mida Golf and Equestrian Center Public Infrastructure District | | | | | | | | |
| 144A 4.50% 6/1/51 # | | | 2,500,000 | | | | 1,913,225 | |
| 144A 4.625% 6/1/57 # | | | 2,000,000 | | | | 1,509,640 | |
| Palomar Health | | | | | | | | |
| Series A 15.36% 8/1/33 ^ | | | 5,000,000 | | | | 3,499,100 | |
| Series A 16.10% 8/1/32 ^ | | | 5,000,000 | | | | 3,643,450 | |
| Series A 16.984% 8/1/31 ^ | | | 3,315,000 | | | | 2,510,582 | |
| | | | | | | | 13,609,207 | |
| Pre-Refunded/Escrowed to Maturity Bonds — 2.60% | | | | | | | | |
| Central Texas Turnpike System 1st Tier 13.777% 8/15/26 ^ | | | 1,340,000 | | | | 1,226,395 | |
| Metropolitan Washington Airports Authority Dulles Toll Road Revenue | | | | | | | | |
| Series C 6.50% 10/1/41-26 § | | | 7,000,000 | | | | 7,952,350 | |
| | | | | | | | 9,178,745 | |
| Special Tax Revenue Bonds — 19.08% | | | | | | | | |
| Commonwealth of Puerto Rico | | | | | | | | |
| Series C 3.116% 11/1/43 •, ^ | | | 17,781,327 | | | | 7,757,104 | |
| (Restructured) | | | | | | | | |
| 6.014% 11/1/51•,^ | | | 1,511,427 | | | | 510,107 | |
| GDB Debt Recovery Authority of Puerto Rico | | | | | | | | |
| (Taxable) | | | | | | | | |
| 7.50% 8/20/40 | | | 19,738,197 | | | | 16,382,704 | |
| Matching Fund Special Purpose Securitization | | | | | | | | |
| Series A 5.00% 10/1/39 | | | 3,130,000 | | | | 3,072,784 | |
| New York Convention Center Development Revenue | | | | | | | | |
| 5.00% 11/15/34 | | | 2,000,000 | | | | 2,070,180 | |
| New York State Dormitory Authority Personal Income Tax Revenue | | | | | | | | |
| (General Purpose) | | | | | | | | |
| Series E 3.00% 3/15/50 | | | 2,500,000 | | | | 1,920,750 | |
| Puerto Rico Sales Tax Financing Revenue | | | | | | | | |
| Series A-1 5.168% 7/1/51 ^ | | | 69,134,000 | | | | 13,454,859 | |
| Series A-1 5.373% 7/1/46 ^ | | | 26,435,000 | | | | 6,941,567 | |
| (Restructured) | | | | | | | | |
| Series A-1 4.75% 7/1/53 | | | 3,730,000 | | | | 3,421,156 | |
| Series A-1 5.00% 7/1/58 | | | 6,900,000 | | | | 6,514,773 | |
| Series A-2 4.329% 7/1/40 | | | 2,340,000 | | | | 2,135,343 | |
| Regional Transportation Authority | | | | | | | | |
| Series A 6.00% 7/1/24 | | | 3,080,000 | | | | 3,193,775 | |
| | | | | | | | 67,375,102 | |
| State General Obligation Bonds — 3.18% | | | | | | | | |
| California State | | | | | | | | |
| (Various Purpose) | | | | | | | | |
| 5.00% 4/1/37 | | | 5,000,000 | | | | 5,010,500 | |
| Commonwealth of Puerto Rico | | | | | | | | |
| (Restructured) | | | | | | | | |
| Series A-1 4.00% 7/1/46 | | | 3,700,000 | | | | 2,895,065 | |
| Illinois State | | | | | | | | |
| Series A 5.50% 3/1/47 | | | 3,000,000 | | | | 3,308,850 | |
| | | | | | | | 11,214,415 | |
| Transportation Revenue Bonds — 16.20% | | | | | | | | |
| Central Texas Turnpike System | | | | | | | | |
| Series A 13.746% 8/15/26 ^ | | | 15,000,000 | | | | 13,674,450 | |
| Chicago O’Hare International Airport | | | | | | | | |
| Series A 5.00% 1/1/38 (AMT) | | | 605,000 | | | | 638,372 | |
| Series B 5.00% 1/1/34 | | | 1,000,000 | | | | 1,029,880 | |
| Series D 5.25% 1/1/37 | | | 1,500,000 | | | | 1,591,785 | |
| Foothill-Eastern Transportation Corridor Agency Revenue | | | | | | | | |
| (Senior Lien) | | | | | | | | |
| Series A 4.00% 1/15/46 | | | 2,000,000 | | | | 1,875,000 | |
| | | Principal | | | | |
| | | amount° | | | Value (US $) | |
| Municipal Bonds (continued) | | | | | | | | |
| Transportation Revenue Bonds (continued) | | | | | | | | |
| Illinois State Toll Highway Authority | | | | | | | | |
| Series B 5.00% 1/1/37 | | | 1,500,000 | | | $ | 1,576,725 | |
| Metropolitan Transportation Authority | | | | | | | | |
| Series C 5.00% 11/15/36 | | | 1,125,000 | | | | 1,137,251 | |
| Series C-1 5.00% 11/15/35 | | | 2,500,000 | | | | 2,573,450 | |
| Miami-Dade County Florida Aviation Revenue | | | | | | | | |
| Series A 4.00% 10/1/44 (AMT) | | | 1,500,000 | | | | 1,412,310 | |
| Monroe County Airport Revenue | | | | | | | | |
| 5.00% 10/1/42 (AMT) | | | 1,505,000 | | | | 1,553,280 | |
| 5.00% 10/1/52 (AMT) | | | 2,445,000 | | | | 2,473,020 | |
| 5.25% 10/1/47 (AMT) | | | 1,100,000 | | | | 1,141,096 | |
| North Carolina Turnpike Authority | | | | | | | | |
| Series B 5.296% 1/1/34 ^ | | | 10,000,000 | | | | 6,817,300 | |
| North Texas Tollway Authority | | | | | | | | |
| 1st Tier 15.18% 1/1/30 ^ | | | 12,000,000 | | | | 9,571,920 | |
| Pennsylvania Turnpike Commission | | | | | | | | |
| Series C 6.25% 6/1/33 (AGM) | | | 4,000,000 | | | | 4,431,680 | |
| Port of Portland Oregon Airport Revenue | | | | | | | | |
| Series 23 5.00% 7/1/33 | | | 3,500,000 | | | | 3,666,950 | |
| Port of Seattle | | | | | | | | |
| Series B 5.00% 3/1/35 | | | 2,000,000 | | | | 2,046,440 | |
| | | | | | | | 57,210,909 | |
| Water & Sewer Revenue Bonds — 3.47% | | | | | | | | |
| Los Angeles California Wastewater System Revenue | | | | | | | | |
| Series D 5.00% 6/1/34 | | | 1,500,000 | | | | 1,574,880 | |
| New York City Municipal Water Finance Authority | | | | | | | | |
| Series HH 5.00% 6/15/37 | | | 5,000,000 | | | | 5,197,550 | |
| Texas Water Development Board | | | | | | | | |
| Series B 5.00% 10/15/38 | | | 5,000,000 | | | | 5,472,300 | |
| | | | | | | | 12,244,730 | |
Total Municipal Bonds
(cost $359,397,694) | | | | | | | 348,672,923 | |
| | | | | | | | | |
| Short-Term Investments — 0.56% | | | | | | | | |
| Money Market Mutual Funds — 0.56% | | | | | | | | |
| State Street Institutional US Government Money Market Fund – Premier Class (seven-day effective yield 4.70%) | | | 1,977,698 | | | | 1,977,698 | |
Total Short-Term Investments
(cost $1,977,698) | | | | | | | 1,977,698 | |
Total Value of Securities—99.30%
(cost $361,375,392) | | | | | | $ | 350,650,621 | |
| ° | Principal amount shown is stated in USD unless noted that the security is denominated in another currency. |
| ‡ | Non-income producing security. Security is currently in default. |
| # | Security exempt from registration under Rule 144A of the Securities Act of 1933, as amended. At March 31, 2023, the aggregate value of Rule 144A securities was $28,216,794, which represents 7.99% of the Fund’s net assets. See Note 13 in “Notes to financial statements.” |
| • | Variable rate investment. Rates reset periodically. Rate shown reflects the rate in effect at March 31, 2023. For securities based on a published reference rate and spread, the reference rate and spread are indicated in their descriptions. The reference rate descriptions (i.e. LIBOR03M, LIBOR06M, etc.) used in this report are identical for different securities, but the underlying reference rates may differ due to the timing of the reset period. Certain variable rate securities are not based on a published reference rate and spread but are determined by the issuer or agent and are based on current market conditions, or for mortgage-backed securities, are impacted by the individual mortgages which are paying off over time. These securities do not indicate a reference rate and spread in their descriptions. |
| ^ | Zero-coupon security. The rate shown is the effective yield at the time of purchase. |
| § | Pre-refunded bonds. Municipal bonds that are generally backed or secured by US Treasury bonds. For pre-refunded bonds, the stated maturity is followed by the year in which the bond will be pre-refunded. See Note 13 in “Notes to financial statements.” |
Schedules of investments
Delaware Ivy Municipal Bond Fund
Summary of abbreviations:
AGM – Insured by Assured Guaranty Municipal Corporation
AMT – Subject to Alternative Minimum Tax
BAM – Insured by Build America Mutual Assurance
ICE – Intercontinental Exchange, Inc.
LIBOR – London Interbank Offered Rate
LIBOR03M – ICE LIBOR USD 3 Month
LIBOR06M – ICE LIBOR USD 6 Month
USD – US Dollar
See accompanying notes, which are an integral part of the financial statements.
| Delaware Ivy Municipal High Income Fund | March 31, 2023 |
| | | Principal | | | | |
| | | amount° | | | Value (US $) | |
| Municipal Bonds — 97.05% | | | | | | | | |
| Education Revenue Bonds — 14.81% | | | | | | | | |
| Arlington Higher Education Finance | | | | | | | | |
| (Newman International Academy) | | | | | | | | |
| Series A 4.00% 8/15/31 | | | 200,000 | | | $ | 181,972 | |
| Series A 5.00% 8/15/41 | | | 600,000 | | | | 539,268 | |
| California Educational Facilities Authority Revenue | | | | | | | | |
| (Stanford University) | | | | | | | | |
| Series V-1 5.00% 5/1/49 | | | 9,000,000 | | | | 10,660,500 | |
| California Municipal Finance Authority Revenue | | | | | | | | |
| (Julian Charter School) | | | | | | | | |
| Series A 144A 5.625% 3/1/45 # | | | 510,000 | | | | 476,238 | |
| California School Finance Authority | | | | | | | | |
| (Aspire Public School) | | | | | | | | |
| 144A 5.00% 8/1/41 # | | | 1,375,000 | | | | 1,385,931 | |
| (Rocketship Public Schools - Obligated Group) | | | | | | | | |
| Series G | | | | | | | | |
| 144A 5.00% 6/1/47 # | | | 675,000 | | | | 614,196 | |
| Series G | | | | | | | | |
| 144A 5.00% 6/1/53 # | | | 675,000 | | | | 603,713 | |
| Capital Trust Agency, Florida Revenue | | | | | | | | |
| (Lutz Preparatory School Project) | | | | | | | | |
| Series A 4.00% 6/1/41 | | | 330,000 | | | | 317,909 | |
| Chester Economic Development Authority Lease Revenue | | | | | | | | |
| (Chester Community Charter School Project) | | | | | | | | |
| Series A 144A 5.625% 8/15/48 # | | | 12,000,000 | | | | 11,476,560 | |
| Florida Development Finance Corporation Educational Facilities Revenue | | | | | | | | |
| (Renaissance Charter School project) | | | | | | | | |
| Series A | | | | | | | | |
| 144A 6.00% 6/15/35 # | | | 2,000,000 | | | | 2,021,060 | |
| Series A | | | | | | | | |
| 144A 6.125% 6/15/44 # | | | 5,300,000 | | | | 5,367,363 | |
| Michigan Finance Authority Limited Obligation Revenue | | | | | | | | |
| (Hanley International Academy Project) | | | | | | | | |
| 5.00% 9/1/40 | | | 1,115,000 | | | | 1,019,121 | |
| (Old Redford Academy Project) | | | | | | | | |
| Series A 5.90% 12/1/30 | | | 1,690,000 | | | | 1,658,279 | |
| Series A 6.50% 12/1/40 | | | 3,000,000 | | | | 2,898,960 | |
| Michigan Public Educational Facilities Authority Revenue | | | | | | | | |
| (Old Redford Project) | | | | | | | | |
| Series A 5.875% 12/1/30 | | | 1,720,000 | | | | 1,685,118 | |
| Nevada State Department of Business & Industry | | | | | | | | |
| (Somerset Academy) | | | | | | | | |
| Series A | | | | | | | | |
| 144A 5.00% 12/15/48 # | | | 500,000 | | | | 445,000 | |
| Series A | | | | | | | | |
| 144A 5.125% 12/15/45 # | | | 2,515,000 | | | | 2,316,893 | |
| Philadelphia Authority for Industrial Development | | | | | | | | |
| (Mast Community Charter School II Project) | | | | | | | | |
| 5.00% 8/1/50 | | | 375,000 | | | | 377,089 | |
| Pima County, Arizona Industrial Development Authority Revenue | | | | | | | | |
| (Noah webster Schools) | | | | | | | | |
| Series A 7.00% 12/15/43 | | | 1,500,000 | | | | 1,523,760 | |
| Public Finance Authority Education Revenue | | | | | | | | |
| (Cornerstone Charter Academy Project) | | | | | | | | |
| Series A 144A 5.125% 2/1/46 # | | | 3,000,000 | | | | 2,781,000 | |
| (Triad Educational Services) | | | | | | | | |
| Series A 144A 5.50% 6/15/45 # | | | 6,000,000 | | | | 6,041,700 | |
| (Wittenberg University Project) | | | | | | | | |
| 144A 5.25% 12/1/39 # | | | 5,000,000 | | | | 4,305,400 | |
| University of Texas System Board of Regents | | | | | | | | |
| Series B 5.00% 8/15/49 | | | 7,320,000 | | | | 8,585,116 | |
Schedules of investments
Delaware Ivy Municipal High Income Fund
| | | Principal | | | | |
| | | amount° | | | Value (US $) | |
| Municipal Bonds (continued) | | | | | | | | |
| Education Revenue Bonds (continued) | | | | | | | | |
| University of Virginia | | | | | | | | |
| (Green Bond) | | | | | | | | |
| Series 2 3.57 % 4/1/45 | | | 10,000,000 | | | $ | 9,192,500 | |
| | | | | | | | 76,474,646 | |
| Electric Revenue Bonds — 4.31% | | | | | | | | |
| Arkansas River Power Authority | | | | | | | | |
| Series A 5.00% 10/1/43 | | | 5,000,000 | | | | 5,025,850 | |
| Development Authority of Burke County Pollution Control Revenue | | | | | | | | |
| (Oglethrope Power Corporation Vogtle Project) | | | | | | | | |
| Series A 1.50% 1/1/40 • | | | 700,000 | | | | 667,219 | |
| Guam Power Authority Revenue | | | | | | | | |
| (Tax-Exempt Forward Delivery) | | | | | | | | |
| Series A 5.00% 10/1/38 | | | 135,000 | | | | 144,072 | |
| Series A 5.00% 10/1/43 | | | 1,450,000 | | | | 1,514,453 | |
| Puerto Rico Electric Power Authority Revenue | | | | | | | | |
| Series TT 5.00% 7/1/23 ‡ | | | 2,785,000 | | | | 1,987,794 | |
| Series TT 5.00% 7/1/37 ‡ | | | 3,730,000 | | | | 2,676,275 | |
| Series WW 5.00% 7/1/28 ‡ | | | 2,635,000 | | | | 1,877,437 | |
| Series WW 5.25% 7/1/33 ‡ | | | 430,000 | | | | 305,300 | |
| Series XX 5.25% 7/1/40 ‡ | | | 9,505,000 | | | | 6,843,600 | |
| Series XX 5.75% 7/1/36 ‡ | | | 1,630,000 | | | | 1,185,825 | |
| | | | | | | | 22,227,825 | |
| Healthcare Revenue Bonds — 14.14% | | | | | | | | |
| Arizona Industrial Development Authority Revenue | | | | | | | | |
| (Great Lakes Senior Living Communities LLC Project Fourth Tier) | | | | | | | | |
| Series D-2 144A 7.75% 1/1/54 # | | | 2,100,000 | | | | 1,157,730 | |
| (Great Lakes Senior Living Communities LLC Project Third Tier) | | | | | | | | |
| Series C 144A 5.50% 1/1/54 # | | | 4,000,000 | | | | 2,072,200 | |
| Bexar County Health Facilities Development | | | | | | | | |
| (Army Retirement Residence Foundation Project) | | | | | | | | |
| 5.00% 7/15/41 | | | 5,395,000 | | | | 4,963,346 | |
| California Educational Facilities Authority Revenue | | | | | | | | |
| (Stanford University) | | | | | | | | |
| Series V-2 5.00% 4/1/51 | | | 6,210,000 | | | | 7,362,638 | |
| City of Chicago, Illinois | | | | | | | | |
| (Goldblatts Supportive Living Project) | | | | | | | | |
| 6.125% 12/1/43 ‡ | | | 8,395,000 | | | | 5,474,380 | |
| Connecticut State Health & Educational Facilities Authority Revenue | | | | | | | | |
| (Church Home of Hartford Incorporated Project) | | | | | | | | |
| Series A 144A 5.00% 9/1/46 # | | | 1,000,000 | | | | 860,450 | |
| Series A 144A 5.00% 9/1/53 # | | | 1,600,000 | | | | 1,327,248 | |
| Gainesville & Hall County, Georgia Hospital Authority Revenue | | | | | | | | |
| (Northeast Georgia Health System Project) | | | | | | | | |
| Series A 3.00% 2/15/47 | | | 3,775,000 | | | | 2,885,723 | |
| Iowa Finance Authority | | | | | | | | |
| (Childserve Project) | | | | | | | | |
| Series B 5.00% 6/1/36 | | | 2,425,000 | | | | 2,245,841 | |
| Kirkwood, Missouri Industrial Development Authority | | | | | | | | |
| (Aberdeen Heights) | | | | | | | | |
| Series A 5.25% 5/15/50 | | | 4,000,000 | | | | 3,296,160 | |
| Lenexa City, Kansas health Care Facility Revenue | | | | | | | | |
| (Lakeview Village) | | | | | | | | |
| Series A 4.00% 5/15/34 | | | 1,000,000 | | | | 889,490 | |
| Series A 5.00% 5/15/39 | | | 1,500,000 | | | | 1,432,770 | |
| Michigan Finance Authority Limited Obligation Revenue | | | | | | | | |
| Series A 3.00% 12/1/49 | | | 7,000,000 | | | | 5,186,370 | |
| Muskingum County Ohio Hospital Facilities Revenue | | | | | | | | |
| (Genesis HealthCare System Obligated Group Project) | | | | | | | | |
| 5.00% 2/15/48 | | | 2,000,000 | | | | 1,737,560 | |
| Nassau County Industrial Development Agency | | | | | | | | |
| (Amsterdam at Harborside Project) | | | | | | | | |
| Series B 5.00% 1/1/58 • | | | 10,884,206 | | | | 4,897,784 | |
| | | Principal | | | | |
| | | amount° | | | Value (US $) | |
| Municipal Bonds (continued) | | | | | | | | |
| Healthcare Revenue Bonds (continued) | | | | | | | | |
| New Hope, Texas Cultural Education Facilities Finance | | | | | | | | |
| (Sanctuary LTC Project) | | | | | | | | |
| Series A-1 5.50% 1/1/57 | | | 3,805,000 | | | $ | 2,760,452 | |
| Oklahoma Development Finance Authority | | | | | | | | |
| (OU Medicine Project) | | | | | | | | |
| Series B 5.50% 8/15/57 | | | 3,000,000 | | | | 2,874,030 | |
| Orange County, New York Funding Assisted Living Residence Revenue | | | | | | | | |
| (The Hamlet at Wallkill Assisted Living Project) | | | | | | | | |
| 6.50% 1/1/46 | | | 4,800,000 | | | | 3,839,856 | |
| Palomar Health | | | | | | | | |
| 4.00% 11/1/39 | | | 4,375,000 | | | | 4,119,106 | |
| Salem, Oregon Hospital Facility | | | | | | | | |
| Authority Revenue | | | | | | | | |
| (Capital Manor Project) | | | | | | | | |
| 5.00% 5/15/53 | | | 1,895,000 | | | | 1,738,037 | |
| Seminole County, Florida Industrial Development Authority | | | | | | | | |
| (Legacy Pointe at UCF Project) | | | | | | | | |
| Series A 5.25% 11/15/39 | | | 2,000,000 | | | | 1,699,360 | |
| Tarrant County, Texas Cultural Education Facilities Finance | | | | | | | | |
| (Air Force Villages Obligated Group Project) | | | | | | | | |
| 5.00% 5/15/45 | | | 3,650,000 | | | | 3,079,943 | |
| (Buckner Senior Living - Ventana Project) | | | | | | | | |
| Series A 6.75% 11/15/47 | | | 1,000,000 | | | | 1,005,230 | |
| Series A 6.75% 11/15/52 | | | 2,500,000 | | | | 2,505,950 | |
| Terre Haute Revenue | | | | | | | | |
| (Westminster Village Project) | | | | | | | | |
| 6.00% 8/1/39 | | | 4,000,000 | | | | 3,585,280 | |
| | | | | | | | 72,996,934 | |
| Housing Revenue Bond — 0.10% | | | | | | | | |
| CSCDA Community Improvement Authority Essential Housing Revenue | | | | | | | | |
| (Parallel - Anaheim) | | | | | | | | |
| Series A 144A 4.00% 8/1/56 # | | | 700,000 | | | | 538,601 | |
| | | | | | | | 538,601 | |
| Industrial Development Revenue/Pollution Control | | | | | | | | |
| Revenue Bonds — 22.74% | | | | | | | | |
| Arizona Industrial Development Authority Revenue | | | | | | | | |
| (Legacy Cares Project) | | | | | | | | |
| Series A | | | | | | | | |
| 144A 6.00% 7/1/51 #, ‡ | | | 5,350,000 | | | | 3,477,500 | |
| Series A | | | | | | | | |
| 144A 7.75% 7/1/50 #, ‡ | | | 1,000,000 | | | | 650,000 | |
| Buckeye, Ohio Tobacco Settlement Financing Authority | | | | | | | | |
| Series B-2 5.00% 6/1/55 | | | 12,470,000 | | | | 11,307,671 | |
| California County Tobacco Securitization Agency | | | | | | | | |
| (Capital Appreciation Bonds) | | | | | | | | |
| Series D 8.238% 6/1/55 ^ | | | 6,250,000 | | | | 415,938 | |
| Chicago, Illinois O’Hare International Airport Revenue | | | | | | | | |
| (Trips Obligated Group) | | | | | | | | |
| 5.00% 7/1/48 (AMT) | | | 150,000 | | | | 149,522 | |
| Children’s Trust fund, Puerto Rico | | | | | | | | |
| (Asset-Backed) | | | | | | | | |
| Series A 7.713% 5/15/57 ^ | | | 225,000,000 | | | | 15,286,500 | |
| District of Columbia Tobacco Settlement Financing | | | | | | | | |
| (Capital Appreciation- Asset-Backed) | | | | | | | | |
| Series C 0.15% 6/15/55 ^ | | | 60,000,000 | | | | 5,725,200 | |
| Erie, New York Tobacco Asset Securitization | | | | | | | | |
| (Capital Appreciation- Asset-Backed) | | | | | | | | |
| Series D 0.675% 6/1/55 ^ | | | 4,000,000 | | | | 255,440 | |
| Finance Authority of Maine Solid Waste Disposal Revenue | | | | | | | | |
| (Casella Waste System Project) | | | | | | | | |
| Series R-2 144A 4.375% 8/1/35 (AMT) #, • | | | 1,000,000 | | | | 979,300 | |
| Florida Development Finance Surface Transportation Facilities Revenue | | | | | | | | |
| (Brightline Passenger Rail Project - Green Bonds) | | | | | | | | |
| Series B 144A 7.375% 1/1/49 (AMT) # | | | 7,500,000 | | | | 6,930,225 | |
Schedules of investments
Delaware Ivy Municipal High Income Fund
| | | Principal
amount° | | Value (US $) | |
| Municipal Bonds (continued) | | | | | |
Industrial Development Revenue/Pollution Control
Revenue Bonds (continued) | | | | | | |
| George L Smith II Congress Center Authority (Convention Center Hotel) | | | | | | |
| Series A 4.00% 1/1/54 | | 4,000,000 | | $ | 3,173,240 | |
Inland, California Empire Tobacco Securitization
(Capital Appreciation Asset-Backed) | | | | | | |
| Series E 144A 0.63% 6/1/57 #, ^ | | 7,000,000 | | | 410,200 | |
| Series F 144A 0.24% 6/1/57 #, ^ | | 163,120,000 | | | 8,036,922 | |
| Louisiana Public Facilities Authority (Louisiana Pellets Project) | | | | | | |
| Series A 8.375% 7/1/39 (AMT) ‡ | | 13,547,003 | | | 135 | |
| Series B 10.50% 7/1/39 (AMT) ‡ | | 12,201,586 | | | 122 | |
| Series LA 144A 7.75% 7/1/39 (AMT) #, ‡ | | 1,976,705 | | | 20 | |
| Lower Alabama Gas District (Gas Project Revenue Bonds) | | | | | | |
| Series A 5.00% 9/1/46 | | 6,000,000 | | | 6,194,400 | |
| Main Street Natural Gas Revenue | | | | | | |
| Series A 4.00% 5/15/39 | | 2,500,000 | | | 2,310,075 | |
| Nassau County Tobacco Settlement (Asset-Backed) | | | | | | |
| Series A-3 5.125% 6/1/46 | | 10,000,000 | | | 9,228,700 | |
| New York City Industrial Development Agency (Yankee Stadium Project) | | | | | | |
| Series A 3.00% 3/1/49 | | 1,000,000 | | | 741,310 | |
| New York Counties Tobacco Trust (Pass Through Program) | | | | | | |
| Series 4B 144A 0.622% 6/1/60 #, ^ | | 322,800,000 | | | 11,849,988 | |
| Series C 5.00% 6/1/51 | | 1,000,000 | | | 934,160 | |
| Series F 7.084% 6/1/60 ^ | | 55,000,000 | | | 2,939,200 | |
| Public Authority for Colorado Energy Natural Gas Revenue 6.50% 11/15/38 | | 9,000,000 | | | 10,781,190 | |
Public Finance Authority Education Revenue
(Grand Hyatt San Antonio Hotel Acquisition Project) | | | | | | |
| Series A 5.00% 2/1/62 | | 3,030,000 | | | 3,003,033 | |
| Sanger Industrial Development (Texas Pellets Project) | | | | | | |
| Series B 8.00% 7/1/38 (AMT) ‡ | | 17,870,000 | | | 4,467,500 | |
Tobacco Securitization Authority of Southern California
(Capital Appreciation Bonds) | | | | | | |
| Series C 1.746% 6/1/46 ^ | | 3,515,000 | | | 571,434 | |
| Series D 2.151% 6/1/46 ^ | | 6,540,000 | | | 834,635 | |
| (San Diego County Tobacco Asset Securitization Corporation) | | | | | | |
| Series B-1 5.00% 6/1/48 | | 875,000 | | | 889,796 | |
| Tobacco Settlement Financing | | | | | | |
| Series B 5.00% 6/1/50 | | 5,000,000 | | | 4,912,900 | |
Vermont Economic Development Authority Solid Waste Disposal Revenue
(Casella Waste System Project) | | | | | | |
| 144A 4.625% | | | | | | |
| 4/1/36 (AMT) #, • | | 1,000,000 | | | 963,060 | |
| | | | | | 117,419,316 | |
| Lease Revenue Bonds — 1.73% | | | | | | |
California Statewide Communities Development Authority Revenue
(Lancer Plaza Project) | | | | | | |
| 5.625% 11/1/33 | | 1,400,000 | | | 1,404,746 | |
| 5.875% 11/1/43 | | 1,890,000 | | | 1,896,086 | |
New York Liberty Development Revenue
(Class 3-3 World Trade Center Project) | | | | | | |
| 144A 7.25% 11/15/44 # | | 2,000,000 | | | 2,025,160 | |
St. Louis Municipal Finance
(Convention Center Capital Improvement Project) | | | | | | |
| Series A 6.43% 7/15/36 ^ | | 2,250,000 | | | 1,350,382 | |
| Series A 6.44% 7/15/37 ^ | | 4,000,000 | | | 2,255,320 | |
| | | | | | 8,931,694 | |
| | | Principal
amount° | | Value (US $) | |
| Municipal Bonds (continued) | | | | | |
| Local General Obligation Bonds — 3.48% | | | | | | |
| City of Detroit, Michigan 5.25% 4/1/23 | | 220,100 | | $ | 220,100 | |
| City of Fairfield, Alabama 6.00% 6/1/37 ‡ | | 8,485,000 | | | 6,788,000 | |
| MIDA Golf and Equestrian Center Public Infrastructure District | | | | | | |
| 144A 4.50% 6/1/51 # | | 2,665,000 | | | 2,039,498 | |
| 144A 4.625% 6/1/57 # | | 2,310,000 | | | 1,743,634 | |
| Village of Riverdale, Illinois 8.00% 10/1/36 | | 7,140,000 | | | 7,156,636 | |
| | | | | | 17,947,868 | |
| Pre-Refunded/Escrowed to Maturity Bonds — 5.83% | | | | | | |
California School Finance Authority
(Aspire Public School) | | | | | | |
| 144A 5.00% 8/1/41-25 #, § | | 125,000 | | | 132,089 | |
| Central Texas Regional Mobility Authority Revenue | | | | | | |
| Series A 5.00% 1/1/45-25 § | | 4,000,000 | | | 4,216,840 | |
| Golden State, California Tobacco Securitization Corporate Settlement Revenue | | | | | | |
| Series A-1 5.00% 6/1/29-27 § | | 1,250,000 | | | 1,391,575 | |
| (Asset-Backed Enhanced) | | | | | | |
| Series A 5.00% 6/1/35-25 § | | 6,265,000 | | | 6,614,900 | |
North Texas Tollway Authority Revenue Special Project System Revenue
(Convertible Capital Appreciation Bonds) | | | | | | |
| Series C 11.205% 9/1/43-31 § | | 5,000,000 | | | 6,389,950 | |
Osceola County, Florida Expressway System Senior Lien
(Poinciana Parkway Project) | | | | | | |
| Series A 5.375% 10/1/47-24 § | | 2,000,000 | | | 2,077,740 | |
Savannah Economic Development Authority
(The Marshes of Skidway Island Project) | | | | | | |
| 7.25% 1/1/49-24 § | | 4,000,000 | | | 4,130,960 | |
Washington State Housing Finance Commission
(Rockwood Retirement Communities Project) | | | | | |
| Series A 144A 7.50% 1/1/49-24 #, § | | 5,000,000 | | | 5,167,200 | |
| | | | | | 30,121,254 | |
| Special Tax Revenue Bonds — 18.20% | | | | | | |
| Alabama Economic Settlement Authority Revenue | | | | | | |
| Series A 4.00% 9/15/33 | | 9,000,000 | | | 9,022,770 | |
Branson Industrial Development Authority
(Branson Shoppes Redevelopment Project) | | | | | | |
| Series A 3.90% 11/1/29 | | 530,000 | | | 488,681 | |
| Broadway-Fairview Transportation Development District | | | | | | |
| Series A 5.875% 12/1/31 | | 675,000 | | | 423,563 | |
| Series A 6.125% 12/1/36 | | 1,050,000 | | | 658,875 | |
| Commonwealth of Puerto Rico 2.859% 11/1/43 • | | 40,956,182 | | | 17,867,134 | |
GDB Debt Recovery Authority of Puerto Rico
7.50% 8/20/40 | | 24,000,001 | | | 19,920,001 | |
| Grandview City, Missouri Industrial Development Authority Tax Increment Revenue (Grandview Crossing Project) | | | | | | |
| 5.75% 12/1/28 ‡ | | 1,000,000 | | | 220,000 | |
Kansas City, Missouri Tax Increment Financing Commission Tax Increment Revenue
(Brywood Centre Project) | | | | | | |
| Series A 8.00% 4/1/33 ‡ | | 3,950,000 | | | 1,343,000 | |
| Lakeside 370 Levee District - Subdistrict B | | | | | | |
| Series 2015-B 0.00% 4/1/55 | | 853,802 | | | 768,422 | |
Lees Summit Industrial Development Authority
(Kensington Farms Improvement Project) | | | | | | |
| 5.75% 3/1/29 ‡ | | 2,185,000 | | | 1,267,300 | |
Schedules of investments
Delaware Ivy Municipal High Income Fund
| | | Principal
amount° | | Value (US $) | |
| Municipal Bonds (continued) | | | | | |
| Special Tax Revenue Bonds (continued) | | | | | | |
Marquis Community
Development Authority of York County Virginia | | | | | | |
| Series B 5.625% 9/1/41 ‡ | | 2,779,000 | | $ | 130,613 | |
| (Capital Appreciation Bonds) | | | | | | |
| Series C 0.00% 9/1/41 ^ | | 821,000 | | | 2,053 | |
| (Convertible Capital Appreciation Bonds) | | | | | | |
| 144A 7.50% 9/1/45 #, ‡ | | 859,000 | | | 40,373 | |
| Matching Fund Special Purpose Securitization | | | | | | |
| Series A 5.00% 10/1/39 | | 1,290,000 | | | 1,266,419 | |
Puerto Rico Sales Tax Financing Revenue
(Restructured) | | | | | | |
| Series A-1 0.751% 7/1/51 ^ | | 28,564,000 | | | 5,559,125 | |
| Series A-1 2.706% 7/1/46 ^ | | 9,915,000 | | | 2,603,580 | |
| Series A-1 5.00% 7/1/58 | | 11,100,000 | | | 10,480,287 | |
| Series A-2 4.784% 7/1/58 | | 8,072,000 | | | 7,346,650 | |
| Series B-1 4.75% 7/1/53 | | 5,484,000 | | | 5,029,925 | |
San Buenaventura Redevelopment Agency
(Merged San Buenaventura Redevelopment Project) | | | | | | |
| 7.75% 8/1/28 | | 1,000,000 | | | 1,003,970 | |
| 8.00% 8/1/38 | | 1,500,000 | | | 1,505,985 | |
Stone Canyon Community Improvement District
(Infrastructure Improvement Project) | | | | | | |
| 5.75% 4/1/27 ‡ | | 1,250,000 | | | 325,000 | |
| Village of East Dundee (Route 25 South Redevelopment Project) | | | | | | |
| 5.625% 12/1/31 | | 1,505,000 | | | 1,426,890 | |
| Whiting Redevelopment District | | | | | | |
| 4.00% 1/15/32 | | 2,600,000 | | | 2,452,216 | |
Wyandotte County, Kansas City, Kansas Unified Government Special Obligation Revenue
(Wyandotte Plaza Redevelopment Project) | | | | | | |
| 5.00% 12/1/34 | | 3,000,000 | | | 2,820,240 | |
| | | | | | 93,973,072 | |
| State General Obligation Bonds — 2.54% | | | | | | |
| Commonwealth of Massachusetts | | | | | | |
| Series C 2.75% 3/1/50 | | 5,000,000 | | | 3,661,100 | |
| Commonwealth of Puerto Rico (Restructured) | | | | | | |
| Series A-1 4.00% 7/1/41 | | 5,360,400 | | | 4,361,114 | |
| Series A-1 4.00% 7/1/46 | | 2,071,000 | | | 1,620,454 | |
| Illinois State | | | | | | |
| 4.00% 6/1/32 | | 3,410,000 | | | 3,479,291 | |
| | | | | | 13,121,959 | |
| Transportation Revenue Bonds — 9.17% | | | | | | |
| Austin Texas Airport System Revenue | | | | | | |
| 5.00% 11/15/24 (AMT) | | 1,650,000 | | | 1,692,223 | |
California Municipal Finance Authority Revenue
(LINXS APM Project) | | | | | | |
| Series A 4.00% 12/31/47 (AMT) | | 2,650,000 | | | 2,374,400 | |
| Series A 5.00% 12/31/43 | | 1,500,000 | | | 1,519,785 | |
Central Texas Regional Mobility Authority Revenue
(Capital Appreciation Bonds) | | | | | | |
| 7.81% 1/1/36 ^ | | 2,500,000 | | | 1,503,650 | |
| 7.85% 1/1/40 ^ | | 2,000,000 | | | 936,080 | |
Colorado High Performance Transportation Enterprise Revenue
(U.S. 36 & I-25 Managed Lanes) | | | | | | |
| 5.75% 1/1/44 (AMT) | | 3,250,000 | | | 3,252,145 | |
Florida Development Finance Revenue
(Brightline Florida Passenger Rail Expansion Project) | | | | | | |
| Series A 144A 7.25% 7/1/57 (AMT) #, • | | 2,500,000 | | | 2,519,800 | |
| Foothill-Eastern, California Transportation Corridor Agency | | | | | | |
| Series B-1 3.95% 1/15/53 | | 2,800,000 | | | 2,517,984 | |
| Series B-2 3.50% 1/15/53 | | 1,600,000 | | | 1,342,976 | |
Metropolitan Washington Airports Authority Dulles Toll Road Revenue
(Convertible Capital Appreciation Bonds) | | | | | | |
| Series B 6.50% 10/1/44 | | 1,000,000 | | | 1,134,580 | |
| | | Principal
amount° | |
Value (US $) | |
| Municipal Bonds (continued) | | | | | |
| Transportation Revenue Bonds (continued) | | | | | | |
| New York Metropolitan Transportation Authority Revenue (Climate Bond Certified - Green Bonds) | | | | | | |
| Series B 4.00% 11/15/50 | | 5,000,000 | | $ | 4,558,950 | |
| New York Transportation Development Corporation Special Facilities Revenue (Delta Air Lines - LaGuardia Airport Terminals C&D Redevelopment Project) | | | | | | |
| 4.00% 1/1/36 (AMT) | | 1,000,000 | | | 954,310 | |
| North Carolina Turnpike Authority Triangle Expressway System Revenue (Capital Appreciation Bonds) | | | | | | |
| Series C 0.001% 7/1/41 ^ | | 4,160,000 | | | 1,633,050 | |
| (Triangle Expressway System Senior Lien Turnpike Revenue Bonds) | | | | | | |
| 4.00% 1/1/55 | | 1,000,000 | | | 947,900 | |
| Pennsylvania Turnpike Commission (Convertible Capital Appreciation Bonds) | | | | | | |
| Series E 6.375% 12/1/38 | | 13,500,000 | | | 15,355,170 | |
| Phoenix, Arizona Civic Improvement Corporation Airport Revenue | | | | | | |
| Series B 3.25% 7/1/49 (AMT) | | 1,555,000 | | | 1,214,828 | |
| Virginia Small Business Financing Authority Revenue (Transform 66 P3 Project) | | | | | | |
| 5.00% 12/31/52 (AMT) | | 3,930,000 | | | 3,869,832 | |
| | | | | | 47,327,663 | |
Total Municipal Bonds
(cost $595,229,835) | | | | | 501,080,832 | |
| | | | | | | |
| | | Number of
shares | | Value (US $) | |
| Short-Term Investments — 0.98% | | | | | |
| Money Market Mutual Funds — 0.00% | | | | | | |
State Street Institutional
US Government Money Market
Fund – Premier Class (seven- day effective yield 4.70%) | | 16,715 | | $ | 16,715 | |
| | | | | | 16,715 | |
| | | | | | | |
| | | Principal
amount° | | Value (US $) | |
| Variable Rate Demand Notes — 0.98%¤ | | | | | | |
City of Minneapolis, Minnesota Health Care System Revenue
(Fairview Health Services) | | | | | | |
| Series C 3.70% 11/15/48 | | | | | | |
| (LOC – Wells Fargo Bank N.A.) | | 560,000 | | | 560,000 | |
| Los Angeles Department of Water & Power Revenue | | | | | | |
| Subordinate Series A-2 3.35% 7/1/45 | | | | | | |
| (SPA - Barclays Bank) | | 2,500,000 | | | 2,500,000 | |
| Subordinate Series B-3 3.35% 7/1/34 | | | | | | |
| (SPA - Barclays Bank) | | 2,000,000 | | | 2,000,000 | |
| | | | | | 5,060,000 | |
Total Short-Term Investments
(cost $5,076,715) | | | | | 5,076,715 | |
Total Value of Securities—98.03%
(cost $600,306,550) | | | | $ | 506,157,547 | |
| | |
| ° | Principal amount shown is stated in USD unless noted that the security is denominated in another currency. |
| | |
| # | Security exempt from registration under Rule 144A of the Securities Act of 1933, as amended. At March 31, 2023, the aggregate value of Rule 144A securities was $90,756,252, which represents 17.58% of the Fund's net assets. See Note 13 in “Notes to financial statements." |
| | |
| • | Variable rate investment. Rates reset periodically. Rate shown reflects the rate in effect at March 31, 2023. For securities based on a published reference rate and spread, the reference rate and spread are indicated in their descriptions. The reference rate descriptions (i.e. LIBOR03M, LIBOR06M, etc.) used in this report are identical for different securities, but the underlying reference rates may differ due to the timing of the reset period. Certain variable rate securities are not based on a published reference rate and spread but are determined by the issuer or agent and are based on current market conditions, or for mortgage-backed securities, are impacted by the individual mortgages which are paying off over time. These securities do not indicate a reference rate and spread in their descriptions. |
Schedules of investments
Delaware Ivy Municipal High Income Fund
| ‡ | Non-income producing security. Security is currently in default. |
| | |
| ^ | Zero-coupon security. The rate shown is the effective yield at the time of purchase. |
| | |
| § | Pre-refunded bonds. Municipal bonds that are generally backed or secured by US Treasury bonds. For pre-refunded bonds, the stated maturity is followed by the year in which the bond will be pre-refunded. See Note 13 in “Notes to financial statements.” |
| | |
| ¤ | Tax-exempt obligations that contain a floating or variable interest rate adjustment formula and an unconditional right of demand to receive payment of the unpaid principal balance plus accrued interest upon a short notice period (generally up to 30 days) prior to specified dates either from the issuer or by drawing on a bank letter of credit, a guarantee, or insurance issued with respect to such instrument. Each rate shown is as of March 31, 2023. |
Summary of abbreviations:
AMT – Subject to Alternative Minimum Tax
ICE – Intercontinental Exchange, Inc.
LIBOR – London Interbank Offered Rate
LIBOR03M – ICE LIBOR USD 3 Month
LIBOR06M – ICE LIBOR USD 6 Month
LLC – Limited Liability Corporation
LOC – Letter of Credit
N.A. – National Association
SPA – Stand-by Purchase Agreement
USD – US Dollar
See accompanying notes, which are an integral part of the financial statements.
Delaware Ivy Small Cap Growth Fund | March 31, 2023 |
| | | Number of
shares | | Value (US $) | |
| Common Stocks — 98.73% ♦ | | | | |
| Communication Services — 1.55% | | | | | | |
| Iridium Communications | | 383,275 | | $ | 23,736,221 | |
| | | | | | 23,736,221 | |
| Consumer Discretionary — 15.61% | | | | | | |
| Boot Barn Holdings † | | 291,355 | | | 22,329,447 | |
| Fox Factory Holding † | | 281,625 | | | 34,180,826 | |
| Marriott Vacations Worldwide | | 223,091 | | | 30,086,052 | |
| Monarch Casino & Resort | | 340,183 | | | 25,224,570 | |
| Red Rock Resorts Class A | | 885,065 | | | 39,447,347 | |
| Texas Roadhouse | | 325,633 | | | 35,187,902 | |
| Visteon † | | 204,631 | | | 32,092,280 | |
| Wingstop | | 115,792 | | | 21,257,095 | |
| | | | | | 239,805,519 | |
| Consumer Staples — 4.14% | | | | | | |
| BJ's Wholesale Club Holdings † | | 436,452 | | | 33,200,904 | |
| Duckhorn Portfolio † | | 842,127 | | | 13,389,819 | |
| MGP Ingredients | | 176,120 | | | 17,034,326 | |
| | | | | | 63,625,049 | |
| Energy — 4.63% | | | | | | |
| Cactus Class A | | 645,502 | | | 26,614,048 | |
| Liberty Energy | | 911,432 | | | 11,675,444 | |
| SM Energy | | 266,568 | | | 7,506,555 | |
| Weatherford International † | | 427,109 | | | 25,348,919 | |
| | | | | | 71,144,966 | |
| Financials — 4.62% | | | | | | |
| Houlihan Lokey | | 243,951 | | | 21,343,273 | |
| Kinsale Capital Group | | 123,255 | | | 36,994,988 | |
| Seacoast Banking | | 532,742 | | | 12,625,986 | |
| | | | | | 70,964,247 | |
| Healthcare — 20.83% | | | | | | |
| Acadia Healthcare † | | 328,820 | | | 23,757,245 | |
| Axonics † | | 223,896 | | | 12,215,766 | |
| CryoPort † | | 984,772 | | | 23,634,528 | |
| Cytek Biosciences † | | 1,158,034 | | | 10,642,332 | |
| Evolent Health Class A † | | 841,270 | | | 27,299,212 | |
| Halozyme Therapeutics † | | 412,258 | | | 15,744,133 | |
| Harmony | | | | | | |
| Biosciences Holdings † | | 550,164 | | | 17,962,855 | |
| Inmode † | | 814,031 | | | 26,016,431 | |
| Insmed † | | 587,509 | | | 10,017,028 | |
| Pacira BioSciences † | | 507,793 | | | 20,723,032 | |
| Penumbra † | | 73,100 | | | 20,372,239 | |
| Privia Health Group † | | 776,834 | | | 21,448,387 | |
| Progyny † | | 947,974 | | | 30,448,925 | |
| PTC Therapeutics † | | 179,083 | | | 8,674,781 | |
| R1 RCM † | | 618,452 | | | 9,276,780 | |
| TransMedics Group † | | 251,343 | | | 19,034,205 | |
| Vericel † | | 770,614 | | | 22,594,402 | |
| | | | | | 319,862,281 | |
| Industrials — 18.44% | | | | | | |
| AAON | | 194,045 | | | 18,762,211 | |
| Casella Waste Systems Class A † | | 222,672 | | | 18,406,067 | |
| CBIZ † | | 465,142 | | | 23,019,878 | |
| Chart Industries † | | 64,812 | | | 8,127,425 | |
| Clean Harbors † | | 244,329 | | | 34,831,542 | |
| EnerSys | | 358,855 | | | 31,177,322 | |
| Federal Signal | | 151,752 | | | 8,226,476 | |
| Kirby † | | 364,624 | | | 25,414,293 | |
| Parsons † | | 363,654 | | | 16,269,880 | |
| RBC Bearings † | | 78,719 | | | 18,320,273 | |
| Saia † | | 80,125 | | | 21,800,410 | |
| Shoals Technologies Group | | | | | | |
| Class A † | | 1,013,980 | | | 23,108,604 | |
| SiteOne Landscape Supply † | | 100,646 | | | 13,775,418 | |
| Valmont Industries | | 68,749 | | | 21,950,181 | |
| | | | | | 283,189,980 | |
| Information Technology — 26.19% | | | | | | |
| Allegro MicroSystems † | | 1,168,322 | | | 56,067,773 | |
| Belden | | 173,629 | | | 15,065,788 | |
| Box Class A † | | 783,856 | | | 20,999,502 | |
| Calix † | | 288,574 | | | 15,464,681 | |
| CyberArk Software † | | 237,499 | | | 35,145,102 | |
| DoubleVerify Holdings † | | 1,136,952 | | | 34,279,103 | |
| Five9 † | | 59,770 | | | 4,320,773 | |
| Globant † | | 42,525 | | | 6,974,525 | |
| Instructure Holdings † | | 669,802 | | | 17,347,872 | |
| Jamf Holding † | | 484,780 | | | 9,414,428 | |
| Onto Innovation † | | 159,812 | | | 14,044,279 | |
| Paycor HCM † | | 1,240,516 | | | 32,898,484 | |
| Power Integrations | | 184,587 | | | 15,623,444 | |
| Shift4 Payments Class A † | | 410,301 | | | 31,100,816 | |
| Silicon Laboratories † | | 56,858 | | | 9,955,267 | |
| Smartsheet Class A † | | 572,374 | | | 27,359,477 | |
| Sprout Social Class A † | | 460,191 | | | 28,016,428 | |
| Tenable Holdings † | | 593,630 | | | 28,203,361 | |
| | | | | | 402,281,103 | |
| Materials — 1.94% | | | | | | |
| ATI † | | 753,723 | | | 29,741,910 | |
| | | | | | 29,741,910 | |
Schedules of investments
Delaware Ivy Small Cap Growth Fund
| | | Number of
shares | | Value (US $) | |
| Common Stocks ♦ (continued) | | | | |
| Real Estate — 0.78% | | | | | | |
| Ryman Hospitality Properties | | 133,095 | | $ | 11,942,614 | |
| | | | | | 11,942,614 | |
Total Common Stocks
(cost $1,346,943,609) | | | | | 1,516,293,890 | |
| | | | | | | |
| Short-Term Investments — 1.25% | | | | | | |
| Money Market Mutual Funds — 1.25% | | | | | | |
| BlackRock Liquidity FedFund – Institutional Shares (seven- day effective yield 4.72%) | | 4,798,305 | | | 4,798,305 | |
| Fidelity Investments Money Market Government Portfolio – Class I (seven-day effective yield 4.72%) | | 4,798,305 | | | 4,798,305 | |
| Goldman Sachs Financial Square Government Fund – Institutional Shares (seven- day effective yield 4.84%) | | 4,798,305 | | | 4,798,305 | |
| Morgan Stanley Institutional Liquidity Funds Government Portfolio – Institutional Class (seven-day effective yield 4.73%) | | 4,798,305 | | | 4,798,305 | |
Total Short-Term Investments
(cost $19,193,220) | | | | | 19,193,220 | |
Total Value of Securities—99.98%
(cost $1,366,136,829) | | | | $ | 1,535,487,110 | |
| | |
| ♦ | Narrow industries are utilized for compliance purposes for concentration whereas broad sectors are used for financial reporting. |
| | |
| † | Non-income producing security. |
See accompanying notes, which are an integral part of the financial statements.
Delaware Ivy Smid Cap Core Fund | March 31, 2023 |
| | | Number of
shares | | Value (US $) | |
| Common Stocks — 98.65% | | | | | |
| Basic Materials — 8.19% | | | | | | |
| Beacon Roofing Supply † | | 54,833 | | $ | 3,226,922 | |
| Boise Cascade | | 41,880 | | | 2,648,910 | |
| Huntsman | | 179,029 | | | 4,898,233 | |
| Kaiser Aluminum | | 25,769 | | | 1,923,141 | |
| Minerals Technologies | | 60,295 | | | 3,643,024 | |
| Reliance Steel & Aluminum | | 26,249 | | | 6,739,168 | |
| Westrock | | 61,551 | | | 1,875,459 | |
| Worthington Industries | | 54,496 | | | 3,523,166 | |
| | | | | | 28,478,023 | |
| Business Services — 5.28% | | | | | | |
| ABM Industries | | 55,259 | | | 2,483,340 | |
| Aramark | | 102,798 | | | 3,680,168 | |
| ASGN † | | 34,000 | | | 2,810,780 | |
| Casella Waste Systems Class A † | | 22,721 | | | 1,878,118 | |
| Clean Harbors † | | 21,509 | | | 3,066,323 | |
| WillScot Mobile Mini Holdings † | | 94,965 | | | 4,451,959 | |
| | | | | | 18,370,688 | |
| Capital Goods — 11.68% | | | | | | |
| Ameresco Class A † | | 29,458 | | | 1,449,923 | |
| Barnes Group | | 22,145 | | | 892,001 | |
| Carlisle | | 11,882 | | | 2,686,164 | |
| Chart Industries † | | 7,003 | | | 878,176 | |
| Coherent † | | 58,748 | | | 2,237,124 | |
| Federal Signal | | 41,179 | | | 2,232,313 | |
| Gates Industrial † | | 76,292 | | | 1,059,696 | |
| Graco | | 31,841 | | | 2,324,711 | |
| Jacobs Solutions | | 14,742 | | | 1,732,332 | |
| Kadant | | 8,005 | | | 1,669,203 | |
| KBR | | 49,098 | | | 2,702,845 | |
| Lincoln Electric Holdings | | 21,909 | | | 3,704,812 | |
| MasTec † | | 31,423 | | | 2,967,588 | |
| Quanta Services | | 35,275 | | | 5,878,226 | |
| Tetra Tech | | 16,757 | | | 2,461,771 | |
| WESCO International | | 25,131 | | | 3,883,745 | |
| Zurn Elkay Water Solutions | | 87,145 | | | 1,861,417 | |
| | | | | | 40,622,047 | |
| Consumer Discretionary — 6.26% | | | | | | |
| BJ's Wholesale Club Holdings † | | 41,822 | | | 3,181,400 | |
| Dick's Sporting Goods | | 36,624 | | | 5,196,579 | |
| Five Below † | | 21,563 | | | 4,441,331 | |
| Malibu Boats Class A † | | 48,009 | | | 2,710,108 | |
| Steven Madden | | 105,665 | | | 3,803,940 | |
| Tractor Supply | | 10,333 | | | 2,428,668 | |
| | | | | | 21,762,026 | |
| Consumer Services — 2.39% | | | | | | |
| Brinker International † | | 51,568 | | | 1,959,584 | |
| Jack in the Box | | 17,304 | | | 1,515,657 | |
| Texas Roadhouse | | 23,646 | | | 2,555,187 | |
| Wendy's | | 105,048 | | | 2,287,945 | |
| | | | | | 8,318,373 | |
| Consumer Staples — 3.10% | | | | | | |
| Casey's General Stores | | 21,860 | | | 4,731,816 | |
| Helen of Troy † | | 8,721 | | | 829,977 | |
| J & J Snack Foods | | 17,976 | | | 2,664,403 | |
| YETI Holdings † | | 63,864 | | | 2,554,560 | |
| | | | | | 10,780,756 | |
| Credit Cyclicals — 3.67% | | | | | | |
| BorgWarner | | 55,479 | | | 2,724,574 | |
| Dana | | 89,982 | | | 1,354,229 | |
| KB Home | | 34,988 | | | 1,405,818 | |
| La-Z-Boy | | 55,176 | | | 1,604,518 | |
| Taylor Morrison Home † | | 50,477 | | | 1,931,250 | |
| Toll Brothers | | 62,204 | | | 3,734,106 | |
| | | | | | 12,754,495 | |
| Energy — 4.08% | | | | | | |
| Chesapeake Energy | | 64,346 | | | 4,892,870 | |
| Diamondback Energy | | 25,267 | | | 3,415,340 | |
| Liberty Energy | | 457,950 | | | 5,866,340 | |
| | | | | | 14,174,550 | |
| Financials — 13.09% | | | | | | |
| Axis Capital Holdings | | 56,306 | | | 3,069,803 | |
| Columbia Banking System | | 117,253 | | | 2,511,559 | |
| East West Bancorp | | 75,932 | | | 4,214,226 | |
| Essent Group | | 75,439 | | | 3,021,332 | |
| Hamilton Lane Class A | | 30,235 | | | 2,236,785 | |
| Kemper | | 57,170 | | | 3,124,912 | |
| NMI Holdings Class A † | | 73,788 | | | 1,647,686 | |
| Primerica | | 33,655 | | | 5,796,737 | |
| Raymond James Financial | | 25,176 | | | 2,348,166 | |
| Reinsurance Group of America | | 26,383 | | | 3,502,607 | |
| SouthState | | 38,261 | | | 2,726,479 | |
| Stifel Financial | | 64,692 | | | 3,822,650 | |
| Valley National Bancorp | | 227,043 | | | 2,097,878 | |
| Webster Financial | | 85,372 | | | 3,365,364 | |
| WSFS Financial | | 53,900 | | | 2,027,179 | |
| | | | | | 45,513,363 | |
| Healthcare — 12.51% | | | | | | |
| Amicus Therapeutics † | | 145,173 | | | 1,609,969 | |
| Azenta † | | 34,845 | | | 1,554,784 | |
| Bio-Techne | | 36,359 | | | 2,697,474 | |
| Blueprint Medicines † | | 36,879 | | | 1,659,186 | |
| Catalent † | | 32,430 | | | 2,130,975 | |
| Encompass Health | | 49,767 | | | 2,692,395 | |
| Exact Sciences † | | 27,270 | | | 1,849,179 | |
| Halozyme Therapeutics † | | 73,784 | | | 2,817,811 | |
| ICON † | | 12,833 | | | 2,741,000 | |
Schedules of investments
Delaware Ivy Smid Cap Core Fund
| | | Number of
shares | | Value (US $) | |
| Common Stocks (continued) | | | | | |
| Healthcare (continued) | | | | | | |
| Insmed † | | 77,920 | | $ | 1,328,536 | |
| Inspire Medical Systems † | | 14,041 | | | 3,286,577 | |
| Ligand Pharmaceuticals † | | 23,199 | | | 1,706,518 | |
| Natera † | | 47,552 | | | 2,640,087 | |
| Neurocrine Biosciences † | | 32,700 | | | 3,309,894 | |
| OmniAb † | | 136,839 | | | 503,568 | |
| OmniAb 12.5 =, † | | 10,854 | | | 0 | |
| OmniAb 15 =, † | | 10,855 | | | 0 | |
| QuidelOrtho † | | 18,517 | | | 1,649,680 | |
| Repligen † | | 17,610 | | | 2,964,820 | |
| Shockwave Medical † | | 14,545 | | | 3,153,792 | |
| Supernus Pharmaceuticals † | | 51,340 | | | 1,860,048 | |
| Ultragenyx Pharmaceutical † | | 33,764 | | | 1,353,936 | |
| | | | | | 43,510,229 | |
| Media — 2.10% | | | | | | |
| IMAX † | | 108,094 | | | 2,073,243 | |
| Interpublic Group | | 92,825 | | | 3,456,803 | |
| Nexstar Media Group | | 10,385 | | | 1,793,074 | |
| | | | | | 7,323,120 | |
| Real Estate Investment Trusts — 7.17% | | | | | | |
| Brixmor Property Group | | 156,103 | | | 3,359,337 | |
| Camden Property Trust | | 28,410 | | | 2,978,504 | |
| DiamondRock Hospitality | | 142,063 | | | 1,154,972 | |
| EastGroup Properties | | 15,165 | | | 2,507,078 | |
| First Industrial Realty Trust | | 68,989 | | | 3,670,215 | |
| Kite Realty Group Trust | | 141,852 | | | 2,967,544 | |
| Life Storage | | 37,143 | | | 4,869,076 | |
| Pebblebrook Hotel Trust | | 99,496 | | | 1,396,924 | |
| Physicians Realty Trust | | 137,281 | | | 2,049,605 | |
| | | | | | 24,953,255 | |
| Technology — 13.85% | | | | | | |
| Blackline † | | 13,441 | | | 902,563 | |
| Box Class A † | | 33,727 | | | 903,546 | |
| Dynatrace † | | 46,337 | | | 1,960,055 | |
| ExlService Holdings † | | 29,560 | | | 4,783,695 | |
| Guidewire Software † | | 22,638 | | | 1,857,448 | |
| MACOM Technology Solutions Holdings † | | 38,216 | | | 2,707,221 | |
| MaxLinear † | | 59,114 | | | 2,081,404 | |
| ON Semiconductor † | | 22,207 | | | 1,828,080 | |
| Paycom Software † | | 3,086 | | | 938,175 | |
| Procore Technologies † | | 29,692 | | | 1,859,610 | |
| PTC † | | 34,992 | | | 4,487,024 | |
| Q2 Holdings † | | 47,192 | | | 1,161,867 | |
| Rapid7 † | | 26,405 | | | 1,212,254 | |
| Regal Rexnord | | 17,015 | | | 2,394,521 | |
| Semtech † | | 69,049 | | | 1,666,843 | |
| Silicon Laboratories † | | 14,824 | | | 2,595,534 | |
| Smartsheet Class A † | | 40,205 | | | 1,921,799 | |
| Sprout Social Class A † | | 16,852 | | | 1,025,950 | |
| SS&C Technologies Holdings | | 21,249 | | | 1,199,931 | |
| Tyler Technologies † | | 1,871 | | | 663,531 | |
| Varonis Systems † | | 59,312 | | | 1,542,705 | |
| WNS Holdings ADR † | | 48,503 | | | 4,519,025 | |
| Yelp † | | 55,744 | | | 1,711,341 | |
| Ziff Davis † | | 28,660 | | | 2,236,913 | |
| | | | | | 48,161,035 | |
| Transportation — 3.47% | | | | | | |
| Allegiant Travel † | | 15,892 | | | 1,461,746 | |
| Kirby † | | 46,767 | | | 3,259,660 | |
| Knight-Swift Transportation Holdings | | 64,925 | | | 3,673,457 | |
| Werner Enterprises | | 80,676 | | | 3,669,951 | |
| | | | | | 12,064,814 | |
| Utilities — 1.81% | | | | | | |
| Black Hills | | 50,130 | | | 3,163,203 | |
| Spire | | 44,694 | | | 3,134,837 | |
| | | | | | 6,298,040 | |
Total Common Stocks
(cost $338,235,853) | | | | | 343,084,814 | |
| | | | | | | |
| Short-Term Investments — 1.54% | | | | | | |
| Money Market Mutual Funds — 1.54% | | | | | | |
BlackRock Liquidity FedFund –
Institutional Shares
(seven-day effective yield 4.72%) | | 1,336,758 | | | 1,336,758 | |
| Fidelity Investments Money Market Government Portfolio – Class I (seven-day effective yield 4.72%) | | 1,336,759 | | | 1,336,759 | |
| Goldman Sachs Financial Square Government Fund – Institutional Shares (seven-day effective yield 4.84%) | | 1,336,759 | | | 1,336,759 | |
Morgan Stanley Institutional Liquidity Funds Government Portfolio –
Institutional Class
(seven-day effective yield 4.73%) | | 1,336,758 | | | 1,336,758 | |
Total Short-Term Investments
(cost $5,347,034) | | | | | 5,347,034 | |
Total Value of Securities—100.19%
(cost $343,582,887) | | | | $ | 348,431,848 | |
| † | Non-income producing security. |
| = | The value of this security was determined using significant unobservable inputs and is reported as a Level 3 security in the disclosure table located in Note 3 in “Notes to financial statements.” |
Summary of abbreviations:
ADR – American Depositary Receipt
See accompanying notes, which are an integral part of the financial statements.
Consolidated schedules of investments
Delaware Ivy Systematic Emerging Markets Equity Fund | March 31, 2023 |
| | | Number of
shares | | Value (US $) | |
| Common Stocks — 98.98% | | | | | |
| Communication Services — 11.56% | | | | | | |
| 37 Interactive Entertainment Network Technology Group Class A | | 200,100 | | $ | 828,024 | |
| America Movil | | 10,950,933 | | | 11,546,489 | |
| Baidu Class A † | | 291,950 | | | 5,500,711 | |
| Baidu ADR † | | 16,299 | | | 2,459,845 | |
| Bharti Airtel | | 1,830,731 | | | 16,695,360 | |
| iQIYI ADR † | | 96,526 | | | 702,709 | |
| Kuaishou Technology 144A #, † | | 246,800 | | | 1,897,724 | |
| MTN Group | | 92,308 | | | 661,336 | |
| NCSoft | | 1,513 | | | 433,582 | |
| NetEase | | 753,700 | | | 13,304,979 | |
| Saudi Telecom | | 149,294 | | | 1,596,848 | |
| Sitios Latinoamerica † | | 1 | | | 0 | |
| Tencent Holdings | | 997,920 | | | 48,767,675 | |
| Turkcell Iletisim Hizmetleri | | 807,096 | | | 1,350,601 | |
| Yandex Class A =, † | | 195,088 | | | 0 | |
| | | | | | 105,745,883 | |
| Consumer Discretionary — 13.33% | | | | | | |
| Alibaba Group Holding † | | 1,383,700 | | | 17,525,247 | |
| Alibaba Group Holding ADR † | | 70,222 | | | 7,175,284 | |
| Bethel Automotive Safety Systems Class A | | 92,300 | | | 957,759 | |
| BYD Class H | | 160,500 | | | 4,721,293 | |
| Ford Otomotiv Sanayi | | 26,626 | | | 813,151 | |
| Geely Automobile Holdings | | 3,100,000 | | | 3,994,730 | |
| Great Wall Motor Class H | | 1,562,500 | | | 1,933,362 | |
| Hyundai Motor | | 84,696 | | | 12,049,920 | |
| JD.com Class A | | 382,161 | | | 8,344,943 | |
| Kia | | 175,332 | | | 10,942,135 | |
| Li Auto † | | 312,000 | | | 3,901,892 | |
| Li Ning | | 767,500 | | | 6,035,555 | |
| Lojas Renner | | 1,261,294 | | | 4,130,944 | |
| Maruti Suzuki India | | 23,106 | | | 2,336,677 | |
| Meituan Class B #, † | | 661,012 | | | 11,992,222 | |
| Naspers Class N | | 41,575 | | | 7,703,613 | |
| PDD Holdings ADR † | | 93,962 | | | 7,131,716 | |
| Shenzhou International Group Holdings | | 295,700 | | | 3,101,941 | |
| Trip.com Group ADR † | | 51,375 | | | 1,935,296 | |
| Vipshop Holdings ADR † | | 44,191 | | | 670,819 | |
| Yum China Holdings | | 70,297 | | | 4,456,127 | |
| | | | | | 121,854,626 | |
| Consumer Staples — 8.17% | | | | | | |
| Ambev | | 3,335,313 | | | 9,456,234 | |
| BIM Birlesik Magazalar | | 333,262 | | | 2,588,379 | |
| China Mengniu Dairy | | 1,515,000 | | | 6,210,663 | |
| China Resources Beer Holdings | | 1,002,000 | | | 8,049,477 | |
| Chongqing Brewery Class A | | 36,601 | | | 666,389 | |
| CP ALL | | 1,465,000 | | | 2,666,947 | |
| Fix Price Group GDR 144A #, =, † | | 1,489,220 | | | 1,130,874 | |
| Hindustan Unilever | | 104,115 | | | 3,251,439 | |
| ITC | | 3,039,292 | | | 14,220,500 | |
| Jiangsu Yanghe Brewery Joint- Stock Class A | | 45,900 | | | 1,101,796 | |
| Kweichow Moutai Class A | | 15,501 | | | 4,094,738 | |
| Meihua Holdings Group Class A | | 539,200 | | | 767,925 | |
| Shanxi Xinghuacun Fen Wine Factory Class A | | 85,015 | | | 3,361,788 | |
| Wal-Mart de Mexico | | 3,419,669 | | | 13,663,494 | |
| Wuliangye Yibin Class A | | 122,161 | | | 3,490,190 | |
| | | | | | 74,720,833 | |
| Energy — 5.74% | | | | | | |
| Banpu | | 4,305,400 | | | 1,361,877 | |
| China Shenhua Energy Class A | | 479,592 | | | 1,965,053 | |
| China Shenhua Energy Class H | | 2,319,500 | | | 7,299,288 | |
| LUKOIL = | | 276,569 | | | 0 | |
| Petro Rio † | | 248,299 | | | 1,529,931 | |
| PetroChina Class H | | 5,788,000 | | | 3,419,171 | |
| Petroleo Brasileiro | | 318,171 | | | 1,666,044 | |
| PTT Exploration & Production | | 1,900,600 | | | 8,364,974 | |
| Reliance Industries | | 434,439 | | | 12,353,095 | |
| Saudi Arabian Oil 144A # | | 861,811 | | | 7,428,118 | |
| Shaanxi Coal Industry Class A | | 1,611,000 | | | 4,768,117 | |
| Shanxi Coking Coal Energy Group Class A | | 480,700 | | | 769,055 | |
| Yankuang Energy Group Class H | | 442,000 | | | 1,582,557 | |
| | | | | | 52,507,280 | |
| Financials — 22.50% | | | | | | |
| Agricultural Bank of China Class A | | 9,601,600 | | | 4,347,599 | |
| Al Rajhi Bank | | 670,584 | | | 13,201,157 | |
| Alinma Bank | | 91,168 | | | 718,911 | |
| Axis Bank | | 1,071,624 | | | 11,227,155 | |
| Bajaj Finance | | 8,851 | | | 607,309 | |
| Banco do Brasil | | 1,495,109 | | | 11,545,653 | |
| Bank Central Asia | | 27,910,500 | | | 16,328,873 | |
| Bank of Chengdu Class A | | 1,659,800 | | | 3,276,084 | |
| Bank of China Class A | | 6,168,879 | | | 3,033,604 | |
| Bank of China Class H | | 34,775,000 | | | 13,331,589 | |
| Bank Rakyat Indonesia Persero | | 48,301,000 | | | 15,304,308 | |
| BB Seguridade Participacoes | | 1,062,820 | | | 6,815,032 | |
| China Construction Bank Class A | | 3,020,500 | | | 2,611,284 | |
| China Construction Bank Class H | | 14,273,000 | | | 9,237,414 | |
| China Life Insurance Class H | | 829,000 | | | 1,360,447 | |
| China Merchants Bank Class H | | 566,500 | | | 2,876,698 | |
| Credicorp | | 65,638 | | | 8,689,815 | |
| FirstRand | | 3,708,117 | | | 12,568,289 | |
| Grupo Financiero Banorte Class O | | 983,000 | | | 8,276,402 | |
| | | Number of
shares | | Value (US $) | |
| Common Stocks (continued) | | | | | |
| Financials (continued) | | | | | | |
| Hana Financial Group | | 137,987 | | $ | 4,321,611 | |
| ICICI Bank | | 2,309,731 | | | 24,682,813 | |
| Industrial & Commercial Bank of China Class H | | 12,798,000 | | | 6,801,364 | |
| Kasikornbank | | 442,300 | | | 1,713,840 | |
| KB Financial Group | | 78,074 | | | 2,851,433 | |
| Lufax Holding ADR | | 863,596 | | | 1,761,736 | |
| Ping An Insurance Group Co. of China Class H | | 337,500 | | | 2,183,360 | |
| Saudi National Bank | | 676,662 | | | 8,286,227 | |
| Sberbank of Russia ADR =, † | | 1,032,386 | | | 0 | |
| Shinhan Financial Group | | 137,336 | | | 3,730,776 | |
| Standard Bank Group | | 416,439 | | | 4,037,722 | |
| | | | | | 205,728,505 | |
| Healthcare — 2.29% | | | | | | |
| Bangkok Dusit Medical Services | | 1,868,700 | | | 1,612,126 | |
| Bloomage Biotechnology Class A | | 62,950 | | | 1,039,545 | |
| China Resources Sanjiu Medical & Pharmaceutical Class A | | 359,300 | | | 3,003,818 | |
| CSPC Pharmaceutical Group | | 5,732,000 | | | 5,619,180 | |
| Daan Gene Class A | | 333,740 | | | 782,403 | |
| Imeik Technology Development Class A | | 29,574 | | | 2,405,815 | |
| Shenzhen Mindray Bio-Medical Electronics Class A | | 62,200 | | | 2,822,148 | |
| Wuxi Biologics Cayman 144A #, † | | 596,500 | | | 3,675,610 | |
| | | | | | 20,960,645 | |
| Industrials — 5.21% | | | | | | |
| Airports of Thailand † | | 1,594,300 | | | 3,313,138 | |
| Contemporary Amperex Technology Class A | | 16,604 | | | 982,817 | |
| Evergreen Marine Taiwan | | 503,200 | | | 2,635,445 | |
| GoodWe Technologies | | 26,353 | | | 1,112,517 | |
| Guangzhou Great Power Energy & Technology | | 111,300 | | | 922,443 | |
| KOC Holding | | 1,758,780 | | | 7,025,324 | |
| Korea Aerospace Industries | | 150,399 | | | 5,492,332 | |
| Larsen & Toubro | | 736,228 | | | 19,433,704 | |
| Wan Hai Lines | | 200,300 | | | 453,324 | |
| Xiamen C & D Class A | | 995,158 | | | 1,745,056 | |
| Yang Ming Marine Transport | | 913,000 | | | 1,938,238 | |
| YTO Express Group Class A | | 331,200 | | | 882,043 | |
| ZTO Express Cayman ADR | | 59,679 | | | 1,710,400 | |
| | | | | | 47,646,781 | |
| Information Technology — 23.34% | | | | | | |
| Delta Electronics | | 299,794 | | | 2,974,448 | |
| E Ink Holdings | | 467,000 | | | 2,850,403 | |
| eMemory Technology | | 58,382 | | | 3,593,881 | |
| HCL Technologies | | 318,170 | | | 4,223,893 | |
| Hon Hai Precision Industry | | 1,045,000 | | | 3,577,029 | |
| Infosys | | 1,079,360 | | | 18,870,604 | |
| Largan Precision | | 32,000 | | | 2,294,215 | |
| Lenovo Group | | 1,030,000 | | | 1,115,917 | |
| LG Innotek | | 23,687 | | | 4,967,458 | |
| MediaTek | | 526,879 | | | 13,659,931 | |
| Nan Ya Printed Circuit Board | | 363,000 | | | 3,402,749 | |
| Novatek Microelectronics | | 458,000 | | | 6,508,424 | |
| Parade Technologies | | 28,000 | | | 969,412 | |
| Samsung Electro-Mechanics | | 8,760 | | | 1,034,304 | |
| Samsung Electronics | | 909,589 | | | 44,980,051 | |
| Samsung SDI | | 4,115 | | | 2,337,480 | |
| SK Hynix | | 51,113 | | | 3,497,916 | |
| Taiwan Semiconductor Manufacturing | | 3,900,404 | | | 68,353,104 | |
| Tata Consultancy Services | | 300,810 | | | 11,791,105 | |
| Unimicron Technology | | 1,291,000 | | | 6,296,556 | |
| United Microelectronics | | 1,668,000 | | | 2,918,888 | |
| Wiwynn | | 85,000 | | | 3,153,622 | |
| | | | | | 213,371,390 | |
| Materials — 5.15% | | | | | | |
| Asian Paints | | 67,617 | | | 2,278,130 | |
| Guangzhou Tinci Materials Technology Class A | | 83,040 | | | 507,805 | |
| Hindalco Industries | | 385,946 | | | 1,913,569 | |
| Hubei Xingfa Chemicals Group Class A | | 524,201 | | | 2,326,281 | |
| Jiangsu Eastern Shenghong Class A | | 208,360 | | | 412,478 | |
| LG Chem | | 14,376 | | | 7,895,214 | |
| POSCO Holdings | | 29,476 | | | 8,339,388 | |
| Saudi Basic Industries | | 296,890 | | | 7,164,420 | |
| Sichuan Yahua Industrial Group Class A | | 284,200 | | | 876,993 | |
| Tata Steel | | 1,332,556 | | | 1,702,302 | |
| Vale | | 604,723 | | | 9,556,829 | |
| Vedanta | | 215,893 | | | 723,220 | |
| YongXing Special Materials Technology Class A | | 86,100 | | | 1,055,805 | |
| Yunnan Aluminium Class A | | 715,100 | | | 1,415,084 | |
| Zangge Mining Class A | | 255,200 | | | 898,436 | |
| | | | | | 47,065,954 | |
| Real Estate — 1.37% | | | | | | |
| China Overseas Land & Investment | | 1,337,500 | | | 3,226,689 | |
| China Resources Land | | 1,486,000 | | | 6,766,998 | |
Consolidated schedules of investments
Delaware Ivy Systematic Emerging Markets Equity Fund
| | | Number of
shares | | Value (US $) | |
| Common Stocks (continued) | | | | | |
| Real Estate (continued) | | | | | | |
| Country Garden Services Holdings | | 703,000 | | $ | 1,212,036 | |
| Etalon Group GDR † | | 2,791,564 | | | 0 | |
| Longfor Group Holdings 144A # | | 466,500 | | | 1,315,701 | |
| | | | | | 12,521,424 | |
| Utilities — 0.32% | | | | | | |
| Centrais Eletricas Brasileiras | | 445,920 | | | 2,925,320 | |
| | | | | | 2,925,320 | |
Total Common Stocks
(cost $831,209,478) | | | | | 905,048,641 | |
| | | | | | | |
| Preferred Stocks — 0.56% | | | | | | |
| Petroleo Brasileiro 42.97% | | 1,057,598 | | | 4,882,714 | |
| Sociedad Quimica y Minera de Chile Class B 10.72% | | 3,154 | | | 253,149 | |
Total Preferred Stocks
(cost $3,457,111) | | | | | 5,135,863 | |
| | | | | | | |
| Short-Term Investments — 0.18% | | | | | | |
| Money Market Mutual Funds — 0.18% | | | | | | |
BlackRock Liquidity FedFund –
Institutional Shares (seven-day effective yield 4.72%) | | 419,280 | | | 419,280 | |
Fidelity Investments Money Market Government Portfolio – Class I
(seven-day effective yield 4.72%) | | 419,280 | | | 419,280 | |
Goldman Sachs Financial Square Government Fund –
Institutional Shares (seven-day effective yield 4.84%) | | 419,280 | | | 419,280 | |
| Morgan Stanley Institutional | | | | | | |
Liquidity Funds Government Portfolio –
Institutional Class
(seven-day effective yield 4.73%) | | 419,279 | | | 419,279 | |
Total Short-Term Investments
(cost $1,677,119) | | | | | 1,677,119 | |
Total Value of Securities—99.72%
(cost $836,343,708) | | | | $ | 911,861,623 | |
| † | Non-income producing security. |
| # | Security exempt from registration under Rule 144A of the Securities Act of 1933, as amended. At March 31, 2023, the aggregate value of Rule 144A securities was $27,440,249, which represents 3.00% of the Fund's net assets. See Note 13 in “Notes to financial statements." |
| = | The value of this security was determined using significant unobservable inputs and is reported as a Level 3 security in the disclosure table located in Note 3 in “Notes to financial statements.” |
Summary of abbreviations:
ADR – American Depositary Receipt
GDR – Global Depositary Receipt
See accompanying notes, which are an integral part of the financial statements.
Delaware Ivy Value Fund | March 31, 2023 |
| | | Number of
shares | | Value (US $) | |
| Common Stocks — 98.89% | | | | | | |
| Communication Services — 9.00% | | | | | | |
| Comcast Class A | | 519,000 | | $ | 19,675,290 | |
| Verizon Communications | | 498,139 | | | 19,372,626 | |
| Walt Disney † | | 217,208 | | | 21,749,037 | |
| | | | | | 60,796,953 | |
| Consumer Discretionary — 6.30% | | | | | | |
| Lowe's | | 107,867 | | | 21,570,164 | |
| TJX | | 268,245 | | | 21,019,678 | |
| | | | | | 42,589,842 | |
| Consumer Staples — 12.11% | | | | | | |
| Archer-Daniels-Midland | | 247,200 | | | 19,691,952 | |
| Conagra Brands | | 563,378 | | | 21,160,477 | |
| Dollar General | | 97,519 | | | 20,523,849 | |
| Dollar Tree † | | 142,385 | | | 20,439,367 | |
| | | | | | 81,815,645 | |
| Energy — 2.90% | | | | | | |
| ConocoPhillips | | 197,791 | | | 19,622,845 | |
| | | | | | 19,622,845 | |
| Financials — 11.66% | | | | | | |
| American International Group | | 362,940 | | | 18,277,658 | |
| Fidelity National Information Services | | 258,903 | | | 14,066,200 | |
| MetLife | | 338,143 | | | 19,592,006 | |
| Truist Financial | | 397,433 | | | 13,552,465 | |
| US Bancorp | | 368,200 | | | 13,273,610 | |
| | | | | | 78,761,939 | |
| Healthcare — 17.39% | | | | | | |
| Baxter International | | 503,859 | | | 20,436,521 | |
| Cigna | | 69,477 | | | 17,753,458 | |
| CVS Health | | 222,581 | | | 16,539,994 | |
| Hologic † | | 252,470 | | | 20,374,329 | |
| Johnson & Johnson | | 137,472 | | | 21,308,160 | |
| Merck & Co. | | 198,136 | | | 21,079,689 | |
| | | | | | 117,492,151 | |
| Industrials — 12.72% | | | | | | |
| Dover | | 143,310 | | | 21,774,521 | |
| Honeywell International | | 106,080 | | | 20,274,010 | |
| Northrop Grumman | | 45,100 | | | 20,823,572 | |
| Raytheon Technologies | | 235,600 | | | 23,072,308 | |
| | | | | | 85,944,411 | |
| Information Technology — 17.37% | | | | | | |
| Broadcom | | 38,474 | | | 24,682,610 | |
| Cisco Systems | | 474,619 | | | 24,810,708 | |
| Cognizant Technology Solutions Class A | | 345,673 | | | 21,061,856 | |
| Motorola Solutions | | 89,146 | | | 25,507,345 | |
| Oracle | | 229,377 | | | 21,313,711 | |
| | | | | | 117,376,230 | |
| Materials — 3.28% | | | | | | |
| DuPont de Nemours | | 308,640 | | | 22,151,093 | |
| | | | | | 22,151,093 | |
| Real Estate — 2.77% | | | | | | |
| Equity Residential | | 311,596 | | | 18,695,760 | |
| | | | | | 18,695,760 | |
| Utilities — 3.39% | | | | | | |
| Edison International | | 324,759 | | | 22,924,738 | |
| | | | | | 22,924,738 | |
Total Common Stocks
(cost $681,805,936) | | | | | 668,171,607 | |
| | | | | | | |
| Short-Term Investments — 0.58% | | | | | | |
| Money Market Mutual Funds — 0.58% | | | | | | |
BlackRock Liquidity FedFund –
Institutional Shares (seven-day effective yield 4.72%) | | 974,973 | | | 974,973 | |
Fidelity Investments Money Market Government Portfolio – Class I
(seven-day effective yield 4.72%) | | 974,973 | | | 974,973 | |
Goldman Sachs Financial Square Government Fund – Institutional Shares
(seven-day effective yield 4.84%) | | 974,973 | | | 974,973 | |
Morgan Stanley Institutional Liquidity Funds Government Portfolio –
Institutional Class (seven-day effective yield 4.73%) | | 974,973 | | | 974,973 | |
Total Short-Term Investments
(cost $3,899,892) | | | | | 3,899,892 | |
Total Value of Securities—99.47%
(cost $685,705,828) | | | | $ | 672,071,499 | |
| | |
| † | Non-income producing security. |
See accompanying notes, which are an integral part of the financial statements.
Statements of assets and liabilities
| | | Delaware | | | Delaware Ivy | | | Delaware Ivy | | | Delaware Ivy | |
| | | Global Value | | | Core Bond | | | Core Equity | | | Global Bond | |
| | | Equity Fund | | | Fund | | | Fund | | | Fund | |
| Assets: | | | | | | | | | | | | | | | | |
| Investments, at value* | | $ | 319,547,101 | | | $ | 475,552,840 | | | $ | 3,431,972,260 | | | $ | 422,026,273 | |
| Cash | | | — | | | | 61,209 | | | | — | | | | 1,962,165 | |
| Cash collateral due from brokers | | | — | | | | 1,552,107 | | | | — | | | | 3,830,999 | |
| Foreign currencies, at valueD | | | 2,015 | | | | — | | | | — | | | | 644,787 | |
| Receivable for securities sold | | | 1,012,821 | | | | 916,580 | | | | 26,390,938 | | | | — | |
| Foreign tax reclaims receivable | | | 877,667 | | | | — | | | | — | | | | — | |
| Dividends and interest receivable | | | 683,560 | | | | 3,366,493 | | | | 1,707,296 | | | | 4,594,576 | |
| Receivable for fund shares sold | | | 563,812 | | | | 991,815 | | | | 2,443,887 | | | | 307,887 | |
| Prepaid expenses | | | 21,749 | | | | 37,221 | | | | 33,107 | | | | 25,732 | |
| Securities lending income receivable | | | 1,027 | | | | — | | | | 208 | | | | 6,258 | |
| Variation margin due from broker on futures contracts | | | — | | | | 147,155 | | | | — | | | | 55,335 | |
| Unrealized appreciation on foreign currency exchange contracts | | | — | | | | — | | | | — | | | | 1,068,546 | |
| Receivable due from Advisor | | | — | | | | 275,393 | | | | — | | | | — | |
| Variation margin due from brokers on centrally cleared credit default swap contracts | | | — | | | | 35,552 | | | | — | | | | — | |
| Other assets | | | 38,088 | | | | 53,664 | | | | 138,723 | | | | 42,732 | |
| Total Assets | | | 322,747,840 | | | | 482,990,029 | | | | 3,462,686,419 | | | | 434,565,290 | |
| Liabilities: | | | | | | | | | | | | | | | | |
| Options written, at valueS | | | — | | | | — | | | | — | | | | 548,093 | |
| Due to custodian | | | 701,658 | | | | — | | | | 827 | | | | — | |
| Payable for fund shares redeemed | | | 844,538 | | | | 1,753,793 | | | | 4,060,190 | | | | 409,725 | |
| Other accrued expenses | | | 313,861 | | | | 778,208 | | | | 2,363,956 | | | | 315,763 | |
| Investment management fees payable to affiliates | | | 154,028 | | | | — | | | | 1,720,070 | | | | 203,882 | |
| Administration expenses payable to affiliates | | | 66,840 | | | | 110,266 | | | | 114,321 | | | | 54,518 | |
| Distribution fees payable to affiliates | | | 43,079 | | | | — | | | | 558,011 | | | | 26,223 | |
| Payable for securities purchased | | | — | | | | 10,220,747 | | | | 43,102,301 | | | | 4,053,843 | |
| Distribution payable | | | — | | | | 7,063 | | | | — | | | | — | |
| Unrealized depreciation on foreign currency exchange contracts | | | — | | | | — | | | | — | | | | 481,184 | |
| Cash collateral due to brokers | | | — | | | | — | | | | — | | | | 270,000 | |
| Due to broker | | | — | | | | 32,306 | | | | — | | | | — | |
| Total Liabilities | | | 2,124,004 | | | | 12,902,383 | | | | 51,919,676 | | | | 6,363,231 | |
| Total Net Assets | | $ | 320,623,836 | | | $ | 470,087,646 | | | $ | 3,410,766,743 | | | $ | 428,202,059 | |
| |
| Net Assets Consist of: | | | | | | | | | | | | | | | | |
| Paid-in capital | | $ | 336,050,174 | | | $ | 573,744,606 | | | $ | 2,052,675,808 | | | $ | 537,349,015 | |
| Total distributable earnings (loss) | | | (15,426,338 | ) | | | (103,656,960 | ) | | | 1,358,090,935 | | | | (109,146,956 | ) |
| Total Net Assets | | $ | 320,623,836 | | | $ | 470,087,646 | | | $ | 3,410,766,743 | | | $ | 428,202,059 | |
| | | Delaware | | | Delaware Ivy | | | Delaware Ivy | | | Delaware Ivy | |
| | | Global Value | | | Core Bond | | | Core Equity | | | Global Bond | |
| | | Equity Fund | | | Fund | | | Fund | | | Fund | |
| Net Asset Value | | | | | | | | | | | | | | | | |
| | | | | | | | | | | | | | | | | |
| Class A: | | | | | | | | | | | | | | | | |
| Net assets | | $ | 197,879,133 | | | $ | 135,039,493 | | | $ | 2,574,629,506 | | | $ | 111,266,215 | |
| Shares of beneficial interest outstanding, unlimited authorization, no par | | | 24,556,521 | | | | 14,457,248 | | | | 175,237,181 | | | | 12,237,303 | |
| Net asset value per share | | $ | 8.06 | | | $ | 9.34 | | | $ | 14.69 | | | $ | 9.09 | |
| Sales charge | | | 5.75 | % | | | 4.50 | % | | | 5.75 | % | | | 4.50 | % |
| Offering price per share, equal to net asset value per share / (1 - sales charge) | | $ | 8.55 | | | $ | 9.78 | | | $ | 15.59 | | | $ | 9.52 | |
| | | | | | | | | | | | | | | | | |
| Class C: | | | | | | | | | | | | | | | | |
| Net assets | | $ | 2,384,130 | | | $ | 4,021,920 | | | $ | 17,253,263 | | | $ | 2,675,293 | |
| Shares of beneficial interest outstanding, unlimited authorization, no par | | | 298,805 | | | | 430,590 | | | | 1,555,614 | | | | 294,433 | |
| Net asset value per share | | $ | 7.98 | | | $ | 9.34 | | | $ | 11.09 | | | $ | 9.09 | |
| | | | | | | | | | | | | | | | | |
| Class I: | | | | | | | | | | | | | | | | |
| Net assets | | $ | 117,590,062 | | | $ | 250,768,755 | | | $ | 744,911,232 | | | $ | 179,445,855 | |
| Shares of beneficial interest outstanding, unlimited authorization, no par | | | 14,538,230 | | | | 26,844,191 | | | | 42,155,615 | | | | 19,740,553 | |
| Net asset value per share | | $ | 8.09 | | | $ | 9.34 | | | $ | 17.67 | | | $ | 9.09 | |
| | | | | | | | | | | | | | | | | |
| Class R: | | | | | | | | | | | | | | | | |
| Net assets | | $ | 231,453 | | | $ | 890,547 | | | $ | 231,040 | | | $ | 257,078 | |
| Shares of beneficial interest outstanding, unlimited authorization, no par | | | 28,776 | | | | 95,325 | | | | 15,969 | | | | 28,341 | |
| Net asset value per share | | $ | 8.04 | | | $ | 9.34 | | | $ | 14.47 | | | $ | 9.07 | |
| | | | | | | | | | | | | | | | | |
| Class R6: | | | | | | | | | | | | | | | | |
| Net assets | | $ | 1,129,666 | | | $ | 74,458,081 | | | $ | 48,677,129 | | | $ | 132,678,812 | |
| Shares of beneficial interest outstanding, unlimited authorization, no par | | | 139,189 | | | | 7,971,735 | | | | 2,745,117 | | | | 14,595,337 | |
| Net asset value per share | | $ | 8.12 | | | $ | 9.34 | | | $ | 17.73 | | | $ | 9.09 | |
| | | | | | | | | | | | | | | | | |
| Class Y: | | | | | | | | | | | | | | | | |
| Net assets | | $ | 1,409,392 | | | $ | 4,908,850 | | | $ | 25,064,573 | | | $ | 1,878,806 | |
| Shares of beneficial interest outstanding, unlimited authorization, no par | | | 174,824 | | | | 525,511 | | | | 1,489,249 | | | | 206,650 | |
| Net asset value per share | | $ | 8.06 | | | $ | 9.34 | | | $ | 16.83 | | | $ | 9.09 | |
| ________________ | | | | | | | | | | | | | | | | |
| *Investments, at cost | | $ | 310,641,699 | | | $ | 497,002,376 | | | $ | 2,258,666,683 | | | $ | 433,219,410 | |
| DForeign currencies, at cost | | | 2,013 | | | | — | | | | — | | | | 645,185 | |
| SOptions written, premium received | | | — | | | | — | | | | — | | | | (990,335 | ) |
See accompanying notes, which are an integral part of the financial statements.
Statements of assets and liabilities
Ivy Funds
| | | | | | | | | Delaware Ivy | | | | |
| | | Delaware Ivy | | | Delaware Ivy | | | International | | | Delaware Ivy | |
| | | Global Growth | | | High Income | | | Core Equity | | | International | |
| | | Fund | | | Fund | | | Fund | | | Value Fund | |
| Assets: | | | | | | | | | | | | | | | | |
| Investments, at value* | | $ | 538,404,472 | | | $ | 2,365,064,130 | | | $ | 1,336,885,547 | | | $ | 130,879,049 | |
| Investments of affiliated issuers, at value** | | | — | | | | 118,286,307 | | | | — | | | | — | |
| Cash | | | — | | | | 2,368,931 | | | | — | | | | 112,992 | |
| Foreign currencies, at valueD | | | 2,083 | | | | 145,992 | | | | 17,937,026 | | | | 74,276 | |
| Dividends and interest receivable | | | 399,807 | | | | 47,361,443 | | | | 5,152,030 | | | | 276,139 | |
| Receivable for fund shares sold | | | 391,893 | | | | 14,651,944 | | | | 1,261,075 | | | | 613,373 | |
| Foreign tax reclaims receivable | | | 296,494 | | | | — | | | | 7,076,146 | | | | 983,751 | |
| Prepaid expenses | | | 18,248 | | | | 15,869 | | | | 22,949 | | | | 22,420 | |
| Securities lending income receivable | | | 470 | | | | 113,103 | | | | 17,629 | | | | — | |
| Receivable for securities sold | | | — | | | | 17,189,836 | | | | — | | | | — | |
| Unrealized appreciation on foreign currency exchange contracts | | | — | | | | 60,529 | | | | — | | | | — | |
| Other assets | | | 59,752 | | | | 127,957 | | | | 48,268 | | | | 36,517 | |
| Total Assets | | | 539,573,219 | | | | 2,565,386,041 | | | | 1,368,400,670 | | | | 132,998,517 | |
| Liabilities: | | | | | | | | | | | | | | | | |
| Due to custodian | | | — | | | | — | | | | 301,737 | | | | — | |
| Payable for fund shares redeemed | | | 988,389 | | | | 8,468,814 | | | | 3,378,229 | | | | 687,044 | |
| Other accrued expenses | | | 964,485 | | | | 3,408,738 | | | | 1,160,746 | | | | 171,836 | |
| Investment management fees payable to affiliates | | | 312,898 | | | | 1,195,819 | | | | 733,478 | | | | 70,223 | |
| Accrued capital gains taxes on appreciated securities | | | 278,607 | | | | — | | | | — | | | | — | |
| Administration expenses payable to affiliates | | | 109,671 | | | | 109,040 | | | | 109,040 | | | | 28,107 | |
| Distribution fees payable to affiliates | | | 69,758 | | | | 406,280 | | | | 108,539 | | | | 9,077 | |
| Payable for securities purchased | | | — | | | | 15,058,348 | | | | 5,724,723 | | | | 4,123,666 | |
| Distribution payable | | | — | | | | 236,853 | | | | — | | | | — | |
| Total Liabilities | | | 2,723,808 | | | | 28,883,892 | | | | 11,516,492 | | | | 5,089,953 | |
| Total Net Assets | | $ | 536,849,411 | | | $ | 2,536,502,149 | | | $ | 1,356,884,178 | | | $ | 127,908,564 | |
| |
| Net Assets Consist of: | | | | | | | | | | | | | | | | |
| Paid-in capital | | $ | 420,451,728 | | | $ | 4,631,266,358 | | | $ | 1,277,910,028 | | | $ | 144,214,967 | |
| Total distributable earnings (loss) | | | 116,397,683 | | | | (2,094,764,209 | ) | | | 78,974,150 | | | | (16,306,403 | ) |
| Total Net Assets | | $ | 536,849,411 | | | $ | 2,536,502,149 | | | $ | 1,356,884,178 | | | $ | 127,908,564 | |
| | | Delaware Ivy | | | Delaware Ivy | | | Delaware Ivy
International | | | Delaware Ivy | |
| | | Global Growth | | | High Income | | | Core Equity | | | International | |
| | | Fund | | | Fund | | | Fund | | | Value Fund | |
| Net Asset Value | | | | | | | | | | | | |
| | | | | | | | | | | | | |
| Class A: | | | | | | | | | | | | | | | | |
| Net assets | | $ | 333,400,296 | | | $ | 1,196,374,566 | | | $ | 278,606,280 | | | $ | 41,664,458 | |
| Shares of beneficial interest outstanding, unlimited authorization, no par | | | 11,358,953 | | | | 203,883,455 | | | | 14,792,443 | | | | 2,794,079 | |
| Net asset value per share | | $ | 29.35 | | | $ | 5.87 | | | $ | 18.83 | | | $ | 14.91 | |
| Sales charge | | | 5.75 | % | | | 4.50 | % | | | 5.75 | % | | | 5.75 | % |
| Offering price per share, equal to net asset value per share / (1 - sales charge) | | $ | 31.14 | | | $ | 6.15 | | | $ | 19.98 | | | $ | 15.82 | |
| | | | | | | | | | | | | | | | | |
| Class C: | | | | | | | | | | | | | | | | |
| Net assets | | $ | 2,186,619 | | | $ | 141,497,390 | | | $ | 28,549,131 | | | $ | 395,451 | |
| Shares of beneficial interest outstanding, unlimited authorization, no par | | | 118,863 | | | | 24,113,525 | | | | 1,742,130 | | | | 29,236 | |
| Net asset value per share | | $ | 18.40 | | | $ | 5.87 | | | $ | 16.39 | | | $ | 13.53 | |
| | | | | | | | | | | | | | | | | |
| Class I: | | | | | | | | | | | | | | | | |
| Net assets | | $ | 196,155,194 | | | $ | 1,035,891,094 | | | $ | 723,001,867 | | | $ | 40,057,971 | |
| Shares of beneficial interest outstanding, unlimited authorization, no par | | | 6,355,402 | | | | 176,538,230 | | | | 38,056,520 | | | | 2,595,499 | |
| Net asset value per share | | $ | 30.86 | | | $ | 5.87 | | | $ | 19.00 | | | $ | 15.43 | |
| | | | | | | | | | | | | | | | | |
| Class R: | | | | | | | | | | | | | | | | |
| Net assets | | $ | 715,777 | | | $ | 34,322,350 | | | $ | 41,758,369 | | | $ | 132,368 | |
| Shares of beneficial interest outstanding, unlimited authorization, no par | | | 25,153 | | | | 5,848,970 | | | | 2,219,968 | | | | 8,920 | |
| Net asset value per share | | $ | 28.46 | | | $ | 5.87 | | | $ | 18.81 | | | $ | 14.84 | |
| | | | | | | | | | | | | | | | | |
| Class R6: | | | | | | | | | | | | | | | | |
| Net assets | | $ | 2,908,402 | | | $ | 59,659,185 | | | $ | 243,848,371 | | | $ | 44,969,164 | |
| Shares of beneficial interest outstanding, unlimited authorization, no par | | | 93,711 | | | | 10,166,848 | | | | 12,798,834 | | | | 2,904,091 | |
| Net asset value per share | | $ | 31.04 | | | $ | 5.87 | | | $ | 19.05 | | | $ | 15.48 | |
| | | | | | | | | | | | | | | | | |
| Class Y: | | | | | | | | | | | | | | | | |
| Net assets | | $ | 1,483,123 | | | $ | 68,757,564 | | | $ | 41,120,160 | | | $ | 689,152 | |
| Shares of beneficial interest outstanding, unlimited authorization, no par | | | 50,006 | | | | 11,716,540 | | | | 2,165,909 | | | | 45,290 | |
| Net asset value per share | | $ | 29.66 | | | $ | 5.87 | | | $ | 18.99 | | | $ | 15.22 | |
| _________________ | | | | | | | | | | | | | | | | |
| *Investments, at cost | | $ | 434,363,883 | | | $ | 2,711,009,030 | | | $ | 1,187,387,072 | | | $ | 133,732,958 | |
| **Investments of affiliated issuers, at cost | | | — | | | | 294,821,686 | | | | — | | | | — | |
| DForeign currencies, at cost | | | 2,114 | | | | 196,430 | | | | 18,415,322 | | | | 91,657 | |
See accompanying notes, which are an integral part of the financial statements.
Statements of assets and liabilities
Ivy Funds
| | | | | | | | | Delaware Ivy | | | | |
| | | | | | | | | Managed | | | | |
| | | Delaware Ivy | | | Delaware Ivy | | | International | | | Delaware Ivy | |
| | | Large Cap | | | Limited-Term | | | Opportunities | | | Mid Cap | |
| | | Growth Fund | | | Bond Fund | | | Fund | | | Growth Fund | |
| Assets: | | | | | | | | | | | | | | | | |
| Investments, at value* | | $ | 5,074,300,517 | | | $ | 554,455,632 | | | $ | 387,944 | | | $ | 5,889,718,855 | |
| Investments of affiliated issuers, at value** | | | — | | | | — | | | | 77,934,648 | | | | — | |
| Cash | | | 41,267,928 | | | | — | | | | 122 | | | | — | |
| Cash collateral due from brokers | | | — | | | | 519,420 | | | | — | | | | — | |
| Receivable for fund shares sold | | | 9,493,771 | | | | 722,834 | | | | 71,242 | | | | 6,992,655 | |
| Dividends and interest receivable | | | 2,639,609 | | | | 4,296,946 | | | | 1,470 | | | | 2,207,885 | |
| Prepaid expenses | | | 244,948 | | | | 12,314 | | | | — | | | | 41,587 | |
| Foreign tax reclaims receivable | | | 42,977 | | | | — | | | | — | | | | — | |
| Securities lending income receivable | | | 15,183 | | | | 670 | | | | — | | | | 4,014 | |
| Receivable for securities sold | | | — | | | | 180,524 | | | | 76,297 | | | | 12,108,729 | |
| Variation margin due from broker on futures contracts | | | — | | | | 47,391 | | | | — | | | | — | |
| Other assets | | | 113,482 | | | | 51,431 | | | | 33,443 | | | | 67,060 | |
| Total Assets | | | 5,128,118,415 | | | | 560,287,162 | | | | 78,505,166 | | | | 5,911,140,785 | |
| Liabilities: | | | | | | | | | | | | | | | | |
| Due to custodian | | | — | | | | 22,410 | | | | — | | | | 243 | |
| Payable for fund shares redeemed | | | 6,971,041 | | | | 2,250,263 | | | | 145,522 | | | | 6,667,995 | |
| Investment management fees payable to affiliates | | | 2,704,052 | | | | 177,103 | | | | 3,294 | | | | 3,417,554 | |
| Other accrued expenses | | | 1,736,792 | | | | 436,433 | | | | 79,132 | | | | 1,155,045 | |
| Distribution fees payable to affiliates | | | 476,488 | | | | 67,982 | | | | 8,130 | | | | 462,772 | |
| Administration expenses payable to affiliates | | | 109,236 | | | | 111,121 | | | | 19,957 | | | | 109,040 | |
| Payable for securities purchased | | | — | | | | 145,426 | | | | — | | | | 22,176,158 | |
| Distribution payable | | | — | | | | 14,869 | | | | — | | | | — | |
| Total Liabilities | | | 11,997,609 | | | | 3,225,607 | | | | 256,035 | | | | 33,988,807 | |
| Total Net Assets | | $ | 5,116,120,806 | | | $ | 557,061,555 | | | $ | 78,249,131 | | | $ | 5,877,151,978 | |
| |
| Net Assets Consist of: | | | | | | | | | | | | | | | | |
| Paid-in capital | | $ | 2,516,610,121 | | | $ | 611,446,627 | | | $ | 68,387,600 | | | $ | 4,311,497,439 | |
| Total distributable earnings (loss) | | | 2,599,510,685 | | | | (54,385,072 | ) | | | 9,861,531 | | | | 1,565,654,539 | |
| Total Net Assets | | $ | 5,116,120,806 | | | $ | 557,061,555 | | | $ | 78,249,131 | | | $ | 5,877,151,978 | |
| | | | | | | | | Delaware Ivy | | | | |
| | | | | | | | | Managed | | | | |
| | | Delaware Ivy | | | Delaware Ivy | | | International | | | Delaware Ivy | |
| | | Large Cap | | | Limited-Term | | | Opportunities | | | Mid Cap | |
| | | Growth Fund | | | Bond Fund | | | Fund | | | Growth Fund | |
| Net Asset Value | | | | | | | | | | | | | | | | |
| | | | | | | | | | | | | | | | | |
| Class A: | | | | | | | | | | | | | | | | |
| Net assets | | $ | 2,127,512,907 | | | $ | 286,217,656 | | | $ | 36,341,215 | | | $ | 1,582,726,115 | |
| Shares of beneficial interest outstanding, unlimited authorization, no par | | | 84,497,042 | | | | 27,578,973 | | | | 3,887,355 | | | | 60,554,489 | |
| Net asset value per share | | $ | 25.18 | | | $ | 10.38 | | | $ | 9.35 | | | $ | 26.14 | |
| Sales charge | | | 5.75 | % | | | 2.75 | % | | | 5.75 | % | | | 5.75 | % |
| Offering price per share, equal to net asset value per share / (1 - sales charge) | | $ | 26.72 | | | $ | 10.67 | | | $ | 9.92 | | | $ | 27.73 | |
| | | | | | | | | | | | | | | | | |
| Class C: | | | | | | | | | | | | | | | | |
| Net assets | | $ | 44,772,500 | | | $ | 7,123,793 | | | $ | 565,758 | | | $ | 75,825,730 | |
| Shares of beneficial interest outstanding, unlimited authorization, no par | | | 2,564,606 | | | | 686,450 | | | | 63,160 | | | | 3,957,632 | |
| Net asset value per share | | $ | 17.46 | | | $ | 10.38 | | | $ | 8.96 | | | $ | 19.16 | |
| | | | | | | | | | | | | | | | | |
| Class I: | | | | | | | | | | | | | | | | |
| Net assets | | $ | 2,723,100,994 | | | $ | 257,145,767 | | | $ | 41,078,613 | | | $ | 2,887,695,446 | |
| Shares of beneficial interest outstanding, unlimited authorization, no par | | | 98,900,391 | | | | 24,778,072 | | | | 4,338,279 | | | | 96,774,185 | |
| Net asset value per share | | $ | 27.53 | | | $ | 10.38 | | | $ | 9.47 | | | $ | 29.84 | |
| | | | | | | | | | | | | | | | | |
| Class R: | | | | | | | | | | | | | | | | |
| Net assets | | $ | 10,598,488 | | | $ | 335,882 | | | $ | 90,961 | | | $ | 58,838,886 | |
| Shares of beneficial interest outstanding, unlimited authorization, no par | | | 455,635 | | | | 32,364 | | | | 9,808 | | | | 2,381,156 | |
| Net asset value per share | | $ | 23.26 | | | $ | 10.38 | | | $ | 9.27 | | | $ | 24.71 | |
| | | | | | | | | | | | | | | | | |
| Class R6: | | | | | | | | | | | | | | | | |
| Net assets | | $ | 185,286,600 | | | $ | 4,283,833 | | | $ | 76,415 | | | $ | 1,048,373,665 | |
| Shares of beneficial interest outstanding, unlimited authorization, no par | | | 6,668,973 | | | | 412,765 | | | | 8,064 | | | | 34,706,200 | |
| Net asset value per share | | $ | 27.78 | | | $ | 10.38 | | | $ | 9.48 | | | $ | 30.21 | |
| | | | | | | | | | | | | | | | | |
| Class Y: | | | | | | | | | | | | | | | | |
| Net assets | | $ | 24,849,317 | | | $ | 1,954,624 | | | $ | 96,169 | | | $ | 223,692,136 | |
| Shares of beneficial interest outstanding, unlimited authorization, no par | | | 946,936 | | | | 188,345 | | | | 10,265 | | | | 7,976,778 | |
| Net asset value per share | | $ | 26.24 | | | $ | 10.38 | | | $ | 9.37 | | | $ | 28.04 | |
| ________________ | | | | | | | | | | | | | | | | |
| *Investments, at cost | | $ | 2,509,132,708 | | | $ | 570,719,968 | | | $ | 387,944 | | | $ | 4,582,128,926 | |
| **Investments of affiliated issuers, at cost | | | — | | | | — | | | | 64,304,504 | | | | — | |
See accompanying notes, which are an integral part of the financial statements.
Statements of assets and liabilities
Ivy Funds
| | | Delaware Ivy | | | | | | | | | | |
| | | Mid Cap | | | | | | | | | | |
| | | Income | | | Delaware Ivy | | | Delaware Ivy | | | Delaware Ivy | |
| | | Opportunities | | | Municipal | | | Municipal High | | | Small Cap | |
| | | Fund | | | Bond Fund | | | Income Fund | | | Growth Fund | |
| Assets: | | | | | | | | | | | | | | | | |
| Investments, at value* | | $ | 1,279,608,658 | | | $ | 350,650,621 | | | $ | 506,157,547 | | | $ | 1,535,487,110 | |
| Cash | | | 2,050 | | | | — | | | | — | | | | 2,347 | |
| Receivable for securities sold | | | 40,430,210 | | | | — | | | | 6,284,214 | | | | 12,567,818 | |
| Receivable for fund shares sold | | | 3,170,445 | | | | 178,633 | | | | 229,599 | | | | 1,132,721 | |
| Dividends and interest receivable | | | 1,392,522 | | | | 3,541,029 | | | | 6,059,085 | | | | 234,095 | |
| Prepaid expenses | | | 8,803 | | | | 10,700 | | | | 41,645 | | | | 14,933 | |
| Securities lending income receivable | | | 2,037 | | | | — | | | | — | | | | 3,460 | |
| Other assets | | | 88,611 | | | | 57,327 | | | | 35,072 | | | | 75,038 | |
| Total Assets | | | 1,324,703,336 | | | | 354,438,310 | | | | 518,807,162 | | | | 1,549,517,522 | |
| Liabilities: | | | | | | | | | | | | | | | | |
| Due to custodian | | | — | | | | 79,736 | | | | 180,200 | | | | — | |
| Payable for securities purchased | | | 28,616,584 | | | | — | | | | — | | | | 9,192,324 | |
| Payable for fund shares redeemed | | | 4,437,505 | | | | 675,438 | | | | 1,178,132 | | | | 1,948,906 | |
| Investment management fees payable to affiliates | | | 840,106 | | | | 97,376 | | | | 189,134 | | | | 935,190 | |
| Other accrued expenses | | | 697,899 | | | | 304,647 | | | | 648,850 | | | | 1,282,914 | |
| Administration expenses payable to affiliates | | | 127,587 | | | | 83,489 | | | | 109,813 | | | | 124,422 | |
| Distribution fees payable to affiliates | | | 1,731 | | | | 54,910 | | | | 85,962 | | | | 195,184 | |
| Distribution payable | | | — | | | | 12,380 | | | | 70,197 | | | | — | |
| Total Liabilities | | | 34,721,412 | | | | 1,307,976 | | | | 2,462,288 | | | | 13,678,940 | |
| Total Net Assets | | $ | 1,289,981,924 | | | $ | 353,130,334 | | | $ | 516,344,874 | | | $ | 1,535,838,582 | |
| |
| Net Assets Consist of: | | | | | | | | | | | | | | | | |
| Paid-in capital | | $ | 1,017,986,087 | | | $ | 393,451,369 | | | $ | 693,764,688 | | | $ | 1,324,682,898 | |
| Total distributable earnings (loss) | | | 271,995,837 | | | | (40,321,035 | ) | | | (177,419,814 | ) | | | 211,155,684 | |
| Total Net Assets | | $ | 1,289,981,924 | | | $ | 353,130,334 | | | $ | 516,344,874 | | | $ | 1,535,838,582 | |
| | | Delaware Ivy | | | | | | | | | | |
| | | Mid Cap | | | | | | | | | | |
| | | Income | | | Delaware Ivy | | | Delaware Ivy | | | Delaware Ivy | |
| | | Opportunities | | | Municipal | | | Municipal High | | | Small Cap | |
| | | Fund | | | Bond Fund | | | Income Fund | | | Growth Fund | |
| Net Asset Value | | | | | | | | | | | | | | | | |
| | | | | | | | | | | | | | | | | |
| Class A: | | | | | | | | | | | | | | | | |
| Net assets | | $ | 171,182,564 | | | $ | 244,980,711 | | | $ | 357,077,902 | | | $ | 681,797,958 | |
| Shares of beneficial interest outstanding, unlimited authorization, no par | | | 9,915,088 | | | | 24,198,612 | | | | 83,323,527 | | | | 58,435,749 | |
| Net asset value per share | | $ | 17.26 | | | $ | 10.12 | | | $ | 4.29 | | | $ | 11.67 | |
| Sales charge | | | 5.75 | % | | | 4.50 | % | | | 4.50 | % | | | 5.75 | % |
| Offering price per share, equal to net asset value per share / (1 - sales charge) | | $ | 18.31 | | | $ | 10.60 | | | $ | 4.49 | | | $ | 12.38 | |
| | | | | | | | | | | | | | | | | |
| Class C: | | | | | | | | | | | | | | | | |
| Net assets | | $ | 20,280,453 | | | $ | 3,400,916 | | | $ | 10,441,657 | | | $ | 20,606,674 | |
| Shares of beneficial interest outstanding, unlimited authorization, no par | | | 1,177,490 | | | | 335,938 | | | | 2,436,563 | | | | 3,090,679 | |
| Net asset value per share | | $ | 17.22 | | | $ | 10.12 | | | $ | 4.29 | | | $ | 6.67 | |
| | | | | | | | | | | | | | | | | |
| Class I: | | | | | | | | | | | | | | | | |
| Net assets | | $ | 996,722,118 | | | $ | 103,953,048 | | | $ | 144,710,075 | | | $ | 560,402,615 | |
| Shares of beneficial interest outstanding, unlimited authorization, no par | | | 57,705,697 | | | | 10,268,830 | | | | 33,767,287 | | | | 28,900,748 | |
| Net asset value per share | | $ | 17.27 | | | $ | 10.12 | | | $ | 4.29 | | | $ | 19.39 | |
| | | | | | | | | | | | | | | | | |
| Class R: | | | | | | | | | | | | | | | | |
| Net assets | | $ | 1,130,753 | | | $ | — | | | $ | — | | | $ | 43,146,054 | |
| Shares of beneficial interest outstanding, unlimited authorization, no par | | | 65,497 | | | | — | | | | — | | | | 3,913,515 | |
| Net asset value per share | | $ | 17.26 | | | $ | — | | | $ | — | | | $ | 11.02 | |
| | | | | | | | | | | | | | | | | |
| Class R6: | | | | | | | | | | | | | | | | |
| Net assets | | $ | 89,010,210 | | | $ | 795,659 | | | $ | 1,117,810 | | | $ | 157,250,830 | |
| Shares of beneficial interest outstanding, unlimited authorization, no par | | | 5,151,792 | | | | 78,584 | | | | 260,849 | | | | 8,030,091 | |
| Net asset value per share | | $ | 17.28 | | | $ | 10.12 | | | $ | 4.29 | | | $ | 19.58 | |
| | | | | | | | | | | | | | | | | |
| Class Y: | | | | | | | | | | | | | | | | |
| Net assets | | $ | 11,655,826 | | | $ | — | | | $ | 2,997,430 | | | $ | 72,634,451 | |
| Shares of beneficial interest outstanding, unlimited authorization, no par | | | 671,166 | | | | — | | | | 699,381 | | | | 4,196,865 | |
| Net asset value per share | | $ | 17.37 | | | $ | — | | | $ | 4.29 | | | $ | 17.31 | |
| _________________ | | | | | | | | | | | | | | | | |
| *Investments, at cost | | $ | 1,017,929,729 | | | $ | 361,375,392 | | | $ | 600,306,550 | | | $ | 1,366,136,829 | |
See accompanying notes, which are an integral part of the financial statements.
Statements of assets and liabilities
Ivy Funds
| | | | | | Delaware Ivy | | | | |
| | | | | | Systematic | | | | |
| | | Delaware Ivy | | | Emerging | | | | |
| | | Smid Cap | | | Markets Equity | | | Delaware Ivy | |
| | | Core Fund | | | Fundf | | | Value Fund | |
| Assets: | | | | | | | | | | | | |
| Investments, at value* | | $ | 348,431,848 | | | $ | 911,861,623 | | | $ | 672,071,499 | |
| Cash | | | — | | | | 302,373 | | | | 3,311 | |
| Foreign currencies, at valueD | | | — | | | | 3,086,006 | | | | — | |
| Receivable for fund shares sold | | | 302,822 | | | | 1,012,407 | | | | 763,834 | |
| Dividends and interest receivable | | | 278,607 | | | | 3,751,200 | | | | 1,140,283 | |
| Prepaid expenses | | | 222,443 | | | | 25,491 | | | | 15,494 | |
| Securities lending income receivable | | | 930 | | | | 3,986 | | | | — | |
| Receivable for securities sold | | | — | | | | — | | | | 3,840,523 | |
| Foreign tax reclaims receivable | | | — | | | | 86,866 | | | | 71,780 | |
| Other assets | | | 60,437 | | | | 47,898 | | | | 64,541 | |
| Total Assets | | | 349,297,087 | | | | 920,177,850 | | | | 677,971,265 | |
| Liabilities: | | | | | | | | | | | | |
| Payable for fund shares redeemed | | | 632,366 | | | | 1,627,466 | | | | 1,569,746 | |
| Investment management fees payable to affiliates | | | 448,714 | | | | 457,551 | | | | 385,968 | |
| Distribution fees payable to affiliates | | | 355,295 | | | | 65,219 | | | | 73,057 | |
| Administration expenses payable to affiliates | | | 79,627 | | | | 110,410 | | | | 108,957 | |
| Other accrued expenses | | | — | | | | 849,795 | | | | 184,588 | |
| Accrued capital gains taxes on appreciated securities | | | — | | | | 2,677,428 | | | | — | |
| Total Liabilities | | | 1,516,002 | | | | 5,787,869 | | | | 2,322,316 | |
| Total Net Assets | | $ | 347,781,085 | | | $ | 914,389,981 | | | $ | 675,648,949 | |
| |
| Net Assets Consist of: | | | | | | | | | | | | |
| Paid-in capital | | $ | 356,233,989 | | | $ | 853,542,781 | | | $ | 554,417,101 | |
| Total distributable earnings (loss) | | | (8,452,904 | ) | | | 60,847,200 | | | | 121,231,848 | |
| Total Net Assets | | $ | 347,781,085 | | | $ | 914,389,981 | | | $ | 675,648,949 | |
| | | | | | Delaware Ivy | | | | |
| | | | | | Systematic | | | | |
| | | Delaware Ivy | | | Emerging | | | | |
| | | Smid Cap | | | Markets Equity | | | Delaware Ivy | |
| | | Core Fund | | | Fundf | | | Value Fund | |
| Net Asset Value | | | | | | | | | | | | |
| | | | | | | | | | | | | |
| Class A: | | | | | | | | | | | | |
| Net assets | | $ | 111,950,358 | | | $ | 179,755,252 | | | $ | 318,903,285 | |
| Shares of beneficial interest outstanding, unlimited authorization, no par | | | 8,474,187 | | | | 10,345,768 | | | | 15,173,031 | |
| Net asset value per share | | $ | 13.21 | | | $ | 17.37 | | | $ | 21.02 | |
| Sales charge | | | 5.75 | % | | | 5.75 | % | | | 5.75 | % |
| Offering price per share, equal to net asset value per share / (1 - sales charge) | | $ | 14.02 | | | $ | 18.43 | | | $ | 22.30 | |
| | | | | | | | | | | | | |
| Class C: | | | | | | | | | | | | |
| Net assets | | $ | 12,187,628 | | | $ | 23,136,166 | | | $ | 6,143,157 | |
| Shares of beneficial interest outstanding, unlimited authorization, no par | | | 1,241,434 | | | | 1,622,049 | | | | 312,566 | |
| Net asset value per share | | $ | 9.82 | | | $ | 14.26 | | | $ | 19.65 | |
| | | | | | | | | | | | | |
| Class I: | | | | | | | | | | | | |
| Net assets | | $ | 159,793,662 | | | $ | 532,765,930 | | | $ | 346,248,502 | |
| Shares of beneficial interest outstanding, unlimited authorization, no par | | | 10,459,671 | | | | 29,404,333 | | | | 16,348,337 | |
| Net asset value per share | | $ | 15.28 | | | $ | 18.12 | | | $ | 21.18 | |
| | | | | | | | | | | | | |
| Class R: | | | | | | | | | | | | |
| Net assets | | $ | 18,550,536 | | | $ | 6,070,087 | | | $ | 20,016 | |
| Shares of beneficial interest outstanding, unlimited authorization, no par | | | 1,426,125 | | | | 354,657 | | | | 957 | |
| Net asset value per share | | $ | 13.01 | | | $ | 17.12 | | | $ | 20.92 | |
| | | | | | | | | | | | | |
| Class R6: | | | | | | | | | | | | |
| Net assets | | $ | 39,950,734 | | | $ | 144,998,932 | | | $ | 4,246,911 | |
| Shares of beneficial interest outstanding, unlimited authorization, no par | | | 2,580,656 | | | | 7,957,151 | | | | 198,653 | |
| Net asset value per share | | $ | 15.48 | | | $ | 18.22 | | | $ | 21.38 | |
| | | | | | | | | | | | | |
| Class Y: | | | | | | | | | | | | |
| Net assets | | $ | 5,348,167 | | | $ | 27,663,614 | | | $ | 87,078 | |
| Shares of beneficial interest outstanding, unlimited authorization, no par | | | 370,839 | | | | 1,555,024 | | | | 4,153 | |
| Net asset value per share | | $ | 14.42 | | | $ | 17.79 | | | $ | 20.97 | |
| _________________ | | | | | | | | | | | | |
| *Investments, at cost | | $ | 343,582,887 | | | $ | 836,343,708 | | | $ | 685,705,828 | |
| DForeign currencies, at cost | | | — | | | | 3,084,708 | | | | — | |
f Consolidated statement of assets and liabilities.
See accompanying notes, which are an integral part of the financial statements.
Statements of operations
Ivy Funds | Year ended March 31, 2023 |
| | | Delaware
Global Value | | | Delaware Ivy | | | Delaware Ivy | | | Delaware Ivy | |
| | | Equity Fund | | | Core Bond Fund | | | Core Equity Fund | | | Global Bond Fund | |
| Investment Income: | | | | | | | | | | | | | | | | |
| Dividends | | $ | 9,452,615 | | | $ | 600,810 | | | $ | 49,524,645 | | | $ | 427,906 | |
| Reclaim income | | | 587,520 | | | | — | | | | — | | | | — | |
| Securities lending income | | | 127,466 | | | | 42,050 | | | | 11,220 | | | | 79,972 | |
| Interest | | | — | | | | 21,634,509 | | | | — | | | | 15,237,626 | |
| Foreign tax withheld | | | (881,731 | ) | | | — | | | | (61,506 | ) | | | (10,215 | ) |
| | | | 9,285,870 | | | | 22,277,369 | | | | 49,474,359 | | | | 15,735,289 | |
| Expenses: | | | | | | | | | | | | | | | | |
| Investment advisory fees | | | 2,634,680 | | | | 3,023,401 | | | | 23,497,037 | | | | 2,716,376 | |
| Distribution expenses — Class A | | | 539,212 | | | | 367,635 | | | | 7,010,910 | | | | 314,219 | |
| Distribution expenses — Class C | | | 35,431 | | | | 46,978 | | | | 201,921 | | | | 29,073 | |
| Distribution expenses — Class E | | | 2,311 | | | | 2,020 | | | | 8,674 | | | | — | |
| Distribution expenses — Class R | | | 1,372 | | | | 4,288 | | | | 1,114 | | | | 1,311 | |
| Distribution expenses — Class Y | | | 3,421 | | | | 13,598 | | | | 64,824 | | | | 2,253 | |
| Dividend disbursing and transfer agent fees and expenses | | | 757,658 | | | | 501,178 | | | | 3,938,167 | | | | 465,860 | |
| Accounting and administration expenses | | | 136,116 | | | | 197,627 | | | | 513,817 | | | | 129,479 | |
| Registration fees | | | 109,921 | | | | 104,431 | | | | 140,897 | | | | 81,233 | |
| Trustees’ fees and expenses | | | 72,983 | | | | 56,569 | | | | 378,829 | | | | 61,780 | |
| Custodian fees | | | 48,457 | | | | 24,477 | | | | 55,360 | | | | 8,103 | |
| Audit and tax fees | | | 24,839 | | | | 41,876 | | | | 27,519 | | | | 37,883 | |
| Reports and statements to shareholders servicing expenses | | | 16,294 | | | | 17,024 | | | | 125,037 | | | | 16,502 | |
| Legal fees | | | 1,836 | | | | 2,811 | | | | 80,731 | | | | 1,084 | |
| Other | | | 32,486 | | | | 48,095 | | | | 165,135 | | | | 25,253 | |
| | | | 4,417,017 | | | | 4,452,008 | | | | 36,209,972 | | | | 3,890,409 | |
| Less expenses waived | | | (49,844 | ) | | | (1,071,741 | ) | | | (153,248 | ) | | | (128,664 | ) |
| Less waived distribution expenses — Class A | | | (274,839 | ) | | | (183,158 | ) | | | (487,496 | ) | | | (275,512 | ) |
| Less waived distribution expenses — Class C | | | (7,945 | ) | | | (11,552 | ) | | | (30,398 | ) | | | (9,632 | ) |
| Less waived distribution expenses — Class E | | | (2,339 | ) | | | (1,413 | ) | | | (6,340 | ) | | | — | |
| Less waived distribution expenses — Class R | | | — | | | | (7 | ) | | | — | | | | (10 | ) |
| Less waived distribution expenses — Class Y | | | — | | | | (881 | ) | | | (6,469 | ) | | | (63 | ) |
| Less expenses paid indirectly | | | (931 | ) | | | (1,102 | ) | | | (3,655 | ) | | | (915 | ) |
| Total operating expenses | | | 4,081,119 | | | | 3,182,154 | | | | 35,522,366 | | | | 3,475,613 | |
| Net Investment Income (Loss) | | | 5,204,751 | | | | 19,095,215 | | | | 13,951,993 | | | | 12,259,676 | |
| | | Delaware | | | | | | | | | | |
| | | Global Value | | | Delaware Ivy | | | Delaware Ivy | | | Delaware Ivy | |
| | | Equity Fund | | | Core Bond Fund | | | Core Equity Fund | | | Global Bond Fund | |
| Net Realized and Unrealized Gain (Loss): | | | | | | | | | | | | | | | | |
| Net realized gain (loss) on: | | | | | | | | | | | | | | | | |
| Investments | | $ | (24,129,031 | ) | | $ | (69,411,840 | ) | | $ | 353,974,155 | | | $ | (31,767,672 | ) |
| Foreign currencies | | | (141,267 | ) | | | — | | | | — | | | | (1,290,457 | ) |
| Foreign currency exchange contracts | | | (153,471 | ) | | | — | | | | — | | | | (792,109 | ) |
| Futures contracts | | | — | | | | (5,691,004 | ) | | | — | | | | 1,609,313 | |
| Options purchased | | | — | | | | (142,363 | ) | | | — | | | | (610,767 | ) |
| Options written | | | — | | | | — | | | | — | | | | 939,222 | |
| Swap contracts | | | — | | | | 161 | | | | — | | | | (259,233 | ) |
| Net realized gain (loss) | | | (24,423,769 | ) | | | (75,245,046 | ) | | | 353,974,155 | | | | (32,171,703 | ) |
| |
| Net change in unrealized appreciation (depreciation) on: | | | | | | | | | | | | | | | | |
| Investments | | | 26,529,841 | | | | 10,626,874 | | | | (714,374,302 | ) | | | 8,532,512 | |
| Foreign currencies | | | 32,710 | | | | — | | | | — | | | | 64,299 | |
| Foreign currency exchange contracts | | | (3,220 | ) | | | — | | | | — | | | | (479,460 | ) |
| Futures contracts | | | — | | | | 4,108,445 | | | | — | | | | 647,349 | |
| Options purchased | | | — | | | | — | | | | — | | | | (451,387 | ) |
| Options written | | | — | | | | — | | | | — | | | | 372,790 | |
| Swap contracts | | | — | | | | 113,882 | | | | — | | | | 8,146 | |
| Net change in unrealized appreciation (depreciation) | | | 26,559,331 | | | | 14,849,201 | | | | (714,374,302 | ) | | | 8,694,249 | |
| Net Realized and Unrealized Gain (Loss) | | | 2,135,562 | | | | (60,395,845 | ) | | | (360,400,147 | ) | | | (23,477,454 | ) |
| Net Increase (Decrease) in Net Assets Resulting from Operations | | $ | 7,340,313 | | | $ | (41,300,630 | ) | | $ | (346,448,154 | ) | | $ | (11,217,778 | ) |
See accompanying notes, which are an integral part of the financial statements.
Statements of operations
Ivy Funds
| | | | | | | | | Delaware Ivy | | | | |
| | | Delaware Ivy | | | Delaware Ivy | | | International | | | Delaware Ivy | |
| | | Global Growth Fund | | | High Income Fund | | | Core Equity Fund | | | International Value Fund | |
| Investment Income: | | | | | | | | | | | | | | | | |
| Dividends | | $ | 12,092,187 | | | $ | 6,921,837 | | | $ | 49,595,498 | | | $ | 3,417,746 | |
| Reclaim income | | | 535,610 | | | | — | | | | 2,528,033 | | | | 305,151 | |
| Securities lending income | | | 50,075 | | | | 4,400,921 | | | | 297,556 | | | | 65,190 | |
| Interest | | | — | | | | 214,121,636 | | | | 153,955 | | | | — | |
| Interest from affiliated investments | | | — | | | | 7,569,437 | | | | — | | | | — | |
| Foreign tax withheld | | | (902,181 | ) | | | — | | | | (4,916,497 | ) | | | (427,991 | ) |
| | | | 11,775,691 | | | | 233,013,831 | | | | 47,658,545 | | | | 3,360,096 | |
| |
| Expenses: | | | | | | | | | | | | | | | | |
| Investment advisory fees | | | 5,473,907 | | | | 15,300,833 | | | | 12,083,285 | | | | 1,152,392 | |
| Distribution expenses — Class A | | | 921,214 | | | | 3,233,120 | | | | 693,885 | | | | 106,509 | |
| Distribution expenses — Class C | | | 26,456 | | | | 1,678,549 | | | | 339,684 | | | | 4,759 | |
| Distribution expenses — Class E | | | — | | | | 3,893 | | | | 3,554 | | | | — | |
| Distribution expenses — Class R | | | 3,618 | | | | 185,907 | | | | 208,605 | | | | 190 | |
| Distribution expenses — Class Y | | | 4,088 | | | | 188,837 | | | | 106,063 | | | | 1,884 | |
| Dividend disbursing and transfer agent fees and expenses | | | 919,447 | | | | 3,963,565 | | | | 1,128,057 | | | | 253,653 | |
| Accounting and administration expenses | | | 204,248 | | | | 427,212 | | | | 291,955 | | | | 74,800 | |
| Trustees’ fees and expenses | | | 110,148 | | | | 339,142 | | | | 185,798 | | | | 75,417 | |
| Registration fees | | | 78,512 | | | | 137,771 | | | | 106,301 | | | | 72,205 | |
| Custodian fees | | | 48,556 | | | | 72,807 | | | | 277,411 | | | | 26,911 | |
| Audit and tax fees | | | 24,703 | | | | 42,559 | | | | 28,567 | | | | 28,493 | |
| Reports and statements to shareholders servicing expenses | | | 16,582 | | | | 19,046 | | | | 17,772 | | | | 16,082 | |
| Legal fees | | | 4,121 | | | | 537,411 | | | | 4,771 | | | | 391 | |
| Other | | | 236,720 | | | | 367,478 | | | | 104,493 | | | | 28,367 | |
| | | | 8,072,320 | | | | 26,498,130 | | | | 15,580,201 | | | | 1,842,053 | |
| Less expenses waived | | | (142,148 | ) | | | (29 | ) | | | (2,132,789 | ) | | | (274,082 | ) |
| Less waived distribution expenses — Class A | | | (372,295 | ) | | | (301,906 | ) | | | (432,147 | ) | | | (48,632 | ) |
| Less waived distribution expenses — Class C | | | (8,536 | ) | | | (166,612 | ) | | | (78,103 | ) | | | (993 | ) |
| Less waived distribution expenses — Class E | | | — | | | | (3,718 | ) | | | (3,601 | ) | | | — | |
| Less waived distribution expenses — Class R | | | (8 | ) | | | — | | | | (358 | ) | | | (4 | ) |
| Less waived distribution expenses — Class Y | | | (296 | ) | | | — | | | | (4,110 | ) | | | (127 | ) |
| Less expenses paid indirectly | | | (1,359 | ) | | | (2,802 | ) | | | (1,808 | ) | | | (470 | ) |
| Total operating expenses | | | 7,547,678 | | | | 26,023,063 | | | | 12,927,285 | | | | 1,517,745 | |
| Net Investment Income (Loss) | | | 4,228,013 | | | | 206,990,768 | | | | 34,731,260 | | | | 1,842,351 | |
| | | | | | | | | Delaware Ivy | | | | |
| | | Delaware Ivy | | | Delaware Ivy | | | International | | | Delaware Ivy | |
| | | Global Growth Fund | | | High Income Fund | | | Core Equity Fund | | | International Value Fund | |
| Net Realized and Unrealized Gain (Loss): | | | | | | | | | | | | | | | | |
| Net realized gain (loss) on: | | | | | | | | | | | | | | | | |
| Investments1 | | $ | 44,947,443 | | | $ | (231,848,901 | ) | | $ | (11,491,812 | ) | | $ | (12,746,680 | ) |
| Foreign currencies | | | 199,345 | | | | (2,953,131 | ) | | | (1,630,749 | ) | | | (178,483 | ) |
| Foreign currency exchange contracts | | | (407,791 | ) | | | 2,302,527 | | | | (2,851,758 | ) | | | (200,197 | ) |
| Net realized gain (loss) | | | 44,738,997 | | | | (232,499,505 | ) | | | (15,974,319 | ) | | | (13,125,360 | ) |
| |
| Net change in unrealized appreciation (depreciation) on: | | | | | | | | | | | | | | | | |
| Investments1 | | | (103,276,900 | ) | | | (239,766,509 | ) | | | (62,147,906 | ) | | | 4,950,227 | |
| Affiliated investments | | | — | | | | 35,150,173 | | | | — | | | | — | |
| Foreign currencies | | | (24,143 | ) | | | (56,463 | ) | | | (750,538 | ) | | | (16,655 | ) |
| Foreign currency exchange contracts | | | (988 | ) | | | 689,735 | | | | (12,362 | ) | | | (1,715 | ) |
| Net change in unrealized appreciation (depreciation) | | | (103,302,031 | ) | | | (203,983,064 | ) | | | (62,910,806 | ) | | | 4,931,857 | |
| Net Realized and Unrealized Gain (Loss) | | | (58,563,034 | ) | | | (436,482,569 | ) | | | (78,885,125 | ) | | | (8,193,503 | ) |
| Net Increase (Decrease) in Net Assets Resulting from Operations | | $ | (54,335,021 | ) | | $ | (229,491,801 | ) | | $ | (44,153,865 | ) | | $ | (6,351,152 | ) |
| 1 | Includes $590,138 capital gains tax paid and $278,607 capital gains tax accrued for Delaware Ivy Global Growth Fund. |
See accompanying notes, which are an integral part of the financial statements.
Statements of operations
Ivy Funds
| | | | | | | | | Delaware Ivy | | | | |
| | | Delaware Ivy | | | Delaware Ivy | | | Managed International | | | Delaware Ivy | |
| | | Large Cap Growth Fund | | | Limited-Term Bond Fund | | | Opportunities Fund | | | Mid Cap Growth Fund | |
| Investment Income: | | | | | | | | | | | | | | | | |
| Dividends | | $ | 33,482,019 | | | $ | 202,536 | | | $ | 11,572 | | | $ | 28,940,844 | |
| Securities lending income | | | 309,189 | | | | 75,872 | | | | — | | | | 442,325 | |
| Dividends from affiliated investments | | | — | | | | — | | | | 760,740 | | | | — | |
| Interest | | | — | | | | 20,094,422 | | | | — | | | | — | |
| Foreign tax withheld | | | (304,189 | ) | | | — | | | | — | | | | — | |
| | | | 33,487,019 | | | | 20,372,830 | | | | 772,312 | | | | 29,383,169 | |
| |
| Expenses: | | | | | | | | | | | | | | | | |
| Investment advisory fees | | | 28,929,789 | | | | 3,471,426 | | | | 48,608 | | | | 45,873,032 | |
| Distribution expenses — Class A | | | 5,524,047 | | | | 820,378 | | | | 100,035 | | | | 4,184,906 | |
| Distribution expenses — Class C | | | 473,616 | | | | 105,290 | | | | 6,272 | | | | 866,906 | |
| Distribution expenses — Class E | | | 15,208 | | | | 3,177 | | | | — | | | | 8,568 | |
| Distribution expenses — Class R | | | 49,091 | | | | 1,738 | | | | 385 | | | | 295,448 | |
| Distribution expenses — Class Y | | | 65,405 | | | | 4,977 | | | | 271 | | | | 559,353 | |
| Dividend disbursing and transfer agent fees and expenses | | | 2,921,172 | | | | 797,370 | | | | 68,845 | | | | 3,291,224 | |
| Accounting and administration expenses | | | 616,757 | | | | 208,460 | | | | 61,130 | | | | 731,280 | |
| Trustees’ fees and expenses | | | 354,075 | | | | 53,957 | | | | 8,351 | | | | 478,223 | |
| Registration fees | | | 176,430 | | | | 112,637 | | | | 112,163 | | | | 171,325 | |
| Custodian fees | | | 62,382 | | | | 17,199 | | | | 1,661 | | | | 132,320 | |
| Audit and tax fees | | | 26,682 | | | | 34,475 | | | | 44,981 | | | | 29,980 | |
| Reports and statements to shareholders servicing expenses | | | 20,447 | | | | 16,743 | | | | 42,659 | | | | 20,783 | |
| Legal fees | | | 13,469 | | | | 4,281 | | | | 13,742 | | | | 13,501 | |
| Other | | | 131,935 | | | | 45,664 | | | | 13,460 | | | | 138,687 | |
| | | | 39,380,505 | | | | 5,697,772 | | | | 522,563 | | | | 56,795,536 | |
| Less expenses waived | | | (821,225 | ) | | | (240,275 | ) | | | (38,314 | ) | | | (2,480,728 | ) |
| Less waived distribution expenses — Class A | | | (1,297,820 | ) | | | (253,245 | ) | | | (8,283 | ) | | | (1,326,011 | ) |
| Less waived distribution expenses — Class C | | | (72,278 | ) | | | (16,823 | ) | | | (502 | ) | | | (124,188 | ) |
| Less waived distribution expenses — Class E | | | (570 | ) | | | (2,040 | ) | | | — | | | | (4,124 | ) |
| Less waived distribution expenses — Class R | | | (93 | ) | | | (9 | ) | | | — | | | | (1,354 | ) |
| Less waived distribution expenses — Class Y | | | (1,121 | ) | | | (238 | ) | | | (27 | ) | | | (3,077 | ) |
| Less expenses paid indirectly | | | (3,721 | ) | | | (1,068 | ) | | | (360 | ) | | | (4,086 | ) |
| Total operating expenses | | | 37,183,677 | | | | 5,184,074 | | | | 475,077 | | | | 52,851,968 | |
| Net Investment Income (Loss) | | | (3,696,658 | ) | | | 15,188,756 | | | | 297,235 | | | | (23,468,799 | ) |
| | | | | | | | | Delaware Ivy | | | | |
| | | Delaware Ivy | | | Delaware Ivy | | | Managed International | | | Delaware Ivy | |
| | | Large Cap Growth Fund | | | Limited-Term Bond Fund | | | Opportunities Fund | | | Mid Cap Growth Fund | |
| Net Realized and Unrealized Gain (Loss): | | | | | | | | | | | | | | | | |
| Net realized gain (loss) on: | | | | | | | | | | | | | | | | |
| Investments | | $ | 192,458,427 | | | $ | (19,695,820 | ) | | $ | — | | | $ | 567,038,566 | |
| Affiliated investments | | | — | | | | — | | | | (6,131,150 | ) | | | — | |
| Capital gain received from investments in affiliated funds | | | — | | | | — | | | | 7,067,802 | | | | — | |
| Foreign currencies | | | (10,461 | ) | | | — | | | | — | | | | — | |
| Foreign currency exchange contracts | | | 18,009 | | | | — | | | | — | | | | — | |
| Futures contracts | | | — | | | | (4,885,500 | ) | | | — | | | | — | |
| Options written | | | — | | | | — | | | | — | | | | 5,097,960 | |
| Swap contracts | | | — | | | | 234,901 | | | | — | | | | — | |
| Net realized gain (loss) | | | 192,465,975 | | | | (24,346,419 | ) | | | 936,652 | | | | 572,136,526 | |
| |
| Net change in unrealized appreciation (depreciation) on: | | | | | | | | | | | | | | | | |
| Investments | | | (716,913,321 | ) | | | 3,683,597 | | | | — | | | | (1,310,789,074 | ) |
| Affiliated investments | | | — | | | | — | | | | (9,469,527 | ) | | | — | |
| Futures contracts | | | — | | | | 1,270,194 | | | | — | | | | — | |
| Options written | | | — | | | | — | | | | — | | | | (1,901,379 | ) |
| Net change in unrealized appreciation (depreciation) | | | (716,913,321 | ) | | | 4,953,791 | | | | (9,469,527 | ) | | | (1,312,690,453 | ) |
| Net Realized and Unrealized Gain (Loss) | | | (524,447,346 | ) | | | (19,392,628 | ) | | | (8,532,875 | ) | | | (740,553,927 | ) |
| Net Increase (Decrease) in Net Assets Resulting from Operations | | $ | (528,144,004 | ) | | $ | (4,203,872 | ) | | $ | (8,235,640 | ) | | $ | (764,022,726 | ) |
See accompanying notes, which are an integral part of the financial statements.
Statements of operations
Ivy Funds
| | | Delaware Ivy | | | | | | | | | | |
| | | Mid Cap Income | | | Delaware Ivy | | | Delaware Ivy | | | Delaware Ivy | |
| | | Opportunities Fund | | | Municipal Bond Fund | | | Municipal High Income Fund | | | Small Cap Growth Fund | |
| Investment Income: | | | | | | | | | | | | | | | | |
| Dividends | | $ | 38,101,078 | | | $ | 33,855 | | | $ | 41,594 | | | $ | 9,221,629 | |
| Dividends from affiliated funds | | | 603,908 | | | | — | | | | — | | | | — | |
| Securities lending income | | | 40,676 | | | | — | | | | — | | | | 1,673,164 | |
| Interest | | | — | | | | 19,439,179 | | | | 28,106,924 | | | | — | |
| | | | 38,745,662 | | | | 19,473,034 | | | | 28,148,518 | | | | 10,894,793 | |
| |
| Expenses: | | | | | | | | | | | | | | | | |
| Investment advisory fees | | | 12,126,237 | | | | 2,410,699 | | | | 3,426,069 | | | | 14,515,743 | |
| Distribution expenses — Class A | | | 423,709 | | | | 746,017 | | | | 1,103,789 | | | | 1,934,611 | |
| Distribution expenses — Class C | | | 228,279 | | | | 39,804 | | | | 134,333 | | | | 253,328 | |
| Distribution expenses — Class E | | | — | | | | — | | | | — | | | | 5,902 | |
| Distribution expenses — Class R | | | 5,622 | | | | — | | | | — | | | | 224,325 | |
| Distribution expenses — Class Y | | | 40,627 | | | | — | | | | 8,092 | | | | 197,058 | |
| Dividend disbursing and transfer agent fees and expenses | | | 353,487 | | | | 386,292 | | | | 450,332 | | | | 1,988,092 | |
| Accounting and administration expenses | | | 277,949 | | | | 158,303 | | | | 201,998 | | | | 322,357 | |
| Registration fees | | | 130,528 | | | | 72,006 | | | | 92,185 | | | | 115,539 | |
| Trustees’ fees and expenses | | | 86,900 | | | | 155,029 | | | | 96,203 | | | | 222,951 | |
| Audit and tax fees | | | 27,614 | | | | 36,665 | | | | 36,359 | | | | 27,547 | |
| Reports and statements to shareholders servicing expenses | | | 16,921 | | | | 16,403 | | | | 18,396 | | | | 17,998 | |
| Custodian fees | | | 15,834 | | | | 8,588 | | | | 10,705 | | | | 35,923 | |
| Legal fees | | | 3,365 | | | | 4,398 | | | | 8,742 | | | | 8,928 | |
| Other | | | 32,948 | | | | 35,226 | | | | 97,833 | | | | 76,207 | |
| | | | 13,770,020 | | | | 4,069,430 | | | | 5,685,036 | | | | 19,946,509 | |
| Less expenses waived | | | (959,040 | ) | | | (328,978 | ) | | | (101,408 | ) | | | (406,992 | ) |
| Less waived distribution expenses — Class A | | | (129,508 | ) | | | (269,580 | ) | | | (184,001 | ) | | | (840,571 | ) |
| Less waived distribution expenses — Class C | | | (19,341 | ) | | | (6,945 | ) | | | (36,387 | ) | | | (79,930 | ) |
| Less waived distribution expenses — Class E | | | — | | | | — | | | | — | | | | (5,223 | ) |
| Less waived distribution expenses — Class R | | | (28 | ) | | | — | | | | — | | | | (1,359 | ) |
| Less waived distribution expenses — Class Y | | | (1,819 | ) | | | — | | | | (260 | ) | | | (1,626 | ) |
| Less expenses paid indirectly | | | (900 | ) | | | (429 | ) | | | (469 | ) | | | (2,527 | ) |
| Total operating expenses | | | 12,659,384 | | | | 3,463,498 | | | | 5,362,511 | | | | 18,608,281 | |
| Net Investment Income (Loss) | | | 26,086,278 | | | | 16,009,536 | | �� | | 22,786,007 | | | | (7,713,488 | ) |
| | | Delaware Ivy | | | | | | | | | | |
| | | Mid Cap Income | | | Delaware Ivy | | | Delaware Ivy | | | Delaware Ivy | |
| | | Opportunities Fund | | | Municipal Bond Fund | | | Municipal High Income Fund | | | Small Cap Growth Fund | |
| Net Realized and Unrealized Gain (Loss): | | | | | | | | | | | | | | | | |
| Net realized gain (loss) on: | | | | | | | | | | | | | | | | |
| Investments | | $ | 19,004,118 | | | $ | (32,262,958 | ) | | $ | (49,401,801 | ) | | $ | 69,329,948 | |
| Affiliated investments | | | (1,376,599 | ) | | | — | | | | — | | | | (20,140,630 | ) |
| Net realized gain (loss) | | | 17,627,519 | | | | (32,262,958 | ) | | | (49,401,801 | ) | | | 49,189,318 | |
| |
| Net change in unrealized appreciation (depreciation) on: | | | | | | | | | | | | | | | | |
| Investments | | | (130,907,617 | ) | | | (10,664,826 | ) | | | (31,778,063 | ) | | | (399,479,754 | ) |
| Affiliated investments | | | 3,086,646 | | | | — | | | | — | | | | 3,003,208 | |
| Net change in unrealized appreciation (depreciation) | | | (127,820,971 | ) | | | (10,664,826 | ) | | | (31,778,063 | ) | | | (396,476,546 | ) |
| Net Realized and Unrealized Gain (Loss) | | | (110,193,452 | ) | | | (42,927,784 | ) | | | (81,179,864 | ) | | | (347,287,228 | ) |
| Net Increase (Decrease) in Net Assets Resulting from Operations | | $ | (84,107,174 | ) | | $ | (26,918,248 | ) | | $ | (58,393,857 | ) | | $ | (355,000,716 | ) |
See accompanying notes, which are an integral part of the financial statements.
Statements of operations
Ivy Funds
| | | | | | Delaware Ivy | | | | |
| | | | | | Systematic | | | | |
| | | | | | Emerging | | | | |
| | | Delaware Ivy | | | Markets Equity | | | Delaware Ivy | |
| | | Smid Cap Core Fund | | | Fundf | | | Value Fund | |
| Investment Income: | | | | | | | | | | | | |
| Dividends | | $ | 6,964,552 | | | $ | 57,825,910 | | | $ | 26,193,089 | |
| Securities lending income | | | 26,017 | | | | 108,617 | | | | 10,495 | |
| Foreign tax withheld | | | — | | | | (5,989,896 | ) | | | — | |
| | | | 6,990,569 | | | | 51,944,631 | | | | 26,203,584 | |
| |
| Expenses: | | | | | | | | | | | | |
| Investment advisory fees | | | 3,804,779 | | | | 9,976,818 | | | | 8,031,324 | |
| Distribution expenses — Class A | | | 312,697 | | | | 510,390 | | | | 903,663 | |
| Distribution expenses — Class C | | | 139,435 | | | | 288,383 | | | | 68,348 | |
| Distribution expenses — Class R | | | 98,096 | | | | 31,837 | | | | 95 | |
| Distribution expenses — Class Y | | | 15,205 | | | | 66,499 | | | | 242 | |
| Dividend disbursing and transfer agent fees and expenses | | | 477,036 | | | | 1,095,926 | | | | 1,448,318 | |
| Accounting and administration expenses | | | 155,765 | | | | 254,656 | | | | 249,069 | |
| Registration fees | | | 88,157 | | | | 117,726 | | | | 95,283 | |
| Trustees’ fees and expenses | | | 40,084 | | | | 128,088 | | | | 93,150 | |
| Audit and tax fees | | | 27,517 | | | | 33,092 | | | | 30,518 | |
| Custodian fees | | | 20,871 | | | | 540,824 | | | | 14,764 | |
| Reports and statements to shareholders servicing expenses | | | 16,629 | | | | 17,502 | | | | 16,754 | |
| Legal fees | | | 2,281 | | | | 3,657 | | | | 2,694 | |
| Other | | | 25,376 | | | | 79,512 | | | | 34,342 | |
| | | | 5,223,928 | | | | 13,144,910 | | | | 10,988,564 | |
| Less expenses waived | | | (342,584 | ) | | | (2,965,537 | ) | | | (31,024 | ) |
| Less waived distribution expenses — Class A | | | (164,024 | ) | | | (306,898 | ) | | | (137,772 | ) |
| Less waived distribution expenses — Class C | | | (20,043 | ) | | | (50,044 | ) | | | (6,295 | ) |
| Less waived distribution expenses — Class R | | | (279 | ) | | | (3 | ) | | | (45 | ) |
| Less waived distribution expenses — Class Y | | | (563 | ) | | | — | | | | (1 | ) |
| Less expenses paid indirectly | | | (721 | ) | | | (1,416 | ) | | | (1,387 | ) |
| Total operating expenses | | | 4,695,714 | | | | 9,821,012 | | | | 10,812,040 | |
| Net Investment Income (Loss) | | | 2,294,855 | | | | 42,123,619 | | | | 15,391,544 | |
| | | | | | Delaware Ivy | | | | |
| | | | | | Systematic | | | | |
| | | | | | Emerging | | | | |
| | | Delaware Ivy | | | Markets Equity | | | Delaware Ivy | |
| | | Smid Cap Core Fund | | | Fundf | | | Value Fund | |
| Net Realized and Unrealized Gain (Loss): | | | | | | | | | | | | |
| Net realized gain (loss) on: | | | | | | | | | | | | |
| Investments1 | | $ | (13,210,907 | ) | | | $ 13,596,114 | | | $ | 298,521,757 | |
| Foreign currencies | | | — | | | | (2,336,137 | ) | | | — | |
| Foreign currency exchange contracts | | | — | | | | (1,812,203 | ) | | | — | |
| Options written | | | — | | | | — | | | | 1,747,049 | |
| Net realized gain (loss) | | | (13,210,907 | ) | | | 9,447,774 | | | | 300,268,806 | |
| |
| Net change in unrealized appreciation (depreciation) on: | | | | | | | | | | | | |
| Investments1 | | | (31,254,611 | ) | | | (231,797,355 | ) | | | (387,597,951 | ) |
| Foreign currencies | | | — | | | | (144,284 | ) | | | — | |
| Foreign currency exchange contracts | | | — | | | | 76,514 | | | | — | |
| Net change in unrealized appreciation (depreciation) | | | (31,254,611 | ) | | | (231,865,125 | ) | | | (387,597,951 | ) |
| Net Realized and Unrealized Gain (Loss) | | | (44,465,518 | ) | | | (222,417,351 | ) | | | (87,329,145 | ) |
| Net Increase (Decrease) in Net Assets Resulting from Operations | | $ | (42,170,663 | ) | | $ | (180,293,732 | )$ | | | (71,937,601 | ) |
| 1 | Includes $6,672,146 capital gains tax paid and $2,677,428 capital gains tax accrued for Delaware Ivy Systematic Emerging Markets Equity Fund. |
fConsolidated statement of operations.
See accompanying notes, which are an integral part of the financial statements.
Statements of changes in net assets
Ivy Funds
| | | Delaware | | | | | | | |
| | | Global Value | | | Delaware Ivy | |
| | | Equity Fund | | | Core Bond Fund | |
| | | Year ended | | | Year ended | |
| | | 3/31/23 | | | 3/31/22 | | | 3/31/23 | | | 3/31/22 | |
| Increase (Decrease) in Net Assets from Operations: | | | | | | | | | | | | | | | | |
| Net investment income (loss) | | $ | 5,204,751 | | | $ | 9,114,877 | | | $ | 19,095,215 | | | $ | 21,373,162 | |
| Net realized gain (loss) | | | (24,423,769 | ) | | | 166,778,294 | | | | (75,245,046 | ) | | | 1,322,202 | |
| Net change in unrealized appreciation (depreciation) | | | 26,559,331 | | | | (167,295,304 | ) | | | 14,849,201 | | | | (50,087,676 | ) |
| Net increase (decrease) in net assets resulting from operations | | | 7,340,313 | | | | 8,597,867 | | | | (41,300,630 | ) | | | (27,392,312 | ) |
| |
| Dividends and Distributions to Shareholders from: | | | | | | | | | | | | | | | | |
| Distributable earnings: | | | | | | | | | | | | | | | | |
| Class A | | | (81,042,548 | ) | | | (23,674,162 | ) | | | (4,701,474 | ) | | | (4,300,352 | ) |
| Class B | | | — | | | | (5,160 | ) | | | — | | | | (451 | ) |
| Class C | | | (1,361,394 | ) | �� | | (428,360 | ) | | | (110,000 | ) | | | (107,408 | ) |
| Class E1 | | | (32,359 | ) | | | (411,260 | ) | | | (16,886 | ) | | | (93,356 | ) |
| Class I | | | (50,606,591 | ) | | | (20,136,462 | ) | | | (11,332,718 | ) | | | (16,917,711 | ) |
| Class R | | | (129,753 | ) | | | (25,605 | ) | | | (25,837 | ) | | | (16,125 | ) |
| Class R62 | | | (3,693,717 | ) | | | (1,606,584 | ) | | | (3,132,679 | ) | | | (4,387,977 | ) |
| Class Y | | | (529,120 | ) | | | (145,138 | ) | | | (175,668 | ) | | | (143,173 | ) |
| | | | (137,395,482 | ) | | | (46,432,731 | ) | | | (19,495,262 | ) | | | (25,966,553 | ) |
| |
| Capital Share Transactions: | | | | | | | | | | | | | | | | |
| Proceeds from shares sold: | | | | | | | | | | | | | | | | |
| Class A | | | 8,664,763 | | | | 10,124,948 | | | | 19,809,524 | | | | 25,181,156 | |
| Class B3 | | | — | | | | 685 | | | | — | | | | 14 | |
| Class C | | | 366,067 | | | | 276,779 | | | | 738,399 | | | | 777,213 | |
| Class E1 | | | 35,545 | | | | 321,660 | | | | 113,072 | | | | 482,302 | |
| Class I | | | 17,609,351 | | | | 18,144,845 | | | | 48,452,721 | | | | 107,242,913 | |
| Class R | | | 31,074 | | | | 22,608 | | | | 90,963 | | | | 48,723 | |
| Class R62 | | | 426,695 | | | | 1,075,014 | | | | 13,865,413 | | | | 22,975,266 | |
| Class Y | | | 171,385 | | | | 127,515 | | | | 815,233 | | | | 1,347,905 | |
| |
| Net asset value of shares issued upon reinvestment of dividends and distributions: | | | | | | | | | | | | | | | | |
| Class A | | | 80,002,306 | | | | 23,262,836 | | | | 4,690,766 | | | | 4,196,324 | |
| Class B3 | | | — | | | | 3,792 | | | | — | | | | 505 | |
| Class C | | | 1,360,573 | | | | 426,488 | | | | 110,044 | | | | 104,133 | |
| Class E1 | | | 32,293 | | | | 410,752 | | | | 14,231 | | | | 92,826 | |
| Class I | | | 50,502,191 | | | | 19,929,627 | | | | 11,387,611 | | | | 16,716,268 | |
| Class R | | | 21,553 | | | | 1,355 | | | | 25,930 | | | | 16,005 | |
| Class R62 | | | 3,693,717 | | | | 1,606,584 | | | | 3,164,882 | | | | 4,386,947 | |
| Class Y | | | 460,409 | | | | 125,134 | | | | 176,508 | | | | 141,158 | |
| | | | 163,377,922 | | | | 75,860,622 | | | | 103,455,297 | | | | 183,709,658 | |
| | | Delaware | | | | | | | |
| | | Global Value | | | Delaware Ivy | |
| | | Equity Fund | | | Core Bond Fund | |
| | | Year ended | | | Year ended | |
| | | 3/31/23 | | | 3/31/22 | | | 3/31/23 | | | 3/31/22 | |
| Cost of shares redeemed: | | | | | | | | | | | | | | | | |
| Class A | | $ | (79,974,018 | ) | | $ | (58,688,910 | ) | | $ | (53,694,913 | ) | | $ | (58,972,803 | ) |
| Class B3 | | | — | | | | (2,054,611 | ) | | | — | | | | (268,756 | ) |
| Class C | | | (2,719,923 | ) | | | (2,700,187 | ) | | | (2,726,324 | ) | | | (4,853,032 | ) |
| Class E1 | | | (4,439,845 | ) | | | (779,973 | ) | | | (4,075,122 | ) | | | (986,430 | ) |
| Class I | | | (106,565,919 | ) | | | (84,494,656 | ) | | | (266,358,184 | ) | | | (371,656,574 | ) |
| Class R | | | (9,226 | ) | | | (62,211 | ) | | | (19,726 | ) | | | (59,109 | ) |
| Class R62 | | | (13,437,416 | ) | | | (11,682,523 | ) | | | (80,144,435 | ) | | | (54,790,998 | ) |
| Class Y | | | (364,631 | ) | | | (549,922 | ) | | | (1,776,621 | ) | | | (1,827,653 | ) |
| | | | (207,510,978 | ) | | | (161,012,993 | ) | | | (408,795,325 | ) | | | (493,415,355 | ) |
| Decrease in net assets derived from capital share transactions | | | (44,133,056 | ) | | | (85,152,371 | ) | | | (305,340,028 | ) | | | (309,705,697 | ) |
| Net Decrease in Net Assets | | | (174,188,225 | ) | | | (122,987,235 | ) | | | (366,135,920 | ) | | | (363,064,562 | ) |
| |
| Net Assets: | | | | | | | | | | | | | | | | |
| Beginning of year | | | 494,812,061 | | | | 617,799,296 | | | | 836,223,566 | | | | 1,199,288,128 | |
| End of year | | $ | 320,623,836 | | | $ | 494,812,061 | | | $ | 470,087,646 | | | $ | 836,223,566 | |
| 1 | On June 13, 2022, all Class E shares were liquidated. |
| 2 | Effective July 1, 2021, Class N shares were renamed Class R6 shares. |
| 3 | On December 10, 2021, all Class B shares were converted into Class A shares. These transactions are included as subscriptions of Class A shares and redemptions of Class B shares in the tables above and on the previous page. |
See accompanying notes, which are an integral part of the financial statements.
Statements of changes in net assets
Ivy Funds
| | | Delaware Ivy | | | Delaware Ivy | |
| | | Core Equity Fund | | | Global Bond Fund | |
| | | Year ended | | | Year ended | |
| | | 3/31/23 | | | 3/31/22 | | | 3/31/23 | | | 3/31/22 | |
| Increase (Decrease) in Net Assets from Operations: | | | | | | | | | | | | | | | | |
| Net investment income (loss) | | $ | 13,951,993 | | | $ | 11,625,782 | | | $ | 12,259,676 | | | $ | 13,565,596 | |
| Net realized gain (loss) | | | 353,974,155 | | | | 620,775,458 | | | | (32,171,703 | ) | | | 360,033 | |
| Net change in unrealized appreciation (depreciation) | | | (714,374,302 | ) | | | 12,211,951 | | | | 8,694,249 | | | | (37,091,261 | ) |
| Net increase (decrease) in net assets resulting from operations | | | (346,448,154 | ) | | | 644,613,191 | | | | (11,217,778 | ) | | | (23,165,632 | ) |
| |
| Dividends and Distributions to Shareholders from: | | | | | | | | | | | | | | | | |
| Distributable earnings: | | | | | | | | | | | | | | | | |
| Class A | | | (342,961,157 | ) | | | (440,158,837 | ) | | | (3,824,601 | ) | | | (4,228,642 | ) |
| Class B | | | — | | | | — | | | | — | | | | (2,154 | ) |
| Class C | | | (2,939,747 | ) | | | (4,346,536 | ) | | | (66,601 | ) | | | (67,807 | ) |
| Class E1 | | | — | | | | (2,351,783 | ) | | | — | | | | — | |
| Class I | | | (80,967,246 | ) | | | (126,305,684 | ) | | | (5,563,554 | ) | | | (6,678,968 | ) |
| Class R | | | (28,492 | ) | | | (22,112 | ) | | | (7,389 | ) | | | (5,580 | ) |
| Class R62 | | | (5,421,130 | ) | | | (10,536,169 | ) | | | (4,487,164 | ) | | | (2,741,755 | ) |
| Class Y | | | (2,866,099 | ) | | | (3,106,280 | ) | | | (26,642 | ) | | | (20,123 | ) |
| | | | (435,183,871 | ) | | | (586,827,401 | ) | | | (13,975,951 | ) | | | (13,745,029 | ) |
| |
| Capital Share Transactions: | | | | | | | | | | | | | | | | |
| Proceeds from shares sold: | | | | | | | | | | | | | | | | |
| Class A | | | 87,255,284 | | | | 97,561,830 | | | | 8,814,666 | | | | 18,224,192 | |
| Class B3 | | | — | | | | 44,904 | | | | — | | | | — | |
| Class C | | | 3,112,586 | | | | 3,729,013 | | | | 865,984 | | | | 816,020 | |
| Class E1 | | | 503,440 | | | | 1,528,615 | | | | — | | | | — | |
| Class I | | | 180,284,312 | | | | 249,154,599 | | | | 78,770,943 | | | | 86,615,153 | |
| Class R | | | 85,535 | | | | 54,097 | | | | 126,430 | | | | 68,884 | |
| Class R62 | | | 13,260,393 | | | | 18,992,680 | | | | 27,755,010 | | | | 106,364,093 | |
| Class Y | | | 1,478,436 | | | | 4,801,997 | | | | 1,228,234 | | | | 764,667 | |
| |
| Net asset value of shares issued upon reinvestment of dividends and distributions: | | | | | | | | | | | | | | | | |
| Class A | | | 338,942,481 | | | | 435,755,580 | | | | 3,792,848 | | | | 4,133,615 | |
| Class B3 | | | — | | | | — | | | | — | | | | 2,154 | |
| Class C | | | 2,934,654 | | | | 4,317,684 | | | | 66,536 | | | | 67,341 | |
| Class E1 | | | — | | | | 2,352,392 | | | | — | | | | — | |
| Class I | | | 80,887,209 | | | | 125,676,581 | | | | 5,527,257 | | | | 6,610,361 | |
| Class R | | | 16,771 | | | | 9,521 | | | | 7,389 | | | | 5,580 | |
| Class R62 | | | 5,132,630 | | | | 10,530,349 | | | | 4,487,164 | | | | 2,741,760 | |
| Class Y | | | 2,816,322 | | | | 3,009,063 | | | | 26,219 | | | | 19,928 | |
| | | | 716,710,053 | | | | 957,518,905 | | | | 131,468,680 | | | | 226,433,748 | |
| | | Delaware Ivy | | | Delaware Ivy | |
| | | Core Equity Fund | | | Global Bond Fund | |
| | | Year ended | | | Year ended | |
| | | 3/31/23 | | | 3/31/22 | | | 3/31/23 | | | 3/31/22 | |
| Cost of shares redeemed: | | | | | | | | | | | | | | | | |
| Class A | | $ | (682,251,142 | ) | | $ | (546,980,026 | ) | | $ | (43,979,991 | ) | | $ | (39,165,573 | ) |
| Class B3 | | | — | | | | (3,011,706 | ) | | | — | | | | (337,370 | ) |
| Class C | | | (11,110,263 | ) | | | (13,615,017 | ) | | | (1,582,762 | ) | | | (1,366,987 | ) |
| Class E1 | | | (16,725,317 | ) | | | (3,173,900 | ) | | | — | | | | — | |
| Class I | | | (423,654,966 | ) | | | (433,465,706 | ) | | | (93,272,155 | ) | | | (118,845,672 | ) |
| Class R | | | (44,300 | ) | | | (449,522 | ) | | | (122,474 | ) | | | (61,424 | ) |
| Class R62 | | | (49,308,112 | ) | | | (29,367,774 | ) | | | (35,888,243 | ) | | | (17,685,376 | ) |
| Class Y | | | (4,137,750 | ) | | | (4,440,427 | ) | | | (228,688 | ) | | | (705,721 | ) |
| | | | (1,187,231,850 | ) | | | (1,034,504,078 | ) | | | (175,074,313 | ) | | | (178,168,123 | ) |
| Increase (decrease) in net assets derived from capital share transactions | | | (470,521,797 | ) | | | (76,985,173 | ) | | | (43,605,633 | ) | | | 48,265,625 | |
| Net Increase (Decrease) in Net Assets | | | (1,252,153,822 | ) | | | (19,199,383 | ) | | | (68,799,362 | ) | | | 11,354,964 | |
| |
| Net Assets: | | | | | | | | | | | | | | | | |
| Beginning of year | | | 4,662,920,565 | | | | 4,682,119,948 | | | | 497,001,421 | | | | 485,646,457 | |
| End of year | | $ | 3,410,766,743 | | | $ | 4,662,920,565 | | | $ | 428,202,059 | | | $ | 497,001,421 | |
| 1 | On June 13, 2022, all Class E shares were liquidated. |
| 2 | Effective July 1, 2021, Class N shares were renamed Class R6 shares. |
| 3 | On December 10, 2021, all Class B shares were converted into Class A shares. These transactions are included as subscriptions of Class A shares and redemptions of Class B shares in the tables above and on the previous page. |
See accompanying notes, which are an integral part of the financial statements.
Statements of changes in net assets
Ivy Funds
| | | Delaware Ivy | | | Delaware Ivy | |
| | | Global Growth Fund | | | High Income Fund | |
| | | Year ended | | | Year ended | |
| | | 3/31/23 | | | 3/31/22 | | | 3/31/23 | | | 3/31/22 | |
| Increase (Decrease) in Net Assets from Operations: | | | | | | | | | | | | | | | | |
| Net investment income (loss) | | $ | 4,228,013 | | | $ | 2,345,934 | | | $ | 206,990,768 | | | $ | 258,700,798 | |
| Net realized gain (loss) | | | 44,738,997 | | | | 239,199,127 | | | | (232,499,505 | ) | | | (120,520,317 | ) |
| Net change in unrealized appreciation (depreciation) | | | (103,302,031 | ) | | | (200,176,370 | ) | | | (203,983,064 | ) | | | (79,733,406 | ) |
| Net increase (decrease) in net assets resulting from operations | | | (54,335,021 | ) | | | 41,368,691 | | | | (229,491,801 | ) | | | 58,447,075 | |
| |
| Dividends and Distributions to Shareholders from: | | | | | | | | | | | | | | | | |
| Distributable earnings: | | | | | | | | | | | | | | | | |
| Class A | | | (155,638,225 | ) | | | (36,031,217 | ) | | | (95,683,062 | ) | | | (112,821,128 | ) |
| Class B | | | — | | | | — | | | | — | | | | (129,238 | ) |
| Class C | | | (1,384,485 | ) | | | (323,584 | ) | | | (11,167,120 | ) | | | (15,976,695 | ) |
| Class E1 | | | — | | | | — | | | | (99,739 | ) | | | (564,977 | ) |
| Class I | | | (95,860,473 | ) | | | (30,621,298 | ) | | | (87,942,232 | ) | | | (113,914,816 | ) |
| Class R | | | (320,470 | ) | | | (55,912 | ) | | | (2,642,896 | ) | | | (2,886,148 | ) |
| Class R62 | | | (1,461,934 | ) | | | (1,371,440 | ) | | | (4,396,791 | ) | | | (4,531,342 | ) |
| Class Y | | | (638,758 | ) | | | (139,716 | ) | | | (5,574,837 | ) | | | (7,371,863 | ) |
| | | | (255,304,345 | ) | | | (68,543,167 | ) | | | (207,506,677 | ) | | | (258,196,207 | ) |
| |
| Capital Share Transactions: | | | | | | | | | | | | | | | | |
| Proceeds from shares sold: | | | | | | | | | | | | | | | | |
| Class A | | | 9,190,401 | | | | 14,858,614 | | | | 128,428,311 | | | | 210,089,2053 | |
| Class B4 | | | — | | | | — | | | | — | | | | 9,0153 | |
| Class C | | | 293,294 | | | | 404,203 | | | | 11,609,666 | | | | 23,975,9333 | |
| Class E1 | | | — | | | | — | | | | 75,619 | | | | 734,3973 | |
| Class I | | | 52,313,898 | | | | 48,560,979 | | | | 369,674,854 | | | | 417,506,9713 | |
| Class R | | | 28,946 | | | | 27,859 | | | | 1,057,896 | | | | 3,805,8403 | |
| Class R62 | | | 1,768,200 | | | | 3,096,360 | | | | 21,534,370 | | | | 19,816,4333 | |
| Class Y | | | 124,289 | | | | 256,274 | | | | 30,153,445 | | | | 37,062,3233 | |
| |
| Net asset value of shares issued upon reinvestment of dividends and distributions: | | | | | | | | | | | | | | | | |
| Class A | | | 152,055,253 | | | | 35,179,582 | | | | 93,326,521 | | | | 104,615,394 | |
| Class B4 | | | — | | | | — | | | | — | | | | 114,702 | |
| Class C | | | 1,380,869 | | | | 322,666 | | | | 10,740,503 | | | | 13,805,357 | |
| Class E1 | | | — | | | | — | | | | 88,592 | | | | 560,402 | |
| Class I | | | 95,712,821 | | | | 30,456,201 | | | | 86,841,370 | | | | 108,600,030 | |
| Class R | | | 320,470 | | | | 55,741 | | | | 2,672,221 | | | | 2,862,999 | |
| Class R62 | | | 875,824 | | | | 1,371,440 | | | | 4,327,070 | | | | 4,282,439 | |
| Class Y | | | 637,520 | | | | 138,003 | | | | 5,277,734 | | | | 6,345,822 | |
| | | | 314,701,785 | | | | 134,727,922 | | | | 765,808,172 | | | | 954,187,262 | |
| | | Delaware Ivy | | | Delaware Ivy | |
| | | Global Growth Fund | | | High Income Fund | |
| | | Year ended | | | Year ended | |
| | | 3/31/23 | | | 3/31/22 | | | 3/31/23 | | | 3/31/22 | |
| Cost of shares redeemed: | | | | | | | | | | | | | | | | |
| Class A | | $ | (126,112,955 | ) | | $ | (81,523,032 | ) | | $ | (403,931,896 | ) | | $ | (463,391,374 | ) |
| Class B4 | | | — | | | | (209,558 | ) | | | — | | | | (7,891,700 | ) |
| Class C | | | (1,406,795 | ) | | | (2,281,288 | ) | | | (75,352,072 | ) | | | (124,226,591 | ) |
| Class E1 | | | — | | | | — | | | | (7,695,819 | ) | | | (1,698,399 | ) |
| Class I | | | (209,246,811 | ) | | | (184,377,731 | ) | | | (689,215,973 | ) | | | (855,546,952 | ) |
| Class R | | | (104,477 | ) | | | (177,653 | ) | | | (8,374,156 | ) | | | (7,779,309 | ) |
| Class R62 | | | (892,205 | ) | | | (20,545,928 | ) | | | (23,188,049 | ) | | | (22,553,399 | ) |
| Class Y | | | (498,722 | ) | | | (1,609,631 | ) | | | (54,458,875 | ) | | | (76,241,529 | ) |
| | | | (338,261,965 | ) | | | (290,724,821 | ) | | | (1,262,216,840 | ) | | | (1,559,329,253 | ) |
| Decrease in net assets derived from capital share transactions | | | (23,560,180 | ) | | | (155,996,899 | ) | | | (496,408,668 | ) | | | (605,141,991 | ) |
| Net Decrease in Net Assets | | | (333,199,546 | ) | | | (183,171,375 | ) | | | (933,407,146 | ) | | | (804,891,123 | ) |
| |
| Net Assets: | | | | | | | | | | | | | | | | |
| Beginning of year | | | 870,048,957 | | | | 1,053,220,332 | | | | 3,469,909,295 | | | | 4,274,800,418 | |
| End of year | | $ | 536,849,411 | | | | $ 870,048,957 | | | $ | 2,536,502,149 | | | $ | 3,469,909,295 | |
| 1 | On June 13, 2022, all Class E shares were liquidated. |
| 2 | Effective July 1, 2021, Class N shares were renamed Class R6 shares. |
| 3 | Included payments from affiliates. |
| 4 | On December 10, 2021, all Class B shares were converted into Class A shares. These transactions are included as subscriptions of Class A shares and redemptions of Class B shares in the tables above and on the previous page. |
See accompanying notes, which are an integral part of the financial statements.
Statements of changes in net assets
Ivy Funds
| | | Delaware Ivy | | | | | | | |
| | | International | | | Delaware Ivy | |
| | | Core Equity Fund | | | International Value Fund | |
| | | Year ended | | | Year ended | |
| | | 3/31/23 | | | 3/31/22 | | | 3/31/23 | | | 3/31/22 | |
| Increase (Decrease) in Net Assets from Operations: | | | | | | | | | | | | | | | | |
| Net investment income (loss) | | $ | 34,731,260 | | | $ | 28,482,227 | | | $ | 1,842,351 | | | $ | 3,564,527 | |
| Net realized gain (loss) | | | (15,974,319 | ) | | | 314,263,356 | | | | (13,125,360 | ) | | | 25,460,010 | |
| Net change in unrealized appreciation (depreciation) | | | (62,910,806 | ) | | | (323,960,669 | ) | | | 4,931,857 | | | | (45,548,366 | ) |
| Net increase (decrease) in net assets resulting from operations | | | (44,153,865 | ) | | | 18,784,914 | | | | (6,351,152 | ) | | | (16,523,829 | ) |
| |
| Dividends and Distributions to Shareholders from: | | | | | | | | | | | | | | | | |
| Distributable earnings: | | | | | | | | | | | | | | | | |
| Class A | | | (2,204,684 | ) | | | (8,853,185 | ) | | | (4,061,811 | ) | | | (1,399,472 | ) |
| Class C | | | (48,427 | ) | | | (1,170,851 | ) | | | (46,922 | ) | | | (13,413 | ) |
| Class E1 | | | — | | | | (196,693 | ) | | | — | | | | — | |
| Class I | | | (7,716,433 | ) | | | (35,278,433 | ) | | | (3,198,870 | ) | | | (2,264,679 | ) |
| Class R | | | (243,139 | ) | | | (1,134,673 | ) | | | (3,437 | ) | | | (180 | ) |
| Class R62 | | | (2,574,522 | ) | | | (10,803,496 | ) | | | (3,920,833 | ) | | | (1,788,388 | ) |
| Class Y | | | (349,221 | ) | | | (2,038,110 | ) | | | (68,504 | ) | | | (25,173 | ) |
| | | | (13,136,426 | ) | | | (59,475,441 | ) | | | (11,300,377 | ) | | | (5,491,305 | ) |
| |
| Capital Share Transactions: | | | | | | | | | | | | | | | | |
| Proceeds from shares sold: | | | | | | | | | | | | | | | | |
| Class A | | | 29,761,426 | | | | 34,316,906 | | | | 1,447,444 | | | | 5,057,204 | |
| Class B3 | | | — | | | | 13,787 | | | | — | | | | 5,007 | |
| Class C | | | 1,043,394 | | | | 1,764,684 | | | | 30,790 | | | | 314,259 | |
| Class E1 | | | 70,210 | | | | 825,207 | | | | — | | | | — | |
| Class I | | | 121,901,540 | | | | 212,112,881 | | | | 14,116,573 | | | | 45,531,787 | |
| Class R | | | 2,049,682 | | | | 2,355,677 | | | | 129,893 | | | | 6,645 | |
| Class R62 | | | 29,813,846 | | | | 58,908,975 | | | | 8,158,494 | | | | 26,114,709 | |
| Class Y | | | 6,485,905 | | | | 15,685,221 | | | | 59,944 | | | | 117,130 | |
| |
| Net asset value of shares issued upon reinvestment of dividends and distributions: | | | | | | | | | | | | | | | | |
| Class A | | | 2,164,453 | | | | 8,278,215 | | | | 3,990,201 | | | | 1,372,071 | |
| Class C | | | 48,018 | | | | 1,124,160 | | | | 46,922 | | | | 13,413 | |
| Class E1 | | | — | | | | 196,693 | | | | — | | | | — | |
| Class I | | | 7,462,418 | | | | 33,388,533 | | | | 3,195,614 | | | | 2,247,859 | |
| Class R | | | 243,083 | | | | 1,124,048 | | | | 3,437 | | | | 180 | |
| Class R62 | | | 2,550,093 | | | | 10,490,428 | | | | 3,920,833 | | | | 1,788,386 | |
| Class Y | | | 347,762 | | | | 1,606,531 | | | | 68,419 | | | | 25,149 | |
| | | | 203,941,830 | | | | 382,191,946 | | | | 35,168,564 | | | | 82,593,799 | |
| | | Delaware Ivy | | | | | | | |
| | | International | | | Delaware Ivy | |
| | | Core Equity Fund | | | International Value Fund | |
| | | Year ended | | | Year ended | |
| | | 3/31/23 | | | 3/31/22 | | | 3/31/23 | | | 3/31/22 | |
| Cost of shares redeemed: | | | | | | | | | | | | | | | | |
| Class A | | $ | (74,640,222 | ) | | $ | (91,062,798 | ) | | $ | (11,744,674 | ) | | $ | (12,395,558 | ) |
| Class B3 | | | — | | | | (559,083 | ) | | | — | | | | (59,546 | ) |
| Class C | | | (16,543,106 | ) | | | (22,470,383 | ) | | | (253,378 | ) | | | (283,913 | ) |
| Class E1 | | | (6,986,287 | ) | | | (784,442 | ) | | | — | | | | — | |
| Class I | | | (395,974,846 | ) | | | (607,176,990 | ) | | | (36,732,469 | ) | | | (64,549,672 | ) |
| Class R | | | (7,344,492 | ) | | | (9,728,192 | ) | | | (18,125 | ) | | | (369,054 | ) |
| Class R62 | | | (125,803,841 | ) | | | (213,053,801 | ) | | | (27,906,179 | ) | | | (45,256,371 | ) |
| Class Y | | | (13,993,979 | ) | | | (58,960,454 | ) | | | (296,311 | ) | | | (173,145 | ) |
| | | | (641,286,773 | ) | | | (1,003,796,143 | ) | | | (76,951,136 | ) | | | (123,087,259 | ) |
| Decrease in net assets derived from capital share transactions | | | (437,344,943 | ) | | | (621,604,197 | ) | | | (41,782,572 | ) | | | (40,493,460 | ) |
| Net Decrease in Net Assets | | | (494,635,234 | ) | | | (662,294,724 | ) | | | (59,434,101 | ) | | | (62,508,594 | ) |
| |
| Net Assets: | | | | | | | | | | | | | | | | |
| Beginning of year | | | 1,851,519,412 | | | | 2,513,814,136 | | | | 187,342,665 | | | | 249,851,259 | |
| End of year | | $ | 1,356,884,178 | | | $ | 1,851,519,412 | | | $ | 127,908,564 | | | $ | 187,342,665 | |
| 1 | On June 13, 2022, all Class E shares were liquidated. |
| 2 | Effective July 1, 2021, Class N shares were renamed Class R6 shares. |
| 3 | On December 10, 2021, all Class B shares were converted into Class A shares. These transactions are included as subscriptions of Class A shares and redemptions of Class B shares in the tables above and on the previous page. |
See accompanying notes, which are an integral part of the financial statements.
Statements of changes in net assets
Ivy Funds
| | | Delaware Ivy | | | Delaware Ivy | |
| | | Large Cap Growth Fund | | | Limited-Term Bond Fund | |
| | | Year ended | | | Year ended | |
| | | 3/31/23 | | | 3/31/22 | | | 3/31/23 | | | 3/31/22 | |
| Increase (Decrease) in Net Assets from Operations: | | | | | | | | | | | | | | | | |
| Net investment income (loss) | | $ | (3,696,658 | ) | | $ | (14,152,948 | ) | | $ | 15,188,756 | | | $ | 12,465,598 | |
| Net realized gain (loss) | | | 192,465,975 | | | | 667,588,189 | | | | (24,346,419 | ) | | | (3,343,879 | ) |
| Net change in unrealized appreciation (depreciation) | | | (716,913,321 | ) | | | 280,860,520 | | | | 4,953,791 | | | | (38,222,332 | ) |
| Net increase (decrease) in net assets resulting from operations | | | (528,144,004 | ) | | | 934,295,761 | | | | (4,203,872 | ) | | | (29,100,613 | ) |
| |
| Dividends and Distributions to Shareholders from: | | | | | | | | | | | | | | | | |
| Distributable earnings: | | | | | | | | | | | | | | | | |
| Class A | | | (233,211,332 | ) | | | (288,499,969 | ) | | | (6,520,492 | ) | | | (3,879,665 | ) |
| Class C | | | (6,803,751 | ) | | | (8,096,887 | ) | | | (115,453 | ) | | | (39,579 | ) |
| Class E1 | | | (449 | ) | | | (3,328,409 | ) | | | (15,828 | ) | | | (71,337 | ) |
| Class I | | | (202,306,553 | ) | | | (249,922,112 | ) | | | (7,552,404 | ) | | | (6,411,450 | ) |
| Class R | | | (1,077,786 | ) | | | (1,248,920 | ) | | | (5,854 | ) | | | (2,683 | ) |
| Class R62 | | | (15,565,662 | ) | | | (15,436,229 | ) | | | (425,074 | ) | | | (1,900,886 | ) |
| Class Y | | | (2,693,440 | ) | | | (3,085,607 | ) | | | (39,690 | ) | | | (25,433 | ) |
| | | | (461,658,973 | ) | | | (569,618,133 | ) | | | (14,674,795 | ) | | | (12,331,033 | ) |
| |
| Capital Share Transactions: | | | | | | | | | | | | | | | | |
| Proceeds from shares sold: | | | | | | | | | | | | | | | | |
| Class A | | | 176,012,893 | | | | 130,922,593 | | | | 139,175,593 | | | | 95,877,635 | |
| Class B3 | | | — | | | | 122,314 | | | | — | | | | 1,734 | |
| Class C | | | 8,452,969 | | | | 10,049,136 | | | | 4,063,350 | | | | 4,934,272 | |
| Class E1 | | | 513,750 | | | | 3,545,116 | | | | 147,777 | | | | 1,353,352 | |
| Class I | | | 1,335,000,059 | | | | 518,398,941 | | | | 74,060,936 | | | | 104,404,767 | |
| Class R | | | 2,714,377 | | | | 2,628,654 | | | | 5,211 | | | | 75,344 | |
| Class R62 | | | 108,362,725 | | | | 26,939,732 | | | | 4,299,695 | | | | 68,826,701 | |
| Class Y | | | 2,867,825 | | | | 11,047,810 | | | | 278,647 | | | | 355,498 | |
| |
| Net asset value of shares issued upon reinvestment of dividends and distributions: | | | | | | | | | | | | | | | | |
| Class A | | | 231,503,608 | | | | 283,173,518 | | | | 6,452,647 | | | | 3,758,367 | |
| Class B3 | | | — | | | | — | | | | — | | | | 46 | |
| Class C | | | 6,795,138 | | | | 7,796,485 | | | | 110,164 | | | | 34,845 | |
| Class E1 | | | — | | | | 3,328,867 | | | | 13,398 | | | | 71,257 | |
| Class I | | | 198,918,523 | | | | 243,387,205 | | | | 7,549,855 | | | | 6,266,300 | |
| Class R | | | 1,077,786 | | | | 1,244,939 | | | | 5,758 | | | | 1,945 | |
| Class R62 | | | 15,305,442 | | | | 15,436,229 | | | | 427,185 | | | | 1,900,083 | |
| Class Y | | | 2,680,400 | | | | 2,997,477 | | | | 38,878 | | | | 23,239 | |
| | | | 2,090,205,495 | | | | 1,261,019,016 | | | | 236,629,094 | | | | 287,885,385 | |
| | | Delaware Ivy | | | Delaware Ivy | |
| | | Large Cap Growth Fund | | | Limited-Term Bond Fund | |
| | | Year ended | | | Year ended | |
| | | 3/31/23 | | | 3/31/22 | | | 3/31/23 | | | 3/31/22 | |
| Cost of shares redeemed: | | | | | | | | | | | | | | | | |
| Class A | | $ | (590,512,483 | ) | | $ | (486,388,644 | ) | | $ | (199,952,330 | ) | | $ | (157,872,183 | ) |
| Class B3 | | | — | | | | (4,717,491 | ) | | | — | | | | (232,009 | ) |
| Class C | | | (20,130,759 | ) | | | (25,813,552 | ) | | | (10,940,796 | ) | | | (14,766,562 | ) |
| Class E1 | | | (28,413,405 | ) | | | (4,755,959 | ) | | | (6,461,822 | ) | | | (2,231,845 | ) |
| Class I | | | (1,028,298,682 | ) | | | (840,079,246 | ) | | | (249,525,788 | ) | | | (252,244,365 | ) |
| Class R | | | (3,108,406 | ) | | | (5,629,895 | ) | | | (144,991 | ) | | | (20,827 | ) |
| Class R62 | | | (77,388,981 | ) | | | (52,131,380 | ) | | | (139,864,369 | ) | | | (45,824,105 | ) |
| Class Y | | | (10,280,136 | ) | | | (11,379,215 | ) | | | (445,442 | ) | | | (842,044 | ) |
| | | | (1,758,132,852 | ) | | | (1,430,895,382 | ) | | | (607,335,538 | ) | | | (474,033,940 | ) |
| Increase (decrease) in net assets derived from capital share transactions | | | 332,072,643 | | | | (169,876,366 | ) | | | (370,706,444 | ) | | | (186,148,555 | ) |
| Net Increase (Decrease) in Net Assets | | | (657,730,334 | ) | | | 194,801,262 | | | | (389,585,111 | ) | | | (227,580,201 | ) |
| |
| Net Assets: | | | | | | | | | | | | | | | | |
| Beginning of year | | | 5,773,851,140 | | | | 5,579,049,878 | | | | 946,646,666 | | | | 1,174,226,867 | |
| End of year | | $ | 5,116,120,806 | | | $ | 5,773,851,140 | | | $ | 557,061,555 | | | $ | 946,646,666 | |
| 1 | On June 13, 2022, all Class E shares were liquidated. |
| 2 | Effective July 1, 2021, Class N shares were renamed Class R6 shares. |
| 3 | On December 10, 2021, all Class B shares were converted into Class A shares. These transactions are included as subscriptions of Class A shares and redemptions of Class B shares in the tables above and on the previous page. |
See accompanying notes, which are an integral part of the financial statements.
Statements of changes in net assets
Ivy Funds
| | | Delaware Ivy | | | | | | | |
| | | Managed International | | | Delaware Ivy | |
| | | Opportunities Fund | | | Mid Cap Growth Fund | |
| | | Year ended | | | Year ended | |
| | | 3/31/23 | | | 3/31/22 | | | 3/31/23 | | | 3/31/22 | |
| Increase (Decrease) in Net Assets from Operations: | | | | | | | | | | | | | | | | |
| Net investment income (loss) | | $ | 297,235 | | | $ | 3,634,238 | | | $ | (23,468,799 | ) | | $ | (46,105,236 | ) |
| Net realized gain (loss) | | | 936,652 | | | | 16,049,457 | | | | 572,136,526 | | | | 756,637,129 | |
| Net change in unrealized appreciation (depreciation) | | | (9,469,527 | ) | | | (29,528,244 | ) | | | (1,312,690,453 | ) | | | (836,958,370 | ) |
| Net increase (decrease) in net assets resulting from operations | | | (8,235,640 | ) | | | (9,844,549 | ) | | | (764,022,726 | ) | | | (126,426,477 | ) |
| |
| Dividends and Distributions to Shareholders from: | | | | | | | | | | | | | | | | |
| Distributable earnings: | | | | | | | | | | | | | | | | |
| Class A | | | (5,093,238 | ) | | | (1,496,141 | ) | | | (164,406,300 | ) | | | (304,452,989 | ) |
| Class C | | | (82,022 | ) | | | (24,621 | ) | | | (10,932,969 | ) | | | (22,625,735 | ) |
| Class E1 | | | — | | | | — | | | | (17 | ) | | | (2,666,741 | ) |
| Class I | | | (6,195,794 | ) | | | (2,564,748 | ) | | | (255,989,188 | ) | | | (442,470,544 | ) |
| Class R | | | (11,316 | ) | | | (1,831 | ) | | | (6,221,362 | ) | | | (10,968,579 | ) |
| Class R62 | | | (12,765 | ) | | | (2,886 | ) | | | (77,842,989 | ) | | | (108,105,215 | ) |
| Class Y | | | (13,118 | ) | | | (3,937 | ) | | | (21,051,425 | ) | | | (40,580,612 | ) |
| | | | (11,408,253 | ) | | | (4,094,164 | ) | | | (536,444,250 | ) | | | (931,870,415 | ) |
| |
| Capital Share Transactions: | | | | | | | | | | | | | | | | |
| Proceeds from shares sold: | | | | | | | | | | | | | | | | |
| Class A | | | 2,068,217 | | | | 3,646,352 | | | | 116,730,479 | | | | 176,583,191 | |
| Class B3 | | | — | | | | 1,276 | | | | — | | | | 22,893 | |
| Class C | | | 53,423 | | | | 234,492 | | | | 8,020,697 | | | | 22,556,385 | |
| Class E1 | | | — | | | | — | | | | 208,019 | | | | 2,120,942 | |
| Class I | | | 11,353,893 | | | | 16,337,165 | | | | 820,478,205 | | | | 1,149,273,771 | |
| Class R | | | 17,606 | | | | 14,063 | | | | 8,960,574 | | | | 15,245,075 | |
| Class R62 | | | 60,332 | | | | 25,551 | | | | 395,392,794 | | | | 518,879,668 | |
| Class Y | | | 2,953 | | | | 14,633 | | | | 31,335,214 | | | | 81,619,888 | |
| |
| Net asset value of shares issued upon reinvestment of dividends and distributions: | | | | | | | | | | | | | | | | |
| Class A | | | 5,087,312 | | | | 1,487,205 | | | | 163,484,209 | | | | 299,979,244 | |
| Class C | | | 82,022 | | | | 24,545 | | | | 10,892,763 | | | | 22,199,637 | |
| Class E1 | | | — | | | | — | | | | — | | | | 2,669,507 | |
| Class I | | | 6,194,130 | | | | 2,561,359 | | | | 249,728,118 | | | | 421,375,039 | |
| Class R | | | 11,316 | | | | 1,831 | | | | 6,209,860 | | | | 10,875,261 | |
| Class R62 | | | 12,765 | | | | 2,886 | | | | 77,701,319 | | | | 106,195,229 | |
| Class Y | | | 13,118 | | | | 3,937 | | | | 21,013,263 | | | | 38,073,093 | |
| | | | 24,957,087 | | | | 24,355,295 | | | | 1,910,155,514 | | | | 2,867,668,823 | |
| | | Delaware Ivy | | | | | | | |
| | | Managed International | | | Delaware Ivy | |
| | | Opportunities Fund | | | Mid Cap Growth Fund | |
| | | Year ended | | | Year ended | |
| | | 3/31/23 | | | 3/31/22 | | | 3/31/23 | | | 3/31/22 | |
| Cost of shares redeemed: | | | | | | | | | | | | | | | | |
| Class A | | $ | (14,206,983 | ) | | $ | (12,129,365 | )$ | | | (454,648,001 | ) | | $ | (439,644,873 | ) |
| Class B3 | | | — | | | | (63,389 | ) | | | — | | | | (4,245,237 | ) |
| Class C | | | (306,865 | ) | | | (584,637 | ) | | | (38,853,344 | ) | | | (68,525,944 | ) |
| Class E1 | | | — | | | | — | | | | (15,934,312 | ) | | | (2,199,652 | ) |
| Class I | | | (45,844,028 | ) | | | (41,958,311 | ) | | | (1,128,346,626 | ) | | | (1,094,660,484 | ) |
| Class R | | | (25 | ) | | | (318,636 | ) | | | (16,761,799 | ) | | | (26,673,837 | ) |
| Class R62 | | | (65,177 | ) | | | (351,373 | ) | | | (233,573,867 | ) | | | (241,640,653 | ) |
| Class Y | | | (33,955 | ) | | | (44,331 | ) | | | (61,854,490 | ) | | | (156,632,665 | ) |
| | | | (60,457,033 | ) | | | (55,450,042 | ) | | | (1,949,972,439 | ) | | | (2,034,223,345 | ) |
| Increase (decrease) in net assets derived from capital share transactions | | | (35,499,946 | ) | | | (31,094,747 | ) | | | (39,816,925 | ) | | | 833,445,478 | |
| Net Decrease in Net Assets | | | (55,143,839 | ) | | | (45,033,460 | ) | | | (1,340,283,901 | ) | | | (224,851,414 | ) |
| |
| Net Assets: | | | | | | | | | | | | | | | | |
| Beginning of year | | | 133,392,970 | | | | 178,426,430 | | | | 7,217,435,879 | | | | 7,442,287,293 | |
| End of year | | $ | 78,249,131 | | | | $133,392,970 | | | $ | 5,877,151,978 | | | $ | 7,217,435,879 | |
| 1 | On June 13, 2022, all Class E shares were liquidated. |
| 2 | Effective July 1, 2021, Class N shares were renamed Class R6 shares. |
| 3 | On December 10, 2021, all Class B shares were converted into Class A shares. These transactions are included as subscriptions of Class A shares and redemptions of Class B shares in the tables above and on the previous page. |
See accompanying notes, which are an integral part of the financial statements.
Statements of changes in net assets
Ivy Funds
| | | Delaware Ivy | | | | | | | |
| | | Mid Cap Income | | | Delaware Ivy | |
| | | Opportunities Fund | | | Municipal Bond Fund | |
| | | Year ended | | | Year ended | |
| | | 3/31/23 | | | 3/31/22 | | | 3/31/23 | | | 3/31/22 | |
| Increase (Decrease) in Net Assets from Operations: | | | | | | | | | | | | | | | | |
| Net investment income (loss) | | $ | 26,086,278 | | | $ | 22,846,839 | | | $ | 16,009,536 | | | $ | 18,338,283 | |
| Net realized gain (loss) | | | 17,627,519 | | | | 61,988,899 | | | | (32,262,958 | ) | | | 2,866,444 | |
| Net change in unrealized appreciation (depreciation) | | | (127,820,971 | ) | | | 10,826,915 | | | | (10,664,826 | ) | | | (54,454,142 | ) |
| Net increase (decrease) in net assets resulting from operations | | | (84,107,174 | ) | | | 95,662,653 | | | | (26,918,248 | ) | | | (33,249,415 | ) |
| |
| Dividends and Distributions to Shareholders from: | | | | | | | | | | | | | | | | |
| Distributable earnings: | | | | | | | | | | | | | | | | |
| Class A | | | (6,514,556 | ) | | | (6,545,273 | ) | | | (11,398,372 | ) | | | (12,703,971 | ) |
| Class C | | | (609,409 | ) | | | (724,574 | ) | | | (119,014 | ) | | | (130,002 | ) |
| Class I | | | (46,510,991 | ) | | | (53,147,351 | ) | | | (6,207,966 | ) | | | (9,016,564 | ) |
| Class R | | | (37,033 | ) | | | (35,357 | ) | | | — | | | | — | |
| Class R61 | | | (3,921,104 | ) | | | (4,321,653 | ) | | | (33,447 | ) | | | (43,622 | ) |
| Class Y | | | (439,212 | ) | | | (983,852 | ) | | | — | | | | (852 | ) |
| |
| Return of capital: | | | | | | | | | | | | | | | | |
| Class A | | | — | | | | — | | | | (306,538 | ) | | | — | |
| Class C | | | — | | | | — | | | | (4,089 | ) | | | — | |
| Class I | | | — | | | | — | | | | (161,183 | ) | | | — | |
| Class R61 | | | — | | | | — | | | | (848 | ) | | | — | |
| | | | (58,032,305 | ) | | | (65,758,060 | ) | | | (18,231,457 | ) | | | (21,895,011 | ) |
| |
| Capital Share Transactions: | | | | | | | | | | | | | | | | |
| Proceeds from shares sold: | | | | | | | | | | | | | | | | |
| Class A | | | 39,515,455 | | | | 45,643,057 | | | | 38,670,536 | | | | 29,192,716 | |
| Class C | | | 2,445,278 | | | | 7,942,037 | | | | 1,228,617 | | | | 432,369 | |
| Class I | | | 260,587,380 | | | | 600,589,785 | | | | 34,977,576 | | | | 41,765,158 | |
| Class R | | | 126,008 | | | | 543,358 | | | | — | | | | — | |
| Class R61 | | | 30,058,898 | | | | 35,347,214 | | | | 491,707 | | | | 672,585 | |
| Class Y | | | 1,924,707 | | | | 13,837,777 | | | | — | | | | 457 | |
| |
| Net asset value of shares issued upon reinvestment of dividends and distributions: | | | | | | | | | | | | | | | | |
| Class A | | | 6,504,171 | | | | 6,501,998 | | | | 11,675,185 | | | | 12,286,505 | |
| Class B2 | | | — | | | | — | | | | — | | | | 109 | |
| Class C | | | 607,537 | | | | 705,921 | | | | 122,263 | | | | 127,219 | |
| Class I | | | 45,322,699 | | | | 51,961,316 | | | | 6,354,544 | | | | 8,862,796 | |
| Class R | | | 37,033 | | | | 35,357 | | | | — | | | | — | |
| Class R61 | | | 3,861,579 | | | | 4,320,455 | | | | 34,696 | | | | 43,393 | |
| Class Y | | | 436,561 | | | | 975,684 | | | | — | | | | 6 | |
| | | | 391,427,306 | | | | 768,403,959 | | | | 93,555,124 | | | | 93,383,313 | |
| | | Delaware Ivy | | | | | | | |
| | | Mid Cap Income | | | Delaware Ivy | |
| | | Opportunities Fund | | | Municipal Bond Fund | |
| | | Year ended | | | Year ended | |
| | | 3/31/23 | | | 3/31/22 | | | 3/31/23 | | | 3/31/22 | |
| Cost of shares redeemed: | | | | | | | | | | | | | | | | |
| Class A | | $ | (48,258,982 | ) | | $ | (44,931,437 | ) | | $ | (153,172,382 | ) | | $ | (78,253,814 | ) |
| Class B2 | | | — | | | | — | | | | — | | | | (162,394 | ) |
| Class C | | | (7,797,412 | ) | | | (5,812,493 | ) | | | (2,446,594 | ) | | | (3,329,056 | ) |
| Class I | | | (595,631,582 | ) | | | (498,531,739 | ) | | | (159,238,392 | ) | | | (92,195,378 | ) |
| Class R | | | (135,688 | ) | | | (177,890 | ) | | | — | | | | — | |
| Class R61 | | | (48,698,820 | ) | | | (32,436,353 | ) | | | (779,389 | ) | | | (596,508 | ) |
| Class Y | | | (16,337,458 | ) | | | (26,436,267 | ) | | | — | | | | (434,132 | ) |
| | | | (716,859,942 | ) | | | (608,326,179 | ) | | | (315,636,757 | ) | | | (174,971,282 | ) |
| Increase (decrease) in net assets derived from capital share transactions | | | (325,432,636 | ) | | | 160,077,780 | | | | (222,081,633 | ) | | | (81,587,969 | ) |
| Net Increase (Decrease) in Net Assets | | | (467,572,115 | ) | | | 189,982,373 | | | | (267,231,338 | ) | | | (136,732,395 | ) |
| |
| Net Assets: | | | | | | | | | | | | | | | | |
| Beginning of year | | | 1,757,554,039 | | | | 1,567,571,666 | | | | 620,361,672 | | | | 757,094,067 | |
| End of year | | $ | 1,289,981,924 | | | $ | 1,757,554,039 | | | $ | 353,130,334 | | | $ | 620,361,672 | |
| 1 | Effective July 1, 2021, Class N shares were renamed Class R6 shares. |
| 2 | On December 10, 2021, all Class B shares were converted into Class A shares. These transactions are included as subscriptions of Class A shares and redemptions of Class B shares in the tables above and on the previous page. |
See accompanying notes, which are an integral part of the financial statements.
Statements of changes in net assets
Ivy Funds
| | | Delaware Ivy | | | Delaware Ivy | |
| | | Municipal High Income Fund | | | Small Cap Growth Fund | |
| | | Year ended | | | Year ended | |
| | | 3/31/23 | | | 3/31/22 | | | 3/31/23 | | | 3/31/22 | |
| Increase (Decrease) in Net Assets from Operations: | | | | | | | | | | | | | | | | |
| Net investment income (loss) | | $ | 22,786,007 | | | $ | 40,592,313 | | | $ | (7,713,488 | ) | | $ | (19,046,420 | ) |
| Net realized gain (loss) | | | (49,401,801 | ) | | | 17,736,682 | | | | 49,189,318 | | | | 312,905,216 | |
| Net change in unrealized appreciation (depreciation) | | | (31,778,063 | ) | | | (69,282,700 | ) | | | (396,476,546 | ) | | | (512,116,182 | ) |
| Net increase (decrease) in net assets resulting from operations | | | (58,393,857 | ) | | | (10,953,705 | ) | | | (355,000,716 | ) | | | (218,257,386 | ) |
| |
| Dividends and Distributions to Shareholders from: | | | | | | | | | | | | | | | | |
| Distributable earnings: | | | | | | | | | | | | | | | | |
| Class A | | | (19,304,205 | ) | | | (20,047,395 | ) | | | (35,978,096 | ) | | | (332,393,017 | ) |
| Class B | | | — | | | | (3,116 | ) | | | — | | | | — | |
| Class C | | | (490,929 | ) | | | (614,887 | ) | | | (1,946,695 | ) | | | (17,480,609 | ) |
| Class E1 | | | — | | | | — | | | | (337 | ) | | | (4,012,535 | ) |
| Class I | | | (9,321,569 | ) | | | (10,905,942 | ) | | | (17,341,942 | ) | | | (210,162,997 | ) |
| Class R | | | — | | | | — | | | | (2,310,793 | ) | | | (17,696,170 | ) |
| Class R62 | | | (39,603 | ) | | | (41,646 | ) | | | (4,990,253 | ) | | | (42,723,185 | ) |
| Class Y | | | (141,229 | ) | | | (140,031 | ) | | | (2,620,597 | ) | | | (25,154,209 | ) |
| | | | (29,297,535 | ) | | | (31,753,017 | ) | | | (65,188,713 | ) | | | (649,622,722 | ) |
| |
| Capital Share Transactions: | | | | | | | | | | | | | | | | |
| Proceeds from shares sold: | | | | | | | | | | | | | | | | |
| Class A | | | 51,429,502 | | | | 52,218,579 | | | | 42,280,458 | | | | 64,562,524 | |
| Class B3 | | | — | | | | 1,238 | | | | — | | | | 5,448 | |
| Class C | | | 1,442,233 | | | | 1,686,840 | | | | 1,906,837 | | | | 3,740,509 | |
| Class E1 | | | — | | | | — | | | | 141,458 | | | | 1,270,482 | |
| Class I | | | 77,265,926 | | | | 70,868,476 | | | | 151,993,044 | | | | 175,954,227 | |
| Class R | | | — | | | | — | | | | 3,877,925 | | | | 11,408,965 | |
| Class R62 | | | 861,682 | | | | 595,008 | | | | 28,475,201 | | | | 50,550,845 | |
| Class Y | | | 50,419 | | | | 68,913 | | | | 8,314,846 | | | | 12,905,519 | |
| |
| Net asset value of shares issued upon reinvestment of dividends and distributions: | | | | | | | | | | | | | | | | |
| Class A | | | 18,936,774 | | | | 18,177,355 | | | | 35,770,613 | | | | 328,991,229 | |
| Class B3 | | | — | | | | 1,554 | | | | — | | | | — | |
| Class C | | | 491,434 | | | | 587,596 | | | | 1,921,869 | | | | 17,040,622 | |
| Class E1 | | | — | | | | — | | | | — | | | | 4,019,129 | |
| Class I | | | 8,773,334 | | | | 10,057,003 | | | | 16,814,919 | | | | 202,762,602 | |
| Class R | | | — | | | | — | | | | 2,308,442 | | | | 17,673,243 | |
| Class R62 | | | 39,779 | | | | 41,524 | | | | 4,857,773 | | | | 42,161,242 | |
| Class Y | | | 141,976 | | | | 138,693 | | | | 2,503,946 | | | | 24,012,660 | |
| | | | 159,433,059 | | | | 154,442,779 | | | | 301,167,331 | | | | 957,059,246 | |
| | | Delaware Ivy | | | Delaware Ivy | |
| | | Municipal High Income Fund | | | Small Cap Growth Fund | |
| | | Year ended | | | Year ended | |
| | | 3/31/23 | | | 3/31/22 | | | 3/31/23 | | | 3/31/22 | |
| Cost of shares redeemed: | | | | | | | | | | | | | | | | |
| Class A | | $ | (212,633,722 | ) | | $ | (122,831,503 | ) | | $ | (235,462,828 | ) | | $ | (250,589,350 | ) |
| Class B3 | | | — | | | | (421,748 | ) | | | — | | | | (1,789,345 | ) |
| Class C | | | (8,560,538 | ) | | | (12,058,208 | ) | | | (11,707,208 | ) | | | (20,204,300 | ) |
| Class E1 | | | — | | | | — | | | | (10,999,250 | ) | | | (1,415,270 | ) |
| Class I | | | (192,193,878 | ) | | | (100,915,845 | ) | | | (358,561,415 | ) | | | (396,651,613 | ) |
| Class R | | | — | | | | — | | | | (8,334,107 | ) | | | (20,122,361 | ) |
| Class R62 | | | (777,537 | ) | | | (526,114 | ) | | | (49,967,732 | ) | | | (76,175,004 | ) |
| Class Y | | | (754,536 | ) | | | (535,631 | ) | | | (20,072,822 | ) | | | (37,378,113 | ) |
| | | | (414,920,211 | ) | | | (237,289,049 | ) | | | (695,105,362 | ) | | | (804,325,356 | ) |
| Increase (decrease) in net assets derived from capital share transactions | | | (255,487,152 | ) | | | (82,846,270 | ) | | | (393,938,031 | ) | | | 152,733,890 | |
| Net Decrease in Net Assets | | | (343,178,544 | ) | | | (125,552,992 | ) | | | (814,127,460 | ) | | | (715,146,218 | ) |
| |
| Net Assets: | | | | | | | | | | | | | | | | |
| Beginning of year | | | 859,523,418 | | | | 985,076,410 | | | | 2,349,966,042 | | | | 3,065,112,260 | |
| End of year | | $ | 516,344,874 | | | $ | 859,523,418 | | | $ | 1,535,838,582 | | | $ | 2,349,966,042 | |
| 1 | On June 13, 2022, all Class E shares were liquidated. |
| 2 | Effective July 1, 2021, Class N shares were renamed Class R6 shares. |
| 3 | On December 10, 2021, all Class B shares were converted into Class A shares. These transactions are included as subscriptions of Class A shares and redemptions of Class B shares in the tables above and on the previous page. |
See accompanying notes, which are an integral part of the financial statements.
Statements of changes in net assets
Ivy Funds
| | | | | | | | | Delaware Ivy | |
| | | | | | | | | Systematic | |
| | | Delaware Ivy | | | Emerging Markets Equity | |
| | | Smid Cap Core Fund | | | Fundf | |
| | | Year ended | | | Year ended | |
| | | 3/31/23 | | | 3/31/22 | | | 3/31/23 | | | 3/31/22 | |
| Increase (Decrease) in Net Assets from Operations: | | | | | | | | | | | | | | | | |
| Net investment income (loss) | | $ | 2,294,855 | | | $ | 580,295 | | | $ | 42,123,619 | $ | | | 18,315,506 | |
| Net realized gain (loss) | | | (13,210,907 | ) | | | 163,532,328 | | | | 9,447,774 | | | | 205,742,289 | |
| Net change in unrealized appreciation (depreciation) | | | (31,254,611 | ) | | | (167,794,397 | ) | | | (231,865,125 | ) | | | (609,999,484 | ) |
| Net increase (decrease) in net assets resulting from operations | | | (42,170,663 | ) | | | (3,681,774 | ) | | | (180,293,732 | ) | | | (385,941,689 | ) |
| |
| Dividends and Distributions to Shareholders from: | | | | | | | | | | | | | | | | |
| Distributable earnings: | | | | | | | | | | | | | | | | |
| Class A | | | (26,732,151 | ) | | | (27,297,432 | ) | | | (23,862,228 | ) | | | (1,779,222 | ) |
| Class C | | | (3,710,461 | ) | | | (3,619,618 | ) | | | (3,799,756 | ) | | | (145,959 | ) |
| Class I | | | (36,815,324 | ) | | | (62,029,098 | ) | | | (67,508,510 | ) | | | (10,755,123 | ) |
| Class R | | | (4,392,345 | ) | | | (3,982,883 | ) | | | (761,742 | ) | | | (29,737 | ) |
| Class R61 | | | (12,259,333 | ) | | | (13,887,422 | ) | | | (19,569,993 | ) | | | (3,035,209 | ) |
| Class Y | | | (1,153,288 | ) | | | (1,335,914 | ) | | | (3,290,998 | ) | | | (203,602 | ) |
| | | | (85,062,902 | ) | | | (112,152,367 | ) | | | (118,793,227 | ) | | | (15,948,852 | ) |
| |
| Capital Share Transactions: | | | | | | | | | | | | | | | | |
| Proceeds from shares sold: | | | | | | | | | | | | | | | | |
| Class A | | | 14,242,069 | | | | 22,320,506 | | | | 13,991,590 | | | | 36,480,844 | |
| Class B2 | | | — | | | | 3,008 | | | | — | | | | 512 | |
| Class C | | | 1,026,594 | | | | 2,470,553 | | | | 1,201,866 | | | | 4,154,604 | |
| Class I | | | 46,699,579 | | | | 83,720,358 | | | | 166,521,673 | | | | 381,212,563 | |
| Class R | | | 1,713,392 | | | | 4,026,380 | | | | 1,512,449 | | | | 2,186,225 | |
| Class R61 | | | 7,482,685 | | | | 37,280,267 | | | | 25,177,569 | | | | 92,301,717 | |
| Class Y | | | 952,837 | | | | 1,813,958 | | | | 11,947,670 | | | | 11,496,885 | |
| |
| Net asset value of shares issued upon reinvestment of dividends and distributions: | | | | | | | | | | | | | | | | |
| Class A | | | 26,410,183 | | | | 26,976,317 | | | | 23,187,118 | | | | 1,733,296 | |
| Class C | | | 3,691,446 | | | | 3,608,383 | | | | 3,695,972 | | | | 138,903 | |
| Class I | | | 36,412,424 | | | | 61,009,593 | | | | 60,246,877 | | | | 9,580,446 | |
| Class R | | | 4,384,756 | | | | 3,976,715 | | | | 709,240 | | | | 27,889 | |
| Class R61 | | | 12,229,704 | | | | 13,886,899 | | | | 19,518,747 | | | | 3,031,127 | |
| Class Y | | | 980,068 | | | | 1,196,333 | | | | 775,952 | | | | 51,568 | |
| | | | 156,225,737 | | | | 262,289,270 | | | | 328,486,723 | | | | 542,396,579 | |
| Cost of shares redeemed: | | | | | | | | | | | | | | | | |
| Class A | | | (42,325,453 | ) | | | (45,235,026 | ) | | | (65,930,457 | ) | | | (84,100,853 | ) |
| Class B2 | | | — | | | | (423,679 | ) | | | — | | | | (382,513 | ) |
| Class C | | | (4,923,834 | ) | | | (6,350,534 | ) | | | (12,182,076 | ) | | | (11,561,072 | ) |
| Class I | | | (179,974,386 | ) | | | (217,293,502 | ) | | | (426,635,179 | ) | | | (776,427,073 | ) |
| Class R | | | (4,468,380 | ) | | | (5,299,115 | ) | | | (2,008,209 | ) | | | (4,162,138 | ) |
| Class R61 | | | (45,397,284 | ) | | | (29,651,488 | ) | | | (107,210,543 | ) | | | (129,430,864 | ) |
| Class Y | | | (2,937,629 | ) | | | (2,961,342 | ) | | | (7,824,761 | ) | | | (14,156,096 | ) |
| | | | (280,026,966 | ) | | | (307,214,686 | ) | | | (621,791,225 | ) | | | (1,020,220,609 | ) |
| Decrease in net assets derived from capital share transactions | | | (123,801,229 | ) | | | (44,925,416 | ) | | | (293,304,502 | ) | | | (477,824,030 | ) |
| Net Decrease in Net Assets | | | (251,034,794 | ) | | | (160,759,557 | ) | | | (592,391,461 | ) | | | (879,714,571 | ) |
| | | | | | | | | Delaware Ivy | |
| | | | | | | | | Systematic | |
| | | Delaware Ivy | | | Emerging Markets Equity | |
| | | Smid Cap Core Fund | | | Fundf | |
| | | Year ended | | | Year ended | |
| | | 3/31/23 | | | 3/31/22 | | | 3/31/23 | | | 3/31/22 | |
| |
| Net Assets: | | | | | | | | | | | | | | | | |
| Beginning of year | | $ | 598,815,879 | | | $ | 759,575,436 | | | $ | 1,506,781,442 | | | $ | 2,386,496,013 | |
| End of year | | $ | 347,781,085 | | | $ | 598,815,879 | | | $ | 914,389,981 | | | $ | 1,506,781,442 | |
| 1 | Effective July 1, 2021, Class N shares were renamed Class R6 shares. |
| 2 | On December 10, 2021, all Class B shares were converted into Class A shares. These transactions are included as subscriptions of Class A shares and redemptions of Class B shares in the tables above and on the previous page. |
| f | Consolidated statements of changes in net assets |
See accompanying notes, which are an integral part of the financial statements.
Statements of changes in net assets
Ivy Funds
| | | Delaware Ivy | |
| | | Value Fund | |
| | | Year ended | |
| | | 3/31/23 | | | 3/31/22 | |
| Increase (Decrease) in Net Assets from Operations: | | | | | | | | |
| Net investment income (loss) | | $ | 15,391,544 | | | $ | 17,854,525 | |
| Net realized gain (loss) | | | 300,268,806 | | | | 251,783,222 | |
| Net change in unrealized appreciation (depreciation) | | | (387,597,951 | ) | | | (36,217,559 | ) |
| Net increase (decrease) in net assets resulting from operations | | | (71,937,601 | ) | | | 233,420,188 | |
| |
| Dividends and Distributions to Shareholders from: | | | | | | | | |
| Distributable earnings: | | | | | | | | |
| Class A | | | (64,572,042 | ) | | | (40,659,803 | ) |
| Class B | | | — | | | | (2,022 | ) |
| Class C | | | (1,294,711 | ) | | | (639,475 | ) |
| Class I | | | (134,186,525 | ) | | | (96,645,064 | ) |
| Class R | | | (3,635 | ) | | | (1,273 | ) |
| Class R61 | | | (11,915,526 | ) | | | (14,155,158 | ) |
| Class Y | | | (16,310 | ) | | | (10,948 | ) |
| | | | (211,988,749 | ) | | | (152,113,743 | ) |
| |
| Capital Share Transactions: | | | | | | | | |
| Proceeds from shares sold: | | | | | | | | |
| Class A | | | 60,344,321 | | | | 57,850,250 | |
| Class B2 | | | — | | | | 25,068 | |
| Class C | | | 3,746,973 | | | | 2,447,185 | |
| Class I | | | 155,732,308 | | | | 309,658,818 | |
| Class R | | | 7,344 | | | | 8,009 | |
| Class R61 | | | 8,750,632 | | | | 14,308,462 | |
| Class Y | | | 29,289 | | | | 21,400 | |
| |
| Net asset value of shares issued upon reinvestment of dividends and distributions: | | | | | | | | |
| Class A | | | 64,090,801 | | | | 40,195,932 | |
| Class B2 | | | — | | | | 1,790 | |
| Class C | | | 1,293,492 | | | | 636,546 | |
| Class I | | | 134,063,974 | | | | 96,353,876 | |
| Class R | | | 3,635 | | | | 1,273 | |
| Class R61 | | | 11,441,895 | | | | 14,155,158 | |
| Class Y | | | 16,110 | | | | 6,199 | |
| | | | 439,520,774 | | | | 535,669,966 | |
| Cost of shares redeemed: | | | | | | | | |
| Class A | | | (120,780,702 | ) | | | (72,601,019 | ) |
| Class B2 | | | — | | | | (634,954 | ) |
| Class C | | | (3,662,866 | ) | | | (4,131,977 | ) |
| Class I | | | (705,769,539 | ) | | | (346,062,110 | ) |
| Class R | | | (57 | ) | | | (393,937 | ) |
| Class R61 | | | (127,494,556 | ) | | | (57,384,835 | ) |
| Class Y | | | (41,516 | ) | | | (53,436 | ) |
| | | | (957,749,236 | ) | | | (481,262,268 | ) |
| Increase (decrease) in net assets derived from capital share transactions | | | (518,228,462 | ) | | | 54,407,698 | |
| Net Increase (Decrease) in Net Assets | | | (802,154,812 | ) | | | 135,714,143 | |
| | | Delaware Ivy | |
| | | Value Fund | |
| | | Year ended | |
| | | 3/31/23 | | | 3/31/22 | |
| |
| Net Assets: | | | | | | | | |
| Beginning of year | | $ | 1,477,803,761 | | | $ | 1,342,089,618 | |
| End of year | | $ | 675,648,949 | | | $ | 1,477,803,761 | |
| 1 | Effective July 1, 2021, Class N shares were renamed Class R6 shares. |
| 2 | On December 10, 2021, all Class B shares were converted into Class A shares. These transactions are included as subscriptions of Class A shares and redemptions of Class B shares in the tables above and on the previous page. |
See accompanying notes, which are an integral part of the financial statements.
Financial highlights
Delaware Global Value Equity Fund Class A
Selected data for each share of the Fund outstanding throughout each period were as follows:
| | | Year ended | |
| | | 3/31/23 | | | 3/31/22 | | | 3/31/21 | | | 3/31/20 | | | 3/31/19 | |
| Net asset value, beginning of period | | $ | 12.72 | | | $ | 13.72 | | | $ | 9.64 | | | $ | 11.90 | | | $ | 13.84 | |
| |
| Income (loss) from investment operations: | | | | | | | | | | | | | | | | | | | | |
| Net investment income1 | | | 0.13 | | | | 0.20 | | | | 0.26 | | | | 0.29 | | | | 0.29 | |
| Net realized and unrealized gain (loss) | | | 0.12 | | | | (0.07 | ) | | | 4.23 | | | | (2.13 | ) | | | (0.34 | ) |
| Total from investment operations | | | 0.25 | | | | 0.13 | | | | 4.49 | | | | (1.84 | ) | | | (0.05 | ) |
| |
| Less dividends and distributions from: | | | | | | | | | | | | | | | | | | | | |
| Net investment income | | | (0.11 | ) | | | (0.42 | ) | | | (0.23 | ) | | | (0.30 | ) | | | (0.32 | ) |
| Net realized gain | | | (4.80 | ) | | | (0.71 | ) | | | (0.18 | ) | | | (0.12 | ) | | | (1.57 | ) |
| Total dividends and distributions | | | (4.91 | ) | | | (1.13 | ) | | | (0.41 | ) | | | (0.42 | ) | | | (1.89 | ) |
| |
| Net asset value, end of period | | $ | 8.06 | | | $ | 12.72 | | | $ | 13.72 | | | $ | 9.64 | | | $ | 11.90 | |
| |
| Total return2 | | | 5.75 | %3 | | | 0.51 | %3 | | | 47.07 | %3 | | | (16.11 | )%3 | | | 0.47 | % |
| |
| Ratios and supplemental data: | | | | | | | | | | | | | | | | | | | | |
| Net assets, end of period (000 omitted) | | $ | 197,879 | | | $ | 263,835 | | | $ | 310 | 4 | | $ | 260 | 4 | | $ | 387 | 4 |
| Ratio of expenses to average net assets5 | | | 1.19 | % | | | 1.22 | % | | | 1.22 | % | | | 1.24 | % | | | 1.24 | % |
| Ratio of expenses to average net assets prior to fees waived5 | | | 1.33 | % | | | 1.25 | % | | | 1.24 | % | | | 1.25 | % | | | 1.24 | % |
| Ratio of net investment income to average net assets | | | 1.25 | % | | | 1.41 | % | | | 2.16 | % | | | 2.43 | % | | | 2.27 | % |
| Ratio of net investment income to average net assets prior to fees waived | | | 1.11 | % | | | 1.38 | % | | | 2.14 | % | | | 2.42 | % | | | 2.27 | % |
| Portfolio turnover | | | 25 | % | | | 111 | % | | | 39 | % | | | 43 | % | | | 28 | % |
| 1 | Calculated using average shares outstanding. |
| 2 | Total return is based on the change in net asset value of a share during the period and assumes reinvestment of dividends and distributions at net asset value and does not reflect the impact of a sales charge. |
| 3 | Total return during the period reflects waivers by the manager and/or distributor. Performance would have been lower had the waivers not been in effect. |
| 4 | Net assets reported in millions. |
| 5 | Expense ratios do not include expenses of any investment companies in which the Fund invests. |
See accompanying notes, which are an integral part of the financial statements.
Delaware Global Value Equity Fund Class C
Selected data for each share of the Fund outstanding throughout each period were as follows:
| | | Year ended | |
| | | 3/31/23 | | | 3/31/22 | | | 3/31/21 | | | 3/31/20 | | | 3/31/19 | |
| Net asset value, beginning of period | | $ | 12.69 | | | $ | 13.72 | | | $ | 9.64 | | | $ | 11.90 | | | $ | 13.82 | |
| |
| Income (loss) from investment operations: | | | | | | | | | | | | | | | | | | | | |
| Net investment income1 | | | 0.05 | | | | 0.09 | | | | 0.16 | | | | 0.21 | | | | 0.21 | |
| Net realized and unrealized gain (loss) | | | 0.11 | | | | (0.08 | ) | | | 4.23 | | | | (2.13 | ) | | | (0.35 | ) |
| Total from investment operations | | | 0.16 | | | | 0.01 | | | | 4.39 | | | | (1.92 | ) | | | (0.14 | ) |
| |
| Less dividends and distributions from: | | | | | | | | | | | | | | | | | | | | |
| Net investment income | | | (0.07 | ) | | | (0.33 | ) | | | (0.13 | ) | | | (0.22 | ) | | | (0.21 | ) |
| Net realized gain | | | (4.80 | ) | | | (0.71 | ) | | | (0.18 | ) | | | (0.12 | ) | | | (1.57 | ) |
| Total dividends and distributions | | | (4.87 | ) | | | (1.04 | ) | | | (0.31 | ) | | | (0.34 | ) | | | (1.78 | ) |
| |
| Net asset value, end of period | | $ | 7.98 | | | $ | 12.69 | | | $ | 13.72 | | | $ | 9.64 | | | $ | 11.90 | |
| |
| Total return2 | | | 4.84 | %3 | | | (0.32 | )% | | | 45.88 | % | | | (16.75 | )% | | | (0.21 | )% |
| |
| Ratios and supplemental data: | | | | | | | | | | | | | | | | | | | | |
| Net assets, end of period (000 omitted) | | $ | 2,384 | | | $ | 4,780 | | | $ | 7 | 4 | | $ | 10 | 4 | | $ | 22 | 4 |
| Ratio of expenses to average net assets5 | | | 2.04 | % | | | 2.04 | % | | | 2.03 | % | | | 2.00 | % | | | 1.94 | % |
| Ratio of expenses to average net assets prior to fees waived5 | | | 2.27 | % | | | 2.04 | % | | | 2.03 | % | | | 2.00 | % | | | 1.94 | % |
| Ratio of net investment income to average net assets | | | 0.44 | % | | | 0.64 | % | | | 1.34 | % | | | 1.76 | % | | | 1.64 | % |
| Ratio of net investment income to average net assets prior to fees waived | | | 0.21 | % | | | 0.64 | % | | | 1.34 | % | | | 1.76 | % | | | 1.64 | % |
| Portfolio turnover | | | 25 | % | | | 111 | % | | | 39 | % | | | 43 | % | | | 28 | % |
| 1 | Calculated using average shares outstanding. |
| 2 | Total return is based on the change in net asset value of a share during the period and assumes reinvestment of dividends and distributions at net asset value and does not reflect the impact of a sales charge. |
| 3 | Total return during the period reflects waivers by the manager and/or distributor. Performance would have been lower had the waivers not been in effect. |
| 4 | Net assets reported in millions. |
| 5 | Expense ratios do not include expenses of any investment companies in which the Fund invests. |
See accompanying notes, which are an integral part of the financial statements.
Financial highlights
Delaware Global Value Equity Fund Class I
Selected data for each share of the Fund outstanding throughout each period were as follows:
| | | Year ended | |
| | | 3/31/23 | | | 3/31/22 | | | 3/31/21 | | | 3/31/20 | | | 3/31/19 | |
| Net asset value, beginning of period | | $ | 12.74 | | | $ | 13.73 | | | $ | 9.64 | | | $ | 11.91 | | | $ | 13.85 | |
| |
| Income (loss) from investment operations: | | | | | | | | | | | | | | | | | | | | |
| Net investment income1 | | | 0.16 | | | | 0.24 | | | | 0.29 | | | | 0.33 | | | | 0.34 | |
| Net realized and unrealized gain (loss) | | | 0.12 | | | | (0.07 | ) | | | 4.24 | | | | (2.14 | ) | | | (0.35 | ) |
| Total from investment operations | | | 0.28 | | | | 0.17 | | | | 4.53 | | | | (1.81 | ) | | | (0.01 | ) |
| |
| Less dividends and distributions from: | | | | | | | | | | | | | | | | | | | | |
| Net investment income | | | (0.13 | ) | | | (0.45 | ) | | | (0.26 | ) | | | (0.34 | ) | | | (0.36 | ) |
| Net realized gain | | | (4.80 | ) | | | (0.71 | ) | | | (0.18 | ) | | | (0.12 | ) | | | (1.57 | ) |
| Total dividends and distributions | | | (4.93 | ) | | | (1.16 | ) | | | (0.44 | ) | | | (0.46 | ) | | | (1.93 | ) |
| |
| Net asset value, end of period | | $ | 8.09 | | | $ | 12.74 | | | $ | 13.73 | | | $ | 9.64 | | | $ | 11.91 | |
| |
| Total return2 | | | 5.99 | % | | | 0.81 | % | | | 47.60 | % | | | (15.90 | )% | | | 0.78 | % |
| |
| Ratios and supplemental data: | | | | | | | | | | | | | | | | | | | | |
| Net assets, end of period (000 omitted) | | $ | 117,590 | | | $ | 205,264 | | | $ | 268 | 3 | | $ | 242 | 3 | | $ | 374 | 3 |
| Ratio of expenses to average net assets4 | | | 0.92 | % | | | 0.92 | % | | | 0.92 | % | | | 0.92 | % | | | 0.93 | % |
| Ratio of expenses to average net assets prior to fees waived4 | | | 0.93 | % | | | 0.94 | % | | | 0.95 | % | | | 0.95 | % | | | 0.95 | % |
| Ratio of net investment income to average net assets | | | 1.58 | % | | | 1.72 | % | | | 2.46 | % | | | 2.76 | % | | | 2.58 | % |
| Ratio of net investment income to average net assets prior to fees waived | | | 1.57 | % | | | 1.70 | % | | | 2.43 | % | | | 2.73 | % | | | 2.56 | % |
| Portfolio turnover | | | 25 | % | | | 111 | % | | | 39 | % | | | 43 | % | | | 28 | % |
| 1 | Calculated using average shares outstanding. |
| 2 | Total return is based on the change in net asset value of a share during the period and assumes reinvestment of dividends and distributions at net asset value. Total return during the period reflects waivers by the manager and/or distributor. Performance would have been lower had the waivers not been in effect. |
| 3 | Net assets reported in millions. |
| 4 | Expense ratios do not include expenses of any investment companies in which the Fund invests. |
See accompanying notes, which are an integral part of the financial statements.
Delaware Global Value Equity Fund Class R
Selected data for each share of the Fund outstanding throughout each period were as follows:
| | | Year ended | |
| | | 3/31/23 | | | 3/31/22 | | | 3/31/21 | | | 3/31/20 | | | 3/31/19 | |
| Net asset value, beginning of period | | $ | 12.72 | | | $ | 13.73 | | | $ | 9.65 | | | $ | 11.91 | | | $ | 13.84 | |
| |
| Income (loss) from investment operations: | | | | | | | | | | | | | | | | | | | | |
| Net investment income1 | | | 0.10 | | | | 0.15 | | | | 0.22 | | | | 0.26 | | | | 0.25 | |
| Net realized and unrealized gain (loss) | | | 0.12 | | | | (0.07 | ) | | | 4.23 | | | | (2.13 | ) | | | (0.33 | ) |
| Total from investment operations | | | 0.22 | | | | 0.08 | | | | 4.45 | | | | (1.87 | ) | | | (0.08 | ) |
| |
| Less dividends and distributions from: | | | | | | | | | | | | | | | | | | | | |
| Net investment income | | | (0.10 | ) | | | (0.38 | ) | | | (0.19 | ) | | | (0.27 | ) | | | (0.28 | ) |
| Net realized gain | | | (4.80 | ) | | | (0.71 | ) | | | (0.18 | ) | | | (0.12 | ) | | | (1.57 | ) |
| Total dividends and distributions | | | (4.90 | ) | | | (1.09 | ) | | | (0.37 | ) | | | (0.39 | ) | | | (1.85 | ) |
| |
| Net asset value, end of period | | $ | 8.04 | | | $ | 12.72 | | | $ | 13.73 | | | $ | 9.65 | | | $ | 11.91 | |
| |
| Total return2 | | | 5.37 | %3 | | | 0.18 | % | | | 46.59 | % | | | (16.36 | )% | | | 0.22 | % |
| |
| Ratios and supplemental data: | | | | | | | | | | | | | | | | | | | | |
| Net assets, end of period (000 omitted) | | $ | 232 | | | $ | 308 | 4 | | $ | — | 4,5 | | $ | 1 | 5 | | $ | 1 | 5 |
| Ratio of expenses to average net assets6 | | | 1.47 | % | | | 1.54 | % | | | 1.54 | % | | | 1.53 | % | | | 1.52 | % |
| Ratio of expenses to average net assets prior to fees waived6 | | | 1.48 | % | | | 1.54 | % | | | 1.54 | % | | | 1.53 | % | | | 1.52 | % |
| Ratio of net investment income to average net assets | | | 0.92 | % | | | 1.09 | % | | | 1.89 | % | | | 2.14 | % | | | 1.97 | % |
| Ratio of net investment income to average net assets prior to fees waived | | | 0.91 | % | | | 1.09 | % | | | 1.89 | % | | | 2.14 | % | | | 1.97 | % |
| Portfolio turnover | | | 25 | % | | | 111 | % | | | 39 | % | | | 43 | % | | | 28 | % |
| 1 | Calculated using average shares outstanding. |
| 2 | Total return is based on the change in net asset value of a share during the period and assumes reinvestment of dividends and distributions at net asset value. |
| 3 | Total return during the period reflects waivers by the manager and/or distributor. Performance would have been lower had the waivers not been in effect. |
| 4 | Rounds to less than $500 thousands. |
| 5 | Net assets reported in millions. |
| 6 | Expense ratios do not include expenses of any investment companies in which the Fund invests. |
See accompanying notes, which are an integral part of the financial statements.
Financial highlights
Delaware Global Value Equity Fund Class R6
Selected data for each share of the Fund outstanding throughout each period were as follows:
| | | Year ended | |
| | | 3/31/23 | | | 3/31/22 | | | 3/31/21 | | | 3/31/20 | | | 3/31/19 | |
| Net asset value, beginning of period | | $ | 12.76 | | | $ | 13.74 | | | $ | 9.65 | | | $ | 11.92 | | | $ | 13.86 | |
| |
| Income (loss) from investment operations: | | | | | | | | | | | | | | | | | | | | |
| Net investment income1 | | | 0.19 | | | | 0.26 | | | | 0.30 | | | | 0.35 | | | | 0.30 | |
| Net realized and unrealized gain (loss) | | | 0.10 | | | | (0.06 | ) | | | 4.24 | | | | (2.14 | ) | | | (0.29 | ) |
| Total from investment operations | | | 0.29 | | | | 0.20 | | | | 4.54 | | | | (1.79 | ) | | | 0.01 | |
| |
| Less dividends and distributions from: | | | | | | | | | | | | | | | | | | | | |
| Net investment income | | | (0.13 | ) | | | (0.47 | ) | | | (0.27 | ) | | | (0.36 | ) | | | (0.38 | ) |
| Net realized gain | | | (4.80 | ) | | | (0.71 | ) | | | (0.18 | ) | | | (0.12 | ) | | | (1.57 | ) |
| Total dividends and distributions | | | (4.93 | ) | | | (1.18 | ) | | | (0.45 | ) | | | (0.48 | ) | | | (1.95 | ) |
| |
| Net asset value, end of period | | $ | 8.12 | | | $ | 12.76 | | | $ | 13.74 | | | $ | 9.65 | | | $ | 11.92 | |
| |
| Total return2 | | | 6.09 | % | | | 0.99 | % | | | 47.70 | % | | | (15.76 | )% | | | 0.93 | % |
| |
| Ratios and supplemental data: | | | | | | | | | | | | | | | | | | | | |
| Net assets, end of period (000 omitted) | | $ | 1,130 | | | $ | 14,281 | | | $ | 24 | 3 | | $ | 17 | 3 | | $ | 22 | 3 |
| Ratio of expenses to average net assets4 | | | 0.83 | % | | | 0.79 | % | | | 0.79 | % | | | 0.79 | % | | | 0.78 | % |
| Ratio of net investment income to average net assets | | | 1.68 | % | | | 1.90 | % | | | 2.54 | % | | | 2.87 | % | | | 2.40 | % |
| Portfolio turnover | | | 25 | % | | | 111 | % | | | 39 | % | | | 43 | % | | | 28 | % |
| 1 | Calculated using average shares outstanding. |
| 2 | Total return is based on the change in net asset value of a share during the period and assumes reinvestment of dividends and distributions at net asset value. |
| 3 | Net assets reported in millions. |
| 4 | Expense ratios do not include expenses of any investment companies in which the Fund invests. |
See accompanying notes, which are an integral part of the financial statements.
Delaware Global Value Equity Fund Class Y
Selected data for each share of the Fund outstanding throughout each period were as follows:
| | | Year ended | |
| | | 3/31/23 | | | 3/31/22 | | | 3/31/21 | | | 3/31/20 | | | 3/31/19 | |
| Net asset value, beginning of period | | $ | 12.72 | | | $ | 13.72 | | | $ | 9.64 | | | $ | 11.90 | | | $ | 13.84 | |
| |
| Income (loss) from investment operations: | | | | | | | | | | | | | | | | | | | | |
| Net investment income1 | | | 0.13 | | | | 0.20 | | | | 0.26 | | | | 0.30 | | | | 0.30 | |
| Net realized and unrealized gain (loss) | | | 0.12 | | | | (0.07 | ) | | | 4.23 | | | | (2.13 | ) | | | (0.34 | ) |
| Total from investment operations | | | 0.25 | | | | 0.13 | | | | 4.49 | | | | (1.83 | ) | | | (0.04 | ) |
| |
| Less dividends and distributions from: | | | | | | | | | | | | | | | | | | | | |
| Net investment income | | | (0.11 | ) | | | (0.42 | ) | | | (0.23 | ) | | | (0.31 | ) | | | (0.33 | ) |
| Net realized gain | | | (4.80 | ) | | | (0.71 | ) | | | (0.18 | ) | | | (0.12 | ) | | | (1.57 | ) |
| Total dividends and distributions | | | (4.91 | ) | | | (1.13 | ) | | | (0.41 | ) | | | (0.43 | ) | | | (1.90 | ) |
| |
| Net asset value, end of period | | $ | 8.06 | | | $ | 12.72 | | | $ | 13.72 | | | $ | 9.64 | | | $ | 11.90 | |
| |
| Total return2 | | | 5.74 | %3 | | | 0.53 | % | | | 47.11 | % | | | (16.06 | )% | | | 0.49 | % |
| |
| Ratios and supplemental data: | | | | | | | | | | | | | | | | | | | | |
| Net assets, end of period (000 omitted) | | $ | 1,409 | | | $ | 1,612 | | | $ | 2 | 4 | | $ | 5 | 4 | | $ | 7 | 4 |
| Ratio of expenses to average net assets5 | | | 1.18 | % | | | 1.18 | % | | | 1.18 | % | | | 1.19 | % | | | 1.21 | %6 |
| Ratio of expenses to average net assets prior to fees waived5 | | | 1.19 | % | | | 1.18 | % | | | 1.18 | % | | | 1.19 | % | | | 1.21 | %6 |
| Ratio of net investment income to average net assets | | | 1.26 | % | | | 1.45 | % | | | 2.25 | % | | | 2.49 | % | | | 2.30 | % |
| Ratio of net investment income to average net assets prior to fees waived | | | 1.25 | % | | | 1.45 | % | | | 2.25 | % | | | 2.49 | % | | | 2.30 | % |
| Portfolio turnover | | | 25 | % | | | 111 | % | | | 39 | % | | | 43 | % | | | 28 | % |
| 1 | Calculated using average shares outstanding. |
| 2 | Total return is based on the change in net asset value of a share during the period and assumes reinvestment of dividends and distributions at net asset value. |
| 3 | Total return during the period reflects waivers by the manager and/or distributor. Performance would have been lower had the waivers not been in effect. |
| 4 | Net assets reported in millions. |
| 5 | Expense ratios do not include expenses of any investment companies in which the Fund invests. |
| 6 | Expense ratio based on the period excluding reorganization expenses was 1.19%. |
See accompanying notes, which are an integral part of the financial statements.
Financial highlights
Delaware Ivy Core Bond Fund Class A
Selected data for each share of the Fund outstanding throughout each period were as follows:
| | | Year ended | |
| | | 3/31/23 | | | 3/31/22 | | | 3/31/21 | | | 3/31/20 | | | 3/31/19 | |
| Net asset value, beginning of period | | $ | 10.15 | | | $ | 10.79 | | | $ | 10.49 | | | $ | 10.66 | | | $ | 10.57 | |
| |
| Income (loss) from investment operations: | | | | | | | | | | | | | | | | | | | | |
| Net investment income1 | | | 0.30 | | | | 0.18 | | | | 0.20 | | | | 0.27 | | | | 0.32 | |
| Net realized and unrealized gain (loss) | | | (0.80 | ) | | | (0.59 | ) | | | 0.57 | | | | (0.07 | ) | | | 0.09 | |
| Total from investment operations | | | (0.50 | ) | | | (0.41 | ) | | | 0.77 | | | | 0.20 | | | | 0.41 | |
| |
| Less dividends and distributions from: | | | | | | | | | | | | | | | | | | | | |
| Net investment income | | | (0.31 | ) | | | (0.20 | ) | | | (0.22 | ) | | | (0.28 | ) | | | (0.32 | ) |
| Net realized gain | | | — | | | | (0.03 | ) | | | (0.25 | ) | | | (0.09 | ) | | | — | |
| Total dividends and distributions | | | (0.31 | ) | | | (0.23 | ) | | | (0.47 | ) | | | (0.37 | ) | | | (0.32 | ) |
| |
| Net asset value, end of period | | $ | 9.34 | | | $ | 10.15 | | | $ | 10.79 | | | $ | 10.49 | | | $ | 10.66 | |
| |
| Total return2 | | | (4.91 | )% | | | (3.95 | )% | | | 7.32 | % | | | 1.79 | % | | | 3.96 | % |
| |
| Ratios and supplemental data: | | | | | | | | | | | | | | | | | | | | |
| Net assets, end of period (000 omitted) | | $ | 135,039 | | | $ | 177,936 | | | $ | 219 | 3 | | $ | 199 | 3 | | $ | 177 | 3 |
| Ratio of expenses to average net assets4 | | | 0.78 | % | | | 0.86 | % | | | 0.87 | % | | | 1.00 | % | | | 1.02 | % |
| Ratio of expenses to average net assets prior to fees waived4 | | | 1.09 | % | | | 0.98 | % | | | 0.97 | % | | | 1.02 | % | | | 1.05 | % |
| Ratio of net investment income to average net assets | | | 3.12 | % | | | 1.65 | % | | | 1.77 | % | | | 2.48 | % | | | 2.95 | % |
| Ratio of net investment income to average net assets prior to fees waived | | | 2.81 | % | | | 1.53 | % | | | 1.67 | % | | | 2.46 | % | | | 2.92 | % |
| Portfolio turnover | | | 128 | % | | | 86 | % | | | 98 | % | | | 118 | % | | | 91 | % |
| 1 | Calculated using average shares outstanding. |
| 2 | Total return is based on the change in net asset value of a share during the period and assumes reinvestment of dividends and distributions at net asset value and does not reflect the impact of a sales charge. Total return during the period reflects waivers by the manager and/or distributor. Performance would have been lower had the waivers not been in effect. |
| 3 | Net assets reported in millions. |
| 4 | Expense ratios do not include expenses of any investment companies in which the Fund invests. |
See accompanying notes, which are an integral part of the financial statements.
Delaware Ivy Core Bond Fund Class C
Selected data for each share of the Fund outstanding throughout each period were as follows:
| | | Year ended | |
| | | 3/31/23 | | | 3/31/22 | | | 3/31/21 | | | 3/31/20 | | | 3/31/19 | |
| Net asset value, beginning of period | | $ | 10.15 | | | $ | 10.79 | | | $ | 10.49 | | | $ | 10.66 | | | $ | 10.57 | |
| |
| Income (loss) from investment operations: | | | | | | | | | | | | | | | | | | | | |
| Net investment income1 | | | 0.21 | | | | 0.09 | | | | 0.11 | | | | 0.19 | | | | 0.25 | |
| Net realized and unrealized gain (loss) | | | (0.79 | ) | | | (0.59 | ) | | | 0.58 | | | | (0.07 | ) | | | 0.09 | |
| Total from investment operations | | | (0.58 | ) | | | (0.50 | ) | | | 0.69 | | | | 0.12 | | | | 0.34 | |
| |
| Less dividends and distributions from: | | | | | | | | | | | | | | | | | | | | |
| Net investment income | | | (0.23 | ) | | | (0.11 | ) | | | (0.14 | ) | | | (0.20 | ) | | | (0.25 | ) |
| Net realized gain | | | — | | | | (0.03 | ) | | | (0.25 | ) | | | (0.09 | ) | | | — | |
| Total dividends and distributions | | | (0.23 | ) | | | (0.14 | ) | | | (0.39 | ) | | | (0.29 | ) | | | (0.25 | ) |
| |
| Net asset value, end of period | | $ | 9.34 | | | $ | 10.15 | | | $ | 10.79 | | | $ | 10.49 | | | $ | 10.66 | |
| |
| Total return2 | | | (5.69 | )% | | | (4.71 | )% | | | 6.50 | % | | | 1.02 | % | | | 3.25 | % |
| |
| Ratios and supplemental data: | | | | | | | | | | | | | | | | | | | | |
| Net assets, end of period (000 omitted) | | $ | 4,022 | | | $ | 6,362 | | | $ | 11 | 3 | | $ | 14 | 3 | | $ | 13 | 3 |
| Ratio of expenses to average net assets4 | | | 1.61 | % | | | 1.66 | % | | | 1.64 | % | | | 1.75 | % | | | 1.71 | % |
| Ratio of expenses to average net assets prior to fees waived4 | | | 2.02 | % | | | 1.76 | % | | | 1.74 | % | | | 1.77 | % | | | 1.74 | % |
| Ratio of net investment income to average net assets | | | 2.27 | % | | | 0.85 | % | | | 1.01 | % | | | 1.73 | % | | | 2.26 | % |
| Ratio of net investment income to average net assets prior to fees waived | | | 1.86 | % | | | 0.75 | % | | | 0.91 | % | | | 1.71 | % | | | 2.23 | % |
| Portfolio turnover | | | 128 | % | | | 86 | % | | | 98 | % | | | 118 | % | | | 91 | % |
| 1 | Calculated using average shares outstanding. |
| 2 | Total return is based on the change in net asset value of a share during the period and assumes reinvestment of dividends and distributions at net asset value and does not reflect the impact of a sales charge. Total return during the period reflects waivers by the manager and/or distributor. Performance would have been lower had the waivers not been in effect. |
| 3 | Net assets reported in millions. |
| 4 | Expense ratios do not include expenses of any investment companies in which the Fund invests. |
See accompanying notes, which are an integral part of the financial statements.
Financial highlights
Delaware Ivy Core Bond Fund Class I
Selected data for each share of the Fund outstanding throughout each period were as follows:
| | | Year ended | |
| | | 3/31/23 | | | 3/31/22 | | | 3/31/21 | | | 3/31/20 | | | 3/31/19 | |
| Net asset value, beginning of period | | $ | 10.15 | | | $ | 10.79 | | | $ | 10.49 | | | $ | 10.66 | | | $ | 10.57 | |
| |
| Income (loss) from investment operations: | | | | | | | | | | | | | | | | | | | | |
| Net investment income1 | | | 0.32 | | | | 0.22 | | | | 0.24 | | | | 0.32 | | | | 0.37 | |
| Net realized and unrealized gain (loss) | | | (0.79 | ) | | | (0.59 | ) | | | 0.58 | | | | (0.07 | ) | | | 0.09 | |
| Total from investment operations | | | (0.47 | ) | | | (0.37 | ) | | | 0.82 | | | | 0.25 | | | | 0.46 | |
| |
| Less dividends and distributions from: | | | | | | | | | | | | | | | | | | | | |
| Net investment income | | | (0.34 | ) | | | (0.24 | ) | | | (0.27 | ) | | | (0.33 | ) | | | (0.37 | ) |
| Net realized gain | | | — | | | | (0.03 | ) | | | (0.25 | ) | | | (0.09 | ) | | | — | |
| Total dividends and distributions | | | (0.34 | ) | | | (0.27 | ) | | | (0.52 | ) | | | (0.42 | ) | | | (0.37 | ) |
| |
| Net asset value, end of period | | $ | 9.34 | | | $ | 10.15 | | | $ | 10.79 | | | $ | 10.49 | | | $ | 10.66 | |
| |
| Total return2 | | | (4.61 | )% | | | (3.55 | )% | | | 7.77 | % | | | 2.25 | % | | | 4.46 | % |
| |
| Ratios and supplemental data: | | | | | | | | | | | | | | | | | | | | |
| Net assets, end of period (000 omitted) | | $ | 250,769 | | | $ | 493,000 | | | $ | 772 | 3 | | $ | 742 | 3 | | $ | 586 | 3 |
| Ratio of expenses to average net assets4 | | | 0.45 | % | | | 0.45 | % | | | 0.45 | % | | | 0.54 | % | | | 0.54 | % |
| Ratio of expenses to average net assets prior to fees waived4 | | | 0.64 | % | | | 0.71 | % | | | 0.72 | % | | | 0.73 | % | | | 0.74 | % |
| Ratio of net investment income to average net assets | | | 3.37 | % | | | 2.06 | % | | | 2.20 | % | | | 2.93 | % | | | 3.43 | % |
| Ratio of net investment income to average net assets prior to fees waived | | | 3.18 | % | | | 1.80 | % | | | 1.93 | % | | | 2.74 | % | | | 3.23 | % |
| Portfolio turnover | | | 128 | % | | | 86 | % | | | 98 | % | | | 118 | % | | | 91 | % |
| 1 | Calculated using average shares outstanding. |
| 2 | Total return is based on the change in net asset value of a share during the period and assumes reinvestment of dividends and distributions at net asset value. Total return during the period reflects waivers by the manager and/or distributor. Performance would have been lower had the waivers not been in effect. |
| 3 | Net assets reported in millions. |
| 4 | Expense ratios do not include expenses of any investment companies in which the Fund invests. |
See accompanying notes, which are an integral part of the financial statements.
Delaware Ivy Core Bond Fund Class R
Selected data for each share of the Fund outstanding throughout each period were as follows:
| | | Year ended |
| | | 3/31/23 | | | 3/31/22 | | | 3/31/21 | | | 3/31/20 | | | 3/31/19 | |
| Net asset value, beginning of period | | $ | 10.15 | | | $ | 10.79 | | | $ | 10.49 | | | $ | 10.66 | | | $ | 10.57 | |
| |
| Income (loss) from investment operations: | | | | | | | | | | | | | | | | | | | | |
| Net investment income1 | | | 0.28 | | | | 0.14 | | | | 0.16 | | | | 0.24 | | | | 0.29 | |
| Net realized and unrealized gain (loss) | | | (0.81 | ) | | | (0.59 | ) | | | 0.57 | | | | (0.07 | ) | | | 0.09 | |
| Total from investment operations | | | (0.53 | ) | | | (0.45 | ) | | | 0.73 | | | | 0.17 | | | | 0.38 | |
| |
| Less dividends and distributions from: | | | | | | | | | | | | | | | | | | | | |
| Net investment income | | | (0.28 | ) | | | (0.16 | ) | | | (0.18 | ) | | | (0.25 | ) | | | (0.29 | ) |
| Net realized gain | | | — | | | | (0.03 | ) | | | (0.25 | ) | | | (0.09 | ) | | | — | |
| Total dividends and distributions | | | (0.28 | ) | | | (0.19 | ) | | | (0.43 | ) | | | (0.34 | ) | | | (0.29 | ) |
| |
| Net asset value, end of period | | $ | 9.34 | | | $ | 10.15 | | | $ | 10.79 | | | $ | 10.49 | | | $ | 10.66 | |
| |
| Total return2 | | | (5.17 | )% | | | (4.28 | )% | | | 6.97 | % | | | 1.48 | % | | | 3.67 | % |
| |
| Ratios and supplemental data: | | | | | | | | | | | | | | | | | | | | |
| Net assets, end of period (000 omitted) | | $ | 891 | | | $ | 863 | | | $ | 1 | 3 | | $ | 1 | 3 | | $ | 1 | 3 |
| Ratio of expenses to average net assets4 | | | 1.03 | % | | | 1.21 | % | | | 1.20 | % | | | 1.30 | % | | | 1.30 | % |
| Ratio of expenses to average net assets prior to fees waived4 | | | 1.20 | % | | | 1.34 | % | | | 1.30 | % | | | 1.32 | % | | | 1.33 | % |
| Ratio of net investment income to average net assets | | | 2.95 | % | | | 1.30 | % | | | 1.46 | % | | | 2.18 | % | | | 2.67 | % |
| Ratio of net investment income to average net assets prior to fees waived | | | 2.78 | % | | | 1.17 | % | | | 1.36 | % | | | 2.16 | % | | | 2.64 | % |
| Portfolio turnover | | | 128 | % | | | 86 | % | | | 98 | % | | | 118 | % | | | 91 | % |
| 1 | Calculated using average shares outstanding. |
| 2 | Total return is based on the change in net asset value of a share during the period and assumes reinvestment of dividends and distributions at net asset value. Total return during the period reflects waivers by the manager and/or distributor. Performance would have been lower had the waivers not been in effect. |
| 3 | Net assets reported in millions. |
| 4 | Expense ratios do not include expenses of any investment companies in which the Fund invests. |
See accompanying notes, which are an integral part of the financial statements.
Financial highlights
Delaware Ivy Core Bond Fund Class R6
Selected data for each share of the Fund outstanding throughout each period were as follows:
| | | Year ended | |
| | | 3/31/23 | | | 3/31/22 | | | 3/31/21 | | | 3/31/20 | | | 3/31/19 | |
| Net asset value, beginning of period | | $ | 10.15 | | | $ | 10.79 | | | $ | 10.49 | | | $ | 10.66 | | | $ | 10.57 | |
| |
| Income (loss) from investment operations: | | | | | | | | | | | | | | | | | | | | |
| Net investment income1 | | | 0.32 | | | | 0.22 | | | | 0.24 | | | | 0.32 | | | | 0.37 | |
| Net realized and unrealized gain (loss) | | | (0.79 | ) | | | (0.59 | ) | | | 0.58 | | | | (0.07 | ) | | | 0.09 | |
| Total from investment operations | | | (0.47 | ) | | | (0.37 | ) | | | 0.82 | | | | 0.25 | | | | 0.46 | |
| |
| Less dividends and distributions from: | | | | | | | | | | | | | | | | | | | | |
| Net investment income | | | (0.34 | ) | | | (0.24 | ) | | | (0.27 | ) | | | (0.33 | ) | | | (0.37 | ) |
| Net realized gain | | | — | | | | (0.03 | ) | | | (0.25 | ) | | | (0.09 | ) | | | — | |
| Total dividends and distributions | | | (0.34 | ) | | | (0.27 | ) | | | (0.52 | ) | | | (0.42 | ) | | | (0.37 | ) |
| |
| Net asset value, end of period | | $ | 9.34 | | | $ | 10.15 | | | $ | 10.79 | | | $ | 10.49 | | | $ | 10.66 | |
| |
| Total return2 | | | (4.60 | )% | | | (3.55 | )% | | | 7.77 | % | | | 2.25 | % | | | 4.46 | % |
| |
| Ratios and supplemental data: | | | | | | | | | | | | | | | | | | | | |
| Net assets, end of period (000 omitted) | | $ | 74,458 | | | $ | 147,696 | | | $ | 184 | 3 | | $ | 133 | 3 | | $ | 110 | 3 |
| Ratio of expenses to average net assets4 | | | 0.45 | % | | | 0.45 | % | | | 0.45 | % | | | 0.54 | % | | | 0.54 | % |
| Ratio of expenses to average net assets prior to fees waived4 | | | 0.62 | % | | | 0.58 | % | | | 0.57 | % | | | 0.58 | % | | | 0.58 | % |
| Ratio of net investment income to average net assets | | | 3.35 | % | | | 2.06 | % | | | 2.20 | % | | | 2.94 | % | | | 3.41 | % |
| Ratio of net investment income to average net assets prior to fees waived | | | 3.18 | % | | | 1.93 | % | | | 2.08 | % | | | 2.90 | % | | | 3.37 | % |
| Portfolio turnover | | | 128 | % | | | 86 | % | | | 98 | % | | | 118 | % | | | 91 | % |
| 1 | Calculated using average shares outstanding. |
| 2 | Total return is based on the change in net asset value of a share during the period and assumes reinvestment of dividends and distributions at net asset value. Total return during the period reflects waivers by the manager and/or distributor. Performance would have been lower had the waivers not been in effect. |
| 3 | Net assets reported in millions. |
| 4 | Expense ratios do not include expenses of any investment companies in which the Fund invests. |
See accompanying notes, which are an integral part of the financial statements.
Delaware Ivy Core Bond Fund Class Y
Selected data for each share of the Fund outstanding throughout each period were as follows:
| | | Year ended | |
| | | 3/31/23 | | | 3/31/22 | | | 3/31/21 | | | 3/31/20 | | | 3/31/19 | |
| Net asset value, beginning of period | | $ | 10.15 | | | $ | 10.79 | | | $ | 10.49 | | | $ | 10.66 | | | $ | 10.57 | |
| |
| Income (loss) from investment operations: | | | | | | | | | | | | | | | | | | | | |
| Net investment income1 | | | 0.30 | | | | 0.18 | | | | 0.20 | | | | 0.27 | | | | 0.33 | |
| Net realized and unrealized gain (loss) | | | (0.80 | ) | | | (0.59 | ) | | | 0.57 | | | | (0.07 | ) | | | 0.09 | |
| Total from investment operations | | | (0.50 | ) | | | (0.41 | ) | | | 0.77 | | | | 0.20 | | | | 0.42 | |
| |
| Less dividends and distributions from: | | | | | | | | | | | | | | | | | | | | |
| Net investment income | | | (0.31 | ) | | | (0.20 | ) | | | (0.22 | ) | | | (0.28 | ) | | | (0.33 | ) |
| Net realized gain | | | — | | | | (0.03 | ) | | | (0.25 | ) | | | (0.09 | ) | | | — | |
| Total dividends and distributions | | | (0.31 | ) | | | (0.23 | ) | | | (0.47 | ) | | | (0.37 | ) | | | (0.33 | ) |
| |
| Net asset value, end of period | | $ | 9.34 | | | $ | 10.15 | | | $ | 10.79 | | | $ | 10.49 | | | $ | 10.66 | |
| |
| Total return2 | | | (4.90 | )% | | | (3.94 | )% | | | 7.33 | % | | | 1.82 | % | | | 4.04 | % |
| |
| Ratios and supplemental data: | | | | | | | | | | | | | | | | | | | | |
| Net assets, end of period (000 omitted) | | $ | 4,909 | | | $ | 6,186 | | | $ | 7 | 3 | | $ | 10 | 3 | | $ | 5 | 3 |
| Ratio of expenses to average net assets4 | | | 0.76 | % | | | 0.86 | % | | | 0.87 | % | | | 0.96 | % | | | 0.95 | % |
| Ratio of expenses to average net assets prior to fees waived4 | | | 0.95 | % | | | 0.99 | % | | | 0.97 | % | | | 0.98 | % | | | 0.98 | % |
| Ratio of net investment income to average net assets | | | 3.16 | % | | | 1.65 | % | | | 1.78 | % | | | 2.48 | % | | | 3.03 | % |
| Ratio of net investment income to average net assets prior to fees waived | | | 2.97 | % | | | 1.52 | % | | | 1.68 | % | | | 2.46 | % | | | 3.00 | % |
| Portfolio turnover | | | 128 | % | | | 86 | % | | | 98 | % | | | 118 | % | | | 91 | % |
| 1 | Calculated using average shares outstanding. |
| 2 | Total return is based on the change in net asset value of a share during the period and assumes reinvestment of dividends and distributions at net asset value. Total return during the period reflects waivers by the manager and/or distributor. Performance would have been lower had the waivers not been in effect. |
| 3 | Net assets reported in millions. |
| 4 | Expense ratios do not include expenses of any investment companies in which the Fund invests. |
See accompanying notes, which are an integral part of the financial statements.
Financial highlights
Delaware Ivy Core Equity Fund Class A
Selected data for each share of the Fund outstanding throughout each period were as follows:
| | | Year ended | |
| | | 3/31/23 | | | 3/31/22 | | | 3/31/21 | | | 3/31/20 | | | 3/31/19 | |
| Net asset value, beginning of period | | $ | 18.10 | | | $ | 18.01 | | | $ | 11.73 | | | $ | 13.47 | | | $ | 14.78 | |
| |
| Income (loss) from investment operations: | | | | | | | | | | | | | | | | | | | | |
| Net investment income1 | | | 0.05 | | | | 0.04 | | | | 0.06 | | | | 0.06 | | | | 0.09 | |
| Net realized and unrealized gain (loss) | | | (1.36 | ) | | | 2.56 | | | | 6.65 | | | | (0.29 | ) | | | 0.60 | |
| Total from investment operations | | | (1.31 | ) | | | 2.60 | | | | 6.71 | | | | (0.23 | ) | | | 0.69 | |
| |
| Less dividends and distributions from: | | | | | | | | | | | | | | | | | | | | |
| Net investment income | | | (0.08 | ) | | | (0.09 | ) | | | (0.04 | ) | | | (0.09 | ) | | | (0.09 | ) |
| Net realized gain | | | (2.02 | ) | | | (2.42 | ) | | | (0.39 | ) | | | (1.42 | ) | | | (1.91 | ) |
| Total dividends and distributions | | | (2.10 | ) | | | (2.51 | ) | | | (0.43 | ) | | | (1.51 | ) | | | (2.00 | ) |
| |
| Net asset value, end of period | | $ | 14.69 | | | $ | 18.10 | | | $ | 18.01 | | | $ | 11.73 | | | $ | 13.47 | |
| |
| Total return2 | | | (6.71 | )%3 | | | 13.88 | % | | | 57.58 | % | | | (3.57 | )% | | | 5.56 | % |
| |
| Ratios and supplemental data: | | | | | | | | | | | | | | | | | | | | |
| Net assets, end of period (000 omitted) | | $ | 2,574,630 | | | $ | 3,424,139 | | | $ | 3,411 | 4 | | $ | 2,409 | 4 | | $ | 2,895 | 4 |
| Ratio of expenses to average net assets5 | | | 1.00 | % | | | 0.97 | % | | | 1.00 | % | | | 1.03 | % | | | 1.02 | % |
| Ratio of expenses to average net assets prior to fees waived5 | | | 1.03 | % | | | 0.97 | % | | | 1.00 | % | | | 1.03 | % | | | 1.02 | % |
| Ratio of net investment income to average net assets | | | 0.32 | % | | | 0.19 | % | | | 0.36 | % | | | 0.42 | % | | | 0.64 | % |
| Ratio of net investment income to average net assets prior to fees waived | | | 0.29 | % | | | 0.19 | % | | | 0.36 | % | | | 0.42 | % | | | 0.64 | % |
| Portfolio turnover | | | 37 | % | | | 36 | % | | | 49 | % | | | 66 | % | | | 97 | % |
| 1 | Calculated using average shares outstanding. |
| 2 | Total return is based on the change in net asset value of a share during the period and assumes reinvestment of dividends and distributions at net asset value and does not reflect the impact of a sales charge. |
| 3 | Total return during the period reflects waivers by the manager and/or distributor. Performance would have been lower had the waivers not been in effect. |
| 4 | Net assets reported in millions. |
| 5 | Expense ratios do not include expenses of any investment companies in which the Fund invests. |
See accompanying notes, which are an integral part of the financial statements.
Delaware Ivy Core Equity Fund Class C
Selected data for each share of the Fund outstanding throughout each period were as follows:
| | | Year ended | |
| | | 3/31/23 | | | 3/31/22 | | | 3/31/21 | | | 3/31/20 | | | 3/31/19 | |
| Net asset value, beginning of period | | $ | 14.27 | | | $ | 14.65 | | | $ | 9.63 | | | $ | 11.31 | | | $ | 12.69 | |
| |
| Income (loss) from investment operations: | | | | | | | | | | | | | | | | | | | | |
| Net investment loss1 | | | (0.06 | ) | | | (0.11 | ) | | | (0.06 | ) | | | (0.05 | ) | | | (0.03 | ) |
| Net realized and unrealized gain (loss) | | | (1.10 | ) | | | 2.10 | | | | 5.45 | | | | (0.22 | ) | | | 0.51 | |
| Total from investment operations | | | (1.16 | ) | | | 1.99 | | | | 5.39 | | | | (0.27 | ) | | | 0.48 | |
| |
| Less dividends and distributions from: | | | | | | | | | | | | | | | | | | | | |
| Net investment income | | | — | | | | (0.01 | ) | | | — | | | | (0.01 | ) | | | — | |
| Net realized gain | | | (2.02 | ) | | | (2.36 | ) | | | (0.37 | ) | | | (1.40 | ) | | | (1.86 | ) |
| Total dividends and distributions | | | (2.02 | ) | | | (2.37 | ) | | | (0.37 | ) | | | (1.41 | ) | | | (1.86 | ) |
| |
| Net asset value, end of period | | $ | 11.09 | | | $ | 14.27 | | | $ | 14.65 | | | $ | 9.63 | | | $ | 11.31 | |
| |
| Total return2 | | | (7.48 | )%3 | | | 12.85 | % | | | 56.31 | % | | | (4.44 | )% | | | 4.74 | % |
| |
| Ratios and supplemental data: | | | | | | | | | | | | | | | | | | | | |
| Net assets, end of period (000 omitted) | | $ | 17,253 | | | $ | 27,556 | | | $ | 33 | 4 | | $ | 37 | 4 | | $ | 52 | 4 |
| Ratio of expenses to average net assets5 | | | 1.84 | % | | | 1.85 | % | | | 1.88 | % | | | 1.89 | % | | | 1.85 | % |
| Ratio of expenses to average net assets prior to fees waived5 | | | 1.99 | % | | | 1.85 | % | | | 1.88 | % | | | 1.89 | % | | | 1.85 | % |
| Ratio of net investment loss to average net assets | | | (0.52 | )% | | | (0.70 | )% | | | (0.51 | )% | | | (0.44 | )% | | | (0.20 | )% |
| Ratio of net investment loss to average net assets prior to fees waived | | | (0.67 | )% | | | (0.70 | )% | | | (0.51 | )% | | | (0.44 | )% | | | (0.20 | )% |
| Portfolio turnover | | | 37 | % | | | 36 | % | | | 49 | % | | | 66 | % | | | 97 | % |
| 1 | Calculated using average shares outstanding. |
| 2 | Total return is based on the change in net asset value of a share during the period and assumes reinvestment of dividends and distributions at net asset value and does not reflect the impact of a sales charge. |
| 3 | Total return during the period reflects waivers by the manager and/or distributor. Performance would have been lower had the waivers not been in effect. |
| 4 | Net assets reported in millions. |
| 5 | Expense ratios do not include expenses of any investment companies in which the Fund invests. |
See accompanying notes, which are an integral part of the financial statements.
Financial highlights
Delaware Ivy Core Equity Fund Class I
Selected data for each share of the Fund outstanding throughout each period were as follows:
| | | Year ended | |
| | | 3/31/23 | | | 3/31/22 | | | 3/31/21 | | | 3/31/20 | | | 3/31/19 | |
| Net asset value, beginning of period | | $ | 21.24 | | | $ | 20.77 | | | $ | 13.47 | | | $ | 15.27 | | | $ | 16.48 | |
| |
| Income (loss) from investment operations: | | | | | | | | | | | | | | | | | | | | |
| Net investment income1 | | | 0.10 | | | | 0.08 | | | | 0.10 | | | | 0.10 | | | | 0.14 | |
| Net realized and unrealized gain (loss) | | | (1.57 | ) | | | 2.93 | | | | 7.66 | | | | (0.37 | ) | | | 0.69 | |
| Total from investment operations | | | (1.47 | ) | | | 3.01 | | | | 7.76 | | | | (0.27 | ) | | | 0.83 | |
| |
| Less dividends and distributions from: | | | | | | | | | | | | | | | | | | | | |
| Net investment income | | | (0.08 | ) | | | (0.12 | ) | | | (0.07 | ) | | | (0.11 | ) | | | (0.13 | ) |
| Net realized gain | | | (2.02 | ) | | | (2.42 | ) | | | (0.39 | ) | | | (1.42 | ) | | | (1.91 | ) |
| Total dividends and distributions | | | (2.10 | ) | | | (2.54 | ) | | | (0.46 | ) | | | (1.53 | ) | | | (2.04 | ) |
| |
| Net asset value, end of period | | $ | 17.67 | | | $ | 21.24 | | | $ | 20.77 | | | $ | 13.47 | | | $ | 15.27 | |
| |
| Total return2 | | | (6.46 | )% | | | 14.00 | % | | | 57.92 | % | | | (3.38 | )% | | | 5.84 | % |
| |
| Ratios and supplemental data: | | | | | | | | | | | | | | | | | | | | |
| Net assets, end of period (000 omitted) | | $ | 744,911 | | | $ | 1,070,912 | | | $ | 1,101 | 3 | | $ | 861 | 3 | | $ | 1,089 | 3 |
| Ratio of expenses to average net assets4 | | | 0.78 | % | | | 0.79 | % | | | 0.81 | % | | | 0.83 | % | | | 0.81 | % |
| Ratio of net investment income to average net assets | | | 0.55 | % | | | 0.37 | % | | | 0.55 | % | | | 0.63 | % | | | 0.85 | % |
| Portfolio turnover | | | 37 | % | | | 36 | % | | | 49 | % | | | 66 | % | | | 97 | % |
| 1 | Calculated using average shares outstanding. |
| 2 | Total return is based on the change in net asset value of a share during the period and assumes reinvestment of dividends and distributions at net asset value. |
| 3 | Net assets reported in millions. |
| 4 | Expense ratios do not include expenses of any investment companies in which the Fund invests. |
See accompanying notes, which are an integral part of the financial statements.
Delaware Ivy Core Equity Fund Class R
Selected data for each share of the Fund outstanding throughout each period were as follows:
| | | Year ended | |
| | | 3/31/23 | | | 3/31/22 | | | 3/31/21 | | | 3/31/20 | | | 3/31/19 | |
| Net asset value, beginning of period | | $ | 17.88 | | | $ | 17.82 | | | $ | 11.62 | | | $ | 13.36 | | | $ | 14.67 | |
| |
| Income (loss) from investment operations: | | | | | | | | | | | | | | | | | | | | |
| Net investment income (loss)1 | | | 0.01 | | | | (0.04 | ) | | | (0.01 | ) | | | 0.01 | | | | 0.03 | |
| Net realized and unrealized gain (loss) | | | (1.35 | ) | | | 2.53 | | | | 6.59 | | | | (0.30 | ) | | | 0.60 | |
| Total from investment operations | | | (1.34 | ) | | | 2.49 | | | | 6.58 | | | | (0.29 | ) | | | 0.63 | |
| |
| Less dividends and distributions from: | | | | | | | | | | | | | | | | | | | | |
| Net investment income | | | (0.05 | ) | | | (0.04 | ) | | | — | | | | (0.03 | ) | | | (0.03 | ) |
| Net realized gain | | | (2.02 | ) | | | (2.39 | ) | | | (0.38 | ) | | | (1.42 | ) | | | (1.91 | ) |
| Total dividends and distributions | | | (2.07 | ) | | | (2.43 | ) | | | (0.38 | ) | | | (1.45 | ) | | | (1.94 | ) |
| |
| Net asset value, end of period | | $ | 14.47 | | | $ | 17.88 | | | $ | 17.82 | | | $ | 11.62 | | | $ | 13.36 | |
| |
| Total return2 | | | (6.98 | )%3 | | | 13.42 | % | | | 56.93 | % | | | (3.93 | )% | | | 5.16 | % |
| |
| Ratios and supplemental data: | | | | | | | | | | | | | | | | | | | | |
| Net assets, end of period (000 omitted) | | $ | 231 | | | $ | 212 | | | $ | 1 | 4 | | $ | — | 4,5 | | $ | 1 | 4 |
| Ratio of expenses to average net assets6 | | | 1.30 | % | | | 1.39 | % | | | 1.40 | % | | | 1.42 | % | | | 1.40 | % |
| Ratio of expenses to average net assets prior to fees waived6 | | | 1.31 | % | | | 1.39 | % | | | 1.40 | % | | | 1.42 | % | | | 1.40 | % |
| Ratio of net investment income (loss) to average net assets | | | 0.03 | % | | | (0.22 | )% | | | (0.04 | )% | | | 0.04 | % | | | 0.22 | % |
| Ratio of net investment income (loss) to average net assets prior to fees waived | | | 0.02 | % | | | (0.22 | )% | | | (0.04 | )% | | | 0.04 | % | | | 0.22 | % |
| Portfolio turnover | | | 37 | % | | | 36 | % | | | 49 | % | | | 66 | % | | | 97 | % |
| 1 | Calculated using average shares outstanding. |
| 2 | Total return is based on the change in net asset value of a share during the period and assumes reinvestment of dividends and distributions at net asset value. |
| 3 | Total return during the period reflects waivers by the manager and/or distributor. Performance would have been lower had the waivers not been in effect. |
| 4 | Net assets reported in millions. |
| 5 | Rounds to less than $500 thousands. |
| 6 | Expense ratios do not include expenses of any investment companies in which the Fund invests. |
See accompanying notes, which are an integral part of the financial statements.
Financial highlights
Delaware Ivy Core Equity Fund Class R6
Selected data for each share of the Fund outstanding throughout each period were as follows:
| | | Year ended | |
| | | 3/31/23 | | | 3/31/22 | | | 3/31/21 | | | 3/31/20 | | | 3/31/19 | |
| Net asset value, beginning of period | | $ | 21.31 | | | $ | 20.82 | | | $ | 13.50 | | | $ | 15.30 | | | $ | 16.51 | |
| |
| Income (loss) from investment operations: | | | | | | | | | | | | | | | | | | | | |
| Net investment income1 | | | 0.12 | | | | 0.12 | | | | 0.12 | | | | 0.13 | | | | 0.16 | |
| Net realized and unrealized gain (loss) | | | (1.59 | ) | | | 2.94 | | | | 7.68 | | | | (0.37 | ) | | | 0.69 | |
| Total from investment operations | | | (1.47 | ) | | | 3.06 | | | | 7.80 | | | | (0.24 | ) | | | 0.85 | |
| |
| Less dividends and distributions from: | | | | | | | | | | | | | | | | | | | | |
| Net investment income | | | (0.09 | ) | | | (0.15 | ) | | | (0.09 | ) | | | (0.14 | ) | | | (0.15 | ) |
| Net realized gain | | | (2.02 | ) | | | (2.42 | ) | | | (0.39 | ) | | | (1.42 | ) | | | (1.91 | ) |
| Total dividends and distributions | | | (2.11 | ) | | | (2.57 | ) | | | (0.48 | ) | | | (1.56 | ) | | | (2.06 | ) |
| |
| Net asset value, end of period | | $ | 17.73 | | | $ | 21.31 | | | $ | 20.82 | | | $ | 13.50 | | | $ | 15.30 | |
| |
| Total return2 | | | (6.44 | )% | | | 14.23 | % | | | 58.14 | % | | | (3.23 | )% | | | 6.01 | % |
| |
| Ratios and supplemental data: | | | | | | | | | | | | | | | | | | | | |
| Net assets, end of period (000 omitted) | | $ | 48,677 | | | $ | 91,633 | | | $ | 90 | 3 | | $ | 31 | 3 | | $ | 45 | 3 |
| Ratio of expenses to average net assets4 | | | 0.69 | % | | | 0.64 | % | | | 0.66 | % | | | 0.67 | % | | | 0.65 | % |
| Ratio of net investment income to average net assets | | | 0.64 | % | | | 0.52 | % | | | 0.68 | % | | | 0.78 | % | | | 0.97 | % |
| Portfolio turnover | | | 37 | % | | | 36 | % | | | 49 | % | | | 66 | % | | | 97 | % |
| 1 | Calculated using average shares outstanding. |
| 2 | Total return is based on the change in net asset value of a share during the period and assumes reinvestment of dividends and distributions at net asset value. |
| 3 | Net assets reported in millions. |
| 4 | Expense ratios do not include expenses of any investment companies in which the Fund invests. |
See accompanying notes, which are an integral part of the financial statements.
Delaware Ivy Core Equity Fund Class Y
Selected data for each share of the Fund outstanding throughout each period were as follows:
| | | Year ended | |
| | | 3/31/23 | | | 3/31/22 | | | 3/31/21 | | | 3/31/20 | | | 3/31/19 | |
| Net asset value, beginning of period | | $ | 20.38 | | | $ | 20.01 | | | $ | 13.00 | | | $ | 14.78 | | | $ | 16.02 | |
| |
| Income (loss) from investment operations: | | | | | | | | | | | | | | | | | | | | |
| Net investment income1 | | | 0.07 | | | | 0.07 | | | | 0.09 | | | | 0.09 | | | | 0.13 | |
| Net realized and unrealized gain (loss) | | | (1.52 | ) | | | 2.83 | | | | 7.37 | | | | (0.34 | ) | | | 0.67 | |
| Total from investment operations | | | (1.45 | ) | | | 2.90 | | | | 7.46 | | | | (0.25 | ) | | | 0.80 | |
| |
| Less dividends and distributions from: | | | | | | | | | | | | | | | | | | | | |
| Net investment income | | | (0.08 | ) | | | (0.11 | ) | | | (0.06 | ) | | | (0.11 | ) | | | (0.13 | ) |
| Net realized gain | | | (2.02 | ) | | | (2.42 | ) | | | (0.39 | ) | | | (1.42 | ) | | | (1.91 | ) |
| Total dividends and distributions | | | (2.10 | ) | | | (2.53 | ) | | | (0.45 | ) | | | (1.53 | ) | | | (2.04 | ) |
| |
| Net asset value, end of period | | $ | 16.83 | | | $ | 20.38 | | | $ | 20.01 | | | $ | 13.00 | | | $ | 14.78 | |
| |
| Total return2 | | | (6.63 | )% | | | 13.99 | % | | | 57.75 | % | | | (3.37 | )% | | | 5.81 | % |
| |
| Ratios and supplemental data: | | | | | | | | | | | | | | | | | | | | |
| Net assets, end of period (000 omitted) | | $ | 25,065 | | | $ | 29,855 | | | $ | 26 | 3 | | $ | 23 | 3 | | $ | 45 | 3 |
| Ratio of expenses to average net assets4 | | | 0.94 | % | | | 0.84 | % | | | 0.85 | % | | | 0.84 | % | | | 0.84 | % |
| Ratio of expenses to average net assets prior to fees waived4 | | | 0.97 | % | | | 1.04 | % | | | 1.05 | % | | | 1.08 | % | | | 1.05 | % |
| Ratio of net investment income to average net assets | | | 0.39 | % | | | 0.32 | % | | | 0.50 | % | | | 0.60 | % | | | 0.80 | % |
| Ratio of net investment income to average net assets prior to fees waived | | | 0.36 | % | | | 0.12 | % | | | 0.30 | % | | | 0.36 | % | | | 0.59 | % |
| Portfolio turnover | | | 37 | % | | | 36 | % | | | 49 | % | | | 66 | % | | | 97 | % |
| 1 | Calculated using average shares outstanding. |
| 2 | Total return is based on the change in net asset value of a share during the period and assumes reinvestment of dividends and distributions at net asset value. Total return during the period reflects waivers by the manager and/or distributor. Performance would have been lower had the waivers not been in effect. |
| 3 | Net assets reported in millions. |
| 4 | Expense ratios do not include expenses of any investment companies in which the Fund invests. |
See accompanying notes, which are an integral part of the financial statements.
Financial highlights
Delaware Ivy Global Bond Fund Class A
Selected data for each share of the Fund outstanding throughout each period were as follows:
| | | Year ended | |
| | | 3/31/23 | | | 3/31/22 | | | 3/31/21 | | | 3/31/20 | | | 3/31/19 | |
| Net asset value, beginning of period | | $ | 9.57 | | | $ | 10.26 | | | $ | 9.26 | | | $ | 9.71 | | | $ | 9.68 | |
| |
| Income (loss) from investment operations: | | | | | | | | | | | | | | | | | | | | |
| Net investment income1 | | | 0.24 | | | | 0.25 | | | | 0.32 | | | | 0.34 | | | | 0.32 | |
| Net realized and unrealized gain (loss) | | | (0.44 | ) | | | (0.69 | ) | | | 0.95 | | | | (0.59 | ) | | | 0.01 | |
| Total from investment operations | | | (0.20 | ) | | | (0.44 | ) | | | 1.27 | | | | (0.25 | ) | | | 0.33 | |
| |
| Less dividends and distributions from: | | | | | | | | | | | | | | | | | | | | |
| Net investment income | | | (0.28 | ) | | | (0.25 | ) | | | (0.27 | ) | | | (0.20 | ) | | | (0.28 | ) |
| Net realized gain | | | — | | | | — | | | | — | | | | — | | | | (0.02 | ) |
| Total dividends and distributions | | | (0.28 | ) | | | (0.25 | ) | | | (0.27 | ) | | | (0.20 | ) | | | (0.30 | ) |
| |
| Net asset value, end of period | | $ | 9.09 | | | $ | 9.57 | | | $ | 10.26 | | | $ | 9.26 | | | $ | 9.71 | |
| |
| Total return2 | | | (2.00 | )% | | | (4.39 | )% | | | 13.77 | % | | | (2.69 | )% | | | 3.47 | % |
| |
| Ratios and supplemental data: | | | | | | | | | | | | | | | | | | | | |
| Net assets, end of period (000 omitted) | | $ | 111,266 | | | $ | 150,133 | | | $ | 178 | 3 | | $ | 170 | 3 | | $ | 211 | 3 |
| Ratio of expenses to average net assets4 | | | 0.96 | % | | | 0.96 | % | | | 0.96 | % | | | 0.99 | % | | | 0.99 | % |
| Ratio of expenses to average net assets prior to fees waived4 | | | 1.24 | % | | | 1.19 | % | | | 1.20 | % | | | 1.22 | % | | | 1.23 | % |
| Ratio of net investment income to average net assets | | | 2.64 | % | | | 2.46 | % | | | 3.18 | % | | | 3.43 | % | | | 3.32 | % |
| Ratio of net investment income to average net assets prior to fees waived | | | 2.36 | % | | | 2.23 | % | | | 2.94 | % | | | 3.20 | % | | | 3.08 | % |
| Portfolio turnover | | | 124 | % | | | 50 | % | | | 43 | % | | | 38 | % | | | 35 | % |
| 1 | Calculated using average shares outstanding. |
| 2 | Total return is based on the change in net asset value of a share during the period and assumes reinvestment of dividends and distributions at net asset value and does not reflect the impact of a sales charge. Total return during the period reflects waivers by the manager and/or distributor. Performance would have been lower had the waivers not been in effect. |
| 3 | Net assets reported in millions. |
| 4 | Expense ratios do not include expenses of any investment companies in which the Fund invests. |
See accompanying notes, which are an integral part of the financial statements.
Delaware Ivy Global Bond Fund Class C
Selected data for each share of the Fund outstanding throughout each period were as follows:
| | | Year ended | |
| | | 3/31/23 | | | 3/31/22 | | | 3/31/21 | | | 3/31/20 | | | 3/31/19 | |
| Net asset value, beginning of period | | $ | 9.57 | | | $ | 10.25 | | | $ | 9.26 | | | $ | 9.71 | | | $ | 9.68 | |
| |
| Income (loss) from investment operations: | | | | | | | | | | | | | | | | | | | | |
| Net investment income1 | | | 0.17 | | | | 0.17 | | | | 0.25 | | | | 0.26 | | | | 0.25 | |
| Net realized and unrealized gain (loss) | | | (0.43 | ) | | | (0.68 | ) | | | 0.94 | | | | (0.59 | ) | | | 0.01 | |
| Total from investment operations | | | (0.26 | ) | | | (0.51 | ) | | | 1.19 | | | | (0.33 | ) | | | 0.26 | |
| |
| Less dividends and distributions from: | | | | | | | | | | | | | | | | | | | | |
| Net investment income | | | (0.22 | ) | | | (0.17 | ) | | | (0.20 | ) | | | (0.12 | ) | | | (0.21 | ) |
| Net realized gain | | | — | | | | — | | | | — | | | | — | | | | (0.02 | ) |
| Total dividends and distributions | | | (0.22 | ) | | | (0.17 | ) | | | (0.20 | ) | | | (0.12 | ) | | | (0.23 | ) |
| |
| Net asset value, end of period | | $ | 9.09 | | | $ | 9.57 | | | $ | 10.25 | | | $ | 9.26 | | | $ | 9.71 | |
| |
| Total return2 | | | (2.68 | )% | | | (5.04 | )% | | | 12.81 | % | | | (3.42 | )% | | | 2.71 | % |
| |
| Ratios and supplemental data: | | | | | | | | | | | | | | | | | | | | |
| Net assets, end of period (000 omitted) | | $ | 2,675 | | | $ | 3,499 | | | $ | 4 | 3 | | $ | 6 | 3 | | $ | 9 | 3 |
| Ratio of expenses to average net assets4 | | | 1.71 | % | | | 1.72 | % | | | 1.72 | % | | | 1.74 | % | | | 1.73 | % |
| Ratio of expenses to average net assets prior to fees waived4 | | | 2.06 | % | | | 1.97 | % | | | 1.96 | % | | | 1.98 | % | | | 1.93 | % |
| Ratio of net investment income to average net assets | | | 1.91 | % | | | 1.69 | % | | | 2.45 | % | | | 2.68 | % | | | 2.58 | % |
| Ratio of net investment income to average net assets prior to fees waived | | | 1.56 | % | | | 1.44 | % | | | 2.21 | % | | | 2.44 | % | | | 2.38 | % |
| Portfolio turnover | | | 124 | % | | | 50 | % | | | 43 | % | | | 38 | % | | | 35 | % |
| 1 | Calculated using average shares outstanding. |
| 2 | Total return is based on the change in net asset value of a share during the period and assumes reinvestment of dividends and distributions at net asset value and does not reflect the impact of a sales charge. Total return during the period reflects waivers by the manager and/or distributor. Performance would have been lower had the waivers not been in effect. |
| 3 | Net assets reported in millions. |
| 4 | Expense ratios do not include expenses of any investment companies in which the Fund invests. |
See accompanying notes, which are an integral part of the financial statements.
Financial highlights
Delaware Ivy Global Bond Fund Class I
Selected data for each share of the Fund outstanding throughout each period were as follows:
| | | Year ended | |
| | | 3/31/23 | | | 3/31/22 | | | 3/31/21 | | | 3/31/20 | | | 3/31/19 | |
| Net asset value, beginning of period | | $ | 9.57 | | | $ | 10.25 | | | $ | 9.26 | | | $ | 9.71 | | | $ | 9.68 | |
| |
| Income (loss) from investment operations: | | | | | | | | | | | | | | | | | | | | |
| Net investment income1 | | | 0.26 | | | | 0.27 | | | | 0.35 | | | | 0.36 | | | | 0.34 | |
| Net realized and unrealized gain (loss) | | | (0.43 | ) | | | (0.68 | ) | | | 0.93 | | | | (0.59 | ) | | | 0.01 | |
| Total from investment operations | | | (0.17 | ) | | | (0.41 | ) | | | 1.28 | | | | (0.23 | ) | | | 0.35 | |
| |
| Less dividends and distributions from: | | | | | | | | | | | | | | | | | | | | |
| Net investment income | | | (0.31 | ) | | | (0.27 | ) | | | (0.29 | ) | | | (0.22 | ) | | | (0.30 | ) |
| Net realized gain | | | — | | | | — | | | | — | | | | — | | | | (0.02 | ) |
| Total dividends and distributions | | | (0.31 | ) | | | (0.27 | ) | | | (0.29 | ) | | | (0.22 | ) | | | (0.32 | ) |
| |
| Net asset value, end of period | | $ | 9.09 | | | $ | 9.57 | | | $ | 10.25 | | | $ | 9.26 | | | $ | 9.71 | |
| |
| Total return2 | | | (1.76 | )% | | | (4.08 | )% | | | 13.90 | % | | | (2.45 | )% | | | 3.73 | % |
| |
| Ratios and supplemental data: | | | | | | | | | | | | | | | | | | | | |
| Net assets, end of period (000 omitted) | | $ | 179,446 | | | $ | 198,358 | | | $ | 241 | 3 | | $ | 204 | 3 | | $ | 240 | 3 |
| Ratio of expenses to average net assets4 | | | 0.72 | % | | | 0.74 | % | | | 0.74 | % | | | 0.74 | % | | | 0.74 | % |
| Ratio of expenses to average net assets prior to fees waived4 | | | 0.75 | % | | | 0.86 | % | | | 0.89 | % | | | 0.89 | % | | | 0.88 | % |
| Ratio of net investment income to average net assets | | | 2.91 | % | | | 2.67 | % | | | 3.39 | % | | | 3.67 | % | | | 3.58 | % |
| Ratio of net investment income to average net assets prior to fees waived | | | 2.88 | % | | | 2.55 | % | | | 3.24 | % | | | 3.52 | % | | | 3.44 | % |
| Portfolio turnover | | | 124 | % | | | 50 | % | | | 43 | % | | | 38 | % | | | 35 | % |
| 1 | Calculated using average shares outstanding. |
| 2 | Total return is based on the change in net asset value of a share during the period and assumes reinvestment of dividends and distributions at net asset value. Total return during the period reflects waivers by the manager and/or distributor. Performance would have been lower had the waivers not been in effect. |
| 3 | Net assets reported in millions. |
| 4 | Expense ratios do not include expenses of any investment companies in which the Fund invests. |
See accompanying notes, which are an integral part of the financial statements.
Delaware Ivy Global Bond Fund Class R
Selected data for each share of the Fund outstanding throughout each period were as follows:
| | | Year ended | |
| | | 3/31/23 | | | 3/31/22 | | | 3/31/21 | | | 3/31/20 | | | 3/31/19 | |
| Net asset value, beginning of period | | $ | 9.55 | | | $ | 10.23 | | | $ | 9.24 | | | $ | 9.69 | | | $ | 9.67 | |
| |
| Income (loss) from investment operations: | | | | | | | | | | | | | | | | | | | | |
| Net investment income1 | | | 0.21 | | | | 0.20 | | | | 0.28 | | | | 0.29 | | | | 0.27 | |
| Net realized and unrealized gain (loss) | | | (0.43 | ) | | | (0.68 | ) | | | 0.93 | | | | (0.59 | ) | | | 0.01 | |
| Total from investment operations | | | (0.22 | ) | | | (0.48 | ) | | | 1.21 | | | | (0.30 | ) | | | 0.28 | |
| |
| Less dividends and distributions from: | | | | | | | | | | | | | | | | | | | | |
| Net investment income | | | (0.26 | ) | | | (0.20 | ) | | | (0.22 | ) | | | (0.15 | ) | | | (0.24 | ) |
| Net realized gain | | | — | | | | — | | | | — | | | | — | | | | (0.02 | ) |
| Total dividends and distributions | | | (0.26 | ) | | | (0.20 | ) | | | (0.22 | ) | | | (0.15 | ) | | | (0.26 | ) |
| |
| Net asset value, end of period | | $ | 9.07 | | | $ | 9.55 | | | $ | 10.23 | | | $ | 9.24 | | | $ | 9.69 | |
| |
| Total return2 | | | (2.31 | )%3 | | | (4.77 | )% | | | 13.13 | % | | | (3.16 | )% | | | 2.89 | % |
| |
| Ratios and supplemental data: | | | | | | | | | | | | | | | | | | | | |
| Net assets, end of period (000 omitted) | | $ | 257 | | | $ | 260 | | | $ | — | 4,5 | | $ | 1 | 4 | | $ | 1 | 4 |
| Ratio of expenses to average net assets6 | | | 1.29 | % | | | 1.45 | % | | | 1.46 | % | | | 1.47 | % | | | 1.45 | % |
| Ratio of expenses to average net assets prior to fees waived6 | | | 1.31 | % | | | 1.45 | % | | | 1.46 | % | | | 1.47 | % | | | 1.45 | % |
| Ratio of net investment income to average net assets | | | 2.35 | % | | | 1.96 | % | | | 2.77 | % | | | 2.95 | % | | | 2.86 | % |
| Ratio of net investment income to average net assets prior to fees waived | | | 2.33 | % | | | 1.96 | % | | | 2.77 | % | | | 2.95 | % | | | 2.86 | % |
| Portfolio turnover | | | 124 | % | | | 50 | % | | | 43 | % | | | 38 | % | | | 35 | % |
| 1 | Calculated using average shares outstanding. |
| 2 | Total return is based on the change in net asset value of a share during the period and assumes reinvestment of dividends and distributions at net asset value. |
| 3 | Total return during the period reflects waivers by the manager and/or distributor. Performance would have been lower had the waivers not been in effect. |
| 4 | Net assets reported in millions. |
| 5 | Rounds to less than $500 thousands. |
| 6 | Expense ratios do not include expenses of any investment companies in which the Fund invests. |
See accompanying notes, which are an integral part of the financial statements.
Financial highlights
Delaware Ivy Global Bond Fund Class R6
Selected data for each share of the Fund outstanding throughout each period were as follows:
| | | Year ended | |
| | | 3/31/23 | | | 3/31/22 | | | 3/31/21 | | | 3/31/20 | | | 3/31/19 | |
| Net asset value, beginning of period | | $ | 9.57 | | | $ | 10.26 | | | $ | 9.26 | | | $ | 9.71 | | | $ | 9.69 | |
| |
| Income (loss) from investment operations: | | | | | | | | | | | | | | | | | | | | |
| Net investment income1 | | | 0.26 | | | | 0.27 | | | | 0.34 | | | | 0.36 | | | | 0.34 | |
| Net realized and unrealized gain (loss) | | | (0.43 | ) | | | (0.68 | ) | | | 0.95 | | | | (0.58 | ) | | | 0.01 | |
| Total from investment operations | | | (0.17 | ) | | | (0.41 | ) | | | 1.29 | | | | (0.22 | ) | | | 0.35 | |
| |
| Less dividends and distributions from: | | | | | | | | | | | | | | | | | | | | |
| Net investment income | | | (0.31 | ) | | | (0.28 | ) | | | (0.29 | ) | | | (0.23 | ) | | | (0.31 | ) |
| Net realized gain | | | — | | | | — | | | | — | | | | — | | | | (0.02 | ) |
| Total dividends and distributions | | | (0.31 | ) | | | (0.28 | ) | | | (0.29 | ) | | | (0.23 | ) | | | (0.33 | ) |
| |
| Net asset value, end of period | | $ | 9.09 | | | $ | 9.57 | | | $ | 10.26 | | | $ | 9.26 | | | $ | 9.71 | |
| |
| Total return2 | | | (1.75 | )% | | | (4.14 | )% | | | 14.02 | % | | | (2.42 | )% | | | 3.75 | % |
| |
| Ratios and supplemental data: | | | | | | | | | | | | | | | | | | | | |
| Net assets, end of period (000 omitted) | | $ | 132,679 | | | $ | 143,870 | | | $ | 62 | 3 | | $ | 23 | 3 | | $ | 31 | 3 |
| Ratio of expenses to average net assets4 | | | 0.73 | % | | | 0.70 | % | | | 0.72 | % | | | 0.73 | % | | | 0.71 | % |
| Ratio of net investment income to average net assets | | | 2.90 | % | | | 2.65 | % | | | 3.32 | % | | | 3.69 | % | | | 3.61 | % |
| Portfolio turnover | | | 124 | % | | | 50 | % | | | 43 | % | | | 38 | % | | | 35 | % |
| 1 | Calculated using average shares outstanding. |
| 2 | Total return is based on the change in net asset value of a share during the period and assumes reinvestment of dividends and distributions at net asset value. |
| 3 | Net assets reported in millions. |
| 4 | Expense ratios do not include expenses of any investment companies in which the Fund invests. |
See accompanying notes, which are an integral part of the financial statements.
Delaware Ivy Global Bond Fund Class Y
Selected data for each share of the Fund outstanding throughout each period were as follows:
| | | Year ended | |
| | | 3/31/23 | | | 3/31/22 | | | 3/31/21 | | | 3/31/20 | | | 3/31/19 | |
| Net asset value, beginning of period | | $ | 9.58 | | | $ | 10.26 | | | $ | 9.26 | | | $ | 9.71 | | | $ | 9.69 | |
| |
| Income (loss) from investment operations: | | | | | | | | | | | | | | | | | | | | |
| Net investment income1 | | | 0.25 | | | | 0.25 | | | | 0.32 | | | | 0.34 | | | | 0.32 | |
| Net realized and unrealized gain (loss) | | | (0.45 | ) | | | (0.68 | ) | | | 0.95 | | | | (0.59 | ) | | | — | |
| Total from investment operations | | | (0.20 | ) | | | (0.43 | ) | | | 1.27 | | | | (0.25 | ) | | | 0.32 | |
| |
| Less dividends and distributions from: | | | | | | | | | | | | | | | | | | | | |
| Net investment income | | | (0.29 | ) | | | (0.25 | ) | | | (0.27 | ) | | | (0.20 | ) | | | (0.28 | ) |
| Net realized gain | | | — | | | | — | | | | — | | | | — | | | | (0.02 | ) |
| Total dividends and distributions | | | (0.29 | ) | | | (0.25 | ) | | | (0.27 | ) | | | (0.20 | ) | | | (0.30 | ) |
| |
| Net asset value, end of period | | $ | 9.09 | | | $ | 9.58 | | | $ | 10.26 | | | $ | 9.26 | | | $ | 9.71 | |
| |
| Total return2 | | | (2.06 | )% | | | (4.29 | )% | | | 13.76 | % | | | (2.69 | )% | | | 3.36 | % |
| |
| Ratios and supplemental data: | | | | | | | | | | | | | | | | | | | | |
| Net assets, end of period (000 omitted) | | $ | 1,879 | | | $ | 881 | | | $ | 1 | 3 | | $ | 1 | 3 | | $ | 1 | 3 |
| Ratio of expenses to average net assets4 | | | 0.96 | % | | | 0.96 | % | | | 0.96 | % | | | 0.99 | % | | | 0.99 | % |
| Ratio of expenses to average net assets prior to fees waived4 | | | 0.99 | % | | | 1.11 | % | | | 1.12 | % | | | 1.23 | % | | | 1.11 | % |
| Ratio of net investment income to average net assets | | | 2.74 | % | | | 2.42 | % | | | 3.18 | % | | | 3.46 | % | | | 3.29 | % |
| Ratio of net investment income to average net assets prior to fees waived | | | 2.71 | % | | | 2.27 | % | | | 3.02 | % | | | 3.22 | % | | | 3.17 | % |
| Portfolio turnover | | | 124 | % | | | 50 | % | | | 43 | % | | | 38 | % | | | 35 | % |
| 1 | Calculated using average shares outstanding. |
| 2 | Total return is based on the change in net asset value of a share during the period and assumes reinvestment of dividends and distributions at net asset value. Total return during the period reflects waivers by the manager and/or distributor. Performance would have been lower had the waivers not been in effect. |
| 3 | Net assets reported in millions. |
| 4 | Expense ratios do not include expenses of any investment companies in which the Fund invests. |
See accompanying notes, which are an integral part of the financial statements.
Financial highlights
Delaware Ivy Global Growth Fund Class A
Selected data for each share of the Fund outstanding throughout each period were as follows:
| | | Year ended | |
| | | 3/31/23 | | | 3/31/22 | | | 3/31/21 | | | 3/31/20 | | | 3/31/19 | |
| Net asset value, beginning of period | | $ | 54.30 | | | $ | 56.56 | | | $ | 37.75 | | | $ | 43.12 | | | $ | 46.78 | |
| |
| Income (loss) from investment operations: | | | | | | | | | | | | | | | | | | | | |
| Net investment income (loss)1 | | | 0.22 | | | | 0.08 | | | | (0.04 | ) | | | 0.05 | | | | 0.09 | |
| Net realized and unrealized gain (loss) | | | (3.65 | ) | | | 1.81 | | | | 21.67 | | | | (4.97 | ) | | | 1.02 | |
| Total from investment operations | | | (3.43 | ) | | | 1.89 | | | | 21.63 | | | | (4.92 | ) | | | 1.11 | |
| |
| Less dividends and distributions from: | | | | | | | | | | | | | | | | | | | | |
| Net investment income | | | — | | | | (0.19 | ) | | | — | | | | (0.09 | ) | | | (0.08 | ) |
| Net realized gain | | | (21.52 | ) | | | (3.96 | ) | | | (2.82 | ) | | | (0.36 | ) | | | (4.69 | ) |
| Total dividends and distributions | | | (21.52 | ) | | | (4.15 | ) | | | (2.82 | ) | | | (0.45 | ) | | | (4.77 | ) |
| |
| Net asset value, end of period | | $ | 29.35 | | | $ | 54.30 | | | $ | 56.56 | | | $ | 37.75 | | | $ | 43.12 | |
| |
| Total return2 | | | (4.48 | )%3 | | | 2.84 | % | | | 57.85 | % | | | (11.62 | )% | | | 3.12 | % |
| |
| Ratios and supplemental data: | | | | | | | | | | | | | | | | | | | | |
| Net assets, end of period (000 omitted) | | $ | 333,400 | | | $ | 481,991 | | | $ | 531 | 4 | | $ | 369 | 4 | | $ | 477 | 4 |
| Ratio of expenses to average net assets5 | | | 1.28 | % | | | 1.27 | % | | | 1.34 | % | | | 1.36 | % | | | 1.37 | % |
| Ratio of expenses to average net assets prior to fees waived5 | | | 1.39 | % | | | 1.27 | % | | | 1.34 | % | | | 1.36 | % | | | 1.37 | % |
| Ratio of net investment income (loss) to average net assets | | | 0.53 | % | | | 0.14 | % | | | (0.08 | )% | | | 0.11 | % | | | 0.19 | % |
| Ratio of net investment income (loss) to average net assets prior to fees waived | | | 0.42 | % | | | 0.14 | % | | | (0.08 | )% | | | 0.11 | % | | | 0.19 | % |
| Portfolio turnover | | | 39 | % | | | 45 | % | | | 32 | % | | | 26 | % | | | 54 | % |
| 1 | Calculated using average shares outstanding. |
| 2 | Total return is based on the change in net asset value of a share during the period and assumes reinvestment of dividends and distributions at net asset value and does not reflect the impact of a sales charge. |
| 3 | Total return during the period reflects waivers by the manager and/or distributor. Performance would have been lower had the waivers not been in effect. |
| 4 | Net assets reported in millions. |
| 5 | Expense ratios do not include expenses of any investment companies in which the Fund invests. |
See accompanying notes, which are an integral part of the financial statements.
Delaware Ivy Global Growth Fund Class C
Selected data for each share of the Fund outstanding throughout each period were as follows:
| | | Year ended | |
| | | 3/31/23 | | | 3/31/22 | | | 3/31/21 | | | 3/31/20 | | | 3/31/19 | |
| Net asset value, beginning of period | | $ | 43.16 | | | $ | 45.65 | | | $ | 31.11 | | | $ | 35.84 | | | $ | 39.93 | |
| |
| Income (loss) from investment operations: | | | | | | | | | | | | | | | | | | | | |
| Net investment loss1 | | | (0.10 | )2 | | | (0.40 | ) | | | (0.41 | ) | | | (0.28 | ) | | | (0.23 | ) |
| Net realized and unrealized gain (loss) | | | (3.14 | ) | | | 1.51 | | | | 17.77 | | | | (4.09 | ) | | | 0.83 | |
| Total from investment operations | | | (3.24 | ) | | | 1.11 | | | | 17.36 | | | | (4.37 | ) | | | 0.60 | |
| |
| Less dividends and distributions from: | | | | | | | | | | | | | | | | | | | | |
| Net realized gain | | | (21.52 | ) | | | (3.60 | ) | | | (2.82 | ) | | | (0.36 | ) | | | (4.69 | ) |
| Total dividends and distributions | | | (21.52 | ) | | | (3.60 | ) | | | (2.82 | ) | | | (0.36 | ) | | | (4.69 | ) |
| |
| Net asset value, end of period | | $ | 18.40 | | | $ | 43.16 | | | $ | 45.65 | | | $ | 31.11 | | | $ | 35.84 | |
| |
| Total return3 | | | (5.30 | )%4 | | | 1.88 | % | | | 56.45 | % | | | (12.42 | )% | | | 2.33 | % |
| |
| Ratios and supplemental data: | | | | | | | | | | | | | | | | | | | | |
| Net assets, end of period (000 omitted) | | $ | 2,187 | | | $ | 3,530 | | | $ | 5 | 5 | | $ | 5 | 5 | | $ | 9 | 5 |
| Ratio of expenses to average net assets6 | | | 2.17 | % | | | 2.22 | % | | | 2.25 | % | | | 2.24 | % | | | 2.15 | % |
| Ratio of expenses to average net assets prior to fees waived6 | | | 2.51 | % | | | 2.22 | % | | | 2.25 | % | | | 2.24 | % | | | 2.15 | % |
| Ratio of net investment loss to average net assets | | | (0.35 | )% | | | (0.84 | )% | | | (1.00 | )% | | | (0.76 | )% | | | (0.60 | )% |
| Ratio of net investment loss to average net assets prior to fees waived | | | (0.69 | )% | | | (0.84 | )% | | | (1.00 | )% | | | (0.76 | )% | | | (0.60 | )% |
| Portfolio turnover | | | 39 | % | | | 45 | % | | | 32 | % | | | 26 | % | | | 54 | % |
| 1 | Calculated using average shares outstanding. |
| 2 | The per share amount of net investment income (loss) does not directly correlate to the amounts reported in the Statements of operations due to class specific expenses. |
| 3 | Total return is based on the change in net asset value of a share during the period and assumes reinvestment of dividends and distributions at net asset value and does not reflect the impact of a sales charge. |
| 4 | Total return during the period reflects waivers by the manager and/or distributor. Performance would have been lower had the waivers not been in effect. |
| 5 | Net assets reported in millions. |
| 6 | Expense ratios do not include expenses of any investment companies in which the Fund invests. |
See accompanying notes, which are an integral part of the financial statements.
Financial highlights
Delaware Ivy Global Growth Fund Class I
Selected data for each share of the Fund outstanding throughout each period were as follows:
| | | Year ended | |
| | | 3/31/23 | | | 3/31/22 | | | 3/31/21 | | | 3/31/20 | | | 3/31/19 | |
| Net asset value, beginning of period | | $ | 55.82 | | | $ | 58.10 | | | $ | 38.63 | | | $ | 44.10 | | | $ | 47.72 | |
| |
| Income (loss) from investment operations: | | | | | | | | | | | | | | | | | | | | |
| Net investment income1 | | | 0.37 | | | | 0.20 | | | | 0.10 | | | | 0.18 | | | | 0.24 | |
| Net realized and unrealized gain (loss) | | | (3.75 | ) | | | 1.89 | | | | 22.20 | | | | (5.07 | ) | | | 1.05 | |
| Total from investment operations | | | (3.38 | ) | | | 2.09 | | | | 22.30 | | | | (4.89 | ) | | | 1.29 | |
| |
| Less dividends and distributions from: | | | | | | | | | | | | | | | | | | | | |
| Net investment income | | | (0.06 | ) | | | (0.41 | ) | | | (0.01 | ) | | | (0.22 | ) | | | (0.22 | ) |
| Net realized gain | | | (21.52 | ) | | | (3.96 | ) | | | (2.82 | ) | | | (0.36 | ) | | | (4.69 | ) |
| Total dividends and distributions | | | (21.58 | ) | | | (4.37 | ) | | | (2.83 | ) | | | (0.58 | ) | | | (4.91 | ) |
| |
| Net asset value, end of period | | $ | 30.86 | | | $ | 55.82 | | | $ | 58.10 | | | $ | 38.63 | | | $ | 44.10 | |
| |
| Total return2 | | | (4.25 | )% | | | 3.09 | % | | | 58.28 | % | | | (11.35 | )% | | | 3.43 | % |
| |
| Ratios and supplemental data: | | | | | | | | | | | | | | | | | | | | |
| Net assets, end of period (000 omitted) | | $ | 196,155 | | | $ | 379,099 | | | $ | 494 | 3 | | $ | 346 | 3 | | $ | 436 | 3 |
| Ratio of expenses to average net assets4 | | | 1.01 | % | | | 1.06 | % | | | 1.06 | % | | | 1.06 | % | | | 1.06 | % |
| Ratio of expenses to average net assets prior to fees waived4 | | | 1.03 | % | | | 1.07 | % | | | 1.09 | % | | | 1.10 | % | | | 1.08 | % |
| Ratio of net investment income to average net assets | | | 0.85 | % | | | 0.33 | % | | | 0.19 | % | | | 0.40 | % | | | 0.50 | % |
| Ratio of net investment income to average net assets prior to fees waived | | | 0.83 | % | | | 0.32 | % | | | 0.16 | % | | | 0.36 | % | | | 0.48 | % |
| Portfolio turnover | | | 39 | % | | | 45 | % | | | 32 | % | | | 26 | % | | | 54 | % |
| 1 | Calculated using average shares outstanding. |
| 2 | Total return is based on the change in net asset value of a share during the period and assumes reinvestment of dividends and distributions at net asset value. Total return during the period reflects waivers by the manager and/or distributor. Performance would have been lower had the waivers not been in effect. |
| 3 | Net assets reported in millions. |
| 4 | Expense ratios do not include expenses of any investment companies in which the Fund invests. |
See accompanying notes, which are an integral part of the financial statements.
Delaware Ivy Global Growth Fund Class R
Selected data for each share of the Fund outstanding throughout each period were as follows:
| | | Year ended | |
| | | 3/31/23 | | | 3/31/22 | | | 3/31/21 | | | 3/31/20 | | | 3/31/19 | |
| Net asset value, beginning of period | | $ | 53.50 | | | $ | 55.69 | | | $ | 37.32 | | | $ | 42.69 | | | $ | 46.41 | |
| |
| Income (loss) from investment operations: | | | | | | | | | | | | | | | | | | | | |
| Net investment income (loss)1 | | | 0.09 | | | | (0.15 | ) | | | (0.21 | ) | | | (0.08 | ) | | | (0.05 | ) |
| Net realized and unrealized gain (loss) | | | (3.61 | ) | | | 1.78 | | | | 21.40 | | | | (4.93 | ) | | | 1.02 | |
| Total from investment operations | | | (3.52 | ) | | | 1.63 | | | | 21.19 | | | | (5.01 | ) | | | 0.97 | |
| |
| Less dividends and distributions from: | | | | | | | | | | | | | | | | | | | | |
| Net investment income | | | — | | | | (0.01 | ) | | | — | | | | — | | | | — | |
| Net realized gain | | | (21.52 | ) | | | (3.81 | ) | | | (2.82 | ) | | | (0.36 | ) | | | (4.69 | ) |
| Total dividends and distributions | | | (21.52 | ) | | | (3.82 | ) | | | (2.82 | ) | | | (0.36 | ) | | | (4.69 | ) |
| |
| Net asset value, end of period | | $ | 28.46 | | | $ | 53.50 | | | $ | 55.69 | | | $ | 37.32 | | | $ | 42.69 | |
| |
| Total return2 | | | (4.74 | )%3 | | | 2.46 | % | | | 57.33 | % | | | (11.92 | )% | | | 2.82 | % |
| |
| Ratios and supplemental data: | | | | | | | | | | | | | | | | | | | | |
| Net assets, end of period (000 omitted) | | $ | 716 | | | $ | 835 | | | $ | 1 | 4 | | $ | 1 | 4 | | $ | 1 | 4 |
| Ratio of expenses to average net assets5 | | | 1.55 | % | | | 1.66 | % | | | 1.68 | % | | | 1.68 | % | | | 1.67 | % |
| Ratio of expenses to average net assets prior to fees waived5 | | | 1.57 | % | | | 1.66 | % | | | 1.68 | % | | | 1.68 | % | | | 1.67 | % |
| Ratio of net investment income (loss) to average net assets | | | 0.23 | % | | | (0.25 | )% | | | (0.42 | )% | | | (0.18 | )% | | | (0.10 | )% |
| Ratio of net investment income (loss) to average net assets prior to fees waived | | | 0.21 | % | | | (0.25 | )% | | | (0.42 | )% | | | (0.18 | )% | | | (0.10 | )% |
| Portfolio turnover | | | 39 | % | | | 45 | % | | | 32 | % | | | 26 | % | | | 54 | % |
| 1 | Calculated using average shares outstanding. |
| 2 | Total return is based on the change in net asset value of a share during the period and assumes reinvestment of dividends and distributions at net asset value. |
| 3 | Total return during the period reflects waivers by the manager and/or distributor. Performance would have been lower had the waivers not been in effect. |
| 4 | Net assets reported in millions. |
| 5 | Expense ratios do not include expenses of any investment companies in which the Fund invests. |
See accompanying notes, which are an integral part of the financial statements.
Financial highlights
Delaware Ivy Global Growth Fund Class R6
Selected data for each share of the Fund outstanding throughout each period were as follows:
| | | Year ended | |
| | | 3/31/23 | | | 3/31/22 | | | 3/31/21 | | | 3/31/20 | | | 3/31/19 | |
| Net asset value, beginning of period | | $ | 56.21 | | | $ | 58.51 | | | $ | 38.85 | | | $ | 44.35 | | | $ | 47.99 | |
| |
| Income (loss) from investment operations: | | | | | | | | | | | | | | | | | | | | |
| Net investment income1 | | | 0.31 | | | | 0.23 | | | | 0.16 | | | | 0.24 | | | | 0.30 | |
| Net realized and unrealized gain (loss) | | | (3.70 | ) | | | 1.96 | | | | 22.35 | | | | (5.10 | ) | | | 1.04 | |
| Total from investment operations | | | (3.39 | ) | | | 2.19 | | | | 22.51 | | | | (4.86 | ) | | | 1.34 | |
| |
| Less dividends and distributions from: | | | | | | | | | | | | | | | | | | | | |
| Net investment income | | | (0.26 | ) | | | (0.53 | ) | | | (0.03 | ) | | | (0.28 | ) | | | (0.29 | ) |
| Net realized gain | | | (21.52 | ) | | | (3.96 | ) | | | (2.82 | ) | | | (0.36 | ) | | | (4.69 | ) |
| Total dividends and distributions | | | (21.78 | ) | | | (4.49 | ) | | | (2.85 | ) | | | (0.64 | ) | | | (4.98 | ) |
| |
| Net asset value, end of period | | $ | 31.04 | | | $ | 56.21 | | | $ | 58.51 | | | $ | 38.85 | | | $ | 44.35 | |
| |
| Total return2 | | | (4.20 | )%3 | | | 3.22 | % | | | 58.50 | % | | | (11.26 | )% | | | 3.59 | % |
| |
| Ratios and supplemental data: | | | | | | | | | | | | | | | | | | | | |
| Net assets, end of period (000 omitted) | | $ | 2,908 | | | $ | 2,633 | | | $ | 19 | 4 | | $ | 16 | 4 | | $ | 19 | 4 |
| Ratio of expenses to average net assets5 | | | 0.98 | % | | | 0.91 | % | | | 0.94 | % | | | 0.94 | % | | | 0.92 | % |
| Ratio of expenses to average net assets prior to fees waived5 | | | 1.00 | % | | | 0.91 | % | | | 0.94 | % | | | 0.94 | % | | | 0.92 | % |
| Ratio of net investment income to average net assets | | | 0.73 | % | | | 0.37 | % | | | 0.31 | % | | | 0.53 | % | | | 0.64 | % |
| Ratio of net investment income to average net assets prior to fees waived | | | 0.71 | % | | | 0.37 | % | | | 0.31 | % | | | 0.53 | % | | | 0.64 | % |
| Portfolio turnover | | | 39 | % | | | 45 | % | | | 32 | % | | | 26 | % | | | 54 | % |
| 1 | Calculated using average shares outstanding. |
| 2 | Total return is based on the change in net asset value of a share during the period and assumes reinvestment of dividends and distributions at net asset value. |
| 3 | Total return during the period reflects waivers by the manager and/or distributor. Performance would have been lower had the waivers not been in effect. |
| 4 | Net assets reported in millions. |
| 5 | Expense ratios do not include expenses of any investment companies in which the Fund invests. |
See accompanying notes, which are an integral part of the financial statements.
Delaware Ivy Global Growth Fund Class Y
Selected data for each share of the Fund outstanding throughout each period were as follows:
| | | Year ended | |
| | | 3/31/23 | | | 3/31/22 | | | 3/31/21 | | | 3/31/20 | | | 3/31/19 | |
| Net asset value, beginning of period | | $ | 54.63 | | | $ | 56.88 | | | $ | 37.95 | | | $ | 43.35 | | | $ | 47.00 | |
| |
| Income (loss) from investment operations: | | | | | | | | | | | | | | | | | | | | |
| Net investment income (loss)1 | | | 0.21 | | | | 0.07 | | | | (0.05 | ) | | | 0.08 | | | | 0.09 | |
| Net realized and unrealized gain (loss) | | | (3.66 | ) | | | 1.83 | | | | 21.80 | | | | (5.03 | ) | | | 1.04 | |
| Total from investment operations | | | (3.45 | ) | | | 1.90 | | | | 21.75 | | | | (4.95 | ) | | | 1.13 | |
| |
| Less dividends and distributions from: | | | | | | | | | | | | | | | | | | | | |
| Net investment income | | | — | | | | (0.19 | ) | | | — | | | | (0.09 | ) | | | (0.09 | ) |
| Net realized gain | | | (21.52 | ) | | | (3.96 | ) | | | (2.82 | ) | | | (0.36 | ) | | | (4.69 | ) |
| Total dividends and distributions | | | (21.52 | ) | | | (4.15 | ) | | | (2.82 | ) | | | (0.45 | ) | | | (4.78 | ) |
| |
| Net asset value, end of period | | $ | 29.66 | | | $ | 54.63 | | | $ | 56.88 | | | $ | 37.95 | | | $ | 43.35 | |
| |
| Total return2 | | | (4.50 | )%3 | | | 2.85 | %3 | | | 57.86 | %3 | | | (11.63 | )%3 | | | 3.17 | % |
| |
| Ratios and supplemental data: | | | | | | | | | | | | | | | | | | | | |
| Net assets, end of period (000 omitted) | | $ | 1,483 | | | $ | 1,962 | | | $ | 3 | 4 | | $ | 2 | 4 | | $ | 5 | 4 |
| Ratio of expenses to average net assets5 | | | 1.28 | % | | | 1.28 | % | | | 1.34 | % | | | 1.36 | % | | | 1.33 | % |
| Ratio of expenses to average net assets prior to fees waived5 | | | 1.32 | % | | | 1.32 | % | | | 1.36 | % | | | 1.38 | % | | | 1.33 | % |
| Ratio of net investment income (loss) to average net assets | | | 0.51 | % | | | 0.11 | % | | | (0.09 | )% | | | 0.19 | % | | | 0.20 | % |
| Ratio of net investment income (loss) to average net assets prior to fees waived | | | 0.47 | % | | | 0.07 | % | | | (0.11 | )% | | | 0.17 | % | | | 0.20 | % |
| Portfolio turnover | | | 39 | % | | | 45 | % | | | 32 | % | | | 26 | % | | | 54 | % |
| 1 | Calculated using average shares outstanding. |
| 2 | Total return is based on the change in net asset value of a share during the period and assumes reinvestment of dividends and distributions at net asset value. |
| 3 | Total return during the period reflects waivers by the manager and/or distributor. Performance would have been lower had the waivers not been in effect. |
| 4 | Net assets reported in millions. |
| 5 | Expense ratios do not include expenses of any investment companies in which the Fund invests. |
See accompanying notes, which are an integral part of the financial statements.
Financial highlights
Delaware Ivy High Income Fund Class A
Selected data for each share of the Fund outstanding throughout each period were as follows:
| | | Year ended | |
| | | 3/31/23 | | | 3/31/22 | | | 3/31/21 | | | 3/31/20 | | | 3/31/19 | |
| Net asset value, beginning of period | | $ | 6.73 | | | $ | 7.10 | | | $ | 5.91 | | | $ | 7.20 | | | $ | 7.49 | |
| |
| Income (loss) from investment operations: | | | | | | | | | | | | | | | | | | | | |
| Net investment income1 | | | 0.44 | | | | 0.46 | | | | 0.41 | | | | 0.49 | | | | 0.50 | |
| Net realized and unrealized gain (loss) | | | (0.86 | ) | | | (0.38 | ) | | | 1.21 | | | | (1.29 | ) | | | (0.29 | ) |
| Total from investment operations | | | (0.42 | ) | | | 0.08 | | | | 1.62 | | | | (0.80 | ) | | | 0.21 | |
| |
| Less dividends and distributions from: | | | | | | | | | | | | | | | | | | | | |
| Net investment income | | | (0.44 | ) | | | (0.45 | ) | | | (0.43 | ) | | | (0.49 | ) | | | (0.50 | ) |
| Total dividends and distributions | | | (0.44 | ) | | | (0.45 | ) | | | (0.43 | ) | | | (0.49 | ) | | | (0.50 | ) |
| |
| Net asset value, end of period | | $ | 5.87 | | | $ | 6.73 | | | $ | 7.10 | | | $ | 5.91 | | | $ | 7.20 | |
| |
| Total return2 | | | (6.02 | )%3 | | | 1.09 | %4 | | | 28.16 | % | | | (12.03 | )% | | | 2.93 | % |
| |
| Ratios and supplemental data: | | | | | | | | | | | | | | | | | | | | |
| Net assets, end of period (000 omitted) | | $ | 1,196,375 | | | $ | 1,576,813 | | | $ | 1,816 | 5 | | $ | 1,465 | 5 | | $ | 1,930 | 5 |
| Ratio of expenses to average net assets6 | | | 1.00 | % | | | 0.95 | % | | | 0.97 | % | | | 0.95 | % | | | 0.95 | % |
| Ratio of expenses to average net assets prior to fees waived6 | | | 1.02 | % | | | 0.95 | % | | | 0.97 | % | | | 0.95 | % | | | 0.95 | % |
| Ratio of net investment income to average net assets | | | 7.38 | % | | | 6.44 | % | | | 6.16 | % | | | 6.89 | % | | | 6.81 | % |
| Ratio of net investment income to average net assets prior to fees waived | | | 7.36 | % | | | 6.44 | % | | | 6.16 | % | | | 6.89 | % | | | 6.81 | % |
| Portfolio turnover | | | 50 | % | | | 48 | % | | | 59 | % | | | 30 | % | | | 41 | % |
| 1 | Calculated using average shares outstanding. |
| 2 | Total return is based on the change in net asset value of a share during the period and assumes reinvestment of dividends and distributions at net asset value and does not reflect the impact of a sales charge. |
| 3 | Total return during the period reflects waivers by the manager and/or distributor. Performance would have been lower had the waivers not been in effect. |
| 4 | Payments from affiliates had no impact on net asset value and total return. |
| 5 | Net assets reported in millions. |
| 6 | Expense ratios do not include expenses of any investment companies in which the Fund invests. |
See accompanying notes, which are an integral part of the financial statements.
Delaware Ivy High Income Fund Class C
Selected data for each share of the Fund outstanding throughout each period were as follows:
| | | Year ended | |
| | | 3/31/23 | | | 3/31/22 | | | 3/31/21 | | | 3/31/20 | | | 3/31/19 | |
| Net asset value, beginning of period | | $ | 6.73 | | | $ | 7.10 | | | $ | 5.91 | | | $ | 7.20 | | | $ | 7.49 | |
| |
| Income (loss) from investment operations: | | | | | | | | | | | | | | | | | | | | |
| Net investment income1 | | | 0.40 | | | | 0.40 | | | | 0.36 | | | | 0.44 | | | | 0.45 | |
| Net realized and unrealized gain (loss) | | | (0.86 | ) | | | (0.37 | ) | | | 1.22 | | | | (1.29 | ) | | | (0.29 | ) |
| Total from investment operations | | | (0.46 | ) | | | 0.03 | | | | 1.58 | | | | (0.85 | ) | | | 0.16 | |
| |
| Less dividends and distributions from: | | | | | | | | | | | | | | | | | | | | |
| Net investment income | | | (0.40 | ) | | | (0.40 | ) | | | (0.39 | ) | | | (0.44 | ) | | | (0.45 | ) |
| Total dividends and distributions | | | (0.40 | ) | | | (0.40 | ) | | | (0.39 | ) | | | (0.44 | ) | | | (0.45 | ) |
| |
| Net asset value, end of period | | $ | 5.87 | | | $ | 6.73 | | | $ | 7.10 | | | $ | 5.91 | | | $ | 7.20 | |
| |
| Total return2 | | | (6.70 | )%3 | | | 0.38 | %3,4 | | | 27.28 | %3 | | | (12.66 | )%3 | | | 2.21 | % |
| |
| Ratios and supplemental data: | | | | | | | | | | | | | | | | | | | | |
| Net assets, end of period (000 omitted) | | $ | 141,497 | | | $ | 221,601 | | | $ | 321 | 5 | | $ | 447 | 5 | | $ | 683 | 5 |
| Ratio of expenses to average net assets6 | | | 1.71 | % | | | 1.66 | % | | | 1.66 | % | | | 1.66 | % | | | 1.66 | % |
| Ratio of expenses to average net assets prior to fees waived6 | | | 1.81 | % | | | 1.70 | % | | | 1.70 | % | | | 1.68 | % | | | 1.66 | % |
| Ratio of net investment income to average net assets | | | 6.64 | % | | | 5.72 | % | | | 5.50 | % | | | 6.17 | % | | | 6.10 | % |
| Ratio of net investment income to average net assets prior to fees waived | | | 6.54 | % | | | 5.68 | % | | | 5.46 | % | | | 6.15 | % | | | 6.10 | % |
| Portfolio turnover | | | 50 | % | | | 48 | % | | | 59 | % | | | 30 | % | | | 41 | % |
| 1 | Calculated using average shares outstanding. |
| 2 | Total return is based on the change in net asset value of a share during the period and assumes reinvestment of dividends and distributions at net asset value and does not reflect the impact of a sales charge. |
| 3 | Total return during the period reflects waivers by the manager and/or distributor. Performance would have been lower had the waivers not been in effect. |
| 4 | Payments from affiliates had no impact on net asset value and total return. |
| 5 | Net assets reported in millions. |
| 6 | Expense ratios do not include expenses of any investment companies in which the Fund invests. |
See accompanying notes, which are an integral part of the financial statements.
Financial highlights
Delaware Ivy High Income Fund Class I
Selected data for each share of the Fund outstanding throughout each period were as follows:
| | | Year ended | |
| | | 3/31/23 | | | 3/31/22 | | | 3/31/21 | | | 3/31/20 | | | 3/31/19 | |
| Net asset value, beginning of period | | $ | 6.73 | | | $ | 7.10 | | | $ | 5.91 | | | $ | 7.20 | | | $ | 7.49 | |
| |
| Income (loss) from investment operations: | | | | | | | | | | | | | | | | | | | | |
| Net investment income1 | | | 0.45 | | | | 0.47 | | | | 0.43 | | | | 0.50 | | | | 0.52 | |
| Net realized and unrealized gain (loss) | | | (0.85 | ) | | | (0.37 | ) | | | 1.21 | | | | (1.29 | ) | | | (0.29 | ) |
| Total from investment operations | | | (0.40 | ) | | | 0.10 | | | | 1.64 | | | | (0.79 | ) | | | 0.23 | |
| |
| Less dividends and distributions from: | | | | | | | | | | | | | | | | | | | | |
| Net investment income | | | (0.46 | ) | | | (0.47 | ) | | | (0.45 | ) | | | (0.50 | ) | | | (0.52 | ) |
| Total dividends and distributions | | | (0.46 | ) | | | (0.47 | ) | | | (0.45 | ) | | | (0.50 | ) | | | (0.52 | ) |
| |
| Net asset value, end of period | | $ | 5.87 | | | $ | 6.73 | | | $ | 7.10 | | | $ | 5.91 | | | $ | 7.20 | |
| |
| Total return2 | | | (5.79 | )% | | | 1.31 | %3 | | | 28.44 | % | | | (11.83 | )% | | | 3.18 | % |
| |
| Ratios and supplemental data: | | | | | | | | | | | | | | | | | | | | |
| Net assets, end of period (000 omitted) | | $ | 1,035,891 | | | $ | 1,454,150 | | | $ | 1,868 | 4 | | $ | 1,487 | 4 | | $ | 2,058 | 4 |
| Ratio of expenses to average net assets5 | | | 0.75 | % | | | 0.74 | % | | | 0.75 | % | | | 0.73 | % | | | 0.72 | % |
| Ratio of net investment income to average net assets | | | 7.61 | % | | | 6.66 | % | | | 6.38 | % | | | 7.11 | % | | | 7.05 | % |
| Portfolio turnover | | | 50 | % | | | 48 | % | | | 59 | % | | | 30 | % | | | 41 | % |
| 1 | Calculated using average shares outstanding. |
| 2 | Total return is based on the change in net asset value of a share during the period and assumes reinvestment of dividends and distributions at net asset value. |
| 3 | Payments from affiliates had no impact on net asset value and total return. |
| 4 | Net assets reported in millions. |
| 5 | Expense ratios do not include expenses of any investment companies in which the Fund invests. |
See accompanying notes, which are an integral part of the financial statements.
Delaware Ivy High Income Fund Class R
Selected data for each share of the Fund outstanding throughout each period were as follows:
| | | Year ended | |
| | | 3/31/23 | | | 3/31/22 | | | 3/31/21 | | | 3/31/20 | | | 3/31/19 | |
| Net asset value, beginning of period | | $ | 6.73 | | | $ | 7.10 | | | $ | 5.91 | | | $ | 7.20 | | | $ | 7.49 | |
| |
| Income (loss) from investment operations: | | | | | | | | | | | | | | | | | | | | |
| Net investment income1 | | | 0.42 | | | | 0.43 | | | | 0.39 | | | | 0.46 | | | | 0.47 | |
| Net realized and unrealized gain (loss) | | | (0.85 | ) | | | (0.37 | ) | | | 1.21 | | | | (1.29 | ) | | | (0.29 | ) |
| Total from investment operations | | | (0.43 | ) | | | 0.06 | | | | 1.60 | | | | (0.83 | ) | | | 0.18 | |
| |
| Less dividends and distributions from: | | | | | | | | | | | | | | | | | | | | |
| Net investment income | | | (0.43 | ) | | | (0.43 | ) | | | (0.41 | ) | | | (0.46 | ) | | | (0.47 | ) |
| Total dividends and distributions | | | (0.43 | ) | | | (0.43 | ) | | | (0.41 | ) | | | (0.46 | ) | | | (0.47 | ) |
| |
| Net asset value, end of period | | $ | 5.87 | | | $ | 6.73 | | | $ | 7.10 | | | $ | 5.91 | | | $ | 7.20 | |
| |
| Total return2 | | | (6.29 | )% | | | 0.71 | %3 | | | 27.67 | % | | | (12.36 | )% | | | 2.58 | % |
| |
| Ratios and supplemental data: | | | | | | | | | | | | | | | | | | | | |
| Net assets, end of period (000 omitted) | | $ | 34,322 | | | $ | 44,613 | | | $ | 48 | 4 | | $ | 45 | 4 | | $ | 62 | 4 |
| Ratio of expenses to average net assets5 | | | 1.28 | % | | | 1.34 | % | | | 1.35 | % | | | 1.32 | % | | | 1.30 | % |
| Ratio of net investment income to average net assets | | | 7.09 | % | | | 6.05 | % | | | 5.79 | % | | | 6.52 | % | | | 6.47 | % |
| Portfolio turnover | | | 50 | % | | | 48 | % | | | 59 | % | | | 30 | % | | | 41 | % |
| 1 | Calculated using average shares outstanding. |
| 2 | Total return is based on the change in net asset value of a share during the period and assumes reinvestment of dividends and distributions at net asset value. |
| 3 | Payments from affiliates had no impact on net asset value and total return. |
| 4 | Net assets reported in millions. |
| 5 | Expense ratios do not include expenses of any investment companies in which the Fund invests. |
See accompanying notes, which are an integral part of the financial statements.
Financial highlights
Delaware Ivy High Income Fund Class R6
Selected data for each share of the Fund outstanding throughout each period were as follows:
| | | Year ended | |
| | | 3/31/23 | | | 3/31/22 | | | 3/31/21 | | | 3/31/20 | | | 3/31/19 | |
| Net asset value, beginning of period | | $ | 6.73 | | | $ | 7.10 | | | $ | 5.91 | | | $ | 7.20 | | | $ | 7.49 | |
| |
| Income (loss) from investment operations: | | | | | | | | | | | | | | | | | | | | |
| Net investment income1 | | | 0.46 | | | | 0.48 | | | | 0.44 | | | | 0.51 | | | | 0.53 | |
| Net realized and unrealized gain (loss) | | | (0.86 | ) | | | (0.37 | ) | | | 1.21 | | | | (1.29 | ) | | | (0.29 | ) |
| Total from investment operations | | | (0.40 | ) | | | 0.11 | | | | 1.65 | | | | (0.78 | ) | | | 0.24 | |
| |
| Less dividends and distributions from: | | | | | | | | | | | | | | | | | | | | |
| Net investment income | | | (0.46 | ) | | | (0.48 | ) | | | (0.46 | ) | | | (0.51 | ) | | | (0.53 | ) |
| Total dividends and distributions | | | (0.46 | ) | | | (0.48 | ) | | | (0.46 | ) | | | (0.51 | ) | | | (0.53 | ) |
| |
| Net asset value, end of period | | $ | 5.87 | | | $ | 6.73 | | | $ | 7.10 | | | $ | 5.91 | | | $ | 7.20 | |
| |
| Total return2 | | | (5.68 | )% | | | 1.45 | %3 | | | 28.63 | % | | | (11.69 | )% | | | 3.35 | % |
| |
| Ratios and supplemental data: | | | | | | | | | | | | | | | | | | | | |
| Net assets, end of period (000 omitted) | | $ | 59,659 | | | $ | 64,630 | | | $ | 67 | 4 | | $ | 64 | 4 | | $ | 71 | 4 |
| Ratio of expenses to average net assets5 | | | 0.64 | % | | | 0.60 | % | | | 0.60 | % | | | 0.58 | % | | | 0.56 | % |
| Ratio of net investment income to average net assets | | | 7.78 | % | | | 6.78 | % | | | 6.54 | % | | | 7.27 | % | | | 7.22 | % |
| Portfolio turnover | | | 50 | % | | | 48 | % | | | 59 | % | | | 30 | % | | | 41 | % |
| 1 | Calculated using average shares outstanding. |
| 2 | Total return is based on the change in net asset value of a share during the period and assumes reinvestment of dividends and distributions at net asset value. |
| 3 | Payments from affiliates had no impact on net asset value and total return. |
| 4 | Net assets reported in millions. |
| 5 | Expense ratios do not include expenses of any investment companies in which the Fund invests. |
See accompanying notes, which are an integral part of the financial statements.
Delaware Ivy High Income Fund Class Y
Selected data for each share of the Fund outstanding throughout each period were as follows:
| | | Year ended | |
| | | 3/31/23 | | | 3/31/22 | | | 3/31/21 | | | 3/31/20 | | | 3/31/19 | |
| Net asset value, beginning of period | | $ | 6.73 | | | $ | 7.10 | | | $ | 5.91 | | | $ | 7.20 | | | $ | 7.49 | |
| |
| Income (loss) from investment operations: | | | | | | | | | | | | | | | | | | | | |
| Net investment income1 | | | 0.44 | | | | 0.45 | | | | 0.41 | | | | 0.49 | | | | 0.50 | |
| Net realized and unrealized gain (loss) | | | (0.86 | ) | | | (0.37 | ) | | | 1.21 | | | | (1.29 | ) | | | (0.29 | ) |
| Total from investment operations | | | (0.42 | ) | | | 0.08 | | | | 1.62 | | | | (0.80 | ) | | | 0.21 | |
| |
| Less dividends and distributions from: | | | | | | | | | | | | | | | | | | | | |
| Net investment income | | | (0.44 | ) | | | (0.45 | ) | | | (0.43 | ) | | | (0.49 | ) | | | (0.50 | ) |
| Total dividends and distributions | | | (0.44 | ) | | | (0.45 | ) | | | (0.43 | ) | | | (0.49 | ) | | | (0.50 | ) |
| |
| Net asset value, end of period | | $ | 5.87 | | | $ | 6.73 | | | $ | 7.10 | | | $ | 5.91 | | | $ | 7.20 | |
| |
| Total return2 | | | (6.02 | )% | | | 1.09 | %3,4 | | | 28.17 | %4 | | | (12.03 | )%4 | | | 2.94 | %4 |
| |
| Ratios and supplemental data: | | | | | | | | | | | | | | | | | | | | |
| Net assets, end of period (000 omitted) | | $ | 68,758 | | | $ | 99,847 | | | $ | 138 | 5 | | $ | 133 | 5 | | $ | 239 | 5 |
| Ratio of expenses to average net assets6 | | | 1.00 | % | | | 0.96 | % | | | 0.97 | % | | | 0.95 | % | | | 0.95 | % |
| Ratio of expenses to average net assets prior to fees waived6 | | | 1.00 | % | | | 0.99 | % | | | 1.00 | % | | | 0.98 | % | | | 0.96 | % |
| Ratio of net investment income to average net assets | | | 7.34 | % | | | 6.37 | % | | | 6.17 | % | | | 6.87 | % | | | 6.80 | % |
| Ratio of net investment income to average net assets prior to fees waived | | | 7.34 | % | | | 6.34 | % | | | 6.14 | % | | | 6.84 | % | | | 6.79 | % |
| Portfolio turnover | | | 50 | % | | | 48 | % | | | 59 | % | | | 30 | % | | | 41 | % |
| 1 | Calculated using average shares outstanding. |
| 2 | Total return is based on the change in net asset value of a share during the period and assumes reinvestment of dividends and distributions at net asset value. |
| 3 | Payments from affiliates had no impact on net asset value and total return. |
| 4 | Total return during the period reflects waivers by the manager and/or distributor. Performance would have been lower had the waivers not been in effect. |
| 5 | Net assets reported in millions. |
| 6 | Expense ratios do not include expenses of any investment companies in which the Fund invests. |
See accompanying notes, which are an integral part of the financial statements.
Financial highlights
Delaware Ivy International Core Equity Fund Class A
Selected data for each share of the Fund outstanding throughout each period were as follows:
| | | Year ended | |
| | | 3/31/23 | | | 3/31/22 | | | 3/31/21 | | | 3/31/20 | | | 3/31/19 | |
| Net asset value, beginning of period | | $ | 19.09 | | | $ | 19.82 | | | $ | 13.29 | | | $ | 16.75 | | | $ | 19.98 | |
| |
| Income (loss) from investment operations: | | | | | | | | | | | | | | | | | | | | |
| Net investment income1 | | | 0.38 | | | | 0.18 | | | | 0.23 | | | | 0.26 | | | | 0.35 | |
| Net realized and unrealized gain (loss) | | | (0.50 | ) | | | (0.41 | ) | | | 6.48 | | | | (3.30 | ) | | | (2.11 | ) |
| Total from investment operations | | | (0.12 | ) | | | (0.23 | ) | | | 6.71 | | | | (3.04 | ) | | | (1.76 | ) |
| |
| Less dividends and distributions from: | | | | | | | | | | | | | | | | | | | | |
| Net investment income | | | (0.14 | ) | | | (0.50 | ) | | | (0.18 | ) | | | (0.42 | ) | | | (0.36 | ) |
| Net realized gain | | | — | | | | — | | | | — | | | | — | | | | (1.11 | ) |
| Total dividends and distributions | | | (0.14 | ) | | | (0.50 | ) | | | (0.18 | ) | | | (0.42 | ) | | | (1.47 | ) |
| |
| Net asset value, end of period | | $ | 18.83 | | | $ | 19.09 | | | $ | 19.82 | | | $ | 13.29 | | | $ | 16.75 | |
| |
| Total return2 | | | (0.55 | )% | | | (1.28 | )% | | | 50.62 | % | | | (18.72 | )% | | | (8.57 | )% |
| |
| Ratios and supplemental data: | | | | | | | | | | | | | | | | | | | | |
| Net assets, end of period (000 omitted) | | $ | 278,607 | | | $ | 329,081 | | | $ | 388 | 3 | | $ | 322 | 3 | | $ | 568 | 3 |
| Ratio of expenses to average net assets4 | | | 1.11 | % | | | 1.23 | % | | | 1.23 | % | | | 1.25 | % | | | 1.26 | % |
| Ratio of expenses to average net assets prior to fees waived4 | | | 1.42 | % | | | 1.36 | % | | | 1.35 | % | | | 1.31 | % | | | 1.27 | % |
| Ratio of net investment income to average net assets | | | 2.20 | % | | | 0.89 | % | | | 1.33 | % | | | 1.57 | % | | | 1.90 | % |
| Ratio of net investment income to average net assets prior to fees waived | | | 1.89 | % | | | 0.76 | % | | | 1.21 | % | | | 1.51 | % | | | 1.89 | % |
| Portfolio turnover | | | 43 | % | | | 71 | % | | | 76 | % | | | 62 | % | | | 52 | % |
| 1 | Calculated using average shares outstanding. |
| 2 | Total return is based on the change in net asset value of a share during the period and assumes reinvestment of dividends and distributions at net asset value and does not reflect the impact of a sales charge. Total return during the period reflects waivers by the manager and/or distributor. Performance would have been lower had the waivers not been in effect. |
| 3 | Net assets reported in millions. |
| 4 | Expense ratios do not include expenses of any investment companies in which the Fund invests. |
See accompanying notes, which are an integral part of the financial statements.
Delaware Ivy International Core Equity Fund Class C
Selected data for each share of the Fund outstanding throughout each period were as follows:
| | | Year ended | |
| | | 3/31/23 | | | 3/31/22 | | | 3/31/21 | | | 3/31/20 | | | 3/31/19 | |
| Net asset value, beginning of period | | $ | 16.62 | | | $ | 17.33 | | | $ | 11.65 | | | $ | 14.75 | | | $ | 17.77 | |
| |
| Income (loss) from investment operations: | | | | | | | | | | | | | | | | | | | | |
| Net investment income1 | | | 0.22 | | | | 0.04 | | | | 0.09 | | | | 0.14 | | | | 0.20 | |
| Net realized and unrealized gain (loss) | | | (0.43 | ) | | | (0.36 | ) | | | 5.68 | | | | (2.91 | ) | | | (1.87 | ) |
| Total from investment operations | | | (0.21 | ) | | | (0.32 | ) | | | 5.77 | | | | (2.77 | ) | | | (1.67 | ) |
| |
| Less dividends and distributions from: | | | | | | | | | | | | | | | | | | | | |
| Net investment income | | | (0.02 | ) | | | (0.39 | ) | | | (0.09 | ) | | | (0.33 | ) | | | (0.24 | ) |
| Net realized gain | | | — | | | | — | | | | — | | | | — | | | | (1.11 | ) |
| Total dividends and distributions | | | (0.02 | ) | | | (0.39 | ) | | | (0.09 | ) | | | (0.33 | ) | | | (1.35 | ) |
| |
| Net asset value, end of period | | $ | 16.39 | | | $ | 16.62 | | | $ | 17.33 | | | $ | 11.65 | | | $ | 14.75 | |
| |
| Total return2 | | | (1.23 | )% | | | (1.97 | )% | | | 49.63 | % | | | (19.30 | )% | | | (9.14 | )% |
| |
| Ratios and supplemental data: | | | | | | | | | | | | | | | | | | | | |
| Net assets, end of period (000 omitted) | | $ | 28,549 | | | $ | 45,987 | | | $ | 67 | 3 | | $ | 77 | 3 | | $ | 163 | 3 |
| Ratio of expenses to average net assets4 | | | 1.84 | % | | | 1.92 | % | | | 1.92 | % | | | 1.93 | % | | | 1.91 | % |
| Ratio of expenses to average net assets prior to fees waived4 | | | 2.20 | % | | | 2.06 | % | | | 2.05 | % | | | 1.99 | % | | | 1.92 | % |
| Ratio of net investment income to average net assets | | | 1.46 | % | | | 0.23 | % | | | 0.58 | % | | | 0.94 | % | | | 1.24 | % |
| Ratio of net investment income to average net assets prior to fees waived | | | 1.10 | % | | | 0.09 | % | | | 0.45 | % | | | 0.88 | % | | | 1.23 | % |
| Portfolio turnover | | | 43 | % | | | 71 | % | | | 76 | % | | | 62 | % | | | 52 | % |
| 1 | Calculated using average shares outstanding. |
| 2 | Total return is based on the change in net asset value of a share during the period and assumes reinvestment of dividends and distributions at net asset value and does not reflect the impact of a sales charge. Total return during the period reflects waivers by the manager and/or distributor. Performance would have been lower had the waivers not been in effect. |
| 3 | Net assets reported in millions. |
| 4 | Expense ratios do not include expenses of any investment companies in which the Fund invests. |
See accompanying notes, which are an integral part of the financial statements.
Financial highlights
Delaware Ivy International Core Equity Fund Class I
Selected data for each share of the Fund outstanding throughout each period were as follows:
| | | Year ended | |
| | | 3/31/23 | | | 3/31/22 | | | 3/31/21 | | | 3/31/20 | | | 3/31/19 | |
| Net asset value, beginning of period | | $ | 19.24 | | | $ | 19.98 | | | $ | 13.39 | | | $ | 16.86 | | | $ | 20.10 | |
| |
| Income (loss) from investment operations: | | | | | | | | | | | | | | | | | | | | |
| Net investment income1 | | | 0.45 | | | | 0.28 | | | | 0.29 | | | | 0.35 | | | | 0.42 | |
| Net realized and unrealized gain (loss) | | | (0.50 | ) | | | (0.42 | ) | | | 6.55 | | | | (3.32 | ) | | | (2.12 | ) |
| Total from investment operations | | | (0.05 | ) | | | (0.14 | ) | | | 6.84 | | | | (2.97 | ) | | | (1.70 | ) |
| |
| Less dividends and distributions from: | | | | | | | | | | | | | | | | | | | | |
| Net investment income | | | (0.19 | ) | | | (0.60 | ) | | | (0.25 | ) | | | (0.50 | ) | | | (0.43 | ) |
| Net realized gain | | | — | | | | — | | | | — | | | | — | | | | (1.11 | ) |
| Total dividends and distributions | | | (0.19 | ) | | | (0.60 | ) | | | (0.25 | ) | | | (0.50 | ) | | | (1.54 | ) |
| |
| Net asset value, end of period | | $ | 19.00 | | | $ | 19.24 | | | $ | 19.98 | | | $ | 13.39 | | | $ | 16.86 | |
| |
| Total return2 | | | (0.17 | )% | | | (0.88 | )% | | | 51.27 | % | | | (18.30 | )% | | | (8.20 | )% |
| |
| Ratios and supplemental data: | | | | | | | | | | | | | | | | | | | | |
| Net assets, end of period (000 omitted) | | $ | 723,002 | | | $ | 1,024,716 | | | $ | 1,408 | 3 | | $ | 1,483 | 3 | | $ | 3,149 | 3 |
| Ratio of expenses to average net assets4 | | | 0.79 | % | | | 0.79 | % | | | 0.79 | % | | | 0.79 | % | | | 0.85 | % |
| Ratio of expenses to average net assets prior to fees waived4 | | | 0.94 | % | | | 1.02 | % | | | 1.03 | % | | | 0.98 | % | | | 0.95 | % |
| Ratio of net investment income to average net assets | | | 2.54 | % | | | 1.34 | % | | | 1.72 | % | | | 2.08 | % | | | 2.27 | % |
| Ratio of net investment income to average net assets prior to fees waived | | | 2.39 | % | | | 1.11 | % | | | 1.48 | % | | | 1.89 | % | | | 2.17 | % |
| Portfolio turnover | | | 43 | % | | | 71 | % | | | 76 | % | | | 62 | % | | | 52 | % |
| 1 | Calculated using average shares outstanding. |
| 2 | Total return is based on the change in net asset value of a share during the period and assumes reinvestment of dividends and distributions at net asset value. Total return during the period reflects waivers by the manager and/or distributor. Performance would have been lower had the waivers not been in effect. |
| 3 | Net assets reported in millions. |
| 4 | Expense ratios do not include expenses of any investment companies in which the Fund invests. |
See accompanying notes, which are an integral part of the financial statements.
Delaware Ivy International Core Equity Fund Class R
Selected data for each share of the Fund outstanding throughout each period were as follows:
| | | Year ended | |
| | | 3/31/23 | | | 3/31/22 | | | 3/31/21 | | | 3/31/20 | | | 3/31/19 | |
| Net asset value, beginning of period | | $ | 19.07 | | | $ | 19.80 | | | $ | 13.29 | | | $ | 16.75 | | | $ | 19.97 | |
| |
| Income (loss) from investment operations: | | | | | | | | | | | | | | | | | | | | |
| Net investment income1 | | | 0.33 | | | | 0.12 | | | | 0.17 | | | | 0.20 | | | | 0.29 | |
| Net realized and unrealized gain (loss) | | | (0.49 | ) | | | (0.41 | ) | | | 6.48 | | | | (3.28 | ) | | | (2.10 | ) |
| Total from investment operations | | | (0.16 | ) | | | (0.29 | ) | | | 6.65 | | | | (3.08 | ) | | | (1.81 | ) |
| |
| Less dividends and distributions from: | | | | | | | | | | | | | | | | | | | | |
| Net investment income | | | (0.10 | ) | | | (0.44 | ) | | | (0.14 | ) | | | (0.38 | ) | | | (0.30 | ) |
| Net realized gain | | | — | | | | — | | | | — | | | | — | | | | (1.11 | ) |
| Total dividends and distributions | | | (0.10 | ) | | | (0.44 | ) | | | (0.14 | ) | | | (0.38 | ) | | | (1.41 | ) |
| |
| Net asset value, end of period | | $ | 18.81 | | | $ | 19.07 | | | $ | 19.80 | | | $ | 13.29 | | | $ | 16.75 | |
| |
| Total return2 | | | (0.78 | )% | | | (1.57 | )% | | | 50.08 | % | | | (18.93 | )% | | | (8.82 | )% |
| |
| Ratios and supplemental data: | | | | | | | | | | | | | | | | | | | | |
| Net assets, end of period (000 omitted) | | $ | 41,758 | | | $ | 47,807 | | | $ | 55 | 3 | | $ | 47 | 3 | | $ | 104 | 3 |
| Ratio of expenses to average net assets4 | | | 1.37 | % | | | 1.53 | % | | | 1.53 | % | | | 1.53 | % | | | 1.53 | % |
| Ratio of expenses to average net assets prior to fees waived4 | | | 1.51 | % | | | 1.63 | % | | | 1.62 | % | | | 1.57 | % | | | 1.54 | % |
| Ratio of net investment income to average net assets | | | 1.92 | % | | | 0.58 | % | | | 1.02 | % | | | 1.21 | % | | | 1.60 | % |
| Ratio of net investment income to average net assets prior to fees waived | | | 1.78 | % | | | 0.48 | % | | | 0.93 | % | | | 1.17 | % | | | 1.59 | % |
| Portfolio turnover | | | 43 | % | | | 71 | % | | | 76 | % | | | 62 | % | | | 52 | % |
| 1 | Calculated using average shares outstanding. |
| 2 | Total return is based on the change in net asset value of a share during the period and assumes reinvestment of dividends and distributions at net asset value. Total return during the period reflects waivers by the manager and/or distributor. Performance would have been lower had the waivers not been in effect. |
| 3 | Net assets reported in millions. |
| 4 | Expense ratios do not include expenses of any investment companies in which the Fund invests. |
See accompanying notes, which are an integral part of the financial statements.
Financial highlights
Delaware Ivy International Core Equity Fund Class R6
Selected data for each share of the Fund outstanding throughout each period were as follows:
| | | Year ended | |
| | | 3/31/23 | | | 3/31/22 | | | 3/31/21 | | | 3/31/20 | | | 3/31/19 | |
| Net asset value, beginning of period | | $ | 19.30 | | | $ | 20.03 | | | $ | 13.43 | | | $ | 16.91 | | | $ | 20.16 | |
| |
| Income (loss) from investment operations: | | | | | | | | | | | | | | | | | | | | |
| Net investment income1 | | | 0.45 | | | | 0.29 | | | | 0.29 | | | | 0.36 | | | | 0.43 | |
| Net realized and unrealized gain (loss) | | | (0.51 | ) | | | (0.42 | ) | | | 6.56 | | | | (3.34 | ) | | | (2.12 | ) |
| Total from investment operations | | | (0.06 | ) | | | (0.13 | ) | | | 6.85 | | | | (2.98 | ) | | | (1.69 | ) |
| |
| Less dividends and distributions from: | | | | | | | | | | | | | | | | | | | | |
| Net investment income | | | (0.19 | ) | | | (0.60 | ) | | | (0.25 | ) | | | (0.50 | ) | | | (0.45 | ) |
| Net realized gain | | | — | | | | — | | | | — | | | | — | | | | (1.11 | ) |
| Total dividends and distributions | | | (0.19 | ) | | | (0.60 | ) | | | (0.25 | ) | | | (0.50 | ) | | | (1.56 | ) |
| |
| Net asset value, end of period | | $ | 19.05 | | | $ | 19.30 | | | $ | 20.03 | | | $ | 13.43 | | | $ | 16.91 | |
| |
| Total return2 | | | (0.22 | )% | | | (0.83 | )% | | | 51.19 | % | | | (18.31 | )% | | | (8.12 | )% |
| |
| Ratios and supplemental data: | | | | | | | | | | | | | | | | | | | | |
| Net assets, end of period (000 omitted) | | $ | 243,848 | | | $ | 347,008 | | | $ | 497 | 3 | | $ | 620 | 3 | | $ | 1,437 | 3 |
| Ratio of expenses to average net assets4 | | | 0.79 | % | | | 0.79 | % | | | 0.79 | % | | | 0.79 | % | | | 0.79 | % |
| Ratio of expenses to average net assets prior to fees waived4 | | | 0.93 | % | | | 0.88 | % | | | 0.88 | % | | | 0.83 | % | | | 0.80 | % |
| Ratio of net investment income to average net assets | | | 2.55 | % | | | 1.37 | % | | | 1.69 | % | | | 2.09 | % | | | 2.35 | % |
| Ratio of net investment income to average net assets prior to fees waived | | | 2.41 | % | | | 1.28 | % | | | 1.60 | % | | | 2.05 | % | | | 2.34 | % |
| Portfolio turnover | | | 43 | % | | | 71 | % | | | 76 | % | | | 62 | % | | | 52 | % |
| 1 | Calculated using average shares outstanding. |
| 2 | Total return is based on the change in net asset value of a share during the period and assumes reinvestment of dividends and distributions at net asset value. Total return during the period reflects waivers by the manager and/or distributor. Performance would have been lower had the waivers not been in effect. |
| 3 | Net assets reported in millions. |
| 4 | Expense ratios do not include expenses of any investment companies in which the Fund invests. |
See accompanying notes, which are an integral part of the financial statements.
Delaware Ivy International Core Equity Fund Class Y
Selected data for each share of the Fund outstanding throughout each period were as follows:
| | | Year ended | |
| | | 3/31/23 | | | 3/31/22 | | | 3/31/21 | | | 3/31/20 | | | 3/31/19 | |
| Net asset value, beginning of period | | $ | 19.24 | | | $ | 19.98 | | | $ | 13.39 | | | $ | 16.87 | | | $ | 20.12 | |
| |
| Income (loss) from investment operations: | | | | | | | | | | | | | | | | | | | | |
| Net investment income1 | | | 0.39 | | | | 0.21 | | | | 0.22 | | | | 0.27 | | | | 0.37 | |
| Net realized and unrealized gain (loss) | | | (0.49 | ) | | | (0.43 | ) | | | 6.56 | | | | (3.32 | ) | | | (2.14 | ) |
| Total from investment operations | | | (0.10 | ) | | | (0.22 | ) | | | 6.78 | | | | (3.05 | ) | | | (1.77 | ) |
| |
| Less dividends and distributions from: | | | | | | | | | | | | | | | | | | | | |
| Net investment income | | | (0.15 | ) | | | (0.52 | ) | | | (0.19 | ) | | | (0.43 | ) | | | (0.37 | ) |
| Net realized gain | | | — | | | | — | | | | — | | | | — | | | | (1.11 | ) |
| Total dividends and distributions | | | (0.15 | ) | | | (0.52 | ) | | | (0.19 | ) | | | (0.43 | ) | | | (1.48 | ) |
| |
| Net asset value, end of period | | $ | 18.99 | | | $ | 19.24 | | | $ | 19.98 | | | $ | 13.39 | | | $ | 16.87 | |
| |
| Total return2 | | | (0.46 | )%3 | | | (1.26 | )%3 | | | 50.76 | %3 | | | (18.65 | )%3 | | | (8.55 | )% |
| |
| Ratios and supplemental data: | | | | | | | | | | | | | | | | | | | | |
| Net assets, end of period (000 omitted) | | $ | 41,120 | | | $ | 49,433 | | | $ | 91 | 4 | | $ | 176 | 4 | | $ | 377 | 4 |
| Ratio of expenses to average net assets5 | | | 1.09 | % | | | 1.18 | % | | | 1.17 | % | | | 1.18 | % | | | 1.19 | % |
| Ratio of expenses to average net assets prior to fees waived5 | | | 1.24 | % | | | 1.28 | % | | | 1.29 | % | | | 1.23 | % | | | 1.19 | % |
| Ratio of net investment income to average net assets | | | 2.20 | % | | | 0.99 | % | | | 1.33 | % | | | 1.62 | % | | | 1.99 | % |
| Ratio of net investment income to average net assets prior to fees waived | | | 2.05 | % | | | 0.89 | % | | | 1.21 | % | | | 1.57 | % | | | 1.99 | % |
| Portfolio turnover | | | 43 | % | | | 71 | % | | | 76 | % | | | 62 | % | | | 52 | % |
| 1 | Calculated using average shares outstanding. |
| 2 | Total return is based on the change in net asset value of a share during the period and assumes reinvestment of dividends and distributions at net asset value. |
| 3 | Total return during the period reflects waivers by the manager and/or distributor. Performance would have been lower had the waivers not been in effect. |
| 4 | Net assets reported in millions. |
| 5 | Expense ratios do not include expenses of any investment companies in which the Fund invests. |
See accompanying notes, which are an integral part of the financial statements.
Financial highlights
Delaware Ivy International Value Fund Class A
Selected data for each share of the Fund outstanding throughout each period were as follows:
| | | Year ended | |
| | | 3/31/23 | | | 3/31/22 | | | 3/31/21 | | | 3/31/20 | | | 3/31/19 | |
| Net asset value, beginning of period | | $ | 16.57 | | | $ | 18.54 | | | $ | 11.08 | | | $ | 14.93 | | | $ | 18.08 | |
| |
| Income (loss) from investment operations: | | | | | | | | | | | | | | | | | | | | |
| Net investment income1 | | | 0.16 | | | | 0.21 | | | | 0.16 | | | | 0.32 | | | | 0.16 | |
| Net realized and unrealized gain (loss) | | | (0.31 | ) | | | (1.76 | ) | | | 7.48 | | | | (3.81 | ) | | | (1.33 | ) |
| Total from investment operations | | | (0.15 | ) | | | (1.55 | ) | | | 7.64 | | | | (3.49 | ) | | | (1.17 | ) |
| |
| Less dividends and distributions from: | | | | | | | | | | | | | | | | | | | | |
| Net investment income | | | — | | | | (0.42 | ) | | | (0.18 | ) | | | (0.36 | ) | | | (0.07 | ) |
| Net realized gain | | | (1.51 | ) | | | — | | | | — | | | | — | | | | (1.91 | ) |
| Total dividends and distributions | | | (1.51 | ) | | | (0.42 | ) | | | (0.18 | ) | | | (0.36 | ) | | | (1.98 | ) |
| |
| Net asset value, end of period | | $ | 14.91 | | | $ | 16.57 | | | $ | 18.54 | | | $ | 11.08 | | | $ | 14.93 | |
| |
| Total return2 | | | 0.23 | %3 | | | (8.50 | )% | | | 69.18 | %3 | | | (24.08 | )%3 | | | (6.19 | )%3 |
| |
| Ratios and supplemental data: | | | | | | | | | | | | | | | | | | | | |
| Net assets, end of period (000 omitted) | | $ | 41,665 | | | $ | 53,118 | | | $ | 66 | 4 | | $ | 45 | 4 | | $ | 75 | 4 |
| Ratio of expenses to average net assets5 | | | 1.37 | % | | | 1.45 | % | | | 1.55 | % | | | 1.56 | % | | | 1.55 | % |
| Ratio of expenses to average net assets prior to fees waived5 | | | 1.79 | % | | | 1.45 | % | | | 1.76 | % | | | 1.77 | % | | | 1.75 | % |
| Ratio of net investment income to average net assets | | | 1.10 | % | | | 1.13 | % | | | 1.08 | % | | | 2.19 | % | | | 0.99 | % |
| Ratio of net investment income to average net assets prior to fees waived | | | 0.68 | % | | | 1.13 | % | | | 0.87 | % | | | 1.98 | % | | | 0.79 | % |
| Portfolio turnover | | | 36 | % | | | 119 | % | | | 20 | % | | | 26 | % | | | 85 | % |
| 1 | Calculated using average shares outstanding. |
| 2 | Total return is based on the change in net asset value of a share during the period and assumes reinvestment of dividends and distributions at net asset value and does not reflect the impact of a sales charge. |
| 3 | Total return during the period reflects waivers by the manager and/or distributor. Performance would have been lower had the waivers not been in effect. |
| 4 | Net assets reported in millions. |
| 5 | Expense ratios do not include expenses of any investment companies in which the Fund invests. |
See accompanying notes, which are an integral part of the financial statements.
Delaware Ivy International Value Fund Class C
Selected data for each share of the Fund outstanding throughout each period were as follows:
| | | Year ended | |
| | | 3/31/23 | | | 3/31/22 | | | 3/31/21 | | | 3/31/20 | | | 3/31/19 | |
| Net asset value, beginning of period | | $ | 15.29 | | | $ | 17.16 | | | $ | 10.28 | | | $ | 13.89 | | | $ | 16.99 | |
| |
| Income (loss) from investment operations: | | | | | | | | | | | | | | | | | | | | |
| Net investment income1 | | | 0.06 | | | | 0.04 | | | | 0.02 | | | | 0.22 | | | | 0.06 | |
| Net realized and unrealized gain (loss) | | | (0.31 | ) | | | (1.62 | ) | | | 6.95 | | | | (3.55 | ) | | | (1.25 | ) |
| Total from investment operations | | | (0.25 | ) | | | (1.58 | ) | | | 6.97 | | | | (3.33 | ) | | | (1.19 | ) |
| |
| Less dividends and distributions from: | | | | | | | | | | | | | | | | | | | | |
| Net investment income | | | — | | | | (0.29 | ) | | | (0.09 | ) | | | (0.28 | ) | | | — | |
| Net realized gain | | | (1.51 | ) | | | — | | | | — | | | | — | | | | (1.91 | ) |
| Total dividends and distributions | | | (1.51 | ) | | | (0.29 | ) | | | (0.09 | ) | | | (0.28 | ) | | | (1.91 | ) |
| |
| Net asset value, end of period | | $ | 13.53 | | | $ | 15.29 | | | $ | 17.16 | | | $ | 10.28 | | | $ | 13.89 | |
| |
| Total return2 | | | (0.42 | )%3 | | | (9.30 | )% | | | 67.92 | %3 | | | (24.55 | )%3 | | | (6.74 | )%3 |
| |
| Ratios and supplemental data: | | | | | | | | | | | | | | | | | | | | |
| Net assets, end of period (000 omitted) | | $ | 396 | | | $ | 650 | | | $ | 1 | 4 | | $ | 1 | 4 | | $ | 2 | 4 |
| Ratio of expenses to average net assets5 | | | 2.12 | % | | | 2.28 | % | | | 2.31 | % | | | 2.20 | % | | | 2.13 | % |
| Ratio of expenses to average net assets prior to fees waived5 | | | 2.52 | % | | | 2.28 | % | | | 2.52 | % | | | 2.41 | % | | | 2.33 | % |
| Ratio of net investment income to average net assets | | | 0.44 | % | | | 0.23 | % | | | 0.18 | % | | | 1.57 | % | | | 0.39 | % |
| Ratio of net investment income (loss) to average net assets prior to fees waived | | | 0.04 | % | | | 0.23 | % | | | (0.03 | )% | | | 1.36 | % | | | 0.19 | % |
| Portfolio turnover | | | 36 | % | | | 119 | % | | | 20 | % | | | 26 | % | | | 85 | % |
| 1 | Calculated using average shares outstanding. |
| 2 | Total return is based on the change in net asset value of a share during the period and assumes reinvestment of dividends and distributions at net asset value and does not reflect the impact of a sales charge. |
| 3 | Total return during the period reflects waivers by the manager and/or distributor. Performance would have been lower had the waivers not been in effect. |
| 4 | Net assets reported in millions. |
| 5 | Expense ratios do not include expenses of any investment companies in which the Fund invests. |
See accompanying notes, which are an integral part of the financial statements.
Financial highlights
Delaware Ivy International Value Fund Class I
Selected data for each share of the Fund outstanding throughout each period were as follows:
| | | Year ended | |
| | | 3/31/23 | | | 3/31/22 | | | 3/31/21 | | | 3/31/20 | | | 3/31/19 | |
| Net asset value, beginning of period | | $ | 17.03 | | | $ | 19.05 | | | $ | 11.37 | | | $ | 15.30 | | | $ | 18.48 | |
| |
| Income (loss) from investment operations: | | | | | | | | | | | | | | | | | | | | |
| Net investment income1 | | | 0.24 | | | | 0.30 | | | | 0.22 | | | | 0.39 | | | | 0.24 | |
| Net realized and unrealized gain (loss) | | | (0.33 | ) | | | (1.83 | ) | | | 7.70 | | | | (3.89 | ) | | | (1.37 | ) |
| Total from investment operations | | | (0.09 | ) | | | (1.53 | ) | | | 7.92 | | | | (3.50 | ) | | | (1.13 | ) |
| |
| Less dividends and distributions from: | | | | | | | | | | | | | | | | | | | | |
| Net investment income | | | — | | | | (0.49 | ) | | | (0.24 | ) | | | (0.43 | ) | | | (0.14 | ) |
| Net realized gain | | | (1.51 | ) | | | — | | | | — | | | | — | | | | (1.91 | ) |
| Total dividends and distributions | | | (1.51 | ) | | | (0.49 | ) | | | (0.24 | ) | | | (0.43 | ) | | | (2.05 | ) |
| |
| Net asset value, end of period | | $ | 15.43 | | | $ | 17.03 | | | $ | 19.05 | | | $ | 11.37 | | | $ | 15.30 | |
| |
| Total return2 | | | 0.58 | %3 | | | (8.21 | )% | | | 69.97 | %3 | | | (23.71 | )%3 | | | (5.79 | )%3 |
| |
| Ratios and supplemental data: | | | | | | | | | | | | | | | | | | | | |
| Net assets, end of period (000 omitted) | | $ | 40,058 | | | $ | 66,566 | | | $ | 92 | 4 | | $ | 74 | 4 | | $ | 95 | 4 |
| Ratio of expenses to average net assets5 | | | 1.06 | % | | | 1.08 | % | | | 1.12 | % | | | 1.11 | % | | | 1.12 | % |
| Ratio of expenses to average net assets prior to fees waived5 | | | 1.26 | % | | | 1.08 | % | | | 1.33 | % | | | 1.32 | % | | | 1.32 | % |
| Ratio of net investment income to average net assets | | | 1.62 | % | | | 1.54 | % | | | 1.48 | % | | | 2.60 | % | | | 1.43 | % |
| Ratio of net investment income to average net assets prior to fees waived | | | 1.42 | % | | | 1.54 | % | | | 1.27 | % | | | 2.39 | % | | | 1.23 | % |
| Portfolio turnover | | | 36 | % | | | 119 | % | | | 20 | % | | | 26 | % | | | 85 | % |
| 1 | Calculated using average shares outstanding. |
| 2 | Total return is based on the change in net asset value of a share during the period and assumes reinvestment of dividends and distributions at net asset value. |
| 3 | Total return during the period reflects waivers by the manager and/or distributor. Performance would have been lower had the waivers not been in effect. |
| 4 | Net assets reported in millions. |
| 5 | Expense ratios do not include expenses of any investment companies in which the Fund invests. |
See accompanying notes, which are an integral part of the financial statements.
Delaware Ivy International Value Fund Class R
Selected data for each share of the Fund outstanding throughout each period were as follows:
| | | Year ended | |
| | | 3/31/23 | | | 3/31/22 | | | 3/31/21 | | | 3/31/20 | | | 3/31/19 | |
| Net asset value, beginning of period | | $ | 16.52 | | | $ | 18.50 | | | $ | 11.06 | | | $ | 14.90 | | | $ | 18.05 | |
| |
| Income (loss) from investment operations: | | | | | | | | | | | | | | | | | | | | |
| Net investment income1 | | | 0.07 | | | | 0.50 | | | | 0.14 | | | | 0.30 | | | | 0.14 | |
| Net realized and unrealized gain (loss) | | | (0.24 | ) | | | (2.10 | ) | | | 7.47 | | | | (3.79 | ) | | | (1.33 | ) |
| Total from investment operations | | | (0.17 | ) | | | (1.60 | ) | | | 7.61 | | | | (3.49 | ) | | | (1.19 | ) |
| |
| Less dividends and distributions from: | | | | | | | | | | | | | | | | | | | | |
| Net investment income | | | — | | | | (0.38 | ) | | | (0.17 | ) | | | (0.35 | ) | | | (0.05 | ) |
| Net realized gain | | | (1.51 | ) | | | — | | | | — | | | | — | | | | (1.91 | ) |
| Total dividends and distributions | | | (1.51 | ) | | | (0.38 | ) | | | (0.17 | ) | | | (0.35 | ) | | | (1.96 | ) |
| |
| Net asset value, end of period | | $ | 14.84 | | | $ | 16.52 | | | $ | 18.50 | | | $ | 11.06 | | | $ | 14.90 | |
| |
| Total return2 | | | 0.10 | %3 | | | (8.79 | )% | | | 68.98 | %3 | | | (24.13 | )%3 | | | (6.33 | )%3 |
| |
| Ratios and supplemental data: | | | | | | | | | | | | | | | | | | | | |
| Net assets, end of period (000 omitted) | | $ | 132 | | | $ | 6 | | | $ | — | 4,5 | | $ | — | 4,5 | | $ | — | 4,5 |
| Ratio of expenses to average net assets6 | | | 1.47 | % | | | 1.75 | % | | | 1.69 | % | | | 1.67 | % | | | 1.69 | % |
| Ratio of expenses to average net assets prior to fees waived6 | | | 1.89 | % | | | 1.75 | % | | | 1.90 | % | | | 1.88 | % | | | 1.89 | % |
| Ratio of net investment income to average net assets | | | 0.52 | % | | | 2.66 | % | | | 0.98 | % | | | 2.03 | % | | | 0.85 | % |
| Ratio of net investment income to average net assets prior to fees waived | | | 0.10 | % | | | 2.66 | % | | | 0.77 | % | | | 1.82 | % | | | 0.65 | % |
| Portfolio turnover | | | 36 | % | | | 119 | % | | | 20 | % | | | 26 | % | | | 85 | % |
| 1 | Calculated using average shares outstanding. |
| 2 | Total return is based on the change in net asset value of a share during the period and assumes reinvestment of dividends and distributions at net asset value. |
| 3 | Total return during the period reflects waivers by the manager and/or distributor. Performance would have been lower had the waivers not been in effect. |
| 4 | Net assets reported in millions. |
| 5 | Rounds to less than $500 thousands. |
| 6 | Expense ratios do not include expenses of any investment companies in which the Fund invests. |
See accompanying notes, which are an integral part of the financial statements.
Financial highlights
Delaware Ivy International Value Fund Class R6
Selected data for each share of the Fund outstanding throughout each period were as follows:
| | | Year ended | |
| | | 3/31/23 | | | 3/31/22 | | | 3/31/21 | | | 3/31/20 | | | 3/31/19 | |
| Net asset value, beginning of period | | $ | 17.08 | | | $ | 19.11 | | | $ | 11.40 | | | $ | 15.34 | | | $ | 18.53 | |
| |
| Income (loss) from investment operations: | | | | | | | | | | | | | | | | | | | | |
| Net investment income1 | | | 0.23 | | | | 0.32 | | | | 0.24 | | | | 0.43 | | | | 0.28 | |
| Net realized and unrealized gain (loss) | | | (0.32 | ) | | | (1.83 | ) | | | 7.74 | | | | (3.91 | ) | | | (1.39 | ) |
| Total from investment operations | | | (0.09 | ) | | | (1.51 | ) | | | 7.98 | | | | (3.48 | ) | | | (1.11 | ) |
| |
| Less dividends and distributions from: | | | | | | | | | | | | | | | | | | | | |
| Net investment income | | | — | | | | (0.52 | ) | | | (0.27 | ) | | | (0.46 | ) | | | (0.17 | ) |
| Net realized gain | | | (1.51 | ) | | | — | | | | — | | | | — | | | | (1.91 | ) |
| Total dividends and distributions | | | (1.51 | ) | | | (0.52 | ) | | | (0.27 | ) | | | (0.46 | ) | | | (2.08 | ) |
| |
| Net asset value, end of period | | $ | 15.48 | | | $ | 17.08 | | | $ | 19.11 | | | $ | 11.40 | | | $ | 15.34 | |
| |
| Total return2 | | | 0.58 | %3 | | | (8.08 | )% | | | 70.31 | %3 | | | (23.58 | )%3 | | | (5.66 | )%3 |
| |
| Ratios and supplemental data: | | | | | | | | | | | | | | | | | | | | |
| Net assets, end of period (000 omitted) | | $ | 44,969 | | | $ | 66,050 | | | $ | 90 | 4 | | $ | 84 | 4 | | $ | 105 | 4 |
| Ratio of expenses to average net assets5 | | | 1.03 | % | | | 0.92 | % | | | 0.94 | % | | | 0.93 | % | | | 0.91 | % |
| Ratio of expenses to average net assets prior to fees waived5 | | | 1.16 | % | | | 0.92 | % | | | 1.15 | % | | | 1.14 | % | | | 1.11 | % |
| Ratio of net investment income to average net assets | | | 1.51 | % | | | 1.69 | % | | | 1.62 | % | | | 2.84 | % | | | 1.72 | % |
| Ratio of net investment income to average net assets prior to fees waived | | | 1.38 | % | | | 1.69 | % | | | 1.41 | % | | | 2.63 | % | | | 1.52 | % |
| Portfolio turnover | | | 36 | % | | | 119 | % | | | 20 | % | | | 26 | % | | | 85 | % |
| 1 | Calculated using average shares outstanding. |
| 2 | Total return is based on the change in net asset value of a share during the period and assumes reinvestment of dividends and distributions at net asset value. |
| 3 | Total return during the period reflects waivers by the manager and/or distributor. Performance would have been lower had the waivers not been in effect. |
| 4 | Net assets reported in millions. |
| 5 | Expense ratios do not include expenses of any investment companies in which the Fund invests. |
See accompanying notes, which are an integral part of the financial statements.
Delaware Ivy International Value Fund Class Y
Selected data for each share of the Fund outstanding throughout each period were as follows:
| | | Year ended | |
| | | 3/31/23 | | | 3/31/22 | | | 3/31/21 | | | 3/31/20 | | | 3/31/19 | |
| Net asset value, beginning of period | | $ | 16.85 | | | $ | 18.85 | | | $ | 11.26 | | | $ | 15.16 | | | $ | 18.33 | |
| |
| Income (loss) from investment operations: | | | | | | | | | | | | | | | | | | | | |
| Net investment income1 | | | 0.18 | | | | 0.23 | | | | 0.20 | | | | 0.38 | | | | 0.20 | |
| Net realized and unrealized gain (loss) | | | (0.30 | ) | | | (1.79 | ) | | | 7.60 | | | | (3.89 | ) | | | (1.36 | ) |
| Total from investment operations | | | (0.12 | ) | | | (1.56 | ) | | | 7.80 | | | | (3.51 | ) | | | (1.16 | ) |
| |
| Less dividends and distributions from: | | | | | | | | | | | | | | | | | | | | |
| Net investment income | | | — | | | | (0.44 | ) | | | (0.21 | ) | | | (0.39 | ) | | | (0.10 | ) |
| Net realized gain | | | (1.51 | ) | | | — | | | | — | | | | — | | | | (1.91 | ) |
| Total dividends and distributions | | | (1.51 | ) | | | (0.44 | ) | | | (0.21 | ) | | | (0.39 | ) | | | (2.01 | ) |
| |
| Net asset value, end of period | | $ | 15.22 | | | $ | 16.85 | | | $ | 18.85 | | | $ | 11.26 | | | $ | 15.16 | |
| |
| Total return2 | | | 0.41 | %3 | | | (8.43 | )% | | | 69.55 | %3 | | | (23.93 | )%3 | | | (6.04 | )%3 |
| |
| Ratios and supplemental data: | | | | | | | | | | | | | | | | | | | | |
| Net assets, end of period (000 omitted) | | $ | 689 | | | $ | 953 | | | $ | 1 | 4 | | $ | 1 | 4 | | $ | 2 | 4 |
| Ratio of expenses to average net assets5 | | | 1.29 | % | | | 1.34 | % | | | 1.36 | % | | | 1.41 | % | | | 1.36 | % |
| Ratio of expenses to average net assets prior to fees waived5 | | | 1.50 | % | | | 1.34 | % | | | 1.57 | % | | | 1.62 | % | | | 1.56 | % |
| Ratio of net investment income to average net assets | | | 1.24 | % | | | 1.23 | % | | | 1.32 | % | | | 2.52 | % | | | 1.17 | % |
| Ratio of net investment income to average net assets prior to fees waived | | | 1.03 | % | | | 1.23 | % | | | 1.11 | % | | | 2.31 | % | | | 0.97 | % |
| Portfolio turnover | | | 36 | % | | | 119 | % | | | 20 | % | | | 26 | % | | | 85 | % |
| 1 | Calculated using average shares outstanding. |
| 2 | Total return is based on the change in net asset value of a share during the period and assumes reinvestment of dividends and distributions at net asset value. |
| 3 | Total return during the period reflects waivers by the manager and/or distributor. Performance would have been lower had the waivers not been in effect. |
| 4 | Net assets reported in millions. |
| 5 | Expense ratios do not include expenses of any investment companies in which the Fund invests. |
See accompanying notes, which are an integral part of the financial statements.
Financial highlights
Delaware Ivy Large Cap Growth Fund Class A
Selected data for each share of the Fund outstanding throughout each period were as follows:
| | | Year ended | |
| | | 3/31/23 | | | 3/31/22 | | | 3/31/21 | | | 3/31/20 | | | 3/31/19 | |
| Net asset value, beginning of period | | $ | 31.11 | | | $ | 29.35 | | | $ | 20.52 | | | $ | 22.73 | | | $ | 22.65 | |
| |
| Income (loss) from investment operations: | | | | | | | | | | | | | | | | | | | | |
| Net investment loss1 | | | (0.06 | ) | | | (0.12 | ) | | | (0.07 | ) | | | (0.02 | ) | | | (0.01 | ) |
| Net realized and unrealized gain (loss) | | | (2.99 | ) | | | 5.20 | | | | 10.80 | | | | 0.85 | | | | 2.87 | |
| Total from investment operations | | | (3.05 | ) | | | 5.08 | | | | 10.73 | | | | 0.83 | | | | 2.86 | |
| |
| Less dividends and distributions from: | | | | | | | | | | | | | | | | | | | | |
| Net realized gain | | | (2.88 | ) | | | (3.32 | ) | | | (1.90 | ) | | | (3.04 | ) | | | (2.78 | ) |
| Total dividends and distributions | | | (2.88 | ) | | | (3.32 | ) | | | (1.90 | ) | | | (3.04 | ) | | | (2.78 | ) |
| |
| Net asset value, end of period | | $ | 25.18 | | | $ | 31.11 | | | $ | 29.35 | | | $ | 20.52 | | | $ | 22.73 | |
| |
| Total return2 | | | (9.24 | )%3 | | | 16.52 | % | | | 52.78 | % | | | 2.18 | % | | | 13.65 | % |
| |
| Ratios and supplemental data: | | | | | | | | | | | | | | | | | | | | |
| Net assets, end of period (000 omitted) | | $ | 2,127,513 | | | $ | 2,834,191 | | | $ | 2,740 | 4 | | $ | 1,936 | 4 | | $ | 2,113 | 4 |
| Ratio of expenses to average net assets5 | | | 0.93 | % | | | 0.94 | % | | | 0.98 | % | | | 1.01 | % | | | 1.04 | % |
| Ratio of expenses to average net assets prior to fees waived5 | | | 1.00 | % | | | 0.94 | % | | | 0.98 | % | | | 1.01 | % | | | 1.04 | % |
| Ratio of net investment loss to average net assets | | | (0.22 | )% | | | (0.36 | )% | | | (0.24 | )% | | | (0.07 | )% | | | (0.04 | )% |
| Ratio of net investment loss to average net assets prior to fees waived | | | (0.29 | )% | | | (0.28 | )% | | | (0.36 | )% | | | (0.24 | )% | | | (0.07 | )% |
| Portfolio turnover | | | 20 | % | | | 12 | % | | | 23 | % | | | 33 | % | | | 37 | % |
| 1 | Calculated using average shares outstanding. |
| 2 | Total return is based on the change in net asset value of a share during the period and assumes reinvestment of dividends and distributions at net asset value and does not reflect the impact of a sales charge. |
| 3 | Total return during the period reflects waivers by the manager and/or distributor. Performance would have been lower had the waivers not been in effect. |
| 4 | Net assets reported in millions. |
| 5 | Expense ratios do not include expenses of any investment companies in which the Fund invests. |
See accompanying notes, which are an integral part of the financial statements.
Delaware Ivy Large Cap Growth Fund Class C
Selected data for each share of the Fund outstanding throughout each period were as follows:
| | | Year ended | |
| | | 3/31/23 | | | 3/31/22 | | | 3/31/21 | | | 3/31/20 | | | 3/31/19 | |
| Net asset value, beginning of period | | $ | 22.78 | | | $ | 22.15 | | | $ | 15.94 | | | $ | 18.30 | | | $ | 18.87 | |
| |
| Income (loss) from investment operations: | | | | | | | | | | | | | | | | | | | | |
| Net investment loss1 | | | (0.19 | ) | | | (0.30 | ) | | | (0.22 | ) | | | (0.17 | ) | | | (0.15 | ) |
| Net realized and unrealized gain (loss) | | | (2.25 | ) | | | 3.96 | | | | 8.33 | | | | 0.75 | | | | 2.33 | |
| Total from investment operations | | | (2.44 | ) | | | 3.66 | | | | 8.11 | | | | 0.58 | | | | 2.18 | |
| |
| Less dividends and distributions from: | | | | | | | | | | | | | | | | | | | | |
| Net realized gain | | | (2.88 | ) | | | (3.03 | ) | | | (1.90 | ) | | | (2.94 | ) | | | (2.75 | ) |
| Total dividends and distributions | | | (2.88 | ) | | | (3.03 | ) | | | (1.90 | ) | | | (2.94 | ) | | | (2.75 | ) |
| |
| Net asset value, end of period | | $ | 17.46 | | | $ | 22.78 | | | $ | 22.15 | | | $ | 15.94 | | | $ | 18.30 | |
| |
| Total return2 | | | (9.97 | )%3 | | | 15.55 | % | | | 51.46 | % | | | 1.38 | % | | | 12.75 | % |
| |
| Ratios and supplemental data: | | | | | | | | | | | | | | | | | | | | |
| Net assets, end of period (000 omitted) | | $ | 44,773 | | | $ | 63,666 | | | $ | 69 | 4 | | $ | 69 | 4 | | $ | 88 | 4 |
| Ratio of expenses to average net assets5 | | | 1.73 | % | | | 1.80 | % | | | 1.82 | % | | | 1.83 | % | | | 1.81 | % |
| Ratio of expenses to average net assets prior to fees waived5 | | | 1.90 | % | | | 1.80 | % | | | 1.82 | % | | | 1.83 | % | | | 1.81 | % |
| Ratio of net investment loss to average net assets | | | (1.03 | )% | | | (1.23 | )% | | | (1.07 | )% | | | (0.89 | )% | | | (0.81 | )% |
| Ratio of net investment loss to average net assets prior to fees waived | | | (1.20 | )% | | | (1.23 | )% | | | (1.07 | )% | | | (0.89 | )% | | | (0.81 | )% |
| Portfolio turnover | | | 20 | % | | | 12 | % | | | 23 | % | | | 33 | % | | | 37 | % |
| 1 | Calculated using average shares outstanding. |
| 2 | Total return is based on the change in net asset value of a share during the period and assumes reinvestment of dividends and distributions at net asset value and does not reflect the impact of a sales charge. |
| 3 | Total return during the period reflects waivers by the manager and/or distributor. Performance would have been lower had the waivers not been in effect. |
| 4 | Net assets reported in millions. |
| 5 | Expense ratios do not include expenses of any investment companies in which the Fund invests. |
See accompanying notes, which are an integral part of the financial statements.
Financial highlights
Delaware Ivy Large Cap Growth Fund Class I
Selected data for each share of the Fund outstanding throughout each period were as follows:
| | | Year ended | |
| | | 3/31/23 | | | 3/31/22 | | | 3/31/21 | | | 3/31/20 | | | 3/31/19 | |
| Net asset value, beginning of period | | $ | 33.61 | | | $ | 31.48 | | | $ | 21.90 | | | $ | 24.09 | | | $ | 23.80 | |
| |
| Income (loss) from investment operations: | | | | | | | | | | | | | | | | | | | | |
| Net investment income (loss)1 | | | 0.02 | 2 | | | (0.02 | ) | | | 0.03 | | | | 0.06 | | | | 0.06 | |
| Net realized and unrealized gain (loss) | | | (3.22 | ) | | | 5.56 | | | | 11.52 | | | | 0.89 | | | | 3.03 | |
| Total from investment operations | | | (3.20 | ) | | | 5.54 | | | | 11.55 | | | | 0.95 | | | | 3.09 | |
| |
| Less dividends and distributions from: | | | | | | | | | | | | | | | | | | | | |
| Net investment income | | | — | | | | — | | | | (0.01 | ) | | | (0.07 | ) | | | — | |
| Net realized gain | | | (2.88 | ) | | | (3.41 | ) | | | (1.96 | ) | | | (3.07 | ) | | | (2.80 | ) |
| Total dividends and distributions | | | (2.88 | ) | | | (3.41 | ) | | | (1.97 | ) | | | (3.14 | ) | | | (2.80 | ) |
| |
| Net asset value, end of period | | $ | 27.53 | | | $ | 33.61 | | | $ | 31.48 | | | $ | 21.90 | | | $ | 24.09 | |
| |
| Total return3 | | | (8.99 | )% | | | 16.87 | % | | | 53.25 | % | | | 2.51 | % | | | 13.99 | % |
| |
| Ratios and supplemental data: | | | | | | | | | | | | | | | | | | | | |
| Net assets, end of period (000 omitted) | | $ | 2,723,101 | | | $ | 2,626,992 | | | $ | 2,527 | 4 | | $ | 1,819 | 4 | | $ | 1,970 | 4 |
| Ratio of expenses to average net assets5 | | | 0.64 | % | | | 0.64 | % | | | 0.64 | % | | | 0.69 | % | | | 0.73 | % |
| Ratio of expenses to average net assets prior to fees waived5 | | | 0.66 | % | | | 0.77 | % | | | 0.79 | % | | | 0.80 | % | | | 0.82 | % |
| Ratio of net investment income (loss) to average net assets | | | 0.07 | % | | | (0.06 | )% | | | 0.09 | % | | | 0.24 | % | | | 0.27 | % |
| Ratio of net investment income (loss) to average net assets prior to fees waived | | | 0.05 | % | | | (0.19 | )% | | | (0.06 | )% | | | 0.13 | % | | | 0.18 | % |
| Portfolio turnover | | | 20 | % | | | 12 | % | | | 23 | % | | | 33 | % | | | 37 | % |
| 1 | Calculated using average shares outstanding. |
| 2 | The per share amount of net investment income (loss) does not directly correlate to the amounts reported in the Statements of operations due to class specific expenses. |
| 3 | Total return is based on the change in net asset value of a share during the period and assumes reinvestment of dividends and distributions at net asset value. Total return during the period reflects waivers by the manager and/or distributor. Performance would have been lower had the waivers not been in effect. |
| 4 | Net assets reported in millions. |
| 5 | Expense ratios do not include expenses of any investment companies in which the Fund invests. |
See accompanying notes, which are an integral part of the financial statements.
Delaware Ivy Large Cap Growth Fund Class R
Selected data for each share of the Fund outstanding throughout each period were as follows:
| | | Year ended | |
| | | 3/31/23 | | | 3/31/22 | | | 3/31/21 | | | 3/31/20 | | | 3/31/19 | |
| Net asset value, beginning of period | | $ | 29.09 | | | $ | 27.57 | | | $ | 19.43 | | | $ | 21.69 | | | $ | 21.79 | |
| |
| Income (loss) from investment operations: | | | | | | | | | | | | | | | | | | | | |
| Net investment loss1 | | | (0.12 | ) | | | (0.24 | ) | | | (0.16 | ) | | | (0.10 | ) | | | (0.09 | ) |
| Net realized and unrealized gain (loss) | | | (2.83 | ) | | | 4.89 | | | | 10.20 | | | | 0.82 | | | | 2.74 | |
| Total from investment operations | | | (2.95 | ) | | | 4.65 | | | | 10.04 | | | | 0.72 | | | | 2.65 | |
| |
| Less dividends and distributions from: | | | | | | | | | | | | | | | | | | | | |
| Net realized gain | | | (2.88 | ) | | | (3.13 | ) | | | (1.90 | ) | | | (2.98 | ) | | | (2.75 | ) |
| Total dividends and distributions | | | (2.88 | ) | | | (3.13 | ) | | | (1.90 | ) | | | (2.98 | ) | | | (2.75 | ) |
| |
| Net asset value, end of period | | $ | 23.26 | | | $ | 29.09 | | | $ | 27.57 | | | $ | 19.43 | | | $ | 21.69 | |
| |
| Total return2 | | | (9.55 | )%3 | | | 16.07 | % | | | 52.17 | % | | | 1.75 | % | | | 13.22 | % |
| |
| Ratios and supplemental data: | | | | | | | | | | | | | | | | | | | | |
| Net assets, end of period (000 omitted) | | $ | 10,598 | | | $ | 12,298 | | | $ | 13 | 4 | | $ | 13 | 4 | | $ | 18 | 4 |
| Ratio of expenses to average net assets5 | | | 1.23 | % | | | 1.37 | % | | | 1.38 | % | | | 1.40 | % | | | 1.40 | % |
| Ratio of expenses to average net assets prior to fees waived5 | | | 1.24 | % | | | 1.37 | % | | | 1.38 | % | | | 1.40 | % | | | 1.40 | % |
| Ratio of net investment loss to average net assets | | | (0.51 | )% | | | (0.79 | )% | | | (0.63 | )% | | | (0.46 | )% | | | (0.40 | )% |
| Ratio of net investment loss to average net assets prior to fees waived | | | (0.52 | )% | | | (0.79 | )% | | | (0.63 | )% | | | (0.46 | )% | | | (0.40 | )% |
| Portfolio turnover | | | 20 | % | | | 12 | % | | | 23 | % | | | 33 | % | | | 37 | % |
| 1 | Calculated using average shares outstanding. |
| 2 | Total return is based on the change in net asset value of a share during the period and assumes reinvestment of dividends and distributions at net asset value. |
| 3 | Total return during the period reflects waivers by the manager and/or distributor. Performance would have been lower had the waivers not been in effect. |
| 4 | Net assets reported in millions. |
| 5 | Expense ratios do not include expenses of any investment companies in which the Fund invests. |
See accompanying notes, which are an integral part of the financial statements.
Financial highlights
Delaware Ivy Large Cap Growth Fund Class R6
Selected data for each share of the Fund outstanding throughout each period were as follows:
| | | Year ended | |
| | | 3/31/23 | | | 3/31/22 | | | 3/31/21 | | | 3/31/20 | | | 3/31/19 | |
| Net asset value, beginning of period | | $ | 33.89 | | | $ | 31.71 | | | $ | 22.05 | | | $ | 24.25 | | | $ | 23.91 | |
| |
| Income (loss) from investment operations: | | | | | | | | | | | | | | | | | | | | |
| Net investment income (loss)1 | | | 0.03 | 2 | | | (0.02 | ) | | | 0.03 | | | | 0.07 | | | | 0.08 | |
| Net realized and unrealized gain (loss) | | | (3.26 | ) | | | 5.61 | | | | 11.61 | | | | 0.89 | | | | 3.04 | |
| Total from investment operations | | | (3.23 | ) | | | 5.59 | | | | 11.64 | | | | 0.96 | | | | 3.12 | |
| |
| Less dividends and distributions from: | | | | | | | | | | | | | | | | | | | | |
| Net investment income | | | — | | | | — | | | | (0.02 | ) | | | (0.09 | ) | | | — | |
| Net realized gain | | | (2.88 | ) | | | (3.41 | ) | | | (1.96 | ) | | | (3.07 | ) | | | (2.78 | ) |
| Total dividends and distributions | | | (2.88 | ) | | | (3.41 | ) | | | (1.98 | ) | | | (3.16 | ) | | | (2.78 | ) |
| |
| Net asset value, end of period | | $ | 27.78 | | | $ | 33.89 | | | $ | 31.71 | | | $ | 22.05 | | | $ | 24.25 | |
| |
| Total return3 | | | (9.01 | )%4 | | | 16.90 | % | | | 53.28 | % | | | 2.54 | % | | | 14.06 | % |
| |
| Ratios and supplemental data: | | | | | | | | | | | | | | | | | | | | |
| Net assets, end of period (000 omitted) | | $ | 185,287 | | | $ | 166,623 | | | $ | 164 | 5 | | $ | 107 | 5 | | $ | 108 | 5 |
| Ratio of expenses to average net assets6 | | | 0.64 | % | | | 0.64 | % | | | 0.64 | % | | | 0.66 | % | | | 0.66 | % |
| Ratio of expenses to average net assets prior to fees waived6 | | | 0.66 | % | | | 0.64 | % | | | 0.64 | % | | | 0.66 | % | | | 0.66 | % |
| Ratio of net investment income (loss) to average net assets | | | 0.09 | % | | | (0.06 | )% | | | 0.10 | % | | | 0.28 | % | | | 0.33 | % |
| Ratio of net investment income (loss) to average net assets prior to fees waived | | | 0.07 | % | | | (0.06 | )% | | | 0.10 | % | | | 0.28 | % | | | 0.33 | % |
| Portfolio turnover | | | 20 | % | | | 12 | % | | | 23 | % | | | 33 | % | | | 37 | % |
| 1 | Calculated using average shares outstanding. |
| 2 | The per share amount of net investment income (loss) does not directly correlate to the amounts reported in the Statements of operations due to class specific expenses. |
| 3 | Total return is based on the change in net asset value of a share during the period and assumes reinvestment of dividends and distributions at net asset value. |
| 4 | Total return during the period reflects waivers by the manager and/or distributor. Performance would have been lower had the waivers not been in effect. |
| 5 | Net assets reported in millions. |
| 6 | Expense ratios do not include expenses of any investment companies in which the Fund invests. |
See accompanying notes, which are an integral part of the financial statements.
Delaware Ivy Large Cap Growth Fund Class Y
Selected data for each share of the Fund outstanding throughout each period were as follows:
| | | Year ended | |
| | | 3/31/23 | | | 3/31/22 | | | 3/31/21 | | | 3/31/20 | | | 3/31/19 | |
| Net asset value, beginning of period | | $ | 32.29 | | | $ | 30.36 | | | $ | 21.18 | | | $ | 23.37 | | | $ | 23.24 | |
| |
| Income (loss) from investment operations: | | | | | | | | | | | | | | | | | | | | |
| Net investment loss1 | | | (0.06 | ) | | | (0.13 | ) | | | (0.07 | ) | | | (0.02 | ) | | | (0.01 | ) |
| Net realized and unrealized gain (loss) | | | (3.11 | ) | | | 5.37 | | | | 11.15 | | | | 0.86 | | | | 2.94 | |
| Total from investment operations | | | (3.17 | ) | | | 5.24 | | | | 11.08 | | | | 0.84 | | | | 2.93 | |
| |
| Less dividends and distributions from: | | | | | | | | | | | | | | | | | | | | |
| Net realized gain | | | (2.88 | ) | | | (3.31 | ) | | | (1.90 | ) | | | (3.03 | ) | | | (2.80 | ) |
| Total dividends and distributions | | | (2.88 | ) | | | (3.31 | ) | | | (1.90 | ) | | | (3.03 | ) | | | (2.80 | ) |
| |
| Net asset value, end of period | | $ | 26.24 | | | $ | 32.29 | | | $ | 30.36 | | | $ | 21.18 | | | $ | 23.37 | |
| |
| Total return2 | | | (9.28 | )% | | | 16.51 | % | | | 52.78 | % | | | 2.19 | % | | | 13.61 | % |
| |
| Ratios and supplemental data: | | | | | | | | | | | | | | | | | | | | |
| Net assets, end of period (000 omitted) | | $ | 24,849 | | | $ | 35,926 | | | $ | 31 | 3 | | $ | 26 | 3 | | $ | 38 | 3 |
| Ratio of expenses to average net assets4 | | | 0.95 | % | | | 0.95 | % | | | 0.98 | % | | | 1.01 | % | | | 1.05 | % |
| Ratio of expenses to average net assets prior to fees waived4 | | | 0.96 | % | | | 1.02 | % | | | 1.04 | % | | | 1.05 | % | | | 1.06 | % |
| Ratio of net investment loss to average net assets | | | (0.24 | )% | | | (0.37 | )% | | | (0.24 | )% | | | (0.08 | )% | | | (0.05 | )% |
| Ratio of net investment loss to average net assets prior to fees waived | | | (0.25 | )% | | | (0.44 | )% | | | (0.30 | )% | | | (0.12 | )% | | | (0.06 | )% |
| Portfolio turnover | | | 20 | % | | | 12 | % | | | 23 | % | | | 33 | % | | | 37 | % |
| 1 | Calculated using average shares outstanding. |
| 2 | Total return is based on the change in net asset value of a share during the period and assumes reinvestment of dividends and distributions at net asset value. Total return during the period reflects waivers by the manager and/or distributor. Performance would have been lower had the waivers not been in effect. |
| 3 | Net assets reported in millions. |
| 4 | Expense ratios do not include expenses of any investment companies in which the Fund invests. |
See accompanying notes, which are an integral part of the financial statements.
Financial highlights
Delaware Ivy Limited-Term Bond Fund Class A
Selected data for each share of the Fund outstanding throughout each period were as follows:
| | | Year ended | |
| | | 3/31/23 | | | 3/31/22 | | | 3/31/21 | | | 3/31/20 | | | 3/31/19 | |
| Net asset value, beginning of period | | $ | 10.61 | | | $ | 11.04 | | | $ | 10.87 | | | $ | 10.74 | | | $ | 10.64 | |
| |
| Income (loss) from investment operations: | | | | | | | | | | | | | | | | | | | | |
| Net investment income1 | | | 0.21 | | | | 0.11 | | | | 0.15 | | | | 0.20 | | | | 0.21 | |
| Net realized and unrealized gain (loss) | | | (0.23 | ) | | | (0.43 | ) | | | 0.17 | | | | 0.14 | | | | 0.10 | |
| Total from investment operations | | | (0.02 | ) | | | (0.32 | ) | | | 0.32 | | | | 0.34 | | | | 0.31 | |
| |
| Less dividends and distributions from: | | | | | | | | | | | | | | | | | | | | |
| Net investment income | | | (0.21 | ) | | | (0.11 | ) | | | (0.15 | ) | | | (0.21 | ) | | | (0.21 | ) |
| Total dividends and distributions | | | (0.21 | ) | | | (0.11 | ) | | | (0.15 | ) | | | (0.21 | ) | | | (0.21 | ) |
| |
| Net asset value, end of period | | $ | 10.38 | | | $ | 10.61 | | | $ | 11.04 | | | $ | 10.87 | | | $ | 10.74 | |
| |
| Total return2 | | | (0.17 | )%3 | | | (2.95 | )% | | | 2.99 | % | | | 3.14 | % | | | 2.95 | % |
| |
| Ratios and supplemental data: | | | | | | | | | | | | | | | | | | | | |
| Net assets, end of period (000 omitted) | | $ | 286,217 | | | $ | 348,269 | | | $ | 421 | 4 | | $ | 381 | 4 | | $ | 382 | 4 |
| Ratio of expenses to average net assets5 | | | 0.84 | % | | | 0.89 | % | | | 0.89 | % | | | 0.91 | % | | | 0.91 | % |
| Ratio of expenses to average net assets prior to fees waived5 | | | 0.95 | % | | | 0.89 | % | | | 0.89 | % | | | 0.91 | % | | | 0.91 | % |
| Ratio of net investment income to average net assets | | | 2.06 | % | | | 0.98 | % | | | 1.39 | % | | | 1.86 | % | | | 1.90 | % |
| Ratio of net investment income to average net assets prior to fees waived | | | 1.95 | % | | | 0.98 | % | | | 1.39 | % | | | 1.86 | % | | | 1.90 | % |
| Portfolio turnover | | | 120 | % | | | 88 | % | | | 55 | % | | | 61 | % | | | 83 | % |
| 1 | Calculated using average shares outstanding. |
| 2 | Total return is based on the change in net asset value of a share during the period and assumes reinvestment of dividends and distributions at net asset value and does not reflect the impact of a sales charge. |
| 3 | Total return during the period reflects waivers by the manager and/or distributor. Performance would have been lower had the waivers not been in effect. |
| 4 | Net assets reported in millions. |
| 5 | Expense ratios do not include expenses of any investment companies in which the Fund invests. |
See accompanying notes, which are an integral part of the financial statements.
Delaware Ivy Limited-Term Bond Fund Class C
Selected data for each share of the Fund outstanding throughout each period were as follows:
| | | Year ended | |
| | | 3/31/23 | | | 3/31/22 | | | 3/31/21 | | | 3/31/20 | | | 3/31/19 | |
| Net asset value, beginning of period | | $ | 10.61 | | | $ | 11.04 | | | $ | 10.87 | | | $ | 10.74 | | | $ | 10.64 | |
| |
| Income (loss) from investment operations: | | | | | | | | | | | | | | | | | | | | |
| Net investment income1 | | | 0.12 | | | | 0.02 | | | | 0.07 | | | | 0.12 | | | | 0.13 | |
| Net realized and unrealized gain (loss) | | | (0.22 | ) | | | (0.43 | ) | | | 0.17 | | | | 0.13 | | | | 0.10 | |
| Total from investment operations | | | (0.10 | ) | | | (0.41 | ) | | | 0.24 | | | | 0.25 | | | | 0.23 | |
| |
| Less dividends and distributions from: | | | | | | | | | | | | | | | | | | | | |
| Net investment income | | | (0.13 | ) | | | (0.02 | ) | | | (0.07 | ) | | | (0.12 | ) | | | (0.13 | ) |
| Total dividends and distributions | | | (0.13 | ) | | | (0.02 | ) | | | (0.07 | ) | | | (0.12 | ) | | | (0.13 | ) |
| |
| Net asset value, end of period | | $ | 10.38 | | | $ | 10.61 | | | $ | 11.04 | | | $ | 10.87 | | | $ | 10.74 | |
| |
| Total return2 | | | (0.95 | )%3 | | | (3.70 | )% | | | 2.23 | % | | | 2.36 | % | | | 2.20 | % |
| |
| Ratios and supplemental data: | | | | | | | | | | | | | | | | | | | | |
| Net assets, end of period (000 omitted) | | $ | 7,124 | | | $ | 14,208 | | | $ | 25 | 4 | | $ | 27 | 4 | | $ | 45 | 4 |
| Ratio of expenses to average net assets5 | | | 1.64 | % | | | 1.67 | % | | | 1.65 | % | | | 1.67 | % | | | 1.65 | % |
| Ratio of expenses to average net assets prior to fees waived5 | | | 1.83 | % | | | 1.67 | % | | | 1.65 | % | | | 1.67 | % | | | 1.65 | % |
| Ratio of net investment income to average net assets | | | 1.17 | % | | | 0.22 | % | | | 0.65 | % | | | 1.12 | % | | | 1.16 | % |
| Ratio of net investment income to average net assets prior to fees waived | | | 0.98 | % | | | 0.22 | % | | | 0.65 | % | | | 1.12 | % | | | 1.16 | % |
| Portfolio turnover | | | 120 | % | | | 88 | % | | | 55 | % | | | 61 | % | | | 83 | % |
| 1 | Calculated using average shares outstanding. |
| 2 | Total return is based on the change in net asset value of a share during the period and assumes reinvestment of dividends and distributions at net asset value and does not reflect the impact of a sales charge. |
| 3 | Total return during the period reflects waivers by the manager and/or distributor. Performance would have been lower had the waivers not been in effect. |
| 4 | Net assets reported in millions. |
| 5 | Expense ratios do not include expenses of any investment companies in which the Fund invests. |
See accompanying notes, which are an integral part of the financial statements.
Financial highlights
Delaware Ivy Limited-Term Bond Fund Class I
Selected data for each share of the Fund outstanding throughout each period were as follows:
| | | Year ended | |
| | | 3/31/23 | | | 3/31/22 | | | 3/31/21 | | 3/31/20 | | | 3/31/19 | |
| Net asset value, beginning of period | | $ | 10.61 | | | $ | 11.04 | | | $ | 10.87 | | | $ | 10.74 | | | $ | 10.64 | |
| |
| Income (loss) from investment operations: | | | | | | | | | | | | | | | | | | | | |
| Net investment income1 | | | 0.23 | | | | 0.13 | | | | 0.18 | | | | 0.23 | | | | 0.24 | |
| Net realized and unrealized gain (loss) | | | (0.23 | ) | | | (0.43 | ) | | | 0.17 | | | | 0.13 | | | | 0.10 | |
| Total from investment operations | | | — | | | | (0.30 | ) | | | 0.35 | | | | 0.36 | | | | 0.34 | |
| |
| Less dividends and distributions from: | | | | | | | | | | | | | | | | | | | | |
| Net investment income | | | (0.23 | ) | | | (0.13 | ) | | | (0.18 | ) | | | (0.23 | ) | | | (0.24 | ) |
| Total dividends and distributions | | | (0.23 | ) | | | (0.13 | ) | | | (0.18 | ) | | | (0.23 | ) | | | (0.24 | ) |
| |
| Net asset value, end of period | | $ | 10.38 | | | $ | 10.61 | | | $ | 11.04 | | | $ | 10.87 | | | $ | 10.74 | |
| |
| Total return2 | | | 0.07 | %3 | | | (2.76 | )% | | | 3.21 | % | | | 3.38 | % | | | 3.19 | % |
| |
| Ratios and supplemental data: | | | | | | | | | | | | | | | | | | | | |
| Net assets, end of period (000 omitted) | | $ | 257,146 | | | $ | 434,583 | | | $ | 596 | 4 | | $ | 570 | 4 | | $ | 677 | 4 |
| Ratio of expenses to average net assets5 | | | 0.60 | % | | | 0.68 | % | | | 0.68 | % | | | 0.69 | % | | | 0.67 | % |
| Ratio of expenses to average net assets prior to fees waived5 | | | 0.64 | % | | | 0.68 | % | | | 0.68 | % | | | 0.69 | % | | | 0.67 | % |
| Ratio of net investment income to average net assets | | | 2.24 | % | | | 1.19 | % | | | 1.61 | % | | | 2.10 | % | | | 2.14 | % |
| Ratio of net investment income to average net assets prior to fees waived | | | 2.20 | % | | | 1.19 | % | | | 1.61 | % | | | 2.10 | % | | | 2.14 | % |
| Portfolio turnover | | | 120 | % | | | 88 | % | | | 55 | % | | | 61 | % | | | 83 | % |
| 1 | Calculated using average shares outstanding. |
| 2 | Total return is based on the change in net asset value of a share during the period and assumes reinvestment of dividends and distributions at net asset value. |
| 3 | Total return during the period reflects waivers by the manager and/or distributor. Performance would have been lower had the waivers not been in effect. |
| 4 | Net assets reported in millions. |
| 5 | Expense ratios do not include expenses of any investment companies in which the Fund invests. |
See accompanying notes, which are an integral part of the financial statements.
Delaware Ivy Limited-Term Bond Fund Class R
Selected data for each share of the Fund outstanding throughout each period were as follows:
| | | Year ended | |
| | | 3/31/23 | | | 3/31/22 | | | 3/31/21 | | | 3/31/20 | | | 3/31/19 | |
| Net asset value, beginning of period | | $ | 10.61 | | | $ | 11.04 | | | $ | 10.87 | | | $ | 10.74 | | | $ | 10.64 | |
| |
| Income (loss) from investment operations: | | | | | | | | | | | | | | | | | | | | |
| Net investment income1 | | | 0.18 | | | | 0.06 | | | | 0.12 | | | | 0.16 | | | | 0.17 | |
| Net realized and unrealized gain (loss) | | | (0.23 | ) | | | (0.43 | ) | | | 0.16 | | | | 0.14 | | | | 0.10 | |
| Total from investment operations | | | (0.05 | ) | | | (0.37 | ) | | | 0.28 | | | | 0.30 | | | | 0.27 | |
| |
| Less dividends and distributions from: | | | | | | | | | | | | | | | | | | | | |
| Net investment income | | | (0.18 | ) | | | (0.06 | ) | | | (0.11 | ) | | | (0.17 | ) | | | (0.17 | ) |
| Total dividends and distributions | | | (0.18 | ) | | | (0.06 | ) | | | (0.11 | ) | | | (0.17 | ) | | | (0.17 | ) |
| |
| Net asset value, end of period | | $ | 10.38 | | | $ | 10.61 | | | $ | 11.04 | | | $ | 10.87 | | | $ | 10.74 | |
| |
| Total return2 | | | (0.46 | )%3 | | | (3.34 | )% | | | 2.61 | % | | | 2.76 | % | | | 2.60 | % |
| |
| Ratios and supplemental data: | | | | | | | | | | | | | | | | | | | | |
| Net assets, end of period (000 omitted) | | $ | 336 | | | $ | 478 | | | $ | — | 4,5 | | $ | 1 | 4 | | $ | — | 4,5 |
| Ratio of expenses to average net assets6 | | | 1.13 | % | | | 1.29 | % | | | 1.27 | % | | | 1.28 | % | | | 1.26 | % |
| Ratio of expenses to average net assets prior to fees waived6 | | | 1.16 | % | | | 1.29 | % | | | 1.27 | % | | | 1.28 | % | | | 1.26 | % |
| Ratio of net investment income to average net assets | | | 1.76 | % | | | 0.59 | % | | | 1.06 | % | | | 1.47 | % | | | 1.54 | % |
| Ratio of net investment income to average net assets prior to fees waived | | | 1.73 | % | | | 0.59 | % | | | 1.06 | % | | | 1.47 | % | | | 1.54 | % |
| Portfolio turnover | | | 120 | % | | | 88 | % | | | 55 | % | | | 61 | % | | | 83 | % |
| 1 | Calculated using average shares outstanding. |
| 2 | Total return is based on the change in net asset value of a share during the period and assumes reinvestment of dividends and distributions at net asset value. |
| 3 | Total return during the period reflects waivers by the manager and/or distributor. Performance would have been lower had the waivers not been in effect. |
| 4 | Net assets reported in millions. |
| 5 | Rounds to less than $500 thousands. |
| 6 | Expense ratios do not include expenses of any investment companies in which the Fund invests. |
See accompanying notes, which are an integral part of the financial statements.
Financial highlights
Delaware Ivy Limited-Term Bond Fund Class R6
Selected data for each share of the Fund outstanding throughout each period were as follows:
| | | Year ended | |
| | | 3/31/23 | | | 3/31/22 | | | 3/31/21 | | | 3/31/20 | | | 3/31/19 | |
| Net asset value, beginning of period | | $ | 10.61 | | | $ | 11.04 | | | $ | 10.87 | | | $ | 10.74 | | | $ | 10.64 | |
| |
| Income (loss) from investment operations: | | | | | | | | | | | | | | | | | | | | |
| Net investment income1 | | | 0.18 | | | | 0.15 | | | | 0.20 | | | | 0.24 | | | | 0.25 | |
| Net realized and unrealized gain (loss) | | | (0.17 | ) | | | (0.43 | ) | | | 0.17 | | | | 0.14 | | | | 0.10 | |
| Total from investment operations | | | 0.01 | | | | (0.28 | ) | | | 0.37 | | | | 0.38 | | | | 0.35 | |
| |
| Less dividends and distributions from: | | | | | | | | | | | | | | | | | | | | |
| Net investment income | | | (0.24 | ) | | | (0.15 | ) | | | (0.20 | ) | | | (0.25 | ) | | | (0.25 | ) |
| Total dividends and distributions | | | (0.24 | ) | | | (0.15 | ) | | | (0.20 | ) | | | (0.25 | ) | | | (0.25 | ) |
| |
| Net asset value, end of period | | $ | 10.38 | | | $ | 10.61 | | | $ | 11.04 | | | $ | 10.87 | | | $ | 10.74 | |
| |
| Total return2 | | | 0.11 | %3 | | | (2.60 | )% | | | 3.37 | % | | | 3.54 | % | | | 3.36 | % |
| |
| Ratios and supplemental data: | | | | | | | | | | | | | | | | | | | | |
| Net assets, end of period (000 omitted) | | $ | 4,284 | | | $ | 140,580 | | | $ | 122 | 4 | | $ | 130 | 4 | | $ | 169 | 4 |
| Ratio of expenses to average net assets5 | | | 0.54 | % | | | 0.53 | % | | | 0.53 | % | | | 0.53 | % | | | 0.51 | % |
| Ratio of expenses to average net assets prior to fees waived5 | | | 0.55 | % | | | 0.53 | % | | | 0.53 | % | | | 0.53 | % | | | 0.51 | % |
| Ratio of net investment income to average net assets | | | 1.73 | % | | | 1.34 | % | | | 1.77 | % | | | 2.25 | % | | | 2.30 | % |
| Ratio of net investment income to average net assets prior to fees waived | | | 1.72 | % | | | 1.34 | % | | | 1.77 | % | | | 2.25 | % | | | 2.30 | % |
| Portfolio turnover | | | 120 | % | | | 88 | % | | | 55 | % | | | 61 | % | | | 83 | % |
| 1 | Calculated using average shares outstanding. |
| 2 | Total return is based on the change in net asset value of a share during the period and assumes reinvestment of dividends and distributions at net asset value. |
| 3 | Total return during the period reflects waivers by the manager and/or distributor. Performance would have been lower had the waivers not been in effect. |
| 4 | Net assets reported in millions. |
| 5 | Expense ratios do not include expenses of any investment companies in which the Fund invests. |
See accompanying notes, which are an integral part of the financial statements.
Delaware Ivy Limited-Term Bond Fund Class Y
Selected data for each share of the Fund outstanding throughout each period were as follows:
| | | Year ended | |
| | | | 3/31/23 | | | | 3/31/22 | | | | 3/31/21 | | | | 3/31/20 | | | | 3/31/19 | |
| Net asset value, beginning of period | | $ | 10.61 | | | $ | 11.04 | | | $ | 10.87 | | | $ | 10.74 | | | $ | 10.64 | |
| | | | | | | | | | | | | | | | | | | | | |
| Income (loss) from investment operations: | | | | | | | | | | | | | | | | | | | | |
| Net investment income1 | | | 0.21 | | | | 0.11 | | | | 0.16 | | | | 0.20 | | | | 0.21 | |
| Net realized and unrealized gain (loss) | | | (0.23 | ) | | | (0.43 | ) | | | 0.16 | | | | 0.14 | | | | 0.10 | |
| Total from investment operations | | | (0.02 | ) | | | (0.32 | ) | | | 0.32 | | | | 0.34 | | | | 0.31 | |
| | | | | | | | | | | | | | | | | | | | | |
| Less dividends and distributions from: | | | | | | | | | | | | | | | | | | | | |
| Net investment income | | | (0.21 | ) | | | (0.11 | ) | | | (0.15 | ) | | | (0.21 | ) | | | (0.21 | ) |
| Total dividends and distributions | | | (0.21 | ) | | | (0.11 | ) | | | (0.15 | ) | | | (0.21 | ) | | | (0.21 | ) |
| | | | | | | | | | | | | | | | | | | | | |
| Net asset value, end of period | | $ | 10.38 | | | $ | 10.61 | | | $ | 11.04 | | | $ | 10.87 | | | $ | 10.74 | |
| | | | | | | | | | | | | | | | | | | | | |
| Total return2 | | | (0.18 | )%3 | | | (2.95 | )%3 | | | 2.99 | %3 | | | 3.14 | %3 | | | 2.95 | % |
| | | | | | | | | | | | | | | | | | | | | |
| Ratios and supplemental data: | | | | | | | | | | | | | | | | | | | | |
| Net assets, end of period (000 omitted) | | $ | 1,955 | | | $ | 2,129 | | | $ | 3 | 4 | | $ | 6 | 4 | | $ | 7 | 4 |
| Ratio of expenses to average net assets5 | | | 0.85 | % | | | 0.89 | % | | | 0.89 | % | | | 0.91 | % | | | 0.91 | % |
| Ratio of expenses to average net assets prior to fees waived5 | | | 0.89 | % | | | 0.93 | % | | | 0.93 | % | | | 0.96 | % | | | 0.91 | % |
| Ratio of net investment income to average net assets | | | 2.06 | % | | | 0.98 | % | | | 1.45 | % | | | 1.88 | % | | | 1.89 | % |
| Ratio of net investment income to average net assets prior to fees waived | | | 2.02 | % | | | 0.94 | % | | | 1.41 | % | | | 1.83 | % | | | 1.89 | % |
| Portfolio turnover | | | 120 | % | | | 88 | % | | | 55 | % | | | 61 | % | | | 83 | % |
| 1 | Calculated using average shares outstanding. |
| 2 | Total return is based on the change in net asset value of a share during the period and assumes reinvestment of dividends and distributions at net asset value. |
| 3 | Total return during the period reflects waivers by the manager and/or distributor. Performance would have been lower had the waivers not been in effect. |
| 4 | Net assets reported in millions. |
| 5 | Expense ratios do not include expenses of any investment companies in which the Fund invests. |
See accompanying notes, which are an integral part of the financial statements.
Financial highlights
Delaware Ivy Managed International Opportunities Fund Class A
Selected data for each share of the Fund outstanding throughout each period were as follows:
| | | Year ended | |
| | | 3/31/23 | | | 3/31/22 | | | 3/31/21 | | | 3/31/20 | | | 3/31/19 | |
| Net asset value, beginning of period | | $ | 11.31 | | | $ | 12.52 | | | $ | 7.80 | | | $ | 10.18 | | | $ | 11.87 | |
| | | | | | | | | | | | | | | | | | | | | |
| Income (loss) from investment operations: | | | | | | | | | | | | | | | | | | | | |
| Net investment income1 | | | 0.07 | | | | 0.26 | | | | 0.08 | | | | 0.18 | | | | 0.14 | |
| Net realized and unrealized gain (loss) | | | (0.62 | ) | | | (1.16 | ) | | | 4.73 | | | | (1.88 | ) | | | (1.08 | ) |
| Total from investment operations | | | (0.55 | ) | | | (0.90 | ) | | | 4.81 | | | | (1.70 | ) | | | (0.94 | ) |
| | | | | | | | | | | | | | | | | | | | | |
| Less dividends and distributions from: | | | | | | | | | | | | | | | | | | | | |
| Net investment income | | | — | | | | (0.28 | ) | | | (0.09 | ) | | | (0.20 | ) | | | (0.16 | ) |
| Net realized gain | | | (1.41 | ) | | | (0.03 | ) | | | — | | | | (0.48 | ) | | | (0.59 | ) |
| Total dividends and distributions | | | (1.41 | ) | | | (0.31 | ) | | | (0.09 | ) | | | (0.68 | ) | | | (0.75 | ) |
| | | | | | | | | | | | | | | | | | | | | |
| Net asset value, end of period | | $ | 9.35 | | | $ | 11.31 | | | $ | 12.52 | | | $ | 7.80 | | | $ | 10.18 | |
| | | | | | | | | | | | | | | | | | | | | |
| Total return2 | | | (3.79 | )% | | | (7.34 | )% | | | 61.81 | % | | | (18.31 | )% | | | (7.32 | )% |
| | | | | | | | | | | | | | | | | | | | | |
| Ratios and supplemental data: | | | | | | | | | | | | | | | | | | | | |
| Net assets, end of period (000 omitted) | | $ | 36,341 | | | $ | 51,379 | | | $ | 64 | 3 | | $ | 45 | 3 | | $ | 66 | 3 |
| Ratio of expenses to average net assets4 | | | 0.68 | % | | | 0.46 | % | | | 0.46 | % | | | 0.48 | % | | | 0.49 | % |
| Ratio of expenses to average net assets prior to fees waived4 | | | 0.73 | % | | | 0.59 | % | | | 0.50 | % | | | 0.51 | % | | | 0.51 | % |
| Ratio of net investment income to average net assets | | | 0.73 | % | | | 2.06 | % | | | 0.80 | % | | | 1.82 | % | | | 1.32 | % |
| Ratio of net investment income to average net assets prior to fees waived | | | 0.68 | % | | | 1.93 | % | | | 0.76 | % | | | 1.79 | % | | | 1.30 | % |
| Portfolio turnover | | | 19 | % | | | 36 | % | | | 17 | % | | | 10 | % | | | 71 | % |
| 1 | Calculated using average shares outstanding. |
| 2 | Total return is based on the change in net asset value of a share during the period and assumes reinvestment of dividends and distributions at net asset value and does not reflect the impact of a sales charge. Total return during the period reflects waivers by the manager and/or distributor. Performance would have been lower had the waivers not been in effect. |
| 3 | Net assets reported in millions. |
| 4 | Expense ratios do not include expenses of any investment companies in which the Fund invests. |
See accompanying notes, which are an integral part of the financial statements.
Delaware Ivy Managed International Opportunities Fund Class C
Selected data for each share of the Fund outstanding throughout each period were as follows:
| | | Year ended | |
| | | 3/31/23 | | | 3/31/22 | | | 3/31/21 | | | 3/31/20 | | | 3/31/19 | |
| Net asset value, beginning of period | | $ | 10.99 | | | $ | 12.22 | | | $ | 7.53 | | | $ | 9.92 | | | $ | 11.64 | |
| | | | | | | | | | | | | | | | | | | | | |
| Income (loss) from investment operations: | | | | | | | | | | | | | | | | | | | | |
| Net investment income (loss)1 | | | (0.02 | )2 | | | 0.17 | | | | — | 3 | | | 0.10 | | | | 0.06 | |
| Net realized and unrealized gain (loss) | | | (0.60 | ) | | | (1.16 | ) | | | 4.73 | | | | (1.86 | ) | | | (1.09 | ) |
| Total from investment operations | | | (0.62 | ) | | | (0.99 | ) | | | 4.73 | | | | (1.76 | ) | | | (1.03 | ) |
| | | | | | | | | | | | | | | | | | | | | |
| Less dividends and distributions from: | | | | | | | | | | | | | | | | | | | | |
| Net investment income | | | — | | | | (0.21 | ) | | | (0.04 | ) | | | (0.15 | ) | | | (0.10 | ) |
| Net realized gain | | | (1.41 | ) | | | (0.03 | ) | | | — | | | | (0.48 | ) | | | (0.59 | ) |
| Total dividends and distributions | | | (1.41 | ) | | | (0.24 | ) | | | (0.04 | ) | | | (0.63 | ) | | | (0.69 | ) |
| | | | | | | | | | | | | | | | | | | | | |
| Net asset value, end of period | | $ | 8.96 | | | $ | 10.99 | | | $ | 12.22 | | | $ | 7.53 | | | $ | 9.92 | |
| | | | | | | | | | | | | | | | | | | | | |
| Total return4 | | | (4.57 | )% | | | (8.22 | )% | | | 62.89 | % | | | (19.36 | )% | | | (8.32 | )% |
| | | | | | | | | | | | | | | | | | | | | |
| Ratios and supplemental data: | | | | | | | | | | | | | | | | | | | | |
| Net assets, end of period (000 omitted) | | $ | 566 | | | $ | 876 | | | $ | 1 | 5 | | $ | 1 | 5 | | $ | 2 | 5 |
| Ratio of expenses to average net assets6 | | | 1.56 | % | | | 1.25 | % | | | 1.25 | % | | | 1.29 | % | | | 1.29 | % |
| Ratio of expenses to average net assets prior to fees waived6 | | | 1.67 | % | | | 1.48 | % | | | 1.36 | % | | | 1.36 | % | | | 1.31 | % |
| Ratio of net investment income (loss) to average net assets | | | (0.21 | )% | | | 1.34 | % | | | 0.01 | % | | | 0.98 | % | | | 0.58 | % |
| Ratio of net investment income (loss) to average net assets prior to fees waived | | | (0.32 | )% | | | 1.11 | % | | | (0.10 | )% | | | 0.91 | % | | | 0.56 | % |
| Portfolio turnover | | | 19 | % | | | 36 | % | | | 17 | % | | | 10 | % | | | 71 | % |
| 1 | Calculated using average shares outstanding. |
| 2 | The per share amount of net investment income (loss) does not directly correlate to the amounts reported in the Statements of operations due to class specific expenses. |
| 3 | Amount is less than $(0.005) per share. |
| 4 | Total return is based on the change in net asset value of a share during the period and assumes reinvestment of dividends and distributions at net asset value and does not reflect the impact of a sales charge. Total return during the period reflects waivers by the manager and/or distributor. Performance would have been lower had the waivers not been in effect. |
| 5 | Net assets reported in millions. |
| 6 | Expense ratios do not include expenses of any investment companies in which the Fund invests. |
See accompanying notes, which are an integral part of the financial statements.
Financial highlights
Delaware Ivy Managed International Opportunities Fund Class I
Selected data for each share of the Fund outstanding throughout each period were as follows:
| | | Year ended | |
| | | 3/31/23 | | | 3/31/22 | | | 3/31/21 | | | 3/31/20 | | | 3/31/19 | |
| Net asset value, beginning of period | | $ | 11.40 | | | $ | 12.61 | | | $ | 7.87 | | | $ | 10.24 | | | $ | 11.93 | |
| | | | | | | | | | | | | | | | | | | | | |
| Income (loss) from investment operations: | | | | | | | | | | | | | | | | | | | | |
| Net investment income1 | | | — | 2 | | | 0.29 | | | | 0.12 | | | | 0.22 | | | | 0.18 | |
| Net realized and unrealized gain (loss) | | | (0.52 | ) | | | (1.16 | ) | | | 4.74 | | | | (1.88 | ) | | | (1.09 | ) |
| Total from investment operations | | | (0.52 | ) | | | (0.87 | ) | | | 4.86 | | | | (1.66 | ) | | | (0.91 | ) |
| | | | | | | | | | | | | | | | | | | | | |
| Less dividends and distributions from: | | | | | | | | | | | | | | | | | | | | |
| Net investment income | | | — | | | | (0.31 | ) | | | (0.12 | ) | | | (0.23 | ) | | | (0.19 | ) |
| Net realized gain | | | (1.41 | ) | | | (0.03 | ) | | | — | | | | (0.48 | ) | | | (0.59 | ) |
| Total dividends and distributions | | | (1.41 | ) | | | (0.34 | ) | | | (0.12 | ) | | | (0.71 | ) | | | (0.78 | ) |
| | | | | | | | | | | | | | | | | | | | | |
| Net asset value, end of period | | $ | 9.47 | | | $ | 11.40 | | | $ | 12.61 | | | $ | 7.87 | | | $ | 10.24 | |
| | | | | | | | | | | | | | | | | | | | | |
| Total return3 | | | (3.50 | )% | | | (7.08 | )% | | | 61.80 | % | | | (17.91 | )% | | | (7.03 | )% |
| | | | | | | | | | | | | | | | | | | | | |
| Ratios and supplemental data: | | | | | | | | | | | | | | | | | | | | |
| Net assets, end of period (000 omitted) | | $ | 41,079 | | | $ | 80,847 | | | $ | 112 | 4 | | $ | 90 | 4 | | $ | 109 | 4 |
| Ratio of expenses to average net assets5 | | | 0.34 | % | | | 0.16 | % | | | 0.16 | % | | | 0.16 | % | | | 0.16 | % |
| Ratio of expenses to average net assets prior to fees waived5 | | | 0.39 | % | | | 0.20 | % | | | 0.19 | % | | | 0.19 | % | | | 0.19 | % |
| Ratio of net investment income to average net assets | | | 0.01 | % | | | 2.23 | % | | | 1.10 | % | | | 2.19 | % | | | 1.59 | % |
| Ratio of net investment income (loss) to average net assets prior to fees waived | | | (0.04 | )% | | | 2.19 | % | | | 1.07 | % | | | 2.16 | % | | | 1.56 | % |
| Portfolio turnover | | | 19 | % | | | 36 | % | | | 17 | % | | | 10 | % | | | 71 | % |
| 1 | Calculated using average shares outstanding. |
| 2 | Amount is less than $0.005 per share. |
| 3 | Total return is based on the change in net asset value of a share during the period and assumes reinvestment of dividends and distributions at net asset value. Total return during the period reflects waivers by the manager and/or distributor. Performance would have been lower had the waivers not been in effect. |
| 4 | Net assets reported in millions. |
| 5 | Expense ratios do not include expenses of any investment companies in which the Fund invests. |
See accompanying notes, which are an integral part of the financial statements.
Delaware Ivy Managed International Opportunities Fund Class R
Selected data for each share of the Fund outstanding throughout each period were as follows:
| | | Year ended | |
| | | | 3/31/23 | | | | 3/31/22 | | | | 3/31/21 | | | | 3/31/20 | | | | 3/31/19 | |
| Net asset value, beginning of period | | $ | 11.25 | | | $ | 12.47 | | | $ | 7.75 | | | $ | 10.14 | | | $ | 11.83 | |
| | | | | | | | | | | | | | | | | | | | | |
| Income (loss) from investment operations: | | | | | | | | | | | | | | | | | | | | |
| Net investment income1 | | | 0.17 | | | | 0.15 | | | | 0.02 | | | | 0.18 | | | | 0.13 | |
| Net realized and unrealized gain (loss) | | | (0.74 | ) | | | (1.08 | ) | | | 4.78 | | | | (1.90 | ) | | | (1.08 | ) |
| Total from investment operations | | | (0.57 | ) | | | (0.93 | ) | | | 4.80 | | | | (1.72 | ) | | | (0.95 | ) |
| | | | | | | | | | | | | | | | | | | | | |
| Less dividends and distributions from: | | | | | | | | | | | | | | | | | | | | |
| Net investment income | | | — | | | | (0.26 | ) | | | (0.08 | ) | | | (0.19 | ) | | | (0.15 | ) |
| Net realized gain | | | (1.41 | ) | | | (0.03 | ) | | | — | | | | (0.48 | ) | | | (0.59 | ) |
| Total dividends and distributions | | | (1.41 | ) | | | (0.29 | ) | | | (0.08 | ) | | | (0.67 | ) | | | (0.74 | ) |
| | | | | | | | | | | | | | | | | | | | | |
| Net asset value, end of period | | $ | 9.27 | | | $ | 11.25 | | | $ | 12.47 | | | $ | 7.75 | | | $ | 10.14 | |
| | | | | | | | | | | | | | | | | | | | | |
| Total return2 | | | (4.01 | )%3 | | | (7.58 | )%3 | | | 62.03 | %3 | | | (18.59 | )% | | | (7.47 | )%3 |
| | | | | | | | | | | | | | | | | | | | | |
| Ratios and supplemental data: | | | | | | | | | | | | | | | | | | | | |
| Net assets, end of period (000 omitted) | | $ | 91 | | | $ | 75 | | | $ | — | 4,5 | | $ | 1 | 4 | | $ | 1 | 4 |
| Ratio of expenses to average net assets6 | | | 0.90 | % | | | 0.67 | % | | | 0.66 | % | | | 0.67 | % | | | 0.66 | % |
| Ratio of expenses to average net assets prior to fees waived6 | | | 0.92 | % | | | 0.70 | % | | | 0.67 | % | | | 0.67 | % | | | 0.67 | % |
| Ratio of net investment income to average net assets | | | 1.71 | % | | | 1.18 | % | | | 0.23 | % | | | 1.77 | % | | | 1.16 | % |
| Ratio of net investment income to average net assets prior to fees waived | | | 1.69 | % | | | 1.15 | % | | | 0.22 | % | | | 1.77 | % | | | 1.15 | % |
| Portfolio turnover | | | 19 | % | | | 36 | % | | | 17 | % | | | 10 | % | | | 71 | % |
| 1 | Calculated using average shares outstanding. |
| 2 | Total return is based on the change in net asset value of a share during the period and assumes reinvestment of dividends and distributions at net asset value. |
| 3 | Total return during the period reflects waivers by the manager and/or distributor. Performance would have been lower had the waivers not been in effect. |
| 4 | Net assets reported in millions. |
| 5 | Rounds to less than $500 thousands. |
| 6 | Expense ratios do not include expenses of any investment companies in which the Fund invests. |
See accompanying notes, which are an integral part of the financial statements.
Financial highlights
Delaware Ivy Managed International Opportunities Fund Class R6
Selected data for each share of the Fund outstanding throughout each period were as follows:
| | | Year ended | |
| | | | 3/31/23 | | | | 3/31/22 | | | | 3/31/21 | | | | 3/31/20 | | | | 3/31/19 | |
| Net asset value, beginning of period | | $ | 11.41 | | | $ | 12.62 | | | $ | 7.88 | | | $ | 10.25 | | | $ | 11.94 | |
| | | | | | | | | | | | | | | | | | | | | |
| Income (loss) from investment operations: | | | | | | | | | | | | | | | | | | | | |
| Net investment income1 | | | 0.24 | | | | 0.23 | | | | 0.12 | | | | 0.23 | | | | 0.19 | |
| Net realized and unrealized gain (loss) | | | (0.76 | ) | | | (1.10 | ) | | | 4.74 | | | | (1.89 | ) | | | (1.10 | ) |
| Total from investment operations | | | (0.52 | ) | | | (0.87 | ) | | | 4.86 | | | | (1.66 | ) | | | (0.91 | ) |
| | | | | | | | | | | | | | | | | | | | | |
| Less dividends and distributions from: | | | | | | | | | | | | | | | | | | | | |
| Net investment income | | | — | | | | (0.31 | ) | | | (0.12 | ) | | | (0.23 | ) | | | (0.19 | ) |
| Net realized gain | | | (1.41 | ) | | | (0.03 | ) | | | — | | | | (0.48 | ) | | | (0.59 | ) |
| Total dividends and distributions | | | (1.41 | ) | | | (0.34 | ) | | | (0.12 | ) | | | (0.71 | ) | | | (0.78 | ) |
| | | | | | | | | | | | | | | | | | | | | |
| Net asset value, end of period | | $ | 9.48 | | | $ | 11.41 | | | $ | 12.62 | | | $ | 7.88 | | | $ | 10.25 | |
| | | | | | | | | | | | | | | | | | | | | |
| Total return2 | | | (3.48 | )% | | | (7.07 | )% | | | 61.72 | % | | | (17.90 | )% | | | (7.03 | )% |
| | | | | | | | | | | | | | | | | | | | | |
| Ratios and supplemental data: | | | | | | | | | | | | | | | | | | | | |
| Net assets, end of period (000 omitted) | | $ | 76 | | | $ | 81 | | | $ | 1 | 3 | | $ | — | 3,4 | | $ | — | 3,4 |
| Ratio of expenses to average net assets5 | | | 0.43 | % | | | 0.16 | % | | | 0.16 | % | | | 0.16 | % | | | 0.16 | % |
| Ratio of expenses to average net assets prior to fees waived5 | | | 0.45 | % | | | 0.21 | % | | | 0.18 | % | | | 0.19 | % | | | 0.17 | % |
| Ratio of net investment income to average net assets | | | 2.47 | % | | | 1.82 | % | | | 1.08 | % | | | 2.25 | % | | | 1.71 | % |
| Ratio of net investment income to average net assets prior to fees waived | | | 2.45 | % | | | 1.77 | % | | | 1.06 | % | | | 2.22 | % | | | 1.70 | % |
| Portfolio turnover | | | 19 | % | | | 36 | % | | | 17 | % | | | 10 | % | | | 71 | % |
| 1 | Calculated using average shares outstanding. |
| 2 | Total return is based on the change in net asset value of a share during the period and assumes reinvestment of dividends and distributions at net asset value. Total return during the period reflects waivers by the manager and/or distributor. Performance would have been lower had the waivers not been in effect. |
| 3 | Net assets reported in millions. |
| 4 | Rounds to less than $500 thousands. |
| 5 | Expense ratios do not include expenses of any investment companies in which the Fund invests. |
See accompanying notes, which are an integral part of the financial statements.
Delaware Ivy Managed International Opportunities Fund Class Y
Selected data for each share of the Fund outstanding throughout each period were as follows:
| | | Year ended | |
| | | | 3/31/23 | | | | 3/31/22 | | | | 3/31/21 | | | | 3/31/20 | | | | 3/31/19 | |
| Net asset value, beginning of period | | $ | 11.32 | | | $ | 12.53 | | | $ | 7.81 | | | $ | 10.18 | | | $ | 11.87 | |
| | | | | | | | | | | | | | | | | | | | | |
| Income (loss) from investment operations: | | | | | | | | | | | | | | | | | | | | |
| Net investment income1 | | | 0.04 | | | | 0.28 | | | | 0.09 | | | | 0.10 | | | | 0.16 | |
| Net realized and unrealized gain (loss) | | | (0.58 | ) | | | (1.17 | ) | | | 4.73 | | | | (1.78 | ) | | | (1.09 | ) |
| Total from investment operations | | | (0.54 | ) | | | (0.89 | ) | | | 4.82 | | | | (1.68 | ) | | | (0.93 | ) |
| | | | | | | | | | | | | | | | | | | | | |
| Less dividends and distributions from: | | | | | | | | | | | | | | | | | | | | |
| Net investment income | | | — | | | | (0.29 | ) | | | (0.10 | ) | | | (0.21 | ) | | | (0.17 | ) |
| Net realized gain | | | (1.41 | ) | | | (0.03 | ) | | | — | | | | (0.48 | ) | | | (0.59 | ) |
| Total dividends and distributions | | | (1.41 | ) | | | (0.32 | ) | | | (0.10 | ) | | | (0.69 | ) | | | (0.76 | ) |
| | | | | | | | | | | | | | | | | | | | | |
| Net asset value, end of period | | $ | 9.37 | | | $ | 11.32 | | | $ | 12.53 | | | $ | 7.81 | | | $ | 10.18 | |
| | | | | | | | | | | | | | | | | | | | | |
| Total return2 | | | (3.70 | )% | | | (7.27 | )% | | | 61.81 | % | | | (18.15 | )% | | | (7.24 | )% |
| | | | | | | | | | | | | | | | | | | | | |
| Ratios and supplemental data: | | | | | | | | | | | | | | | | | | | | |
| Net assets, end of period (000 omitted) | | $ | 96 | | | $ | 135 | | | $ | — | 3,4 | | $ | — | 3,4 | | $ | 1 | 3 |
| Ratio of expenses to average net assets5 | | | 0.61 | % | | | 0.38 | % | | | 0.38 | % | | | 0.38 | % | | | 0.38 | % |
| Ratio of expenses to average net assets prior to fees waived5 | | | 0.66 | % | | | 0.48 | % | | | 0.44 | % | | | 0.76 | % | | | 0.43 | % |
| Ratio of net investment income to average net assets | | | 0.36 | % | | | 2.16 | % | | | 0.82 | % | | | 0.95 | % | | | 1.44 | % |
| Ratio of net investment income to average net assets prior to fees waived | | | 0.31 | % | | | 2.06 | % | | | 0.76 | % | | | 0.57 | % | | | 1.39 | % |
| Portfolio turnover | | | 19 | % | | | 36 | % | | | 17 | % | | | 10 | % | | | 71 | % |
| 1 | Calculated using average shares outstanding. |
| 2 | Total return is based on the change in net asset value of a share during the period and assumes reinvestment of dividends and distributions at net asset value. Total return during the period reflects waivers by the manager and/or distributor. Performance would have been lower had the waivers not been in effect. |
| 3 | Net assets reported in millions. |
| 4 | Rounds to less than $500 thousands. |
| 5 | Expense ratios do not include expenses of any investment companies in which the Fund invests. |
See accompanying notes, which are an integral part of the financial statements.
Financial highlights
Delaware Ivy Mid Cap Growth Fund Class A
Selected data for each share of the Fund outstanding throughout each period were as follows:
| | | Year ended | |
| | | | 3/31/23 | | | | 3/31/22 | | | | 3/31/21 | | | | 3/31/20 | | | | 3/31/19 | |
| Net asset value, beginning of period | | $ | 32.31 | | | $ | 37.42 | | | $ | 22.28 | | | $ | 25.28 | | | $ | 23.99 | |
| | | | | | | | | | | | | | | | | | | | | |
| Income (loss) from investment operations: | | | | | | | | | | | | | | | | | | | | |
| Net investment loss1 | | | (0.16 | ) | | | (0.29 | ) | | | (0.23 | ) | | | (0.15 | ) | | | (0.13 | ) |
| Net realized and unrealized gain (loss) | | | (3.20 | ) | | | 0.11 | | | | 19.03 | | | | (1.42 | ) | | | 3.56 | |
| Total from investment operations | | | (3.36 | ) | | | (0.18 | ) | | | 18.80 | | | | (1.57 | ) | | | 3.43 | |
| | | | | | | | | | | | | | | | | | | | | |
| Less dividends and distributions from: | | | | | | | | | | | | | | | | | | | | |
| Net realized gain | | | (2.81 | ) | | | (4.93 | ) | | | (3.66 | ) | | | (1.43 | ) | | | (2.14 | ) |
| Total dividends and distributions | | | (2.81 | ) | | | (4.93 | ) | | | (3.66 | ) | | | (1.43 | ) | | | (2.14 | ) |
| | | | | | | | | | | | | | | | | | | | | |
| Net asset value, end of period | | $ | 26.14 | | | $ | 32.31 | | | $ | 37.42 | | | $ | 22.28 | | | $ | 25.28 | |
| | | | | | | | | | | | | | | | | | | | | |
| Total return2 | | | (10.07 | )%3 | | | (1.90 | )% | | | 85.37 | %3 | | | (7.20 | )%3 | | | 15.72 | %3 |
| | | | | | | | | | | | | | | | | | | | | |
| Ratios and supplemental data: | | | | | | | | | | | | | | | | | | | | |
| Net assets, end of period (000 omitted) | | $ | 1,582,726 | | | $ | 2,158,678 | | | $ | 2,453 | 4 | | $ | 1,391 | 4 | | $ | 1,668 | 4 |
| Ratio of expenses to average net assets5 | | | 1.09 | % | | | 1.12 | % | | | 1.16 | % | | | 1.20 | % | | | 1.23 | % |
| Ratio of expenses to average net assets prior to fees waived5 | | | 1.21 | % | | | 1.12 | % | | | 1.17 | % | | | 1.23 | % | | | 1.25 | % |
| Ratio of net investment loss to average net assets | | | (0.59 | )% | | | (0.76 | )% | | | (0.68 | )% | | | (0.55 | )% | | | (0.53 | )% |
| Ratio of net investment loss to average net assets prior to fees waived | | | (0.71 | )% | | | (0.76 | )% | | | (0.69 | )% | | | (0.58 | )% | | | (0.55 | )% |
| Portfolio turnover | | | 23 | % | | | 27 | % | | | 33 | % | | | 22 | % | | | 38 | % |
| 1 | Calculated using average shares outstanding. |
| 2 | Total return is based on the change in net asset value of a share during the period and assumes reinvestment of dividends and distributions at net asset value and does not reflect the impact of a sales charge. |
| 3 | Total return during the period reflects waivers by the manager and/or distributor. Performance would have been lower had the waivers not been in effect. |
| 4 | Net assets reported in millions. |
| 5 | Expense ratios do not include expenses of any investment companies in which the Fund invests. |
See accompanying notes, which are an integral part of the financial statements.
Delaware Ivy Mid Cap Growth Fund Class C
Selected data for each share of the Fund outstanding throughout each period were as follows:
| | | Year ended | |
| | | | 3/31/23 | | | | 3/31/22 | | | | 3/31/21 | | | | 3/31/20 | | | | 3/31/19 | |
| Net asset value, beginning of period | | $ | 24.74 | | | $ | 29.76 | | | $ | 18.26 | | | $ | 21.02 | | | $ | 20.44 | |
| | | | | | | | | | | | | | | | | | | | | |
| Income (loss) from investment operations: | | | | | | | | | | | | | | | | | | | | |
| Net investment loss1 | | | (0.28 | ) | | | (0.48 | ) | | | (0.39 | ) | | | (0.28 | ) | | | (0.26 | ) |
| Net realized and unrealized gain (loss) | | | (2.49 | ) | | | 0.20 | | | | 15.51 | | | | (1.15 | ) | | | 2.98 | |
| Total from investment operations | | | (2.77 | ) | | | (0.28 | ) | | | 15.12 | | | | (1.43 | ) | | | 2.72 | |
| | | | | | | | | | | | | | | | | | | | | |
| Less dividends and distributions from: | | | | | | | | | | | | | | | | | | | | |
| Net realized gain | | | (2.81 | ) | | | (4.74 | ) | | | (3.62 | ) | | | (1.33 | ) | | | (2.14 | ) |
| Total dividends and distributions | | | (2.81 | ) | | | (4.74 | ) | | | (3.62 | ) | | | (1.33 | ) | | | (2.14 | ) |
| | | | | | | | | | | | | | | | | | | | | |
| Net asset value, end of period | | $ | 19.16 | | | $ | 24.74 | | | $ | 29.76 | | | $ | 18.26 | | | $ | 21.02 | |
| | | | | | | | | | | | | | | | | | | | | |
| Total return2 | | | (10.79 | )%3 | | | (2.67 | )% | | | 83.95 | %3 | | | (7.88 | )%3 | | | 14.90 | %3 |
| | | | | | | | | | | | | | | | | | | | | |
| Ratios and supplemental data: | | | | | | | | | | | | | | | | | | | | |
| Net assets, end of period (000 omitted) | | $ | 75,826 | | | $ | 121,668 | | | $ | 170 | 4 | | $ | 143 | 4 | | $ | 207 | 4 |
| Ratio of expenses to average net assets5 | | | 1.88 | % | | | 1.93 | % | | | 1.92 | % | | | 1.95 | % | | | 1.94 | % |
| Ratio of expenses to average net assets prior to fees waived5 | | | 2.06 | % | | | 1.93 | % | | | 1.94 | % | | | 1.98 | % | | | 1.96 | % |
| Ratio of net investment loss to average net assets | | | (1.38 | )% | | | (1.57 | )% | | | (1.43 | )% | | | (1.30 | )% | | | (1.25 | )% |
| Ratio of net investment loss to average net assets prior to fees waived | | | (1.56 | )% | | | (1.57 | )% | | | (1.45 | )% | | | (1.33 | )% | | | (1.27 | )% |
| Portfolio turnover | | | 23 | % | | | 27 | % | | | 33 | % | | | 22 | % | | | 38 | % |
| 1 | Calculated using average shares outstanding. |
| 2 | Total return is based on the change in net asset value of a share during the period and assumes reinvestment of dividends and distributions at net asset value and does not reflect the impact of a sales charge. |
| 3 | Total return during the period reflects waivers by the manager and/or distributor. Performance would have been lower had the waivers not been in effect. |
| 4 | Net assets reported in millions. |
| 5 | Expense ratios do not include expenses of any investment companies in which the Fund invests. |
See accompanying notes, which are an integral part of the financial statements.
Financial highlights
Delaware Ivy Mid Cap Growth Fund Class I
Selected data for each share of the Fund outstanding throughout each period were as follows:
| | | Year ended | |
| | | | 3/31/23 | | | | 3/31/22 | | | | 3/31/21 | | | | 3/31/20 | | | | 3/31/19 | |
| Net asset value, beginning of period | | $ | 36.32 | | | $ | 41.48 | | | $ | 24.41 | | | $ | 27.52 | | | $ | 25.83 | |
| | | | | | | | | | | | | | | | | | | | | |
| Income (loss) from investment operations: | | | | | | | | | | | | | | | | | | | | |
| Net investment loss1 | | | (0.09 | ) | | | (0.18 | ) | | | (0.12 | ) | | | (0.04 | ) | | | (0.04 | ) |
| Net realized and unrealized gain (loss) | | | (3.58 | ) | | | 0.07 | | | | 20.89 | | | | (1.57 | ) | | | 3.87 | |
| Total from investment operations | | | (3.67 | ) | | | (0.11 | ) | | | 20.77 | | | | (1.61 | ) | | | 3.83 | |
| | | | | | | | | | | | | | | | | | | | | |
| Less dividends and distributions from: | | | | | | | | | | | | | | | | | | | | |
| Net realized gain | | | (2.81 | ) | | | (5.05 | ) | | | (3.70 | ) | | | (1.50 | ) | | | (2.14 | ) |
| Total dividends and distributions | | | (2.81 | ) | | | (5.05 | ) | | | (3.70 | ) | | | (1.50 | ) | | | (2.14 | ) |
| | | | | | | | | | | | | | | | | | | | | |
| Net asset value, end of period | | $ | 29.84 | | | $ | 36.32 | | | $ | 41.48 | | | $ | 24.41 | | | $ | 27.52 | |
| | | | | | | | | | | | | | | | | | | | | |
| Total return2 | | | (9.80 | )% | | | (1.56 | )% | | | 86.00 | % | | | (6.75 | )% | | | 16.12 | % |
| | | | | | | | | | | | | | | | | | | | | |
| Ratios and supplemental data: | | | | | | | | | | | | | | | | | | | | |
| Net assets, end of period (000 omitted) | | $ | 2,887,695 | | | $ | 3,577,939 | | | $ | 3,609 | 3 | | $ | 1,898 | 3 | | $ | 2,250 | 3 |
| Ratio of expenses to average net assets4 | | | 0.79 | % | | | 0.79 | % | | | 0.79 | % | | | 0.79 | % | | | 0.85 | % |
| Ratio of expenses to average net assets prior to fees waived4 | | | 0.84 | % | | | 0.95 | % | | | 0.97 | % | | | 1.00 | % | | | 1.00 | % |
| Ratio of net investment loss to average net assets | | | (0.28 | )% | | | (0.43 | )% | | | (0.31 | )% | | | (0.15 | )% | | | (0.16 | )% |
| Ratio of net investment loss to average net assets prior to fees waived | | | (0.33 | )% | | | (0.59 | )% | | | (0.49 | )% | | | (0.36 | )% | | | (0.31 | )% |
| Portfolio turnover | | | 23 | % | | | 27 | % | | | 33 | % | | | 22 | % | | | 38 | % |
| 1 | Calculated using average shares outstanding. |
| 2 | Total return is based on the change in net asset value of a share during the period and assumes reinvestment of dividends and distributions at net asset value. Total return during the period reflects waivers by the manager and/or distributor. Performance would have been lower had the waivers not been in effect. |
| 3 | Net assets reported in millions. |
| 4 | Expense ratios do not include expenses of any investment companies in which the Fund invests. |
See accompanying notes, which are an integral part of the financial statements.
Delaware Ivy Mid Cap Growth Fund Class R
Selected data for each share of the Fund outstanding throughout each period were as follows:
| | | Year ended | |
| | | | 3/31/23 | | | | 3/31/22 | | | | 3/31/21 | | | | 3/31/20 | | | | 3/31/19 | |
| Net asset value, beginning of period | | $ | 30.81 | | | $ | 35.92 | | | $ | 21.54 | | | $ | 24.51 | | | $ | 23.40 | |
| | | | | | | | | | | | | | | | | | | | | |
| Income (loss) from investment operations: | | | | | | | | | | | | | | | | | | | | |
| Net investment loss1 | | | (0.22 | ) | | | (0.44 | ) | | | (0.35 | ) | | | (0.23 | ) | | | (0.21 | ) |
| Net realized and unrealized gain (loss) | | | (3.07 | ) | | | 0.14 | | | | 18.37 | | | | (1.37 | ) | | | 3.46 | |
| Total from investment operations | | | (3.29 | ) | | | (0.30 | ) | | | 18.02 | | | | (1.60 | ) | | | 3.25 | |
| | | | | | | | | | | | | | | | | | | | | |
| Less dividends and distributions from: | | | | | | | | | | | | | | | | | | | | |
| Net realized gain | | | (2.81 | ) | | | (4.81 | ) | | | (3.64 | ) | | | (1.37 | ) | | | (2.14 | ) |
| Total dividends and distributions | | | (2.81 | ) | | | (4.81 | ) | | | (3.64 | ) | | | (1.37 | ) | | | (2.14 | ) |
| | | | | | | | | | | | | | | | | | | | | |
| Net asset value, end of period | | $ | 24.71 | | | $ | 30.81 | | | $ | 35.92 | | | $ | 21.54 | | | $ | 24.51 | |
| | | | | | | | | | | | | | | | | | | | | |
| Total return2 | | | (10.34 | )% | | | (2.30 | )% | | | 84.62 | % | | | (7.47 | )% | | | 15.29 | % |
| | | | | | | | | | | | | | | | | | | | | |
| Ratios and supplemental data: | | | | | | | | | | | | | | | | | | | | |
| Net assets, end of period (000 omitted) | | $ | 58,839 | | | $ | 74,908 | | | $ | 88 | 3 | | $ | 46 | 3 | | $ | 63 | 3 |
| Ratio of expenses to average net assets4 | | | 1.38 | % | | | 1.54 | % | | | 1.55 | % | | | 1.55 | % | | | 1.55 | % |
| Ratio of expenses to average net assets prior to fees waived4 | | | 1.42 | % | | | 1.55 | % | | | 1.56 | % | | | 1.58 | % | | | 1.57 | % |
| Ratio of net investment loss to average net assets | | | (0.87 | )% | | | (1.18 | )% | | | (1.07 | )% | | | (0.90 | )% | | | (0.86 | )% |
| Ratio of net investment loss to average net assets prior to fees waived | | | (0.91 | )% | | | (1.19 | )% | | | (1.08 | )% | | | (0.93 | )% | | | (0.88 | )% |
| Portfolio turnover | | | 23 | % | | | 27 | % | | | 33 | % | | | 22 | % | | | 38 | % |
| 1 | Calculated using average shares outstanding. |
| 2 | Total return is based on the change in net asset value of a share during the period and assumes reinvestment of dividends and distributions at net asset value. Total return during the period reflects waivers by the manager and/or distributor. Performance would have been lower had the waivers not been in effect. |
| 3 | Net assets reported in millions. |
| 4 | Expense ratios do not include expenses of any investment companies in which the Fund invests. |
See accompanying notes, which are an integral part of the financial statements.
Financial highlights
Delaware Ivy Mid Cap Growth Fund Class R6
Selected data for each share of the Fund outstanding throughout each period were as follows:
| | | Year ended | |
| | | | 3/31/23 | | | | 3/31/22 | | | | 3/31/21 | | | | 3/31/20 | | | | 3/31/19 | |
| Net asset value, beginning of period | | $ | 36.73 | | | $ | 41.89 | | | $ | 24.63 | | | $ | 27.76 | | | $ | 26.02 | |
| | | | | | | | | | | | | | | | | | | | | |
| Income (loss) from investment operations: | | | | | | | | | | | | | | | | | | | | |
| Net investment loss1 | | | (0.08 | ) | | | (0.18 | ) | | | (0.13 | ) | | | (0.04 | ) | | | (0.03 | ) |
| Net realized and unrealized gain (loss) | | | (3.63 | ) | | | 0.07 | | | | 21.09 | | | | (1.59 | ) | | | 3.91 | |
| Total from investment operations | | | (3.71 | ) | | | (0.11 | ) | | | 20.96 | | | | (1.63 | ) | | | 3.88 | |
| | | | | | | | | | | | | | | | | | | | | |
| Less dividends and distributions from: | | | | | | | | | | | | | | | | | | | | |
| Net realized gain | | | (2.81 | ) | | | (5.05 | ) | | | (3.70 | ) | | | (1.50 | ) | | | (2.14 | ) |
| Total dividends and distributions | | | (2.81 | ) | | | (5.05 | ) | | | (3.70 | ) | | | (1.50 | ) | | | (2.14 | ) |
| | | | | | | | | | | | | | | | | | | | | |
| Net asset value, end of period | | $ | 30.21 | | | $ | 36.73 | | | $ | 41.89 | | | $ | 24.63 | | | $ | 27.76 | |
| | | | | | | | | | | | | | | | | | | | | |
| Total return2 | | | (9.80 | )% | | | (1.54 | )% | | | 86.00 | % | | | (6.77 | )% | | | 16.19 | % |
| | | | | | | | | | | | | | | | | | | | | |
| Ratios and supplemental data: | | | | | | | | | | | | | | | | | | | | |
| Net assets, end of period (000 omitted) | | $ | 1,048,374 | | | $ | 980,539 | | | $ | 736 | 3 | | $ | 256 | 3 | | $ | 282 | 3 |
| Ratio of expenses to average net assets4 | | | 0.79 | % | | | 0.79 | % | | | 0.79 | % | | | 0.79 | % | | | 0.80 | % |
| Ratio of expenses to average net assets prior to fees waived4 | | | 0.83 | % | | | 0.80 | % | | | 0.82 | % | | | 0.85 | % | | | 0.85 | % |
| Ratio of net investment loss to average net assets | | | (0.28 | )% | | | (0.43 | )% | | | (0.33 | )% | | | (0.15 | )% | | | (0.11 | )% |
| Ratio of net investment income (loss) to average net assets prior to fees waived | | | (0.32 | )% | | | (0.44 | )% | | | (0.36 | )% | | | (0.21 | )% | | | (0.16 | )% |
| Portfolio turnover | | | 23 | % | | | 27 | % | | | 33 | % | | | 22 | % | | | 38 | % |
| 1 | Calculated using average shares outstanding. |
| 2 | Total return is based on the change in net asset value of a share during the period and assumes reinvestment of dividends and distributions at net asset value. Total return during the period reflects waivers by the manager and/or distributor. Performance would have been lower had the waivers not been in effect. |
| 3 | Net assets reported in millions. |
| 4 | Expense ratios do not include expenses of any investment companies in which the Fund invests. |
See accompanying notes, which are an integral part of the financial statements.
Delaware Ivy Mid Cap Growth Fund Class Y
Selected data for each share of the Fund outstanding throughout each period were as follows:
| | | Year ended | |
| | | | 3/31/23 | | | | 3/31/22 | | | | 3/31/21 | | | | 3/31/20 | | | | 3/31/19 | |
| Net asset value, beginning of period | | $ | 34.43 | | | $ | 39.57 | | | $ | 23.45 | | | $ | 26.53 | | | $ | 25.06 | |
| | | | | | | | | | | | | | | | | | | | | |
| Income (loss) from investment operations: | | | | | | | | | | | | | | | | | | | | |
| Net investment loss1 | | | (0.17 | ) | | | (0.31 | ) | | | (0.24 | ) | | | (0.15 | ) | | | (0.13 | ) |
| Net realized and unrealized gain (loss) | | | (3.41 | ) | | | 0.09 | | | | 20.02 | | | | (1.50 | ) | | | 3.74 | |
| Total from investment operations | | | (3.58 | ) | | | (0.22 | ) | | | 19.78 | | | | (1.65 | ) | | | 3.61 | |
| | | | | | | | | | | | | | | | | | | | | |
| Less dividends and distributions from: | | | | | | | | | | | | | | | | | | | | |
| Net realized gain | | | (2.81 | ) | | | (4.92 | ) | | | (3.66 | ) | | | (1.43 | ) | | | (2.14 | ) |
| Total dividends and distributions | | | (2.81 | ) | | | (4.92 | ) | | | (3.66 | ) | | | (1.43 | ) | | | (2.14 | ) |
| | | | | | | | | | | | | | | | | | | | | |
| Net asset value, end of period | | $ | 28.04 | | | $ | 34.43 | | | $ | 39.57 | | | $ | 23.45 | | | $ | 26.53 | |
| | | | | | | | | | | | | | | | | | | | | |
| Total return2 | | | (10.09 | )% | | | (1.89 | )% | | | 85.29 | % | | | (7.14 | )% | | | 15.72 | % |
| | | | | | | | | | | | | | | | | | | | | |
| Ratios and supplemental data: | | | | | | | | | | | | | | | | | | | | |
| Net assets, end of period (000 omitted) | | $ | 223,692 | | | $ | 284,480 | | | $ | 363 | 3 | | $ | 215 | 3 | | $ | 295 | 3 |
| Ratio of expenses to average net assets4 | | | 1.09 | % | | | 1.13 | % | | | 1.16 | % | | | 1.20 | % | | | 1.21 | % |
| Ratio of expenses to average net assets prior to fees waived4 | | | 1.13 | % | | | 1.19 | % | | | 1.21 | % | | | 1.24 | % | | | 1.23 | % |
| Ratio of net investment loss to average net assets | | | (0.59 | )% | | | (0.77 | )% | | | (0.68 | )% | | | (0.55 | )% | | | (0.51 | )% |
| Ratio of net investment loss to average net assets prior to fees waived | | | (0.63 | )% | | | (0.83 | )% | | | (0.73 | )% | | | (0.59 | )% | | | (0.53 | )% |
| Portfolio turnover | | | 23 | % | | | 27 | % | | | 33 | % | | | 22 | % | | | 38 | % |
| 1 | Calculated using average shares outstanding. |
| 2 | Total return is based on the change in net asset value of a share during the period and assumes reinvestment of dividends and distributions at net asset value. Total return during the period reflects waivers by the manager and/or distributor. Performance would have been lower had the waivers not been in effect. |
| 3 | Net assets reported in millions. |
| 4 | Expense ratios do not include expenses of any investment companies in which the Fund invests. |
See accompanying notes, which are an integral part of the financial statements.
Financial highlights
Delaware Ivy Mid Cap Income Opportunities Fund Class A
Selected data for each share of the Fund outstanding throughout each period were as follows:
| | | Year ended | |
| | | | 3/31/23 | | | | 3/31/22 | | | | 3/31/21 | | | | 3/31/20 | | | | 3/31/19 | |
| Net asset value, beginning of period | | $ | 18.81 | | | $ | 18.38 | | | $ | 10.98 | | | $ | 13.98 | | | $ | 13.76 | |
| | | | | | | | | | | | | | | | | | | | | |
| Income (loss) from investment operations: | | | | | | | | | | | | | | | | | | | | |
| Net investment income1 | | | 0.27 | | | | 0.18 | | | | 0.21 | | | | 0.25 | | | | 0.21 | |
| Net realized and unrealized gain (loss) | | | (1.15 | ) | | | 0.89 | | | | 7.40 | | | | (2.96 | ) | | | 0.51 | |
| Total from investment operations | | | (0.88 | ) | | | 1.07 | | | | 7.61 | | | | (2.71 | ) | | | 0.72 | |
| | | | | | | | | | | | | | | | | | | | | |
| Less dividends and distributions from: | | | | | | | | | | | | | | | | | | | | |
| Net investment income | | | (0.27 | ) | | | (0.18 | ) | | | (0.21 | ) | | | (0.24 | ) | | | (0.20 | ) |
| Net realized gain | | | (0.40 | ) | | | (0.46 | ) | | | — | | | | (0.05 | ) | | | (0.30 | ) |
| Total dividends and distributions | | | (0.67 | ) | | | (0.64 | ) | | | (0.21 | ) | | | (0.29 | ) | | | (0.50 | ) |
| | | | | | | | | | | | | | | | | | | | | |
| Net asset value, end of period | | $ | 17.26 | | | $ | 18.81 | | | $ | 18.38 | | | $ | 10.98 | | | $ | 13.98 | |
| | | | | | | | | | | | | | | | | | | | | |
| Total return2 | | | (4.73 | )% | | | 5.71 | % | | | 69.70 | % | | | (19.84 | )% | | | 5.37 | % |
| | | | | | | | | | | | | | | | | | | | | |
| Ratios and supplemental data: | | | | | | | | | | | | | | | | | | | | |
| Net assets, end of period (000 omitted) | | $ | 171,183 | | | $ | 188,631 | | | $ | 178 | 3 | | $ | 111 | 3 | | $ | 135 | 3 |
| Ratio of expenses to average net assets4 | | | 1.12 | % | | | 1.21 | % | | | 1.24 | % | | | 1.27 | % | | | 1.35 | % |
| Ratio of expenses to average net assets prior to fees waived4 | | | 1.26 | % | | | 1.26 | % | | | 1.31 | % | | | 1.34 | % | | | 1.37 | % |
| Ratio of net investment income to average net assets | | | 1.58 | % | | | 0.95 | % | | | 1.42 | % | | | 1.70 | % | | | 1.51 | % |
| Ratio of net investment income to average net assets prior to fees waived | | | 1.44 | % | | | 0.90 | % | | | 1.35 | % | | | 1.63 | % | | | 1.49 | % |
| Portfolio turnover | | | 29 | % | | | 20 | % | | | 23 | % | | | 25 | % | | | 17 | % |
| 1 | Calculated using average shares outstanding. |
| 2 | Total return is based on the change in net asset value of a share during the period and assumes reinvestment of dividends and distributions at net asset value and does not reflect the impact of a sales charge. Total return during the period reflects waivers by the manager and/or distributor. Performance would have been lower had the waivers not been in effect. |
| 3 | Net assets reported in millions. |
| 4 | Expense ratios do not include expenses of any investment companies in which the Fund invests. |
See accompanying notes, which are an integral part of the financial statements.
Delaware Ivy Mid Cap Income Opportunities Fund Class C
Selected data for each share of the Fund outstanding throughout each period were as follows:
| | | Year ended | |
| | | | 3/31/23 | | | | 3/31/22 | | | | 3/31/21 | | | | 3/31/20 | | | | 3/31/19 | |
| Net asset value, beginning of period | | $ | 18.71 | | | $ | 18.30 | | | $ | 10.93 | | | $ | 13.92 | | | $ | 13.70 | |
| | | | | | | | | | | | | | | | | | | | | |
| Income (loss) from investment operations: | | | | | | | | | | | | | | | | | | | | |
| Net investment income1 | | | 0.14 | | | | 0.04 | | | | 0.10 | | | | 0.14 | | | | 0.11 | |
| Net realized and unrealized gain (loss) | | | (1.14 | ) | | | 0.87 | | | | 7.37 | | | | (2.95 | ) | | | 0.51 | |
| Total from investment operations | | | (1.00 | ) | | | 0.91 | | | | 7.47 | | | | (2.81 | ) | | | 0.62 | |
| | | | | | | | | | | | | | | | | | | | | |
| Less dividends and distributions from: | | | | | | | | | | | | | | | | | | | | |
| Net investment income | | | (0.09 | ) | | | (0.04 | ) | | | (0.10 | ) | | | (0.13 | ) | | | (0.10 | ) |
| Net realized gain | | | (0.40 | ) | | | (0.46 | ) | | | — | | | | (0.05 | ) | | | (0.30 | ) |
| Total dividends and distributions | | | (0.49 | ) | | | (0.50 | ) | | | (0.10 | ) | | | (0.18 | ) | | | (0.40 | ) |
| | | | | | | | | | | | | | | | | | | | | |
| Net asset value, end of period | | $ | 17.22 | | | $ | 18.71 | | | $ | 18.30 | | | $ | 10.93 | | | $ | 13.92 | |
| | | | | | | | | | | | | | | | | | | | | |
| Total return2 | | | (5.42 | )% | | | 4.85 | % | | | 68.61 | % | | | (20.50 | )% | | | 4.58 | % |
| | | | | | | | | | | | | | | | | | | | | |
| Ratios and supplemental data: | | | | | | | | | | | | | | | | | | | | |
| Net assets, end of period (000 omitted) | | $ | 20,280 | | | $ | 27,245 | | | $ | 24 | 3 | | $ | 15 | 3 | | $ | 17 | 3 |
| Ratio of expenses to average net assets4 | | | 1.88 | % | | | 1.96 | % | | | 2.00 | % | | | 2.02 | % | | | 2.07 | % |
| Ratio of expenses to average net assets prior to fees waived4 | | | 2.02 | % | | | 2.01 | % | | | 2.07 | % | | | 2.09 | % | | | 2.12 | % |
| Ratio of net investment income to average net assets | | | 0.82 | % | | | 0.21 | % | | | 0.66 | % | | | 0.95 | % | | | 0.79 | % |
| Ratio of net investment income to average net assets prior to fees waived | | | 0.68 | % | | | 0.16 | % | | | 0.59 | % | | | 0.88 | % | | | 0.74 | % |
| Portfolio turnover | | | 29 | % | | | 20 | % | | | 23 | % | | | 25 | % | | | 17 | % |
| 1 | Calculated using average shares outstanding. |
| 2 | Total return is based on the change in net asset value of a share during the period and assumes reinvestment of dividends and distributions at net asset value and does not reflect the impact of a sales charge. Total return during the period reflects waivers by the manager and/or distributor. Performance would have been lower had the waivers not been in effect. |
| 3 | Net assets reported in millions. |
| 4 | Expense ratios do not include expenses of any investment companies in which the Fund invests. |
See accompanying notes, which are an integral part of the financial statements.
Financial highlights
Delaware Ivy Mid Cap Income Opportunities Fund Class I
Selected data for each share of the Fund outstanding throughout each period were as follows:
| | | Year ended | |
| | | | 3/31/23 | | | | 3/31/22 | | | | 3/31/21 | | | | 3/31/20 | | | | 3/31/19 | |
| Net asset value, beginning of period | | $ | 18.84 | | | $ | 18.42 | | | $ | 10.99 | | | $ | 14.00 | | | $ | 13.78 | |
| | | | | | | | | | | | | | | | | | | | | |
| Income (loss) from investment operations: | | | | | | | | | | | | | | | | | | | | |
| Net investment income1 | | | 0.33 | | | | 0.26 | | | | 0.27 | | | | 0.31 | | | | 0.25 | |
| Net realized and unrealized gain (loss) | | | (1.16 | ) | | | 0.88 | | | | 7.43 | | | | (2.97 | ) | | | 0.51 | |
| Total from investment operations | | | (0.83 | ) | | | 1.14 | | | | 7.70 | | | | (2.66 | ) | | | 0.76 | |
| | | | | | | | | | | | | | | | | | | | | |
| Less dividends and distributions from: | | | | | | | | | | | | | | | | | | | | |
| Net investment income | | | (0.34 | ) | | | (0.26 | ) | | | (0.27 | ) | | | (0.30 | ) | | | (0.24 | ) |
| Net realized gain | | | (0.40 | ) | | | (0.46 | ) | | | — | | | | (0.05 | ) | | | (0.30 | ) |
| Total dividends and distributions | | | (0.74 | ) | | | (0.72 | ) | | | (0.27 | ) | | | (0.35 | ) | | | (0.54 | ) |
| | | | | | | | | | | | | | | | | | | | | |
| Net asset value, end of period | | $ | 17.27 | | | $ | 18.84 | | | $ | 18.42 | | | $ | 10.99 | | | $ | 14.00 | |
| | | | | | | | | | | | | | | | | | | | | |
| Total return2 | | | (4.42 | )% | | | 6.05 | % | | | 70.58 | % | | | (19.53 | )% | | | 5.67 | % |
| | | | | | | | | | | | | | | | | | | | | |
| Ratios and supplemental data: | | | | | | | | | | | | | | | | | | | | |
| Net assets, end of period (000 omitted) | | $ | 996,722 | | | $ | 1,399,865 | | | $ | 1,224 | 3 | | $ | 401 | 3 | | $ | 431 | 3 |
| Ratio of expenses to average net assets4 | | | 0.83 | % | | | 0.83 | % | | | 0.83 | % | | | 0.83 | % | | | 1.05 | % |
| Ratio of expenses to average net assets prior to fees waived4 | | | 0.89 | % | | | 1.07 | % | | | 1.06 | % | | | 1.08 | % | | | 1.09 | % |
| Ratio of net investment income to average net assets | | | 1.87 | % | | | 1.34 | % | | | 1.78 | % | | | 2.13 | % | | | 1.81 | % |
| Ratio of net investment income to average net assets prior to fees waived | | | 1.81 | % | | | 1.10 | % | | | 1.55 | % | | | 1.88 | % | | | 1.77 | % |
| Portfolio turnover | | | 29 | % | | | 20 | % | | | 23 | % | | | 25 | % | | | 17 | % |
| 1 | Calculated using average shares outstanding. |
| 2 | Total return is based on the change in net asset value of a share during the period and assumes reinvestment of dividends and distributions at net asset value. Total return during the period reflects waivers by the manager and/or distributor. Performance would have been lower had the waivers not been in effect. |
| 3 | Net assets reported in millions. |
| 4 | Expense ratios do not include expenses of any investment companies in which the Fund invests. |
See accompanying notes, which are an integral part of the financial statements.
Delaware Ivy Mid Cap Income Opportunities Fund Class R
Selected data for each share of the Fund outstanding throughout each period were as follows:
| | | Year ended | |
| | | | 3/31/23 | | | | 3/31/22 | | | | 3/31/21 | | | | 3/31/20 | | | | 3/31/19 | |
| Net asset value, beginning of period | | $ | 18.77 | | | $ | 18.35 | | | $ | 10.96 | | | $ | 13.96 | | | $ | 13.74 | |
| | | | | | | | | | | | | | | | | | | | | |
| Income (loss) from investment operations: | | | | | | | | | | | | | | | | | | | | |
| Net investment income1 | | | 0.22 | | | | 0.12 | | | | 0.16 | | | | 0.20 | | | | 0.17 | |
| Net realized and unrealized gain (loss) | | | (1.15 | ) | | | 0.87 | | | | 7.39 | | | | (2.96 | ) | | | 0.51 | |
| Total from investment operations | | | (0.93 | ) | | | 0.99 | | | | 7.55 | | | | (2.76 | ) | | | 0.68 | |
| | | | | | | | | | | | | | | | | | | | | |
| Less dividends and distributions from: | | | | | | | | | | | | | | | | | | | | |
| Net investment income | | | (0.18 | ) | | | (0.11 | ) | | | (0.16 | ) | | | (0.19 | ) | | | (0.16 | ) |
| Net realized gain | | | (0.40 | ) | | | (0.46 | ) | | | — | | | | (0.05 | ) | | | (0.30 | ) |
| Total dividends and distributions | | | (0.58 | ) | | | (0.57 | ) | | | (0.16 | ) | | | (0.24 | ) | | | (0.46 | ) |
| | | | | | | | | | | | | | | | | | | | | |
| Net asset value, end of period | | $ | 17.26 | | | $ | 18.77 | | | $ | 18.35 | | | $ | 10.96 | | | $ | 13.96 | |
| | | | | | | | | | | | | | | | | | | | | |
| Total return2 | | | (4.99 | )%3 | | | 5.28 | %3 | | | 69.22 | %3 | | | (20.15 | )%3 | | | 5.05 | % |
| | | | | | | | | | | | | | | | | | | | | |
| Ratios and supplemental data: | | | | | | | | | | | | | | | | | | | | |
| Net assets, end of period (000 omitted) | | $ | 1,131 | | | $ | 1,205 | | | $ | 1 | 4 | | $ | 3 | 4 | | $ | 3 | 4 |
| Ratio of expenses to average net assets5 | | | 1.41 | % | | | 1.58 | % | | | 1.58 | % | | | 1.59 | % | | | 1.67 | % |
| Ratio of expenses to average net assets prior to fees waived5 | | | 1.47 | % | | | 1.63 | % | | | 1.64 | % | | | 1.66 | % | | | 1.67 | % |
| Ratio of net investment income to average net assets | | | 1.29 | % | | | 0.60 | % | | | 1.16 | % | | | 1.38 | % | | | 1.19 | % |
| Ratio of net investment income to average net assets prior to fees waived | | | 1.23 | % | | | 0.55 | % | | | 1.10 | % | | | 1.31 | % | | | 1.19 | % |
| Portfolio turnover | | | 29 | % | | | 20 | % | | | 23 | % | | | 25 | % | | | 17 | % |
| 1 | Calculated using average shares outstanding. |
| 2 | Total return is based on the change in net asset value of a share during the period and assumes reinvestment of dividends and distributions at net asset value. |
| 3 | Total return during the period reflects waivers by the manager and/or distributor. Performance would have been lower had the waivers not been in effect. |
| 4 | Net assets reported in millions. |
| 5 | Expense ratios do not include expenses of any investment companies in which the Fund invests. |
See accompanying notes, which are an integral part of the financial statements.
Financial highlights
Delaware Ivy Mid Cap Income Opportunities Fund Class R6
Selected data for each share of the Fund outstanding throughout each period were as follows:
| | | Year ended | |
| | | | 3/31/23 | | | | 3/31/22 | | | | 3/31/21 | | | | 3/31/20 | | | | 3/31/19 | |
| Net asset value, beginning of period | | $ | 18.84 | | | $ | 18.42 | | | $ | 10.99 | | | $ | 14.01 | | | $ | 13.78 | |
| | | | | | | | | | | | | | | | | | | | | |
| Income (loss) from investment operations: | | | | | | | | | | | | | | | | | | | | |
| Net investment income1 | | | 0.33 | | | | 0.26 | | | | 0.27 | | | | 0.32 | | | | 0.27 | |
| Net realized and unrealized gain (loss) | | | (1.15 | ) | | | 0.88 | | | | 7.43 | | | | (2.98 | ) | | | 0.52 | |
| Total from investment operations | | | (0.82 | ) | | | 1.14 | | | | 7.70 | | | | (2.66 | ) | | | 0.79 | |
| | | | | | | | | | | | | | | | | | | | | |
| Less dividends and distributions from: | | | | | | | | | | | | | | | | | | | | |
| Net investment income | | | (0.34 | ) | | | (0.26 | ) | | | (0.27 | ) | | | (0.31 | ) | | | (0.26 | ) |
| Net realized gain | | | (0.40 | ) | | | (0.46 | ) | | | — | | | | (0.05 | ) | | | (0.30 | ) |
| Total dividends and distributions | | | (0.74 | ) | | | (0.72 | ) | | | (0.27 | ) | | | (0.36 | ) | | | (0.56 | ) |
| | | | | | | | | | | | | | | | | | | | | |
| Net asset value, end of period | | $ | 17.28 | | | $ | 18.84 | | | $ | 18.42 | | | $ | 10.99 | | | $ | 14.01 | |
| | | | | | | | | | | | | | | | | | | | | |
| Total return2 | | | (4.37 | )%3 | | | 6.05 | %3 | | | 70.58 | %3 | | | (19.57 | )%3 | | | 5.85 | % |
| | | | | | | | | | | | | | | | | | | | | |
| Ratios and supplemental data: | | | | | | | | | | | | | | | | | | | | |
| Net assets, end of period (000 omitted) | | $ | 89,010 | | | $ | 112,720 | | | $ | 103 | 4 | | $ | 65 | 4 | | $ | 60 | 4 |
| Ratio of expenses to average net assets5 | | | 0.83 | % | | | 0.83 | % | | | 0.83 | % | | | 0.83 | % | | | 0.94 | % |
| Ratio of expenses to average net assets prior to fees waived5 | | | 0.89 | % | | | 0.89 | % | | | 0.92 | % | | | 0.93 | % | | | 0.94 | % |
| Ratio of net investment income to average net assets | | | 1.87 | % | | | 1.34 | % | | | 1.80 | % | | | 2.15 | % | | | 1.92 | % |
| Ratio of net investment income to average net assets prior to fees waived | | | 1.81 | % | | | 1.28 | % | | | 1.71 | % | | | 2.05 | % | | | 1.92 | % |
| Portfolio turnover | | | 29 | % | | | 20 | % | | | 23 | % | | | 25 | % | | | 17 | % |
| 1 | Calculated using average shares outstanding. |
| 2 | Total return is based on the change in net asset value of a share during the period and assumes reinvestment of dividends and distributions at net asset value. |
| 3 | Total return during the period reflects waivers by the manager and/or distributor. Performance would have been lower had the waivers not been in effect. |
| 4 | Net assets reported in millions. |
| 5 | Expense ratios do not include expenses of any investment companies in which the Fund invests. |
See accompanying notes, which are an integral part of the financial statements.
Delaware Ivy Mid Cap Income Opportunities Fund Class Y
Selected data for each share of the Fund outstanding throughout each period were as follows:
| | | Year ended | |
| | | | 3/31/23 | | | | 3/31/22 | | | | 3/31/21 | | | | 3/31/20 | | | | 3/31/19 | |
| Net asset value, beginning of period | | $ | 18.81 | | | $ | 18.39 | | | $ | 10.98 | | | $ | 13.98 | | | $ | 13.76 | |
| | | | | | | | | | | | | | | | | | | | | |
| Income (loss) from investment operations: | | | | | | | | | | | | | | | | | | | | |
| Net investment income1 | | | 0.27 | | | | 0.18 | | | | 0.21 | | | | 0.25 | | | | 0.22 | |
| Net realized and unrealized gain (loss) | | | (1.14 | ) | | | 0.88 | | | | 7.41 | | | | (2.96 | ) | | | 0.50 | |
| Total from investment operations | | | (0.87 | ) | | | 1.06 | | | | 7.62 | | | | (2.71 | ) | | | 0.72 | |
| | | | | | | | | | | | | | | | | | | | | |
| Less dividends and distributions from: | | | | | | | | | | | | | | | | | | | | |
| Net investment income | | | (0.17 | ) | | | (0.18 | ) | | | (0.21 | ) | | | (0.24 | ) | | | (0.20 | ) |
| Net realized gain | | | (0.40 | ) | | | (0.46 | ) | | | — | | | | (0.05 | ) | | | (0.30 | ) |
| Total dividends and distributions | | | (0.57 | ) | | | (0.64 | ) | | | (0.21 | ) | | | (0.29 | ) | | | (0.50 | ) |
| | | | | | | | | | | | | | | | | | | | | |
| Net asset value, end of period | | $ | 17.37 | | | $ | 18.81 | | | $ | 18.39 | | | $ | 10.98 | | | $ | 13.98 | |
| | | | | | | | | | | | | | | | | | | | | |
| Total return2 | | | (4.68 | )%3 | | | 5.63 | %3 | | | 69.84 | %3 | | | (19.89 | )%3 | | | 5.45 | % |
| | | | | | | | | | | | | | | | | | | | | |
| Ratios and supplemental data: | | | | | | | | | | | | | | | | | | | | |
| Net assets, end of period (000 omitted) | | $ | 11,656 | | | $ | 27,888 | | | $ | 38 | 4 | | $ | 13 | 4 | | $ | 14 | 4 |
| Ratio of expenses to average net assets5 | | | 1.15 | % | | | 1.22 | % | | | 1.24 | % | | | 1.26 | % | | | 1.33 | % |
| Ratio of expenses to average net assets prior to fees waived5 | | | 1.22 | % | | | 1.30 | % | | | 1.31 | % | | | 1.33 | % | | | 1.33 | % |
| Ratio of net investment income to average net assets | | | 1.52 | % | | | 0.92 | % | | | 1.40 | % | | | 1.71 | % | | | 1.54 | % |
| Ratio of net investment income to average net assets prior to fees waived | | | 1.45 | % | | | 0.84 | % | | | 1.33 | % | | | 1.64 | % | | | 1.54 | % |
| Portfolio turnover | | | 29 | % | | | 20 | % | | | 23 | % | | | 25 | % | | | 17 | % |
| 1 | Calculated using average shares outstanding. |
| 2 | Total return is based on the change in net asset value of a share during the period and assumes reinvestment of dividends and distributions at net asset value. |
| 3 | Total return during the period reflects waivers by the manager and/or distributor. Performance would have been lower had the waivers not been in effect. |
| 4 | Net assets reported in millions. |
| 5 | Expense ratios do not include expenses of any investment companies in which the Fund invests. |
See accompanying notes, which are an integral part of the financial statements.
Financial highlights
Delaware Ivy Municipal Bond Fund Class A
Selected data for each share of the Fund outstanding throughout each period were as follows:
| | | Year ended | |
| | | | 3/31/23 | | | | 3/31/22 | | | | 3/31/21 | | | | 3/31/20 | | | | 3/31/19 | |
| Net asset value, beginning of period | | $ | 10.95 | | | $ | 11.89 | | | $ | 11.68 | | | $ | 11.70 | | | $ | 11.72 | |
| | | | | | | | | | | | | | | | | | | | | |
| Income (loss) from investment operations: | | | | | | | | | | | | | | | | | | | | |
| Net investment income1 | | | 0.35 | | | | 0.30 | | | | 0.26 | | | | 0.34 | | | | 0.40 | |
| Net realized and unrealized gain (loss) | | | (0.77 | ) | | | (0.88 | ) | | | 0.21 | | | | (0.03 | ) | | | (0.03 | ) |
| Total from investment operations | | | (0.42 | ) | | | (0.58 | ) | | | 0.47 | | | | 0.31 | | | | 0.37 | |
| | | | | | | | | | | | | | | | | | | | | |
| Less dividends and distributions from: | | | | | | | | | | | | | | | | | | | | |
| Net investment income | | | (0.37 | ) | | | (0.25 | ) | | | (0.26 | ) | | | (0.33 | ) | | | (0.39 | ) |
| Net realized gain | | | (0.03 | ) | | | (0.11 | ) | | | — | | | | — | | | | — | |
| Return of capital | | | (0.01 | ) | | | — | | | | — | | | | — | | | | — | |
| Total dividends and distributions | | | (0.41 | ) | | | (0.36 | ) | | | (0.26 | ) | | | (0.33 | ) | | | (0.39 | ) |
| | | | | | | | | | | | | | | | | | | | | |
| Net asset value, end of period | | $ | 10.12 | | | $ | 10.95 | | | $ | 11.89 | | | $ | 11.68 | | | $ | 11.70 | |
| | | | | | | | | | | | | | | | | | | | | |
| Total return2 | | | (3.83 | )% | | | (5.09 | )% | | | 4.07 | % | | | 2.68 | % | | | 3.28 | % |
| | | | | | | | | | | | | | | | | | | | | |
| Ratios and supplemental data: | | | | | | | | | | | | | | | | | | | | |
| Net assets, end of period (000 omitted) | | $ | 244,981 | | | $ | 375,510 | | | $ | 445 | 3 | | $ | 453 | 3 | | $ | 476 | 3 |
| Ratio of expenses to average net assets4 | | | 0.81 | % | | | 0.83 | % | | | 0.83 | % | | | 0.84 | % | | | 0.84 | % |
| Ratio of expenses to average net assets prior to fees waived4 | | | 0.97 | % | | | 0.87 | % | | | 0.90 | % | | | 0.91 | % | | | 0.90 | % |
| Ratio of net investment income to average net assets | | | 3.46 | % | | | 2.50 | % | | | 2.21 | % | | | 2.87 | % | | | 3.38 | % |
| Ratio of net investment income to average net assets prior to fees waived | | | 3.30 | % | | | 2.46 | % | | | 2.14 | % | | | 2.80 | % | | | 3.32 | % |
| Portfolio turnover | | | 49 | % | | | 60 | % | | | 22 | % | | | 18 | % | | | 7 | % |
| 1 | Calculated using average shares outstanding. |
| 2 | Total return is based on the change in net asset value of a share during the period and assumes reinvestment of dividends and distributions at net asset value and does not reflect the impact of a sales charge. Total return during the period reflects waivers by the manager and/or distributor. Performance would have been lower had the waivers not been in effect. |
| 3 | Net assets reported in millions. |
| 4 | Expense ratios do not include expenses of any investment companies in which the Fund invests. |
See accompanying notes, which are an integral part of the financial statements.
Delaware Ivy Municipal Bond Fund Class C
Selected data for each share of the Fund outstanding throughout each period were as follows:
| | | Year ended | |
| | | | 3/31/23 | | | | 3/31/22 | | | | 3/31/21 | | | | 3/31/20 | | | | 3/31/19 | |
| Net asset value, beginning of period | | $ | 10.95 | | | $ | 11.89 | | | $ | 11.68 | | | $ | 11.70 | | | $ | 11.72 | |
| | | | | | | | | | | | | | | | | | | | | |
| Income (loss) from investment operations: | | | | | | | | | | | | | | | | | | | | |
| Net investment income1 | | | 0.27 | | | | 0.18 | | | | 0.16 | | | | 0.24 | | | | 0.30 | |
| Net realized and unrealized gain (loss) | | | (0.78 | ) | | | (0.86 | ) | | | 0.21 | | | | (0.03 | ) | | | (0.01 | ) |
| Total from investment operations | | | (0.51 | ) | | | (0.68 | ) | | | 0.37 | | | | 0.21 | | | | 0.29 | |
| | | | | | | | | | | | | | | | | | | | | |
| Less dividends and distributions from: | | | | | | | | | | | | | | | | | | | | |
| Net investment income | | | (0.28 | ) | | | (0.15 | ) | | | (0.16 | ) | | | (0.23 | ) | | | (0.31 | ) |
| Net realized gain | | | (0.03 | ) | | | (0.11 | ) | | | — | | | | — | | | | — | |
| Return of capital | | | (0.01 | ) | | | — | | | | — | | | | — | | | | — | |
| Total dividends and distributions | | | (0.32 | ) | | | (0.26 | ) | | | (0.16 | ) | | | (0.23 | ) | | | (0.31 | ) |
| | | | | | | | | | | | | | | | | | | | | |
| Net asset value, end of period | | $ | 10.12 | | | $ | 10.95 | | | $ | 11.89 | | | $ | 11.68 | | | $ | 11.70 | |
| | | | | | | | | | | | | | | | | | | | | |
| Total return2 | | | (4.65 | )%3 | | | (5.87 | )% | | | 3.14 | % | | | 1.80 | % | | | 2.50 | % |
| | | | | | | | | | | | | | | | | | | | | |
| Ratios and supplemental data: | | | | | | | | | | | | | | | | | | | | |
| Net assets, end of period (000 omitted) | | $ | 3,401 | | | $ | 4,842 | | | $ | 8 | 4 | | $ | 16 | 4 | | $ | 19 | 4 |
| Ratio of expenses to average net assets5 | | | 1.68 | % | | | 1.67 | % | | | 1.73 | % | | | 1.72 | % | | | 1.70 | % |
| Ratio of expenses to average net assets prior to fees waived5 | | | 1.93 | % | | | 1.67 | % | | | 1.73 | % | | | 1.72 | % | | | 1.70 | % |
| Ratio of net investment income to average net assets | | | 2.61 | % | | | 1.56 | % | | | 1.36 | % | | | 2.00 | % | | | 2.53 | % |
| Ratio of net investment income to average net assets prior to fees waived | | | 2.36 | % | | | 1.56 | % | | | 1.36 | % | | | 2.00 | % | | | 2.53 | % |
| Portfolio turnover | | | 49 | % | | | 60 | % | | | 22 | % | | | 18 | % | | | 7 | % |
| 1 | Calculated using average shares outstanding. |
| 2 | Total return is based on the change in net asset value of a share during the period and assumes reinvestment of dividends and distributions at net asset value and does not reflect the impact of a sales charge. |
| 3 | Total return during the period reflects waivers by the manager and/or distributor. Performance would have been lower had the waivers not been in effect. |
| 4 | Net assets reported in millions. |
| 5 | Expense ratios do not include expenses of any investment companies in which the Fund invests. |
See accompanying notes, which are an integral part of the financial statements.
Financial highlights
Delaware Ivy Municipal Bond Fund Class I
Selected data for each share of the Fund outstanding throughout each period were as follows:
| | | Year ended | |
| | | | 3/31/23 | | | | 3/31/22 | | | | 3/31/21 | | | | 3/31/20 | | | | 3/31/19 | |
| Net asset value, beginning of period | | $ | 10.95 | | | $ | 11.89 | | | $ | 11.68 | | | $ | 11.70 | | | $ | 11.72 | |
| | | | | | | | | | | | | | | | | | | | | |
| Income (loss) from investment operations: | | | | | | | | | | | | | | | | | | | | |
| Net investment income1 | | | 0.37 | | | | 0.31 | | | | 0.28 | | | | 0.36 | | | | 0.42 | |
| Net realized and unrealized gain (loss) | | | (0.77 | ) | | | (0.88 | ) | | | 0.21 | | | | (0.03 | ) | | | (0.02 | ) |
| Total from investment operations | | | (0.40 | ) | | | (0.57 | ) | | | 0.49 | | | | 0.33 | | | | 0.40 | |
| | | | | | | | | | | | | | | | | | | | | |
| Less dividends and distributions from: | | | | | | | | | | | | | | | | | | | | |
| Net investment income | | | (0.39 | ) | | | (0.26 | ) | | | (0.28 | ) | | | (0.35 | ) | | | (0.42 | ) |
| Net realized gain | | | (0.03 | ) | | | (0.11 | ) | | | — | | | | — | | | | — | |
| Return of capital | | | (0.01 | ) | | | — | | | | — | | | | — | | | | — | |
| Total dividends and distributions | | | (0.43 | ) | | | (0.37 | ) | | | (0.28 | ) | | | (0.35 | ) | | | (0.42 | ) |
| | | | | | | | | | | | | | | | | | | | | |
| Net asset value, end of period | | $ | 10.12 | | | $ | 10.95 | | | $ | 11.89 | | | $ | 11.68 | | | $ | 11.70 | |
| | | | | | | | | | | | | | | | | | | | | |
| Total return2 | | | (3.62 | )% | | | (4.96 | )% | | | 4.21 | % | | | 2.83 | % | | | 3.53 | % |
| | | | | | | | | | | | | | | | | | | | | |
| Ratios and supplemental data: | | | | | | | | | | | | | | | | | | | | |
| Net assets, end of period (000 omitted) | | $ | 103,953 | | | $ | 238,886 | | | $ | 302 | 3 | | $ | 293 | 3 | | $ | 315 | 3 |
| Ratio of expenses to average net assets4 | | | 0.62 | % | | | 0.70 | % | | | 0.70 | % | | | 0.70 | % | | | 0.70 | % |
| Ratio of expenses to average net assets prior to fees waived4 | | | 0.69 | % | | | 0.72 | % | | | 0.74 | % | | | 0.74 | % | | | 0.73 | % |
| Ratio of net investment income to average net assets | | | 3.54 | % | | | 2.59 | % | | | 2.33 | % | | | 3.01 | % | | | 3.52 | % |
| Ratio of net investment income to average net assets prior to fees waived | | | 3.47 | % | | | 2.57 | % | | | 2.29 | % | | | 2.97 | % | | | 3.49 | % |
| Portfolio turnover | | | 49 | % | | | 60 | % | | | 22 | % | | | 18 | % | | | 7 | % |
| 1 | Calculated using average shares outstanding. |
| 2 | Total return is based on the change in net asset value of a share during the period and assumes reinvestment of dividends and distributions at net asset value. Total return during the period reflects waivers by the manager and/or distributor. Performance would have been lower had the waivers not been in effect. |
| 3 | Net assets reported in millions. |
| 4 | Expense ratios do not include expenses of any investment companies in which the Fund invests. |
See accompanying notes, which are an integral part of the financial statements.
Delaware Ivy Municipal Bond Fund Class R6
Selected data for each share of the Fund outstanding throughout each period were as follows:
| | | Year ended | |
| | | | 3/31/23 | | | | 3/31/22 | | | | 3/31/21 | | | | 3/31/20 | | | | 3/31/19 | |
| Net asset value, beginning of period | | $ | 10.95 | | | $ | 11.89 | | | $ | 11.68 | | | $ | 11.70 | | | $ | 11.72 | |
| | | | | | | | | | | | | | | | | | | | | |
| Income (loss) from investment operations: | | | | | | | | | | | | | | | | | | | | |
| Net investment income1 | | | 0.38 | | | | 0.32 | | | | 0.29 | | | | 0.36 | | | | 0.43 | |
| Net realized and unrealized gain (loss) | | | (0.78 | ) | | | (0.87 | ) | | | 0.21 | | | | (0.02 | ) | | | (0.02 | ) |
| Total from investment operations | | | (0.40 | ) | | | (0.55 | ) | | | 0.50 | | | | 0.34 | | | | 0.41 | |
| | | | | | | | | | | | | | | | | | | | | |
| Less dividends and distributions from: | | | | | | | | | | | | | | | | | | | | |
| Net investment income | | | (0.39 | ) | | | (0.28 | ) | | | (0.29 | ) | | | (0.36 | ) | | | (0.43 | ) |
| Net realized gain | | | (0.03 | ) | | | (0.11 | ) | | | — | | | | — | | | | — | |
| Return of capital | | | (0.01 | ) | | | — | | | | — | | | | — | | | | — | |
| Total dividends and distributions | | | (0.43 | ) | | | (0.39 | ) | | | (0.29 | ) | | | (0.36 | ) | | | (0.43 | ) |
| | | | | | | | | | | | | | | | | | | | | |
| Net asset value, end of period | | $ | 10.12 | | | $ | 10.95 | | | $ | 11.89 | | | $ | 11.68 | | | $ | 11.70 | |
| | | | | | | | | | | | | | | | | | | | | |
| Total return2 | | | (3.60 | )%3 | | | (4.84 | )% | | | 4.32 | % | | | 2.94 | % | | | 3.62 | % |
| | | | | | | | | | | | | | | | | | | | | |
| Ratios and supplemental data: | | | | | | | | | | | | | | | | | | | | |
| Net assets, end of period (000 omitted) | | $ | 795 | | | $ | 1,124 | | | $ | 1 | 4 | | $ | 1 | 4 | | $ | 1 | 4 |
| Ratio of expenses to average net assets5 | | | 0.58 | % | | | 0.58 | % | | | 0.60 | % | | | 0.60 | % | | | 0.59 | % |
| Ratio of expenses to average net assets prior to fees waived5 | | | 0.66 | % | | | 0.58 | % | | | 0.60 | % | | | 0.60 | % | | | 0.59 | % |
| Ratio of net investment income to average net assets | | | 3.68 | % | | | 2.75 | % | | | 2.43 | % | | | 3.09 | % | | | 3.62 | % |
| Ratio of net investment income to average net assets prior to fees waived | | | 3.60 | % | | | 2.75 | % | | | 2.43 | % | | | 3.09 | % | | | 3.62 | % |
| Portfolio turnover | | | 49 | % | | | 60 | % | | | 22 | % | | | 18 | % | | | 7 | % |
| 1 | Calculated using average shares outstanding. |
| 2 | Total return is based on the change in net asset value of a share during the period and assumes reinvestment of dividends and distributions at net asset value. |
| 3 | Total return during the period reflects waivers by the manager and/or distributor. Performance would have been lower had the waivers not been in effect. |
| 4 | Net assets reported in millions. |
| 5 | Expense ratios do not include expenses of any investment companies in which the Fund invests. |
See accompanying notes, which are an integral part of the financial statements.
Financial highlights
Delaware Ivy Municipal High Income Fund Class A
Selected data for each share of the Fund outstanding throughout each period were as follows:
| | | Year ended | |
| | | | 3/31/23 | | | | 3/31/22 | | | | 3/31/21 | | | | 3/31/20 | | | | 3/31/19 | |
| Net asset value, beginning of period | | $ | 4.81 | | | $ | 5.04 | | | $ | 4.87 | | | $ | 5.02 | | | $ | 5.05 | |
| | | | | | | | | | | | | | | | | | | | | |
| Income (loss) from investment operations: | | | | | | | | | | | | | | | | | | | | |
| Net investment income1 | | | 0.15 | | | | 0.21 | | | | 0.17 | | | | 0.19 | | | | 0.22 | |
| Net realized and unrealized gain (loss) | | | (0.48 | ) | | | (0.28 | ) | | | 0.17 | | | | (0.15 | ) | | | (0.03 | ) |
| Total from investment operations | | | (0.33 | ) | | | (0.07 | ) | | | 0.34 | | | | 0.04 | | | | 0.19 | |
| | | | | | | | | | | | | | | | | | | | | |
| Less dividends and distributions from: | | | | | | | | | | | | | | | | | | | | |
| Net investment income | | | (0.19 | ) | | | (0.16 | ) | | | (0.17 | ) | | | (0.19 | ) | | | (0.22 | ) |
| Total dividends and distributions | | | (0.19 | ) | | | (0.16 | ) | | | (0.17 | ) | | | (0.19 | ) | | | (0.22 | ) |
| | | | | | | | | | | | | | | | | | | | | |
| Net asset value, end of period | | $ | 4.29 | | | $ | 4.81 | | | $ | 5.04 | | | $ | 4.87 | | | $ | 5.02 | |
| | | | | | | | | | | | | | | | | | | | | |
| Total return2 | | | (6.78 | )%3 | | | (1.44 | )% | | | 7.13 | % | | | 0.72 | % | | | 3.76 | % |
| | | | | | | | | | | | | | | | | | | | | |
| Ratios and supplemental data: | | | | | | | | | | | | | | | | | | | | |
| Net assets, end of period (000 omitted) | | $ | 357,078 | | | $ | 556,920 | | | $ | 6,367 | 4 | | $ | 610 | 4 | | $ | 665 | 4 |
| Ratio of expenses to average net assets5 | | | 0.88 | % | | | 0.89 | % | | | 0.89 | % | | | 0.88 | % | | | 0.87 | % |
| Ratio of expenses to average net assets prior to fees waived5 | | | 0.94 | % | | | 0.89 | % | | | 0.89 | % | | | 0.88 | % | | | 0.87 | % |
| Ratio of net investment income to average net assets | | | 3.42 | % | | | 4.14 | % | | | 3.47 | % | | | 3.76 | % | | | 4.32 | % |
| Ratio of net investment income to average net assets prior to fees waived | | | 3.36 | % | | | 4.14 | % | | | 3.47 | % | | | 3.76 | % | | | 4.32 | % |
| Portfolio turnover | | | 79 | % | | | 42 | % | | | 7 | % | | | 18 | % | | | 10 | % |
| 1 | Calculated using average shares outstanding. |
| 2 | Total return is based on the change in net asset value of a share during the period and assumes reinvestment of dividends and distributions at net asset value and does not reflect the impact of a sales charge. |
| 3 | Total return during the period reflects waivers by the manager and/or distributor. Performance would have been lower had the waivers not been in effect. |
| 4 | Net assets reported in millions. |
| 5 | Expense ratios do not include expenses of any investment companies in which the Fund invests. |
See accompanying notes, which are an integral part of the financial statements.
Delaware Ivy Municipal High Income Fund Class C
Selected data for each share of the Fund outstanding throughout each period were as follows:
| | | Year ended | |
| | | | 3/31/23 | | | | 3/31/22 | | | | 3/31/21 | | | | 3/31/20 | | | | 3/31/19 | |
| Net asset value, beginning of period | | $ | 4.81 | | | $ | 5.04 | | | $ | 4.87 | | | $ | 5.02 | | | $ | 5.05 | |
| | | | | | | | | | | | | | | | | | | | | |
| Income (loss) from investment operations: | | | | | | | | | | | | | | | | | | | | |
| Net investment income1 | | | 0.11 | | | | 0.17 | | | | 0.14 | | | | 0.15 | | | | 0.18 | |
| Net realized and unrealized gain (loss) | | | (0.47 | ) | | | (0.27 | ) | | | 0.17 | | | | (0.15 | ) | | | (0.03 | ) |
| Total from investment operations | | | (0.36 | ) | | | (0.10 | ) | | | 0.31 | | | | — | | | | 0.15 | |
| | | | | | | | | | | | | | | | | | | | | |
| Less dividends and distributions from: | | | | | | | | | | | | | | | | | | | | |
| Net investment income | | | (0.16 | ) | | | (0.13 | ) | | | (0.14 | ) | | | (0.15 | ) | | | (0.18 | ) |
| Total dividends and distributions | | | (0.16 | ) | | | (0.13 | ) | | | (0.14 | ) | | | (0.15 | ) | | | (0.18 | ) |
| | | | | | | | | | | | | | | | | | | | | |
| Net asset value, end of period | | $ | 4.29 | | | $ | 4.81 | | | $ | 5.04 | | | $ | 4.87 | | | $ | 5.02 | |
| | | | | | | | | | | | | | | | | | | | | |
| Total return2 | | | (7.44 | )% | | | (2.12 | )% | | | 6.39 | % | | | 0.01 | % | | | 3.06 | % |
| | | | | | | | | | | | | | | | | | | | | |
| Ratios and supplemental data: | | | | | | | | | | | | | | | | | | | | |
| Net assets, end of period (000 omitted) | | $ | 10,442 | | | $ | 18,899 | | | $ | 30 | 3 | | $ | 79 | 3 | | $ | 106 | 3 |
| Ratio of expenses to average net assets4 | | | 1.58 | % | | | 1.58 | % | | | 1.58 | % | | | 1.58 | % | | | 1.58 | % |
| Ratio of expenses to average net assets prior to fees waived4 | | | 1.87 | % | | | 1.71 | % | | | 1.68 | % | | | 1.65 | % | | | 1.63 | % |
| Ratio of net investment income to average net assets | | | 2.59 | % | | | 3.32 | % | | | 2.85 | % | | | 3.06 | % | | | 3.63 | % |
| Ratio of net investment income to average net assets prior to fees waived | | | 2.30 | % | | | 3.19 | % | | | 2.75 | % | | | 2.99 | % | | | 3.58 | % |
| Portfolio turnover | | | 79 | % | | | 42 | % | | | 7 | % | | | 18 | % | | | 10 | % |
| 1 | Calculated using average shares outstanding. |
| 2 | Total return is based on the change in net asset value of a share during the period and assumes reinvestment of dividends and distributions at net asset value and does not reflect the impact of a sales charge. Total return during the period reflects waivers by the manager and/or distributor. Performance would have been lower had the waivers not been in effect. |
| 3 | Net assets reported in millions. |
| 4 | Expense ratios do not include expenses of any investment companies in which the Fund invests. |
See accompanying notes, which are an integral part of the financial statements.
Financial highlights
Delaware Ivy Municipal High Income Fund Class I
Selected data for each share of the Fund outstanding throughout each period were as follows:
| | | Year ended | |
| | | | 3/31/23 | | | | 3/31/22 | | | | 3/31/21 | | | | 3/31/20 | | | | 3/31/19 | |
| Net asset value, beginning of period | | $ | 4.81 | | | $ | 5.04 | | | $ | 4.87 | | | $ | 5.02 | | | $ | 5.05 | |
| | | | | | | | | | | | | | | | | | | | | |
| Income (loss) from investment operations: | | | | | | | | | | | | | | | | | | | | |
| Net investment income1 | | | 0.16 | | | | 0.23 | | | | 0.19 | | | | 0.20 | | | | 0.23 | |
| Net realized and unrealized gain (loss) | | | (0.47 | ) | | | (0.28 | ) | | | 0.17 | | | | (0.15 | ) | | | (0.03 | ) |
| Total from investment operations | | | (0.31 | ) | | | (0.05 | ) | | | 0.36 | | | | 0.05 | | | | 0.20 | |
| | | | | | | | | | | | | | | | | | | | | |
| Less dividends and distributions from: | | | | | | | | | | | | | | | | | | | | |
| Net investment income | | | (0.21 | ) | | | (0.18 | ) | | | (0.19 | ) | | | (0.20 | ) | | | (0.23 | ) |
| Total dividends and distributions | | | (0.21 | ) | | | (0.18 | ) | | | (0.19 | ) | | | (0.20 | ) | | | (0.23 | ) |
| | | | | | | | | | | | | | | | | | | | | |
| Net asset value, end of period | | $ | 4.29 | | | $ | 4.81 | | | $ | 5.04 | | | $ | 4.87 | | | $ | 5.02 | |
| | | | | | | | | | | | | | | | | | | | | |
| Total return2 | | | (6.53 | )% | | | (1.16 | )% | | | 7.42 | % | | | 0.99 | % | | | 4.04 | % |
| | | | | | | | | | | | | | | | | | | | | |
| Ratios and supplemental data: | | | | | | | | | | | | | | | | | | | | |
| Net assets, end of period (000 omitted) | | $ | 144,710 | | | $ | 278,654 | | | $ | 313 | 3 | | $ | 355 | 3 | | $ | 413 | 3 |
| Ratio of expenses to average net assets4 | | | 0.61 | % | | | 0.61 | % | | | 0.61 | % | | | 0.61 | % | | | 0.64 | % |
| Ratio of expenses to average net assets prior to fees waived4 | | | 0.63 | % | | | 0.75 | % | | | 0.74 | % | | | 0.72 | % | | | 0.71 | % |
| Ratio of net investment income to average net assets | | | 3.58 | % | | | 4.42 | % | | | 3.76 | % | | | 4.02 | % | | | 4.57 | % |
| Ratio of net investment income to average net assets prior to fees waived | | | 3.56 | % | | | 4.28 | % | | | 3.63 | % | | | 3.91 | % | | | 4.50 | % |
| Portfolio turnover | | | 79 | % | | | 42 | % | | | 7 | % | | | 18 | % | | | 10 | % |
| 1 | Calculated using average shares outstanding. |
| 2 | Total return is based on the change in net asset value of a share during the period and assumes reinvestment of dividends and distributions at net asset value and does not reflect the impact of a sales charge. Total return during the period reflects waivers by the manager and/or distributor. Performance would have been lower had the waivers not been in effect. |
| 3 | Net assets reported in millions. |
| 4 | Expense ratios do not include expenses of any investment companies in which the Fund invests. |
See accompanying notes, which are an integral part of the financial statements.
Delaware Ivy Municipal High Income Fund Class R6
Selected data for each share of the Fund outstanding throughout each period were as follows:
| | | Year ended | |
| | | | 3/31/23 | | | | 3/31/22 | | | | 3/31/21 | | | | 3/31/20 | | | | 3/31/19 | |
| Net asset value, beginning of period | | $ | 4.81 | | | $ | 5.04 | | | $ | 4.87 | | | $ | 5.02 | | | $ | 5.05 | |
| | | | | | | | | | | | | | | | | | | | | |
| Income (loss) from investment operations: | | | | | | | | | | | | | | | | | | | | |
| Net investment income1 | | | 0.16 | | | | 0.23 | | | | 0.19 | | | | 0.20 | | | | 0.23 | |
| Net realized and unrealized gain (loss) | | | (0.48 | ) | | | (0.28 | ) | | | 0.17 | | | | (0.14 | ) | | | (0.03 | ) |
| Total from investment operations | | | (0.32 | ) | | | (0.05 | ) | | | 0.36 | | | | 0.06 | | | | 0.20 | |
| | | | | | | | | | | | | | | | | | | | | |
| Less dividends and distributions from: | | | | | | | | | | | | | | | | | | | | |
| Net investment income | | | (0.20 | ) | | | (0.18 | ) | | | (0.19 | ) | | | (0.21 | ) | | | (0.23 | ) |
| Total dividends and distributions | | | (0.20 | ) | | | (0.18 | ) | | | (0.19 | ) | | | (0.21 | ) | | | (0.23 | ) |
| | | | | | | | | | | | | | | | | | | | | |
| Net asset value, end of period | | $ | 4.29 | | | $ | 4.81 | | | $ | 5.04 | | | $ | 4.87 | | | $ | 5.02 | |
| | | | | | | | | | | | | | | | | | | | | |
| Total return2 | | | (6.55 | )%3 | | | (1.15 | )% | | | 7.43 | % | | | 1.03 | % | | | 4.13 | % |
| | | | | | | | | | | | | | | | | | | | | |
| Ratios and supplemental data: | | | | | | | | | | | | | | | | | | | | |
| Net assets, end of period (000 omitted) | | $ | 1,118 | | | $ | 1,095 | | | $ | 1 | 4 | | $ | 1 | 4 | | $ | 1 | 4 |
| Ratio of expenses to average net assets5 | | | 0.64 | % | | | 0.60 | % | | | 0.60 | % | | | 0.58 | % | | | 0.57 | % |
| Ratio of expenses to average net assets prior to fees waived5 | | | 0.65 | % | | | 0.60 | % | | | 0.60 | % | | | 0.58 | % | | | 0.57 | % |
| Ratio of net investment income to average net assets | | | 3.72 | % | | | 4.46 | % | | | 3.77 | % | | | 4.03 | % | | | 4.56 | % |
| Ratio of net investment income to average net assets prior to fees waived | | | 3.71 | % | | | 4.46 | % | | | 3.77 | % | | | 4.03 | % | | | 4.56 | % |
| Portfolio turnover | | | 79 | % | | | 42 | % | | | 7 | % | | | 18 | % | | | 10 | % |
| 1 | Calculated using average shares outstanding. |
| 2 | Total return is based on the change in net asset value of a share during the period and assumes reinvestment of dividends and distributions at net asset value. |
| 3 | Total return during the period reflects waivers by the manager and/or distributor. Performance would have been lower had the waivers not been in effect. |
| 4 | Net assets reported in millions. |
| 5 | Expense ratios do not include expenses of any investment companies in which the Fund invests. |
See accompanying notes, which are an integral part of the financial statements.
Financial highlights
Delaware Ivy Municipal High Income Fund Class Y
Selected data for each share of the Fund outstanding throughout each period were as follows:
| | | Year ended | |
| | | | 3/31/23 | | | | 3/31/22 | | | | 3/31/21 | | | | 3/31/20 | | | | 3/31/19 | |
| Net asset value, beginning of period | | $ | 4.81 | | | $ | 5.04 | | | $ | 4.87 | | | $ | 5.02 | | | $ | 5.05 | |
| | | | | | | | | | | | | | | | | | | | | |
| Income (loss) from investment operations: | | | | | | | | | | | | | | | | | | | | |
| Net investment income1 | | | 0.15 | | | | 0.21 | | | | 0.17 | | | | 0.19 | | | | 0.22 | |
| Net realized and unrealized gain (loss) | | | (0.48 | ) | | | (0.28 | ) | | | 0.17 | | | | (0.15 | ) | | | (0.03 | ) |
| Total from investment operations | | | (0.33 | ) | | | (0.07 | ) | | | 0.34 | | | | 0.04 | | | | 0.19 | |
| | | | | | | | | | | | | | | | | | | | | |
| Less dividends and distributions from: | | | | | | | | | | | | | | | | | | | | |
| Net investment income | | | (0.19 | ) | | | (0.16 | ) | | | (0.17 | ) | | | (0.19 | ) | | | (0.22 | ) |
| Total dividends and distributions | | | (0.19 | ) | | | (0.16 | ) | | | (0.17 | ) | | | (0.19 | ) | | | (0.22 | ) |
| | | | | | | | | | | | | | | | | | | | | |
| Net asset value, end of period | | $ | 4.29 | | | $ | 4.81 | | | $ | 5.04 | | | $ | 4.87 | | | $ | 5.02 | |
| | | | | | | | | | | | | | | | | | | | | |
| Total return2 | | | (6.79 | )% | | | (1.44 | )% | | | 7.12 | % | | | 0.72 | % | | | 3.79 | % |
| | | | | | | | | | | | | | | | | | | | | |
| Ratios and supplemental data: | | | | | | | | | | | | | | | | | | | | |
| Net assets, end of period (000 omitted) | | $ | 2,997 | | | $ | 3,955 | | | $ | 4 | 3 | | $ | 6 | 3 | | $ | 7 | 3 |
| Ratio of expenses to average net assets4 | | | 0.89 | % | | | 0.89 | % | | | 0.89 | % | | | 0.88 | % | | | 0.87 | % |
| Ratio of expenses to average net assets prior to fees waived4 | | | 0.91 | % | | | 1.00 | % | | | 0.99 | % | | | 0.98 | % | | | 0.96 | % |
| Ratio of net investment income to average net assets | | | 3.45 | % | | | 4.14 | % | | | 3.49 | % | | | 3.75 | % | | | 4.36 | % |
| Ratio of net investment income to average net assets prior to fees waived | | | 3.43 | % | | | 4.03 | % | | | 3.39 | % | | | 3.65 | % | | | 4.27 | % |
| Portfolio turnover | | | 79 | % | | | 42 | % | | | 7 | % | | | 18 | % | | | 10 | % |
| 1 | Calculated using average shares outstanding. |
| 2 | Total return is based on the change in net asset value of a share during the period and assumes reinvestment of dividends and distributions at net asset value and does not reflect the impact of a sales charge. Total return during the period reflects waivers by the manager and/or distributor. Performance would have been lower had the waivers not been in effect. |
| 3 | Net assets reported in millions. |
| 4 | Expense ratios do not include expenses of any investment companies in which the Fund invests. |
See accompanying notes, which are an integral part of the financial statements.
Delaware Ivy Small Cap Growth Fund Class A
Selected data for each share of the Fund outstanding throughout each period were as follows:
| | | Year ended | |
| | | | 3/31/23 | | | | 3/31/22 | | | | 3/31/21 | | | | 3/31/20 | | | | 3/31/19 | |
| Net asset value, beginning of period | | $ | 14.47 | | | $ | 22.28 | | | $ | 13.27 | | | $ | 17.19 | | | $ | 18.63 | |
| | | | | | | | | | | | | | | | | | | | | |
| Income (loss) from investment operations: | | | | | | | | | | | | | | | | | | | | |
| Net investment loss1 | | | (0.07 | ) | | | (0.16 | ) | | | (0.18 | ) | | | (0.15 | ) | | | (0.15 | ) |
| Net realized and unrealized gain (loss) | | | (2.12 | ) | | | (1.56 | ) | | | 11.15 | | | | (2.59 | ) | | | 1.44 | |
| Total from investment operations | | | (2.19 | ) | | | (1.72 | ) | | | 10.97 | | | | (2.74 | ) | | | 1.29 | |
| | | | | | | | | | | | | | | | | | | | | |
| Less dividends and distributions from: | | | | | | | | | | | | | | | | | | | | |
| Net investment income | | | — | | | | (0.19 | ) | | | — | | | | — | | | | — | |
| Net realized gain | | | (0.61 | ) | | | (5.90 | ) | | | (1.96 | ) | | | (1.18 | ) | | | (2.73 | ) |
| Total dividends and distributions | | | (0.61 | ) | | | (6.09 | ) | | | (1.96 | ) | | | (1.18 | ) | | | (2.73 | ) |
| | | | | | | | | | | | | | | | | | | | | |
| Net asset value, end of period | | $ | 11.67 | | | $ | 14.47 | | | $ | 22.28 | | | $ | 13.27 | | | $ | 17.19 | |
| | | | | | | | | | | | | | | | | | | | | |
| Total return2 | | | (14.90 | )%3 | | | (8.23 | )% | | | 84.34 | % | | | (17.35 | )% | | | 7.76 | % |
| | | | | | | | | | | | | | | | | | | | | |
| Ratios and supplemental data: | | | | | | | | | | | | | | | | | | | | |
| Net assets, end of period (000 omitted) | | $ | 681,798 | | | $ | 1,030,905 | | | $ | 1,318 | 4 | | $ | 788 | 4 | | $ | 1,099 | 4 |
| Ratio of expenses to average net assets5 | | | 1.21 | % | | | 1.24 | % | | | 1.26 | % | | | 1.31 | % | | | 1.32 | % |
| Ratio of expenses to average net assets prior to fees waived5 | | | 1.34 | % | | | 1.24 | % | | | 1.26 | % | | | 1.31 | % | | | 1.32 | % |
| Ratio of net investment loss to average net assets | | | (0.58 | )% | | | (0.81 | )% | | | (0.93 | )% | | | (0.87 | )% | | | (0.84 | )% |
| Ratio of net investment loss to average net assets prior to fees waived | | | (0.71 | )% | | | (0.81 | )% | | | (0.93 | )% | | | (0.87 | )% | | | (0.84 | )% |
| Portfolio turnover | | | 51 | % | | | 40 | % | | | 57 | % | | | 40 | % | | | 42 | % |
| 1 | Calculated using average shares outstanding. |
| 2 | Total return is based on the change in net asset value of a share during the period and assumes reinvestment of dividends and distributions at net asset value and does not reflect the impact of a sales charge. |
| 3 | Total return during the period reflects waivers by the manager and/or distributor. Performance would have been lower had the waivers not been in effect. |
| 4 | Net assets reported in millions. |
| 5 | Expense ratios do not include expenses of any investment companies in which the Fund invests. |
See accompanying notes, which are an integral part of the financial statements.
Financial highlights
Delaware Ivy Small Cap Growth Fund Class C
Selected data for each share of the Fund outstanding throughout each period were as follows:
| | | Year ended | |
| | | | 3/31/23 | | | | 3/31/22 | | | | 3/31/21 | | | | 3/31/20 | | | | 3/31/19 | |
| Net asset value, beginning of period | | $ | 8.66 | | | $ | 15.96 | | | $ | 9.92 | | | $ | 13.23 | | | $ | 14.97 | |
| | | | | | | | | | | | | | | | | | | | | |
| Income (loss) from investment operations: | | | | | | | | | | | | | | | | | | | | |
| Net investment loss1 | | | (0.09 | ) | | | (0.22 | ) | | | (0.24 | ) | | | (0.21 | ) | | | (0.23 | ) |
| Net realized and unrealized gain (loss) | | | (1.29 | ) | | | (1.07 | ) | | | 8.24 | | | | (1.92 | ) | | | 1.14 | |
| Total from investment operations | | | (1.38 | ) | | | (1.29 | ) | | | 8.00 | | | | (2.13 | ) | | | 0.91 | |
| | | | | | | | | | | | | | | | | | | | | |
| Less dividends and distributions from: | | | | | | | | | | | | | | | | | | | | |
| Net investment income | | | — | | | | (0.11 | ) | | | — | | | | — | | | | — | |
| Net realized gain | | | (0.61 | ) | | | (5.90 | ) | | | (1.96 | ) | | | (1.18 | ) | | | (2.65 | ) |
| Total dividends and distributions | | | (0.61 | ) | | | (6.01 | ) | | | (1.96 | ) | | | (1.18 | ) | | | (2.65 | ) |
| | | | | | | | | | | | | | | | | | | | | |
| Net asset value, end of period | | $ | 6.67 | | | $ | 8.66 | | | $ | 15.96 | | | $ | 9.92 | | | $ | 13.23 | |
| | | | | | | | | | | | | | | | | | | | | |
| Total return2 | | | (15.56 | )%3 | | | (8.89 | )%3 | | | 82.81 | % | | | (17.94 | )%3 | | | 6.99 | %3 |
| | | | | | | | | | | | | | | | | | | | | |
| Ratios and supplemental data: | | | | | | | | | | | | | | | | | | | | |
| Net assets, end of period (000 omitted) | | $ | 20,607 | | | $ | 36,063 | | | $ | 57 | 4 | | $ | 51 | 4 | | $ | 88 | 4 |
| Ratio of expenses to average net assets5 | | | 1.95 | % | | | 2.04 | % | | | 2.04 | % | | | 2.05 | % | | | 2.05 | % |
| Ratio of expenses to average net assets prior to fees waived5 | | | 2.28 | % | | | 2.11 | % | | | 2.04 | % | | | 2.09 | % | | | 2.06 | % |
| Ratio of net investment loss to average net assets | | | (1.33 | )% | | | (1.62 | )% | | | (1.69 | )% | | | (1.62 | )% | | | (1.56 | )% |
| Ratio of net investment loss to average net assets prior to fees waived | | | (1.66 | )% | | | (1.69 | )% | | | (1.69 | )% | | | (1.66 | )% | | | (1.57 | )% |
| Portfolio turnover | | | 51 | % | | | 40 | % | | | 57 | % | | | 40 | % | | | 42 | % |
| 1 | Calculated using average shares outstanding. |
| 2 | Total return is based on the change in net asset value of a share during the period and assumes reinvestment of dividends and distributions at net asset value and does not reflect the impact of a sales charge. |
| 3 | Total return during the period reflects waivers by the manager and/or distributor. Performance would have been lower had the waivers not been in effect. |
| 4 | Net assets reported in millions. |
| 5 | Expense ratios do not include expenses of any investment companies in which the Fund invests. |
See accompanying notes, which are an integral part of the financial statements.
Delaware Ivy Small Cap Growth Fund Class I
Selected data for each share of the Fund outstanding throughout each period were as follows:
| | | Year ended | |
| | | | 3/31/23 | | | | 3/31/22 | | | | 3/31/21 | | | | 3/31/20 | | | | 3/31/19 | |
| Net asset value, beginning of period | | $ | 23.48 | | | $ | 32.06 | | | $ | 18.51 | | | $ | 23.43 | | | $ | 24.36 | |
| | | | | | | | | | | | | | | | | | | | | |
| Income (loss) from investment operations: | | | | | | | | | | | | | | | | | | | | |
| Net investment loss1 | | | (0.05 | ) | | | (0.14 | ) | | | (0.15 | ) | | | (0.11 | ) | | | (0.11 | ) |
| Net realized and unrealized gain (loss) | | | (3.43 | ) | | | (2.28 | ) | | | 15.66 | | | | (3.63 | ) | | | 1.93 | |
| Total from investment operations | | | (3.48 | ) | | | (2.42 | ) | | | 15.51 | | | | (3.74 | ) | | | 1.82 | |
| | | | | | | | | | | | | | | | | | | | | |
| Less dividends and distributions from: | | | | | | | | | | | | | | | | | | | | |
| Net investment income | | | — | | | | (0.26 | ) | | | — | | | | — | | | | — | |
| Net realized gain | | | (0.61 | ) | | | (5.90 | ) | | | (1.96 | ) | | | (1.18 | ) | | | (2.75 | ) |
| Total dividends and distributions | | | (0.61 | ) | | | (6.16 | ) | | | (1.96 | ) | | | (1.18 | ) | | | (2.75 | ) |
| | | | | | | | | | | | | | | | | | | | | |
| Net asset value, end of period | | $ | 19.39 | | | $ | 23.48 | | | $ | 32.06 | | | $ | 18.51 | | | $ | 23.43 | |
| | | | | | | | | | | | | | | | | | | | | |
| Total return2 | | | (14.68 | )% | | | (7.88 | )% | | | 85.00 | % | | | (16.99 | )% | | | 8.14 | % |
| | | | | | | | | | | | | | | | | | | | | |
| Ratios and supplemental data: | | | | | | | | | | | | | | | | | | | | |
| Net assets, end of period (000 omitted) | | $ | 560,403 | | | $ | 904,112 | | | $ | 1,216 | 3 | | $ | 778 | 3 | | $ | 1,034 | 3 |
| Ratio of expenses to average net assets4 | | | 0.89 | % | | | 0.89 | % | | | 0.89 | % | | | 0.89 | % | | | 0.94 | % |
| Ratio of expenses to average net assets prior to fees waived4 | | | 0.92 | % | | | 1.02 | % | | | 1.03 | % | | | 1.04 | % | | | 1.04 | % |
| Ratio of net investment loss to average net assets | | | (0.26 | )% | | | (0.46 | )% | | | (0.55 | )% | | | (0.46 | )% | | | (0.47 | )% |
| Ratio of net investment loss to average net assets prior to fees waived | | | (0.29 | )% | | | (0.59 | )% | | | (0.69 | )% | | | (0.61 | )% | | | (0.57 | )% |
| Portfolio turnover | | | 51 | % | | | 40 | % | | | 57 | % | | | 40 | % | | | 42 | % |
| 1 | Calculated using average shares outstanding. |
| 2 | Total return is based on the change in net asset value of a share during the period and assumes reinvestment of dividends and distributions at net asset value. Total return during the period reflects waivers by the manager and/or distributor. Performance would have been lower had the waivers not been in effect. |
| 3 | Net assets reported in millions. |
| 4 | Expense ratios do not include expenses of any investment companies in which the Fund invests. |
See accompanying notes, which are an integral part of the financial statements.
Financial highlights
Delaware Ivy Small Cap Growth Fund Class R
Selected data for each share of the Fund outstanding throughout each period were as follows:
| | | Year ended | |
| | | | 3/31/23 | | | | 3/31/22 | | | | 3/31/21 | | | | 3/31/20 | | | | 3/31/19 | |
| Net asset value, beginning of period | | $ | 13.75 | | | $ | 21.50 | | | $ | 12.89 | | | $ | 16.78 | | | $ | 18.27 | |
| | | | | | | | | | | | | | | | | | | | | |
| Income (loss) from investment operations: | | | | | | | | | | | | | | | | | | | | |
| Net investment loss1 | | | (0.10 | ) | | | (0.23 | ) | | | (0.24 | ) | | | (0.20 | ) | | | (0.20 | ) |
| Net realized and unrealized gain (loss) | | | (2.02 | ) | | | (1.49 | ) | | | 10.81 | | | | (2.51 | ) | | | 1.41 | |
| Total from investment operations | | | (2.12 | ) | | | (1.72 | ) | | | 10.57 | | | | (2.71 | ) | | | 1.21 | |
| | | | | | | | | | | | | | | | | | | | | |
| Less dividends and distributions from: | | | | | | | | | | | | | | | | | | | | |
| Net investment income | | | — | | | | (0.13 | ) | | | — | | | | — | | | | — | |
| Net realized gain | | | (0.61 | ) | | | (5.90 | ) | | | (1.96 | ) | | | (1.18 | ) | | | (2.70 | ) |
| Total dividends and distributions | | | (0.61 | ) | | | (6.03 | ) | | | (1.96 | ) | | | (1.18 | ) | | | (2.70 | ) |
| | | | | | | | | | | | | | | | | | | | | |
| Net asset value, end of period | | $ | 11.02 | | | $ | 13.75 | | | $ | 21.50 | | | $ | 12.89 | | | $ | 16.78 | |
| | | | | | | | | | | | | | | | | | | | | |
| Total return2 | | | (15.18 | )%3 | | | (8.57 | )% | | | 83.70 | % | | | (17.60 | )% | | | 7.42 | % |
| | | | | | | | | | | | | | | | | | | | | |
| Ratios and supplemental data: | | | | | | | | | | | | | | | | | | | | |
| Net assets, end of period (000 omitted) | | $ | 43,146 | | | $ | 56,050 | | | $ | 70 | 4 | | $ | 43 | 4 | | $ | 66 | 4 |
| Ratio of expenses to average net assets5 | | | 1.48 | % | | | 1.61 | % | | | 1.62 | % | | | 1.63 | % | | | 1.62 | % |
| Ratio of expenses to average net assets prior to fees waived5 | | | 1.50 | % | | | 1.61 | % | | | 1.62 | % | | | 1.63 | % | | | 1.62 | % |
| Ratio of net investment loss to average net assets | | | (0.84 | )% | | | (1.19 | )% | | | (1.29 | )% | | | (1.19 | )% | | | (1.14 | )% |
| Ratio of net investment loss to average net assets prior to fees waived | | | (0.86 | )% | | | (1.19 | )% | | | (1.29 | )% | | | (1.19 | )% | | | (1.14 | )% |
| Portfolio turnover | | | 51 | % | | | 40 | % | | | 57 | % | | | 40 | % | | | 42 | % |
| 1 | Calculated using average shares outstanding. |
| 2 | Total return is based on the change in net asset value of a share during the period and assumes reinvestment of dividends and distributions at net asset value. |
| 3 | Total return during the period reflects waivers by the manager and/or distributor. Performance would have been lower had the waivers not been in effect. |
| 4 | Net assets reported in millions. |
| 5 | Expense ratios do not include expenses of any investment companies in which the Fund invests. |
See accompanying notes, which are an integral part of the financial statements.
Delaware Ivy Small Cap Growth Fund Class R6
Selected data for each share of the Fund outstanding throughout each period were as follows:
| | | Year ended | |
| | | | 3/31/23 | | | | 3/31/22 | | | | 3/31/21 | | | | 3/31/20 | | | | 3/31/19 | |
| Net asset value, beginning of period | | $ | 23.70 | | | $ | 32.30 | | | $ | 18.63 | | | $ | 23.58 | | | $ | 24.49 | |
| | | | | | | | | | | | | | | | | | | | | |
| Income (loss) from investment operations: | | | | | | | | | | | | | | | | | | | | |
| Net investment loss1 | | | (0.05 | ) | | | (0.13 | ) | | | (0.15 | ) | | | (0.10 | ) | | | (0.10 | ) |
| Net realized and unrealized gain (loss) | | | (3.46 | ) | | | (2.30 | ) | | | 15.78 | | | | (3.67 | ) | | | 1.96 | |
| Total from investment operations | | | (3.51 | ) | | | (2.43 | ) | | | 15.63 | | | | (3.77 | ) | | | 1.86 | |
| | | | | | | | | | | | | | | | | | | | | |
| Less dividends and distributions from: | | | | | | | | | | | | | | | | | | | | |
| Net investment income | | | — | | | | (0.27 | ) | | | — | | | | — | | | | — | |
| Net realized gain | | | (0.61 | ) | | | (5.90 | ) | | | (1.96 | ) | | | (1.18 | ) | | | (2.77 | ) |
| Total dividends and distributions | | | (0.61 | ) | | | (6.17 | ) | | | (1.96 | ) | | | (1.18 | ) | | | (2.77 | ) |
| | | | | | | | | | | | | | | | | | | | | |
| Net asset value, end of period | | $ | 19.58 | | | $ | 23.70 | | | $ | 32.30 | | | $ | 18.63 | | | $ | 23.58 | |
| | | | | | | | | | | | | | | | | | | | | |
| Total return2 | | | (14.67 | )%3 | | | (7.88 | )% | | | 85.10 | % | | | (17.01 | )% | | | 8.19 | % |
| | | | | | | | | | | | | | | | | | | | | |
| Ratios and supplemental data: | | | | | | | | | | | | | | | | | | | | |
| Net assets, end of period (000 omitted) | | $ | 157,251 | | | $ | 209,855 | | | $ | 252 | 4 | | $ | 161 | 4 | | $ | 155 | 4 |
| Ratio of expenses to average net assets5 | | | 0.89 | % | | | 0.87 | % | | | 0.87 | % | | | 0.89 | % | | | 0.89 | % |
| Ratio of expenses to average net assets prior to fees waived5 | | | 0.91 | % | | | 0.87 | % | | | 0.87 | % | | | 0.89 | % | | | 0.89 | % |
| Ratio of net investment loss to average net assets | | | (0.25 | )% | | | (0.44 | )% | | | (0.54 | )% | | | (0.44 | )% | | | (0.42 | )% |
| Ratio of net investment income (loss) to average net assets prior to fees waived | | | (0.27 | )% | | | (0.44 | )% | | | (0.54 | )% | | | (0.44 | )% | | | (0.42 | )% |
| Portfolio turnover | | | 51 | % | | | 40 | % | | | 57 | % | | | 40 | % | | | 42 | % |
| 1 | Calculated using average shares outstanding. |
| 2 | Total return is based on the change in net asset value of a share during the period and assumes reinvestment of dividends and distributions at net asset value. |
| 3 | Total return during the period reflects waivers by the manager and/or distributor. Performance would have been lower had the waivers not been in effect. |
| 4 | Net assets reported in millions. |
| 5 | Expense ratios do not include expenses of any investment companies in which the Fund invests. |
See accompanying notes, which are an integral part of the financial statements.
Financial highlights
Delaware Ivy Small Cap Growth Fund Class Y
Selected data for each share of the Fund outstanding throughout each period were as follows:
| | | Year ended | |
| | | | 3/31/23 | | | | 3/31/22 | | | | 3/31/21 | | | | 3/31/20 | | | | 3/31/19 | |
| Net asset value, beginning of period | | $ | 21.10 | | | $ | 29.47 | | | $ | 17.17 | | | $ | 21.90 | | | $ | 23.00 | |
| | | | | | | | | | | | | | | | | | | | | |
| Income (loss) from investment operations: | | | | | | | | | | | | | | | | | | | | |
| Net investment loss1 | | | (0.10 | ) | | | (0.22 | ) | | | (0.23 | ) | | | (0.18 | ) | | | (0.18 | ) |
| Net realized and unrealized gain (loss) | | | (3.08 | ) | | | (2.08 | ) | | | 14.49 | | | | (3.37 | ) | | | 1.82 | |
| Total from investment operations | | | (3.18 | ) | | | (2.30 | ) | | | 14.26 | | | | (3.55 | ) | | | 1.64 | |
| | | | | | | | | | | | | | | | | | | | | |
| Less dividends and distributions from: | | | | | | | | | | | | | | | | | | | | |
| Net investment income | | | — | | | | (0.17 | ) | | | — | | | | — | | | | — | |
| Net realized gain | | | (0.61 | ) | | | (5.90 | ) | | | (1.96 | ) | | | (1.18 | ) | | | (2.74 | ) |
| Total dividends and distributions | | | (0.61 | ) | | | (6.07 | ) | | | (1.96 | ) | | | (1.18 | ) | | | (2.74 | ) |
| | | | | | | | | | | | | | | | | | | | | |
| Net asset value, end of period | | $ | 17.31 | | | $ | 21.10 | | | $ | 29.47 | | | $ | 17.17 | | | $ | 21.90 | |
| | | | | | | | | | | | | | | | | | | | | |
| Total return2 | | | (14.91 | )%3 | | | (8.19 | )%3 | | | 84.34 | % | | | (17.36 | )% | | | 7.83 | % |
| | | | | | | | | | | | | | | | | | | | | |
| Ratios and supplemental data: | | | | | | | | | | | | | | | | | | | | |
| Net assets, end of period (000 omitted) | | $ | 72,634 | | | $ | 99,698 | | | $ | 135 | 4 | | $ | 91 | 4 | | $ | 141 | 4 |
| Ratio of expenses to average net assets5 | | | 1.19 | % | | | 1.23 | % | | | 1.26 | % | | | 1.28 | % | | | 1.27 | % |
| Ratio of expenses to average net assets prior to fees waived5 | | | 1.21 | % | | | 1.26 | % | | | 1.26 | % | | | 1.28 | % | | | 1.27 | % |
| Ratio of net investment loss to average net assets | | | (0.56 | )% | | | (0.81 | )% | | | (0.93 | )% | | | (0.84 | )% | | | (0.79 | )% |
| Ratio of net investment loss to average net assets prior to fees waived | | | (0.58 | )% | | | (0.84 | )% | | | (0.93 | )% | | | (0.84 | )% | | | (0.79 | )% |
| Portfolio turnover | | | 51 | % | | | 40 | % | | | 57 | % | | | 40 | % | | | 42 | % |
| 1 | Calculated using average shares outstanding. |
| 2 | Total return is based on the change in net asset value of a share during the period and assumes reinvestment of dividends and distributions at net asset value. |
| 3 | Total return during the period reflects waivers by the manager and/or distributor. Performance would have been lower had the waivers not been in effect. |
| 4 | Net assets reported in millions. |
| 5 | Expense ratios do not include expenses of any investment companies in which the Fund invests. |
See accompanying notes, which are an integral part of the financial statements.
Delaware Ivy Smid Cap Core Fund Class A
Selected data for each share of the Fund outstanding throughout each period were as follows:
| | | Year ended | |
| | | | 3/31/23 | | | | 3/31/22 | | | | 3/31/21 | | | | 3/31/20 | | | | 3/31/19 | |
| Net asset value, beginning of period | | $ | 18.43 | | | $ | 22.43 | | | $ | 12.88 | | | $ | 16.87 | | | $ | 18.29 | |
| | | | | | | | | | | | | | | | | | | | | |
| Income (loss) from investment operations: | | | | | | | | | | | | | | | | | | | | |
| Net investment income (loss)1 | | | 0.05 | | | | (0.04 | ) | | | (0.06 | ) | | | (0.04 | ) | | | (0.09 | ) |
| Net realized and unrealized gain (loss) | | | (1.44 | ) | | | (0.18 | ) | | | 9.61 | | | | (3.83 | ) | | | 1.04 | |
| Total from investment operations | | | (1.39 | ) | | | (0.22 | ) | | | 9.55 | | | | (3.87 | ) | | | 0.95 | |
| | | | | | | | | | | | | | | | | | | | | |
| Less dividends and distributions from: | | | | | | | | | | | | | | | | | | | | |
| Net investment income | | | (0.05 | ) | | | — | | | | — | | | | — | | | | — | |
| Net realized gain | | | (3.78 | ) | | | (3.78 | ) | | | — | | | | (0.12 | ) | | | (2.37 | ) |
| Total dividends and distributions | | | (3.83 | ) | | | (3.78 | ) | | | — | | | | (0.12 | ) | | | (2.37 | ) |
| | | | | | | | | | | | | | | | | | | | | |
| Net asset value, end of period | | $ | 13.21 | | | $ | 18.43 | | | $ | 22.43 | | | $ | 12.88 | | | $ | 16.87 | |
| | | | | | | | | | | | | | | | | | | | | |
| Total return2 | | | (7.02 | )% | | | (1.21 | )% | | | 74.15 | % | | | (23.13 | )% | | | 6.30 | % |
| | | | | | | | | | | | | | | | | | | | | |
| Ratios and supplemental data: | | | | | | | | | | | | | | | | | | | | |
| Net assets, end of period (000 omitted) | | $ | 111,950 | | | $ | 151,380 | | | $ | 176 | 3 | | $ | 114 | 3 | | $ | 174 | 3 |
| Ratio of expenses to average net assets4 | | | 1.23 | % | | | 1.33 | % | | | 1.37 | % | | | 1.38 | % | | | 1.40 | % |
| Ratio of expenses to average net assets prior to fees waived4 | | | 1.44 | % | | | 1.36 | % | | | 1.41 | % | | | 1.41 | % | | | 1.42 | % |
| Ratio of net investment income (loss) to average net assets | | | 0.33 | % | | | (0.19 | )% | | | (0.37 | )% | | | (0.24 | )% | | | (0.48 | )% |
| Ratio of net investment income (loss) to average net assets prior to fees waived | | | 0.12 | % | | | (0.22 | )% | | | (0.41 | )% | | | (0.27 | )% | | | (0.50 | )% |
| Portfolio turnover | | | 13 | % | | | 122 | % | | | 127 | % | | | 138 | % | | | 119 | % |
| 1 | Calculated using average shares outstanding. |
| 2 | Total return is based on the change in net asset value of a share during the period and assumes reinvestment of dividends and distributions at net asset value and does not reflect the impact of a sales charge. Total return during the period reflects waivers by the manager and/or distributor. Performance would have been lower had the waivers not been in effect. |
| 3 | Net assets reported in millions. |
| 4 | Expense ratios do not include expenses of any investment companies in which the Fund invests. |
See accompanying notes, which are an integral part of the financial statements.
Financial highlights
Delaware Ivy Smid Cap Core Fund Class C
Selected data for each share of the Fund outstanding throughout each period were as follows:
| | | Year ended | |
| | | | 3/31/23 | | | | 3/31/22 | | | | 3/31/21 | | | | 3/31/20 | | | | 3/31/19 | |
| Net asset value, beginning of period | | $ | 14.84 | | | $ | 18.75 | | | $ | 10.85 | | | $ | 14.32 | | | $ | 15.81 | |
| | | | | | | | | | | | | | | | | | | | | |
| Income (loss) from investment operations: | | | | | | | | | | | | | | | | | | | | |
| Net investment loss1 | | | (0.05 | )2 | | | (0.17 | ) | | | (0.15 | ) | | | (0.14 | ) | | | (0.19 | ) |
| Net realized and unrealized gain (loss) | | | (1.18 | ) | | | (0.14 | ) | | | 8.05 | | | | (3.21 | ) | | | 0.89 | |
| Total from investment operations | | | (1.23 | ) | | | (0.31 | ) | | | 7.90 | | | | (3.35 | ) | | | 0.70 | |
| | | | | | | | | | | | | | | | | | | | | |
| Less dividends and distributions from: | | | | | | | | | | | | | | | | | | | | |
| Net investment income | | | (0.01 | ) | | | — | | | | — | | | | — | | | | — | |
| Net realized gain | | | (3.78 | ) | | | (3.60 | ) | | | — | | | | (0.12 | ) | | | (2.19 | ) |
| Total dividends and distributions | | | (3.79 | ) | | | (3.60 | ) | | | — | | | | (0.12 | ) | | | (2.19 | ) |
| | | | | | | | | | | | | | | | | | | | | |
| Net asset value, end of period | | $ | 9.82 | | | $ | 14.84 | | | $ | 18.75 | | | $ | 10.85 | | | $ | 14.32 | |
| | | | | | | | | | | | | | | | | | | | | |
| Total return3 | | | (7.71 | )% | | | (1.93 | )% | | | 72.81 | % | | | (23.62 | )% | | | 5.59 | % |
| | | | | | | | | | | | | | | | | | | | | |
| Ratios and supplemental data: | | | | | | | | | | | | | | | | | | | | |
| Net assets, end of period (000 omitted) | | $ | 12,188 | | | $ | 17,505 | | | $ | 22 | 4 | | $ | 20 | 4 | | $ | 35 | 4 |
| Ratio of expenses to average net assets5 | | | 1.98 | % | | | 2.07 | % | | | 2.09 | % | | | 2.10 | % | | | 2.07 | % |
| Ratio of expenses to average net assets prior to fees waived5 | | | 2.18 | % | | | 2.10 | % | | | 2.12 | % | | | 2.12 | % | | | 2.09 | % |
| Ratio of net investment loss to average net assets | | | (0.42 | )% | | | (0.94 | )% | | | (1.07 | )% | | | (0.96 | )% | | | (1.15 | )% |
| Ratio of net investment loss to average net assets prior to fees waived | | | (0.62 | )% | | | (0.97 | )% | | | (1.10 | )% | | | (0.98 | )% | | | (1.17 | )% |
| Portfolio turnover | | | 13 | % | | | 122 | % | | | 127 | % | | | 138 | % | | | 119 | % |
| 1 | Calculated using average shares outstanding. |
| 2 | The per share amount of net investment income (loss) does not directly correlate to the amounts reported in the Statements of operations due to class specific expenses. |
| 3 | Total return is based on the change in net asset value of a share during the period and assumes reinvestment of dividends and distributions at net asset value and does not reflect the impact of a sales charge. Total return during the period reflects waivers by the manager and/or distributor. Performance would have been lower had the waivers not been in effect. |
| 4 | Net assets reported in millions. |
| 5 | Expense ratios do not include expenses of any investment companies in which the Fund invests. |
See accompanying notes, which are an integral part of the financial statements.
Delaware Ivy Smid Cap Core Fund Class I
Selected data for each share of the Fund outstanding throughout each period were as follows:
| | | Year ended | |
| | | | 3/31/23 | | | | 3/31/22 | | | | 3/31/21 | | | | 3/31/20 | | | | 3/31/19 | |
| Net asset value, beginning of period | | $ | 20.60 | | | $ | 24.68 | | | $ | 14.10 | | | $ | 18.40 | | | $ | 19.79 | |
| | | | | | | | | | | | | | | | | | | | | |
| Income (loss) from investment operations: | | | | | | | | | | | | | | | | | | | | |
| Net investment income (loss)1 | | | 0.12 | | | | 0.06 | | | | 0.02 | | | | 0.05 | | | | (0.01 | ) |
| Net realized and unrealized gain (loss) | | | (1.60 | ) | | | (0.21 | ) | | | 10.56 | | | | (4.19 | ) | | | 1.13 | |
| Total from investment operations | | | (1.48 | ) | | | (0.15 | ) | | | 10.58 | | | | (4.14 | ) | | | 1.12 | |
| | | | | | | | | | | | | | | | | | | | | |
| Less dividends and distributions from: | | | | | | | | | | | | | | | | | | | | |
| Net investment income | | | (0.06 | ) | | | — | | | | — | | | | (0.02 | ) | | | — | |
| Net realized gain | | | (3.78 | ) | | | (3.93 | ) | | | — | | | | (0.14 | ) | | | (2.51 | ) |
| Total dividends and distributions | | | (3.84 | ) | | | (3.93 | ) | | | — | | | | (0.16 | ) | | | (2.51 | ) |
| | | | | | | | | | | | | | | | | | | | | |
| Net asset value, end of period | | $ | 15.28 | | | $ | 20.60 | | | $ | 24.68 | | | $ | 14.10 | | | $ | 18.40 | |
| | | | | | | | | | | | | | | | | | | | | |
| Total return2 | | | (6.69 | )% | | | (0.79 | )% | | | 75.04 | % | | | (22.74 | )% | | | 6.79 | % |
| | | | | | | | | | | | | | | | | | | | | |
| Ratios and supplemental data: | | | | | | | | | | | | | | | | | | | | |
| Net assets, end of period (000 omitted) | | $ | 159,794 | | | $ | 316,727 | | | $ | 451 | 3 | | $ | 304 | 3 | | $ | 393 | 3 |
| Ratio of expenses to average net assets4 | | | 0.89 | % | | | 0.89 | % | | | 0.89 | % | | | 0.89 | % | | | 0.95 | % |
| Ratio of expenses to average net assets prior to fees waived4 | | | 0.97 | % | | | 1.07 | % | | | 1.09 | % | | | 1.10 | % | | | 1.09 | % |
| Ratio of net investment income (loss) to average net assets | | | 0.68 | % | | | 0.25 | % | | | 0.11 | % | | | 0.25 | % | | | (0.03 | )% |
| Ratio of net investment income (loss) to average net assets prior to fees waived | | | 0.60 | % | | | 0.07 | % | | | (0.09 | )% | | | 0.04 | % | | | (0.17 | )% |
| Portfolio turnover | | | 13 | % | | | 122 | % | | | 127 | % | | | 138 | % | | | 119 | % |
| 1 | Calculated using average shares outstanding. |
| 2 | Total return is based on the change in net asset value of a share during the period and assumes reinvestment of dividends and distributions at net asset value. Total return during the period reflects waivers by the manager and/or distributor. Performance would have been lower had the waivers not been in effect. |
| 3 | Net assets reported in millions. |
| 4 | Expense ratios do not include expenses of any investment companies in which the Fund invests. |
See accompanying notes, which are an integral part of the financial statements.
Financial highlights
Delaware Ivy Smid Cap Core Fund Class R
Selected data for each share of the Fund outstanding throughout each period were as follows:
| | | Year ended | |
| | | | 3/31/23 | | | | 3/31/22 | | | | 3/31/21 | | | | 3/31/20 | | | | 3/31/19 | |
| Net asset value, beginning of period | | $ | 18.22 | | | $ | 22.20 | | | $ | 12.78 | | | $ | 16.78 | | | $ | 18.18 | |
| | | | | | | | | | | | | | | | | | | | | |
| Income (loss) from investment operations: | | | | | | | | | | | | | | | | | | | | |
| Net investment income (loss)1 | | | 0.01 | | | | (0.11 | ) | | | (0.11 | ) | | | (0.09 | ) | | | (0.13 | ) |
| Net realized and unrealized gain (loss) | | | (1.42 | ) | | | (0.19 | ) | | | 9.53 | | | | (3.79 | ) | | | 1.03 | |
| Total from investment operations | | | (1.41 | ) | | | (0.30 | ) | | | 9.42 | | | | (3.88 | ) | | | 0.90 | |
| | | | | | | | | | | | | | | | | | | | | |
| Less dividends and distributions from: | | | | | | | | | | | | | | | | | | | | |
| Net investment income | | | (0.02 | ) | | | — | | | | — | | | | — | | | | — | |
| Net realized gain | | | (3.78 | ) | | | (3.68 | ) | | | — | | | | (0.12 | ) | | | (2.30 | ) |
| Total dividends and distributions | | | (3.80 | ) | | | (3.68 | ) | | | — | | | | (0.12 | ) | | | (2.30 | ) |
| | | | | | | | | | | | | | | | | | | | | |
| Net asset value, end of period | | $ | 13.01 | | | $ | 18.22 | | | $ | 22.20 | | | $ | 12.78 | | | $ | 16.78 | |
| | | | | | | | | | | | | | | | | | | | | |
| Total return2 | | | (7.21 | )% | | | (1.57 | )% | | | 73.71 | % | | | (23.32 | )% | | | 6.04 | % |
| | | | | | | | | | | | | | | | | | | | | |
| Ratios and supplemental data: | | | | | | | | | | | | | | | | | | | | |
| Net assets, end of period (000 omitted) | | $ | 18,550 | | | $ | 22,950 | | | $ | 25 | 3 | | $ | 15 | 3 | | $ | 16 | 3 |
| Ratio of expenses to average net assets4 | | | 1.48 | % | | | 1.64 | % | | | 1.64 | % | | | 1.65 | % | | | 1.65 | % |
| Ratio of expenses to average net assets prior to fees waived4 | | | 1.54 | % | | | 1.67 | % | | | 1.67 | % | | | 1.67 | % | | | 1.67 | % |
| Ratio of net investment income (loss) to average net assets | | | 0.08 | % | | | (0.50 | )% | | | (0.64 | )% | | | (0.52 | )% | | | (0.73 | )% |
| | | | | | | | | | | | | | | | | | | | | |
| Ratio of net investment income (loss) to average net assets prior to fees waived | | | 0.02 | % | | | (0.53 | )% | | | (0.67 | )% | | | (0.54 | )% | | | (0.75 | )% |
| Portfolio turnover | | | 13 | % | | | 122 | % | | | 127 | % | | | 138 | % | | | 119 | % |
| 1 | Calculated using average shares outstanding. |
| 2 | Total return is based on the change in net asset value of a share during the period and assumes reinvestment of dividends and distributions at net asset value. Total return during the period reflects waivers by the manager and/or distributor. Performance would have been lower had the waivers not been in effect. |
| 3 | Net assets reported in millions. |
| 4 | Expense ratios do not include expenses of any investment companies in which the Fund invests. |
See accompanying notes, which are an integral part of the financial statements.
Delaware Ivy Smid Cap Core Fund Class R6
Selected data for each share of the Fund outstanding throughout each period were as follows:
| | | Year ended | |
| | | | 3/31/23 | | | | 3/31/22 | | | | 3/31/21 | | | | 3/31/20 | | | | 3/31/19 | |
| Net asset value, beginning of period | | $ | 20.80 | | | $ | 24.88 | | | $ | 14.22 | | | $ | 18.55 | | | $ | 19.96 | |
| | | | | | | | | | | | | | | | | | | | | |
| Income (loss) from investment operations: | | | | | | | | | | | | | | | | | | | | |
| Net investment income1 | | | 0.12 | | | | 0.06 | | | | 0.02 | | | | 0.05 | | | | 0.01 | |
| Net realized and unrealized gain (loss) | | | (1.62 | ) | | | (0.21 | ) | | | 10.64 | | | | (4.22 | ) | | | 1.13 | |
| Total from investment operations | | | (1.50 | ) | | | (0.15 | ) | | | 10.66 | | | | (4.17 | ) | | | 1.14 | |
| | | | | | | | | | | | | | | | | | | | | |
| Less dividends and distributions from: | | | | | | | | | | | | | | | | | | | | |
| Net investment income | | | (0.04 | ) | | | — | | | | — | | | | (0.02 | ) | | | — | |
| Net realized gain | | | (3.78 | ) | | | (3.93 | ) | | | — | | | | (0.14 | ) | | | (2.55 | ) |
| Total dividends and distributions | | | (3.82 | ) | | | (3.93 | ) | | | — | | | | (0.16 | ) | | | (2.55 | ) |
| | | | | | | | | | | | | | | | | | | | | |
| Net asset value, end of period | | $ | 15.48 | | | $ | 20.80 | | | $ | 24.88 | | | $ | 14.22 | | | $ | 18.55 | |
| | | | | | | | | | | | | | | | | | | | | |
| Total return2 | | | (6.73 | )% | | | (0.79 | )% | | | 74.96 | % | | | (22.72 | )% | | | 6.87 | % |
| | | | | | | | | | | | | | | | | | | | | |
| Ratios and supplemental data: | | | | | | | | | | | | | | | | | | | | |
| Net assets, end of period (000 omitted) | | $ | 39,951 | | | $ | 82,144 | | | $ | 77 | 3 | | $ | 59 | 3 | | $ | 77 | 3 |
| Ratio of expenses to average net assets4 | | | 0.89 | % | | | 0.89 | % | | | 0.89 | % | | | 0.89 | % | | | 0.90 | % |
| Ratio of expenses to average net assets prior to fees waived4 | | | 0.96 | % | | | 0.94 | % | | | 0.95 | % | | | 0.95 | % | | | 0.94 | % |
| Ratio of net investment income to average net assets | | | 0.67 | % | | | 0.25 | % | | | 0.11 | % | | | 0.24 | % | | | 0.04 | % |
| Ratio of net investment income to average net assets prior to fees waived | | | 0.60 | % | | | 0.20 | % | | | 0.05 | % | | | 0.18 | % | | | 0.04 | % |
| Portfolio turnover | | | 13 | % | | | 122 | % | | | 127 | % | | | 138 | % | | | 119 | % |
| 1 | Calculated using average shares outstanding. |
| 2 | Total return is based on the change in net asset value of a share during the period and assumes reinvestment of dividends and distributions at net asset value. Total return during the period reflects waivers by the manager and/or distributor. Performance would have been lower had the waivers not been in effect. |
| 3 | Net assets reported in millions. |
| 4 | Expense ratios do not include expenses of any investment companies in which the Fund invests. |
See accompanying notes, which are an integral part of the financial statements.
Financial highlights
Delaware Ivy Smid Cap Core Fund Class Y
Selected data for each share of the Fund outstanding throughout each period were as follows:
| | | Year ended | |
| | | | 3/31/23 | | | | 3/31/22 | | | | 3/31/21 | | | | 3/31/20 | | | | 3/31/19 | |
| Net asset value, beginning of period | | $ | 19.71 | | | $ | 23.73 | | | $ | 13.62 | | | $ | 17.81 | | | $ | 19.20 | |
| | | | | | | | | | | | | | | | | | | | | |
| Income (loss) from investment operations: | | | | | | | | | | | | | | | | | | | | |
| Net investment income (loss)1 | | | 0.06 | | | | (0.04 | ) | | | (0.05 | ) | | | (0.03 | ) | | | (0.08 | ) |
| Net realized and unrealized gain (loss) | | | (1.53 | ) | | | (0.19 | ) | | | 10.16 | | | | (4.04 | ) | | | 1.10 | |
| Total from investment operations | | | (1.47 | ) | | | (0.23 | ) | | | 10.11 | | | | (4.07 | ) | | | 1.02 | |
| | | | | | | | | | | | | | | | | | | | | |
| Less dividends and distributions from: | | | | | | | | | | | | | | | | | | | | |
| Net investment income | | | (0.04 | ) | | | — | | | | — | | | | — | | | | — | |
| Net realized gain | | | (3.78 | ) | | | (3.79 | ) | | | — | | | | (0.12 | ) | | | (2.41 | ) |
| Total dividends and distributions | | | (3.82 | ) | | | (3.79 | ) | | | — | | | | (0.12 | ) | | | (2.41 | ) |
| | | | | | | | | | | | | | | | | | | | | |
| Net asset value, end of period | | $ | 14.42 | | | $ | 19.71 | | | $ | 23.73 | | | $ | 13.62 | | | $ | 17.81 | |
| | | | | | | | | | | | | | | | | | | | | |
| Total return2 | | | (7.00 | )% | | | (1.19 | )% | | | 74.23 | % | | | (23.08 | )% | | | 6.45 | % |
| | | | | | | | | | | | | | | | | | | | | |
| Ratios and supplemental data: | | | | | | | | | | | | | | | | | | | | |
| Net assets, end of period (000 omitted) | | $ | 5,348 | | | $ | 8,110 | | | $ | 9 | 3 | | $ | 7 | 3 | | $ | 16 | 3 |
| Ratio of expenses to average net assets4 | | | 1.20 | % | | | 1.30 | % | | | 1.30 | % | | | 1.32 | % | | | 1.31 | % |
| Ratio of expenses to average net assets prior to fees waived4 | | | 1.27 | % | | | 1.33 | % | | | 1.34 | % | | | 1.35 | % | | | 1.33 | % |
| Ratio of net investment income (loss) to average net assets | | | 0.35 | % | | | (0.17 | )% | | | (0.28 | )% | | | (0.19 | )% | | | (0.41 | )% |
| Ratio of net investment income (loss) to average net assets prior to fees waived | | | 0.28 | % | | | (0.20 | )% | | | (0.32 | )% | | | (0.22 | )% | | | (0.43 | )% |
| Portfolio turnover | | | 13 | % | | | 122 | % | | | 127 | % | | | 138 | % | | | 119 | % |
| 1 | Calculated using average shares outstanding. |
| 2 | Total return is based on the change in net asset value of a share during the period and assumes reinvestment of dividends and distributions at net asset value. Total return during the period reflects waivers by the manager and/or distributor. Performance would have been lower had the waivers not been in effect. |
| 3 | Net assets reported in millions. |
| 4 | Expense ratios do not include expenses of any investment companies in which the Fund invests. |
See accompanying notes, which are an integral part of the financial statements.
Delaware Ivy Systematic Emerging Markets Equity Fund Class AΦ
Selected data for each share of the Fund outstanding throughout each period were as follows:
| | | Year ended | |
| | | | 3/31/23 | | | | 3/31/22 | | | | 3/31/21 | | | | 3/31/20 | | | | 3/31/19 | |
| Net asset value, beginning of period | | $ | 22.54 | | | $ | 28.07 | | | $ | 15.61 | | | $ | 19.15 | | | $ | 21.60 | |
| | | | | | | | | | | | | | | | | | | | | |
| Income (loss) from investment operations: | | | | | | | | | | | | | | | | | | | | |
| Net investment income (loss)1 | | | 0.68 | | | | 0.15 | | | | (0.01 | ) | | | 0.12 | | | | 0.12 | |
| Net realized and unrealized gain (loss) | | | (3.40 | ) | | | (5.54 | ) | | | 12.68 | | | | (3.51 | ) | | | (2.46 | ) |
| Total from investment operations | | | (2.72 | ) | | | (5.39 | ) | | | 12.67 | | | | (3.39 | ) | | | (2.34 | ) |
| | | | | | | | | | | | | | | | | | | | | |
| Less dividends and distributions from: | | | | | | | | | | | | | | | | | | | | |
| Net investment income | | | (0.20 | ) | | | (0.14 | ) | | | (0.21 | ) | | | (0.15 | ) | | | (0.11 | ) |
| Net realized gain | | | (2.25 | ) | | | — | | | | — | | | | — | | | | — | |
| Total dividends and distributions | | | (2.45 | ) | | | (0.14 | ) | | | (0.21 | ) | | | (0.15 | ) | | | (0.11 | ) |
| | | | | | | | | | | | | | | | | | | | | |
| Net asset value, end of period | | $ | 17.37 | | | $ | 22.54 | | | $ | 28.07 | | | $ | 15.61 | | | $ | 19.15 | |
| | | | | | | | | | | | | | | | | | | | | |
| Total return2 | | | (11.42 | )%3 | | | (19.25 | )%3 | | | 81.21 | % | | | (17.87 | )% | | | (10.75 | )% |
| | | | | | | | | | | | | | | | | | | | | |
| Ratios and supplemental data: | | | | | | | | | | | | | | | | | | | | |
| Net assets, end of period (000 omitted) | | $ | 179,755 | | | $ | 263,968 | | | $ | 377 | 4 | | $ | 229 | 4 | | $ | 344 | 4 |
| Ratio of expenses to average net assets5 | | | 1.15 | % | | | 1.35 | % | | | 1.39 | % | | | 1.46 | % | | | 1.44 | % |
| Ratio of expenses to average net assets prior to fees waived5 | | | 1.57 | % | | | 1.37 | % | | | 1.39 | % | | | 1.46 | % | | | 1.44 | % |
| Ratio of net investment income (loss) to average net assets | | | 3.59 | % | | | 0.55 | % | | | (0.03 | )% | | | 0.61 | % | | | 0.62 | % |
| Ratio of net investment income (loss) to average net assets prior to fees waived | | | 3.17 | % | | | 0.53 | % | | | (0.03 | )% | | | 0.61 | % | | | 0.62 | % |
| Portfolio turnover | | | 65 | % | | | 38 | % | | | 39 | % | | | 32 | % | | | 59 | % |
| Φ | Consolidated financial highlights. |
| 1 | Calculated using average shares outstanding. |
| 2 | Total return is based on the change in net asset value of a share during the period and assumes reinvestment of dividends and distributions at net asset value and does not reflect the impact of a sales charge. |
| 3 | Total return during the period reflects waivers by the manager and/or distributor. Performance would have been lower had the waivers not been in effect. |
| 4 | Net assets reported in millions. |
| 5 | Expense ratios do not include expenses of any investment companies in which the Fund invests. |
See accompanying notes, which are an integral part of the financial statements.
Financial highlights
Delaware Ivy Systematic Emerging Markets Equity Fund Class CΦ
Selected data for each share of the Fund outstanding throughout each period were as follows:
| | | Year ended | |
| | | | 3/31/23 | | | | 3/31/22 | | | | 3/31/21 | | | | 3/31/20 | | | | 3/31/19 | |
| Net asset value, beginning of period | | $ | 19.07 | | | $ | 23.86 | | | $ | 13.31 | | | $ | 16.39 | | | $ | 18.54 | |
| | | | | | | | | | | | | | | | | | | | | |
| Income (loss) from investment operations: | | | | | | | | | | | | | | | | | | | | |
| Net investment income (loss)1 | | | 0.47 | | | | (0.04 | ) | | | (0.15 | ) | | | (0.01 | ) | | | (0.01 | ) |
| Net realized and unrealized gain (loss) | | | (2.90 | ) | | | (4.68 | ) | | | 10.79 | | | | (2.99 | ) | | | (2.10 | ) |
| Total from investment operations | | | (2.43 | ) | | | (4.72 | ) | | | 10.64 | | | | (3.00 | ) | | | (2.11 | ) |
| | | | | | | | | | | | | | | | | | | | | |
| Less dividends and distributions from: | | | | | | | | | | | | | | | | | | | | |
| Net investment income | | | (0.13 | ) | | | (0.07 | ) | | | (0.09 | ) | | | (0.08 | ) | | | (0.04 | ) |
| Net realized gain | | | (2.25 | ) | | | — | | | | — | | | | — | | | | — | |
| Total dividends and distributions | | | (2.38 | ) | | | (0.07 | ) | | | (0.09 | ) | | | (0.08 | ) | | | (0.04 | ) |
| | | | | | | | | | | | | | | | | | | | | |
| Net asset value, end of period | | $ | 14.26 | | | $ | 19.07 | | | $ | 23.86 | | | $ | 13.31 | | | $ | 16.39 | |
| | | | | | | | | | | | | | | | | | | | | |
| Total return2 | | | (12.02 | )%3 | | | (19.83 | )%3 | | | 80.00 | % | | | (18.43 | )% | | | (11.36 | )% |
| | | | | | | | | | | | | | | | | | | | | |
| Ratios and supplemental data: | | | | | | | | | | | | | | | | | | | | |
| Net assets, end of period (000 omitted) | | $ | 23,136 | | | $ | 39,227 | | | $ | 57 | 4 | | $ | 43 | 4 | | $ | 72 | 4 |
| Ratio of expenses to average net assets5 | | | 1.84 | % | | | 2.07 | % | | | 2.10 | % | | | 2.16 | % | | | 2.11 | % |
| Ratio of expenses to average net assets prior to fees waived5 | | | 2.29 | % | | | 2.09 | % | | | 2.10 | % | | | 2.16 | % | | | 2.11 | % |
| Ratio of net investment income (loss) to average net assets | | | 2.95 | % | | | (0.17 | )% | | | (0.73 | )% | | | (0.07 | )% | | | (0.08 | )% |
| Ratio of net investment income (loss) to average net assets prior to fees waived | | | 2.50 | % | | | (0.19 | )% | | | (0.73 | )% | | | (0.07 | )% | | | (0.08 | )% |
| Portfolio turnover | | | 65 | % | | | 38 | % | | | 39 | % | | | 32 | % | | | 59 | % |
| Φ | Consolidated financial highlights. |
| 1 | Calculated using average shares outstanding. |
| 2 | Total return is based on the change in net asset value of a share during the period and assumes reinvestment of dividends and distributions at net asset value and does not reflect the impact of a sales charge. |
| 3 | Total return during the period reflects waivers by the manager and/or distributor. Performance would have been lower had the waivers not been in effect. |
| 4 | Net assets reported in millions. |
| 5 | Expense ratios do not include expenses of any investment companies in which the Fund invests. |
See accompanying notes, which are an integral part of the financial statements.
Delaware Ivy Systematic Emerging Markets Equity Fund Class IΦ
Selected data for each share of the Fund outstanding throughout each period were as follows:
| | | Year ended | |
| | | | 3/31/23 | | | | 3/31/22 | | | | 3/31/21 | | | | 3/31/20 | | | | 3/31/19 | |
| Net asset value, beginning of period | | $ | 23.33 | | | $ | 29.05 | | | $ | 16.13 | | | $ | 19.77 | | | $ | 22.30 | |
| | | | | | | | | | | | | | | | | | | | | |
| Income (loss) from investment operations: | | | | | | | | | | | | | | | | | | | | |
| Net investment income1 | | | 0.79 | | | | 0.26 | | | | 0.09 | | | | 0.21 | | | | 0.21 | |
| Net realized and unrealized gain (loss) | | | (3.53 | ) | | | (5.74 | ) | | | 13.12 | | | | (3.61 | ) | | | (2.55 | ) |
| Total from investment operations | | | (2.74 | ) | | | (5.48 | ) | | | 13.21 | | | | (3.40 | ) | | | (2.34 | ) |
| | | | | | | | | | | | | | | | | | | | | |
| Less dividends and distributions from: | | | | | | | | | | | | | | | | | | | | |
| Net investment income | | | (0.22 | ) | | | (0.24 | ) | | | (0.29 | ) | | | (0.24 | ) | | | (0.19 | ) |
| Net realized gain | | | (2.25 | ) | | | — | | | | — | | | | — | | | | — | |
| Total dividends and distributions | | | (2.47 | ) | | | (0.24 | ) | | | (0.29 | ) | | | (0.24 | ) | | | (0.19 | ) |
| | | | | | | | | | | | | | | | | | | | | |
| Net asset value, end of period | | $ | 18.12 | | | $ | 23.33 | | | $ | 29.05 | | | $ | 16.13 | | | $ | 19.77 | |
| | | | | | | | | | | | | | | | | | | | | |
| Total return2 | | | (11.08 | )% | | | (18.96 | )% | | | 82.02 | % | | | (17.50 | )% | | | (10.34 | )% |
| | | | | | | | | | | | | | | | | | | | | |
| Ratios and supplemental data: | | | | | | | | | | | | | | | | | | | | |
| Net assets, end of period (000 omitted) | | $ | 532,766 | | | $ | 912,326 | | | $ | 1,548 | 3 | | $ | 826 | 3 | | $ | 1,209 | 3 |
| Ratio of expenses to average net assets4 | | | 0.81 | % | | | 0.98 | % | | | 0.99 | % | | | 0.99 | % | | | 0.99 | % |
| Ratio of expenses to average net assets prior to fees waived4 | | | 1.08 | % | | | 1.08 | % | | | 1.10 | % | | | 1.14 | % | | | 1.11 | % |
| Ratio of net investment income to average net assets | | | 4.00 | % | | | 0.93 | % | | | 0.37 | % | | | 1.09 | % | | | 1.06 | % |
| Ratio of net investment income to average net assets prior to fees waived | | | 3.73 | % | | | 0.83 | % | | | 0.26 | % | | | 0.94 | % | | | 0.94 | % |
| Portfolio turnover | | | 65 | % | | | 38 | % | | | 39 | % | | | 32 | % | | | 59 | % |
| Φ | Consolidated financial highlights. |
| 1 | Calculated using average shares outstanding. |
| 2 | Total return is based on the change in net asset value of a share during the period and assumes reinvestment of dividends and distributions at net asset value. Total return during the period reflects waivers by the manager and/or distributor. Performance would have been lower had the waivers not been in effect. |
| 3 | Net assets reported in millions. |
| 4 | Expense ratios do not include expenses of any investment companies in which the Fund invests. |
See accompanying notes, which are an integral part of the financial statements.
Financial highlights
Delaware Ivy Systematic Emerging Markets Equity Fund Class RΦ
Selected data for each share of the Fund outstanding throughout each period were as follows:
| | | Year ended | |
| | | | 3/31/23 | | | | 3/31/22 | | | | 3/31/21 | | | | 3/31/20 | | | | 3/31/19 | |
| Net asset value, beginning of period | | $ | 22.26 | | | $ | 27.75 | | | $ | 15.44 | | | $ | 18.95 | | | $ | 21.40 | |
| | | | | | | | | | | | | | | | | | | | | |
| Income (loss) from investment operations: | | | | | | | | | | | | | | | | | | | | |
| Net investment income (loss)1 | | | 0.61 | | | | 0.06 | | | | (0.07 | ) | | | 0.07 | | | | 0.06 | |
| Net realized and unrealized gain (loss) | | | (3.33 | ) | | | (5.46 | ) | | | 12.53 | | | | (3.47 | ) | | | (2.43 | ) |
| Total from investment operations | | | (2.72 | ) | | | (5.40 | ) | | | 12.46 | | | | (3.40 | ) | | | (2.37 | ) |
| | | | | | | | | | | | | | | | | | | | | |
| Less dividends and distributions from: | | | | | | | | | | | | | | | | | | | | |
| Net investment income | | | (0.17 | ) | | | (0.09 | ) | | | (0.15 | ) | | | (0.11 | ) | | | (0.08 | ) |
| Net realized gain | | | (2.25 | ) | | | — | | | | — | | | | — | | | | — | |
| Total dividends and distributions | | | (2.42 | ) | | | (0.09 | ) | | | (0.15 | ) | | | (0.11 | ) | | | (0.08 | ) |
| | | | | | | | | | | | | | | | | | | | | |
| Net asset value, end of period | | $ | 17.12 | | | $ | 22.26 | | | $ | 27.75 | | | $ | 15.44 | | | $ | 18.95 | |
| | | | | | | | | | | | | | | | | | | | | |
| Total return2 | | | (11.57 | )%3 | | | (19.51 | )%3 | | | 80.73 | % | | | (18.07 | )% | | | (11.03 | )% |
| | | | | | | | | | | | | | | | | | | | | |
| Ratios and supplemental data: | | | | | | | | | | | | | | | | | | | | |
| Net assets, end of period (000 omitted) | | $ | 6,070 | | | $ | 7,540 | | | $ | 11 | 4 | | $ | 9 | 4 | | $ | 15 | 4 |
| Ratio of expenses to average net assets5 | | | 1.37 | % | | | 1.67 | % | | | 1.69 | % | | | 1.72 | % | | | 1.70 | % |
| Ratio of expenses to average net assets prior to fees waived5 | | | 1.64 | % | | | 1.68 | % | | | 1.69 | % | | | 1.72 | % | | | 1.70 | % |
| Ratio of net investment income (loss) to average net assets | | | 3.30 | % | | | 0.22 | % | | | (0.32 | )% | | | 0.39 | % | | | 0.32 | % |
| | | | | | | | | | | | | | | | | | | | | |
| Ratio of net investment income (loss) to average net assets prior to fees waived | | | 3.03 | % | | | 0.21 | % | | | (0.32 | )% | | | 0.39 | % | | | 0.32 | % |
| Portfolio turnover | | | 65 | % | | | 38 | % | | | 39 | % | | | 32 | % | | | 59 | % |
| Φ | Consolidated financial highlights. |
| 1 | Calculated using average shares outstanding. |
| 2 | Total return is based on the change in net asset value of a share during the period and assumes reinvestment of dividends and distributions at net asset value. |
| 3 | Total return during the period reflects waivers by the manager and/or distributor. Performance would have been lower had the waivers not been in effect. |
| 4 | Net assets reported in millions. |
| 5 | Expense ratios do not include expenses of any investment companies in which the Fund invests. |
See accompanying notes, which are an integral part of the financial statements.
Delaware Ivy Systematic Emerging Markets Equity Fund Class R6Φ
Selected data for each share of the Fund outstanding throughout each period were as follows:
| | | Year ended | |
| | | | 3/31/23 | | | | 3/31/22 | | | | 3/31/21 | | | | 3/31/20 | | | | 3/31/19 | |
| Net asset value, beginning of period | | $ | 23.46 | | | $ | 29.21 | | | $ | 16.22 | | | $ | 19.88 | | | $ | 22.42 | |
| | | | | | | | | | | | | | | | | | | | | |
| Income (loss) from investment operations: | | | | | | | | | | | | | | | | | | | | |
| Net investment income1 | | | 0.78 | | | | 0.28 | | | | 0.10 | | | | 0.21 | | | | 0.20 | |
| Net realized and unrealized gain (loss) | | | (3.53 | ) | | | (5.77 | ) | | | 13.19 | | | | (3.63 | ) | | | (2.54 | ) |
| Total from investment operations | | | (2.75 | ) | | | (5.49 | ) | | | 13.29 | | | | (3.42 | ) | | | (2.34 | ) |
| | | | | | | | | | | | | | | | | | | | | |
| Less dividends and distributions from: | | | | | | | | | | | | | | | | | | | | |
| Net investment income | | | (0.24 | ) | | | (0.26 | ) | | | (0.30 | ) | | | (0.24 | ) | | | (0.20 | ) |
| Net realized gain | | | (2.25 | ) | | | — | | | | — | | | | — | | | | — | |
| Total dividends and distributions | | | (2.49 | ) | | | (0.26 | ) | | | (0.30 | ) | | | (0.24 | ) | | | (0.20 | ) |
| | | | | | | | | | | | | | | | | | | | | |
| Net asset value, end of period | | $ | 18.22 | | | $ | 23.46 | | | $ | 29.21 | | | $ | 16.22 | | | $ | 19.88 | |
| | | | | | | | | | | | | | | | | | | | | |
| Total return2 | | | (11.06 | )%3 | | | (18.89 | )%3 | | | 82.01 | % | | | (17.46 | )% | | | (10.32 | )% |
| | | | | | | | | | | | | | | | | | | | | |
| Ratios and supplemental data: | | | | | | | | | | | | | | | | | | | | |
| Net assets, end of period (000 omitted) | | $ | 144,999 | | | $ | 254,340 | | | $ | 353 | 4 | | $ | 200 | 4 | | $ | 300 | 4 |
| Ratio of expenses to average net assets5 | | | 0.76 | % | | | 0.92 | % | | | 0.95 | % | | | 0.99 | % | | | 0.96 | % |
| Ratio of expenses to average net assets prior to fees waived5 | | | 1.05 | % | | | 0.93 | % | | | 0.95 | % | | | 0.99 | % | | | 0.96 | % |
| Ratio of net investment income to average net assets | | | 3.94 | % | | | 0.98 | % | | | 0.40 | % | | | 1.05 | % | | | 1.03 | % |
| Ratio of net investment income to average net assets prior to fees waived | | | 3.65 | % | | | 0.97 | % | | | 0.40 | % | | | 1.05 | % | | | 1.03 | % |
| Portfolio turnover | | | 65 | % | | | 38 | % | | | 39 | % | | | 32 | % | | | 59 | % |
| Φ | Consolidated financial highlights. |
| 1 | Calculated using average shares outstanding. |
| 2 | Total return is based on the change in net asset value of a share during the period and assumes reinvestment of dividends and distributions at net asset value. |
| 3 | Total return during the period reflects waivers by the manager and/or distributor. Performance would have been lower had the waivers not been in effect. |
| 4 | Net assets reported in millions. |
| 5 | Expense ratios do not include expenses of any investment companies in which the Fund invests. |
See accompanying notes, which are an integral part of the financial statements.
Financial highlights
Delaware Ivy Systematic Emerging Markets Equity Fund Class YΦ
Selected data for each share of the Fund outstanding throughout each period were as follows:
| | | Year ended | |
| | | | 3/31/23 | | | | 3/31/22 | | | | 3/31/21 | | | | 3/31/20 | | | | 3/31/19 | |
| Net asset value, beginning of period | | $ | 23.01 | | | $ | 28.65 | | | $ | 15.92 | | | $ | 19.53 | | | $ | 22.02 | |
| | | | | | | | | | | | | | | | | | | | | |
| Income (loss) from investment operations: | | | | | | | | | | | | | | | | | | | | |
| Net investment income1 | | | 0.67 | | | | 0.16 | | | | 0.01 | | | | 0.14 | | | | 0.13 | |
| Net realized and unrealized gain (loss) | | | (3.44 | ) | | | (5.65 | ) | | | 12.94 | | | | (3.58 | ) | | | (2.50 | ) |
| Total from investment operations | | | (2.77 | ) | | | (5.49 | ) | | | 12.95 | | | | (3.44 | ) | | | (2.37 | ) |
| | | | | | | | | | | | | | | | | | | | | |
| Less dividends and distributions from: | | | | | | | | | | | | | | | | | | | | |
| Net investment income | | | (0.20 | ) | | | (0.15 | ) | | | (0.22 | ) | | | (0.17 | ) | | | (0.12 | ) |
| Net realized gain | | | (2.25 | ) | | | — | | | | — | | | | — | | | | — | |
| Total dividends and distributions | | | (2.45 | ) | | | (0.15 | ) | | | (0.22 | ) | | | (0.17 | ) | | | (0.12 | ) |
| | | | | | | | | | | | | | | | | | | | | |
| Net asset value, end of period | | $ | 17.79 | | | $ | 23.01 | | | $ | 28.65 | | | $ | 15.92 | | | $ | 19.53 | |
| | | | | | | | | | | | | | | | | | | | | |
| Total return2 | | | (11.38 | )%3 | | | (19.23 | )%3 | | | 81.40 | % | | | (17.80 | )% | | | (10.68 | )% |
| | | | | | | | | | | | | | | | | | | | | |
| Ratios and supplemental data: | | | | | | | | | | | | | | | | | | | | |
| Net assets, end of period (000 omitted) | | $ | 27,664 | | | $ | 29,380 | | | $ | 40 | 4 | | $ | 31 | 4 | | $ | 45 | 4 |
| Ratio of expenses to average net assets5 | | | 1.14 | % | | | 1.31 | % | | | 1.34 | % | | | 1.37 | % | | | 1.35 | % |
| Ratio of expenses to average net assets prior to fees waived5 | | | 1.41 | % | | | 1.32 | % | | | 1.34 | % | | | 1.37 | % | | | 1.35 | % |
| Ratio of net investment income to average net assets | | | 3.50 | % | | | 0.59 | % | | | 0.04 | % | | | 0.70 | % | | | 0.69 | % |
| Ratio of net investment income to average net assets prior to fees waived | | | 3.23 | % | | | 0.58 | % | | | 0.04 | % | | | 0.70 | % | | | 0.69 | % |
| Portfolio turnover | | | 65 | % | | | 38 | % | | | 39 | % | | | 32 | % | | | 59 | % |
| Φ | Consolidated financial highlights. |
| 1 | Calculated using average shares outstanding. |
| 2 | Total return is based on the change in net asset value of a share during the period and assumes reinvestment of dividends and distributions at net asset value. |
| 3 | Total return during the period reflects waivers by the manager and/or distributor. Performance would have been lower had the waivers not been in effect. |
| 4 | Net assets reported in millions. |
| 5 | Expense ratios do not include expenses of any investment companies in which the Fund invests. |
See accompanying notes, which are an integral part of the financial statements.
Delaware Ivy Value Fund Class A
Selected data for each share of the Fund outstanding throughout each period were as follows:
| | | Year ended | |
| | | | 3/31/23 | | | | 3/31/22 | | | | 3/31/21 | | | | 3/31/20 | | | | 3/31/19 | |
| Net asset value, beginning of period | | $ | 27.62 | | | $ | 26.18 | | | $ | 16.79 | | | $ | 22.61 | | | $ | 23.27 | |
| | | | | | | | | | | | | | | | | | | | | |
| Income (loss) from investment operations: | | | | | | | | | | | | | | | | | | | | |
| Net investment income1 | | | 0.25 | | | | 0.31 | | | | 0.29 | | | | 0.41 | | | | 0.28 | |
| Net realized and unrealized gain (loss) | | | (2.01 | ) | | | 4.14 | | | | 9.86 | | | | (3.98 | ) | | | 0.50 | |
| Total from investment operations | | | (1.76 | ) | | | 4.45 | | | | 10.15 | | | | (3.57 | ) | | | 0.78 | |
| | | | | | | | | | | | | | | | | | | | | |
| Less dividends and distributions from: | | | | | | | | | | | | | | | | | | | | |
| Net investment income | | | (0.45 | ) | | | (0.44 | ) | | | (0.29 | ) | | | (0.33 | ) | | | (0.20 | ) |
| Net realized gain | | | (4.39 | ) | | | (2.57 | ) | | | (0.47 | ) | | | (1.92 | ) | | | (1.24 | ) |
| Total dividends and distributions | | | (4.84 | ) | | | (3.01 | ) | | | (0.76 | ) | | | (2.25 | ) | | | (1.44 | ) |
| | | | | | | | | | | | | | | | | | | | | |
| Net asset value, end of period | | $ | 21.02 | | | $ | 27.62 | | | $ | 26.18 | | | $ | 16.79 | | | $ | 22.61 | |
| | | | | | | | | | | | | | | | | | | | | |
| Total return2 | | | (6.47 | )%3 | | | 17.35 | % | | | 61.22 | %3 | | | (18.67 | )% | | | 3.69 | % |
| | | | | | | | | | | | | | | | | | | | | |
| Ratios and supplemental data: | | | | | | | | | | | | | | | | | | | | |
| Net assets, end of period (000 omitted) | | $ | 318,903 | | | $ | 405,826 | | | $ | 359 | 4 | | $ | 251 | 4 | | $ | 354 | 4 |
| Ratio of expenses to average net assets5 | | | 1.10 | % | | | 1.09 | % | | | 1.19 | % | | | 1.21 | % | | | 1.21 | % |
| Ratio of expenses to average net assets prior to fees waived5 | | | 1.14 | % | | | 1.09 | % | | | 1.20 | % | | | 1.21 | % | | | 1.21 | % |
| Ratio of net investment income to average net assets | | | 1.01 | % | | | 1.07 | % | | | 1.36 | % | | | 1.68 | % | | | 1.21 | % |
| Ratio of net investment income to average net assets prior to fees waived | | | 0.97 | % | | | 1.07 | % | | | 1.35 | % | | | 1.68 | % | | | 1.21 | % |
| Portfolio turnover | | | 103 | % | | | 64 | % | | | 60 | % | | | 68 | % | | | 51 | % |
| 1 | Calculated using average shares outstanding. |
| 2 | Total return is based on the change in net asset value of a share during the period and assumes reinvestment of dividends and distributions at net asset value and does not reflect the impact of a sales charge. |
| 3 | Total return during the period reflects waivers by the manager and/or distributor. Performance would have been lower had the waivers not been in effect. |
| 4 | Net assets reported in millions. |
| 5 | Expense ratios do not include expenses of any investment companies in which the Fund invests. |
See accompanying notes, which are an integral part of the financial statements.
Financial highlights
Delaware Ivy Value Fund Class C
Selected data for each share of the Fund outstanding throughout each period were as follows:
| | | Year ended | |
| | | | 3/31/23 | | | | 3/31/22 | | | | 3/31/21 | | | | 3/31/20 | | | | 3/31/19 | |
| Net asset value, beginning of period | | $ | 26.19 | | | $ | 24.95 | | | $ | 16.02 | | | $ | 21.69 | | | $ | 22.40 | |
| | | | | | | | | | | | | | | | | | | | | |
| Income (loss) from investment operations: | | | | | | | | | | | | | | | | | | | | |
| Net investment income1 | | | 0.05 | | | | 0.05 | | | | 0.13 | | | | 0.22 | | | | 0.13 | |
| Net realized and unrealized gain (loss) | | | (1.90 | ) | | | 3.95 | | | | 9.39 | | | | (3.79 | ) | | | 0.45 | |
| Total from investment operations | | | (1.85 | ) | | | 4.00 | | | | 9.52 | | | | (3.57 | ) | | | 0.58 | |
| | | | | | | | | | | | | | | | | | | | | |
| Less dividends and distributions from: | | | | | | | | | | | | | | | | | | | | |
| Net investment income | | | (0.30 | ) | | | (0.19 | ) | | | (0.12 | ) | | | (0.18 | ) | | | (0.05 | ) |
| Net realized gain | | | (4.39 | ) | | | (2.57 | ) | | | (0.47 | ) | | | (1.92 | ) | | | (1.24 | ) |
| Total dividends and distributions | | | (4.69 | ) | | | (2.76 | ) | | | (0.59 | ) | | | (2.10 | ) | | | (1.29 | ) |
| | | | | | | | | | | | | | | | | | | | | |
| Net asset value, end of period | | $ | 19.65 | | | $ | 26.19 | | | $ | 24.95 | | | $ | 16.02 | | | $ | 21.69 | |
| | | | | | | | | | | | | | | | | | | | | |
| Total return2 | | | (7.24 | )%3 | | | 16.32 | % | | | 59.94 | % | | | (19.29 | )% | | | 2.94 | % |
| | | | | | | | | | | | | | | | | | | | | |
| Ratios and supplemental data: | | | | | | | | | | | | | | | | | | | | |
| Net assets, end of period (000 omitted) | | $ | 6,143 | | | $ | 6,611 | | | $ | 7 | 4 | | $ | 8 | 4 | | $ | 14 | 4 |
| Ratio of expenses to average net assets5 | | | 1.88 | % | | | 1.97 | % | | | 1.99 | % | | | 1.99 | % | | | 1.94 | % |
| Ratio of expenses to average net assets prior to fees waived5 | | | 1.98 | % | | | 1.97 | % | | | 1.99 | % | | | 1.99 | % | | | 1.94 | % |
| Ratio of net investment income to average net assets | | | 0.23 | % | | | 0.18 | % | | | 0.65 | % | | | 0.94 | % | | | 0.59 | % |
| Ratio of net investment income to average net assets prior to fees waived | | | 0.13 | % | | | 0.18 | % | | | 0.65 | % | | | 0.94 | % | | | 0.59 | % |
| Portfolio turnover | | | 103 | % | | | 64 | % | | | 60 | % | | | 68 | % | | | 51 | % |
| 1 | Calculated using average shares outstanding. |
| 2 | Total return is based on the change in net asset value of a share during the period and assumes reinvestment of dividends and distributions at net asset value and does not reflect the impact of a sales charge. |
| 3 | Total return during the period reflects waivers by the manager and/or distributor. Performance would have been lower had the waivers not been in effect. |
| 4 | Net assets reported in millions. |
| 5 | Expense ratios do not include expenses of any investment companies in which the Fund invests. |
See accompanying notes, which are an integral part of the financial statements.
Delaware Ivy Value Fund Class I
Selected data for each share of the Fund outstanding throughout each period were as follows:
| | | Year ended | |
| | | | 3/31/23 | | | | 3/31/22 | | | | 3/31/21 | | | | 3/31/20 | | | | 3/31/19 | |
| Net asset value, beginning of period | | $ | 27.78 | | | $ | 26.31 | | | $ | 16.88 | | | $ | 22.72 | | | $ | 23.38 | |
| | | | | | | | | | | | | | | | | | | | | |
| Income (loss) from investment operations: | | | | | | | | | | | | | | | | | | | | |
| Net investment income1 | | | 0.36 | | | | 0.37 | | | | 0.35 | | | | 0.47 | | | | 0.36 | |
| Net realized and unrealized gain (loss) | | | (2.07 | ) | | | 4.17 | | | | 9.91 | | | | (4.00 | ) | | | 0.50 | |
| Total from investment operations | | | (1.71 | ) | | | 4.54 | | | | 10.26 | | | | (3.53 | ) | | | 0.86 | |
| | | | | | | | | | | | | | | | | | | | | |
| Less dividends and distributions from: | | | | | | | | | | | | | | | | | | | | |
| Net investment income | | | (0.50 | ) | | | (0.50 | ) | | | (0.36 | ) | | | (0.39 | ) | | | (0.28 | ) |
| Net realized gain | | | (4.39 | ) | | | (2.57 | ) | | | (0.47 | ) | | | (1.92 | ) | | | (1.24 | ) |
| Total dividends and distributions | | | (4.89 | ) | | | (3.07 | ) | | | (0.83 | ) | | | (2.31 | ) | | | (1.52 | ) |
| | | | | | | | | | | | | | | | | | | | | |
| Net asset value, end of period | | $ | 21.18 | | | $ | 27.78 | | | $ | 26.31 | | | $ | 16.88 | | | $ | 22.72 | |
| | | | | | | | | | | | | | | | | | | | | |
| Total return2 | | | (6.25 | )% | | | 17.61 | % | | | 61.66 | %3 | | | (18.40 | )% | | | 3.95 | % |
| | | | | | | | | | | | | | | | | | | | | |
| Ratios and supplemental data: | | | | | | | | | | | | | | | | | | | | |
| Net assets, end of period (000 omitted) | | $ | 346,249 | | | $ | 938,672 | | | $ | 829 | 4 | | $ | 522 | 4 | | $ | 579 | 4 |
| Ratio of expenses to average net assets5 | | | 0.86 | % | | | 0.88 | % | | | 0.91 | % | | | 0.92 | % | | | 0.91 | % |
| Ratio of expenses to average net assets prior to fees waived5 | | | 0.86 | % | | | 0.88 | % | | | 0.92 | % | | | 0.92 | % | | | 0.91 | % |
| Ratio of net investment income to average net assets | | | 1.45 | % | | | 1.28 | % | | | 1.62 | % | | | 1.94 | % | | | 1.51 | % |
| Ratio of net investment income to average net assets prior to fees waived | | | 1.45 | % | | | 1.28 | % | | | 1.61 | % | | | 1.94 | % | | | 1.51 | % |
| Portfolio turnover | | | 103 | % | | | 64 | % | | | 60 | % | | | 68 | % | | | 51 | % |
| 1 | Calculated using average shares outstanding. |
| 2 | Total return is based on the change in net asset value of a share during the period and assumes reinvestment of dividends and distributions at net asset value. |
| 3 | Total return during the period reflects waivers by the manager and/or distributor. Performance would have been lower had the waivers not been in effect. |
| 4 | Net assets reported in millions. |
| 5 | Expense ratios do not include expenses of any investment companies in which the Fund invests. |
See accompanying notes, which are an integral part of the financial statements.
Financial highlights
Delaware Ivy Value Fund Class R
Selected data for each share of the Fund outstanding throughout each period were as follows:
| | | Year ended | |
| | | | 3/31/23 | | | | 3/31/22 | | | | 3/31/21 | | | | 3/31/20 | | | | 3/31/19 | |
| Net asset value, beginning of period | | $ | 27.54 | | | $ | 26.11 | | | $ | 16.74 | | | $ | 22.56 | | | $ | 23.22 | |
| | | | | | | | | | | | | | | | | | | | | |
| Income (loss) from investment operations: | | | | | | | | | | | | | | | | | | | | |
| Net investment income1 | | | 0.12 | | | | 0.08 | | | | 0.21 | | | | 0.33 | | | | 0.22 | |
| Net realized and unrealized gain (loss) | | | (2.00 | ) | | | 4.28 | | | | 9.83 | | | | (3.98 | ) | | | 0.49 | |
| Total from investment operations | | | (1.88 | ) | | | 4.36 | | | | 10.04 | | | | (3.65 | ) | | | 0.71 | |
| | | | | | | | | | | | | | | | | | | | | |
| Less dividends and distributions from: | | | | | | | | | | | | | | | | | | | | |
| Net investment income | | | (0.35 | ) | | | (0.36 | ) | | | (0.20 | ) | | | (0.25 | ) | | | (0.13 | ) |
| Net realized gain | | | (4.39 | ) | | | (2.57 | ) | | | (0.47 | ) | | | (1.92 | ) | | | (1.24 | ) |
| Total dividends and distributions | | | (4.74 | ) | | | (2.93 | ) | | | (0.67 | ) | | | (2.17 | ) | | | (1.37 | ) |
| | | | | | | | | | | | | | | | | | | | | |
| Net asset value, end of period | | $ | 20.92 | | | $ | 27.54 | | | $ | 26.11 | | | $ | 16.74 | | | $ | 22.56 | |
| | | | | | | | | | | | | | | | | | | | | |
| Total return2 | | | (6.95 | )%3 | | | 16.99 | % | | | 60.59 | % | | | (18.94 | )% | | | 3.35 | % |
| | | | | | | | | | | | | | | | | | | | | |
| Ratios and supplemental data: | | | | | | | | | | | | | | | | | | | | |
| Net assets, end of period (000 omitted) | | $ | 20 | | | $ | 14 | | | $ | — | 4,5 | | $ | — | 4,5 | | $ | — | 4,5 |
| Ratio of expenses to average net assets6 | | | 1.56 | % | | | 1.53 | % | | | 1.57 | % | | | 1.55 | % | | | 1.52 | % |
| Ratio of expenses to average net assets prior to fees waived6 | | | 1.80 | % | | | 1.53 | % | | | 1.57 | % | | | 1.55 | % | | | 1.52 | % |
| Ratio of net investment income to average net assets | | | 0.49 | % | | | 0.29 | % | | | 0.96 | % | | | 1.34 | % | | | 0.95 | % |
| Ratio of net investment income to average net assets prior to fees waived | | | 0.25 | % | | | 0.29 | % | | | 0.96 | % | | | 1.34 | % | | | 0.95 | % |
| Portfolio turnover | | | 103 | % | | | 64 | % | | | 60 | % | | | 68 | % | | | 51 | % |
| 1 | Calculated using average shares outstanding. |
| 2 | Total return is based on the change in net asset value of a share during the period and assumes reinvestment of dividends and distributions at net asset value. |
| 3 | Total return during the period reflects waivers by the manager and/or distributor. Performance would have been lower had the waivers not been in effect. |
| 4 | Net assets reported in millions. |
| 5 | Rounds to less than $500 thousands. |
| 6 | Expense ratios do not include expenses of any investment companies in which the Fund invests. |
See accompanying notes, which are an integral part of the financial statements.
Delaware Ivy Value Fund Class R6
Selected data for each share of the Fund outstanding throughout each period were as follows:
| | | Year ended | |
| | | | 3/31/23 | | | | 3/31/22 | | | | 3/31/21 | | | | 3/31/20 | | | | 3/31/19 | |
| Net asset value, beginning of period | | $ | 27.89 | | | $ | 26.40 | | | $ | 16.94 | | | $ | 22.80 | | | $ | 23.45 | |
| | | | | | | | | | | | | | | | | | | | | |
| Income (loss) from investment operations: | | | | | | | | | | | | | | | | | | | | |
| Net investment income1 | | | 0.44 | | | | 0.41 | | | | 0.39 | | | | 0.51 | | | | 0.41 | |
| Net realized and unrealized gain (loss) | | | (2.13 | ) | | | 4.19 | | | | 9.94 | | | | (4.02 | ) | | | 0.50 | |
| Total from investment operations | | | (1.69 | ) | | | 4.60 | | | | 10.33 | | | | (3.51 | ) | | | 0.91 | |
| | | | | | | | | | | | | | | | | | | | | |
| Less dividends and distributions from: | | | | | | | | | | | | | | | | | | | | |
| Net investment income | | | (0.43 | ) | | | (0.54 | ) | | | (0.40 | ) | | | (0.43 | ) | | | (0.32 | ) |
| Net realized gain | | | (4.39 | ) | | | (2.57 | ) | | | (0.47 | ) | | | (1.92 | ) | | | (1.24 | ) |
| Total dividends and distributions | | | (4.82 | ) | | | (3.11 | ) | | | (0.87 | ) | | | (2.35 | ) | | | (1.56 | ) |
| | | | | | | | | | | | | | | | | | | | | |
| Net asset value, end of period | | $ | 21.38 | | | $ | 27.89 | | | $ | 26.40 | | | $ | 16.94 | | | $ | 22.80 | |
| | | | | | | | | | | | | | | | | | | | | |
| Total return2 | | | (6.18 | )% | | | 17.81 | % | | | 61.93 | % | | | (18.29 | )% | | | 4.15 | % |
| | | | | | | | | | | | | | | | | | | | | |
| Ratios and supplemental data: | | | | | | | | | | | | | | | | | | | | |
| Net assets, end of period (000 omitted) | | $ | 4,247 | | | $ | 126,573 | | | $ | 146 | 3 | | $ | 113 | 3 | | $ | 140 | 3 |
| Ratio of expenses to average net assets4 | | | 0.74 | % | | | 0.72 | % | | | 0.76 | % | | | 0.77 | % | | | 0.76 | % |
| Ratio of net investment income to average net assets | | | 1.70 | % | | | 1.42 | % | | | 1.81 | % | | | 2.13 | % | | | 1.72 | % |
| Portfolio turnover | | | 103 | % | | | 64 | % | | | 60 | % | | | 68 | % | | | 51 | % |
| 1 | Calculated using average shares outstanding. |
| 2 | Total return is based on the change in net asset value of a share during the period and assumes reinvestment of dividends and distributions at net asset value. |
| 3 | Net assets reported in millions. |
| 4 | Expense ratios do not include expenses of any investment companies in which the Fund invests. |
See accompanying notes, which are an integral part of the financial statements.
Financial highlights
Delaware Ivy Value Fund Class Y
Selected data for each share of the Fund outstanding throughout each period were as follows:
| | | Year ended | |
| | | | 3/31/23 | | | | 3/31/22 | | | | 3/31/21 | | | | 3/31/20 | | | | 3/31/19 | |
| Net asset value, beginning of period | | $ | 27.57 | | | $ | 26.14 | | | $ | 16.77 | | | $ | 22.65 | | | $ | 23.31 | |
| | | | | | | | | | | | | | | | | | | | | |
| Income (loss) from investment operations: | | | | | | | | | | | | | | | | | | | | |
| Net investment income1 | | | 0.25 | | | | 0.28 | | | | 0.33 | | | | 0.46 | | | | 0.33 | |
| Net realized and unrealized gain (loss) | | | (2.01 | ) | | | 4.16 | | | | 9.80 | | | | (4.09 | ) | | | 0.47 | |
| Total from investment operations | | | (1.76 | ) | | | 4.44 | | | | 10.13 | | | | (3.63 | ) | | | 0.80 | |
| | | | | | | | | | | | | | | | | | | | | |
| Less dividends and distributions from: | | | | | | | | | | | | | | | | | | | | |
| Net investment income | | | (0.45 | ) | | | (0.44 | ) | | | (0.29 | ) | | | (0.33 | ) | | | (0.22 | ) |
| Net realized gain | | | (4.39 | ) | | | (2.57 | ) | | | (0.47 | ) | | | (1.92 | ) | | | (1.24 | ) |
| Total dividends and distributions | | | (4.84 | ) | | | (3.01 | ) | | | (0.76 | ) | | | (2.25 | ) | | | (1.46 | ) |
| | | | | | | | | | | | | | | | | | | | | |
| Net asset value, end of period | | $ | 20.97 | | | $ | 27.57 | | | $ | 26.14 | | | $ | 16.77 | | | $ | 22.65 | |
| | | | | | | | | | | | | | | | | | | | | |
| Total return2 | | | (6.49 | )% | | | 17.32 | %3 | | | 61.18 | % | | | (18.89 | )% | | | 3.76 | % |
| | | | | | | | | | | | | | | | | | | | | |
| Ratios and supplemental data: | | | | | | | | | | | | | | | | | | | | |
| Net assets, end of period (000 omitted) | | $ | 87 | | | $ | 108 | | | $ | — | 4,5 | | $ | — | 4,5 | | $ | — | 4,5 |
| Ratio of expenses to average net assets6 | | | 1.11 | % | | | 1.11 | % | | | 1.18 | % | | | 1.19 | % | | | 1.15 | % |
| Ratio of expenses to average net assets prior to fees waived6 | | | 1.11 | % | | | 1.14 | % | | | 1.18 | % | | | 1.19 | % | | | 1.15 | % |
| Ratio of net investment income to average net assets | | | 1.01 | % | | | 1.03 | % | | | 1.61 | % | | | 1.93 | % | | | 1.37 | % |
| Ratio of net investment income to average net assets prior to fees waived | | | 1.01 | % | | | 1.00 | % | | | 1.61 | % | | | 1.93 | % | | | 1.37 | % |
| Portfolio turnover | | | 103 | % | | | 64 | % | | | 60 | % | | | 68 | % | | | 51 | % |
| 1 | Calculated using average shares outstanding. |
| 2 | Total return is based on the change in net asset value of a share during the period and assumes reinvestment of dividends and distributions at net asset value. |
| 3 | Total return during the period reflects waivers by the manager and/or distributor. Performance would have been lower had the waivers not been in effect. |
| 4 | Net assets reported in millions. |
| 5 | Rounds to less than $500 thousands. |
| 6 | Expense ratios do not include expenses of any investment companies in which the Fund invests. |
See accompanying notes, which are an integral part of the financial statements.
Notes to financial statements
Ivy Funds (Trust) is organized as a Delaware statutory trust and offers 39 series. These financial statements and the related notes pertain to 19 funds: Delaware Global Value Equity Fund, Delaware Ivy Core Bond Fund, Delaware Ivy Core Equity Fund, Delaware Ivy Global Bond Fund, Delaware Ivy Global Growth Fund, Delaware Ivy High Income Fund, Delaware Ivy International Core Equity Fund, Delaware Ivy International Value Fund, Delaware Ivy Large Cap Growth Fund, Delaware Ivy Limited-Term Bond Fund, Delaware Ivy Managed International Opportunities Fund, Delaware Ivy Mid Cap Growth Fund, Delaware Ivy Mid Cap Income Opportunities Fund, Delaware Ivy Municipal Bond Fund, Delaware Ivy Municipal High Income Fund, Delaware Ivy Small Cap Growth Fund, Delaware Ivy Smid Cap Core Fund, Delaware Ivy Systematic Emerging Markets Equity Fund, and Delaware Ivy Value Fund, (each a Fund, or collectively, the Funds). The Trust is an open-end investment company. The Funds, except for Delaware Global Value Equity Fund, Delaware Ivy International Value Fund, and Delaware Ivy Large Cap Growth Fund are considered diversified under the Investment Company Act of 1940, as amended (1940 Act). Delaware Global Value Equity Fund, Delaware Ivy International Value Fund, and Delaware Ivy Large Cap Growth Fund are considered nondiversified.
The Funds offer Class A, Class C, Class I, and Class R6 shares. Each Fund (other than Delaware Ivy Municipal Bond Fund) offers Class Y shares and each Fund (other than Delaware Ivy Municipal Bond Fund and Delaware Ivy Municipal High Income Fund) offer Class R shares. Effective December 10, 2021, all remaining shares of Class B were converted to Class A shares. On June 13, 2022, all Class E shares were liquidated. Class A shares are subject to an initial sales charge. If you are investing $1 million or more ($250,000 or more for Delaware Ivy Municipal Bond Fund or Delaware Ivy Municipal High Income Fund), either as a lump sum or through one of the sales charge reduction features described in the prospectus, you may be eligible to buy Class A shares without a sales charge. However, for shares of the Funds purchased prior to July 1, 2021, you will have to pay a Limited CDSC of 1.00% if you redeem these shares within the first year after your purchase; or if the Distributor paid your financial intermediary a commission on your purchase of $1 million or more of Class A shares ($250,000 or more for Delaware Ivy Municipal Bond Fund and Delaware Ivy Municipal High Income Fund) that received a net asset value (NAV) breakpoint, for shares purchased on or after July 1, 2021 that are subject to a CDSC, for each Fund except Delaware Ivy Limited-Term Bond Fund, you will have to pay a Limited CDSC of 1.00% if you redeem these shares within the first 18 months after your purchase, unless a specific waiver of the Limited CDSC applies. For Delaware Ivy Limited-Term Bond Fund, if the Distributor paid your financial intermediary a commission on your purchase of $1 million or more of Class A shares that received an NAV breakpoint, for shares purchased on or after July 1, 2021 that are subject to a CDSC, you will have to pay a Limited CDSC of 0.75% if you redeem these shares within the first 12 months after your purchase, unless a specific waiver of the Limited CDSC applies. Class C shares have no upfront sales charge, but are sold with a CDSC of 1.00%, which will be incurred if redeemed during the first 12 months. Class I, Class R, Class R6, and Class Y shares are not subject to a sales charge and are offered for sale exclusively to certain eligible investors. In addition, Class R6 shares do not pay any service fees, sub-accounting fees, and/or sub-transfer agency fees to any brokers, dealers, or other financial intermediaries.
1. Significant Accounting Policies
Each Fund follows accounting and reporting guidance under Financial Accounting Standards Board (FASB) Accounting Standards Codification Topic 946, Financial Services — Investment Companies. The following accounting policies are in accordance with US generally accepted accounting principles (US GAAP) and are consistently followed by the Funds.
Security Valuation — Equity securities and exchange-traded funds (ETFs), except those traded on the Nasdaq Stock Market LLC (Nasdaq), are valued at the last quoted sales price as of the time of the regular close of the New York Stock Exchange on the valuation date. Equity securities and ETFs traded on the Nasdaq are valued in accordance with the Nasdaq Official Closing Price, which may not be the last sales price. If, on a particular day, an equity security or ETF does not trade, the mean between the bid and the ask prices will be used, which approximates fair value. Equity securities listed on a foreign exchange are normally valued at the last quoted sales price on the valuation date. US government and agency securities are valued at the mean between the bid and the ask prices, which approximates fair value. Other debt securities, credit default swap (CDS) contracts and interest rate swap (IRS) contracts are valued based upon valuations provided by an independent pricing service or broker/counterparty and reviewed by management. To the extent current market prices are not available, the pricing service may take into account developments related to the specific security, as well as transactions in comparable securities. Valuations for fixed income securities utilize matrix systems, which reflect such factors as security prices, yields, maturities, and ratings, and are supplemented by dealer and exchange quotations. For asset-backed securities, collateralized mortgage obligations (CMOs), commercial mortgage securities, and US government agency mortgage securities, pricing vendors utilize matrix pricing which considers prepayment speed, attributes of the collateral, yield or price of bonds of comparable quality, coupon, maturity, and type as well as broker/dealer-supplied prices. Swap prices are derived using daily swap curves and models that incorporate a number of market data factors, such as discounted cash flows, trades, and values of the underlying reference instruments. Foreign currency exchange contracts and foreign cross currency exchange
Notes to financial statements
Ivy Funds
1. Significant Accounting Policies (continued)
contracts are valued at the mean between the bid and the ask prices, which approximates fair value. Interpolated values are derived when the settlement date of the contract is an interim date for which quotations are not available. Futures contracts and options on futures contracts are valued at the daily quoted settlement prices. Exchange-traded options are valued at the last reported sale price or, if no sales are reported, at the mean between the last reported bid and the ask prices, which approximates fair value. Open-end investment companies, other than ETFs, are valued at their published NAV. Generally, other securities and assets for which market quotations are not readily available are valued at fair value as determined in good faith by each Fund's valuation designee, Delaware Management Company (DMC). Subject to the oversight of the Trust's Board of Trustees (Board), DMC, as valuation designee, has adopted policies and procedures to fair value securities for which market quotations are not readily available consistent with the requirements of Rule 2a-5 under the 1940 Act. In determining whether market quotations are readily available or fair valuation will be used, various factors will be taken into consideration, such as market closures or suspension of trading in a security. Restricted securities and private placements are valued at fair value.
Federal and Foreign Income Taxes — No provision for federal income taxes has been made as each Fund intends to continue to qualify for federal income tax purposes as a regulated investment company under Subchapter M of the Internal Revenue Code of 1986, as amended, and make the requisite distributions to shareholders. Each Fund evaluates tax positions taken or expected to be taken in the course of preparing each Fund's tax returns to determine whether the tax positions are “more-likely-than-not” of being sustained by the applicable tax authority. Tax positions not deemed to meet the “more-likely-than-not” threshold are recorded as a tax benefit or expense in the current year. Management has analyzed each Fund's tax positions taken or expected to be taken on each Fund's federal income tax returns through the year ended March 31, 2023, and for all open tax years (years ended March 31, 2020 - March 31, 2022), and has concluded that no provision for federal income tax is required in each Fund's financial statements. In regard to foreign taxes only, each Fund has open tax years in certain foreign countries in which it invests in that may date back to the inception of each Fund. If applicable, each Fund recognizes interest accrued on unrecognized tax benefits in interest expense and penalties in “Other” on the “Statements of operations.” During the year ended March 31, 2023, the Funds did not incur any interest or tax penalties.
Class Accounting — Investment income, common expenses, and realized and unrealized gain (loss) on investments are allocated to the various classes of each Fund on the basis of daily net assets of each class. Distribution expenses relating to a specific class are charged directly to that class. Class R6 shares will not be allocated any expenses related to service fees, sub-accounting fees, and/or sub-transfer agency fees paid to brokers, dealers, or other financial intermediaries.
Foreign Currency Transactions — Transactions denominated in foreign currencies are recorded at the prevailing exchange rates on the valuation date. The value of all assets and liabilities denominated in foreign currencies is translated daily into US dollars at the exchange rate of such currencies against the US dollar. Transaction gains or losses resulting from changes in exchange rates during the reporting period or upon settlement of the foreign currency transaction are reported in operations for the current period. The Funds generally bifurcate that portion of realized gains and losses on investments in debt securities which is due to changes in foreign exchange rates from that which is due to changes in market prices of debt securities. That portion of gains (losses), which is due to changes in foreign exchange rates, is included on the “Statements of operations” under “Net realized gain (loss) on foreign currencies.” For foreign equity securities, the realized gains and losses are included on the “Statements of operations” under “Net realized gain (loss) on investments.” The Funds report certain foreign currency related transactions as components of realized gains (losses) for financial reporting purposes, whereas such components are treated as ordinary income (loss) for federal income tax purposes.
Derivative Financial Instruments — The Funds may invest in various derivative financial instruments. These instruments are used to obtain exposure to a security, commodity, index, market, and/or other assets without owning or taking physical custody of securities, commodities and/ or other referenced assets or to manage market, equity, credit, interest rate, foreign currency exchange rate, commodity and/or other risks. Derivative financial instruments may give rise to a form of economic leverage and involve risks, including the imperfect correlation between the value of a derivative financial instrument and the underlying asset, possible default of the counterparty to the transaction or illiquidity of the instrument. Pursuant to Rule 18f-4 under the 1940 Act, among other things, the Funds must either use derivative financial instruments with embedded leverage in a limited manner or comply with an outer limit on fund leverage risk based on value-at-risk. The Funds' successful use of a derivative financial instrument depends on the investment adviser's ability to predict pertinent market movements accurately, which cannot be assured. The use of these instruments may result in losses greater than if they had not been used, may limit the amount of appreciation the Funds can realize on an investment and/or may result in lower distributions paid to shareholders. The Funds' investments in these instruments, if any, are discussed in detail in the Notes to financial statements.
Segregation and Collateralizations — In certain cases, based on requirements and agreements with certain exchanges and third-party broker-dealers, the Funds may deliver or receive collateral in connection with certain investments (e.g., futures contracts, foreign currency exchange contracts, options written, securities with extended settlement periods, and swaps). Certain countries require that cash reserves be held while investing in companies incorporated in that country. These cash reserves and cash collateral that has been pledged/received to cover obligations of the Funds under derivative contracts, if any, will be reported separately on the "Statements of assets and liabilities" as cash collateral due to/from broker. Securities collateral pledged for the same purpose, if any, is noted on the "Schedules of investments."
Use of Estimates — The preparation of financial statements in conformity with US GAAP requires management to make estimates and assumptions that affect the fair value of investments, the reported amounts of assets and liabilities and disclosure of contingent assets and liabilities at the date of the financial statements, and the reported amounts of revenues and expenses during the reporting period. Actual results could differ from those estimates and the differences could be material.
Other — Expenses directly attributable to a Fund are charged directly to that Fund. Other expenses common to various funds within the Delaware Funds by Macquarie® (Delaware Funds) are generally allocated among such funds on the basis of average net assets. Management fees and certain other expenses are paid monthly. Security transactions are recorded on the date the securities are purchased or sold (trade date) for financial reporting purposes. Costs used in calculating realized gains and losses on the sale of investment securities are those of the specific securities sold. Dividend income is recorded on the ex-dividend date and interest income is recorded on an accrual basis. Income and capital gain distributions from any investment companies (Underlying Funds) in which each Fund invests are recorded on the ex-dividend date. Discounts and premiums on debt securities are accreted or amortized to interest income, respectively, over the lives of the respective securities using the effective interest method. Premiums on callable debt securities are amortized to interest income to the earliest call date using the effective interest method. Realized gains (losses) on paydowns of asset- and mortgage-backed securities are classified as interest income. Distributions received from investments in real estate investment trusts (REITs) are recorded as dividend income on the ex-dividend date, subject to reclassification upon notice of the character of such distributions by the issuer. Foreign dividends are also recorded on the ex-dividend date or as soon after the ex-dividend date that the Funds are aware of such dividends, net of all tax withholdings, a portion of which may be reclaimable. Withholding taxes and reclaims on foreign dividends and interest have been recorded in accordance with the Funds’ understanding of the applicable country’s tax rules and rates. Each Fund may pay foreign capital gains taxes on certain foreign securities held, which are reported as components of realized losses for financial reporting purposes, whereas such components are treated as ordinary loss for federal income tax purposes. Delaware Ivy Core Bond Fund, Delaware Ivy High Income Fund, Delaware Ivy Limited-Term Bond Fund, Delaware Ivy Municipal Bond Fund, and Delaware Ivy Municipal High Income Fund declare daily and pay monthly. Delaware Global Value Equity Fund, Delaware Ivy Mid Cap Income Opportunities Fund, Delaware Ivy Smid Cap Core Fund and Delaware Ivy Value Fund declare and pay quarterly. Delaware Ivy Core Equity Fund, Delaware Ivy Systematic Emerging Markets Equity Fund, Delaware Ivy Global Growth Fund, Delaware Ivy International Core Equity Fund, Delaware Ivy International Value Fund, Delaware Ivy Large Cap Growth Fund, Delaware Ivy Managed International Opportunities Fund, Delaware Ivy Mid Cap Growth Fund, and Delaware Ivy Small Cap Growth Fund declare and pay dividends annually. Each Fund declares and pays distributions from net realized gain on investments, if any, at least annually. Each Fund may distribute more frequently, if necessary for tax purposes. Dividends and distributions, if any, are recorded on the ex-dividend date.
Each Fund receives earnings credits from its transfer agent when positive cash balances are maintained, which may be used to offset transfer agent fees. If the amount earned is greater than $1, the expenses paid under this arrangement are included on the “Statements of operations” under “Dividend disbursing and transfer agent fees and expenses” with the corresponding expenses offset included under “Less expenses paid indirectly.”
Notes to financial statements
Ivy Funds
2. Investment Management, Administration Agreements, and Other Transactions with Affiliates
In accordance with the terms of its respective investment management agreement, each Fund pays DMC, a series of Macquarie Investment Management Business Trust and the investment manager, an annual fee which is calculated daily and paid monthly, based on each Fund's average daily net assets as follows:
| Fund | | Management Fee (annual rate as a percentage of average daily net assets) |
| Delaware Global Value Equity Fund | | 0.70% of net assets up to $1 billion; |
| | | 0.65% of net assets over $1 billion and up to $2 billion; |
| | | 0.60% of net assets over $2 billion and up to $3 billion; |
| | | 0.55% of net assets over $3 billion and up to $5 billion; |
| | | 0.545% of net assets over $5 billion and up to $10 billion; |
| | | 0.54% of net assets over $10 billion. |
| | |
| Delaware Ivy Core Bond Fund1 | | 0.525% of net assets up to $500 million; |
| | | 0.50% of net assets over $500 million and up to $1 billion; |
| | | 0.45% of net assets over $1 billion and up to $1.5 billion; |
| | | 0.40% of net assets over $1.5 billion and up to $5 billion; |
| | | 0.395% of net assets over $5 billion and up to $10 billion; |
| | | 0.39% of net assets over $10 billion. |
| | |
| Delaware Ivy Core Equity Fund | | 0.70% of net assets up to $1 billion; |
| | | 0.65% of net assets over $1 billion and up to $2 billion; |
| | | 0.60% of net assets over $2 billion and up to $3 billion; |
| | | 0.55% of net assets over $3 billion and up to $5 billion; |
| | | 0.525% of net assets over $5 billion and up to $6 billion; |
| | | 0.50% of net assets over $6 billion and up to $10 billion; |
| | | 0.49% of net assets over $10 billion. |
| | |
| Delaware Ivy Global Bond Fund | | 0.625% of net assets up to $500 million; |
| | | 0.60% of net assets over $500 million and up to $1 billion; |
| | | 0.55% of net assets over $1 billion and up to $1.5 billion; |
| | | 0.50% of net assets over $1.5 billion and up to $5 billion; |
| | | 0.49% of net assets over $5 billion and up to $10 billion; |
| | | 0.48% of net assets over $10 billion. |
| | |
| Delaware Ivy Global Growth Fund | | 0.85% of net assets up to $1 billion; |
| | | 0.83% of net assets over $1 billion and up to $2 billion; |
| | | 0.80% of net assets over $2 billion and up to $3 billion; |
| | | 0.70% of net assets over $3 billion and up to $5 billion; |
| | | 0.695% of net assets over $5 billion and up to $10 billion; |
| | | 0.69% of net assets over $10 billion. |
| | |
| Delaware Ivy High Income Fund | | 0.625% of net assets up to $500 million; |
| | | 0.60% of net assets over $500 million and up to $1 billion; |
| | | 0.55% of net assets over $1 billion and up to $1.5 billion; |
| | | 0.50% of net assets over $1.5 billion and up to $10 billion; |
| | | 0.49% of net assets over $10 billion and up to $20 billion; |
| | | 0.48% of net assets over $20 billion. |
| Fund | | Management Fee (annual rate as a percentage of average daily net assets) |
| Delaware Ivy International Core Equity Fund | | 0.85% of net assets up to $1 billion; |
| | | 0.83% of net assets over $1 billion and up to $2 billion; |
| | | 0.80% of net assets over $2 billion and up to $3 billion; |
| | | 0.70% of net assets over $3 billion and up to $5 billion; |
| | | 0.69% of net assets over $5 billion and up to $10 billion; |
| | | 0.68% of net assets over $10 billion. |
| | |
| Delaware Ivy International Value Fund2 | | 1.00% of net assets up to $500 million; |
| | | 0.85% of net assets over $500 million and up to $1 billion; |
| | | 0.83% of net assets over $1 billion and up to $2 billion; |
| | | 0.80% of net assets over $2 billion and up to $3 billion; |
| | | 0.76% of net assets over $3 billion and up to $5 billion; |
| | | 0.73% of net assets over $5 billion and up to $10 billion; |
| | | 0.70% of net assets over $10 billion. |
| | |
| Delaware Ivy Large Cap Growth Fund | | 0.70% of net assets up to $1 billion; |
| | | 0.65% of net assets over $1 billion and up to $2 billion; |
| | | 0.60% of net assets over $2 billion and up to $3 billion; |
| | | 0.55% of net assets over$3 billion and up to $5 billion; |
| | | 0.545% of net assets over $5 billion and up to $10 billion; |
| | | 0.54% of net assets over $10 billion. |
| | | |
| Delaware Ivy Limited-Term Bond Fund | | 0.50% of net assets up to $500 million; |
| | | 0.45% of net assets over $500 million and up to $1 billion; |
| | | 0.40% of net assets over $1 billion and up to $1.5 billion; |
| | | 0.35% of net assets over $1.5 billion and up to $5 billion; |
| | | 0.34% of net assets over $5 billion and up to $10 billion; |
| | | 0.33% of net assets over $10 billion. |
| | | |
| Delaware Ivy Managed International Opportunities Fund | | 0.05% of net assets. |
| | | |
| Delaware Ivy Mid Cap Growth Fund | | 0.85% of net assets up to $1 billion; |
| | | 0.83% of net assets over $1 billion and up to $2 billion; |
| | | 0.80% of net assets over $2 billion and up to $3 billion; |
| | | 0.76% of net assets over $3 billion and up to $5 billion; |
| | | 0.73% of net assets over $5 billion and up to $10 billion; |
| | | 0.70% of net assets over $10 billion and up to $15 billion; |
| | | 0.67% of net assets over $15 billion. |
| | | |
| Delaware Ivy Mid Cap Income Opportunities Fund | | 0.85% of net assets up to $1 billion; |
| | | 0.83% of net assets over $1 billion and up to $2 billion; |
| | | 0.80% of net assets over $2 billion and up to $3 billion; |
| | | 0.76% of net assets over $3 billion and up to $5 billion; |
| | | 0.73% of net assets over $5 billion and up to $10 billion; |
| | | 0.70% of net assets over $10 billion and up to $15 billion; |
| | | 0.67% of net assets over $15 billion. | |
Notes to financial statements
Ivy Funds
2. Investment Management, Administration Agreements, and Other Transactions with Affiliates (continued)
| Fund | | Management Fee (annual rate as a percentage of average daily net assets) |
| Delaware Ivy Municipal Bond Fund | | 0.525% of net assets up to $500 million; |
| | | 0.50% of net assets over $500 million and up to $1 billion; |
| | | 0.45% of net assets over $1 billion and up to $1.5 billion; |
| | | 0.40% of net assets over $1.5 billion and up to $5 billion; |
| | | 0.395% of net assets over $5 billion and up to $10 billion; |
| | | 0.39% of net assets over $10 billion and up to $15 billion; |
| | | 0.385% of net assets over $15 billion. |
| | |
| Delaware Ivy Municipal High Income Fund | | 0.525% of net assets up to $500 million; |
| | | 0.50% of net assets over $500 million and up to $1 billion; |
| | | 0.45% of net assets over $1 billion and up to $1.5 billion; |
| | | 0.40% of net assets over $1.5 billion and up to $5 billion; |
| | | 0.395% of net assets over $5 billion and up to $10 billion; |
| | | 0.39% of net assets over $10 billion and up to $15 billion; |
| | | 0.385% of net assets over $15 billion. |
| | |
| Delaware Ivy Small Cap Growth Fund | | 0.85% of net assets up to $1 billion; |
| | | 0.83% of net assets over $1 billion and up to $2 billion; |
| | | 0.80% of net assets over $2 billion and up to $3 billion; |
| | | 0.76% of net assets over $3 billion and up to $5 billion; |
| | | 0.73% of net assets over $5 billion and up to $10 billion; |
| | | 0.72% of net assets over $10 billion. |
| | |
| Delaware Ivy Smid Cap Core Fund | | 0.85% of net assets up to $1 billion; |
| | | 0.83% of net assets over $1 billion and up to $2 billion; |
| | | 0.80% of net assets over $2 billion and up to $3 billion; |
| | | 0.76% of net assets over $3 billion and up to $5 billion; |
| | | 0.73% of net assets over $5 billion and up to $10 billion; |
| | | 0.72% of net assets over $10 billion. |
| | |
| Delaware Ivy Systematic Emerging Markets Equity Fund | | 1.00% of net assets up to $500 million; |
| | | 0.85% of net assets over $500 million and up to $1 billion; |
| | | 0.83% of net assets over $1 billion and up to $2 billion; |
| | | 0.80% of net assets over $2 billion and up to $3 billion; |
| | | 0.76% of net assets over $3 billion and up to $5 billion; |
| | | 0.755% of net assets over $5 billion and up to $10 billion; |
| | | 0.75% of net assets over $10 billion. |
| | |
| Delaware Ivy Value Fund | | 0.70% of net assets up to $1 billion; |
| | | 0.65% of net assets over $1 billion and up to $2 billion; |
| | | 0.60% of net assets over $2 billion and up to $3 billion; |
| | | 0.55% of net assets over $3 billion and up to $5 billion; |
| | | 0.545% of net assets over $5 billion and up to $10 billion; |
| | | 0.54% of net assets over $10 billion. |
| | |
| 1 | DMC had contractually agreed to reduce the management fee paid by the Fund by an annual rate of 0.10% of average daily net assets from July 29, 2021 through July 29, 2022. |
| 2 | DMC had also contractually agreed to reduce the management fee paid by the Fund by an annual rate of 0.21% of average daily net assets from November 15, 2021 through November 15, 2022. |
DMC has entered into sub-advisory agreements with the following entities on behalf of the Funds:
Prior to July 29, 2022, under an agreement between DMC and Securian Asset Management, Inc. (Securian AM), Securian AM served as subadviser to Delaware Ivy Core Bond Fund. The subadviser made investment decisions in accordance with the Fund’s investment objectives, policies and restrictions under the supervision of DMC and the oversight of the Board. DMC paid all applicable costs of the subadviser. Following July 29, 2022, DMC became primarily responsible for the day-to-day management of Delaware Ivy Core Bond Fund. DMC may seek fixed income investment advice, recommendations, discretionary investment advice and trading from its affiliates Macquarie Investment Management Austria Kapitalanlage AG (MIMAK), Macquarie Investment Management Europe Limited (MIMEL), and Macquarie Investment Management Global Limited (MIMGL). DMC pays a sub-advisory fee to each of MIMAK, MIMEL and MIMGL based on the extent to which they provide services to the Fund.
In connection with its management of Delaware Ivy Global Bond Fund, Delaware Ivy High Income Fund, and Delaware Ivy Limited-Term Bond Fund, DMC may seek fixed income investment advice, recommendations, discretionary investment advice and trading from its affiliates MIMAK, MIMEL, and MIMGL. DMC pays a sub-advisory fee to each of MIMAK, MIMEL and MIMGL based on the extent to which they provide services to the Funds.
In addition and with respect only to Delaware Ivy Managed International Opportunities Fund, MIMAK is responsible for the day-to-day management of the Fund. MIMAK may utilize its affiliate MIMGL to execute security trades. DMC pays a sub-advisory fee to each of MIMAK and MIMGL for their services to the Fund.
In addition and with respect only to Delaware Ivy Systematic Emerging Markets Equity Fund, MIMGL is responsible for the day-to-day management of the Fund. MIMGL may utilize its affiliate Macquarie Funds Management Hong Kong Limited (MFMHKL, also an affiliate of DMC) to execute security trades. DMC pays a sub-advisory fee to each of MIMGL and MFMHKL for their services to the Fund.
MIMGL and MFMHKL each serve as sub-advisor to Delaware Ivy Core Equity Fund, Delaware Ivy Large Cap Growth Fund, Delaware Ivy Mid Cap Growth Fund, Delaware Ivy Mid Cap Income Opportunities Fund, Delaware Ivy Small Cap Growth Fund, Delaware Ivy Smid Cap Core Fund, Delaware Ivy Value Fund, Delaware Global Value Equity Fund, Delaware Ivy Global Growth Fund, Delaware Ivy International Core Equity Fund, and Delaware Ivy International Value Fund, executing security trades on behalf of DMC. DMC pays a sub-advisory fee to each of MIMGL and MFMHKL for their services to the Funds.
Delaware Investments Fund Services Company (DIFSC), an affiliate of DMC, provides fund accounting and financial administrative oversight services to each Fund. For these services, DIFSC’s fees are calculated daily and paid monthly, based on the aggregate daily net assets of all funds within the Delaware Funds at the following annual rates: 0.00475% of the first $35 billion; 0.0040% of the next $10 billion; 0.0025% of the next $45 billion; and 0.0015% of aggregate average daily net assets in excess of $90 billion (Total Fee). Each fund in the Delaware Funds pays a minimum of $4,000, which, in aggregate, is subtracted from the Total Fee. Each fund then pays its portion of the remainder of the Total Fee on a relative NAV basis. These amounts are included on the “Statements of operations” under “Accounting and administration expenses.” For the year ended March 31, 2023, each Fund paid for these services as follows:
| Fund | | Fees | |
| Delaware Global Value Equity Fund | | $ | 17,458 | |
| Delaware Ivy Core Bond Fund | | | 32,494 | |
| Delaware Ivy Core Equity Fund | | | 122,238 | |
| Delaware Ivy Global Bond Fund | | | 21,779 | |
| Delaware Ivy Global Growth Fund | | | 25,886 | |
| Delaware Ivy High Income Fund | | | 97,184 | |
| Delaware Ivy International Core Equity Fund | | | 51,867 | |
| Delaware Ivy International Value Fund | | | 9,812 | |
| Delaware Ivy Large Cap Growth Fund | | | 151,028 | |
| Delaware Ivy Limited-Term Bond Fund | | | 32,052 | |
| Delaware Ivy Managed International Opportunities Fund | | | 6,716 | |
| Delaware Ivy Mid Cap Growth Fund | | | 186,532 | |
| Delaware Ivy Mid Cap Income Opportunities Fund | | | 49,577 | |
| Delaware Ivy Municipal Bond Fund | | | 19,683 | |
| Delaware Ivy Municipal High Income Fund | | | 25,974 | |
Notes to financial statements
Ivy Funds
2. Investment Management, Administration Agreements, and Other Transactions with Affiliates (continued)
| Fund | | Fees | |
| Delaware Ivy Small Cap Growth Fund | | $ | 59,647 | |
| Delaware Ivy Smid Cap Core Fund | | | 18,848 | |
| Delaware Ivy Systematic Emerging Markets Equity Fund | | | 36,704 | |
| Delaware Ivy Value Fund | | | 41,935 | |
Effective June 27, 2022, DIFSC is also the transfer agent and dividend disbursing agent of the Funds. For these services, DIFSC's fees are calculated daily and paid monthly, based on the aggregate daily net assets of the retail funds within the Delaware Funds at the following annual rates: 0.014% of the first $20 billion; 0.011% of the next $5 billion; 0.007% of the next $5 billion; 0.004% of the next $20 billion; 0.002% of the next $25 billion; and 0.0015% of average daily net assets in excess of $75 billion. The fees payable to DIFSC under the shareholder services agreement described above are allocated among all retail funds in the Delaware Funds on a relative NAV basis. These amounts are included on the "Statements of operations" under "Dividend disbursing and transfer agent fees and expenses." From June 27, 2022 through March 31, 2023, each Fund paid for these services as follows:
| Fund | | Fees | |
| Delaware Global Value Equity Fund | | $ | 217,536 | |
| Delaware Ivy Core Bond Fund | | | 246,638 | |
| Delaware Ivy Core Equity Fund | | | 1,466,225 | |
| Delaware Ivy Global Bond Fund | | | 170,566 | |
| Delaware Ivy Global Growth Fund | | | 342,244 | |
| Delaware Ivy High Income Fund | | | 1,050,671 | |
| Delaware Ivy International Core Equity Fund | | | 540,181 | |
| Delaware Ivy International Value Fund | | | 66,499 | |
| Delaware Ivy Large Cap Growth Fund | | | 1,791,713 | |
| Delaware Ivy Limited-Term Bond Fund | | | 306,821 | |
| Delaware Ivy Managed International Opportunities Fund | | | 67,419 | |
| Delaware Ivy Mid Cap Growth Fund | | | 1,964,699 | |
| Delaware Ivy Mid Cap Income Opportunities Fund | | | 496,351 | |
| Delaware Ivy Municipal Bond Fund | | | 156,012 | |
| Delaware Ivy Municipal High Income Fund | | | 185,225 | |
| Delaware Ivy Small Cap Growth Fund | | | 843,673 | |
| Delaware Ivy Smid Cap Core Fund | | | 192,904 | |
| Delaware Ivy Systematic Emerging Markets Equity Fund | | | 511,231 | |
| Delaware Ivy Value Fund | | | 483,163 | |
Pursuant to a sub-transfer agency agreement between DIFSC and BNY Mellon Investment Servicing (US) Inc. (BNYMIS), effective June 27, 2022, BNYMIS provides certain sub-transfer agency services to the Funds. Sub-transfer agency fees are paid by the Funds and are also included on the "Statements of operations" under "Dividend disbursing and transfer agent fees and expenses." The fees are calculated daily and paid as invoices are received on a monthly or quarterly basis.
Under the Shareholder Servicing Agreement between the Trust and WI Services Company (WISC) (that was in effect until June 27, 2022), with respect to Class A and Class C shares, for each shareholder account that was in existence at any time during the prior month, each Fund paid a monthly fee that ranged from $1.5042 to $1.6958 per account; however, WISC had agreed to reduce that fee if the number of total shareholder accounts within the Complex (InvestEd Portfolios and Ivy Funds) reached certain levels. Delaware Ivy Limited-Term Bond Fund Class A, which also had check writing privileges, paid $0.75 for each shareholder check processed in the prior month. For Class R shares, each Fund paid a monthly fee equal to one-twelfth of 0.25 of 1.00% of the average daily net assets of the class for the preceding month. For Class I and Class Y shares, each Fund paid a monthly fee equal to one-twelfth of 0.15 of 1.00% of the average daily net assets of the class for the preceding month. For Class R6 shares, each Fund paid WISC a monthly fee equal to one-twelfth of 0.01 of 1.00% of the average daily net assets of the class for the preceding month. Each Fund also reimbursed WISC for certain out-of-pocket costs for all classes.
For certain networked accounts (that is, those accounts whose Fund shares were purchased through certain financial intermediaries), WISC had agreed to reduce its per account fees charged to the Funds to $0.50 per month per shareholder account. Additional fees may have been paid by the Funds to those intermediaries. The Fund would reimburse WISC for such costs if the annual rate of the third-party per account charged for a Fund were less than or equal to $12.00 per account or an annual fee of 0.14 of 1.00% that is based on average daily net assets.
Certain broker/dealers that maintained shareholder accounts with each Fund through an omnibus account provided transfer agent and other shareholder-related services that would otherwise have been provided by WISC if the individual accounts that comprised the omnibus account were opened by their beneficial owners directly. Each Fund could pay such broker-dealers a per account fee for each open account within the omnibus account (up to $18.00 per account), or a fixed rate fee (up to an annual fee of 0.20 of 1% that is based on average daily net assets), based on the average daily NAV of the omnibus account (or a combination thereof).
Pursuant to a distribution agreement and distribution plan, each Fund pays DDLP, the distributor and an affiliate of DMC, an annual distribution and service (12b-1) fee of 0.25%, 1.00%, 0.50% and 0.25% of the average daily net assets of the Class A, Class C, Class R, and Class Y shares, respectively. The fees are calculated daily and paid monthly. Class I and Class R6 shares do not pay a 12b-1 fee.
From July 29, 2022, (except as noted below) DMC, DDLP and/or DIFSC (through July 29, 2023), have contractually agreed to waive all or a portion of its fees and/or pay/reimburse expenses (excluding acquired fund fees and expenses, taxes, interest, short sale dividend and interest expenses, brokerage fees, certain insurance costs, and nonroutine expenses or costs, including, but not limited to, those relating to reorganizations, litigation, conducting shareholder meetings, and liquidations), in order to prevent total annual fund operating expenses from exceeding the following percentages of each Fund’s average daily net assets. These waivers and reimbursements may only be terminated by agreement of DMC, DDLP, DIFSC and/or each Fund. The waivers and reimbursements are accrued daily and received monthly.
| Fund | | Operating
expense
limitation as a
percentage of
average
daily net assets
Class A | | | Operating
expense
limitation as a
percentage of
average
daily net assets
Class C | | | Operating
expense
limitation as a
percentage of
average
daily net assets
Class I | | | Operating
expense
limitation as a
percentage of
average
daily net assets
Class R | | | Operating
expense
limitation as a
percentage of
average
daily net assets
Class R6 | | | Operating
expense
limitation as a
percentage of
average
daily net assets
Class Y | |
| Delaware Global Value Equity Fund | | 1.17 | % | | 1.92 | % | | 0.92 | % | | 1.42 | % | | n/a | | | 1.17 | % |
| Delaware Ivy Core Bond Fund | | 0.70 | % | | 1.45 | % | | 0.45 | % | | 0.95 | % | | 0.45 | % | | 0.70 | % |
| Delaware Ivy Core Equity Fund | | 1.00 | % | | 1.75 | % | | 0.75 | % | | 1.25 | % | | n/a | | | 1.00 | % |
| Delaware Ivy Global Bond Fund | | 0.96 | % | | 1.71 | % | | 0.71 | % | | 1.21 | % | | n/a | | | 0.96 | % |
| Delaware Ivy Global Growth Fund | | 1.21 | % | | 1.97 | % | | 0.97 | % | | 1.47 | % | | n/a | | | 1.22 | % |
| Delaware Ivy High Income Fund | | 1.00 | % | | 1.75 | % | | 0.75 | % | | 1.25 | % | | n/a | | | 1.00 | % |
| Delaware Ivy International Core Equity Fund | | 1.04 | % | | 1.79 | % | | 0.79 | % | | 1.29 | % | | 0.79 | % | | 1.04 | % |
| Delaware Ivy International Value Fund | | 1.20 | % | | 1.95 | % | | 0.95 | % | | 1.45 | % | | n/a | | | 1.20 | % |
Notes to financial statements
Ivy Funds
2. Investment Management, Administration Agreements, and Other Transactions with Affiliates (continued)
| Fund | | Operating
expense
limitation as a
percentage of
average
daily net assets
Class A | | | Operating
expense
limitation as a
percentage of
average
daily net assets
Class C | | | Operating
expense
limitation as a
percentage of
average
daily net assets
Class I | | | Operating
expense
limitation as a
percentage of
average
daily net assets
Class R | | | Operating
expense
limitation as a
percentage of
average
daily net assets
Class R6 | | | Operating
expense
limitation as a
percentage of
average
daily net assets
Class Y | |
| Delaware Ivy Large Cap Growth Fund | | 0.89 | % | | 1.64 | % | | 0.64 | % | | 1.14 | % | | 0.64 | % | | 0.89 | % |
| Delaware Ivy Limited-Term Bond Fund | | 0.78 | % | | 1.53 | % | | 0.53 | % | | 1.03 | % | | n/a | | | 0.78 | % |
| Delaware Ivy Managed International Opportunities Fund | | n/a | | | n/a | | | n/a | | | n/a | | | n/a | | | n/a | |
| Delaware Ivy Mid Cap Growth Fund | | 1.04 | % | | 1.79 | % | | 0.79 | % | | 1.29 | % | | 0.79 | % | | 1.04 | % |
| Delaware Ivy Mid Cap Income Opportunities Fund | | 1.08 | % | | 1.83 | % | | 0.83 | % | | 1.33 | % | | 0.83 | % | | 1.08 | % |
| Delaware Ivy Municipal Bond Fund | | 0.80 | % | | 1.55 | % | | 0.55 | % | | n/a | | | 0.55 | % | | n/a | |
| Delaware Ivy Municipal High Income Fund | | 0.86 | % | | 1.58 | % | | 0.61 | % | | n/a | | | n/a | | | 0.86 | % |
| Delaware Ivy Small Cap Growth Fund | | 1.14 | % | | 1.89 | % | | 0.89 | % | | 1.39 | % | | 0.89 | % | | 1.14 | % |
| Delaware Ivy Smid Cap Core Fund | | 1.14 | % | | 1.89 | % | | 0.89 | % | | 1.39 | % | | 0.89 | % | | 1.14 | % |
| Delaware Ivy Systematic Emerging Markets Equity Fund | | 1.15 | % | | 1.80 | % | | 0.80 | % | | 1.30 | % | | 0.76 | % | | 1.15 | % |
| Delaware Ivy Value Fund | | 1.08 | % | | 1.83 | % | | 0.83 | % | | 1.33 | % | | n/a | | | 1.08 | % |
Prior to July 29, 2022, DMC, DDLP, DIFSC (from June 27, 2022) and Waddell & Reed Services Company (WRSCO) (through June 27, 2022), had contractually agreed to waive all or a portion of its fees and/or pay/reimburse expenses in order to prevent total annual fund operating expenses from exceeding the following percentages of each Fund’s average daily net assets.
| Fund | | Operating
expense
limitation as a
percentage of
average
daily net assets
Class A | | | Operating
expense
limitation as a
percentage of
average
daily net assets
Class C | | | Operating
expense
limitation as a
percentage of
average
daily net assets
Class I | | | Operating
expense
limitation as a
percentage of
average
daily net assets
Class R | | | Operating
expense
limitation as a
percentage of
average
daily net assets
Class R6 | | | Operating
expense
limitation as a
percentage of
average
daily net assets
Class Y | |
| Delaware Global Value Equity Fund | | 1.22 | % | | n/a | | | 0.92 | % | | n/a | | | n/a | | | 1.19 | % |
| Delaware Ivy Core Bond Fund1 | | n/a | | | n/a | | | 0.45 | % | | n/a | | | 0.45 | % | | n/a | |
| Delaware Ivy Core Equity Fund | | 1.03 | % | | n/a | | | 0.84 | % | | n/a | | | n/a | | | 0.84 | % |
| Delaware Ivy Global Bond Fund2 | | 0.96 | % | | 1.72 | % | | 0.74 | % | | n/a | | | 0.74 | % | | 0.96 | % |
| Delaware Ivy Global Growth Fund | | n/a | | | n/a | | | 1.06 | % | | n/a | | | n/a | | | n/a | |
| Delaware Ivy High Income Fund | | n/a | | | 1.66 | % | | n/a | | | n/a | | | n/a | | | n/a | |
| Delaware Ivy International Core Equity Fund1 | | 1.23 | % | | 1.92 | % | | 0.79 | % | | 1.53 | % | | 0.79 | % | | 1.18 | % |
| Delaware Ivy International Value Fund | | n/a | | | n/a | | | n/a | | | n/a | | | n/a | | | n/a | |
| Delaware Ivy Large Cap Growth Fund | | 1.04 | % | | n/a | | | 0.64 | % | | n/a | | | 0.64 | % | | 1.05 | % |
| Delaware Ivy Limited-Term Bond Fund | | n/a | | | n/a | | | n/a | | | n/a | | | n/a | | | n/a | |
| Delaware Ivy Managed International Opportunities Fund1 | | 0.46 | % | | 1.25 | % | | 0.16 | % | | 0.72 | % | | n/a | | | 0.38 | % |
| Delaware Ivy Mid Cap Growth Fund1 | | 1.30 | % | | n/a | | | 0.79 | % | | n/a | | | 0.79 | % | | n/a | |
Notes to financial statements
Ivy Funds
2. Investment Management, Administration Agreements, and Other Transactions with Affiliates (continued)
| Fund | | Operating
expense
limitation as a
percentage of
average
daily net assets
Class A | | | Operating
expense
limitation as a
percentage of
average
daily net assets
Class C | | | Operating
expense
limitation as a
percentage of
average
daily net assets
Class I | | | Operating
expense
limitation as a
percentage of
average
daily net assets
Class R | | | Operating
expense
limitation as a
percentage of
average
daily net assets
Class R6 | | | Operating
expense
limitation as a
percentage of
average
daily net assets
Class Y | |
| Delaware Ivy Mid Cap Income Opportunities Fund1 | | 1.34 | % | | 2.06 | % | | 0.83 | % | | 1.80 | % | | 0.83 | % | | 1.35 | % |
| Delaware Ivy Municipal Bond Fund | | 0.83 | % | | n/a | | | 0.70 | % | | n/a | | | n/a | | | n/a | |
| Delaware Ivy Municipal High Income Fund | | n/a | | | 1.58 | % | | 0.61 | % | | n/a | | | n/a | | | 0.94 | % |
| Delaware Ivy Small Cap Growth Fund | | n/a | | | 2.04 | % | | 0.89 | % | | n/a | | | 0.89 | % | | n/a | |
| Delaware Ivy Smid Cap Core Fund1 | | n/a | | | n/a | | | 0.89 | % | | n/a | | | 0.89 | % | | n/a | |
| Delaware Ivy Systematic Emerging Markets Equity Fund | | 1.56 | % | | n/a | | | 0.99 | % | | n/a | | | 0.99 | % | | n/a | |
| Delaware Ivy Value Fund | | 1.20 | % | | n/a | | | 0.92 | % | | n/a | | | n/a | | | n/a | |
| 1 | Due to a separate contractual class waiver, certain common expenses applicable to all share classes also may be waived to cap total annual ordinary fund operating expenses, which may serve to reduce the expense ratio of certain share classes. |
| 2 | Effective November 15, 2021 through November 15, 2022. Prior to July 29, 2021, the Class Y expense limit in effect was 0.99%. |
As provided in the investment management agreement, each Fund bears a portion of the cost of certain resources shared with DMC, including the cost of internal personnel of DMC and/or its affiliates that provide legal and regulatory reporting services to each Fund. These amounts are included on the “Statements of operations” under “Legal fees.” For the year ended March 31, 2023, each Fund paid for internal legal and regulatory reporting services provided by DMC and/or its affiliates’ employees as follows:
| Fund | | Fees | |
| Delaware Global Value Equity Fund | | $ | 10,544 | |
| Delaware Ivy Core Bond Fund | | | 20,794 | |
| Delaware Ivy Core Equity Fund | | | 65,716 | |
| Delaware Ivy Global Bond Fund | | | 8,529 | |
| Delaware Ivy Global Growth Fund | | | 12,050 | |
| Delaware Ivy High Income Fund | | | 66,039 | |
| Delaware Ivy International Core Equity Fund | | | 28,223 | |
| Delaware Ivy International Value Fund | | | 6,171 | |
| Delaware Ivy Large Cap Growth Fund | | | 83,060 | |
| Delaware Ivy Limited-Term Bond Fund | | | 13,371 | |
| Fund | | Fees | |
| Delaware Ivy Managed International Opportunities Fund | | $ | 1,828 | |
| Delaware Ivy Mid Cap Growth Fund | | | 101,988 | |
| Delaware Ivy Mid Cap Income Opportunities Fund | | | 24,995 | |
| Delaware Ivy Municipal Bond Fund | | | 8,559 | |
| Delaware Ivy Municipal High Income Fund | | | 12,567 | |
| Delaware Ivy Small Cap Growth Fund | | | 31,708 | |
| Delaware Ivy Smid Cap Core Fund | | | 8,247 | |
| Delaware Ivy Systematic Emerging Markets Equity Fund | | | 27,996 | |
| Delaware Ivy Value Fund | | | 21,338 | |
For the year ended March 31, 2023, DDLP earned commissions on sales of Class A shares for each Fund as follows:
| Fund | | Class A | |
| Delaware Global Value Equity Fund | | $ | 19,315 | |
| Delaware Ivy Core Bond Fund | | | 13,986 | |
| Delaware Ivy Core Equity Fund | | | 297,931 | |
| Delaware Ivy Global Bond Fund | | | 5,620 | |
| Delaware Ivy Global Growth Fund | | | 23,737 | |
| Delaware Ivy High Income Fund | | | 154,084 | |
| Delaware Ivy International Core Equity Fund | | | 28,953 | |
| Delaware Ivy International Value Fund | | | 4,649 | |
| Delaware Ivy Large Cap Growth Fund | | | 359,397 | |
| Delaware Ivy Limited-Term Bond Fund | | | 41,023 | |
| Delaware Ivy Managed International Opportunities Fund | | | 5,183 | |
| Delaware Ivy Mid Cap Growth Fund | | | 263,894 | |
| Delaware Ivy Mid Cap Income Opportunities Fund | | | 39,675 | |
| Delaware Ivy Municipal Bond Fund | | | 7,767 | |
| Delaware Ivy Municipal High Income Fund | | | 13,648 | |
| Delaware Ivy Small Cap Growth Fund | | | 128,420 | |
| Delaware Ivy Smid Cap Core Fund | | | 24,012 | |
| Delaware Ivy Systematic Emerging Markets Equity Fund | | | 30,195 | |
| Delaware Ivy Value Fund | | | 94,540 | |
For the year ended March 31, 2023, DDLP received gross CDSC commissions on redemptions of each Fund’s Class A and Class C shares and these commissions were entirely used to offset upfront commissions previously paid by DDLP to broker/dealers on sales of those shares. The amounts received were as follows:
| Fund | | Class A | | | Class C | |
| Delaware Global Value Equity Fund | | $ | 720 | | | $ | 190 | |
| Delaware Ivy Core Bond Fund | | | 649 | | | | 843 | |
| Delaware Ivy Core Equity Fund | | | 7,464 | | | | 3,140 | |
| Delaware Ivy Global Bond Fund | | | 662 | | | | 71 | |
| Delaware Ivy Global Growth Fund | | | 1,214 | | | | 1,156 | |
| Delaware Ivy High Income Fund | | | 6,677 | | | | 5,902 | |
| Delaware Ivy International Core Equity Fund | | | 1,454 | | | | 572 | |
| Delaware Ivy International Value Fund | | | 522 | | | | 603 | |
| Delaware Ivy Large Cap Growth Fund | | | 10,325 | | | | 5,960 | |
| Delaware Ivy Limited-Term Bond Fund | | | 3,448 | | | | 941 | |
| Delaware Ivy Managed International Opportunities Fund | | | 375 | | | | 84 | |
| Delaware Ivy Mid Cap Growth Fund | | | 12,903 | | | | 11,296 | |
| Delaware Ivy Mid Cap Income Opportunities Fund | | | 1,454 | | | | 1,308 | |
| Delaware Ivy Municipal Bond Fund | | | 11,932 | | | | 230 | |
| Delaware Ivy Municipal High Income Fund | | | 12,166 | | | | 929 | |
| Delaware Ivy Small Cap Growth Fund | | | 4,504 | | | | 2,443 | |
Notes to financial statements
Ivy Funds
2. Investment Management, Administration Agreements, and Other Transactions with Affiliates (continued)
| Fund | | Class A | | | Class C | |
| Delaware Ivy Smid Cap Core Fund | | $ | 1,518 | | | $ | 298 | |
| Delaware Ivy Systematic Emerging Markets Equity Fund | | | 1,774 | | | | 1,199 | |
| Delaware Ivy Value Fund | | | 5,662 | | | | 1,612 | |
Trustees’ fees include expenses accrued by each Fund for each Trustee’s retainer and meeting fees. Certain officers of DMC, DIFSC, and DDLP are officers and/or Trustees of the Trust. These officers and Trustees are paid no compensation by the Funds.
In addition to the management fees and other expenses of a Fund, a Fund indirectly bears the investment management fees and other expenses of any Underlying Funds including ETFs in which it invests. The amount of these fees and expenses incurred indirectly by a Fund will vary based upon the expense and fee levels of any Underlying Funds and the number of shares that are owned of any Underlying Funds at different times.
Cross trades for the year ended March 31, 2023, were executed by the Funds pursuant to procedures adopted by the Board designed to ensure compliance with Rule 17a-7 under the 1940 Act. Cross trading is the buying or selling of portfolio securities between funds of investment companies, or between a fund of an investment company and another entity, that are or could be considered affiliates by virtue of having a common investment advisor (or affiliated investment advisors), common directors/trustees and/or common officers. At its regularly scheduled meetings, the Board reviews a report related to the Funds' compliance with the procedures adopted by the Board. Pursuant to these procedures, for the year ended March 31, 2023, the following Funds engaged in Rule 17a-7 securities purchases and securities sales, which resulted in net gains or losses as follows:
| | | | Purchases | | | | Sales | | | | Net realized
gain (loss) | |
| Delaware Ivy Municipal Bond Fund | | $ | 58,471,075 | | | $ | 72,584,951 | | | $ | (9,828,274 | ) |
| Delaware Ivy Municipal High Income Fund | | | 455,036,604 | | | | 467,075,329 | | | | (33,766,077 | ) |
| Delaware Ivy Smid Cap Core Fund | | | 7,318,268 | | | | 1,728,140 | | | | 408,542 | |
| Delaware Ivy Value Fund | | | — | | | | 45,669,383 | | | | 665,807 | |
A summary of the transactions in affiliated companies during the year ended March 31, 2023 was as follows:
| | | Value,
beginning
of period | | | Gross
additions | | | Gross
reductions(1) | | | Net
realized
gain (loss)
on
affiliated
investments | | | Net change in
unrealized
appreciation
(depreciation)
on affiliated
investments(2) | | | Value,
end of
period | | | Shares | | Income
distributions | |
| Delaware Ivy High Income Fund | | | | | | | | | | | | | | | | | | | |
| Common Stocks—1.98% | | | | | | | | | | | | | | | | | | | | | | | | |
| ASG Warrant =, † | | | | | | | | | | | | | | | | | | | | | | | |
| | | $ | — | | | $ | — | | | $ | — | | | $ | — | | | $ | — | | | $ | — | (3) | | | 19,688 | | $ | — | |
| BIS Industries Holdings =,† | | | | | | | | | | | | | | | | | | | | | | | |
| | | | — | | | | — | | | | — | | | | — | | | | — | | | | — | | | | 19,682,813 | | | — | |
| Foresight Energy =,† | | | | | | | | | | | | | | | | | | | | | | |
| | | | 24,337,269 | | | | — | | | | — | | | | — | | | | (5,240,670 | ) | | | 19,096,599 | | | | 1,117,414 | | | — | |
| Larchmont Resources =,† | | | | | | | | | | | | | | | | | | | | | | | | |
| | | | 1,678,897 | | | | — | | | | (1,271,945 | ) | | | — | | | | (193,491 | ) | | | 213,461 | | | | 18,338 | | | — | |
| Maritime Finance =,† | | | | | | | | | | | | | | | | | | | | | | | | |
| | | | 4,444,478 | | | | — | | | | (3,370,497 | ) | | | — | | | | 2,511,540 | | | | 3,585,521 | | | | 1,750,000 | | | — | |
| New Cotai =,† | | | | | | | | | | | | | | | | | | | | | | | | | | | | |
| | | | 18,723,614 | | | | — | | | | — | | | | — | | | | 1,976,369 | | | | 20,699,983 | | | | 20,316,462 | | | — | |
| True Religion Apparel = | | | | | | | | | | | | | | | | | | | | | | | | |
| | | | 7,866,362 | | | | — | | | | — | | | | — | | | | (1,317,054 | ) | | | 6,549,308 | | | | 395 | | | 6,299,922 | |
| | | | 57,050,620 | | | | — | | | | (4,642,442 | ) | | | — | | | | (2,263,306 | ) | | | 50,144,872 | | | | | | | 6,299,922 | |
| Preferred Stock—0.08% | | | | | | | | | | | | | | | | | | | | | | | | |
| True Religion Apparel=,ω | | | | | | | | | | | | | | | | | | | | | | | | |
| | | | 2,050,430 | | | | — | | | | — | | | | — | | | | — | | | | 2,050,430 | | | | 410 | | | — | |
| Convertible Bond—2.31% | | | | | | | | | | | | | | | | | | | | | | | | |
| New Cotai=,* | | | | | | | | | | | | | | | | | | | | | | | | | | |
| | | | 50,239,865 | | | | 452,819 | | | | — | | | | — | | | | 7,998,944 | | | | 58,691,628 | | | | 23,041,685 | | | 1,269,515 | |
| Loan Agreements—0.29% | | | | | | | | | | | | | | | | | | | | | | | | |
| Foresight Energy Operating Tranche A•,** | | | | | | | | | | | | | | | | | | | | |
| | | | — | | | | 7,706,826 | | | | (117,721 | ) | | | — | | | | (189,728 | ) | | | 7,399,377 | | | | 7,589,105 | | | — | |
| Foresight Exit TL A | | | | | | | | | | | | | | | | | | | | | | | |
| | | | 7,745,361 | | | | — | | | | (7,706,826 | ) | | | — | | | | (38,535 | ) | | | — | | | | — | | | — | |
| | | | 7,745,361 | | | | 7,706,826 | | | | (7,824,547 | ) | | | — | | | | (228,263 | ) | | | 7,399,377 | | | | | | | — | |
| Total | | $ | 117,086,276 | | | $ | 8,159,645 | | | $ | (12,466,989 | ) | | $ | — | | | $ | 5,507,375 | | | $ | 118,286,307 | | | | | | | $7,569,437 | |
Notes to financial statements
Ivy Funds
2. Investment Management, Administration Agreements, and Other Transactions with Affiliates (continued)
| | | Value,
beginning
of period | | | Gross
additions | | | Gross
reductions | | | Net
realized
gain (loss)
on
affiliated
investments | | | Net change in
unrealized
appreciation
(depreciation)
on affiliated
investments(2) | | | Value,
end of
period | | | Shares | | | Income
distributions | | Capital gain
distributions | |
| Delaware Ivy Managed International Opportunities Fund | | | | | | | | | | |
| Affiliated Mutual Funds—99.60% | | | | | | | | | | | |
| Delaware Global Value Equity Fund Class R6 | | | | | | | | | | | | | | | | | | | | | |
| | | $ | 12,801,018 | | | $ | 3,346,863 | | | $ | (12,752,448 | ) | | $ | (2,895,330 | ) | | $ | (500,103 | ) | | $ | — | | | | — | | | $ | 112,991 | | $ | 3,095,782 | |
| Delaware Ivy International Core Equity Fund Class R6 | | | | | | | | | | | | | | | |
| | | | 60,045,970 | | | | 4,597,886 | | | | (23,562,320 | ) | | | (2,743,270 | ) | | | 194,517 | | | | 38,532,783 | | | | 2,022,718 | | | | 398,745 | | | — | |
| Delaware Ivy International Small Cap Fund Class R6 | | | | | | | | | | | | | | | | | | | | |
| | | | 6,730,074 | | | | 781,694 | | | | (2,293,254 | ) | | | (566,372 | ) | | | (866,876 | ) | | | 3,785,266 | | | | 417,339 | | | | — | | | 410,990 | |
| Delaware Ivy International Value Fund Class R6 | | | | | | | | | | | | | | | | | | | | | | |
| | | | 20,115,871 | | | | 5,590,181 | | | | (7,732,543 | ) | | | (1,604,350 | ) | | | (186,787 | ) | | | 16,182,372 | | | | 1,045,373 | | | | — | | | 1,230,764 | |
| Delaware Ivy Systematic Emerging Markets Equity Fund Class R6 | | | | | | | | | | | | | | | |
| | | | 33,029,847 | | | | 4,128,964 | | | | (11,292,478 | ) | | | 1,678,172 | | | | (8,110,278 | ) | | | 19,434,227 | | | | 1,066,643 | | | | 249,004 | | | 2,330,266 | |
| Total | | $ | 132,722,780 | | | $ | 18,445,588 | | | $ | (57,633,043 | ) | | $ | (6,131,150 | ) | | $ | (9,469,527 | ) | | $ | 77,934,648 | | | | | | | $ | 760,740 | | $ | 7,067,802 |
| | | Value,
beginning
of period | | | Gross
additions | | | Gross
reductions(1) | | | Net
realized
gain (loss)
on
affiliated
investments | | | Net change in
unrealized
appreciation
(depreciation)
on affiliated
investments(2) | | | Value,
end of
period | | | Shares | | | Income
distributions | |
| Delaware Ivy Mid Cap Income Opportunities Fund | | | | | | | | | | | | | | | | | | | | | | | | | | |
| Limited Partnerships—0.00% | | | | | | | | | | | | | | | | | | | | | | | | | | |
| Rattler Midstream | | | | | | | | | | | | | | | | | | | | | | | | | | |
| | | $ | 28,122,001 | | | $ | — | | | $ | (29,832,048 | ) | | $ | (1,376,599 | ) | | $ | 3,086,646 | | | $ | — | | | | — | | | $ | 603,908 | |
| Total | | $ | 28,122,001 | | | $ | — | | | $ | (29,832,048 | ) | | $ | (1,376,599 | ) | | $ | 3,086,646 | | | $ | — | | | | | | | $ | 603,908 | |
| | | Value,
beginning of
period | | | Gross
additions | | | Gross
reductions(1) | | | Net
realized
gain (loss)
on
affiliated
investments | | | Net change in
unrealized
appreciation
(depreciation)
on affiliated
investments(2) | | | Value,
end of
period | | | Shares | |
| Delaware Ivy Small Cap Growth Fund | | | | | | | | | | | | | | | | | | | | | | | | | |
| Common Stock—0.00% | | | | | | | | | | | | | | | | | | | | | | | | | |
| PetIQ | | | | | | | | | | | | | | | | | | | | | | | | | |
| | | $ | 34,267,604 | | | $ | — | | | $ | (17,130,182 | ) | | $ | (20,140,630 | ) | | $ | 3,003,208 | | | $ | — | | | | — | |
| Total | | $ | 34,267,604 | | | $ | — | | | $ | (17,130,182 | ) | | $ | (20,140,630 | ) | | $ | 3,003,208 | | | $ | — | | | | | |
| (1) | The amount shown included return of capital. |
| (2) | Does not tie to Net change in unrealized appreciation (depreciation) on affiliated investments on the Statements of operations as a result of previously unaffiliated securities moving to affiliated. |
| (3) | This value is not included on the Statements of of assets and liabilities, as it is not affiliated as of March 31, 2022. |
| * | Issuer is not an affiliated investment of the Fund at March 31, 2022. |
| ** | Issuer is not an affiliated investment of the Fund at March 31, 2023. |
| ω | Perpetual security with no stated maturity date. |
| = | The value of this security was determined using significant unobservable inputs and is reported as a Level 3 security in the disclosure table located in Note 3 in “Notes to financial statements.” |
| † | Non-income producing security. |
| • | Variable rate investment. Rates reset periodically. Rate shown reflects the rate in effect at March 31, 2023. For securities based on a published reference rate and spread, the reference rate and spread are indicated in their descriptions. The reference rate descriptions (i.e. LIBOR03M, LIBOR06M, etc.) used in this report are identical for different securities, but the underlying reference rates may differ due to the timing of the reset period. Certain variable rate securities are not based on a published reference rate and spread but are determined by the issuer or agent and are based on current market conditions, or for mortgage-backed securities, are impacted by the individual mortgages which are paying off over time. These securities do not indicate a reference rate and spread in their descriptions. |
3. Investments
For the year ended March 31, 2023, each Fund made purchases and sales of investment securities other than short-term investments as follows:
| Fund | | Purchases
other than
US government
securities | | Purchases of
US government
securities | | Sales
other than
US government
securities | | Sales of
US government
securities | |
| Delaware Global Value Equity Fund | | $ | 94,869,051 | | | $ | — | | | $ | 271,156,180 | | | $ | — | |
| Delaware Ivy Core Bond Fund | | | 227,121,618 | | | | 504,069,864 | | | | 519,399,478 | | | | 514,026,295 | |
| Delaware Ivy Core Equity Fund | | | 1,337,178,578 | | | | — | | | | 2,220,171,956 | | | | — | |
| Delaware Ivy Global Bond Fund | | | 361,314,313 | | | | 152,261,328 | | | | 428,277,754 | | | | 139,594,483 | |
| Delaware Ivy Global Growth Fund | | | 251,681,795 | | | | — | | | | 527,457,605 | | | | — | |
| Delaware Ivy High Income Fund | | | 1,335,163,385 | | | | — | | | | 1,678,772,712 | | | | — | |
| Delaware Ivy International Core Equity Fund | | | 606,701,790 | | | | — | | | | 1,022,541,244 | | | | — | |
| Delaware Ivy International Value Fund | | | 47,750,844 | | | | — | | | | 100,092,885 | | | | — | |
| Delaware Ivy Large Cap Growth Fund | | | 942,104,893 | | | | — | | | | 1,106,070,498 | | | | — | |
| Delaware Ivy Limited-Term Bond Fund | | | 164,765,220 | | | | 689,701,119 | | | | 467,130,256 | | | | 751,493,953 | |
| Delaware Ivy Managed International Opportunities Fund | | | 18,445,588 | | | | — | | | | 57,633,043 | | | | — | |
| Delaware Ivy Mid Cap Growth Fund | | | 1,343,567,765 | | | | — | | | | 2,087,141,868 | | | | — | |
| Delaware Ivy Mid Cap Income Opportunities Fund | | | 411,739,095 | | | | — | | | | 751,772,658 | | | | — | |
| Delaware Ivy Municipal Bond Fund | | | 223,976,593 | | | | — | | | | 448,261,453 | | | | — | |
| Delaware Ivy Municipal High Income Fund | | | 508,323,423 | | | | — | | | | 740,110,573 | | | | — | |
| Delaware Ivy Small Cap Growth Fund | | | 878,329,163 | | | | — | | | | 1,355,466,941 | | | | — | |
| Delaware Ivy Smid Cap Core Fund | | | 56,403,862 | | | | — | | | | 256,627,219 | | | | — | |
| Delaware Ivy Systematic Emerging Markets Equity Fund | | | 704,734,909 | | | | — | | | | 1,051,561,626 | | | | — | |
| Delaware Ivy Value Fund | | | 1,159,295,210 | | | | — | | | | 1,850,329,619 | | | | — | |
Notes to financial statements
Ivy Funds
3. Investments (continued)
The tax cost of investments and derivatives includes adjustments to net unrealized appreciation (depreciation) which may not necessarily be the final tax cost basis adjustments, but approximates the tax basis unrealized gains and losses that may be realized and distributed to shareholders. At March 31, 2023, the cost and unrealized appreciation (depreciation) of investments and derivatives for federal income tax purposes were as follows:
| Fund | | Cost of
investments
and derivatives | | Aggregate
unrealized
appreciation
of investments
and derivatives | | Aggregate
unrealized
depreciation
of investments
and derivatives | | Net unrealized
appreciation
(depreciation)
of investments
and derivatives | |
| Delaware Global Value Equity Fund | | $ | 319,152,420 | | | $ | 20,308,300 | | | $ | (19,913,619 | ) | | $ | 394,681 | |
| Delaware Ivy Core Bond Fund | | | 498,607,191 | | | | 3,911,542 | | | | (25,372,020 | ) | | | (21,460,478 | ) |
| Delaware Ivy Core Equity Fund | | | 2,289,938,555 | | | | 1,200,965,743 | | | | (58,932,038 | ) | | | 1,142,033,705 | |
| Delaware Ivy Global Bond Fund | | | 433,112,491 | | | | 6,360,920 | | | | (16,543,516 | ) | | | (10,182,596 | ) |
| Delaware Ivy Global Growth Fund | | | 436,592,775 | | | | 119,685,487 | | | | (17,873,790 | ) | | | 101,811,697 | |
| Delaware Ivy High Income Fund | | | 3,066,047,270 | | | | 225,991,947 | | | | (808,628,251 | ) | | | (582,636,304 | ) |
| Delaware Ivy International Core Equity Fund | | | 1,208,207,975 | | | | 204,556,407 | | | | (75,878,835 | ) | | | 128,677,572 | |
| Delaware Ivy International Value Fund | | | 138,010,966 | | | | 3,486,756 | | | | (10,618,673 | ) | | | (7,131,917 | ) |
| Delaware Ivy Large Cap Growth Fund | | | 2,526,234,309 | | | | 2,615,653,712 | | | | (67,587,504 | ) | | | 2,548,066,208 | |
| Delaware Ivy Limited-Term Bond Fund | | | 571,464,643 | | | | 1,246,249 | | | | (17,546,376 | ) | | | (16,300,127 | ) |
| Delaware Ivy Managed International Opportunities Fund | | | 69,147,637 | | | | 14,209,121 | | | | (5,034,166 | ) | | | 9,174,955 | |
| Delaware Ivy Mid Cap Growth Fund | | | 4,591,457,841 | | | | 1,783,360,864 | | | | (485,099,850 | ) | | | 1,298,261,014 | |
| Delaware Ivy Mid Cap Income Opportunities Fund | | | 1,026,781,585 | | | | 312,905,158 | | | | (60,078,085 | ) | | | 252,827,073 | |
| Delaware Ivy Municipal Bond Fund | | | 358,648,165 | | | | 17,350,123 | | | | (25,347,667 | ) | | | (7,997,544 | ) |
| Delaware Ivy Municipal High Income Fund | | | 620,013,119 | | | | 10,463,370 | | | | (124,318,942 | ) | | | (113,855,572 | ) |
| Delaware Ivy Small Cap Growth Fund | | | 1,374,170,734 | | | | 265,718,482 | | | | (104,402,106 | ) | | | 161,316,376 | |
| Delaware Ivy Smid Cap Core Fund | | | 346,758,978 | | | | 38,483,415 | | | | (36,810,545 | ) | | | 1,672,870 | |
| Delaware Ivy Systematic Emerging Markets Equity Fund | | | 843,017,150 | | | | 186,043,081 | | | | (117,198,608 | ) | | | 68,844,473 | |
| Delaware Ivy Value Fund | | | 687,262,911 | | | | 39,293,036 | | | | (54,484,448 | ) | | | (15,191,412 | ) |
US GAAP defines fair value as the price that each Fund would receive to sell an asset or pay to transfer a liability in an orderly transaction between market participants at the measurement date under current market conditions. A three-level hierarchy for fair value measurements has been established based upon the transparency of inputs to the valuation of an asset or liability. Inputs may be observable or unobservable and refer broadly to the assumptions that market participants would use in pricing the asset or liability. Observable inputs reflect the assumptions market participants would use in pricing the asset or liability based on market data obtained from sources independent of the reporting entity. Unobservable inputs reflect the reporting entity’s own assumptions about the assumptions that market participants would use in pricing the asset or liability based on the best information available under the circumstances. Each Fund's investment in its entirety is assigned a level based upon the observability of the inputs which are significant to the overall valuation. The three-level hierarchy of inputs is summarized as follows:
| Level 1 – | Inputs are quoted prices in active markets for identical investments. (Examples: equity securities, open-end investment companies, futures contracts, and exchange-traded options contracts) |
| | |
| Level 2 – | Other observable inputs, including, but not limited to: quoted prices for similar assets or liabilities in markets that are active, quoted prices for identical or similar assets or liabilities in markets that are not active, inputs other than quoted prices that are observable for the assets or liabilities (such as interest rates, yield curves, volatilities, prepayment speeds, loss severities, credit risks, and default rates) or other market-corroborated inputs. (Examples: debt securities, government securities, swap contracts, foreign currency exchange contracts, foreign securities utilizing international fair value pricing, broker-quoted securities, and fair valued securities) |
| | |
| Level 3 – | Significant unobservable inputs, including each Fund's own assumptions used to determine the fair value of investments. (Examples: broker-quoted securities and fair valued securities) |
Level 3 investments are valued using significant unobservable inputs. Each Fund may also use an income-based valuation approach in which the anticipated future cash flows of the investment are discounted to calculate fair value. Discounts may also be applied due to the nature or duration of any restrictions on the disposition of the investments. Valuations may also be based upon current market prices of securities that are comparable in coupon, rating, maturity, and industry. The derived value of a Level 3 investment may not represent the value which is received upon disposition and this could impact the results of operations.
The following tables summarize the valuation of each Fund’s investments by fair value hierarchy levels as of March 31, 2023:
| | | Delaware Global Value Equity Fund | |
| | | Level 1 | | Level 2 | | Total | |
| Securities | | | | | | | |
| Assets: | | | | | | | |
| Common Stocks | | | | | | | | | | |
| Denmark | | $ | — | | $ | 7,513,840 | | $ | 7,513,840 | |
| France | | | — | | | 45,154,419 | | | 45,154,419 | |
| Germany | | | — | | | 35,086,603 | | | 35,086,603 | |
| Japan | | | — | | | 14,740,607 | | | 14,740,607 | |
| Netherlands | | | — | | | 17,122,196 | | | 17,122,196 | |
| Spain | | | — | | | 14,247,877 | | | 14,247,877 | |
| Sweden | | | — | | | 25,814,008 | | | 25,814,008 | |
| Switzerland | | | — | | | 32,095,517 | | | 32,095,517 | |
| United Kingdom | | | — | | | 41,468,525 | | | 41,468,525 | |
| United States | | | 82,832,383 | | | — | | | 82,832,383 | |
| Exchange-Traded Fund | | | 3,471,126 | | | — | | | 3,471,126 | |
| Total Value of Securities | | $ | 86,303,509 | | $ | 233,243,592 | | $ | 319,547,101 | |
| | | | | | | | |
| | | Delaware Ivy Core Bond Fund | |
| | | Level 1 | | Level 2 | | Total | |
| Securities | | | | | | | |
| Assets: | | | | | | | |
| Agency Collateralized Mortgage Obligations | | $ | — | | $ | 689,907 | | $ | 689,907 | |
| Agency Mortgage-Backed Securities | | | — | | | 127,673,729 | | | 127,673,729 | |
| Collateralized Debt Obligations | | | — | | | 9,111,387 | | | 9,111,387 | |
| Corporate Bonds | | | — | | | 179,057,107 | | | 179,057,107 | |
| Municipal Bonds | | | — | | | 11,841,972 | | | 11,841,972 | |
| Non-Agency Asset-Backed Securities | | | — | | | 18,471,377 | | | 18,471,377 | |
| Non-Agency Collateralized Mortgage Obligations | | | — | | | 34,369,328 | | | 34,369,328 | |
| Non-Agency Commercial Mortgage-Backed Securities | | | — | | | 41,668,469 | | | 41,668,469 | |
| Preferred Stock | | | 3,716,000 | | | — | | | 3,716,000 | |
| Sovereign Bonds | | | — | | | 10,444,209 | | | 10,444,209 | |
| US Treasury Obligations | | | — | | | 18,831,771 | | | 18,831,771 | |
| Short-Term Investments | | | 19,677,584 | | | — | | | 19,677,584 | |
| Total Value of Securities | | $ | 23,393,584 | | $ | 452,159,256 | | $ | 475,552,840 | |
| | | | | | | | | | | |
| Derivatives1 | | | | | | | | | | |
| Assets: | | | | | | | | | | |
| Centrally Cleared Credit Default Swaps | | $ | — | | $ | 110,612 | | $ | 110,612 | |
| Futures Contracts | | | 1,483,261 | | | — | | | 1,483,261 | |
Notes to financial statements
Ivy Funds
3. Investments (continued)
1Futures contracts and swap contracts are valued at the unrealized appreciation (depreciation) on the instrument at the year end.
| | | Delaware Ivy
Core Equity
Fund | |
| | | Level 1 | |
| Securities | | | |
| Assets: | | | |
| Common Stocks | | $ | 3,241,254,587 | |
| Short-Term Investments | | | 190,717,673 | |
| Total Value of Securities | | $ | 3,431,972,260 | |
| | | |
| | | Delaware Ivy Global Bond Fund | |
| | | Level 1 | | Level 2 | | Total |
| Securities | | | | | | | |
| Assets: | | | | | | | |
| Agency Mortgage-Backed Securities | | $ | — | | $ | 30,862,323 | | $ | 30,862,323 | |
| Corporate Bonds | | | — | | | 186,138,411 | | | 186,138,411 | |
| Sovereign Bonds | | | — | | | 107,593,030 | | | 107,593,030 | |
| Supranational Banks | | | — | | | 10,200,848 | | | 10,200,848 | |
| US Treasury Obligations | | | — | | | 70,147,647 | | | 70,147,647 | |
| Options Purchased | | | — | | | 778,582 | | | 778,582 | |
| Short-Term Investments | | | 16,305,432 | | | — | | | 16,305,432 | |
| Total Value of Securities Before Options Written | | $ | 16,305,432 | | $ | 405,720,841 | | $ | 422,026,273 | |
| Liabilities: | | | | | | | | | | |
| Options Written | | $ | — | | $ | (548,093 | ) | $ | (548,093 | ) |
| | | | | | | | | | | |
| Derivatives1 | | | | | | | | | | |
| Assets: | | | | | | | | | | |
| Foreign Currency Exchange Contracts | | $ | — | | $ | 1,068,546 | | $ | 1,068,546 | |
| Futures Contracts | | | 2,287,347 | | | — | | | 2,287,347 | |
| Liabilities: | | | | | | | | | | |
| Foreign Currency Exchange Contracts | | $ | — | | $ | (481,184 | ) | $ | (481,184 | ) |
| Futures Contracts | | | (1,422,994 | ) | | — | | | (1,422,994 | ) |
1Foreign currency exchange contracts and futures contracts are valued at the unrealized appreciation (depreciation) on the instrument at the year end.
| | | Delaware Ivy Global Growth Fund | |
| | | Level 1 | | Level 2 | | Total | |
| Securities | | | | | | | | | | |
| Assets: | | | | | | | | | | |
| Common Stocks | | | | | | | | | | |
| Canada | | $ | 17,112,084 | | $ | — | | $ | 17,112,084 | |
| China | | | 8,145,766 | | | — | | | 8,145,766 | |
| China/Hong Kong | | | — | | | 18,344,354 | | | 18,344,354 | |
| Denmark | | | — | | | 9,804,702 | | | 9,804,702 | |
| France | | | — | | | 46,619,586 | | | 46,619,586 | |
| Germany | | | — | | | 28,059,810 | | | 28,059,810 | |
| Hong Kong | | | — | | | 7,857,493 | | | 7,857,493 | |
| India | | | — | | | 25,260,835 | | | 25,260,835 | |
| Israel | | | 10,033,920 | | | — | | | 10,033,920 | |
| Italy | | | — | | | 8,433,287 | | | 8,433,287 | |
| Japan | | | — | | | 18,997,525 | | | 18,997,525 | |
| Netherlands | | | — | | | 4,263,281 | | | 4,263,281 | |
| Taiwan | | | — | | | 10,357,051 | | | 10,357,051 | |
| United Kingdom | | | — | | | 20,103,982 | | | 20,103,982 | |
| United States | | | 302,283,268 | | | — | | | 302,283,268 | |
| Short-Term Investments | | | 2,727,528 | | | — | | | 2,727,528 | |
| Total Value of Securities | | $ | 340,302,566 | | $ | 198,101,906 | | $ | 538,404,472 | |
| | | | | | | | | | | |
| | | Delaware Ivy High Income Fund | |
| | | Level 1 | | Level 2 | | Level 3 | | Total | |
| Securities | | | | | | | | | | | | | |
| Assets: | | | | | | | | | | | | | |
| Common Stocks | | | | | | | | | | | | | |
| Basic Industry | | $ | — | | $ | — | | $ | 19,191,962 | | $ | 19,191,962 | |
| Consumer Goods | | | — | | | — | | | — | 1 | | — | |
| Energy | | | — | | | — | | | 11,074,647 | | | 11,074,647 | |
| Financial Services | | | — | | | — | | | 20,699,983 | | | 20,699,983 | |
| Leisure | | | 40,678,522 | | | — | | | — | | | 40,678,522 | |
| Media | | | 424 | | | — | | | — | | | 424 | |
| Retail | | | — | | | — | | | 6,549,308 | | | 6,549,308 | |
| Utilities | | | — | | | — | | | 213,461 | | | 213,461 | |
| Convertible Bonds | | | — | | | 3,936,599 | | | 58,691,628 | | | 62,628,227 | |
| Corporate Bonds | | | — | | | 1,953,582,942 | | | — | | | 1,953,582,942 | |
| Loan Agreements | | | — | | | 320,981,615 | | | — | | | 320,981,615 | |
| Municipal Bonds | | | — | | | 13,974,066 | | | — | | | 13,974,066 | |
| Preferred Stock | | | — | | | — | | | 2,050,430 | | | 2,050,430 | |
| Warrants | | | 342,287 | | | — | | | — | | | 342,287 | |
| Short-Term Investments | | | 31,382,563 | | | — | | | — | | | 31,382,563 | |
| Total Value of Securities | | $ | 72,403,796 | | $ | 2,292,475,222 | | $ | 118,471,419 | | $ | 2,483,350,437 | |
Notes to financial statements
Ivy Funds
3. Investments (continued)
| | | Delaware Ivy High Income Fund | |
| | | Level 1 | | Level 2 | | Level 3 | | Total | |
| Derivatives2 | | | | | | | | | |
| Assets: | | | | | | | | | | | | | |
| Foreign Currency Exchange Contracts | | $ | — | | $ | 60,529 | | $ | — | | $ | 60,529 | |
1The security that has been valued at zero on the "Schedules of investments" is considered to be Level 3 investments in this table.
2Foreign currency exchange contracts are valued at the unrealized appreciation (depreciation) on the instrument at the year end.
| | | Delaware Ivy International Core Equity Fund | |
| | | Level 1 | | | Level 2 | | | Total | |
| Securities | | | | | | | | | |
| Assets: | | | | | | | | | |
| Common Stocks | | | | | | | | | | | | |
| Australia | | $ | — | | | $ | 24,627,453 | | | $ | 24,627,453 | |
| Austria | | | — | | | | 12,217,322 | | | | 12,217,322 | |
| Brazil | | | 66,249,541 | | | | — | | | | 66,249,541 | |
| Canada | | | 72,062,873 | | | | — | | | | 72,062,873 | |
| China | | | 44,855,767 | | | | 85,700,884 | | | | 130,556,651 | |
| China/Hong Kong | | | — | | | | 523,947 | | | | 523,947 | |
| Denmark | | | — | | | | 65,515,922 | | | | 65,515,922 | |
| France | | | — | | | | 187,875,687 | | | | 187,875,687 | |
| Germany | | | — | | | | 151,382,162 | | | | 151,382,162 | |
| Hong Kong | | | — | | | | 24,826,332 | | | | 24,826,332 | |
| India | | | — | | | | 74,038,148 | | | | 74,038,148 | |
| Japan | | | — | | | | 169,821,015 | | | | 169,821,015 | |
| Netherlands | | | — | | | | 69,889,472 | | | | 69,889,472 | |
| Republic of Korea | | | — | | | | 51,565,407 | | | | 51,565,407 | |
| Spain | | | — | | | | 18,356,085 | | | | 18,356,085 | |
| Switzerland | | | 20,704,689 | | | | — | | | | 20,704,689 | |
| Taiwan | | | — | | | | 29,826,906 | | | | 29,826,906 | |
| United Kingdom | | | 24,602,028 | | | | 76,268,154 | | | | 100,870,182 | |
| United States | | | 41,843,792 | | | | 16,466,127 | | | | 58,309,919 | |
| Short-Term Investments | | | 7,665,834 | | | | — | | | | 7,665,834 | |
| Total Value of Securities | | $ | 277,984,524 | | | $ | 1,058,901,023 | | | $ | 1,336,885,547 | |
| | | Delaware Ivy International Value Fund | |
| | | Level 1 | | | Level 2 | | | Total | |
| Securities | | | | | | | | | |
| Assets: | | | | | | | | | |
| Common Stocks | | | | | | | | | | | | |
| Denmark | | $ | — | | | $ | 3,334,455 | | | $ | 3,334,455 | |
| Finland | | | — | | | | 17,181 | | | | 17,181 | |
| France | | | 21,170 | | | | 25,628,547 | | | | 25,649,717 | |
| Germany | | | — | | | | 17,292,923 | | | | 17,292,923 | |
| Hong Kong | | | — | | | | 13,378 | | | | 13,378 | |
| Japan | | | — | | | | 12,104,423 | | | | 12,104,423 | |
| Netherlands | | | — | | | | 8,472,269 | | | | 8,472,269 | |
| Spain | | | — | | | | 6,143,512 | | | | 6,143,512 | |
| Sweden | | | — | | | | 13,262,543 | | | | 13,262,543 | |
| Switzerland | | | — | | | | 15,947,729 | | | | 15,947,729 | |
| United Kingdom | | | — | | | | 22,161,782 | | | | 22,161,782 | |
| Exchange-Traded Funds | | | 1,516,125 | | | | — | | | | 1,516,125 | |
| Short-Term Investments | | | 4,963,012 | | | | — | | | | 4,963,012 | |
| Total Value of Securities | | $ | 6,500,307 | | | $ | 124,378,742 | | | $ | 130,879,049 | |
| | | | |
| | | Delaware Ivy
Large Cap
Growth Fund | |
| | | Level 1 | |
| Securities | | | | |
| Assets: | | | | |
| Common Stocks | | $ | 5,074,300,517 | |
| | | | | | | | | | |
| | | Delaware Ivy Limited-Term Bond Fund | |
| | | Level 1 | | | Level 2 | | | Total | |
| Securities | | | | | | | | | |
| Assets: | | | | | | | | | |
| Agency Collateralized Mortgage Obligations | | $ | — | | | $ | 2,275,976 | | | $ | 2,275,976 | |
| Agency Commercial Mortgage-Backed Securities | | | — | | | | 47,190,371 | | | | 47,190,371 | |
| Agency Obligation | | | — | | | | 2,902,324 | | | | 2,902,324 | |
| Collateralized Debt Obligations | | | — | | | | 61,969,512 | | | | 61,969,512 | |
| Corporate Bonds | | | — | | | | 316,328,282 | | | | 316,328,282 | |
| Non-Agency Asset-Backed Securities | | | — | | | | 43,475,700 | | | | 43,475,700 | |
| Supranational Bank | | | — | | | | 1,495,156 | | | | 1,495,156 | |
| US Treasury Obligations | | | — | | | | 75,619,886 | | | | 75,619,886 | |
| Short-Term Investments | | | 3,198,425 | | | | — | | | | 3,198,425 | |
| Total Value of Securities | | $ | 3,198,425 | | | $ | 551,257,207 | | | $ | 554,455,632 | |
| | | | | | | | | | | | | |
| Derivatives1 | | | | | | | | | | | | |
| Assets: | | | | | | | | | | | | |
| Futures Contracts | | $ | 763,128 | | | $ | — | | | $ | 763,128 | |
Notes to financial statements
Ivy Funds
3. Investments (continued)
| | | Delaware Ivy Limited-Term Bond Fund | |
| | | Level 1 | | | Level 2 | | | Total | |
| Liabilities: | | | | | | | | | | | | |
| Futures Contracts | | $ | (54,244 | ) | | $ | — | | | $ | (54,244 | ) |
1Futures contracts are valued at the unrealized appreciation (depreciation) on the instrument at the year end.
| | | Delaware Ivy
Managed
International
Opportunities
Fund | |
| | | Level 1 | |
| Securities | | | | |
| Assets: | | | | |
| Affiliated Mutual Funds | | $ | 77,934,648 | |
| Short-Term Investments | | | 387,944 | |
| Total Value of Securities | | $ | 78,322,592 | |
| | | | | |
| | | Delaware Ivy
Mid Cap
Growth Fund | |
| | | Level 1 | |
| Securities | | | | |
| Assets: | | | | |
| Common Stocks | | $ | 5,731,076,284 | |
| Short-Term Investments | | | 158,642,571 | |
| Total Value of Securities | | $ | 5,889,718,855 | |
| | | | | |
| | | Delaware Ivy
Mid Cap Income
Opportunities
Fund | |
| | | Level 1 | |
| Securities | | | | |
| Assets: | | | | |
| Common Stocks | | $ | 1,278,184,799 | |
| Short-Term Investments | | | 1,423,859 | |
| Total Value of Securities | | $ | 1,279,608,658 | |
| | | Delaware Ivy Municipal Bond Fund | |
| | | Level 1 | | Level 2 | | Total | |
| Securities | | | | | | | | | | | | |
| Assets: | | | | | | | | | | | | |
| Municipal Bonds | | $ | — | | | $ | 348,672,923 | | | $ | 348,672,923 | |
| Short-Term Investments | | | 1,977,698 | | | | — | | | | 1,977,698 | |
| Total Value of Securities | | $ | 1,977,698 | | | $ | 348,672,923 | | | $ | 350,650,621 | |
| | | | | | | | | | | | | |
| | | | Delaware Ivy Municipal High Income Fund | |
| | | | Level 1 | | | Level 2 | | | Total | |
| Securities | | | | | | | | | | | | |
| Assets: | | | | | | | | | | | | |
| Municipal Bonds | | $ | — | | | $ | 501,080,832 | | | $ | 501,080,832 | |
| Short-Term Investments | | | 16,715 | | | | 5,060,000 | | | | 5,076,715 | |
| Total Value of Securities | | $ | 16,715 | | | $ | 506,140,832 | | | $ | 506,157,547 | |
| | | | | | | | | | | | | |
| | | | | | | | | | | Delaware Ivy
Small Cap
Growth Fund | |
| | | | | | | | | | | Level 1 | |
| Securities | | | | | | | | | | | | |
| Assets: | | | | | | | | | | | | |
| Common Stocks | | | | | | | | | | $ | 1,516,293,890 | |
| Short-Term Investments | | | | | | | | | | | 19,193,220 | |
| Total Value of Securities | | | | | | | | | | $ | 1,535,487,110 | |
| | | | | | | | | | |
| | | Delaware Ivy Smid Cap Core Fund | |
| | | Level 1 | | Level 3 | | Total | |
| Securities | | | | | | | | | | | | |
| Assets: | | | | | | | | | | | | |
| Common Stocks | | | | | | | | | | | | |
| Basic Materials | | $ | 28,478,023 | | | $ | — | | | $ | 28,478,023 | |
| Business Services | | | 18,370,688 | | | | — | | | | 18,370,688 | |
| Capital Goods | | | 40,622,047 | | | | — | | | | 40,622,047 | |
| Consumer Discretionary | | | 21,762,026 | | | | — | | | | 21,762,026 | |
| Consumer Services | | | 8,318,373 | | | | — | | | | 8,318,373 | |
| Consumer Staples | | | 10,780,756 | | | | — | | | | 10,780,756 | |
| Credit Cyclicals | | | 12,754,495 | | | | — | | | | 12,754,495 | |
| Energy | | | 14,174,550 | | | | — | | | | 14,174,550 | |
| Financials | | | 45,513,363 | | | | — | | | | 45,513,363 | |
| Healthcare | | | 43,510,229 | | | | — | 1 | | | 43,510,229 | |
| Media | | | 7,323,120 | | | | — | | | | 7,323,120 | |
| Real Estate Investment Trusts | | | 24,953,255 | | | | — | | | | 24,953,255 | |
| Technology | | | 48,161,035 | | | | — | | | | 48,161,035 | |
| Transportation | | | 12,064,814 | | | | — | | | | 12,064,814 | |
| Utilities | | | 6,298,040 | | | | — | | | | 6,298,040 | |
| Short-Term Investments | | | 5,347,034 | | | | — | | | | 5,347,034 | |
Notes to financial statements
Ivy Funds
3. Investments (continued)
| | | Delaware Ivy Smid Cap Core Fund | |
| | | Level 1 | | | Level 3 | | | Total | |
| Total Value of Securities | | $ | 348,431,848 | | | $ | — | | | $ | 348,431,848 | |
1The security that has been valued at zero on the "Schedules of investments" is considered to be Level 3 investments in this table.
| | | Delaware Ivy Systematic Emerging Markets Equity Fund | |
| | | Level 1 | | | Level 2 | | | Level 3 | | | Total | |
| Securities | | | | | | | | | | | | | | | | |
| Assets: | | | | | | | | | | | | | | | | |
| Common Stocks | | | | | | | | | | | | | | | | |
| Communication Services | | $ | 14,709,043 | | | $ | 91,036,840 | | | $ | — | | | $ | 105,745,883 | |
| Consumer Discretionary | | | 25,500,186 | | | | 96,354,440 | | | | — | | | | 121,854,626 | |
| Consumer Staples | | | 25,786,675 | | | | 47,803,284 | | | | 1,130,874 | | | | 74,720,833 | |
| Energy | | | 11,560,949 | | | | 40,946,331 | | | | — | | | | 52,507,280 | |
| Financials | | | 38,802,478 | | | | 166,926,027 | | | | —1 | | | | 205,728,505 | |
| Healthcare | | | 4,615,944 | | | | 16,344,701 | | | | — | | | | 20,960,645 | |
| Industrials | | | 1,710,400 | | | | 45,936,381 | | | | — | | | | 47,646,781 | |
| Information Technology | | | — | | | | 213,371,390 | | | | — | | | | 213,371,390 | |
| Materials | | | 9,556,829 | | | | 37,509,125 | | | | — | | | | 47,065,954 | |
| Real Estate | | | — | | | | 12,521,424 | | | | — | | | | 12,521,424 | |
| Utilities | | | 2,925,320 | | | | — | | | | — | | | | 2,925,320 | |
| Preferred Stocks | | | 5,135,863 | | | | — | | | | — | | | | 5,135,863 | |
| Short-Term Investments | | | 1,677,119 | | | | — | | | | — | | | | 1,677,119 | |
| Total Value of Securities | | $ | 141,980,806 | | | $ | 768,749,943 | | | $ | 1,130,874 | | | $ | 911,861,623 | |
1The value represents valuations of Russian Common Stocks for which Management has determined include significant unobservable inputs as of March 31, 2023.
| | | Delaware Ivy
Value Fund | |
| | | Level 1 | |
| Securities | | | | |
| Assets: | | | | |
| Common Stocks | | $ | 668,171,607 | |
| Short-Term Investments | | | 3,899,892 | |
| Total Value of Securities | | $ | 672,071,499 | |
During the year ended March 31, 2023, for all funds except Delaware Ivy High Income Fund, there were no transfers into or out of Level 3 investments. Each Fund's policy is to recognize transfers into or out of Level 3 investments based on fair value at the beginning of the reporting year.
A reconciliation of Level 3 investments is presented when a Fund has a significant amount of Level 3 investments at the beginning or end of the year in relation to each Fund’s net assets.
Management has determined not to provide a reconciliation of Level 3 investments as the Level 3 investments were not considered significant to Delaware Ivy Smid Cap Core Fund and Delaware Ivy Systematic Emerging Markets Equity Fund’s net assets at the beginning or end of the period. Management has determined not to provide additional disclosure on Level 3 inputs since the Level 3 investments were not considered significant to each Fund’s net assets at the end of the year except for Delaware Ivy High Income Fund. At March 31, 2023, Delaware Global Value Equity Fund, Delaware Ivy Core Bond Fund, Delaware Ivy Core Equity Fund, Delaware Ivy Global Bond Fund, Delaware Ivy Global Growth Fund, Delaware Ivy International Core Equity Fund, Delaware Ivy International Value Fund, Delaware Ivy Large Cap Growth Fund, Delaware Ivy Limited-Term Bond Fund, Delaware Ivy Managed International Opportunities Fund, Delaware Ivy Mid Cap Growth Fund, Delaware Ivy Mid Cap Income Opportunities Fund, Delaware Ivy Municipal Bond Fund, Delaware Ivy Municipal High Income Fund, Delaware Ivy Small Cap Growth Fund, and Delaware Ivy Value Fund had no level 3 investments.
The following is a reconciliation of investments in which significant unobservable inputs (Level 3) were used in determining fair value for the Fund:
| Delaware Ivy High Income Fund | | | | | | | | | | | | |
| | | Corporate Bonds | | | Common Stock | | | Preferred Stock | | | Total | |
| Balance as of 3/31/22 | | $ | — | | | $ | 20,937,602 | | | $ | — | | | $ | 20,937,602 | |
| Sales | | | (871,897 | ) | | | (2,020,000 | ) | | | — | | | | (2,891,897 | ) |
| Net realized gain (loss) | | | — | | | | 363,600 | | | | — | | | | 363,600 | |
| Amortization | | | 173,868 | | | | — | | | | — | | | | 173,868 | |
| Corporate actions | | | 1,150,848 | | | | (4,642,442 | ) | | | — | | | | (3,491,594 | ) |
| Transfers into Level 3 | | | 21,803,067 | | | | 74,116,825 | | | | 6,748,583 | | | | 102,668,475 | |
| Net change in unrealized appreciation (depreciation) | | | 36,435,742 | | | | (31,026,224 | ) | | | (4,698,153 | ) | | | 711,365 | |
| Balance as of 3/31/23 | | $ | 58,691,628 | | | $ | 57,729,361 | | | $ | 2,050,430 | | | $ | 118,471,419 | |
| Net change in unrealized appreciation (depreciation) from Level 3 investments still held as of 3/31/23 | | $ | 36,435,742 | | | $ | (31,026,224 | ) | | $ | (4,698,153 | ) | | $ | 711,365 | |
A significant change to the inputs may result in a significant change to the valuation. Quantitative information about Level 3 fair value measurements for the Portfolio is as follows:
Delaware Ivy High Income Fund
| Assets | | Value | | Valuation
Techniques | | Unobservable Inputs | | Input
Value |
| Common Stock | | 19,096,599 | | Market approach | | EV/Revenue multiple | | 0.68 |
| | | | | | | EV/EBITDA multiple | | 1.65 |
| Common Stock | | 7,482,455 | | Market approach | | Broker quotes | | N/A |
| Common Stock | | 213,461 | | Liquidation approach | | Net asset value | | N/A |
| Common Stock | | 3,585,521 | | Market approach | | Sum of Parts (Adjusted Book Value) | | N/A |
| Common Stock | | 20,699,983 | | Market approach | | Financials | | N/A |
| Corporate Bonds | | 58,691,628 | | Market approach | | Financials | | N/A |
| Common Stock | | 6,671 | | Net Asset Value / Liquidation | | Financials | | N/A |
| Common Stock | | 6,549,308 | | Market approach | | EV/Revenue multiple | | 0.43 |
| | | | | | | EV/EBITDA multiple | | 5.66 |
| Preferred Stock | | 2,050,430 | | Market approach | | EV/Revenue multiple | | 0.43 |
| | | | | | | EV/EBITDA multiple | | 5.66 |
| Common Stock | | 95,363 | | Market approach | | Broker quotes | | N/A |
Notes to financial statements
Ivy Funds
4. Dividend and Distribution Information
Income and long-term capital gain distributions are determined in accordance with federal income tax regulations, which may differ from US GAAP. Additionally, distributions from net gains on foreign currency transactions and net short-term gains on sales of investment securities are treated as ordinary income for federal income tax purposes. The tax character of dividends and distributions paid during the years ended March 31, 2023 and 2022 were as follows:
| | | Tax-exempt
income | | | Ordinary
income | | | Long-term
capital
gains | | | Return of
capital | | | Total | |
| Year ended March 31, 2023: | | | | | | | | | | | | | | | | | | | | |
| Delaware Global Value Equity Fund | | $ | — | | | $ | 22,649,837 | | | $ | 114,745,645 | | | $ | — | | | $ | 137,395,482 | |
| Delaware Ivy Core Bond Fund | | | — | | | | 19,495,262 | | | | — | | | | — | | | | 19,495,262 | |
| Delaware Ivy Core Equity Fund | | | — | | | | 15,564,921 | | | | 419,618,950 | | | | — | | | | 435,183,871 | |
| Delaware Ivy Global Bond Fund | | | — | | | | 13,975,951 | | | | — | | | | — | | | | 13,975,951 | |
| Delaware Ivy Global Growth Fund | | | — | | | | 266,255 | | | | 255,038,090 | | | | — | | | | 255,304,345 | |
| Delaware Ivy High Income Fund | | | — | | | | 207,506,677 | | | | — | | | | — | | | | 207,506,677 | |
| Delaware Ivy International Core Equity Fund | | | — | | | | 13,136,426 | | | | — | | | | — | | | | 13,136,426 | |
| Delaware Ivy International Value Fund | | | — | | | | 2,024,961 | | | | 9,275,416 | | | | — | | | | 11,300,377 | |
| Delaware Ivy Large Cap Growth Fund | | | — | | | | 29,826,075 | | | | 431,832,898 | | | | — | | | | 461,658,973 | |
| Delaware Ivy Limited-Term Bond Fund | | | — | | | | 14,674,795 | | | | — | | | | — | | | | 14,674,795 | |
| Delaware Ivy Managed International Opportunities Fund | | | — | | | | 3,178 | | | | 11,405,075 | | | | — | | | | 11,408,253 | |
| Delaware Ivy Mid Cap Growth Fund | | | — | | | | — | | | | 536,444,250 | | | | — | | | | 536,444,250 | |
| Delaware Ivy Mid Cap Income Opportunities Fund | | | — | | | | 34,260,987 | | | | 23,771,318 | | | | — | | | | 58,032,305 | |
| Delaware Ivy Municipal Bond Fund | | | 16,791,304 | | | | 2,059 | | | | 965,436 | | | | 472,658 | | | | 18,231,457 | |
| Delaware Ivy Municipal High Income Fund | | | 28,817,009 | | | | 480,526 | | | | — | | | | — | | | | 29,297,535 | |
| Delaware Ivy Small Cap Growth Fund | | | — | | | | — | | | | 65,188,713 | | | | — | | | | 65,188,713 | |
| Delaware Ivy Smid Cap Core Fund | | | — | | | | 1,270,514 | | | | 83,792,388 | | | | — | | | | 85,062,902 | |
| Delaware Ivy Systematic Emerging Markets Equity Fund | | | — | | | | 10,423,187 | | | | 108,370,040 | | | | — | | | | 118,793,227 | |
| Delaware Ivy Value Fund | | | — | | | | 46,307,593 | | | | 165,681,156 | | | | — | | | | 211,988,749 | |
| | | | | | | | | | | | | | | | | | | | | |
| Year ended March 31, 2022: | | | | | | | | | | | | | | | | | | | | |
| Delaware Global Value Equity Fund | | | — | | | | 21,733,923 | | | | 24,698,808 | | | | — | | | | 46,432,731 | |
| Delaware Ivy Core Bond Fund | | | — | | | | 23,935,064 | | | | 2,031,489 | | | | — | | | | 25,966,553 | |
| Delaware Ivy Core Equity Fund | | | — | | | | 142,481,004 | | | | 444,346,397 | | | | — | | | | 586,827,401 | |
| Delaware Ivy Global Bond Fund | | | — | | | | 13,745,029 | | | | — | | | | — | | | | 13,745,029 | |
| Delaware Ivy Global Growth Fund | | | — | | | | 13,191,774 | | | | 55,351,393 | | | | — | | | | 68,543,167 | |
| Delaware Ivy High Income Fund | | | — | | | | 258,196,207 | | | | — | | | | — | | | | 258,196,207 | |
| Delaware Ivy International Core Equity Fund | | | — | | | | 59,475,441 | | | | — | | | | — | | | | 59,475,441 | |
| Delaware Ivy International Value Fund | | | — | | | | 5,491,305 | | | | — | | | | — | | | | 5,491,305 | |
| Delaware Ivy Large Cap Growth Fund | | | — | | | | 195,191,405 | | | | 374,426,728 | | | | — | | | | 569,618,133 | |
| Delaware Ivy Limited-Term Bond Fund | | | — | | | | 12,331,033 | | | | — | | | | — | | | | 12,331,033 | |
| Delaware Ivy Managed International Opportunities Fund | | | — | | | | 3,750,514 | | | | 343,650 | | | | — | | | | 4,094,164 | |
| Delaware Ivy Mid Cap Growth Fund | | | — | | | | 128,694,208 | | | | 803,176,207 | | | | — | | | | 931,870,415 | |
| Delaware Ivy Mid Cap Income Opportunities Fund | | | — | | | | 39,308,250 | | | | 26,449,810 | | | | — | | | | 65,758,060 | |
| Delaware Ivy Municipal Bond Fund | | | 15,441,016 | | | | 6,949 | | | | 6,447,046 | | | | — | | | | 21,895,011 | |
| Delaware Ivy Municipal High Income Fund | | | 31,750,840 | | | | 2,177 | | | | — | | | | — | | | | 31,753,017 | |
| Delaware Ivy Small Cap Growth Fund | | | — | | | | 81,413,974 | | | | 568,208,748 | | | | — | | | | 649,622,722 | |
| Delaware Ivy Smid Cap Core Fund | | | — | | | | 66,534,796 | | | | 45,617,571 | | | | — | | | | 112,152,367 | |
| Delaware Ivy Systematic Emerging Markets Equity Fund | | | — | | | | 15,948,852 | | | | — | | | | — | | | | 15,948,852 | |
| Delaware Ivy Value Fund | | | — | | | | 53,603,389 | | | | 98,510,354 | | | | — | | | | 152,113,743 | |
5. Components of Net Assets on a Tax Basis
As of March 31, 2023, the components of net assets on a tax basis were as follows:
| | | Delaware
Global Value
Equity Fund | | Delaware Ivy
Core Bond
Fund | | Delaware Ivy
Core Equity
Fund | |
| Shares of beneficial interest | | $ | 336,050,174 | | | $ | 573,744,606 | | | $ | 2,052,675,808 | |
| Undistributed ordinary income | | | 1,309,223 | | | | 459,571 | | | | 2,871,980 | |
| Undistributed long-term capital gains | | | — | | | | — | | | | 213,701,970 | |
| Distributions payable | | | — | | | | (7,063 | ) | | | — | |
| Capital loss carryforwards | | | (17,026,486 | ) | | | (82,614,744 | ) | | | — | |
| Deferred directors fees | | | (81,898 | ) | | | (37,516 | ) | | | (516,720 | ) |
| Unamortized organizational costs | | | (1,207 | ) | | | — | | | | — | |
| Unrealized appreciation (depreciation) of investments, foreign currencies and derivatives | | | 374,030 | | | | (21,457,208 | ) | | | 1,142,033,705 | |
| Net assets | | $ | 320,623,836 | | | $ | 470,087,646 | | | $ | 3,410,766,743 | |
| | | Delaware Ivy
Global Bond
Fund | | Delaware Ivy
Global Growth
Fund | | Delaware Ivy
High Income
Fund | |
| Shares of beneficial interest | | $ | 537,349,015 | | | $ | 420,451,728 | | | $ | 4,631,266,358 | |
| Undistributed ordinary income | | | — | | | | 984,751 | | | | 1,047,497 | |
| Undistributed long-term capital gains | | | — | | | | 14,031,717 | | | | — | |
| Qualified late year loss deferrals | | | (2,607,687 | ) | | | — | | | | — | |
| Distributions payable | | | — | | | | — | | | | (236,853 | ) |
| Capital loss carryforwards | | | (96,328,272 | ) | | | — | | | | (1,512,607,993 | ) |
| Deferred directors fees | | | (70,968 | ) | | | (117,392 | ) | | | (280,117 | ) |
| Unrealized appreciation (depreciation) of investments, foreign currencies and derivatives | | | (10,140,029 | ) | | | 101,498,607 | | | | (582,686,743 | ) |
| Net assets | | $ | 428,202,059 | | | $ | 536,849,411 | | | $ | 2,536,502,149 | |
| | | Delaware Ivy
International
Core Equity
Fund | | Delaware Ivy
International
Value Fund | | Delaware Ivy
Large Cap
Growth Fund | |
| Shares of beneficial interest | | $ | 1,277,910,028 | | | $ | 144,214,967 | | | $ | 2,516,610,121 | |
| Undistributed ordinary income | | | 12,512,991 | | | | 1,418,543 | | | | — | |
| Undistributed long-term capital gains | | | — | | | | — | | | | 52,187,617 | |
| Qualified late year loss deferrals | | | (1 | ) | | | — | | | | (451,194 | ) |
| Capital loss carryforwards | | | (61,459,693 | ) | | | (10,409,488 | ) | | | — | |
| Deferred directors fees | | | (129,060 | ) | | | (38,979 | ) | | | (291,946 | ) |
| Unrealized appreciation (depreciation) of investments, foreign currencies and derivatives | | | 128,049,913 | | | | (7,276,479 | ) | | | 2,548,066,208 | |
| Net assets | | $ | 1,356,884,178 | | | $ | 127,908,564 | | | $ | 5,116,120,806 | |
Notes to financial statements
Ivy Funds
5. Components of Net Assets on a Tax Basis (continued)
| | | Delaware Ivy
Limited-Term
Bond Fund | | Delaware Ivy
Managed
International
Opportunities
Fund | | Delaware Ivy
Mid Cap Growth
Fund | |
| Shares of beneficial interest | | $ | 611,446,627 | | | $ | 68,387,600 | | | $ | 4,311,497,439 | |
| Undistributed ordinary income | | | 1,062,260 | | | | 835,036 | | | | — | |
| Undistributed long-term capital gains | | | — | | | | — | | | | 272,187,353 | |
| Qualified late year loss deferrals | | | — | | | | — | | | | (4,544,813 | ) |
| Distributions payable | | | (14,869 | ) | | | — | | | | — | |
| Capital loss carryforwards | | | (39,087,961 | ) | | | (141,418 | ) | | | — | |
| Deferred directors fees | | | (44,375 | ) | | | (7,040 | ) | | | (249,016 | ) |
| Unrealized appreciation (depreciation) of investments, foreign currencies and derivatives | | | (16,300,127 | ) | | | 9,174,953 | | | | 1,298,261,015 | |
| Net assets | | $ | 557,061,555 | | | $ | 78,249,131 | | | $ | 5,877,151,978 | |
| | | Delaware Ivy
Mid Cap Income
Opportunities
Fund | |
Delaware Ivy
Municipal Bond
Fund | | Delaware Ivy
Municipal High
Income Fund | |
| Shares of beneficial interest | | $ | 1,017,986,087 | | | $ | 393,451,369 | | | $ | 693,764,688 | |
| Undistributed ordinary income | | | 1,142,478 | | | | — | | | | — | |
| Undistributed tax-exempt income | | | — | | | | — | | | | 358,209 | |
| Undistributed long-term capital gains | | | 18,038,255 | | | | — | | | | — | |
| Distributions payable | | | — | | | | (12,380 | ) | | | (70,197 | ) |
| Capital loss carryforwards | | | — | | | | (32,217,602 | ) | | | (63,752,271 | ) |
| Deferred directors fees | | | (1,130 | ) | | | (93,508 | ) | | | (99,984 | ) |
| Unamortized organizational costs | | | (10,839 | ) | | | — | | | | — | |
| Unrealized appreciation (depreciation) of investments, foreign currencies and derivatives | | | 252,827,073 | | | | (7,997,545 | ) | | | (113,855,571 | ) |
| Net assets | | $ | 1,289,981,924 | | | $ | 353,130,334 | | | $ | 516,344,874 | |
| | | Delaware Ivy
Small Cap
Growth Fund | | Delaware Ivy
Smid Cap Core
Fund | | Delaware Ivy
Systematic
Emerging
Markets Equity
Fund | |
| Shares of beneficial interest | | $ | 1,324,682,898 | | | $ | 356,233,989 | | | $ | 853,542,781 | |
| Undistributed ordinary income | | | — | | | | 1,014,374 | | | | 13,179,097 | |
| Undistributed long-term capital gains | | | 50,724,583 | | | | — | | | | — | |
| Qualified late year loss deferrals | | | (640,625 | ) | | | — | | | | (18,449,738 | ) |
| Capital loss carryforwards | | | — | | | | (11,120,994 | ) | | | — | |
| Deferred directors fees | | | (244,651 | ) | | | (19,154 | ) | | | (47,326 | ) |
| Unrealized appreciation (depreciation) of investments, foreign currencies and derivatives | | | 161,316,377 | | | | 1,672,870 | | | | 66,165,167 | |
| Net assets | | $ | 1,535,838,582 | | | $ | 347,781,085 | | | $ | 914,389,981 | |
| | | Delaware Ivy
Value Fund | |
| Shares of beneficial interest | | $ | 554,417,101 | |
| Undistributed long-term capital gains | | | 136,501,168 | |
| Deferred directors fees | | | (77,908 | ) |
| Unrealized appreciation (depreciation) of investments, foreign currencies and derivatives | | | (15,191,412 | ) |
| Net assets | | $ | 675,648,949 | |
Differences between components of net assets unrealized and tax cost unrealized may arise due to certain foreign currency transactions and foreign capital gains taxes.
The differences between book basis and tax basis components of net assets are primarily attributable to tax deferral of losses on wash sales, tax deferral of losses on straddles, mark-to-market of foreign currency exchange contracts, mark-to-market of futures contracts, tax recognition of unrealized gain on passive foreign investment companies, tax treatment of swap contracts, contingent payment debt instruments, amortization of premium on convertible securities, trust preferred securities, partnership interest and deemed dividend income.
Qualified late year ordinary and capital losses (including currency and specified gain/loss items) represent losses realized from January 1, 2023 through March 31, 2023 and November 1, 2022 through March 31, 2023, respectively, that, in accordance with federal income tax regulations, the Funds have elected to defer and treat as having arisen in the following fiscal year.
For financial reporting purposes, capital accounts are adjusted to reflect the tax character of permanent book/tax differences. Reclassifications are primarily due to write-off of net operating losses, tax treatment of partnerships, gain (loss) on foreign currency transactions, amortization of premium on convertible securities, swap contracts, deemed dividend income, contingent payment on debt instruments, earnings and profits distributed to shareholders on the redemption of shares, trust preferred securities, paydown gains (losses) of asset- and mortgage-backed securities, realizedg gain on passive foreign investment companies and foreign capital gains taxes. Results of operations and net assets were not affected by these reclassifications. For the year ended March 31, 2023, the Funds recorded the following reclassifications:
| | | Paid-in capital | | | Total
distributable
earnings (loss) | |
| Delaware Global Value Equity Fund | | $ | 13,650,208 | | | | (13,650,208 | ) |
| Delaware Ivy Core Equity Fund | | | 47,404,461 | | | | (47,404,461 | ) |
| Delaware Ivy High Income Fund | | | (345,148 | ) | | | 345,148 | |
| Delaware Ivy Large Cap Growth Fund | | | (3,403,723 | ) | | | 3,403,723 | |
| Delaware Ivy Mid Cap Growth Fund | | | (19,931 | ) | | | 19,931 | |
| Delaware Ivy Small Cap Growth Fund | | | 501,777 | | | | (501,777 | ) |
| Delaware Ivy Smid Cap Core Fund | | | 13,404,933 | | | | (13,404,933 | ) |
| Delaware Ivy Value Fund | | | (63,835,479 | ) | | | 63,835,479 | |
For federal income tax purposes, capital loss carryforwards may be carried forward and applied against future capital gains. At March 31, 2023, capital loss carryforwards available to offset future realized capital gains are as follows:
| | | Loss carryforward character | | | | |
| | | Short-term | | | Long-term | | | Total | |
| Delaware Global Value Equity Fund | | $ | 16,381,868 | | | $ | 644,618 | | | $ | 17,026,486 | |
| Delaware Ivy Core Bond Fund | | | 41,301,170 | | | | 41,313,574 | | | | 82,614,744 | |
| Delaware Ivy Global Bond Fund | | | 57,277,514 | | | | 39,050,758 | | | | 96,328,272 | |
| Delaware Ivy High Income Fund | | | 236,549,486 | | | | 1,276,058,507 | | | | 1,512,607,993 | |
| Delaware Ivy International Core Equity Fund | | | 61,459,693 | | | | — | | | | 61,459,693 | |
| Delaware Ivy International Value Fund | | | 9,714,148 | | | | 695,340 | | | | 10,409,488 | |
| Delaware Ivy Limited-Term Bond Fund | | | 17,301,890 | | | | 21,786,071 | | | | 39,087,961 | |
| Delaware Ivy Managed International Opportunities Fund | | | 141,418 | | | | — | | | | 141,418 | |
| Delaware Ivy Municipal Bond Fund | | | 24,121,910 | | | | 8,095,692 | | | | 32,217,602 | |
| Delaware Ivy Municipal High Income Fund | | | 6,491,245 | | | | 57,261,026 | | | | 63,752,271 | |
| Delaware Ivy Smid Cap Core Fund | | | 11,120,994 | | | | — | | | | 11,120,994 | |
Notes to financial statements
Ivy Funds
6. Capital Shares
Transactions in capital shares were as follows:
| | | Delaware
Global Value
Equity Fund | | | Delaware Ivy
Core Bond Fund | | | Delaware Ivy
Core Equity Fund | |
| | | Year ended | | | Year ended | | | Year ended | |
| | | 3/31/23 | | | 3/31/22 | | | 3/31/23 | | | 3/31/22 | | | 3/31/23 | | | 3/31/22 | |
| Shares sold: | | | | | | | | | | | | | | | | | | | | | | | | |
| Class A | | | 946,030 | | | | 727,114 | | | | 2,118,999 | | | | 2,321,079 | | | | 5,664,102 | | | | 5,062,451 | |
| Class B1 | | | — | | | | 10 | | | | — | | | | — | | | | — | | | | 3,016 | |
| Class C | | | 39,759 | | | | 20,250 | | | | 80,032 | | | | 71,454 | | | | 260,572 | | | | 241,524 | |
| Class E2 | | | 2,825 | | | | 23,204 | | | | 11,585 | | | | 44,412 | | | | 30,338 | | | | 79,268 | |
| Class I | | | 1,644,621 | | | | 1,307,962 | | | | 5,143,104 | | | | 9,895,333 | | | | 9,719,353 | | | | 11,001,554 | |
| Class R | | | 2,735 | | | | 1,627 | | | | 9,618 | | | | 4,483 | | | | 5,696 | | | | 2,984 | |
| Class R63 | | | 37,951 | | | | 77,451 | | | | 1,450,072 | | | | 2,118,948 | | | | 707,512 | | | | 814,428 | |
| Class Y | | | 20,578 | | | | 9,298 | | | | 84,790 | | | | 124,007 | | | | 85,056 | | | | 226,982 | |
| | | | | | | | | | | | | | | | | | | | | | | | | |
| Shares issued upon reinvestment of dividends and distributions: |
| Class A | | | 10,772,445 | | | | 1,701,216 | | | | 501,672 | | | | 387,774 | | | | 24,210,173 | | | | 23,068,056 | |
| Class B1 | | | — | | | | 265 | | | | — | | | | 46 | | | | — | | | | — | |
| Class C | | | 185,306 | | | | 31,193 | | | | 11,802 | | | | 9,603 | | | | 277,116 | | | | 289,195 | |
| Class E2 | | | 2,617 | | | | 30,031 | | | | 1,449 | | | | 8,581 | | | | — | | | | 125,327 | |
| Class I | | | 6,753,797 | | | | 1,454,940 | | | | 1,213,398 | | | | 1,542,969 | | | | 4,808,986 | | | | 5,671,255 | |
| Class R | | | 2,923 | | | | 100 | | | | 2,780 | | | | 1,480 | | | | 1,215 | | | | 510 | |
| Class R63 | | | 493,195 | | | | 116,938 | | | | 336,877 | | | | 405,312 | | | | 304,066 | | | | 474,126 | |
| Class Y | | | 61,990 | | | | 9,138 | | | | 18,883 | | | | 13,049 | | | | 175,581 | | | | 141,536 | |
| | | | 20,966,772 | | | | 5,510,737 | | | | 10,985,061 | | | | 16,948,530 | | | | 46,249,766 | | | | 47,202,212 | |
| Shares redeemed: | | | | | | | | | | | | | | | | | | | | | | | | |
| Class A | | | (7,899,675 | ) | | | (4,245,448 | ) | | | (5,686,132 | ) | | | (5,470,636 | ) | | | (43,823,230 | ) | | | (28,289,040 | ) |
| Class B1 | | | — | | | | (143,225 | ) | | | — | | | | (24,604 | ) | | | — | | | | (196,988 | ) |
| Class C | | | (302,897 | ) | | | (194,724 | ) | | | (287,802 | ) | | | (446,388 | ) | | | (913,362 | ) | | | (872,010 | ) |
| Class E2 | | | (377,166 | ) | | | (56,499 | ) | | | (424,744 | ) | | | (91,151 | ) | | | (1,065,074 | ) | | | (163,361 | ) |
| Class I | | | (9,971,917 | ) | | | (6,138,844 | ) | | | (28,061,535 | ) | | | (34,439,232 | ) | | | (22,780,577 | ) | | | (19,284,543 | ) |
| Class R | | | (1,129 | ) | | | (4,456 | ) | | | (2,089 | ) | | | (5,459 | ) | | | (2,809 | ) | | | (23,781 | ) |
| Class R63 | | | (1,511,438 | ) | | | (838,043 | ) | | | (8,359,920 | ) | | | (5,059,794 | ) | | | (2,567,325 | ) | | | (1,309,870 | ) |
| Class Y | | | (34,411 | ) | | | (39,530 | ) | | | (187,306 | ) | | | (168,975 | ) | | | (236,161 | ) | | | (203,602 | ) |
| | | | (20,098,633 | ) | | | (11,660,769 | ) | | | (43,009,528 | ) | | | (45,706,239 | ) | | | (71,388,538 | ) | | | (50,343,195 | ) |
| Net increase (decrease) | | | 868,139 | | | | (6,150,032 | ) | | | (32,024,467 | ) | | | (28,757,709 | ) | | | (25,138,772 | ) | | | (3,140,983 | ) |
| | | Delaware Ivy
Global Bond Fund | | | Delaware Ivy
Global Growth Fund | | | Delaware Ivy
High Income Fund | |
| | | Year ended | | | Year ended | | | Year ended | |
| | | 3/31/23 | | | 3/31/22 | | | 3/31/23 | | | 3/31/22 | | | 3/31/23 | | | 3/31/22 | |
| Shares sold: | | | | | | | | | | | | | | | | | | | | | | | | |
| Class A | | | 971,840 | | | | 1,792,314 | | | | 250,983 | | | | 250,954 | | | | 21,521,185 | | | | 29,639,151 | |
| Class B1 | | | — | | | | — | | | | — | | | | — | | | | — | | | | 1,224 | |
| Class C | | | 96,205 | | | | 79,603 | | | | 9,764 | | | | 8,492 | | | | 1,956,685 | | | | 3,370,392 | |
| Class E2 | | | — | | | | — | | | | — | | | | — | | | | 11,753 | | | | 103,840 | |
| Class I | | | 8,670,881 | | | | 8,501,414 | | | | 1,190,101 | | | | 795,576 | | | | 61,354,987 | | | | 58,949,790 | |
| Class R | | | 13,813 | | | | 6,723 | | | | 700 | | | | 478 | | | | 173,192 | | | | 538,192 | |
| Class R63 | | | 3,035,570 | | | | 10,500,290 | | | | 36,838 | | | | 49,768 | | | | 3,616,197 | | | | 2,799,677 | |
| Class Y | | | 137,530 | | | | 75,469 | | | | 3,435 | | | | 4,252 | | | | 5,039,853 | | | | 5,267,236 | |
| | | | | | | | | | | | | | | | | | | | | | | | | |
| Shares issued upon reinvestment of dividends and distributions: |
| Class A | | | 419,165 | | | | 406,091 | | | | 5,420,865 | | | | 603,941 | | | | 15,755,345 | | | | 14,856,337 | |
| Class B1 | | | — | | | | 209 | | | | — | | | | — | | | | — | | | | 16,030 | |
| Class C | | | 7,359 | | | | 6,610 | | | | 78,369 | | | | 6,950 | | | | 1,813,001 | | | | 1,958,489 | |
| Class E2 | | | — | | | | — | | | | — | | | | — | | | | 13,889 | | | | 79,588 | |
| Class I | | | 610,925 | | | | 649,756 | | | | 3,246,704 | | | | 509,131 | | | | 14,655,833 | | | | 15,408,486 | |
| Class R | | | 820 | | | | 549 | | | | 11,773 | | | | 970 | | | | 451,171 | | | | 406,680 | |
| Class R63 | | | 495,984 | | | | 270,580 | | | | 29,549 | | | | 22,774 | | | | 731,120 | | | | 608,214 | |
| Class Y | | | 2,896 | | | | 1,960 | | | | 22,487 | | | | 2,355 | | | | 890,874 | | | | 899,715 | |
| | | | 14,462,988 | | | | 22,291,568 | | | | 10,301,568 | | | | 2,255,641 | | | | 127,985,085 | | | | 134,903,041 | |
| Shares redeemed: | | | | | | | | | | | | | | | | | | | | | | | | |
| Class A | | | (4,834,589 | ) | | | (3,871,917 | ) | | | (3,188,523 | ) | | | (1,374,548 | ) | | | (67,831,222 | ) | | | (65,773,913 | ) |
| Class B1 | | | — | | | | (32,934 | ) | | | — | | | | (4,414 | ) | | | — | | | | (1,101,616 | ) |
| Class C | | | (174,702 | ) | | | (134,565 | ) | | | (51,054 | ) | | | (47,994 | ) | | | (12,602,999 | ) | | | (17,607,476 | ) |
| Class E2 | | | — | | | | — | | | | — | | | | — | | | | (1,253,077 | ) | | | (240,798 | ) |
| Class I | | | (10,264,231 | ) | | | (11,866,855 | ) | | | (4,873,426 | ) | | | (3,006,958 | ) | | | (115,686,036 | ) | | | (121,072,408 | ) |
| Class R | | | (13,483 | ) | | | (6,058 | ) | | | (2,921 | ) | | | (2,978 | ) | | | (1,408,491 | ) | | | (1,106,366 | ) |
| Class R63 | | | (3,962,500 | ) | | | (1,755,102 | ) | | | (19,534 | ) | | | (346,205 | ) | | | (3,789,604 | ) | | | (3,190,709 | ) |
| Class Y | | | (25,824 | ) | | | (69,391 | ) | | | (11,824 | ) | | | (26,198 | ) | | | (9,059,782 | ) | | | (10,771,871 | ) |
| | | | (19,275,329 | ) | | | (17,736,822 | ) | | | (8,147,282 | ) | | | (4,809,295 | ) | | | (211,631,211 | ) | | | (220,865,157 | ) |
| Net increase (decrease) | | | (4,812,341 | ) | | | 4,554,746 | | | | 2,154,286 | | | | (2,553,654 | ) | | | (83,646,126 | ) | | | (85,962,116 | ) |
Notes to financial statements
Ivy Funds
6. Capital Shares (continued)
| | | Delaware Ivy
International
Core Equity Fund | | | Delaware Ivy
International Value Fund | | | Delaware Ivy
Large Cap Growth Fund | |
| | | Year ended | | | Year ended | | | Year ended | |
| | | 3/31/23 | | | 3/31/22 | | | 3/31/23 | | | 3/31/22 | | | 3/31/23 | | | 3/31/22 | |
| Shares sold: | | | | | | | | | | | | | | | | | | | | | | | | |
| Class A | | | 1,715,939 | | | | 1,651,930 | | | | 102,325 | | | | 267,711 | | | | 6,997,654 | | | | 3,976,672 | |
| Class B1 | | | — | | | | 750 | | | | — | | | | 299 | | | | — | | | | 5,646 | |
| Class C | | | 68,725 | | | | 98,125 | | | | 2,289 | | | | 18,075 | | | | 474,476 | | | | 406,686 | |
| Class E2 | | | 3,809 | | | | 39,245 | | | | — | | | | — | | | | 18,523 | | | | 106,534 | |
| Class I | | | 6,880,534 | | | | 10,163,634 | | | | 941,585 | | | | 2,370,059 | | | | 50,607,900 | | | | 14,739,402 | |
| Class R | | | 117,834 | | | | 113,866 | | | | 9,690 | | | | 364 | | | | 114,906 | | | | 84,431 | |
| Class R63 | | | 1,685,375 | | | | 2,814,038 | | | | 554,556 | | | | 1,403,533 | | | | 3,891,542 | | | | 771,044 | |
| Class Y | | | 368,862 | | | | 747,020 | | | | 4,050 | | | | 6,235 | | | | 110,683 | | | | 345,189 | |
| | | | | | | | | | | | | | | | | | | | | | | | | |
| Shares issued upon reinvestment of dividends and distributions: |
| Class A | | | 125,330 | | | | 410,422 | | | | 300,241 | | | | 77,387 | | | | 9,751,628 | | | | 8,475,712 | |
| Class C | | | 3,188 | | | | 63,873 | | | | 3,884 | | | | 818 | | | | 411,826 | | | | 317,964 | |
| Class E2 | | | — | | | | 9,670 | | | | — | | | | — | | | | — | | | | 100,086 | |
| Class I | | | 428,628 | | | | 1,643,945 | | | | 232,408 | | | | 123,441 | | | | 7,668,405 | | | | 6,749,507 | |
| Class R | | | 14,084 | | | | 55,729 | | | | 260 | | | | 10 | | | | 49,102 | | | | 39,813 | |
| Class R63 | | | 146,053 | | | | 514,994 | | | | 284,118 | | | | 97,994 | | | | 584,623 | | | | 424,539 | |
| Class Y | | | 19,975 | | | | 79,023 | | | | 5,046 | | | | 1,395 | | | | 108,299 | | | | 86,432 | |
| | | | 11,578,336 | | | | 18,406,264 | | | | 2,440,452 | | | | 4,367,321 | | | | 80,789,567 | | | | 36,629,657 | |
| Shares redeemed: | | | | | | | | | | | | | | | | | | | | | | | | |
| Class A | | | (4,288,005 | ) | | | (4,380,189 | ) | | | (814,900 | ) | | | (673,016 | ) | | | (23,343,189 | ) | | | (14,725,393 | ) |
| Class B1 | | | — | | | | (30,696 | ) | | | — | | | | (3,598 | ) | | | — | | | | (214,153 | ) |
| Class C | | | (1,096,662 | ) | | | (1,238,865 | ) | | | (19,449 | ) | | | (16,825 | ) | | | (1,116,503 | ) | | | (1,054,728 | ) |
| Class E2 | | | (392,689 | ) | | | (37,722 | ) | | | — | | | | — | | | | (1,121,521 | ) | | | (144,768 | ) |
| Class I | | | (22,500,038 | ) | | | (29,029,247 | ) | | | (2,486,241 | ) | | | (3,408,758 | ) | | | (37,526,076 | ) | | | (23,617,949 | ) |
| Class R | | | (418,535 | ) | | | (469,390 | ) | | | (1,398 | ) | | | (18,882 | ) | | | (131,160 | ) | | | (179,339 | ) |
| Class R63 | | | (7,012,615 | ) | | | (10,142,650 | ) | | | (1,801,114 | ) | | | (2,358,134 | ) | | | (2,723,715 | ) | | | (1,461,593 | ) |
| Class Y | | | (791,830 | ) | | | (2,850,084 | ) | | | (20,323 | ) | | | (9,459 | ) | | | (384,633 | ) | | | (345,757 | ) |
| | | | (36,500,374 | ) | | | (48,178,843 | ) | | | (5,143,425 | ) | | | (6,488,672 | ) | | | (66,346,797 | ) | | | (41,743,680 | ) |
| Net increase (decrease) | | | (24,922,038 | ) | | | (29,772,579 | ) | | | (2,702,973 | ) | | | (2,121,351 | ) | | | 14,442,770 | | | | (5,114,023 | ) |
| | | Delaware Ivy
Limited-Term Bond Fund | | | Delaware Ivy
Managed International
Opportunities Fund | | | Delaware Ivy
Mid Cap Growth Fund | |
| | | Year ended | | | Year ended | | | Year ended | |
| | | 3/31/23 | | | 3/31/22 | | | 3/31/23 | | | 3/31/22 | | | 3/31/23 | | | 3/31/22 | |
| Shares sold: | | | | | | | | | | | | | | | | | | | | | | | | |
| Class A | | | 13,394,245 | | | | 8,743,097 | | | | 209,633 | | | | 285,368 | | | | 4,472,771 | | | | 4,603,765 | |
| Class B1 | | | — | | | | 156 | | | | — | | | | 101 | | | | — | | | | 758 | |
| Class C | | | 390,480 | | | | 451,663 | | | | 5,620 | | | | 18,676 | | | | 403,369 | | | | 759,871 | |
| Class E2 | | | 14,035 | | | | 123,070 | | | | — | | | | — | | | | 7,521 | | | | 56,629 | |
| Class I | | | 7,109,079 | | | | 9,518,352 | | | | 1,152,757 | | | | 1,302,124 | | | | 27,392,818 | | | | 27,507,242 | |
| Class R | | | 499 | | | | 6,857 | | | | 1,810 | | | | 1,126 | | | | 356,176 | | | | 411,490 | |
| Class R63 | | | 409,570 | | | | 6,248,399 | | | | 6,085 | | | | 1,963 | | | | 13,069,664 | | | | 12,178,329 | |
| Class Y | | | 26,620 | | | | 32,285 | | | | 295 | | | | 1,134 | | | | 1,100,761 | | | | 2,014,653 | |
| | | | | | | | | | | | | | | | | | | | | | | | | |
| Shares issued upon reinvestment of dividends and distributions: |
| Class A | | | 622,474 | | | | 342,955 | | | | 590,861 | | | | 121,207 | | | | 6,500,367 | | | | 8,289,009 | |
| Class B1 | | | — | | | | 4 | | | | — | | | | — | | | | — | | | | — | |
| Class C | | | 10,648 | | | | 3,168 | | | | 9,918 | | | | 2,051 | | | | 589,436 | | | | 799,411 | |
| Class E2 | | | 1,269 | | | | 6,504 | | | | — | | | | — | | | | — | | | | 76,622 | |
| Class I | | | 727,822 | | | | 571,643 | | | | 710,336 | | | | 207,398 | | | | 8,704,362 | | | | 10,368,480 | |
| Class R | | | 556 | | | | 178 | | | | 1,323 | | | | 150 | | | | 260,919 | | | | 314,769 | |
| Class R63 | | | 40,658 | | | | 173,596 | | | | 1,464 | | | | 233 | | | | 2,674,744 | | | | 2,583,826 | |
| Class Y | | | 3,752 | | | | 2,120 | | | | 1,520 | | | | 321 | | | | 778,557 | | | | 987,117 | |
| | | | 22,751,707 | | | | 26,224,047 | | | | 2,691,622 | | | | 1,941,852 | | | | 66,311,465 | | | | 70,951,971 | |
| Shares redeemed: | | | | | | | | | | | | | | | | | | | | | | | | |
| Class A | | | (19,256,052 | ) | | | (14,420,896 | ) | | | (1,457,615 | ) | | | (965,744 | ) | | | (17,227,391 | ) | | | (11,647,387 | ) |
| Class B1 | | | — | | | | (21,011 | ) | | | — | | | | (5,008 | ) | | | — | | | | (143,977 | ) |
| Class C | | | (1,053,562 | ) | | | (1,346,058 | ) | | | (32,065 | ) | | | (48,440 | ) | | | (1,953,603 | ) | | | (2,345,845 | ) |
| Class E2 | | | (618,387 | ) | | | (203,876 | ) | | | — | | | | — | | | | (625,672 | ) | | | (58,994 | ) |
| Class I | | | (24,010,903 | ) | | | (23,076,869 | ) | | | (4,618,409 | ) | | | (3,316,248 | ) | | | (37,826,781 | ) | | | (26,370,336 | ) |
| Class R | | | (13,780 | ) | | | (1,900 | ) | | | (3 | ) | | | (24,286 | ) | | | (667,231 | ) | | | (737,808 | ) |
| Class R63 | | | (13,284,608 | ) | | | (4,190,388 | ) | | | (6,617 | ) | | | (26,790 | ) | | | (7,734,193 | ) | | | (5,633,560 | ) |
| Class Y | | | (42,685 | ) | | | (77,200 | ) | | | (3,426 | ) | | | (3,439 | ) | | | (2,165,158 | ) | | | (3,916,957 | ) |
| | | | (58,279,977 | ) | | | (43,338,198 | ) | | | (6,118,135 | ) | | | (4,389,955 | ) | | | (68,200,029 | ) | | | (50,854,864 | ) |
| Net increase (decrease) | | | (35,528,270 | ) | | | (17,114,151 | ) | | | (3,426,513 | ) | | | (2,448,103 | ) | | | (1,888,564 | ) | | | 20,097,107 | |
Notes to financial statements
Ivy Funds
6. Capital Shares (continued)
| | | Delaware Ivy
Mid Cap Income
Opportunities Fund | | | Delaware Ivy
Municipal Bond Fund | | | Delaware Ivy
Municipal High Income Fund | |
| | | Year ended | | | Year ended | | | Year ended | |
| | | 3/31/23 | | | 3/31/22 | | | 3/31/23 | | | 3/31/22 | | | 3/31/23 | | | 3/31/22 | |
| Shares sold: | | | | | | | | | | | | | | | | | | | | | | | | |
| Class A | | | 2,277,685 | | | | 2,371,041 | | | | 3,800,014 | | | | 2,465,655 | | | | 11,781,303 | | | | 10,239,019 | |
| Class B1 | | | — | | | | — | | | | — | | | | — | | | | — | | | | 242 | |
| Class C | | | 141,366 | | | | 413,646 | | | | 121,266 | | | | 36,404 | | | | 328,691 | | | | 330,583 | |
| Class I | | | 15,027,963 | | | | 31,062,626 | | | | 3,387,549 | | | | 3,518,199 | | | | 17,426,005 | | | | 13,917,671 | |
| Class R | | | 7,179 | | | | 28,262 | | | | — | | | | — | | | | — | | | | — | |
| Class R63 | | | 1,707,628 | | | | 1,831,453 | | | | 47,550 | | | | 56,536 | | | | 200,067 | | | | 116,345 | |
| Class Y | | | 111,122 | | | | 723,454 | | | | — | | | | 28 | | | | 11,563 | | | | 13,474 | |
| | | | | | | | | | | | | | | | | | | | | | | | | |
| Shares issued upon reinvestment of dividends and distributions: |
| Class A | | | 371,379 | | | | 332,216 | | | | 1,145,515 | | | | 1,045,701 | | | | 4,321,850 | | | | 3,578,535 | |
| Class B1 | | | — | | | | — | | | | — | | | | 11 | | | | — | | | | 304 | |
| Class C | | | 34,686 | | | | 36,037 | | | | 12,027 | | | | 10,820 | | | | 112,054 | | | | 115,548 | |
| Class I | | | 2,585,954 | | | | 2,656,733 | | | | 622,126 | | | | 753,744 | | | | 1,997,949 | | | | 1,979,587 | |
| Class R | | | 2,115 | | | | 1,805 | | | | — | | | | — | | | | — | | | | — | |
| Class R63 | | | 220,268 | | | | 220,806 | | | | 3,401 | | | | 3,693 | | | | 9,082 | | | | 8,175 | |
| Class Y | | | 24,819 | | | | 49,864 | | | | — | | | | — | | | | 32,442 | | | | 27,292 | |
| | | | 22,512,164 | | | | 39,727,943 | | | | 9,139,448 | | | | 7,890,791 | | | | 36,221,006 | | | | 30,326,775 | |
| Shares redeemed: | | | | | | | | | | | | | | | | | | | | | | | | |
| Class A | | | (2,763,164 | ) | | | (2,324,516 | ) | | | (15,045,582 | ) | | | (6,657,845 | ) | | | (48,599,693 | ) | | | (24,209,293 | ) |
| Class B1 | | | — | | | | — | | | | — | | | | (13,587 | ) | | | — | | | | (82,298 | ) |
| Class C | | | (454,679 | ) | | | (302,434 | ) | | | (239,598 | ) | | | (280,956 | ) | | | (1,934,628 | ) | | | (2,369,397 | ) |
| Class I | | | (34,208,643 | ) | | | (25,896,446 | ) | | | (15,560,564 | ) | | | (7,868,698 | ) | | | (43,606,056 | ) | | | (19,969,197 | ) |
| Class R | | | (8,021 | ) | | | (9,105 | ) | | | — | | | | — | | | | — | | | | — | |
| Class R63 | | | (2,758,059 | ) | | | (1,682,275 | ) | | | (75,036 | ) | | | (51,402 | ) | | | (176,009 | ) | | | (103,890 | ) |
| Class Y | | | (947,318 | ) | | | (1,343,690 | ) | | | — | | | | (36,238 | ) | | | (167,120 | ) | | | (104,858 | ) |
| | | | (41,139,884 | ) | | | (31,558,466 | ) | | | (30,920,780 | ) | | | (14,908,726 | ) | | | (94,483,506 | ) | | | (46,838,933 | ) |
| Net increase (decrease) | | | (18,627,720 | ) | | | 8,169,477 | | | | (21,781,332 | ) | | | (7,017,935 | ) | | | (58,262,500 | ) | | | (16,512,158 | ) |
| | | Delaware Ivy
Small Cap Growth Fund | | | Delaware Ivy
Smid Cap Core Fund | | | Delaware Ivy
Systematic Emerging
Markets Equity Fund | |
| | | Year ended | | | Year ended | | | Year ended | |
| | | 3/31/23 | | | 3/31/22 | | | 3/31/23 | | | 3/31/22 | | | 3/31/23 | | | 3/31/22 | |
| Shares sold: | | | | | | | | | | | | | | | | | | | | | | | | |
| Class A | | | 3,551,182 | | | | 3,238,756 | | | | 930,462 | | | | 1,011,064 | | | | 726,610 | | | | 1,321,304 | |
| Class B1 | | | — | | | | 399 | | | | — | | | | 169 | | | | — | | | | 21 | |
| Class C | | | 273,918 | | | | 290,361 | | | | 83,983 | | | | 138,304 | | | | 73,840 | | | | 176,657 | |
| Class E2 | | | 11,061 | | | | 61,786 | | | | — | | | | — | | | | — | | | | — | |
| Class I | | | 7,754,908 | | | | 6,161,192 | | | | 2,630,478 | | | | 3,463,947 | | | | 8,492,067 | | | | 13,519,403 | |
| Class R | | | 348,740 | | | | 593,925 | | | | 112,367 | | | | 185,454 | | | | 83,272 | | | | 83,454 | |
| Class R63 | | | 1,450,957 | | | | 1,767,840 | | | | 422,747 | | | | 1,471,722 | | | | 1,254,874 | | | | 3,248,360 | |
| Class Y | | | 477,499 | | | | 502,748 | | | | 60,447 | | | | 79,028 | | | | 644,276 | | | | 419,358 | |
| | | | | | | | | | | | | | | | | | | | | | | | | |
| Shares issued upon reinvestment of dividends and distributions: |
| Class A | | | 3,257,801 | | | | 22,304,490 | | | | 2,046,136 | | | | 1,444,128 | | | | 1,418,172 | | | | 67,286 | |
| Class C | | | 305,543 | | | | 1,927,672 | | | | 384,714 | | | | 239,441 | | | | 274,998 | | | | 6,360 | |
| Class E2 | | | — | | | | 277,756 | | | | — | | | | — | | | | — | | | | — | |
| Class I | | | 921,867 | | | | 8,483,791 | | | | 2,438,040 | | | | 2,926,120 | | | | 3,537,690 | | | | 359,761 | |
| Class R | | | 222,179 | | | | 1,259,675 | | | | 345,269 | | | | 215,190 | | | | 44,025 | | | | 1,095 | |
| Class R63 | | | 263,723 | | | | 1,747,254 | | | | 809,901 | | | | 659,710 | | | | 1,140,114 | | | | 113,228 | |
| Class Y | | | 153,711 | | | | 1,116,868 | | | | 69,584 | | | | 59,907 | | | | 46,353 | | | | 1,961 | |
| | | | 18,993,089 | | | | 49,734,513 | | | | 10,334,128 | | | | 11,894,184 | | | | 17,736,291 | | | | 19,318,248 | |
| Shares redeemed: | | | | | | | | | | | | | | | | | | | | | | | | |
| Class A | | | (19,599,553 | ) | | | (13,496,298 | ) | | | (2,716,861 | ) | | | (2,098,133 | ) | | | (3,510,339 | ) | | | (3,124,643 | ) |
| Class B1 | | | — | | | | (127,890 | ) | | | — | | | | (23,959 | ) | | | — | | | | (16,982 | ) |
| Class C | | | (1,654,505 | ) | | | (1,625,786 | ) | | | (406,980 | ) | | | (356,399 | ) | | | (783,935 | ) | | | (505,284 | ) |
| Class E2 | | | (946,425 | ) | | | (69,685 | ) | | | — | | | | — | | | | — | | | | — | |
| Class I | | | (18,281,878 | ) | | | (14,060,256 | ) | | | (9,983,238 | ) | | | (9,275,091 | ) | | | (21,732,308 | ) | | | (28,048,008 | ) |
| Class R | | | (732,333 | ) | | | (1,038,559 | ) | | | (290,777 | ) | | | (249,462 | ) | | | (111,439 | ) | | | (156,860 | ) |
| Class R63 | | | (2,537,411 | ) | | | (2,475,471 | ) | | | (2,602,096 | ) | | | (1,255,062 | ) | | | (5,279,853 | ) | | | (4,613,604 | ) |
| Class Y | | | (1,159,136 | ) | | | (1,484,211 | ) | | | (170,622 | ) | | | (126,372 | ) | | | (412,328 | ) | | | (527,155 | ) |
| | | | (44,911,241 | ) | | | (34,378,156 | ) | | | (16,170,574 | ) | | | (13,384,478 | ) | | | (31,830,202 | ) | | | (36,992,536 | ) |
| Net increase (decrease) | | | (25,918,152 | ) | | | 15,356,357 | | | | (5,836,446 | ) | | | (1,490,294 | ) | | | (14,093,911 | ) | | | (17,674,288 | ) |
Notes to financial statements
Ivy Funds
6. Capital Shares (continued)
| | | Delaware Ivy
Value Fund |
| | | Year ended |
| | | | 3/31/23 | | | | 3/31/22 | |
| Shares sold: | | | | | | | | |
| Class A | | | 2,443,219 | | | | 2,084,012 | |
| Class B1 | | | — | | | | 978 | |
| Class C | | | 155,737 | | | | 92,758 | |
| Class I | | | 6,223,766 | | | | 11,134,048 | |
| Class R | | | 276 | | | | 288 | |
| Class R63 | | | 347,447 | | | | 503,923 | |
| Class Y | | | 1,202 | | | | 771 | |
| Shares issued upon reinvestment of dividends and distributions: | | | | | | | | |
| Class A | | | 2,997,298 | | | | 1,482,584 | |
| Class B1 | | | — | | | | 70 | |
| Class C | | | 64,817 | | | | 24,762 | |
| Class I | | | 6,217,698 | | | | 3,533,785 | |
| Class R | | | 171 | | | | 47 | |
| Class R63 | | | 526,918 | | | | 516,827 | |
| Class Y | | | 755 | | | | 229 | |
| | | | 18,979,304 | | | | 19,375,082 | |
| Shares redeemed: | | | | | | | | |
| Class A | | | (4,960,038 | ) | | | (2,590,489 | ) |
| Class B1 | | | — | | | | (24,671 | ) |
| Class C | | | (160,441 | ) | | | (155,379 | ) |
| Class I | | | (29,885,797 | ) | | | (12,359,342 | ) |
| Class R | | | (3 | ) | | | (13,915 | ) |
| Class R63 | | | (5,214,751 | ) | | | (2,018,283 | ) |
| Class Y | | | (1,728 | ) | | | (1,947 | ) |
| | | | (40,222,758 | ) | | | (17,164,026 | ) |
| Net increase (decrease) | | | (21,243,454 | ) | | | 2,211,056 | |
| 1 | On December 10, 2021, all Class B shares were converted into Class A shares. These transactions are included as subscriptions of Class A shares and redemptions of Class B shares in the tables above and on the previous page. |
| 2 | On June 13, 2022, all Class E shares were liquidated. |
| 3 | Effective July 1, 2021, Class N shares were renamed Class R6 shares. |
Certain shareholders may exchange shares of one class for shares of another class in the same Fund. These exchange transactions are included as subscriptions and redemptions in the tables above and on the previous pages and on the “Statements of changes in net assets.” For the years ended March 31, 2023 and 2022, each Fund had the following exchange transactions:
| | | Year ended March 31, 2023 | | Year Ended March 31, 2022 | |
| | | Exchange
Redemptions | | Exchange
Subscriptions | | Value | | Exchange
Redemptions | | Exchange
Subscriptions | | Value | |
| Delaware Global Value Equity Fund | | | | | | | | $ | 3,295,720 | | | | | | | | $ | 4,760,923 | |
| Class A | | | 271,660 | | | 35,662 | | | | | | 182,286 | | | 155,696 | | | | |
| Class B | | | — | | | — | | | | | | 17,998 | | | — | | | | |
| Class C | | | 34,073 | | | — | | | | | | 52,495 | | | — | | | | |
| Class I | | | 6,751 | | | 271,328 | | | | | | 85,864 | | | 182,784 | | | | |
| Class R6 | | | — | | | 4,638 | | | | | | — | | | — | | | | |
| Delaware Ivy Core Bond Fund | | | | | | | | $ | 2,900,691 | | | | | | | | $ | 2,698,177 | |
| Class A | | | 232,365 | | | 62,877 | | | | | | 76,312 | | | 171,640 | | | | |
| Class B | | | — | | | — | | | | | | 6,557 | | | — | | | | |
| Class C | | | 37,273 | | | — | | | | | | 32,175 | | | — | | | | |
| Class I | | | 31,186 | | | 231,011 | | | | | | 132,908 | | | 76,312 | | | | |
| Class R6 | | | — | | | 7,065 | | | | | | — | | | — | | | | |
| Delaware Ivy Core Equity Fund | | | | | | | | $ | 51,739,268 | | | | | | | | $ | 15,952,467 | |
| Class A | | | 3,125,978 | | | 166,321 | | | | | | 407,501 | | | 411,252 | | | | |
| Class B | | | — | | | — | | | | | | 109,798 | | | — | | | | |
| Class C | | | 211,751 | | | — | | | | | | 137,396 | | | — | | | | |
| Class E | | | — | | | — | | | | | | — | | | 90 | | | | |
| Class I | | | 39,339 | | | 2,561,919 | | | | | | 190,924 | | | 354,854 | | | | |
| Class R6 | | | — | | | 97,093 | | | | | | — | | | 1,428 | | | | |
| Delaware Ivy Global Bond Fund | | | | | | | | $ | 2,039,684 | | | | | | | | $ | 1,192,998 | |
| Class A | | | 203,533 | | | 17,954 | | | | | | 21,776 | | | 94,441 | | | | |
| Class B | | | — | | | — | | | | | | 16,015 | | | — | | | | |
| Class C | | | 16,751 | | | — | | | | | | 20,854 | | | — | | | | |
| Class I | | | 1,344 | | | 202,932 | | | | | | 57,596 | | | 21,779 | | | | |
| Class R6 | | | — | | | 748 | | | | | | — | | | — | | | | |
| Delaware Ivy Global Growth Fund | | | | | | | | $ | 7,344,087 | | | | | | | | $ | 2,800,716 | |
| Class A | | | 200,562 | | | 7,061 | | | | | | 13,736 | | | 32,498 | | | | |
| Class B | | | — | | | — | | | | | | 1,895 | | | — | | | | |
| Class C | | | 7,687 | | | — | | | | | | 7,744 | | | — | | | | |
| Class I | | | 3,336 | | | 192,677 | | | | | | 25,232 | | | 13,398 | | | | |
| Class R6 | | | — | | | 1,300 | | | | | | — | | | 1,047 | | | | |
| Delaware Ivy High Income Fund | | | | | | | | $ | 31,873,099 | | | | | | | | $ | 23,336,214 | |
| Class A | | | 2,173,088 | | | 2,568,449 | | | | | | 402,843 | | | 2,731,674 | | | | |
| Class B | | | — | | | — | | | | | | 211,898 | | | — | | | | |
| Class C | | | 2,597,510 | | | 3,959 | | | | | | 2,264,228 | | | — | | | | |
| Class I | | | 346,224 | | | 2,264,784 | | | | | | 397,751 | | | 492,440 | | | | |
| Class R6 | | | 2,575 | | | 291,646 | | | | | | — | | | 65,544 | | | | |
| Class Y | | | 7,127 | | | 742 | | | | | | 12,918 | | | — | | | | |
| Delaware Ivy International Core Equity Fund | | | | | | | | $ | 9,824,756 | | | | | | | | $ | 5,337,742 | |
| Class A | | | 262,146 | | | 178,308 | | | | | | 66,522 | | | 179,211 | | | | |
| Class B | | | — | | | — | | | | | | 12,284 | | | — | | | | |
| Class C | | | 212,712 | | | — | | | | | | 53,205 | | | — | | | | |
| Class E | | | — | | | — | | | | | | — | | | 64 | | | | |
| Class I | | | 52,475 | | | 348,394 | | | | | | 127,971 | | | 70,304 | | | | |
| Class R6 | | | 15,123 | | | 16,870 | | | | | | — | | | 5,999 | | | | |
| Class Y | | | 31,091 | | | — | | | | | | 3,604 | | | — | | | | |
| Delaware Ivy International Value Fund | | | | | | | | $ | 600,836 | | | | | | | | $ | 777,970 | |
Notes to financial statements
Ivy Funds
6. Capital Shares (continued)
| | | Year ended March 31, 2023 | | Year Ended March 31, 2022 |
| | | Exchange
Redemptions | | Exchange
Subscriptions | | Value | | Exchange
Redemptions | | Exchange
Subscriptions | | Value | |
| Class A | | | 37,159 | | | 3,183 | | | | | | 6,881 | | | 32,974 | | | | |
| Class B | | | — | | | — | | | | | | 1,320 | | | — | | | | |
| Class C | | | 2,944 | | | — | | | | | | 4,774 | | | — | | | | |
| Class I | | | 619 | | | 35,958 | | | | | | 26,697 | | | 7,687 | | | | |
| Class R6 | | | — | | | 148 | | | | | | — | | | — | | | | |
| Class Y | | | — | | | — | | | | | | 1,005 | | | — | | | | |
| Delaware Ivy Large Cap Growth Fund | | | | | | | | $ | 45,749,858 | | | | | | | | $ | 21,593,574 | |
| Class A | | | 1,560,072 | | | 154,813 | | | | | | 377,452 | | | 281,091 | | | | |
| Class B | | | — | | | — | | | | | | 51,893 | | | — | | | | |
| Class C | | | 167,743 | | | — | | | | | | 127,398 | | | — | | | | |
| Class I | | | 85,786 | | | 1,427,674 | | | | | | 143,969 | | | 352,842 | | | | |
| Class R6 | | | — | | | 62,489 | | | | | | — | | | 1,625 | | | | |
| Class Y | | | 102 | | | — | | | | | | — | | | — | | | | |
| Delaware Ivy Limited-Term Bond Fund | | | | | | | | $ | 5,212,461 | | | | | | | | $ | 3,634,750 | |
| Class A | | | 317,065 | | | 176,885 | | | | | | 121,330 | | | 207,921 | | | | |
| Class B | | | — | | | — | | | | | | 8,473 | | | — | | | | |
| Class C | | | 154,503 | | | — | | | | | | 65,202 | | | — | | | | |
| Class I | | | 26,333 | | | 311,079 | | | | | | 134,545 | | | 121,330 | | | | |
| Class R6 | | | — | | | 10,022 | | | | | | — | | | 298 | | | | |
| Delaware Ivy Managed International | | | | | | | | | | | | | | | | | | | |
| Opportunities Fund | | | | | | | | $ | 885,892 | | | | | | | | $ | 690,840 | |
| Class A | | | 73,451 | | | 9,745 | | | | | | 14,488 | | | 38,795 | | | | |
| Class B | | | — | | | — | | | | | | 3,438 | | | — | | | | |
| Class C | | | 10,866 | | | — | | | | | | 4,510 | | | — | | | | |
| Class I | | | 806 | | | 73,649 | | | | | | 30,837 | | | 14,385 | | | | |
| Class R6 | | | — | | | 748 | | | | | | — | | | — | | | | |
| Delaware Ivy Mid Cap Growth Fund | | | | | | | | $ | 42,258,437 | | | | | | | | $ | 20,579,387 | |
| Class A | | | 1,159,074 | | | 294,343 | | | | | | 227,673 | | | 260,891 | | | | |
| Class B | | | — | | | — | | | | | | 55,102 | | | — | | | | |
| Class C | | | 340,741 | | | — | | | | | | 199,097 | | | — | | | | |
| Class E | | | — | | | — | | | | | | — | | | 404 | | | | |
| Class I | | | 111,992 | | | 994,731 | | | | | | 77,725 | | | 219,165 | | | | |
| Class R6 | | | 3,624 | | | 118,397 | | | | | | — | | | 11,997 | | | | |
| Class Y | | | 1,843 | | | — | | | | | | 7,926 | | | — | | | | |
| Delaware Ivy Mid Cap Income | | | | | | | | | | | | | | | | | | | |
| Opportunities Fund | | | | | | | | $ | 14,172,200 | | | | | | | | $ | 3,391,009 | |
| Class A | | | 178,065 | | | 35,619 | | | | | | 87,731 | | | 58,934 | | | | |
| Class C | | | 57,991 | | | — | | | | | | 47,674 | | | — | | | | |
| Class I | | | 424,756 | | | 346,583 | | | | | | 25,680 | | | 103,007 | | | | |
| Class R6 | | | — | | | 402,002 | | | | | | — | | | 12,492 | | | | |
| Class Y | | | 151,733 | | | 27,372 | | | | | | 13,993 | | | 164 | | | | |
| Delaware Ivy Municipal Bond Fund | | | | | | | | $ | 4,487,454 | | | | | | | | $ | 2,850,297 | |
| Class A | | | 400,917 | | | 20,510 | | | | | | 127,857 | | | 110,332 | | | | |
| Class B | | | — | | | — | | | | | | 7,432 | | | — | | | | |
| Class C | | | 19,741 | | | — | | | | | | 39,617 | | | — | | | | |
| Class I | | | 8,633 | | | 396,265 | | | | | | 63,283 | | | 127,857 | | | | |
| Class R6 | | | — | | | 12,653 | | | | | | — | | | — | | | | |
| Delaware Ivy Municipal High Income Fund | | | | | | | | $ | 6,162,072 | | | | | | | | $ | 2,927,239 | |
| | | Year ended March 31, 2023 | | Year Ended March 31, 2022 |
| | | Exchange
Redemptions | | Exchange
Subscriptions | | Value | | Exchange
Redemptions | | Exchange
Subscriptions | | Value | |
| Class A | | | 867,086 | | | 346,702 | | | | | | 239,935 | | | 313,057 | | | | |
| Class B | | | — | | | — | | | | | | 32,419 | | | — | | | | |
| Class C | | | 397,700 | | | — | | | | | | 239,636 | | | — | | | | |
| Class I | | | 97,283 | | | 929,019 | | | | | | 68,335 | | | 261,267 | | | | |
| Class R6 | | | — | | | 96,441 | | | | | | — | | | — | | | | |
| Class Y | | | 9,661 | | | — | | | | | | — | | | — | | | | |
| Delaware Ivy Small Cap Growth Fund | | | | | | | | $ | 19,282,180 | | | | | | | | $ | 8,598,975 | |
| Class A | | | 1,309,874 | | | 155,193 | | | | | | 147,771 | | | 223,726 | | | | |
| Class B | | | — | | | — | | | | | | 63,374 | | | — | | | | |
| Class C | | | 268,714 | | | — | | | | | | 186,859 | | | — | | | | |
| Class E | | | — | | | — | | | | | | — | | | 747 | | | | |
| Class I | | | 8,292 | | | 844,551 | | | | | | 56,351 | | | 113,185 | | | | |
| Class R6 | | | — | | | 4,612 | | | | | | — | | | 2,572 | | | | |
| Class Y | | | 59,775 | | | — | | | | | | 251 | | | 109 | | | | |
| Delaware Ivy Smid Cap Core Fund | | | | | | | | $ | 4,687,942 | | | | | | | | $ | 2,542,339 | |
| Class A | | | 179,334 | | | 37,637 | | | | | | 39,918 | | | 64,787 | | | | |
| Class B | | | — | | | — | | | | | | 12,804 | | | — | | | | |
| Class C | | | 94,833 | | | — | | | | | | 53,839 | | | — | | | | |
| Class I | | | 38,510 | | | 193,627 | | | | | | 16,906 | | | 42,682 | | | | |
| Class R6 | | | — | | | 35,849 | | | | | | — | | | 933 | | | | |
| Class Y | | | 402 | | | — | | | | | | — | | | — | | | | |
| Delaware Ivy Systematic Emerging Markets Equity Fund | | | | | | | | $ | 6,353,727 | | | | | | | | $ | 3,521,919 | |
| Class A | | | 216,275 | | | 51,246 | | | | | | 49,114 | | | 65,592 | | | | |
| Class B | | | — | | | — | | | | | | 5,963 | | | — | | | | |
| Class C | | | 49,960 | | | — | | | | | | 24,045 | | | — | | | | |
| Class I | | | 68,143 | | | 224,215 | | | | | | 40,778 | | | 58,690 | | | | |
| Class R6 | | | — | | | 43,046 | | | | | | — | | | — | | | | |
| Class Y | | | — | | | — | | | | | | 9,687 | | | — | | | | |
| Delaware Ivy Value Fund | | | | | | | | $ | 8,647,748 | | | | | | | | $ | 3,641,213 | |
| Class A | | | 315,332 | | | 30,511 | | | | | | 34,259 | | | 97,491 | | | | |
| Class B | | | — | | | — | | | | | | 9,508 | | | — | | | | |
| Class C | | | 27,532 | | | — | | | | | | 18,161 | | | — | | | | |
| Class I | | | 7,270 | | | 313,977 | | | | | | 71,243 | | | 34,076 | | | | |
| Class R6 | | | — | | | 2,108 | | | | | | — | | | — | | | | |
7. Basis of consolidation for Delaware Ivy Systematic Emerging Markets Equity Fund
Delaware Ivy EME, Ltd. (the Subsidiary), a Cayman Islands exempted company, was incorporated as a wholly owned subsidiary acting as an investment vehicle for Delaware Ivy Systematic Emerging Markets Equity Fund (referred to as the Fund in this subsection). The Subsidiary acts as an investment vehicle for the Fund, in order to affect certain investments for the Fund consistent with the Fund’s investment objectives and policies as specified in its prospectus and SAI. The Fund’s investment portfolio has been consolidated and includes the portfolio holdings of the Fund and its Subsidiary. The consolidated financial statements include the accounts of the Fund and its Subsidiary. All inter-company transactions and balances have been eliminated. A subscription agreement was entered into between the Fund and its Subsidiary comprising the entire issued share capital of the Subsidiary with the intent that the Fund will remain the sole shareholder and retain all rights. Under the Articles of Association, shares issued by the Subsidiary confer upon a shareholder the right to receive notice of, to attend and to vote at general meetings of the Subsidiary and the Fund and shall confer upon the shareholder rights in a winding-up or repayment of capital and the right to participate in the profits or assets of the Subsidiary and the Fund.
Notes to financial statements
Ivy Funds
7. Basis of consolidation for Delaware Ivy Systematic Emerging Markets Equity Fund (continued)
See the table below for details regarding the structure, incorporation and relationship as of March 31, 2023 of the Subsidiary and the company to the Fund.
| | | Date of
Incorporation | | Subscription
Agreement | | | Fund Net Assets | | | | Subsidiary/ company
net assets | | | | Percentage
of Fund net assets | |
| Ivy EME, Ltd. | | 1-31-13 | | 4-10-13 | | $ | 914,389,981 | | | $ | 315,585 | | | | 0.03 | % |
8. Line of Credit
Each Fund, along with certain other funds in the Delaware Funds (Participants), was a participant in a $355,000,000 revolving line of credit (Agreement) intended to be used for temporary or emergency purposes as an additional source of liquidity to fund redemptions of investor shares. Under the Agreement, the Participants were charged an annual commitment fee of 0.15%, which was allocated across the Participants based on a weighted average of the respective net assets of each Participant. The Participants were permitted to borrow up to a maximum of one-third of their net assets under the Agreement. Each Participant was individually, and not jointly, liable for its particular advances, if any, under the line of credit. The line of credit available under the Agreement expired on October 31, 2022.
On October 31, 2022, each Fund, along with the other Participants, entered into an amendment to the Agreement for a $355,000,000 revolving line of credit to be used as described above. It operates in substantially the same manner as the original Agreement. Under the amendment to the Agreement, the Participants are charged an annual commitment fee of 0.15%, which is allocated across the Participants based on a weighted average of the respective net assets of each Participant. The line of credit available under the Agreement expires on October 30, 2023.
Each Fund had no amounts outstanding as of March 31, 2023, or at any time during the year then ended.
9. Interfund Lending Program
Pursuant to an exemptive order issued by the SEC (Order), the Ivy Funds and Ivy Variable Insurance Portfolios (collectively, the Funds, only for purposes of this Note 9) have the ability to lend money to, and borrow money from, each other pursuant to a master interfund lending agreement (Interfund Lending Program). Under the Interfund Lending Program, the Funds may lend or borrow money for temporary purposes directly to or from one another (each, an Interfund Loan), subject to meeting the conditions of the Order. The interest rate to be charged on an Interfund Loan is the average of the overnight repurchase agreement rate and the short-term bank loan rate. This program is in existence but is not currently in use. The Funds made no Interfund Loans under the Interfund Lending Program during the year ended March 31, 2023.
10. Derivatives
US GAAP requires disclosures that enable investors to understand: (1) how and why an entity uses derivatives; (2) how they are accounted for; and (3) how they affect an entity’s results of operations and financial position.
Foreign Currency Exchange Contracts — Each Fund may enter into foreign currency exchange contracts and foreign cross currency exchange contracts as a way of managing foreign exchange rate risk. Each Fund may enter into these contracts to fix the US dollar value of a security that it has agreed to buy or sell for the period between the date the trade was entered into and the date the security is delivered and paid for. Each Fund may also enter into these contracts to hedge the US dollar value of securities it already owns that are denominated in foreign currencies. In addition, each Fund may enter into these contracts to facilitate or expedite the settlement of portfolio transactions. The change in value is recorded as an unrealized gain or loss. When the contract is closed, a realized gain or loss is recorded equal to the difference between the value of the contract at the time it was opened and the value at the time it was closed.
The use of foreign currency exchange contracts and foreign cross currency exchange contracts does not eliminate fluctuations in the underlying prices of the securities, but does establish a rate of exchange that can be achieved in the future. Although foreign currency exchange contracts and foreign cross currency exchange contracts limit the risk of loss due to an unfavorable change in the value of the hedged currency, they also limit any potential gain that might result should the value of the currency change favorably. In addition, each Fund could be exposed to risks if the counterparties to the contracts are unable to meet the terms of their contracts. Each Fund’s maximum risk of loss from counterparty credit
risk is the value of its currency exchanged with the counterparty. The risk is generally mitigated by having a netting arrangement between each Fund and the counterparty and by the posting of collateral by the counterparty to the Funds to cover each Fund's exposure to the counterparty. Open foreign currency exchange contracts, if any, are disclosed on the "Schedules of investments." At March 31, 2023, Delaware Ivy Global Bond Fund posted $260,000 in cash and received $270,000 in cash and $318,000 in securities as collateral for foreign currency exchange contracts. Cash collateral posted and received is presented as "Cash collateral due from brokers" and "Cash collateral due to brokers", respectively on the "Statements of assets and liabilities." At March 31, 2023, Delaware Ivy High Income Fund received $207,000 in securities as collateral for foreign currency exchange contracts.
During the year ended March 31, 2023, Delaware Ivy Global Bond Fund used foreign currency exchange contracts to hedge the US dollar value of securities it already owns that are denominated in foreign currencies to increase/decrease exposure to foreign currencies and to facilitate or expedite the settlement of portfolio transactions.
During the year ended March 31, 2023, Delaware Global Value Equity Fund and Delaware Ivy International Value Fund used foreign currency exchange contracts to fix the US dollar value of a security between trade date and settlement date.
During the year ended March 31, 2023, Delaware Ivy High Income Fund used foreign currency exchange contracts to hedge the U.S. dollar value of securities it already owns that are denominated in foreign currencies to increase/decrease exposure to foreign currencies.
During the year ended March 31, 2023, Delaware Ivy Global Growth Fund, Delaware Ivy International Core Equity Fund, Delaware Ivy Large Cap Growth Fund and Delaware Ivy Systematic Emerging Markets Equity Fund used foreign currency exchange contracts to facilitate or expedite the settlement of portfolio transactions.
During the year ended March 31, 2023, Delaware Global Value Equity Fund, Delaware Ivy Global Growth Fund, Delaware Ivy High Income Fund, Delaware Ivy International Core Equity Fund, Delaware Ivy International Value Fund, Delaware Ivy Large Cap Growth Fund and Delaware Ivy Systematic Emerging Markets Equity Fund experienced net realized and unrealized gains or losses attributable to foreign currency exchange contracts, which are disclosed on the “Statements of operations" and/or "Statements of assets and liabilities.”
Futures Contracts — A futures contract is an agreement in which the writer (or seller) of the contract agrees to deliver to the buyer an amount of cash or securities equal to a specific dollar amount times the difference between the value of a specific security or index at the close of the last trading day of the contract and the price at which the agreement is made. The Funds may use futures in the normal course of pursuing its investment objective. The Funds may invest in futures contracts to hedge its existing portfolio securities against fluctuations in fair value caused by changes in prevailing market interest rates. Upon entering into a futures contract, the Funds deposit cash or pledge US government securities to a broker, equal to the minimum “initial margin” requirements of the exchange on which the contract is traded. Subsequent payments are received from the broker or paid to the broker each day, based on the daily fluctuation in the market value of the contract. These receipts or payments are known as “variation margin” and are recorded daily by the Funds as unrealized gains or losses until the contracts are closed. When the contracts are closed, the Funds record a realized gain or loss equal to the difference between the value of the contract at the time it was opened and the value at the time it was closed. Risks of entering into futures contracts include potential imperfect correlation between the futures contracts and the underlying securities and the possibility of an illiquid secondary market for these instruments. When investing in futures, there is reduced counterparty credit risk to the Funds because futures are exchange-traded and the exchange’s clearinghouse, as counterparty to all exchange-traded futures, guarantees against default. At March 31, 2023, Delaware Ivy Global Bond Fund, Delaware Ivy Limited-Term Bond Fund and Delaware Ivy Core Bond Fund posted $3,570,999, $519,420 and 1,132,560 respectively, cash collateral as margin for open futures contracts, which is included in "Cash collateral due to brokers" on the "Statements of assets and liabilities". Open futures contracts, if any, are disclosed on the "Schedules of investments."
During the year ended March 31, 2023, Delaware Ivy Global Bond Fund invested in futures contracts to hedge the Fund’s existing portfolio securities against fluctuations in value caused by changes in interest rates or market conditions and to reduce transaction costs.
During the year ended March 31, 2023, Delaware Ivy Core Bond Fund and Delaware Ivy Limited-Term Bond Fund invested in futures contracts to hedge the Fund’s existing portfolio securities against fluctuations in value caused by changes in interest rates or market conditions.
Options Contracts — Each Fund may enter into options contracts in the normal course of pursuing its investment objective. Each Fund may buy or write options contracts for any number of reasons, including without limitation: to manage each Fund’s exposure to changes in securities prices caused by interest rates or market conditions and foreign currencies; as an efficient means of adjusting each Fund’s overall exposure to
Notes to financial statements
Ivy Funds
10. Derivatives (continued)
certain markets; to protect the value of portfolio securities; and as a cash management tool. Each Fund may buy or write call or put options on securities, futures, swaps, swaptions, financial indices, and foreign currencies. When each Fund buys an option, a premium is paid and an asset is recorded and adjusted on a daily basis to reflect the current market value of the option purchased. When each Fund writes an option, a premium is received and a liability is recorded and adjusted on a daily basis to reflect the current market value of the option written. Premiums received from writing options that expire unexercised are treated by each Fund on the expiration date as realized gains. The difference between the premium received and the amount paid on effecting a closing purchase transaction, including brokerage commissions, is treated as realized gain or loss. If a call option is exercised, the premium is added to the proceeds from the sale of the underlying security in determining whether each Fund has a realized gain or loss. If a put option is exercised, the premium reduces the cost basis of the securities purchased by each Fund. Each Fund, as writer of an option, bears the market risk of an unfavorable change in the price of the security underlying the written option. When writing options, each Fund is subject to minimal counterparty risk because the counterparty is only obligated to pay premiums and does not bear the market risk of an unfavorable market change. At March 31, 2023, Delaware Ivy Mid Cap Growth Fund posted $137,817,782 in securities as collateral for open options contracts, which is included on the "Schedules of investments."
During the year ended March 31, 2023, Delaware Ivy Core Bond Fund used options contracts to manage the Fund's exposure to changes in securities prices caused by interest rates or market conditions.
During the year ended March 31, 2023, Delaware Ivy Global Bond Fund used options contracts to manage the Fund's exposure to changes in securities prices caused by interest rates or market conditions, to manage the Fund's exposure to changes in foreign currencies, to adjust the Fund's overall exposure to certain markets and to offset capital losses.
During the year ended March 31, 2023, Delaware Ivy Mid Cap Growth Fund used options contracts to facilitate investments in portfolio securities.
During the year ended March 31, 2023, Delaware Ivy Value Fund used options contracts to receive premiums for writing options.
During the year ended March 31, 2023, Delaware Ivy Mid Cap Growth Fund and Delaware Ivy Value Fund experienced net realized and unrealized gains or losses attributable to options contracts, which are disclosed on the “Statements of operations" and/or "Statements of assets and liabilities.”
Swap Contracts — Certain Funds enter into CDS contracts in the normal course of pursuing its investment objective. The Fund entered into CDS contracts in order to hedge against a credit event and to gain exposure to certain securities or markets. The Fund will not be permitted to enter into any swap transactions unless, at the time of entering into such transactions, the unsecured long-term debt of the actual counterparty, combined with any credit enhancements, is rated at least BBB- by Standard & Poor’s Financial Services LLC (S&P) or Baa3 by Moody’s Investors Service, Inc. (Moody’s) or is determined to be of equivalent credit quality by DMC.
Credit Default Swaps. A CDS contract is a risk-transfer instrument through which one party (purchaser of protection) transfers to another party (seller of protection) the financial risk of a credit event (as defined in the CDS agreement), as it relates to a particular reference security or basket of securities (such as an index). In exchange for the protection offered by the seller of protection, the purchaser of protection agrees to pay the seller of protection a periodic amount at a stated rate that is applied to the notional amount of the CDS contract. In addition, an upfront payment may be made or received by the Fund in connection with an unwinding or assignment of a CDS contract. In addition, an upfront payment may be made or received by the Fund in connection with an unwinding or assignment of a CDS contract. Upon the occurrence of a credit event, the seller of protection would pay the par (or other agreed-upon) value of the reference security (or basket of securities) to the counterparty. Credit events generally include, among others, bankruptcy, failure to pay, and obligation default.
During the year ended March 31, 2023, Delaware Ivy Core Bond Fund, Delaware Ivy Global Bond Fund and Delaware Ivy Limited-Term Bond Fund entered into CDS contracts as a purchaser and seller of protection, as a hedge against credit events. Periodic payments (receipts) on such contracts are accrued daily and recorded as unrealized losses (gains) on swap contracts. Upon payment (receipt), such amounts are recorded as realized losses (gains) on swap contracts. Upfront payments made or received in connection with CDS contracts are amortized over the expected life of the CDS contracts as unrealized losses (gains) on swap contracts. The change in value of CDS contracts is recorded daily as unrealized appreciation or depreciation. A realized gain or loss is recorded upon a credit event (as defined in the CDS agreement) or the maturity or termination of the agreement. Initial margin and variation margin are posted to central counterparties for centrally cleared CDS basket trades, as determined by the applicable central counterparty.
CDS contracts may involve greater risks than if the Fund had invested in the reference obligation directly. CDS contracts are subject to general market risk, liquidity risk, counterparty risk, and credit risk. The Fund’s maximum risk of loss from counterparty credit risk, either as the seller of protection or the buyer of protection, is the fair value of the contract. This risk is mitigated by (1) for bilateral swap contracts, having a netting arrangement between the Fund and the counterparty and by the posting of collateral by the counterparty to the Fund to cover the Fund’s exposure to the counterparty, and (2) for cleared swaps, trading these instruments through a central counterparty.
During the year ended March 31, 2023, Delaware Ivy Core Bond Fund and Delaware Ivy Limited-Term Bond Fund used CDS contracts to gain exposure to certain securities or markets.
During the year ended March 31, 2023, Delaware Ivy Global Bond Fund used CDS contracts to hedge against credit events.
Interest Rate Swaps. An interest rate swap contract is an exchange of interest rates between counterparties. In one instance, an interest rate swap involves payments received by Delaware Ivy Global Bond Fund from another party based on a variable or floating interest rate, in return for making payments based on a fixed interest rate. An interest rate swap can also work in reverse with the Fund receiving payments based on a fixed interest rate and making payments based on a variable or floating interest rate. Interest rate swaps may be used to adjust the Fund’s sensitivity to interest rates or to hedge against changes in interest rates. Periodic payments on such contracts are accrued daily and recorded as unrealized appreciation (depreciation) on swap contracts. Upon periodic payment (receipt) or termination of the contract, such amounts are recorded as realized gains or losses on swap contracts. The Fund’s maximum risk of loss from counterparty credit risk is the discounted net value of the cash flows to be received from/paid to the counterparty over the interest rate swap contract’s remaining life, to the extent that the amount is positive. This risk is mitigated by (1) for bilateral swap contracts, having a netting arrangement between the Fund and the counterparty and by the posting of collateral by the counterparty to the Fund to cover the Fund’s exposure to the counterparty and (2) for cleared swaps, trading these instruments through a central counterparty. No interest rate swap contracts were open at the year ended March 31, 2023.
During the year ended March 31, 2023, Delaware Ivy Global Bond Fund used interest rate swap contracts to manage the Fund’s sensitivity to interest rates or to hedge against changes in interest rates.
Swaps Generally. For centrally cleared swaps, payments are received from the broker or paid to the broker each day, based on the daily fluctuation in the market value of the contract. These receipts or payments are known as “variation margin” and are recorded by the Fund as unrealized gains or losses until the contracts are closed. When the contracts are closed, the Fund records a realized gain or loss equal to the difference between the value of the contract at the time it was opened and the value at the time it was closed. The value of open swaps may differ from that which would be realized in the event the Fund terminated its position in the contract on a given day. Risks of entering into these contracts include the potential inability of the counterparty to meet the terms of the contracts. This type of risk is generally limited to the amount of favorable movement in the value of the underlying security, instrument or basket of instruments, if any, at the day of default. Risks also arise from potential losses from adverse market movements and such losses could exceed the unrealized amounts shown on the “Schedules of investments.”
At March 31, 2023, for bilateral derivative contracts, Delaware Ivy Core Bond Fund posted $499,866 cash collateral for certain centrally cleared derivatives, which is included in “Cash collateral due from brokers” on the “Statements of assets and liabilities.”
Fair values of derivative instruments as of March 31, 2023 were as follows:
| | | Delaware Ivy Core Bond Fund
Asset Derivatives Fair Value |
Statement of Assets and
Liabilities Location | | | Interest
Rate
Contracts | | | Credit
Contracts | | | Total | |
| Variation margin due from broker on futures contracts* | | $ | 1,483,261 | | $ | — | | $ | 1,483,261 | |
| Variation margin due from brokers on centrally cleared credit default swap contracts* | | | — | | | 110,612 | | | 110,612 | |
| Total | | $ | 1,483,261 | | $ | 110,612 | | $ | 1,593,873 | |
Notes to financial statements
Ivy Funds
10. Derivatives (continued)
| | | Delaware Ivy Global Bond Fund
Asset Derivatives Fair Value |
Statements of Assets and
Liabilities Location | | Currency Contracts | | | Interest
Rate
Contracts | | | Credit Contracts | | | Total | |
| Unrealized appreciation on foreign currency exchange contracts | | $ | 1,068,546 | | | $ | — | | | $ | — | | | $ | 1,068,546 | |
| Variation margin due from broker on futures contracts* | | | — | | | | 2,287,347 | | | | — | | | | 2,287,347 | |
| Options purchased, at value** | | | 10,734 | | | | — | | | | 767,848 | | | | 778,582 | |
| Total | | $ | 1,079,280 | | | $ | 2,287,347 | | | $ | 767,848 | | | $ | 4,134,475 | |
| | | |
| | | Delaware Ivy Global Bond Fund
Liability Derivatives Fair Value |
Statements of Assets and
Liabilities Location | | Currency
Contracts | | | Interest
Rate
Contracts | | | Credit
Contracts | | | Total | |
| Unrealized depreciation on foreign currency exchange contracts | | $ | (481,184 | ) | | $ | — | | | $ | — | | | $ | (481,184 | ) |
| Variation margin due from broker on futures contracts* | | | — | | | | (1,422,994 | ) | | | — | | | | (1,422,994 | ) |
| Options written, at value | | | (1,786 | ) | | | — | | | | (546,307 | ) | | | (548,093 | ) |
| Total | | $ | (482,970 | ) | | $ | (1,422,994 | ) | | $ | (546,307 | ) | | $ | (2,452,271 | ) |
| | | | |
| | | Delaware Ivy
Limited-Term
Bond Fund
Asset
Derivatives Fair
Value | |
Statement of Assets and
Liabilities Location | | Interest
Rate
Contracts | |
| Variation margin due from broker on futures contracts* | | $ | 763,128 | |
| | | | | |
| | | Delaware Ivy
Limited-Term
Bond Fund
Liability
Derivatives Fair
Value | |
Statement of Assets and
Liabilities Location | | Interest
Rate
Contracts | |
| Variation margin due from broker on futures contracts* | | $ | (54,244 | ) |
| * | Includes cumulative appreciation (depreciation) of futures contracts from the date the contracts were opened through March 31, 2023. Only current day variation margin is reported on the Fund's "Statements of assets and liabilities." |
| | |
| ** | Included with Investments, at value. |
The effect of derivative instruments on the Fund's “Statements of operations” for the year ended March 31, 2023 was as follows:
| Delaware Ivy Core Bond Fund | | Net Realized Gain (loss) on: |
| | | Futures
Contracts | | | Options
Purchased | | | Swap
Contracts | | | Total | |
| Interest rate contracts | | $ | (5,691,004 | ) | | $ | — | | | $ | — | | | $ | (5,691,004 | ) |
| Equity contracts | | | — | | | | (142,363 | ) | | | — | | | | (142,363 | ) |
| Credit contracts | | | — | | | | — | | | | 161 | | | | 161 | |
| Total | | $ | (5,691,004 | ) | | $ | (142,363 | ) | | $ | 161 | | | $ | (5,833,206 | ) |
| | | |
| | | Net Change in Unrealized Appreciation (Depreciation) on: |
| | | Futures
Contracts | | | Swap
Contracts | | | Total | |
| Interest rate contracts | | $ | 4,108,445 | | | $ | — | | | $ | 4,108,445 | |
| Credit contracts | | | — | | | | 113,882 | | | | 113,882 | |
| Total | | $ | 4,108,445 | | | $ | 113,882 | | | $ | 4,222,327 | |
| Delaware Ivy Global Bond Fund | | Net Realized Gain (loss) on: |
| | | Foreign
Currency
Exchange
Contracts | | | Futures
Contracts | | | Options
Purchased | | | Options
Written | | | Swap
Contracts | | | Total | |
| Currency contracts | | $ | (792,109 | ) | | $ | 6,937,799 | | | $ | (580,878 | ) | | $ | 224,810 | | | $ | — | | | $ | 5,789,622 | |
| Interest rate contracts | | | — | | | | (5,328,486 | ) | | | (191,240 | ) | | | 512,907 | | | | — | | | | (5,006,819 | ) |
| Credit contracts | | | — | | | | — | | | | 161,351 | | | | 201,505 | | | | (259,233 | ) | | | 103,623 | |
| Total | | $ | (792,109 | ) | | $ | 1,609,313 | | | $ | (610,767 | ) | | $ | 939,222 | | | $ | (259,233 | ) | | $ | 886,426 | |
| | | Net Change in Unrealized Appreciation (Depreciation) on: |
| | | Foreign
Currency
Exchange
Contracts | | | Futures
Contracts | | | Options
Purchased | | | Options
Written | | | Swap
Contracts | | | Total | |
| Currency contracts | | $ | (479,460 | ) | | $ | (24,042 | ) | | $ | (557,255 | ) | | $ | 343,929 | | | $ | — | | | $ | (716,828 | ) |
| Interest rate contracts | | | — | | | | 671,391 | | | | — | | | | — | | | | — | | | | 671,391 | |
| Credit contracts | | | — | | | | — | | | | 105,868 | | | | 28,861 | | | | 8,146 | | | | 142,875 | |
| Total | | $ | (479,460 | ) | | $ | 647,349 | | | $ | (451,387 | ) | | $ | 372,790 | | | $ | 8,146 | | | $ | 97,438 | |
Notes to financial statements
Ivy Funds
10. Derivatives (continued)
| Delaware Ivy Limited-Term Bond Fund | | Net Realized Gain (loss) on: |
| | | Futures
Contracts | | | Swap
Contracts | | | Total | |
| Interest rate contracts | | $ | (4,885,500 | ) | | $ | — | | | $ | (4,885,500 | ) |
| Credit contracts | | | — | | | | 234,901 | | | | 234,901 | |
| Total | | $ | (4,885,500 | ) | | $ | 234,901 | | | $ | (4,650,599 | ) |
| | | |
| | | Net Change in
Unrealized
Appreciation
(Depreciation)
on: |
| | | Futures
Contracts |
| Interest rate contracts | | $ | 1,270,194 | |
The tables below summarizes the average daily balance of derivative holdings by certain Funds during the year ended March 31, 2023:
| | | Long Derivative Volume |
| | | Delaware
Global Value
Equity Fund | | | Delaware Ivy
Core Bond Fund | |
| Foreign currency exchange contracts (average notional value) | | $ | 211,330 | | | $ | — | |
| Futures contracts (average notional value) | | | — | | | | 73,847,928 | |
| Options contracts (average notional value)* | | | — | | | | 939 | |
| Interest rate swap contracts (average notional value) | | | — | | | | 112,351 | |
| | | Long Derivative Volume |
| | | Delaware Ivy
Global Bond Fund | | | Delaware Ivy
Global Growth Fund | | | Delaware Ivy
High Income Fund | |
| Foreign currency exchange contracts (average notional value) | | $ | 17,811,036 | | | $ | 404,402 | | | $ | 271,307 | |
| Futures contracts (average notional value) | | | 471,179,471 | | | | — | | | | — | |
| Options contracts (average notional value)* | | | 395,339 | | | | — | | | | — | |
| CDS contracts (average notional value)** | | | 10,509,562 | | | | — | | | | — | |
| | | Long Derivative Volume | |
| | | Delaware Ivy
International
Core Equity Fund | | | Delaware Ivy
International Value Fund | |
| Foreign currency exchange contracts (average notional value) | | $ | 1,475,898 | | | $ | 113,904 | |
| | | | | | | | |
| | | | | | | Long Derivative Volume | |
| | | | | | | Delaware Ivy
Limited-Term Bond Fund | |
| Futures contracts (average notional value) | | | | | | | 119,335,377 | |
| | | | | | | | |
| | | | | | | Long Derivative Volume | |
| | | | | | | Delaware Ivy
Systematic Emerging
Markets Equity Fund | |
| Foreign currency exchange contracts (average notional value) | | | | | | $ | 1,002,161 | |
| | | Short Derivative Volume |
| | | Delaware
Global Value
Equity Fund | | Delaware Ivy
Core Bond Fund | |
| Foreign currency exchange contracts (average notional value) | | $ | 568,147 | | $ | — | |
| Futures contracts (average notional value) | | | — | | | 13,365,768 | |
| | | | | | | | |
| | | Short Derivative Volume |
| | | Delaware Ivy
Global Bond Fund | | Delaware Ivy
Global Growth Fund | | Delaware Ivy
High Income Fund | |
| Foreign currency exchange contracts (average notional value) | | $ | 79,558,090 | | $ | 605,746 | | $ | 30,443,247 | |
| Futures contracts (average notional value) | | | 212,425,704 | | | — | | | — | |
| Options contracts (average notional value)* | | | 269,114 | | | — | | | — | |
| | | Short Derivative Volume |
| | | Delaware Ivy
International Core
Equity Fund | | Delaware Ivy
International Value
Fund | |
| Foreign currency exchange contracts (average notional value) | | $ | 3,260,517 | | $ | 342,443 | |
| | | Short Derivative Volume |
| | | Delaware Ivy
Limited-Term Bond Fund | | Delaware Ivy
Mid Cap Growth Fund | |
| Futures contracts (average notional value) | | | 28,580,451 | | | — | |
| Options contracts (average notional value)* | | | — | | | 2,129,737 | |
| Interest rate swap contracts (average notional value) | | AUD | 423,136 | | AUD | — | |
| | Short Derivative Volume
Delaware Ivy
Systematic Emerging
Markets Equity Fund |
| Foreign currency exchange contracts (average notional value) | | $ | 1,176,459 | |
| | | | |
| | Short Derivative Volume | |
| | Delaware Ivy Value Fund | |
| Options contracts (average notional value)* | | | 310,306 | |
| | |
| * | Long represents purchased options and short represents written options. |
| | |
| ** | Long represents buying protection and short represents selling protection. |
Notes to financial statements
Ivy Funds
11. Offsetting
Certain Funds entered into an International Swaps and Derivatives Association, Inc. Master Agreement (ISDA Master Agreement) or a similar agreement with certain of its derivative contract counterparties in order to better define its contractual rights and to secure rights that will help certain Funds mitigate its counterparty risk. An ISDA Master Agreement is a bilateral agreement between certain Funds and a counterparty that governs over-the-counter (OTC) derivatives and foreign exchange contracts and typically contains, among other things, collateral posting items and netting provisions in the event of a default and/or termination event. Under an ISDA Master Agreement, certain Funds may, under certain circumstances, offset with the counterparty certain derivative financial instruments’ payables and/or receivables with collateral held and/or posted and create one single net payment. The provisions of the ISDA Master Agreement typically permit a single net payment in the event of default (close-out), including the bankruptcy or insolvency of the counterparty. However, bankruptcy or insolvency laws of a particular jurisdiction may impose restrictions on or prohibitions against the right of offset in bankruptcy, insolvency, or other events.
For financial reporting purposes, certain Funds do not offset derivative assets and derivative liabilities that are subject to netting arrangements on the “Statements of assets and liabilities.”
At March 31, 2023, certain Funds had the following assets and liabilities subject to offsetting provisions:
Offsetting of Financial Assets and Liabilities and Derivative Assets and Liabilities
| Delaware Ivy Global Bond Fund | | | | | | |
| Counterparty | | Gross Value of
Derivative Asset | | Gross Value of
Derivative
Liability | | Net Position |
| BNP Paribas | | $ | 134,729 | | | $ | — | | | $ | 134,729 | |
| JPMorgan Chase Bank | | | 1,049,803 | | | | (1,093,241 | ) | | | (43,438 | ) |
| TD Bank | | | 432,124 | | | | (165,831 | ) | | | 266,293 | |
| Total | | $ | 1,616,656 | | | $ | (1,259,072 | ) | | $ | 357,584 | |
| Counterparty | | Net Position | | Fair Value of
Non-Cash
Collateral Received(a) | | Cash Collateral
Received | | Fair Value of
Non-Cash
Collateral Pledged | | Cash Collateral
Pledged | | Net Exposure(b) |
| BNP Paribas | | $ | 134,729 | | | $ | (134,729 | ) | | $ | — | | | $ | — | | | $ | — | | | $ | — | |
| JPMorgan Chase Bank | | | (43,438 | ) | | | — | | | | — | | | | — | | | | — | | | | (43,438 | ) |
| TD Bank | | | 266,293 | | | | — | | | | — | | | | — | | | | — | | | | 266,293 | |
| Total | | $ | 357,584 | | | $ | (134,729 | ) | | $ | — | | | $ | — | | | $ | — | | | $ | 222,855 | |
| Delaware Ivy High Income Fund | | | | | | |
| Counterparty | | Gross Value of
Derivative Asset | | Gross Value of
Derivative
Liability | | Net Position |
| TD Bank | | $ | 60,529 | | | $ | — | | | $ | 60,529 | |
| Counterparty | | Net Position | | Fair Value of
Non-Cash
Collateral Received(a) | | Cash Collateral
Received | | Fair Value of
Non-Cash
Collateral Pledged | | Cash Collateral
Pledged | | Net Exposure(b) |
| TD Bank | | $ | 60,529 | | | $ | (60,529 | ) | | $ | — | | | $ | — | | | $ | — | | | $ | — | |
(a) The value of the related collateral exceeded the value of the derivatives, repurchase agreements, and securities lending transactions as of March 31, 2023, as applicable.
(b) Net exposure represents the receivable (payable) that would be due from (to) the counterparty in the event of default.
12. Securities Lending
Each Fund, along with other funds in the Delaware Funds, may lend its securities pursuant to a security lending agreement (Lending Agreement) with The Bank of New York Mellon (BNY Mellon). At the time a security is loaned, the borrower must post collateral equal to the required percentage of the market value of the loaned security, including any accrued interest. The required percentage is: (1) 102% with respect to US securities and foreign securities that are denominated and payable in US dollars; and (2) 105% with respect to foreign securities. With respect to each loan, if on any business day the aggregate market value of securities collateral plus cash collateral held is less than the aggregate market value of the securities which are the subject of such loan, the borrower will be notified to provide additional collateral by the end of the following business day, which, together with the collateral already held, will be not less than the applicable initial collateral requirements for such security loan. If the aggregate market value of securities collateral and cash collateral held with respect to a security loan exceeds the applicable initial collateral requirement, upon the request of the borrower, BNY Mellon must return enough collateral to the borrower by the end of the following business day to reduce the value of the remaining collateral to the applicable initial collateral requirement for such security loan. As a result of the foregoing, the value of the collateral held with respect to a loaned security on any particular day, may be more or less than the value of the security on loan. The collateral percentage with respect to the market value of the loaned security is determined by the security lending agent.
Cash collateral received by each Fund of the Trust is generally invested in a series of individual separate accounts, each corresponding to a fund. The investment guidelines permit each separate account to hold certain securities that would be considered eligible securities for a money market fund. Cash collateral received is generally invested in government securities; certain obligations issued by government sponsored enterprises; repurchase agreements collateralized by US Treasury securities; obligations issued by the central government of any Organization for Economic Cooperation and Development (OECD) country or its agencies, instrumentalities, or establishments; obligations of supranational organizations; commercial paper, notes, bonds, and other debt obligations; certificates of deposit, time deposits, and other bank obligations; certain money market funds; and asset-backed securities. Each Fund can also accept US government securities and letters of credit (non-cash collateral) in connection with securities loans.
In the event of default or bankruptcy by the lending agent, realization and/or retention of the collateral may be subject to legal proceedings. In the event the borrower fails to return loaned securities and the collateral received is insufficient to cover the value of the loaned securities and provided such collateral shortfall is not the result of investment losses, the lending agent has agreed to pay the amount of the shortfall to each Fund or, at the discretion of the lending agent, replace the loaned securities. Each Fund continues to record dividends or interest, as applicable, on the securities loaned and is subject to changes in value of the securities loaned that may occur during the term of the loan. Each Fund has the right under the Lending Agreement to recover the securities from the borrower on demand. With respect to security loans collateralized by non-cash collateral, each Fund receives loan premiums paid by the borrower. With respect to security loans collateralized by cash collateral, the earnings from the collateral investments are shared among each Fund, the security lending agent, and the borrower. Each Fund records security lending income net of allocations to the security lending agent and the borrower.
Each Fund may incur investment losses as a result of investing securities lending collateral. This could occur if an investment in each collateral investment account defaulted or became impaired. Under those circumstances, the value of each Fund's cash collateral account may be less than the amount each Fund would be required to return to the borrowers of the securities and each Fund would be required to make up for this shortfall.
At the year ended March 31, 2023, each Fund had no securities out on loan.
Notes to financial statements
Ivy Funds
13. Credit and Market Risk
The global outbreak of COVID-19 has resulted in travel restrictions, closed international borders, enhanced health screenings at ports of entry and elsewhere, disruption of and delays in healthcare service preparation and delivery, prolonged quarantines, cancellations, supply chain disruptions, and lower consumer demand, as well as general concern and uncertainty. The impact of COVID-19, and other infectious illness outbreaks that may arise in the future, could adversely affect the economies of many nations or the entire global economy, individual issuers and capital markets in ways that cannot necessarily be foreseen. In addition, the impact of infectious illnesses in emerging market countries may be greater due to generally less established healthcare systems. Public health crises caused by the COVID-19 outbreak may exacerbate other pre-existing political, social and economic risks in certain countries or globally. The duration of the outbreak, its full economic impact and ongoing effects at the macro-level and on individual businesses are unpredictable and may result in significant and prolonged effects on a Fund's performance.
Beginning in late February 2022, global financial markets have experienced and may continue to experience significant volatility related to military action by Russia in Ukraine. As a result of this military action, the US and many other countries have imposed sanctions on Russia and certain Russian individuals, banks and corporations. The ongoing hostilities and resulting sanctions are expected to have a severe adverse effect on the region’s economies and more globally, including significant negative impact on markets for certain securities and commodities, such as oil and natural gas. Any cessation of trading on the Russian securities markets will impact the value and liquidity of certain portfolio holdings. The extent and duration of military action, sanctions, and resulting market disruptions are impossible to predict, but could be substantial and prolonged and impact the Funds’ performance.
When interest rates rise, fixed income securities (i.e. debt obligations) generally will decline in value. These declines in value are greater for fixed income securities with longer maturities or durations. Interest rate changes are influenced by a number of factors, such as government policy, monetary policy, inflation expectations, and the supply and demand of bonds. A fund may be subject to a greater risk of rising interest rates when interest rates are low or inflation rates are high or rising.
IBOR is the risk that changes related to the use of the London interbank offered rate (LIBOR) and other interbank offered rate (collectively, IBORs) could have adverse impacts on financial instruments that reference LIBOR (or the corresponding IBOR). The abandonment of LIBOR could affect the value and liquidity of instruments that reference LIBOR. The use of alternative reference rate products may impact investment strategy performance. These risks may also apply with respect to changes in connection with other IBORs, such as the euro overnight index average (EONIA), which are also the subject of recent reform.
Investments in equity securities in general are subject to market risks that may cause their prices to fluctuate over time. Fluctuations in the value of equity securities in which the Funds invest will cause the NAV of the Funds to fluctuate.
Some countries in which the Funds may invest require governmental approval for the repatriation of investment income, capital, or the proceeds of sales of securities by foreign investors. In addition, if there is deterioration in a country’s balance of payments or for other reasons, a country may impose temporary restrictions on foreign capital remittances abroad.
The securities exchanges of certain foreign markets are substantially smaller, less liquid, and more volatile than the major securities markets in the United States. Consequently, acquisition and disposition of securities by the Funds may be inhibited. In addition, a significant portion of the aggregate market value of securities listed on the major securities exchanges in emerging markets is held by a smaller number of investors. This may limit the number of shares available for acquisition or disposition by the Funds.
Certain Funds invest a portion of its assets in high yield fixed income securities, which are securities rated lower than BBB- by S&P and lower than Baa3 by Moody’s, or similarly rated by another nationally recognized statistical rating organization. Investments in these higher yielding securities are generally accompanied by a greater degree of credit risk than higher-rated securities. Additionally, lower-rated securities may be more susceptible to adverse economic and competitive industry conditions than investment grade securities.
Certain Funds invest in fixed income securities whose value is derived from an underlying pool of mortgages or consumer loans. The value of these securities is sensitive to changes in economic conditions, including delinquencies and/or defaults, and may be adversely affected by shifts in the market’s perception of the issuers and changes in interest rates. Investors receive principal and interest payments as the underlying mortgages and consumer loans are paid back. Some of these securities are CMOs. CMOs are debt securities issued by US government agencies or by financial institutions and other mortgage lenders, which are collateralized by a pool of mortgages held under an indenture.
Prepayment of mortgages may shorten the stated maturity of the obligations and can result in a loss of premium, if any has been paid. Certain of these securities may be stripped (securities which provide only the principal or interest feature of the underlying security). The yield to maturity on an interest-only CMO is extremely sensitive not only to changes in prevailing interest rates, but also to the rate of principal payments (including prepayments) on the related underlying mortgage assets. A rapid rate of principal payments may have a material adverse effect on a Fund’s yield to maturity. If the underlying mortgage assets experience greater than anticipated prepayments of principal, a Fund may fail to fully recoup its initial investment in these securities even if the securities are rated in the highest rating categories.
Certain Funds invest in bank loans and other securities that may subject them to direct indebtedness risk, the risk that the Funds will not receive payment of principal, interest, and other amounts due in connection with these investments and will depend primarily on the financial condition of the borrower. Loans that are fully secured offer the Fund more protection than unsecured loans in the event of nonpayment of scheduled interest or principal, although there is no assurance that the liquidation of collateral from a secured loan would satisfy the corporate borrower’s obligation, or that the collateral can be liquidated. Some loans or claims may be in default at the time of purchase. Certain of the loans and the other direct indebtedness acquired by the Fund may involve revolving credit facilities or other standby financing commitments that obligate the Fund to pay additional cash on a certain date or on demand. These commitments may require each Fund to increase its investment in a company at a time when the Fund might not otherwise decide to do so (including at a time when the company’s financial condition makes it unlikely that such amounts will be repaid). To the extent that each Fund is committed to advance additional funds, it will at all times hold and maintain cash or other high grade debt obligations in an amount sufficient to meet such commitments. When a loan agreement is purchased, the Fund may pay an assignment fee. On an ongoing basis, the Fund may receive a commitment fee based on the undrawn portion of the underlying line of credit portion of a loan agreement. Prepayment penalty fees are received upon the prepayment of a loan agreement by the borrower. Prepayment penalty, facility, commitment, consent, and amendment fees are recorded to income as earned or paid.
As the Fund may be required to rely upon another lending institution to collect and pass on to the Fund amounts payable with respect to the loan and to enforce the Fund’s rights under the loan and other direct indebtedness, an insolvency, bankruptcy, or reorganization of the lending institution may delay or prevent the Fund from receiving such amounts. The highly leveraged nature of many loans may make them especially vulnerable to adverse changes in economic or market conditions. Investments in such loans and other direct indebtedness may involve additional risk to the Fund.
Certain Funds invest in certain obligations that may have liquidity protection designed to ensure that the receipt of payments due on the underlying security is timely. Such protection may be provided through guarantees, insurance policies, or letters of credit obtained by the issuer or sponsor through third parties, through various means of structuring the transaction, or through a combination of such approaches. The Funds will not pay any additional fees for such credit support, although the existence of credit support may increase the price of a security.
Each Fund may invest in advance refunded bonds, escrow secured bonds, or defeased bonds. Under current federal tax laws and regulations, state and local government borrowers are permitted to refinance outstanding bonds by issuing new bonds. The issuer refinances the outstanding debt to either reduce interest costs or to remove or alter restrictive covenants imposed by the bonds being refinanced. A refunding transaction where the municipal securities are being refunded within 90 days from the issuance of the refunding issue is known as a “current refunding.” Advance refunded bonds are bonds in which the refunded bond issue remains outstanding for more than 90 days following the issuance of the refunding issue. In an advance refunding, the issuer will use the proceeds of a new bond issue to purchase high grade interest-bearing debt securities, which are then deposited in an irrevocable escrow account held by an escrow agent to secure all future payments of principal and interest and bond premium of the advance refunded bond. Bonds are “escrowed to maturity” when the proceeds of the refunding issue are deposited in an escrow account for investment sufficient to pay all of the principal and interest on the original interest payment and maturity dates.
Bonds are considered “pre-refunded” when the refunding issue’s proceeds are escrowed only until a permitted call date or dates on the refunded issue with the refunded issue being redeemed at the time, including any required premium. Bonds become “defeased” when the rights and interests of the bondholders and of their lien on the pledged revenues or other security under the terms of the bond contract are substituted with an alternative source of revenues (the escrow securities) sufficient to meet payments of principal and interest to maturity or to the first call dates. Escrowed secured bonds will often receive a rating of AAA from Moody’s, S&P, and/or Fitch Ratings due to the strong credit quality of the escrow securities and the irrevocable nature of the escrow deposit agreement.
Certain Funds may invest in REITs and are subject to the risks associated with that industry. If a Fund holds real estate directly or receives rental income directly from real estate holdings, its tax status as a regulated investment company may be jeopardized. There were no direct real
Notes to financial statements
Ivy Funds
13. Credit and Market Risk (continued)
estate holdings during the year ended March 31, 2023. The Funds’ REIT holdings are also affected by interest rate changes, particularly if the REITs they hold use floating rate debt to finance their ongoing operations. The Funds also invest in real estate acquired as a result of ownership of securities or other instruments, including issuers that invest, deal, or otherwise engage in transactions in real estate or interests therein. These instruments may include interests in private equity limited partnerships or limited liability companies that hold real estate investments (Real Estate Limited Partnerships). The Funds will limit their investments in Real Estate Limited Partnerships to 5% of their total assets at the time of purchase.
Each Fund may invest up to 15% of its net assets in illiquid securities, which may include securities with contractual restrictions on resale, securities exempt from registration under Rule 144A promulgated under the Securities Act of 1933, as amended, and other securities which may not be readily marketable. The relative illiquidity of these securities may impair each Fund from disposing of them in a timely manner and at a fair price when it is necessary or desirable to do so. While maintaining oversight, the Board has delegated to DMC, the day-to-day functions of determining whether individual securities are liquid for purposes of the Funds’ limitation on investments in illiquid securities. Securities eligible for resale pursuant to Rule 144A, which are determined to be liquid, are not subject to the Funds’ 15% limit on investments in illiquid securities. Rule 144A securities have been identified on the “Schedules of investments.”
14. Contractual Obligations
Each Fund enters into contracts in the normal course of business that contain a variety of indemnifications. Each Fund's maximum exposure under these arrangements is unknown. However, each Fund has not had prior claims or losses pursuant to these contracts. Management has reviewed each Fund's existing contracts and expects the risk of loss to be remote.
15. Recent Accounting Pronouncements
In March 2020, FASB issued an Accounting Standards Update (ASU), ASU 2020-04, Reference Rate Reform (Topic 848) - Facilitation of the Effects of Reference Rate Reform on Financial Reporting. The amendments in ASU 2020-04 provide optional temporary financial reporting relief from the effect of certain types of contract modifications due to the planned discontinuation of LIBOR and other interbank-offered based reference rates as of the end of 2021. In March 2021, the administrator for LIBOR announced the extension of the publication of a majority of the USD LIBOR settings to June 30, 2023. On December 21, 2022, FASB issued ASU 2022-06 to defer the sunset date of Accounting Standards Codification Topic 848 until December 31, 2024. ASU 2020-04 is effective for certain reference rate-related contract modifications that occur during the period March 12, 2020 through December 31, 2024. Management is currently evaluating ASU 2020-04 and ASU 2022-06, but does not believe there will be a material impact.
16. New Regulatory Pronouncement
In October 2022, the Securities and Exchange Commission (SEC) adopted a rule and form amendments relating to tailored shareholder reports for mutual funds and ETFs; and fee information in investment company advertisements. The rule and form amendments will require mutual funds and ETFs to transmit streamlined shareholder reports that highlight key information to investors. The rule amendments will require that certain more in-depth information be made available online and available for delivery free of charge to investors on request. The amendments became effective in January 2023 and there is an 18-month transition period after the effective date of the amendment with a compliance date of July 2024.
17. Subsequent Events
On February 15-16, 2023, the Board approved the reorganization of the Funds below into and with a substantially similar fund and class of another Delaware Fund (each a “Reorganization”) as shown in the table below:
| Acquired Fund | | Acquiring Fund |
| Delaware Ivy Municipal Bond Fund, a series of the Trust | | Delaware Tax-Free USA Fund, a series of Delaware Group® Tax-Free Fund |
| Delaware Ivy Municipal High Income Fund, a series of the Trust | | Delaware National High-Yield Municipal Bond Fund, a series of Voyageur Mutual Funds |
| Delaware Ivy Limited-Term Bond Fund, a series of the Trust | | Delaware Limited-Term Diversified Income Fund, a series of Delaware Group Limited-Term Government Funds |
Each Reorganization is subject to the approval of Fund shareholders at a special shareholder meeting scheduled to be held on June 27, 2023.
If each Reorganization is approved by shareholders at that June 27, 2023 special shareholder meeting, each Reorganization is expected to occur on or about September 15, 2023.
Management has determined that no other material events or transactions occurred subsequent to March 31, 2023, that would require recognition or disclosure in the Funds' financial statements.
Report of independent
registered public accounting firm
To the Board of Trustees of Ivy Funds and Shareholders of Delaware Ivy Core Equity Fund, Delaware Ivy Large Cap Growth Fund, Delaware Ivy Mid Cap Growth Fund, Delaware Ivy Mid Cap Income Opportunities Fund, Delaware Ivy Small Cap Growth Fund, Delaware Ivy Smid Cap Core Fund, Delaware Ivy Value Fund, Delaware Ivy Core Bond Fund, Delaware Ivy Global Bond Fund, Delaware Ivy High Income Fund, Delaware Ivy Limited-Term Bond Fund, Delaware Ivy Municipal Bond Fund, Delaware Ivy Municipal High Income Fund, Delaware Global Value Equity Fund, Delaware Ivy Global Growth Fund, Delaware Ivy International Core Equity Fund, Delaware Ivy International Value Fund, Delaware Ivy Systematic Emerging Markets Equity Fund and Delaware Ivy Managed International Opportunities Fund
Opinions on the Financial Statements
We have audited the accompanying statements of assets and liabilities, including the schedules of investments, of each of the funds listed in the table below (nineteen of the funds constituting Ivy Funds, hereafter collectively referred to as the “Funds”) as of March 31, 2023, the related statements of operations and of changes in net assets for each of the periods indicated in the table below, including the related notes, and the financial highlights for each of the periods indicated in the table below (collectively referred to as the “financial statements”). In our opinion, the financial statements present fairly, in all material respects, the financial position of each of the Funds as of March 31, 2023, the results of each of their operations, the changes in each of their net assets, and each of the financial highlights for each of the periods indicated in the table below, in conformity with accounting principles generally accepted in the United States of America.
Delaware Ivy Core Equity Fund(1) Delaware Ivy Large Cap Growth Fund(1) Delaware Ivy Mid Cap Growth Fund(1) Delaware Ivy Mid Cap Income Opportunities Fund(1) Delaware Ivy Small Cap Growth Fund(1) Delaware Ivy Smid Cap Core Fund(1) Delaware Ivy Value Fund(1) Delaware Ivy Core Bond Fund(1) Delaware Ivy Global Bond Fund(1) Delaware Ivy High Income Fund(1) | Delaware Ivy Limited-Term Bond Fund(1) Delaware Ivy Municipal Bond Fund(1) Delaware Ivy Municipal High Income Fund(1) Delaware Global Value Equity Fund(1) Delaware Ivy Global Growth Fund(1) Delaware Ivy International Core Equity Fund(1) Delaware Ivy International Value Fund(1) Delaware Ivy Systematic Emerging Markets Equity Fund(2) Delaware Ivy Managed International Opportunities Fund(1) |
(1) Statement of assets and liabilities, including the schedule of investments, as of March 31, 2023, the related statement of operations for the year ended March 31, 2023, the statements of changes in net assets for each of the two years in the period ended March 31, 2023 and the financial highlights for each of the three years in the period ended March 31, 2023.
(2) Consolidated statement of assets and liabilities, including the consolidated schedule of investments, as of March 31, 2023, the related consolidated statement of operations for the year ended March 31, 2023, the consolidated statements of changes in net assets for each of the two years in the period ended March 31, 2023 and the consolidated financial highlights for each of the three years in the period ended March 31, 2023.
The financial statements of the Funds as of and for the year ended March 31, 2020 and the financial highlights for each of the periods ended on or prior to March 31, 2020 (not presented herein, other than the financial highlights) were audited by other auditors whose report dated May 18, 2020 expressed an unqualified opinion on those financial statements and financial highlights.
Basis for Opinions
These financial statements are the responsibility of the Funds’ management. Our responsibility is to express an opinion on the Funds’ financial statements based on our audits. We are a public accounting firm registered with the Public Company Accounting Oversight Board (United States) (PCAOB) and are required to be independent with respect to the Funds in accordance with the U.S. federal securities laws and the applicable rules and regulations of the Securities and Exchange Commission and the PCAOB.
We conducted our audits of these financial statements in accordance with the standards of the PCAOB. Those standards require that we plan and perform the audit to obtain reasonable assurance about whether the financial statements are free of material misstatement, whether due to error or fraud.
Our audits included performing procedures to assess the risks of material misstatement of the financial statements, whether due to error or fraud, and performing procedures that respond to those risks. Such procedures included examining, on a test basis, evidence regarding the amounts and disclosures in the financial statements. Our audits also included evaluating the accounting principles used and significant estimates made by management, as well as evaluating the overall presentation of the financial statements. Our procedures included confirmation of securities owned as of March 31, 2023 by correspondence with the custodian, transfer agents, portfolio company investees,
Report of independent
registered public accounting firm
agent banks and brokers; when replies were not received from agent banks and brokers, we performed other auditing procedures. We believe that our audits provide a reasonable basis for our opinions.
/s/PricewaterhouseCoopers LLP
Philadelphia, Pennsylvania
June 9, 2023
We have served as the auditor of one or more investment companies in Delaware Funds by Macquarie® since 2010.
Other Fund information (Unaudited)
Ivy Funds
| | | (A)
Long-Term
Capital
Gains
Distributions
(Tax Basis) | | | (B)
Ordinary
Income
Distributions*
(Tax Basis) | | | (C)
Tax-Exempt
Distributions
(Tax Basis) | | | (D)
Return
of
Capital
(Tax Basis) | | | Total
Distributions
(Tax Basis) | | | (E)
Qualifying
Dividends1 | |
| Delaware Global Value Equity Fund | | | 83.51 | % | | | 16.49 | % | | | — | | | | — | | | | 100.00 | % | | | 12.38 | % |
| Delaware Ivy Core Bond Fund | | | — | | | | 100.00 | % | | | — | | | | — | | | | 100.00 | % | | | — | |
| Delaware Ivy Core Equity Fund | | | 96.42 | % | | | 3.58 | % | | | — | | | | — | | | | 100.00 | % | | | 100.00 | % |
| Delaware Ivy Global Bond Fund | | | — | | | | 100.00 | % | | | — | | | | — | | | | 100.00 | % | | | — | |
| Delaware Ivy Global Growth Fund | | | 99.90 | % | | | 0.10 | % | | | — | | | | — | | | | 100.00 | % | | | 100.00 | % |
| Delaware Ivy High Income Fund | | | — | | | | 100.00 | % | | | — | | | | — | | | | 100.00 | % | | | 5.53 | % |
| Delaware Ivy International Core Equity Fund | | | — | | | | 100.00 | % | | | — | | | | — | | | | 100.00 | % | | | — | |
| Delaware Ivy International Value Fund | | | 82.08 | % | | | 17.92 | % | | | — | | | | — | | | | 100.00 | % | | | — | |
| Delaware Ivy Large Cap Growth Fund | | | 93.54 | % | | | 6.46 | % | | | — | | | | — | | | | 100.00 | % | | | 100.00 | % |
| Delaware Ivy Limited-Term Bond Fund | | | — | | | | 100.00 | % | | | — | | | | — | | | | 100.00 | % | | | — | |
Delaware Ivy Managed International
Opportunities Fund | | | 99.97 | % | | | 0.03 | % | | | — | | | | — | | | | 100.00 | % | | | — | |
| Delaware Ivy Mid Cap Growth Fund | | | 100.00 | % | | | — | | | | — | | | | — | | | | 100.00 | % | | | — | |
| Delaware Ivy Mid Cap Income Opportunities Fund | | | 40.96 | % | | | 59.04 | % | | | — | | | | — | | | | 100.00 | % | | | 94.24 | % |
| Delaware Ivy Municipal Bond Fund | | | 5.30 | % | | | 0.01 | % | | | 92.10 | % | | | 2.59 | % | | | 100.00 | % | | | — | |
| Delaware Ivy Municipal High Income Fund | | | — | | | | 1.64 | % | | | 98.36 | % | | | — | | | | 100.00 | % | | | — | |
| Delaware Ivy Small Cap Growth Fund | | | 100.00 | % | | | — | | | | — | | | | — | | | | 100.00 | % | | | — | |
| Delaware Ivy Smid Cap Core Fund | | | 98.51 | % | | | 1.49 | % | | | — | | | | — | | | | 100.00 | % | | | 100.00 | % |
Delaware Ivy Systematic Emerging Markets
Equity Fund | | | 91.23 | % | | | 8.77 | % | | | — | | | | — | | | | 100.00 | % | | | — | |
| Delaware Ivy Value Fund | | | 78.16 | % | | | 21.84 | % | | | — | | | | — | | | | 100.00 | % | | | 44.53 | % |
(A), (B), (C) and (D) are based on a percentage of the Fund's total distributions.
(E) is based on each Fund’s ordinary income distributions.
1 Qualified dividends represent dividends which qualify for the corporate dividends received deduction.
* For the fiscal year ended March 31, 2023, certain dividends paid by the Fund may be subject to a maximum tax rate of 20%. The percentage of dividends paid by the Fund from ordinary income reported as qualified dividend income is as follows:
| | | Percentage | |
| Delaware Global Value Equity Fund | | | 29.09 | % |
| Delaware Ivy Core Bond Fund | | | 1.28 | % |
| Delaware Ivy Core Equity Fund | | | 100.00 | % |
| Delaware Ivy Global Bond Fund | | | — | % |
| Delaware Ivy Global Growth Fund | | | 100.00 | % |
| Delaware Ivy High Income Fund | | | 5.53 | % |
| Delaware Ivy International Core Equity Fund | | | 100.00 | % |
| Delaware Ivy International Value Fund | | | 100.00 | % |
| Delaware Ivy Large Cap Growth Fund | | | 100.00 | % |
| Delaware Ivy Limited-Term Bond Fund | | | — | % |
| Delaware Ivy Managed International Opportunities Fund | | | — | % |
| Delaware Ivy Mid Cap Growth Fund | | | — | % |
| Delaware Ivy Mid Cap Income Opportunities Fund | | | 100.00 | % |
| Delaware Ivy Municipal Bond Fund | | | — | % |
| Delaware Ivy Municipal High Income Fund | | | — | % |
| Delaware Ivy Small Cap Growth Fund | | | — | % |
| Delaware Ivy Smid Cap Core Fund | | | 100.00 | % |
| Delaware Ivy Systematic Emerging Markets Equity Fund | | | 100.00 | % |
| Delaware Ivy Value Fund | | | 53.57 | % |
Other Fund information (Unaudited)
Ivy Funds
Complete information will be computed and reported in conjunction with your 2023 Form 1099-DIV.
Certain Funds intend to pass through foreign tax credits. The gross foreign source income earned during the fiscal year March 31, 2023 is as follows:
| | | Foreign Tax Credits | | Gross Foreign Source Income Earned |
| Delaware Global Value Equity Fund | | | $ 415,860 | | | | $ 7,082,146 | |
| Delaware Ivy International Core Equity Fund | | | 33,718 | | | | 51,277,259 | |
| Delaware Ivy International Value Fund | | | 255,856 | | | | 3,651,063 | |
| Delaware Ivy Managed International Opportunities Fund | | | 261,164 | | | | 1,357,632 | |
| Delaware Ivy Systematic Emerging Markets Equity Fund | | | 3,024,920 | | | | 57,617,545 | |
The percentage of the ordinary dividends reported is treated as a Section 163(j) interest dividend and thus is eligible to be treated as interest income for purposes of Section 163(j) and the regulations thereunder is as follows:
| | | Percentage |
| Delaware Ivy Core Bond Fund | | | 95.49 | % |
| Delaware Ivy Global Bond Fund | | | 84.07 | % |
| Delaware Ivy High Income Fund | | | 95.10 | % |
| Delaware Ivy Limited-Term Bond Fund | | | 100.00 | % |
Form N-PORT and proxy voting information
Each Fund files its complete schedule of portfolio holdings with the Securities and Exchange Commission (SEC) for the first and third quarters of each fiscal year on Form N-PORT. Each Fund’s Form N-PORT, as well as a description of the policies and procedures that the Funds use to determine how to vote proxies (if any) relating to portfolio securities, are available without charge (i) upon request, by calling 800 523-1918; and (ii) on the SEC’s website at sec.gov. In addition, a description of the policies and procedures that the Funds use to determine how to vote proxies (if any) relating to portfolio securities and the Schedule of investments included in each Fund's most recent Form N-PORT are available without charge on the Funds’ website at delawarefunds.com/literature.
Information (if any) regarding how the Funds voted proxies relating to portfolio securities during the most recently disclosed 12-month period ended June 30 is available without charge (i) through the Funds’ website at delawarefunds.com/proxy; and (ii) on the SEC’s website at sec.gov.
Board of trustees and officers addendum
Delaware Funds by Macquarie®
A mutual fund is governed by a Board of Trustees (“Trustees”), which has oversight responsibility for the management of a fund’s business affairs. Trustees establish procedures and oversee and review the performance of the investment manager, the distributor, and others who perform services for the fund. The independent fund trustees, in particular, are advocates for shareholder interests. Each trustee has served in that capacity since he or she was elected to or appointed to the Board of Trustees, and will continue to serve until his or her retirement or the election of a new trustee in his or her place. The following is a list of the Trustees and Officers with certain background and related information.
Name,
Address,
and Birth Year | | Position(s)
Held with
the Trust | | Length of Time
Served1 | | Number of
Funds in Fund
Complex Overseen
by Trustee | | Principal
Occupation(s)
During the
Past Five Years | | Other
Directorships
Held by Trustee
During the
Past Five Years |
| Interested Trustee |
| | | | | | | | | | | |
Shawn K. Lytle2
100 Independence
610 Market Street
Philadelphia, PA
19106-2354
1970 | | President,
Chief Executive Officer,
and Trustee | | President and
Chief Executive Officer
since August 2015
Trustee since
September 2015 | | 117 | | Macquarie Asset Management3
(2015–Present)
-Global Head of Macquarie Asset Management Public Investments
(2019–Present)
-Head of Americas of Macquarie Group
(2017–Present) | | None |
| | | | | | | | | | | |
| Independent Trustees |
| | | | | | | | | | | |
Jerome D. Abernathy
100 Independence
610 Market Street
Philadelphia, PA
19106-2354
1959 | | Trustee | | Since January 2019 | | 117 | | Stonebrook Capital
Management, LLC
(financial
technology: macro factors and databases) -Managing Member
(1993-Present) | | None |
| | | | | | | | | | | |
Ann D. Borowiec
100 Independence
610 Market Street
Philadelphia, PA
19106-2354
1958 | | Trustee | | Since March 2015 | | 117 | | J.P. Morgan Chase & Co.
(1987-2013)
-Chief Executive Officer, Private Wealth Management
(2011– 2013) | | Banco Santander International
(2016–2019)
Santander Bank, N.A.
(2016-2019) |
| | | | | | | | | | | |
Joseph W. Chow
100 Independence
610 Market Street
Philadelphia, PA
19106-2354 1953 | | Trustee | | Since January 2013 | | 117 | | Private Investor
(2011–Present)
State Street Bank and Trust Company
(1996-2011)
-Executive Vice President of Enterprise Risk Management and Emerging Economies Strategy; and Chief Risk and Corporate Administration Officer | | None |
| | | | | | | | | | | |
H. Jeffrey Dobbs
100 Independence
610 Market Street
Philadelphia, PA
19106-2354
1955 | | Trustee | | Since April 20194 | | 117 | | KPMG LLP
(2002-2015)
-Global Sector Chairman,
Industrial Manufacturing
(2010-2015) | | TechAccel LLC
(2015–Present) PatientsVoices, Inc.
(2018–Present) Valparaiso University Board
(2012-Present) Ivy Funds Complex
(2019- 2021) |
Board of trustees and officers addendum
Delaware Funds by Macquarie®
Name,
Address,
and Birth Year | | Position(s)
Held with
the Trust | | Length of Time
Served1 | | Number of
Funds in Fund
Complex Overseen
by Trustee | | Principal
Occupation(s)
During the
Past Five Years | | Other
Directorships
Held by Trustee
During the
Past Five Years |
| | | | | | | | | | | |
John A. Fry
100 Independence
610 Market Street
Philadelphia, PA
19106-2354
1960 | | Trustee | | Since January 2001 | | 117 | | Drexel University
-President
(2010–Present) | | Federal Reserve Bank of Philadelphia
(2020–Present) Kresge Foundation
(2018-Present) FS Credit Real Estate Income Trust, Inc.
(2018–Present) vTv Therapeutics Inc.
(2017–Present) Community Health Systems
(2004–Present) Drexel Morgan & Co.
(2015–2019) |
| | | | | | | | | | | |
Joseph Harroz, Jr.
100 Independence
610 Market Street
Philadelphia, PA
19106-2354
1967 | | Trustee | | Since November 19984 | | 117 | | University of Oklahoma -President
(2020–Present) -Interim President
(2019–2020) -Vice President and Dean, College of Law
(2010–2019) Brookhaven Investments LLC (commercial enterprises) -Managing Member
(2019–Present) St. Clair, LLC (commercial enterprises) -Managing Member
(2019–Present) | | OU Medicine, Inc.
(2020–Present) Big 12 Athletic Conference
(2019-Present) Valliance Bank
(2007–Present) Ivy Funds Complex
(1998-2021) |
| | | | | | | | | | | |
Sandra A.J. Lawrence
100 Independence
610 Market Street
Philadelphia, PA
19106-2354
1957 | | Trustee | | Since April 20194 | | 117 | | Children’s Mercy Hospitals and Clinics
(2005–2019)
-Chief Administrative Officer
(2016–2019) | | Brixmor Property Group Inc.
(2021-Present) Sera Prognostics Inc. (biotechnology)
(2021-Present) Recology (resource recovery)
(2021-Present) Evergy, Inc., Kansas City Power & Light Company, KCP&L Greater Missouri Operations Company, Westar Energy, Inc. and Kansas Gas and Electric Company (related utility companies)
(2018-Present) National Association of Corporate Directors
(2017-Present) American Shared Hospital Services (medical device)
(2017-2021) Ivy Funds Complex
(2019-2021) |
Name,
Address,
and Birth Year | | Position(s)
Held with
the Trust | | Length of Time
Served1 | | Number of
Funds in Fund
Complex Overseen
by Trustee | | Principal
Occupation(s)
During the
Past Five Years | | Other
Directorships
Held by Trustee
During the
Past Five Years |
| | | | | | | | | | | |
Frances A.
Sevilla-Sacasa
100 Independence
610 Market Street
Philadelphia, PA
19106-2354
1956 | | Trustee | | Since September 2011 | | 117 | | Banco Itaú International -Chief Executive Officer
(2012–2016)
Bank of America, U.S. Trust Private Wealth -President
(2007-2008)
U.S. Trust Corp. -President & CEO
(2005-2007) | | Florida Chapter of National Association of Corporate Directors
(2021-Present)
Callon Petroleum Company
(2019-Present) Camden Property Trust
(2011-Present) New Senior Investment Group Inc.
(2021) Carrizo Oil & Gas, Inc.
(2018-2019) |
| | | | | | | | | | | |
Thomas K. Whitford
100 Independence
610 Market Street
Philadelphia, PA
19106-2354
1956 | | Chair and Trustee | | Trustee since January 2013
Chair since January
2023 | | 117 | | PNC Financial Services Group
(1983–2013)
-Vice Chairman
(2009- 2013) | | HSBC USA Inc.
(2014–2022) HSBC North America Holdings Inc.
(2013–2022) |
| | | | | | | | | | | |
Christianna Wood
100 Independence
610 Market Street
Philadelphia, PA
19106-2354
1959 | | Trustee | | Since January 2019 | | 117 | | Gore Creek Capital, Ltd. -Chief Executive Officer and President
(2009–Present) Capital Z Asset Management -Chief Executive Officer
(2008-2009) California Public Employees' Retirement System (CalPERS) -Senior Investment Officer of Global Equity
(2002-2008) | | The Merger Fund
(2013–2021), The Merger Fund VL
(2013–2021), WCM Alternatives: Event- Driven Fund
(2013–2021), and WCM Alternatives: Credit Event Fund
(2017–2021) Grange Insurance
(2013–Present) H&R Block Corporation
(2008–2022) International Securities Exchange
(2010-2018) Vassar College Trustee
(2006-2018) |
| | | | | | | | | | | |
Janet L. Yeomans
100 Independence
610 Market Street
Philadelphia, PA
19106-2354
1948 | | Trustee | | Since April 1999 | | 117 | | 3M Company
(1995-2012) -
Vice President and Treasurer
(2006–2012) | | Temple University Hospital
(2017-Present) Pennsylvania State System of Higher Education
(2018-Present) |
| | | | | | | | | | | |
| Officers | | | | | | | | | | |
| | | | | | | | | | | |
David F. Connor
100 Independence
610 Market Street
Philadelphia, PA
19106-2354
1963 | | Senior Vice President, General Counsel, and Secretary | | Senior Vice President, since May 2013; General Counsel since May 2015; Secretary since October 2005 | | 117 | | David F. Connor has served in various capacities at different times at Macquarie Asset Management. | | None5 |
| | | | | | | | | | | |
Daniel V. Geatens
100 Independence
610 Market Street
Philadelphia, PA
19106-2354
1972 | | Senior Vice President and Treasurer | | Senior Vice President and Treasurer since October 2007 | | 117 | | Daniel V. Geatens has served in various capacities at different times at Macquarie Asset Management. | | None5 |
Board of trustees and officers addendum
Delaware Funds by Macquarie®
Name,
Address,
and Birth Year | | Position(s)
Held with
the Trust | | Length of Time
Served1 | | Number of
Funds in Fund
Complex Overseen
by Trustee | | Principal
Occupation(s)
During the
Past Five Years | | Other
Directorships
Held by Trustee
During the
Past Five Years |
| | | | | | | | | | | |
Richard Salus
100 Independence
610 Market Street
Philadelphia, PA
19106-2354
1963 | | Senior Vice President and Chief Financial Officer | | Senior Vice President and Chief Financial Officer since November 2006 | | 117 | | Richard Salus has served in various capacities at different times at Macquarie Asset Management. | | None |
1 “Length of Time Served” refers to the time since the Trustee or officer began serving one or more of the Trusts in the Delaware Funds complex.
2 Shawn K. Lytle is considered to be an “Interested Trustee” because he is an executive officer of the Funds' investment advisor.
3 Macquarie Asset Management is the marketing name for certain companies comprising the asset management division of Macquarie Group, including the Funds' investment advisor, principal underwriter, and transfer agent.
4 Includes time served on the Board of Ivy Funds prior to the date when Ivy Funds joined the Delaware Funds complex.
5 David F. Connor and Daniel V. Geatens serve in similar capacities for the six portfolios of the Optimum Fund Trust, which have the same investment manager, principal underwriter, and transfer agent as the Funds. Mr. Geatens also serves as the Chief Financial Officer of the Optimum Fund Trust.
The Statement of Additional Information for the Fund(s) includes additional information about the Trustees and Officers and is available, without charge, upon request by calling 800 523-1918.
Delaware Funds by Macquarie® privacy practices notice
We are committed to protecting the privacy of our potential, current, and former customers. To provide the products and services you request, we must collect personal information about you. We do not sell your personal information to third parties. We collect your personal information and share it with third parties as necessary to provide you with the products or services you request and to administer your business with us. This notice describes our current privacy practices. While your relationship with us continues, we will update and send our privacy practices notice as required by law. We are committed to continuing to protect your personal information even after that relationship ends. You do not need to take any action because of this notice.
Information we may collect and use
We collect personal information about you to help us identify you as our potential, current, or former customer; to process your requests and transactions; to offer investment services to you; or to tell you about our products or services we believe you may want to use. The type of personal information we collect depends on the products or services you request and may include the following:
| ● | Information from you: When you submit your application or other forms or request information on our products (online or otherwise), you give us information such as your name, address, Social Security number, your financial account information, and your financial history. |
| ● | Information about your transactions: We keep information about your transactions with us, such as the products you buy from us; the amount you paid for those products; your investment activity; and your account balances. |
| ● | Information from your employer: In connection with administering your retirement plan, we may obtain information about you from your employer. |
| ● | Information received from third parties: In order to verify your identity or to prevent fraud, we may obtain information about you from third parties. |
How we use your personal information
We do not disclose nonpublic personal information about our potential, current, and former customers unless allowed or required by law. We may share your personal information within our companies and with certain service providers. They use this information to process transactions you have requested; provide customer service; and inform you of products or services we offer that you may find useful. Our service providers may or may not be affiliated with us. They include financial service providers (for example, third-party administrators; broker/dealers; and other financial services companies with whom we have joint marketing agreements). Our service providers also include nonfinancial companies and individuals (for example, consultants; information services vendors; and companies that perform mailing or marketing services on our behalf). Information obtained from a report prepared by a service provider may be kept by the service provider and shared with other persons; however, we require our service providers to protect your personal information and to use or disclose it only for the work they are performing for us, or as permitted by law.
We also may provide information to regulatory authorities, law enforcement officials, and others to prevent fraud or when we believe in good faith that the law requires disclosure. In the event of a sale of all or part of our businesses, we may share customer information as part of the sale. We do not sell or share your information with outside marketers who may want to offer you their own products and services.
Security of information
Keeping your information safe is one of our most important responsibilities. We maintain physical, electronic, and procedural safeguards to protect your information. Our employees are authorized to access your information only when they need it to provide you with products and services or to maintain your accounts. Employees who have access to your personal information are required to keep it strictly confidential. We provide training to our employees about the importance of protecting the privacy of your information.
Macquarie Asset Management (MAM) is the asset management division of Macquarie Group. MAM, through its entities, operates as a full- service asset manager offering a diverse range of products including securities investment management, infrastructure and real asset management, and fund and equity-based structured products.
Other than Macquarie Bank Limited ABN
46 008 583 542 ("Macquarie Bank"), any Macquarie Group entity noted in this document is not an authorized deposit-taking institution for the purposes of the Banking Act 1959 (Commonwealth of Australia). The obligations of these other Macquarie Group entities do not represent deposits or other liabilities of Macquarie Bank. Macquarie Bank does not guarantee or otherwise provide assurance in respect of the obligations of these other Macquarie Group entities. In addition, if this document relates to an investment, (a) the investor is subject to investment risk including possible delays in repayment and loss of income and principal invested and (b) none of Macquarie Bank or any other Macquarie Group entity guarantees any particular rate of return on or the performance of the investment, nor do they guarantee repayment of capital in respect of the investment.
| i | This page is not part of the annual report. | |
Delaware Funds by Macquarie® privacy practices notice
This privacy practices notice is being provided on behalf of the following:
Macquarie Management Holdings, Inc. and each of its affiliates, such as direct or indirect subsidiaries, and any fund or product sponsored by or otherwise affiliated with Macquarie
Central Park Group (CPG) Funds
Delaware Funds by Macquarie®
Macquarie Funds Management Hong Kong Limited
Macquarie Investment Management Austria Kapitalanlage AG
Macquarie Investment Management Europe Limited
Macquarie Investment Management Europe S.A.
Macquarie Investment Management Global Limited
Optimum Fund Trust
Revised April 2023
| | This page is not part of the annual report. | ii |
Delaware Funds by Macquarie®
Equity funds
US equity funds
| ● | Delaware Growth and Income Fund |
| ● | Delaware Ivy Accumulative Fund |
| ● | Delaware Ivy Core Equity Fund |
| ● | Delaware Ivy Large Cap Growth Fund |
| ● | Delaware Ivy Mid Cap Growth Fund |
| ● | Delaware Ivy Mid Cap Income Opportunities Fund |
| ● | Delaware Ivy Smid Cap Core Fund |
| ● | Delaware Ivy Small Cap Growth Fund |
| ● | Delaware Ivy Value Fund |
| ● | Delaware Mid Cap Growth Equity Fund (formerly, Delaware Smid Cap Growth Fund) |
| ● | Delaware Opportunity Fund |
| ● | Delaware Select Growth Fund |
| ● | Delaware Small Cap Core Fund* |
| ● | Delaware Small Cap Growth Fund |
| ● | Delaware Small Cap Value Fund |
| ● | Delaware Sustainable Equity Income Fund (formerly, Delaware Ivy S&P 500 Dividend Aristocrats Index Fund)* |
| ● | Delaware Value® Fund |
| | |
Global / international equity funds |
| ● | Delaware Emerging Markets Fund |
| ● | Delaware Global Equity Fund |
| ● | Delaware Global Value Equity Fund (formerly, Delaware Ivy Global Equity Income Fund) |
| ● | Delaware International Small Cap Fund |
| ● | Delaware International Value Equity Fund |
| ● | Delaware Ivy Global Growth Fund |
| ● | Delaware Ivy International Core Equity Fund |
| ● | Delaware Ivy International Small Cap Fund |
| ● | Delaware Ivy International Value Fund |
| ● | Delaware Ivy Managed International Opportunities Fund |
| ● | Delaware Ivy Systematic Emerging Markets Equity Fund |
| | |
| Alternative / specialty funds |
| ● | Delaware Climate Solutions Fund (formerly, Delaware Ivy Energy Fund) |
| ● | Delaware Covered Call Strategy Fund |
| ● | Delaware Global Real Estate Fund (formerly, Delaware Ivy LaSalle Global Real Estate Fund) |
| ● | Delaware Healthcare Fund |
| ● | Delaware Hedged U.S. Equity Opportunities Fund |
| ● | Delaware Ivy Natural Resources Fund |
| ● | Delaware Ivy Science and Technology Fund |
| ● | Delaware Premium Income Fund |
| ● | Delaware Real Estate Securities Fund (formerly, Delaware Ivy Securian Real Estate Securities Fund) |
| | |
| Multi-asset funds |
| ● | Delaware Global Listed Real Assets Fund |
| ● | Delaware Ivy Asset Strategy Fund |
| ● | Delaware Ivy Balanced Fund |
| ● | Delaware Ivy Multi-Asset Income Fund |
| ● | Delaware Ivy Wilshire Global Allocation Fund |
| ● | Delaware Wealth Builder Fund |
Carefully consider a Fund’s investment objectives, risk factors, charges, and expenses before investing. This and other information can be found in each Fund’s prospectus and, if available, its summary prospectus. A Delaware Funds by Macquarie prospectus may be obtained by visiting delawarefunds.com/literature or calling 800 523-1918. Investors should read the prospectus and, if available, the summary prospectus carefully before investing.
Investing involves risk, including the possible loss of principal.
| iii | This page is not part of the annual report. | |
Delaware Funds by Macquarie®
Fixed income funds
Taxable fixed income funds
| ● | Delaware Corporate Bond Fund |
| ● | Delaware Diversified Income Fund |
| ● | Delaware Emerging Markets Debt Corporate Fund |
| ● | Delaware Extended Duration Bond Fund |
| ● | Delaware Floating Rate Fund |
| ● | Delaware High-Yield Opportunities Fund |
| ● | Delaware Investments Ultrashort Fund |
| ● | Delaware Ivy Core Bond Fund (formerly, Delaware Ivy Securian Core Bond Fund) |
| ● | Delaware Ivy Corporate Bond Fund |
| ● | Delaware Ivy Crossover Credit Fund |
| ● | Delaware Ivy Emerging Markets Local Currency Debt Fund |
| ● | Delaware Ivy Global Bond Fund |
| ● | Delaware Ivy Government Securities Fund |
| ● | Delaware Ivy High Income Fund |
| ● | Delaware Ivy High Yield Fund |
| ● | Delaware Ivy Limited-Term Bond Fund |
| ● | Delaware Ivy Strategic Income Fund |
| ● | Delaware Ivy Total Return Bond Fund |
| ● | Delaware Limited-Term Diversified Income Fund |
| ● | Delaware Strategic Income Fund |
| Municipal fixed income funds |
| ● | Delaware Ivy California Municipal High Income Fund |
| ● | Delaware Ivy Municipal Bond Fund |
| ● | Delaware Ivy Municipal High Income Fund |
| ● | Delaware Minnesota High-Yield Municipal Bond Fund |
| ● | Delaware National High-Yield Municipal Bond Fund |
| ● | Delaware Tax-Free Arizona Fund |
| ● | Delaware Tax-Free California Fund |
| ● | Delaware Tax-Free Colorado Fund |
| ● | Delaware Tax-Free Idaho Fund |
| ● | Delaware Tax-Free Minnesota Fund |
| ● | Delaware Tax-Free Minnesota Intermediate Fund |
| ● | Delaware Tax-Free New Jersey Fund |
| ● | Delaware Tax-Free New York Fund |
| ● | Delaware Tax-Free Oregon Fund |
| ● | Delaware Tax-Free Pennsylvania Fund |
| ● | Delaware Tax-Free USA Fund |
| ● | Delaware Tax-Free USA Intermediate Fund |
The Funds are distributed by Delaware Distributors, L.P. (DDLP), an affiliate of MIMBT and Macquarie Group Limited.
| | This page is not part of the annual report. | iv |
Caring for your portfolio
Over a lifetime, things change. When they do, it’s important to ensure that your investments stay in tune with your personal situation.
If you decide to make some changes, check out the convenient options provided by Macquarie Asset Management. We try to make it easy for you to avoid some of the sales charges that you might otherwise have to pay when you withdraw and invest your money with another firm.
Most importantly, you may generally exchange all or part of your shares in one Delaware Funds by Macquarie® mutual fund for shares of the same class of another fund without paying a front-end sales charge or a contingent deferred sales charge (CDSC).
Choose the investment method suitable for you
After you’ve evaluated your overall investments, you have choices about how to implement any changes:
| 1. | Move assets all at once at any time. |
| 2. | Migrate funds to a different investment slowly through a systematic exchange. You can arrange automatic monthly exchanges of your shares in one Delaware Fund for those in another Delaware Fund. Systematic exchanges are subject to the same rules as regular exchanges, which are explained in the right column, including a $100 minimum monthly amount per fund. |
| 3. | Use our automatic investment plan for future investments in different vehicles. To allocate your future investments differently, the Delaware Funds by Macquarie automatic investment plan allows you to make regular monthly or quarterly investments directly from your checking account. |
Important notes about exchanging or redeeming shares
For automated exchanges, a minimum exchange of $100 per fund is required monthly. If the value of your account is $5,000 or more, you can make systematic withdrawals of at least $25 monthly, or $75 quarterly. If the annual amount you withdraw is less than 12% of your account balance at the time the systematic withdrawal plan is established, the CDSC ordinarily applicable to certain fund classes will be waived. More details are available in your prospectus or at delawarefunds.com/literature.
If you exchange shares from Class R shares of any fund, you will pay any applicable sales charge on your new shares.
When exchanging Class C shares of one fund for the same class of shares in other funds, your new shares will be subject to the same CDSC as the shares you originally purchased. The holding period for the CDSC will also remain the same, with the amount of time you held your original shares being credited toward the holding period of your new shares.
You do not pay sales charges on shares that you acquired through the reinvestment of dividends. You may have to pay taxes on your exchange. When you exchange shares, you are purchasing shares in another fund, so you should be sure to get a copy of the fund’s prospectus and read it carefully before buying shares through an exchange.
We may refuse the purchase side of any exchange request if, in the manager’s judgment, the fund would be unable to invest effectively in accordance with its investment objective and policies, or would otherwise potentially be adversely affected.
| v | This page is not part of the annual report. | |
Contact information
Shareholder assistance by phone
800 523-1918, weekdays from 8:30am to
6:00pm ET
For securities dealers and financial
institutions representatives only
800 362-7500
Regular mail
Delaware Funds by Macquarie
P.O. Box 534437
Pittsburgh, PA 15253-4437
Overnight courier service
Delaware Funds by Macquarie
Attention: 534437 500
Ross Street, 154-0520
Pittsburgh, PA 15262
Macquarie Asset Management ● 610 Market Street ● Philadelphia, PA 19106-2354
Macquarie Asset Management (MAM) is the asset management division of Macquarie Group. MAM is a full-service asset manager offering a diverse range of products across public and private markets including fixed income, equities, multi-asset solutions, private credit, infrastructure, renewables, natural assets, real estate, and asset finance. The Public Investments business is a part of MAM and includes the following investment advisers: Macquarie Investment Management Business Trust (MIMBT), Macquarie Funds Management Hong Kong Limited, Macquarie Investment Management Austria Kapitalanlage AG, Macquarie Investment Management Global Limited, Macquarie Investment Management Europe Limited, and Macquarie Investment Management Europe S.A.
The Funds are distributed by Delaware Distributors, L.P. (DDLP), an affiliate of MIMBT and Macquarie Group Limited.
Other than Macquarie Bank Limited ABN 46 008 583 542 ("Macquarie Bank"), any Macquarie Group entity noted in this document is not an authorized deposit-taking institution for the purposes of the Banking Act 1959 (Commonwealth of Australia). The obligations of these other Macquarie Group entities do not represent deposits or other liabilities of Macquarie Bank. Macquarie Bank does not guarantee or otherwise provide assurance in respect of the obligations of these other Macquarie Group entities. In addition, if this document relates to an investment, (a) the investor is subject to investment risk including possible delays in repayment and loss of income and principal invested and (b) none of Macquarie Bank or any other Macquarie Group entity guarantees any particular rate of return on or the performance of the investment, nor do they guarantee repayment of capital in respect of the investment.
The Funds are governed by US laws and regulations.
(2821448)
ANN-IVYFUNDS-0523
| | This page is not part of the annual report. | vi |
Annual report
Alternative / specialty funds
Delaware Climate Solutions Fund
(formerly, Delaware Ivy Energy Fund)
Delaware Global Real Estate Fund
(formerly, Delaware Ivy LaSalle Global Real Estate Fund)
Delaware Ivy Natural Resources Fund
Delaware Ivy Science and Technology Fund
Delaware Real Estate Securities Fund
(formerly, Delaware Ivy Securian Real Estate Securities Fund)
Multi-asset funds
Delaware Ivy Asset Strategy Fund
Delaware Ivy Balanced Fund
March 31, 2023
Carefully consider the Funds’ investment objectives, risk factors, charges, and expenses before investing. This and other information can be found in the Funds’ prospectus and their summary prospectuses, which may be obtained by visiting delawarefunds.com/literature or calling 800 523-1918. Investors should read the prospectus and the summary prospectus carefully before investing.
You can obtain shareholder reports and prospectuses online instead of in the mail.
Visit delawarefunds.com/edelivery.
Table of contents
Experience Delaware Funds by Macquarie®
Macquarie Asset Management (MAM) is a global asset manager that aims to deliver positive impact for everyone. MAM Public Investments traces its roots to 1929 and partners with institutional and individual clients to deliver specialist active investment capabilities across global equities, fixed income, and multi-asset solutions using a conviction-based, long-term approach to investing. In the US, retail investors recognize our Delaware Funds by Macquarie family of funds as one of the oldest mutual fund families.
If you are interested in learning more about creating an investment plan, contact your financial advisor.
You can learn more about Delaware Funds or obtain a prospectus for the Funds at delawarefunds.com/literature.
Manage your account online
| ● | Check your account balance and transactions |
| ● | View statements and tax forms |
| ● | Make purchases and redemptions |
Visit delawarefunds.com/account-access.
Macquarie Asset Management (MAM) is the asset management division of Macquarie Group. MAM is a full-service asset manager offering a diverse range of products across public and private markets including fixed income, equities, multi-asset solutions, private credit, infrastructure, renewables, natural assets, real estate, and asset finance. The Public Investments business is a part of MAM and includes the following investment advisers: Macquarie Investment Management Business Trust (MIMBT), Macquarie Funds Management Hong Kong Limited, Macquarie Investment Management Austria Kapitalanlage AG, Macquarie Investment Management Global Limited, Macquarie Investment Management Europe Limited, and Macquarie Investment Management Europe S.A.
The Funds are distributed by Delaware Distributors, L.P. (DDLP), an affiliate of MIMBT and Macquarie Group Limited.
Other than Macquarie Bank Limited ABN 46 008 583 542 (“Macquarie Bank”), any Macquarie Group entity noted in this document is not an authorized deposit-taking institution for the purposes of the Banking Act 1959 (Commonwealth of Australia). The obligations of these other Macquarie Group entities do not represent deposits or other liabilities of Macquarie Bank. Macquarie Bank does not guarantee or otherwise provide assurance in respect of the obligations of these other Macquarie Group entities. In addition, if this document relates to an investment, (a) the investor is subject to investment risk including possible delays in repayment and loss of income and principal invested and (b) none of Macquarie Bank or any other Macquarie Group entity guarantees any particular rate of return on or the performance of the investment, nor do they guarantee repayment of capital in respect of the investment.
The Funds are governed by US laws and regulations.
This annual report is for the information of Delaware Climate Solutions Fund, Delaware Global Real Estate Fund, Delaware Ivy Asset Strategy Fund, Delaware Ivy Balanced Fund, Delaware Ivy Natural Resources Fund, Delaware Ivy Science and Technology Fund, and Delaware Real Estate Securities Fund shareholders, but it may be used with prospective investors when preceded or accompanied by the Delaware Fund fact sheet for the most recently completed calendar quarter. These documents are available at delawarefunds.com/literature.
Unless otherwise noted, views expressed herein are current as of March 31, 2023, and subject to change for events occurring after such date.
The Funds are not FDIC insured and are not guaranteed. It is possible to lose the principal amount invested.
Advisory services provided by Delaware Management Company, a series of MIMBT, a US registered investment advisor.
All third-party marks cited are the property of their respective owners.
© 2023 Macquarie Management Holdings, Inc.
Portfolio management reviews
| Delaware Climate Solutions Fund | March 31, 2023 (Unaudited) |
Performance preview (for the year ended March 31, 2023)
| Delaware Climate Solutions Fund (Class I shares) | 1-year return | +3.97% |
| Delaware Climate Solutions Fund (Class A shares) | 1-year return | +3.68% |
| MSCI ACWI Investable Market Index (net) (benchmark) | 1-year return | -7.68% |
| MSCI ACWI Investable Market Index (gross) (benchmark) | 1-year return | -7.21% |
| S&P 1500 Energy Sector Index (former benchmark) | 1-year return | +11.92% |
Past performance does not guarantee future results.
For complete, annualized performance for Delaware Climate Solutions Fund, please see the table on page 17.
Class I shares are not subject to a sales charge and are offered for sale exclusively to certain eligible investors. In addition, Class I shares pay no distribution and service fee. The performance of Class A shares excludes the applicable sales charge. The performance of both Class I shares and Class A shares reflects the reinvestment of all distributions. Please see page 20 for a description of the indices. Index performance returns do not reflect any management fees, transaction costs, or expenses. Indices are unmanaged and one cannot invest directly in an index.
Investment objective
The Fund seeks to provide capital growth while also seeking to invest in companies committed to reducing greenhouse gas (GHG) emissions within their operations and/or through the products or services they offer.
Significant Fund event
Effective July 29, 2022, the Fund’s name changed to Delaware Climate Solutions Fund (formerly, Delaware Ivy Energy Fund), and portfolio managers Barry Gladstein and Barry Klein were appointed to manage the Fund. The Fund’s investment objective, investment strategies, and benchmark also changed. In connection with these changes, the Fund now seeks to invest its assets in securities of companies that have been identified as being capable of reducing, displacing and/or sequestering GHG emissions or helping others to do so. These changes may result in higher portfolio turnover in the near term as the portfolio management team purchases and sells securities to reflect the Fund’s repositioning. A higher portfolio turnover is likely to cause the Fund to realize capital gains and incur transaction costs. You should consult your financial advisor about the changes that will result from the repositioning.
Effective July 29, 2022, the MSCI ACWI (All Country World Index) Investable Market Index replaced the S&P 1500 Energy Sector Index as the Fund’s benchmark. The MSCI ACWI Investable Market Index, the Fund’s new benchmark, measures the performance of large-, mid-, and small-cap equities across 23 developed markets and 24 emerging markets countries. The S&P 1500 Energy Sector Index, the Fund’s former benchmark, comprises those companies included in the S&P Composite 1500® that are classified as members of the GICS® Energy sector.
Market review
During the year ended March 31, 2023, the MSCI ACWI (All Country World Index) Investable Market Index declined 7.68% (net). Throughout the period, investor sentiment lagged as the US Federal Reserve aggressively raised rates, the economy slowed, and a small-scale “banking crisis” erupted following the two largest bank failures since the recession of 2008-2009. Energy and materials companies were notable outperformers as commodity-supply issues continued and demand remained steady despite economic headwinds. High-growth companies, notably in the technology sector, were laggards as rates increased, raising the cost of capital. Utilities were also a notable underperformer; rising rates undercut their attraction as a source of yield. Although the Fed remained hawkish throughout the period, the dollar was just 11% off its peak in the third quarter of 2022. Yields rose significantly during the period with the 10-year Treasury rising approximately 0.83 percentage points to 3.48% and the 2-year rising 1.15 percentage points to 4.03%. The yield curve was inverted throughout the period. Coupled with unease about the banking system and slowing economic data, the possibility of a recession was and continues to be a lingering concern for investors.
Within the Fund
The Fund performance discussed in this commentary is broken into two measurement periods. The first is April 1, 2022, to July 28, 2022, and the second is July 29, 2022 (when the Fund was repositioned and renamed Delaware Climate Solutions Fund and the firm’s current portfolio management team began serving as the investment manager) to March 31, 2023.
For the first measurement period (April 1, 2022, to July 28, 2022), the Fund outperformed its benchmark, the S&P 1500 Energy Sector Index. The Fund’s Class I shares rose 2.86%. The Fund’s Class A shares increased 2.79% at net asset value and fell 3.11% at maximum offering price. These figures reflect all distributions reinvested. During the same period, the Fund’s benchmark fell 0.73%.
The leading detractors for the Fund for the period were the consumer staples and utilities sectors. The leading contributors for the Fund were energy and industrials.
Portfolio management reviews
Delaware Climate Solutions Fund
For the second measurement period (July 29, 2022, to March 31, 2023), the Fund underperformed its benchmark, the MSCI ACWI Investable Market Index. The Fund’s Class I shares rose 1.07%. The Fund’s Class A shares increased 0.87% at net asset value and fell 7.83% at maximum offering price. These figures reflect all distributions reinvested. During the same period, the Fund’s benchmark rose 3.55% (net). For complete, annualized performance of Delaware Climate Solutions Fund, please see the table on page 17.
While we differentiate portfolio investments as either reducers or facilitators according to their role in mitigating GHG emissions, these investments can also be classified as either cyclical or defensive depending upon how they typically behave under varying economic conditions. The Fund’s portfolio contains a blend of both cyclical and defensive stocks. Given our investment strategy of building a portfolio of both reducers and facilitators to be held for the long term, we do not typically make material changes in our approach to the market environment.
Energy was the key sector contributing positively to the Fund’s performance during the period from July 29, 2022, to March 31, 2023. Energy markets remain supported by constrained supply meeting pre-pandemic demand levels. Supply remains constrained due to producer discipline, dwindling OPEC spare capacity, and a lack of access to capital due to environmental, social, and governance (ESG) considerations.
The sector detracting most notably from the Fund’s performance during the period was industrials. The combination of bank stress and rapidly rising interest rates brought on by the Fed’s tightening cycle led to further concern that lower growth and a recession may lie ahead. Slower growth or a recession will likely have a negative impact on demand for industrial goods.
Archaea Energy Inc. was our largest contributor during the period. Archaea is a renewable natural gas producer that was formed in 2021 through the combination of two legacy renewable natural gas (RNG) producing businesses with a special purpose acquisition company (SPAC). We initially invested in Archaea upon the announcement of its combination with the SPAC. The business experienced rapid growth, ultimately securing a major joint venture with Republic Services Inc. to help it develop RNG solutions at its landfills. BP PLC, a major European integrated oil company, announced the acquisition of Archaea on October 17, 2022, for $4 billion, a premium of more than 50%.
Schlumberger NV was our second-largest contributor during the period from July 29, 2022, to March 31, 2023. Schlumberger is a major international services company that is actively involved in the transition to renewable energy. The company hosted an analyst day during the fourth quarter of 2022, outlining its growth plans and new technologies. We think this should allow for higher growth and margins across its historical businesses. Importantly, this is coinciding with the advent of another international oil service spending cycle to which Schlumberger is the most exposed of the three main service providers. In our view, the company continues to execute well and is benefiting from significant macro tailwinds.
Our largest detractor during the period was Sunrun Inc., which installs, monitors, and maintains residential solar installations in the US. A large part of Sunrun’s business is leasing solar installations from homeowners, packaging the leases, and monetizing them via the asset-backed securities (ABS) market. The discounted value of the cash flows from the portfolio of leases less the company’s debt equates to the company’s net earnings assets. When we added Sunrun to the Fund’s portfolio, the value of the company’s contracted residential solar portfolio exceeded its valuation. The rising interest rate environment had a detrimental effect on the company’s cost of capital, negatively affecting the discounted cash flows and net earnings assets. Also, during the fourth quarter of 2022, the largest solar market in California came out with a new net-metering proposal, which will negatively affect the economics of solar installations starting in 2023. Despite the rising interest rate environment and likely slowing of growth in California, we remain enthused about continued growth in the solar sector and the company’s underlying fundamentals. We continue to hold the shares, calculating that Sunrun’s implied valuation is less than the intrinsic value of the company’s earnings assets.
Our second-largest detractor during the period was Orsted AS. Like Sunrun, Orsted was negatively affected by rising interest rates, due to the company’s highly contracted offshore wind portfolio. Meanwhile, as power prices rose, the company was also negatively affected by supply chain issues that delayed projects and increased costs for projects under construction. As in-service dates lagged expectations, Orsted needed to compensate customers by buying power in a high-priced energy market. With contracted sales and delayed project in-service dates, it was put into a net-short power price position at the wrong time, and this required high levels of collateral posting. Additionally, the project delays combined with higher commodity costs. This increased capital costs for assets with locked-in revenue streams. These items created a perfect storm, resulting in Orsted’s underperformance during the fiscal year. Going forward, however, we think Orsted maintains its position as a leader in the offshore wind business and should potentially be a leading beneficiary in the coming global offshore wind build-out.
The Fund’s use of foreign exchange (FX) currency positions had a limited effect. Overall, derivatives were immaterial to the Fund’s performance during the fiscal year.
Climate solutions progress
The Fund seeks to provide capital growth while also seeking to invest in companies committed to reducing GHG emissions within their operations and/or through the products or services they offer. Accordingly, the Fund targets investments in companies that are actively working toward reducing, displacing, or sequestering their GHG emissions (referred to as “reducers”), or helping others to do so through development of products and/or services designed to help reduce GHG emissions (referred to as “facilitators”).
The Fund’s portfolio companies that are identified by the Fund’s investment manager as reducers are collectively estimated not only to meet but to exceed the requirements of The Glasgow Pact of 2021, with a 62% GHG reduction by the year 2030 from a 2010 base, versus the Glasgow Pact’s goal of a 45% GHG reduction by the year 2030 from a 2010 base, and net zero emissions by the year 2050. For the purposes of this estimate, 2010 emissions were obtained from MSCI, CDP disclosures, or company reports. 2030 estimated emissions for the portfolio companies identified as reducers were obtained from company-disclosed targets and/or estimates from the Transition Pathways Initiative. Some emissions estimates were calculated by applying forecasted changes in carbon intensity on a percentage basis and applying that percent change to a base level of emissions. Over the past two years (ending December 31, 2021), we estimate that the reducers within the Fund’s portfolio have collectively reduced their own emissions by more than 8%, while global emissions have stayed flat.
In 2021, we estimate that the portfolio companies that the Fund’s investment manager identifies as facilitators helped avoid approximately 186 million tons of GHG emissions through the use of their products and/or services. As the investment in climate transition solutions accelerates, we believe this contribution will continue to grow. Our estimate is based on company disclosures of emissions savings as well as our own calculations that use company disclosed product usage data and utilizes the US Environmental Protection Agency’s (EPA’s) GHG Equivalencies Calculator to provide a GHG equivalent.
Portfolio management reviews
| Delaware Global Real Estate Fund | March 31, 2023 (Unaudited) |
Performance preview (for the year ended March 31, 2023)
| Delaware Global Real Estate Fund (Class I shares) | 1-year return | -20.24% |
| Delaware Global Real Estate Fund (Class A shares) | 1-year return | -20.45% |
| FTSE EPRA Nareit Developed Index (benchmark) | 1-year return | -20.63% |
Past performance does not guarantee future results.
For complete, annualized performance for Delaware Global Real Estate Fund, please see the table on page 21.
Class I shares are not subject to a sales charge and are offered for sale exclusively to certain eligible investors. In addition, Class I shares pay no distribution and service fee. The performance of Class A shares excludes the applicable sales charge. The performance of both Class I shares and Class A shares reflects the reinvestment of all distributions. Please see page 23 for a description of the index. Index performance returns do not reflect any management fees, transaction costs, or expenses. Indices are unmanaged and one cannot invest directly in an index.
Investment objective
The Fund seeks to provide total return through long-term capital appreciation and current income.
Significant Fund event
On May 19, 2022, the Board of Trustees of the Ivy Funds (“Board”) approved the termination of the Sub-Advisory Agreement between Delaware Management Company (the “Manager” or “DMC”), and LaSalle Investment Management Securities, LLC. In addition, the Board approved the transition of day-to-day portfolio management responsibilities to the Macquarie Global Listed Real Estate team (“GLRE team”), whose members provide services via DMC and DMC’s affiliated sub-advisors. Accordingly, the Board approved the appointment of the following affiliated sub-advisors of the Manager: Macquarie Investment Management Global Limited (“MIMGL”), Macquarie Investment Management Europe Limited (“MIMEL”), and Macquarie Funds Management Hong Kong Limited (“MFMHKL”). In addition, the Board approved the appointment of MFMHKL and MIMGL to provide trading and quantitative support services to the Fund. Further, the Board approved a name change of the Fund, with all such changes to take effect on or about July 31, 2022 (the “Effective Date”). Please note that, as of May 2, 2023, MFMHKL is no longer an affiliated sub-advisor for the Fund.
Following is a discussion about performance during the period from August 1, 2022 (when the firm’s current portfolio management team began serving as the investment manager for the Fund) to March 31, 2023.
Market review
Over the period of August 1, 2022 through March 31, 2023, the FTSE EPRA Nareit Developed Index was down 10.9%. Banking concerns in both the US and Europe weighed on those risk assets dependent on debt capital, such as listed real estate. A speedy and coordinated response from governments in both the US and Switzerland to step in and backstop those targeted banks showcased the minimal appetite that exists to risk any destabilization of the banking sector. In our opinion, this should give investors comfort that there is a response mechanism in place to prevent anything systemic going forward. Either way, we think this risk is likely to remain elevated and at the front of investor thinking over the near term as consideration is given to what bank might be next, or what sector is more at risk.
Within the Fund
For the fiscal year ended March 31, 2023, Delaware Global Real Estate Fund declined as did its benchmark, the FTSE EPRA Nareit Developed Index. The Fund’s Class I shares fell 20.24%. The Fund’s Class A shares declined 20.45% at net asset value and declined 25.05% at maximum offering price. These figures reflect all distributions reinvested. During the same period, the Fund’s benchmark declined 20.63%. For complete annualized performance of Delaware Global Real Estate Fund, please see the table on page 21.
At the regional level in absolute returns, Asia was the standout during the period from August 1, 2022, to March 31, 2023, delivering positive gains and outperforming all other regions. Europe experienced the most challenging performance over the period. The leverage ratios within each European region partly explain this. Asia, however, in addition to its strong underlying real estate fundamentals, offers more defensive exposure to balance sheet risks when banking concerns become elevated.
At the sector level, residential sales, gaming, and hotels performed relatively well as hotel and gaming continued to benefit from the reopening of global economies and a resumption of travel. On the flip side, those exposed to venture capitalist or banking tenants, higher leverage, and those most exposed to any potential banking difficulties performed poorly, especially US office, life science, and healthcare.
Equity deals have begun to accelerate in the listed real estate sector with companies taking advantage of acquiring or developing strong assets such as storage and logistics in the Asia-Pacific region. We also see equity deals where listed real estate companies are taking advantage of vendor distress for well-positioned, underlying assets
that remain in significant investor demand, including Australian healthcare. We continue to anticipate further merger and acquisition activity in the sector as the disconnect between listed assets and private assets showcases what we view as a meaningful arbitrage across the asset class and an abundance of opportunity for those that have equity dry powder to deploy.
As always, we continue to favor quality within our portfolio construction. At this juncture, we think diversity of capital sources and a more measured appetite for leverage ratios are important within the quality framework. Underlying real estate fundamentals are also important and we remain supportive in our chosen sector exposures that have access to long-term structural growth. In our opinion, material discounts continue to exist across the asset class. We think that as interest rates begin to top out and banking risks stabilize, a capital-intensive asset such as real estate is likely to come back into focus for diversified investors and patient capital looking to take advantage of any remaining arbitrage in the real estate sector.
The Fund’s use of foreign exchange (FX) currency positions had a limited effect. Overall, derivatives were immaterial to the Fund’s performance during the fiscal year.
Portfolio management reviews
| Delaware Ivy Asset Strategy Fund | March 31, 2023 (Unaudited) |
Performance preview (for the year ended March 31, 2023)
| Delaware Ivy Asset Strategy Fund (Class I shares) | 1-year return | -4.58% |
| Delaware Ivy Asset Strategy Fund (Class A shares) | 1-year return | -4.79% |
| MSCI ACWI (All Country World Index) (net) (benchmark) | 1-year return | -7.44% |
| MSCI ACWI (All Country World Index) (gross) (benchmark) | 1-year return | -6.96% |
Past performance does not guarantee future results.
For complete, annualized performance for Delaware Ivy Asset Strategy Fund, please see the table on page 24.
Class I shares are not subject to a sales charge and are offered for sale exclusively to certain eligible investors. In addition, Class I shares pay no distribution and service fee. The performance of Class A shares excludes the applicable sales charge. The performance of both Class I shares and Class A shares reflects the reinvestment of all distributions. Please see page 26 for a description of the index. Index performance returns do not reflect any management fees, transaction costs, or expenses. Indices are unmanaged and one cannot invest directly in an index.
Investment objective
The Fund seeks to provide total return.
Market review
Fiscal year 2023 marked one of the great paradigm shifts for global markets and economies in recent history. A confluence of events, including fallout from pandemic spending and loose monetary policy, catalyzed what had been years in the making.
Major central bank policy shifts, inflation, changes to global supply chains, the end of inexpensive Russian energy for Europe, and labor shortages created broad-based asset price declines with few exceptions. Equities fell along with bond markets, which typically provide protection, as investors scrambled to face what we believe will be a new reality.
Years of lower interest rates and quantitative easing finally came to roost in the form of inflation. Perpetuating inflationary pressure, the war in Ukraine drove increases to energy and food prices, particularly in Europe. As a result of Russia’s actions, Western nations implemented sanctions against Russia. This all but cut off Russia’s ability to supply natural gas, oil, wheat, and other commodities to most of the world. In addition, rising home prices and rapid wage growth became concerning. Home affordability was historically low and labor shortages along with demographic shifts created a difficult task for central banks.
In response, the US Federal Reserve acted through a series of interest rate hikes. Central banks around the world soon followed. The Fed and the European Central Bank increased rates throughout the year. Europe abandoned negative rate policy after nearly a decade. With higher rates, market valuations quickly declined. Extremely high valuations, afforded by longer-duration growth companies in a low-rate environment, were hit particularly hard. US regional banks were caught with liability mismatches and mark-to-market losses in their Treasury holdings, all stemming from the rapid rate increases. This caused a run on several banks and turmoil in the system. At the same time, one of the oldest Swiss financial institutions, Credit Suisse, was rescued in a coordinated effort between UBS and the Swiss central bank.
China maintained its zero-COVID policy throughout most of calendar year 2022 before finally reopening in December when the pressure from its population and weakening economy became too great. With this overhang finally easing, economic activity has accelerated.
Within the Fund
For the fiscal year ended March 31, 2023, Delaware Ivy Asset Strategy Fund declined, although it outperformed its benchmark, the MSCI All Country World Index, which also declined. The Fund’s Class I shares fell 4.58%. The Fund’s Class A shares declined 4.79% at net asset value and declined 10.27% at maximum offering price. These figures reflect all distributions reinvested. During the same period, the Fund’s benchmark declined 7.44% (net). For complete annualized performance of Delaware Ivy Asset Strategy Fund, please see the table on page 24.
The Fund posted a negative return for the fiscal year but outperformed its benchmark. The largest contribution came from stock selection in the consumer discretionary, communication services, and healthcare sectors while stock selection in the consumer staples sector had the largest negative impact. Geographically, stock selection in the US and India contributed most while selection in Japan and Germany was a drag on performance. Sector and country exposure is primarily a result of our bottom-up (stock-by-stock) process.
On an individual stock basis, Deutsche Telekom AG, a large German telecommunications company, and Darden Restaurants Inc., a US restaurant operator best known for its Olive Garden franchise, were the leading contributors. Deutsche Telekom has continued to execute and benefit from the strength of its US subsidiary, T-Mobile US Inc. Deutsche Telekom appears to be ahead of schedule in bringing its ownership stake in T-Mobile to greater than 50%. This should help enable the firm to generate more cash, which it plans to return to shareholders through dividends. T-Mobile is
gaining share in a competitive US wireless environment and German operations are growing. Darden has grown significantly post the COVID-19 reopening, as diners were eager to eat out again. It has also been able to pass on inflationary pressures and maintain profit margins in the face of labor cost increases and higher raw material expenses.
The largest detractors from performance were First Republic Bank, a US-based regional bank, and Alphabet Inc., the US-based internet company and parent of Google. First Republic was swept up in a broad run on regional bank deposits. Historically, it has been a well-managed bank, but was quickly put under pressure after several peers in similar geographies showed signs of collapsing. While we believe First Republic had a different risk profile, many depositors withdrew their money, and we were no longer able to handicap the risk of owning. We exited the position after the initial pullback, but before the major selloff in shares. Alphabet’s business fell under pressure when advertising spending, a major source of revenue, slowed across the industry as advertising is highly sensitive to economic cycles. The stock also fell along with other large benchmark growth names sensitive to higher interest rates. We exited our position.
The fixed income and diversifying portfolios were mixed during the fiscal year as higher rates pushed down areas of the market, particularly US Treasurys, but strong corporate cash balances and the long timeline before credits come due helped issuers. High yield, on average, performed slightly better than investment grade bonds, despite its higher risk profile, as duration was a greater headwind than credit spreads. Energy credits were key contributors within the Fund’s portfolio. Gold also provided a tailwind as it outperformed the global equity index.
The Fund’s use of options contracts and foreign exchange (FX) currency positions had a limited effect. Overall, derivatives were immaterial to the Fund’s performance during the fiscal year.
Portfolio management reviews
| Delaware Ivy Balanced Fund | March 31, 2023 (Unaudited) |
Performance preview (for the year ended March 31, 2023)
| Delaware Ivy Balanced Fund (Class I shares) | 1-year return | -6.52% |
| Delaware Ivy Balanced Fund (Class A shares) | 1-year return | -6.71% |
| S&P 500® Index (benchmark) | 1-year return | -7.73% |
| Bloomberg US Aggregate Index (benchmark) | 1-year return | -4.78% |
Past performance does not guarantee future results.
For complete, annualized performance for Delaware Ivy Balanced Fund, please see the table on page 27.
Class I shares are not subject to a sales charge and are offered for sale exclusively to certain eligible investors. In addition, Class I shares pay no distribution and service fee. The performance of Class A shares excludes the applicable sales charge. The performance of both Class I shares and Class A shares reflects the reinvestment of all distributions. Please see page 29 for a description of the indices. Index performance returns do not reflect any management fees, transaction costs, or expenses. Indices are unmanaged and one cannot invest directly in an index.
Investment objective
The Fund seeks to provide total return through a combination of capital appreciation and current income.
Market review
At the start of the Fund’s fiscal year in March 2022, persistently high inflation led to tighter central bank monetary policy, with the US Federal Reserve leading the way in raising interest rates. This increase in rates was the Fed’s aggressive attempt to try to bring inflation under control. Other central banks, including the Bank of England and the European Central Bank (ECB), also took repeated steps to tighten monetary policy in their jurisdictions. Meanwhile, equities and bonds posted poor performance in the face of brutal headwinds and unrelenting negative news. This included soaring inflation, consequent aggressive monetary tightening, ongoing supply chain problems, China’s zero-COVID policy-related lockdowns, the Russia-Ukraine war, and soaring energy prices. The higher prices and disruptions within the supply of oil and gas hit Europe hardest as Russia cut off gas to several European Union (EU) countries. In turn, the Group of Seven (G7) nations and later the EU implemented an oil embargo.
Markets rallied briefly in July 2022, when a near-term turnaround in inflation seemed possible. Despite investors’ concerns about the slowing of economic growth, stocks appreciated along with other risk asset classes, including corporate, high yield, convertible, and emerging market bonds. A key reason for this appreciation was the decline in yields on US and euro-zone government bonds, leading to significant price gains. However, the tide turned again in mid-August and the bear market returned for most asset classes when hopes for a slowdown in inflation were dashed. Central banks then reaffirmed their intentions to continue aggressively tightening monetary policy. Recession fears mounted and the energy crisis worsened as Russia announced it was shutting down a gas pipeline for maintenance. German yields rose sharply, and the euro fell below parity with the US dollar for the first time in 20 years.
The fourth quarter of 2022, like the third quarter, had a friendly start. Most equities advanced, and the US and European broad indices posted substantial gains. Continued high inflation and interest rate hikes by numerous central banks characterized the market environment in October, and by November, it appeared that markets were in recovery mode. After the Fed’s expected 0.75-percentage-point interest rate hike at the beginning of October, poorer economic data and slightly declining inflation rates fueled hopes of slower interest rate hikes in the near future. But, instead of a year-end rally, equities and bonds suffered significant losses in December. Global inflation rates fell slightly, and as expected, the major central banks raised key interest rates but by less than before (for example, the Fed and the ECB each raised rates by 0.50 percentage points).
The positive reversal of trends from the challenges and large drawdowns that had occurred for most of calendar year 2022 continued as the new year began. The equity and bond markets started 2023 strong on the heels of China’s reopening and hopes of falling inflation. Although headline inflation rates fell due to declining energy prices, core inflation fluctuated. This caused the ECB and the Fed to again emphasize their intention to remain restrictive longer. GDP growth for the fourth quarter of 2022 was better than expected in the US and in China, but slightly negative in Germany and other European countries.
In February 2023, inflation and interest rate hike expectations rose once again as did bond yields. In the US in particular, the January inflation rate was surprisingly high, the labor market remained strong, and globally, indicators pointed to high demand in the services sector. Fed and ECB spokespersons again stressed that they would remain hawkish. In this environment, government and corporate bonds fell in unison. In the equity markets, North America and emerging markets lost ground while Europe and Japan gained. Commodities fell sharply in some cases, partly because demand from China was weaker than expected. The US dollar broke out of a four-month downtrend and strengthened against the euro.
The collapse of three US regional banks and Switzerland’s Credit Suisse caused severe turbulence in March. Bank share prices
plummeted, and stock markets in general fell quite sharply. Government bonds and gold rallied, risk premiums on corporate bonds widened, and the US dollar lost ground against the euro. Since one contributory factor was the sharp interest rate hikes, central banks sought to perform a balancing act between maintaining financial stability and fighting inflation. While the ECB and Fed guaranteed massive liquidity for the banking system, it also raised key interest rates due to continued high core inflation. Markets then calmed down, and broad equity indices turned positive again.
Source: Bloomberg, unless noted otherwise.
Within the Fund
For the fiscal year ended March 31, 2023, Delaware Ivy Balanced Fund declined, although it outperformed its equity benchmark, the S&P 500 Index, which also declined. It did, however, underperform its fixed income benchmark, the Bloomberg US Aggregate Index, which likewise declined. The Fund’s Class I shares fell 6.52%. The Fund’s Class A shares fell 6.71% at net asset value and fell 12.08% at maximum offer price. These figures reflect all distributions reinvested. During the same period, the S&P 500 Index declined 7.73% and the Bloomberg US Aggregate Index declined 4.78%. For complete, annualized performance of Delaware Ivy Balanced Fund, please see the table on page 27.
The Fund’s performance reflected both the mix of returns in the underlying assets as well as their allocation weightings for the fiscal period. The Fund benefited from an underweight to equity securities and from outperformance within the equity portion of the Fund’s portfolio. An underweight allocation to fixed income detracted from the Fund’s performance.
Within equities, outperformance was strongest within the consumer discretionary sector, where the sleeve’s meaningful underweight compared with the benchmark contributed to relative performance. Stock selection within the healthcare sector also contributed. What somewhat offset these benefits, however, was the Fund’s underweight allocation to the top-performing energy sector and its underweight allocation to the consumer staples sector.
Leading contributors to equity portfolio performance for the period included United Rentals Inc., an equipment rental company that benefited from higher rental rates and a robust recovery in non-residential construction activity. The Progressive Corp. also added strongly to performance. Progressive led the insurance industry in recapturing pricing following the loss of profitability during the pandemic, when used-car prices and associated repair costs rapidly inflated. Eli Lilly & Co. also contributed significantly on expectations that it would achieve blockbuster status for a new diabetes drug that has ancillary weight-loss benefits.
Blackstone Inc. and Union Pacific Corp. were two of the leading detractors from the Fund’s performance for the period as tighter monetary conditions and reduced freight activity, respectively, weighed on the share price. CME Group Inc. also detracted as investors priced in peak financial and interest rate volatility. Given the decline in the overall market, the Fund’s modest cash holdings were beneficial.
The Fund’s current positioning increasingly reflects more caution with respect to the ultimate impact of a rapid decrease in banks’ willingness to extend credit. We recently moderated our allocations and holdings in more economically sensitive equities that do not appear to us to reflect further weakness in growth. We reduced our weighting in the financial sector, with sales of The Charles Schwab Corp., Discover Financial Services, and Bank of America Corp., and reduced weightings in our alternative investment positions, Blackstone Inc. and KKR & Co. Inc. We also reduced positions in two industrials, Deere & Co. and United Rentals Inc., which we think appear at risk to short-term tightness in lending standards.
Finally, we reduced our weight in semiconductors, which should likely continue to benefit from easing supply chain pressures but could be susceptible to reductions in demand if critical industrial end markets weaken. At the same time, we increased the Fund’s positions in more defensive companies such as hospital HCA Healthcare Inc., auto parts retailer AutoZone Inc., as well as the consumer staples sector. One cyclical area where we retain high conviction is in commercial aerospace-associated holdings. While recessionary conditions appear more likely to us in some sectors, commercial aerospace has been in a deep recession with the inability to supply the world’s airlines with planes ordered many years ago. Additionally, safety issues interrupted production of The Boeing Co.’s 737 and 787. Airbus SE and Raytheon Technologies Corp. remain our preferred ways to profit from increased aircraft production over the next four to five years.
The unprecedented hiking cycle in the US and the euro zone has already begun to affect the economy’s largest stakeholders, in our view. One year after the Fed’s initial rate hike of 0.25 percentage points, the current financial market environment seems staged for a binary outcome, in our opinion. We believe much depends on how confidence in the banking sector develops and whether more pain appears on the horizon. Central banks in the US and the euro zone face a dilemma as the targets of both price and financial market stability seem to us hard to achieve simultaneously. Even though the situation is fluid, we believe that unlike 2022, there are more asset classes that could offer intrinsic diversification. Our focus remains then on risk management while we seek what we consider to be the most attractive investment opportunities in the context of carefully constructed, well-diversified portfolios.
Portfolio management reviews
| Delaware Ivy Natural Resources Fund | March 31, 2023 (Unaudited) |
Performance preview (for the year ended March 31, 2023)
| Delaware Ivy Natural Resources Fund (Class I shares) | 1-year return | -4.73% |
| Delaware Ivy Natural Resources Fund (Class A shares) | 1-year return | -5.03% |
| S&P North American Natural Resources Sector Index (benchmark) | 1-year return | +0.73% |
Past performance does not guarantee future results.
For complete, annualized performance for Delaware Ivy Natural Resources Fund, please see the table on page 30.
Class I shares are not subject to a sales charge and are offered for sale exclusively to certain eligible investors. In addition, Class I shares pay no distribution and service fee. The performance of Class A shares excludes the applicable sales charge. The performance of both Class I shares and Class A shares reflects the reinvestment of all distributions. Please see page 32 for a description of the index. Index performance returns do not reflect any management fees, transaction costs, or expenses. Indices are unmanaged and one cannot invest directly in an index.
Investment objective
The Fund seeks to provide capital growth and appreciation.
Market review
The fiscal year ended March 31, 2023, was a volatile period for equities generally, and especially so in the natural resources sector. Russia’s invasion of Ukraine in February 2022, less than two months before the beginning of the period, led to supply constraints and surging prices through June. The sector retreated during the third calendar quarter 2022 as slowing economic growth in Europe and China rattled investors. From there through the end of the calendar year, the sector rallied, spurred on by the end of China’s zero-COVID policy, which ignited consumer demand.
Commodities did not all move in lock step, however. Steel and agricultural commodities outperformed while energy and copper, which are more economically sensitive, fell in value during the year. Even so, energy subindices outperformed the S&P 500® Index during the year.
Throughout the fiscal period, severe cross currents buffeted global economies and markets, placing central bankers in a precarious position. Inflation remained stubbornly high even as the US Federal Reserve and other central banks aggressively raised rates. Economic indicators sent mixed signals. While the job market remained tight with decades-low unemployment, the yield curve was inverted, the money supply was collapsing, job layoffs picked up, and the US banking experienced a mini panic, all portents of a possible recession. The Fed may need to reverse course, in our view, even though inflation remains above its 2.0% target. We believe that the energy transition, onshoring and deglobalization, budget-deficit, dollar weakness, and increased geopolitical uncertainty could sustain inflation.
We believe, and the market is currently discounting, that the Fed will reverse course by the second half of 2023. If this happens, gold should outperform after it was flat during the fiscal period. Similar policy shifts have occurred 10 times since 1980, each one resulting in a bull market, albeit with differing duration and strength. We would argue that there were five meaningful cycles since 1980, with durations of at least 1,000 days and gains of at least 75% and as much as almost 200%. Gold equities have almost always outperformed the commodity in these environments. Gold equities currently represent the highest percentage of the portfolio since the COVID-19 summer.
While the environment highlighted above would not normally be conducive to a positive outlook for base metals, we see relatively limited downside in most metals following their negative return in 2022. Copper inventories were exceptionally low throughout 2022 and remain so today. A declining production surplus, increased demand from China, and a tailwind from the energy transition should aid copper. This is juxtaposed against the potential for a global slowdown that, in our estimation, would hurt pricing. However, with costs rising substantially over the last several years and operators reconfiguring mine plans to optimize recoverable grades in recent quarters, we feel that there is support in the $3 to $3.25 per-pound range, approximately 25% lower than current copper prices. Aluminum, which also had a rough year, declining roughly 31%, should find support now that supplies are constrained both by ongoing power issues and by Chinese curtailments. Against a backdrop of reasonable demand, we believe that any weakness in aluminum would provide a compelling opportunity for us to add exposure.
For more than 10 years, the oil market has been the scene of a battle between OPEC+ and US shale producers. With its short-cycle nature (compared to the long lead time of major offshore projects), US shale oil production rose from 5 million barrels per day in 2005 to 12 million today. The US largely acted as the swing producer, quickly adding barrels when the market was undersupplied. We believe this growth has largely played out, however, as we are seeing evidence of performance degradation in well production across the major US oil plays. At present, we expect oil and gas companies that boast a deep well inventory, solid balance sheets, and shareholder-friendly return strategies to outperform.
While the longer-term outlook for North American natural gas demand remains bullish, the short-term supply outlook is rather
bleak. The Department of Energy estimated that lower 48 natural gas production in January hit an all-time high of 112.3 billion cubic feet per day (bcf/day) while demand is estimated at approximately 106.8 bcf/day. Unlike crude oil, natural gas export capacity is limited by LNG liquefaction capacity, which is maxed out until new expansions arrive in 2025. We believe this roughly 6 bcf/day of oversupply is likely to continue to grow in the short term as the gas rig count has yet to fall even though prices have declined more than 50%. Further, associated gas production from oil drilling continues to grow. Given this backdrop, we chose to reduce the portfolio’s natural-gas exposure. We maintained the Fund’s exposure to several companies that are trading at discounted valuations from a normalized gas price.
With the reduction in the Fund’s North American natural gas exposure, we added to the portfolio’s crude oil exposure. Much of this came from adding European integrated oil companies to the portfolio. European integrated oil companies currently trade at half the financial multiples of their North American peers despite having better cash return profiles and comparable asset bases. We also added to high-quality North American oil producers with solid balance sheets, deep inventories, and shareholder-friendly return programs. Given our expectations of more subdued growth in the US, we believe these companies are likely to command a premium and continue to outperform.
Within the Fund
For the fiscal year ended March 31, 2023, Delaware Ivy Natural Resources Fund underperformed its benchmark, the S&P North American Natural Resources Sector Index, which advanced. The Fund’s Class I shares fell 4.73%. The Fund’s Class A shares declined 5.03% at net asset value and declined 10.49% at maximum offer price. These figures reflect all distributions reinvested. During the same period, the S&P North American Natural Resources Sector Index gained 0.73%. For complete, annualized performance of Delaware Ivy Natural Resources Fund, please see the table on page 30.
As of March 31, 2023, the Fund’s largest sector allocation was traditional energy, which constituted approximately 41% of the portfolio; followed by materials (metals and mining, agriculture, and wood products), 38%; consumer staples (agriculture), 7%; industrials (renewable energy and aggregates), 7%; other (uranium, utilities, nuclear and cash), 5%; and real estate (timber), 2%. At fiscal year end, the Fund’s portfolio was 69% weighted to the US, 19% to Canada, and 12% to Western Europe.
Energy was the largest contributor to performance in terms of both weighting and total return for the year despite negative performance in energy commodities. The largest detractors from performance were two metals and mining positions, which were negatively affected by rising costs.
During the pandemic demand for petroleum products cratered, refining margins collapsed, and oil companies hemorrhaged cash, stressing balance sheets. Growing acceptance of electric vehicles and increased use of biofuels added to the pressure. More than two million barrels per day of refining capacity was removed from the global system before demand started to rise, eventually reaching pre-pandemic levels. Because it can take a decade to bring a new refinery online, there is little cure for the current supply-demand imbalance. Given this backdrop, Valero Energy Corp., the largest independent refiner with a high complexity refining system, was the Fund’s leading contributor to performance for the fiscal year. Compared with its peers, Valero Energy sits on the lower end of the operational cost curve. It is also the largest and lowest-cost producer of renewable diesel and boasts a substantial and low-cost ethanol business. Coming out of the pandemic the company took on leverage to protect its dividend and overall balance sheet. During the subsequent refining boom Valero paid its debt down, leaving it in an enviable position to increase shareholder returns. We expect refining to remain highly cyclical and volatile, but with higher mid-cycle earnings power.
Archaea Energy Inc., the second-largest contributor to performance during the year, is a landfill natural gas producer that was formed in 2021 through the combination of two legacy renewable natural gas producing businesses with a special purpose acquisition company (SPAC). We invested in Archaea Energy from the beginning. The business experienced rapid growth, ultimately securing a major joint venture with Republic Services Group. BP PLC, a major European integrated oil company, acquired Archaea Energy on October 17, 2022, for $4 billion, a 50% premium.
Anglo American PLC and Newmont Corp. were among the biggest detractors from performance for the year. Metals and mining struggled throughout the year as slowing growth, weakening economic data, and rising interest rates cast a pall over the sector. Higher mining costs also negatively affected the sector’s performance.
Anglo American struggled in particular as it took a substantial write-down on its controversial and highly complex Woodsmith potash and polyhalite project, which generated higher-than-expected capital expenditures. That led to a more subdued free cash flow outlook, which, we think, should translate to lower shareholder returns in the coming years. Despite these issues and foreseeable higher capital expenditures, we believe Anglo American is attractively valued, and have maintained the Fund’s position.
Newmont also struggled as its second-quarter earnings came in below consensus estimates, with slightly lower volumes, 2021 profit
Portfolio management reviews
Delaware Ivy Natural Resources Fund
share, timing of sales, and higher costs driving the negative numbers. While costs will likely remain elevated, we think Newmont’s free cash generation should start to increase next year as capital expenditures decelerate and production growth increases. Additionally, we see gold as having significant upside potential.
While we maintain an optimistic view on natural resources in the long term, we expect global economic conditions to deteriorate further. We think this will have a severe impact on short-term demand, further depressing commodity prices and natural-resource equities. We think several of our favorite economically sensitive commodities – oil, natural gas, refined products, copper, and aluminum – will likely be negatively affected in the short term.
The supply outlook for these commodities remains troubled, in our view. Increasingly, investors are considering environmental, social, and governance (ESG) issues, which are having both a push and pull effect. Reduced access to capital, geology, geography, and regulation all continue to limit growth. The current volatility in commodity prices will also likely inhibit growth by curtailing capital programs. When economic conditions inevitably improve, however, we think supply will likely remain constrained while demand surges. That’s where, in our view, ESG considerations will likely stimulate demand. Specifically, the environmental push is driving demand for renewable energy, electric vehicles, and battery storage. Current investment in renewable energy remains inadequate to meet demand, and investment in the commodities required to facilitate this transition remains woefully deficient. We don’t see this abating for a multitude of reasons, including political issues, lack of access to capital, higher cost of capital, and capital-return strategies that favor shareholders rather than growth. We believe that the outlook for reduced supplies combined with rising demand may cause severe inflationary pressure across the energy complex.
Portfolio management reviews
| Delaware Ivy Science and Technology Fund | March 31, 2023 (Unaudited) |
| Performance preview (for the year ended March 31, 2023) | | | |
| Delaware Ivy Science and Technology Fund (Class I shares) | 1-year return | -12.12% | * |
| Delaware Ivy Science and Technology Fund (Class A shares) | 1-year return | -12.32% | |
| S&P North American Technology Sector Index (benchmark) | 1-year return | -11.73% | |
Past performance does not guarantee future results.
*Total return for the report period presented in the table differs from the return in “Financial highlights.” The total return presented in the above table is calculated based on the net asset value (NAV) at which shareholder transactions were processed. The total return presented in “Financial highlights” is calculated in the same manner but also takes into account certain adjustments that are necessary under US generally accepted accounting principles required in the annual report.
For complete, annualized performance for Delaware Ivy Science and Technology Fund, please see the table on page 33.
Class I shares are not subject to a sales charge and are offered for sale exclusively to certain eligible investors. In addition, Class I shares pay no distribution and service fee. The performance of Class A shares excludes the applicable sales charge. The performance of both Class I shares and Class A shares reflects the reinvestment of all distributions. Please see page 35 for a description of the index. Index performance returns do not reflect any management fees, transaction costs, or expenses. Indices are unmanaged and one cannot invest directly in an index.
Investment objective
The Fund seeks to provide growth of capital.
Market review
Throughout the Fund’s fiscal year ended March 31, 2023, financial markets hung on every word uttered by the US Federal Reserve. Rapidly rising inflation, accompanied by a 50-year low in unemployment, drove the Fed, beginning in March 2022, to raise interest rates aggressively throughout the year. By the end of the fiscal period, the federal funds rate had increased more than four percentage points to a rate of nearly 5%. At the same time, the Fed began to reduce its balance sheet, selling $80 billion to $90 billion of assets each month through September.
The US was not alone, as other central banks followed suit raising rates to battle inflation. The European Central Bank (ECB) and the Bank of England raised interest rates to their respective highest levels in more than a decade. Additionally, in December, the Bank of Japan surprised investors when it allowed the 10-year government bond yield to rise to the highest level in seven years.
Even as the central banks acted to constrain inflation, robust consumer demand and supply chain disruptions continued to exert upward pressure on prices. Government stimulus during the COVID-19 pandemic and pent-up demand for goods and services led to healthy spending throughout the economy. Supply chains struggled to keep up, however, as economic disruptions continued, largely due to the Russia-Ukraine war and the lingering effects of COVID-19, particularly in China. Inflation rose to 40-year highs and housing prices briefly accelerated before succumbing to higher mortgage rates. As the Fed’s actions took hold during the course of calendar year 2022, inventories increased meaningfully even as demand slowed, and supply chains recovered. Eventually, retailers went from empty shelves to heavily discounting certain products.
The financial market narrative shifted slightly in early calendar 2023 as investors anticipated a potential slowing of further interest rate hikes. This psychological shift led to a rally, particularly boosting some stocks that had been hurt the most in 2022. While investors remain concerned about soft economic data and the potential for a recession, some of the latest data, indicating slowing inflation and continuing job growth, has been supportive of recent market activity.
On the government side, the US Congress passed the Inflation Reduction Act, which set a 15% minimum corporate tax rate and a 1% tax on equity buybacks. Additionally, the bill addressed Medicare prescription-drug pricing and introduced several incentives for more efficient energy use and development. From investors’ perspective, overall corporate taxes are set to increase approximately $100 billion as tax extenders expire and the Inflation Reduction Act takes effect. The CHIPS and Science Act also passed during the fiscal period, providing $280 billion in new funding to boost domestic research and semiconductor manufacturing.
Internationally, the Russia-Ukraine war and China’s continued aggressive COVID-19 lockdown policy dominated headlines. While the war was particularly disruptive to energy consumption in Europe, the early humanitarian crisis waned as the region adapted to what will likely be a drawn-out conflict. China’s zero-COVID policy led to economic weakness and the country’s weakest GDP growth on record. As a result, late in the fiscal period, China’s government undertook some fiscal and monetary easing. China ultimately reopened the economy at the beginning of 2023. After a spike in infection rates and the associated slowdown in consumption, the Chinese economy began showing some signs of improvement during the latest quarter.
The return of higher interest rates and the threat of persistent inflation led to a challenging year in financial markets. Fundamentally, after a decade of easy monetary policy and extended periods of zero interest rates, investors were reminded that capital has a cost. In this context, market multiples contracted meaningfully, especially for the most highly valued growth stocks.
Within the Fund
For the fiscal year ended March 31, 2023, Delaware Ivy Science and Technology Fund declined as did its benchmark, the S&P North
Portfolio management reviews
Delaware Ivy Science and Technology Fund
American Technology Sector Index. The Fund’s Class I shares declined 12.12%. The Fund’s Class A shares fell 12.32% at net asset value and fell 17.36% at maximum offer price. These figures reflect all distributions reinvested. During the same period, the Fund’s benchmark declined 11.73%. For complete, annualized performance of Delaware Ivy Science and Technology Fund, please see the table on page 33.
During the fiscal year, information technology (IT) stocks came under significant pressure. Within this sector, the IT services and interactive media subsectors were the weakest performers. While still negative on an absolute basis, the hardware, semiconductor, and software subsectors outperformed the broader sector. The healthcare sector broadly outperformed the technology universe.
Relative outperformers in the Fund’s IT sector included ON Semiconductor Corp., Microchip Technology Inc., and T-Mobile US Inc. An underweight position in Amazon.com Inc. also contributed to relative performance. Positions in Snap Inc., Luminar Technologies Inc., and Workday Inc. were detractors, while an underweight position in Meta Platforms Inc. also hurt relative performance. Snap, Workday, and Meta Platforms are no longer Fund holdings.
During the reporting period, our exposure to healthcare underperformed the Fund’s all-technology benchmark. Since healthcare is not represented in the benchmark, the Fund’s allocation to the sector is an important distinction when comparing performance metrics. The Fund’s healthcare equipment subsector exposure drove the underperformance.
The Fund maintained a mid-single-digits average cash position during the fiscal year, which positively contributed to relative performance due to the market’s overall decline.
As we entered fiscal 2023, we were concerned about the rising specter of inflation and tightening monetary policy. These concerns materialized with widespread pressure on higher multiple stocks within our universe. Given our market view and with our disciplined valuation approach to investing in innovation, we started the fiscal year with increased weightings in larger-capitalization companies and a healthy amount of cash. We anticipated opportunities over the course of the fiscal year to invest in what we considered to be attractive stocks at more compelling valuations. As the fiscal year progressed, we lowered our exposure to the “mega-cap” technology stocks and added a handful of what we consider to be attractively valued stocks that offered compelling innovation opportunities. This reduced exposure to the “mega-cap” technology stocks helped us during 2022, but hurt us in the first calendar quarter of 2023.
The Fund had approximately 65.8% of its equity exposure in the IT sector as of March 31, 2023. The overall exposure in IT is more appropriately assessed by including the communication services sector, which includes many companies previously in the IT sector. The Fund had approximately 10.9% of its equity assets in the communication services sector at fiscal year end, for a total of 76.7% of assets exposed to the IT and communication services sectors.
At the end of the reporting period, 7.5% of the Fund’s equity assets were in the healthcare sector. Our lower healthcare exposure compared to historical averages is primarily a result of reducing the Fund’s biotechnology weighting. In developing markets, as the standard of living increases, we believe the demand for quality healthcare should increase. In our opinion, biotechnology, healthcare IT systems, and pharmaceuticals are among the leading innovators and early adopters of new science and technology, so we continue to focus on companies in those areas.
The Fund’s “applied science and technology” holdings span several industries and sectors and, along with the consumer discretionary sector (largely Amazon.com), make up the remainder of the Fund’s equity composition. At the end of the fiscal year, the Fund’s cash position was 8.05% of net assets. We consistently have some cash on hand to take advantage of opportunities that may present themselves.
At the end of the Fund’s fiscal year, volatility continued in the equity markets. And, while volatility creates near-term uncertainty, we use these times in the market to opportunistically add new companies or adjust weightings to take advantage of what we believe are great long-term stories. We view our long-term investment horizon and concentrated Fund as compelling advantages during these times of market uncertainty.
We see innovation in the changes brought about by the work-from-home trend, the early development of the metaverse, and the continued electrification of transportation as potentially driving new investment opportunities. Additionally, the persisting supply chain shortages highlight the increasing value and integral role of semiconductors in the global economy.
As always, we will continue to carefully examine the macroeconomic factors underlying our investment universe, especially current issues like the regulatory risks facing big technology and China’s restrictive technology policies. We have high conviction that our attention to bottom-up (stock by stock) research, coupled with the innovation happening across the globe should continue to provide the Fund with potentially attractive investment opportunities.
The Fund’s use of foreign exchange (FX) currency positions had a limited effect. Overall, derivatives were immaterial to the Fund’s performance during the fiscal year.
Portfolio management reviews
| Delaware Real Estate Securities Fund | March 31, 2023 (Unaudited) |
Performance preview (for the year ended March 31, 2023)
| Delaware Real Estate Securities Fund (Class I shares) | 1-year return | -20.02% | * |
| Delaware Real Estate Securities Fund (Class A shares) | 1-year return | -20.26% | |
| FTSE Nareit Equity REITs Index (benchmark) | 1-year return | -19.22% | |
Past performance does not guarantee future results.
*Total return for the report period presented in the table differs from the return in “Financial highlights.” The total return presented in the above table is calculated based on the net asset value (NAV) at which shareholder transactions were processed. The total return presented in “Financial highlights” is calculated in the same manner but also takes into account certain adjustments that are necessary under US generally accepted accounting principles required in the annual report.
For complete, annualized performance for Delaware Real Estate Securities Fund, please see the table on page 36.
Class I shares are not subject to a sales charge and are offered for sale exclusively to certain eligible investors. In addition, Class I shares pay no distribution and service fee. The performance of Class A shares excludes the applicable sales charge. The performance of both Class I shares and Class A shares reflects the reinvestment of all distributions. Please see page 38 for a description of the index. Index performance returns do not reflect any management fees, transaction costs, or expenses. Indices are unmanaged and one cannot invest directly in an index.
Investment objective
The Fund seeks to provide total return through capital appreciation and current income.
Significant Fund event
On May 19, 2022, the Board of Trustees of the Ivy Funds (“Board”) approved the termination of the Sub-Advisory Agreement between Delaware Management Company (the “Manager” or “DMC”), and Securian Asset Management, Inc. as it relates to the Fund. In addition, the Board approved the transition of day-to-day portfolio management responsibilities to the Macquarie Global Listed Real Estate team (“GLRE team”), whose members provide services via DMC and DMC’s affiliated sub-advisors. Accordingly, the Board approved the appointment of the following affiliated sub-advisors of the Manager: Macquarie Investment Management Global Limited (“MIMGL”), Macquarie Investment Management Europe Limited (“MIMEL”), and Macquarie Funds Management Hong Kong Limited (“MFMHKL”). In addition, the Board approved the appointment of MFMHKL and MIMGL to provide trading and quantitative support services to the Fund. Further, the Board approved a name change of the Fund, with all such changes to take effect on or about July 31, 2022 (the “Effective Date”). Please note that, as of May 2, 2023, MFMHKL is no longer an affiliated sub-advisor for the Fund.
Market review
During the Fund’s fiscal year, investors learned there is no good place to hide when inflation takes hold. With its inflation-fighting credentials in question, the US Federal Reserve got serious, setting the stage for a tightening cycle at the same time the economy was already slowing. Investors hoped for the best but prepared for the worst as recession worries had taken firm hold.
Real estate stocks struggled under the same forces as the broader equities market, with the added dread that stagflation could be on the horizon. Amid a constant barrage of higher inflation readings, aggressive Fed action, and plummeting consumer confidence, the sector delivered poor results as measured by the FTSE Nareit Equity REITs Index. Simply put, there were very few places to hide within real estate investment trusts (REITs).
Over the period of August 1, 2022 through March 31, 2023, the FTSE Nareit Equity REITs Index was down 9.94%. The index performed well into January 2023 but was somewhat negatively impacted by banking sector stresses, credit tightening, and increased investor belief in a second half of the year recession scenario. The 10-year Treasury yield began March 2023 at around 4% before finishing the month lower, falling to around 3.5%. High beta names were the worst performers over the eight-month period. Businesses with high cyclicality, high exposure to the US economy, and higher levels of debt on average saw the largest drawdowns, particularly the office segment. In terms of sectors, retail and gaming were the strongest-performing sectors over the eight-month period.
Within the Fund
For the fiscal year ended March 31, 2023, Delaware Real Estate Securities Fund declined, underperforming its benchmark, the FTSE Nareit Equity REITs Index, which also declined. The Fund’s Class I shares fell 20.02%. The Fund’s Class A shares declined 20.26% at net asset value and declined 24.85% at maximum offering price. These figures reflect all distributions reinvested. During the same period, the Fund’s benchmark declined 19.22%. For complete annualized performance of Delaware Real Estate Securities Fund, please see the table on page 36.
During the August 1, 2022 through March 31, 2023 period in which the Macquarie Global Listed Real Estate team managed the Fund, merger and acquisition activity continued to be top of mind in the storage sector, as rumors of Extra Space Storage REIT Inc. weighing a bid for Life Storage Inc. came out after Life Storage publicly rejected a bid by Public Storage REIT to buy its business in
Portfolio management reviews
Delaware Real Estate Securities Fund
February. Life Storage released its updated proxy statement, which improved the change in control provisions for its executive officers, a move that could push the company closer to accepting a bid. We continue to favor storage, which remains one of the Fund’s core overweight positions as we believe the current discounted valuations are low relative to the businesses’ long-term growth. Although these names are shorter duration in nature, we think they offer an affordable storage alternative to both consumers and small businesses, remain well occupied, and have strong pricing power.
Gaming continues to perform well, with no signs of slowing casino demand. Investors continue to favor businesses with leases exposed to higher-than-expected Consumer Price Index numbers within lease escalators and healthy growth prospects. We continue to monitor the unemployment backdrop, as we remain cautious given the sustained strength of the US job market despite the Fed’s rate hikes and other macroeconomic headwinds. We think any meaningful uptick in unemployment could affect discretionary spending in gaming, but these signs have yet to appear, and we remain optimistic on gaming.
In Canada, the federal government released its budget, which was closely watched by REIT investors for any ramifications in the multifamily space. The updated budget didn’t offer any guidance on potential legislation for REITs; instead, it hinted at the possibility of policy changes for corporate landlords. The budget offered no further clarity on exactly what would be done, if anything, and did not make any specific mention of REITs. While there remains an overhang from potential future legislation, we view this as a positive for Canadian multi-family residential given that it maintains the status quo. We think the softening of the language around policy changes is likely a good sign as well. We continue to believe the demand created by immigration into Canada, combined with a very tight housing market, lower supply growth, and the softening of regulatory headwinds will lead to better earnings growth, higher margins, and healthy occupancies going forward, in our opinion.
While certain Sun Belt markets are holding up and will likely sustain long-term demand, the large oncoming supply wave in this region gives us pause in the near term. Given the risks of rising unemployment into a recessionary environment, apartments remain relatively higher risk versus other components of the housing sector. Still, apartments have remained healthy in terms of occupancy and leasing volumes as the job market has remained quite strong.
Office continues to struggle, though we saw a rally in the last week of March 2023. We think this was more likely fueled by short covering rather than an improving operating environment or fundamentals. Banking sector stress in the beginning of March 2023 with the fall of Silicon Valley Bank impacted office REITs, particularly those with West Coast and life science exposure. Concerns over the health of regional banks, which hold a large amount of commercial real estate debt, as well as increased tightening of lending standards, remain a headwind to office names. Additionally, we have seen a few more tech-sector layoffs in March as well as space reductions. Defaults and vacancies continue to rise, even in high-end office buildings. We maintain an underweight position for the sector, though we recognize that select deep-value opportunities could emerge.
The Fund’s use of foreign exchange (FX) currency positions had a limited effect. Overall, derivatives were immaterial to the Fund’s performance during the fiscal year.
Performance summaries
| Delaware Climate Solutions Fund | March 31, 2023 (Unaudited) |
The performance quoted represents past performance and does not guarantee future results. Investment return and principal value of an investment will fluctuate so that shares, when redeemed, may be worth more or less than their original cost. Current performance may be lower or higher than the performance quoted. Performance data current to the most recent month end may be obtained by calling 800 523-1918 or visiting delawarefunds.com/performance.
| Fund and benchmark performance1,2 | Average annual total returns through March 31, 2023 |
| | 1 year | 5 year | 10 year | Lifetime |
| Class A (Est. April 3, 2006) | | | | |
| Excluding sales charge | +3.68% | -2.03% | -2.70% | — |
| Including sales charge | -2.27% | -3.18% | -3.28% | — |
| Class C (Est. April 3, 2006) | | | | |
| Excluding sales charge | +2.88% | -2.74% | -3.22% | — |
| Including sales charge | +1.88% | -2.74% | -3.22% | — |
| Class I (Est. April 2, 2007) | | | | |
| Excluding sales charge | +3.97% | -1.66% | -2.33% | — |
| Including sales charge | +3.97% | -1.66% | -2.33% | — |
| Class R (Est. December 19, 2012) | | | | |
| Excluding sales charge | +3.31% | -2.37% | -2.96% | — |
| Including sales charge | +3.31% | -2.37% | -2.96% | — |
| Class R6 (Est. July 31, 2014) | | | | |
| Excluding sales charge | +4.03% | -1.66% | — | -5.39% |
| Including sales charge | +4.03% | -1.66% | — | -5.39% |
| Class Y (Est. April 3, 2006) | | | | |
| Excluding sales charge | +3.69% | -2.01% | -2.62% | — |
| Including sales charge | +3.69% | -2.01% | -2.62% | — |
| MSCI ACWI Investable Market Index (net) | -7.68% | +6.58% | +7.95% | — |
| MSCI ACWI Investable Market Index (gross) | -7.21% | +7.10% | +8.49% | — |
| S&P 1500 Energy Sector Index | +11.92% | +8.60% | +3.60% | — |
1Returns reflect the reinvestment of all distributions and are presented both with and without the applicable sales charges described below. Returns do not reflect the deduction of taxes the shareholder would pay on Fund distributions or redemptions of Fund shares.
Expense limitations were in effect for certain classes during some or all of the periods shown in the “Fund and benchmark performance” table. Expenses for each class are listed in the “Fund expense ratios” table on page 19. Performance would have been lower had expense limitations not been in effect.
Class A shares are sold with a maximum front-end sales charge of 5.75%, and have an annual distribution and service (12b-1) fee of 0.25% of average daily net assets. Performance for Class A shares, excluding sales charges, assumes that no front-end sales charge applied.
Class C shares are sold with a contingent deferred sales charge (CDSC) of 1.00% if redeemed during the first 12 months. They are also subject to an annual 12b-1 fee of 1.00% of average daily net assets. Performance for Class C shares, excluding sales charges, assumes either that CDSCs did not apply or that the investment was not redeemed.
Class I shares are not subject to a sales charge and are offered for sale exclusively to certain eligible investors. In addition, Class I shares pay no 12b-1 fee.
Effective July 1, 2021, Class N shares were renamed Class R6 shares. Class R6 shares are available only to certain investors. In addition, Class R6 shares do not pay any service fees, sub-accounting fees, and/or sub-transfer agency fees to any brokers, dealers, or other financial intermediaries. Class R6 shares pay no 12b-1 fee.
Performance summaries
Delaware Climate Solutions Fund
Class R shares are available only for certain retirement plan products. They are sold without a sales charge and have an annual 12b-1 fee of 0.50% of average daily net assets.
Class Y shares are available only to certain investors. Class Y shares have an annual 12b-1 fee of 0.25% of average daily net assets.
Using ESG criteria in the investment process may exclude certain companies for non-investment reasons and, therefore, the Fund may forgo some market opportunities available to funds that do not use ESG factors. In addition, because company greenhouse gas (GHG) emissions data are not standardized (and are further subject to estimation error when not company-reported), the data sets the Fund must rely on may imperfectly represent companies’ true GHG emissions. Also, the company emissions targets that the Manager sets are based on model assumptions and estimations that carry the inherent risk associated with any modeling or estimating process.
Investing in energy securities may include price fluctuation caused by real and perceived inflationary trends and political developments, the cost assumed in complying with environmental safety regulations, changing demand for different types of energy, changes in methods for conserving energy, the uncertain success rates for exploration projects, tax and other governmental regulations, and other risks associated with generating or distributing energy.
The Fund has the flexibility to invest as much as 50% of its assets in as few as two issuers with no single issuer accounting for more than 25% of the portfolio. The remaining 50% of its assets must be diversified so that no more than 5% of its assets are invested in the securities of a single issuer. Because a non-diversified portfolio may invest its assets in fewer issuers, the value of its shares may increase or decrease more rapidly than if it were fully diversified.
Risk is increased in a concentrated portfolio since it holds a limited number of securities with each investment having a greater effect on the overall performance.
The Fund’s focus on securities of issuers that seek to reduce, displace, and/or sequester GHG emissions or help others to do so may affect the Fund’s exposure to certain sectors or types of investments. The Fund’s relative investment performance may also be impacted depending on whether such sectors or investments are in or out of favor with the market. Certain investments may be dependent on US and foreign government policies, including tax incentives and subsidies, as well as on political support for certain environmental initiatives and developments affecting companies focused on sustainable energy and climate change solutions generally.
The Fund may invest in initial public offerings (IPOs), which can have a significant positive impact on the Fund’s performance that may not be replicated in the future.
International investments entail risks including fluctuation in currency values, differences in accounting principles, or economic or political instability. Investing in emerging markets can be riskier than investing in established foreign markets due to increased volatility, lower trading volume, and higher risk of market closures. In many emerging markets, there is substantially less publicly available information and the available information may be incomplete or misleading. Legal claims are generally more difficult to pursue.
The disruptions caused by natural disasters, pandemics, or similar events could prevent the Fund from executing advantageous investment decisions in a timely manner and could negatively impact the Fund’s ability to achieve its investment objective and the value of the Fund’s investments.
2The Fund’s expense ratios, as described in the most recent prospectus, are disclosed in the following “Fund expense ratios” table. The expense ratios below may differ from the expense ratios in the “Financial highlights” since they are based on different time periods and the expense ratios in the prospectus include acquired fund fees and expenses, if any. See Note 2 in “Notes to financial statements” for additional details. Please see the “Financial highlights” section in this report for the most recent expense ratios.
Fund expense
ratios | Class A | Class C | Class I | Class R | Class R6 | Class Y |
| Total annual operating expenses (without fee waivers) | 1.72% | 2.34% | 1.14% | 1.73% | 0.99% | 1.38% |
| Net expenses (including fee waivers, if any) | 1.24% | 1.99% | 0.99% | 1.49% | 0.99% | 1.24% |
| | | | | | | |
| Type of waiver | Contractual | Contractual | Contractual | Contractual | Contractual | Contractual |
Performance of a $10,000 investment1
For the period March 31, 2013 through March 31, 2023
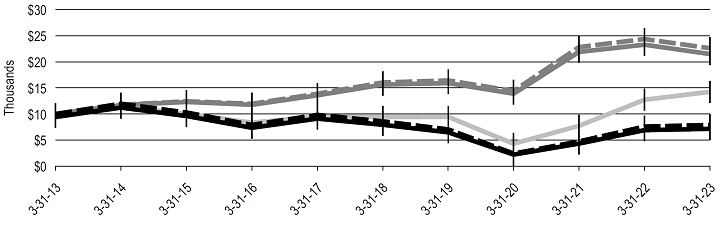
| | | | Starting value | | Ending value |
 | MSCI ACWI Investable Market Index (gross) | | $ | 10,000 | | | $ | 22,597 | |
 | MSCI ACWI Investable Market Index (net) | | $ | 10,000 | | | $ | 21,484 | |
 | S&P 1500 Energy Sector Index | | $ | 10,000 | | | $ | 14,245 | |
 | Delaware Climate Solutions Fund – Class I shares | | $ | 10,000 | | | $ | 7,903 | |
 | Delaware Climate Solutions Fund – Class A shares | | $ | 9,425 | | | $ | 7,166 | |
1The “Performance of a $10,000 investment” graph assumes $10,000 invested in Class I and Class A shares of the Fund on March 31, 2013, and includes the effect of a 5.75% front-end sales charge (for Class A shares) and the reinvestment of all distributions. The graph does not reflect the deduction of taxes the shareholders would pay on Fund distributions or redemptions of Fund shares. Expense limitations may have been in effect for some or all of the periods shown. Performance would have been lower had expense limitations not been in effect. Expenses are listed in the “Fund expense ratios” table on page 19. Please note additional details on pages 17 through 20.
Performance summaries
Delaware Climate Solutions Fund
The graph also assumes $10,000 invested in the MSCI ACWI Investable Market Index and the S&P 1500 Energy Sector Index as of March 31, 2013.
The MSCI ACWI (All Country World) Investable Market Index (IMI) represents large-, mid-, and small-cap stocks across 23 developed market countries and 24 emerging market countries. Index “net” return approximates the minimum possible dividend reinvestment, after deduction of withholding tax at the highest possible rate. Index “gross” return approximates the maximum possible dividend reinvestment.
The S&P 1500 Energy Sector Index comprises those companies included in the S&P Composite 1500® that are classified as members of the GICS® Energy sector.
Index performance returns do not reflect any management fees, transaction costs, or expenses. Indices are unmanaged and one cannot invest directly in an index. Past performance does not guarantee future results.
Performance of other Fund classes will vary due to different charges and expenses.
| | Nasdaq
symbols | CUSIPs |
| Class A | IEYAX | 466000395 |
| Class C | IEYCX | 466000379 |
| Class I | IVEIX | 466000148 |
| Class R | IYEFX | 465899367 |
| Class R6 | IENRX | 46600A807 |
| Class Y | IEYYX | 466000361 |
Performance summaries
| Delaware Global Real Estate Fund | March 31, 2023 (Unaudited) |
The performance quoted represents past performance and does not guarantee future results. Investment return and principal value of an investment will fluctuate so that shares, when redeemed, may be worth more or less than their original cost. Current performance may be lower or higher than the performance quoted. Performance data current to the most recent month end may be obtained by calling 800 523-1918 or visiting delawarefunds.com/performance.
| Fund and benchmark performance1,2 | Average annual total returns through March 31, 2023 |
| | 1 year | 5 year | Lifetime |
| Class A (Est. April 1, 2013) | | | |
| Excluding sales charge | -20.45% | +2.10% | +2.60% |
| Including sales charge | -25.05% | +0.90% | +2.00% |
| Class C (Est. April 1, 2013) | | | |
| Excluding sales charge | -21.14% | +1.35% | +1.84% |
| Including sales charge | -21.83% | +1.35% | +1.84% |
| Class I (Est. April 1, 2013) | | | |
| Excluding sales charge | -20.24% | +2.51% | +2.82% |
| Including sales charge | -20.24% | +2.51% | +2.82% |
| Class R (Est. April 1, 2013) | | | |
| Excluding sales charge | -20.76%* | +1.76% | +2.13% |
| Including sales charge | -20.76% | +1.76% | +2.13% |
| Class R6 (Est. July 5, 2017) | | | |
| Excluding sales charge | -20.21% | +2.51% | +2.52% |
| Including sales charge | -20.21% | +2.51% | +2.52% |
| Class Y (Est. April 1, 2013) | | | |
| Excluding sales charge | -20.49% | +2.13% | +2.74% |
| Including sales charge | -20.49% | +2.13% | +2.74% |
| FTSE EPRA Nareit Developed Index | -20.63% | +1.79% | +3.44%** |
*Total return for the report period presented in the table differs from the return in “Financial highlights.” The total return presented in the above table is calculated based on the net asset value (NAV) at which shareholder transactions were processed. The total return presented in “Financial highlights” is calculated in the same manner but also takes into account certain adjustments that are necessary under US generally accepted accounting principles required in the annual report.
**The benchmark lifetime return is for Class I share comparison only and is calculated using the Fund’s Class I inception date.
1Returns reflect the reinvestment of all distributions and are presented both with and without the applicable sales charges described below. Returns do not reflect the deduction of taxes the shareholder would pay on Fund distributions or redemptions of Fund shares.
Expense limitations were in effect for certain classes during some or all of the periods shown in the “Fund and benchmark performance” table. Expenses for each class are listed in the “Fund expense ratios” table on page 22. Performance would have been lower had expense limitations not been in effect.
Class A shares are sold with a maximum front-end sales charge of 5.75%, and have an annual distribution and service (12b-1) fee of 0.25% of average daily net assets. Performance for Class A shares, excluding sales charges, assumes that no front-end sales charge applied.
Class C shares are sold with a contingent deferred sales charge (CDSC) of 1.00% if redeemed during the first 12 months. They are also subject to an annual 12b-1 fee of 1.00% of average daily net assets. Performance for Class C shares, excluding sales charges, assumes either that CDSCs did not apply or that the investment was not redeemed.
Class I shares are not subject to a sales charge and are offered for sale exclusively to certain eligible investors. In addition, Class I shares pay no 12b-1 fee.
Performance summaries
Delaware Global Real Estate Fund
Effective July 1, 2021, Class N shares were renamed Class R6 shares. Class R6 shares are available only to certain investors. In addition, Class R6 shares do not pay any service fees, sub-accounting fees, and/or sub-transfer agency fees to any brokers, dealers, or other financial intermediaries. Class R6 shares pay no 12b-1 fee.
Class R shares are available only for certain retirement plan products. They are sold without a sales charge and have an annual 12b-1 fee of 0.50% of average daily net assets.
Class Y shares are available only to certain investors. Class Y shares have an annual 12b-1 fee of 0.25% of average daily net assets.
“Non-diversified” investments may allocate more of their net assets to investments in single securities than “diversified” investments. Resulting adverse effects may subject these investments to greater risks and volatility.
International investments entail risks including fluctuation in currency values, differences in accounting principles, or economic or political instability. Investing in emerging markets can be riskier than investing in established foreign markets due to increased volatility, lower trading volume, and higher risk of market closures. In many emerging markets, there is substantially less publicly available information and the available information may be incomplete or misleading. Legal claims are generally more difficult to pursue.
Risk is increased in a concentrated portfolio since it holds a limited number of securities with each investment having a greater effect on the overall performance.
Investing in the real estate industry includes risks such as declines in real estate value, lack of availability of mortgage funds, overbuilding, extended vacancies, increases in property taxes, changes in zoning laws, costs from cleanup of environmental problems, uninsured damages, variations in rents, and changes in interest rates.
The disruptions caused by natural disasters, pandemics, or similar events could prevent the Fund from executing advantageous investment decisions in a timely manner and could negatively impact the Fund’s ability to achieve its investment objective and the value of the Fund’s investments.
2The Fund’s expense ratios, as described in the most recent prospectus, are disclosed in the following “Fund expense ratios” table. The expense ratios below may differ from the expense ratios in the “Financial highlights” since they are based on different time periods and the expense ratios in the prospectus include acquired fund fees and expenses, if any. See Note 2 in “Notes to financial statements” for additional details. Please see the “Financial highlights” section in this report for the most recent expense ratios.
Fund expense
ratios | Class A | Class C | Class I | Class R | Class R6 | Class Y |
| Total annual operating expenses (without fee waivers) | 1.76% | 2.21% | 1.36% | 1.97% | 1.30% | 1.65% |
| Net expenses (including fee waivers, if any) | 1.30% | 2.05% | 1.05% | 1.55% | 1.05% | 1.30% |
| | | | | | | |
| Type of waiver | Contractual | Contractual | Contractual | Contractual | Contractual | Contractual |
Performance of a $10,000 investment1
For the period April 1, 2013 (Fund’s inception date) through March 31, 2023
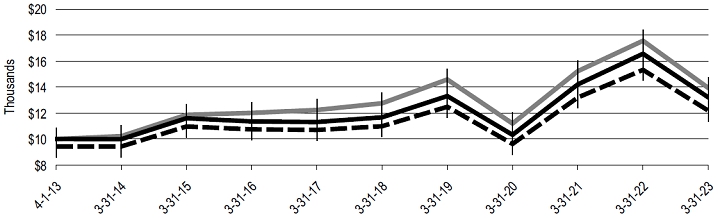
| | | | Starting value | | Ending value |
| FTSE EPRA Nareit Developed Index | | $ | 10,000 | | | $ | 13,935 | |
| Delaware Global Real Estate Fund – Class I shares | | $ | 10,000 | | | $ | 13,209 | |
| Delaware Global Real Estate Fund – Class A shares | | $ | 9,425 | | | $ | 12,187 | |
1The “Performance of a $10,000 investment” graph assumes $10,000 invested in Class I and Class A shares of the Fund on April 1, 2013, and includes the effect of a 5.75% front-end sales charge (for Class A shares) and the reinvestment of all distributions. The graph does not reflect the deduction of taxes the shareholders would pay on Fund distributions or redemptions of Fund shares. Expense limitations may have been in effect for some or all of the periods shown. Performance would have been lower had expense limitations not been in effect. Expenses are listed in the “Fund expense ratios” table on page 22. Please note additional details on pages 21 through 23.
The graph also assumes $10,000 invested in the FTSE EPRA Nareit Developed Index as of March 31, 2013. The FTSE EPRA Nareit Developed Index tracks the performance of listed real estate companies and real estate investment trusts (REITs) worldwide, based in US dollars.
Index performance returns do not reflect any management fees, transaction costs, or expenses. Indices are unmanaged and one cannot invest directly in an index. Past performance does not guarantee future results.
Performance of other Fund classes will vary due to different charges and expenses.
| | Nasdaq
symbols | CUSIPs |
| Class A | IREAX | 465899359 |
| Class C | IRECX | 465899334 |
| Class I | IRESX | 465899326 |
| Class R | IRERX | 465899318 |
| Class R6 | IRENX | 46600A245 |
| Class Y | IREYX | 465899292 |
Performance summaries
| Delaware Ivy Asset Strategy Fund | March 31, 2023 (Unaudited) |
The performance quoted represents past performance and does not guarantee future results. Investment return and principal value of an investment will fluctuate so that shares, when redeemed, may be worth more or less than their original cost. Current performance may be lower or higher than the performance quoted. Performance data current to the most recent month end may be obtained by calling 800 523-1918 or visiting delawarefunds.com/performance.
| Fund and benchmark performance1,2 | Average annual total returns through March 31, 2023 |
| | 1 year | 5 year | 10 year | Lifetime |
| Class A (Est. July 10, 2000) | | | | |
| Excluding sales charge | -4.79% | +5.84% | +4.48% | — |
| Including sales charge | -10.27% | +4.59% | +3.86% | — |
| Class C (Est. April 20, 1995) | | | | |
| Excluding sales charge | -5.80% | +4.99% | +3.87% | — |
| Including sales charge | -6.59% | +4.99% | +3.87% | — |
| Class I (Est. April 2, 2007) | | | | |
| Excluding sales charge | -4.58% | +6.11% | +4.74% | — |
| Including sales charge | -4.58% | +6.11% | +4.74% | — |
| Class R (Est. July 31, 2008) | | | | |
| Excluding sales charge | -5.10% | +5.50% | +4.12% | — |
| Including sales charge | -5.10% | +5.50% | +4.12% | — |
| Class R6 (Est. July 31, 2014) | | | | |
| Excluding sales charge | -4.39% | +6.25% | — | +3.70% |
| Including sales charge | -4.39% | +6.25% | — | +3.70% |
| Class Y (Est. December 29, 1995) | | | | |
| Excluding sales charge | -4.72% | +5.87% | +4.50% | — |
| Including sales charge | -4.72% | +5.87% | +4.50% | — |
| MSCI ACWI Index (net) | -7.44% | +6.93% | +8.06% | — |
| MSCI ACWI Index (gross) | -6.96% | +7.46% | +8.62% | — |
1Returns reflect the reinvestment of all distributions and are presented both with and without the applicable sales charges described below. Returns do not reflect the deduction of taxes the shareholder would pay on Fund distributions or redemptions of Fund shares.
Expense limitations were in effect for certain classes during some or all of the periods shown in the “Fund and benchmark performance” table. Expenses for each class are listed in the “Fund expense ratios” table on page 25. Performance would have been lower had expense limitations not been in effect.
Class A shares are sold with a maximum front-end sales charge of 5.75%, and have an annual distribution and service (12b-1) fee of 0.25% of average daily net assets. Performance for Class A shares, excluding sales charges, assumes that no front-end sales charge applied.
Class C shares are sold with a contingent deferred sales charge (CDSC) of 1.00% if redeemed during the first 12 months. They are also subject to an annual 12b-1 fee of 1.00% of average daily net assets. Performance for Class C shares, excluding sales charges, assumes either that CDSCs did not apply or that the investment was not redeemed.
Class I shares are not subject to a sales charge and are offered for sale exclusively to certain eligible investors. In addition, Class I shares pay no 12b-1 fee.
Effective July 1, 2021, Class N shares were renamed Class R6 shares. Class R6 shares are available only to certain investors. In addition, Class R6 shares do not pay any service fees, sub-accounting fees, and/or sub-transfer agency fees to any brokers, dealers, or other financial intermediaries. Class R6 shares pay no 12b-1 fee.
Class R shares are available only for certain retirement plan products. They are sold without a sales charge and have an annual 12b-1 fee of 0.50% of average daily net assets.
Class Y shares are available only to certain investors. Class Y shares have an annual 12b-1 fee of 0.25% of average daily net assets.
Risk is increased in a concentrated portfolio since it holds a limited number of securities with each investment having a greater effect on the overall performance.
International investments entail risks including fluctuation in currency values, differences in accounting principles, or economic or political instability. Investing in emerging markets can be riskier than investing in established foreign markets due to increased volatility, lower trading volume, and higher risk of market closures. In many emerging markets, there is substantially less publicly available information and the available information may be incomplete or misleading. Legal claims are generally more difficult to pursue.
Fixed income securities and bond funds can lose value, and investors can lose principal, as interest rates rise. They also may be affected by economic conditions that hinder an issuer’s ability to make interest and principal payments on its debt. This includes prepayment risk, the risk that the principal of a bond that is held by a portfolio will be prepaid prior to maturity, at the time when interest rates are lower than what the bond was paying. A portfolio may then have to reinvest that money at a lower interest rate.
High yielding, non-investment-grade bonds (junk bonds) involve higher risk than investment grade bonds. The high yield secondary market is particularly susceptible to liquidity problems when institutional investors, such as mutual funds and certain other financial institutions, temporarily stop buying bonds for regulatory, financial, or other reasons. In addition, a less liquid secondary market makes it more difficult to obtain precise valuations of the high yield securities.
The Fund may invest in derivatives, which may involve additional expenses and are subject to risk, including the risk that an underlying security or securities index moves in the opposite direction from what the portfolio manager anticipated. A derivatives transaction depends upon the counterparties’ ability to fulfil their contractual obligations.
Exposure to the commodities markets may subject the Fund to greater volatility than investments in traditional securities.
IBOR risk is the risk that changes related to the use of the London interbank offered rate (LIBOR) or similar rates (such as EONIA) could have adverse impacts on financial instruments that reference these rates. The abandonment of these rates and transition to alternative rates could affect the value and liquidity of instruments that reference them and could affect investment strategy performance.
The disruptions caused by natural disasters, pandemics, or similar events could prevent the Fund from executing advantageous investment decisions in a timely manner and could negatively impact the Fund’s ability to achieve its investment objective and the value of the Fund’s investments.
2The Fund’s expense ratios, as described in the most recent prospectus, are disclosed in the following “Fund expense ratios” table. The expense ratios below may differ from the expense ratios in the “Financial highlights” since they are based on different time periods and the expense ratios in the prospectus include acquired fund fees and expenses, if any. See Note 2 in “Notes to financial statements” for additional details. Please see the “Financial highlights” section in this report for the most recent expense ratios.
Fund expense
ratios | Class A | Class C | Class I | Class R | Class R6 | Class Y |
| Total annual operating expenses (without fee waivers) | 1.11% | 1.92% | 0.88% | 1.46% | 0.72% | 1.11% |
| Net expenses (including fee waivers, if any) | 1.11% | 1.92% | 0.88% | 1.46% | 0.72% | 1.11% |
| | | | | | | |
| Type of waiver | n/a | n/a | n/a | n/a | n/a | Contractual |
Performance summaries
Delaware Ivy Asset Strategy Fund
Performance of a $10,000 investment1
For the period March 31, 2013 through March 31, 2023

| | | | Starting value | | Ending value |
| MSCI ACWI Index (gross) | | $ | 10,000 | | | $ | 22,859 | |
| MSCI ACWI Index (net) | | $ | 10,000 | | | $ | 21,708 | |
| Delaware Ivy Asset Strategy Fund – Class I shares | | $ | 10,000 | | | $ | 15,892 | |
| Delaware Ivy Asset Strategy Fund – Class A shares | | $ | 9,425 | | | $ | 14,604 | |
1The “Performance of a $10,000 investment” graph assumes $10,000 invested in Class I and Class A shares of the Fund on March 31, 2013, and includes the effect of a 5.75% front-end sales charge (for Class A shares) and the reinvestment of all distributions. The graph does not reflect the deduction of taxes the shareholders would pay on Fund distributions or redemptions of Fund shares. Expense limitations may have been in effect for some or all of the periods shown. Performance would have been lower had expense limitations not been in effect. Expenses are listed in the “Fund expense ratios” table on page 25. Please note additional details on pages 24 through 26.
The graph also assumes $10,000 invested in the MSCI ACWI Index as of March 31, 2013. The MSCI ACWI (All Country World Index) represents large- and mid-cap stocks across developed and emerging markets worldwide. The index covers approximately 85% of the global investable equity opportunity set. Index “net” return approximates the minimum possible dividend reinvestment, after deduction of withholding tax at the highest possible rate. Index “gross” return approximates the maximum possible dividend reinvestment.
Index performance returns do not reflect any management fees, transaction costs, or expenses. Indices are unmanaged and one cannot invest directly in an index. Past performance does not guarantee future results.
Performance of other Fund classes will vary due to different charges and expenses.
| | Nasdaq
symbols | CUSIPs |
| Class A | WASAX | 466000759 |
| Class C | WASCX | 466000734 |
| Class I | IVAEX | 466001864 |
| Class R | IASRX | 466000114 |
| Class R6 | IASTX | 46600A104 |
| Class Y | WASYX | 466000726 |
Performance summaries
| Delaware Ivy Balanced Fund | March 31, 2023 (Unaudited) |
The performance quoted represents past performance and does not guarantee future results. Investment return and principal value of an investment will fluctuate so that shares, when redeemed, may be worth more or less than their original cost. Current performance may be lower or higher than the performance quoted. Performance data current to the most recent month end may be obtained by calling 800 523-1918 or visiting delawarefunds.com/performance.
| Fund and benchmark performance1,2 | Average annual total returns through March 31, 2023 |
| | 1 year | 5 year | 10 year | Lifetime |
| Class A (Est. November 16, 1987) | | | | |
| Excluding sales charge | -6.71% | +6.71% | +6.73% | — |
| Including sales charge | -12.08% | +5.45% | +6.10% | — |
| Class C (Est. December 8, 2003) | | | | |
| Excluding sales charge | -7.58%* | +5.88% | +6.13% | — |
| Including sales charge | -8.32% | +5.88% | +6.13% | — |
| Class I (Est. April 2, 2007) | | | | |
| Excluding sales charge | -6.52% | +6.96% | +6.99% | — |
| Including sales charge | -6.52% | +6.96% | +6.99% | — |
| Class R (Est. December 19, 2012) | | | | |
| Excluding sales charge | -6.97% | +6.33% | +6.37% | — |
| Including sales charge | -6.97% | +6.33% | +6.37% | — |
| Class R6 (Est. July 31, 2014) | | | | |
| Excluding sales charge | -6.39% | +7.10% | — | +6.25% |
| Including sales charge | -6.39% | +7.10% | — | +6.25% |
| Class Y (Est. December 8, 2003) | | | | |
| Excluding sales charge | -6.71% | +6.70% | +6.74% | — |
| Including sales charge | -6.71% | +6.70% | +6.74% | — |
| S&P 500 Index | -7.73% | +11.19% | +12.24% | — |
| Bloomberg US Aggregate Index | -4.78% | +0.91% | +1.36% | — |
*Total return for the report period presented in the table differs from the return in “Financial highlights.” The total return presented in the above table is calculated based on the net asset value (NAV) at which shareholder transactions were processed. The total return presented in “Financial highlights” is calculated in the same manner but also takes into account certain adjustments that are necessary under US generally accepted accounting principles required in the annual report.
1Returns reflect the reinvestment of all distributions and are presented both with and without the applicable sales charges described below. Returns do not reflect the deduction of taxes the shareholder would pay on Fund distributions or redemptions of Fund shares.
Expense limitations were in effect for certain classes during some or all of the periods shown in the “Fund and benchmark performance” table. Expenses for each class are listed in the “Fund expense ratios” table on page 28. Performance would have been lower had expense limitations not been in effect.
Class A shares are sold with a maximum front-end sales charge of 5.75%, and have an annual distribution and service (12b-1) fee of 0.25% of average daily net assets. Performance for Class A shares, excluding sales charges, assumes that no front-end sales charge applied.
Class C shares are sold with a contingent deferred sales charge (CDSC) of 1.00% if redeemed during the first 12 months. They are also subject to an annual 12b-1 fee of 1.00% of average daily net assets. Performance for Class C shares, excluding sales charges, assumes either that CDSCs did not apply or that the investment was not redeemed.
Class I shares are not subject to a sales charge and are offered for sale exclusively to certain eligible investors. In addition, Class I shares pay no 12b-1 fee.
Performance summaries
Delaware Ivy Balanced Fund
Effective July 1, 2021, Class N shares were renamed Class R6 shares. Class R6 shares are available only to certain investors. In addition, Class R6 shares do not pay any service fees, sub-accounting fees, and/or sub-transfer agency fees to any brokers, dealers, or other financial intermediaries. Class R6 shares pay no 12b-1 fee.
Class R shares are available only for certain retirement plan products. They are sold without a sales charge and have an annual 12b-1 fee of 0.50% of average daily net assets.
Class Y shares are available only to certain investors. Class Y shares have an annual 12b-1 fee of 0.25% of average daily net assets.
Fixed income securities and bond funds can lose value, and investors can lose principal, as interest rates rise. They also may be affected by economic conditions that hinder an issuer’s ability to make interest and principal payments on its debt. This includes prepayment risk, the risk that the principal of a bond that is held by a portfolio will be prepaid prior to maturity, at the time when interest rates are lower than what the bond was paying. A portfolio may then have to reinvest that money at a lower interest rate.
Risk is increased in a concentrated portfolio since it holds a limited number of securities with each investment having a greater effect on the overall performance.
There is no guarantee that dividend-paying stocks will continue to pay dividends.
IBOR risk is the risk that changes related to the use of the London interbank offered rate (LIBOR) or similar rates (such as EONIA) could have adverse impacts on financial instruments that reference these rates. The abandonment of these rates and transition to alternative rates could affect the value and liquidity of instruments that reference them and could affect investment strategy performance.
The disruptions caused by natural disasters, pandemics, or similar events could prevent the Fund from executing advantageous investment decisions in a timely manner and could negatively impact the Fund’s ability to achieve its investment objective and the value of the Fund’s investments.
2The Fund’s expense ratios, as described in the most recent prospectus, are disclosed in the following “Fund expense ratios” table. The expense ratios below may differ from the expense ratios in the “Financial highlights” since they are based on different time periods and the expense ratios in the prospectus include acquired fund fees and expenses, if any. See Note 2 in “Notes to financial statements” for additional details. Please see the “Financial highlights” section in this report for the most recent expense ratios.
Fund expense
ratios | Class A | Class C | Class I | Class R | Class R6 | Class Y |
| Total annual operating expenses (without fee waivers) | 1.04% | 1.82% | 0.84% | 1.44% | 0.70% | 1.08% |
| Net expenses (including fee waivers, if any) | 1.04% | 1.82% | 0.84% | 1.34% | 0.70% | 1.07% |
| | | | | | | |
| Type of waiver | n/a | n/a | n/a | Contractual | n/a | Contractual |
Performance of a $10,000 investment1
For the period March 31, 2013 through March 31, 2023

| | | | Starting value | | Ending value |
| S&P 500 Index | | $ | 10,000 | | | $ | 31,736 | |
| Delaware Ivy Balanced Fund – Class I shares | | $ | 10,000 | | | $ | 19,659 | |
| Delaware Ivy Balanced Fund – Class A shares | | $ | 9,425 | | | $ | 18,081 | |
| Bloomberg US Aggregate Index | | $ | 10,000 | | | $ | 11,451 | |
1The “Performance of a $10,000 investment” graph assumes $10,000 invested in Class I and Class A shares of the Fund on March 31, 2013, and includes the effect of a 5.75% front-end sales charge (for Class A shares) and the reinvestment of all distributions. The graph does not reflect the deduction of taxes the shareholders would pay on Fund distributions or redemptions of Fund shares. Expense limitations may have been in effect for some or all of the periods shown. Performance would have been lower had expense limitations not been in effect. Expenses are listed in the “Fund expense ratios” table on page 28. Please note additional details on pages 27 through 29.
The graph also assumes $10,000 invested in the S&P 500 Index and the Bloomberg US Aggregate Index as of March 31, 2013.
The S&P 500 Index measures the performance of 500 mostly large-cap stocks weighted by market value and is often used to represent performance of the US stock market.
The Bloomberg US Aggregate Index is a broad-based benchmark that measures the investment grade, US dollar-denominated, fixed-rate taxable bond market.
Index performance returns do not reflect any management fees, transaction costs, or expenses. Indices are unmanaged and one cannot invest directly in an index. Past performance does not guarantee future results.
Performance of other Fund classes will vary due to different charges and expenses.
| | Nasdaq
symbols | CUSIPs |
| Class A | IBNAX | 465898625 |
| Class C | IBNCX | 465898591 |
| Class I | IYBIX | 465898146 |
| Class R | IYBFX | 465899375 |
| Class R6 | IBARX | 46600A203 |
| Class Y | IBNYX | 465898583 |
Performance summaries
| Delaware Ivy Natural Resources Fund | March 31, 2023 (Unaudited) |
The performance quoted represents past performance and does not guarantee future results. Investment return and principal value of an investment will fluctuate so that shares, when redeemed, may be worth more or less than their original cost. Current performance may be lower or higher than the performance quoted. Performance data current to the most recent month end may be obtained by calling 800 523-1918 or visiting delawarefunds.com/performance.
| Fund and benchmark performance1,2 | Average annual total returns through March 31, 2023 |
| | 1 year | 5 year | 10 year | Lifetime |
| Class A (Est. January 2, 1997) | | | | |
| Excluding sales charge | -5.03% | +2.52% | -0.60% | — |
| Including sales charge | -10.49% | +1.32% | -1.18% | — |
| Class C (Est. January 2, 1997) | | | | |
| Excluding sales charge | -5.76% | +1.86% | -1.09% | — |
| Including sales charge | -6.68% | +1.86% | -1.09% | — |
| Class I (Est. April 2, 2007) | | | | |
| Excluding sales charge | -4.73% | +3.07% | -0.08% | — |
| Including sales charge | -4.73% | +3.07% | -0.08% | — |
| Class R (Est. December 29, 2005) | | | | |
| Excluding sales charge | -5.21% | +2.51% | -0.65% | — |
| Including sales charge | -5.21% | +2.51% | -0.65% | — |
| Class R6 (Est. July 31, 2014) | | | | |
| Excluding sales charge | -4.63% | +3.24% | — | -1.44% |
| Including sales charge | -4.63% | +3.24% | — | -1.44% |
| Class Y (Est. July 24, 2003) | | | | |
| Excluding sales charge | -4.95% | +2.84% | -0.32% | — |
| Including sales charge | -4.95% | +2.84% | -0.32% | — |
| S&P North American Natural Resources Sector Index | +0.73% | +7.85% | +3.04% | — |
1Returns reflect the reinvestment of all distributions and are presented both with and without the applicable sales charges described below. Returns do not reflect the deduction of taxes the shareholder would pay on Fund distributions or redemptions of Fund shares.
Expense limitations were in effect for certain classes during some or all of the periods shown in the “Fund and benchmark performance” table. Expenses for each class are listed in the “Fund expense ratios” table on page 31. Performance would have been lower had expense limitations not been in effect.
Class A shares are sold with a maximum front-end sales charge of 5.75%, and have an annual distribution and service (12b-1) fee of 0.25% of average daily net assets. Performance for Class A shares, excluding sales charges, assumes that no front-end sales charge applied.
Class C shares are sold with a contingent deferred sales charge (CDSC) of 1.00% if redeemed during the first 12 months. They are also subject to an annual 12b-1 fee of 1.00% of average daily net assets. Performance for Class C shares, excluding sales charges, assumes either that CDSCs did not apply or that the investment was not redeemed.
Class I shares are not subject to a sales charge and are offered for sale exclusively to certain eligible investors. In addition, Class I shares pay no 12b-1 fee.
Effective July 1, 2021, Class N shares were renamed Class R6 shares. Class R6 shares are available only to certain investors. In addition, Class R6 shares do not pay any service fees, sub-accounting fees, and/or sub-transfer agency fees to any brokers, dealers, or other financial intermediaries. Class R6 shares pay no 12b-1 fee.
Class R shares are available only for certain retirement plan products. They are sold without a sales charge and have an annual 12b-1 fee of 0.50% of average daily net assets.
Class Y shares are available only to certain investors. Class Y shares have an annual 12b-1 fee of 0.25% of average daily net assets.
International investments entail risks including fluctuation in currency values, differences in accounting principles, or economic or political instability. Investing in emerging markets can be riskier than investing in established foreign markets due to increased volatility, lower trading volume, and higher risk of market closures. In many emerging markets, there is substantially less publicly available information and the available information may be incomplete or misleading. Legal claims are generally more difficult to pursue.
Because the Fund invests significantly in natural resources securities, there is the risk that the Fund will perform poorly during a downturn in the natural resource sector.
The Fund may invest in derivatives, which may involve additional expenses and are subject to risk, including the risk that an underlying security or securities index moves in the opposite direction from what the portfolio manager anticipated. A derivatives transaction depends upon the counterparties’ ability to fulfill their contractual obligations.
The disruptions caused by natural disasters, pandemics, or similar events could prevent the Fund from executing advantageous investment decisions in a timely manner and could negatively impact the Fund’s ability to achieve its investment objective and the value of the Fund’s investments.
2The Fund’s expense ratios, as described in the most recent prospectus, are disclosed in the following “Fund expense ratios” table. The expense ratios below may differ from the expense ratios in the “Financial highlights” since they are based on different time periods and the expense ratios in the prospectus include acquired fund fees and expenses, if any. See Note 2 in “Notes to financial statements” for additional details. Please see the “Financial highlights” section in this report for the most recent expense ratios.
Fund expense
ratios | Class A | Class C | Class I | Class R | Class R6 | Class Y |
| Total annual operating expenses (without fee waivers) | 1.83% | 2.53% | 1.22% | 1.79% | 1.05% | 1.43% |
| Net expenses (including fee waivers, if any) | 1.33% | 2.08% | 1.08% | 1.58% | 1.05% | 1.33% |
| | | | | | | |
| Type of waiver | Contractual | Contractual | Contractual | Contractual | Contractual | Contractual |
Performance summaries
Delaware Ivy Natural Resources Fund
Performance of a $10,000 investment1
For the period March 31, 2013 through March 31, 2023

| | | | Starting value | | Ending value |
| S&P North American Natural Resources Sector Index | | $ | 10,000 | | | $ | 13,492 | |
| Delaware Ivy Natural Resources Fund – Class I shares | | $ | 10,000 | | | $ | 9,921 | |
| Delaware Ivy Natural Resources Fund – Class A shares | | $ | 9,425 | | | $ | 8,877 | |
1The “Performance of a $10,000 investment” graph assumes $10,000 invested in Class I and Class A shares of the Fund on March 31, 2013, and includes the effect of a 5.75% front-end sales charge (for Class A shares) and the reinvestment of all distributions. The graph does not reflect the deduction of taxes the shareholders would pay on Fund distributions or redemptions of Fund shares. Expense limitations may have been in effect for some or all of the periods shown. Performance would have been lower had expense limitations not been in effect. Expenses are listed in the “Fund expense ratios” table on page 31. Please note additional details on pages 30 through 32.
The graph also assumes $10,000 invested in the S&P North American Natural Resources Sector Index as of March 31, 2013. The S&P North American Natural Resources Sector Index provides investors with a benchmark that represents US traded securities that are classified under the GICS® energy and materials sector, excluding the chemicals industry and steel subindustry.
The S&P 500 Index, mentioned on page 10, measures the performance of 500 mostly large-cap stocks weighted by market value and is often used to represent performance of the US stock market.
Index performance returns do not reflect any management fees, transaction costs, or expenses. Indices are unmanaged and one cannot invest directly in an index. Past performance does not guarantee future results.
Performance of other Fund classes will vary due to different charges and expenses.
| | Nasdaq
symbols | CUSIPs |
| Class A | IGNAX | 465897429 |
| Class C | IGNCX | 465897395 |
| Class I | IGNIX | 465899508 |
| Class R | IGNRX | 465898310 |
| Class R6 | INRSX | 46600A849 |
| Class Y | IGNYX | 465897122 |
Performance summaries
| Delaware Ivy Science and Technology Fund | March 31, 2023 (Unaudited) |
The performance quoted represents past performance and does not guarantee future results. Investment return and principal value of an investment will fluctuate so that shares, when redeemed, may be worth more or less than their original cost. Current performance may be lower or higher than the performance quoted. Performance data current to the most recent month end may be obtained by calling 800 523-1918 or visiting delawarefunds.com/performance.
| Fund and benchmark performance1,2 | Average annual total returns through March 31, 2023 |
| | 1 year | 5 year | 10 year | Lifetime |
| Class A (Est. July 3, 2000) | | | | |
| Excluding sales charge | -12.32% | +11.21% | +12.38% | — |
| Including sales charge | -17.36% | +9.90% | +11.71% | — |
| Class C (Est. July 31, 1997) | | | | |
| Excluding sales charge | -13.14% | +10.32% | +11.72% | — |
| Including sales charge | -13.71% | +10.32% | +11.72% | — |
| Class I (Est. April 2, 2007) | | | | |
| Excluding sales charge | -12.12%* | +11.44% | +12.65% | — |
| Including sales charge | -12.12% | +11.44% | +12.65% | — |
| Class R (Est. December 29, 2005) | | | | |
| Excluding sales charge | -12.62%* | +10.79% | +11.99% | — |
| Including sales charge | -12.62% | +10.79% | +11.99% | — |
| Class R6 (Est. July 31, 2014) | | | | |
| Excluding sales charge | -12.02% | +11.60% | — | +10.78% |
| Including sales charge | -12.02% | +11.60% | — | +10.78% |
| Class Y (Est. June 9, 1998) | | | | |
| Excluding sales charge | -12.34% | +11.21% | +12.39% | — |
| Including sales charge | -12.34% | +11.21% | +12.39% | — |
| S&P North American Technology Sector Index | -11.73% | +14.66% | +17.98% | — |
*Total return for the report period presented in the table differs from the return in “Financial highlights.” The total return presented in the above table is calculated based on the net asset value (NAV) at which shareholder transactions were processed. The total return presented in “Financial highlights” is calculated in the same manner but also takes into account certain adjustments that are necessary under US generally accepted accounting principles required in the annual report.
1Returns reflect the reinvestment of all distributions and are presented both with and without the applicable sales charges described below. Returns do not reflect the deduction of taxes the shareholder would pay on Fund distributions or redemptions of Fund shares.
Expense limitations were in effect for certain classes during some or all of the periods shown in the “Fund and benchmark performance” table. Expenses for each class are listed in the “Fund expense ratios” table on page 34. Performance would have been lower had expense limitations not been in effect.
Class A shares are sold with a maximum front-end sales charge of 5.75%, and have an annual distribution and service (12b-1) fee of 0.25% of average daily net assets. Performance for Class A shares, excluding sales charges, assumes that no front-end sales charge applied.
Class C shares are sold with a contingent deferred sales charge (CDSC) of 1.00% if redeemed during the first 12 months. They are also subject to an annual 12b-1 fee of 1.00% of average daily net assets. Performance for Class C shares, excluding sales charges, assumes either that CDSCs did not apply or that the investment was not redeemed.
Class I shares are not subject to a sales charge and are offered for sale exclusively to certain eligible investors. In addition, Class I shares pay no 12b-1 fee.
Performance summaries
Delaware Ivy Science and Technology Fund
Effective July 1, 2021, Class N shares were renamed Class R6 shares. Class R6 shares are available only to certain investors. In addition, Class R6 shares do not pay any service fees, sub-accounting fees, and/or sub-transfer agency fees to any brokers, dealers, or other financial intermediaries. Class R6 shares pay no 12b-1 fee.
Class R shares are available only for certain retirement plan products. They are sold without a sales charge and have an annual 12b-1 fee of 0.50% of average daily net assets.
Class Y shares are available only to certain investors. Class Y shares have an annual 12b-1 fee of 0.25% of average daily net assets.
Because the Fund invests more than 25% of its total assets in the science and technology industry, the Fund’s performance may be more susceptible to a single economic, regulatory or technological occurrence than a fund that does not concentrate its investments in this industry.
“Non-diversified” funds may allocate more of their net assets to investments in single securities than “diversified” funds. Resulting adverse effects may subject these funds to greater risks and volatility.
Securities of companies within specific industries or sectors of the economy may periodically perform differently than the overall market. In addition, the Fund’s performance may be more volatile than an investment in a portfolio of broad market securities and may underperform the market as a whole, due to the relatively limited number of issuers of science and technology related securities. Investment risks associated with investing in science and technology securities, in addition to other risks, include: operating in rapidly changing fields, abrupt or erratic market movements, limited product lines, markets or financial resources, management that is dependent on a limited number of people, short product cycles, aggressive pricing of products and services, new market entrants, and obsolescence of existing technology.
The disruptions caused by natural disasters, pandemics, or similar events could prevent the Fund from executing advantageous investment decisions in a timely manner and could negatively impact the Fund’s ability to achieve its investment objective and the value of the Fund’s investments.
2The Fund’s expense ratios, as described in the most recent prospectus, are disclosed in the following “Fund expense ratios” table. The expense ratios below may differ from the expense ratios in the “Financial highlights” since they are based on different time periods and the expense ratios in the prospectus include acquired fund fees and expenses, if any. See Note 2 in “Notes to financial statements” for additional details. Please see the “Financial highlights” section in this report for the most recent expense ratios.
Fund expense
ratios | Class A | Class C | Class I | Class R | Class R6 | Class Y |
| Total annual operating expenses (without fee waivers) | 1.13% | 1.92% | 0.96% | 1.55% | 0.81% | 1.20% |
| Net expenses (including fee waivers, if any) | 1.13% | 1.92% | 0.96% | 1.55% | 0.81% | 1.20% |
| | | | | | | |
| Type of waiver | n/a | n/a | n/a | n/a | n/a | n/a |
Performance of a $10,000 investment1
For the period March 31, 2013 through March 31, 2023
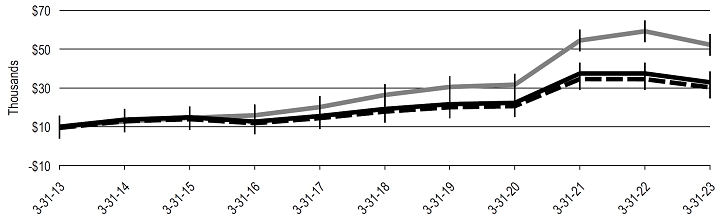
| | | | Starting value | | Ending value |
| S&P North American Technology Sector Index | | $ | 10,000 | | | $ | 52,267 | |
| Delaware Ivy Science and Technology Fund – Class I shares | | $ | 10,000 | | | $ | 32,899 | |
| Delaware Ivy Science and Technology Fund – Class A shares | | $ | 9,425 | | | $ | 30,269 | |
1The “Performance of a $10,000 investment” graph assumes $10,000 invested in Class I and Class A shares of the Fund on March 31, 2013, and includes the effect of a 5.75% front-end sales charge (for Class A shares) and the reinvestment of all distributions. The graph does not reflect the deduction of taxes the shareholders would pay on Fund distributions or redemptions of Fund shares. Expense limitations may have been in effect for some or all of the periods shown. Performance would have been lower had expense limitations not been in effect. Expenses are listed in the “Fund expense ratios” table on page 34. Please note additional details on pages 33 through 35.
The graph also assumes $10,000 invested in the S&P North American Technology Sector Index as of March 31, 2013. The S&P North American Technology Sector Index is a modified-capitalization weighted index providing investors with a benchmark that represents US securities classified under the GICS® technology sector and internet retail sub-industry.
Index performance returns do not reflect any management fees, transaction costs, or expenses. Indices are unmanaged and one cannot invest directly in an index. Past performance does not guarantee future results.
Performance of other Fund classes will vary due to different charges and expenses.
| | Nasdaq
symbols | CUSIPs |
| Class A | WSTAX | 466000718 |
| Class C | WSTCX | 466000684 |
| Class I | ISTIX | 466001807 |
| Class R | WSTRX | 466000437 |
| Class R6 | ISTNX | 46600A740 |
| Class Y | WSTYX | 466000676 |
Performance summaries
| Delaware Real Estate Securities Fund | March 31, 2023 (Unaudited) |
The performance quoted represents past performance and does not guarantee future results. Investment return and principal value of an investment will fluctuate so that shares, when redeemed, may be worth more or less than their original cost. Current performance may be lower or higher than the performance quoted. Performance data current to the most recent month end may be obtained by calling 800 523-1918 or visiting delawarefunds.com/performance.
| Fund and benchmark performance1,2 | Average annual total returns through March 31, 2023 |
| | 1 year | 5 year | 10 year | Lifetime |
| Class A (Est. February 25, 1999) | | | | |
| Excluding sales charge | -20.26% | +6.08% | +5.80% | — |
| Including sales charge | -24.85% | +4.83% | +5.17% | — |
| Class C (Est. December 8, 2003) | | | | |
| Excluding sales charge | -20.95%* | +5.18% | +5.15% | — |
| Including sales charge | -21.54% | +5.18% | +5.15% | — |
| Class I (Est. April 2, 2007) | | | | |
| Excluding sales charge | -20.02%* | +6.44% | +6.21% | — |
| Including sales charge | -20.02% | +6.44% | +6.21% | — |
| Class R (Est. December 29, 2005) | | | | |
| Excluding sales charge | -20.45%* | +5.83% | +5.57% | — |
| Including sales charge | -20.45% | +5.83% | +5.57% | — |
| Class R6 (Est. July 31, 2014) | | | | |
| Excluding sales charge | -19.99% | +6.57% | — | +6.00% |
| Including sales charge | -19.99% | +6.57% | — | +6.00% |
| Class Y (Est. December 8, 2003) | | | | |
| Excluding sales charge | -20.22%* | +6.20% | +5.96% | — |
| Including sales charge | -20.22% | +6.20% | +5.96% | — |
| FTSE Nareit Equity REITs Index | -19.22% | +6.02% | +5.97% | — |
*Total return for the report period presented in the table differs from the return in “Financial highlights.” The total return presented in the above table is calculated based on the net asset value (NAV) at which shareholder transactions were processed. The total return presented in “Financial highlights” is calculated in the same manner but also takes into account certain adjustments that are necessary under US generally accepted accounting principles required in the annual report.
1Returns reflect the reinvestment of all distributions and are presented both with and without the applicable sales charges described below. Returns do not reflect the deduction of taxes the shareholder would pay on Fund distributions or redemptions of Fund shares.
Expense limitations were in effect for certain classes during some or all of the periods shown in the “Fund and benchmark performance” table. Expenses for each class are listed in the “Fund expense ratios” table on page 37. Performance would have been lower had expense limitations not been in effect.
Class A shares are sold with a maximum front-end sales charge of 5.75%, and have an annual distribution and service (12b-1) fee of 0.25% of average daily net assets. Performance for Class A shares, excluding sales charges, assumes that no front-end sales charge applied.
Class C shares are sold with a contingent deferred sales charge (CDSC) of 1.00% if redeemed during the first 12 months. They are also subject to an annual 12b-1 fee of 1.00% of average daily net assets. Performance for Class C shares, excluding sales charges, assumes either that CDSCs did not apply or that the investment was not redeemed.
Class I shares are not subject to a sales charge and are offered for sale exclusively to certain eligible investors. In addition, Class I shares pay no 12b-1 fee.
Effective July 1, 2021, Class N shares were renamed Class R6 shares. Class R6 shares are available only to certain investors. In addition, Class R6 shares do not pay any service fees, sub-accounting fees, and/or sub-transfer agency fees to any brokers, dealers, or other financial intermediaries. Class R6 shares pay no 12b-1 fee.
Class R shares are available only for certain retirement plan products. They are sold without a sales charge and have an annual 12b-1 fee of 0.50% of average daily net assets.
Class Y shares are available only to certain investors. Class Y shares have an annual 12b-1 fee of 0.25% of average daily net assets.
Investing in the real estate industry includes risks such as declines in real estate value, lack of availability of mortgage funds, overbuilding, extended vacancies, increases in property taxes, changes in zoning laws, costs from cleanup of environmental problems, uninsured damages, variations in rents, and changes in interest rates.
The disruptions caused by natural disasters, pandemics, or similar events could prevent the Fund from executing advantageous investment decisions in a timely manner and could negatively impact the Fund’s ability to achieve its investment objective and the value of the Fund’s investments.
2The Fund’s expense ratios, as described in the most recent prospectus, are disclosed in the following “Fund expense ratios” table. The expense ratios below may differ from the expense ratios in the “Financial highlights” since they are based on different time periods and the expense ratios in the prospectus include acquired fund fees and expenses, if any. See Note 2 in “Notes to financial statements” for additional details. Please see the “Financial highlights” section in this report for the most recent expense ratios.
Fund expense
ratios | Class A | Class C | Class I | Class R | Class R6 | Class Y |
| Total annual operating expenses (without fee waivers) | 1.38% | 2.33% | 1.09% | 1.69% | 0.93% | 1.31% |
| Net expenses (including fee waivers, if any) | 1.20% | 1.95% | 0.95% | 1.45% | 0.93% | 1.20% |
| | | | | | | |
| Type of waiver | Contractual | Contractual | Contractual | Contractual | Contractual | Contractual |
Performance summaries
Delaware Real Estate Securities Fund
Performance of a $10,000 investment1
For the period March 31, 2013 through March 31, 2023

| | | | Starting value | | Ending value |
| Delaware Real Estate Securities Fund – Class I shares | | $ | 10,000 | | | $ | 18,259 | |
| FTSE Nareit Equity REITs Index | | $ | 10,000 | | | $ | 17,863 | |
| Delaware Real Estate Securities Fund – Class A shares | | $ | 9,425 | | | $ | 16,554 | |
1The “Performance of a $10,000 investment” graph assumes $10,000 invested in Class I and Class A shares of the Fund on March 31, 2013, and includes the effect of a 5.75% front-end sales charge (for Class A shares) and the reinvestment of all distributions. The graph does not reflect the deduction of taxes the shareholders would pay on Fund distributions or redemptions of Fund shares. Expense limitations may have been in effect for some or all of the periods shown. Performance would have been lower had expense limitations not been in effect. Expenses are listed in the “Fund expense ratios” table on page 37. Please note additional details on pages 36 through 38.
The graph also assumes $10,000 invested in the FTSE Nareit Equity REITs Index as of March 31, 2013. The FTSE Nareit Equity REITs Index contains all tax-qualified real estate investment trusts (REITs) traded on US exchanges, excluding timber and infrastructure REITs, with more than 50% of total assets in qualifying real estate assets other than mortgages secured by real property that also meet minimum size and liquidity criteria.
The US Consumer Price Index (CPI), mentioned on page 16, is a measure of inflation that is calculated by the US Department of Labor, representing changes in prices of all goods and services purchased for consumption by urban households.
Index performance returns do not reflect any management fees, transaction costs, or expenses. Indices are unmanaged and one cannot invest directly in an index. Past performance does not guarantee future results.
Performance of other Fund classes will vary due to different charges and expenses.
| | Nasdaq
symbols | CUSIPs |
| Class A | IRSAX | 465898476 |
| Class C | IRSCX | 465898450 |
| Class I | IREIX | 465899839 |
| Class R | IRSRX | 465898294 |
| Class R6 | IRSEX | 46600A757 |
| Class Y | IRSYX | 465898443 |
Disclosure of Fund expenses
For the six-month period from October 1, 2022 to March 31, 2023 (Unaudited)
As a shareholder of a Fund, you incur two types of costs: (1) transaction costs, including sales charges (loads) on purchase payments, reinvested dividends, or other distributions; redemption fees; and exchange fees; and (2) ongoing costs, including management fees; distribution and service (12b-1) fees; and other Fund expenses. The following examples are intended to help you understand your ongoing costs (in dollars) of investing in a Fund and to compare these costs with the ongoing costs of investing in other mutual funds.
The examples are based on an investment of $1,000 invested at the beginning of the period and held for the entire six-month period from October 1, 2022 to March 31, 2023.
Actual expenses
The first section of the tables shown, “Actual Fund return,” provides information about actual account values and actual expenses. You may use the information in this section of the table, together with the amount you invested, to estimate the expenses that you paid over the period. Simply divide your account value by $1,000 (for example, an $8,600 account value divided by $1,000 = 8.6), then multiply the result by the number in the first section under the heading entitled “Expenses Paid During Period” to estimate the expenses you paid on your account during this period.
Hypothetical example for comparison purposes
The second section of the tables shown, “Hypothetical 5% return,” provides information about hypothetical account values and hypothetical expenses based on a Fund’s actual expense ratio and an assumed rate of return of 5% per year before expenses, which is not the Fund’s actual return. The hypothetical account values and expenses may not be used to estimate the actual ending account balance or expenses you paid for the period. You may use this information to compare the ongoing costs of investing in each Fund and other funds. To do so, compare this 5% hypothetical example with the 5% hypothetical examples that appear in the shareholder reports of the other funds.
Please note that the expenses shown in the tables are meant to highlight your ongoing costs only and do not reflect any transactional costs, such as sales charges (loads), redemption fees, or exchange fees. Therefore, the second section of each table is useful in comparing ongoing costs only, and will not help you determine the relative total costs of owning different funds. In addition, if these transactional costs were included, your costs would have been higher. The Funds’ expenses shown in the tables reflect fee waivers in effect and assume reinvestment of all dividends and distributions.
Delaware Climate Solutions Fund
Expense analysis of an investment of $1,000
| | | Beginning
Account
Value
10/1/22 | | Ending
Account
Value
3/31/23 | | Annualized
Expense
Ratio | | Expenses
Paid
During
Period
10/1/22 to
3/31/23* |
| Actual Fund return† | | | | | | | | | | | | | | |
| Class A | | $ | 1,000.00 | | | $ | 1,123.80 | | | 1.24% | | $ | 6.57 | |
| Class C | | | 1,000.00 | | | | 1,119.50 | | | 2.00% | | | 10.57 | |
| Class I | | | 1,000.00 | | | | 1,126.40 | | | 0.99% | | | 5.25 | |
| Class R | | | 1,000.00 | | | | 1,122.20 | | | 1.49% | | | 7.88 | |
| Class R6 | | | 1,000.00 | | | | 1,125.40 | | | 0.97% | | | 5.14 | |
| Class Y | | | 1,000.00 | | | | 1,124.80 | | | 1.24% | | | 6.57 | |
| Hypothetical 5% return (5% return before expenses) | | | | | | | | | | | | | | |
| Class A | | $ | 1,000.00 | | | $ | 1,018.75 | | | 1.24% | | $ | 6.24 | |
| Class C | | | 1,000.00 | | | | 1,014.96 | | | 2.00% | | | 10.05 | |
| Class I | | | 1,000.00 | | | | 1,020.00 | | | 0.99% | | | 4.99 | |
| Class R | | | 1,000.00 | | | | 1,017.50 | | | 1.49% | | | 7.49 | |
| Class R6 | | | 1,000.00 | | | | 1,020.09 | | | 0.97% | | | 4.89 | |
| Class Y | | | 1,000.00 | | | | 1,018.75 | | | 1.24% | | | 6.24 | |
Delaware Global Real Estate Fund
Expense analysis of an investment of $1,000
| | | Beginning
Account
Value
10/1/22 | | Ending
Account
Value
3/31/23 | | Annualized
Expense
Ratio | | Expenses
Paid
During
Period
10/1/22 to
3/31/23* |
| Actual Fund return† | | | | | | | | | | | | | | |
| Class A | | $ | 1,000.00 | | | $ | 1,064.90 | | | 1.33% | | $ | 6.85 | |
| Class C | | | 1,000.00 | | | | 1,059.80 | | | 2.09% | | | 10.73 | |
| Class I | | | 1,000.00 | | | | 1,065.20 | | | 1.05% | | | 5.41 | |
| Class R | | | 1,000.00 | | | | 1,063.40 | | | 1.56% | | | 8.03 | |
| Class R6 | | | 1,000.00 | | | | 1,065.40 | | | 1.05% | | | 5.41 | |
| Class Y | | | 1,000.00 | | | | 1,064.80 | | | 1.31% | | | 6.74 | |
| Hypothetical 5% return (5% return before expenses) | | | | | | | | | | | | | | |
| Class A | | $ | 1,000.00 | | | $ | 1,018.30 | | | 1.33% | | $ | 6.69 | |
| Class C | | | 1,000.00 | | | | 1,014.51 | | | 2.09% | | | 10.50 | |
| Class I | | | 1,000.00 | | | | 1,019.70 | | | 1.05% | | | 5.29 | |
| Class R | | | 1,000.00 | | | | 1,017.15 | | | 1.56% | | | 7.85 | |
| Class R6 | | | 1,000.00 | | | | 1,019.70 | | | 1.05% | | | 5.29 | |
| Class Y | | | 1,000.00 | | | | 1,018.40 | | | 1.31% | | | 6.59 | |
Disclosure of Fund expenses
Delaware Ivy Asset Strategy Fund
Expense analysis of an investment of $1,000
| | | Beginning
Account
Value
10/1/22 | | Ending
Account
Value
3/31/23 | | Annualized
Expense
Ratio | | Expenses
Paid
During
Period
10/1/22 to
3/31/23* |
| Actual Fund return† | | | | | | | | | | | | | | |
| Class A | | $ | 1,000.00 | | | $ | 1,146.80 | | | 1.16% | | $ | 6.21 | |
| Class C | | | 1,000.00 | | | | 1,140.00 | | | 2.29% | | | 12.22 | |
| Class I | | | 1,000.00 | | | | 1,148.00 | | | 0.91% | | | 4.87 | |
| Class R | | | 1,000.00 | | | | 1,145.30 | | | 1.50% | | | 8.02 | |
| Class R6 | | | 1,000.00 | | | | 1,149.30 | | | 0.79% | | | 4.23 | |
| Class Y | | | 1,000.00 | | | | 1,147.80 | | | 1.11% | | | 5.94 | |
| Hypothetical 5% return (5% return before expenses) | | | | | | | | | | | |
| Class A | | $ | 1,000.00 | | | $ | 1,019.15 | | | 1.16% | | $ | 5.84 | |
| Class C | | | 1,000.00 | | | | 1,013.51 | | | 2.29% | | | 11.50 | |
| Class I | | | 1,000.00 | | | | 1,020.39 | | | 0.91% | | | 4.58 | |
| Class R | | | 1,000.00 | | | | 1,017.45 | | | 1.50% | | | 7.54 | |
| Class R6 | | | 1,000.00 | | | | 1,020.99 | | | 0.79% | | | 3.98 | |
| Class Y | | | 1,000.00 | | | | 1,019.40 | | | 1.11% | | | 5.59 | |
Delaware Ivy Balanced Fund
Expense analysis of an investment of $1,000
| | | Beginning
Account
Value
10/1/22 | | Ending
Account
Value
3/31/23 | | Annualized
Expense
Ratio | | Expenses
Paid
During
Period
10/1/22 to
3/31/23* |
| Actual Fund return† | | | | | | | | | | | | | | |
| Class A | | $ | 1,000.00 | | | $ | 1,099.30 | | | 1.12% | | $ | 5.86 | |
| Class C | | | 1,000.00 | | | | 1,094.90 | | | 2.04% | | | 10.65 | |
| Class I | | | 1,000.00 | | | | 1,101.10 | | | 0.90% | | | 4.71 | |
| Class R | | | 1,000.00 | | | | 1,098.60 | | | 1.34% | | | 7.01 | |
| Class R6 | | | 1,000.00 | | | | 1,101.30 | | | 0.77% | | | 4.03 | |
| Class Y | | | 1,000.00 | | | | 1,099.80 | | | 1.07% | | | 5.60 | |
| Hypothetical 5% return (5% return before expenses) | | | | | | | | | | | |
| Class A | | $ | 1,000.00 | | | $ | 1,019.35 | | | 1.12% | | $ | 5.64 | |
| Class C | | | 1,000.00 | | | | 1,014.76 | | | 2.04% | | | 10.25 | |
| Class I | | | 1,000.00 | | | | 1,020.44 | | | 0.90% | | | 4.53 | |
| Class R | | | 1,000.00 | | | | 1,018.25 | | | 1.34% | | | 6.74 | |
| Class R6 | | | 1,000.00 | | | | 1,021.09 | | | 0.77% | | | 3.88 | |
| Class Y | | | 1,000.00 | | | | 1,019.60 | | | 1.07% | | | 5.39 | |
Delaware Ivy Natural Resources Fund
Expense analysis of an investment of $1,000
| | | Beginning
Account
Value
10/1/22 | | Ending
Account
Value
3/31/23 | | Annualized
Expense
Ratio | | Expenses
Paid
During
Period
10/1/22 to
3/31/23* |
| Actual Fund return† | | | | | | | | | | | | | | |
| Class A | | $ | 1,000.00 | | | $ | 1,077.70 | | | 1.32% | | $ | 6.84 | |
| Class C | | | 1,000.00 | | | | 1,073.80 | | | 2.06% | | | 10.65 | |
| Class I | | | 1,000.00 | | | | 1,078.80 | | | 1.08% | | | 5.60 | |
| Class R | | | 1,000.00 | | | | 1,076.30 | | | 1.59% | | | 8.23 | |
| Class R6 | | | 1,000.00 | | | | 1,079.30 | | | 1.05% | | | 5.44 | |
| Class Y | | | 1,000.00 | | | | 1,077.60 | | | 1.32% | | | 6.84 | |
| Hypothetical 5% return (5% return before expenses) | | | | | | | | | | | |
| Class A | | $ | 1,000.00 | | | $ | 1,018.35 | | | 1.32% | | $ | 6.64 | |
| Class C | | | 1,000.00 | | | | 1,014.66 | | | 2.06% | | | 10.35 | |
| Class I | | | 1,000.00 | | | | 1,019.55 | | | 1.08% | | | 5.44 | |
| Class R | | | 1,000.00 | | | | 1,017.00 | | | 1.59% | | | 8.00 | |
| Class R6 | | | 1,000.00 | | | | 1,019.70 | | | 1.05% | | | 5.29 | |
| Class Y | | | 1,000.00 | | | | 1,018.35 | | | 1.32% | | | 6.64 | |
Delaware Ivy Science and Technology Fund
Expense analysis of an investment of $1,000
| | | Beginning
Account
Value
10/1/22 | | Ending
Account
Value
3/31/23 | | Annualized
Expense
Ratio | | Expenses
Paid
During
Period
10/1/22 to
3/31/23* |
| Actual Fund return† | | | | | | | | | | | | | | |
| Class A | | $ | 1,000.00 | | | $ | 1,194.40 | | | 1.22% | | $ | 6.67 | |
| Class C | | | 1,000.00 | | | | 1,189.00 | | | 2.16% | | | 11.79 | |
| Class I | | | 1,000.00 | | | | 1,195.70 | | | 0.99% | | | 5.42 | |
| Class R | | | 1,000.00 | | | | 1,192.30 | | | 1.55% | | | 8.47 | |
| Class R6 | | | 1,000.00 | | | | 1,196.50 | | | 0.88% | | | 4.82 | |
| Class Y | | | 1,000.00 | | | | 1,194.40 | | | 1.23% | | | 6.73 | |
| Hypothetical 5% return (5% return before expenses) | | | | | | | | | | | |
| Class A | | $ | 1,000.00 | | | $ | 1,018.85 | | | 1.22% | | $ | 6.14 | |
| Class C | | | 1,000.00 | | | | 1,014.16 | | | 2.16% | | | 10.85 | |
| Class I | | | 1,000.00 | | | | 1,020.00 | | | 0.99% | | | 4.99 | |
| Class R | | | 1,000.00 | | | | 1,017.20 | | | 1.55% | | | 7.80 | |
| Class R6 | | | 1,000.00 | | | | 1,020.54 | | | 0.88% | | | 4.43 | |
| Class Y | | | 1,000.00 | | | | 1,018.80 | | | 1.23% | | | 6.19 | |
Delaware Real Estate Securities Fund
Expense analysis of an investment of $1,000
| | | Beginning
Account
Value
10/1/22 | | Ending
Account
Value
3/31/23 | | Annualized
Expense
Ratio | | Expenses
Paid
During
Period
10/1/22 to
3/31/23* |
| Actual Fund return† | | | | | | | | | | | | | | |
| Class A | | $ | 1,000.00 | | | $ | 1,066.90 | | | 1.22% | | $ | 6.29 | |
| Class C | | | 1,000.00 | | | | 1,062.40 | | | 2.02% | | | 10.39 | |
| Class I | | | 1,000.00 | | | | 1,067.90 | | | 0.95% | | | 4.90 | |
| Class R | | | 1,000.00 | | | | 1,065.10 | | | 1.46% | | | 7.52 | |
| Class R6 | | | 1,000.00 | | | | 1,068.00 | | | 1.05% | | | 5.41 | |
| Class Y | | | 1,000.00 | | | | 1,066.30 | | | 1.23% | | | 6.34 | |
| Hypothetical 5% return (5% return before expenses) | | | | | | | | | | | |
| Class A | | $ | 1,000.00 | | | $ | 1,018.85 | | | 1.22% | | $ | 6.14 | |
| Class C | | | 1,000.00 | | | | 1,014.86 | | | 2.02% | | | 10.15 | |
| Class I | | | 1,000.00 | | | | 1,020.19 | | | 0.95% | | | 4.78 | |
| Class R | | | 1,000.00 | | | | 1,017.65 | | | 1.46% | | | 7.34 | |
| Class R6 | | | 1,000.00 | | | | 1,019.70 | | | 1.05% | | | 5.29 | |
| Class Y | | | 1,000.00 | | | | 1,018.80 | | | 1.23% | | | 6.19 | |
*“Expenses Paid During Period” are equal to the relevant Fund’s annualized expense ratio, multiplied by the average account value over the period, multiplied by 182/365 (to reflect the one-half year period).
†Because actual returns reflect only the most recent six-month period, the returns shown may differ significantly from fiscal year returns.
In addition to the Funds’ expenses reflected above and on the previous pages, each Fund also indirectly bears its portion of the fees and expenses of any investment companies (Underlying Funds), including exchange-traded funds in which it invests. The tables above and on the previous pages do not reflect the expenses of any applicable Underlying Funds.
Security type / sector allocations and top 10 equity holdings
| Delaware Climate Solutions Fund | As of March 31, 2023 (Unaudited) |
Sector designations may be different from the sector designations presented in other Fund materials. The sector designations may represent the investment manager’s internal sector classifications, which may result in the sector designations for one fund being different from another fund’s sector designations.
| Security type / sector | | Percentage
of net assets |
| Common Stocks | | | 98.83 | % |
| Consumer Discretionary | | | 3.50 | % |
| Consumer Staples | | | 5.99 | % |
| Energy | | | 16.98 | % |
| Financials | | | 1.55 | % |
| Industrials | | | 19.19 | % |
| Materials | | | 11.89 | % |
| Real Estate | | | 2.58 | % |
| Utilities* | | | 37.15 | % |
| Total Value of Securities | | | 98.83 | % |
| Receivables and Other Assets Net of Liabilities | | | 1.17 | % |
| Total Net Assets | | | 100.00 | % |
*To monitor compliance with the Fund’s concentration guidelines as described in the Fund’s Prospectus and Statement of Additional Information, the Utilities sector (as disclosed herein for financial reporting purposes) is subdivided into a variety of “industries” (in accordance with the requirements of the Investment Company Act of 1940, as amended). The Utilities sector consisted of Electric Utilities, Independent Power and Renewable Electricity Producers, and Multi-Utilities. As of March 31, 2023, such amounts, as a percentage of total net assets were 21.26%, 10.13%, and 5.76% respectively. The percentage in any such single industry will comply with the Fund’s concentration policy even if the percentage in the Utilities sector for financial reporting purposes may exceed 25%.
Holdings are for informational purposes only and are subject to change at any time. They are not a recommendation to buy, sell, or hold any security.
| Top 10 equity holdings | | Percentage
of net assets |
| Valero Energy | | | 3.97 | % |
| Schneider Electric | | | 3.78 | % |
| Denbury | | | 3.74 | % |
| Schlumberger | | | 3.74 | % |
| Iberdrola | | | 3.61 | % |
| BorgWarner | | | 3.51 | % |
| Cummins | | | 3.38 | % |
| Alcoa | | | 3.35 | % |
| Anglo American | | | 3.32 | % |
| Terna – Rete Elettrica Nazionale | | | 3.30 | % |
Security type / country and sector allocations
| Delaware Global Real Estate Fund | As of March 31, 2023 (Unaudited) |
Sector designations may be different from the sector designations presented in other Fund materials. The sector designations may represent the investment manager’s internal sector classifications, which may result in the sector designations for one fund being different from another fund’s sector designations.
| Security type / country | | Percentage
of net assets |
| Common Stocks by Country | | | 99.55 | % |
| Australia | | | 3.10 | % |
| Belgium | | | 1.34 | % |
| Canada | | | 2.32 | % |
| China/Hong Kong | | | 0.21 | % |
| France | | | 1.04 | % |
| Germany | | | 1.58 | % |
| Hong Kong | | | 5.55 | % |
| Japan | | | 10.42 | % |
| Singapore | | | 3.95 | % |
| Spain | | | 1.33 | % |
| Sweden | | | 1.09 | % |
| United Kingdom | | | 4.15 | % |
| United States | | | 63.47 | % |
| Short-Term Investments | | | 0.05 | % |
| Total Value of Securities | | | 99.60 | % |
| Receivables and Other Assets Net of Liabilities | | | 0.40 | % |
| Total Net Assets | | | 100.00 | % |
| Common stocks by sector | | Percentage
of net assets |
| Communications | | | 1.37 | % |
| Consumer Cyclical | | | 1.53 | % |
| Real Estate | | | 9.10 | % |
| REIT Diversified | | | 20.32 | % |
| REIT Healthcare | | | 6.63 | % |
| REIT Hotel | | | 1.75 | % |
| REIT Industrial | | | 13.95 | % |
| REIT Information Technology | | | 0.43 | % |
| REIT Mall | | | 1.00 | % |
| REIT Manufactured Housing | | | 3.45 | % |
| REIT Multifamily | | | 12.31 | % |
| REIT Office | | | 6.06 | % |
| REIT Retail | | | 1.61 | % |
| REIT Self-Storage | | | 8.93 | % |
| REIT Shopping Center | | | 6.12 | % |
| REIT Single Tenant | | | 4.99 | % |
| Total | | | 99.55 | % |
Security type / sector allocations and top 10 equity holdings
| Delaware Ivy Asset Strategy Fund | As of March 31, 2023 (Unaudited) |
Sector designations may be different from the sector designations presented in other Fund materials. The sector designations may represent the investment manager’s internal sector classifications, which may result in the sector designations for one fund being different from another fund’s sector designations.
| Security type / sector | | Percentage
of net assets |
| Agency Collateralized Mortgage Obligations | | | 0.32 | % |
| Agency Mortgage-Backed Securities | | | 2.95 | % |
| Convertible Bond | | | 0.29 | % |
| Corporate Bonds | | | 12.92 | % |
| Banking | | | 1.35 | % |
| Basic Industry | | | 0.12 | % |
| Capital Goods | | | 0.18 | % |
| Communication Services | | | 2.61 | % |
| Communications | | | 0.35 | % |
| Consumer Cyclical | | | 0.16 | % |
| Consumer Discretionary | | | 1.87 | % |
| Consumer Non-Cyclical | | | 0.32 | % |
| Electric | | | 0.44 | % |
| Energy | | | 3.13 | % |
| Finance Companies | | | 0.17 | % |
| Industrials | | | 0.43 | % |
| Information Technology | | | 0.08 | % |
| Insurance | | | 0.67 | % |
| Materials | | | 0.36 | % |
| Natural Gas | | | 0.02 | % |
| Real Estate Investment Trusts | | | 0.01 | % |
| Technology | | | 0.50 | % |
| Transportation | | | 0.15 | % |
| Municipal Bonds | | | 0.08 | % |
| Non-Agency Collateralized Mortgage Obligations | | | 0.35 | % |
| Non-Agency Commercial Mortgage-Backed Securities | | | 1.10 | % |
| Loan Agreements | | | 2.20 | % |
| US Treasury Obligations | | | 2.89 | % |
| Common Stocks | | | 66.40 | % |
| Communication Services | | | 4.53 | % |
| Security type / sector | | Percentage
of net assets |
| Consumer Discretionary | | | 7.99 | % |
| Consumer Staples | | | 5.25 | % |
| Energy | | | 4.12 | % |
| Financials | | | 7.55 | % |
| Healthcare | | | 11.00 | % |
| Industrials | | | 8.23 | % |
| Information Technology | | | 15.55 | % |
| Materials | | | 0.62 | % |
| Utilities | | | 1.56 | % |
| Exchange-Traded Funds | | | 2.69 | % |
| Bullion | | | 5.21 | % |
| Short-Term Investments | | | 2.57 | % |
| Total Value of Securities | | | 99.97 | % |
| Receivables and Other Assets Net of Liabilities | | | 0.03 | % |
| Total Net Assets | | | 100.00 | % |
Holdings are for informational purposes only and are subject to change at any time. They are not a recommendation to buy, sell, or hold any security.
| Top 10 equity holdings | | Percentage
of net assets |
| Microsoft | | | 2.35 | % |
| Mastercard Class A | | | 1.61 | % |
| Deutsche Telekom | | | 1.51 | % |
| Canadian Natural Resources | | | 1.50 | % |
| UnitedHealth Group | | | 1.44 | % |
| Airbus | | | 1.44 | % |
| Regeneron Pharmaceuticals | | | 1.38 | % |
| Reckitt Benckiser Group | | | 1.37 | % |
| Procter & Gamble | | | 1.36 | % |
| Vertex Pharmaceuticals | | | 1.32 | % |
Security type / sector allocations and top 10 equity holdings
| Delaware Ivy Balanced Fund | As of March 31, 2023 (Unaudited) |
Sector designations may be different from the sector designations presented in other Fund materials. The sector designations may represent the investment manager’s internal sector classifications, which may result in the sector designations for one fund being different from another fund’s sector designations.
| Security type / sector | | Percentage
of net assets |
| Agency Collateralized Mortgage Obligations | | | 0.95 | % |
| Agency Mortgage-Backed Securities | | | 9.59 | % |
| Corporate Bonds | | | 10.76 | % |
| Banking | | | 2.02 | % |
| Basic Industry | | | 0.23 | % |
| Capital Goods | | | 0.72 | % |
| Communications | | | 1.81 | % |
| Consumer Cyclical | | | 0.21 | % |
| Consumer Non-Cyclical | | | 0.66 | % |
| Electric | | | 1.25 | % |
| Energy | | | 0.78 | % |
| Finance Companies | | | 0.53 | % |
| Insurance | | | 0.94 | % |
| Natural Gas | | | 0.07 | % |
| Real Estate Investment Trusts | | | 0.23 | % |
| Technology | | | 1.12 | % |
| Transportation | | | 0.19 | % |
| Non-Agency Collateralized Mortgage Obligations | | | 0.10 | % |
| Non-Agency Commercial Mortgage-Backed Securities | | | 3.49 | % |
| US Treasury Obligations | | | 10.07 | % |
| Common Stocks | | | 57.79 | % |
| Communication Services | | | 3.29 | % |
| Consumer Discretionary | | | 4.95 | % |
| Consumer Staples | | | 2.18 | % |
| Energy | | | 1.59 | % |
| Financials | | | 8.94 | % |
| Healthcare | | | 7.59 | % |
| Industrials | | | 5.65 | % |
| Information Technology | | | 19.14 | % |
| Materials | | | 2.64 | % |
| Utilities | | | 1.82 | % |
| Exchange-Traded Funds | | | 3.91 | % |
| Options Purchased | | | 0.03 | % |
| Short-Term Investments | | | 3.66 | % |
| Total Value of Securities Before Options Written | | | 100.35 | % |
| Options Written | | | (0.02 | )% |
| Liabilities Net of Receivables and Other Assets | | | (0.33 | )% |
| Total Net Assets | | | 100.00 | % |
Holdings are for informational purposes only and are subject to change at any time. They are not a recommendation to buy, sell, or hold any security.
| Top 10 equity holdings | | Percentage
of net assets |
| Microsoft | | | 4.61 | % |
| UnitedHealth Group | | | 3.01 | % |
| Apple | | | 2.55 | % |
| HCA Healthcare | | | 1.91 | % |
| TE Connectivity | | | 1.91 | % |
| Microchip Technology | | | 1.86 | % |
| NextEra Energy | | | 1.82 | % |
| Amazon.com | | | 1.75 | % |
| AutoZone | | | 1.67 | % |
| Airbus ADR | | | 1.63 | % |
Security type / country and sector allocations
| Delaware Ivy Natural Resources Fund | As of March 31, 2023 (Unaudited) |
Sector designations may be different from the sector designations presented in other Fund materials. The sector designations may represent the investment manager’s internal sector classifications, which may result in the sector designations for one fund being different from another fund’s sector designations.
| Security type / country | | Percentage
of net assets |
| Closed-Ended Trust | | | 2.51 | % |
| Common Stocks by Country | | | 96.97 | % |
| Brazil | | | 4.45 | % |
| Burkina Faso | | | 1.04 | % |
| Canada | | | 12.61 | % |
| Hong Kong | | | 0.00 | % |
| Netherlands | | | 4.38 | % |
| South Africa | | | 3.16 | % |
| United Kingdom | | | 3.10 | % |
| United States | | | 68.23 | % |
| Short-Term Investments | | | 0.92 | % |
| Total Value of Securities | | | 100.40 | % |
| Liabilities Net of Receivables and Other Assets | | | (0.40 | )% |
| Total Net Assets | | | 100.00 | % |
| | | | | |
| Common stocks by sector | | | Percentage
of net assets | |
| Consumer Discretionary | | | 0.49 | % |
| Consumer Staples | | | 7.49 | % |
| Energy* | | | 41.79 | % |
| Financials | | | 0.54 | % |
| Industrials | | | 6.25 | % |
| Materials* | | | 38.36 | % |
| Real Estate | | | 2.05 | % |
| Total | | | 96.97 | % |
*To monitor compliance with the Fund’s concentration guidelines as described in the Fund’s Prospectus and Statement of Additional Information, the Energy and Materials sectors (as disclosed herein for financial reporting purposes) are subdivided into a variety of “industries” (in accordance with the requirements of the Investment Company Act of 1940, as amended). The Energy sector consisted of Energy-Alternate Sources, Oil & Gas, and Oil & Gas Services. As of March 31, 2023, such amounts, as a percentage of total net assets were 1.09%, 36.95%, and 3.75%, respectively. The Materials sector consisted of Biotechnology, Building Materials, Chemicals, Forest Products & Paper, Iron/Steel, and Mining. As of March 31, 2023, such amounts, as a percentage of total net assets were 1.07%, 1.42%, 6.76%, 1.35%, 0.94%, and 26.82%, respectively. The percentage in any such single industry will comply with the Fund’s concentration policy even if the percentage in the Energy and Materials sector for financial reporting purposes may exceed 25%.
Security type / sector allocations and top 10 equity holdings
| Delaware Ivy Science and Technology Fund | As of March 31, 2023 (Unaudited) |
Sector designations may be different from the sector designations presented in other Fund materials. The sector designations may represent the investment manager’s internal sector classifications, which may result in the sector designations for one fund being different from another fund’s sector designations.
| Security type / sector | | Percentage
of net assets |
| Common Stocks | | | 92.15 | % |
| Communication Services | | | 10.91 | % |
| Consumer Discretionary | | | 7.01 | % |
| Healthcare | | | 7.51 | % |
| Industrials | | | 0.89 | % |
| Information Technology* | | | 65.83 | % |
| Short-Term Investments | | | 6.03 | % |
| Total Value of Securities | | | 98.18 | % |
| Receivables and Other Assets Net of Liabilities | | | 1.82 | % |
| Total Net Assets | | | 100.00 | % |
*To monitor compliance with the Fund’s concentration guidelines as described in the Fund’s Prospectus and Statement of Additional Information, the Information Technology sector (as disclosed herein for financial reporting purposes) is subdivided into a variety of “industries” (in accordance with the requirements of the Investment Company Act of 1940, as amended). The Information Technology sector consisted of Commercial Services, Computers, Diversified Financial Services, Electronics, Internet, Office/Business Equipment, Semiconductors, and Software. As of March 31, 2023, such amounts, as a percentage of total net assets were 3.12%, 10.00%, 2.75%, 2.05%, 3.82%, 3.08%, 25.08%, and 15.93%, respectively. The percentage in any such single industry will comply with the Fund’s concentration policy even if the percentage in the Information Technology sector for financial reporting purposes may exceed 25%.
Holdings are for informational purposes only and are subject to change at any time. They are not a recommendation to buy, sell, or hold any security.
| Top 10 equity holdings | | Percentage
of net assets |
| Microsoft | | | 8.27 | % |
| ASML Holding | | | 4.99 | % |
| Amazon.com | | | 4.45 | % |
| Seagate Technology Holdings | | | 4.33 | % |
| Analog Devices | | | 3.81 | % |
| T-Mobile US | | | 3.76 | % |
| Pinterest Class A | | | 3.64 | % |
| NVIDIA | | | 3.52 | % |
| Apple | | | 3.48 | % |
| Microchip Technology | | | 3.47 | % |
Security type / sector allocations and top 10 equity holdings
| Delaware Real Estate Securities Fund | As of March 31, 2023 (Unaudited) |
Sector designations may be different from the sector designations presented in other Fund materials. The sector designations may represent the investment manager’s internal sector classifications, which may result in the sector designations for one fund being different from another fund’s sector designations.
| Security type / sector | | Percentage
of net assets |
| Common Stocks | | | 97.21 | % |
| REIT Healthcare | | | 9.45 | % |
| REIT Hotel | | | 2.71 | % |
| REIT Industrial | | | 15.09 | % |
| REIT Information Technology | | | 17.14 | % |
| REIT Mall | | | 2.72 | % |
| REIT Manufactured Housing | | | 5.04 | % |
| REIT Multifamily | | | 14.34 | % |
| REIT Office | | | 5.23 | % |
| REIT Self-Storage | | | 10.74 | % |
| REIT Shopping Center | | | 6.55 | % |
| REIT Single Tenant | | | 7.79 | % |
| Telecommunication Services | | | 0.41 | % |
| Short-Term Investments | | | 0.80 | % |
| Total Value of Securities | | | 98.01 | % |
| Receivables and Other Assets Net of Liabilities | | | 1.99 | % |
| Total Net Assets | | | 100.00 | % |
Holdings are for informational purposes only and are subject to change at any time. They are not a recommendation to buy, sell, or hold any security.
| Top 10 equity holdings | | Percentage
of net assets |
| Prologis | | | 9.63 | % |
| Welltower | | | 6.61 | % |
| Equinix | | | 6.25 | % |
| VICI Properties | | | 4.68 | % |
| Realty Income | | | 4.63 | % |
| Digital Realty Trust | | | 4.54 | % |
| Public Storage | | | 4.01 | % |
| Extra Space Storage | | | 3.95 | % |
| Equity Residential | | | 3.87 | % |
| Alexandria Real Estate Equities | | | 3.78 | % |
Schedules of investments
| Delaware Climate Solutions | Fund March 31, 2023 |
| | | Number of
shares | | Value (US $) | |
| Common Stocks — 98.83% t | | | | | | |
| Consumer Discretionary — 3.50% | | | | | | |
| BorgWarner | | 173,630 | | $ | 8,526,969 | |
| | | | | | 8,526,969 | |
| Consumer Staples — 5.99% | | | | | | |
| Archer-Daniels-Midland | | 92,142 | | | 7,340,032 | |
| Darling Ingredients † | | 123,673 | | | 7,222,503 | |
| | | | | | 14,562,535 | |
| Energy — 16.98% | | | | | | |
| Denbury † | | 103,910 | | | 9,105,633 | |
| Equinor | | 207,857 | | | 5,909,046 | |
| Occidental Petroleum | | 120,876 | | | 7,546,289 | |
| Schlumberger | | 185,015 | | | 9,084,237 | |
| Valero Energy | | 69,139 | | | 9,651,804 | |
| | | | | | 41,297,009 | |
| Financials — 1.55% | | | | | | |
| Rice Acquisition Class A † | | 368,650 | | | 3,773,133 | |
| | | | | | 3,773,133 | |
| Industrials — 19.19% | | | | | | |
| AP Moller - Maersk Class B | | 1,846 | | | 3,355,492 | |
| Cummins | | 34,424 | | | 8,223,205 | |
| Kingspan Group | | 112,374 | | | 7,700,466 | |
| Li-Cycle Holdings † | | 503,148 | | | 2,832,723 | |
| NuScale Power † | | 320,060 | | | 2,909,345 | |
| Schneider Electric | | 54,991 | | | 9,190,312 | |
| Sunrun † | | 237,504 | | | 4,785,706 | |
| Waste Management | | 47,095 | | | 7,684,491 | |
| | | | | | 46,681,740 | |
| Materials — 11.89% | | | | | | |
| Alcoa | | 191,357 | | | 8,144,154 | |
| Anglo American | | 242,950 | | | 8,080,886 | |
| Holcim | | 80,956 | | | 5,220,961 | |
| Nutrien | | 101,167 | | | 7,471,183 | |
| | | | | | 28,917,184 | |
| Real Estate — 2.58% | | | | | | |
| Weyerhaeuser | | 208,180 | | | 6,272,464 | |
| | | | | | 6,272,464 | |
| Utilities — 37.15% | | | | | | |
| AES | | 328,578 | | | 7,912,157 | |
| Ameren | | 83,854 | | | 7,244,147 | |
| American Electric Power | | 75,611 | | | 6,879,845 | |
| CMS Energy | | 110,150 | | | 6,761,007 | |
| Iberdrola | | 705,504 | | | 8,789,033 | |
| NextEra Energy | | 85,900 | | | 6,621,172 | |
| Northland Power | | 228,982 | | | 5,740,222 | |
| Orsted 144A # | | 79,037 | | | 6,739,326 | |
| ReNew Energy Global Class A † | | 550,823 | | | 3,095,625 | |
| RWE | | 183,370 | | | 7,890,115 | |
| SSE | | 350,089 | | | 7,811,835 | |
| Terna - Rete Elettrica Nazionale | | 979,192 | | | 8,036,608 | |
| Xcel Energy | | 101,358 | | | 6,835,584 | |
| | | | | | 90,356,676 | |
Total Common Stocks
(cost $231,520,164) | | | | | 240,387,710 | |
Total Value of Securities—98.83%
(cost $231,520,164) | | | | $ | 240,387,710 | |
| t | Narrow industries are utilized for compliance purposes for concentration whereas broad sectors are used for financial reporting. |
| † | Non-income producing security. |
| # | Security exempt from registration under Rule 144A of the Securities Act of 1933, as amended. At March 31, 2023, the aggregate value of Rule 144A securities was $6,739,326, which represents 2.77% of the Fund’s net assets. See Note 12 in “Notes to financial statements.” |
See accompanying notes, which are an integral part of the financial statements.
Schedules of investments
| Delaware Global Real Estate Fund | March 31, 2023 |
| | | Number of
shares | | Value (US $) | |
| Common Stocks – 99.55%Δ | | | | | | |
| Australia – 3.10% | | | | | | |
| Charter Hall Group | | 26,194 | | $ | 194,585 | |
| Goodman Group | | 30,212 | | | 383,386 | |
| HealthCo REIT | | 107,897 | | | 96,646 | |
| Lifestyle Communities | | 9,478 | | | 101,557 | |
| National Storage REIT | | 124,468 | | | 210,812 | |
| NEXTDC † | | 14,813 | | | 104,828 | |
| | | | | | 1,091,814 | |
| Belgium – 1.34% | | | | | | |
| Aedifica | | 1,733 | | | 139,618 | |
| Warehouses De Pauw CVA | | 11,142 | | | 331,320 | |
| | | | | | 470,938 | |
| Canada – 2.32% | | | | | | |
| Boardwalk Real Estate Investment Trust | | 4,438 | | | 181,066 | |
| Canadian Apartment Properties REIT | | 9,486 | | | 332,765 | |
| InterRent Real Estate Investment Trust | | 15,588 | | | 154,438 | |
| SmartCentres Real Estate Investment Trust | | 7,651 | | | 150,416 | |
| | | | | | 818,685 | |
| China/Hong Kong – 0.21% | | | | | | |
| China Resources Land | | 16,000 | | | 72,862 | |
| | | | | | 72,862 | |
| France – 1.04% | | | | | | |
| Gecina | | 2,297 | | | 238,430 | |
| Unibail-Rodamco-Westfield † | | 2,359 | | | 126,928 | |
| | | | | | 365,358 | |
| Germany – 1.58% | | | | | | |
| Aroundtown | | 36,563 | | | 52,268 | |
| LEG Immobilien | | 3,328 | | | 182,894 | |
| Vonovia | | 17,046 | | | 321,058 | |
| | | | | | 556,220 | |
| Hong Kong – 5.55% | | | | | | |
| CK Asset Holdings | | 58,500 | | | 354,666 | |
| Link REIT | | 88,166 | | | 566,928 | |
| Sun Hung Kai Properties | | 59,500 | | | 833,572 | |
| Wharf Real Estate Investment | | 35,000 | | | 201,508 | |
| | | | | | 1,956,674 | |
| Japan – 10.42% | | | | | | |
| Industrial & Infrastructure Fund Investment | | 214 | | | 232,912 | |
| Japan Real Estate Investment | | 65 | | | 259,041 | |
| Kenedix Retail REIT | | 55 | | | 97,455 | |
| Mitsubishi Estate | | 63,450 | | | 754,717 | |
| Mitsubishi Estate Logistics REIT Investment | | 101 | | | 297,597 | |
| Nomura Real Estate Master Fund | | 519 | | | 581,585 | |
| Sekisui House | | 21,400 | | | 436,158 | |
| Sumitomo Realty & Development | | 16,800 | | | 379,368 | |
| Tokyu REIT | | 160 | | | 218,437 | |
| United Urban Investment | | 386 | | | 416,469 | |
| | | | | | 3,673,739 | |
| Singapore – 3.95% | | | | | | |
| CapitaLand Integrated Commercial Trust | | 162,400 | | | 242,208 | |
| Capitaland Investment | | 95,300 | | | 264,412 | |
| Mapletree Logistics Trust | | 399,600 | | | 515,470 | |
| Mapletree Pan Asia Commercial Trust | | 272,300 | | | 369,188 | |
| | | | | | 1,391,278 | |
| Spain – 1.33% | | | | | | |
| Cellnex Telecom 144A # | | 7,285 | | | 283,297 | |
| Inmobiliaria Colonial Socimi | | 29,071 | | | 184,242 | |
| | | | | | 467,539 | |
| Sweden – 1.09% | | | | | | |
| Castellum | | 8,771 | | | 102,040 | |
| Fabege | | 14,386 | | | 110,342 | |
| Fastighets Balder Class B † | | 21,094 | | | 86,666 | |
| Wihlborgs Fastigheter | | 11,348 | | | 86,959 | |
| | | | | | 386,007 | |
| United Kingdom – 4.15% | | | | | | |
| Big Yellow Group | | 20,738 | | | 298,951 | |
| Derwent London | | 4,280 | | | 124,570 | |
| Land Securities Group | | 30,188 | | | 231,740 | |
| Segro | | 35,025 | | | 333,641 | |
| Shaftesbury Capital | | 80,269 | | | 113,576 | |
| UNITE Group | | 30,543 | | | 361,850 | |
| | | | | | 1,464,328 | |
| United States – 63.47% | | | | | | |
| Agree Realty | | 5,651 | | | 387,715 | |
| Alexandria Real Estate Equities | | 8,054 | | | 1,011,502 | |
| American Homes 4 Rent Class A | | 15,675 | | | 492,979 | |
| American Tower | | 1,631 | | | 333,279 | |
| Americold Realty Trust | | 16,691 | | | 474,859 | |
| Apple Hospitality REIT | | 15,611 | | | 242,283 | |
| Boston Properties | | 5,677 | | | 307,239 | |
| Digital Realty Trust | | 12,125 | | | 1,192,009 | |
| DigitalBridge Group | | 7,754 | | | 92,971 | |
| Equinix | | 1,734 | | | 1,250,283 | |
| Equity LifeStyle Properties | | 7,924 | | | 531,938 | |
| Equity Residential | | 15,318 | | | 919,080 | |
| Essex Property Trust | | 2,424 | | | 506,955 | |
| Extra Space Storage | | 6,194 | | | 1,009,188 | |
| Federal Realty Investment Trust | | 3,041 | | | 300,542 | |
| First Industrial Realty Trust | | 7,927 | | | 421,716 | |
| Healthpeak Properties | | 26,756 | | | 587,829 | |
| Invitation Homes | | 7,471 | | | 233,319 | |
| Kimco Realty | | 27,459 | | | 536,274 | |
| Kite Realty Group Trust | | 19,183 | | | 401,308 | |
| Life Storage | | 6,277 | | | 822,852 | |
| | | Number of
shares | | Value (US $) | |
| Common StocksΔ (continued) | | | | | | |
| United States (continued) | | | | | | |
| Mid-America Apartment Communities | | 612 | | $ | 92,437 | |
| NETSTREIT | | 16,348 | | | 298,842 | |
| Prologis | | 17,956 | | | 2,240,369 | |
| Public Storage | | 2,666 | | | 805,505 | |
| Realty Income | | 16,977 | | | 1,074,984 | |
| Rexford Industrial Realty | | 8,953 | | | 534,047 | |
| Ryman Hospitality Properties | | 2,333 | | | 209,340 | |
| SBA Communications | | 581 | | | 151,682 | |
| Simon Property Group | | 3,155 | | | 353,265 | |
| Spirit Realty Capital | | 7,417 | | | 295,493 | |
| Sun Communities | | 4,857 | | | 684,254 | |
| UDR | | 18,121 | | | 744,048 | |
| VICI Properties | | 35,328 | | | 1,152,399 | |
| Welltower | | 21,078 | | | 1,511,082 | |
| Xenia Hotels & Resorts | | 12,751 | | | 166,911 | |
| | | | | | 22,370,778 | |
Total Common Stocks
(cost $34,954,662) | | | | | 35,086,220 | |
| |
| Short-Term Investments – 0.05% | | | | | | |
| Money Market Mutual Funds – 0.05% | | | | | | |
| BlackRock Liquidity FedFund – Institutional Shares (seven-day effective yield 4.72%) | | 4,171 | | | 4,171 | |
| Fidelity Investments Money Market Government Portfolio – Class I (seven-day effective yield 4.72%) | | 4,171 | | | 4,171 | |
| Goldman Sachs Financial Square Government Fund – Institutional Shares (seven-day effective yield 4.84%) | | 4,171 | | | 4,171 | |
| Morgan Stanley Institutional Liquidity Funds Government Portfolio – Institutional Class (seven-day effective yield 4.73%) | | 4,170 | | | 4,170 | |
Total Short-Term Investments
(cost $16,683) | | | | | 16,683 | |
Total Value of Securities – 99.60%
(cost $34,971,345) | | | | $ | 35,102,903 | |
| Δ | Securities have been classified by country of risk. |
| † | Non-income producing security. |
| # | Security exempt from registration under Rule 144A of the Securities Act of 1933, as amended. At March 31, 2023, the aggregate value of Rule 144A securities was $283,297, which represents 0.80% of the Fund’s net assets. See Note 12 in “Notes to financial statements.” |
Summary of abbreviations:
CVA – Certified Dutch Certificate
REIT – Real Estate Investment Trust
See accompanying notes, which are an integral part of the financial statements.
Consolidated schedules of investments
| Delaware Ivy Asset Strategy Fund | March 31, 2023 |
| | | Principal
amount° | | Value (US $) | |
| Agency Collateralized Mortgage Obligations — 0.32% |
| Fannie Mae REMICs | | | | | | |
| Series 2015-18 NS 1.275% (6.12% minus LIBOR01M, Cap 6.12%) 4/25/45 Σ, • | | 3,967,126 | | $ | 485,683 | |
| Series 2015-37 SB 0.775% (5.62% minus LIBOR01M, Cap 5.62%) 6/25/45 Σ, • | | 8,488,408 | | | 795,348 | |
| Series 2016-48 US 1.255% (6.10% minus LIBOR01M, Cap 6.10%) 8/25/46 Σ, • | | 10,122,865 | | | 844,965 | |
| Series 2017-33 AI 4.50% 5/25/47 Σ | | 3,683,691 | | | 542,575 | |
| Series 2019-13 IP 5.00% 3/25/49 Σ | | 2,601,254 | | | 516,866 | |
| Series 4740 SB 1.466% (6.15% minus LIBOR01M, Cap 6.15%) 11/15/47 Σ, • | | 3,902,852 | | | 441,202 | |
| GNMA | | | | | | |
| Series 2021-162 IN 3.00% 9/20/51 Σ | | 16,393,173 | | | 2,263,030 | |
Total Agency Collateralized Mortgage Obligations
(cost $7,765,265) | | | | | 5,889,669 | |
| | | | | | | |
| Agency Mortgage-Backed Securities — 2.95% | | | | | | |
| Fannie Mae S.F. 30 yr | | | | | | |
| 2.00% 3/1/51 | | 3,955,559 | | | 3,279,792 | |
| 2.50% 4/1/51 | | 1,914,231 | | | 1,650,291 | |
| 3.00% 4/1/47 | | 1,982,331 | | | 1,812,693 | |
| 3.00% 12/1/51 | | 2,251,522 | | | 2,037,450 | |
| 3.00% 2/1/52 | | 420,097 | | | 378,531 | |
| 3.50% 6/1/52 | | 3,975,201 | | | 3,694,007 | |
| 4.50% 10/1/52 | | 2,315,206 | | | 2,268,269 | |
| 5.00% 9/1/52 | | 1,990,572 | | | 1,985,087 | |
| 5.50% 8/1/52 | | 2,316,228 | | | 2,347,905 | |
| 5.50% 3/1/53 | | 2,306,021 | | | 2,329,208 | |
| Freddie Mac S.F. 20 yr | | | | | | |
| 2.50% 2/1/42 | | 1,138,566 | | | 1,008,696 | |
| 3.00% 3/1/37 | | 927,081 | | | 868,878 | |
| Freddie Mac S.F. 30 yr | | | | | | |
| 2.50% 1/1/52 | | 4,982,525 | | | 4,310,762 | |
| 3.00% 12/1/46 | | 1,959,709 | | | 1,793,305 | |
| 3.00% 1/1/52 | | 943,150 | | | 847,465 | |
| 3.50% 6/1/47 | | 2,539,348 | | | 2,397,380 | |
| 3.50% 4/1/52 | | 2,410,508 | | | 2,244,706 | |
| 4.00% 8/1/52 | | 2,628,952 | | | 2,528,965 | |
| 4.00% 9/1/52 | | 2,046,443 | | | 1,964,620 | |
| 4.50% 9/1/52 | | 5,094,923 | | | 5,008,409 | |
| 5.00% 7/1/52 | | 1,865,490 | | | 1,863,083 | |
| 5.50% 9/1/52 | | 497,245 | | | 510,172 | |
| Freddie Mac S.F. 30 yr | | | | | | |
| 5.50% 2/1/53 | | 3,457,249 | | | 3,514,638 | |
| GNMA II S.F. 30 yr | | | | | | |
| 3.00% 12/20/51 | | 675,692 | | | 616,647 | |
| 5.00% 9/20/52 | | 2,337,168 | | | 2,341,398 | |
Total Agency Mortgage-Backed Securities
(cost $53,925,827) | | | | | 53,602,357 | |
| | | | | | | |
| Convertible Bond — 0.29% | | | | | | |
| New Cotai 5.00% exercise price $100.00, maturity date 2/2/ 27 = | | 2,063,385 | | | 5,255,840 | |
Total Convertible Bond
(cost $1,992,968) | | | | | 5,255,840 | |
| | | | | | | |
| Corporate Bonds — 12.92% | | | | | | |
| Banking — 1.35% | | | | | | |
| Banco de Credito del Peru 144A 3.125% 7/1/30 #, µ | | 1,562,000 | | | 1,407,385 | |
| Bank of America | | | | | | |
| 2.482% 9/21/36 µ | | 695,000 | | | 528,296 | |
| 6.204% 11/10/28 µ | | 470,000 | | | 491,751 | |
| Bank of New York Mellon 5.802% 10/25/28 µ | | 234,000 | | | 243,990 | |
| Barclays 7.385% 11/2/28 µ | | 305,000 | | | 323,557 | |
| BPCE 144A 5.125% 1/18/28 # | | 445,000 | | | 441,290 | |
| Citigroup 5.61% 9/29/26 µ | | 1,220,000 | | | 1,229,923 | |
| Citizens Bank 6.064% 10/24/25 µ | | 840,000 | | | 790,994 | |
| Credit Agricole 144A 5.301% 7/12/28 # | | 355,000 | | | 360,165 | |
| Credit Suisse 7.95% 1/9/25 | | 250,000 | | | 254,440 | |
| Deutsche Bank | | | | | | |
| 3.729% 1/14/32 µ | | 301,000 | | | 224,734 | |
| 3.742% 1/7/33 µ | | 200,000 | | | 144,877 | |
| 6.72% 1/18/29 µ | | 434,000 | | | 431,316 | |
| Fifth Third Bancorp 6.361% 10/27/28 µ | | 1,099,000 | | | 1,107,276 | |
| Fifth Third Bank 5.852% 10/27/25 µ | | 625,000 | | | 616,484 | |
| Goldman Sachs Group 1.542% 9/10/27 µ | | 2,600,000 | | | 2,289,393 | |
| Huntington National Bank | | | | | | |
| 4.552% 5/17/28 µ | | 1,946,000 | | | 1,836,407 | |
| 5.65% 1/10/30 | | 330,000 | | | 316,488 | |
| Jefferies Financial Group 2.625% 10/15/31 | | 2,195,000 | | | 1,679,522 | |
| JPMorgan Chase & Co. 1.953% 2/4/32 µ | | 410,000 | | | 330,106 | |
| KeyBank 5.00% 1/26/33 | | 1,405,000 | | | 1,306,642 | |
| | | Principal
amount° | | Value (US $) | |
| Corporate Bonds (continued) | | | | | | |
| Banking (continued) | | | | | | |
| KeyBank 5.85% 11/15/27 | | 205,000 | | $ | 201,754 | |
| KeyCorp 4.789% 6/1/33 µ | | 448,000 | | | 401,522 | |
| Morgan Stanley | | | | | | |
| 1.928% 4/28/32 µ | | 2,265,000 | | | 1,783,329 | |
| 2.484% 9/16/36 µ | | 805,000 | | | 612,080 | |
| 6.138% 10/16/26 µ | | 340,000 | | | 346,721 | |
| 6.296% 10/18/28 µ | | 575,000 | | | 605,137 | |
| 6.342% 10/18/33 µ | | 280,000 | | | 306,059 | |
| PNC Financial Services Group 5.671% 10/28/25 µ | | 495,000 | | | 495,614 | |
| Popular 7.25% 3/13/28 | | 320,000 | | | 316,877 | |
| State Street | | | | | | |
| 2.203% 2/7/28 µ | | 350,000 | | | 318,938 | |
| 5.751% 11/4/26 µ | | 110,000 | | | 112,190 | |
| 5.82% 11/4/28 µ | | 75,000 | | | 78,295 | |
| SVB Financial Group 4.57% 4/29/33 ‡ | | 390,000 | | | 226,551 | |
| Toronto-Dominion Bank 4.108% 6/8/27 | | 1,210,000 | | | 1,172,674 | |
| Truist Financial 6.123% 10/28/33 µ | | 298,000 | | | 312,929 | |
| US Bancorp | | | | | | |
| 4.653% 2/1/29 µ | | 271,000 | | | 265,103 | |
| 4.839% 2/1/34 µ | | 300,000 | | | 291,271 | |
| 5.727% 10/21/26 µ | | 350,000 | | | 351,842 | |
| | | | | | 24,553,922 | |
| Basic Industry — 0.12% | | | | | | |
| Celanese US Holdings | | | | | | |
| 6.05% 3/15/25 | | 1,015,000 | | | 1,021,533 | |
| 6.165% 7/15/27 | | 5,000 | | | 5,036 | |
| Nutrien 4.90% 3/27/28 | | 170,000 | | | 170,078 | |
| Sherwin-Williams 2.90% 3/15/52 | | 1,650,000 | | | 1,063,403 | |
| | | | | | 2,260,050 | |
| Capital Goods — 0.18% | | | | | | |
| Boeing 4.875% 5/1/25 | | 1,937,000 | | | 1,934,013 | |
| Eaton 4.15% 3/15/33 | | 1,350,000 | | | 1,306,686 | |
| | | | | | 3,240,699 | |
| Communication Services — 2.61% | | | | | | |
| Altice France Holding 144A 10.50% 5/15/27 # | | 8,387,000 | | | 6,423,603 | |
| CCO Holdings 144A 4.50% 8/15/30 # | | 8,000,000 | | | 6,769,080 | |
| Connect Finco 144A 6.75% 10/1/26 # | | 7,000,000 | | | 6,586,300 | |
| Consolidated Communications 144A 5.00% 10/1/28 # | | 684,000 | | | 465,314 | |
| Consolidated Communications 144A 6.50% 10/1/28 # | | 1,474,000 | | | 1,072,039 | |
| Directv Financing 144A 5.875% 8/15/27 # | | 7,420,000 | | | 6,727,417 | |
| Frontier Communications Holdings | | | | | | |
| 5.875% 11/1/29 | | 7,927,781 | | | 6,053,376 | |
| 144A 6.00% 1/15/30 # | | 461,000 | | | 351,125 | |
| Gray Escrow II 144A 5.375% 11/15/31 # | | 4,780,000 | | | 3,179,345 | |
| Gray Television 144A 4.75% 10/15/30 # | | 4,830,000 | | | 3,211,950 | |
| Sirius XM Radio 144A 4.125% 7/1/30 # | | 8,155,000 | | | 6,675,928 | |
| | | | | | 47,515,477 | |
| Communications — 0.35% | | | | | | |
| AT&T 3.50% 9/15/53 | | 3,490,000 | | | 2,538,272 | |
| Charter Communications Operating 3.85% 4/1/61 | | 1,790,000 | | | 1,118,317 | |
| Crown Castle | | | | | | |
| 1.05% 7/15/26 | | 735,000 | | | 648,073 | |
| 2.10% 4/1/31 | | 1,405,000 | | | 1,148,821 | |
| Discovery Communications 4.00% 9/15/55 | | 400,000 | | | 265,808 | |
| Verizon Communications 2.875% 11/20/50 | | 375,000 | | | 249,802 | |
| Warnermedia Holdings 144A 5.141% 3/15/52 # | | 445,000 | | | 361,049 | |
| | | | | | 6,330,142 | |
| Consumer Cyclical — 0.16% | | | | | | |
| Amazon.com 2.50% 6/3/50 | | 1,322,000 | | | 897,179 | |
| Aptiv 3.10% 12/1/51 | | 1,890,000 | | | 1,200,316 | |
| VICI Properties 4.95% 2/15/30 | | 945,000 | | | 887,711 | |
| | | | | | 2,985,206 | |
| Consumer Discretionary — 1.87% | | | | | | |
| Bath & Body Works 6.875% 11/1/35 | | 7,245,000 | | | 6,537,790 | |
| Carnival 144A 7.625% 3/1/26 # | | 7,735,000 | | | 7,065,768 | |
| Ford Motor 6.10% 8/19/32 | | 7,000,000 | | | 6,793,227 | |
| Royal Caribbean Cruises 144A 5.50% 4/1/28 # | | 7,565,000 | | | 6,687,460 | |
| Staples 144A 7.50% 4/15/26 # | | 7,809,000 | | | 6,849,274 | |
| | | | | | 33,933,519 | |
| Consumer Non-Cyclical — 0.32% | | | | | | |
| Amgen | | | | | | |
| 5.15% 3/2/28 | | 225,000 | | | 229,850 | |
| 5.25% 3/2/30 | | 270,000 | | | 276,245 | |
| 5.25% 3/2/33 | | 468,000 | | | 481,079 | |
| 5.65% 3/2/53 | | 195,000 | | | 203,135 | |
Consolidated schedules of investments
Delaware Ivy Asset Strategy Fund
| | | Principal
amount° | | Value (US $) | |
| Corporate Bonds (continued) | | | | | | |
| Consumer Non-Cyclical (continued) | | | | | | |
| CVS Health | | | | | | |
| 2.70% 8/21/40 | | 1,655,000 | | $ | 1,185,276 | |
| 4.78% 3/25/38 | | 555,000 | | | 529,467 | |
| GE HealthCare Technologies | | | | | | |
| 144A 5.60% 11/15/25 # | | 285,000 | | | 288,607 | |
| 144A 5.65% 11/15/27 # | | 285,000 | | | 294,745 | |
| JBS USA Lux 144A 3.00% 2/2/29 # | | 558,000 | | | 476,769 | |
| JBS USA LUX 144A 3.625% 1/15/32 # | | 2,000,000 | | | 1,659,440 | |
| Zoetis 5.40% 11/14/25 | | 165,000 | | | 167,873 | |
| | | | | | 5,792,486 | |
| Electric — 0.44% | | | | | | |
| AEP Transmission 5.40% 3/15/53 | | 130,000 | | | 135,619 | |
| Appalachian Power 4.50% 8/1/32 | | 1,375,000 | | | 1,320,974 | |
| Berkshire Hathaway Energy 2.85% 5/15/51 | | 1,725,000 | | | 1,188,181 | |
| Duke Energy Carolinas 4.95% 1/15/33 | | 285,000 | | | 293,063 | |
| Exelon 5.30% 3/15/33 | | 245,000 | | | 249,493 | |
| Indianapolis Power & Light 144A 5.65% 12/1/32 # | | 430,000 | | | 452,181 | |
| National Rural Utilities | | | | | | |
| Cooperative Finance 5.80% 1/15/33 | | 80,000 | | | 85,274 | |
| NextEra Energy Capital Holdings 3.00% 1/15/52 | | 425,000 | | | 286,952 | |
| NRG Energy | | | | | | |
| 144A 2.00% 12/2/25 # | | 3,470,000 | | | 3,128,104 | |
| 144A 2.45% 12/2/27 # | | 390,000 | | | 333,970 | |
| PacifiCorp 5.35% 12/1/53 | | 230,000 | | | 235,891 | |
| Public Service of Colorado 5.25% 4/1/53 | | 280,000 | | | 285,641 | |
| | | | | | 7,995,343 | |
| Energy — 3.13% | | | | | | |
| BP Capital Markets America | | | | | | |
| 2.721% 1/12/32 | | 530,000 | | | 462,377 | |
| 2.939% 6/4/51 | | 1,255,000 | | | 872,004 | |
| 4.812% 2/13/33 | | 255,000 | | | 259,018 | |
| Diamondback Energy 4.25% 3/15/52 | | 510,000 | | | 400,977 | |
| Enbridge 5.70% 3/8/33 | | 175,000 | | | 182,130 | |
| Energy Transfer | | | | | | |
| 5.75% 2/15/33 | | 93,000 | | | 95,348 | |
| 6.75% 5/15/25 µ, Ψ | | 5,879,000 | | | 5,196,180 | |
| 7.125% 5/15/30 µ, Ψ | | 15,000,000 | | | 12,652,500 | |
| 8.892% 4/17/23 µ, Ψ | | 5,000,000 | | | 4,453,228 | |
| Enterprise Products Operating | | | | | | |
| 3.30% 2/15/53 | | 1,555,000 | | | 1,127,764 | |
| 5.35% 1/31/33 | | 105,000 | | | 108,874 | |
| Guara Norte 144A 5.198% 6/15/34 # | | 1,821,140 | | | 1,569,722 | |
| Hilcorp Energy I | | | | | | |
| 144A 6.00% 2/1/31 # | | 3,725,000 | | | 3,443,720 | |
| 144A 6.25% 4/15/32 # | | 3,487,000 | | | 3,229,450 | |
| Kinder Morgan 5.20% 6/1/33 | | 380,000 | | | 377,817 | |
| Petroleos Mexicanos 6.70% 2/16/32 | | 2,595,000 | | | 2,067,598 | |
| Targa Resources Partners 5.00% 1/15/28 | | 1,770,000 | | | 1,713,130 | |
| Valero Energy 2.15% 9/15/27 | | 1,496,000 | | | 1,351,782 | |
| Vital Energy | | | | | | |
| 9.50% 1/15/25 | | 8,259,000 | | | 8,324,742 | |
| 10.125% 1/15/28 | | 9,436,000 | | | 9,069,789 | |
| | | | | | 56,958,150 | |
| Finance Companies — 0.17% | | | | | | |
| Air Lease | | | | | | |
| 2.875% 1/15/32 | | 1,810,000 | | | 1,496,750 | |
| 5.85% 12/15/27 | | 280,000 | | | 281,724 | |
| Aviation Capital Group | | | | | | |
| 144A 3.50% 11/1/27 # | | 1,265,000 | | | 1,130,936 | |
| 144A 6.25% 4/15/28 # | | 110,000 | | | 110,170 | |
| | | | | | 3,019,580 | |
| Industrials — 0.43% | | | | | | |
| AerCap Holdings 5.875% 10/10/79 µ | | 8,090,000 | | | 7,379,294 | |
| Wesco Aircraft Holdings 144A 8.50% 11/15/24 # | | 6,543,000 | | | 490,725 | |
| | | | | | 7,870,019 | |
| Information Technology — 0.08% | | | | | | |
| NCR | | | | | | |
| 144A 5.00% 10/1/28 # | | 1,000,000 | | | 880,000 | |
| 144A 5.125% 4/15/29 # | | 455,000 | | | 394,143 | |
| Workday | | | | | | |
| 3.50% 4/1/27 | | 55,000 | | | 52,659 | |
| 3.70% 4/1/29 | | 110,000 | | | 103,214 | |
| 3.80% 4/1/32 | | 110,000 | | | 100,951 | |
| | | | | | 1,530,967 | |
| Insurance — 0.67% | | | | | | |
| AIA Group | | | | | | |
| 144A 3.20% 9/16/40 # | | 3,902,000 | | | 2,920,727 | |
| 144A 3.375% 4/7/30 # | | 1,960,000 | | | 1,803,812 | |
| American International Group | | | | | | |
| 5.125% 3/27/33 | | 815,000 | | | 810,610 | |
| Aon 5.00% 9/12/32 | | 1,605,000 | | | 1,613,439 | |
| | | Principal
amount° | | Value (US $) | |
| Corporate Bonds (continued) | | | | | | |
| Insurance (continued) | | | | | | |
| Athene Holding | | | | | | |
| 3.45% 5/15/52 | | 985,000 | | $ | 624,482 | |
| 3.95% 5/25/51 | | 440,000 | | | 303,564 | |
| Berkshire Hathaway Finance 3.85% 3/15/52 | | 695,000 | | | 583,258 | |
| Elevance Health 5.125% 2/15/53 | | 135,000 | | | 134,607 | |
| Humana 5.75% 3/1/28 | | 206,000 | | | 214,098 | |
| UnitedHealth Group | | | | | | |
| 4.50% 4/15/33 | | 1,660,000 | | | 1,651,188 | |
| 5.05% 4/15/53 | | 1,580,000 | | | 1,599,175 | |
| | | | | | 12,258,960 | |
| Materials — 0.36% | | | | | | |
| First Quantum Minerals | | | | | | |
| 144A 6.875% 3/1/26 # | | 3,000,000 | | | 2,912,945 | |
| 144A 6.875% 10/15/27 # | | 3,750,000 | | | 3,618,569 | |
| | | | | | 6,531,514 | |
| Natural Gas — 0.02% | | | | | | |
| Atmos Energy 2.85% 2/15/52 | | 385,000 | | | 262,132 | |
| | | | | | 262,132 | |
| Real Estate Investment Trusts — 0.01% | | | | | | |
| American Homes 4 Rent 3.625% 4/15/32 | | 220,000 | | | 190,813 | |
| | | | | | 190,813 | |
| Technology — 0.50% | | | | | | |
| Apple 2.40% 8/20/50 | | 3,122,000 | | | 2,096,720 | |
| Autodesk 2.40% 12/15/31 | | 420,000 | | | 349,554 | |
| Baidu 1.72% 4/9/26 | | 1,672,000 | | | 1,512,568 | |
| CDW 3.276% 12/1/28 | | 1,035,000 | | | 913,672 | |
| Entegris Escrow 144A 4.75% 4/15/29 # | | 385,000 | | | 364,330 | |
| Micron Technology 6.75% 11/1/29 | | 120,000 | | | 127,539 | |
| Oracle | | | | | | |
| 4.65% 5/6/30 | | 170,000 | | | 165,585 | |
| 5.55% 2/6/53 | | 730,000 | | | 695,910 | |
| 6.15% 11/9/29 | | 240,000 | | | 255,744 | |
| Tencent Holdings 144A 3.24% 6/3/50 # | | 3,910,000 | | | 2,572,364 | |
| | | | | | 9,053,986 | |
| Transportation — 0.15% | | | | | | |
| Azul Investments 144A 7.25% 6/15/26 # | | 1,500,000 | | | 984,863 | |
| Burlington Northern Santa Fe 2.875% 6/15/52 | | 330,000 | | | 231,580 | |
| Simpar Europe 144A 5.20% 1/26/31 # | | 2,000,000 | | | 1,463,420 | |
| | | | | | 2,679,863 | |
Total Corporate Bonds
(cost $253,628,306) | | | | | 234,962,828 | |
| | | | | | | |
| Municipal Bonds — 0.08% | | | | | | |
| Commonwealth of Puerto Rico (Restructured) | | | | | | |
| Series A-1 3.045% 7/1/24 ^ | | 62,870 | | | 59,195 | |
| Series A-1 4.00% 7/1/35 | | 137,232 | | | 119,950 | |
| Series A-1 4.00% 7/1/37 | | 145,770 | | | 123,718 | |
| GDB Debt Recovery Authority of Puerto Rico | | | | | | |
| 7.50% 8/20/40 | | 1,415,984 | | | 1,175,267 | |
| | | | | | | |
Total Municipal Bonds
(cost $1,687,265) | | | | | 1,478,130 | |
| | | | | | | |
| Non-Agency Collateralized Mortgage Obligations — 0.35% |
| COLT Mortgage Loan Trust | | | | | | |
| Series 2021-3 B1 144A 3.059% 9/27/66 #, • | | 2,000,000 | | | 1,116,587 | |
| CSMC Trust | | | | | | |
| Series 2020-NQM1 B1 144A 4.462% 5/25/65 #, • | | 4,968,250 | | | 4,291,872 | |
| Verus Securitization Trust | | | | | | |
| Series 2019-INV2 B1 144A 4.452% 7/25/59 #, • | | 1,097,000 | | | 905,787 | |
Total Non-Agency Collateralized Mortgage Obligations
(cost $8,276,040) | | | | | 6,314,246 | |
| | | | | | | |
| Non-Agency Commercial Mortgage-Backed Securities — 1.10% |
| BANK | | | | | | |
| Series 2020-BN25 A5 2.649% 1/15/63 | | 2,163,000 | | | 1,847,293 | |
| Series 2022-BNK41 A4 3.79% 4/15/65 • | | 2,000,000 | | | 1,809,931 | |
| BBCMS Mortgage Trust | | | | | | |
| Series 2020-C7 A5 2.037% 4/15/53 | | 2,500,000 | | | 2,044,945 | |
| Benchmark Mortgage Trust | | | | | | |
| Series 2018-B1 A5 3.666% 1/15/51 • | | 2,000,000 | | | 1,859,500 | |
| Series 2020-B20 A5 2.034% 10/15/53 | | 2,000,000 | | | 1,598,131 | |
| Series 2021-B24 A5 2.584% 3/15/54 | | 2,250,000 | | | 1,852,313 | |
| Series 2021-B25 A5 2.577% 4/15/54 | | 4,000,000 | | | 3,302,818 | |
Consolidated schedules of investments
Delaware Ivy Asset Strategy Fund
| | | Principal
amount° | | Value (US $) | |
| Non-Agency Commercial Mortgage-Backed Securities (continued) | | | | | | |
| Citigroup Commercial Mortgage Trust | | | | | | |
| Series 2020-555 A 144A 2.647% 12/10/41 # | | 2,000,000 | | $ | 1,698,444 | |
| Grace Trust | | | | | | |
| Series 2020-GRCE A 144A 2.347% 12/10/40 # | | 2,225,000 | | | 1,734,400 | |
| GS Mortgage Securities Trust | | | | | | |
| Series 2020-GC47 A5 2.377% 5/12/53 | | 2,813,000 | | | 2,329,011 | |
Total Non-Agency Commercial Mortgage-Backed Securities
(cost $21,115,022) | | | | | 20,076,786 | |
| | | | | | | |
| Loan Agreements — 2.20% | | | | | | |
| Advantage Sales & Marketing Tranche B-1 9.288% (LIBOR03M + 4.50%) 10/28/27 • | | 3,026,095 | | | 2,611,898 | |
| Epic Crude Services LP 10.288% (LIBOR03M + 5.00%) 3/1/26 • | | 21 | | | 19 | |
| MLN US HoldCo 1st Lien 11.556% (SOFR03M + 6.70%) 10/18/27 • | | 7,567,274 | | | 4,351,182 | |
| PetsMart 8.657% (LIBOR01M + 3.50%) 11/2/28 • | | 6,797,210 | | | 6,753,314 | |
| Surgery Center Holdings 8.46% (LIBOR01M + 3.75%) 8/31/26 • | | 9,137,916 | | | 9,095,864 | |
| White Cap Buyer 8.462% (SOFR01M + 3.75%) 10/19/27 • | | 17,412,060 | | | 17,232,507 | |
Total Loan Agreements
(cost $42,602,606) | | | | | 40,044,784 | |
| | | | | | | |
| US Treasury Obligations — 2.89% | | | | | | |
| US Treasury Bonds | | | | | | |
| 2.75% 8/15/47 | | 1,495,000 | | | 1,243,770 | |
| 3.00% 2/15/49 | | 3,564,000 | | | 3,122,398 | |
| 3.625% 2/15/53 | | 1,420,000 | | | 1,410,127 | |
| 3.875% 2/15/43 | | 210,000 | | | 211,920 | |
| US Treasury Floating Rate Notes | | | | | | |
| 4.871% (USBMMY3M + 0.14%) 10/31/24 • | | 35,385,000 | | | 35,382,771 | |
| 4.931% (USBMMY3M + 0.20%) 1/31/25 • | | 4,675,000 | | | 4,678,178 | |
| US Treasury Notes | | | | | | |
| 3.50% 2/15/33 | | 35,000 | | | 35,057 | |
| 3.625% 3/31/28 | | 2,515,000 | | | 2,519,323 | |
| 3.625% 3/31/30 | | 120,000 | | | 120,581 | |
| US Treasury Notes | | | | | | |
| 3.875% 11/30/29 | | 400,000 | | | 407,031 | |
| 4.125% 11/15/32 | | 280,000 | | | 294,262 | |
| 4.375% 10/31/24 | | 3,100,000 | | | 3,104,178 | |
| 4.625% 3/15/26 | | 95,000 | | | 97,171 | |
Total US Treasury Obligations
(cost $53,108,830) | | | | | 52,626,767 | |
| |
| | | Number of
shares | | | | |
| Common Stocks — 66.40% | | | | | | |
| Communication Services — 4.53% | | | | | | |
| Deutsche Telekom | | 1,136,376 | | | 27,537,001 | |
| New Cotai =, † | | 1,819,823 | | | 1,854,176 | |
| Pinterest Class A † | | 735,685 | | | 20,062,130 | |
| Tencent Holdings | | 411,100 | | | 20,090,179 | |
| T-Mobile US † | | 88,719 | | | 12,850,060 | |
| | | | | | 82,393,546 | |
| Consumer Discretionary — 7.99% | | | | | | |
| Amazon.com † | | 191,860 | | | 19,817,219 | |
| Aptiv † | | 187,732 | | | 21,061,653 | |
| Burlington Stores † | | 77,184 | | | 15,598,886 | |
| Darden Restaurants | | 125,099 | | | 19,410,361 | |
| Ferrari | | 69,946 | | | 18,954,233 | |
| H World Group ADR † | | 373,803 | | | 18,308,871 | |
| LVMH Moet Hennessy Louis Vuitton | | 15,664 | | | 14,378,120 | |
| Media Group Holdings Series H <<, =, † | | 640,301 | | | 0 | |
| Media Group Holdings Series T <<, =, † | | 80,253 | | | 0 | |
| Meituan Class B #, † | | 34,020 | | | 617,198 | |
| Skechers USA Class A † | | 305,359 | | | 14,510,660 | |
| Studio City International Holdings † | | 184,458 | | | 1,227,863 | |
| Studio City International Holdings ADR † | | 203,063 | | | 1,351,709 | |
| | | | | | 145,236,773 | |
| Consumer Staples — 5.25% | | | | | | |
| Asahi Group Holdings | | 393,900 | | | 14,660,185 | |
| Casey’s General Stores | | 51,190 | | | 11,080,588 | |
| China Mengniu Dairy | | 4,935,687 | | | 20,233,591 | |
| Procter & Gamble | | 165,648 | | | 24,630,201 | |
| Reckitt Benckiser Group | | 326,642 | | | 24,850,117 | |
| | | | | | 95,454,682 | |
| Energy — 4.12% | | | | | | |
| Canadian Natural Resources | | 492,117 | | | 27,238,676 | |
| ConocoPhillips | | 233,632 | | | 23,178,631 | |
| | | Number of
shares | | Value (US $) | |
| Common Stocks (continued) | | | | | | |
| Energy (continued) | | | | | | |
| Schlumberger | | 112,950 | | $ | 5,545,845 | |
| Shell | | 334,596 | | | 9,586,537 | |
| TotalEnergies | | 157,351 | | | 9,278,001 | |
| | | | | | 74,827,690 | |
| Financials — 7.55% | | | | | | |
| AGNC Investment | | 1,587,336 | | | 16,000,347 | |
| BNP Paribas | | 334,019 | | | 19,946,809 | |
| ICICI Bank | | 1,204,601 | | | 12,872,902 | |
| Intercontinental Exchange | | 128,291 | | | 13,379,468 | |
| Mitsubishi UFJ Financial Group | | 2,628,700 | | | 16,846,467 | |
| Morgan Stanley | | 194,226 | | | 17,053,043 | |
| ORIX | | 682,603 | | | 11,255,155 | |
| Prudential | | 1,289,985 | | | 17,662,006 | |
| State Bank of India | | 1,927,884 | | | 12,324,079 | |
| | | | | | 137,340,276 | |
| Healthcare — 11.00% | | | | | | |
| Abbott Laboratories | | 145,111 | | | 14,693,940 | |
| AstraZeneca | | 146,775 | | | 20,336,315 | |
| Bayer | | 311,665 | | | 19,909,662 | |
| Danaher | | 69,606 | | | 17,543,496 | |
| Eli Lilly & Co. | | 46,078 | | | 15,824,107 | |
| Genmab † | | 58,293 | | | 22,035,063 | |
| Regeneron Pharmaceuticals † | | 30,616 | | | 25,156,249 | |
| Thermo Fisher Scientific | | 25,078 | | | 14,454,207 | |
| UnitedHealth Group | | 55,397 | | | 26,180,068 | |
| Vertex Pharmaceuticals † | | 75,976 | | | 23,937,758 | |
| | | | | | 200,070,865 | |
| Industrials — 8.23% | | | | | | |
| Airbus | | 195,849 | | | 26,159,067 | |
| Generac Holdings † | | 104,592 | | | 11,296,982 | |
| Ingersoll Rand | | 296,626 | | | 17,257,701 | |
| Larsen & Toubro | | 719,117 | | | 18,982,036 | |
| Raytheon Technologies | | 237,439 | | | 23,252,401 | |
| Thales | | 126,233 | | | 18,663,151 | |
| Union Pacific | | 87,729 | | | 17,656,339 | |
| Vinci | | 142,423 | | | 16,327,720 | |
| | | | | | 149,595,397 | |
| Information Technology — 15.55% | | | | | | |
| Ambarella † | | 143,214 | | | 11,087,628 | |
| Apple | | 99,487 | | | 16,405,406 | |
| Autodesk † | | 70,202 | | | 14,613,248 | |
| Check Point Software Technologies † | | 173,485 | | | 22,553,050 | |
| Intuit ~ | | 52,698 | | | 23,494,349 | |
| KLA | | 27,282 | | | 10,890,156 | |
| Mastercard Class A | | 80,704 | | | 29,328,641 | |
| Microchip Technology | | 159,172 | | | 13,335,430 | |
| Microsoft ~ | | 148,125 | | | 42,704,438 | |
| NVIDIA | | 64,855 | | | 18,014,773 | |
| PayPal Holdings † | | 217,685 | | | 16,530,999 | |
| Seagate Technology Holdings | | 322,954 | | | 21,353,719 | |
| Taiwan Semiconductor Manufacturing | | 1,272,550 | | | 22,300,957 | |
| VeriSign † | | 94,635 | | | 19,999,215 | |
| | | | | | 282,612,009 | |
| Materials — 0.62% | | | | | | |
| Barrick Gold | | 605,206 | | | 11,238,675 | |
| | | | | | 11,238,675 | |
| Utilities — 1.56% | | | | | | |
| NTPC | | 5,897,433 | | | 12,590,688 | |
| RWE | | 365,746 | | | 15,737,460 | |
| | | | | | 28,328,148 | |
| | | | | | | |
Total Common Stocks
(cost $1,613,753,907) | | | | | 1,207,098,061 | |
| | | | | | | |
| Exchange-Traded Funds — 2.69% | | | | | | |
| iShares 0-5 Year High Yield Corporate Bond ETF | | 562,912 | | | 23,462,172 | |
| Vanguard Russell 2000 ETF | | 352,007 | | | 25,372,665 | |
Total Exchange-Traded Funds
(cost $50,329,777) | | | | | 48,834,837 | |
| | | | | | | |
| | | Troy
Ounces | | | | |
| Bullion — 5.21% | | | | | | |
| Gold | | 48,025 | | | 94,653,108 | |
Total Bullion
(cost $56,154,778) | | | | | 94,653,108 | |
| | | | | | | |
| | | Number of
shares | | | | |
| Short-Term Investments — 2.57% | | | | | | |
| Money Market Mutual Funds — 2.57% | | | | | | |
| BlackRock Liquidity FedFund – Institutional Shares (seven-day effective yield 4.72%) | | 11,673,634 | | | 11,673,634 | |
| Fidelity Investments Money Market Government Portfolio – Class I (seven-day effective yield 4.72%) | | 11,673,634 | | | 11,673,634 | |
| Goldman Sachs Financial Square Government Fund – Institutional Shares (seven-day effective yield 4.84%) | | 11,673,634 | | | 11,673,634 | |
Consolidated schedules of investments
Delaware Ivy Asset Strategy Fund
| | | Number of
shares | | Value (US $) | |
| Short-Term Investments (continued) | | | | | | |
| Money Market Mutual Funds (continued) | | | | | | |
| Morgan Stanley Institutional Liquidity Funds Government Portfolio – Institutional Class (seven-day effective yield 4.73%) | | 11,673,634 | | $ | 11,673,634 | |
Total Short-Term Investments
(cost $46,694,536) | | | | | 46,694,536 | |
Total Value of Securities—99.97%
(cost $2,211,035,127) | | | | $ | 1,817,531,949 | |
| ° | Principal amount shown is stated in USD unless noted that the security is denominated in another currency. |
| Σ | Interest only security. An interest only security is the interest only portion of a fixed income security, which is separated and sold individually from the principal portion of the security. |
| • | Variable rate investment. Rates reset periodically. Rate shown reflects the rate in effect at March 31, 2023. For securities based on a published reference rate and spread, the reference rate and spread are indicated in their descriptions. The reference rate descriptions (i.e. LIBOR03M, LIBOR06M, etc.) used in this report are identical for different securities, but the underlying reference rates may differ due to the timing of the reset period. Certain variable rate securities are not based on a published reference rate and spread but are determined by the issuer or agent and are based on current market conditions, or for mortgage-backed securities, are impacted by the individual mortgages which are paying off over time. These securities do not indicate a reference rate and spread in their descriptions. |
| = | The value of this security was determined using significant unobservable inputs and is reported as a Level 3 security in the disclosure table located in Note 3 in “Notes to financial statements.” |
| # | Security exempt from registration under Rule 144A of the Securities Act of 1933, as amended. At March 31, 2023, the aggregate value of Rule 144A securities was $109,522,492, which represents 6.02% of the Fund’s net assets. See Note 12 in “Notes to financial statements.” |
| µ | Fixed to variable rate investment. The rate shown reflects the fixed rate in effect at March 31, 2023. Rate will reset at a future date. |
| ‡ | Non-income producing security. Security is currently in default. |
| Ψ | Perpetual security. Maturity date represents next call date. |
| ^ | Zero-coupon security. The rate shown is the effective yield at the time of purchase. |
| † | Non-income producing security. |
| << | Affiliated company. See Note 2 in “Notes to financial statements.” |
| ~ | All or portion of the security has been pledged as collateral for potential options written. |
The following futures contracts were outstanding at March 31, 2023:1
Futures Contracts Exchange-Traded
| Contracts to Buy (Sell) | | Notional
Amount | | | Notional
Cost
(Proceeds) | | | Expiration
Date | | Value/
Unrealized
Appreciation | | | Variation
Margin
Due from
(Due to)
Brokers | |
| 217 | | US Treasury 5 yr Notes | | $ | 23,763,195 | | | $ | 23,570,921 | | | 6/30/23 | | $ | 192,274 | | | $ | 49,163 | |
| 61 | | US Treasury 10 yr Notes | | | 7,010,235 | | | | 6,792,204 | | | 6/21/23 | | | 218,031 | | | | 20,969 | |
| Total Futures Contracts | | | | | | $ | 30,363,125 | | | | | $ | 410,305 | | | $ | 70,132 | |
The use of futures contracts involves elements of market risk and risks in excess of the amounts disclosed in the financial statements. The notional amounts presented above represent the Fund’s total exposure in such contracts, whereas only the variation margin is reflected in the Fund’s net assets.
| 1 | See Note 10 in “Notes to financial statements.” |
Summary of abbreviations:
ADR – American Depositary Receipt
Summary of abbreviations: (continued)
ETF – Exchange-Traded Fund
GNMA – Government National Mortgage Association
GS – Goldman Sachs
ICE – Intercontinental Exchange, Inc.
LIBOR – London Interbank Offered Rate
LIBOR01M – ICE LIBOR USD 1 Month
LIBOR03M – ICE LIBOR USD 3 Month
LIBOR06M �� ICE LIBOR USD 6 Month
S.F. – Single Family
SOFR01M – Secured Overnight Financing Rate 1 Month
SOFR03M – Secured Overnight Financing Rate 3 Month
USBMMY3M – US Treasury 3 Month Bill Money Market Yield
USD – US Dollar
yr – Year
See accompanying notes, which are an integral part of the financial statements.
Schedules of investments
| Delaware Ivy Balanced Fund | March 31, 2023 |
| | | Principal
amount° | | Value (US $) | |
| Agency Collateralized Mortgage Obligations — 0.95% | | | | | | |
| Fannie Mae REMICs | | | | | | |
| Series 2016-36 VB 3.50% 6/25/29 | | 3,697,465 | | $ | 3,591,242 | |
| Series 2016-71 NB 3.00% 10/25/46 | | 4,897,422 | | | 4,524,796 | |
| Freddie Mac REMICs Series 4616 HW 3.00% 6/15/45 | | 3,007,462 | | | 2,841,224 | |
| Freddie Mac STACR REMIC Trust Series 2021-HQA2 M2 144A 6.61% (SOFR + 2.05%) 12/25/33 #, • | | 4,518,000 | | | 4,275,326 | |
| | | | | | | |
Total Agency Collateralized Mortgage Obligations
(cost $16,369,686) | | | | | 15,232,588 | |
| | | | | | | |
| Agency Mortgage-Backed Securities — 9.59% | | | | | | |
| Fannie Mae S.F. 15 yr 2.50% 8/1/35 | | 1,807,174 | | | 1,681,456 | |
| Fannie Mae S.F. 20 yr 2.00% 5/1/41 | | 2,279,986 | | | 1,971,093 | |
| Fannie Mae S.F. 30 yr | | | | | | |
| 2.00% 3/1/51 | | 1,611,066 | | | 1,335,832 | |
| 2.00% 4/1/51 | | 7,349,910 | | | 6,093,107 | |
| 2.50% 1/1/52 | | 4,341,329 | | | 3,745,130 | |
| 2.50% 4/1/52 | | 1,339,551 | | | 1,158,332 | |
| 3.00% 12/1/51 | | 3,601,711 | | | 3,259,265 | |
| 3.50% 1/1/48 | | 676,774 | | | 638,376 | |
| 3.50% 8/1/50 | | 589,999 | | | 556,865 | |
| 3.50% 8/1/51 | | 4,426,963 | | | 4,123,859 | |
| 3.50% 4/1/52 | | 11,690,319 | | | 10,967,229 | |
| 4.00% 6/1/52 | | 3,035,560 | | | 2,903,209 | |
| 4.50% 11/1/43 | | 2,319,956 | | | 2,323,596 | |
| 4.50% 10/1/44 | | 723,427 | | | 723,073 | |
| 4.50% 5/1/49 | | 1,837,422 | | | 1,822,582 | |
| 4.50% 10/1/52 | | 5,544,438 | | | 5,432,032 | |
| 5.00% 6/1/52 | | 3,126,939 | | | 3,119,649 | |
| 5.00% 9/1/52 | | 6,509,373 | | | 6,491,435 | |
| 5.50% 10/1/52 | | 9,086,835 | | | 9,228,565 | |
| 5.50% 11/1/52 | | 1,857,516 | | | 1,893,576 | |
| 5.50% 3/1/53 | | 6,454,072 | | | 6,518,967 | |
| 6.50% 10/1/28 | | 9,073 | | | 9,355 | |
| 6.50% 2/1/29 | | 1,301 | | | 1,335 | |
| 6.50% 2/1/32 | | 12,006 | | | 12,689 | |
| 6.50% 9/1/32 | | 10,302 | | | 10,725 | |
| 7.00% 11/1/31 | | 12,872 | | | 13,125 | |
| 7.00% 2/1/32 | | 10,149 | | | 10,479 | |
| 7.00% 3/1/32 | | 5,986 | | | 6,328 | |
| 7.00% 7/1/32 | | 11,091 | | | 11,392 | |
| Freddie Mac S.F. 15 yr 2.00% 12/1/35 | | 2,532,747 | | | 2,297,566 | |
| Freddie Mac S.F. 20 yr | | | | | | |
| 2.00% 3/1/41 | | 8,214,280 | | | 7,100,803 | |
| 2.50% 2/1/42 | | 3,462,914 | | | 3,067,919 | |
| 3.00% 3/1/37 | | 2,236,732 | | | 2,096,307 | |
| Freddie Mac S.F. 30 yr | | | | | | |
| 2.00% 3/1/52 | | 2,013,330 | | | 1,665,391 | |
| 2.50% 7/1/50 | | 3,776,175 | | | 3,306,975 | |
| 2.50% 1/1/52 | | 11,382,473 | | | 9,868,245 | |
| 3.00% 8/1/51 | | 349,630 | | | 315,578 | |
| 3.00% 1/1/52 | | 19,593,200 | | | 17,605,428 | |
| 3.50% 6/1/47 | | 3,631,485 | | | 3,428,458 | |
| 3.50% 4/1/52 | | 3,211,425 | | | 2,998,871 | |
| 4.00% 8/1/52 | | 6,753,803 | | | 6,496,936 | |
| 4.00% 9/1/52 | | 2,462,566 | | | 2,355,953 | |
| 4.50% 9/1/52 | | 3,755,653 | | | 3,683,996 | |
| 5.00% 7/1/52 | | 2,640,175 | | | 2,636,769 | |
| 5.50% 9/1/52 | | 2,081,098 | | | 2,124,424 | |
| 5.50% 11/1/52 | | 1,007,456 | | | 1,021,854 | |
| 5.50% 3/1/53 | | 2,101,000 | | | 2,149,236 | |
| 6.50% 12/1/31 | | 13,531 | | | 13,971 | |
| 6.50% 1/1/32 | | 10,374 | | | 10,873 | |
| GNMA I S.F. 30 yr 6.50% 8/15/28 | | 5,507 | | | 5,667 | |
| GNMA II S.F. 30 yr | | | | | | |
| 3.00% 12/20/51 | | 1,712,592 | | | 1,562,938 | |
| 5.00% 9/20/52 | | 1,631,589 | | | 1,634,542 | |
Total Agency Mortgage-Backed Securities
(cost $159,886,005) | | | | | 153,511,356 | |
| | | | | | | |
| Corporate Bonds — 10.76% | | | | | | |
| Banking — 2.02% | | | | | | |
| Bank of America | | | | | | |
| 2.482% 9/21/36 µ | | 2,540,000 | | | 1,930,751 | |
| 6.204% 11/10/28 µ | | 2,305,000 | | | 2,411,671 | |
| Bank of New York Mellon 4.70% 9/20/25 µ, Ψ | | 1,475,000 | | | 1,399,434 | |
| Barclays 7.385% 11/2/28 µ | | 443,000 | | | 469,954 | |
| BPCE 144A 5.125% 1/18/28 # | | 1,460,000 | | | 1,447,828 | |
| Citigroup 5.61% 9/29/26 µ | | 335,000 | | | 337,725 | |
| Citizens Bank 6.064% 10/24/25 µ | | 2,585,000 | | | 2,434,189 | |
| Credit Agricole 144A 5.301% 7/12/28 # | | 435,000 | | | 441,329 | |
| Credit Suisse 7.95% 1/9/25 | | 2,020,000 | | | 2,055,875 | |
| Deutsche Bank | | | | | | |
| 3.729% 1/14/32 µ | | 718,000 | | | 536,077 | |
| 3.742% 1/7/33 µ | | 351,000 | | | 254,259 | |
| 6.72% 1/18/29 µ | | 496,000 | | | 492,933 | |
| Fifth Third Bancorp 6.361% 10/27/28 µ | | 170,000 | | | 171,280 | |
| | | Principal
amount° | | Value (US $) | |
| Corporate Bonds (continued) | | | | | | |
| Banking (continued) | | | | | | |
| Fifth Third Bank 5.852% 10/27/25 µ | | 1,430,000 | | $ | 1,410,516 | |
| Goldman Sachs Group 1.542% 9/10/27 µ | | 205,000 | | | 180,510 | |
| Huntington National Bank | | | | | | |
| 4.552% 5/17/28 µ | | 250,000 | | | 235,921 | |
| 5.65% 1/10/30 | | 430,000 | | | 412,393 | |
| JPMorgan Chase & Co. | | | | | | |
| 1.953% 2/4/32 µ | | 605,000 | | | 487,107 | |
| 5.00% 8/1/24 µ, Ψ | | 2,476,000 | | | 2,378,755 | |
| KeyBank | | | | | | |
| 5.00% 1/26/33 | | 500,000 | | | 464,997 | |
| 5.85% 11/15/27 | | 479,000 | | | 471,415 | |
| KeyCorp 4.789% 6/1/33 µ | | 269,000 | | | 241,093 | |
| Morgan Stanley | | | | | | |
| 2.484% 9/16/36 µ | | 790,000 | | | 600,675 | |
| 6.138% 10/16/26 µ | | 1,085,000 | | | 1,106,446 | |
| 6.296% 10/18/28 µ | | 728,000 | | | 766,155 | |
| 6.342% 10/18/33 µ | | 365,000 | | | 398,969 | |
| PNC Financial Services Group | | | | | | |
| 5.671% 10/28/25 µ | | 1,720,000 | | | 1,722,135 | |
| Popular 7.25% 3/13/28 | | 375,000 | | | 371,340 | |
| State Street | | | | | | |
| 2.203% 2/7/28 µ | | 495,000 | | | 451,070 | |
| 5.751% 11/4/26 µ | | 140,000 | | | 142,787 | |
| 5.82% 11/4/28 µ | | 100,000 | | | 104,394 | |
| SVB Financial Group 4.57% 4/29/33 ‡ | | 1,413,000 | | | 820,812 | |
| Truist Financial 6.123% 10/28/33 µ | | 386,000 | | | 405,338 | |
| US Bancorp | | | | | | |
| 3.10% 4/27/26 | | 4,400,000 | | | 4,091,999 | |
| 4.653% 2/1/29 µ | | 328,000 | | | 320,863 | |
| 4.839% 2/1/34 µ | | 365,000 | | | 354,380 | |
| | | | | | 32,323,375 | |
| Basic Industry — 0.23% | | | | | | |
| Celanese US Holdings | | | | | | |
| 6.05% 3/15/25 | | 2,015,000 | | | 2,027,969 | |
| 6.165% 7/15/27 | | 5,000 | | | 5,036 | |
| Newmont 2.60% 7/15/32 | | 275,000 | | | 230,321 | |
| Nutrien 4.90% 3/27/28 | | 210,000 | | | 210,096 | |
| Sherwin-Williams 3.30% 5/15/50 | | 1,775,000 | | | 1,257,550 | |
| | | | | | 3,730,972 | |
| Capital Goods — 0.72% | | | | | | |
| Boeing | | | | | | |
| 3.25% 2/1/28 | | 160,000 | | | 149,166 | |
| 3.75% 2/1/50 | | 3,025,000 | | | 2,295,245 | |
| Eaton 4.15% 3/15/33 | | 1,525,000 | | | 1,476,072 | |
| Standard Industries 144A 4.375% 7/15/30 # | | 2,098,000 | | | 1,827,631 | |
| Waste Management 3.15% 11/15/27 | | 6,000,000 | | | 5,708,591 | |
| | | | | | 11,456,705 | |
| Communications — 1.81% | | | | | | |
| AT&T | | | | | | |
| 3.50% 9/15/53 | | 2,550,000 | | | 1,854,611 | |
| 3.65% 6/1/51 | | 1,950,000 | | | 1,479,230 | |
| CCO Holdings 144A 4.25% 1/15/34 # | | 4,205,000 | | | 3,293,293 | |
| Charter Communications Operating 3.85% 4/1/61 | | 2,635,000 | | | 1,646,237 | |
| Comcast | | | | | | |
| 3.45% 2/1/50 | | 4,325,000 | | | 3,346,378 | |
| 3.90% 3/1/38 | | 3,500,000 | | | 3,137,692 | |
| Crown Castle | | | | | | |
| 1.05% 7/15/26 | | 950,000 | | | 837,645 | |
| 2.10% 4/1/31 | | 1,815,000 | | | 1,484,064 | |
| Frontier Communications | | | | | | |
| Holdings 144A 5.00% 5/1/28 # | | 940,000 | | | 816,747 | |
| Sprint 7.875% 9/15/23 | | 2,235,000 | | | 2,253,537 | |
| T-Mobile USA 3.875% 4/15/30 | | 4,425,000 | | | 4,155,526 | |
| Verizon Communications | | | | | | |
| 2.875% 11/20/50 | | 480,000 | | | 319,746 | |
| 4.50% 8/10/33 | | 4,000,000 | | | 3,867,050 | |
| Warnermedia Holdings 144A 5.141% 3/15/52 # | | 635,000 | | | 515,205 | |
| | | | | | 29,006,961 | |
| Consumer Cyclical — 0.21% | | | | | | |
| Amazon.com 2.50% 6/3/50 | | 750,000 | | | 508,990 | |
| Carnival 144A 4.00% 8/1/28 # | | 985,000 | | | 848,947 | |
| VICI Properties 4.95% 2/15/30 | | 2,075,000 | | | 1,949,207 | |
| | | | | | 3,307,144 | |
| Consumer Non-Cyclical — 0.66% | | | | | | |
| Amgen | | | | | | |
| 5.15% 3/2/28 | | 265,000 | | | 270,712 | |
| 5.25% 3/2/30 | | 320,000 | | | 327,402 | |
| 5.25% 3/2/33 | | 618,000 | | | 635,271 | |
| 5.65% 3/2/53 | | 230,000 | | | 239,595 | |
| CVS Health | | | | | | |
| 4.78% 3/25/38 | | 1,085,000 | | | 1,035,084 | |
| 5.05% 3/25/48 | | 1,020,000 | | | 955,198 | |
| DaVita | | | | | | |
| 144A 3.75% 2/15/31 # | | 370,000 | | | 292,196 | |
| 144A 4.625% 6/1/30 # | | 670,000 | | | 572,515 | |
Schedules of investments
Delaware Ivy Balanced Fund
| | | Principal
amount° | | Value (US $) | |
| Corporate Bonds (continued) | | | | | | |
| Consumer Non-Cyclical (continued) | | | | | | |
| GE HealthCare Technologies | | | | | | |
| 144A 5.60% 11/15/25 # | | 1,930,000 | | $ | 1,954,423 | |
| 144A 5.65% 11/15/27 # | | 370,000 | | | 382,652 | |
| JBS USA 144A 3.00% 2/2/29 # | | 793,000 | | | 677,559 | |
| Merck & Co. 2.75% 12/10/51 | | 3,750,000 | | | 2,658,088 | |
| Royalty Pharma 3.55% 9/2/50 | | 444,000 | | | 306,635 | |
| Zoetis 5.40% 11/14/25 | | 215,000 | | | 218,744 | |
| | | | | | 10,526,074 | |
| Electric — 1.25% | | | | | | |
| AEP Transmission 5.40% 3/15/53 | | 150,000 | | | 156,483 | |
| Ameren Illinois 3.25% 3/15/50 | | 2,000,000 | | | 1,491,544 | |
| Appalachian Power 4.50% 8/1/32 | | 1,775,000 | | | 1,705,257 | |
| Berkshire Hathaway Energy 4.60% 5/1/53 | | 3,000,000 | | | 2,740,176 | |
| Commonwealth Edison 2.20% 3/1/30 | | 2,650,000 | | | 2,278,889 | |
| Duke Energy Carolinas 4.95% 1/15/33 | | 1,190,000 | | | 1,223,668 | |
| Entergy | | | | | | |
| 2.80% 6/15/30 | | 1,765,000 | | | 1,528,818 | |
| 3.75% 6/15/50 | | 700,000 | | | 531,665 | |
| Exelon 5.30% 3/15/33 | | 290,000 | | | 295,318 | |
| Florida Power & Light 3.15% 10/1/49 | | 2,575,000 | | | 1,939,579 | |
| Indianapolis Power & Light 144A 5.65% 12/1/32 # | | 550,000 | | | 578,371 | |
| National Rural Utilities Cooperative Finance 5.80% 1/15/33 | | 95,000 | | | 101,263 | |
| NextEra Energy Capital Holdings 3.00% 1/15/52 | | 635,000 | | | 428,740 | |
| Oglethorpe Power 5.05% 10/1/48 | | 1,584,000 | | | 1,447,815 | |
| PacifiCorp 5.35% 12/1/53 | | 295,000 | | | 302,556 | |
| Public Service of Colorado 5.25% 4/1/53 | | 340,000 | | | 346,850 | |
| Southern 5.70% 10/15/32 | | 640,000 | | | 673,687 | |
| Southern California Edison | | | | | | |
| 3.45% 2/1/52 | | 859,000 | | | 630,564 | |
| 4.125% 3/1/48 | | 2,000,000 | | | 1,658,679 | |
| | | | | | 20,059,922 | |
| Energy — 0.78% | | | | | | |
| BP Capital Markets America | | | | | | |
| 2.721% 1/12/32 | | 760,000 | | | 663,031 | |
| 4.812% 2/13/33 | | 305,000 | | | 309,806 | |
| Diamondback Energy 4.25% 3/15/52 | | 731,000 | | | 574,734 | |
| Enbridge 5.70% 3/8/33 | | 205,000 | | | 213,352 | |
| Energy Transfer | | | | | | |
| 5.75% 2/15/33 | | 484,000 | | | 496,221 | |
| 6.25% 4/15/49 | | 860,000 | | | 853,642 | |
| 6.50% 11/15/26 µ, Ψ | | 950,000 | | | 838,375 | |
| Enterprise Products Operating | | | | | | |
| 3.30% 2/15/53 | | 1,195,000 | | | 866,674 | |
| 5.35% 1/31/33 | | 1,975,000 | | | 2,047,877 | |
| Kinder Morgan 5.20% 6/1/33 | | 460,000 | | | 457,358 | |
| ONEOK 6.10% 11/15/32 | | 1,395,000 | | | 1,445,323 | |
| Targa Resources Partners 5.00% 1/15/28 | | 3,020,000 | | | 2,922,967 | |
| Valero Energy 3.65% 12/1/51 | | 1,083,000 | | | 788,160 | |
| | | | | | 12,477,520 | |
| Finance Companies — 0.53% | | | | | | |
| AerCap Ireland Capital DAC 6.50% 7/15/25 | | 2,605,000 | | | 2,625,961 | |
| Air Lease | | | | | | |
| 2.875% 1/15/32 | | 1,560,000 | | | 1,290,017 | |
| 5.85% 12/15/27 | | 1,040,000 | | | 1,046,402 | |
| American Tower Trust #1 144A 3.652% 3/15/48 # | | 2,000,000 | | | 1,886,545 | |
| Aviation Capital Group | | | | | | |
| 144A 3.50% 11/1/27 # | | 1,635,000 | | | 1,461,724 | |
| 144A 6.25% 4/15/28 # | | 135,000 | | | 135,208 | |
| | | | | | 8,445,857 | |
| Insurance — 0.94% | | | | | | |
| American International Group | | | | | | |
| 5.125% 3/27/33 | | 1,000,000 | | | 994,614 | |
| Aon 5.00% 9/12/32 | | 2,080,000 | | | 2,090,937 | |
| Athene Holding | | | | | | |
| 3.45% 5/15/52 | | 1,275,000 | | | 808,339 | |
| 3.95% 5/25/51 | | 565,000 | | | 389,803 | |
| Berkshire Hathaway Finance 3.85% 3/15/52 | | 2,885,000 | | | 2,421,152 | |
| Elevance Health 5.125% 2/15/53 | | 165,000 | | | 164,520 | |
| Humana 5.75% 3/1/28 | | 184,000 | | | 191,233 | |
| Northwestern Mutual Life Insurance 144A 3.85% 9/30/47 # | | 5,000,000 | | | 4,008,020 | |
| UnitedHealth Group | | | | | | |
| 4.50% 4/15/33 | | 2,045,000 | | | 2,034,144 | |
| 5.05% 4/15/53 | | 1,945,000 | | | 1,968,605 | |
| | | | | | 15,071,367 | |
| Natural Gas — 0.07% | | | | | | |
| Atmos Energy 2.85% 2/15/52 | | 495,000 | | | 337,027 | |
| Southern Co. Gas Capital 5.15% 9/15/32 | | 784,000 | | | 791,229 | |
| | | | | | 1,128,256 | |
| | | Principal
amount° | | Value (US $) | |
| Corporate Bonds (continued) | | | | | | |
| Real Estate Investment Trusts — 0.23% | | | | | | |
| American Homes 4 Rent 3.625% 4/15/32 | | 310,000 | | $ | 268,872 | |
| Extra Space Storage 2.35% 3/15/32 | | 4,400,000 | | | 3,463,005 | |
| | | | | | 3,731,877 | |
| Technology — 1.12% | | | | | | |
| Autodesk | | | | | | |
| 2.40% 12/15/31 | | 605,000 | | | 503,524 | |
| 2.85% 1/15/30 | | 4,500,000 | | | 3,977,855 | |
| CDW 3.276% 12/1/28 | | 325,000 | | | 286,902 | |
| CoStar Group 144A 2.80% 7/15/30 # | | 2,650,000 | | | 2,223,274 | |
| Entegris Escrow 144A 4.75% 4/15/29 # | | 535,000 | | | 506,277 | |
| Iron Mountain 144A 5.25% 7/15/30 # | | 517,000 | | | 466,658 | |
| Iron Mountain Information Management Services 144A 5.00% 7/15/32 # | | 1,595,000 | | | 1,371,192 | |
| Micron Technology 6.75% 11/1/29 | | 146,000 | | | 155,172 | |
| Oracle | | | | | | |
| 4.65% 5/6/30 | | 205,000 | | | 199,677 | |
| 5.55% 2/6/53 | | 1,950,000 | | | 1,858,937 | |
| 6.15% 11/9/29 | | 310,000 | | | 330,336 | |
| PayPal Holdings 3.90% 6/1/27 | | 140,000 | | | 137,655 | |
| TSMC Global 144A 1.75% 4/23/28 # | | 4,400,000 | | | 3,867,444 | |
| Workday | | | | | | |
| 3.50% 4/1/27 | | 485,000 | | | 464,358 | |
| 3.70% 4/1/29 | | 155,000 | | | 145,438 | |
| 3.80% 4/1/32 | | 1,560,000 | | | 1,431,662 | |
| | | | | | 17,926,361 | |
| Transportation — 0.19% | | | | | | |
| American Airlines 144A 5.50% 4/20/26 # | | 192,442 | | | 189,621 | |
| Burlington Northern Santa Fe 2.875% 6/15/52 | | 455,000 | | | 319,300 | |
| Delta Air Lines 144A 7.00% 5/1/25 # | | 2,480,000 | | | 2,544,286 | |
| | | | | | 3,053,207 | |
Total Corporate Bonds
(cost $186,402,046) | | | | | 172,245,598 | |
| | | | | | | |
| Non-Agency Collateralized Mortgage Obligations — 0.10% | | | | | | |
| Connecticut Avenue Securities Trust Series 2022-R01 1M2 144A 6.46% (SOFR + 1.90%) 12/25/41 #, • | | 1,750,000 | | $ | 1,675,177 | |
| | | | | | | |
Total Non-Agency Collateralized Mortgage Obligations
(cost $1,708,159) | | | | | 1,675,177 | |
| | | | | | | |
| Non-Agency Commercial Mortgage-Backed Securities — 3.49% | | | | | | |
| BANK | | | | | | |
| Series 2021-BN32 A5 2.643% 4/15/54 | | 7,060,000 | | | 5,912,930 | |
| Series 2021-BN36 A5 2.47% 9/15/64 | | 10,096,000 | | | 8,256,019 | |
| Series 2022-BNK39 A4 2.928% 2/15/55 | | 8,345,000 | | | 7,028,511 | |
| Series 2022-BNK39 B 3.239% 2/15/55 • | | 588,000 | | | 462,720 | |
| Series 2022-BNK39 C 3.27% 2/15/55 • | | 432,000 | | | 301,204 | |
| Series 2022-BNK40 A4 3.394% 3/15/64 • | | 8,150,000 | | | 7,146,072 | |
| Series 2022-BNK40 B 3.394% 3/15/64 • | | 1,000,000 | | | 781,625 | |
| Benchmark Mortgage Trust | | | | | | |
| Series 2021-B24 A5 2.584% 3/15/54 | | 6,000,000 | | | 4,939,501 | |
| Series 2022-B32 A5 3.002% 1/15/55 • | | 9,000,000 | | | 7,550,272 | |
| Series 2022-B32 B 3.202% 1/15/55 • | | 975,000 | | | 757,721 | |
| Series 2022-B32 C 3.454% 1/15/55 • | | 1,196,000 | | | 846,938 | |
| Series 2022-B33 A5 3.458% 3/15/55 | | 8,100,000 | | | 7,125,918 | |
| Series 2022-B33 B 3.615% 3/15/55 • | | 500,000 | | | 408,324 | |
| Series 2022-B33 C 3.615% 3/15/55 • | | 500,000 | | | 369,503 | |
| BMO Mortgage Trust Series 2022-C1 A5 3.374% 2/15/55 • | | 4,500,000 | | | 3,929,093 | |
Total Non-Agency Commercial Mortgage-Backed Securities
(cost $66,747,738) | | | | | 55,816,351 | |
| | | | | | | |
| US Treasury Obligations — 10.07% | | | | | | |
| US Treasury Bonds | | | | | | |
| 1.75% 8/15/41 | | 8,370,000 | | | 6,066,943 | |
| 3.625% 2/15/53 | | 12,130,000 | | | 12,045,659 | |
| 3.875% 2/15/43 | | 18,815,000 | | | 18,986,980 | |
| 4.375% 2/15/38 | | 1,770,000 | | | 1,940,190 | |
Schedules of investments
Delaware Ivy Balanced Fund
| | | Principal
amount° | | Value (US $) | |
| US Treasury Obligations (continued) | | | | | | |
| US Treasury Floating Rate Notes | | | | | | |
| 4.871% (USBMMY3M + 0.14%) 10/31/24 • | | 14,880,000 | | $ | 14,879,063 | |
| 4.931% (USBMMY3M + 0.20%) 1/31/25 • | | 2,145,000 | | | 2,146,458 | |
| US Treasury Notes | | | | | | |
| 0.125% 4/30/23 | | 14,040,700 | | | 13,992,340 | |
| 3.50% 1/31/30 | | 8,110,000 | | | 8,078,321 | |
| 3.50% 2/15/33 | | 2,970,000 | | | 2,974,873 | |
| 3.625% 3/31/28 | | 13,725,000 | | | 13,748,590 | |
| 3.625% 3/31/30 | | 145,000 | | | 145,702 | |
| 3.875% 12/31/27 | | 25,285,000 | | | 25,556,123 | |
| 3.875% 11/30/29 | | 14,425,000 | | | 14,678,564 | |
| 4.00% 2/15/26 | | 5,705,000 | | | 5,729,291 | |
| 4.00% 2/28/30 | | 30,000 | | | 30,797 | |
| 4.125% 11/15/32 | | 1,695,000 | | | 1,781,339 | |
| 4.25% 10/15/25 | | 16,480,000 | | | 16,610,681 | |
| 4.625% 3/15/26 | | 1,670,000 | | | 1,708,162 | |
Total US Treasury Obligations
(cost $161,942,083) | | | | | 161,100,076 | |
| | | | | | | |
| | | Number of
shares | | | | |
| Common Stocks — 57.79% | | | | | | |
| Communication Services — 3.29% | | | | | | |
| Alphabet Class A † | | 179,664 | | | 18,636,547 | |
| Alphabet Class C † | | 155,926 | | | 16,216,304 | |
| Take-Two Interactive Software † | | 149,747 | | | 17,864,817 | |
| | | | | | 52,717,668 | |
| Consumer Discretionary — 4.95% | | | | | | |
| Amazon.com † | | 271,054 | | | 27,997,168 | |
| Aptiv † | | 217,836 | | | 24,439,021 | |
| AutoZone † | | 10,869 | | | 26,717,632 | |
| | | | | | 79,153,821 | |
| Consumer Staples — 2.18% | | | | | | |
| Costco Wholesale | | 48,880 | | | 24,287,005 | |
| General Mills | | 11,572 | | | 988,943 | |
| Sysco | | 124,425 | | | 9,609,343 | |
| | | | | | 34,885,291 | |
| Energy — 1.59% | | | | | | |
| ConocoPhillips | | 149,273 | | | 14,809,375 | |
| Schlumberger | | 217,183 | | | 10,663,685 | |
| | | | | | 25,473,060 | |
| Financials — 8.94% | | | | | | |
| American Express | | 87,220 | | | 14,386,939 | |
| Aon Class A | | 60,464 | | | 19,063,695 | |
| Artisan Partners Asset Management Class A | | 311,003 | | | 9,945,876 | |
| Blackstone | | 115,974 | | | 10,187,156 | |
| Capital One Financial | | 54,597 | | | 5,250,047 | |
| Intercontinental Exchange | | 99,880 | | | 10,416,485 | |
| JPMorgan Chase & Co. | | 70,222 | | | 9,150,629 | |
| KKR & Co. | | 371,208 | | | 19,495,844 | |
| Morgan Stanley | | 270,472 | | | 23,747,442 | |
| Progressive | | 149,402 | | | 21,373,450 | |
| | | | | | 143,017,563 | |
| Healthcare — 7.59% | | | | | | |
| Danaher | | 64,115 | | | 16,159,544 | |
| HCA Healthcare | | 116,177 | | | 30,633,551 | |
| UnitedHealth Group | | 102,053 | | | 48,229,227 | |
| Vertex Pharmaceuticals † | | 44,052 | | | 13,879,464 | |
| Zoetis | | 75,831 | | | 12,621,312 | |
| | | | | | 121,523,098 | |
| Industrials — 5.65% | | | | | | |
| Airbus ADR | | 781,943 | | | 26,179,452 | |
| Deere & Co. | | 35,775 | | | 14,770,782 | |
| Equifax | | 87,167 | | | 17,680,954 | |
| Raytheon Technologies | | 126,843 | | | 12,421,735 | |
| United Rentals | | 49,057 | | | 19,414,798 | |
| | | | | | 90,467,721 | |
| Information Technology — 19.14% | | | | | | |
| Apple ~ | | 247,318 | | | 40,782,738 | |
| Applied Materials | | 180,487 | | | 22,169,218 | |
| Fiserv † | | 130,631 | | | 14,765,222 | |
| Intuit | | 40,646 | | | 18,121,206 | |
| Mastercard Class A | | 48,381 | | | 17,582,139 | |
| Microchip Technology | | 354,993 | | | 29,741,313 | |
| Microsoft | | 255,966 | | | 73,794,998 | |
| Salesforce † | | 70,213 | | | 14,027,153 | |
| Seagate Technology Holdings | | 190,723 | | | 12,610,605 | |
| TE Connectivity | | 232,651 | | | 30,512,179 | |
| VeriSign † | | 91,614 | | | 19,360,787 | |
| Zebra Technologies Class A † | | 40,617 | | | 12,916,206 | |
| | | | | | 306,383,764 | |
| Materials — 2.64% | | | | | | |
| Linde | | 70,218 | | | 24,958,286 | |
| Sherwin-Williams | | 76,588 | | | 17,214,685 | |
| | | | | | 42,172,971 | |
| | | Number of
shares | | Value (US $) | |
| Common Stocks (continued) | | | | | | |
| Utilities — 1.82% | | | | | | |
| NextEra Energy | | 377,773 | | $ | 29,118,743 | |
| | | | | | 29,118,743 | |
Total Common Stocks
(cost $797,401,712) | | | | | 924,913,700 | |
| | | | | | | |
| Exchange-Traded Funds — 3.91% | | | | | | |
| iShares 0-5 Year Investment Grade Corporate Bond ETF | | 310,921 | | | 15,073,450 | |
| iShares Latin America 40 ETF | | 173,323 | | | 4,137,220 | |
| iShares MSCI China ETF | | 111,850 | | | 5,580,196 | |
| iShares MSCI Emerging Markets Asia ETF | | 96,647 | | | 6,422,193 | |
| Vanguard Russell 2000 ETF | | 435,257 | | | 31,373,325 | |
Total Exchange-Traded Funds
(cost $65,023,889) | | | | | 62,586,384 | |
| | | | | | | |
| | | Notional
amount* | | | | |
| Options Purchased — 0.03% | | | | | | |
| Put Swaptions — 0.03% | | | | | | |
| CDX.NA.HY.39.V1 5 yr strike price $100.50, expiration date 5/17/23 | | 32,300,000 | | | 416,241 | |
| | | | | | | |
Total Options Purchased
(cost $436,050) | | | | | 416,241 | |
| | | | | | | |
| | | Number of
shares | | | | |
| Short-Term Investments — 3.66% | | | | | | |
| Money Market Mutual Funds — 3.66% | | | | | | |
| BlackRock Liquidity FedFund – Institutional Shares (seven-day effective yield 4.72%) | | 14,632,206 | | | 14,632,206 | |
| Fidelity Investments Money Market Government Portfolio – Class I (seven-day effective yield 4.72%) | | 14,632,206 | | | 14,632,206 | |
| Goldman Sachs Financial Square Government Fund – Institutional Shares (seven-day effective yield 4.84%) | | 14,632,206 | | | 14,632,206 | |
| Morgan Stanley Institutional Liquidity Funds Government Portfolio – Institutional Class (seven-day effective yield 4.73%) | | 14,632,206 | | | 14,632,206 | |
Total Short-Term Investments
(cost $58,528,824) | | | | | 58,528,824 | |
Total Value of Securities Before Options Written—100.35%
(cost $1,514,446,192) | | | | | 1,606,026,295 | |
| | | | | | | |
| | | Notional
amount* | | | | |
| Options Written — (0.02%) | | | | | | |
| Put Swaptions — (0.02%) | | | | | | |
| CDX.NA.HY.39.V1 5 yr strike price $96.50, expiration date 5/17/23 | | (32,300,000) | | | (129,551 | ) |
| CDX.NA.HY.39.V1 5 yr strike price $98.50, expiration date 5/17/23 | | (16,900,000) | | | (119,386 | ) |
| | | | | | | |
Total Options Written
(premium received $322,690) | | | | | (248,937 | ) |
| ° | Principal amount shown is stated in USD unless noted that the security is denominated in another currency. |
| # | Security exempt from registration under Rule 144A of the Securities Act of 1933, as amended. At March 31, 2023, the aggregate value of Rule 144A securities was $38,259,448, which represents 2.39% of the Fund’s net assets. See Note 12 in “Notes to financial statements.” |
| • | Variable rate investment. Rates reset periodically. Rate shown reflects the rate in effect at March 31, 2023. For securities based on a published reference rate and spread, the reference rate and spread are indicated in their descriptions. The reference rate descriptions (i.e. LIBOR03M, LIBOR06M, etc.) used in this report are identical for different securities, but the underlying reference rates may differ due to the timing of the reset period. Certain variable rate securities are not based on a published reference rate and spread but are determined by the issuer or agent and are based on current market conditions, or for mortgage-backed securities, are impacted by the individual mortgages which are paying off over time. These securities do not indicate a reference rate and spread in their descriptions. |
| µ | Fixed to variable rate investment. The rate shown reflects the fixed rate in effect at March 31, 2023. Rate will reset at a future date. |
| Ψ | Perpetual security. Maturity date represents next call date. |
Schedules of investments
Delaware Ivy Balanced Fund
| ‡ | Non-income producing security. Security is currently in default. |
| † | Non-income producing security. |
| ~ | All or portion of the security has been pledged as collateral for potential options written. |
| * | Notional amount shown is stated in USD unless noted that the swap is denominated in another currency. |
The following futures contracts and swap contracts were outstanding at March 31, 2023:1
Futures Contracts Exchange-Traded
| Contracts to Buy (Sell) | | Notional
Amount | | | Notional
Cost
(Proceeds) | | | Expiration
Date | | Value/
Unrealized
Appreciation | | | Value/
Unrealized
Depreciation | | | Variation
Margin
Due from
(Due to)
Brokers | |
| 530 | | US Treasury 5 yr Notes | | $ | 58,039,140 | | | $ | 56,847,897 | | | 6/30/23 | | $ | 1,191,243 | | | $ | — | | | $ | 120,077 | |
| (58) | | US Treasury 10 yr Notes | | | (6,665,469 | ) | | | (6,478,635 | ) | | 6/21/23 | | | — | | | | (186,834 | ) | | | (19,938 | ) |
| (222) | | US Treasury 10 yr Ultra Notes | | | (26,893,220 | ) | | | (25,940,488 | ) | | 6/21/23 | | | — | | | | (952,732 | ) | | | (121,407 | ) |
| 21 | | US Treasury Ultra Bonds | | | 2,963,625 | | | | 2,820,126 | | | 6/21/23 | | | 143,499 | | | | — | | | | 28,219 | |
| Total Futures Contracts | | | | | | $ | 27,248,900 | | | | | $ | 1,334,742 | | | $ | (1,139,566 | ) | | $ | 6,951 | |
CDS Contracts2
Counterparty/
Reference Obligation/
Termination Date/
Payment Frequency | | Notional
Amount3 | | | Annual Protection
Payments | | | Value | | | Upfront
Payments
Paid
(Received) | | | Unrealized
Appreciation4 | | | Variation Margin
Due from
(Due to) Brokers | |
| Centrally Cleared: | | | | | | | | | | | | | | | | | | | | | | | | |
| Protection Sold/ Moody’s Ratings: | | | | | | | | | | | | | | | | | | | | | | | | |
| CDX.NA.HY.39.V15 12/20/27-Quarterly | | | 5,600,000 | | | | 5.000% | | | $ | 65,525 | | | $ | (66,267 | ) | | $ | 131,792 | | | $ | 42,360 | |
| Total CDS Contracts | | | | | | | | | | $ | 65,525 | | | $ | (66,267 | ) | | $ | 131,792 | | | $ | 42,360 | |
The use of futures contracts and swap contracts involves elements of market risk and risks in excess of the amounts disclosed in the financial statements. The notional amounts presented above represent the Fund’s total exposure in such contracts, whereas only the variation margin is reflected in the Fund’s net assets.
| 1 | See Note 10 in “Notes to financial statements.” |
| 2 | A CDS contract is a risk-transfer instrument through which one party (purchaser of protection) transfers to another party (seller of protection) the financial risk of a credit event (as defined in the CDS agreement), as it relates to a particular reference security or basket of securities (such as an index). Periodic payments (receipts) on such contracts are accrued daily and recorded as unrealized losses (gains) on swap contracts. Upon payment (receipt), such amounts are recorded as realized losses (gains) on swap contracts. Upfront payments made or received in connection with CDS contracts are amortized over the expected life of the CDS contracts as unrealized losses (gains) on swap contracts. The change in value of CDS contracts is recorded daily as unrealized appreciation or depreciation. A realized gain or loss is recorded upon a credit event (as defined in the CDS agreement) or the maturity or termination of the CDS agreement. |
| 3 | Notional amount shown is stated in USD unless noted that the swap is denominated in another currency. |
| 4 | Unrealized appreciation (depreciation) does not include periodic interest (payments) receipt on swap contracts accrued daily in the amount of $(8) |
| 5 | Markit’s North America High Yield CDX Index, or the CDX.NA.HY Index, is composed of 100 liquid North American entities with high yield credit ratings that trade is in the CDS market. |
Summary of abbreviations:
ADR – American Depositary Receipt
CDX.NA.HY – Credit Default Swap Index North America High Yield
DAC – Designated Activity Company
ETF – Exchange-Traded Fund
GNMA – Government National Mortgage Association
ICE – Intercontinental Exchange, Inc.
LIBOR – London Interbank Offered Rate
LIBOR03M – ICE LIBOR USD 3 Month
LIBOR06M – ICE LIBOR USD 6 Month
MSCI – Morgan Stanley Capital International
REMIC – Real Estate Mortgage Investment Conduit
S.F. – Single Family
SOFR – Secured Overnight Financing Rate
USBMMY3M – US Treasury 3 Month Bill Money Market Yield
yr – Year
USD – US Dollar
See accompanying notes, which are an integral part of the financial statements.
Schedules of investments
| Delaware Ivy Natural Resources Fund | March 31, 2023 |
| | | Number of
shares | | Value (US $) | |
| Closed-Ended Trust – 2.51% | | | | | | |
| Sprott Physical Uranium Trust † | | 557,864 | | $ | 6,521,828 | |
Total Closed-Ended Trust
(cost $6,522,343) | | | | | 6,521,828 | |
| | | | | | | |
| Common Stocks – 96.97% Δ | | | | | | |
| Brazil – 4.45% | | | | | | |
| Wheaton Precious Metals | | 240,162 | | | 11,566,202 | |
| | | | | | 11,566,202 | |
| Burkina Faso – 1.04% | | | | | | |
| Endeavour Mining | | 109,465 | | | 2,702,341 | |
| | | | | | 2,702,341 | |
| Canada – 12.61% | | | | | | |
| ERO Copper † | | 384,842 | | | 6,808,415 | |
| Hudbay Minerals | | 1,125,773 | | | 5,910,308 | |
| Kinross Gold | | 1,183,573 | | | 5,574,629 | |
| Li-Cycle Holdings † | | 533,232 | | | 3,002,096 | |
| Nutrien | | 100,985 | | | 7,457,742 | |
| Parex Resources | | 215,247 | | | 4,003,929 | |
| | | | | | 32,757,119 | |
| Hong Kong – 0.00% | | | | | | |
| China Metal Recycling Holdings =, † | | 30,000,000 | | | 4 | |
| | | | | | 4 | |
| Netherlands – 4.38% | | | | | | |
| Shell | | 398,975 | | | 11,370,229 | |
| | | | | | 11,370,229 | |
| South Africa – 3.16% | | | | | | |
| Anglo American | | 246,527 | | | 8,199,862 | |
| | | | | | 8,199,862 | |
| United Kingdom – 3.10% | | | | | | |
| BP ADR | | 211,954 | | | 8,041,535 | |
| | | | | | 8,041,535 | |
| United States – 68.23% | | | | | | |
| Alcoa | | 188,081 | | | 8,004,727 | |
| Archer-Daniels-Midland | | 73,982 | | | 5,893,406 | |
| Arcosa | | 120,141 | | | 7,582,098 | |
| Bunge | | 78,236 | | | 7,473,103 | |
| CF Industries Holdings | | 139,210 | | | 10,091,333 | |
| Chesapeake Energy | | 118,557 | | | 9,015,074 | |
| Chord Energy | | 48,223 | | | 6,490,816 | |
| Corteva | | 46,189 | | | 2,785,658 | |
| Darling Ingredients † | | 103,954 | | | 6,070,914 | |
| Denbury † | | 130,220 | | | 11,411,179 | |
| EOG Resources | | 65,651 | | | 7,525,574 | |
| Freeport-McMoRan | | 215,225 | | | 8,804,855 | |
| GrafTech International | | 541,924 | | | 2,633,751 | |
| Kimbell Royalty Partners | | 532,356 | | | 8,107,782 | |
| Louisiana-Pacific | | 67,861 | | | 3,678,745 | |
| Newmont | | 246,980 | | | 12,106,959 | |
| NuScale Power † | | 332,410 | | | 3,021,607 | |
| Occidental Petroleum | | 105,348 | | | 6,576,876 | |
| Rice Acquisition Class A † | | 137,495 | | | 1,407,261 | |
| Schlumberger | | 198,568 | | | 9,749,689 | |
| Spruce Power Holding † | | 1,560,467 | | | 1,279,583 | |
| Sunrun † | | 139,862 | | | 2,818,219 | |
| Sylvamo | | 75,946 | | | 3,513,262 | |
| Unit | | 139,762 | | | 6,100,611 | |
| United States Steel | | 93,776 | | | 2,447,554 | |
| Valaris † | | 96,552 | | | 6,281,673 | |
| Valero Energy | | 79,103 | | | 11,042,779 | |
| Weyerhaeuser | | 176,376 | | | 5,314,209 | |
| | | | | | 177,229,297 | |
Total Common Stocks
(cost $276,402,301) | | | | | 251,866,589 | |
| | | | | | | |
| Short-Term Investments – 0.92% | | | | | | |
| Money Market Mutual Funds – 0.92% | | | | | | |
| BlackRock Liquidity FedFund – Institutional Shares (seven-day effective yield 4.72%) | | 600,340 | | | 600,340 | |
| Fidelity Investments Money Market Government Portfolio – Class I (seven-day effective yield 4.72%) | | 600,341 | | | 600,341 | |
| Goldman Sachs Financial Square Government Fund – Institutional Shares (seven-day effective yield 4.84%) | | 600,341 | | | 600,341 | |
| Morgan Stanley Institutional Liquidity Funds Government Portfolio – Institutional Class (seven-day effective yield 4.73%) | | 600,341 | | | 600,341 | |
Total Short-Term Investments
(cost $2,401,363) | | | | | 2,401,363 | |
Total Value of Securities–100.40%
(cost $285,326,007) | | | | $ | 260,789,780 | |
| † | Non-income producing security. |
| Δ | Securities have been classified by country of risk. |
| = | The value of this security was determined using significant unobservable inputs and is reported as a Level 3 security in the disclosure table located in Note 3 in “Notes to financial statements.” |
Summary of abbreviations:
ADR – American Depositary Receipt
See accompanying notes, which are an integral part of the financial statements.
Schedules of investments
| Delaware Ivy Science and Technology Fund | March 31, 2023 |
| | | Number of
shares | | Value (US $) | |
| Common Stocks — 92.15% | | | | | | |
| Communication Services — 10.91% | | | | | | |
| Netflix † | | 320,231 | | $ | 110,633,406 | |
| Pinterest Class A † | | 6,675,729 | | | 182,047,130 | |
| Take-Two Interactive Software † | | 550,454 | | | 65,669,162 | |
| T-Mobile US † | | 1,300,557 | | | 188,372,676 | |
| | | | | | 546,722,374 | |
| Consumer Discretionary — 7.01% | | | | | | |
| Amazon.com † | | 2,158,775 | | | 222,979,870 | |
| Etsy † | | 737,862 | | | 82,146,176 | |
| Luminar Technologies † | | 7,068,682 | | | 45,875,746 | |
| | | | | | 351,001,792 | |
| Healthcare — 7.51% | | | | | | |
| Danaher | | 466,495 | | | 117,575,400 | |
| Intuitive Surgical † | | 306,382 | | | 78,271,410 | |
| Ionis Pharmaceuticals † | | 1,340,222 | | | 47,899,534 | |
| Vertex Pharmaceuticals † | | 256,056 | | | 80,675,564 | |
| West Pharmaceutical Services | | 149,898 | | | 51,935,160 | |
| | | | | | 376,357,068 | |
| Industrials — 0.89% | | | | | | |
| Copart † | | 590,667 | | | 44,424,065 | |
| | | | | | 44,424,065 | |
| Information Technology — 65.83% | | | | | | |
| Adyen 144A #, † | | 34,098 | | | 54,332,735 | |
| Ambarella † | | 1,268,614 | | | 98,216,096 | |
| Amphenol Class A | | 219,844 | | | 17,965,652 | |
| Analog Devices | | 968,340 | | | 190,976,015 | |
| Apple | | 1,058,225 | | | 174,501,302 | |
| ASML Holding | | 367,264 | | | 250,000,277 | |
| Autodesk † | | 486,088 | | | 101,184,078 | |
| Broadcom | | 169,852 | | | 108,966,852 | |
| Cadence Design Systems † | | 614,142 | | | 129,025,093 | |
| CDW | | 196,653 | | | 38,325,703 | |
| Flex † | | 1,622,257 | | | 37,328,134 | |
| Intuit | | 289,045 | | | 128,864,932 | |
| Keysight Technologies † | | 292,683 | | | 47,262,451 | |
| Mastercard Class A | | 379,064 | | | 137,755,648 | |
| Microchip Technology | | 2,074,821 | | | 173,828,503 | |
| Micron Technology | | 2,289,882 | | | 138,171,480 | |
| Microsoft | | 1,436,053 | | | 414,014,080 | |
| NVIDIA | | 634,986 | | | 176,380,061 | |
| ON Semiconductor † | | 1,454,694 | | | 119,750,410 | |
| Salesforce † | | 67,651 | | | 13,515,317 | |
| Seagate Technology Holdings | | 3,281,515 | | | 216,973,772 | |
| Shift4 Payments Class A † | | 1,344,886 | | | 101,942,359 | |
| VeriSign † | | 724,644 | | | 153,139,016 | |
| WNS Holdings ADR † | | 1,175,498 | | | 109,521,149 | |
| Workday Class A † | | 55,705 | | | 11,505,311 | |
| Zebra Technologies Class A † | | 484,781 | | | 154,160,358 | |
| | | | | | 3,297,606,784 | |
| Total Common Stocks | | | | | | |
| (cost $3,445,200,652) | | | | | 4,616,112,083 | |
| | | | | | | |
| Short-Term Investments — 6.03% | | | | | | |
| Money Market Mutual Funds — 6.03% | | | | | | |
| BlackRock Liquidity FedFund – Institutional Shares (seven-day effective yield 4.72%) | | 75,559,443 | | | 75,559,443 | |
| Fidelity Investments Money Market Government Portfolio – Class I (seven-day effective yield 4.72%) | | 75,559,441 | | | 75,559,441 | |
| Goldman Sachs Financial Square Government Fund – Institutional Shares (seven-day effective yield 4.84%) | | 75,559,443 | | | 75,559,443 | |
| Morgan Stanley Institutional Liquidity Funds Government Portfolio – Institutional Class (seven-day effective yield 4.73%) | | 75,559,442 | | | 75,559,442 | |
Total Short-Term Investments
(cost $302,237,769) | | | | | 302,237,769 | |
Total Value of Securities—98.18%
(cost $3,747,438,421) | | | | $ | 4,918,349,852 | |
| † | Non-income producing security. |
| # | Security exempt from registration under Rule 144A of the Securities Act of 1933, as amended. At March 31, 2023, the aggregate value of Rule 144A securities was $54,332,735, which represents 1.08% of the Fund’s net assets. See Note 12 in “Notes to financial statements.” |
Summary of abbreviations:
ADR – American Depositary Receipt
See accompanying notes, which are an integral part of the financial statements.
| Delaware Real Estate Securities Fund | March 31, 2023 |
| | | Number of
shares | | Value (US $) | |
| Common Stocks — 97.21% | | | | | | |
| REIT Healthcare — 9.45% | | | | | | |
| Healthpeak Properties | | 204,455 | | $ | 4,491,876 | |
| Welltower | | 145,627 | | | 10,440,000 | |
| | | | | | 14,931,876 | |
| REIT Hotel — 2.71% | | | | | | |
| Apple Hospitality REIT | | 103,768 | | | 1,610,480 | |
| Ryman Hospitality Properties | | 20,311 | | | 1,822,506 | |
| Xenia Hotels & Resorts | | 65,325 | | | 855,104 | |
| | | | | | 4,288,090 | |
| REIT Industrial — 15.09% | | | | | | |
| Americold Realty Trust | | 93,146 | | | 2,650,004 | |
| First Industrial Realty Trust | | 44,880 | | | 2,387,616 | |
| Prologis | | 122,061 | | | 15,229,551 | |
| Rexford Industrial Realty | | 60,128 | | | 3,586,635 | |
| | | | | | 23,853,806 | |
| REIT Information Technology — 17.14% | | | | | | |
| American Tower | | 7,758 | | | 1,585,270 | |
| Digital Realty Trust | | 73,038 | | | 7,180,366 | |
| Equinix | | 13,699 | | | 9,877,527 | |
| SBA Communications | | 4,037 | | | 1,053,939 | |
| VICI Properties | | 226,569 | | | 7,390,681 | |
| | | | | | 27,087,783 | |
| REIT Mall — 2.72% | | | | | | |
| Simon Property Group | | 38,426 | | | 4,302,559 | |
| | | | | | 4,302,559 | |
| REIT Manufactured Housing — 5.04% | | | | | | |
| Equity LifeStyle Properties | | 52,175 | | | 3,502,508 | |
| Sun Communities | | 31,692 | | | 4,464,769 | |
| | | | | | 7,967,277 | |
| REIT Multifamily — 14.34% | | | | | | |
| American Homes 4 Rent Class A | | 78,187 | | | 2,458,981 | |
| Boardwalk Real Estate Investment Trust | | 15,148 | | | 618,025 | |
| Canadian Apartment Properties REIT | | 22,965 | | | 805,602 | |
| Equity Residential | | 102,014 | | | 6,120,840 | |
| Essex Property Trust | | 15,479 | | | 3,237,278 | |
| Independence Realty Trust | | 66,366 | | | 1,063,847 | |
| InterRent Real Estate Investment Trust | | 53,199 | | | 527,070 | |
| Invitation Homes | | 72,658 | | | 2,269,109 | |
| Mid-America Apartment Communities | | 3,315 | | | 500,697 | |
| UDR | | 123,500 | | | 5,070,910 | |
| | | | | | 22,672,359 | |
| REIT Office — 5.23% | | | | | | |
| Alexandria Real Estate Equities | | 47,519 | | | 5,967,911 | |
| Boston Properties | | 42,559 | | | 2,303,293 | |
| | | | | | 8,271,204 | |
| REIT Self-Storage — 10.74% | | | | | | |
| Extra Space Storage | | 38,293 | | $ | 6,239,079 | |
| Life Storage | | 33,549 | | | 4,397,938 | |
| Public Storage | | 21,001 | | | 6,345,242 | |
| | | | | | 16,982,259 | |
| REIT Shopping Center — 6.55% | | | | | | |
| Federal Realty Investment Trust | | 22,161 | | | 2,190,172 | |
| Kimco Realty | | 193,043 | | | 3,770,130 | |
| Kite Realty Group Trust | | 129,766 | | | 2,714,705 | |
| NETSTREIT | | 91,359 | | | 1,670,042 | |
| | | | | | 10,345,049 | |
| REIT Single Tenant — 7.79% | | | | | | |
| Agree Realty | | 43,704 | | | 2,998,531 | |
| Realty Income | | 115,672 | | | 7,324,351 | |
| Spirit Realty Capital | | 49,933 | | | 1,989,331 | |
| | | | | | 12,312,213 | |
| Telecommunication Services — 0.41% | | | | | | |
| DigitalBridge Group | | 54,343 | | | 651,572 | |
| | | | | | 651,572 | |
Total Common Stocks
(cost $104,173,844) | | | | | 153,666,047 | |
| | | | | | | |
| Short-Term Investments — 0.80% | | | | | | |
| Money Market Mutual Funds — 0.80% | | | | | | |
| BlackRock Liquidity FedFund – Institutional Shares (seven-day effective yield 4.72%) | | 314,771 | | | 314,771 | |
| Fidelity Investments Money Market Government Portfolio – Class I (seven-day effective yield 4.72%) | | 314,770 | | | 314,770 | |
| Goldman Sachs Financial Square Government Fund – Institutional Shares (seven-day effective yield 4.84%) | | 314,770 | | | 314,770 | |
| Morgan Stanley Institutional Liquidity Funds Government Portfolio – Institutional Class (seven-day effective yield 4.73%) | | 314,771 | | | 314,771 | |
Total Short-Term Investments
(cost $1,259,082) | | | | | 1,259,082 | |
Total Value of Securities—98.01%
(cost $105,432,926) | | | | $ | 154,925,129 | |
Summary of abbreviations:
REIT – Real Estate Investment Trust
See accompanying notes, which are an integral part of the financial statements.
Statements of assets and liabilities
| | | Delaware
Climate
Solutions Fund | | | Delaware
Global
Real Estate
Fund | | | Delaware Ivy
Asset Strategy
FundΦ | | | Delaware Ivy
Balanced
Fund | |
| Assets: | | | | | | | | | | | | | | | | |
| Investments, at value* | | $ | 240,387,710 | | | $ | 35,102,903 | | | $ | 1,722,878,841 | | | $ | 1,606,026,295 | |
| Investments of affiliated issuers, at value** | | | — | | | | — | | | | — | | | | — | |
| Cash | | | — | | | | 10,414 | | | | 1,277,044 | | | | 97,312 | |
| Cash collateral due from brokers | | | — | | | | — | | | | 556,765 | | | | 1,055,766 | |
| Foreign currencies, at valueΔ | | | 995,099 | | | | 154,740 | | | | 159,619 | | | | — | |
| Receivable for securities sold | | | 2,423,972 | | | | 524,564 | | | | 4,345,369 | | | | 8,600,318 | |
| Receivable for fund shares sold | | | 420,657 | | | | 93,683 | | | | 1,167,228 | | | | 1,506,509 | |
| Dividends and interest receivable | | | 366,540 | | | | 142,491 | | | | 7,642,190 | | | | 4,342,164 | |
| Foreign tax reclaims receivable | | | 96,187 | | | | 59,571 | | | | 963,675 | | | | 73,140 | |
| Prepaid expenses | | | 19,002 | | | | 42,878 | | | | 19,522 | | | | 1,991,695 | |
| Securities lending income receivable | | | 18,519 | | | | — | | | | 9,121 | | | | 3,802 | |
| Bullion at value‡ | | | — | | | | — | | | | 94,653,108 | | | | — | |
| Variation margin due from broker on futures contracts | | | — | | | | — | | | | 70,132 | | | | 6,951 | |
| Receivable from investment manager | | | — | | | | 47,335 | | | | — | | | | — | |
| Variation margin due from brokers on centrally cleared credit default swap contracts | | | — | | | | — | | | | — | | | | 42,360 | |
| Other assets | | | 26,896 | | | | 19,296 | | | | 55,155 | | | | 100,182 | |
| Total Assets | | | 244,754,582 | | | | 36,197,875 | | | | 1,833,797,769 | | | | 1,623,846,494 | |
| Liabilities: | | | | | | | | | | | | | | | | |
| Options written, at valueΣ | | | — | | | | — | | | | — | | | | 248,937 | |
| Due to custodian | | | 535,647 | | | | — | | | | — | | | | — | |
| Payable for fund shares redeemed | | | 607,564 | | | | 124,105 | | | | 2,733,277 | | | | 2,559,395 | |
| Other accrued expenses | | | 159,754 | | | | 112,847 | | | | 2,490,753 | | | | 3,234,480 | |
| Investment management fees payable to affiliates | | | 150,874 | | | | — | | | | 1,034,408 | | | | 878,233 | |
| Distribution fees payable to affiliates | | | 44,128 | | | | 1,777 | | | | 330,472 | | | | — | |
| Administration expenses payable to affiliates | | | 25,426 | | | | 10,695 | | | | 110,136 | | | | 110,136 | |
| Payable for securities purchased | | | — | | | | 705,560 | | | | 9,104,538 | | | | 16,271,575 | |
| Cash collateral due to brokers | | | — | | | | — | | | | — | | | | 37,957 | |
| Total Liabilities | | | 1,523,393 | | | | 954,984 | | | | 15,803,584 | | | | 23,340,713 | |
| Total Net Assets | | $ | 243,231,189 | | | $ | 35,242,891 | | | $ | 1,817,994,185 | | | $ | 1,600,505,781 | |
| | | | | | | | | | | | | | | | | |
| Net Assets Consist of: | | | | | | | | | | | | | | | | |
| Paid-in capital | | $ | 392,344,964 | | | $ | 37,478,811 | | | $ | 2,319,362,588 | | | $ | 1,631,192,568 | |
| Total distributable earnings (loss) | | | (149,113,775 | ) | | | (2,235,920 | ) | | | (501,368,403 | ) | | | (30,686,787 | ) |
| Total Net Assets | | $ | 243,231,189 | | | $ | 35,242,891 | | | $ | 1,817,994,185 | | | $ | 1,600,505,781 | |
| | | Delaware
Climate
Solutions Fund | | | Delaware
Global
Real Estate
Fund | | | Delaware Ivy
Asset Strategy
FundΦ | | | Delaware Ivy
Balanced
Fund | |
| Net Asset Value | | | | | | | | | | | | | | | | |
| | | | | | | | | | | | | | | | | |
| Class A: | | | | | | | | | | | | | | | | |
| Net assets | | $ | 91,378,921 | | | $ | 5,413,171 | | | $ | 1,259,211,428 | | | $ | 1,102,496,228 | |
| Shares of beneficial interest outstanding, unlimited authorization, no par | | | 9,250,650 | | | | 639,306 | | | | 67,697,944 | | | | 58,482,391 | |
| Net asset value per share | | $ | 9.88 | | | $ | 8.47 | | | $ | 18.60 | | | $ | 18.85 | |
| Sales charge | | | 5.75 | % | | | 5.75 | % | | | 5.75 | % | | | 5.75 | % |
| Offering price per share, equal to net asset value per share / (1 - sales charge) | | $ | 10.48 | | | $ | 8.99 | | | $ | 19.73 | | | $ | 20.00 | |
| | | | | | | | | | | | | | | | | |
| Class C: | | | | | | | | | | | | | | | | |
| Net assets | | $ | 9,909,599 | | | $ | 195,519 | | | $ | 48,215,577 | | | $ | 63,536,929 | |
| Shares of beneficial interest outstanding, unlimited authorization, no par | | | 1,096,892 | | | | 23,404 | | | | 2,863,341 | | | | 3,437,133 | |
| Net asset value per share | | $ | 9.03 | | | $ | 8.35 | | | $ | 16.84 | | | $ | 18.49 | |
| | | | | | | | | | | | | | | | | |
| Class I: | | | | | | | | | | | | | | | | |
| Net assets | | $ | 97,635,995 | | | $ | 16,455,414 | | | $ | 393,751,306 | | | $ | 406,338,257 | |
| Shares of beneficial interest outstanding, unlimited authorization, no par | | | 9,446,511 | | | | 1,931,285 | | | | 20,709,364 | | | | 21,545,291 | |
| Net asset value per share | | $ | 10.34 | | | $ | 8.52 | | | $ | 19.01 | | | $ | 18.86 | |
| | | | | | | | | | | | | | | | | |
| Class R: | | | | | | | | | | | | | | | | |
| Net assets | | $ | 33,605,623 | | | $ | 631,140 | | | $ | 20,072,915 | | | $ | 8,649,780 | |
| Shares of beneficial interest outstanding, unlimited authorization, no par | | | 3,450,050 | | | | 74,995 | | | | 1,100,481 | | | | 460,569 | |
| Net asset value per share | | $ | 9.74 | | | $ | 8.42 | | | $ | 18.24 | | | $ | 18.78 | |
| | | | | | | | | | | | | | | | | |
| Class R6: | | | | | | | | | | | | | | | | |
| Net assets | | $ | 3,411,296 | | | $ | 11,623,941 | | | $ | 17,913,566 | | | $ | 9,290,427 | |
| Shares of beneficial interest outstanding, unlimited authorization, no par | | | 328,435 | | | | 1,364,667 | | | | 939,060 | | | | 491,297 | |
| Net asset value per share | | $ | 10.39 | | | $ | 8.52 | | | $ | 19.08 | | | $ | 18.91 | |
| | | | | | | | | | | | | | | | | |
| Class Y: | | | | | | | | | | | | | | | | |
| Net assets | | $ | 7,289,755 | | | $ | 923,706 | | | $ | 78,829,393 | | | $ | 10,194,160 | |
| Shares of beneficial interest outstanding, unlimited authorization, no par | | | 723,548 | | | | 107,561 | | | | 4,218,574 | | | | 540,662 | |
| Net asset value per share | | $ | 10.08 | | | $ | 8.59 | | | $ | 18.69 | | | $ | 18.85 | |
| | | | | | | | | | | | | | | | |
| *Investments, at cost | | $ | 231,520,164 | | | $ | 34,971,345 | | | $ | 1,541,275,130 | | | $ | 1,514,446,192 | |
| **Investments of affiliated issuers, at cost | | | — | | | | — | | | | 613,605,219 | | | | — | |
| ‡Bullion, at cost | | | — | | | | — | | | | 56,154,778 | | | | — | |
| ΔForeign currencies, at cost | | | 997,526 | | | | 154,488 | | | | 159,656 | | | | — | |
| ΣOptions written, premium received | | | — | | | | — | | | | — | | | | (322,690 | ) |
ΦConsolidated statement of assets and liabilities
See accompanying notes, which are an integral part of the financial statements.
Statements of assets and liabilities
Ivy Funds
| | | Delaware Ivy
Natural
Resources
Fund | | | Delaware Ivy
Science and
Technology
Fund | | | Delaware
Real Estate
Securities
Fund | |
| Assets: | | | | | | | | | | | | |
| Investments, at value* | | $ | 260,789,780 | | | $ | 4,918,349,852 | | | $ | 154,925,129 | |
| Cash | | | 85,065 | | | | — | | | | 260 | |
| Dividends and interest receivable | | | 326,768 | | | | 3,318,554 | | | | 575,930 | |
| Receivable for fund shares sold | | | 149,904 | | | | 3,341,626 | | | | 250,047 | |
| Foreign tax reclaims receivable | | | 100,359 | | | | 524,291 | | | | 2,288 | |
| Prepaid expenses | | | 42,979 | | | | 75,071 | | | | 14,741 | |
| Securities lending income receivable | | | 19,637 | | | | 75,169 | | | | — | |
| Receivable for securities sold | | | — | | | | 100,771,291 | | | | 4,627,118 | |
| Other assets | | | 43,446 | | | | 188,387 | | | | 50,919 | |
| Total Assets | | | 261,557,938 | | | | 5,026,644,241 | | | | 160,446,432 | |
| Liabilities: | | | | | | | | | | | | |
| Other accrued expenses | | | 926,628 | | | | 3,775,564 | | | | 416,380 | |
| Payable for fund shares redeemed | | | 672,541 | | | | 9,009,648 | | | | 332,191 | |
| Investment management fees payable to affiliates | | | 139,912 | | | | 3,357,080 | | | | 69,687 | |
| Distribution fees payable to affiliates | | | 42,707 | | | | 827,551 | | | | 19,922 | |
| Administration expenses payable to affiliates | | | 25,656 | | | | 109,321 | | | | 38,189 | |
| Payable for securities purchased | | | — | | | | — | | | | 1,492,737 | |
| Total Liabilities | | | 1,807,444 | | | | 17,079,164 | | | | 2,369,106 | |
| Total Net Assets | | $ | 259,750,494 | | | $ | 5,009,565,077 | | | $ | 158,077,326 | |
| | | | | | | | | | | | | |
| Net Assets Consist of: | | | | | | | | | | | | |
| Paid-in capital | | $ | 879,002,590 | | | $ | 3,444,618,805 | | | $ | 104,948,454 | |
| Total distributable earnings (loss) | | | (619,252,096 | ) | | | 1,564,946,272 | | | | 53,128,872 | |
| Total Net Assets | | $ | 259,750,494 | | | $ | 5,009,565,077 | | | $ | 158,077,326 | |
| | | Delaware Ivy
Natural
Resources
Fund | | | Delaware Ivy
Science and
Technology
Fund | | | Delaware
Real Estate
Securities
Fund | |
| Net Asset Value | | | | | | | | | | | | |
| | | | | | | | | | | | | |
| Class A: | | | | | | | | | | | | |
| Net assets | | $ | 150,382,781 | | | $ | 3,186,208,252 | | | $ | 86,795,481 | |
| Shares of beneficial interest outstanding, unlimited authorization, no par | | | 9,548,257 | | | | 75,183,962 | | | | 5,283,701 | |
| Net asset value per share | | $ | 15.75 | | | $ | 42.38 | | | $ | 16.43 | |
| Sales charge | | | 5.75 | % | | | 5.75 | % | | | 5.75 | % |
| Offering price per share, equal to net asset value per share / (1 - sales charge) | | $ | 16.71 | | | $ | 44.97 | | | $ | 17.43 | |
| | | | | | | | | | | | | |
| Class C: | | | | | | | | | | | | |
| Net assets | | $ | 3,846,077 | | | $ | 109,543,956 | | | $ | 814,616 | |
| Shares of beneficial interest outstanding, unlimited authorization, no par | | | 302,547 | | | | 4,424,368 | | | | 52,205 | |
| Net asset value per share | | $ | 12.71 | | | $ | 24.76 | | | $ | 15.60 | |
| | | | | | | | | | | | | |
| Class I: | | | | | | | | | | | | |
| Net assets | | $ | 76,474,401 | | | $ | 1,281,421,541 | | | $ | 64,516,597 | |
| Shares of beneficial interest outstanding, unlimited authorization, no par | | | 4,629,006 | | | | 23,689,305 | | | | 3,862,237 | |
| Net asset value per share | | $ | 16.52 | | | $ | 54.09 | | | $ | 16.70 | |
| | | | | | | | | | | | | |
| Class R: | | | | | | | | | | | | |
| Net assets | | $ | 12,202,217 | | | $ | 94,005,470 | | | $ | 496,652 | |
| Shares of beneficial interest outstanding, unlimited authorization, no par | | | 786,340 | | | | 2,443,928 | | | | 30,350 | |
| Net asset value per share | | $ | 15.52 | | | $ | 38.46 | | | $ | 16.36 | |
| | | | | | | | | | | | | |
| Class R6: | | | | | | | | | | | | |
| Net assets | | $ | 4,213,364 | | | $ | 108,423,749 | | | $ | 1,972,805 | |
| Shares of beneficial interest outstanding, unlimited authorization, no par | | | 254,492 | | | | 1,967,391 | | | | 117,865 | |
| Net asset value per share | | $ | 16.56 | | | $ | 55.11 | | | $ | 16.74 | |
| | | | | | | | | | | | | |
| Class Y: | | | | | | | | | | | | |
| Net assets | | $ | 12,631,654 | | | $ | 229,962,109 | | | $ | 3,481,175 | |
| Shares of beneficial interest outstanding, unlimited authorization, no par | | | 780,362 | | | | 4,746,256 | | | | 209,667 | |
| Net asset value per share | | $ | 16.19 | | | $ | 48.45 | | | $ | 16.60 | |
| | | | | | | | | | | | |
| *Investments, at cost | | $ | 285,326,007 | | | $ | 3,747,438,421 | | | $ | 105,432,926 | |
See accompanying notes, which are an integral part of the financial statements.
Statements of operations
| Ivy Funds | Year ended March 31, 2023 |
| | | Delaware Climate
Solutions Fund | | | Delaware Global
Real Estate Fund | | | Delaware Ivy
Asset Strategy FundΦ | |
| Investment Income: | | | | | | | | | | | | |
| Dividends | | $ | 8,253,207 | | | $ | 1,625,750 | | | $ | 27,462,309 | |
| Securities lending income | | | 602,261 | | | | 437 | | | | 706,400 | |
| Interest | | | — | | | | — | | | | 27,909,420 | |
| Foreign tax withheld | | | (472,993 | ) | | | (53,131 | ) | | | (1,764,635 | ) |
| | | | 8,382,475 | | | | 1,573,056 | | | | 54,313,494 | |
| | | | | | | | | | | | | |
| Expenses: | | | | | | | | | | | | |
| Investment advisory fees | | | 2,318,037 | | | | 484,664 | | | | 13,230,600 | |
| Distribution expenses — Class A | | | 254,117 | | | | 18,770 | | | | 3,288,612 | |
| Distribution expenses — Class C | | | 125,693 | | | | 3,262 | | | | 617,573 | |
| Distribution expenses — Class E | | | — | | | | — | | | | 18,177 | |
| Distribution expenses — Class R | | | 189,815 | | | | 3,503 | | | | 103,537 | |
| Distribution expenses — Class Y | | | 23,774 | | | | 2,473 | | | | 206,601 | |
| Dividend disbursing and transfer agent fees and expenses | | | 442,121 | | | | 62,685 | | | | 3,506,496 | |
| Registration fees | | | 105,157 | | | | 71,928 | | | | 102,824 | |
| Accounting and administration expenses | | | 81,053 | | | | 50,909 | | | | 342,071 | |
| Trustees’ fees and expenses | | | 22,622 | | | | 4,972 | | | | 401,723 | |
| Reports and statements to shareholders servicing expenses | | | 16,082 | | | | 32,451 | | | | 19,462 | |
| Audit and tax fees | | | 15,009 | | | | 75,044 | | | | 47,260 | |
| Custodian fees | | | 5,625 | | | | 24,473 | | | | 115,052 | |
| Legal fees | | | 774 | | | | 398 | | | | 8,764 | |
| Other | | | 13,749 | | | | 23,809 | | | | 97,356 | |
| | | | 3,613,628 | | | | 859,341 | | | | 22,106,108 | |
| Less expenses waived | | | (49,009 | ) | | | (272,266 | ) | | | (4,005 | ) |
| Less waived distribution expenses — Class A | | | (180,945 | ) | | | (13,794 | ) | | | — | |
| Less waived distribution expenses — Class C | | | (16,426 | ) | | | (1,931 | ) | | | — | |
| Less waived distribution expenses — Class E | | | — | | | | — | | | | (18,403 | ) |
| Less waived distribution expenses — Class R | | | — | | | | (115 | ) | | | — | |
| Less waived distribution expenses — Class Y | | | — | | | | (50 | ) | | | — | |
| Less expenses paid indirectly | | | (562 | ) | | | (289 | ) | | | (1,740 | ) |
| Total operating expenses | | | 3,366,686 | | | | 570,896 | | | | 22,081,960 | |
| Net Investment Income (Loss) | | | 5,015,789 | | | | 1,002,160 | | | | 32,231,534 | |
| | | Delaware Climate
Solutions Fund | | | Delaware Global
Real Estate Fund | | | Delaware Ivy
Asset Strategy FundΦ | |
| Net Realized and Unrealized Gain (Loss): | | | | | | | | | | | | |
| Net realized gain (loss) on: | | | | | | | | | | | | |
| Investments | | $ | 67,365,580 | | | $ | 260,646 | | | $ | 13,662,319 | |
| Foreign currencies | | | 372,400 | | | | (49,007 | ) | | | 338,190 | |
| Foreign currency exchange contracts | | | (361,023 | ) | | | 2,799 | | | | (1,724,116 | ) |
| Futures contracts | | | — | | | | — | | | | (2,883,492 | ) |
| Options written | | | — | | | | — | | | | (47,270 | ) |
| Net realized gain (loss) | | | 67,376,957 | | | | 214,438 | | | | 9,345,631 | |
| | | | | | | | | | | | | |
| Net change in unrealized appreciation (depreciation) on: | | | | | | | | | | | | |
| Investments | | | (65,029,565 | ) | | | (15,098,954 | ) | | | (188,186,035 | ) |
| Affiliated investments | | | — | | | | — | | | | 11,460,487 | |
| Foreign currencies | | | (7,506 | ) | | | 1,276 | | | | (10,858 | ) |
| Foreign currency exchange contracts | | | — | | | | (1,478 | ) | | | 7,030 | |
| Futures contracts | | | — | | | | — | | | | 2,001,115 | |
| Net change in unrealized appreciation (depreciation) | | | (65,037,071 | ) | | | (15,099,156 | ) | | | (174,728,261 | ) |
| Net Realized and Unrealized Gain (Loss) | | | 2,339,886 | | | | (14,884,718 | ) | | | (165,382,630 | ) |
| Net Increase (Decrease) in Net Assets Resulting from Operations | | $ | 7,355,675 | | | $ | (13,882,558 | ) | | $ | (133,151,096 | ) |
Φ Consolidated statements of operations.
See accompanying notes, which are an integral part of the financial statements.
Statements of operations
Ivy Funds
| | | Delaware Ivy
Balanced Fund | | | Delaware Ivy
Natural Resources Fund | | | Delaware Ivy
Science and Technology Fund | |
| Investment Income: | | | | | | | | | | | | |
| Interest | | $ | 22,392,304 | | | $ | — | | | $ | 172,422 | |
| Dividends | | | 16,087,496 | | | | 9,215,714 | | | | 39,582,589 | |
| Securities lending income | | | 90,268 | | | | 732,923 | | | | 951,285 | |
| Foreign tax withheld | | | (20,970 | ) | | | (122,983 | ) | | | (535,333 | ) |
| | | | 38,549,098 | | | | 9,825,654 | | | | 40,170,963 | |
| | | | | | | | | | | | | |
| Expenses: | | | | | | | | | | | | |
| Investment advisory fees | | | 12,642,248 | | | | 2,294,493 | | | | 45,543,637 | |
| Distribution expenses — Class A | | | 3,066,041 | | | | 395,682 | | | | 8,869,855 | |
| Distribution expenses — Class C | | | 839,650 | | | | 37,167 | | | | 1,457,031 | |
| Distribution expenses — Class E | | | — | | | | 1,755 | | | | 25,730 | |
| Distribution expenses — Class R | | | 45,949 | | | | 67,364 | | | | 464,853 | |
| Distribution expenses — Class Y | | | 26,967 | | | | 33,600 | | | | 624,665 | |
| Dividend disbursing and transfer agent fees and expenses | | | 2,748,702 | | | | 811,659 | | | | 8,081,168 | |
| Accounting and administration expenses | | | 323,291 | | | | 85,255 | | | | 748,315 | |
| Trustees’ fees and expenses | | | 147,930 | | | | 131,038 | | | | 663,826 | |
| Registration fees | | | 97,198 | | | | 99,871 | | | | 181,697 | |
| Audit and tax fees | | | 36,372 | | | | 37,931 | | | | 28,042 | |
| Custodian fees | | | 28,375 | | | | 8,935 | | | | 163,195 | |
| Reports and statements to shareholders servicing expenses | | | 18,170 | | | | 15,239 | | | | 23,835 | |
| Legal fees | | | 7,304 | | | | 438 | | | | 36,872 | |
| Other | | | 77,710 | | | | 21,210 | | | | 234,280 | |
| | | | 20,105,907 | | | | 4,041,637 | | | | 67,147,001 | |
| Less expenses waived | | | (279 | ) | | | (148,060 | ) | | | — | |
| Less waived distribution expenses — Class A | | | — | | | | (214,337 | ) | | | — | |
| Less waived distribution expenses — Class C | | | — | | | | (7,073 | ) | | | — | |
| Less waived distribution expenses — Class E | | | — | | | | (1,780 | ) | | | (10,906 | ) |
| Less expenses paid indirectly | | | (2,167 | ) | | | (662 | ) | | | (5,106 | ) |
| Total operating expenses | | | 20,103,461 | | | | 3,669,725 | | | | 67,130,989 | |
| Net Investment Income (Loss) | | | 18,445,637 | | | | 6,155,929 | | | | (26,960,026 | ) |
| | | Delaware Ivy
Balanced Fund | | | Delaware Ivy
Natural Resources Fund | | | Delaware Ivy
Science and Technology Fund | |
| Net Realized and Unrealized Gain (Loss): | | | | | | | | | | | | |
| Net realized gain (loss) on: | | | | | | | | | | | | |
| Investments | | $ | (114,090,089 | ) | | $ | 13,712,752 | | | $ | 722,988,793 | |
| Foreign currencies | | | — | | | | 177,609 | | | | 38,662 | |
| Foreign currency exchange contracts | | | — | | | | (223,170 | ) | | | (124,444 | ) |
| Futures contracts | | | (204,367 | ) | | | — | | | | — | |
| Swap contracts | | | 49,261 | | | | — | | | | — | |
| Net realized gain (loss) | | | (114,245,195 | ) | | | 13,667,191 | | | | 722,903,011 | |
| | | | | | | | | | | | | |
| Net change in unrealized appreciation (depreciation) on: | | | | | | | | | | | | |
| Investments | | | (80,330,472 | ) | | | (35,369,998 | ) | | | (1,789,865,287 | ) |
| Affiliated investments | | | — | | | | — | | | | (94,951,606 | ) |
| Foreign currencies | | | — | | | | (3,937 | ) | | | (10,514 | ) |
| Foreign currency exchange contracts | | | — | | | | 1,171 | | | | — | |
| Futures contracts | | | 195,176 | | | | — | | | | — | |
| Options purchased | | | (19,809 | ) | | | — | | | | — | |
| Options written | | | 73,753 | | | | — | | | | — | |
| Swap contracts | | | 135,689 | | | | — | | | | — | |
| Net change in unrealized appreciation (depreciation) | | | (79,945,663 | ) | | | (35,372,764 | ) | | | (1,884,827,407 | ) |
| Net Realized and Unrealized Gain (Loss) | | | (194,190,858 | ) | | | (21,705,573 | ) | | | (1,161,924,396 | ) |
| Net Increase (Decrease) in Net Assets Resulting from Operations | | $ | (175,745,221 | ) | | $ | (15,549,644 | ) | | $ | (1,188,884,422 | ) |
See accompanying notes, which are an integral part of the financial statements.
Statements of operations
Ivy Funds
| | | Delaware
Real Estate
Securities Fund | |
| Investment Income: | | | | |
| Dividends | | $ | 6,866,980 | |
| Foreign tax withheld | | | (3,442 | ) |
| | | | 6,863,538 | |
| | | | | |
| Expenses: | | | | |
| Investment advisory fees | | | 2,075,566 | |
| Distribution expenses — Class A | | | 267,308 | |
| Distribution expenses — Class C | | | 11,103 | |
| Distribution expenses — Class E | | | 1,389 | |
| Distribution expenses — Class R | | | 2,286 | |
| Distribution expenses — Class Y | | | 117,566 | |
| Dividend disbursing and transfer agent fees and expenses | | | 499,223 | |
| Registration fees | | | 108,749 | |
| Accounting and administration expenses | | | 95,098 | |
| Trustees’ fees and expenses | | | 34,058 | |
| Audit and tax fees | | | 30,812 | |
| Reports and statements to shareholders servicing expenses | | | 17,152 | |
| Custodian fees | | | 7,815 | |
| Legal fees | | | 1,405 | |
| Other | | | 18,831 | |
| | | | 3,288,361 | |
| Less expenses waived | | | (204,340 | ) |
| Less waived distribution expenses — Class A | | | (143,127 | ) |
| Less waived distribution expenses — Class C | | | (4,842 | ) |
| Less waived distribution expenses — Class E | | | (1,406 | ) |
| Less waived distribution expenses — Class R | | | (117 | ) |
| Less waived distribution expenses — Class Y | | | (249 | ) |
| Less expenses paid indirectly | | | (683 | ) |
| Less waived shareholder servicing expenses | | | (1,214 | ) |
| Total operating expenses | | | 2,932,383 | |
| Net Investment Income (Loss) | | | 3,931,155 | |
| | | Delaware
Real Estate
Securities Fund | |
| Net Realized and Unrealized Gain (Loss): | | | | |
| Net realized gain (loss) on: | | | | |
| Investments | | $ | 37,220,065 | |
| Foreign currencies | | | 5,664 | |
| Foreign currency exchange contracts | | | (9,736 | ) |
| Net realized gain (loss) | | | 37,215,993 | |
| | | | | |
| Net change in unrealized appreciation (depreciation) on: | | | | |
| Investments | | | (114,365,453 | ) |
| Foreign currencies | | | 6 | |
| Net change in unrealized appreciation (depreciation) | | | (114,365,447 | ) |
| Net Realized and Unrealized Gain (Loss) | | | (77,149,454 | ) |
| Net Increase (Decrease) in Net Assets Resulting from Operations | | $ | (73,218,299 | ) |
See accompanying notes, which are an integral part of the financial statements.
Statements of changes in net assets
Ivy Funds
| | | Delaware Climate
Solutions Fund | | | Delaware Global
Real Estate Fund | |
| | | Year ended | | | Year ended | |
| | | 3/31/23 | | | 3/31/22 | | | 3/31/23 | | | 3/31/22 | |
| Increase (Decrease) in Net Assets from Operations: | | | | | | | | | | | | | | | | |
| Net investment income (loss) | | $ | 5,015,789 | | | $ | 3,695,617 | | | $ | 1,002,160 | | | $ | 1,538,799 | |
| Net realized gain (loss) | | | 67,376,957 | | | | 75,909,685 | | | | 214,438 | | | | 16,803,665 | |
| Net change in unrealized appreciation (depreciation) | | | (65,037,071 | ) | | | 28,580,345 | | | | (15,099,156 | ) | | | (3,922,360 | ) |
| Net increase (decrease) in net assets resulting from operations | | | 7,355,675 | | | | 108,185,647 | | | | (13,882,558 | ) | | | 14,420,104 | |
| | | | | | | | | | | | | | | | | |
| Dividends and Distributions to Shareholders from: | | | | | | | | | | | | | | | | |
| Distributable earnings: | | | | | | | | | | | | | | | | |
| Class A | | | (1,674,353 | ) | | | (1,117,215 | ) | | | (813,026 | ) | | | (378,619 | ) |
| Class B | | | — | | | | — | | | | — | | | | (382 | ) |
| Class C | | | (142,972 | ) | | | (92,780 | ) | | | (38,504 | ) | | | (47,941 | ) |
| Class I | | | (1,910,696 | ) | | | (1,566,499 | ) | | | (2,983,116 | ) | | | (2,045,754 | ) |
| Class R | | | (579,941 | ) | | | (302,961 | ) | | | (85,965 | ) | | | (27,935 | ) |
| Class R61 | | | (107,100 | ) | | | (73,668 | ) | | | (1,685,050 | ) | | | (506,542 | ) |
| Class Y | | | (108,504 | ) | | | (120,593 | ) | | | (124,066 | ) | | | (35,699 | ) |
| | | | (4,523,566 | ) | | | (3,273,716 | ) | | | (5,729,727 | ) | | | (3,042,872 | ) |
| | | | | | | | | | | | | | | | | |
| Capital Share Transactions: | | | | | | | | | | | | | | | | |
| Proceeds from shares sold: | | | | | | | | | | | | | | | | |
| Class A | | | 33,904,823 | | | | 34,260,612 | | | | 847,362 | | | | 2,734,446 | |
| Class C | | | 2,851,350 | | | | 3,128,620 | | | | 32,513 | | | | 40,529 | |
| Class I | | | 64,816,483 | | | | 26,692,477 | | | | 2,326,977 | | | | 3,605,189 | |
| Class R | | | 13,223,829 | | | | 14,255,610 | | | | 17,302 | | | | 76,092 | |
| Class R61 | | | 3,759,496 | | | | 5,132,162 | | | | 1,331,405 | | | | 10,008,503 | |
| Class Y | | | 5,301,106 | | | | 5,122,734 | | | | — | | | | 5,050 | |
| | | | | | | | | | | | | | | | | |
| | | | | | | | | | | | | | | | | |
| Net asset value of shares issued upon reinvestment of dividends and distributions: | | | | | | | | | | | | | | | | |
| Class A | | | 1,665,927 | | | | 1,099,510 | | | | 811,067 | | | | 353,943 | |
| Class B2 | | | — | | | | — | | | | — | | | | 382 | |
| Class C | | | 142,083 | | | | 87,810 | | | | 38,303 | | | | 14,501 | |
| Class I | | | 1,635,342 | | | | 1,531,605 | | | | 2,980,572 | | | | 2,017,933 | |
| Class R | | | 579,892 | | | | 301,597 | | | | 85,965 | | | | 27,935 | |
| Class R61 | | | 107,100 | | | | 73,668 | | | | 1,685,050 | | | | 506,542 | |
| Class Y | | | 107,967 | | | | 114,813 | | | | 124,066 | | | | 35,699 | |
| | | | 128,095,398 | | | | 91,801,218 | | | | 10,280,582 | | | | 19,426,744 | |
| | | Delaware Climate
Solutions Fund | | | Delaware Global
Real Estate Fund | |
| | | Year ended | | | Year ended | |
| | | 3/31/23 | | | 3/31/22 | | | 3/31/23 | | | 3/31/22 | |
| Capital Share Transactions (continued): | | | | | | | | | | | | | | | | |
| Cost of shares redeemed: | | | | | | | | | | | | | | | | |
| Class A | | $ | (49,320,690 | ) | | $ | (40,203,242 | ) | | $ | (4,155,915 | ) | | $ | (4,737,461 | ) |
| Class B2 | | | — | | | | (504,854 | ) | | | — | | | | (781,062 | ) |
| Class C | | | (6,736,229 | ) | | | (3,699,064 | ) | | | (242,092 | ) | | | (3,152,429 | ) |
| Class I | | | (81,731,515 | ) | | | (58,083,400 | ) | | | (21,611,463 | ) | | | (32,168,103 | ) |
| Class R | | | (16,573,419 | ) | | | (15,402,978 | ) | | | (68,216 | ) | | | (462,199 | ) |
| Class R61 | | | (6,939,537 | ) | | | (3,864,905 | ) | | | (8,378,702 | ) | | | (5,061,109 | ) |
| Class Y | | | (9,464,274 | ) | | | (5,238,188 | ) | | | (38,569 | ) | | | (18,331 | ) |
| | | | (170,765,664 | ) | | | (126,996,631 | ) | | | (34,494,957 | ) | | | (46,380,694 | ) |
| Decrease in net assets derived from capital share transactions | | | (42,670,266 | ) | | | (35,195,413 | ) | | | (24,214,375 | ) | | | (26,953,950 | ) |
| Net Increase (Decrease) in Net Assets | | | (39,838,157 | ) | | | 69,716,518 | | | | (43,826,660 | ) | | | (15,576,718 | ) |
| | | | | | | | | | | | | | | | | |
| Net Assets: | | | | | | | | | | | | | | | | |
| Beginning of year | | | 283,069,346 | | | | 213,352,828 | | | | 79,069,551 | | | | 94,646,269 | |
| End of year | | $ | 243,231,189 | | | $ | 283,069,346 | | | $ | 35,242,891 | | | $ | 79,069,551 | |
| 1 | Effective July 1, 2021, Class N shares were renamed Class R6 shares. |
| 2 | On December 10, 2021, all Class B shares were converted into Class A shares. These transactions are included as subscriptions of Class A shares and redemptions of Class B shares in the tables above and on the previous page. |
See accompanying notes, which are an integral part of the financial statements.
Statements of changes in net assets
Ivy Funds
| | | Delaware Ivy
Asset Strategy FundΦ | | | Delaware Ivy
Balanced Fund | |
| | | Year ended | | | Year ended | |
| | | 3/31/23 | | | 3/31/22 | | | 3/31/23 | | | 3/31/22 | |
| Increase (Decrease) in Net Assets from Operations: | | | | | | | | | | | | | | | | |
| Net investment income (loss) | | $ | 32,231,534 | | | $ | 31,392,806 | | | $ | 18,445,637 | | | $ | 11,991,157 | |
| Net realized gain (loss) | | | 9,345,631 | | | | 311,989,171 | | | | (114,245,195 | ) | | | 551,780,536 | |
| Net change in unrealized appreciation (depreciation) | | | (174,728,261 | ) | | | (193,418,320 | ) | | | (79,945,663 | ) | | | (439,261,460 | ) |
| Net increase (decrease) in net assets resulting from operations | | | (133,151,096 | ) | | | 149,963,657 | | | | (175,745,221 | ) | | | 124,510,233 | |
| | | | | | | | | | | | | | | | | |
| Dividends and Distributions to Shareholders from: | | | | | | | | | | | | | | | | |
| Distributable earnings: | | | | | | | | | | | | | | | | |
| Class A | | | (198,200,145 | ) | | | (175,318,750 | ) | | | (239,823,165 | ) | | | (170,015,564 | ) |
| Class B | | | — | | | | (42,536 | ) | | | — | | | | — | |
| Class C | | | (8,862,743 | ) | | | (12,324,565 | ) | | | (15,608,600 | ) | | | (14,282,406 | ) |
| Class E1 | | | (138,326 | ) | | | (4,366,558 | ) | | | — | | | | — | |
| Class I | | | (65,268,076 | ) | | | (72,386,268 | ) | | | (98,263,451 | ) | | | (92,393,854 | ) |
| Class R | | | (3,097,220 | ) | | | (2,762,528 | ) | | | (1,837,021 | ) | | | (1,203,217 | ) |
| Class R62 | | | (2,204,079 | ) | | | (1,889,134 | ) | | | (1,669,943 | ) | | | (1,198,396 | ) |
| Class Y | | | (12,448,555 | ) | | | (11,274,721 | ) | | | (2,201,984 | ) | | | (1,666,306 | ) |
| | | | (290,219,144 | ) | | | (280,365,060 | ) | | | (359,404,164 | ) | | | (280,759,743 | ) |
| | | | | | | | | | | | | | | | | |
| Capital Share Transactions: | | | | | | | | | | | | | | | | |
| Proceeds from shares sold: | | | | | | | | | | | | | | | | |
| Class A | | | 70,991,325 | | | | 107,147,075 | 3 | | | 104,011,965 | | | | 158,026,004 | |
| Class B4 | | | — | | | | 24,590 | 3 | | | — | | | | 33,172 | |
| Class C | | | 3,997,654 | | | | 6,546,021 | 3 | | | 5,573,674 | | | | 10,887,561 | |
| Class E1 | | | 311,695 | | | | 2,620,753 | 3 | | | — | | | | — | |
| Class I | | | 58,677,325 | | | | 60,720,827 | 3 | | | 64,476,235 | | | | 114,463,862 | |
| Class R | | | 2,098,446 | | | | 2,727,673 | 3 | | | 570,783 | | | | 1,388,957 | |
| Class R62 | | | 5,633,693 | | | | 3,811,600 | 3 | | | 3,396,821 | | | | 2,268,269 | |
| Class Y | | | 3,788,156 | | | | 5,001,260 | 3 | | | 901,963 | | | | 1,754,031 | |
| | | | | | | | | | | | | | | | | |
| Net asset value of shares issued upon reinvestment of dividends and distributions: | | | | | | | | | | | | | | | | |
| Class A | | | 184,407,759 | | | | 160,806,169 | | | | 231,207,512 | | | | 162,754,443 | |
| Class B4 | | | — | | | | 38,816 | | | | — | | | | — | |
| Class C | | | 8,851,448 | | | | 12,151,358 | | | | 15,567,233 | | | | 14,112,065 | |
| Class E1 | | | 136,389 | | | | 4,361,923 | | | | — | | | | — | |
| Class I | | | 63,369,252 | | | | 70,008,470 | | | | 97,522,283 | | | | 90,605,200 | |
| Class R | | | 2,963,840 | | | | 2,648,431 | | | | 1,833,012 | | | | 1,197,259 | |
| Class R62 | | | 2,198,192 | | | | 1,874,088 | | | | 1,668,083 | | | | 1,196,162 | |
| Class Y | | | 12,012,298 | | | | 10,861,498 | | | | 1,948,405 | | | | 1,462,126 | |
| | | | 419,437,472 | | | | 451,350,552 | | | | 528,677,969 | | | | 560,149,111 | |
| | | Delaware Ivy
Asset Strategy FundΦ | | | Delaware Ivy
Balanced Fund | |
| | | Year ended | | | Year ended | |
| | | 3/31/23 | | | 3/31/22 | | | 3/31/23 | | | 3/31/22 | |
| Capital Share Transactions (continued): | | | | | | | | | | | | | | | | |
| Cost of shares redeemed: | | | | | | | | | | | | | | | | |
| Class A | | $ | (248,055,924 | ) | | $ | (251,348,935 | ) | | $ | (370,808,272 | ) | | $ | (246,509,829 | ) |
| Class B4 | | | — | | | | (9,485,078 | ) | | | — | | | | (10,811,875 | ) |
| Class C | | | (39,296,049 | ) | | | (70,455,268 | ) | | | (49,314,290 | ) | | | (84,463,045 | ) |
| Class E1 | | | (35,354,533 | ) | | | (4,954,641 | ) | | | — | | | | — | |
| Class I | | | (225,672,990 | ) | | | (215,429,711 | ) | | | (346,775,406 | ) | | | (256,029,558 | ) |
| Class R | | | (4,368,412 | ) | | | (8,845,297 | ) | | | (1,975,980 | ) | | | (2,044,337 | ) |
| Class R62 | | | (3,440,969 | ) | | | (7,755,755 | ) | | | (3,620,638 | ) | | | (3,193,859 | ) |
| Class Y | | | (16,289,861 | ) | | | (22,347,142 | ) | | | (2,251,540 | ) | | | (5,418,651 | ) |
| | | | (572,478,738 | ) | | | (590,621,827 | ) | | | (774,746,126 | ) | | | (608,471,154 | ) |
| Decrease in net assets derived from capital share transactions | | | (153,041,266 | ) | | | (139,271,275 | ) | | | (246,068,157 | ) | | | (48,322,043 | ) |
| Net Decrease in Net Assets | | | (576,411,506 | ) | | | (269,672,678 | ) | | | (781,217,542 | ) | | | (204,571,553 | ) |
| | | | | | | | | | | | | | | | | |
| Net Assets: | | | | | | | | | | | | | | | | |
| Beginning of year | | | 2,394,405,691 | | | | 2,664,078,369 | | | | 2,381,723,323 | | | | 2,586,294,876 | |
| End of year | | $ | 1,817,994,185 | | | $ | 2,394,405,691 | | | $ | 1,600,505,781 | | | $ | 2,381,723,323 | |
| 1 | On June 13, 2022, all Class E shares were liquidated. |
| 2 | Effective July 1, 2021, Class N shares were renamed Class R6 shares. |
| 3 | Included payments from affiliates. |
| 4 | On December 10, 2021, all Class B shares were converted into Class A shares. These transactions are included as subscriptions of Class A shares and redemptions of Class B shares in the tables above and on the previous page. |
| Φ | Consolidated statements of changes in net assets. |
See accompanying notes, which are an integral part of the financial statements.
Statements of changes in net assets
Ivy Funds
| | | Delaware Ivy
Natural Resources Fund | | | Delaware Ivy
Science and Technology Fund | |
| | | Year ended | | | Year ended | |
| | | 3/31/23 | | | 3/31/22 | | | 3/31/23 | | | 3/31/22 | |
| Increase (Decrease) in Net Assets from Operations: | | | | | | | | | | | | | | | | |
| Net investment income (loss) | | $ | 6,155,929 | | | $ | 4,364,247 | | | $ | (26,960,026 | ) | | $ | (72,596,588 | ) |
| Net realized gain (loss) | | | 13,667,191 | | | | 80,651,573 | | | | 722,903,011 | | | | 3,890,988,694 | |
| Net change in unrealized appreciation (depreciation) | | | (35,372,764 | ) | | | 765,539 | | | | (1,884,827,407 | ) | | | (3,751,673,768 | ) |
| Net increase (decrease) in net assets resulting from operations | | | (15,549,644 | ) | | | 85,781,359 | | | | (1,188,884,422 | ) | | | 66,718,338 | |
| | | | | | | | | | | | | | | | | |
| Dividends and Distributions to Shareholders from: | | | | | | | | | | | | | | | | |
| Distributable earnings: | | | | | | | | | | | | | | | | |
| Class A | | | (3,199,467 | ) | | | (3,146,954 | ) | | | (782,618,874 | ) | | | (1,784,827,190 | ) |
| Class C | | | (96,004 | ) | | | (70,862 | ) | | | (45,179,380 | ) | | | (125,153,174 | ) |
| Class E1 | | | — | | | | (80,542 | ) | | | — | | | | (19,789,487 | ) |
| Class I | | | (1,651,226 | ) | | | (1,959,146 | ) | | | (303,978,643 | ) | | | (785,259,857 | ) |
| Class R | | | (260,792 | ) | | | (268,318 | ) | | | (23,301,889 | ) | | | (44,371,491 | ) |
| Class R62 | | | (68,096 | ) | | | (38,129 | ) | | | (25,974,492 | ) | | | (52,529,517 | ) |
| Class Y | | | (265,312 | ) | | | (282,747 | ) | | | (49,230,989 | ) | | | (122,334,761 | ) |
| | | | (5,540,897 | ) | | | (5,846,698 | ) | | | (1,230,284,267 | ) | | | (2,934,265,477 | ) |
| | | | | | | | | | | | | | | | | |
| Capital Share Transactions: | | | | | | | | | | | | | | | | |
| Proceeds from shares sold: | | | | | | | | | | | | | | | | |
| Class A | | | 26,773,852 | | | | 13,336,225 | | | | 177,282,686 | | | | 339,601,285 | |
| Class B3 | | | — | | | | — | | | | — | | | | 73,803 | |
| Class C | | | 2,380,151 | | | | 852,447 | | | | 8,396,050 | | | | 16,743,149 | |
| Class E1 | | | 56,482 | | | | 375,186 | | | | 833,192 | | | | 5,794,087 | |
| Class I | | | 28,169,210 | | | | 16,031,438 | | | | 445,523,362 | | | | 479,654,451 | |
| Class R | | | 5,434,088 | | | | 4,620,739 | | | | 13,281,156 | | | | 14,364,657 | |
| Class R62 | | | 3,467,180 | | | | 1,115,493 | | | | 31,227,613 | | | | 38,642,237 | |
| Class Y | | | 4,530,890 | | | | 3,316,726 | | | | 30,515,678 | | | | 48,460,741 | |
| | | | | | | | | | | | | | | | | |
| Net asset value of shares issued upon reinvestment of dividends and distributions: | | | | | | | | | | | | | | | | |
| Class A | | | 3,155,342 | | | | 3,002,510 | | | | 776,653,782 | | | | 1,732,093,310 | |
| Class C | | | 95,887 | | | | 68,749 | | | | 45,119,637 | | | | 123,088,388 | |
| Class E1 | | | — | | | | 80,529 | | | | — | | | | 19,798,396 | |
| Class I | | | 1,584,800 | | | | 1,912,065 | | | | 302,239,275 | | | | 765,677,262 | |
| Class R | | | 260,792 | | | | 267,052 | | | | 23,286,268 | | | | 44,192,071 | |
| Class R62 | | | 68,096 | | | | 38,129 | | | | 25,429,104 | | | | 52,395,887 | |
| Class Y | | | 265,106 | | | | 276,133 | | | | 48,881,615 | | | | 117,831,872 | |
| | | | 76,241,876 | | | | 45,293,421 | | | | 1,928,669,418 | | | | 3,798,411,596 | |
| | | Delaware Ivy
Natural Resources Fund | | | Delaware Ivy
Science and Technology Fund | |
| | | Year ended | | | Year ended | |
| | | 3/31/23 | | | 3/31/22 | | | 3/31/23 | | | 3/31/22 | |
| Capital Share Transactions (continued): | | | | | | | | | | | | | | | | |
| Cost of shares redeemed: | | | | | | | | | | | | | | | | |
| Class A | | $ | (37,617,901 | ) | | $ | (27,895,089 | ) | | $ | (1,248,499,762 | ) | | $ | (1,052,534,059 | ) |
| Class B3 | | | — | | | | (107,394 | ) | | | — | | | | (17,090,289 | ) |
| Class C | | | (1,742,377 | ) | | | (1,649,400 | ) | | | (99,434,772 | ) | | | (194,928,669 | ) |
| Class E1 | | | (3,604,681 | ) | | | (463,852 | ) | | | (47,478,791 | ) | | | (7,308,076 | ) |
| Class I | | | (31,750,609 | ) | | | (28,379,444 | ) | | | (1,161,941,145 | ) | | | (1,010,870,001 | ) |
| Class R | | | (6,758,540 | ) | | | (6,527,736 | ) | | | (24,041,061 | ) | | | (44,614,075 | ) |
| Class R62 | | | (1,325,926 | ) | | | (646,663 | ) | | | (70,859,889 | ) | | | (58,417,659 | ) |
| Class Y | | | (5,393,400 | ) | | | (3,395,471 | ) | | | (101,864,828 | ) | | | (151,601,849 | ) |
| | | | (88,193,434 | ) | | | (69,065,049 | ) | | | (2,754,120,248 | ) | | | (2,537,364,677 | ) |
| Increase (decrease) in net assets derived from capital share transactions | | | (11,951,558 | ) | | | (23,771,628 | ) | | | (825,450,830 | ) | | | 1,261,046,919 | |
| Net Increase (Decrease) in Net Assets | | | (33,042,099 | ) | | | 56,163,033 | | | | (3,244,619,519 | ) | | | (1,606,500,220 | ) |
| | | | | | | | | | | | | | | | | |
| Net Assets: | | | | | | | | | | | | | | | | |
| Beginning of year | | | 292,792,593 | | | | 236,629,560 | | | | 8,254,184,596 | | | | 9,860,684,816 | |
| End of year | | $ | 259,750,494 | | | $ | 292,792,593 | | | $ | 5,009,565,077 | | | $ | 8,254,184,596 | |
| 1 | On June 13, 2022, all Class E shares were liquidated. |
| 2 | Effective July 1, 2021, Class N shares were renamed Class R6 shares. |
| 3 | On December 10, 2021, all Class B shares were converted into Class A shares. These transactions are included as subscriptions of Class A shares and redemptions of Class B shares in the tables above and on the previous page. |
See accompanying notes, which are an integral part of the financial statements.
Statements of changes in net assets
Ivy Funds
| | | Delaware
Real Estate
Securities Fund | |
| | | Year ended | |
| | | 3/31/23 | | | 3/31/22 | |
| Increase (Decrease) in Net Assets from Operations: | | | | | | | | |
| Net investment income (loss) | | $ | 3,931,155 | | | $ | 3,170,450 | |
| Net realized gain (loss) | | | 37,215,993 | | | | 37,809,150 | |
| Net change in unrealized appreciation (depreciation) | | | (114,365,447 | ) | | | 45,947,974 | |
| Net increase (decrease) in net assets resulting from operations | | | (73,218,299 | ) | | | 86,927,574 | |
| | | | | | | | | |
| Dividends and Distributions to Shareholders from: | | | | | | | | |
| Distributable earnings: | | | | | | | | |
| Class A | | | (24,763,072 | ) | | | (18,007,963 | ) |
| Class C | | | (242,070 | ) | | | (220,828 | ) |
| Class E1 | | | — | | | | (367,446 | ) |
| Class I | | | (19,385,867 | ) | | | (16,315,128 | ) |
| Class R | | | (95,212 | ) | | | (65,284 | ) |
| Class R62 | | | (556,795 | ) | | | (117,215 | ) |
| Class Y | | | (1,549,753 | ) | | | (10,935,534 | ) |
| | | | (46,592,769 | ) | | | (46,029,398 | ) |
| | | | | | | | | |
| Capital Share Transactions: | | | | | | | | |
| Proceeds from shares sold: | | | | | | | | |
| Class A | | | 3,569,395 | | | | 9,444,998 | |
| Class B3 | | | — | | | | 14,988 | |
| Class C | | | 86,384 | | | | 311,780 | |
| Class E1 | | | 21,550 | | | | 222,451 | |
| Class I | | | 17,888,895 | | | | 33,094,238 | |
| Class R | | | 238,766 | | | | 157,393 | |
| Class R62 | | | 1,609,172 | | | | 619,095 | |
| Class Y | | | 3,272,891 | | | | 15,233,806 | |
| | | | | | | | | |
| Net asset value of shares issued upon reinvestment of dividends and distributions: | | | | | | | | |
| Class A | | | 24,611,672 | | | | 17,800,733 | |
| Class C | | | 241,328 | | | | 213,597 | |
| Class E1 | | | — | | | | 368,040 | |
| Class I | | | 19,368,967 | | | | 16,144,683 | |
| Class R | | | 95,212 | | | | 65,283 | |
| Class R62 | | | 556,795 | | | | 117,215 | |
| Class Y | | | 1,367,436 | | | | 10,823,228 | |
| | | | 72,928,463 | | | | 104,631,528 | |
| | | Delaware
Real Estate
Securities Fund | |
| | | Year ended | |
| | | 3/31/23 | | | 3/31/22 | |
| Capital Share Transactions (continued): | | | | | | | | |
| Cost of shares redeemed: | | | | | | | | |
| Class A | | $ | (32,271,177 | ) | | $ | (29,411,210 | ) |
| Class B3 | | | — | | | | (479,079 | ) |
| Class C | | | (653,661 | ) | | | (939,453 | ) |
| Class E1 | | | (2,513,515 | ) | | | (458,430 | ) |
| Class I | | | (60,994,295 | ) | | | (60,019,310 | ) |
| Class R | | | (167,550 | ) | | | (215,612 | ) |
| Class R62 | | | (665,821 | ) | | | (184,537 | ) |
| Class Y | | | (71,224,094 | ) | | | (13,293,007 | ) |
| | | | (168,490,113 | ) | | | (105,000,638 | ) |
| Decrease in net assets derived from capital share transactions | | | (95,561,650 | ) | | | (369,110 | ) |
| Net Increase (Decrease) in Net Assets | | | (215,372,718 | ) | | | 40,529,066 | |
| | | | | | | | | |
| Net Assets: | | | | | | | | |
| Beginning of year | | | 373,450,044 | | | | 332,920,978 | |
| End of year | | $ | 158,077,326 | | | $ | 373,450,044 | |
| 1 | On June 13, 2022, all Class E shares were liquidated. |
| 2 | Effective July 1, 2021, Class N shares were renamed Class R6 shares. |
| 3 | On December 10, 2021, all Class B shares were converted into Class A shares. These transactions are included as subscriptions of Class A shares and redemptions of Class B shares in the tables above and on the previous page. |
See accompanying notes, which are an integral part of the financial statements.
Financial highlights
Delaware Climate Solutions Fund Class A
Selected data for each share of the Fund outstanding throughout each period were as follows:
| | | Year ended |
| | | 3/31/23 | | 3/31/22 | | 3/31/21 | | 3/31/20 | | 3/31/19 |
| Net asset value, beginning of period | | $ | 9.69 | | | $ | 6.18 | | | $ | 3.25 | | | $ | 9.45 | | | $ | 11.55 | |
| | | | | | | | | | | | | | | | | | | | | |
| Income (loss) from investment operations: | | | | | | | | | | | | | | | | | | | | |
| Net investment income (loss)1 | | | 0.18 | | | | 0.11 | | | | 0.07 | | | | 0.04 | | | | (0.05 | ) |
| Net realized and unrealized gain (loss) | | | 0.18 | | | | 3.51 | | | | 2.97 | | | | (6.24 | ) | | | (2.05 | ) |
| Total from investment operations | | | 0.36 | | | | 3.62 | | | | 3.04 | | | | (6.20 | ) | | | (2.10 | ) |
| | | | | | | | | | | | | | | | | | | | | |
| Less dividends and distributions from: | | | | | | | | | | | | | | | | | | | | |
| Net investment income | | | (0.17 | ) | | | (0.11 | ) | | | (0.11 | ) | | | — | | | | — | |
| Total dividends and distributions | | | (0.17 | ) | | | (0.11 | ) | | | (0.11 | ) | | | — | | | | — | |
| | | | | | | | | | | | | | | | | | | | | |
| Net asset value, end of period | | $ | 9.88 | | | $ | 9.69 | | | $ | 6.18 | | | $ | 3.25 | | | $ | 9.45 | |
| | | | | | | | | | | | | | | | | | | | | |
| Total return2 | | | 3.68 | % | | | 59.24 | % | | | 94.23 | % | | | (65.61 | )% | | | (18.18 | )% |
| | | | | | | | | | | | | | | | | | | | | |
| Ratios and supplemental data: | | | | | | | | | | | | | | | | | | | | |
| Net assets, end of period (000 omitted) | | $ | 91,379 | | | $ | 104,280 | | | $ | 72 | 3 | | $ | 40 | 3 | | $ | 134 | 3 |
| Ratio of expenses to average net assets4 | | | 1.28 | % | | | 1.35 | % | | | 1.35 | % | | | 1.41 | % | | | 1.41 | % |
| Ratio of expenses to average net assets prior to fees waived4 | | | 1.48 | % | | | 1.72 | % | | | 1.87 | % | | | 1.71 | % | | | 1.55 | % |
| Ratio of net investment income (loss) to average net assets | | | 1.80 | % | | | 1.60 | % | | | 1.52 | % | | | 0.52 | % | | | (0.46 | )% |
| Ratio of net investment income (loss) to average net assets prior to fees waived | | | 1.60 | % | | | 1.23 | % | | | 1.00 | % | | | 0.22 | % | | | (0.60 | )% |
| Portfolio turnover | | | 108 | % | | | 113 | % | | | 30 | % | | | 23 | % | | | 31 | % |
| 1 | Calculated using average shares outstanding. |
| 2 | Total return is based on the change in net asset value of a share during the period and assumes reinvestment of dividends and distributions at net asset value and does not reflect the impact of a sales charge. Total return during the period reflects waivers by the manager and/or distributor. Performance would have been lower had the waivers not been in effect. |
| 3 | Net assets reported in millions. |
| 4 | Expense ratios do not include expenses of any investment companies in which the Fund invests. |
See accompanying notes, which are an integral part of the financial statements.
Delaware Climate Solutions Fund Class C
Selected data for each share of the Fund outstanding throughout each period were as follows:
| | | Year ended |
| | | 3/31/23 | | 3/31/22 | | 3/31/21 | | 3/31/20 | | 3/31/19 |
| Net asset value, beginning of period | | $ | 8.88 | | | $ | 5.68 | | | $ | 2.97 | | | $ | 8.70 | | | $ | 10.71 | |
| | | | | | | | | | | | | | | | | | | | | |
| Income (loss) from investment operations: | | | | | | | | | | | | | | | | | | | | |
| Net investment income (loss)1 | | | 0.09 | | | | 0.06 | | | | 0.03 | | | | (0.01 | ) | | | (0.12 | ) |
| Net realized and unrealized gain (loss) | | | 0.17 | | | | 3.21 | | | | 2.73 | | | | (5.72 | ) | | | (1.89 | ) |
| Total from investment operations | | | 0.26 | | | | 3.27 | | | | 2.76 | | | | (5.73 | ) | | | (2.01 | ) |
| | | | | | | | | | | | | | | | | | | | | |
| Less dividends and distributions from: | | | | | | | | | | | | | | | | | | | | |
| Net investment income | | | (0.11 | ) | | | (0.07 | ) | | | (0.05 | ) | | | — | | | | — | |
| Total dividends and distributions | | | (0.11 | ) | | | (0.07 | ) | | | (0.05 | ) | | | — | | | | — | |
| | | | | | | | | | | | | | | | | | | | | |
| Net asset value, end of period | | $ | 9.03 | | | $ | 8.88 | | | $ | 5.68 | | | $ | 2.97 | | | $ | 8.70 | |
| | | | | | | | | | | | | | | | | | | | | |
| Total return2 | | | 2.88 | % | | | 57.97 | % | | | 93.07 | % | | | (65.86 | )% | | | (18.77 | )% |
| | | | | | | | | | | | | | | | | | | | | |
| Ratios and supplemental data: | | | | | | | | | | | | | | | | | | | | |
| Net assets, end of period (000 omitted) | | $ | 9,909 | | | $ | 13,503 | | | $ | 9 | 3 | | $ | 6 | 3 | | $ | 27 | 3 |
| Ratio of expenses to average net assets4 | | | 2.03 | % | | | 2.09 | % | | | 2.09 | % | | | 2.11 | % | | | 2.11 | % |
| Ratio of expenses to average net assets prior to fees waived4 | | | 2.17 | % | | | 2.34 | % | | | 2.44 | % | | | 2.31 | % | | | 2.12 | % |
| Ratio of net investment income (loss) to average net assets | | | 1.00 | % | | | 0.87 | % | | | 0.77 | % | | | (0.20 | )% | | | (1.17 | )% |
| Ratio of net investment income (loss) to average net assets prior to fees waived | | | 0.86 | % | | | 0.62 | % | | | 0.42 | % | | | (0.40 | )% | | | (1.18 | )% |
| Portfolio turnover | | | 108 | % | | | 113 | % | | | 30 | % | | | 23 | % | | | 31 | % |
| 1 | Calculated using average shares outstanding. |
| 2 | Total return is based on the change in net asset value of a share during the period and assumes reinvestment of dividends and distributions at net asset value and does not reflect the impact of a sales charge. Total return during the period reflects waivers by the manager and/or distributor. Performance would have been lower had the waivers not been in effect. |
| 3 | Net assets reported in millions. |
| 4 | Expense ratios do not include expenses of any investment companies in which the Fund invests. |
See accompanying notes, which are an integral part of the financial statements.
Financial highlights
Delaware Climate Solutions Fund Class I
Selected data for each share of the Fund outstanding throughout each period were as follows:
| | | Year ended |
| | | 3/31/23 | | 3/31/22 | | 3/31/21 | | 3/31/20 | | 3/31/19 |
| Net asset value, beginning of period | | $ | 10.13 | | | $ | 6.45 | | | $ | 3.40 | | | $ | 9.85 | | | $ | 11.99 | |
| | | | | | | | | | | | | | | | | | | | | |
| Income (loss) from investment operations: | | | | | | | | | | | | | | | | | | | | |
| Net investment income (loss)1 | | | 0.22 | | | | 0.14 | | | | 0.09 | | | | 0.08 | | | | (0.01 | ) |
| Net realized and unrealized gain (loss) | | | 0.18 | | | | 3.67 | | | | 3.11 | | | | (6.53 | ) | | | (2.13 | ) |
| Total from investment operations | | | 0.40 | | | | 3.81 | | | | 3.20 | | | | (6.45 | ) | | | (2.14 | ) |
| | | | | | | | | | | | | | | | | | | | | |
| Less dividends and distributions from: | | | | | | | | | | | | | | | | | | | | |
| Net investment income | | | (0.19 | ) | | | (0.13 | ) | | | (0.15 | ) | | | — | | | | — | |
| Total dividends and distributions | | | (0.19 | ) | | | (0.13 | ) | | | (0.15 | ) | | | — | | | | — | |
| | | | | | | | | | | | | | | | | | | | | |
| Net asset value, end of period | | $ | 10.34 | | | $ | 10.13 | | | $ | 6.45 | | | $ | 3.40 | | | $ | 9.85 | |
| | | | | | | | | | | | | | | | | | | | | |
| Total return2 | | | 3.97 | % | | | 59.90 | % | | | 95.08 | % | | | (65.48 | )% | | | (17.85 | )% |
| | | | | | | | | | | | | | | | | | | | | |
| Ratios and supplemental data: | | | | | | | | | | | | | | | | | | | | |
| Net assets, end of period (000 omitted) | | $ | 97,636 | | | $ | 110,841 | | | $ | 97 | 3 | | $ | 52 | 3 | | $ | 158 | 3 |
| Ratio of expenses to average net assets4 | | | 0.99 | % | | | 0.99 | % | | | 0.99 | % | | | 0.99 | % | | | 1.03 | % |
| Ratio of expenses to average net assets prior to fees waived4 | | | 1.00 | % | | | 1.14 | % | | | 1.20 | % | | | 1.17 | % | | | 1.11 | % |
| Ratio of net investment income (loss) to average net assets | | | 2.09 | % | | | 1.93 | % | | | 1.87 | % | | | 0.95 | % | | | (0.08 | )% |
| Ratio of net investment income (loss) to average net assets prior to fees waived | | | 2.08 | % | | | 1.78 | % | | | 1.66 | % | | | 0.77 | % | | | (0.16 | )% |
| Portfolio turnover | | | 108 | % | | | 113 | % | | | 30 | % | | | 23 | % | | | 31 | % |
| 1 | Calculated using average shares outstanding. |
| 2 | Total return is based on the change in net asset value of a share during the period and assumes reinvestment of dividends and distributions at net asset value. Total return during the period reflects waivers by the manager and/or distributor. Performance would have been lower had the waivers not been in effect. |
| 3 | Net assets reported in millions. |
| 4 | Expense ratios do not include expenses of any investment companies in which the Fund invests. |
See accompanying notes, which are an integral part of the financial statements.
Delaware Climate Solutions Fund Class R
Selected data for each share of the Fund outstanding throughout each period were as follows:
| | | Year ended |
| | | 3/31/23 | | 3/31/22 | | 3/31/21 | | 3/31/20 | | 3/31/19 |
| Net asset value, beginning of period | | $ | 9.57 | | | $ | 6.10 | | | $ | 3.20 | | | $ | 9.34 | | | $ | 11.45 | |
| | | | | | | | | | | | | | | | | | | | | |
| Income (loss) from investment operations: | | | | | | | | | | | | | | | | | | | | |
| Net investment income (loss)1 | | | 0.15 | | | | 0.09 | | | | 0.05 | | | | 0.01 | | | | (0.08 | ) |
| Net realized and unrealized gain (loss) | | | 0.17 | | | | 3.46 | | | | 2.93 | | | | (6.15 | ) | | | (2.03 | ) |
| Total from investment operations | | | 0.32 | | | | 3.55 | | | | 2.98 | | | | (6.14 | ) | | | (2.11 | ) |
| | | | | | | | | | | | | | | | | | | | | |
| Less dividends and distributions from: | | | | | | | | | | | | | | | | | | | | |
| Net investment income | | | (0.15 | ) | | | (0.08 | ) | | | (0.08 | ) | | | — | | | | — | |
| Total dividends and distributions | | | (0.15 | ) | | | (0.08 | ) | | | (0.08 | ) | | | — | | | | — | |
| | | | | | | | | | | | | | | | | | | | | |
| Net asset value, end of period | | $ | 9.74 | | | $ | 9.57 | | | $ | 6.10 | | | $ | 3.20 | | | $ | 9.34 | |
| | | | | | | | | | | | | | | | | | | | | |
| Total return2 | | | 3.31 | %3 | | | 58.80 | % | | | 93.40 | %3 | | | (65.74 | )% | | | (18.43 | )% |
| | | | | | | | | | | | | | | | | | | | | |
| Ratios and supplemental data: | | | | | | | | | | | | | | | | | | | | |
| Net assets, end of period (000 omitted) | | $ | 33,606 | | | $ | 36,368 | | | $ | 24 | 4 | | $ | 7 | 4 | | $ | 18 | 4 |
| Ratio of expenses to average net assets5 | | | 1.56 | % | | | 1.73 | % | | | 1.75 | % | | | 1.74 | % | | | 1.68 | % |
| Ratio of expenses to average net assets prior to fees waived5 | | | 1.57 | % | | | 1.73 | % | | | 1.77 | % | | | 1.74 | % | | | 1.68 | % |
| Ratio of net investment income (loss) to average net assets | | | 1.49 | % | | | 1.23 | % | | | 1.06 | % | | | 0.19 | % | | | (0.72 | )% |
| Ratio of net investment income (loss) to average net assets prior to fees waived | | | 1.48 | % | | | 1.23 | % | | | 1.04 | % | | | 0.19 | % | | | (0.72 | )% |
| Portfolio turnover | | | 108 | % | | | 113 | % | | | 30 | % | | | 23 | % | | | 31 | % |
| 1 | Calculated using average shares outstanding. |
| 2 | Total return is based on the change in net asset value of a share during the period and assumes reinvestment of dividends and distributions at net asset value. |
| 3 | Total return during the period reflects waivers by the manager and/or distributor. Performance would have been lower had the waivers not been in effect. |
| 4 | Net assets reported in millions. |
| 5 | Expense ratios do not include expenses of any investment companies in which the Fund invests. |
See accompanying notes, which are an integral part of the financial statements.
Financial highlights
Delaware Climate Solutions Fund Class R6
Selected data for each share of the Fund outstanding throughout each period were as follows:
| | | Year ended |
| | | 3/31/23 | | 3/31/22 | | 3/31/21 | | 3/31/20 | | 3/31/19 |
| Net asset value, beginning of period | | $ | 10.18 | | | $ | 6.49 | | | $ | 3.42 | | | $ | 9.90 | | | $ | 12.05 | |
| | | | | | | | | | | | | | | | | | | | | |
| Income (loss) from investment operations: | | | | | | | | | | | | | | | | | | | | |
| Net investment income1 | | | 0.22 | | | | 0.16 | | | | 0.09 | | | | 0.08 | | | | — | 2 |
| Net realized and unrealized gain (loss) | | | 0.19 | | | | 3.66 | | | | 3.13 | | | | (6.56 | ) | | | (2.15 | ) |
| Total from investment operations | | | 0.41 | | | | 3.82 | | | | 3.22 | | | | (6.48 | ) | | | (2.15 | ) |
| | | | | | | | | | | | | | | | | | | | | |
| Less dividends and distributions from: | | | | | | | | | | | | | | | | | | | | |
| Net investment income | | | (0.20 | ) | | | (0.13 | ) | | | (0.15 | ) | | | — | | | | — | |
| Total dividends and distributions | | | (0.20 | ) | | | (0.13 | ) | | | (0.15 | ) | | | — | | | | — | |
| | | | | | | | | | | | | | | | | | | | | |
| Net asset value, end of period | | $ | 10.39 | | | $ | 10.18 | | | $ | 6.49 | | | $ | 3.42 | | | $ | 9.90 | |
| | | | | | | | | | | | | | | | | | | | | |
| Total return3 | | | 4.03 | %4 | | | 59.68 | %4 | | | 95.11 | %4 | | | (65.45 | )% | | | (17.84 | )% |
| | | | | | | | | | | | | | | | | | | | | |
| Ratios and supplemental data: | | | | | | | | | | | | | | | | | | | | |
| Net assets, end of period (000 omitted) | | $ | 3,411 | | | $ | 6,610 | | | $ | 3 | 5 | | $ | 2 | 5 | | $ | 5 | 5 |
| Ratio of expenses to average net assets6 | | | 0.96 | % | | | 0.98 | % | | | 0.99 | % | | | 0.99 | % | | | 0.94 | % |
| Ratio of expenses to average net assets prior to fees waived6 | | | 0.97 | % | | | 0.99 | % | | | 1.02 | % | | | 0.99 | % | | | 0.94 | % |
| Ratio of net investment income to average net assets | | | 2.09 | % | | | 2.07 | % | | | 1.84 | % | | | 0.95 | % | | | 0.04 | % |
| Ratio of net investment income to average net assets prior to fees waived | | | 2.08 | % | | | 2.06 | % | | | 1.81 | % | | | 0.95 | % | | | 0.04 | % |
| Portfolio turnover | | | 108 | % | | | 113 | % | | | 30 | % | | | 23 | % | | | 31 | % |
| 1 | Calculated using average shares outstanding. |
| 2 | Amount is less than $0.005 per share. |
| 3 | Total return is based on the change in net asset value of a share during the period and assumes reinvestment of dividends and distributions at net asset value. |
| 4 | Total return during the period reflects waivers by the manager and/or distributor. Performance would have been lower had the waivers not been in effect. |
| 5 | Net assets reported in millions. |
| 6 | Expense ratios do not include expenses of any investment companies in which the Fund invests. |
See accompanying notes, which are an integral part of the financial statements.
Delaware Climate Solutions Fund Class Y
Selected data for each share of the Fund outstanding throughout each period were as follows:
| | | Year ended |
| | | 3/31/23 | | 3/31/22 | | 3/31/21 | | 3/31/20 | | 3/31/19 |
| Net asset value, beginning of period | | $ | 9.85 | | | $ | 6.28 | | | $ | 3.30 | | | $ | 9.59 | | | $ | 11.72 | |
| | | | | | | | | | | | | | | | | | | | | |
| Income (loss) from investment operations: | | | | | | | | | | | | | | | | | | | | |
| Net investment income (loss)1 | | | 0.18 | | | | 0.12 | | | | 0.07 | | | | 0.04 | | | | (0.05 | ) |
| Net realized and unrealized gain (loss) | | | 0.19 | | | | 3.56 | | | | 3.02 | | | | (6.33 | ) | | | (2.08 | ) |
| Total from investment operations | | | 0.37 | | | | 3.68 | | | | 3.09 | | | | (6.29 | ) | | | (2.13 | ) |
| | | | | | | | | | | | | | | | | | | | | |
| Less dividends and distributions from: | | | | | | | | | | | | | | | | | | | | |
| Net investment income | | | (0.14 | ) | | | (0.11 | ) | | | (0.11 | ) | | | — | | | | — | |
| Total dividends and distributions | | | (0.14 | ) | | | (0.11 | ) | | | (0.11 | ) | | | — | | | | — | |
| | | | | | | | | | | | | | | | | | | | | |
| Net asset value, end of period | | $ | 10.08 | | | $ | 9.85 | | | $ | 6.28 | | | $ | 3.30 | | | $ | 9.59 | |
| | | | | | | | | | | | | | | | | | | | | |
| Total return2 | | | 3.69 | %3 | | | 59.24 | %3 | | | 94.31 | %3 | | | (65.59 | )%3 | | | (18.17 | )% |
| | | | | | | | | | | | | | | | | | | | | |
| Ratios and supplemental data: | | | | | | | | | | | | | | | | | | | | |
| Net assets, end of period (000 omitted) | | $ | 7,290 | | | $ | 11,467 | | | $ | 8 | 4 | | $ | 4 | 4 | | $ | 22 | 4 |
| Ratio of expenses to average net assets5 | | | 1.28 | % | | | 1.35 | % | | | 1.35 | % | | | 1.41 | % | | | 1.34 | % |
| Ratio of expenses to average net assets prior to fees waived5 | | | 1.29 | % | | | 1.38 | % | | | 1.42 | % | | | 1.42 | % | | | 1.34 | % |
| Ratio of net investment income (loss) to average net assets | | | 1.81 | % | | | 1.61 | % | | | 1.50 | % | | | 0.46 | % | | | (0.42 | )% |
| Ratio of net investment income (loss) to average net assets prior to fees waived | | | 1.80 | % | | | 1.58 | % | | | 1.43 | % | | | 0.45 | % | | | (0.42 | )% |
| Portfolio turnover | | | 108 | % | | | 113 | % | | | 30 | % | | | 23 | % | | | 31 | % |
| 1 | Calculated using average shares outstanding. |
| 2 | Total return is based on the change in net asset value of a share during the period and assumes reinvestment of dividends and distributions at net asset value. |
| 3 | Total return during the period reflects waivers by the manager and/or distributor. Performance would have been lower had the waivers not been in effect. |
| 4 | Net assets reported in millions. |
| 5 | Expense ratios do not include expenses of any investment companies in which the Fund invests. |
See accompanying notes, which are an integral part of the financial statements.
Financial highlights
Delaware Global Real Estate Fund Class A
Selected data for each share of the Fund outstanding throughout each period were as follows:
| | | Year ended |
| | | 3/31/23 | | 3/31/22 | | 3/31/21 | | 3/31/20 | | 3/31/19 |
| Net asset value, beginning of period | | $ | 12.23 | | | $ | 10.86 | | | $ | 8.16 | | | $ | 11.22 | | | $ | 10.38 | |
| | | | | | | | | | | | | | | | | | | | | |
| Income (loss) from investment operations: | | | | | | | | | | | | | | | | | | | | |
| Net investment income1 | | | 0.17 | | | | 0.16 | | | | 0.12 | | | | 0.15 | | | | 0.15 | |
| Net realized and unrealized gain (loss) | | | (2.64 | ) | | | 1.58 | | | | 2.88 | | | | (2.57 | ) | | | 1.21 | |
| Total from investment operations | | | (2.47 | ) | | | 1.74 | | | | 3.00 | | | | (2.42 | ) | | | 1.36 | |
| | | | | | | | | | | | | | | | | | | | | |
| Less dividends and distributions from: | | | | | | | | | | | | | | | | | | | | |
| Net investment income | | | (0.17 | ) | | | (0.37 | ) | | | (0.30 | ) | | | (0.38 | ) | | | (0.31 | ) |
| Net realized gain | | | (1.12 | ) | | | — | | | | — | | | | (0.26 | ) | | | (0.21 | ) |
| Total dividends and distributions | | | (1.29 | ) | | | (0.37 | ) | | | (0.30 | ) | | | (0.64 | ) | | | (0.52 | ) |
| | | | | | | | | | | | | | | | | | | | | |
| Net asset value, end of period | | $ | 8.47 | | | $ | 12.23 | | | $ | 10.86 | | | $ | 8.16 | | | $ | 11.22 | |
| | | | | | | | | | | | | | | | | | | | | |
| Total return2 | | | (20.45 | )% | | | 16.12 | % | | | 37.08 | % | | | (22.88 | )% | | | 13.61 | % |
| | | | | | | | | | | | | | | | | | | | | |
| Ratios and supplemental data: | | | | | | | | | | | | | | | | | | | | |
| Net assets, end of period (000 omitted) | | $ | 5,413 | | | $ | 10,754 | | | $ | 11 | 3 | | $ | 11 | 3 | | $ | 20 | 3 |
| Ratio of expenses to average net assets4 | | | 1.38 | % | | | 1.48 | % | | | 1.48 | % | | | 1.51 | % | | | 1.61 | %5 |
| Ratio of expenses to average net assets prior to fees waived4 | | | 2.14 | % | | | 1.76 | % | | | 1.79 | % | | | 1.68 | % | | | 1.90 | % |
| Ratio of net investment income to average net assets | | | 1.70 | % | | | 1.38 | % | | | 1.23 | % | | | 1.44 | % | | | 1.40 | % |
| Ratio of net investment income to average net assets prior to fees waived | | | 0.94 | % | | | 1.10 | % | | | 0.92 | % | | | 1.27 | % | | | 1.11 | % |
| Portfolio turnover | | | 109 | % | | | 88 | % | | | 90 | % | | | 88 | % | | | 91 | % |
| 1 | Calculated using average shares outstanding. |
| 2 | Total return is based on the change in net asset value of a share during the period and assumes reinvestment of dividends and distributions at net asset value and does not reflect the impact of a sales charge. Total return during the period reflects waivers by the manager and/or distributor. Performance would have been lower had the waivers not been in effect. |
| 3 | Net assets reported in millions. |
| 4 | Expense ratios do not include expenses of any investment companies in which the Fund invests. |
| 5 | Expense ratio based on the period excluding reorganization expenses was 1.51%. |
See accompanying notes, which are an integral part of the financial statements.
Delaware Global Real Estate Fund Class C
Selected data for each share of the Fund outstanding throughout each period were as follows:
| | | Year ended |
| | | 3/31/23 | | 3/31/22 | | 3/31/21 | | 3/31/20 | | 3/31/19 |
| Net asset value, beginning of period | | $ | 12.10 | | | $ | 10 .76 | | | $ | 8.11 | | | $ | 11.15 | | | $ | 10.32 | |
| | | | | | | | | | | | | | | | | | | | | |
| Income (loss) from investment operations: | | | | | | | | | | | | | | | | | | | | |
| Net investment income1 | | | 0.10 | | | | 0.08 | | | | 0.05 | | | | 0.08 | | | | 0.06 | |
| Net realized and unrealized gain (loss) | | | (2.62 | ) | | | 1.56 | | | | 2.86 | | | | (2.55 | ) | | | 1.21 | |
| Total from investment operations | | | (2.52 | ) | | | 1.64 | | | | 2.91 | | | | (2.47 | ) | | | 1.27 | |
| | | | | | | | | | | | | | | | | | | | | |
| Less dividends and distributions from: | | | | | | | | | | | | | | | | | | | | |
| Net investment income | | | (0.11 | ) | | | (0.30 | ) | | | (0.26 | ) | | | (0.31 | ) | | | (0.23 | ) |
| Net realized gain | | | (1.12 | ) | | | — | | | | — | | | | (0.26 | ) | | | (0.21 | ) |
| Total dividends and distributions | | | (1.23 | ) | | | (0.30 | ) | | | (0.26 | ) | | | (0.57 | ) | | | (0.44 | ) |
| | | | | | | | | | | | | | | | | | | | | |
| Net asset value, end of period | | $ | 8.35 | | | $ | 12.10 | | | $ | 10.76 | | | $ | 8.11 | | | $ | 11.15 | |
| | | | | | | | | | | | | | | | | | | | | |
| Total return2 | | | (21.14 | )% | | | 15.28 | % | | | 36.12 | % | | | (23.32 | )% | | | 12.72 | % |
| | | | | | | | | | | | | | | | | | | | | |
| Ratios and supplemental data: | | | | | | | | | | | | | | | | | | | | |
| Net assets, end of period (000 omitted) | | $ | 196 | | | $ | 499 | | | $ | 3 | 3 | | $ | 3 | 3 | | $ | 4 | 3 |
| Ratio of expenses to average net assets4 | | | 2.16 | % | | | 2.15 | % | | | 2.15 | % | | | 2.17 | % | | | 2.27 | % |
| Ratio of expenses to average net assets prior to fees waived4 | | | 3.22 | % | | | 2.21 | % | | | 2.31 | % | | | 2.26 | % | | | 2.44 | % |
| Ratio of net investment income to average net assets | | | 0.99 | % | | | 0.64 | % | | | 0.52 | % | | | 0.75 | % | | | 0.60 | % |
| Ratio of net investment income (loss) to average net assets prior to fees waived | | | (0.07 | )% | | | 0.58 | % | | | 0.36 | % | | | 0.66 | % | | | 0.43 | % |
| Portfolio turnover | | | 109 | % | | | 88 | % | | | 90 | % | | | 88 | % | | | 91 | % |
| 1 | Calculated using average shares outstanding. |
| 2 | Total return is based on the change in net asset value of a share during the period and assumes reinvestment of dividends and distributions at net asset value and does not reflect the impact of a sales charge. Total return during the period reflects waivers by the manager and/or distributor. Performance would have been lower had the waivers not been in effect. |
| 3 | Net assets reported in millions. |
| 4 | Expense ratios do not include expenses of any investment companies in which the Fund invests. |
See accompanying notes, which are an integral part of the financial statements.
Financial highlights
Delaware Global Real Estate Fund Class I
Selected data for each share of the Fund outstanding throughout each period were as follows:
| | | Year ended |
| | | 3/31/23 | | 3/31/22 | | 3/31/21 | | 3/31/20 | | 3/31/19 |
| Net asset value, beginning of period | | $ | 12.29 | | | $ | 10.91 | | | $ | 8.19 | | | $ | 11.24 | | | $ | 10.41 | |
| | | | | | | | | | | | | | | | | | | | | |
| Income (loss) from investment operations: | | | | | | | | | | | | | | | | | | | | |
| Net investment income1 | | | 0.21 | | | | 0.21 | | | | 0.16 | | | | 0.21 | | | | 0.19 | |
| Net realized and unrealized gain (loss) | | | (2.66 | ) | | | 1.59 | | | | 2.89 | | | | (2.57 | ) | | | 1.21 | |
| Total from investment operations | | | (2.45 | ) | | | 1.80 | | | | 3.05 | | | | (2.36 | ) | | | 1.40 | |
| | | | | | | | | | | | | | | | | | | | | |
| Less dividends and distributions from: | | | | | | | | | | | | | | | | | | | | |
| Net investment income | | | (0.20 | ) | | | (0.42 | ) | | | (0.33 | ) | | | (0.43 | ) | | | (0.36 | ) |
| Net realized gain | | | (1.12 | ) | | | — | | | | — | | | | (0.26 | ) | | | (0.21 | ) |
| Total dividends and distributions | | | (1.32 | ) | | | (0.42 | ) | | | (0.33 | ) | | | (0.69 | ) | | | (0.57 | ) |
| | | | | | | | | | | | | | | | | | | | | |
| Net asset value, end of period | | $ | 8.52 | | | $ | 12.29 | | | $ | 10.91 | | | $ | 8.19 | | | $ | 11.24 | |
| | | | | | | | | | | | | | | | | | | | | |
| Total return2 | | | (20.24 | )% | | | 16.62 | % | | | 37.55 | % | | | (22.41 | )% | | | 14.00 | % |
| | | | | | | | | | | | | | | | | | | | | |
| Ratios and supplemental data: | | | | | | | | | | | | | | | | | | | | |
| Net assets, end of period (000 omitted) | | $ | 16,455 | | | $ | 43,193 | | | $ | 63 | 3 | | $ | 60 | 3 | | $ | 88 | 3 |
| Ratio of expenses to average net assets4 | | | 1.05 | % | | | 1.05 | % | | | 1.05 | % | | | 1.05 | % | | | 1.20 | %5 |
| Ratio of expenses to average net assets prior to fees waived4 | | | 1.59 | % | | | 1.36 | % | | | 1.41 | % | | | 1.34 | % | | | 1.55 | % |
| Ratio of net investment income to average net assets | | | 2.09 | % | | | 1.77 | % | | | 1.64 | % | | | 1.90 | % | | | 1.76 | % |
| Ratio of net investment income to average net assets prior to | | | | | | | | | | | | | | | | | | | | |
| fees waived | | | 1.55 | % | | | 1.46 | % | | | 1.28 | % | | | 1.61 | % | | | 1.41 | % |
| Portfolio turnover | | | 109 | % | | | 88 | % | | | 90 | % | | | 88 | % | | | 91 | % |
| 1 | Calculated using average shares outstanding. |
| 2 | Total return is based on the change in net asset value of a share during the period and assumes reinvestment of dividends and distributions at net asset value. Total return during the period reflects waivers by the manager and/or distributor. Performance would have been lower had the waivers not been in effect. |
| 3 | Net assets reported in millions. |
| 4 | Expense ratios do not include expenses of any investment companies in which the Fund invests. |
| 5 | Expense ratio based on the period excluding reorganization expenses was 1.05%. |
See accompanying notes, which are an integral part of the financial statements.
Delaware Global Real Estate Fund Class R
Selected data for each share of the Fund outstanding throughout each period were as follows:
| | | Year ended |
| | | 3/31/23 | | 3/31/22 | | 3/31/21 | | 3/31/20 | | 3/31/19 |
| Net asset value, beginning of period | | $ | 12.18 | | | $ | 10.82 | | | $ | 8.14 | | | $ | 11.19 | | | $ | 10.36 | |
| | | | | | | | | | | | | | | | | | | | | |
| Income (loss) from investment operations: | | | | | | | | | | | | | | | | | | | | |
| Net investment income1 | | | 0.13 | | | | 0.12 | | | | 0.15 | | | | 0.12 | | | | 0.09 | |
| Net realized and unrealized gain (loss) | | | (2.61 | ) | | | 1.58 | | | | 2.81 | | | | (2.56 | ) | | | 1.23 | |
| Total from investment operations | | | (2.48 | ) | | | 1.70 | | | | 2.96 | | | | (2.44 | ) | | | 1.32 | |
| | | | | | | | | | | | | | | | | | | | | |
| Less dividends and distributions from: | | | | | | | | | | | | | | | | | | | | |
| Net investment income | | | (0.16 | ) | | | (0.34 | ) | | | (0.28 | ) | | | (0.35 | ) | | | (0.28 | ) |
| Net realized gain | | | (1.12 | ) | | | — | | | | — | | | | (0.26 | ) | | | (0.21 | ) |
| Total dividends and distributions | | | (1.28 | ) | | | (0.34 | ) | | | (0.28 | ) | | | (0.61 | ) | | | (0.49 | ) |
| | | | | | | | | | | | | | | | | | | | | |
| Net asset value, end of period | | $ | 8.42 | | | $ | 12.18 | | | $ | 10.82 | | | $ | 8.14 | | | $ | 11.19 | |
| | | | | | | | | | | | | | | | | | | | | |
| Total return2 | | | (20.66 | )% | | | 15.74 | % | | | 36.66 | % | | | (23.08 | )% | | | 13.19 | % |
| | | | | | | | | | | | | | | | | | | | | |
| Ratios and supplemental data: | | | | | | | | | | | | | | | | | | | | |
| Net assets, end of period (000 omitted) | | $ | 631 | | | $ | 857 | | | $ | 1 | 3 | | $ | 3 | 3 | | $ | 6 | 3 |
| Ratio of expenses to average net assets4 | | | 1.64 | % | | | 1.80 | % | | | 1.80 | % | | | 1.80 | % | | | 1.93 | % |
| Ratio of expenses to average net assets prior to fees waived4 | | | 2.18 | % | | | 1.97 | % | | | 1.98 | % | | | 1.93 | % | | | 2.10 | % |
| Ratio of net investment income to average net assets | | | 1.28 | % | | | 1.03 | % | | | 1.66 | % | | | 1.16 | % | | | 0.83 | % |
| Ratio of net investment income to average net assets prior to fees waived | | | 0.74 | % | | | 0.86 | % | | | 1.48 | % | | | 1.03 | % | | | 0.66 | % |
| Portfolio turnover | | | 109 | % | | | 88 | % | | | 90 | % | | | 88 | % | | | 91 | % |
| 1 | Calculated using average shares outstanding. |
| 2 | Total return is based on the change in net asset value of a share during the period and assumes reinvestment of dividends and distributions at net asset value. Total return during the period reflects waivers by the manager and/or distributor. Performance would have been lower had the waivers not been in effect. |
| 3 | Net assets reported in millions. |
| 4 | Expense ratios do not include expenses of any investment companies in which the Fund invests. |
See accompanying notes, which are an integral part of the financial statements.
Financial highlights
Delaware Global Real Estate Fund Class R6
Selected data for each share of the Fund outstanding throughout each period were as follows:
| | | Year ended |
| | | 3/31/23 | | 3/31/22 | | 3/31/21 | | 3/31/20 | | 3/31/19 |
| Net asset value, beginning of period | | $ | 12.30 | | | $ | 10.92 | | | $ | 8.19 | | | $ | 11.26 | | | $ | 10.42 | |
| | | | | | | | | | | | | | | | | | | | | |
| Income (loss) from investment operations: | | | | | | | | | | | | | | | | | | | | |
| Net investment income1 | | | 0.20 | | | | 0.23 | | | | 0.16 | | | | 0.20 | | | | 0.21 | |
| Net realized and unrealized gain (loss) | | | (2.65 | ) | | | 1.57 | | | | 2.90 | | | | (2.58 | ) | | | 1.19 | |
| Total from investment operations | | | (2.45 | ) | | | 1.80 | | | | 3.06 | | | | (2.38 | ) | | | 1.40 | |
| | | | | | | | | | | | | | | | | | | | | |
| Less dividends and distributions from: | | | | | | | | | | | | | | | | | | | | |
| Net investment income | | | (0.21 | ) | | | (0.42 | ) | | | (0.33 | ) | | | (0.43 | ) | | | (0.35 | ) |
| Net realized gain | | | (1.12 | ) | | | — | | | | — | | | | (0.26 | ) | | | (0.21 | ) |
| Total dividends and distributions | | | (1.33 | ) | | | (0.42 | ) | | | (0.33 | ) | | | (0.69 | ) | | | (0.56 | ) |
| | | | | | | | | | | | | | | | | | | | | |
| Net asset value, end of period | | $ | 8.52 | | | $ | 12.30 | | | $ | 10.92 | | | $ | 8.19 | | | $ | 11.26 | |
| | | | | | | | | | | | | | | | | | | | | |
| Total return2 | | | (20.21 | )% | | | 16.60 | % | | | 37.67 | % | | | (22.53 | )% | | | 14.08 | % |
| | | | | | | | | | | | | | | | | | | | | |
| Ratios and supplemental data: | | | | | | | | | | | | | | | | | | | | |
| Net assets, end of period (000 omitted) | | $ | 11,624 | | | $ | 22,562 | | | $ | 15 | 3 | | $ | 22 | 3 | | $ | 30 | 3 |
| Ratio of expenses to average net assets4 | | | 1.05 | % | | | 1.05 | % | | | 1.05 | % | | | 1.05 | % | | | 1.13 | %5 |
| Ratio of expenses to average net assets prior to fees waived4 | | | 1.54 | % | | | 1.30 | % | | | 1.22 | % | | | 1.16 | % | | | 1.31 | % |
| Ratio of net investment income to average net assets | | | 1.94 | % | | | 1.92 | % | | | 1.71 | % | | | 1.90 | % | | | 2.01 | % |
| Ratio of net investment income to average net assets prior to fees waived | | | 1.45 | % | | | 1.67 | % | | | 1.54 | % | | | 1.79 | % | | | 1.83 | % |
| Portfolio turnover | | | 109 | % | | | 88 | % | | | 90 | % | | | 88 | % | | | 91 | % |
| 1 | Calculated using average shares outstanding. |
| 2 | Total return is based on the change in net asset value of a share during the period and assumes reinvestment of dividends and distributions at net asset value. Total return during the period reflects waivers by the manager and/or distributor. Performance would have been lower had the waivers not been in effect. |
| 3 | Net assets reported in millions. |
| 4 | Expense ratios do not include expenses of any investment companies in which the Fund invests. |
| 5 | Expense ratio based on the period excluding reorganization expenses was 1.05%. |
See accompanying notes, which are an integral part of the financial statements.
Delaware Global Real Estate Fund Class Y
Selected data for each share of the Fund outstanding throughout each period were as follows:
| | | Year ended |
| | | 3/31/23 | | 3/31/22 | | 3/31/21 | | 3/31/20 | | 3/31/19 |
| Net asset value, beginning of period | | $ | 12.40 | | | $ | 11.00 | | | $ | 8.27 | | | $ | 11.35 | | | $ | 10.50 | |
| | | | | | | | | | | | | | | | | | | | | |
| Income (loss) from investment operations: | | | | | | | | | | | | | | | | | | | | |
| Net investment income1 | | | 0.16 | | | | 0.17 | | | | 0.20 | | | | 0.16 | | | | 0.14 | |
| Net realized and unrealized gain (loss) | | | (2.67 | ) | | | 1.61 | | | | 2.83 | | | | (2.59 | ) | | | 1.24 | |
| Total from investment operations | | | (2.51 | ) | | | 1.78 | | | | 3.03 | | | | (2.43 | ) | | | 1.38 | |
| | | | | | | | | | | | | | | | | | | | | |
| Less dividends and distributions from: | | | | | | | | | | | | | | | | | | | | |
| Net investment income | | | (0.18 | ) | | | (0.38 | ) | | | (0.30 | ) | | | (0.39 | ) | | | (0.32 | ) |
| Net realized gain | | | (1.12 | ) | | | — | | | | — | | | | (0.26 | ) | | | (0.21 | ) |
| Total dividends and distributions | | | (1.30 | ) | | | (0.38 | ) | | | (0.30 | ) | | | (0.65 | ) | | | (0.53 | ) |
| | | | | | | | | | | | | | | | | | | | | |
| Net asset value, end of period | | $ | 8.59 | | | $ | 12.40 | | | $ | 11.00 | | | $ | 8.27 | | | $ | 11.35 | |
| | | | | | | | | | | | | | | | | | | | | |
| Total return2 | | | (20.49 | )% | | | 16.21 | % | | | 36.96 | % | | | (22.73 | )% | | | 13.64 | % |
| | | | | | | | | | | | | | | | | | | | | |
| Ratios and supplemental data: | | | | | | | | | | | | | | | | | | | | |
| Net assets, end of period (000 omitted) | | $ | 924 | | | $ | 1,205 | | | $ | 1 | 3 | | $ | 4 | 3 | | $ | 5 | 3 |
| Ratio of expenses to average net assets4 | | | 1.36 | % | | | 1.47 | % | | | 1.45 | % | | | 1.46 | % | | | 1.51 | % |
| Ratio of expenses to average net assets prior to fees waived4 | | | 1.89 | % | | | 1.65 | % | | | 1.61 | % | | | 1.55 | % | | | 1.68 | % |
| Ratio of net investment income to average net assets | | | 1.55 | % | | | 1.39 | % | | | 2.15 | % | | | 1.46 | % | | | 1.29 | % |
| Ratio of net investment income to average net assets prior to fees waived | | | 1.02 | % | | | 1.21 | % | | | 1.99 | % | | | 1.37 | % | | | 1.12 | % |
| Portfolio turnover | | | 109 | % | | | 88 | % | | | 90 | % | | | 88 | % | | | 91 | % |
| 1 | Calculated using average shares outstanding. |
| 2 | Total return is based on the change in net asset value of a share during the period and assumes reinvestment of dividends and distributions at net asset value. Total return during the period reflects waivers by the manager and/or distributor. Performance would have been lower had the waivers not been in effect. |
| 3 | Net assets reported in millions. |
| 4 | Expense ratios do not include expenses of any investment companies in which the Fund invests. |
See accompanying notes, which are an integral part of the financial statements.
Consolidated financial highlights
Delaware Ivy Asset Strategy Fund Class A
Selected data for each share of the Fund outstanding throughout each period were as follows:
| | | Year ended |
| | | 3/31/23 | | 3/31/22 | | 3/31/21 | | 3/31/20 | | 3/31/19 |
| Net asset value, beginning of period | | $ | 23.05 | | | $ | 24.45 | | | $ | 17.41 | | | $ | 20.63 | | | $ | 24.02 | |
| | | | | | | | | | | | | | | | | | | | | |
| Income (loss) from investment operations: | | | | | | | | | | | | | | | | | | | | |
| Net investment income1 | | | 0.32 | | | | 0.29 | | | | 0.29 | | | | 0.43 | | | | 0.38 | |
| Net realized and unrealized gain (loss) | | | (1.53 | ) | | | 1.12 | | | | 7.39 | | | | (2.42 | ) | | | 0.09 | |
| Total from investment operations | | | (1.21 | ) | | | 1.41 | | | | 7.68 | | | | (1.99 | ) | | | 0.47 | |
| | | | | | | | | | | | | | | | | | | | | |
| Less dividends and distributions from: | | | | | | | | | | | | | | | | | | | | |
| Net investment income | | | (0.27 | ) | | | (0.55 | ) | | | (0.39 | ) | | | (0.42 | ) | | | (0.40 | ) |
| Net realized gain | | | (2.97 | ) | | | (2.26 | ) | | | (0.25 | ) | | | (0.81 | ) | | | (3.46 | ) |
| Total dividends and distributions | | | (3.24 | ) | | | (2.81 | ) | | | (0.64 | ) | | | (1.23 | ) | | | (3.86 | ) |
| | | | | | | | | | | | | | | | | | | | | |
| Net asset value, end of period | | $ | 18.60 | | | $ | 23.05 | | | $ | 24.45 | | | $ | 17.41 | | | $ | 20.63 | |
| | | | | | | | | | | | | | | | | | | | | |
| Total return2 | | | (4.79 | )% | | | 5.33 | %3 | | | 44.79 | % | | | (10.69 | )% | | | 2.67 | % |
| | | | | | | | | | | | | | | | | | | | | |
| Ratios and supplemental data: | | | | | | | | | | | | | | | | | | | | |
| Net assets, end of period (000 omitted) | | $ | 1,259,211 | | | $ | 1,531,209 | | | $ | 1,601 | 4 | | $ | 1,128 | 4 | | $ | 1,361 | 4 |
| Ratio of expenses to average net assets5 | | | 1.15 | % | | | 1.11 | % | | | 1.07 | % | | | 1.13 | % | | | 1.16 | % |
| Ratio of net investment income to average net assets | | | 1.61 | % | | | 1.16 | % | | | 1.33 | % | | | 2.03 | % | | | 1.71 | % |
| Portfolio turnover | | | 74 | % | | | 33 | % | | | 40 | % | | | 44 | % | | | 52 | % |
| 1 | Calculated using average shares outstanding. |
| 2 | Total return is based on the change in net asset value of a share during the period and assumes reinvestment of dividends and distributions at net asset value and does not reflect the impact of a sales charge. |
| 3 | Payments from affiliates had no impact on net asset value and total return. |
| 4 | Net assets reported in millions. |
| 5 | Expense ratios do not include expenses of any investment companies in which the Fund invests. |
See accompanying notes, which are an integral part of the financial statements.
Delaware Ivy Asset Strategy Fund Class C
Selected data for each share of the Fund outstanding throughout each period were as follows:
| | | Year ended |
| | | 3/31/23 | | 3/31/22 | | 3/31/21 | | 3/31/20 | | 3/31/19 |
| Net asset value, beginning of period | | $ | 21.25 | | | $ | 22.75 | | | $ | 16.24 | | | $ | 19.33 | | | $ | 22.71 | |
| | | | | | | | | | | | | | | | | | | | | |
| Income (loss) from investment operations: | | | | | | | | | | | | | | | | | | | | |
| Net investment income1 | | | 0.11 | | | | 0.08 | | | | 0.13 | | | | 0.27 | | | | 0.22 | |
| Net realized and unrealized gain (loss) | | | (1.44 | ) | | | 1.05 | | | | 6.87 | | | | (2.26 | ) | | | 0.07 | |
| Total from investment operations | | | (1.33 | ) | | | 1.13 | | | | 7.00 | | | | (1.99 | ) | | | 0.29 | |
| | | | | | | | | | | | | | | | | | | | | |
| Less dividends and distributions from: | | | | | | | | | | | | | | | | | | | | |
| Net investment income | | | (0.11 | ) | | | (0.37 | ) | | | (0.24 | ) | | | (0.29 | ) | | | (0.21 | ) |
| Net realized gain | | | (2.97 | ) | | | (2.26 | ) | | | (0.25 | ) | | | (0.81 | ) | | | (3.46 | ) |
| Total dividends and distributions | | | (3.08 | ) | | | (2.63 | ) | | | (0.49 | ) | | | (1.10 | ) | | | (3.67 | ) |
| | | | | | | | | | | | | | | | | | | | | |
| Net asset value, end of period | | $ | 16.84 | | | $ | 21.25 | | | $ | 22.75 | | | $ | 16.24 | | | $ | 19.33 | |
| | | | | | | | | | | | | | | | | | | | | |
| Total return2 | | | (5.80 | )% | | | 4.49 | %3 | | | 43.70 | % | | | (11.37 | )% | | | 1.99 | % |
| | | | | | | | | | | | | | | | | | | | | |
| Ratios and supplemental data: | | | | | | | | | | | | | | | | | | | | |
| Net assets, end of period (000 omitted) | | $ | 48,216 | | | $ | 89,955 | | | $ | 146 | 4 | | $ | 298 | 4 | | $ | 634 | 4 |
| Ratio of expenses to average net assets5 | | | 2.18 | % | | | 1.92 | % | | | 1.86 | % | | | 1.88 | % | | | 1.83 | % |
| Ratio of net investment income to average net assets | | | 0.58 | % | | | 0.35 | % | | | 0.63 | % | | | 1.34 | % | | | 1.05 | % |
| Portfolio turnover | | | 74 | % | | | 33 | % | | | 40 | % | | | 44 | % | | | 52 | % |
| 1 | Calculated using average shares outstanding. |
| 2 | Total return is based on the change in net asset value of a share during the period and assumes reinvestment of dividends and distributions at net asset value and does not reflect the impact of a sales charge. |
| 3 | Payments from affiliates had no impact on net asset value and total return. |
| 4 | Net assets reported in millions. |
| 5 | Expense ratios do not include expenses of any investment companies in which the Fund invests. |
See accompanying notes, which are an integral part of the financial statements.
Consolidated financial highlights
Delaware Ivy Asset Strategy Fund Class I
Selected data for each share of the Fund outstanding throughout each period were as follows:
| | | Year ended |
| | | 3/31/23 | | 3/31/22 | | 3/31/21 | | 3/31/20 | | 3/31/19 |
| Net asset value, beginning of period | | $ | 23.48 | | | $ | 24.85 | | | $ | 17.68 | | | $ | 20.93 | | | $ | 24.33 | |
| | | | | | | | | | | | | | | | | | | | | |
| Income (loss) from investment operations: | | | | | | | | | | | | | | | | | | | | |
| Net investment income1 | | | 0.38 | | | | 0.36 | | | | 0.35 | | | | 0.50 | | | | 0.44 | |
| Net realized and unrealized gain (loss) | | | (1.57 | ) | | | 1.14 | | | | 7.51 | | | | (2.46 | ) | | | 0.10 | |
| Total from investment operations | | | (1.19 | ) | | | 1.50 | | | | 7.86 | | | | (1.96 | ) | | | 0.54 | |
| | | | | | | | | | | | | | | | | | | | | |
| Less dividends and distributions from: | | | | | | | | | | | | | | | | | | | | |
| Net investment income | | | (0.31 | ) | | | (0.61 | ) | | | (0.44 | ) | | | (0.48 | ) | | | (0.48 | ) |
| Net realized gain | | | (2.97 | ) | | | (2.26 | ) | | | (0.25 | ) | | | (0.81 | ) | | | (3.46 | ) |
| Total dividends and distributions | | | (3.28 | ) | | | (2.87 | ) | | | (0.69 | ) | | | (1.29 | ) | | | (3.94 | ) |
| | | | | | | | | | | | | | | | | | | | | |
| Net asset value, end of period | | $ | 19.01 | | | $ | 23.48 | | | $ | 24.85 | | | $ | 17.68 | | | $ | 20.93 | |
| | | | | | | | | | | | | | | | | | | | | |
| Total return2 | | | (4.58 | )% | | | 5.59 | %3 | | | 45.16 | % | | | (10.44 | )% | | | 2.93 | % |
| | | | | | | | | | | | | | | | | | | | | |
| Ratios and supplemental data: | | | | | | | | | | | | | | | | | | | | |
| Net assets, end of period (000 omitted) | | $ | 393,751 | | | $ | 597,362 | | | $ | 713 | 4 | | $ | 586 | 4 | | $ | 805 | 4 |
| Ratio of expenses to average net assets5 | | | 0.90 | % | | | 0.88 | % | | | 0.83 | % | | | 0.87 | % | | | 0.89 | % |
| Ratio of net investment income to average net assets | | | 1.86 | % | | | 1.39 | % | | | 1.59 | % | | | 2.31 | % | | | 1.97 | % |
| Portfolio turnover | | | 74 | % | | | 33 | % | | | 40 | % | | | 44 | % | | | 52 | % |
| 1 | Calculated using average shares outstanding. |
| 2 | Total return is based on the change in net asset value of a share during the period and assumes reinvestment of dividends and distributions at net asset value. |
| 3 | Payments from affiliates had no impact on net asset value and total return. |
| 4 | Net assets reported in millions. |
| 5 | Expense ratios do not include expenses of any investment companies in which the Fund invests. |
See accompanying notes, which are an integral part of the financial statements.
Delaware Ivy Asset Strategy Fund Class R
Selected data for each share of the Fund outstanding throughout each period were as follows:
| | | Year ended |
| | | 3/31/23 | | 3/31/22 | | 3/31/21 | | 3/31/20 | | 3/31/19 |
| Net asset value, beginning of period | | $ | 22.68 | | | $ | 24.09 | | | $ | 17.17 | | | $ | 20.35 | | | $ | 23.73 | |
| | | | | | | | | | | | | | | | | | | | | |
| Income (loss) from investment operations: | | | | | | | | | | | | | | | | | | | | |
| Net investment income1 | | | 0.25 | | | | 0.20 | | | | 0.22 | | | | 0.36 | | | | 0.31 | |
| Net realized and unrealized gain (loss) | | | (1.51 | ) | | | 1.11 | | | | 7.27 | | | | (2.37 | ) | | | 0.08 | |
| Total from investment operations | | | (1.26 | ) | | | 1.31 | | | | 7.49 | | | | (2.01 | ) | | | 0.39 | |
| | | | | | | | | | | | | | | | | | | | | |
| Less dividends and distributions from: | | | | | | | | | | | | | | | | | | | | |
| Net investment income | | | (0.21 | ) | | | (0.46 | ) | | | (0.32 | ) | | | (0.36 | ) | | | (0.31 | ) |
| Net realized gain | | | (2.97 | ) | | | (2.26 | ) | | | (0.25 | ) | | | (0.81 | ) | | | (3.46 | ) |
| Total dividends and distributions | | | (3.18 | ) | | | (2.72 | ) | | | (0.57 | ) | | | (1.17 | ) | | | (3.77 | ) |
| | | | | | | | | | | | | | | | | | | | | |
| Net asset value, end of period | | $ | 18.24 | | | $ | 22.68 | | | $ | 24.09 | | | $ | 17.17 | | | $ | 20.35 | |
| | | | | | | | | | | | | | | | | | | | | |
| Total return2 | | | (5.10 | )% | | | 4.98 | %3 | | | 44.26 | % | | | (10.93 | )% | | | 2.32 | % |
| | | | | | | | | | | | | | | | | | | | | |
| Ratios and supplemental data: | | | | | | | | | | | | | | | | | | | | |
| Net assets, end of period (000 omitted) | | $ | 20,073 | | | $ | 23,787 | | | $ | 28 | 4 | | $ | 28 | 4 | | $ | 44 | 4 |
| Ratio of expenses to average net assets5 | | | 1.47 | % | | | 1.46 | % | | | 1.42 | % | | | 1.46 | % | | | 1.47 | % |
| Ratio of net investment income to average net assets | | | 1.29 | % | | | 0.81 | % | | | 1.02 | % | | | 1.72 | % | | | 1.40 | % |
| Portfolio turnover | | | 74 | % | | | 33 | % | | | 40 | % | | | 44 | % | | | 52 | % |
| 1 | Calculated using average shares outstanding. |
| 2 | Total return is based on the change in net asset value of a share during the period and assumes reinvestment of dividends and distributions at net asset value. |
| 3 | Payments from affiliates had no impact on net asset value and total return. |
| 4 | Net assets reported in millions. |
| 5 | Expense ratios do not include expenses of any investment companies in which the Fund invests. |
See accompanying notes, which are an integral part of the financial statements.
Consolidated financial highlights
Delaware Ivy Asset Strategy Fund Class R6
Selected data for each share of the Fund outstanding throughout each period were as follows:
| | | Year ended |
| | | 3/31/23 | | 3/31/22 | | 3/31/21 | | 3/31/20 | | 3/31/19 |
| Net asset value, beginning of period | | $ | 23.55 | | | $ | 24.92 | | | $ | 17.73 | | | $ | 20.99 | | | $ | 24.40 | |
| | | | | | | | | | | | | | | | | | | | | |
| Income (loss) from investment operations: | | | | | | | | | | | | | | | | | | | | |
| Net investment income1 | | | 0.41 | | | | 0.40 | | | | 0.37 | | | | 0.51 | | | | 0.45 | |
| Net realized and unrealized gain (loss) | | | (1.56 | ) | | | 1.14 | | | | 7.54 | | | | (2.45 | ) | | | 0.11 | |
| Total from investment operations | | | (1.15 | ) | | | 1.54 | | | | 7.91 | | | | (1.94 | ) | | | 0.56 | |
| | | | | | | | | | | | | | | | | | | | | |
| Less dividends and distributions from: | | | | | | | | | | | | | | | | | | | | |
| Net investment income | | | (0.35 | ) | | | (0.65 | ) | | | (0.47 | ) | | | (0.51 | ) | | | (0.51 | ) |
| Net realized gain | | | (2.97 | ) | | | (2.26 | ) | | | (0.25 | ) | | | (0.81 | ) | | | (3.46 | ) |
| Total dividends and distributions | | | (3.32 | ) | | | (2.91 | ) | | | (0.72 | ) | | | (1.32 | ) | | | (3.97 | ) |
| | | | | | | | | | | | | | | | | | | | | |
| Net asset value, end of period | | $ | 19.08 | | | $ | 23.55 | | | $ | 24.92 | | | $ | 17.73 | | | $ | 20.99 | |
| | | | | | | | | | | | | | | | | | | | | |
| Total return2 | | | (4.39 | )% | | | 5.73 | %3 | | | 45.35 | % | | | (10.32 | )% | | | 3.03 | % |
| | | | | | | | | | | | | | | | | | | | | |
| Ratios and supplemental data: | | | | | | | | | | | | | | | | | | | | |
| Net assets, end of period (000 omitted) | | $ | 17,914 | | | $ | 16,520 | | | $ | 19 | 4 | | $ | 8 | 4 | | $ | 5 | 4 |
| Ratio of expenses to average net assets5 | | | 0.77 | % | | | 0.72 | % | | | 0.67 | % | | | 0.72 | % | | | 0.79 | % |
| Ratio of net investment income to average net assets | | | 1.99 | % | | | 1.56 | % | | | 1.62 | % | | | 2.35 | % | | | 2.03 | % |
| Portfolio turnover | | | 74 | % | | | 33 | % | | | 40 | % | | | 44 | % | | | 52 | % |
| 1 | Calculated using average shares outstanding. |
| 2 | Total return is based on the change in net asset value of a share during the period and assumes reinvestment of dividends and distributions at net asset value. |
| 3 | Payments from affiliates had no impact on net asset value and total return. |
| 4 | Net assets reported in millions. |
| 5 | Expense ratios do not include expenses of any investment companies in which the Fund invests. |
See accompanying notes, which are an integral part of the financial statements.
Delaware Ivy Asset Strategy Fund Class Y
Selected data for each share of the Fund outstanding throughout each period were as follows:
| | | Year ended |
| | | 3/31/23 | | 3/31/22 | | 3/31/21 | | 3/31/20 | | 3/31/19 |
| Net asset value, beginning of period | | $ | 23.14 | | | $ | 24.53 | | | $ | 17.47 | | | $ | 20.69 | | | $ | 24.09 | |
| | | | | | | | | | | | | | | | | | | | | |
| Income (loss) from investment operations: | | | | | | | | | | | | | | | | | | | | |
| Net investment income1 | | | 0.33 | | | | 0.30 | | | | 0.30 | | | | 0.44 | | | | 0.39 | |
| Net realized and unrealized gain (loss) | | | (1.53 | ) | | | 1.12 | | | | 7.40 | | | | (2.42 | ) | | | 0.08 | |
| Total from investment operations | | | (1.20 | ) | | | 1.42 | | | | 7.70 | | | | (1.98 | ) | | | 0.47 | |
| | | | | | | | | | | | | | | | | | | | | |
| Less dividends and distributions from: | | | | | | | | | | | | | | | | | | | | |
| Net investment income | | | (0.28 | ) | | | (0.55 | ) | | | (0.39 | ) | | | (0.43 | ) | | | (0.41 | ) |
| Net realized gain | | | (2.97 | ) | | | (2.26 | ) | | | (0.25 | ) | | | (0.81 | ) | | | (3.46 | ) |
| Total dividends and distributions | | | (3.25 | ) | | | (2.81 | ) | | | (0.64 | ) | | | (1.24 | ) | | | (3.87 | ) |
| | | | | | | | | | | | | | | | | | | | | |
| Net asset value, end of period | | $ | 18.69 | | | $ | 23.14 | | | $ | 24.53 | | | $ | 17.47 | | | $ | 20.69 | |
| | | | | | | | | | | | | | | | | | | | | |
| Total return2 | | | (4.72 | )%3 | | | 5.35 | %3,4 | | | 44.75 | %3 | | | (10.64 | )% | | | 2.70 | % |
| | | | | | | | | | | | | | | | | | | | | |
| Ratios and supplemental data: | | | | | | | | | | | | | | | | | | | | |
| Net assets, end of period (000 omitted) | | $ | 78,829 | | | $ | 96,913 | | | $ | 109 | 5 | | $ | 98 | 5 | | $ | 151 | 5 |
| Ratio of expenses to average net assets6 | | | 1.11 | % | | | 1.09 | % | | | 1.07 | % | | | 1.11 | % | | | 1.13 | % |
| Ratio of expenses to average net assets prior to fees waived6 | | | 1.11 | % | | | 1.11 | % | | | 1.08 | % | | | 1.11 | % | | | 1.13 | % |
| Ratio of net investment income to average net assets | | | 1.65 | % | | | 1.17 | % | | | 1.36 | % | | | 2.08 | % | | | 1.73 | % |
| Ratio of net investment income to average net assets prior to fees waived | | | 1.65 | % | | | 1.15 | % | | | 1.35 | % | | | 2.08 | % | | | 1.73 | % |
| Portfolio turnover | | | 74 | % | | | 33 | % | | | 40 | % | | | 44 | % | | | 52 | % |
| 1 | Calculated using average shares outstanding. |
| 2 | Total return is based on the change in net asset value of a share during the period and assumes reinvestment of dividends and distributions at net asset value. |
| 3 | Total return during the period reflects waivers by the manager and/or distributor. Performance would have been lower had the waivers not been in effect. |
| 4 | Payments from affiliates had no impact on net asset value and total return. |
| 5 | Net assets reported in millions. |
| 6 | Expense ratios do not include expenses of any investment companies in which the Fund invests. |
See accompanying notes, which are an integral part of the financial statements.
Financial highlights
Delaware Ivy Balanced Fund Class A
Selected data for each share of the Fund outstanding throughout each period were as follows:
| | | Year ended |
| | | 3/31/23 | | 3/31/22 | | 3/31/21 | | 3/31/20 | | 3/31/19 |
| Net asset value, beginning of period | | $ | 25.53 | | | $ | 27.29 | | | $ | 20.43 | | | $ | 23.58 | | | $ | 24.74 | |
| | | | | | | | | | | | | | | | | | | | | |
| Income (loss) from investment operations: | | | | | | | | | | | | | | | | | | | | |
| Net investment income1 | | | 0.21 | | | | 0.12 | | | | 0.24 | | | | 0.31 | | | | 0.37 | |
| Net realized and unrealized gain (loss) | | | (2.06 | ) | | | 1.28 | | | | 8.38 | | | | (1.57 | ) | | | 1.03 | |
| Total from investment operations | | | (1.85 | ) | | | 1.40 | | | | 8.62 | | | | (1.26 | ) | | | 1.40 | |
| | | | | | | | | | | | | | | | | | | | | |
| Less dividends and distributions from: | | | | | | | | | | | | | | | | | | | | |
| Net investment income | | | (0.15 | ) | | | (0.12 | ) | | | (0.28 | ) | | | (0.34 | ) | | | (0.36 | ) |
| Net realized gain | | | (4.68 | ) | | | (3.04 | ) | | | (1.48 | ) | | | (1.55 | ) | | | (2.20 | ) |
| Total dividends and distributions | | | (4.83 | ) | | | (3.16 | ) | | | (1.76 | ) | | | (1.89 | ) | | | (2.56 | ) |
| | | | | | | | | | | | | | | | | | | | | |
| Net asset value, end of period | | $ | 18.85 | | | $ | 25.53 | | | $ | 27.29 | | | $ | 20.43 | | | $ | 23.58 | |
| | | | | | | | | | | | | | | | | | | | | |
| Total return2 | | | (6.71 | )% | | | 4.57 | % | | | 42.81 | % | | | (6.55 | )% | | | 6.25 | % |
| | | | | | | | | | | | | | | | | | | | | |
| Ratios and supplemental data: | | | | | | | | | | | | | | | | | | | | |
| Net assets, end of period (000 omitted) | | $ | 1,102,496 | | | $ | 1,485,004 | | | $ | 1,509 | 3 | | $ | 1,086 | 3 | | $ | 1,275 | 3 |
| Ratio of expenses to average net assets4 | | | 1.10 | % | | | 1.04 | % | | | 1.07 | % | | | 1.10 | % | | | 1.09 | % |
| Ratio of net investment income to average net assets | | | 0.97 | % | | | 0.44 | % | | | 0.95 | % | | | 1.27 | % | | | 1.49 | % |
| Portfolio turnover | | | 82 | % | | | 94 | % | | | 52 | % | | | 43 | % | | | 53 | % |
| 1 | Calculated using average shares outstanding. |
| 2 | Total return is based on the change in net asset value of a share during the period and assumes reinvestment of dividends and distributions at net asset value and does not reflect the impact of a sales charge. |
| 3 | Net assets reported in millions. |
| 4 | Expense ratios do not include expenses of any investment companies in which the Fund invests. |
See accompanying notes, which are an integral part of the financial statements.
Delaware Ivy Balanced Fund Class C
Selected data for each share of the Fund outstanding throughout each period were as follows:
| | | Year ended |
| | | 3/31/23 | | 3/31/22 | | 3/31/21 | | 3/31/20 | | 3/31/19 |
| Net asset value, beginning of period | | $ | 25.21 | | | $ | 26.98 | | | $ | 20.24 | | | $ | 23.38 | | | $ | 24.56 | |
| | | | | | | | | | | | | | | | | | | | | |
| Income (loss) from investment operations: | | | | | | | | | | | | | | | | | | | | |
| Net investment income (loss)1 | | | 0.01 | | | | (0.09 | ) | | | 0.06 | | | | 0.13 | | | | 0.19 | |
| Net realized and unrealized gain (loss) | | | (2.03 | ) | | | 1.25 | | | | 8.30 | | | | (1.55 | ) | | | 1.01 | |
| Total from investment operations | | | (2.02 | ) | | | 1.16 | | | | 8.36 | | | | (1.42 | ) | | | 1.20 | |
| | | | | | | | | | | | | | | | | | | | | |
| Less dividends and distributions from: | | | | | | | | | | | | | | | | | | | | |
| Net investment income | | | (0.02 | ) | | | — | | | | (0.14 | ) | | | (0.17 | ) | | | (0.18 | ) |
| Net realized gain | | | (4.68 | ) | | | (2.93 | ) | | | (1.48 | ) | | | (1.55 | ) | | | (2.20 | ) |
| Total dividends and distributions | | | (4.70 | ) | | | (2.93 | ) | | | (1.62 | ) | | | (1.72 | ) | | | (2.38 | ) |
| | | | | | | | | | | | | | | | | | | | | |
| Net asset value, end of period | | $ | 18.49 | | | $ | 25.21 | | | $ | 26.98 | | | $ | 20.24 | | | $ | 23.38 | |
| | | | | | | | | | | | | | | | | | | | | |
| Total return2 | | | (7.53 | )% | | | 3.77 | % | | | 41.82 | % | | | (7.24 | )% | | | 5.46 | % |
| | | | | | | | | | | | | | | | | | | | | |
| Ratios and supplemental data: | | | | | | | | | | | | | | | | | | | | |
| Net assets, end of period (000 omitted) | | $ | 63,537 | | | $ | 117,058 | | | $ | 183 | 3 | | $ | 243 | 3 | | $ | 366 | 3 |
| Ratio of expenses to average net assets4 | | | 1.98 | % | | | 1.82 | % | | | 1.82 | % | | | 1.83 | % | | | 1.80 | % |
| Ratio of net investment income (loss) to average net assets | | | 0.06 | % | | | (0.34 | )% | | | 0.23 | % | | | 0.54 | % | | | 0.78 | % |
| Portfolio turnover | | | 82 | % | | | 94 | % | | | 52 | % | | | 43 | % | | | 53 | % |
| 1 | Calculated using average shares outstanding. |
| 2 | Total return is based on the change in net asset value of a share during the period and assumes reinvestment of dividends and distributions at net asset value and does not reflect the impact of a sales charge. |
| 3 | Net assets reported in millions. |
| 4 | Expense ratios do not include expenses of any investment companies in which the Fund invests. |
See accompanying notes, which are an integral part of the financial statements.
Financial highlights
Delaware Ivy Balanced Fund Class I
Selected data for each share of the Fund outstanding throughout each period were as follows:
| | | Year ended |
| | | 3/31/23 | | 3/31/22 | | 3/31/21 | | 3/31/20 | | 3/31/19 |
| Net asset value, beginning of period | | $ | 25.54 | | | $ | 27.29 | | | $ | 20.42 | | | $ | 23.57 | | | $ | 24.74 | |
| | | | | | | | | | | | | | | | | | | | | |
| Income (loss) from investment operations: | | | | | | | | | | | | | | | | | | | | |
| Net investment income1 | | | 0.26 | | | | 0.18 | | | | 0.29 | | | | 0.36 | | | | 0.43 | |
| Net realized and unrealized gain (loss) | | | (2.06 | ) | | | 1.28 | | | | 8.39 | | | | (1.57 | ) | | | 1.02 | |
| Total from investment operations | | | (1.80 | ) | | | 1.46 | | | | 8.68 | | | | (1.21 | ) | | | 1.45 | |
| | | | | | | | | | | | | | | | | | | | | |
| Less dividends and distributions from: | | | | | | | | | | | | | | | | | | | | |
| Net investment income | | | (0.20 | ) | | | (0.17 | ) | | | (0.33 | ) | | | (0.39 | ) | | | (0.42 | ) |
| Net realized gain | | | (4.68 | ) | | | (3.04 | ) | | | (1.48 | ) | | | (1.55 | ) | | | (2.20 | ) |
| Total dividends and distributions | | | (4.88 | ) | | | (3.21 | ) | | | (1.81 | ) | | | (1.94 | ) | | | (2.62 | ) |
| | | | | | | | | | | | | | | | | | | | | |
| Net asset value, end of period | | $ | 18.86 | | | $ | 25.54 | | | $ | 27.29 | | | $ | 20.42 | | | $ | 23.57 | |
| | | | | | | | | | | | | | | | | | | | | |
| Total return2 | | | (6.52 | )% | | | 4.82 | % | | | 43.15 | % | | | (6.32 | )% | | | 6.51 | % |
| | | | | | | | | | | | | | | | | | | | | |
| Ratios and supplemental data: | | | | | | | | | | | | | | | | | | | | |
| Net assets, end of period (000 omitted) | | $ | 406,338 | | | $ | 745,878 | | | $ | 846 | 3 | | $ | 671 | 3 | | $ | 873 | 3 |
| Ratio of expenses to average net assets4 | | | 0.88 | % | | | 0.84 | % | | | 0.86 | % | | | 0.86 | % | | | 0.84 | % |
| Ratio of net investment income to average net assets | | | 1.17 | % | | | 0.64 | % | | | 1.17 | % | | | 1.51 | % | | | 1.73 | % |
| Portfolio turnover | | | 82 | % | | | 94 | % | | | 52 | % | | | 43 | % | | | 53 | % |
| 1 | Calculated using average shares outstanding. |
| 2 | Total return is based on the change in net asset value of a share during the period and assumes reinvestment of dividends and distributions at net asset value. |
| 3 | Net assets reported in millions. |
| 4 | Expense ratios do not include expenses of any investment companies in which the Fund invests. |
See accompanying notes, which are an integral part of the financial statements.
Delaware Ivy Balanced Fund Class R
Selected data for each share of the Fund outstanding throughout each period were as follows:
| | | Year ended |
| | | 3/31/23 | | 3/31/22 | | 3/31/21 | | 3/31/20 | | 3/31/19 |
| Net asset value, beginning of period | | $ | 25.46 | | | $ | 27.22 | | | $ | 20.39 | | | $ | 23.54 | | | $ | 24.70 | |
| | | | | | | | | | | | | | | | | | | | | |
| Income (loss) from investment operations: | | | | | | | | | | | | | | | | | | | | |
| Net investment income1 | | | 0.15 | | | | 0.01 | | | | 0.15 | | | | 0.22 | | | | 0.28 | |
| Net realized and unrealized gain (loss) | | | (2.05 | ) | | | 1.26 | | | | 8.36 | | | | (1.57 | ) | | | 1.04 | |
| Total from investment operations | | | (1.90 | ) | | | 1.27 | | | | 8.51 | | | | (1.35 | ) | | | 1.32 | |
| | | | | | | | | | | | | | | | | | | | | |
| Less dividends and distributions from: | | | | | | | | | | | | | | | | | | | | |
| Net investment income | | | (0.10 | ) | | | (0.01 | ) | | | (0.20 | ) | | | (0.25 | ) | | | (0.28 | ) |
| Net realized gain | | | (4.68 | ) | | | (3.02 | ) | | | (1.48 | ) | | | (1.55 | ) | | | (2.20 | ) |
| Total dividends and distributions | | | (4.78 | ) | | | (3.03 | ) | | | (1.68 | ) | | | (1.80 | ) | | | (2.48 | ) |
| | | | | | | | | | | | | | | | | | | | | |
| Net asset value, end of period | | $ | 18.78 | | | $ | 25.46 | | | $ | 27.22 | | | $ | 20.39 | | | $ | 23.54 | |
| | | | | | | | | | | | | | | | | | | | | |
| Total return2 | | | (6.97 | )% | | | 4.15 | % | | | 42.31 | % | | | (6.90 | )% | | | 5.91 | % |
| | | | | | | | | | | | | | | | | | | | | |
| Ratios and supplemental data: | | | | | | | | | | | | | | | | | | | | |
| Net assets, end of period (000 omitted) | | $ | 8,650 | | | $ | 10,852 | | | $ | 11 | 3 | | $ | 11 | 3 | | $ | 13 | 3 |
| Ratio of expenses to average net assets4 | | | 1.38 | % | | | 1.44 | % | | | 1.45 | % | | | 1.45 | % | | | 1.43 | % |
| Ratio of net investment income to average net assets | | | 0.70 | % | | | 0.04 | % | | | 0.60 | % | | | 0.91 | % | | | 1.14 | % |
| Portfolio turnover | | | 82 | % | | | 94 | % | | | 52 | % | | | 43 | % | | | 53 | % |
| 1 | Calculated using average shares outstanding. |
| 2 | Total return is based on the change in net asset value of a share during the period and assumes reinvestment of dividends and distributions at net asset value. |
| 3 | Net assets reported in millions. |
| 4 | Expense ratios do not include expenses of any investment companies in which the Fund invests. |
See accompanying notes, which are an integral part of the financial statements.
Financial highlights
Delaware Ivy Balanced Fund Class R6
Selected data for each share of the Fund outstanding throughout each period were as follows:
| | | Year ended |
| | | 3/31/23 | | 3/31/22 | | 3/31/21 | | 3/31/20 | | 3/31/19 |
| Net asset value, beginning of period | | $ | 25.60 | | | $ | 27.36 | | | $ | 20.47 | | | $ | 23.62 | | | $ | 24.78 | |
| | | | | | | | | | | | | | | | | | | | | |
| Income (loss) from investment operations: | | | | | | | | | | | | | | | | | | | | |
| Net investment income1 | | | 0.29 | | | | 0.22 | | | | 0.33 | | | | 0.40 | | | | 0.46 | |
| Net realized and unrealized gain (loss) | | | (2.07 | ) | | | 1.27 | | | | 8.40 | | | | (1.57 | ) | | | 1.04 | |
| Total from investment operations | | | (1.78 | ) | | | 1.49 | | | | 8.73 | | | | (1.17 | ) | | | 1.50 | |
| | | | | | | | | | | | | | | | | | | | | |
| Less dividends and distributions from: | | | | | | | | | | | | | | | | | | | | |
| Net investment income | | | (0.23 | ) | | | (0.21 | ) | | | (0.36 | ) | | | (0.43 | ) | | | (0.46 | ) |
| Net realized gain | | | (4.68 | ) | | | (3.04 | ) | | | (1.48 | ) | | | (1.55 | ) | | | (2.20 | ) |
| Total dividends and distributions | | | (4.91 | ) | | | (3.25 | ) | | | (1.84 | ) | | | (1.98 | ) | | | (2.66 | ) |
| | | | | | | | | | | | | | | | | | | | | |
| Net asset value, end of period | | $ | 18.91 | | | $ | 25.60 | | | $ | 27.36 | | | $ | 20.47 | | | $ | 23.62 | |
| | | | | | | | | | | | | | | | | | | | | |
| Total return2 | | | (6.39 | )% | | | 4.93 | % | | | 43.34 | % | | | (6.16 | )% | | | 6.66 | % |
| | | | | | | | | | | | | | | | | | | | | |
| Ratios and supplemental data: | | | | | | | | | | | | | | | | | | | | |
| Net assets, end of period (000 omitted) | | $ | 9,291 | | | $ | 10,232 | | | $ | 11 | 3 | | $ | 7 | 3 | | $ | 15 | 3 |
| Ratio of expenses to average net assets4 | | | 0.75 | % | | | 0.70 | % | | | 0.71 | % | | | 0.71 | % | | | 0.70 | % |
| Ratio of net investment income to average net assets | | | 1.33 | % | | | 0.78 | % | | | 1.30 | % | | | 1.65 | % | | | 1.88 | % |
| Portfolio turnover | | | 82 | % | | | 94 | % | | | 52 | % | | | 43 | % | | | 53 | % |
| 1 | Calculated using average shares outstanding. |
| 2 | Total return is based on the change in net asset value of a share during the period and assumes reinvestment of dividends and distributions at net asset value. |
| 3 | Net assets reported in millions. |
| 4 | Expense ratios do not include expenses of any investment companies in which the Fund invests. |
See accompanying notes, which are an integral part of the financial statements.
Delaware Ivy Balanced Fund Class Y
Selected data for each share of the Fund outstanding throughout each period were as follows:
| | | Year ended |
| | | 3/31/23 | | 3/31/22 | | 3/31/21 | | 3/31/20 | | 3/31/19 |
| Net asset value, beginning of period | | $ | 25.54 | | | $ | 27.29 | | | $ | 20.43 | | | $ | 23.58 | | | $ | 24.75 | |
| | | | | | | | | | | | | | | | | | | | | |
| Income (loss) from investment operations: | | | | | | | | | | | | | | | | | | | | |
| Net investment income1 | | | 0.22 | | | | 0.12 | | | | 0.24 | | | | 0.31 | | | | 0.37 | |
| Net realized and unrealized gain (loss) | | | (2.07 | ) | | | 1.28 | | | | 8.38 | | | | (1.57 | ) | | | 1.02 | |
| Total from investment operations | | | (1.85 | ) | | | 1.40 | | | | 8.62 | | | | (1.26 | ) | | | 1.39 | |
| | | | | | | | | | | | | | | | | | | | | |
| Less dividends and distributions from: | | | | | | | | | | | | | | | | | | | | |
| Net investment income | | | (0.16 | ) | | | (0.11 | ) | | | (0.28 | ) | | | (0.34 | ) | | | (0.36 | ) |
| Net realized gain | | | (4.68 | ) | | | (3.04 | ) | | | (1.48 | ) | | | (1.55 | ) | | | (2.20 | ) |
| Total dividends and distributions | | | (4.84 | ) | | | (3.15 | ) | | | (1.76 | ) | | | (1.89 | ) | | | (2.56 | ) |
| | | | | | | | | | | | | | | | | | | | | |
| Net asset value, end of period | | $ | 18.85 | | | $ | 25.54 | | | $ | 27.29 | | | $ | 20.43 | | | $ | 23.58 | |
| | | | | | | | | | | | | | | | | | | | | |
| Total return2 | | | (6.71 | )%3 | | | 4.59 | %3 | | | 42.81 | %3 | | | (6.55 | )%3 | | | 6.22 | % |
| | | | | | | | | | | | | | | | | | | | | |
| Ratios and supplemental data: | | | | | | | | | | | | | | | | | | | | |
| Net assets, end of period (000 omitted) | | $ | 10,194 | | | $ | 12,699 | | | $ | 16 | 4 | | $ | 14 | 4 | | $ | 24 | 4 |
| Ratio of expenses to average net assets5 | | | 1.07 | % | | | 1.04 | % | | | 1.07 | % | | | 1.10 | % | | | 1.09 | % |
| Ratio of expenses to average net assets prior to fees waived5 | | | 1.07 | % | | | 1.08 | % | | | 1.10 | % | | | 1.11 | % | | | 1.09 | % |
| Ratio of net investment income to average net assets | | | 1.01 | % | | | 0.44 | % | | | 0.97 | % | | | 1.27 | % | | | 1.49 | % |
| Ratio of net investment income to average net assets prior to fees waived | | | 1.01 | % | | | 0.40 | % | | | 0.94 | % | | | 1.26 | % | | | 1.49 | % |
| Portfolio turnover | | | 82 | % | | | 94 | % | | | 52 | % | | | 43 | % | | | 53 | % |
| 1 | Calculated using average shares outstanding. |
| 2 | Total return is based on the change in net asset value of a share during the period and assumes reinvestment of dividends and distributions at net asset value. |
| 3 | Total return during the period reflects waivers by the manager and/or distributor. Performance would have been lower had the waivers not been in effect. |
| 4 | Net assets reported in millions. |
| 5 | Expense ratios do not include expenses of any investment companies in which the Fund invests. |
See accompanying notes, which are an integral part of the financial statements.
Financial highlights
Delaware Ivy Natural Resources Fund Class A
Selected data for each share of the Fund outstanding throughout each period were as follows:
| | | Year ended |
| | | 3/31/23 | | 3/31/22 | | 3/31/21 | | 3/31/20 | | 3/31/19 |
| Net asset value, beginning of period | | $ | 16.92 | | | $ | 12.42 | | | $ | 7.85 | | | $ | 13.45 | | | $ | 14.82 | |
| | | | | | | | | | | | | | | | | | | | | |
| Income (loss) from investment operations: | | | | | | | | | | | | | | | | | | | | |
| Net investment income1 | | | 0.35 | | | | 0.21 | | | | 0.09 | | | | 0.13 | | | | 0.12 | |
| Net realized and unrealized gain (loss) | | | (1.20 | ) | | | 4.61 | | | | 4.51 | | | | (5.51 | ) | | | (1.49 | ) |
| Total from investment operations | | | (0.85 | ) | | | 4.82 | | | | 4.60 | | | | (5.38 | ) | | | (1.37 | ) |
| | | | | | | | | | | | | | | | | | | | | |
| Less dividends and distributions from: | | | | | | | | | | | | | | | | | | | | |
| Net investment income | | | (0.32 | ) | | | (0.32 | ) | | | (0.03 | ) | | | (0.22 | ) | | | — | |
| Total dividends and distributions | | | (0.32 | ) | | | (0.32 | ) | | | (0.03 | ) | | | (0.22 | ) | | | — | |
| | | | | | | | | | | | | | | | | | | | | |
| Net asset value, end of period | | $ | 15.75 | | | $ | 16.92 | | | $ | 12.42 | | | $ | 7.85 | | | $ | 13.45 | |
| | | | | | | | | | | | | | | | | | | | | |
| Total return2 | | | (5.03 | )%3 | | | 39.47 | % | | | 58.68 | % | | | (40.58 | )% | | | (9.31 | )% |
| | | | | | | | | | | | | | | | | | | | | |
| Ratios and supplemental data: | | | | | | | | | | | | | | | | | | | | |
| Net assets, end of period (000 omitted) | | $ | 150,383 | | | $ | 170,746 | | | $ | 136 | 4 | | $ | 102 | 4 | | $ | 218 | 4 |
| Ratio of expenses to average net assets5 | | | 1.44 | % | | | 1.82 | % | | | 1.84 | % | | | 1.77 | % | | | 1.59 | % |
| Ratio of expenses to average net assets prior to fees waived5 | | | 1.65 | % | | | 1.82 | % | | | 1.84 | % | | | 1.77 | % | | | 1.59 | % |
| Ratio of net investment income to average net assets | | | 2.20 | % | | | 1.57 | % | | | 0.82 | % | | | 1.05 | % | | | 0.82 | % |
| Ratio of net investment income to average net assets prior to fees waived | | | 1.99 | % | | | 1.57 | % | | | 0.82 | % | | | 1.05 | % | | | 0.82 | % |
| Portfolio turnover | | | 48 | % | | | 116 | % | | | 52 | % | | | 44 | % | | | 21 | % |
| 1 | Calculated using average shares outstanding. |
| 2 | Total return is based on the change in net asset value of a share during the period and assumes reinvestment of dividends and distributions at net asset value and does not reflect the impact of a sales charge. |
| 3 | Total return during the period reflects waivers by the manager and/or distributor. Performance would have been lower had the waivers not been in effect. |
| 4 | Net assets reported in millions. |
| 5 | Expense ratios do not include expenses of any investment companies in which the Fund invests. |
See accompanying notes, which are an integral part of the financial statements.
Delaware Ivy Natural Resources Fund Class C
Selected data for each share of the Fund outstanding throughout each period were as follows:
| | | Year ended |
| | | 3/31/23 | | 3/31/22 | | 3/31/21 | | 3/31/20 | | 3/31/19 |
| Net asset value, beginning of period | | $ | 13.81 | | | $ | 10.22 | | | $ | 6.48 | | | $ | 11.13 | | | $ | 12.33 | |
| | | | | | | | | | | | | | | | | | | | | |
| Income (loss) from investment operations: | | | | | | | | | | | | | | | | | | | | |
| Net investment income1 | | | 0.19 | | | | 0.09 | | | | 0.01 | | | | 0.03 | | | | 0.03 | |
| Net realized and unrealized gain (loss) | | | (0.98 | ) | | | 3.77 | | | | 3.74 | | | | (4.55 | ) | | | (1.23 | ) |
| Total from investment operations | | | (0.79 | ) | | | 3.86 | | | | 3.75 | | | | (4.52 | ) | | | (1.20 | ) |
| | | | | | | | | | | | | | | | | | | | | |
| Less dividends and distributions from: | | | | | | | | | | | | | | | | | | | | |
| Net investment income | | | (0.31 | ) | | | (0.27 | ) | | | (0.01 | ) | | | (0.13 | ) | | | — | |
| Total dividends and distributions | | | (0.31 | ) | | | (0.27 | ) | | | (0.01 | ) | | | (0.13 | ) | | | — | |
| | | | | | | | | | | | | | | | | | | | | |
| Net asset value, end of period | | $ | 12.71 | | | $ | 13.81 | | | $ | 10.22 | | | $ | 6.48 | | | $ | 11.13 | |
| | | | | | | | | | | | | | | | | | | | | |
| Total return2 | | | (5.76 | )%3 | | | 38.45 | % | | | 57.83 | % | | | (41.02 | )% | | | (9.73 | )% |
| | | | | | | | | | | | | | | | | | | | | |
| Ratios and supplemental data: | | | | | | | | | | | | | | | | | | | | |
| Net assets, end of period (000 omitted) | | $ | 3,846 | | | $ | 3,460 | | | $ | 3 | 4 | | $ | 5 | 4 | | $ | 21 | 4 |
| Ratio of expenses to average net assets5 | | | 2.20 | % | | | 2.52 | % | | | 2.49 | % | | | 2.48 | % | | | 2.07 | % |
| Ratio of expenses to average net assets prior to fees waived5 | | | 2.42 | % | | | 2.52 | % | | | 2.49 | % | | | 2.48 | % | | | 2.07 | % |
| Ratio of net investment income to average net assets | | | 1.46 | % | | | 0.84 | % | | | 0.07 | % | | | 0.30 | % | | | 0.28 | % |
| Ratio of net investment income to average net assets prior to fees waived | | | 1.24 | % | | | 0.84 | % | | | 0.07 | % | | | 0.03 | % | | | 0.28 | % |
| Portfolio turnover | | | 48 | % | | | 116 | % | | | 52 | % | | | 44 | % | | | 21 | % |
| 1 | Calculated using average shares outstanding. |
| 2 | Total return is based on the change in net asset value of a share during the period and assumes reinvestment of dividends and distributions at net asset value and does not reflect the impact of a sales charge. |
| 3 | Total return during the period reflects waivers by the manager and/or distributor. Performance would have been lower had the waivers not been in effect. |
| 4 | Net assets reported in millions. |
| 5 | Expense ratios do not include expenses of any investment companies in which the Fund invests. |
See accompanying notes, which are an integral part of the financial statements.
Financial highlights
Delaware Ivy Natural Resources Fund Class I
Selected data for each share of the Fund outstanding throughout each period were as follows:
| | | Year ended |
| | | 3/31/23 | | 3/31/22 | | 3/31/21 | | 3/31/20 | | 3/31/19 |
| Net asset value, beginning of period | | $ | 17.72 | | | $ | 12.99 | | | $ | 8.18 | | | $ | 14.06 | | | $ | 15.50 | |
| | | | | | | | | | | | | | | | | | | | | |
| Income (loss) from investment operations: | | | | | | | | | | | | | | | | | | | | |
| Net investment income1 | | | 0.42 | | | | 0.31 | | | | 0.16 | | | | 0.21 | | | | 0.20 | |
| Net realized and unrealized gain (loss) | | | (1.25 | ) | | | 4.82 | | | | 4.73 | | | | (5.74 | ) | | | (1.57 | ) |
| Total from investment operations | | | (0.83 | ) | | | 5.13 | | | | 4.89 | | | | (5.53 | ) | | | (1.37 | ) |
| | | | | | | | | | | | | | | | | | | | | |
| Less dividends and distributions from: | | | | | | | | | | | | | | | | | | | | |
| Net investment income | | | (0.37 | ) | | | (0.40 | ) | | | (0.08 | ) | | | (0.35 | ) | | | (0.07 | ) |
| Total dividends and distributions | | | (0.37 | ) | | | (0.40 | ) | | | (0.08 | ) | | | (0.35 | ) | | | (0.07 | ) |
| | | | | | | | | | | | | | | | | | | | | |
| Net asset value, end of period | | $ | 16.52 | | | $ | 17.72 | | | $ | 12.99 | | | $ | 8.18 | | | $ | 14.06 | |
| | | | | | | | | | | | | | | | | | | | | |
| Total return2 | | | (4.73 | )%3 | | | 40.30 | % | | | 59.85 | % | | | (40.26 | )% | | | (8.86 | )% |
| | | | | | | | | | | | | | | | | | | | | |
| Ratios and supplemental data: | | | | | | | | | | | | | | | | | | | | |
| Net assets, end of period (000 omitted) | | $ | 76,474 | | | $ | 84,343 | | | $ | 71 | 4 | | $ | 54 | 4 | | $ | 106 | 4 |
| Ratio of expenses to average net assets5 | | | 1.11 | % | | | 1.21 | % | | | 1.20 | % | | | 1.19 | % | | | 1.10 | % |
| Ratio of expenses to average net assets prior to fees waived5 | | | 1.14 | % | | | 1.21 | % | | | 1.20 | % | | | 1.19 | % | | | 1.10 | % |
| Ratio of net investment income to average net assets | | | 2.52 | % | | | 2.17 | % | | | 1.46 | % | | | 1.63 | % | | | 1.30 | % |
| Ratio of net investment income to average net assets prior to fees waived | | | 2.49 | % | | | 2.17 | % | | | 1.46 | % | | | 1.63 | % | | | 1.30 | % |
| Portfolio turnover | | | 48 | % | | | 116 | % | | | 52 | % | | | 44 | % | | | 21 | % |
| 1 | Calculated using average shares outstanding. |
| 2 | Total return is based on the change in net asset value of a share during the period and assumes reinvestment of dividends and distributions at net asset value. |
| 3 | Total return during the period reflects waivers by the manager and/or distributor. Performance would have been lower had the waivers not been in effect. |
| 4 | Net assets reported in millions. |
| 5 | Expense ratios do not include expenses of any investment companies in which the Fund invests. |
See accompanying notes, which are an integral part of the financial statements.
Delaware Ivy Natural Resources Fund Class R
Selected data for each share of the Fund outstanding throughout each period were as follows:
| | | Year ended |
| | | 3/31/23 | | 3/31/22 | | 3/31/21 | | 3/31/20 | | 3/31/19 |
| Net asset value, beginning of period | | $ | 16.69 | | | $ | 12.25 | | | $ | 7.75 | | | $ | 13.26 | | | $ | 14.63 | |
| | | | | | | | | | | | | | | | | | | | | |
| Income (loss) from investment operations: | | | | | | | | | | | | | | | | | | | | |
| Net investment income1 | | | 0.32 | | | | 0.22 | | | | 0.09 | | | | 0.13 | | | | 0.10 | |
| Net realized and unrealized gain (loss) | | | (1.19 | ) | | | 4.54 | | | | 4.45 | | | | (5.42 | ) | | | (1.47 | ) |
| Total from investment operations | | | (0.87 | ) | | | 4.76 | | | | 4.54 | | | | (5.29 | ) | | | (1.37 | ) |
| | | | | | | | | | | | | | | | | | | | | |
| Less dividends and distributions from: | | | | | | | | | | | | | | | | | | | | |
| Net investment income | | | (0.30 | ) | | | (0.32 | ) | | | (0.04 | ) | | | (0.22 | ) | | | — | |
| Total dividends and distributions | | | (0.30 | ) | | | (0.32 | ) | | | (0.04 | ) | | | (0.22 | ) | | | — | |
| | | | | | | | | | | | | | | | | | | | | |
| Net asset value, end of period | | $ | 15.52 | | | $ | 16.69 | | | $ | 12.25 | | | $ | 7.75 | | | $ | 13.26 | |
| | | | | | | | | | | | | | | | | | | | | |
| Total return2 | | | (5.21 | )%3 | | | 39.60 | % | | | 58.67 | % | | | (40.53 | )% | | | (9.36 | )% |
| | | | | | | | | | | | | | | | | | | | | |
| Ratios and supplemental data: | | | | | | | | | | | | | | | | | | | | |
| Net assets, end of period (000 omitted) | | $ | 12,202 | | | $ | 14,145 | | | $ | 12 | 4 | | $ | 7 | 4 | | $ | 15 | 4 |
| Ratio of expenses to average net assets5 | | | 1.64 | % | | | 1.78 | % | | | 1.77 | % | | | 1.76 | % | | | 1.67 | % |
| Ratio of expenses to average net assets prior to fees waived5 | | | 1.66 | % | | | 1.78 | % | | | 1.77 | % | | | 1.76 | % | | | 1.67 | % |
| Ratio of net investment income to average net assets | | | 2.03 | % | | | 1.60 | % | | | 0.90 | % | | | 1.06 | % | | | 0.73 | % |
| Ratio of net investment income to average net assets prior to fees waived | | | 2.01 | % | | | 1.60 | % | | | 0.90 | % | | | 1.06 | % | | | 0.73 | % |
| Portfolio turnover | | | 48 | % | | | 116 | % | | | 52 | % | | | 44 | % | | | 21 | % |
| 1 | Calculated using average shares outstanding. |
| 2 | Total return is based on the change in net asset value of a share during the period and assumes reinvestment of dividends and distributions at net asset value. |
| 3 | Total return during the period reflects waivers by the manager and/or distributor. Performance would have been lower had the waivers not been in effect. |
| 4 | Net assets reported in millions. |
| 5 | Expense ratios do not include expenses of any investment companies in which the Fund invests. |
See accompanying notes, which are an integral part of the financial statements.
Financial highlights
Delaware Ivy Natural Resources Fund Class R6
Selected data for each share of the Fund outstanding throughout each period were as follows:
| | | Year ended |
| | | 3/31/23 | | 3/31/22 | | 3/31/21 | | 3/31/20 | | 3/31/19 |
| Net asset value, beginning of period | | $ | 17.79 | | | $ | 13.03 | | | $ | 8.21 | | | $ | 14.12 | | | $ | 15.58 | |
| | | | | | | | | | | | | | | | | | | | | |
| Income (loss) from investment operations: | | | | | | | | | | | | | | | | | | | | |
| Net investment income1 | | | 0.42 | | | | 0.36 | | | | 0.18 | | | | 0.23 | | | | 0.23 | |
| Net realized and unrealized gain (loss) | | | (1.24 | ) | | | 4.82 | | | | 4.73 | | | | (5.75 | ) | | | (1.59 | ) |
| Total from investment operations | | | (0.82 | ) | | | 5.18 | | | | 4.91 | | | | (5.52 | ) | | | (1.36 | ) |
| | | | | | | | | | | | | | | | | | | | | |
| Less dividends and distributions from: | | | | | | | | | | | | | | | | | | | | |
| Net investment income | | | (0.41 | ) | | | (0.42 | ) | | | (0.09 | ) | | | (0.39 | ) | | | (0.10 | ) |
| Total dividends and distributions | | | (0.41 | ) | | | (0.42 | ) | | | (0.09 | ) | | | (0.39 | ) | | | (0.10 | ) |
| | | | | | | | | | | | | | | | | | | | | |
| Net asset value, end of period | | $ | 16.56 | | | $ | 17.79 | | | $ | 13.03 | | | $ | 8.21 | | | $ | 14.12 | |
| | | | | | | | | | | | | | | | | | | | | |
| Total return2 | | | (4.63 | )%3 | | | 40.61 | % | | | 59.94 | % | | | (40.11 | )% | | | (8.71 | )% |
| | | | | | | | | | | | | | | | | | | | | |
| Ratios and supplemental data: | | | | | | | | | | | | | | | | | | | | |
| Net assets, end of period (000 omitted) | | $ | 4,213 | | | $ | 2,228 | | | $ | 1 | 4 | | $ | 3 | 4 | | $ | 5 | 4 |
| Ratio of expenses to average net assets5 | | | 1.03 | % | | | 1.04 | % | | | 0.99 | % | | | 1.02 | % | | | 0.93 | % |
| Ratio of expenses to average net assets prior to fees waived5 | | | 1.07 | % | | | 1.04 | % | | | 0.99 | % | | | 1.02 | % | | | 0.93 | % |
| Ratio of net investment income to average net assets | | | 2.49 | % | | | 2.46 | % | | | 1.64 | % | | | 1.81 | % | | | 1.48 | % |
| Ratio of net investment income to average net assets prior to fees waived | | | 2.45 | % | | | 2.46 | % | | | 1.64 | % | | | 1.81 | % | | | 1.48 | % |
| Portfolio turnover | | | 48 | % | | | 116 | % | | | 52 | % | | | 44 | % | | | 21 | % |
| 1 | Calculated using average shares outstanding. |
| 2 | Total return is based on the change in net asset value of a share during the period and assumes reinvestment of dividends and distributions at net asset value. |
| 3 | Total return during the period reflects waivers by the manager and/or distributor. Performance would have been lower had the waivers not been in effect. |
| 4 | Net assets reported in millions. |
| 5 | Expense ratios do not include expenses of any investment companies in which the Fund invests. |
See accompanying notes, which are an integral part of the financial statements.
Delaware Ivy Natural Resources Fund Class Y
Selected data for each share of the Fund outstanding throughout each period were as follows:
| | | Year ended |
| | | 3/31/23 | | 3/31/22 | | 3/31/21 | | 3/31/20 | | 3/31/19 |
| Net asset value, beginning of period | | $ | 17.38 | | | $ | 12.74 | | | $ | 8.04 | | | $ | 13.79 | | | $ | 15.21 | |
| | | | | | | | | | | | | | | | | | | | | |
| Income (loss) from investment operations: | | | | | | | | | | | | | | | | | | | | |
| Net investment income1 | | | 0.38 | | | | 0.28 | | | | 0.13 | | | | 0.17 | | | | 0.16 | |
| Net realized and unrealized gain (loss) | | | (1.24 | ) | | | 4.73 | | | | 4.63 | | | | (5.63 | ) | | | (1.54 | ) |
| Total from investment operations | | | (0.86 | ) | | | 5.01 | | | | 4.76 | | | | (5.46 | ) | | | (1.38 | ) |
| | | | | | | | | | | | | | | | | | | | | |
| Less dividends and distributions from: | | | | | | | | | | | | | | | | | | | | |
| Net investment income | | | (0.33 | ) | | | (0.37 | ) | | | (0.06 | ) | | | (0.29 | ) | | | (0.04 | ) |
| Total dividends and distributions | | | (0.33 | ) | | | (0.37 | ) | | | (0.06 | ) | | | (0.29 | ) | | | (0.04 | ) |
| | | | | | | | | | | | | | | | | | | | | |
| Net asset value, end of period | | $ | 16.19 | | | $ | 17.38 | | | $ | 12.74 | | | $ | 8.04 | | | $ | 13.79 | |
| | | | | | | | | | | | | | | | | | | | | |
| Total return2 | | | (4.95 | )%3 | | | 40.08 | % | | | 59.33 | % | | | (40.40 | )% | | | (9.03 | )% |
| | | | | | | | | | | | | | | | | | | | | |
| Ratios and supplemental data: | | | | | | | | | | | | | | | | | | | | |
| Net assets, end of period (000 omitted) | | $ | 12,632 | | | $ | 14,348 | | | $ | 11 | 4 | | $ | 8 | 4 | | $ | 18 | 4 |
| Ratio of expenses to average net assets5 | | | 1.35 | % | | | 1.42 | % | | | 1.42 | % | | | 1.42 | % | | | 1.33 | % |
| Ratio of expenses to average net assets prior to fees waived5 | | | 1.38 | % | | | 1.42 | % | | | 1.42 | % | | | 1.42 | % | | | 1.33 | % |
| Ratio of net investment income to average net assets | | | 2.27 | % | | | 1.97 | % | | | 1.23 | % | | | 1.39 | % | | | 1.09 | % |
| Ratio of net investment income to average net assets prior to fees waived | | | 2.24 | % | | | 1.97 | % | | | 1.23 | % | | | 1.39 | % | | | 1.09 | % |
| Portfolio turnover | | | 48 | % | | | 116 | % | | | 52 | % | | | 44 | % | | | 21 | % |
| 1 | Calculated using average shares outstanding. |
| 2 | Total return is based on the change in net asset value of a share during the period and assumes reinvestment of dividends and distributions at net asset value. |
| 3 | Total return during the period reflects waivers by the manager and/or distributor. Performance would have been lower had the waivers not been in effect. |
| 4 | Net assets reported in millions. |
| 5 | Expense ratios do not include expenses of any investment companies in which the Fund invests. |
See accompanying notes, which are an integral part of the financial statements.
Financial highlights
Delaware Ivy Science and Technology Fund Class A
Selected data for each share of the Fund outstanding throughout each period were as follows:
| | | Year ended |
| | | 3/31/23 | | 3/31/22 | | 3/31/21 | | 3/31/20 | | 3/31/19 |
| Net asset value, beginning of period | | $ | 63.48 | | | $ | 92.04 | | | $ | 59.85 | | | $ | 65.00 | | | $ | 65.33 | |
| | | | | | | | | | | | | | | | | | | | | |
| Income (loss) from investment operations: | | | | | | | | | | | | | | | | | | | | |
| Net investment loss1 | | | (0.24 | ) | | | (0.66 | ) | | | (0.55 | ) | | | (0.38 | ) | | | (0.30 | ) |
| Net realized and unrealized gain (loss) | | | (8.49 | ) | | | 2.73 | | | | 40.68 | | | | 3.45 | | | | 7.42 | |
| Total from investment operations | | | (8.73 | ) | | | 2.07 | | | | 40.13 | | | | 3.07 | | | | 7.12 | |
| | | | | | | | | | | | | | | | | | | | | |
| Less dividends and distributions from: | | | | | | | | | | | | | | | | | | | | |
| Net realized gain | | | (12.37 | ) | | | (30.63 | ) | | | (7.94 | ) | | | (8.22 | ) | | | (7.45 | ) |
| Total dividends and distributions | | | (12.37 | ) | | | (30.63 | ) | | | (7.94 | ) | | | (8.22 | ) | | | (7.45 | ) |
| | | | | | | | | | | | | | | | | | | | | |
| Net asset value, end of period | | $ | 42.38 | | | $ | 63.48 | | | $ | 92.04 | | | $ | 59.85 | | | $ | 65.00 | |
| | | | | | | | | | | | | | | | | | | | | |
| Total return2 | | | (12.32 | )% | | | (0.21 | )% | | | 67.65 | % | | | 2.98 | % | | | 12.63 | % |
| | | | | | | | | | | | | | | | | | | | | |
| Ratios and supplemental data: | | | | | | | | | | | | | | | | | | | | |
| Net assets, end of period (000 omitted) | | $ | 3,186,208 | | | $ | 4,958,005 | | | $ | 5,696 | 3 | | $ | 3,626 | 3 | | $ | 3,956 | 3 |
| Ratio of expenses to average net assets4 | | | 1.21 | % | | | 1.13 | % | | | 1.14 | % | | | 1.18 | % | | | 1.20 | % |
| Ratio of net investment loss to average net assets | | | (0.51 | )% | | | (0.76 | )% | | | (0.66 | )% | | | (0.54 | )% | | | (0.45 | )% |
| Portfolio turnover | | | 51 | % | | | 53 | % | | | 9 | % | | | 23 | % | | | 14 | % |
| 1 | Calculated using average shares outstanding. |
| 2 | Total return is based on the change in net asset value of a share during the period and assumes reinvestment of dividends and distributions at net asset value and does not reflect the impact of a sales charge. |
| 3 | Net assets reported in millions. |
| 4 | Expense ratios do not include expenses of any investment companies in which the Fund invests. |
See accompanying notes, which are an integral part of the financial statements.
Delaware Ivy Science and Technology Fund Class C
Selected data for each share of the Fund outstanding throughout each period were as follows:
| | | Year ended |
| | | 3/31/23 | | 3/31/22 | | 3/31/21 | | 3/31/20 | | 3/31/19 |
| Net asset value, beginning of period | | $ | 43.75 | | | $ | 72.44 | | | $ | 48.52 | | | $ | 54.26 | | | $ | 56.20 | |
| | | | | | | | | | | | | | | | | | | | | |
| Income (loss) from investment operations: | | | | | | | | | | | | | | | | | | | | |
| Net investment loss1 | | | (0.46 | ) | | | (1.04 | ) | | | (0.95 | ) | | | (0.76 | ) | | | (0.67 | ) |
| Net realized and unrealized gain (loss) | | | (6.16 | ) | | | 2.62 | | | | 32.81 | | | | 3.07 | | | | 6.18 | |
| Total from investment operations | | | (6.62 | ) | | | 1.58 | | | | 31.86 | | | | 2.31 | | | | 5.51 | |
| | | | | | | | | | | | | | | | | | | | | |
| Less dividends and distributions from: | | | | | | | | | | | | | | | | | | | | |
| Net realized gain | | | (12.37 | ) | | | (30.27 | ) | | | (7.94 | ) | | | (8.05 | ) | | | (7.45 | ) |
| Total dividends and distributions | | | (12.37 | ) | | | (30.27 | ) | | | (7.94 | ) | | | (8.05 | ) | | | (7.45 | ) |
| | | | | | | | | | | | | | | | | | | | | |
| Net asset value, end of period | | $ | 24.76 | | | $ | 43.75 | | | $ | 72.44 | | | $ | 48.52 | | | $ | 54.26 | |
| | | | | | | | | | | | | | | | | | | | | |
| Total return2 | | | (13.14 | )% | | | (1.00 | )% | | | 66.37 | % | | | 2.17 | % | | | 11.79 | % |
| | | | | | | | | | | | | | | | | | | | | |
| Ratios and supplemental data: | | | | | | | | | | | | | | | | | | | | |
| Net assets, end of period (000 omitted) | | $ | 109,544 | | | $ | 237,610 | | | $ | 413 | 3 | | $ | 407 | 3 | | $ | 532 | 3 |
| Ratio of expenses to average net assets4 | | | 2.14 | % | | | 1.92 | % | | | 1.92 | % | | | 1.95 | % | | | 1.94 | % |
| Ratio of net investment loss to average net assets | | | (1.45 | )% | | | (1.56 | )% | | | (1.45 | )% | | | (1.31 | )% | | | (1.18 | )% |
| Portfolio turnover | | | 51 | % | | | 53 | % | | | 9 | % | | | 23 | % | | | 14 | % |
| 1 | Calculated using average shares outstanding. |
| 2 | Total return is based on the change in net asset value of a share during the period and assumes reinvestment of dividends and distributions at net asset value and does not reflect the impact of a sales charge. |
| 3 | Net assets reported in millions. |
| 4 | Expense ratios do not include expenses of any investment companies in which the Fund invests. |
See accompanying notes, which are an integral part of the financial statements.
Financial highlights
Delaware Ivy Science and Technology Fund Class I
Selected data for each share of the Fund outstanding throughout each period were as follows:
| | | Year ended |
| | | 3/31/23 | | 3/31/22 | | 3/31/21 | | 3/31/20 | | 3/31/19 |
| Net asset value, beginning of period | | $ | 76.68 | | | $ | 105.32 | | | $ | 67.65 | | | $ | 72.51 | | | $ | 71.85 | |
| | | | | | | | | | | | | | | | | | | | | |
| Income (loss) from investment operations: | | | | | | | | | | | | | | | | | | | | |
| Net investment loss1 | | | (0.17 | ) | | | (0.60 | ) | | | (0.45 | ) | | | (0.27 | ) | | | (0.17 | ) |
| Net realized and unrealized gain (loss) | | | (10.05 | ) | | | 2.83 | | | | 46.06 | | | | 3.71 | | | | 8.28 | |
| Total from investment operations | | | (10.22 | ) | | | 2.23 | | | | 45.61 | | | | 3.44 | | | | 8.11 | |
| | | | | | | | | | | | | | | | | | | | | |
| Less dividends and distributions from: | | | | | | | | | | | | | | | | | | | | |
| Net realized gain | | | (12.37 | ) | | | (30.87 | ) | | | (7.94 | ) | | | (8.30 | ) | | | (7.45 | ) |
| Total dividends and distributions | | | (12.37 | ) | | | (30.87 | ) | | | (7.94 | ) | | | (8.30 | ) | | | (7.45 | ) |
| | | | | | | | | | | | | | | | | | | | | |
| Net asset value, end of period | | $ | 54.09 | | | $ | 76.68 | | | $ | 105.32 | | | $ | 67.65 | | | $ | 72.51 | |
| | | | | | | | | | | | | | | | | | | | | |
| Total return2 | | | (12.14 | )% | | | (0.04 | )% | | | 67.96 | % | | | 3.17 | % | | | 12.88 | % |
| | | | | | | | | | | | | | | | | | | | | |
| Ratios and supplemental data: | | | | | | | | | | | | | | | | | | | | |
| Net assets, end of period (000 omitted) | | $ | 1,281,422 | | | $ | 2,354,813 | | | $ | 2,878 | 3 | | $ | 1,938 | 3 | | $ | 2,203 | 3 |
| Ratio of expenses to average net assets4 | | | 0.99 | % | | | 0.96 | % | | | 0.96 | % | | | 0.98 | % | | | 0.98 | % |
| Ratio of net investment loss to average net assets | | | (0.29 | )% | | | (0.59 | )% | | | (0.48 | )% | | | (0.34 | )% | | | (0.23 | )% |
| Portfolio turnover | | | 51 | % | | | 53 | % | | | 9 | % | | | 23 | % | | | 14 | % |
| 1 | Calculated using average shares outstanding. |
| 2 | Total return is based on the change in net asset value of a share during the period and assumes reinvestment of dividends and distributions at net asset value. |
| 3 | Net assets reported in millions. |
| 4 | Expense ratios do not include expenses of any investment companies in which the Fund invests. |
See accompanying notes, which are an integral part of the financial statements.
Delaware Ivy Science and Technology Fund Class R
Selected data for each share of the Fund outstanding throughout each period were as follows:
| | | Year ended |
| | | 3/31/23 | | 3/31/22 | | 3/31/21 | | 3/31/20 | | 3/31/19 |
| Net asset value, beginning of period | | $ | 59.21 | | | $ | 87.86 | | | $ | 57.58 | | | $ | 62.89 | | | $ | 63.68 | |
| | | | | | | | | | | | | | | | | | | | | |
| Income (loss) from investment operations: | | | | | | | | | | | | | | | | | | | | |
| Net investment loss1 | | | (0.38 | ) | | | (0.97 | ) | | | (0.85 | ) | | | (0.63 | ) | | | (0.52 | ) |
| Net realized and unrealized gain (loss) | | | (8.00 | ) | | | 2.69 | | | | 39.07 | | | | 3.37 | | | | 7.18 | |
| Total from investment operations | | | (8.38 | ) | | | 1.72 | | | | 38.22 | | | | 2.74 | | | | 6.66 | |
| | | | | | | | | | | | | | | | | | | | | |
| Less dividends and distributions from: | | | | | | | | | | | | | | | | | | | | |
| Net realized gain | | | (12.37 | ) | | | (30.37 | ) | | | (7.94 | ) | | | (8.05 | ) | | | (7.45 | ) |
| Total dividends and distributions | | | (12.37 | ) | | | (30.37 | ) | | | (7.94 | ) | | | (8.05 | ) | | | (7.45 | ) |
| | | | | | | | | | | | | | | | | | | | | |
| Net asset value, end of period | | $ | 38.46 | | | $ | 59.21 | | | $ | 87.86 | | | $ | 57.58 | | | $ | 62.89 | |
| | | | | | | | | | | | | | | | | | | | | |
| Total return2 | | | (12.65 | )% | | | (0.63 | )% | | | 66.99 | % | | | 2.57 | % | | | 12.23 | % |
| | | | | | | | | | | | | | | | | | | | | |
| Ratios and supplemental data: | | | | | | | | | | | | | | | | | | | | |
| Net assets, end of period (000 omitted) | | $ | 94,005 | | | $ | 120,945 | | | $ | 151 | 3 | | $ | 110 | 3 | | $ | 127 | 3 |
| Ratio of expenses to average net assets4 | | | 1.57 | % | | | 1.55 | % | | | 1.55 | % | | | 1.57 | % | | | 1.56 | % |
| Ratio of net investment loss to average net assets | | | (0.86 | )% | | | (1.18 | )% | | | (1.08 | )% | | | (0.93 | )% | | | (0.81 | )% |
| Portfolio turnover | | | 51 | % | | | 53 | % | | | 9 | % | | | 23 | % | | | 14 | % |
| 1 | Calculated using average shares outstanding. |
| 2 | Total return is based on the change in net asset value of a share during the period and assumes reinvestment of dividends and distributions at net asset value. |
| 3 | Net assets reported in millions. |
| 4 | Expense ratios do not include expenses of any investment companies in which the Fund invests. |
See accompanying notes, which are an integral part of the financial statements.
Financial highlights
Delaware Ivy Science and Technology Fund Class R6
Selected data for each share of the Fund outstanding throughout each period were as follows:
| | | Year ended |
| | | 3/31/23 | | 3/31/22 | | 3/31/21 | | 3/31/20 | | 3/31/19 |
| Net asset value, beginning of period | | $ | 77.75 | | | $ | 106.48 | | | $ | 68.24 | | | $ | 73.03 | | | $ | 72.20 | |
| | | | | | | | | | | | | | | | | | | | | |
| Income (loss) from investment operations: | | | | | | | | | | | | | | | | | | | | |
| Net investment loss1 | | | (0.09 | ) | | | (0.45 | ) | | | (0.32 | ) | | | (0.15 | ) | | | (0.04 | ) |
| Net realized and unrealized gain (loss) | | | (10.18 | ) | | | 2.84 | | | | 46.50 | | | | 3.75 | | | | 8.32 | |
| Total from investment operations | | | (10.27 | ) | | | 2.39 | | | | 46.18 | | | | 3.60 | | | | 8.28 | |
| | | | | | | | | | | | | | | | | | | | | |
| Less dividends and distributions from: | | | | | | | | | | | | | | | | | | | | |
| Net realized gain | | | (12.37 | ) | | | (31.12 | ) | | | (7.94 | ) | | | (8.39 | ) | | | (7.45 | ) |
| Total dividends and distributions | | | (12.37 | ) | | | (31.12 | ) | | | (7.94 | ) | | | (8.39 | ) | | | (7.45 | ) |
| | | | | | | | | | | | | | | | | | | | | |
| Net asset value, end of period | | $ | 55.11 | | | $ | 77.75 | | | $ | 106.48 | | | $ | 68.24 | | | $ | 73.03 | |
| | | | | | | | | | | | | | | | | | | | | |
| Total return2 | | | (12.02 | )% | | | 0.10 | % | | | 68.22 | % | | | 3.34 | % | | | 13.07 | % |
| | | | | | | | | | | | | | | | | | | | | |
| Ratios and supplemental data: | | | | | | | | | | | | | | | | | | | | |
| Net assets, end of period (000 omitted) | | $ | 108,424 | | | $ | 173,276 | | | $ | 192 | 3 | | $ | 96 | 3 | | $ | 101 | 3 |
| Ratio of expenses to average net assets4 | | | 0.86 | % | | | 0.81 | % | | | 0.81 | % | | | 0.83 | % | | | 0.82 | % |
| Ratio of net investment loss to average net assets | | | (0.15 | )% | | | (0.44 | )% | | | (0.33 | )% | | | (0.20 | )% | | | (0.05 | )% |
| Portfolio turnover | | | 51 | % | | | 53 | % | | | 9 | % | | | 23 | % | | | 14 | % |
| 1 | Calculated using average shares outstanding. |
| 2 | Total return is based on the change in net asset value of a share during the period and assumes reinvestment of dividends and distributions at net asset value. |
| 3 | Net assets reported in millions. |
| 4 | Expense ratios do not include expenses of any investment companies in which the Fund invests. |
See accompanying notes, which are an integral part of the financial statements.
Delaware Ivy Science and Technology Fund Class Y
Selected data for each share of the Fund outstanding throughout each period were as follows:
| | | Year ended |
| | | 3/31/23 | | 3/31/22 | | 3/31/21 | | 3/31/20 | | 3/31/19 |
| Net asset value, beginning of period | | $ | 70.42 | | | $ | 98.99 | | | $ | 64.00 | | | $ | 69.01 | | | $ | 68.90 | |
| | | | | | | | | | | | | | | | | | | | | |
| Income (loss) from investment operations: | | | | | | | | | | | | | | | | | | | | |
| Net investment loss1 | | | (0.28 | ) | | | (0.74 | ) | | | (0.58 | ) | | | (0.40 | ) | | | (0.31 | ) |
| Net realized and unrealized gain (loss) | | | (9.32 | ) | | | 2.79 | | | | 43.51 | | | | 3.60 | | | | 7.87 | |
| Total from investment operations | | | (9.60 | ) | | | 2.05 | | | | 42.93 | | | | 3.20 | | | | 7.56 | |
| | | | | | | | | | | | | | | | | | | | | |
| Less dividends and distributions from: | | | | | | | | | | | | | | | | | | | | |
| Net realized gain | | | (12.37 | ) | | | (30.62 | ) | | | (7.94 | ) | | | (8.21 | ) | | | (7.45 | ) |
| Total dividends and distributions | | | (12.37 | ) | | | (30.62 | ) | | | (7.94 | ) | | | (8.21 | ) | | | (7.45 | ) |
| | | | | | | | | | | | | | | | | | | | | |
| Net asset value, end of period | | $ | 48.45 | | | $ | 70.42 | | | $ | 98.99 | | | $ | 64.00 | | | $ | 69.01 | |
| | | | | | | | | | | | | | | | | | | | | |
| Total return2 | | | (12.34 | )% | | | (0.22 | )%3 | | | 67.64 | %3 | | | 2.98 | %3 | | | 12.64 | %3 |
| | | | | | | | | | | | | | | | | | | | | |
| Ratios and supplemental data: | | | | | | | | | | | | | | | | | | | | |
| Net assets, end of period (000 omitted) | | $ | 229,962 | | | $ | 351,136 | | | $ | 455 | 4 | | $ | 340 | 4 | | $ | 442 | 4 |
| Ratio of expenses to average net assets5 | | | 1.23 | % | | | 1.14 | % | | | 1.14 | % | | | 1.18 | % | | | 1.20 | % |
| Ratio of expenses to average net assets prior to fees waived5 | | | 1.23 | % | | | 1.20 | % | | | 1.20 | % | | | 1.22 | % | | | 1.21 | % |
| Ratio of net investment loss to average net assets | | | (0.53 | )% | | | (0.78 | )% | | | (0.66 | )% | | | (0.54 | )% | | | (0.44 | )% |
| Ratio of net investment loss to average net assets prior to fees waived | | | (0.53 | )% | | | (0.84 | )% | | | (0.72 | )% | | | (0.58 | )% | | | (0.45 | )% |
| Portfolio turnover | | | 51 | % | | | 53 | % | | | 9 | % | | | 23 | % | | | 14 | % |
| 1 | Calculated using average shares outstanding. |
| 2 | Total return is based on the change in net asset value of a share during the period and assumes reinvestment of dividends and distributions at net asset value. |
| 3 | Total return during the period reflects waivers by the manager and/or distributor. Performance would have been lower had the waivers not been in effect. |
| 4 | Net assets reported in millions. |
| 5 | Expense ratios do not include expenses of any investment companies in which the Fund invests. |
See accompanying notes, which are an integral part of the financial statements.
Financial highlights
Delaware Real Estate Securities Fund Class A
Selected data for each share of the Fund outstanding throughout each period were as follows:
| | | Year ended |
| | | 3/31/23 | | 3/31/22 | | 3/31/21 | | 3/31/20 | | 3/31/19 |
| Net asset value, beginning of period | | $ | 27.72 | | | $ | 24.82 | | | $ | 18.83 | | | $ | 24.45 | | | $ | 22.41 | |
| | | | | | | | | | | | | | | | | | | | | |
| Income (loss) from investment operations: | | | | | | | | | | | | | | | | | | | | |
| Net investment income1 | | | 0.30 | | | | 0.21 | | | | 0.17 | | | | 0.30 | | | | 0.30 | |
| Net realized and unrealized gain (loss) | | | (5.87 | ) | | | 6.44 | | | | 6.22 | | | | (3.61 | ) | | | 3.35 | |
| Total from investment operations | | | (5.57 | ) | | | 6.65 | | | | 6.39 | | | | (3.31 | ) | | | 3.65 | |
| | | | | | | | | | | | | | | | | | | | | |
| Less dividends and distributions from: | | | | | | | | | | | | | | | | | | | | |
| Net investment income | | | (0.40 | ) | | | (0.14 | ) | | | (0.25 | ) | | | (0.32 | ) | | | (0.33 | ) |
| Net realized gain | | | (5.32 | ) | | | (3.61 | ) | | | (0.15 | ) | | | (1.99 | ) | | | (1.28 | ) |
| Total dividends and distributions | | | (5.72 | ) | | | (3.75 | ) | | | (0.40 | ) | | | (2.31 | ) | | | (1.61 | ) |
| | | | | | | | | | | | | | | | | | | | | |
| Net asset value, end of period | | $ | 16.43 | | | $ | 27.72 | | | $ | 24.82 | | | $ | 18.83 | | | $ | 24.45 | |
| | | | | | | | | | | | | | | | | | | | | |
| Total return2 | | | (20.26 | )%3 | | | 26.90 | % | | | 34.24 | %3 | | | (15.35 | )%3 | | | 16.83 | %3 |
| | | | | | | | | | | | | | | | | | | | | |
| Ratios and supplemental data: | | | | | | | | | | | | | | | | | | | | |
| Net assets, end of period (000 omitted) | | $ | 86,795 | | | $ | 143,562 | | | $ | 130 | 4 | | $ | 122 | 4 | | $ | 173 | 4 |
| Ratio of expenses to average net assets5 | | | 1.29 | % | | | 1.38 | % | | | 1.45 | % | | | 1.43 | % | | | 1.44 | % |
| Ratio of expenses to average net assets prior to fees waived5 | | | 1.57 | % | | | 1.38 | % | | | 1.55 | % | | | 1.53 | % | | | 1.54 | % |
| Ratio of net investment income to average net assets | | | 1.39 | % | | | 0.74 | % | | | 0.79 | % | | | 1.21 | % | | | 1.29 | % |
| Ratio of net investment income to average net assets prior to | | | | | | | | | | | | | | | | | | | | |
| fees waived | | | 1.11 | % | | | 0.74 | % | | | 0.69 | % | | | 1.11 | % | | | 1.19 | % |
| Portfolio turnover | | | 57 | % | | | 43 | % | | | 76 | % | | | 59 | % | | | 69 | % |
| 1 | Calculated using average shares outstanding. |
| 2 | Total return is based on the change in net asset value of a share during the period and assumes reinvestment of dividends and distributions at net asset value and does not reflect the impact of a sales charge. |
| 3 | Total return during the period reflects waivers by the manager and/or distributor. Performance would have been lower had the waivers not been in effect. |
| 4 | Net assets reported in millions. |
| 5 | Expense ratios do not include expenses of any investment companies in which the Fund invests. |
See accompanying notes, which are an integral part of the financial statements.
Delaware Real Estate Securities Fund Class C
Selected data for each share of the Fund outstanding throughout each period were as follows:
| | | Year ended |
| | | 3/31/23 | | 3/31/22 | | 3/31/21 | | 3/31/20 | | 3/31/19 |
| Net asset value, beginning of period | | $ | 26.73 | | | $ | 24.11 | | | $ | 18.32 | | | $ | 23.86 | | | $ | 21.90 | |
| | | | | | | | | | | | | | | | | | | | | |
| Income (loss) from investment operations: | | | | | | | | | | | | | | | | | | | | |
| Net investment income (loss)1 | | | 0.10 | | | | (0.07 | ) | | | 0.06 | | | | 0.12 | | | | 0.17 | |
| Net realized and unrealized gain (loss) | | | (5.66 | ) | | | 6.27 | | | | 5.96 | | | | (3.52 | ) | | | 3.21 | |
| Total from investment operations | | | (5.56 | ) | | | 6.20 | | | | 6.02 | | | | (3.40 | ) | | | 3.38 | |
| | | | | | | | | | | | | | | | | | | | | |
| Less dividends and distributions from: | | | | | | | | | | | | | | | | | | | | |
| Net investment income | | | (0.25 | ) | | | — | | | | (0.08 | ) | | | (0.15 | ) | | | (0.14 | ) |
| Net realized gain | | | (5.32 | ) | | | (3.58 | ) | | | (0.15 | ) | | | (1.99 | ) | | | (1.28 | ) |
| Total dividends and distributions | | | (5.57 | ) | | | (3.58 | ) | | | (0.23 | ) | | | (2.14 | ) | | | (1.42 | ) |
| | | | | | | | | | | | | | | | | | | | | |
| Net asset value, end of period | | $ | 15.60 | | | $ | 26.73 | | | $ | 24.11 | | | $ | 18.32 | | | $ | 23.86 | |
| | | | | | | | | | | | | | | | | | | | | |
| Total return2 | | | (21.00 | )%3 | | | 25.74 | % | | | 33.03 | %3 | | | (15.99 | )%3 | | | 15.90 | %3 |
| | | | | | | | | | | | | | | | | | | | | |
| Ratios and supplemental data: | | | | | | | | | | | | | | | | | | | | |
| Net assets, end of period (000 omitted) | | $ | 815 | | | $ | 1,707 | | | $ | 2 | 4 | | $ | 3 | 4 | | $ | 6 | 4 |
| Ratio of expenses to average net assets5 | | | 2.19 | % | | | 2.33 | % | | | 2.33 | % | | | 2.25 | % | | | 2.19 | % |
| Ratio of expenses to average net assets prior to fees waived5 | | | 2.76 | % | | | 2.33 | % | | | 2.43 | % | | | 2.35 | % | | | 2.29 | % |
| Ratio of net investment income (loss) to average net assets | | | 0.49 | % | | | (0.24 | )% | | | 0.27 | % | | | 0.50 | % | | | 0.74 | % |
| Ratio of net investment income (loss) to average net assets prior to fees waived | | | (0.08 | )% | | | (0.24 | )% | | | 0.17 | % | | | 0.40 | % | | | 0.64 | % |
| Portfolio turnover | | | 57 | % | | | 43 | % | | | 76 | % | | | 59 | % | | | 69 | % |
| 1 | Calculated using average shares outstanding. |
| 2 | Total return is based on the change in net asset value of a share during the period and assumes reinvestment of dividends and distributions at net asset value and does not reflect the impact of a sales charge. |
| 3 | Total return during the period reflects waivers by the manager and/or distributor. Performance would have been lower had the waivers not been in effect. |
| 4 | Net assets reported in millions. |
| 5 | Expense ratios do not include expenses of any investment companies in which the Fund invests. |
See accompanying notes, which are an integral part of the financial statements.
Financial highlights
Delaware Real Estate Securities Fund Class I
Selected data for each share of the Fund outstanding throughout each period were as follows:
| | | Year ended |
| | | 3/31/23 | | 3/31/22 | | 3/31/21 | | 3/31/20 | | 3/31/19 |
| Net asset value, beginning of period | | $ | 28.05 | | | $ | 25.05 | | | $ | 18.99 | | | $ | 24.63 | | | $ | 22.57 | |
| | | | | | | | | | | | | | | | | | | | | |
| Income (loss) from investment operations: | | | | | | | | | | | | | | | | | | | | |
| Net investment income1 | | | 0.38 | | | | 0.29 | | | | 0.25 | | | | 0.38 | | | | 0.39 | |
| Net realized and unrealized gain (loss) | | | (5.97 | ) | | | 6.52 | | | | 6.27 | | | | (3.62 | ) | | | 3.36 | |
| Total from investment operations | | | (5.59 | ) | | | 6.81 | | | | 6.52 | | | | (3.24 | ) | | | 3.75 | |
| | | | | | | | | | | | | | | | | | | | | |
| Less dividends and distributions from: | | | | | | | | | | | | | | | | | | | | |
| Net investment income | | | (0.44 | ) | | | (0.20 | ) | | | (0.31 | ) | | | (0.41 | ) | | | (0.41 | ) |
| Net realized gain | | | (5.32 | ) | | | (3.61 | ) | | | (0.15 | ) | | | (1.99 | ) | | | (1.28 | ) |
| Total dividends and distributions | | | (5.76 | ) | | | (3.81 | ) | | | (0.46 | ) | | | (2.40 | ) | | | (1.69 | ) |
| | | | | | | | | | | | | | | | | | | | | |
| Net asset value, end of period | | $ | 16.70 | | | $ | 28.05 | | | $ | 25.05 | | | $ | 18.99 | | | $ | 24.63 | |
| | | | | | | | | | | | | | | | | | | | | |
| Total return2 | | | (20.07 | )%3 | | | 27.32 | % | | | 34.68 | %3 | | | (15.01 | )%3 | | | 17.22 | %3 |
| | | | | | | | | | | | | | | | | | | | | |
| Ratios and supplemental data: | | | | | | | | | | | | | | | | | | | | |
| Net assets, end of period (000 omitted) | | $ | 64,516 | | | $ | 133,161 | | | $ | 127 | 4 | | $ | 121 | 4 | | $ | 160 | 4 |
| Ratio of expenses to average net assets5 | | | 1.00 | % | | | 1.09 | % | | | 1.08 | % | | | 1.08 | % | | | 1.07 | % |
| Ratio of expenses to average net assets prior to fees waived5 | | | 1.09 | % | | | 1.09 | % | | | 1.18 | % | | | 1.18 | % | | | 1.17 | % |
| Ratio of net investment income to average net assets | | | 1.74 | % | | | 1.01 | % | | | 1.15 | % | | | 1.54 | % | | | 1.65 | % |
| Ratio of net investment income to average net assets prior to fees waived | | | 1.65 | % | | | 1.01 | % | | | 1.05 | % | | | 1.44 | % | | | 1.55 | % |
| Portfolio turnover | | | 57 | % | | | 43 | % | | | 76 | % | | | 59 | % | | | 69 | % |
| 1 | Calculated using average shares outstanding. |
| 2 | Total return is based on the change in net asset value of a share during the period and assumes reinvestment of dividends and distributions at net asset value. |
| 3 | Total return during the period reflects waivers by the manager and/or distributor. Performance would have been lower had the waivers not been in effect. |
| 4 | Net assets reported in millions. |
| 5 | Expense ratios do not include expenses of any investment companies in which the Fund invests. |
See accompanying notes, which are an integral part of the financial statements.
Delaware Real Estate Securities Fund Class R
Selected data for each share of the Fund outstanding throughout each period were as follows:
| | | Year ended |
| | | 3/31/23 | | 3/31/22 | | 3/31/21 | | 3/31/20 | | 3/31/19 |
| Net asset value, beginning of period | | $ | 27.66 | | | $ | 24.78 | | | $ | 18.81 | | | $ | 24.42 | | | $ | 22.39 | |
| | | | | | | | | | | | | | | | | | | | | |
| Income (loss) from investment operations: | | | | | | | | | | | | | | | | | | | | |
| Net investment income1 | | | 0.20 | | | | 0.12 | | | | 0.13 | | | | 0.27 | | | | 0.25 | |
| Net realized and unrealized gain (loss) | | | (5.82 | ) | | | 6.44 | | | | 6.20 | | | | (3.62 | ) | | | 3.34 | |
| Total from investment operations | | | (5.62 | ) | | | 6.56 | | | | 6.33 | | | | (3.35 | ) | | | 3.59 | |
| | | | | | | | | | | | | | | | | | | | | |
| Less dividends and distributions from: | | | | | | | | | | | | | | | | | | | | |
| Net investment income | | | (0.36 | ) | | | (0.07 | ) | | | (0.21 | ) | | | (0.27 | ) | | | (0.28 | ) |
| Net realized gain | | | (5.32 | ) | | | (3.61 | ) | | | (0.15 | ) | | | (1.99 | ) | | | (1.28 | ) |
| Total dividends and distributions | | | (5.68 | ) | | | (3.68 | ) | | | (0.36 | ) | | | (2.26 | ) | | | (1.56 | ) |
| | | | | | | | | | | | | | | | | | | | | |
| Net asset value, end of period | | $ | 16.36 | | | $ | 27.66 | | | $ | 24.78 | | | $ | 18.81 | | | $ | 24.42 | |
| | | | | | | | | | | | | | | | | | | | | |
| Total return2 | | | (20.50 | )%3 | | | 26.55 | % | | | 33.88 | %3 | | | (15.51 | )%3 | | | 16.57 | %3 |
| | | | | | | | | | | | | | | | | | | | | |
| Ratios and supplemental data: | | | | | | | | | | | | | | | | | | | | |
| Net assets, end of period (000 omitted) | | $ | 497 | | | $ | 555 | | | $ | — | 4,5 | | $ | — | 4,5 | | $ | 1 | 4 |
| Ratio of expenses to average net assets6 | | | 1.54 | % | | | 1.69 | % | | | 1.67 | % | | | 1.69 | % | | | 1.64 | % |
| Ratio of expenses to average net assets prior to fees waived6 | | | 1.65 | % | | | 1.69 | % | | | 1.77 | % | | | 1.79 | % | | | 1.74 | % |
| Ratio of net investment income to average net assets | | | 0.93 | % | | | 0.42 | % | | | 0.61 | % | | | 1.07 | % | | | 1.05 | % |
| Ratio of net investment income to average net assets prior to fees waived | | | 0.82 | % | | | 0.42 | % | | | 0.51 | % | | | 0.97 | % | | | 0.95 | % |
| Portfolio turnover | | | 57 | % | | | 43 | % | | | 76 | % | | | 59 | % | | | 69 | % |
| 1 | Calculated using average shares outstanding. |
| 2 | Total return is based on the change in net asset value of a share during the period and assumes reinvestment of dividends and distributions at net asset value. |
| 3 | Total return during the period reflects waivers by the manager and/or distributor. Performance would have been lower had the waivers not been in effect. |
| 4 | Net assets reported in millions. |
| 5 | Rounds to less than $500 thousands. |
| 6 | Expense ratios do not include expenses of any investment companies in which the Fund invests. |
See accompanying notes, which are an integral part of the financial statements.
Financial highlights
Delaware Real Estate Securities Fund Class R6
Selected data for each share of the Fund outstanding throughout each period were as follows:
| | | Year ended |
| | | 3/31/23 | | 3/31/22 | | 3/31/21 | | 3/31/20 | | 3/31/19 |
| Net asset value, beginning of period | | $ | 28.10 | | | $ | 25.09 | | | $ | 19.02 | | | $ | 24.66 | | | $ | 22.59 | |
| | | | | | | | | | | | | | | | | | | | | |
| Income (loss) from investment operations: | | | | | | | | | | | | | | | | | | | | |
| Net investment income1 | | | 0.28 | | | | 0.36 | | | | 0.28 | | | | 0.43 | | | | 0.57 | |
| Net realized and unrealized gain (loss) | | | (5.86 | ) | | | 6.50 | | | | 6.28 | | | | (3.64 | ) | | | 3.23 | |
| Total from investment operations | | | (5.58 | ) | | | 6.86 | | | | 6.56 | | | | (3.21 | ) | | | 3.80 | |
| | | | | | | | | | | | | | | | | | | | | |
| Less dividends and distributions from: | | | | | | | | | | | | | | | | | | | | |
| Net investment income | | | (0.46 | ) | | | (0.24 | ) | | | (0.34 | ) | | | (0.44 | ) | | | (0.45 | ) |
| Net realized gain | | | (5.32 | ) | | | (3.61 | ) | | | (0.15 | ) | | | (1.99 | ) | | | (1.28 | ) |
| Total dividends and distributions | | | (5.78 | ) | | | (3.85 | ) | | | (0.49 | ) | | | (2.43 | ) | | | (1.73 | ) |
| | | | | | | | | | | | | | | | | | | | | |
| Net asset value, end of period | | $ | 16.74 | | | $ | 28.10 | | | $ | 25.09 | | | $ | 19.02 | | | $ | 24.66 | |
| | | | | | | | | | | | | | | | | | | | | |
| Total return2 | | | (19.99 | )%3 | | | 27.48 | % | | | 34.84 | %3 | | | (14.86 | )%3 | | | 17.42 | %3 |
| | | | | | | | | | | | | | | | | | | | | |
| Ratios and supplemental data: | | | | | | | | | | | | | | | | | | | | |
| Net assets, end of period (000 omitted) | | $ | 1,973 | | | $ | 1,112 | | | $ | 1 | 4 | | $ | — | 4,5 | | $ | 1 | 4 |
| Ratio of expenses to average net assets6 | | | 0.99 | % | | | 0.93 | % | | | 0.94 | % | | | 0.94 | % | | | 0.91 | % |
| Ratio of expenses to average net assets prior to fees waived6 | | | 1.06 | % | | | 0.93 | % | | | 1.04 | % | | | 1.04 | % | | | 1.01 | % |
| Ratio of net investment income to average net assets | | | 1.38 | % | | | 1.26 | % | | | 1.26 | % | | | 1.70 | % | | | 2.40 | % |
| Ratio of net investment income to average net assets prior to fees waived | | | 1.31 | % | | | 1.26 | % | | | 1.16 | % | | | 1.60 | % | | | 2.30 | % |
| Portfolio turnover | | | 57 | % | | | 43 | % | | | 76 | % | | | 59 | % | | | 69 | % |
| 1 | Calculated using average shares outstanding. |
| 2 | Total return is based on the change in net asset value of a share during the period and assumes reinvestment of dividends and distributions at net asset value. |
| 3 | Total return during the period reflects waivers by the manager and/or distributor. Performance would have been lower had the waivers not been in effect. |
| 4 | Net assets reported in millions. |
| 5 | Rounds to less than $500 thousands. |
| 6 | Expense ratios do not include expenses of any investment companies in which the Fund invests. |
See accompanying notes, which are an integral part of the financial statements.
Delaware Real Estate Securities Fund Class Y
Selected data for each share of the Fund outstanding throughout each period were as follows:
| | | Year ended |
| | | 3/31/23 | | 3/31/22 | | 3/31/21 | | 3/31/20 | | 3/31/19 |
| Net asset value, beginning of period | | $ | 27.79 | | | $ | 24.87 | | | $ | 18.86 | | | $ | 24.48 | | | $ | 22.44 | |
| | | | | | | | | | | | | | | | | | | | | |
| Income (loss) from investment operations: | | | | | | | | | | | | | | | | | | | | |
| Net investment income1 | | | 0.43 | | | | 0.23 | | | | 0.21 | | | | 0.33 | | | | 0.34 | |
| Net realized and unrealized gain (loss) | | | (6.02 | ) | | | 6.45 | | | | 6.23 | | | | (3.60 | ) | | | 3.34 | |
| Total from investment operations | | | (5.59 | ) | | | 6.68 | | | | 6.44 | | | | (3.27 | ) | | | 3.68 | |
| | | | | | | | | | | | | | | | | | | | | |
| Less dividends and distributions from: | | | | | | | | | | | | | | | | | | | | |
| Net investment income | | | (0.28 | ) | | | (0.15 | ) | | | (0.28 | ) | | | (0.36 | ) | | | (0.36 | ) |
| Net realized gain | | | (5.32 | ) | | | (3.61 | ) | | | (0.15 | ) | | | (1.99 | ) | | | (1.28 | ) |
| Total dividends and distributions | | | (5.60 | ) | | | (3.76 | ) | | | (0.43 | ) | | | (2.35 | ) | | | (1.64 | ) |
| | | | | | | | | | | | | | | | | | | | | |
| Net asset value, end of period | | $ | 16.60 | | | $ | 27.79 | | | $ | 24.87 | | | $ | 18.86 | | | $ | 24.48 | |
| | | | | | | | | | | | | | | | | | | | | |
| Total return2 | | | (20.27 | )%3 | | | 26.98 | % | | | 34.45 | %3 | | | (15.21 | )%3 | | | 16.99 | %3 |
| | | | | | | | | | | | | | | | | | | | | |
| Ratios and supplemental data: | | | | | | | | | | | | | | | | | | | | |
| Net assets, end of period (000 omitted) | | $ | 3,481 | | | $ | 90,376 | | | $ | 70 | 4 | | $ | 63 | 4 | | $ | 90 | 4 |
| Ratio of expenses to average net assets5 | | | 1.25 | % | | | 1.31 | % | | | 1.30 | % | | | 1.29 | % | | | 1.28 | % |
| Ratio of expenses to average net assets prior to fees waived5 | | | 1.29 | % | | | 1.31 | % | | | 1.40 | % | | | 1.39 | % | | | 1.38 | % |
| Ratio of net investment income to average net assets | | | 1.79 | % | | | 0.82 | % | | | 0.95 | % | | | 1.35 | % | | | 1.45 | % |
| Ratio of net investment income to average net assets prior to fees waived | | | 1.75 | % | | | 0.82 | % | | | 0.85 | % | | | 1.25 | % | | | 1.35 | % |
| Portfolio turnover | | | 57 | % | | | 43 | % | | | 76 | % | | | 59 | % | | | 69 | % |
| 1 | Calculated using average shares outstanding. |
| 2 | Total return is based on the change in net asset value of a share during the period and assumes reinvestment of dividends and distributions at net asset value. |
| 3 | Total return during the period reflects waivers by the manager and/or distributor. Performance would have been lower had the waivers not been in effect. |
| 4 | Net assets reported in millions. |
| 5 | Expense ratios do not include expenses of any investment companies in which the Fund invests. |
See accompanying notes, which are an integral part of the financial statements.
Notes to financial statements
Ivy Funds
March 31, 2023
Ivy Funds (Trust) is organized as a Delaware statutory trust and offers 39 series. These financial statements and the related notes pertain to 7 funds: Delaware Climate Solutions Fund (formerly, Delaware Ivy Energy Fund), Delaware Global Real Estate Fund (formerly, Delaware Ivy LaSalle Global Real Estate Fund), Delaware Ivy Asset Strategy Fund, Delaware Ivy Balanced Fund, Delaware Ivy Natural Resources Fund, Delaware Ivy Science and Technology Fund, and Delaware Real Estate Securities Fund (formerly, Delaware Ivy Securian Real Estate Securities Fund) (each a Fund, or collectively, the Funds). The Trust is an open-end investment company. Delaware Ivy Asset Strategy Fund, Delaware Ivy Balanced Fund, Delaware Ivy Natural Resources Fund, and Delaware Real Estate Securities Fund are considered diversified under the Investment Company Act of 1940, as amended (1940 Act). Delaware Climate Solutions Fund, Delaware Global Real Estate Fund, and Delaware Ivy Science and Technology Fund are considered nondiversified.
Each Fund offers Class A, Class C, Class I, Class R, Class R6, and Class Y shares. On June 13, 2022, all Class E shares were liquidated. Effective December 10, 2021, all remaining shares of Class B were converted to Class A shares. Class A shares are subject to an initial sales charge. If you are investing $1 million or more either as a lump sum or through one of the sales charge reduction features described in the prospectus, you may be eligible to buy Class A shares without a sales charge. However, if Delaware Distributors, L.P. (DDLP) or a predecessor distributor paid your financial intermediary a commission on your purchase that received a net asset value (NAV) breakpoint of Class A shares, for shares of the Funds purchased prior to July 1, 2021, you will have to pay a limited contingent deferred sales charge (Limited CDSC) of 1.00% if you redeem these shares within the first year after your purchase, or if DDLP paid your financial intermediary a commission on your purchase of $1 million or more of Class A shares that received an NAV breakpoint, for shares purchased on or after July 1, 2021 that are subject to a contingent deferred sales charge (CDSC), you will have to pay a Limited CDSC of 1.00% if you redeem these shares within the first 18 months after your purchase, unless a specific waiver of the Limited CDSC applies. Class C shares have no upfront sales charge, but are sold with a CDSC of 1.00%, which will be incurred if redeemed during the first 12 months. Class I, Class R, Class R6, and Class Y shares are not subject to a sales charge and are offered for sale exclusively to certain eligible investors. In addition, Class R6 shares do not pay any service fees, sub-accounting fees, and/or sub-transfer agency fees to any brokers, dealers, or other financial intermediaries.
1. Significant Accounting Policies
Each Fund follows accounting and reporting guidance under Financial Accounting Standards Board (FASB) Accounting Standards Codification Topic 946, Financial Services — Investment Companies. The following accounting policies are in accordance with US generally accepted accounting principles (US GAAP) and are consistently followed by the Funds.
Security Valuation — Equity securities and exchange-traded funds (ETFs), except those traded on the Nasdaq Stock Market LLC (Nasdaq), are valued at the last quoted sales price as of the time of the regular close of the New York Stock Exchange on the valuation date. Equity securities and ETFs traded on the Nasdaq are valued in accordance with the Nasdaq Official Closing Price, which may not be the last sales price. If, on a particular day, an equity security or ETF does not trade, the mean between the bid and the ask prices will be used, which approximates fair value. Equity securities listed on a foreign exchange are normally valued at the last quoted sales price on the valuation date. The fair value of bullion is at the last settlement price at the end of each day on the board of trade or exchange upon which they are traded. US government and agency securities are valued at the mean between the bid and the ask prices, which approximates fair value. Other debt securities, credit default swap (CDS) contracts and interest rate swap options contracts (swaptions) are valued based upon valuations provided by an independent pricing service or broker/counterparty and reviewed by management. To the extent current market prices are not available, the pricing service may take into account developments related to the specific security, as well as transactions in comparable securities. Valuations for fixed income securities utilize matrix systems, which reflect such factors as security prices, yields, maturities, and ratings, and are supplemented by dealer and exchange quotations. For asset-backed securities, collateralized mortgage obligations (CMOs), commercial mortgage securities, and US government agency mortgage securities, pricing vendors utilize matrix pricing which considers prepayment speed, attributes of the collateral, yield or price of bonds of comparable quality, coupon, maturity, and type as well as broker/dealer-supplied prices. Swap prices are derived using daily swap curves and models that incorporate a number of market data factors, such as discounted cash flows, trades, and values of the underlying reference instruments. Foreign currency exchange contracts and foreign cross currency exchange contracts are valued at the mean between the bid and the ask prices, which approximates fair value. Interpolated values are derived when the settlement date of the contract is an interim date for which quotations are not available. Futures contracts and options on futures contracts are valued at the daily quoted settlement prices. Exchange-traded options are valued at the last reported sale price or, if no sales are reported, at the mean between the last reported bid and the ask prices, which approximates fair value. Open-end investment companies, other than ETFs, are valued at their published NAV. Generally, other securities and assets for which market quotations are not readily available are valued at fair value as determined in good faith by each Fund’s valuation designee, Delaware Management Company (DMC). Subject to the oversight of the
Trust’s Board of Trustees (Board), DMC, as valuation designee, has adopted policies and procedures to fair value securities for which market quotations are not readily available consistent with the requirements of Rule 2a-5 under the 1940 Act. In determining whether market quotations are readily available or fair valuation will be used, various factors will be taken into consideration, such as market closures or suspension of trading in a security. Restricted securities and private placements are valued at fair value.
Federal and Foreign Income Taxes — No provision for federal income taxes has been made as each Fund intends to continue to qualify for federal income tax purposes as a regulated investment company under Subchapter M of the Internal Revenue Code of 1986, as amended, and make the requisite distributions to shareholders. Each Fund evaluates tax positions taken or expected to be taken in the course of preparing each Fund’s tax returns to determine whether the tax positions are “more-likely-than-not” of being sustained by the applicable tax authority. Tax positions not deemed to meet the “more-likely-than-not” threshold are recorded as a tax benefit or expense in the current year. Management has analyzed each Fund’s tax positions taken or expected to be taken on each Fund’s federal income tax returns through the year ended March 31, 2023, and for all open tax years (years ended March 31, 2020 - March 31, 2022), and has concluded that no provision for federal income tax is required in each Fund’s financial statements. In regard to foreign taxes only, each Fund has open tax years in certain foreign countries in which it invests that may date back to the inception of each Fund. If applicable, each Fund recognizes interest accrued on unrecognized tax benefits in interest expense and penalties in “Other” on the “Statements of operations.” During the year ended March 31, 2023, the Funds did not incur any interest or tax penalties.
Class Accounting — Investment income, common expenses, and realized and unrealized gain (loss) on investments are allocated to the various classes of each Fund on the basis of daily net assets of each class. Distribution expenses relating to a specific class are charged directly to that class. Class R6 shares will not be allocated any expenses related to service fees, sub-accounting fees, and/or sub-transfer agency fees paid to brokers, dealers, or other financial intermediaries.
Foreign Currency Transactions — Transactions denominated in foreign currencies are recorded at the prevailing exchange rates on the valuation date. The value of all assets and liabilities denominated in foreign currencies is translated daily into US dollars at the exchange rate of such currencies against the US dollar. Transaction gains or losses resulting from changes in exchange rates during the reporting period or upon settlement of the foreign currency transaction are reported in operations for the current period. The Funds generally bifurcate that portion of realized gains and losses on investments in debt securities which is due to changes in foreign exchange rates from that which is due to changes in market prices of debt securities. That portion of gains (losses), which is due to changes in foreign exchange rates, is included on the “Statements of operations” under “Net realized gain (loss) on foreign currencies.” For foreign equity securities, the realized gains and losses are included on the “Statements of operations” under “Net realized gain (loss) on investments.” The Funds report certain foreign currency related transactions as components of realized gains (losses) for financial reporting purposes, whereas such components are treated as ordinary income (loss) for federal income tax purposes.
Derivative Financial Instruments — The Funds may invest in various derivative financial instruments. These instruments are used to obtain exposure to a security, commodity, index, market, and/or other assets without owning or taking physical custody of securities, commodities and/ or other referenced assets or to manage market, equity, credit, interest rate, foreign currency exchange rate, commodity and/or other risks. Derivative financial instruments may give rise to a form of economic leverage and involve risks, including the imperfect correlation between the value of a derivative financial instrument and the underlying asset, possible default of the counterparty to the transaction or illiquidity of the instrument. Pursuant to Rule 18f-4 under the 1940 Act, among other things, the Funds must either use derivative financial instruments with embedded leverage in a limited manner or comply with an outer limit on fund leverage risk based on value-at-risk. The Funds’ successful use of a derivative financial instrument depends on the investment adviser’s ability to predict pertinent market movements accurately, which cannot be assured. The use of these instruments may result in losses greater than if they had not been used, may limit the amount of appreciation the Funds can realize on an investment and/or may result in lower distributions paid to shareholders. The Funds’ investments in these instruments, if any, are discussed in detail in the Notes to financial statements.
Segregation and Collateralizations — In certain cases, based on requirements and agreements with certain exchanges and third-party broker-dealers, the Funds may deliver or receive collateral in connection with certain investments (e.g., futures contracts, foreign currency exchange contracts, options written, securities with extended settlement periods, and swaps). Certain countries require that cash reserves be held while investing in companies incorporated in that country. These cash reserves and cash collateral that has been pledged/received to cover obligations of the Funds under derivative contracts, if any, will be reported separately on the “Statements of assets and liabilities” as cash collateral due to/from broker. Securities collateral pledged for the same purpose, if any, is noted on the “Schedules of investments.”
Notes to financial statements
Ivy Funds
1. Significant Accounting Policies (continued)
Use of Estimates — The preparation of financial statements in conformity with US GAAP requires management to make estimates and assumptions that affect the fair value of investments, the reported amounts of assets and liabilities and disclosure of contingent assets and liabilities at the date of the financial statements, and the reported amounts of revenues and expenses during the reporting period. Actual results could differ from those estimates and the differences could be material.
Other — Expenses directly attributable to a Fund are charged directly to that Fund. Other expenses common to various funds within the Delaware Funds by Macquarie® (Delaware Funds) are generally allocated among such funds on the basis of average net assets. Management fees and certain other expenses are paid monthly. Security transactions are recorded on the date the securities are purchased or sold (trade date) for financial reporting purposes. Costs used in calculating realized gains and losses on the sale of investment securities are those of the specific securities sold. Dividend income is recorded on the ex-dividend date and interest income is recorded on an accrual basis. Income and capital gain distributions from any investment companies (Underlying Funds) in which each Fund invests are recorded on the ex-dividend date. Discounts and premiums on debt securities are accreted or amortized to interest income, respectively, over the lives of the respective securities using the effective interest method. Premiums on callable debt securities are amortized to interest income to the earliest call date using the effective interest method. Realized gains (losses) on paydowns of asset- and mortgage-backed securities are classified as interest income. Distributions received from investments in real estate investment trusts (REITs) are recorded as dividend income on the ex-dividend date, subject to reclassification upon notice of the character of such distributions by the issuer. Foreign dividends are also recorded on the ex-dividend date or as soon after the ex-dividend date that the Funds are aware of such dividends, net of all tax withholdings, a portion of which may be reclaimable. Withholding taxes and reclaims on foreign dividends and interest have been recorded in accordance with the Funds’ understanding of the applicable country’s tax rules and rates. Each Fund may pay foreign capital gains taxes on certain foreign securities held, which are reported as components of realized losses for financial reporting purposes, whereas such components are treated as ordinary loss for federal income tax purposes. Delaware Global Real Estate Fund, Delaware Ivy Asset Strategy Fund, Delaware Ivy Balanced Fund, and Delaware Real Estate Securities Fund declare and pay dividends quarterly. Delaware Climate Solutions Fund, Delaware Ivy Natural Resources Fund, and Delaware Ivy Science and Technology Fund declare and pay dividends annually. Each Fund declares and pays distributions from net realized gain on investments, if any, at least annually. Each Fund may distribute more frequently, if necessary for tax purposes. Dividends and distributions, if any, are recorded on the ex-dividend date.
Each Fund receives earnings credits from its transfer agent when positive cash balances are maintained, which may be used to offset transfer agent fees. If the amount earned is greater than $1, the expenses paid under this arrangement are included on the “Statements of operations” under “Dividend disbursing and transfer agent fees and expenses” with the corresponding expenses offset included under “Less expenses paid indirectly.”
2. Investment Management, Administration Agreements, and Other Transactions with Affiliates
In accordance with the terms of its respective investment management agreement, each Fund pays DMC, a series of Macquarie Investment Management Business Trust and the investment manager, an annual fee which is calculated daily and paid monthly, based on each Fund’s average daily net assets as follows:
| Fund | | Management Fee (annual rate as a percentage of average daily net assets) |
| Delaware Climate Solutions Fund | | 0.85% of net assets up to $1 billion; |
| | | 0.83% of net assets over $1 billion and up to $2 billion; |
| | | 0.80% of net assets over $2 billion and up to $3 billion; |
| | | 0.76% of net assets over $3 billion and up to $5 billion; |
| | | 0.75% of net assets over $5 billion and up to $10 billion; |
| | | 0.74% of net assets over $10 billion. |
| | | |
| Delaware Global Real Estate Fund | | 0.95% of net assets up to $1 billion; |
| | | 0.92% of net assets over $1 billion and up to $2 billion; |
| | | 0.87% of net assets over $2 billion and up to $3 billion; |
| | | 0.84% of net assets over $3 billion and up to $5 billion; |
| | | 0.82% of net assets over $5 billion and up to $10 billion; |
| | | 0.80% of net assets over $10 billion. |
| Fund | | Management Fee (annual rate as a percentage of average daily net assets) |
| Delaware Ivy Asset Strategy Fund | | 0.70% of net assets up to $1 billion; |
| | | 0.65% of net assets over $1 billion and up to $2 billion; |
| | | 0.60% of net assets over $2 billion and up to $3 billion; |
| | | 0.55% of net assets over $3 billion and up to $28 billion; |
| | | 0.545% of net assets over $28 billion and up to $53 billion; |
| | | 0.54% of net assets over $53 billion. |
| | | |
| Delaware Ivy Balanced Fund | | 0.70% of net assets up to $1 billion; |
| | | 0.65% of net assets over $1 billion and up to $2 billion; |
| | | 0.60% of net assets over $2 billion and up to $3 billion; |
| | | 0.55% of net assets over $3 billion and up to $5 billion; |
| | | 0.54% of net assets over $5 billion and up to $10 billion; |
| | | 0.53% of net assets over $10 billion. |
| | | |
| Delaware Ivy Natural Resources Fund | | 0.85% of net assets up to $1 billion; |
| | | 0.83% of net assets over $1 billion and up to $2 billion; |
| | | 0.80% of net assets over $2 billion and up to $3 billion; |
| | | 0.76% of net assets over $3 billion and up to $5 billion; |
| | | 0.73% of net assets over $5 billion and up to $10 billion; |
| | | 0.70% of net assets over $10 billion. |
| | | |
| Delaware Ivy Science and Technology Fund | | 0.85% of net assets up to $1 billion; |
| | | 0.83% of net assets over $1 billion and up to $2 billion; |
| | | 0.80% of net assets over $2 billion and up to $3 billion; |
| | | 0.76% of net assets over $3 billion and up to $8 billion; |
| | | 0.755% of net assets over $8 billion and up to $13 billion; |
| | | 0.75% of net assets over $13 billion. |
| | | |
| Delaware Real Estate Securities Fund1 | | 0.90% of net assets up to $1 billion; |
| | | 0.87% of net assets over $1 billion and up to $2 billion; |
| | | 0.84% of net assets over $2 billion and up to $3 billion; |
| | | 0.80% of net assets over $3 billion and up to $5 billion; |
| | | 0.76% of net assets over $5 billion and up to $10 billion; |
| | | 0.72% of net assets over $10 billion. |
| 1 | DMC had contractually agreed to reduce the management fee paid by the Fund by an annual rate of 0.10% of average daily net assets from July 29, 2021 through July 29, 2022. |
DMC has entered into sub-advisory agreements with the following entities on behalf of the Funds:
Prior to July 29, 2022, under an agreement between DMC and Securian Asset Management, Inc. (Securian AM), Securian AM served as subadviser to Delaware Real Estate Securities Fund. Prior to July 29, 2022, under an agreement between DMC and LaSalle Investment Management Securities, LLC (LaSalle), LaSalle served as subadviser to Delaware Global Real Estate Fund. Each subadviser made investment decisions in accordance with the Fund’s investment objectives, policies and restrictions under the supervision of DMC and the oversight of the Board. DMC paid all applicable costs of the subadvisers. Following July 29, 2022, under agreements between DMC and each of Macquarie Funds Management Hong Kong Limited (MFMHKL), Macquarie Investment Management Europe Limited (MIMEL) and Macquarie Investment Management Global Limited (MIMGL), each of MFMHKL, MIMEL and MIMGL serves as sub-advisor to Delaware Real Estate Securities Fund and Delaware Global Real Estate Fund, and along with DMC, are responsible for its day to day management. In addition, each of these Funds may use MIMGL and MFMHKL to execute Fund security trades. For their services, each of MFMHKL, MIMEL and MIMGL receive a sub-advisory fee from DMC. As noted earlier in this report, as of May 2, 2023, MFMHKL is no longer an affiliated sub-advisor of these funds.
Notes to financial statements
Ivy Funds
2. Investment Management, Administration Agreements, and Other Transactions with Affiliates (continued)
Macquarie Investment Management Austria Kapitalanlage AG (MIMAK), is a part of Macquarie Asset Management (MAM). MAM is the marketing name for certain companies comprising the asset management division of Macquarie Group Limited. DMC and MIMAK are primarily responsible for the day-to-day management of the Delaware Ivy Asset Strategy Fund and Delaware Ivy Balanced Fund portfolios. In addition, DMC may also seek fixed income investment advice and recommendations from MIMAK and DMC may also permit MIMAK to execute Fund security trades on behalf of DMC and exercise investment discretion for securities in certain markets where DMC believes it will be beneficial to utilize MIMAK’s specialized market knowledge.
With respect to Delaware Ivy Asset Strategy Fund and Delaware Ivy Balanced Fund, MIMEL serves as sub-advisor, DMC may seek investment advice and recommendations from MIMEL and DMC may also permit MIMEL to execute Fund security trades on behalf of DMC and exercise investment discretion for securities in certain markets where DMC believes it will be beneficial to utilize MIMEL’s specialized market knowledge.
MIMGL and MFMHKL each serve as sub-advisor to Delaware Ivy Climate Solutions, Delaware Ivy Asset Strategy, Delaware Ivy Balanced, Delaware Ivy Natural Resources and Delaware Ivy Science and Technology Funds, executing security trades on behalf of DMC. MIMGL also exercises investment discretion for securities in certain markets where DMC believes it will be beneficial to utilize MIMGL’s specialized market knowledge for Delaware Ivy Asset Strategy Fund and Delaware Ivy Balanced Fund. For its services, MIMGL receives a sub-advisory fee from DMC.
Pursuant to the terms of the relevant sub-advisory agreement, an investment sub-advisory fee is paid by DMC to each Affiliated Sub-Advisor.
Delaware Investments Fund Services Company (DIFSC), an affiliate of DMC, provides fund accounting and financial administrative oversight services to each Fund. For these services, DIFSC’s fees are calculated daily and paid monthly, based on the aggregate daily net assets of all funds within the Delaware Funds at the following annual rates: 0.00475% of the first $35 billion; 0.0040% of the next $10 billion; 0.0025% of the next $45 billion; and 0.0015% of aggregate average daily net assets in excess of $90 billion (Total Fee). Each fund in the Delaware Funds pays a minimum of $4,000, which, in aggregate, is subtracted from the Total Fee. Each fund then pays its portion of the remainder of the Total Fee on a relative NAV basis. These amounts are included on the “Statements of operations” under “Accounting and administration expenses.” For the year ended March 31, 2023, each Fund paid for these services as follows:
| Fund | | Fees | |
| Delaware Climate Solutions Fund | | $ | 12,702 | |
| Delaware Global Real Estate Fund | | | 7,312 | |
| Delaware Ivy Asset Strategy Fund | | | 69,665 | |
| Delaware Ivy Balanced Fund | | | 67,335 | |
| Delaware Ivy Natural Resources Fund | | | 12,554 | |
| Delaware Ivy Science and Technology Fund | | | 191,035 | |
| Delaware Real Estate Securities Fund | | | 12,488 | |
Effective June 27, 2022, DIFSC is also the transfer agent and dividend disbursing agent of the Funds. For these services, DIFSC’s fees are calculated daily and paid monthly, based on the aggregate daily net assets of the retail funds within the Delaware Funds at the following annual rates: 0.014% of the first $20 billion; 0.011% of the next $5 billion; 0.007% of the next $5 billion; 0.004% of the next $20 billion; 0.002% of the next $25 billion; and 0.0015% of average daily net assets in excess of $75 billion. The fees payable to DIFSC under the shareholder services agreement described above are allocated among all retail funds in the Delaware Funds on a relative NAV basis. These amounts are included on the “Statements of operations” under “Dividend disbursing and transfer agent fees and expenses.” From June 27, 2022 through March 31, 2023, each Fund paid for these services as follows:
| Fund | | Fees | |
| Delaware Climate Solutions Fund | | $ | 174,167 | |
| Delaware Global Real Estate Fund | | | 23,505 | |
| Delaware Ivy Asset Strategy Fund | | | 695,850 | |
| Delaware Ivy Balanced Fund | | | 732,686 | |
| Delaware Ivy Natural Resources Fund | | | 179,124 | |
| Delaware Ivy Science and Technology Fund | | | 2,255,746 | |
| Delaware Real Estate Securities Fund | | | 131,441 | |
Pursuant to a sub-transfer agency agreement between DIFSC and BNY Mellon Investment Servicing (US) Inc. (BNYMIS), effective June 27, 2022, BNYMIS provides certain sub-transfer agency services to the Funds. Sub-transfer agency fees are paid by the Funds and are also included on the “Statements of operations” under “Dividend disbursing and transfer agent fees and expenses.” The fees that are calculated daily and paid as invoices are received on a monthly or quarterly basis.
Under the Shareholder Servicing Agreement between the Trust and WI Services Company (WISC) (that was in effect until June 27, 2022), with respect to Class A and Class C shares, for each shareholder account that was in existence at any time during the prior month, each Fund paid a monthly fee that ranged from $1.5042 to $1.6958 per account; however, WISC had agreed to reduce that fee if the number of total shareholder accounts within the Complex (InvestEd Portfolios and Ivy Funds) reached certain levels. For Class R shares, each Fund paid a monthly fee equal to one-twelfth of 0.25 of 1% of the average daily net assets of the class for the preceding month. For Class I and Class Y shares, each Fund paid a monthly fee equal to one-twelfth of 0.15 of 1.00% of the average daily net assets of the class for the preceding month. For Class R6 shares, each Fund paid WISC a monthly fee equal to one-twelfth of 0.01 of 1.00% of the average daily net assets of the class for the preceding month. Each Fund also reimbursed WISC for certain out-of-pocket costs for all classes.
For certain networked accounts (that is, those accounts whose Fund shares were purchased through certain financial intermediaries), WISC had agreed to reduce its per account fees charged to the Funds to $0.50 per month per shareholder account. Additional fees may have been paid by the Funds to those intermediaries. The Fund would reimburse WISC for such costs if the annual rate of the third-party per account charged for a Fund were less than or equal to $12.00 per account or an annual fee of 0.14 of 1.00% that is based on average daily net assets.
Certain broker/dealers that maintained shareholder accounts with each Fund through an omnibus account provided transfer agent and other shareholder-related services that would otherwise have been provided by WISC if the individual accounts that comprised the omnibus account were opened by their beneficial owners directly. Each Fund could pay such broker-dealers a per account fee for each open account within the omnibus account (up to $18.00 per account), or a fixed rate fee (up to an annual fee of 0.20 of 1% that is based on average daily net assets), based on the average daily NAV of the omnibus account (or a combination thereof).
Pursuant to a distribution agreement and distribution plan, each Fund pays DDLP, the distributor and an affiliate of DMC, an annual distribution and service (12b-1) fee of 0.25%, 1.00%, 0.50% and 0.25% of the average daily net assets of the Class A, Class C, Class R, and Class Y shares, respectively. The fees are calculated daily and paid monthly. Class I and Class R6 shares do not pay a 12b-1 fee.
From April 1, 2022, (except as noted below) DMC, DDLP (through July 29, 2023) and/or DIFSC (from June 27, 2022 through July 29, 2023) and Waddell & Reed Services Company (WRSCO) (through June 27, 2022), have contractually agreed to waive all or a portion of fees and/or pay/ reimburse expenses (excluding acquired fund fees and expenses, taxes, interest, short sale dividend and interest expenses, brokerage fees, certain insurance costs, and nonroutine expenses or costs, including, but not limited to, those relating to reorganizations, litigation, conducting shareholder meetings, and liquidations), in order to prevent total annual fund operating expenses from exceeding the following percentages of each Fund’s average daily net assets. These waivers and reimbursements may only be terminated by agreement of DMC, DDLP, DIFSC and/or each Fund. The waivers and reimbursements are accrued daily and received monthly.
| Fund | | Operating
expense
limitation as a
percentage of
average
daily net assets
Class A | | | Operating
expense
limitation as a
percentage of
average
daily net assets
Class C | | | Operating
expense
limitation as a
percentage of
average
daily net assets
Class I | | | Operating
expense
limitation as a
percentage of
average
daily net assets
Class R | | | Operating
expense
limitation as a
percentage of
average
daily net assets
Class R6 | | | Operating
expense
limitation as a
percentage of
average
daily net assets
Class Y | |
| Delaware Climate Solutions Fund1 | | | 1.24 | %2 | | | 1.99 | %2 | | | 0.99 | % | | | 1.49 | % | | | 0.99 | % | | | 1.24 | % |
| Delaware Global Real Estate Fund1, 3 | | | 1.30 | % | | | 2.05 | % | | | 1.05 | % | | | 1.55 | % | | | 1.05 | % | | | 1.30 | % |
Notes to financial statements
Ivy Funds
2. Investment Management, Administration Agreements, and Other Transactions with Affiliates (continued)
| Fund | | Operating
expense
limitation as a
percentage of
average
daily net assets
Class A | | | Operating
expense
limitation as a
percentage of
average
daily net assets
Class C | | | Operating
expense
limitation as a
percentage of
average
daily net assets
Class I | | | Operating
expense
limitation as a
percentage of
average
daily net assets
Class R | | | Operating
expense
limitation as a
percentage of
average
daily net assets
Class R6 | | | Operating
expense
limitation as a
percentage of
average
daily net assets
Class Y | |
| Delaware Ivy Asset Strategy Fund | | | n/a | | | | n/a | | | | n/a | | | | n/a | | | | n/a | | | | 1.11 | %4 |
| Delaware Ivy Balanced Fund | | | n/a | | | | n/a | | | | n/a | | | | 1.34 | %5 | | | n/a | | | | 1.07 | %4 |
| Delaware Ivy Natural Resources Fund5 | | | 1.33 | % | | | 2.08 | % | | | 1.08 | % | | | 1.58 | % | | | 1.08 | % | | | 1.33 | % |
| Delaware Ivy Science and Technology Fund | | | n/a | | | | n/a | | | | n/a | | | | n/a | | | | n/a | | | | n/a | |
| Delaware Real Estate Securities Fund5 | | | 1.20 | % | | | 1.95 | % | | | 0.95 | % | | | 1.45 | % | | | 0.95 | % | | | 1.20 | % |
| 1 | Prior to July 29, 2022, due to a separate contractual class waiver, certain common expenses applicable to all share classes also may be waived to cap total annual ordinary fund operating expenses, which may serve to reduce the expense ratio of certain share classes. |
| 2 | Effective July 29, 2022 for Class A and Class C shares. Prior to July 29, 2022, the expense limit in effect for Class A and Class shares was 1.35% and 2.09%, respectively. |
| 3 | Effective July 29, 2022. Prior to July 29, 2022, the expense limit in effect for Class A, Class C, Class I, Class R, Class R6 and Class Y was 1.48%, n/a, 1.05%, 1.80%, 1.05% and n/a, respectively. |
| 4 | Effective November 15, 2021 through November 15, 2022. |
| 5 | Effective July 29, 2022. |
As provided in the investment management agreement, each Fund bears a portion of the cost of certain resources shared with DMC, including the cost of internal personnel of DMC and/or its affiliates that provide legal and regulatory reporting services to each Fund. These amounts are included on the “Statements of operations” under “Legal fees.” For the year ended March 31, 2023, each Fund paid for internal legal and regulatory reporting services provided by DMC and/or its affiliates’ employees as follows:
| Fund | | Fees | |
| Delaware Climate Solutions Fund | | $ | 18,595 | |
| Delaware Global Real Estate Fund | | | 1,017 | |
| Delaware Ivy Asset Strategy Fund | | | 39,060 | |
| Delaware Ivy Balanced Fund | | | 33,387 | |
| Delaware Ivy Natural Resources Fund | | | 5,821 | |
| Delaware Ivy Science and Technology Fund | | | 108,736 | |
| Delaware Real Estate Securities Fund | | | 4,588 | |
For the year ended March 31, 2023, DDLP earned commissions on sales of Class A shares for each Fund as follows:
| Fund | | Class A | |
| Delaware Climate Solutions Fund | | $ | 93,309 | |
| Delaware Global Real Estate Fund | | | 1,163 | |
| Delaware Ivy Asset Strategy Fund | | | 115,093 | |
| Delaware Ivy Balanced Fund | | | 204,784 | |
| Delaware Ivy Natural Resources Fund | | | 35,226 | |
| Delaware Ivy Science and Technology Fund | | | 580,160 | |
| Delaware Real Estate Securities Fund | | | 20,725 | |
For the year ended March 31, 2023, DDLP received gross CDSC commissions on redemptions of each Fund’s Class A and Class C shares and these commissions were entirely used to offset upfront commissions previously paid by DDLP to broker/dealers on sales of those shares. The amounts received were as follows:
| Fund | | Class A | | | Class C | |
| Delaware Climate Solutions Fund | | $ | 508 | | | $ | 3,448 | |
| Delaware Global Real Estate Fund | | | 27 | | | | 14 | |
| Delaware Ivy Asset Strategy Fund | | | 1,365 | | | | 3,452 | |
| Delaware Ivy Balanced Fund | | | 6,071 | | | | 5,343 | |
| Delaware Ivy Natural Resources Fund | | | 593 | | | | 417 | |
| Delaware Ivy Science and Technology Fund | | | 13,294 | | | | 7,917 | |
| Delaware Real Estate Securities Fund | | | 129 | | | | 87 | |
Trustees’ fees include expenses accrued by each Fund for each Trustee’s retainer and meeting fees. Certain officers of DMC, DIFSC, and DDLP are officers and/or Trustees of the Trust. These officers and Trustees are paid no compensation by the Funds.
In addition to the management fees and other expenses of a Fund, a Fund indirectly bears the investment management fees and other expenses of any Underlying Funds including ETFs in which it invests. The amount of these fees and expenses incurred indirectly by a Fund will vary based upon the expense and fee levels of any Underlying Funds and the number of shares that are owned of any Underlying Funds at different times.
A summary of the transactions in affiliated companies during the year ended March 31, 2023 was as follows:
| | | Value,
beginning
of period | | | Gross
additions | | | Gross
reductions(1) | | | Net
realized
gain (loss)
on
affiliated
investments | | | Net change in
unrealized
appreciation
(depreciation)
on affiliated investments(2) | | | Value,
end of
period | | | Shares | |
| Delaware Ivy Asset Strategy Fund | |
| Common Stocks—0.00% | |
| Media Group Holdings Series H=,† | | $ | — | | | $ | — | | | $ | (813,673 | ) | | $ | — | | | $ | 813,673 | | | $ | — | | | | 640,301 | |
| Media Group Holdings Series T=,† | | | — | | | | — | | | | — | | | | — | | | | — | | | | — | | | | 80,253 | |
| New Cotai=,† | | | 1,677,146 | | | | — | | | | — | | | | — | | | | 177,030 | | | | 1,854,176 | * | | | 1,819,823 | |
| Total | | $ | 1,677,146 | | | $ | — | | | $ | (813,673 | ) | | $ | — | | | $ | 990,703 | | | $ | 1,854,176 | | | | | |
Notes to financial statements
Ivy Funds
2. Investment Management, Administration Agreements, and Other Transactions with Affiliates (continued)
| | | Value,
beginning
of period | | | Gross
additions | | | Gross
reductions | | | Net
realized
gain (loss)
on
affiliated
investments | | | Net change in
unrealized
appreciation
(depreciation)
on affiliated investments(2) | | | Value,
end of
period | | | Shares | |
| Delaware Ivy Science and Technology Fund | | |
| Common Stock—2.19% | |
| WNS Holdings ADR† | | $ | 106,974,834 | | | $ | — | | | $ | (6,596,872 | ) | | $ | 5,816,668 | | | $ | 3,326,519 | | | $ | 109,521,149 | * | | | 1,175,498 | |
| Corporate Bond—0.00% | | | | | | | | | | | | | | | | | | | | | | | | | | | | |
| Marrone Bio Innovations | | | 4,688,466 | | | | — | | | | (4,712,500 | ) | | | — | | | | 24,034 | | | | — | | | | — | |
| Total | | $ | 111,663,300 | | | $ | — | | | $ | (11,309,372 | ) | | $ | 5,816,668 | | | $ | 3,350,553 | | | $ | 109,521,149 | | | | | |
| * | Issuer was not an affiliated investment of the Fund at March 31, 2023. This value is not included in the Statements of assets and liabilities balance as it is not affiliated as of March 31, 2023. |
| † | Non-income producing security. |
| = | The value of this security was determined using significant unobservable inputs and is reported as a Level 3 security in the disclosure table located in Note 3 in “Notes to financial statements.” |
| (1) | The amount shown included return of capital. |
| (2) | Does not tie to Net change in unrealized appreciation (depreciation) on affiliated investments on the Statements of operations as a result of previously unaffiliated securities moving to affiliated. |
3. Investments
For the year ended March 31, 2023, each Fund made purchases and sales of investment securities other than short-term investments as follows:
| Fund | | Purchases
other than
US government
securities | | | Purchases of
US government
securities | | | Sales
other than
US government
securities | | | Sales of
US government
securities | |
| Delaware Climate Solutions Fund | | $ | 288,013,294 | | | $ | — | | | $ | 327,080,439 | | | $ | — | |
| Delaware Global Real Estate Fund | | | 56,044,716 | | | | — | | | | 84,350,487 | | | | — | |
| Delaware Ivy Asset Strategy Fund | | | 881,054,293 | | | | 430,357,129 | | | | 1,321,137,831 | | | | 356,783,552 | |
| Delaware Ivy Balanced Fund | | | 669,647,115 | | | | 773,375,916 | | | | 1,193,692,503 | | | | 834,369,854 | |
| Delaware Ivy Natural Resources Fund | | | 125,936,761 | | | | — | | | | 127,900,633 | | | | — | |
| Delaware Ivy Science and Technology Fund | | | 2,811,202,677 | | | | — | | | | 5,139,424,648 | | | | — | |
| Delaware Real Estate Securities Fund | | | 140,931,582 | | | | — | | | | 277,553,648 | | | | — | |
The tax cost of investments and derivatives includes adjustments to net unrealized appreciation (depreciation) which may not necessarily be the final tax cost basis adjustments but which approximates the tax basis unrealized gains and losses that may be realized and distributed to shareholders. At March 31, 2023, the cost and unrealized appreciation (depreciation) of investments and derivatives for federal income tax purposes for each fund were as follows:
| Fund | | Cost of
investments
and derivatives | | | Aggregate
unrealized
appreciation
of investments
and derivatives | | | Aggregate
unrealized
depreciation
of investments
and derivatives | | | Net unrealized
appreciation
(depreciation)
of investments
and derivatives | |
| Delaware Climate Solutions Fund | | $ | 235,746,691 | | | $ | 25,982,350 | | | $ | (21,341,331 | ) | | $ | 4,641,019 | |
| Delaware Global Real Estate Fund | | | 36,039,923 | | | | 3,918,440 | | | | (4,855,460 | ) | | | (937,020 | ) |
| Delaware Ivy Asset Strategy Fund | | | 2,791,107,688 | | | | 1,225,746,672 | | | | (2,198,536,570 | ) | | | (972,789,898 | ) |
| Delaware Ivy Balanced Fund | | | 1,531,908,098 | | | | 180,254,312 | | | | (106,058,084 | ) | | | 74,196,228 | |
| Delaware Ivy Natural Resources Fund | | | 286,421,592 | | | | 33,560,145 | | | | (59,191,957 | ) | | | (25,631,812 | ) |
| Delaware Ivy Science and Technology Fund | | | 3,777,973,501 | | | | 1,510,526,787 | | | | (370,150,436 | ) | | | 1,140,376,351 | |
| Delaware Real Estate Securities Fund | | | 109,671,023 | | | | 54,297,955 | | | | (9,043,849 | ) | | | 45,254,106 | |
US GAAP defines fair value as the price that each Fund would receive to sell an asset or pay to transfer a liability in an orderly transaction between market participants at the measurement date under current market conditions. A three-level hierarchy for fair value measurements has been established based upon the transparency of inputs to the valuation of an asset or liability. Inputs may be observable or unobservable and refer broadly to the assumptions that market participants would use in pricing the asset or liability. Observable inputs reflect the assumptions market participants would use in pricing the asset or liability based on market data obtained from sources independent of the reporting entity. Unobservable inputs reflect the reporting entity’s own assumptions about the assumptions that market participants would use in pricing the asset or liability based on the best information available under the circumstances. Each Fund’s investment in its entirety is assigned a level based upon the observability of the inputs which are significant to the overall valuation. The three-level hierarchy of inputs is summarized as follows:
| Level 1 – | Inputs are quoted prices in active markets for identical investments. (Examples: equity securities, open-end investment companies, futures contracts, and exchange-traded options contracts) |
| Level 2 – | Other observable inputs, including, but not limited to: quoted prices for similar assets or liabilities in markets that are active, quoted prices for identical or similar assets or liabilities in markets that are not active, inputs other than quoted prices that are observable for the assets or liabilities (such as interest rates, yield curves, volatilities, prepayment speeds, loss severities, credit risks, and default rates) or other market-corroborated inputs. (Examples: debt securities, government securities, swap contracts, foreign currency exchange contracts, foreign securities utilizing international fair value pricing, broker-quoted securities, and fair valued securities) |
| Level 3 – | Significant unobservable inputs, including each Fund’s own assumptions used to determine the fair value of investments. (Examples: broker-quoted securities and fair valued securities) |
Level 3 investments are valued using significant unobservable inputs. Each Fund may also use an income-based valuation approach in which the anticipated future cash flows of the investment are discounted to calculate fair value. Discounts may also be applied due to the nature or duration of any restrictions on the disposition of the investments. Valuations may also be based upon current market prices of securities that are comparable in coupon, rating, maturity, and industry. The derived value of a Level 3 investment may not represent the value which is received upon disposition and this could impact the results of operations.
The following tables summarize the valuation of each Fund’s investments by fair value hierarchy levels as of March 31, 2023:
| | | Delaware Climate Solutions Fund | |
| | | Level 1 | | | Level 2 | | | Total | |
| Securities | | | | | | | | | | | | |
| Assets: | | | | | | | | | | | | |
| Common Stocks | | | | | | | | | | | | |
| Consumer Discretionary | | $ | 8,526,969 | | | $ | — | | | $ | 8,526,969 | |
| Consumer Staples | | | 14,562,535 | | | | — | | | | 14,562,535 | |
Notes to financial statements
Ivy Funds
3. Investments (continued)
| | | | | | Delaware Climate Solutions Fund | |
| | | | | | Level 1 | | | Level 2 | | | Total | |
| Energy | | | | | | $ | 35,387,963 | | | $ | 5,909,046 | | | $ | 41,297,009 | |
| Financials | | | | | | | 3,773,133 | | | | — | | | | 3,773,133 | |
| Industrials | | | | | | | 26,435,470 | | | | 20,246,270 | | | | 46,681,740 | |
| Materials | | | | | | | 15,615,337 | | | | 13,301,847 | | | | 28,917,184 | |
| Real Estate | | | | | | | 6,272,464 | | | | — | | | | 6,272,464 | |
| Utilities | | | | | | | 51,089,759 | | | | 39,266,917 | | | | 90,356,676 | |
| Total Value of Securities | | | | | | $ | 161,663,630 | | | $ | 78,724,080 | | | $ | 240,387,710 | |
| | | | | | | | | | | | | | | | | |
| | | | | | | | | | | | | | | | | |
| | | | | | | | Delaware Global Real Estate Fund | |
| | | | | | | | Level 1 | | | | Level 2 | | | | Total | |
| Securities | | | | | | | | | | | | | | | | |
| Assets: | | | | | | | | | | | | | | | | |
| Common Stocks | | | | | | | | | | | | | | | | |
| Australia | | | | | | $ | 96,646 | | | $ | 995,168 | | | $ | 1,091,814 | |
| Belgium | | | | | | | — | | | | 470,938 | | | | 470,938 | |
| Canada | | | | | | | 818,685 | | | | — | | | | 818,685 | |
| China/Hong Kong | | | | | | | — | | | | 72,862 | | | | 72,862 | |
| France | | | | | | | 238,430 | | | | 126,928 | | | | 365,358 | |
| Germany | | | | | | | — | | | | 556,220 | | | | 556,220 | |
| Hong Kong | | | | | | | — | | | | 1,956,674 | | | | 1,956,674 | |
| Japan | | | | | | | — | | | | 3,673,739 | | | | 3,673,739 | |
| Singapore | | | | | | | — | | | | 1,391,278 | | | | 1,391,278 | |
| Spain | | | | | | | — | | | | 467,539 | | | | 467,539 | |
| Sweden | | | | | | | — | | | | 386,007 | | | | 386,007 | |
| United Kingdom | | | | | | | 113,576 | | | | 1,350,752 | | | | 1,464,328 | |
| United States | | | | | | | 22,370,778 | | | | — | | | | 22,370,778 | |
| Short-Term Investments | | | | | | | 16,683 | | | | — | | | | 16,683 | |
| Total Value of Securities | | | | | | $ | 23,654,798 | | | $ | 11,448,105 | | | $ | 35,102,903 | |
| | | | | | | | | | | | | | | | | |
| | | Delaware Ivy Asset Strategy Fund | |
| | | Level 1 | | | Level 2 | | | Level 3 | | | Total | |
| Securities | | | | | | | | | | | | | | | | |
| Assets: | | | | | | | | | | | | | | | | |
| Agency Collateralized Mortgage Obligations | | $ | — | | | $ | 5,889,669 | | | $ | — | | | $ | 5,889,669 | |
| Agency Mortgage-Backed Securities | | | — | | | | 53,602,357 | | | | — | | | | 53,602,357 | |
| Bullion | | | 94,653,108 | | | | — | | | | — | | | | 94,653,108 | |
| Common Stocks | | | | | | | | | | | | | | | | |
| Communication Services | | | 32,912,190 | | | | 47,627,180 | | | | 1,854,176 | | | | 82,393,546 | |
| Consumer Discretionary | | | 111,287,222 | | | | 33,949,551 | | | | — | 1 | | | 145,236,773 | |
| Consumer Staples | | | 35,710,789 | | | | 59,743,893 | | | | — | | | | 95,454,682 | |
| Energy | | | 55,963,152 | | | | 18,864,538 | | | | — | | | | 74,827,690 | |
| Financials | | | 46,432,858 | | | | 90,907,418 | | | | — | | | | 137,340,276 | |
| Healthcare | | | 137,789,825 | | | | 62,281,040 | | | | — | | | | 200,070,865 | |
| | | Delaware Ivy Asset Strategy Fund | |
| | | Level 1 | | | Level 2 | | | Level 3 | | | Total | |
| Industrials | | $ | 69,463,423 | | | $ | 80,131,974 | | | $ | — | | | $ | 149,595,397 | |
| Information Technology | | | 260,311,052 | | | | 22,300,957 | | | | — | | | | 282,612,009 | |
| Materials | | | 11,238,675 | | | | — | | | | — | | | | 11,238,675 | |
| Utilities | | | — | | | | 28,328,148 | | | | — | | | | 28,328,148 | |
| Convertible Bond | | | — | | | | — | | | | 5,255,840 | | | | 5,255,840 | |
| Corporate Bonds | | | — | | | | 234,962,828 | | | | — | | | | 234,962,828 | |
| Exchange-Traded Funds | | | 48,834,837 | | | | — | | | | — | | | | 48,834,837 | |
| Loan Agreements | | | — | | | | 40,044,784 | | | | — | | | | 40,044,784 | |
| Municipal Bonds | | | — | | | | 1,478,130 | | | | — | | | | 1,478,130 | |
| Non-Agency Collateralized Mortgage Obligations | | | — | | | | 6,314,246 | | | | — | | | | 6,314,246 | |
| Non-Agency Commercial Mortgage-Backed Securities | | | — | | | | 20,076,786 | | | | — | | | | 20,076,786 | |
| US Treasury Obligations | | | — | | | | 52,626,767 | | | | — | | | | 52,626,767 | |
| Short-Term Investments | | | 46,694,536 | | | | — | | | | — | | | | 46,694,536 | |
| Total Value of Securities | | $ | 951,291,667 | | | $ | 859,130,266 | | | $ | 7,110,016 | | | $ | 1,817,531,949 | |
| | | | | | | | | | | | | | | | | |
| Derivatives2 | | | | | | | | | | | | | | | | |
| Assets: | | | | | | | | | | | | | | | | |
| Futures Contracts | | $ | 410,305 | | | $ | — | | | $ | — | | | $ | 410,305 | |
| 1 | The security that has been valued at zero on the “Schedules of investments” is considered to be Level 3 investments in this table. |
| 2 | Futures contracts are valued at the unrealized appreciation (depreciation) on the instrument at the year end. |
| | | | | | | Delaware Ivy Balanced Fund | |
| | | | | | | Level 1 | | | Level 2 | | | Total | |
| Securities | | | | | | | | | | | | | | | | |
| Assets: | | | | | | | | | | | | | | | | |
| Agency Collateralized Mortgage Obligations | | | | | | $ | — | | | $ | 15,232,588 | | | $ | 15,232,588 | |
| Agency Mortgage-Backed Securities | | | | | | | — | | | | 153,511,356 | | | | 153,511,356 | |
| Common Stocks | | | | | | | 924,913,700 | | | | — | | | | 924,913,700 | |
| Corporate Bonds | | | | | | | — | | | | 172,245,598 | | | | 172,245,598 | |
| Exchange-Traded Funds | | | | | | | 62,586,384 | | | | — | | | | 62,586,384 | |
| Non-Agency Collateralized Mortgage Obligations | | | | | | | — | | | | 1,675,177 | | | | 1,675,177 | |
| Non-Agency Commercial Mortgage-Backed Securities | | | | | | | — | | | | 55,816,351 | | | | 55,816,351 | |
| US Treasury Obligations | | | | | | | — | | | | 161,100,076 | | | | 161,100,076 | |
| Options Purchased | | | | | | | — | | | | 416,241 | | | | 416,241 | |
| Short-Term Investments | | | | | | | 58,528,824 | | | | — | | | | 58,528,824 | |
| Total Value of Securities Before Options Written | | | | | | $ | 1,046,028,908 | | | $ | 559,997,387 | | | $ | 1,606,026,295 | |
| Liabilities: | | | | | | | | | | | | | | | | |
| Options Written | | | | | | $ | — | | | $ | (248,937 | ) | | $ | (248,937 | ) |
Notes to financial statements
Ivy Funds
3. Investments (continued)
| | | | | | | Delaware Ivy Balanced Fund | |
| | | | | | | Level 1 | | | Level 2 | | | Total | |
| Derivatives1 | | | | | | | | | | | | | | | | |
| Assets: | | | | | | | | | | | | | | | | |
| Centrally Cleared Credit Default Swaps | | | | | | $ | — | | | $ | 131,792 | | | $ | 131,792 | |
| Futures Contracts | | | | | | | 1,334,742 | | | | — | | | | 1,334,742 | |
| Liabilities: | | | | | | | | | | | | | | | | |
| Futures Contracts | | | | | | $ | (1,139,566 | ) | | $ | — | | | $ | (1,139,566 | ) |
| 1 | Futures contracts and swap contracts are valued at the unrealized appreciation (depreciation) on the instrument at the year end. |
| | | Delaware Ivy Natural Resources Fund | |
| | | Level 1 | | | Level 2 | | | Level 3 | | | Total | |
| Securities | | | | | | | | | | | | | | | | |
| Assets: | | | | | | | | | | | | | | | | |
| Closed-Ended Trust | | $ | 6,521,828 | | | $ | — | | | $ | — | | | $ | 6,521,828 | |
| Common Stocks | | | | | | | | | | | | | | | | |
| Brazil | | | 11,566,202 | | | | — | | | | — | | | | 11,566,202 | |
| Burkina Faso | | | — | | | | 2,702,341 | | | | — | | | | 2,702,341 | |
| Canada | | | 32,757,119 | | | | — | | | | — | | | | 32,757,119 | |
| Hong Kong | | | — | | | | — | | | | 4 | | | | 4 | |
| Netherlands | | | — | | | | 11,370,229 | | | | — | | | | 11,370,229 | |
| South Africa | | | — | | | | 8,199,862 | | | | — | | | | 8,199,862 | |
| United Kingdom | | | 8,041,535 | | | | — | | | | — | | | | 8,041,535 | |
| United States | | | 177,229,297 | | | | — | | | | — | | | | 177,229,297 | |
| Short-Term Investments | | | 2,401,363 | | | | — | | | | — | | | | 2,401,363 | |
| Total Value of Securities | | $ | 238,517,344 | | | $ | 22,272,432 | | | $ | 4 | | | $ | 260,789,780 | |
| | | | | | | | | | | | | | | | | |
| | | | | | | Delaware Ivy Science and Technology Fund | |
| | | | | | | Level 1 | | | Level 2 | | | Total | |
| Securities | | | | | | | | | | | | | | | | |
| Assets: | | | | | | | | | | | | | | | | |
| Common Stocks | | | | | | | | | | | | | | | | |
| Communication Services | | | | | | $ | 546,722,374 | | | $ | — | | | $ | 546,722,374 | |
| Consumer Discretionary | | | | | | | 351,001,792 | | | | — | | | | 351,001,792 | |
| Healthcare | | | | | | | 376,357,068 | | | | — | | | | 376,357,068 | |
| Industrials | | | | | | | 44,424,065 | | | | — | | | | 44,424,065 | |
| Information Technology | | | | | | | 3,243,274,049 | | | | 54,332,735 | | | | 3,297,606,784 | |
| Short-Term Investments | | | | | | | 302,237,769 | | | | — | | | | 302,237,769 | |
| Total Value of Securities | | | | | | $ | 4,864,017,117 | | | $ | 54,332,735 | | | $ | 4,918,349,852 | |
| | | Delaware Real
Estate
Securities Fund | |
| | | Level 1 | |
| Securities | | | | |
| Assets: | | | | |
| Common Stocks | | $ | 153,666,047 | |
| Short-Term Investments | | | 1,259,082 | |
| Total Value of Securities | | $ | 154,925,129 | |
During the year ended March 31, 2023, there were no transfers into or out of Level 3 investments that had a significant impact to each Fund. Each Fund’s policy is to recognize transfers into or out of Level 3 investments based on fair value at the beginning of the reporting year.
A reconciliation of Level 3 investments is presented when each Fund has a significant amount of Level 3 investments at the beginning or end of the year in relation to each Fund’s net assets. Management has determined not to provide a reconciliation of Level 3 investments as the Level 3 investments were not considered significant to Delaware Ivy Asset Strategy Fund and Delaware Ivy Natural Resources Fund’s net assets at the beginning or end of the year. Management has determined not to provide additional disclosure on Level 3 inputs since the Level 3 investments were not considered significant to Delaware Ivy Asset Strategy Fund and Delaware Ivy Natural Resources Fund’s net assets at the end of the year. At March 31, 2023, Delaware Climate Solutions Fund, Delaware Global Real Estate Fund, Delaware Ivy Balanced Fund, Delaware Ivy Science and Technology Fund and Delaware Real Estate Securities Fund had no Level 3 investments.
4. Dividend and Distribution Information
Income and long-term capital gain distributions are determined in accordance with federal income tax regulations, which may differ from US GAAP. Additionally, distributions from net gains on foreign currency transactions and net short-term gains on sales of investment securities are treated as ordinary income for federal income tax purposes. The tax character of dividends and distributions paid during the years ended March 31, 2023 and 2022 were as follows:
| | | Ordinary
income | | | Long-term
capital
gains | | | Total | |
| Year ended March 31, 2023: | | | | | | | | | |
| Delaware Climate Solutions Fund | | $ | 4,523,566 | | | $ | — | | | $ | 4,523,566 | |
| Delaware Global Real Estate Fund | | | 951,365 | | | | 4,778,362 | | | | 5,729,727 | |
| Delaware Ivy Asset Strategy Fund | | | 58,380,197 | | | | 231,838,947 | | | | 290,219,144 | |
| Delaware Ivy Balanced Fund | | | 13,370,266 | | | | 346,033,898 | | | | 359,404,164 | |
| Delaware Ivy Natural Resources Fund | | | 5,540,897 | | | | — | | | | 5,540,897 | |
| Delaware Ivy Science and Technology Fund | | | — | | | | 1,230,284,267 | | | | 1,230,284,267 | |
| Delaware Real Estate Securities Fund | | | 7,474,865 | | | | 39,117,904 | | | | 46,592,769 | |
| | | | | | | | | | | | | |
| Year ended March 31, 2022: | | | | | | | | | | | | |
| Delaware Climate Solutions Fund | | | 3,273,716 | | | | — | | | | 3,273,716 | |
| Delaware Global Real Estate Fund | | | 3,042,872 | | | | — | | | | 3,042,872 | |
| Delaware Ivy Asset Strategy Fund | | | 72,213,034 | | | | 208,152,026 | | | | 280,365,060 | |
| Delaware Ivy Balanced Fund | | | 31,080,250 | | | | 249,679,493 | | | | 280,759,743 | |
| Delaware Ivy Natural Resources Fund | | | 5,846,698 | | | | — | | | | 5,846,698 | |
| Delaware Ivy Science and Technology Fund | | | 43,079,322 | | | | 2,891,186,155 | | | | 2,934,265,477 | |
| Delaware Real Estate Securities Fund | | | 14,749,227 | | | | 31,280,171 | | | | 46,029,398 | |
Notes to financial statements
Ivy Funds
5. Components of Net Assets on a Tax Basis
As of March 31, 2023, the components of net assets on a tax basis were as follows:
| | | Delaware
Climate
Solutions Fund | | | Delaware
Global
Real Estate
Fund | | | Delaware Ivy
Asset Strategy
Fund | | | Delaware Ivy
Balanced Fund | |
| Shares of beneficial interest | | $ | 392,344,964 | | | $ | 37,478,811 | | | $ | 2,319,362,588 | | | $ | 1,631,192,568 | |
| Undistributed ordinary income | | | 3,436,263 | | | | 73,159 | | | | 15,531,025 | | | | 13,378,191 | |
| Undistributed long-term capital gains | | | — | | | | — | | | | — | | | | — | |
| Qualified late year loss deferrals | | | (787,138 | ) | | | (949,493 | ) | | | (33,294,593 | ) | | | — | |
| Capital loss carryforwards | | | (156,372,855 | ) | | | (415,906 | ) | | | — | | | | (118,094,211 | ) |
| Deferred directors fees | | | (25,245 | ) | | | (2,441 | ) | | | (497,036 | ) | | | (170,891 | ) |
| Unrealized appreciation (depreciation) of investments, foreign currencies and derivatives | | | 4,635,200 | | | | (941,239 | ) | | | (483,107,799 | ) | | | 74,200,124 | |
| Net assets | | $ | 243,231,189 | | | $ | 35,242,891 | | | $ | 1,817,994,185 | | | $ | 1,600,505,781 | |
| | | | | | | | | | | | | | | | | |
| | | Delaware Ivy
Natural
Resources
Fund | | | Delaware Ivy
Science and
Technology
Fund | | | Delaware
Real Estate
Securities Fund | |
| Shares of beneficial interest | | $ | 879,002,590 | | | $ | 3,444,618,805 | | | $ | 104,948,454 | |
| Undistributed ordinary income | | | 4,227,869 | | | | — | | | | 909,166 | |
| Undistributed long-term capital gains | | | — | | | | 429,810,384 | | | | 6,999,594 | |
| Qualified late year loss deferrals | | | — | | | | (4,771,564 | ) | | | — | |
| Capital loss carryforwards | | | (597,635,800 | ) | | | — | | | | — | |
| Deferred directors fees | | | (207,734 | ) | | | (442,491 | ) | | | (34,000 | ) |
| Unrealized appreciation (depreciation) of investments, foreign currencies and derivatives | | | (25,636,431 | ) | | | 1,140,349,943 | | | | 45,254,112 | |
| Net assets | | $ | 259,750,494 | | | $ | 5,009,565,077 | | | $ | 158,077,326 | |
Differences between components of net assets unrealized and tax cost unrealized may arise due to certain foreign currency transactions, foreign capital gains taxes, and amortization of callable bond premiums in accordance with ASU 2017-08.
The differences between book basis and tax basis components of net assets are primarily attributable to tax deferral of losses on wash sales, tax deferral of post-October losses, tax deferral losses on straddles, investments held within the wholly-owned subsidiary, mark-to market of foreign currency exchange contracts, mark-to-market of futures contracts, tax recognition of unrealized gain on passive foreign investment companies, tax treatment of swap contracts, tax treatment of REITs, tax treatment of partnerships, and deferred directors fees.
Qualified late year ordinary and capital losses (including currency and specified gain/loss items) represent losses realized from January 1, 2023 through March 31, 2023 and November 1, 2022 through March 31, 2023, respectively, that, in accordance with federal income tax regulations, the Funds have elected to defer and treat as having arisen in the following fiscal year.
For financial reporting purposes, capital accounts are adjusted to reflect the tax character of permanent book/tax differences. Reclassifications are primarily due to tax treatment of partnerships, earnings and profits distributed to shareholders on the redemption of shares, write-off of net operating losses, gain (loss) on foreign currency transactions, swap contracts, passive foreign investment companies (PFICs) and securities no longer deemed to be PFICs. Results of operations and net assets were not affected by these reclassifications. For the year ended March 31, 2023, the Funds recorded the following reclassifications:
| | | Delaware
Climate
Solutions Fund | | | Delaware Ivy
Asset Strategy
Fund | | | Delaware Ivy
Balanced Fund | | | Delaware Ivy
Natural
Resources
Fund | | | Delaware Ivy
Science and
Technology
Fund | |
| Paid-in capital | | $ | (140 | ) | | $ | (336 | ) | | $ | 40,967,090 | | | $ | (11 | ) | | $ | 240,622,715 | |
| Total distributable earnings (loss) | | | 140 | | | | 336 | | | | (40,967,090 | ) | | | 11 | | | | (240,622,715 | ) |
For federal income tax purposes, capital loss carryforwards may be carried forward and applied against future capital gains. At March 31, 2023, the Funds utilized the following capital loss carryforwards:
| Delaware Climate Solutions Fund | | $ | 69,693,666 | |
| Delaware Ivy Natural Resources Fund | | | 14,054,156 | |
At March 31, 2023, capital loss carryforwards available to offset future realized capital gains are as follows:
| | | Loss carryforward character | | | | |
| | | Short-term | | | Long-term | | | Total | |
| Delaware Climate Solutions Fund | | $ | 58,590,591 | | | $ | 97,782,264 | | | $ | 156,372,855 | |
| Delaware Global Real Estate Fund | | | 415,906 | | | | — | | | | 415,906 | |
| Delaware Ivy Balanced Fund | | | 118,094,211 | | | | — | | | | 118,094,211 | |
| Delaware Ivy Natural Resources Fund | | | 274,432,290 | | | | 323,203,510 | | | | 597,635,800 | |
Notes to financial statements
Ivy Funds
6. Capital Shares
Transactions in capital shares were as follows:
| | | Delaware Climate Solutions Fund | | | Delaware Global
Real Estate Fund | | | Delaware Ivy Asset Strategy Fund | |
| | | Year ended | | | Year ended | | | Year ended | |
| | | 3/31/23 | | | 3/31/22 | | | 3/31/23 | | | 3/31/22 | | | 3/31/23 | | | 3/31/22 | |
| Shares sold: | | | | | | | | | | | | | | | | | | | | | | | | |
| Class A | | | 3,360,135 | | | | 4,705,388 | | | | 80,517 | | | | 232,651 | | | | 3,600,067 | | | | 4,259,933 | |
| Class B1 | | | — | | | | — | | | | — | | | | — | | | | — | | | | 1,014 | |
| Class C | | | 305,099 | | | | 438,922 | | | | 3,279 | | | | 3,481 | | | | 218,910 | | | | 278,424 | |
| Class E2 | | | — | | | | — | | | | — | | | | — | | | | 14,181 | | | | 102,477 | |
| Class I | | | 6,148,059 | | | | 3,453,528 | | | | 227,717 | | | | 300,215 | | | | 2,863,384 | | | | 2,367,228 | |
| Class R | | | 1,323,253 | | | | 2,003,888 | | | | 1,806 | | | | 6,397 | | | | 108,368 | | | | 109,168 | |
| Class R63 | | | 349,217 | | | | 652,484 | | | | 133,466 | | | | 827,423 | | | | 288,876 | | | | 145,601 | |
| Class Y | | | 508,801 | | | | 695,073 | | | | — | | | | 421 | | | | 188,761 | | | | 196,380 | |
| | | | | | | | | | | | | | | | | | | | | | | | | |
| Shares issued upon reinvestment of dividends and distributions: |
| Class A | | | 166,426 | | | | 157,298 | | | | 91,800 | | | | 29,239 | | | | 10,128,431 | | | | 6,636,530 | |
| Class B1 | | | — | | | | — | | | | — | | | | 31 | | | | — | | | | 1,616 | |
| Class C | | | 15,477 | | | | 13,678 | | | | 4,424 | | | | 1,208 | | | | 537,801 | | | | 543,359 | |
| Class E2 | | | — | | | | — | | | | — | | | | — | | | | 6,259 | | | | 179,109 | |
| Class I | | | 156,193 | | | | 209,809 | | | | 334,598 | | | | 166,050 | | | | 3,400,804 | | | | 2,836,033 | |
| Class R | | | 58,694 | | | | 43,646 | | | | 9,834 | | | | 2,314 | | | | 166,158 | | | | 111,079 | |
| Class R63 | | | 10,181 | | | | 10,036 | | | | 189,759 | | | | 41,660 | | | | 117,659 | | | | 75,763 | |
| Class Y | | | 10,575 | | | | 16,148 | | | | 13,901 | | | | 2,911 | | | | 656,827 | | | | 446,437 | |
| | | | 12,412,110 | | | | 12,399,898 | | | | 1,091,101 | | | | 1,614,001 | | | | 22,296,486 | | | | 18,290,151 | |
| | | | | | | | | | | | | | | | | | | | | | | | | |
| Shares redeemed: |
| Class A | | | (5,034,974 | ) | | | (5,694,944 | ) | | | (412,115 | ) | | | (393,150 | ) | | | (12,448,492 | ) | | | (9,960,159 | ) |
| Class B1 | | | — | | | | (82,199 | ) | | | — | | | | (67,792 | ) | | | — | | | | (396,688 | ) |
| Class C | | | (743,495 | ) | | | (566,225 | ) | | | (25,556 | ) | | | (263,588 | ) | | | (2,126,624 | ) | | | (3,018,317 | ) |
| Class E2 | | | — | | | | — | | | | — | | | | — | | | | (1,688,882 | ) | | | (193,554 | ) |
| Class I | | | (7,801,503 | ) | | | (7,760,733 | ) | | | (2,146,084 | ) | | | (2,672,908 | ) | | | (10,997,515 | ) | | | (8,433,665 | ) |
| Class R | | | (1,733,467 | ) | | | (2,220,335 | ) | | | (7,025 | ) | | | (38,709 | ) | | | (222,826 | ) | | | (351,700 | ) |
| Class R63 | | | (680,008 | ) | | | (507,131 | ) | | | (792,676 | ) | | | (424,336 | ) | | | (168,804 | ) | | | (301,208 | ) |
| Class Y | | | (960,111 | ) | | | (740,388 | ) | | | (3,512 | ) | | | (1,545 | ) | | | (814,275 | ) | | | (880,161 | ) |
| | | | (16,953,558 | ) | | | (17,571,955 | ) | | | (3,386,968 | ) | | | (3,862,028 | ) | | | (28,467,418 | ) | | | (23,535,452 | ) |
| Net decrease | | | (4,541,448 | ) | | | (5,172,057 | ) | | | (2,295,867 | ) | | | (2,248,027 | ) | | | (6,170,932 | ) | | | (5,245,301 | ) |
| | | Delaware Ivy
Balanced Fund | | | Delaware Ivy Natural Resources Fund | | | Delaware Ivy
Science and Technology Fund | |
| | | Year ended | | | Year ended | | | Year ended | |
| | | 3/31/23 | | | 3/31/22 | | | 3/31/23 | | | 3/31/22 | | | 3/31/23 | | | 3/31/22 | |
| Shares sold: |
| Class A | | | 4,972,586 | | | | 5,631,565 | | | | 1,614,322 | | | | 945,401 | | | | 3,891,255 | | | | 4,004,575 | |
| Class B1 | | | — | | | | 1,202 | | | | — | | | | — | | | | — | | | | 1,014 | |
| Class C | | | 265,487 | | | | 394,571 | | | | 180,503 | | | | 71,389 | | | | 274,707 | | | | 254,903 | |
| Class E2 | | | — | | | | — | | | | 3,220 | | | | 26,539 | | | | 15,280 | | | | 66,979 | |
| Class I | | | 2,975,259 | | | | 4,063,515 | | | | 1,671,380 | | | | 1,093,121 | | | | 7,422,586 | | | | 4,784,274 | |
| Class R | | | 26,228 | | | | 48,780 | | | | 347,154 | | | | 331,021 | | | | 286,923 | | | | 173,854 | |
| Class R63 | | | 167,428 | | | | 80,331 | | | | 205,121 | | | | 72,848 | | | | 539,044 | | | | 378,020 | |
| Class Y | | | 43,816 | | | | 62,297 | | | | 269,789 | | | | 224,789 | | | | 572,209 | | | | 541,145 | |
| | | | | | | | | | | | | | | | | | | | | | | | | |
| Shares issued upon reinvestment of dividends and distributions: |
| Class A | | | 12,523,810 | | | | 6,063,065 | | | | 198,574 | | | | 225,076 | | | | 19,667,101 | | | | 25,267,590 | |
| Class B1 | | | — | | | | — | | | | — | | | | — | | | | — | | | | — | |
| Class C | | | 862,921 | | | | 531,929 | | | | 7,456 | | | | 6,296 | | | | 1,949,854 | | | | 2,598,995 | |
| Class E2 | | | — | | | | — | | | | — | | | | 5,869 | | | | — | | | | 294,444 | |
| Class I | | | 5,275,245 | | | | 3,374,499 | | | | 95,126 | | | | 136,967 | | | | 6,000,379 | | | | 9,251,779 | |
| Class R | | | 99,859 | | | | 44,727 | | | | 16,643 | | | | 20,277 | | | | 649,004 | | | | 690,285 | |
| Class R63 | | | 89,913 | | | | 44,433 | | | | 4,080 | | | | 2,723 | | | | 495,694 | | | | 624,653 | |
| Class Y | | | 105,532 | | | | 54,452 | | | | 16,224 | | | | 20,170 | | | | 1,082,649 | | | | 1,549,400 | |
| | | | 27,408,084 | | | | 20,395,366 | | | | 4,629,592 | | | | 3,182,486 | | | | 42,846,685 | | | | 50,481,910 | |
| | | | | | | | | | | | | | | | | | | | | | | | | |
| Shares redeemed: |
| Class A | | | (17,171,517 | ) | | | (8,851,402 | ) | | | (2,354,474 | ) | | | (2,031,894 | ) | | | (26,476,477 | ) | | | (13,059,493 | ) |
| Class B1 | | | — | | | | (380,859 | ) | | | — | | | | (10,498 | ) | | | — | | | | (233,908 | ) |
| Class C | | | (2,335,250 | ) | | | (3,054,999 | ) | | | (135,876 | ) | | | (144,639 | ) | | | (3,231,415 | ) | | | (3,123,952 | ) |
| Class E2 | | | — | | | | — | | | | (205,467 | ) | | | (33,640 | ) | | | (953,424 | ) | | | (83,798 | ) |
| Class I | | | (15,913,958 | ) | | | (9,245,460 | ) | | | (1,896,750 | ) | | | (1,947,863 | ) | | | (20,441,504 | ) | | | (10,656,206 | ) |
| Class R | | | (91,719 | ) | | | (73,277 | ) | | | (424,877 | ) | | | (476,270 | ) | | | (534,567 | ) | | | (537,937 | ) |
| Class R63 | | | (165,689 | ) | | | (113,539 | ) | | | (79,972 | ) | | | (41,185 | ) | | | (1,296,102 | ) | | | (572,579 | ) |
| Class Y | | | (105,862 | ) | | | (195,968 | ) | | | (331,182 | ) | | | (242,979 | ) | | | (1,894,782 | ) | | | (1,697,455 | ) |
| | | | (35,783,995 | ) | | | (21,915,504 | ) | | | (5,428,598 | ) | | | (4,928,968 | ) | | | (54,828,271 | ) | | | (29,965,328 | ) |
| Net increase (decrease) | | | (8,375,911 | ) | | | (1,520,138 | ) | | | (799,006 | ) | | | (1,746,482 | ) | | | (11,981,586 | ) | | | 20,516,582 | |
Notes to financial statements
Ivy Funds
6. Capital Shares (continued)
| | | Delaware
Real Estate Securities Fund | |
| | | Year ended | |
| | | 3/31/23 | | | 3/31/22 | |
| Shares sold: |
| Class A | | | 169,507 | | | | 336,547 | |
| Class B1 | | | — | | | | 590 | |
| Class C | | | 4,359 | | | | 11,424 | |
| Class E2 | | | 849 | | | | 8,063 | |
| Class I | | | 792,851 | | | | 1,182,727 | |
| Class R | | | 12,254 | | | | 5,896 | |
| Class R63 | | | 78,473 | | | | 21,285 | |
| Class Y | | | 139,644 | | | | 529,171 | |
| | | | | | | | | |
| Shares issued upon reinvestment of dividends and distributions: |
| Class A | | | 1,466,631 | | | | 645,153 | |
| Class C | | | 15,179 | | | | 8,012 | |
| Class E2 | | | — | | | | 13,322 | |
| Class I | | | 1,133,716 | | | | 578,344 | |
| Class R | | | 5,699 | | | | 2,372 | |
| Class R63 | | | 32,765 | | | | 4,194 | |
| Class Y | | | 73,372 | | | | 391,367 | |
| | | | 3,925,299 | | | | 3,738,467 | |
| | | | | | | | | |
| Shares redeemed: |
| Class A | | | (1,531,092 | ) | | | (1,044,572 | ) |
| Class B1 | | | — | | | | (18,164 | ) |
| Class C | | | (31,187 | ) | | | (34,410 | ) |
| Class E2 | | | (108,075 | ) | | | (16,173 | ) |
| Class I | | | (2,811,727 | ) | | | (2,096,504 | ) |
| Class R | | | (7,676 | ) | | | (7,768 | ) |
| Class R63 | | | (32,944 | ) | | | (6,593 | ) |
| Class Y | | | (3,255,252 | ) | | | (468,792 | ) |
| | | | (7,777,953 | ) | | | (3,692,976 | ) |
| Net increase (decrease) | | | (3,852,654 | ) | | | 45,491 | |
| 1 | On December 10, 2021, all Class B shares were converted into Class A shares. These transactions are included as subscriptions of Class A shares and redemptions of Class B shares in the tables above and on the previous page. |
| 2 | On June 13, 2022, all Class E shares were liquidated. |
| 3 | Effective July 1, 2021, Class N shares were renamed Class R6 shares. |
Certain shareholders may exchange shares of one class for shares of another class in the same Fund. These exchange transactions are included as subscriptions and redemptions in the tables above and on previous pages and on the “Statements of changes in net assets.” For the years ended March 31, 2023 and 2022, each Fund had the following exchange transactions:
| | | Year ended March 31, 2023 | | | Year Ended March 31, 2022 | |
| | | Exchange
Redemptions | | | Exchange
Subscriptions | | | Value | | | Exchange
Redemptions | | | Exchange
Subscriptions | | | Value | |
| Delaware Climate Solutions Fund | | | | | | | | | | $ | 2,688,406 | | | | | | | | | | | $ | 701,688 | |
| Class A | | | 179,306 | | | | 50,142 | | | | | | | | 14,481 | | | | 90,137 | | | | | |
| Class B | | | — | | | | — | | | | | | | | 4,510 | | | | — | | | | | |
| Class C | | | 86,971 | | | | — | | | | | | | | 31,674 | | | | — | | | | | |
| Class I | | | 907 | | | | 200,575 | | | | | | | | 58,546 | | | | 17,696 | | | | | |
| Class R6 | | | — | | | | 17 | | | | | | | | — | | | | — | | | | | |
| Delaware Global Real Estate Fund | | | | | | | | | | $ | 356,167 | | | | | | | | | | | $ | 1,645,927 | |
| Class A | | | 26,312 | | | | 6,804 | | | | | | | | 8,376 | | | | 133,331 | | | | | |
| Class B | | | — | | | | — | | | | | | | | 66,400 | | | | — | | | | | |
| Class C | | | 7,572 | | | | — | | | | | | | | 44,132 | | | | — | | | | | |
| Class I | | | 961 | | | | 26,825 | | | | | | | | 24,528 | | | | 9,072 | | | | | |
| Class R6 | | | — | | | | 961 | | | | | | | | — | | | | — | | | | | |
| Delaware Ivy Asset Strategy Fund | | | | | | | | | | $ | 29,036,328 | | | | | | | | | | | $ | 24,343,152 | |
| Class A | | | 495,262 | | | | 745,847 | | | | | | | | 232,417 | | | | 707,648 | | | | | |
| Class B | | | — | | | | — | | | | | | | | 132,613 | | | | — | | | | | |
| Class C | | | 803,534 | | | | — | | | | | | | | 556,832 | | | | — | | | | | |
| Class I | | | 181,475 | | | | 491,352 | | | | | | | | 77,011 | | | | 229,910 | | | | | |
| Class R6 | | | — | | | | 171,608 | | | | | | | | — | | | | 10,933 | | | | | |
| Class Y | | | 3,390 | | | | — | | | | | | | | 4,052 | | | | — | | | | | |
| Delaware Ivy Balanced Fund | | | | | | | | | | $ | 26,464,453 | | | | | | | | | | | $ | 20,149,636 | |
| Class A | | | 557,378 | | | | 509,401 | | | | | | | | 118,173 | | | | 573,375 | | | | | |
| Class B | | | — | | | | — | | | | | | | | 86,638 | | | | — | | | | | |
| Class C | | | 519,898 | | | | — | | | | | | | | 433,758 | | | | 35 | | | | | |
| Class I | | | 117,983 | | | | 577,669 | | | | | | | | 79,924 | | | | 143,179 | | | | | |
| Class R6 | | | — | | | | 107,515 | | | | | | | | — | | | | — | | | | | |
| Class Y | | | 7,224 | | | | 440 | | | | | | | | — | | | | 5,538 | | | | | |
| Delaware Ivy Natural Resources Fund | | | | | | | | | | $ | 3,947,855 | | | | | | | | | | | $ | 2,168,723 | |
| Class A | | | 134,876 | | | | 15,461 | | | | | | | | 116,343 | | | | 30,234 | | | | | |
| Class B | | | — | | | | — | | | | | | | | 6,142 | | | | — | | | | | |
| Class C | | | 15,452 | | | | — | | | | | | | | 29,803 | | | | — | | | | | |
| Class I | | | 87,011 | | | | 131,445 | | | | | | | | 10,526 | | | | 120,373 | | | | | |
| Class R6 | | | — | | | | 82,558 | | | | | | | | — | | | | — | | | | | |
| Class Y | | | 1,241 | | | | — | | | | | | | | — | | | | — | | | | | |
| Delaware Ivy Science and Technology Fund | | | | | | | | | | $ | 84,882,252 | | | | | | | | | | | $ | 52,698,135 | |
| Class A | | | 1,069,466 | | | | 450,782 | | | | | | | | 224,177 | | | | 319,262 | | | | | |
| Class B | | | — | | | | — | | | | | | | | 85,188 | | | | — | | | | | |
| Class C | | | 682,317 | | | | — | | | | | | | | 289,867 | | | | — | | | | | |
| Class E | | | — | | | | — | | | | | | | | — | | | | 357 | | | | | |
| Class I | | | 133,928 | | | | 914,702 | | | | | | | | 31,620 | | | | 211,548 | | | | | |
| Class R6 | | | 970 | | | | 133,678 | | | | | | | | — | | | | 5,406 | | | | | |
| Class Y | | | 49,891 | | | | — | | | | | | | | 27,184 | | | | — | | | | | |
| Delaware Real Estate Securities Fund | | | | | | | | | | $ | 2,131,329 | | | | | | | | | | | $ | 1,393,141 | |
| Class A | | | 88,911 | | | | 7,374 | | | | | | | | 13,147 | | | | 36,759 | | | | | |
| Class B | | | — | | | | — | | | | | | | | 12,943 | | | | — | | | | | |
| Class C | | | 9,394 | | | | — | | | | | | | | 10,657 | | | | — | | | | | |
| Class I | | | 346 | | | | 89,033 | | | | | | | | 14,660 | | | | 13,650 | | | | | |
| Class R6 | | | — | | | | 542 | | | | | | | | — | | | | — | | | | | |
Notes to financial statements
Ivy Funds
7. Basis of consolidation for Delaware Ivy Asset Strategy Fund
Ivy ASF II, Ltd. (the Subsidiary), a Cayman Islands exempted company, was incorporated as a wholly owned subsidiary acting as an investment vehicle for Delaware Ivy Asset Strategy Fund (referred to as the Fund in this subsection). Ivy ASF III (SBP), LLC (the Company), a Delaware limited liability company, was incorporated as a wholly owned company acting as an investment vehicle for the Fund. The Subsidiary and the Company act as investment vehicles for the Fund, in order to affect certain investments for the Fund consistent with the Fund’s investment objectives and policies as specified in its prospectus and SAI.
The Fund’s investment portfolio has been consolidated and includes the portfolio holdings of the Fund, its Subsidiary and the Company. The consolidated financial statements include the accounts of the Fund and its Subsidiary and the Company. All inter-company transactions and balances have been eliminated. A subscription agreement was entered into between the Fund and its Subsidiary and the Company comprising the entire issued share capital of the Subsidiary and the Company with the intent that the Fund will remain the sole shareholder and retain all rights. Under the Articles of Association, shares issued by the Subsidiary and the Company confer upon a shareholder the right to receive notice of, to attend and to vote at general meetings of the Subsidiary and the Company and shall confer upon the shareholder rights in a winding-up or repayment of capital and the right to participate in the profits or assets of the Subsidiary and the Company.
See the table below for details regarding the structure, incorporation and relationship as of March 31, 2023 of the Subsidiary and the Company to the Fund.
| | | Date of
Incorporation | | Subscription
Agreement | | Fund’s Net Assets | | | Subsidiary/
company net assets | | | Percentage
of Fund’s net assets | |
| Ivy ASF ll, Ltd | | 1-31-13 | | 4-10-13 | | $ | 1,817,994,185 | | | $ | 94,907,035 | | | | 5.22 | % |
| Ivy ASF lll (SBP), LLC | | 4-9-13 | | 4-23-13 | | $ | 1,817,994,185 | | | | 121,223 | | | | 0.01 | % |
8. Line of Credit
Each Fund, along with certain other funds in the Delaware Funds (Participants), was a participant in a $355,000,000 revolving line of credit (Agreement) intended to be used for temporary or emergency purposes as an additional source of liquidity to fund redemptions of investor shares. Under the Agreement, the Participants were charged an annual commitment fee of 0.15%, which was allocated across the Participants based on a weighted average of the respective net assets of each Participant. The Participants were permitted to borrow up to a maximum of one-third of their net assets under the Agreement. Each Participant was individually, and not jointly, liable for its particular advances, if any, under the line of credit. The line of credit available under the Agreement expired on October 31, 2022.
On October 31, 2022, each Fund, along with the other Participants, entered into an amendment to the Agreement for a $355,000,000 revolving line of credit to be used as described above. It operates in substantially the same manner as the original Agreement. Under the amendment to the Agreement, the Participants are charged an annual commitment fee of 0.15%, which is allocated across the Participants based on a weighted average of the respective net assets of each Participant. The line of credit available under the Agreement expires on October 30, 2023.
Each Fund had no amounts outstanding as of March 31, 2023, or at any time during the year then ended.
9. Interfund Lending Program
Pursuant to an exemptive order issued by the SEC (Order), the Ivy Funds and Ivy Variable Insurance Portfolios (collectively, the Funds, only for purposes of this Note 9) have the ability to lend money to, and borrow money from, each other pursuant to a master interfund lending agreement (Interfund Lending Program). Under the Interfund Lending Program, the Funds may lend or borrow money for temporary purposes directly to or from one another (each, an Interfund Loan), subject to meeting the conditions of the Order. The interest rate to be charged on an Interfund Loan is the average of the overnight repurchase agreement rate and the short-term bank loan rate. This program is in existence but is not currently in use. The Funds made no Interfund Loans under the Interfund Lending Program during the year ended March 31, 2023.
10. Derivatives
US GAAP requires disclosures that enable investors to understand: (1) how and why an entity uses derivatives; (2) how they are accounted for; and (3) how they affect an entity’s results of operations and financial position.
Foreign Currency Exchange Contracts — Each Fund may enter into foreign currency exchange contracts and foreign cross currency exchange contracts as a way of managing foreign exchange rate risk. Each Fund may enter into these contracts to fix the US dollar value of a security that it has agreed to buy or sell for the period between the date the trade was entered into and the date the security is delivered and paid for. Each Fund may also enter into these contracts to hedge the US dollar value of securities it already owns that are denominated in foreign currencies. In addition, each Fund may enter into these contracts to facilitate or expedite the settlement of portfolio transactions. The change in value is recorded as an unrealized gain or loss. When the contract is closed, a realized gain or loss is recorded equal to the difference between the value of the contract at the time it was opened and the value at the time it was closed.
The use of foreign currency exchange contracts and foreign cross currency exchange contracts does not eliminate fluctuations in the underlying prices of the securities, but does establish a rate of exchange that can be achieved in the future. Although foreign currency exchange contracts and foreign cross currency exchange contracts limit the risk of loss due to an unfavorable change in the value of the hedged currency, they also limit any potential gain that might result should the value of the currency change favorably. In addition, each Fund could be exposed to risks if the counterparties to the contracts are unable to meet the terms of their contracts. Each Fund’s maximum risk of loss from counterparty credit risk is the value of its currency exchanged with the counterparty. The risk is generally mitigated by having a netting arrangement between each Fund and the counterparty and by the posting of collateral by the counterparty to the Funds to cover each Fund’s exposure to the counterparty. Open foreign currency exchange contracts, if any, are disclosed on the “Schedules of investments.”
During the year ended March 31, 2023, Delaware Ivy Science and Technology Fund used foreign currency exchange contracts to hedge the US dollar value of securities it already owns that are denominated in foreign currencies to increase/decrease exposure to foreign currencies.
During the year ended March 31, 2023, Delaware Climate Solutions Fund, Delaware Global Real Estate Fund, Delaware Ivy Asset Strategy Fund, Delaware Ivy Natural Resources Fund and Delaware Real Estate Securities Fund each used foreign currency exchange contracts to facilitate or expedite the settlement of portfolio transactions.
Futures Contracts — A futures contract is an agreement in which the writer (or seller) of the contract agrees to deliver to the buyer an amount of cash or securities equal to a specific dollar amount times the difference between the value of a specific security or index at the close of the last trading day of the contract and the price at which the agreement is made. The Funds may use futures contracts in the normal course of pursuing its investment objective. The Funds may invest in futures contracts to hedge its existing portfolio securities against fluctuations in value caused by changes in interest rates. Upon entering into a futures contract, the Funds deposit cash or pledge US government securities to a broker, equal to the minimum “initial margin” requirements of the exchange on which the contract is traded. Subsequent payments are received from the broker or paid to the broker each day, based on the daily fluctuation in the market value of the contract. These receipts or payments are known as “variation margin” and are recorded daily by the Funds as unrealized gains or losses until the contracts are closed. When the contracts are closed, the Funds record a realized gain or loss equal to the difference between the value of the contract at the time it was opened and the value at the time it was closed. Risks of entering into futures contracts include potential imperfect correlation between the futures contracts and the underlying securities and the possibility of an illiquid secondary market for these instruments. When investing in futures, there is reduced counterparty credit risk to the Funds because futures are exchange-traded and the exchange’s clearinghouse, as counterparty to all exchange-traded futures, guarantees against default. Delaware Ivy Asset Strategy Fund and Delaware Ivy Balanced Fund posted $556,765 and $555,880, respectively as cash collateral as margin for open futures contracts, which is presented as Cash collateral due from brokers” on the “Statements of assets and liabilities.” Open futures contracts, if any, are disclosed on the “Schedules of investments.”
During the year ended March 31, 2023, Delaware Ivy Asset Strategy Fund and Delaware Ivy Balanced Fund invested in futures contracts to hedge the Funds’ existing portfolio securities against fluctuations in value caused by changes in interest rates or market conditions and as a cash management tool.
Options Contracts — Each Fund may enter into options contracts in the normal course of pursuing its investment objective. Each Fund may buy or write options contracts for any number of reasons, including without limitation: to manage each Fund’s exposure to changes in securities prices caused by interest rates or market conditions and foreign currencies; as an efficient means of adjusting each Fund’s overall exposure to certain markets; to protect the value of portfolio securities; and as a cash management tool. Each Fund may buy or write call or put options on
Notes to financial statements
Ivy Funds
10. Derivatives (continued)
securities, futures, swaps, swaptions, financial indices, and foreign currencies. When each Fund buys an option, a premium is paid and an asset is recorded and adjusted on a daily basis to reflect the current market value of the option purchased. When each Fund writes an option, a premium is received and a liability is recorded and adjusted on a daily basis to reflect the current market value of the option written. Premiums received from writing options that expire unexercised are treated by each Fund on the expiration date as realized gains. The difference between the premium received and the amount paid on effecting a closing purchase transaction, including brokerage commissions, is treated as realized gain or loss. If a call option is exercised, the premium is added to the proceeds from the sale of the underlying security in determining whether each Fund has a realized gain or loss. If a put option is exercised, the premium reduces the cost basis of the securities purchased by each Fund. Each Fund, as writer of an option, bears the market risk of an unfavorable change in the price of the security underlying the written option. When writing options, each Fund is subject to minimal counterparty risk because the counterparty is only obligated to pay premiums and does not bear the market risk of an unfavorable market change. At March 31, 2023, Delaware Ivy Asset Strategy Fund and Delaware Ivy Balanced Fund posted $50,229,840 and $16,490,000, respectively, in securities as collateral for potential options contracts, which is included on the “Schedules of investments.”
During the year ended March 31, 2023, Delaware Ivy Asset Strategy Fund and Delaware Ivy Balanced Fund used options contracts to manage the Funds’ exposure to changes in securities prices caused by interest rates or market conditions.
Swap Contracts — Delaware Ivy Balanced Fund may enter into CDS contracts in the normal course of pursuing its investment objective. The Fund may enter into CDS contracts in order to hedge against a credit event, to enhance total return or to gain exposure to certain securities or markets. The Fund will not be permitted to enter into any swap transactions unless, at the time of entering into such transactions, the unsecured long-term debt of the actual counterparty, combined with any credit enhancements, is rated at least BBB- by Standard & Poor’s Financial Services LLC (S&P) or Baa3 by Moody’s Investors Service, Inc. (Moody’s) or is determined to be of equivalent credit quality by DMC.
Credit Default Swaps. A CDS contract is a risk-transfer instrument through which one party (purchaser of protection) transfers to another party (seller of protection) the financial risk of a credit event (as defined in the CDS agreement), as it relates to a particular reference security or basket of securities (such as an index). In exchange for the protection offered by the seller of protection, the purchaser of protection agrees to pay the seller of protection a periodic amount at a stated rate that is applied to the notional amount of the CDS contract. In addition, an upfront payment may be made or received by the Fund in connection with an unwinding or assignment of a CDS contract. Upon the occurrence of a credit event, the seller of protection would pay the par (or other agreed-upon) value of the reference security (or basket of securities) to the counterparty. Credit events generally include, among others, bankruptcy, failure to pay, and obligation default.
During the year ended March 31, 2023, Delaware Ivy Balanced Fund entered into CDS contracts as a seller of protection, as a hedge against credit events. Periodic payments (receipts) on such contracts are accrued daily and recorded as unrealized losses (gains) on swap contracts. Upon payment (receipt), such amounts are recorded as realized losses (gains) on swap contracts. Upfront payments made or received in connection with CDS contracts are amortized over the expected life of the CDS contracts as unrealized losses (gains) on swap contracts. The change in value of CDS contracts is recorded daily as unrealized appreciation or depreciation. A realized gain or loss is recorded upon a credit event (as defined in the CDS agreement) or the maturity or termination of the agreement. Initial margin and variation margin are posted to central counterparties for centrally cleared CDS basket trades, as determined by the applicable central counterparty.
CDS contracts may involve greater risks than if Delaware Ivy Balanced Fund had invested in the reference obligation directly. CDS contracts are subject to general market risk, liquidity risk, counterparty risk, and credit risk. The Fund’s maximum risk of loss from counterparty credit risk, either as the seller of protection or the buyer of protection, is the fair value of the contract. This risk is mitigated by (1) for bilateral swap contracts, having a netting arrangement between the Fund and the counterparty and by the posting of collateral by the counterparty to the Fund to cover the Fund’s exposure to the counterparty, and (2) for cleared swaps, trading these instruments through a central counterparty.
During the year ended March 31, 2023, Delaware Ivy Balanced Fund used CDS contracts to hedge against credit events and to gain exposure to certain securities or markets.
Swaps Generally. For centrally cleared swaps, payments are received from the broker or paid to the broker each day, based on the daily fluctuation in the market value of the contract. These receipts or payments are known as “variation margin” and are recorded by the Fund as unrealized gains or losses until the contracts are closed. When the contracts are closed, the Fund records a realized gain or loss equal to the difference between the value of the contract at the time it was opened and the value at the time it was closed. The value of open swaps may
differ from that which would be realized in the event the Fund terminated its position in the contract on a given day. Risks of entering into these contracts include the potential inability of the counterparty to meet the terms of the contracts. This type of risk is generally limited to the amount of favorable movement in the value of the underlying security, instrument, or basket of instruments, if any, at the day of default. Risks also arise from potential losses from adverse market movements and such losses could exceed the unrealized amounts shown on the “Schedules of investments.”
At March 31, 2023, for bilateral derivative contracts, Delaware Ivy Balanced Fund posted $499,886 cash collateral for certain centrally cleared derivatives, which is included in “Cash collateral due from brokers” on the “Statements of assets and liabilities.” At March 31, 2023, for bilateral derivative contracts, the Fund received $37,957 in cash collateral, which is included in “Cash collateral due to brokers” on the “Statements of assets and liabilities.”
Fair values of derivative instruments as of March 31, 2023 were as follows:
| | | | | | Delaware Ivy
Asset Strategy
Fund
Asset
Derivatives Fair
Value | |
Statement of Assets and
Liabilities Location | | | | | Interest
Rate
Contracts | |
| Variation margin due to broker on futures contracts* | | | | | | $ | 410,305 | |
| | | | | | | | | |
| | | Delaware Ivy Balanced Fund
Asset Derivatives Fair Value | |
Statement of Assets and
Liabilities Location | | Interest
Rate
Contracts | | | Credit
Contracts | |
| Variation margin due from broker on futures contracts* | | $ | 1,334,742 | | | $ | — | |
| Variation margin due from brokers on centrally cleared credit default swap contracts* | | | — | | | | 131,792 | |
| Options purchased, at value** | | | — | | | | 416,241 | |
| Total | | $ | 1,334,742 | | | $ | 548,033 | |
| | | | | | | | | |
| | | Delaware Ivy Balanced Fund
Liability Derivatives Fair Value | |
Statement of Assets and
Liabilities Location | | Interest
Rate
Contracts | | | Credit
Contracts | |
| Variation margin due to broker on futures contracts* | | $ | (1,139,566 | ) | | $ | — | |
| Options written, at value | | | — | | | | (248,937 | ) |
| Total | | $ | (1,139,566 | ) | | $ | (248,937 | ) |
| * | Includes cumulative appreciation (depreciation) of futures contracts and centrally cleared CDS contracts from the date the contracts were opened through March 31, 2023. Only current day variation margin is reported on the Fund’s “Statements of assets and liabilities.” |
| ** | Included with “Investments, at value.” |
Notes to financial statements
Ivy Funds
10. Derivatives (continued)
The effect of derivative instruments on each Fund’s “Statements of operations” for the year ended March 31, 2023 was as follows:
| Delaware Ivy Asset Strategy Fund | | | | | Net Realized Gain (loss) on: | |
| | | | | | Foreign
Currency
Exchange
Contracts | | | Futures
Contracts | | | Options
Written | | | Total | |
| Currency contracts | | | | | | $ | (1,724,116 | ) | | $ | — | | | $ | — | | | $ | (1,724,116 | ) |
| Interest rate contracts | | | | | | | — | | | | (2,883,492 | ) | | | (47,270 | ) | | | (2,930,762 | ) |
| Total | | | | | | $ | (1,724,116 | ) | | $ | (2,883,492 | ) | | $ | (47,270 | ) | | $ | (4,654,878 | ) |
| | | | | | | | | | | | | | | | | | | | | |
| | | | | | | | | | | Net Change in Unrealized Appreciation (Depreciation)
on: | |
| | | | | | | | | | | Foreign
Currency
Exchange
Contracts | | | Futures
Contracts | | | Total | |
| Currency contracts | | | | | | | | | | $ | 7,030 | | | $ | — | | | $ | 7,030 | |
| Interest rate contracts | | | | | | | | | | | — | | | | 2,001,115 | | | | 2,001,115 | |
| Total | | | | | | | | | | $ | 7,030 | | | $ | 2,001,115 | | | $ | 2,008,145 | |
| | | | | | | | | | | | | | | | | | | | | |
| Delaware Ivy Balanced Fund | | | | | | | | | | Net Realized Gain (loss) on: | |
| | | | | | | | | | | Futures
Contracts | | | Swap
Contracts | | | Total | |
| Interest rate contracts | | | | | | | | | | $ | (204,367 | ) | | $ | — | | | $ | (204,367 | ) |
| Credit contracts | | | | | | | | | | | — | | | | 49,261 | | | | 49,261 | |
| Total | | | | | | | | | | $ | (204,367 | ) | | $ | 49,261 | | | $ | (155,106 | ) |
| | | | | | | | | | | | | | | | | | | | | |
| | | Net Change in Unrealized Appreciation (Depreciation) on: | |
| | | | Futures
Contracts | | | | Options
Purchased | | | | Options
Written | | | | Swap
Contracts | | | | Total | |
| Interest rate contracts | | $ | 195,176 | | | $ | — | | | $ | — | | | $ | — | | | $ | 195,176 | |
| Credit contracts | | | — | | | | (19,809 | ) | | | 73,753 | | | | 135,689 | | | | 189,633 | |
| Total | | $ | 195,176 | | | $ | (19,809 | ) | | $ | 73,753 | | | $ | 135,689 | | | $ | 384,809 | |
During the year ended March 31, 2023, Delaware Climate Solutions Fund, Delaware Global Real Estate Fund, Delaware Ivy Natural Resources Fund, Delaware Ivy Science and Technology Fund, and Delaware Real Estate Securities Fund experienced net realized and unrealized gains or losses attributable to foreign currency exchange contracts, which are disclosed on the “Statements of operations” and/or “Statements of assets and liabilities.”
The tables below summarizes the average daily balance of derivative holdings by certain Funds during the year ended March 31, 2023:
| | | Long Derivative Volume | |
| | | Delaware Climate Solutions Fund | | | Delaware Global
Real Estate Fund | | | Delaware Ivy Asset Strategy
Fund | |
| Foreign currency exchange contracts (average notional value) | | $ | 291,855 | | | $ | 26,069 | | | $ | 947,299 | |
| Futures contracts (average notional value) | | | — | | | | — | | | | 22,757,894 | |
| Options contracts (average notional value)* | | | — | | | | — | | | | 456 | |
| | | Long Derivative Volume | |
| | | Delaware Ivy
Balanced Fund | | | Delaware Ivy Natural Resources Fund | | | Delaware Ivy
Science and Technology Fund | |
| Foreign currency exchange contracts (average notional value) | | $ | — | | | $ | 53,270 | | | $ | 29,965 | |
| Futures contracts (average notional value) | | | 57,707,674 | | | | — | | | | — | |
| Options contracts (average notional value)* | | | 80,301 | | | | — | | | | — | |
| CDS contracts (average notional value)** | | | 133,865 | | | | — | | | | — | |
| | | Long Derivative Volume |
| | | Delaware
Real Estate Securities Fund |
| Foreign currency exchange contracts (average notional value) | $ | 812 |
| | | Short Derivative Volume | |
| | | Delaware Climate Solutions Fund | | | Delaware Global
Real Estate Fund | | | Delaware Ivy Asset Strategy
Fund | |
| Foreign currency exchange contracts (average notional value) | | $ | 190,289 | | | $ | 65,145 | | | $ | 1,192,651 | |
| Futures contracts (average notional value) | | | — | | | | — | | | | 1,943,128 | |
| Options contracts (average notional value)* | | | — | | | | — | | | | 205 | |
| | | Short Derivative Volume | |
| | | Delaware Ivy
Balanced Fund | | | Delaware Ivy Natural Resources Fund | | | Delaware Ivy
Science and Technology Fund | |
| Foreign currency exchange contracts (average notional value) | | $ | — | | | $ | 50,924 | | | $ | 443,816 | |
| Futures contracts (average notional value) | | | 29,255,523 | | | | — | | | | — | |
| Options contracts (average notional value)* | | | 58,591 | | | | — | | | | — | |
| CDS contracts (average notional value)** | | | 88,390 | | | | — | | | | — | |
| | | Short Derivative Volume | |
| | | Delaware
Real Estate Securities Fund | |
| Foreign currency exchange contracts (average notional value) | | $ | 5,611 | |
| * | Long represents purchased options and short represents written options. |
| ** | Long represents buying protection and short represents selling protection. |
11. Securities Lending
Each Fund, along with other funds in the Delaware Funds, may lend its securities pursuant to a security lending agreement (Lending Agreement) with The Bank of New York Mellon (BNY Mellon). At the time a security is loaned, the borrower must post collateral equal to the required percentage of the market value of the loaned security, including any accrued interest. The required percentage is: (1) 102% with respect to US securities and foreign securities that are denominated and payable in US dollars; and (2) 105% with respect to foreign securities.
Notes to financial statements
Ivy Funds
11. Securities Lending (continued)
With respect to each loan, if on any business day the aggregate market value of securities collateral plus cash collateral held is less than the aggregate market value of the securities which are the subject of such loan, the borrower will be notified to provide additional collateral by the end of the following business day, which, together with the collateral already held, will be not less than the applicable initial collateral requirements for such security loan. If the aggregate market value of securities collateral and cash collateral held with respect to a security loan exceeds the applicable initial collateral requirement, upon the request of the borrower, BNY Mellon must return enough collateral to the borrower by the end of the following business day to reduce the value of the remaining collateral to the applicable initial collateral requirement for such security loan. As a result of the foregoing, the value of the collateral held with respect to a loaned security on any particular day, may be more or less than the value of the security on loan. The collateral percentage with respect to the market value of the loaned security is determined by the security lending agent.
Cash collateral received by each Fund of the Trust is generally invested in a series of individual separate accounts, each corresponding to a fund. The investment guidelines permit each separate account to hold certain securities that would be considered eligible securities for a money market fund. Cash collateral received is generally invested in government securities; certain obligations issued by government sponsored enterprises; repurchase agreements collateralized by US Treasury securities; obligations issued by the central government of any Organization for Economic Cooperation and Development (OECD) country or its agencies, instrumentalities, or establishments; obligations of supranational organizations; commercial paper, notes, bonds, and other debt obligations; certificates of deposit, time deposits, and other bank obligations; certain money market funds; and asset-backed securities. Each Fund can also accept US government securities and letters of credit (non-cash collateral) in connection with securities loans.
In the event of default or bankruptcy by the lending agent, realization and/or retention of the collateral may be subject to legal proceedings. In the event the borrower fails to return loaned securities and the collateral received is insufficient to cover the value of the loaned securities and provided such collateral shortfall is not the result of investment losses, the lending agent has agreed to pay the amount of the shortfall to each Fund or, at the discretion of the lending agent, replace the loaned securities. Each Fund continues to record dividends or interest, as applicable, on the securities loaned and is subject to changes in value of the securities loaned that may occur during the term of the loan. Each Fund has the right under the Lending Agreement to recover the securities from the borrower on demand. With respect to security loans collateralized by non-cash collateral, each Fund receives loan premiums paid by the borrower. With respect to security loans collateralized by cash collateral, the earnings from the collateral investments are shared among each Fund, the security lending agent, and the borrower. Each Fund records security lending income net of allocations to the security lending agent and the borrower.
Each Fund may incur investment losses as a result of investing securities lending collateral. This could occur if an investment in each collateral investment account defaulted or became impaired. Under those circumstances, the value of each Fund’s cash collateral account may be less than the amount each Fund would be required to return to the borrowers of the securities and each Fund would be required to make up for this shortfall.
At the year ended March 31, 2023, each Fund had no securities out on loan.
12. Credit and Market Risk
The global outbreak of COVID-19 has resulted in travel restrictions, closed international borders, enhanced health screenings at ports of entry and elsewhere, disruption of and delays in healthcare service preparation and delivery, prolonged quarantines, cancellations, supply chain disruptions, and lower consumer demand, as well as general concern and uncertainty. The impact of COVID-19, and other infectious illness outbreaks that may arise in the future, could adversely affect the economies of many nations or the entire global economy, individual issuers and capital markets in ways that cannot necessarily be foreseen. In addition, the impact of infectious illnesses in emerging market countries may be greater due to generally less established healthcare systems. Public health crises caused by the COVID-19 outbreak may exacerbate other pre-existing political, social and economic risks in certain countries or globally. The duration of the outbreak, its full economic impact and ongoing effects at the macro-level and on individual businesses are unpredictable and may result in significant and prolonged effects on a Fund’s performance.
When interest rates rise, fixed income securities (i.e. debt obligations) generally will decline in value. These declines in value are greater for fixed income securities with longer maturities or durations. Interest rate changes are influenced by a number of factors, such as government policy, monetary policy, inflation expectations, and the supply and demand of bonds. A fund may be subject to a greater risk of rising interest
rates when interest rates are low or inflation rates are high or rising.
IBOR is the risk that changes related to the use of the London interbank offered rate (LIBOR) and other interbank offered rate (collectively, IBORs) could have adverse impacts on financial instruments that reference LIBOR (or the corresponding IBOR). The abandonment of LIBOR could affect the value and liquidity of instruments that reference LIBOR. The use of alternative reference rate products may impact investment strategy performance. These risks may also apply with respect to changes in connection with other IBORs, such as the euro overnight index average (EONIA), which are also the subject of recent reform.
Investments in equity securities in general are subject to market risks that may cause their prices to fluctuate over time. Fluctuations in the value of equity securities in which the Funds invest will cause the NAV of the Funds to fluctuate.
Some countries in which the Funds may invest require governmental approval for the repatriation of investment income, capital, or the proceeds of sales of securities by foreign investors. In addition, if there is deterioration in a country’s balance of payments or for other reasons, a country may impose temporary restrictions on foreign capital remittances abroad.
The securities exchanges of certain foreign markets are substantially smaller, less liquid, and more volatile than the major securities markets in the United States. Consequently, acquisition and disposition of securities by the Funds may be inhibited. In addition, a significant portion of the aggregate market value of securities listed on the major securities exchanges in emerging markets is held by a smaller number of investors. This may limit the number of shares available for acquisition or disposition by the Funds.
Certain Funds invest a portion of its assets in high yield fixed income securities, which are securities rated lower than BBB-by S&P and lower than Baa3 by Moody’s, or similarly rated by another nationally recognized statistical rating organization. Investments in these higher yielding securities are generally accompanied by a greater degree of credit risk than higher-rated securities. Additionally, lower-rated securities may be more susceptible to adverse economic and competitive industry conditions than investment grade securities.
Certain Funds invest in fixed income securities whose value is derived from an underlying pool of mortgages or consumer loans. The value of these securities is sensitive to changes in economic conditions, including delinquencies and/or defaults, and may be adversely affected by shifts in the market’s perception of the issuers and changes in interest rates. Investors receive principal and interest payments as the underlying mortgages and consumer loans are paid back. Some of these securities are CMOs. CMOs are debt securities issued by US government agencies or by financial institutions and other mortgage lenders, which are collateralized by a pool of mortgages held under an indenture. Prepayment of mortgages may shorten the stated maturity of the obligations and can result in a loss of premium, if any has been paid. Certain of these securities may be stripped (securities which provide only the principal or interest feature of the underlying security). The yield to maturity on an interest-only CMO is extremely sensitive not only to changes in prevailing interest rates, but also to the rate of principal payments (including prepayments) on the related underlying mortgage assets. A rapid rate of principal payments may have a material adverse effect on a Fund’s yield to maturity. If the underlying mortgage assets experience greater than anticipated prepayments of principal, a Fund may fail to fully recoup its initial investment in these securities even if the securities are rated in the highest rating categories.
Certain Funds invest in bank loans and other securities that may subject them to direct indebtedness risk, the risk that the Funds will not receive payment of principal, interest, and other amounts due in connection with these investments and will depend primarily on the financial condition of the borrower. Loans that are fully secured offer the Fund more protection than unsecured loans in the event of non-payment of scheduled interest or principal, although there is no assurance that the liquidation of collateral from a secured loan would satisfy the corporate borrower’s obligation, or that the collateral can be liquidated. Some loans or claims may be in default at the time of purchase. Certain of the loans and the other direct indebtedness acquired by the Fund may involve revolving credit facilities or other standby financing commitments that obligate the Fund to pay additional cash on a certain date or on demand. These commitments may require each Fund to increase its investment in a company at a time when the Fund might not otherwise decide to do so (including at a time when the company’s financial condition makes it unlikely that such amounts will be repaid). To the extent that each Fund is committed to advance additional funds, it will at all times hold and maintain cash or other high grade debt obligations in an amount sufficient to meet such commitments. When a loan agreement is purchased, the Fund may pay an assignment fee. On an ongoing basis, the Fund may receive a commitment fee based on the undrawn portion of the underlying line of credit portion of a loan agreement. Prepayment penalty fees are received upon the prepayment of a loan agreement by the borrower. Prepayment penalty, facility, commitment, consent, and amendment fees are recorded to income as earned or paid.
As the Fund may be required to rely upon another lending institution to collect and pass on to the Fund amounts payable with respect to the loan and to enforce the Fund’s rights under the loan and other direct indebtedness, an insolvency, bankruptcy, or reorganization of the lending
Notes to financial statements
Ivy Funds
12. Credit and Market Risk (continued)
institution may delay or prevent the Fund from receiving such amounts. The highly leveraged nature of many loans may make them especially vulnerable to adverse changes in economic or market conditions. Investments in such loans and other direct indebtedness may involve additional risk to the Fund.
Certain Funds invest in certain obligations that may have liquidity protection designed to ensure that the receipt of payments due on the underlying security is timely. Such protection may be provided through guarantees, insurance policies, or letters of credit obtained by the issuer or sponsor through third parties, through various means of structuring the transaction, or through a combination of such approaches. The Funds will not pay any additional fees for such credit support, although the existence of credit support may increase the price of a security.
Certain Funds may invest in REITs and are subject to the risks associated with that industry. If a Fund holds real estate directly or receives rental income directly from real estate holdings, its tax status as a regulated investment company may be jeopardized. There were no direct real estate holdings during the year ended March 31, 2023. The Funds’ REIT holdings are also affected by interest rate changes, particularly if the REITs they hold use floating rate debt to finance their ongoing operations. The Funds also invest in real estate acquired as a result of ownership of securities or other instruments, including issuers that invest, deal, or otherwise engage in transactions in real estate or interests therein. These instruments may include interests in private equity limited partnerships or limited liability companies that hold real estate investments (Real Estate Limited Partnerships). The Funds will limit their investments in Real Estate Limited Partnerships to 5% of their total assets at the time of purchase.
Each Fund may invest up to 15% of its net assets in illiquid securities, which may include securities with contractual restrictions on resale, securities exempt from registration under Rule 144A promulgated under the Securities Act of 1933, as amended and other securities which may not be readily marketable. The relative illiquidity of these securities may impair each Fund from disposing of them in a timely manner and at a fair price when it is necessary or desirable to do so. While maintaining oversight, the Board has delegated to DMC the day-to-day functions of determining whether individual securities are liquid for purposes of the Funds’ limitation on investments in illiquid securities. Securities eligible for resale pursuant to Rule 144A, which are determined to be liquid, are not subject to the Funds’ 15% limit on investments in illiquid securities. Rule 144A securities have been identified on the “Schedules of investments.”
13. Contractual Obligations
Each Fund enters into contracts in the normal course of business that contain a variety of indemnifications. Each Fund’s maximum exposure under these arrangements is unknown. However, each Fund has not had prior claims or losses pursuant to these contracts. Management has reviewed each Fund’s existing contracts and expects the risk of loss to be remote.
14. Recent Accounting Pronouncements
In March 2020, FASB issued an Accounting Standards Update (ASU), ASU 2020-04, Reference Rate Reform (Topic 848) - Facilitation of the Effects of Reference Rate Reform on Financial Reporting. The amendments in ASU 2020-04 provide optional temporary financial reporting relief from the effect of certain types of contract modifications due to the planned discontinuation of LIBOR and other interbank-offered based reference rates as of the end of 2021. In March 2021, the administrator for LIBOR announced the extension of the publication of a majority of the USD LIBOR settings to June 30, 2023. On December 21, 2022, FASB issued ASU 2022-06 to defer the sunset date of Accounting Standards Codification Topic 848 until December 31, 2024. ASU 2020-04 is effective for certain reference rate-related contract modifications that occur during the period March 12, 2020 through December 31, 2024. Management is currently evaluating ASU 2020-04 and ASU 2022-06, but does not believe there will be a material impact.
15. New Regulatory Pronouncement
In October 2022, the Securities and Exchange Commission (SEC) adopted a rule and form amendments relating to tailored shareholder reports for mutual funds and ETFs; and fee information in investment company advertisements. The rule and form amendments will require mutual funds and ETFs to transmit streamlined shareholder reports that highlight key information to investors. The rule amendments will require that certain more in-depth information be made available online and available for delivery free of charge to investors on request. The amendments became effective in January 2023 and there is an 18-month transition period after the effective date of the amendment with a compliance date of July 2024.
16. Subsequent Events
Management has determined that no material events or transactions occurred subsequent to March 31, 2023, that would require recognition or disclosure in the Funds’ financial statements.
Report of independent
registered public accounting firm
To the Board of Trustees of Ivy Funds and Shareholders of Delaware Climate Solutions Fund, Delaware Global Real Estate Fund, Delaware Ivy Natural Resources Fund, Delaware Ivy Science and Technology Fund, Delaware Real Estate Securities Fund, Delaware Ivy Asset Strategy Fund and Delaware Ivy Balanced Fund
Opinions on the Financial Statements
We have audited the accompanying statements of assets and liabilities, including the schedules of investments, of each of the funds listed in the table below (seven of the funds constituting Ivy Funds, hereafter collectively referred to as the “Funds”) as of March 31, 2023, the related statements of operations and of changes in net assets for each of the periods indicated in the table below, including the related notes, and the financial highlights for each of the periods indicated in the table below (collectively referred to as the “financial statements”). In our opinion, the financial statements present fairly, in all material respects, the financial position of each of the Funds as of March 31, 2023, the results of each of their operations, the changes in each of their net assets, and each of the financial highlights for each of the periods indicated in the table below, in conformity with accounting principles generally accepted in the United States of America.
Delaware Climate Solutions Fund(1)
Delaware Global Real Estate Fund(1)
Delaware Ivy Natural Resources Fund(1)
Delaware Ivy Science and Technology Fund(1) | Delaware Real Estate Securities Fund(1)
Delaware Ivy Asset Strategy Fund(2)
Delaware Ivy Balanced Fund(1) |
(1) Statement of assets and liabilities, including the schedule of investments, as of March 31, 2023, the related statement of operations for the year ended March 31, 2023, the statements of changes in net assets for each of the two years in the period ended March 31, 2023 and the financial highlights for each of the three years in the period ended March 31, 2023.
(2) Consolidated statement of assets and liabilities, including the consolidated schedule of investments, as of March 31, 2023, the related consolidated statement of operations for the year ended March 31, 2023, the consolidated statements of changes in net assets for each of the two years in the period ended March 31, 2023 and the consolidated financial highlights for each of the three years in the period ended March 31, 2023.
The financial statements of the Funds as of and for the year ended March 31, 2020 and the financial highlights for each of the periods ended on or prior to March 31, 2020 (not presented herein, other than the financial highlights) were audited by other auditors whose report dated May 18, 2020 expressed an unqualified opinion on those financial statements and financial highlights.
Basis for Opinions
These financial statements are the responsibility of the Funds’ management. Our responsibility is to express an opinion on the Funds’ financial statements based on our audits. We are a public accounting firm registered with the Public Company Accounting Oversight Board (United States) (PCAOB) and are required to be independent with respect to the Funds in accordance with the U.S. federal securities laws and the applicable rules and regulations of the Securities and Exchange Commission and the PCAOB.
We conducted our audits of these financial statements in accordance with the standards of the PCAOB. Those standards require that we plan and perform the audit to obtain reasonable assurance about whether the financial statements are free of material misstatement, whether due to error or fraud.
Report of independent
registered public accounting firm
Our audits included performing procedures to assess the risks of material misstatement of the financial statements, whether due to error or fraud, and performing procedures that respond to those risks. Such procedures included examining, on a test basis, evidence regarding the amounts and disclosures in the financial statements. Our audits also included evaluating the accounting principles used and significant estimates made by management, as well as evaluating the overall presentation of the financial statements. Our procedures included confirmation of securities owned as of March 31, 2023 by correspondence with the custodian, transfer agents, portfolio company investees, agent banks and brokers; when replies were not received from brokers, we performed other auditing procedures. We believe that our audits provide a reasonable basis for our opinions.
/s/PricewaterhouseCoopers LLP
Philadelphia, Pennsylvania
June 9, 2023
We have served as the auditor of one or more investment companies in Delaware Funds by Macquarie® since 2010.
Other Fund information (Unaudited)
Ivy Funds
Tax Information
The information set forth below is for the Fund’s fiscal year as required by federal income tax laws. Shareholders, however, must report distributions on a calendar year basis for income tax purposes, which may include distributions for portions of two fiscal years of the Fund. Accordingly, the information needed by shareholders for income tax purposes will be sent to them in January of each year. Please consult your tax advisor for proper treatment of this information.
All disclosures are based on financial information available as of the date of this annual report and, accordingly are subject to change. For any and all items requiring reporting, it is the intention of the Fund to report the maximum amount permitted under the Internal Revenue Code and the regulations thereunder.
For the fiscal year ended March 31, 2023, the Funds report distributions paid during the year as follows:
| | | (A)
Long-Term
Capital Gains
Distributions
(Tax Basis) | | | (B)
Ordinary Income
Distributions*
(Tax Basis) | | | Total
Distributions
(Tax Basis) | | | (C)
Qualifying
Dividends1 | |
| Delaware Climate Solutions Fund | | | — | | | | 100.00 | % | | | 100.00 | % | | | 67.77 | % |
| Delaware Global Real Estate Fund | | | 83.40 | % | | | 16.60 | % | | | 100.00 | % | | | 0.03 | % |
| Delaware Ivy Asset Strategy Fund | | | 79.88 | % | | | 20.12 | % | | | 100.00 | % | | | 13.12 | % |
| Delaware Ivy Balanced Fund | | | 96.28 | % | | | 3.72 | % | | | 100.00 | % | | | 92.96 | % |
| Delaware Ivy Natural Resources Fund | | | — | | | | 100.00 | % | | | 100.00 | % | | | 82.16 | % |
| Delaware Ivy Science and Technology Fund | | | 100.00 | % | | | — | | | | 100.00 | % | | | — | |
| Delaware Real Estate Securities Fund | | | 83.96 | % | | | 16.04 | % | | | 100.00 | % | | | — | |
(A) and (B) are based on a percentage of each Fund’s total distributions.
(C) is based on each Fund’s ordinary income distributions.
1Qualified dividends represent dividends which qualify for the corporate dividends received deduction.
*For the fiscal year ended March 31, 2023, certain dividends paid by the Funds may be subject to a maximum tax rate of 20%. The percentage of dividends paid by the Funds from ordinary income reported as qualified income are as reported in the following table. Complete information will be computed and reported in conjunction with your 2023 Form 1099-DIV.
| | | Percentage | |
| Delaware Climate Solutions Fund | | | 100.00 | % |
| Delaware Global Real Estate Fund | | | 35.05 | % |
| Delaware Ivy Asset Strategy Fund | | | 26.92 | % |
| Delaware Ivy Balanced Fund | | | 100.00 | % |
| Delaware Ivy Natural Resources Fund | | | 100.00 | % |
| Delaware Ivy Science and Technology Fund | | | — | % |
| Delaware Real Estate Securities Fund | | | — | % |
Form N-PORT and proxy voting information
Each Fund files its complete schedule of portfolio holdings with the Securities and Exchange Commission (SEC) for the first and third quarters of each fiscal year on Form N-PORT. Each Fund’s Form N-PORT, as well as a description of the policies and procedures that the Funds use to determine how to vote proxies (if any) relating to portfolio securities, are available without charge (i) upon request, by calling 800 523-1918; and (ii) on the SEC’s website at sec.gov. In addition, a description of the policies and procedures that the Funds use to determine how to vote proxies (if any) relating to portfolio securities and the Schedule of investments included in each Fund’s most recent Form N-PORT are available without charge on the Funds’ website at delawarefunds.com/literature.
Information (if any) regarding how the Funds voted proxies relating to portfolio securities during the most recently disclosed 12-month period ended June 30 is available without charge (i) through the Funds’ website at delawarefunds.com/proxy; and (ii) on the SEC’s website at sec.gov.
Board of trustees and officers addendum
Delaware Funds by Macquarie®
A mutual fund is governed by a Board of Trustees (“Trustees”), which has oversight responsibility for the management of a fund’s business affairs. Trustees establish procedures and oversee and review the performance of the investment manager, the distributor, and others who perform services for the fund. The independent fund trustees, in particular, are advocates for shareholder interests. Each trustee has served in that capacity since he or she was elected to or appointed to the Board of Trustees, and will continue to serve until his or her retirement or the election of a new trustee in his or her place. The following is a list of the Trustees and Officers with certain background and related information.
Name,
Address,
and Birth Year | Position(s)
Held with
the Trust | Length of Time
Served1 | Number of
Funds in Fund
Complex Overseen
by Trustee | Principal
Occupation(s)
During the
Past Five Years | Other
Directorships
Held by Trustee
During the
Past Five Years |
| Interested Trustee | | | | |
| |
Shawn K. Lytle2
100 Independence
610 Market Street
Philadelphia, PA
19106-2354
1970 | President,
Chief Executive Officer,
and Trustee | President and
Chief Executive Officer
since August 2015
Trustee since
September 2015 | 117 | Macquarie Asset
Management3
(2015–Present)
-Global Head of
Macquarie Asset
Management Public
Investments
(2019–Present)
-Head of Americas of
Macquarie Group
(2017–Present) | None |
| |
| Independent Trustees | |
| |
Jerome D. Abernathy
100 Independence
610 Market Street
Philadelphia, PA
19106-2354
1959 | Trustee | Since January 2019 | 117 | Stonebrook Capital
Management, LLC
(financial
technology: macro
factors and databases)
-Managing Member
(1993-Present) | None |
| |
Ann D. Borowiec
100 Independence
610 Market Street
Philadelphia, PA
19106-2354
1958 | Trustee | Since March 2015 | 117 | J.P. Morgan Chase &
Co. (1987-2013)
-Chief Executive Officer,
Private Wealth
Management (2011–
2013) | Banco Santander
International
(2016–2019)
Santander Bank, N.A.
(2016-2019) |
| |
Joseph W. Chow
100 Independence
610 Market Street
Philadelphia, PA
19106-2354
1953 | Trustee | Since January 2013 | 117 | Private Investor
(2011–Present)
State Street Bank and
Trust Company
(1996-2011)
-Executive Vice
President of Enterprise
Risk Management and
Emerging Economies
Strategy; and Chief Risk
and Corporate
Administration Officer | None |
| |
H. Jeffrey Dobbs
100 Independence
610 Market Street
Philadelphia, PA
19106-2354
1955 | Trustee | Since April 20194 | 117 | KPMG LLP
(2002-2015)
-Global Sector
Chairman,
Industrial Manufacturing
(2010-2015) | TechAccel LLC
(2015–Present)
PatientsVoices, Inc.
(2018–Present)
Valparaiso University
Board
(2012-Present)
Ivy Funds Complex (2019-
2021) |
Name,
Address,
and Birth Year | Position(s)
Held with
the Trust | Length of Time
Served1 | Number of
Funds in Fund
Complex Overseen
by Trustee | Principal
Occupation(s)
During the
Past Five Years | Other
Directorships
Held by Trustee
During the
Past Five Years |
| | | | | | |
John A. Fry
100 Independence
610 Market Street
Philadelphia, PA
19106-2354
1960 | Trustee | Since January 2001 | 117 | Drexel University
-President
(2010–Present) | Federal Reserve
Bank of Philadelphia
(2020–Present)
Kresge Foundation
(2018-Present)
FS Credit Real Estate
Income Trust, Inc.
(2018–Present)
vTv Therapeutics Inc.
(2017–Present)
Community Health
Systems
(2004–Present)
Drexel Morgan & Co.
(2015–2019) |
| | | | | | |
Joseph Harroz, Jr.
100 Independence
610 Market Street
Philadelphia, PA
19106-2354
1967 | Trustee | Since November 19984 | 117 | University of Oklahoma
-President
(2020–Present)
-Interim President
(2019–2020)
-Vice President and
Dean, College of Law
(2010–2019)
Brookhaven
Investments LLC
(commercial
enterprises)
-Managing Member
(2019–Present)
St. Clair, LLC
(commercial
enterprises)
-Managing Member
(2019–Present) | OU Medicine, Inc.
(2020–Present)
Big 12 Athletic Conference
(2019-Present)
Valliance Bank
(2007–Present)
Ivy Funds Complex
(1998-2021) |
| | | | | | |
Sandra A.J. Lawrence
100 Independence
610 Market Street
Philadelphia, PA
19106-2354
1957 | Trustee | Since April 20194 | 117 | Children’s Mercy
Hospitals and Clinics
(2005–2019)
-Chief Administrative
Officer
(2016–2019) | Brixmor Property
Group Inc. (2021-Present)
Sera Prognostics Inc.
(biotechnology)
(2021-Present)
Recology (resource
recovery) (2021-Present)
Evergy, Inc., Kansas City
Power & Light Company,
KCP&L Greater Missouri
Operations Company,
Westar Energy, Inc. and
Kansas Gas and Electric
Company (related utility
companies)
(2018-Present)
National Association of
Corporate Directors
(2017-Present)
American Shared Hospital
Services (medical device)
(2017-2021)
Ivy Funds Complex (2019-
2021) |
Board of trustees and officers addendum
Delaware Funds by Macquarie®
Name,
Address,
and Birth Year | Position(s)
Held with
the Trust | Length of Time
Served1 | Number of
Funds in Fund
Complex Overseen
by Trustee | Principal
Occupation(s)
During the
Past Five Years | Other
Directorships
Held by Trustee
During the
Past Five Years |
| | | | | | |
Frances A.
Sevilla-Sacasa
100 Independence
610 Market Street
Philadelphia, PA
19106-2354
1956 | Trustee | Since September 2011 | 117 | Banco Itaú International
-Chief Executive Officer
(2012–2016)
Bank of America,
U.S. Trust Private
Wealth
-President (2007-2008)
U.S. Trust Corp.
-President & CEO
(2005-2007) | Florida Chapter of
National Association of
Corporate Directors
(2021-Present)
Callon Petroleum
Company (2019-Present)
Camden Property Trust
(2011-Present)
New Senior Investment
Group Inc. (2021)
Carrizo Oil & Gas, Inc.
(2018-2019) |
| | | | | | |
Thomas K. Whitford
100 Independence
610 Market Street
Philadelphia, PA
19106-2354
1956 | Chair and Trustee | Trustee since January
2013
Chair since January
2023 | 117 | PNC Financial Services
Group (1983–2013)
-Vice Chairman (2009-
2013) | HSBC USA Inc.
(2014–2022)
HSBC North America
Holdings Inc.
(2013–2022) |
| | | | | | |
Christianna Wood
100 Independence
610 Market Street
Philadelphia, PA
19106-2354
1959 | Trustee | Since January 2019 | 117 | Gore Creek
Capital, Ltd.
-Chief Executive Officer
and President
(2009–Present)
Capital Z Asset
Management
-Chief Executive Officer
(2008-2009)
California Public
Employees’ Retirement
System (CalPERS)
-Senior Investment
Officer of Global Equity
(2002-2008) | The Merger Fund
(2013–2021),
The Merger Fund VL
(2013–2021),
WCM Alternatives: Event-
Driven Fund (2013–2021),
and WCM
Alternatives: Credit Event
Fund (2017–2021)
Grange Insurance
(2013–Present)
H&R Block Corporation
(2008–2022)
International Securities
Exchange (2010-2018)
Vassar College Trustee
(2006-2018) |
| | | | | | |
Janet L. Yeomans
100 Independence
610 Market Street
Philadelphia, PA
19106-2354
1948 | Trustee | Since April 1999 | 117 | 3M Company
(1995-2012)
-Vice President and
Treasurer (2006–2012) | Temple University Hospital
(2017-Present)
Pennsylvania State
System of Higher
Education (2018-Present) |
| |
| Officers | | | | | |
| |
David F. Connor
100 Independence
610 Market Street
Philadelphia, PA
19106-2354
1963 | Senior Vice President,
General Counsel, and
Secretary | Senior Vice President,
since May 2013; General
Counsel since May
2015; Secretary since
October 2005 | 117 | David F. Connor has
served in various
capacities at different
times at Macquarie
Asset Management. | None5 |
| | | | | | |
Daniel V. Geatens
100 Independence
610 Market Street
Philadelphia, PA
19106-2354
1972 | Senior Vice President
and Treasurer | Senior Vice President
and Treasurer since
October 2007 | 117 | Daniel V. Geatens has
served in various
capacities at different
times at Macquarie
Asset Management. | None5 |
Name,
Address,
and Birth Year | Position(s)
Held with
the Trust | Length of Time
Served1 | Number of
Funds in Fund
Complex Overseen
by Trustee | Principal
Occupation(s)
During the
Past Five Years | Other
Directorships
Held by Trustee
During the
Past Five Years |
| | | | | | |
Richard Salus
100 Independence
610 Market Street
Philadelphia, PA
19106-2354
1963 | Senior Vice President
and Chief Financial
Officer | Senior Vice President
and Chief Financial
Officer since November
2006 | 117 | Richard Salus has
served in various
capacities at different
times at Macquarie
Asset Management. | None |
1 “Length of Time Served” refers to the time since the Trustee or officer began serving one or more of the Trusts in the Delaware Funds complex.
2 Shawn K. Lytle is considered to be an “Interested Trustee” because he is an executive officer of the Funds’ investment advisor.
3 Macquarie Asset Management is the marketing name for certain companies comprising the asset management division of Macquarie Group, including the Funds’ investment advisor, principal underwriter, and transfer agent.
4 Includes time served on the Board of Ivy Funds prior to the date when Ivy Funds joined the Delaware Funds complex.
5David F. Connor and Daniel V. Geatens serve in similar capacities for the six portfolios of the Optimum Fund Trust, which have the same investment manager, principal underwriter, and transfer agent as the Funds. Mr. Geatens also serves as the Chief Financial Officer of the Optimum Fund Trust.
The Statement of Additional Information for the Fund(s) includes additional information about the Trustees and Officers and is available, without charge, upon request by calling 800 523-1918.
Delaware Funds by Macquarie® privacy practices notice
We are committed to protecting the privacy of our potential, current, and former customers. To provide the products and services you request, we must collect personal information about you. We do not sell your personal information to third parties. We collect your personal information and share it with third parties as necessary to provide you with the products or services you request and to administer your business with us. This notice describes our current privacy practices. While your relationship with us continues, we will update and send our privacy practices notice as required by law. We are committed to continuing to protect your personal information even after that relationship ends. You do not need to take any action because of this notice.
Information we may collect and use
We collect personal information about you to help us identify you as our potential, current, or former customer; to process your requests and transactions; to offer investment services to you; or to tell you about our products or services we believe you may want to use. The type of personal information we collect depends on the products or services you request and may include the following:
| ● | Information from you: When you submit your application or other forms or request information on our products (online or otherwise), you give us information such as your name, address, Social Security number, your financial account information, and your financial history. |
| ● | Information about your transactions: We keep information about your transactions with us, such as the products you buy from us; the amount you paid for those products; your investment activity; and your account balances. |
| ● | Information from your employer: In connection with administering your retirement plan, we may obtain information about you from your employer. |
| ● | Information received from third parties: In order to verify your identity or to prevent fraud, we may obtain information about you from third parties. |
How we use your personal information
We do not disclose nonpublic personal information about our potential, current, and former customers unless allowed or required by law. We may share your personal information within our companies and with certain service providers. They use this information to process transactions you have requested; provide customer service; and inform you of products or services we offer that you may find useful. Our service providers may or may not be affiliated with us. They include financial service providers (for example, third-party administrators; broker/dealers; and other financial services companies with whom we have joint marketing agreements). Our service providers also include nonfinancial companies and individuals (for example, consultants; information services vendors; and companies that perform mailing or marketing services on our behalf). Information obtained from a report prepared by a service provider may be kept by the service provider and shared with other persons; however, we require our service providers to protect your personal information and to use or disclose it only for the work they are performing for us, or as permitted by law.
We also may provide information to regulatory authorities, law enforcement officials, and others to prevent fraud or when we believe in good faith that the law requires disclosure. In the event of a sale of all or part of our businesses, we may share customer information as part of the sale. We do not sell or share your information with outside marketers who may want to offer you their own products and services.
Security of information
Keeping your information safe is one of our most important responsibilities. We maintain physical, electronic, and procedural safeguards to protect your information. Our employees are authorized to access your information only when they need it to provide you with products and services or to maintain your accounts. Employees who have access to your personal information are required to keep it strictly confidential. We provide training to our employees about the importance of protecting the privacy of your information.
Macquarie Asset Management (MAM) is the asset management division of Macquarie Group. MAM, through its entities, operates as a full- service asset manager offering a diverse range of products including securities investment management, infrastructure and real asset management, and fund and equity-based structured products.
Other than Macquarie Bank Limited ABN
46 008 583 542 (“Macquarie Bank”), any Macquarie Group entity noted in this document is not an authorized deposit-taking institution for the purposes of the Banking Act 1959 (Commonwealth of Australia). The obligations of these other Macquarie Group entities do not represent deposits or other liabilities of Macquarie Bank. Macquarie Bank does not guarantee or otherwise provide assurance in respect of the obligations of these other Macquarie Group entities. In addition, if this document relates to an investment, (a) the investor is subject to investment risk including possible delays in repayment and loss of income and principal invested and (b) none of Macquarie Bank or any other Macquarie Group entity guarantees any particular rate of return on or the performance of the investment, nor do they guarantee repayment of capital in respect of the investment.
| i | This page is not part of the annual report. |
Delaware Funds by Macquarie® privacy practices notice
This privacy practices notice is being provided on behalf of the following:
Macquarie Management Holdings, Inc. and each of its affiliates, such as direct or indirect subsidiaries, and any fund or product sponsored by or otherwise affiliated with Macquarie
Central Park Group (CPG) Funds
Delaware Funds by Macquarie®
Macquarie Funds Management Hong Kong Limited
Macquarie Investment Management Austria Kapitalanlage AG
Macquarie Investment Management Europe Limited
Macquarie Investment Management Europe S.A.
Macquarie Investment Management Global Limited
Optimum Fund Trust
Revised April 2023
| This page is not part of the annual report. | ii |
Delaware Funds by Macquarie®
Equity funds
US equity funds
| ● | Delaware Growth and Income Fund |
| ● | Delaware Ivy Accumulative Fund |
| ● | Delaware Ivy Core Equity Fund |
| ● | Delaware Ivy Large Cap Growth Fund |
| ● | Delaware Ivy Mid Cap Growth Fund |
| ● | Delaware Ivy Mid Cap Income Opportunities Fund |
| ● | Delaware Ivy Smid Cap Core Fund |
| ● | Delaware Ivy Small Cap Growth Fund |
| ● | Delaware Ivy Value Fund |
| ● | Delaware Mid Cap Growth Equity Fund (formerly, Delaware Smid Cap Growth Fund) |
| ● | Delaware Opportunity Fund |
| ● | Delaware Select Growth Fund |
| ● | Delaware Small Cap Core Fund* |
| ● | Delaware Small Cap Growth Fund |
| ● | Delaware Small Cap Value Fund |
| ● | Delaware Sustainable Equity Income Fund (formerly, Delaware Ivy S&P 500 Dividend Aristocrats Index Fund)* |
| ● | Delaware Value® Fund |
Global / international equity funds
| ● | Delaware Emerging Markets Fund |
| ● | Delaware Global Equity Fund |
| ● | Delaware Global Value Equity Fund (formerly, Delaware Ivy Global Equity Income Fund) |
| ● | Delaware International Small Cap Fund |
| ● | Delaware International Value Equity Fund |
| ● | Delaware Ivy Global Growth Fund |
| ● | Delaware Ivy International Core Equity Fund |
| ● | Delaware Ivy International Small Cap Fund |
| ● | Delaware Ivy International Value Fund |
| ● | Delaware Ivy Managed International Opportunities Fund |
| ● | Delaware Ivy Systematic Emerging Markets Equity Fund |
Alternative / specialty funds
| ● | Delaware Climate Solutions Fund (formerly, Delaware Ivy Energy Fund) |
| ● | Delaware Covered Call Strategy Fund |
| ● | Delaware Global Real Estate Fund (formerly, Delaware Ivy LaSalle Global Real Estate Fund) |
| ● | Delaware Healthcare Fund |
| ● | Delaware Hedged U.S. Equity Opportunities Fund |
| ● | Delaware Ivy Natural Resources Fund |
| ● | Delaware Ivy Science and Technology Fund |
| ● | Delaware Premium Income Fund |
| ● | Delaware Real Estate Securities Fund (formerly, Delaware Ivy Securian Real Estate Securities Fund) |
Multi-asset funds
| ● | Delaware Global Listed Real Assets Fund |
| ● | Delaware Ivy Asset Strategy Fund |
| ● | Delaware Ivy Balanced Fund |
| ● | Delaware Ivy Multi-Asset Income Fund |
| ● | Delaware Ivy Wilshire Global Allocation Fund |
| ● | Delaware Wealth Builder Fund |
*Closed to certain new investors.
Carefully consider a Fund’s investment objectives, risk factors, charges, and expenses before investing. This and other information can be found in each Fund’s prospectus and, if available, its summary prospectus. A Delaware Funds by Macquarie prospectus may be obtained by visiting delawarefunds.com/literature or calling 800 523-1918. Investors should read the prospectus and, if available, the summary prospectus carefully before investing.
Investing involves risk, including the possible loss of principal.
| iii | This page is not part of the annual report. |
Fixed income funds
Taxable fixed income funds
| ● | Delaware Corporate Bond Fund |
| ● | Delaware Diversified Income Fund |
| ● | Delaware Emerging Markets Debt Corporate Fund |
| ● | Delaware Extended Duration Bond Fund |
| ● | Delaware Floating Rate Fund |
| ● | Delaware High-Yield Opportunities Fund |
| ● | Delaware Investments Ultrashort Fund |
| ● | Delaware Ivy Core Bond Fund (formerly, Delaware Ivy Securian Core Bond Fund) |
| ● | Delaware Ivy Corporate Bond Fund |
| ● | Delaware Ivy Crossover Credit Fund |
| ● | Delaware Ivy Emerging Markets Local Currency Debt Fund |
| ● | Delaware Ivy Global Bond Fund |
| ● | Delaware Ivy Government Securities Fund |
| ● | Delaware Ivy High Income Fund |
| ● | Delaware Ivy High Yield Fund |
| ● | Delaware Ivy Limited-Term Bond Fund |
| ● | Delaware Ivy Strategic Income Fund |
| ● | Delaware Ivy Total Return Bond Fund |
| ● | Delaware Limited-Term Diversified Income Fund |
| ● | Delaware Strategic Income Fund |
Municipal fixed income funds
| ● | Delaware Ivy California Municipal High Income Fund |
| ● | Delaware Ivy Municipal Bond Fund |
| ● | Delaware Ivy Municipal High Income Fund |
| ● | Delaware Minnesota High-Yield Municipal Bond Fund |
| ● | Delaware National High-Yield Municipal Bond Fund |
| ● | Delaware Tax-Free Arizona Fund |
| ● | Delaware Tax-Free California Fund |
| ● | Delaware Tax-Free Colorado Fund |
| ● | Delaware Tax-Free Idaho Fund |
| ● | Delaware Tax-Free Minnesota Fund |
| ● | Delaware Tax-Free Minnesota Intermediate Fund |
| ● | Delaware Tax-Free New Jersey Fund |
| ● | Delaware Tax-Free New York Fund |
| ● | Delaware Tax-Free Oregon Fund |
| ● | Delaware Tax-Free Pennsylvania Fund |
| ● | Delaware Tax-Free USA Fund |
| ● | Delaware Tax-Free USA Intermediate Fund |
The Funds are distributed by Delaware Distributors, L.P. (DDLP), an affiliate of MIMBT and Macquarie Group Limited.
| This page is not part of the annual report. | iv |
Caring for your portfolio
Over a lifetime, things change. When they do, it’s important to ensure that your investments stay in tune with your personal situation.
If you decide to make some changes, check out the convenient options provided by Macquarie Asset Management. We try to make it easy for you to avoid some of the sales charges that you might otherwise have to pay when you withdraw and invest your money with another firm.
Most importantly, you may generally exchange all or part of your shares in one Delaware Funds by Macquarie® mutual fund for shares of the same class of another fund without paying a front-end sales charge or a contingent deferred sales charge (CDSC).
Choose the investment method suitable for you
After you’ve evaluated your overall investments, you have choices about how to implement any changes:
| 1. | Move assets all at once at any time. |
| | |
| 2. | Migrate funds to a different investment slowly through a systematic exchange. You can arrange automatic monthly exchanges of your shares in one Delaware Fund for those in another Delaware Fund. Systematic exchanges are subject to the same rules as regular exchanges, which are explained in the right column, including a $100 minimum monthly amount per fund. |
| | |
| 3. | Use our automatic investment plan for future investments in different vehicles. To allocate your future investments differently, the Delaware Funds by Macquarie automatic investment plan allows you to make regular monthly or quarterly investments directly from your checking account. |
Important notes about exchanging or redeeming shares
For automated exchanges, a minimum exchange of $100 per fund is required monthly. If the value of your account is $5,000 or more, you can make systematic withdrawals of at least $25 monthly, or $75 quarterly. If the annual amount you withdraw is less than 12% of your account balance at the time the systematic withdrawal plan is established, the CDSC ordinarily applicable to certain fund classes will be waived. More details are available in your prospectus or at delawarefunds.com/literature.
If you exchange shares from Class R shares of any fund, you will pay any applicable sales charge on your new shares.
When exchanging Class C shares of one fund for the same class of shares in other funds, your new shares will be subject to the same CDSC as the shares you originally purchased. The holding period for the CDSC will also remain the same, with the amount of time you held your original shares being credited toward the holding period of your new shares.
You do not pay sales charges on shares that you acquired through the reinvestment of dividends. You may have to pay taxes on your exchange. When you exchange shares, you are purchasing shares in another fund, so you should be sure to get a copy of the fund’s prospectus and read it carefully before buying shares through an exchange.
We may refuse the purchase side of any exchange request if, in the manager’s judgment, the fund would be unable to invest effectively in accordance with its investment objective and policies, or would otherwise potentially be adversely affected.
| v | This page is not part of the annual report. |
This page intentionally left blank.
Contact information
Shareholder assistance by phone
800 523-1918, weekdays from 8:30am to
6:00pm ET
For securities dealers and financial
institutions representatives only
800 362-7500
Regular mail
Delaware Funds by Macquarie
P.O. Box 534437
Pittsburgh, PA 15253-4437
Overnight courier service
Delaware Funds by Macquarie
Attention: 534437
500 Ross Street, 154-0520
Pittsburgh, PA 15262
Macquarie Asset Management ● 610 Market Street ● Philadelphia, PA 19106-2354
Macquarie Asset Management (MAM) is the asset management division of Macquarie Group. MAM is a full-service asset manager offering a diverse range of products across public and private markets including fixed income, equities, multi-asset solutions, private credit, infrastructure, renewables, natural assets, real estate, and asset finance. The Public Investments business is a part of MAM and includes the following investment advisers: Macquarie Investment Management Business Trust (MIMBT), Macquarie Funds Management Hong Kong Limited, Macquarie Investment Management Austria Kapitalanlage AG, Macquarie Investment Management Global Limited, Macquarie Investment Management Europe Limited, and Macquarie Investment Management Europe S.A.
The Funds are distributed by Delaware Distributors, L.P. (DDLP), an affiliate of MIMBT and Macquarie Group Limited.
Other than Macquarie Bank Limited ABN 46 008 583 542 (“Macquarie Bank”), any Macquarie Group entity noted in this document is not an authorized deposit-taking institution for the purposes of the Banking Act 1959 (Commonwealth of Australia). The obligations of these other Macquarie Group entities do not represent deposits or other liabilities of Macquarie Bank. Macquarie Bank does not guarantee or otherwise provide assurance in respect of the obligations of these other Macquarie Group entities. In addition, if this document relates to an investment, (a) the investor is subject to investment risk including possible delays in repayment and loss of income and principal invested and (b) none of Macquarie Bank or any other Macquarie Group entity guarantees any particular rate of return on or the performance of the investment, nor do they guarantee repayment of capital in respect of the investment.
The Funds are governed by US laws and regulations.
(2832975)
ANN-IVYSPEC-0523
| vii | This page is not part of the annual report. |
Item 2. Code of Ethics
The registrant has adopted a code of ethics that applies to the registrant’s principal executive officer, principal financial officer, principal accounting officer or controller, or persons performing similar functions, regardless of whether these individuals are employed by the registrant or a third party. A copy of the registrant’s Code of Business Ethics has been posted on the Delaware Funds by Macquarie® Internet Web site at www.delawarefunds.com. Any amendments to the Code of Business Ethics, and information on any waiver from its provisions granted by the registrant, will also be posted on this Web site within five business days of such amendment or waiver and will remain on the Web site for at least 12 months.
Item 3. Audit Committee Financial Expert
The registrant’s Board of Trustees has determined that certain members of the registrant’s Audit Committee are audit committee financial experts, as defined below. For purposes of this item, an “audit committee financial expert” is a person who has the following attributes:
a. An understanding of generally accepted accounting principles and financial statements;
b. The ability to assess the general application of such principles in connection with the accounting for estimates, accruals, and reserves;
c. Experience preparing, auditing, analyzing, or evaluating financial statements that present a breadth and level of complexity of accounting issues that are generally comparable to the breadth and complexity of issues that can reasonably be expected to be raised by the registrant’s financial statements, or experience actively supervising one or more persons engaged in such activities;
d. An understanding of internal controls and procedures for financial reporting; and
e. An understanding of audit committee functions.
An “audit committee financial expert” shall have acquired such attributes through:
a. Education and experience as a principal financial officer, principal accounting officer, controller, public accountant, or auditor or experience in one or more positions that involve the performance of similar functions;
b. Experience actively supervising a principal financial officer, principal accounting officer, controller, public accountant, auditor, or person performing similar functions;
c. Experience overseeing or assessing the performance of companies or public accountants with respect to the preparation, auditing, or evaluation of financial statements; or
d. Other relevant experience.
The registrant’s Board of Trustees has also determined that each member of the registrant’s Audit Committee is independent. In order to be “independent” for purposes of this item, the Audit Committee member may not: (i) other than in his or her capacity as a member of the Board of Trustees or any committee thereof, accept directly or indirectly any consulting, advisory or other compensatory fee from the issuer; or (ii) be an “interested person” of the registrant as defined in Section 2(a)(19) of the Investment Company Act of 1940.
The names of the audit committee financial experts on the registrant’s Audit Committee are set forth below:
H. Jeffrey Dobbs
Sandra A.J. Lawrence
Frances Sevilla-Sacasa, Chair
Item 4. Principal Accountant Fees and Services
(a) Audit fees.
The aggregate fees billed for services provided to the registrant by its independent auditors for the audit of the registrant’s annual financial statements and for services normally provided by the independent auditors in connection with statutory and regulatory filings or engagements were $873,581 for the fiscal year ended March 31, 2023.
The aggregate fees billed for services provided to the registrant by its independent auditors for the audit of the registrant’s annual financial statements and for services normally provided by the independent auditors in connection with statutory and regulatory filings or engagements were $826,803 for the fiscal year ended March 31, 2022.
(b) Audit-related fees.
The aggregate fees billed by the registrant’s independent auditors for services relating to the performance of the audit of the registrant’s financial statements and not reported under paragraph (a) of this Item were $0 for the fiscal year ended March 31, 2023.
The aggregate fees billed by the registrant’s independent auditors for services relating to the performance of the audit of the financial statements of the registrant’s investment adviser and other service providers under common control with the adviser and that relate directly to the operations or financial reporting of the registrant were $2,050,189 for the registrant’s fiscal year ended March 31, 2023. The percentage of these fees relating to services approved by the registrant’s Audit Committee pursuant to the de minimis exception from the pre-approval requirement in Rule 2-01(c)(7)(i)(C) of Regulation S-X was 0%. These audit-related services were as follows: year end audit procedures; group reporting and subsidiary statutory audits.
The aggregate fees billed by the registrant’s independent auditors for services relating to the performance of the audit of the registrant’s financial statements and not reported under paragraph (a) of this Item were $0 for the fiscal year ended March 31, 2022. These audit-related services were related to the review of Form N-1A.
The aggregate fees billed by the registrant’s independent auditors for services relating to the performance of the audit of the financial statements of the registrant’s investment adviser and other service providers under common control with the adviser and that relate directly to the operations or financial reporting of the registrant were $1,134,001 for the registrant’s fiscal year ended March 31, 2022. The percentage of these fees relating to services approved by the registrant’s Audit Committee pursuant to the de minimis exception from the pre-approval requirement in Rule 2-01(c)(7)(i)(C) of Regulation S-X was 0%. These audit-related services were as follows: year-end audit procedures; group reporting and subsidiary statutory audits.
(c) Tax fees.
The aggregate fees billed by the registrant’s independent auditors for tax-related services provided to the registrant were $157,658 for the fiscal year ended March 31, 2023. The percentage of these fees relating to services approved by the registrant’s Audit Committee pursuant to the de minimis exception from the pre-approval requirement in Rule 2-01(c)(7)(i)(C) of Regulation S-X was 0%. These tax-related services were as follows: review of income tax returns and review of annual excise distribution calculations.
The aggregate fees billed by the registrant’s independent auditors for tax-related services provided to the registrant’s investment adviser and other service providers under common control with the adviser and that relate directly to the operations or financial reporting of the registrant were $0 for the registrant’s fiscal year ended March 31, 2023. The percentage of these fees relating to services approved by the registrant’s Audit Committee pursuant to the de minimis exception from the pre-approval requirement in Rule 2-01(c)(7)(i)(C) of Regulation S-X was 0%.
The aggregate fees billed by the registrant’s independent auditors for tax-related services provided to the registrant were $153,252 for the fiscal year ended March 31, 2022. The percentage of these fees relating to services approved by the registrant’s Audit Committee pursuant to the de minimis exception from the pre-approval requirement in Rule 2-01(c)(7)(i)(C) of Regulation S-X was 0%. These tax-related services were as follows: review of income tax returns and review of annual excise distribution calculations.
The aggregate fees billed by the registrant’s independent auditors for tax-related services provided to the registrant’s investment adviser and other service providers under common control with the adviser and that relate directly to the operations or financial reporting of the registrant were $0 for the registrant’s fiscal year ended March 31, 2022. The percentage of these fees relating to services approved by the registrant’s Audit Committee pursuant to the de minimis exception from the pre-approval requirement in Rule 2-01(c)(7)(i)(C) of Regulation S-X was 0%.
(d) All other fees.
The aggregate fees billed for all services provided by the independent auditors to the registrant other than those set forth in paragraphs (a), (b) and (c) of this Item were $0 for the fiscal year ended March 31, 2023.
The aggregate fees billed for all services other than those set forth in paragraphs (b) and (c) of this Item provided by the registrant’s independent auditors to the registrant’s adviser and other service providers under common control with the adviser and that relate directly to the operations or financial reporting of the registrant were $0 for the registrant’s fiscal year ended March 31, 2023. The percentage of these fees relating to services approved by the registrant’s Audit Committee pursuant to the de minimis exception from the pre-approval requirement in Rule 2-01(c)(7)(i)(C) of Regulation S-X was 0%.
The aggregate fees billed for all services provided by the independent auditors to the registrant other than those set forth in paragraphs (a), (b) and (c) of this Item were $0 for the fiscal year ended March 31, 2022.
(e) The registrant’s Audit Committee has established pre-approval policies and procedures as permitted by Rule 2-01(c)(7)(i)(B) of Regulation S-X (the “Pre-Approval Policy”) with respect to services provided by the registrant’s independent auditors. Pursuant to the Pre-Approval Policy, the Audit Committee has pre-approved the services set forth in the table below with respect to the registrant up to the specified fee limits. Certain fee limits are based on aggregate fees to the registrant and other registrants within the Delaware Funds by Macquarie®.
| Service | Range of Fees |
| Audit Services | |
| Statutory audits or financial audits for new Funds | up to $50,000 per Fund |
| Services associated with SEC registration statements (e.g., Form N-1A, Form N-14, etc.), periodic reports and other documents filed with the SEC or other documents issued in connection with securities offerings (e.g., comfort letters for closed-end Fund offerings, consents), and assistance in responding to SEC comment letters | up to $10,000 per Fund |
| Consultations by Fund management as to the accounting or disclosure treatment of transactions or events and/or the actual or potential impact of final or proposed rules, standards or interpretations by the SEC, FASB, or other regulatory or standard-setting bodies (Note: Under SEC rules, some consultations may be considered “audit-related services” rather than “audit services”) | up to $25,000 in the aggregate |
| Audit-Related Services | |
| Consultations by Fund management as to the accounting or disclosure treatment of transactions or events and /or the actual or potential impact of final or proposed rules, standards or interpretations by the SEC, FASB, or other regulatory or standard-setting bodies (Note: Under SEC rules, some consultations may be considered “audit services” rather than “audit-related services”) | up to $25,000 in the aggregate |
| Tax Services | |
| U.S. federal, state and local and international tax planning and advice (e.g., consulting on statutory, regulatory or administrative developments, evaluation of Funds’ tax compliance function, etc.) | up to $25,000 in the aggregate |
| U.S. federal, state and local tax compliance (e.g., excise distribution reviews, etc.) | up to $5,000 per Fund |
| Review of federal, state, local and international income, franchise and other tax returns | up to $5,000 per Fund |
Fs
Under the Pre-Approval Policy, the Audit Committee has also pre-approved the services set forth in the table below with respect to the registrant’s investment adviser and other entities controlling, controlled by or under common control with the investment adviser that provide ongoing services to the registrant (the “Control Affiliates”) up to the specified fee limit. This fee limit is based on aggregate fees to the investment adviser and its Control Affiliates.
| Service | Range of Fees |
| Non-Audit Services | |
| Services associated with periodic reports and other documents filed with the SEC and assistance in responding to SEC comment letters | up to $10,000 in the aggregate |
Fs
The Pre-Approval Policy requires the registrant’s independent auditors to report to the Audit Committee at each of its regular meetings regarding all services initiated since the last such report was rendered, including those services authorized by the Pre-Approval Policy.
(f) Not applicable.
(g) The aggregate non-audit fees billed by the registrant’s independent auditors for services rendered to the registrant and to its investment adviser and other service providers under common control with the adviser were 9,044,000 and $9,044,000 for the registrant’s fiscal years ended March 31, 2023 and March 31, 2022, respectively.
(h) In connection with its selection of the independent auditors, the registrant’s Audit Committee has considered the independent auditors’ provision of non-audit services to the registrant’s investment adviser and other service providers under common control with the adviser that were not required to be pre-approved pursuant to Rule 2-01(c)(7)(ii) of Regulation S-X. The Audit Committee has determined that the independent auditors’ provision of these services is compatible with maintaining the auditors’ independence.
(i) Not applicable.
(j) Not applicable.
Item 5. Audit Committee of Listed Registrants
Not applicable.
Item 6. Investments
(a) Included as part of report to shareholders filed under Item 1 of this Form N-CSR.
(b) Divestment of securities in accordance with Section 13(c) of the Investment Company Act of 1940.
Not applicable.
Item 7. Disclosure of Proxy Voting Policies and Procedures for Closed-End Management Investment Companies
Not applicable.
Item 8. Portfolio Managers of Closed-End Management Investment Companies
Not applicable.
Item 9. Purchases of Equity Securities by Closed-End Management Investment Companies and Affiliated Purchasers
Not applicable.
Item 10. Submission of Matters to a Vote of Security Holders
Not applicable.
Item 11. Controls and Procedures
The registrant’s principal executive officer and principal financial officers, or persons performing similar functions, have concluded that the registrant’s disclosure controls and procedures (as defined in Rule 30a-3(c) under the Investment Company Act of 1940, as amended (17 CFR 270.30a-3(c))) are effective, as of a date within 90 days of the filing of this report, based on their evaluation of these controls and procedures required by Rule 30a-3(b) under the Investment Company Act of 1940 (17 CFR 270.30a-3(b)) and Rules 13a-15(b) or 15d-15(b) under the Securities Exchange Act of 1934, as amended (17 CFR 240.13a-15(b) or 240.15d-15(b)) and provide reasonable assurance that the information required to be disclosed by the registrant in its reports or statements filed under the Securities Exchange Act of 1934 is recorded, processed, summarized and reported within the time periods specified in the rules and forms of the Securities and Exchange Commission.
There were no significant changes in the registrant’s internal control over financial reporting (as defined in Rule 30a-3(d) under the Investment Company Act of 1940 (17 CFR 270.30a-3(d)) that occurred during the period covered by the report to stockholders included herein that have materially affected, or are reasonably likely to materially affect, the registrant’s internal control over financial reporting.
Item 12. Disclosure of Securities Lending Activities for Closed-End Management Investment Companies
Not applicable.
Item 13. Exhibits
Not applicable.
(2) Certifications of Principal Executive Officer and Principal Financial Officer pursuant to Rule 30a-2 under the Investment Company Act of 1940 are attached hereto as Exhibit 99.CERT.
(3) Written solicitations to purchase securities pursuant to Rule 23c-1 under the Securities Exchange Act of 1934.
Not applicable.
(b) Certifications pursuant to Section 906 of the Sarbanes-Oxley Act of 2002 are furnished herewith as Exhibit 99.906CERT.
SIGNATURES
Pursuant to the requirements of the Securities Exchange Act of 1934 and the Investment Company Act of 1940, the registrant has duly caused this report to be signed on its behalf, by the undersigned, thereunto duly authorized.
IVY FUNDS
| /s/SHAWN K. LYTLE | |
| By: | Shawn K. Lytle | |
| Title: | President and Chief Executive Officer | |
| Date: | June 9, 2023 | |
Pursuant to the requirements of the Securities Exchange Act of 1934 and the Investment Company Act of 1940, this report has been signed below by the following persons on behalf of the registrant and in the capacities and on the dates indicated.
| /s/SHAWN K. LYTLE | |
| By: | Shawn K. Lytle | |
| Title: | President and Chief Executive Officer | |
| Date: | June 9, 2023 | |
| | | |
| | | |
| /s/RICHARD SALUS | |
| By: | Richard Salus | |
| Title: | Chief Financial Officer | |
| Date: | June 9, 2023 | |