UNITED STATES
SECURITIES AND EXCHANGE COMMISSION
WASHINGTON, D.C. 20549
FORMN-CSR
CERTIFIED SHAREHOLDER REPORT OF REGISTERED
MANAGEMENT INVESTMENT COMPANIES
Investment Company Act file number:811-06554
AB GLOBAL BOND FUND, INC.
(Exact name of registrant as specified in charter)
1345 Avenue of the Americas, New York, New York 10105
(Address of principal executive offices) (Zip code)
Joseph J. Mantineo
AllianceBernstein L.P.
1345 Avenue of the Americas
New York, New York 10105
(Name and address of agent for service)
Registrant’s telephone number, including area code: (800)221-5672
Date of fiscal year end: September 30, 2019
Date of reporting period: September 30, 2019
| ITEM 1. | REPORTS TO STOCKHOLDERS. |
SEP 09.30.19

ANNUAL REPORT
AB GLOBAL BOND FUND

Beginning January 1, 2021, as permitted by new regulations adopted by the Securities and Exchange Commission, the Fund’s annual and semi-annual shareholder reports will no longer be sent by mail, unless you specifically request paper copies of the reports. Instead, the reports will be made available on a website, and you will be notified by mail each time a report is posted and provided with a website address to access the report.
If you already elected to receive shareholder reports electronically, you will not be affected by this change and you need not take any action. You may elect to receive shareholder reports and other communications from the Fund electronically at any time by contacting your financial intermediary (such as a broker-dealer or bank) or, if you are a direct investor, by calling the Fund at (800) 221 5672.
You may elect to receive all future reports in paper form free of charge. If you invest through a financial intermediary, you can contact your financial intermediary to request that you continue to receive paper copies of your shareholder reports; if you invest directly with the Fund, you can call the Fund at (800) 221 5672. Your election to receive reports in paper form will apply to all funds held in your account with your financial intermediary or, if you invest directly, to all AB Mutual Funds you hold.
| | |
| |
| Investment Products Offered | | • Are Not FDIC Insured• May Lose Value• Are Not Bank Guaranteed |
Investors should consider the investment objectives, risks, charges and expenses of the Fund carefully before investing. For copies of our prospectus or summary prospectus, which contain this and other information, visit us online at www.abfunds.com or contact your AB representative. Please read the prospectus and/or summary prospectus carefully before investing.
This shareholder report must be preceded or accompanied by the Fund’s prospectus for individuals who are not current shareholders of the Fund.
You may obtain a description of the Fund’s proxy voting policies and procedures, and information regarding how the Fund voted proxies relating to portfolio securities during the most recent12-month period ended June 30, without charge. Simply visit AB’s website at www.abfunds.com, or go to the Securities and Exchange Commission’s (the “Commission”) website at www.sec.gov, or call AB at (800) 227 4618.
The Fund files its complete schedule of portfolio holdings with the Commission for the first and third quarters of each fiscal year as an exhibit to its reports onForm N-PORT. The Fund’sForm N-PORT reports are available on the Commission’s website at www.sec.gov. The Fund’s Forms N-PORT may also be reviewed and copied at the Commission’s Public Reference Room in Washington, DC; information on the operation of the Public Reference Room may be obtained by calling (800) SEC 0330. AB publishes full portfolio holdings for the Fund monthly at www.abfunds.com.
AllianceBernstein Investments, Inc. (ABI) is the distributor of the AB family of mutual funds. ABI is a member of FINRA and is an affiliate of AllianceBernstein L.P., the Adviser of the funds.
The [A/B] logo is a registered service mark of AllianceBernstein and AllianceBernstein® is a registered service mark used by permission of the owner, AllianceBernstein L.P.
| | |
| FROM THE PRESIDENT | |  |
Dear Shareholder,
We are pleased to provide this report for AB Global Bond Fund (the “Fund”). Please review the discussion of Fund performance, the market conditions during the reporting period and the Fund’s investment strategy.
As always, AB strives to keep clients ahead of what’s next by:
| + | | Transforming uncommon insights into uncommon knowledge with a global research scope |
| + | | Navigating markets with seasoned investment experience and sophisticated solutions |
| + | | Providing thoughtful investment insights and actionable ideas |
Whether you’re an individual investor or a multi-billion-dollar institution, we put knowledge and experience to work for you.
AB’s global research organization connects and collaborates across platforms and teams to deliver impactful insights and innovative products. Better insights lead to better opportunities—anywhere in the world.
For additional information about AB’s range of products and shareholder resources, please log on to www.abfunds.com.
Thank you for your investment in the AB Mutual Funds.
Sincerely,

Robert M. Keith
President and Chief Executive Officer, AB Mutual Funds
| | |
| |
| abfunds.com | | AB GLOBAL BOND FUND | 1 |
ANNUAL REPORT
November 12, 2019
This report provides management’s discussion of fund performance for AB Global Bond Fund for the annual reporting period ended September 30, 2019.
The Fund’s investment objective is to generate current income consistent with preservation of capital.
NAV RETURNS AS OF SEPTEMBER 30, 2019(unaudited)
| | | | | | | | |
| | |
| | | 6 Months | | | 12 Months | |
| | |
| AB GLOBAL BOND FUND | | | | | | | | |
| | |
| Class A Shares | | | 4.26% | | | | 8.58% | |
| | |
| Class B Shares1 | | | 3.83% | | | | 7.69% | |
| | |
| Class C Shares | | | 3.97% | | | | 7.87% | |
| | |
| Advisor Class Shares2 | | | 4.39% | | | | 8.86% | |
| | |
| Class R Shares2 | | | 4.04% | | | | 8.13% | |
| | |
| Class K Shares2 | | | 4.20% | | | | 8.46% | |
| | |
| Class I Shares2 | | | 4.40% | | | | 8.87% | |
| | |
| Class Z Shares2 | | | 4.42% | | | | 8.93% | |
| | |
| Bloomberg Barclays Global Aggregate Bond Index (USD hedged) | | | 5.59% | | | | 10.65% | |
| 1 | Class B shares are no longer available for purchase to new investors. Please see Note A for more information. |
| 2 | Please note that these share classes are for investors purchasing shares through accounts established under certainfee-based programs sponsored and maintained by certain broker-dealers and financial intermediaries, institutional pension plans and/or investment advisory clients of, and certain other persons associated with, the Adviser and its affiliates or the Fund. |
INVESTMENT RESULTS
The table above shows the Fund’s performance compared to its benchmark, the Bloomberg Barclays Global Aggregate Bond Index (USD hedged), for thesix- and12-month periods ended September 30, 2019.
For both periods, all share classes of the Fund underperformed the benchmark, before sales charges. During the12-month period, yield-curve positioning, particularly underweights in five- and10-year maturities in the eurozone and insix-month and longer-term maturities in the US, detracted from relative performance. Currency decisions detracted, specifically long positions in the Brazilian real, South Korean won and Polish zloty. Security selection within eurozone treasuries and US investment-grade corporates contributed. Country allocation (a result ofbottom-up security analysis combined with fundamental research) was also positive, as an underweight in Japan contributed. Sector allocations did not have a meaningful impact on overall performance in the period.
| | |
| |
| 2 | AB GLOBAL BOND FUND | | abfunds.com |
During thesix-month period, yield-curve positioning detracted, as a result of underweights in10-year maturities in the US and longer-term maturities in the eurozone. Currency investments also detracted, specifically long positions in the Brazilian real and South Korean won. Security selection within eurozone treasuries, commercial mortgage-backed securities and US investment-grade corporates contributed. Country positioning also contributed, particularly an underweight in Japan. Sector allocations did not have a meaningful impact on overall performance in the period.
During both periods, the Fund utilized derivatives in the form of interest rate swaps, futures and interest rate swaptions to manage and hedge duration risk and/or to take active yield-curve positioning. Currency forwards and currency options, both written and purchased, were used to hedge foreign currency exposure and to take active currency risk. Credit default swaps were utilized to hedge credit risk and as a tool to effectively gain exposure to specific sectors. For the12-month period, variance swaps were utilized as tail hedges to hedge againstflight-to-quality tail events.
MARKET REVIEW AND INVESTMENT STRATEGY
Fixed-income markets performed strongly over the 12-month period ended September 30, 2019. After holding rates steady in early 2019, the US Federal Reserve lowered interest rates in July and September, reacting to slowing global growth, declining manufacturing output and faltering business confidence from the ongoingUS-China trade war. The European Central Bank followed suit in September by cutting rates to a record low and announcing the resumption of quantitative easing. The Reserve Bank of Australia cut interest rates for a second time to a new low, as well, while the Bank of Japan issued guidance that interest rates would remain low well into 2020. The Bank of Canada maintained interest rates as the country’s overall economy remained in balance. Central bankers in numerous other developed and emerging markets also lowered interest rates and signaled further monetary easing and potential fiscal stimulus measures to boost faltering demand. Inflation remained below target in most developed countries and was falling in emerging markets.
Heavy investor demand for sovereign debt increased negative-yielding bonds to over US$17 trillion. Long-dated developed-market treasury securities and emerging-market sovereign debt were strong performers given their interest-rate sensitivity. Investment-grade corporate bond returns were also robust, and spreads remained near historical lows, outperforming high-yield bonds. However, various geopolitical risks remained, including escalating Hong Kong demonstrations, the possibility of a hard Brexit, a potential US–European Union trade conflict and the prospect of a global currency war. The US dollar remained strong as a safe haven during this period of increased global growth uncertainty.
The Fund’s Senior Investment Management Team (the “Team”) invests in fixed-income securities with no sector restrictions. The Fund holds debt
| | |
| |
| abfunds.com | | AB GLOBAL BOND FUND | 3 |
securities from both developed and emerging markets. The Team’s core fixed-income strategy pursues an attractive risk/return profile by managing currency exposure. The Team utilizes a disciplined investment process, which draws on a rigorous quantitative research toolset with fundamental expertise across all regions and markets.
INVESTMENT POLICIES
The Fund invests, under normal circumstances, at least 80% of its net assets in fixed-income securities. Under normal market conditions, the Fund invests significantly in fixed-income securities ofnon-US companies. In addition, the Fund invests, under normal circumstances, in the fixed-income securities of companies located in at least three countries. The Fund may invest in a broad range of fixed-income securities in both developed and emerging markets. The Fund may invest across all fixed-income sectors, including US andnon-US government and corporate debt securities. The Fund’s investments may be denominated in local currency or US dollar-denominated. The Fund may invest in debt securities with a range of maturities from short- to long-term. The Fund may use borrowings or other leverage for investment purposes.
The Adviser will actively manage the Fund’s assets in relation to market conditions and general economic conditions and adjust the Fund’s investments in an effort to best enable the Fund to achieve its investment objective. Thus, the percentage of the Fund’s assets invested in a particular country or denominated in a particular currency will vary in accordance with the Adviser’s assessment of the relative yield and appreciation potential of such securities and the relationship of the country’s currency to the US dollar.
Under normal circumstances, the Fund invests at least 75% of its net assets in fixed-income securities rated investment-grade at the time of investment and may invest up to 25% of its net assets in below investment-grade fixed-income securities (commonly known as “junk bonds”).
The Fund may invest in mortgage-related and other asset-backed securities, loan participations, inflation-indexed securities, structured securities, variable, floating, and inverse floating-rate instruments and preferred stock, and may use other investment techniques. The Fund intends, among other things, to enter into transactions such as reverse repurchase agreements and dollar rolls. The Fund may invest, without limit, in derivatives, such as options, futures contracts, forwards or swaps.
| | |
| |
| 4 | AB GLOBAL BOND FUND | | abfunds.com |
DISCLOSURES AND RISKS
Benchmark Disclosure
The Bloomberg Barclays Global Aggregate Bond Index (USD hedged) is unmanaged and does not reflect fees and expenses associated with the active management of a mutual fund portfolio. The Bloomberg Barclays Global Aggregate Bond Index represents the performance of the global investment-grade developed fixed-income markets, hedged to the US dollar. An investor cannot invest directly in an index, and its results are not indicative of the performance for any specific investment, including the Fund.
A Word About Risk
Market Risk: The value of the Fund’s assets will fluctuate as the stock or bond market fluctuates. The value of its investments may decline, sometimes rapidly and unpredictably, simply because of economic changes or other events that affect large portions of the market.
Interest-Rate Risk: Changes in interest rates will affect the value of investments in fixed-income securities. When interest rates rise, the value of existing investments in fixed-income securities tends to fall and this decrease in value may not be offset by higher income from new investments. Interest-rate risk is generally greater for fixed-income securities with longer maturities or durations.
Credit Risk: An issuer or guarantor of a fixed-income security, or the counterparty to a derivatives or other contract, may be unable or unwilling to make timely payments of interest or principal, or to otherwise honor its obligations. The issuer or guarantor may default, causing a loss of the full principal amount of a security and accrued interest. The degree of risk for a particular security may be reflected in its credit rating. There is the possibility that the credit rating of a fixed-income security may be downgraded after purchase, which may adversely affect the value of the security.
Below Investment-Grade Securities Risk: Investments in fixed-income securities with lower ratings (commonly known as “junk bonds”) are subject to a higher probability that an issuer will default or fail to meet its payment obligations. These securities may be subject to greater price volatility due to such factors as specific corporate developments and negative perceptions of the junk bond market generally and may be more difficult to trade or dispose of than other types of securities.
Duration Risk: Duration is a measure that relates the expected price volatility of a fixed-income security to changes in interest rates. The duration of a fixed-income security may be shorter than or equal to full maturity of a fixed-income security. Fixed-income securities with longer durations have more risk and will decrease in price as interest rates rise.
| | |
| |
| abfunds.com | | AB GLOBAL BOND FUND | 5 |
DISCLOSURES AND RISKS(continued)
Inflation Risk: This is the risk that the value of assets or income from investments will be less in the future as inflation decreases the value of money. As inflation increases, the value of the Fund’s assets can decline as can the value of the Fund’s distributions. This risk is significantly greater if the Fund invests a significant portion of its assets in fixed-income securities with longer maturities.
Foreign(Non-US) Risk: Investments in securities ofnon-US issuers may involve more risk than those of US issuers. These securities may fluctuate more widely in price and may be more difficult to trade or dispose of due to adverse market, economic, political, regulatory or other factors.
Emerging-Market Risk: Investments in emerging-market countries may have more risk because the markets are less developed and less liquid as well as being subject to increased economic, political, regulatory or other uncertainties.
Currency Risk: Fluctuations in currency exchange rates may negatively affect the value of the Fund’s investments or reduce its returns.
Mortgage-Related and/or Other Asset-Backed Securities Risk: Investments in mortgage-related and other asset-backed securities are subject to certain additional risks. The value of these securities may be particularly sensitive to changes in interest rates. These risks include “extension risk”, which is the risk that, in periods of rising interest rates, issuers may delay the payment of principal, and “prepayment risk”, which is the risk that in periods of falling interest rates, issuers may pay principal sooner than expected, exposing the Fund to a lower rate of return upon reinvestment of principal. Mortgage-backed securities offered bynon-governmental issuers and other asset-backed securities may be subject to other risks, such as higher rates of default in the mortgages or assets backing the securities or risks associated with the nature and servicing of mortgages or assets backing the securities.
Leverage Risk: To the extent the Fund uses leveraging techniques, its net asset value (“NAV”) may be more volatile because leverage tends to exaggerate the effect of changes in interest rates and any increase or decrease in the value of the Fund’s investments.
Derivatives Risk: Derivatives may be illiquid, difficult to price or unwind and leveraged so that small changes may produce disproportionate losses for the Fund. Derivatives may also be subject to counterparty risk to a greater degree than more traditional investments.
Illiquid Investments Risk: Illiquid investments risk exists when certain investments become difficult to purchase or sell. Difficulty in selling such
| | |
| |
| 6 | AB GLOBAL BOND FUND | | abfunds.com |
DISCLOSURES AND RISKS(continued)
investments may result in sales at disadvantageous prices affecting the value of your investment in the Fund. Causes of illiquid investments risk may include low trading volumes, large positions and heavy redemption of Fund shares. Foreign fixed-income securities may have more illiquid investments risk because secondary trading markets for these securities may be smaller and less well-developed and the securities may trade less frequently. Illiquid investments risk may be higher in a rising interest-rate environment, when the value and liquidity of fixed-income securities generally decline.
Active Trading Risk: The Fund expects to engage in active and frequent trading of its portfolio securities and its portfolio turnover rate may greatly exceed 100%. A higher rate of portfolio turnover increases transaction costs, which may negatively affect the Fund’s return. In addition, a high rate of portfolio turnover may result in substantial short-term gains, which may have adverse tax consequences for Fund shareholders.
Management Risk: The Fund is subject to management risk because it is an actively managed investment fund. The Adviser will apply its investment techniques and risk analyses in making investment decisions, but there is no guarantee that its techniques will produce the intended results.
These risks are fully discussed in the Fund’s prospectus. As with all investments, you may lose money by investing in the Fund.
An Important Note About Historical Performance
The investment return and principal value of an investment in the Fund will fluctuate, so that shares, when redeemed, may be worth more or less than their original cost. Performance shown in this report represents past performance and does not guarantee future results. Current performance may be lower or higher than the performance information shown. You may obtain performance information current to the most recentmonth-end by visiting www.abfunds.com.
All fees and expenses related to the operation of the Fund have been deducted. NAV returns do not reflect sales charges; if sales charges were reflected, the Fund’s quoted performance would be lower. SEC returns reflect the applicable sales charges for each share class: a 4.25% maximumfront-end sales charge for Class A shares; the applicable contingent deferred sales charge for Class B shares (3% year 1, 2% year 2, 1% year 3) and a 1%1-year contingent deferred sales charge for Class C shares. Returns for the different share classes will vary due to different expenses associated with each class. Performance assumes reinvestment of distributions and does not account for taxes.
| | |
| |
| abfunds.com | | AB GLOBAL BOND FUND | 7 |
HISTORICAL PERFORMANCE
GROWTH OF A $10,000 INVESTMENT IN THE FUND(unaudited)
9/30/2009 TO 9/30/2019
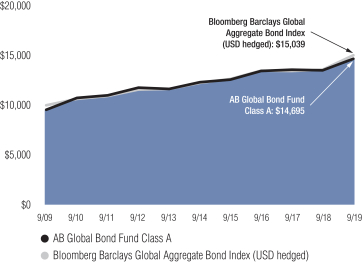
This chart illustrates the total value of an assumed $10,000 investment in AB Global Bond Fund Class A shares (from 9/30/2009 to 9/30/2019) as compared to the performance of its benchmark. The chart reflects the deduction of the maximum 4.25% sales charge from the initial $10,000 investment in the Fund and assumes the reinvestment of dividends and capital gains distributions.
| | |
| |
| 8 | AB GLOBAL BOND FUND | | abfunds.com |
HISTORICAL PERFORMANCE(continued)
AVERAGE ANNUAL RETURNS AS OF SEPTEMBER 30, 2019(unaudited)
| | | | | | | | | | | | |
| | | |
| | | NAV Returns | | | SEC Returns
(reflects applicable
sales charges) | | | SEC Yields1 | |
| | | |
| CLASS A SHARES | | | | | | | | | | | 1.24% | |
| | | |
| 1 Year | | | 8.58% | | | | 4.01% | | | | | |
| | | |
| 5 Years | | | 3.55% | | | | 2.65% | | | | | |
| | | |
| 10 Years | | | 4.38% | | | | 3.92% | | | | | |
| | | |
| CLASS B SHARES | | | | | | | | | | | 0.48% | |
| | | |
| 1 Year | | | 7.69% | | | | 4.69% | | | | | |
| | | |
| 5 Years | | | 2.75% | | | | 2.75% | | | | | |
| | | |
| 10 Years2 | | | 3.92% | | | | 3.92% | | | | | |
| | | |
| CLASS C SHARES | | | | | | | | | | | 0.55% | |
| | | |
| 1 Year | | | 7.87% | | | | 6.87% | | | | | |
| | | |
| 5 Years | | | 2.80% | | | | 2.80% | | | | | |
| | | |
| 10 Years | | | 3.62% | | | | 3.62% | | | | | |
| | | |
| ADVISOR CLASS SHARES3 | | | | | | | | | | | 1.54% | |
| | | |
| 1 Year | | | 8.86% | | | | 8.86% | | | | | |
| | | |
| 5 Years | | | 3.83% | | | | 3.83% | | | | | |
| | | |
| 10 Years | | | 4.66% | | | | 4.66% | | | | | |
| | | |
| CLASS R SHARES3 | | | | | | | | | | | 0.87% | |
| | | |
| 1 Year | | | 8.13% | | | | 8.13% | | | | | |
| | | |
| 5 Years | | | 3.14% | | | | 3.14% | | | | | |
| | | |
| 10 Years | | | 4.01% | | | | 4.01% | | | | | |
| | | |
| CLASS K SHARES3 | | | | | | | | | | | 1.18% | |
| | | |
| 1 Year | | | 8.46% | | | | 8.46% | | | | | |
| | | |
| 5 Years | | | 3.47% | | | | 3.47% | | | | | |
| | | |
| 10 Years | | | 4.35% | | | | 4.35% | | | | | |
| | | |
| CLASS I SHARES3 | | | | | | | | | | | 1.58% | |
| | | |
| 1 Year | | | 8.87% | | | | 8.87% | | | | | |
| | | |
| 5 Years | | | 3.84% | | | | 3.84% | | | | | |
| | | |
| 10 Years | | | 4.69% | | | | 4.69% | | | | | |
| | | |
| CLASS Z SHARES3 | | | | | | | | | | | 1.61% | |
| | | |
| 1 Year | | | 8.93% | | | | 8.93% | | | | | |
| | | |
| 5 Years | | | 3.89% | | | | 3.89% | | | | | |
| | | |
| Since Inception4 | | | 4.33% | | | | 4.33% | | | | | |
The Fund’s prospectus fee table shows the Fund’s total annual operating expense ratios as 0.83%, 1.63%, 1.56%, 0.58%, 1.23%, 0.92%, 0.56% and 0.51% for Class A, Class B, Class C, Advisor Class, Class R, Class K, Class I and Class Z shares, respectively. The Financial Highlights section of this report sets forth expense ratio data for the current reporting period; the expense ratios shown above may differ from the expense ratios in the Financial Highlights section since they are based on different time periods.
(footnotes continued on next page)
| | |
| |
| abfunds.com | | AB GLOBAL BOND FUND | 9 |
HISTORICAL PERFORMANCE(continued)
| 1 | SEC yields are calculated based on SEC guidelines for the30-day period ended September 30, 2019. |
| 2 | Assumes conversion of Class B shares into Class A shares after six years. |
| 3 | These share classes are offered at NAV to eligible investors and their SEC returns are the same as their NAV returns. Please note that these share classes are for investors purchasing shares through accounts established under certainfee-based programs sponsored and maintained by certain broker-dealers and financial intermediaries, institutional pension plans and/or investment advisory clients of, and certain other persons associated with, the Adviser and its affiliates or the Fund. |
| 4 | Inception date: 10/15/2013. |
| | |
| |
| 10 | AB GLOBAL BOND FUND | | abfunds.com |
HISTORICAL PERFORMANCE(continued)
SEC AVERAGE ANNUAL RETURNS
AS OF THE MOST RECENT CALENDARQUARTER-END
SEPTEMBER 30, 2019(unaudited)
| | | | |
| |
| | | SEC Returns
(reflects applicable
sales charges) | |
| |
| CLASS A SHARES | | | | |
| |
| 1 Year | | | 4.01% | |
| |
| 5 Years | | | 2.65% | |
| |
| 10 Years | | | 3.92% | |
| |
| CLASS B SHARES | | | | |
| |
| 1 Year | | | 4.69% | |
| |
| 5 Years | | | 2.75% | |
| |
| 10 Years1 | | | 3.92% | |
| |
| CLASS C SHARES | | | | |
| |
| 1 Year | | | 6.87% | |
| |
| 5 Years | | | 2.80% | |
| |
| 10 Years | | | 3.62% | |
| |
| ADVISOR CLASS SHARES2 | | | | |
| |
| 1 Year | | | 8.86% | |
| |
| 5 Years | | | 3.83% | |
| |
| 10 Years | | | 4.66% | |
| |
| CLASS R SHARES2 | | | | |
| |
| 1 Year | | | 8.13% | |
| |
| 5 Years | | | 3.14% | |
| |
| 10 Years | | | 4.01% | |
| |
| CLASS K SHARES2 | | | | |
| |
| 1 Year | | | 8.46% | |
| |
| 5 Years | | | 3.47% | |
| |
| 10 Years | | | 4.35% | |
| |
| CLASS I SHARES2 | | | | |
| |
| 1 Year | | | 8.87% | |
| |
| 5 Years | | | 3.84% | |
| |
| 10 Years | | | 4.69% | |
| |
| CLASS Z SHARES2 | | | | |
| |
| 1 Year | | | 8.93% | |
| |
| 5 Years | | | 3.89% | |
| |
| Since Inception3 | | | 4.33% | |
| 1 | Assumes conversion of Class B shares into Class A shares after six years. |
| 2 | Please note that these share classes are for investors purchasing shares through accounts established under certainfee-based programs sponsored and maintained by certain broker-dealers and financial intermediaries, institutional pension plans and/or investment advisory clients of, and certain other persons associated with, the Adviser and its affiliates or the Fund. |
| 3 | Inception date: 10/15/2013. |
| | |
| |
| abfunds.com | | AB GLOBAL BOND FUND | 11 |
EXPENSE EXAMPLE
(unaudited)
As a shareholder of the Fund, you incur two types of costs: (1) transaction costs, including sales charges (loads) on purchase payments, contingent deferred sales charges on redemptions and (2) ongoing costs, including management fees; distribution(12b-1) fees; and other Fund expenses. This example is intended to help you understand your ongoing costs (in dollars) of investing in the Fund and to compare these costs with the ongoing costs of investing in other mutual funds.
The Example is based on an investment of $1,000 invested at the beginning of the period and held for the entire period as indicated below.
Actual Expenses
The table below provides information about actual account values and actual expenses. You may use the information in this line, together with the amount you invested, to estimate the expenses that you paid over the period. Simply divide your account value by $1,000 (for example, an $8,600 account value divided by $1,000 = 8.6), then multiply the result by the number in the first line under the heading entitled “Expenses Paid During Period” to estimate the expenses you paid on your account during this period.
Hypothetical Example for Comparison Purposes
The table below provides information about hypothetical account values and hypothetical expenses based on the Fund’s actual expense ratio and an assumed annual rate of return of 5% before expenses, which is not the Fund’s actual return. The hypothetical account values and expenses may not be used to estimate the actual ending account balance or expenses you paid for the period. You may use this information to compare the ongoing costs of investing in the Fund and other funds by comparing this 5% hypothetical example with the 5% hypothetical examples that appear in the shareholder reports of other funds.
Please note that the expenses shown in the table are meant to highlight your ongoing costs only and do not reflect any transactional costs, such as sales charges (loads), or contingent deferred sales charges on redemptions. Therefore, the second line of the table is useful in comparing ongoing costs only, and will not help you determine the relative total costs of owning different funds. In addition, if these transactional costs were included, your costs would have been higher.
| | |
| |
| 12 | AB GLOBAL BOND FUND | | abfunds.com |
EXPENSE EXAMPLE(continued)
| | | | | | | | | | | | | | | | |
| | | Beginning
Account Value
4/1/2019 | | | Ending
Account Value
9/30/2019 | | | Expenses Paid
During Period* | | | Annualized
Expense Ratio* | |
| Class A | | | | | | | | | | | | | | | | |
Actual | | $ | 1,000 | | | $ | 1,042.60 | | | $ | 4.15 | | | | 0.81 | % |
Hypothetical** | | $ | 1,000 | | | $ | 1,021.01 | | | $ | 4.10 | | | | 0.81 | % |
| Class B | | | | | | | | | | | | | | | | |
Actual | | $ | 1,000 | | | $ | 1,038.30 | | | $ | 8.33 | | | | 1.63 | % |
Hypothetical** | | $ | 1,000 | | | $ | 1,016.90 | | | $ | 8.24 | | | | 1.63 | % |
| Class C | | | | | | | | | | | | | | | | |
Actual | | $ | 1,000 | | | $ | 1,039.70 | | | $ | 7.98 | | | | 1.56 | % |
Hypothetical** | | $ | 1,000 | | | $ | 1,017.25 | | | $ | 7.89 | | | | 1.56 | % |
| Advisor Class | | | | | | | | | | | | | |
Actual | | $ | 1,000 | | | $ | 1,043.90 | | | $ | 2.87 | | | | 0.56 | % |
Hypothetical** | | $ | 1,000 | | | $ | 1,022.26 | | | $ | 2.84 | | | | 0.56 | % |
| Class R | | | | | | | | | | | | | | | | |
Actual | | $ | 1,000 | | | $ | 1,040.40 | | | $ | 6.34 | | | | 1.24 | % |
Hypothetical** | | $ | 1,000 | | | $ | 1,018.85 | | | $ | 6.28 | | | | 1.24 | % |
| Class K | | | | | | | | | | | | | | | | |
Actual | | $ | 1,000 | | | $ | 1,042.00 | | | $ | 4.76 | | | | 0.93 | % |
Hypothetical** | | $ | 1,000 | | | $ | 1,020.41 | | | $ | 4.71 | | | | 0.93 | % |
| Class I | | | | | | | | | | | | | | | | |
Actual | | $ | 1,000 | | | $ | 1,044.00 | | | $ | 2.77 | | | | 0.54 | % |
Hypothetical** | | $ | 1,000 | | | $ | 1,022.36 | | | $ | 2.74 | | | | 0.54 | % |
| Class Z | | | | | | | | | | | | | | | | |
Actual | | $ | 1,000 | | | $ | 1,044.20 | | | $ | 2.56 | | | | 0.50 | % |
Hypothetical** | | $ | 1,000 | | | $ | 1,022.56 | | | $ | 2.54 | | | | 0.50 | % |
| * | Expenses are equal to the classes’ annualized expense ratios multiplied by the average account value over the period, multiplied by 183/365 (to reflect theone-half year period). |
| ** | Assumes 5% annual return before expenses. |
| | |
| |
| abfunds.com | | AB GLOBAL BOND FUND | 13 |
PORTFOLIO SUMMARY
September 30, 2019(unaudited)
PORTFOLIO STATISTICS
Net Assets ($mil): $7,230.9
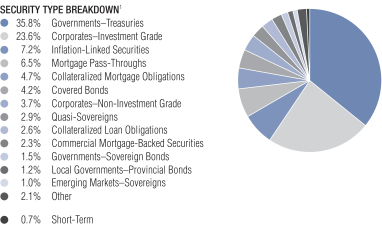
| 1 | All data are as of September 30, 2019. The Fund’s security type breakdown is expressed as a percentage of total investments and may vary over time. The Fund also enters into derivative transactions, which may be used for hedging or investment purposes (see “Portfolio of Investments” section of the report for additional details). “Other” security type weightings represent 0.6% or less in the following security types: Agencies, Asset-Backed Securities, Bank Loans, Common Stocks, Emerging Markets–Corporate Bonds, Emerging Markets–Treasuries, Local Governments–US Municipal Bonds, Supranationals, Warrants and Whole Loan Trusts. |
| | |
| |
| 14 | AB GLOBAL BOND FUND | | abfunds.com |
PORTFOLIO SUMMARY(continued)
September 30, 2019(unaudited)
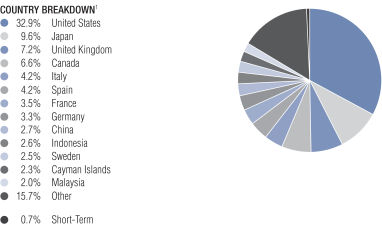
| 1 | All data are as of September 30, 2019. The Fund’s country breakdown is expressed as a percentage of total investments and may vary over time. The Fund also enters into derivative transactions, which may be used for hedging or investment purposes (see “Portfolio of Investments” section of the report for additional details). “Other” country weightings represent 2.0% or less in the following: Australia, Austria, Bahrain, Belgium, Bermuda, Brazil, Chile, Colombia, Denmark, Dominican Republic, Egypt, Finland, Gabon, Hong Kong, India, Ireland, Ivory Coast, Kazakhstan, Kuwait, Mexico, Netherlands, Nigeria, Norway, Peru, Qatar, Russia, Saudi Arabia, Singapore, South Africa, Sri Lanka, Supranational, Switzerland, Turkey and United Arab Emirates. |
| | |
| |
| abfunds.com | | AB GLOBAL BOND FUND | 15 |
PORTFOLIO OF INVESTMENTS
September 30, 2019
| | | | | | | | | | | | |
| | | | | | Principal
Amount
(000) | | | U.S. $ Value | |
| |
GOVERNMENTS – TREASURIES – 35.9% | | | | | | | | | | | | |
Austria – 0.9% | | | | | | | | | | | | |
Republic of Austria Government Bond
0.50%, 2/20/29(a) | | | EUR | | | | 57,980 | | | $ | 68,201,632 | |
| | | | | | | | | | | | |
| | | |
Belgium – 1.8% | | | | | | | | | | | | |
Kingdom of Belgium Government Bond
Series 44
5.00%, 3/28/35(a) | | | | | | | 4,410 | | | | 8,495,070 | |
Series 71
3.75%, 6/22/45(a) | | | | | | | 2,300 | | | | 4,585,657 | |
Series 81
0.80%, 6/22/27(a) | | | | | | | 70,935 | | | | 84,628,695 | |
Series 88
1.70%, 6/22/50(a) | | | | | | | 23,462 | | | | 33,988,661 | |
| | | | | | | | | | | | |
| | | | | | | | | | | 131,698,083 | |
| | | | | | | | | | | | |
Canada – 4.8% | | | | | | | | | | | | |
Canadian Government Bond
1.75%, 3/01/23 | | | CAD | | | | 84,491 | | | | 64,341,409 | |
2.25%, 3/01/24 | | | | | | | 336,825 | | | | 263,035,194 | |
2.75%, 12/01/48 | | | | | | | 17,110 | | | | 16,570,167 | |
| | | | | | | | | | | | |
| | | | | | | | | | | 343,946,770 | |
| | | | | | | | | | | | |
Finland – 0.9% | | | | | | | | | | | | |
Finland Government Bond
0.50%, 9/15/29(a) | | | EUR | | | | 56,064 | | | | 66,118,520 | |
| | | | | | | | | | | | |
| | | |
France – 1.5% | | | | | | | | | | | | |
French Republic Government Bond OAT
1.25%, 5/25/34(a) | | | | | | | 50,415 | | | | 65,060,671 | |
1.50%, 5/25/50(a) | | | | | | | 29,015 | | | | 40,220,103 | |
| | | | | | | | | | | | |
| | | | | | | | | | | 105,280,774 | |
| | | | | | | | | | | | |
Germany – 2.6% | | | | | | | | | | | | |
Bundesrepublik Deutschland Bundesanleihe
Series 2007
4.25%, 7/04/39(a) | | | | | | | 89,917 | | | | 189,180,171 | |
| | | | | | | | | | | | |
| | | |
Indonesia – 1.1% | | | | | | | | | | | | |
Indonesia Treasury Bond
Series FR68
8.375%, 3/15/34 | | | IDR | | | | 588,191,000 | | | | 43,653,344 | |
Series FR70
8.375%, 3/15/24 | | | | | | | 437,499,000 | | | | 32,654,469 | |
| | | | | | | | | | | | |
| | | | | | | | | | | 76,307,813 | |
| | | | | | | | | | | | |
Ireland – 0.6% | | | | | | | | | | | | |
Ireland Government Bond
1.00%, 5/15/26(a) | | | EUR | | | | 37,007 | | | | 43,811,392 | |
| | | | | | | | | | | | |
| | |
| |
| 16 | AB GLOBAL BOND FUND | | abfunds.com |
PORTFOLIO OF INVESTMENTS(continued)
| | | | | | | | | | | | |
| | | | | | Principal
Amount
(000) | | | U.S. $ Value | |
| |
Italy – 3.1% | | | | | | | | | | | | |
Italy Buoni Poliennali Del Tesoro
1.35%, 4/15/22 | | | EUR | | | | 58,260 | | | $ | 65,885,437 | |
2.20%, 6/01/27 | | | | | | | 30,630 | | | | 37,443,402 | |
3.35%, 3/01/35(a) | | | | | | | 40,632 | | | | 56,498,857 | |
3.85%, 9/01/49(a) | | | | | | | 40,309 | | | | 63,458,230 | |
| | | | | | | | | | | | |
| | | | | | | | | | | 223,285,926 | |
| | | | | | | | | | | | |
Japan – 4.5% | | | | | | | | | | | | |
Japan Government Thirty Year Bond
Series 62
0.50%, 3/20/49 | | | JPY | | | | 5,288,350 | | | | 50,748,645 | |
Japan Government Twenty Year Bond
Series 150
1.40%, 9/20/34 | | | | | | | 6,281,600 | | | | 69,974,381 | |
Series 158
0.50%, 9/20/36 | | | | | | | 11,339,350 | | | | 111,854,914 | |
Series 159
0.60%, 12/20/36 | | | | | | | 4,022,550 | | | | 40,258,759 | |
Series 169
0.30%, 6/20/39 | | | | | | | 5,494,850 | | | | 51,832,304 | |
| | | | | | | | | | | | |
| | | | | | | | | | | 324,669,003 | |
| | | | | | | | | | | | |
Malaysia – 2.0% | | | | | | | | | | | | |
Malaysia Government Bond
Series 0114
4.181%, 7/15/24 | | | MYR | | | | 72,655 | | | | 18,036,070 | |
Series 0119
3.906%, 7/15/26 | | | | | | | 78,423 | | | | 19,362,109 | |
Series 0217
4.059%, 9/30/24 | | | | | | | 72,978 | | | | 18,036,913 | |
Series 0218
3.757%, 4/20/23 | | | | | | | 131,916 | | | | 32,047,239 | |
Series 0219
3.885%, 8/15/29 | | | | | | | 112,220 | | | | 28,033,290 | |
Series 0313
3.48%, 3/15/23 | | | | | | | 59,440 | | | | 14,304,029 | |
Series 0316
3.90%, 11/30/26 | | | | | | | 73,262 | | | | 17,997,623 | |
| | | | | | | | | | | | |
| | | | | | | | | | | 147,817,273 | |
| | | | | | | | | | | | |
Mexico – 1.0% | | | | | | | | | | | | |
Mexican Bonos
Series M 20
7.50%, 6/03/27 | | | MXN | | | | 1,353,382 | | | | 71,014,226 | |
| | | | | | | | | | | | |
| | | |
Russia – 1.1% | | | | | | | | | | | | |
Russian Federal Bond – OFZ
Series 6212
7.05%, 1/19/28 | | | RUB | | | | 640,375 | | | | 10,009,716 | |
| | |
| |
| abfunds.com | | AB GLOBAL BOND FUND | 17 |
PORTFOLIO OF INVESTMENTS(continued)
| | | | | | | | | | | | |
| | | | | | Principal
Amount
(000) | | | U.S. $ Value | |
| |
Series 6215
7.00%, 8/16/23 | | | RUB | | | | 1,797,090 | | | $ | 28,085,091 | |
Series 6222
7.10%, 10/16/24 | | | | | | | 590,115 | | | | 9,240,479 | |
Series 6227
7.40%, 7/17/24 | | | | | | | 1,861,821 | | | | 29,519,860 | |
| | | | | | | | | | | | |
| | | | | | | | | | | 76,855,146 | |
| | | | | | | | | | | | |
Singapore – 0.4% | | | | | | | | | | | | |
Singapore Government Bond
3.00%, 9/01/24 | | | SGD | | | | 36,000 | | | | 27,619,578 | |
| | | | | | | | | | | | |
| | | |
Spain – 3.6% | | | | | | | | | | | | |
Spain Government Bond
1.95%, 4/30/26(a) | | | EUR | | | | 25,353 | | | | 31,423,216 | |
2.35%, 7/30/33(a) | | | | | | | 70,367 | | | | 96,552,623 | |
2.90%, 10/31/46(a) | | | | | | | 22,840 | | | | 36,089,794 | |
4.20%, 1/31/37(a) | | | | | | | 21,865 | | | | 38,040,726 | |
4.40%, 10/31/23(a) | | | | | | | 44,885 | | | | 58,469,416 | |
| | | | | | | | | | | | |
| | | | | | | | | | | 260,575,775 | |
| | | | | | | | | | | | |
United Kingdom – 4.0% | | | | | | | | | | | | |
United Kingdom Gilt
1.00%, 4/22/24(a) | | | GBP | | | | 73,870 | | | | 93,772,370 | |
1.50%, 7/22/47(a) | | | | | | | 1,319 | | | | 1,825,997 | |
1.75%, 9/07/37(a) | | | | | | | 127,551 | | | | 179,656,039 | |
4.25%, 12/07/40(a) | | | | | | | 8,574 | | | | 17,308,257 | |
| | | | | | | | | | | | |
| | | | | | | | | | | 292,562,663 | |
| | | | | | | | | | | | |
United States – 2.0% | | | | | | | | | | | | |
U.S. Treasury Bonds
2.25%, 8/15/46(b)(c)(d) | | | U.S.$ | | | | 82,440 | | | | 84,539,648 | |
2.875%, 5/15/43(b) | | | | | | | 16,930 | | | | 19,411,303 | |
3.00%, 2/15/47(b) | | | | | | | 31,220 | | | | 37,005,457 | |
U.S. Treasury Notes
1.625%, 2/15/26(b) | | | | | | | 6,274 | | | | 6,276,841 | |
| | | | | | | | | | | | |
| | | | | | | | | | | 147,233,249 | |
| | | | | | | | | | | | |
Total Governments – Treasuries
(cost $2,455,429,633) | | | | | | | | | | | 2,596,177,994 | |
| | | | | | | | | | | | |
| | | | | | | | | | | | |
CORPORATES – INVESTMENT GRADE – 23.7% | | | | | | | | | | | | |
Industrial – 12.0% | | | | | | | | | | | | |
Basic – 0.8% | | | | | | | | | | | | |
Alpek SAB de CV
4.50%, 11/20/22(a) | | | | | | | 220 | | | | 228,731 | |
Anglo American Capital PLC
3.625%, 9/11/24(a) | | | | | | | 200 | | | | 205,914 | |
| | |
| |
| 18 | AB GLOBAL BOND FUND | | abfunds.com |
PORTFOLIO OF INVESTMENTS(continued)
| | | | | | | | | | |
| | | | | Principal
Amount
(000) | | | U.S. $ Value | |
| |
3.75%, 4/10/22(a) | | U.S.$ | | | 280 | | | $ | 287,476 | |
4.875%, 5/14/25(a) | | | | | 200 | | | | 217,141 | |
Celulosa Arauco y Constitucion SA
4.25%, 4/30/29(a) | | | | | 230 | | | | 239,339 | |
4.50%, 8/01/24 | | | | | 270 | | | | 284,681 | |
Dow Chemical Co. (The)
3.625%, 5/15/26(a) | | | | | 231 | | | | 241,188 | |
4.55%, 11/30/25(a) | | | | | 214 | | | | 234,544 | |
4.80%, 5/15/49(a) | | | | | 139 | | | | 153,432 | |
DuPont de Nemours, Inc.
4.493%, 11/15/25 | | | | | 375 | | | | 414,523 | |
5.419%, 11/15/48 | | | | | 216 | | | | 273,491 | |
Equate Petrochemical BV
3.00%, 3/03/22(a) | | | | | 15,619 | | | | 15,682,452 | |
4.25%, 11/03/26(a) | | | | | 200 | | | | 215,188 | |
Glencore Finance Canada Ltd.
4.95%, 11/15/21(a) | | | | | 105 | | | | 109,834 | |
Glencore Finance Europe Ltd.
1.75%, 3/17/25(a) | | EUR | | | 2,383 | | | | 2,721,579 | |
1.875%, 9/13/23(a) | | | | | 10,148 | | | | 11,653,274 | |
Glencore Funding LLC
4.00%, 3/27/27(a) | | U.S.$ | | | 2,431 | | | | 2,497,575 | |
4.125%, 5/30/23-3/12/24(a) | | | | | 444 | | | | 465,557 | |
4.625%, 4/29/24(a) | | | | | 4,507 | | | | 4,822,184 | |
Gold Fields Orogen Holdings BVI Ltd.
5.125%, 5/15/24(a) | | | | | 3,401 | | | | 3,594,432 | |
GTL Trade Finance, Inc./Gerdau Holdings, Inc.
5.893%, 4/29/24(a) | | | | | 782 | | | | 855,068 | |
Inversiones CMPC SA
4.375%, 4/04/27(a) | | | | | 265 | | | | 280,296 | |
Nexa Resources SA
5.375%, 5/04/27(a) | | | | | 200 | | | | 212,291 | |
Nutrien Ltd.
3.375%, 3/15/25 | | | | | 394 | | | | 407,731 | |
Orbia Advance Corp SAB de CV
4.00%, 10/04/27(a) | | | | | 280 | | | | 283,762 | |
SABIC Capital II BV
4.00%, 10/10/23(a) | | | | | 9,776 | | | | 10,289,269 | |
| | | | | | | | | | |
| | | | | | | | | 56,870,952 | |
| | | | | | | | | | |
Capital Goods – 0.3% | | | | | | | | | | |
3M Co.
3.125%, 9/19/46 | | | | | 145 | | | | 140,731 | |
3.25%, 8/26/49 | | | | | 10,898 | | | | 10,915,437 | |
CNH Industrial Capital LLC
4.375%, 4/05/22 | | | | | 102 | | | | 106,602 | |
| | |
| |
| abfunds.com | | AB GLOBAL BOND FUND | 19 |
PORTFOLIO OF INVESTMENTS(continued)
| | | | | | | | | | |
| | | | | Principal
Amount
(000) | | | U.S. $ Value | |
| |
General Electric Co.
0.875%, 5/17/25 | | EUR | | | 4,853 | | | $ | 5,328,130 | |
Series G
6.875%, 1/10/39 | | U.S.$ | | | 175 | | | | 232,255 | |
Johnson Controls International PLC
4.50%, 2/15/47 | | | | | 120 | | | | 131,449 | |
4.625%, 7/02/44 | | | | | 194 | | | | 211,427 | |
United Technologies Corp.
1.15%, 5/18/24 | | EUR | | | 929 | | | | 1,055,207 | |
Wabtec Corp.
4.40%, 3/15/24 | | U.S.$ | | | 4,990 | | | | 5,313,108 | |
| | | | | | | | | | |
| | | | | | | | | 23,434,346 | |
| | | | | | | | | | |
Communications - Media – 1.0% | | | | | | | | | | |
CBS Corp.
3.375%, 2/15/28 | | | | | 85 | | | | 86,716 | |
3.50%, 1/15/25 | | | | | 55 | | | | 57,202 | |
4.00%, 1/15/26 | | | | | 1,847 | | | | 1,968,028 | |
4.20%, 6/01/29 | | | | | 10,147 | | | | 11,023,417 | |
4.60%, 1/15/45 | | | | | 121 | | | | 130,966 | |
5.50%, 5/15/33 | | | | | 85 | | | | 101,795 | |
Charter Communications Operating LLC/Charter Communications Operating Capital
4.908%, 7/23/25 | | | | | 36,264 | | | | 39,803,511 | |
5.05%, 3/30/29 | | | | | 240 | | | | 268,210 | |
5.75%, 4/01/48 | | | | | 245 | | | | 279,282 | |
Comcast Corp.
3.40%, 7/15/46 | | | | | 180 | | | | 183,077 | |
3.90%, 3/01/38 | | | | | 280 | | | | 308,459 | |
3.999%, 11/01/49 | | | | | 6,455 | | | | 7,177,760 | |
4.25%, 1/15/33 | | | | | 350 | | | | 402,692 | |
4.60%, 10/15/38 | | | | | 411 | | | | 491,693 | |
4.70%, 10/15/48 | | | | | 220 | | | | 269,313 | |
4.75%, 3/01/44 | | | | | 100 | | | | 121,056 | |
Cox Communications, Inc.
4.50%, 6/30/43(a) | | | | | 160 | | | | 169,322 | |
Discovery Communications LLC
3.95%, 3/20/28 | | | | | 144 | | | | 150,062 | |
5.20%, 9/20/47 | | | | | 175 | | | | 191,291 | |
Fox Corp.
5.476%, 1/25/39(a) | | | | | 109 | | | | 133,834 | |
Interpublic Group of Cos., Inc. (The)
5.40%, 10/01/48 | | | | | 70 | | | | 83,654 | |
Myriad International Holdings BV
6.00%, 7/18/20(a) | | | | | 5,287 | | | | 5,413,174 | |
Omnicom Group, Inc./Omnicom Capital, Inc.
3.60%, 4/15/26 | | | | | 201 | | | | 211,869 | |
| | |
| |
| 20 | AB GLOBAL BOND FUND | | abfunds.com |
PORTFOLIO OF INVESTMENTS(continued)
| | | | | | | | | | | | |
| | | | | | Principal
Amount
(000) | | | U.S. $ Value | |
| |
Thomson Reuters Corp.
4.30%, 11/23/23 | | | U.S.$ | | | | 275 | | | $ | 293,370 | |
Time Warner Cable LLC
4.50%, 9/15/42 | | | | | | | 100 | | | | 98,047 | |
6.55%, 5/01/37 | | | | | | | 105 | | | | 125,574 | |
TWDC Enterprises 18 Corp.
Series G
4.125%, 6/01/44 | | | | | | | 110 | | | | 132,327 | |
Walt Disney Co. (The)
2.75%, 9/01/49 | | | | | | | 185 | | | | 177,537 | |
5.40%, 10/01/43(a) | | | | | | | 230 | | | | 319,704 | |
Weibo Corp.
3.50%, 7/05/24 | | | | | | | 359 | | | | 364,987 | |
| | | | | | | | | | | | |
| | | | | | | | | | | 70,537,929 | |
| | | | | | | | | | | | |
Communications - Telecommunications – 1.4% | | | | | | | | | | | | |
AT&T, Inc.
2.95%, 7/15/26 | | | | | | | 120 | | | | 121,355 | |
3.40%, 5/15/25 | | | | | | | 5,641 | | | | 5,886,457 | |
3.55%, 6/01/24 | | | | | | | 6,274 | | | | 6,572,542 | |
3.60%, 7/15/25 | | | | | | | 150 | | | | 157,735 | |
4.125%, 2/17/26 | | | | | | | 5,849 | | | | 6,313,744 | |
4.25%, 3/01/27 | | | | | | | 22,945 | | | | 25,006,700 | |
4.55%, 3/09/49 | | | | | | | 10,100 | | | | 10,915,332 | |
4.75%, 5/15/46 | | | | | | | 112 | | | | 124,457 | |
4.80%, 6/15/44 | | | | | | | 70 | | | | 77,574 | |
4.85%, 3/01/39-7/15/45 | | | | | | | 379 | | | | 427,487 | |
5.15%, 2/15/50 | | | | | | | 290 | | | | 339,748 | |
5.45%, 3/01/47 | | | | | | | 288 | | | | 347,610 | |
British Telecommunications PLC
9.625%, 12/15/30 | | | | | | | 150 | | | | 228,784 | |
Qwest Corp.
6.75%, 12/01/21 | | | | | | | 150 | | | | 162,394 | |
Rogers Communications, Inc.
4.00%, 6/06/22 | | | CAD | | | | 5,000 | | | | 3,942,223 | |
Sprint Spectrum Co. LLC/Sprint Spectrum Co. II LLC/Sprint Spectrum Co. III LLC
4.738%, 3/20/25(a) | | | U.S.$ | | | | 17,360 | | | | 18,440,521 | |
Verizon Communications, Inc.
2.625%, 8/15/26 | | | | | | | 599 | | | | 607,209 | |
3.376%, 2/15/25 | | | | | | | 23 | | | | 24,266 | |
4.016%, 12/03/29 | | | | | | | 428 | | | | 477,062 | |
4.125%, 3/16/27 | | | | | | | 110 | | | | 121,408 | |
4.272%, 1/15/36 | | | | | | | 139 | | | | 156,482 | |
4.329%, 9/21/28 | | | | | | | 277 | | | | 313,874 | |
4.522%, 9/15/48 | | | | | | | 9,240 | | | | 10,872,800 | |
| | |
| |
| abfunds.com | | AB GLOBAL BOND FUND | 21 |
PORTFOLIO OF INVESTMENTS(continued)
| | | | | | | | | | | | |
| | | | | | Principal
Amount
(000) | | | U.S. $ Value | |
| |
4.862%, 8/21/46 | | | U.S.$ | | | | 250 | | | $ | 305,036 | |
5.012%, 4/15/49 | | | | | | | 212 | | | | 265,789 | |
Vodafone Group PLC
4.125%, 5/30/25 | | | | | | | 463 | | | | 500,300 | |
4.25%, 9/17/50 | | | | | | | 6,111 | | | | 6,203,508 | |
4.875%, 6/19/49 | | | | | | | 81 | | | | 90,064 | |
| | | | | | | | | | | | |
| | | | | | | | | | | 99,002,461 | |
| | | | | | | | | | | | |
Consumer Cyclical - Automotive – 0.6% | | | | | | | | | | | | |
Daimler Finance North America LLC
3.65%, 2/22/24(a) | | | | | | | 223 | | | | 232,620 | |
Ford Motor Credit Co. LLC
3.20%, 1/15/21 | | | | | | | 275 | | | | 275,439 | |
3.219%, 1/09/22 | | | | | | | 375 | | | | 374,569 | |
General Motors Co.
5.95%, 4/01/49 | | | | | | | 80 | | | | 85,638 | |
General Motors Financial Co., Inc.
2.20%, 4/01/24(a) | | | EUR | | | | 902 | | | | 1,038,791 | |
3.50%, 11/07/24 | | | U.S.$ | | | | 570 | | | | 576,279 | |
4.35%, 4/09/25 | | | | | | | 475 | | | | 495,076 | |
5.10%, 1/17/24 | | | | | | | 9,765 | | | | 10,499,631 | |
Volkswagen Bank GmbH
1.25%, 6/10/24(a) | | | EUR | | | | 15,200 | | | | 17,049,247 | |
Volkswagen Leasing GmbH
2.625%, 1/15/24(a) | | | | | | | 8,245 | | | | 9,773,490 | |
ZF North America Capital, Inc.
4.75%, 4/29/25(a) | | | U.S.$ | | | | 234 | | | | 243,749 | |
| | | | | | | | | | | | |
| | | | | | | | | | | 40,644,529 | |
| | | | | | | | | | | | |
Consumer Cyclical - Other – 0.2% | | | | | | | | | | | | |
James Hardie International Finance DAC
3.625%, 10/01/26(a) | | | EUR | | | | 4,800 | | | | 5,540,094 | |
Las Vegas Sands Corp.
3.20%, 8/08/24 | | | U.S.$ | | | | 301 | | | | 306,826 | |
3.50%, 8/18/26 | | | | | | | 6,755 | | | | 6,855,217 | |
Marriott International, Inc.
Series X
4.00%, 4/15/28 | | | | | | | 228 | | | | 245,305 | |
Marriott International, Inc./MD
Series AA
4.65%, 12/01/28 | | | | | | | 218 | | | | 245,987 | |
Owens Corning
7.00%, 12/01/36 | | | | | | | 50 | | | | 61,752 | |
| | | | | | | | | | | | |
| | | | | | | | | | | 13,255,181 | |
| | | | | | | | | | | | |
Consumer Cyclical - Restaurants – 0.1% | | | | | | | | | | | | |
Starbucks Corp.
4.50%, 11/15/48 | | | | | | | 6,573 | | | | 7,648,362 | |
| | | | | | | | | | | | |
| | |
| |
| 22 | AB GLOBAL BOND FUND | | abfunds.com |
PORTFOLIO OF INVESTMENTS(continued)
| | | | | | | | | | | | |
| | | | | | Principal
Amount
(000) | | | U.S. $ Value | |
| |
Consumer Cyclical - Retailers – 0.1% | | | | | | | | | | | | |
Lowe’s Cos., Inc.
3.70%, 4/15/46 | | | U.S.$ | | | | 115 | | | $ | 115,764 | |
4.55%, 4/05/49 | | | | | | | 6,351 | | | | 7,324,780 | |
Walgreens Boots Alliance, Inc.
3.80%, 11/18/24 | | | | | | | 430 | | | | 453,359 | |
| | | | | | | | | | | | |
| | | | | | | | | | | 7,893,903 | |
| | | | | | | | | | | | |
Consumer Non-Cyclical – 3.2% | | | | | | | | | | | | |
AbbVie, Inc.
3.20%, 5/14/26 | | | | | | | 235 | | | | 239,084 | |
3.60%, 5/14/25 | | | | | | | 538 | | | | 559,192 | |
4.45%, 5/14/46 | | | | | | | 115 | | | | 118,968 | |
4.70%, 5/14/45 | | | | | | | 100 | | | | 106,899 | |
4.875%, 11/14/48 | | | | | | | 183 | | | | 201,871 | |
Allergan Funding SCS
2.625%, 11/15/28 | | | EUR | | | | 2,286 | | | | 2,859,071 | |
Altria Group, Inc.
1.70%, 6/15/25 | | | | | | | 20,030 | | | | 22,760,746 | |
3.875%, 9/16/46 | | | U.S.$ | | | | 189 | | | | 173,416 | |
4.40%, 2/14/26 | | | | | | | 549 | | | | 586,893 | |
4.80%, 2/14/29 | | | | | | | 281 | | | | 307,100 | |
AmerisourceBergen Corp.
4.30%, 12/15/47 | | | | | | | 146 | | | | 148,693 | |
Amgen, Inc.
4.40%, 5/01/45 | | | | | | | 225 | | | | 253,108 | |
4.663%, 6/15/51 | | | | | | | 9,508 | | | | 11,074,186 | |
Anheuser-Busch Cos LLC/Anheuser-Busch InBev Worldwide, Inc.
4.90%, 2/01/46 | | | | | | | 620 | | | | 739,731 | |
Anheuser-Busch InBev Worldwide, Inc.
4.375%, 4/15/38 | | | | | | | 220 | | | | 247,388 | |
4.60%, 4/15/48 | | | | | | | 158 | | | | 181,790 | |
5.45%, 1/23/39 | | | | | | | 109 | | | | 138,096 | |
5.55%, 1/23/49 | | | | | | | 8,611 | | | | 11,260,174 | |
BAT Capital Corp.
3.215%, 9/06/26 | | | | | | | 20,520 | | | | 20,310,019 | |
3.222%, 8/15/24 | | | | | | | 285 | | | | 288,102 | |
4.54%, 8/15/47 | | | | | | | 70 | | | | 67,157 | |
Baxter International, Inc.
0.40%, 5/15/24 | | | EUR | | | | 14,098 | | | | 15,536,172 | |
1.30%, 5/30/25 | | | | | | | 6,918 | | | | 7,973,538 | |
Bayer US Finance II LLC
2.85%, 4/15/25(a) | | | U.S.$ | | | | 275 | | | | 264,830 | |
Biogen, Inc.
5.20%, 9/15/45 | | | | | | | 76 | | | | 89,927 | |
Bristol-Myers Squibb Co.
4.125%, 6/15/39(a) | | | | | | | 175 | | | | 198,592 | |
| | |
| |
| abfunds.com | | AB GLOBAL BOND FUND | 23 |
PORTFOLIO OF INVESTMENTS(continued)
| | | | | | | | | | |
| | | | | Principal
Amount
(000) | | | U.S. $ Value | |
| |
4.25%, 10/26/49(a) | | U.S.$ | | | 115 | | | $ | 133,498 | |
Bunge Ltd. Finance Corp.
3.25%, 8/15/26 | | | | | 248 | | | | 248,421 | |
Cardinal Health, Inc.
3.079%, 6/15/24 | | | | | 275 | | | | 278,345 | |
Celgene Corp.
3.625%, 5/15/24 | | | | | 220 | | | | 231,755 | |
3.875%, 8/15/25 | | | | | 275 | | | | 296,758 | |
4.55%, 2/20/48 | | | | | 273 | | | | 328,494 | |
Cigna Corp.
4.125%, 11/15/25 | | | | | 206 | | | | 221,526 | |
4.375%, 10/15/28 | | | | | 165 | | | | 180,790 | |
4.90%, 12/15/48 | | | | | 133 | | | | 152,652 | |
CVS Health Corp.
3.25%, 8/15/29 | | | | | 5,976 | | | | 6,004,404 | |
3.875%, 7/20/25 | | | | | 440 | | | | 465,565 | |
4.10%, 3/25/25 | | | | | 13,945 | | | | 14,895,170 | |
4.30%, 3/25/28 | | | | | 227 | | | | 245,329 | |
4.78%, 3/25/38 | | | | | 490 | | | | 539,803 | |
5.125%, 7/20/45 | | | | | 72 | | | | 81,686 | |
DH Europe Finance II SARL
0.45%, 3/18/28 | | EUR | | | 8,347 | | | | 9,124,296 | |
Express Scripts Holding Co.
3.40%, 3/01/27 | | U.S.$ | | | 130 | | | | 134,340 | |
4.80%, 7/15/46 | | | | | 193 | | | | 217,075 | |
Fresenius Medical Care US Finance, Inc.
5.75%, 2/15/21(a) | | | | | 200 | | | | 208,031 | |
Gilead Sciences, Inc.
4.15%, 3/01/47 | | | | | 110 | | | | 122,318 | |
4.50%, 2/01/45 | | | | | 220 | | | | 254,209 | |
4.60%, 9/01/35 | | | | | 210 | | | | 248,786 | |
4.80%, 4/01/44 | | | | | 128 | | | | 153,227 | |
Imperial Brands Finance PLC
3.50%, 7/26/26(a) | | | | | 240 | | | | 239,954 | |
Keurig Dr Pepper, Inc.
2.55%, 9/15/26 | | | | | 251 | | | | 247,832 | |
4.417%, 5/25/25 | | | | | 270 | | | | 293,886 | |
Kraft Heinz Foods Co.
3.00%, 6/01/26 | | | | | 240 | | | | 237,292 | |
3.75%, 4/01/30(a) | | | | | 12,594 | | | | 12,706,124 | |
3.95%, 7/15/25 | | | | | 3,062 | | | | 3,200,852 | |
4.00%, 6/15/23 | | | | | 435 | | | | 453,644 | |
4.375%, 6/01/46 | | | | | 155 | | | | 147,031 | |
Laboratory Corp. of America Holdings
3.60%, 2/01/25 | | | | | 100 | | | | 104,856 | |
| | |
| |
| 24 | AB GLOBAL BOND FUND | | abfunds.com |
PORTFOLIO OF INVESTMENTS(continued)
| | | | | | | | | | | | |
| | | | | | Principal
Amount
(000) | | | U.S. $ Value | |
| |
Leggett & Platt, Inc.
4.40%, 3/15/29 | | | U.S.$ | | | | 279 | | | $ | 300,262 | |
Medtronic Global Holdings SCA
0.25%, 7/02/25 | | | EUR | | | | 4,418 | | | | 4,857,394 | |
1.125%, 3/07/27 | | | | | | | 6,517 | | | | 7,551,921 | |
Series 0000
0.375%, 3/07/23 | | | | | | | 7,685 | | | | 8,484,110 | |
Medtronic, Inc.
4.375%, 3/15/35 | | | U.S.$ | | | | 108 | | | | 130,007 | |
Merck & Co., Inc.
4.00%, 3/07/49 | | | | | | | 170 | | | | 202,476 | |
Mylan NV
3.95%, 6/15/26 | | | | | | | 21,044 | | | | 21,734,601 | |
Mylan, Inc.
3.125%, 1/15/23(a) | | | | | | | 100 | | | | 101,009 | |
4.20%, 11/29/23 | | | | | | | 105 | | | | 110,017 | |
Pfizer, Inc.
4.10%, 9/15/38 | | | | | | | 165 | | | | 190,859 | |
7.20%, 3/15/39 | | | | | | | 80 | | | | 125,364 | |
Philip Morris International, Inc.
4.25%, 11/10/44 | | | | | | | 320 | | | | 349,397 | |
Reynolds American, Inc.
4.45%, 6/12/25 | | | | | | | 8,780 | | | | 9,357,724 | |
Smithfield Foods, Inc.
3.35%, 2/01/22(a) | | | | | | | 113 | | | | 113,289 | |
Takeda Pharmaceutical Co., Ltd.
4.40%, 11/26/23(a) | | | | | | | 16,397 | | | | 17,669,522 | |
Tyson Foods, Inc.
4.00%, 3/01/26 | | | | | | | 4,858 | | | | 5,259,417 | |
4.35%, 3/01/29 | | | | | | | 5,296 | | | | 5,986,927 | |
5.10%, 9/28/48 | | | | | | | 263 | | | | 319,300 | |
| | | | | | | | | | | | |
| | | | | | | | | | | 231,926,288 | |
| | | | | | | | | | | | |
Energy – 2.2% | | | | | | | | | | | | |
Apache Corp.
7.75%, 12/15/29 | | | | | | | 20 | | | | 25,083 | |
Baker Hughes a GE Co. LLC/Baker Hughes Co-Obligor, Inc.
4.08%, 12/15/47 | | | | | | | 11,335 | | | | 11,405,878 | |
Boardwalk Pipelines LP
4.80%, 5/03/29 | | | | | | | 177 | | | | 188,341 | |
4.95%, 12/15/24 | | | | | | | 100 | | | | 107,427 | |
5.95%, 6/01/26 | | | | | | | 200 | | | | 224,066 | |
Buckeye Partners LP
4.125%, 12/01/27 | | | | | | | 240 | | | | 209,685 | |
| | |
| |
| abfunds.com | | AB GLOBAL BOND FUND | 25 |
PORTFOLIO OF INVESTMENTS(continued)
| | | | | | | | | | |
| | | | | Principal
Amount
(000) | | | U.S. $ Value | |
| |
Canadian Natural Resources Ltd.
3.80%, 4/15/24 | | U.S.$ | | | 110 | | | $ | 115,599 | |
Cenovus Energy, Inc.
3.00%, 8/15/22 | | | | | 115 | | | | 115,862 | |
ConocoPhillips
6.50%, 2/01/39 | | | | | 125 | | | | 181,272 | |
Continental Resources, Inc./OK
3.80%, 6/01/24 | | | | | 110 | | | | 112,175 | |
4.50%, 4/15/23 | | | | | 388 | | | | 402,949 | |
Crescent Point Energy Corp.
5.13%, 4/14/21(e)(f) | | | | | 15,250 | | | | 15,685,287 | |
Ecopetrol SA
5.875%, 9/18/23 | | | | | 131 | | | | 145,869 | |
Enable Midstream Partners LP
4.40%, 3/15/27 | | | | | 79 | | | | 79,182 | |
Enbridge Energy Partners LP
5.875%, 10/15/25 | | | | | 160 | | | | 186,168 | |
Energy Transfer Operating LP
4.25%, 3/15/23 | | | | | 10,290 | | | | 10,756,857 | |
4.50%, 4/15/24 | | | | | 1,744 | | | | 1,859,983 | |
4.90%, 2/01/24 | | | | | 2,700 | | | | 2,902,254 | |
5.50%, 6/01/27 | | | | | 271 | | | | 306,512 | |
6.05%, 6/01/41 | | | | | 85 | | | | 97,609 | |
6.25%, 4/15/49 | | | | | 163 | | | | 198,064 | |
Energy Transfer Partners LP/Regency Energy Finance Corp.
4.50%, 11/01/23 | | | | | 155 | | | | 164,131 | |
Eni SpA
4.25%, 5/09/29(a) | | | | | 9,257 | | | | 10,132,962 | |
Series X-R
4.00%, 9/12/23(a) | | | | | 200 | | | | 211,738 | |
Enterprise Products Operating LLC
4.20%, 1/31/50 | | | | | 180 | | | | 193,289 | |
4.80%, 2/01/49 | | | | | 223 | | | | 258,893 | |
5.10%, 2/15/45 | | | | | 125 | | | | 147,526 | |
EQT Corp.
3.00%, 10/01/22 | | | | | 130 | | | | 125,077 | |
Exxon Mobil Corp.
4.114%, 3/01/46 | | | | | 135 | | | | 159,639 | |
Hess Corp.
4.30%, 4/01/27 | | | | | 5,605 | | | | 5,849,042 | |
7.125%, 3/15/33 | | | | | 60 | | | | 74,535 | |
Husky Energy, Inc.
4.00%, 4/15/24 | | | | | 115 | | | | 120,399 | |
4.40%, 4/15/29 | | | | | 171 | | | | 179,626 | |
| | |
| |
| 26 | AB GLOBAL BOND FUND | | abfunds.com |
PORTFOLIO OF INVESTMENTS(continued)
| | | | | | | | | | |
| | | | | Principal
Amount
(000) | | | U.S. $ Value | |
| |
Kinder Morgan Energy Partners LP
4.30%, 5/01/24 | | U.S.$ | | | 380 | | | $ | 406,108 | |
7.30%, 8/15/33 | | | | | 90 | | | | 120,910 | |
Marathon Oil Corp.
6.80%, 3/15/32 | | | | | 277 | | | | 345,766 | |
Marathon Petroleum Corp.
4.75%, 12/15/23 | | | | | 260 | | | | 282,451 | |
5.125%, 12/15/26 | | | | | 200 | | | | 224,640 | |
5.85%, 12/15/45 | | | | | 67 | | | | 75,526 | |
6.50%, 3/01/41 | | | | | 139 | | | | 173,154 | |
MPLX LP
4.875%, 12/01/24 | | | | | 100 | | | | 109,733 | |
Newfield Exploration Co.
5.375%, 1/01/26 | | | | | 65 | | | | 70,689 | |
5.625%, 7/01/24 | | | | | 365 | | | | 402,743 | |
Noble Energy, Inc.
3.25%, 10/15/29 | | | | | 250 | | | | 247,577 | |
3.90%, 11/15/24 | | | | | 15,277 | | | | 16,004,644 | |
Occidental Petroleum Corp.
2.90%, 8/15/24 | | | | | 9,110 | | | | 9,172,431 | |
3.20%, 8/15/26 | | | | | 1,409 | | | | 1,419,870 | |
4.30%, 8/15/39 | | | | | 185 | | | | 190,165 | |
4.50%, 7/15/44 | | | | | 123 | | | | 126,020 | |
6.20%, 3/15/40 | | | | | 115 | | | | 139,639 | |
6.95%, 7/01/24 | | | | | 90 | | | | 105,521 | |
Oleoducto Central SA
4.00%, 5/07/21(a) | | | | | 3,210 | | | | 3,273,197 | |
ONEOK Partners LP
4.90%, 3/15/25 | | | | | 145 | | | | 159,298 | |
ONEOK, Inc.
5.20%, 7/15/48 | | | | | 245 | | | | 271,872 | |
Peru LNG Srl
5.375%, 3/22/30(a) | | | | | 275 | | | | 285,055 | |
Plains All American Pipeline LP/PAA Finance Corp.
3.60%, 11/01/24 | | | | | 11,321 | | | | 11,604,659 | |
3.85%, 10/15/23 | | | | | 5,943 | | | | 6,145,359 | |
4.65%, 10/15/25 | | | | | 150 | | | | 160,375 | |
Sabine Pass Liquefaction LLC
5.75%, 5/15/24 | | | | | 14,000 | | | | 15,596,896 | |
Shell International Finance BV
4.375%, 5/11/45 | | | | | 210 | | | | 253,323 | |
Southern Star Central Corp.
5.125%, 7/15/22(a) | | | | | 5,000 | | | | 5,043,360 | |
| | |
| |
| abfunds.com | | AB GLOBAL BOND FUND | 27 |
PORTFOLIO OF INVESTMENTS(continued)
| | | | | | | | | | | | |
| | | | | | Principal
Amount
(000) | | | U.S. $ Value | |
| |
Spectra Energy Partners LP
3.50%, 3/15/25 | | | U.S.$ | | | | 85 | | | $ | 88,322 | |
Suncor Energy, Inc.
6.50%, 6/15/38 | | | | | | | 76 | | | | 104,897 | |
Sunoco Logistics Partners Operations LP
3.90%, 7/15/26 | | | | | | | 246 | | | | 255,819 | |
4.25%, 4/01/24 | | | | | | | 9,200 | | | | 9,693,341 | |
5.40%, 10/01/47 | | | | | | | 100 | | | | 109,210 | |
Tengizchevroil Finance Co. International Ltd.
4.00%, 8/15/26(a) | | | | | | | 6,019 | | | | 6,280,827 | |
TransCanada PipeLines Ltd.
6.20%, 10/15/37 | | | | | | | 95 | | | | 122,813 | |
Valero Energy Corp.
3.40%, 9/15/26 | | | | | | | 90 | | | | 92,439 | |
6.625%, 6/15/37 | | | | | | | 100 | | | | 129,206 | |
Western Midstream Operating LP
4.50%, 3/01/28 | | | | | | | 110 | | | | 106,391 | |
4.75%, 8/15/28 | | | | | | | 66 | | | | 64,893 | |
5.30%, 3/01/48 | | | | | | | 108 | | | | 93,550 | |
Williams Cos., Inc. (The)
3.90%, 1/15/25 | | | | | | | 4,098 | | | | 4,298,486 | |
4.50%, 11/15/23 | | | | | | | 4,465 | | | | 4,777,889 | |
| | | | | | | | | | | | |
| | | | | | | | | | | 161,552,043 | |
| | | | | | | | | | | | |
Other Industrial – 0.0% | | | | | | | | | | | | |
Alfa SAB de CV
5.25%, 3/25/24(a) | | | | | | | 200 | | | | 215,600 | |
| | | | | | | | | | | | |
| | | |
Services – 0.1% | | | | | | | | | | | | |
Amazon.com, Inc.
3.875%, 8/22/37 | | | | | | | 120 | | | | 137,879 | |
Global Payments, Inc.
3.20%, 8/15/29 | | | | | | | 306 | | | | 310,300 | |
IHS Markit Ltd.
3.625%, 5/01/24 | | | | | | | 4,749 | | | | 4,931,855 | |
4.00%, 3/01/26(a) | | | | | | | 98 | | | | 103,698 | |
4.125%, 8/01/23 | | | | | | | 255 | | | | 268,330 | |
4.75%, 2/15/25(a) | | | | | | | 109 | | | | 118,314 | |
Moody’s Corp.
5.25%, 7/15/44 | | | | | | | 101 | | | | 128,765 | |
Total System Services, Inc.
4.00%, 6/01/23 | | | | | | | 181 | | | | 189,869 | |
| | | | | | | | | | | | |
| | | | | | | | | | | 6,189,010 | |
| | | | | | | | | | | | |
Technology – 1.7% | | | | | | | | | | | | |
Analog Devices, Inc.
5.30%, 12/15/45 | | | | | | | 124 | | | | 154,872 | |
| | |
| |
| 28 | AB GLOBAL BOND FUND | | abfunds.com |
PORTFOLIO OF INVESTMENTS(continued)
| | | | | | | | | | |
| | | | | Principal
Amount
(000) | | | U.S. $ Value | |
| |
Apple, Inc.
3.45%, 2/09/45 | | U.S.$ | | | 450 | | | $ | 477,500 | |
4.375%, 5/13/45 | | | | | 145 | | | | 175,442 | |
4.65%, 2/23/46 | | | | | 125 | | | | 157,139 | |
Autodesk, Inc.
4.375%, 6/15/25 | | | | | 385 | | | | 416,369 | |
Baidu, Inc.
2.875%, 7/06/22 | | | | | 275 | | | | 276,654 | |
3.875%, 9/29/23 | | | | | 200 | | | | 208,462 | |
Broadcom Corp./Broadcom Cayman Finance Ltd.
3.625%, 1/15/24 | | | | | 2,525 | | | | 2,580,727 | |
3.875%, 1/15/27 | | | | | 6,978 | | | | 7,010,085 | |
Broadcom, Inc.
3.625%, 10/15/24(a) | | | | | 10,120 | | | | 10,300,106 | |
4.25%, 4/15/26(a) | | | | | 7,704 | | | | 7,958,178 | |
Cisco Systems, Inc.
5.50%, 1/15/40 | | | | | 90 | | | | 123,824 | |
5.90%, 2/15/39 | | | | | 75 | | | | 106,888 | |
Dell International LLC/EMC Corp.
4.90%, 10/01/26(a) | | | | | 279 | | | | 298,986 | |
6.02%, 6/15/26(a) | | | | | 1,996 | | | | 2,245,891 | |
Fidelity National Information Services, Inc.
1.50%, 5/21/27 | | EUR | | | 15,180 | | | | 17,725,561 | |
Fiserv, Inc.
1.125%, 7/01/27 | | | | | 4,662 | | | | 5,288,462 | |
4.40%, 7/01/49 | | U.S.$ | | | 117 | | | | 131,208 | |
International Business Machines Corp.
0.375%, 1/31/23 | | EUR | | | 12,988 | | | | 14,354,699 | |
0.875%, 1/31/25 | | | | | 8,805 | | | | 10,000,909 | |
4.00%, 6/20/42 | | U.S.$ | | | 229 | | | | 252,376 | |
4.15%, 5/15/39 | | | | | 116 | | | | 132,484 | |
4.25%, 5/15/49 | | | | | 173 | | | | 199,550 | |
Juniper Networks, Inc.
4.50%, 3/15/24 | | | | | 150 | | | | 160,995 | |
Lam Research Corp.
3.75%, 3/15/26 | | | | | 130 | | | | 138,879 | |
4.875%, 3/15/49 | | | | | 277 | | | | 338,746 | |
Micron Technology, Inc.
4.64%, 2/06/24 | | | | | 130 | | | | 138,172 | |
4.975%, 2/06/26 | | | | | 193 | | | | 207,853 | |
Microsoft Corp.
3.45%, 8/08/36 | | | | | 540 | | | | 595,154 | |
3.70%, 8/08/46 | | | | | 275 | | | | 314,854 | |
Series 30Y
4.25%, 2/06/47 | | | | | 130 | | | | 162,344 | |
| | |
| |
| abfunds.com | | AB GLOBAL BOND FUND | 29 |
PORTFOLIO OF INVESTMENTS(continued)
| | | | | | | | | | | | |
| | | | | | Principal
Amount
(000) | | | U.S. $ Value | |
| |
NXP BV/NXP Funding LLC/NXP USA, Inc.
3.875%, 6/18/26(a) | | | U.S.$ | | | | 7,413 | | | $ | 7,779,985 | |
Oracle Corp.
3.90%, 5/15/35 | | | | | | | 190 | | | | 211,306 | |
4.00%, 7/15/46-11/15/47 | | | | | | | 10,429 | | | | 11,673,675 | |
5.375%, 7/15/40 | | | | | | | 150 | | | | 194,950 | |
QUALCOMM, Inc.
4.30%, 5/20/47 | | | | | | | 115 | | | | 128,228 | |
4.80%, 5/20/45 | | | | | | | 107 | | | | 127,596 | |
Seagate HDD Cayman
4.75%, 6/01/23-1/01/25 | | | | | | | 2,435 | | | | 2,519,286 | |
4.875%, 3/01/24 | | | | | | | 3,953 | | | | 4,139,309 | |
Tencent Holdings Ltd.
3.975%, 4/11/29(a) | | | | | | | 285 | | | | 304,734 | |
Western Digital Corp.
4.75%, 2/15/26 | | | | | | | 10,309 | | | | 10,614,507 | |
| | | | | | | | | | | | |
| | | | | | | | | | | 120,326,945 | |
| | | | | | | | | | | | |
Transportation - Airlines – 0.0% | | | | | | | | | | | | |
Southwest Airlines Co. Pass-Through Trust
Series 07-1
6.15%, 8/01/22 | | | | | | | 3,360 | | | | 3,547,052 | |
| | | | | | | | | | | | |
| | | |
Transportation - Railroads – 0.0% | | | | | | | | | | | | |
CSX Corp.
3.35%, 9/15/49 | | | | | | | 185 | | | | 181,020 | |
Pacific National Finance Pty Ltd.
4.625%, 9/23/20(a) | | | | | | | 1,501 | | | | 1,529,716 | |
Union Pacific Corp.
3.55%, 8/15/39 | | | | | | | 206 | | | | 216,164 | |
| | | | | | | | | | | | |
| | | | | | | | | | | 1,926,900 | |
| | | | | | | | | | | | |
Transportation - Services – 0.3% | | | | | | | | | | | | |
Adani Ports & Special Economic Zone Ltd.
3.95%, 1/19/22(a) | | | | | | | 12,115 | | | | 12,387,588 | |
4.00%, 7/30/27(a) | | | | | | | 12,212 | | | | 12,479,137 | |
Aviation Capital Group LLC
3.875%, 5/01/23(a) | | | | | | | 270 | | | | 279,199 | |
FedEx Corp.
4.95%, 10/17/48 | | | | | | | 110 | | | | 122,171 | |
Penske Truck Leasing Co. Lp/PTL Finance Corp.
3.90%, 2/01/24(a) | | | | | | | 270 | | | | 284,378 | |
| | | | | | | | | | | | |
| | | | | | | | | | | 25,552,473 | |
| | | | | | | | | | | | |
| | | | | | | | | | | 870,523,974 | |
| | | | | | | | | | | | |
Financial Institutions – 11.2% | | | | | | | | | | | | |
Banking – 8.4% | | | | | | | | | | | | |
ABN AMRO Bank NV
4.75%, 7/28/25(a) | | | | | | | 220 | | | | 236,736 | |
| | |
| |
| 30 | AB GLOBAL BOND FUND | | abfunds.com |
PORTFOLIO OF INVESTMENTS(continued)
| | | | | | | | | | |
| | | | | Principal
Amount
(000) | | | U.S. $ Value | |
| |
AIB Group PLC
4.263%, 4/10/25(a) | | U.S.$ | | | 12,984 | | | $ | 13,485,299 | |
4.75%, 10/12/23(a) | | | | | 17,876 | | | | 18,890,749 | |
Ally Financial, Inc.
3.875%, 5/21/24 | | | | | 219 | | | | 226,684 | |
American Express Co.
Series C
4.90%, 3/15/20(g) | | | | | 114 | | | | 114,046 | |
Australia & New Zealand Banking Group Ltd.
4.40%, 5/19/26(a) | | | | | 434 | | | | 463,236 | |
4.50%, 3/19/24(a) | | | | | 554 | | | | 589,623 | |
Banco BBVA Peru SA
5.00%, 8/26/22(a) | | | | | 4,224 | | | | 4,491,303 | |
Banco Santander SA
3.306%, 6/27/29 | | | | | 200 | | | | 206,571 | |
5.179%, 11/19/25 | | | | | 800 | | | | 882,640 | |
Bank of America Corp.
2.375%, 6/19/24(a) | | EUR | | | 13,070 | | | | 15,772,651 | |
3.824%, 1/20/28 | | U.S.$ | | | 450 | | | | 482,820 | |
4.00%, 1/22/25 | | | | | 448 | | | | 475,853 | |
4.078%, 4/23/40 | | | | | 172 | | | | 191,871 | |
4.20%, 8/26/24 | | | | | 300 | | | | 321,842 | |
4.45%, 3/03/26 | | | | | 150 | | | | 163,360 | |
Series B
8.05%, 6/15/27 | | | | | 1,037 | | | | 1,358,520 | |
Series V
5.526% (LIBOR 3 Month + 3.39%), 10/28/19(g)(h) | | | | | 896 | | | | 897,120 | |
Series X
6.25%, 9/05/24(g) | | | | | 220 | | | | 239,808 | |
Series Z
6.50%, 10/23/24(g) | | | | | 7,074 | | | | 7,868,637 | |
Bank of Ireland Group PLC
4.50%, 11/25/23(a) | | | | | 24,080 | | | | 25,194,061 | |
Bank of New York Mellon Corp. (The) Series E
4.95%, 6/20/20(g) | | | | | 112 | | | | 113,300 | |
Bank One Michigan
8.25%, 11/01/24 | | | | | 210 | | | | 265,081 | |
Barclays Bank PLC
6.86%, 6/15/32(a)(g) | | | | | 37 | | | | 42,918 | |
Barclays PLC
2.375%, 10/06/23(a) | | GBP | | | 1,725 | | | | 2,138,805 | |
3.684%, 1/10/23 | | U.S.$ | | | 12,370 | | | | 12,572,633 | |
4.338%, 5/16/24 | | | | | 2,065 | | | | 2,157,120 | |
4.61%, 2/15/23 | | | | | 277 | | | | 287,349 | |
5.088%, 6/20/30 | | | | | 15,065 | | | | 15,697,986 | |
| | |
| |
| abfunds.com | | AB GLOBAL BOND FUND | 31 |
PORTFOLIO OF INVESTMENTS(continued)
| | | | | | | | | | |
| | | | | Principal
Amount
(000) | | | U.S. $ Value | |
| |
BBVA Bancomer SA
5.875%, 9/13/34(a) | | U.S.$ | | | 310 | | | $ | 308,063 | |
BBVA Global Finance Ltd.
7.00%, 12/01/25 | | | | | 110 | | | | 126,951 | |
BNP Paribas SA
4.375%, 9/28/25-5/12/26(a) | | | | | 41,269 | | | | 43,840,188 | |
BPCE SA
4.00%, 9/12/23(a) | | | | | 250 | | | | 263,709 | |
5.15%, 7/21/24(a) | | | | | 260 | | | | 283,253 | |
5.70%, 10/22/23(a) | | | | | 8,936 | | | | 9,855,425 | |
CaixaBank SA
1.125%, 5/17/24(a) | | EUR | | | 5,800 | | | | 6,583,795 | |
2.375%, 2/01/24(a) | | | | | 5,200 | | | | 6,110,090 | |
Capital One Bank USA, NA
3.375%, 2/15/23 | | U.S.$ | | | 615 | | | | 633,571 | |
Capital One Financial Corp.
0.80%, 6/12/24 | | EUR | | | 6,040 | | | | 6,709,934 | |
1.65%, 6/12/29 | | | | | 7,826 | | | | 8,908,584 | |
3.75%, 7/28/26 | | U.S.$ | | | 236 | | | | 245,144 | |
Citigroup, Inc.
3.20%, 10/21/26 | | | | | 115 | | | | 118,930 | |
3.40%, 5/01/26 | | | | | 227 | | | | 237,379 | |
3.52%, 10/27/28 | | | | | 175 | | | | 183,383 | |
3.875%, 3/26/25 | | | | | 373 | | | | 392,770 | |
4.40%, 6/10/25 | | | | | 598 | | | | 644,437 | |
4.45%, 9/29/27 | | | | | 275 | | | | 299,926 | |
Commonwealth Bank of Australia
4.50%, 12/09/25(a) | | | | | 754 | | | | 810,760 | |
Cooperatieve Rabobank UA
3.75%, 7/21/26 | | | | | 267 | | | | 277,179 | |
3.95%, 11/09/22 | | | | | 3,962 | | | | 4,124,660 | |
4.375%, 8/04/25 | | | | | 9,145 | | | | 9,857,889 | |
4.625%, 12/29/25(a)(g) | | EUR | | | 11,600 | | | | 13,731,045 | |
Credit Agricole SA
6.50%, 6/23/21(a)(g) | | | | | 5,550 | | | | 6,537,334 | |
8.125%, 12/23/25(a)(g) | | U.S.$ | | | 205 | | | | 240,875 | |
8.375%, 10/13/19(a)(g) | | | | | 175 | | | | 175,404 | |
Credit Agricole SA/London
2.375%, 7/01/21(a) | | | | | 4,033 | | | | 4,044,986 | |
3.25%, 10/04/24(a) | | | | | 1,713 | | | | 1,762,156 | |
3.375%, 1/10/22(a) | | | | | 1,401 | | | | 1,431,615 | |
4.125%, 1/10/27(a) | | | | | 4,715 | | | | 5,109,636 | |
Credit Suisse Group AG
2.125%, 9/12/25(a) | | GBP | | | 9,917 | | | | 12,365,259 | |
4.207%, 6/12/24(a) | | U.S.$ | | | 4,200 | | | | 4,421,920 | |
Credit Suisse Group Funding Guernsey Ltd.
3.80%, 6/09/23 | | | | | 1,559 | | | | 1,627,713 | |
4.55%, 4/17/26 | | | | | 15,415 | | | | 16,917,700 | |
| | |
| |
| 32 | AB GLOBAL BOND FUND | | abfunds.com |
PORTFOLIO OF INVESTMENTS(continued)
| | | | | | | | | | |
| | | | | Principal
Amount
(000) | | | U.S. $ Value | |
| |
Danske Bank A/S
3.244%, 12/20/25(a) | | U.S.$ | | | 8,550 | | | $ | 8,616,741 | |
3.875%, 9/12/23(a) | | | | | 325 | | | | 336,564 | |
5.375%, 1/12/24(a) | | | | | 8,672 | | | | 9,519,289 | |
Deutsche Bank AG/New York NY
3.375%, 5/12/21 | | | | | 165 | | | | 164,755 | |
Discover Bank
4.682%, 8/09/28 | | | | | 328 | | | | 342,836 | |
DNB Bank ASA
6.50%, 3/26/22(a)(g) | | | | | 200 | | | | 209,539 | |
Fifth Third Bancorp
3.50%, 3/15/22 | | | | | 15 | | | | 15,462 | |
Goldman Sachs Group, Inc. (The)
2.905%, 7/24/23 | | | | | 2,275 | | | | 2,307,448 | |
3.75%, 5/22/25-2/25/26 | | | | | 313 | | | | 331,142 | |
3.85%, 7/08/24 | | | | | 1,055 | | | | 1,117,703 | |
4.25%, 10/21/25 | | | | | 385 | | | | 412,517 | |
4.411%, 4/23/39 | | | | | 385 | | | | 433,247 | |
HSBC Holdings PLC
4.25%, 3/14/24 | | | | | 8,584 | | | | 9,022,153 | |
4.292%, 9/12/26 | | | | | 6,801 | | | | 7,287,666 | |
6.00%, 9/29/23(a)(g) | | EUR | | | 2,915 | | | | 3,614,019 | |
Series E
4.75%, 7/04/29(a)(g) | | | | | 8,048 | | | | 9,299,040 | |
ING Groep NV
4.05%, 4/09/29 | | U.S.$ | | | 285 | | | | 313,283 | |
6.50%, 4/16/25(g) | | | | | 226 | | | | 237,300 | |
6.875%, 4/16/22(a)(g) | | | | | 422 | | | | 443,655 | |
Intesa Sanpaolo SpA
3.125%, 7/14/22(a) | | | | | 16,385 | | | | 16,429,600 | |
3.375%, 1/12/23(a) | | | | | 13,790 | | | | 13,897,162 | |
5.017%, 6/26/24(a) | | | | | 6,713 | | | | 6,896,493 | |
JPMorgan Chase & Co.
3.22%, 3/01/25 | | | | | 270 | | | | 279,476 | |
3.509%, 1/23/29 | | | | | 115 | | | | 121,103 | |
3.882%, 7/24/38 | | | | | 115 | | | | 126,115 | |
3.96%, 1/29/27 | | | | | 383 | | | | 413,911 | |
3.964%, 11/15/48 | | | | | 117 | | | | 130,672 | |
4.452%, 12/05/29 | | | | | 535 | | | | 604,944 | |
Series FF
5.00%, 8/01/24(g) | | | | | 12,050 | | | | 12,377,555 | |
Series V
5.419% (LIBOR 3 Month + 3.32%),
1/01/20(g)(h) | | | | | 608 | | | | 611,353 | |
Series Z
5.30%, 5/01/20(g) | | | | | 37 | | | | 37,416 | |
Lloyds Banking Group PLC
4.05%, 8/16/23 | | | | | 2,917 | | | | 3,061,753 | |
4.375%, 3/22/28 | | | | | 3,169 | | | | 3,430,091 | |
| | |
| |
| abfunds.com | | AB GLOBAL BOND FUND | 33 |
PORTFOLIO OF INVESTMENTS(continued)
| | | | | | | | | | |
| | | | | Principal
Amount
(000) | | | U.S. $ Value | |
| |
4.45%, 5/08/25 | | U.S.$ | | | 5,546 | | | $ | 5,977,102 | |
4.50%, 11/04/24 | | | | | 12,869 | | | | 13,496,299 | |
4.582%, 12/10/25 | | | | | 6,060 | | | | 6,369,272 | |
6.657%, 5/21/37(a)(g) | | | | | 129 | | | | 138,240 | |
M&T Bank Corp.
Series G
5.00%, 8/01/24(g) | | | | | 176 | | | | 182,481 | |
Mastercard, Inc.
3.65%, 6/01/49 | | | | | 269 | | | | 304,894 | |
Mizuho Financial Group Cayman 3 Ltd.
4.60%, 3/27/24(a) | | | | | 222 | | | | 236,740 | |
Morgan Stanley
3.125%, 7/27/26 | | | | | 115 | | | | 118,528 | |
5.00%, 11/24/25 | | | | | 160 | | | | 179,505 | |
Series G
1.375%, 10/27/26 | | EUR | | | 17,531 | | | | 20,380,882 | |
1.75%, 3/11/24 | | | | | 13,530 | | | | 15,743,022 | |
4.35%, 9/08/26 | | U.S.$ | | | 700 | | | | 758,107 | |
4.431%, 1/23/30 | | | | | 275 | | | | 308,912 | |
Nationwide Building Society
4.00%, 9/14/26(a) | | | | | 7,555 | | | | 7,714,426 | |
4.363%, 8/01/24(a) | | | | | 282 | | | | 295,916 | |
Nordea Bank Abp
3.75%, 8/30/23(a) | | | | | 7,401 | | | | 7,742,231 | |
4.875%, 5/13/21(a) | | | | | 12,295 | | | | 12,717,001 | |
Royal Bank of Scotland Group PLC
5.125%, 5/28/24 | | | | | 215 | | | | 229,228 | |
Santander Holdings USA, Inc.
3.40%, 1/18/23 | | | | | 88 | | | | 89,944 | |
3.50%, 6/07/24 | | | | | 155 | | | | 158,989 | |
4.40%, 7/13/27 | | | | | 16,388 | | | | 17,565,609 | |
Santander UK Group Holdings PLC
4.75%, 9/15/25(a) | | | | | 5,781 | | | | 6,038,966 | |
4.796%, 11/15/24 | | | | | 8,882 | | | | 9,499,450 | |
Santander UK PLC
5.00%, 11/07/23(a) | | | | | 265 | | | | 281,640 | |
Skandinaviska Enskilda Banken AB
5.625%, 5/13/22(a)(g) | | | | | 3,200 | | | | 3,250,701 | |
Societe Generale SA
4.25%, 4/14/25-8/19/26(a) | | | | | 509 | | | | 531,726 | |
4.75%, 11/24/25(a) | | | | | 345 | | | | 369,708 | |
Standard Chartered PLC
2.744%, 9/10/22(a) | | | | | 8,945 | | | | 8,956,745 | |
3.785%, 5/21/25(a) | | | | | 15,730 | | | | 16,281,242 | |
3.95%, 1/11/23(a) | | | | | 1,179 | | | | 1,208,888 | |
5.20%, 1/26/24(a) | | | | | 3,435 | | | | 3,691,107 | |
SunTrust Banks, Inc.
5.625%, 12/15/19(g) | | | | | 2,167 | | | | 2,175,022 | |
| | |
| |
| 34 | AB GLOBAL BOND FUND | | abfunds.com |
PORTFOLIO OF INVESTMENTS(continued)
| | | | | | | | | | | | |
| | | | | | Principal
Amount
(000) | | | U.S. $ Value | |
| |
Svenska Handelsbanken AB
5.25%, 3/01/21(a)(g) | | | U.S.$ | | | | 225 | | | $ | 226,678 | |
UBS AG/Stamford CT
7.625%, 8/17/22 | | | | | | | 3,671 | | | | 4,134,280 | |
UBS Group Funding Switzerland AG
4.125%, 9/24/25(a) | | | | | | | 210 | | | | 226,510 | |
6.875%, 3/22/21(a)(g) | | | | | | | 12,055 | | | | 12,511,149 | |
7.125%, 2/19/20-8/10/21(a)(g) | | | | | | | 853 | | | | 886,797 | |
UniCredit SpA
3.75%, 4/12/22(a) | | | | | | | 11,665 | | | | 11,893,762 | |
US Bancorp
Series J
5.30%, 4/15/27(g) | | | | | | | 6,399 | | | | 6,836,301 | |
Wachovia Corp.
5.50%, 8/01/35 | | | | | | | 305 | | | | 380,842 | |
Wells Fargo & Co.
2.625%, 8/16/22(a) | | | EUR | | | | 383 | | | | 448,985 | |
3.00%, 10/23/26 | | | U.S.$ | | | | 849 | | | | 870,537 | |
4.15%, 1/24/29 | | | | | | | 272 | | | | 301,710 | |
Series G
4.30%, 7/22/27 | | | | | | | 165 | | | | 180,829 | |
Series K
5.889% (LIBOR 3 Month + 3.77%), 12/15/19(g)(h) | | | | | | | 116 | | | | 117,328 | |
Westpac Banking Corp.
4.421%, 7/24/39 | | | | | | | 240 | | | | 263,776 | |
Zions Bancorp NA
4.50%, 6/13/23 | | | | | | | 26 | | | | 27,400 | |
| | | | | | | | | | | | |
| | | | | | | | | | | 609,751,695 | |
| | | | | | | | | | | | |
Finance – 0.2% | | | | | | | | | | | | |
Air Lease Corp.
3.25%, 3/01/25 | | | | | | | 285 | | | | 289,886 | |
GE Capital International Funding Co. Unlimited Co.
3.373%, 11/15/25 | | | | | | | 846 | | | | 863,077 | |
4.418%, 11/15/35 | | | | | | | 420 | | | | 439,696 | |
Harborwalk Funding Trust
5.077%, 2/15/69(a) | | | | | | | 112 | | | | 135,101 | |
Synchrony Financial
3.95%, 12/01/27 | | | | | | | 1,839 | | | | 1,882,958 | |
4.25%, 8/15/24 | | | | | | | 74 | | | | 78,055 | |
4.375%, 3/19/24 | | | | | | | 45 | | | | 47,756 | |
4.50%, 7/23/25 | | | | | | | 12,780 | | | | 13,632,145 | |
| | | | | | | | | | | | |
| | | | | | | | | | | 17,368,674 | |
| | | | | | | | | | | | |
Insurance – 2.1% | | | | | | | | | | | | |
ACE Capital Trust II
9.70%, 4/01/30 | | | | | | | 150 | | | | 222,027 | |
| | |
| |
| abfunds.com | | AB GLOBAL BOND FUND | 35 |
PORTFOLIO OF INVESTMENTS(continued)
| | | | | | | | | | |
| | | | | Principal
Amount
(000) | | | U.S. $ Value | |
| |
Aegon NV
5.50%, 4/11/48 | | U.S.$ | | | 275 | | | $ | 293,393 | |
Allstate Corp. (The)
6.50%, 5/15/57 | | | | | 160 | | | | 194,078 | |
American International Group, Inc.
6.82%, 11/15/37 | | | | | 198 | | | | 260,562 | |
Anthem, Inc.
3.30%, 1/15/23 | | | | | 15 | | | | 15,484 | |
Aon Corp.
8.205%, 1/01/27 | | | | | 155 | | | | 197,818 | |
ASR Nederland NV
5.125%, 9/29/45(a) | | EUR | | | 15,640 | | | | 20,273,303 | |
Assicurazioni Generali SpA
Series E
5.50%, 10/27/47(a) | | | | | 7,099 | | | | 9,308,124 | |
Aviva PLC
3.375%, 12/04/45(a) | | | | | 5,953 | | | | 7,026,042 | |
Series E
6.125%, 7/05/43(a) | | | | | 7,208 | | | | 9,193,009 | |
Caisse Nationale de Reassurance Mutuelle Agricole Groupama
6.00%, 1/23/27 | | | | | 6,700 | | | | 9,308,970 | |
Chubb INA Holdings, Inc.
0.875%, 6/15/27 | | | | | 4,718 | | | | 5,309,810 | |
Cloverie PLC for Swiss Re Corporate Solutions Ltd.
4.50%, 9/11/44(a) | | U.S.$ | | | 200 | | | | 207,586 | |
CNP Assurances
4.25%, 6/05/45(a) | | EUR | | | 15,800 | | | | 19,786,619 | |
4.50%, 6/10/47(a) | | | | | 2,100 | | | | 2,720,869 | |
Credit Agricole Assurances SA
4.75%, 9/27/48(a) | | | | | 15,700 | | | | 20,522,576 | |
Guardian Life Insurance Co. of America (The)
4.85%, 1/24/77(a) | | U.S.$ | | | 149 | | | | 189,872 | |
Hartford Financial Services Group, Inc. (The)
Series ICON
4.283% (LIBOR 3 Month + 2.13%), 2/12/47(a)(h) | | | | | 280 | | | | 238,082 | |
Lincoln National Corp.
7.00%, 6/15/40 | | | | | 90 | | | | 127,998 | |
Massachusetts Mutual Life Insurance Co.
8.875%, 6/01/39(a) | | | | | 2 | | | | 3,392 | |
MetLife Capital Trust IV
7.875%, 12/15/37(a) | | | | | 207 | | | | 272,179 | |
| | |
| |
| 36 | AB GLOBAL BOND FUND | | abfunds.com |
PORTFOLIO OF INVESTMENTS(continued)
| | | | | | | | | | | | |
| | | | | | Principal
Amount
(000) | | | U.S. $ Value | |
| |
MetLife, Inc.
Series C
5.25%, 6/15/20(g) | | | U.S.$ | | | | 260 | | | $ | 262,833 | |
Muenchener Rueckversicherungs-Gesellschaft AG in Muenchen
3.25%, 5/26/49(a) | | | EUR | | | | 16,300 | | | | 21,114,737 | |
Nationwide Mutual Insurance Co.
9.375%, 8/15/39(a) | | | U.S.$ | | | | 4,415 | | | | 7,533,964 | |
New York Life Insurance Co.
4.45%, 5/15/69(a) | | | | | | | 160 | | | | 186,528 | |
Northwestern Mutual Life Insurance Co. (The)
3.625%, 9/30/59(a) | | | | | | | 220 | | | | 223,415 | |
Peachtree Corners Funding Trust
3.976%, 2/15/25(a) | | | | | | | 250 | | | | 262,798 | |
Principal Financial Group, Inc.
4.70%, 5/15/55 | | | | | | | 290 | | | | 288,875 | |
Prudential Financial, Inc.
5.20%, 3/15/44 | | | | | | | 240 | | | | 250,416 | |
5.625%, 6/15/43 | | | | | | | 282 | | | | 303,016 | |
5.875%, 9/15/42 | | | | | | | 230 | | | | 247,322 | |
QBE Insurance Group Ltd.
6.75%, 12/02/44(a) | | | | | | | 305 | | | | 336,947 | |
Swiss Re Finance Luxembourg SA
5.00%, 4/02/49(a) | | | | | | | 286 | | | | 316,120 | |
UnitedHealth Group, Inc.
3.50%, 8/15/39 | | | | | | | 240 | | | | 250,586 | |
Voya Financial, Inc.
4.70%, 1/23/48 | | | | | | | 225 | | | | 210,675 | |
5.65%, 5/15/53 | | | | | | | 10,120 | | | | 10,648,557 | |
| | | | | | | | | | | | |
| | | | | | | | | | | 148,108,582 | |
| | | | | | | | | | | | |
REITS – 0.5% | | | | | | | | | | | | |
Alexandria Real Estate Equities, Inc.
3.375%, 8/15/31 | | | | | | | 300 | | | | 313,604 | |
3.45%, 4/30/25 | | | | | | | 112 | | | | 117,099 | |
4.85%, 4/15/49 | | | | | | | 110 | | | | 135,812 | |
American Homes 4 Rent LP
4.25%, 2/15/28 | | | | | | | 280 | | | | 301,609 | |
American Tower Corp.
3.125%, 1/15/27 | | | | | | | 296 | | | | 302,219 | |
3.80%, 8/15/29 | | | | | | | 353 | | | | 376,603 | |
Boston Properties LP
2.75%, 10/01/26 | | | | | | | 120 | | | | 121,431 | |
Brixmor Operating Partnership LP
3.85%, 2/01/25 | | | | | | | 224 | | | | 234,231 | |
EPR Properties
4.75%, 12/15/26 | | | | | | | 182 | | | | 195,523 | |
4.95%, 4/15/28 | | | | | | | 220 | | | | 239,340 | |
| | |
| |
| abfunds.com | | AB GLOBAL BOND FUND | 37 |
PORTFOLIO OF INVESTMENTS(continued)
| | | | | | | | | | |
| | | | | Principal
Amount
(000) | | | U.S. $ Value | |
| |
Equinix, Inc.
2.875%, 3/15/24-2/01/26 | | EUR | | | 6,785 | | | $ | 7,694,971 | |
GLP Capital LP/GLP Financing II, Inc.
3.35%, 9/01/24 | | U.S.$ | | | 188 | | | | 189,498 | |
HCP, Inc.
3.25%, 7/15/26 | | | | | 59 | | | | 60,658 | |
Hospitality Properties Trust
4.65%, 3/15/24 | | | | | 225 | | | | 231,512 | |
Host Hotels & Resorts LP
3.875%, 4/01/24 | | | | | 218 | | | | 227,911 | |
Kilroy Realty LP
3.45%, 12/15/24 | | | | | 50 | | | | 51,978 | |
Kimco Realty Corp.
2.80%, 10/01/26 | | | | | 122 | | | | 122,539 | |
3.70%, 10/01/49 | | | | | 125 | | | | 121,923 | |
LifeStorage LP/CA
3.50%, 7/01/26 | | | | | 295 | | | | 303,254 | |
Mid-America Apartments LP
3.75%, 6/15/24 | | | | | 100 | | | | 104,913 | |
National Retail Properties, Inc.
3.90%, 6/15/24 | | | | | 216 | | | | 228,264 | |
Omega Healthcare Investors, Inc.
4.375%, 8/01/23 | | | | | 215 | | | | 226,696 | |
4.50%, 1/15/25 | | | | | 97 | | | | 102,047 | |
5.25%, 1/15/26 | | | | | 291 | | | | 319,029 | |
Realty Income Corp.
3.25%, 6/15/29 | | | | | 168 | | | | 175,705 | |
Regency Centers LP
3.60%, 2/01/27 | | | | | 230 | | | | 241,468 | |
3.75%, 6/15/24 | | | | | 41 | | | | 42,998 | |
Sabra Health Care LP/Sabra Capital Corp.
4.80%, 6/01/24 | | | | | 312 | | | | 329,348 | |
Senior Housing Properties Trust
6.75%, 12/15/21 | | | | | 165 | | | | 176,014 | |
Service Properties Trust
4.35%, 10/01/24 | | | | | 185 | | | | 187,298 | |
4.75%, 10/01/26 | | | | | 185 | | | | 186,169 | |
SITE Centers Corp.
3.625%, 2/01/25 | | | | | 170 | | | | 174,785 | |
4.70%, 6/01/27 | | | | | 280 | | | | 306,585 | |
Spirit Realty LP
3.20%, 1/15/27 | | | | | 125 | | | | 124,076 | |
4.00%, 7/15/29 | | | | | 76 | | | | 79,409 | |
4.45%, 9/15/26 | | | | | 2,017 | | | | 2,149,164 | |
STORE Capital Corp.
4.625%, 3/15/29 | | | | | 103 | | | | 112,778 | |
Ventas Realty LP
4.125%, 1/15/26 | | | | | 220 | | | | 237,987 | |
| | |
| |
| 38 | AB GLOBAL BOND FUND | | abfunds.com |
PORTFOLIO OF INVESTMENTS(continued)
| | | | | | | | | | | | |
| | | | | | Principal
Amount
(000) | | | U.S. $ Value | |
| |
VEREIT Operating Partnership LP
4.60%, 2/06/24 | | | U.S.$ | | | | 3,710 | | | $ | 3,985,301 | |
Vornado Realty LP
3.50%, 1/15/25 | | | | | | | 560 | | | | 576,957 | |
Welltower, Inc.
4.00%, 6/01/25 | | | | | | | 379 | | | | 404,997 | |
4.95%, 9/01/48 | | | | | | | 220 | | | | 264,731 | |
WP Carey, Inc.
3.85%, 7/15/29 | | | | | | | 353 | | | | 373,578 | |
4.60%, 4/01/24 | | | | | | | 58 | | | | 62,030 | |
WPC Eurobond BV
2.125%, 4/15/27 | | | EUR | | | | 8,082 | | | | 9,382,722 | |
| | | | | | | | | | | | |
| | | | | | | | | | | 31,896,764 | |
| | | | | | | | | | | | |
| | | | | | | | | | | 807,125,715 | |
| | | | | | | | | | | | |
| Utility – 0.5% | | | | | | | | | | | | |
Electric – 0.4% | | | | | | | | | | | | |
Abu Dhabi National Energy Co. PJSC
4.375%, 4/23/25(a) | | | U.S.$ | | | | 275 | | | | 295,281 | |
Adani Transmission Ltd.
4.00%, 8/03/26(a) | | | | | | | 7,886 | | | | 8,060,971 | |
Berkshire Hathaway Energy Co.
3.80%, 7/15/48 | | | | | | | 120 | | | | 129,513 | |
4.50%, 2/01/45 | | | | | | | 150 | | | | 177,688 | |
Consumers Energy Co.
3.10%, 8/15/50 | | | | | | | 185 | | | | 184,975 | |
Duke Energy Corp.
4.875%, 9/16/24(g) | | | | | | | 103 | | | | 105,563 | |
Duke Energy Florida LLC
6.40%, 6/15/38 | | | | | | | 150 | | | | 219,138 | |
Duke Energy Indiana LLC
Series YYY
3.25%, 10/01/49 | | | | | | | 160 | | | | 160,045 | |
Duke Energy Progress LLC
4.20%, 8/15/45 | | | | | | | 122 | | | | 140,730 | |
Empresas Publicas de Medellin ESP
4.25%, 7/18/29(a) | | | | | | | 200 | | | | 209,400 | |
Enel Americas SA
4.00%, 10/25/26 | | | | | | | 91 | | | | 94,868 | |
Enel Chile SA
4.875%, 6/12/28 | | | | | | | 75 | | | | 83,648 | |
Enel Finance International NV
3.625%, 5/25/27(a) | | | | | | | 225 | | | | 233,475 | |
4.25%, 9/14/23(a) | | | | | | | 14,191 | | | | 15,065,606 | |
Enel Generacion Chile SA
4.25%, 4/15/24 | | | | | | | 100 | | | | 105,469 | |
| | |
| |
| abfunds.com | | AB GLOBAL BOND FUND | 39 |
PORTFOLIO OF INVESTMENTS(continued)
| | | | | | | | | | | | |
| | | | | | Principal
Amount
(000) | | | U.S. $ Value | |
| |
Entergy Texas, Inc.
3.55%, 9/30/49 | | | U.S.$ | | | | 220 | | | $ | 227,991 | |
Exelon Corp.
5.625%, 6/15/35 | | | | | | | 55 | | | | 68,915 | |
Jersey Central Power & Light Co.
4.30%, 1/15/26(a) | | | | | | | 221 | | | | 241,400 | |
Kallpa Generacion SA
4.125%, 8/16/27(a) | | | | | | | 200 | | | | 207,437 | |
MidAmerican Energy Co.
4.25%, 7/15/49 | | | | | | | 324 | | | | 389,511 | |
National Rural Utilities Cooperative Finance Corp.
4.30%, 3/15/49 | | | | | | | 179 | | | | 214,466 | |
NRG Energy, Inc.
3.75%, 6/15/24(a) | | | | | | | 94 | | | | 96,721 | |
Oncor Electric Delivery Co. LLC
7.00%, 5/01/32 | | | | | | | 175 | | | | 251,643 | |
Public Service Co. of New Hampshire
3.60%, 7/01/49 | | | | | | | 238 | | | | 256,381 | |
Sempra Energy
4.00%, 2/01/48 | | | | | | | 127 | | | | 134,355 | |
Southern Co. (The)
3.25%, 7/01/26 | | | | | | | 115 | | | | 118,529 | |
Southern Power Co.
Series F
4.95%, 12/15/46 | | | | | | | 345 | | | | 385,316 | |
Wisconsin Electric Power Co.
4.25%, 12/15/19 | | | | | | | 35 | | | | 35,139 | |
| | | | | | | | | | | | |
| | | | | | | | | | | 27,894,174 | |
| | | | | | | | | | | | |
Natural Gas – 0.1% | | | | | | | | | | | | |
Brooklyn Union Gas Co. (The)
4.487%, 3/04/49(a) | | | | | | | 112 | | | | 135,305 | |
CenterPoint Energy Resources Corp.
4.10%, 9/01/47 | | | | | | | 107 | | | | 116,197 | |
NiSource, Inc.
3.95%, 3/30/48 | | | | | | | 110 | | | | 116,314 | |
Talent Yield Investments Ltd.
4.50%, 4/25/22(a) | | | | | | | 6,500 | | | | 6,757,969 | |
| | | | | | | | | | | | |
| | | | | | | | | | | 7,125,785 | |
| | | | | | | | | | | | |
Other Utility – 0.0% | | | | | | | | | | | | |
Veolia Environnement SA
0.314%, 10/04/23(a) | | | EUR | | | | 3,000 | | | | 3,317,004 | |
| | | | | | | | | | | | |
| | | | | | | | | | | 38,336,963 | |
| | | | | | | | | | | | |
Total Corporates – Investment Grade
(cost $1,664,852,245) | | | | | | | | | | | 1,715,986,652 | |
| | | | | | | | | | | | |
| | |
| |
| 40 | AB GLOBAL BOND FUND | | abfunds.com |
PORTFOLIO OF INVESTMENTS(continued)
| | | | | | | | | | | | |
| | | | | | Principal
Amount
(000) | | | U.S. $ Value | |
| |
INFLATION-LINKED SECURITIES – 7.2% | | | | | | | | | | | | |
Japan – 4.8% | | | | | | | | | | | | |
Japanese Government CPI Linked Bond
Series 21
0.10%, 3/10/26 | | | JPY | | | | 6,591,520 | | | $ | 63,167,458 | |
Series 22
0.10%, 3/10/27 | | | | | | | 9,407,528 | | | | 90,616,263 | |
Series 23
0.10%, 3/10/28 | | | | | | | 20,468,540 | | | | 197,495,050 | |
| | | | | | | | | | | | |
| | | | | | | | | | | 351,278,771 | |
| | | | | | | | | | | | |
United States – 2.4% | | | | | | | | | | | | |
U.S. Treasury Inflation Index
0.125%, 7/15/24-7/15/26 (TIPS) | | | U.S.$ | | | | 157,095 | | | | 156,951,054 | |
2.375%, 1/15/25 (TIPS) | | | | | | | 13,278 | | | | 14,777,715 | |
| | | | | | | | | | | | |
| | | | | | | | | | | 171,728,769 | |
| | | | | | | | | | | | |
Total Inflation-Linked Securities
(cost $513,202,368) | | | | | | | | | | | 523,007,540 | |
| | | | | | | | | | | | |
| | | | | | | | | | | | |
MORTGAGE PASS-THROUGHS – 6.5% | | | | | | | | | | | | |
Agency Fixed Rate 30-Year – 6.3% | | | | | | | | | | | | |
Federal Home Loan Mortgage Corp. Gold
Series 2018
4.00%, 12/01/48 | | | | | | | 30,310 | | | | 31,984,372 | |
Series 2019
4.50%, 2/01/49 | | | | | | | 24,160 | | | | 25,998,902 | |
Federal National Mortgage Association
Series 2005
5.50%, 2/01/35 | | | | | | | 15 | | | | 16,359 | |
Series 2007
5.50%, 9/01/36-8/01/37 | | | | | | | 20 | | | | 22,072 | |
Series 2008
5.50%, 3/01/37-5/01/38 | | | | | | | 1,947 | | | | 2,180,999 | |
Series 2017
3.50%, 6/01/47-1/01/48 | | | | | | | 9,855 | | | | 10,186,859 | |
Series 2018
3.50%, 1/01/48-5/01/48 | | | | | | | 95,114 | | | | 98,739,216 | |
4.00%, 8/01/48-9/01/48 | | | | | | | 83,495 | | | | 88,058,467 | |
4.50%, 9/01/48-12/01/48 | | | | | | | 65,619 | | | | 70,389,101 | |
Series 2019
3.50%, 10/01/49, TBA | | | | | | | 128,474 | | | | 131,786,214 | |
| | | | | | | | | | | | |
| | | | | | | | | | | 459,362,561 | |
| | | | | | | | | | | | |
| | |
| |
| abfunds.com | | AB GLOBAL BOND FUND | 41 |
PORTFOLIO OF INVESTMENTS(continued)
| | | | | | | | | | | | |
| | | | | | Principal
Amount
(000) | | | U.S. $ Value | |
| |
Other Agency Fixed Rate
Programs – 0.2% | | | | | | | | | | | | |
Canadian Mortgage Pools
6.125%, 12/15/24 | | | CAD | | | | 12,907 | | | $ | 11,289,228 | |
| | | | | | | | | | | | |
| | | |
Total Mortgage Pass-Throughs
(cost $458,017,041) | | | | | | | | | | | 470,651,789 | |
| | | | | | | | | | | | |
| | | | | | | | | | | | |
COLLATERALIZED MORTGAGE OBLIGATIONS – 4.7% | | | | | | | | | | | | |
Risk Share Floating Rate – 4.6% | | | | | | | | | | | | |
Bellemeade Re Ltd.
Series 2018-2A, Class M1B
3.368% (LIBOR 1 Month + 1.35%),
8/25/28(a)(h) | | | U.S.$ | | | | 5,745 | | | | 5,757,689 | |
Series 2019-1A, Class M1B
3.768% (LIBOR 1 Month + 1.75%),
3/25/29(a)(h) | | | | | | | 12,871 | | | | 12,897,161 | |
Series 2019-2A, Class M1C
4.018% (LIBOR 1 Month + 2.00%),
4/25/29(a)(h) | | | | | | | 8,716 | | | | 8,699,443 | |
Series 2019-3A, Class M1B
3.618% (LIBOR 1 Month + 1.60%),
7/25/29(a)(h) | | | | | | | 8,919 | | | | 8,926,873 | |
Series 2019-3A, Class M1C
3.968% (LIBOR 1 Month + 1.95%),
7/25/29(a)(h) | | | | | | | 10,500 | | | | 10,509,470 | |
Connecticut Avenue Securities Trust
Series 2019-R02, Class 1M2
4.318% (LIBOR 1 Month + 2.30%),
8/25/31(a)(h) | | | | | | | 6,616 | | | | 6,658,543 | |
Series 2019-R03, Class 1M2
4.168% (LIBOR 1 Month + 2.15%),
9/25/31(a)(h) | | | | | | | 4,304 | | | | 4,324,439 | |
Series 2019-R05, Class 1M2
4.018% (LIBOR 1 Month + 2.00%),
7/25/39(a)(h) | | | | | | | 6,370 | | | | 6,386,137 | |
Eagle RE Ltd.
Series 2018-1, Class M1
3.718% (LIBOR 1 Month + 1.70%),
11/25/28(a)(h) | | | | | | | 12,589 | | | | 12,619,780 | |
Federal Home Loan Mortgage Corp. Structured Agency Credit Risk Debt Notes
Series 2013-DN1, Class M2
9.168% (LIBOR 1 Month + 7.15%),
7/25/23(h) | | | | | | | 4,704 | | | | 5,310,678 | |
| | |
| |
| 42 | AB GLOBAL BOND FUND | | abfunds.com |
PORTFOLIO OF INVESTMENTS(continued)
| | | | | | | | | | |
| | | | | Principal
Amount
(000) | | | U.S. $ Value | |
| |
Series 2013-DN2, Class M2
6.268% (LIBOR 1 Month + 4.25%),
11/25/23(h) | | U.S.$ | | | 4,845 | | | $ | 5,214,352 | |
Series 2014-DN1, Class M2
4.218% (LIBOR 1 Month + 2.20%),
2/25/24(h) | | | | | 3,403 | | | | 3,443,066 | |
Series 2014-DN1, Class M3
6.518% (LIBOR 1 Month + 4.50%),
2/25/24(h) | | | | | 4,290 | | | | 4,664,839 | |
Series 2014-DN3, Class M3
6.018% (LIBOR 1 Month + 4.00%),
8/25/24(h) | | | | | 9,902 | | | | 10,463,127 | |
Series 2014-HQ2, Class M3
5.768% (LIBOR 1 Month + 3.75%),
9/25/24(h) | | | | | 1,595 | | | | 1,726,973 | |
Series 2014-HQ3, Class M3
6.768% (LIBOR 1 Month + 4.75%),
10/25/24(h) | | | | | 4,867 | | | | 5,167,033 | |
Series 2015-DNA2, Class M2
4.618% (LIBOR 1 Month + 2.60%),
12/25/27(h) | | | | | 1,696 | | | | 1,704,137 | |
Series 2015-DNA3, Class M3
6.718% (LIBOR 1 Month + 4.70%),
4/25/28(h) | | | | | 2,209 | | | | 2,437,134 | |
Series 2015-HQA1, Class M2
4.668% (LIBOR 1 Month + 2.65%),
3/25/28(h) | | | | | 1,533 | | | | 1,539,120 | |
Series 2015-HQA1, Class M3
6.718% (LIBOR 1 Month + 4.70%),
3/25/28(h) | | | | | 2,080 | | | | 2,220,696 | |
Series 2015-HQA2, Class M2
4.818% (LIBOR 1 Month + 2.80%),
5/25/28(h) | | | | | 2,674 | | | | 2,691,348 | |
Series 2015-HQA2, Class M3
6.818% (LIBOR 1 Month + 4.80%),
5/25/28(h) | | | | | 9,364 | | | | 10,091,049 | |
Series 2016-DNA1, Class M2
5.045% (LIBOR 1 Month + 2.90%),
7/25/28(h) | | | | | 1,179 | | | | 1,186,518 | |
Series 2016-DNA2, Class M3
6.668% (LIBOR 1 Month + 4.65%),
10/25/28(h) | | | | | 2,907 | | | | 3,114,856 | |
Series 2016-DNA3, Class M2
4.018% (LIBOR 1 Month + 2.00%),
12/25/28(h) | | | | | 782 | | | | 783,691 | |
Series 2016-DNA4, Class M2
3.318% (LIBOR 1 Month + 1.30%),
3/25/29(h) | | | | | 1,328 | | | | 1,331,953 | |
| | |
| |
| abfunds.com | | AB GLOBAL BOND FUND | 43 |
PORTFOLIO OF INVESTMENTS(continued)
| | | | | | | | | | |
| | | | | Principal
Amount
(000) | | | U.S. $ Value | |
| |
Series 2016-HQA1, Class M3
8.368% (LIBOR 1 Month + 6.35%),
9/25/28(h) | | U.S.$ | | | 4,984 | | | $ | 5,540,930 | |
Series 2017-DNA2, Class M2
5.468% (LIBOR 1 Month + 3.45%),
10/25/29(h) | | | | | 7,204 | | | | 7,605,832 | |
Series 2017-HQA3, Class M2
4.368% (LIBOR 1 Month + 2.35%),
4/25/30(h) | | | | | 4,105 | | | | 4,152,726 | |
Federal National Mortgage Association Connecticut Avenue Securities
Series 2013-C01, Class M2
7.268% (LIBOR 1 Month + 5.25%),
10/25/23(h) | | | | | 1,342 | | | | 1,484,263 | |
Series 2014-C01, Class M2
6.418% (LIBOR 1 Month + 4.40%),
1/25/24(h) | | | | | 2,544 | | | | 2,763,622 | |
Series 2014-C04, Class 1M2
6.918% (LIBOR 1 Month + 4.90%),
11/25/24(h) | | | | | 8,761 | | | | 9,562,582 | |
Series 2014-C04, Class 2M2
7.018% (LIBOR 1 Month + 5.00%),
11/25/24(h) | | | | | 9,771 | | | | 10,445,986 | |
Series 2015-C01, Class 1M2
6.318% (LIBOR 1 Month + 4.30%),
2/25/25(h) | | | | | 9,268 | | | | 9,816,365 | |
Series 2015-C02, Class 1M2
6.018% (LIBOR 1 Month + 4.00%),
5/25/25(h) | | | | | 4,036 | | | | 4,261,995 | |
Series 2015-C02, Class 2M2
6.018% (LIBOR 1 Month + 4.00%),
5/25/25(h) | | | | | 9,045 | | | | 9,358,792 | |
Series 2015-C03, Class 1M2
7.018% (LIBOR 1 Month + 5.00%),
7/25/25(h) | | | | | 1,585 | | | | 1,712,512 | |
Series 2015-C03, Class 2M2
7.018% (LIBOR 1 Month + 5.00%),
7/25/25(h) | | | | | 11,117 | | | | 11,768,929 | |
Series 2015-C04, Class 1M2
7.718% (LIBOR 1 Month + 5.70%),
4/25/28(h) | | | | | 2,264 | | | | 2,485,845 | |
Series 2015-C04, Class 2M2
7.568% (LIBOR 1 Month + 5.55%),
4/25/28(h) | | | | | 12,923 | | | | 13,801,962 | |
Series 2016-C01, Class 1M2
8.768% (LIBOR 1 Month + 6.75%),
8/25/28(h) | | | | | 6,940 | | | | 7,617,898 | |
| | |
| |
| 44 | AB GLOBAL BOND FUND | | abfunds.com |
PORTFOLIO OF INVESTMENTS(continued)
| | | | | | | | | | | | |
| | | | | | Principal
Amount
(000) | | | U.S. $ Value | |
| |
Series 2016-C01, Class 2M2
8.968% (LIBOR 1 Month + 6.95%),
8/25/28(h) | | | U.S.$ | | | | 2,630 | | | $ | 2,845,951 | |
Series 2016-C02, Class 1M2
8.018% (LIBOR 1 Month + 6.00%),
9/25/28(h) | | | | | | | 9,399 | | | | 10,247,077 | |
Series 2016-C03, Class 1M1
4.018% (LIBOR 1 Month + 2.00%),
10/25/28(h) | | | | | | | 651 | | | | 652,961 | |
Series 2016-C04, Class 1M2
6.268% (LIBOR 1 Month + 4.25%),
1/25/29(h) | | | | | | | 5,061 | | | | 5,345,560 | |
Series 2016-C05, Class 2M2
6.468% (LIBOR 1 Month + 4.45%),
1/25/29(h) | | | | | | | 13,204 | | | | 13,901,852 | |
Series 2016-C07, Class 2M2
6.368% (LIBOR 1 Month + 4.35%),
5/25/29(h) | | | | | | | 4,325 | | | | 4,558,622 | |
JP Morgan Madison Avenue Securities Trust
Series 2015-CH1, Class M2
7.518% (LIBOR 1 Month + 5.50%),
10/25/25(h)(i) | | | | | | | 5,387 | | | | 6,056,553 | |
PMT Credit Risk Transfer Trust
Series 2019-1R, Class A
4.14% (LIBOR 1 Month + 2.00%),
3/27/24(h)(i) | | | | | | | 10,196 | | | | 10,169,222 | |
Series 2019-2R, Class A
4.89% (LIBOR 1 Month + 2.75%),
5/27/23(h)(i) | | | | | | | 11,161 | | | | 11,183,255 | |
Radnor Re Ltd.
Series 2019-1, Class M1B
3.968% (LIBOR 1 Month + 1.95%),
2/25/29(a)(h) | | | | | | | 7,240 | | | | 7,271,096 | |
Series 2019-2, Class M1B
3.768% (LIBOR 1 Month + 1.75%),
6/25/29(a)(h) | | | | | | | 15,427 | | | | 15,427,166 | |
STACR Trust
Series 2019-DNA3, Class M2
4.068% (LIBOR 1 Month + 2.05%),
7/25/49(a)(h) | | | | | | | 1,837 | | | | 1,836,847 | |
| | | | | | | | | | | | |
| | | | | | | | | | | 331,746,506 | |
| | | | | | | | | | | | |
Non-Agency Fixed Rate – 0.1% | | | | | | | | | | | | |
Alternative Loan Trust
Series 2006-24CB, Class A15
5.75%, 8/25/36 | | | | | | | 1,939 | | | | 1,595,024 | |
| | |
| |
| abfunds.com | | AB GLOBAL BOND FUND | 45 |
PORTFOLIO OF INVESTMENTS(continued)
| | | | | | | | | | | | |
| | | | | | Principal
Amount
(000) | | | U.S. $ Value | |
| |
Series 2006-26CB, Class A6
6.25%, 9/25/36 | | | U.S.$ | | | | 146 | | | $ | 114,037 | |
Series 2006-26CB, Class A8
6.25%, 9/25/36 | | | | | | | 545 | | | | 425,998 | |
Series 2006-J1, Class 1A11
5.50%, 2/25/36 | | | | | | | 1,216 | | | | 1,089,820 | |
Series 2007-15CB, Class A19
5.75%, 7/25/37 | | | | | | | 407 | | | | 363,094 | |
Citigroup Mortgage Loan Trust
Series 2007-AR4, Class 1A1A
4.606%, 3/25/37 | | | | | | | 308 | | | | 308,374 | |
Countrywide Home Loan MortgagePass-Through Trust
Series 2007-3, Class A30
5.75%, 4/25/37 | | | | | | | 1,302 | | | | 1,065,371 | |
Series 2007-HY4, Class 1A1
3.864%, 9/25/47 | | | | | | | 495 | | | | 469,918 | |
CSMC Mortgage-Backed Trust
Series 2006-7, Class 3A12
6.25%, 8/25/36 | | | | | | | 802 | | | | 637,119 | |
Residential Accredit Loans, Inc. Trust
Series 2005-QS14, Class 3A1
6.00%, 9/25/35 | | | | | | | 1,126 | | | | 1,087,869 | |
Wells Fargo Mortgage Backed Securities Trust
Series 2007-AR7, Class A1
4.674%, 12/28/37 | | | | | | | 1,989 | | | | 1,972,895 | |
| | | | | | | | | | | | |
| | | | | | | | | | | 9,129,519 | |
| | | | | | | | | | | | |
Non-Agency Floating Rate – 0.0% | | | | | | | | | | | | |
First Horizon Alternative Mortgage Securities Trust
Series 2007-FA2, Class 1A10
2.268% (LIBOR 1 Month + 0.25%), 4/25/37(h) | | | | | | | 746 | | | | 355,266 | |
| | | | | | | | | | | | |
| | | |
Total Collateralized Mortgage Obligations
(cost $331,631,045) | | | | | | | | | | | 341,231,291 | |
| | | | | | | | | | | | |
| | | | | | | | | | | | |
COVERED BONDS – 4.2% | | | | | | | | | | | | |
Bank of Nova Scotia (The)
0.75%, 9/17/21(a) | | | EUR | | | | 9,465 | | | | 10,560,823 | |
BPCE SFH SA
1.00%, 2/24/25(a) | | | | | | | 8,800 | | | | 10,313,632 | |
Credit Suisse AG/Guernsey
0.75%, 9/17/21(a) | | | | | | | 23,000 | | | | 25,638,113 | |
Danske Bank A/S
0.125%, 2/14/22(a) | | | | | | | 13,970 | | | | 15,425,994 | |
1.25%, 6/11/21(a) | | | | | | | 9,195 | | | | 10,309,814 | |
| | |
| |
| 46 | AB GLOBAL BOND FUND | | abfunds.com |
PORTFOLIO OF INVESTMENTS(continued)
| | | | | | | | | | | | |
| | | | | | Principal
Amount
(000) | | | U.S. $ Value | |
| |
Danske Hypotek AB
Series 2312
1.00%, 12/20/23(a) | | | SEK | | | | 320,000 | | | $ | 33,798,284 | |
DNB Boligkreditt AS
2.75%, 3/21/22(a) | | | EUR | | | | 21,250 | | | | 25,002,655 | |
National Australia Bank Ltd.
1.375%, 5/28/21(a) | | | | | | | 8,427 | | | | 9,459,796 | |
Nationwide Building Society
4.625%, 2/08/21(a) | | | | | | | 4,879 | | | | 5,679,327 | |
Nordea Hypotek AB
Series 5534
1.00%, 9/18/24(a) | | | SEK | | | | 320,000 | | | | 33,898,211 | |
Santander UK PLC
4.25%, 4/12/21(a) | | | EUR | | | | 8,100 | | | | 9,457,950 | |
Skandinaviska Enskilda Banken AB
Series 576
1.00%, 12/20/23(a) | | | SEK | | | | 320,000 | | | | 33,782,161 | |
Stadshypotek AB
Series 1588
1.50%, 3/01/24(a) | | | | | | | 313,000 | | | | 33,806,054 | |
Swedbank Hypotek AB
Series 194
1.00%, 9/18/24(a) | | | | | | | 319,900 | | | | 33,875,139 | |
1.125%, 5/21/21(a) | | | EUR | | | | 9,200 | | | | 10,290,121 | |
Turkiye Vakiflar Bankasi TAO
2.375%, 5/04/21(a) | | | | | | | 3,299 | | | | 3,615,629 | |
| | | | | | | | | | | | |
| | | |
Total Covered Bonds
(cost $313,771,351) | | | | | | | | | | | 304,913,703 | |
| | | | | | | | | | | | |
| | | | | | | | | | | | |
CORPORATES – NON-INVESTMENT GRADE – 3.7% | | | | | | | | | | | | |
Industrial – 1.9% | | | | | | | | | | | | |
Basic – 0.1% | | | | | | | | | | | | |
FMG Resources (August 2006) Pty Ltd.
5.125%, 5/15/24(a) | | | U.S.$ | | | | 165 | | | | 171,712 | |
Smurfit Kappa Acquisitions ULC
2.875%, 1/15/26(a) | | | EUR | | | | 8,450 | | | | 10,142,791 | |
| | | | | | | | | | | | |
| | | | | | | | | | | 10,314,503 | |
| | | | | | | | | | | | |
Capital Goods – 0.3% | | | | | | | | | | | | |
Ardagh Packaging Finance PLC/Ardagh Holdings USA, Inc.
4.25%, 9/15/22(a) | | | U.S.$ | | | | 200 | | | | 202,096 | |
Clean Harbors, Inc.
5.125%, 7/15/29(a) | | | | | | | 58 | | | | 61,562 | |
Colfax Corp.
3.25%, 5/15/25(a) | | | EUR | | | | 6,829 | | | | 7,658,907 | |
| | |
| |
| abfunds.com | | AB GLOBAL BOND FUND | 47 |
PORTFOLIO OF INVESTMENTS(continued)
| | | | | | | | | | | | |
| | | | | | Principal
Amount
(000) | | | U.S. $ Value | |
| |
Tervita Corp.
7.625%, 12/01/21(a) | | | U.S.$ | | | | 74 | | | $ | 75,251 | |
TransDigm, Inc.
6.25%, 3/15/26(a) | | | | | | | 8,414 | | | | 9,035,323 | |
Trivium Packaging Finance BV
5.50%, 8/15/26(a) | | | | | | | 1,702 | | | | 1,783,970 | |
| | | | | | | | | | | | |
| | | | | | | | | | | 18,817,109 | |
| | | | | | | | | | | | |
Communications - Media – 0.0% | | | | | | | | | | | | |
CCO Holdings LLC/CCO Holdings Capital Corp.
5.00%, 2/01/28(a) | | | | | | | 110 | | | | 113,818 | |
| | | | | | | | | | | | |
| | | |
Communications - Telecommunications – 0.1% | | | | | | | | | | | | |
Major League Baseball
3.44%, 12/10/20(e)(f) | | | | | | | 5,350 | | | | 5,407,485 | |
| | | | | | | | | | | | |
| | | |
Consumer Cyclical -
Automotive – 0.1% | | | | | | | | | | | | |
LKQ European Holdings BV
3.625%, 4/01/26(a) | | | EUR | | | | 109 | | | | 124,524 | |
Panther BF Aggregator 2 LP/Panther Finance Co., Inc.
4.375%, 5/15/26(a) | | | | | | | 1,819 | | | | 2,020,091 | |
6.25%, 5/15/26(a) | | | U.S.$ | | | | 40 | | | | 42,095 | |
Tenneco, Inc.
5.00%, 7/15/24(a) | | | EUR | | | | 5,570 | | | | 6,177,264 | |
| | | | | | | | | | | | |
| | | | | | | | | | | 8,363,974 | |
| | | | | | | | | | | | |
Consumer Cyclical - Other – 0.1% | | | | | | | | | | | | |
International Game Technology PLC
6.50%, 2/15/25(a) | | | U.S.$ | | | | 3,090 | | | | 3,421,903 | |
PulteGroup, Inc.
5.00%, 1/15/27 | | | | | | | 38 | | | | 41,061 | |
6.375%, 5/15/33 | | | | | | | 26 | | | | 28,745 | |
7.875%, 6/15/32 | | | | | | | 11 | | | | 13,430 | |
Wyndham Destinations, Inc.
4.25%, 3/01/22 | | | | | | | 3,300 | | | | 3,375,359 | |
| | | | | | | | | | | | |
| | | | | | | | | | | 6,880,498 | |
| | | | | | | | | | | | |
Consumer Cyclical - Retailers – 0.0% | | | | | | | | | | | | |
Group 1 Automotive, Inc.
5.25%, 12/15/23(a) | | | | | | | 90 | | | | 92,641 | |
| | | | | | | | | | | | |
| | | |
Consumer Non-Cyclical – 0.2% | | | | | | | | | | | | |
HCA, Inc.
5.375%, 9/01/26 | | | | | | | 162 | | | | 177,827 | |
| | |
| |
| 48 | AB GLOBAL BOND FUND | | abfunds.com |
PORTFOLIO OF INVESTMENTS(continued)
| | | | | | | | | | | | |
| | | | | | Principal
Amount
(000) | | | U.S. $ Value | |
| |
Leisureworld Senior Care LP
Series B
3.474%, 2/03/21 | | | CAD | | | | 7,675 | | | $ | 5,875,776 | |
Spectrum Brands, Inc.
5.75%, 7/15/25 | | | U.S.$ | | | | 9,505 | | | | 9,910,911 | |
| | | | | | | | | | | | |
| | | | | | | | | | | 15,964,514 | |
| | | | | | | | | | | | |
Energy – 0.4% | | | | | | | | | | | | |
Antero Resources Corp.
5.125%, 12/01/22 | | | | | | | 10,343 | | | | 9,078,744 | |
California Resources Corp.
5.50%, 9/15/21(e) | | | | | | | 363 | | | | 176,052 | |
Cheniere Energy Partners LP
5.25%, 10/01/25 | | | | | | | 69 | | | | 71,644 | |
Hess Infrastructure Partners LP/Hess Infrastructure Partners Finance Corp.
5.625%, 2/15/26(a) | | | | | | | 55 | | | | 57,456 | |
PDC Energy, Inc.
5.75%, 5/15/26 | | | | | | | 7,459 | | | | 7,342,721 | |
SandRidge Energy, Inc.
7.50%, 2/15/23(e)(f)(j)(k) | | | | | | | 1,894 | | | | – 0 | – |
Sunoco LP/Sunoco Finance Corp.
4.875%, 1/15/23 | | | | | | | 3,152 | | | | 3,238,100 | |
Transocean Poseidon Ltd.
6.875%, 2/01/27(a) | | | | | | | 4,220 | | | | 4,428,156 | |
UGI International LLC
3.25%, 11/01/25(a) | | | EUR | | | | 3,879 | | | | 4,478,259 | |
| | | | | | | | | | | | |
| | | | | | | | | | | 28,871,132 | |
| | | | | | | | | | | | |
Other Industrial – 0.0% | | | | | | | | | | | | |
ProGroup AG
3.00%, 3/31/26(a) | | | | | | | 649 | | | | 710,133 | |
| | | | | | | | | | | | |
| | | |
Services – 0.1% | | | | | | | | | | | | |
Intertrust Group BV
3.375%, 11/15/25(a) | | | | | | | 6,925 | | | | 7,942,085 | |
| | | | | | | | | | | | |
| | | |
Technology – 0.2% | | | | | | | | | | | | |
CommScope, Inc.
5.50%, 3/01/24(a) | | | U.S.$ | | | | 4,690 | | | | 4,818,633 | |
6.00%, 3/01/26(a) | | | | | | | 6,577 | | | | 6,808,227 | |
| | | | | | | | | | | | |
| | | | | | | | | | | 11,626,860 | |
| | | | | | | | | | | | |
Transportation - Services – 0.3% | | | | | | | | | | | | |
Chicago Parking Meters LLC
4.93%, 12/30/25(e)(f) | | | | | | | 16,500 | | | | 18,232,551 | |
Europcar Mobility Group
4.00%, 4/30/26 | | | EUR | | | | 1,877 | | | | 2,083,389 | |
| | |
| |
| abfunds.com | | AB GLOBAL BOND FUND | 49 |
PORTFOLIO OF INVESTMENTS(continued)
| | | | | | | | | | | | |
| | | | | | Principal
Amount
(000) | | | U.S. $ Value | |
| |
Loxam SAS
4.25%, 4/15/24(a) | | | EUR | | | | 1,564 | | | $ | 1,767,216 | |
| | | | | | | | | | | | |
| | | | | | | | | | | 22,083,156 | |
| | | | | | | | | | | | |
| | | | | | | | | | | 137,187,908 | |
| | | | | | | | | | | | |
Financial Institutions – 1.8% | | | | | | | | | | | | |
Banking – 1.5% | | | | | | | | | | | | |
ABN AMRO Bank NV
4.75%, 9/22/27(a)(g) | | | | | | | 11,900 | | | | 13,537,860 | |
Allied Irish Banks PLC
Series E
7.375%, 12/03/20(a)(g) | | | | | | | 1,033 | | | | 1,196,230 | |
Banco Bilbao Vizcaya Argentaria SA
5.875%, 5/24/22(a)(g) | | | | | | | 10,400 | | | | 11,880,524 | |
Series 9
6.50%, 3/05/25(g) | | | U.S.$ | | | | 1,000 | | | | 1,020,000 | |
Banco Santander SA
6.25%, 9/11/21(a)(g) | | | EUR | | | | 8,300 | | | | 9,548,127 | |
6.75%, 4/25/22(a)(g) | | | | | | | 2,300 | | | | 2,723,590 | |
Barclays PLC
7.875%, 3/15/22(a)(g) | | | U.S.$ | | | | 200 | | | | 211,757 | |
CaixaBank SA
6.75%, 6/13/24(a)(g) | | | EUR | | | | 2,800 | | | | 3,353,231 | |
CIT Group, Inc.
4.125%, 3/09/21 | | | U.S.$ | | | | 106 | | | | 108,164 | |
5.25%, 3/07/25 | | | | | | | 79 | | | | 86,242 | |
Citigroup, Inc.
5.95%, 1/30/23(g) | | | | | | | 1,644 | | | | 1,714,452 | |
Series P
5.95%, 5/15/25(g) | | | | | | | 2,793 | | | | 2,957,145 | |
Series Q
5.95%, 8/15/20(g) | | | | | | | 5,255 | | | | 5,349,453 | |
Citizens Financial Group, Inc.
Series A
5.50%, 4/06/20(g) | | | | | | | 33 | | | | 33,297 | |
Credit Suisse Group AG
6.25%, 12/18/24(a)(g) | | | | | | | 11,489 | | | | 12,166,104 | |
6.375%, 8/21/26(a)(g) | | | | | | | 246 | | | | 255,069 | |
7.50%, 7/17/23(a)(g) | | | | | | | 240 | | | | 257,188 | |
Danske Bank A/S
Series E
5.875%, 4/06/22(a)(g) | | | EUR | | | | 12,180 | | | | 14,086,265 | |
Goldman Sachs Group, Inc. (The)
Series L
6.065%, 10/31/19(g) | | | U.S.$ | | | | 14 | | | | 14,023 | |
Series M
5.375%, 5/10/20(g) | | | | | | | 90 | | | | 90,844 | |
Series P
5.00%, 11/10/22(g) | | | | | | | 3,901 | | | | 3,825,379 | |
| | |
| |
| 50 | AB GLOBAL BOND FUND | | abfunds.com |
PORTFOLIO OF INVESTMENTS(continued)
| | | | | | | | | | | | |
| | | | | | Principal
Amount
(000) | | | U.S. $ Value | |
| |
Series Q
5.50%, 8/10/24(g) | | | U.S.$ | | | | 5,723 | | | $ | 5,994,270 | |
Morgan Stanley
Series J
5.55%, 7/15/20(g) | | | | | | | 97 | | | | 98,337 | |
Royal Bank of Scotland Group PLC
8.625%, 8/15/21(g) | | | | | | | 8,654 | | | | 9,268,503 | |
Series U
4.424% (LIBOR 3 Month + 2.32%), 9/30/27(g)(h) | | | | | | | 3,700 | | | | 3,506,764 | |
Societe Generale SA
6.75%, 4/07/21(a)(g) | | | EUR | | | | 5,544 | | | | 6,466,124 | |
Standard Chartered PLC
3.776% (LIBOR 3 Month + 1.51%), 1/30/27(a)(g)(h) | | | U.S.$ | | | | 200 | | | | 161,602 | |
| | | | | | | | | | | | |
| | | | | | | | | | | 109,910,544 | |
| | | | | | | | | | | | |
Brokerage – 0.0% | | | | | | | | | | | | |
LPL Holdings, Inc.
5.75%, 9/15/25(a) | | | | | | | 94 | | | | 97,762 | |
| | | | | | | | | | | | |
| | | |
Finance – 0.1% | | | | | | | | | | | | |
Navient Corp.
6.625%, 7/26/21 | | | | | | | 8,420 | | | | 8,886,325 | |
8.00%, 3/25/20 | | | | | | | 410 | | | | 418,192 | |
| | | | | | | | | | | | |
| | | | | | | | | | | 9,304,517 | |
| | | | | | | | | | | | |
REITS – 0.2% | | | | | | | | | | | | |
Iron Mountain, Inc.
4.875%, 9/15/29(a) | | | | | | | 105 | | | | 106,616 | |
MGM Growth Properties Operating Partnership LP/MGP Finance Co-Issuer, Inc.
5.75%, 2/01/27(a) | | | | | | | 9,798 | | | | 11,015,823 | |
| | | | | | | | | | | | |
| | | | | | | | | | | 11,122,439 | |
| | | | | | | | | | | | |
| | | | | | | | | | | 130,435,262 | |
| | | | | | | | | | | | |
Utility – 0.0% | | | | | | | | | | | | |
Electric – 0.0% | | | | | | | | | | | | |
AES Corp./VA
4.00%, 3/15/21 | | | | | | | 216 | | | | 220,038 | |
| | | | | | | | | | | | |
| | | |
Total Corporates – Non-Investment Grade
(cost $267,466,012) | | | | | | | | | | | 267,843,208 | |
| | | | | | | | | | | | |
| | | | | | | | | | | | |
QUASI-SOVEREIGNS – 2.9% | | | | | | | | | | | | |
Quasi-Sovereign Bonds – 2.9% | | | | | | | | | | | | |
Chile – 0.0% | | | | | | | | | | | | |
Corp. Nacional del Cobre de Chile
3.00%, 9/30/29(a) | | | | | | | 200 | | | | 198,927 | |
3.625%, 8/01/27(a) | | | | | | | 275 | | | | 288,836 | |
| | |
| |
| abfunds.com | | AB GLOBAL BOND FUND | 51 |
PORTFOLIO OF INVESTMENTS(continued)
| | | | | | | | | | | | |
| | | | | | Principal
Amount
(000) | | | U.S. $ Value | |
| |
Empresa Nacional del Petroleo
3.75%, 8/05/26(a) | | | U.S.$ | | | | 220 | | | $ | 227,494 | |
| | | | | | | | | | | | |
| | | | | | | | | | | 715,257 | |
| | | | | | | | | | | | |
China – 2.6% | | | | | | | | | | | | |
China Development Bank
Series 1903
3.30%, 2/01/24 | | | CNY | | | | 60,000 | | | | 8,332,144 | |
Series 1904
3.68%, 2/26/26 | | | | | | | 1,122,390 | | | | 156,598,169 | |
State Grid Overseas Investment 2014 Ltd.
4.125%, 5/07/24(a) | | | U.S.$ | | | | 8,049 | | | | 8,632,552 | |
State Grid Overseas Investment 2016 Ltd.
2.25%, 5/04/20(a) | | | | | | | 15,757 | | | | 15,725,727 | |
| | | | | | | | | | | | |
| | | | | | | | | | | 189,288,592 | |
| | | | | | | | | | | | |
Indonesia – 0.1% | | | | | | | | | | | | |
Perusahaan Listrik Negara PT
5.50%, 11/22/21(a) | | | | | | | 3,874 | | | | 4,104,019 | |
| | | | | | | | | | | | |
| | | |
Mexico – 0.1% | | | | | | | | | | | | |
Petroleos Mexicanos
6.49%, 1/23/27(a) | | | | | | | 66 | | | | 68,805 | |
6.84%, 1/23/30(a) | | | | | | | 6,038 | | | | 6,242,688 | |
| | | | | | | | | | | | |
| | | | | | | | | | | 6,311,493 | |
| | | | | | | | | | | | |
Saudi Arabia – 0.1% | | | | | | | | | | | | |
Saudi Arabian Oil Co.
2.875%, 4/16/24(a) | | | | | | | 9,400 | | | | 9,503,400 | |
3.50%, 4/16/29(a) | | | | | | | 2,150 | | | | 2,244,062 | |
| | | | | | | | | | | | |
| | | | | | | | | | | 11,747,462 | |
| | | | | | | | | | | | |
United Arab Emirates – 0.0% | | | | | | | | | | | | |
Abu Dhabi Crude Oil Pipeline LLC
4.60%, 11/02/47(a) | | | | | | | 225 | | | | 261,563 | |
| | | | | | | | | | | | |
| | | |
Total Quasi-Sovereigns
(cost $214,223,452) | | | | | | | | | | | 212,428,386 | |
| | | | | | | | | | | | |
| | | | | | | | | | | | |
COLLATERALIZED LOAN OBLIGATIONS – 2.6% | | | | | | | | | | | | |
CLO - Floating Rate – 2.6% | | | | | | | | | | | | |
Black Diamond CLO Ltd.
Series 2016-1A, Class A2AR
4.017% (LIBOR 3 Month + 1.75%),
4/26/31(a)(h)(j) | | | | | | | 4,580 | | | | 4,512,166 | |
CIFC Funding Ltd.
Series 2017-3A, Class A1
3.498% (LIBOR 3 Month + 1.22%),
7/20/30(a)(h)(j) | | | | | | | 1,500 | | | | 1,499,979 | |
| | |
| |
| 52 | AB GLOBAL BOND FUND | | abfunds.com |
PORTFOLIO OF INVESTMENTS(continued)
| | | | | | | | | | |
| | | | | Principal
Amount
(000) | | | U.S. $ Value | |
| |
Dryden CLO Ltd.
Series 2018-57A, Class A
3.168% (LIBOR 3 Month + 1.01%),
5/15/31(a)(h)(j) | | U.S.$ | | | 14,550 | | | $ | 14,425,845 | |
Goldentree Loan Opportunities Ltd.
Series 2015-11A, Class AR2
3.37% (LIBOR 3 Month + 1.07%),
1/18/31(a)(h)(j) | | | | | 7,079 | | | | 7,054,241 | |
Greywolf CLO V Ltd.
Series 2015-1A, Class A1R
3.436% (LIBOR 3 Month + 1.16%),
1/27/31(a)(h)(j) | | | | | 6,573 | | | | 6,540,677 | |
Greywolf CLO VI Ltd.
Series 2018-1A, Class A1
3.297% (LIBOR 3 Month + 1.03%),
4/26/31(a)(h)(j) | | | | | 5,155 | | | | 5,104,187 | |
Series 2018-1A, Class A2
3.897% (LIBOR 3 Month + 1.63%),
4/26/31(a)(h)(j) | | | | | 4,035 | | | | 3,988,747 | |
Madison Park Funding Ltd.
Series 2014-12A, Class AR
3.538% (LIBOR 3 Month + 1.26%),
7/20/26(a)(h)(j) | | | | | 223 | | | | 223,161 | |
Marble Point CLO XI Ltd.
Series 2017-2A, Class A
3.48% (LIBOR 3 Month + 1.18%),
12/18/30(a)(h)(j) | | | | | 17,519 | | | | 17,432,015 | |
Octagon Investment Partners 30 Ltd.
Series 2017-1A, Class A1
3.598% (LIBOR 3 Month + 1.32%),
3/17/30(a)(h)(j) | | | | | 4,030 | | | | 4,039,938 | |
Octagon Loan Funding Ltd.
Series 2014-1A, Class ARR
3.304% (LIBOR 3 Month + 1.18%),
11/18/31(a)(h)(j) | | | | | 8,984 | | | | 8,952,969 | |
OZLM Ltd.
Series 2018-18A, Class A
3.323% (LIBOR 3 Month + 1.02%),
4/15/31(a)(h)(j) | | | | | 17,040 | | | | 16,818,429 | |
Series 2018-22A, Class A1
3.373% (LIBOR 3 Month + 1.07%),
1/17/31(a)(h)(j) | | | | | 7,199 | | | | 7,114,764 | |
Rockford Tower CLO Ltd.
Series 2017-3A, Class A
3.468% (LIBOR 3 Month + 1.19%),
10/20/30(a)(h)(j) | | | | | 14,194 | | | | 14,159,092 | |
Series 2018-2A, Class A
3.438% (LIBOR 3 Month + 1.16%),
10/20/31(a)(h)(j) | | | | | 8,500 | | | | 8,483,178 | |
| | |
| |
| abfunds.com | | AB GLOBAL BOND FUND | 53 |
PORTFOLIO OF INVESTMENTS(continued)
| | | | | | | | | | | | |
| | | | | | Principal
Amount
(000) | | | U.S. $ Value | |
| |
Romark CLO III Ltd.
Series 2019-3A, Class A1
3.529% (LIBOR 3 Month + 1.37%),
7/15/32(a)(h)(j) | | | U.S.$ | | | | 11,840 | | | $ | 11,825,674 | |
Sound Point CLO XIX Ltd.
Series 2018-1A, Class A
3.303% (LIBOR 3 Month + 1.00%),
4/15/31(a)(h)(j) | | | | | | | 24,065 | | | | 23,755,019 | |
THL Credit Wind River CLO Ltd.
Series 2014-2A, Class AR
3.443% (LIBOR 3 Month + 1.14%),
1/15/31(a)(h)(j) | | | | | | | 16,285 | | | | 16,187,006 | |
Series 2017-4A, Class B
3.586% (LIBOR 3 Month + 1.45%),
11/20/30(a)(h)(j) | | | | | | | 6,000 | | | | 5,889,210 | |
TIAA CLO IV Ltd.
Series 2018-1A, Class A1A
3.508% (LIBOR 3 Month + 1.23%),
1/20/32(a)(h)(j) | | | | | | | 4,510 | | | | 4,511,105 | |
Voya CLO Ltd.
Series 2016-3A, Class A1R
3.49% (LIBOR 3 Month + 1.19%),
10/18/31(a)(h)(j) | | | | | | | 7,375 | | | | 7,365,862 | |
| | | | | | | | | | | | |
| | | |
Total Collateralized Loan Obligations
(cost $191,169,268) | | | | | | | | | | | 189,883,264 | |
| | | | | | | | | | | | |
| | | | | | | | | | | | |
COMMERCIAL MORTGAGE-BACKED SECURITIES – 2.3% | | | | | | | | | | | | |
Non-Agency Floating Rate CMBS – 1.5% | | | | | | | | | | | | |
Ashford Hospitality Trust
Series 2018-KEYS, Class A
3.028% (LIBOR 1 Month + 1.00%),
5/15/35(a)(h) | | | | | | | 14,000 | | | | 13,982,332 | |
BAMLL Commercial Mortgage Securities Trust
Series 2017-SCH, Class AF
3.028% (LIBOR 1 Month + 1.00%),
11/15/33(a)(h) | | | | | | | 6,275 | | | | 6,276,851 | |
BHMS
Series 2018-ATLS, Class A
3.278% (LIBOR 1 Month + 1.25%),
7/15/35(a)(h) | | | | | | | 13,884 | | | | 13,883,967 | |
BHP Trust
Series 2019-BXHP, Class C
3.55% (LIBOR 1 Month + 1.52%),
8/15/36(a)(h) | | | | | | | 7,400 | | | | 7,377,023 | |
| | |
| |
| 54 | AB GLOBAL BOND FUND | | abfunds.com |
PORTFOLIO OF INVESTMENTS(continued)
| | | | | | | | | | | | |
| | | | | | Principal
Amount
(000) | | | U.S. $ Value | |
| |
BX Trust
Series 2018-EXCL, Class A
3.115% (LIBOR 1 Month + 1.09%),
9/15/37(a)(h) | | | U.S.$ | | | | 10,734 | | | $ | 10,714,727 | |
Citigroup Commercial Mortgage Trust
Series 2015-SHP2, Class E
6.378% (LIBOR 1 Month + 4.35%),
7/15/27(a)(h) | | | | | | | 2,315 | | | | 2,318,945 | |
CLNS Trust
Series 2017-IKPR, Class F
6.55% (LIBOR 1 Month + 4.50%),
6/11/32(a)(h) | | | | | | | 5,743 | | | | 5,760,894 | |
DBWF Mortgage Trust
Series 2018-GLKS, Class A
3.087% (LIBOR 1 Month + 1.03%),
11/19/35(a)(h) | | | | | | | 18,535 | | | | 18,541,097 | |
GS Mortgage Securities Corp. Trust
Series 2019-SMP, Class D
4.09% (LIBOR 1 Month + 1.95%),
8/15/32(a)(h) | | | | | | | 5,035 | | | | 5,035,006 | |
Invitation Homes Trust
Series 2018-SFR4, Class E
3.975% (LIBOR 1 Month + 1.95%),
1/17/38(a)(h) | | | | | | | 13,925 | | | | 13,924,529 | |
Morgan Stanley Capital I Trust
Series 2015-XLF2, Class SNMD
3.762% (LIBOR 1 Month + 1.73%),
11/15/26(h)(i) | | | | | | | 5,700 | | | | 5,625,877 | |
Starwood Retail Property Trust
Series 2014-STAR, Class A
3.248% (LIBOR 1 Month + 1.22%),
11/15/27(a)(h) | | | | | | | 7,487 | | | | 7,477,247 | |
| | | | | | | | | | | | |
| | | | | | | | | | | 110,918,495 | |
| | | | | | | | | | | | |
Non-Agency Fixed Rate CMBS – 0.8% | | | | | | | | | | | | |
225 Liberty Street Trust
Series 2016-225L, Class E
4.804%, 2/10/36(a) | | | | | | | 11,986 | | | | 12,815,788 | |
Citigroup Commercial Mortgage Trust
Series 2013-GC17, Class D
5.262%, 11/10/46(a) | | | | | | | 2,783 | | | | 2,892,424 | |
Series 2014-GC23, Class D
4.641%, 7/10/47(a) | | | | | | | 2,196 | | | | 2,183,998 | |
Commercial Mortgage Trust
Series 2012-CR3, Class D
4.91%, 10/15/45(a) | | | | | | | 2,322 | | | | 2,341,627 | |
Series 2013-CR6, Class D
4.218%, 3/10/46(a) | | | | | | | 7,385 | | | | 7,476,728 | |
| | |
| |
| abfunds.com | | AB GLOBAL BOND FUND | 55 |
PORTFOLIO OF INVESTMENTS(continued)
| | | | | | | | | | | | |
| | | | | | Principal
Amount
(000) | | | U.S. $ Value | |
| |
Series 2013-SFS, Class A1
1.873%, 4/12/35(a) | | | U.S.$ | | | | 1,838 | | | $ | 1,830,394 | |
GS Mortgage Securities Trust
Series 2011-GC5, Class D
5.556%, 8/10/44(a) | | | | | | | 1,000 | | | | 995,734 | |
Series 2013-G1, Class A2
3.557%, 4/10/31(a) | | | | | | | 4,825 | | | | 4,928,665 | |
Series 2013-GC12, Class C
4.179%, 6/10/46 | | | | | | | 4,270 | | | | 4,373,219 | |
JP Morgan Chase Commercial Mortgage Securities Trust
Series 2011-C5, Class D
5.554%, 8/15/46(a) | | | | | | | 890 | | | | 906,937 | |
Series 2012-CBX, Class E
5.303%, 6/15/45(a) | | | | | | | 4,544 | | | | 4,388,911 | |
Morgan Stanley Bank of America Merrill Lynch Trust
Series 2014-C14, Class D
5.10%, 2/15/47(a) | | | | | | | 4,250 | | | | 4,368,308 | |
WF-RBS Commercial Mortgage Trust
Series 2012-C8, Class E
5.049%, 8/15/45(a) | | | | | | | 1,600 | | | | 1,638,396 | |
Series 2013-C18, Class D
4.85%, 12/15/46(a) | | | | | | | 3,000 | | | | 3,044,245 | |
| | | | | | | | | | | | |
| | | | | | | | | | | 54,185,374 | |
| | | | | | | | | | | | |
Total Commercial Mortgage-Backed Securities
(cost $160,961,428) | | | | | | | | | | | 165,103,869 | |
| | | | | | | | | | | | |
| | | | | | | | | | | | |
GOVERNMENTS – SOVEREIGN BONDS – 1.5% | | | | | | | | | | | | |
Indonesia – 1.5% | | | | | | | | | | | | |
Indonesia Government International Bond
4.45%, 2/11/24 | | | | | | | 9,319 | | | | 10,006,276 | |
5.875%, 1/15/24(a) | | | | | | | 84,371 | | | | 95,101,937 | |
| | | | | | | | | | | | |
| | | | | | | | | | | 105,108,213 | |
| | | | | | | | | | | | |
Qatar – 0.0% | | | | | | | | | | | | |
Qatar Government International Bond
4.817%, 3/14/49(a) | | | | | | | 225 | | | | 278,859 | |
| | | | | | | | | | | | |
| | | |
Saudi Arabia – 0.0% | | | | | | | | | | | | |
Saudi Government International Bond
4.375%, 4/16/29(a) | | | | | | | 200 | | | | 224,400 | |
| | | | | | | | | | | | |
| | | |
United Arab Emirates – 0.0% | | | | | | | | | | | | |
Abu Dhabi Government International Bond
3.125%, 9/30/49(a) | | | | | | | 245 | | | | 237,649 | |
| | | | | | | | | | | | |
| | | |
Total Governments – Sovereign Bonds
(cost $98,451,376) | | | | | | | | | | | 105,849,121 | |
| | | | | | | | | | | | |
| | |
| |
| 56 | AB GLOBAL BOND FUND | | abfunds.com |
PORTFOLIO OF INVESTMENTS(continued)
| | | | | | | | | | | | |
| | | | | | Principal
Amount
(000) | | | U.S. $ Value | |
| |
LOCAL GOVERNMENTS – PROVINCIAL BONDS – 1.2% | | | | | | | | | | | | |
Canada – 1.2% | | | | | | | | | | | | |
Province of Ontario Canada
2.40%, 6/02/26 | | | CAD | | | | 14,705 | | | $ | 11,418,921 | |
2.60%, 6/02/25 | | | | | | | 41,498 | | | | 32,519,197 | |
Province of Quebec Canada
2.75%, 9/01/25 | | | | | | | 51,720 | | | | 40,934,007 | |
| | | | | | | | | | | | |
| | | |
Total Local Governments – Provincial Bonds
(cost $83,248,825) | | | | | | | | | | | 84,872,125 | |
| | | | | | | | | | | | |
| | | | | | | | | | | | |
EMERGING MARKETS – SOVEREIGNS – 1.0% | | | | | | | | | | | | |
Bahrain – 0.1% | | | | | | | | | | | | |
Bahrain Government International Bond
5.625%, 9/30/31(a) | | | U.S.$ | | | | 5,572 | | | | 5,595,681 | |
| | | | | | | | | | | | |
| | | |
Dominican Republic – 0.2% | | | | | | | | | | | | |
Dominican Republic International Bond
5.95%, 1/25/27(a) | | | | | | | 7,617 | | | | 8,223,980 | |
7.50%, 5/06/21(a) | | | | | | | 6,273 | | | | 6,555,633 | |
| | | | | | | | | | | | |
| | | | | | | | | | | 14,779,613 | |
| | | | | | | | | | | | |
Egypt – 0.2% | | | | | | | | | | | | |
Egypt Government International Bond
5.577%, 2/21/23(a) | | | | | | | 4,695 | | | | 4,777,163 | |
7.50%, 1/31/27(a) | | | | | | | 8,593 | | | | 9,237,475 | |
| | | | | | | | | | | | |
| | | | | | | | | | | 14,014,638 | |
| | | | | | | | | | | | |
Gabon – 0.1% | | | | | | | | | | | | |
Gabon Government International Bond
6.375%, 12/12/24(a) | | | | | | | 6,855 | | | | 6,745,748 | |
| | | | | | | | | | | | |
| | | |
Ivory Coast – 0.2% | | | | | | | | | | | | |
Ivory Coast Government International Bond
5.125%, 6/15/25(a) | | | EUR | | | | 1,087 | | | | 1,265,118 | |
5.375%, 7/23/24(a) | | | U.S.$ | | | | 12,515 | | | | 12,820,053 | |
| | | | | | | | | | | | |
| | | | | | | | | | | 14,085,171 | |
| | | | | | | | | | | | |
Nigeria – 0.1% | | | | | | | | | | | | |
Nigeria Government International Bond
5.625%, 6/27/22 | | | | | | | 6,710 | | | | 6,932,269 | |
6.75%, 1/28/21(a) | | | | | | | 6,440 | | | | 6,665,400 | |
| | | | | | | | | | | | |
| | | | | | | | | | | 13,597,669 | |
| | | | | | | | | | | | |
| | |
| |
| abfunds.com | | AB GLOBAL BOND FUND | 57 |
PORTFOLIO OF INVESTMENTS(continued)
| | | | | | | | | | | | |
| | | | | | Principal
Amount
(000) | | | U.S. $ Value | |
| |
Sri Lanka – 0.1% | | | | | | | | | | | | |
Sri Lanka Government International Bond
6.85%, 3/14/24(a) | | | U.S.$ | | | | 2,963 | | | $ | 3,028,947 | |
7.85%, 3/14/29(a) | | | | | | | 3,642 | | | | 3,671,526 | |
| | | | | | | | | | | | |
| | | | | | | | | | | 6,700,473 | |
| | | | | | | | | | | | |
| | | |
Total Emerging Markets – Sovereigns
(cost $72,439,642) | | | | | | | | | | | 75,518,993 | |
| | | | | | | | | | | | |
| | | | | | | | | | | | |
SUPRANATIONALS – 0.6% | | | | | | | | | | | | |
Supranational – 0.6% | | | | | | | | | | | | |
European Financial Stability Facility
0.125%, 10/17/23(a)
(cost $45,173,089) | | | EUR | | | | 38,629 | | | | 43,238,709 | |
| | | | | | | | | | | | |
| | | | | | | | | | | | |
BANK LOANS – 0.5% | | | | | | | | | | | | |
Industrial – 0.5% | | | | | | | | | | | | |
Capital Goods – 0.0% | | | | | | | | | | | | |
Gardner Denver, Inc.
4.794% (LIBOR 1 Month + 2.75%), 7/30/24(l) | | | U.S.$ | | | | 975 | | | | 978,713 | |
| | | | | | | | | | | | |
| | | |
Consumer Cyclical - Restaurants – 0.0% | | | | | | | | | | | | |
IRB Holding Corp. (fka Arby’s/Buffalo Wild Wings)
5.550% (LIBOR 3 Month + 3.25%), 2/05/25(l) | | | | | | | 1,239 | | | | 1,232,716 | |
| | | | | | | | | | | | |
| | | |
Consumer Non-Cyclical – 0.4% | | | | | | | | | | | | |
athenahealth, Inc.
6.681% (LIBOR 3 Month + 4.50%), 2/11/26(j)(l) | | | | | | | 9,555 | | | | 9,518,883 | |
BI-LO, LLC
10.127% (LIBOR 3 Month + 8.00%), 5/31/24(l) | | | | | | | 3,984 | | | | 3,792,591 | |
10.187% (LIBOR 3 Month + 8.00%), 5/31/24(l) | | | | | | | 4,177 | | | | 3,975,852 | |
10.338% (LIBOR 3 Month + 8.00%), 5/31/24(l) | | | | | | | 4,115 | | | | 3,916,836 | |
Regionalcare Hospital Partners Holdings, Inc.
6.554% (LIBOR 1 Month + 4.50%), 11/16/25(l) | | | | | | | 6,650 | | | | 6,650,814 | |
| | | | | | | | | | | | |
| | | | | | | | | | | 27,854,976 | |
| | | | | | | | | | | | |
| | |
| |
| 58 | AB GLOBAL BOND FUND | | abfunds.com |
PORTFOLIO OF INVESTMENTS(continued)
| | | | | | | | | | | | |
| | | | | | Principal
Amount
(000) | | | U.S. $ Value | |
| |
Energy – 0.1% | | | | | | | | | | | | |
California Resources Corporation
12.419% (LIBOR 1 Month + 10.38%), 12/31/21(l) | | | U.S.$ | | | | 9,558 | | | $ | 8,298,005 | |
| | | | | | | | | | | | |
| | | |
Total Bank Loans
(cost $39,633,939) | | | | | | | | | | | 38,364,410 | |
| | | | | | | | | | | | |
| | | | | | | | | | | | |
ASSET-BACKED SECURITIES – 0.3% | | | | | | | | | | | | |
Other ABS - Fixed Rate – 0.3% | | | | | | | | | | | | |
Atlas Ltd.
Series 2014-1, Class B
6.875%, 12/15/39(e)(f)(j) | | | | | | | 1,621 | | | | 1,555,832 | |
CLUB Credit Trust
Series 2018-P3, Class B
4.32%, 1/15/26(a)(j) | | | | | | | 6,594 | | | | 6,763,656 | |
SBA Tower Trust
Series 2014-2A, Class C
3.869%, 10/15/49(a)(j) | | | | | | | 3,008 | | | | 3,131,934 | |
SoFi Consumer Loan Program LLC
Series 2017-2, Class A
3.28%, 2/25/26(a)(j) | | | | | | | 2,799 | | | | 2,821,095 | |
SoFi Consumer Loan Program Trust Series 2018-1, Class B
3.65%, 2/25/27(a)(j) | | | | | | | 5,582 | | | | 5,716,259 | |
| | | | | | | | | | | | |
| | | |
Total Asset-Backed Securities
(cost $19,583,985) | | | | | | | | | | | 19,988,776 | |
| | | | | | | | | | | | |
| | | | | | | | | | | | |
LOCAL GOVERNMENTS – US MUNICIPAL BONDS – 0.2% | | | | | | | | | | | | |
United States – 0.2% | | | | | | | | | | | | |
State of California
Series 2010
7.625%, 3/01/40 | | | | | | | 30 | | | | 49,224 | |
7.95%, 3/01/36 | | | | | | | 10,685 | | | | 10,939,624 | |
Texas Transportation Commission State Highway Fund
Series 2010B
5.178%, 4/01/30 | | | | | | | 3,400 | | | | 4,183,904 | |
| | | | | | | | | | | | |
| | | |
Total Local Governments – US Municipal Bonds
(cost $14,141,029) | | | | | | | | | | | 15,172,752 | |
| | | | | | | | | | | | |
| | | | | | | | | | | | |
EMERGING MARKETS – CORPORATE BONDS – 0.2% | | | | | | | | | | | | |
Industrial – 0.1% | | | | | | | | | | | | |
Capital Goods – 0.0% | | | | | | | | | | | | |
Odebrecht Finance Ltd.
4.375%, 4/25/25(a)(k)(m) | | | | | | | 8,945 | | | | 930,839 | |
| | |
| |
| abfunds.com | | AB GLOBAL BOND FUND | 59 |
PORTFOLIO OF INVESTMENTS(continued)
| | | | | | | | | | | | |
| | | | | | Principal
Amount
(000) | | | U.S. $ Value | |
| |
5.25%, 6/27/29(a)(k)(m) | | | U.S.$ | | | | 2,796 | | | $ | 297,949 | |
7.125%, 6/26/42(a)(k)(m) | | | | | | | 3,663 | | | | 377,747 | |
| | | | | | | | | | | | |
| | | | | | | | | | | 1,606,535 | |
| | | | | | | | | | | | |
Consumer Cyclical - Other – 0.0% | | | | | | | | | | | | |
MGM China Holdings Ltd.
5.375%, 5/15/24(a) | | | | | | | 200 | | | | 206,733 | |
Servicios Corporativos Javer SAB de CV
9.875%, 4/06/21(a) | | | | | | | 1,416 | | | | 1,400,513 | |
| | | | | | | | | | | | |
| | | | | | | | | | | 1,607,246 | |
| | | | | | | | | | | | |
Consumer Non-Cyclical – 0.0% | | | | | | | | | | | | |
Minerva Luxembourg SA
6.50%, 9/20/26(a) | | | | | | | 2,035 | | | | 2,112,075 | |
Virgolino de Oliveira Finance SA
10.50%, 1/28/18(i)(k)(n) | | | | | | | 4,300 | | | | 129,929 | |
| | | | | | | | | | | | |
| | | | | | | | | | | 2,242,004 | |
| | | | | | | | | | | | |
Energy – 0.0% | | | | | | | | | | | | |
Petrobras Global Finance BV
5.093%, 1/15/30(a) | | | | | | | 5 | | | | 5,214 | |
| | | | | | | | | | | | |
| | | |
Transportation - Services – 0.1% | | | | | | | | | | | | |
Rumo Luxembourg SARL
7.375%, 2/09/24(a) | | | | | | | 2,960 | | | | 3,182,000 | |
| | | | | | | | | | | | |
| | | | | | | | | | | 8,642,999 | |
| | | | | | | | | | | | |
Utility – 0.1% | | | | | | | | | | | | |
Electric – 0.1% | | | | | | | | | | | | |
Terraform Global Operating LLC
6.125%, 3/01/26(i) | | | | | | | 2,748 | | | | 2,820,786 | |
| | | | | | | | | | | | |
| | | |
Total Emerging Markets – Corporate Bonds
(cost $26,180,570) | | | | | | | | | | | 11,463,785 | |
| | | | | | | | | | | | |
| | | |
| | | | | | Shares | | | | |
COMMON STOCKS – 0.2% | | | | | | | | | | | | |
Financials – 0.2% | | | | | | | | | | | | |
Insurance – 0.2% | | | | | | | | | | | | |
Mt. Logan Re Ltd. (Preference Shares)(j)(k)(o) | | | | | | | 9,702 | | | | 9,350,684 | |
| | | | | | | | | | | | |
| | | |
Energy – 0.0% | | | | | | | | | | | | |
Oil, Gas & Consumable Fuels – 0.0% | | | | | | | | | | | | |
Golden Energy Offshore Services AS(e)(k) | | | | | | | 3,089,816 | | | | 1,659,983 | |
SandRidge Energy, Inc.(k) | | | | | | | 4,301 | | | | 20,215 | |
| | | | | | | | | | | | |
| | | | | | | | | | | 1,680,198 | |
| | | | | | | | | | | | |
| | |
| |
| 60 | AB GLOBAL BOND FUND | | abfunds.com |
PORTFOLIO OF INVESTMENTS(continued)
| | | | | | | | | | | | |
| Company | | | | |
Shares | | | U.S. $ Value | |
| |
Information Technology – 0.0% | | | | | | | | | | | | |
Software – 0.0% | | | | | | | | | | | | |
Avaya Holdings Corp.(k) | | | | | | | 2,248 | | | $ | 22,997 | |
| | | | | | | | | | | | |
| | | |
Total Common Stocks
(cost $15,421,201) | | | | | | | | | | | 11,053,879 | |
| | | | | | | | | | | | |
| | | |
| | | | | | Principal
Amount
(000)
| | | | |
EMERGING MARKETS – TREASURIES – 0.2% | | | | | | | | | |
South Africa – 0.2% | | | | | | | | | | | | |
Republic of South Africa Government Bond
Series 2030
8.00%, 1/31/30 | | | ZAR | | | | 93,583 | | | | 5,767,653 | |
Series 2048
8.75%, 2/28/48 | | | | | | | 87,060 | | | | 5,111,293 | |
| | | | | | | | | | | | |
| | | |
Total Emerging Markets – Treasuries
(cost $11,042,925) | | | | | | | | | | | 10,878,946 | |
| | | | | | | | | | | | |
| | | | | | | | | | | | |
WHOLE LOAN TRUSTS – 0.0% | | | | | | | | | | | | |
Performing Asset – 0.0% | | | | | | | | | | | | |
Sheridan Auto Loan Holdings I LLC
10.00%, 9/01/20-9/30/21(e)(f)(j) | | | U.S.$ | | | | 3,893 | | | | 769,177 | |
Sheridan Consumer Finance Trust
10.86%, 3/01/21(e)(f)(j) | | | | | | | 188 | | | | 188,281 | |
| | | | | | | | | | | | |
| | | |
Total Whole Loan Trusts
(cost $4,081,431) | | | | | | | | | | | 957,458 | |
| | | | | | | | | | | | |
| | | | | | | | | | | | |
AGENCIES – 0.0% | | | | | | | | | | | | |
Agency Debentures – 0.0% | | | | | | | | | | | | |
Federal National Mortgage Association
6.25%, 5/15/29 | | | | | | | 95 | | | | 131,294 | |
6.625%, 11/15/30 | | | | | | | 150 | | | | 219,701 | |
Residual Funding Corp. Principal Strip Zero Coupon, 7/15/20 | | | | | | | 225 | | | | 221,514 | |
| | | | | | | | | | | | |
| | | |
Total Agencies
(cost $520,025) | | | | | | | | | | | 572,509 | |
| | | | | | | | | | | | |
| | | |
| | | | | | Shares | | | | |
WARRANTS – 0.0% | | | | | | | | | | | | |
Encore Automotive Acceptance, expiring 7/05/31(e)(f)(j)(k) | | | | | | | 27 | | | | – 0 | – |
| | |
| |
| abfunds.com | | AB GLOBAL BOND FUND | 61 |
PORTFOLIO OF INVESTMENTS(continued)
| | | | | | | | | | | | |
| Company | | | | |
Shares | | | U.S. $ Value | |
| |
Flexpath Capital, Inc., expiring 4/15/31(e)(f)(j)(k) | | | | | | | 42,267 | | | $ | – 0 | – |
SandRidge Energy, Inc., A-CW22, expiring 10/03/22(e)(k) | | | | | | | 3,724 | | | | 186 | |
SandRidge Energy, Inc., B-CW22, expiring 10/03/22(e)(k) | | | | | | | 1,568 | | | | 157 | |
| | | | | | | | | | | | |
| | | |
Total Warrants
(cost $27,089) | | | | | | | | | | | 343 | |
| | | | | | | | | | | | |
| | | | | | | | | | | | |
SHORT-TERM INVESTMENTS – 0.7% | | | | | | | | | |
Investment Companies – 0.4% | | | | | | | | | | | | |
AB Fixed Income Shares, Inc. –Government Money Market Portfolio – Class AB, 1.89%(p)(q)(r)
(cost $25,883,752) | | | | | | | 25,883,752 | | | | 25,883,752 | |
| | | | | | | | | | | | |
| | | |
| | | | | | Principal
Amount
(000)
| | | | |
| | | |
Time Deposits – 0.3% | | | | | | | | | | | | |
BBH, Grand Cayman
(0.51)%, 10/01/19 | | | SEK | | | | 6,399 | | | | 650,037 | |
0.38%, 10/01/19 | | | GBP | | | | 0 | ** | | | 8 | |
0.84%, 10/01/19 | | | CAD | | | | 60 | | | | 45,086 | |
Citibank, London
(0.67)%, 10/01/19 | | | EUR | | | | 4,822 | | | | 5,255,315 | |
Citibank, New York
1.25%, 10/01/19 | | | U.S.$ | | | | 17,035 | | | | 17,034,627 | |
Hong Kong & Shanghai Bank, Singapore
0.79%, 10/01/19 | | | SGD | | | | 540 | | | | 390,696 | |
Sumitomo, Tokyo
(0.26)%, 10/01/19 | | | JPY | | | | 103,792 | | | | 959,929 | |
| | | | | | | | | | | | |
| | | |
Total Time Deposits
(cost $24,335,698) | | | | | | | | | | | 24,335,698 | |
| | | | | | | | | | | | |
| | | |
Total Short-Term Investments
(cost $50,219,450) | | | | | | | | | | | 50,219,450 | |
| | | | | | | | | | | | |
| | | |
Total Investments – 100.3%
(cost $7,050,888,419) | | | | | | | | | | | 7,255,378,952 | |
Other assets less liabilities – (0.3)% | | | | | | | | | | | (24,512,009 | ) |
| | | | | | | | | | | | |
| | | |
Net Assets – 100.0% | | | | | | | | | | $ | 7,230,866,943 | |
| | | | | | | | | | | | |
| | |
| |
| 62 | AB GLOBAL BOND FUND | | abfunds.com |
PORTFOLIO OF INVESTMENTS(continued)
FUTURES (see Note D)
| | | | | | | | | | | | | | | | |
| Description | | Number of
Contracts | | | Expiration
Month | | | Current
Notional | | | Value and
Unrealized
Appreciation/
(Depreciation) | |
Purchased Contracts | | | | | | | | | | | | | |
Euro-OAT Futures | | | 781 | | | | December 2019 | | | $ | 144,976,547 | | | $ | (1,363,843 | ) |
Long Gilt Futures | | | 84 | | | | December 2019 | | �� | | 13,864,602 | | | | 191,072 | |
U.S. 10 Yr Ultra Futures | | | 86 | | | | December 2019 | | | | 12,246,938 | | | | (70,094 | ) |
U.S. Long Bond (CBT) Futures | | | 718 | | | | December 2019 | | | | 116,540,375 | | | | (1,810,570 | ) |
U.S. T-Note 2 Yr (CBT) Futures | | | 28 | | | | December 2019 | | | | 6,034,000 | | | | (13,781 | ) |
U.S. T-Note 10 Yr (CBT) Futures | | | 10 | | | | December 2019 | | | | 1,303,125 | | | | (14,383 | ) |
U.S. Ultra Bond (CBT) Futures | | | 2,052 | | | | December 2019 | | | | 393,791,625 | | | | (8,462,993 | ) |
| | | | | | | | | | | | | | | | |
Sold Contracts | | | | | | | | | | | | | | | | |
10 Yr Canadian Bond Futures | | | 324 | | | | December 2019 | | | | 34,873,684 | | | | 465,676 | |
Euro Buxl 30 Yr Bond Futures | | | 29 | | | | December 2019 | | | | 6,874,859 | | | | 118,194 | |
Euro-BOBL Futures | | | 984 | | | | December 2019 | | | | 145,486,087 | | | | 987,844 | |
Euro-Bund Futures | | | 1,279 | | | | December 2019 | | | | 242,912,520 | | | | (65,507 | ) |
Euro-Schatz Futures | | | 221 | | | | December 2019 | | | | 27,057,932 | | | | 85,512 | |
Japan 10 Yr Bond (OSE) Futures | | | 42 | | | | December 2019 | | | | 60,215,861 | | | | 59,237 | |
U.S. T-Note 2 Yr (CBT) Futures | | | 780 | | | | December 2019 | | | | 168,090,000 | | | | 309,508 | |
U.S. T-Note 5 Yr (CBT) Futures | | | 1,470 | | | | December 2019 | | | | 175,148,204 | | | | 596,742 | |
U.S. T-Note 10 Yr (CBT) Futures | | | 1,547 | | | | December 2019 | | | | 201,593,438 | | | | (2,152,406 | ) |
| | | | | | | | | | | | | | | | |
| | | $ | (11,139,792 | ) |
| | | | | | | | | | | | | | | | |
FORWARD CURRENCY EXCHANGE CONTRACTS (see Note D)
| | | | | | | | | | | | | | | | |
| Counterparty | | Contracts to
Deliver
(000) | | | In Exchange
For
(000) | | | Settlement
Date | | | Unrealized
Appreciation/
(Depreciation) | |
Australia and New Zealand Banking Group Ltd. | | EUR | 10,426 | | | USD | 11,528 | | | | 10/10/19 | | | $ | 157,984 | |
Australia and New Zealand Banking Group Ltd. | | USD | 14,646 | | | EUR | 13,372 | | | | 10/10/19 | | | | (61,513 | ) |
Bank of America, NA | | EUR | 8,279 | | | USD | 9,282 | | | | 10/10/19 | | | | 252,506 | |
Bank of America, NA | | USD | 6,663 | | | EUR | 5,901 | | | | 10/10/19 | | | | (227,589 | ) |
Bank of America, NA | | ILS | 242,205 | | | USD | 68,497 | | | | 10/16/19 | | | | (1,231,706 | ) |
Bank of America, NA | | RUB | 3,240,750 | | | USD | 50,000 | | | | 11/14/19 | | | | 316,065 | |
Bank of America, NA | | USD | 30,905 | | | RUB | 1,994,095 | | | | 11/14/19 | | | | (333,952 | ) |
Bank of America, NA | | ZAR | 119,300 | | | USD | 8,068 | | | | 11/21/19 | | | | 243,717 | |
Barclays Bank PLC | | EUR | 13,728 | | | USD | 15,576 | | | | 10/10/19 | | | | 603,607 | |
Barclays Bank PLC | | USD | 93,893 | | | EUR | 85,126 | | | | 10/10/19 | | | | (1,053,223 | ) |
Barclays Bank PLC | | USD | 83,757 | | | GBP | 68,798 | | | | 10/18/19 | | | | 892,763 | |
Barclays Bank PLC | | INR | 4,800,981 | | | USD | 66,713 | | | | 10/24/19 | | | | (1,025,988 | ) |
Barclays Bank PLC | | MXN | 3,563,319 | | | USD | 176,765 | | | | 10/25/19 | | | | (3,050,754 | ) |
Barclays Bank PLC | | MYR | 73,136 | | | USD | 17,430 | | | | 2/13/20 | | | | 26,130 | |
BNP Paribas SA | | USD | 53,799 | | | EUR | 48,908 | | | | 10/10/19 | | | | (458,406 | ) |
BNP Paribas SA | | PLN | 399,519 | | | USD | 103,737 | | | | 10/11/19 | | | | 4,098,239 | |
Brown Brothers Harriman & Co. | | EUR | 2,306 | | | USD | 2,596 | | | | 10/10/19 | | | | 81,346 | |
Brown Brothers Harriman & Co. | | USD | 126,820 | | | EUR | 113,938 | | | | 10/10/19 | | | | (2,556,783 | ) |
Brown Brothers Harriman & Co. | | CNH | 713,199 | | | USD | 99,312 | | | | 10/24/19 | | | | (511,026 | ) |
Citibank, NA | | BRL | 404,221 | | | USD | 97,066 | | | | 10/02/19 | | | | (220,766 | ) |
Citibank, NA | | USD | 97,082 | | | BRL | 404,221 | | | | 10/02/19 | | | | 204,447 | |
Citibank, NA | | EUR | 48,412 | | | USD | 54,199 | | | | 10/10/19 | | | | 1,400,100 | |
Citibank, NA | | USD | 78,366 | | | GBP | 63,634 | | | | 10/18/19 | | | | (69,624 | ) |
| | |
| |
| abfunds.com | | AB GLOBAL BOND FUND | 63 |
PORTFOLIO OF INVESTMENTS(continued)
| | | | | | | | | | | | | | | | |
| Counterparty | | Contracts to
Deliver
(000) | | | In Exchange
For
(000) | | | Settlement
Date | | | Unrealized
Appreciation/
(Depreciation) | |
Citibank, NA | | CNH | 490,697 | | | USD | 69,498 | | | | 10/24/19 | | | $ | 817,539 | |
Citibank, NA | | SGD | 38,767 | | | USD | 27,988 | | | | 10/31/19 | | | | (70,049 | ) |
Citibank, NA | | RUB | 412,902 | | | USD | 6,368 | | | | 11/14/19 | | | | 38,161 | |
Citibank, NA | | USD | 38,078 | | | JPY | 4,085,094 | | | | 11/21/19 | | | | (168,986 | ) |
Credit Suisse International | | EUR | 18,928 | | | USD | 21,328 | | | | 10/10/19 | | | | 685,179 | |
Credit Suisse International | | USD | 4,689 | | | ILS | 16,290 | | | | 10/16/19 | | | | 656 | |
Credit Suisse International | | USD | 32,587 | | | MXN | 661,250 | | | | 10/25/19 | | | | 781,575 | |
Deutsche Bank AG | | USD | 16,846 | | | EUR | 15,378 | | | | 10/10/19 | | | | (74,828 | ) |
Goldman Sachs Bank USA | | EUR | 100,599 | | | USD | 111,270 | | | | 10/10/19 | | | | 1,553,619 | |
Goldman Sachs Bank USA | | USD | 46,667 | | | INR | 3,238,906 | | | | 10/24/19 | | | | (968,643 | ) |
Goldman Sachs Bank USA | | IDR | 1,141,311,570 | | | USD | 80,216 | | | | 11/21/19 | | | | 208,061 | |
Goldman Sachs Bank USA | | CAD | 779,039 | | | USD | 587,217 | | | | 11/22/19 | | | | (1,271,759 | ) |
Goldman Sachs Bank USA | | SEK | 1,675,006 | | | USD | 174,014 | | | | 1/08/20 | | | | 2,665,087 | |
Goldman Sachs Bank USA | | MYR | 485,420 | | | USD | 115,282 | | | | 2/13/20 | | | | (230,439 | ) |
HSBC Bank USA | | EUR | 14,652 | | | USD | 16,203 | | | | 10/10/19 | | | | 224,083 | |
HSBC Bank USA | | USD | 23,460 | | | INR | 1,628,867 | | | | 10/24/19 | | | | (477,638 | ) |
HSBC Bank USA | | JPY | 57,504,015 | | | USD | 537,924 | | | | 11/21/19 | | | | 4,298,136 | |
JPMorgan Chase Bank, NA | | BRL | 50,327 | | | USD | 12,085 | | | | 10/02/19 | | | | (27,486 | ) |
JPMorgan Chase Bank, NA | | USD | 12,060 | | | BRL | 50,327 | �� | | | 10/02/19 | | | | 52,392 | |
JPMorgan Chase Bank, NA | | USD | 150,977 | | | EUR | 135,030 | | | | 10/10/19 | | | | (3,711,284 | ) |
JPMorgan Chase Bank, NA | | USD | 5,393 | | | ILS | 18,730 | | | | 10/16/19 | | | | (431 | ) |
JPMorgan Chase Bank, NA | | GBP | 147,887 | | | USD | 184,714 | | | | 10/18/19 | | | | 2,751,746 | |
JPMorgan Chase Bank, NA | | USD | 75,728 | | | MXN | 1,480,426 | | | | 10/25/19 | | | | (1,021,366 | ) |
JPMorgan Chase Bank, NA | | SGD | 99,305 | | | USD | 72,262 | | | | 10/31/19 | | | | 388,263 | |
Morgan Stanley Capital Services LLC | | EUR | 91,782 | | | USD | 103,486 | | | | 10/10/19 | | | | 3,385,502 | |
Morgan Stanley Capital Services LLC | | USD | 105,206 | | | PLN | 399,409 | | | | 10/11/19 | | | | (5,594,572 | ) |
Morgan Stanley Capital Services LLC | | GBP | 145,944 | | | USD | 178,937 | | | | 10/18/19 | | | | (634,107 | ) |
Morgan Stanley Capital Services LLC | | EUR | 578,166 | | | USD | 643,418 | | | | 12/11/19 | | | | 9,829,293 | |
Morgan Stanley Capital Services LLC | | MYR | 70,070 | | | USD | 16,695 | | | | 2/13/20 | | | | 20,997 | |
Royal Bank of Scotland PLC | | BRL | 454,548 | | | USD | 108,588 | | | | 10/02/19 | | | | (811,477 | ) |
Royal Bank of Scotland PLC | | USD | 109,151 | | | BRL | 454,548 | | | | 10/02/19 | | | | 248,252 | |
Royal Bank of Scotland PLC | | EUR | 911,798 | | | USD | 1,029,277 | | | | 10/10/19 | | | | 34,850,629 | |
Royal Bank of Scotland PLC | | USD | 149,501 | | | EUR | 133,556 | | | | 10/10/19 | | | | (3,841,325 | ) |
Royal Bank of Scotland PLC | | USD | 60,072 | | | ILS | 208,309 | | | | 10/16/19 | | | | (101,486 | ) |
Royal Bank of Scotland PLC | | USD | 108,375 | | | BRL | 454,548 | | | | 11/04/19 | | | | 754,820 | |
Royal Bank of Scotland PLC | | NZD | 109,599 | | | USD | 69,863 | | | | 11/07/19 | | | | 1,173,175 | |
Royal Bank of Scotland PLC | | CLP | 51,637,257 | | | USD | 72,699 | | | | 11/14/19 | | | | 1,817,432 | |
Royal Bank of Scotland PLC | | USD | 37,157 | | | COP | 125,114,326 | | | | 11/14/19 | | | | (1,278,876 | ) |
Standard Chartered Bank | | EUR | 18,251 | | | USD | 20,595 | | | | 10/10/19 | | | | 690,124 | |
Standard Chartered Bank | | USD | 6,149 | | | EUR | 5,484 | | | | 10/10/19 | | | | (167,652 | ) |
Standard Chartered Bank | | GBP | 69,947 | | | USD | 87,006 | | | | 10/18/19 | | | | 942,053 | |
UBS AG | | EUR | 483,000 | | | USD | 545,095 | | | | 11/08/19 | | | | 17,098,006 | |
| | | | | | | | | | | | | | | | |
| | | | | | | | | | | | | | $ | 62,297,950 | |
| | | | | | | | | | | | | | | | |
| | |
| |
| 64 | AB GLOBAL BOND FUND | | abfunds.com |
PORTFOLIO OF INVESTMENTS(continued)
CENTRALLY CLEARED CREDIT DEFAULT SWAPS (see Note D)
| | | | | | | | | | | | | | | | | | | | | | | | | | | | | | | | |
| Description | | Fixed
Rate
(Pay)
Receive | | | Payment
Frequency | | | Implied
Credit
Spread at
September 30,
2019 | | | Notional
Amount
(000) | | | Market
Value | | | Upfront
Premiums
Paid
(Received) | | | Unrealized
Appreciation/
(Depreciation) | |
Buy Contracts | | | | | | | | | | | | | | | | | | | | | | | | | | | | | |
CDX-NAHY Series 32, 5 Year Index, 6/20/24* | | | (5.00 | )% | | | Quarterly | | | | 3.29 | % | | | USD | | | | 100,203 | | | $ | (7,214,721 | ) | | $ | (4,232,513 | ) | | $ | (2,982,208 | ) |
CDX-NAHY Series 33, 5 Year Index, 12/20/24* | | | (5.00 | ) | | | Quarterly | | | | 3.51 | | | | USD | | | | 101,215 | | | | (6,900,424 | ) | | | (6,735,858 | ) | | | (164,566 | ) |
iTraxx Australia Series 32, 5 Year Index, 12/20/24* | | | (1.00 | ) | | | Quarterly | | | | 0.67 | | | | USD | | | | 168,000 | | | | (2,790,750 | ) | | | (2,854,391 | ) | | | 63,641 | |
| | | | | | | |
Sale Contracts | | | | | | | | | | | | | | | | | | | | | | | | | | | | | |
CDX-NAHY Series 32, 5 Year Index, 6/20/24* | | | 5.00 | | | | Quarterly | | | | 3.29 | | | | USD | | | | 100,203 | | | | 7,214,721 | | | | 7,095,364 | | | | 119,357 | |
CDX-NAIG Series 33, 5 Year Index, 12/20/24* | | | 1.00 | | | | Quarterly | | | | 0.60 | | | | USD | | | | 168,000 | | | | 3,346,647 | | | | 3,276,849 | | | | 69,798 | |
| | | | | | | | | | | | | | | | | | | | | | | | | | | | | | | | |
| | | | | | | | | | | | | | | | | | | | | | $ | (6,344,527 | ) | | $ | (3,450,549 | ) | | $ | (2,893,978 | ) |
| | | | | | | | | | | | | | | | | | | | | | | | | | | | | | | | |
CENTRALLY CLEARED INTEREST RATE SWAPS (see Note D)
| | | | | | | | | | | | | | | | | | | | | | | | | | |
| | | | | | | | | Rate Type | | | | | | | | | | | |
Notional
Amount
(000) | | | Termination
Date | | | Payments
made
by the
Fund | | Payments
received
by the
Fund | | Payment
Frequency
Paid/
Received | | Market
Value | | | Upfront
Premiums
Paid
(Received) | | | Unrealized
Appreciation/
(Depreciation) | |
USD | | | 700,920 | | | | 9/10/20 | | | 3 Month
LIBOR | | 2.824% | | Quarterly/
Semi-Annual | | $ | 6,503,254 | | | $ | — | | | $ | 6,503,254 | |
USD | | | 1,000 | | | | 3/17/21 | | | 3 Month
LIBOR | | 1.404% | | Quarterly/
Semi-Annual | | | (5,062 | ) | | | — | | | | (5,062 | ) |
| | |
| |
| abfunds.com | | AB GLOBAL BOND FUND | 65 |
PORTFOLIO OF INVESTMENTS(continued)
| | | | | | | | | | | | | | | | | | | | | | | | | | | | | | | | |
| | | | | | | | | Rate Type | | | | | | | | | | | | | |
Notional
Amount
(000) | | | Termination
Date | | | Payments
made
by the
Fund | | | Payments
received
by the
Fund | | | Payment
Frequency
Paid/
Received | | | Market
Value | | | Upfront
Premiums
Paid
(Received) | | | Unrealized
Appreciation/
(Depreciation) | |
USD | | | 264,760 | | | | 5/24/21 | | | | 2.288% | | |
| 3 Month
LIBOR |
| |
| Semi-Annual/
Quarterly |
| | $ | (4,117,260 | ) | | $ | — | | | $ | (4,117,260 | ) |
USD | | | 145,430 | | | | 8/08/23 | | |
| 3 Month
LIBOR |
| | | 2.823% | | |
| Quarterly/
Semi-Annual |
| | | 7,155,366 | | | | — | | | | 7,155,366 | |
USD | | | 291,180 | | | | 9/10/23 | | |
| 3 Month
LIBOR |
| | | 2.883% | | |
| Quarterly/
Semi-Annual |
| | | 15,276,126 | | | | — | | | | 15,276,126 | |
GBP | | | 17,540 | | | | 2/29/24 | | |
| 6 Month
LIBOR |
| | | 1.251% | | |
| Semi-Annual/
Semi-Annual |
| | | 625,248 | | | | 70,500 | | | | 554,748 | |
GBP | | | 17,540 | | | | 2/29/24 | | | | 1.251% | | |
| 6 Month
LIBOR |
| |
| Semi-Annual/
Semi-Annual |
| | | (625,330 | ) | | | (106,288 | ) | | | (519,042 | ) |
CAD | | | 288,230 | | | | 5/22/24 | | |
| 3 Month
CDOR |
| | | 1.980% | | |
| Semi-Annual/
Semi-Annual |
| | | 2,304,788 | | | | — | | | | 2,304,788 | |
USD | | | 108,590 | | | | 5/24/24 | | | | 2.200% | | |
| 3 Month
LIBOR |
| |
| Semi-Annual/
Quarterly |
| | | (3,969,889 | ) | | | — | | | | (3,969,889 | ) |
USD | | | 58,500 | | | | 11/09/25 | | | | 2.130% | | |
| 3 Month
LIBOR |
| |
| Semi-Annual/
Quarterly |
| | | (2,403,357 | ) | | | — | | | | (2,403,357 | ) |
USD | | | 600 | | | | 1/30/27 | | | | 2.459% | | |
| 3 Month
LIBOR |
| |
| Semi-Annual/
Quarterly |
| | | (38,933 | ) | | | — | | | | (38,933 | ) |
USD | | | 150 | | | | 5/05/45 | | |
| 3 Month
LIBOR |
| | | 2.566% | | |
| Quarterly/
Semi-Annual |
| | | 27,976 | | | | 1 | | | | 27,975 | |
USD | | | 100 | | | | 7/16/45 | | |
| 3 Month
LIBOR |
| | | 3.019% | | |
| Quarterly/
Semi-Annual |
| | | 27,964 | | | | 9,466 | | | | 18,498 | |
USD | | | 131,760 | | | | 9/10/48 | | | | 2.980% | | |
| 3 Month
LIBOR |
| |
| Semi-Annual/
Quarterly |
| | | (39,194,294 | ) | | | — | | | | (39,194,294 | ) |
| | | | | | | | | | | | | | | | | | | | | | | | | | | | | | | | |
| | | | | | | | | | | | | | | | | | | | | | $ | (18,433,403 | ) | | $ | (26,321 | ) | | $ | (18,407,082 | ) |
| | | | | | | | | | | | | | | | | | | | | | | | | | | | | | | | |
CREDIT DEFAULT SWAPS (see Note D)
| | | | | | | | | | | | | | | | | | | | | | | | | | | | |
Swap
Counterparty &
Referenced
Obligation | | Fixed
Rate
(Pay)
Receive | | | Payment
Frequency | | Implied
Credit
Spread at
September 30,
2019 | | | Notional
Amount
(000) | | | Market
Value | | | Upfront
Premiums
Paid
(Received) | | | Unrealized
Appreciation/
(Depreciation) | |
Sale Contracts | | | | | | | | | | | | | | | | | | | | | | | | | | | | |
Bank of America, NA | | | | | | | | | | | | | | | | | | | | | | | | | | | | |
Genworth Holdings, Inc., 4.800%, 2/15/24, 6/20/20* | | | 5.00 | % | | Quarterly | | | 1.16 | % | | USD | | | 950 | | | $ | 27,770 | | | $ | 6,067 | | | $ | 21,703 | |
Barclays Bank PLC | | | | | | | | | | | | | | | | | | | | | | | | | | | | |
Assured Guaranty Municipal Corp., 6.110% 6/29/25, 6/20/20* | | | 5.00 | | | Quarterly | | | 0.09 | | | USD | | | 950 | | | | 35,312 | | | | 10,836 | | | | 24,476 | |
Citibank, NA | | | | | | | | | | | | | | | | | | | | | | | | | | | | |
Nabors Industries, Inc., 5.500%, 1/15/23, 6/20/20* | | | 1.00 | | | Quarterly | | | 2.22 | | | USD | | | 950 | | | | (8,016 | ) | | | (16,465 | ) | | | 8,449 | |
Safeway, Inc., 7.250%, 2/01/31, 6/20/20* | | | 1.00 | | | Quarterly | | | 0.20 | | | USD | | | 950 | | | | 5,818 | | | | (12,004 | ) | | | 17,822 | |
Staples, Inc., 8.500%, 9/15/25, 6/20/20* | | | 1.00 | | | Quarterly | | | 0.40 | | | USD | | | 950 | | | | 4,450 | | | | (5,854 | ) | | | 10,304 | |
Citigroup Global Markets, Inc. | | | | | | | | | | | | | | | | | | | | | | | | | | | | |
CDX-CMBX.NA.BBB- Series 6, 5/11/63* | | | 3.00 | | | Monthly | | | 6.28 | | | USD | | | 5,000 | | | | (420,500 | ) | | | (720,497 | ) | | | 299,997 | |
| | |
| |
| 66 | AB GLOBAL BOND FUND | | abfunds.com |
PORTFOLIO OF INVESTMENTS(continued)
| | | | | | | | | | | | | | | | | | | | | | | | | | | | |
Swap
Counterparty &
Referenced
Obligation | | Fixed
Rate
(Pay)
Receive | | | Payment
Frequency | | Implied
Credit
Spread at
September 30,
2019 | | | Notional
Amount
(000) | | | Market
Value | | | Upfront
Premiums
Paid
(Received) | | | Unrealized
Appreciation/
(Depreciation) | |
CDX-CMBX.NA.BBB- Series 6, 5/11/63* | | | 3.00 | % | | Monthly | | | 6.28 | % | | USD | | | 735 | | | $ | (61,936 | ) | | $ | (100,297 | ) | | $ | 38,361 | |
CDX-CMBX.NA.BBB- Series 6, 5/11/63* | | | 3.00 | | | Monthly | | | 6.28 | | | USD | | | 1,088 | | | | (91,591 | ) | | | (122,889 | ) | | | 31,298 | |
Credit Suisse International | | | | | | | | | | | | | | | | | | | | | | | | | | | | |
Avon Products, Inc., 5.000%, 3/15/23, 6/20/20* | | | 1.00 | | | Quarterly | | | 0.33 | | | USD | | | 950 | | | | 4,930 | | | | (25,435 | ) | | | 30,365 | |
CDX-CMBX.NA.A Series 6, 5/11/63* | | | 2.00 | | | Monthly | | | 1.94 | | | USD | | | 12,060 | | | | 30,552 | | | | (476,810 | ) | | | 507,362 | |
CDX-CMBX.NA.A Series 6, 5/11/63* | | | 2.00 | | | Monthly | | | 1.94 | | | USD | | | 8,513 | | | | 21,093 | | | | (465,242 | ) | | | 486,335 | |
CDX-CMBX.NA.A Series 6, 5/11/63* | | | 2.00 | | | Monthly | | | 1.94 | | | USD | | | 9,831 | | | | 24,905 | | | | (408,128 | ) | | | 433,033 | |
CDX-CMBX.NA.A Series 6, 5/11/63* | | | 2.00 | | | Monthly | | | 1.94 | | | USD | | | 5,987 | | | | 14,834 | | | | (240,280 | ) | | | 255,114 | |
CDX-CMBX.NA.A Series 6, 5/11/63* | | | 2.00 | | | Monthly | | | 1.94 | | | USD | | | 2,395 | | | | 5,934 | | | | (97,943 | ) | | | 103,877 | |
CDX-CMBX.NA.A Series 6, 5/11/63* | | | 2.00 | | | Monthly | | | 1.94 | | | USD | | | 1,198 | | | | 2,968 | | | | (48,080 | ) | | | 51,048 | |
CDX-CMBX.NA.BBB- Series 6, 5/11/63* | | | 3.00 | | | Monthly | | | 6.28 | | | USD | | | 6,500 | | | | (546,650 | ) | | | (936,646 | ) | | | 389,996 | |
CDX-CMBX.NA.BBB- Series 6, 5/11/63* | | | 3.00 | | | Monthly | | | 6.28 | | | USD | | | 5,000 | | | | (420,500 | ) | | | (721,341 | ) | | | 300,841 | |
CDX-CMBX.NA.BBB- Series 6, 5/11/63* | | | 3.00 | | | Monthly | | | 6.28 | | | USD | | | 2,925 | | | | (245,993 | ) | | | (168,392 | ) | | | (77,601 | ) |
Freeport-Mcmoran, Inc., 3.550%, 3/01/22, 6/20/20* | | | 1.00 | | | Quarterly | | | 0.20 | | | USD | | | 950 | | | | 5,823 | | | | (10,424 | ) | | | 16,247 | |
Teck Resources Ltd., 3.750%, 2/01/23, 6/20/20* | | | 1.00 | | | Quarterly | | | 0.20 | | | USD | | | 950 | | | | 5,791 | | | | (11,083 | ) | | | 16,874 | |
Transocean, Inc., 3.800%, 10/15/22, 6/20/20* | | | 1.00 | | | Quarterly | | | 2.17 | | | USD | | | 950 | | | | (7,687 | ) | | | (31,047 | ) | | | 23,360 | |
Deutsche Bank AG | | | | | | | | | | | | | | | | | | | | | | | | | | | | |
CDX-CMBX.NA.A Series 6, 5/11/63* | | | 2.00 | | | Monthly | | | 1.94 | | | USD | | | 6,900 | | | | 17,480 | | | | (269,257 | ) | | | 286,737 | |
| | |
| |
| abfunds.com | | AB GLOBAL BOND FUND | 67 |
PORTFOLIO OF INVESTMENTS(continued)
| | | | | | | | | | | | | | | | | | | | | | | | | | | | |
Swap
Counterparty &
Referenced
Obligation | | Fixed
Rate
(Pay)
Receive | | | Payment
Frequency | | Implied
Credit
Spread at
September 30,
2019 | | | Notional
Amount
(000) | | | Market
Value | | | Upfront
Premiums
Paid
(Received) | | | Unrealized
Appreciation/
(Depreciation) | |
CDX-CMBX.NA.A Series 6, 5/11/63* | | | 2.00 | % | | Monthly | | | 1.94 | % | | USD | | | 8,901 | | | $ | 22,549 | | | $ | (84,209 | ) | | $ | 106,758 | |
CDX-CMBX.NA.BBB- Series 6, 5/11/63* | | | 3.00 | | | Monthly | | | 6.28 | | | USD | | | 564 | | | | (47,526 | ) | | | (66,463 | ) | | | 18,937 | |
CDX-CMBX.NA.BBB- Series 6, 5/11/63* | | | 3.00 | | | Monthly | | | 6.28 | | | USD | | | 618 | | | | (52,025 | ) | | | (68,963 | ) | | | 16,938 | |
CDX-CMBX.NA.BBB- Series 6, 5/11/63* | | | 3.00 | | | Monthly | | | 6.28 | | | USD | | | 53 | | | | (4,462 | ) | | | (3,707 | ) | | | (755 | ) |
Goldman Sachs International | | | | | | | | | | | | | | | | | | | | | | | | | | | | |
CDX-CMBX.NA.A Series 6, 5/11/63* | | | 2.00 | | | Monthly | | | 1.94 | | | USD | | | 8,358 | | | | 21,174 | | | | (60,173 | ) | | | 81,347 | |
CDX-CMBX.NA.A Series 6, 5/11/63* | | | 2.00 | | | Monthly | | | 1.94 | | | USD | | | 8,359 | | | | 21,176 | | | | (50,741 | ) | | | 71,917 | |
CDX-CMBX.NA.A Series 6, 5/11/63* | | | 2.00 | | | Monthly | | | 1.94 | | | USD | | | 3,000 | | | | 7,600 | | | | (54,609 | ) | | | 62,209 | |
CDX-CMBX.NA.BBB- Series 6, 5/11/63* | | | 3.00 | | | Monthly | | | 6.28 | | | USD | | | 1,611 | | | | (135,619 | ) | | | (174,737 | ) | | | 39,118 | |
CDX-CMBX.NA.BBB- Series 6, 5/11/63* | | | 3.00 | | | Monthly | | | 6.28 | | | USD | | | 1,115 | | | | (93,957 | ) | | | (121,008 | ) | | | 27,051 | |
CDX-CMBX.NA.BBB- Series 6, 5/11/63* | | | 3.00 | | | Monthly | | | 6.28 | | | USD | | | 979 | | | | (82,415 | ) | | | (105,481 | ) | | | 23,066 | |
CDX-CMBX.NA.BBB- Series 6, 5/11/63* | | | 3.00 | | | Monthly | | | 6.28 | | | USD | | | 3,346 | | | | (281,956 | ) | | | (290,661 | ) | | | 8,705 | |
CDX-CMBX.NA.BBB- Series 6, 5/11/63* | | | 3.00 | | | Monthly | | | 6.28 | | | USD | | | 558 | | | | (47,021 | ) | | | (55,406 | ) | | | 8,385 | |
CDX-CMBX.NA.BBB- Series 6, 5/11/63* | | | 3.00 | | | Monthly | | | 6.28 | | | USD | | | 244 | | | | (20,541 | ) | | | (26,480 | ) | | | 5,939 | |
CDX-CMBX.NA.BBB- Series 6, 5/11/63* | | | 3.00 | | | Monthly | | | 6.28 | | | USD | | | 557 | | | | (46,937 | ) | | | (51,110 | ) | | | 4,173 | |
| | |
| |
| 68 | AB GLOBAL BOND FUND | | abfunds.com |
PORTFOLIO OF INVESTMENTS(continued)
| | | | | | | | | | | | | | | | | | | | | | | | | | | | |
Swap
Counterparty &
Referenced
Obligation | | Fixed
Rate
(Pay)
Receive | | | Payment
Frequency | | Implied
Credit
Spread at
September 30,
2019 | | | Notional
Amount
(000) | | | Market
Value | | | Upfront
Premiums
Paid
(Received) | | | Unrealized
Appreciation/
(Depreciation) | |
CDX-CMBX.NA.BBB- Series 6, 5/11/63* | | | 3.00 | % | | Monthly | | | 6.28 | % | | USD | | | 575 | | | $ | (48,453 | ) | | $ | (48,805 | ) | | $ | 352 | |
CDX-CMBX.NA.BBB- Series 6, 5/11/63* | | | 3.00 | | | Monthly | | | 6.28 | | | USD | | | 279 | | | | (23,510 | ) | | | (25,135 | ) | | | 1,625 | |
CDX-CMBX.NA.BBB- Series 6, 5/11/63* | | | 3.00 | | | Monthly | | | 6.28 | | | USD | | | 5,000 | | | | (421,333 | ) | | | (398,479 | ) | | | (22,854 | ) |
CDX-CMBX.NA.BBB- Series 6, 5/11/63* | | | 3.00 | | | Monthly | | | 6.28 | | | USD | | | 15,000 | | | | (1,264,000 | ) | | | (1,195,438 | ) | | | (68,562 | ) |
CDX-CMBX.NA.BBB- Series 6, 5/11/63* | | | 3.00 | | | Monthly | | | 6.28 | | | USD | | | 5,000 | | | | (421,333 | ) | | | (381,506 | ) | | | (39,827 | ) |
CDX-CMBX.NA.BBB- Series 6, 5/11/63* | | | 3.00 | | | Monthly | | | 6.28 | | | USD | | | 1,260 | | | | (105,966 | ) | | | (74,910 | ) | | | (31,056 | ) |
CDX-CMBX.NA.BBB- Series 6, 5/11/63* | | | 3.00 | | | Monthly | | | 6.28 | | | USD | | | 10,000 | | | | (842,667 | ) | | | (771,573 | ) | | | (71,094 | ) |
CDX-CMBX.NA.BBB- Series 6, 5/11/63* | | | 3.00 | | | Monthly | | | 6.28 | | | USD | | | 10,000 | | | | (842,667 | ) | | | (763,011 | ) | | | (79,656 | ) |
CDX-CMBX.NA.BBB- Series 6, 5/11/63* | | | 3.00 | | | Monthly | | | 6.28 | | | USD | | | 5,815 | | | | (489,042 | ) | | | (345,715 | ) | | | (143,327 | ) |
| | | | | | | | | | | | | | | | | | | | | | | | | | | | |
| | | $ | (6,794,144 | ) | | $ | (10,089,531 | ) | | $ | 3,295,387 | |
| | | | | | | | | | | | | | | | | | | | | | | | | | | | |
| ** | Principal amount less than 500. |
| (a) | Security is exempt from registration under Rule 144A of the Securities Act of 1933. These securities are considered restricted, but liquid and may be resold in transactions exempt from registration, normally to qualified institutional buyers. At September 30, 2019, the aggregate market value of these securities amounted to $3,215,469,387 or 44.5% of net assets. |
| (b) | Position, or a portion thereof, has been segregated to collateralize OTC derivatives outstanding. |
| (c) | Position, or a portion thereof, has been segregated to collateralize margin requirements for open futures contracts. |
| (d) | Position, or a portion thereof, has been segregated to collateralize margin requirements for open centrally cleared swaps. |
| (f) | Fair valued by the Adviser. |
| (g) | Securities are perpetual and, thus, do not have a predetermined maturity date. The date shown, if applicable, reflects the next call date. |
| (h) | Floating Rate Security. Stated interest/floor/ceiling rate was in effect at September 30, 2019. |
| | |
| |
| abfunds.com | | AB GLOBAL BOND FUND | 69 |
PORTFOLIO OF INVESTMENTS(continued)
| (i) | Security is exempt from registration under Rule 144A of the Securities Act of 1933. These securities, which represent 0.50% of net assets as of September 30, 2019, are considered illiquid and restricted. Additional information regarding such securities follows: |
| | | | | | | | | | | | | | | | |
144A/Restricted &
Illiquid Securities | | Acquisition
Date | | | Cost | | | Market
Value | | | Percentage of
Net Assets | |
JP Morgan Madison Avenue Securities Trust
Series 2015-CH1, Class M2
7.518%, 10/25/25 | | | 9/18/15 | | | $ | 5,369,779 | | | $ | 6,056,553 | | | | 0.08 | % |
Morgan Stanley Capital I Trust
Series 2015-XLF2, Class SNMD
3.762%, 11/15/26 | | | 11/13/15 | | | | 5,409,774 | | | | 5,625,877 | | | | 0.08 | % |
PMT Credit Risk Transfer Trust
Series 2019-1R, Class A
4.14%, 3/27/24 | | | 3/21/19 | | | | 10,195,909 | | | | 10,169,222 | | | | 0.14 | % |
PMT Credit Risk Transfer Trust
Series 2019-2R, Class A
4.89%, 5/27/23 | | | 6/07/19 | | | | 11,161,098 | | | | 11,183,255 | | | | 0.16 | % |
Terraform Global Operating LLC
6.125%, 3/01/26 | | | 2/08/18 | | | | 2,748,000 | | | | 2,820,786 | | | | 0.04 | % |
Virgolino de Oliveira Finance SA
10.50%, 1/28/18 | | | 6/13/13 | | | | 3,886,876 | | | | 129,929 | | | | 0.00 | % |
| (j) | Security in which significant unobservable inputs (Level 3) were used in determining fair value. |
| (k) | Non-income producing security. |
| (l) | The stated coupon rate represents the greater of the LIBOR or the LIBOR floor rate plus a spread at September 30, 2019. |
| (n) | Defaulted matured security. |
| (o) | Restricted and illiquid security. |
| | | | | | | | | | | | | | | | |
Restricted & Illiquid
Securities | | Acquisition
Date | | | Cost | | | Market Value | | | Percentage of
Net Assets | |
Mt. Logan Re Ltd. (Preference Shares) | | | 12/30/14 | | | $ | 9,702,000 | | | $ | 9,350,684 | | | | 0.13 | % |
| (p) | Affiliated investments. |
| (q) | To obtain a copy of the fund’s shareholder report, please go to the Securities and Exchange Commission’s website at www.sec.gov, or call AB at (800) 227-4618. |
| (r) | The rate shown represents the 7-day yield as of period end. |
Currency Abbreviations:
|
| BRL – Brazilian Real |
| CAD – Canadian Dollar |
| CLP – Chilean Peso |
| CNH – Chinese Yuan Renminbi (Offshore) |
| CNY – Chinese Yuan Renminbi |
| COP – Colombian Peso |
| EUR – Euro |
| GBP – Great British Pound |
| IDR – Indonesian Rupiah |
| ILS – Israeli Shekel |
| | |
| |
| 70 | AB GLOBAL BOND FUND | | abfunds.com |
PORTFOLIO OF INVESTMENTS(continued)
|
| INR – Indian Rupee |
| JPY – Japanese Yen |
| MXN – Mexican Peso |
| MYR – Malaysian Ringgit |
| NZD – New Zealand Dollar |
| PLN – Polish Zloty |
| RUB – Russian Ruble |
| SEK – Swedish Krona |
| SGD – Singapore Dollar |
| USD – United States Dollar |
| ZAR – South African Rand |
Glossary:
ABS – Asset-Backed Securities
BOBL – Bundesobligationen
CBT – Chicago Board of Trade
CDOR – Canadian Dealer Offered Rate
CDX-CMBX.NA – North American Commercial Mortgage-Backed Index
CDX-NAHY – North American High Yield Credit Default Swap Index
CDX-NAIG – North American Investment Grade Credit Default Swap Index
CMBS – Commercial Mortgage-Backed Securities
CPI – Consumer Price Index
LIBOR – London Interbank Offered Rates
OAT – Obligations Assimilables du Trésor
OSE – Osaka Securities Exchange
PJSC – Public Joint Stock Company
REIT – Real Estate Investment Trust
TBA – To Be Announced
TIPS – Treasury Inflation Protected Security
See notes to financial statements.
| | |
| |
| abfunds.com | | AB GLOBAL BOND FUND | 71 |
STATEMENT OF ASSETS & LIABILITIES
September 30, 2019
| | | | |
| Assets | | | | |
Investments in securities, at value | | | | |
Unaffiliated issuers (cost $7,025,004,667) | | $ | 7,229,495,200 | |
Affiliated issuers (cost $25,883,752) | | | 25,883,752 | |
Cash collateral due from broker | | | 3,868,120 | |
Foreign currencies, at value (cost $5,119,504) | | | 5,007,746 | |
Receivable for investment securities sold and foreign currency transactions | | | 148,734,294 | |
Unrealized appreciation on forward currency exchange contracts | | | 93,551,684 | |
Unaffiliated interest receivable | | | 45,186,542 | |
Receivable for capital stock sold | | | 13,289,971 | |
Receivable for newly entered credit default swaps | | | 6,890,492 | |
Receivable for variation margin on futures | | | 391,287 | |
Market value of credit default swaps (net premiums received $2,303,369) | | | 280,159 | |
Receivable for variation margin on centrally cleared swaps | | | 154,213 | |
Affiliated dividends receivable | | | 154,206 | |
| | | | |
Total assets | | | 7,572,887,666 | |
| | | | |
| Liabilities | | | | |
Payable for investment securities purchased | | | 280,083,318 | |
Unrealized depreciation on forward currency exchange contracts | | | 31,253,734 | |
Payable for capital stock redeemed | | | 8,489,071 | |
Payable for newly entered credit default swaps | | | 7,248,451 | |
Market value of credit default swaps (net premiums received $7,786,162) | | | 7,074,303 | |
Advisory fee payable | | | 2,494,542 | |
Dividends payable | | | 1,790,655 | |
Distribution fee payable | | | 257,742 | |
Payable for variation margin on centrally cleared swaps | | | 221,639 | |
Transfer Agent fee payable | | | 138,487 | |
Cash collateral received from broker | | | 57,000 | |
Due to Counterparty | | | 17,442 | |
Administrative fee payable | | | 16,984 | |
Payable for variation margin on futures | | | 8,249 | |
Accrued expenses and other liabilities | | | 2,869,106 | |
| | | | |
Total liabilities | | | 342,020,723 | |
| | | | |
Net Assets | | $ | 7,230,866,943 | |
| | | | |
| Composition of Net Assets | | | | |
Capital stock, at par | | $ | 834,815 | |
Additionalpaid-in capital | | | 6,950,828,332 | |
Distributable earnings | | | 279,203,796 | |
| | | | |
| | $ | 7,230,866,943 | |
| | | | |
See notes to financial statements.
| | |
| |
| 72 | AB GLOBAL BOND FUND | | abfunds.com |
STATEMENT OF ASSETS & LIABILITIES(continued)
Net Asset Value Per Share—27 billion shares of capital stock authorized, $.001 par value
| | | | | | | | | | | | |
| Class | | Net Assets | | | Shares
Outstanding | | | Net Asset
Value | |
| |
| A | | $ | 758,637,794 | | | | 87,522,726 | | | $ | 8.67 | * |
| |
| B | | $ | 327,058 | | | | 37,720 | | | $ | 8.67 | |
| |
| C | | $ | 104,089,200 | | | | 11,970,610 | | | $ | 8.70 | |
| |
| Advisor | | $ | 4,845,448,303 | | | | 559,493,151 | | | $ | 8.66 | |
| |
| R | | $ | 69,423,545 | | | | 8,015,385 | | | $ | 8.66 | |
| |
| K | | $ | 19,575,850 | | | | 2,259,791 | | | $ | 8.66 | |
| |
| I | | $ | 852,565,810 | | | | 98,461,356 | | | $ | 8.66 | |
| |
| Z | | $ | 580,799,383 | | | | 67,054,273 | | | $ | 8.66 | |
| |
| * | The maximum offering price per share for Class A shares was $9.05, which reflects a sales charge of 4.25%. |
See notes to financial statements.
| | |
| |
| abfunds.com | | AB GLOBAL BOND FUND | 73 |
STATEMENT OF OPERATIONS
Year Ended September 30, 2019
| | | | | | | | |
| Investment Income | | | | | | | | |
Interest (net of foreign taxes withheld of $488,694) | | $ | 192,956,610 | | | | | |
Dividends | | | | | | | | |
Affiliated issuers | | | 2,111,972 | | | | | |
Unaffiliated issuers | | | 100,092 | | | $ | 195,168,674 | |
| | | | | | | | |
| Expenses | | | | | | | | |
Advisory fee (see Note B) | | | 31,395,900 | | | | | |
Transfer agency—Class A | | | 629,324 | | | | | |
Transfer agency—Class B | | | 641 | | | | | |
Transfer agency—Class C | | | 105,047 | | | | | |
Transfer agency—Advisor Class | | | 3,728,916 | | | | | |
Transfer agency—Class R | | | 184,995 | | | | | |
Transfer agency—Class K | | | 36,340 | | | | | |
Transfer agency—Class I | | | 583,194 | | | | | |
Transfer agency—Class Z | | | 106,018 | | | | | |
Distribution fee—Class A | | | 1,936,076 | | | | | |
Distribution fee—Class B | | | 4,251 | | | | | |
Distribution fee—Class C | | | 1,271,227 | | | | | |
Distribution fee—Class R | | | 355,760 | | | | | |
Distribution fee—Class K | | | 45,425 | | | | | |
Custodian | | | 657,308 | | | | | |
Printing | | | 412,123 | | | | | |
Registration fees | | | 248,017 | | | | | |
Audit and tax | | | 130,621 | | | | | |
Administrative | | | 72,771 | | | | | |
Legal | | | 42,796 | | | | | |
Directors’ fees | | | 23,463 | | | | | |
Miscellaneous | | | 211,625 | | | | | |
| | | | | | | | |
Total expenses before interest expense | | | 42,181,838 | | | | | |
Interest expense | | | 71,840 | | | | | |
| | | | | | | | |
Total expenses | | | 42,253,678 | | | | | |
Less: expenses waived and reimbursed by the Adviser (see Note B) | | | (91,848 | ) | | | | |
| | | | | | | | |
Net expenses | | | | | | | 42,161,830 | |
| | | | | | | | |
Net investment income | | | | | | | 153,006,844 | |
| | | | | | | | |
See notes to financial statements.
| | |
| |
| 74 | AB GLOBAL BOND FUND | | abfunds.com |
STATEMENT OF OPERATIONS(continued)
| | | | | | | | |
| Realized and Unrealized Gain (Loss) on Investment and Foreign Currency Transactions | | | | | | | | |
Net realized gain (loss) on: | | | | | | | | |
Investment transactions | | | | | | $ | 65,955,004 | (a) |
Forward currency exchange contracts | | | | | | | 180,955,524 | |
Futures | | | | | | | (6,776,174 | ) |
Options written | | | | | | | 7,717,585 | |
Swaps | | | | | | | (8,860,786 | ) |
Swaptions written | | | | | | | 2,670,990 | |
Foreign currency transactions | | | | | | | (69,411,125 | ) |
Net change in unrealized appreciation/depreciation on: | | | | | | | | |
Investments | | | | | | | 276,266,367 | (b) |
Forward currency exchange contracts | | | | | | | 20,955,266 | |
Futures | | | | | | | (17,982,529 | ) |
Options written | | | | | | | 1,992,588 | |
Swaps | | | | | | | (23,650,582 | ) |
Foreign currency denominated assets and liabilities | | | | | | | 468,867 | |
| | | | | | | | |
Net gain on investment and foreign currency transactions | | | | | | | 430,300,995 | |
| | | | | | | | |
Contributions from Affiliates (see Note B) | | | | | | | 5,411 | |
| | | | | | | | |
Net Increase in Net Assets from Operations | | | | | | $ | 583,313,250 | |
| | | | | | | | |
| (a) | Net of foreign capital gains taxes of $378,797. |
| (b) | Net of increase in accrued foreign capital gains of $1,218,673. |
See notes to financial statements.
| | |
| |
| abfunds.com | | AB GLOBAL BOND FUND | 75 |
STATEMENT OF CHANGES IN NET ASSETS
| | | | | | | | |
| | | Year Ended
September 30,
2019 | | | Year Ended
September 30,
2018 | |
| Increase (Decrease) in Net Assets from Operations | | | | | | | | |
Net investment income | | $ | 153,006,844 | | | $ | 163,965,434 | |
Net realized gain (loss) on investment and foreign currency transactions | | | 172,251,018 | | | | (834,219 | ) |
Net change in unrealized appreciation/depreciation on investments and foreign currency denominated assets and liabilities | | | 258,049,977 | | | | (186,985,105 | ) |
Contributions from Affiliates (see Note B) | | | 5,411 | | | | – 0 | – |
| | | | | | | | |
Net increase (decrease) in net assets from operations | | | 583,313,250 | | | | (23,853,890 | ) |
| Distributions to Shareholders | | | | | | | | |
Class A | | | (19,779,538 | ) | | | (21,810,531 | ) |
Class B | | | (7,743 | ) | | | (11,284 | ) |
Class C | | | (2,327,089 | ) | | | (2,966,052 | ) |
Advisor Class | | | (127,853,549 | ) | | | (119,675,497 | ) |
Class R | | | (1,517,069 | ) | | | (1,604,973 | ) |
Class K | | | (436,278 | ) | | | (844,316 | ) |
Class I | | | (21,987,749 | ) | | | (20,149,714 | ) |
Class Z | | | (15,015,492 | ) | | | (11,306,387 | ) |
| Capital Stock Transactions | | | | | | | | |
Net increase (decrease) | | | (46,474,488 | ) | | | 270,112,242 | |
Proceeds from third party service provider (see Note E) | | | – 0 | – | | | 1,081 | |
| | | | | | | | |
Total increase | | | 347,914,255 | | | | 67,890,679 | |
| Net Assets | | | | | | | | |
Beginning of period | | | 6,882,952,688 | | | | 6,815,062,009 | |
| | | | | | | | |
End of period | | $ | 7,230,866,943 | | | $ | 6,882,952,688 | |
| | | | | | | | |
See notes to financial statements.
| | |
| |
| 76 | AB GLOBAL BOND FUND | | abfunds.com |
NOTES TO FINANCIAL STATEMENTS
September 30, 2019
NOTE A
Significant Accounting Policies
AB Global Bond Fund, Inc. (the “Fund”) was incorporated as a Maryland corporation on February 3, 1992 and is registered under the Investment Company Act of 1940 as a diversified,open-end management investment company. The Fund offers Class A, Class B, Class C, Advisor Class, Class R, Class K, Class I and Class Z shares. Class T shares have been authorized but currently are not offered. Class A shares are sold with afront-end sales charge of up to 4.25% for purchases not exceeding $1,000,000. With respect to purchases of $1,000,000 or more, Class A shares redeemed within one year of purchase may be subject to a contingent deferred sales charge of 1%. Effective August 2, 2019, sales of Class B shares were suspended. On November 7, 2019, all remaining outstanding Class B shares of the Fund were converted to Class A shares. Class C shares are subject to a contingent deferred sales charge of 1% on redemptions made within the first year after purchase, and 0% after the first year of purchase. Class C shares will automatically convert to Class A shares ten years after the end of the calendar month of purchase. Class R and Class K shares are sold without an initial or contingent deferred sales charge. Advisor Class, Class I and Class Z shares are sold without an initial or contingent deferred sales charge and are not subject to ongoing distribution expense. All nine classes of shares have identical voting, dividend, liquidation and other rights, except that the classes bear different distribution and transfer agency expenses. Each class has exclusive voting rights with respect to its distribution plan. The financial statements have been prepared in conformity with U.S. generally accepted accounting principles (“U.S. GAAP”), which require management to make certain estimates and assumptions that affect the reported amounts of assets and liabilities in the financial statements and amounts of income and expenses during the reporting period. Actual results could differ from those estimates. The Fund is an investment company under U.S. GAAP and follows the accounting and reporting guidance applicable to investment companies. The following is a summary of significant accounting policies followed by the Fund.
1. Security Valuation
Portfolio securities are valued at their current market value determined on the basis of market quotations or, if market quotations are not readily available or are deemed unreliable, at “fair value” as determined in accordance with procedures established by and under the general supervision of the Fund’s Board of Directors (the “Board”).
In general, the market values of securities which are readily available and deemed reliable are determined as follows: securities listed on a national
| | |
| |
| abfunds.com | | AB GLOBAL BOND FUND | 77 |
NOTES TO FINANCIAL STATEMENTS(continued)
securities exchange (other than securities listed on the NASDAQ Stock Market, Inc. (“NASDAQ”)) or on a foreign securities exchange are valued at the last sale price at the close of the exchange or foreign securities exchange. If there has been no sale on such day, the securities are valued at the last traded price from the previous day. Securities listed on more than one exchange are valued by reference to the principal exchange on which the securities are traded; securities listed only on NASDAQ are valued in accordance with the NASDAQ Official Closing Price; listed or over the counter (“OTC”) market put or call options are valued at the mid level between the current bid and ask prices. If either a current bid or current ask price is unavailable, AllianceBernstein L.P. (the “Adviser”) will have discretion to determine the best valuation (e.g., last trade price in the case of listed options); open futures are valued using the closing settlement price or, in the absence of such a price, the most recent quoted bid price. If there are no quotations available for the day of valuation, the last available closing settlement price is used; U.S. Government securities and any other debt instruments having 60 days or less remaining until maturity are generally valued at market by an independent pricing vendor, if a market price is available. If a market price is not available, the securities are valued at amortized cost. This methodology is commonly used for short term securities that have an original maturity of 60 days or less, as well as short term securities that had an original term to maturity that exceeded 60 days. In instances when amortized cost is utilized, the Valuation Committee (the “Committee”) must reasonably conclude that the utilization of amortized cost is approximately the same as the fair value of the security. Such factors the Committee will consider include, but are not limited to, an impairment of the creditworthiness of the issuer or material changes in interest rates. Fixed-income securities, including mortgage-backed and asset-backed securities, may be valued on the basis of prices provided by a pricing service or at a price obtained from one or more of the major broker-dealers. In cases where broker-dealer quotes are obtained, the Adviser may establish procedures whereby changes in market yields or spreads are used to adjust, on a daily basis, a recently obtained quoted price on a security. Swaps and other derivatives are valued daily, primarily using independent pricing services, independent pricing models using market inputs, as well as third party broker-dealers or counterparties. Open end mutual funds are valued at the closing net asset value per share, while exchange traded funds are valued at the closing market price per share.
Securities for which market quotations are not readily available (including restricted securities) or are deemed unreliable are valued at fair value as deemed appropriate by the Adviser. Factors considered in making this determination may include, but are not limited to, information obtained by contacting the issuer, analysts, analysis of the issuer’s financial statements
| | |
| |
| 78 | AB GLOBAL BOND FUND | | abfunds.com |
NOTES TO FINANCIAL STATEMENTS(continued)
or other available documents. In addition, the Fund may use fair value pricing for securities primarily traded innon-U.S. markets because most foreign markets close well before the Fund values its securities at 4:00 p.m., Eastern Time. The earlier close of these foreign markets gives rise to the possibility that significant events, including broad market moves, may have occurred in the interim and may materially affect the value of those securities. To account for this, the Fund generally values many of its foreign equity securities using fair value prices based on third party vendor modeling tools to the extent available.
2. Fair Value Measurements
In accordance with U.S. GAAP regarding fair value measurements, fair value is defined as the price that the Fund would receive to sell an asset or pay to transfer a liability in an orderly transaction between market participants at the measurement date. U.S. GAAP establishes a framework for measuring fair value, and a three-level hierarchy for fair value measurements based upon the transparency of inputs to the valuation of an asset or liability (including those valued based on their market values as described in Note A.1 above). Inputs may be observable or unobservable and refer broadly to the assumptions that market participants would use in pricing the asset or liability. Observable inputs reflect the assumptions market participants would use in pricing the asset or liability based on market data obtained from sources independent of the Fund. Unobservable inputs reflect the Fund’s own assumptions about the assumptions that market participants would use in pricing the asset or liability based on the best information available in the circumstances. Each investment is assigned a level based upon the observability of the inputs which are significant to the overall valuation. The three-tier hierarchy of inputs is summarized below.
| | • | | Level 1—quoted prices in active markets for identical investments |
| | • | | Level 2—other significant observable inputs (including quoted prices for similar investments, interest rates, prepayment speeds, credit risk, etc.) |
| | • | | Level 3—significant unobservable inputs (including the Fund’s own assumptions in determining the fair value of investments) |
The fair value of debt instruments, such as bonds, andover-the-counter derivatives is generally based on market price quotations, recently executed market transactions (where observable) or industry recognized modeling techniques and are generally classified as Level 2. Pricing vendor inputs to Level 2 valuations may include quoted prices for similar investments in active markets, interest rate curves, coupon rates, currency rates, yield curves, option adjusted spreads, default rates, credit spreads and other unique security features in order to estimate the relevant cash flows
| | |
| |
| abfunds.com | | AB GLOBAL BOND FUND | 79 |
NOTES TO FINANCIAL STATEMENTS(continued)
which are then discounted to calculate fair values. If these inputs are unobservable and significant to the fair value, these investments will be classified as Level 3.
Where readily available market prices or relevant bid prices are not available for certain equity investments, such investments may be valued based on similar publicly traded investments, movements in relevant indices since last available prices or based upon underlying company fundamentals and comparable company data (such as multiples to earnings or other multiples to equity). Where an investment is valued using an observable input, such as another publicly traded security, the investment will be classified as Level 2. If management determines that an adjustment is appropriate based on restrictions on resale, illiquidity or uncertainty, and such adjustment is a significant component of the valuation, the investment will be classified as Level 3. An investment will also be classified as Level 3 where management uses company fundamentals and other significant inputs to determine the valuation.
Options are valued using market-based inputs to models, broker or dealer quotations, or alternative pricing sources with reasonable levels of price transparency, where such inputs and models are available. Alternatively, the values may be obtained through unobservable management determined inputs and/or management’s proprietary models. Where models are used, the selection of a particular model to value an option depends upon the contractual terms of, and specific risks inherent in, the option as well as the availability of pricing information in the market. Valuation models require a variety of inputs, including contractual terms, market prices, measures of volatility and correlations of such inputs. Exchange traded options generally will be classified as Level 2. For options that do not trade on exchange but trade in liquid markets, inputs can generally be verified and model selection does not involve significant management judgment. Options are classified within Level 2 on the fair value hierarchy when all of the significant inputs can be corroborated to market evidence. Otherwise such instruments are classified as Level 3.
Valuations of mortgage-backed or other asset-backed securities, by pricing vendors, are based on both proprietary and industry recognized models and discounted cash flow techniques. Significant inputs to the valuation of these instruments are value of the collateral, the rates and timing of delinquencies, the rates and timing of prepayments, and default and loss expectations, which are driven in part by housing prices for residential mortgages. Significant inputs are determined based on relative value analyses, which incorporate comparisons to instruments with similar collateral and risk profiles, including relevant indices. Mortgage and asset-backed securities for which management has collected current observable data
| | |
| |
| 80 | AB GLOBAL BOND FUND | | abfunds.com |
NOTES TO FINANCIAL STATEMENTS(continued)
through pricing services are generally categorized within Level 2. Those investments for which current observable data has not been provided are classified as Level 3.
Bank loan prices are provided by third party pricing services and consist of a composite of the quotes received by the vendor into a consensus price. Certain bank loans are classified as Level 3, as significant input used in the fair value measurement of these instruments is the market quotes that are received by the vendor and these inputs are not observable.
Other fixed income investments, includingnon-U.S. government and corporate debt, are generally valued using quoted market prices, if available, which are typically impacted by current interest rates, maturity dates and any perceived credit risk of the issuer. Additionally, in the absence of quoted market prices, these inputs are used by pricing vendors to derive a valuation based upon industry or proprietary models which incorporate issuer specific data with relevant yield/spread comparisons with more widely quoted bonds with similar key characteristics. Those investments for which there are observable inputs are classified as Level 2. Where the inputs are not observable, the investments are classified as Level 3.
The following table summarizes the valuation of the Fund’s investments by the above fair value hierarchy levels as of September 30, 2019:
| | | | | | | | | | | | | | | | |
Investments in
Securities | | Level 1 | | | Level 2 | | | Level 3 | | | Total | |
Assets: | | | | | | | | | | | | | | | | |
Governments – Treasuries | | $ | – 0 | – | | $ | 2,596,177,994 | | | $ | – 0 | – | | $ | 2,596,177,994 | |
Corporates – Investment Grade | | | �� 0 | – | | | 1,715,986,652 | | | | – 0 | – | | | 1,715,986,652 | |
Inflation-Linked Securities | | | – 0 | – | | | 523,007,540 | | | | – 0 | – | | | 523,007,540 | |
Mortgage Pass-Throughs | | | – 0 | – | | | 470,651,789 | | | | – 0 | – | | | 470,651,789 | |
Collateralized Mortgage Obligations | | | – 0 | – | | | 341,231,291 | | | | – 0 | – | | | 341,231,291 | |
Covered Bonds | | | – 0 | – | | | 304,913,703 | | | | – 0 | – | | | 304,913,703 | |
Corporates –Non-Investment Grade | | | – 0 | – | | | 267,843,208 | | | | 0 | # | | | 267,843,208 | |
Quasi-Sovereigns | | | – 0 | – | | | 212,428,386 | | | | – 0 | – | | | 212,428,386 | |
Collateralized Loan Obligations | | | – 0 | – | | | – 0 | – | | | 189,883,264 | | | | 189,883,264 | |
Commercial Mortgage-Backed Securities | | | – 0 | – | | | 165,103,869 | | | | – 0 | – | | | 165,103,869 | |
Governments – Sovereign Bonds | | | – 0 | – | | | 105,849,121 | | | | – 0 | – | | | 105,849,121 | |
Local Governments – Provincial Bonds | | | – 0 | – | | | 84,872,125 | | | | – 0 | – | | | 84,872,125 | |
| | |
| |
| abfunds.com | | AB GLOBAL BOND FUND | 81 |
NOTES TO FINANCIAL STATEMENTS(continued)
| | | | | | | | | | | | | | | | |
Investments in
Securities | | Level 1 | | | Level 2 | | | Level 3 | | | Total | |
Emerging Markets – Sovereigns | | $ | – 0 | – | | $ | 75,518,993 | | | $ | – 0 | – | | $ | 75,518,993 | |
Supranationals | | | – 0 | – | | | 43,238,709 | | | | – 0 | – | | | 43,238,709 | |
Bank Loans | | | – 0 | – | | | 28,845,527 | | | | 9,518,883 | | | | 38,364,410 | |
Asset-Backed Securities | | | – 0 | – | | | – 0 | – | | | 19,988,776 | | | | 19,988,776 | |
Local Governments – US Municipal Bonds | | | – 0 | – | | | 15,172,752 | | | | – 0 | – | | | 15,172,752 | |
Emerging Markets – Corporate Bonds | | | – 0 | – | | | 11,463,785 | | | | – 0 | – | | | 11,463,785 | |
Common Stocks | | | 43,212 | | | | 1,659,983 | | | | 9,350,684 | | | | 11,053,879 | |
Emerging Markets – Treasuries | | | – 0 | – | | | 10,878,946 | | | | – 0 | – | | | 10,878,946 | |
Whole Loan Trusts | | | – 0 | – | | | – 0 | – | | | 957,458 | | | | 957,458 | |
Agencies | | | – 0 | – | | | 572,509 | | | | – 0 | – | | | 572,509 | |
Warrants | | | 343 | | | | – 0 | – | | | 0 | # | | | 343 | |
Short-Term Investments: | | | | | | | | | | | | | | | | |
Investment Companies | | | 25,883,752 | | | | – 0 | – | | | – 0 | – | | | 25,883,752 | |
Time Deposits | | | – 0 | – | | | 24,335,698 | | | | – 0 | – | | | 24,335,698 | |
| | | | | | | | | | | | | | | | |
Total Investments in Securities | | | 25,927,307 | | | | 6,999,752,580 | | | | 229,699,065 | | | | 7,255,378,952 | |
Other Financial Instruments*: | | | | | | | | | | | | | | | | |
Assets | | | | | | | | | | | | | | | | |
Futures | | �� | 2,813,785 | | | | – 0 | – | | | – 0 | – | | | 2,813,785 | † |
Forward Currency Exchange Contracts | | | – 0 | – | | | 93,551,684 | | | | – 0 | – | | | 93,551,684 | |
Centrally Cleared Credit Default Swaps | | | – 0 | – | | | 10,561,368 | | | | – 0 | – | | | 10,561,368 | † |
Centrally Cleared Interest Rate Swaps | | | – 0 | – | | | 31,920,722 | | | | – 0 | – | | | 31,920,722 | † |
Credit Default Swaps | | | – 0 | – | | | 280,159 | | | | – 0 | – | | | 280,159 | |
Liabilities | | | | | | | | | | | | | | | | |
Futures | | | (13,953,577 | ) | | | – 0 | – | | | – 0 | – | | | (13,953,577 | )† |
Forward Currency Exchange Contracts | | | – 0 | – | | | (31,253,734 | ) | | | – 0 | – | | | (31,253,734 | ) |
Centrally Cleared Credit Default Swaps | | | – 0 | – | | | (16,905,895 | ) | | | – 0 | – | | | (16,905,895 | )† |
Centrally Cleared Interest Rate Swaps | | | – 0 | – | | | (50,354,125 | ) | | | – 0 | – | | | (50,354,125 | )† |
Credit Default Swaps | | | – 0 | – | | | (7,074,303 | ) | | | – 0 | – | | | (7,074,303 | ) |
| | | | | | | | | | | | | | | | |
Total | | $ | 14,787,515 | | | $ | 7,030,478,456 | | | $ | 229,699,065 | | | $ | 7,274,965,036 | |
| | | | | | | | | | | | | | | | |
| # | The Fund held securities with zero market value at period end. |
| * | Other financial instruments are derivative instruments, such as futures, forwards and swaps, which are valued at the unrealized appreciation/(depreciation) on the instrument. Other financial instruments may also include swaps with upfront premiums, options written and swaptions written which are valued at market value. |
| † | Only variation margin receivable/payable at period end is reported within the statement of assets and liabilities. This amount reflects cumulative unrealized appreciation/(depreciation) on futures and centrally cleared swaps as reported in the portfolio of investments. Where applicable, centrally cleared swaps with upfront premiums are presented here at market value. |
| | |
| |
| 82 | AB GLOBAL BOND FUND | | abfunds.com |
NOTES TO FINANCIAL STATEMENTS(continued)
The following is a reconciliation of investments in which significant unobservable inputs (Level 3) were used in determining fair value.
| | | | | | | | | | | | | | | | |
| | | Corporates -
Investment Grade | | | Corporates -
Non-Investment
Grade# | | | Collateralized
Loan
Obligations | | | Commercial
Mortgage -
Backed
Securities | |
Balance as of 9/30/18 | | $ | 23,829,854 | | | $ | – 0 | – | | $ | 145,611,533 | | | $ | 73,001,921 | |
Accrued discounts/ (premiums) | | | – 0 | – | | | – 0 | – | | | 1,409 | | | | 6,462 | |
Realized gain (loss) | | | 263,770 | | | | – 0 | – | | | (34,112 | ) | | | 371,969 | |
Change in unrealized appreciation/ depreciation | | | (69,854 | ) | | | – 0 | – | | | (1,048,167 | ) | | | (233,088 | ) |
Purchases | | | – 0 | – | | | – 0 | – | | | 48,223,223 | | | | – 0 | – |
Sales/Paydowns | | | (24,023,770 | ) | | | – 0 | – | | | (2,870,622 | ) | | | (11,493,768 | ) |
Transfers into Level 3 | | | – 0 | – | | | – 0 | – | | | – 0 | – | | | – 0 | – |
Transfers out of Level 3 | | | – 0 | – | | | – 0 | – | | | – 0 | – | | | (61,653,496 | ) |
| | | | | | | | | | | | | | | | |
Balance as of 9/30/19 | | $ | – 0 | – | | $ | – 0 | – | | $ | 189,883,264 | | | $ | – 0 | – |
| | | | | | | | | | | | | | | | |
Net change in unrealized appreciation/ depreciation from investments held as of 9/30/19** | | $ | – 0 | – | | $ | – 0 | – | | $ | (1,048,272 | ) | | $ | – 0 | – |
| | | | | | | | | | | | | | | | |
| | | | |
| | | Bank Loans | | | Asset-Backed
Securities | | | Emerging Markets -
Corporate Bonds | | | Common
Stocks | |
Balance as of 9/30/18 | | $ | 13,652,453 | | | $ | 19,479,566 | | | $ | 260,365 | | | $ | 11,779,842 | |
Accrued discounts/ (premiums) | | | 15,640 | | | | 4,050 | | | | – 0 | – | | | – 0 | – |
Realized gain (loss) | | | 559 | | | | 3,652 | | | | – 0 | – | | | 1,121,969 | |
Change in unrealized appreciation/ depreciation | | | 125,164 | | | | 625,661 | | | | – 0 | – | | | (1,595,529 | ) |
Purchases | | | 9,425,534 | | | | 6,592,475 | | | | – 0 | – | | | – 0 | – |
Sales/Paydowns | | | (48,014 | ) | | | (6,716,628 | ) | | | – 0 | – | | | (1,955,598 | ) |
Transfers into Level 3 | | | – 0 | – | | | – 0 | – | | | – 0 | – | | | – 0 | – |
| | |
| |
| abfunds.com | | AB GLOBAL BOND FUND | 83 |
NOTES TO FINANCIAL STATEMENTS(continued)
| | | | | | | | | | | | | | | | |
| | | | |
| | | Bank Loans | | | Asset-Backed
Securities | | | Emerging Markets -
Corporate Bonds | | | Common
Stocks | |
Transfers out of Level 3 | | $ | (13,652,453 | ) | | $ | – 0 | – | | $ | (260,365 | ) | | $ | – 0 | – |
| | | | | | | | | | | | | | | | |
Balance as of 9/30/19 | | $ | 9,518,883 | | | $ | 19,988,776 | | | $ | – 0 | – | | $ | 9,350,684 | |
| | | | | | | | | | | | | | | | |
Net change in unrealized appreciation/ depreciation from investments held as of 9/30/19** | | $ | 125,164 | | | $ | 618,336 | | | $ | – 0 | – | | $ | (379,892 | ) |
| | | | | | | | | | | | | | | | |
| | | | |
| | | Whole Loan
Trusts | | | Warrants# | | | Total | | | | |
Balance as of 9/30/18 | | $ | 3,054,565 | | | $ | – 0 | – | | $ | 290,670,099 | | | | | |
Accrued discounts/ (premiums) | | | 2,453 | | | | – 0 | – | | | 30,014 | | | | | |
Realized gain (loss) | | | (1,751,218 | ) | | | – 0 | – | | | (23,411 | ) | | | | |
Change in unrealized appreciation/ depreciation | | | 947,361 | | | | – 0 | – | | | (1,248,452 | ) | | | | |
Purchases | | | – 0 | – | | | – 0 | – | | | 64,241,232 | | | | | |
Sales/Paydowns | | | (1,295,703 | ) | | | – 0 | – | | | (48,404,103 | ) | | | | |
Transfers into Level 3 | | | – 0 | – | | | – 0 | – | | | – 0 | – | | | | |
Transfers out of Level 3 | | | – 0 | – | | | – 0 | – | | | (75,566,314 | ) | | | | |
| | | | | | | | | | | | | | | | |
Balance as of 9/30/19 | | $ | 957,458 | | | $ | – 0 | – | | $ | 229,699,065 | + | | | | |
| | | | | | | | | | | | | | | | |
Net change in unrealized appreciation/depreciation from investments held as of 9/30/19** | | $ | (461,499 | ) | | $ | – 0 | – | | $ | (1,146,163 | ) | | | | |
| | | | | | | | | | | | | | | | |
| ** | The unrealized appreciation/depreciation is included in net change in unrealized appreciation/depreciation on investments and other financial instruments in the accompanying statement of operations. |
| # | The Fund held securities with zero market value at period end. |
| + | An amount of $75,566,314 was transferred out of Level 3 into Level 2 as improved transparency of price inputs has increased the observability during the reporting period. |
| | |
| |
| 84 | AB GLOBAL BOND FUND | | abfunds.com |
NOTES TO FINANCIAL STATEMENTS(continued)
The following presents information about significant unobservable inputs related to the Fund’s Level 3 investments at September 30, 2019. Securities priced by third party vendors, are excluded from the following table.
Quantitative Information about Level 3 Fair Value Measurements
| | | | | | | | | | | | | | | | |
| | | Fair
Value at
9/30/19 | | | Valuation
Technique | | | Unobservable
Input | | | Input | |
Common Stocks | | $ | 9,350,684 | | |
| Market
Approach |
| | | NAV Equivalent | | | | $963.79 | |
Whole Loan Trusts | |
$ |
606,639 |
| |
|
Recovery
Analysis |
| |
|
Cumulative Loss |
| |
|
28% |
|
| | $ | 162,538 | | |
| Recovery
Analysis |
| | | Cumulative Loss | | | | 32% | |
| | $ | 188,281 | | |
| Discounted
Cash Flow |
| | | Cash Flow Yield | | | | 100.00% | |
| | | | | | | | | | | | | | | | |
| | $ | 957,458 | | | | | | | | | | | | | |
| | | | | | | | | | | | | | | | |
Generally, a change in the assumptions used in any input in isolation may be accompanied by a change in another input. Significant changes in any of the unobservable inputs may significantly impact the fair value measurement. Significant increases (decreases) in NAV Equivalent and Cash Flow Yield in isolation would be expected to result in a significantly higher (lower) fair value measurement. A significant increase (decrease) in Cumulative Loss in isolation would be expected to result in a significant lower (higher) fair value measurement.
3. Currency Translation
Assets and liabilities denominated in foreign currencies and commitments under forward currency exchange contracts are translated into U.S. dollars at the mean of the quoted bid and ask prices of such currencies against the U.S. dollar. Purchases and sales of portfolio securities are translated into U.S. dollars at the rates of exchange prevailing when such securities were acquired or sold. Income and expenses are translated into U.S. dollars at the rates of exchange prevailing when accrued.
Net realized gain or loss on foreign currency transactions represents foreign exchange gains and losses from sales and maturities of foreign fixed income investments, holding of foreign currencies, currency gains or losses realized between the trade and settlement dates on foreign investment transactions, and the difference between the amounts of dividends, interest and foreign withholding taxes recorded on the Fund’s books and the U.S. dollar equivalent amounts actually received or paid. Net unrealized currency gains and losses from valuing foreign currency denominated assets and liabilities at period end exchange rates are reflected as a component of net unrealized appreciation or depreciation of foreign currency denominated assets and liabilities.
| | |
| |
| abfunds.com | | AB GLOBAL BOND FUND | 85 |
NOTES TO FINANCIAL STATEMENTS(continued)
4. Taxes
It is the Fund’s policy to meet the requirements of the Internal Revenue Code applicable to regulated investment companies and to distribute all of its investment company taxable income and net realized gains, if any, to shareholders. Therefore, no provisions for federal income or excise taxes are required. The Fund may be subject to taxes imposed by countries in which it invests. Such taxes are generally based on income and/or capital gains earned or repatriated. Taxes are accrued and applied to net investment income, net realized gains and net unrealized appreciation/depreciation as such income and/or gains are earned.
In accordance with U.S. GAAP requirements regarding accounting for uncertainties in income taxes, management has analyzed the Fund’s tax positions taken or expected to be taken on federal and state income tax returns for all open tax years (the current and the prior three tax years) and has concluded that no provision for income tax is required in the Fund’s financial statements.
5. Investment Income and Investment Transactions
Dividend income is recorded on theex-dividend date or as soon as the Fund is informed of the dividend. Interest income is accrued daily. Investment transactions are accounted for on the date the securities are purchased or sold. Investment gains or losses are determined on the identified cost basis. The Fund amortizes premiums and accretes discounts as adjustments to interest income.
6. Class Allocations
All income earned and expenses incurred by the Fund are borne on apro-rata basis by each settled class of shares, based on the proportionate interest in the Fund represented by the net assets of such class, except for class specific expenses which are allocated to the respective class. Realized and unrealized gains and losses are allocated among the various share classes based on respective net assets.
7. Dividends and Distributions
Dividends and distributions to shareholders, if any, are recorded on theex-dividend date. Income dividends and capital gains distributions are determined in accordance with federal tax regulations and may differ from those determined in accordance with U.S. GAAP. To the extent these differences are permanent, such amounts are reclassified within the capital accounts based on their federal tax basis treatment; temporary differences do not require such reclassification.
| | |
| |
| 86 | AB GLOBAL BOND FUND | | abfunds.com |
NOTES TO FINANCIAL STATEMENTS(continued)
NOTE B
Advisory Fee and Other Transactions with Affiliates
Under the terms of the investment advisory agreement, the Fund pays the Adviser an advisory fee at an annual rate of .50% of the first $2.5 billion, .45% of the next $2.5 billion and .40% in excess of $5 billion, of the Fund’s average daily net assets. The fee is accrued daily and paid monthly.
Pursuant to the investment advisory agreement, the Fund may reimburse the Adviser for certain legal and accounting services provided to the Fund by the Adviser. For the year ended September 30, 2019, the reimbursement for such services amounted to $72,771.
The Fund compensates AllianceBernstein Investor Services, Inc. (“ABIS”), a wholly-owned subsidiary of the Adviser, under a Transfer Agency Agreement for providing personnel and facilities to perform transfer agency services for the Fund. ABIS may make payments to intermediaries that provide omnibus account services,sub-accounting services and/or networking services. Such compensation retained by ABIS amounted to $1,639,062 for the year ended September 30, 2019.
AllianceBernstein Investments, Inc. (the “Distributor”), a wholly-owned subsidiary of the Adviser, serves as the distributor of the Fund’s shares. The Distributor has advised the Fund that it has retainedfront-end sales charges of $8,806 from the sale of Class A shares and received $4,176, $246 and $7,138 in contingent deferred sales charges imposed upon redemptions by shareholders of Class A, Class B and Class C shares, respectively, for the year ended September 30, 2019.
The Fund may invest in AB Government Money Market Portfolio (the “Government Money Market Portfolio”) which has a contractual annual advisory fee rate of ..20% of the portfolio’s average daily net assets and bears its own expenses. Effective August 1, 2018, the Adviser has contractually agreed to waive .10% of the advisory fee of Government Money Market Portfolio (resulting in a net advisory fee of .10%) until August 31, 2020. In connection with the investment by the Fund in the Government Money Market Portfolio, the Adviser has contractually agreed to waive its advisory fee from the Fund in an amount equal to the Fund’s share of the effective advisory fee of Government Money Market Portfolio, as borne indirectly by the Fund as an acquired fund fee and expense. For the year ended September 30, 2019, such waiver amounted to $91,848.
| | |
| |
| abfunds.com | | AB GLOBAL BOND FUND | 87 |
NOTES TO FINANCIAL STATEMENTS(continued)
A summary of the Fund’s transactions in AB mutual funds for the year ended September 30, 2019 is as follows:
| | | | | | | | | | | | | | | | | | | | |
Fund | | Market Value
9/30/18
(000) | | | Purchases
at Cost
(000) | | | Sales
Proceeds
(000) | | | Market Value
9/30/19
(000) | | | Dividend
Income
(000) | |
Government Money Market Portfolio | | $ | 46,959 | | | $ | 3,165,944 | | | $ | 3,187,019 | | | $ | 25,884 | | | $ | 2,112 | |
During the year ended September 30, 2019, the Adviser reimbursed the Fund $5,411 for trading losses incurred due to a trade entry error.
During the second quarter of 2018, AXA S.A. (“AXA”), a French holding company for the AXA Group, a worldwide leader in life, property and casualty and health insurance and asset management, completed the sale of a minority stake in its subsidiary, AXA Equitable Holdings, Inc. (“AXA Equitable”), through an initial public offering. AXA Equitable is the holding company for a diverse group of financial services companies, including an approximately 65.3% economic interest in the Adviser and a 100% interest in AllianceBernstein Corporation, the general partner of the Adviser. Since the initial sale, AXA has completed additional offerings, most recently during the fourth quarter of 2019. As a result, AXA owned 10.1% of the outstanding shares of common stock of AXA Equitable as of November 13, 2019, and no longer owns a controlling interest in AXA Equitable. AXA previously announced its intention to sell its entire interest in AXA Equitable over time, subject to market conditions and other factors (the “Plan”). Most of AXA’s remaining AXA Equitable shares are to be delivered on redemption of AXA bonds mandatorily exchangeable into AXA Equitable shares and maturing in May 2021. AXA retains sole discretion to determine the timing of any future sales of its remaining shares of AXA Equitable common stock.
The latest transaction under the Plan, which occurred on November 13, 2019, resulted in the indirect transfer of a “controlling block” of voting securities of the Adviser (a “Change of Control Event”) and was deemed an “assignment” causing a termination of the Fund’s investment advisory agreement. In order to ensure that investment advisory services could continue uninterrupted in the event of a Change of Control Event, the Board previously approved a new investment advisory agreement with the Adviser. Shareholders of the Fund subsequently approved the new investment advisory agreement, which became effective on November 13, 2019.
| | |
| |
| 88 | AB GLOBAL BOND FUND | | abfunds.com |
NOTES TO FINANCIAL STATEMENTS(continued)
NOTE C
Distribution Services Agreement
The Fund has adopted a Distribution Services Agreement (the “Agreement”) pursuant to Rule12b-1 under the Investment Company Act of 1940. Under the Agreement, the Fund pays distribution and servicing fees to the Distributor at an annual rate of up to .30% of the Fund’s average daily net assets attributable to Class A shares, 1% of the Fund’s average daily net assets attributable to both Class B and Class C shares, .50% of the Fund’s average daily net assets attributable to Class R shares and .25% of the Fund’s average daily net assets attributable to Class K shares. There are no distribution and servicing fees on Advisor Class, Class I and Class Z shares. Payments under the Agreement in respect of Class A shares are currently limited to an annual rate of .25% of Class A shares’ average daily net assets. The fees are accrued daily and paid monthly. The Agreement provides that the Distributor will use such payments in their entirety for distribution assistance and promotional activities. Since the commencement of the Fund’s operations, the Distributor has incurred expenses in excess of the distribution costs reimbursed by the Fund in the amounts of $25,194,879, $15,477,145, $1,169,969, and $294,730 for Class B, Class C, Class R and Class K shares, respectively. While such costs may be recovered from the Fund in future periods so long as the Agreement is in effect, the rate of the distribution and servicing fees payable under the Agreement may not be increased without a shareholder vote. In accordance with the Agreement, there is no provision for recovery of unreimbursed distribution costs incurred by the Distributor beyond the current fiscal year for Class A shares. The Agreement also provides that the Adviser may use its own resources to finance the distribution of the Fund’s shares.
NOTE D
Investment Transactions
Purchases and sales of investment securities (excluding short-term investments) for the year ended September 30, 2019, were as follows:
| | | | | | | | |
| | | Purchases | | | Sales | |
Investment securities (excluding U.S. government securities) | | $ | 6,776,044,902 | | | $ | 5,909,739,454 | |
U.S. government securities | | | 1,946,579,148 | | | | 2,759,969,325 | |
The cost of investments for federal income tax purposes, gross unrealized appreciation and unrealized depreciation are as follows:
| | | | |
Cost | | $ | 7,056,643,744 | |
| | | | |
Gross unrealized appreciation | | $ | 399,469,729 | |
Gross unrealized depreciation | | | (217,469,733 | ) |
| | | | |
Net unrealized appreciation | | $ | 181,999,996 | |
| | | | |
| | |
| |
| abfunds.com | | AB GLOBAL BOND FUND | 89 |
NOTES TO FINANCIAL STATEMENTS(continued)
1. Derivative Financial Instruments
The Fund may use derivatives in an effort to earn income and enhance returns, to replace more traditional direct investments, to obtain exposure to otherwise inaccessible markets (collectively, “investment purposes”), or to hedge or adjust the risk profile of its portfolio.
The principal types of derivatives utilized by the Fund, as well as the methods in which they may be used are:
| | • | | Forward Currency Exchange Contracts |
The Fund may enter into forward currency exchange contracts in order to hedge its exposure to changes in foreign currency exchange rates on its foreign portfolio holdings, to hedge certain firm purchase and sale commitments denominated in foreign currencies and fornon-hedging purposes as a means of making direct investments in foreign currencies, as described below under “Currency Transactions”.
A forward currency exchange contract is a commitment to purchase or sell a foreign currency at a future date at a negotiated forward rate. The gain or loss arising from the difference between the original contract and the closing of such contract would be included in net realized gain or loss on forward currency exchange contracts. Fluctuations in the value of open forward currency exchange contracts are recorded for financial reporting purposes as unrealized appreciation and/or depreciation by the Fund. Risks may arise from the potential inability of a counterparty to meet the terms of a contract and from unanticipated movements in the value of a foreign currency relative to the U.S. dollar.
During the year ended September 30, 2019, the Fund held forward currency exchange contracts for hedging andnon-hedging purposes.
The Fund may buy or sell futures for investment purposes or for the purpose of hedging its portfolio against adverse effects of potential movements in the market. The Fund bears the market risk that arises from changes in the value of these instruments and the imperfect correlation between movements in the price of the futures and movements in the price of the assets, reference rates or indices which they are designed to track. Among other things, the Fund may purchase or sell futures for foreign currencies or options thereon fornon-hedging purposes as a means of making direct investment in foreign currencies, as described below under “Currency Transactions”.
At the time the Fund enters into futures, the Fund deposits and maintains as collateral an initial margin with the broker, as required by
| | |
| |
| 90 | AB GLOBAL BOND FUND | | abfunds.com |
NOTES TO FINANCIAL STATEMENTS(continued)
the exchange on which the transaction is effected. Such amount is shown as cash collateral due from broker on the statement of assets and liabilities. Pursuant to the contract, the Fund agrees to receive from or pay to the broker an amount of cash equal to the daily fluctuation in the value of the contract. Such receipts or payments are known as variation margin and are recorded by the Fund as unrealized gains or losses. Risks may arise from the potential inability of a counterparty to meet the terms of the contract. The credit/counterparty risk for exchange-traded futures is generally less than privately negotiated futures, since the clearinghouse, which is the issuer or counterparty to each exchange-traded future, has robust risk mitigation standards, including the requirement to provide initial and variation margin. When the contract is closed, the Fund records a realized gain or loss equal to the difference between the value of the contract at the time it was opened and the time it was closed.
Use of long futures subjects the Fund to risk of loss in excess of the amounts shown on the statement of assets and liabilities, up to the notional value of the futures. Use of short futures subjects the Fund to unlimited risk of loss. Under some circumstances, futures exchanges may establish daily limits on the amount that the price of futures can vary from the previous day’s settlement price, which could effectively prevent liquidation of unfavorable positions.
During the year ended September 30, 2019, the Fund held futures for hedging andnon-hedging purposes.
For hedging and investment purposes, the Fund may purchase and write (sell) put and call options on U.S. and foreign securities, including government securities, and foreign currencies that are traded on U.S. and foreign securities exchanges andover-the-counter markets. Among other things, the Fund may use options transactions fornon-hedging purposes as a means of making direct investments in foreign currencies, as described below under “Currency Transactions” and may use options strategies involving the purchase and/or writing of various combinations of call and/or put options, for hedging and investment purposes.
The risk associated with purchasing an option is that the Fund pays a premium whether or not the option is exercised. Additionally, the Fund bears the risk of loss of the premium and change in market value should the counterparty not perform under the contract. If a put or call option purchased by the Fund were permitted to expire without being sold or exercised, its premium would represent a loss to the Fund. Put and call options purchased are accounted for in the same manner as portfolio securities. The cost of securities acquired through the
| | |
| |
| abfunds.com | | AB GLOBAL BOND FUND | 91 |
NOTES TO FINANCIAL STATEMENTS(continued)
exercise of call options is increased by premiums paid. The proceeds from securities sold through the exercise of put options are decreased by the premiums paid.
When the Fund writes an option, the premium received by the Fund is recorded as a liability and is subsequently adjusted to the current market value of the option written. The Fund’s maximum payment for written put options equates to the number of shares multiplied by the strike price. In certain circumstances maximum payout amounts may be partially offset by recovery values of the respective referenced assets and upfront premium received upon entering into the contract. Premiums received from written options which expire unexercised are recorded by the Fund on the expiration date as realized gains from options written. The difference between the premium received and the amount paid on effecting a closing purchase transaction, including brokerage commissions, is also treated as a realized gain, or if the premium received is less than the amount paid for the closing purchase transaction, as a realized loss. If a call option is exercised, the premium received is added to the proceeds from the sale of the underlying security or currency in determining whether the Fund has realized a gain or loss. If a put option is exercised, the premium received reduces the cost basis of the security or currency purchased by the Fund. In writing an option, the Fund bears the market risk of an unfavorable change in the price of the security or currency underlying the written option. Exercise of an option written by the Fund could result in the Fund selling or buying a security or currency at a price different from the current market value.
The Fund may also invest in options on swap agreements, also called “swaptions”. A swaption is an option that gives the buyer the right, but not the obligation, to enter into a swap on a future date in exchange for paying a market-based “premium”. A receiver swaption gives the owner the right to receive the total return of a specified asset, reference rate, or index. A payer swaption gives the owner the right to pay the total return of a specified asset, reference rate, or index. Swaptions also include options that allow an existing swap to be terminated or extended by one of the counterparties. The Fund’s maximum payment for written put swaptions equates to the notional amount of the underlying swap. In certain circumstances maximum payout amounts may be partially offset by recovery values of the respective referenced assets and upfront premium received upon entering into the contract.
During the year ended September 30, 2019, the Fund held purchased options for hedging andnon-hedging purposes.
| | |
| |
| 92 | AB GLOBAL BOND FUND | | abfunds.com |
NOTES TO FINANCIAL STATEMENTS(continued)
During the year ended September 30, 2019, the Fund held purchased swaptions for hedging andnon-hedging purposes.
During the year ended September 30, 2019, the Fund held written options for hedging andnon-hedging purposes.
During the year ended September 30, 2019, the Fund held written swaptions for hedging andnon-hedging purposes.
The Fund may enter into swaps to hedge its exposure to interest rates, credit risk, and currencies. The Fund may also enter into swaps fornon-hedging purposes as a means of gaining market exposures including by making direct investments in foreign currencies, as described below under “Currency Transactions”. A swap is an agreement that obligates two parties to exchange a series of cash flows at specified intervals based upon or calculated by reference to changes in specified prices or rates for a specified amount of an underlying asset. The payment flows are usually netted against each other, with the difference being paid by one party to the other. In addition, collateral may be pledged or received by the Fund in accordance with the terms of the respective swaps to provide value and recourse to the Fund or its counterparties in the event of default, bankruptcy or insolvency by one of the parties to the swap.
Risks may arise as a result of the failure of the counterparty to the swap to comply with the terms of the swap. The loss incurred by the failure of a counterparty is generally limited to the net interim payment to be received by the Fund, and/or the termination value at the end of the contract. Therefore, the Fund considers the creditworthiness of each counterparty to a swap in evaluating potential counterparty risk. This risk is mitigated by having a netting arrangement between the Fund and the counterparty and by the posting of collateral by the counterparty to the Fund to cover the Fund’s exposure to the counterparty. Additionally, risks may arise from unanticipated movements in interest rates or in the value of the underlying securities. The Fund accrues for the interim payments on swaps on a daily basis, with the net amount recorded within unrealized appreciation/depreciation of swaps on the statement of assets and liabilities, where applicable. Once the interim payments are settled in cash, the net amount is recorded as realized gain/(loss) on swaps on the statement of operations, in addition to any realized gain/(loss) recorded upon the termination of swaps. Upfront premiums paid or received for OTC swaps are recognized as cost or proceeds on the statement of assets and liabilities and are amortized on a straight line basis over the life of the contract. Amortized upfront premiums are included in net realized gain/(loss) from swaps on the statement of operations. Fluctuations in
| | |
| |
| abfunds.com | | AB GLOBAL BOND FUND | 93 |
NOTES TO FINANCIAL STATEMENTS(continued)
the value of swaps are recorded as a component of net change in unrealized appreciation/depreciation of swaps on the statement of operations.
Certain standardized swaps, including certain interest rate swaps and credit default swaps, are (or soon will be) subject to mandatory central clearing. Cleared swaps are transacted through futures commission merchants (“FCMs”) that are members of central clearinghouses, with the clearinghouse serving as central counterparty, similar to transactions in futures contracts. Centralized clearing will be required for additional categories of swaps on aphased-in basis based on requirements published by the Securities and Exchange Commission and Commodity Futures Trading Commission.
At the time the Fund enters into a centrally cleared swap, the Fund deposits and maintains as collateral an initial margin with the broker, as required by the clearinghouse on which the transaction is effected. Such amount is shown as cash collateral due from broker on the statement of assets and liabilities. Pursuant to the contract, the Fund agrees to receive from or pay to the broker an amount of cash equal to the daily fluctuation in the value of the contract. Such receipts or payments are known as variation margin and are recorded by the Fund as unrealized gains or losses. Risks may arise from the potential inability of a counterparty to meet the terms of the contract. The credit/counterparty risk for centrally cleared swaps is generally less thannon-centrally cleared swaps, since the clearinghouse, which is the issuer or counterparty to each centrally cleared swap, has robust risk mitigation standards, including the requirement to provide initial and variation margin. When the contract is closed, the Fund records a realized gain or loss equal to the difference between the value of the contract at the time it was opened and the time it was closed.
Interest Rate Swaps:
The Fund is subject to interest rate risk exposure in the normal course of pursuing its investment objectives. Because the Fund holds fixed rate bonds, the value of these bonds may decrease if interest rates rise. To help hedge against this risk and to maintain its ability to generate income at prevailing market rates, the Fund may enter into interest rate swaps. Interest rate swaps are agreements between two parties to exchange cash flows based on a notional amount. The Fund may elect to pay a fixed rate and receive a floating rate, or, receive a fixed rate and pay a floating rate on a notional amount.
In addition, the Fund may also enter into interest rate swap transactions to preserve a return or spread on a particular investment or portion of its portfolio, or protecting against an increase in the price of securities the Fund anticipates purchasing at a later date. Interest
| | |
| |
| 94 | AB GLOBAL BOND FUND | | abfunds.com |
NOTES TO FINANCIAL STATEMENTS(continued)
rate swaps involve the exchange by a Fund with another party of their respective commitments to pay or receive interest (e.g., an exchange of floating rate payments for fixed rate payments) computed based on a contractually-based principal (or “notional”) amount. Interest rate swaps are entered into on a net basis (i.e., the two payment streams are netted out, with the Fund receiving or paying, as the case may be, only the net amount of the two payments).
During the year ended September 30, 2019, the Fund held interest rate swaps for hedging andnon-hedging purposes.
Credit Default Swaps:
The Fund may enter into credit default swaps, including to manage its exposure to the market or certain sectors of the market, to reduce its risk exposure to defaults by corporate and sovereign issuers held by the Fund, or to create exposure to corporate or sovereign issuers to which it is not otherwise exposed. The Fund may purchase credit protection (“Buy Contract”) or provide credit protection (“Sale Contract”) on the referenced obligation of the credit default swap. During the term of the swap, the Fund receives/(pays) fixed payments from/(to) the respective counterparty, calculated at the agreed upon rate applied to the notional amount. If the Fund is a buyer/(seller) of protection and a credit event occurs, as defined under the terms of the swap, the Fund will either (i) receive from the seller/(pay to the buyer) of protection an amount equal to the notional amount of the swap (the “Maximum Payout Amount”) and deliver/(take delivery of) the referenced obligation or (ii) receive/(pay) a net settlement amount in the form of cash or securities equal to the notional amount of the swap less the recovery value of the referenced obligation. In certain circumstances Maximum Payout Amounts may be partially offset by recovery values of the respective referenced obligations, upfront premium received upon entering into the agreement, or net amounts received from settlement of buy protection credit default swaps entered into by the Fund for the same referenced obligation with the same counterparty.
Credit default swaps may involve greater risks than if the Fund had invested in the referenced obligation directly. Credit default swaps are subject to general market risk, liquidity risk, counterparty risk and credit risk. If the Fund is a buyer of protection and no credit event occurs, it will lose the payments it made to its counterparty. If the Fund is a seller of protection and a credit event occurs, the value of the referenced obligation received by the Fund coupled with the periodic payments previously received may be less than the Maximum Payout Amount it pays to the buyer, resulting in a net loss to the Fund.
| | |
| |
| abfunds.com | | AB GLOBAL BOND FUND | 95 |
NOTES TO FINANCIAL STATEMENTS(continued)
Implied credit spreads over U.S. Treasuries of comparable maturity utilized in determining the market value of credit default swaps on issuers as of period end are disclosed in the portfolio of investments. The implied spreads serve as an indicator of the current status of the payment/performance risk and typically reflect the likelihood of default by the issuer of the referenced obligation. The implied credit spread of a particular reference obligation also reflects the cost of buying/selling protection and may reflect upfront payments required to be made to enter into the agreement. Widening credit spreads typically represent a deterioration of the referenced obligation’s credit soundness and greater likelihood of default or other credit event occurring as defined under the terms of the agreement. A credit spread identified as “Defaulted” indicates a credit event has occurred for the referenced obligation.
During the year ended September 30, 2019, the Fund held credit default swaps for hedging andnon-hedging purposes.
Variance Swaps:
The Fund may enter into variance swaps to hedge equity market risk or adjust exposure to the equity markets. Variance swaps are contracts in which two parties agree to exchange cash payments based on the difference between the stated level of variance and the actual variance realized on underlying asset(s) or index(es). Actual “variance” as used here is defined as the sum of the square of the returns on the reference asset(s) or index(es) (which in effect is a measure of its “volatility”) over the length of the contract term. So the parties to a variance swap can be said to exchange actual volatility for a contractually stated rate of volatility.
During the year ended September 30, 2019, the Fund held variance swaps for hedging purposes.
The Fund typically enters into International Swaps and Derivatives Association, Inc. Master Agreements (“ISDA Master Agreement”) with its OTC derivative contract counterparties in order to, among other things, reduce its credit risk to OTC counterparties. ISDA Master Agreements include provisions for general obligations, representations, collateral and events of default or termination. Under an ISDA Master Agreement, the Fund typically may offset with the OTC counterparty certain derivative financial instruments’ payables and/or receivables with collateral held and/or posted and create one single net payment(close-out netting) in the event of default or termination. In the event of a default by an OTC counterparty, the return of collateral with market value in excess of the Fund’s net liability, held by the defaulting party, may be delayed or denied.
| | |
| |
| 96 | AB GLOBAL BOND FUND | | abfunds.com |
NOTES TO FINANCIAL STATEMENTS(continued)
The Fund’s ISDA Master Agreements may contain provisions for early termination of OTC derivative transactions in the event the net assets of the Fund decline below specific levels (“net asset contingent features”). If these levels are triggered, the Fund’s OTC counterparty has the right to terminate such transaction and require the Fund to pay or receive a settlement amount in connection with the terminated transaction. If OTC derivatives were held at period end, please refer to netting arrangements by the OTC counterparty tables below for additional details.
During the year ended September 30, 2019, the Fund had entered into the following derivatives:
| | | | | | | | | | | | |
| | | Asset Derivatives | | | Liability Derivatives | |
Derivative Type | | Statement of
Assets and
Liabilities
Location | | Fair Value | | | Statement of
Assets and
Liabilities
Location | | Fair Value | |
Interest rate
contracts | |
Receivable/Payable for variation margin on futures | |
$ |
2,813,785 |
* | | Receivable/Payable for variation margin on futures | |
$ |
13,953,577 |
* |
| | | | |
Interest rate
contracts | |
Receivable/Payable for variation margin on centrally cleared swaps | |
|
31,840,755 |
* | |
Receivable/Payable for variation margin on centrally cleared swaps | |
|
50,247,837 |
* |
| | | | |
Foreign currency
contracts | |
Unrealized appreciation on forward currency exchange contracts | |
|
93,551,684 |
| |
Unrealized depreciation on forward currency exchange contracts | |
|
31,253,734 |
|
| | | | |
Credit contracts | | Market value of credit default swaps | | | 280,159 | | | Market value of credit default swaps | | | 7,074,303 | |
| | | | |
Credit contracts | | Receivable/Payable for variation margin on centrally cleared swaps | | | 252,796 | * | | Receivable/Payable for variation margin on centrally cleared swaps | | | 3,146,774 | * |
| | | | | | | | | | | | |
Total | | | | $ | 128,739,179 | | | | | $ | 105,676,225 | |
| | | | | | | | | | | | |
| * | Only variation margin receivable/payable at period end is reported within the statement of assets and liabilities. This amount reflects cumulative unrealized appreciation/depreciation on futures and centrally cleared swaps as reported in the portfolio of investments. |
| | |
| |
| abfunds.com | | AB GLOBAL BOND FUND | 97 |
NOTES TO FINANCIAL STATEMENTS(continued)
| | | | | | | | | | |
Derivative Type | | Location of Gain or
(Loss) on Derivatives
Within Statement
of Operations | | Realized Gain
or (Loss) on
Derivatives | | | Change in
Unrealized
Appreciation or
(Depreciation) | |
Interest rate contracts | | Net realized gain/(loss) on swaps; Net change in unrealized appreciation/depreciation on swaps | | $ | (1,687,183 | ) | | $ | (24,239,175 | ) |
| | | |
Interest rate contracts | | Net realized gain/(loss) on futures; Net change in unrealized appreciation/depreciation on futures | | | (6,776,174 | ) | | | (17,982,529 | ) |
| | | |
Interest rate contracts | | Net realized gain/(loss) on investment transactions; Net change in unrealized appreciation/depreciation on investments | | | (3,891,624 | ) | | | – 0 | – |
| | | |
Interest rate contracts | | Net realized gain/(loss) on swaptions written; Net change in unrealized appreciation/depreciation on swaptions written | | | 2,670,990 | | | | – 0 | – |
| | | |
Foreign currency contracts | | Net realized gain/(loss) on forward currency exchange contracts; Net change in unrealized appreciation/depreciation on forward currency exchange contracts | | | 180,955,524 | | | | 20,955,266 | |
| | | |
Foreign currency contracts | | Net realized gain/(loss)
on investment transactions; Net change in unrealized appreciation/depreciation on investments | | | (7,854,112 | ) | | | 1,069,130 | |
| | | |
Foreign currency contracts | | Net realized gain/(loss) on options written; Net change in unrealized appreciation/depreciation on options written | | | 7,717,585 | | | | 1,992,588 | |
| | |
| |
| 98 | AB GLOBAL BOND FUND | | abfunds.com |
NOTES TO FINANCIAL STATEMENTS(continued)
| | | | | | | | | | |
Derivative Type | | Location of Gain or
(Loss) on Derivatives
Within Statement
of Operations | | Realized Gain
or (Loss) on
Derivatives | | | Change in
Unrealized
Appreciation or
(Depreciation) | |
| | | |
Foreign currency contracts | | Net realized gain/(loss) on swaps; Net change in unrealized appreciation/depreciation on swaps | | $ | (6,440,239 | ) | | $ | 354,879 | |
| | | |
Credit contracts | | Net realized gain/(loss) on swaps; Net change in unrealized appreciation/depreciation on swaps | | | (733,364 | ) | | | 233,714 | |
| | | | | | | | | | |
Total | | | | $ | 163,961,403 | | | $ | (17,616,127 | ) |
| | | | | | | | | | |
The following table represents the average monthly volume of the Fund’s derivative transactions during the year ended September 30, 2019:
| | | | |
Centrally Cleared Credit Default Swaps: | | | | |
Average notional amount of buy contracts | | $ | 277,414,251 | |
Average notional amount of sale contracts | | $ | 175,707,912 | |
| |
Centrally Cleared Interest Rate Swaps | | | | |
Average notional amount | | $ | 2,697,994,759 | |
| |
Credit Default Swaps: | | | | |
Average notional amount of sale contracts | | $ | 199,884,615 | |
| |
Forward Currency Exchange Contracts: | | | | |
Average principal amount on buy contracts | | $ | 1,540,698,498 | |
Average principal amount on sale contracts | | $ | 5,196,464,318 | |
| |
Futures: | | | | |
Average notional amount of buy contracts | | $ | 1,706,691,064 | |
Average notional amount of sale contracts | | $ | 1,172,011,513 | |
| |
Variance Swaps: | | | | |
Average notional amount | | $ | 1,947,341 | (a) |
Options Written: | | | | |
Average notional amount | | $ | 226,053,722 | (b) |
| |
Purchased Options: | | | | |
Average notional amount | | $ | 362,871,068 | (c) |
| |
Purchased Swaptions: | | | | |
Average notional amount | | $ | 401,078,172 | (c) |
| |
Swaptions Written: | | | | |
Average notional amount | | $ | 740,768,414 | (d) |
| (a) | Positions were open for seven months during the reporting period. |
| (b) | Positions were open for nine months during the reporting period. |
| (c) | Positions were open for five months during the reporting period. |
| (d) | Positions were open for six months during the reporting period. |
| | |
| |
| abfunds.com | | AB GLOBAL BOND FUND | 99 |
NOTES TO FINANCIAL STATEMENTS(continued)
For financial reporting purposes, the Fund does not offset derivative assets and derivative liabilities that are subject to netting arrangements in the statement of assets and liabilities.
All OTC derivatives held at period end were subject to netting arrangements. The following table presents the Fund’s derivative assets and liabilities by OTC counterparty net of amounts available for offset under ISDA Master Agreements (“MA”) and net of the related collateral received/pledged by the Fund as of September 30, 2019. Exchange-traded derivatives and centrally cleared swaps are not subject to netting arrangements and as such are excluded from the tables.
| | | | | | | | | | | | | | | | | | | | |
Counterparty | | Derivative
Assets
Subject to a
MA | | | Derivatives
Available for
Offset | | | Cash
Collateral
Received* | | | Security
Collateral
Received* | | | Net Amount
of Derivative
Assets | |
Australia & New Zealand Bank Group Ltd. | | $ | 157,984 | | | $ | (61,513 | ) | | $ | – 0 | – | | $ | – 0 | – | | $ | 96,471 | |
Bank of America, NA | | | 840,058 | | | | (840,058 | ) | | | – 0 | – | | | – 0 | – | | | – 0 | – |
Barclays Bank PLC | | | 1,557,812 | | | | (1,557,812 | ) | | | – 0 | – | | | – 0 | – | | | – 0 | – |
BNP Paribas SA | | | 4,098,239 | | | | (458,406 | ) | | | – 0 | – | | | – 0 | – | | | 3,639,833 | |
Brown Brothers Harriman & Co. | | | 81,346 | | | | (81,346 | ) | | | – 0 | – | | | – 0 | – | | | – 0 | – |
Citibank, NA / Citigroup Global Markets, Inc. | | | 2,470,515 | | | | (1,111,468 | ) | | | – 0 | – | | | – 0 | – | | | 1,359,047 | |
Credit Suisse International | | | 1,584,240 | | | | (1,220,830 | ) | | | – 0 | – | | | – 0 | – | | | 363,410 | |
Deutsche Bank AG | | | 40,029 | | | | (40,029 | ) | | | – 0 | – | | | – 0 | – | | | – 0 | – |
Goldman Sachs Bank USA / Goldman Sachs International | | | 4,476,717 | | | | (4,476,717 | ) | | | – 0 | – | | | – 0 | – | | | – 0 | – |
HSBC Bank USA | | | 4,522,219 | | | | (477,638 | ) | | | – 0 | – | | | – 0 | – | | | 4,044,581 | |
JPMorgan Chase Bank, NA | | | 3,192,401 | | | | (3,192,401 | ) | | | – 0 | – | | | – 0 | – | | | – 0 | – |
Morgan Stanley Capital Services LLC | | | 13,235,792 | | | | (6,228,679 | ) | | | – 0 | – | | | – 0 | – | | | 7,007,113 | |
Royal Bank of Scotland PLC/ Natwest Markets PLC | | | 38,844,308 | | | | (6,033,164 | ) | | | – 0 | – | | | (358,928 | ) | | | 32,452,216 | |
Standard Chartered Bank | | | 1,632,177 | | | | (167,652 | ) | | | – 0 | – | | | – 0 | – | | | 1,464,525 | |
UBS AG | | | 17,098,006 | | | | – 0 | – | | | – 0 | – | | | – 0 | – | | | 17,098,006 | |
| | | | | | | | | | | | | | | | | | | | |
Total | | $ | 93,831,843 | | | $ | (25,947,713 | ) | | $ | – 0 | – | | $ | (358,928 | ) | | $ | 67,525,202 | ^ |
| | | | | | | | | | | | | | | | | | | | |
| | |
| |
| 100 | AB GLOBAL BOND FUND | | abfunds.com |
NOTES TO FINANCIAL STATEMENTS(continued)
| | | | | | | | | | | | | | | | | | | | |
Counterparty | | Derivative
Liabilities
Subject to a
MA | | | Derivatives
Available for
Offset | | | Cash
Collateral
Pledged* | | | Security
Collateral
Pledged* | | | Net Amount
of Derivative
Liabilities | |
Australia & New Zealand Bank Group Ltd. | | $ | 61,513 | | | $ | (61,513 | ) | | $ | – 0 | – | | $ | – 0 | – | | $ | – 0 | – |
Bank of America, NA | | | 1,793,247 | | | | (840,058 | ) | | | – 0 | – | | | (257,977 | ) | | | 695,212 | |
Barclays Bank PLC | | | 5,129,965 | | | | (1,557,812 | ) | | | – 0 | – | | | (1,068,678 | ) | | | 2,503,475 | |
BNP Paribas SA | | | 458,406 | | | | (458,406 | ) | | | – 0 | – | | | – 0 | – | | | – 0 | – |
Brown Brothers Harriman & Co. | | | 3,067,809 | | | | (81,346 | ) | | | – 0 | – | | | – 0 | – | | | 2,986,463 | |
Citibank, NA / Citigroup Global Markets, Inc. | | | 1,111,468 | | | | (1,111,468 | ) | | | – 0 | – | | | – 0 | – | | | – 0 | – |
Credit Suisse International | | | 1,220,830 | | | | (1,220,830 | ) | | | – 0 | – | | | – 0 | – | | | – 0 | – |
Deutsche Bank AG | | | 178,841 | | | | (40,029 | ) | | | – 0 | – | | | (138,812 | ) | | | – 0 | – |
Goldman Sachs Bank USA / Goldman Sachs International | | | 7,638,258 | | | | (4,476,717 | ) | | | – 0 | – | | | (3,161,541 | ) | | | – 0 | – |
HSBC Bank USA | | | 477,638 | | | | (477,638 | ) | | | – 0 | – | | | – 0 | – | | | – 0 | – |
JPMorgan Chase Bank, NA | | | 4,760,567 | | | | (3,192,401 | ) | | | – 0 | – | | | – 0 | – | | | 1,568,166 | |
Morgan Stanley Capital Services LLC | | | 6,228,679 | | | | (6,228,679 | ) | | | – 0 | – | | | – 0 | – | | | – 0 | – |
Royal Bank of Scotland PLC/ Natwest Markets PLC | | | 6,033,164 | | | | (6,033,164 | ) | | | – 0 | – | | | – 0 | – | | | – 0 | – |
Standard Chartered Bank | | | 167,652 | | | | (167,652 | ) | | | – 0 | – | | | – 0 | – | | | – 0 | – |
| | | | | | | | | | | | | | | | | | | | |
Total | | $ | 38,328,037 | | | $ | (25,947,713 | ) | | $ | – 0 | – | | $ | (4,627,008 | ) | | $ | 7,753,316 | ^ |
| | | | | | | | | | | | | | | | | | | | |
| * | The actual collateral received/pledged may be more than the amount reported due to overcollateralization. |
| ^ | Net amount represents the net receivable/(payable) that would be due from/to the counterparty in the event of default or termination. The net amount from OTC financial derivative instruments can only be netted across transactions governed under the same master agreement with the same counterparty. |
2. Currency Transactions
The Fund may invest innon-U.S. Dollar-denominated securities on a currency hedged or unhedged basis. The Fund may seek investment opportunities by taking long or short positions in currencies through the use of currency-related derivatives, including forward currency exchange contracts, futures and options on futures, swaps, and other options. The Fund may enter into transactions for investment opportunities when it anticipates that a foreign currency will appreciate or depreciate in value but securities denominated in that currency are not held by the Fund and do not present attractive investment opportunities. Such transactions may also be used when the Adviser believes that it may be more efficient than a direct investment in a foreign currency-denominated security. The Fund may also conduct currency exchange contracts on a spot basis (i.e., for cash at the spot rate prevailing in the currency exchange market for buying or selling currencies).
| | |
| |
| abfunds.com | | AB GLOBAL BOND FUND | 101 |
NOTES TO FINANCIAL STATEMENTS(continued)
3. TBA and Dollar Rolls
The Fund may invest in TBA mortgage-backed securities. A TBA, or “To Be Announced”, trade represents a contract for the purchase or sale of mortgage-backed securities to be delivered at a future agreed-upon date; however, the specific mortgage pool numbers or the number of pools that will be delivered to fulfill the trade obligation or terms of the contract are unknown at the time of the trade.
Mortgage pools (including fixed-rate or variable-rate mortgages) guaranteed by the Government National Mortgage Association, or GNMA, the Federal National Mortgage Association, or FNMA, or the Federal Home Loan Mortgage Corporation, or FHLMC, are subsequently allocated to the TBA transactions.
The Fund may enter into certain TBA transactions known as dollar rolls. Dollar rolls involve sales by the Fund of securities for delivery in the current month and the Fund’s simultaneously contracting to repurchase substantially similar (same type and coupon) securities on a specified future date. During the roll period, the Fund forgoes principal and interest paid on the securities. The Fund is compensated by the difference between the current sales price and the lower forward price for the future purchase (often referred to as the “drop”) as well as by the interest earned on the cash proceeds of the initial sale. Dollar rolls involve the risk that the market value of the securities the Fund is obligated to repurchase under the agreement may decline below the repurchase price. Dollar rolls are speculative techniques. During the year ended September 30, 2019, the Fund did not engage in dollar rolls.
4. Reverse Repurchase Agreements
The Fund may enter into reverse repurchase transactions (“RVP”) in accordance with the terms of a Master Repurchase Agreement (“MRA”), under which the Fund sells securities and agrees to repurchase them at a mutually agreed upon date and price. At the time the Fund enters into a reverse repurchase agreement, it will establish a segregated account with the custodian containing liquid assets having a value comparable to the repurchase price. Under the MRA and other Master Agreements, the Fund is permitted to offset payables and/or receivables with collateral held and/or posted to the counterparty and create one single net payment due to or from the Fund in the event of a default. In the event of a default by a MRA counterparty, the Fund may be considered an unsecured creditor with respect to any excess collateral (collateral with a market value in excess of the repurchase price) held by and/or posted to the counterparty, and as such, the return of such excess collateral may be delayed or denied. For the year ended September 30, 2019, the average amount of reverse repurchase agreements outstanding was $2,704,025 and the daily
| | |
| |
| 102 | AB GLOBAL BOND FUND | | abfunds.com |
NOTES TO FINANCIAL STATEMENTS(continued)
weighted average interest rate was 0.99%. As of September 30, 2019, the Fund did not hold reverse repurchase agreements.
5. Loan Participations and Assignments
The Fund may invest in direct debt instruments which are interests in amounts owed to lenders or lending syndicates by corporate, governmental, or other borrowers, either in the form of participations at the time the loan is originated (“Participations”) or by buying an interest in the loan in the secondary market from a financial institution or institutional investor (“Assignments”). A loan is often administered by a bank or other financial institution (the “Lender”) that acts as agent for all holders. The agent administers the terms of the loan as specified in the loan agreement. When investing in Participations, the Fund generally has no right to enforce compliance with the terms of the loan agreement with the borrower. In addition, when investing in Participations, the Fund has the right to receive payments of principal, interest and any fees to which it is entitled only from the Lender and only upon receipt of payments by the Lender from the borrower. As a result, the Fund may be subject to the credit risk of both the borrower and the Lender. When the Fund purchases Assignments from Lenders, it will typically acquire direct rights against the borrower on the loan. These loans may include participations in “bridge loans”, which are loans taken out by borrowers for a short period (typically less than six months) pending arrangement of more permanent financing through, for example, the issuance of bonds, frequently high-yield bonds issued for the purpose of acquisitions. The Fund may also participate in unfunded loan commitments, which are contractual obligations for investing in future Participations, and may receive a commitment fee based on the amount of the commitment. Under these arrangements, the Fund may receive a fixed rate commitment fee and, if and to the extent the borrower borrows under the facility, the Fund may receive an additional funding fee.
Unfunded loan commitments and funded loans are marked to market daily.
As of September 30, 2019, the Fund had no unfunded loan commitments outstanding.
As of September 30, 2019, the Fund had no bridge loan commitments outstanding.
During the year ended September 30, 2019, the Fund received no commitment fees or additional funding fees.
| | |
| |
| abfunds.com | | AB GLOBAL BOND FUND | 103 |
NOTES TO FINANCIAL STATEMENTS(continued)
NOTE E
Capital Stock
Each class consists of 3,000,000,000 authorized shares. Transactions in capital shares for each class were as follows:
| | | | | | | | | | | | | | | | | | | | | | | | |
| | | | | | | | | | | | | | | | | | | | | | | | |
| | | Shares | | | | | | Amount | | | | |
| | | Year Ended
September 30,
2019 | | | Year Ended
September 30,
2018 | | | | | | Year Ended
September 30,
2019 | | | Year Ended
September 30,
2018 | | | | |
| | | | | | | | |
| Class A | | | | | | | | | | | | | | | | | | | | | |
Shares sold | | | 13,185,600 | | | | 20,073,580 | | | | | | | $ | 109,965,283 | | | $ | 167,038,449 | | | | | |
| | | | | |
Shares issued in reinvestment of dividends | | | 1,794,824 | | | | 1,936,251 | | | | | | | | 14,973,830 | | | | 16,089,465 | | | | | |
| | | | | |
Shares converted from Class B | | | 24,068 | | | | 59,796 | | | | | | | | 201,430 | | | | 499,892 | | | | | |
| | | | | |
Shares converted from Class C | | | 2,853,231 | | | | 3,093,435 | | | | | | | | 24,254,477 | | | | 25,707,038 | | | | | |
| | | | | |
Shares redeemed | | | (29,369,389 | ) | | | (45,114,469 | ) | | | | | | | (245,198,136 | ) | | | (374,827,042 | ) | | | | |
| | | | | |
Net decrease | | | (11,511,666 | ) | | | (19,951,407 | ) | | | | | | $ | (95,803,116 | ) | | $ | (165,492,198 | ) | | | | |
| | | | | |
| | | | | | | | | | | | | | | | | | | | | | | | |
| Class B | | | | | | | | | | | | | | | | | | | | | | | | |
Shares sold | | | 2,639 | | | | 4,124 | | | | | | | $ | 21,966 | | | $ | 34,304 | | | | | |
| | | | | |
Shares issued in reinvestment of dividends | | | 877 | | | | 1,218 | | | | | | | | 7,280 | | | | 10,135 | | | | | |
| | | | | |
Shares converted to Class A | | | (24,065 | ) | | | (59,792 | ) | | | | | | | (201,430 | ) | | | (499,892 | ) | | | | |
| | | | | |
Shares redeemed | | | (5,164 | ) | | | (8,441 | ) | | | | | | | (43,520 | ) | | | (70,523 | ) | | | | |
| | | | | |
Net decrease | | | (25,713 | ) | | | (62,891 | ) | | | | | | $ | (215,704 | ) | | $ | (525,976 | ) | | | | |
| | | | | |
| | | | | | | | | | | | | | | | | | | | | | | | |
| Class C | | | | | | | | | | | | | | | | | | | | | | | | |
Shares sold | | | 1,165,503 | | | | 1,313,140 | | | | | | | $ | 9,751,559 | | | $ | 10,981,636 | | | | | |
| | | | | |
Shares issued in reinvestment of dividends | | | 214,585 | | | | 270,005 | | | | | | | | 1,789,198 | | | | 2,251,210 | | | | | |
| | | | | |
Shares converted to Class A | | | (2,843,852 | ) | | | (3,082,719 | ) | | | | | | | (24,254,477 | ) | | | (25,707,038 | ) | | | | |
| | | | | |
Shares redeemed | | | (4,380,365 | ) | | | (6,678,456 | ) | | | | | | | (36,622,842 | ) | | | (55,720,665 | ) | | | | |
| | | | | |
Net decrease | | | (5,844,129 | ) | | | (8,178,030 | ) | | | | | | $ | (49,336,562 | ) | | $ | (68,194,857 | ) | | | | |
| | | | | |
| | | | | | | | | | | | | | | | | | | | | | | | |
| Advisor Class | | | | | | | | | | | | | | | | | | | | | | | | |
Shares sold | | | 160,197,522 | | | | 183,038,844 | | | | | | | $ | 1,338,116,377 | | | $ | 1,521,545,978 | | | | | |
| | | | | |
Shares issued in reinvestment of dividends | | | 11,227,537 | | | | 10,615,631 | | | | | | | | 93,696,688 | | | | 88,067,430 | | | | | |
| | | | | |
Shares redeemed | | | (170,683,834 | ) | | | (154,088,929 | ) | | | | | | | (1,418,887,407 | ) | | | (1,278,807,982 | ) | | | | |
| | | | | |
Net increase | | | 741,225 | | | | 39,565,546 | | | | | | | $ | 12,925,658 | | | $ | 330,805,426 | | | | | |
| | | | | |
| | |
| |
| 104 | AB GLOBAL BOND FUND | | abfunds.com |
NOTES TO FINANCIAL STATEMENTS(continued)
| | | | | | | | | | | | | | | | | | | | | | | | |
| | | | | | | | | | | | | | | | | | | | | | | | |
| | | Shares | | | | | | Amount | | | | |
| | | Year Ended
September 30,
2019 | | | Year Ended
September 30,
2018 | | | | | | Year Ended
September 30,
2019 | | | Year Ended
September 30,
2018 | | | | |
| | | | | | | | |
| Class R | | | | | | | | | | | | | | | | | | | | | | | | |
Shares sold | | | 2,107,504 | | | | 3,324,704 | | | | | | | $ | 17,600,783 | | | $ | 27,726,727 | | | | | |
| | | | | |
Shares issued in reinvestment of dividends | | | 181,939 | | | | 192,292 | | | | | | | | 1,514,274 | | | | 1,596,148 | | | | | |
| | | | | |
Shares redeemed | | | (3,458,926 | ) | | | (4,293,094 | ) | | | | | | | (28,829,199 | ) | | | (35,744,275 | ) | | | | |
| | | | | |
Net decrease | | | (1,169,483 | ) | | | (776,098 | ) | | | | | | $ | (9,714,142 | ) | | $ | (6,421,400 | ) | | | | |
| | | | | |
| | | | | | | | | | | | | | | | | | | | | | | | |
| Class K | | | | | | | | | | | | | | | | | | | | | | | | |
Shares sold | | | 816,047 | | | | 1,537,186 | | | | | | | $ | 6,831,469 | | | $ | 12,785,721 | | | | | |
| | | | | |
Shares issued in reinvestment of dividends | | | 52,186 | | | | 97,925 | | | | | | | | 435,444 | | | | 813,042 | | | | | |
| | | | | |
Shares redeemed | | | (642,414 | ) | | | (3,909,077 | ) | | | | | | | (5,377,731 | ) | | | (32,199,370 | ) | | | | |
| | | | | |
Net increase (decrease) | | | 225,819 | | | | (2,273,966 | ) | | | | | | $ | 1,889,182 | | | $ | (18,600,607 | ) | | | | |
| | | | | |
| | | | | | | | | | | | | | | | | | | | | | | | |
| Class I | | | | | | | | | | | | | | | | | | | | | | | | |
Shares sold | | | 19,464,845 | | | | 22,528,212 | | | | | | | $ | 162,839,609 | | | $ | 186,861,568 | | | | | |
| | | | | |
Shares issued in reinvestment of dividends | | | 2,556,550 | | | | 2,386,088 | | | | | | | | 21,348,629 | | | | 19,793,000 | | | | | |
| | | | | |
Shares redeemed | | | (18,096,409 | ) | | | (19,234,816 | ) | | | | | | | (150,457,051 | ) | | | (159,640,437 | ) | | | | |
| | | | | |
Net increase | | | 3,924,986 | | | | 5,679,484 | | | | | | | $ | 33,731,187 | | | $ | 47,014,131 | | | | | |
| | | | | |
| | | | | | | | | | | | | | | | | | | | | | | | |
| Class Z | | | | | | | | | | | | | | | | | | | | | |
Shares sold | | | 27,111,318 | | | | 27,187,414 | | | | | | | $ | 226,662,183 | | | $ | 225,668,100 | | | | | |
| | | | | |
Shares issued in reinvestment of dividends | | | 1,779,404 | | | | 1,350,047 | | | | | | | | 14,868,369 | | | | 11,193,204 | | | | | |
| | | | | |
Shares redeemed | | | (21,720,766 | ) | | | (10,278,394 | ) | | | | | | | (181,481,543 | ) | | | (85,333,581 | ) | | | | |
| | | | | |
Net increase | | | 7,169,956 | | | | 18,259,067 | | | | | | | $ | 60,049,009 | | | $ | 151,527,723 | | | | | |
| | | | | |
For the year ended September 30, 2018 a third party vendor reimbursed the Fund $1,081, for losses incurred due to a trade entry error. This amount is presented in the Fund’s statement of changes in net assets. Neither the Fund nor its affiliates were involved in the proceedings or the calculation of the payment.
NOTE F
Risks Involved in Investing in the Fund
Interest Rate Risk—Changes in interest rates will affect the value of investments in fixed-income securities. When interest rates rise, the value of existing investments in fixed-income securities tends to fall and this decrease in value may not be offset by higher income from new investments. Interest rate risk is generally greater for fixed-income securities with longer maturities or durations.
| | |
| |
| abfunds.com | | AB GLOBAL BOND FUND | 105 |
NOTES TO FINANCIAL STATEMENTS(continued)
Credit Risk—An issuer or guarantor of a fixed-income security, or the counterparty to a derivatives or other contract, may be unable or unwilling to make timely payments of interest or principal, or to otherwise honor its obligations. The issuer or guarantor may default, causing a loss of the full principal amount of a security and accrued interest. The degree of risk for a particular security may be reflected in its credit rating. There is the possibility that the credit rating of a fixed-income security may be downgraded after purchase, which may adversely affect the value of the security.
Below Investment Grade Securities Risk—Investments in fixed-income securities with lower ratings (commonly known as “junk bonds”) are subject to a higher probability that an issuer will default or fail to meet its payment obligations. These securities may be subject to greater price volatility due to such factors as specific corporate developments and negative perceptions of the junk bond market generally and may be more difficult to trade or dispose of than other types of securities.
Duration Risk—Duration is a measure that relates the expected price volatility of a fixed-income security to changes in interest rates. The duration of a fixed-income security may be shorter than or equal to full maturity of a fixed-income security. Fixed-income securities with longer durations have more risk and will decrease in price as interest rates rise.
Inflation Risk—This is the risk that the value of assets or income from investments will be less in the future as inflation decreases the value of money. As inflation increases, the value of the Fund’s assets can decline as can the value of the Fund’s distributions. This risk is significantly greater if the Fund invests a significant portion of its assets in fixed-income securities with longer maturities.
Foreign (Non-U.S.) Risk—Investments in securities ofnon-U.S. issuers may involve more risk than those of U.S. issuers. These securities may fluctuate more widely in price and may be more difficult to trade or dispose of due to adverse market, economic, political, regulatory or other factors.
Emerging Market Risk—Investments in emerging market countries may have more risk because the markets are less developed and less liquid, and because these investments may be subject to increased economic, political, regulatory or other uncertainties.
Currency Risk—Fluctuations in currency exchange rates may negatively affect the value of the Fund’s investments or reduce its returns.
Mortgage-Related and/or Other Asset-Backed Securities Risk—Investments in mortgage-related and other asset-backed securities are subject to certain additional risks. The value of these securities may be
| | |
| |
| 106 | AB GLOBAL BOND FUND | | abfunds.com |
NOTES TO FINANCIAL STATEMENTS(continued)
particularly sensitive to changes in interest rates. These risks include “extension risk”, which is the risk that, in periods of rising interest rates, issuers may delay the payment of principal, and “prepayment risk”, which is the risk that in periods of falling interest rates, issuers may pay principal sooner than expected, exposing the Fund to a lower rate of return upon reinvestment of principal. Mortgage-backed securities offered bynon-governmental issuers and other asset-backed securities may be subject to other risks, such as higher rates of default in the mortgages or assets backing the securities or risks associated with the nature and servicing of mortgages or assets backing the securities.
Leverage Risk—When the Fund borrows money or otherwise leverages its investments, its performance may be volatile because leverage tends to exaggerate the effect of any increase or decrease in the value of the Fund’s investments. The Fund may create leverage through the use of reverse repurchase arrangements, forward currency exchange contracts, forward commitments, dollar rolls or futures or by borrowing money. The use of other types of derivative instruments by the Fund, such as options and swaps, may also result in a form of leverage. Leverage may result in higher returns to the Fund than if the Fund were not leveraged, but may also adversely affect returns, particularly if the market is declining.
Derivatives Risk—The Fund may enter into derivative transactions such as forwards, options, futures and swaps. Derivatives may be illiquid, difficult to price, and leveraged so that small changes may produce disproportionate losses for the Fund, and subject to counterparty risk to a greater degree than more traditional investments. Derivatives may result in significant losses, including losses that are far greater than the value of the derivatives reflected on the statement of assets and liabilities.
Illiquid Investments Risk—Illiquid investments risk exists when certain investments become difficult to purchase or sell. Difficulty in selling such investments may result in sales at disadvantageous prices affecting the value of your investment in the Fund. Causes of illiquid investments risk may include low trading volumes, large positions and heavy redemption of Fund shares. Foreign fixed-income securities may have more illiquid investments risk because secondary trading markets for these securities may be smaller and less well-developed and the securities may trade less frequently. Illiquid investments risk may be higher in a rising interest rate environment, when the value and liquidity of fixed-income securities generally decline.
Active Trading Risk—The Fund expects to engage in active and frequent trading of its portfolio securities and its portfolio turnover rate may greatly exceed 100%. A higher rate of portfolio turnover increases transaction costs, which may negatively affect the Fund’s return. In addition, a high
| | |
| |
| abfunds.com | | AB GLOBAL BOND FUND | 107 |
NOTES TO FINANCIAL STATEMENTS(continued)
rate of portfolio turnover may result in substantial short-term gains, which may have adverse tax consequences for Fund shareholders.
LIBOR Risk—A Fund may invest in certain debt securities, derivatives or other financial instruments that utilize the London Interbank Offered Rate, or “LIBOR,” as a “benchmark” or “reference rate” for various interest rate calculations. In July 2017, the United Kingdom Financial Conduct Authority, which regulates LIBOR, announced a desire to phase out the use of LIBOR by the end of 2021. Although financial regulators and industry working groups have suggested alternative reference rates, such as European Interbank Offer Rate (“EURIBOR”), Sterling Overnight Interbank Average Rate (“SONIA”) and Secured Overnight Financing Rate (“SOFR”), global consensus on alternative rates is lacking and the process for amending existing contracts or instruments to transition away from LIBOR remains unclear. The elimination of LIBOR or changes to other reference rates or any other changes or reforms to the determination or supervision of reference rates could have an adverse impact on the market for, or value of, any securities or payments linked to those reference rates, which may adversely affect a Fund’s performance and/or net asset value. Uncertainty and risk also remain regarding the willingness and ability of issuers and lenders to include revised provisions in new and existing contracts or instruments. Consequently, the transition away from LIBOR to other reference rates may lead to increased volatility and illiquidity in markets that are tied to LIBOR, fluctuations in values of LIBOR-related investments or investments in issuers that utilize LIBOR, increased difficulty in borrowing or refinancing and diminished effectiveness of hedging strategies, adversely affecting a Fund’s performance. Furthermore, the risks associated with the expected discontinuation of LIBOR and transition may be exacerbated if the work necessary to effect an orderly transition to an alternative reference rate is not completed in a timely manner. Because the usefulness of LIBOR as a benchmark could deteriorate during the transition period, these effects could occur prior to the end of 2021.
Indemnification Risk—In the ordinary course of business, the Fund enters into contracts that contain a variety of indemnifications. The Fund’s maximum exposure under these arrangements is unknown. However, the Fund has not had prior claims or losses pursuant to these indemnification provisions and expects the risk of loss thereunder to be remote. Therefore, the Fund has not accrued any liability in connection with these indemnification provisions.
| | |
| |
| 108 | AB GLOBAL BOND FUND | | abfunds.com |
NOTES TO FINANCIAL STATEMENTS(continued)
NOTE G
Joint Credit Facility
A number ofopen-end mutual funds managed by the Adviser, including the Fund, participate in a $325 million revolving credit facility (the “Facility”) intended to provide short-term financing, if necessary, subject to certain restrictions in connection with abnormal redemption activity. Commitment fees related to the Facility are paid by the participating funds and are included in miscellaneous expenses in the statement of operations. The Fund did not utilize the Facility during the year ended September 30, 2019.
NOTE H
Distributions to Shareholders
The tax character of distributions paid during the fiscal years ended September 30, 2019 and September 30, 2018 were as follows:
| | | | | | | | |
| | | 2019 | | | 2018 | |
Distributions paid from: | | | | | | | | |
Ordinary income | | $ | 188,924,507 | | | $ | 178,368,754 | |
| | | | | | | | |
Total taxable distributions paid | | $ | 188,924,507 | | | $ | 178,368,754 | |
| | | | | | | | |
As of September 30, 2019, the components of accumulated earnings/(deficit) on a tax basis were as follows:
| | | | |
Undistributed ordinary income | | $ | 142,552,626 | |
Accumulated capital and other losses | | | (38,445,806 | )(a) |
Unrealized appreciation/(depreciation) | | | 180,424,652 | (b) |
| | | | |
Total accumulated earnings/(deficit) | | $ | 284,531,472 | (c) |
| | | | |
| (a) | As of September 30, 2019, the Fund had a net capital loss carryforward of $29,099,037. During the fiscal year, the Fund utilized $46,641,997 of capital loss carry forwards to offset current year net realized gains. As of September 30, 2019, the cumulative deferred loss on straddles was $9,346,769. |
| (b) | The differences between book-basis and tax-basis unrealized appreciation/(depreciation) are attributable primarily to the recognition for tax purposes of unrealized gains/losses on certain derivative instruments, the tax treatment of passive foreign investment companies (PFICs), the tax treatment of swaps, the tax deferral of losses on wash sales, and amortization on callable bonds. |
| (c) | The differences between book-basis and tax-basis components of accumulated earnings/(deficit) are attributable primarily to the accrual of foreign capital gains tax, the tax treatment of defaulted securities, and dividends payable. |
For tax purposes, net realized capital losses may be carried over to offset future capital gains, if any. Funds are permitted to carry forward capital losses for an indefinite period, and such losses will retain their character as either short-term or long-term capital losses. As of September 30, 2019, the Fund had a net long-term capital loss carryforward of $29,099,037, which may be carried forward for an indefinite period.
| | |
| |
| abfunds.com | | AB GLOBAL BOND FUND | 109 |
NOTES TO FINANCIAL STATEMENTS(continued)
During the current fiscal year, permanent differences primarily due to contributions from the Adviser resulted in a net increase in distributable earnings and a net decrease in additional paid-in capital. These reclassifications had no effect on net assets.
NOTE I
Recent Accounting Pronouncements
In March 2017, the Financial Accounting Standards Board issued an Accounting Standards Update, ASU2017-08, Receivables – Nonrefundable Fees and Other Costs (Subtopic310-20), Premium Amortization on Purchased Callable Debt Securities which amends the amortization period for certain purchased callable debt securities held at a premium, shortening such period to the earliest call date. ASU2017-08 does not require any accounting change for debt securities held at a discount; the discount continues to be amortized to maturity. ASU2017-08 is effective for fiscal years, and interim periods within those fiscal years, beginning after December 15, 2018. At this time, management is evaluating the implications of these changes on the financial statements.
In August 2018, the Financial Accounting Standards Board issued an Accounting Standards Update, ASU2018-13, Fair Value Measurement (Topic 820), Disclosure Framework-Changes to the Disclosure Requirements for Fair Value Measurement which removes, modifies and adds disclosures to Topic 820. The amendments in this ASU2018-13 (“ASU”) apply to all entities that are required, under existing U.S. GAAP, to make disclosures about recurring or nonrecurring fair value measurements. The amendments in this ASU are effective for all entities for fiscal years, and interim periods within those fiscal years, beginning after December 15, 2019. Management has evaluated the impact of the amendments and elected to early adopt the ASU. The adoption of this ASU did not have a material impact on the disclosure and presentation of the financial statements of the Fund.
NOTE J
Subsequent Events
Management has evaluated subsequent events for possible recognition or disclosure in the financial statements through the date the financial statements are issued. Management has determined that there are no material events that would require disclosure in the Fund’s financial statements through this date.
| | |
| |
| 110 | AB GLOBAL BOND FUND | | abfunds.com |
FINANCIAL HIGHLIGHTS
Selected Data For A Share Of Capital Stock Outstanding Throughout Each Period
| | | | | | | | | | | | | | | | | | | | |
| | | Class A | |
| | | Year Ended September 30, | |
| | | 2019 | | | 2018 | | | 2017 | | | 2016 | | | 2015 | |
| | | | |
| | | | | | | | | | | | | | | | | | | | |
Net asset value, beginning of period | | | $ 8.19 | | | | $ 8.43 | | | | $ 8.59 | | | | $ 8.34 | | | | $ 8.52 | |
| | | | |
Income From Investment Operations | | | | | | | | | | | | | | | | | | | | |
| | | | | |
Net investment income(a) | | | .17 | (b) | | | .18 | (b) | | | .18 | (b) | | | .17 | (b) | | | .18 | |
| | | | | |
Net realized and unrealized gain (loss) on investment and foreign currency transactions | | | .52 | | | | (.22 | ) | | | (.09 | ) | | | .39 | | | | (.02 | ) |
| | | | | |
Contributions from Affiliates | | | .00 | (c) | | | – 0 | – | | | – 0 | – | | | .00 | (c) | | | .00 | (c) |
| | | | | |
Capital Contributions | | | – 0 | – | | | .00 | (c) | | | – 0 | – | | | .00 | (c) | | �� | – 0 | – |
| | | | |
Net increase (decrease) in net asset value from operations | | | .69 | | | | (.04 | ) | | | .09 | | | | .56 | | | | .16 | |
| | | | |
Less: Dividends and Distributions | | | | | | | | | | | | | | | | | | | | |
| | | | | |
Dividends from net investment income | | | (.21 | ) | | | (.20 | ) | | | (.18 | ) | | | (.30 | ) | | | (.34 | ) |
| | | | | |
Distributions from net realized gain on investment and foreign currency transactions | | | – 0 | – | | | – 0 | – | | | (.07 | ) | | | (.01 | ) | | | (.00 | )(c) |
| | | | |
Total dividends and distributions | | | (.21 | ) | | | (.20 | ) | | | (.25 | ) | | | (.31 | ) | | | (.34 | ) |
| | | | |
Net asset value, end of period | | | $ 8.67 | | | | $ 8.19 | | | | $ 8.43 | | | | $ 8.59 | | | | $ 8.34 | |
| | | | |
| | | | | |
Total Return | | | | | | | | | | | | | | | | | | | | |
| | | | | |
Total investment return based on net asset value(d)* | | | 8.58 | % | | | (.50 | )% | | | 1.10 | % | | | 6.92 | % | | | 1.95 | % |
| | | | | |
Ratios/Supplemental Data | | | | | | | | | | | | | | | | | | | | |
| | | | | |
Net assets, end of period (000’s omitted) | | | $758,638 | | | | $810,782 | | | | $1,002,880 | | | | $1,293,750 | | | | $1,060,976 | |
| | | | | |
Ratio to average net assets of: | | | | | | | | | | | | | | | | | | | | |
| | | | | |
Expenses, net of waivers/reimbursements(e) | | | .81 | % | | | .81 | % | | | .82 | % | | | .85 | % | | | .90 | % |
| | | | | |
Expenses, before waivers/reimbursements(e) | | | .81 | % | | | .82 | % | | | .83 | % | | | .85 | % | | | .90 | % |
| | | | | |
Net investment income | | | 2.02 | %(b) | | | 2.16 | %(b) | | | 2.09 | %(b) | | | 2.05 | %(b) | | | 2.09 | % |
| | | | | |
Portfolio turnover rate | | | 126 | % | | | 369 | % | | | 107 | % | | | 113 | % | | | 167 | % |
See footnote summary on page 119.
| | |
| |
| abfunds.com | | AB GLOBAL BOND FUND | 111 |
FINANCIAL HIGHLIGHTS(continued)
Selected Data For A Share Of Capital Stock Outstanding Throughout Each Period
| | | | | | | | | | | | | | | | | | | | |
| | | Class B | |
| | | Year Ended September 30, | |
| | | 2019 | | | 2018 | | | 2017 | | | 2016 | | | 2015 | |
| | | | |
| | | | | | | | | | | | | | | | | | | | |
| | | | | | | | | | | | | | | | | | | | |
Net asset value, beginning of period | | | $ 8.19 | | | | $ 8.43 | | | | $ 8.59 | | | | $ 8.34 | | | | $ 8.52 | |
| | | | |
Income From Investment Operations | | | | | | | | | | | | | | | | | | | | |
| | | | | |
Net investment income(a) | | | .10 | (b) | | | .11 | (b) | | | .11 | (b) | | | .10 | (b) | | | .11 | |
| | | | | |
Net realized and unrealized gain (loss) on investment and foreign currency transactions | | | .52 | | | | (.22 | ) | | | (.09 | ) | | | .40 | | | | (.01 | ) |
| | | | | |
Contributions from Affiliates | | | .00 | (c) | | | – 0 | – | | | – 0 | – | | | .00 | (c) | | | .00 | (c) |
| | | | | |
Capital Contributions | | | – 0 | – | | | .00 | (c) | | | – 0 | – | | | .00 | (c) | | | – 0 | – |
| | | | |
Net increase (decrease) in net asset value from operations | | | .62 | | | | (.11 | ) | | | .02 | | | | .50 | | | | .10 | |
| | | | |
Less: Dividends and Distributions | | | | | | | | | | | | | | | | | | | | |
| | | | | |
Dividends from net investment income | | | (.14 | ) | | | (.13 | ) | | | (.11 | ) | | | (.24 | ) | | | (.28 | ) |
| | | | | |
Distributions from net realized gain on investment and foreign currency transactions | | | – 0 | – | | | – 0 | – | | | (.07 | ) | | | (.01 | ) | | | (.00 | )(c) |
| | | | |
Total dividends and distributions | | | (.14 | ) | | | (.13 | ) | | | (.18 | ) | | | (.25 | ) | | | (.28 | ) |
| | | | |
Net asset value, end of period | | | $ 8.67 | | | | $ 8.19 | | | | $ 8.43 | | | | $ 8.59 | | | | $ 8.34 | |
| | | | |
| | | | | |
Total Return | | | | | | | | | | | | | | | | | | | | |
| | | | | |
Total investment return based on net asset value(d)* | | | 7.69 | % | | | (1.30 | )% | | | .29 | % | | | 6.11 | % | | | 1.21 | % |
| | | | | |
Ratios/Supplemental Data | | | | | | | | | | | | | | | | | | | | |
| | | | | |
Net assets, end of period (000’s omitted) | | | $327 | | | | $519 | | | | $1,065 | | | | $1,668 | | | | $3,410 | |
| | | | | |
Ratio to average net assets of: | | | | | | | | | | | | | | | | | | | | |
| | | | | |
Expenses, net of waivers/reimbursements(e) | | | 1.63 | % | | | 1.61 | % | | | 1.62 | % | | | 1.61 | % | | | 1.63 | % |
| | | | | |
Expenses, before waivers/reimbursements(e) | | | 1.63 | % | | | 1.62 | % | | | 1.62 | % | | | 1.61 | % | | | 1.63 | % |
| | | | | |
Net investment income | | | 1.19 | %(b) | | | 1.28 | %(b) | | | 1.29 | %(b) | | | 1.25 | %(b) | | | 1.36 | % |
| | | | | |
Portfolio turnover rate | | | 126 | % | | | 369 | % | | | 107 | % | | | 113 | % | | | 167 | % |
See footnote summary on page 119.
| | |
| |
| 112 | AB GLOBAL BOND FUND | | abfunds.com |
FINANCIAL HIGHLIGHTS(continued)
Selected Data For A Share Of Capital Stock Outstanding Throughout Each Period
| | | | | | | | | | | | | | | | | | | | |
| | | Class C | |
| | | Year Ended September 30, | |
| | | 2019 | | | 2018 | | | 2017 | | | 2016 | | | 2015 | |
| | | | |
| | | | | | | | | | | | | | | | | | | | |
Net asset value, beginning of period | | | $ 8.21 | | | | $ 8.46 | | | | $ 8.62 | | | | $ 8.36 | | | | $ 8.54 | |
| | | | |
Income From Investment Operations | | | | | | | | | | | | | | | | | | | | |
| | | | | |
Net investment income(a) | | | .11 | (b) | | | .12 | (b) | | | .11 | (b) | | | .11 | (b) | | | .12 | |
| | | | | |
Net realized and unrealized gain (loss) on investment and foreign currency transactions | | | .53 | | | | (.23 | ) | | | (.08 | ) | | | .40 | | | | (.01 | ) |
| | | | | |
Contributions from Affiliates | | | .00 | (c) | | | – 0 | – | | | – 0 | – | | | .00 | (c) | | | .00 | (c) |
| | | | | |
Capital Contributions | | | – 0 | – | | | .00 | (c) | | | – 0 | – | | | .00 | (c) | | | – 0 | – |
| | | | |
Net increase (decrease) in net asset value from operations | | | .64 | | | | (.11 | ) | | | .03 | | | | .51 | | | | .11 | |
| | | | |
Less: Dividends and Distributions | | | | | | | | | | | | | | | | | | | | |
| | | | | |
Dividends from net investment income | | | (.15 | ) | | | (.14 | ) | | | (.12 | ) | | | (.24 | ) | | | (.29 | ) |
| | | | | |
Distributions from net realized gain on investment and foreign currency transactions | | | – 0 | – | | | – 0 | – | | | (.07 | ) | | | (.01 | ) | | | (.00 | )(c) |
| | | | |
Total dividends and distributions | | | (.15 | ) | | | (.14 | ) | | | (.19 | ) | | | (.25 | ) | | | (.29 | ) |
| | | | |
Net asset value, end of period | | | $ 8.70 | | | | $ 8.21 | | | | $ 8.46 | | | | $ 8.62 | | | | $ 8.36 | |
| | | | |
| | | | | |
Total Return | | | | | | | | | | | | | | | | | | | | |
| | | | | |
Total investment return based on net asset value(d)* | | | 7.87 | % | | | (1.36 | )% | | | .34 | % | | | 6.24 | % | | | 1.23 | % |
| | | | | |
Ratios/Supplemental Data | | | | | | | | | | | | | | | | | | | | |
| | | | | |
Net assets, end of period (000’s omitted) | | | $104,089 | | | | $146,309 | | | | $219,785 | | | | $349,965 | | | | $356,483 | |
| | | | | |
Ratio to average net assets of: | | | | | | | | | | | | | | | | | | | | |
| | | | | |
Expenses, net of waivers/reimbursements(e) | | | 1.56 | % | | | 1.56 | % | | | 1.57 | % | | | 1.58 | % | | | 1.60 | % |
| | | | | |
Expenses, before waivers/reimbursements(e) | | | 1.56 | % | | | 1.56 | % | | | 1.57 | % | | | 1.58 | % | | | 1.60 | % |
| | | | | |
Net investment income | | | 1.26 | %(b) | | | 1.38 | %(b) | | | 1.34 | %(b) | | | 1.30 | %(b) | | | 1.38 | % |
| | | | | |
Portfolio turnover rate | | | 126 | % | | | 369 | % | | | 107 | % | | | 113 | % | | | 167 | % |
See footnote summary on page 119.
| | |
| |
| abfunds.com | | AB GLOBAL BOND FUND | 113 |
FINANCIAL HIGHLIGHTS(continued)
Selected Data For A Share Of Capital Stock Outstanding Throughout Each Period
| | | | | | | | | | | | | | | | | | | | |
| | | Advisor Class | |
| | | Year Ended September 30, | |
| | | 2019 | | | 2018 | | | 2017 | | | 2016 | | | 2015 | |
| | | | |
| | | | | | | | | | | | | | | | | | | | |
Net asset value, beginning of period | | | $ 8.18 | | | | $ 8.42 | | | | $ 8.58 | | | | $ 8.33 | | | | $ 8.51 | |
| | | | |
Income From Investment Operations | | | | | | | | | | | | | | | | | | | | |
| | | | | |
Net investment income(a) | | | .19 | (b) | | | .20 | (b) | | | .20 | (b) | | | .20 | (b) | | | .20 | |
| | | | | |
Net realized and unrealized gain (loss) on investment and foreign currency transactions | | | .52 | | | | (.22 | ) | | | (.09 | ) | | | .38 | | | | (.01 | ) |
| | | | | |
Contributions from Affiliates | | | .00 | (c) | | | – 0 | – | | | – 0 | – | | | .00 | (c) | | | .00 | (c) |
| | | | | |
Capital Contributions | | | – 0 | – | | | .00 | (c) | | | – 0 | – | | | .00 | (c) | | | – 0 | – |
| | | | |
Net increase (decrease) in net asset value from operations | | | .71 | | | | (.02 | ) | | | .11 | | | | .58 | | | | .19 | |
| | | | |
Less: Dividends and Distributions | | | | | | | | | | | | | | | | | | | | |
| | | | | |
Dividends from net investment income | | | (.23 | ) | | | (.22 | ) | | | (.20 | ) | | | (.32 | ) | | | (.37 | ) |
| | | | | |
Distributions from net realized gain on investment and foreign currency transactions | | | – 0 | – | | | – 0 | – | | | (.07 | ) | | | (.01 | ) | | | (.00 | )(c) |
| | | | |
Total dividends and distributions | | | (.23 | ) | | | (.22 | ) | | | (.27 | ) | | | (.33 | ) | | | (.37 | ) |
| | | | |
Net asset value, end of period | | | $ 8.66 | | | | $ 8.18 | | | | $ 8.42 | | | | $ 8.58 | | | | $ 8.33 | |
| | | | |
| | | | | |
Total Return | | | | | | | | | | | | | | | | | | | | |
| | | | | |
Total investment return based on net asset value(d)* | | | 8.86 | % | | | (.25 | )% | | | 1.35 | % | | | 7.21 | % | | | 2.26 | % |
| | | | | |
Ratios/Supplemental Data | | | | | | | | | | | | | | | | | | | | |
| | | | | |
Net assets, end of period (000’s omitted) | | | $4,845,448 | | | | $4,570,491 | | | | $4,372,280 | | | | $3,275,362 | | | | $2,247,582 | |
| | | | | |
Ratio to average net assets of: | | | | | | | | | | | | | | | | | | | | |
| | | | | |
Expenses, net of waivers/reimbursements(e) | | | .56 | % | | | .56 | % | | | .58 | % | | | .58 | % | | | .60 | % |
| | | | | |
Expenses, before waivers/reimbursements(e) | | | .56 | % | | | .57 | % | | | .58 | % | | | .58 | % | | | .60 | % |
| | | | | |
Net investment income | | | 2.26 | %(b) | | | 2.44 | %(b) | | | 2.34 | %(b) | | | 2.33 | %(b) | | | 2.39 | % |
| | | | | |
Portfolio turnover rate | | | 126 | % | | | 369 | % | | | 107 | % | | | 113 | % | | | 167 | % |
See footnote summary on page 119.
| | |
| |
| 114 | AB GLOBAL BOND FUND | | abfunds.com |
FINANCIAL HIGHLIGHTS(continued)
Selected Data For A Share Of Capital Stock Outstanding Throughout Each Period
| | | | | | | | | | | | | | | | | | | | |
| | | Class R | |
| | | Year Ended September 30, | |
| | | 2019 | | | 2018 | | | 2017 | | | 2016 | | | 2015 | |
| | | | |
| | | | | | | | | | | | | | | | | | | | |
Net asset value, beginning of period | | | $ 8.18 | | | | $ 8.42 | | | | $ 8.59 | | | | $ 8.33 | | | | $ 8.51 | |
| | | | |
Income From Investment Operations | | | | | | | | | | | | | | | | | | | | |
| | | | | |
Net investment income(a) | | | .13 | (b) | | | .15 | (b) | | | .14 | (b) | | | .14 | (b) | | | .15 | |
| | | | | |
Net realized and unrealized gain (loss) on investment and foreign currency transactions | | | .53 | | | | (.23 | ) | | | (.09 | ) | | | .40 | | | | (.02 | ) |
| | | | | |
Contributions from Affiliates | | | .00 | (c) | | | – 0 | – | | | – 0 | – | | | .00 | (c) | | | .00 | (c) |
| | | | | |
Capital Contributions | | | – 0 | – | | | .00 | (c) | | | – 0 | – | | | .00 | (c) | | | – 0 | – |
| | | | |
Net increase (decrease) in net asset value from operations | | | .66 | | | | (.08 | ) | | | .05 | | | | .54 | | | | .13 | |
| | | | |
Less: Dividends and Distributions | | | | | | | | | | | | | | | | | | | | |
| | | | | |
Dividends from net investment income | | | (.18 | ) | | | (.16 | ) | | | (.15 | ) | | | (.27 | ) | | | (.31 | ) |
| | | | | |
Distributions from net realized gain on investment and foreign currency transactions | | | – 0 | – | | | – 0 | – | | | (.07 | ) | | | (.01 | ) | | | (.00 | )(c) |
| | | | |
Total dividends and distributions | | | (.18 | ) | | | (.16 | ) | | | (.22 | ) | | | (.28 | ) | | | (.31 | ) |
| | | | |
Net asset value, end of period | | | $ 8.66 | | | | $ 8.18 | | | | $ 8.42 | | | | $ 8.59 | | | | $ 8.33 | |
| | | | |
| | | | | |
Total Return | | | | | | | | | | | | | | | | | | | | |
| | | | | |
Total investment return based on net asset value(d)* | | | 8.13 | % | | | (.91 | )% | | | .57 | % | | | 6.63 | % | | | 1.57 | % |
| | | | | |
Ratios/Supplemental Data | | | | | | | | | | | | | | | | | | | | |
| | | | | |
Net assets, end of period (000’s omitted) | | | $69,424 | | | | $75,138 | | | | $83,901 | | | | $80,625 | | | | $60,300 | |
| | | | | |
Ratio to average net assets of: | | | | | | | | | | | | | | | | | | | | |
| | | | | |
Expenses, net of waivers/reimbursements(e) | | | 1.24 | % | | | 1.23 | % | | | 1.22 | % | | | 1.25 | % | | | 1.27 | % |
| | | | | |
Expenses, before waivers/reimbursements(e) | | | 1.24 | % | | | 1.23 | % | | | 1.23 | % | | | 1.25 | % | | | 1.27 | % |
| | | | | |
Net investment income | | | 1.59 | %(b) | | | 1.75 | %(b) | | | 1.70 | %(b) | | | 1.66 | %(b) | | | 1.72 | % |
| | | | | |
Portfolio turnover rate | | | 126 | % | | | 369 | % | | | 107 | % | | | 113 | % | | | 167 | % |
See footnote summary on page 119.
| | |
| |
| abfunds.com | | AB GLOBAL BOND FUND | 115 |
FINANCIAL HIGHLIGHTS(continued)
Selected Data For A Share Of Capital Stock Outstanding Throughout Each Period
| | | | | | | | | | | | | | | | | | | | |
| | | Class K | |
| | | Year Ended September 30, | |
| | | 2019 | | | 2018 | | | 2017 | | | 2016 | | | 2015 | |
| | | | |
| | | | | | | | | | | | | | | | | | | | |
Net asset value, beginning of period | | | $ 8.18 | | | | $ 8.42 | | | | $ 8.59 | | | | $ 8.33 | | | | $ 8.51 | |
| | | | |
Income From Investment Operations | | | | | | | | | | | | | | | | | | | | |
| | | | | |
Net investment income(a) | | | .16 | (b) | | | .17 | (b) | | | .17 | (b) | | | .17 | (b) | | | .17 | |
| | | | | |
Net realized and unrealized gain (loss) on investment and foreign currency transactions | | | .52 | | | | (.22 | ) | | | (.10 | ) | | | .40 | | | | (.01 | ) |
| | | | | |
Contributions from Affiliates | | | .00 | (c) | | | – 0 | – | | | – 0 | – | | | .00 | (c) | | | .00 | (c) |
| | | | | |
Capital Contributions | | | – 0 | – | | | .00 | (c) | | | – 0 | – | | | .00 | (c) | | | – 0 | – |
| | | | |
Net increase (decrease) in net asset value from operations | | | .68 | | | | (.05 | ) | | | .07 | | | | .57 | | | | .16 | |
| | | | |
Less: Dividends and Distributions | | | | | | | | | | | | | | | | | | | | |
| | | | | |
Dividends from net investment income | | | (.20 | ) | | | (.19 | ) | | | (.17 | ) | | | (.30 | ) | | | (.34 | ) |
| | | | | |
Distributions from net realized gain on investment and foreign currency transactions | | | – 0 | – | | | – 0 | – | | | (.07 | ) | | | (.01 | ) | | | (.00 | )(c) |
| | | | |
Total dividends and distributions | | | (.20 | ) | | | (.19 | ) | | | (.24 | ) | | | (.31 | ) | | | (.34 | ) |
| | | | |
Net asset value, end of period | | | $ 8.66 | | | | $ 8.18 | | | | $ 8.42 | | | | $ 8.59 | | | | $ 8.33 | |
| | | | |
| | | | | |
Total Return | | | | | | | | | | | | | | | | | | | | |
| | | | | |
Total investment return based on net asset value(d)* | | | 8.46 | % | | | (.60 | )% | | | .90 | % | | | 6.97 | % | | | 1.90 | % |
| | | | | |
Ratios/Supplemental Data | | | | | | | | | | | | | | | | | | | | |
| | | | | |
Net assets, end of period (000’s omitted) | | | $19,576 | | | | $16,642 | | | | $36,288 | | | | $31,361 | | | | $23,625 | |
| | | | | |
Ratio to average net assets of: | | | | | | | | | | | | | | | | | | | | |
| | | | | |
Expenses, net of waivers/reimbursements(e) | | | .93 | % | | | .92 | % | | | .89 | % | | | .93 | % | | | .95 | % |
| | | | | |
Expenses, before waivers/reimbursements(e) | | | .93 | % | | | .92 | % | | | .90 | % | | | .93 | % | | | .95 | % |
| | | | | |
Net investment income | | | 1.89 | %(b) | | | 2.09 | %(b) | | | 2.03 | %(b) | | | 1.98 | %(b) | | | 2.04 | % |
| | | | | |
Portfolio turnover rate | | | 126 | % | | | 369 | % | | | 107 | % | | | 113 | % | | | 167 | % |
See footnote summary on page 119.
| | |
| |
| 116 | AB GLOBAL BOND FUND | | abfunds.com |
FINANCIAL HIGHLIGHTS(continued)
Selected Data For A Share Of Capital Stock Outstanding Throughout Each Period
| | | | | | | | | | | | | | | | | | | | |
| | | Class I | |
| | | Year Ended September 30, | |
| | | 2019 | | | 2018 | | | 2017 | | | 2016 | | | 2015 | |
| | | | |
| | | | | | | | | | | | | | | | | | | | |
Net asset value, beginning of period | | | $ 8.18 | | | | $ 8.42 | | | | $ 8.58 | | | | $ 8.33 | | | | $ 8.51 | |
| | | | |
Income From Investment Operations | | | | | | | | | | | | | | | | | | | | |
| | | | | |
Net investment income(a) | | | .19 | (b) | | | .20 | (b) | | | .20 | (b) | | | .20 | (b) | | | .20 | |
| | | | | |
Net realized and unrealized gain (loss) on investment and foreign currency transactions | | | .52 | | | | (.22 | ) | | | (.09 | ) | | | .38 | | | | (.01 | ) |
| | | | | |
Contributions from Affiliates | | | .00 | (c) | | | – 0 | – | | | – 0 | – | | | .00 | (c) | | | .00 | (c) |
| | | | | |
Capital Contributions | | | – 0 | – | | | .00 | (c) | | | – 0 | – | | | .00 | (c) | | | – 0 | – |
| | | | |
Net increase (decrease) in net asset value from operations | | | .71 | | | | (.02 | ) | | | .11 | | | | .58 | | | | .19 | |
| | | | |
Less: Dividends and Distributions | | | | | | | | | | | | | | | | | | | | |
| | | | | |
Dividends from net investment income | | | (.23 | ) | | | (.22 | ) | | | (.20 | ) | | | (.32 | ) | | | (.37 | ) |
| | | | | |
Distributions from net realized gain on investment and foreign currency transactions | | | – 0 | – | | | – 0 | – | | | (.07 | ) | | | (.01 | ) | | | (.00 | )(c) |
| | | | |
Total dividends and distributions | | | (.23 | ) | | | (.22 | ) | | | (.27 | ) | | | (.33 | ) | | | (.37 | ) |
| | | | |
Net asset value, end of period | | | $ 8.66 | | | | $ 8.18 | | | | $ 8.42 | | | | $ 8.58 | | | | $ 8.33 | |
| | | | |
| | | | | |
Total Return | | | | | | | | | | | | | | | | | | | | |
| | | | | |
Total investment return based on net asset value(d)* | | | 8.87 | % | | | (.23 | )% | | | 1.36 | % | | | 7.22 | % | | | 2.27 | % |
| | | | | |
Ratios/Supplemental Data | | | | | | | | | | | | | | | | | | | | |
| | | | | |
Net assets, end of period (000’s omitted) | | | $852,566 | | | | $773,149 | | | | $748,238 | | | | $715,514 | | | | $536,411 | |
| | | | | |
Ratio to average net assets of: | | | | | | | | | | | | | | | | | | | | |
| | | | | |
Expenses, net of waivers/reimbursements(e) | | | .55 | % | | | .54 | % | | | .56 | % | | | .57 | % | | | .59 | % |
| | | | | |
Expenses, before waivers/reimbursements(e) | | | .56 | % | | | .55 | % | | | .56 | % | | | .58 | % | | | .59 | % |
| | | | | |
Net investment income | | | 2.27 | %(b) | | | 2.46 | %(b) | | | 2.36 | %(b) | | | 2.33 | %(b) | | | 2.40 | % |
| | | | | |
Portfolio turnover rate | | | 126 | % | | | 369 | % | | | 107 | % | | | 113 | % | | | 167 | % |
See footnote summary on page 119.
| | |
| |
| abfunds.com | | AB GLOBAL BOND FUND | 117 |
FINANCIAL HIGHLIGHTS(continued)
Selected Data For A Share Of Capital Stock Outstanding Throughout Each Period
| | | | | | | | | | | | | | | | | | | | |
| | | Class Z | |
| | | Year Ended September 30, | |
| | | 2019 | | | 2018 | | | 2017 | | | 2016 | | | 2015 | |
| | | | |
| | | | | | | | | | | | | | | | | | | | |
Net asset value, beginning of period | | | $ 8.18 | | | | $ 8.42 | | | | $ 8.59 | | | | $ 8.33 | | | | $ 8.51 | |
| | | | |
Income From Investment Operations | | | | | | | | | | | | | | | | | | | | |
| | | | | |
Net investment income(a) | | | .19 | (b) | | | .21 | (b) | | | .20 | (b) | | | .20 | (b) | | | .21 | |
| | | | | |
Net realized and unrealized gain (loss) on investment and foreign currency transactions | | | .53 | | | | (.22 | ) | | | (.09 | ) | | | .40 | | | | (.02 | ) |
| | | | | |
Contributions from Affiliates | | | .00 | (c) | | | – 0 | – | | | – 0 | – | | | .00 | (c) | | | – 0 | – |
| | | | | |
Capital Contributions | | | – 0 | – | | | .00 | (c) | | | – 0 | – | | | .00 | (c) | | | – 0 | – |
| | | | |
Net increase (decrease) in net asset value from operations | | | .72 | | | | (.01 | ) | | | .11 | | | | .60 | | | | .19 | |
| | | | |
Less: Dividends and Distributions | | | | | | | | | | | | | | | | | | | | |
| | | | | |
Dividends from net investment income | | | (.24 | ) | | | (.23 | ) | | | (.21 | ) | | | (.33 | ) | | | (.37 | ) |
| | | | | |
Distributions from net realized gain on investment and foreign currency transactions | | | – 0 | – | | | – 0 | – | | | (.07 | ) | | | (.01 | ) | | | (.00 | )(c) |
| | | | |
Total dividends and distributions | | | (.24 | ) | | | (.23 | ) | | | (.28 | ) | | | (.34 | ) | | | (.37 | ) |
| | | | |
Net asset value, end of period | | | $ 8.66 | | | | $ 8.18 | | | | $ 8.42 | | | | $ 8.59 | | | | $ 8.33 | |
| | | | |
| | | | | |
Total Return | | | | | | | | | | | | | | | | | | | | |
| | | | | |
Total investment return based on net asset value(d)* | | | 8.93 | % | | | (.18 | )% | | | 1.29 | % | | | 7.39 | % | | | 2.32 | % |
| | | | | |
Ratios/Supplemental Data | | | | | | | | | | | | | | | | | | | | |
| | | | | |
Net assets, end of period (000’s omitted) | | | $580,799 | | | | $489,921 | | | | $350,625 | | | | $200,617 | | | | $167,830 | |
| | | | | |
Ratio to average net assets of: | | | | | | | | | | | | | | | | | | | | |
| | | | | |
Expenses, net of waivers/reimbursements(e) | | | .50 | % | | | .49 | % | | | .51 | % | | | .52 | % | | | .53 | % |
| | | | | |
Expenses, before waivers/reimbursements(e) | | | .50 | % | | | .50 | % | | | .52 | % | | | .53 | % | | | .53 | % |
| | | | | |
Net investment income | | | 2.33 | %(b) | | | 2.54 | %(b) | | | 2.41 | %(b) | | | 2.38 | %(b) | | | 2.47 | % |
| | | | | |
Portfolio turnover rate | | | 126 | % | | | 369 | % | | | 107 | % | | | 113 | % | | | 167 | % |
See footnote summary on page 119.
| | |
| |
| 118 | AB GLOBAL BOND FUND | | abfunds.com |
FINANCIAL HIGHLIGHTS(continued)
Selected Data For A Share Of Capital Stock Outstanding Throughout Each Period
| (a) | Based on average shares outstanding. |
| (b) | Net of expenses waived/reimbursed by the Adviser. |
| (c) | Amount is less than $0.005. |
| (d) | Total investment return is calculated assuming an initial investment made at the net asset value at the beginning of the period, reinvestment of all dividends and distributions at net asset value during the period, and redemption on the last day of the period. Initial sales charge or contingent deferred sales charge is not reflected in the calculation of total investment return. Total investment return does not reflect the deduction of taxes that a shareholder would pay on fund distributions or the redemption of fund shares. Total investment return for a period of less than one year is not annualized. |
| (e) | The expense ratios presented below exclude interest expense: |
| | | | | | | | | | | | | | | | | | | | |
| | | Year Ended September 30, | |
| | 2019 | | | 2018 | | | 2017 | | | 2016 | | | 2015 | |
| | | | |
Class A | | | | | | | | | | | | | | | | | | | | |
Net of waivers/reimbursements | | | .81 | % | | | .81 | % | | | .82 | % | | | .85 | % | | | .90 | % |
Before waivers/reimbursements | | | .81 | % | | | .82 | % | | | .83 | % | | | .85 | % | | | .90 | % |
Class B | | | | | | | | | | | | | | | | | | | | |
Net of waivers/reimbursements | | | 1.63 | % | | | 1.61 | % | | | 1.62 | % | | | 1.61 | % | | | 1.63 | % |
Before waivers/reimbursements | | | 1.63 | % | | | 1.62 | % | | | 1.62 | % | | | 1.61 | % | | | 1.63 | % |
Class C | | | | | | | | | | | | | | | | | | | | |
Net of waivers/reimbursements | | | 1.56 | % | | | 1.56 | % | | | 1.57 | % | | | 1.58 | % | | | 1.60 | % |
Before waivers/reimbursements | | | 1.56 | % | | | 1.56 | % | | | 1.57 | % | | | 1.58 | % | | | 1.60 | % |
Advisor Class | | | | | | | | | | | | | | | | | | | | |
Net of waivers/reimbursements | | | .56 | % | | | .56 | % | | | .58 | % | | | .58 | % | | | .60 | % |
Before waivers/reimbursements | | | .56 | % | | | .57 | % | | | .58 | % | | | .58 | % | | | .60 | % |
Class R | | | | | | | | | | | | | | | | | | | | |
Net of waivers/reimbursements | | | 1.24 | % | | | 1.23 | % | | | 1.22 | % | | | 1.25 | % | | | 1.27 | % |
Before waivers/reimbursements | | | 1.24 | % | | | 1.23 | % | | | 1.23 | % | | | 1.25 | % | | | 1.27 | % |
Class K | | | | | | | | | | | | | | | | | | | | |
Net of waivers/reimbursements | | | .93 | % | | | .92 | % | | | .89 | % | | | .93 | % | | | .95 | % |
Before waivers/reimbursements | | | .93 | % | | | .92 | % | | | .90 | % | | | .93 | % | | | .95 | % |
Class I | | | | | | | | | | | | | | | | | | | | |
Net of waivers/reimbursements | | | .55 | % | | | .54 | % | | | .56 | % | | | .57 | % | | | .59 | % |
Before waivers/reimbursements | | | .56 | % | | | .55 | % | | | .56 | % | | | .58 | % | | | .59 | % |
Class Z | | | | | | | | | | | | | | | | | | | | |
Net of waivers/reimbursements | | | .50 | % | | | .49 | % | | | .51 | % | | | .52 | % | | | .53 | % |
Before waivers/reimbursements | | | .50 | % | | | .50 | % | | | .52 | % | | | .53 | % | | | .53 | % |
| * | Includes the impact of proceeds received and credited to the Fund in connection with a residual distribution relating to regulatory settlements, which enhanced the Fund’s performance for the year ended September 30, 2016 by 0.01%. |
See notes to financial statements.
| | |
| |
| abfunds.com | | AB GLOBAL BOND FUND | 119 |
REPORT OF INDEPENDENT REGISTERED
PUBLIC ACCOUNTING FIRM
To the Board of Directors and Shareholders of
AB Global Bond Fund, Inc.
Opinion on the Financial Statements
We have audited the accompanying statement of assets and liabilities of AB Global Bond Fund, Inc. (the “Fund”), including the portfolio of investments, as of September 30, 2019, and the related statement of operations for the year then ended, the statements of changes in net assets for each of the two years in the period then ended, the financial highlights for each of the five years in the period then ended and the related notes (collectively referred to as the “financial statements”). In our opinion, the financial statements present fairly, in all material respects, the financial position of the Fund at September 30, 2019, the results of its operations for the year then ended, the changes in its net assets for each of the two years in the period then ended and its financial highlights for each of the five years in the period then ended, in conformity with U.S. generally accepted accounting principles.
Basis for Opinion
These financial statements are the responsibility of the Fund’s management. Our responsibility is to express an opinion on the Fund’s financial statements based on our audits. We are a public accounting firm registered with the Public Company Accounting Oversight Board (United States) (“PCAOB”) and are required to be independent with respect to the Fund in accordance with the U.S. federal securities laws and the applicable rules and regulations of the Securities and Exchange Commission and the PCAOB.
We conducted our audits in accordance with the standards of the PCAOB. Those standards require that we plan and perform the audit to obtain reasonable assurance about whether the financial statements are free of material misstatement, whether due to error or fraud. The Fund is not required to have, nor were we engaged to perform, an audit of the Fund’s internal control over financial reporting. As part of our audits, we are required to obtain an understanding of internal control over financial reporting, but not for the purpose of expressing an opinion on the effectiveness of the Fund’s internal control over financial reporting. Accordingly, we express no such opinion.
Our audits included performing procedures to assess the risks of material misstatement of the financial statements, whether due to error or fraud, and performing procedures that respond to those risks. Such procedures included examining, on a test basis, evidence regarding the amounts and disclosures in the financial statements. Our procedures included confirmation
| | |
| |
| 120 | AB GLOBAL BOND FUND | | abfunds.com |
REPORT OF INDEPENDENT REGISTERED
PUBLIC ACCOUNTING FIRM(continued)
of securities owned as of September 30, 2019, by correspondence with the custodian and others or by other appropriate auditing procedures where replies from others were not received. Our audits also included evaluating the accounting principles used and significant estimates made by management, as well as evaluating the overall presentation of the financial statements. We believe that our audits provide a reasonable basis for our opinion.

We have served as the auditor of one or more of the AB investment companies since 1968.
New York, New York
November 26, 2019
| | |
| |
| abfunds.com | | AB GLOBAL BOND FUND | 121 |
2019 FEDERAL TAX INFORMATION
(unaudited)
For Federal income tax purposes, the following information is furnished with respect to the distributions paid by the Fund during the taxable year ended September 30, 2019. For foreign shareholders, 29.95% of ordinary income dividends paid may be considered to be qualifying to be taxed as interest-related dividends.
Shareholders should not use the above information to prepare their income tax returns. The information necessary to complete your income tax returns will be included with your Form 1099-DIV which will be sent to you separately in January 2020.
| | |
| |
| 122 | AB GLOBAL BOND FUND | | abfunds.com |
BOARD OF DIRECTORS
| | |
Marshall C. Turner, Jr.(1),Chairman Michael J. Downey(1) Nancy P. Jacklin(1) Robert M. Keith,President and Chief Executive Officer | | Carol C. McMullen(1) Garry L. Moody(1) Earl D. Weiner(1) |
| |
| OFFICERS | | |
Paul J. DeNoon(2)*,
Vice President Scott A. DiMaggio(2),
Vice President Douglas J. Peebles(2),
Vice President Matthew S. Sheridan(2),
Vice President John Taylor(2),Vice President | | Emilie D. Wrapp,Secretary Michael B. Reyes,
Senior Analyst Joseph J. Mantineo,Treasurer and Chief Financial Officer Stephen M. Woetzel,Controller Vincent S. Noto, Chief
Compliance Officer |
| | |
Custodian and Accounting Agent Brown Brothers Harriman & Co. 50 Post Office Square Boston, MA 02110 Principal Underwriter AllianceBernstein Investments, Inc. 1345 Avenue of the Americas New York, NY 10105 Legal Counsel Seward & Kissel LLP One Battery Park Plaza New York, NY 10004 | | Transfer Agent AllianceBernstein Investor Services, Inc. P.O. Box 786003 San Antonio, TX 78278-6003 Toll-Free (800) 221-5672 Independent Registered Public Accounting Firm Ernst & Young LLP 5 Times Square New York, NY 10036 |
| 1 | Member of the Audit Committee, the Governance and Nominating Committee, and the Independent Directors Committee. |
| 2 | The day-to-day management of, and investment decisions for, the Fund’s portfolio are made by the Global Fixed Income Investment Team. Messrs. DeNoon, DiMaggio, Peebles, Sheridan and Taylor are the investment professionals with the most significant responsibility for theday-to-day management of the Fund’s portfolio. |
| * | Mr. DeNoon is expected to retire from the Adviser effective January 1, 2020. |
| | |
| |
| abfunds.com | | AB GLOBAL BOND FUND | 123 |
MANAGEMENT OF THE FUND
Board of Directors Information
The business and affairs of the Fund are managed under the direction of the Board of Directors. Certain information concerning the Fund’s Directors is set forth below.
| | | | | | | | |
NAME, ADDRESS*, AGE,
(YEAR FIRST ELECTED**) | | PRINCIPAL
OCCUPATION(S)
DURING PAST FIVE YEARS
AND OTHER INFORMATION*** | | PORTFOLIOS
IN AB FUND
COMPLEX
OVERSEEN BY
DIRECTOR | | | OTHER PUBLIC COMPANY DIRECTORSHIPS
CURRENTLY
HELD BY DIRECTOR |
| INTERESTED DIRECTOR | | | | | | | | |
| | | |
Robert M. Keith,#
1345 Avenue of the Americas
NewYork, NY 10105
59 (2010) | | Senior Vice President of AllianceBernstein L.P. (the “Adviser”) and the head of AllianceBernstein Investments, Inc. (“ABI”) since July 2008; Director of ABI and President of the AB Mutual Funds. Previously, he served as Executive Managing Director of ABI from December 2006 to June 2008. Prior to joining ABI in 2006, Executive Managing Director of Bernstein Global Wealth Management, and prior thereto, Senior Managing Director and Global Head of Client Service and Sales of the Adviser’s institutional investment management business since 2004. Prior thereto, he was Managing Director and Head of North American Client Service and Sales in the Adviser’s institutional investment management business with which he had been associated since prior to 2004. | | | 91 | | | None |
| | |
| |
| 124 | AB GLOBAL BOND FUND | | abfunds.com |
MANAGEMENT OF THE FUND(continued)
| | | | | | | | |
NAME, ADDRESS*, AGE,
(YEAR FIRST ELECTED**) | | PRINCIPAL
OCCUPATION(S)
DURING PAST FIVE YEARS
AND OTHER INFORMATION*** | | PORTFOLIOS
IN AB FUND
COMPLEX
OVERSEEN BY
DIRECTOR | | | OTHER PUBLIC COMPANY DIRECTORSHIPS
CURRENTLY
HELD BY DIRECTOR |
| INDEPENDENT DIRECTORS |
| | | |
Marshall C. Turner, Jr.,##
Chairman of the Board
78
(2005) | | Private Investor since prior to 2014. Former Chairman and CEO of Dupont Photomasks, Inc. (components of semi-conductor manufacturing). He has extensive operating leadership, and venture capital investing experience, including five interim or full-time CEO roles, and prior service as general partner of institutional venture capital partnerships. He also has extensivenon-profit board leadership experience, and currently serves on the boards of two education and science-relatednon-profit organizations. He has served as a director of one AB Fund since 1992, and director or trustee of all AB Funds since 2005. He has been Chairman of the AB Funds since January 2014, and the Chairman of the Independent Directors Committees of such AB Funds since February 2014. | | | 91 | | | Xilinx, Inc. (programmable logic semi-conductors) since 2007 |
| | | | | | | | |
| | | |
Michael J. Downey,##
75 (2005)
| | Private Investor since prior to 2014. Formerly, Chairman of The Asia Pacific Fund, Inc. (registered investment company) since prior to 2014 until January 2019. From 1987 until 1993, Chairman and CEO of Prudential Mutual Fund Management, director of the Prudential mutual funds, and member of the Executive Committee of Prudential Securities, Inc. He has served as a director or trustee of the AB Funds since 2005. | | | 91 | | | None |
| | |
| |
| abfunds.com | | AB GLOBAL BOND FUND | 125 |
MANAGEMENT OF THE FUND(continued)
| | | | | | | | |
NAME, ADDRESS*, AGE,
(YEAR FIRST ELECTED**) | | PRINCIPAL
OCCUPATION(S)
DURING PAST FIVE YEARS
AND OTHER INFORMATION*** | | PORTFOLIOS
IN AB FUND
COMPLEX
OVERSEEN BY
DIRECTOR | | | OTHER PUBLIC COMPANY DIRECTORSHIPS
CURRENTLY
HELD BY DIRECTOR |
INDEPENDENT DIRECTORS (continued) | | | | | | |
| | | |
Nancy P. Jacklin,##
71
(2006) | | Private Investor since prior to 2014. Professorial Lecturer at the Johns Hopkins School of Advanced International Studies (2008-2015). U.S. Executive Director of the International Monetary Fund (which is responsible for ensuring the stability of the international monetary system), (December2002-May 2006); Partner, Clifford Chance (1992-2002); Sector Counsel, International Banking and Finance, and Associate General Counsel, Citicorp (1985-1992); Assistant General Counsel (International), Federal Reserve Board of Governors (1982-1985); and Attorney Advisor, U.S. Department of the Treasury (1973-1982). Member of the Bar of the District of Columbia and of New York; and member of the Council on Foreign Relations. She has served as a director or trustee of the AB Funds since 2006 and has been Chair of the Governance and Nominating Committees of the AB Funds since August 2014. | | | 91 | | | None |
| | |
| |
| 126 | AB GLOBAL BOND FUND | | abfunds.com |
MANAGEMENT OF THE FUND(continued)
| | | | | | | | |
NAME, ADDRESS*, AGE,
(YEAR FIRST ELECTED**) | | PRINCIPAL
OCCUPATION(S)
DURING PAST FIVE YEARS
AND OTHER INFORMATION*** | | PORTFOLIOS
IN AB FUND
COMPLEX
OVERSEEN BY
DIRECTOR | | | OTHER PUBLIC COMPANY DIRECTORSHIPS
CURRENTLY
HELD BY DIRECTOR |
INDEPENDENT DIRECTORS (continued) | | | | | | |
| | | |
Carol C. McMullen,## 64
(2016)
| | Managing Director of Slalom Consulting (consulting) since 2014, private investor and member of the Advisory Board of Butcher Box (since 2018). Formerly, member, Partners Healthcare Investment Committee (2010-2019); Director of Norfolk & Dedham Group (mutual property and casualty insurance) from 2011 until November 2016; Director of Partners Community Physicians Organization (healthcare) from 2014 until December 2016; and Managing Director of The Crossland Group (consulting) from 2012 until 2013. She has held a number of senior positions in the asset and wealth management industries, including at Eastern Bank (where her roles included President of Eastern Wealth Management), Thomson Financial (Global Head of Sales for Investment Management), and Putnam Investments (where her roles included Chief Investment Officer, Core and Growth and Head of Global Investment Research). She has served on a number of private company and non-profit boards, and as a director or trustee of the AB Funds since June 2016. | | | 91 | | | None |
| | |
| |
| abfunds.com | | AB GLOBAL BOND FUND | 127 |
MANAGEMENT OF THE FUND(continued)
| | | | | | | | |
NAME, ADDRESS*, AGE,
(YEAR FIRST ELECTED**) | | PRINCIPAL
OCCUPATION(S)
DURING PAST FIVE YEARS
AND OTHER INFORMATION*** | | PORTFOLIOS
IN AB FUND
COMPLEX
OVERSEEN BY
DIRECTOR | | | OTHER PUBLIC COMPANY DIRECTORSHIPS
CURRENTLY
HELD BY DIRECTOR |
INDEPENDENT DIRECTORS (continued) | | | | | | |
| | | |
Garry L. Moody,##
67 (2008) | | Formerly, Partner, Deloitte & Touche LLP (1995-2008) where he held a number of senior positions, including Vice Chairman, and U.S. and Global Investment Management Practice Managing Partner; President, Fidelity Accounting and Custody Services Company (1993-1995), where he was responsible for accounting, pricing, custody and reporting for the Fidelity mutual funds; and Partner, Ernst & Young LLP (1975-1993), where he served as the National Director of Mutual Fund Tax Services and Managing Partner of its Chicago Office Tax department. He is a member of the Trustee Advisory Board of BoardIQ, a biweekly publication focused on issues and news affecting directors of mutual funds. He is also a member of the Investment Company Institute’s Board of Governors and the Independent Directors Council Governing Council. He has served as a director or trustee, and as Chairman of the Audit Committees, of the AB Funds since 2008. | | | 91 | | | None |
| | |
| |
| 128 | AB GLOBAL BOND FUND | | abfunds.com |
MANAGEMENT OF THE FUND(continued)
| | | | | | | | |
NAME, ADDRESS*, AGE,
(YEAR FIRST ELECTED**) | | PRINCIPAL
OCCUPATION(S)
DURING PAST FIVE YEARS
AND OTHER INFORMATION*** | | PORTFOLIOS
IN AB FUND
COMPLEX
OVERSEEN BY
DIRECTOR | | | OTHER PUBLIC COMPANY DIRECTORSHIPS
CURRENTLY
HELD BY DIRECTOR |
INDEPENDENT DIRECTORS (continued) | | | | | | |
| | | |
Earl D. Weiner,##
80
(2007) | | Senior Counsel since 2017, Of Counsel from 2007 to 2016, and Partner prior to then, of the law firm Sullivan & Cromwell LLP. He is a former member of the ABA Federal Regulation of Securities Committee Task Force to draft editions of the Fund Director’s Guidebook. He also serves as a director or trustee of variousnon-profit organizations and has served as Chairman or Vice Chairman of a number of them. He has served as a director or trustee of the AB Funds since 2007 and served as Chairman of the Governance and Nominating Committees of the AB Funds from 2007 until August 2014. | | | 91 | | | None |
| * | The address for each of the Fund’s disinterested Directors is c/o AllianceBernstein L.P., Attention: Legal and Compliance Department—Mutual Fund Legal, 1345 Avenue of the Americas, New York, NY 10105. |
| ** | There is no stated term of office for the Fund’s Directors. |
| *** | The information above includes each Director’s principal occupation during the last five years and other information relating to the experience, attributes, and skills relevant to each Director’s qualifications to serve as a Director, which led to the conclusion that each Director should serve as a Director for the Fund. |
| # | Mr. Keith is an “interested person” of the Fund, as defined in the 1940 Act, due to his position as a Senior Vice President of the Adviser. |
| ## | Member of the Audit Committee, the Governance and Nominating Committee, and the Independent Directors Committee. |
| | |
| |
| abfunds.com | | AB GLOBAL BOND FUND | 129 |
MANAGEMENT OF THE FUND(continued)
Officer Information
Certain information concerning the Fund’s Officers is listed below.
| | | | |
NAME, ADDRESS*
AND AGE | | POSITION(S)
HELD WITH FUND | | PRINCIPAL OCCUPATION
DURING PAST FIVE YEARS** |
Robert M. Keith,
59 | | President and Chief Executive Officer | | See biography above. |
| | | | |
Paul J. DeNoon,^
57 | | Vice President | | Senior Vice President of the Adviser,** with which he has been associated since prior to 2014. |
| | | | |
Scott A. DiMaggio,
48 | | Vice President | | Senior Vice President of the Adviser,** with which he has been associated since prior to 2014. He is also Co-Head of Fixed Income. |
| | | | |
Douglas J. Peebles,
54 | | Vice President | | Senior Vice President of the Adviser,** with which he has been associated since prior to 2014. He is also Chief Investment Officer of Fixed Income. As CIO, he is also Co-Chairman of the Interest Rates and Currencies Research Review team, which is responsible for setting interest-rate and currency policy for all fixed-income portfolios. |
| | | | |
Matthew S. Sheridan,
44 | | Vice President | | Senior Vice President of the Adviser,** with which he has been associated since prior to 2014. |
| | | | |
John Taylor 42 | | Vice President | | Senior Vice President of the Adviser,** with which he has been associated since prior to 2014. He is also Co-Head—European Fixed-Income. |
| | | | |
Emilie D. Wrapp,
63 | | Secretary | | Senior Vice President, Assistant General Counsel and Assistant Secretary of ABI,** with which she has been associated since prior to 2014. |
| | | | |
Michael B. Reyes
43 | | Senior Analyst | | Vice President of the Adviser,** with which he has been associated since prior to 2014. |
| | | | |
Joseph J. Mantineo,
60 | | Treasurer and Chief Financial Officer | | Senior Vice President of AllianceBernstein Investor Services, Inc. (“ABIS”),** with which he has been associated since prior to 2014. |
| | | | |
Stephen M. Woetzel,
48 | | Controller | | Senior Vice President of ABIS,** with which he has been associated since prior to 2014. |
| | | | |
Vincent S. Noto,
54 | | Chief Compliance Officer | | Senior Vice President since 2015 and Mutual Fund Chief Compliance Officer of the Adviser** since 2014. Prior thereto, he was Vice President and Director of Mutual Fund Compliance of the Adviser** since 2012. |
| * | The address for each of the Fund’s Officers is 1345 Avenue of the Americas, New York, NY 10105. |
| ** | The Adviser, ABI and ABIS are affiliates of the Fund. |
| ^ | Mr. DeNoon is expected to retire from the Adviser effective January 1, 2020. |
The Fund’s Statement of Additional Information (“SAI”) has additional information about the Fund’s Directors and Officers and is available without charge upon request. Contact your financial representative or AB at(800)-227-4618, or visit www.abfunds.com, for a free prospectus or SAI.
| | |
| |
| 130 | AB GLOBAL BOND FUND | | abfunds.com |
Information Regarding the Review and Approval of the Fund’s Advisory Agreement
The disinterested directors (the “directors”) of AB Global Bond Fund, Inc. (the “Fund”) unanimously approved the continuance of the Fund’s Advisory Agreement with the Adviser at a meeting held onNovember 6-8, 2018 (the “Meeting”).
Prior to approval of the continuance of the Advisory Agreement, the directors had requested from the Adviser, and received and evaluated, extensive materials. They reviewed the proposed continuance of the Advisory Agreement with the Adviser and with experienced counsel who are independent of the Adviser, who advised on the relevant legal standards. The directors also reviewed additional materials, including materials from an outside consultant, who acted as their independent fee consultant, and comparative analytical data prepared by the Senior Analyst for the Fund. The directors also discussed the proposed continuance in private sessions with counsel.
The directors considered their knowledge of the nature and quality of the services provided by the Adviser to the Fund gained from their experience as directors or trustees of most of the registered investment companies advised by the Adviser, their overall confidence in the Adviser’s integrity and competence they have gained from that experience, the Adviser’s initiative in identifying and raising potential issues with the directors and its responsiveness, frankness and attention to concerns raised by the directors in the past, including the Adviser’s willingness to consider and implement organizational and operational changes designed to improve investment results and the services provided to the AB Funds. The directors noted that they have four regular meetings each year, at each of which they review extensive materials and information from the Adviser, including information on the investment performance of the Fund.
The directors also considered all factors they believed relevant, including the specific matters discussed below. During the course of their deliberations, the directors evaluated, among other things, the reasonableness of the advisory fee. The directors did not identify any particular information that wasall-important or controlling, and different directors may have attributed different weights to the various factors. The directors determined that the selection of the Adviser to manage the Fund and the overall arrangements between the Fund and the Adviser, as provided in the Advisory Agreement, including the advisory fee, were fair and reasonable in light of the services performed, expenses incurred and such other matters as the directors considered relevant in the exercise of their business judgment. The material factors and conclusions that formed the basis for the directors’ determinations included the following:
Nature, Extent and Quality of Services Provided
The directors considered the scope and quality of services provided by the Adviser under the Advisory Agreement, including the quality of the investment
| | |
| |
| abfunds.com | | AB GLOBAL BOND FUND | 131 |
research capabilities of the Adviser and the other resources it has dedicated to performing services for the Fund. The directors noted that the Adviser from time to time reviews the Fund’s investment strategies and from time to time proposes changes intended to improve the Fund’s relative or absolute performance for the directors’ consideration. They also noted the professional experience and qualifications of the Fund’s portfolio management team and other senior personnel of the Adviser. The directors also considered that the Advisory Agreement provides that the Fund will reimburse the Adviser for the cost to it of providing certain clerical, accounting, administrative and other services to the Fund by employees of the Adviser or its affiliates. Requests for these reimbursements are made on a quarterly basis and subject to approval by the directors. Reimbursements, to the extent requested and paid, result in a higher rate of total compensation from the Fund to the Adviser than the fee rate stated in the Advisory Agreement. The directors noted that the methodology used to determine the reimbursement amounts had been reviewed by an independent consultant retained by the Fund’s former Senior Officer/Independent Compliance Officer. The quality of administrative and other services, including the Adviser’s role in coordinating the activities of the Fund’s other service providers, also was considered. The directors concluded that, overall, they were satisfied with the nature, extent and quality of services provided to the Fund under the Advisory Agreement.
Costs of Services Provided and Profitability
The directors reviewed a schedule of the revenues and expenses and related notes indicating the profitability of the Fund to the Adviser for calendar years 2016 and 2017 that had been prepared with an expense allocation methodology arrived at in consultation with an independent consultant retained by the Fund’s former Senior Officer/Independent Compliance Officer. The directors noted the assumptions and methods of allocation used by the Adviser in preparing fund-specific profitability data and understood that there are a number of potentially acceptable allocation methodologies for information of this type. The directors noted that the profitability information reflected all revenues and expenses of the Adviser’s relationship with the Fund, including those relating to its subsidiaries that provide transfer agency and distribution services to the Fund. The directors recognized that it is difficult to make comparisons of the profitability of the Advisory Agreement with the profitability of fund advisory contracts for unaffiliated funds because comparative information is not generally publicly available and is affected by numerous factors. The directors focused on the profitability of the Adviser’s relationship with the Fund before taxes and distribution expenses. The directors concluded that the Adviser’s level of profitability from its relationship with the Fund was not unreasonable.
Fall-Out Benefits
The directors considered the other benefits to the Adviser and its affiliates from their relationships with the Fund and the underlying fund advised by the Adviser in which the Fund invests, including, but not limited to, benefits relating to12b-1 fees and sales charges received by the Fund’s principal
| | |
| |
| 132 | AB GLOBAL BOND FUND | | abfunds.com |
underwriter (which is a wholly owned subsidiary of the Adviser) in respect of certain classes of the Fund’s shares; and transfer agency fees paid by the Fund to a wholly owned subsidiary of the Adviser. The directors recognized that the Adviser’s profitability would be somewhat lower without these benefits. The directors understood that the Adviser also might derive reputational and other benefits from its association with the Fund.
Investment Results
In addition to the information reviewed by the directors in connection with the Meeting, the directors receive detailed performance information for the Fund at each regular Board meeting during the year.
At the Meeting, the directors reviewed performance information prepared by an independent service provider (the “15(c) service provider”), showing the performance of the Class A Shares of the Fund against a group of similar funds (“peer group”) and a larger group of similar funds (“peer universe”), each selected by the 15(c) service provider, and information prepared by the Adviser showing performance of the Class A Shares against a broad-based securities market index, in each case for the1-,3-,5- and10-year periods ended July 31, 2018 and (in the case of comparisons with the broad-based securities market index) for the period from inception. Based on their review, the directors concluded that the Fund’s investment performance was acceptable.
Advisory Fees and Other Expenses
The directors considered the advisory fee rate payable by the Fund to the Adviser and information prepared by the 15(c) service provider concerning advisory fee rates payable by other funds in the same category as the Fund. The directors recognized that it is difficult to make comparisons of advisory fees because there are variations in the services that are included in the fees payable by other funds. The directors compared the Fund’s contractual effective advisory fee rate with a peer group median and took into account the impact on the advisory fee rate of the administrative expense reimbursement paid to the Adviser in the latest fiscal year.
The directors also considered the Adviser’s fee schedule for other clients pursuing a similar investment style to the Fund. For this purpose, they reviewed the relevant advisory fee information from the Adviser’s Form ADV and in a report from the Fund’s Senior Analyst and noted the differences between the Fund’s fee schedule, on the one hand, and the Adviser’s institutional fee schedule and the schedule of fees charged by the Adviser to any offshore funds and for services to anysub-advised funds pursuing a similar investment strategy as the Fund, on the other. The directors noted that the Adviser may, in some cases, agree to fee rates with large institutional clients that are lower than those reviewed by the directors and that they had previously discussed with the Adviser its policies in respect of such arrangements. The directors also discussed these matters with their independent fee consultant.
| | |
| |
| abfunds.com | | AB GLOBAL BOND FUND | 133 |
The Adviser reviewed with the directors the significantly greater scope of the services it provides to the Fund relative to institutional, offshore fund andsub-advised fund clients. In this regard, the Adviser noted, among other things, that, compared to institutional and offshore orsub-advisory accounts, the Fund (i) demands considerably more portfolio management, research and trading resources due to significantly higher daily cash flows; (ii) has more tax and regulatory restrictions and compliance obligations; (iii) must prepare and file or distribute regulatory and other communications about fund operations; and (iv) must provide shareholder servicing to retail investors. The Adviser also reviewed the greater legal risks presented by the large and changing population of Fund shareholders who may assert claims against the Adviser in individual or class actions, and the greater entrepreneurial risk in offering new fund products, which require substantial investment to launch, may not succeed, and generally must be priced to compete with larger, more established funds resulting in lack of profitability to the Adviser until a new fund achieves scale. In light of the substantial differences in services rendered by the Adviser to institutional, offshore fund andsub-advised fund clients as compared to the Fund, the directors considered these fee comparisons inapt and did not place significant weight on them in their deliberations.
In connection with their review of the Fund’s advisory fee, the directors also considered the total expense ratio of the Class A shares of the Fund in comparison to a peer group and a peer universe selected by the 15(c) service provider. The Class A expense ratio of the Fund was based on the Fund’s latest fiscal year. The directors noted that it was likely that the expense ratios of some of the other funds in the Fund’s category were lowered by waivers or reimbursements by those funds’ investment advisers, which in some cases might be voluntary or temporary. The directors view expense ratio information as relevant to their evaluation of the Adviser’s services because the Adviser is responsible for coordinating services provided to the Fund by others. Based on their review, the directors concluded that the Fund’s expense ratio was acceptable.
Economies of Scale
The directors noted that the advisory fee schedule for the Fund contains breakpoints and that the Fund’s net assets were higher than the breakpoint levels. Accordingly, the Fund’s current effective advisory fee rate reflected a reduction due to the breakpoints and would be further reduced to the extent the net assets of the Fund increase. The directors took into consideration presentations by an independent consultant on economies of scale in the mutual fund industry and for the AB Funds, and presentations from time to time by the Adviser concerning certain of its views on economies of scale. The directors also discussed economies of scale with their independent fee consultant. The directors also had requested and received from the Adviser certain updates on economies of scale in advance of the Meeting. The directors believe that economies of scale may
| | |
| |
| 134 | AB GLOBAL BOND FUND | | abfunds.com |
be realized (if at all) by the Adviser across a variety of products and services, and not only in respect of a single fund. The directors noted that there is no established methodology for setting breakpoints that give effect to the fund-specific services provided by a fund’s adviser and to the economies of scale that an adviser may realize in its overall mutual fund business or those components of it which directly or indirectly affect a fund’s operations. The directors observed that in the mutual fund industry as a whole, as well as among funds similar to the Fund, there is no uniformity or pattern in the fees and asset levels at which breakpoints (if any) apply. The directors also noted that the advisory agreements for many funds do not have breakpoints at all. Having taken these factors into account, the directors concluded that the Fund’s breakpoint arrangements were acceptable and provide a means for sharing of any economies of scale.
| | |
| |
| abfunds.com | | AB GLOBAL BOND FUND | 135 |
This page is not part of the Shareholder Report or the Financial Statements.
AB FAMILY OF FUNDS
US EQUITY
US CORE
Core Opportunities Fund
FlexFee™ US Thematic Portfolio
Select US Equity Portfolio
US GROWTH
Concentrated Growth Fund
Discovery Growth Fund
FlexFee™ Large Cap Growth Portfolio
Growth Fund
Large Cap Growth Fund
Small Cap Growth Portfolio
US VALUE
Discovery Value Fund
Equity Income Fund
Relative Value Fund
Small Cap Value Portfolio
Value Fund
INTERNATIONAL/ GLOBAL EQUITY
INTERNATIONAL/ GLOBAL CORE
FlexFee™ International Strategic Core Portfolio
Global Core Equity Portfolio
International Portfolio
International Strategic Core Portfolio
Sustainable Global Thematic Fund
Tax-Managed International Portfolio
Tax-Managed Wealth Appreciation Strategy
Wealth Appreciation Strategy
INTERNATIONAL/ GLOBAL GROWTH
Concentrated International Growth Portfolio
FlexFee™ Emerging Markets Growth Portfolio
INTERNATIONAL/ GLOBAL EQUITY(continued)
Sustainable International Thematic Fund
INTERNATIONAL/ GLOBAL VALUE
All China Equity Portfolio
International Value Fund
FIXED INCOME
MUNICIPAL
High Income Municipal Portfolio
Intermediate California Municipal Portfolio
Intermediate Diversified Municipal Portfolio
Intermediate New York Municipal Portfolio
Municipal Bond Inflation Strategy
Tax-Aware Fixed Income Portfolio
National Portfolio
Arizona Portfolio
California Portfolio
Massachusetts Portfolio
Minnesota Portfolio
New Jersey Portfolio
New York Portfolio
Ohio Portfolio
Pennsylvania Portfolio
Virginia Portfolio
TAXABLE
Bond Inflation Strategy
FlexFee™ High Yield Portfolio
FlexFee™ International Bond Portfolio
Global Bond Fund
High Income Fund
Income Fund
Intermediate Duration Portfolio
Limited Duration High Income Portfolio
Short Duration Portfolio
Total Return Bond Portfolio1
ALTERNATIVES
All Market Real Return Portfolio
Global Real Estate Investment Fund
Select US Long/Short Portfolio
Unconstrained Bond Fund
MULTI-ASSET
All Market Income Portfolio
All Market Total Return Portfolio
Conservative Wealth Strategy
Emerging Markets Multi-Asset Portfolio
Global Risk Allocation Fund
Tax-Managed All Market Income Portfolio
TARGET-DATE
Multi-Manager Select Retirement Allocation Fund
Multi-Manager Select 2010 Fund
Multi-Manager Select 2015 Fund
Multi-Manager Select 2020 Fund
Multi-Manager Select 2025 Fund
Multi-Manager Select 2030 Fund
Multi-Manager Select 2035 Fund
Multi-Manager Select 2040 Fund
Multi-Manager Select 2045 Fund
Multi-Manager Select 2050 Fund
Multi-Manager Select 2055 Fund
Multi-Manager Select 2060 Fund
CLOSED-END FUNDS
AllianceBernstein Global High Income Fund
AllianceBernstein National Municipal Income Fund
We also offer Government Money Market Portfolio, which serves as the money market fund exchange vehicle for the AB mutual funds. You could lose money by investing in the Fund. Although the Fund seeks to preserve the value of your investment at $1.00 per share, it cannot guarantee it will do so. The Fund may impose a fee upon sale of your shares or may temporarily suspend your ability to sell shares if the Fund’s liquidity falls below required minimums because of market conditions or other factors. An investment in the Fund is not insured or guaranteed by the Federal Deposit Insurance Corporation or any other government agency. The Fund’s sponsor has no legal obligation to provide financial support to the Fund, and you should not expect that the sponsor will provide financial support to the Fund at any time.
Investors should consider the investment objectives, risks, charges and expenses of the Fund carefully before investing. For copies of our prospectus or summary prospectus, which contain this and other information, visit us online at www.abfunds.com or contact your AB representative. Please read the prospectus and/or summary prospectus carefully before investing.
| 1 | Prior to July 12, 2019, Total Return Bond Portfolio was named Intermediate Bond Portfolio. |
| | |
| |
| 136 | AB GLOBAL BOND FUND | | abfunds.com |
NOTES
| | |
| |
| abfunds.com | | AB GLOBAL BOND FUND | 137 |
NOTES
| | |
| |
| 138 | AB GLOBAL BOND FUND | | abfunds.com |
NOTES
| | |
| |
| abfunds.com | | AB GLOBAL BOND FUND | 139 |
NOTES
| | |
| |
| 140 | AB GLOBAL BOND FUND | | abfunds.com |
AB GLOBAL BOND FUND
1345 Avenue of the Americas
New York, NY 10105
800 221 5672
GB-0151-0919 
ITEM 2. CODE OF ETHICS.
(a) The registrant has adopted a code of ethics that applies to its principal executive officer, principal financial officer and principal accounting officer. A copy of the registrant’s code of ethics is filed herewith as Exhibit 12(a)(1).
(b) During the period covered by this report, no material amendments were made to the provisions of the code of ethics adopted in 2(a) above.
(c) During the period covered by this report, no implicit or explicit waivers to the provisions of the code of ethics adopted in 2(a) above were granted.
ITEM 3. AUDIT COMMITTEE FINANCIAL EXPERT.
The registrant’s Board of Directors has determined that independent directors Garry L. Moody and Marshall C. Turner, Jr. qualify as audit committee financial experts.
ITEM 4. PRINCIPAL ACCOUNTANT FEES AND SERVICES.
(a) - (c) The following table sets forth the aggregate fees billed by the independent registered public accounting firm Ernst & Young LLP, for the Fund’s last two fiscal years for professional services rendered for: (i) the audit of the Fund’s annual financial statements included in the Fund’s annual report to stockholders; (ii) assurance and related services that are reasonably related to the performance of the audit of the Fund’s financial statements and are not reported under (i), which include advice and education related to accounting and auditing issues and quarterly press release review (for those Funds which issue press releases), and preferred stock maintenance testing (for those Funds that issue preferred stock); and (iii) tax compliance, tax advice and tax return preparation.
| | | | | | | | | | | | | | | | |
| | | | | | Audit Fees | | | Audit-Related
Fees | | | Tax Fees | |
AB Global Bond Fund | | | 2018 | | | $ | 102,815 | | | $ | (2 | ) | | $ | 26,788 | |
| | | 2019 | | | $ | 102,815 | | | $ | — | | | $ | 26,234 | |
(d) Not applicable.
(e) (1) Beginning with audit andnon-audit service contracts entered into on or after May 6, 2003, the Fund’s Audit Committee policies and procedures require thepre-approval of all audit andnon-audit services provided to the Fund by the Fund’s independent registered public accounting firm. The Fund’s Audit Committee policies and procedures also requirepre-approval of all audit andnon-audit services provided to the Adviser and Service Affiliates to the extent that these services are directly related to the operations or financial reporting of the Fund.
(e) (2) All of the amounts for Audit Fees, Audit-Related Fees and Tax Fees in the table under Item 4 (a) – (c) are for servicespre-approved by the Fund’s Audit Committee.
(f) Not applicable.
(g) The following table sets forth the aggregatenon-audit services provided to the Fund, the Fund’s Adviser and entities that control, are controlled by or under common control with the Adviser that provide ongoing services to the Fund:
| | | | | | | | | | | | |
| | | | | | All Fees for
Non-Audit Services
Provided to the
Portfolio, the Adviser
and Service Affiliates | | | Total Amount of
Foregoing Column Pre-
approved by the Audit
Committee
(Portion Comprised of
Audit Related Fees)
(Portion Comprised of
Tax Fees) | |
AB Global Bond Fund | | | 2018 | | | $ | 676,250 | | | $ | 26,786 | |
| | | | | | | | | | $ | 2 | |
| | | | | | | | | | $ | (26,788 | ) |
| | | 2019 | | | $ | 888,619 | | | $ | 26,234 | |
| | | | | | | | | | $ | — | |
| | | | | | | | | | $ | (26,234 | ) |
(h) The Audit Committee of the Fund has considered whether the provision of anynon-audit services notpre-approved by the Audit Committee provided by the Fund’s independent registered public accounting firm to the Adviser and Service Affiliates is compatible with maintaining the auditor’s independence.
ITEM 5. AUDIT COMMITTEE OF LISTED REGISTRANTS.
Not applicable to the registrant.
ITEM 6. SCHEDULE OF INVESTMENTS.
Please see Schedule of Investments contained in the Report to Shareholders included under Item 1 of this FormN-CSR.
ITEM 7. DISCLOSURE OF PROXY VOTING POLICIES AND PROCEDURES FORCLOSED-END MANAGEMENT INVESTMENT COMPANIES.
Not applicable to the registrant.
ITEM 8. PORTFOLIO MANAGERS OFCLOSED-END MANAGEMENT INVESTMENT COMPANIES.
Not applicable to the registrant.
ITEM 9. PURCHASES OF EQUITY SECURITIES BYCLOSED-END MANAGEMENT INVESTMENT COMPANY AND AFFILIATED PURCHASERS.
Not applicable to the registrant.
ITEM 10. SUBMISSION OF MATTERS TO A VOTE OF SECURITY HOLDERS.
There have been no material changes to the procedures by which shareholders may recommend nominees to the Fund’s Board of Directors since the Fund last provided disclosure in response to this item.
ITEM 11. CONTROLS AND PROCEDURES.
(a) The registrant’s principal executive officer and principal financial officer have concluded that the registrant’s disclosure controls and procedures (as defined in Rule30a-2(c) under the Investment Company Act of 1940, as amended) are effective at the reasonable assurance level based on their evaluation of these controls and procedures as of a date within 90 days of the filing date of this document.
(b) There were no changes in the registrant’s internal controls over financial reporting that occurred during the second fiscal quarter of the period that has materially affected, or is reasonably likely to materially affect, the registrant’s internal control over financial reporting.
ITEM 12. EXHIBITS.
The following exhibits are attached to this FormN-CSR:
| | |
EXHIBIT NO. | | DESCRIPTION OF EXHIBIT |
| |
12 (a) (1) | | Code of Ethics that is subject to the disclosure of Item 2 hereof |
| |
12 (b) (1) | | Certification of Principal Executive Officer Pursuant to Section 302 of the Sarbanes-Oxley Act of 2002 |
| |
12 (b) (2) | | Certification of Principal Financial Officer Pursuant to Section 302 of the Sarbanes-Oxley Act of 2002 |
| |
12 (c) | | Certification of Principal Executive Officer and Principal Financial Officer Pursuant to Section 906 of theSarbanes-Oxley Act of 2002 |
SIGNATURES
Pursuant to the requirements of the Securities Exchange Act of 1934 and the Investment Company Act of 1940, the registrant has duly caused this report to be signed on its behalf by the undersigned, thereunto duly authorized.
| | |
| (Registrant): AB Global Bond Fund, Inc. |
| |
| By: | | /s/ Robert M. Keith |
| | Robert M. Keith |
| | President |
|
| Date: November 29, 2019 |
Pursuant to the requirements of the Securities Exchange Act of 1934 and the Investment Company Act of 1940, this report has been signed below by the following persons on behalf of the registrant and in the capacities and on the dates indicated.
| | |
| By: | | /s/ Robert M. Keith |
| | Robert M. Keith |
| | President |
|
| Date: November 29, 2019 |
| |
| By: | | /s/ Joseph J. Mantineo |
| | Joseph J. Mantineo |
| | Treasurer and Chief Financial Officer |
|
| Date: November 29, 2019 |