UNITED STATES
SECURITIES AND EXCHANGE COMMISSION
WASHINGTON, D.C. 20549
FORM N-CSR
CERTIFIED SHAREHOLDER REPORT OF REGISTERED
MANAGEMENT INVESTMENT COMPANIES
Investment Company Act file number: 811-06554
AB GLOBAL BOND FUND, INC.
(Exact name of registrant as specified in charter)
1345 Avenue of the Americas, New York, New York 10105
(Address of principal executive offices) (Zip code)
Joseph J. Mantineo
AllianceBernstein L.P.
1345 Avenue of the Americas
New York, New York 10105
(Name and address of agent for service)
Registrant’s telephone number, including area code: (800) 221-5672
Date of fiscal year end: September 30, 2022
Date of reporting period: September 30, 2022
ITEM 1. REPORTS TO STOCKHOLDERS.
SEP 09.30.22

ANNUAL REPORT
AB GLOBAL BOND FUND

| | |
| |
| Investment Products Offered | | • Are Not FDIC Insured • May Lose Value • Are Not Bank Guaranteed |
Investors should consider the investment objectives, risks, charges and expenses of the Fund carefully before investing. For copies of our prospectus or summary prospectus, which contain this and other information, visit us online at www.abfunds.com or contact your AB representative. Please read the prospectus and/or summary prospectus carefully before investing.
This shareholder report must be preceded or accompanied by the Fund’s prospectus for individuals who are not current shareholders of the Fund.
You may obtain a description of the Fund’s proxy voting policies and procedures, and information regarding how the Fund voted proxies relating to portfolio securities during the most recent 12-month period ended June 30, without charge. Simply visit AB’s website at www.abfunds.com, or go to the Securities and Exchange Commission’s (the “Commission”) website at www.sec.gov, or call AB at (800) 227 4618.
The Fund files its complete schedule of portfolio holdings with the Commission for the first and third quarters of each fiscal year as an exhibit to its reports on Form N-PORT. The Fund’s Form N-PORT reports are available on the Commission’s website at www.sec.gov. AB publishes full portfolio holdings for the Fund monthly at www.abfunds.com.
AllianceBernstein Investments, Inc. (ABI) is the distributor of the AB family of mutual funds. ABI is a member of FINRA and is an affiliate of AllianceBernstein L.P., the Adviser of the funds.
The [A/B] logo is a registered service mark of AllianceBernstein and AllianceBernstein® is a registered service mark used by permission of the owner, AllianceBernstein L.P.
| | |
| FROM THE PRESIDENT | |  |
Dear Shareholder,
We’re pleased to provide this report for the AB Global Bond Fund (the “Fund”). Please review the discussion of Fund performance, the market conditions during the reporting period and the Fund’s investment strategy.
At AB, we’re striving to help our clients achieve better outcomes by:
| + | | Fostering diverse perspectives that give us a distinctive approach to navigating global capital markets |
| + | | Applying differentiated investment insights through a connected global research network |
| + | | Embracing innovation to design better ways to invest and leading-edge mutual-fund solutions |
Whether you’re an individual investor or a multibillion-dollar institution, we’re putting our knowledge and experience to work for you every day.
For more information about AB’s comprehensive range of products and shareholder resources, please log on to www.abfunds.com.
Thank you for your investment in AB mutual funds—and for placing your trust in our firm.
Sincerely,

Onur Erzan
President and Chief Executive Officer, AB Mutual Funds
| | |
| |
| abfunds.com | | AB GLOBAL BOND FUND | 1 |
ANNUAL REPORT
November 9, 2022
This report provides management’s discussion of fund performance for the AB Global Bond Fund for the annual reporting period ended September 30, 2022.
The Fund’s investment objective is to generate current income consistent with preservation of capital.
NAV RETURNS AS OF SEPTEMBER 30, 2022 (unaudited)
| | | | | | | | |
| | |
| | | 6 Months | | | 12 Months | |
| | |
| AB GLOBAL BOND FUND | | | | | | | | |
| | |
| Class A Shares | | | -8.43% | | | | -13.27% | |
| | |
| Class C Shares | | | -8.74% | | | | -13.88% | |
| | |
| Advisor Class Shares1 | | | -8.19% | | | | -12.95% | |
| | |
| Class R Shares1 | | | -8.63% | | | | -13.65% | |
| | |
| Class K Shares1 | | | -8.48% | | | | -13.38% | |
| | |
| Class I Shares1 | | | -8.20% | | | | -13.06% | |
| | |
| Class Z Shares1 | | | -8.29% | | | | -13.01% | |
| | |
| Bloomberg Global Aggregate Bond Index (USD hedged) | | | -7.49% | | | | -12.05% | |
| 1 | Please note that these share classes are for investors purchasing shares through accounts established under certain fee-based programs sponsored and maintained by certain broker-dealers and financial intermediaries, institutional pension plans and/or investment advisory clients of, and certain other persons associated with, the Adviser and its affiliates or the Fund. |
INVESTMENT RESULTS
The table above shows the Fund’s performance compared to its benchmark, the Bloomberg Global Aggregate Bond Index (USD hedged), for the six- and 12-month periods ended September 30, 2022.
During both periods, all share classes of the Fund underperformed the benchmark, before sales charges. During the 12-month period, sector allocation was the primary detractor, relative to the benchmark. Losses from exposure to emerging-market corporate and sovereign bonds, and high-yield corporate bonds in the eurozone and US were greater than gains from underweights to US agency mortgages and investment-grade corporate bonds, as well as exposure to inflation-linked bonds in Australia and agency risk-sharing transactions in the US. Country allocation (a result of bottom-up security analysis combined with fundamental research) also detracted, primarily due to underweights to Japan and China, and an overweight to the US that were partially offset by an underweight to the UK and no exposure to Russia. Security selection among emerging-market corporate and sovereign bonds, and eurozone high-yield corporates
| | |
| |
2 | AB GLOBAL BOND FUND | | abfunds.com |
added more than losses from selection in US investment-grade and eurozone high-yield corporate bonds. Currency decisions contributed, as gains from a short position in the euro, combined with a net short in the Chinese renminbi and a long position in the Brazilian real, were greater than losses from a long position in the South Korean won and a short in the Swedish krona. Yield-curve positioning added, mostly due to gains from an underweight to the five- and 20-year parts of the curve in the US, along with an underweight to the 10-year part of the curve in the UK, which offset losses from overweights to the 10- to 20-year parts of the curve in Australia and underweights to the 10- to 30-year parts of the curve in Japan.
During the six-month period, country allocation was the primary detractor, as underweights to Japan and China, and overweights to the US and eurozone lost more than gains from an underweight to the UK and an overweight to Australia. Security selection in US and eurozone investment-grade corporate bonds and emerging-market corporate bonds detracted, offset partially by selection in commercial mortgage-backed securities and US high-yield corporate bonds. Sector allocation also hampered results, mostly from exposure to high-yield corporate bonds in the US and eurozone that exceeded gains from an underweight to US agency mortgages and an overweight to US Treasuries. Currency decisions contributed, mainly from beneficial short positions in the euro, net Chinese renminbi, Brazilian real, New Zealand dollar and Mexican peso that were more than losses from long positions in the South Korean won, Norwegian krone and Singapore dollar. Yield-curve positioning also contributed, as underweights to the 10-year part of the curve in the UK and the 20- to 30-year parts of the US curve added more than losses from an overweight to the 10-year part of the curve in the eurozone and overweights to the long end of the Japanese curve.
During both periods, the Fund utilized derivatives in the form of interest rate swaps and futures and to manage and hedge duration risk and/or to take active yield-curve positioning. The Fund utilized currency forwards to hedge foreign currency exposure and to take active currency risk. Credit default swaps were utilized to hedge credit risk and as a tool to effectively gain exposure to specific sectors. Purchased options were utilized as a hedging tool to reduce risk exposure.
MARKET REVIEW AND INVESTMENT STRATEGY
During the 12-month period ended September 30, 2022, fixed-income government bond market yields increased rapidly, and bond prices fell in all developed markets. Most major central banks aggressively tightened monetary policy by raising short-term interest rates and ending bond purchases to combat high and persistent inflation. Developed-market government bonds fell the most in the UK and eurozone, and by the least in Japan. In credit risk sectors, securitized assets generally outperformed corporate bonds. Investment-grade corporate bonds trailed treasuries,
| | |
| |
| abfunds.com | | AB GLOBAL BOND FUND | 3 |
underperforming in the US against US Treasuries, while outperforming in the eurozone relative to eurozone treasuries. High-yield corporate bonds trailed in the US versus US Treasuries while eurozone high yield outperformed eurozone treasuries. Investment-grade emerging-market corporate bonds slightly trailed developed-market corporates. Longer-maturity emerging-market sovereign bonds underperformed developed-market treasuries. Emerging-market local-currency bonds lagged as the US dollar advanced against almost all developed- and emerging-market currencies. Brent crude oil prices ended the period higher, even as prices fell sharply in the final quarter on global growth concerns and reduced demand.
The Fund’s Senior Investment Management Team (the “Team”) invests in fixed-income securities with no sector restrictions. The Fund holds debt securities from both developed and emerging markets. The Team’s core fixed-income strategy pursues an attractive risk/return profile by managing currency exposure. The Team utilizes a disciplined investment process, which draws on a rigorous quantitative research toolset with fundamental expertise across all regions and markets.
INVESTMENT POLICIES
The Fund invests, under normal circumstances, at least 80% of its net assets in fixed-income securities. Under normal market conditions, the Fund invests significantly in fixed-income securities of non-US companies. In addition, the Fund invests, under normal circumstances, in the fixed-income securities of companies located in at least three countries. The Fund may invest in a broad range of fixed-income securities in both developed and emerging markets. The Fund may invest across all fixed-income sectors, including US and non-US government and corporate debt securities. The Fund’s investments may be denominated in local currency or US dollar-denominated. The Fund may invest in debt securities with a range of maturities from short- to long-term. The Fund may use borrowings or other leverage for investment purposes.
The Adviser actively manages the Fund’s assets in relation to market conditions and general economic conditions and adjusts the Fund’s investments in an effort to best enable the Fund to achieve its investment objective. Thus, the percentage of the Fund’s assets invested in a particular country or denominated in a particular currency will vary in accordance with the Adviser’s assessment of the relative yield and appreciation potential of such securities and the relationship of the country’s currency to the US dollar.
Under normal circumstances, the Fund invests at least 75% of its net assets in fixed-income securities rated investment-grade at the time of
(continued on next page)
| | |
| |
4 | AB GLOBAL BOND FUND | | abfunds.com |
investment and may invest up to 25% of its net assets in below investment-grade fixed-income securities (commonly known as “junk bonds”).
The Fund may invest in mortgage-related and other asset-backed securities; loan participations and assignments; inflation-indexed securities; structured securities; variable-, floating- and inverse-floating-rate instruments; and preferred stock, and may use other investment techniques. The Fund intends, among other things, to enter into transactions such as reverse repurchase agreements and dollar rolls. The Fund may invest, without limit, in derivatives, such as options, futures contracts, forwards or swaps.
| | |
| |
| abfunds.com | | AB GLOBAL BOND FUND | 5 |
DISCLOSURES AND RISKS
Benchmark Disclosure
The Bloomberg Global Aggregate Bond Index (USD hedged) is unmanaged and does not reflect fees and expenses associated with the active management of a mutual fund portfolio. The Bloomberg Global Aggregate Bond Index represents the performance of the global investment-grade developed fixed-income markets, hedged to the US dollar. An investor cannot invest directly in an index, and its results are not indicative of the performance for any specific investment, including the Fund.
A Word About Risk
Market Risk: The value of the Fund’s assets will fluctuate as the stock or bond market fluctuates. The value of its investments may decline, sometimes rapidly and unpredictably, simply because of economic changes or other events, including public health crises (including the occurrence of a contagious disease or illness) and regional and global conflicts, that affect large portions of the market.
Interest-Rate Risk: Changes in interest rates will affect the value of investments in fixed-income securities. When interest rates rise, the value of existing investments in fixed-income securities tends to fall and this decrease in value may not be offset by higher income from new investments. Interest-rate risk is generally greater for fixed-income securities with longer maturities or durations. The Fund may be subject to greater risk of rising interest rates than would normally be the case due to the end of a recent period of historically low rates and the effect of potential government fiscal policy initiatives and resulting market reaction to those initiatives.
Credit Risk: An issuer or guarantor of a fixed-income security, or the counterparty to a derivatives or other contract, may be unable or unwilling to make timely payments of interest or principal, or to otherwise honor its obligations. The issuer or guarantor may default, causing a loss of the full principal amount of a security and accrued interest. The degree of risk for a particular security may be reflected in its credit rating. There is the possibility that the credit rating of a fixed-income security may be downgraded after purchase, which may adversely affect the value of the security.
Below Investment-Grade Securities Risk: Investments in fixed-income securities with lower ratings (commonly known as “junk bonds”) are subject to a higher probability that an issuer will default or fail to meet its payment obligations. These securities may be subject to greater price volatility due to such factors as specific corporate developments and negative perceptions of the junk bond market generally and may be more difficult to trade than other types of securities.
| | |
| |
6 | AB GLOBAL BOND FUND | | abfunds.com |
DISCLOSURES AND RISKS (continued)
Duration Risk: Duration is a measure that relates the expected price volatility of a fixed-income security to changes in interest rates. The duration of a fixed-income security may be shorter than or equal to full maturity of a fixed-income security. Fixed-income securities with longer durations have more risk and will decrease in price as interest rates rise.
Inflation Risk: This is the risk that the value of assets or income from investments will be less in the future as inflation decreases the value of money. As inflation increases, the value of the Fund’s assets can decline as can the value of the Fund’s distributions. This risk is significantly greater for fixed-income securities with longer maturities.
Foreign (Non-US) Risk: Investments in securities of non-US issuers may involve more risk than those of US issuers. These securities may fluctuate more widely in price and may be more difficult to trade due to adverse market, economic, political, regulatory or other factors.
Emerging-Market Risk: Investments in emerging-market countries may have more risk because the markets are less developed and less liquid and are subject to increased economic, political, regulatory or other uncertainties.
Currency Risk: Fluctuations in currency exchange rates may negatively affect the value of the Fund’s investments or reduce its returns.
Mortgage-Related and/or Other Asset-Backed Securities Risk: Investments in mortgage-related and other asset-backed securities are subject to certain additional risks. The value of these securities may be particularly sensitive to changes in interest rates. These risks include “extension risk”, which is the risk that, in periods of rising interest rates, issuers may delay the payment of principal, and “prepayment risk”, which is the risk that in periods of falling interest rates, issuers may pay principal sooner than expected, exposing the Fund to a lower rate of return upon reinvestment of principal. Mortgage-backed securities offered by non-governmental issuers and other asset-backed securities may be subject to other risks, such as higher rates of default in the mortgages or assets backing the securities or risks associated with the nature and servicing of mortgages or assets backing the securities.
Leverage Risk: To the extent the Fund uses leveraging techniques, its net asset value (“NAV”) may be more volatile because leverage tends to exaggerate the effect of changes in interest rates and any increase or decrease in the value of the Fund’s investments.
Derivatives Risk: Derivatives may be illiquid, difficult to price or unwind and leveraged so that small changes may produce disproportionate losses
| | |
| |
| abfunds.com | | AB GLOBAL BOND FUND | 7 |
DISCLOSURES AND RISKS (continued)
for the Fund. Derivatives, especially over-the-counter derivatives, are also subject to counterparty risk, which is the risk that the counterparty (the party on the other side of the transaction) on a derivative transaction will be unable or unwilling to honor its contractual obligations to the Fund.
Illiquid Investments Risk: Illiquid investments risk exists when certain investments become difficult to purchase or sell. Difficulty in selling such investments may result in sales at disadvantageous prices affecting the value of your investment in the Fund. Causes of illiquid investments risk may include low trading volumes, large positions and heavy redemption of Fund shares. Foreign fixed-income securities may have more illiquid investments risk because secondary trading markets for these securities may be smaller and less well-developed and the securities may trade less frequently. Illiquid investments risk may be higher in a rising interest-rate environment, when the value and liquidity of fixed-income securities generally decline.
Active Trading Risk: The Fund expects to engage in active and frequent trading of its portfolio securities and its portfolio turnover rate may greatly exceed 100%. A higher rate of portfolio turnover increases transaction costs, which may negatively affect the Fund’s return. In addition, a high rate of portfolio turnover may result in substantial short-term gains, which may have adverse tax consequences for Fund shareholders.
Management Risk: The Fund is subject to management risk because it is an actively managed investment fund. The Adviser will apply its investment techniques and risk analyses in making investment decisions, but there is no guarantee that its techniques will produce the intended results. Some of these techniques may incorporate, or rely upon, quantitative models, but there is no guarantee that these models will generate accurate forecasts, reduce risk or otherwise perform as expected.
These risks are fully discussed in the Fund’s prospectus. As with all investments, you may lose money by investing in the Fund.
An Important Note About Historical Performance
The investment return and principal value of an investment in the Fund will fluctuate, so that shares, when redeemed, may be worth more or less than their original cost. Performance shown in this report represents past performance and does not guarantee future results. Current performance may be lower or higher than the performance information shown. You may obtain performance information current to the most recent month-end by visiting www.abfunds.com.
| | |
| |
8 | AB GLOBAL BOND FUND | | abfunds.com |
DISCLOSURES AND RISKS (continued)
All fees and expenses related to the operation of the Fund have been deducted. NAV returns do not reflect sales charges; if sales charges were reflected, the Fund’s quoted performance would be lower. SEC returns reflect the applicable sales charges for each share class: a 4.25% maximum front-end sales charge for Class A shares and a 1% 1-year contingent deferred sales charge for Class C shares. Returns for the different share classes will vary due to different expenses associated with each class. Performance assumes reinvestment of distributions and does not account for taxes.
| | |
| |
| abfunds.com | | AB GLOBAL BOND FUND | 9 |
HISTORICAL PERFORMANCE
GROWTH OF A $10,000 INVESTMENT IN THE FUND (unaudited)
9/30/2012 TO 9/30/2022
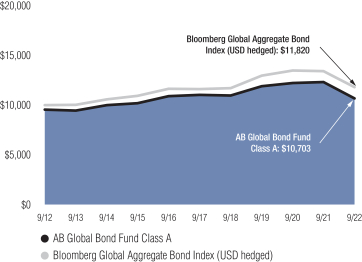
This chart illustrates the total value of an assumed $10,000 investment in AB Global Bond Fund Class A shares (from 9/30/2012 to 9/30/2022) as compared to the performance of its benchmark. The chart reflects the deduction of the maximum 4.25% sales charge from the initial $10,000 investment in the Fund and assumes the reinvestment of dividends and capital gains distributions.
| | |
| |
10 | AB GLOBAL BOND FUND | | abfunds.com |
HISTORICAL PERFORMANCE (continued)
AVERAGE ANNUAL RETURNS AS OF SEPTEMBER 30, 2022 (unaudited)
| | | | | | | | | | | | |
| | | |
| | | NAV Returns | | | SEC Returns
(reflects applicable
sales charges) | | | SEC
Yields1 | |
| | | |
| CLASS A SHARES | | | | | | | | | | | 3.19% | |
| | | |
| 1 Year | | | -13.27% | | | | -16.97% | | | | | |
| | | |
| 5 Years | | | -0.61% | | | | -1.46% | | | | | |
| | | |
| 10 Years | | | 1.12% | | | | 0.68% | | | | | |
| | | |
| CLASS C SHARES | | | | | | | | | | | 2.53% | |
| | | |
| 1 Year | | | -13.88% | | | | -14.71% | | | | | |
| | | |
| 5 Years | | | -1.35% | | | | -1.35% | | | | | |
| | | |
| 10 Years2 | | | 0.38% | | | | 0.38% | | | | | |
| | | |
| ADVISOR CLASS SHARES3 | | | | | | | | | | | 3.58% | |
| | | |
| 1 Year | | | -12.95% | | | | -12.95% | | | | | |
| | | |
| 5 Years | | | -0.34% | | | | -0.34% | | | | | |
| | | |
| 10 Years | | | 1.40% | | | | 1.40% | | | | | |
| | | |
| CLASS R SHARES3 | | | | | | | | | | | 2.80% | |
| | | |
| 1 Year | | | -13.65% | | | | -13.65% | | | | | |
| | | |
| 5 Years | | | -1.02% | | | | -1.02% | | | | | |
| | | |
| 10 Years | | | 0.72% | | | | 0.72% | | | | | |
| | | |
| CLASS K SHARES3 | | | | | | | | | | | 3.12% | |
| | | |
| 1 Year | | | -13.38% | | | | -13.38% | | | | | |
| | | |
| 5 Years | | | -0.71% | | | | -0.71% | | | | | |
| | | |
| 10 Years | | | 1.04% | | | | 1.04% | | | | | |
| | | |
| CLASS I SHARES3 | | | | | | | | | | | 3.48% | |
| | | |
| 1 Year | | | -13.06% | | | | -13.06% | | | | | |
| | | |
| 5 Years | | | -0.34% | | | | -0.34% | | | | | |
| | | |
| 10 Years | | | 1.41% | | | | 1.41% | | | | | |
| | | |
| CLASS Z SHARES3 | | | | | | | | | | | 3.55% | |
| | | |
| 1 Year | | | -13.01% | | | | -13.01% | | | | | |
| | | |
| 5 Years | | | -0.29% | | | | -0.29% | | | | | |
| | | |
| Since Inception4 | | | 1.74% | | | | 1.74% | | | | | |
The Fund’s prospectus fee table shows the Fund’s total annual operating expense ratios as 0.80%, 1.55%, 0.55%, 1.24%, 0.93%, 0.55% and 0.50% for Class A, Class C, Advisor Class, Class R, Class K, Class I and Class Z shares, respectively. The Financial Highlights section of this report sets forth expense ratio data for the current reporting period; the expense ratios shown above may differ from the expense ratios in the Financial Highlights section since they are based on different time periods.
| 1 | SEC yields are calculated based on SEC guidelines for the 30-day period ended September 30, 2022. |
| 2 | Assumes conversion of Class C shares into Class A shares after eight years. |
| 3 | These share classes are offered at NAV to eligible investors and their SEC returns are the same as their NAV returns. Please note that these share classes are for investors purchasing shares through accounts established under certain fee-based programs sponsored and maintained by certain broker-dealers and financial intermediaries, institutional pension plans and/or investment advisory clients of, and certain other persons associated with, the Adviser and its affiliates or the Fund. |
| 4 | Inception date: 10/15/2013. |
| | |
| |
| abfunds.com | | AB GLOBAL BOND FUND | 11 |
HISTORICAL PERFORMANCE (continued)
SEC AVERAGE ANNUAL RETURNS
AS OF THE MOST RECENT CALENDAR QUARTER-END
SEPTEMBER 30, 2022 (unaudited)
| | | | |
| |
| | | SEC Returns
(reflects applicable
sales charges) | |
| |
| CLASS A SHARES | | | | |
| |
| 1 Year | | | -16.97% | |
| |
| 5 Years | | | -1.46% | |
| |
| 10 Years | | | 0.68% | |
| |
| CLASS C SHARES | | | | |
| |
| 1 Year | | | -14.71% | |
| |
| 5 Years | | | -1.35% | |
| |
| 10 Years1 | | | 0.38% | |
| |
| ADVISOR CLASS SHARES2 | | | | |
| |
| 1 Year | | | -12.95% | |
| |
| 5 Years | | | -0.34% | |
| |
| 10 Years | | | 1.40% | |
| |
| CLASS R SHARES2 | | | | |
| |
| 1 Year | | | -13.65% | |
| |
| 5 Years | | | -1.02% | |
| |
| 10 Years | | | 0.72% | |
| |
| CLASS K SHARES2 | | | | |
| |
| 1 Year | | | -13.38% | |
| |
| 5 Years | | | -0.71% | |
| |
| 10 Years | | | 1.04% | |
| |
| CLASS I SHARES2 | | | | |
| |
| 1 Year | | | -13.06% | |
| |
| 5 Years | | | -0.34% | |
| |
| 10 Years | | | 1.41% | |
| |
| CLASS Z SHARES2 | | | | |
| |
| 1 Year | | | -13.01% | |
| |
| 5 Years | | | -0.29% | |
| |
| Since Inception3 | | | 1.74% | |
| 1 | Assumes conversion of Class C shares into Class A shares after eight years. |
| 2 | Please note that these share classes are for investors purchasing shares through accounts established under certain fee-based programs sponsored and maintained by certain broker-dealers and financial intermediaries, institutional pension plans and/or investment advisory clients of, and certain other persons associated with, the Adviser and its affiliates or the Fund. |
| 3 | Inception date: 10/15/2013. |
| | |
| |
12 | AB GLOBAL BOND FUND | | abfunds.com |
EXPENSE EXAMPLE
(unaudited)
As a shareholder of the Fund, you incur two types of costs: (1) transaction costs, including sales charges (loads) on purchase payments, contingent deferred sales charges on redemptions and (2) ongoing costs, including management fees; distribution (12b-1) fees; and other Fund expenses. This example is intended to help you understand your ongoing costs (in dollars) of investing in the Fund and to compare these costs with the ongoing costs of investing in other mutual funds.
The Example is based on an investment of $1,000 invested at the beginning of the period and held for the entire period as indicated below.
Actual Expenses
The table below provides information about actual account values and actual expenses. You may use the information in this line, together with the amount you invested, to estimate the expenses that you paid over the period. Simply divide your account value by $1,000 (for example, an $8,600 account value divided by $1,000 = 8.6), then multiply the result by the number in the first line under the heading entitled “Expenses Paid During Period” to estimate the expenses you paid on your account during this period.
Hypothetical Example for Comparison Purposes
The table below provides information about hypothetical account values and hypothetical expenses based on the Fund’s actual expense ratio and an assumed annual rate of return of 5% before expenses, which is not the Fund’s actual return. The hypothetical account values and expenses may not be used to estimate the actual ending account balance or expenses you paid for the period. You may use this information to compare the ongoing costs of investing in the Fund and other funds by comparing this 5% hypothetical example with the 5% hypothetical examples that appear in the shareholder reports of other funds.
Please note that the expenses shown in the table are meant to highlight your ongoing costs only and do not reflect any transactional costs, such as sales charges (loads), or contingent deferred sales charges on redemptions. Therefore, the second line of the table is useful in comparing ongoing costs only, and will not help you determine the relative total costs of owning different funds. In addition, if these transactional costs were included, your costs would have been higher.
| | |
| |
| abfunds.com | | AB GLOBAL BOND FUND | 13 |
EXPENSE EXAMPLE (continued)
| | | | | | | | | | | | | | | | |
| | | Beginning
Account Value
April 1, 2022 | | | Ending
Account Value
September 30, 2022 | | | Expenses Paid
During Period* | | | Annualized
Expense Ratio* | |
| Class A | | | | | | | | | | | | | | | | |
Actual | | $ | 1,000 | | | $ | 915.70 | | | $ | 3.89 | | | | 0.81 | % |
Hypothetical** | | $ | 1,000 | | | $ | 1,021.01 | | | $ | 4.10 | | | | 0.81 | % |
| Class C | | | | | | | | | | | | | | | | |
Actual | | $ | 1,000 | | | $ | 912.60 | | | $ | 7.48 | | | | 1.56 | % |
Hypothetical** | | $ | 1,000 | | | $ | 1,017.25 | | | $ | 7.89 | | | | 1.56 | % |
| Advisor Class | | | | | | | | | | | | | | | | |
Actual | | $ | 1,000 | | | $ | 918.10 | | | $ | 2.69 | | | | 0.56 | % |
Hypothetical** | | $ | 1,000 | | | $ | 1,022.26 | | | $ | 2.84 | | | | 0.56 | % |
| Class R | | | | | | | | | | | | | | | | |
Actual | | $ | 1,000 | | | $ | 913.70 | | | $ | 6.00 | | | | 1.25 | % |
Hypothetical** | | $ | 1,000 | | | $ | 1,018.80 | | | $ | 6.33 | | | | 1.25 | % |
| Class K | | | | | | | | | | | | | | | | |
Actual | | $ | 1,000 | | | $ | 915.20 | | | $ | 4.51 | | | | 0.94 | % |
Hypothetical** | | $ | 1,000 | | | $ | 1,020.36 | | | $ | 4.76 | | | | 0.94 | % |
| Class I | | | | | | | | | | | | | | | | |
Actual | | $ | 1,000 | | | $ | 918.00 | | | $ | 2.79 | | | | 0.58 | % |
Hypothetical** | | $ | 1,000 | | | $ | 1,022.16 | | | $ | 2.94 | | | | 0.58 | % |
| Class Z | | | | | | | | | | | | | | | | |
Actual | | $ | 1,000 | | | $ | 917.10 | | | $ | 2.45 | | | | 0.51 | % |
Hypothetical** | | $ | 1,000 | | | $ | 1,022.51 | | | $ | 2.59 | | | | 0.51 | % |
| * | Expenses are equal to the classes’ annualized expense ratios multiplied by the average account value over the period, multiplied by 183/365 (to reflect the one-half year period). |
| ** | Assumes 5% annual return before expenses. |
| | |
| |
14 | AB GLOBAL BOND FUND | | abfunds.com |
PORTFOLIO SUMMARY
September 30, 2022 (unaudited)
PORTFOLIO STATISTICS
Net Assets ($mil): $5,399.7
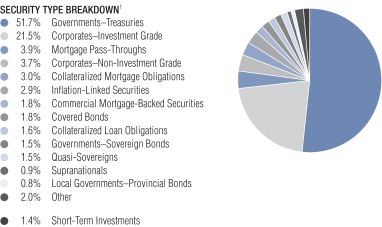
| 1 | All data are as of September 30, 2022. The Fund’s security type breakdown is expressed as a percentage of total investments and may vary over time. The Fund also enters into derivative transactions, which may be used for hedging or investment purposes (see “Portfolio of Investments” section of the report for additional details). “Other” security type weightings represent 0.5% or less in the following security types: Asset-Backed Securities, Bank Loans, Common Stocks, Emerging Markets–Corporate Bonds, Emerging Markets–Sovereigns, Governments–Sovereign Agencies, Local Governments–Regional Bonds and Warrants. |
| | |
| |
| abfunds.com | | AB GLOBAL BOND FUND | 15 |
PORTFOLIO SUMMARY (continued)
September 30, 2022 (unaudited)
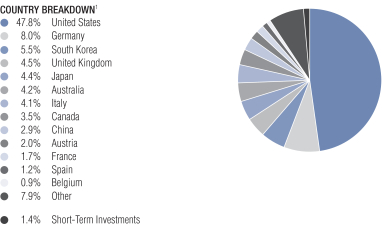
| 1 | All data are as of September 30, 2022. The Fund’s country breakdown is expressed as a percentage of total investments and may vary over time. The Fund also enters into derivative transactions, which may be used for hedging or other investment purposes (see “Portfolio of Investments” section of the report for additional details). “Other” country weightings represent 0.9% or less in the following: Brazil, Chile, Colombia, Denmark, Finland, Hong Kong, Hungary, India, Indonesia, Ireland, Israel, Ivory Coast, Kazakhstan, Kuwait, Luxembourg, Macau, Malaysia, Mexico, Netherlands, New Zealand, Norway, Panama, Peru, Philippines, Portugal, Qatar, Romania, Saudi Arabia, Singapore, South Africa, Supranational, Sweden, Switzerland, Taiwan, Thailand, United Arab Emirates and Uruguay. |
| | |
| |
16 | AB GLOBAL BOND FUND | | abfunds.com |
PORTFOLIO OF INVESTMENTS
September 30, 2022
| | | | | | | | | | | | |
| | | | | | Principal
Amount
(000) | | | U.S. $ Value | |
| |
GOVERNMENTS - TREASURIES – 52.1% | | | | | | | | | | | | |
Australia – 3.2% | | | | | | | | | | | | |
Australia Government Bond
Series 136
4.75%, 04/21/2027(a) | | | AUD | | | | 207,274 | | | $ | 138,759,993 | |
Series 145
2.75%, 06/21/2035(a) | | | | | | | 51,003 | | | | 28,596,281 | |
Series 150
3.00%, 03/21/2047(a) | | | | | | | 14,094 | | | | 7,472,252 | |
| | | | | | | | | | | | |
| | | | | | | | | | | 174,828,526 | |
| | | | | | | | | | | | |
Austria – 2.0% | | | | | | | | | | | | |
Republic of Austria Government Bond
Zero Coupon, 02/20/2030(a) | | | EUR | | | | 5,136 | | | | 4,151,626 | |
0.50%, 02/20/2029(a) | | | | | | | 4,212 | | | | 3,626,640 | |
0.90%, 02/20/2032(a) | | | | | | | 121,364 | | | | 100,367,634 | |
| | | | | | | | | | | | |
| | | | | | | | | | | 108,145,900 | |
| | | | | | | | | | | | |
Belgium – 0.8% | | | | | | | | | | | | |
Kingdom of Belgium Government Bond
Series 84
1.45%, 06/22/2037(a) | | | | | | | 25,528 | | | | 20,234,703 | |
Series 96
2.75%, 04/22/2039(a) | | | | | | | 27,732 | | | | 25,959,602 | |
| | | | | | | | | | | | |
| | | | | | | | | | | 46,194,305 | |
| | | | | | | | | | | | |
Canada – 1.4% | | | | | | | | | | | | |
Canadian Government Bond
1.25%, 03/01/2027 | | | CAD | | | | 63,190 | | | | 41,792,978 | |
2.00%, 12/01/2051 | | | | | | | 40,465 | | | | 23,110,551 | |
2.25%, 12/01/2029 | | | | | | | 17,213 | | | | 11,730,017 | |
| | | | | | | | | | | | |
| | | | | | | | | | | 76,633,546 | |
| | | | | | | | | | | | |
China – 1.5% | | | | | | | | | | | | |
China Government Bond
Series INBK
2.80%, 03/24/2029 | | | CNY | | | | 181,350 | | | | 25,646,379 | |
3.81%, 09/14/2050 | | | | | | | 365,210 | | | | 56,894,930 | |
| | | | | | | | | | | | |
| | | | | | | | | | | 82,541,309 | |
| | | | | | | | | | | | |
Germany – 6.7% | | | | | | | | | | | | |
Bundesrepublik Deutschland Bundesanleihe
Zero Coupon, 02/15/2032(a) | | | EUR | | | | 172,707 | | | | 139,594,825 | |
Zero Coupon, 08/15/2050(a) | | | | | | | 27,220 | | | | 14,958,262 | |
0.25%, 02/15/2029(a) | | | | | | | 94,287 | | | | 82,979,448 | |
3.25%, 07/04/2042(a) | | | | | | | 59,627 | | | | 68,295,373 | |
Series G
Zero Coupon, 08/15/2031(a) | | | | | | | 44,893 | | | | 36,813,355 | |
Zero Coupon, 08/15/2050(a) | | | | | | | 31,390 | | | | 17,296,078 | |
| | | | | | | | | | | | |
| | | | | | | | | | | 359,937,341 | |
| | | | | | | | | | | | |
| | |
| |
| abfunds.com | | AB GLOBAL BOND FUND | 17 |
PORTFOLIO OF INVESTMENTS (continued)
| | | | | | | | | | | | |
| | | | | | Principal
Amount
(000) | | | U.S. $ Value | |
| |
Indonesia – 0.5% | | | | | | | | | | | | |
Indonesia Treasury Bond
Series FR87
6.50%, 02/15/2031 | | | IDR | | | | 414,116,000 | | | $ | 25,699,532 | |
| | | | | | | | | | | | |
| | | |
Ireland – 0.2% | | | | | | | | | | | | |
Ireland Government Bond
Zero Coupon, 10/18/2031(a) | | | EUR | | | | 13,190 | | | | 10,265,502 | |
| | | | | | | | | | | | |
| | | |
Italy – 2.6% | | | | | | | | | | | | |
Italy Buoni Poliennali Del Tesoro
0.25%, 03/15/2028(a) | | | | | | | 79,018 | | | | 63,893,258 | |
2.80%, 06/15/2029(a) | | | | | | | 65,970 | | | | 59,878,333 | |
4.00%, 04/30/2035(a) | | | | | | | 16,125 | | | | 15,081,114 | |
| | | | | | | | | | | | |
| | | | | | | | | | | 138,852,705 | |
| | | | | | | | | | | | |
Japan – 3.6% | | | | | | | | | | | | |
Japan Government Five Year Bond
Series 138
0.10%, 12/20/2023 | | | JPY | | | | 3,707,000 | | | | 25,677,232 | |
Japan Government Forty Year Bond
Series 15
1.00%, 03/20/2062 | | | | | | | 6,382,500 | | | | 37,921,799 | |
Japan Government Ten Year Bond
Series 332
0.60%, 12/20/2023 | | | | | | | 4,073,350 | | | | 28,385,607 | |
Japan Government Thirty Year Bond
Series 65
0.40%, 12/20/2049 | | | | | | | 5,587,150 | | | | 30,570,966 | |
Series 68
0.60%, 09/20/2050 | | | | | | | 3,939,050 | | | | 22,567,369 | |
Series 74
1.00%, 03/20/2052 | | | | | | | 1,468,300 | | | | 9,280,914 | |
Japan Government Twenty Year Bond
Series 159
0.60%, 12/20/2036 | | | | | | | 4,022,550 | | | | 27,588,566 | |
Series 169
0.30%, 06/20/2039 | | | | | | | 1,984,250 | | | | 12,558,573 | |
| | | | | | | | | | | | |
| | | | | | | | | | | 194,551,026 | |
| | | | | | | | | | | | |
Malaysia – 0.4% | | | | | | | | | | | | |
Malaysia Government Bond
Series 310
4.498%, 04/15/2030 | | | MYR | | | | 101,778 | | | | 22,013,196 | |
| | | | | | | | | | | | |
| | | |
South Korea – 5.5% | | | | | | | | | | | | |
Korea Treasury Bond
Series 2506
3.125%, 06/10/2025 | | | KRW | | | | 280,508,520 | | | | 190,716,678 | |
| | |
| |
18 | AB GLOBAL BOND FUND | | abfunds.com |
PORTFOLIO OF INVESTMENTS (continued)
| | | | | | | | | | | | |
| | | | | | Principal
Amount
(000) | | | U.S. $ Value | |
| |
Series 2703
2.375%, 03/10/2027 | | | KRW | | | | 164,589,530 | | | $ | 106,519,912 | |
| | | | | | | | | | | | |
| | | | | | | | | | | 297,236,590 | |
| | | | | | | | | | | | |
Thailand – 0.3% | | | | | | | | | | | | |
Thailand Government Bond
2.00%, 12/17/2031 | | | THB | | | | 663,490 | | | | 16,211,970 | |
| | | | | | | | | | | | |
| | | |
United Kingdom – 1.6% | | | | | | | | | | | | |
United Kingdom Gilt
0.875%, 01/31/2046(a) | | | GBP | | | | 35,592 | | | | 21,465,565 | |
1.25%, 07/31/2051(a) | | | | | | | 4,547 | | | | 2,839,568 | |
1.50%, 07/31/2053(a) | | | | | | | 14,980 | | | | 9,909,055 | |
1.75%, 09/07/2037(a) | | | | | | | 61,155 | | | | 50,069,008 | |
| | | | | | | | | | | | |
| | | | | | | | | | | 84,283,196 | |
| | | | | | | | | | | | |
United States – 21.8% | | | | | | | | | | | | |
U.S. Treasury Bonds
1.125%, 05/15/2040 | | | U.S.$ | | | | 125,315 | | | | 78,243,553 | |
1.125%, 08/15/2040 | | | | | | | 95,345 | | | | 58,994,719 | |
1.75%, 08/15/2041 | | | | | | | 34,810 | | | | 23,790,459 | |
1.875%, 02/15/2051 | | | | | | | 99,191 | | | | 65,652,109 | |
2.00%, 08/15/2051 | | | | | | | 43,935 | | | | 29,999,367 | |
2.375%, 02/15/2042 | | | | | | | 21,356 | | | | 16,360,699 | |
3.00%, 11/15/2045 | | | | | | | 3,529 | | | | 2,945,612 | |
4.50%, 08/15/2039 | | | | | | | 3,839 | | | | 4,117,927 | |
U.S. Treasury Notes
0.25%, 05/31/2025 | | | | | | | 189,085 | | | | 170,087,857 | |
0.50%, 11/30/2023 | | | | | | | 28,495 | | | | 27,275,154 | |
0.50%, 02/28/2026 | | | | | | | 29,655 | | | | 26,170,538 | |
1.25%, 11/30/2026 | | | | | | | 58,060 | | | | 51,682,469 | |
2.25%, 02/15/2027 | | | | | | | 127,825 | | | | 118,218,159 | |
2.50%, 04/30/2024 | | | | | | | 175,082 | | | | 170,212,532 | |
2.625%, 12/31/2023(b) | | | | | | | 57,340 | | | | 56,166,319 | |
2.75%, 04/30/2027 | | | | | | | 150,162 | | | | 141,762,313 | |
2.75%, 08/15/2032 | | | | | | | 102,895 | | | | 94,036,378 | |
2.875%, 05/15/2032 | | | | | | | 45,264 | | | | 41,833,840 | |
| | | | | | | | | | | | |
| | | | | | | | | | | 1,177,550,004 | |
| | | | | | | | | | | | |
Total Governments - Treasuries
(cost $3,305,154,271) | | | | | | | | | | | 2,814,944,648 | |
| | | | | | | | | | | | |
| | | | | | | | | | | | |
CORPORATES - INVESTMENT GRADE – 21.7% | | | | | | | | | | | | |
Financial Institutions – 11.7% | | | | | | | | | | | | |
Banking – 8.0% | | | | | | | | | | | | |
AIB Group PLC
0.50%, 11/17/2027(a) | | | EUR | | | | 14,715 | | | | 12,059,616 | |
4.263%, 04/10/2025(a) | | | U.S.$ | | | | 853 | | | | 818,242 | |
| | |
| |
| abfunds.com | | AB GLOBAL BOND FUND | 19 |
PORTFOLIO OF INVESTMENTS (continued)
| | | | | | | | | | |
| | | | | Principal
Amount
(000) | | | U.S. $ Value | |
| |
ASB Finance Ltd.
0.25%, 09/08/2028(a) | | EUR | | | 559 | | | $ | 437,622 | |
Australia & New Zealand Banking Group Ltd.
4.40%, 05/19/2026(a) | | U.S.$ | | | 9,412 | | | | 8,946,846 | |
Banco de Credito del Peru SA
3.25%, 09/30/2031(a) | | | | | 510 | | | | 430,567 | |
Banco Santander Mexico SA Institucion de Banca Multiple Grupo Financiero Santand
5.375%, 04/17/2025(a) | | | | | 450 | | | | 438,484 | |
Banco Santander SA
4.175%, 03/24/2028 | | | | | 17,400 | | | | 15,751,623 | |
5.147%, 08/18/2025 | | | | | 200 | | | | 194,373 | |
5.294%, 08/18/2027 | | | | | 600 | | | | 566,870 | |
Bangkok Bank PCL/Hong Kong
9.025%, 03/15/2029(a) | | | | | 440 | | | | 503,250 | |
Bank Hapoalim BM
3.255%, 01/21/2032(a) | | | | | 257 | | | | 210,740 | |
Bank Leumi Le-Israel BM
3.275%, 01/29/2031(a) | | | | | 290 | | | | 247,787 | |
Bank Mandiri Persero Tbk PT
4.75%, 05/13/2025(a) | | | | | 320 | | | | 311,060 | |
Bank of America Corp.
0.583%, 08/24/2028(a) | | EUR | | | 9,840 | | | | 8,099,498 | |
1.898%, 07/23/2031 | | U.S.$ | | | 270 | | | | 201,124 | |
1.922%, 10/24/2031 | | | | | 673 | | | | 498,103 | |
2.884%, 10/22/2030 | | | | | 461 | | | | 378,395 | |
3.194%, 07/23/2030 | | | | | 573 | | | | 482,596 | |
3.384%, 04/02/2026 | | | | | 68 | | | | 64,271 | |
3.419%, 12/20/2028 | | | | | 9,403 | | | | 8,340,946 | |
3.559%, 04/23/2027 | | | | | 3,854 | | | | 3,557,432 | |
3.824%, 01/20/2028 | | | | | 450 | | | | 414,439 | |
3.846%, 03/08/2037 | | | | | 240 | | | | 193,937 | |
3.97%, 03/05/2029 | | | | | 560 | | | | 505,246 | |
3.974%, 02/07/2030 | | | | | 461 | | | | 411,414 | |
4.571%, 04/27/2033 | | | | | 124 | | | | 111,275 | |
4.948%, 07/22/2028 | | | | | 603 | | | | 579,911 | |
5.015%, 07/22/2033 | | | | | 603 | | | | 560,968 | |
Series B
8.05%, 06/15/2027 | | | | | 930 | | | | 1,015,254 | |
Series N
2.651%, 03/11/2032 | | | | | 686 | | | | 534,812 | |
Bank of Ireland Group PLC
6.253%, 09/16/2026(a) | | | | | 200 | | | | 195,712 | |
Bank of Nova Scotia (The)
0.125%, 09/04/2026(a) | | EUR | | | 531 | | | | 448,540 | |
0.25%, 11/01/2028(a) | | | | | 111 | | | | 85,462 | |
| | |
| |
20 | AB GLOBAL BOND FUND | | abfunds.com |
PORTFOLIO OF INVESTMENTS (continued)
| | | | | | | | | | |
| | | | | Principal
Amount
(000) | | | U.S. $ Value | |
| |
Banque Federative du Credit Mutuel SA
0.625%, 11/19/2027(a) | | EUR | | | 100 | | | $ | 81,533 | |
2.375%, 03/24/2026(a) | | | | | 500 | | | | 456,183 | |
Barclays PLC
5.088%, 06/20/2030 | | U.S.$ | | | 405 | | | | 354,434 | |
8.00%, 03/15/2029(c) | | | | | 11,342 | | | | 9,951,004 | |
Bbva Bancomer Sa/texas
1.875%, 09/18/2025(a) | | | | | 600 | | | | 534,675 | |
BDO Unibank, Inc.
2.125%, 01/13/2026(a) | | | | | 240 | | | | 216,600 | |
Belfius Bank SA
3.125%, 05/11/2026(a) | | EUR | | | 500 | | | | 457,551 | |
Berlin Hyp AG
1.25%, 01/22/2025 | | | | | 500 | | | | 465,518 | |
BNP Paribas SA
2.219%, 06/09/2026(a) | | U.S.$ | | | 475 | | | | 427,938 | |
7.75%, 08/16/2029(a)(c) | | | | | 7,767 | | | | 7,195,264 | |
BPCE SA
2.875%, 04/22/2026(a) | | EUR | | | 500 | | | | 462,575 | |
3.25%, 01/11/2028(a) | | U.S.$ | | | 338 | | | | 298,620 | |
4.50%, 03/15/2025(a) | | | | | 8,251 | | | | 7,838,179 | |
4.625%, 07/11/2024(a) | | | | | 470 | | | | 456,660 | |
4.75%, 07/19/2027(a) | | | | | 598 | | | | 572,716 | |
5.15%, 07/21/2024(a) | | | | | 260 | | | | 255,187 | |
5.25%, 04/16/2029(a) | | GBP | | | 100 | | | | 96,501 | |
CaixaBank SA
0.375%, 11/18/2026(a) | | EUR | | | 10,300 | | | | 8,832,921 | |
1.50%, 12/03/2026(a) | | GBP | | | 2,200 | | | | 2,035,289 | |
Capital One Financial Corp.
1.65%, 06/12/2029 | | EUR | | | 325 | | | | 250,917 | |
4.985%, 07/24/2026 | | U.S.$ | | | 135 | | | | 132,139 | |
CBQ Finance Ltd.
2.00%, 05/12/2026(a) | | | | | 450 | | | | 397,913 | |
Citigroup, Inc.
0.50%, 10/08/2027(a) | | EUR | | | 440 | | | | 372,521 | |
1.462%, 06/09/2027 | | U.S.$ | | | 5,627 | | | | 4,790,322 | |
4.412%, 03/31/2031 | | | | | 625 | | | | 562,040 | |
5.95%, 01/30/2023(c) | | | | | 1,384 | | | | 1,368,126 | |
Series P
5.95%, 05/15/2025(c) | | | | | 2,793 | | | | 2,542,681 | |
Series W
4.00%, 12/10/2025(c) | | | | | 232 | | | | 195,762 | |
Series Y
4.15%, 11/15/2026(c) | | | | | 7,121 | | | | 5,686,706 | |
CMB Wing Lung Bank Ltd.
3.75%, 11/22/2027(a) | | | | | 290 | | | | 289,148 | |
| | |
| |
| abfunds.com | | AB GLOBAL BOND FUND | 21 |
PORTFOLIO OF INVESTMENTS (continued)
| | | | | | | | | | |
| | | | | Principal
Amount
(000) | | | U.S. $ Value | |
| |
Commonwealth Bank of Australia
2.688%, 03/11/2031(a) | | U.S.$ | | | 365 | | | $ | 276,177 | |
3.784%, 03/14/2032(a) | | | | | 7,204 | | | | 5,782,044 | |
Cooperatieve Rabobank UA
3.25%, 12/29/2026(a)(c) | | EUR | | | 5,600 | | | | 4,191,674 | |
4.375%, 06/29/2027(a)(c) | | | | | 6,200 | | | | 5,020,120 | |
4.625%, 05/23/2029(a) | | GBP | | | 125 | | | | 117,135 | |
Credit Suisse AG/London
0.25%, 01/05/2026(a) | | EUR | | | 531 | | | | 453,667 | |
0.25%, 09/01/2028(a) | | | | | 455 | | | | 338,757 | |
Credit Suisse Group AG
0.625%, 01/18/2033(a) | | | | | 971 | | | | 568,818 | |
2.125%, 11/15/2029(a) | | GBP | | | 260 | | | | 203,567 | |
4.194%, 04/01/2031(a) | | U.S.$ | | | 15,457 | | | | 12,273,168 | |
6.373%, 07/15/2026(a) | | | | | 1,625 | | | | 1,572,770 | |
6.442%, 08/11/2028(a) | | | | | 613 | | | | 571,983 | |
6.537%, 08/12/2033(a) | | | | | 290 | | | | 261,749 | |
Danske Bank A/S
0.75%, 06/09/2029(a) | | EUR | | | 14,640 | | | | 11,370,956 | |
3.244%, 12/20/2025(a) | | U.S.$ | | | 3,465 | | | | 3,228,171 | |
4.298%, 04/01/2028(a) | | | | | 6,347 | | | | 5,690,339 | |
DBS Group Holdings Ltd.
Series G
3.30%, 02/27/2025(a)(c) | | | | | 240 | | | | 216,600 | |
Deutsche Bank AG
1.625%, 01/20/2027(a) | | EUR | | | 500 | | | | 416,821 | |
1.75%, 11/19/2030(a) | | | | | 300 | | | | 222,671 | |
1.875%, 02/23/2028(a) | | | | | 9,700 | | | | 8,104,587 | |
2.625%, 02/12/2026(a) | | | | | 7,400 | | | | 6,708,732 | |
Deutsche Bank AG/New York NY
3.961%, 11/26/2025 | | U.S.$ | | | 240 | | | | 224,255 | |
6.119%, 07/14/2026 | | | | | 555 | | | | 540,064 | |
DNB Bank ASA
0.25%, 02/23/2029(a) | | EUR | | | 180 | | | | 143,021 | |
0.375%, 01/18/2028(a) | | | | | 257 | | | | 219,165 | |
1.625%, 05/31/2026(a) | | | | | 120 | | | | 111,869 | |
Doha Finance Ltd.
2.375%, 03/31/2026(a) | | U.S.$ | | | 590 | | | | 524,923 | |
Erste Group Bank AG
0.875%, 05/13/2027(a) | | EUR | | | 300 | | | | 256,228 | |
1.625%, 09/08/2031(a) | | | | | 200 | | | | 166,342 | |
4.25%, 10/15/2027(a)(c) | | | | | 200 | | | | 141,042 | |
Federation des Caisses Desjardins du Quebec
4.40%, 08/23/2025(a) | | U.S.$ | | | 315 | | | | 304,629 | |
4.55%, 08/23/2027(a) | | | | | 618 | | | | 583,779 | |
First Abu Dhabi Bank PJSC
4.50%, 04/05/2026(a)(c) | | | | | 480 | | | | 446,490 | |
| | |
| |
22 | AB GLOBAL BOND FUND | | abfunds.com |
PORTFOLIO OF INVESTMENTS (continued)
| | | | | | | | | | |
| | | | | Principal
Amount
(000) | | | U.S. $ Value | |
| |
Goldman Sachs Group, Inc. (The)
2.383%, 07/21/2032 | | U.S.$ | | | 13,982 | | | $ | 10,561,906 | |
2.615%, 04/22/2032 | | | | | 1,860 | | | | 1,441,921 | |
2.64%, 02/24/2028 | | | | | 4,396 | | | | 3,818,570 | |
3.102%, 02/24/2033 | | | | | 265 | | | | 210,518 | |
3.272% (SOFR + 1.39%), 03/15/2024(d) | | | | | 285 | | | | 284,646 | |
3.375%, 03/27/2025(a) | | EUR | | | 4,000 | | | | 3,900,366 | |
3.615%, 03/15/2028 | | U.S.$ | | | 1,805 | | | | 1,642,576 | |
4.223%, 05/01/2029 | | | | | 230 | | | | 209,445 | |
4.25%, 01/29/2026(a) | | GBP | | | 335 | | | | 343,692 | |
4.387%, 06/15/2027 | | U.S.$ | | | 123 | | | | 117,161 | |
4.482%, 08/23/2028 | | | | | 124 | | | | 116,473 | |
6.875%, 01/18/2038 | | GBP | | | 75 | | | | 80,642 | |
HSBC Holdings PLC
1.645%, 04/18/2026 | | U.S.$ | | | 431 | | | | 384,297 | |
2.013%, 09/22/2028 | | | | | 699 | | | | 562,016 | |
3.125%, 06/07/2028 | | EUR | | | 484 | | | | 432,132 | |
3.973%, 05/22/2030 | | U.S.$ | | | 420 | | | | 355,794 | |
4.18%, 12/09/2025 | | | | | 619 | | | | 592,404 | |
4.292%, 09/12/2026 | | | | | 204 | | | | 192,974 | |
4.755%, 06/09/2028 | | | | | 819 | | | | 753,781 | |
4.762%, 03/29/2033 | | | | | 675 | | | | 558,786 | |
5.21%, 08/11/2028 | | | | | 9,435 | | | | 8,848,429 | |
5.75%, 12/20/2027(a) | | GBP | | | 125 | | | | 126,366 | |
6.375%, 03/30/2025(c) | | U.S.$ | | | 14,348 | | | | 12,859,395 | |
ING Groep NV
1.75%, 02/16/2031(a) | | EUR | | | 100 | | | | 79,507 | |
2.125%, 05/26/2031(a) | | | | | 200 | | | | 174,703 | |
4.017%, 03/28/2028 | | U.S.$ | | | 295 | | | | 268,846 | |
5.75%, 11/16/2026(c) | | | | | 200 | | | | 172,182 | |
6.50%, 04/16/2025(c) | | | | | 226 | | | | 201,729 | |
Intesa Sanpaolo SpA
1.35%, 02/24/2031(a) | | EUR | | | 250 | | | | 170,577 | |
3.875%, 07/14/2027(a) | | U.S.$ | | | 200 | | | | 177,192 | |
Series XR
4.00%, 09/23/2029(a) | | | | | 200 | | | | 166,243 | |
JPMorgan Chase & Co.
1.09%, 03/11/2027(a) | | EUR | | | 7,804 | | | | 6,921,578 | |
1.578%, 04/22/2027 | | U.S.$ | | | 580 | | | | 501,365 | |
2.522%, 04/22/2031 | | | | | 206 | | | | 162,804 | |
2.545%, 11/08/2032 | | | | | 315 | | | | 239,459 | |
2.947%, 02/24/2028 | | | | | 720 | | | | 638,061 | |
3.22%, 03/01/2025 | | | | | 11 | | | | 10,645 | |
3.509%, 01/23/2029 | | | | | 235 | | | | 208,177 | �� |
3.96%, 01/29/2027 | | | | | 383 | | | | 361,378 | |
4.005%, 04/23/2029 | | | | | 2,349 | | | | 2,124,646 | |
| | |
| |
| abfunds.com | | AB GLOBAL BOND FUND | 23 |
PORTFOLIO OF INVESTMENTS (continued)
| | | | | | | | | | |
| | | | | Principal
Amount
(000) | | | U.S. $ Value | |
| |
4.323%, 04/26/2028 | | U.S.$ | | | 618 | | | $ | 581,290 | |
4.452%, 12/05/2029 | | | | | 604 | | | | 552,489 | |
4.565%, 06/14/2030 | | | | | 15,926 | | | | 14,621,844 | |
4.586%, 04/26/2033 | | | | | 124 | | | | 111,661 | |
4.851%, 07/25/2028 | | | | | 268 | | | | 257,140 | |
4.912%, 07/25/2033 | | | | | 604 | | | | 557,812 | |
5.717%, 09/14/2033 | | | | | 175 | | | | 165,346 | |
Series I
6.276% (LIBOR 3 Month + 3.47%), 01/30/2023(c)(d) | | | | | 2,251 | | | | 2,240,868 | |
Series V
5.597% (LIBOR 3 Month + 3.32%), 10/01/2022(c)(d) | | | | | 97 | | | | 97,000 | |
Jyske Bank A/S
2.25%, 04/05/2029(a) | | EUR | | | 100 | | | | 93,527 | |
KBC Group NV
1.50%, 03/29/2026(a) | | | | | 100 | | | | 92,152 | |
Kookmin Bank
2.50%, 11/04/2030(a) | | U.S.$ | | | 810 | | | | 624,206 | |
Lloyds Banking Group PLC
1.50%, 09/12/2027(a) | | EUR | | | 508 | | | | 440,267 | |
3.75%, 03/18/2028 | | U.S.$ | | | 285 | | | | 257,593 | |
5.125%, 12/27/2024(c) | | GBP | | | 200 | | | | 186,451 | |
7.50%, 06/27/2024(c) | | U.S.$ | | | 15,460 | | | | 14,311,528 | |
Macquarie Group Ltd.
0.35%, 03/03/2028(a) | | EUR | | | 555 | | | | 435,474 | |
0.625%, 02/03/2027(a) | | | | | 100 | | | | 83,658 | |
3.763%, 11/28/2028(a) | | U.S.$ | | | 188 | | | | 168,528 | |
5.108%, 08/09/2026(a) | | | | | 270 | | | | 264,899 | |
5.491%, 11/09/2033(a) | | | | | 124 | | | | 114,599 | |
Mitsubishi UFJ Financial Group, Inc.
3.741%, 03/07/2029 | | | | | 417 | | | | 375,361 | |
4.08%, 04/19/2028 | | | | | 200 | | | | 186,451 | |
5.354%, 09/13/2028 | | | | | 200 | | | | 195,629 | |
Mizuho Financial Group, Inc.
0.184%, 04/13/2026(a) | | EUR | | | 528 | | | | 451,461 | |
0.47%, 09/06/2029(a) | | | | | 135 | | | | 104,038 | |
0.693%, 10/07/2030(a) | | | | | 111 | | | | 81,125 | |
2.26%, 07/09/2032 | | U.S.$ | | | 200 | | | | 147,942 | |
4.353%, 10/20/2025(a) | | | | | 325 | | | | 311,007 | |
5.414%, 09/13/2028 | | | | | 200 | | | | 196,295 | |
Morgan Stanley
0.406%, 10/29/2027 | | EUR | | | 14,525 | | | | 12,261,061 | |
2.95%, 05/07/2032 | | | | | 235 | | | | 203,958 | |
3.772%, 01/24/2029 | | U.S.$ | | | 95 | | | | 85,608 | |
4.21%, 04/20/2028 | | | | | 4,737 | | | | 4,430,797 | |
4.679%, 07/17/2026 | | | | | 152 | | | | 147,979 | |
Series G
2.625%, 03/09/2027 | | GBP | | | 245 | | | | 232,832 | |
| | |
| |
24 | AB GLOBAL BOND FUND | | abfunds.com |
PORTFOLIO OF INVESTMENTS (continued)
| | | | | | | | | | |
| | | | | Principal
Amount
(000) | | | U.S. $ Value | |
| |
Nanyang Commercial Bank Ltd.
3.80%, 11/20/2029(a) | | U.S.$ | | | 570 | | | $ | 538,401 | |
National Australia Bank Ltd.
1.375%, 08/30/2028(a) | | EUR | | | 102 | | | | 87,609 | |
Nationwide Building Society
0.25%, 09/14/2028(a) | | | | | 554 | | | | 430,487 | |
2.647% (SOFR + 1.29%), 02/16/2028(a)(d) | | U.S.$ | | | 290 | | | | 271,338 | |
2.972%, 02/16/2028(a) | | | | | 4,664 | | | | 4,028,787 | |
4.00%, 09/14/2026(a) | | | | | 250 | | | | 227,402 | |
4.85%, 07/27/2027(a) | | | | | 200 | | | | 190,634 | |
NatWest Group PLC
0.78%, 02/26/2030(a) | | EUR | | | 17,390 | | | | 12,960,407 | |
3.622%, 08/14/2030(a) | | GBP | | | 105 | | | | 103,478 | |
4.445%, 05/08/2030 | | U.S.$ | | | 455 | | | | 400,616 | |
5.076%, 01/27/2030 | | | | | 791 | | | | 723,180 | |
NatWest Markets PLC
0.125%, 11/12/2025(a) | | EUR | | | 105 | | | | 91,501 | |
0.125%, 06/18/2026(a) | | | | | 534 | | | | 452,570 | |
1.60%, 09/29/2026(a) | | U.S.$ | | | 400 | | | | 340,395 | |
NBK Tier 1 Financing 2 Ltd.
4.50%, 08/27/2025(a)(c) | | | | | 290 | | | | 259,695 | |
NIBC Bank NV
0.25%, 09/09/2026(a) | | EUR | | | 500 | | | | 407,429 | |
Nordea Bank Abp
4.75%, 09/22/2025(a) | | U.S.$ | | | 200 | | | | 197,106 | |
Nykredit Realkredit AS
0.25%, 01/13/2026(a) | | EUR | | | 528 | | | | 455,353 | |
OP Corporate Bank PLC
0.375%, 06/16/2028(a) | | | | | 554 | | | | 431,950 | |
Oversea-Chinese Banking Corp. Ltd.
1.832%, 09/10/2030(a) | | U.S.$ | | | 530 | | | | 473,566 | |
Philippine National Bank
3.28%, 09/27/2024(a) | | | | | 480 | | | | 456,540 | |
PNC Financial Services Group, Inc. (The)
Series O
6.46% (LIBOR 3 Month + 3.68%), 11/01/2022(c)(d) | | | | | 1,214 | | | | 1,210,478 | |
QIB Sukuk Ltd.
1.95%, 10/27/2025(a) | | | | | 300 | | | | 274,931 | |
QNB Finance Ltd.
1.375%, 01/26/2026(a) | | | | | 510 | | | | 449,374 | |
Raiffeisen Bank International AG
0.05%, 09/01/2027(a) | | EUR | | | 600 | | | | 462,640 | |
Santander Consumer Bank AS
0.125%, 09/11/2024(a) | | | | | 200 | | | | 183,834 | |
Santander Holdings USA, Inc.
2.49%, 01/06/2028 | | U.S.$ | | | 5,605 | | | | 4,667,383 | |
5.807%, 09/09/2026 | | | | | 120 | | | | 117,350 | |
| | |
| |
| abfunds.com | | AB GLOBAL BOND FUND | 25 |
PORTFOLIO OF INVESTMENTS (continued)
| | | | | | | | | | |
| | | | | Principal
Amount
(000) | | | U.S. $ Value | |
| |
Santander UK Group Holdings PLC
0.603%, 09/13/2029(a) | | EUR | | | 1,438 | | | $ | 1,080,655 | |
2.469%, 01/11/2028 | | U.S.$ | | | 450 | | | | 376,035 | |
Shinhan Bank Co., Ltd.
4.00%, 04/23/2029(a) | | | | | 760 | | | | 688,987 | |
Shinhan Financial Group Co., Ltd.
3.34%, 02/05/2030(a) | | | | | 540 | | | | 503,989 | |
5.875%, 08/13/2023(a)(c) | | | | | 230 | | | | 227,024 | |
Siam Commercial Bank PCL/Cayman Islands
Series G
4.40%, 02/11/2029(a) | | | | | 350 | | | | 333,550 | |
Societe Generale SA
0.125%, 02/18/2028(a) | | EUR | | | 600 | | | | 481,448 | |
1.50%, 05/30/2025(a) | | | | | 100 | | | | 95,069 | |
2.797%, 01/19/2028(a) | | U.S.$ | | | 16,809 | | | | 14,220,838 | |
Standard Chartered PLC
0.80%, 11/17/2029(a) | | EUR | | | 195 | | | | 148,091 | |
2.608%, 01/12/2028(a) | | U.S.$ | | | 12,199 | | | | 10,370,110 | |
2.819%, 01/30/2026(a) | | | | | 480 | | | | 441,528 | |
3.125%, 11/19/2024(a) | | EUR | | | 479 | | | | 455,065 | |
4.316% (LIBOR 3 Month + 1.51%), 01/30/2027(a)(c)(d) | | U.S.$ | | | 12,300 | | | | 9,268,431 | |
Sumitomo Mitsui Financial Group, Inc.
0.632%, 10/23/2029(a) | | EUR | | | 110 | | | | 82,968 | |
1.546%, 06/15/2026(a) | | | | | 499 | | | | 448,307 | |
3.04%, 07/16/2029 | | U.S.$ | | | 585 | | | | 493,714 | |
Sumitomo Mitsui Trust Bank Ltd.
0.85%, 03/25/2024(a) | | | | | 209 | | | | 196,357 | |
2.55%, 03/10/2025(a) | | | | | 200 | | | | 187,725 | |
Svenska Handelsbanken AB
4.375%, 03/01/2027(a)(c) | | | | | 200 | | | | 162,852 | |
Swedbank AB
0.20%, 01/12/2028(a) | | EUR | | | 556 | | | | 438,925 | |
Series G
0.25%, 11/02/2026(a) | | | | | 265 | | | | 227,370 | |
Series NC5
5.625%, 09/17/2024(a)(c) | | U.S.$ | | | 3,600 | | | | 3,330,699 | |
Toronto-Dominion Bank (The)
0.50%, 01/18/2027(a) | | EUR | | | 526 | | | | 444,003 | |
UBS Group AG
0.25%, 02/24/2028(a) | | | | | 547 | | | | 429,004 | |
2.904% (SOFR + 1.58%), 05/12/2026(a)(d) | | U.S.$ | | | 17,565 | | | | 17,509,514 | |
3.126%, 08/13/2030(a) | | | | | 295 | | | | 242,979 | |
5.125%, 07/29/2026(a)(c) | | | | | 200 | | | | 169,042 | |
| | |
| |
26 | AB GLOBAL BOND FUND | | abfunds.com |
PORTFOLIO OF INVESTMENTS (continued)
| | | | | | | | | | | | |
| | | | | | Principal
Amount
(000) | | | U.S. $ Value | |
| |
UniCredit SpA
1.982%, 06/03/2027(a) | | | U.S.$ | | | | 619 | | | $ | 508,617 | |
2.569%, 09/22/2026(a) | | | | | | | 15,592 | | | | 13,342,964 | |
3.127%, 06/03/2032(a) | | | | | | | 9,962 | | | | 7,130,684 | |
United Overseas Bank Ltd.
2.00%, 10/14/2031(a) | | | | | | | 200 | | | | 172,236 | |
Series G
1.75%, 03/16/2031(a) | | | | | | | 250 | | | | 217,873 | |
Virgin Money UK PLC
Series G
5.125%, 12/11/2030(a) | | | GBP | | | | 135 | | | | 133,997 | |
Visa, Inc.
1.50%, 06/15/2026 | | | EUR | | | | 375 | | | | 347,014 | |
Wells Fargo & Co.
2.393%, 06/02/2028 | | | U.S.$ | | | | 200 | | | | 171,479 | |
4.54%, 08/15/2026 | | | | | | | 123 | | | | 119,103 | |
Western Union Co. (The)
2.75%, 03/15/2031 | | | | | | | 221 | | | | 166,113 | |
Westpac Banking Corp.
Series G
4.322%, 11/23/2031 | | | | | | | 185 | | | | 170,228 | |
Woori Bank
5.125%, 08/06/2028(a) | | | | | | | 210 | | | | 200,524 | |
Yorkshire Building Society
0.50%, 07/01/2028(a) | | | EUR | | | | 553 | | | | 434,320 | |
| | | | | | | | | | | | |
| | | | | | | | | | | 430,133,474 | |
| | | | | | | | | | | | |
Brokerage – 0.3% | | | | | | | | | | | | |
Abrdn PLC
4.25%, 06/30/2028(a) | | | U.S.$ | | | | 299 | | | | 257,929 | |
Blue Owl Finance LLC
4.375%, 02/15/2032(a) | | | | | | | 133 | | | | 104,756 | |
Brookfield Finance, Inc.
3.90%, 01/25/2028 | | | | | | | 583 | | | | 526,602 | |
Charles Schwab Corp. (The)
Series I
4.00%, 06/01/2026(c) | | | | | | | 17,210 | | | | 14,188,992 | |
CI Financial Corp.
3.20%, 12/17/2030 | | | | | | | 157 | | | | 113,052 | |
Clearstream Banking AG
Zero Coupon, 12/01/2025(a) | | | EUR | | | | 200 | | | | 179,000 | |
Intercorp Peru Ltd.
3.875%, 08/15/2029(a) | | | U.S.$ | | | | 370 | | | | 299,700 | |
| | | | | | | | | | | | |
| | | | | | | | | | | 15,670,031 | |
| | | | | | | | | | | | |
Finance – 1.0% | | | | | | | | | | | | |
Aareal Bank AG
0.75%, 04/18/2028(a) | | | EUR | | | | 500 | | | | 369,001 | |
| | |
| |
| abfunds.com | | AB GLOBAL BOND FUND | 27 |
PORTFOLIO OF INVESTMENTS (continued)
| | | | | | | | | | |
| | | | | Principal
Amount
(000) | | | U.S. $ Value | |
| |
AerCap Ireland Capital DAC/AerCap Global Aviation Trust
3.30%, 01/30/2032 | | U.S.$ | | | 6,374 | | | $ | 4,813,473 | |
Air Lease Corp.
2.10%, 09/01/2028 | | | | | 2,747 | | | | 2,141,230 | |
2.875%, 01/15/2026 | | | | | 1,977 | | | | 1,772,493 | |
3.25%, 03/01/2025 | | | | | 568 | | | | 532,064 | |
3.625%, 04/01/2027 | | | | | 827 | | | | 732,659 | |
4.625%, 10/01/2028 | | | | | 1,867 | | | | 1,672,658 | |
Aircastle Ltd.
2.85%, 01/26/2028(a) | | | | | 9,362 | | | | 7,170,809 | |
4.25%, 06/15/2026 | | | | | 4,586 | | | | 4,112,606 | |
5.25%, 08/11/2025(a) | | | | | 6,102 | | | | 5,748,007 | |
Aviation Capital Group LLC
1.95%, 01/30/2026(a) | | | | | 1,965 | | | | 1,649,994 | |
1.95%, 09/20/2026(a) | | | | | 2,125 | | | | 1,721,095 | |
3.50%, 11/01/2027(a) | | | | | 1,342 | | | | 1,114,804 | |
4.125%, 08/01/2025(a) | | | | | 23 | | | | 21,074 | |
4.375%, 01/30/2024(a) | | | | | 1,889 | | | | 1,825,913 | |
4.875%, 10/01/2025(a) | | | | | 926 | | | | 864,938 | |
5.50%, 12/15/2024(a) | | | | | 5,268 | | | | 5,098,378 | |
Bain Capital Specialty Finance, Inc.
2.55%, 10/13/2026 | | | | | 139 | | | | 114,007 | |
Blackstone Private Credit Fund
3.25%, 03/15/2027 | | | | | 139 | | | | 115,336 | |
7.05%, 09/29/2025(a) | | | | | 590 | | | | 582,800 | |
BOC Aviation Ltd.
3.875%, 04/27/2026(a) | | | | | 620 | | | | 586,404 | |
CCBL Cayman 1 Corp. Ltd.
1.80%, 07/22/2026(a) | | | | | 400 | | | | 352,700 | |
CDBL Funding 1
3.50%, 10/24/2027(a) | | | | | 430 | | | | 392,642 | |
China Development Bank Financial Leasing Co., Ltd.
2.875%, 09/28/2030(a) | | | | | 350 | | | | 323,159 | |
EQT AB
0.875%, 05/14/2031(a) | | EUR | | | 586 | | | | 393,897 | |
Huarong Finance 2017 Co., Ltd.
4.25%, 11/07/2027(a) | | U.S.$ | | | 530 | | | | 395,844 | |
4.75%, 04/27/2027(a) | | | | | 290 | | | | 225,801 | |
Huarong Finance 2019 Co., Ltd.
3.25%, 11/13/2024(a) | | | | | 260 | | | | 228,962 | |
3.375%, 02/24/2030(a) | | | | | 570 | | | | 370,251 | |
ICBCIL Finance Co., Ltd.
3.625%, 05/19/2026(a) | | | | | 230 | | | | 218,256 | |
Intercorp Financial Services, Inc.
4.125%, 10/19/2027(a) | | | | | 840 | | | | 725,182 | |
| | |
| |
28 | AB GLOBAL BOND FUND | | abfunds.com |
PORTFOLIO OF INVESTMENTS (continued)
| | | | | | | | | | | | |
| | | | | | Principal
Amount
(000) | | | U.S. $ Value | |
| |
KKR Group Finance Co. X LLC
3.25%, 12/15/2051(a) | | | U.S.$ | | | | 139 | | | $ | 90,665 | |
ORIX Corp.
5.20%, 09/13/2032 | | | | | | | 120 | | | | 115,530 | |
OWL Rock Core Income Corp.
7.75%, 09/16/2027(a) | | | | | | | 594 | | | | 585,395 | |
Owl Rock Technology Finance Corp.
2.50%, 01/15/2027 | | | | | | | 288 | | | | 230,163 | |
Power Finance Corp., Ltd.
Series G
3.35%, 05/16/2031(a) | | | | | | | 360 | | | | 278,863 | |
Prospect Capital Corp.
3.364%, 11/15/2026 | | | | | | | 666 | | | | 551,097 | |
Synchrony Financial
2.875%, 10/28/2031 | | | | | | | 9,262 | | | | 6,579,880 | |
3.95%, 12/01/2027 | | | | | | | 1,270 | | | | 1,106,913 | |
5.15%, 03/19/2029 | | | | | | | 220 | | | | 200,182 | |
| | | | | | | | | | | | |
| | | | | | | | | | | 56,125,125 | |
| | | | | | | | | | | | |
Insurance – 1.1% | | | | | | | | | | | | |
ACE Capital Trust II
9.70%, 04/01/2030 | | | | | | | 150 | | | | 187,841 | |
Aegon NV
5.50%, 04/11/2048 | | | | | | | 653 | | | | 565,302 | |
Ageas SA/NV
1.875%, 11/24/2051(a) | | | EUR | | | | 100 | | | | 69,720 | |
Allianz SE
3.099%, 07/06/2047(a) | | | | | | | 200 | | | | 179,855 | |
3.375%, 09/18/2024(a)(c) | | | | | | | 200 | | | | 185,804 | |
4.75%, 10/24/2023(a)(c) | | | | | | | 200 | | | | 193,428 | |
Argentum Netherlands BV for Swiss Re Ltd.
5.625%, 08/15/2052(a) | | | U.S.$ | | | | 597 | | | | 531,315 | |
5.75%, 08/15/2050(a) | | | | | | | 365 | | | | 334,670 | |
Argentum Netherlands BV for Zurich Insurance Co., Ltd.
3.50%, 10/01/2046(a) | | | EUR | | | | 155 | | | | 142,612 | |
Assicurazioni Generali SpA
3.875%, 01/29/2029(a) | | | | | | | 305 | | | | 264,482 | |
5.00%, 06/08/2048(a) | | | | | | | 1,801 | | | | 1,647,139 | |
5.50%, 10/27/2047(a) | | | | | | | 7,099 | | | | 6,666,554 | |
Athene Global Funding
0.366%, 09/10/2026(a) | | | | | | | 107 | | | | 89,525 | |
0.832%, 01/08/2027(a) | | | | | | | 530 | | | | 444,698 | |
0.95%, 01/08/2024(a) | | | U.S.$ | | | | 201 | | | | 189,628 | |
2.646%, 10/04/2031(a) | | | | | | | 139 | | | | 104,801 | |
2.717%, 01/07/2029(a) | | | | | | | 13 | | | | 10,511 | |
| | |
| |
| abfunds.com | | AB GLOBAL BOND FUND | 29 |
PORTFOLIO OF INVESTMENTS (continued)
| | | | | | | | | | |
| | | | | Principal
Amount
(000) | | | U.S. $ Value | |
| |
Athene Holding Ltd.
3.45%, 05/15/2052 | | U.S.$ | | | 139 | | | $ | 85,893 | |
3.50%, 01/15/2031 | | | | | 454 | | | | 363,373 | |
4.125%, 01/12/2028 | | | | | 467 | | | | 420,322 | |
Aviva PLC
4.00%, 06/03/2055(a) | | GBP | | | 135 | | | | 100,553 | |
AXA SA
3.25%, 05/28/2049(a) | | EUR | | | 299 | | | | 254,686 | |
Berkshire Hathaway, Inc.
2.15%, 03/15/2028 | | | | | 280 | | | | 254,135 | |
Brown & Brown, Inc.
4.20%, 03/17/2032 | | U.S.$ | | | 642 | | | | 552,094 | |
Cloverie PLC for Zurich Insurance Co., Ltd.
5.625%, 06/24/2046(a) | | | | | 859 | | | | 792,603 | |
CNP Assurances
1.25%, 01/27/2029(a) | | EUR | | | 500 | | | | 388,007 | |
2.50%, 06/30/2051(a) | | | | | 200 | | | | 154,376 | |
Credit Agricole Assurances SA
4.75%, 09/27/2048(a) | | | | | 8,900 | | | | 8,075,628 | |
Elevance Health, Inc.
2.375%, 01/15/2025 | | U.S.$ | | | 46 | | | | 43,393 | |
F&G Global Funding
2.30%, 04/11/2027(a) | | | | | 138 | | | | 118,848 | |
5.15%, 07/07/2025(a) | | | | | 594 | | | | 579,151 | |
Fairfax Financial Holdings Ltd.
5.625%, 08/16/2032(a) | | | | | 123 | | | | 113,503 | |
GA Global Funding Trust
2.25%, 01/06/2027(a) | | | | | 150 | | | | 130,217 | |
Globe Life, Inc.
4.80%, 06/15/2032 | | | | | 121 | | | | 112,077 | |
Guardian Life Insurance Co. of America (The)
4.85%, 01/24/2077(a) | | | | | 149 | | | | 122,127 | |
Liberty Mutual Group, Inc.
3.625%, 05/23/2059(a) | | EUR | | | 8,585 | | | | 7,172,900 | |
MetLife Capital Trust IV
7.875%, 12/15/2037(a) | | U.S.$ | | | 276 | | | | 295,655 | |
MetLife, Inc.
9.25%, 04/08/2038(a) | | | | | 232 | | | | 269,392 | |
Metropolitan Life Global Funding I
2.95%, 04/09/2030(a) | | | | | 150 | | | | 127,282 | |
3.86% (SOFR + 0.91%), 03/21/2025(a)(d) | | | | | 285 | | | | 284,597 | |
4.30%, 08/25/2029(a) | | | | | 614 | | | | 572,800 | |
Muenchener Rueckversicherungs-Gesellschaft AG in Muenchen
3.25%, 05/26/2049(a) | | EUR | | | 3,700 | | | | 3,168,285 | |
| | |
| |
30 | AB GLOBAL BOND FUND | | abfunds.com |
PORTFOLIO OF INVESTMENTS (continued)
| | | | | | | | | | | | |
| | | | | | Principal
Amount
(000) | | | U.S. $ Value | |
| |
Nationwide Mutual Insurance Co.
9.375%, 08/15/2039(a) | | | U.S.$ | | | | 4,295 | | | $ | 5,510,364 | |
New York Life Insurance Co.
4.45%, 05/15/2069(a) | | | | | | | 80 | | | | 63,176 | |
Pacific Life Global Funding II
1.375%, 04/14/2026(a) | | | | | | | 659 | | | | 577,567 | |
Principal Life Global Funding II
1.50%, 11/17/2026(a) | | | | | | | 140 | | | | 120,825 | |
Protective Life Global Funding
3.218%, 03/28/2025(a) | | | | | | | 150 | | | | 142,338 | |
4.714%, 07/06/2027(a) | | | | | | | 150 | | | | 144,607 | |
Prudential Financial, Inc.
5.20%, 03/15/2044 | | | | | | | 385 | | | | 367,987 | |
5.625%, 06/15/2043 | | | | | | | 435 | | | | 427,715 | |
QBE Insurance Group Ltd.
5.875%, 05/12/2025(a)(c) | | | | | | | 325 | | | | 299,871 | |
Sammons Financial Group, Inc.
4.75%, 04/08/2032(a) | | | | | | | 129 | | | | 104,805 | |
Swiss Re Finance Luxembourg SA
4.25%, 09/04/2024(a)(c) | | | | | | | 200 | | | | 174,157 | |
UNIQA Insurance Group AG
1.375%, 07/09/2030(a) | | | EUR | | | | 500 | | | | 385,880 | |
UnitedHealth Group, Inc.
3.875%, 08/15/2059 | | | U.S.$ | | | | 644 | | | | 480,706 | |
4.75%, 05/15/2052 | | | | | | | 121 | | | | 108,203 | |
4.95%, 05/15/2062 | | | | | | | 616 | | | | 551,708 | |
Voya Financial, Inc.
5.65%, 05/15/2053 | | | | | | | 12,751 | | | | 12,523,481 | |
| | | | | | | | | | | | |
| | | | | | | | | | | 58,343,172 | |
| | | | | | | | | | | | |
Other Finance – 0.0% | | | | | | | | | | | | |
China Cinda 2020 I Management Ltd.
3.00%, 01/20/2031(a) | | | | | | | 510 | | | | 372,715 | |
Computershare US, Inc.
1.125%, 10/07/2031(a) | | | EUR | | | | 305 | | | | 217,015 | |
Intercontinental Exchange, Inc.
5.20%, 06/15/2062 | | | U.S.$ | | | | 122 | | | | 109,419 | |
| | | | | | | | | | | | |
| | | | | | | | | | | 699,149 | |
| | | | | | | | | | | | |
REITs – 1.3% | | | | | | | | | | | | |
Acef Holding SCA
1.25%, 04/26/2030(a) | | | EUR | | | | 436 | | | | 313,453 | |
Alexandria Real Estate Equities, Inc.
4.50%, 07/30/2029 | | | U.S.$ | | | | 220 | | | | 204,030 | |
American Tower Corp.
0.40%, 02/15/2027 | | | EUR | | | | 270 | | | | 221,934 | |
0.50%, 01/15/2028 | | | | | | | 196 | | | | 155,598 | |
0.875%, 05/21/2029 | | | | | | | 225 | | | | 172,369 | |
4.00%, 06/01/2025 | | | U.S.$ | | | | 282 | | | | 272,372 | |
| | |
| |
| abfunds.com | | AB GLOBAL BOND FUND | 31 |
PORTFOLIO OF INVESTMENTS (continued)
| | | | | | | | | | |
| | | | | Principal
Amount
(000) | | | U.S. $ Value | |
| |
Aroundtown SA
0.375%, 04/15/2027(a) | | EUR | | | 100 | | | $ | 74,360 | |
Boston Properties LP
3.40%, 06/21/2029 | | U.S.$ | | | 380 | | | | 321,620 | |
Castellum Helsinki Finance Holding Abp
0.875%, 09/17/2029(a) | | EUR | | | 596 | | | | 375,695 | |
CBRE Services, Inc.
2.50%, 04/01/2031 | | U.S.$ | | | 647 | | | | 492,145 | |
Digital Dutch Finco BV
1.25%, 02/01/2031(a) | | EUR | | | 502 | | | | 354,411 | |
Digital Euro Finco LLC
2.50%, 01/16/2026(a) | | | | | 15,955 | | | | 14,500,038 | |
Digital Intrepid Holding BV
0.625%, 07/15/2031(a) | | | | | 330 | | | | 216,526 | |
Equinix, Inc.
3.90%, 04/15/2032 | | U.S.$ | | | 129 | | | | 109,533 | |
Essential Properties LP
2.95%, 07/15/2031 | | | | | 10,801 | | | | 7,891,530 | |
Fastighets AB Balder
1.25%, 01/28/2028(a) | | EUR | | | 265 | | | | 188,428 | |
Federal Realty Investment Trust
3.50%, 06/01/2030 | | U.S.$ | | | 140 | | | | 119,353 | |
GLP Capital LP/GLP Financing II, Inc.
3.25%, 01/15/2032 | | | | | 5,638 | | | | 4,230,202 | |
5.25%, 06/01/2025 | | | | | 560 | | | | 542,004 | |
Heimstaden Bostad Treasury BV
0.75%, 09/06/2029(a) | | EUR | | | 275 | | | | 185,331 | |
Host Hotels & Resorts LP
Series I
3.50%, 09/15/2030 | | U.S.$ | | | 6,531 | | | | 5,217,060 | |
Series J
2.90%, 12/15/2031 | | | | | 6,958 | | | | 5,106,528 | |
Kilroy Realty LP
2.50%, 11/15/2032 | | | | | 160 | | | | 115,241 | |
MAF Sukuk Ltd.
3.933%, 02/28/2030(a) | | | | | 340 | | | | 309,464 | |
NE Property BV
1.75%, 11/23/2024(a) | | EUR | | | 509 | | | | 458,002 | |
1.875%, 10/09/2026(a) | | | | | 107 | | | | 86,075 | |
3.375%, 07/14/2027(a) | | | | | 101 | | | | 83,444 | |
Nerval SAS
2.875%, 04/14/2032(a) | | | | | 300 | | | | 240,881 | |
Office Properties Income Trust
2.40%, 02/01/2027 | | U.S.$ | | | 365 | | | | 262,609 | |
3.45%, 10/15/2031 | | | | | 534 | | | | 323,667 | |
Omega Healthcare Investors, Inc.
3.25%, 04/15/2033 | | | | | 8,923 | | | | 6,323,013 | |
| | |
| |
32 | AB GLOBAL BOND FUND | | abfunds.com |
PORTFOLIO OF INVESTMENTS (continued)
| | | | | | | | | | | | |
| | | | | | Principal
Amount
(000) | | | U.S. $ Value | |
| |
3.375%, 02/01/2031 | | | U.S.$ | | | | 405 | | | $ | 309,760 | |
3.625%, 10/01/2029 | | | | | | | 1,382 | | | | 1,124,460 | |
Prologis Euro Finance LLC
0.375%, 02/06/2028 | | | EUR | | | | 145 | | | | 117,863 | |
1.00%, 02/08/2029 | | | | | | | 220 | | | | 177,061 | |
Realty Income Corp.
1.125%, 07/13/2027 | | | GBP | | | | 230 | | | | 200,954 | |
Regency Centers LP
4.40%, 02/01/2047 | | | U.S.$ | | | | 33 | | | | 25,534 | |
Sabra Health Care LP
5.125%, 08/15/2026 | | | | | | | 320 | | | | 300,393 | |
Samhallsbyggnadsbolaget i Norden AB
1.125%, 09/04/2026(a) | | | EUR | | | | 100 | | | | 73,554 | |
SBB Treasury Oyj
0.75%, 12/14/2028(a) | | | | | | | 10,119 | | | | 6,171,484 | |
1.125%, 11/26/2029(a) | | | | | | | 314 | | | | 190,796 | |
Spirit Realty LP
4.45%, 09/15/2026 | | | U.S.$ | | | | 393 | | | | 372,733 | |
Trust Fibra Uno
4.869%, 01/15/2030(a) | | | | | | | 735 | | | | 559,657 | |
6.39%, 01/15/2050(a) | | | | | | | 205 | | | | 142,321 | |
Unibail-Rodamco-Westfield SE
1.875%, 01/15/2031(a) | | | EUR | | | | 200 | | | | 147,053 | |
2.25%, 05/14/2038(a) | | | | | | | 500 | | | | 302,240 | |
VICI Properties LP
4.75%, 02/15/2028 | | | U.S.$ | | | | 123 | | | | 113,022 | |
4.95%, 02/15/2030 | | | | | | | 123 | | | | 111,218 | |
5.125%, 05/15/2032 | | | | | | | 615 | | | | 545,588 | |
VICI Properties LP/VICI Note Co., Inc.
4.25%, 12/01/2026(a) | | | | | | | 101 | | | | 90,716 | |
Vornado Realty LP
3.40%, 06/01/2031 | | | | | | | 233 | | | | 178,057 | |
WEA Finance LLC
2.875%, 01/15/2027(a) | | | | | | | 650 | | | | 553,127 | |
WEA Finance LLC/Westfield UK & Europe Finance PLC
3.75%, 09/17/2024(a) | | | | | | | 607 | | | | 571,461 | |
Weyerhaeuser Co.
7.375%, 03/15/2032 | | | | | | | 140 | | | | 151,445 | |
WPC Eurobond BV
0.95%, 06/01/2030 | | | EUR | | | | 582 | | | | 406,095 | |
1.35%, 04/15/2028 | | | | | | | 10,003 | | | | 8,062,097 | |
| | | | | | | | | | | | |
| | | | | | | | | | | 70,465,605 | |
| | | | | | | | | | | | |
| | | | | | | | | | | 631,436,556 | |
| | | | | | | | | | | | |
| | |
| |
| abfunds.com | | AB GLOBAL BOND FUND | 33 |
PORTFOLIO OF INVESTMENTS (continued)
| | | | | | | | | | | | |
| | | | | | Principal
Amount
(000) | | | U.S. $ Value | |
| |
Industrial – 8.9% | | | | | | | | | | | | |
Basic – 0.5% | | | | | | | | | | | | |
Air Products and Chemicals, Inc.
0.50%, 05/05/2028 | | | EUR | | | | 175 | | | $ | 144,857 | |
Amcor Flexibles North America, Inc.
2.69%, 05/25/2031 | | | U.S.$ | | | | 651 | | | | 510,958 | |
Amcor UK Finance PLC
1.125%, 06/23/2027 | | | EUR | | | | 103 | | | | 86,119 | |
Anglo American Capital PLC
1.625%, 09/18/2025(a) | | | | | | | 506 | | | | 465,655 | |
1.625%, 03/11/2026(a) | | | | | | | 210 | | | | 190,992 | |
5.625%, 04/01/2030(a) | | | U.S.$ | | | | 260 | | | | 246,968 | |
BHP Billiton Finance Ltd.
6.50%, 10/22/2077(a) | | | GBP | | | | 210 | | | | 234,370 | |
Series 17
1.50%, 04/29/2030(a) | | | EUR | | | | 125 | | | | 101,019 | |
Braskem Netherlands Finance BV
4.50%, 01/10/2028(a) | | | U.S.$ | | | | 450 | | | | 379,665 | |
Celanese US Holdings LLC
5.90%, 07/05/2024 | | | | | | | 130 | | | | 128,260 | |
6.05%, 03/15/2025 | | | | | | | 90 | | | | 87,937 | |
6.165%, 07/15/2027 | | | | | | | 311 | | | | 293,799 | |
6.33%, 07/15/2029 | | | | | | | 311 | | | | 290,368 | |
Celulosa Arauco y Constitucion SA
3.875%, 11/02/2027 | | | | | | | 200 | | | | 173,600 | |
4.20%, 01/29/2030(a) | | | | | | | 470 | | | | 383,872 | |
5.50%, 04/30/2049(a) | | | | | | | 260 | | | | 190,011 | |
Dow Chemical Co. (The)
9.40%, 05/15/2039 | | | | | | | 279 | | | | 354,676 | |
DuPont de Nemours, Inc.
5.419%, 11/15/2048 | | | | | | | 216 | | | | 194,100 | |
Equate Petrochemical BV
2.625%, 04/28/2028(a) | | | | | | | 1,000 | | | | 843,625 | |
Freeport Indonesia PT
4.763%, 04/14/2027(a) | | | | | | | 320 | | | | 289,600 | |
5.315%, 04/14/2032(a) | | | | | | | 404 | | | | 334,310 | |
Fresnillo PLC
4.25%, 10/02/2050(a) | | | | | | | 240 | | | | 164,595 | |
GC Treasury Center Co., Ltd.
2.98%, 03/18/2031(a) | | | | | | | 310 | | | | 240,889 | |
4.40%, 03/30/2032(a) | | | | | | | 200 | | | | 171,519 | |
Georgia-Pacific LLC
0.625%, 05/15/2024(a) | | | | | | | 376 | | | | 349,180 | |
Glencore Capital Finance DAC
1.125%, 03/10/2028(a) | | | EUR | | | | 260 | | | | 207,092 | |
Glencore Finance Europe Ltd.
3.125%, 03/26/2026(a) | | | GBP | | | | 105 | | | | 101,439 | |
3.75%, 04/01/2026(a) | | | EUR | | | | 160 | | | | 153,077 | |
| | |
| |
34 | AB GLOBAL BOND FUND | | abfunds.com |
PORTFOLIO OF INVESTMENTS (continued)
| | | | | | | | | | | | |
| | | | | | Principal
Amount
(000) | | | U.S. $ Value | |
| |
Gold Fields Orogen Holdings BVI Ltd.
6.125%, 05/15/2029(a) | | | U.S.$ | | | | 200 | | | $ | 187,855 | |
Industrias Penoles SAB de CV
4.75%, 08/06/2050(a) | | | | | | | 230 | | | | 163,559 | |
Inversiones CMPC SA
3.00%, 04/06/2031(a) | | | | | | | 530 | | | | 392,134 | |
LANXESS AG
0.625%, 12/01/2029(a) | | | EUR | | | | 600 | | | | 436,092 | |
LG Chem Ltd.
2.375%, 07/07/2031(a) | | | U.S.$ | | | | 510 | | | | 397,142 | |
LYB International Finance II BV
0.875%, 09/17/2026 | | | EUR | | | | 214 | | | | 182,620 | |
LyondellBasell Industries NV
4.625%, 02/26/2055 | | | U.S.$ | | | | 150 | | | | 113,629 | |
Mondi Finance Europe GmbH
2.375%, 04/01/2028(a) | | | EUR | | | | 490 | | | | 427,928 | |
Newmont Corp.
2.60%, 07/15/2032 | | | U.S.$ | | | | 140 | | | | 106,351 | |
Nexa Resources SA
6.50%, 01/18/2028(a) | | | | | | | 7,304 | | | | 6,678,814 | |
Nucor Corp.
4.30%, 05/23/2027 | | | | | | | 128 | | | | 122,815 | |
PPG Industries, Inc.
1.875%, 06/01/2025 | | | EUR | | | | 255 | | | | 238,717 | |
SABIC Capital I BV
2.15%, 09/14/2030(a) | | | U.S.$ | | | | 1,020 | | | | 816,191 | |
SKF AB
0.25%, 02/15/2031(a) | | | EUR | | | | 294 | | | | 210,914 | |
Solvay SA
0.50%, 09/06/2029(a) | | | | | | | 600 | | | | 437,543 | |
Southern Copper Corp.
3.875%, 04/23/2025 | | | U.S.$ | | | | 180 | | | | 171,338 | |
5.875%, 04/23/2045 | | | | | | | 170 | | | | 159,170 | |
Suzano Austria GmbH
3.75%, 01/15/2031 | | | | | | | 6,276 | | | | 4,895,280 | |
5.00%, 01/15/2030 | | | | | | | 200 | | | | 172,935 | |
Series DM3N
3.125%, 01/15/2032 | | | | | | | 500 | | | | 357,813 | |
UPL Corp. Ltd.
4.625%, 06/16/2030(a) | | | | | | | 380 | | | | 297,896 | |
Vale Overseas Ltd.
3.75%, 07/08/2030 | | | | | | | 200 | | | | 161,125 | |
Westlake Corp.
3.375%, 08/15/2061 | | | | | | | 160 | | | | 92,313 | |
| | | | | | | | | | | | |
| | | | | | | | | | | 24,532,726 | |
| | | | | | | | | | | | |
| | |
| |
| abfunds.com | | AB GLOBAL BOND FUND | 35 |
PORTFOLIO OF INVESTMENTS (continued)
| | | | | | | | | | | | |
| | | | | | Principal
Amount
(000) | | | U.S. $ Value | |
| |
Capital Goods – 0.1% | | | | | | | | | | | | |
3M Co.
2.375%, 08/26/2029 | | | U.S.$ | | | | 637 | | | $ | 523,150 | |
3.375%, 03/01/2029 | | | | | | | 591 | | | | 527,069 | |
AGCO International Holdings BV
0.80%, 10/06/2028(a) | | | EUR | | | | 559 | | | | 420,885 | |
Carlisle Cos., Inc.
0.55%, 09/01/2023 | | | U.S.$ | | | | 323 | | | | 310,239 | |
CNH Industrial Capital LLC
1.45%, 07/15/2026 | | | | | | | 205 | | | | 176,911 | |
CNH Industrial Finance Europe SA
1.75%, 09/12/2025(a) | | | EUR | | | | 210 | | | | 195,502 | |
Eaton Corp.
4.70%, 08/23/2052 | | | U.S.$ | | | | 180 | | | | 158,088 | |
HeidelbergCement Finance Luxembourg SA
1.75%, 04/24/2028(a) | | | EUR | | | | 370 | | | | 320,773 | |
IDEX Corp.
2.625%, 06/15/2031 | | | U.S.$ | | | | 667 | | | | 536,178 | |
John Deere Capital Corp.
4.05%, 09/08/2025 | | | | | | | 120 | | | | 117,924 | |
4.15%, 09/15/2027 | | | | | | | 106 | | | | 102,881 | |
4.35%, 09/15/2032 | | | | | | | 465 | | | | 442,098 | |
Metso Outotec Oyj
0.875%, 05/26/2028(a) | | | EUR | | | | 179 | | | | 136,822 | |
Safran SA
0.125%, 03/16/2026(a) | | | | | | | 500 | | | | 434,667 | |
Schneider Electric SE
0.25%, 09/09/2024(a) | | | | | | | 100 | | | | 93,749 | |
1.50%, 09/08/2023(a) | | | | | | | 200 | | | | 194,208 | |
St Marys Cement, Inc. Canada
5.75%, 01/28/2027(a) | | | U.S.$ | | | | 440 | | | | 427,103 | |
UltraTech Cement Ltd.
2.80%, 02/16/2031(a) | | | | | | | 410 | | | | 315,521 | |
Waste Connections, Inc.
4.20%, 01/15/2033 | | | | | | | 124 | | | | 112,363 | |
| | | | | | | | | | | | |
| | | | | | | | | | | 5,546,131 | |
| | | | | | | | | | | | |
Communications - Media – 0.7% | | | | | | | | | | | | |
Charter Communications Operating LLC/Charter Communications Operating Capital
4.80%, 03/01/2050 | | | | | | | 330 | | | | 236,021 | |
5.375%, 05/01/2047 | | | | | | | 2,760 | | | | 2,125,311 | |
5.75%, 04/01/2048 | | | | | | | 245 | | | | 198,109 | |
6.484%, 10/23/2045 | | | | | | | 115 | | | | 101,599 | |
Comcast Corp.
1.875%, 02/20/2036 | | | GBP | | | | 122 | | | | 88,305 | |
| | |
| |
36 | AB GLOBAL BOND FUND | | abfunds.com |
PORTFOLIO OF INVESTMENTS (continued)
| | | | | | | | | | | | |
| | | | | | Principal
Amount
(000) | | | U.S. $ Value | |
| |
3.90%, 03/01/2038 | | | U.S.$ | | | | 230 | | | $ | 188,070 | |
4.65%, 07/15/2042 | | | | | | | 210 | | | | 179,944 | |
Directv Financing LLC/Directv Financing Co-Obligor, Inc.
5.875%, 08/15/2027(a) | | | | | | | 145 | | | | 125,290 | |
Discovery Communications LLC
1.90%, 03/19/2027 | | | EUR | | | | 144 | | | | 120,547 | |
5.20%, 09/20/2047 | | | U.S.$ | | | | 9,179 | | | | 6,788,933 | |
5.30%, 05/15/2049 | | | | | | | 3,856 | | | | 2,886,312 | |
Fox Corp.
3.50%, 04/08/2030 | | | | | | | 190 | | | | 162,864 | |
5.476%, 01/25/2039 | | | | | | | 240 | | | | 208,309 | |
Informa PLC
2.125%, 10/06/2025(a) | | | EUR | | | | 496 | | | | 450,190 | |
Interpublic Group of Cos., Inc. (The)
3.375%, 03/01/2041 | | | U.S.$ | | | | 105 | | | | 69,524 | |
4.75%, 03/30/2030 | | | | | | | 175 | | | | 160,507 | |
ITV PLC
1.375%, 09/26/2026(a) | | | EUR | | | | 517 | | | | 439,415 | |
JCDecaux SA
1.625%, 02/07/2030(a) | | | | | | | 100 | | | | 74,425 | |
2.625%, 04/24/2028(a) | | | | | | | 500 | | | | 419,120 | |
Meta Platforms, Inc.
4.65%, 08/15/2062(a) | | | U.S.$ | | | | 92 | | | | 74,109 | |
Netflix, Inc.
3.625%, 05/15/2027 | | | EUR | | | | 6,300 | | | | 5,816,168 | |
4.625%, 05/15/2029 | | | | | | | 5,971 | | | | 5,467,610 | |
Paramount Global
4.20%, 05/19/2032 | | | U.S.$ | | | | 2,223 | | | | 1,801,539 | |
Prosus NV
1.539%, 08/03/2028(a) | | | EUR | | | | 230 | | | | 170,465 | |
3.257%, 01/19/2027(a) | | | U.S.$ | | | | 250 | | | | 209,375 | |
3.68%, 01/21/2030(a) | | | | | | | 970 | | | | 734,387 | |
Tencent Holdings Ltd.
2.39%, 06/03/2030(a) | | | | | | | 820 | | | | 644,366 | |
Time Warner Cable LLC
5.25%, 07/15/2042 | | | GBP | | | | 100 | | | | 83,253 | |
Walt Disney Co. (The)
3.80%, 05/13/2060 | | | U.S.$ | | | | 215 | | | | 159,369 | |
Warnermedia Holdings, Inc.
3.755%, 03/15/2027(a) | | | | | | | 4,535 | | | | 4,070,319 | |
5.05%, 03/15/2042(a) | | | | | | | 190 | | | | 142,214 | |
Weibo Corp.
3.375%, 07/08/2030 | | | | | | | 6,799 | | | | 5,011,288 | |
3.50%, 07/05/2024 | | | | | | | 290 | | | | 276,986 | |
Wolters Kluwer NV
0.75%, 07/03/2030(a) | | | EUR | | | | 267 | | | | 206,719 | |
| | | | | | | | | | | | |
| | | | | | | | | | | 39,890,962 | |
| | | | | | | | | | | | |
| | |
| |
| abfunds.com | | AB GLOBAL BOND FUND | 37 |
PORTFOLIO OF INVESTMENTS (continued)
| | | | | | | | | | | | |
| | | | | | Principal
Amount
(000) | | | U.S. $ Value | |
| |
Communications - Telecommunications – 0.4% | | | | | | | | | | | | |
America Movil SAB de CV
2.875%, 05/07/2030 | | | U.S.$ | | | | 340 | | | $ | 285,541 | |
AT&T, Inc.
3.55%, 09/15/2055 | | | | | | | 320 | | | | 210,137 | |
Series B
2.875%, 03/02/2025(c) | | | EUR | | | | 6,100 | | | | 5,270,679 | |
British Telecommunications PLC
9.625%, 12/15/2030 | | | U.S.$ | | | | 6,607 | | | | 7,658,860 | |
CK Hutchison Group Telecom Finance SA
1.125%, 10/17/2028(a) | | | EUR | | | | 260 | | | | 207,695 | |
Corning, Inc.
5.45%, 11/15/2079 | | | U.S.$ | | | | 80 | | | | 65,335 | |
Deutsche Telekom International Finance BV
2.00%, 12/01/2029(a) | | | EUR | | | | 246 | | | | 218,826 | |
4.375%, 06/21/2028(a) | | | U.S.$ | | | | 270 | | | | 256,318 | |
8.75%, 06/15/2030 | | | | | | | 325 | | | | 373,311 | |
HKT Capital No. 4 Ltd.
3.00%, 07/14/2026(a) | | | | | | | 760 | | | | 699,343 | |
Koninklijke KPN NV
0.625%, 04/09/2025(a) | | | EUR | | | | 500 | | | | 458,287 | |
NTT Finance Corp.
0.082%, 12/13/2025(a) | | | | | | | 521 | | | | 464,151 | |
0.399%, 12/13/2028(a) | | | | | | | 109 | | | | 88,523 | |
4.239%, 07/25/2025(a) | | | U.S.$ | | | | 200 | | | | 196,221 | |
O2 Telefonica Deutschland Finanzierungs GmbH
1.75%, 07/05/2025(a) | | | EUR | | | | 500 | | | | 466,204 | |
Ooredoo International Finance Ltd.
2.625%, 04/08/2031(a) | | | U.S.$ | | | | 740 | | | | 616,050 | |
Orange SA
2.375%, 01/15/2025(a)(c) | | | EUR | | | | 200 | | | | 180,819 | |
5.25%, 02/07/2024(a)(c) | | | | | | | 160 | | | | 156,458 | |
PLDT, Inc.
2.50%, 01/23/2031(a) | | | U.S.$ | | | | 870 | | | | 708,669 | |
Rogers Communications, Inc.
4.55%, 03/15/2052(a) | | | | | | | 638 | | | | 510,874 | |
SingTel Group Treasury Pte Ltd.
2.375%, 08/28/2029(a) | | | | | | | 290 | | | | 247,823 | |
T-Mobile USA, Inc.
2.625%, 04/15/2026 | | | | | | | 200 | | | | 180,835 | |
Telefonica Emisiones SA
7.045%, 06/20/2036 | | | | | | | 384 | | | | 378,881 | |
Verizon Communications, Inc.
3.875%, 02/08/2029 | | | | | | | 320 | | | | 292,141 | |
| | |
| |
38 | AB GLOBAL BOND FUND | | abfunds.com |
PORTFOLIO OF INVESTMENTS (continued)
| | | | | | | | | | | | |
| | | | | | Principal
Amount
(000) | | | U.S. $ Value | |
| |
Vodafone Group PLC
3.00%, 08/12/2056(a) | | | GBP | | | | 100 | | | $ | 63,837 | |
4.20%, 12/13/2027(a) | | | AUD | | | | 320 | | | | 192,695 | |
| | | | | | | | | | | | |
| | | | | | | | | | | 20,448,513 | |
| | | | | | | | | | | | |
Consumer Cyclical - Automotive – 0.6% | | | | | | | | | | | | |
American Honda Finance Corp.
0.30%, 07/07/2028 | | | EUR | | | | 546 | | | | 438,952 | |
Aptiv PLC
1.50%, 03/10/2025 | | | | | | | 210 | | | | 192,957 | |
Aptiv PLC/Aptiv Corp.
4.15%, 05/01/2052 | | | U.S.$ | | | | 79 | | | | 53,590 | |
General Motors Co.
5.00%, 10/01/2028 | | | | | | | 265 | | | | 243,836 | |
5.00%, 04/01/2035 | | | | | | | 316 | | | | 257,757 | |
5.40%, 10/15/2029 | | | | | | | 122 | | | | 112,685 | |
5.60%, 10/15/2032 | | | | | | | 122 | | | | 108,823 | |
General Motors Financial Co., Inc.
3.10%, 01/12/2032 | | | | | | | 500 | | | | 375,993 | |
Harley-Davidson Financial Services, Inc.
3.05%, 02/14/2027(a) | | | | | | | 9,781 | | | | 8,391,516 | |
3.35%, 06/08/2025(a) | | | | | | | 4,587 | | | | 4,306,374 | |
Hella GmbH & Co. KGaA
1.00%, 05/17/2024 | | | EUR | | | | 505 | | | | 474,449 | |
Hyundai Capital America
1.30%, 01/08/2026(a) | | | U.S.$ | | | | 365 | | | | 314,791 | |
2.375%, 10/15/2027(a) | | | | | | | 590 | | | | 494,049 | |
Hyundai Motor Manufacturing Indonesia PT
1.75%, 05/06/2026(a) | | | | | | | 250 | | | | 215,516 | |
Kia Corp.
2.75%, 02/14/2027(a) | | | | | | | 290 | | | | 256,099 | |
3.50%, 10/25/2027(a) | | | | | | | 230 | | | | 207,834 | |
Lear Corp.
3.50%, 05/30/2030 | | | | | | | 802 | | | | 655,371 | |
Nissan Motor Acceptance Co. LLC
2.75%, 03/09/2028(a) | | | | | | | 255 | | | | 200,849 | |
RCI Banque SA
1.75%, 04/10/2026(a) | | | EUR | | | | 521 | | | | 461,971 | |
Volkswagen Financial Services NV
0.875%, 02/20/2025(a) | | | GBP | | | | 100 | | | | 96,644 | |
Volkswagen International Finance NV
0.875%, 09/22/2028(a) | | | EUR | | | | 8,600 | | | | 6,927,078 | |
3.50%, 06/17/2025(a)(c) | | | | | | | 5,500 | | | | 4,905,150 | |
3.875%, 06/14/2027(a)(c) | | | | | | | 300 | | | | 252,535 | |
3.875%, 06/17/2029(a)(c) | | | | | | | 100 | | | | 79,423 | |
4.125%, 11/16/2038(a) | | | | | | | 100 | | | | 89,024 | |
| | |
| |
| abfunds.com | | AB GLOBAL BOND FUND | 39 |
PORTFOLIO OF INVESTMENTS (continued)
| | | | | | | | | | | | |
| | | | | | Principal
Amount
(000) | | | U.S. $ Value | |
| |
Series 10Y
1.875%, 03/30/2027(a) | | | EUR | | | | 100 | | | $ | 88,595 | |
| | | | | | | | | | | | |
| | | | | | | | | | | 30,201,861 | |
| | | | | | | | | | | | |
Consumer Cyclical - Entertainment – 0.0% | | | | | | | | | | | | |
CPUK Finance Ltd.
3.588%, 08/28/2025(a) | | | GBP | | | | 275 | | | | 277,913 | |
| | | | | | | | | | | | |
| | | |
Consumer Cyclical - Other – 0.4% | | | | | | | | | | | | |
Gohl Capital Ltd.
4.25%, 01/24/2027(a) | | | U.S.$ | | | | 220 | | | | 182,710 | |
HOCHTIEF AG
0.625%, 04/26/2029(a) | | | EUR | | | | 180 | | | | 125,210 | |
Imerys SA
1.50%, 01/15/2027(a) | | | | | | | 500 | | | | 426,175 | |
InterContinental Hotels Group PLC
1.625%, 10/08/2024(a) | | | | | | | 403 | | | | 373,888 | |
Las Vegas Sands Corp.
2.90%, 06/25/2025 | | | U.S.$ | | | | 200 | | | | 179,656 | |
3.50%, 08/18/2026 | | | | | | | 6,755 | | | | 5,930,396 | |
3.90%, 08/08/2029 | | | | | | | 5,194 | | | | 4,304,200 | |
Lennar Corp.
4.75%, 05/30/2025 | | | | | | | 162 | | | | 158,661 | |
Marriott International, Inc./MD
Series AA
4.65%, 12/01/2028 | | | | | | | 218 | | | | 203,031 | |
MDC Holdings, Inc.
2.50%, 01/15/2031 | | | | | | | 315 | | | | 211,726 | |
6.00%, 01/15/2043 | | | | | | | 11,397 | | | | 8,683,482 | |
Nissan Motor Co., Ltd.
2.652%, 03/17/2026(a) | | | EUR | | | | 125 | | | | 112,721 | |
NVR, Inc.
3.00%, 05/15/2030 | | | U.S.$ | | | | 661 | | | | 539,110 | |
Owens Corning
7.00%, 12/01/2036 | | | | | | | 50 | | | | 51,584 | |
PulteGroup, Inc.
6.375%, 05/15/2033 | | | | | | | 350 | | | | 328,927 | |
Sands China Ltd.
3.75%, 08/08/2031 | | | | | | | 1,060 | | | | 764,243 | |
Toll Brothers Finance Corp.
3.80%, 11/01/2029 | | | | | | | 190 | | | | 154,289 | |
| | | | | | | | | | | | |
| | | | | | | | | | | 22,730,009 | |
| | | | | | | | | | | | |
Consumer Cyclical - Restaurants – 0.0% | | | | | | | | | | | | |
Haidilao International Holding Ltd.
2.15%, 01/14/2026(a) | | | | | | | 670 | | | | 539,350 | |
| | |
| |
40 | AB GLOBAL BOND FUND | | abfunds.com |
PORTFOLIO OF INVESTMENTS (continued)
| | | | | | | | | | | | |
| | | | | | Principal
Amount
(000) | | | U.S. $ Value | |
| |
McDonald’s Corp.
4.45%, 09/01/2048 | | | U.S.$ | | | | 143 | | | $ | 119,628 | |
5.15%, 09/09/2052 | | | | | | | 598 | | | | 556,126 | |
| | | | | | | | | | | | |
| | | | | | | | | | | 1,215,104 | |
| | | | | | | | | | | | |
Consumer Cyclical - Retailers – 0.4% | | | | | | | | | |
Alimentation Couche-Tard, Inc.
1.875%, 05/06/2026(a) | | | EUR | | | | 506 | | | | 456,202 | |
3.55%, 07/26/2027(a) | | | U.S.$ | | | | 643 | | | | 574,350 | |
AutoNation, Inc.
3.80%, 11/15/2027 | | | | | | | 5,371 | | | | 4,763,186 | |
3.85%, 03/01/2032 | | | | | | | 572 | | | | 454,688 | |
4.50%, 10/01/2025 | | | | | | | 1,361 | | | | 1,316,596 | |
4.75%, 06/01/2030 | | | | | | | 722 | | | | 635,236 | |
CK Hutchison Europe Finance 21 Ltd.
0.75%, 11/02/2029(a) | | | EUR | | | | 245 | | | | 186,185 | |
CK Hutchison International 21 Ltd.
2.50%, 04/15/2031(a) | | | U.S.$ | | | | 790 | | | | 644,336 | |
Costco Wholesale Corp.
1.60%, 04/20/2030 | | | | | | | 312 | | | | 251,215 | |
Falabella SA
3.75%, 10/30/2027(a) | | | | | | | 261 | | | | 234,949 | |
Home Depot, Inc. (The)
3.50%, 09/15/2056 | | | | | | | 194 | | | | 137,729 | |
4.00%, 09/15/2025 | | | | | | | 300 | | | | 295,228 | |
4.50%, 09/15/2032 | | | | | | | 119 | | | | 113,857 | |
4.50%, 12/06/2048 | | | | | | | 370 | | | | 323,710 | |
4.95%, 09/15/2052 | | | | | | | 461 | | | | 432,183 | |
5.875%, 12/16/2036 | | | | | | | 489 | | | | 508,671 | |
Lowe’s Cos., Inc.
4.05%, 05/03/2047 | | | | | | | 360 | | | | 270,508 | |
5.00%, 04/15/2033 | | | | | | | 120 | | | | 113,644 | |
5.625%, 04/15/2053 | | | | | | | 120 | | | | 110,924 | |
5.80%, 09/15/2062 | | | | | | | 569 | | | | 523,183 | |
PVH Corp.
3.125%, 12/15/2027(a) | | | EUR | | | | 8,275 | | | | 7,118,669 | |
3.625%, 07/15/2024(a) | | | | | | | 481 | | | | 467,960 | |
4.625%, 07/10/2025 | | | U.S.$ | | | | 185 | | | | 177,376 | |
VF Corp.
0.25%, 02/25/2028 | | | EUR | | | | 100 | | | | 79,950 | |
Walmart, Inc.
3.90%, 09/09/2025 | | | U.S.$ | | | | 120 | | | | 117,902 | |
3.95%, 09/09/2027 | | | | | | | 120 | | | | 116,517 | |
4.15%, 09/09/2032 | | | | | | | 120 | | | | 114,999 | |
4.50%, 09/09/2052 | | | | | | | 120 | | | | 112,604 | |
| | | | | | | | | | | | |
| | | | | | | | | | | 20,652,557 | |
| | | | | | | | | | | | |
| | |
| |
| abfunds.com | | AB GLOBAL BOND FUND | 41 |
PORTFOLIO OF INVESTMENTS (continued)
| | | | | | | | | | | | |
| | | | | | Principal
Amount
(000) | | | U.S. $ Value | |
| |
Consumer Non-Cyclical – 1.3% | | | | | | | | | | | | |
AbbVie, Inc.
2.60%, 11/21/2024 | | | U.S.$ | | | | 552 | | | $ | 525,820 | |
2.625%, 11/15/2028 | | | EUR | | | | 320 | | | | 296,092 | |
4.45%, 05/14/2046 | | | U.S.$ | | | | 75 | | | | 61,257 | |
Altria Group, Inc.
3.125%, 06/15/2031 | | | EUR | | | | 14,933 | | | | 11,986,364 | |
3.875%, 09/16/2046 | | | U.S.$ | | | | 160 | | | | 101,441 | |
4.00%, 02/04/2061 | | | | | | | 621 | | | | 381,032 | |
4.80%, 02/14/2029 | | | | | | | 135 | | | | 124,604 | |
5.80%, 02/14/2039 | | | | | | | 130 | | | | 112,613 | |
American Medical Systems Europe BV
1.375%, 03/08/2028 | | | EUR | | | | 180 | | | | 156,146 | |
AmerisourceBergen Corp.
2.70%, 03/15/2031 | | | U.S.$ | | | | 381 | | | | 306,422 | |
2.80%, 05/15/2030 | | | | | | | 245 | | | | 203,084 | |
4.30%, 12/15/2047 | | | | | | | 146 | | | | 116,762 | |
Amgen, Inc.
3.35%, 02/22/2032 | | | | | | | 58 | | | | 49,535 | |
4.20%, 02/22/2052 | | | | | | | 220 | | | | 172,945 | |
4.40%, 05/01/2045 | | | | | | | 225 | | | | 183,489 | |
4.40%, 02/22/2062 | | | | | | | 195 | | | | 151,670 | |
4.663%, 06/15/2051 | | | | | | | 213 | | | | 180,026 | |
4.875%, 03/01/2053 | | | | | | | 720 | | | | 634,068 | |
Anheuser-Busch InBev SA/NV
2.75%, 03/17/2036(a) | | | EUR | | | | 100 | | | | 81,820 | |
Archer-Daniels-Midland Co.
2.50%, 08/11/2026 | | | U.S.$ | | | | 576 | | | | 529,723 | |
3.25%, 03/27/2030 | | | | | | | 627 | | | | 559,843 | |
4.535%, 03/26/2042 | | | | | | | 91 | | | | 81,871 | |
5.935%, 10/01/2032 | | | | | | | 190 | | | | 200,810 | |
Asahi Group Holdings Ltd.
0.336%, 04/19/2027(a) | | | EUR | | | | 535 | | | | 453,844 | |
0.541%, 10/23/2028(a) | | | | | | | 109 | | | | 87,779 | |
Astrazeneca Finance LLC
1.20%, 05/28/2026 | | | U.S.$ | | | | 616 | | | | 541,447 | |
AstraZeneca PLC
0.70%, 04/08/2026 | | | | | | | 667 | | | | 578,810 | |
3.375%, 11/16/2025 | | | | | | | 392 | | | | 374,971 | |
BAT Capital Corp.
4.54%, 08/15/2047 | | | | | | | 70 | | | | 46,627 | |
BAT International Finance PLC
2.25%, 09/09/2052(a) | | | GBP | | | | 110 | | | | 49,321 | |
4.448%, 03/16/2028 | | | U.S.$ | | | | 235 | | | | 210,138 | |
Baxter International, Inc.
1.30%, 05/15/2029 | | | EUR | | | | 521 | | | | 426,043 | |
| | |
| |
42 | AB GLOBAL BOND FUND | | abfunds.com |
PORTFOLIO OF INVESTMENTS (continued)
| | | | | | | | | | |
| | | | | Principal
Amount
(000) | | | U.S. $ Value | |
| |
Bayer AG
0.375%, 01/12/2029(a) | | EUR | | | 600 | | | $ | 459,608 | �� |
1.375%, 07/06/2032(a) | | | | | 200 | | | | 146,293 | |
Becton Dickinson Euro Finance SARL
0.334%, 08/13/2028 | | | | | 370 | | | | 296,040 | |
Biogen, Inc.
3.25%, 02/15/2051 | | U.S.$ | | | 85 | | | | 54,814 | |
Boston Scientific Corp.
0.625%, 12/01/2027 | | EUR | | | 310 | | | | 261,102 | |
Bristol-Myers Squibb Co.
3.40%, 07/26/2029 | | U.S.$ | | | 536 | | | | 486,963 | |
3.90%, 03/15/2062 | | | | | 235 | | | | 177,969 | |
British American Tobacco PLC
Series 5.25
3.00%, 09/27/2026(a)(c) | | EUR | | | 10,456 | | | | 7,556,736 | |
Bunge Ltd. Finance Corp.
2.75%, 05/14/2031 | | U.S.$ | | | 717 | | | | 563,264 | |
Cardinal Health, Inc.
4.90%, 09/15/2045 | | | | | 45 | | | | 37,725 | |
Cargill, Inc.
4.375%, 04/22/2052(a) | | | | | 311 | | | | 267,398 | |
CCEP Finance Ireland DAC
0.50%, 09/06/2029(a) | | EUR | | | 355 | | | | 278,769 | |
Cencosud SA
4.375%, 07/17/2027(a) | | U.S.$ | | | 230 | | | | 209,199 | |
Cia Cervecerias Unidas SA
3.35%, 01/19/2032(a) | | | | | 200 | | | | 166,600 | |
Cigna Corp.
3.40%, 03/15/2050 | | | | | 235 | | | | 159,442 | |
4.80%, 08/15/2038 | | | | | 574 | | | | 509,357 | |
4.80%, 07/15/2046 | | | | | 193 | | | | 165,632 | |
4.90%, 12/15/2048 | | | | | 133 | | | | 115,197 | |
Coca-Cola Co. (The)
0.125%, 03/09/2029 | | EUR | | | 180 | | | | 142,917 | |
CVS Health Corp.
4.25%, 04/01/2050 | | U.S.$ | | | 205 | | | | 160,462 | |
4.78%, 03/25/2038 | | | | | 295 | | | | 258,546 | |
DH Europe Finance II Sarl
2.60%, 11/15/2029 | | | | | 345 | | | | 295,319 | |
Diageo Finance PLC
0.125%, 10/12/2023(a) | | EUR | | | 136 | | | | 129,581 | |
1.875%, 03/27/2027(a) | | | | | 235 | | | | 216,749 | |
Essity AB
0.25%, 02/08/2031(a) | | | | | 588 | | | | 418,966 | |
Fresenius Medical Care US Finance III, Inc.
3.75%, 06/15/2029(a) | | U.S.$ | | | 190 | | | | 158,231 | |
| | |
| |
| abfunds.com | | AB GLOBAL BOND FUND | 43 |
PORTFOLIO OF INVESTMENTS (continued)
| | | | | | | | | | |
| | | | | Principal
Amount
(000) | | | U.S. $ Value | |
| |
General Mills, Inc.
0.45%, 01/15/2026 | | EUR | | | 519 | | | $ | 460,808 | |
4.00%, 04/17/2025 | | U.S.$ | | | 43 | | | | 41,987 | |
Gilead Sciences, Inc.
2.80%, 10/01/2050 | | | | | 145 | | | | 89,404 | |
4.80%, 04/01/2044 | | | | | 280 | | | | 244,304 | |
HCA, Inc.
5.50%, 06/15/2047 | | | | | 366 | | | | 308,463 | |
Hormel Foods Corp.
1.80%, 06/11/2030 | | | | | 266 | | | | 212,335 | |
Imperial Brands Finance Netherlands BV
1.75%, 03/18/2033(a) | | EUR | | | 14,609 | | | | 9,520,520 | |
Indofood CBP Sukses Makmur Tbk PT
3.398%, 06/09/2031(a) | | U.S.$ | | | 490 | | | | 361,429 | |
Ingredion, Inc.
2.90%, 06/01/2030 | | | | | 361 | | | | 297,915 | |
Johnson & Johnson
3.40%, 01/15/2038 | | | | | 622 | | | | 516,765 | |
5.85%, 07/15/2038 | | | | | 187 | | | | 198,939 | |
5.95%, 08/15/2037 | | | | | 290 | | | | 312,783 | |
Kellogg Co.
1.25%, 03/10/2025 | | EUR | | | 500 | | | | 469,283 | |
Keurig Dr Pepper, Inc.
0.75%, 03/15/2024 | | U.S.$ | | | 555 | | | | 523,191 | |
4.05%, 04/15/2032 | | | | | 127 | | | | 111,761 | |
4.50%, 04/15/2052 | | | | | 634 | | | | 501,479 | |
Laboratory Corp. of America Holdings
2.70%, 06/01/2031 | | | | | 673 | | | | 543,907 | |
4.70%, 02/01/2045 | | | | | 254 | | | | 210,413 | |
McKesson Corp.
1.50%, 11/17/2025 | | EUR | | | 226 | | | | 209,254 | |
3.125%, 02/17/2029 | | GBP | | | 205 | | | | 186,885 | |
Medtronic Global Holdings SCA
3.00%, 10/15/2028 | | EUR | | | 345 | | | | 328,495 | |
Merck & Co., Inc.
2.90%, 12/10/2061 | | U.S.$ | | | 432 | | | | 269,797 | |
3.90%, 03/07/2039 | | | | | 543 | | | | 462,010 | |
4.00%, 03/07/2049 | | | | | 170 | | | | 140,277 | |
Molson Coors Beverage Co.
1.25%, 07/15/2024 | | EUR | | | 500 | | | | 467,444 | |
5.00%, 05/01/2042 | | U.S.$ | | | 217 | | | | 182,989 | |
Molson Coors Brewing Co.
4.20%, 07/15/2046 | | | | | 436 | | | | 324,484 | |
Mondelez International Holdings Netherlands BV
4.25%, 09/15/2025(a) | | | | | 598 | | | | 586,992 | |
| | |
| |
44 | AB GLOBAL BOND FUND | | abfunds.com |
PORTFOLIO OF INVESTMENTS (continued)
| | | | | | | | | | |
| | | | | Principal
Amount
(000) | | | U.S. $ Value | |
| |
Mondelez International, Inc.
2.625%, 03/17/2027 | | U.S.$ | | | 131 | | | $ | 117,676 | |
Nestle Holdings, Inc.
0.375%, 01/15/2024(a) | | | | | 157 | | | | 148,629 | |
1.25%, 09/15/2030(a) | | | | | 643 | | | | 494,032 | |
4.00%, 09/12/2025(a) | | | | | 150 | | | | 147,756 | |
4.125%, 10/01/2027(a) | | | | | 150 | | | | 145,487 | |
4.25%, 10/01/2029(a) | | | | | 150 | | | | 144,883 | |
4.70%, 01/15/2053(a) | | | | | 150 | | | | 140,017 | |
Newell Brands, Inc.
6.375%, 09/15/2027 | | | | | 10,760 | | | | 10,670,746 | |
Panasonic Holdings Corp.
2.679%, 07/19/2024(a) | | | | | 252 | | | | 240,999 | |
PepsiCo, Inc.
2.25%, 03/19/2025 | | | | | 295 | | | | 279,394 | |
2.625%, 07/29/2029 | | | | | 599 | | | | 521,349 | |
3.20%, 07/22/2029 | | GBP | | | 100 | | | | 96,021 | |
3.90%, 07/18/2032 | | U.S.$ | | | 265 | | | | 245,165 | |
Pfizer, Inc.
7.20%, 03/15/2039 | | | | | 488 | | | | 580,905 | |
Philip Morris International, Inc.
1.75%, 11/01/2030 | | | | | 89 | | | | 64,797 | |
2.10%, 05/01/2030 | | | | | 709 | | | | 538,588 | |
4.25%, 11/10/2044 | | | | | 160 | | | | 111,980 | |
4.375%, 11/15/2041 | | | | | 613 | | | | 451,133 | |
Pilgrim’s Pride Corp.
3.50%, 03/01/2032(a) | | | | | 105 | | | | 79,193 | |
5.875%, 09/30/2027(a) | | | | | 454 | | | | 441,399 | |
Reynolds American, Inc.
5.85%, 08/15/2045 | | | | | 352 | | | | 276,029 | |
Sigma Finance Netherlands BV
4.875%, 03/27/2028(a) | | | | | 350 | | | | 311,500 | |
Smithfield Foods, Inc.
2.625%, 09/13/2031(a) | | | | | 315 | | | | 232,787 | |
Stryker Corp.
2.625%, 11/30/2030 | | EUR | | | 270 | | | | 238,152 | |
Sysco Corp.
3.15%, 12/14/2051 | | U.S.$ | | | 210 | | | | 132,457 | |
6.60%, 04/01/2050 | | | | | 117 | | | | 122,513 | |
Takeda Pharmaceutical Co., Ltd.
3.175%, 07/09/2050 | | | | | 250 | | | | 167,431 | |
Tyson Foods, Inc.
3.55%, 06/02/2027 | | | | | 599 | | | | 553,961 | |
Viterra Finance BV
4.90%, 04/21/2027(a) | | | | | 625 | | | | 580,180 | |
5.25%, 04/21/2032(a) | | | | | 200 | | | | 172,337 | |
| | |
| |
| abfunds.com | | AB GLOBAL BOND FUND | 45 |
PORTFOLIO OF INVESTMENTS (continued)
| | | | | | | | | | | | |
| | | | | | Principal
Amount
(000) | | | U.S. $ Value | |
| |
Wyeth LLC
5.95%, 04/01/2037 | | | U.S.$ | | | | 673 | | | $ | 708,464 | |
| | | | | | | | | | | | |
| | | | | | | | | | | 70,899,569 | |
| | | | | | | | | | | | |
Energy – 2.2% | | | | | | | | | | | | |
APA Infrastructure Ltd.
2.00%, 03/22/2027(a) | | | EUR | | | | 502 | | | | 443,737 | |
4.25%, 07/15/2027(a) | | | U.S.$ | | | | 393 | | | | 366,414 | |
Apache Corp.
5.10%, 09/01/2040 | | | | | | | 180 | | | | 145,613 | |
Boardwalk Pipelines LP
3.40%, 02/15/2031 | | | | | | | 150 | | | | 120,874 | |
BP Capital Markets America, Inc.
2.772%, 11/10/2050 | | | | | | | 330 | | | | 204,723 | |
BP Capital Markets PLC
3.25%, 03/22/2026(a)(c) | | | EUR | | | | 1,179 | | | | 1,027,524 | |
3.625%, 03/22/2029(a)(c) | | | | | | | 12,390 | | | | 9,817,601 | |
Canadian Natural Resources Ltd.
3.85%, 06/01/2027 | | | U.S.$ | | | | 140 | | | | 129,164 | |
6.25%, 03/15/2038 | | | | | | | 424 | | | | 408,443 | |
Columbia Pipeline Group, Inc.
4.50%, 06/01/2025 | | | | | | | 399 | | | | 391,041 | |
ConocoPhillips Co.
4.025%, 03/15/2062(a) | | | | | | | 345 | | | | 262,296 | |
6.95%, 04/15/2029 | | | | | | | 466 | | | | 511,148 | |
Contemporary Ruiding Development Ltd.
2.625%, 09/17/2030(a) | | | | | | | 800 | | | | 622,176 | |
Continental Resources, Inc./OK
2.875%, 04/01/2032(a) | | | | | | | 9,526 | | | | 6,959,412 | |
4.375%, 01/15/2028 | | | | | | | 185 | | | | 165,552 | |
4.90%, 06/01/2044 | | | | | | | 100 | | | | 71,276 | |
5.75%, 01/15/2031(a) | | | | | | | 6,979 | | | | 6,307,403 | |
COSL Singapore Capital Ltd.
1.875%, 06/24/2025(a) | | | | | | | 200 | | | | 182,850 | |
DCP Midstream Operating LP
5.375%, 07/15/2025 | | | | | | | 88 | | | | 85,561 | |
Devon Energy Corp.
5.00%, 06/15/2045 | | | | | | | 220 | | | | 183,315 | |
5.60%, 07/15/2041 | | | | | | | 10,811 | | | | 9,704,332 | |
Diamondback Energy, Inc.
4.25%, 03/15/2052 | | | | | | | 138 | | | | 101,221 | |
El Paso Natural Gas Co. LLC
3.50%, 02/15/2032(a) | | | | | | | 63 | | | | 51,816 | |
Enbridge Energy Partners LP
7.375%, 10/15/2045 | | | | | | | 8,987 | | | | 9,723,385 | |
Energy Transfer LP
4.40%, 03/15/2027 | | | | | | | 235 | | | | 219,398 | |
5.35%, 05/15/2045 | | | | | | | 270 | | | | 217,794 | |
| | |
| |
46 | AB GLOBAL BOND FUND | | abfunds.com |
PORTFOLIO OF INVESTMENTS (continued)
| | | | | | | | | | |
| | | | | Principal
Amount
(000) | | | U.S. $ Value | |
| |
6.05%, 06/01/2041 | | U.S.$ | | | 85 | | | $ | 76,330 | |
6.125%, 12/15/2045 | | | | | 205 | | | | 179,145 | |
6.25%, 04/15/2049 | | | | | 13,810 | | | | 12,335,207 | |
6.50%, 02/01/2042 | | | | | 384 | | | | 357,156 | |
Eni SpA
0.375%, 06/14/2028(a) | | EUR | | | 135 | | | | 108,673 | |
Series NC5.
2.625%, 10/13/2025(a)(c) | | | | | 170 | | | | 142,911 | |
Series NC9
3.375%, 07/13/2029(a)(c) | | | | | 12,030 | | | | 8,900,380 | |
Enterprise Products Operating LLC
3.70%, 01/31/2051 | | U.S.$ | | | 345 | | | | 242,853 | |
4.85%, 03/15/2044 | | | | | 130 | | | | 108,663 | |
Series E
5.25%, 08/16/2077 | | | | | 678 | | | | 569,700 | |
EQT Corp.
5.70%, 04/01/2028 | | | | | 2,688 | | | | 2,639,661 | |
Exxon Mobil Corp.
2.275%, 08/16/2026 | | | | | 582 | | | | 531,112 | |
2.992%, 03/19/2025 | | | | | 246 | | | | 236,434 | |
4.227%, 03/19/2040 | | | | | 215 | | | | 186,903 | |
Halliburton Co.
6.70%, 09/15/2038 | | | | | 303 | | | | 304,730 | |
7.45%, 09/15/2039 | | | | | 459 | | | | 490,125 | |
Hess Corp.
4.30%, 04/01/2027 | | | | | 230 | | | | 216,084 | |
5.60%, 02/15/2041 | | | | | 395 | | | | 346,200 | |
6.00%, 01/15/2040 | | | | | 369 | | | | 341,804 | |
Kinder Morgan Energy Partners LP
5.00%, 03/01/2043 | | | | | 175 | | | | 141,797 | |
6.95%, 01/15/2038 | | | | | 392 | | | | 393,727 | |
Kinder Morgan, Inc.
5.45%, 08/01/2052 | | | | | 123 | | | | 106,392 | |
7.75%, 01/15/2032 | | | | | 70 | | | | 75,910 | |
Marathon Oil Corp.
4.40%, 07/15/2027 | | | | | 90 | | | | 84,067 | |
6.60%, 10/01/2037 | | | | | 703 | | | | 683,958 | |
6.80%, 03/15/2032 | | | | | 277 | | | | 277,100 | |
Marathon Petroleum Corp.
4.75%, 09/15/2044 | | | | | 265 | | | | 212,447 | |
6.50%, 03/01/2041 | | | | | 3,097 | | | | 3,066,530 | |
Midwest Connector Capital Co. LLC
3.90%, 04/01/2024(a) | | | | | 364 | | | | 351,388 | |
4.625%, 04/01/2029(a) | | | | | 288 | | | | 256,940 | |
MOL Hungarian Oil & Gas PLC
1.50%, 10/08/2027(a) | | EUR | | | 539 | | | | 423,918 | |
2.625%, 04/28/2023(a) | | | | | 100 | | | | 97,227 | |
| | |
| |
| abfunds.com | | AB GLOBAL BOND FUND | 47 |
PORTFOLIO OF INVESTMENTS (continued)
| | | | | | | | | | |
| | | | | Principal
Amount
(000) | | | U.S. $ Value | |
| |
MPLX LP
4.50%, 04/15/2038 | | U.S.$ | | | 180 | | | $ | 144,596 | |
4.875%, 06/01/2025 | | | | | 95 | | | | 93,292 | |
4.95%, 09/01/2032 | | | | | 213 | | | | 193,555 | |
4.95%, 03/14/2052 | | | | | 516 | | | | 405,824 | |
5.50%, 02/15/2049 | | | | | 287 | | | | 244,592 | |
Oil India International Pte Ltd.
4.00%, 04/21/2027(a) | | | | | 470 | | | | 433,369 | |
ONEOK Partners LP
6.125%, 02/01/2041 | | | | | 616 | | | | 546,787 | |
ONEOK, Inc.
3.40%, 09/01/2029 | | | | | 390 | | | | 327,774 | |
5.20%, 07/15/2048 | | | | | 588 | | | | 471,208 | |
6.35%, 01/15/2031 | | | | | 9,379 | | | | 9,202,823 | |
Pioneer Natural Resources Co.
2.15%, 01/15/2031 | | | | | 370 | | | | 285,181 | |
Plains All American Pipeline LP/PAA Finance Corp.
3.60%, 11/01/2024 | | | | | 335 | | | | 322,313 | |
PTTEP Treasury Center Co., Ltd.
2.993%, 01/15/2030(a) | | | | | 300 | | | | 254,730 | |
Raizen Fuels Finance SA
5.30%, 01/20/2027(a) | | | | | 290 | | | | 275,500 | |
Ras Laffan Liquefied Natural Gas Co., Ltd. III
5.838%, 09/30/2027(a) | | | | | 391 | | | | 394,284 | |
Reliance Industries Ltd.
2.875%, 01/12/2032(a) | | | | | 250 | | | | 195,694 | |
3.625%, 01/12/2052(a) | | | | | 300 | | | | 196,556 | |
SA Global Sukuk Ltd.
1.602%, 06/17/2026(a) | | | | | 1,000 | | | | 886,250 | |
Saudi Arabian Oil Co.
2.25%, 11/24/2030(a) | | | | | 1,100 | | | | 892,375 | |
2.875%, 04/16/2024(a) | | | | | 483 | | | | 466,699 | |
3.25%, 11/24/2050(a) | | | | | 410 | | | | 273,111 | |
Schlumberger Finance BV
0.50%, 10/15/2031(a) | | EUR | | | 568 | | | | 418,422 | |
Shell International Finance BV
4.375%, 05/11/2045 | | U.S.$ | | | 210 | | | | 177,338 | |
4.55%, 08/12/2043 | | | | | 560 | | | | 487,465 | |
6.375%, 12/15/2038 | | | | | 441 | | | | 470,097 | |
Suncor Energy, Inc.
6.50%, 06/15/2038 | | | | | 4,255 | | | | 4,203,399 | |
6.80%, 05/15/2038 | | | | | 204 | | | | 206,558 | |
6.85%, 06/01/2039 | | | | | 3,654 | | | | 3,734,391 | |
7.15%, 02/01/2032 | | | | | 75 | | | | 78,359 | |
| | |
| |
48 | AB GLOBAL BOND FUND | | abfunds.com |
PORTFOLIO OF INVESTMENTS (continued)
| | | | | | | | | | | | |
| | | | | | Principal
Amount
(000) | | | U.S. $ Value | |
| |
Sweihan PV Power Co. PJSC
3.625%, 01/31/2049(a) | | | U.S.$ | | | | 685 | | | $ | 539,814 | |
Targa Resources Corp.
5.20%, 07/01/2027 | | | | | | | 94 | | | | 90,854 | |
6.25%, 07/01/2052 | | | | | | | 722 | | | | 657,851 | |
Tengizchevroil Finance Co. International Ltd.
3.25%, 08/15/2030(a) | | | | | | | 750 | | | | 533,109 | |
Tennessee Gas Pipeline Co. LLC
2.90%, 03/01/2030(a) | | | | | | | 250 | | | | 205,281 | |
7.00%, 10/15/2028 | | | | | | | 120 | | | | 124,051 | |
Thaioil Treasury Center Co., Ltd.
2.50%, 06/18/2030(a) | | | | | | | 530 | | | | 408,862 | |
TotalEnergies Capital Canada Ltd.
2.125%, 09/18/2029(a) | | | EUR | | | | 500 | | | | 447,407 | |
TotalEnergies Capital International SA
2.50%, 03/25/2026(a) | | | | | | | 100 | | | | 96,121 | |
3.386%, 06/29/2060 | | | U.S.$ | | | | 76 | | | | 51,025 | |
TotalEnergies SE
Series NC7
1.625%, 10/25/2027(a)(c) | | | EUR | | | | 450 | | | | 343,998 | |
TransCanada PipeLines Ltd.
4.75%, 05/15/2038 | | | U.S.$ | | | | 175 | | | | 152,126 | |
Transcontinental Gas Pipe Line Co., LLC
3.25%, 05/15/2030 | | | | | | | 290 | | | | 244,907 | |
Transportadora de Gas Internacional SA ESP
5.55%, 11/01/2028(a) | | | | | | | 850 | | | | 756,925 | |
Valero Energy Corp.
4.00%, 06/01/2052 | | | | | | | 46 | | | | 33,256 | |
6.625%, 06/15/2037 | | | | | | | 3,128 | | | | 3,128,442 | |
7.50%, 04/15/2032 | | | | | | | 495 | | | | 537,445 | |
Var Energi ASA
5.00%, 05/18/2027(a) | | | | | | | 269 | | | | 257,113 | |
Vier Gas Transport GmbH
Series DIP
1.50%, 09/25/2028(a) | | | EUR | | | | 500 | | | | 412,437 | |
Williams Cos., Inc. (The)
4.65%, 08/15/2032 | | | U.S.$ | | | | 90 | | | | 81,753 | |
5.30%, 08/15/2052 | | | | | | | 123 | | | | 107,757 | |
Wintershall Dea Finance BV
0.452%, 09/25/2023(a) | | | EUR | | | | 500 | | | | 473,775 | |
Woodside Finance Ltd.
3.70%, 09/15/2026(a) | | | U.S.$ | | | | 628 | | | | 582,677 | |
4.50%, 03/04/2029(a) | | | | | | | 531 | | | | 487,655 | |
| | | | | | | | | | | | |
| | | | | | | | | | | 119,946,724 | |
| | | | | | | | | | | | |
| | |
| |
| abfunds.com | | AB GLOBAL BOND FUND | 49 |
PORTFOLIO OF INVESTMENTS (continued)
| | | | | | | | | | | | |
| | | | | | Principal
Amount
(000) | | | U.S. $ Value | |
| |
Other Industrial – 0.1% | | | | | | | | | | | | |
Alfa Desarrollo SpA
4.55%, 09/27/2051(a) | | | U.S.$ | | | | 508 | | | $ | 330,292 | |
CITIC Ltd.
Series E
2.85%, 02/25/2030(a) | | | | | | | 250 | | | | 209,402 | |
Ferguson Finance PLC
4.25%, 04/20/2027(a) | | | | | | | 624 | | | | 586,242 | |
4.65%, 04/20/2032(a) | | | | | | | 624 | | | | 551,295 | |
Massachusetts Institute of Technology
5.60%, 07/01/2111 | | | | | | | 245 | | | | 249,461 | |
Swire Pacific Mtn Financing HK Ltd.
2.875%, 01/30/2030(a) | | | | | | | 340 | | | | 290,020 | |
Technip Energies NV
1.125%, 05/28/2028(a) | | | EUR | | | | 565 | | | | 430,230 | |
Worley US Finance Sub Ltd.
0.875%, 06/09/2026(a) | | | | | | | 531 | | | | 456,807 | |
WW Grainger, Inc.
4.60%, 06/15/2045 | | | U.S.$ | | | | 364 | | | | 328,387 | |
| | | | | | | | | | | | |
| | | | | | | | | | | 3,432,136 | |
| | | | | | | | | | | | |
Services – 0.4% | | | | | | | | | | | | |
Alibaba Group Holding Ltd.
2.125%, 02/09/2031 | | | | | | | 630 | | | | 484,205 | |
Amazon.com, Inc.
3.25%, 05/12/2061 | | | | | | | 677 | | | | 455,805 | |
4.10%, 04/13/2062 | | | | | | | 126 | | | | 101,114 | |
4.25%, 08/22/2057 | | | | | | | 496 | | | | 414,234 | |
Chicago Parking Meters LLC
4.93%, 12/30/2025(e) | | | | | | | 16,500 | | | | 15,831,161 | |
eBay, Inc.
2.70%, 03/11/2030 | | | | | | | 350 | | | | 285,064 | |
Edenred
1.375%, 06/18/2029(a) | | | EUR | | | | 500 | | | | 415,410 | |
Euronet Worldwide, Inc.
1.375%, 05/22/2026 | | | | | | | 142 | | | | 119,040 | |
Global Payments, Inc.
5.30%, 08/15/2029 | | | U.S.$ | | | | 60 | | | | 56,485 | |
5.40%, 08/15/2032 | | | | | | | 102 | | | | 94,560 | |
5.95%, 08/15/2052 | | | | | | | 123 | | | | 108,103 | |
ISS Global A/S
0.875%, 06/18/2026(a) | | | EUR | | | | 106 | | | | 91,658 | |
1.50%, 08/31/2027(a) | | | | | | | 527 | | | | 445,802 | |
JD.com, Inc.
3.875%, 04/29/2026 | | | U.S.$ | | | | 320 | | | | 303,060 | |
Mastercard, Inc.
1.00%, 02/22/2029 | | | EUR | | | | 295 | | | | 247,382 | |
2.95%, 06/01/2029 | | | U.S.$ | | | | 567 | | | | 505,019 | |
| | |
| |
50 | AB GLOBAL BOND FUND | | abfunds.com |
PORTFOLIO OF INVESTMENTS (continued)
| | | | | | | | | | | | |
| | | | | | Principal
Amount
(000) | | | U.S. $ Value | |
| |
3.65%, 06/01/2049 | | | U.S.$ | | | | 269 | | | $ | 209,780 | |
3.85%, 03/26/2050 | | | | | | | 400 | | | | 322,310 | |
Moody’s Corp.
2.55%, 08/18/2060 | | | | | | | 120 | | | | 64,776 | |
3.75%, 02/25/2052 | | | | | | | 227 | | | | 167,738 | |
PayPal Holdings, Inc.
5.05%, 06/01/2052 | | | | | | | 606 | | | | 538,281 | |
Rentokil Initial PLC
0.50%, 10/14/2028(a) | | | EUR | | | | 557 | | | | 435,001 | |
Securitas AB
0.25%, 02/22/2028(a) | | | | | | | 570 | | | | 421,199 | |
SGS Nederland Holding BV
0.125%, 04/21/2027(a) | | | | | | | 500 | | | | 414,099 | |
Verisk Analytics, Inc.
4.125%, 03/15/2029 | | | U.S.$ | | | | 230 | | | | 209,473 | |
Visa, Inc.
4.15%, 12/14/2035 | | | | | | | 360 | | | | 329,007 | |
| | | | | | | | | | | | |
| | | | | | | | | | | 23,069,766 | |
| | | | | | | | | | | | |
Technology – 1.4% | | | | | | | | | | | | |
Agilent Technologies, Inc.
2.30%, 03/12/2031 | | | | | | | 673 | | | | 527,123 | |
Apple, Inc.
2.00%, 09/17/2027 | | | EUR | | | | 240 | | | | 224,310 | |
2.45%, 08/04/2026 | | | U.S.$ | | | | 495 | | | | 457,394 | |
2.80%, 02/08/2061 | | | | | | | 418 | | | | 261,948 | |
2.85%, 08/05/2061 | | | | | | | 257 | | | | 162,251 | |
2.90%, 09/12/2027 | | | | | | | 573 | | | | 528,696 | |
3.00%, 11/13/2027 | | | | | | | 570 | | | | 527,323 | |
3.25%, 08/08/2029 | | | | | | | 124 | | | | 113,354 | |
3.35%, 08/08/2032 | | | | | | | 124 | | | | 110,330 | |
3.95%, 08/08/2052 | | | | | | | 124 | | | | 103,382 | |
4.10%, 08/08/2062 | | | | | | | 224 | | | | 183,653 | |
4.375%, 05/13/2045 | | | | | | | 145 | | | | 130,108 | |
4.45%, 05/06/2044 | | | | | | | 485 | | | | 445,211 | |
Avnet, Inc.
5.50%, 06/01/2032 | | | | | | | 609 | | | | 553,697 | |
Axiata SPV2 Bhd
2.163%, 08/19/2030(a) | | | | | | | 610 | | | | 490,974 | |
Baidu, Inc.
2.375%, 08/23/2031 | | | | | | | 630 | | | | 489,075 | |
Broadcom, Inc.
2.45%, 02/15/2031(a) | | | | | | | 160 | | | | 120,477 | |
3.137%, 11/15/2035(a) | | | | | | | 205 | | | | 143,732 | |
4.15%, 04/15/2032(a) | | | | | | | 94 | | | | 79,089 | |
4.926%, 05/15/2037(a) | | | | | | | 135 | | | | 111,682 | |
Cisco Systems, Inc.
5.50%, 01/15/2040 | | | | | | | 328 | | | | 326,711 | |
5.90%, 02/15/2039 | | | | | | | 312 | | | | 324,502 | |
| | |
| |
| abfunds.com | | AB GLOBAL BOND FUND | 51 |
PORTFOLIO OF INVESTMENTS (continued)
| | | | | | | | | | |
| | | | | Principal
Amount
(000) | | | U.S. $ Value | |
| |
Dell International LLC/EMC Corp.
4.90%, 10/01/2026 | | U.S.$ | | | 360 | | | $ | 347,456 | |
8.10%, 07/15/2036 | | | | | 109 | | | | 115,621 | |
8.35%, 07/15/2046 | | | | | 2,243 | | | | 2,428,758 | |
DXC Capital Funding DAC
0.45%, 09/15/2027(a) | | EUR | | | 686 | | | | 554,614 | |
DXC Technology Co.
1.75%, 01/15/2026 | | | | | 101 | | | | 91,440 | |
Entegris Escrow Corp.
4.75%, 04/15/2029(a) | | U.S.$ | | | 9,256 | | | | 8,211,130 | |
Fidelity National Information Services, Inc.
0.625%, 12/03/2025 | | EUR | | | 903 | | | | 806,137 | |
1.00%, 12/03/2028 | | | | | 791 | | | | 637,202 | |
4.50%, 07/15/2025 | | U.S.$ | | | 603 | | | | 590,502 | |
4.70%, 07/15/2027 | | | | | 603 | | | | 580,570 | |
Fiserv, Inc.
4.40%, 07/01/2049 | | | | | 140 | | | | 108,521 | |
Hewlett Packard Enterprise Co.
6.35%, 10/15/2045 | | | | | 529 | | | | 481,562 | |
HP, Inc.
2.65%, 06/17/2031 | | | | | 64 | | | | 47,098 | |
3.00%, 06/17/2027 | | | | | 25 | | | | 22,193 | |
4.20%, 04/15/2032 | | | | | 345 | | | | 280,893 | |
4.75%, 01/15/2028 | | | | | 75 | | | | 70,471 | |
5.50%, 01/15/2033 | | | | | 11,648 | | | | 10,330,771 | |
6.00%, 09/15/2041 | | | | | 531 | | | | 461,623 | |
Intel Corp.
3.05%, 08/12/2051 | | | | | 115 | | | | 73,565 | |
3.25%, 11/15/2049 | | | | | 150 | | | | 99,831 | |
3.75%, 08/05/2027 | | | | | 622 | | | | 590,455 | |
4.00%, 08/05/2029 | | | | | 124 | | | | 115,185 | |
4.15%, 08/05/2032 | | | | | 124 | | | | 113,173 | |
4.75%, 03/25/2050 | | | | | 470 | | | | 405,291 | |
4.90%, 08/05/2052 | | | | | 124 | | | | 109,434 | |
4.95%, 03/25/2060 | | | | | 472 | | | | 403,317 | |
5.05%, 08/05/2062 | | | | | 8,442 | | | | 7,328,371 | |
International Business Machines Corp.
3.30%, 05/15/2026 | | | | | 704 | | | | 663,864 | |
3.43%, 02/09/2052 | | | | | 135 | | | | 91,905 | |
3.50%, 05/15/2029 | | | | | 100 | | | | 90,373 | |
4.00%, 07/27/2025 | | | | | 120 | | | | 117,590 | |
4.00%, 06/20/2042 | | | | | 150 | | | | 117,971 | |
4.25%, 05/15/2049 | | | | | 100 | | | | 79,042 | |
4.40%, 07/27/2032 | | | | | 120 | | | | 110,690 | |
4.90%, 07/27/2052 | | | | | 284 | | | | 248,917 | |
KLA Corp.
4.95%, 07/15/2052 | | | | | 354 | | | | 321,537 | |
| | |
| |
52 | AB GLOBAL BOND FUND | | abfunds.com |
PORTFOLIO OF INVESTMENTS (continued)
| | | | | | | | | | |
| | | | | Principal
Amount
(000) | | | U.S. $ Value | |
| |
Kyndryl Holdings, Inc.
2.05%, 10/15/2026(a) | | U.S.$ | | | 10,101 | | | $ | 8,113,012 | |
Lam Research Corp.
4.00%, 03/15/2029 | | | | | 225 | | | | 210,571 | |
4.875%, 03/15/2049 | | | | | 277 | | | | 254,653 | |
Lenovo Group Ltd.
3.421%, 11/02/2030(a) | | | | | 250 | | | | 190,359 | |
Microsoft Corp.
2.675%, 06/01/2060 | | | | | 150 | | | | 95,007 | |
2.921%, 03/17/2052 | | | | | 674 | | | | 476,549 | |
3.041%, 03/17/2062 | | | | | 200 | | | | 136,446 | |
3.45%, 08/08/2036 | | | | | 246 | | | | 214,994 | |
4.50%, 02/06/2057 | | | | | 126 | | | | 116,205 | |
Motorola Solutions, Inc.
5.60%, 06/01/2032 | | | | | 583 | | | | 552,919 | |
NXP BV/NXP Funding LLC
5.35%, 03/01/2026 | | | | | 445 | | | | 439,994 | |
Oracle Corp.
3.25%, 05/15/2030 | | | | | 150 | | | | 123,489 | |
3.60%, 04/01/2040 | | | | | 7,716 | | | | 5,232,458 | |
3.65%, 03/25/2041 | | | | | 676 | | | | 458,870 | |
3.85%, 07/15/2036 | | | | | 181 | | | | 135,512 | |
3.90%, 05/15/2035 | | | | | 190 | | | | 145,653 | |
4.00%, 07/15/2046 | | | | | 160 | | | | 108,289 | |
4.10%, 03/25/2061 | | | | | 551 | | | | 348,764 | |
5.375%, 07/15/2040 | | | | | 2,830 | | | | 2,356,586 | |
6.50%, 04/15/2038 | | | | | 211 | | | | 201,061 | |
SK Hynix, Inc.
2.375%, 01/19/2031(a) | | | | | 460 | | | | 338,761 | |
Skyworks Solutions, Inc.
3.00%, 06/01/2031 | | | | | 355 | | | | 269,800 | |
Take-Two Interactive Software, Inc.
3.30%, 03/28/2024 | | | | | 219 | | | | 213,465 | |
Telefonaktiebolaget LM Ericsson
1.00%, 05/26/2029(a) | | EUR | | | 396 | | | | 278,167 | |
Texas Instruments, Inc.
2.25%, 09/04/2029 | | U.S.$ | | | 661 | | | | 558,333 | |
4.10%, 08/16/2052 | | | | | 183 | | | | 156,430 | |
TSMC Arizona Corp.
3.875%, 04/22/2027 | | | | | 360 | | | | 342,976 | |
4.125%, 04/22/2029 | | | | | 230 | | | | 216,568 | |
4.25%, 04/22/2032 | | | | | 380 | | | | 350,777 | |
4.50%, 04/22/2052 | | | | | 230 | | | | 200,351 | |
TSMC Global Ltd.
1.375%, 09/28/2030(a) | | | | | 540 | | | | 403,007 | |
2.25%, 04/23/2031(a) | | | | | 410 | | | | 321,042 | |
| | |
| |
| abfunds.com | | AB GLOBAL BOND FUND | 53 |
PORTFOLIO OF INVESTMENTS (continued)
| | | | | | | | | | | | |
| | | | | | Principal
Amount
(000) | | | U.S. $ Value | |
| |
Tyco Electronics Group SA
Zero Coupon, 02/16/2029 | | | EUR | | | | 135 | | | $ | 104,429 | |
VeriSign, Inc.
2.70%, 06/15/2031 | | | U.S.$ | | | | 155 | | | | 121,007 | |
Western Digital Corp.
2.85%, 02/01/2029 | | | | | | | 2,233 | | | | 1,735,550 | |
3.10%, 02/01/2032 | | | | | | | 7,315 | | | | 4,994,393 | |
4.75%, 02/15/2026 | | | | | | | 561 | | | | 519,453 | |
Wipro IT Services LLC
1.50%, 06/23/2026(a) | | | | | | | 250 | | | | 217,656 | |
Workday, Inc.
3.80%, 04/01/2032 | | | | | | | 108 | | | | 93,951 | |
Xiaomi Best Time International Ltd.
2.875%, 07/14/2031(a) | | | | | | | 460 | | | | 317,199 | |
| | | | | | | | | | | | |
| | | | | | | | | | | 75,326,801 | |
| | | | | | | | | | | | |
Transportation - Airlines – 0.0% | | | | | | | | | | | | |
Alaska Airlines Pass Through Trust
Series 2020-1, Class A
4.80%, 08/15/2027(a) | | | | | | | 568 | | | | 535,724 | |
Delta Air Lines, Inc./SkyMiles IP Ltd.
4.50%, 10/20/2025(a) | | | | | | | 978 | | | | 950,499 | |
4.75%, 10/20/2028(a) | | | | | | | 356 | | | | 331,080 | |
easyJet FinCo BV
1.875%, 03/03/2028(a) | | | EUR | | | | 226 | | | | 172,055 | |
Mileage Plus Holdings LLC/Mileage Plus Intellectual Property Assets Ltd.
6.50%, 06/20/2027(a) | | | U.S.$ | | | | 356 | | | | 348,930 | |
| | | | | | | | | | | | |
| | | | | | | | | | | 2,338,288 | |
| | | | | | | | | | | | |
Transportation - Railroads – 0.1% | | | | | | | | | | | | |
Burlington Northern Santa Fe LLC
4.45%, 01/15/2053 | | | | | | | 124 | | | | 107,446 | |
Canadian National Railway Co.
3.60%, 08/01/2047 | | | CAD | | | | 355 | | | | 207,958 | |
4.40%, 08/05/2052 | | | U.S.$ | | | | 124 | | | | 107,003 | |
Canadian Pacific Railway Co.
6.125%, 09/15/2115 | | | | | | | 235 | | | | 222,840 | |
Lima Metro Line 2 Finance Ltd.
4.35%, 04/05/2036(a) | | | | | | | 451 | | | | 394,453 | |
5.875%, 07/05/2034(a) | | | | | | | 763 | | | | 721,317 | |
MTR Corp. Ltd.
1.625%, 08/19/2030(a) | | | | | | | 260 | | | | 205,855 | |
Union Pacific Corp.
3.85%, 02/14/2072 | | | | | | | 133 | | | | 95,311 | |
4.50%, 01/20/2033 | | | | | | | 120 | | | | 114,029 | |
4.95%, 09/09/2052 | | | | | | | 120 | | | | 112,222 | |
5.15%, 01/20/2063 | | | | | | | 598 | | | | 555,017 | |
| | | | | | | | | | | | |
| | | | | | | | | | | 2,843,451 | |
| | | | | | | | | | | | |
| | |
| |
54 | AB GLOBAL BOND FUND | | abfunds.com |
PORTFOLIO OF INVESTMENTS (continued)
| | | | | | | | | | | | |
| | | | | | Principal
Amount
(000) | | | U.S. $ Value | |
| |
Transportation - Services – 0.3% | | | | | | | | | | | | |
Adani Ports & Special Economic Zone Ltd.
3.10%, 02/02/2031(a) | | | U.S.$ | | | | 360 | | | $ | 258,480 | |
Ashtead Capital, Inc.
5.50%, 08/11/2032(a) | | | | | | | 429 | | | | 397,597 | |
ENA Master Trust
4.00%, 05/19/2048(a) | | | | | | | 1,716 | | | | 1,262,332 | |
FedEx Corp.
0.45%, 05/04/2029 | | | EUR | | | | 12,816 | | | | 9,672,045 | |
Gatwick Funding Ltd.
2.625%, 10/07/2046(a) | | | GBP | | | | 120 | | | | 69,158 | |
Heathrow Funding Ltd.
1.50%, 02/11/2030(a) | | | EUR | | | | 536 | | | | 431,170 | |
2.625%, 03/16/2028(a) | | | GBP | | | | 295 | | | | 249,580 | |
HPHT Finance 21 Ltd.
2.00%, 03/19/2026(a) | | | U.S.$ | | | | 250 | | | | 223,865 | |
Ryder System, Inc.
1.75%, 09/01/2026 | | | | | | | 139 | | | | 121,589 | |
Shanghai Port Group BVI Development 2 Co., Ltd.
1.50%, 07/13/2025(a) | | | | | | | 500 | | | | 452,175 | |
Sydney Airport Finance Co. Pty Ltd.
3.625%, 04/28/2026(a) | | | | | | | 365 | | | | 338,434 | |
Transurban Finance Co. Pty Ltd.
2.45%, 03/16/2031(a) | | | | | | | 715 | | | | 553,467 | |
| | | | | | | | | | | | |
| | | | | | | | | | | 14,029,892 | |
| | | | | | | | | | | | |
| | | | | | | | | | | 477,382,403 | |
| | | | | | | | | | | | |
Utility – 1.1% | | | | | | | | | | | | |
Electric – 1.1% | | | | | | | | | | | | |
Abu Dhabi National Energy Co. PJSC
4.875%, 04/23/2030(a) | | | | | | | 420 | | | | 413,123 | |
Adani Electricity Mumbai Ltd.
3.867%, 07/22/2031(a) | | | | | | | 710 | | | | 505,201 | |
Adani Transmission Step-One Ltd.
4.00%, 08/03/2026(a) | | | | | | | 7,886 | | | | 7,133,380 | |
AEP Texas, Inc.
4.70%, 05/15/2032 | | | | | | | 401 | | | | 367,007 | |
5.25%, 05/15/2052 | | | | | | | 121 | | | | 110,706 | |
AES Corp. (The)
3.30%, 07/15/2025(a) | | | | | | | 23 | | | | 21,177 | |
AES Panama Generation Holdings SRL
4.375%, 05/31/2030(a) | | | | | | | 2,885 | | | | 2,271,937 | |
Appalachian Power Co.
Series BB
4.50%, 08/01/2032 | | | | | | | 57 | | | | 51,315 | |
AusNet Services Holdings Pty Ltd.
1.50%, 02/26/2027(a) | | | EUR | | | | 507 | | | | 448,388 | |
| | |
| |
| abfunds.com | | AB GLOBAL BOND FUND | 55 |
PORTFOLIO OF INVESTMENTS (continued)
| | | | | | | | | | |
| | | | | Principal
Amount
(000) | | | U.S. $ Value | |
| |
Avangrid, Inc.
3.20%, 04/15/2025 | | U.S.$ | | | 99 | | | $ | 93,625 | |
3.80%, 06/01/2029 | | | | | 637 | | | | 565,979 | |
Cadent Finance PLC
0.625%, 03/19/2030(a) | | EUR | | | 307 | | | | 224,668 | |
Chile Electricity PEC SpA
Zero Coupon, 01/25/2028(f) | | U.S.$ | | | 206 | | | | 145,488 | |
Cometa Energia SA de CV
6.375%, 04/24/2035(a) | | | | | 666 | | | | 597,644 | |
Commonwealth Edison Co.
5.90%, 03/15/2036 | | | | | 150 | | | | 154,098 | |
Series 133
3.85%, 03/15/2052 | | | | | 229 | | | | 178,866 | |
Consolidated Edison Co. of New York, Inc.
Series 06-A
5.85%, 03/15/2036 | | | | | 115 | | | | 114,444 | |
Series 12-A
4.20%, 03/15/2042 | | | | | 270 | | | | 212,559 | |
Consorcio Transmantaro SA
5.20%, 04/11/2038(a) | | | | | 460 | | | | 393,300 | |
Consumers Energy Co.
4.20%, 09/01/2052 | | | | | 124 | | | | 103,070 | |
Dte Energy Co.
4.22%, 11/01/2024 | | | | | 123 | | | | 120,503 | |
Duke Energy Indiana LLC
Series YYY
3.25%, 10/01/2049 | | | | | 300 | | | | 204,860 | |
Duke Energy Ohio, Inc.
4.30%, 02/01/2049 | | | | | 130 | | | | 104,298 | |
Duke Energy Progress LLC
4.00%, 04/01/2052 | | | | | 43 | | | | 33,654 | |
E.ON International Finance BV
5.75%, 02/14/2033(a) | | EUR | | | 373 | | | | 401,563 | |
Series DIP
1.00%, 04/13/2025(a) | | | | | 91 | | | | 84,261 | |
Electricite de France SA
2.875%, 12/15/2026(a)(c) | | | | | 8,400 | | | | 6,297,309 | |
5.25%, 01/29/2023(a)(c) | | U.S.$ | | | 485 | | | | 453,475 | |
Elia Transmission Belgium SA
0.875%, 04/28/2030(a) | | EUR | | | 500 | | | | 392,185 | |
Emirates Semb Corp. Water & Power Co. PJSC
4.45%, 08/01/2035(a) | | U.S.$ | | | 220 | | | | 199,650 | |
Enel Chile SA
4.875%, 06/12/2028 | | | | | 270 | | | | 249,379 | |
| | |
| |
56 | AB GLOBAL BOND FUND | | abfunds.com |
PORTFOLIO OF INVESTMENTS (continued)
| | | | | | | | | | |
| | | | | Principal
Amount
(000) | | | U.S. $ Value | |
| |
Enel Finance International NV
0.375%, 05/28/2029(a) | | EUR | | | 360 | | | $ | 268,574 | |
0.50%, 06/17/2030(a) | | | | | 6,949 | | | | 4,999,520 | |
2.25%, 07/12/2031(a) | | U.S.$ | | | 4,990 | | | | 3,485,872 | |
4.25%, 06/15/2025(a) | | | | | 564 | | | | 543,152 | |
4.625%, 06/15/2027(a) | | | | | 537 | | | | 502,680 | |
5.00%, 06/15/2032(a) | | | | | 200 | | | | 170,805 | |
6.00%, 10/07/2039(a) | | | | | 115 | | | | 101,366 | |
Engie Energia Chile SA
3.40%, 01/28/2030(a) | | | | | 670 | | | | 505,850 | |
Entergy Louisiana LLC
4.75%, 09/15/2052 | | | | | 123 | | | | 107,190 | |
Entergy Texas, Inc.
5.00%, 09/15/2052 | | | | | 610 | | | | 546,204 | |
Exelon Generation Co. LLC
5.75%, 10/01/2041 | | | | | 170 | | | | 155,695 | |
Florida Power & Light Co.
4.05%, 06/01/2042 | | | | | 435 | | | | 362,480 | |
4.125%, 06/01/2048 | | | | | 125 | | | | 105,000 | |
Georgia Power Co.
Series B
3.70%, 01/30/2050 | | | | | 290 | | | | 209,708 | |
Iberdrola International BV
Series NC5
1.874%, 01/28/2026(a)(c) | | EUR | | | 300 | | | | 250,005 | |
Series NC6
1.45%, 11/09/2026(a)(c) | | | | | 11,700 | | | | 9,295,328 | |
Infraestructura Energetica Nova SAPI de CV
4.75%, 01/15/2051(a) | | U.S.$ | | | 480 | | | | 324,900 | |
Israel Electric Corp. Ltd.
Series G
3.75%, 02/22/2032(a) | | | | | 290 | | | | 246,500 | |
4.25%, 08/14/2028(a) | | | | | 450 | | | | 415,209 | |
LLPL Capital Pte Ltd.
6.875%, 02/04/2039(a) | | | | | 410 | | | | 329,625 | |
Massachusetts Electric Co.
5.90%, 11/15/2039(a) | | | | | 345 | | | | 335,677 | |
Minejesa Capital BV
4.625%, 08/10/2030(a) | | | | | 730 | | | | 596,775 | |
National Central Cooling Co. PJSC
2.50%, 10/21/2027(a) | | | | | 730 | | | | 619,952 | |
National Grid PLC
0.553%, 09/18/2029(a) | | EUR | | | 554 | | | | 419,480 | |
National Rural Utilities Cooperative Finance Corp.
4.15%, 12/15/2032 | | U.S.$ | | | 123 | | | | 112,556 | |
| | |
| |
| abfunds.com | | AB GLOBAL BOND FUND | 57 |
PORTFOLIO OF INVESTMENTS (continued)
| | | | | | | | | | |
| | | | | Principal
Amount
(000) | | | U.S. $ Value | |
| |
NextEra Energy Capital Holdings, Inc.
1.90%, 06/15/2028 | | U.S.$ | | | 3,879 | | | $ | 3,216,213 | |
Niagara Mohawk Power Corp.
4.278%, 12/15/2028(a) | | | | | 230 | | | | 211,356 | |
5.783%, 09/16/2052(a) | | | | | 130 | | | | 123,322 | |
NSTAR Electric Co.
4.55%, 06/01/2052 | | | | | 122 | | | | 106,051 | |
4.95%, 09/15/2052 | | | | | 596 | | | | 555,897 | |
NTPC Ltd.
4.25%, 02/26/2026(a) | | | | | 370 | | | | 354,229 | |
Oncor Electric Delivery Co. LLC
4.55%, 09/15/2032(a) | | | | | 120 | | | | 115,535 | |
4.95%, 09/15/2052(a) | | | | | 598 | | | | 564,024 | |
Origin Energy Finance Ltd.
1.00%, 09/17/2029(a) | | EUR | | | 452 | | | | 325,461 | |
Pacific Gas and Electric Co.
4.20%, 03/01/2029 | | U.S.$ | | | 131 | | | | 111,543 | |
4.40%, 03/01/2032 | | | | | 131 | | | | 107,873 | |
4.95%, 07/01/2050 | | | | | 272 | | | | 200,015 | |
5.25%, 03/01/2052 | | | | | 131 | | | | 100,481 | |
5.45%, 06/15/2027 | | | | | 312 | | | | 294,435 | |
5.90%, 06/15/2032 | | | | | 613 | | | | 559,440 | |
PacifiCorp
4.15%, 02/15/2050 | | | | | 390 | | | | 313,444 | |
6.35%, 07/15/2038 | | | | | 110 | | | | 114,346 | |
PECO Energy Co.
2.85%, 09/15/2051 | | | | | 155 | | | | 100,059 | |
Public Service Co. of Colorado
Series 38
4.10%, 06/01/2032 | | | | | 121 | | | | 111,833 | |
Public Service Electric and Gas Co.
3.80%, 03/01/2046 | | | | | 410 | | | | 321,958 | |
RH International Singapore Corp. Pte Ltd.
4.50%, 03/27/2028(a) | | | | | 470 | | | | 443,357 | |
San Diego Gas & Electric Co.
3.70%, 03/15/2052 | | | | | 634 | | | | 479,635 | |
Series UUU
3.32%, 04/15/2050 | | | | | 175 | | | | 122,386 | |
Series WWW
2.95%, 08/15/2051 | | | | | 231 | | | | 150,686 | |
Sociedad de Transmision Austral SA
4.00%, 01/27/2032(a) | | | | | 390 | | | | 315,486 | |
Southern California Edison Co.
Series C
4.20%, 06/01/2025 | | | | | 602 | | | | 587,282 | |
Series E
5.45%, 06/01/2052 | | | | | 120 | | | | 107,408 | |
| | |
| |
58 | AB GLOBAL BOND FUND | | abfunds.com |
PORTFOLIO OF INVESTMENTS (continued)
| | | | | | | | | | | | |
| | | | | | Principal
Amount
(000) | | | U.S. $ Value | |
| |
Southern Power Co.
Series F
4.95%, 12/15/2046 | | | U.S.$ | | | | 345 | | | $ | 289,498 | |
Southwestern Public Service Co.
Series 9
5.15%, 06/01/2052 | | | | | | | 122 | | | | 109,685 | |
SSE PLC
2.875%, 08/01/2029(a) | | | EUR | | | | 233 | | | | 210,112 | |
Tampa Electric Co.
5.00%, 07/15/2052 | | | U.S.$ | | | | 120 | | | | 109,676 | |
TenneT Holding BV
2.374%, 07/22/2025(a)(c) | | | EUR | | | | 125 | | | | 111,016 | |
TNB Global Ventures Capital Bhd
4.851%, 11/01/2028(a) | | | U.S.$ | | | | 430 | | | | 412,343 | |
Union Electric Co.
3.90%, 04/01/2052 | | | | | | | 129 | | | | 101,454 | |
Virginia Electric and Power Co.
Series C
4.625%, 05/15/2052 | | | | | | | 121 | | | | 104,150 | |
Vistra Operations Co. LLC
3.55%, 07/15/2024(a) | | | | | | | 571 | | | | 543,906 | |
Wisconsin Electric Power Co.
4.75%, 09/30/2032 | | | | | | | 175 | | | | 168,748 | |
| | | | | | | | | | | | |
| | | | | | | | | | | 59,931,558 | |
| | | | | | | | | | | | |
Natural Gas – 0.0% | | | | | | | | | | | | |
Atmos Energy Corp.
2.625%, 09/15/2029 | | | | | | | 345 | | | | 294,211 | |
5.45%, 10/15/2032 | | | | | | | 32 | | | | 32,339 | |
5.75%, 10/15/2052 | | | | | | | 114 | | | | 114,073 | |
ENN Energy Holdings Ltd.
2.625%, 09/17/2030(a) | | | | | | | 290 | | | | 233,414 | |
Grupo Energia Bogota SA ESP
4.875%, 05/15/2030(a) | | | | | | | 314 | | | | 269,255 | |
KeySpan Gas East Corp.
3.586%, 01/18/2052(a) | | | | | | | 137 | | | | 88,892 | |
National Grid North America, Inc.
1.054%, 01/20/2031(a) | | | EUR | | | | 109 | | | | 81,947 | |
NiSource, Inc.
5.00%, 06/15/2052 | | | U.S.$ | | | | 122 | | | | 106,628 | |
5.65%, 02/01/2045 | | | | | | | 230 | | | | 215,106 | |
ONE Gas, Inc.
4.25%, 09/01/2032 | | | | | | | 130 | | | | 117,662 | |
Southwest Gas Corp.
4.05%, 03/15/2032 | | | | | | | 128 | | | | 107,904 | |
| | | | | | | | | | | | |
| | | | | | | | | | | 1,661,431 | |
| | | | | | | | | | | | |
| | | | | | | | | | | 61,592,989 | |
| | | | | | | | | | | | |
Total Corporates - Investment Grade
(cost $1,474,870,907) | | | | | | | | | | | 1,170,411,948 | |
| | | | | | | | | | | | |
| | |
| |
| abfunds.com | | AB GLOBAL BOND FUND | 59 |
PORTFOLIO OF INVESTMENTS (continued)
| | | | | | | | | | | | |
| | | | | | Principal
Amount
(000) | | | U.S. $ Value | �� |
| |
MORTGAGE PASS-THROUGHS – 3.9% | | | | | | | | | | | | |
Agency Fixed Rate 30-Year – 3.9% | | | | | | | | | | | | |
Federal Home Loan Mortgage Corp.
Series 2019
3.50%, 09/01/2049 | | | U.S.$ | | | | 13,109 | | | $ | 11,948,371 | |
Series 2020
2.50%, 07/01/2050 | | | | | | | 14,115 | | | | 12,008,962 | |
3.50%, 01/01/2050 | | | | | | | 10,235 | | | | 9,342,381 | |
Federal Home Loan Mortgage Corp. Gold
Series 2019
4.50%, 02/01/2049 | | | | | | | 7,085 | | | | 6,876,351 | |
Federal National Mortgage Association
Series 2005
5.50%, 02/01/2035 | | | | | | | 7 | | | | 7,273 | |
Series 2007
5.50%, 09/01/2036 | | | | | | | 5 | | | | 4,953 | |
5.50%, 08/01/2037 | | | | | | | 5 | | | | 5,385 | |
Series 2008
5.50%, 03/01/2037 | | | | | | | 2 | | | | 2,215 | |
5.50%, 05/01/2038 | | | | | | | 929 | | | | 953,725 | |
Series 2012
3.50%, 02/01/2042 | | | | | | | 1,732 | | | | 1,626,447 | |
3.50%, 11/01/2042 | | | | | | | 18,328 | | | | 16,904,541 | |
3.50%, 01/01/2043 | | | | | | | 3,098 | | | | 2,857,301 | |
Series 2013
3.50%, 04/01/2043 | | | | | | | 10,566 | | | | 9,745,335 | |
Series 2017
3.50%, 06/01/2047 | | | | | | | 13 | | | | 11,571 | |
3.50%, 08/01/2047 | | | | | | | 21 | | | | 19,131 | |
3.50%, 10/01/2047 | | | | | | | 156 | | | | 142,455 | |
3.50%, 01/01/2048 | | | | | | | 8 | | | | 6,983 | |
Series 2018
3.50%, 01/01/2048 | | | | | | | 415 | | | | 379,629 | |
3.50%, 02/01/2048 | | | | | | | 176 | | | | 161,126 | |
3.50%, 03/01/2048 | | | | | | | 11,493 | | | | 10,542,802 | |
3.50%, 05/01/2048 | | | | | | | 291 | | | | 265,479 | |
4.50%, 09/01/2048 | | | | | | | 9,364 | | | | 9,059,629 | |
4.50%, 12/01/2048 | | | | | | | 5,754 | | | | 5,581,768 | |
Series 2020
2.50%, 07/01/2050 | | | | | | | 30,936 | | | | 26,391,189 | |
3.50%, 01/01/2050 | | | | | | | 16,102 | | | | 14,672,183 | |
Government National Mortgage Association
Series 2022
4.50%, 10/01/2052, TBA | | | | | | | 40,927 | | | | 39,123,900 | |
| | |
| |
60 | AB GLOBAL BOND FUND | | abfunds.com |
PORTFOLIO OF INVESTMENTS (continued)
| | | | | | | | | | | | |
| | | | | | Principal
Amount
(000) | | | U.S. $ Value | |
| |
Uniform Mortgage-Backed Security
Series 2022
2.50%, 10/01/2052, TBA | | | U.S.$ | | | | 2,750 | | | $ | 2,307,546 | |
3.00%, 10/01/2052, TBA | | | | | | | 35,030 | | | | 30,454,206 | |
| | | | | | | | | | | | |
| | | |
Total Mortgage Pass-Throughs
(cost $235,966,421) | | | | | | | | | | | 211,402,837 | |
| | | | | | | | | | | | |
| | | | | | | | | | | | |
CORPORATES - NON-INVESTMENT GRADE – 3.7% | | | | | | | | | | | | |
Industrial – 2.3% | | | | | | | | | | | | |
Basic – 0.2% | | | | | | | | | | | | |
INEOS Quattro Finance 2 PLC
2.50%, 01/15/2026(a) | | | EUR | | | | 5,045 | | | | 4,062,557 | |
Rimini Bidco SpA
6.25%, 12/14/2026(d)(g) | | | | | | | 9,315 | | | | 7,707,411 | |
| | | | | | | | | | | | |
| | | | | | | | | | | 11,769,968 | |
| | | | | | | | | | | | |
Capital Goods – 0.2% | | | | | | | | | | | | |
Ardagh Metal Packaging Finance USA LLC/Ardagh Metal Packaging Finance PLC
3.00%, 09/01/2029(a) | | | | | | | 100 | | | | 69,588 | |
Silgan Holdings, Inc.
2.25%, 06/01/2028 | | | | | | | 3,680 | | | | 2,885,871 | |
TK Elevator Midco GmbH
4.375%, 07/15/2027(a) | | | | | | | 7,170 | | | | 5,905,537 | |
| | | | | | | | | | | | |
| | | | | | | | | | | 8,860,996 | |
| | | | | | | | | | | | |
Communications - Media – 0.3% | | | | | | | | | | | | |
CCO Holdings LLC/CCO Holdings Capital Corp.
4.50%, 06/01/2033(a) | | | U.S.$ | | | | 6,943 | | | | 5,149,794 | |
4.75%, 02/01/2032(a) | | | | | | | 141 | | | | 110,030 | |
DISH DBS Corp.
5.25%, 12/01/2026(a) | | | | | | | 9,670 | | | | 7,981,315 | |
5.75%, 12/01/2028(a) | | | | | | | 6,707 | | | | 5,056,643 | |
Virgin Media Finance PLC
5.00%, 07/15/2030(a) | | | | | | | 200 | | | | 149,748 | |
VZ Secured Financing BV
3.50%, 01/15/2032(a) | | | EUR | | | | 105 | | | | 74,028 | |
| | | | | | | | | | | | |
| | | | | | | | | | | 18,521,558 | |
| | | | | | | | | | | | |
Communications - Telecommunications – 0.4% | | | | | | | | | | | | |
Lorca Telecom Bondco SA
4.00%, 09/18/2027(a) | | | | | | | 8,685 | | | | 7,406,375 | |
Telecom Italia SpA/Milano
1.625%, 01/18/2029(a) | | | | | | | 12,035 | | | | 8,388,174 | |
| | |
| |
| abfunds.com | | AB GLOBAL BOND FUND | 61 |
PORTFOLIO OF INVESTMENTS (continued)
| | | | | | | | | | | | |
| | | | | | Principal
Amount
(000) | | | U.S. $ Value | |
| |
Telefonica Europe BV
4.375%, 12/14/2024(a)(c) | | | EUR | | | | 5,700 | | | $ | 5,287,604 | |
| | | | | | | | | | | | |
| | | | | | | | | | | 21,082,153 | |
| | | | | | | | | | | | |
Consumer Cyclical - Automotive – 0.4% | | | | | | | | | | | | |
Faurecia SE
2.75%, 02/15/2027(a) | | | | | | | 105 | | | | 79,071 | |
Ford Motor Co.
6.10%, 08/19/2032 | | | U.S.$ | | | | 11,106 | | | | 9,790,233 | |
Jaguar Land Rover Automotive PLC
4.50%, 10/01/2027(a) | | | | | | | 200 | | | | 136,691 | |
Schaeffler AG
2.875%, 03/26/2027(a) | | | EUR | | | | 120 | | | | 100,479 | |
ZF Finance GmbH
2.00%, 05/06/2027(a) | | | | | | | 13,000 | | | | 9,847,484 | |
2.25%, 05/03/2028(a) | | | | | | | 200 | | | | 144,310 | |
| | | | | | | | | | | | |
| | | | | | | | | | | 20,098,268 | |
| | | | | | | | | | | | |
Consumer Cyclical - Entertainment – 0.3% | | | | | | | | | | | | |
Carnival Corp.
4.00%, 08/01/2028(a) | | | U.S.$ | | | | 5,542 | | | | 4,461,310 | |
Carnival PLC
1.00%, 10/28/2029 | | | EUR | | | | 9,042 | | | | 4,249,387 | |
Royal Caribbean Cruises Ltd.
8.25%, 01/15/2029(a) | | | U.S.$ | | | | 7,127 | | | | 6,917,822 | |
11.50%, 06/01/2025(a) | | | | | | | 125 | | | | 132,500 | |
| | | | | | | | | | | | |
| | | | | | | | | | | 15,761,019 | |
| | | | | | | | | | | | |
Consumer Cyclical - Other – 0.1% | | | | | | | | | | | | |
Castle UK Finco PLC
5.571%, 05/15/2028(d) | | | EUR | | | | 130 | | | | 101,126 | |
NAC Aviation 29 DAC
4.75%, 06/30/2026(e)(h) | | | U.S.$ | | | | 4,914 | | | | 4,078,892 | |
Travel + Leisure Co.
6.625%, 07/31/2026(a) | | | | | | | 135 | | | | 127,000 | |
| | | | | | | | | | | | |
| | | | | | | | | | | 4,307,018 | |
| | | | | | | | | | | | |
Consumer Cyclical - Restaurants – 0.1% | | | | | | | | | | | | |
1011778 BC ULC/New Red Finance, Inc.
3.50%, 02/15/2029(a) | | | | | | | 1,309 | | | | 1,083,272 | |
Stonegate Pub Co. Financing 2019 PLC
8.25%, 07/31/2025(a) | | | GBP | | | | 5,175 | | | | 5,066,954 | |
| | | | | | | | | | | | |
| | | | | | | | | | | 6,150,226 | |
| | | | | | | | | | | | |
Consumer Cyclical - Retailers – 0.0% | | | | | | | | | |
Bath & Body Works, Inc.
5.25%, 02/01/2028 | | | U.S.$ | | | | 140 | | | | 121,912 | |
| | |
| |
62 | AB GLOBAL BOND FUND | | abfunds.com |
PORTFOLIO OF INVESTMENTS (continued)
| | | | | | | | | | | | |
| | | | | | Principal
Amount
(000) | | | U.S. $ Value | |
| |
Maxeda DIY Holding BV
5.875%, 10/01/2026(a) | | | EUR | | | | 100 | | | $ | 66,897 | |
| | | | | | | | | | | | |
| | | | | | | | | | | 188,809 | |
| | | | | | | | | | | | |
Consumer Non-Cyclical – 0.2% | | | | | | | | | | | | |
Albertsons Cos., Inc./Safeway, Inc./New Albertsons LP/Albertsons LLC
3.50%, 02/15/2023(a) | | | U.S.$ | | | | 3,143 | | | | 3,115,030 | |
5.875%, 02/15/2028(a) | | | | | | | 140 | | | | 129,151 | |
Cheplapharm Arzneimittel GmbH
4.375%, 01/15/2028(a) | | | EUR | | | | 100 | | | | 80,466 | |
Grifols Escrow Issuer SA
3.875%, 10/15/2028(a) | | | | | | | 3,339 | | | | 2,418,293 | |
Grifols SA
1.625%, 02/15/2025(a) | | | | | | | 2,846 | | | | 2,465,126 | |
| | | | | | | | | | | | |
| | | | | | | | | | | 8,208,066 | |
| | | | | | | | | | | | |
Services – 0.1% | | | | | | | | | | | | |
Verisure Holding AB
3.25%, 02/15/2027(a) | | | | | | | 8,815 | | | | 7,013,089 | |
| | | | | | | | | | | | |
| | | |
Technology – 0.0% | | | | | | | | | | | | |
Cedacri Mergeco SpA
4.946% (EURIBOR 3 Month + 4.62%), 05/15/2028(a)(d)(g) | | | | | | | 2,835 | | | | 2,580,507 | |
| | | | | | | | | | | | |
| | | |
Transportation - Services – 0.0% | | | | | | | | | | | | |
BCP V Modular Services Finance II PLC
4.75%, 11/30/2028(a) | | | | | | | 105 | | | | 82,777 | |
Kapla Holding SAS
4.25% (EURIBOR 3 Month + 3.25%), 12/15/2026(a)(d) | | | | | | | 100 | | | | 87,557 | |
| | | | | | | | | | | | |
| | | | | | | | | | | 170,334 | |
| | | | | | | | | | | | |
| | | | | | | | | | | 124,712,011 | |
| | | | | | | | | | | | |
Financial Institutions – 1.3% | | | | | | | | | | | | |
Banking – 0.9% | | | | | | | | | | | | |
Ally Financial, Inc.
Series C
4.70%, 05/15/2028(c) | | | U.S.$ | | | | 100 | | | | 71,250 | |
Banco Bilbao Vizcaya Argentaria SA
Series 9
6.50%, 03/05/2025(c) | | | | | | | 12,400 | | | | 10,786,964 | |
Credit Suisse Group AG
6.25%, 12/18/2024(a)(c) | | | | | | | 11,289 | | | | 9,682,313 | |
Intesa Sanpaolo SpA
5.017%, 06/26/2024(a) | | | | | | | 9,793 | | | | 9,188,685 | |
5.71%, 01/15/2026(a) | | | | | | | 5,580 | | | | 5,092,658 | |
Societe Generale SA
7.875%, 12/18/2023(a)(c) | | | | | | | 15,565 | | | | 14,845,119 | |
| | | | | | | | | | | | |
| | | | | | | | | | | 49,666,989 | |
| | | | | | | | | | | | |
| | |
| |
| abfunds.com | | AB GLOBAL BOND FUND | 63 |
PORTFOLIO OF INVESTMENTS (continued)
| | | | | | | | | | | | |
| | | | | | Principal
Amount
(000) | | | U.S. $ Value | |
| |
Finance – 0.1% | | | | | | | | | | | | |
Aircastle Ltd.
5.25%, 06/15/2026(a)(c) | | | U.S.$ | | | | 195 | | | $ | 147,137 | |
SLM Corp.
4.20%, 10/29/2025 | | | | | | | 6,276 | | | | 5,629,680 | |
| | | | | | | | | | | | |
| | | | | | | | | | | 5,776,817 | |
| | | | | | | | | | | | |
Other Finance – 0.1% | | | | | | | | | | | | |
Motion Finco SARL
7.00%, 05/15/2025(a) | | | EUR | | | | 5,545 | | | | 5,380,467 | |
| | | | | | | | | | | | |
| | | |
REITs – 0.2% | | | | | | | | | | | | |
Neinor Homes SA
4.50%, 10/15/2026(a) | | | | | | | 100 | | | | 82,108 | |
Via Celere Desarrollos Inmobiliarios SA
5.25%, 04/01/2026(a) | | | | | | | 100 | | | | 86,601 | |
Vivion Investments SARL
3.00%, 08/08/2024(a) | | | | | | | 400 | | | | 355,632 | |
3.00%, 08/08/2024(a)(g) | | | | | | | 7,600 | | | | 6,757,003 | |
3.50%, 11/01/2025(a) | | | | | | | 3,300 | | | | 2,868,501 | |
| | | | | | | | | | | | |
| | | | | | | | | | | 10,149,845 | |
| | | | | | | | | | | | |
| | | | | | | | | | | 70,974,118 | |
| | | | | | | | | | | | |
Utility – 0.1% | | | | | | | | | | | | |
Electric – 0.1% | | | | | | | | | | | | |
EDP – Energias de Portugal SA
Series NC5.
1.50%, 03/14/2082(a) | | | | | | | 6,200 | | | | 4,745,304 | |
Vistra Corp.
7.00%, 12/15/2026(a)(c) | | | U.S.$ | | | | 100 | | | | 87,435 | |
| | | | | | | | | | | | |
| | | | | | | | | | | 4,832,739 | |
| | | | | | | | | | | | |
Total Corporates - Non-Investment Grade
(cost $258,478,316) | | | | | | | | | | | 200,518,868 | |
| | | | | | | | | | | | |
| | | | | | | | | | | | |
COLLATERALIZED MORTGAGE OBLIGATIONS – 3.0% | | | | | | | | | | | | |
Risk Share Floating Rate – 2.9% | | | | | | | | | | | | |
Bellemeade Re Ltd.
Series 2018-1A, Class M2
5.984% (LIBOR 1 Month + 2.90%), 04/25/2028(a)(d) | | | | | | | 630 | | | | 627,525 | |
Series 2019-1A, Class M1B
4.834% (LIBOR 1 Month + 1.75%), 03/25/2029(a)(d) | | | | | | | 2,042 | | | | 2,039,260 | |
Series 2019-2A, Class M1C
5.084% (LIBOR 1 Month + 2.00%), 04/25/2029(a)(d) | | | | | | | 8,716 | | | | 8,653,826 | |
| | |
| |
64 | AB GLOBAL BOND FUND | | abfunds.com |
PORTFOLIO OF INVESTMENTS (continued)
| | | | | | | | | | |
| | | | | Principal
Amount
(000) | | | U.S. $ Value | |
| |
Series 2019-2A, Class M2
6.184% (LIBOR 1 Month + 3.10%), 04/25/2029(a)(d) | | U.S.$ | | | 5,800 | | | $ | 5,625,172 | |
Series 2019-3A, Class M1B
4.684% (LIBOR 1 Month + 1.60%), 07/25/2029(a)(d) | | | | | 2,215 | | | | 2,213,418 | |
Series 2019-3A, Class M1C
5.034% (LIBOR 1 Month + 1.95%), 07/25/2029(a)(d) | | | | | 10,500 | | | | 10,373,782 | |
Series 2019-4A, Class M1C
5.584% (LIBOR 1 Month + 2.50%), 10/25/2029(a)(d) | | | | | 5,676 | | | | 5,660,793 | |
Series 2020-3A, Class M1C
6.784% (LIBOR 1 Month + 3.70%), 10/25/2030(a)(d) | | | | | 4,776 | | | | 4,788,848 | |
Series 2021-3A, Class A2
3.281% (SOFR + 1.00%), 09/25/2031(a)(d) | | | | | 7,225 | | | | 6,682,849 | |
Connecticut Avenue Securities Trust
Series 2019-R02, Class 1M2
5.384% (LIBOR 1 Month + 2.30%), 08/25/2031(a)(d) | | | | | 355 | | | | 354,052 | |
Series 2019-R03, Class 1M2
5.234% (LIBOR 1 Month + 2.15%), 09/25/2031(a)(d) | | | | | 265 | | | | 263,897 | |
Series 2019-R06, Class 2M2
5.184% (LIBOR 1 Month + 2.10%), 09/25/2039(a)(d) | | | | | 200 | | | | 200,056 | |
Series 2019-R07, Class 1M2
5.184% (LIBOR 1 Month + 2.10%), 10/25/2039(a)(d) | | | | | 730 | | | | 726,061 | |
Series 2020-R01, Class 1M2
5.134% (LIBOR 1 Month + 2.05%), 01/25/2040(a)(d) | | | | | 2,450 | | | | 2,414,171 | |
Series 2021-R01, Class 1M1
3.031% (SOFR + 0.75%), 10/25/2041(a)(d) | | | | | 407 | | | | 402,114 | |
Series 2021-R01, Class 1M2
3.831% (SOFR + 1.55%), 10/25/2041(a)(d) | | | | | 878 | | | | 831,165 | |
Eagle Re Ltd.
Series 2018-1, Class M1
4.784% (LIBOR 1 Month + 1.70%), 11/25/2028(a)(d) | | | | | 4,843 | | | | 4,804,877 | |
Series 2021-2, Class M1B
4.331% (SOFR + 2.05%), 04/25/2034(a)(d) | | | | | 3,700 | | | | 3,597,525 | |
| | |
| |
| abfunds.com | | AB GLOBAL BOND FUND | 65 |
PORTFOLIO OF INVESTMENTS (continued)
| | | | | | | | | | |
| | | | | Principal
Amount
(000) | | | U.S. $ Value | |
| |
Federal Home Loan Mortgage Corp. Structured Agency Credit Risk Debt Notes
Series 2013-DN2, Class M2
7.334% (LIBOR 1 Month + 4.25%), 11/25/2023(d) | | U.S.$ | | | 4,127 | | | $ | 4,174,883 | |
Series 2015-DNA1, Class M3
6.384% (LIBOR 1 Month + 3.30%), 10/25/2027(d) | | | | | 3,401 | | | | 3,432,422 | |
Series 2019-DNA3, Class M2
5.134% (LIBOR 1 Month + 2.05%), 07/25/2049(a)(d) | | | | | 777 | | | | 765,507 | |
Series 2019-DNA4, Class M2
5.034% (LIBOR 1 Month + 1.95%), 10/25/2049(a)(d) | | | | | 600 | | | | 596,784 | |
Series 2020-DNA1, Class M2
4.784% (LIBOR 1 Month + 1.70%), 01/25/2050(a)(d) | | | | | 409 | | | | 405,100 | |
Series 2020-HQA2, Class M2
6.184% (LIBOR 1 Month + 3.10%), 03/25/2050(a)(d) | | | | | 1,917 | | | | 1,942,677 | |
Series 2021-DNA5, Class M2
3.931% (SOFR + 1.65%), 01/25/2034(a)(d) | | | | | 3,518 | | | | 3,431,019 | |
Series 2021-DNA6, Class M1
3.081% (SOFR + 0.80%), 10/25/2041(a)(d) | | | | | 730 | | | | 714,810 | |
Series 2021-DNA6, Class M2
3.781% (SOFR + 1.50%), 10/25/2041(a)(d) | | | | | 11,395 | | | | 10,341,095 | |
Series 2021-DNA7, Class M2
4.081% (SOFR + 1.80%), 11/25/2041(a)(d) | | | | | 13,277 | | | | 11,899,593 | |
Series 2021-HQA4, Class M1
3.231% (SOFR + 0.95%), 12/25/2041(a)(d) | | | | | 7,011 | | | | 6,780,924 | |
Series 2021-HQA4, Class M2
4.631% (SOFR + 2.35%), 12/25/2041(a)(d) | | | | | 6,919 | | | | 5,881,139 | |
Federal National Mortgage Association Connecticut Avenue Securities
Series 2013-C01, Class M2
8.334% (LIBOR 1 Month + 5.25%), 10/25/2023(d) | | | | | 104 | | | | 106,634 | |
Series 2014-C01, Class M2
7.484% (LIBOR 1 Month + 4.40%), 01/25/2024(d) | | | | | 429 | | | | 435,266 | |
| | |
| |
66 | AB GLOBAL BOND FUND | | abfunds.com |
PORTFOLIO OF INVESTMENTS (continued)
| | | | | | | | | | |
| | | | | Principal
Amount
(000) | | | U.S. $ Value | |
| |
Series 2014-C04, Class 1M2
7.984% (LIBOR 1 Month + 4.90%), 11/25/2024(d) | | U.S.$ | | | 1,445 | | | $ | 1,493,713 | |
Series 2014-C04, Class 2M2
8.084% (LIBOR 1 Month + 5.00%), 11/25/2024(d) | | | | | 653 | | | | 657,164 | |
Series 2015-C01, Class 1M2
7.384% (LIBOR 1 Month + 4.30%), 02/25/2025(d) | | | | | 1,854 | | | | 1,892,086 | |
Series 2015-C02, Class 1M2
7.084% (LIBOR 1 Month + 4.00%), 05/25/2025(d) | | | | | 1,631 | | | | 1,656,098 | |
Series 2015-C03, Class 1M2
8.084% (LIBOR 1 Month + 5.00%), 07/25/2025(d) | | | | | 373 | | | | 380,307 | |
Series 2015-C04, Class 1M2
8.784% (LIBOR 1 Month + 5.70%), 04/25/2028(d) | | | | | 1,079 | | | | 1,116,698 | |
Series 2015-C04, Class 2M2
8.634% (LIBOR 1 Month + 5.55%), 04/25/2028(d) | | | | | 5,522 | | | | 5,653,560 | |
Series 2016-C01, Class 2M2
10.034% (LIBOR 1 Month + 6.95%), 08/25/2028(d) | | | | | 851 | | | | 878,325 | |
Series 2016-C02, Class 1M2
9.084% (LIBOR 1 Month + 6.00%), 09/25/2028(d) | | | | | 2,375 | | | | 2,459,793 | |
Series 2018-C01, Class 1B1
6.634% (LIBOR 1 Month + 3.55%), 07/25/2030(d) | | | | | 1,487 | | | | 1,481,476 | |
Series 2021-R02, Class 2M2
4.281% (SOFR + 2.00%), 11/25/2041(a)(d) | | | | | 7,361 | | | | 6,580,295 | |
JPMorgan Madison Avenue Securities Trust
Series 2015-CH1, Class M2
8.584% (LIBOR 1 Month + 5.50%), 10/25/2025(d)(f) | | | | | 1,601 | | | | 1,564,669 | |
PMT Credit Risk Transfer Trust
Series 2019-2R, Class A
5.86%, 05/27/2023 | | | | | 5,045 | | | | 4,841,397 | |
Series 2019-3R, Class A
5.813% (LIBOR 1 Month + 2.70%), 10/27/2022(a)(d) | | | | | 368 | | | | 354,234 | |
Radnor Re Ltd.
Series 2019-1, Class M1B
5.034% (LIBOR 1 Month + 1.95%), 02/25/2029(a)(d) | | | | | 4,623 | | | | 4,567,674 | |
| | |
| |
| abfunds.com | | AB GLOBAL BOND FUND | 67 |
PORTFOLIO OF INVESTMENTS (continued)
| | | | | | | | | | | | |
| | | | | | Principal
Amount
(000) | | | U.S. $ Value | |
| |
Series 2019-2, Class M1B
4.834% (LIBOR 1 Month + 1.75%), 06/25/2029(a)(d) | | | U.S.$ | | | | 3,293 | | | $ | 3,285,558 | |
Traingle Re Ltd.
Series 2021-3, Class M1A
4.181% (SOFR + 1.90%), 02/25/2034(a)(d) | | | | | | | 9,778 | | | | 9,599,695 | |
| | | | | | | | | | | | |
| | | | | | | | | | | 159,629,986 | |
| | | | | | | | | | | | |
Non-Agency Fixed Rate – 0.1% | | | | | | | | | | | | |
Alternative Loan Trust
Series 2006-24CB, Class A15
5.75%, 08/25/2036 | | | | | | | 1,327 | | | | 766,455 | |
Series 2006-26CB, Class A6
6.25%, 09/25/2036 | | | | | | | 114 | | | | 64,027 | |
Series 2006-26CB, Class A8
6.25%, 09/25/2036 | | | | | | | 426 | | | | 239,182 | |
Series 2006-J1, Class 1A11
5.50%, 02/25/2036 | | | | | | | 678 | | | | 493,481 | |
Series 2007-15CB, Class A19
5.75%, 07/25/2037 | | | | | | | 265 | | | | 170,555 | |
CHL Mortgage Pass-Through Trust
Series 2007-3, Class A30
5.75%, 04/25/2037 | | | | | | | 793 | | | | 421,393 | |
Series 2007-HY4, Class 1A1
3.339%, 09/25/2047 | | | | | | | 240 | | | | 215,186 | |
Citigroup Mortgage Loan Trust
Series 2007-AR4, Class 1A1A
3.328%, 03/25/2037 | | | | | | | 122 | | | | 108,008 | |
CSMC Mortgage-Backed Trust
Series 2006-7, Class 3A12
6.25%, 08/25/2036 | | | | | | | 491 | | | | 223,749 | |
Residential Accredit Loans, Inc. Trust
Series 2005-QS14, Class 3A1
6.00%, 09/25/2035 | | | | | | | 540 | | | | 466,274 | |
Wells Fargo Mortgage Backed Securities Trust
Series 2007-AR7, Class A1
3.24%, 12/28/2037 | | | | | | | 834 | | | | 761,051 | |
| | | | | | | | | | | | |
| | | | | | | | | | | 3,929,361 | |
| | | | | | | | | | | | |
Non-Agency Floating Rate – 0.0% | | | | | | | | | | | | |
First Horizon Alternative Mortgage Securities Trust
Series 2007-FA2, Class 1A10
3.334% (LIBOR 1 Month + 0.25%), 04/25/2037(d) | | | | | | | 533 | | | | 142,433 | |
| | | | | | | | | | | | |
| | | |
Total Collateralized Mortgage Obligations
(cost $170,750,188) | | | | | | | | | | | 163,701,780 | |
| | | | | | | | | | | | |
| | |
| |
68 | AB GLOBAL BOND FUND | | abfunds.com |
PORTFOLIO OF INVESTMENTS (continued)
| | | | | | | | | | | | |
| | | | | | Principal
Amount
(000) | | | U.S. $ Value | |
| |
INFLATION-LINKED SECURITIES – 2.9% | | | | | | | | | | | | |
United States – 2.9% | | | | | | | | | | | | |
U.S. Treasury Inflation Index
0.125%, 07/15/2024 (TIPS) | | | U.S.$ | | | | 66,582 | | | $ | 64,251,963 | |
0.125%, 10/15/2026 (TIPS) | | | | | | | 101,588 | | | | 94,656,315 | |
| | | | | | | | | | | | |
| | | |
Total Inflation-Linked Securities
(cost $169,759,338) | | | | | | | | | | | 158,908,278 | |
| | | | | | | | | | | | |
| | | | | | | | | | | | |
COMMERCIAL MORTGAGE-BACKED SECURITIES – 1.9% | | | | | | | | | | | | |
Non-Agency Floating Rate CMBS – 1.5% | | | | | | | | | | | | |
Ashford Hospitality Trust
Series 2018-KEYS, Class A
3.818% (LIBOR 1 Month + 1.00%), 06/15/2035(a)(d) | | | | | | | 14,000 | | | | 13,559,311 | |
BAMLL Commercial Mortgage Securities Trust
Series 2017-SCH, Class AF
3.818% (LIBOR 1 Month + 1.00%), 11/15/2033(a)(d) | | | | | | | 6,275 | | | | 5,910,557 | |
BHMS
Series 2018-ATLS, Class A
4.068% (LIBOR 1 Month + 1.25%), 07/15/2035(a)(d) | | | | | | | 13,884 | | | | 13,405,321 | |
BHP Trust
Series 2019-BXHP, Class C
4.34% (LIBOR 1 Month + 1.52%), 08/15/2036(a)(d) | | | | | | | 5,180 | | | | 4,945,573 | |
BX Trust
Series 2018-EXCL, Class A
3.906% (LIBOR 1 Month + 1.09%), 09/15/2037(a)(d) | | | | | | | 1,467 | | | | 1,436,295 | |
DBWF Mortgage Trust
Series 2018-GLKS, Class A
4.023% (LIBOR 1 Month + 1.03%), 12/19/2030(a)(d) | | | | | | | 18,535 | | | | 18,010,452 | |
GS Mortgage Securities Corp. Trust
Series 2019-SMP, Class D
4.768% (LIBOR 1 Month + 1.95%), 08/15/2032(a)(d) | | | | | | | 5,035 | | | | 4,756,474 | |
Natixis Commercial Mortgage Securities Trust
Series 2019-MILE, Class A
4.318% (LIBOR 1 Month + 1.50%), 07/15/2036(a)(d) | | | | | | | 12,593 | | | | 12,387,200 | |
| | |
| |
| abfunds.com | | AB GLOBAL BOND FUND | 69 |
PORTFOLIO OF INVESTMENTS (continued)
| | | | | | | | | | | | |
| | | | | | Principal
Amount
(000) | | | U.S. $ Value | |
| |
Series 2022-JERI, Class A
4.247% (SOFR + 1.40%), 01/15/2039(a)(d) | | | U.S.$ | | | | 8,113 | | | $ | 7,796,428 | |
| | | | | | | | | | | | |
| | | | | | | | | | | 82,207,611 | |
| | | | | | | | | | | | |
Non-Agency Fixed Rate CMBS – 0.4% | | | | | | | | | | | | |
225 Liberty Street Trust
Series 2016-225L, Class E
4.804%, 02/10/2036(a) | | | | | | | 9,098 | | | | 7,755,864 | |
Commercial Mortgage Trust
Series 2012-CR3, Class D
4.894%, 10/15/2045(a) | | | | | | | 2,322 | | | | 1,810,851 | |
Series 2013-SFS, Class A1
1.873%, 04/12/2035(a) | | | | | | | 314 | | | | 310,425 | |
GS Mortgage Securities Trust
Series 2011-GC5, Class D
5.302%, 08/10/2044(a) | | | | | | | 205 | | | | 87,001 | |
Series 2013-G1, Class A2
3.557%, 04/10/2031(a) | | | | | | | 2,569 | | | | 2,548,286 | |
JPMBB Commercial Mortgage Securities Trust
Series 2014-C21, Class B
4.341%, 08/15/2047 | | | | | | | 6,329 | | | | 5,887,058 | |
| | | | | | | | | | | | |
| | | | | | | | | | | 18,399,485 | |
| | | | | | | | | | | | |
Total Commercial Mortgage-Backed Securities
(cost $104,659,476) | | | | | | | | | | | 100,607,096 | |
| | | | | | | | | | | | |
| | | | | | | | | | | | |
COVERED BONDS – 1.8% | | | | | | | | | | | | |
Bank of Montreal
0.125%, 01/26/2027(a) | | | EUR | | | | 17,195 | | | | 14,875,184 | |
Bank of Nova Scotia (The)
0.01%, 01/14/2027(a) | | | | | | | 17,880 | | | | 15,405,258 | |
0.01%, 12/15/2027(a) | | | | | | | 400 | | | | 333,948 | |
BPCE SFH SA
0.125%, 03/31/2025(a) | | | | | | | 300 | | | | 275,235 | |
Commonwealth Bank of Australia
0.125%, 10/15/2029(a) | | | | | | | 17,890 | | | | 14,142,357 | |
DNB Boligkreditt AS
0.625%, 06/19/2025(a) | | | | | | | 4,751 | | | | 4,392,973 | |
National Australia Bank Ltd.
0.01%, 01/06/2029(a) | | | | | | | 17,865 | | | | 14,363,626 | |
National Bank of Canada
0.01%, 09/29/2026(a) | | | | | | | 7,000 | | | | 6,099,151 | |
National Westminster Bank PLC
0.50%, 05/15/2024(a) | | | | | | | 310 | | | | 293,280 | |
Nationwide Building Society
0.625%, 03/25/2027(a) | | | | | | | 4,570 | | | | 4,033,414 | |
| | |
| |
70 | AB GLOBAL BOND FUND | | abfunds.com |
PORTFOLIO OF INVESTMENTS (continued)
| | | | | | | | | | | | |
| | | | | | Principal
Amount
(000) | | | U.S. $ Value | |
| |
Royal Bank of Canada
0.01%, 01/21/2027(a) | | | EUR | | | | 3,100 | | | $ | 2,669,239 | |
0.125%, 04/26/2027(a) | | | | | | | 20,240 | | | | 17,362,253 | |
Skandinaviska Enskilda Banken AB
0.375%, 02/09/2026(a) | | | | | | | 320 | | | | 288,683 | |
Societe Generale SFH SA
0.01%, 12/02/2026(a) | | | | | | | 600 | | | | 521,756 | |
Stadshypotek AB
0.375%, 03/13/2026(a) | | | | | | | 320 | | | | 288,090 | |
| | | | | | | | | | | | |
| | | |
Total Covered Bonds
(cost $117,104,814) | | | | | | | | | | | 95,344,447 | |
| | | | | | | | | | | | |
| | | | | | | | | | | | |
COLLATERALIZED LOAN OBLIGATIONS – 1.6% | | | | | | | | | | | | |
CLO - Floating Rate – 1.6% | | | | | | | | | | | | |
AGL CLO 16 Ltd.
Series 2021-16A, Class A
3.84% (LIBOR 3 Month + 1.13%), 01/20/2035(a)(d) | | | U.S.$ | | | | 700 | | | | 662,225 | |
Balboa Bay Loan Funding Ltd.
Series 2021-1A, Class B
4.36% (LIBOR 3 Month + 1.65%), 07/20/2034(a)(d) | | | | | | | 1,600 | | | | 1,484,592 | |
Crown Point CLO 11 Ltd.
Series 2021-11A, Class D
6.34% (LIBOR 3 Month + 3.60%), 01/17/2034(a)(d) | | | | | | | 500 | | | | 448,582 | |
Kings Park CLO Ltd.
Series 2021-1A, Class A
3.862% (LIBOR 3 Month + 1.13%), 01/21/2035(a)(d) | | | | | | | 700 | | | | 666,983 | |
Marble Point CLO XI Ltd.
Series 2017-2A, Class A
3.92% (LIBOR 3 Month + 1.18%), 12/18/2030(a)(d) | | | | | | | 17,519 | | | | 16,888,571 | |
Neuberger Berman Loan Advisers Euro CLO 3 DAC
Series 2022-3A, Class D
3.20% (EURIBOR 3 Month + 3.20%), 10/25/2034(a)(d) | | | EUR | | | | 437 | | | | 334,937 | |
New Mountain CLO 3 Ltd.
Series CLO-3A, Class B1
4.41% (LIBOR 3 Month + 1.70%), 10/20/2034(a)(d) | | | U.S.$ | | | | 5,734 | | | | 5,255,530 | |
| | |
| |
| abfunds.com | | AB GLOBAL BOND FUND | 71 |
PORTFOLIO OF INVESTMENTS (continued)
| | | | | | | | | | | | |
| | | | | | Principal
Amount
(000) | | | U.S. $ Value | |
| |
OCP CLO Ltd.
Series 2020-18A, Class AR
3.80% (LIBOR 3 Month + 1.09%), 07/20/2032(a)(d) | | | U.S.$ | | | | 3,453 | | | $ | 3,337,001 | |
Octagon Loan Funding Ltd.
Series 2014-1A, Class ARR
4.141% (LIBOR 3 Month + 1.18%), 11/18/2031(a)(d) | | | | | | | 8,984 | | | | 8,709,792 | |
OZLM XVIII Ltd.
Series 2018-18A, Class A
3.532% (LIBOR 3 Month + 1.02%), 04/15/2031(a)(d) | | | | | | | 17,040 | | | | 16,393,741 | |
Peace Park CLO Ltd.
Series 2021-1A, Class A
3.84% (LIBOR 3 Month + 1.13%), 10/20/2034(a)(d) | | | | | | | 4,620 | | | | 4,430,520 | |
Pikes Peak CLO 8
Series 2021-8A, Class A
3.88% (LIBOR 3 Month + 1.17%), 07/20/2034(a)(d) | | | | | | | 14,279 | | | | 13,668,014 | |
Regatta XXIV Funding Ltd.
Series 2021-5A, Class A1
3.86% (LIBOR 3 Month + 1.15%), 01/20/2035(a)(d) | | | | | | | 450 | | | | 427,374 | |
Rockford Tower CLO Ltd.
Series 2018-2A, Class A
3.87% (LIBOR 3 Month + 1.16%), 10/20/2031(a)(d) | | | | | | | 8,500 | | | | 8,241,626 | |
TIAA CLO IV Ltd.
Series 2018-1A, Class A1A
3.94% (LIBOR 3 Month + 1.23%), 01/20/2032(a)(d) | | | | | | | 4,510 | | | | 4,402,540 | |
| | | | | | | | | | | | |
| | | |
Total Collateralized Loan Obligations
(cost $89,061,243) | | | | | | | | | | | 85,352,028 | |
| | | | | | | | | | | | |
| | | | | | | | | | | | |
GOVERNMENTS - SOVEREIGN BONDS – 1.5% | | | | | | | | | | | | |
Chile – 0.0% | | | | | | | | | | | | |
Chile Government International Bond
2.45%, 01/31/2031 | | | | | | | 250 | | | | 199,656 | |
2.55%, 01/27/2032 | | | | | | | 250 | | | | 195,594 | |
3.10%, 05/07/2041 | | | | | | | 825 | | | | 559,350 | |
3.10%, 01/22/2061 | | | | | | | 280 | | | | 161,753 | |
| | | | | | | | | | | | |
| | | | | | | | | | | 1,116,353 | |
| | | | | | | | | | | | |
| | |
| |
72 | AB GLOBAL BOND FUND | | abfunds.com |
PORTFOLIO OF INVESTMENTS (continued)
| | | | | | | | | | | | |
| | | | | | Principal
Amount
(000) | | | U.S. $ Value | |
| |
Colombia – 0.2% | | | | | | | | | | | | |
Colombia Government International Bond
3.875%, 04/25/2027 | | | U.S.$ | | | | 9,941 | | | $ | 8,423,755 | |
| | | | | | | | | | | | |
| | | |
France – 0.5% | | | | | | | | | | | | |
Dexia Credit Local SA
Zero Coupon, 01/21/2028(a) | | | EUR | | | | 22,100 | | | | 18,549,121 | |
0.01%, 01/22/2027(a) | | | | | | | 7,200 | | | | 6,242,161 | |
| | | | | | | | | | | | |
| | | | | | | | | | | 24,791,282 | |
| | | | | | | | | | | | |
Germany – 0.4% | | | | | | | | | | | | |
Kreditanstalt fuer Wiederaufbau
3.20%, 09/11/2026 | | | AUD | | | | 1,008 | | | | 618,557 | |
Landwirtschaftliche Rentenbank
Zero Coupon, 11/27/2029(a) | | | EUR | | | | 24,583 | | | | 19,749,820 | |
| | | | | | | | | | | | |
| | | | | | | | | | | 20,368,377 | |
| | | | | | | | | | | | |
Hungary – 0.0% | | | | | | | | | | | | |
Hungary Government International Bond
2.125%, 09/22/2031(a) | | | U.S.$ | | | | 673 | | | | 462,183 | |
3.125%, 09/21/2051(a) | | | | | | | 200 | | | | 106,413 | |
5.25%, 06/16/2029(a) | | | | | | | 310 | | | | 279,542 | |
| | | | | | | | | | | | |
| | | | | | | | | | | 848,138 | |
| | | | | | | | | | | | |
Indonesia – 0.3% | | | | | | | | | | | | |
Indonesia Government International Bond
1.00%, 07/28/2029 | | | EUR | | | | 5,330 | | | | 4,068,910 | |
2.15%, 07/28/2031 | | | U.S.$ | | | | 1,030 | | | | 808,663 | |
3.20%, 09/23/2061 | | | | | | | 640 | | | | 398,470 | |
3.375%, 07/30/2025(a) | | | EUR | | | | 10,564 | | | | 10,141,654 | |
3.55%, 03/31/2032 | | | U.S.$ | | | | 200 | | | | 173,522 | |
4.125%, 01/15/2025(a) | | | | | | | 590 | | | | 577,020 | |
4.30%, 03/31/2052 | | | | | | | 200 | | | | 155,022 | |
| | | | | | | | | | | | |
| | | | | | | | | | | 16,323,261 | |
| | | | | | | | | | | | |
Mexico – 0.0% | | | | | | | | | | | | |
Mexico Government International Bond
2.659%, 05/24/2031 | | | | | | | 400 | | | | 306,800 | |
4.28%, 08/14/2041 | | | | | | | 500 | | | | 363,375 | |
| | | | | | | | | | | | |
| | | | | | | | | | | 670,175 | |
| | | | | | | | | | | | |
Panama – 0.0% | | | | | | | | | | | | |
Panama Bonos del Tesoro
Series DOM
3.362%, 06/30/2031 | | | | | | | 500 | | | | 411,562 | |
Panama Government International Bond
2.252%, 09/29/2032 | | | | | | | 408 | | | | 285,422 | |
3.87%, 07/23/2060 | | | | | | | 400 | | | | 236,800 | |
3.875%, 03/17/2028 | | | | | | | 920 | | | | 833,635 | |
| | | | | | | | | | | | |
| | | | | | | | | | | 1,767,419 | |
| | | | | | | | | | | | |
| | |
| |
| abfunds.com | | AB GLOBAL BOND FUND | 73 |
PORTFOLIO OF INVESTMENTS (continued)
| | | | | | | | | | | | |
| | | | | | Principal
Amount
(000) | | | U.S. $ Value | |
| |
Peru – 0.0% | | | | | | | | | | | | |
Peruvian Government International Bond
2.392%, 01/23/2026 | | | U.S.$ | | | | 380 | | | $ | 344,327 | |
2.78%, 12/01/2060 | | | | | | | 210 | | | | 112,521 | |
| | | | | | | | | | | | |
| | | | | | | | | | | 456,848 | |
| | | | | | | | | | | | |
Philippines – 0.1% | | | | | | | | | | | | |
Philippine Government International Bond
1.95%, 01/06/2032 | | | | | | | 1,660 | | | | 1,278,382 | |
3.229%, 03/29/2027 | | | | | | | 205 | | | | 191,185 | |
3.556%, 09/29/2032 | | | | | | | 205 | | | | 178,885 | |
4.20%, 03/29/2047 | | | | | | | 205 | | | | 159,234 | |
| | | | | | | | | | | | |
| | | | | | | | | | | 1,807,686 | |
| | | | | | | | | | | | |
Qatar – 0.0% | | | | | | | | | | | | |
Qatar Government International Bond
3.75%, 04/16/2030(a) | | | | | | | 1,110 | | | | 1,039,237 | |
4.40%, 04/16/2050(a) | | | | | | | 490 | | | | 428,750 | |
| | | | | | | | | | | | |
| | | | | | | | | | | 1,467,987 | |
| | | | | | | | | | | | |
Romania – 0.0% | | | | | | | | | | | | |
Romanian Government International Bond
2.875%, 04/13/2042(a) | | | EUR | | | | 300 | | | | 150,371 | |
3.00%, 02/14/2031(a) | | | U.S.$ | | | | 250 | | | | 177,156 | |
3.625%, 03/27/2032(a) | | | | | | | 256 | | | | 184,368 | |
5.25%, 11/25/2027(a) | | | | | | | 694 | | | | 628,070 | |
| | | | | | | | | | | | |
| | | | | | | | | | | 1,139,965 | |
| | | | | | | | | | | | |
Saudi Arabia – 0.0% | | | | | | | | | | | | |
Saudi Government International Bond
3.45%, 02/02/2061(a) | | | | | | | 335 | | | | 226,963 | |
3.625%, 03/04/2028(a) | | | | | | | 370 | | | | 349,187 | |
3.75%, 01/21/2055(a) | | | | | | | 970 | | | | 717,800 | |
5.00%, 04/17/2049(a) | | | | | | | 407 | | | | 366,300 | |
| | | | | | | | | | | | |
| | | | | | | | | | | 1,660,250 | |
| | | | | | | | | | | | |
Uruguay – 0.0% | | | | | | | | | | | | |
Uruguay Government International Bond
4.375%, 10/27/2027 | | | | | | | 260 | | | | 255,905 | |
4.375%, 01/23/2031 | | | | | | | 430 | | | | 411,134 | |
| | | | | | | | | | | | |
| | | | | | | | | | | 667,039 | |
| | | | | | | | | | | | |
Total Governments - Sovereign Bonds
(cost $97,382,316) | | | | | | | | | | | 81,508,535 | |
| | | | | | | | | | | | |
| | | | | | | | | | | | |
QUASI-SOVEREIGNS – 1.5% | | | | | | | | | | | | |
Quasi-Sovereign Bonds – 1.5% | | | | | | | | | | | | |
Chile – 0.0% | | | | | | | | | | | | |
Empresa de Transporte de Pasajeros Metro SA
3.65%, 05/07/2030(a) | | | | | | | 370 | | | | 319,194 | |
| | |
| |
74 | AB GLOBAL BOND FUND | | abfunds.com |
PORTFOLIO OF INVESTMENTS (continued)
| | | | | | | | | | | | |
| | | | | | Principal
Amount
(000) | | | U.S. $ Value | |
| |
4.70%, 05/07/2050(a) | | | U.S.$ | | | | 370 | | | $ | 276,982 | |
| | | | | | | | | | | | |
| | | | | | | | | | | 596,176 | |
| | | | | | | | | | | | |
China – 1.1% | | | | | | | | | | | | |
China Development Bank
Series 1904
3.68%, 02/26/2026 | | | CNY | | | | 388,280 | | | | 56,773,373 | |
CNAC HK Finbridge Co., Ltd.
3.00%, 09/22/2030(a) | | | U.S.$ | | | | 800 | | | | 645,292 | |
4.875%, 03/14/2025(a) | | | | | | | 230 | | | | 225,986 | |
| | | | | | | | | | | | |
| | | | | | | | | | | 57,644,651 | |
| | | | | | | | | | | | |
Hong Kong – 0.0% | | | | | | | | | | | | |
Airport Authority
2.10%, 03/08/2026(a)(c) | | | | | | | 250 | | | | 223,172 | |
3.50%, 01/12/2062(a) | | | | | | | 350 | | | | 252,941 | |
| | | | | | | | | | | | |
| | | | | | | | | | | 476,113 | |
| | | | | | | | | | | | |
India – 0.0% | | | | | | | | | | | | |
Indian Railway Finance Corp. Ltd.
3.249%, 02/13/2030(a) | | | | | | | 250 | | | | 204,422 | |
| | | | | | | | | | | | |
| | | |
Indonesia – 0.0% | | | | | | | | | | | | |
Pertamina Persero PT
1.40%, 02/09/2026(a) | | | | | | | 770 | | | | 660,360 | |
4.15%, 02/25/2060(a) | | | | | | | 410 | | | | 264,014 | |
Perusahaan Perseroan Persero PT Perusahaan Listrik Negara
4.125%, 05/15/2027(a) | | | | | | | 460 | | | | 424,074 | |
| | | | | | | | | | | | |
| | | | | | | | | | | 1,348,448 | |
| | | | | | | | | | | | |
Kazakhstan – 0.0% | | | | | | | | | | | | |
Development Bank of Kazakhstan JSC
5.75%, 05/12/2025(a) | | | | | | | 310 | | | | 308,314 | |
Fund of National Welfare Samruk-Kazyna JSC
2.00%, 10/28/2026(a) | | | | | | | 473 | | | | 399,183 | |
KazMunayGas National Co. JSC
3.50%, 04/14/2033(a) | | | | | | | 240 | | | | 157,080 | |
| | | | | | | | | | | | |
| | | | | | | | | | | 864,577 | |
| | | | | | | | | | | | |
Malaysia – 0.0% | | | | | | | | | | | | |
Petronas Capital Ltd.
2.48%, 01/28/2032(a) | | | | | | | 1,000 | | | | 812,200 | |
| | | | | | | | | | | | |
| | | |
Mexico – 0.3% | | | | | | | | | | | | |
Comision Federal de Electricidad
3.348%, 02/09/2031(a) | | | | | | | 13,250 | | | | 9,534,203 | |
4.677%, 02/09/2051(a) | | | | | | | 430 | | | | 250,152 | |
4.688%, 05/15/2029(a) | | | | | | | 1,010 | | | | 841,646 | |
| | |
| |
| abfunds.com | | AB GLOBAL BOND FUND | 75 |
PORTFOLIO OF INVESTMENTS (continued)
| | | | | | | | | | | | |
| | | | | | Principal
Amount
(000) | | | U.S. $ Value | |
| |
5.00%, 09/29/2036(a) | | | U.S.$ | | | | 3,441 | | | $ | 2,649,416 | |
| | | | | | | | | | | | |
| | | | | | | | | | | 13,275,417 | |
| | | | | | | | | | | | |
Panama – 0.0% | | | | | | | | | | | | |
Aeropuerto Internacional de Tocumen SA
5.125%, 08/11/2061(a) | | | | | | | 240 | | | | 170,970 | |
Banco Nacional de Panama
2.50%, 08/11/2030(a) | | | | | | | 580 | | | | 423,509 | |
| | | | | | | | | | | | |
| | | | | | | | | | | 594,479 | |
| | | | | | | | | | | | |
Qatar – 0.0% | | | | | | | | | | | | |
Qatar Energy
2.25%, 07/12/2031(a) | | | | | | | 540 | | | | 434,700 | |
3.30%, 07/12/2051(a) | | | | | | | 500 | | | | 352,281 | |
| | | | | | | | | | | | |
| | | | | | | | | | | 786,981 | |
| | | | | | | | | | | | |
United Arab Emirates – 0.1% | | | | | | | | | | | | |
Abu Dhabi Crude Oil Pipeline LLC
3.65%, 11/02/2029(a) | | | | | | | 270 | | | | 249,345 | |
4.60%, 11/02/2047(a) | | | | | | | 250 | | | | 221,141 | |
Abu Dhabi Ports Co. PJSC
2.50%, 05/06/2031(a) | | | | | | | 500 | | | | 403,125 | |
DP World Crescent Ltd.
3.75%, 01/30/2030(a) | | | | | | | 200 | | | | 179,163 | |
DP World Ltd./United Arab Emirates
4.70%, 09/30/2049(a) | | | | | | | 440 | | | | 331,045 | |
MDGH GMTN RSC Ltd.
3.70%, 11/07/2049(a) | | | | | | | 520 | | | | 399,847 | |
Series G
2.50%, 06/03/2031(a) | | | | | | | 690 | | | | 567,870 | |
| | | | | | | | | | | | |
| | | | | | | | | | | 2,351,536 | |
| | | | | | | | | | | | |
Total Quasi-Sovereigns
(cost $83,725,797) | | | | | | | | | | | 78,955,000 | |
| | | | | | | | | | | | |
| | | | | | | | | | | | |
SUPRANATIONALS – 0.9% | | | | | | | | | | | | |
Supranational – 0.9% | | | | | | | | | | | | |
European Investment Bank
0.50%, 06/21/2023 | | | AUD | | | | 3,200 | | | | 1,999,546 | |
0.75%, 07/15/2027 | | | | | | | 15,292 | | | | 8,210,369 | |
1.80%, 01/19/2027 | | | | | | | 19,295 | | | | 11,088,557 | |
Inter-American Development Bank
2.50%, 04/14/2027(a) | | | | | | | 2,505 | | | | 1,466,626 | |
2.70%, 01/29/2026 | | | | | | | 2,485 | | | | 1,503,892 | |
International Bank for Reconstruction & Development
Zero Coupon, 01/15/2027 | | | EUR | | | | 14,647 | | | | 12,760,740 | |
Series GDIF
0.01%, 04/24/2028 | | | | | | | 7,398 | | | | 6,192,824 | |
| | |
| |
76 | AB GLOBAL BOND FUND | | abfunds.com |
PORTFOLIO OF INVESTMENTS (continued)
| | | | | | | | | | | | |
| | | | | | Principal
Amount
(000) | | | U.S. $ Value | |
| |
Nordic Investment Bank
4.75%, 02/28/2024 | | | AUD | | | | 6,590 | | | $ | 4,254,812 | |
| | | | | | | | | | | | |
| | | |
Total Supranationals
(cost $57,738,705) | | | | | | | | | | | 47,477,366 | |
| | | | | | | | | | | | |
| | | | | | | | | | | | |
LOCAL GOVERNMENTS - PROVINCIAL BONDS – 0.8% | | | | | | | | | | | | |
Canada – 0.8% | | | | | | | | | | | | |
Province of Ontario Canada
2.70%, 06/02/2029 | | | CAD | | | | 28,190 | | | | 19,053,442 | |
Province of Quebec Canada
0.875%, 05/04/2027(a) | | | EUR | | | | 19,183 | | | | 17,135,455 | |
3.65%, 05/20/2032 | | | CAD | | | | 10,105 | | | | 7,190,432 | |
| | | | | | | | | | | | |
| | | |
Total Local Governments - Provincial Bonds
(cost $49,656,467) | | | | | | | | | | | 43,379,329 | |
| | | | | | | | | | | | |
| | | | | | | | | | | | |
EMERGING MARKETS - CORPORATE BONDS – 0.5% | | | | | | | | | | | | |
Industrial – 0.4% | | | | | | | | | | | | |
Basic – 0.1% | | | | | | | | | | | | |
Braskem Idesa SAPI
6.99%, 02/20/2032(a) | | | U.S.$ | | | | 4,279 | | | | 2,834,837 | |
Cia de Minas Buenaventura SAA
5.50%, 07/23/2026(a) | | | | | | | 4,883 | | | | 4,049,228 | |
Volcan Cia Minera SAA
4.375%, 02/11/2026(a) | | | | | | | 927 | | | | 759,155 | |
| | | | | | | | | | | | |
| | | | | | | | | | | 7,643,220 | |
| | | | | | | | | | | | |
Capital Goods – 0.0% | | | | | | | | | | | | |
Cemex SAB de CV
5.45%, 11/19/2029(a) | | | | | | | 227 | | | | 202,308 | |
Odebrecht Holdco Finance Ltd.
Zero Coupon, 09/10/2058(a) | | | | | | | 9,813 | | | | 19,626 | |
| | | | | | | | | | | | |
| | | | | | | | | | | 221,934 | |
| | | | | | | | | | | | |
Communications - Media – 0.0% | | | | | | | | | | | | |
Globo Comunicacao e Participacoes SA
4.875%, 01/22/2030(a) | | | | | | | 879 | | | | 661,448 | |
| | | | | | | | | | | | |
| | | |
Consumer Cyclical - Other – 0.2% | | | | | | | | | | | | |
Allwyn Entertainment Financing UK PLC
4.446%, 02/15/2028(d) | | | EUR | | | | 4,602 | | | | 4,158,278 | |
Studio City Finance Ltd.
6.50%, 01/15/2028(a) | | | U.S.$ | | | | 3,465 | | | | 1,672,512 | |
| | |
| |
| abfunds.com | | AB GLOBAL BOND FUND | 77 |
PORTFOLIO OF INVESTMENTS (continued)
| | | | | | | | | | | | |
| | | | | | Principal
Amount
(000) | | | U.S. $ Value | |
| |
Wynn Macau Ltd.
5.625%, 08/26/2028(a) | | | U.S.$ | | | | 3,203 | | | $ | 2,146,010 | |
| | | | | | | | | | | | |
| | | | | | | | | | | 7,976,800 | |
| | | | | | | | | | | | |
Consumer Non-Cyclical – 0.0% | | | | | | | | | | | | |
Virgolino de Oliveira Finance SA
10.50%, 01/28/2018(e)(f)(h)(i)(k) | | | | | | | 4,300 | | | | 430 | |
| | | | | | | | | | | | |
| | | |
Energy – 0.1% | | | | | | | | | | | | |
Acu Petroleo Luxembourg SARL
7.50%, 01/13/2032(a) | | | | | | | 3,453 | | | | 2,745,782 | |
Greenko Dutch BV
3.85%, 03/29/2026(a) | | | | | | | 382 | | | | 305,600 | |
Greenko Solar Mauritius Ltd.
5.95%, 07/29/2026(a) | | | | | | | 215 | | | | 178,719 | |
Leviathan Bond Ltd.
6.125%, 06/30/2025(a) | | | | | | | 3,835 | | | | 3,599,213 | |
| | | | | | | | | | | | |
| | | | | | | | | | | 6,829,314 | |
| | | | | | | | | | | | |
| | | | | | | | | | | 23,333,146 | |
| | | | | | | | | | | | |
Utility – 0.1% | | | | | | | | | | | | |
Electric – 0.1% | | | | | | | | | | | | |
Adani Green Energy Ltd.
4.375%, 09/08/2024(a) | | | | | | | 3,315 | | | | 2,718,300 | |
JSW Hydro Energy Ltd.
4.125%, 05/18/2031(a) | | | | | | | 1,113 | | | | 877,202 | |
Terraform Global Operating LP
6.125%, 03/01/2026(f) | | | | | | | 1,155 | | | | 1,087,746 | |
| | | | | | | | | | | | |
| | | | | | | | | | | 4,683,248 | |
| | | | | | | | | | | | |
Financial Institutions – 0.0% | | | | | | | | | | | | |
Other Finance – 0.0% | | | | | | | | | | | | |
OEC Finance Ltd.
4.375%, 10/25/2029(a)(j) | | | | | | | 4,985 | | | | 147,838 | |
5.25%, 12/27/2033(a)(j) | | | | | | | 1,623 | | | | 35,818 | |
7.125%, 12/26/2046(a)(j) | | | | | | | 2,302 | | | | 60,697 | |
| | | | | | | | | | | | |
| | | | | | | | | | | 244,353 | |
| | | | | | | | | | | | |
Total Emerging Markets - Corporate Bonds
(cost $53,328,613) | | | | | | | | | | | 28,260,747 | |
| | | | | | | | | | | | |
| | | | | | | | | | | | |
LOCAL GOVERNMENTS - REGIONAL BONDS – 0.5% | | | | | | | | | | | | |
Australia – 0.0% | | | | | | | | | | | | |
Queensland Treasury Corp.
Series 24
5.75%, 07/22/2024(a) | | | AUD | | | | 3,061 | | | | 2,023,827 | |
| | | | | | | | | | | | |
| | |
| |
78 | AB GLOBAL BOND FUND | | abfunds.com |
PORTFOLIO OF INVESTMENTS (continued)
| | | | | | | | | | | | |
| | | | | | Principal
Amount
(000) | | | U.S. $ Value | |
| |
Japan – 0.5% | | | | | | | | | | | | |
Japan Finance Organization for Municipalities
Series G
0.05%, 02/12/2027(a) | | | EUR | | | | 29,930 | | | $ | 25,797,798 | |
| | | | | | | | | | | | |
| | | |
Total Local Governments - Regional Bonds
(cost $35,710,084) | | | | | | | | | | | 27,821,625 | |
| | | | | | | | | | | | |
| | | | | | | | | | | | |
ASSET-BACKED SECURITIES – 0.4% | | | | | | | | | | | | |
Other ABS - Fixed Rate – 0.3% | | | | | | | | | | | | |
Marlette Funding Trust
Series 2022-2A, Class A
4.25%, 08/15/2032(a) | | | U.S.$ | | | | 5,986 | | | | 5,946,984 | |
Nelnet Student Loan Trust
Series 2021-CA, Class B
2.53%, 04/20/2062(a) | | | | | | | 8,191 | | | | 6,384,028 | |
SBA Tower Trust
Series 2014-2A, Class C
3.869%, 10/15/2049(a) | | | | | | | 3,008 | | | | 2,908,871 | |
| | | | | | | | | | | | |
| | | | | | | | | | | 15,239,883 | |
| | | | | | | | | | | | |
Autos - Fixed Rate – 0.1% | | | | | | | | | | | | |
Santander Bank Auto Credit-Linked Notes
Series 2022-B, Class B
5.721%, 08/16/2032(a) | | | | | | | 5,964 | | | | 5,972,896 | |
| | | | | | | | | | | | |
| | | |
Total Asset-Backed Securities
(cost $23,126,983) | | | | | | | | | | | 21,212,779 | |
| | | | | | | | | | | | |
| | | | | | | | | | | | |
GOVERNMENTS - SOVEREIGN AGENCIES – 0.4% | | | | | | | | | | | | |
Japan – 0.2% | | | | | | | | | | | | |
Development Bank of Japan, Inc.
0.01%, 10/15/2024(a) | | | EUR | | | | 7,071 | | | | 6,540,147 | |
Series G
0.875%, 10/10/2025(a) | | | | | | | 5,600 | | | | 5,155,945 | |
| | | | | | | | | | | | |
| | | | | | | | | | | 11,696,092 | |
| | | | | | | | | | | | |
Netherlands – 0.1% | | | | | | | | | | | | |
BNG Bank NV
0.75%, 01/24/2029(a) | | | | | | | 4,715 | | | | 4,053,315 | |
| | | | | | | | | | | | |
| | | |
Norway – 0.1% | | | | | | | | | | | | |
Kommunalbanken AS
4.50%, 04/17/2023(a) | | | AUD | | | | 5,050 | | | | 3,244,897 | |
| | | | | | | | | | | | |
| | |
| |
| abfunds.com | | AB GLOBAL BOND FUND | 79 |
PORTFOLIO OF INVESTMENTS (continued)
| | | | | | | | | | | | |
| | | | | | Principal
Amount
(000) | | | U.S. $ Value | |
| |
South Korea – 0.0% | | | | | | | | | | | | |
Korea Gas Corp.
1.125%, 07/13/2026(a) | | | U.S.$ | | | | 290 | | | $ | 250,624 | |
| | | | | | | | | | | | |
| | | |
Total Governments - Sovereign Agencies
(cost $23,630,616) | | | | | | | | | | | 19,244,928 | |
| | | | | | | | | | | | |
| | | | | | | | | | | | |
BANK LOANS – 0.1% | | | | | | | | | | | | |
Industrial – 0.1% | | | | | | | | | | | | |
Consumer Cyclical - Restaurants – 0.0% | | | | | | | | | | | | |
IRB Holding Corp.
5.274% (LIBOR 1 Month + 2.75%), 02/05/2025(l) | | | | | | | 1,201 | | | | 1,159,107 | |
| | | | | | | | | | | | |
| | | |
Consumer Non-Cyclical – 0.1% | | | | | | | | | | | | |
LifePoint Health, Inc. (fka Regionalcare Hospital Partners Holdings, Inc.)
6.871% (LIBOR 1 Month + 3.75%), 11/16/2025(l) | | | | | | | 5,087 | | | | 4,718,957 | |
| | | | | | | | | | | | |
| | | |
Total Bank Loans
(cost $6,244,395) | | | | | | | | | | | 5,878,064 | |
| | | | | | | | | | | | |
| | | |
| | | | | | Shares | | | | |
COMMON STOCKS – 0.1% | |
Financials – 0.1% | | | | | | | | | | | | |
Banks – 0.0% | | | | | | | | | | | | |
Nordic Aviation Capital DAC(e)(h)(k) | | | | | | | 86,655 | | | | 1,733,100 | |
| | | | | | | | | | | | |
| | | |
Insurance – 0.1% | | | | | | | | | | | | |
Mt Logan Re Ltd. (Special Investment)(e)(h)(k) | | | | | | | 2,703 | | | | 2,267,826 | |
| | | | | | | | | | | | |
| | | | | | | | | | | 4,000,926 | |
| | | | | | | | | | | | |
Energy – 0.0% | | | | | | | | | | | | |
Oil, Gas & Consumable Fuels – 0.0% | | | | | | | | | | | | |
Golden Energy Offshore Services
AS^(k) | | | | | | | 3,089,816 | | | | 561,862 | |
SandRidge Energy, Inc.(k) | | | | | | | 4,459 | | | | 72,727 | |
| | | | | | | | | | | | |
| | | | | | | | | | | 634,589 | |
| | | | | | | | | | | | |
Total Common Stocks
(cost $10,091,974) | | | | | | | | | | | 4,635,515 | |
| | | | | | | | | | | | |
| | |
| |
80 | AB GLOBAL BOND FUND | | abfunds.com |
PORTFOLIO OF INVESTMENTS (continued)
| | | | | | | | | | | | |
| | | | | | Principal
Amount
(000) | | | U.S. $ Value | |
| |
EMERGING MARKETS - SOVEREIGNS – 0.1% | | | | | | | | | | | | |
Ivory Coast – 0.1% | | | | | | | | | | | | |
Ivory Coast Government International Bond
4.875%, 01/30/2032(a) | | | EUR | | | | 3,350 | | | $ | 2,193,156 | |
5.875%, 10/17/2031(a) | | | | | | | 3,030 | | | | 2,138,635 | |
| | | | | | | | | | | | |
| | | |
Total Emerging Markets - Sovereigns
(cost $7,388,551) | | | | | | | | | | | 4,331,791 | |
| | | | | | | | | | | | |
| | | |
| | | | | | Shares | | | | |
WARRANTS – 0.0% | |
Encore Automotive Acceptance,
expiring 07/05/2031(e)(h)(k) | | | | | | | 27 | | | | – 0 | – |
Flexpath Capital, Inc.,
expiring 04/15/2031(e)(h)(k) | | | | | | | 42,267 | | | | – 0 | – |
SandRidge Energy, Inc., A-CW22,
expiring 10/03/2022(k) | | | | | | | 3,861 | | | | 12 | |
SandRidge Energy, Inc., B-CW22,
expiring 10/03/2022(k) | | | | | | | 1,625 | | | | – 0 | – |
| | | | | | | | | | | | |
| | | |
Total Warrants
(cost $27,079) | | | | | | | | | | | 12 | |
| | | | | | | | | | | | |
| | | | | | | | | | | | |
SHORT-TERM INVESTMENTS – 1.4% | |
Investment Companies – 1.2% | | | | | | | | | | | | |
AB Fixed Income Shares, Inc. – Government Money Market Portfolio – Class AB, 2.58%(m)(n)(o)
(cost $64,625,952) | | | | | | | 64,625,952 | | | | 64,625,952 | |
| | | | | | | | | | | | |
| | | |
| | | | | | Principal
Amount
(000) | | | | |
Time Deposits – 0.2% | |
BBH, Grand Cayman
1.00%, 10/03/2022 | | | NZD | | | | 0 | ** | | | 153 | |
1.17%, 10/03/2022 | | | GBP | | | | 32 | | | | 36,224 | |
Citibank, London
0.29%, 10/03/2022 | | | EUR | | | | 2,099 | | | | 2,057,165 | |
SEB, Stockholm
2.43%, 10/03/2022 | | | U.S.$ | | | | 10,050 | | | | 10,050,479 | |
| | | | | | | | | | | | |
| | | |
Total Time Deposits
(cost $12,144,021) | | | | | | | | | | | 12,144,021 | |
| | | | | | | | | | | | |
| | |
| |
| abfunds.com | | AB GLOBAL BOND FUND | 81 |
PORTFOLIO OF INVESTMENTS (continued)
| | | | | | | | | | | | |
| | | | | | Principal
Amount
(000) | | | U.S. $ Value | |
| |
Governments - Treasuries – 0.0% | | | | | | | | | | | | |
Japan – 0.0% | | | | | | | | | | | | |
Japan Treasury Discount Bill
Series 1093
Zero Coupon, 10/11/2022
(cost $2,170,188) | | | JPY | | | | 302,100 | | | $ | 2,087,507 | |
| | | | | | | | | | | | |
| | | |
Total Short-Term Investments
(cost $78,940,161) | | | | | | | | | | | 78,857,480 | |
| | | | | | | | | | | | |
| | | |
Total Investments – 100.8%
(cost $6,452,796,715) | | | | | | | | | | | 5,442,755,101 | |
Other assets less liabilities – (0.8)% | | | | | | | | | | | (43,077,010 | ) |
| | | | | | | | | | | | |
| | | |
Net Assets – 100.0% | | | | | | | | | | $ | 5,399,678,091 | |
| | | | | | | | | | | | |
FUTURES (see Note D)
| | | | | | | | | | | | | | | | |
| Description | | Number of
Contracts | | | Expiration
Month | | | Current
Notional | | | Value and
Unrealized
Appreciation/
(Depreciation) | |
Purchased Contracts | | | | | | | | | | | | | | | | |
5 Yr Canadian Bond Futures | | | 10 | | | | December 2022 | | | $ | 813,624 | | | $ | (3,996 | ) |
Euro-Bund Futures | | | 577 | | | | December 2022 | | | | 78,314,549 | | | | (2,827,562 | ) |
Euro-BUXL 30Y Bond Futures | | | 5 | | | | December 2022 | | | | 718,573 | | | | (57,686 | ) |
U.S. 10 Yr Ultra Futures | | | 2,465 | | | | December 2022 | | | | 292,063,984 | | | | (8,855,313 | ) |
U.S. T-Note 2 Yr (CBT) Futures | | | 38 | | | | December 2022 | | | | 7,804,844 | | | | (126,164 | ) |
U.S. T-Note 5 Yr (CBT) Futures | | | 690 | | | | December 2022 | | | | 74,180,391 | | | | (1,511,820 | ) |
U.S. T-Note 10 Yr (CBT) Futures | | | 23 | | | | December 2022 | | | | 2,577,438 | | | | (133,508 | ) |
U.S. Ultra Bond (CBT) Futures | | | 20 | | | | December 2022 | | | | 2,740,000 | | | | (242,406 | ) |
| | | | |
Sold Contracts | | | | | | | | | | | | | | | | |
10 Yr Canadian Bond Futures | | | 215 | | | | December 2022 | | | | 19,236,146 | | | | 182,597 | |
Euro-BOBL Futures | | | 2,016 | | | | December 2022 | | | | 236,599,745 | | | | 6,934,990 | |
Euro-OAT Futures | | | 393 | | | | December 2022 | | | | 50,887,292 | | | | 2,494,835 | |
Euro-Schatz Futures | | | 6,305 | | | | December 2022 | | | | 662,195,587 | | | | 3,851,048 | |
Japan 10 Yr Bond (OSE) Futures | | | 164 | | | | December 2022 | | | | 168,045,326 | | | | 455,123 | |
Long Gilt Futures | | | 2,023 | | | | December 2022 | | | | 217,746,444 | | | | 9,445,633 | |
U.S. Long Bond (CBT) Futures | | | 13 | | | | December 2022 | | | | 1,643,281 | | | | 75,969 | |
U.S. T-Note 5 Yr (CBT) Futures | | | 80 | | | | December 2022 | | | | 8,600,625 | | | | 289,680 | |
| | | | | | | | | | | | | | | | |
| | | | | | | | | | | | | | $ | 9,971,420 | |
| | | | | | | | | | | | | | | | |
| | |
| |
82 | AB GLOBAL BOND FUND | | abfunds.com |
PORTFOLIO OF INVESTMENTS (continued)
FORWARD CURRENCY EXCHANGE CONTRACTS (see Note D)
| | | | | | | | | | | | | | | | |
| Counterparty | | Contracts to
Deliver
(000) | | | In Exchange
For
(000) | | | Settlement
Date | | | Unrealized
Appreciation/
(Depreciation) | |
Australia and New Zealand Banking Group Ltd. | | AUD | 5,178 | | | USD | 3,498 | | | | 10/20/2022 | | | $ | 185,065 | |
Bank of America, NA | | BRL | 294,456 | | | USD | 56,293 | | | | 10/04/2022 | | | | 1,707,110 | |
Bank of America, NA | | BRL | 592,441 | | | USD | 109,577 | | | | 10/04/2022 | | | | (248,838 | ) |
Bank of America, NA | | USD | 54,462 | | | BRL | 294,456 | | | | 10/04/2022 | | | | 123,678 | |
Bank of America, NA | | USD | 110,737 | | | BRL | 592,441 | | | | 10/04/2022 | | | | (910,428 | ) |
Bank of America, NA | | USD | 59,669 | | | ZAR | 986,416 | | | | 10/13/2022 | | | | (5,215,633 | ) |
Bank of America, NA | | USD | 58,184 | | | CNH | 414,619 | | | | 10/20/2022 | | | | (95,400 | ) |
Bank of America, NA | | USD | 1,241 | | | CAD | 1,612 | | | | 10/27/2022 | | | | (74,270 | ) |
Bank of America, NA | | BRL | 592,441 | | | USD | 109,961 | | | | 11/03/2022 | | | | 953,421 | |
Bank of America, NA | | MXN | 1,106,390 | | | USD | 53,714 | | | | 11/18/2022 | | | | (755,641 | ) |
Bank of America, NA | | CLP | 53,127,147 | | | USD | 54,850 | | | | 11/22/2022 | | | | 440,771 | |
Bank of America, NA | | JPY | 7,740,239 | | | USD | 54,190 | | | | 12/02/2022 | | | | 376,787 | |
Bank of America, NA | | EUR | 555,590 | | | USD | 537,703 | | | | 12/08/2022 | | | | (9,452,263 | ) |
Bank of America, NA | | USD | 54,125 | | | INR | 4,425,007 | | | | 12/21/2022 | | | | (292,459 | ) |
Barclays Bank PLC | | USD | 55,752 | | | AUD | 83,244 | | | | 10/20/2022 | | | | (2,494,297 | ) |
Barclays Bank PLC | | IDR | 274,154,192 | | | USD | 18,057 | | | | 10/27/2022 | | | | 167,337 | |
Barclays Bank PLC | | GBP | 49,725 | | | USD | 57,915 | | | | 11/17/2022 | | | | 2,354,920 | |
Barclays Bank PLC | | USD | 14,282 | | | GBP | 12,659 | | | | 11/17/2022 | | | | (136,944 | ) |
Barclays Bank PLC | | PLN | 144,550 | | | USD | 29,003 | | | | 11/30/2022 | | | | 108,410 | |
Barclays Bank PLC | | USD | 52,984 | | | NOK | 575,252 | | | | 12/01/2022 | | | | (90,635 | ) |
Barclays Bank PLC | | MYR | 120,125 | | | USD | 27,200 | | | | 12/15/2022 | | | | 1,482,624 | |
BNP Paribas SA | | BRL | 295,191 | | | USD | 56,783 | | | | 10/04/2022 | | | | 2,060,531 | |
BNP Paribas SA | | USD | 54,598 | | | BRL | 295,191 | | | | 10/04/2022 | | | | 123,987 | |
BNP Paribas SA | | ZAR | 1,964,796 | | | USD | 112,823 | | | | 10/13/2022 | | | | 4,359,664 | |
BNP Paribas SA | | AUD | 92,178 | | | USD | 64,899 | | | | 10/20/2022 | | | | 5,926,886 | |
BNP Paribas SA | | EUR | 368,115 | | | USD | 368,349 | | | | 10/20/2022 | | | | 7,172,318 | |
BNP Paribas SA | | CAD | 74,735 | | | USD | 54,559 | | | | 10/27/2022 | | | | 459,118 | |
BNP Paribas SA | | USD | 111,078 | | | CAD | 145,432 | | | | 10/27/2022 | | | | (5,802,857 | ) |
BNP Paribas SA | | THB | 675,325 | | | USD | 19,126 | | | | 11/10/2022 | | | | 1,185,466 | |
BNP Paribas SA | | NZD | 183,795 | | | USD | 108,561 | | | | 11/18/2022 | | | | 5,680,277 | |
BNP Paribas SA | | USD | 113,555 | | | NZD | 189,117 | | | | 11/18/2022 | | | | (7,695,362 | ) |
BNP Paribas SA | | USD | 56,104 | | | CLP | 51,553,670 | | | | 11/22/2022 | | | | (3,306,767 | ) |
BNP Paribas SA | | USD | 56,344 | | | CHF | 54,957 | | | | 12/07/2022 | | | | (287,871 | ) |
Brown Brothers Harriman & Co. | | AUD | 306 | | | USD | 211 | | | | 10/20/2022 | | | | 15,545 | |
Brown Brothers Harriman & Co. | | USD | 23 | | | AUD | 34 | | | | 10/20/2022 | | | | (1,858 | ) |
Brown Brothers Harriman & Co. | | CAD | 298 | | | USD | 229 | | | | 10/27/2022 | | | | 13,736 | |
Brown Brothers Harriman & Co. | | EUR | 9,825 | | | USD | 9,430 | | | | 10/28/2022 | | | | (216,084 | ) |
Brown Brothers Harriman & Co. | | GBP | 293 | | | USD | 319 | | | | 11/17/2022 | | | | (8,472 | ) |
Brown Brothers Harriman & Co. | | USD | 249 | | | GBP | 232 | | | | 11/17/2022 | | | | 9,772 | |
Brown Brothers Harriman & Co. | | USD | 476 | | | GBP | 408 | | | | 11/17/2022 | | | | (20,269 | ) |
Brown Brothers Harriman & Co. | | USD | 37 | | | CHF | 36 | | | | 12/07/2022 | | | | (141 | ) |
Citibank, NA | | AUD | 81,307 | | | USD | 56,793 | | | | 10/20/2022 | | | | 4,775,384 | |
Citibank, NA | | TWD | 5,251,101 | | | USD | 175,269 | | | | 10/21/2022 | | | | 10,297,742 | |
Citibank, NA | | CAD | 147,604 | | | USD | 113,394 | | | | 10/27/2022 | | | | 6,545,867 | |
Citibank, NA | | KRW | 217,706,944 | | | USD | 162,570 | | | | 10/27/2022 | | | | 11,384,628 | |
Citibank, NA | | USD | 56,799 | | | KRW | 74,929,522 | | | | 10/27/2022 | | | | (4,764,424 | ) |
Citibank, NA | | GBP | 18,059 | | | USD | 20,748 | | | | 11/17/2022 | | | | 569,900 | |
Citibank, NA | | USD | 57,115 | | | GBP | 49,615 | | | | 11/17/2022 | | | | (1,677,502 | ) |
Citibank, NA | | USD | 55,835 | | | CLP | 52,242,575 | | | | 11/22/2022 | | | | (2,332,465 | ) |
| | |
| |
| abfunds.com | | AB GLOBAL BOND FUND | 83 |
PORTFOLIO OF INVESTMENTS (continued)
| | | | | | | | | | | | | | | | |
| Counterparty | | Contracts to
Deliver
(000) | | | In Exchange
For
(000) | | | Settlement
Date | | | Unrealized
Appreciation/
(Depreciation) | |
Citibank, NA | | USD | 116,916 | | | JPY | 16,476,684 | | | | 12/02/2022 | | | $ | (2,362,976 | ) |
Citibank, NA | | USD | 129,402 | | | EUR | 134,046 | | | | 12/08/2022 | | | | 2,609,071 | |
Credit Suisse International | | USD | 111,380 | | | ZAR | 1,961,302 | | | | 10/13/2022 | | | | (3,110,053 | ) |
Credit Suisse International | | AUD | 79,576 | | | USD | 54,934 | | | | 10/20/2022 | | | | 4,022,950 | |
Credit Suisse International | | USD | 110,722 | | | AUD | 159,795 | | | | 10/20/2022 | | | | (8,490,193 | ) |
Goldman Sachs Bank USA | | CNH | 1,718,031 | | | USD | 254,493 | | | | 10/20/2022 | | | | 13,792,837 | |
Goldman Sachs Bank USA | | KRW | 103,800,579 | | | USD | 79,352 | | | | 10/27/2022 | | | | 7,268,482 | |
Goldman Sachs Bank USA | | USD | 55,841 | | | NZD | 93,199 | | | | 11/18/2022 | | | | (3,671,807 | ) |
Goldman Sachs Bank USA | | EUR | 830 | | | USD | 817 | | | | 12/08/2022 | | | | (801 | ) |
HSBC Bank USA | | BRL | 297,900 | | | USD | 55,099 | | | | 10/04/2022 | | | | (125,125 | ) |
HSBC Bank USA | | USD | 58,452 | | | BRL | 297,900 | | | | 10/04/2022 | | | | (3,227,313 | ) |
HSBC Bank USA | | CNH | 54,530 | | | USD | 8,075 | | | | 10/20/2022 | | | | 435,013 | |
HSBC Bank USA | | USD | 52,738 | | | CNH | 375,503 | | | | 10/20/2022 | | | | (129,162 | ) |
HSBC Bank USA | | USD | 58,393 | | | TWD | 1,733,032 | | | | 10/21/2022 | | | | (3,946,594 | ) |
HSBC Bank USA | | IDR | 130,812,683 | | | USD | 8,756 | | | | 10/27/2022 | | | | 219,980 | |
HSBC Bank USA | | KRW | 271,756,608 | | | USD | 203,120 | | | | 10/27/2022 | | | | 14,400,695 | |
HSBC Bank USA | | USD | 116,401 | | | KRW | 155,888,315 | | | | 10/27/2022 | | | | (8,145,288 | ) |
HSBC Bank USA | | CLP | 50,750,986 | | | USD | 53,343 | | | | 11/22/2022 | | | | 1,368,038 | |
HSBC Bank USA | | USD | 57,577 | | | PLN | 276,790 | | | | 11/30/2022 | | | | (2,247,996 | ) |
HSBC Bank USA | | SGD | 79,223 | | | USD | 55,139 | | | | 12/07/2022 | | | | (63,779 | ) |
HSBC Bank USA | | INR | 4,478,158 | | | USD | 55,627 | | | | 12/21/2022 | | | | 1,147,973 | |
HSBC Bank USA | | USD | 54,863 | | | INR | 4,516,328 | �� | | | 12/21/2022 | | | | 79,866 | |
JPMorgan Chase Bank, NA | | ZAR | 985,068 | | | USD | 56,905 | | | | 10/13/2022 | | | | 2,526,436 | |
JPMorgan Chase Bank, NA | | USD | 300,082 | | | AUD | 434,918 | | | | 10/20/2022 | | | | (21,835,406 | ) |
JPMorgan Chase Bank, NA | | CAD | 316,573 | | | USD | 245,528 | | | | 10/27/2022 | | | | 16,366,566 | |
JPMorgan Chase Bank, NA | | USD | 58,899 | | | CAD | 75,718 | | | | 10/27/2022 | | | | (4,088,131 | ) |
JPMorgan Chase Bank, NA | | GBP | 47,654 | | | USD | 51,944 | | | | 11/17/2022 | | | | (1,301,757 | ) |
JPMorgan Chase Bank, NA | | USD | 58,255 | | | NZD | 93,879 | | | | 11/18/2022 | | | | (5,705,403 | ) |
JPMorgan Chase Bank, NA | | CLP | 52,360,417 | | | USD | 58,878 | | | | 11/22/2022 | | | | 5,254,536 | |
JPMorgan Chase Bank, NA | | PLN | 269,370 | | | USD | 55,365 | | | | 11/30/2022 | | | | 1,519,750 | |
JPMorgan Chase Bank, NA | | USD | 55,097 | | | PLN | 260,856 | | | | 11/30/2022 | | | | (2,952,954 | ) |
JPMorgan Chase Bank, NA | | USD | 54,301 | | | SEK | 608,207 | | | | 12/01/2022 | | | | 671,661 | |
JPMorgan Chase Bank, NA | | JPY | 179,489 | | | USD | 1,266 | | | | 12/02/2022 | | | | 17,811 | |
JPMorgan Chase Bank, NA | | USD | 1,270 | | | JPY | 179,489 | | | | 12/02/2022 | | | | (22,569 | ) |
JPMorgan Chase Bank, NA | | CHF | 53,742 | | | USD | 56,110 | | | | 12/07/2022 | | | | 1,294,386 | |
Morgan Stanley Capital Services LLC | | BRL | 300,694 | | | USD | 59,341 | | | | 10/04/2022 | | | | 3,598,856 | |
Morgan Stanley Capital Services LLC | | USD | 55,616 | | | BRL | 300,694 | | | | 10/04/2022 | | | | 126,298 | |
Morgan Stanley Capital Services LLC | | USD | 54,494 | | | ZAR | 981,339 | | | | 10/13/2022 | | | | (321,348 | ) |
Morgan Stanley Capital Services LLC | | EUR | 9,869 | | | USD | 9,505 | | | | 10/14/2022 | | | | (173,210 | ) |
Morgan Stanley Capital Services LLC | | USD | 573 | | | EUR | 588 | | | | 10/14/2022 | | | | 3,882 | |
Morgan Stanley Capital Services LLC | | AUD | 81,576 | | | USD | 56,862 | | | | 10/20/2022 | | | | 4,671,925 | |
Morgan Stanley Capital Services LLC | | KRW | 77,454,570 | | | USD | 58,411 | | | | 10/27/2022 | | | | 4,623,032 | |
Morgan Stanley Capital Services LLC | | NZD | 93,143 | | | USD | 56,893 | | | | 11/18/2022 | | | | 4,755,076 | |
| | |
| |
84 | AB GLOBAL BOND FUND | | abfunds.com |
PORTFOLIO OF INVESTMENTS (continued)
| | | | | | | | | | | | | | | | |
| Counterparty | | Contracts to
Deliver
(000) | | | In Exchange
For
(000) | | | Settlement
Date | | | Unrealized
Appreciation/
(Depreciation) | |
Morgan Stanley Capital Services LLC | | USD | 56,250 | | | SGD | 79,132 | | | | 12/07/2022 | | | $ | (1,110,563 | ) |
Morgan Stanley Capital Services LLC | | USD | 17,118 | | | EUR | 17,504 | | | | 12/08/2022 | | | | 119,898 | |
Royal Bank of Scotland PLC | | USD | 58,760 | | | CAD | 75,747 | | | | 10/27/2022 | | | | (3,928,159 | ) |
Royal Bank of Scotland PLC | | GBP | 30,930 | | | USD | 36,757 | | | | 11/17/2022 | | | | 2,197,276 | |
Royal Bank of Scotland PLC | | USD | 109,143 | | | JPY | 15,691,104 | | | | 12/02/2022 | | | | (51,980 | ) |
Standard Chartered Bank | | AUD | 13,038 | | | USD | 9,054 | | | | 10/20/2022 | | | | 712,665 | |
Standard Chartered Bank | | USD | 118,104 | | | TWD | 3,518,928 | | | | 10/21/2022 | | | | (7,551,145 | ) |
Standard Chartered Bank | | KRW | 67,355,384 | | | USD | 47,276 | | | | 10/27/2022 | | | | 501,416 | |
Standard Chartered Bank | | USD | 63,455 | | | KRW | 85,944,267 | | | | 10/27/2022 | | | | (3,771,885 | ) |
UBS AG | | AUD | 743,918 | | | USD | 513,914 | | | | 10/20/2022 | | | | 37,977,417 | |
UBS AG | | MXN | 1,118,710 | | | USD | 54,448 | | | | 11/18/2022 | | | | (628,134 | ) |
UBS AG | | EUR | 555,590 | | | USD | 535,375 | | | | 12/01/2022 | | | | (11,394,658 | ) |
UBS AG | | JPY | 26,557,697 | | | USD | 187,608 | | | | 12/02/2022 | | | | 2,967,802 | |
UBS AG | | USD | 33,264 | | | JPY | 4,775,535 | | | | 12/02/2022 | | | | (62,291 | ) |
UBS AG | | CHF | 109,784 | | | USD | 115,165 | | | | 12/07/2022 | | | | 3,186,148 | |
UBS AG | | USD | 57,158 | | | CHF | 55,658 | | | | 12/07/2022 | | | | (387,295 | ) |
UBS AG | | EUR | 47,895 | | | USD | 46,180 | | | | 12/08/2022 | | | | (988,363 | ) |
| | | | | | | | | | | | | | | | |
| | | | | | | | | | | | | | $ | 59,241,468 | |
| | | | | | | | | | | | | | | | |
CENTRALLY CLEARED CREDIT DEFAULT SWAPS (see Note D)
| | | | | | | | | | | | | | | | | | | | | | | | | | | | |
| Description | | Fixed
Rate
(Pay)
Receive | | | Payment
Frequency | | | Implied
Credit
Spread at
September 30,
2022 | | | Notional
Amount
(000) | | | Market
Value | | | Upfront
Premiums Paid/ (Received) | | | Unrealized
Appreciation/
(Depreciation) | |
Sale Contracts | | | | | | | | | | | | | | | | | | | | | | | | | | | | |
CDX-NAHY Series 39, 5 Year Index, 12/20/2027* | | | 5.00 | % | | | Quarterly | | | | 5.00 | % | | | USD 4,082 | | | $ | (161,534 | ) | | $ | (162,160 | ) | | $ | 626 | |
CENTRALLY CLEARED INTEREST RATE SWAPS (see Note D)
| | | | | | | | | | | | | | | | | | | | | | | | | | |
| | | | | | | | | Rate Type | | | | | | | | | | | |
Notional
Amount
(000) | | | Termination
Date | | | Payments
made
by the
Fund | | Payments
received
by the
Fund | | Payment
Frequency
Paid/
Received | | Market
Value | | | Upfront
Premiums
Paid/
(Received) | | | Unrealized
Appreciation/
(Depreciation) | |
| NZD | | | 43,642 | | | | 11/01/2024 | | | 3 Month
BKBM | | 2.580% | | Quarterly/Semi-Annual | | $ | (874,212 | ) | | $ | – 0 | – | | $ | (874,212 | ) |
| NZD | | | 116,738 | | | | 11/02/2024 | | | 3 Month
BKBM | | 2.503% | | Quarterly/Semi-Annual | | | (2,467,114 | ) | | | – 0 | – | | | (2,467,114 | ) |
| GBP | | | 1,290 | | | | 01/14/2027 | | | 1.139% | | 1 Day
SONIA | | Annual | | | 217,901 | | | | – 0 | – | | | 217,901 | |
| USD | | | 600 | | | | 01/30/2027 | | | 2.459% | | 3 Month
LIBOR | | Semi-Annual/Quarterly | | | 38,968 | | | | – 0 | – | | | 38,968 | |
| EUR | | | 70,942 | | | | 05/12/2027 | | | 6 Month
EURIBOR | | 1.494% | | Semi-Annual/ Annual | | | (3,893,403 | ) | | | – 0 | – | | | (3,893,403 | ) |
| EUR | | | 54,178 | | | | 05/13/2027 | | | 6 Month
EURIBOR | | 1.464% | | Semi-Annual/ Annual | | | (3,048,743 | ) | | | – 0 | – | | | (3,048,743 | ) |
| EUR | | | 62,410 | | | | 08/18/2032 | | | 6 Month
EURIBOR | | 1.800% | | Semi-Annual/ Annual | | | (6,580,567 | ) | | | – 0 | – | | | (6,580,567 | ) |
| | |
| |
| abfunds.com | | AB GLOBAL BOND FUND | 85 |
PORTFOLIO OF INVESTMENTS (continued)
| | | | | | | | | | | | | | | | | | | | | | | | | | | | | | |
| | | | | | | | | Rate Type | | | | | | | | | | | | |
Notional
Amount
(000) | | | Termination
Date | | | Payments
made
by the
Fund | | | Payments
received
by the
Fund | | | Payment
Frequency
Paid/
Received | | Market
Value | | | Upfront
Premiums
Paid/
(Received) | | | Unrealized
Appreciation/
(Depreciation) | |
| USD | | | 150 | | | | 05/05/2045 | | |
| 3 Month
LIBOR |
| | | 2.566% | | | Quarterly/Semi-Annual | | $ | (21,451 | ) | | $ | 1 | | | $ | (21,452 | ) |
| USD | | | 100 | | | | 07/16/2045 | | |
| 3 Month
LIBOR |
| | | 3.019% | | | Quarterly/Semi-Annual | | | (7,740 | ) | | | 9,466 | | | | (17,206 | ) |
| EUR | | | 45,250 | | | | 09/30/2050 | | | | 0.122% | | |
| 6 Month
EURIBOR |
| | Annual/ Semi-Annual | | | 20,604,403 | | | | – 0 | – | | | 20,604,403 | |
| EUR | | | 45,250 | | | | 09/30/2050 | | |
| 6 Month
EURIBOR |
| | | (0.017)% | | | Semi-Annual/ Annual | | | (21,797,021 | ) | | | – 0 | – | | | (21,797,021 | ) |
| EUR | | | 45,740 | | | | 11/10/2050 | | | | 0.022% | | |
| 6 Month
EURIBOR |
| | Annual/ Semi-Annual | | | 21,582,411 | | | | 357,073 | | | | 21,225,338 | |
| EUR | | | 45,740 | | | | 11/10/2050 | | |
| 6 Month
EURIBOR |
| | | (0.043)% | | | Semi-Annual/ Annual | | | (22,175,713 | ) | | | – 0 | – | | | (22,175,713 | ) |
| GBP | | | 80 | | | | 01/14/2052 | | |
| 1 Day
SONIA |
| | | 0.942% | | | Annual | | | (43,218 | ) | | | – 0 | – | | | (43,218 | ) |
| GBP | | | 140 | | | | 01/31/2052 | | |
| 1 Day
SONIA |
| | | 1.068% | | | Annual | | | (72,267 | ) | | | – 0 | – | | | (72,267 | ) |
| | | | | | | | | | | | | | | | | | | | | | | | | | | | | | |
| | | | | | | | | | | | | | | | | | | | $ | (18,537,766 | ) | | $ | 366,540 | | | $ | (18,904,306 | ) |
| | | | | | | | | | | | | | | | | | | | | | | | | | | | | | |
CREDIT DEFAULT SWAPS (see Note D)
| | | | | | | | | | | | | | | | | | | | | | | | | | | | | | | | |
Swap Counterparty &
Referenced Obligation | | Fixed
Rate
(Pay)
Receive | | | Payment
Frequency | | | Implied
Credit
Spread at
September 30,
2022 | | | Notional
Amount
(000) | | | Market
Value | | | Upfront
Premiums
Paid/
(Received) | | | Unrealized
Appreciation/
(Depreciation) | |
Sale Contracts | | | | | | | | | | | | | | | | | | | | | | | | | | | | | | | | |
Credit Suisse International | | | | | | | | | | | | | | | | | | | | | | | | | | | | | |
CDX-CMBX.NA.BBB- Series 6, 05/11/2063* | | | 3.00 | % | | | Monthly | | | | 3.00 | % | | | USD | | | | 3,590 | | | $ | (805,218 | ) | | $ | (482,311 | ) | | $ | (322,907 | ) |
CDX-CMBX.NA.BBB- Series 6, 05/11/2063* | | | 3.00 | | | | Monthly | | | | 3.00 | | | | USD | | | | 4,667 | | | | (1,046,784 | ) | | | (626,272 | ) | | | (420,512 | ) |
Goldman Sachs International | | | | | | | | | | | | | | | | | | | | | | | | | | | | | |
CDX-CMBX.NA.BBB- Series 6, 05/11/2063* | | | 3.00 | | | | Monthly | | | | 3.00 | | | | USD | | | | 2,154 | | | | (483,310 | ) | | | (159,861 | ) | | | (323,449 | ) |
CDX-CMBX.NA.BBB- Series 6, 05/11/2063* | | | 3.00 | | | | Monthly | | | | 3.00 | | | | USD | | | | 7,180 | | | | (1,611,035 | ) | | | (515,899 | ) | | | (1,095,136 | ) |
| | | | | | | | | | | | | | | | | | | | | | | | | | | | | | | | |
| | | | | | | | | | | | | | | | | | | | | | $ | (3,946,347 | ) | | $ | (1,784,343 | ) | | $ | (2,162,004 | ) |
| | | | | | | | | | | | | | | | | | | | | | | | | | | | | | | | |
REVERSE REPURCHASE AGREEMENTS (see Note D)
| | | | | | | | | | | | | | | | | | | | |
| Broker | | Currency | | | Principal
Amount
(000) | | | Interest
Rate | | | Maturity | | | U.S. $
Value at
September 30,
2022 | |
Credit Suisse Securities (USA)† | | | EUR | | | | 5,518 | | | | (2.00 | )%* | | | — | | | $ | 5,395,523 | |
Credit Suisse Securities (USA)† | | | EUR | | | | 2,722 | | | | (0.50 | )%* | | | — | | | | 2,664,618 | |
Credit Suisse Securities (USA)† | | | EUR | | | | 7,899 | | | | 0.00 | % | | | — | | | | 7,736,170 | |
| | | | | | | | | | | | | | | | | | | | |
| | | | | | | | | | | | | | | | | | $ | 15,796,311 | |
| | | | | | | | | | | | | | | | | | | | |
| † | The reverse repurchase agreement matures on demand. Interest rate resets daily and the rate shown is the rate in effect on September 30, 2022. |
| * | Interest payment due from counterparty. |
| | |
| |
86 | AB GLOBAL BOND FUND | | abfunds.com |
PORTFOLIO OF INVESTMENTS (continued)
The type of underlying collateral and the remaining maturity of open reverse repurchase agreements on the statements of assets and liabilities is as follows:
| | | | | | | | | | | | | | | | | | | | |
| | | Overnight
and
Continuous | | | Up to 30 Days | | | 31-90 Days | | | Greater than
90 Days | | | Total | |
Corporates – Non-Investment Grade | | $ | 15,796,311 | | | $ | – 0 | – | | $ | – 0 | – | | $ | – 0 | – | | $ | 15,796,311 | |
| ^ | Deemed an affiliated company as defined by the Investment Company Act of 1940 since the Fund owns 5% or more of the outstanding voting securities. |
| ** | Principal amount less than 500. |
| (a) | Security is exempt from registration under Rule 144A or Regulation S of the Securities Act of 1933. These securities are considered restricted, but liquid and may be resold in transactions exempt from registration. At September 30, 2022, the aggregate market value of these securities amounted to $2,257,925,012 or 41.8% of net assets. |
| (b) | Position, or a portion thereof, has been segregated to collateralize OTC derivatives outstanding. |
| (c) | Securities are perpetual and, thus, do not have a predetermined maturity date. The date shown, if applicable, reflects the next call date. |
| (d) | Floating Rate Security. Stated interest/floor/ceiling rate was in effect at September 30, 2022. |
| (e) | Fair valued by the Adviser. |
| (f) | Security is exempt from registration under Rule 144A or Regulation S of the Securities Act of 1933. These securities, which represent 0.05% of net assets as of September 30, 2022, are considered illiquid and restricted. Additional information regarding such securities follows: |
| | | | | | | | | | | | | | | | |
144A/Restricted & Illiquid
Securities | | Acquisition
Date | | | Cost | | | Market
Value | | | Percentage of
Net Assets | |
Chile Electricity PEC SpA
0.0%, 01/25/2028 | | | 10/06/2021 | | | $ | 177,307 | | | $ | 145,488 | | | | 0.00 | % |
JPMorgan Madison Avenue Securities Trust
Series 2015-CH1, Class M2
8.584%, 10/25/2025 | | | 09/18/2015 | | | | 1,601,431 | | | | 1,564,669 | | | | 0.03 | % |
Terraform Global Operating LP
6.125%, 03/01/2026 | | | 02/08/2018 | | | | 1,155,000 | | | | 1,087,746 | | | | 0.02 | % |
Virgolino de Oliveira Finance SA
10.50%, 01/28/2018 | |
| 06/13/2013 -
09/23/2014 |
| | | 3,886,876 | | | | 430 | | | | 0.00 | % |
| (g) | Position, or a portion thereof, has been segregated to collateralize reverse repurchase agreements. |
| (h) | Security in which significant unobservable inputs (Level 3) were used in determining fair value. |
| (i) | Defaulted matured security. |
| (j) | Pay-In-Kind Payments (PIK). The issuer may pay cash interest and/or interest in additional debt securities. Rates shown are the rates in effect at September 30, 2022. |
| (k) | Non-income producing security. |
| (l) | The stated coupon rate represents the greater of the LIBOR or the LIBOR floor rate plus a spread at September 30, 2022. |
| (m) | The rate shown represents the 7-day yield as of period end. |
| (n) | To obtain a copy of the fund’s shareholder report, please go to the Securities and Exchange Commission’s website at www.sec.gov, or call AB at (800) 227-4618. |
| (o) | Affiliated investments. |
| | |
| |
| abfunds.com | | AB GLOBAL BOND FUND | 87 |
PORTFOLIO OF INVESTMENTS (continued)
| | |
Currency Abbreviations: AUD – Australian Dollar BRL – Brazilian Real CAD – Canadian Dollar CHF – Swiss Franc CLP – Chilean Peso CNH – Chinese Yuan Renminbi (Offshore) CNY – Chinese Yuan Renminbi EUR – Euro GBP – Great British Pound IDR – Indonesian Rupiah INR – Indian Rupee | | JPY – Japanese Yen KRW – South Korean Won MXN – Mexican Peso MYR – Malaysian Ringgit NOK – Norwegian Krone NZD – New Zealand Dollar PLN – Polish Zloty SEK – Swedish Krona SGD – Singapore Dollar THB – Thailand Baht TWD – New Taiwan Dollar USD – United States Dollar ZAR – South African Rand |
Glossary:
ABS – Asset-Backed Securities
BKBM – Bank Bill Benchmark (New Zealand)
BOBL – Bundesobligationen
CBT – Chicago Board of Trade
CDX-CMBX.NA – North American Commercial Mortgage-Backed Index
CDX-NAHY – North American High Yield Credit Default Swap Index
CLO – Collateralized Loan Obligations
CMBS – Commercial Mortgage-Backed Securities
EURIBOR – Euro Interbank Offered Rate
JSC – Joint Stock Company
LIBOR – London Interbank Offered Rate
OAT – Obligations Assimilables du Trésor
OSE – Osaka Securities Exchange
PJSC – Public Joint Stock Company
REIT – Real Estate Investment Trust
SOFR – Secured Overnight Financing Rate
SONIA – Sterling Overnight Index Average
TBA – To Be Announced
TIPS – Treasury Inflation Protected Security
See notes to financial statements.
| | |
| |
88 | AB GLOBAL BOND FUND | | abfunds.com |
STATEMENT OF ASSETS & LIABILITIES
September 30, 2022
| | | | |
| Assets | | | | |
Investments in securities, at value | | | | |
Unaffiliated issuers (cost $6,383,873,262) | | $ | 5,377,567,287 | |
Affiliated issuers (cost $68,923,453) | | | 65,187,814 | |
Cash collateral due from broker | | | 45,376,065 | |
Unrealized appreciation on forward currency
exchange contracts | | | 206,918,686 | |
Unaffiliated interest receivable | | | 36,689,714 | |
Receivable for capital stock sold | | | 2,734,249 | |
Receivable for investment securities sold and foreign
currency transactions | | | 201,700 | |
Affiliated dividends receivable | | | 158,068 | |
Receivable for variation margin on centrally cleared swaps | | | 7,845 | |
| | | | |
Total assets | | | 5,734,841,428 | |
| | | | |
| Liabilities | | | | |
Due to Custodian (includes foreign currency overdraft of $82 with a cost of $81) | | | 255,389 | |
Unrealized depreciation on forward currency exchange contracts | | | 147,677,218 | |
Payable for investment securities purchased | | | 101,800,292 | |
Cash collateral due to broker | | | 36,286,985 | |
Payable for capital stock redeemed | | | 15,893,163 | |
Payable for reverse repurchase agreements | | | 15,796,311 | |
Payable for variation margin on futures | | | 8,451,155 | |
Market value of credit default swaps (net premiums received $1,784,343) | | | 3,946,347 | |
Advisory fee payable | | | 2,137,945 | |
Payable for capital gains taxes | | | 841,002 | |
Dividends payable | | | 527,432 | |
Distribution fee payable | | | 124,014 | |
Transfer Agent fee payable | | | 101,019 | |
Administrative fee payable | | | 72,237 | |
Directors’ fee payable | | | 8,708 | |
Payable for variation margin on centrally cleared swaps | | | 245 | |
Accrued expenses | | | 1,243,875 | |
| | | | |
Total liabilities | | | 335,163,337 | |
| | | | |
Net Assets | | $ | 5,399,678,091 | |
| | | | |
| Composition of Net Assets | | | | |
Capital stock, at par | | $ | 761,717 | |
Additional paid-in capital | | | 6,433,986,711 | |
Accumulated loss | | | (1,035,070,337 | ) |
| | | | |
| | $ | 5,399,678,091 | |
| | | | |
See notes to financial statements.
| | |
| |
| abfunds.com | | AB GLOBAL BOND FUND | 89 |
STATEMENT OF ASSETS & LIABILITIES (continued)
Net Asset Value Per Share—27 billion shares of capital stock authorized, $.001 par value
| | | | | | | | | | | | |
| Class | | Net Assets | | | Shares
Outstanding | | | Net Asset
Value | |
| |
| A | | $ | 409,768,015 | | | | 57,763,234 | | | $ | 7.09 | * |
| |
| C | | $ | 22,598,517 | | | | 3,175,422 | | | $ | 7.12 | |
| |
| Advisor | | $ | 3,441,514,152 | | | | 485,558,853 | | | $ | 7.09 | |
| |
| R | | $ | 37,212,801 | | | | 5,247,965 | | | $ | 7.09 | |
| |
| K | | $ | 8,420,418 | | | | 1,187,156 | | | $ | 7.09 | |
| |
| I | | $ | 724,876,222 | | | | 102,259,633 | | | $ | 7.09 | |
| |
| Z | | $ | 755,287,966 | | | | 106,524,386 | | | $ | 7.09 | |
| |
| * | The maximum offering price per share for Class A shares was $7.40, which reflects a sales charge of 4.25%. |
See notes to financial statements.
| | |
| |
90 | AB GLOBAL BOND FUND | | abfunds.com |
STATEMENT OF OPERATIONS
Year Ended September 30, 2022
| | | | | | | | |
| Investment Income | | | | | | | | |
Interest (net of foreign taxes withheld of $380,104) | | $ | 140,964,267 | | | | | |
Dividends | | | | | | | | |
Affiliated issuers | | | 676,665 | | | $ | 141,640,932 | |
| | | | | | | | |
| Expenses | | | | | | | | |
Advisory fee (see Note B) | | | 29,349,394 | | | | | |
Transfer agency—Class A | | | 332,260 | | | | | |
Transfer agency—Class C | | | 21,715 | | | | | |
Transfer agency—Advisor Class | | | 2,756,388 | | | | | |
Transfer agency—Class R | | | 115,484 | | | | | |
Transfer agency—Class K | | | 22,491 | | | | | |
Transfer agency—Class I | | | 649,934 | | | | | |
Transfer agency—Class Z | | | 185,598 | | | | | |
Distribution fee—Class A | | | 1,245,739 | | | | | |
Distribution fee—Class C | | | 314,210 | | | | | |
Distribution fee—Class R | | | 222,085 | | | | | |
Distribution fee—Class K | | | 28,113 | | | | | |
Custody and accounting | | | 731,621 | | | | | |
Printing | | | 306,117 | | | | | |
Registration fees | | | 183,946 | | | | | |
Audit and tax | | | 133,353 | | | | | |
Directors’ fees | | | 105,947 | | | | | |
Administrative | | | 98,365 | | | | | |
Legal | | | 82,468 | | | | | |
Miscellaneous | | | 227,180 | | | | | |
| | | | | | | | |
Total expenses before interest expense | | | 37,112,408 | | | | | |
Interest expense | | | 50,094 | | | | | |
| | | | | | | | |
Total expenses | | | 37,162,502 | | | | | |
Less: expenses waived and reimbursed by the Adviser (see Note B) | | | (91,125 | ) | | | | |
| | | | | | | | |
Net expenses | | | | | | | 37,071,377 | |
| | | | | | | | |
Net investment income | | | | | | | 104,569,555 | |
| | | | | | | | |
See notes to financial statements.
| | |
| |
| abfunds.com | | AB GLOBAL BOND FUND | 91 |
STATEMENT OF OPERATIONS (continued)
| | | | | | | | |
| Realized and Unrealized Gain (Loss) on Investment and Foreign Currency Transactions | | | | | | | | |
Net realized gain (loss) on: | | | | | | | | |
Investment transactions(a) | | | | | | $ | (320,864,215 | ) |
Forward currency exchange contracts | | | | | | | 498,899,905 | |
Futures | | | | | | | 4,076,956 | |
Swaps | | | | | | | 8,250,090 | |
Foreign currency transactions | | | | | | | (204,419,193 | ) |
Net change in unrealized appreciation/depreciation on: | | | | | | | | |
Affiliated Issuers | | | | | | | 252,589 | |
Investments(b) | | | | | | | (966,897,528 | ) |
Forward currency exchange contracts | | | | | | | 8,043,182 | |
Futures | | | | | | | 10,146,723 | |
Swaps | | | | | | | (13,123,528 | ) |
Foreign currency denominated assets and liabilities | | | | | | | (1,634,847 | ) |
| | | | | | | | |
Net loss on investment and foreign currency transactions | | | | | | | (977,269,866 | ) |
| | | | | | | | |
Contributions from Affiliates (see Note B) | | | | | | | 716 | |
| | | | | | | | |
Net Decrease in Net Assets from Operations | | | | | | $ | (872,699,595 | ) |
| | | | | | | | |
| (a) | Net of foreign realized capital gains taxes of $449,474. |
| (b) | Net of decrease in accrued foreign capital gains taxes on unrealized gains of $130,021. |
See notes to financial statements.
| | |
| |
92 | AB GLOBAL BOND FUND | | abfunds.com |
STATEMENT OF CHANGES IN NET ASSETS
| | | | | | | | |
| | | Year Ended
September 30,
2022 | | | Year Ended
September 30,
2021 | |
| Increase (Decrease) in Net Assets from Operations | | | | | | | | |
Net investment income | | $ | 104,569,555 | | | $ | 102,878,918 | |
Net realized gain (loss) on investment and foreign currency transactions | | | (14,056,457 | ) | | | 135,490,772 | |
Net change in unrealized appreciation/depreciation on investments and foreign currency denominated assets and liabilities | | | (963,213,409 | ) | | | (153,314,263 | ) |
Contributions from Affiliates (see Note B) | | | 716 | | | | – 0 | – |
| | | | | | | | |
Net increase (decrease) in net assets from operations | | | (872,699,595 | ) | | | 85,055,427 | |
| Distributions to Shareholders | | | | | | | | |
Class A | | | (21,975,166 | ) | | | (13,885,781 | ) |
Class C | | | (1,182,268 | ) | | | (822,067 | ) |
Advisor Class | | | (190,054,777 | ) | | | (116,998,733 | ) |
Class R | | | (1,745,135 | ) | | | (950,682 | ) |
Class K | | | (501,460 | ) | | | (323,896 | ) |
Class I | | | (38,514,337 | ) | | | (21,565,537 | ) |
Class Z | | | (39,231,722 | ) | | | (15,767,733 | ) |
| Capital Stock Transactions | | | | | | | | |
Net increase (decrease) | | | (462,510,929 | ) | | | 237,830,852 | |
| | | | | | | | |
Total increase (decrease) | | | (1,628,415,389 | ) | | | 152,571,850 | |
| Net Assets | | | | | | | | |
Beginning of period | | | 7,028,093,480 | | | | 6,875,521,630 | |
| | | | | | | | |
End of period | | $ | 5,399,678,091 | | | $ | 7,028,093,480 | |
| | | | | | | | |
See notes to financial statements.
| | |
| |
| abfunds.com | | AB GLOBAL BOND FUND | 93 |
NOTES TO FINANCIAL STATEMENTS
September 30, 2022
NOTE A
Significant Accounting Policies
AB Global Bond Fund, Inc. (the “Fund”) is organized as a Maryland corporation and is registered under the Investment Company Act of 1940 as a diversified, open-end management investment company. The Fund offers Class A, Class C, Advisor Class, Class R, Class K, Class I and Class Z shares. Class B and Class T shares have been authorized but currently are not offered. Class A shares are sold with a front-end sales charge of up to 4.25% for purchases not exceeding $1,000,000. With respect to purchases of $1,000,000 or more, Class A shares redeemed within one year of purchase may be subject to a contingent deferred sales charge of 1%. Class C shares are subject to a contingent deferred sales charge of 1% on redemptions made within the first year after purchase, and 0% after the first year of purchase. Effective May 31, 2021, Class C shares automatically convert to Class A shares eight years after the end of the calendar month of purchase. Prior to May 31, 2021, Class C shares automatically converted to Class A shares 10 years after the end of the calendar month of purchase. Class R and Class K shares are sold without an initial or contingent deferred sales charge. Advisor Class, Class I and Class Z shares are sold without an initial or contingent deferred sales charge and are not subject to ongoing distribution expenses. All nine classes of shares have identical voting, dividend, liquidation and other rights, except that the classes bear different distribution and transfer agency expenses. Each class has exclusive voting rights with respect to its distribution plan. The financial statements have been prepared in conformity with U.S. generally accepted accounting principles (“U.S. GAAP”), which require management to make certain estimates and assumptions that affect the reported amounts of assets and liabilities in the financial statements and amounts of income and expenses during the reporting period. Actual results could differ from those estimates. The Fund is an investment company under U.S. GAAP and follows the accounting and reporting guidance applicable to investment companies. The following is a summary of significant accounting policies followed by the Fund.
1. Security Valuation
Portfolio securities are valued at market value determined on the basis of market quotations or, if market quotations are not readily available or are unreliable, at “fair value” as determined in accordance with procedures approved by and under the oversight of the Fund’s Board of Directors (the “Board”). Pursuant to these procedures, AllianceBernstein L.P. (the “Adviser”) serves as the Fund’s valuation designee pursuant to Rule 2a-5 of the 1940 Act. In this capacity, the Adviser is responsible, among other things, for making all fair value determinations relating to the Fund’s portfolio investments, subject to the Board’s oversight.
| | |
| |
94 | AB GLOBAL BOND FUND | | abfunds.com |
NOTES TO FINANCIAL STATEMENTS (continued)
In general, the market values of securities which are readily available and deemed reliable are determined as follows: securities listed on a national securities exchange (other than securities listed on the NASDAQ Stock Market, Inc. (“NASDAQ”)) or on a foreign securities exchange are valued at the last sale price at the close of the exchange or foreign securities exchange. If there has been no sale on such day, the securities are valued at the last traded price from the previous day. Securities listed on more than one exchange are valued by reference to the principal exchange on which the securities are traded; securities listed only on NASDAQ are valued in accordance with the NASDAQ Official Closing Price; listed or over the counter (“OTC”) market put or call options are valued at the mid level between the current bid and ask prices. If either a current bid or current ask price is unavailable, the Adviser will have discretion to determine the best valuation (e.g., last trade price in the case of listed options); open futures are valued using the closing settlement price or, in the absence of such a price, the most recent quoted bid price. If there are no quotations available for the day of valuation, the last available closing settlement price is used; U.S. Government securities and any other debt instruments having 60 days or less remaining until maturity are generally valued at market by an independent pricing vendor, if a market price is available. If a market price is not available, the securities are valued at amortized cost. This methodology is commonly used for short term securities that have an original maturity of 60 days or less, as well as short term securities that had an original term to maturity that exceeded 60 days. In instances when amortized cost is utilized, the Valuation Committee (the “Committee”) must reasonably conclude that the utilization of amortized cost is approximately the same as the fair value of the security. Factors the Committee will consider include, but are not limited to, an impairment of the creditworthiness of the issuer or material changes in interest rates. Fixed-income securities, including mortgage-backed and asset-backed securities, may be valued on the basis of prices provided by a pricing service or at a price obtained from one or more of the major broker-dealers. In cases where broker-dealer quotes are obtained, the Adviser may establish procedures whereby changes in market yields or spreads are used to adjust, on a daily basis, a recently obtained quoted price on a security. Swaps and other derivatives are valued daily, primarily using independent pricing services, independent pricing models using market inputs, as well as third party broker-dealers or counterparties. Open-end mutual funds are valued at the closing net asset value per share, while exchange traded funds are valued at the closing market price per share.
Securities for which market quotations are not readily available (including restricted securities) or are deemed unreliable are valued at fair value as deemed appropriate by the Adviser. Factors considered in making this determination may include, but are not limited to, information obtained by
| | |
| |
| abfunds.com | | AB GLOBAL BOND FUND | 95 |
NOTES TO FINANCIAL STATEMENTS (continued)
contacting the issuer, analysts, analysis of the issuer’s financial statements or other available documents. In addition, the Fund may use fair value pricing for securities primarily traded in non-U.S. markets because most foreign markets close well before the Fund values its securities at 4:00 p.m., Eastern Time. The earlier close of these foreign markets gives rise to the possibility that significant events, including broad market moves, may have occurred in the interim and may materially affect the value of those securities. To account for this, the Fund generally values many of its foreign equity securities using fair value prices based on third party vendor modeling tools to the extent available.
2. Fair Value Measurements
In accordance with U.S. GAAP regarding fair value measurements, fair value is defined as the price that the Fund would receive to sell an asset or pay to transfer a liability in an orderly transaction between market participants at the measurement date. U.S. GAAP establishes a framework for measuring fair value, and a three-level hierarchy for fair value measurements based upon the transparency of inputs to the valuation of an asset or liability (including those valued based on their market values as described in Note A.1 above). Inputs may be observable or unobservable and refer broadly to the assumptions that market participants would use in pricing the asset or liability. Observable inputs reflect the assumptions market participants would use in pricing the asset or liability based on market data obtained from sources independent of the Fund. Unobservable inputs reflect the Fund’s own assumptions about the assumptions that market participants would use in pricing the asset or liability based on the best information available in the circumstances. Each investment is assigned a level based upon the observability of the inputs which are significant to the overall valuation. The three-tier hierarchy of inputs is summarized below.
| | • | | Level 1—quoted prices in active markets for identical investments |
| | • | | Level 2—other significant observable inputs (including quoted prices for similar investments, interest rates, prepayment speeds, credit risk, etc.) |
| | • | | Level 3—significant unobservable inputs (including the Fund’s own assumptions in determining the fair value of investments) |
The fair value of debt instruments, such as bonds, and over-the-counter derivatives is generally based on market price quotations, recently executed market transactions (where observable) or industry recognized modeling techniques and are generally classified as Level 2. Pricing vendor inputs to Level 2 valuations may include quoted prices for similar investments in active markets, interest rate curves, coupon rates, currency rates, yield curves, option adjusted spreads, default rates, credit spreads and
| | |
| |
96 | AB GLOBAL BOND FUND | | abfunds.com |
NOTES TO FINANCIAL STATEMENTS (continued)
other unique security features in order to estimate the relevant cash flows which are then discounted to calculate fair values. If these inputs are unobservable and significant to the fair value, these investments will be classified as Level 3.
Where readily available market prices or relevant bid prices are not available for certain equity investments, such investments may be valued based on similar publicly traded investments, movements in relevant indices since last available prices or based upon underlying company fundamentals and comparable company data (such as multiples to earnings or other multiples to equity). Where an investment is valued using an observable input, such as another publicly traded security, the investment will be classified as Level 2. If management determines that an adjustment is appropriate based on restrictions on resale, illiquidity or uncertainty, and such adjustment is a significant component of the valuation, the investment will be classified as Level 3. An investment will also be classified as Level 3 where management uses company fundamentals and other significant inputs to determine the valuation.
Options are valued using market-based inputs to models, broker or dealer quotations, or alternative pricing sources with reasonable levels of price transparency, where such inputs and models are available. Alternatively, the values may be obtained through unobservable management determined inputs and/or management’s proprietary models. Where models are used, the selection of a particular model to value an option depends upon the contractual terms of, and specific risks inherent in, the option as well as the availability of pricing information in the market. Valuation models require a variety of inputs, including contractual terms, market prices, measures of volatility and correlations of such inputs. Exchange traded options generally will be classified as Level 2. For options that do not trade on an exchange but trade in liquid markets, inputs can generally be verified and model selection does not involve significant management judgment. Options are classified within Level 2 on the fair value hierarchy when all of the significant inputs can be corroborated to market evidence. Otherwise such instruments are classified as Level 3.
Valuations of mortgage-backed or other asset-backed securities, by pricing vendors, are based on both proprietary and industry recognized models and discounted cash flow techniques. Significant inputs to the valuation of these instruments are value of the collateral, the rates and timing of delinquencies, the rates and timing of prepayments, and default and loss expectations, which are driven in part by housing prices for residential mortgages. Significant inputs are determined based on relative value analyses, which incorporate comparisons to instruments with similar collateral and risk profiles, including relevant indices. Mortgage and asset-backed
| | |
| |
| abfunds.com | | AB GLOBAL BOND FUND | 97 |
NOTES TO FINANCIAL STATEMENTS (continued)
securities for which management has collected current observable data through pricing services are generally categorized within Level 2. Those investments for which current observable data has not been provided are classified as Level 3.
Bank loan prices are provided by third party pricing services and consist of a composite of the quotes received by the vendor into a consensus price. Certain bank loans are classified as Level 3, as a significant input used in the fair value measurement of these instruments is the market quotes that are received by the vendor and these inputs are not observable.
Other fixed income investments, including non-U.S. government and corporate debt, are generally valued using quoted market prices, if available, which are typically impacted by current interest rates, maturity dates and any perceived credit risk of the issuer. Additionally, in the absence of quoted market prices, these inputs are used by pricing vendors to derive a valuation based upon industry or proprietary models which incorporate issuer specific data with relevant yield/spread comparisons with more widely quoted bonds with similar key characteristics. Those investments for which there are observable inputs are classified as Level 2. Where the inputs are not observable, the investments are classified as Level 3.
The following table summarizes the valuation of the Fund’s investments by the above fair value hierarchy levels as of September 30, 2022:
| | | | | | | | | | | | | | | | |
Investments in
Securities | | Level 1 | | | Level 2 | | | Level 3 | | | Total | |
Assets: | | | | | | | | | | | | | | | | |
Governments – Treasuries | | $ | – 0 | – | | $ | 2,814,944,648 | | | $ | – 0 | – | | $ | 2,814,944,648 | |
Corporates – Investment Grade | | | – 0 | – | | | 1,170,411,948 | | | | – 0 | – | | | 1,170,411,948 | |
Mortgage Pass-Throughs | | | – 0 | – | | | 211,402,837 | | | | – 0 | – | | | 211,402,837 | |
Corporates – Non-Investment Grade | | | – 0 | – | | | 196,439,976 | | | | 4,078,892 | | | | 200,518,868 | |
Collateralized Mortgage Obligations | | | – 0 | – | | | 163,701,780 | | | | – 0 | – | | | 163,701,780 | |
Inflation-Linked Securities | | | – 0 | – | | | 158,908,278 | | | | – 0 | – | | | 158,908,278 | |
Commercial Mortgage-Backed Securities | | | – 0 | – | | | 100,607,096 | | | | – 0 | – | | | 100,607,096 | |
Covered Bonds | | | – 0 | – | | | 95,344,447 | | | | – 0 | – | | | 95,344,447 | |
Collateralized Loan Obligations | | | – 0 | – | | | 85,352,028 | | | | – 0 | – | | | 85,352,028 | |
Governments – Sovereign Bonds | | | – 0 | – | | | 81,508,535 | | | | – 0 | – | | | 81,508,535 | |
| | |
| |
98 | AB GLOBAL BOND FUND | | abfunds.com |
NOTES TO FINANCIAL STATEMENTS (continued)
| | | | | | | | | | | | | | | | |
Investments in
Securities | | Level 1 | | | Level 2 | | | Level 3 | | | Total | |
Quasi-Sovereigns | | $ | – 0 | – | | $ | 78,955,000 | | | $ | – 0 | – | | $ | 78,955,000 | |
Supranationals | | | – 0 | – | | | 47,477,366 | | | | – 0 | – | | | 47,477,366 | |
Local Governments – Provincial Bonds | | | – 0 | – | | | 43,379,329 | | | | – 0 | – | | | 43,379,329 | |
Emerging Markets – Corporate Bonds | | | – 0 | – | | | 28,260,317 | | | | 430 | | | | 28,260,747 | |
Local Governments – Regional Bonds | | | – 0 | – | | | 27,821,625 | | | | – 0 | – | | | 27,821,625 | |
Asset-Backed Securities | | | – 0 | – | | | 21,212,779 | | | | – 0 | – | | | 21,212,779 | |
Governments – Sovereign Agencies | | | – 0 | – | | | 19,244,928 | | | | – 0 | – | | | 19,244,928 | |
Bank Loans | | | – 0 | – | | | 5,878,064 | | | | – 0 | – | | | 5,878,064 | |
Common Stocks | | | 634,589 | | | | – 0 | – | | | 4,000,926 | | | | 4,635,515 | |
Emerging Markets – Sovereigns | | | – 0 | – | | | 4,331,791 | | | | – 0 | – | | | 4,331,791 | |
Warrants | | | 12 | # | | | – 0 | – | | | 0 | # | | | 12 | |
Short-Term Investments: | | | | | | | | | | | | | | | | |
Investment Companies | | | 64,625,952 | | | | – 0 | – | | | – 0 | – | | | 64,625,952 | |
Time Deposits | | | – 0 | – | | | 12,144,021 | | | | – 0 | – | | | 12,144,021 | |
Governments – Treasuries | | | – 0 | – | | | 2,087,507 | | | | – 0 | – | | | 2,087,507 | |
| | | | | | | | | | | | | | | | |
Total Investments in Securities | | | 65,260,553 | | | | 5,369,414,300 | | | | 8,080,248 | | | | 5,442,755,101 | |
Other Financial Instruments*: | | | | | | | | | | | | | | | | |
Assets | | | | | | | | | | | | | | | | |
Futures | | | 23,729,875 | | | | – 0 | – | | | – 0 | – | | | 23,729,875 | † |
Forward Currency Exchange Contracts | | | – 0 | – | | | 206,918,686 | | | | – 0 | – | | | 206,918,686 | |
Centrally Cleared Interest Rate Swaps | | | – 0 | – | | | 42,443,683 | | | | – 0 | – | | | 42,443,683 | † |
Liabilities | | | | | | | | | | | | | | | | |
Futures | | | (13,758,455 | ) | | | – 0 | – | | | – 0 | – | | | (13,758,455 | )† |
Forward Currency Exchange Contracts | | | – 0 | – | | | (147,677,218 | ) | | | – 0 | – | | | (147,677,218 | ) |
Centrally Cleared Credit Default Swaps | | | – 0 | – | | | (161,534 | ) | | | – 0 | – | | | (161,534 | )† |
Centrally Cleared Interest Rate Swaps | | | – 0 | – | | | (60,981,449 | ) | | | – 0 | – | | | (60,981,449 | )† |
Credit Default Swaps | | | – 0 | – | | | (3,946,347 | ) | | | – 0 | – | | | (3,946,347 | ) |
Reverse Repurchase Agreements | | | (15,796,311 | ) | | | – 0 | – | | | – 0 | – | | | (15,796,311 | ) |
| | | | | | | | | | | | | | | | |
Total | | $ | 59,435,662 | | | $ | 5,406,010,121 | | | $ | 8,080,248 | | | $ | 5,473,526,031 | |
| | | | | | | | | | | | | | | | |
| # | The Fund held securities with zero market value at period end. |
| | |
| |
| abfunds.com | | AB GLOBAL BOND FUND | 99 |
NOTES TO FINANCIAL STATEMENTS (continued)
| * | Other financial instruments are derivative instruments, such as futures, forwards and swaps, which are valued at the unrealized appreciation/(depreciation) on the instrument. Other financial instruments may also include swaps with upfront premiums, written options and written swaptions which are valued at market value. |
| † | Only variation margin receivable/(payable) at period end is reported within the statement of assets and liabilities. This amount reflects cumulative unrealized appreciation/(depreciation) on futures and centrally cleared swaps as reported in the portfolio of investments. Where applicable, centrally cleared swaps with upfront premiums are presented here at market value. |
3. Currency Translation
Assets and liabilities denominated in foreign currencies and commitments under forward currency exchange contracts are translated into U.S. dollars at the mean of the quoted bid and ask prices of such currencies against the U.S. dollar. Purchases and sales of portfolio securities are translated into U.S. dollars at the rates of exchange prevailing when such securities were acquired or sold. Income and expenses are translated into U.S. dollars at the rates of exchange prevailing when accrued.
Net realized gain or loss on foreign currency transactions represents foreign exchange gains and losses from sales and maturities of foreign fixed income investments, holding of foreign currencies, currency gains or losses realized between the trade and settlement dates on foreign investment transactions, and the difference between the amounts of dividends, interest and foreign withholding taxes recorded on the Fund’s books and the U.S. dollar equivalent amounts actually received or paid. Net unrealized currency gains and losses from valuing foreign currency denominated assets and liabilities at period end exchange rates are reflected as a component of net unrealized appreciation or depreciation of foreign currency denominated assets and liabilities.
4. Taxes
It is the Fund’s policy to meet the requirements of the Internal Revenue Code applicable to regulated investment companies and to distribute all of its investment company taxable income and net realized gains, if any, to shareholders. Therefore, no provisions for federal income or excise taxes are required. The Fund may be subject to taxes imposed by countries in which it invests. Such taxes are generally based on income and/or capital gains earned or repatriated. Taxes are accrued and applied to net investment income, net realized gains and net unrealized appreciation/depreciation as such income and/or gains are earned.
In accordance with U.S. GAAP requirements regarding accounting for uncertainties in income taxes, management has analyzed the Fund’s tax positions taken or expected to be taken on federal and state income tax returns for all open tax years (the current and the prior three tax years) and has concluded that no provision for income tax is required in the Fund’s financial statements.
| | |
| |
100 | AB GLOBAL BOND FUND | | abfunds.com |
NOTES TO FINANCIAL STATEMENTS (continued)
5. Investment Income and Investment Transactions
Dividend income is recorded on the ex-dividend date or as soon as the Fund is informed of the dividend. Interest income is accrued daily. Investment transactions are accounted for on the date the securities are purchased or sold. Investment gains or losses are determined on the identified cost basis. Non-cash dividends, if any, are recorded on the ex-dividend date at the fair value of the securities received. The Fund amortizes premiums and accretes discounts as adjustments to interest income. The Fund accounts for distributions received from REIT investments or from regulated investment companies as dividend income, realized gain, or return of capital based on information provided by the REIT or the investment company.
6. Class Allocations
All income earned and expenses incurred by the Fund are borne on a pro-rata basis by each settled class of shares, based on the proportionate interest in the Fund represented by the net assets of such class, except for class specific expenses which are allocated to the respective class. Realized and unrealized gains and losses are allocated among the various share classes based on respective net assets.
7. Dividends and Distributions
Dividends and distributions to shareholders, if any, are recorded on the ex-dividend date. Income dividends and capital gains distributions are determined in accordance with federal tax regulations and may differ from those determined in accordance with U.S. GAAP. To the extent these differences are permanent, such amounts are reclassified within the capital accounts based on their federal tax basis treatment; temporary differences do not require such reclassification.
NOTE B
Advisory Fee and Other Transactions with Affiliates
Under the terms of the investment advisory agreement, the Fund pays the Adviser an advisory fee at an annual rate of .50% of the first $2.5 billion, .45% of the next $2.5 billion and .40% in excess of $5 billion of the Fund’s average daily net assets. The fee is accrued daily and paid monthly.
Pursuant to the investment advisory agreement, the Fund may reimburse the Adviser for certain legal and accounting services provided to the Fund by the Adviser. For the year ended September 30, 2022, the reimbursement for such services amounted to $98,365.
The Fund compensates AllianceBernstein Investor Services, Inc. (“ABIS”), a wholly-owned subsidiary of the Adviser, under a Transfer Agency Agreement for providing personnel and facilities to perform transfer agency
| | |
| |
| abfunds.com | | AB GLOBAL BOND FUND | 101 |
NOTES TO FINANCIAL STATEMENTS (continued)
services for the Fund. ABIS may make payments to intermediaries that provide omnibus account services, sub-accounting services and/or networking services. Such compensation retained by ABIS amounted to $1,205,684 for the year ended September 30, 2022.
AllianceBernstein Investments, Inc. (the “Distributor”), a wholly-owned subsidiary of the Adviser, serves as the distributor of the Fund’s shares. The Distributor has advised the Fund that it has retained front-end sales charges of $2,262 from the sale of Class A shares and received $474 and $2,935 in contingent deferred sales charges imposed upon redemptions by shareholders of Class A and Class C shares, respectively, for the year ended September 30, 2022.
The Fund may invest in AB Government Money Market Portfolio (the “Government Money Market Portfolio”) which has a contractual annual advisory fee rate of ..20% of the portfolio’s average daily net assets and bears its own expenses. The Adviser has contractually agreed to waive .10% of the advisory fee of Government Money Market Portfolio (resulting in a net advisory fee of .10%) until August 31, 2023. In connection with the investment by the Fund in Government Money Market Portfolio, the Adviser has contractually agreed to waive its advisory fee from the Fund in an amount equal to the Fund’s pro rata share of the effective advisory fee of Government Money Market Portfolio, as borne indirectly by the Fund as an acquired fund fee and expense. For the year ended September 30, 2022, such waiver amounted to $91,125.
A summary of the Fund’s transactions in affiliated issuers for the year ended September 30, 2022 is as follows:
| | | | | | | | | | | | | | | | | | | | | | | | | | | | |
Fund | | Market
Value
9/30/21
(000) | | | Purchases
at Cost
(000) | | | Sales
Proceeds
(000) | | | Realized
Gain
(000) | | | Change in
Unrealized
Appr./
(Depr.)
(000) | | | Market
Value
9/30/22
(000) | | | Dividend
Income
(000) | |
Government Money Market Portfolio | | $ | 66,333 | | | $ | 2,445,353 | | | $ | 2,447,060 | | | $ | – 0 | – | | $ | – 0 | – | | $ | 64,626 | | | $ | 677 | |
Golden Energy Offshore Services AS | | | 309 | | | | – 0 | – | | | – 0 | – | | | – 0 | – | | | 253 | | | | 562 | | | | – 0 | – |
| | | | | | | | | | | | | | | | | | | | | | | | | | | | |
Total | | | | | | | | | | | | | | $ | – 0 | – | | $ | 253 | | | $ | 65,188 | | | $ | 677 | |
| | | | | | | | | | | | | | | | | | | | | | | | | | | | |
During the year ended September 30, 2022, the Adviser reimbursed the Fund $716 for trading losses incurred due to a trade entry error.
NOTE C
Distribution Services Agreement
The Fund has adopted a Distribution Services Agreement (the “Agreement”) pursuant to Rule 12b-1 under the Investment Company Act
| | |
| |
102 | AB GLOBAL BOND FUND | | abfunds.com |
NOTES TO FINANCIAL STATEMENTS (continued)
of 1940. Under the Agreement, the Fund pays distribution and servicing fees to the Distributor at an annual rate of up to .30% of the Fund’s average daily net assets attributable to Class A shares, 1% of the Fund’s average daily net assets attributable to Class C shares, .50% of the Fund’s average daily net assets attributable to Class R shares and .25% of the Fund’s average daily net assets attributable to Class K shares. There are no distribution and servicing fees on Advisor Class, Class I and Class Z shares. Payments under the Agreement in respect of Class A shares are currently limited to an annual rate of .25% of Class A shares’ average daily net assets. The fees are accrued daily and paid monthly. The Agreement provides that the Distributor will use such payments in their entirety for distribution assistance and promotional activities. Since the commencement of the Fund’s operations, the Distributor has incurred expenses in excess of the distribution costs reimbursed by the Fund in the amounts of $15,584,322, $1,415,347 and $320,114 for Class C, Class R and Class K shares, respectively. While such costs may be recovered from the Fund in future periods so long as the Agreement is in effect, the rate of the distribution and servicing fees payable under the Agreement may not be increased without a shareholder vote. In accordance with the Agreement, there is no provision for recovery of unreimbursed distribution costs incurred by the Distributor beyond the current fiscal year for Class A shares. The Agreement also provides that the Adviser may use its own resources to finance the distribution of the Fund’s shares.
NOTE D
Investment Transactions
Purchases and sales of investment securities (excluding short-term investments) for the year ended September 30, 2022, were as follows:
| | | | | | | | |
| | | Purchases | | | Sales | |
Investment securities (excluding U.S. government securities) | | $ | 5,850,503,900 | | | $ | 6,466,156,670 | |
U.S. government securities | | | 4,147,667,776 | | | | 3,634,819,892 | |
The cost of investments for federal income tax purposes, gross unrealized appreciation and unrealized depreciation are as follows:
| | | | |
Cost | | $ | 6,478,579,293 | |
| | | | |
Gross unrealized appreciation | | $ | 278,472,120 | |
Gross unrealized depreciation | | | (1,331,629,052 | ) |
| | | | |
Net unrealized depreciation | | $ | (1,053,156,932 | ) |
| | | | |
1. Derivative Financial Instruments
The Fund may use derivatives in an effort to earn income and enhance returns, to replace more traditional direct investments, to obtain exposure
| | |
| |
| abfunds.com | | AB GLOBAL BOND FUND | 103 |
NOTES TO FINANCIAL STATEMENTS (continued)
to otherwise inaccessible markets (collectively, “investment purposes”), or to hedge or adjust the risk profile of its portfolio.
The principal types of derivatives utilized by the Fund, as well as the methods in which they may be used are:
| | • | | Forward Currency Exchange Contracts |
The Fund may enter into forward currency exchange contracts in order to hedge its exposure to changes in foreign currency exchange rates on its foreign portfolio holdings, to hedge certain firm purchase and sale commitments denominated in foreign currencies and for non-hedging purposes as a means of making direct investments in foreign currencies, as described below under “Currency Transactions”.
A forward currency exchange contract is a commitment to purchase or sell a foreign currency at a future date at a negotiated forward rate. The gain or loss arising from the difference between the original contract and the closing of such contract would be included in net realized gain or loss on forward currency exchange contracts. Fluctuations in the value of open forward currency exchange contracts are recorded for financial reporting purposes as unrealized appreciation and/or depreciation by the Fund. Risks may arise from the potential inability of a counterparty to meet the terms of a contract and from unanticipated movements in the value of a foreign currency relative to the U.S. dollar.
During the year ended September 30, 2022, the Fund held forward currency exchange contracts for hedging and non-hedging purposes.
The Fund may buy or sell futures for investment purposes or for the purpose of hedging its portfolio against adverse effects of potential movements in the market. The Fund bears the market risk that arises from changes in the value of these instruments and the imperfect correlation between movements in the price of the futures and movements in the price of the assets, reference rates or indices which they are designed to track. Among other things, the Fund may purchase or sell futures for foreign currencies or options thereon for non-hedging purposes as a means of making direct investment in foreign currencies, as described below under “Currency Transactions”.
At the time the Fund enters into futures, the Fund deposits and maintains as collateral an initial margin with the broker, as required by the exchange on which the transaction is effected. Such amount is shown as cash collateral due from broker on the statement of assets and liabilities. Pursuant to the contract, the Fund agrees to receive from or pay to the broker an amount of cash equal to the daily fluctuation in the value of the contract. Such receipts or payments are
| | |
| |
104 | AB GLOBAL BOND FUND | | abfunds.com |
NOTES TO FINANCIAL STATEMENTS (continued)
known as variation margin and are recorded by the Fund as unrealized gains or losses. Risks may arise from the potential inability of a counterparty to meet the terms of the contract. The credit/ counterparty risk for exchange-traded futures is generally less than privately negotiated futures, since the clearinghouse, which is the issuer or counterparty to each exchange-traded future, has robust risk mitigation standards, including the requirement to provide initial and variation margin. When the contract is closed, the Fund records a realized gain or loss equal to the difference between the value of the contract at the time it was opened and the time it was closed.
Use of long futures subjects the Fund to risk of loss in excess of the amounts shown on the statement of assets and liabilities, up to the notional value of the futures. Use of short futures subjects the Fund to unlimited risk of loss. Under some circumstances, futures exchanges may establish daily limits on the amount that the price of futures can vary from the previous day’s settlement price, which could effectively prevent liquidation of unfavorable positions.
During the year ended September 30, 2022, the Fund held futures for hedging and non-hedging purposes.
For hedging and investment purposes, the Fund may purchase and write (sell) put and call options on U.S. and foreign securities, including government securities, and foreign currencies that are traded on U.S. and foreign securities exchanges and over-the-counter markets. Among other things, the Fund may use options transactions for non-hedging purposes as a means of making direct investments in foreign currencies, as described below under “Currency Transactions” and may use options strategies involving the purchase and/or writing of various combinations of call and/or put options, for hedging and investment purposes.
The risk associated with purchasing an option is that the Fund pays a premium whether or not the option is exercised. Additionally, the Fund bears the risk of loss of the premium and change in market value should the counterparty not perform under the contract. If a put or call option purchased by the Fund were permitted to expire without being sold or exercised, its premium would represent a loss to the Fund. Put and call options purchased are accounted for in the same manner as portfolio securities. The cost of securities acquired through the exercise of call options is increased by premiums paid. The proceeds from securities sold through the exercise of put options are decreased by the premiums paid.
When the Fund writes an option, the premium received by the Fund is recorded as a liability and is subsequently adjusted to the current
| | |
| |
| abfunds.com | | AB GLOBAL BOND FUND | 105 |
NOTES TO FINANCIAL STATEMENTS (continued)
market value of the written option. The Fund’s maximum payment for written put options equates to the number of shares multiplied by the strike price. In certain circumstances maximum payout amounts may be partially offset by recovery values of the respective referenced assets and upfront premium received upon entering into the contract. Premiums received from written options which expire unexercised are recorded by the Fund on the expiration date as realized gains from written options. The difference between the premium received and the amount paid on effecting a closing purchase transaction, including brokerage commissions, is also treated as a realized gain, or if the premium received is less than the amount paid for the closing purchase transaction, as a realized loss. If a call option is exercised, the premium received is added to the proceeds from the sale of the underlying security or currency in determining whether the Fund has realized a gain or loss. If a put option is exercised, the premium received reduces the cost basis of the security or currency purchased by the Fund. In writing an option, the Fund bears the market risk of an unfavorable change in the price of the security or currency underlying the written option. Exercise of a written option by the Fund could result in the Fund selling or buying a security or currency at a price different from the current market value.
The Fund may also invest in options on swap agreements, also called “swaptions”. A swaption is an option that gives the buyer the right, but not the obligation, to enter into a swap on a future date in exchange for paying a market-based “premium”. A receiver swaption gives the owner the right to receive the total return of a specified asset, reference rate, or index. A payer swaption gives the owner the right to pay the total return of a specified asset, reference rate, or index. Swaptions also include options that allow an existing swap to be terminated or extended by one of the counterparties. The Fund’s maximum payment for written put swaptions equates to the notional amount of the underlying swap. In certain circumstances maximum payout amounts may be partially offset by recovery values of the respective referenced assets and upfront premium received upon entering into the contract.
During the year ended September 30, 2022, the Fund held purchased options for hedging purposes.
The Fund may enter into swaps to hedge its exposure to interest rates, credit risk or currencies. The Fund may also enter into swaps for non-hedging purposes as a means of gaining market exposures including by making direct investments in foreign currencies, as described below under “Currency Transactions”. A swap is an
| | |
| |
106 | AB GLOBAL BOND FUND | | abfunds.com |
NOTES TO FINANCIAL STATEMENTS (continued)
agreement that obligates two parties to exchange a series of cash flows at specified intervals based upon or calculated by reference to changes in specified prices or rates for a specified amount of an underlying asset. The payment flows are usually netted against each other, with the difference being paid by one party to the other. In addition, collateral may be pledged or received by the Fund in accordance with the terms of the respective swaps to provide value and recourse to the Fund or its counterparties in the event of default, bankruptcy or insolvency by one of the parties to the swap.
Risks may arise as a result of the failure of the counterparty to the swap to comply with the terms of the swap. The loss incurred by the failure of a counterparty is generally limited to the net interim payment to be received by the Fund, and/or the termination value at the end of the contract. Therefore, the Fund considers the creditworthiness of each counterparty to a swap in evaluating potential counterparty risk. This risk is mitigated by having a netting arrangement between the Fund and the counterparty and by the posting of collateral by the counterparty to the Fund to cover the Fund’s exposure to the counterparty. Additionally, risks may arise from unanticipated movements in interest rates or in the value of the underlying securities. The Fund accrues for the interim payments on swaps on a daily basis, with the net amount recorded within unrealized appreciation/ depreciation of swaps on the statement of assets and liabilities, where applicable. Once the interim payments are settled in cash, the net amount is recorded as realized gain/(loss) on swaps on the statement of operations, in addition to any realized gain/(loss) recorded upon the termination of swaps. Upfront premiums paid or received for swaps are recognized as cost or proceeds on the statement of assets and liabilities and are amortized on a straight line basis over the life of the contract. Amortized upfront premiums are included in net realized gain/(loss) from swaps on the statement of operations. Fluctuations in the value of swaps are recorded as a component of net change in unrealized appreciation/depreciation of swaps on the statement of operations.
Certain standardized swaps, including certain interest rate swaps and credit default swaps, are (or soon will be) subject to mandatory central clearing. Cleared swaps are transacted through futures commission merchants (“FCMs”) that are members of central clearinghouses, with the clearinghouse serving as central counterparty, similar to transactions in futures contracts. Centralized clearing will be required for additional categories of swaps on a phased-in basis based on requirements published by the Securities and Exchange Commission and Commodity Futures Trading Commission.
| | |
| |
| abfunds.com | | AB GLOBAL BOND FUND | 107 |
NOTES TO FINANCIAL STATEMENTS (continued)
At the time the Fund enters into a centrally cleared swap, the Fund deposits and maintains as collateral an initial margin with the broker, as required by the clearinghouse on which the transaction is effected. Such amount is shown as cash collateral due from broker on the statement of assets and liabilities. Pursuant to the contract, the Fund agrees to receive from or pay to the broker an amount of cash equal to the daily fluctuation in the value of the contract. Such receipts or payments are known as variation margin and are recorded by the Fund as unrealized gains or losses. Risks may arise from the potential inability of a counterparty to meet the terms of the contract. The credit/counterparty risk for centrally cleared swaps is generally less than non-centrally cleared swaps, since the clearinghouse, which is the issuer or counterparty to each centrally cleared swap, has robust risk mitigation standards, including the requirement to provide initial and variation margin. When the contract is closed, the Fund records a realized gain or loss equal to the difference between the value of the contract at the time it was opened and the time it was closed.
Interest Rate Swaps:
The Fund is subject to interest rate risk exposure in the normal course of pursuing its investment objectives. Because the Fund holds fixed rate bonds, the value of these bonds may decrease if interest rates rise. To help hedge against this risk and to maintain its ability to generate income at prevailing market rates, the Fund may enter into interest rate swaps. Interest rate swaps are agreements between two parties to exchange cash flows based on a notional amount. The Fund may elect to pay a fixed rate and receive a floating rate, or, receive a fixed rate and pay a floating rate on a notional amount.
In addition, the Fund may also enter into interest rate swap transactions to preserve a return or spread on a particular investment or portion of its portfolio, or protecting against an increase in the price of securities the Fund anticipates purchasing at a later date. Interest rate swaps involve the exchange by a Fund with another party of their respective commitments to pay or receive interest (e.g., an exchange of floating rate payments for fixed rate payments) computed based on a contractually-based principal (or “notional”) amount. Interest rate swaps are entered into on a net basis (i.e., the two payment streams are netted out, with the Fund receiving or paying, as the case may be, only the net amount of the two payments).
During the year ended September 30, 2022, the Fund held interest rate swaps for hedging and non-hedging purposes.
Credit Default Swaps:
The Fund may enter into credit default swaps, including to manage its exposure to the market or certain sectors of the market, to reduce its
| | |
| |
108 | AB GLOBAL BOND FUND | | abfunds.com |
NOTES TO FINANCIAL STATEMENTS (continued)
risk exposure to defaults by corporate and sovereign issuers held by the Fund, or to create exposure to corporate or sovereign issuers to which it is not otherwise exposed. The Fund may purchase credit protection (“Buy Contract”) or provide credit protection (“Sale Contract”) on the referenced obligation of the credit default swap. During the term of the swap, the Fund receives/(pays) fixed payments from/(to) the respective counterparty, calculated at the agreed upon rate applied to the notional amount. If the Fund is a buyer/(seller) of protection and a credit event occurs, as defined under the terms of the swap, the Fund will either (i) receive from the seller/(pay to the buyer) of protection an amount equal to the notional amount of the swap (the “Maximum Payout Amount”) and deliver/(take delivery of) the referenced obligation or (ii) receive/(pay) a net settlement amount in the form of cash or securities equal to the notional amount of the swap less the recovery value of the referenced obligation. In certain circumstances Maximum Payout Amounts may be partially offset by recovery values of the respective referenced obligations, upfront premium received upon entering into the agreement, or net amounts received from settlement of buy protection credit default swaps entered into by the Fund for the same referenced obligation with the same counterparty.
Credit default swaps may involve greater risks than if the Fund had invested in the referenced obligation directly. Credit default swaps are subject to general market risk, liquidity risk, counterparty risk and credit risk. If the Fund is a buyer of protection and no credit event occurs, it will lose the payments it made to its counterparty. If the Fund is a seller of protection and a credit event occurs, the value of the referenced obligation received by the Fund coupled with the periodic payments previously received may be less than the Maximum Payout Amount it pays to the buyer, resulting in a net loss to the Fund.
Implied credit spreads over U.S. Treasuries of comparable maturity utilized in determining the market value of credit default swaps on issuers as of period end are disclosed in the portfolio of investments. The implied spreads serve as an indicator of the current status of the payment/ performance risk and typically reflect the likelihood of default by the issuer of the referenced obligation. The implied credit spread of a particular reference obligation also reflects the cost of buying/selling protection and may reflect upfront payments required to be made to enter into the agreement. Widening credit spreads typically represent a deterioration of the referenced obligation’s credit soundness and greater likelihood of default or other credit event occurring as defined under the terms of the agreement. A credit spread identified as “Defaulted” indicates a credit event has occurred for the referenced obligation.
| | |
| |
| abfunds.com | | AB GLOBAL BOND FUND | 109 |
NOTES TO FINANCIAL STATEMENTS (continued)
During the year ended September 30, 2022, the Fund held credit default swaps for hedging and non-hedging purposes.
The Fund typically enters into International Swaps and Derivatives Association, Inc. Master Agreements (“ISDA Master Agreement”) with its OTC derivative contract counterparties in order to, among other things, reduce its credit risk to OTC counterparties. ISDA Master Agreements include provisions for general obligations, representations, collateral and events of default or termination. Under an ISDA Master Agreement, the Fund typically may offset with the OTC counterparty certain derivative financial instruments’ payables and/or receivables with collateral held and/or posted and create one single net payment (close-out netting) in the event of default or termination. In the event of a default by an OTC counterparty, the return of collateral with market value in excess of the Fund’s net liability, held by the defaulting party, may be delayed or denied.
The Fund’s ISDA Master Agreements may contain provisions for early termination of OTC derivative transactions in the event the net assets of the Fund decline below specific levels (“net asset contingent features”). If these levels are triggered, the Fund’s OTC counterparty has the right to terminate such transaction and require the Fund to pay or receive a settlement amount in connection with the terminated transaction. If OTC derivatives were held at period end, please refer to netting arrangements by the OTC counterparty tables below for additional details.
During the year ended September 30, 2022, the Fund had entered into the following derivatives:
| | | | | | | | | | | | |
| | | Asset Derivatives | | | Liability Derivatives | |
Derivative Type | | Statement of
Assets and
Liabilities
Location | | Fair Value | | | Statement of
Assets and
Liabilities
Location | | Fair Value | |
Interest rate contracts | |
Receivable/
Payable for
variation margin
on futures | |
$ |
23,729,875 |
* | |
Receivable/
Payable for
variation margin
on futures | |
$ |
13,758,455 |
* |
| | | | |
Interest rate contracts | |
Receivable/
Payable for
variation margin
on centrally
cleared swaps | |
|
42,086,610 |
* | |
Receivable/
Payable for
variation margin
on centrally
cleared swaps | |
|
60,990,916 |
* |
| | |
| |
110 | AB GLOBAL BOND FUND | | abfunds.com |
NOTES TO FINANCIAL STATEMENTS (continued)
| | | | | | | | | | | | | | |
| | | Asset Derivatives | | | Liability Derivatives | |
Derivative Type | | Statement of
Assets and
Liabilities
Location | | Fair Value | | | Statement of
Assets and
Liabilities
Location | | | Fair Value | |
| | | | |
Foreign currency contracts | |
Unrealized
appreciation on
forward
currency
exchange
contracts | |
$ |
206,918,686 |
| |
|
Unrealized
depreciation on
forward currency
exchange
contracts |
| |
$ |
147,677,218 |
|
| | | | |
Credit contracts | | | | | | | |
| Market value of
credit
default swaps |
| | | 3,946,347 | |
| | | | |
Credit contracts | | Receivable/
Payable for
variation margin
on centrally
cleared swaps | | | 626 | * | | | | | | | | |
| | | | | | | | | | | | | | |
Total | | | | $ | 272,735,797 | | | | | | | $ | 226,372,936 | |
| | | | | | | | | | | | | | |
| * | Only variation margin receivable/payable at period end is reported within the statement of assets and liabilities. This amount reflects cumulative unrealized appreciation/depreciation on futures and centrally cleared swaps as reported in the portfolio of investments. |
| | | | | | | | | | |
Derivative Type | | Location of Gain or
(Loss) on Derivatives
Within Statement of
Operations | | Realized Gain
or (Loss) on
Derivatives | | | Change in
Unrealized
Appreciation or
(Depreciation) | |
Interest rate contracts | | Net realized gain/(loss) on swaps; Net change in unrealized appreciation/ depreciation on swaps | | $ | 5,169,228 | | | $ | (21,785,794 | ) |
| | | |
Interest rate contracts | | Net realized gain/(loss) on futures; Net change in unrealized appreciation/ depreciation on futures | | | 4,076,956 | | | | 10,146,723 | |
| | | |
Foreign currency contracts | | Net realized gain/(loss) on forward currency exchange contracts; Net change in unrealized appreciation/depreciation on forward currency exchange contracts | | | 498,899,905 | | | | 8,043,182 | |
| | |
| |
| abfunds.com | | AB GLOBAL BOND FUND | 111 |
NOTES TO FINANCIAL STATEMENTS (continued)
| | | | | | | | | | |
Derivative Type | | Location of Gain or
(Loss) on Derivatives
Within Statement of
Operations | | Realized Gain
or (Loss) on
Derivatives | | | Change in
Unrealized
Appreciation or
(Depreciation) | |
| | | |
Credit contracts | | Net realized gain/(loss) on swaps; Net change in unrealized appreciation/ depreciation on swaps | | $ | 3,080,862 | | | $ | 8,662,266 | |
| | | |
Equity contracts | | Net realized gain/(loss) on investment transactions; Net change in unrealized appreciation/depreciation on investments | | | (81,122 | ) | | | – 0 | – |
| | | | | | | | | | |
Total | | | | $ | 511,145,829 | | | $ | 5,066,377 | |
| | | | | | | | | | |
The following table represents the average monthly volume of the Fund’s derivative transactions during the year ended September 30, 2022:
| | | | |
Centrally Cleared Credit Default Swaps: | | | | |
Average notional amount of buy contracts | | $ | 172,590,532 | (a) |
Average notional amount of sale contracts | | $ | 19,324,600 | (b) |
| |
Centrally Cleared Interest Rate Swaps | | | | |
Average notional amount | | $ | 376,446,316 | |
| |
Credit Default Swaps: | | | | |
Average notional amount of sale contracts | | $ | 43,501,266 | |
| |
Forward Currency Exchange Contracts: | | | | |
Average principal amount of buy contracts | | $ | 2,277,160,675 | |
Average principal amount of sale contracts | | $ | 5,405,527,211 | |
| |
Futures: | | | | |
Average notional amount of buy contracts | | $ | 414,510,927 | |
Average notional amount of sale contracts | | $ | 569,545,177 | |
| |
Purchased Options: | | | | |
Average notional amount | | $ | 9,280,316 | (c) |
| (a) | Positions were open for six months during the reporting period. |
| (b) | Positions were open for five months during the reporting period. |
| (c) | Positions were open for one month during the reporting period. |
For financial reporting purposes, the Fund does not offset derivative assets and derivative liabilities that are subject to netting arrangements in the statement of assets and liabilities.
All OTC derivatives held at period end were subject to netting arrangements. The following table presents the Fund’s derivative assets and liabilities by OTC counterparty net of amounts available for offset under
| | |
| |
112 | AB GLOBAL BOND FUND | | abfunds.com |
NOTES TO FINANCIAL STATEMENTS (continued)
ISDA Master Agreements (“MA”) and net of the related collateral received/pledged by the Fund as of September 30, 2022. Exchange-traded derivatives and centrally cleared swaps are not subject to netting arrangements and as such are excluded from the tables.
| | | | | | | | | | | | | | | | | | | | |
Counterparty | | Derivative
Assets
Subject to a
MA | | | Derivatives
Available
for Offset | | | Cash
Collateral
Received* | | | Security
Collateral
Received* | | | Net Amount
of Derivative
Assets | |
Australia & New Zealand Bank Group Ltd. | | $ | 185,065 | | | $ | – 0 | – | | $ | – 0 | – | | $ | – 0 | – | | $ | 185,065 | |
Bank of America, NA. | | | 3,601,767 | | | | (3,601,767 | ) | | | – 0 | – | | | – 0 | – | | | – 0 | – |
Barclays Bank PLC | | | 4,113,291 | | | | (2,721,876 | ) | | | (1,391,415 | ) | | | – 0 | – | | | – 0 | – |
BNP Paribas SA | | | 26,968,247 | | | | (17,092,857 | ) | | | – 0 | – | | | – 0 | – | | | 9,875,390 | |
Brown Brothers Harriman & Co. | | | 39,053 | | | | (39,053 | ) | | | – 0 | – | | | – 0 | – | | | – 0 | – |
Citibank, NA | | | 36,182,592 | | | | (11,137,367 | ) | | | (13,869,985 | ) | | | – 0 | – | | | 11,175,240 | |
Credit Suisse International | | | 4,022,950 | | | | (4,022,950 | ) | | | – 0 | – | | | – 0 | – | | | – 0 | – |
Goldman Sachs Bank USA / Goldman Sachs International | | | 21,061,319 | | | | (5,766,953 | ) | | | (6,760,000 | ) | | | – 0 | – | | | 8,534,366 | |
HSBC Bank USA | | | 17,651,565 | | | | (17,651,565 | ) | | | – 0 | – | | | – 0 | – | | | – 0 | – |
JPMorgan Chase Bank, NA | | | 27,651,146 | | | | (27,651,146 | ) | | | – 0 | – | | | – 0 | – | | | – 0 | – |
Morgan Stanley Capital Services LLC. | | | 17,898,967 | | | | (1,605,121 | ) | | | (7,900,000 | ) | | | – 0 | – | | | 8,393,846 | |
Royal Bank of Scotland PLC. | | | 2,197,276 | | | | (2,197,276 | ) | | | – 0 | – | | | – 0 | – | | | – 0 | – |
Standard Chartered Bank | | | 1,214,081 | | | | (1,214,081 | ) | | | – 0 | – | | | – 0 | – | | | – 0 | – |
UBS AG | | | 44,131,367 | | | | (13,460,741 | ) | | | – 0 | – | | | – 0 | – | | | 30,670,626 | |
| | | | | | | | | | | | | | | | | | | | |
Total | | $ | 206,918,686 | | | $ | (108,162,753 | ) | | $ | (29,921,400 | ) | | $ | – 0 | – | | $ | 68,834,533 | ^ |
| | | | | | | | | | | | | | | | | | | | |
| | | | | | | | | | | | | | | | | | | | |
Counterparty | | Derivative
Liabilities
Subject to a
MA | | | Derivatives
Available
for Offset | | | Cash
Collateral
Pledged* | | | Security
Collateral
Pledged* | | | Net Amount
of Derivative
Liabilities | |
Bank of America,
NA | | $ | 17,044,932 | | | $ | (3,601,767 | ) | | $ | – 0 | – | | $ | – 0 | – | | $ | 13,443,165 | |
Barclays Bank PLC | | | 2,721,876 | | | | (2,721,876 | ) | | | – 0 | – | | | – 0 | – | | | – 0 | – |
BNP Paribas SA | | | 17,092,857 | | | | (17,092,857 | ) | | | – 0 | – | | | – 0 | – | | | – 0 | – |
Brown Brothers Harriman & Co. | | | 246,824 | | | | (39,053 | ) | | | – 0 | – | | | – 0 | – | | | 207,771 | |
Citibank, NA | | | 11,137,367 | | | | (11,137,367 | ) | | | – 0 | – | | | – 0 | – | | | – 0 | – |
Credit Suisse International | | | 13,452,248 | | | | (4,022,950 | ) | | | (1,843,200 | ) | | | – 0 | – | | | 7,586,098 | |
| | |
| |
| abfunds.com | | AB GLOBAL BOND FUND | 113 |
NOTES TO FINANCIAL STATEMENTS (continued)
| | | | | | | | | | | | | | | | | | | | |
Counterparty | | Derivative
Liabilities
Subject to a
MA | | | Derivatives
Available
for Offset | | | Cash
Collateral
Pledged* | | | Security
Collateral
Pledged* | | | Net Amount
of Derivative
Liabilities | |
Goldman Sachs Bank USA / Goldman Sachs International | | $ | 5,766,953 | | | $ | (5,766,953 | ) | | $ | – 0 | – | | $ | – 0 | – | | $ | – 0 | – |
HSBC Bank USA | | | 17,885,257 | | | | (17,651,565 | ) | | | – 0 | – | | | – 0 | – | | | 233,692 | |
JPMorgan Chase Bank, NA | | | 35,906,220 | | | | (27,651,146 | ) | | | – 0 | – | | | – 0 | – | | | 8,255,074 | |
Morgan Stanley Capital Services LLC. | | | 1,605,121 | | | | (1,605,121 | ) | | | – 0 | – | | | – 0 | – | | | – 0 | – |
Royal Bank of Scotland PLC. | | | 3,980,139 | | | | (2,197,276 | ) | | | – 0 | – | | | – 0 | – | | | 1,782,863 | |
Standard Chartered Bank | | | 11,323,030 | | | | (1,214,081 | ) | | | – 0 | – | | | (10,108,949 | ) | | | – 0 | – |
UBS AG | | | 13,460,741 | | | | (13,460,741 | ) | | | – 0 | – | | | – 0 | – | | | – 0 | – |
| | | | | | | | | | | | | | | | | | | | |
Total | | $ | 151,623,565 | | | $ | (108,162,753 | ) | | $ | (1,843,200 | ) | | $ | (10,108,949 | ) | | $ | 31,508,663 | ^ |
| | | | | | | | | | | | | | | | | | | | |
| * | The actual collateral received/pledged may be more than the amount reported due to overcollateralization. |
| ^ | Net amount represents the net receivable/(payable) that would be due from/to the counterparty in the event of default or termination. The net amount from OTC financial derivative instruments can only be netted across transactions governed under the same master agreement with the same counterparty. |
| | See Note D.4 for additional disclosure of netting arrangements regarding reverse repurchase agreements. |
2. Currency Transactions
The Fund may invest in non-U.S. Dollar-denominated securities on a currency hedged or unhedged basis. The Fund may seek investment opportunities by taking long or short positions in currencies through the use of currency-related derivatives, including forward currency exchange contracts, futures and options on futures, swaps, and other options. The Fund may enter into transactions for investment opportunities when it anticipates that a foreign currency will appreciate or depreciate in value but securities denominated in that currency are not held by the Fund and do not present attractive investment opportunities. Such transactions may also be used when the Adviser believes that it may be more efficient than a direct investment in a foreign currency-denominated security. The Fund may also conduct currency exchange contracts on a spot basis (i.e., for cash at the spot rate prevailing in the currency exchange market for buying or selling currencies).
3. TBA and Dollar Rolls
The Fund may invest in TBA mortgage-backed securities. A TBA, or “To Be Announced”, trade represents a contract for the purchase or sale of mortgage-backed securities to be delivered at a future agreed-upon date; however, the specific mortgage pool numbers or the number of pools that
| | |
| |
114 | AB GLOBAL BOND FUND | | abfunds.com |
NOTES TO FINANCIAL STATEMENTS (continued)
will be delivered to fulfill the trade obligation or terms of the contract are unknown at the time of the trade.
Mortgage pools (including fixed-rate or variable-rate mortgages) guaranteed by the Government National Mortgage Association, or GNMA, the Federal National Mortgage Association, or FNMA, or the Federal Home Loan Mortgage Corporation, or FHLMC, are subsequently allocated to the TBA transactions.
The Fund may enter into certain TBA transactions known as dollar rolls. Dollar rolls involve sales by the Fund of securities for delivery in the current month and the Fund’s simultaneously contracting to repurchase substantially similar (same type and coupon) securities on a specified future date. During the roll period, the Fund forgoes principal and interest paid on the securities. The Fund is compensated by the difference between the current sales price and the lower forward price for the future purchase (often referred to as the “drop”) as well as by the interest earned on the cash proceeds of the initial sale. Dollar rolls involve the risk that the market value of the securities the Fund is obligated to repurchase under the agreement may decline below the repurchase price. Dollar rolls are speculative techniques. For the year ended September 30, 2022, the Fund earned drop income of $1,698,455 which is included in interest income in the accompanying statement of operations.
4. Reverse Repurchase Agreements
The Fund may enter into reverse repurchase transactions (“RVP”) in accordance with the terms of a Master Repurchase Agreement (“MRA”), under which the Fund sells securities and agrees to repurchase them at a mutually agreed upon date and price. At the time the Fund enters into a reverse repurchase agreement, it will establish a segregated account with the custodian containing liquid assets having a value comparable to the repurchase price. Under the MRA and other Master Agreements, the Fund is permitted to offset payables and/or receivables with collateral held and/or posted to the counterparty and create one single net payment due to or from the Fund in the event of a default. In the event of a default by a MRA counterparty, the Fund may be considered an unsecured creditor with respect to any excess collateral (collateral with a market value in excess of the repurchase price) held by and/or posted to the counterparty, and as such the return of such excess collateral may be delayed or denied. For the year ended September 30, 2022, the average amount of reverse repurchase agreements outstanding was $14,645,969 and the daily weighted average interest rate was (2.33)%. During the period, the Fund received net interest payments from counterparties. At September 30, 2022, the Fund had reverse repurchase agreements outstanding in the amount of $15,796,311 as reported in the statement of assets and liabilities.
| | |
| |
| abfunds.com | | AB GLOBAL BOND FUND | 115 |
NOTES TO FINANCIAL STATEMENTS (continued)
The following table presents the Fund’s RVP liabilities by counterparty net of the related collateral pledged by the Fund as of September 30, 2022:
| | | | | | | | | | | | |
Counterparty | | RVP Liabilities
Subject to a MRA | | | Securities
Collateral
Pledged†* | | | Net Amount of RVP
Liabilities | |
Credit Suisse Securities (USA) LLC. | | $ | 15,796,311 | | | $ | (15,642,608 | ) | | $ | 153,703 | |
| † | Including accrued interest. |
| * | The actual collateral pledged may be more than the amount reported due to overcollateralization. |
NOTE E
Capital Stock
Each class consists of 3,000,000,000 authorized shares. Transactions in capital shares for each class were as follows:
| | | | | | | | | | | | | | | | | | | | | | | | |
| | | | | | | | | | | | | | | | | | | | | | | | |
| | | Shares | | | | | | Amount | | | | |
| | | Year Ended
September 30, 2022 | | | Year Ended
September 30, 2021 | | | | | | Year Ended
September 30, 2022 | | | Year Ended
September 30, 2021 | | | | |
| | | | | | | | |
| Class A | | | | | | | | | | | | | | | | | | | | | | | | |
Shares sold | | | 4,950,816 | | | | 7,911,067 | | | | | | | $ | 39,184,488 | | | $ | 68,027,475 | | | | | |
| | | | | |
Shares issued in reinvestment of dividends and distributions | | | 2,067,039 | | | | 1,245,209 | | | | | | | | 16,764,841 | | | | 10,706,612 | | | | | |
| | | | | |
Shares converted from Class C | | | 704,291 | | | | 1,919,524 | | | | | | | | 5,483,574 | | | | 16,399,839 | | | | | |
| | | | | |
Shares redeemed | | | (18,092,414 | ) | | | (19,085,592 | ) | | | | | | | (142,150,009 | ) | | | (163,874,705 | ) | | | | |
| | | | | |
Net decrease | | | (10,370,268 | ) | | | (8,009,792 | ) | | | | | | $ | (80,717,106 | ) | | $ | (68,740,779 | ) | | | | |
| | | | | |
| | | | | | | | | | | | | | | | | | | | | | | | |
| Class C | | | | | | | | | | | | | | | | | | | | | | | | |
Shares sold | | | 276,563 | | | | 592,241 | | | | | | | $ | 2,233,094 | | | $ | 5,097,519 | | | | | |
| | | | | |
Shares issued in reinvestment of dividends and distributions | | | 123,567 | | | | 79,143 | | | | | | | | 1,014,799 | | | | 683,896 | | | | | |
| | | | | |
Shares converted to Class A | | | (701,834 | ) | | | (1,912,981 | ) | | | | | | | (5,483,574 | ) | | | (16,399,839 | ) | | | | |
| | | | | |
Shares redeemed | | | (1,193,631 | ) | | | (1,709,545 | ) | | | | | | | (9,474,619 | ) | | | (14,731,884 | ) | | | | |
| | | | | |
Net decrease | | | (1,495,335 | ) | | | (2,951,142 | ) | | | | | | $ | (11,710,300 | ) | | $ | (25,350,308 | ) | | | | |
| | | | | |
| | |
| |
116 | AB GLOBAL BOND FUND | | abfunds.com |
NOTES TO FINANCIAL STATEMENTS (continued)
| | | | | | | | | | | | | | | | | | | | | | | | |
| | | | | | | | | | | | | | | | | | | | | | | | |
| | | Shares | | | | | | Amount | | | | |
| | | Year Ended
September 30, 2022 | | | Year Ended
September 30, 2021 | | | | | | Year Ended
September 30, 2022 | | | Year Ended
September 30, 2021 | | | | |
| | | | | | | | |
| Advisor Class | | | | | | | | | | | | | | | | | | | | | | | | |
Shares sold | | | 92,883,007 | | | | 140,397,551 | | | | | | | $ | 733,805,941 | | | $ | 1,204,584,552 | | | | | |
| | | | | |
Shares issued in reinvestment of dividends and distributions | | | 18,069,481 | | | | 10,534,592 | | | | | | | | 146,241,591 | | | | 90,455,102 | | | | | |
| | | | | |
Shares redeemed | | | (178,294,111 | ) | | | (137,064,887 | ) | | | | | | | (1,396,559,349 | ) | | | (1,174,773,475 | ) | | | | |
| | | | | |
Net increase (decrease) | | | (67,341,623 | ) | | | 13,867,256 | | | | | | | $ | (516,511,817 | ) | | $ | 120,266,179 | | | | | |
| | | | | |
| | | | | | | | | | | | | | | | | | | | | | | | |
| Class R | | | | | | | | | | | | | | | | | | | | | | | | |
Shares sold | | | 1,095,028 | | | | 1,536,894 | | | | | | | $ | 8,744,132 | | | $ | 13,185,566 | | | | | |
| | | | | |
Shares issued in reinvestment of dividends and distributions | | | 214,722 | | | | 110,123 | | | | | | | | 1,745,775 | | | | 946,464 | | | | | |
| | | | | |
Shares redeemed | | | (1,884,158 | ) | | | (2,371,665 | ) | | | | | | | (14,837,194 | ) | | | (20,370,004 | ) | | | | |
| | | | | |
Net decrease | | | (574,408 | ) | | | (724,648 | ) | | | | | | $ | (4,347,287 | ) | | $ | (6,237,974 | ) | | | | |
| | | | | |
| | | | | | | | | | | | | | | | | | | | | | | | |
| Class K | | | | | | | | | | | | | | | | | | | | | | | | |
Shares sold | | | 320,299 | | | | 461,197 | | | | | | | $ | 2,564,766 | | | $ | 3,962,201 | | | | | |
| | | | | |
Shares issued in reinvestment of dividends and distributions | | | 61,487 | | | | 37,554 | | | | | | | | 500,253 | | | | 322,729 | | | | | |
| | | | | |
Shares redeemed | | | (749,614 | ) | | | (872,634 | ) | | | | | | | (5,838,903 | ) | | | (7,504,502 | ) | | | | |
| | | | | |
Net decrease | | | (367,828 | ) | | | (373,883 | ) | | | | | | $ | (2,773,884 | ) | | $ | (3,219,572 | ) | | | | |
| | | | | |
| | | | | | | | | | | | | | | | | | | | | | | | |
| Class I | | | | | | | | | | | | | | | | | | | | | | | | |
Shares sold | | | 14,043,371 | | | | 27,003,408 | | | | | | | $ | 113,080,949 | | | $ | 232,597,236 | | | | | |
| | | | | |
Shares issued in reinvestment of dividends and distributions | | | 4,583,235 | | | | 2,396,958 | | | | | | | | 37,041,565 | | | | 20,577,774 | | | | | |
| | | | | |
Shares redeemed | | | (24,308,868 | ) | | | (20,680,649 | ) | | | | | | | (190,795,317 | ) | | | (177,209,488 | ) | | | | |
| | | | | |
Net increase (decrease) | | | (5,682,262 | ) | | | 8,719,717 | | | | | | | $ | (40,672,803 | ) | | $ | 75,965,522 | | | | | |
| | | | | |
| | | | | | | | | | | | | | | | | | | | | | | | |
| Class Z | | | | | | | | | | | | | | | | | | | | | | | | |
Shares sold | | | 41,432,532 | | | | 34,911,160 | | | | | | | $ | 342,522,824 | | | $ | 298,883,974 | | | | | |
| | | | | |
Shares issued in reinvestment of dividends and distributions | | | 4,672,398 | | | | 1,826,139 | | | | | | | | 37,670,207 | | | | 15,675,204 | | | | | |
| | | | | |
Shares redeemed | | | (23,845,413 | ) | | | (19,759,784 | ) | | | | | | | (185,970,763 | ) | | | (169,411,394 | ) | | | | |
| | | | | |
Net increase | | | 22,259,517 | | | | 16,977,515 | | | | | | | $ | 194,222,268 | | | $ | 145,147,784 | | | | | |
| | | | | |
| | |
| |
| abfunds.com | | AB GLOBAL BOND FUND | 117 |
NOTES TO FINANCIAL STATEMENTS (continued)
NOTE F
Risks Involved in Investing in the Fund
Market Risk—The value of the Fund’s assets will fluctuate as the stock or bond market fluctuates. The value of its investments may decline, sometimes rapidly and unpredictably, simply because of economic changes or other events, including public health crises (including the occurrence of a contagious disease or illness) and regional and global conflicts, that affect large portions of the market.
Interest-Rate Risk—Changes in interest rates will affect the value of investments in fixed-income securities. When interest rates rise, the value of existing investments in fixed-income securities tends to fall and this decrease in value may not be offset by higher income from new investments. Interest rate risk is generally greater for fixed-income securities with longer maturities or durations. The Fund may be subject to a greater risk of rising interest rates than would normally be the case due to the end of a recent period of historically low rates and the effect of potential government fiscal policy initiatives and resulting market reaction to those initiatives.
Credit Risk—An issuer or guarantor of a fixed-income security, or the counterparty to a derivatives or other contract, may be unable or unwilling to make timely payments of interest or principal, or to otherwise honor its obligations. The issuer or guarantor may default, causing a loss of the full principal amount of a security and accrued interest. The degree of risk for a particular security may be reflected in its credit rating. There is the possibility that the credit rating of a fixed-income security may be downgraded after purchase, which may adversely affect the value of the security.
Below Investment-Grade Securities Risk—Investments in fixed-income securities with lower ratings (commonly known as “junk bonds”) are subject to a higher probability that an issuer will default or fail to meet its payment obligations. These securities may be subject to greater price volatility due to such factors as specific corporate developments and negative perceptions of the junk bond market generally and may be more difficult to trade than other types of securities.
Duration Risk—Duration is a measure that relates the expected price volatility of a fixed-income security to changes in interest rates. The duration of a fixed-income security may be shorter than or equal to full maturity of a fixed-income security. Fixed-income securities with longer durations have more risk and will decrease in price as interest rates rise.
Inflation Risk—This is the risk that the value of assets or income from investments will be less in the future as inflation decreases the value of
| | |
| |
118 | AB GLOBAL BOND FUND | | abfunds.com |
NOTES TO FINANCIAL STATEMENTS (continued)
money. As inflation increases, the value of the Fund’s assets can decline as can the value of the Fund’s distributions. This risk is significantly greater for fixed-income securities with longer maturities.
Foreign (Non-U.S.) Risk—Investments in securities of non-U.S. issuers may involve more risk than those of U.S. issuers. These securities may fluctuate more widely in price and may be more difficult to trade due to adverse market, economic, political, regulatory or other factors.
Emerging-Market Risk—Investments in emerging market countries may have more risk because the markets are less developed and less liquid and are subject to increased economic, political, regulatory or other uncertainties.
Currency Risk—Fluctuations in currency exchange rates may negatively affect the value of the Fund’s investments or reduce its returns.
Mortgage-Related and/or Other Asset-Backed Securities Risk—Investments in mortgage-related and other asset-backed securities are subject to certain additional risks. The value of these securities may be particularly sensitive to changes in interest rates. These risks include “extension risk”, which is the risk that, in periods of rising interest rates, issuers may delay the payment of principal, and “prepayment risk”, which is the risk that in periods of falling interest rates, issuers may pay principal sooner than expected, exposing the Fund to a lower rate of return upon reinvestment of principal. Mortgage-backed securities offered by non-governmental issuers and other asset-backed securities may be subject to other risks, such as higher rates of default in the mortgages or assets backing the securities or risks associated with the nature and servicing of mortgages or assets backing the securities.
Leverage Risk—When the Fund borrows money or otherwise leverages its investments, its performance may be volatile because leverage tends to exaggerate the effect of any increase or decrease in the value of the Fund’s investments. The Fund may create leverage through the use of reverse repurchase arrangements, forward currency exchange contracts, forward commitments, dollar rolls or futures or by borrowing money. The use of other types of derivative instruments by the Fund, such as options and swaps, may also result in a form of leverage. Leverage may result in higher returns to the Fund than if the Fund were not leveraged, but may also adversely affect returns, particularly if the market is declining.
Derivatives Risk—Derivatives may be difficult to price or unwind and leveraged so that small changes may produce disproportionate losses for the Fund. A short position in a derivative instrument involves the risk of a theoretically unlimited increase in the value of the underlying instrument,
| | |
| |
| abfunds.com | | AB GLOBAL BOND FUND | 119 |
NOTES TO FINANCIAL STATEMENTS (continued)
which could cause the Fund to suffer a (potentially unlimited) loss. Derivatives, especially over-the-counter derivatives, are also subject to counterparty risk, which is the risk that the counterparty (the party on the other side of the transaction) on a derivative transaction will be unable or unwilling to honor its contractual obligations to the Fund.
Illiquid Investments Risk—Illiquid investments risk exists when certain investments become difficult to purchase or sell. Difficulty in selling such investments may result in sales at disadvantageous prices affecting the value of your investment in the Fund. Causes of illiquid investments risk may include low trading volumes, large positions and heavy redemption of Fund shares. Foreign fixed-income securities may have more illiquid investments risk because secondary trading markets for these securities may be smaller and less well-developed and the securities may trade less frequently. Illiquid investments risk may be higher in a rising interest rate environment, when the value and liquidity of fixed-income securities generally decline.
Active Trading Risk—The Fund expects to engage in active and frequent trading of its portfolio securities and its portfolio turnover rate may greatly exceed 100%. A higher rate of portfolio turnover increases transaction costs, which may negatively affect the Fund’s return. In addition, a high rate of portfolio turnover may result in substantial short-term gains, which may have adverse tax consequences for Fund shareholders.
LIBOR Transition and Associated Risk—A Fund may be exposed to debt securities, derivatives or other financial instruments that utilize the London Interbank Offered Rate, or “LIBOR,” as a “benchmark” or “reference rate” for various interest rate calculations. In 2017, the United Kingdom Financial Conduct Authority (“FCA”), which regulates LIBOR, announced a desire to phase out the use of LIBOR by the end of 2021. The FCA and LIBOR’s administrator, ICE Benchmark Administration, have since announced that most LIBOR settings (which reflect LIBOR rates quoted in different currencies over various time periods) will no longer be published after the end of 2021 but that the most widely used U.S. Dollar LIBOR settings will continue to be published until June 30, 2023. However, banks were strongly encouraged to cease entering into agreements with counterparties referencing LIBOR by the end of 2021. It is possible that a subset of LIBOR settings will be published after these dates on a “synthetic” basis, but any such publications would be considered non-representative of the underlying market. Since 2018 the Federal Reserve Bank of New York has published the secured overnight funding rate (referred to as SOFR), which is intended to replace U.S. Dollar LIBOR. SOFR is a broad measure of the cost of borrowing cash overnight collateralized by U.S. Treasury securities in the repurchase agreement
| | |
| |
120 | AB GLOBAL BOND FUND | | abfunds.com |
NOTES TO FINANCIAL STATEMENTS (continued)
(repo) market and has been used increasingly on a voluntary basis in new instruments and transactions. In addition, on March 15, 2022, the Adjustable Interest Rate Act was signed into law. This law provides a statutory fallback mechanism to replace LIBOR with a benchmark rate that is selected by the Federal Reserve Board and based on SOFR for certain contracts that reference LIBOR without adequate fallback provisions.
The elimination of LIBOR or changes to other reference rates or any other changes or reforms to the determination or supervision of reference rates could have an adverse impact on the market for, or value of, any securities or payments linked to those reference rates, which may adversely affect a Fund’s performance and/or net asset value. Uncertainty and risk also remain regarding the willingness and ability of issuers and lenders to include revised provisions in new and existing contracts or instruments. Consequently, the transition from LIBOR to other reference rates may lead to increased volatility and illiquidity in markets that are tied to LIBOR, fluctuations in values of LIBOR-related investments or investments in issuers that utilize LIBOR, increased difficulty in borrowing or refinancing and diminished effectiveness of hedging strategies, potentially adversely affecting a Fund’s performance. Furthermore, the risks associated with the expected discontinuation of LIBOR and transition may be exacerbated if the work necessary to effect an orderly transition to an alternative reference rate is not completed in a timely manner. Neither the effect of the LIBOR transition process nor its ultimate success can yet be known.
Indemnification Risk—In the ordinary course of business, the Fund enters into contracts that contain a variety of indemnifications. The Fund’s maximum exposure under these arrangements is unknown. However, the Fund has not had prior claims or losses pursuant to these indemnification provisions and expects the risk of loss thereunder to be remote. Therefore, the Fund has not accrued any liability in connection with these indemnification provisions.
Management Risk—The Fund is subject to management risk because it is an actively-managed investment fund. The Adviser will apply its investment techniques and risk analyses in making investment decisions, but there is no guarantee that its techniques will produce the intended results. Some of these techniques may incorporate, or rely upon, quantitative models, but there is no guarantee that these models will generate accurate forecasts, reduce risk or otherwise perform as expected.
NOTE G
Joint Credit Facility
A number of open-end mutual funds managed by the Adviser, including the Fund, participate in a $325 million revolving credit facility (the “Facility”) intended to provide short-term financing related to redemptions and other short term liquidity requirements, subject to certain restrictions. Commitment
| | |
| |
| abfunds.com | | AB GLOBAL BOND FUND | 121 |
NOTES TO FINANCIAL STATEMENTS (continued)
fees related to the Facility are paid by the participating funds and are included in miscellaneous expenses in the statement of operations. The Fund did not utilize the Facility during the year ended September 30, 2022.
NOTE H
Distributions to Shareholders
The tax character of distributions paid during the fiscal years ended September 30, 2022 and September 30, 2021 were as follows:
| | | | | | | | |
| | | 2022 | | | 2021 | |
Distributions paid from: | | | | | | | | |
Ordinary income | | $ | 239,373,330 | | | $ | 122,071,131 | |
Net long-term capital gains | | | 53,831,535 | | | | 48,243,298 | |
| | | | | | | | |
Total taxable distributions paid | | $ | 293,204,865 | | | $ | 170,314,429 | |
| | | | | | | | |
As of September 30, 2022, the components of accumulated earnings/(deficit) on a tax basis were as follows:
| | | | |
Undistributed ordinary income | | $ | 318,864,894 | |
Accumulated capital and other losses | | | (296,258,318 | )(a) |
Unrealized appreciation/(depreciation) | | | (1,054,690,106 | )(b) |
| | | | |
Total accumulated earnings/(deficit) | | $ | (1,032,083,530 | )(c) |
| | | | |
| (a) | As of September 30, 2022, the Fund had a net capital loss carryforward of $295,944,350. As of September 30, 2022, the cumulative deferred loss on straddles was $313,968. |
| (b) | The differences between book-basis and tax-basis unrealized appreciation/(depreciation) are attributable primarily to the recognition for tax purposes of unrealized gains/losses on certain derivative instruments, the tax treatment of passive foreign investment companies (PFICs), the tax treatment of swaps, the tax deferral of losses on wash sales, and the tax treatment of callable bond. |
| (c) | The differences between book-basis and tax-basis components of accumulated earnings/(deficit) are attributable primarily to the accrual of foreign capital gains tax, the tax treatment of defaulted securities, and dividends payable. |
For tax purposes, net realized capital losses may be carried over to offset future capital gains, if any. Funds are permitted to carry forward capital losses for an indefinite period, and such losses will retain their character as either short-term or long-term capital losses. As of September 30, 2022, the Fund had a net short-term capital loss carryforward of $177,170,464 and a net long-term capital loss carryforward of $118,773,886, which may be carried forward for an indefinite period.
During the current fiscal year, permanent differences primarily due to contributions from the Adviser resulted in a net decrease in accumulated loss and a net decrease in additional paid-in capital. These reclassifications had no effect on net assets.
| | |
| |
122 | AB GLOBAL BOND FUND | | abfunds.com |
NOTES TO FINANCIAL STATEMENTS (continued)
NOTE I
Recent Accounting Pronouncements
In March 2020, the Financial Accounting Standards Board issued an Accounting Standards Update, ASU 2020-04, “Reference Rate Reform (Topic 848) – Facilitation of the Effects of Reference Rate Reform on Financial Reporting.” ASU 2020-04 provides optional guidance to ease the potential accounting burden due to the discontinuation of the LIBOR and other interbank-offered based reference rates. ASU 2020-04 is effective as of March 12, 2020 through December 31, 2022. Management is currently evaluating the impact, if any, of applying ASU 2020-04.
NOTE J
Subsequent Events
Management has evaluated subsequent events for possible recognition or disclosure in the financial statements through the date the financial statements are issued. Management has determined that there are no material events that would require disclosure in the Fund’s financial statements through this date.
| | |
| |
| abfunds.com | | AB GLOBAL BOND FUND | 123 |
FINANCIAL HIGHLIGHTS
Selected Data For A Share Of Capital Stock Outstanding Throughout Each Period
| | | | | | | | | | | | | | | | | | | | |
| | | Class A | |
| | | Year Ended September 30, | |
| | | 2022 | | | 2021 | | | 2020 | | | 2019 | | | 2018 | |
| | | | |
| | | | | | | | | | | | | | | | | | | | |
Net asset value, beginning of period | | | $ 8.52 | | | | $ 8.62 | | | | $ 8.67 | | | | $ 8.19 | | | | $ 8.43 | |
| | | | |
Income From Investment Operations | | | | | | | | | | | | | | | | | | | | |
| | | | | |
Net investment income(a)(b) | | | .11 | | | | .11 | | | | .14 | | | | .17 | | | | .18 | |
| | | | | |
Net realized and unrealized gain (loss) on investment and foreign currency transactions | | | (1.20 | ) | | | (.02 | ) | | | .07 | | | | .52 | | | | (.22 | ) |
| | | | | |
Contributions from Affiliates | | | .00 | (c) | | | – 0 | – | | | .00 | (c) | | | .00 | (c) | | | – 0 | – |
| | | | | |
Capital Contributions | | | – 0 | – | | | – 0 | – | | | – 0 | – | | | – 0 | – | | | .00 | (c) |
| | | | |
Net increase (decrease) in net asset value from operations | | | (1.09 | ) | | | .09 | | | | .21 | | | | .69 | | | | (.04 | ) |
| | | | |
Less: Dividends and Distributions | | | | | | | | | | | | | | | | | | | | |
| | | | | |
Dividends from net investment income | | | (.24 | ) | | | (.13 | ) | | | (.26 | ) | | | (.21 | ) | | | (.20 | ) |
| | | | | |
Distributions from net realized gain on investment and foreign currency transactions | | | (.10 | ) | | | (.06 | ) | | | – 0 | – | | | – 0 | – | | | – 0 | – |
| | | | |
Total dividends and distributions | | | (.34 | ) | | | (.19 | ) | | | (.26 | ) | | | (.21 | ) | | | (.20 | ) |
| | | | |
Net asset value, end of period | | | $ 7.09 | | | | $ 8.52 | | | | $ 8.62 | | | | $ 8.67 | | | | $ 8.19 | |
| | | | |
| | | | | |
Total Return | | | | | | | | | | | | | | | | | | | | |
| | | | | |
Total investment return based on net asset value(d) | | | (13.27 | )% | | | .92 | % | | | 2.44 | %^ | | | 8.58 | % | | | (.50 | )% |
| | | | | |
Ratios/Supplemental Data | | | | | | | | | | | | | | | | | | | | |
| | | | | |
Net assets, end of period
(000’s omitted) | | | $409,768 | | | | $580,627 | | | | $656,731 | | | | $758,638 | | | | $810,782 | |
| | | | | |
Ratio to average net assets of: | | | | | | | | | | | | | | | | | | | | |
| | | | | |
Expenses, net of waivers/reimbursements(e) | | | .80 | % | | | .80 | % | | | .80 | % | | | .81 | % | | | .81 | % |
| | | | | |
Expenses, before waivers/reimbursements(e) | | | .80 | % | | | .80 | % | | | .80 | % | | | .81 | % | | | .82 | % |
| | | | | |
Net investment income(b) | | | 1.40 | % | | | 1.24 | % | | | 1.62 | % | | | 2.02 | % | | | 2.16 | % |
| | | | | |
Portfolio turnover rate* | | | 159 | % | | | 130 | % | | | 135 | % | | | 126 | % | | | 369 | % |
See footnote summary on page 131.
| | |
| |
124 | AB GLOBAL BOND FUND | | abfunds.com |
FINANCIAL HIGHLIGHTS (continued)
Selected Data For A Share Of Capital Stock Outstanding Throughout Each Period
| | | | | | | | | | | | | | | | | | | | |
| | | Class C | |
| | | Year Ended September 30, | |
| | | 2022 | | | 2021 | | | 2020 | | | 2019 | | | 2018 | |
| | | | |
| | | | | | | | | | | | | | | | | | | | |
Net asset value, beginning of period | | | $ 8.55 | | | | $ 8.65 | | | | $ 8.70 | | | | $ 8.21 | | | | $ 8.46 | |
| | | | |
Income From Investment Operations | | | | | | | | | | | | | | | | | | | | |
| | | | | |
Net investment income(a)(b) | | | .05 | | | | .04 | | | | .08 | | | | .11 | | | | .12 | |
| | | | | |
Net realized and unrealized gain (loss) on investment and foreign currency transactions | | | (1.20 | ) | | | (.02 | ) | | | .06 | | | | .53 | | | | (.23 | ) |
| | | | | |
Contributions from Affiliates | | | .00 | (c) | | | – 0 | – | | | .00 | (c) | | | .00 | (c) | | | – 0 | – |
| | | | | |
Capital Contributions | | | – 0 | – | | | – 0 | – | | | – 0 | – | | | – 0 | – | | | .00 | (c) |
| | | | |
Net increase (decrease) in net asset value from operations | | | (1.15 | ) | | | .02 | | | | .14 | | | | .64 | | | | (.11 | ) |
| | | | |
Less: Dividends and Distributions | | | | | | | | | | | | | | | | | | | | |
| | | | | |
Dividends from net investment income | | | (.18 | ) | | | (.06 | ) | | | (.19 | ) | | | (.15 | ) | | | (.14 | ) |
| | | | | |
Distributions from net realized gain on investment and foreign currency transactions | | | (.10 | ) | | | (.06 | ) | | | – 0 | – | | | – 0 | – | | | – 0 | – |
| | | | |
Total dividends and distributions | | | (.28 | ) | | | (.12 | ) | | | (.19 | ) | | | (.15 | ) | | | (.14 | ) |
| | | | |
Net asset value, end of period | | | $ 7.12 | | | | $ 8.55 | | | | $ 8.65 | | | | $ 8.70 | | | | $ 8.21 | |
| | | | |
| | | | | |
Total Return | | | | | | | | | | | | | | | | | | | | |
| | | | | |
Total investment return based on net asset value(d) | | | (13.88 | )% | | | .27 | % | | | 1.66 | % | | | 7.87 | % | | | (1.36 | )% |
| | | | | |
Ratios/Supplemental Data | | | | | | | | | | | | | | | | | | | | |
| | | | | |
Net assets, end of period (000’s omitted) | | | $22,599 | | | | $39,929 | | | | $65,949 | | | | $104,089 | | | | $146,309 | |
| | | | | |
Ratio to average net assets of: | | | | | | | | | | | | | | | | | | | | |
| | | | | |
Expenses, net of waivers/reimbursements(e) | | | 1.55 | % | | | 1.55 | % | | | 1.55 | % | | | 1.56 | % | | | 1.56 | % |
| | | | | |
Expenses, before waivers/reimbursements(e) | | | 1.56 | % | | | 1.55 | % | | | 1.55 | % | | | 1.56 | % | | | 1.56 | % |
| | | | | |
Net investment income(b) | | | .62 | % | | | .49 | % | | | .93 | % | | | 1.26 | % | | | 1.38 | % |
| | | | | |
Portfolio turnover rate* | | | 159 | % | | | 130 | % | | | 135 | % | | | 126 | % | | | 369 | % |
See footnote summary on page 131.
| | |
| |
| abfunds.com | | AB GLOBAL BOND FUND | 125 |
FINANCIAL HIGHLIGHTS (continued)
Selected Data For A Share Of Capital Stock Outstanding Throughout Each Period
| | | | | | | | | | | | | | | | | | | | |
| | | Advisor Class | |
| | | Year Ended September 30, | |
| | | 2022 | | | 2021 | | | 2020 | | | 2019 | | | 2018 | |
| | | | |
| | | | | | | | | | | | | | | | | | | | |
Net asset value, beginning of period | | | $ 8.51 | | | | $ 8.62 | | | | $ 8.66 | | | | $ 8.18 | | | | $ 8.42 | |
| | | | |
Income From Investment Operations | | | | | | | | | | | | | | | | | | | | |
| | | | | |
Net investment income(a)(b) | | | .13 | | | | .13 | | | | .16 | | | | .19 | | | | .20 | |
| | | | | |
Net realized and unrealized gain (loss) on investment and foreign currency transactions | | | (1.19 | ) | | | (.03 | ) | | | .08 | | | | .52 | | | | (.22 | ) |
| | | | | |
Contributions from Affiliates | | | .00 | (c) | | | – 0 | – | | | .00 | (c) | | | .00 | (c) | | | – 0 | – |
| | | | | |
Capital Contributions | | | – 0 | – | | | – 0 | – | | | – 0 | – | | | – 0 | – | | | .00 | (c) |
| | | | |
Net increase (decrease) in net asset value from operations | | | (1.06 | ) | | | .10 | | | | .24 | | | | .71 | | | | (.02 | ) |
| | | | |
Less: Dividends and Distributions | | | | | | | | | | | | | | | | | | | | |
| | | | | |
Dividends from net investment income | | | (.26 | ) | | | (.15 | ) | | | (.28 | ) | | | (.23 | ) | | | (.22 | ) |
| | | | | |
Distributions from net realized gain on investment and foreign currency transactions | | | (.10 | ) | | | (.06 | ) | | | – 0 | – | | | – 0 | – | | | – 0 | – |
| | | | |
Total dividends and distributions | | | (.36 | ) | | | (.21 | ) | | | (.28 | ) | | | (.23 | ) | | | (.22 | ) |
| | | | |
Net asset value, end of period | | | $ 7.09 | | | | $ 8.51 | | | | $ 8.62 | | | | $ 8.66 | | | | $ 8.18 | |
| | | | |
| | | | | |
Total Return | | | | | | | | | | | | | | | | | | | | |
| | | | | |
Total investment return based on net asset value(d) | | | (12.95 | )% | | | 1.17 | % | | | 2.82 | % | | | 8.86 | % | | | (.25 | )% |
| | | | | |
Ratios/Supplemental Data | | | | | | | | | | | | | | | | | | | | |
| | | | | |
Net assets, end of period
(000’s omitted) | | | $3,441,514 | | | | $4,707,655 | | | | $4,645,021 | | | | $4,845,448 | | | | $4,570,491 | |
| | | | | |
Ratio to average net assets of: | | | | | | | | | | | | | | | | | | | | |
| | | | | |
Expenses, net of waivers/reimbursements(e) | | | .55 | % | | | .55 | % | | | .55 | % | | | .56 | % | | | .56 | % |
| | | | | |
Expenses, before waivers/reimbursements(e) | | | .56 | % | | | .55 | % | | | .55 | % | | | .56 | % | | | .57 | % |
| | | | | |
Net investment income(b) | | | 1.66 | % | | | 1.49 | % | | | 1.91 | % | | | 2.26 | % | | | 2.44 | % |
| | | | | |
Portfolio turnover rate* | | | 159 | % | | | 130 | % | | | 135 | % | | | 126 | % | | | 369 | % |
See footnote summary on page 131.
| | |
| |
126 | AB GLOBAL BOND FUND | | abfunds.com |
FINANCIAL HIGHLIGHTS (continued)
Selected Data For A Share Of Capital Stock Outstanding Throughout Each Period
| | | | | | | | | | | | | | | | | | | | |
| | | Class R | |
| | | Year Ended September 30, | |
| | | 2022 | | | 2021 | | | 2020 | | | 2019 | | | 2018 | |
| | | | |
| | | | | | | | | | | | | | | | | | | | |
Net asset value, beginning of period | | | $ 8.52 | | | | $ 8.62 | | | | $ 8.66 | | | | $ 8.18 | | | | $ 8.42 | |
| | | | |
Income From Investment Operations | | | | | | | | | | | | | | | | | | | | |
| | | | | |
Net investment income(a)(b) | | | .08 | | | | .07 | | | | .10 | | | | .13 | | | | .15 | |
| | | | | |
Net realized and unrealized gain (loss) on investment and foreign currency transactions | | | (1.21 | ) | | | (.02 | ) | | | .08 | | | | .53 | | | | (.23 | ) |
| | | | | |
Contributions from Affiliates | | | .00 | (c) | | | – 0 | – | | | .00 | (c) | | | .00 | (c) | | | – 0 | – |
| | | | | |
Capital Contributions | | | – 0 | – | | | – 0 | – | | | – 0 | – | | | – 0 | – | | | .00 | (c) |
| | | | |
Net increase (decrease) in net asset value from operations | | | (1.13 | ) | | | .05 | | | | .18 | | | | .66 | | | | (.08 | ) |
| | | | |
Less: Dividends and Distributions | | | | | | | | | | | | | | | | | | | | |
| | | | | |
Dividends from net investment income | | | (.20 | ) | | | (.09 | ) | | | (.22 | ) | | | (.18 | ) | | | (.16 | ) |
| | | | | |
Distributions from net realized gain on investment and foreign currency transactions | | | (.10 | ) | | | (.06 | ) | | | – 0 | – | | | – 0 | – | | | – 0 | – |
| | | | |
Total dividends and distributions | | | (.30 | ) | | | (.15 | ) | | | (.22 | ) | | | (.18 | ) | | | (.16 | ) |
| | | | |
Net asset value, end of period | | | $ 7.09 | | | | $ 8.52 | | | | $ 8.62 | | | | $ 8.66 | | | | $ 8.18 | |
| | | | |
| | | | | |
Total Return | | | | | | | | | | | | | | | | | | | | |
| | | | | |
Total investment return based on net asset value(d) | | | (13.65 | )% | | | .59 | % | | | 2.08 | % | | | 8.13 | % | | | (.91 | )% |
| | | | | |
Ratios/Supplemental Data | | | | | | | | | | | | | | | | | | | | |
| | | | | |
Net assets, end of period
(000’s omitted) | | | $37,213 | | | | $49,599 | | | | $56,424 | | | | $69,424 | | | | $75,138 | |
| | | | | |
Ratio to average net assets of: | | | | | | | | | | | | | | | | | | | | |
| | | | | |
Expenses, net of waivers/reimbursements(e) | | | 1.25 | % | | | 1.24 | % | | | 1.27 | % | | | 1.24 | % | | | 1.23 | % |
| | | | | |
Expenses, before waivers/reimbursements(e) | | | 1.25 | % | | | 1.24 | % | | | 1.27 | % | | | 1.24 | % | | | 1.23 | % |
| | | | | |
Net investment income(b) | | | .96 | % | | | .80 | % | | | 1.20 | % | | | 1.59 | % | | | 1.75 | % |
| | | | | |
Portfolio turnover rate* | | | 159 | % | | | 130 | % | | | 135 | % | | | 126 | % | | | 369 | % |
See footnote summary on page 131.
| | |
| |
| abfunds.com | | AB GLOBAL BOND FUND | 127 |
FINANCIAL HIGHLIGHTS (continued)
Selected Data For A Share Of Capital Stock Outstanding Throughout Each Period
| | | | | | | | | | | | | | | | | | | | |
| | | Class K | |
| | | Year Ended September 30, | |
| | | 2022 | | | 2021 | | | 2020 | | | 2019 | | | 2018 | |
| | | | |
| | | | | | | | | | | | | | | | | | | | |
Net asset value, beginning of period | | | $ 8.52 | | | | $ 8.62 | | | | $ 8.66 | | | | $ 8.18 | | | | $ 8.42 | |
| | | | |
Income From Investment Operations | | | | | | | | | | | | | | | | | | | | |
| | | | | |
Net investment income(a)(b) | | | .10 | | | | .10 | | | | .13 | | | | .16 | | | | .17 | |
| | | | | |
Net realized and unrealized gain (loss) on investment and foreign currency transactions | | | (1.20 | ) | | | (.02 | ) | | | .07 | | | | .52 | | | | (.22 | ) |
| | | | | |
Contributions from Affiliates | | | .00 | (c) | | | – 0 | – | | | .00 | (c) | | | .00 | (c) | | | – 0 | – |
| | | | | |
Capital Contributions | | | – 0 | – | | | – 0 | – | | | – 0 | – | | | – 0 | – | | | .00 | (c) |
| | | | |
Net increase (decrease) in net asset value from operations | | | (1.10 | ) | | | .08 | | | | .20 | | | | .68 | | | | (.05 | ) |
| | | | |
Less: Dividends and Distributions | | | | | | | | | | | | | | | | | | | | |
| | | | | |
Dividends from net investment income | | | (.23 | ) | | | (.12 | ) | | | (.24 | ) | | | (.20 | ) | | | (.19 | ) |
| | | | | |
Distributions from net realized gain on investment and foreign currency transactions | | | (.10 | ) | | | (.06 | ) | | | – 0 | – | | | – 0 | – | | | – 0 | – |
| | | | |
Total dividends and distributions | | | (.33 | ) | | | (.18 | ) | | | (.24 | ) | | | (.20 | ) | | | (.19 | ) |
| | | | |
Net asset value, end of period | | | $ 7.09 | | | | $ 8.52 | | | | $ 8.62 | | | | $ 8.66 | | | | $ 8.18 | |
| | | | |
| | | | | |
Total Return | | | | | | | | | | | | | | | | | | | | |
| | | | | |
Total investment return based on net asset value(d) | | | (13.38 | )% | | | .90 | % | | | 2.39 | % | | | 8.46 | % | | | (.60 | )% |
| | | | | |
Ratios/Supplemental Data | | | | | | | | | | | | | | | | | | | | |
| | | | | |
Net assets, end of period
(000’s omitted) | | | $8,420 | | | | $13,249 | | | | $16,627 | | | | $19,576 | | | | $16,642 | |
| | | | | |
Ratio to average net assets of: | | | | | | | | | | | | | | | | | | | | |
| | | | | |
Expenses, net of waivers/reimbursements(e) | | | .94 | % | | | .93 | % | | | .96 | % | | | .93 | % | | | .92 | % |
| | | | | |
Expenses, before waivers/reimbursements(e) | | | .94 | % | | | .93 | % | | | .96 | % | | | .93 | % | | | .92 | % |
| | | | | |
Net investment income(b) | | | 1.24 | % | | | 1.11 | % | | | 1.51 | % | | | 1.89 | % | | | 2.09 | % |
| | | | | |
Portfolio turnover rate* | | | 159 | % | | | 130 | % | | | 135 | % | | | 126 | % | | | 369 | % |
See footnote summary on page 131.
| | |
| |
128 | AB GLOBAL BOND FUND | | abfunds.com |
FINANCIAL HIGHLIGHTS (continued)
Selected Data For A Share Of Capital Stock Outstanding Throughout Each Period
| | | | | | | | | | | | | | | | | | | | |
| | | Class I | |
| | | Year Ended September 30, | |
| | | 2022 | | | 2021 | | | 2020 | | | 2019 | | | 2018 | |
| | | | |
| | | | | | | | | | | | | | | | | | | | |
Net asset value, beginning of period | | | $ 8.52 | | | | $ 8.62 | | | | $ 8.66 | | | | $ 8.18 | | | | $ 8.42 | |
| | | | |
Income From Investment Operations | | | | | | | | | | | | | | | | | | | | |
| | | | | |
Net investment income(a)(b) | | | .13 | | | | .13 | | | | .16 | | | | .19 | | | | .20 | |
| | | | | |
Net realized and unrealized gain (loss) on investment and foreign currency transactions | | | (1.20 | ) | | | (.02 | ) | | | .07 | | | | .52 | | | | (.22 | ) |
| | | | | |
Contributions from Affiliates | | | .00 | (c) | | | – 0 | – | | | .00 | (c) | | | .00 | (c) | | | – 0 | – |
| | | | | |
Capital Contributions | | | – 0 | – | | | – 0 | – | | | – 0 | – | | | – 0 | – | | | .00 | (c) |
| | | | |
Net increase (decrease) in net asset value from operations | | | (1.07 | ) | | | .11 | | | | .23 | | | | .71 | | | | (.02 | ) |
| | | | |
Less: Dividends and Distributions | | | | | | | | | | | | | | | | | | | | |
| | | | | |
Dividends from net investment income | | | (.26 | ) | | | (.15 | ) | | | (.27 | ) | | | (.23 | ) | | | (.22 | ) |
| | | | | |
Distributions from net realized gain on investment and foreign currency transactions | | | (.10 | ) | | | (.06 | ) | | | – 0 | – | | | – 0 | – | | | – 0 | – |
| | | | |
Total dividends and distributions | | | (.36 | ) | | | (.21 | ) | | | (.27 | ) | | | (.23 | ) | | | (.22 | ) |
| | | | |
Net asset value, end of period | | | $ 7.09 | | | | $ 8.52 | | | | $ 8.62 | | | | $ 8.66 | | | | $ 8.18 | |
| | | | |
| | | | | |
Total Return | | | | | | | | | | | | | | | | | | | | |
| | | | | |
Total investment return based on net asset value(d) | | | (13.06 | )% | | | 1.29 | % | | | 2.79 | % | | | 8.87 | % | | | (.23 | )% |
| | | | | |
Ratios/Supplemental Data | | | | | | | | | | | | | | | | | | | | |
| | | | | |
Net assets, end of period (000’s omitted) | | | $724,876 | | | | $919,250 | | | | $854,892 | | | | $852,566 | | | | $773,149 | |
| | | | | |
Ratio to average net assets of: | | | | | | | | | | | | | | | | | | | | |
| | | | | |
Expenses, net of waivers/reimbursements(e) | | | .56 | % | | | .55 | % | | | .58 | % | | | .55 | % | | | .54 | % |
| | | | | |
Expenses, before waivers/reimbursements(e) | | | .57 | % | | | .55 | % | | | .58 | % | | | .56 | % | | | .55 | % |
| | | | | |
Net investment income(b) | | | 1.65 | % | | | 1.49 | % | | | 1.88 | % | | | 2.27 | % | | | 2.46 | % |
| | | | | |
Portfolio turnover rate* | | | 159 | % | | | 130 | % | | | 135 | % | | | 126 | % | | | 369 | % |
See footnote summary on page 131.
| | |
| |
| abfunds.com | | AB GLOBAL BOND FUND | 129 |
FINANCIAL HIGHLIGHTS (continued)
Selected Data For A Share Of Capital Stock Outstanding Throughout Each Period
| | | | | | | | | | | | | | | | | | | | |
| | | Class Z | |
| | | Year Ended September 30, | |
| | | 2022 | | | 2021 | | | 2020 | | | 2019 | | | 2018 | |
| | | | |
| | | | | | | | | | | | | | | | | | | | |
Net asset value, beginning of period | | | $ 8.52 | | | | $ 8.62 | | | | $ 8.66 | | | | $ 8.18 | | | | $ 8.42 | |
| | | | |
Income From Investment Operations | | | | | | | | | | | | | | | | | | | | |
| | | | | |
Net investment income(a)(b) | | | .14 | | | | .13 | | | | .16 | | | | .19 | | | | .21 | |
| | | | | |
Net realized and unrealized gain (loss) on investment and foreign currency transactions | | | (1.21 | ) | | | (.02 | ) | | | .08 | | | | .53 | | | | (.22 | ) |
| | | | | |
Contributions from Affiliates | | | .00 | (c) | | | – 0 | – | | | .00 | (c) | | | .00 | (c) | | | – 0 | – |
| | | | | |
Capital Contributions | | | – 0 | – | | | – 0 | – | | | – 0 | – | | | – 0 | – | | | .00 | (c) |
| | | | |
Net increase (decrease) in net asset value from operations | | | (1.07 | ) | | | .11 | | | | .24 | | | | .72 | | | | (.01 | ) |
| | | | |
Less: Dividends and Distributions | | | | | | | | | | | | | | | | | | | | |
| | | | | |
Dividends from net investment income | | | (.26 | ) | | | (.15 | ) | | | (.28 | ) | | | (.24 | ) | | | (.23 | ) |
| | | | | |
Distributions from net realized gain on investment and foreign currency transactions | | | (.10 | ) | | | (.06 | ) | | | – 0 | – | | | – 0 | – | | | – 0 | – |
| | | | |
Total dividends and distributions | | | (.36 | ) | | | (.21 | ) | | | (.28 | ) | | | (.24 | ) | | | (.23 | ) |
| | | | |
Net asset value, end of period | | | $ 7.09 | | | | $ 8.52 | | | | $ 8.62 | | | | $ 8.66 | | | | $ 8.18 | |
| | | | |
| | | | | |
Total Return | | | | | | | | | | | | | | | | | | | | |
| | | | | |
Total investment return based on net asset value(d) | | | (13.01 | )% | | | 1.34 | % | | | 2.84 | % | | | 8.93 | % | | | (.18 | )% |
| | | | | |
Ratios/Supplemental Data | | | | | | | | | | | | | | | | | | | | |
| | | | | |
Net assets, end of period
(000’s omitted) | | | $755,288 | | | | $717,784 | | | | $579,878 | | | | $580,799 | | | | $489,921 | |
| | | | | |
Ratio to average net assets of: | | | | | | | | | | | | | | | | | | | | |
| | | | | |
Expenses, net of waivers/reimbursements(e) | | | .51 | % | | | .50 | % | | | .53 | % | | | .50 | % | | | .49 | % |
| | | | | |
Expenses, before waivers/reimbursements(e) | | | .51 | % | | | .50 | % | | | .53 | % | | | .50 | % | | | .50 | % |
| | | | | |
Net investment income(b) | | | 1.73 | % | | | 1.53 | % | | | 1.93 | % | | | 2.33 | % | | | 2.54 | % |
| | | | | |
Portfolio turnover rate* | | | 159 | % | | | 130 | % | | | 135 | % | | | 126 | % | | | 369 | % |
See footnote summary on page 131.
| | |
| |
130 | AB GLOBAL BOND FUND | | abfunds.com |
FINANCIAL HIGHLIGHTS (continued)
Selected Data For A Share Of Capital Stock Outstanding Throughout Each Period
| (a) | Based on average shares outstanding. |
| (b) | Net of expenses waived/reimbursed by the Adviser. |
| (c) | Amount is less than $0.005. |
| (d) | Total investment return is calculated assuming an initial investment made at the net asset value at the beginning of the period, reinvestment of all dividends and distributions at net asset value during the period, and redemption on the last day of the period. Initial sales charge or contingent deferred sales charge is not reflected in the calculation of total investment return. Total investment return does not reflect the deduction of taxes that a shareholder would pay on fund distributions or the redemption of fund shares. Total investment return for a period of less than one year is not annualized. |
| (e) | The expense ratios presented below exclude interest expense: |
| | | | | | | | | | | | | | | | | | | | |
| | | Year Ended September 30, | |
| | 2022 | | | 2021 | | | 2020 | | | 2019 | | | 2018 | |
| | | | |
Class A | | | | | | | | | | | | | | | | | | | | |
Net of waivers/reimbursements | | | .80 | % | | | .80 | % | | | .80 | % | | | .81 | % | | | .81 | % |
Before waivers/reimbursements | | | .80 | % | | | .80 | % | | | .80 | % | | | .81 | % | | | .82 | % |
Class C | | | | | | | | | | | | | | | | | | | | |
Net of waivers/reimbursements | | | 1.55 | % | | | 1.55 | % | | | 1.55 | % | | | 1.56 | % | | | 1.56 | % |
Before waivers/reimbursements | | | 1.56 | % | | | 1.55 | % | | | 1.55 | % | | | 1.56 | % | | | 1.56 | % |
Advisor Class | | | | | | | | | | | | | | | | | | | | |
Net of waivers/reimbursements | | | .55 | % | | | .55 | % | | | .55 | % | | | .56 | % | | | .56 | % |
Before waivers/reimbursements | | | .56 | % | | | .55 | % | | | .55 | % | | | .56 | % | | | .57 | % |
Class R | | | | | | | | | | | | | | | | | | | | |
Net of waivers/reimbursements | | | 1.25 | % | | | 1.24 | % | | | 1.27 | % | | | 1.24 | % | | | 1.23 | % |
Before waivers/reimbursements | | | 1.25 | % | | | 1.24 | % | | | 1.27 | % | | | 1.24 | % | | | 1.23 | % |
Class K | | | | | | | | | | | | | | | | | | | | |
Net of waivers/reimbursements | | | .94 | % | | | .93 | % | | | .96 | % | | | .93 | % | | | .92 | % |
Before waivers/reimbursements | | | .94 | % | | | .93 | % | | | .96 | % | | | .93 | % | | | .92 | % |
Class I | | | | | | | | | | | | | | | | | | | | |
Net of waivers/reimbursements | | | .56 | % | | | .55 | % | | | .58 | % | | | .55 | % | | | .54 | % |
Before waivers/reimbursements | | | .57 | % | | | .55 | % | | | .58 | % | | | .56 | % | | | .55 | % |
Class Z | | | | | | | | | | | | | | | | | | | | |
Net of waivers/reimbursements | | | .51 | % | | | .50 | % | | | .53 | % | | | .50 | % | | | .49 | % |
Before waivers/reimbursements | | | .51 | % | | | .50 | % | | | .53 | % | | | .50 | % | | | .50 | % |
| ^ | The net asset value and total return include adjustments in accordance with accounting principles generally accepted in the United States of America for financial reporting purposes. As such, the net asset value and total return for shareholder transactions may differ from financial statements. |
| * | The Fund accounts for dollar roll transactions as purchases and sales. |
See notes to financial statements.
| | |
| |
| abfunds.com | | AB GLOBAL BOND FUND | 131 |
REPORT OF INDEPENDENT REGISTERED
PUBLIC ACCOUNTING FIRM
To the Shareholders and the Board of Directors of
AB Global Bond Fund, Inc.
Opinion on the Financial Statements
We have audited the accompanying statement of assets and liabilities of AB Global Bond Fund, Inc. (the “Fund”), including the portfolio of investments, as of September 30, 2022, and the related statement of operations for the year then ended, the statements of changes in net assets for each of the two years in the period then ended, the financial highlights for each of the five years in the period then ended and the related notes (collectively referred to as the “financial statements”). In our opinion, the financial statements present fairly, in all material respects, the financial position of the Fund at September 30, 2022, the results of its operations for the year then ended, the changes in its net assets for each of the two years in the period then ended and its financial highlights for each of the five years in the period then ended, in conformity with U.S. generally accepted accounting principles.
Basis for Opinion
These financial statements are the responsibility of the Fund’s management. Our responsibility is to express an opinion on the Fund’s financial statements based on our audits. We are a public accounting firm registered with the Public Company Accounting Oversight Board (United States) (“PCAOB”) and are required to be independent with respect to the Fund in accordance with the U.S. federal securities laws and the applicable rules and regulations of the Securities and Exchange Commission and the PCAOB.
We conducted our audits in accordance with the standards of the PCAOB. Those standards require that we plan and perform the audit to obtain reasonable assurance about whether the financial statements are free of material misstatement, whether due to error or fraud. The Fund is not required to have, nor were we engaged to perform, an audit of the Fund’s internal control over financial reporting. As part of our audits, we are required to obtain an understanding of internal control over financial reporting, but not for the purpose of expressing an opinion on the effectiveness of the Fund’s internal control over financial reporting. Accordingly, we express no such opinion.
Our audits included performing procedures to assess the risks of material misstatement of the financial statements, whether due to error or fraud, and performing procedures that respond to those risks. Such procedures included examining, on a test basis, evidence regarding the amounts and disclosures in the financial statements. Our procedures included confirmation
| | |
| |
132 | AB GLOBAL BOND FUND | | abfunds.com |
REPORT OF INDEPENDENT REGISTERED
PUBLIC ACCOUNTING FIRM (continued)
of securities owned as of September 30, 2022, by correspondence with the custodian, brokers and others; when replies were not received from brokers or others, we performed other auditing procedures. Our audits also included evaluating the accounting principles used and significant estimates made by management, as well as evaluating the overall presentation of the financial statements. We believe that our audits provide a reasonable basis for our opinion.

We have served as the auditor of one or more of the AB investment companies since 1968.
New York, New York
November 23, 2022
| | |
| |
| abfunds.com | | AB GLOBAL BOND FUND | 133 |
2022 FEDERAL TAX INFORMATION
(unaudited)
For Federal income tax purposes, the following information is furnished with respect to the distributions paid by the Fund during the taxable year ended September 30, 2022. For foreign shareholders, 19.63% of ordinary income dividends paid may be considered to be qualifying to be taxed as interest-related dividends. The Fund designates $53,831,535 of dividends paid as long-term capital gains dividends.
Shareholders should not use the above information to prepare their income tax returns. The information necessary to complete your income tax returns will be included with your Form 1099-DIV which will be sent to you separately in January 2023.
| | |
| |
134 | AB GLOBAL BOND FUND | | abfunds.com |
BOARD OF DIRECTORS
| | |
Marshall C. Turner, Jr.(1),
Chairman Jorge A. Bermudez(1) Michael J. Downey(1) Onur Erzan, President and Chief Executive Officer | | Nancy P. Jacklin(1) Jeanette W. Loeb(1) Carol C. McMullen(1) Garry L. Moody(1) |
| |
| OFFICERS | | |
Scott A. DiMaggio(2),
Vice President Matthew S. Sheridan(2),
Vice President John Taylor(2), Vice President Emilie D. Wrapp, Secretary | | Michael B. Reyes,
Senior Vice President Joseph J. Mantineo, Treasurer and Chief Financial Officer Stephen M. Woetzel, Controller Vincent S. Noto, Chief
Compliance Officer |
| | |
Custodian and Accounting Agent Brown Brothers Harriman & Co. 50 Post Office Square Boston, MA 02110 Principal Underwriter AllianceBernstein Investments, Inc. 501 Commerce Street Nashville, TN 37203 Legal Counsel Seward & Kissel LLP One Battery Park Plaza New York, NY 10004 | | Transfer Agent AllianceBernstein Investor Services, Inc. P.O. Box 786003 San Antonio, TX 78278 Toll-Free (800) 221-5672 Independent Registered Public Accounting Firm Ernst & Young LLP One Manhattan West New York, NY 10001 |
| 1 | Member of the Audit Committee, the Governance and Nominating Committee, and the Independent Directors Committee. |
| 2 | The day-to-day management of, and investment decisions for, the Fund’s portfolio are made by the Adviser’s Global Fixed Income Investment Team. Messrs. DiMaggio, Sheridan and Taylor are the investment professionals with the most significant responsibility for the day-to-day management of the Fund’s portfolio. |
| | |
| |
| abfunds.com | | AB GLOBAL BOND FUND | 135 |
MANAGEMENT OF THE FUND
Board of Directors Information
The business and affairs of the Fund are managed under the direction of the Board of Directors. Certain information concerning the Fund’s Directors is set forth below.
| | | | | | | | |
NAME, ADDRESS*, AGE,
(YEAR FIRST ELECTED**) | | PRINCIPAL
OCCUPATION(S)
DURING PAST FIVE YEARS
AND OTHER INFORMATION*** | | PORTFOLIOS
IN AB FUND
COMPLEX
OVERSEEN BY
DIRECTOR | | | OTHER PUBLIC COMPANY DIRECTORSHIPS
CURRENTLY
HELD BY DIRECTOR |
| INTERESTED DIRECTOR | | | | | | |
| | | |
Onur Erzan,# AllianceBernstein L.P.
1345 Avenue of the Americas
New York, NY 10105
46
(2021) | | Senior Vice President of AllianceBernstein L.P. (the “Adviser”), Head of Global Client Group and Head of Private Wealth. He oversees AB’s entire private wealth management business and third-party institutional and retail franchise, where he is responsible for all client services, sales and marketing, as well as product strategy, management and development worldwide. Director, President and Chief Executive Officer of the AB Mutual Funds as of April 1, 2021. He is also a member of the Equitable Holdings Management Committee. Prior to joining the firm in 2021, he spent over 19 years with McKinsey, most recently as a senior partner and co-leader of its Wealth & Asset Management practice. In addition, he co-led McKinsey’s Banking & Securities Solutions (a portfolio of data, analytics and digital assets and capabilities) globally. | | | 75 | | | None |
| | |
| |
136 | AB GLOBAL BOND FUND | | abfunds.com |
MANAGEMENT OF THE FUND (continued)
| | | | | | | | |
NAME, ADDRESS*, AGE,
(YEAR FIRST ELECTED**) | | PRINCIPAL
OCCUPATION(S)
DURING PAST FIVE YEARS
AND OTHER INFORMATION*** | | PORTFOLIOS
IN AB FUND
COMPLEX
OVERSEEN BY
DIRECTOR | | | OTHER PUBLIC COMPANY DIRECTORSHIPS
CURRENTLY
HELD BY DIRECTOR |
| INDEPENDENT DIRECTORS |
| | | |
Marshall C. Turner, Jr.,##
Chairman of the Board
81
(2005) | | Private Investor since prior to 2017. Former Chairman and CEO of Dupont Photomasks, Inc. (semi-conductor manufacturing equipment). He was Director of Xilinx, Inc. (programmable logic semi-conductors and adaptable, intelligent computing) from 2007 through August 2020, and is a former director of 33 other companies and organizations. He has extensive operating leadership, and venture capital investing experience, including five interim or full-time CEO roles, and prior service as general partner of institutional venture capital partnerships. He also has extensive non-profit board leadership experience, and currently serves on the board of the George Lucas Educational Foundation. He has served as a director of one AB Fund since 1992, and director or trustee of all AB Funds since 2005. He has been Chairman of the AB Funds since January 2014, and the Chairman of the Independent Directors Committees of such AB Funds since February 2014. | | | 75 | | | None |
| | |
| |
| abfunds.com | | AB GLOBAL BOND FUND | 137 |
MANAGEMENT OF THE FUND (continued)
| | | | | | | | |
NAME, ADDRESS*, AGE,
(YEAR FIRST ELECTED**) | | PRINCIPAL
OCCUPATION(S)
DURING PAST FIVE YEARS
AND OTHER INFORMATION*** | | PORTFOLIOS
IN AB FUND
COMPLEX
OVERSEEN BY
DIRECTOR | | | OTHER PUBLIC COMPANY DIRECTORSHIPS
CURRENTLY
HELD BY DIRECTOR |
INDEPENDENT DIRECTORS (continued) | | | | | | |
| | | |
Jorge A. Bermudez,##
71
(2020) | | Private Investor since prior to 2017. Formerly, Chief Risk Officer of Citigroup, Inc., a global financial services company, from November 2007 to March 2008, Chief Executive Officer of Citigroup’s Commercial Business Group in North America and Citibank Texas from 2005 to 2007, and a variety of other executive and leadership roles at various businesses within Citigroup prior to then; Chairman (2018) of the Texas A&M Foundation Board of Trustees (Trustee since 2013) and Chairman of the Smart Grid Center Board at Texas A&M University since 2012; director of, among others, Citibank N.A. from 2005 to 2008, the Federal Reserve Bank of Dallas, Houston Branch from 2009 to 2011, the Federal Reserve Bank of Dallas from 2011 to 2017, and the Electric Reliability Council of Texas from 2010 to 2016. He has served as director or trustee of the AB Funds since January 2020. | | | 75 | | | Moody’s Corporation since April 2011 |
| | | | | | | | |
| | | |
Michael J. Downey,##
78 (2005)
| | Private Investor since prior to 2017. Formerly, Chairman of The Asia Pacific Fund, Inc. (registered investment company) since prior to 2017 until January 2019. From 1987 until 1993, Chairman and CEO of Prudential Mutual Fund Management, director of the Prudential mutual funds, and member of the Executive Committee of Prudential Securities, Inc. He has served as a director or trustee of the AB Funds since 2005. | | | 75 | | | None |
| | |
| |
138 | AB GLOBAL BOND FUND | | abfunds.com |
MANAGEMENT OF THE FUND (continued)
| | | | | | | | |
NAME, ADDRESS*, AGE,
(YEAR FIRST ELECTED**) | | PRINCIPAL
OCCUPATION(S)
DURING PAST FIVE YEARS
AND OTHER INFORMATION*** | | PORTFOLIOS
IN AB FUND
COMPLEX
OVERSEEN BY
DIRECTOR | | | OTHER PUBLIC COMPANY DIRECTORSHIPS
CURRENTLY
HELD BY DIRECTOR |
INDEPENDENT DIRECTORS (continued) | | | | | | |
| | | |
Nancy P. Jacklin,##
74
(2006) | | Private Investor since prior to 2017. Professorial Lecturer at the Johns Hopkins School of Advanced International Studies (2008-2015). U.S. Executive Director of the International Monetary Fund (which is responsible for ensuring the stability of the international monetary system), (December 2002-May 2006); Partner, Clifford Chance (1992-2002); Sector Counsel, International Banking and Finance, and Associate General Counsel, Citicorp (1985-1992); Assistant General Counsel (International), Federal Reserve Board of Governors (1982-1985); and Attorney Advisor, U.S. Department of the Treasury (1973-1982). Member of the Bar of the District of Columbia and of New York; and member of the Council on Foreign Relations. She has served as a director or trustee of the AB Funds since 2006 and has been Chair of the Governance and Nominating Committees of the AB Funds since August 2014. | | | 75 | | | None |
| | | | | | | | |
| | | |
Jeanette W. Loeb,##
70
(2020)
| | Chief Executive Officer of PetCareRx (e-commerce pet pharmacy) from 2002 to 2011 and 2015 to present. Director of New York City Center since 2005. She was a director of AB Multi-Manager Alternative Fund, Inc. (fund of hedge funds) from 2012 to 2018. Formerly, affiliated with Goldman Sachs Group, Inc. (financial services) from 1977 to 1994, including as a partner thereof from 1986 to 1994. She has served as director or trustee of the AB Funds since April 2020. | | | 75 | | | Apollo Investment Corp. (business development company) since August 2011 |
| | |
| |
| abfunds.com | | AB GLOBAL BOND FUND | 139 |
MANAGEMENT OF THE FUND (continued)
| | | | | | | | |
NAME, ADDRESS*, AGE,
(YEAR FIRST ELECTED**) | | PRINCIPAL
OCCUPATION(S)
DURING PAST FIVE YEARS
AND OTHER INFORMATION*** | | PORTFOLIOS
IN AB FUND
COMPLEX
OVERSEEN BY
DIRECTOR | | | OTHER PUBLIC COMPANY DIRECTORSHIPS
CURRENTLY
HELD BY DIRECTOR |
INDEPENDENT DIRECTORS (continued) | | | | | | |
| | | |
Carol C. McMullen,## 67
(2016)
| | Managing Director of Slalom Consulting (consulting) since 2014, private investor and a member of the Advisory Board of Butcher Box (since 2018). Formerly, member, Partners Healthcare Investment Committee (2010-2019); Director of Norfolk & Dedham Group (mutual property and casualty insurance) from 2011 until November 2016; Director of Partners Community Physicians Organization (healthcare) from 2014 until December 2016; and Managing Director of The Crossland Group (consulting) from 2012 until 2013. She has held a number of senior positions in the asset and wealth management industries, including at Eastern Bank (where her roles included President of Eastern Wealth Management), Thomson Financial (Global Head of Sales for Investment Management), and Putnam Investments (where her roles included Chief Investment Officer, Core and Growth and Head of Global Investment Research). She has served on a number of private company and non-profit boards, and as a director or trustee of the AB Funds since June 2016. | | | 75 | | | None |
| | |
| |
140 | AB GLOBAL BOND FUND | | abfunds.com |
MANAGEMENT OF THE FUND (continued)
| | | | | | | | |
NAME, ADDRESS*, AGE,
(YEAR FIRST ELECTED**) | | PRINCIPAL
OCCUPATION(S)
DURING PAST FIVE YEARS
AND OTHER INFORMATION*** | | PORTFOLIOS
IN AB FUND
COMPLEX
OVERSEEN BY
DIRECTOR | | | OTHER PUBLIC COMPANY DIRECTORSHIPS
CURRENTLY
HELD BY DIRECTOR |
INDEPENDENT DIRECTORS (continued) | | | | | | |
| | | |
Garry L. Moody,##
70 (2008) | | Private Investor since prior to 2017. Formerly, Partner, Deloitte & Touche LLP (1995-2008) where he held a number of senior positions, including Vice Chairman, and U.S. and Global Investment Management Practice Managing Partner; President, Fidelity Accounting and Custody Services Company (1993-1995), where he was responsible for accounting, pricing, custody and reporting for the Fidelity mutual funds; and Partner, Ernst & Young LLP (1975-1993), where he served as the National Director of Mutual Fund Tax Services and Managing Partner of its Chicago Office Tax department. He is a member of the Investment Company Institute’s Board of Governors and the Independent Directors Council’s Governing Council, where he serves as Chairman of its Governance Committee. He has served as a director or trustee, and as Chairman of the Audit Committees, of the AB Funds since 2008. | | | 75 | | | None |
| * | The address for each of the Fund’s disinterested Directors is c/o AllianceBernstein L.P., Attention: Legal and Compliance Department—Mutual Fund Legal, 1345 Avenue of the Americas, New York, NY 10105. |
| ** | There is no stated term of office for the Fund’s Directors. |
| *** | The information above includes each Director’s principal occupation during the last five years and other information relating to the experience, attributes, and skills relevant to each Director’s qualifications to serve as a Director, which led to the conclusion that each Director should serve as a Director for the Fund. |
| # | Mr. Erzan is an “interested person” of the Fund, as defined in the 1940 Act, due to his position as a Senior Vice President of the Adviser. |
| ## | Member of the Audit Committee, the Governance and Nominating Committee, and the Independent Directors Committee. |
| | |
| |
| abfunds.com | | AB GLOBAL BOND FUND | 141 |
MANAGEMENT OF THE FUND (continued)
Officer Information
Certain information concerning the Fund’s Officers is listed below.
| | | | |
NAME, ADDRESS*
AND AGE | | POSITION(S)
HELD WITH FUND | | PRINCIPAL OCCUPATION
DURING PAST FIVE YEARS** |
Onur Erzan,
46 | | President and Chief Executive Officer | | See biography above. |
| | | | |
Scott A. DiMaggio,
51 | | Vice President | | Senior Vice President of the Adviser**, with which he has been associated since prior to 2017. He is also Co-Head of Fixed Income. |
| | | | |
Matthew S. Sheridan,
47 | | Vice President | | Senior Vice President of the Adviser**, with which he has been associated since prior to 2017. |
| | | | |
John Taylor, 45 | | Vice President | | Senior Vice President of the Adviser**, with which he has been associated since prior to 2017. He is also Director—Global Multi-Sector. |
| | | | |
Emilie D. Wrapp,
66 | | Secretary | | Senior Vice President, Assistant General Counsel and Assistant Secretary of AllianceBernstein Investments, Inc. (“ABI”),** with which she has been associated since prior to 2017. |
| | | | |
Michael B. Reyes,
46 | | Senior Vice President | | Vice President of the Adviser,** with which he has been associated since prior to 2017. |
| | | | |
Joseph J. Mantineo,
63 | | Treasurer and Chief Financial Officer | | Senior Vice President of AllianceBernstein Investor Services, Inc. (“ABIS”),** with which he has been associated since prior to 2017. |
| | | | |
Stephen M. Woetzel,
51 | | Controller | | Senior Vice President of ABIS**, with which he has been associated since prior to 2017. |
| | | | |
Vincent S. Noto,
57 | | Chief Compliance Officer | | Senior Vice President and Mutual Fund Chief Compliance Officer of the Adviser** since prior to 2017. |
| * | The address for each of the Fund’s Officers is 1345 Avenue of the Americas, New York, NY 10105. |
| ** | The Adviser, ABI and ABIS are affiliates of the Fund. |
The Fund’s Statement of Additional Information (“SAI”) has additional information about the Fund’s Directors and Officers and is available without charge upon request. Contact your financial representative or AB at (800) 227-4618, or visit www.abfunds.com, for a free prospectus or SAI.
| | |
| |
142 | AB GLOBAL BOND FUND | | abfunds.com |
Operation and Effectiveness of the Funds’ Liquidity Risk Management Program:
In October 2016, the Securities and Exchange Commission (“SEC”) adopted the open-end fund liquidity rule (the “Liquidity Rule”). In June 2018 the SEC adopted a requirement that funds disclose information about the operation and effectiveness of their Liquidity Risk Management Program (“LRMP”) in their reports to shareholders.
One of the requirements of the Liquidity Rule is for the Fund to designate an Administrator of the Fund’s Liquidity Risk Management Program. The Administrator of the Fund’s LRMP is AllianceBernstein L.P., the Fund’s investment adviser (the “Adviser”). The Adviser has delegated the responsibility to its Liquidity Risk Management Committee (the “Committee”).
Another requirement of the Liquidity Rule is for the Fund’s Board of Directors/Trustees (the “Fund Board”) to receive an annual written report from the Administrator of the LRMP, which addresses the operation of the fund’s LRMP and assesses its adequacy and effectiveness. The Adviser provided the Fund Board with such annual report during the first quarter of 2022, which covered the period January 1, 2021 through December 31, 2021 (the “Program Reporting Period”).
The LRMP’s principal objectives include supporting the Fund’s compliance with limits on investments in illiquid assets and mitigating the risk that the Fund will be unable to meet its redemption obligations in a timely manner.
Pursuant to the LRMP, the Fund classifies the liquidity of its portfolio investments into one of the four categories defined by the SEC: Highly Liquid, Moderately Liquid, Less Liquid, and Illiquid. These classifications are reported to the SEC on Form N-PORT.
During the Program Reporting Period, the Committee reviewed whether the Fund’s strategy is appropriate for an open-end structure, incorporating any holdings of less liquid and illiquid assets. If the Fund participated in derivative transactions, the exposure from such transactions were considered in the LRMP.
The Committee also performed an analysis to determine whether the Fund is required to maintain a Highly Liquid Investment Minimum (“HLIM”). The Committee also incorporated the following information when determining the Fund’s reasonably anticipated trading size for purposes of liquidity monitoring: historical net redemption activity, a Fund’s concentration in an issuer, shareholder concentration, investment performance, total net assets, and distribution channels.
The Adviser informed the Fund Board that the Committee believes the Funds’ LRMP is adequately designed, has been implemented as intended,
| | |
| |
| abfunds.com | | AB GLOBAL BOND FUND | 143 |
and has operated effectively since its inception. No material exceptions have been noted since the implementation of the LRMP. During the Program Reporting Period, liquidity in all markets was significantly recovered and improved compared to the prior reporting period which included extreme levels of price volatility and relative illiquidity beginning in March 2020 with COVID 19 impacts. As such, the Program operated in a relatively robust and benign liquidity environment experienced in markets during the Program Reporting Period. There were no liquidity events that impacted the Fund or its ability to timely meet redemptions during the Program Reporting Period.
| | |
| |
144 | AB GLOBAL BOND FUND | | abfunds.com |
Information Regarding the Review and Approval of the Fund’s Advisory Agreement
The disinterested directors (the “directors”) of AB Global Bond Fund, Inc. (the “Fund”) unanimously approved the continuance of the Fund’s Advisory Agreement with the Adviser at a meeting held by video conference on November 2-4, 2021 (the “Meeting”).
Prior to approval of the continuance of the Advisory Agreement, the directors had requested from the Adviser, and received and evaluated, extensive materials. They reviewed the proposed continuance of the Advisory Agreement with the Adviser and with experienced counsel who are independent of the Adviser, who advised on the relevant legal standards. The directors also reviewed additional materials, including comparative analytical data prepared by the Senior Analyst for the Fund. The directors also discussed the proposed continuance in private sessions with counsel.
The directors considered their knowledge of the nature and quality of the services provided by the Adviser to the Fund gained from their experience as directors or trustees of most of the registered investment companies advised by the Adviser, their overall confidence in the Adviser’s integrity and competence they have gained from that experience, the Adviser’s initiative in identifying and raising potential issues with the directors and its responsiveness, frankness and attention to concerns raised by the directors in the past, including the Adviser’s willingness to consider and implement organizational and operational changes designed to improve investment results and the services provided to the AB Funds. The directors noted that they have four regular meetings each year, at each of which they review extensive materials and information from the Adviser, including information on the investment performance of the Fund and the money market fund advised by the Adviser in which the Fund invests a portion of its assets.
The directors also considered all factors they believed relevant, including the specific matters discussed below. During the course of their deliberations, the directors evaluated, among other things, the reasonableness of the advisory fee. The directors did not identify any particular information that was all-important or controlling, and different directors may have attributed different weights to the various factors. The directors determined that the selection of the Adviser to manage the Fund and the overall arrangements between the Fund and the Adviser, as provided in the Advisory Agreement, including the advisory fee, were fair and reasonable in light of the services performed, expenses incurred and such other matters as the directors considered relevant in the exercise of their business judgment. The material factors and conclusions that formed the basis for the directors’ determinations included the following:
Nature, Extent and Quality of Services Provided
The directors considered the scope and quality of services provided by the Adviser under the Advisory Agreement, including the quality of the
| | |
| |
| abfunds.com | | AB GLOBAL BOND FUND | 145 |
investment research capabilities of the Adviser and the other resources it has dedicated to performing services for the Fund. The directors noted that the Adviser from time to time reviews the Fund’s investment strategies and from time to time proposes changes intended to improve the Fund’s relative or absolute performance for the directors’ consideration. They also noted the professional experience and qualifications of the Fund’s portfolio management team and other senior personnel of the Adviser. The directors also considered that the Advisory Agreement provides that the Fund will reimburse the Adviser for the cost to it of providing certain clerical, accounting, administrative and other services to the Fund by employees of the Adviser or its affiliates. Requests for these reimbursements are made on a quarterly basis and subject to approval by the directors. Reimbursements, to the extent requested and paid, result in a higher rate of total compensation from the Fund to the Adviser than the fee rate stated in the Advisory Agreement. The directors noted that the methodology used to determine the reimbursement amounts had been reviewed by an independent consultant at the request of the directors. The quality of administrative and other services, including the Adviser’s role in coordinating the activities of the Fund’s other service providers, also was considered. The directors concluded that, overall, they were satisfied with the nature, extent and quality of services provided to the Fund under the Advisory Agreement.
Costs of Services Provided and Profitability
The directors reviewed a schedule of the revenues and expenses and related notes indicating the profitability of the Fund to the Adviser for calendar years 2019 and 2020 that had been prepared with an expense allocation methodology arrived at in consultation with an independent consultant at the request of the directors. The directors noted the assumptions and methods of allocation used by the Adviser in preparing fund-specific profitability data and understood that there are a number of potentially acceptable allocation methodologies for information of this type. The directors noted that the profitability information reflected all revenues and expenses of the Adviser’s relationship with the Fund, including those relating to its subsidiaries that provide transfer agency and distribution services to the Fund. The directors recognized that it is difficult to make comparisons of the profitability of the Advisory Agreement with the profitability of fund advisory contracts for unaffiliated funds because comparative information is not generally publicly available and is affected by numerous factors. The directors focused on the profitability of the Adviser’s relationship with the Fund before taxes and distribution expenses. The directors concluded that the Adviser’s level of profitability from its relationship with the Fund was not unreasonable.
Fall-Out Benefits
The directors considered the other benefits to the Adviser and its affiliates from their relationships with the Fund and the money market fund advised
| | |
| |
146 | AB GLOBAL BOND FUND | | abfunds.com |
by the Adviser in which the Fund invests, including, but not limited to, benefits relating to 12b-1 fees and sales charges received by the Fund’s principal underwriter (which is a wholly owned subsidiary of the Adviser) in respect of certain classes of the Fund’s shares; and transfer agency fees paid by the Fund to a wholly owned subsidiary of the Adviser. The directors recognized that the Adviser’s profitability would be somewhat lower without these benefits. The directors understood that the Adviser also might derive reputational and other benefits from its association with the Fund.
Investment Results
In addition to the information reviewed by the directors in connection with the Meeting, the directors receive detailed performance information for the Fund at each regular Board meeting during the year.
At the Meeting, the directors reviewed performance information prepared by an independent service provider (the “15(c) service provider”), showing the performance of the Class A Shares of the Fund against a group of similar funds (“peer group”) and a larger group of similar funds (“peer universe”), each selected by the 15(c) service provider, and information prepared by the Adviser showing performance of the Class A Shares against a broad-based securities market index, in each case for the 1-, 3-, 5- and 10-year periods ended July 31, 2021 and (in the case of comparisons with the broad-based securities market index) for the period from inception. Based on their review and their discussion with the Adviser of the reasons for the Fund’s underperformance in the periods reviewed, the directors concluded that the Fund’s investment performance was acceptable.
Advisory Fees and Other Expenses
The directors considered the advisory fee rate payable by the Fund to the Adviser and information prepared by the 15(c) service provider concerning advisory fee rates payable by other funds in the same category as the Fund. The directors recognized that it is difficult to make comparisons of advisory fees because there are variations in the services that are included in the fees payable by other funds. The directors compared the Fund’s contractual effective advisory fee rate with a peer group median and took into account the impact on the advisory fee rate of the administrative expense reimbursement paid to the Adviser in the latest fiscal year.
The directors also considered the Adviser’s fee schedule for other clients utilizing investment strategies similar to those of the Fund. For this purpose, they reviewed the relevant advisory fee information from the Adviser’s Form ADV and in a report from the Fund’s Senior Analyst and noted the differences between the Fund’s fee schedule, on the one hand, and the Adviser’s institutional fee schedule and the schedule of fees charged by the Adviser to any offshore funds and for services to any sub-advised funds utilizing investment strategies similar to those of the
| | |
| |
| abfunds.com | | AB GLOBAL BOND FUND | 147 |
Fund, on the other. The directors noted that the Adviser may, in some cases, agree to fee rates with large institutional clients that are lower than those reviewed by the directors and that they had previously discussed with the Adviser its policies in respect of such arrangements.
The Adviser reviewed with the directors the significantly greater scope of the services it provides to the Fund relative to institutional, offshore fund and sub-advised fund clients. In this regard, the Adviser noted, among other things, that, compared to institutional and offshore or sub-advisory accounts, the Fund (i) demands considerably more portfolio management, research and trading resources due to significantly higher daily cash flows; (ii) has more tax and regulatory restrictions and compliance obligations; (iii) must prepare and file or distribute regulatory and other communications about fund operations; and (iv) must provide shareholder servicing to retail investors. The Adviser also reviewed the greater legal risks presented by the large and changing population of Fund shareholders who may assert claims against the Adviser in individual or class actions, and the greater entrepreneurial risk in offering new fund products, which require substantial investment to launch, may not succeed, and generally must be priced to compete with larger, more established funds resulting in lack of profitability to the Adviser until a new fund achieves scale. In light of the substantial differences in services rendered by the Adviser to institutional, offshore fund and sub-advised fund clients as compared to the Fund, and the different risk profile, the directors considered these fee comparisons inapt and did not place significant weight on them in their deliberations.
In connection with their review of the Fund’s advisory fee, the directors also considered the total expense ratio of the Class A shares of the Fund in comparison to a peer group and a peer universe selected by the 15(c) service provider. The Class A expense ratio of the Fund was based on the Fund’s latest fiscal year. The directors noted that it was likely that the expense ratios of some of the other funds in the Fund’s category were lowered by waivers or reimbursements by those funds’ investment advisers, which in some cases might be voluntary or temporary. The directors view expense ratio information as relevant to their evaluation of the Adviser’s services because the Adviser is responsible for coordinating services provided to the Fund by others. Based on their review, the directors concluded that the Fund’s expense ratio was acceptable.
Economies of Scale
The directors noted that the advisory fee schedule for the Fund contains breakpoints and that the Fund’s net assets were higher than the breakpoint levels. Accordingly, the Fund’s current effective advisory fee rate reflected a reduction due to the breakpoints and would be further reduced to the extent the net assets of the Fund increase. The directors took into consideration prior presentations by an independent consultant on economies of scale in the mutual fund industry and for the AB Funds, and
| | |
| |
148 | AB GLOBAL BOND FUND | | abfunds.com |
presentations from time to time by the Adviser concerning certain of its views on economies of scale. The directors also had requested and received from the Adviser certain updates on economies of scale in advance of the Meeting. The directors believe that economies of scale may be realized (if at all) by the Adviser across a variety of products and services, and not only in respect of a single fund. The directors noted that there is no established methodology for setting breakpoints that give effect to the fund-specific services provided by a fund’s adviser and to the economies of scale that an adviser may realize in its overall mutual fund business or those components of it which directly or indirectly affect a fund’s operations. The directors observed that in the mutual fund industry as a whole, as well as among funds similar to the Fund, there is no uniformity or pattern in the fees and asset levels at which breakpoints (if any) apply. The directors also noted that the advisory agreements for many funds do not have breakpoints at all. Having taken these factors into account, the directors concluded that the Fund’s breakpoint arrangements were acceptable and provide a means for sharing of any economies of scale. The directors also informed the Adviser that they would continue to monitor the Fund’s asset levels and consider whether additional breakpoints should be imposed in the future if circumstances warranted doing so.
| | |
| |
| abfunds.com | | AB GLOBAL BOND FUND | 149 |
This page is not part of the Shareholder Report or the Financial Statements.
AB FAMILY OF FUNDS
US EQUITY
CORE
Core Opportunities Fund
Select US Equity Portfolio
Sustainable US Thematic Portfolio
GROWTH
Concentrated Growth Fund
Discovery Growth Fund
Growth Fund
Large Cap Growth Fund
Small Cap Growth Portfolio
VALUE
Discovery Value Fund
Equity Income Fund
Relative Value Fund
Small Cap Value Portfolio
Value Fund
INTERNATIONAL/ GLOBAL EQUITY
CORE
Global Core Equity Portfolio
International Strategic Core Portfolio
Sustainable Global Thematic Fund
Sustainable International Thematic Fund
Tax-Managed Wealth Appreciation Strategy
Wealth Appreciation Strategy
GROWTH
Concentrated International Growth Portfolio
VALUE
All China Equity Portfolio
International Value Fund
FIXED INCOME
MUNICIPAL
High Income Municipal Portfolio
Intermediate California Municipal Portfolio
Intermediate Diversified Municipal Portfolio
Intermediate New York Municipal Portfolio
Municipal Bond Inflation Strategy
Tax-Aware Fixed Income Opportunities Portfolio
National Portfolio
Arizona Portfolio
California Portfolio
Massachusetts Portfolio
Minnesota Portfolio
New Jersey Portfolio
New York Portfolio
Ohio Portfolio
Pennsylvania Portfolio
Virginia Portfolio
TAXABLE
Bond Inflation Strategy
Global Bond Fund
High Income Fund
High Yield Portfolio
Income Fund
Intermediate Duration Portfolio
Limited Duration High Income Portfolio
Short Duration Income Portfolio
Short Duration Portfolio
Sustainable Thematic Credit Portfolio
Total Return Bond Portfolio
ALTERNATIVES
All Market Real Return Portfolio
Global Real Estate Investment Fund
Select US Long/Short Portfolio
MULTI-ASSET
All Market Income Portfolio
All Market Total Return Portfolio
Emerging Markets Multi-Asset Portfolio
Global Risk Allocation Fund
Sustainable Thematic Balanced Portfolio1
Tax-Managed All Market Income Portfolio
CLOSED-END FUNDS
AllianceBernstein Global High Income Fund
AllianceBernstein National Municipal Income Fund
EXCHANGE-TRADED FUNDS
Tax-Aware Short Duration Municipal ETF
Ultra Short Income ETF
We also offer Government Money Market Portfolio, which serves as the money market fund exchange vehicle for the AB mutual funds. You could lose money by investing in the Fund. Although the Fund seeks to preserve the value of your investment at $1.00 per share, it cannot guarantee it will do so. The Fund may impose a fee upon sale of your shares or may temporarily suspend your ability to sell shares if the Fund’s liquidity falls below required minimums because of market conditions or other factors. An investment in the Fund is not insured or guaranteed by the Federal Deposit Insurance Corporation or any other government agency. The Fund’s sponsor has no legal obligation to provide financial support to the Fund, and you should not expect that the sponsor will provide financial support to the Fund at any time.
Investors should consider the investment objectives, risks, charges and expenses of the Fund carefully before investing. For copies of our prospectus or summary prospectus, which contain this and other information, visit us online at www.abfunds.com or contact your AB representative. Please read the prospectus and/or summary prospectus carefully before investing.
| 1 | Prior to December 1, 2021, Sustainable Thematic Balanced Portfolio was named Conservative Wealth Strategy. |
| | |
| |
150 | AB GLOBAL BOND FUND | | abfunds.com |
NOTES
| | |
| |
| abfunds.com | | AB GLOBAL BOND FUND | 151 |
NOTES
| | |
| |
152 | AB GLOBAL BOND FUND | | abfunds.com |
AB GLOBAL BOND FUND
1345 Avenue of the Americas
New York, NY 10105
800 221 5672
GB-0151-0922 
ITEM 2. CODE OF ETHICS.
(a) The registrant has adopted a code of ethics that applies to its principal executive officer, principal financial officer and principal accounting officer. A copy of the registrant’s code of ethics is filed herewith as Exhibit 12(a)(1).
(b) During the period covered by this report, no material amendments were made to the provisions of the code of ethics adopted in 2(a) above.
(c) During the period covered by this report, no implicit or explicit waivers to the provisions of the code of ethics adopted in 2(a) above were granted.
ITEM 3. AUDIT COMMITTEE FINANCIAL EXPERT.
The registrant’s Board of Directors has determined that independent directors Garry L. Moody, Marshall C. Turner, Jr. and Jorge A. Bermudez qualify as audit committee financial experts.
ITEM 4. PRINCIPAL ACCOUNTANT FEES AND SERVICES.
(a) - (c) The following table sets forth the aggregate fees billed by the independent registered public accounting firm Ernst & Young LLP, for the Fund’s last two fiscal years for professional services rendered for: (i) the audit of the Fund’s annual financial statements included in the Fund’s annual report to stockholders; (ii) assurance and related services that are reasonably related to the performance of the audit of the Fund’s financial statements and are not reported under (i), which include advice and education related to accounting and auditing issues and quarterly press release review (for those Funds which issue press releases), and preferred stock maintenance testing (for those Funds that issue preferred stock); and (iii) tax compliance, tax advice and tax return preparation.
| | | | | | | | | | | | | | | | |
| | | | | | Audit Fees | | | Audit-Related
Fees | | | Tax Fees | |
AB Global Bond Fund | | | 2021 | | | $ | 102,815 | | | $ | — | | | $ | 34,878 | |
| | | 2022 | | | $ | 107,956 | | | $ | — | | | $ | 24,515 | |
(d) Not applicable.
(e) (1) Beginning with audit and non-audit service contracts entered into on or after May 6, 2003, the Fund’s Audit Committee policies and procedures require the pre-approval of all audit and non-audit services provided to the Fund by the Fund’s independent registered public accounting firm. The Fund’s Audit Committee policies and procedures also require pre-approval of all audit and non-audit services provided to the Adviser and Service Affiliates to the extent that these services are directly related to the operations or financial reporting of the Fund.
(e) (2) All of the amounts for Audit Fees, Audit-Related Fees and Tax Fees in the table under Item 4 (a) – (c) are for services pre-approved by the Fund’s Audit Committee.
(f) Not applicable.
(g) The following table sets forth the aggregate non-audit services provided to the Fund, the Fund’s Adviser and entities that control, are controlled by or under common control with the Adviser that provide ongoing services to the Fund:
| | | | | | | | | | | | |
| | | | | | All Fees for
Non-Audit Services
Provided to the
Portfolio, the Adviser
and Service Affiliates | | | Total Amount of
Foregoing Column
Pre-approved by the
Audit Committee
(Portion Comprised of
Audit Related Fees)
(Portion Comprised of
Tax Fees) | |
AB Global Bond Fund | | | 2021 | | | $ | 1,110,018 | | | $ | 34,878 | |
| | | | | | | | | | $ | — | |
| | | | | | | | | | $ | (34,878 | ) |
| | | 2022 | | | $ | 1,956,972 | | | $ | 24,515 | |
| | | | | | | | | | $ | — | |
| | | | | | | | | | $ | (24,515 | ) |
(h) The Audit Committee of the Fund has considered whether the provision of any non-audit services not pre-approved by the Audit Committee provided by the Fund’s independent registered public accounting firm to the Adviser and Service Affiliates is compatible with maintaining the auditor’s independence.
ITEM 5. AUDIT COMMITTEE OF LISTED REGISTRANTS.
Not applicable to the registrant.
ITEM 6. INVESTMENTS.
Please see Schedule of Investments contained in the Report to Shareholders included under Item 1 of this Form N-CSR.
ITEM 7. DISCLOSURE OF PROXY VOTING POLICIES AND PROCEDURES FOR CLOSED-END MANAGEMENT INVESTMENT COMPANIES.
Not applicable to the registrant.
ITEM 8. PORTFOLIO MANAGERS OF CLOSED-END MANAGEMENT INVESTMENT COMPANIES.
Not applicable to the registrant.
ITEM 9. PURCHASES OF EQUITY SECURITIES BY CLOSED-END MANAGEMENT INVESTMENT COMPANY AND AFFILIATED PURCHASERS.
Not applicable to the registrant.
ITEM 10. SUBMISSION OF MATTERS TO A VOTE OF SECURITY HOLDERS.
There have been no material changes to the procedures by which shareholders may recommend nominees to the Fund’s Board of Directors since the Fund last provided disclosure in response to this item.
ITEM 11. CONTROLS AND PROCEDURES.
(a) The registrant’s principal executive officer and principal financial officer have concluded that the registrant’s disclosure controls and procedures (as defined in Rule 30a-2(c) under the Investment Company Act of 1940, as amended) are effective at the reasonable assurance level based on their evaluation of these controls and procedures as of a date within 90 days of the filing date of this document.
(b) There were no changes in the registrant’s internal controls over financial reporting that occurred during the period that has materially affected, or is reasonably likely to materially affect, the registrant’s internal control over financial reporting.
ITEM 12. DISCLOSURE OF SECURITIES LENDING ACTIVITIES FOR CLOSED-END MANAGEMENT INVESTMENT COMPANIES.
Not applicable to the registrant.
The following exhibits are attached to this Form N-CSR:
SIGNATURES
Pursuant to the requirements of the Securities Exchange Act of 1934 and the Investment Company Act of 1940, the registrant has duly caused this report to be signed on its behalf by the undersigned, thereunto duly authorized.
(Registrant): AB Global Bond Fund, Inc.
| | |
| By: | | /s/ Onur Erzan |
| | Onur Erzan |
| | President |
| |
| Date: | | November 29, 2022 |
Pursuant to the requirements of the Securities Exchange Act of 1934 and the Investment Company Act of 1940, this report has been signed below by the following persons on behalf of the registrant and in the capacities and on the dates indicated.
| | |
| By: | | /s/ Onur Erzan |
| | Onur Erzan |
| | President |
| |
| Date: | | November 29, 2022 |
| |
| By: | | /s/ Joseph J. Mantineo |
| | Joseph J. Mantineo |
| | Treasurer and Chief Financial Officer |
| |
| Date: | | November 29, 2022 |