UNITED STATES
SECURITIES AND EXCHANGE COMMISSION
WASHINGTON, D.C. 20549
FORM N-CSR
CERTIFIED SHAREHOLDER REPORT OF REGISTERED
MANAGEMENT INVESTMENT COMPANIES
Investment Company Act file number: 811-06554
AB GLOBAL BOND FUND, INC.
(Exact name of registrant as specified in charter)
66 Hudson Boulevard East, New York, New York 10005
(Address of principal executive offices) (Zip code)
Stephen M. Woetzel
AllianceBernstein L.P.
66 Hudson Boulevard East
New York, New York 10005
(Name and address of agent for service)
Registrant’s telephone number, including area code: (800) 221-5672
Date of fiscal year end: September 30, 2024
Date of reporting period: September 30, 2024
ITEM 1. REPORTS TO STOCKHOLDERS.
Please scan QR code for Fund Information
Annual Shareholder Report
This annual shareholder report contains important information about the AB Global Bond Fund (the “Fund”) for the period of October 1, 2023 to September 30, 2024. You can find additional information about the Fund at https://www.abfunds.com/link/AB/ANAGX-A. You can also request this information by contacting us at (800) 227 4618.
What were the Fund costs for the last year?
(Based on a hypothetical $10,000 investment)
| Class Name | Cost of a $10,000 investment | Costs paid as a percentage of a $10,000 investment |
|---|
| Class A | $84 | 0.80% |
How Did the Fund Perform Last Year? What Affected the Fund's Performance?
During the 12-month period ended September 30, 2024, all share classes except for the C class outperformed the Bloomberg Global Aggregate Bond Index (USD hedged) (“the benchmark”), before sales charges. Country allocation contributed the most to performance, namely underweights to China and Canada, and an overweight to Japan. Security selection in eurozone and US investment-grade corporate bonds and emerging-market corporates was also beneficial. Additionally, sector allocation contributed mainly from an underweight to US Treasuries and off-benchmark exposure to US high-yield corporates. These gains offset losses from yield-curve positioning, particularly in South Korea, the US and the eurozone. At the sector allocation level, off-benchmark exposure to US Treasuries and inflation-linked bonds detracted from performance, while currency decisions were also a minor detractor.
During both periods, the Fund used derivatives in the form of interest rate swaps and futures to manage and hedge duration risk and/or to take active yield-curve positioning. The Fund used currency forwards to hedge foreign currency exposure and to take active currency risk. Credit default swaps were used to hedge credit risk and as a tool to effectively gain exposure to specific sectors.
Top contributors to performance:
Top detractors from performance:
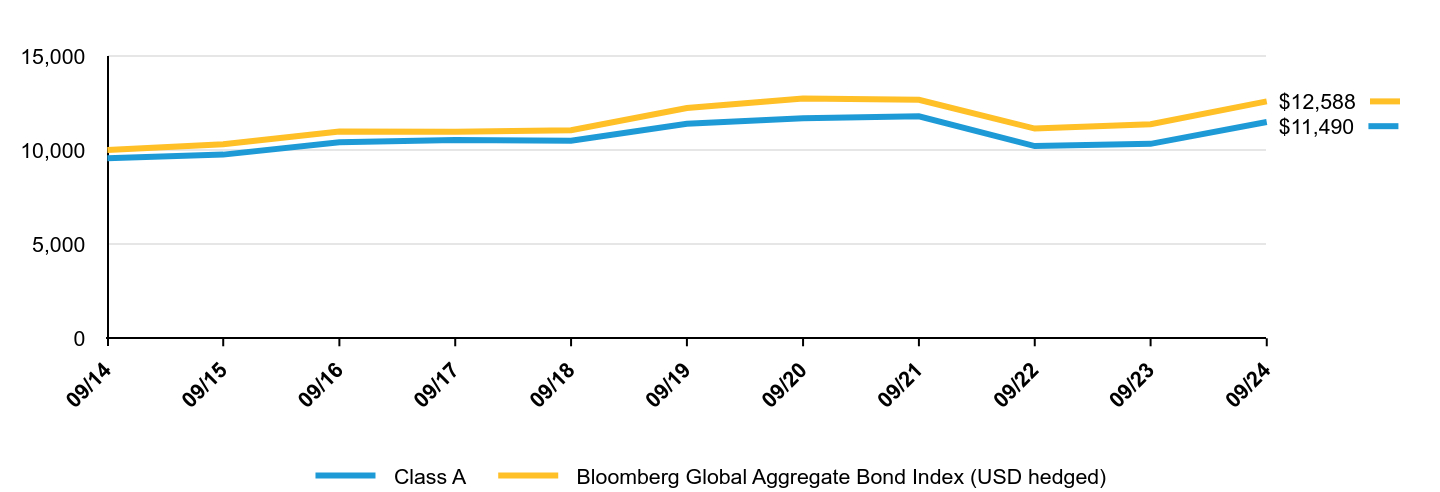
The following graph shows the performance of hypothetical $10,000 investments in the Fund and a broad-based securities market index over the most recently completed 10 fiscal years of the Fund, or since inception, if shorter. The Fund's performance reflects applicable sales charges and assumes the reinvestment of dividends.
| Class A | Bloomberg Global Aggregate Bond Index (USD hedged) |
|---|
| 09/14 | $9,573 | $10,000 |
| 09/15 | $9,760 | $10,314 |
| 09/16 | $10,418 | $10,989 |
| 09/17 | $10,532 | $10,969 |
| 09/18 | $10,497 | $11,060 |
| 09/19 | $11,398 | $12,237 |
| 09/20 | $11,689 | $12,743 |
| 09/21 | $11,797 | $12,672 |
| 09/22 | $10,214 | $11,145 |
| 09/23 | $10,333 | $11,378 |
| 09/24 | $11,490 | $12,588 |
Average Annual Total Returns
| Class Name | 1 Year | 5 Years | 10 Years |
|---|
| Class A (without sales charges) | 10.90% | 0.16% | 1.84% |
| Class A (with sales charges) | 6.21% | -0.69% | 1.40% |
| Bloomberg Global Aggregate Bond Index (USD hedged) | 10.63% | 0.57% | 2.33% |
The Fund’s past performance is not a good predictor of the Fund’s future performance.
The graph and table do not reflect the deduction of taxes that a shareholder would pay on Fund distributions or the redemption or sale of Fund shares.
Visit https://www.abfunds.com/link/AB/ANAGX-A for the most recent performance information.
| Net Assets | $5,823,520,550 |
| # of Portfolio Holdings | 1,694 |
| Portfolio Turnover Rate | 302% |
| Total Advisory Fees Paid | $26,054,282 |
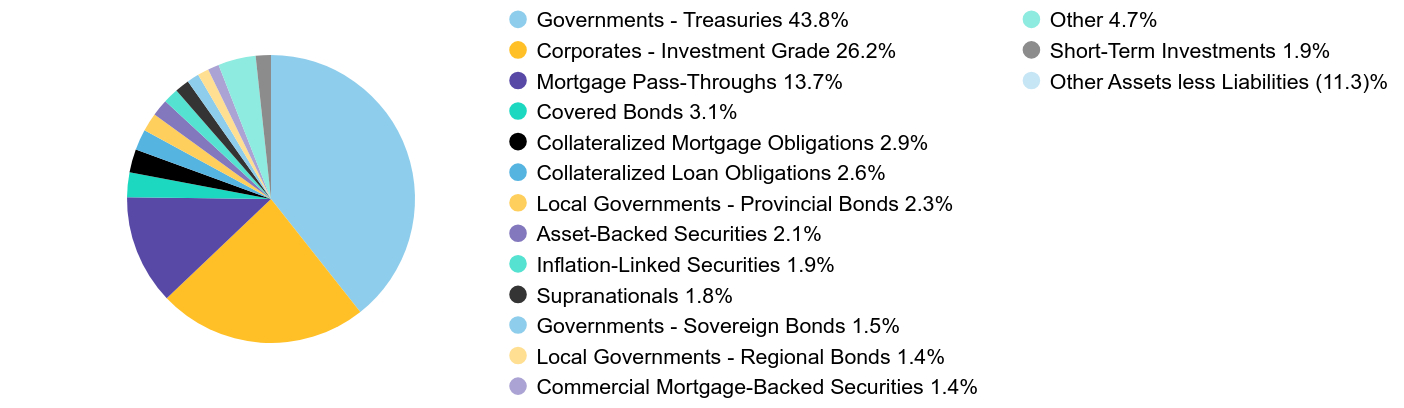
Graphical Representation of Holdings
| Value | Value |
|---|
| Governments - Treasuries | 43.8% |
| Corporates - Investment Grade | 26.2% |
| Mortgage Pass-Throughs | 13.7% |
| Covered Bonds | 3.1% |
| Collateralized Mortgage Obligations | 2.9% |
| Collateralized Loan Obligations | 2.6% |
| Local Governments - Provincial Bonds | 2.3% |
| Asset-Backed Securities | 2.1% |
| Inflation-Linked Securities | 1.9% |
| Supranationals | 1.8% |
| Governments - Sovereign Bonds | 1.5% |
| Local Governments - Regional Bonds | 1.4% |
| Commercial Mortgage-Backed Securities | 1.4% |
| Other | 4.7% |
| Short-Term Investments | 1.9% |
| Other Assets less Liabilities | (11.3)% |
| Value | Value |
|---|
| United States | 51.2% |
| Japan | 8.7% |
| Canada | 8.5% |
| United Kingdom | 8.2% |
| China | 4.4% |
| France | 3.8% |
| Germany | 3.2% |
| Italy | 2.4% |
| Spain | 2.2% |
| Australia | 1.8% |
| Colombia | 1.4% |
| South Korea | 1.4% |
| Supranational | 1.8% |
| Other | 10.4% |
| Short-Term Investments | 1.9% |
| Other Assets less Liabilities | (11.3)% |
Availability of Additional Information
You can find additional information at https://www.abfunds.com/link/AB/ANAGX-A, including the Fund's:
• Prospectus
• Financial information
• Fund holdings
• Proxy voting information
You can also request this information by contacting us at (800) 227 4618.
Shareholders who have consented to receive a single annual or semi-annual shareholder report at a shared address may revoke this consent by contacting us at (800) 227 4618.
Information Regarding the Review and Approval of the Fund’s Advisory Agreement
Information regarding the Fund’s Board of Directors’/Trustees’ review of the advisory agreement is available on the Fund’s website https://www.abfunds.com/link/AB/ANAGX-A. You can request this information, free of charge, by contacting us at (800) 227 4618 or by scanning the QR code below.
The [A/B] logo is a registered service mark of AllianceBernstein and AllianceBernstein® is a registered service mark used by permission of the owner, AllianceBernstein L.P.
Please scan QR code for Fund Information
Please scan QR code for Fund Information
Annual Shareholder Report
This annual shareholder report contains important information about the AB Global Bond Fund (the “Fund”) for the period of October 1, 2023 to September 30, 2024. You can find additional information about the Fund at https://www.abfunds.com/link/AB/ANAYX-A. You can also request this information by contacting us at (800) 227 4618.
What were the Fund costs for the last year?
(Based on a hypothetical $10,000 investment)
| Class Name | Cost of a $10,000 investment | Costs paid as a percentage of a $10,000 investment |
|---|
| Advisor Class | $58 | 0.55% |
How Did the Fund Perform Last Year? What Affected the Fund's Performance?
During the 12-month period ended September 30, 2024, all share classes except for the C class outperformed the Bloomberg Global Aggregate Bond Index (USD hedged) (“the benchmark”), before sales charges. Country allocation contributed the most to performance, namely underweights to China and Canada, and an overweight to Japan. Security selection in eurozone and US investment-grade corporate bonds and emerging-market corporates was also beneficial. Additionally, sector allocation contributed mainly from an underweight to US Treasuries and off-benchmark exposure to US high-yield corporates. These gains offset losses from yield-curve positioning, particularly in South Korea, the US and the eurozone. At the sector allocation level, off-benchmark exposure to US Treasuries and inflation-linked bonds detracted from performance, while currency decisions were also a minor detractor.
During both periods, the Fund used derivatives in the form of interest rate swaps and futures to manage and hedge duration risk and/or to take active yield-curve positioning. The Fund used currency forwards to hedge foreign currency exposure and to take active currency risk. Credit default swaps were used to hedge credit risk and as a tool to effectively gain exposure to specific sectors.
Top contributors to performance:
Top detractors from performance:
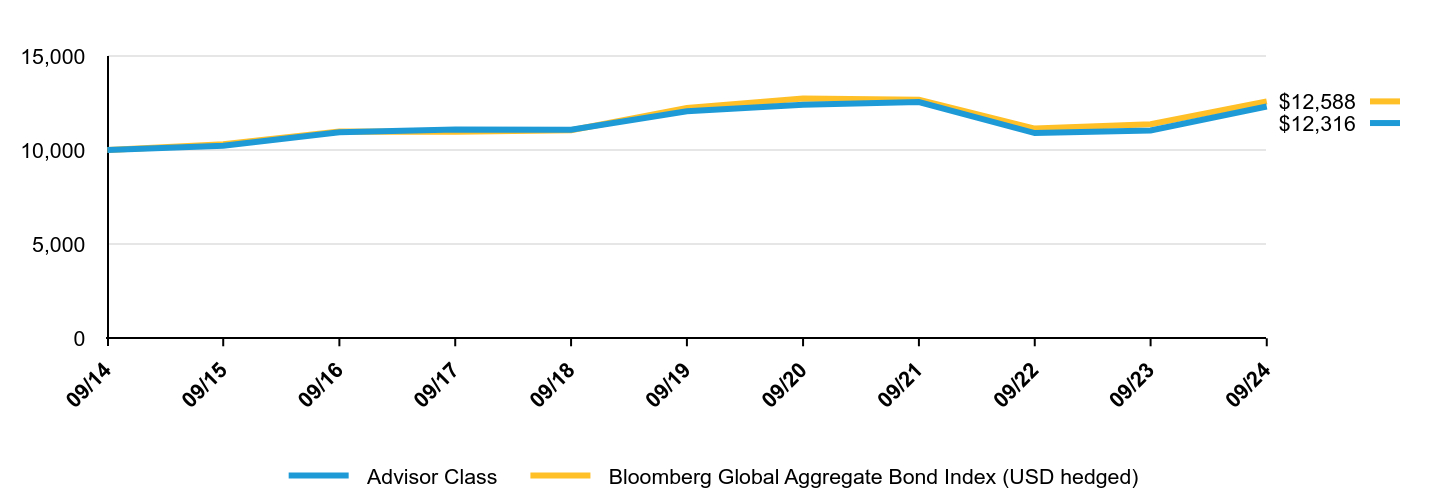
The following graph shows the performance of hypothetical $10,000 investments in the Fund and a broad-based securities market index over the most recently completed 10 fiscal years of the Fund, or since inception, if shorter. The Fund's performance reflects applicable sales charges and assumes the reinvestment of dividends.
| Advisor Class | Bloomberg Global Aggregate Bond Index (USD hedged) |
|---|
| 09/14 | $10,000 | $10,000 |
| 09/15 | $10,226 | $10,314 |
| 09/16 | $10,942 | $10,989 |
| 09/17 | $11,090 | $10,969 |
| 09/18 | $11,083 | $11,060 |
| 09/19 | $12,065 | $12,237 |
| 09/20 | $12,405 | $12,743 |
| 09/21 | $12,551 | $12,672 |
| 09/22 | $10,905 | $11,145 |
| 09/23 | $11,043 | $11,378 |
| 09/24 | $12,316 | $12,588 |
Average Annual Total Returns
| Class Name | 1 Year | 5 Years | 10 Years |
|---|
| Advisor Class | 11.19% | 0.41% | 2.10% |
| Bloomberg Global Aggregate Bond Index (USD hedged) | 10.63% | 0.57% | 2.33% |
The Fund’s past performance is not a good predictor of the Fund’s future performance.
The graph and table do not reflect the deduction of taxes that a shareholder would pay on Fund distributions or the redemption or sale of Fund shares.
Visit https://www.abfunds.com/link/AB/ANAYX-A for the most recent performance information.
| Net Assets | $5,823,520,550 |
| # of Portfolio Holdings | 1,694 |
| Portfolio Turnover Rate | 302% |
| Total Advisory Fees Paid | $26,054,282 |
Graphical Representation of Holdings
| Value | Value |
|---|
| Governments - Treasuries | 43.8% |
| Corporates - Investment Grade | 26.2% |
| Mortgage Pass-Throughs | 13.7% |
| Covered Bonds | 3.1% |
| Collateralized Mortgage Obligations | 2.9% |
| Collateralized Loan Obligations | 2.6% |
| Local Governments - Provincial Bonds | 2.3% |
| Asset-Backed Securities | 2.1% |
| Inflation-Linked Securities | 1.9% |
| Supranationals | 1.8% |
| Governments - Sovereign Bonds | 1.5% |
| Local Governments - Regional Bonds | 1.4% |
| Commercial Mortgage-Backed Securities | 1.4% |
| Other | 4.7% |
| Short-Term Investments | 1.9% |
| Other Assets less Liabilities | (11.3)% |
| Value | Value |
|---|
| United States | 51.2% |
| Japan | 8.7% |
| Canada | 8.5% |
| United Kingdom | 8.2% |
| China | 4.4% |
| France | 3.8% |
| Germany | 3.2% |
| Italy | 2.4% |
| Spain | 2.2% |
| Australia | 1.8% |
| Colombia | 1.4% |
| South Korea | 1.4% |
| Supranational | 1.8% |
| Other | 10.4% |
| Short-Term Investments | 1.9% |
| Other Assets less Liabilities | (11.3)% |
Availability of Additional Information
You can find additional information at https://www.abfunds.com/link/AB/ANAYX-A, including the Fund's:
• Prospectus
• Financial information
• Fund holdings
• Proxy voting information
You can also request this information by contacting us at (800) 227 4618.
Shareholders who have consented to receive a single annual or semi-annual shareholder report at a shared address may revoke this consent by contacting us at (800) 227 4618.
Information Regarding the Review and Approval of the Fund’s Advisory Agreement
Information regarding the Fund’s Board of Directors’/Trustees’ review of the advisory agreement is available on the Fund’s website https://www.abfunds.com/link/AB/ANAYX-A. You can request this information, free of charge, by contacting us at (800) 227 4618 or by scanning the QR code below.
The [A/B] logo is a registered service mark of AllianceBernstein and AllianceBernstein® is a registered service mark used by permission of the owner, AllianceBernstein L.P.
Please scan QR code for Fund Information
Please scan QR code for Fund Information
Annual Shareholder Report
This annual shareholder report contains important information about the AB Global Bond Fund (the “Fund”) for the period of October 1, 2023 to September 30, 2024. You can find additional information about the Fund at https://www.abfunds.com/link/AB/ANACX-A. You can also request this information by contacting us at (800) 227 4618.
What were the Fund costs for the last year?
(Based on a hypothetical $10,000 investment)
| Class Name | Cost of a $10,000 investment | Costs paid as a percentage of a $10,000 investment |
|---|
| Class C | $163 | 1.55% |
How Did the Fund Perform Last Year? What Affected the Fund's Performance?
During the 12-month period ended September 30, 2024, all share classes except for the C class outperformed the Bloomberg Global Aggregate Bond Index (USD hedged) (“the benchmark”), before sales charges. Country allocation contributed the most to performance, namely underweights to China and Canada, and an overweight to Japan. Security selection in eurozone and US investment-grade corporate bonds and emerging-market corporates was also beneficial. Additionally, sector allocation contributed mainly from an underweight to US Treasuries and off-benchmark exposure to US high-yield corporates. These gains offset losses from yield-curve positioning, particularly in South Korea, the US and the eurozone. At the sector allocation level, off-benchmark exposure to US Treasuries and inflation-linked bonds detracted from performance, while currency decisions were also a minor detractor.
During both periods, the Fund used derivatives in the form of interest rate swaps and futures to manage and hedge duration risk and/or to take active yield-curve positioning. The Fund used currency forwards to hedge foreign currency exposure and to take active currency risk. Credit default swaps were used to hedge credit risk and as a tool to effectively gain exposure to specific sectors.
Top contributors to performance:
Top detractors from performance:
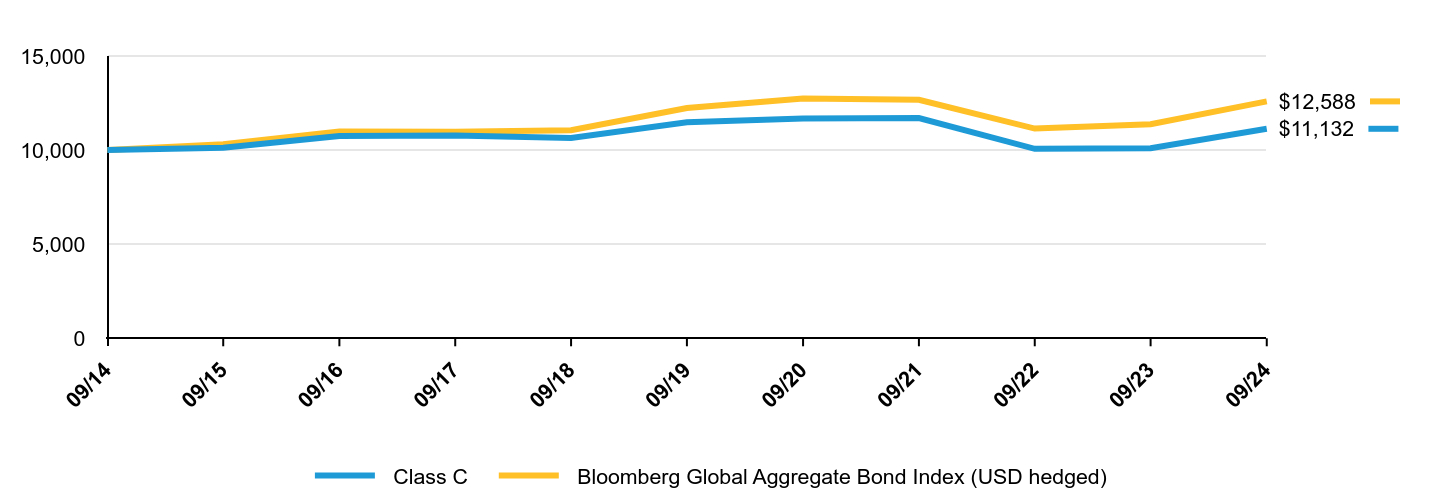
The following graph shows the performance of hypothetical $10,000 investments in the Fund and a broad-based securities market index over the most recently completed 10 fiscal years of the Fund, or since inception, if shorter. The Fund's performance reflects applicable sales charges and assumes the reinvestment of dividends.
| Class C | Bloomberg Global Aggregate Bond Index (USD hedged) |
|---|
| 09/14 | $10,000 | $10,000 |
| 09/15 | $10,123 | $10,314 |
| 09/16 | $10,744 | $10,989 |
| 09/17 | $10,780 | $10,969 |
| 09/18 | $10,645 | $11,060 |
| 09/19 | $11,482 | $12,237 |
| 09/20 | $11,673 | $12,743 |
| 09/21 | $11,705 | $12,672 |
| 09/22 | $10,069 | $11,145 |
| 09/23 | $10,095 | $11,378 |
| 09/24 | $11,132 | $12,588 |
Average Annual Total Returns
| Class Name | 1 Year | 5 Years | 10 Years |
|---|
| Class C (without sales charges) | 10.03% | -0.62% | 1.08% |
| Class C (with sales charges) | 9.03% | -0.62% | 1.08% |
| Bloomberg Global Aggregate Bond Index (USD hedged) | 10.63% | 0.57% | 2.33% |
The Fund’s past performance is not a good predictor of the Fund’s future performance.
The graph and table do not reflect the deduction of taxes that a shareholder would pay on Fund distributions or the redemption or sale of Fund shares.
Visit https://www.abfunds.com/link/AB/ANACX-A for the most recent performance information.
| Net Assets | $5,823,520,550 |
| # of Portfolio Holdings | 1,694 |
| Portfolio Turnover Rate | 302% |
| Total Advisory Fees Paid | $26,054,282 |
Graphical Representation of Holdings
| Value | Value |
|---|
| Governments - Treasuries | 43.8% |
| Corporates - Investment Grade | 26.2% |
| Mortgage Pass-Throughs | 13.7% |
| Covered Bonds | 3.1% |
| Collateralized Mortgage Obligations | 2.9% |
| Collateralized Loan Obligations | 2.6% |
| Local Governments - Provincial Bonds | 2.3% |
| Asset-Backed Securities | 2.1% |
| Inflation-Linked Securities | 1.9% |
| Supranationals | 1.8% |
| Governments - Sovereign Bonds | 1.5% |
| Local Governments - Regional Bonds | 1.4% |
| Commercial Mortgage-Backed Securities | 1.4% |
| Other | 4.7% |
| Short-Term Investments | 1.9% |
| Other Assets less Liabilities | (11.3)% |
| Value | Value |
|---|
| United States | 51.2% |
| Japan | 8.7% |
| Canada | 8.5% |
| United Kingdom | 8.2% |
| China | 4.4% |
| France | 3.8% |
| Germany | 3.2% |
| Italy | 2.4% |
| Spain | 2.2% |
| Australia | 1.8% |
| Colombia | 1.4% |
| South Korea | 1.4% |
| Supranational | 1.8% |
| Other | 10.4% |
| Short-Term Investments | 1.9% |
| Other Assets less Liabilities | (11.3)% |
Availability of Additional Information
You can find additional information at https://www.abfunds.com/link/AB/ANACX-A, including the Fund's:
• Prospectus
• Financial information
• Fund holdings
• Proxy voting information
You can also request this information by contacting us at (800) 227 4618.
Shareholders who have consented to receive a single annual or semi-annual shareholder report at a shared address may revoke this consent by contacting us at (800) 227 4618.
Information Regarding the Review and Approval of the Fund’s Advisory Agreement
Information regarding the Fund’s Board of Directors’/Trustees’ review of the advisory agreement is available on the Fund’s website https://www.abfunds.com/link/AB/ANACX-A. You can request this information, free of charge, by contacting us at (800) 227 4618 or by scanning the QR code below.
The [A/B] logo is a registered service mark of AllianceBernstein and AllianceBernstein® is a registered service mark used by permission of the owner, AllianceBernstein L.P.
Please scan QR code for Fund Information
Please scan QR code for Fund Information
Annual Shareholder Report
This annual shareholder report contains important information about the AB Global Bond Fund (the “Fund”) for the period of October 1, 2023 to September 30, 2024. You can find additional information about the Fund at https://www.abfunds.com/link/AB/ANAIX-A. You can also request this information by contacting us at (800) 227 4618.
What were the Fund costs for the last year?
(Based on a hypothetical $10,000 investment)
| Class Name | Cost of a $10,000 investment | Costs paid as a percentage of a $10,000 investment |
|---|
| Class I | $62 | 0.59% |
How Did the Fund Perform Last Year? What Affected the Fund's Performance?
During the 12-month period ended September 30, 2024, all share classes except for the C class outperformed the Bloomberg Global Aggregate Bond Index (USD hedged) (“the benchmark”), before sales charges. Country allocation contributed the most to performance, namely underweights to China and Canada, and an overweight to Japan. Security selection in eurozone and US investment-grade corporate bonds and emerging-market corporates was also beneficial. Additionally, sector allocation contributed mainly from an underweight to US Treasuries and off-benchmark exposure to US high-yield corporates. These gains offset losses from yield-curve positioning, particularly in South Korea, the US and the eurozone. At the sector allocation level, off-benchmark exposure to US Treasuries and inflation-linked bonds detracted from performance, while currency decisions were also a minor detractor.
During both periods, the Fund used derivatives in the form of interest rate swaps and futures to manage and hedge duration risk and/or to take active yield-curve positioning. The Fund used currency forwards to hedge foreign currency exposure and to take active currency risk. Credit default swaps were used to hedge credit risk and as a tool to effectively gain exposure to specific sectors.
Top contributors to performance:
Top detractors from performance:
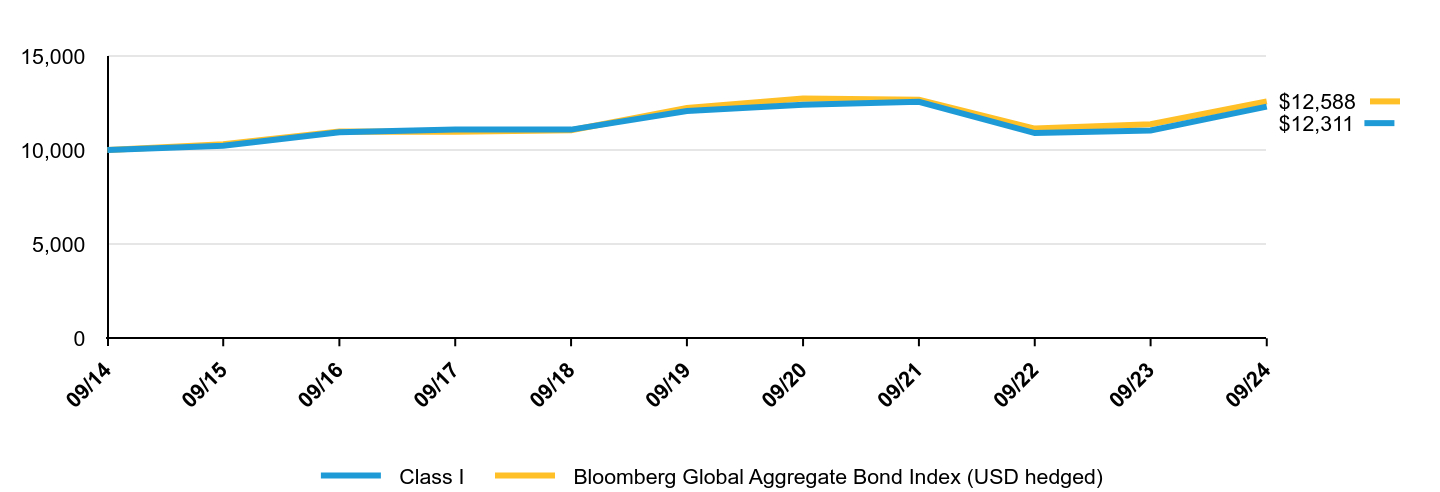
The following graph shows the performance of hypothetical $10,000 investments in the Fund and a broad-based securities market index over the most recently completed 10 fiscal years of the Fund, or since inception, if shorter. The Fund's performance reflects applicable sales charges and assumes the reinvestment of dividends.
| Class I | Bloomberg Global Aggregate Bond Index (USD hedged) |
|---|
| 09/14 | $10,000 | $10,000 |
| 09/15 | $10,227 | $10,314 |
| 09/16 | $10,944 | $10,989 |
| 09/17 | $11,092 | $10,969 |
| 09/18 | $11,089 | $11,060 |
| 09/19 | $12,073 | $12,237 |
| 09/20 | $12,409 | $12,743 |
| 09/21 | $12,569 | $12,672 |
| 09/22 | $10,907 | $11,145 |
| 09/23 | $11,044 | $11,378 |
| 09/24 | $12,311 | $12,588 |
Average Annual Total Returns
| Class Name | 1 Year | 5 Years | 10 Years |
|---|
| Class I | 11.14% | 0.39% | 2.10% |
| Bloomberg Global Aggregate Bond Index (USD hedged) | 10.63% | 0.57% | 2.33% |
The Fund’s past performance is not a good predictor of the Fund’s future performance.
The graph and table do not reflect the deduction of taxes that a shareholder would pay on Fund distributions or the redemption or sale of Fund shares.
Visit https://www.abfunds.com/link/AB/ANAIX-A for the most recent performance information.
| Net Assets | $5,823,520,550 |
| # of Portfolio Holdings | 1,694 |
| Portfolio Turnover Rate | 302% |
| Total Advisory Fees Paid | $26,054,282 |
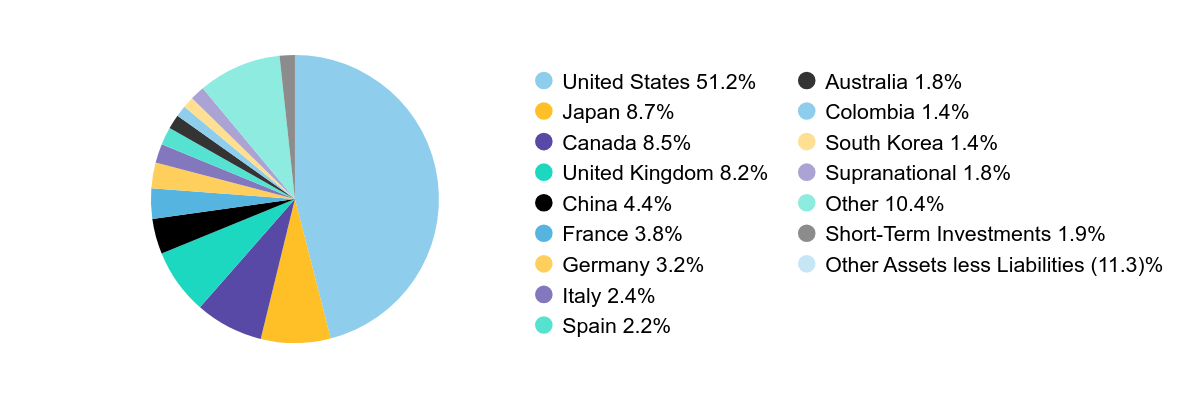
Graphical Representation of Holdings
| Value | Value |
|---|
| Governments - Treasuries | 43.8% |
| Corporates - Investment Grade | 26.2% |
| Mortgage Pass-Throughs | 13.7% |
| Covered Bonds | 3.1% |
| Collateralized Mortgage Obligations | 2.9% |
| Collateralized Loan Obligations | 2.6% |
| Local Governments - Provincial Bonds | 2.3% |
| Asset-Backed Securities | 2.1% |
| Inflation-Linked Securities | 1.9% |
| Supranationals | 1.8% |
| Governments - Sovereign Bonds | 1.5% |
| Local Governments - Regional Bonds | 1.4% |
| Commercial Mortgage-Backed Securities | 1.4% |
| Other | 4.7% |
| Short-Term Investments | 1.9% |
| Other Assets less Liabilities | (11.3)% |
| Value | Value |
|---|
| United States | 51.2% |
| Japan | 8.7% |
| Canada | 8.5% |
| United Kingdom | 8.2% |
| China | 4.4% |
| France | 3.8% |
| Germany | 3.2% |
| Italy | 2.4% |
| Spain | 2.2% |
| Australia | 1.8% |
| Colombia | 1.4% |
| South Korea | 1.4% |
| Supranational | 1.8% |
| Other | 10.4% |
| Short-Term Investments | 1.9% |
| Other Assets less Liabilities | (11.3)% |
Availability of Additional Information
You can find additional information at https://www.abfunds.com/link/AB/ANAIX-A, including the Fund's:
• Prospectus
• Financial information
• Fund holdings
• Proxy voting information
You can also request this information by contacting us at (800) 227 4618.
Shareholders who have consented to receive a single annual or semi-annual shareholder report at a shared address may revoke this consent by contacting us at (800) 227 4618.
Information Regarding the Review and Approval of the Fund’s Advisory Agreement
Information regarding the Fund’s Board of Directors’/Trustees’ review of the advisory agreement is available on the Fund’s website https://www.abfunds.com/link/AB/ANAIX-A. You can request this information, free of charge, by contacting us at (800) 227 4618 or by scanning the QR code below.
The [A/B] logo is a registered service mark of AllianceBernstein and AllianceBernstein® is a registered service mark used by permission of the owner, AllianceBernstein L.P.
Please scan QR code for Fund Information
Please scan QR code for Fund Information
Annual Shareholder Report
This annual shareholder report contains important information about the AB Global Bond Fund (the “Fund”) for the period of October 1, 2023 to September 30, 2024. You can find additional information about the Fund at https://www.abfunds.com/link/AB/ANAZX-A. You can also request this information by contacting us at (800) 227 4618.
What were the Fund costs for the last year?
(Based on a hypothetical $10,000 investment)
| Class Name | Cost of a $10,000 investment | Costs paid as a percentage of a $10,000 investment |
|---|
| Class Z | $55 | 0.52% |
How Did the Fund Perform Last Year? What Affected the Fund's Performance?
During the 12-month period ended September 30, 2024, all share classes except for the C class outperformed the Bloomberg Global Aggregate Bond Index (USD hedged) (“the benchmark”), before sales charges. Country allocation contributed the most to performance, namely underweights to China and Canada, and an overweight to Japan. Security selection in eurozone and US investment-grade corporate bonds and emerging-market corporates was also beneficial. Additionally, sector allocation contributed mainly from an underweight to US Treasuries and off-benchmark exposure to US high-yield corporates. These gains offset losses from yield-curve positioning, particularly in South Korea, the US and the eurozone. At the sector allocation level, off-benchmark exposure to US Treasuries and inflation-linked bonds detracted from performance, while currency decisions were also a minor detractor.
During both periods, the Fund used derivatives in the form of interest rate swaps and futures to manage and hedge duration risk and/or to take active yield-curve positioning. The Fund used currency forwards to hedge foreign currency exposure and to take active currency risk. Credit default swaps were used to hedge credit risk and as a tool to effectively gain exposure to specific sectors.
Top contributors to performance:
Top detractors from performance:
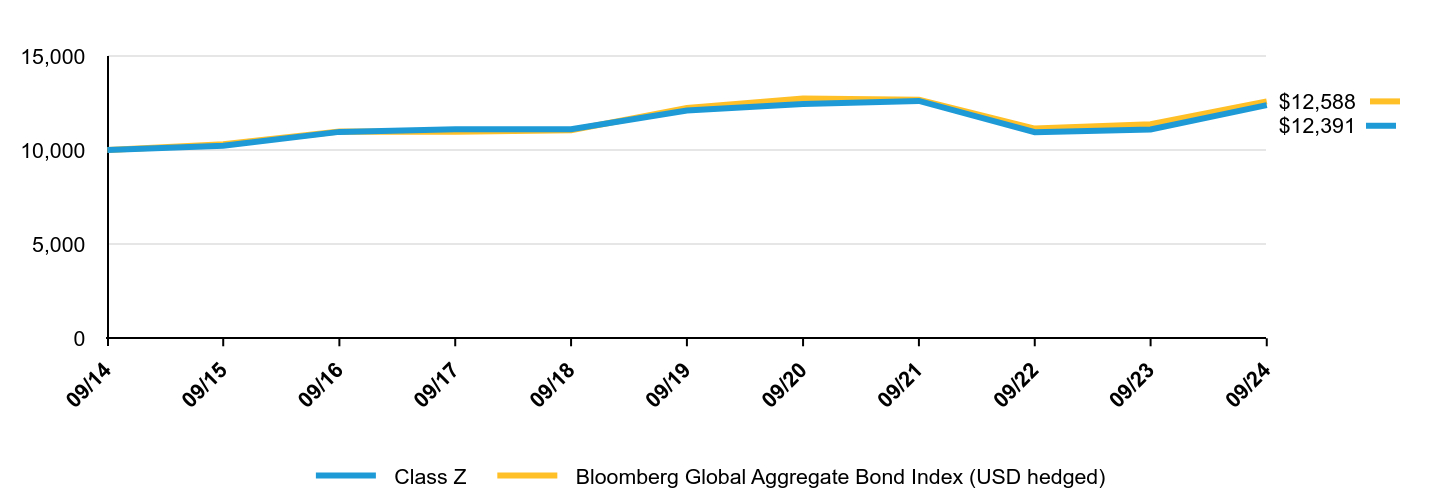
The following graph shows the performance of hypothetical $10,000 investments in the Fund and a broad-based securities market index over the most recently completed 10 fiscal years of the Fund, or since inception, if shorter. The Fund's performance reflects applicable sales charges and assumes the reinvestment of dividends.
| Class Z | Bloomberg Global Aggregate Bond Index (USD hedged) |
|---|
| 09/14 | $10,000 | $10,000 |
| 09/15 | $10,232 | $10,314 |
| 09/16 | $10,967 | $10,989 |
| 09/17 | $11,108 | $10,969 |
| 09/18 | $11,110 | $11,060 |
| 09/19 | $12,102 | $12,237 |
| 09/20 | $12,445 | $12,743 |
| 09/21 | $12,612 | $12,672 |
| 09/22 | $10,950 | $11,145 |
| 09/23 | $11,092 | $11,378 |
| 09/24 | $12,391 | $12,588 |
Average Annual Total Returns
| Class Name | 1 Year | 5 Years | 10 Years |
|---|
| Class Z | 11.38% | 0.47% | 2.17% |
| Bloomberg Global Aggregate Bond Index (USD hedged) | 10.63% | 0.57% | 2.33% |
The Fund’s past performance is not a good predictor of the Fund’s future performance.
The graph and table do not reflect the deduction of taxes that a shareholder would pay on Fund distributions or the redemption or sale of Fund shares.
Visit https://www.abfunds.com/link/AB/ANAZX-A for the most recent performance information.
| Net Assets | $5,823,520,550 |
| # of Portfolio Holdings | 1,694 |
| Portfolio Turnover Rate | 302% |
| Total Advisory Fees Paid | $26,054,282 |
Graphical Representation of Holdings
| Value | Value |
|---|
| Governments - Treasuries | 43.8% |
| Corporates - Investment Grade | 26.2% |
| Mortgage Pass-Throughs | 13.7% |
| Covered Bonds | 3.1% |
| Collateralized Mortgage Obligations | 2.9% |
| Collateralized Loan Obligations | 2.6% |
| Local Governments - Provincial Bonds | 2.3% |
| Asset-Backed Securities | 2.1% |
| Inflation-Linked Securities | 1.9% |
| Supranationals | 1.8% |
| Governments - Sovereign Bonds | 1.5% |
| Local Governments - Regional Bonds | 1.4% |
| Commercial Mortgage-Backed Securities | 1.4% |
| Other | 4.7% |
| Short-Term Investments | 1.9% |
| Other Assets less Liabilities | (11.3)% |
| Value | Value |
|---|
| United States | 51.2% |
| Japan | 8.7% |
| Canada | 8.5% |
| United Kingdom | 8.2% |
| China | 4.4% |
| France | 3.8% |
| Germany | 3.2% |
| Italy | 2.4% |
| Spain | 2.2% |
| Australia | 1.8% |
| Colombia | 1.4% |
| South Korea | 1.4% |
| Supranational | 1.8% |
| Other | 10.4% |
| Short-Term Investments | 1.9% |
| Other Assets less Liabilities | (11.3)% |
Availability of Additional Information
You can find additional information at https://www.abfunds.com/link/AB/ANAZX-A, including the Fund's:
• Prospectus
• Financial information
• Fund holdings
• Proxy voting information
You can also request this information by contacting us at (800) 227 4618.
Shareholders who have consented to receive a single annual or semi-annual shareholder report at a shared address may revoke this consent by contacting us at (800) 227 4618.
Information Regarding the Review and Approval of the Fund’s Advisory Agreement
Information regarding the Fund’s Board of Directors’/Trustees’ review of the advisory agreement is available on the Fund’s website https://www.abfunds.com/link/AB/ANAZX-A. You can request this information, free of charge, by contacting us at (800) 227 4618 or by scanning the QR code below.
The [A/B] logo is a registered service mark of AllianceBernstein and AllianceBernstein® is a registered service mark used by permission of the owner, AllianceBernstein L.P.
Please scan QR code for Fund Information
ITEM 2. CODE OF ETHICS.
(a) The registrant has adopted a code of ethics that applies to its principal executive officer, principal financial officer and principal accounting officer. A copy of the registrant’s code of ethics is filed herewith as Exhibit 19(a)(1).
(b) During the period covered by this report, no material amendments were made to the provisions of the code of ethics adopted in 2(a) above.
(c) During the period covered by this report, no implicit or explicit waivers to the provisions of the code of ethics adopted in 2(a) above were granted.
ITEM 3. AUDIT COMMITTEE FINANCIAL EXPERT.
The registrant’s Board of Directors has determined that independent directors Garry L. Moody, Marshall C. Turner, Jr., Jorge A. Bermudez and Carol C. McMullen qualify as audit committee financial experts.
ITEM 4. PRINCIPAL ACCOUNTANT FEES AND SERVICES.
(a) - (c) The following table sets forth the aggregate fees billed* by the independent registered public accounting firm Ernst & Young LLP, for the Fund’s last two fiscal years, for professional services rendered for: (i) the audit of the Fund’s annual financial statements included in the Fund’s annual report to stockholders; (ii) assurance and related services that are reasonably related to the performance of the audit of the Fund’s financial statements and are not reported under (i), which include advice and education related to accounting and auditing issues, quarterly press release review (for those Funds that issue quarterly press releases), and preferred stock maintenance testing (for those Funds that issue preferred stock); and (iii) tax compliance, tax advice and tax return preparation.
| | | | | | | | | | | | | | | | |
| | | | | | Audit Fees | | | Audit-Related
Fees | | | Tax Fees | |
AB Global Bond Fund | | | 2023 | | | $ | 107,956 | | | $ | — | | | $ | 22,432 | |
| | | 2024 | | | $ | 100,000 | | | $ | — | | | $ | 15,074 | |
(d) Not applicable.
(e) (1) Beginning with audit and non-audit service contracts entered into on or after May 6, 2003, the Fund’s Audit Committee policies and procedures require the pre-approval of all audit and non-audit services provided to the Fund by the Fund’s independent registered public accounting firm. The Fund’s Audit Committee policies and procedures also require pre-approval of all audit and non-audit services provided to the Adviser and Service Affiliates to the extent that these services are directly related to the operations or financial reporting of the Fund.
(e) (2) No percentage of services addressed by (b) and (c) of this Item 4 were approved pursuant to the waiver provision of paragraph (c)(7)(i)(C) of Rule 2-01 of Regulation S-X. No amounts are reported for Item 4 (d).
(f) Not applicable.
(g) The following table sets forth the aggregate non-audit services provided to the Fund, the Fund’s Adviser and entities that control, are controlled by or under common control with the Adviser that provide ongoing services to the Fund: (“Service Affiliates”):
| | | | | | | | | | | | |
| | | | | | All Fees for
Non-Audit Services
Provided to the
Portfolio, the Adviser
and Service Affiliates | | | Total Amount of
Foregoing Column Pre-approved
by the Audit Committee
(Portion Comprised of
Audit Related Fees)
(Portion Comprised of Tax Fees) | |
AB Global Bond Fund | | | 2023 | | | $ | 1,703,463 | | | $ | 22,432 | |
| | | | | | | | | | $ | — | |
| | | | | | | | | | $ | (22,432 | ) |
| | | 2024 | | | $ | 2,068,978 | | | $ | 15,074 | |
| | | | | | | | | | $ | — | |
| | | | | | | | | | $ | (15,074 | ) |
(h) The Audit Committee of the Fund has considered whether the provision of any non-audit services not pre-approved by the Audit Committee provided by the Fund’s independent registered public accounting firm to the Adviser and Service Affiliates is compatible with maintaining the auditor’s independence.
(i) Not applicable.
(j) Not applicable.
ITEM 5. AUDIT COMMITTEE OF LISTED REGISTRANTS.
Not applicable to the registrant.
ITEM 6. INVESTMENTS.
Please see Schedule of Investments contained in the Report to Shareholders included under Item 1 of this Form N-CSR.
ITEM 7. FINANCIAL STATEMENTS AND FINANCIAL HIGHLIGHTS FOR OPEN-END MANAGEMENT INVESTMENT COMPANIES.
SEP 09.30.24

ANNUAL FINANCIAL STATEMENTS AND ADDITIONAL INFORMATION
AB GLOBAL BOND FUND

| | |
| |
| Investment Products Offered | | • Are Not FDIC Insured • May Lose Value • Are Not Bank Guaranteed |
Investors should consider the investment objectives, risks, charges and expenses of the Fund carefully before investing. For copies of our prospectus or summary prospectus, which contain this and other information, visit us online at www.abfunds.com or contact your AB representative. Please read the prospectus and/or summary prospectus carefully before investing.
This shareholder report must be preceded or accompanied by the Fund’s prospectus for individuals who are not current shareholders of the Fund.
You may obtain a description of the Fund’s proxy voting policies and procedures, and information regarding how the Fund voted proxies relating to portfolio securities during the most recent 12-month period ended June 30, without charge. Simply visit AB’s website at www.abfunds.com, or go to the Securities and Exchange Commission’s (the “Commission”) website at www.sec.gov, or call AB at (800) 227 4618.
The Fund files its complete schedule of portfolio holdings with the Commission for the first and third quarters of each fiscal year as an exhibit to its reports on Form N-PORT. The Fund’s Form N-PORT reports are available on the Commission’s website at www.sec.gov. AB publishes full portfolio holdings for the Fund monthly at www.abfunds.com.
AllianceBernstein Investments, Inc. (ABI) is the distributor of the AB family of mutual funds. ABI is a member of FINRA and is an affiliate of AllianceBernstein L.P., the Adviser of the funds.
The [A/B] logo is a registered service mark of AllianceBernstein and AllianceBernstein® is a registered service mark used by permission of the owner, AllianceBernstein L.P.
PORTFOLIO OF INVESTMENTS
September 30, 2024
| | | | | | | | | | | | |
| | | | | | Principal
Amount
(000) | | | U.S. $ Value | |
| |
GOVERNMENTS - TREASURIES – 43.8% | | | | | | | | | | | | |
Australia – 0.1% | | | | | | | | | | | | |
Australia Government Bond
Series 150
3.00%, 03/21/2047(a) | | | AUD | | | | 14,094 | | | $ | 7,645,993 | |
| | | | | | | | | | | | |
| | | |
Austria – 0.4% | | | | | | | | | | | | |
Republic of Austria Government Bond
Zero Coupon, 02/20/2030(a) | | | EUR | | | | 5,136 | | | | 5,047,994 | |
0.90%, 02/20/2032(a) | | | | | | | 15,901 | | | | 15,808,569 | |
| | | | | | | | | | | | |
| | | | | | | | | | | 20,856,563 | |
| | | | | | | | | | | | |
Belgium – 0.4% | | | | | | | | | | | | |
Kingdom of Belgium Government Bond
Series 100
2.85%, 10/22/2034(a) | | | | | | | 11,236 | | | | 12,612,645 | |
Series 60
4.25%, 03/28/2041(a) | | | | | | | 10,407 | | | | 13,221,639 | |
| | | | | | | | | | | | |
| | | | | | | | | | | 25,834,284 | |
| | | | | | | | | | | | |
Canada – 3.0% | | | | | | | | | | | | |
Canadian Government Bond
2.25%, 12/01/2029 | | | CAD | | | | 4,594 | | | | 3,323,626 | |
3.50%, 03/01/2028 | | | | | | | 228,903 | | | | 173,514,130 | |
| | | | | | | | | | | | |
| | | | | | | | | | | 176,837,756 | |
| | | | | | | | | | | | |
China – 4.2% | | | | | | | | | | | | |
China Government Bond
Series INBK
2.12%, 06/25/2031 | | | CNY | | | | 536,900 | | | | 76,712,879 | |
2.28%, 03/25/2031 | | | | | | | 494,770 | | | | 71,355,981 | |
2.40%, 07/15/2028 | | | | | | | 263,350 | | | | 38,306,549 | |
3.01%, 05/13/2028 | | | | | | | 396,870 | | | | 58,977,882 | |
| | | | | | | | | | | | |
| | | | | | | | | | | 245,353,291 | |
| | | | | | | | | | | | |
Colombia – 1.2% | | | | | | | | | | | | |
Colombian TES
Series B
6.25%, 07/09/2036 | | | COP | | | | 16,557,700 | | | | 2,872,703 | |
7.25%, 10/26/2050 | | | | | | | 59,493,900 | | | | 9,740,207 | |
13.25%, 02/09/2033 | | | | | | | 199,579,800 | | | | 56,169,587 | |
| | | | | | | | | | | | |
| | | | | | | | | | | 68,782,497 | |
| | | | | | | | | | | | |
Finland – 1.1% | | | | | | | | | | | | |
Finland Government Bond
2.50%, 04/15/2030(a) | | | EUR | | | | 59,360 | | | | 66,650,333 | |
| | | | | | | | | | | | |
| | | |
France – 0.9% | | | | | | | | | | | | |
French Republic Government Bond OAT
Series OAT
3.50%, 11/25/2033(a) | | | | | | | 42,273 | | | | 49,547,820 | |
| | | | | | | | | | | | |
| | |
| |
| abfunds.com | | AB GLOBAL BOND FUND | 1 |
PORTFOLIO OF INVESTMENTS (continued)
| | | | | | | | | | | | |
| | | | | | Principal
Amount
(000) | | | U.S. $ Value | |
| |
Germany – 1.9% | | | | | | | | | | | | |
Bundesrepublik Deutschland Bundesanleihe
1.00%, 05/15/2038(a) | | | EUR | | | | 22,553 | | | $ | 21,208,195 | |
2.20%, 02/15/2034(a) | | | | | | | 21,917 | | | | 24,617,929 | |
3.25%, 07/04/2042(a) | | | | | | | 53,835 | | | | 66,845,617 | |
| | | | | | | | | | | | |
| | | | | | | | | | | 112,671,741 | |
| | | | | | | | | | | | |
Indonesia – 0.6% | | | | | | | | | | | | |
Indonesia Treasury Bond
Series 101
6.875%, 04/15/2029 | | | IDR | | | | 512,244,000 | | | | 34,750,663 | |
| | | | | | | | | | | | |
| | | |
Italy – 2.1% | | | | | | | | | | | | |
Italy Buoni Poliennali Del Tesoro
Series 10Y
4.20%, 03/01/2034(a) | | | EUR | | | | 29,929 | | | | 35,722,645 | |
Series 13Y
4.05%, 10/30/2037(a) | | | | | | | 17,818 | | | | 20,797,781 | |
Series 16Y
3.25%, 03/01/2038(a) | | | | | | | 6,560 | | | | 6,988,123 | |
Series 7Y
3.50%, 02/15/2031(a) | | | | | | | 49,262 | | | | 56,488,190 | |
| | | | | | | | | | | | |
| | | | | | | | | | | 119,996,739 | |
| | | | | | | | | | | | |
| | | |
Japan – 6.9% | | | | | | | | | | | | |
Japan Government Five Year Bond
Series 161
0.30%, 06/20/2028 | | | JPY | | | | 17,938,100 | | | | 124,215,203 | |
Japan Government Forty Year Bond
Series 16
1.30%, 03/20/2063 | | | | | | | 4,464,500 | | | | 23,172,002 | |
Series 4
2.20%, 03/20/2051 | | | | | | | 5,289,350 | | | | 38,227,386 | |
Japan Government Thirty Year Bond
Series 65
0.40%, 12/20/2049 | | | | | | | 604,000 | | | | 2,904,122 | |
Series 68
0.60%, 09/20/2050 | | | | | | | 3,699,600 | | | | 18,512,357 | |
Series 81
1.60%, 12/20/2053 | | | | | | | 2,350,700 | | | | 14,640,057 | |
Series 82
1.80%, 03/20/2054 | | | | | | | 11,487,450 | | | | 74,890,228 | |
Japan Government Twenty Year Bond
Series 159
0.60%, 12/20/2036 | | | | | | | 4,022,550 | | | | 26,323,047 | |
Series 169
0.30%, 06/20/2039 | | | | | | | 1,984,250 | | | | 11,869,808 | |
| | |
| |
2 | AB GLOBAL BOND FUND | | abfunds.com |
PORTFOLIO OF INVESTMENTS (continued)
| | | | | | | | | | | | |
| | | | | | Principal
Amount
(000) | | | U.S. $ Value | |
| |
Series 183
1.40%, 12/20/2042 | | | JPY | | | | 9,650,800 | | | $ | 65,006,186 | |
| | | | | | | | | | | | |
| | | | | | | | | | | 399,760,396 | |
| | | | | | | | | | | | |
| | | |
Malaysia – 0.5% | | | | | | | | | | | | |
Malaysia Government Bond
Series 0219
3.885%, 08/15/2029 | | | MYR | | | | 50,793 | | | | 12,526,476 | |
Series 0318
4.64%, 11/07/2033 | | | | | | | 58,543 | | | | 15,157,150 | |
| | | | | | | | | | | | |
| | | | | | | | | | | 27,683,626 | |
| | | | | | | | | | | | |
| | | |
South Korea – 1.3% | | | | | | | | | | | | |
Korea Treasury Bond
Series 3312
4.125%, 12/10/2033 | | | KRW | | | | 91,949,350 | | | | 76,474,099 | |
| | | | | | | | | | | | |
| | | |
Spain – 1.1% | | | | | | | | | | | | |
Spain Government Bond
3.90%, 07/30/2039(a) | | | EUR | | | | 45,853 | | | | 54,562,581 | |
4.70%, 07/30/2041(a) | | | | | | | 6,791 | | | | 8,832,730 | |
| | | | | | | | | | | | |
| | | | | | | | | | | 63,395,311 | |
| | | | | | | | | | | | |
| | | |
United Kingdom – 4.4% | | | | | | | | | | | | |
United Kingdom Gilt
0.875%, 01/31/2046(a) | | | GBP | | | | 47,452 | | | | 32,152,432 | |
1.25%, 10/22/2041(a) | | | | | | | 7,042 | | | | 5,906,330 | |
1.50%, 07/31/2053(a) | | | | | | | 192 | | | | 131,917 | |
1.75%, 09/07/2037(a) | | | | | | | 28,348 | | | | 28,854,006 | |
3.75%, 01/29/2038(a) | | | | | | | 10,579 | | | | 13,513,147 | |
3.75%, 10/22/2053(a) | | | | | | | 253 | | | | 293,485 | |
4.125%, 07/22/2029(a) | | | | | | | 10,901 | | | | 14,739,664 | |
4.25%, 07/31/2034(a) | | | | | | | 24,515 | | | | 33,415,540 | |
4.375%, 01/31/2040(a) | | | | | | | 11,244 | | | | 15,114,535 | |
4.375%, 07/31/2054(a) | | | | | | | 28,129 | | | | 36,322,086 | |
4.75%, 10/22/2043(a) | | | | | | | 54,246 | | | | 75,010,605 | |
| | | | | | | | | | | | |
| | | | | | | | | | | 255,453,747 | |
| | | | | | | | | | | | |
| | | |
United States – 13.7% | | | | | | | | | | | | |
U.S. Treasury Bonds
1.125%, 05/15/2040 | | | U.S.$ | | | | 118,732 | | | | 78,288,649 | |
1.125%, 08/15/2040(b)(c) | | | | | | | 110,345 | | | | 72,120,808 | |
1.25%, 05/15/2050 | | | | | | | 118,464 | | | | 63,285,803 | |
1.75%, 08/15/2041 | | | | | | | 39,116 | | | | 27,686,652 | |
1.875%, 02/15/2051 | | | | | | | 7,363 | | | | 4,605,264 | |
3.00%, 11/15/2045 | | | | | | | 13,430 | | | | 11,121,553 | |
4.625%, 05/15/2044 | | | | | | | 7,903 | | | | 8,367,196 | |
4.625%, 05/15/2054 | | | | | | | 26,522 | | | | 28,730,242 | |
| | |
| |
| abfunds.com | | AB GLOBAL BOND FUND | 3 |
PORTFOLIO OF INVESTMENTS (continued)
| | | | | | | | | | | | |
| | | | | | Principal
Amount
(000) | | | U.S. $ Value | |
| |
U.S. Treasury Notes
2.125%, 05/31/2026 | | | U.S.$ | | | | 58,934 | | | $ | 57,423,329 | |
4.00%, 01/31/2029(b)(c) | | | | | | | 281,978 | | | | 286,604,594 | |
4.25%, 02/28/2029 | | | | | | | 156,495 | | | | 160,774,579 | |
| | | | | | | | | | | | |
| | | | | | | | | | | 799,008,669 | |
| | | | | | | | | | | | |
Total Governments - Treasuries
(cost $2,614,883,587) | | | | | | | | | | | 2,550,703,528 | |
| | | | | | | | | | | | |
| | | | | | | | | | | | |
CORPORATES - INVESTMENT GRADE – 26.2% | | | | | | | | | | | | |
Financial Institutions – 12.8% | | | | | | | | | | | | |
Banking – 10.3% | | | | | | | | | | | | |
ABN AMRO Bank NV
4.75%, 09/22/2027(a)(d) | | | EUR | | | | 5,200 | | | | 5,585,652 | |
AIB Group PLC
5.87%, 03/28/2035(a) | | | U.S.$ | | | | 331 | | | | 349,072 | |
Series E
2.25%, 04/04/2028(a) | | | EUR | | | | 12,870 | | | | 14,051,729 | |
Ally Financial, Inc.
6.85%, 01/03/2030 | | | U.S.$ | | | | 66 | | | | 69,705 | |
6.99%, 06/13/2029 | | | | | | | 127 | | | | 134,253 | |
American Express Co.
3.125%, 05/20/2026 | | | | | | | 637 | | | | 626,555 | |
5.10%, 02/16/2028 | | | | | | | 458 | | | | 466,780 | |
5.28%, 07/26/2035 | | | | | | | 133 | | | | 138,496 | |
5.53%, 04/25/2030 | | | | | | | 128 | | | | 134,142 | |
5.645%, 04/23/2027 | | | | | | | 492 | | | | 501,697 | |
Banco Bilbao Vizcaya Argentaria SA
4.625%, 01/13/2031(a) | | | EUR | | | | 100 | | | | 118,545 | |
6.03%, 03/13/2035 | | | U.S.$ | | | | 5,200 | | | | 5,520,204 | |
7.88%, 11/15/2034 | | | | | | | 200 | | | | 230,369 | |
Banco de Credito del Peru SA
3.25%, 09/30/2031(a) | | | | | | | 510 | | | | 482,588 | |
Banco Santander Mexico SA Institucion de Banca Multiple Grupo Financiero Santand
5.375%, 04/17/2025(a) | | | | | | | 450 | | | | 449,843 | |
Banco Santander SA
1.85%, 03/25/2026 | | | | | | | 600 | | | | 576,903 | |
4.175%, 03/24/2028 | | | | | | | 17,200 | | | | 17,047,464 | |
4.38%, 04/12/2028 | | | | | | | 400 | | | | 398,682 | |
5.365%, 07/15/2028 | | | | | | | 200 | | | | 204,826 | |
6.92%, 08/08/2033 | | | | | | | 600 | | | | 664,627 | |
9.625%, 05/21/2033(d) | | | | | | | 200 | | | | 235,553 | |
Series E
1.00%, 11/04/2031(a) | | | EUR | | | | 700 | | | | 672,156 | |
3.50%, 01/09/2030(a) | | | | | | | 300 | | | | 340,518 | |
5.75%, 08/23/2033(a) | | | | | | | 7,000 | | | | 8,301,086 | |
| | |
| |
4 | AB GLOBAL BOND FUND | | abfunds.com |
PORTFOLIO OF INVESTMENTS (continued)
| | | | | | | | | | |
| | | | | Principal
Amount
(000) | | | U.S. $ Value | |
| |
Bangkok Bank PCL/Hong Kong
5.65%, 07/05/2034(a) | | U.S.$ | | | 370 | | | $ | 388,067 | |
9.025%, 03/15/2029(a) | | | | | 440 | | | | 512,235 | |
Bank Hapoalim BM
3.255%, 01/21/2032(a) | | | | | 257 | | | | 237,692 | |
Bank Leumi Le-Israel BM
3.275%, 01/29/2031(a) | | | | | 290 | | | | 275,124 | |
7.13%, 07/18/2033(a) | | | | | 410 | | | | 410,176 | |
Bank Mandiri Persero Tbk PT
Series E
4.75%, 05/13/2025(a) | | | | | 320 | | | | 319,200 | |
Bank of America Corp.
1.73%, 07/22/2027 | | | | | 614 | | | | 586,234 | |
3.38%, 04/02/2026 | | | | | 68 | | | | 67,457 | |
3.56%, 04/23/2027 | | | | | 169 | | | | 166,956 | |
3.85%, 03/08/2037 | | | | | 240 | | | | 221,655 | |
3.97%, 03/05/2029 | | | | | 560 | | | | 553,352 | |
3.97%, 02/07/2030 | | | | | 97 | | | | 95,271 | |
Series B
8.05%, 06/15/2027 | | | | | 930 | | | | 1,007,734 | |
Series E
0.65%, 10/26/2031(a) | | EUR | | | 11,752 | | | | 11,243,316 | |
0.69%, 03/22/2031(a) | | | | | 3,894 | | | | 3,790,694 | |
1.10%, 05/24/2032(a) | | | | | 115 | | | | 111,375 | |
3.65%, 03/31/2029(a) | | | | | 5,885 | | | | 6,700,467 | |
4.13%, 06/12/2028(a) | | | | | 305 | | | | 353,003 | |
Bank of East Asia Ltd. (The)
Series E
6.75%, 03/15/2027(a) | | U.S.$ | | | 250 | | | | 254,980 | |
Bank of Ireland Group PLC
5.60%, 03/20/2030(a) | | | | | 3,110 | | | | 3,225,020 | |
6.25%, 09/16/2026(a) | | | | | 200 | | | | 202,637 | |
Series E
0.375%, 05/10/2027(a) | | EUR | | | 6,478 | | | | 6,926,361 | |
4.625%, 11/13/2029(a) | | | | | 1,944 | | | | 2,281,745 | |
Bank of New York Mellon Corp. (The)
3.44%, 02/07/2028 | | U.S.$ | | | 674 | | | | 663,393 | |
3.99%, 06/13/2028 | | | | | 201 | | | | 200,050 | |
4.89%, 07/21/2028 | | | | | 133 | | | | 135,452 | |
Bank of Nova Scotia (The)
Series E
0.125%, 09/04/2026(a) | | EUR | | | 531 | | | | 561,919 | |
Banque Federative du Credit Mutuel SA
3.875%, 06/16/2032(a) | | | | | 9,800 | | | | 10,950,509 | |
4.935%, 01/26/2026(a) | | U.S.$ | | | 10,579 | | | | 10,661,998 | |
Series E
0.625%, 11/19/2027(a) | | EUR | | | 100 | | | | 103,339 | |
0.625%, 11/03/2028(a) | | | | | 300 | | | | 302,135 | |
| | |
| |
| abfunds.com | | AB GLOBAL BOND FUND | 5 |
PORTFOLIO OF INVESTMENTS (continued)
| | | | | | | | | | |
| | | | | Principal
Amount
(000) | | | U.S. $ Value | |
| |
0.625%, 02/21/2031(a) | | EUR | | | 300 | | | $ | 281,122 | |
1.125%, 01/19/2032(a) | | | | | 300 | | | | 283,169 | |
4.00%, 01/26/2033(a) | | | | | 200 | | | | 230,141 | |
Barclays PLC
5.09%, 06/20/2030 | | U.S.$ | | | 812 | | | | 815,466 | |
5.20%, 05/12/2026 | | | | | 578 | | | | 582,051 | |
5.335%, 09/10/2035 | | | | | 346 | | | | 350,066 | |
6.22%, 05/09/2034 | | | | | 200 | | | | 215,394 | |
6.375%, 12/15/2025(a)(d) | | GBP | | | 9,126 | | | | 12,107,626 | |
7.12%, 06/27/2034 | | U.S.$ | | | 400 | | | | 445,641 | |
Series E
4.92%, 08/08/2030(a) | | EUR | | | 422 | | | | 502,346 | |
5.26%, 01/29/2034(a) | | | | | 5,032 | | | | 6,193,923 | |
8.41%, 11/14/2032(a) | | GBP | | | 5,875 | | | | 8,390,035 | |
BBVA Bancomer SA/Texas
1.875%, 09/18/2025(a) | | U.S.$ | | | 600 | | | | 583,566 | |
5.25%, 09/10/2029(a) | | | | | 290 | | | | 294,350 | |
BDO Unibank, Inc.
Series E
2.125%, 01/13/2026(a) | | | | | 240 | | | | 231,750 | |
BNP Paribas SA
Series E
0.50%, 02/19/2028(a) | | EUR | | | 300 | | | | 314,107 | |
2.75%, 07/25/2028(a) | | | | | 500 | | | | 550,751 | |
4.04%, 01/10/2032(a) | | | | | 200 | | | | 229,325 | |
4.75%, 11/13/2032(a) | | | | | 2,500 | | | | 2,986,562 | |
BPCE SA
2.28%, 01/20/2032(a) | | U.S.$ | | | 3,660 | | | | 3,114,293 | |
3.12%, 10/19/2032(a) | | | | | 10,473 | | | | 9,041,255 | |
4.50%, 03/15/2025(a) | | | | | 8,251 | | | | 8,204,993 | |
4.625%, 03/02/2030(a) | | EUR | | | 200 | | | | 233,676 | |
6.51%, 01/18/2035(a) | | U.S.$ | | | 699 | | | | 736,991 | |
Series E
0.75%, 03/03/2031(a) | | EUR | | | 400 | | | | 377,010 | |
4.125%, 07/10/2028(a) | | | | | 400 | | | | 464,196 | |
4.125%, 03/08/2033(a) | | | | | 100 | | | | 114,683 | |
4.50%, 01/13/2033(a) | | | | | 200 | | | | 236,213 | |
CaixaBank SA
6.04%, 06/15/2035(a) | | U.S.$ | | | 379 | | | | 402,676 | |
6.21%, 01/18/2029(a) | | | | | 10,380 | | | | 10,873,615 | |
6.84%, 09/13/2034(a) | | | | | 5,190 | | | | 5,788,486 | |
Series E
1.50%, 12/03/2026(a) | | GBP | | | 200 | | | | 256,257 | |
Canadian Imperial Bank of Commerce
4.51%, 09/11/2027 | | U.S.$ | | | 884 | | | | 888,558 | |
4.63%, 09/11/2030 | | | | | 685 | | | | 689,632 | |
Capital One Financial Corp.
2.36%, 07/29/2032 | | | | | 762 | | | | 623,691 | |
| | |
| |
6 | AB GLOBAL BOND FUND | | abfunds.com |
PORTFOLIO OF INVESTMENTS (continued)
| | | | | | | | | | |
| | | | | Principal
Amount
(000) | | | U.S. $ Value | |
| |
5.46%, 07/26/2030 | | U.S.$ | | | 453 | | | $ | 464,884 | |
5.82%, 02/01/2034 | | | | | 171 | | | | 177,991 | |
5.88%, 07/26/2035 | | | | | 133 | | | | 139,178 | |
6.05%, 02/01/2035 | | | | | 333 | | | | 352,621 | |
6.38%, 06/08/2034 | | | | | 4,800 | | | | 5,186,476 | |
CBQ Finance Ltd.
Series E
2.00%, 05/12/2026(a) | | | | | 450 | | | | 430,875 | |
Ceska sporitelna AS
Series E
5.74%, 03/08/2028(a) | | EUR | | | 100 | | | | 115,784 | |
5.94%, 06/29/2027(a) | | | | | 400 | | | | 460,844 | |
Citigroup, Inc.
3.67%, 07/24/2028 | | U.S.$ | | | 345 | | | | 338,853 | |
3.75%, 05/14/2032(a) | | EUR | | | 654 | | | | 743,696 | |
3.98%, 03/20/2030 | | U.S.$ | | | 304 | | | | 297,760 | |
4.11%, 09/22/2033(a) | | EUR | | | 298 | | | | 345,969 | |
4.54%, 09/19/2030 | | U.S.$ | | | 4,468 | | | | 4,473,804 | |
5.45%, 06/11/2035 | | | | | 131 | | | | 136,710 | |
5.83%, 02/13/2035 | | | | | 282 | | | | 294,267 | |
5.88% (SOFR + 0.69%),
01/25/2026(e) | | | | | 838 | | | | 838,176 | |
Series AA
7.625%, 11/15/2028(d) | | | | | 1,138 | | | | 1,218,679 | |
Series E
0.50%, 10/08/2027(a) | | EUR | | | 134 | | | | 142,125 | |
Series P
5.95%, 05/15/2025(d) | | U.S.$ | | | 2,793 | | | | 2,793,235 | |
Series W
4.00%, 12/10/2025(d) | | | | | 232 | | | | 227,409 | |
Series Y
4.15%, 11/15/2026(d) | | | | | 7,121 | | | | 6,825,170 | |
Citizens Financial Group, Inc.
5.72%, 07/23/2032 | | | | | 244 | | | | 253,435 | |
5.84%, 01/23/2030 | | | | | 129 | | | | 134,193 | |
Comerica, Inc.
5.98%, 01/30/2030 | | | | | 129 | | | | 132,955 | |
Commerzbank AG
Series E
4.625%, 01/17/2031(a) | | EUR | | | 9,500 | | | | 11,142,249 | |
Commonwealth Bank of Australia
5.65% (SOFR + 0.74%),
03/14/2025(a)(e) | | U.S.$ | | | 5,150 | | | | 5,156,503 | |
Cooperatieve Rabobank UA
4.375%, 06/29/2027(a)(d) | | EUR | | | 200 | | | | 217,043 | |
Series E
4.625%, 05/23/2029(a) | | GBP | | | 9,255 | | | | 12,091,143 | |
| | |
| |
| abfunds.com | | AB GLOBAL BOND FUND | 7 |
PORTFOLIO OF INVESTMENTS (continued)
| | | | | | | | | | |
| | | | | Principal
Amount
(000) | | | U.S. $ Value | |
| |
Credit Agricole SA
2.625%, 03/17/2027(a) | | EUR | | | 256 | | | $ | 281,821 | |
5.13%, 03/11/2027(a) | | U.S.$ | | | 393 | | | | 401,387 | |
Series E
0.875%, 01/14/2032(a) | | EUR | | | 800 | | | | 747,673 | |
Credit Mutuel Arkea SA
Series E
0.75%, 01/18/2030(a) | | | | | 300 | | | | 296,654 | |
4.25%, 12/01/2032(a) | | | | | 200 | | | | 235,717 | |
Danske Bank A/S
1.62%, 09/11/2026(a) | | U.S.$ | | | 441 | | | | 427,868 | |
3.24%, 12/20/2025(a) | | | | | 3,465 | | | | 3,446,891 | |
4.61%, 10/02/2030(a) | | | | | 5,476 | | | | 5,478,578 | |
5.43%, 03/01/2028(a) | | | | | 245 | | | | 251,212 | |
DBS Group Holdings Ltd. | | | | | | | | | | |
Series G
3.30%, 02/27/2025(a)(d) | | | | | 240 | | | | 237,750 | |
Deutsche Bank AG
3.25%, 05/24/2028(a) | | EUR | | | 9,600 | | | | 10,696,975 | |
5.375%, 01/11/2029(a) | | | | | 2,600 | | | | 3,076,657 | |
Series E
1.625%, 01/20/2027(a) | | | | | 100 | | | | 107,700 | |
1.75%, 11/19/2030(a) | | | | | 500 | | | | 508,476 | |
4.125%, 04/04/2030(a) | | | | | 3,100 | | | | 3,537,995 | |
Deutsche Bank AG/New York NY
3.73%, 01/14/2032 | | U.S.$ | | | 707 | | | | 635,156 | |
5.00%, 09/11/2030 | | | | | 363 | | | | 365,384 | |
6.82%, 11/20/2029 | | | | | 150 | | | | 161,369 | |
7.08%, 02/10/2034 | | | | | 498 | | | | 537,123 | |
Deutsche Pfandbriefbank AG
Series E
4.375%, 08/28/2026(a) | | EUR | | | 100 | | | | 111,050 | |
Discover Financial Services
7.96%, 11/02/2034 | | U.S.$ | | | 529 | | | | 621,226 | |
DNB Bank ASA
5.90%, 10/09/2026(a) | | | | | 616 | | | | 624,221 | |
Doha Finance Ltd.
Series E
2.375%, 03/31/2026(a) | | | | | 300 | | | | 289,059 | |
Erste Group Bank AG
4.25%, 10/15/2027(a)(d) | | EUR | | | 200 | | | | 208,848 | |
Fifth Third Bancorp
5.63%, 01/29/2032 | | U.S.$ | | | 20 | | | | 20,883 | |
Fifth Third Bank NA
3.85%, 03/15/2026 | | | | | 591 | | | | 584,932 | |
First Abu Dhabi Bank PJSC
4.50%, 04/05/2026(a)(d) | | | | | 480 | | | | 472,200 | |
| | |
| |
8 | AB GLOBAL BOND FUND | | abfunds.com |
PORTFOLIO OF INVESTMENTS (continued)
| | | | | | | | | | |
| | | | | Principal
Amount
(000) | | | U.S. $ Value | |
| |
Ford Credit Canada Co./Canada
6.38%, 11/10/2028 | | CAD | | | 12,312 | | | $ | 9,726,468 | |
Goldman Sachs Bank USA/New York NY
5.28%, 03/18/2027 | | U.S.$ | | | 131 | | | | 132,705 | |
5.41%, 05/21/2027 | | | | | 462 | | | | 469,503 | |
Goldman Sachs Group, Inc. (The)
1.43%, 03/09/2027 | | | | | 661 | | | | 632,450 | |
3.615%, 03/15/2028 | | | | | 32 | | | | 31,484 | |
3.81%, 04/23/2029 | | | | | 307 | | | | 300,961 | |
5.05%, 07/23/2030 | | | | | 204 | | | | 209,286 | |
5.33%, 07/23/2035 | | | | | 133 | | | | 137,819 | |
Series E
0.875%, 05/09/2029(a) | | EUR | | | 11,489 | | | | 11,614,110 | |
Series P
8.24% (CME Term SOFR 3 Month +
3.14%), 10/21/2024(d)(e) | | U.S.$ | | | 4,168 | | | | 4,171,391 | |
Series VAR
1.09%, 12/09/2026 | | | | | 690 | | | | 661,952 | |
HSBC Holdings PLC
0.64%, 09/24/2029(a) | | EUR | | | 129 | | | | 130,201 | |
0.77%, 11/13/2031(a) | | | | | 420 | | | | 403,681 | |
2.01%, 09/22/2028 | | U.S.$ | | | 327 | | | | 305,162 | |
2.85%, 06/04/2031 | | | | | 244 | | | | 222,261 | |
4.755%, 06/09/2028 | | | | | 9,696 | | | | 9,764,722 | |
5.55%, 03/04/2030 | | | | | 4,783 | | | | 4,967,966 | |
5.73%, 05/17/2032 | | | | | 250 | | | | 263,328 | |
5.89%, 08/14/2027 | | | | | 4,680 | | | | 4,809,837 | |
6.36%, 11/16/2032(a) | | EUR | | | 8,812 | | | | 10,587,884 | |
6.50%, 09/15/2037 | | U.S.$ | | | 103 | | | | 112,936 | |
6.55%, 06/20/2034 | | | | | 413 | | | | 452,796 | |
7.39%, 11/03/2028 | | | | | 200 | | | | 216,613 | |
7.40%, 11/13/2034 | | | | | 519 | | | | 595,831 | |
8.11%, 11/03/2033 | | | | | 656 | | | | 781,002 | |
Huntington National Bank (The)
4.55%, 05/17/2028 | | | | | 627 | | | | 627,371 | |
ING Groep NV
0.25%, 02/18/2029(a) | | EUR | | | 300 | | | | 303,284 | |
0.375%, 09/29/2028(a) | | | | | 300 | | | | 308,819 | |
1.75%, 02/16/2031(a) | | | | | 100 | | | | 103,126 | |
4.125%, 08/24/2033(a) | | | | | 100 | | | | 112,984 | |
4.50%, 05/23/2029(a) | | | | | 100 | | | | 116,353 | |
5.25%, 11/14/2033(a) | | | | | 200 | | | | 250,240 | |
Series E
2.125%, 05/26/2031(a) | | | | | 200 | | | | 217,892 | |
| | |
| |
| abfunds.com | | AB GLOBAL BOND FUND | 9 |
PORTFOLIO OF INVESTMENTS (continued)
| | | | | | | | | | |
| | | | | Principal
Amount
(000) | | | U.S. $ Value | |
| |
Intercorp Peru Ltd.
3.875%, 08/15/2029(a) | | U.S.$ | | | 370 | | | $ | 344,563 | |
Intesa Sanpaolo SpA
3.875%, 07/14/2027(a) | | | | | 200 | | | | 196,349 | |
5.71%, 01/15/2026(a) | | | | | 5,580 | | | | 5,623,239 | |
6.625%, 06/20/2033(a) | | | | | 4,109 | | | | 4,502,459 | |
7.20%, 11/28/2033(a) | | | | | 2,683 | | | | 3,054,651 | |
7.80%, 11/28/2053(a) | | | | | 333 | | | | 398,983 | |
Israel Discount Bank Ltd.
5.375%, 01/26/2028(a) | | | | | 200 | | | | 199,930 | |
JPMorgan Chase & Co.
1.04%, 02/04/2027 | | | | | 697 | | | | 666,250 | |
1.045%, 11/19/2026 | | | | | 699 | | | | 671,927 | |
2.95%, 02/24/2028 | | | | | 720 | | | | 698,280 | |
3.51%, 01/23/2029 | | | | | 235 | | | | 229,451 | |
3.96%, 01/29/2027 | | | | | 600 | | | | 596,523 | |
4.98%, 07/22/2028 | | | | | 274 | | | | 279,278 | |
5.77%, 04/22/2035 | | | | | 600 | | | | 646,071 | |
5.94% (SOFR + 0.92%),
02/24/2026(e) | | | | | 4,649 | | | | 4,657,788 | |
6.25%, 10/23/2034 | | | | | 120 | | | | 133,457 | |
Series E
1.00%, 07/25/2031(a) | | EUR | | | 307 | | | | 303,578 | |
1.96%, 03/23/2030(a) | | | | | 189 | | | | 200,698 | |
4.46%, 11/13/2031(a) | | | | | 13,850 | | | | 16,493,577 | |
Jyske Bank A/S
Series E
0.05%, 09/02/2026(a) | | | | | 170 | | | | 183,861 | |
KBC Group NV
5.80%, 01/19/2029(a) | | U.S.$ | | | 300 | | | | 311,293 | |
Series E
0.125%, 01/14/2029(a) | | EUR | | | 300 | | | | 304,633 | |
4.375%, 11/23/2027(a) | | | | | 100 | | | | 114,609 | |
KEB Hana Bank
1.25%, 12/16/2026(a) | | U.S.$ | | | 200 | | | | 187,484 | |
Kookmin Bank
2.50%, 11/04/2030(a) | | | | | 610 | | | | 533,941 | |
Lloyds Banking Group PLC
3.75%, 03/18/2028 | | | | | 285 | | | | 280,841 | |
5.72%, 06/05/2030 | | | | | 200 | | | | 209,664 | |
7.50%, 09/27/2025(d) | | | | | 2,412 | | | | 2,438,124 | |
Series E
3.125%, 08/24/2030(a) | | EUR | | | 465 | | | | 515,965 | |
4.75%, 09/21/2031(a) | | | | | 2,397 | | | | 2,870,292 | |
M&T Bank Corp.
6.08%, 03/13/2032 | | U.S.$ | | | 622 | | | | 657,787 | |
7.41%, 10/30/2029 | | | | | 585 | | | | 640,681 | |
| | |
| |
10 | AB GLOBAL BOND FUND | | abfunds.com |
PORTFOLIO OF INVESTMENTS (continued)
| | | | | | | | | | |
| | | | | Principal
Amount
(000) | | | U.S. $ Value | |
| |
Macquarie Group Ltd.
0.35%, 03/03/2028(a) | | EUR | | | 555 | | | $ | 564,658 | |
1.34%, 01/12/2027(a) | | U.S.$ | | | 324 | | | | 310,778 | |
Metropolitan Bank & Trust Co.
Series E
5.50%, 03/06/2034(a) | | | | | 200 | | | | 207,188 | |
Mitsubishi UFJ Financial Group, Inc.
5.35%, 09/13/2028 | | | | | 200 | | | | 206,001 | |
Series E
4.64%, 06/07/2031(a) | | EUR | | | 240 | | | | 286,015 | |
Mizuho Financial Group, Inc.
2.20%, 07/10/2031 | | U.S.$ | | | 10,410 | | | | 9,148,132 | |
2.87%, 09/13/2030 | | | | | 1,886 | | | | 1,744,154 | |
4.25%, 09/11/2029 | | | | | 644 | | | | 639,057 | |
4.35%, 10/20/2025(a) | | | | | 325 | | | | 323,084 | |
5.38%, 07/10/2030 | | | | | 288 | | | | 298,821 | |
Series E
0.18%, 04/13/2026(a) | | EUR | | | 528 | | | | 564,578 | |
4.61%, 08/28/2030(a) | | | | | 200 | | | | 238,554 | |
Morgan Stanley
0.495%, 10/26/2029 | | | | | 280 | | | | 281,230 | |
3.59%, 07/22/2028(f) | | U.S.$ | | | 513 | | | | 502,502 | |
3.79%, 03/21/2030 | | EUR | | | 247 | | | | 282,200 | |
4.66%, 03/02/2029 | | | | | 10,875 | | | | 12,724,203 | |
4.68%, 07/17/2026 | | U.S.$ | | | 152 | | | | 151,820 | |
5.65%, 04/13/2028 | | | | | 117 | | | | 120,799 | |
5.83%, 04/19/2035 | | | | | 127 | | | | 136,365 | |
6.14%, 10/16/2026 | | | | | 564 | | | | 572,989 | |
6.63%, 11/01/2034 | | | | | 118 | | | | 133,533 | |
Series G
5.15%, 01/25/2034 | | EUR | | | 8,187 | | | | 10,189,087 | |
Morgan Stanley Bank NA
5.50%, 05/26/2028 | | U.S.$ | | | 250 | | | | 257,856 | |
National Bank of Canada
Series E
3.75%, 01/25/2028(a) | | EUR | | | 248 | | | | 282,181 | |
National Bank of Greece SA
Series G
4.50%, 01/29/2029(a) | | | | | 193 | | | | 220,898 | |
Nationwide Building Society
2.97%, 02/16/2028(a) | | U.S.$ | | | 4,664 | | | | 4,499,449 | |
6.35% (SOFR + 1.29%),
02/16/2028(a)(e) | | | | | 290 | | | | 291,431 | |
6.56%, 10/18/2027(a) | | | | | 307 | | | | 319,773 | |
NatWest Group PLC
3.03%, 11/28/2035 | | | | | 414 | | | | 368,693 | |
3.62%, 08/14/2030(a) | | GBP | | | 105 | | | | 138,480 | |
| | |
| |
| abfunds.com | | AB GLOBAL BOND FUND | 11 |
PORTFOLIO OF INVESTMENTS (continued)
| | | | | | | | | | |
| | | | | Principal
Amount
(000) | | | U.S. $ Value | |
| |
4.96%, 08/15/2030 | | U.S.$ | | | 295 | | | $ | 299,668 | |
6.475%, 06/01/2034 | | | | | 298 | | | | 313,685 | |
8.125%, 11/10/2033(d) | | | | | 2,652 | | | | 2,897,144 | |
Series E
5.76%, 02/28/2034(a) | | EUR | | | 7,135 | | | | 8,518,624 | |
NatWest Markets PLC
Series E
0.125%, 11/12/2025(a) | | | | | 105 | | | | 113,198 | |
0.125%, 06/18/2026(a) | | | | | 534 | | | | 568,934 | |
NBK Tier 1 Financing 2 Ltd.
4.50%, 08/27/2025(a)(d) | | U.S.$ | | | 290 | | | | 285,106 | |
NIBC Bank NV
Series E
0.25%, 09/09/2026(a) | | EUR | | | 300 | | | | 316,402 | |
Nordea Bank Abp
6.625%, 03/26/2026(a)(d) | | U.S.$ | | | 200 | | | | 202,041 | |
Series E
4.375%, 09/06/2026(a) | | EUR | | | 100 | | | | 112,552 | |
Nykredit Realkredit AS
Series E
0.375%, 01/17/2028(a) | | | | | 281 | | | | 285,913 | |
PNC Financial Services Group, Inc. (The)
4.76%, 01/26/2027 | | U.S.$ | | | 666 | | | | 668,659 | |
5.40%, 07/23/2035 | | | | | 668 | | | | 696,787 | |
5.68%, 01/22/2035 | | | | | 267 | | | | 283,172 | |
6.615%, 10/20/2027 | | | | | 119 | | | | 124,365 | |
QIB Sukuk Ltd.
1.95%, 10/27/2025(a) | | | | | 300 | | | | 291,094 | |
QNB Finance Ltd.
Series E
1.375%, 01/26/2026(a) | | | | | 510 | | | | 488,009 | |
1.625%, 09/22/2025(a) | | | | | 200 | | | | 193,740 | |
2.75%, 02/12/2027(a) | | | | | 240 | | | | 230,899 | |
Raiffeisen Bank International AG
Series E
0.05%, 09/01/2027(a) | | EUR | | | 600 | | | | 611,914 | |
Royal Bank of Canada
Series E
4.375%, 10/02/2030(a) | | | | | 235 | | | | 280,528 | |
Series G
4.65%, 01/27/2026 | | U.S.$ | | | 594 | | | | 595,242 | |
5.07%, 07/23/2027 | | | | | 340 | | | | 345,281 | |
Santander Holdings USA, Inc.
6.17%, 01/09/2030 | | | | | 3,469 | | | | 3,619,448 | |
Santander UK Group Holdings PLC
2.47%, 01/11/2028 | | | | | 450 | | | | 428,434 | |
4.86%, 09/11/2030 | | | | | 2,946 | | | | 2,971,507 | |
6.83%, 11/21/2026 | | | | | 9,942 | | | | 10,155,396 | |
| | |
| |
12 | AB GLOBAL BOND FUND | | abfunds.com |
PORTFOLIO OF INVESTMENTS (continued)
| | | | | | | | | | |
| | | | | Principal
Amount
(000) | | | U.S. $ Value | |
| |
Shinhan Bank Co., Ltd.
4.00%, 04/23/2029(a) | | U.S.$ | | | 760 | | | $ | 733,163 | |
Series G
4.50%, 03/26/2028(a) | | | | | 200 | | | | 197,875 | |
Shinhan Financial Group Co., Ltd.
3.34%, 02/05/2030(a) | | | | | 540 | | | | 536,031 | |
Societe Generale SA
0.625%, 12/02/2027(a) | | EUR | | | 300 | | | | 315,594 | |
4.75%, 11/24/2025(a) | | U.S.$ | | | 581 | | | | 577,632 | |
4.875%, 11/21/2031(a) | | EUR | | | 500 | | | | 588,424 | |
5.52%, 01/19/2028(a) | | U.S.$ | | | 282 | | | | 286,020 | |
Series E
0.125%, 02/18/2028(a) | | EUR | | | 600 | | | | 606,977 | |
Standard Chartered PLC
1.46%, 01/14/2027(a) | | U.S.$ | | | 300 | | | | 287,518 | |
2.61%, 01/12/2028(a) | | | | | 12,199 | | | | 11,646,464 | |
4.87%, 03/15/2033(a) | | | | | 580 | | | | 575,471 | |
6.17%, 01/09/2027(a) | | | | | 349 | | | | 355,313 | |
6.30%, 01/09/2029(a) | | | | | 210 | | | | 220,780 | |
7.03% (CME Term SOFR 3 Month + 1.51%), 01/30/2027(a)(d)(e) | | | | | 8,000 | | | | 7,670,401 | |
7.77%, 11/16/2028(a) | | | | | 279 | | | | 304,592 | |
Series E
1.625%, 10/03/2027(a) | | EUR | | | 222 | | | | 240,497 | |
State Street Corp.
4.53%, 02/20/2029 | | U.S.$ | | | 136 | | | | 137,270 | |
Sumitomo Mitsui Financial Group, Inc.
1.40%, 09/17/2026 | | | | | 597 | | | | 565,969 | |
1.55%, 06/15/2026(a) | | EUR | | | 499 | | | | 543,718 | |
3.45%, 01/11/2027 | | U.S.$ | | | 625 | | | | 615,233 | |
5.32%, 07/09/2029 | | | | | 762 | | | | 793,015 | |
5.42%, 07/09/2031 | | | | | 14,001 | | | | 14,690,594 | |
5.88%, 07/13/2026 | | | | | 581 | | | | 597,329 | |
Series E
0.63%, 10/23/2029(a) | | EUR | | | 110 | | | | 108,133 | |
Sumitomo Mitsui Trust Bank Ltd.
4.45%, 09/10/2027(a) | | U.S.$ | | | 1,314 | | | | 1,322,059 | |
Svenska Handelsbanken AB
Series E
4.625%, 08/23/2032(a) | | GBP | | | 6,655 | | | | 8,694,225 | |
Swedbank AB
6.21% (SOFR + 0.91%),
04/04/2025(a)(e) | | U.S.$ | | | 1,070 | | | | 1,072,612 | |
Sydbank AS
Series G
5.125%, 09/06/2028(a) | | EUR | | | 100 | | | | 117,534 | |
| | |
| |
| abfunds.com | | AB GLOBAL BOND FUND | 13 |
PORTFOLIO OF INVESTMENTS (continued)
| | | | | | | | | | |
| | | | | Principal
Amount
(000) | | | U.S. $ Value | |
| |
Synchrony Financial
3.95%, 12/01/2027 | | U.S.$ | | | 376 | | | $ | 365,129 | |
5.935%, 08/02/2030 | | | | | 256 | | | | 263,157 | |
Toronto-Dominion Bank (The)
5.15%, 09/10/2034 | | | | | 173 | | | | 175,036 | |
Series E
3.13%, 08/03/2032(a) | | EUR | | | 100 | | | | 109,987 | |
3.63%, 12/13/2029(a) | | | | | 250 | | | | 285,503 | |
Truist Bank
3.30%, 05/15/2026 | | U.S.$ | | | 611 | | | | 600,069 | |
3.80%, 10/30/2026 | | | | | 623 | | | | 616,035 | |
Truist Financial Corp.
7.16%, 10/30/2029 | | | | | 471 | | | | 516,551 | |
UBS AG/London
Series E
0.25%, 01/05/2026(a) | | EUR | | | 531 | | | | 571,443 | |
UBS Group AG
1.305%, 02/02/2027(a) | | U.S.$ | | | 581 | | | | 555,610 | |
3.13%, 08/13/2030(a) | | | | | 295 | | | | 276,247 | |
4.125%, 09/24/2025(a) | | | | | 496 | | | | 494,377 | |
4.125%, 06/09/2033(a) | | EUR | | | 200 | | | | 232,039 | |
4.19%, 04/01/2031(a) | | U.S.$ | | | 2,312 | | | | 2,257,323 | |
5.125%, 07/29/2026(a)(d) | | | | | 200 | | | | 196,254 | |
5.62%, 09/13/2030(a) | | | | | 200 | | | | 209,204 | |
6.68% (SOFR + 1.58%),
05/12/2026(a)(e) | | | | | 17,565 | | | | 17,676,573 | |
7.75%, 03/01/2029(a) | | EUR | | | 3,309 | | | | 4,216,497 | |
9.25%, 11/13/2028(a)(d) | | U.S.$ | | | 1,652 | | | | 1,827,525 | |
Series E
1.00%, 06/24/2027(a) | | EUR | | | 215 | | | | 231,204 | |
3.125%, 06/15/2030(a) | | | | | 254 | | | | 282,010 | |
4.625%, 03/17/2028(a) | | | | | 5,178 | | | | 5,972,075 | |
4.75%, 03/17/2032(a) | | | | | 330 | | | | 395,107 | |
UniCredit SpA
1.98%, 06/03/2027(a) | | U.S.$ | | | 619 | | | | 591,964 | |
2.57%, 09/22/2026(a) | | | | | 405 | | | | 395,906 | |
Series E
4.30%, 01/23/2031(a) | | EUR | | | 294 | | | | 340,774 | |
United Overseas Bank Ltd.
2.00%, 10/14/2031(a) | | U.S.$ | | | 200 | | | | 189,416 | |
Series G
1.75%, 03/16/2031(a) | | | | | 250 | | | | 239,453 | |
US Bancorp
5.10%, 07/23/2030 | | | | | 107 | | | | 110,104 | |
Virgin Money UK PLC
Series G
4.625%, 10/29/2028(a) | | EUR | | | 100 | | | | 116,070 | |
5.125%, 12/11/2030(a) | | GBP | | | 135 | | | | 179,197 | |
| | |
| |
14 | AB GLOBAL BOND FUND | | abfunds.com |
PORTFOLIO OF INVESTMENTS (continued)
| | | | | | | | | | | | |
| | | | | | Principal
Amount
(000) | | | U.S. $ Value | |
| |
Visa, Inc.
3.65%, 09/15/2047 | | | U.S.$ | | | | 336 | | | $ | 280,922 | |
Wells Fargo & Co.
2.39%, 06/02/2028 | | | | | | | 200 | | | | 190,160 | |
5.08%, 04/26/2028 | | | CAD | | | | 5,045 | | | | 3,856,843 | |
5.71%, 04/22/2028 | | | U.S.$ | | | | 666 | | | | 687,830 | |
Series E
1.74%, 05/04/2030(a) | | | EUR | | | | 10,434 | | | | 10,910,548 | |
3.90%, 07/22/2032(a) | | | | | | | 2,390 | | | | 2,731,415 | |
Westpac Banking Corp.
Series G
4.32%, 11/23/2031 | | | U.S.$ | | | | 185 | | | | 183,753 | |
Woori Bank
5.125%, 08/06/2028(a) | | | | | | | 210 | | | | 211,640 | |
6.375%, 07/24/2029(a)(d) | | | | | | | 230 | | | | 235,750 | |
Yorkshire Building Society
Series E
0.50%, 07/01/2028(a) | | | EUR | | | | 553 | | | | 561,251 | |
| | | | | | | | | | | | |
| | | | | | | | | | | 597,470,729 | |
| | | | | | | | | | | | |
Brokerage – 0.2% | | | | | | | | | | | | |
abrdn PLC
4.25%, 06/30/2028(a) | | | U.S.$ | | | | 866 | | | | 826,665 | |
BlackRock Funding, Inc.
5.35%, 01/08/2055 | | | | | | | 134 | | | | 140,841 | |
Blue Owl Finance LLC
6.25%, 04/18/2034(a) | | | | | | | 128 | | | | 134,023 | |
Charles Schwab Corp. (The)
5.61% (SOFR + 0.52%),
05/13/2026(e) | | | | | | | 5,465 | | | | 5,464,518 | |
China Great Wall International Holdings V Ltd.
2.875%, 11/23/2026(a) | | | | | | | 400 | | | | 379,000 | |
Clearstream Banking AG
Zero Coupon, 12/01/2025(a) | | | EUR | | | | 200 | | | | 215,147 | |
Jefferies Financial Group, Inc.
6.20%, 04/14/2034 | | | U.S.$ | | | | 128 | | | | 137,044 | |
Nomura Holdings, Inc.
1.85%, 07/16/2025 | | | | | | | 5,405 | | | | 5,281,986 | |
5.59%, 07/02/2027 | | | | | | | 656 | | | | 674,385 | |
5.71%, 01/09/2026 | | | | | | | 221 | | | | 223,956 | |
5.78%, 07/03/2034 | | | | | | | 200 | | | | 210,043 | |
| | | | | | | | | | | | |
| | | | | | | | | | | 13,687,608 | |
| | | | | | | | | | | | |
Finance – 0.6% | | | | | | | | | | | | |
3i Group PLC
4.875%, 06/14/2029(a) | | | EUR | | | | 465 | | | | 549,373 | |
| | |
| |
| abfunds.com | | AB GLOBAL BOND FUND | 15 |
PORTFOLIO OF INVESTMENTS (continued)
| | | | | | | | | | |
| | | | | Principal
Amount
(000) | | | U.S. $ Value | |
| |
Air Lease Corp.
5.40%, 06/01/2028 | | CAD | | | 6,005 | | | $ | 4,647,875 | |
Aircastle Ltd.
5.25%, 06/15/2026(a)(d) | | U.S.$ | | | 185 | | | | 183,670 | |
5.95%, 02/15/2029(a) | | | | | 31 | | | | 32,100 | |
Apollo Debt Solutions BDC
6.70%, 07/29/2031(a) | | | | | 664 | | | | 683,256 | |
6.90%, 04/13/2029(a) | | | | | 666 | | | | 692,290 | |
Aviation Capital Group LLC
1.95%, 01/30/2026(a) | | | | | 415 | | | | 399,771 | |
1.95%, 09/20/2026(a) | | | | | 1,590 | | | | 1,506,017 | |
3.50%, 11/01/2027(a) | | | | | 911 | | | | 878,964 | |
4.125%, 08/01/2025(a) | | | | | 23 | | | | 22,847 | |
4.875%, 10/01/2025(a) | | | | | 926 | | | | 924,800 | |
5.50%, 12/15/2024(a) | | | | | 5,268 | | | | 5,262,312 | |
Blackstone Private Credit Fund
4.95%, 09/26/2027(a) | | | | | 139 | | | | 137,750 | |
5.25%, 04/01/2030(a) | | | | | 139 | | | | 136,940 | |
5.95%, 07/16/2029(a) | | | | | 130 | | | | 132,302 | |
Blackstone Secured Lending Fund
5.875%, 11/15/2027 | | | | | 129 | | | | 131,170 | |
Blue Owl Credit Income Corp.
5.80%, 03/15/2030(a) | | | | | 668 | | | | 661,755 | |
6.65%, 03/15/2031 | | | | | 129 | | | | 131,889 | |
7.75%, 09/16/2027 | | | | | 274 | | | | 288,532 | |
7.75%, 01/15/2029 | | | | | 617 | | | | 658,386 | |
Blue Owl Technology Finance Corp.
2.50%, 01/15/2027 | | | | | 288 | | | | 268,418 | |
BOC Aviation Ltd.
3.875%, 04/27/2026(a) | | | | | 620 | | | | 614,804 | |
Brookfield Finance, Inc.
5.675%, 01/15/2035 | | | | | 132 | | | | 138,429 | |
6.35%, 01/05/2034 | | | | | 123 | | | | 135,360 | |
CCBL Cayman 1 Corp., Ltd.
Series E
1.80%, 07/22/2026(a) | | | | | 400 | | | | 381,744 | |
CDBL Funding 1
Series E
3.50%, 10/24/2027(a) | | | | | 230 | | | | 224,466 | |
CIMIC Finance Ltd.
Series G
1.50%, 05/28/2029(a) | | EUR | | | 299 | | | | 296,689 | |
Credicorp Capital Sociedad Titulizadora SA
10.10%, 12/15/2043(a) | | PEN | | | 22,925 | | | | 6,290,251 | |
FS KKR Capital Corp.
3.125%, 10/12/2028 | | U.S.$ | | | 81 | | | | 73,572 | |
6.875%, 08/15/2029 | | | | | 645 | | | | 671,208 | |
| | |
| |
16 | AB GLOBAL BOND FUND | | abfunds.com |
PORTFOLIO OF INVESTMENTS (continued)
| | | | | | | | | | | | |
| | | | | | Principal
Amount
(000) | | | U.S. $ Value | |
| |
Golub Capital BDC, Inc.
6.00%, 07/15/2029 | | | U.S.$ | | | | 129 | | | $ | 131,149 | |
HAT Holdings I LLC/HAT Holdings II LLC
3.375%, 06/15/2026(a) | | | | | | | 654 | | | | 633,695 | |
HPS Corporate Lending Fund
6.25%, 09/30/2029(a) | | | | | | | 130 | | | | 132,336 | |
Huarong Finance 2017 Co., Ltd.
Series E
4.25%, 11/07/2027(a) | | | | | | | 530 | | | | 508,800 | |
Huarong Finance 2019 Co., Ltd.
Series E
3.25%, 11/13/2024(a) | | | | | | | 260 | | | | 258,903 | |
4.50%, 05/29/2029(a) | | | | | | | 200 | | | | 191,000 | |
Huarong Finance II Co., Ltd.
Series E
4.625%, 06/03/2026(a) | | | | | | | 213 | | | | 209,605 | |
Intercorp Financial Services, Inc.
4.125%, 10/19/2027(a) | | | | | | | 840 | | | | 812,175 | |
Intermediate Capital Group PLC
2.50%, 01/28/2030(a) | | | EUR | | | | 277 | | | | 286,544 | |
JAB Holdings BV
5.00%, 06/12/2033(a) | | | | | | | 100 | | | | 120,982 | |
Macquarie Airfinance Holdings Ltd.
5.15%, 03/17/2030(a) | | | U.S.$ | | | | 138 | | | | 138,405 | |
Main Street Capital Corp.
6.50%, 06/04/2027 | | | | | | | 650 | | | | 664,573 | |
Oaktree Strategic Credit Fund
6.50%, 07/23/2029(a) | | | | | | | 665 | | | | 675,119 | |
Power Finance Corp., Ltd.
Series G
3.35%, 05/16/2031(a) | | | | | | | 360 | | | | 327,150 | |
Prospect Capital Corp.
3.36%, 11/15/2026 | | | | | | | 359 | | | | 334,399 | |
REC Ltd.
5.625%, 04/11/2028(a) | | | | | | | 200 | | | | 205,438 | |
Sixth Street Lending Partners
5.75%, 01/15/2030(a) | | | | | | | 691 | | | | 688,622 | |
6.50%, 03/11/2029(a) | | | | | | | 653 | | | | 669,560 | |
Tikehau Capital SCA
6.625%, 03/14/2030(a) | | | EUR | | | | 100 | | | | 125,076 | |
Wendel SE
4.50%, 06/19/2030(a) | | | | | | | 400 | | | | 467,116 | |
| | | | | | | | | | | | |
| | | | | | | | | | | 34,737,587 | |
| | | | | | | | | | | | |
Insurance – 0.9% | | | | | | | | | | | | |
Aegon Ltd.
5.50%, 04/11/2048 | | | U.S.$ | | | | 780 | | | | 778,564 | |
| | |
| |
| abfunds.com | | AB GLOBAL BOND FUND | 17 |
PORTFOLIO OF INVESTMENTS (continued)
| | | | | | | | | | |
| | | | | Principal
Amount
(000) | | | U.S. $ Value | |
| |
AIA Group Ltd.
4.95%, 04/04/2033(a) | | U.S.$ | | | 240 | | | $ | 245,400 | |
4.95%, 03/30/2035(a) | | | | | 250 | | | | 249,535 | |
Allianz SE
5.82%, 07/25/2053(a) | | EUR | | | 100 | | | | 125,713 | |
Series E
4.25%, 07/05/2052(a) | | | | | 200 | | | | 228,197 | |
American International Group, Inc.
Series A-9
5.75%, 04/01/2048 | | U.S.$ | | | 310 | | | | 311,373 | |
Argentum Netherlands BV for Swiss Re Ltd.
5.75%, 08/15/2050(a) | | | | | 365 | | | | 365,530 | |
Argentum Netherlands BV for Zurich Insurance Co., Ltd.
2.75%, 02/19/2049(a) | | EUR | | | 264 | | | | 284,948 | |
Series E
3.50%, 10/01/2046(a) | | | | | 155 | | | | 173,026 | |
Athene Global Funding
1.985%, 08/19/2028(a) | | U.S.$ | | | 3,086 | | | | 2,802,457 | |
2.55%, 11/19/2030(a) | | | | | 22 | | | | 19,380 | |
2.72%, 01/07/2029(a) | | | | | 56 | | | | 51,751 | |
5.35%, 07/09/2027(a) | | | | | 132 | | | | 134,869 | |
5.53%, 07/11/2031(a) | | | | | 12,743 | | | | 13,096,152 | |
5.58%, 01/09/2029(a) | | | | | 15 | | | | 15,527 | |
5.62%, 05/08/2026(a) | | | | | 473 | | | | 480,405 | |
Series E
0.37%, 09/10/2026(a) | | EUR | | | 107 | | | | 113,190 | |
0.83%, 01/08/2027(a) | | | | | 530 | | | | 561,180 | |
Athene Holding Ltd.
6.25%, 04/01/2054 | | U.S.$ | | | 129 | | | | 137,211 | |
Aviva PLC
4.00%, 06/03/2055(a) | | GBP | | | 135 | | | | 150,467 | |
AXA SA
Series E
1.875%, 07/10/2042(a) | | EUR | | | 301 | | | | 289,763 | |
3.25%, 05/28/2049(a) | | | | | 199 | | | | 218,963 | |
Berkshire Hathaway, Inc.
2.15%, 03/15/2028 | | | | | 280 | | | | 306,575 | |
Cigna Group (The)
1.25%, 03/15/2026 | | U.S.$ | | | 294 | | | | 281,362 | |
4.375%, 10/15/2028 | | | | | 7 | | | | 7,027 | |
4.80%, 08/15/2038 | | | | | 568 | | | | 552,751 | |
4.80%, 07/15/2046 | | | | | 193 | | | | 180,576 | |
4.90%, 12/15/2048 | | | | | 656 | | | | 617,627 | |
| | |
| |
18 | AB GLOBAL BOND FUND | | abfunds.com |
PORTFOLIO OF INVESTMENTS (continued)
| | | | | | | | | | |
| | | | | Principal
Amount
(000) | | | U.S. $ Value | |
| |
Cloverie PLC for Zurich Insurance Co., Ltd.
Series E
5.625%, 06/24/2046(a) | | U.S.$ | | | 1,089 | | | $ | 1,095,155 | |
CNO Global Funding
4.95%, 09/09/2029(a) | | | | | 137 | | | | 137,595 | |
5.875%, 06/04/2027(a) | | | | | 645 | | | | 664,605 | |
Credit Agricole Assurances SA
4.75%, 09/27/2048(a) | | EUR | | | 8,900 | | | | 10,247,144 | |
Elevance Health, Inc.
5.15%, 06/15/2029 | | U.S.$ | | | 86 | | | | 89,198 | |
5.375%, 06/15/2034 | | | | | 652 | | | | 685,131 | |
5.65%, 06/15/2054 | | | | | 130 | | | | 137,248 | |
Generali
Series E
5.00%, 06/08/2048(a) | | EUR | | | 167 | | | | 194,367 | |
5.50%, 10/27/2047(a) | | | | | 238 | | | | 279,439 | |
Global Atlantic Fin Co.
7.95%, 06/15/2033(a) | | U.S.$ | | | 557 | | | | 636,163 | |
Guardian Life Global Funding
4.18%, 09/26/2029(a) | | | | | 139 | | | | 138,596 | |
Health Care Service Corp. A Mutual Legal Reserve Co.
5.875%, 06/15/2054(a) | | | | | 657 | | | | 694,214 | |
Jackson National Life Global Funding
4.60%, 10/01/2029(a) | | | | | 696 | | | | 693,342 | |
Met Tower Global Funding
4.00%, 10/01/2027(a) | | | | | 696 | | | | 695,226 | |
MetLife Capital Trust IV
7.875%, 12/15/2037(a) | | | | | 110 | | | | 122,894 | |
Muenchener Rueckversicherungs-Gesellschaft AG in Muenchen
1.25%, 05/26/2041(a) | | EUR | | | 100 | | | | 96,379 | |
New York Life Global Funding
3.90%, 10/01/2027(a) | | U.S.$ | | | 139 | | | | 138,692 | |
New York Life Insurance Co.
4.45%, 05/15/2069(a) | | | | | 80 | | | | 69,583 | |
NN Group NV
Series E
4.625%, 01/13/2048(a) | | EUR | | | 129 | | | | 147,771 | |
Pacific Life Global Funding II
4.50%, 08/28/2029(a) | | U.S.$ | | | 137 | | | | 138,492 | |
Phoenix Group Holdings PLC
Series E
4.375%, 01/24/2029(a) | | EUR | | | 252 | | | | 288,236 | |
Principal Life Global Funding II
4.60%, 08/19/2027(a) | | U.S.$ | | | 186 | | | | 188,536 | |
5.10%, 01/25/2029(a) | | | | | 198 | | | | 204,006 | |
| | |
| |
| abfunds.com | | AB GLOBAL BOND FUND | 19 |
PORTFOLIO OF INVESTMENTS (continued)
| | | | | | | | | | | | |
| | | | | | Principal
Amount
(000) | | | U.S. $ Value | |
| |
Prudential Financial, Inc.
4.50%, 09/15/2047 | | | U.S.$ | | | | 677 | | | $ | 666,685 | |
QBE Insurance Group Ltd.
5.875%, 05/12/2025(a)(d) | | | | | | | 325 | | | | 324,698 | |
RGA Global Funding
5.45%, 05/24/2029(a) | | | | | | | 130 | | | | 135,318 | |
Sammons Financial Group, Inc.
4.75%, 04/08/2032(a) | | | | | | | 129 | | | | 121,254 | |
6.875%, 04/15/2034(a) | | | | | | | 131 | | | | 140,202 | |
Sogecap SA
6.50%, 05/16/2044(a) | | | EUR | | | | 200 | | | | 246,331 | |
UnitedHealth Group, Inc.
3.875%, 08/15/2059 | | | U.S.$ | | | | 325 | | | | 258,138 | |
4.90%, 04/15/2031 | | | | | | | 378 | | | | 390,967 | |
4.95%, 05/15/2062 | | | | | | | 481 | | | | 464,695 | |
5.375%, 04/15/2054 | | | | | | | 129 | | | | 133,878 | |
5.50%, 04/15/2064 | | | | | | | 129 | | | | 134,844 | |
5.625%, 07/15/2054 | | | | | | | 133 | | | | 142,608 | |
5.75%, 07/15/2064 | | | | | | | 8,877 | | | | 9,582,768 | |
6.05%, 02/15/2063 | | | | | | | 111 | | | | 125,366 | |
Unum Group
6.00%, 06/15/2054 | | | | | | | 131 | | | | 136,412 | |
| | | | | | | | | | | | |
| | | | | | | | | | | 53,565,695 | |
| | | | | | | | | | | | |
Other Finance – 0.1% | | | | | | | | | | | | |
Blackstone Private Credit Fund
1.75%, 11/30/2026(a) | | | EUR | | | | 270 | | | | 287,040 | |
China Cinda 2020 I Management Ltd.
Series E
3.00%, 01/20/2031(a) | | | U.S.$ | | | | 510 | | | | 449,162 | |
3.25%, 01/28/2027(a) | | | | | | | 350 | | | | 337,824 | |
Digital Dutch Finco BV
1.50%, 03/15/2030(a) | | | EUR | | | | 2,879 | | | | 2,895,824 | |
Equinix Europe 2 Financing Corp. LLC
3.65%, 09/03/2033 | | | | | | | 270 | | | | 300,841 | |
| | | | | | | | | | | | |
| | | | | | | | | | | 4,270,691 | |
| | | | | | | | | | | | |
REITs – 0.7% | | | | |
American Homes 4 Rent LP
5.50%, 07/15/2034 | | | U.S.$ | | | | 658 | | | | 680,209 | |
American Tower Corp.
0.50%, 01/15/2028 | | | EUR | | | | 196 | | | | 200,949 | |
0.875%, 05/21/2029 | | | | | | | 16,895 | | | | 16,995,886 | |
3.90%, 05/16/2030 | | | | | | | 112 | | | | 128,560 | |
Series E
4.10%, 05/16/2034 | | | | | | | 200 | | | | 230,443 | |
Annington Funding PLC
Series E
3.18%, 07/12/2029(a) | | | GBP | | | | 3,334 | | | | 4,025,411 | |
| | |
| |
20 | AB GLOBAL BOND FUND | | abfunds.com |
PORTFOLIO OF INVESTMENTS (continued)
| | | | | | | | | | |
| | | | | Principal
Amount
(000) | | | U.S. $ Value | |
| |
Aroundtown SA
Series E
0.375%, 04/15/2027(a) | | EUR | | | 100 | | | $ | 101,854 | |
Boston Properties LP
2.75%, 10/01/2026 | | U.S.$ | | | 642 | | | | 618,810 | |
3.65%, 02/01/2026 | | | | | 688 | | | | 677,986 | |
5.75%, 01/15/2035 | | | | | 136 | | | | 138,710 | |
CBRE Services, Inc.
5.50%, 04/01/2029 | | | | | 643 | | | | 670,659 | |
5.95%, 08/15/2034 | | | | | 513 | | | | 550,711 | |
Covivio SA/France
Series E
4.625%, 06/05/2032(a) | | EUR | | | 200 | | | | 233,719 | |
Digital Dutch Finco BV
1.25%, 02/01/2031(a) | | | | | 5,903 | | | | 5,697,725 | |
Digital Intrepid Holding BV
0.625%, 07/15/2031(a) | | | | | 330 | | | | 300,756 | |
Equinix, Inc.
1.00%, 03/15/2033 | | | | | 501 | | | | 460,380 | |
Essential Properties LP
2.95%, 07/15/2031 | | U.S.$ | | | 260 | | | | 226,308 | |
GLP Capital LP/GLP Financing II, Inc.
4.00%, 01/15/2030 | | | | | 260 | | | | 247,715 | |
5.625%, 09/15/2034 | | | | | 292 | | | | 298,467 | |
Heimstaden Bostad AB
Series E
1.125%, 01/21/2026(a) | | EUR | | | 203 | | | | 216,043 | |
Host Hotels & Resorts LP
5.50%, 04/15/2035 | | U.S.$ | | | 295 | | | | 298,821 | |
Indigo Group SAS
4.50%, 04/18/2030(a) | | EUR | | | 200 | | | | 233,588 | |
Invitation Homes Operating Partnership LP
4.875%, 02/01/2035 | | U.S.$ | | | 139 | | | | 137,196 | |
Kimco Realty OP LLC
4.85%, 03/01/2035 | | | | | 139 | | | | 137,914 | |
Newmark Group, Inc.
7.50%, 01/12/2029 | | | | | 141 | | | | 152,332 | |
Omega Healthcare Investors, Inc.
3.375%, 02/01/2031 | | | | | 185 | | | | 168,321 | |
Piedmont Operating Partnership LP
6.875%, 07/15/2029 | | | | | 131 | | | | 137,756 | |
Praemia Healthcare SACA
0.875%, 11/04/2029(a) | | EUR | | | 300 | | | | 291,526 | |
Prologis Euro Finance LLC
0.375%, 02/06/2028 | | | | | 145 | | | | 148,695 | |
Series E
1.00%, 02/08/2029 | | | | | 220 | | | | 224,772 | |
| | |
| |
| abfunds.com | | AB GLOBAL BOND FUND | 21 |
PORTFOLIO OF INVESTMENTS (continued)
| | | | | | | | | | | | |
| | | | | | Principal
Amount
(000) | | | U.S. $ Value | |
| |
Realty Income Corp.
5.00%, 10/15/2029 | | | GBP | | | | 227 | | | $ | 301,891 | |
5.25%, 09/04/2041 | | | | | | | 115 | | | | 147,904 | |
Scentre Group Trust 1/Scentre Group Trust 2
Series E
1.75%, 04/11/2028(a) | | | EUR | | | | 269 | | | | 286,039 | |
Segro Capital SARL
Series E
1.25%, 03/23/2026(a) | | | | | | | 100 | | | | 108,398 | |
Simon Property Group LP
4.75%, 09/26/2034 | | | U.S.$ | | | | 315 | | | | 312,344 | |
Sirius Real Estate Ltd.
1.125%, 06/22/2026(a) | | | EUR | | | | 200 | | | | 213,571 | |
Stockland Trust
Series E
1.625%, 04/27/2026(a) | | | | | | | 100 | | | | 107,945 | |
Tritax EuroBox PLC
0.95%, 06/02/2026(a) | | | | | | | 269 | | | | 287,770 | |
Trust Fibra Uno
4.87%, 01/15/2030(a) | | | U.S.$ | | | | 700 | | | | 649,250 | |
5.25%, 01/30/2026(a) | | | | | | | 285 | | | | 283,729 | |
6.39%, 01/15/2050(a) | | | | | | | 205 | | | | 171,880 | |
7.375%, 02/13/2034(a) | | | | | | | 236 | | | | 241,900 | |
Unibail-Rodamco-Westfield SE
Series E
1.375%, 12/04/2031(a) | | | EUR | | | | 300 | | | | 288,742 | |
Vicinity Centres Trust
Series E
1.125%, 11/07/2029(a) | | | | | | | 288 | | | | 285,644 | |
WEA Finance LLC
2.875%, 01/15/2027(a) | | | U.S.$ | | | | 701 | | | | 670,866 | |
3.50%, 06/15/2029(a) | | | | | | | 688 | | | | 644,501 | |
Wharf REIC Finance BVI Ltd.
Series E
2.875%, 05/07/2030(a) | | | | | | | 260 | | | | 238,712 | |
| | | | | | | | | | | | |
| | | | | | | | | | | 39,873,308 | |
| | | | | | | | | | | | |
| | | | | | | | | | | 743,605,618 | |
| | | | | | | | | | | | |
Industrial – 12.0% | | | | | | | | | | | | |
Basic – 0.4% | | | | | | | | | | | | |
Alpek SAB de CV
3.25%, 02/25/2031(a) | | | | | | | 200 | | | | 176,500 | |
Amcor Group Finance PLC
5.45%, 05/23/2029 | | | | | | | 651 | | | | 674,919 | |
Amcor UK Finance PLC
1.125%, 06/23/2027 | | | EUR | | | | 103 | | | | 109,390 | |
| | |
| |
22 | AB GLOBAL BOND FUND | | abfunds.com |
PORTFOLIO OF INVESTMENTS (continued)
| | | | | | | | | | |
| | | | | Principal
Amount
(000) | | | U.S. $ Value | |
| |
Anglo American Capital PLC
2.625%, 09/10/2030(a) | | U.S.$ | | | 320 | | | $ | 285,053 | |
2.875%, 03/17/2031(a) | | | | | 316 | | | | 281,120 | |
5.75%, 04/05/2034(a) | | | | | 200 | | | | 208,950 | |
Series E
1.625%, 09/18/2025(a) | | EUR | | | 506 | | | | 555,475 | |
AngloGold Ashanti Holdings PLC
3.375%, 11/01/2028 | | U.S.$ | | | 403 | | | | 379,827 | |
3.75%, 10/01/2030 | | | | | 208 | | | | 193,051 | |
Antofagasta PLC
6.25%, 05/02/2034(a) | | | | | 230 | | | | 245,181 | |
BHP Billiton Finance Ltd.
Series 17
1.50%, 04/29/2030(a) | | EUR | | | 100 | | | | 101,989 | |
BHP Billiton Finance USA Ltd.
5.25%, 09/08/2033 | | U.S.$ | | | 572 | | | | 599,443 | |
Celulosa Arauco y Constitucion SA
5.50%, 04/30/2049(a) | | | | | 260 | | | | 245,167 | |
Dow Chemical Co. (The)
6.90%, 05/15/2053 | | | | | 111 | | | | 132,771 | |
Ecolab, Inc.
2.70%, 11/01/2026 | | | | | 520 | | | | 506,791 | |
Freeport Indonesia PT
4.76%, 04/14/2027(a) | | | | | 320 | | | | 321,600 | |
5.315%, 04/14/2032(a) | | | | | 204 | | | | 206,728 | |
Fresnillo PLC
4.25%, 10/02/2050(a) | | | | | 240 | | | | 183,480 | |
Georgia-Pacific LLC
0.95%, 05/15/2026(a) | | | | | 660 | | | | 627,462 | |
Glencore Capital Finance DAC
Series E
1.25%, 03/01/2033(a) | | EUR | | | 325 | | | | 299,645 | |
4.15%, 04/29/2031(a) | | | | | 100 | | | | 114,770 | |
Glencore Funding LLC
5.34%, 04/04/2027(a) | | U.S.$ | | | 475 | | | | 486,787 | |
5.89%, 04/04/2054(a) | | | | | 130 | | | | 136,826 | |
Gold Fields Orogen Holdings BVI Ltd.
6.125%, 05/15/2029(a) | | | | | 200 | | | | 210,000 | |
Industrias Penoles SAB de CV
4.75%, 08/06/2050(a) | | | | | 230 | | | | 184,216 | |
Inversiones CMPC SA
3.00%, 04/06/2031(a) | | | | | 210 | | | | 186,440 | |
6.125%, 02/26/2034(a) | | | | | 482 | | | | 510,339 | |
LG Chem Ltd.
2.375%, 07/07/2031(a) | | | | | 310 | | | | 266,600 | |
LYB International Finance BV
4.875%, 03/15/2044 | | | | | 662 | | | | 613,928 | |
| | |
| |
| abfunds.com | | AB GLOBAL BOND FUND | 23 |
PORTFOLIO OF INVESTMENTS (continued)
| | | | | | | | | | | | |
| | | | | | Principal
Amount
(000) | | | U.S. $ Value | |
| |
LYB International Finance II BV
0.875%, 09/17/2026 | | | EUR | | | | 214 | | | $ | 228,716 | |
LYB International Finance III LLC
5.50%, 03/01/2034 | | | U.S.$ | | | | 286 | | | | 297,735 | |
MEGlobal BV
2.625%, 04/28/2028(a) | | | | | | | 760 | | | | 703,475 | |
Nexa Resources SA
6.75%, 04/09/2034(a) | | | | | | | 7,423 | | | | 7,859,328 | |
Nucor Corp.
4.30%, 05/23/2027 | | | | | | | 128 | | | | 128,985 | |
Orbia Advance Corp. SAB de CV
4.00%, 10/04/2027(a) | | | | | | | 200 | | | | 193,826 | |
POSCO
5.75%, 01/17/2028(a) | | | | | | | 200 | | | | 207,074 | |
Smurfit Kappa Treasury ULC
1.50%, 09/15/2027(a) | | | EUR | | | | 265 | | | | 283,253 | |
Sociedad Quimica y Minera de Chile SA
5.50%, 09/10/2034(a) | | | U.S.$ | | | | 200 | | | | 199,350 | |
6.50%, 11/07/2033(a) | | | | | | | 250 | | | | 268,750 | |
Sonoco Products Co.
4.45%, 09/01/2026 | | | | | | | 140 | | | | 140,041 | |
4.60%, 09/01/2029 | | | | | | | 140 | | | | 139,344 | |
5.00%, 09/01/2034 | | | | | | | 140 | | | | 138,095 | |
Southern Copper Corp.
3.875%, 04/23/2025 | | | | | | | 180 | | | | 178,648 | |
5.875%, 04/23/2045 | | | | | | | 170 | | | | 177,823 | |
7.50%, 07/27/2035 | | | | | | | 200 | | | | 237,180 | |
Suzano Austria GmbH
6.00%, 01/15/2029 | | | | | | | 284 | | | | 293,088 | |
Series DM3N
3.125%, 01/15/2032 | | | | | | | 300 | | | | 260,700 | |
| | | | | | | | | | | | |
| | | | | | | | | | | 20,979,859 | |
| | | | | | | | | | | | |
Capital Goods – 0.5% | | | | | | | | | | | | |
AGCO International Holdings BV
0.80%, 10/06/2028(a) | | | EUR | | | | 341 | | | | 344,043 | |
Airbus SE
Series E
1.625%, 06/09/2030(a) | | | | | | | 396 | | | | 412,146 | |
Boeing Co. (The)
2.20%, 02/04/2026 | | | U.S.$ | | | | 970 | | | | 934,619 | |
2.95%, 02/01/2030 | | | | | | | 338 | | | | 302,211 | |
3.25%, 02/01/2028 | | | | | | | 2,357 | | | | 2,233,812 | |
3.625%, 02/01/2031 | | | | | | | 1,713 | | | | 1,568,977 | |
5.15%, 05/01/2030 | | | | | | | 1,500 | | | | 1,503,350 | |
6.30%, 05/01/2029(a) | | | | | | | 3,772 | | | | 3,967,727 | |
6.53%, 05/01/2034(a) | | | | | | | 5,528 | | | | 5,930,784 | |
| | |
| |
24 | AB GLOBAL BOND FUND | | abfunds.com |
PORTFOLIO OF INVESTMENTS (continued)
| | | | | | | | | | |
| | | | | Principal
Amount
(000) | | | U.S. $ Value | |
| |
Carrier Global Corp.
4.125%, 05/29/2028 | | EUR | | | 247 | | | $ | 285,167 | |
Caterpillar Financial Services Corp.
4.375%, 08/16/2029 | | U.S.$ | | | 674 | | | | 684,013 | |
4.40%, 10/15/2027 | | | | | 674 | | | | 682,828 | |
4.45%, 10/16/2026 | | | | | 876 | | | | 886,375 | |
5.00%, 05/14/2027 | | | | | 332 | | | | 341,100 | |
CNH Industrial Capital LLC
1.45%, 07/15/2026 | | | | | 205 | | | | 194,915 | |
CNH Industrial Finance Europe SA
Series E
1.625%, 07/03/2029(a) | | EUR | | | 275 | | | | 284,974 | |
CNH Industrial NV
Series E
3.75%, 06/11/2031(a) | | | | | 251 | | | | 283,191 | |
CRH SMW Finance DAC
Series E
4.00%, 07/11/2027(a) | | | | | 190 | | | | 217,557 | |
4.25%, 07/11/2035(a) | | | | | 129 | | | | 151,315 | |
Eaton Corp.
4.15%, 03/15/2033 | | U.S.$ | | | 310 | | | | 306,068 | |
General Dynamics Corp.
3.50%, 04/01/2027 | | | | | 253 | | | | 250,513 | |
General Electric Co.
Series E
4.125%, 09/19/2035(a) | | EUR | | | 243 | | | | 286,410 | |
Holcim Finance Luxembourg SA
Series E
0.625%, 04/06/2030(a) | | | | | 295 | | | | 286,900 | |
John Deere Capital Corp.
4.40%, 09/08/2031 | | U.S.$ | | | 298 | | | | 300,188 | |
4.90%, 06/11/2027 | | | | | 288 | | | | 295,186 | |
Johnson Controls International PLC/Tyco Fire & Security Finance SCA
3.00%, 09/15/2028 | | EUR | | | 256 | | | | 285,056 | |
KION Group AG
Series E
1.625%, 09/24/2025(a) | | | | | 300 | | | | 327,645 | |
Legrand SA
0.625%, 06/24/2028(a) | | | | | 500 | | | | 516,419 | |
Lennox International, Inc.
5.50%, 09/15/2028 | | U.S.$ | | | 609 | | | | 634,086 | |
Lockheed Martin Corp.
5.90%, 11/15/2063 | | | | | 521 | | | | 602,202 | |
Metso Oyj
Series E
0.875%, 05/26/2028(a) | | EUR | | | 179 | | | | 183,817 | |
4.875%, 12/07/2027(a) | | | | | 186 | | | | 217,079 | |
| | |
| |
| abfunds.com | | AB GLOBAL BOND FUND | 25 |
PORTFOLIO OF INVESTMENTS (continued)
| | | | | | | | | | | | |
| | | | | | Principal
Amount
(000) | | | U.S. $ Value | |
| |
Nordson Corp.
4.50%, 12/15/2029 | | | U.S.$ | | | | 137 | | | $ | 137,510 | |
Regal Rexnord Corp.
6.05%, 04/15/2028 | | | | | | | 451 | | | | 468,531 | |
6.30%, 02/15/2030 | | | | | | | 120 | | | | 127,784 | |
RTX Corp.
2.15%, 05/18/2030 | | | EUR | | | | 752 | | | | 785,782 | |
Safran SA
0.125%, 03/16/2026(a) | | | | | | | 500 | | | | 535,410 | |
Schneider Electric SE
Series E
0.25%, 03/11/2029(a) | | | | | | | 300 | | | | 300,203 | |
3.125%, 10/13/2029(a) | | | | | | | 100 | | | | 112,963 | |
St. Marys Cement, Inc. Canada
5.75%, 04/02/2034(a) | | | U.S.$ | | | | 204 | | | | 210,094 | |
Textron, Inc.
6.10%, 11/15/2033 | | | | | | | 120 | | | | 129,998 | |
UltraTech Cement Ltd.
2.80%, 02/16/2031(a) | | | | | | | 210 | | | | 184,661 | |
Waste Management, Inc.
4.95%, 07/03/2027 | | | | | | | 372 | | | | 382,020 | |
| | | | | | | | | | | | |
| | | | | | | | | | | 29,075,629 | |
| | | | | | | | | | | | |
Communications - Media – 0.6% | | | | | | | | | | | | |
Charter Communications Operating LLC/Charter Communications Operating Capital
2.25%, 01/15/2029 | | | | | | | 121 | | | | 107,670 | |
5.75%, 04/01/2048 | | | | | | | 245 | | | | 213,478 | |
6.48%, 10/23/2045 | | | | | | | 115 | | | | 110,796 | |
Comcast Corp.
3.25%, 09/26/2032 | | | EUR | | | | 128 | | | | 143,253 | |
Cox Communications, Inc.
5.45%, 09/01/2034(a) | | | U.S.$ | | | | 1,015 | | | | 1,024,751 | |
5.70%, 06/15/2033(a) | | | | | | | 63 | | | | 65,058 | |
Grupo Televisa SAB
4.625%, 01/30/2026 | | | | | | | 200 | | | | 196,704 | |
5.00%, 05/13/2045 | | | | | | | 270 | | | | 219,459 | |
6.625%, 01/15/2040 | | | | | | | 350 | | | | 343,049 | |
Informa PLC
Series E
2.125%, 10/06/2025(a) | | | EUR | | | | 496 | | | | 545,677 | |
ITV PLC
1.375%, 09/26/2026(a) | | | | | | | 125 | | | | 134,823 | |
Meta Platforms, Inc.
4.45%, 08/15/2052 | | | U.S.$ | | | | 160 | | | | 147,560 | |
4.65%, 08/15/2062 | | | | | | | 92 | | | | 85,532 | |
4.75%, 08/15/2034 | | | | | | | 135 | | | | 137,782 | |
| | |
| |
26 | AB GLOBAL BOND FUND | | abfunds.com |
PORTFOLIO OF INVESTMENTS (continued)
| | | | | | | | | | | | |
| | | | | | Principal
Amount
(000) | | | U.S. $ Value | |
| |
5.40%, 08/15/2054 | | | U.S.$ | | | | 135 | | | $ | 141,366 | |
5.55%, 08/15/2064 | | | | | | | 1,166 | | | | 1,236,110 | |
Netflix, Inc.
3.875%, 11/15/2029(a) | | | EUR | | | | 350 | | | | 405,810 | |
Paramount Global
4.20%, 05/19/2032 | | | U.S.$ | | | | 2,305 | | | | 2,046,016 | |
4.375%, 03/15/2043 | | | | | | | 5,417 | | | | 4,011,351 | |
4.95%, 01/15/2031 | | | | | | | 9,590 | | | | 9,063,435 | |
5.85%, 09/01/2043 | | | | | | | 288 | | | | 250,899 | |
Prosus NV
1.21%, 01/19/2026(a) | | | EUR | | | | 166 | | | | 179,541 | |
1.54%, 08/03/2028(a) | | | | | | | 230 | | | | 237,004 | |
3.06%, 07/13/2031(a) | | | U.S.$ | | | | 334 | | | | 294,442 | |
3.68%, 01/21/2030(a) | | | | | | | 1,062 | | | | 999,607 | |
3.83%, 02/08/2051(a) | | | | | | | 200 | | | | 139,994 | |
TDF Infrastructure SASU
5.625%, 07/21/2028(a) | | | EUR | | | | 300 | | | | 355,384 | |
Tencent Holdings Ltd.
2.39%, 06/03/2030(a) | | | U.S.$ | | | | 510 | | | | 461,406 | |
2.88%, 04/22/2031(a) | | | | | | | 200 | | | | 182,113 | |
Time Warner Cable LLC
5.25%, 07/15/2042 | | | GBP | | | | 100 | | | | 109,019 | |
Warnermedia Holdings, Inc.
3.755%, 03/15/2027 | | | U.S.$ | | | | 815 | | | | 788,055 | |
4.28%, 03/15/2032 | | | | | | | 6,522 | | | | 5,792,423 | |
5.05%, 03/15/2042 | | | | | | | 793 | | | | 647,738 | |
5.14%, 03/15/2052 | | | | | | | 7,076 | | | | 5,455,210 | |
Weibo Corp.
3.375%, 07/08/2030 | | | U.S.$ | | | | 540 | | | | 495,790 | |
| | | | | | | | | | | | |
| | | | | | | | | | | 36,768,305 | |
| | | | | | | | | | | | |
Communications - Telecommunications – 1.0% | | | | | | | | | | | | |
America Movil SAB de CV
2.875%, 05/07/2030 | | | | | | | 340 | | | | 313,405 | |
6.125%, 11/15/2037 | | | | | | | 200 | | | | 220,028 | |
Axiata SPV2 Bhd
Series E
2.16%, 08/19/2030(a) | | | | | | | 200 | | | | 175,464 | |
Bell Telephone Co. of Canada or Bell Canada
3.00%, 03/17/2031 | | | CAD | | | | 2,711 | | | | 1,894,421 | |
4.55%, 02/09/2030 | | | | | | | 1,318 | | | | 1,005,796 | |
5.15%, 02/09/2053 | | | | | | | 3,297 | | | | 2,456,868 | |
5.85%, 11/10/2032 | | | | | | | 14,542 | | | | 11,902,086 | |
CK Hutchison Group Telecom Finance SA
1.125%, 10/17/2028(a) | | | EUR | | | | 16,235 | | | | 16,763,981 | |
1.50%, 10/17/2031(a) | | | | | | | 428 | | | | 418,036 | |
| | |
| |
| abfunds.com | | AB GLOBAL BOND FUND | 27 |
PORTFOLIO OF INVESTMENTS (continued)
| | | | | | | | | | |
| | | | | Principal
Amount
(000) | | | U.S. $ Value | |
| |
Empresa Nacional de Telecomunicaciones SA
4.75%, 08/01/2026(a) | | U.S.$ | | | 200 | | | $ | 199,375 | |
Koninklijke KPN NV
Series G
3.875%, 07/03/2031(a) | | EUR | | | 200 | | | | 231,999 | |
NTT Finance Corp.
Series E
0.08%, 12/13/2025(a) | | | | | 521 | | | | 560,265 | |
0.40%, 12/13/2028(a) | | | | | 109 | | | | 109,798 | |
Ooredoo International Finance Ltd.
2.625%, 04/08/2031(a) | | U.S.$ | | | 420 | | | | 380,885 | |
Orange SA
Series E
1.375%, 02/11/2029(a)(d) | | EUR | | | 100 | | | | 99,528 | |
2.375%, 01/15/2025(a)(d) | | | | | 100 | | | | 110,335 | |
PLDT, Inc.
2.50%, 01/23/2031(a) | | U.S.$ | | | 200 | | | | 175,812 | |
PT Tower Bersama Infrastructure Tbk
2.80%, 05/02/2027(a) | | | | | 200 | | | | 188,750 | |
SingTel Group Treasury Pte Ltd.
Series E
2.375%, 08/28/2029(a) | | | | | 290 | | | | 267,434 | |
Sprint LLC
7.625%, 03/01/2026 | | | | | 589 | | | | 607,995 | |
Sprint Spectrum Co. LLC/Sprint Spectrum Co. II LLC/Sprint Spectrum Co. III LLC
5.15%, 03/20/2028(a) | | | | | 729 | | | | 737,062 | |
T-Mobile USA, Inc.
2.625%, 04/15/2026 | | | | | 200 | | | | 194,929 | |
4.70%, 01/15/2035 | | | | | 139 | | | | 138,553 | |
5.25%, 06/15/2055 | | | | | 139 | | | | 138,251 | |
TDC Net A/S
Series E
5.62%, 02/06/2030(a) | | EUR | | | 237 | | | | 279,743 | |
Tele2 AB
Series E
3.75%, 11/22/2029(a) | | | | | 212 | | | | 241,625 | |
TELUS Corp.
4.95%, 02/18/2031 | | CAD | | | 5,000 | | | | 3,870,717 | |
Series CAG
5.25%, 11/15/2032 | | | | | 17,557 | | | | 13,799,317 | |
Verizon Communications, Inc.
2.55%, 03/21/2031 | | U.S.$ | | | 24 | | | | 21,438 | |
4.25%, 10/31/2030 | | EUR | | | 125 | | | | 147,572 | |
| | |
| |
28 | AB GLOBAL BOND FUND | | abfunds.com |
PORTFOLIO OF INVESTMENTS (continued)
| | | | | | | | | | | | |
| | | | | | Principal
Amount
(000) | | | U.S. $ Value | |
| |
Vodafone Group PLC
4.20%, 12/13/2027(a) | | | AUD | | | | 3,570 | | | $ | 2,438,724 | |
Series E
3.00%, 08/12/2056(a) | | | GBP | | | | 100 | | | | 79,454 | |
| | | | | | | | | | | | |
| | | | | | | | | | | 60,169,646 | |
| | | | | | | | | | | | |
Consumer Cyclical - Automotive – 1.5% | | | | | | | | | | | | |
American Honda Finance Corp.
Series E
3.65%, 04/23/2031 | | | EUR | | | | 10,950 | | | | 12,410,183 | |
Series G
4.40%, 09/05/2029 | | | U.S.$ | | | | 199 | | | | 199,818 | |
4.90%, 07/09/2027 | | | | | | | 661 | | | | 675,305 | |
5.05%, 07/10/2031 | | | | | | | 269 | | | | 276,962 | |
Aptiv PLC/Aptiv Corp.
4.15%, 05/01/2052 | | | | | | | 79 | | | | 61,079 | |
Aptiv PLC/Aptiv Global Financing DAC
5.15%, 09/13/2034 | | | | | | | 7,334 | | | | 7,219,489 | |
5.75%, 09/13/2054 | | | | | | | 553 | | | | 536,137 | |
Aptiv PLC/Aptiv Global Financing Ltd.
4.25%, 06/11/2036 | | | EUR | | | | 352 | | | | 395,021 | |
BMW US Capital LLC
4.60%, 08/13/2027(a) | | | U.S.$ | | | | 1,067 | | | | 1,078,746 | |
4.65%, 08/13/2026(a) | | | | | | | 270 | | | | 272,415 | |
4.65%, 08/13/2029(a) | | | | | | | 135 | | | | 136,089 | |
4.85%, 08/13/2031(a) | | | | | | | 13 | | | | 13,061 | |
4.90%, 04/02/2027(a) | | | | | | | 131 | | | | 133,173 | |
BorgWarner, Inc.
1.00%, 05/19/2031 | | | EUR | | | | 302 | | | | 286,688 | |
Cummins, Inc.
4.90%, 02/20/2029 | | | U.S.$ | | | | 327 | | | | 337,895 | |
5.45%, 02/20/2054 | | | | | | | 224 | | | | 236,880 | |
Ford Motor Co.
3.25%, 02/12/2032 | | | | | | | 6,774 | | | | 5,771,014 | |
Ford Motor Credit Co. LLC
3.375%, 11/13/2025 | | | | | | | 200 | | | | 196,147 | |
5.11%, 05/03/2029 | | | | | | | 1,085 | | | | 1,074,145 | |
6.125%, 03/08/2034 | | | | | | | 484 | | | | 489,933 | |
6.80%, 05/12/2028 | | | | | | | 200 | | | | 209,589 | |
General Motors Co.
5.20%, 04/01/2045 | | | | | | | 658 | | | | 599,112 | |
5.40%, 04/01/2048 | | | | | | | 676 | | | | 623,392 | |
General Motors Financial Co., Inc.
2.35%, 01/08/2031 | | | | | | | 29 | | | | 24,784 | |
2.40%, 04/10/2028 | | | | | | | 689 | | | | 638,668 | |
2.70%, 06/10/2031 | | | | | | | 110 | | | | 94,761 | |
5.35%, 07/15/2027 | | | | | | | 137 | | | | 140,100 | |
| | |
| |
| abfunds.com | | AB GLOBAL BOND FUND | 29 |
PORTFOLIO OF INVESTMENTS (continued)
| | | | | | | | | | |
| | | | | Principal
Amount
(000) | | | U.S. $ Value | |
| |
5.40%, 04/06/2026 | | U.S.$ | | | 123 | | | $ | 124,543 | |
5.60%, 06/18/2031 | | | | | 131 | | | | 134,336 | |
5.65%, 01/17/2029 | | | | | 4,160 | | | | 4,296,736 | |
5.75%, 02/08/2031 | | | | | 249 | | | | 257,454 | |
5.80%, 06/23/2028 | | | | | 162 | | | | 168,130 | |
6.10%, 01/07/2034 | | | | | 10,495 | | | | 10,917,397 | |
Series E
4.00%, 07/10/2030(a) | | EUR | | | 318 | | | | 359,633 | |
General Motors Financial of Canada Ltd.
5.10%, 07/14/2028 | | CAD | | | 1,444 | | | | 1,107,580 | |
Harley-Davidson Financial Services, Inc.
3.05%, 02/14/2027(a) | | U.S.$ | | | 3,276 | | | | 3,145,236 | |
5.125%, 04/05/2026(a) | | EUR | | | 228 | | | | 260,324 | |
5.95%, 06/11/2029(a) | | U.S.$ | | | 4,665 | | | | 4,780,346 | |
Hyundai Capital America
1.30%, 01/08/2026(a) | | | | | 365 | | | | 350,644 | |
2.375%, 10/15/2027(a) | | | | | 300 | | | | 282,846 | |
4.30%, 09/24/2027(a) | | | | | 139 | | | | 138,632 | |
4.55%, 09/26/2029(a) | | | | | 101 | | | | 100,779 | |
4.75%, 09/26/2031(a) | | | | | 139 | | | | 138,316 | |
5.25%, 01/08/2027(a) | | | | | 4,211 | | | | 4,286,253 | |
5.30%, 03/19/2027(a) | | | | | 174 | | | | 177,619 | |
5.68%, 06/26/2028(a) | | | | | 6,331 | | | | 6,567,666 | |
6.10%, 09/21/2028(a) | | | | | 59 | | | | 62,170 | |
6.50%, 01/16/2029(a) | | | | | 147 | | | | 157,634 | |
Hyundai Capital Services, Inc.
5.125%, 02/05/2029(a) | | | | | 320 | | | | 326,500 | |
Hyundai Motor Manufacturing Indonesia PT
Series E
1.75%, 05/06/2026(a) | | | | | 250 | | | | 239,342 | |
Kia Corp.
2.75%, 02/14/2027(a) | | | | | 290 | | | | 279,397 | |
3.50%, 10/25/2027(a) | | | | | 230 | | | | 224,048 | |
Mercedes-Benz Finance North America LLC
4.75%, 08/01/2027(a) | | | | | 341 | | | | 346,122 | |
Nissan Motor Acceptance Co. LLC
1.85%, 09/16/2026(a) | | | | | 3,120 | | | | 2,929,785 | |
2.00%, 03/09/2026(a) | | | | | 4,070 | | | | 3,890,395 | |
2.45%, 09/15/2028(a) | | | | | 5,536 | | | | 4,943,011 | |
2.75%, 03/09/2028(a) | | | | | 255 | | | | 233,603 | |
5.30%, 09/13/2027(a) | | | | | 1,655 | | | | 1,651,836 | |
5.55%, 09/13/2029(a) | | | | | 138 | | | | 137,087 | |
RCI Banque SA
Series E
1.75%, 04/10/2026(a) | | EUR | | | 521 | | | | 566,727 | |
| | |
| |
30 | AB GLOBAL BOND FUND | | abfunds.com |
PORTFOLIO OF INVESTMENTS (continued)
| | | | | | | | | | | | |
| | | | | | Principal
Amount
(000) | | | U.S. $ Value | |
| |
Stellantis NV
Series E
4.25%, 06/16/2031(a) | | | EUR | | | | 300 | | | $ | 342,776 | |
Toyota Motor Credit Corp.
4.55%, 08/09/2029 | | | U.S.$ | | | | 296 | | | | 300,604 | |
5.10%, 03/21/2031 | | | | | | | 647 | | | | 673,979 | |
| | | | | | | | | | | | |
| | | | | | | | | | | 89,030,072 | |
| | | | | | | | | | | | |
Consumer Cyclical - Entertainment – 0.3% | | | | | | | | | | | | |
Brunswick Corp./DE
5.85%, 03/18/2029 | | | | | | | 130 | | | | 134,157 | |
CPUK Finance Ltd.
Series E
3.59%, 08/28/2025(a) | | | GBP | | | | 275 | | | | 361,734 | |
Hasbro, Inc.
3.55%, 11/19/2026 | | | U.S.$ | | | | 13,121 | | | | 12,863,382 | |
6.05%, 05/14/2034 | | | | | | | 3,519 | | | | 3,702,830 | |
| | | | | | | | | | | | |
| | | | | | | | | | | 17,062,103 | |
| | | | | | | | | | | | |
Consumer Cyclical - Other – 0.2% | | | | | | | | | | | | |
DR Horton, Inc.
5.00%, 10/15/2034 | | | | | | | 208 | | | | 210,623 | |
Flutter Treasury DAC
5.00%, 04/29/2029(a) | | | EUR | | | | 248 | | | | 284,379 | |
GENM Capital Labuan Ltd.
3.88%, 04/19/2031(a) | | | U.S.$ | | | | 3,148 | | | | 2,861,729 | |
Gohl Capital Ltd.
4.25%, 01/24/2027(a) | | | | | | | 540 | | | | 532,407 | |
Las Vegas Sands Corp.
3.90%, 08/08/2029 | | | | | | | 410 | | | | 390,871 | |
Marriott International, Inc./MD
4.80%, 03/15/2030 | | | | | | | 134 | | | | 135,828 | |
5.30%, 05/15/2034 | | | | | | | 159 | | | | 163,853 | |
5.35%, 03/15/2035 | | | | | | | 352 | | | | 360,591 | |
5.55%, 10/15/2028 | | | | | | | 267 | | | | 279,403 | |
Series HH
2.85%, 04/15/2031 | | | | | | | 175 | | | | 157,451 | |
MDC Holdings, Inc.
2.50%, 01/15/2031 | | | | | | | 315 | | | | 278,964 | |
6.00%, 01/15/2043 | | | | | | | 5,384 | | | | 5,726,185 | |
Owens Corning
5.50%, 06/15/2027 | | | | | | | 647 | | | | 668,220 | |
5.70%, 06/15/2034 | | | | | | | 129 | | | | 136,956 | |
7.00%, 12/01/2036(f) | | | | | | | 50 | | | | 58,161 | |
PulteGroup, Inc.
6.375%, 05/15/2033 | | | | | | | 182 | | | | 200,260 | |
| | |
| |
| abfunds.com | | AB GLOBAL BOND FUND | 31 |
PORTFOLIO OF INVESTMENTS (continued)
| | | | | | | | | | | | |
| | | | | | Principal
Amount
(000) | | | U.S. $ Value | |
| |
Sands China Ltd.
2.30%, 03/08/2027(f) | | | U.S.$ | | | | 221 | | | $ | 206,773 | |
2.85%, 03/08/2029(f) | | | | | | | 277 | | | | 251,322 | |
4.375%, 06/18/2030(f) | | | | | | | 279 | | | | 267,261 | |
5.40%, 08/08/2028(f) | | | | | | | 663 | | | | 667,972 | |
| | | | | | | | | | | | |
| | | | | | | | | | | 13,839,209 | |
| | | | | | | | | | | | |
Consumer Cyclical - Retailers – 0.4% | | | | | | | | | | | | |
Alimentation Couche-Tard, Inc.
1.875%, 05/06/2026(a) | | | EUR | | | | 506 | | | | 551,690 | |
AutoZone, Inc.
5.10%, 07/15/2029 | | | U.S.$ | | | | 132 | | | | 135,970 | |
5.40%, 07/15/2034 | | | | | | | 134 | | | | 138,891 | |
CK Hutchison International 21 Ltd.
2.50%, 04/15/2031(a) | | | | | | | 790 | | | | 693,887 | |
Dick’s Sporting Goods, Inc.
4.10%, 01/15/2052 | | | | | | | 172 | | | | 131,374 | |
Dollarama, Inc.
5.53%, 09/26/2028 | | | CAD | | | | 6,832 | | | | 5,401,952 | |
Genuine Parts Co.
4.95%, 08/15/2029 | | | U.S.$ | | | | 135 | | | | 137,246 | |
Home Depot, Inc. (The)
3.90%, 06/15/2047 | | | | | | | 661 | | | | 564,936 | |
4.25%, 04/01/2046 | | | | | | | 539 | | | | 490,268 | |
4.95%, 09/15/2052 | | | | | | | 247 | | | | 246,426 | |
5.30%, 06/25/2054 | | | | | | | 132 | | | | 138,746 | |
5.95%, 04/01/2041 | | | | | | | 50 | | | | 56,181 | |
Lowe’s Cos., Inc.
4.05%, 05/03/2047 | | | | | | | 98 | | | | 82,037 | |
5.625%, 04/15/2053 | | | | | | | 120 | | | | 124,869 | |
5.75%, 07/01/2053 | | | | | | | 122 | | | | 128,812 | |
5.80%, 09/15/2062 | | | | | | | 484 | | | | 506,444 | |
PVH Corp.
4.125%, 07/16/2029 | | | EUR | | | | 265 | | | | 298,646 | |
Tapestry, Inc.
7.00%, 11/27/2026 | | | U.S.$ | | | | 434 | | | | 449,389 | |
7.05%, 11/27/2025 | | | | | | | 17 | | | | 17,347 | |
7.35%, 11/27/2028 | | | | | | | 613 | | | | 644,170 | |
7.70%, 11/27/2030 | | | | | | | 281 | | | | 302,659 | |
VF Corp.
0.625%, 02/25/2032 | | | EUR | | | | 7,525 | | | | 6,155,209 | |
Series E
4.125%, 03/07/2026 | | | | | | | 100 | | | | 111,300 | |
4.25%, 03/07/2029 | | | | | | | 3,895 | | | | 4,262,900 | |
| | | | | | | | | | | | |
| | | | | | | | | | | 21,771,349 | |
| | | | | | | | | | | | |
| | |
| |
32 | AB GLOBAL BOND FUND | | abfunds.com |
PORTFOLIO OF INVESTMENTS (continued)
| | | | | | | | | | | | |
| | | | | | Principal
Amount
(000) | | | U.S. $ Value | |
| |
Consumer Non-Cyclical – 2.1% | | | | | | | | | | | | |
AbbVie, Inc.
4.70%, 05/14/2045 | | | U.S.$ | | | | 595 | | | $ | 575,247 | |
Agilent Technologies, Inc.
4.20%, 09/09/2027 | | | | | | | 685 | | | | 686,759 | |
Altria Group, Inc.
3.125%, 06/15/2031 | | | EUR | | | | 8,063 | | | | 8,724,975 | |
3.70%, 02/04/2051 | | | U.S.$ | | | | 467 | | | | 344,532 | |
4.25%, 08/09/2042 | | | | | | | 772 | | | | 663,058 | |
6.875%, 11/01/2033 | | | | | | | 79 | | | | 89,222 | |
Amgen, Inc.
4.40%, 05/01/2045 | | | | | | | 716 | | | | 642,740 | |
5.15%, 03/02/2028 | | | | | | | 389 | | | | 400,713 | |
Anheuser-Busch InBev SA/NV
Series E
3.70%, 04/02/2040(a) | | | EUR | | | | 257 | | | | 284,630 | |
Archer-Daniels-Midland Co.
4.535%, 03/26/2042 | | | U.S.$ | | | | 91 | | | | 86,090 | |
Asahi Group Holdings Ltd.
0.34%, 04/19/2027(a) | | | EUR | | | | 535 | | | | 559,868 | |
Barry Callebaut Services NV
4.00%, 06/14/2029(a) | | | | | | | 300 | | | | 342,990 | |
BAT Capital Corp.
4.54%, 08/15/2047 | | | U.S.$ | | | | 14 | | | | 11,828 | |
Becton Dickinson & Co.
3.83%, 06/07/2032 | | | EUR | | | | 308 | | | | 354,296 | |
Becton Dickinson Euro Finance SARL
3.55%, 09/13/2029 | | | | | | | 270 | | | | 307,173 | |
Bimbo Bakeries USA, Inc.
5.375%, 01/09/2036(a) | | | U.S.$ | | | | 225 | | | | 231,540 | |
6.40%, 01/15/2034(a) | | | | | | | 200 | | | | 220,640 | |
Bristol-Myers Squibb Co.
3.90%, 03/15/2062 | | | | | | | 570 | | | | 453,255 | |
Bunge Ltd. Finance Corp.
4.10%, 01/07/2028 | | | | | | | 138 | | | | 137,883 | |
4.65%, 09/17/2034 | | | | | | | 502 | | | | 500,923 | |
Cargill, Inc.
3.875%, 04/24/2030(a) | | | EUR | | | | 5,992 | | | | 6,961,603 | |
4.375%, 04/22/2052(a) | | | U.S.$ | | | | 187 | | | | 169,443 | |
Cencosud SA
4.375%, 07/17/2027(a) | | | | | | | 230 | | | | 228,045 | |
5.95%, 05/28/2031(a) | | | | | | | 280 | | | | 291,830 | |
Cia Cervecerias Unidas SA
3.35%, 01/19/2032(a) | | | | | | | 200 | | | | 176,235 | |
Coca-Cola Co. (The)
1.00%, 03/09/2041 | | | EUR | | | | 318 | | | | 249,327 | |
3.375%, 08/15/2037 | | | | | | | 152 | | | | 171,442 | |
| | |
| |
| abfunds.com | | AB GLOBAL BOND FUND | 33 |
PORTFOLIO OF INVESTMENTS (continued)
| | | | | | | | | | |
| | | | | Principal
Amount
(000) | | | U.S. $ Value | |
| |
3.50%, 05/14/2044 | | EUR | | | 257 | | | $ | 283,039 | |
3.75%, 08/15/2053 | | | | | 224 | | | | 247,950 | |
4.65%, 08/14/2034 | | U.S.$ | | | 674 | | | | 689,581 | |
5.20%, 01/14/2055 | | | | | 135 | | | | 141,590 | |
5.40%, 05/13/2064 | | | | | 335 | | | | 357,233 | |
CVS Health Corp.
2.875%, 06/01/2026 | | | | | 663 | | | | 647,400 | |
4.78%, 03/25/2038 | | | | | 295 | | | | 278,547 | |
5.00%, 02/20/2026 | | | | | 265 | | | | 266,801 | |
5.125%, 07/20/2045 | | | | | 69 | | | | 64,311 | |
5.40%, 06/01/2029 | | | | | 130 | | | | 134,865 | |
5.55%, 06/01/2031 | | | | | 95 | | | | 99,090 | |
5.625%, 02/21/2053 | | | | | 122 | | | | 120,374 | |
5.70%, 06/01/2034 | | | | | 15,883 | | | | 16,565,020 | |
5.875%, 06/01/2053 | | | | | 122 | | | | 124,066 | |
6.00%, 06/01/2044 | | | | | 473 | | | | 489,299 | |
6.05%, 06/01/2054 | | | | | 648 | | | | 675,062 | |
Diageo Finance PLC
Series E
1.50%, 10/22/2027(a) | | EUR | | | 376 | | | | 403,853 | |
1.875%, 03/27/2027(a) | | | | | 135 | | | | 147,483 | |
Electrolux AB
Series E
4.50%, 09/29/2028(a) | | | | | 289 | | | | 334,758 | |
Eli Lilly & Co.
4.60%, 08/14/2034 | | U.S.$ | | | 135 | | | | 136,898 | |
4.95%, 02/27/2063 | | | | | 600 | | | | 598,284 | |
5.00%, 02/09/2054 | | | | | 130 | | | | 132,157 | |
5.05%, 08/14/2054 | | | | | 135 | | | | 138,197 | |
5.10%, 02/09/2064 | | | | | 130 | | | | 132,741 | |
5.20%, 08/14/2064 | | | | | 263 | | | | 271,611 | |
Eurofins Scientific SE
0.875%, 05/19/2031(a) | | EUR | | | 100 | | | | 92,358 | |
4.75%, 09/06/2030(a) | | | | | 248 | | | | 290,319 | |
General Mills, Inc.
0.45%, 01/15/2026 | | | | | 519 | | | | 557,947 | |
3.65%, 10/23/2030 | | | | | 155 | | | | 176,804 | |
4.70%, 01/30/2027 | | U.S.$ | | | 52 | | | | 52,603 | |
HCA, Inc.
3.625%, 03/15/2032 | | | | | 65 | | | | 60,120 | |
5.25%, 06/15/2026 | | | | | 620 | | | | 624,513 | |
5.375%, 09/01/2026 | | | | | 618 | | | | 624,905 | |
5.45%, 09/15/2034 | | | | | 197 | | | | 202,733 | |
5.95%, 09/15/2054 | | | | | 135 | | | | 141,747 | |
Illumina, Inc.
4.65%, 09/09/2026 | | | | | 137 | | | | 137,852 | |
| | |
| |
34 | AB GLOBAL BOND FUND | | abfunds.com |
PORTFOLIO OF INVESTMENTS (continued)
| | | | | | | | | | |
| | | | | Principal
Amount
(000) | | | U.S. $ Value | |
| |
Imperial Brands Finance PLC
5.875%, 07/01/2034(a) | | U.S.$ | | | 13,519 | | | $ | 14,026,725 | |
Indofood CBP Sukses Makmur Tbk PT
3.40%, 06/09/2031(a) | | | | | 490 | | | | 445,513 | |
Johnson & Johnson
5.25%, 06/01/2054 | | | | | 189 | | | | 204,679 | |
5.85%, 07/15/2038 | | | | | 187 | | | | 214,105 | |
Kenvue, Inc.
5.20%, 03/22/2063 | | | | | 130 | | | | 133,301 | |
Kerry Group Financial Services Unltd Co.
2.375%, 09/10/2025(a) | | EUR | | | 246 | | | | 271,967 | |
Keurig Dr. Pepper, Inc.
3.20%, 05/01/2030 | | U.S.$ | | | 148 | | | | 139,667 | |
Kroger Co. (The)
4.60%, 08/15/2027 | | | | | 4,070 | | | | 4,105,091 | |
4.65%, 09/15/2029 | | | | | 980 | | | | 985,560 | |
4.70%, 08/15/2026 | | | | | 64 | | | | 64,459 | |
4.90%, 09/15/2031 | | | | | 136 | | | | 136,878 | |
5.00%, 09/15/2034 | | | | | 133 | | | | 134,164 | |
5.50%, 09/15/2054 | | | | | 136 | | | | 136,822 | |
Laboratory Corp. of America Holdings
4.35%, 04/01/2030 | | | | | 139 | | | | 137,808 | |
4.55%, 04/01/2032 | | | | | 139 | | | | 137,445 | |
Loblaw Cos. Ltd.
5.01%, 09/13/2032 | | CAD | | | 13,800 | | | | 10,888,175 | |
6.54%, 02/17/2033(a) | | | | | 3,182 | | | | 2,687,831 | |
McKesson Corp.
1.50%, 11/17/2025 | | EUR | | | 226 | | | | 247,451 | |
4.90%, 07/15/2028 | | U.S.$ | | | 87 | | | | 89,535 | |
Medtronic, Inc.
4.15%, 10/15/2053 | | EUR | | | 174 | | | | 201,267 | |
Merck & Co., Inc.
2.90%, 12/10/2061 | | U.S.$ | | | 562 | | | | 361,782 | |
3.70%, 02/10/2045 | | | | | 408 | | | | 343,839 | |
3.90%, 03/07/2039 | | | | | 543 | | | | 496,436 | |
4.00%, 03/07/2049 | | | | | 170 | | | | 147,361 | |
5.15%, 05/17/2063 | | | | | 191 | | | | 194,921 | |
METRO AG
4.625%, 03/07/2029(a) | | EUR | | | 243 | | | | 281,560 | |
Metro, Inc./CN
4.66%, 02/07/2033 | | CAD | | | 11,382 | | | | 8,752,771 | |
MSD Netherlands Capital BV
3.70%, 05/30/2044 | | EUR | | | 276 | | | | 310,493 | |
3.75%, 05/30/2054 | | | | | 100 | | | | 110,477 | |
Pepsico Singapore Financing I Pte Ltd.
4.55%, 02/16/2029 | | U.S.$ | | | 282 | | | | 287,677 | |
| | |
| |
| abfunds.com | | AB GLOBAL BOND FUND | 35 |
PORTFOLIO OF INVESTMENTS (continued)
| | | | | | | | | | | | |
| | | | | | Principal
Amount
(000) | | | U.S. $ Value | |
| |
PepsiCo, Inc.
4.65%, 02/15/2053 | | | U.S.$ | | | | 122 | | | $ | 118,011 | |
5.25%, 07/17/2054 | | | | | | | 133 | | | | 140,698 | |
Pfizer, Inc.
7.20%, 03/15/2039 | | | | | | | 95 | | | | 118,751 | |
Philip Morris International, Inc.
2.75%, 02/25/2026 | | | | | | | 599 | | | | 587,410 | |
4.25%, 11/10/2044 | | | | | | | 704 | | | | 621,981 | |
4.875%, 11/15/2043 | | | | | | | 646 | | | | 627,482 | |
5.625%, 11/17/2029 | | | | | | | 32 | | | | 33,960 | |
5.625%, 09/07/2033 | | | | | | | 267 | | | | 284,260 | |
Pilgrim’s Pride Corp.
3.50%, 03/01/2032 | | | | | | | 253 | | | | 224,738 | |
6.875%, 05/15/2034 | | | | | | | 4 | | | | 4,444 | |
Quest Diagnostics, Inc.
4.60%, 12/15/2027 | | | | | | | 681 | | | | 689,964 | |
4.625%, 12/15/2029 | | | | | | | 136 | | | | 137,661 | |
Roche Holdings, Inc.
4.20%, 09/09/2029(a) | | | | | | | 496 | | | | 498,736 | |
5.22%, 03/08/2054(a) | | | | | | | 283 | | | | 297,344 | |
Saputo, Inc.
5.25%, 11/29/2029 | | | CAD | | | | 13,719 | | | | 10,787,277 | |
5.49%, 11/20/2030 | | | | | | | 6,874 | | | | 5,471,640 | |
Sartorius Finance BV
4.50%, 09/14/2032(a) | | | EUR | | | | 200 | | | | 234,806 | |
4.875%, 09/14/2035(a) | | | | | | | 100 | | | | 119,462 | |
Sutter Health
5.16%, 08/15/2033 | | | U.S.$ | | | | 3,533 | | | | 3,665,529 | |
Takeda Pharmaceutical Co., Ltd.
5.65%, 07/05/2044 | | | | | | | 270 | | | | 284,116 | |
Tesco Corporate Treasury Services PLC
Series E
4.25%, 02/27/2031(a) | | | EUR | | | | 146 | | | | 170,515 | |
Thermo Fisher Scientific, Inc.
Series E
1.875%, 10/01/2049 | | | | | | | 137 | | | | 106,112 | |
Unilever Capital Corp.
4.25%, 08/12/2027 | | | U.S.$ | | | | 180 | | | | 181,819 | |
Universal Health Services, Inc.
4.625%, 10/15/2029 | | | | | | | 140 | | | | 139,173 | |
Upjohn Finance BV
1.91%, 06/23/2032(a) | | | EUR | | | | 676 | | | | 656,732 | |
Viterra Finance BV
Series E
1.00%, 09/24/2028(a) | | | | | | | 281 | | | | 288,428 | |
| | | | | | | | | | | | |
| | | | | | | | | | | 123,475,207 | |
| | | | | | | | | | | | |
| | |
| |
36 | AB GLOBAL BOND FUND | | abfunds.com |
PORTFOLIO OF INVESTMENTS (continued)
| | | | | | | | | | | | |
| | | | | | Principal
Amount
(000) | | | U.S. $ Value | |
| |
Energy – 2.4% | | | | | | | | | | | | |
Adnoc Murban Rsc Ltd.
5.125%, 09/11/2054(a) | | | U.S.$ | | | | 200 | | | $ | 196,600 | |
Apache Corp.
4.25%, 01/15/2030 | | | | | | | 111 | | | | 106,723 | |
5.10%, 09/01/2040 | | | | | | | 180 | | | | 159,899 | |
BG Energy Capital PLC
Series E
5.125%, 12/01/2025(a) | | | GBP | | | | 365 | | | | 488,682 | |
BP Capital Markets America, Inc.
5.02%, 11/17/2027 | | | U.S.$ | | | | 285 | | | | 293,133 | |
BP Capital Markets BV
Series E
0.93%, 12/04/2040(a) | | | EUR | | | | 437 | | | | 316,173 | |
BP Capital Markets PLC
3.25%, 03/22/2026(a)(d) | | | | | | | 3,699 | | | | 4,072,018 | |
3.625%, 03/22/2029(a)(d) | | | | | | | 8,995 | | | | 9,810,819 | |
Burlington Resources LLC
7.20%, 08/15/2031 | | | U.S.$ | | | | 173 | | | | 199,694 | |
Canadian Natural Resources Ltd.
3.85%, 06/01/2027 | | | | | | | 140 | | | | 138,040 | |
Columbia Pipelines Holding Co. LLC
5.10%, 10/01/2031(a) | | | | | | | 156 | | | | 157,373 | |
Columbia Pipelines Operating Co. LLC
6.04%, 11/15/2033(a) | | | | | | | 206 | | | | 220,243 | |
ConocoPhillips Co.
4.025%, 03/15/2062 | | | | | | | 210 | | | | 169,549 | |
5.55%, 03/15/2054 | | | | | | | 328 | | | | 343,008 | |
Continental Resources, Inc./OK
2.875%, 04/01/2032(a) | | | | | | | 155 | | | | 131,097 | |
4.375%, 01/15/2028 | | | | | | | 204 | | | | 201,080 | |
COSL Singapore Capital Ltd.
1.875%, 06/24/2025(a) | | | | | | | 200 | | | | 195,937 | |
Devon Energy Corp.
5.20%, 09/15/2034 | | | | | | | 483 | | | | 480,978 | |
7.95%, 04/15/2032 | | | | | | | 7,504 | | | | 8,817,112 | |
Diamondback Energy, Inc.
3.50%, 12/01/2029 | | | | | | | 1,565 | | | | 1,489,888 | |
4.25%, 03/15/2052 | | | | | | | 3 | | | | 2,432 | |
5.20%, 04/18/2027 | | | | | | | 321 | | | | 327,516 | |
El Paso Natural Gas Co. LLC
3.50%, 02/15/2032(a) | | | | | | | 63 | | | | 56,055 | |
Enbridge, Inc.
6.10%, 11/09/2032 | | | CAD | | | | 16,978 | | | | 14,087,748 | |
Energy Transfer LP
5.55%, 05/15/2034 | | | U.S.$ | | | | 94 | | | | 97,305 | |
5.60%, 09/01/2034 | | | | | | | 384 | | | | 398,984 | |
| | |
| |
| abfunds.com | | AB GLOBAL BOND FUND | 37 |
PORTFOLIO OF INVESTMENTS (continued)
| | | | | | | | | | |
| | | | | Principal
Amount
(000) | | | U.S. $ Value | |
| |
6.125%, 12/15/2045 | | U.S.$ | | | 205 | | | $ | 213,632 | |
Eni SpA
Series NC5
2.625%, 10/13/2025(a)(d) | | EUR | | | 170 | | | | 186,496 | |
Series X-R
4.75%, 09/12/2028(a) | | U.S.$ | | | 400 | | | | 405,779 | |
EnLink Midstream LLC
5.65%, 09/01/2034 | | | | | 106 | | | | 109,545 | |
Enterprise Products Operating LLC
4.85%, 03/15/2044 | | | | | 633 | | | | 603,202 | |
5.10%, 02/15/2045 | | | | | 618 | | | | 608,993 | |
5.55%, 02/16/2055 | | | | | 343 | | | | 354,363 | |
Series E
5.25%, 08/16/2077 | | | | | 96 | | | | 94,840 | |
EQT Corp.
5.75%, 02/01/2034 | | | | | 119 | | | | 122,566 | |
Exxon Mobil Corp.
4.23%, 03/19/2040 | | | | | 215 | | | | 201,343 | |
Greensaif Pipelines Bidco SARL
5.85%, 02/23/2036(a) | | | | | 200 | | | | 206,999 | |
Hess Corp.
4.30%, 04/01/2027 | | | | | 230 | | | | 229,945 | |
7.125%, 03/15/2033 | | | | | 9,699 | | | | 11,177,065 | |
7.875%, 10/01/2029 | | | | | 289 | | | | 330,864 | |
Hunt Oil Co. of Peru LLC Sucursal Del Peru
8.55%, 09/18/2033(a) | | | | | 5,059 | | | | 5,673,668 | |
KazMunayGas National Co. JSC
3.50%, 04/14/2033(a) | | | | | 534 | | | | 464,580 | |
5.75%, 04/19/2047(a) | | | | | 260 | | | | 239,931 | |
6.375%, 10/24/2048(a) | | | | | 750 | | | | 743,280 | |
Kinder Morgan Energy Partners LP
6.95%, 01/15/2038 | | | | | 133 | | | | 151,167 | |
Kinder Morgan, Inc.
5.45%, 08/01/2052 | | | | | 123 | | | | 119,618 | |
Marathon Oil Corp.
4.40%, 07/15/2027 | | | | | 90 | | | | 90,132 | |
5.70%, 04/01/2034 | | | | | 190 | | | | 203,831 | |
6.60%, 10/01/2037 | | | | | 190 | | | | 217,206 | |
MOL Hungarian Oil & Gas PLC
1.50%, 10/08/2027(a) | | EUR | | | 539 | | | | 561,271 | |
MPLX LP
4.95%, 03/14/2052 | | U.S.$ | | | 516 | | | | 463,112 | |
5.65%, 03/01/2053 | | | | | 271 | | | | 269,382 | |
Northern Natural Gas Co.
5.625%, 02/01/2054(a) | | | | | 182 | | | | 189,233 | |
| | |
| |
38 | AB GLOBAL BOND FUND | | abfunds.com |
PORTFOLIO OF INVESTMENTS (continued)
| | | | | | | | | | |
| | | | | Principal
Amount
(000) | | | U.S. $ Value | |
| |
Occidental Petroleum Corp.
5.20%, 08/01/2029 | | U.S.$ | | | 4,759 | | | $ | 4,837,111 | |
5.375%, 01/01/2032 | | | | | 4,954 | | | | 5,029,659 | |
6.625%, 09/01/2030 | | | | | 140 | | | | 150,983 | |
ONEOK Partners LP
6.65%, 10/01/2036 | | | | | 36 | | | | 40,076 | |
ONEOK, Inc.
4.25%, 09/24/2027 | | | | | 138 | | | | 138,132 | |
4.40%, 10/15/2029 | | | | | 2,504 | | | | 2,495,672 | |
4.75%, 10/15/2031 | | | | | 50 | | | | 50,007 | |
5.05%, 11/01/2034 | | | | | 404 | | | | 402,158 | |
5.20%, 07/15/2048 | | | | | 588 | | | | 548,674 | |
5.70%, 11/01/2054 | | | | | 637 | | | | 633,686 | |
6.05%, 09/01/2033 | | | | | 2,049 | | | | 2,190,303 | |
Ovintiv, Inc.
6.50%, 02/01/2038 | | | | | 70 | | | | 74,891 | |
Pioneer Natural Resources Co.
5.10%, 03/29/2026 | | | | | 197 | | | | 199,770 | |
Plains All American Pipeline LP/PAA Finance Corp.
5.70%, 09/15/2034 | | | | | 337 | | | | 350,196 | |
Pluspetrol Camisea SA/Pluspetrol Lote 56 SA
6.24%, 07/03/2036(a) | | | | | 230 | | | | 245,596 | |
PTTEP Treasury Center Co., Ltd.
2.99%, 01/15/2030(a) | | | | | 300 | | | | 278,438 | |
QatarEnergy LNG S3
5.84%, 09/30/2027(a) | | | | | 263 | | | | 266,467 | |
Raizen Fuels Finance SA
6.45%, 03/05/2034(a) | | | | | 7,489 | | | | 7,907,742 | |
6.95%, 03/05/2054(a) | | | | | 230 | | | | 245,693 | |
Reliance Industries Ltd.
3.625%, 01/12/2052(a) | | | | | 300 | | | | 226,986 | |
SA Global Sukuk Ltd.
1.60%, 06/17/2026(a) | | | | | 700 | | | | 667,844 | |
Saudi Arabian Oil Co.
2.25%, 11/24/2030(a) | | | | | 1,100 | | | | 966,504 | |
3.25%, 11/24/2050(a) | | | | | 410 | | | | 288,410 | |
5.75%, 07/17/2054(a) | | | | | 6,803 | | | | 6,884,636 | |
5.875%, 07/17/2064(a) | | | | | 522 | | | | 526,594 | |
Schlumberger Finance BV
0.50%, 10/15/2031(a) | | EUR | | | 327 | | | | 304,990 | |
Suncor Energy, Inc.
6.50%, 06/15/2038 | | U.S.$ | | | 225 | | | | 251,708 | |
Sweihan PV Power Co. PJSC
3.625%, 01/31/2049(a) | | | | | 463 | | | | 393,861 | |
| | |
| |
| abfunds.com | | AB GLOBAL BOND FUND | 39 |
PORTFOLIO OF INVESTMENTS (continued)
| | | | | | | | | | | | |
| | | | | | Principal
Amount
(000) | | | U.S. $ Value | |
| |
Targa Resources Corp.
6.25%, 07/01/2052 | | | U.S.$ | | | | 454 | | | $ | 488,610 | |
Tennessee Gas Pipeline Co. LLC
2.90%, 03/01/2030(a) | | | | | | | 250 | | | | 228,900 | |
Thaioil Treasury Center Co., Ltd.
2.50%, 06/18/2030(a) | | | | | | | 530 | | | | 467,228 | |
TotalEnergies Capital SA
5.425%, 09/10/2064 | | | | | | | 397 | | | | 399,708 | |
5.64%, 04/05/2064 | | | | | | | 415 | | | | 434,122 | |
TotalEnergies SE
2.00%, 01/17/2027(a)(d) | | | EUR | | | | 11,880 | | | | 12,662,364 | |
Series NC7
1.625%, 10/25/2027(a)(d) | | | | | | | 1,929 | | | | 2,001,932 | |
TransCanada PipeLines Ltd.
5.33%, 05/12/2032 | | | CAD | | | | 227 | | | | 179,996 | |
Transportadora de Gas del Peru SA
4.25%, 04/30/2028(a) | | | U.S.$ | | | | 160 | | | | 157,316 | |
Transportadora de Gas Internacional SA ESP
5.55%, 11/01/2028(a) | | | | | | | 200 | | | | 200,938 | |
Var Energi ASA
5.00%, 05/18/2027(a) | | | | | | | 269 | | | | 270,194 | |
7.50%, 01/15/2028(a) | | | | | | | 7,328 | | | | 7,838,054 | |
8.00%, 11/15/2032(a) | | | | | | | 5,514 | | | | 6,384,522 | |
Vestas Wind Systems A/S
Series E
4.125%, 06/15/2026(a) | | | EUR | | | | 240 | | | | 271,512 | |
Williams Cos., Inc. (The)
4.80%, 11/15/2029 | | | U.S.$ | | | | 238 | | | | 241,578 | |
Wintershall Dea Finance BV
1.33%, 09/25/2028(a) | | | EUR | | | | 300 | | | | 308,035 | |
| | | | | | | | | | | | |
| | | | | | | | | | | 136,321,925 | |
| | | | | | | | | | | | |
Other Industrial – 0.2% | | | | | | | | | | | | |
Alfa Desarrollo SpA
4.55%, 09/27/2051(a) | | | U.S.$ | | | | 307 | | | | 242,398 | |
CITIC Ltd.
Series E
2.85%, 02/25/2030(a) | | | | | | | 250 | | | | 232,505 | |
Ferguson Finance PLC
4.65%, 04/20/2032(a) | | | | | | | 624 | | | | 611,400 | |
LKQ Dutch Bond BV
4.125%, 03/13/2031 | | | EUR | | | | 7,325 | | | | 8,259,464 | |
Worley US Finance Sub Ltd.
Series E
0.875%, 06/09/2026(a) | | | | | | | 531 | | | | 569,884 | |
WW Grainger, Inc.
4.60%, 06/15/2045 | | | U.S.$ | | | | 234 | | | | 221,791 | |
| | | | | | | | | | | | |
| | | | | | | | | | | 10,137,442 | |
| | | | | | | | | | | | |
| | |
| |
40 | AB GLOBAL BOND FUND | | abfunds.com |
PORTFOLIO OF INVESTMENTS (continued)
| | | | | | | | | | | | |
| | | | | | Principal
Amount
(000) | | | U.S. $ Value | |
| |
Services – 0.8% | | | | | | | | | | | | |
Alibaba Group Holding Ltd.
2.125%, 02/09/2031 | | | U.S.$ | | | | 630 | | | $ | 549,436 | |
Amazon.com, Inc.
3.875%, 08/22/2037 | | | | | | | 606 | | | | 570,751 | |
4.10%, 04/13/2062 | | | | | | | 65 | | | | 56,062 | |
4.25%, 08/22/2057 | | | | | | | 360 | | | | 325,390 | |
Booking Holdings, Inc.
3.50%, 03/01/2029 | | | EUR | | | | 5,255 | | | | 5,995,364 | |
4.25%, 05/15/2029 | | | | | | | 168 | | | | 197,456 | |
4.50%, 11/15/2031 | | | | | | | 6,154 | | | | 7,443,132 | |
4.75%, 11/15/2034 | | | | | | | 199 | | | | 247,252 | |
Boost Newco Borrower LLC/GTCR W Dutch Finance Sub BV
8.50%, 01/15/2031(a) | | | GBP | | | | 424 | | | | 612,216 | |
Chicago Parking Meters LLC 4.93
4.93%, 12/30/2025(g) | | | U.S.$ | | | | 16,500 | | | | 16,297,175 | |
Equifax, Inc.
4.80%, 09/15/2029 | | | | | | | 135 | | | | 136,537 | |
Global Payments, Inc.
4.875%, 03/17/2031 | | | EUR | | | | 8,702 | | | | 10,332,783 | |
ISS Global A/S
Series E
0.875%, 06/18/2026(a) | | | | | | | 106 | | | | 113,812 | |
Mastercard, Inc.
3.85%, 03/26/2050 | | | U.S.$ | | | | 400 | | | | 338,006 | |
4.55%, 01/15/2035 | | | | | | | 355 | | | | 356,673 | |
Meituan
4.50%, 04/02/2028(a) | | | | | | | 200 | | | | 198,443 | |
Moody’s Corp.
0.95%, 02/25/2030 | | | EUR | | | | 285 | | | | 287,434 | |
5.00%, 08/05/2034 | | | U.S.$ | | | | 253 | | | | 258,955 | |
PayPal Holdings, Inc.
5.50%, 06/01/2054 | | | | | | | 130 | | | | 136,747 | |
Rentokil Initial Finance BV
Series E
4.375%, 06/27/2030(a) | | | EUR | | | | 245 | | | | 283,023 | |
Securitas Treasury Ireland DAC
Series E
4.375%, 03/06/2029(a) | | | | | | | 100 | | | | 116,421 | |
Visa, Inc.
4.30%, 12/14/2045 | | | U.S.$ | | | | 650 | | | | 605,064 | |
Wolters Kluwer NV
3.25%, 03/18/2029(a) | | | EUR | | | | 253 | | | | 285,925 | |
| | | | | | | | | | | | |
| | | | | | | | | | | 45,744,057 | |
| | | | | | | | | | | | |
| | |
| |
| abfunds.com | | AB GLOBAL BOND FUND | 41 |
PORTFOLIO OF INVESTMENTS (continued)
| | | | | | | | | | | | |
| | | | | | Principal
Amount
(000) | | | U.S. $ Value | |
| |
Technology – 1.4% | | | | | | | | | | | | |
AAC Technologies Holdings, Inc.
3.75%, 06/02/2031(a) | | | U.S.$ | | | | 290 | | | $ | 263,126 | |
Allegion US Holding Co., Inc.
5.60%, 05/29/2034 | | | | | | | 651 | | | | 680,964 | |
Analog Devices, Inc.
2.95%, 10/01/2051 | | | | | | | 422 | | | | 297,791 | |
Apple, Inc.
4.10%, 08/08/2062 | | | | | | | 100 | | | | 88,585 | |
Applied Materials, Inc.
4.80%, 06/15/2029 | | | | | | | 205 | | | | 211,247 | |
Arrow Electronics, Inc.
5.15%, 08/21/2029 | | | | | | | 135 | | | | 136,996 | |
ASML Holding NV
0.25%, 02/25/2030(a) | | | EUR | | | | 287 | | | | 280,558 | |
1.375%, 07/07/2026(a) | | | | | | | 100 | | | | 108,935 | |
Avnet, Inc.
5.50%, 06/01/2032 | | | U.S.$ | | | | 609 | | | | 618,000 | |
Baidu, Inc.
2.375%, 08/23/2031 | | | | | | | 320 | | | | 278,726 | |
Broadcom, Inc.
4.15%, 02/15/2028 | | | | | | | 4,168 | | | | 4,163,765 | |
4.35%, 02/15/2030 | | | | | | | 139 | | | | 138,748 | |
4.55%, 02/15/2032 | | | | | | | 139 | | | | 138,817 | |
4.80%, 10/15/2034 | | | | | | | 139 | | | | 138,880 | |
Cisco Systems, Inc.
5.35%, 02/26/2064 | | | | | | | 376 | | | | 398,960 | |
Concentrix Corp.
6.65%, 08/02/2026 | | | | | | | 533 | | | | 547,596 | |
Dell International LLC/EMC Corp.
4.90%, 10/01/2026 | | | | | | | 620 | | | | 626,715 | |
8.35%, 07/15/2046 | | | | | | | 125 | | | | 169,078 | |
DXC Capital Funding DAC
0.95%, 09/15/2031(a) | | | EUR | | | | 467 | | | | 422,786 | |
DXC Technology Co.
1.75%, 01/15/2026 | | | | | | | 101 | | | | 110,358 | |
Entegris, Inc.
4.75%, 04/15/2029(a) | | | U.S.$ | | | | 9,256 | | | | 9,121,456 | |
Fidelity National Information Services, Inc.
1.15%, 03/01/2026 | | | | | | | 655 | | | | 626,317 | |
2.00%, 05/21/2030 | | | EUR | | | | 5,601 | | | | 5,868,507 | |
Fiserv, Inc.
1.625%, 07/01/2030 | | | | | | | 6,152 | | | | 6,318,156 | |
2.25%, 07/01/2025 | | | GBP | | | | 250 | | | | 327,031 | |
4.50%, 05/24/2031 | | | EUR | | | | 137 | | | | 162,079 | |
| | |
| |
42 | AB GLOBAL BOND FUND | | abfunds.com |
PORTFOLIO OF INVESTMENTS (continued)
| | | | | | | | | | |
| | | | | Principal
Amount
(000) | | | U.S. $ Value | |
| |
Flex Ltd.
5.25%, 01/15/2032 | | U.S.$ | | | 136 | | | $ | 137,269 | |
Fortive Corp.
3.15%, 06/15/2026 | | | | | 681 | | | | 667,702 | |
3.70%, 08/15/2029 | | EUR | | | 250 | | | | 283,806 | |
Foxconn Far East Ltd.
Series E
2.50%, 10/28/2030(a) | | U.S.$ | | | 200 | | | | 178,891 | |
Hewlett Packard Enterprise Co.
1.75%, 04/01/2026 | | | | | 692 | | | | 665,505 | |
4.40%, 09/25/2027 | | | | | 4,616 | | | | 4,619,985 | |
4.45%, 09/25/2026 | | | | | 139 | | | | 139,292 | |
4.55%, 10/15/2029 | | | | | 139 | | | | 138,556 | |
5.00%, 10/15/2034 | | | | | 139 | | | | 137,639 | |
6.35%, 10/15/2045(f) | | | | | 579 | | | | 634,549 | |
Honeywell International, Inc.
4.125%, 11/02/2034 | | EUR | | | 100 | | | | 117,702 | |
4.65%, 07/30/2027 | | U.S.$ | | | 487 | | | | 496,770 | |
Series 4Y
3.50%, 05/17/2027 | | EUR | | | 8,594 | | | | 9,734,587 | |
HP, Inc.
2.65%, 06/17/2031 | | U.S.$ | | | 714 | | | | 631,119 | |
3.00%, 06/17/2027 | | | | | 636 | | | | 616,279 | |
IBM International Capital Pte Ltd.
5.30%, 02/05/2054 | | | | | 129 | | | | 129,967 | |
Intel Corp.
1.60%, 08/12/2028 | | | | | 2,638 | | | | 2,358,721 | |
2.60%, 05/19/2026 | | | | | 541 | | | | 524,875 | |
3.75%, 03/25/2027 | | | | | 407 | | | | 399,830 | |
3.90%, 03/25/2030 | | | | | 110 | | | | 105,703 | |
4.75%, 03/25/2050 | | | | | 470 | | | | 405,328 | |
4.90%, 08/05/2052 | | | | | 124 | | | | 108,649 | |
4.95%, 03/25/2060 | | | | | 472 | | | | 410,289 | |
5.625%, 02/10/2043 | | | | | 191 | | | | 189,874 | |
International Business Machines Corp.
1.70%, 05/15/2027 | | | | | 666 | | | | 626,969 | |
1.75%, 01/31/2031 | | EUR | | | 100 | | | | 103,774 | |
3.30%, 05/15/2026 | | U.S.$ | | | 634 | | | | 625,798 | |
3.43%, 02/09/2052 | | | | | 135 | | | | 100,887 | |
3.50%, 05/15/2029 | | | | | 100 | | | | 97,124 | |
3.625%, 02/06/2031 | | EUR | | | 240 | | | | 276,164 | |
4.00%, 06/20/2042 | | U.S.$ | | | 178 | | | | 156,768 | |
4.00%, 02/06/2043 | | EUR | | | 168 | | | | 191,977 | |
4.25%, 05/15/2049 | | U.S.$ | | | 100 | | | | 87,643 | |
4.90%, 07/27/2052 | | | | | 284 | | | | 273,003 | |
Intuit, Inc.
5.50%, 09/15/2053 | | | | | 832 | | | | 894,135 | |
| | |
| |
| abfunds.com | | AB GLOBAL BOND FUND | 43 |
PORTFOLIO OF INVESTMENTS (continued)
| | | | | | | | | | |
| | | | | Principal
Amount
(000) | | | U.S. $ Value | |
| |
KLA Corp.
3.30%, 03/01/2050 | | U.S.$ | | | 314 | | | $ | 237,272 | |
4.95%, 07/15/2052 | | | | | 119 | | | | 118,228 | |
Kyndryl Holdings, Inc.
2.05%, 10/15/2026 | | | | | 10,101 | | | | 9,604,338 | |
Lam Research Corp.
4.00%, 03/15/2029 | | | | | 225 | | | | 224,802 | |
4.875%, 03/15/2049 | | | | | 705 | | | | 690,064 | |
Lenovo Group Ltd.
3.42%, 11/02/2030(a) | | | | | 288 | | | | 267,300 | |
Nokia Oyj
Series E
2.00%, 03/11/2026(a) | | EUR | | | 253 | | | | 277,272 | |
Oracle Corp.
1.65%, 03/25/2026 | | U.S.$ | | | 625 | | | | 600,808 | |
2.65%, 07/15/2026 | | | | | 57 | | | | 55,433 | |
4.10%, 03/25/2061 | | | | | 362 | | | | 284,500 | |
5.375%, 07/15/2040 | | | | | 78 | | | | 79,505 | |
QUALCOMM, Inc.
1.30%, 05/20/2028 | | | | | 421 | | | | 383,102 | |
4.30%, 05/20/2047 | | | | | 669 | | | | 606,029 | |
4.80%, 05/20/2045 | | | | | 616 | | | | 603,558 | |
Renesas Electronics Corp.
2.17%, 11/25/2026(a) | | | | | 410 | | | | 390,522 | |
Sage Group PLC (The)
Series E
3.82%, 02/15/2028(a) | | EUR | | | 263 | | | | 300,191 | |
Salesforce, Inc.
1.50%, 07/15/2028 | | U.S.$ | | | 31 | | | | 28,417 | |
1.95%, 07/15/2031 | | | | | 230 | | | | 199,630 | |
2.70%, 07/15/2041 | | | | | 815 | | | | 616,447 | |
SAP SE
0.125%, 05/18/2026(a) | | EUR | | | 100 | | | | 106,920 | |
1.375%, 03/13/2030(a) | | | | | 200 | | | | 208,683 | |
1.625%, 03/10/2031(a) | | | | | 100 | | | | 104,291 | |
SK Hynix, Inc.
2.375%, 01/19/2031(a) | | U.S.$ | | | 555 | | | | 479,059 | |
Skyworks Solutions, Inc.
3.00%, 06/01/2031 | | | | | 213 | | | | 187,629 | |
TD SYNNEX Corp.
6.10%, 04/12/2034 | | | | | 129 | | | | 136,684 | |
Texas Instruments, Inc.
5.00%, 03/14/2053 | | | | | 120 | | | | 120,886 | |
5.05%, 05/18/2063 | | | | | 287 | | | | 287,493 | |
TSMC Global Ltd.
1.375%, 09/28/2030(a) | | | | | 540 | | | | 456,689 | |
2.25%, 04/23/2031(a) | | | | | 790 | | | | 694,552 | |
Tyco Electronics Group SA
Zero Coupon, 02/16/2029 | | EUR | | | 100 | | | | 98,539 | |
4.625%, 02/01/2030 | | U.S.$ | | | 390 | | | | 397,772 | |
| | |
| |
44 | AB GLOBAL BOND FUND | | abfunds.com |
PORTFOLIO OF INVESTMENTS (continued)
| | | | | | | | | | | | |
| | | | | | Principal
Amount
(000) | | | U.S. $ Value | |
| |
Xiaomi Best Time International Ltd.
4.10%, 07/14/2051(a) | | | U.S.$ | | | | 310 | | | $ | 249,352 | |
| | | | | | | | | | | | |
| | | | | | | | | | | 78,607,273 | |
| | | | | | | | | | | | |
Transportation - Airlines – 0.0% | | | | | | | | | | | | |
Alaska Airlines 2020-1 Class A Pass Through Trust
4.80%, 08/15/2027(a) | | | | | | | 527 | | | | 524,010 | |
Delta Air Lines, Inc./SkyMiles IP Ltd.
4.50%, 10/20/2025(a) | | | | | | | 516 | | | | 512,738 | |
4.75%, 10/20/2028(a) | | | | | | | 681 | | | | 679,866 | |
easyJet PLC
Series E
3.75%, 03/20/2031(a) | | | EUR | | | | 253 | | | | 283,955 | |
| | | | | | | | | | | | |
| | | | | | | | | | | 2,000,569 | |
| | | | | | | | | | | | |
Transportation - Railroads – 0.0% | | | | | | | | | | | | |
Canadian National Railway Co.
3.60%, 08/01/2047 | | | CAD | | | | 355 | | | | 226,083 | |
Canadian Pacific Railway Co.
6.125%, 09/15/2115 | | | U.S.$ | | | | 235 | | | | 258,592 | |
Lima Metro Line 2 Finance Ltd.
4.35%, 04/05/2036(a) | | | | | | | 401 | | | | 374,131 | |
5.875%, 07/05/2034(a) | | | | | | | 240 | | | | 243,235 | |
| | | | | | | | | | | | |
| | | | | | | | | | | 1,102,041 | |
| | | | | | | | | | | | |
Transportation - Services – 0.2% | | | | | | | | | | | | |
Abertis Infraestructuras SA
Series E
4.125%, 01/31/2028(a) | | | EUR | | | | 200 | | | | 229,384 | |
Adani Ports & Special Economic Zone Ltd.
3.10%, 02/02/2031(a) | | | U.S.$ | | | | 360 | | | | 306,000 | |
3.83%, 02/02/2032(a) | | | | | | | 290 | | | | 252,120 | |
4.375%, 07/03/2029(a) | | | | | | | 520 | | | | 490,100 | |
Autostrade per l’Italia SpA
2.00%, 12/04/2028(a) | | | EUR | | | | 170 | | | | 180,064 | |
2.00%, 01/15/2030(a) | | | | | | | 100 | | | | 103,599 | |
Series E
4.75%, 01/24/2031(a) | | | | | | | 153 | | | | 180,536 | |
Element Fleet Management Corp.
6.27%, 06/26/2026(a) | | | U.S.$ | | | | 617 | | | | 633,752 | |
ENA Master Trust
4.00%, 05/19/2048(a) | | | | | | | 1,716 | | | | 1,303,714 | |
Heathrow Funding Ltd.
6.45%, 12/10/2031(a) | | | GBP | | | | 2,905 | | | | 4,166,746 | |
HPHT Finance 21 Ltd.
2.00%, 03/19/2026(a) | | | U.S.$ | | | | 250 | | | | 241,016 | |
Mobico Group PLC
Series E
4.875%, 09/26/2031(a) | | | EUR | | | | 100 | | | | 109,562 | |
| | |
| |
| abfunds.com | | AB GLOBAL BOND FUND | 45 |
PORTFOLIO OF INVESTMENTS (continued)
| | | | | | | | | | | | |
| | | | | | Principal
Amount
(000) | | | U.S. $ Value | |
| |
Motability Operations Group PLC
Series E
3.875%, 01/24/2034(a) | | | EUR | | | | 244 | | | $ | 279,617 | |
4.25%, 06/17/2035(a) | | | | | | | 100 | | | | 117,003 | |
Penske Truck Leasing Co. LP/PTL Finance Corp.
5.25%, 07/01/2029(a) | | | U.S.$ | | | | 131 | | | | 134,834 | |
Ryder System, Inc.
Series G
4.95%, 09/01/2029 | | | | | | | 665 | | | | 677,383 | |
Sats Treasury Pte Ltd.
Series G
4.83%, 01/23/2029(a) | | | | | | | 200 | | | | 203,174 | |
TTX Co.
5.50%, 09/25/2026(a) | | | | | | | 250 | | | | 255,209 | |
| | | | | | | | | | | | |
| | | | | | | | | | | 9,863,813 | |
| | | | | | | | | | | | |
| | | | | | | | | | | 695,948,499 | |
| | | | | | | | | | | | |
Utility – 1.4% | | | | | | | | | | | | |
Electric – 0.8% | | | | | | | | | | | | |
Abu Dhabi National Energy Co. PJSC
4.875%, 04/23/2030(a) | | | | | | | 420 | | | | 432,680 | |
Adani Electricity Mumbai Ltd.
3.95%, 02/12/2030(a) | | | | | | | 810 | | | | 730,772 | |
Adani Transmission Step-One Ltd.
4.00%, 08/03/2026(a) | | | | | | | 8,086 | | | | 7,845,947 | |
4.25%, 05/21/2036(a) | | | | | | | 521 | | | | 454,529 | |
AES Andes SA
6.30%, 03/15/2029(a) | | | | | | | 200 | | | | 207,260 | |
AES Panama Generation Holdings SRL
4.375%, 05/31/2030(a) | | | | | | | 627 | | | | 565,367 | |
Alexander Funding Trust II
7.47%, 07/31/2028(a) | | | | | | | 2,863 | | | | 3,087,861 | |
AltaLink LP
4.69%, 11/28/2032 | | | CAD | | | | 3,881 | | | | 3,035,248 | |
Ameren Illinois Co.
5.55%, 07/01/2054 | | | U.S.$ | | | | 132 | | | | 141,829 | |
American Electric Power Co., Inc.
6.95%, 12/15/2054 | | | | | | | 148 | | | | 157,585 | |
Black Hills Corp.
5.95%, 03/15/2028 | | | | | | | 2 | | | | 2,098 | |
Chile Electricity PEC SpA
Zero Coupon, 01/25/2028(h) | | | | | | | 204 | | | | 167,227 | |
Cometa Energia SA de CV
6.375%, 04/24/2035(a) | | | | | | | 430 | | | | 432,531 | |
Commonwealth Edison Co.
5.30%, 02/01/2053 | | | | | | | 130 | | | | 133,312 | |
| | |
| |
46 | AB GLOBAL BOND FUND | | abfunds.com |
PORTFOLIO OF INVESTMENTS (continued)
| | | | | | | | | | |
| | | | | Principal
Amount
(000) | | | U.S. $ Value | |
| |
Series 133
3.85%, 03/15/2052 | | U.S.$ | | | 98 | | | $ | 79,724 | |
Consolidated Edison Co. of New York, Inc.
4.50%, 05/15/2058 | | | | | 102 | | | | 89,708 | |
Consorcio Transmantaro SA
5.20%, 04/11/2038(a) | | | | | 460 | | | | 450,225 | |
DTE Energy Co.
4.95%, 07/01/2027 | | | | | 425 | | | | 432,335 | |
5.85%, 06/01/2034 | | | | | 218 | | | | 234,113 | |
Duke Energy Corp.
3.10%, 06/15/2028 | | EUR | | | 241 | | | | 268,479 | |
3.75%, 04/01/2031 | | | | | 262 | | | | 295,089 | |
5.80%, 06/15/2054 | | U.S.$ | | | 131 | | | | 138,085 | |
Duke Energy Ohio, Inc.
4.30%, 02/01/2049 | | | | | 130 | | | | 112,403 | |
5.55%, 03/15/2054 | | | | | 131 | | | | 136,903 | |
Electricite de France SA
Series MPLE
5.99%, 05/23/2030(a) | | CAD | | | 4,109 | | | | 3,286,975 | |
Emirates Semb Corp. Water & Power Co. PJSC
4.45%, 08/01/2035(a) | | U.S.$ | | | 220 | | | | 213,400 | |
Enel Chile SA
4.875%, 06/12/2028 | | | | | 270 | | | | 270,270 | |
Enel Finance International NV
3.625%, 05/25/2027(a) | | | | | 410 | | | | 402,239 | |
5.50%, 06/26/2034(a) | | | | | 658 | | | | 682,509 | |
7.75%, 10/14/2052(a) | | | | | 200 | | | | 255,223 | |
Engie Energia Chile SA
3.40%, 01/28/2030(a) | | | | | 250 | | | | 229,297 | |
6.375%, 04/17/2034(a) | | | | | 485 | | | | 514,997 | |
Engie SA
1.50%, 05/30/2028(a)(d) | | EUR | | | 100 | | | | 101,182 | |
Entergy Arkansas LLC
5.75%, 06/01/2054 | | U.S.$ | | | 130 | | | | 139,900 | |
Entergy Louisiana LLC
4.75%, 09/15/2052 | | | | | 123 | | | | 113,833 | |
5.15%, 09/15/2034 | | | | | 677 | | | | 698,163 | |
5.70%, 03/15/2054 | | | | | 130 | | | | 138,614 | |
Entergy Texas, Inc.
5.55%, 09/15/2054 | | | | | 328 | | | | 339,461 | |
Eurogrid GmbH
Series E
3.72%, 04/27/2030(a) | | EUR | | | 300 | | | | 341,076 | |
Florida Power & Light Co.
4.05%, 06/01/2042 | | U.S.$ | | | 435 | | | | 388,347 | |
| | |
| |
| abfunds.com | | AB GLOBAL BOND FUND | 47 |
PORTFOLIO OF INVESTMENTS (continued)
| | | | | | | | | | |
| | | | | Principal
Amount
(000) | | | U.S. $ Value | |
| |
4.125%, 06/01/2048 | | U.S.$ | | | 125 | | | $ | 109,174 | |
5.30%, 04/01/2053 | | | | | 130 | | | | 135,970 | |
Georgia Power Co.
Series B
3.70%, 01/30/2050 | | | | | 290 | | | | 230,746 | |
Infraestructura Energetica Nova SAPI de CV
4.75%, 01/15/2051(a) | | | | | 480 | | | | 367,824 | |
Interstate Power & Light Co.
4.95%, 09/30/2034 | | | | | 137 | | | | 139,132 | |
Israel Electric Corp., Ltd.
Series G
3.75%, 02/22/2032(a) | | | | | 290 | | | | 253,825 | |
4.25%, 08/14/2028(a) | | | | | 800 | | | | 766,512 | |
LLPL Capital Pte Ltd.
6.875%, 02/04/2039(a) | | | | | 597 | | | | 617,502 | |
Minejesa Capital BV
4.625%, 08/10/2030(a) | | | | | 1,109 | | | | 1,093,983 | |
National Grid PLC
Series E
0.55%, 09/18/2029(a) | | EUR | | | 156 | | | | 153,134 | |
4.275%, 01/16/2035(a) | | | | | 248 | | | | 289,571 | |
National Rural Utilities Cooperative Finance Corp.
4.12%, 09/16/2027 | | U.S.$ | | | 691 | | | | 695,773 | |
5.15%, 06/15/2029 | | | | | 665 | | | | 690,652 | |
Nevada Power Co.
Series GG
5.90%, 05/01/2053 | | | | | 385 | | | | 416,094 | |
NextEra Energy Capital Holdings, Inc.
6.70%, 09/01/2054 | | | | | 1,705 | | | | 1,786,923 | |
Niagara Energy SAC
5.75%, 10/03/2034(a) | | | | | 690 | | | | 692,070 | |
Niagara Mohawk Power Corp.
4.28%, 12/15/2028(a) | | | | | 230 | | | | 226,533 | |
5.29%, 01/17/2034(a) | | | | | 7,216 | | | | 7,362,657 | |
Oklahoma Gas & Electric Co.
5.60%, 04/01/2053 | | | | | 133 | | | | 140,076 | |
Oncor Electric Delivery Co. LLC
5.55%, 06/15/2054(a) | | | | | 132 | | | | 140,423 | |
Pacific Gas & Electric Co.
5.80%, 05/15/2034 | | | | | 283 | | | | 299,212 | |
PacifiCorp
4.15%, 02/15/2050 | | | | | 390 | | | | 323,681 | |
5.10%, 02/15/2029 | | | | | 23 | | | | 23,754 | |
6.35%, 07/15/2038 | | | | | 110 | | | | 121,566 | |
PECO Energy Co.
2.85%, 09/15/2051 | | | | | 155 | | | | 105,048 | |
| | |
| |
48 | AB GLOBAL BOND FUND | | abfunds.com |
PORTFOLIO OF INVESTMENTS (continued)
| | | | | | | | | | | | |
| | | | | | Principal
Amount
(000) | | | U.S. $ Value | |
| |
PPL Capital Funding, Inc.
5.25%, 09/01/2034 | | | U.S.$ | | | | 68 | | | $ | 70,002 | |
Public Service Electric & Gas Co.
3.80%, 03/01/2046 | | | | | | | 410 | | | | 341,950 | |
5.30%, 08/01/2054 | | | | | | | 132 | | | | 138,301 | |
5.45%, 03/01/2054 | | | | | | | 375 | | | | 398,026 | |
Puget Sound Energy, Inc.
5.685%, 06/15/2054 | | | | | | | 131 | | | | 140,705 | |
San Diego Gas & Electric Co.
Series UUU
3.32%, 04/15/2050 | | | | | | | 360 | | | | 265,085 | |
Series WWW
2.95%, 08/15/2051 | | | | | | | 231 | | | | 162,174 | |
Sierra Pacific Power Co.
5.90%, 03/15/2054 | | | | | | | 178 | | | | 194,922 | |
Southern California Edison Co.
5.70%, 03/01/2053 | | | | | | | 120 | | | | 126,621 | |
5.875%, 12/01/2053 | | | | | | | 123 | | | | 133,392 | |
TenneT Holding BV
2.37%, 07/22/2025(a)(d) | | | EUR | | | | 125 | | | | 136,843 | |
TNB Global Ventures Capital Bhd
4.85%, 11/01/2028(a) | | | U.S.$ | | | | 430 | | | | 437,525 | |
Virginia Electric & Power Co.
5.55%, 08/15/2054 | | | | | | | 480 | | | | 504,802 | |
| | | | | | | | | | | | |
| | | | | | | | | | | 47,978,979 | |
| | | | | | | | | | | | |
Natural Gas – 0.3% | | | | | | | | | | | | |
Boston Gas Co.
6.12%, 07/20/2053(a) | | | | | | | 316 | | | | 333,189 | |
Cadent Finance PLC
Series E
0.625%, 03/19/2030(a) | | | EUR | | | | 14,235 | | | | 13,749,884 | |
4.25%, 07/05/2029(a) | | | | | | | 210 | | | | 245,295 | |
Centrica PLC
Series E
4.375%, 03/13/2029(a) | | | GBP | | | | 120 | | | | 157,389 | |
CU, Inc.
5.90%, 11/20/2034 | | | CAD | | | | 1,227 | | | | 1,030,737 | |
Grupo Energia Bogota SA ESP
7.85%, 11/09/2033(a) | | | U.S.$ | | | | 200 | | | | 231,397 | |
National Grid North America, Inc.
Series E
4.67%, 09/12/2033(a) | | | EUR | | | | 100 | | | | 119,451 | |
| | | | | | | | | | | | |
| | | | | | | | | | | 15,867,342 | |
| | | | | | | | | | | | |
Other Utility – 0.3% | | | | | | | | | | | | |
Buffalo Energy Mexico Holdings/Buffalo Energy Infrastructure/Buffalo Energy 7.875%, 02/15/2039(a) | | | U.S.$ | | | | 435 | | | | 464,363 | |
| | |
| |
| abfunds.com | | AB GLOBAL BOND FUND | 49 |
PORTFOLIO OF INVESTMENTS (continued)
| | | | | | | | | | | | |
| | | | | | Principal
Amount
(000) | | | U.S. $ Value | |
| |
Suez SACA
Series E
2.375%, 05/24/2030(a) | | | EUR | | | | 12,900 | | | $ | 13,689,412 | |
5.00%, 11/03/2032(a) | | | | | | | 4,600 | | | | 5,613,572 | |
| | | | | | | | | | | | |
| | | | | | | | | | | 19,767,347 | |
| | | | | | | | | | | | |
| | | | | | | | | | | 83,613,668 | |
| | | | | | | | | | | | |
Total Corporates - Investment Grade
(cost $1,470,208,436) | | | | | | | | | | | 1,523,167,785 | |
| | | | | | | | | | | | |
| | | | | | | | | | | | |
MORTGAGE PASS-THROUGHS –13.7% | | | | | | | | | | | | |
Agency Fixed Rate 30-Year – 13.7% | | | | | | | | | | | | |
Federal Home Loan Mortgage Corp. Gold
Series 2019
4.50%, 02/01/2049 | | | U.S.$ | | | | 5,925 | | | | 5,932,423 | |
Federal National Mortgage Association
Series 2005
5.50%, 02/01/2035 | | | | | | | 5 | | | | 5,305 | |
Series 2007
5.50%, 09/01/2036 | | | | | | | 3 | | | | 3,426 | |
5.50%, 08/01/2037 | | | | | | | 4 | | | | 3,909 | |
Series 2008
5.50%, 03/01/2037 | | | | | | | 2 | | | | 1,609 | |
Series 2017
3.50%, 06/01/2047 | | | | | | | 10 | | | | 9,849 | |
3.50%, 08/01/2047 | | | | | | | 17 | | | | 16,258 | |
3.50%, 10/01/2047 | | | | | | | 123 | | | | 116,435 | |
3.50%, 01/01/2048 | | | | | | | 6 | | | | 5,823 | |
Series 2018
3.50%, 01/01/2048 | | | | | | | 4 | | | | 4,019 | |
3.50%, 02/01/2048 | | | | | | | 140 | | | | 132,054 | |
3.50%, 03/01/2048 | | | | | | | 3,386 | | | | 3,205,440 | |
3.50%, 05/01/2048 | | | | | | | 13 | | | | 11,952 | |
4.50%, 09/01/2048 | | | | | | | 6,919 | | | | 6,918,672 | |
4.50%, 12/01/2048 | | | | | | | 4,646 | | | | 4,648,987 | |
Government National Mortgage Association
Series 2022
5.00%, 11/20/2052 | | | | | | | 35,780 | | | | 35,890,466 | |
Series 2023
4.50%, 06/20/2053 | | | | | | | 17,850 | | | | 17,620,719 | |
Series 2024
2.50%, 10/01/2054, TBA | | | | | | | 77,474 | | | | 68,241,833 | |
3.00%, 10/01/2054, TBA | | | | | | | 86,646 | | | | 79,018,348 | |
4.00%, 10/01/2054, TBA | | | | | | | 17,468 | | | | 16,889,484 | |
4.50%, 10/01/2054, TBA | | | | | | | 112,495 | | | | 111,062,286 | |
5.00%, 10/01/2054, TBA | | | | | | | 103,295 | | | | 103,485,652 | |
| | |
| |
50 | AB GLOBAL BOND FUND | | abfunds.com |
PORTFOLIO OF INVESTMENTS (continued)
| | | | | | | | | | | | |
| | | | | | Principal
Amount
(000) | | | U.S. $ Value | |
| |
5.50%, 10/01/2054, TBA | | | U.S.$ | | | | 187,007 | | | $ | 188,818,163 | |
6.00%, 10/01/2054, TBA | | | | | | | 33,278 | | | | 33,836,780 | |
Uniform Mortgage-Backed Security
Series 2024
2.00%, 10/01/2054, TBA | | | | | | | 65,737 | | | | 54,355,981 | |
6.00%, 10/01/2054, TBA | | | | | | | 53,685 | | | | 54,861,246 | |
6.50%, 10/01/2054, TBA | | | | | | | 9,793 | | | | 10,096,002 | |
| | | | | | | | | | | | |
| | | |
Total Mortgage Pass-Throughs
(cost $799,343,851) | | | | | | | | | | | 795,193,121 | |
| | | | | | | | | | | | |
| | | | | | | | | | | | |
| COVERED BONDS – 3.1% | | | | | | | | | | | | |
Banco de Sabadell SA
1.00%, 04/26/2027(a) | | | EUR | | | | 7,900 | | | | 8,445,568 | |
Bank of Montreal
Series E
0.125%, 01/26/2027(a) | | | | | | | 17,195 | | | | 18,123,913 | |
Bank of Nova Scotia (The)
0.01%, 01/14/2027(a) | | | | | | | 17,880 | | | | 18,808,395 | |
Series E
0.01%, 12/15/2027(a) | | | | | | | 3,620 | | | | 3,724,599 | |
BPCE SFH SA
0.625%, 09/22/2027(a) | | | | | | | 5,200 | | | | 5,482,901 | |
Caisse de Refinancement de l’Habitat SA
2.75%, 04/12/2028(a) | | | | | | | 7,300 | | | | 8,183,138 | |
Caisse Francaise de Financement Local
0.01%, 02/22/2028(a) | | | | | | | 7,100 | | | | 7,257,622 | |
Cie de Financement Foncier SA
3.125%, 05/18/2027(a) | | | | | | | 4,700 | | | | 5,314,675 | |
Commonwealth Bank of Australia
Series E
0.75%, 02/28/2028(a) | | | | | | | 4,795 | | | | 5,029,203 | |
Credit Agricole Home Loan SFH SA
2.875%, 06/23/2028(a) | | | | | | | 1,600 | | | | 1,803,490 | |
Series E
0.01%, 04/12/2028(a) | | | | | | | 1,900 | | | | 1,937,901 | |
0.875%, 08/31/2027(a) | | | | | | | 1,900 | | | | 2,019,763 | |
3.375%, 09/04/2028(a) | | | | | | | 8,400 | | | | 9,637,951 | |
National Australia Bank Ltd.
0.01%, 01/06/2029(a) | | | | | | | 17,865 | | | | 17,819,494 | |
Series G
0.625%, 03/16/2027(a) | | | | | | | 11,055 | | | | 11,751,823 | |
Nationwide Building Society
3.625%, 03/15/2028(a) | | | | | | | 10,740 | | | | 12,383,952 | |
Series E
1.125%, 05/31/2028(a) | | | | | | | 1,570 | | | | 1,661,247 | |
Royal Bank of Canada
Series E
0.01%, 01/21/2027(a) | | | | | | | 3,100 | | | | 3,261,155 | |
| | |
| |
| abfunds.com | | AB GLOBAL BOND FUND | 51 |
PORTFOLIO OF INVESTMENTS (continued)
| | | | | | | | | | | | |
| | | | | | Principal
Amount
(000) | | | U.S. $ Value | |
| |
Santander UK PLC
1.125%, 03/12/2027(a) | | | EUR | | | | 4,609 | | | $ | 4,961,415 | |
Series G
0.05%, 01/12/2027(a) | | | | | | | 15,000 | | | | 15,779,211 | |
Toronto-Dominion Bank (The)
Series 28
0.10%, 07/19/2027(a) | | | | | | | 3,770 | | | | 3,925,825 | |
Series G
0.86%, 03/24/2027(a) | | | | | | | 1,500 | | | | 1,603,053 | |
Westpac Banking Corp.
Series E
0.01%, 09/22/2028(a) | | | | | | | 10,098 | | | | 10,152,495 | |
| | | | | | | | | | | | |
| | | |
Total Covered Bonds
(cost $175,488,240) | | | | | | | | | | | 179,068,789 | |
| | | | | | | | | | | | |
| | | | | | | | | | | | |
COLLATERALIZED MORTGAGE OBLIGATIONS – 2.9% | | | | | | | | | | | | |
Risk Share Floating Rate – 2.8% | | | | | | | | | | | | |
Bellemeade Re Ltd.
Series 2021-3A, Class A2
6.28% (CME Term SOFR + 1.00%), 09/25/2031(a)(e) | | | U.S.$ | | | | 7,225 | | | | 7,217,652 | |
Connecticut Avenue Securities Trust
Series 2021-R01, Class 1M2
6.83% (CME Term SOFR + 1.55%), 10/25/2041(a)(e) | | | | | | | 758 | | | | 760,720 | |
Series 2022-R06, Class 1M1
8.03% (CME Term SOFR + 2.75%), 05/25/2042(a)(e) | | | | | | | 4,713 | | | | 4,841,348 | |
Series 2022-R08, Class 1M1
7.83% (CME Term SOFR + 2.55%), 07/25/2042(a)(e) | | | | | | | 9,555 | | | | 9,808,473 | |
Series 2023-R04, Class 1M1
7.56% (CME Term SOFR + 2.30%), 05/25/2043(a)(e) | | | | | | | 5,398 | | | | 5,530,057 | |
Series 2023-R05, Class 1M1
7.16% (CME Term SOFR + 1.90%), 06/25/2043(a)(e) | | | | | | | 4,826 | | | | 4,875,160 | |
Series 2024-R04, Class 1M1
6.38% (CME Term SOFR + 1.10%), 05/25/2044(a)(e) | | | | | | | 6,366 | | | | 6,366,247 | |
Series 2024-R06, Class 1M1
6.39% (CME Term SOFR + 1.05%), 09/25/2044(a)(e) | | | | | | | 4,057 | | | | 4,058,589 | |
Eagle RE Ltd.
Series 2021-2, Class M1B
7.33% (CME Term SOFR + 2.05%), 04/25/2034(a)(e) | | | | | | | 677 | | | | 678,044 | |
| | |
| |
52 | AB GLOBAL BOND FUND | | abfunds.com |
PORTFOLIO OF INVESTMENTS (continued)
| | | | | | | | | | |
| | | | | Principal
Amount
(000) | | | U.S. $ Value | |
| |
Federal Home Loan Mortgage Corp. Structured Agency Credit Risk Debt Notes
Series 2021-DNA5, Class M2
6.93% (CME Term SOFR + 1.65%), 01/25/2034(a)(e) | | U.S.$ | | | 3,379 | | | $ | 3,397,929 | |
Series 2021-DNA6, Class M1
6.08% (CME Term SOFR + 0.80%), 10/25/2041(a)(e) | | | | | 125 | | | | 124,972 | |
Series 2021-DNA6, Class M2
6.78% (CME Term SOFR + 1.50%), 10/25/2041(a)(e) | | | | | 15,395 | | | | 15,479,361 | |
Series 2021-DNA7, Class M1
6.13% (CME Term SOFR + 0.85%), 11/25/2041(a)(e) | | | | | 439 | | | | 438,268 | |
Series 2021-DNA7, Class M2
7.08% (CME Term SOFR + 1.80%), 11/25/2041(a)(e) | | | | | 13,277 | | | | 13,414,953 | |
Series 2021-HQA4, Class M1
6.23% (CME Term SOFR + 0.95%), 12/25/2041(a)(e) | | | | | 12,207 | | | | 12,161,408 | |
Series 2021-HQA4, Class M2
7.63% (CME Term SOFR + 2.35%), 12/25/2041(a)(e) | | | | | 6,919 | | | | 7,006,469 | |
Series 2023-DNA1, Class M1A
7.36% (CME Term SOFR + 2.10%), 03/25/2043(a)(e) | | | | | 12,170 | | | | 12,321,721 | |
Federal Home Loan Mortgage Corp. Structured Agency Credit Risk Debt Notes Debt Notes 2015-DNA1
Series 2015-DNA1, Class M3
8.695% (CME Term SOFR + 3.41%), 10/25/2027(e) | | | | | 328 | | | | 328,470 | |
Federal Home Loan Mortgage Corp. Structured Agency Credit Risk Debt Notes 2022-DNA1
Series 2022-DNA1, Class M1A
6.28% (CME Term SOFR + 1.00%), 01/25/2042(a)(e) | | | | | 2,868 | | | | 2,860,424 | |
Federal Home Loan Mortgage Corp. Structured Agency Credit Risk Debt Notes 2022-DNA3
Series 2022-DNA3, Class M2
9.63% (CME Term SOFR + 4.35%), 04/25/2042(a)(e) | | | | | 4,004 | | | | 4,260,748 | |
| | |
| |
| abfunds.com | | AB GLOBAL BOND FUND | 53 |
PORTFOLIO OF INVESTMENTS (continued)
| | | | | | | | | | |
| | | | | Principal
Amount
(000) | | | U.S. $ Value | |
| |
Federal Home Loan Mortgage Corp. Structured Agency Credit Risk Debt Notes 2023-DNA2
Series 2023-DNA2, Class M1A
7.36% (CME Term SOFR + 2.10%), 04/25/2043(a)(e) | | U.S.$ | | | 10,893 | | | $ | 11,058,516 | |
Series 2023-DNA2, Class M1B
8.51% (CME Term SOFR + 3.25%), 04/25/2043(a)(e) | | | | | 2,664 | | | | 2,797,222 | |
Federal Home Loan Mortgage Corp. Structured Agency Credit Risk Debt Notes 2024-DNA2
Series 2024-DNA2, Class A1
6.53% (CME Term SOFR + 1.25%), 05/25/2044(a)(e) | | | | | 2,080 | | | | 2,082,046 | |
Series 2024-DNA2, Class M1
6.48% (CME Term SOFR + 1.20%), 05/25/2044(a)(e) | | | | | 1,953 | | | | 1,952,976 | |
Federal Home Loan Mortgage Corp. Structured Agency Credit Risk Debt Notes 2024-HQA2
Series 2024-HQA2, Class M1
6.48% (CME Term SOFR + 1.20%), 08/25/2044(a)(e) | | | | | 11,190 | | | | 11,195,112 | |
Federal National Mortgage Association Connecticut Avenue Securities
Series 2014-C04, Class 1M2
10.295% (CME Term SOFR + 5.01%), 11/25/2024(e) | | | | | 1,037 | | | | 1,037,431 | |
Series 2015-C01, Class 1M2
9.695% (CME Term SOFR + 4.41%), 02/25/2025(e) | | | | | 950 | | | | 960,276 | |
Series 2015-C02, Class 1M2
9.395% (CME Term SOFR + 4.11%), 05/25/2025(e) | | | | | 1,030 | | | | 1,047,656 | |
Series 2015-C03, Class 1M2
10.395% (CME Term SOFR + 5.11%), 07/25/2025(e) | | | | | 242 | | | | 248,026 | |
Series 2015-C04, Class 1M2
11.095% (CME Term SOFR + 5.81%), 04/25/2028(e) | | | | | 766 | | | | 798,581 | |
Series 2015-C04, Class 2M2
10.945% (CME Term SOFR + 5.66%), 04/25/2028(e) | | | | | 3,070 | | | | 3,091,584 | |
Series 2016-C01, Class 2M2
12.345% (CME Term SOFR + 7.06%), 08/25/2028(e) | | | | | 379 | | | | 397,876 | |
| | |
| |
54 | AB GLOBAL BOND FUND | | abfunds.com |
PORTFOLIO OF INVESTMENTS (continued)
| | | | | | | | | | | | |
| | | | | | Principal
Amount
(000) | | | U.S. $ Value | |
| |
Series 2016-C02, Class 1M2
11.395% (CME Term SOFR + 6.11%), 09/25/2028(e) | | | U.S.$ | | | | 896 | | | $ | 923,271 | |
Series 2021-R02, Class 2M2
7.28% (CME Term SOFR + 2.00%), 11/25/2041(a)(e) | | | | | | | 7,361 | | | | 7,388,243 | |
Home RE Ltd.
Series 2023-1, Class M1A
7.43% (CME Term SOFR + 2.15%), 10/25/2033(a)(e) | | | | | | | 2,697 | | | | 2,699,837 | |
JP Morgan Madison Avenue Securities Trust
Series 2015-CH1, Class M2
10.895% (CME Term SOFR + 5.61%), 10/25/2025(a)(e) | | | | | | | 1,311 | | | | 1,345,115 | |
PMT Credit Risk Transfer Trust
Series 2019-3R, Class A
9.06% (CME Term SOFR + 3.81%), 11/27/2031(a)(e) | | | | | | | 274 | | | | 274,525 | |
| | | | | | | | | | | | |
| | | | | | | | | | | 165,229,306 | |
| | | | | | | | | | | | |
Non-Agency Fixed Rate – 0.1% | | | | | | | | | | | | |
Alternative Loan Trust
Series 2006-24CB, Class A15
5.75%, 08/25/2036 | | | | | | | 1,215 | | | | 656,051 | |
Series 2006-26CB, Class A6
6.25%, 09/25/2036 | | | | | | | 110 | | | | 54,903 | |
Series 2006-26CB, Class A8
6.25%, 09/25/2036 | | | | | | | 412 | | | | 205,099 | |
Series 2006-J1, Class 1A11
5.50%, 02/25/2036 | | | | | | | 568 | | | | 393,159 | |
Series 2007-15CB, Class A19
5.75%, 07/25/2037 | | | | | | | 243 | | | | 141,177 | |
CHL Mortgage Pass-Through Trust
Series 2007-3, Class A30
5.75%, 04/25/2037 | | | | | | | 757 | | | | 355,212 | |
Series 2007-HY4, Class 1A1
4.84%, 09/25/2047 | | | | | | | 204 | | | | 187,415 | |
Citigroup Mortgage Loan Trust
Series 2007-AR4, Class 1A1A
4.71%, 03/25/2037 | | | | | | | 105 | | | | 88,603 | |
Residential Accredit Loans, Inc. Trust
Series 2005-QS14, Class 3A1
6.00%, 09/25/2035 | | | | | | | 433 | | | | 365,455 | |
| | |
| |
| abfunds.com | | AB GLOBAL BOND FUND | 55 |
PORTFOLIO OF INVESTMENTS (continued)
| | | | | | | | | | | | |
| | | | | | Principal
Amount
(000) | | | U.S. $ Value | |
| |
Wells Fargo Mortgage Backed Securities Trust
Series 2007-AR7, Class A1
6.23%, 12/28/2037 | | | U.S.$ | | | | 623 | | | $ | 550,115 | |
| | | | | | | | | | | | |
| | | | | | | | | | | 2,997,189 | |
| | | | | | | | | | | | |
Non-Agency Floating Rate – 0.0% | | | | | | | | | | | | |
First Horizon Alternative Mortgage Securities Trust
Series 2007-FA2, Class 1A10
5.22% (CME Term SOFR 1 Month + 0.36%), 04/25/2037(e) | | | | | | | 527 | | | | 122,358 | |
| | | | | | | | | | | | |
| | | |
Total Collateralized Mortgage Obligations
(cost $168,785,679) | | | | | | | | | | | 168,348,853 | |
| | | | | | | | | | | | |
| | | | | | | | | | | | |
COLLATERALIZED LOAN OBLIGATIONS – 2.6% | | | | | | | | | | | | |
CLO - Floating Rate – 2.6% | | | | | | | | | | | | |
AGL CLO 16 Ltd.
Series 2021-16A, Class A
6.67% (CME Term SOFR 3 Month + 1.39%), 01/20/2035(a)(e) | | | | | | | 700 | | | | 701,389 | |
AIMCO CLO
Series 2015-AA, Class AR3
6.41% (CME Term SOFR 3 Month + 1.25%), 10/17/2034(a)(e) | | | | | | | 8,010 | | | | 8,013,388 | |
Allegro CLO XI Ltd.
Series 2019-2A, Class BR
7.18% (CME Term SOFR 3 Month + 1.90%), 01/19/2033(a)(e) | | | | | | | 11,755 | | | | 11,783,747 | |
Apidos CLO XXXII
Series 2019-32A, Class A1R
6.38% (CME Term SOFR 3 Month + 1.10%), 01/20/2033(a)(e) | | | | | | | 7,975 | | | | 7,979,586 | |
Series 2019-32A, Class B1R
6.78% (CME Term SOFR 3 Month + 1.50%), 01/20/2033(a)(e) | | | | | | | 980 | | | | 980,416 | |
Apidos CLO XXXV
Series 2021-35A, Class A
6.59% (CME Term SOFR 3 Month + 1.31%), 04/20/2034(a)(e) | | | | | | | 5,030 | | | | 5,030,025 | |
Bain Capital Credit CLO Ltd.
Series 2020-1A, Class BR
7.08% (CME Term SOFR 3 Month + 1.80%), 04/18/2033(a)(e) | | | | | | | 6,802 | | | | 6,816,451 | |
| | |
| |
56 | AB GLOBAL BOND FUND | | abfunds.com |
PORTFOLIO OF INVESTMENTS (continued)
| | | | | | | | | | |
| | | | | Principal
Amount
(000) | | | U.S. $ Value | |
| |
Balboa Bay Loan Funding Ltd.
Series 2022-1A, Class A
6.71% (CME Term SOFR 3 Month + 1.43%), 04/20/2034(a)(e) | | U.S.$ | | | 4,500 | | | $ | 4,504,194 | |
Ballyrock CLO 16 Ltd.
Series 2021-16A, Class A1
6.67% (CME Term SOFR 3 Month + 1.39%), 07/20/2034(a)(e) | | | | | 3,917 | | | | 3,919,909 | |
Betony CLO 2 Ltd.
Series 2018-1A, Class A1
6.60% (CME Term SOFR 3 Month + 1.34%), 04/30/2031(a)(e) | | | | | 1,398 | | | | 1,400,323 | |
Elmwood CLO 15 Ltd.
Series 2022-2A, Class A1
6.62% (CME Term SOFR 3 Month + 1.34%), 04/22/2035(a)(e) | | | | | 5,000 | | | | 5,006,935 | |
Invesco CLO Ltd.
Series 2021-1A, Class A1
6.56% (CME Term SOFR 3 Month + 1.26%), 04/15/2034(a)(e) | | | | | 5,500 | | | | 5,503,690 | |
Kings Park CLO Ltd.
Series 2021-1A, Class A
6.67% (CME Term SOFR 3 Month + 1.39%), 01/21/2035(a)(e) | | | | | 5,450 | | | | 5,451,074 | |
Marble Point CLO XI Ltd.
Series 2017-2A, Class A
6.72% (CME Term SOFR 3 Month + 1.44%), 12/18/2030(a)(e) | | | | | 7,067 | | | | 7,070,238 | |
Octagon Loan Funding Ltd.
Series 2014-1A, Class ARR
6.54% (CME Term SOFR 3 Month + 1.44%), 11/18/2031(a)(e) | | | | | 6,845 | | | | 6,849,310 | |
OZLM XVIII Ltd.
Series 2018-18A, Class A
6.58% (CME Term SOFR 3 Month + 1.28%), 04/15/2031(a)(e) | | | | | 9,578 | | | | 9,587,355 | |
Peace Park CLO Ltd.
Series 2021-1A, Class A
6.67% (CME Term SOFR 3 Month + 1.39%), 10/20/2034(a)(e) | | | | | 4,620 | | | | 4,622,629 | |
Series 2021-1A, Class B1
7.14% (CME Term SOFR 3 Month + 1.86%), 10/20/2034(a)(e) | | | | | 3,667 | | | | 3,673,219 | |
Pikes Peak CLO 15 2023 Ltd.
Series 2023-15A, Class A1
7.03% (CME Term SOFR 3 Month + 1.75%), 10/20/2036(a)(e) | | | | | 4,990 | | | | 5,022,394 | |
| | |
| |
| abfunds.com | | AB GLOBAL BOND FUND | 57 |
PORTFOLIO OF INVESTMENTS (continued)
| | | | | | | | | | | | |
| | | | | | Principal
Amount
(000) | | | U.S. $ Value | |
| |
Pikes Peak CLO 8
Series 2021-8A, Class A
6.71% (CME Term SOFR 3 Month + 1.43%), 07/20/2034(a)(e) | | | U.S.$ | | | | 14,279 | | | $ | 14,293,601 | |
Rad CLO 14 Ltd.
Series 2021-14A, Class A
6.73% (CME Term SOFR 3 Month + 1.43%), 01/15/2035(a)(e) | | | | | | | 4,750 | | | | 4,759,595 | |
Regatta XXIV Funding Ltd.
Series 2021-5A, Class A1
6.69% (CME Term SOFR 3 Month + 1.41%), 01/20/2035(a)(e) | | | | | | | 450 | | | | 450,685 | |
Rockford Tower CLO Ltd.
Series 2018-2A, Class A
6.70% (CME Term SOFR 3 Month + 1.42%), 10/20/2031(a)(e) | | | | | | | 6,027 | | | | 6,031,805 | |
Silver Point CLO 3 Ltd.
Series 2023-3A, Class A1
7.21% (CME Term SOFR 3 Month + 1.93%), 11/29/2036(a)(e) | | | | | | | 10,514 | | | | 10,595,083 | |
VERDE CLO Ltd.
Series 2019-1A, Class ARR
6.27% (CME Term SOFR 3 Month + 1.11%), 04/15/2032(a)(e) | | | | | | | 5,000 | | | | 5,001,065 | |
Voya CLO Ltd.
Series 2018-3A, Class BR2
7.10% (CME Term SOFR 3 Month + 1.80%), 10/15/2031(a)(e) | | | | | | | 4,534 | | | | 4,535,286 | |
| | | | | | | | | | | | |
| | | |
Total Collateralized Loan Obligations
(cost $148,858,535) | | | | | | | | | | | 149,583,392 | |
| | | | | | | | | | | | |
| | | | | | | | | | | | |
LOCAL GOVERNMENTS - PROVINCIAL BONDS – 2.3% | | | | | | | | | | | | |
Canada – 2.3% | | | | | | | | | | | | |
Hydro Quebec Interest Strip
Zero Coupon, 08/15/2038 | | | CAD | | | | 5,631 | | | | 2,364,768 | |
Zero Coupon, 08/15/2041 | | | | | | | 5,631 | | | | 2,068,125 | |
Zero Coupon, 02/15/2042 | | | | | | | 5,631 | | | | 2,012,164 | |
Zero Coupon, 08/15/2042 | | | | | | | 5,631 | | | | 1,980,090 | |
Zero Coupon, 02/15/2043 | | | | | | | 5,631 | | | | 1,922,545 | |
Zero Coupon, 02/15/2044 | | | | | | | 5,631 | | | | 1,844,437 | |
Zero Coupon, 08/15/2044 | | | | | | | 5,631 | | | | 1,804,453 | |
Series JN
Zero Coupon, 02/15/2046 | | | | | | | 5,631 | | | | 1,696,441 | |
Province of Ontario Canada
2.90%, 12/02/2046 | | | | | | | 60,112 | | | | 36,668,311 | |
| | |
| |
58 | AB GLOBAL BOND FUND | | abfunds.com |
PORTFOLIO OF INVESTMENTS (continued)
| | | | | | | | | | | | |
| | | | | | Principal
Amount
(000) | | | U.S. $ Value | |
| |
3.45%, 06/02/2045 | | | CAD | | | | 13,812 | | | $ | 9,284,419 | |
3.50%, 06/02/2043 | | | | | | | 13,598 | | | | 9,287,101 | |
Series E
0.375%, 04/08/2027(a) | | | EUR | | | | 9,347 | | | | 9,893,080 | |
Province of Ontario Generic Coupon Strip
Zero Coupon, 12/02/2036 | | | CAD | | | | 5,669 | | | | 2,591,270 | |
Zero Coupon, 06/02/2037 | | | | | | | 5,669 | | | | 2,529,757 | |
Zero Coupon, 12/02/2037 | | | | | | | 5,631 | | | | 2,454,028 | |
Zero Coupon, 06/02/2038 | | | | | | | 5,669 | | | | 2,411,743 | |
Zero Coupon, 12/02/2038 | | | | | | | 5,669 | | | | 2,355,183 | |
Zero Coupon, 06/02/2039 | | | | | | | 5,669 | | | | 2,300,795 | |
Zero Coupon, 06/02/2040 | | | | | | | 5,669 | | | | 2,200,170 | |
Zero Coupon, 12/02/2040 | | | | | | | 5,631 | | | | 2,138,458 | |
Zero Coupon, 06/02/2041 | | | | | | | 5,631 | | | | 2,084,950 | |
Zero Coupon, 12/02/2041 | | | | | | | 5,669 | | | | 2,069,348 | |
Zero Coupon, 06/02/2042 | | | | | | | 5,669 | | | | 2,003,150 | |
Zero Coupon, 12/02/2046 | | | | | | | 5,631 | | | | 1,641,780 | |
Zero Coupon, 06/02/2047 | | | | | | | 5,669 | | | | 1,619,681 | |
Series INT
Zero Coupon, 06/02/2043 | | | | | | | 5,631 | | | | 1,900,474 | |
Zero Coupon, 12/02/2045 | | | | | | | 5,631 | | | | 1,710,997 | |
Zero Coupon, 06/02/2046 | | | | | | | 5,669 | | | | 1,687,710 | |
Province of Quebec Canada
0.875%, 05/04/2027(a) | | | EUR | | | | 19,183 | | | | 20,546,695 | |
| | | | | | | | | | | | |
| | | |
Total Local Governments - Provincial Bonds (cost $129,281,295) | | | | | | | | | | | 135,072,123 | |
| | | | | | | | | | | | |
| | | | | | | | | | | | |
ASSET-BACKED SECURITIES – 2.1% | | | | | | | | | | | | |
Other ABS - Fixed Rate – 1.6% | | | | | | | | | | | | |
Accelerated LLC
Series 2024-1A, Class A
4.68%, 08/22/2044(a)(i) | | | U.S.$ | | | | 8,161 | | | | 8,139,960 | |
Affirm Asset Securitization Trust
Series 2024-B, Class A
4.62%, 09/15/2029(a) | | | | | | | 4,022 | | | | 4,025,230 | |
Amur Equipment Finance Receivables XII LLC
Series 2023-1A, Class A2
6.09%, 12/20/2029(a) | | | | | | | 3,131 | | | | 3,178,684 | |
BHG Securitization Trust
Series 2023-A, Class A
5.55%, 04/17/2036(a) | | | | | | | 3,842 | | | | 3,856,536 | |
Series 2023-B, Class A
6.92%, 12/17/2036(a) | | | | | | | 2,145 | | | | 2,224,431 | |
| | |
| |
| abfunds.com | | AB GLOBAL BOND FUND | 59 |
PORTFOLIO OF INVESTMENTS (continued)
| | | | | | | | | | |
| | | | | Principal
Amount
(000) | | | U.S. $ Value | |
| |
CCG Receivables Trust
Series 2024-1, Class A2
4.99%, 03/15/2032(a) | | U.S.$ | | | 5,771 | | | $ | 5,804,139 | |
Clarus Capital Funding LLC
Series 2024-1A, Class A2
4.71%, 08/20/2032(a) | | | | | 10,581 | | | | 10,574,389 | |
Series 2024-1A, Class B
4.79%, 08/20/2032(a) | | | | | 261 | | | | 260,421 | |
CNH Equipment Trust
Series 2022-C, Class A2
5.42%, 07/15/2026 | | | | | 858 | | | | 858,567 | |
Crossroads Asset Trust
Series 2024-A, Class A2
5.90%, 08/20/2030(a)(i) | | | | | 7,975 | | | | 8,083,264 | |
Dell Equipment Finance Trust
Series 2023-1, Class A2
5.65%, 09/22/2028(a) | | | | | 455 | | | | 454,902 | |
Series 2023-3, Class A2
6.10%, 04/23/2029(a) | | | | | 2,590 | | | | 2,598,113 | |
Dext ABS LLC
Series 2023-1, Class A2
5.99%, 03/15/2032(a) | | | | | 3,927 | | | | 3,952,083 | |
Series 2023-2, Class A2
6.56%, 05/15/2034(a) | | | | | 3,493 | | | | 3,537,054 | |
HINNT LLC
Series 2024-A, Class A
5.49%, 03/15/2043(a) | | | | | 3,543 | | | | 3,618,881 | |
HPEFS Equipment Trust
Series 2023-1A, Class A2
5.43%, 08/20/2025(a) | | | | | 1,203 | | | | 1,203,844 | |
Kubota Credit Owner Trust
Series 2023-1A, Class A2
5.40%, 02/17/2026(a) | | | | | 2,421 | | | | 2,422,121 | |
Marlette Funding Trust
Series 2023-3A, Class A
6.49%, 09/15/2033(a) | | | | | 628 | | | | 628,496 | |
Series 2024-1A, Class A
5.95%, 07/17/2034(a) | | | | | 1,985 | | | | 1,995,641 | |
Nelnet Student Loan Trust
Series 2021-CA, Class B
2.53%, 04/20/2062(a) | | | | | 8,191 | | | | 6,998,016 | |
NMEF Funding LLC
Series 2023-A, Class A2
6.57%, 06/17/2030(a) | | | | | 4,208 | | | | 4,270,066 | |
SBA Tower Trust
Series 2014-2A, Class C
3.87%, 10/15/2049(a) | | | | | 3,008 | | | | 3,005,921 | |
| | |
| |
60 | AB GLOBAL BOND FUND | | abfunds.com |
PORTFOLIO OF INVESTMENTS (continued)
| | | | | | | | | | | | |
| | | | | | Principal
Amount
(000) | | | U.S. $ Value | |
| |
SCF Equipment Leasing LLC
Series 2024-1A, Class A2
5.88%, 11/20/2029(a) | | | U.S.$ | | | | 7,721 | | | $ | 7,792,751 | |
Sierra Timeshare Receivables Funding LLC
Series 2024-2A, Class A
5.14%, 06/20/2041(a) | | | | | | | 3,972 | | | | 4,039,743 | |
| | | | | | | | | | | | |
| | | | | | | | | | | 93,523,253 | |
| | | | | | | | | | | | |
Autos - Fixed Rate – 0.4% | | | | | | | | | | | | |
Ally Bank Auto Credit-Linked Notes
Series 2024-A, Class A2
5.68%, 05/17/2032(a) | | | | | | | 3,647 | | | | 3,700,503 | |
BOF VII AL Funding Trust I
Series 2023-CAR3, Class A2
6.29%, 07/26/2032(a) | | | | | | | 4,441 | | | | 4,523,755 | |
LAD Auto Receivables Trust
Series 2023-2A, Class A2
5.93%, 06/15/2027(a) | | | | | | | 2,177 | | | | 2,183,730 | |
Merchants Fleet Funding LLC
Series 2023-1A, Class A
7.21%, 05/20/2036(a) | | | | | | | 3,789 | | | | 3,837,577 | |
OCCU Auto Receivables Trust
Series 2023-1A, Class A2
6.23%, 04/15/2027(a) | | | | | | | 2,058 | | | | 2,067,800 | |
Santander Bank Auto Credit-Linked Notes
Series 2022-B, Class B
5.72%, 08/16/2032(a) | | | | | | | 526 | | | | 526,004 | |
Wheels Fleet Lease Funding 1 LLC
Series 2023-2A, Class A
6.46%, 08/18/2038(a) | | | | | | | 4,081 | | | | 4,133,575 | |
| | | | | | | | | | | | |
| | | | | | | | | | | 20,972,944 | |
| | | | | | | | | | | | |
Other ABS - Floating Rate – 0.1% | | | | | | | | | | | | |
Sotheby’s Artfi Master Trust
Series 2024-1A, Class A2
6.25% (CME Term SOFR 3 Month + 1.50%), 12/22/2031(a)(e) | | | | | | | 8,490 | | | | 8,489,779 | |
| | | | | | | | | | | | |
| | | |
Total Asset-Backed Securities
(cost $123,281,340) | | | | | | | | | | | 122,985,976 | |
| | | | | | | | | | | | |
| | | | | | | | | | | | |
INFLATION-LINKED SECURITIES – 1.9% | | | | | | | | | | | | |
Canada – 0.2% | | | | | | | | | | | | |
Canadian Government Real Return Bond 4.00%, 12/01/2031 | | | CAD | | | | 15,699 | | | | 13,761,772 | |
| | | | | | | | | | | | |
| | |
| |
| abfunds.com | | AB GLOBAL BOND FUND | 61 |
PORTFOLIO OF INVESTMENTS (continued)
| | | | | | | | | | | | |
| | | | | | Principal
Amount
(000) | | | U.S. $ Value | |
| |
| | | |
Sweden – 0.5% | | | | | | | | | | | | |
Sweden Inflation Linked Bond
Series 3104
3.50%, 12/01/2028(a) | | | SEK | | | | 30,335 | | | $ | 5,427,751 | |
Series 3112
0.125%, 06/01/2026(a) | | | | | | | 54,990 | | | | 7,046,000 | |
Series 3113
0.125%, 12/01/2027(a) | | | | | | | 117,360 | | | | 14,803,419 | |
| | | | | | | | | | | | |
| | | | | | | | | | | 27,277,170 | |
| | | | | | | | | | | | |
United States – 1.2% | | | | | | | | | | | | |
U.S. Treasury Inflation Index
1.375%, 07/15/2033 | | | U.S.$ | | | | 68,145 | | | | 67,191,947 | |
| | | | | | | | | | | | |
| | | |
Total Inflation-Linked Securities
(cost $103,088,089) | | | | | | | | | | | 108,230,889 | |
| | | | | | | | | | | | |
| | | | | | | | | | | | |
SUPRANATIONALS – 1.8% | | | | | | | | | | | | |
European Investment Bank
0.75%, 07/15/2027 | | | AUD | | | | 15,292 | | | | 9,690,526 | |
1.80%, 01/19/2027 | | | | | | | 19,295 | | | | 12,716,854 | |
3.10%, 08/17/2026(a) | | | | | | | 9,991 | | | | 6,799,685 | |
European Union
Series NGEU
3.375%, 10/05/2054(a) | | | EUR | | | | 27,216 | | | | 30,323,454 | |
Inter-American Development Bank
2.50%, 04/14/2027(a) | | | AUD | | | | 2,505 | | | | 1,671,763 | |
Series G
7.35%, 10/06/2030 | | | INR | | | | 1,154,000 | | | | 14,142,085 | |
International Bank for Reconstruction & Development
3.00%, 10/19/2026 | | | AUD | | | | 6,993 | | | | 4,744,528 | |
Series E
6.75%, 07/13/2029 | | | INR | | | | 1,049,000 | | | | 12,549,221 | |
International Finance Corp.
4.45%, 05/14/2027 | | | AUD | | | | 18,234 | | | | 12,766,106 | |
| | | | | | | | | | | | |
| | | |
Total Supranationals
(cost $105,277,180) | | | | | | | | | | | 105,404,222 | |
| | | | | | | | | | | | |
| | | | | | | | | | | | |
GOVERNMENTS - SOVEREIGN BONDS – 1.5% | | | | | | | | | | | | |
Chile – 0.0% | | | | | | | | | | | | |
Chile Electricity Lux MPC SARL
6.01%, 01/20/2033(a) | | | U.S.$ | | | | 425 | | | | 442,056 | |
Chile Government International Bond
3.10%, 05/07/2041 | | | | | | | 825 | | | | 643,087 | |
3.50%, 01/25/2050 | | | | | | | 650 | | | | 498,550 | |
| | |
| |
62 | AB GLOBAL BOND FUND | | abfunds.com |
PORTFOLIO OF INVESTMENTS (continued)
| | | | | | | | | | | | |
| | | | | | Principal
Amount
(000) | | | U.S. $ Value | |
| |
5.33%, 01/05/2054 | | | U.S.$ | | | | 265 | | | $ | 268,313 | |
| | | | | | | | | | | | |
| | | | | | | | | | | 1,852,006 | |
| | | | | | | | | | | | |
Colombia – 0.1% | | | | | | | | | | | | |
Colombia Government International Bond
8.00%, 11/14/2035 | | | | | | | 3,073 | | | | 3,271,209 | |
| | | | | | | | | | | | |
| | | |
Germany – 0.6% | | | | | | | | | | | | |
Kreditanstalt fuer Wiederaufbau
2.00%, 02/15/2027 | | | AUD | | | | 6,000 | | | | 3,970,561 | |
3.20%, 09/11/2026 | | | | | | | 6,008 | | | | 4,097,266 | |
4.10%, 02/20/2026 | | | | | | | 37,326 | | | | 25,835,005 | |
| | | | | | | | | | | | |
| | | | | | | | | | | 33,902,832 | |
| | | | | | | | | | | | |
Hungary – 0.1% | | | | | | | | | | | | |
Hungary Government International Bond
2.125%, 09/22/2031(a) | | | U.S.$ | | | | 673 | | | | 557,580 | |
3.125%, 09/21/2051(a) | | | | | | | 200 | | | | 133,655 | |
5.25%, 06/16/2029(a) | | | | | | | 310 | | | | 314,377 | |
5.50%, 03/26/2036(a) | | | | | | | 470 | | | | 472,938 | |
6.125%, 05/22/2028(a) | | | | | | | 250 | | | | 260,640 | |
6.25%, 09/22/2032(a) | | | | | | | 270 | | | | 289,913 | |
6.75%, 09/25/2052(a) | | | | | | | 420 | | | | 473,445 | |
| | | | | | | | | | | | |
| | | | | | | | | | | 2,502,548 | |
| | | | | | | | | | | | |
Indonesia – 0.3% | | | | | | | | | | | | |
Indonesia Government International Bond
1.00%, 07/28/2029 | | | EUR | | | | 5,330 | | | | 5,326,802 | |
2.15%, 07/28/2031 | | | U.S.$ | | | | 1,030 | | | | 893,134 | |
3.20%, 09/23/2061 | | | | | | | 640 | | | | 447,600 | |
3.375%, 07/30/2025(a) | | | EUR | | | | 10,564 | | | | 11,741,677 | |
3.55%, 03/31/2032 | | | U.S.$ | | | | 200 | | | | 188,250 | |
4.30%, 03/31/2052 | | | | | | | 750 | | | | 679,453 | |
| | | | | | | | | | | | |
| | | | | | | | | | | 19,276,916 | |
| | | | | | | | | | | | |
Israel – 0.0% | | | | | | | | | | | | |
Israel Government International Bond
Series 30Y
5.75%, 03/12/2054 | | | | | | | 360 | | | | 342,285 | |
| | | | | | | | | | | | |
| | | |
Kazakhstan – 0.0% | | | | | | | | | | | | |
Kazakhstan Government International Bond
6.50%, 07/21/2045(a) | | | | | | | 325 | | | | 385,227 | |
| | | | | | | | | | | | |
| | | |
Mexico – 0.0% | | | | | | | | | | | | |
Mexico Government International Bond
2.66%, 05/24/2031 | | | | | | | 400 | | | | 343,124 | |
| | |
| |
| abfunds.com | | AB GLOBAL BOND FUND | 63 |
PORTFOLIO OF INVESTMENTS (continued)
| | | | | | | | | | | | |
| | | | | | Principal
Amount
(000) | | | U.S. $ Value | |
| |
4.28%, 08/14/2041 | | | U.S.$ | | | | 500 | | | $ | 409,531 | |
5.00%, 04/27/2051 | | | | | | | 550 | | | | 463,721 | |
6.34%, 05/04/2053 | | | | | | | 248 | | | | 246,528 | |
| | | | | | | | | | | | |
| | | | | | | | | | | 1,462,904 | |
| | | | | | | | | | | | |
Panama – 0.0% | | | | | | | | | | | | |
Panama Government International Bond
3.87%, 07/23/2060 | | | | | | | 400 | | | | 251,500 | |
3.875%, 03/17/2028 | | | | | | | 920 | | | | 885,500 | |
6.85%, 03/28/2054 | | | | | | | 200 | | | | 202,100 | |
8.00%, 03/01/2038 | | | | | | | 200 | | | | 225,300 | |
| | | | | | | | | | | | |
| | | | | | | | | | | 1,564,400 | |
| | | | | | | | | | | | |
Peru – 0.0% | | | | | | | | | | | | |
Peruvian Government International Bond
1.86%, 12/01/2032 | | | | | | | 150 | | | | 120,516 | |
2.78%, 12/01/2060 | | | | | | | 105 | | | | 63,345 | |
3.55%, 03/10/2051 | | | | | | | 660 | | | | 500,676 | |
| | | | | | | | | | | | |
| | | | | | | | | | | 684,537 | |
| | | | | | | | | | | | |
Philippines – 0.0% | | | | | | | | | | | | |
Philippine Government International Bond
1.95%, 01/06/2032 | | | | | | | 1,660 | | | | 1,406,568 | |
3.23%, 03/29/2027 | | | | | | | 205 | | | | 200,708 | |
3.56%, 09/29/2032 | | | | | | | 205 | | | | 192,123 | |
4.20%, 03/29/2047 | | | | | | | 205 | | | | 183,055 | |
| | | | | | | | | | | | |
| | | | | | | | | | | 1,982,454 | |
| | | | | | | | | | | | |
Poland – 0.0% | | | | | | | | | | | | |
Republic of Poland Government International Bond
4.875%, 10/04/2033 | | | | | | | 442 | | | | 448,625 | |
5.50%, 04/04/2053 | | | | | | | 158 | | | | 162,037 | |
| | | | | | | | | | | | |
| | | | | | | | | | | 610,662 | |
| | | | | | | | | | | | |
Qatar – 0.0% | | | | | | | | | | | | |
Qatar Government International Bond
3.75%, 04/16/2030(a) | | | | | | | 1,110 | | | | 1,098,206 | |
4.40%, 04/16/2050(a) | | | | | | | 490 | | | | 453,250 | |
| | | | | | | | | | | | |
| | | | | | | | | | | 1,551,456 | |
| | | | | | | | | | | | |
Romania – 0.3% | | | | | | | | | | | | |
Romanian Government International Bond
2.875%, 04/13/2042(a) | | | EUR | | | | 300 | | | | 225,413 | |
3.00%, 02/14/2031(a) | | | U.S.$ | | | | 1,130 | | | | 983,383 | |
3.625%, 03/27/2032(a) | | | | | | | 256 | | | | 227,600 | |
5.125%, 09/24/2031(a) | | | EUR | | | | 10,109 | | | | 11,309,097 | |
5.25%, 11/25/2027(a) | | | U.S.$ | | | | 694 | | | | 699,014 | |
| | |
| |
64 | AB GLOBAL BOND FUND | | abfunds.com |
PORTFOLIO OF INVESTMENTS (continued)
| | | | | | | | | | | | |
| | | | | | Principal
Amount
(000) | | | U.S. $ Value | |
| |
5.75%, 03/24/2035(a) | | | U.S.$ | | | | 490 | | | $ | 486,325 | |
6.375%, 01/30/2034(a) | | | | | | | 300 | | | | 311,625 | |
6.625%, 02/17/2028(a) | | | | | | | 270 | | | | 282,285 | |
| | | | | | | | | | | | |
| | | | | | | | | | | 14,524,742 | |
| | | | | | | | | | | | |
Saudi Arabia – 0.1% | | | | | | | | | | | | |
KSA Sukuk Ltd.
5.27%, 10/25/2028(a) | | | | | | | 405 | | | | 421,541 | |
Saudi Government International Bond
3.45%, 02/02/2061(a) | | | | | | | 290 | | | | 196,774 | |
3.625%, 03/04/2028(a) | | | | | | | 370 | | | | 362,600 | |
3.75%, 01/21/2055(a) | | | | | | | 970 | | | | 715,678 | |
5.00%, 04/17/2049(a) | | | | | | | 407 | | | | 382,071 | |
5.75%, 01/16/2054(a) | | | | | | | 225 | | | | 229,219 | |
| | | | | | | | | | | | |
| | | | | | | | | | | 2,307,883 | |
| | | | | | | | | | | | |
Uruguay – 0.0% | | | | | | | | | | | | |
Oriental Republic of Uruguay
5.25%, 09/10/2060 | | | | | | | 595 | | | | 594,814 | |
Uruguay Government International Bond
4.375%, 01/23/2031 | | | | | | | 430 | | | | 432,150 | |
5.75%, 10/28/2034 | | | | | | | 220 | | | | 239,181 | |
| | | | | | | | | | | | |
| | | | | | | | | | | 1,266,145 | |
| | | | | | | | | | | | |
Total Governments - Sovereign Bonds
(cost $89,537,933) | | | | | | | | | | | 87,488,206 | |
| | | | | | | | | | | | |
| | | | | | | | | | | | |
LOCAL GOVERNMENTS - REGIONAL BONDS – 1.4% | | | | | | | | | | | | |
Australia – 0.7% | | | | | | | | | | | | |
Treasury Corp. of Victoria
2.00%, 11/20/2037 | | | AUD | | | | 21,955 | | | | 10,577,556 | |
2.25%, 09/15/2033(a) | | | | | | | 30,763 | | | | 17,437,842 | |
2.25%, 11/20/2034 | | | | | | | 26,945 | | | | 14,731,313 | |
| | | | | | | | | | | | |
| | | | | | | | | | | 42,746,711 | |
| | | | | | | | | | | | |
Japan – 0.7% | | | | | | | | | | | | |
Japan Finance Organization for Municipalities
Series G
0.05%, 02/12/2027(a) | | | EUR | | | | 29,930 | | | | 31,447,354 | |
2.375%, 09/08/2027(a) | | | | | | | 9,345 | | | | 10,351,556 | |
| | | | | | | | | | | | |
| | | | | | | | | | | 41,798,910 | |
| | | | | | | | | | | | |
Total Local Governments - Regional Bonds
(cost $84,222,625) | | | | | | | | | | | 84,545,621 | |
| | | | | | | | | | | | |
| | | | | | | | | | | | |
| | |
| |
| abfunds.com | | AB GLOBAL BOND FUND | 65 |
PORTFOLIO OF INVESTMENTS (continued)
| | | | | | | | | | | | |
| | | | | | Principal
Amount
(000) | | | U.S. $ Value | |
| |
COMMERCIAL MORTGAGE-BACKED SECURITIES – 1.4% | | | | | | | | | | | | |
Non-Agency Floating Rate CMBS – 1.2% | | | | | | | | | | | | |
Ashford Hospitality Trust
Series 2018-KEYS, Class A
6.39% (CME Term SOFR 1 Month + 1.30%), 06/15/2035(a)(e) | | | U.S.$ | | | | 874 | | | $ | 866,757 | |
BAMLL Commercial Mortgage Securities Trust
Series 2017-SCH, Class AF
6.14% (CME Term SOFR 1 Month + 1.05%), 11/15/2033(a)(e) | | | | | | | 6,275 | | | | 6,266,415 | |
BOCA Commercial Mortgage Trust
Series 2024-BOCA, Class A
7.02% (CME Term SOFR 1 Month + 1.92%), 08/15/2041(a)(e) | | | | | | | 2,000 | | | | 1,999,999 | |
BX Commercial Mortgage Trust
Series 2024-AIR2, Class A
6.59% (CME Term SOFR 1 Month + 1.49%), 10/15/2041(a)(e) | | | | | | | 2,460 | | | | 2,460,000 | |
Great Wolf Trust
Series 2024-WOLF, Class A
6.64% (CME Term SOFR 1 Month + 1.54%), 03/15/2039(a)(e) | | | | | | | 16,019 | | | | 15,983,958 | |
Great Wolf Trust 2024
Series 2024-WLF2, Class A
6.79% (CME Term SOFR 1 Month + 1.69%), 05/15/2041(a)(e) | | | | | | | 2,316 | | | | 2,316,005 | |
Natixis Commercial Mortgage Securities Trust
Series 2019-MILE, Class A
6.68% (CME Term SOFR 1 Month + 1.58%), 07/15/2036(a)(e) | | | | | | | 10,690 | | | | 9,625,241 | |
Series 2022-JERI, Class A
6.50% (CME Term SOFR 1 Month + 1.40%), 01/15/2039(a)(e) | | | | | | | 8,113 | | | | 7,406,957 | |
NJ Trust
Series 2023-GSP, Class A
6.70%, 01/06/2029(a) | | | | | | | 6,238 | | | | 6,615,335 | |
NRTH Mortgage Trust
Series 2024-PARK, Class A
6.74% (CME Term SOFR 1 Month + 1.64%), 03/15/2039(a)(e) | | | | | | | 14,214 | | | | 14,220,392 | |
| | |
| |
66 | AB GLOBAL BOND FUND | | abfunds.com |
PORTFOLIO OF INVESTMENTS (continued)
| | | | | | | | | | | | |
| | | | | | Principal
Amount
(000) | | | U.S. $ Value | |
| |
Wells Fargo Commercial Mortgage Trust
Series 2024-MGP, Class A12
6.79% (CME Term SOFR 1 Month + 1.69%), 08/15/2041(a)(e) | | | U.S.$ | | | | 4,555 | | | $ | 4,553,126 | |
| | | | | | | | | | | | |
| | | | | | | | | | | 72,314,185 | |
| | | | | | | | | | | | |
Non-Agency Fixed Rate CMBS – 0.2% | | | | | | | | | | | | |
225 Liberty Street Trust
Series 2016-225L, Class E
4.80%, 02/10/2036(a) | | | | | | | 9,098 | | | | 7,110,194 | |
Commercial Mortgage Trust
Series 2012-CR3, Class D
4.29%, 10/15/2045(a) | | | | | | | 2,322 | | | | 1,532,566 | |
DTP Commercial Mortgage Trust
Series 2023-STE2, Class A
6.04%, 01/15/2041(a) | | | | | | | 1,329 | | | | 1,366,172 | |
| | | | | | | | | | | | |
| | | | | | | | | | | 10,008,932 | |
| | | | | | | | | | | | |
Total Commercial Mortgage-Backed Securities
(cost $85,782,627) | | | | | | | | | | | 82,323,117 | |
| | | | | | | | | | | | |
| | | | | | | | | | | | |
GOVERNMENTS - SOVEREIGN AGENCIES – 1.3% | | | | | | | | | | | | |
Belgium – 0.5% | | | | | | | | | | | | |
Dexia SA
Series E
Zero Coupon, 01/21/2028(a) | | | EUR | | | | 22,100 | | | | 22,755,927 | |
0.01%, 01/22/2027(a) | | | | | | | 7,200 | | | | 7,590,655 | |
| | | | | | | | | | | | |
| | | | | | | | | | | 30,346,582 | |
| | | | | | | | | | | | |
Canada – 0.1% | | | | | | | | | | | | |
Canada Housing Trust No. 1
4.25%, 03/15/2034(a) | | | CAD | | | | 9,605 | | | | 7,629,508 | |
| | | | | | | | | | | | |
| | | |
France – 0.3% | | | | | | | | | | | | |
SNCF Reseau
Series E
1.875%, 03/30/2034(a) | | | EUR | | | | 3,200 | | | | 3,185,431 | |
3.125%, 10/25/2028(a) | | | | | | | 9,800 | | | | 11,068,046 | |
| | | | | | | | | | | | |
| | | | | | | | | | | 14,253,477 | |
| | | | | | | | | | | | |
Japan – 0.4% | | | | | | | | | | | | |
Development Bank of Japan, Inc.
Series G
0.01%, 09/09/2025(a) | | | | | | | 15,859 | | | | 17,199,977 | |
0.875%, 10/10/2025(a) | | | | | | | 5,600 | | | | 6,114,526 | |
| | | | | | | | | | | | |
| | | | | | | | | | | 23,314,503 | |
| | | | | | | | | | | | |
Total Governments - Sovereign Agencies
(cost $73,674,249) | | | | | | | | | | | 75,544,070 | |
| | | | | | | | | | | | |
| | |
| |
| abfunds.com | | AB GLOBAL BOND FUND | 67 |
PORTFOLIO OF INVESTMENTS (continued)
| | | | | | | | | | | | |
| | | | | | Principal
Amount
(000) | | | U.S. $ Value | |
| |
EMERGING MARKETS - CORPORATE BONDS – 0.9% | | | | | | | | | | | | |
Industrial – 0.8% | | | | | | | | | | | | |
Basic – 0.4% | | | | | | | | | | | | |
Braskem Idesa SAPI
6.99%, 02/20/2032(a) | | | U.S.$ | | | | 4,523 | | | $ | 3,561,863 | |
Braskem Netherlands Finance BV
4.50%, 01/10/2028(a) | | | | | | | 8,736 | | | | 8,222,760 | |
JSW Steel Ltd.
3.95%, 04/05/2027(a) | | | | | | | 3,300 | | | | 3,169,031 | |
Periama Holdings LLC/DE
5.95%, 04/19/2026(a) | | | | | | | 2,478 | | | | 2,472,579 | |
Stillwater Mining Co.
4.00%, 11/16/2026(a) | | | | | | | 5,827 | | | | 5,564,785 | |
UPL Corp., Ltd.
4.50%, 03/08/2028(a) | | | | | | | 240 | | | | 216,675 | |
4.625%, 06/16/2030(a) | | | | | | | 380 | | | | 323,594 | |
| | | | | | | | | | | | |
| | | | | | | | | | | 23,531,287 | |
| | | | | | | | | | | | |
Communications - Media – 0.0% | | | | | | | | | | | | |
Globo Comunicacao e Participacoes SA
4.875%, 01/22/2030(a) | | | | | | | 879 | | | | 827,359 | |
| | | | | | | | | | | | |
| | | |
Consumer Non-Cyclical – 0.0% | | | | | | | | | | | | |
BRF GmbH
4.35%, 09/29/2026(a) | | | | | | | 1,475 | | | | 1,439,231 | |
Virgolino de Oliveira Finance SA
10.50%, 01/28/2018(g)(h)(i)(j)(k) | | | | | | | 4,270 | | | | 427 | |
| | | | | | | | | | | | |
| | | | | | | | | | | 1,439,658 | |
| | | | | | | | | | | | |
Energy – 0.4% | | | | | | | | | | | | |
Acu Petroleo Luxembourg SARL
7.50%, 01/13/2032(a) | | | | | | | 3,262 | | | | 3,265,634 | |
Ecopetrol SA
4.625%, 11/02/2031 | | | | | | | 914 | | | | 783,024 | |
6.875%, 04/29/2030 | | | | | | | 1,505 | | | | 1,501,418 | |
8.375%, 01/19/2036 | | | | | | | 1,614 | | | | 1,646,280 | |
8.625%, 01/19/2029 | | | | | | | 4,947 | | | | 5,319,262 | |
Greenko Dutch BV
3.85%, 03/29/2026(a) | | | | | | | 358 | | | | 345,470 | |
Greenko Solar Mauritius Ltd.
5.95%, 07/29/2026(a) | | | | | | | 215 | | | | 214,261 | |
Greenko Wind Projects Mauritius Ltd.
5.50%, 04/06/2025(a) | | | | | | | 7,560 | | | | 7,526,925 | |
Leviathan Bond Ltd.
6.125%, 06/30/2025(a) | | | | | | | 3,835 | | | | 3,767,454 | |
| | | | | | | | | | | | |
| | | | | | | | | | | 24,369,728 | |
| | | | | | | | | | | | |
| | | | | | | | | | | 50,168,032 | |
| | | | | | | | | | | | |
| | |
| |
68 | AB GLOBAL BOND FUND | | abfunds.com |
PORTFOLIO OF INVESTMENTS (continued)
| | | | | | | | | | | | |
| | | | | | Principal
Amount
(000) | | | U.S. $ Value | |
| |
Utility – 0.1% | | | | | | | | | | | | |
Electric – 0.0% | | | | | | | | | | | | |
Diamond II Ltd.
7.95%, 07/28/2026(a) | | | U.S.$ | | | | 2,135 | | | $ | 2,165,175 | |
| | | | | | | | | | | | |
| | | |
Other Utility – 0.1% | | | | | | | | | | | | |
Aegea Finance SARL
6.75%, 05/20/2029(a) | | | | | | | 2,647 | | | | 2,688,745 | |
| | | | | | | | | | | | |
| | | | | | | | | | | 4,853,920 | |
| | | | | | | | | | | | |
Total Emerging Markets - Corporate Bonds
(cost $58,163,214) | | | | | | | | | | | 55,021,952 | |
| | | | | | | | | | | | |
| | | | | | | | | | | | |
CORPORATES - NON-INVESTMENT GRADE – 0.9% | | | | | | | | | | | | |
Industrial – 0.7% | | | | | | | | | | | | |
Basic – 0.0% | | | | | | | | | | | | |
INEOS Quattro Finance 2 PLC
8.50%, 03/15/2029(a) | | | EUR | | | | 2,655 | | | | 3,125,318 | |
| | | | | | | | | | | | |
| | | |
Capital Goods – 0.0% | | | | | | | | | | | | |
Veralto Corp.
4.15%, 09/19/2031 | | | | | | | 237 | | | | 276,687 | |
| | | | | | | | | | | | |
| | | |
Communications - Media – 0.2% | | | | | | | | | | | | |
DISH DBS Corp.
5.25%, 12/01/2026(a) | | | U.S.$ | | | | 6,681 | | | | 6,195,747 | |
5.75%, 12/01/2028(a) | | | | | | | 6,707 | | | | 5,889,122 | |
| | | | | | | | | | | | |
| | | | | | | | | | | 12,084,869 | |
| | | | | | | | | | | | |
Communications - Telecommunications – 0.1% | | | | | | | | | | | | |
Altice France SA
5.50%, 10/15/2029(a) | | | | | | | 7,410 | | | | 5,191,717 | |
| | | | | | | | | | | | |
| | | |
Consumer Cyclical - Automotive – 0.1% | | | | | | | | | | | | |
ZF Finance GmbH
Series E
2.00%, 05/06/2027(a) | | | EUR | | | | 5,300 | | | | 5,488,153 | |
| | | | | | | | | | | | |
| | | |
Consumer Cyclical - Other – 0.1% | | | | | | | | | | | | |
Hilton Domestic Operating Co., Inc.
5.875%, 04/01/2029(a) | | | U.S.$ | | | | 3,279 | | | | 3,363,521 | |
6.125%, 04/01/2032(a) | | | | | | | 1,878 | | | | 1,933,974 | |
| | | | | | | | | | | | |
| | | | | | | | | | | 5,297,495 | |
| | | | | | | | | | | | |
| | |
| |
| abfunds.com | | AB GLOBAL BOND FUND | 69 |
PORTFOLIO OF INVESTMENTS (continued)
| | | | | | | | | | | | |
| | | | | | Principal
Amount
(000) | | | U.S. $ Value | |
| |
Consumer Cyclical - Retailers – 0.1% | | | | | | | | | | | | |
Dollarama, Inc.
2.44%, 07/09/2029 | | | CAD | | | | 6,936 | | | $ | 4,862,734 | |
| | | | | | | | | | | | |
| | | |
Technology – 0.0% | | | | | | | | | | | | |
Cedacri Mergeco SpA
8.17% (EURIBOR 3 Month + 4.63%), 05/15/2028(a)(e) | | | EUR | | | | 2,165 | | | | 2,402,807 | |
| | | | | | | | | | | | |
| | | |
Transportation - Services – 0.1% | | | | | | | | | | | | |
NAC Aviation 29 DAC
4.75%, 06/30/2026 | | | U.S.$ | | | | 4,200 | | | | 4,019,265 | |
| | | | | | | | | | | | |
| | | | | | | | | | | 42,749,045 | |
| | | | | | | | | | | | |
Financial Institutions – 0.2% | | | | | | | | | | | | |
Banking – 0.1% | | | | | | | | | | | | |
Banco Bilbao Vizcaya Argentaria SA
6.125%, 11/16/2027(d) | | | | | | | 3,400 | | | | 3,308,701 | |
| | | | | | | | | | | | |
| | | |
Finance – 0.1% | | | | | | | | | | | | |
SLM Corp.
4.20%, 10/29/2025 | | | | | | | 6,276 | | | | 6,208,252 | |
| | | | | | | | | | | | |
| | | |
REITs – 0.0% | | | | | | | | | | | | |
Vivion Investments SARL
Series E
8.00%, 02/28/2029(a)(f)(l) | | | EUR | | | | 23 | | | | 24,901 | |
| | | | | | | | | | | | |
| | | | | | | | | | | 9,541,854 | |
| | | | | | | | | | | | |
Total Corporates - Non-Investment Grade
(cost $53,341,901) | | | | | | | | | | | 52,290,899 | |
| | | | | | | | | | | | |
| | | | | | | | | | | | |
QUASI-SOVEREIGNS – 0.8% | | | | | | | | | | | | |
Quasi-Sovereign Bonds – 0.8% | | | | | | | | | | | | |
Chile – 0.3% | | | | | | | | | | | | |
Corp. Nacional del Cobre de Chile
3.75%, 01/15/2031(a) | | | U.S.$ | | | | 530 | | | | 494,225 | |
5.125%, 02/02/2033(a) | | | | | | | 3,837 | | | | 3,823,810 | |
5.95%, 01/08/2034(a) | | | | | | | 7,781 | | | | 8,177,345 | |
6.44%, 01/26/2036(a) | | | | | | | 230 | | | | 250,053 | |
Empresa de Transporte de Pasajeros Metro SA
3.65%, 05/07/2030(a) | | | | | | | 370 | | | | 350,344 | |
4.70%, 05/07/2050(a) | | | | | | | 370 | | | | 325,833 | |
Empresa Nacional del Petroleo
5.95%, 07/30/2034(a) | | | | | | | 280 | | | | 294,140 | |
| | | | | | | | | | | | |
| | | | | | | | | | | 13,715,750 | |
| | | | | | | | | | | | |
| | |
| |
70 | AB GLOBAL BOND FUND | | abfunds.com |
PORTFOLIO OF INVESTMENTS (continued)
| | | | | | | | | | | | |
| | | | | | Principal
Amount
(000) | | | U.S. $ Value | |
| |
China – 0.0% | | | | | | | | | | | | |
CNAC HK Finbridge Co., Ltd.
3.00%, 09/22/2030(a) | | | U.S.$ | | | | 540 | | | $ | 494,438 | |
| | | | | | | | | | | | |
| | | |
Hong Kong – 0.0% | | | | | | | | | | | | |
Airport Authority
2.10%, 03/08/2026(a)(d) | | | | | | | 250 | | | | 241,688 | |
3.50%, 01/12/2062(a) | | | | | | | 350 | | | | 280,808 | |
| | | | | | | | | | | | |
| | | | | | | | | | | 522,496 | |
| | | | | | | | | | | | |
Hungary – 0.0% | | | | | | | | | | | | |
Magyar Export-Import Bank Zrt
6.125%, 12/04/2027(a) | | | | | | | 310 | | | | 318,429 | |
| | | | | | | | | | | | |
| | | |
Indonesia – 0.0% | | | | | | | | | | | | |
Pertamina Persero PT
1.40%, 02/09/2026(a) | | | | | | | 480 | | | | 458,400 | |
4.15%, 02/25/2060(a) | | | | | | | 410 | | | | 326,721 | |
Perusahaan Perseroan Persero PT Perusahaan Listrik Negara
4.125%, 05/15/2027(a) | | | | | | | 460 | | | | 455,687 | |
5.25%, 10/24/2042(a) | | | | | | | 205 | | | | 196,544 | |
| | | | | | | | | | | | |
| | | | | | | | | | | 1,437,352 | |
| | | | | | | | | | | | |
Kazakhstan – 0.0% | | | | | | | | | | | | |
Fund of National Welfare Samruk-Kazyna JSC
2.00%, 10/28/2026(a) | | | | | | | 473 | | | | 445,949 | |
| | | | | | | | | | | | |
| | | |
Malaysia – 0.0% | | | | | | | | | | | | |
Petronas Capital Ltd.
2.48%, 01/28/2032(a) | | | | | | | 1,000 | | | | 870,680 | |
| | | | | | | | | | | | |
| | | |
Mexico – 0.3% | | | | | | | | | | | | |
Comision Federal de Electricidad
3.35%, 02/09/2031(a) | | | | | | | 7,524 | | | | 6,456,570 | |
3.875%, 07/26/2033(a) | | | | | | | 2,171 | | | | 1,833,952 | |
4.68%, 02/09/2051(a) | | | | | | | 220 | | | | 165,138 | |
4.69%, 05/15/2029(a) | | | | | | | 240 | | | | 231,871 | |
5.00%, 09/29/2036(a) | | | | | | | 3,054 | | | | 2,786,560 | |
6.45%, 01/24/2035(a) | | | | | | | 390 | | | | 388,732 | |
Petroleos Mexicanos
6.50%, 03/13/2027 | | | | | | | 3,505 | | | | 3,433,148 | |
6.70%, 02/16/2032 | | | | | | | 3,774 | | | | 3,374,522 | |
| | | | | | | | | | | | |
| | | | | | | | | | | 18,670,493 | |
| | | | | | | | | | | | |
Panama – 0.0% | | | | | | | | | | | | |
Banco Nacional de Panama
2.50%, 08/11/2030(a) | | | | | | | 200 | | | | 165,188 | |
| | | | | | | | | | | | |
| | |
| |
| abfunds.com | | AB GLOBAL BOND FUND | 71 |
PORTFOLIO OF INVESTMENTS (continued)
| | | | | | | | | | | | |
| | | | | | Principal
Amount
(000) | | | U.S. $ Value | |
| |
Peru – 0.0% | | | | | | | | | | | | |
Corp. Financiera de Desarrollo SA
5.95%, 04/30/2029(a) | | | U.S.$ | | | | 430 | | | $ | 444,757 | |
| | | | | | | | | | | | |
| | | |
Poland – 0.0% | | | | | | | | | | | | |
Bank Gospodarstwa Krajowego
5.375%, 05/22/2033(a) | | | | | | | 265 | | | | 270,989 | |
6.25%, 10/31/2028(a) | | | | | | | 227 | | | | 243,298 | |
6.25%, 07/09/2054(a) | | | | | | | 415 | | | | 445,486 | |
| | | | | | | | | | | | |
| | | | | | | | | | | 959,773 | |
| | | | | | | | | | | | |
Qatar – 0.0% | | | | | | | | | | | | |
QatarEnergy
2.25%, 07/12/2031(a) | | | | | | | 540 | | | | 475,200 | |
3.30%, 07/12/2051(a) | | | | | | | 500 | | | | 374,375 | |
| | | | | | | | | | | | |
| | | | | | | | | | | 849,575 | |
| | | | | | | | | | | | |
Saudi Arabia – 0.0% | | | | | | | | | | | | |
Gaci First Investment Co.
5.00%, 10/13/2027(a) | | | | | | | 430 | | | | 435,017 | |
5.125%, 02/14/2053(a) | | | | | | | 415 | | | | 376,933 | |
| | | | | | | | | | | | |
| | | | | | | | | | | 811,950 | |
| | | | | | | | | | | | |
South Africa – 0.1% | | | | | | | | | | | | |
Transnet SOC Ltd.
8.25%, 02/06/2028(a) | | | | | | | 5,065 | | | | 5,256,508 | |
| | | | | | | | | | | | |
| | | |
United Arab Emirates – 0.1% | | | | | | | | | | | | |
Abu Dhabi Crude Oil Pipeline LLC
3.65%, 11/02/2029(a) | | | | | | | 270 | | | | 262,575 | |
4.60%, 11/02/2047(a) | | | | | | | 250 | | | | 234,882 | |
Abu Dhabi Ports Co. PJSC
Series E
2.50%, 05/06/2031(a) | | | | | | | 280 | | | | 247,275 | |
DP World Ltd./United Arab Emirates
6.85%, 07/02/2037(a) | | | | | | | 230 | | | | 261,462 | |
MDGH GMTN RSC Ltd.
3.70%, 11/07/2049(a) | | | | | | | 520 | | | | 415,366 | |
Series G
2.50%, 06/03/2031(a) | | | | | | | 690 | | | | 616,472 | |
3.375%, 03/28/2032(a) | | | | | | | 260 | | | | 243,181 | |
| | | | | | | | | | | | |
| | | | | | | | | | | 2,281,213 | |
| | | | | | | | | | | | |
Total Quasi-Sovereigns
(cost $47,889,536) | | | | | | | | | | | 47,244,551 | |
| | | | | | | | | | | | |
| | | | | | | | | | | | |
LOCAL GOVERNMENTS - US MUNICIPAL BONDS – 0.5% | | | | | | | | | | | | |
United States – 0.5% | | | | | | | | | | | | |
California Earthquake Authority
Series 2022-A
5.60%, 07/01/2027 | | | | | | | 4,745 | | | | 4,815,476 | |
| | |
| |
72 | AB GLOBAL BOND FUND | | abfunds.com |
PORTFOLIO OF INVESTMENTS (continued)
| | | | | | | | | | | | |
| | | | | | Principal
Amount
(000) | | | U.S. $ Value | |
| |
Commonwealth Financing Authority
Series 2016-A
4.14%, 06/01/2038 | | | U.S.$ | | | | 2,640 | | | $ | 2,531,696 | |
New Jersey Economic Development Authority
Series 1997-A
7.425%, 02/15/2029 | | | | | | | 5,982 | | | | 6,459,884 | |
New Jersey Transportation Trust Fund Authority
Series 2010-C
5.75%, 12/15/2028 | | | | | | | 4,740 | | | | 4,853,122 | |
State Board of Administration Finance Corp.
Series 2020-A
2.15%, 07/01/2030 | | | | | | | 7,016 | | | | 6,231,942 | |
Series 2024-A
5.53%, 07/01/2034 | | | | | | | 4,802 | | | | 5,063,453 | |
State of Hawaii
Series 2023-G
5.25%, 10/01/2029 | | | | | | | 1,640 | | | | 1,741,976 | |
| | | | | | | | | | | | |
| | | |
Total Local Governments - US Municipal Bonds
(cost $30,790,410) | | | | | | | | | | | 31,697,549 | |
| | | | | | | | | | | | |
| | | | | | | | | | | | |
BANK LOANS – 0.2% | | | | | | | | | | | | |
Industrial – 0.2% | | | | | | | | | | | | |
Consumer Cyclical - Restaurants – 0.0% | | | | | | | | | | | | |
IRB Holding Corp.
8.10% (CME Term SOFR 1 Month + 2.75%), 12/15/2027(m) | | | | | | | 1,083 | | | | 1,081,846 | |
| | | | | | | | | | | | |
| | | |
Consumer Non-Cyclical – 0.2% | | | | | | | | | | | | |
Hertz Corp. (The)
8.46% (CME Term SOFR 1 Month + 3.50%), 06/30/2028(m) | | | | | | | 1,250 | | | | 1,115,762 | |
8.88% (CME Term SOFR 1 Month + 3.50%), 06/30/2028(m) | | | | | | | 7,710 | | | | 6,882,161 | |
| | | | | | | | | | | | |
| | | | | | | | | | | 7,997,923 | |
| | | | | | | | | | | | |
Total Bank Loans
(cost $9,258,940) | | | | | | | | | | | 9,079,769 | |
| | | | | | | | | | | | |
| | | | | | | | | | | | |
EMERGING MARKETS - SOVEREIGNS – 0.1% | | | | | | | | | | | | |
Dominican Republic – 0.1% | | | | | | | | | | | | |
Dominican Republic International Bond
5.95%, 01/25/2027(a)
(cost $6,889,448) | | | | | | | 7,003 | | | | 7,097,103 | |
| | | | | | | | | | | | |
| | |
| |
| abfunds.com | | AB GLOBAL BOND FUND | 73 |
PORTFOLIO OF INVESTMENTS (continued)
| | | | | | | | | | | | |
| | | | | | Principal
Amount
(000) | | | U.S. $ Value | |
| |
LOCAL GOVERNMENTS - CANADIAN MUNICIPAL BONDS – 0.0% | | | | | | | | | | | | |
Canada – 0.0% | | | | | | | | | | | | |
City of Calgary Canada
4.20%, 06/01/2034
(cost $2,561,739) | | | U.S.$ | | | | 3,456 | | | $ | 2,648,195 | |
| | | | | | | | | | | | |
| | | |
| | | | | | Shares | | | | |
COMMON STOCKS – 0.0% | | | | | | | | | | | | |
Financials – 0.0% | | | | | | | | | | | | |
Banks – 0.0% | | | | | | | | | | | | |
Nordic Aviation Capital DAC(g)(i)(k) | | | | | | | 81,699 | | | | 1,593,130 | |
Nordic Aviation Capital DAC (Restrictive Legend)(g)(i)(k) | | | | | | | 4,956 | | | | 96,642 | |
| | | | | | | | | | | | |
| | | | | | | | | | | 1,689,772 | |
| | | | | | | | | | | | |
Energy – 0.0% | | | | | | | | | | | | |
Oil, Gas & Consumable Fuels – 0.0% | | | | | | | | | | | | |
SandRidge Energy, Inc. | | | | | | | 4,459 | | | | 54,534 | |
| | | | | | | | | | | | |
| | | |
Total Common Stocks
(cost $3,448,677) | | | | | | | | | | | 1,744,306 | |
| | | | | | | | | | | | |
| | | |
| | | | | | Principal
Amount
(000) | | | | |
EMERGING MARKETS - TREASURIES – 0.0% | | | | | | | | | | | | |
South Africa – 0.0% | | | | | | | | | | | | |
Republic of South Africa Government Bond
Series 2030
8.00%, 01/31/2030
(cost $1) | | | ZAR | | | | 0 | ** | | | 1 | |
| | | | | | | | | | | | |
| | | |
| | | | | | Shares | | | | |
SHORT-TERM
INVESTMENTS – 1.9% | | | | | | | | | | | | |
Investment Companies – 1.7% | | | | | | | | | | | | |
AB Fixed Income Shares, Inc. – Government Money Market Portfolio – Class AB, 4.73%(n)(o)(p)
(cost $97,830,004) | | | | | | | 97,830,004 | | | | 97,830,004 | |
| | | | | | | | | | | | |
| | |
| |
74 | AB GLOBAL BOND FUND | | abfunds.com |
PORTFOLIO OF INVESTMENTS (continued)
| | | | | | | | | | | | |
| | | | | | Principal
Amount
(000) | | | U.S. $ Value | |
| |
Time Deposits – 0.2% | | | | | | | | | | | | |
BBH, New York
2.83%, 10/01/2024 | | | NZD | | | | 0 | ** | | $ | 1 | |
3.18%, 10/01/2024 | | | NOK | | | | 4 | | | | 367 | |
Citibank, London
2.33%, 10/01/2024 | | | EUR | | | | 2,358 | | | | 2,624,960 | |
JPMorgan Chase, New York
4.18%, 10/01/2024 | | | U.S.$ | | | | 8,842 | | | | 8,841,890 | |
Royal Bank of Canada, London
3.91%, 10/01/2024 | | | GBP | | | | 38 | | | | 51,328 | |
Royal Bank of Canada, Toronto
3.03%, 10/01/2024 | | | CAD | | | | 257 | | | | 189,855 | |
| | | | | | | | | | | | |
| | | |
Total Time Deposits
(cost $11,708,401) | | | | | | | | | | | 11,708,401 | |
| | | | | | | | | | | | |
| | | |
Total Short-Term Investments
(cost $109,538,405) | | | | | | | | | | | 109,538,405 | |
| | | | | | | | | | | | |
| | | |
Total Investments – 111.3%
(cost $6,493,595,937) | | | | | | | | | | | 6,484,022,422 | |
Other assets less liabilities – (11.3)% | | | | | | | | | | | (660,501,872 | ) |
| | | | | | | | | | | | |
| | | |
Net Assets – 100.0% | | | | | | | | | | $ | 5,823,520,550 | |
| | | | | | | | | | | | |
FUTURES (see Note D)
| | | | | | | | | | | | | | | | |
| Description | | Number of
Contracts | | | Expiration
Month | | | Current
Notional | | | Value and
Unrealized
Appreciation
(Depreciation) | |
Purchased Contracts | | | | | | | | | | | | | | | | |
Australian 3 Yr Bond Futures | | | 9 | | | | December 2024 | | | $ | 666,884 | | | $ | (1,375 | ) |
Canadian 5 Yr Bond Futures | | | 6 | | | | December 2024 | | | | 512,137 | | | | 3,505 | |
Canadian 10 Yr Bond Futures | | | 2 | | | | December 2024 | | | | 184,864 | | | | 1,050 | |
Euro-BOBL Futures | | | 1,451 | | | | December 2024 | | | | 193,902,434 | | | | 544,931 | |
Euro-Bund Futures | | | 29 | | | | December 2024 | | | | 4,355,400 | | | | (8,371 | ) |
Euro-Schatz Futures | | | 43 | | | | December 2024 | | | | 5,129,980 | | | | 22,018 | |
Long Gilt Futures | | | 8 | | | | December 2024 | | | | 1,052,768 | | | | (10,896 | ) |
U.S. Long Bond (CBT) Futures | | | 75 | | | | December 2024 | | | | 9,314,062 | | | | (47,117 | ) |
U.S. T-Note 2 Yr (CBT) Futures | | | 2,245 | | | | December 2024 | | | | 467,503,712 | | | | 387,525 | |
U.S. T-Note 5 Yr (CBT) Futures | | | 3,676 | | | | December 2024 | | | | 403,929,221 | | | | (1,099,740 | ) |
U.S. T-Note 10 Yr (CBT) Futures | | | 16 | | | | December 2024 | | | | 1,828,500 | | | | 1,633 | |
U.S. Ultra Bond (CBT) Futures | | | 196 | | | | December 2024 | | | | 26,086,375 | | | | (78,766 | ) |
| | | | |
Sold Contracts | | | | | | | | | | | | | | | | |
Australian 10 Yr Bond Futures | | | 214 | | | | December 2024 | | | | 17,220,698 | | | | 149,981 | |
Canadian 5 Yr Bond Futures | | | 1,479 | | | | December 2024 | | | | 126,241,828 | | | | (863,921 | ) |
Canadian 10 Yr Bond Futures | | | 147 | | | | December 2024 | | | | 13,587,541 | | | | (76,084 | ) |
Euro Buxl 30 Yr Bond Futures | | | 103 | | | | December 2024 | | | | 15,625,108 | | | | (121,444 | ) |
| | |
| |
| abfunds.com | | AB GLOBAL BOND FUND | 75 |
PORTFOLIO OF INVESTMENTS (continued)
| | | | | | | | | | | | | | | | |
| Description | | Number of
Contracts | | | Expiration
Month | | | Current
Notional | | | Value and
Unrealized
Appreciation
(Depreciation) | |
Euro-BOBL Futures | | | 21 | | | | December 2024 | | | $ | 2,806,307 | | | $ | (24,779 | ) |
Euro-Schatz Futures | | | 257 | | | | December 2024 | | | | 30,660,575 | | | | (135,888 | ) |
Japan 10 Yr Bond (OSE) Futures | | | 277 | | | | December 2024 | | | | 278,782,745 | | | | 339,120 | |
U.S. 10 Yr Ultra Futures | | | 1,456 | | | | December 2024 | | | | 172,240,250 | | | | (26,008 | ) |
U.S. Long Bond (CBT) Futures | | | 152 | | | | December 2024 | | | | 18,876,500 | | | | 106,242 | |
U.S. T-Note 2 Yr (CBT) Futures | | | 15 | | | | December 2024 | | | | 3,123,633 | | | | 117 | |
U.S. T-Note 5 Yr (CBT) Futures | | | 45 | | | | December 2024 | | | | 4,944,727 | | | | (5,687 | ) |
| | | | | | | | | | | | | | | | |
| | | | | | | | | | | | | | $ | (943,954 | ) |
| | | | | | | | | | | | | | | | |
FORWARD CURRENCY EXCHANGE CONTRACTS (see Note D)
| | | | | | | | | | | | | | | | |
| Counterparty | | Contracts to
Deliver
(000) | | | In Exchange
For
(000) | | | Settlement
Date | | | Unrealized
Appreciation
(Depreciation) | |
Bank of America NA | | GBP | 31,646 | | | USD | 42,373 | | | | 10/16/2024 | | | $ | 64,295 | |
Bank of America NA | | USD | 1,411 | | | JPY | 201,688 | | | | 10/16/2024 | | | | (4,741 | ) |
Bank of America NA | | EUR | 1,010,430 | | | USD | 1,107,975 | | | | 10/25/2024 | | | | (17,954,018 | ) |
Bank of America NA | | USD | 712 | | | EUR | 641 | | | | 10/25/2024 | | | | 2,654 | |
Bank of America NA | | CAD | 415,542 | | | USD | 306,590 | | | | 11/07/2024 | | | | (936,849 | ) |
Bank of America NA | | GBP | 169,589 | | | USD | 224,566 | | | | 11/08/2024 | | | | (2,158,797 | ) |
Barclays Bank PLC | | BRL | 140,170 | | | USD | 25,224 | | | | 10/02/2024 | | | | (506,535 | ) |
Barclays Bank PLC | | USD | 25,728 | | | BRL | 140,170 | | | | 10/02/2024 | | | | 1,889 | |
Barclays Bank PLC | | AUD | 195,829 | | | USD | 134,575 | | | | 10/16/2024 | | | | (843,763 | ) |
Barclays Bank PLC | | USD | 827 | | | EUR | 754 | | | | 10/25/2024 | | | | 13,551 | |
Barclays Bank PLC | | CNH | 1,060,053 | | | USD | 151,037 | | | | 11/21/2024 | | | | (890,590 | ) |
Barclays Bank PLC | | USD | 868 | | | INR | 73,140 | | | | 12/06/2024 | | | | 1,773 | |
BNP Paribas SA | | CNH | 719,285 | | | USD | 102,492 | | | | 10/16/2024 | | | | (284,314 | ) |
Brown Brothers Harriman & Co. | | EUR | 5,242 | | | USD | 5,856 | | | | 10/16/2024 | | | | 17,914 | |
Brown Brothers Harriman & Co. | | JPY | 30,889 | | | USD | 214 | | | | 10/16/2024 | | | | (1,509 | ) |
Brown Brothers Harriman & Co. | | EUR | 342 | | | USD | 382 | | | | 10/25/2024 | | | | 370 | |
Brown Brothers Harriman & Co. | | EUR | 326 | | | USD | 363 | | | | 10/25/2024 | | | | (920 | ) |
Brown Brothers Harriman & Co. | | USD | 368 | | | CAD | 496 | | | | 11/07/2024 | | | | (1,449 | ) |
Brown Brothers Harriman & Co. | | GBP | 331 | | | USD | 435 | | | | 11/08/2024 | | | | (7,204 | ) |
Brown Brothers Harriman & Co. | | USD | 329 | | | GBP | 252 | | | | 11/08/2024 | | | | 7,799 | |
Brown Brothers Harriman & Co. | | AUD | 285 | | | USD | 193 | | | | 11/22/2024 | | | | (4,296 | ) |
Citibank NA | | EUR | 8,106 | | | USD | 8,887 | | | | 10/10/2024 | | | | (139,104 | ) |
Citibank NA | | USD | 15,161 | | | EUR | 13,586 | | | | 10/16/2024 | | | | (28,569 | ) |
Citibank NA | | CAD | 205,200 | | | USD | 152,636 | | | | 10/18/2024 | | | | 853,536 | |
Citibank NA | | IDR | 1,357,048,358 | | | USD | 83,193 | | | | 10/25/2024 | | | | (6,036,473 | ) |
Citibank NA | | USD | 1,221 | | | EUR | 1,106 | | | | 10/25/2024 | | | | 10,724 | |
Deutsche Bank AG | | JPY | 26,639,537 | | | USD | 185,823 | | | | 10/16/2024 | | | | 87,686 | |
Deutsche Bank AG | | USD | 80,667 | | | JPY | 11,563,796 | | | | 10/16/2024 | | | | (42,424 | ) |
Deutsche Bank AG | | USD | 1,336 | | | EUR | 1,220 | | | | 10/25/2024 | | | | 23,832 | |
HSBC Bank USA | | EUR | 8,474 | | | USD | 9,440 | | | | 10/25/2024 | | | | (2,840 | ) |
HSBC Bank USA | | USD | 2,014 | | | EUR | 1,837 | | | | 10/25/2024 | | | | 33,172 | |
JPMorgan Chase Bank NA | | USD | 18,991 | | | GBP | 14,191 | | | | 10/16/2024 | | | | (18,379 | ) |
JPMorgan Chase Bank NA | | JPY | 42,342,031 | | | USD | 290,047 | | | | 10/17/2024 | | | | (5,216,083 | ) |
JPMorgan Chase Bank NA | | USD | 33,065 | | | CAD | 44,445 | | | | 10/18/2024 | | | | (189,284 | ) |
Morgan Stanley Capital Services LLC | | BRL | 136,949 | | | USD | 25,137 | | | | 10/02/2024 | | | | (1,846 | ) |
Morgan Stanley Capital Services LLC | | USD | 24,909 | | | BRL | 136,949 | | | | 10/02/2024 | | | | 229,989 | |
| | |
| |
76 | AB GLOBAL BOND FUND | | abfunds.com |
PORTFOLIO OF INVESTMENTS (continued)
| | | | | | | | | | | | | | | | |
| Counterparty | | Contracts to
Deliver
(000) | | | In Exchange
For
(000) | | | Settlement
Date | | | Unrealized
Appreciation
(Depreciation) | |
Morgan Stanley Capital Services LLC | | KRW | 102,322,645 | | | USD | 74,714 | | | | 10/18/2024 | | | $ | (2,925,631 | ) |
Morgan Stanley Capital Services LLC | | SEK | 265,695 | | | USD | 26,302 | | | | 10/18/2024 | | | | 118,352 | |
Morgan Stanley Capital Services LLC | | COP | 292,143,252 | | | USD | 69,603 | | | | 11/08/2024 | | | | 496,286 | |
Morgan Stanley Capital Services LLC | | MYR | 115,081 | | | USD | 26,395 | | | | 11/21/2024 | | | | (1,515,004 | ) |
NatWest Markets PLC | | EUR | 187,021 | | | USD | 208,546 | | | | 10/16/2024 | | | | 236,512 | |
Societe Generale | | GBP | 51,318 | | | USD | 68,483 | | | | 10/16/2024 | | | | (125,862 | ) |
Standard Chartered Bank | | USD | 52,341 | | | IDR | 812,686,121 | | | | 10/25/2024 | | | | 1,095,642 | |
UBS AG | | USD | 1,507 | | | EUR | 1,364 | | | | 10/25/2024 | | | | 13,211 | |
UBS AG | | PEN | 24,266 | | | USD | 6,397 | | | | 11/08/2024 | | | | (145,709 | ) |
| | | | | | | | | | | | | | | | |
| | | | | | | | | | | | | | $ | (36,673,006 | ) |
| | | | | | | | | | | | | | | | |
CENTRALLY CLEARED CREDIT DEFAULT SWAPS (see Note D)
| | | | | | | | | | | | | | | | | | | | | | | | | | | | | | | | |
| Description | | Fixed
Rate
(Pay)
Receive | | | Payment
Frequency | | | Implied
Credit
Spread at
September 30,
2024 | | | Notional
Amount
(000) | | | Market
Value | | | Upfront
Premiums
Paid
(Received) | | | Unrealized
Appreciation
(Depreciation) | |
Buy Contracts | | | | | | | | | | | | | | | | | | | | | | | | | |
iTraxx Australia Series 42, 5 Year Index, 12/20/2029* | | | 1.00 | % | | | Quarterly | | | | 0.64 | % | | | USD | | | | 83,510 | | | $ | (1,457,383 | ) | | $ | (1,412,356 | ) | | $ | (45,027 | ) |
iTraxx-Europe Series 42, 5 Year Index, 12/20/2029* | | | 1.00 | | | | Quarterly | | | | 0.59 | | | | EUR | | | | 141,000 | | | | (3,197,731 | ) | | | (3,058,876 | ) | | | (138,855 | ) |
Sale Contracts | | | | | | | | | | | | | |
CDX-NAIG Series 43, 5 Year Index, 12/20/2029* | | | 1.00 | | | | Quarterly | | | | 0.53 | % | | | USD | | | | 83,510 | | | | 1,892,461 | | | | 1,880,498 | | | | 11,963 | |
| | | | | | | | | | | | | | | | | | | | | | | | | | | | | | | | |
| | | | | | | | | | | | | | | | | | | | | | $ | (2,762,653 | ) | | $ | (2,590,734 | ) | | $ | (171,919 | ) |
| | | | | | | | | | | | | | | | | | | | | | | | | | | | | | | | |
| | |
| |
| abfunds.com | | AB GLOBAL BOND FUND | 77 |
PORTFOLIO OF INVESTMENTS (continued)
CENTRALLY CLEARED INTEREST RATE SWAPS (see Note D)
| | | | | | | | | | | | | | | | | | | | | | | | | | | | |
| | | | | | | | | Rate Type | | | | | | | | | | | |
Notional
Amount
(000) | | | Termination
Date | | | Payments
made
by the
Fund | | | Payments
received
by the
Fund | | Payment Frequency Paid/
Received | | Market
Value | | | Upfront
Premiums
Paid
(Received) | | | Unrealized
Appreciation
(Depreciation) | |
| SEK | | | 566,036 | | | | 08/30/2026 | | | | 2.290% | | | 3 Month STIBOR | | Annual/
Quarterly | | $ | (176,839 | ) | | $ | – 0 | – | | $ | (176,839 | ) |
| SEK | | | 566,036 | | | | 09/02/2026 | | | | 2.265% | | | 3 Month STIBOR | | Annual/
Quarterly | | | (158,081 | ) | | | – 0 | – | | | (158,081 | ) |
| SEK | | | 566,036 | | | | 09/02/2026 | | | | 2.298% | | | 3 Month STIBOR | | Annual/
Quarterly | | | (193,840 | ) | | | – 0 | – | | | (193,840 | ) |
| SEK | | | 566,035 | | | | 09/02/2026 | | | | 2.257% | | | 3 Month STIBOR | | Annual/
Quarterly | | | (149,412 | ) | | | – 0 | – | | | (149,412 | ) |
| SEK | | | 517,877 | | | | 09/02/2026 | | | | 2.250% | | | 3 Month STIBOR | | Annual/
Quarterly | | | (129,760 | ) | | | – 0 | – | | | (129,760 | ) |
| | | | | | | | | | | | | | | | | | | | | | | | | | | | |
| | | | | | | | | | | | | | | | | | $ | (807,932 | ) | | $ | – 0 | – | | $ | (807,932 | ) |
| | | | | | | | | | | | | | | | | | | | | | | | | | | | |
| ** | Principal amount less than 500. |
| (a) | Security is exempt from registration under Rule 144A or Regulation S of the Securities Act of 1933. These securities are considered restricted, but liquid and may be resold in transactions exempt from registration. At September 30, 2024, the aggregate market value of these securities amounted to $2,588,439,586 or 44.45% of net assets. |
| (b) | Position, or a portion thereof, has been segregated to collateralize OTC derivatives outstanding. |
| (c) | Position, or a portion thereof, has been segregated to collateralize forward currency exchange contracts. |
| (d) | Securities are perpetual and, thus, do not have a predetermined maturity date. The date shown, if applicable, reflects the next call date. |
| (e) | Floating Rate Security. Stated interest/floor/ceiling rate was in effect at September 30, 2024. |
| (f) | Coupon rate adjusts periodically based upon a predetermined schedule. Stated interest rate in effect at September 30, 2024. |
| (g) | Fair valued by the Adviser. |
| (h) | Security is exempt from registration under Rule 144A or Regulation S of the Securities Act of 1933. These securities, which represent 0.00% of net assets as of September 30, 2024, are considered illiquid and restricted. Additional information regarding such securities follows: |
| | | | | | | | | | | | | | |
144A/Restricted &
Illiquid Securities | | Acquisition
Date | | Cost | | | Market
Value | | | Percentage of
Net Assets | |
Chile Electricity PEC SpA
Zero Coupon, 01/25/2028 | | 10/06/2021 | | $ | 189,662 | | | $ | 167,227 | | | | 0.00 | % |
Virgolino de Oliveira Finance SA
10.50%, 01/28/2018 | | 06/13/2013 – 09/23/2014 | | | 3,859,889 | | | | 427 | | | | 0.00 | % |
| (i) | Security in which significant unobservable inputs (Level 3) were used in determining fair value. |
| (j) | Defaulted matured security. |
| (k) | Non-income producing security. |
| (l) | Pay-In-Kind Payments (PIK). The issuer may pay cash interest and/or interest in additional debt securities. Rates shown are the rates in effect at September 30, 2024. |
| (m) | The stated coupon rate represents the greater of the SOFR or an alternate base rate such as the PRIME or the SOFR/PRIME floor rate plus a spread at September 30, 2024. |
| | |
| |
78 | AB GLOBAL BOND FUND | | abfunds.com |
PORTFOLIO OF INVESTMENTS (continued)
| (n) | The rate shown represents the 7-day yield as of period end. |
| (o) | To obtain a copy of the fund’s shareholder report, please go to the Securities and Exchange Commission’s website at www.sec.gov, or call AB at (800) 227-4618. |
| (p) | Affiliated investments. |
| | |
Currency Abbreviations: AUD – Australian Dollar BRL – Brazilian Real CAD – Canadian Dollar CNH – Chinese Yuan Renminbi (Offshore) CNY – Chinese Yuan Renminbi COP – Colombian Peso EUR – Euro GBP – Great British Pound IDR – Indonesian Rupiah | | INR – Indian Rupee JPY – Japanese Yen KRW – South Korean Won MYR – Malaysian Ringgit NOK – Norwegian Krone NZD – New Zealand Dollar PEN – Peruvian Sol SEK – Swedish Krona USD – United States Dollar ZAR – South African Rand |
Glossary:
ABS – Asset-Backed Securities
BOBL – Bundesobligationen
CBT – Chicago Board of Trade
CDX-NAIG – North American Investment Grade Credit Default Swap Index
CLO – Collateralized Loan Obligations
CMBS – Commercial Mortgage-Backed Securities
CME – Chicago Mercantile Exchange
EURIBOR – Euro Interbank Offered Rate
GMTN – Global Medium Term Note
JSC – Joint Stock Company
LP – Limited Partnership
OAT – Obligations Assimilables du Trésor
OSE – Osaka Securities Exchange
PJSC – Public Joint Stock Company
REIT – Real Estate Investment Trust
SOFR – Secured Overnight Financing Rate
STIBOR – Stockholm Interbank Offered Rate
TBA – To Be Announced
See notes to financial statements.
| | |
| |
| abfunds.com | | AB GLOBAL BOND FUND | 79 |
STATEMENT OF ASSETS & LIABILITIES
September 30, 2024
| | | | |
| Assets | | | | |
Investments in securities, at value | | | | |
Unaffiliated issuers (cost $6,395,765,933) | | $ | 6,386,192,418 | |
Affiliated issuers (cost $97,830,004) | | | 97,830,004 | |
Cash | | | 27,940 | |
Cash collateral due from broker | | | 19,806,614 | |
Foreign currencies, at value (cost $3,772,035) | | | 3,758,716 | |
Receivable for investment securities sold and foreign currency transactions | | | 336,809,596 | |
Unaffiliated interest receivable | | | 52,866,123 | |
Receivable for capital stock sold | | | 13,507,205 | |
Unrealized appreciation on forward currency exchange contracts | | | 3,309,187 | |
Affiliated dividends receivable | | | 381,958 | |
Receivable for variation margin on centrally cleared swaps | | | 290,101 | |
Receivable due from Adviser | | | 17,321 | |
| | | | |
Total assets | | | 6,914,797,183 | |
| | | | |
| Liabilities | | | | |
Payable for investment securities purchased | | | 1,039,083,176 | |
Unrealized depreciation on forward currency exchange contracts | | | 39,982,193 | |
Payable for capital stock redeemed | | | 2,441,318 | |
Payable for unsettled reverse repurchase agreements | | | 2,357,485 | |
Advisory fee payable | | | 2,056,167 | |
Dividends payable | | | 1,899,715 | |
Payable for capital gains taxes | | | 673,770 | |
Cash collateral due to broker | | | 600,000 | |
Payable for variation margin on futures | | | 476,442 | |
Transfer Agent fee payable | | | 120,795 | |
Distribution fee payable | | | 66,813 | |
Administrative fee payable | | | 60,028 | |
Accrued expenses | | | 1,458,731 | |
| | | | |
Total liabilities | | | 1,091,276,633 | |
| | | | |
Net Assets | | $ | 5,823,520,550 | |
| | | | |
| Composition of Net Assets | | | | |
Capital stock, at par | | $ | 827,895 | |
Additional paid-in capital | | | 6,679,124,928 | |
Accumulated loss | | | (856,432,273 | ) |
| | | | |
| | $ | 5,823,520,550 | |
| | | | |
| | |
| |
80 | AB GLOBAL BOND FUND | | abfunds.com |
STATEMENT OF ASSETS & LIABILITIES (continued)
Net Asset Value Per Share—27 billion shares of capital stock authorized, $.001 par value
| | | | | | | | | | | | |
| Class | | Net Assets | | | Shares
Outstanding | | | Net Asset
Value | |
| |
| A | | $ | 312,046,587 | | | | 44,325,496 | | | $ | 7.04 | * |
| |
| C | | $ | 8,926,820 | | | | 1,263,815 | | | $ | 7.06 | |
| |
| Advisor | | $ | 4,052,962,246 | | | | 576,268,893 | | | $ | 7.03 | |
| |
| I | | $ | 592,294,702 | | | | 84,199,472 | | | $ | 7.03 | |
| |
| Z | | $ | 857,290,195 | | | | 121,837,414 | | | $ | 7.04 | |
| |
| * | The maximum offering price per share for Class A shares was $7.35, which reflects a sales charge of 4.25%. |
See notes to financial statements.
| | |
| |
| abfunds.com | | AB GLOBAL BOND FUND | 81 |
STATEMENT OF OPERATIONS
Year Ended September 30, 2024
| | | | | | | | |
| Investment Income | | | | | | | | |
Interest (net of foreign taxes withheld of $566,604) | | $ | 231,229,433 | | | | | |
Dividends | | | | | | | | |
Affiliated issuers | | | 4,033,996 | | | | | |
Unaffiliated issuers | | | 1,696,209 | | | | | |
Other income | | | 55,167 | | | $ | 237,014,805 | |
| | | | | | | | |
| Expenses | | | | | | | | |
Advisory fee (see Note B) | | | 26,200,180 | | | | | |
Transfer agency—Class A | | | 170,197 | | | | | |
Transfer agency—Class C | | | 6,314 | | | | | |
Transfer agency—Advisor Class | | | 1,989,122 | | | | | |
Transfer agency—Class R | | | 47,859 | | | | | |
Transfer agency—Class K | | | 9,514 | | | | | |
Transfer agency—Class I | | | 622,367 | | | | | |
Transfer agency—Class Z | | | 179,406 | | | | | |
Distribution fee—Class A | | | 809,569 | | | | | |
Distribution fee—Class C | | | 112,296 | | | | | |
Distribution fee—Class R | | | 95,380 | | | | | |
Distribution fee—Class K | | | 11,893 | | | | | |
Custody and accounting | | | 789,674 | | | | | |
Printing | | | 282,739 | | | | | |
Registration fees | | | 150,243 | | | | | |
Audit and tax | | | 127,969 | | | | | |
Administrative | | | 115,899 | | | | | |
Directors’ fees | | | 95,140 | | | | | |
Legal | | | 80,571 | | | | | |
Miscellaneous | | | 172,907 | | | | | |
| | | | | | | | |
Total expenses before interest expense | | | 32,069,239 | | | | | |
Interest expense | | | 63,179 | | | | | |
| | | | | | | | |
Total expenses | | | 32,132,418 | | | | | |
Less: expenses waived and reimbursed by the Adviser (see Note B) | | | (145,898 | ) | | | | |
| | | | | | | | |
Net expenses | | | | | | | 31,986,520 | |
| | | | | | | | |
Net investment income | | | | | | | 205,028,285 | |
| | | | | | | | |
| | |
| |
82 | AB GLOBAL BOND FUND | | abfunds.com |
STATEMENT OF OPERATIONS (continued)
| | | | | | | | |
| Realized and Unrealized Gain (Loss) on Investment and Foreign Currency Transactions | | | | | | | | |
Net realized gain (loss) on: | | | | | | | | |
Investment transactions(a) | | | | | | $ | (45,694,875 | ) |
Forward currency exchange contracts | | | | | | | (77,673,829 | ) |
Futures | | | | | | | (2,695,663 | ) |
Swaps | | | | | | | (7,256,007 | ) |
Foreign currency transactions | | | | | | | 79,592,747 | |
Net change in unrealized appreciation (depreciation) on: | | | | | | | | |
Investments(b) | | | | | | | 515,567,008 | |
Forward currency exchange contracts | | | | | | | (90,980,726 | ) |
Futures | | | | | | | 3,943,508 | |
Swaps | | | | | | | 9,561,557 | |
Foreign currency denominated assets and liabilities | | | | | | | 884,584 | |
| | | | | | | | |
Net gain on investment and foreign currency transactions | | | | | | | 385,248,304 | |
| | | | | | | | |
Contributions from Affiliates (see Note B) | | | | | | | 317 | |
| | | | | | | | |
Net Increase in Net Assets from Operations | | | | | | $ | 590,276,906 | |
| | | | | | | | |
| (a) | Net of foreign realized capital gains taxes of $113,219. |
| (b) | Net of increase in accrued foreign capital gains taxes on unrealized gains of $68,117. |
See notes to financial statements.
| | |
| |
| abfunds.com | | AB GLOBAL BOND FUND | 83 |
STATEMENT OF CHANGES IN NET ASSETS
| | | | | | | | |
| | | Year Ended
September 30,
2024 | | | Year Ended
September 30,
2023 | |
| Increase (Decrease) in Net Assets from Operations | | | | | | | | |
Net investment income | | $ | 205,028,285 | | | $ | 180,012,299 | |
Net realized loss on investment and foreign currency transactions | | | (53,727,627 | ) | | | (586,223,440 | ) |
Net change in unrealized appreciation on investments and foreign currency denominated assets and liabilities | | | 438,975,931 | | | | 476,296,037 | |
Contributions from Affiliates (see Note B) | | | 317 | | | | 4,238 | |
| | | | | | | | |
Net increase in net assets from operations | | | 590,276,906 | | | | 70,089,134 | |
| Distributions to Shareholders | | | | | | | | |
Class A | | | (1,959,807 | ) | | | (31,048,451 | ) |
Class C | | | (52,513 | ) | | | (1,479,477 | ) |
Advisor Class | | | (24,801,891 | ) | | | (284,552,068 | ) |
Class R | | | (96,327 | ) | | | (2,714,762 | ) |
Class K | | | (26,491 | ) | | | (676,437 | ) |
Class I | | | (4,217,577 | ) | | | (60,631,879 | ) |
Class Z | | | (5,179,839 | ) | | | (64,290,456 | ) |
Return of Capital | | | | | | | | |
Class A | | | (9,156,363 | ) | | | (2,887,617 | ) |
Class C | | | (245,346 | ) | | | (137,597 | ) |
Advisor Class | | | (115,876,231 | ) | | | (26,464,357 | ) |
Class R | | | (450,046 | ) | | | (252,482 | ) |
Class K | | | (123,767 | ) | | | (62,911 | ) |
Class I | | | (19,704,826 | ) | | | (5,638,981 | ) |
Class Z | | | (24,200,583 | ) | | | (5,979,242 | ) |
| Capital Stock Transactions | | | | | | | | |
Net increase | | | 18,738,909 | | | | 437,645,834 | |
| | | | | | | | |
Total increase | | | 402,924,208 | | | | 20,918,251 | |
| Net Assets | | | | | | | | |
Beginning of period | | | 5,420,596,342 | | | | 5,399,678,091 | |
| | | | | | | | |
End of period | | $ | 5,823,520,550 | | | $ | 5,420,596,342 | |
| | | | | | | | |
See notes to financial statements.
| | |
| |
84 | AB GLOBAL BOND FUND | | abfunds.com |
NOTES TO FINANCIAL STATEMENTS
September 30, 2024
NOTE A
Significant Accounting Policies
AB Global Bond Fund, Inc. (the “Fund”) is organized as a Maryland corporation and is registered under the Investment Company Act of 1940 (the “1940 Act”) as a diversified, open-end management investment company. The Fund offers Class A, Class C, Advisor Class, Class I and Class Z shares. Class B, Class K, Class R and Class T shares have been authorized but currently are not offered. Effective May 20, 2024, Class R and Class K were liquidated. Class A shares are sold with a front-end sales charge of up to 4.25% for purchases not exceeding $1,000,000. With respect to purchases of $1,000,000 or more, Class A shares redeemed within one year of purchase may be subject to a contingent deferred sales charge of 1%. Class C shares are subject to a contingent deferred sales charge of 1% on redemptions made within the first year after purchase, and 0% after the first year of purchase. Class C shares automatically convert to Class A shares eight years after the end of the calendar month of purchase. Advisor Class, Class I and Class Z shares are sold without an initial or contingent deferred sales charge and are not subject to ongoing distribution expenses. All nine classes of shares have identical voting, dividend, liquidation and other rights, except that the classes bear different distribution and transfer agency expenses. Each class has exclusive voting rights with respect to its distribution plan. The financial statements have been prepared in conformity with U.S. generally accepted accounting principles (“U.S. GAAP”), which require management to make certain estimates and assumptions that affect the reported amounts of assets and liabilities in the financial statements and amounts of income and expenses during the reporting period. Actual results could differ from those estimates. The Fund is an investment company under U.S. GAAP and follows the accounting and reporting guidance applicable to investment companies. The following is a summary of significant accounting policies followed by the Fund.
1. Security Valuation
Portfolio securities are valued at market value determined on the basis of market quotations or, if market quotations are not readily available or are unreliable, at “fair value” as determined in accordance with procedures approved by and under the oversight of the Fund’s Board of Directors (the “Board”). Pursuant to these procedures, AllianceBernstein L.P. (the “Adviser”) serves as the Fund’s valuation designee pursuant to Rule 2a-5 of the 1940 Act. In this capacity, the Adviser is responsible, among other things, for making all fair value determinations relating to the Fund’s portfolio investments, subject to the Board’s oversight.
In general, the market values of securities which are readily available and deemed reliable are determined as follows: securities listed on a national
| | |
| |
| abfunds.com | | AB GLOBAL BOND FUND | 85 |
NOTES TO FINANCIAL STATEMENTS (continued)
securities exchange (other than securities listed on the NASDAQ Stock Market, Inc. (“NASDAQ”)) or on a foreign securities exchange are valued at the last sale price at the close of the exchange or foreign securities exchange. If there has been no sale on such day, the securities are valued at the last traded price from the previous day. Securities listed on more than one exchange are valued by reference to the principal exchange on which the securities are traded; securities listed only on NASDAQ are valued in accordance with the NASDAQ Official Closing Price; listed or over the counter (“OTC”) market put or call options are valued at the mid level between the current bid and ask prices. If either a current bid or current ask price is unavailable, the Adviser will have discretion to determine the best valuation (e.g., last trade price in the case of listed options); open futures are valued using the closing settlement price or, in the absence of such a price, the most recent quoted bid price. If there are no quotations available for the day of valuation, the last available closing settlement price is used; U.S. Government securities and any other debt instruments having 60 days or less remaining until maturity are generally valued at market by an independent pricing vendor, if a market price is available. If a market price is not available, the securities are valued at amortized cost. This methodology is commonly used for short term securities that have an original maturity of 60 days or less, as well as short term securities that had an original term to maturity that exceeded 60 days. In instances when amortized cost is utilized, the Valuation Committee (the “Committee”) must reasonably conclude that the utilization of amortized cost is approximately the same as the fair value of the security. Factors the Committee will consider include, but are not limited to, an impairment of the creditworthiness of the issuer or material changes in interest rates. Fixed-income securities, including mortgage-backed and asset-backed securities, may be valued on the basis of prices provided by a pricing service or at a price obtained from one or more of the major broker-dealers. In cases where broker-dealer quotes are obtained, the Adviser may establish procedures whereby changes in market yields or spreads are used to adjust, on a daily basis, a recently obtained quoted price on a security. Swaps and other derivatives are valued daily, primarily using independent pricing services, independent pricing models using market inputs, as well as third party broker-dealers or counterparties. Open-end mutual funds are valued at the closing net asset value per share, while exchange traded funds are valued at the closing market price per share.
Securities for which market quotations are not readily available (including restricted securities) or are deemed unreliable are valued at fair value as deemed appropriate by the Adviser. Factors considered in making this determination may include, but are not limited to, information obtained by contacting the issuer, analysts, analysis of the issuer’s financial statements or other available documents. In addition, the Fund may use fair value pricing for securities primarily traded in non-U.S. markets because most
| | |
| |
86 | AB GLOBAL BOND FUND | | abfunds.com |
NOTES TO FINANCIAL STATEMENTS (continued)
foreign markets close well before the Fund values its securities at 4:00 p.m., Eastern Time. The earlier close of these foreign markets gives rise to the possibility that significant events, including broad market moves, may have occurred in the interim and may materially affect the value of those securities. To account for this, the Fund generally values many of its foreign equity securities using fair value prices based on third party vendor modeling tools to the extent available.
2. Fair Value Measurements
In accordance with U.S. GAAP regarding fair value measurements, fair value is defined as the price that the Fund would receive to sell an asset or pay to transfer a liability in an orderly transaction between market participants at the measurement date. U.S. GAAP establishes a framework for measuring fair value, and a three-level hierarchy for fair value measurements based upon the transparency of inputs to the valuation of an asset or liability (including those valued based on their market values as described in Note A.1 above). Inputs may be observable or unobservable and refer broadly to the assumptions that market participants would use in pricing the asset or liability. Observable inputs reflect the assumptions market participants would use in pricing the asset or liability based on market data obtained from sources independent of the Fund. Unobservable inputs reflect the Fund’s own assumptions about the assumptions that market participants would use in pricing the asset or liability based on the best information available in the circumstances. Each investment is assigned a level based upon the observability of the inputs which are significant to the overall valuation. The three-tier hierarchy of inputs is summarized below.
| | • | | Level 1—quoted prices in active markets for identical investments |
| | • | | Level 2—other significant observable inputs (including quoted prices for similar investments, interest rates, prepayment speeds, credit risk, etc.) |
| | • | | Level 3—significant unobservable inputs (including the Fund’s own assumptions in determining the fair value of investments) |
The fair value of debt instruments, such as bonds, and over-the-counter derivatives is generally based on market price quotations, recently executed market transactions (where observable) or industry recognized modeling techniques and are generally classified as Level 2. Pricing vendor inputs to Level 2 valuations may include quoted prices for similar investments in active markets, interest rate curves, coupon rates, currency rates, yield curves, option adjusted spreads, default rates, credit spreads and other unique security features in order to estimate the relevant cash flows which are then discounted to calculate fair values. If these inputs are unobservable and significant to the fair value, these investments will be classified as Level 3.
| | |
| |
| abfunds.com | | AB GLOBAL BOND FUND | 87 |
NOTES TO FINANCIAL STATEMENTS (continued)
Where readily available market prices or relevant bid prices are not available for certain equity investments, such investments may be valued based on similar publicly traded investments, movements in relevant indices since last available prices or based upon underlying company fundamentals and comparable company data (such as multiples to earnings or other multiples to equity). Where an investment is valued using an observable input, such as another publicly traded security, the investment will be classified as Level 2. If management determines that an adjustment is appropriate based on restrictions on resale, illiquidity or uncertainty, and such adjustment is a significant component of the valuation, the investment will be classified as Level 3. An investment will also be classified as Level 3 where management uses company fundamentals and other significant inputs to determine the valuation.
Valuations of mortgage-backed or other asset-backed securities, by pricing vendors, are based on both proprietary and industry recognized models and discounted cash flow techniques. Significant inputs to the valuation of these instruments are value of the collateral, the rates and timing of delinquencies, the rates and timing of prepayments, and default and loss expectations, which are driven in part by housing prices for residential mortgages. Significant inputs are determined based on relative value analyses, which incorporate comparisons to instruments with similar collateral and risk profiles, including relevant indices. Mortgage and asset-backed securities for which management has collected current observable data through pricing services are generally categorized within Level 2. Those investments for which current observable data has not been provided are classified as Level 3.
Bank loan prices are provided by third party pricing services and consist of a composite of the quotes received by the vendor into a consensus price. Certain bank loans are classified as Level 3, as a significant input used in the fair value measurement of these instruments is the market quotes that are received by the vendor and these inputs are not observable.
Other fixed income investments, including non-U.S. government and corporate debt, are generally valued using quoted market prices, if available, which are typically impacted by current interest rates, maturity dates and any perceived credit risk of the issuer. Additionally, in the absence of quoted market prices, these inputs are used by pricing vendors to derive a valuation based upon industry or proprietary models which incorporate issuer specific data with relevant yield/spread comparisons with more widely quoted bonds with similar key characteristics. Those investments for which there are observable inputs are classified as Level 2. Where the inputs are not observable, the investments are classified as Level 3.
| | |
| |
88 | AB GLOBAL BOND FUND | | abfunds.com |
NOTES TO FINANCIAL STATEMENTS (continued)
The following table summarizes the valuation of the Fund’s investments by the above fair value hierarchy levels as of September 30, 2024:
| | | | | | | | | | | | | | | | |
Investments in
Securities | | Level 1 | | | Level 2 | | | Level 3 | | | Total | |
Assets: | | | | | | | | | | | | | | | | |
Governments – Treasuries | | $ | – 0 | – | | $ | 2,550,703,528 | | | $ | – 0 | – | | $ | 2,550,703,528 | |
Corporates – Investment Grade | | | – 0 | – | | | 1,523,167,785 | | | | – 0 | – | | | 1,523,167,785 | |
Mortgage Pass-Throughs | | | – 0 | – | | | 795,193,121 | | | | – 0 | – | | | 795,193,121 | |
Covered Bonds | | | – 0 | – | | | 179,068,789 | | | | – 0 | – | | | 179,068,789 | |
Collateralized Mortgage Obligations | | | – 0 | – | | | 168,348,853 | | | | – 0 | – | | | 168,348,853 | |
Collateralized Loan Obligations | | | – 0 | – | | | 149,583,392 | | | | – 0 | – | | | 149,583,392 | |
Local Governments – Provincial Bonds | | | – 0 | – | | | 135,072,123 | | | | – 0 | – | | | 135,072,123 | |
Asset-Backed Securities | | | – 0 | – | | | 106,762,752 | | | | 16,223,224 | | | | 122,985,976 | |
Inflation-Linked Securities | | | – 0 | – | | | 108,230,889 | | | | – 0 | – | | | 108,230,889 | |
Supranationals | | | – 0 | – | | | 105,404,222 | | | | – 0 | – | | | 105,404,222 | |
Governments – Sovereign Bonds | | | – 0 | – | | | 87,488,206 | | | | – 0 | – | | | 87,488,206 | |
Local Governments – Regional Bonds | | | – 0 | – | | | 84,545,621 | | | | – 0 | – | | | 84,545,621 | |
Commercial Mortgage-Backed Securities | | | – 0 | – | | | 82,323,117 | | | | – 0 | – | | | 82,323,117 | |
Governments – Sovereign Agencies | | | – 0 | – | | | 75,544,070 | | | | – 0 | – | | | 75,544,070 | |
Emerging Markets – Corporate Bonds | | | – 0 | – | | | 55,021,525 | | | | 427 | | | | 55,021,952 | |
Corporates – Non-Investment Grade | | | – 0 | – | | | 52,290,899 | | | | – 0 | – | | | 52,290,899 | |
Quasi-Sovereigns | | | – 0 | – | | | 47,244,551 | | | | – 0 | – | | | 47,244,551 | |
Local Governments – US Municipal Bonds | | | – 0 | – | | | 31,697,549 | | | | – 0 | – | | | 31,697,549 | |
Bank Loans | | | – 0 | – | | | 9,079,769 | | | | – 0 | – | | | 9,079,769 | |
Emerging Markets – Sovereigns | | | – 0 | – | | | 7,097,103 | | | | – 0 | – | | | 7,097,103 | |
Local Governments – Canadian Municipal Bonds | | | – 0 | – | | | 2,648,195 | | | | – 0 | – | | | 2,648,195 | |
Common Stocks | | | 54,534 | | | | – 0 | – | | | 1,689,772 | | | | 1,744,306 | |
Emerging Markets – Treasuries | | | – 0 | – | | | 1 | | | | – 0 | – | | | 1 | |
Short-Term Investments: | | | | | | | | | | | | | | | | |
Investment Companies | | | 97,830,004 | | | | – 0 | – | | | – 0 | – | | | 97,830,004 | |
Time Deposits | | | 11,708,401 | | | | – 0 | – | | | – 0 | – | | | 11,708,401 | |
| | | | | | | | | | | | | | | | |
Total Investments in Securities | | | 109,592,939 | | | | 6,356,516,060 | | | | 17,913,423 | | | | 6,484,022,422 | |
| | |
| |
| abfunds.com | | AB GLOBAL BOND FUND | 89 |
NOTES TO FINANCIAL STATEMENTS (continued)
| | | | | | | | | | | | | | | | |
Investments in
Securities | | Level 1 | | | Level 2 | | | Level 3 | | | Total | |
Other Financial Instruments*: | | | | | | | | | | | | | | | | |
Assets | | | | | | | | | | | | | | | | |
Futures | | $ | 1,556,122 | | | $ | – 0 | – | | $ | – 0 | – | | $ | 1,556,122 | † |
Forward Currency Exchange Contracts | | | – 0 | – | | | 3,309,187 | | | | – 0 | – | | | 3,309,187 | |
Centrally Cleared Credit Default Swaps | | | – 0 | – | | | 1,892,461 | | | | – 0 | – | | | 1,892,461 | † |
Liabilities | | | | | | | | | | | | | | | | |
Futures | | | (2,500,076 | ) | | | – 0 | – | | | – 0 | – | | | (2,500,076 | )† |
Forward Currency Exchange Contracts | | | – 0 | – | | | (39,982,193 | ) | | | – 0 | – | | | (39,982,193 | ) |
Centrally Cleared Credit Default Swaps | | | – 0 | – | | | (4,655,114 | ) | | | – 0 | – | | | (4,655,114 | )† |
Centrally Cleared Interest Rate Swaps | | | – 0 | – | | | (807,932 | ) | | | – 0 | – | | | (807,932 | )† |
| | | | | | | | | | | | | | | | |
Total | | $ | 108,648,985 | | | $ | 6,316,272,469 | | | $ | 17,913,423 | | | $ | 6,442,834,877 | |
| | | | | | | | | | | | | | | | |
| * | Other financial instruments include reverse repurchase agreements and derivative instruments, such as futures, forwards and swaps. Derivative instruments are valued at the unrealized appreciation (depreciation) on the instrument. Other financial instruments may also include swaps with upfront premiums, written options and written swaptions which are valued at market value. |
| † | Only variation margin receivable (payable) at period end is reported within the statement of assets and liabilities. This amount reflects cumulative unrealized appreciation (depreciation) on futures and centrally cleared swaps as reported in the portfolio of investments. Where applicable, centrally cleared swaps with upfront premiums are presented here at market value. |
3. Currency Translation
Assets and liabilities denominated in foreign currencies and commitments under forward currency exchange contracts are translated into U.S. dollars at the mean of the quoted bid and ask prices of such currencies against the U.S. dollar. Purchases and sales of portfolio securities are translated into U.S. dollars at the rates of exchange prevailing when such securities were acquired or sold. Income and expenses are translated into U.S. dollars at the rates of exchange prevailing when accrued.
Net realized gain or loss on foreign currency transactions represents foreign exchange gains and losses from sales and maturities of foreign fixed income investments, holding of foreign currencies, currency gains or losses realized between the trade and settlement dates on foreign investment transactions, and the difference between the amounts of dividends, interest and foreign withholding taxes recorded on the Fund’s books and the U.S. dollar equivalent amounts actually received or paid. Net unrealized currency gains and losses from valuing foreign currency denominated
| | |
| |
90 | AB GLOBAL BOND FUND | | abfunds.com |
NOTES TO FINANCIAL STATEMENTS (continued)
assets and liabilities at period end exchange rates are reflected as a component of net unrealized appreciation or depreciation of foreign currency denominated assets and liabilities.
4. Taxes
It is the Fund’s policy to meet the requirements of the Internal Revenue Code applicable to regulated investment companies and to distribute all of its investment company taxable income and net realized gains, if any, to shareholders. Therefore, no provisions for federal income or excise taxes are required. The Fund may be subject to taxes imposed by countries in which it invests. Such taxes are generally based on income and/or capital gains earned or repatriated. Taxes are accrued and applied to net investment income, net realized gains and net unrealized appreciation/depreciation as such income and/or gains are earned.
In accordance with U.S. GAAP requirements regarding accounting for uncertainties in income taxes, management has analyzed the Fund’s tax positions taken or expected to be taken on federal and state income tax returns for all open tax years (the current and the prior three tax years) and has concluded that no provision for income tax is required in the Fund’s financial statements.
5. Investment Income and Investment Transactions
Dividend income is recorded on the ex-dividend date or as soon as the Fund is informed of the dividend. Interest income is accrued daily. Investment transactions are accounted for on the date the securities are purchased or sold. Investment gains or losses are determined on the identified cost basis. Non-cash dividends, if any, are recorded on the ex-dividend date at the fair value of the securities received. The Fund amortizes premiums and accretes discounts as adjustments to interest income. The Fund accounts for distributions received from real estate investment trust (“REIT”) investments or from regulated investment companies as dividend income, realized gain, or return of capital based on information provided by the REIT or the investment company.
6. Class Allocations
All income earned and expenses incurred by the Fund are borne on a pro-rata basis by each settled class of shares, based on the proportionate interest in the Fund represented by the net assets of such class, except for class specific expenses which are allocated to the respective class. Realized and unrealized gains and losses are allocated among the various share classes based on respective net assets.
7. Dividends and Distributions
Dividends and distributions to shareholders, if any, are recorded on the ex-dividend date. Income dividends and capital gains distributions are
| | |
| |
| abfunds.com | | AB GLOBAL BOND FUND | 91 |
NOTES TO FINANCIAL STATEMENTS (continued)
determined in accordance with federal tax regulations and may differ from those determined in accordance with U.S. GAAP. To the extent these differences are permanent, such amounts are reclassified within the capital accounts based on their federal tax basis treatment; temporary differences do not require such reclassification.
8. Cash and Short-Term Investments
Cash and short-term investments include cash on hand and short-term investments with maturities of less than one year when purchased.
NOTE B
Advisory Fee and Other Transactions with Affiliates
Under the terms of the investment advisory agreement, the Fund pays the Adviser an advisory fee at an annual rate of .50% of the first $2.5 billion, .45% of the next $2.5 billion and .40% in excess of $5 billion of the Fund’s average daily net assets. The fee is accrued daily and paid monthly.
Pursuant to the investment advisory agreement, the Fund may reimburse the Adviser for certain legal and accounting services provided to the Fund by the Adviser. For the year ended September 30, 2024, the reimbursement for such services amounted to $115,899.
The Fund compensates AllianceBernstein Investor Services, Inc. (“ABIS”), a wholly-owned subsidiary of the Adviser, under a Transfer Agency Agreement for providing personnel and facilities to perform transfer agency services for the Fund. ABIS may make payments to intermediaries that provide omnibus account services, sub-accounting services and/or networking services. Such compensation retained by ABIS amounted to $979,291 for the year ended September 30, 2024.
AllianceBernstein Investments, Inc. (the “Distributor”), a wholly-owned subsidiary of the Adviser, serves as the distributor of the Fund’s shares. The Distributor has advised the Fund that it has retained front-end sales charges of $982 from the sale of Class A shares and received $31,086 and $1,526 in contingent deferred sales charges imposed upon redemptions by shareholders of Class A and Class C shares, respectively, for the year ended September 30, 2024.
The Fund may invest in AB Government Money Market Portfolio (the “Government Money Market Portfolio”) which has a contractual annual advisory fee rate of .20% of the portfolio’s average daily net assets and bears its own expenses. The Adviser had contractually agreed to waive .10% of the advisory fee of Government Money Market Portfolio (resulting in a net advisory fee of .10%) until August 31, 2023. Effective September 1, 2023, the Adviser has contractually agreed to waive .05% of
| | |
| |
92 | AB GLOBAL BOND FUND | | abfunds.com |
NOTES TO FINANCIAL STATEMENTS (continued)
the advisory fee of Government Money Market Portfolio (resulting in a net advisory fee of .15%) until August 31, 2024. In connection with the investment by the Fund in Government Money Market Portfolio, the Adviser has contractually agreed to waive its advisory fee from the Fund in an amount equal to the Fund’s pro rata share of the effective advisory fee of Government Money Market Portfolio, as borne indirectly by the Fund as an acquired fund fee and expense. For the year ended September 30, 2024, such waiver amounted to $145,898.
A summary of the Fund’s transactions in AB mutual funds for the year ended September 30, 2024 is as follows:
| | | | | | | | | | | | | | | | | | | | |
Fund | | Market Value
9/30/23
(000) | | | Purchases
at Cost
(000) | | | Sales
Proceeds
(000) | | | Market Value
9/30/24
(000) | | | Dividend
Income
(000) | |
Government Money Market Portfolio | | $ | 73,931 | | | $ | 2,373,860 | | | $ | 2,349,961 | | | $ | 97,830 | | | $ | 4,034 | |
During the year ended September 30, 2024 and the year ended September 30, 2023, the Adviser reimbursed the Fund $317 and $4,238, respectively, for trading losses incurred due to trade entry errors.
NOTE C
Distribution Services Agreement
The Fund has adopted a Distribution Services Agreement (the “Agreement”) pursuant to Rule 12b-1 under the 1940 Act. Under the Agreement, the Fund pays distribution and servicing fees to the Distributor at an annual rate of up to .30% of the Fund’s average daily net assets attributable to Class A shares, 1% of the Fund’s average daily net assets attributable to Class C shares, .50% of the Fund’s average daily net assets attributable to Class R shares and .25% of the Fund’s average daily net assets attributable to Class K shares. There are no distribution and servicing fees on Advisor Class, Class I and Class Z shares. Payments under the Agreement in respect of Class A shares are currently limited to an annual rate of .25% of Class A shares’ average daily net assets. The fees are accrued daily and paid monthly. The Agreement provides that the Distributor will use such payments in their entirety for distribution assistance and promotional activities. Since the commencement of the Fund’s operations, the Distributor has incurred expenses in excess of the distribution costs reimbursed by the Fund in the amounts of $15,610,051, $1,495,574 and $327,101 for Class C, Class R and Class K shares, respectively. While such costs may be recovered from the Fund in future periods so long as the Agreement is in effect, and the share class is active, the rate of the distribution and servicing fees payable under the Agreement may not be
| | |
| |
| abfunds.com | | AB GLOBAL BOND FUND | 93 |
NOTES TO FINANCIAL STATEMENTS (continued)
increased without a shareholder vote. In accordance with the Agreement, there is no provision for recovery of unreimbursed distribution costs incurred by the Distributor beyond the current fiscal year for Class A shares. The Agreement also provides that the Adviser may use its own resources to finance the distribution of the Fund’s shares.
NOTE D
Investment Transactions
Purchases and sales of investment securities (excluding short-term investments) for the year ended September 30, 2024, were as follows:
| | | | | | | | |
| | | Purchases | | | Sales | |
Investment securities (excluding U.S. government securities) | | $ | 5,382,711,269 | | | $ | 5,553,823,449 | |
U.S. government securities | | | 13,196,576,712 | | | | 12,915,062,770 | |
The cost of investments for federal income tax purposes, gross unrealized appreciation and unrealized depreciation are as follows:
| | | | |
Cost | | $ | 6,503,238,070 | |
| | | | |
Gross unrealized appreciation | | $ | 198,746,131 | |
Gross unrealized depreciation | | | (225,684,661 | ) |
| | | | |
Net unrealized depreciation | | $ | (26,938,530 | ) |
| | | | |
1. Derivative Financial Instruments
The Fund may use derivatives in an effort to earn income and enhance returns, to replace more traditional direct investments, to obtain exposure to otherwise inaccessible markets (collectively, “investment purposes”), or to hedge or adjust the risk profile of its portfolio.
The principal types of derivatives utilized by the Fund, as well as the methods in which they may be used are:
| | • | | Forward Currency Exchange Contracts |
The Fund may enter into forward currency exchange contracts in order to hedge its exposure to changes in foreign currency exchange rates on its foreign portfolio holdings, to hedge certain firm purchase and sale commitments denominated in foreign currencies and for non-hedging purposes as a means of making direct investments in foreign currencies, as described below under “Currency Transactions”.
A forward currency exchange contract is a commitment to purchase or sell a foreign currency at a future date at a negotiated forward rate. The gain or loss arising from the difference between the original contract and the closing of such contract would be included in net realized gain or loss on forward currency exchange contracts.
| | |
| |
94 | AB GLOBAL BOND FUND | | abfunds.com |
NOTES TO FINANCIAL STATEMENTS (continued)
Fluctuations in the value of open forward currency exchange contracts are recorded for financial reporting purposes as unrealized appreciation and/or depreciation by the Fund. Risks may arise from the potential inability of a counterparty to meet the terms of a contract and from unanticipated movements in the value of a foreign currency relative to the U.S. dollar.
During the year ended September 30, 2024, the Fund held forward currency exchange contracts for hedging and non-hedging purposes.
The Fund may buy or sell futures for investment purposes or for the purpose of hedging its portfolio against adverse effects of potential movements in the market. The Fund bears the market risk that arises from changes in the value of these instruments and the imperfect correlation between movements in the price of the futures and movements in the price of the assets, reference rates or indices which they are designed to track. Among other things, the Fund may purchase or sell futures for foreign currencies or options thereon for non-hedging purposes as a means of making direct investment in foreign currencies, as described below under “Currency Transactions”.
At the time the Fund enters into futures, the Fund deposits with the broker or segregates at its custodian cash or securities as collateral to satisfy initial margin requirements set by the exchange on which the transaction is effected. Pursuant to the contract, with respect to cash collateral, the Fund agrees to receive from or pay to the broker an amount of cash equal to the daily fluctuation in the value of the contract; in the case of securities collateral, the Fund agrees to adjust the securities position held in the segregated account accordingly. Such receipts, payments or adjustments are known as variation margin and are recorded by the Fund as unrealized gains or losses. Risks may arise from the potential inability of a counterparty to meet the terms of the contract. The credit/counterparty risk for exchange-traded futures is generally less than privately negotiated futures, since the clearinghouse, which is the issuer or counterparty to each exchange-traded future, has robust risk mitigation standards, including the requirement to provide initial and variation margin. When the contract is closed, the Fund records a realized gain or loss equal to the difference between the value of the contract at the time it was opened and the time it was closed.
Use of long futures subjects the Fund to risk of loss in excess of the amounts shown on the statement of assets and liabilities, up to the notional value of the futures. Use of short futures subjects the Fund to unlimited risk of loss. Under some circumstances, futures exchanges
| | |
| |
| abfunds.com | | AB GLOBAL BOND FUND | 95 |
NOTES TO FINANCIAL STATEMENTS (continued)
may establish daily limits on the amount that the price of futures can vary from the previous day’s settlement price, which could effectively prevent liquidation of unfavorable positions.
During the year ended September 30, 2024, the Fund held futures for hedging and non-hedging purposes.
The Fund may enter into swaps for investment purposes or to hedge its exposure to interest rates, credit risk or inflation. The Fund may also enter into swaps for non-hedging purposes as a means of gaining market exposures including by making direct investments in foreign currencies, as described below under “Currency Transactions”. A swap is an agreement that obligates two parties to exchange a series of cash flows at specified intervals based upon or calculated by reference to changes in specified prices, rates or indexes for a specified amount of an underlying asset or inflation. The payment flows are usually netted against each other, with the difference being paid by one party to the other. In addition, collateral may be pledged or received by the Fund in accordance with the terms of the respective swaps to provide value and recourse to the Fund or its counterparties in the event of default, bankruptcy or insolvency by one of the parties to the swap.
Risks may arise as a result of the failure of the counterparty to the swap to comply with the terms of the swap. The loss incurred by the failure of a counterparty is generally limited to the net interim payment to be received by the Fund, and/or the termination value at the end of the contract. Therefore, the Fund considers the creditworthiness of each counterparty to a swap in evaluating potential counterparty risk. This risk is mitigated by having a netting arrangement between the Fund and the counterparty and by the posting of collateral by the counterparty to the Fund to cover the Fund’s exposure to the counterparty. Additionally, risks may arise from unanticipated movements in interest rates, inflation or in the value of the underlying securities. The Fund accrues for the interim payments on swaps on a daily basis, with the net amount recorded within unrealized appreciation/depreciation of swaps on the statement of assets and liabilities, where applicable. Once the interim payments are settled in cash, the net amount is recorded as realized gain/(loss) on swaps on the statement of operations, in addition to any realized gain/(loss) recorded upon the termination of swaps. Upfront premiums paid or received for swaps are recognized as cost or proceeds on the statement of assets and liabilities and are amortized on a straight line basis over the life of the contract. Amortized upfront premiums are included in net realized gain/(loss) from swaps on the statement of
| | |
| |
96 | AB GLOBAL BOND FUND | | abfunds.com |
NOTES TO FINANCIAL STATEMENTS (continued)
operations. Fluctuations in the value of swaps are recorded as a component of net change in unrealized appreciation/depreciation of swaps on the statement of operations.
Certain standardized swaps, including certain interest rate swaps and credit default swaps, are subject to mandatory central clearing. Cleared swaps are transacted through futures commission merchants (“FCMs”) that are members of central clearinghouses, with the clearinghouse serving as central counterparty, similar to transactions in futures contracts. Centralized clearing will be required for additional categories of swaps on a phased-in basis based on requirements published by the Securities and Exchange Commission and Commodity Futures Trading Commission.
At the time the Fund enters into a centrally cleared swap, the Fund deposits with the broker or segregates at its custodian cash or securities as collateral to satisfy initial margin requirements set by the clearinghouse on which the transaction is effected. Pursuant to the contract, with respect to cash collateral, the Fund agrees to receive from or pay to the broker an amount of cash equal to the daily fluctuation in the value of the contract; in the case of securities collateral, the Fund agrees to adjust the securities position held in the segregated account accordingly. Such receipts, payments or adjustments are known as variation margin and are recorded by the Fund as unrealized gains or losses. Risks may arise from the potential inability of a counterparty to meet the terms of the contract. The credit/counterparty risk for centrally cleared swaps is generally less than non-centrally cleared swaps, since the clearinghouse, which is the issuer or counterparty to each centrally cleared swap, has robust risk mitigation standards, including the requirement to provide initial and variation margin. When the contract is closed, the Fund records a realized gain or loss equal to the difference between the value of the contract at the time it was opened and the time it was closed.
Interest Rate Swaps:
The Fund is subject to interest rate risk exposure in the normal course of pursuing its investment objectives. Because the Fund holds fixed rate bonds, the value of these bonds may decrease if interest rates rise. To help hedge against this risk and to maintain its ability to generate income at prevailing market rates, the Fund may enter into interest rate swaps. Interest rate swaps are agreements between two parties to exchange cash flows based on a notional amount. The Fund may elect to pay a fixed rate and receive a floating rate, or, receive a fixed rate and pay a floating rate on a notional amount.
In addition, the Fund may also enter into interest rate swap transactions to preserve a return or spread on a particular investment
| | |
| |
| abfunds.com | | AB GLOBAL BOND FUND | 97 |
NOTES TO FINANCIAL STATEMENTS (continued)
or portion of its portfolio, or protecting against an increase in the price of securities the Fund anticipates purchasing at a later date. Interest rate swaps involve the exchange by the Fund with another party of their respective commitments to pay or receive interest (e.g., an exchange of floating rate payments for fixed rate payments) computed based on a contractually-based principal (or “notional”) amount. Interest rate swaps are entered into on a net basis (i.e., the two payment streams are netted out, with the Fund receiving or paying, as the case may be, only the net amount of the two payments).
During the year ended September 30, 2024, the Fund held interest rate swaps for hedging and non-hedging purposes.
Credit Default Swaps:
The Fund may enter into credit default swaps, including to manage its exposure to the market or certain sectors of the market, to reduce its risk exposure to defaults by corporate and sovereign issuers held by the Fund, or to create exposure to corporate or sovereign issuers to which it is not otherwise exposed. The Fund may purchase credit protection (“Buy Contract”) or provide credit protection (“Sale Contract”) on the referenced obligation of the credit default swap. During the term of the swap, the Fund receives/(pays) fixed payments from/(to) the respective counterparty, calculated at the agreed upon rate applied to the notional amount. If the Fund is a buyer/(seller) of protection and a credit event occurs, as defined under the terms of the swap, the Fund will either (i) receive from the seller/(pay to the buyer) of protection an amount equal to the notional amount of the swap (the “Maximum Payout Amount”) and deliver/(take delivery of) the referenced obligation or (ii) receive/(pay) a net settlement amount in the form of cash or securities equal to the notional amount of the swap less the recovery value of the referenced obligation. In certain circumstances Maximum Payout Amounts may be partially offset by recovery values of the respective referenced obligations, upfront premium received upon entering into the agreement, or net amounts received from settlement of buy protection credit default swaps entered into by the Fund for the same referenced obligation with the same counterparty.
Credit default swaps may involve greater risks than if the Fund had invested in the referenced obligation directly. Credit default swaps are subject to general market risk, liquidity risk, counterparty risk and credit risk. If the Fund is a buyer of protection and no credit event occurs, it will lose the payments it made to its counterparty. If the Fund is a seller of protection and a credit event occurs, the value of the referenced obligation received by the Fund coupled with the periodic payments previously received may be less than the Maximum Payout Amount it pays to the buyer, resulting in a net loss to the Fund.
| | |
| |
98 | AB GLOBAL BOND FUND | | abfunds.com |
NOTES TO FINANCIAL STATEMENTS (continued)
Implied credit spreads over U.S. Treasuries of comparable maturity utilized in determining the market value of credit default swaps on issuers as of period end are disclosed in the portfolio of investments. The implied spreads serve as an indicator of the current status of the payment/performance risk and typically reflect the likelihood of default by the issuer of the referenced obligation. The implied credit spread of a particular reference obligation also reflects the cost of buying/selling protection and may reflect upfront payments required to be made to enter into the agreement. Widening credit spreads typically represent a deterioration of the referenced obligation’s credit soundness and greater likelihood of default or other credit event occurring as defined under the terms of the agreement. A credit spread identified as “Defaulted” indicates a credit event has occurred for the referenced obligation.
During the year ended September 30, 2024, the Fund held credit default swaps for hedging and non-hedging purposes.
The Fund typically enters into International Swaps and Derivatives Association, Inc. Master Agreements (“ISDA Master Agreement”) with its OTC derivative contract counterparties in order to, among other things, reduce its credit risk to OTC counterparties. ISDA Master Agreements include provisions for general obligations, representations, collateral and events of default or termination. Under an ISDA Master Agreement, the Fund typically may offset with the OTC counterparty certain derivative financial instruments’ payables and/or receivables with collateral held and/or posted and create one single net payment (close-out netting) in the event of default or termination. In the event of a default by an OTC counterparty, the return of collateral with market value in excess of the Fund’s net liability, held by the defaulting party, may be delayed or denied.
The Fund’s ISDA Master Agreements may contain provisions for early termination of OTC derivative transactions in the event the net assets of the Fund decline below specific levels (“net asset contingent features”). If these levels are triggered, the Fund’s OTC counterparty has the right to terminate such transaction and require the Fund to pay or receive a settlement amount in connection with the terminated transaction. If OTC derivatives were held at period end, please refer to netting arrangements by the OTC counterparty tables below for additional details.
| | |
| |
| abfunds.com | | AB GLOBAL BOND FUND | 99 |
NOTES TO FINANCIAL STATEMENTS (continued)
During the year ended September 30, 2024, the Fund had entered into the following derivatives:
| | | | | | | | | | | | |
| | | Asset Derivatives | | | Liability Derivatives | |
Derivative Type | | Statement of
Assets and
Liabilities
Location | | Fair Value | | | Statement of
Assets and
Liabilities
Location | | Fair Value | |
Interest rate contracts | | Receivable for variation margin on futures | | $ | 1,556,122 | * | | Payable for variation margin on futures | | $ | 2,500,076 | * |
| | | | |
Interest rate contracts | | | | | | | | Payable for variation margin on centrally cleared swaps | | | 807,932 | * |
| | | | |
Foreign currency contracts | | Unrealized appreciation on forward currency exchange contracts | | | 3,309,187 | | | Unrealized depreciation on forward currency exchange contracts | | | 39,982,193 | |
| | | | |
Credit contracts | | Receivable for variation margin on centrally cleared swaps | | | 11,963 | * | | Payable for variation margin on centrally cleared swaps | | | 183,882 | * |
| | | | | | | | | | | | |
Total | | | | $ | 4,877,272 | | | | | $ | 43,474,083 | |
| | | | | | | | | | | | |
| * | Only variation margin receivable (payable) at period end is reported within the statement of assets and liabilities. This amount reflects cumulative unrealized appreciation (depreciation) on futures and centrally cleared swaps as reported in the portfolio of investments. |
| | | | | | | | | | |
Derivative Type | | Location of Gain or
(Loss) on Derivatives
Within Statement of
Operations | | Realized Gain
or (Loss) on
Derivatives | | | Change in
Unrealized
Appreciation or
(Depreciation) | |
Interest rate contracts | | Net realized gain/(loss) on swaps; Net change in unrealized appreciation (depreciation) on swaps | | $ | (6,899,097 | ) | | $ | 9,261,028 | |
| | | |
Interest rate contracts | | Net realized gain/(loss) on futures; Net change in unrealized appreciation (depreciation) on futures | | | (2,695,663 | ) | | | 3,943,508 | |
| | |
| |
100 | AB GLOBAL BOND FUND | | abfunds.com |
NOTES TO FINANCIAL STATEMENTS (continued)
| | | | | | | | | | |
Derivative Type | | Location of Gain or
(Loss) on Derivatives
Within Statement of
Operations | | Realized Gain
or (Loss) on
Derivatives | | | Change in
Unrealized
Appreciation or
(Depreciation) | |
| | | |
Foreign currency contracts | | Net realized gain/(loss) on forward currency exchange contracts; Net change in
unrealized appreciation (depreciation) on forward currency exchange contracts | | $ | (77,673,829 | ) | | $ | (90,980,726 | ) |
| | | |
Credit contracts | | Net realized gain/(loss) on swaps; Net change in unrealized appreciation (depreciation) on swaps | | | (356,910 | ) | | | 300,529 | |
| | | | | | | | | | |
Total | | | | $ | (87,625,499 | ) | | $ | (77,475,661 | ) |
| | | | | | | | | | |
The following table represents the average monthly volume of the Fund’s derivative transactions during the year ended September 30, 2024:
| | | | |
Centrally Cleared Credit Default Swaps: | | | | |
Average notional amount of buy contracts | | $ | 107,572,734 | |
Average notional amount of sale contracts | | $ | 86,173,846 | |
| |
Centrally Cleared Interest Rate Swaps: | | | | |
Average notional amount | | $ | 453,757,919 | (a) |
| |
Credit Default Swaps: | | | | |
Average notional amount of sale contracts | | $ | 10,920,620 | (b) |
| |
Forward Currency Exchange Contracts: | | | | |
Average principal amount of buy contracts | | $ | 374,361,722 | |
Average principal amount of sale contracts | | $ | 3,617,255,116 | |
| |
Futures: | | | | |
Average notional amount of buy contracts | | $ | 981,706,460 | |
Average notional amount of sale contracts | | $ | 617,174,382 | |
| (a) | Positions were open for nine months during the reporting period. |
| (b) | Positions were open for ten months during the reporting period. |
For financial reporting purposes, the Fund does not offset derivative assets and derivative liabilities that are subject to netting arrangements in the statement of assets and liabilities.
All OTC derivatives held at period end were subject to netting arrangements. The following table presents the Fund’s derivative assets and liabilities by OTC counterparty net of amounts available for offset under ISDA Master Agreements (“MA”) and net of the related collateral received/pledged by the Fund as of September 30, 2024. Exchange-traded
| | |
| |
| abfunds.com | | AB GLOBAL BOND FUND | 101 |
NOTES TO FINANCIAL STATEMENTS (continued)
derivatives and centrally cleared swaps are not subject to netting arrangements and as such are excluded from the tables.
| | | | | | | | | | | | | | | | | | | | |
Counterparty | | Derivative
Assets
Subject to a
MA | | | Derivatives
Available
for Offset | | | Cash
Collateral
Received* | | | Security
Collateral
Received* | | | Net Amount
of Derivative
Assets | |
Bank of America NA | | $ | 66,949 | | | $ | (66,949 | ) | | $ | – 0 | – | | $ | – 0 | – | | $ | – 0 | – |
Barclays Bank PLC | | | 17,213 | | | | (17,213 | ) | | | – 0 | – | | | – 0 | – | | | – 0 | – |
Brown Brothers Harriman & Co. | | | 26,083 | | | | (15,378 | ) | | | – 0 | – | | | – 0 | – | | | 10,705 | |
Citibank NA | | | 864,260 | | | | (864,260 | ) | | | – 0 | – | | | – 0 | – | | | – 0 | – |
Deutsche Bank AG | | | 111,518 | | | | (42,424 | ) | | | – 0 | – | | | – 0 | – | | | 69,094 | |
HSBC Bank USA | | | 33,172 | | | | (2,840 | ) | | | – 0 | – | | | – 0 | – | | | 30,332 | |
Morgan Stanley Capital Services LLC | | | 844,627 | | | | (844,627 | ) | | | – 0 | – | | | – 0 | – | | | – 0 | – |
Natwest Markets PLC | | | 236,512 | | | | – 0 | – | | | – 0 | – | | | – 0 | – | | | 236,512 | |
Standard Chartered Bank | | | 1,095,642 | | | | – 0 | – | | | (600,000 | ) | | | (495,642 | ) | | | – 0 | – |
UBS AG | | | 13,211 | | | | (13,211 | ) | | | – 0 | – | | | – 0 | – | | | – 0 | – |
| | | | | | | | | | | | | | | | | | | | |
Total | | $ | 3,309,187 | | | $ | (1,866,902 | ) | | $ | (600,000 | ) | | $ | (495,642 | ) | | $ | 346,643 | ^ |
| | | | | | | | | | | | | | | | | | | | |
| | | | | | | | | | | | | | | | | | | | |
Counterparty | | Derivative
Liabilities
Subject to a
MA | | | Derivatives
Available
for Offset | | | Cash
Collateral
Pledged* | | | Security
Collateral
Pledged* | | | Net Amount
of Derivative
Liabilities | |
Bank of America NA | | $ | 21,054,405 | | | $ | (66,949 | ) | | $ | – 0 | – | | $ | – 0 | – | | $ | 20,987,456 | |
Barclays Bank PLC | | | 2,240,888 | | | | (17,213 | ) | | | – 0 | – | | | (767,793 | ) | | | 1,455,882 | |
BNP Paribas SA | | | 284,314 | | | | – 0 | – | | | – 0 | – | | | – 0 | – | | | 284,314 | |
Brown Brothers Harriman & Co. | | | 15,378 | | | | (15,378 | ) | | | – 0 | – | | | – 0 | – | | | – 0 | – |
Citibank NA | | | 6,204,146 | | | | (864,260 | ) | | | (1,120,000 | ) | | | (4,219,886 | ) | | | – 0 | – |
Deutsche Bank AG | | | 42,424 | | | | (42,424 | ) | | | – 0 | – | | | – 0 | – | | | – 0 | – |
HSBC Bank USA | | | 2,840 | | | | (2,840 | ) | | | – 0 | – | | | – 0 | – | | | – 0 | – |
JPMorgan Chase Bank, NA | | | 5,423,746 | | | | – 0 | – | | | – 0 | – | | | – 0 | – | | | 5,423,746 | |
Morgan Stanley Capital Services LLC | | | 4,442,481 | | | | (844,627 | ) | | | – 0 | – | | | (3,597,854 | ) | | | – 0 | – |
Societe Generale | | | 125,862 | | | | – 0 | – | | | – 0 | – | | | – 0 | – | | | 125,862 | |
UBS AG | | | 145,709 | | | | (13,211 | ) | | | – 0 | – | | | – 0 | – | | | 132,498 | |
| | | | | | | | | | | | | | | | | | | | |
Total | | $ | 39,982,193 | | | $ | (1,866,902 | ) | | $ | (1,120,000 | ) | | $ | (8,585,533 | ) | | $ | 28,409,758 | ^ |
| | | | | | | | | | | | | | | | | | | | |
| * | The actual collateral received/pledged may be more than the amount reported due to overcollateralization. |
| ^ | Net amount represents the net receivable (payable) that would be due from/to the counterparty in the event of default or termination. |
| | The net amount from OTC financial derivative instruments can only be netted across transactions governed under the same master agreement with the same counterparty. |
2. Currency Transactions
The Fund may invest in non-U.S. Dollar-denominated securities on a currency hedged or unhedged basis. The Fund may seek investment opportunities by taking long or short positions in currencies through the use of
| | |
| |
102 | AB GLOBAL BOND FUND | | abfunds.com |
NOTES TO FINANCIAL STATEMENTS (continued)
currency-related derivatives, including forward currency exchange contracts, futures and options on futures, swaps, and other options. The Fund may enter into transactions for investment opportunities when it anticipates that a foreign currency will appreciate or depreciate in value but securities denominated in that currency are not held by the Fund and do not present attractive investment opportunities. Such transactions may also be used when the Adviser believes that it may be more efficient than a direct investment in a foreign currency-denominated security. The Fund may also conduct currency exchange contracts on a spot basis (i.e., for cash at the spot rate prevailing in the currency exchange market for buying or selling currencies).
3. TBA and Dollar Rolls
The Fund may invest in TBA mortgage-backed securities. A TBA, or “To Be Announced”, trade represents a contract for the purchase or sale of mortgage-backed securities to be delivered at a future agreed-upon date; however, the specific mortgage pool numbers or the number of pools that will be delivered to fulfill the trade obligation or terms of the contract are unknown at the time of the trade.
Mortgage pools (including fixed-rate or variable-rate mortgages) guaranteed by the Government National Mortgage Association, or GNMA, the Federal National Mortgage Association, or FNMA, or the Federal Home Loan Mortgage Corporation, or FHLMC, are subsequently allocated to the TBA transactions.
The Fund may enter into certain TBA transactions known as dollar rolls. Dollar rolls involve sales by the Fund of securities for delivery in the current month and the Fund’s simultaneously contracting to repurchase substantially similar (same type and coupon) securities on a specified future date. During the roll period, the Fund forgoes principal and interest paid on the securities. The Fund is compensated by the difference between the current sales price and the lower forward price for the future purchase (often referred to as the “drop”) as well as by the interest earned on the cash proceeds of the initial sale. Dollar rolls involve the risk that the market value of the securities the Fund is obligated to repurchase under the agreement may decline below the repurchase price. Dollar rolls are speculative techniques. For the year ended September 30, 2024, the Fund earned drop income of $1,210,227 which is included in interest income in the accompanying statement of operations.
4. Reverse Repurchase Agreements
The Fund may enter into reverse repurchase transactions (“RVP”) in accordance with the terms of a Master Repurchase Agreement (“MRA”), under which the Fund sells securities and agrees to repurchase them at a
| | |
| |
| abfunds.com | | AB GLOBAL BOND FUND | 103 |
NOTES TO FINANCIAL STATEMENTS (continued)
mutually agreed upon date and price. At the time the Fund enters into a reverse repurchase agreement, it will establish a segregated account with the custodian containing liquid assets having a value comparable to the repurchase price. Under the MRA and other master agreements, the Fund is permitted to offset payables and/or receivables with collateral held and/or posted to the counterparty and create one single net payment due to or from the Fund in the event of a default. In the event of a default by a MRA counterparty, the Fund may be considered an unsecured creditor with respect to any excess collateral (collateral with a market value in excess of the repurchase price) held by and/or posted to the counterparty, and as such the return of such excess collateral may be delayed or denied. For the year ended September 30, 2024, the average amount of reverse repurchase agreements outstanding was $578,868 and the daily weighted average interest rate was 4.45%. As of September 30, 2024, the Fund did not hold reverse repurchase agreements.
NOTE E
Capital Stock
Each class consists of 3,000,000,000 authorized shares. Transactions in capital shares for each class were as follows:
| | | | | | | | | | | | | | | | | | | | | | | | |
| | | | | | | | | | | | | | | | | | | | | | | | |
| | | Shares | | | | | | Amount | | | | |
| | | Year Ended
September 30,
2024 | | | Year Ended
September 30,
2023 | | | | | | Year Ended
September 30,
2024 | | | Year Ended
September 30,
2023 | | | | |
| | | | | | | | |
| Class A | | | | | | | | | | | | | | | | | | | | | | | | |
Shares sold | | | 3,153,447 | | | | 4,509,902 | | | | | | | $ | 21,506,717 | | | $ | 30,649,967 | | | | | |
| | | | | |
Shares issued in reinvestment of dividends | | | 1,214,296 | | | | 3,667,291 | | | | | | | | 8,311,805 | | | | 25,074,171 | | | | | |
| | | | | |
Shares converted from Class C | | | 524,071 | | | | 560,882 | | | | | | | | 3,556,959 | | | | 3,843,963 | | | | | |
| | | | | |
Shares redeemed | | | (11,251,094 | ) | | | (15,816,533 | ) | | | | | | | (76,748,387 | ) | | | (108,001,665 | ) | | | | |
| | | | | |
Net decrease | | | (6,359,280 | ) | | | (7,078,458 | ) | | | | | | $ | (43,372,906 | ) | | $ | (48,433,564 | ) | | | | |
| | | | | |
| | | | | | | | | | | | | | | | | | | | | | | | |
| Class C | | | | | | | | | | | | | | | | | | | | | | | | |
Shares sold | | | 133,133 | | | | 274,766 | | | | | | | $ | 907,062 | | | $ | 1,897,691 | | | | | |
| | | | | |
Shares issued in reinvestment of dividends | | | 33,389 | | | | 199,318 | | | | | | | | 228,918 | | | | 1,368,001 | | | | | |
| | | | | |
Shares converted to Class A | | | (522,347 | ) | | | (558,996 | ) | | | | | | | (3,556,959 | ) | | | (3,843,963 | ) | | | | |
| | | | | |
Shares redeemed | | | (519,958 | ) | | | (950,912 | ) | | | | | | | (3,547,965 | ) | | | (6,517,657 | ) | | | | |
| | | | | |
Net decrease | | | (875,783 | ) | | | (1,035,824 | ) | | | | | | $ | (5,968,944 | ) | | $ | (7,095,928 | ) | | | | |
| | | | | |
| | |
| |
104 | AB GLOBAL BOND FUND | | abfunds.com |
NOTES TO FINANCIAL STATEMENTS (continued)
| | | | | | | | | | | | | | | | | | | | | | | | |
| | | | | | | | | | | | | | | | | | | | | | | | |
| | | Shares | | | | | | Amount | | | | |
| | | Year Ended
September 30,
2024 | | | Year Ended
September 30,
2023 | | | | | | Year Ended
September 30,
2024 | | | Year Ended
September 30,
2023 | | | | |
| | | | | | | | |
| | | | | | | | | | | | | | | | | | | | | | | | |
| Advisor Class | | | | | | | | | | | | | | | | | | | | | | | | |
Shares sold | | | 139,810,730 | | | | 138,998,489 | | | | | | | $ | 956,088,709 | | | $ | 945,834,055 | | | | | |
| | | | | |
Shares issued in reinvestment of dividends | | | 15,740,697 | | | | 34,042,911 | | | | | | | | 107,722,639 | | | | 232,307,208 | | | | | |
| | | | | |
Shares redeemed | | | (120,306,363 | ) | | | (117,576,424 | ) | | | | | | | (819,780,007 | ) | | | (802,849,124 | ) | | | | |
| | | | | |
Net increase | | | 35,245,064 | | | | 55,464,976 | | | | | | | $ | 244,031,341 | | | $ | 375,292,139 | | | | | |
| | | | | |
| | | | | | | | | | | | | | | | | | | | | | | | |
| Class R | | | | | | | | | | | | | | | | | | | | | | | | |
Shares sold | | | 549,003 | | | | 877,603 | | | | | | | $ | 3,727,579 | | | $ | 5,971,615 | | | | | |
| | | | | |
Shares issued in reinvestment of dividends | | | 74,015 | | | | 432,248 | | | | | | | | 501,620 | | | | 2,955,309 | | | | | |
| | | | | |
Shares redeemed | | | (5,377,607 | ) | | | (1,803,227 | ) | | | | | | | (36,665,857 | ) | | | (12,333,376 | ) | | | | |
| | | | | |
Net decrease | | | (4,754,589 | ) | | | (493,376 | ) | | | | | | $ | (32,436,658 | ) | | $ | (3,406,452 | ) | | | | |
| | | | | |
| | | | | | | | | | | | | | | | | | | | | | | | |
| Class K | | | | | | | | | | | | | | | | | | | | | | | | |
Shares sold | | | 109,605 | | | | 262,805 | | | | | | | $ | 737,934 | | | $ | 1,784,991 | | | | | |
| | | | | |
Shares issued in reinvestment of dividends | | | 21,135 | | | | 107,902 | | | | | | | | 143,363 | | | | 737,433 | | | | | |
| | | | | |
Shares redeemed | | | (1,363,429 | ) | | | (325,174 | ) | | | | | | | (9,250,336 | ) | | | (2,196,154 | ) | | | | |
| | | | | |
Net increase (decrease) | | | (1,232,689 | ) | | | 45,533 | | | | | | | $ | (8,369,039 | ) | | $ | 326,270 | | | | | |
| | | | | |
| | | | | | | | | | | | | | | | | | | | | | | | |
| Class I | | | | | | | | | | | | | | | | | | | | | | | | |
Shares sold | | | 13,468,821 | | | | 11,945,619 | | | | | | | $ | 92,114,689 | | | $ | 81,348,626 | | | | | |
| | | | | |
Shares issued in reinvestment of dividends | | | 3,327,629 | | | | 9,020,337 | | | | | | | | 22,754,145 | | | | 61,574,598 | | | | | |
| | | | | |
Shares redeemed | | | (34,827,481 | ) | | | (20,995,086 | ) | | | | | | | (238,461,826 | ) | | | (140,660,468 | ) | | | | |
| | | | | |
Net increase (decrease) | | | (18,031,031 | ) | | | (29,130 | ) | | | | | | $ | (123,592,992 | ) | | $ | 2,262,756 | | | | | |
| | | | | |
| | | | | | | | | | | | | | | | | | | | | | | | |
| Class Z | | | | | | | | | | | | | | | | | | | | | | | | |
Shares sold | | | 30,862,594 | | | | 26,748,800 | | | | | | | $ | 211,784,798 | | | $ | 181,371,641 | | | | | |
| | | | | |
Shares issued in reinvestment of dividends | | | 4,201,161 | | | | 10,049,288 | | | | | | | | 28,745,698 | | | | 68,647,726 | | | | | |
| | | | | |
Shares redeemed | | | (37,213,990 | ) | | | (19,334,825 | ) | | | | | | | (252,082,389 | ) | | | (131,318,754 | ) | | | | |
| | | | | |
Net increase (decrease) | | | (2,150,235 | ) | | | 17,463,263 | | | | | | | $ | (11,551,893 | ) | | $ | 118,700,613 | | | | | |
| | | | | |
| | |
| |
| abfunds.com | | AB GLOBAL BOND FUND | 105 |
NOTES TO FINANCIAL STATEMENTS (continued)
NOTE F
Risks Involved in Investing in the Fund
Market Risk—The value of the Fund’s assets will fluctuate as the market or markets in which the Fund invests fluctuate. The value of the Fund’s investments may decline, sometimes rapidly and unpredictably, simply because of economic changes or other events, including public health crises (including the occurrence of a contagious disease or illness) and regional and global conflicts, that affect large portions of the market.
Interest-Rate Risk—Changes in interest rates will affect the value of investments in fixed-income securities. When interest rates rise, the value of existing investments in fixed-income securities tends to fall and this decrease in value may not be offset by higher income from new investments. Interest rate risk is generally greater for fixed-income securities with longer maturities or durations. The Fund may be subject to a greater risk of rising interest rates than would normally be the case due to the recent end of a period of historically low rates and the effects of potential central bank monetary policy, and government fiscal policy, initiatives and market reactions to those initiatives.
Credit Risk—An issuer or guarantor of a fixed-income security, or the counterparty to a derivatives or other contract, may be unable or unwilling to make timely payments of interest or principal, or to otherwise honor its obligations. The issuer or guarantor may default, causing a loss of the full principal amount of a security and accrued interest. The degree of risk for a particular security may be reflected in its credit rating. There is the possibility that the credit rating of a fixed-income security may be downgraded after purchase, which may adversely affect the value of the security.
Below Investment-Grade Securities Risk—Investments in fixed-income securities with lower ratings (commonly known as “junk bonds”) are subject to a higher probability that an issuer will default or fail to meet its payment obligations. These securities may be subject to greater price volatility due to such factors as specific corporate developments and negative perceptions of the junk bond market generally and may be more difficult to trade than other types of securities.
Duration Risk—Duration is a measure that relates the expected price volatility of a fixed-income security to changes in interest rates. The duration of a fixed-income security may be shorter than or equal to full maturity of a fixed-income security. Fixed-income securities with longer durations have more risk and will decrease in price as interest rates rise.
Inflation Risk—This is the risk that the value of assets or income from investments will be less in the future as inflation decreases the value of
| | |
| |
106 | AB GLOBAL BOND FUND | | abfunds.com |
NOTES TO FINANCIAL STATEMENTS (continued)
money. As inflation increases, the value of the Fund’s assets can decline as can the value of the Fund’s distributions. This risk is significantly greater for fixed-income securities with longer maturities.
Foreign (Non-U.S.) Risk—Investments in securities of non-U.S. issuers may involve more risk than those of U.S. issuers. These securities may fluctuate more widely in price and may be more difficult to trade due to adverse market, economic, political, regulatory or other factors.
Mortgage-Related and/or Other Asset-Backed Securities Risk—Investments in mortgage-related and other asset-backed securities are subject to certain additional risks. The value of these securities may be particularly sensitive to changes in interest rates. These risks include “extension risk”, which is the risk that, in periods of rising interest rates, issuers may delay the payment of principal, and “prepayment risk”, which is the risk that in periods of falling interest rates, issuers may pay principal sooner than expected, exposing the Fund to a lower rate of return upon reinvestment of principal. Mortgage-backed securities offered by non-governmental issuers and other asset-backed securities may be subject to other risks, such as higher rates of default in the mortgages or assets backing the securities or risks associated with the nature and servicing of mortgages or assets backing the securities.
Emerging-Market Risk—Investments in emerging market countries may have more risk because the markets are less developed and less liquid and are subject to increased economic, political, regulatory or other uncertainties.
Currency Risk—Fluctuations in currency exchange rates may negatively affect the value of the Fund’s investments or reduce its returns.
Leverage Risk—When the Fund borrows money or otherwise leverages its investments, its performance may be volatile because leverage tends to exaggerate the effect of any increase or decrease in the value of the Fund’s investments. The Fund may create leverage through the use of reverse repurchase arrangements, forward currency exchange contracts, forward commitments, dollar rolls or futures or by borrowing money. The use of other types of derivative instruments by the Fund, such as options and swaps, may also result in a form of leverage. Leverage may result in higher returns to the Fund than if the Fund were not leveraged, but may also adversely affect returns, particularly if the market is declining.
Derivatives Risk—Derivatives may be difficult to price or unwind and leveraged so that small changes may produce disproportionate losses for the Fund. A short position in a derivative instrument involves the risk of a
| | |
| |
| abfunds.com | | AB GLOBAL BOND FUND | 107 |
NOTES TO FINANCIAL STATEMENTS (continued)
theoretically unlimited increase in the value of the underlying asset, reference rate or index, which could cause the Fund to suffer a potentially unlimited loss. Derivatives, especially over-the-counter derivatives, are also subject to counterparty risk, which is the risk that the counterparty (the party on the other side of the transaction) on a derivative transaction will be unable or unwilling to honor its contractual obligations to the Fund.
Illiquid Investments Risk—Illiquid investments risk exists when certain investments become difficult to purchase or sell. Difficulty in selling such investments may result in sales at disadvantageous prices affecting the value of your investment in the Fund. Causes of illiquid investments risk may include low trading volumes, large positions and heavy redemption of Fund shares. Foreign fixed-income securities may have more illiquid investments risk because secondary trading markets for these securities may be smaller and less well-developed and the securities may trade less frequently than domestic securities. Illiquid investments risk may be higher in I rising interest rate environment, when the value and liquidity of fixed-income securities generally decline.
Active Trading Risk—The Fund expects to engage in active and frequent trading of its portfolio securities and its portfolio turnover rate may greatly exceed 100%. A higher rate of portfolio turnover increases transaction costs, which may negatively affect the Fund’s return. In addition, a high rate of portfolio turnover may result in substantial short-term gains, which may have adverse tax consequences for Fund shareholders.
Indemnification Risk—In the ordinary course of business, the Fund enters into contracts that contain a variety of indemnifications. The Fund’s maximum exposure under these arrangements is unknown. However, the Fund has not had prior claims or losses pursuant to these indemnification provisions and expects the risk of loss thereunder to be remote. Therefore, the Fund has not accrued any liability in connection with these indemnification provisions.
Management Risk—The Fund is subject to management risk because it is an actively-managed investment fund. The Adviser will apply its investment techniques and risk analyses in making investment decisions, but there is no guarantee that its techniques will produce the intended results. Some of these techniques may incorporate, or rely upon, quantitative models, but there is no guarantee that these models will generate accurate forecasts, reduce risk or otherwise perform as expected.
NOTE G
Joint Credit Facility
A number of open-end mutual funds managed by the Adviser, including the Fund, participate in a $325 million revolving credit facility (the “Facility”)
| | |
| |
108 | AB GLOBAL BOND FUND | | abfunds.com |
NOTES TO FINANCIAL STATEMENTS (continued)
intended to provide short-term financing related to redemptions and other short term liquidity requirements, subject to certain restrictions. Commitment fees related to the Facility are paid by the participating funds and are included in miscellaneous expenses in the statement of operations. The Fund did not utilize the Facility during the year ended September 30, 2024.
NOTE H
Distributions to Shareholders
The tax character of distributions paid during the fiscal years ended September 30, 2024 and September 30, 2023 were as follows:
| | | | | | | | |
| | | 2024 | | | 2023 | |
Distributions paid from: | | | | | | | | |
Ordinary income | | $ | 36,334,445 | | | $ | 445,393,530 | |
| | | | | | | | |
Total taxable distributions paid | | $ | 36,334,445 | | | $ | 445,393,530 | |
Return of Capital | | | 169,757,162 | | | | 41,423,187 | |
| | | | | | | | |
Total distributions paid | | $ | 206,091,607 | | | $ | 486,816,717 | |
| | | | | | | | |
As of September 30, 2024, the components of accumulated earnings (deficit) on a tax basis were as follows:
| | | | |
Accumulated capital losses | | $ | (714,058,439 | )(a) |
Other losses | | | (111,389,988 | )(b) |
Unrealized appreciation (depreciation) | | | (26,923,820 | )(c) |
| | | | |
Total accumulated earnings (deficit) | | $ | (852,372,247 | )(d) |
| | | | |
| (a) | As of September 30, 2024, the Fund had a net capital loss carryforward of $714,058,439. As of September 30, 2024, the cumulative deferred loss on straddles was $9,177,796. |
| (b) | As of September 30, 2024, the Fund had a qualified late-year ordinary loss deferral of $102,212,192. |
| (c) | The differences between book-basis and tax-basis unrealized appreciation (depreciation) are attributable primarily to the recognition for tax purposes of unrealized gains/losses on certain derivative instruments, the tax treatment of callable bonds, the tax treatment of swaps, and the tax deferral of losses on wash sales. |
| (d) | The differences between book-basis and tax-basis components of accumulated earnings (deficit) are attributable primarily to the accrual of foreign capital gains tax, the tax treatment of defaulted securities, and dividends payable. |
For tax purposes, net realized capital losses may be carried over to offset future capital gains, if any. Funds are permitted to carry forward capital losses for an indefinite period, and such losses will retain their character as either short-term or long-term capital losses. As of September 30, 2024, the Fund had a net short-term capital loss carryforward of $237,901,882 and a net long-term capital loss carryforward of $476,156,557, which may be carried forward for an indefinite period.
During the current fiscal year, permanent differences primarily due to contributions from the Adviser resulted in a net decrease in accumulated loss and a net decrease in additional paid-in capital. These reclassifications had no effect on net assets.
| | |
| |
| abfunds.com | | AB GLOBAL BOND FUND | 109 |
NOTES TO FINANCIAL STATEMENTS (continued)
NOTE I
Recent Accounting Pronouncements
In December 2022, the Financial Accounting Standards Board issued an Accounting Standards Update, ASU 2022-06, “Reference Rate Reform (Topic 848) – Deferral of the Sunset Date of Topic 848”. ASU 2022-06 is an amendment to ASU 2020-04, which provided optional guidance to ease the potential accounting burden due to the discontinuation of the LIBOR and other interbank-offered based reference rates and which was effective as of March 12, 2020 through December 31, 2022. ASU 2022-06 extends the effective period through December 31, 2024. Management is currently evaluating the impact, if any, of applying ASU 2022-06.
NOTE J
Subsequent Events
Management has evaluated subsequent events for possible recognition or disclosure in the financial statements through the date the financial statements are issued. Management has determined that there are no material events that would require disclosure in the Fund’s financial statements through this date.
| | |
| |
110 | AB GLOBAL BOND FUND | | abfunds.com |
FINANCIAL HIGHLIGHTS
Selected Data For A Share Of Capital Stock Outstanding Throughout Each Period
| | | | | | | | | | | | | | | | | | | | |
| | | Class A | |
| | | Year Ended September 30, | |
| | | 2024 | | | 2023 | | | 2022 | | | 2021 | | | 2020 | |
| | | | |
| | | | | | | | | | | | | | | | | | | | |
Net asset value, beginning of period | | | $ 6.57 | | | | $ 7.09 | | | | $ 8.52 | | | | $ 8.62 | | | | $ 8.67 | |
| | | | |
Income From Investment Operations | | | | | | | | | | | | | | | | | | | | |
| | | | | |
Net investment income(a)(b) | | | .23 | | | | .21 | | | | .11 | | | | .11 | | | | .14 | |
| | | | | |
Net realized and unrealized gain (loss) on investment and foreign currency transactions | | | .48 | | | | (.11 | ) | | | (1.20 | ) | | | (.02 | ) | | | .07 | |
| | | | | |
Contributions from Affiliates | | | .00 | (c) | | | .00 | (c) | | | .00 | (c) | | | – 0 | – | | | .00 | (c) |
| | | | |
Net increase (decrease) in net asset value from operations | | | .71 | | | | .10 | | | | (1.09 | ) | | | .09 | | | | .21 | |
| | | | |
Less: Dividends and Distributions | | | | | | | | | | | | | | | | | | | | |
| | | | | |
Dividends from net investment income | | | (.04 | ) | | | (.57 | ) | | | (.24 | ) | | | (.13 | ) | | | (.26 | ) |
| | | | | |
Distributions from net realized gain on investment and foreign currency transactions | | | – 0 | – | | | – 0 | – | | | (.10 | ) | | | (.06 | ) | | | – 0 | – |
| | | | | |
Return of Capital | | | (.20 | ) | | | (.05 | ) | | | – 0 | – | | | – 0 | – | | | – 0 | – |
| | | | |
Total dividends and distributions | | | (.24 | ) | | | (.62 | ) | | | (.34 | ) | | | (.19 | ) | | | (.26 | ) |
| | | | |
Net asset value, end of period | | | $ 7.04 | | | | $ 6.57 | | | | $ 7.09 | | | | $ 8.52 | | | | $ 8.62 | |
| | | | |
| | | | | |
Total Return | | | | | | | | | | | | | | | | | | | | |
| | | | | |
Total investment return based on net asset value(d) | | | 10.90 | % | | | 1.27 | % | | | (13.27 | )% | | | .92 | % | | | 2.44 | %^ |
| | | | | |
Ratios/Supplemental Data | | | | | | | | | | | | | | | | | | | | |
| | | | | |
Net assets, end of period (000’s omitted) | | | $312,047 | | | | $332,871 | | | | $409,768 | | | | $580,627 | | | | $656,731 | |
| | | | | |
Ratio to average net assets of: | | | | | | | | | | | | | | | | | | | | |
| | | | | |
Expenses, net of waivers/reimbursements(e) | | | .80 | % | | | .80 | % | | | .80 | % | | | .80 | % | | | .80 | % |
| | | | | |
Expenses, before waivers/reimbursements(e) | | | .80 | % | | | .80 | % | | | .80 | % | | | .80 | % | | | .80 | % |
| | | | | |
Net investment income(b) | | | 3.42 | % | | | 3.06 | % | | | 1.40 | % | | | 1.24 | % | | | 1.62 | % |
| | | | | |
Portfolio turnover rate* | | | 302 | % | | | 177 | % | | | 159 | % | | | 130 | % | | | 135 | % |
See footnote summary on page 116.
| | |
| |
| abfunds.com | | AB GLOBAL BOND FUND | 111 |
FINANCIAL HIGHLIGHTS (continued)
Selected Data For A Share Of Capital Stock Outstanding Throughout Each Period
| | | | | | | | | | | | | | | | | | | | |
| | | Class C | |
| | | Year Ended September 30, | |
| | | 2024 | | | 2023 | | | 2022 | | | 2021 | | | 2020 | |
| | | | |
| | | | | | | | | | | | | | | | | | | | |
Net asset value, beginning of period | | | $ 6.59 | | | | $ 7.12 | | | | $ 8.55 | | | | $ 8.65 | | | | $ 8.70 | |
| | | | |
Income From Investment Operations | | | | | | | | | | | | | | | | | | | | |
| | | | | |
Net investment income(a)(b) | | | .18 | | | | .16 | | | | .05 | | | | .04 | | | | .08 | |
| | | | | |
Net realized and unrealized gain (loss) on investment and foreign currency transactions | | | .47 | | | | (.12 | ) | | | (1.20 | ) | | | (.02 | ) | | | .06 | |
| | | | | |
Contributions from Affiliates | | | .00 | (c) | | | .00 | (c) | | | .00 | (c) | | | – 0 | – | | | .00 | (c) |
| | | | |
Net increase (decrease) in net asset value from operations | | | .65 | | | | .04 | | | | (1.15 | ) | | | .02 | | | | .14 | |
| | | | |
Less: Dividends and Distributions | | | | | | | | | | | | | | | | | | | | |
| | | | | |
Dividends from net investment income | | | (.03 | ) | | | (.52 | ) | | | (.18 | ) | | | (.06 | ) | | | (.19 | ) |
| | | | | |
Distributions from net realized gain on investment and foreign currency transactions | | | – 0 | – | | | – 0 | – | | | (.10 | ) | | | (.06 | ) | | | – 0 | – |
| | | | | |
Return of Capital | | | (.15 | ) | | | (.05 | ) | | | – 0 | – | | | – 0 | – | | | – 0 | – |
| | | | |
Total dividends and distributions | | | (.18 | ) | | | (.57 | ) | | | (.28 | ) | | | (.12 | ) | | | (.19 | ) |
| | | | |
Net asset value, end of period | | | $ 7.06 | | | | $ 6.59 | | | | $ 7.12 | | | | $ 8.55 | | | | $ 8.65 | |
| | | | |
| | | | | |
Total Return | | | | | | | | | | | | | | | | | | | | |
| | | | | |
Total investment return based on net asset value(d) | | | 10.03 | % | | | .36 | % | | | (13.88 | )% | | | .27 | % | | | 1.66 | % |
| | | | | |
Ratios/Supplemental Data | | | | | | | | | | | | | | | | | | | | |
| | | | | |
Net assets, end of period (000’s omitted) | | | $8,927 | | | | $14,099 | | | | $22,599 | | | | $39,929 | | | | $65,949 | |
| | | | | |
Ratio to average net assets of: | | | | | | | | | | | | | | | | | | | | |
| | | | | |
Expenses, net of waivers/reimbursements(e) | | | 1.55 | % | | | 1.55 | % | | | 1.55 | % | | | 1.55 | % | | | 1.55 | % |
| | | | | |
Expenses, before waivers/reimbursements(e) | | | 1.55 | % | | | 1.55 | % | | | 1.56 | % | | | 1.55 | % | | | 1.55 | % |
| | | | | |
Net investment income(b) | | | 2.65 | % | | | 2.26 | % | | | .62 | % | | | .49 | % | | | .93 | % |
| | | | | |
Portfolio turnover rate* | | | 302 | % | | | 177 | % | | | 159 | % | | | 130 | % | | | 135 | % |
See footnote summary on page 116.
| | |
| |
112 | AB GLOBAL BOND FUND | | abfunds.com |
FINANCIAL HIGHLIGHTS (continued)
Selected Data For A Share Of Capital Stock Outstanding Throughout Each Period
| | | | | | | | | | | | | | | | | | | | |
| | | Advisor Class | |
| | | Year Ended September 30, | |
| | | 2024 | | | 2023 | | | 2022 | | | 2021 | | | 2020 | |
| | | | |
| | | | | | | | | | | | | | | | | | | | |
Net asset value, beginning of period | | | $ 6.56 | | | | $ 7.09 | | | | $ 8.51 | | | | $ 8.62 | | | | $ 8.66 | |
| | | | |
Income From Investment Operations | | | | | | | | | | | | | | | | | | | | |
| | | | | |
Net investment income(a)(b) | | | .25 | | | | .23 | | | | .13 | | | | .13 | | | | .16 | |
| | | | | |
Net realized and unrealized gain (loss) on investment and foreign currency transactions | | | .47 | | | | (.12 | ) | | | (1.19 | ) | | | (.03 | ) | | | .08 | |
| | | | | |
Contributions from Affiliates | | | .00 | (c) | | | .00 | (c) | | | .00 | (c) | | | – 0 | – | | | .00 | (c) |
| | | | |
Net increase (decrease) in net asset value from operations | | | .72 | | | | .11 | | | | (1.06 | ) | | | .10 | | | | .24 | |
| | | | |
Less: Dividends and Distributions | | | | | | | | | | | | | | | | | | | | |
| | | | | |
Dividends from net investment income | | | (.04 | ) | | | (.59 | ) | | | (.26 | ) | | | (.15 | ) | | | (.28 | ) |
| | | | | |
Distributions from net realized gain on investment and foreign currency transactions | | | – 0 | – | | | – 0 | – | | | (.10 | ) | | | (.06 | ) | | | – 0 | – |
| | | | | |
Return of Capital | | | (.21 | ) | | | (.05 | ) | | | – 0 | – | | | – 0 | – | | | – 0 | – |
| | | | |
Total dividends and distributions | | | (.25 | ) | | | (.64 | ) | | | (.36 | ) | | | (.21 | ) | | | (.28 | ) |
| | | | |
Net asset value, end of period | | | $ 7.03 | | | | $ 6.56 | | | | $ 7.09 | | | | $ 8.51 | | | | $ 8.62 | |
| | | | |
| | | | | |
Total Return | | | | | | | | | | | | | | | | | | | | |
| | | | | |
Total investment return based on net asset value(d) | | | 11.19 | % | | | 1.38 | % | | | (12.95 | )% | | | 1.17 | % | | | 2.82 | % |
| | | | | |
Ratios/Supplemental Data | | | | | | | | | | | | | | | | | | | | |
| | | | | |
Net assets, end of period (000’s omitted) | | | $4,052,962 | | | | $3,549,674 | | | | $3,441,514 | | | | $4,707,655 | | | | $4,645,021 | |
| | | | | |
Ratio to average net assets of: | | | | | | | | | | | | | | | | | | | | |
| | | | | |
Expenses, net of waivers/reimbursements(e) | | | .55 | % | | | .55 | % | | | .55 | % | | | .55 | % | | | .55 | % |
| | | | | |
Expenses, before waivers/reimbursements(e) | | | .55 | % | | | .55 | % | | | .56 | % | | | .55 | % | | | .55 | % |
| | | | | |
Net investment income(b) | | | 3.67 | % | | | 3.33 | % | | | 1.66 | % | | | 1.49 | % | | | 1.91 | % |
| | | | | |
Portfolio turnover rate* | | | 302 | % | | | 177 | % | | | 159 | % | | | 130 | % | | | 135 | % |
See footnote summary on page 116.
| | |
| |
| abfunds.com | | AB GLOBAL BOND FUND | 113 |
FINANCIAL HIGHLIGHTS (continued)
Selected Data For A Share Of Capital Stock Outstanding Throughout Each Period
| | | | | | | | | | | | | | | | | | | | |
| | | Class I | |
| | | Year Ended September 30, | |
| | | 2024 | | | 2023 | | | 2022 | | | 2021 | | | 2020 | |
| | | | |
| | | | | | | | | | | | | | | | | | | | |
Net asset value, beginning of period | | | $ 6.56 | | | | $ 7.09 | | | | $ 8.52 | | | | $ 8.62 | | | | $ 8.66 | |
| | | | |
Income From Investment Operations | | | | | | | | | | | | | | | | | | | | |
| | | | | |
Net investment income(a)(b) | | | .25 | | | | .23 | | | | .13 | | | | .13 | | | | .16 | |
| | | | | |
Net realized and unrealized gain (loss) on investment and foreign currency transactions | | | .47 | | | | (.13 | ) | | | (1.20 | ) | | | (.02 | ) | | | .07 | |
| | | | | |
Contributions from Affiliates | | | .00 | (c) | | | .00 | (c) | | | .00 | (c) | | | – 0 | – | | | .00 | (c) |
| | | | |
Net increase (decrease) in net asset value from operations | | | .72 | | | | .10 | | | | (1.07 | ) | | | .11 | | | | .23 | |
| | | | |
Less: Dividends and Distributions | | | | | | | | | | | | | | | | | | | | |
| | | | | |
Dividends from net investment income | | | (.04 | ) | | | (.58 | ) | | | (.26 | ) | | | (.15 | ) | | | (.27 | ) |
| | | | | |
Distributions from net realized gain on investment and foreign currency transactions | | | – 0 | – | | | – 0 | – | | | (.10 | ) | | | (.06 | ) | | | – 0 | – |
| | | | | |
Return of Capital | | | (.21 | ) | | | (.05 | ) | | | – 0 | – | | | – 0 | – | | | – 0 | – |
| | | | |
Total dividends and distributions | | | (.25 | ) | | | (.63 | ) | | | (.36 | ) | | | (.21 | ) | | | (.27 | ) |
| | | | |
Net asset value, end of period | | | $ 7.03 | | | | $ 6.56 | | | | $ 7.09 | | | | $ 8.52 | | | | $ 8.62 | |
| | | | |
| | | | | |
Total Return | | | | | | | | | | | | | | | | | | | | |
| | | | | |
Total investment return based on net asset value(d) | | | 11.14 | % | | | 1.36 | % | | | (13.06 | )% | | | 1.29 | % | | | 2.79 | % |
| | | | | |
Ratios/Supplemental Data | | | | | | | | | | | | | | | | | | | | |
| | | | | |
Net assets, end of period (000’s omitted) | | | $592,295 | | | | $670,854 | | | | $724,876 | | | | $919,250 | | | | $854,892 | |
| | | | | |
Ratio to average net assets of: | | | | | | | | | | | | | | | | | | | | |
| | | | | |
Expenses, net of waivers/reimbursements(e) | | | .59 | % | | | .57 | % | | | .56 | % | | | .55 | % | | | .58 | % |
| | | | | |
Expenses, before waivers/reimbursements(e) | | | .59 | % | | | .57 | % | | | .57 | % | | | .55 | % | | | .58 | % |
| | | | | |
Net investment income(b) | | | 3.63 | % | | | 3.31 | % | | | 1.65 | % | | | 1.49 | % | | | 1.88 | % |
| | | | | |
Portfolio turnover rate* | | | 302 | % | | | 177 | % | | | 159 | % | | | 130 | % | | | 135 | % |
See footnote summary on page 116.
| | |
| |
114 | AB GLOBAL BOND FUND | | abfunds.com |
FINANCIAL HIGHLIGHTS (continued)
Selected Data For A Share Of Capital Stock Outstanding Throughout Each Period
| | | | | | | | | | | | | | | | | | | | |
| | | Class Z | |
| | | Year Ended September 30, | |
| | | 2024 | | | 2023 | | | 2022 | | | 2021 | | | 2020 | |
| | | | |
| | | | | | | | | | | | | | | | | | | | |
Net asset value, beginning of period | | | $ 6.56 | | | | $ 7.09 | | | | $ 8.52 | | | | $ 8.62 | | | | $ 8.66 | |
| | | | |
Income From Investment Operations | | | | | | | | | | | | | | | | | | | | |
| | | | | |
Net investment income(a)(b) | | | .25 | | | | .23 | | | | .14 | | | | .13 | | | | .16 | |
| | | | | |
Net realized and unrealized gain (loss) on investment and foreign currency transactions | | | .48 | | | | (.12 | ) | | | (1.21 | ) | | | (.02 | ) | | | .08 | |
| | | | | |
Contributions from Affiliates | | | .00 | (c) | | | .00 | (c) | | | .00 | (c) | | | – 0 | – | | | .00 | (c) |
| | | | |
Net increase (decrease) in net asset value from operations | | | .73 | | | | .11 | | | | (1.07 | ) | | | .11 | | | | .24 | |
| | | | |
Less: Dividends and Distributions | | | | | | | | | | | | | | | | | | | | |
| | | | | |
Dividends from net investment income | | | (.04 | ) | | | (.59 | ) | | | (.26 | ) | | | (.15 | ) | | | (.28 | ) |
| | | | | |
Distributions from net realized gain on investment and foreign currency transactions | | | – 0 | – | | | – 0 | – | | | (.10 | ) | | | (.06 | ) | | | – 0 | – |
| | | | | |
Return of Capital | | | (.21 | ) | | | (.05 | ) | | | – 0 | – | | | – 0 | – | | | – 0 | – |
| | | | |
Total dividends and distributions | | | (.25 | ) | | | (.64 | ) | | | (.36 | ) | | | (.21 | ) | | | (.28 | ) |
| | | | |
Net asset value, end of period | | | $ 7.04 | | | | $ 6.56 | | | | $ 7.09 | | | | $ 8.52 | | | | $ 8.62 | |
| | | | |
| | | | | |
Total Return | | | | | | | | | | | | | | | | | | | | |
| | | | | |
Total investment return based on net asset value(d) | | | 11.38 | % | | | 1.40 | % | | | (13.01 | )% | | | 1.34 | % | | | 2.84 | % |
| | | | | |
Ratios/Supplemental Data | | | | | | | | | | | | | | | | | | | | |
| | | | | |
Net assets, end of period (000’s omitted) | | | $857,290 | | | | $813,849 | | | | $755,288 | | | | $717,784 | | | | $579,878 | |
| | | | | |
Ratio to average net assets of: | | | | | | | | | | | | | | | | | | | | |
| | | | | |
Expenses, net of waivers/reimbursements(e) | | | .52 | % | | | .52 | % | | | .51 | % | | | .50 | % | | | .53 | % |
| | | | | |
Expenses, before waivers/reimbursements(e) | | | .52 | % | | | .52 | % | | | .51 | % | | | .50 | % | | | .53 | % |
| | | | | |
Net investment income(b) | | | 3.71 | % | | | 3.37 | % | | | 1.73 | % | | | 1.53 | % | | | 1.93 | % |
| | | | | |
Portfolio turnover rate* | | | 302 | % | | | 177 | % | | | 159 | % | | | 130 | % | | | 135 | % |
See footnote summary on page 116.
| | |
| |
| abfunds.com | | AB GLOBAL BOND FUND | 115 |
FINANCIAL HIGHLIGHTS (continued)
Selected Data For A Share Of Capital Stock Outstanding Throughout Each Period
| (a) | Based on average shares outstanding. |
| (b) | Net of expenses waived/reimbursed by the Adviser. |
| (c) | Amount is less than $0.005. |
| (d) | Total investment return is calculated assuming an initial investment made at the net asset value at the beginning of the period, reinvestment of all dividends and distributions at net asset value during the period, and redemption on the last day of the period. Initial sales charge or contingent deferred sales charge is not reflected in the calculation of total investment return. Total investment return does not reflect the deduction of taxes that a shareholder would pay on fund distributions or the redemption of fund shares. Total investment return for a period of less than one year is not annualized. |
| (e) | The expense ratios presented below exclude interest expense: |
| | | | | | | | | | | | | | | | | | | | |
| | | Year Ended September 30, | |
| | 2024 | | | 2023 | | | 2022 | | | 2021 | | | 2020 | |
| | | | |
Class A | | | | | | | | | | | | | | | | | | | | |
Net of waivers/reimbursements | | | .80 | % | | | .80 | % | | | .80 | % | | | .80 | % | | | .80 | % |
Before waivers/reimbursements | | | .80 | % | | | .80 | % | | | .80 | % | | | .80 | % | | | .80 | % |
Class C | | | | | | | | | | | | | | | | | | | | |
Net of waivers/reimbursements | | | 1.55 | % | | | 1.55 | % | | | 1.55 | % | | | 1.55 | % | | | 1.55 | % |
Before waivers/reimbursements | | | 1.55 | % | | | 1.55 | % | | | 1.56 | % | | | 1.55 | % | | | 1.55 | % |
Advisor Class | | | | | | | | | | | | | | | | | | | | |
Net of waivers/reimbursements | | | .55 | % | | | .55 | % | | | .55 | % | | | .55 | % | | | .55 | % |
Before waivers/reimbursements | | | .55 | % | | | .55 | % | | | .56 | % | | | .55 | % | | | .55 | % |
Class I | | | | | | | | | | | | | | | | | | | | |
Net of waivers/reimbursements | | | .59 | % | | | .57 | % | | | .56 | % | | | .55 | % | | | .58 | % |
Before waivers/reimbursements | | | .59 | % | | | .57 | % | | | .57 | % | | | .55 | % | | | .58 | % |
Class Z | | | | | | | | | | | | | | | | | | | | |
Net of waivers/reimbursements | | | .52 | % | | | .52 | % | | | .51 | % | | | .50 | % | | | .53 | % |
Before waivers/reimbursements | | | .52 | % | | | .52 | % | | | .51 | % | | | .50 | % | | | .53 | % |
| ^ | The net asset value and total return include adjustments in accordance with accounting principles generally accepted in the United States of America for financial reporting purposes. As such, the net asset value and total return for shareholder transactions may differ from financial statements. |
| * | The Fund accounts for dollar roll transactions as purchases and sales. |
See notes to financial statements.
| | |
| |
116 | AB GLOBAL BOND FUND | | abfunds.com |
REPORT OF INDEPENDENT REGISTERED
PUBLIC ACCOUNTING FIRM
To the Shareholders and the Board of Directors of
AB Global Bond Fund, Inc.
Opinion on the Financial Statements
We have audited the accompanying statement of assets and liabilities of AB Global Bond Fund, Inc. (the “Fund”), including the portfolio of investments, as of September 30, 2024, and the related statement of operations for the year then ended, the statements of changes in net assets for each of the two years in the period then ended, the financial highlights for each of the five years in the period then ended and the related notes (collectively referred to as the “financial statements”). In our opinion, the financial statements present fairly, in all material respects, the financial position of the Fund at September 30, 2024, the results of its operations for the year then ended, the changes in its net assets for each of the two years in the period then ended and its financial highlights for each of the five years in the period then ended, in conformity with U.S. generally accepted accounting principles.
Basis for Opinion
These financial statements are the responsibility of the Fund’s management. Our responsibility is to express an opinion on the Fund’s financial statements based on our audits. We are a public accounting firm registered with the Public Company Accounting Oversight Board (United States) (“PCAOB”) and are required to be independent with respect to the Fund in accordance with the U.S. federal securities laws and the applicable rules and regulations of the Securities and Exchange Commission and the PCAOB.
We conducted our audits in accordance with the standards of the PCAOB. Those standards require that we plan and perform the audit to obtain reasonable assurance about whether the financial statements are free of material misstatement, whether due to error or fraud. The Fund is not required to have, nor were we engaged to perform, an audit of the Fund’s internal control over financial reporting. As part of our audits, we are required to obtain an understanding of internal control over financial reporting but not for the purpose of expressing an opinion on the effectiveness of the Fund’s internal control over financial reporting. Accordingly, we express no such opinion.
Our audits included performing procedures to assess the risks of material misstatement of the financial statements, whether due to error or fraud, and performing procedures that respond to those risks. Such procedures included examining, on a test basis, evidence regarding the amounts and disclosures in the financial statements. Our procedures included confirmation
| | |
| |
| abfunds.com | | AB GLOBAL BOND FUND | 117 |
REPORT OF INDEPENDENT REGISTERED
PUBLIC ACCOUNTING FIRM (continued)
of securities owned as of September 30, 2024, by correspondence with the custodian, brokers and others; when replies were not received from brokers or others, we performed other auditing procedures. Our audits also included evaluating the accounting principles used and significant estimates made by management, as well as evaluating the overall presentation of the financial statements. We believe that our audits provide a reasonable basis for our opinion.

We have served as the auditor of one or more of the AB investment companies since 1968.
New York, New York
November 26, 2024
| | |
| |
118 | AB GLOBAL BOND FUND | | abfunds.com |
2024 FEDERAL TAX INFORMATION
(unaudited)
For Federal income tax purposes, the following information is furnished with respect to the distributions paid by the Fund during the taxable year ended September 30, 2024. For foreign shareholders, 100% of ordinary income dividends paid may be considered to be qualifying to be taxed as interest-related dividends.
Shareholders should not use the above information to prepare their income tax returns. The information necessary to complete your income tax returns will be included with your Form 1099-DIV which will be sent to you separately in January 2025.
| | |
| |
| abfunds.com | | AB GLOBAL BOND FUND | 119 |
Information Regarding the Review and Approval of the Fund’s Advisory Agreement
The disinterested directors (the “directors”) of AB Global Bond Fund, Inc. (the “Fund”) unanimously approved the continuance of the Fund’s Advisory Agreement with the Adviser at a meeting held in-person on July 30-31, 2024 (the “Meeting”).
Prior to approval of the continuance of the Advisory Agreement, the directors had requested from the Adviser, and received and evaluated, extensive materials. They reviewed the proposed continuance of the Advisory Agreement with the Adviser and with experienced counsel who are independent of the Adviser, who advised on the relevant legal standards. The directors also reviewed additional materials, including comparative analytical data prepared by the Senior Vice President of the Fund. The directors also discussed the proposed continuance in private sessions with counsel.
The directors considered their knowledge of the nature and quality of the services provided by the Adviser to the Fund gained from their experience as directors or trustees of most of the registered investment companies advised by the Adviser, their overall confidence in the Adviser’s integrity and competence they have gained from that experience, the Adviser’s initiative in identifying and raising potential issues with the directors and its responsiveness, frankness and attention to concerns raised by the directors in the past, including the Adviser’s willingness to consider and implement organizational and operational changes designed to improve investment results and the services provided to the AB Funds. The directors noted that they have four regular meetings each year, at each of which they review extensive materials and information from the Adviser, including information on the investment performance of the Fund and the money market fund advised by the Adviser in which the Fund invests a portion of its assets.
The directors also considered all factors they believed relevant, including the specific matters discussed below. During the course of their deliberations, the directors evaluated, among other things, the reasonableness of the advisory fee. The directors did not identify any particular information that was all-important or controlling, and different directors may have attributed different weights to the various factors. The directors determined that the selection of the Adviser to manage the Fund and the overall arrangements between the Fund and the Adviser, as provided in the Advisory Agreement, including the advisory fee, were fair and reasonable in light of the services performed, expenses incurred and such other matters as the directors considered relevant in the exercise of their business
| | |
| |
120 | AB GLOBAL BOND FUND | | abfunds.com |
judgment. The material factors and conclusions that formed the basis for the directors’ determinations included the following:
Nature, Extent and Quality of Services Provided
The directors considered the scope and quality of services provided by the Adviser under the Advisory Agreement, including the quality of the investment research capabilities of the Adviser and the other resources it has dedicated to performing services for the Fund. The directors noted that the Adviser from time to time reviews the Fund’s investment strategies and from time to time proposes changes intended to improve the Fund’s relative or absolute performance for the directors’ consideration. They also noted the professional experience and qualifications of the Fund’s portfolio management team and other senior personnel of the Adviser. The directors also considered that the Advisory Agreement provides that the Fund will reimburse the Adviser for the cost to it of providing certain clerical, accounting, administrative and other services to the Fund by employees of the Adviser or its affiliates. Requests for these reimbursements are made on a quarterly basis and subject to approval by the directors. Reimbursements, to the extent requested and paid, result in a higher rate of total compensation from the Fund to the Adviser than the fee rate stated in the Advisory Agreement. The directors noted that the methodology used to determine the reimbursement amounts had been reviewed by an independent consultant at the request of the directors. The quality of administrative and other services, including the Adviser’s role in coordinating the activities of the Fund’s other service providers, also was considered. The directors concluded that, overall, they were satisfied with the nature, extent and quality of services provided to the Fund under the Advisory Agreement.
Costs of Services Provided and Profitability
The directors reviewed a schedule of the revenues and expenses and related notes indicating the profitability of the Fund to the Adviser for calendar years 2022 and 2023 that had been prepared with an expense allocation methodology arrived at in consultation with an independent consultant at the request of the directors. The directors noted the assumptions and methods of allocation used by the Adviser in preparing fund-specific profitability data and understood that there are a number of potentially acceptable allocation methodologies for information of this type. The directors noted that the profitability information reflected all revenues and expenses of the Adviser’s relationship with the Fund, including those relating to its subsidiaries that provide transfer agency and distribution services to the Fund. The directors recognized that it is difficult to make comparisons of the profitability of the Advisory Agreement with the profitability of fund advisory contracts for unaffiliated funds because comparative information is not generally publicly available and is affected by numerous factors. The directors focused on the profitability of the Adviser’s relationship with the Fund before taxes and distribution
| | |
| |
| abfunds.com | | AB GLOBAL BOND FUND | 121 |
expenses. The directors concluded that the Adviser’s level of profitability from its relationship with the Fund was not unreasonable.
Fall-Out Benefits
The directors considered the other benefits to the Adviser and its affiliates from their relationships with the Fund and the money market fund advised by the Adviser in which the Fund invests, including, but not limited to, benefits relating to 12b-1 fees and sales charges received by the Fund’s principal underwriter (which is a wholly owned subsidiary of the Adviser) in respect of certain classes of the Fund’s shares; and transfer agency fees paid by the Fund to a wholly owned subsidiary of the Adviser. The directors recognized that the Adviser’s profitability would be somewhat lower without these benefits. The directors understood that the Adviser also might derive reputational and other benefits from its association with the Fund.
Investment Results
In addition to the information reviewed by the directors in connection with the Meeting, the directors receive detailed performance information for the Fund at each regular Board meeting during the year.
At the Meeting, the directors reviewed performance information prepared by an independent service provider (the “15(c) service provider”), showing the performance of the Advisor Class shares of the Fund against a group of similar funds (“peer group”) and a larger group of similar funds (“peer universe”), each selected by the 15(c) service provider, and information prepared by the Adviser showing performance of the Advisor Class shares against a broad-based securities market index, in each case for the 1-, 3-, 5- and 10-year periods ended May 31, 2024 and (in the case of comparisons with the broad-based securities market index) for the period from inception. Based on their review, the directors concluded that the Fund’s investment performance was acceptable.
Advisory Fees and Other Expenses
The directors considered the advisory fee rate payable by the Fund to the Adviser and information prepared by the 15(c) service provider concerning advisory fee rates payable by other funds in the same category as the Fund. The directors recognized that it is difficult to make comparisons of advisory fees because there are variations in the services that are included in the fees payable by other funds. The directors compared the Fund’s contractual effective advisory fee rate with a peer group median and noted that it was lower than the median. They also noted that the Adviser’s total rate of compensation, taking into account the impact of the administrative expense reimbursement paid to the Adviser in the latest fiscal year, was lower than the median.
| | |
| |
122 | AB GLOBAL BOND FUND | | abfunds.com |
The directors also considered the Adviser’s fee schedule for other clients utilizing investment strategies similar to those of the Fund. For this purpose, they reviewed the relevant advisory fee information from the Adviser’s Form ADV and in a report from the Fund’s Senior Vice President and noted the differences between the Fund’s fee schedule, on the one hand, and the Adviser’s institutional fee schedule and the schedule of fees charged by the Adviser to any offshore funds and for services to any sub-advised funds utilizing investment strategies similar to those of the Fund, on the other. The directors noted that the Adviser may, in some cases, agree to fee rates with large institutional clients that are lower than those reviewed by the directors and that they had previously discussed with the Adviser its policies in respect of such arrangements.
The Adviser reviewed with the directors the significantly greater scope of the services it provides to the Fund relative to institutional, offshore fund and sub-advised fund clients. In this regard, the Adviser noted, among other things, that, compared to institutional and offshore or sub-advisory accounts, the Fund (i) demands considerably more portfolio management, research and trading resources due to significantly higher daily cash flows; (ii) has more tax and regulatory restrictions and compliance obligations; (iii) must prepare and file or distribute regulatory and other communications about fund operations; and (iv) must provide shareholder servicing to retail investors. The Adviser also reviewed the greater legal risks presented by the large and changing population of Fund shareholders who may assert claims against the Adviser in individual or class actions, and the greater entrepreneurial risk in offering new fund products, which require substantial investment to launch, may not succeed, and generally must be priced to compete with larger, more established funds resulting in lack of profitability to the Adviser until a new fund achieves scale. In light of the substantial differences in services rendered by the Adviser to institutional, offshore fund and sub-advised fund clients as compared to the Fund, and the different risk profile, the directors considered these fee comparisons inapt and did not place significant weight on them in their deliberations.
In connection with their review of the Fund’s advisory fee, the directors also considered the total expense ratio of the Advisor Class shares of the Fund in comparison to the medians for a peer group and a peer universe selected by the 15(c) service provider. The Advisor Class expense ratio of the Fund was based on the Fund’s latest fiscal year. The directors noted that it was likely that the expense ratios of some of the other funds in the Fund’s category were lowered by waivers or reimbursements by those funds’ investment advisers, which in some cases might be voluntary or temporary. The directors view expense ratio information as relevant to their evaluation of the Adviser’s services because the Adviser is responsible for coordinating services provided to the Fund by others. The directors noted that the Fund’s expense ratio was lower than the medians. Based on their review, the directors concluded that the Fund’s expense ratio was acceptable.
| | |
| |
| abfunds.com | | AB GLOBAL BOND FUND | 123 |
Economies of Scale
The directors noted that the advisory fee schedule for the Fund contains breakpoints and that the Fund’s net assets were higher than the breakpoint levels. Accordingly, the Fund’s current effective advisory fee rate reflected a reduction due to the breakpoints and would be further reduced to the extent the net assets of the Fund increase. The directors took into consideration prior presentations by an independent consultant on economies of scale in the mutual fund industry and for the AB Funds, and presentations from time to time by the Adviser concerning certain of its views on economies of scale. The directors also had requested and received from the Adviser certain updates on economies of scale in advance of the Meeting. The directors believe that economies of scale may be realized (if at all) by the Adviser across a variety of products and services, and not only in respect of a single fund. The directors noted that there is no established methodology for setting breakpoints that give effect to the fund-specific services provided by a fund’s adviser and to the economies of scale that an adviser may realize in its overall mutual fund business or those components of it which directly or indirectly affect a fund’s operations. The directors observed that in the mutual fund industry as a whole, as well as among funds similar to the Fund, there is no uniformity or pattern in the fees and asset levels at which breakpoints (if any) apply. The directors also noted that the advisory agreements for many funds do not have breakpoints at all. Having taken these factors into account, the directors concluded that the Fund’s breakpoint arrangements were acceptable and provide a means for sharing of any economies of scale. The directors also determined to monitor changes in the Fund’s asset levels to inform possible future consideration of a recommendation that the Adviser add an additional breakpoint to the fee schedule.
| | |
| |
124 | AB GLOBAL BOND FUND | | abfunds.com |
AB GLOBAL BOND FUND
66 Hudson Boulevard East
New York, NY 10001
800 221 5672
GB-0151-0924 
ITEM 8. CHANGES IN AND DISAGREEMENTS WITH ACCOUNTANTS FOR OPEN-END MANAGEMENT INVESTMENT COMPANIES.
There were no disagreements with accountants during the reporting period.
ITEM 9. PROXY DISCLOSURES FOR OPEN-END MANAGEMENT INVESTMENT COMPANIES
At a Special Meeting held on July 18, 2024, shareholders of the AB Global Bond Fund, Inc. (the “Fund”), elected Directors in connection with the establishment of a single, unitary board (“Unitary Board”) responsible for overseeing mutual funds, exchange-traded funds and certain closed-end investment companies sponsored and advised by the Adviser. In connection with the establishment of the Unitary Board, Ms. Jacklin and Messrs. Downey and Turner will retire as Directors effective December 31, 2024, and Mr. Erzan will resign as a Director effective December 31, 2024, but will continue to serve as President and Chief Executive Officer of the AB Funds. Shareholders of the Fund elected four individuals to serve as Directors effective January 1, 2025 (the “Directors-Elect”), who will serve on the Unitary Board with current Directors Mses. Loeb and McMullen and Messrs. Bermudez and Moody. The number of votes cast for and withheld, as well as the number of abstentions and broker non-votes with respect to the election of each nominee for office is included below.
| | | | | | | | | | | | | | | | |
Director: | | Voted For | | | Withheld
Authority | | | Abstained | | | Broker Non-Votes | |
Jorge A. Bermudez | | | 411,266,538.404 | | | | 4,504,427.840 | | | | 0 | | | | N/A | |
Alexander Chaloff | | | 392,478,869.166 | | | | 23,292,097.078 | | | | 0 | | | | N/A | |
R. Jay Gerken | | | 411,497,611.564 | | | | 4,273,354.680 | | | | 0 | | | | N/A | |
Jeffrey R. Holland | | | 411,854,997.190 | | | | 3,915,969.054 | | | | 0 | | | | N/A | |
Jeanette W. Loeb | | | 407,333,881.002 | | | | 8,437,085.242 | | | | 0 | | | | N/A | |
Carol C. McMullen | | | 411,972,510.581 | | | | 3,798,455.663 | | | | 0 | | | | N/A | |
Garry L. Moody | | | 392,087,167.076 | | | | 23,683,799.168 | | | | 0 | | | | N/A | |
Emilie D. Wrapp | | | 392,530,623.742 | | | | 23,240,342.502 | | | | 0 | | | | N/A | |
ITEM 10. REMUNERATION PAID TO DIRECTORS, OFFICERS, AND OTHERS OF OPEN-END MANAGEMENT INVESTMENT COMPANIES.
Aggregate remuneration paid to all Directors and advisory board members are included within the Financial Statements under Item 7 of this Form N-CSR.
ITEM 11. STATEMENT REGARDING BASIS FOR APPROVAL OF INVESTMENT ADVISORY CONTRACT.
Statement regarding basis for Approval of Investment Advisory Contract included within the Financial Statements under Item 7 of this Form N-CSR.
ITEM 12. DISCLOSURE OF PROXY VOTING POLICIES AND PROCEDURES FOR CLOSED-END MANAGEMENT INVESTMENT COMPANIES.
Not applicable to the registrant.
ITEM 13. PORTFOLIO MANAGERS OF CLOSED END MANAGEMENT INVESTMENT COMPANIES.
Not applicable to the registrant.
ITEM 14. PURCHASES OF EQUITY SECURITIES BY CLOSED-END MANAGEMENT INVESTMENT COMPANY OF AND AFFILIDATED PURCHASERS.
Not applicable to the registrant.
ITEM 15. SUBMISSION OF MATTERS TO A VOTE OF SECURITY HOLDERS.
There have been no material changes to the procedures by which shareholders may recommend nominees to the Fund’s Board of Directors since the Fund last provided disclosure in response to this item.
ITEM 16. CONTROLS AND PROCEDURES.
(a) The registrant’s principal executive officer and principal financial officer have concluded that the registrant’s disclosure controls and procedures (as defined in Rule 30a-2(c) under the Investment Company Act of 1940, as amended) are effective at the reasonable assurance level based on their evaluation of these controls and procedures as of a date within 90 days of the filing date of this document.
(b) There were no changes in the registrant’s internal controls over financial reporting that occurred during the period covered by this report that has materially affected, or is reasonably likely to materially affect, the registrant’s internal control over financial reporting.
ITEM 17. DISCLOSURE OF SECURITIES LENDING ACTIVITIES FOR CLOSED-END MANAGEMENT INVESTMENT COMPANIES.
Not applicable to the registrant.
ITEM 18. RECOVERY OF ERRONEOUSLY AWARDED COMPENSATION.
Not applicable to the registrant
ITEM 19. EXHIBITS.
The following exhibits are attached to this Form N-CSR:
SIGNATURES
Pursuant to the requirements of the Securities Exchange Act of 1934 and the Investment Company Act of 1940, the registrant has duly caused this report to be signed on its behalf by the undersigned, thereunto duly authorized.
| | |
| (Registrant): AB Global Bond Fund, Inc. |
| |
| By: | | /s/ Onur Erzan |
| | Onur Erzan |
| | President |
| |
| Date: | | November 29, 2024 |
Pursuant to the requirements of the Securities Exchange Act of 1934 and the Investment Company Act of 1940, this report has been signed below by the following persons on behalf of the registrant and in the capacities and on the dates indicated.
| | |
| By: | | /s/ Onur Erzan |
| | Onur Erzan |
| | President |
| |
| Date: | | November 29, 2024 |
| |
| By: | | /s/ Stephen M. Woetzel |
| | Stephen M. Woetzel |
| | Treasurer and Chief Financial Officer |
| |
| Date: | | November 29, 2024 |