Table of Contents
UNITED STATES
SECURITIES AND EXCHANGE COMMISSION
Washington, D.C. 20549
FORM N-CSR
CERTIFIED SHAREHOLDER REPORT OF REGISTERED
MANAGEMENT INVESTMENT COMPANIES
Investment Company Act file number: 811-06557
RidgeWorth Funds
(Exact name of registrant as specified in charter)
RidgeWorth Capital Management LLC
3333 Piedmont Road, Suite 1500
Atlanta, GA 30305
(Address of principal executive offices)(Zip code)
| (Name and Address of Agent for Service) | Copy to: | |
| Julia R. Short | W. John McGuire, Esq. | |
| RidgeWorth Funds | Thomas S. Harman, Esq. | |
| 3333 Piedmont Road, Suite 1500 | Morgan, Lewis & Bockius LLP | |
| Atlanta, GA 30305 | 1111 Pennsylvania Avenue, NW | |
| Washington, DC 20004 |
Registrant’s telephone number, including area code: 1-888-784-3863
Date of fiscal year end: March 31
Date of reporting period: March 31, 2017
Table of Contents
| Item 1. | Reports to Shareholders. |
Table of Contents

2017 ANNUAL REPORT
EQUITY FUNDS
MARCH 31, 2017

RidgeWorth Investments is the trade name of RidgeWorth Capital Management LLC.
Table of Contents
RIDGEWORTH FUNDS March 31, 2017
| Letter to Shareholders | 1 | |||
| Management Discussion of Fund Performance | ||||
| Equity Funds: | ||||
Capital Innovations Global Resources and Infrastructure Fund | 2 | |||
| 4 | ||||
| 6 | ||||
| 8 | ||||
| 10 | ||||
| 12 | ||||
| 14 | ||||
| 16 | ||||
| Allocation Strategies: | ||||
| 18 | ||||
| 20 | ||||
| 22 | ||||
| Financial Statements | ||||
| Schedules of Portfolio Investments | 24 | |||
| Statements of Assets and Liabilities | 41 | |||
| Statements of Operations | 44 | |||
| Statements of Changes in Net Assets | 47 | |||
| Financial Highlights | 51 | |||
| Notes to Financial Statements | 57 | |||
| Report of Independent Registered Public Accounting Firm | 79 | |||
| Other Information | ||||
| Other Federal Tax Information | 80 | |||
| Trustees and Officers of the RidgeWorth Funds | 82 | |||
| Annual Approval of Investment Advisory and Subadvisory Agreements | 84 | |||
| Additional Information | 88 | |||
Table of Contents
RIDGEWORTH FUNDS March 31, 2017
Dear Valued Shareholder,
We sincerely thank you for your continued business and support. Our primary objective is to help you achieve your investment goals, and we are grateful you have placed your confidence in us. We aim to earn your trust through competitive investment performance and excellent client service, and strive to exceed your expectations in both areas.
We are pleased to announce our plans to be acquired by Virtus Investment Partners, Inc., which is expected to be finalized in the second quarter of this year. We believe the transaction will provide strength and continuity for our investors, who will continue to partner with the same investment teams they have come to know through their relationship with RidgeWorth. In addition, clients will benefit from a combined company that can deliver an enhanced level of support and more resources to our investors. We look forward to continuing to serve as your asset manager in the months and years to come.
The past year saw a transition from an environment of sluggish growth, and heightened geopolitical uncertainty to one characterized by diminishing downside risks, steadied earnings growth, and rising consumer and business confidence. In short, despite all of the headline volatility, the backdrop for investing improved.
The U.S. economy began this past year battling the negative effects of a strong U.S. dollar and weak oil prices, as well as geopolitical unrest and slowing growth in China. The U.K.’s vote to leave the European Union contributed to heightened volatility. However, on the positive side, moderate job growth continued and housing prices recovered, which helped strengthen consumer incomes and balance sheets, and led to a further rise in consumer durables. In addition, inflation pressures were muted and the Federal Reserve erred on the side of caution and delayed its latest expected interest rate increase.
As the year progressed, oil prices recovered and the value of the dollar edged lower providing a bit of a macro tailwind to the economy and corporate earnings, while moderate job gains continued to support consumer spending. With volatility fears subsiding following the U.K. Brexit vote, evidence of a stabilizing global economy and a return of modest economic momentum in Europe, investor confidence improved. While the U.S. presidential election was one of the more turbulent ones in recent memory, the Trump victory appeared to rekindle and re-energize both consumers and businesses alike amid hopes for the growth engendering effects of lower tax rates, increased infrastructure spending, and reduced regulatory burdens. This combination of moderating headwinds, improved economic momentum, and renewed optimism regarding more pro-cyclical and stimulative fiscal policies helped lift domestic and global equity markets. Indeed, the improvement was sufficient to help prod the Federal Reserve to raise the overnight federal funds rate in December and then again in March.
Looking ahead, we believe the underlying economic fundamentals remain steady. Corporate profits are moving higher and beating expectations. The economy is improving even though the pace of growth is well short of historic averages. With improved earnings momentum, we believe the market can continue to provide reasonable risk-adjusted returns, despite relatively extended valuations.
That said, we are not entirely sanguine about the future. There is a mix of both positive and negative possibilities that are likely to evolve slowly but generate daily headline risk and market volatility. Tax cuts and tax reform are a major potential positive that we believe may only partially be priced into the markets. Repatriation of offshore corporate profits could also likely boost stock repurchase levels and provide a further lift to stock prices. Cuts in personal tax rates would increase both after tax paychecks as well as confidence.
Downside risks are also evident. The Fed’s Federal Open Market Committee (FOMC) is likely to increase short-term interest rates in the coming year. This will increase the cost of credit. Elections in France, the U.K., and Germany could affect confidence and stability in Europe. Most recently, a spike in tensions related to North Korea have eclipsed the already challenging situation in the Middle East. All of these factors (and more) could tilt market momentum to the downside. So, while we are cautiously positive, we are also aware of the multiple risks facing global growth and the markets.
Despite that uncertainty, we continue to see opportunities in the both the equity and fixed income markets. We believe that RidgeWorth’s bottom-up approach to security selection is well-positioned to capitalize on those opportunities, and we wish to thank you again for the trust and confidence you have placed in us.
Sincerely,

Ashi Parikh
Chief Executive Officer, Chief Investment Officer
RidgeWorth Investments
1
Table of Contents
CAPITAL INNOVATIONS GLOBAL RESOURCES AND INFRASTRUCTURE FUND
Portfolio Managers
| • | Michael D. Underhill |
| • | Susan L. Dambekaln |
INVESTMENT CONCERNS
Companies within the infrastructure, agribusiness and timber industries are susceptible to adverse economic or regulatory factors which may affect the Fund’s performance.
Equity securities (stocks) are more volatile and carry more risk than other forms of investments, including investments in high-grade fixed income securities. The net asset value per share of this Fund will fluctuate as the value of the securities in the portfolio changes. Common stocks, and funds investing in common stocks, generally provide greater return potential when compared with other types of investments.
Small- and Mid-capitalization funds typically carry additional risks since smaller companies generally have a higher risk of failure.
Large-capitalization stocks can perform differently from other segments of the equity market or the equity market as a whole. Large capitalization companies may be less flexible in evolving markets or unable to implement change as quickly as smaller capitalization companies.
How did the Fund perform against its benchmark for the fiscal year ended March 31, 2017?
The Capital Innovations Global Resources and Infrastructure Fund (I Shares) delivered a 30.02% return. That compared to a 23.81% return for the S&P Global Natural Resources Index.
What factors influenced the Fund’s performance for the fiscal year ended March 31, 2017?
Economic conditions were favorable during the period under review, and global growth indicators showed encouraging signs. Commodity prices rose, with a rally in select base metals, energy exploration and production industries, and oil services. This environment contributed to the Fund’s positive absolute returns.
The Fund’s relative performance benefited from stock selection in the materials and energy sectors, particularly within the metals and mining industry. An overweight position in a U.S. producer of steel helped relative returns, as markets expected that policies by the new administration, led by President Donald Trump, would boost demand for steel and related products. Exposure to a Swiss mining and agricultural firm also boosted relative performance, as raw material prices rebounded and investors responded positively to the company’s efforts to strengthen its balance sheet. In addition, relative returns were helped by an overweight position in a Swiss agribusiness company. Shares of the company were buoyed by an agreement to be acquired by a Chinese chemical company.
The choice of stocks in the materials and energy sectors dragged on relative returns. The Fund was hurt by an overweight position in a Canadian gold mining firm, as gold prices fell and demand for precious metals decreased. Exposure to a multinational provider of oil drilling and rig services also detracted from relative performance, as markets anticipated a decline in offshore drilling. In addition, investment in a Canadian wood products company dragged on the Fund’s relative returns amid rising prices for raw materials and uncertainty over a softwood trade agreement between the U.S. and Canada.
How do you plan to position the Fund, based on market conditions?
We remain cautiously optimistic about equities, in spite of some investor anxiety about the potential for overheated markets. We expect the energy sector to benefit from moderate oil price increases and consolidation in the industry. We are also bullish on metals, but more cautious about agriculture due to its trading seasonality and barriers to entry.
Strong earnings and sales growth suggest that the fundamentals underpinning the equity market remain intact, and we expect to see more record highs throughout the year if the economy continues to expand and inflation accelerates further.
2
Table of Contents
CAPITAL INNOVATIONS GLOBAL RESOURCES AND INFRASTRUCTURE FUND
Growth of a $10,000 Investment (as of March 31, 2017)
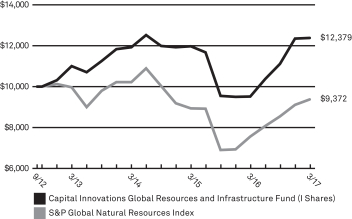 | This chart assumes an initial hypothetical investment of $10,000 made on 9/28/12 (inception date of Predecessor Fund)**. Total return is based on net change in the Net Asset Value (“NAV”) assuming reinvestment of distributions. Returns shown on this page include reinvestment of all dividends and other distributions.
The Fund’s performance is compared to the S&P Global Natural Resources Index. S&P Global Natural Resources Sector Index includes 90 of the largest publicly-traded companies in natural resources and commodities businesses that meet specific investability requirements, offering investors diversified and investable equity exposure across three primary commodity-related sectors: agribusiness, energy, and metals & mining. Investors cannot invest directly in an index. |
| Average Annual Total Returns as of 3/31/17 | ||||||||||||
| Capital Innovations Global Resources and Infrastructure Fund | 1 Year | 3 Year | Since Inception | |||||||||
A Shares | without sales charge | 29.72% | 1.02% | 4.60% | ||||||||
| with sales charge* | 22.27% | –0.96% | 3.23% | |||||||||
C Shares | without CDSC | 28.68% | 0.24% | 3.80% | ||||||||
| with CDSC* | 27.68% | 0.24% | 3.80% | |||||||||
I Shares | 30.02% | 1.26% | 4.85% | |||||||||
| S&P Global Natural Resources Index | 23.81% | –2.84% | –1.23% | |||||||||
| Prospectus Expense Ratio1 | Gross | |||||||||||
| A Shares | 2.11% | |||||||||||
| C Shares | 2.84% | |||||||||||
| I Shares | 1.87% | |||||||||||
Because equity markets may be volatile in the short-term, resulting in unusually high or low performance, investors should evaluate long-term performance before making an investment.
The Adviser has contractually agreed to waive fees and reimburse expenses until at least August 1, 2017 in order to keep total operating expenses (excluding underlying fund fees and expenses) from exceeding 1.40%, 2.15% and 1.15% for A, C and I Shares, respectively. Without these fee waivers, performance would have been lower.
Past performance does not guarantee future results. The performance data quoted represents past performance and current returns may be lower or higher. Total return figures include change in share price, reinvestment of dividends and capital gains and do not reflect taxes that a shareholder would pay on fund distributions or on the redemption of fund shares. The investment return and principal value will fluctuate so that an investor’s shares, when redeemed, may be worth more or less than the original cost. For performance data current to the most recent month end, visit our website at www.ridgeworth.com.
| * | Class A Share performance reflects the maximum front-end sales charge of 5.75% and Class C Shares reflect the maximum CDSC (contingent deferred sales charge) of 1.00% in year one only. |
| 1 | This information is included in the most current prospectus available to current and prospective shareholders of the Fund. Additional information pertaining to the 3/31/17 expense ratios can be found in the financial highlights. |
| ** | Effective the close of business on February 19, 2016, Capital Innovations Global Resources and Infrastructure Fund, a new series of the Trust, acquired the assets and assumed the liabilities of the Capital Innovations Global Agri, Timber, Infrastructure Fund (“Predecessor Fund”), a series of Investment Managers Series Trust, in a tax-free reorganization. |
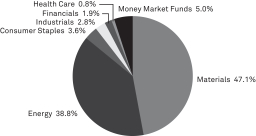
Sector Weightings (as of March 31, 2017)
as a percentage of investments
3
Table of Contents
CEREDEX LARGE CAP VALUE EQUITY FUND
Portfolio Manager
| • | Mills Riddick, CFA |
INVESTMENT CONCERNS
Equity securities (stocks) are more volatile and carry more risk than other forms of investments, including investments in high-grade fixed income securities. The net asset value per share of this Fund will fluctuate as the value of the securities in the portfolio changes. Common stocks, and funds investing in common stocks, generally provide greater return potential when compared with other types of investments.
Value-based investments are subject to the risk that the broad market may not recognize their intrinsic value.
MANAGEMENT DISCUSSION OF FUND PERFORMANCE
How did the Fund perform against its benchmark for the fiscal year ended March 31, 2017?
The Ceredex Large Cap Value Equity Fund (I Shares) delivered an 18.63% return. That compared to a 19.22% return for the Russell 1000 Value Index.
What factors influenced the Fund’s performance for the fiscal year ended March 31, 2017?
Stocks faced major headwinds early in the period, including fears of a global banking crisis, the fallout from the U.K.’s Brexit decision and concerns surrounding the U.S. presidential election. After the U.S. election, however, investment dynamics shifted: Investors sought out stocks with higher growth potential amid expectations that the new administration’s policies would benefit corporate and economic growth. The Fund’s absolute returns benefited from that environment.
The portfolio management team does not attempt to position the Fund based on predictions of macro-economic conditions. The Fund employs a bottom-up investment approach to stock selection that seeks out dividend-paying stocks trading at the lower end of their historical trading ranges, and which display characteristics of financial strength and possess an improving fundamental situation. The Fund does not make active sector allocations but allows its bottom-up investment process to define sector weights.
The Fund’s relative performance was hurt by overweight positions in the consumer discretionary and healthcare sectors. Relative returns were also negatively affected by exposure to a pharmaceutical company, a multinational computer technology company and a wireless telecommunications company.
The Fund benefited from individual exposure to shares of two semiconductor companies, as well as to shares of a leading technology and software company, a petroleum and natural gas company, and a holding company focused on real estate and railways.
How do you plan to position the Fund, based on market conditions?
We will continue to maintain our disciplined, bottom-up fundamental stock analysis when choosing investments for the Fund. Our investment philosophy seeks out investments that meet three key criteria: the existence of a dividend, low valuations and improving fundamentals. In the current environment, we expect to maintain a pro-cyclical bias that includes overweight positions in the information technology and industrials sectors, and underweight positions in the utilities and consumer staples sectors.
4
Table of Contents
CEREDEX LARGE CAP VALUE EQUITY FUND
Growth of a $10,000 Investment (as of March 31, 2017)
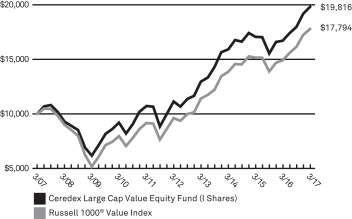 | This chart assumes an initial hypothetical investment of $10,000 made on 3/31/07. Total return is based on net change in the Net Asset Value (“NAV”) assuming reinvestment of distributions. Returns shown on this page include reinvestment of all dividends and other distributions.
The Fund’s performance is compared to the Russell 1000® Value Index, which measures the performance of the large-cap value segment of the U.S. equity universe. It includes those Russell 1000® companies with lower price-to-book ratios and lower expected growth values. The Index is unmanaged and does not reflect the deduction of fees, such as investment and fund accounting fees, associated with a mutual fund. Investors cannot invest directly in an index. Frank Russell Company is the source and owner of the trademarks, service marks and copyrights related to the Russell Indexes. Russell® is a trademark of Frank Russell Company. |
| Average Annual Total Returns as of 3/31/17 | ||||||||||||||||
| RidgeWorth Ceredex Large Cap Value Equity Fund | 1 Year | 3 Year | 5 Year | 10 Year | ||||||||||||
A Shares | without sales charge | 18.31% | 7.27% | 11.90% | 6.78% | |||||||||||
| with sales charge* | 11.51% | 5.18% | 10.58% | 6.14% | ||||||||||||
C Shares | without CDSC | 17.70% | 6.78% | 11.34% | 6.14% | |||||||||||
| with CDSC* | 16.70% | 6.78% | 11.34% | 6.14% | ||||||||||||
I Shares | 18.63% | 7.56% | 12.20% | 7.08% | ||||||||||||
IS Shares** | 18.92% | 7.82% | 12.37% | 7.16% | ||||||||||||
| Russell 1000® Value Index | 19.22% | 8.67% | 13.13% | 5.93% | ||||||||||||
| Prospectus Expense Ratio1 | Gross | |||||||||||||||
| A Shares | 1.37% | |||||||||||||||
| C Shares | 1.71% | |||||||||||||||
| I Shares | 1.09% | |||||||||||||||
| IS Shares | 0.72% | |||||||||||||||
Because equity markets may be volatile in the short-term, resulting in unusually high or low performance, investors should evaluate long-term performance before making an investment.
The Adviser has contractually agreed to waive fees and reimburse expenses until at least August 1, 2017 in order to keep total operating expenses (excluding underlying fund fees and expenses) from exceeding 1.24%, 1.90%, 0.97% and 0.85% for A, C, I and IS Shares, respectively. Without these fee waivers, performance would have been lower.
Past performance does not guarantee future results. The performance data quoted represents past performance and current returns may be lower or higher. Total return figures include change in share price, reinvestment of dividends and capital gains and do not reflect taxes that a shareholder would pay on fund distributions or on the redemption of fund shares. The investment return and principal value will fluctuate so that an investor’s shares, when redeemed, may be worth more or less than the original cost. For performance data current to the most recent month end, visit our website at www.ridgeworth.com.
| * | Class A Share performance reflects the maximum front-end sales charge of 5.75% and Class C Shares reflect the maximum CDSC (contingent deferred sales charge) of 1.00% in year one only. |
| ** | IS Shares were offered beginning on 8/1/14. The performance shown prior to such dates is based on performance of the I Shares of the Fund, and has not been adjusted to reflect IS Share expenses. If it had been, performance would have been higher. |
| 1 | This information is included in the most current prospectus available to current and prospective shareholders of the Fund. Additional information pertaining to the 3/31/17 expense ratios can be found in the financial highlights. |
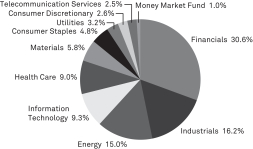
Sector Weightings (as of March 31, 2017)
as a percentage of investments
5
Table of Contents
CEREDEX MID-CAP VALUE EQUITY FUND
Portfolio Manager
| • | Don Wordell, CFA |
INVESTMENT CONCERNS
Equity securities (stocks) are more volatile and carry more risk than other forms of investments, including investments in high-grade fixed income securities. The net asset value per share of this Fund will fluctuate as the value of the securities in the portfolio changes. Common stocks, and funds investing in common stocks, generally provide greater return potential when compared with other types of investments.
Mid-capitalization funds typically carry additional risks since smaller companies generally have a higher risk of failure.
Value-based investments are subject to the risk that the broad market may not recognize their intrinsic value.
MANAGEMENT DISCUSSION OF FUND PERFORMANCE
How did the Fund perform against its benchmark for the fiscal year ended March 31, 2017?
For the fiscal year ended March 31, 2017, the Ceredex Mid-Cap Value Equity Fund (I Shares) delivered a 23.08% return. That compared to a 19.82% return for the Russell Midcap Value Index.
What factors influenced the Fund’s performance for the fiscal year ended March 31, 2017?
Stocks faced major headwinds early in the period, including fears of a global banking crisis, the fallout from the U.K.’s Brexit decision and concerns surrounding the U.S. presidential election. After the U.S. election, however, investment dynamics shifted: Investors sought out stocks with higher growth potential amid expectations that the new administration’s policies would benefit corporate and economic growth. The Fund’s absolute returns benefited from that environment.
The portfolio management team does not attempt to position the Fund based on predictions of macro-economic conditions. The Fund employs a bottom-up investment approach to stock selection that seeks out dividend-paying stocks trading at the lower end of their historical trading ranges, and which display characteristics of financial strength and possess an improving fundamental situation. The Fund does not make active sector allocations but allows its bottom-up investment process to define sector weights.
Stock selection in the energy, healthcare, information technology and real estate sectors boosted the Fund’s relative performance. In particular, the Fund benefited from exposure to two semiconductor companies, a bank holding company and two U.S.-based banks.
Holdings in two clothing companies, an airline, and two health services companies detracted from the Fund’s relative performance.
How do you plan to position the Fund, based on market conditions?
We will continue to maintain our disciplined, bottom-up fundamental stock analysis when choosing investments for the Fund. Our investment philosophy seeks out investments that meet three key criteria: the existence of a dividend, low valuations and improving fundamentals. In the current environment, we expect to maintain a pro-cyclical bias that includes overweight positions in the energy, healthcare and industrials sectors, and underweight positions in the utilities, real estate and consumer staples sectors.
6
Table of Contents
CEREDEX MID-CAP VALUE EQUITY FUND
Growth of a $10,000 Investment (as of March 31, 2017)
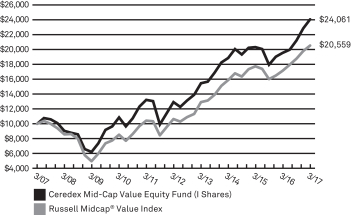 | This chart assumes an initial hypothetical investment of $10,000 made on 3/31/07. Total return is based on net change in the Net Asset Value (“NAV”) assuming reinvestment of distributions. Returns shown on this page include reinvestment of all dividends and other distributions.
The Fund’s performance is compared to the Russell Midcap® Value Index, which measures the performance of the mid-cap value segment of the U.S. equity universe. It includes those Russell Midcap Index companies with lower price-to-book ratios and lower forecasted growth values. The Index is unmanaged and does not reflect the deduction of fees, such as investment and fund accounting fees, associated with a mutual fund. Investors cannot invest directly in an index. Frank Russell Company is the source and owner of the trademarks, service marks and copyrights related to the Russell Indexes. Russell® is a trademark of Frank Russell Company. |
| Average Annual Total Returns as of 3/31/17 | ||||||||||||||||||
| RidgeWorth Ceredex Mid-Cap Value Equity Fund | 1 Year | 3 Year | 5 Year | 10 Year | ||||||||||||||
A Shares | without sales charge | 22.69% | 8.12% | 12.93% | 8.87% | |||||||||||||
| with sales charge* | 15.60% | 6.02% | 11.60% | 8.22% | ||||||||||||||
C Shares | without CDSC | 22.14% | 7.69% | 12.45% | 8.25% | |||||||||||||
| with CDSC* | 21.14% | 7.69% | 12.45% | 8.25% | ||||||||||||||
I Shares | 23.08% | 8.44% | 13.26% | 9.18% | ||||||||||||||
IS Shares** | 23.34% | 8.74% | 13.44% | 9.27% | ||||||||||||||
| Russell Midcap® Value Index | 19.82% | 8.94% | 14.07% | 7.47% | ||||||||||||||
| Prospectus Expense Ratio1 | Gross | |||||||||||||||||
| A Shares | 1.45% | |||||||||||||||||
| C Shares | 1.78% | |||||||||||||||||
| I Shares | 1.12% | |||||||||||||||||
| IS Shares | 0.80% | |||||||||||||||||
Because equity markets may be volatile in the short-term, resulting in unusually high or low performance, investors should evaluate long-term performance before making an investment.
The Adviser has contractually agreed to waive fees and reimburse expenses until at least August 1, 2017 in order to keep total operating expenses (excluding underlying fund fees and expenses) from exceeding 1.38%, 1.95%, 1.15% and 0.95% for A, C, I and IS Shares, respectively. Without these fee waivers, performance would have been lower.
Past performance does not guarantee future results. The performance data quoted represents past performance and current returns may be lower or higher. Total return figures include change in share price, reinvestment of dividends and capital gains and do not reflect taxes that a shareholder would pay on fund distributions or on the redemption of fund shares. The investment return and principal value will fluctuate so that an investor’s shares, when redeemed, may be worth more or less than the original cost. For performance data current to the most recent month end, visit our website at www.ridgeworth.com.
| * | Class A Share performance reflects the maximum front-end sales charge of 5.75% and Class C Shares reflect the maximum CDSC (contingent deferred sales charge) of 1.00% in year one only. |
| ** | IS Shares were offered beginning on 8/1/14. The performance shown prior to such dates is based on performance of the I Shares of the Fund, and has not been adjusted to reflect IS Share expenses. If it had been, performance would have been higher. |
| 1 | This information is included in the most current prospectus available to current and prospective shareholders of the Fund. Additional information pertaining to the 3/31/17 expense ratios can be found in the financial highlights. |
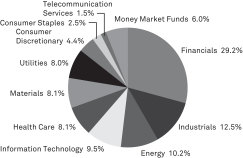
Sector Weightings (as of March 31, 2017)
as a percentage of investments
7
Table of Contents
CEREDEX SMALL CAP VALUE EQUITY FUND
Portfolio Manager
| • | Brett Barner, CFA |
INVESTMENT CONCERNS
Equity securities (stocks) are more volatile and carry more risk than other forms of investments, including investments in high-grade fixed income securities. The net asset value per share of this Fund will fluctuate as the value of the securities in the portfolio changes. Common stocks, and funds investing in common stocks, generally provide greater return potential when compared with other types of investments.
Small-capitalization funds typically carry additional risks since smaller companies generally have a higher risk of failure.
Value-based investments are subject to the risk that the broad market may not recognize their intrinsic value.
MANAGEMENT DISCUSSION OF FUND PERFORMANCE
How did the Fund perform against its benchmark for the fiscal year ended March 31, 2017?
The Ceredex Small Cap Value Equity Fund (I Shares) delivered a 21.15% return. That compared to a 29.37% return for the Russell 2000 Value Index.
What factors influenced the Fund’s performance for the fiscal year ended March 31, 2017?
Stocks faced major headwinds early in the period, including fears of a global banking crisis, the fallout from the U.K.’s Brexit decision and concerns surrounding the U.S. presidential election. After the U.S. election, however, investment dynamics shifted: Investors sought out stocks with higher growth potential amid expectations that the new administration’s policies would benefit corporate and economic growth. The Fund’s absolute returns benefited from that environment.
The portfolio management team does not attempt to position the Fund based on predictions of macro-economic conditions. The Fund employs a bottom-up investment approach to stock selection that seeks out dividend-paying stocks trading at the lower end of their historical trading ranges, and which display characteristics of financial strength and possess an improving fundamental situation. The Fund does not make active sector allocations but allows its bottom-up investment process to define sector weights.
The Fund’s relative performance was hurt by stock selection in the consumer discretionary, industrials and information technology sectors. Exposure to two retailers, an advertising and marketing holding company, and an insurance company dragged on relative returns. In addition, the Fund’s overweight position in the consumer discretionary sector and underweight position in the financials sector adversely affected relative returns.
Stock selection in the materials, healthcare and consumer staples sectors aided the Fund’s relative performance. In particular, relative results were boosted by holdings in a precious metals mining company, an insurance and financial services company, a global investment banking firm, a manufacturer of recreational vehicles, and a battery manufacturer. The Fund’s relative performance also benefited from underweight positions in the energy, real estate and utilities sectors.
How do you plan to position the Fund, based on market conditions?
We will continue to maintain our disciplined, bottom-up fundamental stock analysis when choosing investments for the Fund. Our investment philosophy seeks out investments that meet three key criteria: the existence of a dividend, low valuations and improving fundamentals. In the current environment, we expect to maintain a pro-cyclical bias that includes overweight positions in the consumer discretionary and industrials sectors, and underweight positions in the utilities, energy, and financials sectors.
8
Table of Contents
CEREDEX SMALL CAP VALUE EQUITY FUND
Growth of a $10,000 Investment (as of March 31, 2017)
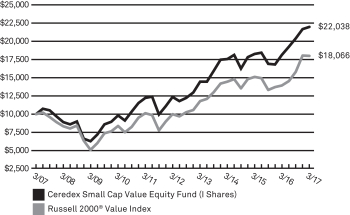 | This chart assumes an initial hypothetical investment of $10,000 made on 3/31/07. Total return is based on net change in the Net Asset Value (“NAV”) assuming reinvestment of distributions. Returns shown on this page include reinvestment of all dividends and other distributions.
The Fund’s performance is compared to the Russell 2000® Value Index, which measures the performance of the small-cap value segment of the U.S. equity universe. It includes those Russell 2000® companies with lower price-to-book ratios and lower forecasted growth values. The Index is unmanaged and does not reflect the deduction of fees, such as investment and fund accounting fees, associated with a mutual fund. Investors cannot invest directly in an index. Frank Russell Company is the source and owner of the trademarks, service marks and copyrights related to the Russell Indexes. Russell® is a trademark of Frank Russell Company. |
| Average Annual Total Returns as of 3/31/17 | ||||||||||||||||
| RidgeWorth Ceredex Small Cap Value Equity Fund | 1 Year | 3 Year | 5 Year | 10 Year | ||||||||||||
A Shares | without sales charge | 20.70% | 7.45% | 11.87% | 7.90% | |||||||||||
| with sales charge* | 13.75% | 5.36% | 10.55% | 7.26% | ||||||||||||
C Shares | without CDSC | 20.35% | 7.08% | 11.45% | 7.42% | |||||||||||
| with CDSC* | 19.35% | 7.08% | 11.45% | 7.42% | ||||||||||||
I Shares | 21.15% | 7.80% | 12.22% | 8.22% | ||||||||||||
| Russell 2000® Value Index | 29.37% | 7.62% | 12.54% | 6.09% | ||||||||||||
| Prospectus Expense Ratio1 | Gross | |||||||||||||||
| A Shares | 1.55% | |||||||||||||||
| C Shares | 1.90% | |||||||||||||||
| I Shares | 1.21% | |||||||||||||||
Because equity markets may be volatile in the short-term, resulting in unusually high or low performance, investors should evaluate long-term performance before making an investment.
Past performance does not guarantee future results. The performance data quoted represents past performance and current returns may be lower or higher. Total return figures include change in share price, reinvestment of dividends and capital gains and do not reflect taxes that a shareholder would pay on fund distributions or on the redemption of fund shares. The investment return and principal value will fluctuate so that an investor’s shares, when redeemed, may be worth more or less than the original cost. For performance data current to the most recent month end, visit our website at www.ridgeworth.com.
| * | Class A Share performance reflects the maximum front-end sales charge of 5.75% and Class C Shares reflect the maximum CDSC (contingent deferred sales charge) of 1.00% in year one only. |
| 1 | This information is included in the most current prospectus available to current and prospective shareholders of the Fund. Additional information pertaining to the 3/31/17 expense ratios can be found in the financial highlights. |
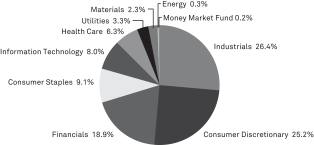
Sector Weightings (as of March 31, 2017)
as a percentage of Investments
9
Table of Contents
Portfolio Managers
| • | Nancy Zevenbergen, CFA, CIC |
| • | Brooke de Boutray, CFA, CIC |
| • | Leslie Tubbs, CFA, CIC |
INVESTMENT CONCERNS
Equity securities (stocks) are more volatile and carry more risk than other forms of investments, including investments in high-grade fixed income securities. The net asset value per share of this Fund will fluctuate as the value of the securities in the portfolio changes. Common stocks, and funds investing in common stocks, generally provide greater return potential when compared with other types of investments.
Small- and mid-capitalization funds typically carry additional risks as smaller companies generally have a higher risk of failure.
MANAGEMENT DISCUSSION OF FUND PERFORMANCE
How did the Fund perform against its benchmark for the fiscal year ended March 31, 2017?
The Innovative Growth Stock Fund (I Shares) returned 20.63%. That compared to a 16.27% return for the Russell 3000 Growth Index.
What factors influenced the Fund’s performance for the fiscal year ended March 31, 2017?
Equity markets in general were buoyed by the outcome of the November presidential election and optimism for the new administration’s growth initiatives.
The Fund’s absolute returns benefited primarily from individual holdings in the consumer discretionary and healthcare sectors. Some of these holdings had performed poorly during the previous year, but rebounded sharply during the 12 months through March 31, 2017.
The Fund’s outperformance compared to the benchmark was largely driven by stock selection among consumer discretionary, healthcare and industrials companies. Individual stocks that contributed to relative results included a logistics company that benefited from enhanced execution in Europe and synergies from recent merger-and-acquisition activity. An e-commerce leader in Latin America was another major contributor. The firm’s shares were boosted by more efficient payments and shipping results. A medical diagnostics company also aided relative performance amid growing acceptance of its services by physicians and the government.
The Fund’s stock selection in financials lagged the benchmark, primarily due to poor performance of an online marketplace lending company.
How do you plan to position the Fund, based on market conditions?
Much of the Fund’s outpeformance this year has been driven by our patience and high conviction in stocks that had, in many cases, underperformed just 12 months before.
We continue to focus on our fundamental research discipline, searching for companies with high secular growth potential and excellent leadership to navigate an everchanging business climate. Piloting through the market’s ups and downs, we remain focused on the long term. Our vision for a company’s prospects beyond the current quarter, or even next year, can provide Fund shareholders the potential for higher returns and wealth creation.
10
Table of Contents
INNOVATIVE GROWTH STOCK FUND
Growth of a $10,000 Investment (as of March 31, 2017)
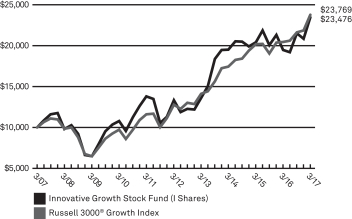 | This chart assumes an initial hypothetical investment of $10,000 made on 3/31/07. Total return is based on net change in the Net Asset Value (“NAV”) assuming reinvestment of distributions. Returns shown on this page include reinvestment of all dividends and other distributions.
The Fund’s performance is compared to the Russell 3000® Growth Index, which measures the performance of the broad growth segment of the U.S. equity universe. It includes those Russell 3000® companies with higher price-to-book ratios and higher forecasted growth values. The Index is unmanaged and does not reflect the deduction of fees, such as investment and fund accounting fees, associated with a mutual fund. Investors cannot invest directly in an index. Frank Russell Company is the source and owner of the trademarks, service marks and copyrights related to the Russell Indexes. Russell® is a trademark of Frank Russell Company. |
| Average Annual Total Returns as of 3/31/17 | ||||||||||||||||
| RidgeWorth Innovative Growth Stock Fund | 1 Year | 3 Year | 5 Year | 10 Year | ||||||||||||
A Shares | without sales charge | 20.42% | 6.14% | 11.75% | 8.63% | |||||||||||
| with sales charge* | 13.50% | 4.06% | 10.44% | 8.00% | ||||||||||||
I Shares | 20.63% | 6.33% | 11.96% | 8.91% | ||||||||||||
| Russell 3000® Growth Index | 16.27% | 10.90% | 13.22% | 9.04% | ||||||||||||
| Prospectus Expense Ratio1 | Gross | |||||||||||||||
| A Shares | 1.49% | |||||||||||||||
| I Shares | 1.39% | |||||||||||||||
Because equity markets may be volatile in the short-term, resulting in unusually high or low performance, investors should evaluate long-term performance before making an investment.
The Adviser has contractually agreed to waive fees and reimburse expenses until at least August 1, 2017 in order to keep total operating expenses (excluding underlying fund fees and expenses) from exceeding 1.50% and 1.30% for A and I Shares, respectively. Without these fee waivers, performance would have been lower.
Past performance does not guarantee future results. The performance data quoted represents past performance and current returns may be lower or higher. Total return figures include change in share price, reinvestment of dividends and capital gains and do not reflect taxes that a shareholder would pay on fund distributions or on the redemption of fund shares. The investment return and principal value will fluctuate so that an investor’s shares, when redeemed, may be worth more or less than the original cost. For performance data current to the most recent month end, visit our website at www.ridgeworth.com.
| * | Class A Share performance reflects the maximum front-end sales charge of 5.75%. |
| 1 | This information is included in the most current prospectus available to current and prospective shareholders of the Fund. Additional information pertaining to the 3/31/17 expense ratios can be found in the financial highlights. |
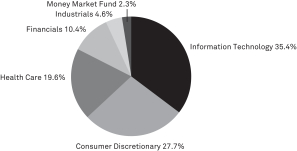
Sector Weightings (as of March 31, 2017)
as a percentage of Investments
11
Table of Contents
Portfolio Managers
| • | Paul R. Black |
| • | Peter J. Hunkel |
| • | Michael B. Trigg |
| • | Kurt R. Winrich |
INVESTMENT CONCERNS
International investing involves increased risk and volatility.
Equity securities (stocks) are more volatile and carry more risk than other forms of investments, including investments in high-grade fixed income securities. The net asset value per share of this Fund will fluctuate as the value of the securities in the portfolio changes. Common stocks, and funds investing in common stocks, generally provide greater return potential when compared with other types of investments.
MANAGEMENT DISCUSSION OF FUND PERFORMANCE
How did the Fund perform against its benchmark for the fiscal year ended March 31, 2017?
The International Equity Fund (I Shares) returned 10.65%. That compared to a return of 13.13% for the MSCI ACWI ex-U.S. Index.
What factors influenced the Fund’s performance for the fiscal year ended March 31, 2017?
On an absolute basis, the strongest returns came from the Fund’s holdings in the technology sector. Holdings in the consumer discretionary and financials sectors were also significant contributors to the Fund’s absolute returns.
Relative to the benchmark, stock selection among technology companies and an overweight allocation to that sector were meaningful contributors to relative performance. Individual holdings that benefited relative results included a Chinese Internet firm and semiconductor companies in Taiwan and the U.K.
A significant underweight position in the financials sector and an overweight weighting in the healthcare sector detracted from relative performance. The largest individual detractors during the period included a Danish pharmaceutical company and an Ireland-domiciled drugmaker. Both holdings are no longer in the Fund’s portfolio.
How do you plan to position the Fund, based on market conditions?
We continue to expect market volatility will be the norm. Rather than trying to predict economic or political events, we will continue to prepare for various outcome scenarios and work to identify stocks to capitalize on as opportunities emerge. Most importantly, we believe our focus on large companies with high-quality growth characteristics and the ability to navigate through uncertainty is well suited for unsettled environments such as these. We are confident that the Fund can deliver solid performance through difficult global conditions and take advantage of short-term mispricing of stocks that turmoil may create.
12
Table of Contents
INTERNATIONAL EQUITY FUND
Growth of a $10,000 Investment (as of March 31, 2017)
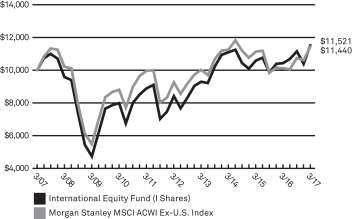 | This chart assumes an initial hypothetical investment of $10,000 made on 3/31/07. Total return is based on net change in the Net Asset Value (“NAV”) assuming reinvestment of distributions. Returns shown on this page include reinvestment of all dividends and other distributions.
MSCI ACWI Ex-U.S. is a market capitalization-weighted index maintained by Morgan Stanley Capital International (MSCI) and designed to provide a broad measure of stock performance throughout the world, with the exception of U.S.-based companies. The MSCI All Country World Index Ex-U.S. includes both developed and emerging markets. MSCI EAFE Index is a free float-adjusted market capitalization index that is designed to measure the equity market performance of developed markets, excluding the U.S. & Canada. The MSCI EAFE Index consists of 21 developed market country indices. EAFE performance data is calculated in U.S. dollars and in local currency. |
| Average Annual Total Returns as of 3/31/17 | ||||||||||||||||
| RidgeWorth International Equity Fund | 1 Year | 3 Year | 5 Year | 10 Year | ||||||||||||
A Shares | without sales charge | 10.41% | 1.05% | 6.31% | 1.18% | |||||||||||
| with sales charge* | 4.06% | –0.92% | 5.06% | 0.58% | ||||||||||||
I Shares | 10.65% | 1.28% | 6.51% | 1.43% | ||||||||||||
IS Shares** | 10.62% | 1.30% | 6.52% | 1.43% | ||||||||||||
| Morgan Stanley MSCI ACWI Ex-U.S. Index | 13.13% | 0.56% | 4.36% | 1.35% | ||||||||||||
| Prospectus Expense Ratio1 | Gross | |||||||||||||||
| A Shares | 1.78% | |||||||||||||||
| I Shares | 1.68% | |||||||||||||||
| IS Shares | 1.55% | |||||||||||||||
Because equity markets may be volatile in the short-term, resulting in unusually high or low performance, investors should evaluate long-term performance before making an investment.
The Adviser has contractually agreed to waive fees and reimburse expenses until at least September 1, 2017 in order to keep total operating expenses (excluding underlying fund fees and expenses) from exceeding 1.48%, 1.25% and 1.10% for A, I and IS Shares, respectively. Without these fee waivers, performance would have been lower. The indirect expenses of the Fund, which represent a pro-rata share of the expenses of the underlying funds in which the Fund invests, totaled 0.01% of net assets and are included in the expense ratios listed in the table above.
Past performance does not guarantee future results. The performance data quoted represents past performance and current returns may be lower or higher. Total return figures include change in share price, reinvestment of dividends and capital gains and do not reflect taxes that a shareholder would pay on fund distributions or on the redemption of fund shares. The investment return and principal value will fluctuate so that an investor’s shares, when redeemed, may be worth more or less than the original cost. For performance data current to the most recent month end, visit our website at www.ridgeworth.com.
| * | Class A Share performance reflects the maximum front-end sales charge of 5.75%. |
| ** | IS Shares were offered beginning on 9/1/15. The performance shown prior to such dates is based on performance of the I Shares of the Fund, and has not been adjusted to reflect IS Share expenses. If it had been, performance would have been higher. |
| 1 | This information is included in the most current prospectus available to current and prospective shareholders of the Fund. Additional information pertaining to the 3/31/17 expense ratios can be found in the financial highlights. |
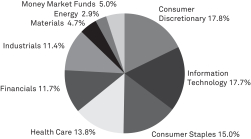
Sector Weightings (as of March 31, 2017)
as a percentage of investments
13
Table of Contents
SILVANT LARGE CAP GROWTH STOCK FUND
Portfolio Managers
| • | Michael A. Sansoterra |
| • | Sandeep Bhatia, PhD, CFA |
INVESTMENT CONCERNS
Equity securities (stocks) are more volatile and carry more risk than other forms of investments, including investments in high-grade fixed income securities. The net asset value per share of this Fund will fluctuate as the value of the securities in the portfolio changes. Common stocks, and funds investing in common stocks, generally provide greater return potential when compared with other types of investments.
Large-capitalization stocks can perform differently from other segments of the equity market or the equity market as a whole. Large capitalization companies may be less flexible in evolving markets or unable to implement change as quickly as smaller capitalization companies.
MANAGEMENT DISCUSSION OF FUND PERFORMANCE
How did the Fund perform against its benchmark for the fiscal year ended March 31, 2017?
The Silvant Large Cap Growth Stock Fund (I Shares) returned 8.14%. That compared to a 15.76% return for the Russell 1000 Growth Index.
What factors influenced the Fund’s performance for the fiscal year ended March 31, 2017?
Stocks benefited from improving U.S. economic data. Consumer and small-business confidence moved sharply higher and corporate earnings continued to grow. Investors responded positively to the election of Donald Trump as President. In that environment, financial stocks performed well as the Federal Reserve raised interest rates twice and investors expected the Trump administration to ease regulations in the financials sector. Energy stocks benefited from rising oil prices.
The majority of the Fund’s underperformance relative to the benchmark index was due to stock selection within the healthcare and technology sectors. The Fund’s healthcare stocks were hurt by political rhetoric over drug pricing during the presidential election cycle, illustrated by the decline of a branded and generic pharmaceutical maker. Negative clinical trial results for a large pharmaceutical maker and a biotechnology company also hampered relative results.
Within the technology sector, most of the Fund’s underperformance occurred because it did not own a position in a major consumer technology company that outperformed the benchmark by a significant amount during the period under review.
How do you plan to position the Fund, based on market conditions?
The market rally during the last half of the 12-month period was largely based on expectations for policy shifts from the Trump administration. However, initial efforts to pass healthcare reform failed and stocks that may benefit from tax reform, trade policy, and infrastructure spending will likely experience elevated volatility as these policy issues move through Washington. Stock fundamentals appear solid, but valuations remain at the higher end of historical norms with moderate revenue and earnings expectations. This suggests security selection may be increasingly important from both return and risk perspectives.
As such, we remain focused on bottom-up research and disciplined risk management, searching for stocks that we believe will exceed investors’ expectations. These stocks typically have positive fundamental secular trends that lead to above average growth with disruptive products or services leading to a change in business landscape. While the last 12 months have been especially difficult, the team does not react solely to price action. Instead, we invest and make decisions based on company fundamentals, and believe that many of the stocks that hurt the Fund’s relative returns in 2016 will recover.
14
Table of Contents
SILVANT LARGE CAP GROWTH STOCK FUND
Growth of a $10,000 Investment (as of March 31, 2017)
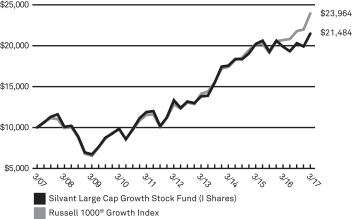 | This chart assumes an initial hypothetical investment of $10,000 made on 3/31/07. Total return is based on net change in the Net Asset Value (“NAV”) assuming reinvestment of distributions. Returns shown on this page include reinvestment of all dividends and other distributions.
The Fund’s performance is compared to the Russell 1000® Growth Index, which measures the performance of the large-cap growth segment of the U.S. equity universe. It includes those Russell 1000® companies with higher price-to-book ratios and higher forecasted growth values. The Index is unmanaged and does not reflect the deduction of fees, such as investment and fund accounting fees, associated with a mutual fund. Investors cannot invest directly in an index. Frank Russell Company is the source and owner of the trademarks, service marks and copyrights related to the Russell Indexes. Russell® is a trademark of Frank Russell Company. |
| Average Annual Total Returns as of 3/31/17 | ||||||||||||||||
| RidgeWorth Silvant Large Cap Growth Stock Fund | 1 Year | 3 Year | 5 Year | 10 Year | ||||||||||||
A Shares | without sales charge | 7.83% | 6.61% | 9.74% | 7.65% | |||||||||||
| with sales charge* | 1.58% | 4.53% | 8.45% | 7.02% | ||||||||||||
C Shares | without CDSC | 7.16% | 5.97% | 9.03% | 6.93% | |||||||||||
| with CDSC* | 6.31% | 5.97% | 9.03% | 6.93% | ||||||||||||
I Shares | 8.14% | 6.90% | 10.03% | 7.95% | ||||||||||||
IS Shares** | 8.23% | 6.96% | 10.06% | 7.96% | ||||||||||||
| Russell 1000® Growth Index | 15.76% | 11.27% | 13.32% | 9.13% | ||||||||||||
| Prospectus Expense Ratio1 | Gross | |||||||||||||||
| A Shares | 1.21% | |||||||||||||||
| C Shares | 1.89% | |||||||||||||||
| I Shares | 1.24% | |||||||||||||||
| IS Shares | 0.89% | |||||||||||||||
Because equity markets may be volatile in the short-term, resulting in unusually high or low performance, investors should evaluate long-term performance before making an investment.
The Adviser has contractually agreed to waive fees and reimburse expenses until at least August 1, 2017 in order to keep total operating expenses (excluding underlying fund fees and expenses) from exceeding 1.23%, 1.95%, 0.97% and 0.95% for A, C, I and IS Shares, respectively. Without these fee waivers, performance would have been lower.
Past performance does not guarantee future results. The performance data quoted represents past performance and current returns may be lower or higher. Total return figures include change in share price, reinvestment of dividends and capital gains and do not reflect taxes that a shareholder would pay on fund distributions or on the redemption of fund shares. The investment return and principal value will fluctuate so that an investor’s shares, when redeemed, may be worth more or less than the original cost. For performance data current to the most recent month end, visit our website at www.ridgeworth.com.
| * | Class A Share performance reflects the maximum front-end sales charge of 5.75% and Class C Shares reflect the maximum CDSC (contingent deferred sales charge) of 1.00% in year one only. |
| ** | IS Shares were offered beginning on 8/1/14. The performance shown prior to such dates is based on performance of the I Shares of the Fund, and has not been adjusted to reflect IS Share expenses. If it had been, performance would have been higher. |
| 1 | This information is included in the most current prospectus available to current and prospective shareholders of the Fund. Additional information pertaining to the 3/31/17 expense ratios can be found in the financial highlights. |
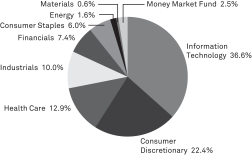
Sector Weightings (as of March 31, 2017)
as a percentage of investments
15
Table of Contents
SILVANT SMALL CAP GROWTH STOCK FUND
Portfolio Managers
| • | Sandeep Bhatia, PhD, CFA |
| • | Michael A. Sansoterra |
INVESTMENT CONCERNS
Equity securities (stocks) are more volatile and carry more risk than other forms of investments, including investments in high-grade fixed income securities. The net asset value per share of this Fund will fluctuate as the value of the securities in the portfolio changes. Common stocks, and funds investing in common stocks, generally provide greater return potential when compared with other types of investments.
Small-capitalization funds typically carry additional risks since smaller companies generally have a higher risk of failure.
MANAGEMENT DISCUSSION OF FUND PERFORMANCE
How did the Fund perform against its benchmark for the fiscal year ended March 31, 2017?
The Silvant Small Cap Growth Stock Fund (I Shares) returned 19.45%. That compared to a 23.03% return for the Russell 2000 Growth Index.
What factors influenced the Fund’s performance for the fiscal year ended March 31, 2017?
Stocks benefited from improving U.S. economic data. Consumer and small-business confidence moved sharply higher and corporate earnings continued to grow. Investors responded positively to the election of Donald Trump as President. In that environment, financial stocks performed well as the Federal Reserve raised interest rates twice and investors expected the Trump administration to ease regulations in the financials sector. Materials stocks benefited from the potential for increased infrastructure spending.
The Fund underperformed relative to the benchmark index, primarily due to stock selection within the energy and industrials sectors. Volatility in the price of oil caused the performance of the Fund’s energy holdings to differ significantly from energy stocks in the benchmark. The Fund’s focus on industrial stocks in the airline, mechanical contracting, transportation and agriculture areas also hurt results relative to the benchmark.
The Fund’s stock selection within the healthcare sector helped relative results. In particular, the Fund benefited from shares of a biotechnology firm that rose amid encouraging news for its pipeline of late-stage cancer treatments.
How do you plan to position the Fund, based on market conditions?
The market rally during the last half of the 12-month period was largely based on expectations for policy shifts from the Trump administration. However, initial efforts to pass healthcare reform failed and stocks that may benefit from tax reform, trade policy, and infrastructure spending will likely experience elevated volatility as these policy issues move through Washington. Stock fundamentals appear solid, but valuations remain at the higher end of historical norms with moderate revenue and earnings expectations. This suggests security selection may be increasingly important from both return and risk perspectives.
As such, we remain focused on bottom-up research and disciplined risk management, searching for stocks that we believe will exceed investors’ expectations. These stocks typically have positive fundamental secular trends that lead to above average growth with disruptive products or services leading to a change in business landscape. While the last 12 months have been challenging, the team does not react solely to price action. Instead, we invest and make decisions based on company fundamentals, and believe that many of the stocks that hurt the Fund’s relative returns in 2016 will recover.
16
Table of Contents
SILVANT SMALL CAP GROWTH STOCK FUND
Growth of a $10,000 Investment (as of March 31, 2017)
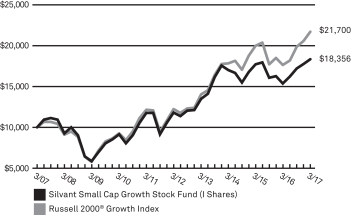 | This chart assumes an initial hypothetical investment of $10,000 made on 3/31/07. Total return is based on net change in the Net Asset Value (“NAV”) assuming reinvestment of distributions. Returns shown on this page include reinvestment of all dividends and other distributions.
The Fund’s performance is compared to the Russell 2000® Growth Index, which measures the performance of the small-cap growth segment of the U.S. equity universe. It includes those Russell 2000® companies with higher price-to-book ratios and higher forecasted growth values. The Index is unmanaged and does not reflect the deduction of fees, such as investment and fund accounting fees, associated with a mutual fund. Investors cannot invest directly in an index. Frank Russell Company is the source and owner of the trademarks, service marks and copyrights related to the Russell Indexes. Russell® is a trademark of Frank Russell Company. |
| Average Annual Total Returns as of 3/31/17 | ||||||||||||||||
| RidgeWorth Silvant Small Cap Growth Stock Fund | 1 Year | 3 Year | 5 Year | 10 Year | ||||||||||||
A Shares | without sales charge | 19.30% | 2.50% | 9.11% | 6.06% | |||||||||||
| with sales charge* | 12.51% | 0.50% | 7.83% | 5.43% | ||||||||||||
C Shares | without CDSC | 18.39% | 1.81% | 8.39% | 5.34% | |||||||||||
| with CDSC* | 17.53% | 1.81% | 8.39% | 5.34% | ||||||||||||
I Shares | 19.45% | 2.58% | 9.21% | 6.26% | ||||||||||||
IS Shares** | 19.82% | 2.82% | 9.36% | 6.34% | ||||||||||||
| Russell 2000® Growth Index | 23.03% | 6.72% | 12.10% | 8.06% | ||||||||||||
| Prospectus Expense Ratio1 | Gross | |||||||||||||||
| A Shares | 1.37% | |||||||||||||||
| C Shares | 2.02% | |||||||||||||||
| I Shares | 1.39% | |||||||||||||||
| IS Shares | 1.02% | |||||||||||||||
Because equity markets may be volatile in the short-term, resulting in unusually high or low performance, investors should evaluate long-term performance before making an investment.
The Adviser has contractually agreed to waive fees and reimburse expenses until at least August 1, 2017 in order to keep total operating expenses (excluding underlying fund fees and expenses) from exceeding 1.50%, 2.15%, 1.30% and 1.10% for A, C, I and IS Shares, respectively. Without these fee waivers, performance would have been lower.
Past performance does not guarantee future results. The performance data quoted represents past performance and current returns may be lower or higher. Total return figures include change in share price, reinvestment of dividends and capital gains and do not reflect taxes that a shareholder would pay on fund distributions or on the redemption of fund shares. The investment return and principal value will fluctuate so that an investor’s shares, when redeemed, may be worth more or less than the original cost. For performance data current to the most recent month end, visit our website at www.ridgeworth.com.
| * | Class A Share performance reflects the maximum front-end sales charge of 5.75% and Class C Shares reflect the maximum CDSC (contingent deferred sales charge) of 1.00% in year one only. |
| ** | IS Shares were offered beginning on 8/1/14. The performance shown prior to such dates is based on performance of the I Shares of the Fund, and has not been adjusted to reflect IS Share expenses. If it had been, performance would have been higher. |
| 1 | This information is included in the most current prospectus available to current and prospective shareholders of the Fund. Additional information pertaining to the 3/31/17 expense ratios can be found in the financial highlights. |
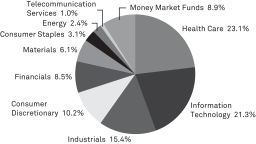
Sector Weightings (as of March 31, 2017)
as a percentage of Investments
17
Table of Contents
CONSERVATIVE ALLOCATION STRATEGY
Portfolio Manager
| • | Alan Gayle |
INVESTMENT CONCERNS
Equity Securities (Stocks) are more volatile and carry more risk and return potential than other forms of investments. Bonds offer a relatively stable level of income, although bond prices will fluctuate, providing the potential for principal gain or loss. Cash equivalents offer low risk and low return potential.
MANAGEMENT DISCUSSION OF FUND PERFORMANCE
How did the Fund perform against its benchmark for the fiscal year ended March 31, 2017?
The RidgeWorth Conservative Allocation Strategy (I Shares) returned 5.66% compared to a 6.84% return for the Lipper Mixed-Asset Target Allocation (Conservative Classification)*, and a 5.27% return for its hybrid benchmark made up of a 30% weighting in the S&P 500 Index and a 70% weighting in the Bloomberg Barclays U.S. Aggregate Bond Index.
What factors influenced the Fund’s performance for the fiscal year ended March 31, 2017?
RidgeWorth Investments manages three distinct asset allocation strategies, each structured to align investment portfolios with specific levels of investor risk tolerance and income requirements. The underlying mutual funds and ETFs typically are the same across the Strategies, but different stock, bond and alternatives allocations create noticeably different total return characteristics, which are intended to align with investor needs and constraints.
Equity markets advanced during the 12-month period due in part to improving economic conditions and investor expectations for greater economic expansion under the new presidential administration. After a period of relatively tepid growth, both U.S. and global economies showed signs of strengthening, a development that prompted the Federal Reserve to raise interest rates in December and again in March. Stocks rallied in the second half of the period amid hopes that proposals to ease regulations and implement more pro-economic policies in Washington, D.C., would drive companies’ future earnings.
In that environment, equities soundly outperformed fixed income securities, led by the performance of small- and mid-cap stocks. The Fund benefited from its sizable overweight in equities, as well as from its exposure to small- and mid-cap positions. Investments in large-cap stocks and developed and emerging market international stocks hurt relative results. However, late in the period, we increased exposure to developed and emerging international equities. We also favored pro-cyclical ETF positions over defensively oriented sectors.
Among fixed income holdings, the Fund’s exposure to credit-oriented issues and a shorter-than-benchmark duration position benefited relative results. We increased the Fund’s cash position toward the end of the period in response to elevated valuations and increased volatility.
How do you plan to position the Fund, based on market conditions?
Over the next quarter, we expect markets to react to uncertainty over a variety of issues, from corporate earnings and the progress of policy, to potential geopolitical events. Regardless, we see a number of encouraging signs for stocks going forward: Steady job and wage growth, a recovering housing market, stabilizing oil prices, and improving economic momentum overseas all give us reason to remain cautiously positive about equities. To that end, the Fund will maintain a moderately overweight allocation to equities relative to its benchmarks.
| * | Lipper Mixed-Asset Target Allocation (Conservative Classification): Funds that, by portfolio practice, maintain a mix of between 20%-40% equity securities, with the remainder invested in bonds, cash, and cash equivalents. |
18
Table of Contents
CONSERVATIVE ALLOCATION STRATEGY
Growth of a $10,000 Investment (as of March 31, 2017)
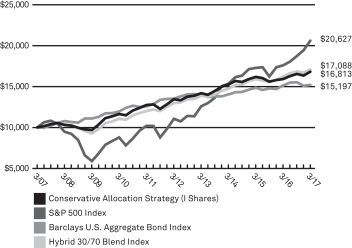 | This chart assumes an initial hypothetical investment of $10,000 made on 3/31/07. Total return is based on net change in the Net Asset Value (“NAV”) assuming reinvestment of distributions. Returns shown on this page include reinvestment of all dividends and other distributions.
The Fund’s performance is compared to the Hybrid 30/70 Blend Index. The Standard & Poors 500 Index (“S&P 500 Index”) is widely regarded as a gauge of the U.S. equities market. This index includes 500 leading companies in leading industries of the U.S. economy. Although the S&P 500 Index focuses on the large cap segment of the market, with approximately 75% coverage of U.S. equities, it is also an ideal proxy for the total market. The Barclays U.S. Aggregate Bond Index is a measure of the overall performance of the U.S. bond market. These indices are unmanaged and do not reflect the deduction of fees, such as investment and fund accounting fees, associated with a mutual fund. Investors cannot invest directly in an index. |
| Average Annual Total Returns as of 3/31/17 | ||||||||||||||||
| RidgeWorth Conservative Allocation Strategy | 1 Year | 3 Year | 5 Year | 10 Year | ||||||||||||
A Shares | without sales charge | 5.28% | 2.99% | 4.27% | 5.02% | |||||||||||
| with sales charge* | 0.27% | 1.33% | 3.26% | 4.51% | ||||||||||||
C Shares | without CDSC | 4.61% | 2.30% | 3.54% | 4.28% | |||||||||||
| with CDSC* | 3.61% | 2.30% | 3.54% | 4.28% | ||||||||||||
I Shares | 5.66% | 3.33% | 4.57% | 5.33% | ||||||||||||
| Hybrid 30/70 Blend Index (30% of the S&P 500 Index, 70% of the Barclays U.S. Aggregate Bond Index) | 5.27% | 5.06% | 5.65% | 5.50% | ||||||||||||
| S&P 500 Index | 17.17% | 10.37% | 13.30% | 7.51% | ||||||||||||
| Barclays U.S. Aggregate Bond Index | 0.44% | 2.68% | 2.34% | 4.27% | ||||||||||||
| Prospectus Expense Ratio1 | Gross | |||||||||||||||
| A Shares | 1.13% | |||||||||||||||
| C Shares | 1.78% | |||||||||||||||
| I Shares | 0.90% | |||||||||||||||
Because equity markets may be volatile in the short-term, resulting in unusually high or low performance, investors should evaluate long-term performance before making an investment.
The Adviser has contractually agreed to waive fees and reimburse expenses until at least August 1, 2017 in order to keep total operating expenses (excluding underlying fund fees and expenses) from exceeding 0.60%, 1.30% and 0.30% for A, C and I Shares, respectively. Without these fee waivers, performance would have been lower. The indirect expenses of the Fund, which represent a pro-rata share of the expenses of the underlying funds in which the Fund invests, totaled 0.46% of net assets and are included in the expense ratios listed in the table above.
Past performance does not guarantee future results. The performance data quoted represents past performance and current returns may be lower or higher. Total return figures include change in share price, reinvestment of dividends and capital gains and do not reflect taxes that a shareholder would pay on fund distributions or on the redemption of fund shares. The investment return and principal value will fluctuate so that an investor’s shares, when redeemed, may be worth more or less than the original cost. For performance data current to the most recent month end, visit our website at www.ridgeworth.com.
| * | Class A Share performance reflects the maximum front-end sales charge of 4.75% and Class C Shares reflect the maximum CDSC (contingent deferred sales charge) of 1.00% in year one only. |
| 1 | This information is included in the most current prospectus available to current and prospective shareholders of the Fund. Additional information pertaining to the 3/31/17 expense ratios can be found in the financial highlights. |
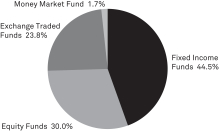
Sector Weightings (as of March 31, 2017)
as a percentage of Investments
19
Table of Contents
Portfolio Manager
| • | Alan Gayle |
INVESTMENT CONCERNS
Equity Securities (Stocks) are more volatile and carry more risk and return potential than other forms of investments. Bonds offer a relatively stable level of income, although bond prices will fluctuate, providing the potential for principal gain or loss. Cash equivalents offer low risk and low return potential.
MANAGEMENT DISCUSSION OF FUND PERFORMANCE
How did the Fund perform against its benchmark for the fiscal year ended March 31, 2017?
The RidgeWorth Growth Allocation Strategy (I Shares) returned 10.83% compared to a 11.16% return for the Lipper Mixed-Asset Target Allocation (Growth Classification)*, and a 11.96% return for its hybrid benchmark made up of a 70% weighting in the S&P 500 Index and a 30% weighting in the Bloomberg Barclays U.S. Aggregate Bond Index.
What factors influenced the Fund’s performance for the fiscal year ended March 31, 2017?
RidgeWorth Investments manages three distinct asset allocation strategies, each structured to align investment portfolios with specific levels of investor risk tolerance and income requirements. The underlying mutual funds and ETFs typically are the same across the Strategies, but different stock, bond and alternatives allocations create noticeably different total return characteristics, which are intended to align with investor needs and constraints.
Equity markets advanced during the 12-month period due in part to improving economic conditions and investor expectations for greater economic expansion under the new presidential administration. After a period of relatively tepid growth, both U.S. and global economies showed signs of strengthening, a development that prompted the Federal Reserve to raise interest rates in December and again in March. Stocks rallied in the second half of the period amid hopes that proposals to ease regulations and implement more pro-economic policies in Washington, D.C., would drive companies’ future earnings.
In that environment, equities soundly outperformed fixed income securities, led by the performance of small- and mid-cap stocks. The Fund benefited from its sizable overweight in equities, as well as from its exposure to small- and mid-cap positions. Investments in large-cap stocks and developed and emerging market international stocks hurt relative results. However, late in the period, we increased exposure to developed and emerging international equities. We also favored pro-cyclical ETF positions over defensively oriented sectors.
Among fixed income holdings, the Fund’s exposure to credit-oriented issues and a shorter-than-benchmark duration position benefited relative results. We increased the Fund’s cash position toward the end of the period in response to elevated valuations and increased volatility.
How do you plan to position the Fund, based on market conditions?
Over the next quarter, we expect markets to react to uncertainty over a variety of issues, from corporate earnings and the progress of policy, to potential geopolitical events. Regardless, we see a number of encouraging signs for stocks going forward: Steady job and wage growth, a recovering housing market, stabilizing oil prices, and improving economic momentum overseas all give us reason to remain cautiously positive about equities. To that end, the Fund will maintain a moderately overweight allocation to equities relative to its benchmarks.
| * | Lipper Mixed-Asset Target Allocation (Growth Classification): Funds that, by portfolio practice, maintain a mix of between 60%-80% equity securities, with the remainder invested in bonds, cash, and cash equivalents. |
20
Table of Contents
GROWTH ALLOCATION STRATEGY
Growth of a $10,000 Investment (as of March 31, 2017)
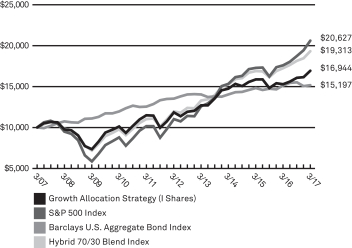 | This chart assumes an initial hypothetical investment of $10,000 made on 3/31/07. Total return is based on net change in the Net Asset Value (“NAV”) assuming reinvestment of distributions. Returns shown on this page include reinvestment of all dividends and other distributions.
The Fund’s performance is compared to the Hybrid 70/30 Blend Index. The Standard & Poors 500 Index (“S&P 500 Index”) is widely regarded as a gauge of the U.S. equities market. This index includes 500 leading companies in leading industries of the U.S. economy. Although the S&P 500 Index focuses on the large cap segment of the market, with approximately 75% coverage of U.S. equities, it is also an ideal proxy for the total market. The Barclays U.S. Aggregate Bond Index is a measure of the overall performance of the U.S. bond market. These indices are unmanaged and do not reflect the deduction of fees, such as investment and fund accounting fees, associated with a mutual fund. Investors cannot invest directly in an index. |
| Average Annual Total Returns as of 3/31/17 | ||||||||||||||||
| RidgeWorth Growth Allocation Strategy | 1 Year | 3 Year | 5 Year | 10 Year | ||||||||||||
A Shares | without sales charge | 10.66% | 4.48% | 7.20% | 5.16% | |||||||||||
| with sales charge** | 4.34% | 2.44% | 5.94% | 4.53% | ||||||||||||
C Shares* | without CDSC | 10.00% | 3.84% | 6.54% | 4.44% | |||||||||||
| with CDSC** | 9.00% | 3.84% | 6.54% | 4.44% | ||||||||||||
I Shares | 10.83% | 4.69% | 7.42% | 5.41% | ||||||||||||
| Hybrid 70/30 Blend Index (70% of the S&P 500 Index, 30% of the Barclays U.S. Aggregate Bond Index) | 11.96% | 8.14% | 10.04% | 6.80% | ||||||||||||
| S&P 500 Index | 17.17% | 10.37% | 13.30% | 7.51% | ||||||||||||
| Barclays U.S. Aggregate Bond Index | 0.44% | 2.68% | 2.34% | 4.27% | ||||||||||||
| Prospectus Expense Ratio1 | Gross | |||||||||||||||
| A Shares | 1.33% | |||||||||||||||
| C Shares | 1.97% | |||||||||||||||
| I Shares | 1.36% | |||||||||||||||
Because equity markets may be volatile in the short-term, resulting in unusually high or low performance, investors should evaluate long-term performance before making an investment.
The Adviser has contractually agreed to waive fees and reimburse expenses until at least August 1, 2017 in order to keep total operating expenses (excluding underlying fund fees and expenses) from exceeding 0.70%, 1.30% and 0.50% for the A, C and I Shares, respectively. Without these fee waivers, performance would have been lower. The indirect expenses of the Fund, which represent a pro-rata share of the expenses of the underlying funds in which the Fund invests, totaled 0.66% of net assets and are included in the expense ratios listed in the table above.
Past performance does not guarantee future results. The performance data quoted represents past performance and current returns may be lower or higher. Total return figures include change in share price, reinvestment of dividends and capital gains and do not reflect taxes that a shareholder would pay on fund distributions or on the redemption of fund shares. The investment return and principal value will fluctuate so that an investor’s shares, when redeemed, may be worth more or less than the original cost. For performance data current to the most recent month end, visit our website at www.ridgeworth.com.
| ** | Class A Share performance reflects the maximum front-end sales charge of 5.75% and Class C Shares reflect the maximum CDSC (contingent deferred sales charge) of 1.00% in year one only. |
| 1 | This information is included in the most current prospectus available to current and prospective shareholders of the Fund. Additional information pertaining to the 3/31/17 expense ratios can be found in the financial highlights. |
Sector Weightings (as of March 31, 2017)
as a percentage of Investments
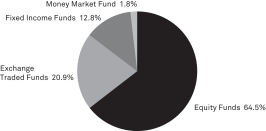
21
Table of Contents
Portfolio Manager
| • | Alan Gayle |
INVESTMENT CONCERNS
Equity Securities (Stocks) are more volatile and carry more risk and return potential than other forms of investments. Bonds offer a relatively stable level of income, although bond prices will fluctuate, providing the potential for principal gain or loss. Cash equivalent offer low risk and low return potential.
MANAGEMENT DISCUSSION OF FUND PERFORMANCE
How did the Fund perform against its benchmark for the fiscal year ended March 31, 2017?
The RidgeWorth Moderate Allocation Strategy (I Shares) returned 8.08% compared to a 9.86% return for the Lipper Mixed-Asset Target Allocation (Moderate Classification)*, and a 8.58% return for its hybrid benchmark made up of a 50% weighting in the S&P 500 Index and a 50% weighting in the Bloomberg Barclays U.S. Aggregate Bond Index.
What factors influenced the Fund’s performance for the fiscal year ended March 31, 2017?
RidgeWorth Investments manages three distinct asset allocation strategies, each structured to align investment portfolios with specific levels of investor risk tolerance and income requirements. The underlying mutual funds and ETFs typically are the same across the Strategies, but different stock, bond and alternatives allocations create noticeably different total return characteristics, which are intended to align with investor needs and constraints.
Equity markets advanced during the 12-month period due in part to improving economic conditions and investor expectations for greater economic expansion under the new presidential administration. After a period of relatively tepid growth, both U.S. and global economies showed signs of strengthening, a development that prompted the Federal Reserve to raise interest rates in December and again in March. Stocks rallied in the second half of the period amid hopes that proposals to ease regulations and implement more pro-economic policies in Washington, D.C., would drive companies’ future earnings.
In that environment, equities soundly outperformed fixed income securities, led by the performance of small- and mid-cap stocks. The Fund benefited from its sizable overweight in equities, as well as from its exposure to small- and mid-cap positions. Investments in large-cap stocks and developed and emerging market international stocks hurt relative results. However, late in the period, we increased exposure to developed and emerging international equities. We also favored pro-cyclical ETF positions over defensively oriented sectors.
Among fixed income holdings, the Fund’s exposure to credit-oriented issues and a shorter-than-benchmark duration position benefited relative results. We increased the Fund’s cash position toward the end of the period in response to elevated valuations and increased volatility.
How do you plan to position the Fund, based on market conditions?
Over the next quarter, we expect markets to react to uncertainty over a variety of issues, from corporate earnings and the progress of policy, to potential geopolitical events. Regardless, we see a number of encouraging signs for stocks going forward: Steady job and wage growth, a recovering housing market, stabilizing oil prices, and improving economic momentum overseas all give us reason to remain cautiously positive about equities. To that end, the Fund will maintain a moderately overweight allocation to equities relative to its benchmarks.
| * | Lipper Mixed-Asset Target Allocation (Moderate Classification): Funds that, by portfolio practice, maintain a mix of between 40%-60% equity securities, with the remainder invested in bonds, cash and cash equivalents. |
22
Table of Contents
MODERATE ALLOCATION STRATEGY
Growth of a $10,000 Investment (as of March 31, 2017)
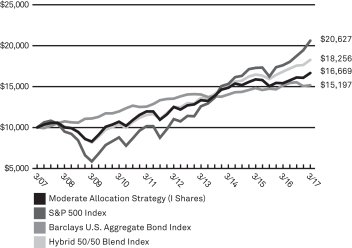 | This chart assumes an initial hypothetical investment of $10,000 made on 3/31/07. Total return is based on net change in the Net Asset Value (“NAV”) assuming reinvestment of distributions. Returns shown on this page include reinvestment of all dividends and other distributions.
The Fund’s performance is compared to the Hybrid 50/50 Blend Index. The Standard & Poors 500 Index (“S&P 500 Index”) is widely regarded as a gauge of the U.S. equities market. This index includes 500 leading companies in leading industries of the U.S. economy. Although the S&P 500 Index focuses on the large cap segment of the market, with approximately 75% coverage of U.S. equities, it is also an ideal proxy for the total market. The Barclays U.S. Aggregate Bond Index is a measure of the overall performance of the U.S. bond market. These indices are unmanaged and do not reflect the deduction of fees, such as investment and fund accounting fees, associated with a mutual fund. Investors cannot invest directly in an index. |
| Average Annual Total Returns as of 3/31/17 | ||||||||||||||||
| RidgeWorth Moderate Allocation Strategy | 1 Year | 3 Year | 5 Year | 10 Year | ||||||||||||
A Shares | without sales charge | 7.84% | 3.67% | 5.73% | 4.99% | |||||||||||
| with sales charge** | 1.64% | 1.65% | 4.48% | 4.38% | ||||||||||||
C Shares* | without CDSC | 7.12% | 3.07% | 5.10% | 4.31% | |||||||||||
| with CDSC** | 6.13% | 3.07% | 5.10% | 4.31% | ||||||||||||
I Shares | 8.08% | 3.85% | 5.90% | 5.24% | ||||||||||||
| Hybrid 50/50 Blend Index (50% of the Barclays U.S. Aggregate Bond Index, 50% of the S&P 500 Index ) | 8.58% | 6.62% | 7.85% | 6.20% | ||||||||||||
| S&P 500 Index | 17.17% | 10.37% | 13.30% | 7.51% | ||||||||||||
| Barclays U.S. Aggregate Bond Index | 0.44% | 2.68% | 2.34% | 4.27% | ||||||||||||
| Prospectus Expense Ratio1 | Gross | |||||||||||||||
| A Shares | 1.24% | |||||||||||||||
| C Shares | 1.82% | |||||||||||||||
| I Shares | 1.13% | |||||||||||||||
Because equity markets may be volatile in the short-term, resulting in unusually high or low performance, investors should evaluate long-term performance before making an investment.
The Adviser has contractually agreed to waive fees and reimburse expenses until at least August 1, 2017 in order to keep total operating expenses (excluding underlying fund fees and expenses) from exceeding 0.70%, 1.30% and 0.50% for A, C and I Shares, respectively. Without these fee waivers, performance would have been lower. The indirect expenses of the Fund, which represent a pro-rata share of the expenses of the underlying funds in which the Fund invests, totaled 0.56% of net assets and are included in the expense ratios listed in the table above.
Past performance does not guarantee future results. The performance data quoted represents past performance and current returns may be lower or higher. Total return figures include change in share price, reinvestment of dividends and capital gains and do not reflect taxes that a shareholder would pay on fund distributions or on the redemption of fund shares. The investment return and principal value will fluctuate so that an investor’s shares, when redeemed, may be worth more or less than the original cost. For performance data current to the most recent month end, visit our website at www.ridgeworth.com.
| * | Class C Shares were offered beginning on 4/5/05. The performance shown prior to such dates is based on performance |
| of the I Shares of the Fund, and has not been adjusted to reflect C Share expenses. If it had been, performance would have been lower. |
| ** | Class A Share performance reflects the maximum front-end sales charge of 5.75% and Class C Shares reflect the maximum CDSC (contingent deferred sales charge) of 1.00% in year one only. |
| 1 | This information is included in the most current prospectus available to current and prospective shareholders of the Fund. Additional information pertaining to the 3/31/17 expense ratios can be found in the financial highlights. |
Sector Weightings (as of March 31, 2017)
as a percentage of Investments
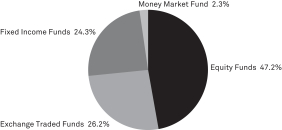
23
Table of Contents
SCHEDULES OF PORTFOLIO INVESTMENTS
RIDGEWORTH FUNDS March 31, 2017
Capital Innovations Global Resources and Infrastructure Fund
| Shares | Value($) | |||||||
| Common Stocks 97.5% | ||||||||
Consumer Staples 3.7% |
| |||||||
Archer-Daniels-Midland Co. | 2,330 | 107,273 | ||||||
Bunge Ltd. | 685 | 54,293 | ||||||
Mondelez International, Inc., Cl A | 4,120 | 177,490 | ||||||
|
| |||||||
| 339,056 | ||||||||
|
| |||||||
Energy 39.8% |
| |||||||
Anadarko Petroleum Corp. | 2,825 | 175,150 | ||||||
BP PLC SP ADR | 3,315 | 114,434 | ||||||
Canadian Natural Resources Ltd. | 2,109 | 69,154 | ||||||
Cheniere Energy, Inc.* | 2,230 | 105,412 | ||||||
Chevron Corp. | 1,290 | 138,507 | ||||||
CNOOC Ltd. SP ADR(a) | 625 | 74,875 | ||||||
ConocoPhillips | 910 | 45,382 | ||||||
CONSOL Energy, Inc.* | 4,310 | 72,322 | ||||||
Eni SpA SP ADR | 2,070 | 67,751 | ||||||
EOG Resources, Inc. | 705 | 68,773 | ||||||
Exxon Mobil Corp. | 2,200 | 180,422 | ||||||
Fairmount Santrol Holdings, Inc.*(a) | 11,170 | 81,876 | ||||||
Gazprom PJSC SP ADR | 15,080 | 67,785 | ||||||
Halliburton Co. | 3,620 | 178,140 | ||||||
Lukoil PJSC SP ADR | 875 | 46,428 | ||||||
Marathon Petroleum Corp. | 2,775 | 140,248 | ||||||
Nabors Industries Ltd. | 10,875 | 142,136 | ||||||
PetroChina Co. Ltd. ADR | 500 | 36,625 | ||||||
Petroleo Brasileiro SA SP ADR* | 4,995 | 48,402 | ||||||
Pioneer Natural Resources Co. | 925 | 172,263 | ||||||
PrairieSky Royalty Ltd.(a) | 20 | 422 | ||||||
Range Resources Corp. | 3,145 | 91,519 | ||||||
Royal Dutch Shell PLC SP ADR, Cl A | 4,455 | 234,912 | ||||||
Schlumberger Ltd. | 1,620 | 126,522 | ||||||
Suncor Energy, Inc. | 6,100 | 187,575 | ||||||
Tenaris SA ADR | 1,650 | 56,331 | ||||||
Tesoro Corp. | 1,580 | 128,075 | ||||||
Total SA SP ADR | 4,524 | 228,100 | ||||||
Transocean Ltd.*(a) | 3,340 | 41,583 | ||||||
Ultrapar Participacoes SA SP ADR | 4,235 | 96,262 | ||||||
Valero Energy Corp. | 1,360 | 90,154 | ||||||
Weatherford International PLC*(a) | 27,830 | 185,069 | ||||||
Whiting Petroleum Corp.* | 14,030 | 132,724 | ||||||
|
| |||||||
| 3,625,333 | ||||||||
|
| |||||||
Financials 2.0% |
| |||||||
Weyerhaeuser Co., REIT | 5,210 | 177,036 | ||||||
|
| |||||||
Health Care 0.9% |
| |||||||
Bayer AG SP ADR | 670 | 77,264 | ||||||
|
| |||||||
Industrials 2.8% |
| |||||||
Deere & Co.(a) | 1,270 | 138,252 | ||||||
Grupo Aeroportuario del Sureste SAB de CV ADR | 375 | 64,965 | ||||||
Kansas City Southern | 635 | 54,458 | ||||||
|
| |||||||
| 257,675 | ||||||||
|
| |||||||
| Shares | Value($) | |||||||
Materials 48.3% |
| |||||||
Agrium, Inc. | 500 | 47,775 | ||||||
Air Products & Chemicals, Inc. | 765 | 103,497 | ||||||
Albemarle Corp. | 1,375 | 145,255 | ||||||
Alcoa Corp. | 3,998 | 137,531 | ||||||
Anglo American PLC* | 12,700 | 194,045 | ||||||
ArcelorMittal* | 22,310 | 186,288 | ||||||
Barrick Gold Corp. | 7,655 | 145,368 | ||||||
BHP Billiton Ltd. SP ADR(a) | 6,505 | 236,262 | ||||||
CF Industries Holdings, Inc.(a) | 4,860 | 142,641 | ||||||
E.I. du Pont de Nemours & Co. | 1,180 | 94,789 | ||||||
First Quantum Minerals Ltd. | 11,000 | 116,878 | ||||||
Freeport-McMoRan, Inc.*(a) | 7,900 | 105,544 | ||||||
Glencore PLC* | 86,200 | 338,202 | ||||||
Goldcorp, Inc.(a) | 4,430 | 64,634 | ||||||
International Paper Co. | 555 | 28,183 | ||||||
KapStone Paper and Packaging Corp. | 6,625 | 153,038 | ||||||
Monsanto Co. | 2,540 | 287,528 | ||||||
Newmont Mining Corp. | 3,780 | 124,589 | ||||||
Nucor Corp. | 1,770 | 105,704 | ||||||
Packaging Corp. of America | 600 | 54,972 | ||||||
Platinum Group Metals Ltd.*(a) | 17,460 | 28,460 | ||||||
Potash Corp. of Saskatchewan, Inc. | 4,610 | 78,739 | ||||||
Randgold Resources Ltd. ADR | 175 | 15,274 | ||||||
Rio Tinto PLC SP ADR | 2,890 | 117,565 | ||||||
Silver Wheaton Corp.(a) | 2,940 | 61,270 | ||||||
Smurfit Kappa Group PLC | 3,340 | 88,757 | ||||||
Southern Copper Corp. | 2,545 | 91,340 | ||||||
Steel Dynamics, Inc. | 5,580 | 193,961 | ||||||
Syngenta AG ADR | 2,360 | 208,860 | ||||||
Teck Resources Ltd., Cl B(a) | 2,670 | 58,473 | ||||||
Turquoise Hill Resources Ltd.* | 16,000 | 49,120 | ||||||
United States Steel Corp. | 4,910 | 166,007 | ||||||
Vale SA SP ADR | 17,000 | 161,500 | ||||||
Vulcan Materials Co. | 1,150 | 138,552 | ||||||
West Fraser Timber Co. Ltd. | 1,630 | 68,174 | ||||||
WestRock Co. | 1,110 | 57,753 | ||||||
|
| |||||||
| 4,396,528 | ||||||||
|
| |||||||
Total Common Stocks | 8,872,892 | |||||||
|
| |||||||
Money Market Funds 5.1% |
| |||||||
State Street Institutional Treasury Money Market Fund, Premier Class, 0.53%(b) | 190,308 | 190,308 | ||||||
State Street Institutional U.S. Government Money Market Fund, Premier Class, 0.62%(b)(c) | 275,536 | 275,536 | ||||||
|
| |||||||
Total Money Market Funds | 465,844 | |||||||
|
| |||||||
See Notes to Financial Statements.
24
Table of Contents
SCHEDULES OF PORTFOLIO INVESTMENTS
RIDGEWORTH FUNDS March 31, 2017
Capital Innovations Global Resources and Infrastructure Fund — concluded
| Shares | Value($) | |||||||
Total Investments | 9,338,736 | |||||||
Liabilities in Excess of Other Assets — (2.6)% | (236,949 | ) | ||||||
|
| |||||||
Net Assets — 100.0% | $ | 9,101,787 | ||||||
|
| |||||||
| * | Non-income producing security. |
| (a) | The security or a partial position of the security was on loan as of March 31, 2017. The total value of securities on loan as of March 31, 2017 was $1,102,933. |
| (b) | Rate disclosed, the 7 day yield, is as of March 31, 2017. |
| (c) | Purchased with cash collateral held from securities lending. The total value of the collateral held by the Fund was $1,136,975. The total value of the collateral includes non-cash U.S. Government securities collateral having a value of $861,439. The value of the collateral could include collateral held for securities that were sold on or before March 31, 2017 (See Note 2(g)). |
Investment Abbreviation
| ADR | — | American Depositary Receipt | ||
| REIT | — | Real Estate Investment Trust | ||
| SAB de CV | — | Sociedad Anónima Bursátil de Capital Variable is the Spanish equivalent to Variable Capital Company | ||
| SP ADR | — | Sponsored American Depositary Receipt |
See Notes to Financial Statements.
25
Table of Contents
SCHEDULES OF PORTFOLIO INVESTMENTS
RIDGEWORTH FUNDS March 31, 2017
Ceredex Large Cap Value Equity Fund
| Shares | Value($) | |||||||
| Common Stocks 99.4% | ||||||||
Consumer Discretionary 2.6% |
| |||||||
Comcast Corp., Cl A | 1,449,686 | 54,493,697 | ||||||
|
| |||||||
Consumer Staples 4.8% |
| |||||||
Mondelez International, Inc., Cl A | 1,095,535 | 47,195,648 | ||||||
Procter & Gamble Co. (The) | 605,263 | 54,382,880 | ||||||
|
| |||||||
| 101,578,528 | ||||||||
|
| |||||||
Energy 15.1% |
| |||||||
Chevron Corp. | 753,004 | 80,850,039 | ||||||
EOG Resources, Inc. | 502,144 | 48,984,147 | ||||||
Exxon Mobil Corp. | 899,278 | 73,749,789 | ||||||
Royal Dutch Shell PLC SP ADR, Cl B | 1,080,944 | 60,349,104 | ||||||
Schlumberger Ltd. | 701,865 | 54,815,657 | ||||||
|
| |||||||
| 318,748,736 | ||||||||
|
| |||||||
Financials 30.7% |
| |||||||
Aon PLC | 236,925 | 28,120,628 | ||||||
BlackRock, Inc. | 150,410 | 57,683,739 | ||||||
Capital One Financial Corp. | 478,136 | 41,435,266 | ||||||
Chubb Ltd. | 310,446 | 42,298,267 | ||||||
Citigroup, Inc. | 1,011,390 | 60,501,350 | ||||||
Crown Castle International Corp., REIT | 490,089 | 46,288,906 | ||||||
JPMorgan Chase & Co. | 834,060 | 73,263,830 | ||||||
MetLife, Inc. | 682,435 | 36,046,217 | ||||||
Progressive Corp. (The) | 542,655 | 21,261,223 | ||||||
Public Storage, REIT | 197,879 | 43,317,692 | ||||||
Regency Centers Corp., REIT | 341,705 | 22,685,795 | ||||||
Synchrony Financial | 823,906 | 28,259,976 | ||||||
U.S. Bancorp | 1,259,888 | 64,884,232 | ||||||
Wells Fargo & Co. | 932,348 | 51,894,490 | ||||||
Willis Towers Watson PLC | 224,742 | 29,416,480 | ||||||
|
| |||||||
| 647,358,091 | ||||||||
|
| |||||||
Health Care 9.0% |
| |||||||
Abbott Laboratories | 1,064,800 | 47,287,768 | ||||||
Cigna Corp. | 346,186 | 50,712,787 | ||||||
Johnson & Johnson | 270,107 | 33,641,827 | ||||||
Pfizer, Inc. | 817,250 | 27,958,123 | ||||||
UnitedHealth Group, Inc. | 188,904 | 30,982,145 | ||||||
|
| |||||||
| 190,582,650 | ||||||||
|
| |||||||
Industrials 16.3% |
| |||||||
Eaton Corp. PLC | 660,560 | 48,980,524 | ||||||
FedEx Corp. | 277,144 | 54,084,652 | ||||||
General Electric Co. | 1,751,387 | 52,191,333 | ||||||
Honeywell International, Inc. | 396,812 | 49,549,914 | ||||||
Northrop Grumman Corp. | 201,558 | 47,938,555 | ||||||
PACCAR, Inc. | 634,470 | 42,636,384 | ||||||
| Shares | Value($) | |||||||
Industrials—continued | ||||||||
United Technologies Corp. | 427,735 | 47,996,144 | ||||||
|
| |||||||
| 343,377,506 | ||||||||
|
| |||||||
Information Technology 9.3% |
| |||||||
Apple, Inc. | 328,810 | 47,236,845 | ||||||
Microsoft Corp. | 969,123 | 63,826,441 | ||||||
Oracle Corp. | 1,181,119 | 52,689,718 | ||||||
Texas Instruments, Inc. | 409,472 | 32,987,064 | ||||||
|
| |||||||
| 196,740,068 | ||||||||
|
| |||||||
Materials 5.9% |
| |||||||
Dow Chemical Co. (The) | 442,132 | 28,093,067 | ||||||
PPG Industries, Inc. | 338,280 | 35,546,462 | ||||||
Praxair, Inc.(a) | 229,931 | 27,269,817 | ||||||
Vulcan Materials Co. | 272,591 | 32,841,764 | ||||||
|
| |||||||
| 123,751,110 | ||||||||
|
| |||||||
Telecommunication Services 2.5% |
| |||||||
Verizon Communications, Inc. | 1,076,067 | 52,458,266 | ||||||
|
| |||||||
Utilities 3.2% |
| |||||||
Edison International | 435,970 | 34,707,572 | ||||||
NextEra Energy, Inc.(a) | 260,939 | 33,496,739 | ||||||
|
| |||||||
| 68,204,311 | ||||||||
|
| |||||||
Total Common Stocks | 2,097,292,963 | |||||||
|
| |||||||
Money Market Fund 1.0% |
| |||||||
State Street Institutional Treasury Money Market Fund, Premier Class, 0.53%(b) | 20,759,114 | 20,759,114 | ||||||
|
| |||||||
Total Money Market Fund | 20,759,114 | |||||||
|
| |||||||
Total Investments |
| 2,118,052,077 | ||||||
Liabilities in Excess of Other Assets — (0.4)% | (9,080,193 | ) | ||||||
|
| |||||||
Net Assets — 100.0% | $ | 2,108,971,884 | ||||||
|
| |||||||
| (a) | The security or a partial position of the security was on loan as of March 31, 2017. The total value of securities on loan as of March 31, 2017 was $9,073,947. The total value of the collateral received is in the form of securities having a value of $9,257,844. The value of the collateral could include collateral held for securities that were sold on or before March 31, 2017 (See Note 2(g)). |
| (b) | Rate disclosed, the 7 day yield, is as of March 31, 2017. |
Investment Abbreviations
| REIT | — | Real Estate Investment Trust | ||
| SP ADR | — | Sponsored American Depositary Receipt |
See Notes to Financial Statements.
26
Table of Contents
SCHEDULES OF PORTFOLIO INVESTMENTS
RIDGEWORTH FUNDS March 31, 2017
Ceredex Mid-Cap Value Equity Fund
| Shares | Value($) | |||||||
| Common Stocks 95.5% | ||||||||
Consumer Discretionary 4.5% |
| |||||||
Coach, Inc. | 1,000,000 | 41,330,000 | ||||||
Ralph Lauren Corp. | 875,000 | 71,417,500 | ||||||
Williams-Sonoma, Inc.(a) | 750,000 | 40,215,000 | ||||||
|
| |||||||
| 152,962,500 | ||||||||
|
| |||||||
Consumer Staples 2.6% |
| |||||||
Dr Pepper Snapple Group, Inc. | 375,000 | 36,720,000 | ||||||
Molson Coors Brewing Co., Cl B | 535,000 | 51,204,850 | ||||||
|
| |||||||
| 87,924,850 | ||||||||
|
| |||||||
Energy 10.4% |
| |||||||
Cabot Oil & Gas Corp. | 2,050,000 | 49,015,500 | ||||||
Core Laboratories NV(a) | 325,000 | 37,544,000 | ||||||
Devon Energy Corp. | 1,100,000 | 45,892,000 | ||||||
Ensco PLC, CL A | 2,450,000 | 21,927,500 | ||||||
Marathon Petroleum Corp. | 1,150,000 | 58,121,000 | ||||||
Noble Energy, Inc. | 1,540,000 | 52,883,600 | ||||||
Patterson-UTI Energy, Inc. | 1,475,000 | 35,798,250 | ||||||
Williams Cos., Inc. (The) | 1,850,000 | 54,741,500 | ||||||
|
| |||||||
| 355,923,350 | ||||||||
|
| |||||||
Financials 29.6% |
| |||||||
Affiliated Managers Group, Inc. | 225,000 | 36,886,500 | ||||||
American Campus Communities, Inc., REIT | 700,000 | 33,313,000 | ||||||
BankUnited, Inc. | 1,300,000 | 48,503,000 | ||||||
CIT Group, Inc. | 1,225,000 | 52,589,250 | ||||||
Citizens Financial Group, Inc. | 1,000,000 | 34,550,000 | ||||||
Cousins Properties, Inc., REIT | 4,700,000 | 38,869,000 | ||||||
CyrusOne, Inc., REIT | 1,075,000 | 55,330,250 | ||||||
Hartford Financial Services Group, Inc. (The) | 950,000 | 45,666,500 | ||||||
KeyCorp | 2,670,000 | 47,472,600 | ||||||
Lazard Ltd., Cl A | 750,000 | 34,492,500 | ||||||
Life Storage, Inc., REIT | 630,000 | 51,735,600 | ||||||
MB Financial, Inc. | 1,180,000 | 50,527,600 | ||||||
Medical Properties Trust, Inc., REIT | 3,100,000 | 39,959,000 | ||||||
National Retail Properties, Inc., REIT | 850,000 | 37,077,000 | ||||||
Progressive Corp. (The) | 1,275,000 | 49,954,500 | ||||||
Prologis, Inc., REIT | 840,000 | 43,579,200 | ||||||
Retail Opportunity Investments Corp., REIT | 1,850,000 | 38,905,500 | ||||||
Synchrony Financial | 1,785,000 | 61,225,500 | ||||||
Taubman Centers, Inc., REIT | 630,000 | 41,592,600 | ||||||
Weyerhaeuser Co., REIT | 1,950,000 | 66,261,000 | ||||||
| Shares | Value($) | |||||||
Financials—continued | ||||||||
Willis Towers Watson PLC | 450,000 | 58,900,500 | ||||||
XL Group Ltd. | 1,250,000 | 49,825,000 | ||||||
|
| |||||||
| 1,017,215,600 | ||||||||
|
| |||||||
Health Care 8.2% |
| |||||||
AmerisourceBergen Corp.(a) | 400,000 | 35,400,000 | ||||||
Cigna Corp. | 465,000 | 68,117,850 | ||||||
Cooper Cos., Inc. (The) | 135,000 | 26,985,150 | ||||||
Humana, Inc. | 310,000 | 63,903,400 | ||||||
STERIS PLC | 885,000 | 61,472,100 | ||||||
Zimmer Biomet Holdings, Inc. | 220,000 | 26,864,200 | ||||||
|
| |||||||
| 282,742,700 | ||||||||
|
| |||||||
Industrials 12.7% |
| |||||||
Acuity Brands, Inc. | 215,000 | 43,860,000 | ||||||
Alaska Air Group, Inc. | 360,000 | 33,199,200 | ||||||
Allison Transmission Holdings, Inc. | 1,000,000 | 36,060,000 | ||||||
AMETEK, Inc. | 800,000 | 43,264,000 | ||||||
Donaldson Co., Inc. | 400,000 | 18,208,000 | ||||||
Fortive Corp. | 575,000 | 34,626,500 | ||||||
Hubbell, Inc. | 280,000 | 33,614,000 | ||||||
Macquarie Infrastructure Corp. | 700,000 | 56,406,000 | ||||||
Pentair PLC | 550,000 | 34,529,000 | ||||||
Rockwell Automation, Inc. | 80,000 | 12,456,800 | ||||||
Rockwell Collins, Inc. | 440,000 | 42,750,400 | ||||||
Xylem, Inc. | 950,000 | 47,709,000 | ||||||
|
| |||||||
| 436,682,900 | ||||||||
|
| |||||||
Information Technology 9.6% |
| |||||||
Analog Devices, Inc. | 820,000 | 67,199,000 | ||||||
Cypress Semiconductor Corp.(a) | 3,700,000 | 50,912,000 | ||||||
Fair Isaac Corp. | 280,000 | 36,106,000 | ||||||
Harris Corp. | 465,000 | 51,740,550 | ||||||
Motorola Solutions, Inc. | 260,600 | 22,468,932 | ||||||
NetApp, Inc. | 350,000 | 14,647,500 | ||||||
Sabre Corp. | 1,850,000 | 39,201,500 | ||||||
Western Digital Corp. | 580,000 | 47,867,400 | ||||||
|
| |||||||
| 330,142,882 | ||||||||
|
| |||||||
Materials 8.2% |
| |||||||
Air Products & Chemicals, Inc. | 375,000 | 50,733,750 | ||||||
International Paper Co. | 825,000 | 41,893,500 | ||||||
Martin Marietta Materials, Inc. | 215,000 | 46,923,750 | ||||||
RPM International, Inc. | 750,000 | 41,272,500 | ||||||
Sherwin-Williams Co. (The) | 165,000 | 51,181,350 | ||||||
Valvoline, Inc.(a) | 2,040,000 | 50,082,000 | ||||||
|
| |||||||
| 282,086,850 | ||||||||
|
| |||||||
See Notes to Financial Statements.
27
Table of Contents
SCHEDULES OF PORTFOLIO INVESTMENTS
RIDGEWORTH FUNDS March 31, 2017
Ceredex Mid-Cap Value Equity Fund — concluded
| Shares | Value($) | |||||||
Telecommunication Services 1.5% |
| |||||||
CenturyLink, Inc.(a) | 2,250,000 | 53,032,500 | ||||||
|
| |||||||
Utilities 8.2% |
| |||||||
American Water Works Co., Inc. | 710,000 | 55,216,700 | ||||||
CMS Energy Corp. | 800,000 | 35,792,000 | ||||||
Edison International | 560,000 | 44,581,600 | ||||||
Great Plains Energy, Inc. | 1,550,000 | 45,291,000 | ||||||
PG&E Corp. | 750,000 | 49,770,000 | ||||||
Sempra Energy | 450,000 | 49,725,000 | ||||||
|
| |||||||
| 280,376,300 | ||||||||
|
| |||||||
Total Common Stocks | 3,279,090,432 | |||||||
|
| |||||||
Money Market Funds 6.1% |
| |||||||
State Street Institutional Treasury Money Market Fund, Premier Class, 0.53%(b) | 138,450,258 | 138,450,258 | ||||||
State Street Institutional U.S. Government Money Market Fund, Premier Class, 0.62%(b)(c) | 69,152,134 | 69,152,134 | ||||||
|
| |||||||
Total Money Market Funds | 207,602,392 | |||||||
|
| |||||||
| Shares | Value($) | |||||||
Total Investments |
| 3,486,692,824 | ||||||
Liabilities in Excess of Other Assets — (1.6)% | (53,897,220 | ) | ||||||
|
| |||||||
Net Assets — 100.0% | $ | 3,432,795,604 | ||||||
|
| |||||||
| (a) | The security or a partial position of the security was on loan as of March 31, 2017. The total value of securities on loan as of March 31, 2017 was $74,559,593. |
| (b) | Rate disclosed, the 7 day yield, is as of March 31, 2017. |
| (c) | Purchased with cash collateral held from securities lending. The total value of the collateral held by the Fund was $76,712,546. The total value of the collateral includes non-cash U.S. Government securities collateral having a value of $7,560,412. The value of the collateral could include collateral held for securities that were sold on or before March 31, 2017 (See Note 2(g)). |
Investment Abbreviation
REIT — Real Estate Investment Trust
See Notes to Financial Statements.
28
Table of Contents
SCHEDULES OF PORTFOLIO INVESTMENTS
RIDGEWORTH FUNDS March 31, 2017
Ceredex Small Cap Value Equity Fund
| Shares | Value($) | |||||||
| Common Stocks 99.8% | ||||||||
Consumer Discretionary 25.2% |
| |||||||
AMC Entertainment Holdings, Inc., Cl A | 824,640 | 25,934,928 | ||||||
American Eagle Outfitters, Inc. | 795,500 | 11,160,865 | ||||||
Bloomin’ Brands, Inc. | 1,411,000 | 27,839,030 | ||||||
Chico’s FAS, Inc. | 1,092,500 | 15,513,500 | ||||||
DSW, Inc., Cl A | 885,800 | 18,318,344 | ||||||
Guess?, Inc. | 1,124,954 | 12,543,237 | ||||||
HSN, Inc. | 627,460 | 23,278,766 | ||||||
Lithia Motors, Inc., Cl A | 201,600 | 17,267,040 | ||||||
Matthews International Corp., Cl A | 44,740 | 3,026,661 | ||||||
Meredith Corp. | 9,890 | 638,894 | ||||||
Papa John’s International, Inc. | 237,500 | 19,009,500 | ||||||
Regal Entertainment Group, Cl A | 620,800 | 14,017,664 | ||||||
Ruth’s Hospitality Group, Inc. | 173,170 | 3,472,059 | ||||||
Scholastic Corp. | 154,890 | 6,593,667 | ||||||
Sonic Automotive, Inc., Cl A | 683,570 | 13,705,578 | ||||||
Sonic Corp. | 752,996 | 19,095,979 | ||||||
Tupperware Brands Corp. | 64,400 | 4,039,168 | ||||||
|
| |||||||
| 235,454,880 | ||||||||
|
| |||||||
Consumer Staples 9.1% |
| |||||||
B&G Foods, Inc. | 544,000 | 21,896,000 | ||||||
Calavo Growers, Inc. | 131,700 | 7,981,020 | ||||||
Energizer Holdings, Inc. | 682,300 | 38,038,225 | ||||||
Inter Parfums, Inc. | 207,600 | 7,587,780 | ||||||
J&J Snack Foods Corp. | 39,000 | 5,286,840 | ||||||
PriceSmart, Inc. | 22,400 | 2,065,280 | ||||||
Sanderson Farms, Inc. | 24,501 | 2,544,184 | ||||||
|
| |||||||
| 85,399,329 | ||||||||
|
| |||||||
Energy 0.3% |
| |||||||
Bristow Group, Inc. | 204,660 | 3,112,879 | ||||||
|
| |||||||
Financials 18.9% |
| |||||||
Alexander & Baldwin, Inc. | 269,510 | 11,998,585 | ||||||
Banco Latinoamericano de Comercio Exterior SA, Cl E | 49,470 | 1,372,298 | ||||||
Bank of Hawaii Corp. | 225,540 | 18,575,474 | ||||||
Cohen & Steers, Inc. | 333,200 | 13,318,004 | ||||||
DiamondRock Hospitality Co., REIT | 643,800 | 7,178,370 | ||||||
Education Realty Trust, Inc., REIT | 541,300 | 22,112,105 | ||||||
Evercore Partners, Inc., Cl A | 337,120 | 26,261,648 | ||||||
First Interstate BancSystem, Inc., Cl A | 32,200 | 1,276,730 | ||||||
Hanover Insurance Group, Inc. (The) | 195,682 | 17,623,121 | ||||||
Horace Mann Educators Corp. | 345,100 | 14,166,355 | ||||||
Monmouth Real Estate Investment Corp., REIT | 57,050 | 814,104 | ||||||
Oppenheimer Holdings, Inc., Cl A | 12,610 | 215,631 | ||||||
| Shares | Value($) | |||||||
Financials—continued | ||||||||
Outfront Media, Inc., REIT | 791,995 | 21,027,467 | ||||||
Retail Opportunity Investments Corp., REIT | 442,693 | 9,309,834 | ||||||
Tanger Factory Outlet Centers, Inc., REIT | 307,200 | 10,066,944 | ||||||
Trust Co Bank Corp. NY | 169,350 | 1,329,397 | ||||||
|
| |||||||
| 176,646,067 | ||||||||
|
| |||||||
Health Care 6.3% |
| |||||||
Ensign Group, Inc. (The) | 142,340 | 2,675,992 | ||||||
Hill-Rom Holdings, Inc. | 453,730 | 32,033,338 | ||||||
Landauer, Inc. | 227,140 | 11,073,075 | ||||||
Phibro Animal Health Corp., Cl A | 450,200 | 12,650,620 | ||||||
|
| |||||||
| 58,433,025 | ||||||||
|
| |||||||
Industrials 26.4% |
| |||||||
AAR Corp. | 282,570 | 9,502,829 | ||||||
ABM Industries, Inc. | 106,027 | 4,622,777 | ||||||
Advanced Drainage Systems, Inc. | 10,900 | 238,710 | ||||||
Apogee Enterprises, Inc. | 121,400 | 7,236,654 | ||||||
Badger Meter, Inc. | 195,182 | 7,172,938 | ||||||
China Yuchai International Ltd. | 50,790 | 940,123 | ||||||
Covanta Holding Corp. | 1,540,300 | 24,182,710 | ||||||
Cubic Corp. | 345,200 | 18,226,560 | ||||||
EMCOR Group, Inc. | 112,440 | 7,078,098 | ||||||
Forward Air Corp. | 375,400 | 17,857,778 | ||||||
Granite Construction, Inc. | 176,240 | 8,845,486 | ||||||
Herman Miller, Inc. | 643,480 | 20,301,794 | ||||||
Interface, Inc. | 124,261 | 2,367,172 | ||||||
ITT, Inc. | 56,957 | 2,336,376 | ||||||
Kelly Services, Inc., Cl A | 786,210 | 17,186,551 | ||||||
Kforce, Inc. | 316,100 | 7,507,375 | ||||||
Knoll, Inc. | 676,900 | 16,116,989 | ||||||
Korn/Ferry International | 307,437 | 9,681,191 | ||||||
Luxfer Holdings PLC ADR | 158,210 | 1,923,834 | ||||||
Mueller Water Products, Inc., Cl A | 1,320,530 | 15,608,665 | ||||||
Multi-Color Corp. | 104,900 | 7,447,900 | ||||||
NN, Inc. | 108,800 | 2,741,760 | ||||||
Sun Hydraulics Corp. | 146,320 | 5,283,615 | ||||||
Tennant Co. | 33,780 | 2,454,117 | ||||||
Tetra Tech, Inc. | 527,800 | 21,560,630 | ||||||
Viad Corp. | 186,390 | 8,424,828 | ||||||
|
| |||||||
| 246,847,460 | ||||||||
|
| |||||||
Information Technology 8.0% |
| |||||||
Black Box Corp. | 39,200 | 350,840 | ||||||
Daktronics, Inc. | 597,050 | 5,642,122 | ||||||
Fair Isaac Corp. | 384,550 | 49,587,722 | ||||||
Plantronics, Inc. | 354,960 | 19,206,886 | ||||||
|
| |||||||
| 74,787,570 | ||||||||
|
| |||||||
See Notes to Financial Statements.
29
Table of Contents
SCHEDULES OF PORTFOLIO INVESTMENTS
RIDGEWORTH FUNDS March 31, 2017
Ceredex Small Cap Value Equity Fund — concluded
| Shares | Value($) | |||||||
Materials 2.3% |
| |||||||
Carpenter Technology Corp. | 181,900 | 6,784,870 | ||||||
Haynes International, Inc. | 82,430 | 3,142,232 | ||||||
Hecla Mining Co. | 2,097,340 | 11,094,928 | ||||||
|
| |||||||
| 21,022,030 | ||||||||
|
| |||||||
Utilities 3.3% |
| |||||||
ALLETE, Inc. | 167,840 | 11,364,446 | ||||||
California Water Service Group | 318,890 | 11,432,207 | ||||||
NorthWestern Corp. | 141,100 | 8,282,570 | ||||||
|
| |||||||
| 31,079,223 | ||||||||
|
| |||||||
Total Common Stocks | 932,782,463 | |||||||
|
| |||||||
Money Market Fund 0.2% |
| |||||||
State Street Institutional Treasury Money Market Fund, Premier Class, 0.53%(a) | 1,500,791 | 1,500,791 | ||||||
|
| |||||||
Total Money Market Fund | 1,500,791 | |||||||
|
| |||||||
| Shares | Value($) | |||||||
Total Investments | 934,283,254 | |||||||
Liabilities in Excess of Other Assets — (0.0)%(b) | (13,443 | ) | ||||||
|
| |||||||
Net Assets — 100.0% | $ | 934,269,811 | ||||||
|
| |||||||
| (a) | Rate disclosed, the 7 day yield, is as of March 31, 2017. |
| (b) | Less than 0.05% of Net Assets. |
Investment Abbreviations
| ADR | — | American Depositary Receipt | ||
| REIT | — | Real Estate Investment Trust |
See Notes to Financial Statements.
30
Table of Contents
SCHEDULES OF PORTFOLIO INVESTMENTS
RIDGEWORTH FUNDS March 31, 2017
Innovative Growth Stock Fund
| Shares | Value($) | |||||||
| Common Stocks 98.6% | ||||||||
Consumer Discretionary 27.9% |
| |||||||
Amazon.com, Inc.* | 2,100 | 1,861,734 | ||||||
Chipotle Mexican Grill, Inc.* | 1,100 | 490,072 | ||||||
Lululemon Athletica, Inc.* | 8,300 | 430,521 | ||||||
Netflix, Inc.* | 11,300 | 1,670,253 | ||||||
Priceline Group, Inc. (The)* | 550 | 978,984 | ||||||
Shake Shack, Inc., Cl A* | 16,000 | 534,400 | ||||||
Tesla, Inc.* | 5,200 | 1,447,160 | ||||||
Ulta Salon Cosmetics & Fragrance, Inc.* | 2,100 | 598,983 | ||||||
|
| |||||||
| 8,012,107 | ||||||||
|
| |||||||
Financials 10.5% |
| |||||||
Bank of the Ozarks, Inc. | 12,200 | 634,522 | ||||||
Charles Schwab Corp. (The) | 28,800 | 1,175,328 | ||||||
First Republic Bank | 5,900 | 553,479 | ||||||
Signature Bank* | 4,400 | 652,916 | ||||||
|
| |||||||
| 3,016,245 | ||||||||
|
| |||||||
Health Care 19.7% |
| |||||||
Alexion Pharmaceuticals, Inc.* | 2,350 | 284,914 | ||||||
BioMarin Pharmaceutical, Inc.* | 4,700 | 412,566 | ||||||
Celgene Corp.* | 10,050 | 1,250,522 | ||||||
DexCom, Inc.* | 9,100 | 771,043 | ||||||
Exact Sciences Corp.* | 32,000 | 755,840 | ||||||
Medidata Solutions, Inc.* | 7,600 | 438,444 | ||||||
Nevro Corp.* | 6,200 | 580,940 | ||||||
Portola Pharmaceuticals, Inc.* | 3,400 | 133,246 | ||||||
Regeneron Pharmaceuticals, Inc.* | 2,300 | 891,273 | ||||||
Teladoc, Inc.* | 5,800 | 145,000 | ||||||
|
| |||||||
| 5,663,788 | ||||||||
|
| |||||||
Industrials 4.7% |
| |||||||
XPO Logistics, Inc.* | 28,000 | 1,340,920 | ||||||
|
| |||||||
| Shares | Value($) | |||||||
Information Technology 35.8% |
| |||||||
2U, Inc.* | 6,000 | 237,960 | ||||||
Adobe Systems, Inc.* | 4,500 | 585,585 | ||||||
Alphabet, Inc., Cl A* | 1,000 | 847,800 | ||||||
Ellie Mae, Inc.* | 8,200 | 822,214 | ||||||
Facebook, Inc., Cl A* | 10,500 | 1,491,525 | ||||||
Inphi Corp.* | 8,000 | 390,560 | ||||||
MercadoLibre, Inc. | 5,900 | 1,247,673 | ||||||
Monolithic Power Systems, Inc. | 10,000 | 921,000 | ||||||
Palo Alto Networks, Inc.* | 5,600 | 631,008 | ||||||
Pandora Media, Inc.* | 31,800 | 375,558 | ||||||
Proofpoint, Inc.* | 5,000 | 371,800 | ||||||
ServiceNow, Inc.* | 6,950 | 607,916 | ||||||
Shopify, Inc., Cl A* | 7,900 | 537,911 | ||||||
Twilio, Inc., Cl A* | 10,300 | 297,361 | ||||||
Zillow Group, Inc., Cl C* | 26,500 | 892,255 | ||||||
|
| |||||||
| 10,258,126 | ||||||||
|
| |||||||
Total Common Stocks | 28,291,186 | |||||||
|
| |||||||
Money Market Fund 2.3% |
| |||||||
State Street Institutional Treasury Money Market Fund, Premier Class, 0.53%(a) | 672,185 | 672,185 | ||||||
|
| |||||||
Total Money Market Fund | 672,185 | |||||||
|
| |||||||
Total Investments | 28,963,371 | |||||||
Liabilities in Excess of Other | (257,919 | ) | ||||||
|
| |||||||
Net Assets — 100.0% | $ | 28,705,452 | ||||||
|
| |||||||
| * | Non-income producing security. |
| (a) | Rate disclosed, the 7 day yield, is as of March 31, 2017. |
See Notes to Financial Statements.
31
Table of Contents
SCHEDULES OF PORTFOLIO INVESTMENTS
RIDGEWORTH FUNDS March 31, 2017
International Equity Fund
| Shares | Value($) | |||||||
| Common Stocks 98.3% | ||||||||
Australia 4.7% |
| |||||||
CSL Ltd. | 35,320 | 3,381,964 | ||||||
|
| |||||||
Bermuda 2.3% |
| |||||||
Lazard Ltd., Cl A | 35,089 | 1,613,743 | ||||||
|
| |||||||
Brazil 2.9% |
| |||||||
Ambev SA ADR(a) | 364,491 | 2,099,468 | ||||||
|
| |||||||
Canada 5.4% |
| |||||||
Canadian Pacific Railway Ltd.(a) | 18,273 | 2,684,669 | ||||||
Constellation Software, Inc. | 2,473 | 1,215,254 | ||||||
|
| |||||||
| 3,899,923 | ||||||||
|
| |||||||
China 6.7% |
| |||||||
Ctrip.com International Ltd. ADR*(a) | 45,862 | 2,254,117 | ||||||
Tencent Holdings Ltd. | 88,340 | 2,532,607 | ||||||
|
| |||||||
| 4,786,724 | ||||||||
|
| |||||||
Denmark 7.8% |
| |||||||
Chr. Hansen Holding A/S | 27,725 | 1,779,527 | ||||||
Coloplast A/S, Cl B | 27,494 | 2,146,737 | ||||||
Novozymes A/S, Cl B | 42,571 | 1,687,310 | ||||||
|
| |||||||
| 5,613,574 | ||||||||
|
| |||||||
France 8.1% |
| |||||||
Essilor International SA | 14,894 | 1,809,748 | ||||||
Hermes International | 3,692 | 1,749,143 | ||||||
LVMH Moet Hennessy Louis Vuitton SE | 10,190 | 2,237,731 | ||||||
|
| |||||||
| 5,796,622 | ||||||||
|
| |||||||
Germany 2.4% |
| |||||||
Adidas AG | 8,988 | 1,709,611 | ||||||
|
| |||||||
Hong Kong 2.3% |
| |||||||
AIA Group Ltd. | 260,400 | 1,641,845 | ||||||
|
| |||||||
India 3.2% |
| |||||||
HDFC Bank Ltd. ADR | 30,633 | 2,304,214 | ||||||
|
| |||||||
Ireland 9.8% |
| |||||||
Accenture PLC, Cl A | 22,884 | 2,743,334 | ||||||
Experian PLC | 138,787 | 2,830,869 | ||||||
ICON PLC* | 18,451 | 1,470,914 | ||||||
|
| |||||||
| 7,045,117 | ||||||||
|
| |||||||
Italy 2.0% |
| |||||||
Luxottica Group SpA | 26,420 | 1,458,566 | ||||||
|
| |||||||
Japan 5.6% |
| |||||||
Keyence Corp. | 6,400 | 2,562,760 | ||||||
Sysmex Corp.(a) | 23,540 | 1,427,243 | ||||||
|
| |||||||
| 3,990,003 | ||||||||
|
| |||||||
Mexico 2.7% |
| |||||||
Wal-Mart de Mexico SAB de CV | 852,890 | 1,967,971 | ||||||
|
| |||||||
| Shares | Value($) | |||||||
Netherlands 5.2% |
| |||||||
Core Laboratories NV(a) | 18,623 | 2,151,329 | ||||||
Yandex NV, Cl A* | 71,327 | 1,564,201 | ||||||
|
| |||||||
| 3,715,530 | ||||||||
|
| |||||||
South Korea 1.6% |
| |||||||
Amorepacific Corp. | 4,702 | 1,179,389 | ||||||
|
| |||||||
Spain 1.4% |
| |||||||
Industria de Diseno Textil SA | 29,185 | 1,028,686 | ||||||
|
| |||||||
Sweden 1.5% |
| |||||||
Atlas Copco AB, Cl A | 29,537 | 1,042,620 | ||||||
|
| |||||||
Switzerland 11.0% |
| |||||||
Chubb Ltd. | 23,271 | 3,170,674 | ||||||
Nestle SA | 36,587 | 2,807,079 | ||||||
SGS SA | 902 | 1,924,399 | ||||||
|
| |||||||
| 7,902,152 | ||||||||
|
| |||||||
Taiwan 3.5% |
| |||||||
Taiwan Semiconductor Manufacturing Co. Ltd. SP ADR | 77,429 | 2,542,768 | ||||||
|
| |||||||
United Kingdom 8.2% |
| |||||||
Compass Group PLC | 145,919 | 2,753,299 | ||||||
Reckitt Benckiser Group PLC | 34,037 | 3,107,113 | ||||||
|
| |||||||
| 5,860,412 | ||||||||
|
| |||||||
Total Common Stocks | 70,580,902 | |||||||
|
| |||||||
Money Market Funds 5.2% |
| |||||||
State Street Institutional Treasury Money Market Fund, Premier Class, 0.53%(b) | 1,673,055 | 1,673,055 | ||||||
State Street Institutional U.S. Government Money Market Fund, Premier Class, 0.62%(b)(c) | 2,043,412 | 2,043,412 | ||||||
|
| |||||||
Total Money Market Funds | 3,716,467 | |||||||
|
| |||||||
Total Investments | 74,297,369 | |||||||
Liabilities in Excess of Other Assets — (3.5)% | (2,503,533 | ) | ||||||
|
| |||||||
Net Assets — 100.0% | $ | 71,793,836 | ||||||
|
| |||||||
| * | Non-income producing security. |
| (a) | The security or a partial position of the security was on loan as of March 31, 2017. The total value of securities on loan as of March 31, 2017 was $4,116,565. |
| (b) | Rate disclosed, the 7 day yield, is as of March 31, 2017. |
See Notes to Financial Statements.
32
Table of Contents
SCHEDULES OF PORTFOLIO INVESTMENTS
RIDGEWORTH FUNDS March 31, 2017
International Equity Fund — concluded
| (c) | Purchased with cash collateral held from securities lending. The total value of the collateral held by the Fund was $4,207,310. The total value of the collateral includes non-cash U.S. Government securities collateral having a value of $2,163,898. The value of the collateral could include collateral held for securities that were sold on or before March 31, 2017 (See Note 2(g)). |
Investment Abbreviations
| ADR | — | American Depositary Receipt | ||
| SAB de CV | — | Sociedad Anónima Bursátil de Capital Variable is the Spanish equivalent to Variable Capital Company | ||
| SP ADR | — | Sponsored American Depositary Receipt |
See Notes to Financial Statements.
33
Table of Contents
SCHEDULES OF PORTFOLIO INVESTMENTS
RIDGEWORTH FUNDS March 31, 2017
Silvant Large Cap Growth Stock Fund
| Shares | Value($) | |||||||
| Common Stocks 97.6% | ||||||||
Consumer Discretionary 22.4% |
| |||||||
Adient PLC | 3,716 | 270,042 | ||||||
Amazon.com, Inc.* | 11,722 | 10,392,022 | ||||||
Chipotle Mexican Grill, Inc.*(a) | 6,030 | 2,686,486 | ||||||
Comcast Corp., Cl A | 115,201 | 4,330,406 | ||||||
DR Horton, Inc. | 88,898 | 2,961,192 | ||||||
Johnson Controls International PLC | 37,151 | 1,564,800 | ||||||
Las Vegas Sands Corp. | 27,209 | 1,552,818 | ||||||
Netflix, Inc.* | 21,356 | 3,156,630 | ||||||
Priceline Group, Inc. (The)* | 3,814 | 6,788,805 | ||||||
Royal Caribbean Cruises Ltd. | 26,569 | 2,606,685 | ||||||
Starbucks Corp. | 62,851 | 3,669,870 | ||||||
Twenty-First Century Fox, Inc., Cl A | 64,154 | 2,077,948 | ||||||
Ulta Salon Cosmetics & Fragrance, Inc.* | 4,746 | 1,353,701 | ||||||
Walt Disney Co. (The) | 40,687 | 4,613,499 | ||||||
|
| |||||||
| 48,024,904 | ||||||||
|
| |||||||
Consumer Staples 6.0% |
| |||||||
Blue Buffalo Pet Products, Inc.* | 75,457 | 1,735,511 | ||||||
Colgate-Palmolive Co. | 34,994 | 2,561,211 | ||||||
Costco Wholesale Corp. | 27,312 | 4,579,949 | ||||||
Estee Lauder Cos., Inc. (The), Cl A | 33,319 | 2,825,118 | ||||||
WhiteWave Foods Co. (The)* | 20,028 | 1,124,572 | ||||||
|
| |||||||
| 12,826,361 | ||||||||
|
| |||||||
Energy 1.6% |
| |||||||
Devon Energy Corp. | 28,270 | 1,179,425 | ||||||
EOG Resources, Inc. | 23,284 | 2,271,354 | ||||||
|
| |||||||
| 3,450,779 | ||||||||
|
| |||||||
Financials 7.4% |
| |||||||
American Express Co. | 40,656 | 3,216,296 | ||||||
Charles Schwab Corp. (The) | 82,275 | 3,357,643 | ||||||
Discover Financial Services | 40,538 | 2,772,394 | ||||||
Equinix, Inc., REIT | 5,777 | 2,312,937 | ||||||
Morgan Stanley | 62,042 | 2,657,879 | ||||||
SunTrust Banks, Inc. | 28,267 | 1,563,165 | ||||||
|
| |||||||
| 15,880,314 | ||||||||
|
| |||||||
Health Care 12.9% |
| |||||||
Agilent Technologies, Inc. | 23,348 | 1,234,409 | ||||||
Alexion Pharmaceuticals, Inc.* | 34,195 | 4,145,802 | ||||||
Allergan PLC | 12,194 | 2,913,390 | ||||||
Biogen, Inc.* | 12,629 | 3,453,021 | ||||||
Bristol-Myers Squibb Co. | 59,675 | 3,245,127 | ||||||
Edwards Lifesciences Corp.* | 39,239 | 3,691,213 | ||||||
HCA Holdings, Inc.* | 24,000 | 2,135,760 | ||||||
Mettler-Toledo International, Inc.* | 2,596 | 1,243,250 | ||||||
Shire PLC ADR | 10,049 | 1,750,837 | ||||||
| Shares | Value($) | |||||||
Health Care—continued | ||||||||
UnitedHealth Group, Inc. | 23,460 | 3,847,675 | ||||||
|
| |||||||
| 27,660,484 | ||||||||
|
| |||||||
Industrials 10.1% |
| |||||||
A.O. Smith Corp. | 45,500 | 2,327,780 | ||||||
Emerson Electric Co. | 36,809 | 2,203,387 | ||||||
Fortune Brands Home & Security, Inc. | 43,062 | 2,620,323 | ||||||
HD Supply Holdings, Inc.* | 68,069 | 2,799,338 | ||||||
Honeywell International, Inc. | 40,205 | 5,020,398 | ||||||
IHS Markit Ltd.* | 36,774 | 1,542,669 | ||||||
J.B. Hunt Transport Services, Inc. | 20,147 | 1,848,286 | ||||||
Waste Management, Inc. | 21,663 | 1,579,666 | ||||||
Xylem, Inc. | 31,243 | 1,569,023 | ||||||
|
| |||||||
| 21,510,870 | ||||||||
|
| |||||||
Information Technology 36.6% |
| |||||||
Adobe Systems, Inc.* | 32,318 | 4,205,541 | ||||||
Alphabet, Inc., Cl C* | 7,106 | 5,894,853 | ||||||
Alphabet, Inc., Cl A* | 6,913 | 5,860,841 | ||||||
Analog Devices, Inc. | 33,783 | 2,768,517 | ||||||
Apple, Inc. | 54,981 | 7,898,571 | ||||||
Applied Materials, Inc. | 82,890 | 3,224,421 | ||||||
Autodesk, Inc.* | 40,792 | 3,527,284 | ||||||
Facebook, Inc., Cl A* | 69,013 | 9,803,297 | ||||||
Microchip Technology, Inc.(a) | 35,587 | 2,625,609 | ||||||
Microsoft Corp. | 182,696 | 12,032,359 | ||||||
NXP Semiconductors NV* | 27,498 | 2,846,043 | ||||||
Oracle Corp. | 28,233 | 1,259,474 | ||||||
Salesforce.com, Inc.* | 36,607 | 3,019,711 | ||||||
Splunk, Inc.* | 34,334 | 2,138,665 | ||||||
Visa, Inc., Cl A(a) | 102,684 | 9,125,527 | ||||||
Workday, Inc., Cl A*(a) | 23,556 | 1,961,744 | ||||||
|
| |||||||
| 78,192,457 | ||||||||
|
| |||||||
Materials 0.6% |
| |||||||
Vulcan Materials Co. | 10,649 | 1,282,991 | ||||||
|
| |||||||
Total Common Stocks | 208,829,160 | |||||||
|
| |||||||
Money Market Fund 2.5% |
| |||||||
State Street Institutional Treasury Money Market Fund, Premier Class, 0.53%(b) | 5,329,074 | 5,329,074 | ||||||
|
| |||||||
Total Money Market Fund | 5,329,074 | |||||||
|
| |||||||
Total Investments | 214,158,234 | |||||||
Liabilities in Excess of Other | (219,559 | ) | ||||||
|
| |||||||
Net Assets — 100.0% | $ | 213,938,675 | ||||||
|
| |||||||
See Notes to Financial Statements.
34
Table of Contents
SCHEDULES OF PORTFOLIO INVESTMENTS
RIDGEWORTH FUNDS March 31, 2017
Silvant Large Cap Growth Stock Fund — concluded
| * | Non-income producing security. |
| (a) | The security or a partial position of the security was on loan as of March 31, 2017. The total value of securities on loan as of March 31, 2017 was $4,356,267. The total value of the collateral received is in the form of securities having a value of $4,453,144. The value of the collateral could include collateral held for securities that were sold on or before March 31, 2017. (See Note 2(g)). |
| (b) | Rate disclosed, the 7 day yield, is as of March 31, 2017. |
Investment Abbreviations
| ADR | — | American Depositary Receipt | ||
| REIT | — | Real Estate Investment Trust |
See Notes to Financial Statements.
35
Table of Contents
SCHEDULES OF PORTFOLIO INVESTMENTS
RIDGEWORTH FUNDS March 31, 2017
Silvant Small Cap Growth Stock Fund
| Shares | Value($) | |||||||
| Common Stocks 99.7% | ||||||||
Consumer Discretionary 11.1% |
| |||||||
Cheesecake Factory, Inc. (The) | 9,600 | 608,256 | ||||||
Cracker Barrel Old Country Store, Inc.(a) | 3,118 | 496,542 | ||||||
Denny’s Corp.* | 31,033 | 383,878 | ||||||
Dorman Products, Inc.* | 6,608 | 542,715 | ||||||
ILG, Inc. | 24,324 | 509,831 | ||||||
Monro Muffler Brake, Inc. | 6,370 | 331,877 | ||||||
Panera Bread Co., Cl A*(a) | 1,560 | 408,517 | ||||||
Tenneco, Inc. | 9,063 | 565,712 | ||||||
Texas Roadhouse, Inc. | 9,335 | 415,688 | ||||||
Winnebago Industries, Inc. | 9,899 | 289,546 | ||||||
|
| |||||||
| 4,552,562 | ||||||||
|
| |||||||
Consumer Staples 3.4% |
| |||||||
Energizer Holdings, Inc. | 8,042 | 448,342 | ||||||
Lancaster Colony Corp. | 2,355 | 303,418 | ||||||
Snyder’s-Lance, Inc.(a) | 7,572 | 305,227 | ||||||
WD-40 Co.(a) | 2,899 | 315,846 | ||||||
|
| |||||||
| 1,372,833 | ||||||||
|
| |||||||
Energy 2.7% |
| |||||||
Carrizo Oil & Gas, Inc.*(a) | 16,954 | 485,902 | ||||||
Fairmount Santrol Holdings, Inc.*(a) | 20,546 | 150,602 | ||||||
PBF Energy, Inc., Cl A(a) | 10,336 | 229,149 | ||||||
Precision Drilling Corp.* | 46,295 | 218,512 | ||||||
|
| |||||||
| 1,084,165 | ||||||||
|
| |||||||
Financials 9.3% |
| |||||||
AMERISAFE, Inc. | 8,715 | 565,603 | ||||||
BNC Bancorp | 11,447 | 401,217 | ||||||
Coresite Realty Corp., REIT(a) | 3,330 | 299,866 | ||||||
Employers Holdings, Inc. | 14,946 | 567,201 | ||||||
First Financial Bankshares, Inc.(a) | 7,025 | 281,703 | ||||||
Greenhill & Co., Inc.(a) | 15,237 | 446,444 | ||||||
Home BancShares, Inc. | 25,737 | 696,701 | ||||||
QTS Realty Trust, Inc., Cl A, REIT | 11,165 | 544,294 | ||||||
|
| |||||||
| 3,803,029 | ||||||||
|
| |||||||
Health Care 25.4% |
| |||||||
AMN Healthcare Services, Inc.*(a) | 12,620 | 512,372 | ||||||
ANI Pharmaceuticals, Inc.*(a) | 6,372 | 315,478 | ||||||
Array BioPharma, Inc.*(a) | 39,216 | 350,591 | ||||||
Cantel Medical Corp. | 4,610 | 369,261 | ||||||
Chemed Corp. | 2,617 | 478,100 | ||||||
Coherus Biosciences, Inc.* | 13,663 | 288,972 | ||||||
CorVel Corp.* | 6,287 | 273,485 | ||||||
Depomed, Inc.*(a) | 23,384 | 293,469 | ||||||
Dermira, Inc.* | 8,695 | 296,586 | ||||||
HealthSouth Corp. | 9,824 | 420,565 | ||||||
ICU Medical, Inc.* | 4,084 | 623,627 | ||||||
Inogen, Inc.* | 10,911 | 846,257 | ||||||
| Shares | Value($) | |||||||
Health Care—continued | ||||||||
Insmed, Inc.* | 28,033 | 490,858 | ||||||
Ironwood Pharmaceuticals, Inc.*(a) | 36,025 | 614,586 | ||||||
La Jolla Pharmaceutical Co.*(a) | 7,616 | 227,338 | ||||||
Neurocrine Biosciences, Inc.* | 5,805 | 251,357 | ||||||
NuVasive, Inc.* | 8,080 | 603,414 | ||||||
NxStage Medical, Inc.* | 20,929 | 561,525 | ||||||
Portola Pharmaceuticals, Inc.* | 10,394 | 407,341 | ||||||
Prestige Brands Holdings, Inc.* | 8,549 | 474,982 | ||||||
Radius Health, Inc.*(a) | 8,385 | 324,080 | ||||||
Supernus Pharmaceuticals, Inc.* | 9,915 | 310,340 | ||||||
TESARO, Inc.*(a) | 2,388 | 367,442 | ||||||
Ultragenyx Pharmaceutical, Inc.* | 5,476 | 371,163 | ||||||
Vanda Pharmaceuticals, Inc.* | 23,425 | 327,950 | ||||||
|
| |||||||
| 10,401,139 | ||||||||
|
| |||||||
Industrials 16.9% |
| |||||||
AAON, Inc. | 13,075 | 462,201 | ||||||
Air Transport Services Group, Inc.* | 36,356 | 583,514 | ||||||
Alamo Group, Inc. | 6,584 | 501,635 | ||||||
Astec Industries, Inc. | 6,029 | 370,753 | ||||||
AZZ, Inc. | 8,083 | 480,938 | ||||||
Beacon Roofing Supply, Inc.* | 10,022 | 492,682 | ||||||
Dycom Industries, Inc.*(a) | 4,344 | 403,775 | ||||||
Forward Air Corp. | 9,695 | 461,191 | ||||||
Franklin Electric Co., Inc. | 9,122 | 392,702 | ||||||
Hawaiian Holdings, Inc.* | 7,267 | 337,552 | ||||||
II-VI, Inc.* | 14,424 | 519,985 | ||||||
Multi-Color Corp. | 4,584 | 325,464 | ||||||
Simpson Manufacturing Co., Inc. | 10,085 | 434,563 | ||||||
Swift Transportation Co.*(a) | 13,840 | 284,274 | ||||||
Teledyne Technologies, Inc.* | 3,219 | 407,075 | ||||||
Universal Forest Products, Inc. | 4,463 | 439,784 | ||||||
|
| |||||||
| 6,898,088 | ||||||||
|
| |||||||
Information Technology 23.3% |
| |||||||
Aspen Technology, Inc.* | 9,497 | 559,563 | ||||||
Coherent, Inc.* | 3,072 | 631,726 | ||||||
Fair Isaac Corp. | 3,382 | 436,109 | ||||||
Gigamon, Inc.* | 9,151 | 325,318 | ||||||
Inphi Corp.*(a) | 11,830 | 577,541 | ||||||
Integrated Device Technology, Inc.* | 15,474 | 366,269 | ||||||
InterXion Holding NV* | 15,569 | 615,910 | ||||||
Littelfuse, Inc. | 4,203 | 672,102 | ||||||
LogMeIn, Inc. | 3,542 | 345,345 | ||||||
MaxLinear, Inc., Cl A* | 20,871 | 585,431 | ||||||
Methode Electronics, Inc. | 10,269 | 468,266 | ||||||
MINDBODY, Inc., Cl A* | 13,700 | 376,065 | ||||||
Monolithic Power Systems, Inc. | 3,847 | 354,309 | ||||||
Oclaro, Inc.* | 42,557 | 417,910 | ||||||
Paycom Software, Inc.*(a) | 5,844 | 336,088 | ||||||
See Notes to Financial Statements.
36
Table of Contents
SCHEDULES OF PORTFOLIO INVESTMENTS
RIDGEWORTH FUNDS March 31, 2017
Silvant Small Cap Growth Stock Fund — concluded
| Shares | Value($) | |||||||
Information Technology—continued | ||||||||
Pegasystems, Inc. | 9,793 | 429,423 | ||||||
Proofpoint, Inc.*(a) | 6,360 | 472,930 | ||||||
Q2 Holdings, Inc.* | 27,669 | 964,265 | ||||||
Versum Materials, Inc.* | 12,247 | 374,758 | ||||||
ViaSat, Inc.*(a) | 3,577 | 228,284 | ||||||
|
| |||||||
| 9,537,612 | ||||||||
|
| |||||||
Materials 6.6% |
| |||||||
Balchem Corp.(a) | 6,653 | 548,340 | ||||||
HB Fuller Co. | 8,994 | 463,731 | ||||||
Olin Corp.(a) | 11,738 | 385,828 | ||||||
Quaker Chemical Corp. | 4,364 | 574,564 | ||||||
Stepan Co. | 4,906 | 386,642 | ||||||
Valvoline, Inc.(a) | 14,629 | 359,142 | ||||||
|
| |||||||
| 2,718,247 | ||||||||
|
| |||||||
Telecommunication Services 1.0% |
| |||||||
8x8, Inc.* | 27,915 | 425,704 | ||||||
|
| |||||||
Total Common Stocks | 40,793,379 | |||||||
|
| |||||||
Money Market Funds 9.7% |
| |||||||
State Street Institutional Treasury Money Market Fund, Premier Class, 0.53%(b) | 196,569 | 196,569 | ||||||
State Street Institutional U.S. Government Money Market Fund, Premier Class, 0.62%(b)(c) | 3,785,707 | 3,785,707 | ||||||
|
| |||||||
Total Money Market Funds | 3,982,276 | |||||||
|
| |||||||
| Shares | Value($) | |||||||
Total Investments | 44,775,655 | |||||||
Liabilities in Excess of Other Assets — (9.4)% | (3,855,887 | ) | ||||||
|
| |||||||
Net Assets — 100.0% | $ | 40,919,768 | ||||||
|
| |||||||
| * | Non-income producing security. |
| (a) | The security or a partial position of the security was on loan as of March 31, 2017. The total value of securities on loan as of March 31, 2017 was $5,972,653. |
| (b) | Rate disclosed, the 7 day yield, is as of March 31, 2017. |
| (c) | Purchased with cash collateral held from securities lending. The total value of the collateral held by the Fund was $6,113,686. The total value of the collateral includes non-cash U.S. Government securities collateral having a value of $2,327,979. The value of the collateral could include collateral held for securities that were sold on or before March 31, 2017 (See Note 2(g)). |
Investment Abbreviation
REIT — Real Estate Investment Trust
See Notes to Financial Statements.
37
Table of Contents
SCHEDULES OF PORTFOLIO INVESTMENTS
RIDGEWORTH FUNDS March 31, 2017
Conservative Allocation Strategy
| Shares | Value($) | |||||||
Equity Funds 29.9% |
| |||||||
RidgeWorth Capital Innovations Global Resources and Infrastructure Fund(a) | 13,141 | 151,643 | ||||||
RidgeWorth Ceredex Large Cap Value Equity Fund(b) | 227,361 | 3,906,070 | ||||||
RidgeWorth Ceredex Mid-Cap Value Equity Fund(b) | 106,388 | 1,541,562 | ||||||
RidgeWorth Ceredex Small Cap Value Equity Fund(a) | 38,988 | 506,460 | ||||||
RidgeWorth International Equity Fund(b) | 130,382 | 1,329,896 | ||||||
RidgeWorth Silvant Large Cap Growth Stock Fund(b) | 531,429 | 4,750,979 | ||||||
RidgeWorth Silvant Small Cap Growth Stock Fund(b) | 51,368 | 464,363 | ||||||
|
| |||||||
Total Equity Funds | 12,650,973 | |||||||
|
| |||||||
Fixed Income Funds 44.5% |
| |||||||
RidgeWorth Seix Core Bond Fund(b) | 773 | 8,168 | ||||||
RidgeWorth Seix Corporate Bond Fund(a) | 86,594 | 749,042 | ||||||
RidgeWorth Seix Floating Rate High Income Fund(b) | 20,542 | 179,950 | ||||||
RidgeWorth Seix High Income Fund(b) | 44,052 | 283,695 | ||||||
RidgeWorth Seix High Yield Fund(b) | 32,627 | 273,089 | ||||||
RidgeWorth Seix Total Return Bond Fund(b) | 1,491,595 | 15,542,421 | ||||||
RidgeWorth Seix U.S. Government Securities Ultra-Short Bond Fund(b) | 176,210 | 1,769,150 | ||||||
|
| |||||||
Total Fixed Income Funds | 18,805,515 | |||||||
|
| |||||||
Exchange Traded Funds 23.7% |
| |||||||
Consumer Discretionary Select Sector SPDR Fund | 1,153 | 101,406 | ||||||
Consumer Staples Select Sector SPDR Fund | 115 | 6,277 | ||||||
Energy Select Sector SPDR Fund | 977 | 68,292 | ||||||
Financial Select Sector SPDR Fund | 5,864 | 139,153 | ||||||
Health Care Select Sector SPDR Fund | 1,736 | 129,089 | ||||||
Industrial Select Sector SPDR Fund | 1,313 | 85,424 | ||||||
iShares Barclays 20+ Year Treasury Bond Fund | �� | 1,319 | 159,217 | |||||
iShares Barclays U.S. Treasury Inflation Protected Securities Fund | 2,518 | 288,689 | ||||||
| Shares | Value($) | |||||||
Exchange Traded Funds—continued | ||||||||
iShares Core S&P 500 Fund | 362 | 85,892 | ||||||
iShares Core U.S. Aggregate Bond Fund | 66,127 | 7,174,118 | ||||||
iShares Currency Hedged MSCI EAFE Fund | 12,705 | 349,642 | ||||||
iShares Currency Hedged MSCI Emerging Markets Fund | 254 | 5,781 | ||||||
iShares Dow Jones U.S. Real Estate Index Fund | 41 | 3,218 | ||||||
iShares MSCI EAFE Fund | 9,744 | 606,954 | ||||||
iShares MSCI Emerging Markets Index Fund | 13,654 | 537,831 | ||||||
iShares MSCI India Fund | 36 | 1,133 | ||||||
iShares Russell 2000 Index Fund | 102 | 14,023 | ||||||
iShares U.S. Telecommunications Fund | 651 | 21,053 | ||||||
Materials Select Sector SPDR Fund | 432 | 22,641 | ||||||
Real Estate Select Sector SPDR Fund | 108 | 3,413 | ||||||
Technology Select Sector SPDR Fund | 4,085 | 217,771 | ||||||
Utilities Select Sector SPDR Fund | 113 | 5,798 | ||||||
VanEck Vectors Gold Miners Fund | 161 | 3,694 | ||||||
|
| |||||||
Total Exchange Traded Funds | 10,030,509 | |||||||
|
| |||||||
Money Market Fund 1.7% |
| |||||||
State Street Institutional Treasury Money Market Fund, Premier Class, 0.53%(c) | 713,569 | 713,569 | ||||||
|
| |||||||
Total Money Market Fund | 713,569 | |||||||
|
| |||||||
Total Investments | 42,200,566 | |||||||
Other Assets in Excess of Liabilities — 0.2% | 67,574 | |||||||
|
| |||||||
Net Assets — 100.0% | $ | 42,268,140 | ||||||
|
| |||||||
| (a) | Affiliated investments. Investments are in each Fund’s I Shares. |
| (b) | Affiliated investments. Investments are in each Fund’s IS Shares. |
| (c) | Rate disclosed, the 7 day yield, is as of March 31, 2017. |
Investment Abbreviations
| EAFE | — | Europe, Australasia and Far East | ||
| MSCI | — | Morgan Stanley Capital International | ||
| SPDR | — | Standard & Poor’s Depositary Receipt |
See Notes to Financial Statements.
38
Table of Contents
SCHEDULES OF PORTFOLIO INVESTMENTS
RIDGEWORTH FUNDS March 31, 2017
Growth Allocation Strategy
| Shares | Value($) | |||||||
Equity Funds 64.2% |
| |||||||
RidgeWorth Capital Innovations Global Resources and Infrastructure Fund(a) | 26,682 | 307,914 | ||||||
RidgeWorth Ceredex Large Cap Value Equity Fund(b) | 470,190 | 8,077,873 | ||||||
RidgeWorth Ceredex Mid-Cap Value Equity Fund(b) | 216,642 | 3,139,143 | ||||||
RidgeWorth Ceredex Small Cap Value Equity Fund(a) | 75,879 | 985,664 | ||||||
RidgeWorth International Equity Fund(b) | 265,739 | 2,710,541 | ||||||
RidgeWorth Silvant Large Cap Growth Stock Fund(b) | 1,095,764 | 9,796,127 | ||||||
RidgeWorth Silvant Small Cap Growth Stock Fund(b) | 100,689 | 910,233 | ||||||
|
| |||||||
Total Equity Funds | 25,927,495 | |||||||
|
| |||||||
Fixed Income Funds 12.8% |
| |||||||
RidgeWorth Seix Core Bond Fund(b) | 269 | 2,845 | ||||||
RidgeWorth Seix Corporate Bond Fund(a) | 28,983 | 250,707 | ||||||
RidgeWorth Seix Floating Rate High Income Fund(b) | 6,841 | 59,927 | ||||||
RidgeWorth Seix High Income Fund(b) | 14,695 | 94,633 | ||||||
RidgeWorth Seix High Yield Fund(b) | 10,887 | 91,124 | ||||||
RidgeWorth Seix Total Return Bond Fund(b) | 389,416 | 4,057,717 | ||||||
RidgeWorth Seix U.S. Government Securities Ultra-Short Bond Fund(b) | 58,957 | 591,923 | ||||||
|
| |||||||
Total Fixed Income Funds | 5,148,876 | |||||||
|
| |||||||
Exchange Traded Funds 20.9% |
| |||||||
Consumer Discretionary Select Sector SPDR Fund | 2,051 | 180,385 | ||||||
Consumer Staples Select Sector SPDR Fund | 189 | 10,316 | ||||||
Energy Select Sector SPDR Fund | 1,745 | 121,975 | ||||||
Financial Select Sector SPDR Fund | 10,470 | 248,453 | ||||||
Health Care Select Sector SPDR Fund | 3,091 | 229,847 | ||||||
Industrial Select Sector SPDR Fund | 2,347 | 152,696 | ||||||
iShares Barclays 20+ Year Treasury Bond Fund | 441 | 53,233 | ||||||
iShares Barclays U.S. Treasury Inflation Protected Securities Fund | 839 | 96,191 | ||||||
| Shares | Value($) | |||||||
Exchange Traded Funds—continued | ||||||||
iShares Core S&P 500 Fund | 555 | 131,685 | ||||||
iShares Core U.S. Aggregate Bond Fund | 32,646 | 3,541,764 | ||||||
iShares Currency Hedged MSCI EAFE Fund | 25,884 | 712,328 | ||||||
iShares Currency Hedged MSCI Emerging Markets Fund | 476 | 10,834 | ||||||
iShares Dow Jones U.S. Real Estate Index Fund | 82 | 6,436 | ||||||
iShares MSCI EAFE Fund | 19,840 | 1,235,834 | ||||||
iShares MSCI Emerging Markets Index Fund | 27,800 | 1,095,042 | ||||||
iShares MSCI India Fund | 59 | 1,858 | ||||||
iShares Russell 2000 Index Fund | 792 | 108,884 | ||||||
iShares U.S. Telecommunications Fund | 1,132 | 36,609 | ||||||
Materials Select Sector SPDR Fund | 790 | 41,404 | ||||||
Real Estate Select Sector SPDR Fund | 217 | 6,857 | ||||||
Technology Select Sector SPDR Fund | 7,287 | 388,470 | ||||||
Utilities Select Sector SPDR Fund | 197 | 10,108 | ||||||
VanEck Vectors Gold Miners Fund | 280 | 6,387 | ||||||
|
| |||||||
Total Exchange Traded Funds | 8,427,596 | |||||||
|
| |||||||
Money Market Fund 1.8% |
| |||||||
State Street Institutional Treasury Money Market Fund, Premier Class, 0.53%(c) | 743,657 | 743,657 | ||||||
|
| |||||||
Total Money Market Fund | 743,657 | |||||||
|
| |||||||
Total Investments | 40,247,624 | |||||||
Other Assets in Excess of Liabilities — 0.3% | 130,301 | |||||||
|
| |||||||
Net Assets — 100.0% | $ | 40,377,925 | ||||||
|
| |||||||
| (a) | Affiliated investments. Investments are in each Fund’s I Shares. |
| (b) | Affiliated investments. Investments are in each Fund’s IS Shares. |
| (c) | Rate disclosed, the 7 day yield, is as of March 31, 2017. |
Investment Abbreviations
| EAFE | — | Europe, Australasia and Far East | ||
| MSCI | — | Morgan Stanley Capital International | ||
| SPDR | — | Standard & Poor’s Depositary Receipt |
See Notes to Financial Statements.
39
Table of Contents
SCHEDULES OF PORTFOLIO INVESTMENTS
RIDGEWORTH FUNDS March 31, 2017
Moderate Allocation Strategy
| Shares | Value($) | |||||||
Equity Funds 47.3% |
| |||||||
RidgeWorth Capital Innovations Global Resources and Infrastructure Fund(a) | 24,821 | 286,431 | ||||||
RidgeWorth Ceredex Large Cap Value Equity Fund(b) | 435,818 | 7,487,355 | ||||||
RidgeWorth Ceredex Mid-Cap Value Equity Fund(b) | 201,228 | 2,915,791 | ||||||
RidgeWorth Ceredex Small Cap Value Equity Fund(a) | 71,289 | 926,049 | ||||||
RidgeWorth International Equity Fund(b) | 246,652 | 2,515,854 | ||||||
RidgeWorth Silvant Large Cap Growth Stock Fund(b) | 1,016,688 | 9,089,187 | ||||||
RidgeWorth Silvant Small Cap Growth Stock Fund(b) | 94,148 | 851,096 | ||||||
|
| |||||||
Total Equity Funds | 24,071,763 | |||||||
|
| |||||||
Fixed Income Funds 24.3% |
| |||||||
RidgeWorth Seix Core Bond Fund(b) | 515 | 5,445 | ||||||
RidgeWorth Seix Corporate Bond Fund(a) | 70,112 | 606,471 | ||||||
RidgeWorth Seix Floating Rate High Income Fund(b) | 16,626 | 145,640 | ||||||
RidgeWorth Seix High Income Fund(b) | 35,619 | 229,386 | ||||||
RidgeWorth Seix High Yield Fund(b) | 26,416 | 221,101 | ||||||
RidgeWorth Seix Total Return Bond Fund(b) | 936,152 | 9,754,708 | ||||||
RidgeWorth Seix U.S. Government Securities Ultra-Short Bond Fund(b) | 142,666 | 1,432,366 | ||||||
|
| |||||||
Total Fixed Income Funds | 12,395,117 | |||||||
|
| |||||||
Exchange Traded Funds 26.3% |
| |||||||
Consumer Discretionary Select Sector SPDR Fund | 1,967 | 172,998 | ||||||
Consumer Staples Select Sector SPDR Fund | 170 | 9,279 | ||||||
Energy Select Sector SPDR Fund | 1,676 | 117,152 | ||||||
Financial Select Sector SPDR Fund | 10,050 | 238,486 | ||||||
Health Care Select Sector SPDR Fund | 2,960 | 220,106 | ||||||
Industrial Select Sector SPDR Fund | 2,245 | 146,060 | ||||||
iShares Barclays 20+ Year Treasury Bond Fund | 1,067 | 128,797 | ||||||
iShares Barclays U.S. Treasury Inflation Protected Securities Fund | 2,029 | 232,625 | ||||||
| Shares | Value($) | |||||||
Exchange Traded Funds—continued | ||||||||
iShares Core S&P 500 Fund | 466 | 110,568 | ||||||
iShares Core U.S. Aggregate Bond Fund | 79,601 | 8,635,912 | ||||||
iShares Currency Hedged MSCI EAFE Fund | 23,992 | 660,260 | ||||||
iShares Currency Hedged MSCI Emerging Markets Fund | 430 | 9,787 | ||||||
iShares Dow Jones U.S. Real Estate Index Fund | 56 | 4,395 | ||||||
iShares MSCI EAFE Fund | 18,450 | 1,149,250 | ||||||
iShares MSCI Emerging Markets Index Fund | 25,858 | 1,018,547 | ||||||
iShares MSCI India Fund | 70 | 2,204 | ||||||
iShares Russell 2000 Index Fund | 623 | 85,650 | ||||||
iShares U.S. Telecommunications Fund | 1,069 | 34,571 | ||||||
Materials Select Sector SPDR Fund | 753 | 39,465 | ||||||
Real Estate Select Sector SPDR Fund | 218 | 6,889 | ||||||
Technology Select Sector SPDR Fund | 6,975 | 371,837 | ||||||
Utilities Select Sector SPDR Fund | 186 | 9,544 | ||||||
VanEck Vectors Gold Miners Fund | 239 | 5,452 | ||||||
|
| |||||||
Total Exchange Traded Funds | 13,409,834 | |||||||
|
| |||||||
Money Market Fund 2.3% |
| |||||||
State Street Institutional Treasury Money Market Fund, Premier Class, 0.53%(c) | 1,169,898 | 1,169,898 | ||||||
|
| |||||||
Total Money Market Fund | 1,169,898 | |||||||
|
| |||||||
Total Investments | 51,046,612 | |||||||
Liabilities in Excess of Other Assets — (0.2)% | (124,282 | ) | ||||||
|
| |||||||
Net Assets — 100.0% | $ | 50,922,330 | ||||||
|
| |||||||
| (a) | Affiliated investments. Investments are in each Fund’s I Shares. |
| (b) | Affiliated investments. Investments are in each Fund’s IS Shares. |
| (c) | Rate disclosed, the 7 day yield, is as of March 31, 2017. |
Investment Abbreviations
| EAFE | — | Europe, Australasia and Far East | ||
| MSCI | — | Morgan Stanley Capital International | ||
| SPDR | — | Standard & Poor’s Depositary Receipt |
See Notes to Financial Statements.
40
Table of Contents
STATEMENTS OF ASSETS AND LIABILITIES
RIDGEWORTH FUNDS March 31, 2017
| Capital Innovations Global Resources and Infrastructure Fund | Ceredex Large Cap Value Equity Fund | Ceredex Mid-Cap Value Equity Fund | Ceredex Small Cap Value Equity Fund | |||||||||||||
Assets: | ||||||||||||||||
Total Investments, at Cost | $8,674,747 | $1,665,449,292 | $3,045,864,433 | $726,480,001 | ||||||||||||
|
|
|
|
|
|
|
| |||||||||
Total Investments, at Value* | $9,338,736 | $2,118,052,077 | $3,486,692,824 | $934,283,254 | ||||||||||||
Cash | 2,532 | — | — | 231 | ||||||||||||
Interest and Dividends Receivable | 14,680 | 2,268,541 | 5,048,527 | 1,391,216 | ||||||||||||
Securities Lending Income Receivable | 159 | 1,028 | 182,705 | — | ||||||||||||
Foreign Currency, at Value (Cost $14, $-, $- and $-, respectively) | 14 | — | — | — | ||||||||||||
Receivable for Capital Shares Issued | 15,750 | 9,122,402 | 3,659,051 | 732,258 | ||||||||||||
Receivable for Investment Securities Sold | — | 25,792,436 | 67,914,579 | — | ||||||||||||
Reclaims Receivable | 4,265 | — | — | — | ||||||||||||
Receivable from Investment Adviser | 10,365 | 167,215 | — | — | ||||||||||||
Prepaid Expenses and Other Assets | 13,287 | 54,910 | 69,677 | 30,559 | ||||||||||||
|
|
|
|
|
|
|
| |||||||||
Total Assets | 9,399,788 | 2,155,458,609 | 3,563,567,363 | 936,437,518 | ||||||||||||
|
|
|
|
|
|
|
| |||||||||
Liabilities: | ||||||||||||||||
Payable for Investment Securities Purchased | — | 28,952,130 | 53,574,703 | — | ||||||||||||
Payable for Capital Shares Redeemed | 9,804 | 14,735,057 | 4,024,033 | 824,613 | ||||||||||||
Payable Upon Return of Securities Loaned | 275,536 | — | 69,152,134 | — | ||||||||||||
Investment Advisory Fees Payable | 7,712 | 1,202,670 | 2,011,554 | 659,606 | ||||||||||||
Compliance and Fund Services Fees Payable | 114 | 26,947 | 42,457 | 11,544 | ||||||||||||
Distribution and Service Fees Payable | 559 | 105,712 | 142,047 | 52,310 | ||||||||||||
Trustee Fees Payable | 6 | 1,322 | 2,082 | 563 | ||||||||||||
Other Accrued Expenses | 4,270 | 1,462,887 | 1,822,749 | 619,071 | ||||||||||||
|
|
|
|
|
|
|
| |||||||||
Total Liabilities | 298,001 | 46,486,725 | 130,771,759 | 2,167,707 | ||||||||||||
|
|
|
|
|
|
|
| |||||||||
Total Net Assets | $9,101,787 | $2,108,971,884 | $3,432,795,604 | $934,269,811 | ||||||||||||
|
|
|
|
|
|
|
| |||||||||
Net Assets Consist of: | ||||||||||||||||
Capital | $9,154,083 | $1,514,733,416 | $2,747,251,474 | $672,517,259 | ||||||||||||
Accumulated Net Investment Income (Loss) | 25,924 | 8,367,620 | 2,004,033 | — | ||||||||||||
Accumulated Net Realized Gain (Loss) from Investments and Foreign Currency Transactions | (742,206 | ) | 133,268,063 | 242,711,706 | 53,949,299 | |||||||||||
Net Unrealized Appreciation on Investments and Foreign Currencies | 663,986 | 452,602,785 | 440,828,391 | 207,803,253 | ||||||||||||
|
|
|
|
|
|
|
| |||||||||
Net Assets | $9,101,787 | $2,108,971,884 | $3,432,795,604 | $934,269,811 | ||||||||||||
|
|
|
|
|
|
|
| |||||||||
Net Assets: | ||||||||||||||||
I Shares | $7,420,615 | $1,432,996,052 | $2,716,559,620 | $786,245,447 | ||||||||||||
A Shares | 1,409,104 | 335,256,465 | 369,102,077 | 123,494,970 | ||||||||||||
C Shares | 272,068 | 18,590,129 | 55,579,656 | 24,529,394 | ||||||||||||
IS Shares | — | 322,129,238 | 291,554,251 | — | ||||||||||||
Shares Outstanding (unlimited number of shares authorized, no par value) | ||||||||||||||||
I Shares | 642,859 | 83,731,242 | 187,594,954 | 60,525,813 | ||||||||||||
A Shares | 122,573 | 19,747,542 | 25,759,334 | 9,815,329 | ||||||||||||
C Shares | 24,199 | 1,120,574 | 3,965,427 | 2,140,790 | ||||||||||||
IS Shares | — | 18,751,703 | 20,118,468 | — | ||||||||||||
Net Asset Value and Redemption Price Per Share: | ||||||||||||||||
I Shares | $11.54 | $17.11 | $14.48 | $12.99 | ||||||||||||
A Shares | 11.50 | 16.98 | 14.33 | 12.58 | ||||||||||||
C Shares(a) | 11.24 | 16.59 | 14.02 | 11.46 | ||||||||||||
IS Shares | — | 17.18 | 14.49 | — | ||||||||||||
Offering Price per Share (100%/(100%-maximum sales charge x net asset value) adjusted to the nearest cent): | ||||||||||||||||
A Shares | $12.20 | $18.02 | $15.20 | $13.35 | ||||||||||||
Maximum Sales Charge — A Shares | 5.75 | % | 5.75 | % | 5.75 | % | 5.75 | % | ||||||||
| * | Investments include securities on loan of $1,102,933, $9,073,947, $74,559,593 and $-, respectively. |
| (a) | Redemption price per share varies based on length of time shares are held. |
See Notes to Financial Statements.
41
Table of Contents
STATEMENTS OF ASSETS AND LIABILITIES
RIDGEWORTH FUNDS March 31, 2017
| Innovative Growth Stock Fund | International Equity Fund | Silvant Large Cap Growth Stock Fund | Silvant Small Cap Growth Stock Fund | |||||||||||||
Assets: | ||||||||||||||||
Total Investments, at Cost | $17,849,267 | $67,169,461 | $133,461,227 | $37,526,997 | ||||||||||||
|
|
|
|
|
|
|
| |||||||||
Total Investments, at Value* | $28,963,371 | $74,297,369 | $214,158,234 | $44,775,655 | ||||||||||||
Interest and Dividends Receivable | 3,001 | 57,937 | 57,975 | 11,842 | ||||||||||||
Securities Lending Income Receivable | — | 881 | 508 | 2,033 | ||||||||||||
Foreign Currency, at Value (Cost $-, $22,446, $- and $-, respectively) | — | 23,107 | — | — | ||||||||||||
Receivable for Capital Shares Issued | 25,487 | 90,663 | 203,946 | 7,657 | ||||||||||||
Receivable for Investment Securities Sold | 71,213 | 193,330 | — | — | ||||||||||||
Reclaims Receivable | — | 71,079 | — | — | ||||||||||||
Receivable from Investment Adviser | — | 11,525 | 18,803 | 1,314 | ||||||||||||
Prepaid Expenses and Other Assets | 8,104 | 14,549 | 15,657 | 19,548 | ||||||||||||
|
|
|
|
|
|
|
| |||||||||
Total Assets | 29,071,176 | 74,760,440 | 214,455,123 | 44,818,049 | ||||||||||||
|
|
|
|
|
|
|
| |||||||||
Liabilities: | ||||||||||||||||
Payable for Investment Securities Purchased | 290,199 | 798,627 | — | — | ||||||||||||
Payable for Capital Shares Redeemed | 36,764 | 40,036 | 217,701 | 42,012 | ||||||||||||
Payable Upon Return of Securities Loaned | — | 2,043,412 | — | 3,785,707 | ||||||||||||
Investment Advisory Fees Payable | 21,421 | 50,945 | 128,877 | 29,998 | ||||||||||||
Compliance and Fund Services Fees Payable | 356 | 888 | 2,683 | 517 | ||||||||||||
Distribution and Service Fees Payable | 1,664 | 3,533 | 46,519 | 5,858 | ||||||||||||
Trustee Fees Payable | 17 | — | 132 | 25 | ||||||||||||
Other Accrued Expenses | 15,303 | 29,163 | 120,536 | 34,164 | ||||||||||||
|
|
|
|
|
|
|
| |||||||||
Total Liabilities | 365,724 | 2,966,604 | 516,448 | 3,898,281 | ||||||||||||
|
|
|
|
|
|
|
| |||||||||
Total Net Assets | $28,705,452 | $71,793,836 | $213,938,675 | $40,919,768 | ||||||||||||
|
|
|
|
|
|
|
| |||||||||
Net Assets Consist of: | ||||||||||||||||
Capital | $16,752,883 | $66,587,830 | $111,640,206 | $31,213,043 | ||||||||||||
Accumulated Net Investment Income (Loss) | (78,294 | ) | 109,720 | (128,809 | ) | (66,579 | ) | |||||||||
Accumulated Net Realized Gain (Loss) from Investments and Foreign Currency Transactions | 916,759 | (2,028,108 | ) | 21,730,271 | 2,524,646 | |||||||||||
Net Unrealized Appreciation on Investments and Foreign Currencies | 11,114,104 | 7,124,394 | 80,697,007 | 7,248,658 | ||||||||||||
|
|
|
|
|
|
|
| |||||||||
Net Assets | $28,705,452 | $71,793,836 | $213,938,675 | $40,919,768 | ||||||||||||
|
|
|
|
|
|
|
| |||||||||
Net Assets: | ||||||||||||||||
I Shares | $22,330,007 | $51,120,285 | $92,637,677 | $26,928,856 | ||||||||||||
A Shares | 6,375,445 | 14,115,614 | 60,899,600 | 7,008,005 | ||||||||||||
C Shares | — | — | 36,140,851 | 4,757,770 | ||||||||||||
IS Shares | — | 6,557,937 | 24,260,547 | 2,225,137 | ||||||||||||
Shares Outstanding (unlimited number of shares authorized, no par value) | ||||||||||||||||
I Shares | 1,145,718 | 5,014,264 | 10,390,977 | 3,007,920 | ||||||||||||
A Shares | 343,475 | 1,405,019 | 8,453,750 | 962,568 | ||||||||||||
C Shares | — | — | 7,827,800 | 1,410,665 | ||||||||||||
IS Shares | — | 642,774 | 2,712,669 | 246,205 | ||||||||||||
Net Asset Value and Redemption Price Per Share: | ||||||||||||||||
I Shares | $19.49 | $10.19 | $8.92 | $8.95 | ||||||||||||
A Shares | 18.56 | 10.05 | 7.20 | 7.28 | ||||||||||||
C Shares(a) | — | — | 4.62 | 3.37 | ||||||||||||
IS Shares | — | 10.20 | 8.94 | 9.04 | ||||||||||||
Offering Price per Share (100%/(100%-maximum sales charge x net asset value) adjusted to the nearest cent): | ||||||||||||||||
A Shares | $19.69 | $10.66 | $7.64 | $7.72 | ||||||||||||
Maximum Sales Charge — A Shares | 5.75 | % | 5.75 | % | 5.75 | % | 5.75 | % | ||||||||
| * | Investments include securities on loan of $-, $4,116,565, $4,356,267 and $5,972,653, respectively. |
| (a) | Redemption price per share varies based on length of time shares are held. |
See Notes to Financial Statements.
42
Table of Contents
STATEMENTS OF ASSETS AND LIABILITIES
RIDGEWORTH FUNDS March 31, 2017
| Conservative Allocation Strategy | Growth Allocation Strategy | Moderate Allocation Strategy | ||||||||||
Assets: | ||||||||||||
Total Investments, at Cost | $39,560,338 | $33,337,329 | $43,018,654 | |||||||||
|
|
|
|
|
| |||||||
Investments in Affiliates, at Value | $31,456,488 | $31,076,371 | $36,466,880 | |||||||||
Investments in Unaffiliated, at Value | 10,744,078 | 9,171,253 | 14,579,732 | |||||||||
|
|
|
|
|
| |||||||
Total Investments | 42,200,566 | 40,247,624 | 51,046,612 | |||||||||
|
|
|
|
|
| |||||||
Dividends Receivable | 78,708 | 21,900 | 51,853 | |||||||||
Receivable for Capital Shares Issued | 2,499 | 90,764 | 72,813 | |||||||||
Receivable for Investment Securities Sold | 132,400 | 127,000 | 18,000 | |||||||||
Receivable from Investment Adviser | 3,729 | 3,775 | 4,557 | |||||||||
Prepaid Expenses and Other Assets | 16,771 | 15,144 | 17,089 | |||||||||
|
|
|
|
|
| |||||||
Total Assets | 42,434,673 | 40,506,207 | 51,210,924 | |||||||||
|
|
|
|
|
| |||||||
Liabilities: | ||||||||||||
Payable for Investment Securities Purchased | 78,518 | 56,581 | 132,285 | |||||||||
Payable for Capital Shares Redeemed | 54,442 | 25,676 | 97,701 | |||||||||
Investment Advisory Fees Payable | 3,634 | 3,429 | 4,405 | |||||||||
Compliance and Fund Services Fees Payable | 526 | 510 | 649 | |||||||||
Distribution and Service Fees Payable | 16,046 | 3,187 | 11,451 | |||||||||
Trustee Fees Payable | 26 | 25 | 32 | |||||||||
Other Accrued Expenses | 13,341 | 38,874 | 42,071 | |||||||||
|
|
|
|
|
| |||||||
Total Liabilities | 166,533 | 128,282 | 288,594 | |||||||||
|
|
|
|
|
| |||||||
Total Net Assets | $42,268,140 | $40,377,925 | $50,922,330 | |||||||||
|
|
|
|
|
| |||||||
Net Assets Consist of: | ||||||||||||
Capital | $38,983,678 | $32,092,089 | $40,933,677 | |||||||||
Accumulated Net Investment Loss | 114,183 | 5,361 | 54,943 | |||||||||
Accumulated Net Realized Gain from Investments Transactions | 530,051 | 1,370,180 | 1,905,752 | |||||||||
Net Unrealized Appreciation on Investments | 2,640,228 | 6,910,295 | 8,027,958 | |||||||||
|
|
|
|
|
| |||||||
Net Assets | $42,268,140 | $40,377,925 | $50,922,330 | |||||||||
|
|
|
|
|
| |||||||
Net Assets: | ||||||||||||
I Shares | $17,927,505 | $32,561,998 | $29,987,867 | |||||||||
A Shares | 8,047,405 | 5,812,703 | 10,864,245 | |||||||||
C Shares | 16,293,230 | 2,003,224 | 10,070,218 | |||||||||
Shares Outstanding (unlimited number of shares authorized, no par value) | ||||||||||||
I Shares | 1,453,083 | 3,128,729 | 3,327,287 | |||||||||
A Shares | 651,574 | 561,450 | 1,212,445 | |||||||||
C Shares | 1,336,588 | 198,510 | 1,134,663 | |||||||||
Net Asset Value and Redemption Price Per Share: |
| |||||||||||
I Shares | $12.34 | $10.41 | $9.01 | |||||||||
A Shares | 12.35 | 10.35 | 8.96 | |||||||||
C Shares(a) | 12.19 | 10.09 | 8.88 | |||||||||
Offering Price per Share (100%/(100%-maximum sales charge x net asset value) adjusted to the nearest cent): | ||||||||||||
A Shares | $12.97 | $10.98 | $9.51 | |||||||||
Maximum Sales Charge — A Shares | 4.75 | % | 5.75 | % | 5.75 | % | ||||||
| (a) | Redemption price per share varies based on length of time shares are held. |
See Notes to Financial Statements.
43
Table of Contents
RIDGEWORTH FUNDS For the Fiscal Year Ended March 31, 2017
| Capital Innovations Global Resources and Infrastructure Fund | Ceredex Large Cap Value Equity Fund | Ceredex Mid-Cap Value Equity Fund | Ceredex Small Cap Value Equity Fund | |||||||||||||
Investment Income: | ||||||||||||||||
Dividend Income | $123,498 | $57,565,486 | $71,415,918 | $19,876,413 | ||||||||||||
Net Income from Securities Lending | 178 | 27,705 | 553,949 | — | ||||||||||||
Less: Foreign Taxes Withheld | (5,512 | ) | — | — | (43,392 | ) | ||||||||||
|
|
|
|
|
|
|
| |||||||||
Total Investment Income | 118,164 | 57,593,191 | 71,969,867 | 19,833,021 | ||||||||||||
|
|
|
|
|
|
|
| |||||||||
Expenses: | ||||||||||||||||
Investment Advisory Fees | 52,660 | 13,960,279 | 22,594,937 | 7,779,690 | ||||||||||||
Administration Fees | 686 | 211,567 | 323,824 | 92,970 | ||||||||||||
Fund Accounting Fees | 561 | 263,116 | 398,661 | 116,187 | ||||||||||||
Transfer Agency Fees | 4,566 | 165,286 | 1,358,753 | 113,979 | ||||||||||||
Compliance & Fund Services Fees | 304 | 118,702 | 183,031 | 51,863 | ||||||||||||
Distribution and Service Fees — A Shares | 3,483 | 1,066,010 | 1,133,134 | 365,724 | ||||||||||||
Distribution and Service Fees — C Shares | 2,320 | 189,371 | 564,071 | 268,637 | ||||||||||||
Shareholder Servicing Fees — I Shares | 3,084 | 5,526,628 | 7,405,233 | 2,653,716 | ||||||||||||
Shareholder Servicing Fees — A Shares | 2 | 1,221,361 | 1,352,646 | 426,230 | ||||||||||||
Custodian Fees | 8,293 | 30,554 | 47,316 | 18,883 | ||||||||||||
Printing Fees | 216 | 127,804 | 362,968 | 83,451 | ||||||||||||
Registration Fees | 37,115 | 57,823 | 110,558 | 50,960 | ||||||||||||
Trustee Fees | 281 | 121,693 | 187,326 | 53,626 | ||||||||||||
Professional Fees | 3,558 | 108,696 | 166,653 | 48,283 | ||||||||||||
Tax Fees | 10,414 | — | — | — | ||||||||||||
Miscellaneous Fees | 2,143 | — | — | — | ||||||||||||
Other Fees | 168 | 145,996 | 225,519 | 71,133 | ||||||||||||
|
|
|
|
|
|
|
| |||||||||
Total Expenses | 129,854 | 23,314,886 | 36,414,630 | 12,195,332 | ||||||||||||
Less: Investment Advisory Fees Waived/Expenses Reimbursed | (63,379 | ) | (2,178,652 | ) | (243,891 | ) | (2,929 | ) | ||||||||
|
|
|
|
|
|
|
| |||||||||
Net Expenses | 66,475 | 21,136,234 | 36,170,739 | 12,192,403 | ||||||||||||
|
|
|
|
|
|
|
| |||||||||
Net Investment Income | 51,689 | 36,456,957 | 35,799,128 | 7,640,618 | ||||||||||||
|
|
|
|
|
|
|
| |||||||||
Net Realized and Unrealized Gain (Loss) on Investments: | ||||||||||||||||
Net Realized Gain (Loss) from: | ||||||||||||||||
Investment Transactions and Foreign Currency Transactions | 157,651 | 198,054,112 | 416,381,930 | 123,270,633 | ||||||||||||
Net Change in Unrealized Appreciation on: | ||||||||||||||||
Investments and Foreign Currencies | 847,865 | 129,586,427 | 220,580,870 | 47,650,389 | ||||||||||||
|
|
|
|
|
|
|
| |||||||||
Net Realized and Unrealized Gain on Investments and Foreign Currencies | 1,005,516 | 327,640,539 | 636,962,800 | 170,921,022 | ||||||||||||
|
|
|
|
|
|
|
| |||||||||
Change in Net Assets from Operations | $1,057,205 | $364,097,496 | $672,761,928 | $178,561,640 | ||||||||||||
|
|
|
|
|
|
|
| |||||||||
See Notes to Financial Statements.
44
Table of Contents
STATEMENTS OF OPERATIONS
RIDGEWORTH FUNDS For the Fiscal Year Ended March 31, 2017
| Innovative Growth Stock Fund | International Equity Fund | Silvant Large Cap Growth Stock Fund | Silvant Small Cap Growth Stock Fund | |||||||||||||
Investment Income: | ||||||||||||||||
Dividend Income | $28,298 | $972,485 | $2,133,472 | $358,016 | ||||||||||||
Net Income from Securities Lending | — | 11,095 | 58,969 | 47,762 | ||||||||||||
Less: Foreign Taxes Withheld | — | (90,967 | ) | — | — | |||||||||||
|
|
|
|
|
|
|
| |||||||||
Total Investment Income | 28,298 | 892,613 | 2,192,441 | 405,778 | ||||||||||||
|
|
|
|
|
|
|
| |||||||||
Expenses: | ||||||||||||||||
Investment Advisory Fees | 203,727 | 515,041 | 1,604,583 | 401,915 | ||||||||||||
Administration Fees | 2,378 | 6,012 | 22,739 | 4,690 | ||||||||||||
Fund Accounting Fees | 2,818 | 7,586 | 28,082 | 5,748 | ||||||||||||
Transfer Agency Fees | 13,314 | 35,405 | 276,224 | 23,092 | ||||||||||||
Compliance & Fund Services Fees | 1,405 | 3,312 | 12,913 | 2,665 | ||||||||||||
Distribution and Service Fees — A Shares | 20,366 | 27,233 | 182,043 | 21,273 | ||||||||||||
Distribution and Service Fees — C Shares | — | — | 375,982 | 47,366 | ||||||||||||
Shareholder Servicing Fees — I Shares | 47,621 | 45,088 | 353,264 | 107,937 | ||||||||||||
Shareholder Servicing Fees — A Shares | 5,535 | 1,478 | 19,851 | 2,600 | ||||||||||||
Custodian Fees | 6,590 | 18,502 | (a) | 4,453 | 4,005 | |||||||||||
Printing Fees | 3,296 | 12,448 | 18,435 | 4,983 | ||||||||||||
Registration Fees | 30,453 | 49,267 | 53,589 | 52,955 | ||||||||||||
Trustee Fees | 1,436 | 3,269 | 13,441 | 2,772 | ||||||||||||
Professional Fees | 1,311 | 9,122 | 11,490 | 2,409 | ||||||||||||
Other Fees | 11,631 | 29,905 | 24,992 | 12,319 | ||||||||||||
|
|
|
|
|
|
|
| |||||||||
Total Expenses | 351,881 | 763,668 | 3,002,081 | 696,729 | ||||||||||||
Less: Investment Advisory Fees Waived/Expenses Reimbursed | (26,011 | ) | (64,503 | ) | (292,474 | ) | (46,193 | ) | ||||||||
|
|
|
|
|
|
|
| |||||||||
Net Expenses | 325,870 | 699,165 | 2,709,607 | 650,536 | ||||||||||||
|
|
|
|
|
|
|
| |||||||||
Net Investment Income (Loss) | (297,572 | ) | 193,448 | (517,166 | ) | (244,758 | ) | |||||||||
|
|
|
|
|
|
|
| |||||||||
Net Realized and Unrealized Gain (Loss) on Investments: | ||||||||||||||||
Net Realized Gain (Loss) from: | ||||||||||||||||
Investment Transactions and Foreign Currency Transactions | 3,192,828 | (210,548 | ) | 51,578,602 | 6,629,706 | |||||||||||
Net Change in Unrealized Appreciation (Depreciation) on: | ||||||||||||||||
Investments and Foreign Currencies | 1,488,150 | 5,750,729 | (34,342,881 | ) | 2,167,591 | |||||||||||
|
|
|
|
|
|
|
| |||||||||
Net Realized and Unrealized Gain (Loss) on Investments and Foreign Currencies | 4,680,978 | 5,540,181 | 17,235,721 | 8,797,297 | ||||||||||||
|
|
|
|
|
|
|
| |||||||||
Change in Net Assets from Operations | $4,383,406 | $5,733,629 | $16,718,555 | $8,552,539 | ||||||||||||
|
|
|
|
|
|
|
| |||||||||
| (a) | Includes a non-recurring refund for overbilling of prior years’. |
See Notes to Financial Statements.
45
Table of Contents
STATEMENTS OF OPERATIONS
RIDGEWORTH FUNDS For the Fiscal Year Ended March 31, 2017
| Conservative Allocation Strategy | Growth Allocation Strategy | Moderate Allocation Strategy | ||||||||||
Investment Income: |
| |||||||||||
Dividend Income | $410,517 | $227,626 | $386,306 | |||||||||
Dividend Income from Affiliated Investment Companies | 642,543 | 359,951 | 569,149 | |||||||||
|
|
|
|
|
| |||||||
Total Investment Income | 1,053,060 | 587,577 | 955,455 | |||||||||
|
|
|
|
|
| |||||||
Expenses: |
| |||||||||||
Investment Advisory Fees | 55,209 | 41,377 | 57,682 | |||||||||
Administration Fees | 5,475 | 4,105 | 5,722 | |||||||||
Fund Accounting Fees | 20,073 | 20,072 | 20,073 | |||||||||
Transfer Agency Fees | 24,461 | 12,854 | 24,591 | |||||||||
Compliance & Fund Services Fees | 3,138 | 2,381 | 3,283 | |||||||||
Distribution and Service Fees — A Shares | 34,779 | 18,580 | 33,015 | |||||||||
Distribution and Service Fees — C Shares | 181,193 | 23,747 | 108,534 | |||||||||
Shareholder Servicing Fees — I Shares | 29,208 | 119,496 | 141,217 | |||||||||
Shareholder Servicing Fees — A Shares | 7,175 | 987 | 9,720 | |||||||||
Custodian Fees | 16,390 | 13,934 | 13,534 | |||||||||
Printing Fees | 7,229 | 2,951 | 5,202 | |||||||||
Registration Fees | 42,169 | 41,924 | 39,934 | |||||||||
Trustee Fees | 3,292 | 2,446 | 3,414 | |||||||||
Professional Fees | 2,536 | 2,030 | 2,807 | |||||||||
Other Fees | 10,250 | 9,518 | 10,753 | |||||||||
|
|
|
|
|
| |||||||
Total Expenses | 442,577 | 316,402 | 479,481 | |||||||||
Less: Investment Advisory Fees Waived/Expenses Reimbursed | (59,801 | ) | (78,160 | ) | (81,002 | ) | ||||||
|
|
|
|
|
| |||||||
Net Expenses | 382,776 | 238,242 | 398,479 | |||||||||
|
|
|
|
|
| |||||||
Net Investment Income | 670,284 | 349,335 | 556,976 | |||||||||
|
|
|
|
|
| |||||||
Net Realized and Unrealized Gain (Loss) on Investments: |
| |||||||||||
Net Realized Gain from: |
| |||||||||||
Investment Transactions | 76,962 | 737,751 | 1,733,770 | |||||||||
Capital Gain Received from Investments in Affiliated Investment Companies | 1,180,208 | 1,618,807 | 1,748,446 | |||||||||
Net Change in Unrealized Appreciation on: |
| |||||||||||
Investments | 900,241 | 1,451,357 | 381,584 | |||||||||
|
|
|
|
|
| |||||||
Net Realized and Unrealized Gain on Investments | 2,157,411 | 3,807,915 | 3,863,800 | |||||||||
|
|
|
|
|
| |||||||
Change in Net Assets from Operations | $2,827,695 | $4,157,250 | $4,420,776 | |||||||||
|
|
|
|
|
| |||||||
See Notes to Financial Statements.
46
Table of Contents
STATEMENTS OF CHANGES IN NET ASSETS
RIDGEWORTH FUNDS For the Fiscal Years Indicated
| Capital Innovations Global Resources and Infrastructure Fund | Ceredex Large Cap Value Equity Fund | |||||||||||||||||||
| 04/01/16- 03/31/17 | 12/01/15- 03/31/16* | 12/01/14- 11/30/15 | 04/01/16- 03/31/17 | 04/01/15- 03/31/16 | ||||||||||||||||
Operations: | ||||||||||||||||||||
Net Investment Income | $ | 51,689 | $ | 28,941 | $ | 135,116 | $ | 36,456,957 | $ | 29,744,157 | ||||||||||
Net Realized Gain (Loss) | 157,651 | (405,694 | ) | (197,517 | ) | 198,054,112 | 61,008,493 | |||||||||||||
Net Change in Unrealized Appreciation (Depreciation) | 847,865 | (22,799 | ) | (1,484,391 | ) | 129,586,427 | (146,176,551 | ) | ||||||||||||
|
|
|
|
|
|
|
|
|
| |||||||||||
Change in Net Assets from Operations | 1,057,205 | (399,552 | ) | (1,546,792 | ) | 364,097,496 | (55,423,901 | ) | ||||||||||||
|
|
|
|
|
|
|
|
|
| |||||||||||
Dividends and Distributions to Shareholders: | ||||||||||||||||||||
Net Investment Income: | ||||||||||||||||||||
I Shares | (68,970 | ) | (47,940 | ) | (100,601 | ) | (23,505,845 | ) | (24,293,067 | ) | ||||||||||
A Shares | (26,765 | ) | (29,983 | ) | (32,013 | ) | (4,823,580 | ) | (4,596,165 | ) | ||||||||||
C Shares | (4,692 | ) | (4,305 | ) | (3,437 | ) | (171,194 | ) | (151,415 | ) | ||||||||||
IS Shares | — | — | — | (5,536,785 | ) | (1,930,728 | ) | |||||||||||||
Net Realized Gains: | ||||||||||||||||||||
I Shares | — | — | — | (5,721,019 | ) | (130,478,463 | ) | |||||||||||||
A Shares | — | — | — | (1,413,158 | ) | (31,413,333 | ) | |||||||||||||
C Shares | — | — | — | (75,218 | ) | (1,618,805 | ) | |||||||||||||
IS Shares | — | — | — | (1,160,657 | ) | (8,723,251 | ) | |||||||||||||
|
|
|
|
|
|
|
|
|
| |||||||||||
Total Dividends and Distributions | (100,427 | ) | (82,228 | ) | (136,051 | ) | (42,407,456 | ) | (203,205,227 | ) | ||||||||||
|
|
|
|
|
|
|
|
|
| |||||||||||
Change in Net Assets from Capital Transactions | 4,736,381 | (1,509,530 | ) | (9,219,400 | ) | (308,024,134 | ) | (93,522,505 | ) | |||||||||||
|
|
|
|
|
|
|
|
|
| |||||||||||
Change in Net Assets | 5,693,159 | (1,991,310 | ) | (10,902,243 | ) | 13,665,906 | (352,151,633 | ) | ||||||||||||
|
|
|
|
|
|
|
|
|
| |||||||||||
Net Assets: | ||||||||||||||||||||
Beginning of Year | 3,408,628 | 5,399,938 | 16,302,181 | 2,095,305,978 | 2,447,457,611 | |||||||||||||||
|
|
|
|
|
|
|
|
|
| |||||||||||
End of Year | $ | 9,101,787 | $ | 3,408,628 | $ | 5,399,938 | $ | 2,108,971,884 | $ | 2,095,305,978 | ||||||||||
|
|
|
|
|
|
|
|
|
| |||||||||||
Accumulated Net Investment Income (Loss), End of Year | $ | 25,924 | $ | 18,707 | $ | (111,545 | ) | $ | 8,367,620 | $ | 5,948,067 | |||||||||
|
|
|
|
|
|
|
|
|
| |||||||||||
| * | The Fund had a fiscal year end change from November 30 to March 31. |
See Notes to Financial Statements.
47
Table of Contents
STATEMENTS OF CHANGES IN NET ASSETS
RIDGEWORTH FUNDS For the Fiscal Years Indicated
| Ceredex Mid-Cap Value Equity Fund | Ceredex Small Cap Value Equity Fund | Innovative Growth Stock Fund | ||||||||||||||||||||||
| 04/01/16- 03/31/17 | 04/01/15- 03/31/16 | 04/01/16- 03/31/17 | 04/01/15- 03/31/16 | 04/01/16- 03/31/17 | 04/01/15- 03/31/16 | |||||||||||||||||||
Operations: |
| |||||||||||||||||||||||
Net Investment Income (Loss) | $ | 35,799,128 | $ | 43,781,852 | $ | 7,640,618 | $ | 9,401,534 | $ | (297,572 | ) | $ | (418,433 | ) | ||||||||||
Net Realized Gain | 416,381,930 | 58,903,761 | 123,270,633 | 160,397,157 | 3,192,828 | 2,936,733 | ||||||||||||||||||
Net Change in Unrealized Appreciation (Depreciation) | 220,580,870 | (309,127,228 | ) | 47,650,389 | (185,414,369 | ) | 1,488,150 | (4,840,884 | ) | |||||||||||||||
|
|
|
|
|
|
|
|
|
|
|
| |||||||||||||
Change in Net Assets from Operations | 672,761,928 | (206,441,615 | ) | 178,561,640 | (15,615,678 | ) | 4,383,406 | (2,322,584 | ) | |||||||||||||||
|
|
|
|
|
|
|
|
|
|
|
| |||||||||||||
Dividends and Distributions to Shareholders: |
| |||||||||||||||||||||||
Net Investment Income: |
| |||||||||||||||||||||||
I Shares | (31,948,717 | ) | (35,723,021 | ) | (7,849,349 | ) | (11,307,431 | ) | — | — | ||||||||||||||
A Shares | (3,509,056 | ) | (3,557,031 | ) | (918,795 | ) | (1,360,683 | ) | — | — | ||||||||||||||
C Shares | (286,575 | ) | (401,359 | ) | (130,786 | ) | (231,971 | ) | — | — | ||||||||||||||
IS Shares | (3,721,071 | ) | (2,319,371 | ) | — | — | — | — | ||||||||||||||||
Net Realized Gains: |
| |||||||||||||||||||||||
I Shares | (91,348,699 | ) | (161,562,467 | ) | (33,290,941 | ) | (207,814,500 | ) | (2,004,924 | ) | (1,394,244 | ) | ||||||||||||
A Shares | (13,157,105 | ) | (23,673,405 | ) | (5,439,162 | ) | (33,547,089 | ) | (970,891 | ) | (701,510 | ) | ||||||||||||
C Shares | (1,988,365 | ) | (4,181,619 | ) | (1,281,420 | ) | (8,088,193 | ) | — | — | ||||||||||||||
IS Shares | (8,470,043 | ) | (7,897,241 | ) | — | — | — | — | ||||||||||||||||
|
|
|
|
|
|
|
|
|
|
|
| |||||||||||||
Total Dividends and Distributions | (154,429,631 | ) | (239,315,514 | ) | (48,910,453 | ) | (262,349,867 | ) | (2,975,815 | ) | (2,095,754 | ) | ||||||||||||
|
|
|
|
|
|
|
|
|
|
|
| |||||||||||||
Change in Net Assets from Capital Transactions | (457,696,242 | ) | (435,212,555 | ) | (164,281,528 | ) | (67,849,231 | ) | 967,671 | (4,108,103 | ) | |||||||||||||
|
|
|
|
|
|
|
|
|
|
|
| |||||||||||||
Change in Net Assets | 60,636,055 | (880,969,684 | ) | (34,630,341 | ) | (345,814,776 | ) | 2,375,262 | (8,526,441 | ) | ||||||||||||||
|
|
|
|
|
|
|
|
|
|
|
| |||||||||||||
Net Assets: |
| |||||||||||||||||||||||
Beginning of Year | 3,372,159,549 | 4,253,129,233 | 968,900,152 | 1,314,714,928 | 26,330,190 | 34,856,631 | ||||||||||||||||||
|
|
|
|
|
|
|
|
|
|
|
| |||||||||||||
End of Year | $ | 3,432,795,604 | $ | 3,372,159,549 | $ | 934,269,811 | $ | 968,900,152 | $ | 28,705,452 | $ | 26,330,190 | ||||||||||||
|
|
|
|
|
|
|
|
|
|
|
| |||||||||||||
Accumulated Net Investment Income (Loss), End of Year | $ | 2,004,033 | $ | 10,555,383 | $ | — | $ | 1,382,858 | $ | (78,294 | ) | $ | (79,099 | ) | ||||||||||
|
|
|
|
|
|
|
|
|
|
|
| |||||||||||||
See Notes to Financial Statements.
48
Table of Contents
STATEMENTS OF CHANGES IN NET ASSETS
RIDGEWORTH FUNDS For the Fiscal Years Indicated
| International Equity Fund | Silvant Large Cap Growth Stock Fund | Silvant Small Cap Growth Stock Fund | ||||||||||||||||||||||
| 04/01/16- 03/31/17 | 04/01/15- 03/31/16 | 04/01/16- 03/31/17 | 04/01/15- 03/31/16 | 04/01/16- 03/31/17 | 04/01/15- 03/31/16 | |||||||||||||||||||
Operations: |
| |||||||||||||||||||||||
Net Investment Income (Loss) | $ | 193,448 | $ | 268,555 | $ | (517,166 | ) | $ | (930,659 | ) | $ | (244,758 | ) | $ | (718,976 | ) | ||||||||
Net Realized Gain (Loss) | (210,548 | ) | 2,971,796 | 51,578,602 | 12,550,924 | 6,629,706 | 23,215,285 | |||||||||||||||||
Net Change in Unrealized Appreciation (Depreciation) | 5,750,729 | (3,563,428 | ) | (34,342,881 | ) | (16,825,838 | ) | 2,167,591 | (34,291,359 | ) | ||||||||||||||
|
|
|
|
|
|
|
|
|
|
|
| |||||||||||||
Change in Net Assets from Operations | 5,733,629 | (323,077 | ) | 16,718,555 | (5,205,573 | ) | 8,552,539 | (11,795,050 | ) | |||||||||||||||
|
|
|
|
|
|
|
|
|
|
|
| |||||||||||||
Dividends and Distributions to Shareholders: |
| |||||||||||||||||||||||
Net Investment Income: |
| |||||||||||||||||||||||
I Shares | (197,965 | ) | (121,394 | ) | — | — | — | — | ||||||||||||||||
A Shares | (61,299 | ) | (23,586 | ) | — | — | — | — | ||||||||||||||||
IS Shares | (32,825 | ) | — | — | — | — | — | |||||||||||||||||
Net Realized Gains: |
| |||||||||||||||||||||||
I Shares | (225,940 | ) | (879,695 | ) | (11,447,462 | ) | (9,096,956 | ) | (3,661,429 | ) | (14,333,125 | ) | ||||||||||||
A Shares | (78,574 | ) | (354,394 | ) | (8,690,053 | ) | (5,723,860 | ) | (1,015,963 | ) | (2,962,694 | ) | ||||||||||||
C Shares | — | — | (7,642,508 | ) | (5,426,509 | ) | (1,293,435 | ) | (2,793,870 | ) | ||||||||||||||
IS Shares | (31,540 | ) | (765,921 | ) | (3,486,146 | ) | (3,074,932 | ) | (439,680 | ) | (1,477,592 | ) | ||||||||||||
|
|
|
|
|
|
|
|
|
|
|
| |||||||||||||
Total Dividends and Distributions | (628,143 | ) | (2,144,990 | ) | (31,266,169 | ) | (23,322,257 | ) | (6,410,507 | ) | (21,567,281 | ) | ||||||||||||
|
|
|
|
|
|
|
|
|
|
|
| |||||||||||||
Change in Net Assets from Capital Transactions | 28,344,755 | 17,666,205 | (21,363,216 | ) | (14,457,456 | ) | (12,488,352 | ) | (64,115,362 | ) | ||||||||||||||
|
|
|
|
|
|
|
|
|
|
|
| |||||||||||||
Change in Net Assets | 33,450,241 | 15,198,138 | (35,910,830 | ) | (42,985,286 | ) | (10,346,320 | ) | (97,477,693 | ) | ||||||||||||||
|
|
|
|
|
|
|
|
|
|
|
| |||||||||||||
Net Assets: |
| |||||||||||||||||||||||
Beginning of Year | 38,343,595 | 23,145,457 | 249,849,505 | 292,834,791 | 51,266,088 | 148,743,781 | ||||||||||||||||||
|
|
|
|
|
|
|
|
|
|
|
| |||||||||||||
End of Year | $ | 71,793,836 | $ | 38,343,595 | $ | 213,938,675 | $ | 249,849,505 | $ | 40,919,768 | $ | 51,266,088 | ||||||||||||
|
|
|
|
|
|
|
|
|
|
|
| |||||||||||||
Accumulated Net Investment Income (Loss), End of Year | $ | 109,720 | $ | 225,036 | $ | (128,809 | ) | $ | (192,950 | ) | $ | (66,579 | ) | $ | (82,836 | ) | ||||||||
|
|
|
|
|
|
|
|
|
|
|
| |||||||||||||
See Notes to Financial Statements.
49
Table of Contents
STATEMENTS OF CHANGES IN NET ASSETS
RIDGEWORTH FUNDS For the Fiscal Years Indicated
| Conservative Allocation Strategy | Growth Allocation Strategy | Moderate Allocation Strategy | ||||||||||||||||||||||
| 04/01/16- 03/31/17 | 04/01/15- 03/31/16 | 04/01/16- 03/31/17 | 04/01/15- 03/31/16 | 04/01/16- 03/31/17 | 04/01/15- 03/31/16 | |||||||||||||||||||
Operations: |
| |||||||||||||||||||||||
Net Investment Income | $ | 670,284 | $ | 853,413 | $ | 349,335 | $ | 488,808 | $ | 556,976 | $ | 952,973 | ||||||||||||
Net Realized Gain | 1,257,170 | 69,982 | 2,356,558 | 2,558,148 | 3,482,216 | 6,381,339 | ||||||||||||||||||
Net Change in Unrealized Appreciation (Depreciation) | 900,241 | (2,319,723 | ) | 1,451,357 | (5,495,254 | ) | 381,584 | (10,430,565 | ) | |||||||||||||||
|
|
|
|
|
|
|
|
|
|
|
| |||||||||||||
Change in Net Assets from Operations | 2,827,695 | (1,396,328 | ) | 4,157,250 | (2,448,298 | ) | 4,420,776 | (3,096,253 | ) | |||||||||||||||
|
|
|
|
|
|
|
|
|
|
|
| |||||||||||||
Dividends and Distributions to Shareholders: |
| |||||||||||||||||||||||
Net Investment Income: |
| |||||||||||||||||||||||
I Shares | (491,676 | ) | (572,569 | ) | (399,125 | ) | (479,108 | ) | (511,434 | ) | (805,343 | ) | ||||||||||||
A Shares | (170,167 | ) | (204,021 | ) | (62,334 | ) | (67,349 | ) | (147,917 | ) | (206,746 | ) | ||||||||||||
C Shares | (231,265 | ) | (157,737 | ) | (11,852 | ) | (11,099 | ) | (85,894 | ) | (124,573 | ) | ||||||||||||
Net Realized Gains: |
| |||||||||||||||||||||||
I Shares | (84,915 | ) | (799,647 | ) | (1,921,798 | ) | (3,232,886 | ) | (2,095,188 | ) | (6,865,380 | ) | ||||||||||||
A Shares | (36,161 | ) | (349,352 | ) | (358,017 | ) | (545,095 | ) | (672,061 | ) | (1,841,985 | ) | ||||||||||||
C Shares | (72,207 | ) | (480,071 | ) | (134,813 | ) | (202,838 | ) | (680,613 | ) | (1,721,546 | ) | ||||||||||||
|
|
|
|
|
|
|
|
|
|
|
| |||||||||||||
Total Dividends and Distributions | (1,086,391 | ) | (2,563,397 | ) | (2,887,939 | ) | (4,538,375 | ) | (4,193,107 | ) | (11,565,573 | ) | ||||||||||||
|
|
|
|
|
|
|
|
|
|
|
| |||||||||||||
Change in Net Assets from Capital Transactions | (24,138,818 | ) | 1,826,875 | (8,953,205 | ) | (10,236,774 | ) | (18,536,293 | ) | (41,933,238 | ) | |||||||||||||
|
|
|
|
|
|
|
|
|
|
|
| |||||||||||||
Change in Net Assets | (22,397,514 | ) | (2,132,850 | ) | (7,683,894 | ) | (17,223,447 | ) | (18,308,624 | ) | (56,595,064 | ) | ||||||||||||
|
|
|
|
|
|
|
|
|
|
|
| |||||||||||||
Net Assets: |
| |||||||||||||||||||||||
Beginning of Year | 64,665,654 | 66,798,504 | 48,061,819 | 65,285,266 | 69,230,954 | 125,826,018 | ||||||||||||||||||
|
|
|
|
|
|
|
|
|
|
|
| |||||||||||||
End of Year | $ | 42,268,140 | $ | 64,665,654 | $ | 40,377,925 | $ | 48,061,819 | $ | 50,922,330 | $ | 69,230,954 | ||||||||||||
|
|
|
|
|
|
|
|
|
|
|
| |||||||||||||
Accumulated Net Investment Income (Loss), End of Year | $ | 114,183 | $ | 125,029 | $ | 5,361 | $ | 14,594 | $ | 54,943 | $ | 62,876 | ||||||||||||
|
|
|
|
|
|
|
|
|
|
|
| |||||||||||||
See Notes to Financial Statements.
50
Table of Contents
RIDGEWORTH FUNDS Selected Data For a Share of Beneficial Interest Outstanding Throughout the Periods Indicated.
| Net Asset Value, Beginning of Period | Net Investment Income (Loss)(a) | Net Realized and Unrealized Gains (Losses) on Investments | Total from Operations | Dividends from Net Investment Income | Distributions from Tax Return of Capital | Distributions from Realized Capital Gains | Total Dividends and Distributions | Payments by Affiliates | Net Asset Value, End of Period | Net Assets End of Period (000) | Total Return(b) | Ratio of Net Expenses to Average Net Assets(c) | Ratio of Expenses to Average Net Assets (Excluding Waivers and Reimburse ments)(c) | Ratio of Net Investment Income to Average Net Assets(c) | Portfolio Turnover Rate(d) | |||||||||||||||||||||||||||||||||||||||||||||||||
Capital Innovations Global Resources and Infrastructure Fund |
| |||||||||||||||||||||||||||||||||||||||||||||||||||||||||||||||
I Shares | ||||||||||||||||||||||||||||||||||||||||||||||||||||||||||||||||
Year Ended March 31, 2017 | $9.04 | $0.12 | $2.58 | $2.70 | $(0.20 | ) | $— | $— | $(0.20 | ) | $— | $11.54 | $7,421 | 30.02 | % | 1.15 | % | 2.38 | % | 1.12 | % | 52 | % | |||||||||||||||||||||||||||||||||||||||||
Period Ended March 31, 2016(e) | 9.91 | 0.07 | (0.76 | ) | (0.69 | ) | (0.18 | ) | — | — | (0.18 | ) | — | 9.04 | 1,955 | (6.93 | ) | 1.28 | 14.19 | 2.52 | 23 | |||||||||||||||||||||||||||||||||||||||||||
Year Ended November 30, 2015 | 11.84 | 0.14 | (1.90 | ) | (1.76 | ) | (0.17 | ) | — | — | (0.17 | ) | — | 9.91 | 3,336 | (14.92 | ) | 1.35 | 3.42 | 1.23 | 19 | |||||||||||||||||||||||||||||||||||||||||||
Year Ended November 30, 2014 | 11.50 | 0.13 | 0.34 | 0.47 | (0.04 | ) | (0.04 | ) | (0.05 | ) | (0.13 | ) | — | 11.84 | 12,532 | 4.12 | 1.35 | 3.29 | 1.13 | 24 | ||||||||||||||||||||||||||||||||||||||||||||
Year Ended November 30, 2013 | 10.03 | 0.09 | 1.43 | 1.52 | (0.05 | ) | — | — | (0.05 | ) | — | 11.50 | 5,436 | 15.15 | 1.35 | 6.57 | 0.85 | 7 | ||||||||||||||||||||||||||||||||||||||||||||||
A Shares | ||||||||||||||||||||||||||||||||||||||||||||||||||||||||||||||||
Year Ended March 31, 2017 | 9.03 | 0.08 | 2.59 | 2.67 | (0.20 | ) | — | — | (0.20 | ) | — | 11.50 | 1,409 | 29.72 | 1.40 | 2.54 | 0.79 | 52 | ||||||||||||||||||||||||||||||||||||||||||||||
Period Ended March 31, 2016(e) | 9.90 | 0.07 | (0.76 | ) | (0.69 | ) | (0.18 | ) | — | — | (0.18 | ) | — | 9.03 | 1,250 | (7.01 | ) | 1.53 | 14.70 | 2.34 | 23 | |||||||||||||||||||||||||||||||||||||||||||
Year Ended November 30, 2015 | 11.83 | 0.11 | (1.90 | ) | (1.79 | ) | (0.14 | ) | — | — | (0.14 | ) | — | 9.90 | 1,756 | (15.14 | ) | 1.60 | 3.67 | 0.98 | 19 | |||||||||||||||||||||||||||||||||||||||||||
Year Ended November 30, 2014 | 11.49 | 0.10 | 0.34 | 0.44 | (0.02 | ) | (0.03 | ) | (0.05 | ) | (0.10 | ) | — | 11.83 | 3,033 | 3.84 | 1.60 | 3.54 | 0.88 | 24 | ||||||||||||||||||||||||||||||||||||||||||||
Year Ended November 30, 2013 | 10.02 | 0.07 | 1.43 | 1.50 | (0.03 | ) | — | — | (0.03 | ) | — | 11.49 | 5,569 | 14.98 | 1.60 | 6.82 | 0.60 | 7 | ||||||||||||||||||||||||||||||||||||||||||||||
C Shares | ||||||||||||||||||||||||||||||||||||||||||||||||||||||||||||||||
Year Ended March 31, 2017 | 8.90 | — | (f) | 2.54 | 2.54 | (0.20 | ) | — | — | (0.20 | ) | — | 11.24 | 272 | 28.68 | 2.15 | 3.29 | 0.01 | 52 | |||||||||||||||||||||||||||||||||||||||||||||
Period Ended March 31, 2016(e) | 9.76 | 0.04 | (0.75 | ) | (0.71 | ) | (0.15 | ) | — | — | (0.15 | ) | — | 8.90 | 204 | (7.24 | ) | 2.28 | 15.42 | 1.50 | 23 | |||||||||||||||||||||||||||||||||||||||||||
Year Ended November 30, 2015 | 11.69 | 0.03 | (1.87 | ) | (1.84 | ) | (0.09 | ) | — | — | (0.09 | ) | — | 9.76 | 308 | (15.76 | ) | 2.35 | 4.42 | 0.23 | 19 | |||||||||||||||||||||||||||||||||||||||||||
Year Ended November 30, 2014 | 11.41 | 0.02 | 0.33 | 0.35 | (0.01 | ) | (0.01 | ) | (0.05 | ) | (0.07 | ) | — | 11.69 | 737 | 3.04 | 2.35 | 4.29 | 0.13 | 24 | ||||||||||||||||||||||||||||||||||||||||||||
Year Ended November 30, 2013 | 10.01 | (0.02 | ) | 1.42 | 1.40 | — | (f) | — | — | — | — | 11.41 | 819 | 14.03 | 2.35 | 7.57 | (0.15 | ) | 7 | |||||||||||||||||||||||||||||||||||||||||||||
Ceredex Large Cap Value Equity Fund |
| |||||||||||||||||||||||||||||||||||||||||||||||||||||||||||||||
I Shares | ||||||||||||||||||||||||||||||||||||||||||||||||||||||||||||||||
Year Ended March 31, 2017 | 14.71 | 0.28 | 2.45 | 2.73 | (0.27 | ) | — | (0.06 | ) | (0.33 | ) | — | 17.11 | 1,432,996 | 18.63 | 0.97 | 1.09 | 1.73 | 77 | |||||||||||||||||||||||||||||||||||||||||||||
Year Ended March 31, 2016 | 16.60 | 0.22 | (0.57 | ) | (0.35 | ) | (0.24 | ) | — | (1.30 | ) | (1.54 | ) | — | 14.71 | 1,440,587 | (2.19 | ) | 0.97 | 1.09 | 1.40 | 66 | ||||||||||||||||||||||||||||||||||||||||||
Year Ended March 31, 2015 | 17.02 | 0.23 | 0.99 | 1.22 | (0.23 | ) | — | (1.41 | ) | (1.64 | ) | — | 16.60 | 1,927,039 | 7.25 | 0.95 | 1.07 | 1.33 | 73 | |||||||||||||||||||||||||||||||||||||||||||||
Year Ended March 31, 2014 | 15.76 | 0.24 | 3.29 | 3.53 | (0.23 | ) | — | (2.04 | ) | (2.27 | ) | — | 17.02 | 1,799,158 | 22.94 | 0.91 | 1.06 | 1.42 | 81 | |||||||||||||||||||||||||||||||||||||||||||||
Year Ended March 31, 2013 | 13.77 | 0.24 | 1.97 | 2.21 | (0.22 | ) | — | — | (0.22 | ) | — | 15.76 | 1,442,154 | 16.24 | 0.89 | 0.89 | 1.74 | 78 | ||||||||||||||||||||||||||||||||||||||||||||||
A Shares | ||||||||||||||||||||||||||||||||||||||||||||||||||||||||||||||||
Year Ended March 31, 2017 | 14.60 | 0.23 | 2.43 | 2.66 | (0.22 | ) | — | (0.06 | ) | (0.28 | ) | — | 16.98 | 335,256 | 18.31 | 1.25 | 1.36 | 1.45 | 77 | |||||||||||||||||||||||||||||||||||||||||||||
Year Ended March 31, 2016 | 16.48 | 0.17 | (0.56 | ) | (0.39 | ) | (0.19 | ) | — | (1.30 | ) | (1.49 | ) | — | 14.60 | 362,805 | (2.46 | ) | 1.27 | 1.37 | 1.09 | 66 | ||||||||||||||||||||||||||||||||||||||||||
Year Ended March 31, 2015 | 16.90 | 0.18 | 0.99 | 1.17 | (0.18 | ) | — | (1.41 | ) | (1.59 | ) | — | 16.48 | 461,642 | 6.98 | 1.25 | 1.36 | 1.03 | 73 | |||||||||||||||||||||||||||||||||||||||||||||
Year Ended March 31, 2014 | 15.67 | 0.19 | 3.27 | 3.46 | (0.19 | ) | — | (2.04 | ) | (2.23 | ) | — | 16.90 | 379,768 | 22.60 | 1.19 | 1.37 | 1.13 | 81 | |||||||||||||||||||||||||||||||||||||||||||||
Year Ended March 31, 2013 | 13.70 | 0.21 | 1.95 | 2.16 | (0.19 | ) | — | — | (0.19 | ) | — | 15.67 | 287,957 | 15.93 | 1.16 | 1.26 | 1.48 | 78 | ||||||||||||||||||||||||||||||||||||||||||||||
C Shares | ||||||||||||||||||||||||||||||||||||||||||||||||||||||||||||||||
Year Ended March 31, 2017 | 14.28 | 0.15 | 2.37 | 2.52 | (0.15 | ) | — | (0.06 | ) | (0.21 | ) | — | 16.59 | 18,590 | 17.70 | 1.72 | 1.72 | 0.98 | 77 | |||||||||||||||||||||||||||||||||||||||||||||
Year Ended March 31, 2016 | 16.15 | 0.10 | (0.55 | ) | (0.45 | ) | (0.12 | ) | — | (1.30 | ) | (1.42 | ) | — | 14.28 | 19,053 | (2.88 | ) | 1.71 | 1.71 | 0.65 | 66 | ||||||||||||||||||||||||||||||||||||||||||
Year Ended March 31, 2015 | 16.59 | 0.10 | 0.97 | 1.07 | (0.10 | ) | — | (1.41 | ) | (1.51 | ) | — | 16.15 | 21,207 | 6.50 | 1.71 | 1.71 | 0.57 | 73 | |||||||||||||||||||||||||||||||||||||||||||||
Year Ended March 31, 2014 | 15.42 | 0.10 | 3.22 | 3.32 | (0.11 | ) | — | (2.04 | ) | (2.15 | ) | — | 16.59 | 20,239 | 21.98 | 1.71 | 1.71 | 0.62 | 81 | |||||||||||||||||||||||||||||||||||||||||||||
Year Ended March 31, 2013 | 13.50 | 0.12 | 1.92 | 2.04 | (0.12 | ) | — | — | (0.12 | ) | — | 15.42 | 16,394 | 15.25 | 1.75 | 1.75 | 0.89 | 78 | ||||||||||||||||||||||||||||||||||||||||||||||
IS Shares | ||||||||||||||||||||||||||||||||||||||||||||||||||||||||||||||||
Year Ended March 31, 2017 | 14.77 | 0.32 | 2.46 | 2.78 | (0.31 | ) | — | (0.06 | ) | (0.37 | ) | — | 17.18 | 322,129 | 18.92 | 0.72 | 0.72 | 1.98 | 77 | |||||||||||||||||||||||||||||||||||||||||||||
Year Ended March 31, 2016 | 16.66 | 0.23 | (0.53 | ) | (0.30 | ) | (0.29 | ) | — | (1.30 | ) | (1.59 | ) | — | 14.77 | 272,861 | (1.90 | ) | 0.72 | 0.72 | 1.48 | 66 | ||||||||||||||||||||||||||||||||||||||||||
Period Ended March 31, 2015(g) | 17.54 | 0.19 | 0.54 | 0.73 | (0.20 | ) | — | (1.41 | ) | (1.61 | ) | — | 16.66 | 37,570 | 4.26 | 0.71 | 0.71 | 1.65 | 73 | |||||||||||||||||||||||||||||||||||||||||||||
See Notes to Financial Highlights and Notes to Financial Statements.
51
Table of Contents
FINANCIAL HIGHLIGHTS
RIDGEWORTH FUNDS Selected Data For a Share of Beneficial Interest Outstanding Throughout the Periods Indicated.
| Net Asset Value, Beginning of Period | Net Investment Income (Loss)(a) | Net Realized and Unrealized Gains (Losses) on Investments | Total from Operations | Dividends from Net Investment Income | Distributions from Tax Return of Capital | Distributions from Realized Capital Gains | Total Dividends and Distributions | Payments by Affiliates | Net Asset Value, End of Period | Net Assets End of Period (000) | Total Return(b) | Ratio of Net Expenses to Average Net Assets(c) | Ratio of Expenses to Average Net Assets (Excluding Waivers and Reimburse ments)(c) | Ratio of Net Investment Income to Average Net Assets(c) | Portfolio Turnover Rate(d) | |||||||||||||||||||||||||||||||||||||||||||||||||
Ceredex Mid-Cap Value Equity Fund |
| |||||||||||||||||||||||||||||||||||||||||||||||||||||||||||||||
I Shares | ||||||||||||||||||||||||||||||||||||||||||||||||||||||||||||||||
Year Ended March 31, 2017 | $ | 12.34 | $ | 0.15 | $ | 2.66 | $ | 2.81 | $ | (0.17 | ) | $ | — | $ | (0.50 | ) | $ | (0.67 | ) | $ | — | $ | 14.48 | $ | 2,716,560 | 23.08 | % | 1.08 | % | 1.08 | % | 1.12 | % | 108 | % | |||||||||||||||||||||||||||||
Year Ended March 31, 2016 | 13.74 | 0.15 | (0.71 | ) | (0.56 | ) | (0.15 | ) | — | (0.69 | ) | (0.84 | ) | — | 12.34 | 2,717,761 | (3.85 | ) | 1.12 | 1.12 | 1.16 | 98 | ||||||||||||||||||||||||||||||||||||||||||
Year Ended March 31, 2015 | 14.09 | 0.13 | 0.93 | 1.06 | (0.12 | ) | — | (1.29 | ) | (1.41 | ) | — | 13.74 | 3,552,288 | 7.76 | 1.10 | 1.10 | 0.92 | 94 | |||||||||||||||||||||||||||||||||||||||||||||
Year Ended March 31, 2014 | 13.06 | 0.14 | 2.64 | 2.78 | (0.12 | ) | — | (1.63 | ) | (1.75 | ) | — | 14.09 | 3,159,585 | 22.03 | 1.09 | 1.10 | 1.02 | 108 | |||||||||||||||||||||||||||||||||||||||||||||
Year Ended March 31, 2013 | 11.07 | 0.16 | 2.00 | 2.16 | (0.14 | ) | — | (0.03 | ) | (0.17 | ) | — | 13.06 | 2,168,210 | 19.73 | 1.08 | 1.08 | 1.44 | 123 | |||||||||||||||||||||||||||||||||||||||||||||
A Shares | ||||||||||||||||||||||||||||||||||||||||||||||||||||||||||||||||
Year Ended March 31, 2017 | 12.22 | 0.11 | 2.63 | 2.74 | (0.13 | ) | — | (0.50 | ) | (0.63 | ) | — | 14.33 | 369,102 | 22.69 | 1.39 | 1.45 | 0.81 | 108 | |||||||||||||||||||||||||||||||||||||||||||||
Year Ended March 31, 2016 | 13.60 | 0.11 | (0.70 | ) | (0.59 | ) | (0.10 | ) | — | (0.69 | ) | (0.79 | ) | — | 12.22 | 397,599 | (4.11 | ) | 1.40 | 1.45 | 0.86 | 98 | ||||||||||||||||||||||||||||||||||||||||||
Year Ended March 31, 2015 | 13.96 | 0.09 | 0.92 | 1.01 | (0.08 | ) | — | (1.29 | ) | (1.37 | ) | — | 13.60 | 590,327 | 7.45 | 1.38 | 1.41 | 0.64 | 94 | |||||||||||||||||||||||||||||||||||||||||||||
Year Ended March 31, 2014 | 12.96 | 0.10 | 2.62 | 2.72 | (0.09 | ) | — | (1.63 | ) | (1.72 | ) | — | 13.96 | 611,880 | 21.68 | 1.35 | 1.40 | 0.76 | 108 | |||||||||||||||||||||||||||||||||||||||||||||
Year Ended March 31, 2013 | 10.99 | 0.13 | 1.98 | 2.11 | (0.11 | ) | — | (0.03 | ) | (0.14 | ) | — | 12.96 | 490,381 | 19.43 | 1.34 | 1.38 | 1.17 | 123 | |||||||||||||||||||||||||||||||||||||||||||||
C Shares | ||||||||||||||||||||||||||||||||||||||||||||||||||||||||||||||||
Year Ended March 31, 2017 | 11.96 | 0.05 | 2.58 | 2.63 | (0.07 | ) | — | (0.50 | ) | (0.57 | ) | — | 14.02 | 55,580 | 22.23 | (h) | 1.80 | 1.80 | 0.39 | 108 | ||||||||||||||||||||||||||||||||||||||||||||
Year Ended March 31, 2016 | 13.34 | 0.06 | (0.68 | ) | (0.62 | ) | (0.07 | ) | — | (0.69 | ) | (0.76 | ) | — | 11.96 | 64,160 | (4.49 | ) | 1.78 | 1.78 | 0.50 | 98 | ||||||||||||||||||||||||||||||||||||||||||
Year Ended March 31, 2015 | 13.72 | 0.04 | 0.90 | 0.94 | (0.03 | ) | — | (1.29 | ) | (1.32 | ) | — | 13.34 | 87,115 | 7.06 | 1.75 | 1.75 | 0.28 | 94 | |||||||||||||||||||||||||||||||||||||||||||||
Year Ended March 31, 2014 | 12.77 | 0.05 | 2.58 | 2.63 | (0.05 | ) | — | (1.63 | ) | (1.68 | ) | — | 13.72 | 81,961 | 21.26 | 1.76 | 1.76 | 0.36 | 108 | |||||||||||||||||||||||||||||||||||||||||||||
Year Ended March 31, 2013 | 10.85 | 0.07 | 1.95 | 2.02 | (0.07 | ) | — | (0.03 | ) | (0.10 | ) | — | 12.77 | 53,893 | 18.75 | 1.86 | 1.86 | 0.65 | 123 | |||||||||||||||||||||||||||||||||||||||||||||
IS Shares | ||||||||||||||||||||||||||||||||||||||||||||||||||||||||||||||||
Year Ended March 31, 2017 | 12.36 | 0.19 | 2.66 | 2.85 | (0.22 | ) | — | (0.50 | ) | (0.72 | ) | — | 14.49 | 291,554 | 23.34 | 0.80 | 0.80 | 1.44 | 108 | |||||||||||||||||||||||||||||||||||||||||||||
Year Ended March 31, 2016 | 13.76 | 0.21 | (0.72 | ) | (0.51 | ) | (0.20 | ) | — | (0.69 | ) | (0.89 | ) | — | 12.36 | 192,640 | (3.45 | ) | 0.80 | 0.80 | 1.68 | 98 | ||||||||||||||||||||||||||||||||||||||||||
Period Ended March 31, 2015(g) | 14.28 | 0.13 | 0.77 | 0.90 | (0.13 | ) | — | (1.29 | ) | (1.42 | ) | — | 13.76 | 23,398 | 6.54 | 0.75 | 0.75 | 1.39 | 94 | |||||||||||||||||||||||||||||||||||||||||||||
Ceredex Small Cap Value Equity Fund |
| |||||||||||||||||||||||||||||||||||||||||||||||||||||||||||||||
I Shares | ||||||||||||||||||||||||||||||||||||||||||||||||||||||||||||||||
Year Ended March 31, 2017 | 11.30 | 0.11 | 2.27 | 2.38 | (0.13 | ) | — | (0.56 | ) | (0.69 | ) | — | 12.99 | $786,245 | 21.15 | 1.24 | 1.24 | 0.87 | 29 | |||||||||||||||||||||||||||||||||||||||||||||
Year Ended March 31, 2016 | 15.59 | 0.13 | (0.50 | ) | (0.37 | ) | (0.20 | ) | — | (3.72 | ) | (3.92 | ) | — | 11.30 | 820,124 | (0.64 | ) | 1.21 | 1.21 | 0.93 | 36 | ||||||||||||||||||||||||||||||||||||||||||
Year Ended March 31, 2015 | 17.95 | 0.20 | 0.38 | 0.58 | (0.15 | ) | — | (2.79 | ) | (2.94 | ) | — | 15.59 | 1,118,190 | 4.07 | 1.21 | 1.21 | 1.16 | 10 | |||||||||||||||||||||||||||||||||||||||||||||
Year Ended March 31, 2014 | 15.45 | 0.17 | 3.11 | 3.28 | (0.14 | ) | — | (0.64 | ) | (0.78 | ) | — | 17.95 | 1,528,174 | 21.34 | 1.22 | 1.22 | 1.01 | 37 | |||||||||||||||||||||||||||||||||||||||||||||
Year Ended March 31, 2013 | 13.80 | 0.20 | 2.08 | 2.28 | (0.23 | ) | — | (0.40 | ) | (0.63 | ) | — | 15.45 | 1,408,597 | 17.07 | 1.20 | 1.20 | 1.44 | 27 | |||||||||||||||||||||||||||||||||||||||||||||
A Shares | ||||||||||||||||||||||||||||||||||||||||||||||||||||||||||||||||
Year Ended March 31, 2017 | 10.96 | 0.07 | 2.20 | 2.27 | (0.09 | ) | — | (0.56 | ) | (0.65 | ) | — | 12.58 | 123,495 | 20.81 | (h) | 1.55 | 1.55 | 0.58 | 29 | ||||||||||||||||||||||||||||||||||||||||||||
Year Ended March 31, 2016 | 15.25 | 0.08 | (0.50 | ) | (0.42 | ) | (0.15 | ) | — | (3.72 | ) | (3.87 | ) | — | 10.96 | 121,367 | (1.07 | )(h) | 1.55 | 1.55 | 0.62 | 36 | ||||||||||||||||||||||||||||||||||||||||||
Year Ended March 31, 2015 | 17.61 | 0.15 | 0.38 | 0.53 | (0.10 | ) | — | (2.79 | ) | (2.89 | ) | — | 15.25 | 162,732 | 3.79 | 1.52 | 1.52 | 0.89 | 10 | |||||||||||||||||||||||||||||||||||||||||||||
Year Ended March 31, 2014 | 15.19 | 0.12 | 3.05 | 3.17 | (0.11 | ) | — | (0.64 | ) | (0.75 | ) | — | 17.61 | 195,098 | 20.96 | 1.50 | 1.50 | 0.73 | 37 | |||||||||||||||||||||||||||||||||||||||||||||
Year Ended March 31, 2013 | 13.58 | 0.15 | 2.05 | 2.20 | (0.19 | ) | — | (0.40 | ) | (0.59 | ) | — | 15.19 | 181,308 | 16.77 | 1.50 | 1.50 | 1.14 | 27 | |||||||||||||||||||||||||||||||||||||||||||||
C Shares | ||||||||||||||||||||||||||||||||||||||||||||||||||||||||||||||||
Year Ended March 31, 2017 | 10.04 | 0.02 | 2.02 | 2.04 | (0.06 | ) | — | (0.56 | ) | (0.62 | ) | — | 11.46 | 24,529 | 20.35 | 1.90 | 1.90 | 0.22 | 29 | |||||||||||||||||||||||||||||||||||||||||||||
Year Ended March 31, 2016 | 14.31 | 0.03 | (0.47 | ) | (0.44 | ) | (0.11 | ) | — | (3.72 | ) | (3.83 | ) | — | 10.04 | 27,410 | (1.34 | ) | 1.90 | 1.90 | 0.28 | 36 | ||||||||||||||||||||||||||||||||||||||||||
Year Ended March 31, 2015 | 16.71 | 0.08 | 0.36 | 0.44 | (0.05 | ) | — | (2.79 | ) | (2.84 | ) | — | 14.31 | 33,793 | 3.42 | 1.88 | 1.88 | 0.54 | 10 | |||||||||||||||||||||||||||||||||||||||||||||
Year Ended March 31, 2014 | 14.47 | 0.06 | 2.90 | 2.96 | (0.08 | ) | — | (0.64 | ) | (0.72 | ) | — | 16.71 | 38,408 | 20.53 | 1.87 | 1.87 | 0.36 | 37 | |||||||||||||||||||||||||||||||||||||||||||||
Year Ended March 31, 2013 | 12.98 | 0.08 | 1.95 | 2.03 | (0.14 | ) | — | (0.40 | ) | (0.54 | ) | — | 14.47 | 36,015 | 16.17 | 1.99 | 1.99 | 0.65 | 27 | |||||||||||||||||||||||||||||||||||||||||||||
See Notes to Financial Highlights and Notes to Financial Statements.
52
Table of Contents
FINANCIAL HIGHLIGHTS
RIDGEWORTH FUNDS Selected Data For a Share of Beneficial Interest Outstanding Throughout the Periods Indicated.
| Net Asset Value, Beginning of Period | Net Investment Income (Loss)(a) | Net Realized and Unrealized Gains (Losses) on Investments | Total from Operations | Dividends from Net Investment Income | Distributions from Tax Return of Capital | Distributions from Realized Capital Gains | Total Dividends and Distributions | Payments by Affiliates | Net Asset Value, End of Period | Net Assets End of Period (000) | Total Return(b) | Ratio of Net Expenses to Average Net Assets(c) | Ratio of Expenses to Average Net Assets (Excluding Waivers and Reimburse ments)(c) | Ratio of Net Investment Income to Average Net Assets(c) | Portfolio Turnover Rate(d) | |||||||||||||||||||||||||||||||||||||||||||||||||
Innovative Growth Stock Fund |
| |||||||||||||||||||||||||||||||||||||||||||||||||||||||||||||||
I Shares | ||||||||||||||||||||||||||||||||||||||||||||||||||||||||||||||||
Year Ended March 31, 2017 | $ | 19.11 | $ | (0.23 | ) | $ | 3.83 | $ | 3.60 | $ | — | $ | — | $ | (3.22 | ) | $ | (3.22 | ) | $ | — | $ | 19.49 | $ | 22,330 | 20.63 | % | 1.30 | % | 1.44 | % | (1.18 | ) % | 64 | % | |||||||||||||||||||||||||||||
Year Ended March 31, 2016 | 21.49 | (0.26 | ) | (0.59 | ) | (0.85 | ) | — | — | (1.53 | ) | (1.53 | ) | — | 19.11 | 18,203 | (4.74 | ) | 1.31 | 1.39 | (1.20 | ) | 59 | |||||||||||||||||||||||||||||||||||||||||
Year Ended March 31, 2015 | 21.20 | (0.26 | ) | 1.21 | 0.95 | — | — | (0.66 | ) | (0.66 | ) | — | 21.49 | 24,321 | 4.61 | 1.31 | 1.34 | (1.20 | ) | 42 | ||||||||||||||||||||||||||||||||||||||||||||
Year Ended March 31, 2014 | 15.60 | (0.22 | ) | 7.01 | 6.79 | — | — | (1.19 | ) | (1.19 | ) | — | 21.20 | 39,495 | 43.70 | 1.29 | 1.37 | (1.08 | ) | 49 | ||||||||||||||||||||||||||||||||||||||||||||
Year Ended March 31, 2013 | 15.94 | (0.14 | ) | 0.42 | 0.28 | — | — | (0.62 | ) | (0.62 | ) | — | 15.60 | 15,840 | 1.84 | 1.20 | 1.21 | (0.98 | ) | 24 | ||||||||||||||||||||||||||||||||||||||||||||
A Shares | ||||||||||||||||||||||||||||||||||||||||||||||||||||||||||||||||
Year Ended March 31, 2017 | 18.37 | (0.26 | ) | 3.67 | 3.41 | — | — | (3.22 | ) | (3.22 | ) | — | 18.56 | 6,375 | 20.42 | 1.50 | 1.55 | (1.39 | ) | 64 | ||||||||||||||||||||||||||||||||||||||||||||
Year Ended March 31, 2016 | 20.76 | (0.29 | ) | (0.57 | ) | (0.86 | ) | — | — | (1.53 | ) | (1.53 | ) | — | 18.37 | 8,127 | (4.96 | ) | 1.49 | 1.49 | (1.38 | ) | 59 | |||||||||||||||||||||||||||||||||||||||||
Year Ended March 31, 2015 | 20.53 | (0.28 | ) | 1.17 | 0.89 | — | — | (0.66 | ) | (0.66 | ) | — | 20.76 | 10,535 | 4.47 | 1.45 | 1.45 | (1.34 | ) | 42 | ||||||||||||||||||||||||||||||||||||||||||||
Year Ended March 31, 2014 | 15.16 | (0.24 | ) | 6.80 | 6.56 | — | — | (1.19 | ) | (1.19 | ) | — | 20.53 | 19,950 | 43.45 | 1.40 | 1.40 | (1.18 | ) | 49 | ||||||||||||||||||||||||||||||||||||||||||||
Year Ended March 31, 2013 | 15.54 | (0.18 | ) | 0.42 | 0.24 | — | — | (0.62 | ) | (0.62 | ) | — | 15.16 | 3,580 | 1.63 | 1.49 | 1.53 | (1.24 | ) | 24 | ||||||||||||||||||||||||||||||||||||||||||||
International Equity Fund |
| |||||||||||||||||||||||||||||||||||||||||||||||||||||||||||||||
I Shares | ||||||||||||||||||||||||||||||||||||||||||||||||||||||||||||||||
Year Ended March 31, 2017 | 9.30 | 0.03 | 0.94 | 0.97 | (0.04 | ) | — | (0.04 | ) | (0.08 | ) | — | 10.19 | 51,120 | 10.54 | (h) | 1.14 | (i) | 1.24 | (i) | 0.34 | 37 | ||||||||||||||||||||||||||||||||||||||||||
Year Ended March 31, 2016 | 10.45 | 0.13 | (0.29 | ) | (0.16 | ) | (0.07 | ) | — | (0.92 | ) | (0.99 | ) | — | 9.30 | 28,756 | (1.59 | ) | 1.30 | 1.67 | 1.28 | 114 | ||||||||||||||||||||||||||||||||||||||||||
Year Ended March 31, 2015 | 12.45 | 0.25 | (0.90 | ) | (0.65 | ) | (0.23 | ) | — | (1.12 | ) | (1.35 | ) | — | 10.45 | 19,023 | (4.59 | ) | 1.37 | 1.48 | 2.15 | 41 | ||||||||||||||||||||||||||||||||||||||||||
Year Ended March 31, 2014 | 11.64 | 0.55 | 1.65 | 2.20 | (1.17 | ) | — | (0.22 | ) | (1.39 | ) | — | 12.45 | 26,932 | 19.52 | 1.20 | 1.20 | 4.55 | (j) | 43 | ||||||||||||||||||||||||||||||||||||||||||||
Year Ended March 31, 2013 | 10.74 | 0.22 | 0.89 | 1.11 | (0.21 | ) | — | — | (0.21 | ) | — | 11.64 | 272,552 | 10.38 | 1.12 | 1.12 | 2.02 | 52 | ||||||||||||||||||||||||||||||||||||||||||||||
A Shares | ||||||||||||||||||||||||||||||||||||||||||||||||||||||||||||||||
Year Ended March 31, 2017 | 9.18 | 0.01 | 0.93 | 0.94 | (0.03 | ) | — | (0.04 | ) | (0.07 | ) | — | 10.05 | 14,116 | 10.41 | 1.33 | (i) | 1.43 | (i) | 0.12 | 37 | |||||||||||||||||||||||||||||||||||||||||||
Year Ended March 31, 2016 | 10.34 | 0.09 | (0.27 | ) | (0.18 | ) | (0.06 | ) | — | (0.92 | ) | (0.98 | ) | — | 9.18 | 3,756 | (1.77 | ) | 1.51 | 1.77 | 0.89 | 114 | ||||||||||||||||||||||||||||||||||||||||||
Year Ended March 31, 2015 | 12.35 | 0.20 | (0.87 | ) | (0.67 | ) | (0.22 | ) | — | (1.12 | ) | (1.34 | ) | — | 10.34 | 4,123 | (4.87 | ) | 1.57 | 1.66 | 1.79 | 41 | ||||||||||||||||||||||||||||||||||||||||||
Year Ended March 31, 2014 | 11.51 | 0.20 | 2.00 | 2.20 | (1.14 | ) | — | (0.22 | ) | (1.36 | ) | — | 12.35 | 4,802 | 19.72 | 1.47 | 1.47 | 1.66 | 43 | |||||||||||||||||||||||||||||||||||||||||||||
Year Ended March 31, 2013 | 10.63 | 0.18 | 0.87 | 1.05 | (0.17 | ) | — | — | (0.17 | ) | — | 11.51 | 4,565 | 9.95 | 1.45 | 1.45 | 1.73 | 52 | ||||||||||||||||||||||||||||||||||||||||||||||
IS Shares | ||||||||||||||||||||||||||||||||||||||||||||||||||||||||||||||||
Year Ended March 31, 2017 | 9.31 | 0.05 | 0.93 | 0.98 | (0.05 | ) | — | (0.04 | ) | (0.09 | ) | — | 10.20 | 6,558 | 10.62 | 1.03 | (i) | 1.14 | (i) | 0.49 | 37 | |||||||||||||||||||||||||||||||||||||||||||
Period Ended March 31, 2016(k) | 9.85 | — | (f) | 0.38 | 0.38 | — | — | (0.92 | ) | (0.92 | ) | — | 9.31 | 5,832 | 3.81 | 1.14 | 1.54 | 0.09 | 114 | |||||||||||||||||||||||||||||||||||||||||||||
Silvant Large Cap Growth Stock Fund |
| |||||||||||||||||||||||||||||||||||||||||||||||||||||||||||||||
I Shares | ||||||||||||||||||||||||||||||||||||||||||||||||||||||||||||||||
Year Ended March 31, 2017 | 9.38 | — | (f) | 0.70 | 0.70 | — | — | (1.16 | ) | (1.16 | ) | — | 8.92 | 92,638 | 8.14 | 0.97 | 1.26 | (0.02 | ) | 42 | ||||||||||||||||||||||||||||||||||||||||||||
Year Ended March 31, 2016 | 10.32 | (0.02 | ) | (0.12 | ) | (0.14 | ) | — | — | (0.80 | ) | (0.80 | ) | — | 9.38 | 110,562 | (1.79 | ) | 0.97 | 1.24 | (0.15 | ) | 10 | |||||||||||||||||||||||||||||||||||||||||
Year Ended March 31, 2015 | 9.70 | — | 1.40 | 1.40 | — | — | (0.78 | ) | (0.78 | ) | — | 10.32 | 127,236 | 15.03 | 0.94 | 1.17 | (0.04 | ) | 13 | |||||||||||||||||||||||||||||||||||||||||||||
Year Ended March 31, 2014 | 8.31 | 0.01 | 2.24 | 2.25 | — | — | (0.86 | ) | (0.86 | ) | — | 9.70 | 188,294 | 27.35 | 0.92 | 1.09 | 0.07 | 21 | ||||||||||||||||||||||||||||||||||||||||||||||
Year Ended March 31, 2013 | 12.95 | 0.03 | 0.24 | 0.27 | (0.01 | ) | — | (4.90 | ) | (4.91 | ) | — | 8.31 | 167,887 | 3.64 | 0.94 | 0.94 | 0.23 | 40 | |||||||||||||||||||||||||||||||||||||||||||||
A Shares | ||||||||||||||||||||||||||||||||||||||||||||||||||||||||||||||||
Year Ended March 31, 2017 | 7.81 | (0.02 | ) | 0.57 | 0.55 | — | — | (1.16 | ) | (1.16 | ) | — | 7.20 | 60,900 | 7.83 | 1.23 | 1.24 | (0.27 | ) | 42 | ||||||||||||||||||||||||||||||||||||||||||||
Year Ended March 31, 2016 | 8.75 | (0.03 | ) | (0.11 | ) | (0.14 | ) | — | — | (0.80 | ) | (0.80 | ) | — | 7.81 | 62,115 | (2.13 | ) | 1.20 | 1.21 | (0.39 | ) | 10 | |||||||||||||||||||||||||||||||||||||||||
Year Ended March 31, 2015 | 8.35 | (0.02 | ) | 1.20 | 1.18 | — | — | (0.78 | ) | (0.78 | ) | — | 8.75 | 65,953 | 14.83 | 1.18 | 1.19 | (0.26 | ) | 13 | ||||||||||||||||||||||||||||||||||||||||||||
Year Ended March 31, 2014 | 7.27 | (0.02 | ) | 1.96 | 1.94 | — | — | (0.86 | ) | (0.86 | ) | — | 8.35 | 64,288 | 26.99 | 1.19 | 1.20 | (0.20 | ) | 21 | ||||||||||||||||||||||||||||||||||||||||||||
Year Ended March 31, 2013 | 11.96 | — | (f) | 0.21 | 0.21 | — | — | (4.90 | ) | (4.90 | ) | — | 7.27 | 56,511 | 3.43 | 1.20 | 1.20 | (0.01 | ) | 40 | ||||||||||||||||||||||||||||||||||||||||||||
See Notes to Financial Highlights and Notes to Financial Statements.
53
Table of Contents
FINANCIAL HIGHLIGHTS
RIDGEWORTH FUNDS Selected Data For a Share of Beneficial Interest Outstanding Throughout the Periods Indicated.
| Net Asset Value, Beginning of Period | Net Investment Income (Loss)(a) | Net Realized and Unrealized Gains (Losses) on Investments | Total from Operations | Dividends from Net Investment Income | Distributions from Tax Return of Capital | Distributions from Realized Capital Gains | Total Dividends and Distributions | Payments by Affiliates | Net Asset Value, End of Period | Net Assets End of Period (000) | Total Return(b) | Ratio of Net Expenses to Average Net Assets(c) | Ratio of Expenses to Average Net Assets (Excluding Waivers and Reimburse ments)(c) | Ratio of Net Investment Income to Average Net Assets(c) | Portfolio Turnover Rate(d) | |||||||||||||||||||||||||||||||||||||||||||||||||
C Shares | ||||||||||||||||||||||||||||||||||||||||||||||||||||||||||||||||
Year Ended March 31, 2017 | $ | 5.45 | $ | (0.05 | ) | $ | 0.38 | $ | 0.33 | $ | — | $ | — | $ | (1.16 | ) | $ | (1.16 | ) | $ | — | $ | 4.62 | $ | 36,141 | 7.16 | % | 1.90 | % | 1.90 | % | (0.95 | ) % | 42 | % | |||||||||||||||||||||||||||||
Year Ended March 31, 2016 | 6.38 | (0.06 | ) | (0.07 | ) | (0.13 | ) | — | — | (0.80 | ) | (0.80 | ) | — | 5.45 | 40,086 | (2.77 | ) | 1.88 | 1.89 | (1.06 | ) | 10 | |||||||||||||||||||||||||||||||||||||||||
Year Ended March 31, 2015 | 6.32 | (0.06 | ) | 0.90 | 0.84 | — | — | (0.78 | ) | (0.78 | ) | — | 6.38 | 46,678 | 14.20 | 1.86 | 1.87 | (0.90 | ) | 13 | ||||||||||||||||||||||||||||||||||||||||||||
Year Ended March 31, 2014 | 5.71 | (0.06 | ) | 1.53 | 1.47 | — | — | (0.86 | ) | (0.86 | ) | — | 6.32 | 34,249 | 26.09 | 1.88 | 1.88 | (0.90 | ) | 21 | ||||||||||||||||||||||||||||||||||||||||||||
Year Ended March 31, 2013 | 10.52 | (0.06 | ) | 0.15 | 0.09 | — | — | (4.90 | ) | (4.90 | ) | — | 5.71 | 31,625 | 2.69 | 1.89 | 1.89 | (0.70 | ) | 40 | ||||||||||||||||||||||||||||||||||||||||||||
IS Shares | ||||||||||||||||||||||||||||||||||||||||||||||||||||||||||||||||
Year Ended March 31, 2017 | 9.39 | 0.01 | 0.70 | 0.71 | — | — | (1.16 | ) | (1.16 | ) | — | 8.94 | 24,261 | 8.23 | 0.90 | 0.90 | 0.05 | 42 | ||||||||||||||||||||||||||||||||||||||||||||||
Year Ended March 31, 2016 | 10.33 | (0.01 | ) | (0.13 | ) | (0.14 | ) | — | — | (0.80 | ) | (0.80 | ) | — | 9.39 | 37,087 | (1.80 | ) | 0.88 | 0.89 | (0.06 | ) | 10 | |||||||||||||||||||||||||||||||||||||||||
Period Ended March 31, 2015(g) | 9.97 | 0.01 | 1.13 | 1.14 | — | — | (0.78 | ) | (0.78 | ) | — | 10.33 | 52,967 | 12.02 | 0.85 | 0.87 | 0.16 | 13 | ||||||||||||||||||||||||||||||||||||||||||||||
Silvant Small Cap Growth Stock Fund |
| |||||||||||||||||||||||||||||||||||||||||||||||||||||||||||||||
I Shares | ||||||||||||||||||||||||||||||||||||||||||||||||||||||||||||||||
Year Ended March 31, 2017 | 8.52 | (0.04 | ) | 1.66 | 1.62 | — | — | (1.19 | ) | (1.19 | ) | — | 8.95 | 26,929 | 19.45 | 1.29 | 1.43 | (0.44 | ) | 56 | ||||||||||||||||||||||||||||||||||||||||||||
Year Ended March 31, 2016 | 14.83 | (0.10 | ) | (1.54 | ) | (1.64 | ) | — | — | (4.67 | ) | (4.67 | ) | — | 8.52 | 36,436 | (13.36 | )(h) | 1.30 | 1.39 | (0.74 | ) | 73 | |||||||||||||||||||||||||||||||||||||||||
Year Ended March 31, 2015 | 16.82 | (0.14 | ) | 0.65 | 0.51 | — | — | (2.50 | ) | (2.50 | ) | — | 14.83 | 126,223 | 4.31 | (h) | 1.28 | 1.34 | (0.92 | ) | 31 | |||||||||||||||||||||||||||||||||||||||||||
Year Ended March 31, 2014 | 15.66 | (0.16 | ) | 4.23 | 4.07 | — | — | (2.91 | ) | (2.91 | ) | — | 16.82 | 170,409 | 25.98 | 1.26 | 1.31 | (0.91 | ) | 90 | ||||||||||||||||||||||||||||||||||||||||||||
Year Ended March 31, 2013 | 17.21 | (0.08 | ) | 2.19 | 2.11 | — | — | (3.66 | ) | (3.66 | ) | — | 15.66 | 152,674 | 14.20 | 1.21 | 1.21 | (0.50 | ) | 50 | ||||||||||||||||||||||||||||||||||||||||||||
A Shares | ||||||||||||||||||||||||||||||||||||||||||||||||||||||||||||||||
Year Ended March 31, 2017 | 7.13 | (0.04 | ) | 1.38 | 1.34 | — | — | (1.19 | ) | (1.19 | ) | — | 7.28 | 7,008 | 19.30 | 1.41 | 1.43 | (0.55 | ) | 56 | ||||||||||||||||||||||||||||||||||||||||||||
Year Ended March 31, 2016 | 13.23 | (0.08 | ) | (1.35 | ) | (1.43 | ) | — | — | (4.67 | ) | (4.67 | ) | — | 7.13 | 6,856 | (13.38 | ) | 1.37 | 1.37 | (0.76 | ) | 73 | |||||||||||||||||||||||||||||||||||||||||
Year Ended March 31, 2015 | 15.30 | (0.13 | ) | 0.56 | 0.43 | — | — | (2.50 | ) | (2.50 | ) | — | 13.23 | 9,889 | 4.21 | 1.32 | 1.32 | (0.96 | ) | 31 | ||||||||||||||||||||||||||||||||||||||||||||
Year Ended March 31, 2014 | 14.46 | (0.15 | ) | 3.90 | 3.75 | — | — | (2.91 | ) | (2.91 | ) | — | 15.30 | 10,880 | 25.92 | 1.29 | 1.29 | (0.94 | ) | 90 | ||||||||||||||||||||||||||||||||||||||||||||
Year Ended March 31, 2013 | 16.18 | (0.11 | ) | 2.05 | 1.94 | — | — | (3.66 | ) | (3.66 | ) | — | 14.46 | 10,226 | 14.07 | 1.37 | 1.37 | (0.69 | ) | 50 | ||||||||||||||||||||||||||||||||||||||||||||
C Shares | ||||||||||||||||||||||||||||||||||||||||||||||||||||||||||||||||
Year Ended March 31, 2017 | 3.88 | (0.05 | ) | 0.73 | 0.68 | — | — | (1.19 | ) | (1.19 | ) | — | 3.37 | 4,758 | 18.39 | 2.08 | 2.09 | (1.21 | ) | 56 | ||||||||||||||||||||||||||||||||||||||||||||
Year Ended March 31, 2016 | 9.53 | (0.10 | ) | (0.88 | ) | (0.98 | ) | — | — | (4.67 | ) | (4.67 | ) | — | 3.88 | 4,686 | (13.91 | ) | 2.02 | 2.02 | (1.40 | ) | 73 | |||||||||||||||||||||||||||||||||||||||||
Year Ended March 31, 2015 | 11.82 | (0.17 | ) | 0.38 | 0.21 | — | — | (2.50 | ) | (2.50 | ) | — | 9.53 | 6,397 | 3.55 | 1.96 | 1.96 | (1.60 | ) | 31 | ||||||||||||||||||||||||||||||||||||||||||||
Year Ended March 31, 2014 | 11.77 | (0.20 | ) | 3.16 | 2.96 | — | — | (2.91 | ) | (2.91 | ) | — | 11.82 | 7,255 | 25.10 | 1.94 | 1.94 | (1.59 | ) | 90 | ||||||||||||||||||||||||||||||||||||||||||||
Year Ended March 31, 2013 | 13.91 | (0.18 | ) | 1.70 | 1.52 | — | — | (3.66 | ) | (3.66 | ) | — | 11.77 | 6,757 | 13.30 | 2.05 | 2.05 | (1.39 | ) | 50 | ||||||||||||||||||||||||||||||||||||||||||||
IS Shares | ||||||||||||||||||||||||||||||||||||||||||||||||||||||||||||||||
Year Ended March 31, 2017 | 8.57 | (0.02 | ) | 1.68 | 1.66 | — | — | (1.19 | ) | (1.19 | ) | — | 9.04 | 2,225 | 19.82 | 1.08 | 1.10 | (0.20 | ) | 56 | ||||||||||||||||||||||||||||||||||||||||||||
Year Ended March 31, 2016 | 14.85 | (0.05 | ) | (1.56 | ) | (1.61 | ) | — | — | (4.67 | ) | (4.67 | ) | — | 8.57 | 3,289 | (13.13 | ) | 1.02 | 1.02 | (0.42 | ) | 73 | |||||||||||||||||||||||||||||||||||||||||
Period Ended March 31, 2015(g) | 15.61 | (0.06 | ) | 1.80 | 1.74 | — | — | (2.50 | ) | (2.50 | ) | — | 14.85 | 6,235 | 12.53 | 0.96 | 0.96 | (0.56 | ) | 31 | ||||||||||||||||||||||||||||||||||||||||||||
Conservative Allocation Strategy(l) |
| |||||||||||||||||||||||||||||||||||||||||||||||||||||||||||||||
I Shares | ||||||||||||||||||||||||||||||||||||||||||||||||||||||||||||||||
Year Ended March 31, 2017 | 12.01 | 0.20 | 0.47 | 0.67 | (0.29 | ) | — | (0.05 | ) | (0.34 | ) | — | 12.34 | 17,928 | 5.66 | 0.30 | 0.46 | 1.59 | 14 | |||||||||||||||||||||||||||||||||||||||||||||
Year Ended March 31, 2016 | 12.76 | 0.20 | (0.42 | ) | (0.22 | ) | (0.22 | ) | — | (0.31 | ) | (0.53 | ) | — | 12.01 | 31,067 | (1.73 | ) | 0.30 | 0.44 | 1.65 | 40 | ||||||||||||||||||||||||||||||||||||||||||
Year Ended March 31, 2015 | 12.60 | 0.23 | 0.53 | 0.76 | (0.32 | ) | — | (0.28 | ) | (0.60 | ) | — | 12.76 | 32,606 | 6.17 | (h) | 0.30 | 0.45 | 1.77 | 17 | ||||||||||||||||||||||||||||||||||||||||||||
Year Ended March 31, 2014 | 12.54 | 0.24 | 0.68 | 0.92 | (0.34 | ) | — | (0.52 | ) | (0.86 | ) | — | 12.60 | 28,894 | 7.48 | (h) | 0.30 | 0.38 | 1.88 | 24 | ||||||||||||||||||||||||||||||||||||||||||||
Year Ended March 31, 2013 | 12.27 | 0.21 | 0.46 | 0.67 | (0.27 | ) | — | (0.13 | ) | (0.40 | ) | — | 12.54 | 27,387 | 5.55 | 0.27 | 0.39 | 1.72 | 40 | |||||||||||||||||||||||||||||||||||||||||||||
A Shares | ||||||||||||||||||||||||||||||||||||||||||||||||||||||||||||||||
Year Ended March 31, 2017 | 12.01 | 0.16 | 0.47 | 0.63 | (0.24 | ) | — | (0.05 | ) | (0.29 | ) | — | 12.35 | 8,047 | 5.28 | 0.60 | 0.70 | 1.26 | 14 | |||||||||||||||||||||||||||||||||||||||||||||
Year Ended March 31, 2016 | 12.75 | 0.16 | (0.41 | ) | (0.25 | ) | (0.18 | ) | — | (0.31 | ) | (0.49 | ) | — | 12.01 | 14,462 | (1.98 | ) | 0.60 | 0.67 | 1.33 | 40 | ||||||||||||||||||||||||||||||||||||||||||
Year Ended March 31, 2015 | 12.59 | 0.19 | 0.53 | 0.72 | (0.28 | ) | — | (0.28 | ) | (0.56 | ) | — | 12.75 | 15,991 | 5.86 | 0.60 | 0.67 | 1.47 | 17 | |||||||||||||||||||||||||||||||||||||||||||||
Year Ended March 31, 2014 | 12.53 | 0.20 | 0.67 | 0.87 | (0.29 | ) | — | (0.52 | ) | (0.81 | ) | — | 12.59 | 15,271 | 7.14 | 0.60 | 0.66 | 1.57 | 24 | |||||||||||||||||||||||||||||||||||||||||||||
Year Ended March 31, 2013 | 12.26 | 0.17 | 0.47 | 0.64 | (0.24 | ) | — | (0.13 | ) | (0.37 | ) | — | 12.53 | 16,940 | 5.29 | 0.56 | 0.68 | 1.37 | 40 | |||||||||||||||||||||||||||||||||||||||||||||
See Notes to Financial Highlights and Notes to Financial Statements.
54
Table of Contents
FINANCIAL HIGHLIGHTS
RIDGEWORTH FUNDS Selected Data For a Share of Beneficial Interest Outstanding Throughout the Periods Indicated.
| Net Asset Value, Beginning of Period | Net Investment Income (Loss)(a) | Net Realized and Unrealized Gains (Losses) on Investments | Total from Operations | Dividends from Net Investment Income | Distributions from Tax Return of Capital | Distributions from Realized Capital Gains | Total Dividends and Distributions | Payments by Affiliates | Net Asset Value, End of Period | Net Assets End of Period (000) | Total Return(b) | Ratio of Net Expenses to Average Net Assets(c) | Ratio of Expenses to Average Net Assets (Excluding Waivers and Reimburse ments)(c) | Ratio of Net Investment Income to Average Net Assets(c) | Portfolio Turnover Rate(d) | |||||||||||||||||||||||||||||||||||||||||||||||||
C Shares | ||||||||||||||||||||||||||||||||||||||||||||||||||||||||||||||||
Year Ended March 31, 2017 | $ | 11.86 | $ | 0.08 | $ | 0.46 | $ | 0.54 | $ | (0.16 | ) | $ | — | $ | (0.05 | ) | $ | (0.21 | ) | $ | — | $ | 12.19 | $ | 16,293 | 4.61 | % | 1.30 | % | 1.35 | % | 0.65 | % | 14 | % | |||||||||||||||||||||||||||||
Year Ended March 31, 2016 | 12.61 | 0.08 | (0.42 | ) | (0.34 | ) | (0.10 | ) | — | (0.31 | ) | (0.41 | ) | — | 11.86 | 19,136 | (2.71 | ) | 1.30 | 1.32 | 0.65 | 40 | ||||||||||||||||||||||||||||||||||||||||||
Year Ended March 31, 2015 | 12.46 | 0.10 | 0.53 | 0.63 | (0.20 | ) | — | (0.28 | ) | (0.48 | ) | — | 12.61 | 18,201 | 5.11 | (h) | 1.30 | 1.33 | 0.76 | 17 | ||||||||||||||||||||||||||||||||||||||||||||
Year Ended March 31, 2014 | 12.42 | 0.11 | 0.67 | 0.78 | (0.22 | ) | — | (0.52 | ) | (0.74 | ) | — | 12.46 | 17,110 | 6.38 | (h) | 1.30 | 1.32 | 0.89 | 24 | ||||||||||||||||||||||||||||||||||||||||||||
Year Ended March 31, 2013 | 12.18 | 0.09 | 0.47 | 0.56 | (0.19 | ) | — | (0.13 | ) | (0.32 | ) | — | 12.42 | 15,410 | 4.58 | 1.27 | 1.35 | 0.73 | 40 | |||||||||||||||||||||||||||||||||||||||||||||
Growth Allocation Strategy(l) |
| |||||||||||||||||||||||||||||||||||||||||||||||||||||||||||||||
I Shares | ||||||||||||||||||||||||||||||||||||||||||||||||||||||||||||||||
Year Ended March 31, 2017 | 10.13 | 0.10 | 0.96 | 1.06 | (0.13 | ) | — | (0.65 | ) | (0.78 | ) | — | 10.41 | 32,562 | 10.83 | 0.50 | 0.74 | 0.92 | 20 | |||||||||||||||||||||||||||||||||||||||||||||
Year Ended March 31, 2016 | 11.46 | 0.10 | (0.52 | ) | (0.42 | ) | (0.12 | ) | — | (0.79 | ) | (0.91 | ) | — | 10.13 | 38,194 | (3.74 | ) | 0.50 | 0.70 | 0.91 | 29 | ||||||||||||||||||||||||||||||||||||||||||
Year Ended March 31, 2015 | 11.38 | 0.09 | 0.75 | 0.84 | (0.24 | ) | — | (0.52 | ) | (0.76 | ) | — | 11.46 | 53,293 | 7.54 | 0.50 | 0.69 | 0.78 | 23 | |||||||||||||||||||||||||||||||||||||||||||||
Year Ended March 31, 2014 | 11.28 | 0.14 | 1.61 | 1.75 | (0.35 | ) | — | (1.30 | ) | (1.65 | ) | — | 11.38 | 53,043 | 15.96 | 0.50 | 0.67 | 1.16 | 14 | |||||||||||||||||||||||||||||||||||||||||||||
Year Ended March 31, 2013 | 10.64 | 0.11 | 0.68 | 0.79 | (0.15 | ) | — | — | (0.15 | ) | — | 11.28 | 55,222 | 7.52 | 0.40 | 0.55 | 1.04 | 20 | ||||||||||||||||||||||||||||||||||||||||||||||
A Shares | ||||||||||||||||||||||||||||||||||||||||||||||||||||||||||||||||
Year Ended March 31, 2017 | 10.07 | 0.07 | 0.97 | 1.04 | (0.11 | ) | — | (0.65 | ) | (0.76 | ) | — | 10.35 | 5,813 | 10.66 | 0.69 | 0.69 | 0.72 | 20 | |||||||||||||||||||||||||||||||||||||||||||||
Year Ended March 31, 2016 | 11.41 | 0.08 | (0.53 | ) | (0.45 | ) | (0.10 | ) | — | (0.79 | ) | (0.89 | ) | — | 10.07 | 7,255 | (4.02 | ) | 0.67 | 0.67 | 0.74 | 29 | ||||||||||||||||||||||||||||||||||||||||||
Year Ended March 31, 2015 | 11.33 | 0.07 | 0.75 | 0.82 | (0.22 | ) | — | (0.52 | ) | (0.74 | ) | — | 11.41 | 8,801 | 7.38 | 0.68 | 0.68 | 0.63 | 23 | |||||||||||||||||||||||||||||||||||||||||||||
Year Ended March 31, 2014 | 11.23 | 0.12 | 1.61 | 1.73 | (0.33 | ) | — | (1.30 | ) | (1.63 | ) | — | 11.33 | 9,609 | 15.84 | 0.67 | 0.67 | 1.06 | 14 | |||||||||||||||||||||||||||||||||||||||||||||
Year Ended March 31, 2013 | 10.61 | 0.09 | 0.66 | 0.75 | (0.13 | ) | — | — | (0.13 | ) | — | 11.23 | 8,975 | 7.16 | 0.61 | 0.64 | 0.84 | 20 | ||||||||||||||||||||||||||||||||||||||||||||||
C Shares | ||||||||||||||||||||||||||||||||||||||||||||||||||||||||||||||||
Year Ended March 31, 2017 | 9.84 | 0.01 | 0.95 | 0.96 | (0.06 | ) | — | (0.65 | ) | (0.71 | ) | — | 10.09 | 2,003 | 10.00 | 1.30 | 1.37 | 0.07 | 20 | |||||||||||||||||||||||||||||||||||||||||||||
Year Ended March 31, 2016 | 11.18 | 0.01 | (0.52 | ) | (0.51 | ) | (0.04 | ) | — | (0.79 | ) | (0.83 | ) | — | 9.84 | 2,613 | (4.60 | ) | 1.30 | 1.31 | 0.08 | 29 | ||||||||||||||||||||||||||||||||||||||||||
Year Ended March 31, 2015 | 11.13 | — | (f) | 0.73 | 0.73 | (0.16 | ) | — | (0.52 | ) | (0.68 | ) | — | 11.18 | 3,192 | 6.70 | 1.30 | 1.30 | — | (f) | 23 | |||||||||||||||||||||||||||||||||||||||||||
Year Ended March 31, 2014 | 11.08 | 0.06 | 1.56 | 1.62 | (0.27 | ) | — | (1.30 | ) | (1.57 | ) | — | 11.13 | 2,989 | 15.05 | 1.28 | 1.28 | 0.49 | 14 | |||||||||||||||||||||||||||||||||||||||||||||
Year Ended March 31, 2013 | 10.48 | 0.02 | 0.66 | 0.68 | (0.08 | ) | — | — | (0.08 | ) | — | 11.08 | 2,602 | 6.55 | 1.25 | 1.28 | 0.22 | 20 | ||||||||||||||||||||||||||||||||||||||||||||||
Moderate Allocation Strategy(l) |
| |||||||||||||||||||||||||||||||||||||||||||||||||||||||||||||||
I Shares | ||||||||||||||||||||||||||||||||||||||||||||||||||||||||||||||||
Year Ended March 31, 2017 | 9.05 | 0.10 | 0.61 | 0.71 | (0.15 | ) | — | (0.60 | ) | (0.75 | ) | — | 9.01 | 29,988 | 8.08 | 0.50 | 0.72 | 1.14 | 15 | |||||||||||||||||||||||||||||||||||||||||||||
Year Ended March 31, 2016 | 11.07 | 0.11 | (0.43 | ) | (0.32 | ) | (0.18 | ) | — | (1.52 | ) | (1.70 | ) | — | 9.05 | 45,980 | (2.96 | ) | 0.50 | 0.57 | 1.08 | 26 | ||||||||||||||||||||||||||||||||||||||||||
Year Ended March 31, 2015 | 11.18 | 0.13 | 0.61 | 0.74 | (0.26 | ) | — | (0.59 | ) | (0.85 | ) | — | 11.07 | 94,978 | 6.77 | 0.50 | 0.52 | 1.18 | 18 | |||||||||||||||||||||||||||||||||||||||||||||
Year Ended March 31, 2014 | 11.11 | 0.16 | 1.09 | 1.25 | (0.31 | ) | — | (0.87 | ) | (1.18 | ) | — | 11.18 | 109,457 | 11.56 | 0.50 | 0.54 | 1.44 | 18 | |||||||||||||||||||||||||||||||||||||||||||||
Year Ended March 31, 2013 | 10.77 | 0.15 | 0.54 | 0.69 | (0.18 | ) | — | (0.17 | ) | (0.35 | ) | — | 11.11 | 139,912 | 6.60 | 0.40 | 0.43 | 1.37 | 29 | |||||||||||||||||||||||||||||||||||||||||||||
A Shares | ||||||||||||||||||||||||||||||||||||||||||||||||||||||||||||||||
Year Ended March 31, 2017 | 9.01 | 0.09 | 0.59 | 0.68 | (0.13 | ) | — | (0.60 | ) | (0.73 | ) | — | 8.96 | 10,864 | 7.84 | 0.70 | 0.71 | 0.98 | 15 | |||||||||||||||||||||||||||||||||||||||||||||
Year Ended March 31, 2016 | 11.04 | 0.11 | (0.45 | ) | (0.34 | ) | (0.17 | ) | — | (1.52 | ) | (1.69 | ) | — | 9.01 | 11,972 | (3.13 | ) | 0.68 | 0.68 | 1.05 | 26 | ||||||||||||||||||||||||||||||||||||||||||
Year Ended March 31, 2015 | 11.15 | 0.11 | 0.62 | 0.73 | (0.25 | ) | — | (0.59 | ) | (0.84 | ) | — | 11.04 | 17,295 | 6.65 | 0.67 | 0.67 | 1.00 | 18 | |||||||||||||||||||||||||||||||||||||||||||||
Year Ended March 31, 2014 | 11.08 | 0.15 | 1.09 | 1.24 | (0.30 | ) | — | (0.87 | ) | (1.17 | ) | — | 11.15 | 20,171 | 11.48 | 0.62 | 0.62 | 1.32 | 18 | |||||||||||||||||||||||||||||||||||||||||||||
Year Ended March 31, 2013 | 10.75 | 0.13 | 0.54 | 0.67 | (0.17 | ) | — | (0.17 | ) | (0.34 | ) | — | 11.08 | 19,622 | 6.36 | 0.58 | 0.59 | 1.19 | 29 | |||||||||||||||||||||||||||||||||||||||||||||
C Shares | ||||||||||||||||||||||||||||||||||||||||||||||||||||||||||||||||
Year Ended March 31, 2017 | 8.93 | 0.03 | 0.60 | 0.63 | (0.08 | ) | — | (0.60 | ) | (0.68 | ) | — | 8.88 | 10,070 | 7.24 | (h) | 1.30 | 1.33 | 0.38 | 15 | ||||||||||||||||||||||||||||||||||||||||||||
Year Ended March 31, 2016 | 10.95 | 0.05 | (0.44 | ) | (0.39 | ) | (0.11 | ) | — | (1.52 | ) | (1.63 | ) | — | 8.93 | 11,279 | (3.65 | ) | 1.26 | 1.26 | 0.45 | 26 | ||||||||||||||||||||||||||||||||||||||||||
Year Ended March 31, 2015 | 11.06 | 0.05 | 0.61 | 0.66 | (0.18 | ) | — | (0.59 | ) | (0.77 | ) | — | 10.95 | 13,553 | 6.07 | 1.23 | 1.23 | 0.47 | 18 | |||||||||||||||||||||||||||||||||||||||||||||
Year Ended March 31, 2014 | 11.00 | 0.08 | 1.08 | 1.16 | (0.23 | ) | — | (0.87 | ) | (1.10 | ) | — | 11.06 | 14,591 | 10.81 | 1.21 | 1.21 | 0.73 | 18 | |||||||||||||||||||||||||||||||||||||||||||||
Year Ended March 31, 2013 | 10.69 | 0.06 | 0.54 | 0.60 | (0.12 | ) | — | (0.17 | ) | (0.29 | ) | — | 11.00 | 14,106 | 5.69 | 1.20 | 1.21 | 0.56 | 29 | |||||||||||||||||||||||||||||||||||||||||||||
See Notes to Financial Highlights and Notes to Financial Statements.
55
Table of Contents
NOTES TO FINANCIAL HIGHLIGHTS
| (a) | Per share data calculated using average shares outstanding method. |
| (b) | Total return excludes sales charge. Not annualized for periods less than one year. |
| (c) | Annualized for periods less than one year. |
| (d) | Not annualized for periods less than one year. |
| (e) | The Fund had a fiscal year end change from November 30 to March 31 and adopted the historical performance of the Predecessor Fund. |
| (f) | Rounds to less than $0.005 per share. |
| (g) | IS Shares commenced operations on August 1, 2014. |
| (h) | Generally accepted accounting principles require adjustments to be made to the net assets of the Fund at period end for financial reporting purposes, and as such, the net asset values for shareholder transactions and the returns based on those net asset values may differ from the net asset values and returns reported in the management’s discussion of Fund performance. |
| (i) | Net investment income per share and the ratio of net investment income to average net assets include a non-recurring refund for overbilling of prior years’ custodian out-of-pocket fees which amounted to $0.01 per share and 0.07%, 0.09%, and 0.07% of average net assets for the I Shares, A Shares, and IS Shares, respectively. |
| (j) | The amount shown for the net investment income ratio does not represent the actual pro rata amount allocated to the share class due to large redemptions during the year. |
| (k) | IS Shares commenced operations on September 1, 2015. |
| (l) | The Fund and its shareholders indirectly bear a pro rata share of the acquired fund fees and expenses incurred by the underlying investment companies in which the Fund is invested. The expense ratios do not include such acquired fund fees and expenses. |
56
Table of Contents
RIDGEWORTH FUNDS March 31, 2017
| 1. | Organization |
RidgeWorth Funds (the “Trust”) is organized as a Massachusetts business trust and is registered under the Investment Company Act of 1940, as amended (the “1940 Act”), as an open-end management investment company. The Trust is authorized to issue an unlimited number of shares without par value. The financial statements presented herein are those of the Capital Innovations Global Resources and Infrastructure Fund, Ceredex Large Cap Value Equity Fund, Ceredex Mid-Cap Value Equity Fund, Ceredex Small Cap Value Equity Fund, Innovative Growth Stock Fund, International Equity Fund, Silvant Large Cap Growth Stock Fund, Silvant Small Cap Growth Stock Fund, Conservative Allocation Strategy, Growth Allocation Strategy and Moderate Allocation Strategy (each, a “Fund” and collectively, the “Funds”), which are each a diversified series of the Trust. Effective the close of business on February 19, 2016, Capital Innovations Global Resources and Infrastructure Fund, a new series of the Trust, acquired the assets and assumed the liabilities of the Capital Innovations Global Agri, Timber, Infrastructure Fund (“Predecessor Fund”), a series of Investment Managers Series Trust, in a tax-free reorganization.
The Innovative Growth Stock Fund offers I Shares and A Shares. The International Equity Fund offers I Shares, A Shares and IS Shares. The Capital Innovations Global Resources and Infrastructure Fund, Ceredex Small Cap Value Equity Fund, Conservative Allocation Strategy, Growth Allocation Strategy and Moderate Allocation Strategy offer I Shares, A Shares and C Shares. The Ceredex Large Cap Value Equity Fund, Ceredex Mid-Cap Value Equity Fund, Silvant Large Cap Growth Stock Fund and Silvant Small Cap Growth Stock Fund offer I Shares, A Shares, C Shares and IS Shares.
The assets of each Fund are segregated and a shareholder’s interest is limited to the Fund in which shares are held. Each class of shares has identical rights and privileges except with respect to fees paid under the Distribution and Service Plan and the Shareholder Servicing Plan (“Plan”), and voting rights on matters affecting a single class of shares and sales charges. The A Shares of the Funds (except Conservative Allocation Strategy) have a maximum sales charge on purchases of 5.75% as a percentage of original purchase price. Conservative Allocation Strategy A Shares have a maximum sales charge on purchases of 4.75% as a percentage of original purchase price. Certain purchases of A Shares will not be subject to a front-end sales charge but will be subject to a contingent deferred sales charge (“CDSC”) of 0.75%, if redeemed within two years of purchase. The deferred sales charge may be waived from time to time for certain broker-dealers that waive payment of compensation to them. The C Shares have a maximum CDSC of 1.00% as a percentage of either the original purchase price or the next calculated price after the Funds receive a redemption request, whichever is less, if shares are redeemed within one year of purchase. There is no sales charge on purchases of I Shares or IS Shares.
The Trust’s officers and trustees are indemnified against certain liabilities arising out of the performance of their duties to the Trust. In addition, in the normal course of business, the Trust enters into contracts with its vendors and others that provide for general indemnifications. The Trust’s maximum exposure under these arrangements is unknown as this would involve future claims that may be made against the Trust. However, based on experience, the Trust expects that risk of loss to be remote.
The Funds are each an investment company and accordingly follow the investment company accounting and reporting guidance of the Financial Accounting Standards Board (“FASB”) Codification Topic 946 (“ASC Topic 946”) Financial Services — Investment Companies.
| 2. | Significant Accounting Policies |
The following are significant accounting policies consistently followed by the Funds which are in conformity with accounting principles generally accepted in the U.S. (“GAAP”). Estimates and assumptions are required to be made regarding assets, liabilities and changes in net assets resulting from operations when financial statements are prepared. Changes in the economic environment, financial markets and any other parameters used in determining these estimates could cause actual results to differ.
(a) Investment Valuation — Equity securities for which market quotations are available are valued at the last reported sales price or official closing price on the primary market or exchange on which they trade. The prices are provided by independent pricing vendors approved by the Board of Trustees of the Trust (the “Board”).
The Funds, in accordance with GAAP, have adopted FASB Codification Topic 820 (“ASC Topic 820”). ASC Topic 820 establishes a single definition of fair value, creates a three-tier hierarchy as a framework for measuring fair value
57
Table of Contents
NOTES TO FINANCIAL STATEMENTS (continued)
RIDGEWORTH FUNDS March 31, 2017
based on inputs used to value the Funds’ investments, and requires additional disclosure about fair value. The hierarchy of inputs is summarized below:
| • | Level 1— Investments whose values are based on quoted market prices in active markets are classified as Level 1 prices, which includes active listed equities. Investments in underlying funds and money market funds are valued at their Net Asset Value (“NAV”) daily and are classified as Level 1 prices. |
| • | Level 2 — Investments that trade in markets that are not considered to be active, but whose values are based on quoted market prices, dealer quotations or valuations provided by alternative pricing sources supported by observable inputs are classified as Level 2 prices. These generally include less liquid equities and certain equity securities listed or traded on foreign security exchanges which include a fair valuation adjustment factor applied to their equity prices as of the end of the period. |
| • | Level 3 — Investments whose values are classified as Level 3 prices have significant unobservable inputs, as they may trade infrequently or not at all. When observable prices are not available for these securities, the Funds use one or more valuation techniques for which sufficient and reliable data is available. The inputs used by the Funds in estimating the value of Level 3 prices may include the original transaction price, quoted prices for similar securities or assets in active markets, completed or pending third-party transactions in the underlying investment or comparable issuers, and changes in financial ratios or cash flows. Level 3 prices may also be adjusted to reflect illiquidity and/or non-transferability, with the amount of such discount estimated by the Funds in the absence of market information. Assumptions used by the Funds due to the lack of observable inputs may significantly impact the resulting fair value and therefore the Funds’ results of operations. |
The inputs or methodology used for valuing securities are not necessarily an indication of the risk associated with investing in those securities.
The Funds use valuation techniques to measure fair value that are consistent with the market approach and/or income approach, depending on the type of security and the particular circumstance. The market approach uses prices and other relevant information generated by market transactions involving identical or comparable securities. The income approach uses valuation techniques to discount estimated future cash flows to present value. Exchange Traded Funds are traded on a securities exchange. The market prices of index-based investments will fluctuate in accordance with changes in the underlying portfolio securities of the investment company and also due to supply and demand of the investment company’s shares on the exchange upon which the shares are traded.
When reliable prices are not readily available, such as when the value of a security has been significantly affected by events after the close of the exchange or market on which the security is principally traded, but before each Fund calculates its NAV, each of the Funds will value the security as determined in accordance with the Pricing and Valuation Procedures approved by the Board. The Pricing and Valuation Procedures are performed and monitored by a Valuation Committee (the “Committee”) designated by the Board. Some of the more common reasons which may necessitate that a security be fair valued in accordance with the Pricing and Valuation Procedures include, but are not limited to: the security’s trading has been halted or suspended; the security has been de-listed from a national exchange; the security’s primary trading market is temporarily closed at a time when, under normal conditions, it would be open; or the security’s primary pricing source is not able or willing to provide a price. When a security is fair valued in accordance with the Pricing and Valuation Procedures, the Committee determines the value after taking into consideration relevant information reasonably available to the Committee. Under the Pricing and Valuation Procedures, such securities may be considered Level 2 or Level 3 in the fair value hierarchy. Equity securities for which market quotations are available are valued at the last reported sales price of official closing price on the primary market or exchange on which they trade and such securities may be considered Level 1 in the fair value hierarchy. Short-term obligations with maturities of 60 days or less are valued at amortized cost, which approximates fair value, and such securities are considered Level 2 in the fair value hierarchy. Certain Funds hold securities or other assets that are denominated in a foreign currency. The Funds will normally use the currency exchange rates as of 4:00 p.m. (Eastern Time) when valuing such assets.
The assets of Conservative Allocation Strategy, Growth Allocation Strategy and Moderate Allocation Strategy (the “Allocation Strategies”) consist of investments in other funds including affiliated Funds (See Note 7), which are valued at their respective daily net asset values. Recognition of net investment income by the Allocation Strategies is affected by the timing of the declaration of dividends by the other funds in which the Allocation Strategies invest.
58
Table of Contents
NOTES TO FINANCIAL STATEMENTS (continued)
RIDGEWORTH FUNDS March 31, 2017
Also, in addition to the Allocation Strategies’ direct expenses, shareholders bear a proportionate share of the underlying funds’ expenses. Each underlying fund’s accounting policies and investment holdings are outlined in the underlying funds’ financial statements and are available upon request.
The following is a summary of the inputs used in valuing the Funds’ assets and liabilities carried at fair value as of March 31, 2017:
| Level 1 - Quoted Prices | Level 2 - Other Significant Observable Inputs | Level 3 - Significant Unobservable Inputs | Total | |||||||||||||
Capital Innovations Global Resources and Infrastructure Fund | ||||||||||||||||
Assets |
| |||||||||||||||
Common Stocks1 | $8,872,892 | $— | $— | $8,872,892 | ||||||||||||
Money Market Funds | 465,844 | — | — | 465,844 | ||||||||||||
|
|
|
|
|
|
|
| |||||||||
Total Investments | 9,338,736 | — | — | 9,338,736 | ||||||||||||
|
|
|
|
|
|
|
| |||||||||
Ceredex Large Cap Value Equity Fund | ||||||||||||||||
Assets |
| |||||||||||||||
Common Stocks1 | 2,097,292,963 | — | — | 2,097,292,963 | ||||||||||||
Money Market Fund | 20,759,114 | — | — | 20,759,114 | ||||||||||||
|
|
|
|
|
|
|
| |||||||||
Total Investments | 2,118,052,077 | — | — | 2,118,052,077 | ||||||||||||
|
|
|
|
|
|
|
| |||||||||
Ceredex Mid-Cap Value Equity Fund |
| |||||||||||||||
Assets |
| |||||||||||||||
Common Stocks1 | 3,279,090,432 | — | — | 3,279,090,432 | ||||||||||||
Money Market Funds | 207,602,392 | — | — | 207,602,392 | ||||||||||||
|
|
|
|
|
|
|
| |||||||||
Total Investments | 3,486,692,824 | — | — | 3,486,692,824 | ||||||||||||
|
|
|
|
|
|
|
| |||||||||
Ceredex Small Cap Value Equity Fund |
| |||||||||||||||
Assets |
| |||||||||||||||
Common Stocks1 | 932,782,463 | — | — | 932,782,463 | ||||||||||||
Money Market Fund | 1,500,791 | — | — | 1,500,791 | ||||||||||||
|
|
|
|
|
|
|
| |||||||||
Total Investments | 934,283,254 | — | — | 934,283,254 | ||||||||||||
|
|
|
|
|
|
|
| |||||||||
Innovative Growth Stock Fund |
| |||||||||||||||
Assets |
| |||||||||||||||
Common Stocks1 | 28,291,186 | — | — | 28,291,186 | ||||||||||||
Money Market Fund | 672,185 | — | — | 672,185 | ||||||||||||
|
|
|
|
|
|
|
| |||||||||
Total Investments | 28,963,371 | — | — | 28,963,371 | ||||||||||||
|
|
|
|
|
|
|
| |||||||||
International Equity Fund |
| |||||||||||||||
Assets |
| |||||||||||||||
Common Stocks1 | 70,580,902 | — | — | 70,580,902 | ||||||||||||
Money Market Funds | 3,716,467 | — | — | 3,716,467 | ||||||||||||
|
|
|
|
|
|
|
| |||||||||
Total Investments | 74,297,369 | — | — | 74,297,369 | ||||||||||||
|
|
|
|
|
|
|
| |||||||||
Silvant Large Cap Growth Stock Fund |
| |||||||||||||||
Assets |
| |||||||||||||||
Common Stocks1 | 208,829,160 | — | — | 208,829,160 | ||||||||||||
Money Market Fund | 5,329,074 | — | — | 5,329,074 | ||||||||||||
|
|
|
|
|
|
|
| |||||||||
Total Investments | 214,158,234 | — | — | 214,158,234 | ||||||||||||
|
|
|
|
|
|
|
| |||||||||
Silvant Small Cap Growth Stock Fund |
| |||||||||||||||
Assets |
| |||||||||||||||
Common Stocks1 | 40,793,379 | — | — | 40,793,379 | ||||||||||||
Money Market Funds | 3,982,276 | — | — | 3,982,276 | ||||||||||||
|
|
|
|
|
|
|
| |||||||||
Total Investments | 44,775,655 | — | — | 44,775,655 | ||||||||||||
|
|
|
|
|
|
|
| |||||||||
59
Table of Contents
NOTES TO FINANCIAL STATEMENTS (continued)
RIDGEWORTH FUNDS March 31, 2017
| Level 1 - Quoted Prices | Level 2 - Other Significant Observable Inputs | Level 3 - Significant Unobservable Inputs | Total | |||||||||||||
Conservative Allocation Strategy2 |
| |||||||||||||||
Assets |
| |||||||||||||||
Equity Funds | $ | 12,650,973 | $ | — | $ | — | $ | 12,650,973 | ||||||||
Fixed Income Funds | 18,805,515 | — | — | 18,805,515 | ||||||||||||
Exchange Traded Funds | 10,030,509 | — | — | 10,030,509 | ||||||||||||
Money Market Fund | 713,569 | — | — | 713,569 | ||||||||||||
|
|
|
|
|
|
|
| |||||||||
Total Investments | 42,200,566 | — | — | 42,200,566 | ||||||||||||
|
|
|
|
|
|
|
| |||||||||
Growth Allocation Strategy2 |
| |||||||||||||||
Assets |
| |||||||||||||||
Equity Funds | 25,927,495 | — | — | 25,927,495 | ||||||||||||
Fixed Income Funds | 5,148,876 | — | — | 5,148,876 | ||||||||||||
Exchange Traded Funds | 8,427,596 | — | — | 8,427,596 | ||||||||||||
Money Market Fund | 743,657 | — | — | 743,657 | ||||||||||||
|
|
|
|
|
|
|
| |||||||||
Total Investments | 40,247,624 | — | — | 40,247,624 | ||||||||||||
|
|
|
|
|
|
|
| |||||||||
Moderate Allocation Strategy2 |
| |||||||||||||||
Assets |
| |||||||||||||||
Equity Funds | 24,071,763 | — | — | 24,071,763 | ||||||||||||
Fixed Income Funds | 12,395,117 | — | — | 12,395,117 | ||||||||||||
Exchange Traded Funds | 13,409,834 | — | — | 13,409,834 | ||||||||||||
Money Market Fund | 1,169,898 | — | — | 1,169,898 | ||||||||||||
|
|
|
|
|
|
|
| |||||||||
Total Investments | 51,046,612 | — | — | 51,046,612 | ||||||||||||
|
|
|
|
|
|
|
| |||||||||
| 1 | Please see the Schedule of Portfolio Investments for Sector or Country Classification. |
| 2 | For additional information regarding the investments of the underlying RidgeWorth Funds, please call 1-888-784-3863 or visit www.ridgeworthfunds.com. |
The Funds’ policy is to disclose transfers between levels based on valuations at the end of the reporting period. Each portfolio may hold securities which are periodically fair valued in accordance with the Pricing and Valuation Procedures. This may result in movements between Level 1 and Level 2 throughout the period. As of March 31, 2017, there were no transfers between Level 1 and Level 2 pursuant to the Pricing and Valuation Procedures.
(b) Security Transactions and Investment Income — Security transactions are accounted for on a trade date basis. Domestic and foreign dividend income is recorded on the ex-dividend date or as soon as practicable after the Funds determine the existence of a dividend declaration after exercising reasonable due diligence. The cost of investments sold is determined by use of the specific identification method. Distributions from gains from underlying funds, if any, are recorded as realized gains on the ex-dividend date.
(c) Distributions to Shareholders — Distributions from net investment income of each of the Funds are declared and paid annually to shareholders of record. Distributions of net realized capital gains, if any, are declared at least annually. Distributions to shareholders from each of the Funds are recorded on the ex-dividend date and are determined in accordance with income tax regulations, which may differ from GAAP.
(d) Distributions from Underlying Funds — Distributions received from underlying funds, whether in the form of cash or securities, are applied as a reduction of the investment’s cost when identified by the underlying fund as a return of capital. Once the investment’s cost is received, any further distributions are recognized as realized gains.
(e) Expenses and Share Class Accounting — Expenses that are directly related to a specific Fund are charged to that Fund. Other operating expenses of the Trust are allocated pro-rata to the Funds on the basis of relative net assets or another appropriate basis. Investment income, common expenses, and realized/unrealized capital gains (losses) on investments are allocated to the various share classes of the Funds on the basis of relative daily net assets of each share class. Fees relating to a specific share class are charged directly to the share class.
(f) Foreign Currency Translation — Investment securities and other assets and liabilities denominated in foreign currencies are translated into U.S. dollar amounts based upon prevailing exchange rates, as of the close of regular trading on the New York Stock Exchange (usually 4:00 p.m. Eastern Time), on the date of valuation. Purchases and
60
Table of Contents
NOTES TO FINANCIAL STATEMENTS (continued)
RIDGEWORTH FUNDS March 31, 2017
sales of investment securities and income and expense items denominated in foreign currencies are translated into U.S. dollar amounts based upon prevailing exchange rates on the respective dates of such transactions.
The Funds do not isolate that portion of the results of operations resulting from fluctuations in foreign exchange rates on investments from the fluctuations arising from changes in market prices of securities held. Such fluctuations are included with the net realized and unrealized gain or loss on investments and foreign currencies.
Net realized foreign exchange gains or losses arise from sales of foreign currencies, including gains and losses on forward foreign currency contracts, currency gains or losses realized between the trade and settlement dates on securities transactions, and the difference between the amounts of dividends, interest and foreign withholding taxes recorded and the amount actually received.
(g) Securities Lending — Each Fund may lend portfolio securities to brokers, dealers and other financial organizations that meet capital and other credit requirements or other criteria established by the Board. These loans may not exceed either (i) 50% of the sum of the market value of all securities of the Fund and the market value of securities purchased with cash collateral or (ii) 33.33% of the total market value of all securities of the Fund. No Fund will lend portfolio securities to its investment adviser, subadviser, or its affiliates unless it has applied for and received specific authority to do so from the Securities and Exchange Commission. Loans of portfolio securities are required to be fully collateralized by cash, letters of credit or U.S. government securities. The initial value of the collateral must be at least 102% of the market value of the securities loaned, if the securities loaned are U.S. securities (105% for non-U.S. securities); and maintained in an amount equal to at least 100% (103% for non-U.S. securities) thereafter. However, due to market fluctuations during the day, the value of securities loaned on a particular day may exceed the value of collateral. On each business day, the amount of collateral is adjusted based on the prior day’s market fluctuations and the current day’s lending activity. Income from lending activity is determined by the amount of interest earned on collateral, less any amounts payable to the borrowers of the securities and the lending agent. Lending securities involves certain risks; including the risk that a Fund may be delayed or prevented from recovering the collateral if the borrower fails to return the securities. A fee will be obtained from the borrower if letters of credit or U.S. government securities are used as collateral which is reflected on the Statements of Operations as a component of the caption “Net Income from Securities Lending”.
For Capital Innovations Global Resources and Infrastructure Fund, Ceredex Large Cap Value Equity Fund, Ceredex Mid-Cap Value Equity Fund, International Equity Fund, Silvant Large Cap Growth Stock Fund and Silvant Small Cap Growth Stock Fund, all of the securities on loan are classified as Common Stock in each Fund’s Schedule of Investments, and remaining contractual maturity of agreements are classified as overnight and continuous as of March 31, 2017.
(h) Real Estate Investment Trusts — Certain Funds may own shares of real estate investment trusts (“REITs”) which report information on the source of their distributions annually. The Funds re-characterize distributions received from REIT investments based on information provided by the REITs into the following categories: ordinary income, long-term capital gains, and return of capital. If information is not available on a timely basis from the REITs, the re-characterization will be estimated based on available information which may include the previous year’s allocation. If new or additional information becomes available from the REITs at a later date, a re-characterization will be made in the following year. The Funds record as dividend income the amount re-characterized as ordinary income and as realized gain the amount re-characterized as long-term capital gain in the Statements of Operations, and the amount re-characterized as a return of capital as a reduction to the cost of investments in the Statements of Assets and Liabilities and in the Schedules of Portfolio Investments. These re-characterizations are reflected in the accompanying financial statements.
(i) Restricted Securities — Certain Funds’ investments are restricted as to resale. All of these restricted securities have been deemed liquid by the Funds’ Investment Adviser based upon procedures approved by the Board, unless stated otherwise in the Funds’ Schedules of Portfolio Investments. As of March 31, 2017, the Funds did not have any restricted securities.
(j) Foreign Investment Risks — Certain Funds may invest in securities of foreign issuers in various countries. Investments in securities of foreign issuers carry certain risks not ordinarily associated with investments in securities of U.S. issuers. These risks include future political and economic developments, and the possible imposition of exchange controls or other foreign governmental laws and restrictions. In addition, with respect to certain countries, there is a possibility of expropriation of assets, confiscatory taxation, political or social instability
61
Table of Contents
NOTES TO FINANCIAL STATEMENTS (continued)
RIDGEWORTH FUNDS March 31, 2017
or diplomatic developments, which could adversely affect investments in those countries. Emerging market countries are countries that the World Bank or the United Nations considers to be emerging or developing. Emerging markets may be more likely to experience political turmoil or rapid changes in market or economic conditions than more developed countries. In addition, the financial stability of issuers, including governments, in emerging market countries may be more precarious than in other countries. As a result, there may be an increased risk of price volatility associated with a Fund’s investments in emerging market countries, which may be magnified by currency fluctuations relative to the U.S. dollar. Please refer to each Fund’s prospectus for additional risks that may be associated with the Funds.
For securities subject to foreign withholding tax upon disposition, liabilities are recorded on the Statements of Assets and Liabilities for the estimated tax withholding based on the securities’ current market value. Upon disposition, realized gains or losses on such securities are recorded net of foreign withholding tax.
(k) Federal and Other Taxes — It is the Funds’ policy to comply with the federal income and excise tax requirements of the Internal Revenue Code of 1986, as amended (the “Code”), applicable to regulated investment companies. Accordingly, the Funds intend to distribute taxable income and net realized gains, if any, to shareholders in accordance with timing requirements imposed by the Code. Therefore, no federal or state income tax provision is required in the Funds’ financial statements.
Management has analyzed the Funds’ tax positions taken on income tax returns for all open tax years and has concluded that as of March 31, 2017, no provision for income tax is required in the Funds’ financial statements. The Funds’ federal and state income and federal excise tax returns for tax years for which the applicable statutes of limitations have not expired are subject to examination by the Internal Revenue Service and state departments of revenue. As of March 31, 2017, open tax years include the tax years of March 31, 2014 through 2017.
Under the applicable foreign tax laws, a withholding tax may be imposed on interest, dividends and capital gains at various rates. The Funds will accrue such taxes and recoveries as applicable, based upon their current interpretation of tax rules and regulations that exist in the markets in which they invest.
(l) Reclassification — GAAP requires that certain components of net assets be reclassified to reflect permanent differences between financial and tax reporting. These reclassifications have no effect on net assets or NAV per share.
(m) Line of Credit —The Funds entered into a committed unsecured revolving line of credit agreement (“LOC”) with a syndicate of banks which includes State Street Bank and Trust Company (“State Street Bank”) and Royal Bank of Canada (“RBC”), for an aggregate amount of $200,000,000. The proceeds may be used only to (1) temporarily finance the purchase and sale of securities; or (2) finance the redemption of shares of the Funds. The Funds will pay a commitment fee on a pro rata basis to State Street Bank and RBC, in the amount of 0.17% per annum on the daily unused portion of the LOC. Borrowings under the LOC will accrue interest at the higher of (a) the Federal Funds Rate, or (b) the one-month LIBOR Rate, plus 1.25% per annum. Generally, repayments must be made within 60 days of the borrowings. Commitment fees and interest expense paid to State Street Bank and RBC pursuant to this agreement are reflected on the Statements of Operations as a component of Other Fees. As of March 31, 2017, the Funds had no outstanding borrowings under the LOC.
The following Funds had an outstanding loan during the year. The borrowings were valued at cost, which approximates fair value.
Fund | Interest Incurred on Borrowing | Average Dollar Amount of Borrowing | Weighted Average Interest Rate on Borrowing | Days Loan was Open | ||||||||||||
Ceredex Small Cap Value Equity Fund | $1,959 | $3,465,467 | 1.85 | % | 11 | |||||||||||
Innovative Growth Stock Fund | 1,674 | 310,628 | 1.80 | 108 | ||||||||||||
International Equity Fund | 724 | 1,847,324 | 2.02 | 7 | ||||||||||||
Silvant Large Cap Growth Stock Fund | 177 | 584,257 | 1.82 | 6 | ||||||||||||
Silvant Small Cap Growth Stock Fund | 419 | 273,942 | 1.84 | 30 | ||||||||||||
Growth Allocation Strategy | 16 | 304,916 | 1.87 | 1 | ||||||||||||
(n) Master Limited Partnership — Certain Funds may invest in domestic master limited partnership (“MLPs”). MLPs are publicly traded companies organized as limited partnerships or limited liability companies and treated as
62
Table of Contents
NOTES TO FINANCIAL STATEMENTS (continued)
RIDGEWORTH FUNDS March 31, 2017
partnerships for federal income tax purposes. An investment in MLP units involves risks in addition to the risks associated with a similar investment in equity securities, such as common stock, of a corporation. As compared to common shareholders of a corporation, holders of MLP units have more limited control and limited rights to vote on matters affecting the partnership. Additional risks inherent to investments in MLP units include cash flow risk, tax risk, risk associated with a potential conflict of interest between unit holders and the MLP’s general partner, and capital markets risk. Moreover, the value of the Fund’s investment in MLPs depends largely on the MLPs being treated as partnerships for U.S. federal income tax purposes. If an MLP does not meet current legal requirements to maintain eligibility for partnership tax treatment, or if it is unable to do so because of tax law changes, it could be taxed as a corporation and there could be a material decrease in the value of its securities. Certain MLP securities may trade in lower volumes due to their smaller capitalizations. Accordingly, those MLPs may be subject to more abrupt or erratic price movements and may lack sufficient market liquidity to enable the Fund to effect sales at an advantageous time or without a substantial drop in price. MLPs are generally considered interest-rate sensitive investments. During periods of interest rate volatility, these investments may not provide attractive returns.
Distributions received from each Fund’s investments in MLPs may be comprised of both income and return of capital. Each Fund records investment income and return of capital based on estimates made at the time such distributions are received. Such estimates are based on historical information available from each MLP and other industry sources. These estimates may subsequently be revised based on information received from MLPs after their tax reporting periods are concluded.
| 3. | Investment Adviser and Other Service Providers |
Investment Adviser — RidgeWorth Investments (“Investment Adviser”) serves as the investment adviser to the Funds. The Trust and the Investment Adviser have entered into an investment advisory agreement (“Advisory Agreement”). The Investment Adviser is a money–management holding company with multiple style-focused investment boutiques which, along with certain unaffiliated advisory firms, serve as subadvisers to the Funds (“Subadvisers”). The Subadvisers for each of the Funds, other than the Allocation Strategies, which are not subadvised, are as follows: Capital Innovations LLC serves as the Subadviser for the Capital Innovations Global Resources and Infrastructure Fund; Ceredex Value Advisors LLC serves as the Subadviser for the Ceredex Large Cap Value Equity Fund, Ceredex Mid-Cap Value Equity Fund and Ceredex Small Cap Value Equity Fund; WCM Investment Management serves as the Subadviser for the International Equity Fund; Silvant Capital Management LLC serves as the Subadviser for the Silvant Large Cap Growth Stock Fund and Silvant Small Cap Growth Stock Fund; and Zevenbergen Capital Investments LLC serves as the Subadviser for the Innovative Growth Stock Fund. Zevenbergen Capital Investments LLC is a minority-owned subsidiary of the Investment Adviser. Capital Innovations LLC and WCM Investment Management are not affiliated with the Investment Adviser. Each of the other Subadvisers is a wholly-owned subsidiary of the Investment Adviser.
The Investment Adviser pays the Subadvisers out of the investment advisory fees it receives from the Funds.
The Predecessor Fund had an Advisory Agreement with Liberty Street Advisors, Inc. (“Liberty Street”). Liberty Street engaged Capital Innovations LLC (the “Sub-Advisor”) to manage the Fund and paid the Sub-Advisor from its advisory fees.
Under the terms of the Advisory Agreement, the Funds are charged annual advisory fees, which are computed daily and paid monthly based upon average daily net assets. Breakpoints are used in computing the overall annual advisory fee. The maximum annual advisory fee is charged on the average daily net assets of each Fund up to $500 million. A discount of 5% applies on the next $500 million, a discount of 10% applies on the next $4 billion and a discount of 15% applies on amounts over $5 billion. Fee rates for the fiscal year ended March 31, 2017 were as follows:
Fund | Maximum Annual Advisory Fee | Discounted Annual Advisory Fee | Advisory Fees Waived* | Net Annual Fees Paid** | ||||||||||||
Capital Innovations Global Resources and Infrastructure Fund | 1.00 | % | 1.00 | % | (1.00 | )% | — | % | ||||||||
Ceredex Large Cap Value Equity Fund | 0.70 | 0.65 | — | 0.65 | ||||||||||||
Ceredex Mid-Cap Value Equity Fund | 0.75 | 0.69 | — | 0.69 | ||||||||||||
Ceredex Small Cap Value Equity Fund | 0.85 | 0.83 | — | 0.83 | ||||||||||||
63
Table of Contents
NOTES TO FINANCIAL STATEMENTS (continued)
RIDGEWORTH FUNDS March 31, 2017
Fund | Maximum Annual Advisory Fee | Discounted Annual Advisory Fee | Advisory Fees Waived | Net Annual Fees Paid* | ||||||||||||
Innovative Growth Stock Fund | 0.85 | % | 0.85 | % | — | % | 0.85 | % | ||||||||
International Equity Fund | 0.85 | 0.85 | (0.11 | ) | 0.74 | |||||||||||
Silvant Large Cap Growth Stock Fund | 0.70 | 0.70 | — | 0.70 | ||||||||||||
Silvant Small Cap Growth Stock Fund | 0.85 | 0.85 | (0.02 | ) | 0.83 | |||||||||||
Conservative Allocation Strategy | 0.10 | 0.10 | (0.04 | ) | 0.06 | |||||||||||
Growth Allocation Strategy | 0.10 | 0.10 | — | 0.10 | ||||||||||||
Moderate Allocation Strategy | 0.10 | 0.10 | — | 0.10 | ||||||||||||
| * | See additional information below related to contractual expense limitations. |
| ** | Aggregate annual fees paid to the Investment Adviser, who pays the applicable Subadviser a portion of the fees for its services to the Funds. |
Amounts designated as “—” are 0%.
The Investment Adviser and the applicable Subadviser have contractually agreed, until at least August 1, 2017, to waive fees and/or reimburse expenses for each of the following Funds to the extent necessary to maintain each Fund’s total annual fund operating expenses (excluding, as applicable, taxes, brokerage commissions, substitute dividend expenses on securities sold short, interest expense, and indirect expenses attributable to the Fund’s investment in other funds), expressed as a percentage of average daily net assets, as noted below:
| Contractual Expense Limitations | ||||||||||||||||
Fund | I Shares | A Shares | C Shares | IS Shares | ||||||||||||
Capital Innovations Global Resources and Infrastructure Fund | 1.15 | % | 1.40 | % | 2.15 | % | N/A | % | ||||||||
Ceredex Large Cap Value Equity Fund* | 0.97 | 1.24 | 1.90 | 0.85 | ||||||||||||
Ceredex Mid-Cap Value Equity Fund* | 1.15 | 1.38 | 1.95 | 0.95 | ||||||||||||
Ceredex Small Cap Value Equity Fund | 1.30 | 1.55 | 2.15 | N/A | ||||||||||||
Innovative Growth Stock Fund | 1.30 | 1.50 | N/A | N/A | ||||||||||||
International Equity Fund* | 1.25 | 1.48 | N/A | 1.10 | ||||||||||||
Silvant Large Cap Growth Stock Fund* | 0.97 | 1.23 | 1.95 | 0.95 | ||||||||||||
Silvant Small Cap Growth Stock Fund* | 1.30 | 1.50 | 2.15 | 1.10 | ||||||||||||
Conservative Allocation Strategy | 0.30 | 0.60 | 1.30 | N/A | ||||||||||||
Growth Allocation Strategy | 0.50 | 0.70 | 1.30 | N/A | ||||||||||||
Moderate Allocation Strategy | 0.50 | 0.70 | 1.30 | N/A | ||||||||||||
| * | For the period ended July 31, 2016 the Contractual Expense Limitations were as follows: |
Fund | I Shares | A Shares | C Shares | IS Shares | ||||||||||||
Ceredex Large Cap Value Equity Fund | 0.97 | % | 1.27 | % | 1.97 | % | 0.85 | % | ||||||||
Ceredex Mid-Cap Value Equity Fund | 1.15 | 1.40 | 1.95 | 0.95 | ||||||||||||
International Equity Fund | 1.25 | 1.50 | N/A | 1.10 | ||||||||||||
Silvant Large Cap Growth Stock Fund | 0.97 | 1.25 | 1.95 | 0.90 | ||||||||||||
Silvant Small Cap Growth Stock Fund | 1.30 | 1.50 | 2.20 | 1.05 | ||||||||||||
Under the Expense Limitation Agreement, the Investment Adviser may retain the difference between the contractual expense limitations identified above and the actual total expenses to recapture any of its prior contractual waivers or reimbursements at a date not to exceed three years from the date of such waivers or reimbursements. Such repayments shall be made monthly, but only to the extent that such repayments would not cause the annualized total expense ratio to exceed, if lower, the contractual expense limitation in place at the time of the waiver or reimbursement. Under certain circumstances, the Investment Adviser may choose to voluntarily waive fees. In the event that the Investment Adviser voluntarily waives any fees, these waived fees are not subject to recoupment by the Investment Adviser. During the fiscal year ended March 31, 2017, the Investment Adviser did
64
Table of Contents
NOTES TO FINANCIAL STATEMENTS (continued)
RIDGEWORTH FUNDS March 31, 2017
not recapture any of its prior contractual waivers or reimbursements. As of March 31, 2017, the cumulative potential recoupments recoverable pursuant to this agreement are as follows:
| Expires | ||||||||||||
Fund | 2018 | 2019 | 2020 | |||||||||
Capital Innovations Global Resources and Infrastructure Fund* |
| |||||||||||
I Shares | $N/A | $46,237 | $44,767 | |||||||||
A Shares | N/A | 26,974 | 15,955 | |||||||||
C Shares | N/A | 4,936 | 2,657 | |||||||||
Ceredex Large Cap Value Equity Fund | ||||||||||||
I Shares | 2,390,881 | 2,067,589 | 1,790,007 | |||||||||
A Shares | 453,683 | 390,166 | 388,645 | |||||||||
Ceredex Mid-Cap Value Equity Fund | ||||||||||||
A Shares | 159,275 | 239,140 | 243,891 | |||||||||
Ceredex Small Cap Value Equity Fund | ||||||||||||
A Shares | — | — | 2,929 | |||||||||
Innovative Growth Stock Fund | ||||||||||||
I Shares | 10,874 | 17,391 | 23,041 | |||||||||
A Shares | — | — | 2,970 | |||||||||
International Equity Fund | ||||||||||||
I Shares | 23,969 | 64,243 | 48,268 | |||||||||
A Shares | 4,126 | 10,677 | 9,674 | |||||||||
IS Shares | — | 19,575 | 6,561 | |||||||||
Silvant Large Cap Growth Stock Fund | ||||||||||||
I Shares | 320,304 | 317,821 | 286,670 | |||||||||
A Shares | 9,682 | 5,664 | 5,804 | |||||||||
C Shares | 5,537 | 3,898 | — | |||||||||
IS Shares | 7,840 | 4,355 | — | |||||||||
Silvant Small Cap Growth Stock Fund | ||||||||||||
I Shares | 79,058 | 63,957 | 43,558 | |||||||||
A Shares | — | — | 1,246 | |||||||||
C Shares | — | — | 829 | |||||||||
IS Shares | — | — | 560 | |||||||||
Conservative Allocation Strategy | ||||||||||||
I Shares | 45,720 | 43,476 | 39,672 | |||||||||
A Shares | 11,261 | 9,950 | 11,887 | |||||||||
C Shares | 5,643 | 3,732 | 8,242 | |||||||||
Growth Allocation Strategy | ||||||||||||
I Shares | 100,956 | 92,695 | 76,506 | |||||||||
C Shares | — | 288 | 1,654 | |||||||||
Moderate Allocation Strategy | ||||||||||||
I Shares | 21,110 | 48,623 | 77,274 | |||||||||
A Shares | — | — | 1,240 | |||||||||
C Shares | — | — | 2,488 | |||||||||
| * | For the year ended November 30, 2015, Liberty Street waived all its fees and absorbed other expenses totaling $246,563. Liberty Street was able to recover from the Predecessor Fund fees and/or expenses previously waived and/or absorbed, if the Predecessor Fund’s expense ratio, including the recovered expenses, fell below the expense at which they were waived. Liberty Street was permitted to seek reimbursement from the Predecessor Fund for a period of three fiscal years following the fiscal year in which such reimbursements occurred. The amounts waived on the Predecessor Fund are not eligible for recapture by Liberty Street or the Investment Adviser. |
Amounts designated as “—” are $0.
Fund Accounting, Custody, Administration, and Transfer Agency — State Street Bank serves as the fund accounting agent and custodian for the Trust pursuant to a Master Custodian Agreement. The custodian is responsible for the
65
Table of Contents
NOTES TO FINANCIAL STATEMENTS (continued)
RIDGEWORTH FUNDS March 31, 2017
safekeeping of the assets of the Funds and the fund accounting agent is responsible for calculating the Funds’ NAVs. State Street Bank, as the Funds’ custodian and fund accounting agent, is paid on the basis of net assets and transaction costs of the Funds. State Street Bank also serves as the administrator for the Trust pursuant to an administration agreement. State Street Bank, as the Funds’ administrator, is paid on the basis of net assets of the Funds which are allocated among the series of the Trust, on the basis of relative net assets. UMB Fund Services, Inc. (“UMBFS”) served as the Predecessor Fund’s fund accountant, transfer agent and co-administrator; and Mutual Fund Administration, LLC (“MFAC”) served as the Fund’s other co-administrator. UMB Bank, n.a., an affiliate of UMBFS, served as the Predecessor Fund’s custodian.
Boston Financial Data Services, Inc. (“BFDS”) serves as the transfer agent to the Trust pursuant to a Transfer Agency and Service Agreement. BFDS is paid on the basis of net assets, per account fees and certain transaction costs.
Custodian Credits — The Funds have an agreement with their custodian under which custody fees may be reduced by balance credits. These credits, if any, are shown as a reduction of custody expenses on the Statements of Operations.
Distribution — The Trust and RidgeWorth Distributors LLC (the “Distributor”) are parties to a Distribution Agreement. Foreside Fund Services, LLC (the “Predecessor Distributor”) served as the Predecessor Fund’s distributor.
In addition, with respect to the A Shares and C Shares, the Distributor receives amounts, pursuant to a Distribution and Service Plan, based upon average daily net assets of each respective class, which are computed daily and paid monthly. For the fiscal year ended March 31, 2017, the Distributor did not retain any of the front end sales charges assessed on the sale of A Shares. For the fiscal year ended March 31, 2017, the Distributor did not retain any commissions from contingent deferred sales charges assessed on the redemption of C Shares. These fees, expressed as a percentage of average daily net assets, for the fiscal year ended March 31, 2017, were as follows:
Fund | A Shares Distribution and Service Fee | C Shares Distribution and Service Fee | ||||||
Capital Innovations Global Resources and Infrastructure Fund | 0.25 | % | 1.00 | % | ||||
Ceredex Large Cap Value Equity Fund | 0.30 | 1.00 | ||||||
Ceredex Mid-Cap Value Equity Fund | 0.30 | 1.00 | ||||||
Ceredex Small Cap Value Equity Fund | 0.30 | 1.00 | ||||||
Innovative Growth Stock Fund | 0.30 | N/A | ||||||
International Equity Fund | 0.30 | N/A | ||||||
Silvant Large Cap Growth Stock Fund | 0.30 | 1.00 | ||||||
Silvant Small Cap Growth Stock Fund | 0.30 | 1.00 | ||||||
Conservative Allocation Strategy | 0.30 | 1.00 | ||||||
Growth Allocation Strategy | 0.30 | 1.00 | ||||||
Moderate Allocation Strategy | 0.30 | 1.00 | ||||||
Shareholder Servicing Fees — The Funds have adopted a shareholder services fee for the I Shares and A Shares. Each of these Funds (or class thereof, as the case may be) may pay a services fee to financial institutions that provide certain services to the Funds. The services under each of these Plans may include, among others, providing general shareholder liaison services (including responding to shareholder inquiries), providing information on shareholder investments, and establishing and maintaining shareholder accounts and records. The Funds may pay a fee under the Plan up to an annual rate of 0.40% (except for Conservative Allocation Strategy which may pay 0.20%) of average daily net assets of a Fund’s I Shares or A Shares.
Compliance & Fund Services Fees — The Investment Adviser provides compliance and certain administrative services to the Trust to ensure compliance with applicable laws and regulations. For the fiscal year ended March 31, 2017, the Investment Adviser was paid $404,235 for these services. Foreside Fund Officer Services, LLC (‘‘FFOS’’), an affiliate of the Distributor, provides an Anti-Money Laundering Officer/Identity Theft Prevention Officer (“AML Officer”) to the Trust. Effective October 2015 through November 2016, Foreside Management Services, LLC (“FMS”), an affiliate of the Distributor, provided Principal Financial Officer (“PFO”) support services to the Trust.
66
Table of Contents
NOTES TO FINANCIAL STATEMENTS (continued)
RIDGEWORTH FUNDS March 31, 2017
Fees paid to FFOS and FMS pursuant to these agreements are reflected on the Statements of Operations as a component of the caption “Other Fees”.
Neither FFOS nor any of their officers or employees who serve as an officer of the Trust, have any role in determining the Funds’ investment policies or which securities are to be purchased or sold by the Trust or its Funds. Dziura Compliance Consulting, LLC. provided Chief Compliance Officer services to the Trust of the Predecessor Fund.
Certain officers of the Trust are also officers or employees of the Investment Adviser, FFOS and the administrator. Such officers receive no fees from the Trust for serving as officers of the Trust.
Each of the Trustees receives an annual retainer and an additional fee for each meeting attended, plus reimbursement for certain expenses incurred. Trustees receive an additional fee for committee service, paid on a per committee meeting basis. Information on the aggregate remuneration paid to the Trustees can be found on the Statements of Operations. Certain trustees and officers of the Predecessor Fund are employees of UMBFS or MFAC. The Predecessor Fund did not compensate trustees and officers affiliated with the Predecessor Fund’s
co-administrators. For the year ended November 30, 2015, the Predecessor Fund’s allocated fees incurred to Trustees who are not affiliated with the Fund’s co-administrators are reported on the Statement of Operations.
| 4. | Capital Stock Transactions |
Transactions in capital shares and dollars for the fiscal years ended March 31, 2017 and March 31, 2016 were as follows:
| Shares Issued | Shares Issued- Merger | Shares Reinvested | Shares Redeemed | Shares Converted | Net Increase (Decrease) in Shares Outstanding | Proceeds from Shares Issued | Issued- Merger | Dividends Reinvested | Cost of Shares Redeemed | Shares Converted | Change in Net Assets from Capital Transactions | |||||||||||||||||||||||||||||||||||||
Capital Innovations Global Resources and Infrastructure Fund* |
| |||||||||||||||||||||||||||||||||||||||||||||||
I Shares | ||||||||||||||||||||||||||||||||||||||||||||||||
3/31/2017 | 502,373 | — | 6,228 | (81,941 | ) | — | 426,660 | $5,686,313 | $— | $68,970 | $(860,899 | ) | $— | $4,894,384 | ||||||||||||||||||||||||||||||||||
3/31/2016 | 3,035 | — | 5,161 | (128,484 | ) | — | (120,288 | ) | 59,395 | — | 46,705 | (1,183,254 | ) | — | (1,077,154 | ) | ||||||||||||||||||||||||||||||||
11/30/2015 | 151,688 | — | 9,145 | (882,873 | ) | — | (722,040 | ) | 1,779,840 | — | 97,384 | (9,919,217 | ) | — | (8,041,993 | ) | ||||||||||||||||||||||||||||||||
A Shares | ||||||||||||||||||||||||||||||||||||||||||||||||
3/31/2017 | 20,213 | — | 2,416 | (38,446 | ) | — | (15,817 | ) | 217,563 | — | 26,663 | (419,044 | ) | — | (174,818 | ) | ||||||||||||||||||||||||||||||||
3/31/2016 | 43,130 | — | 3,308 | (85,449 | ) | — | (39,011 | ) | 370,255 | — | 29,907 | (757,555 | ) | — | (357,393 | ) | ||||||||||||||||||||||||||||||||
11/30/2015 | 21,244 | — | 3,097 | (103,382 | ) | — | (79,041 | ) | 243,958 | — | 31,531 | (1,100,279 | ) | — | (824,790 | ) | ||||||||||||||||||||||||||||||||
C Shares | ||||||||||||||||||||||||||||||||||||||||||||||||
3/31/2017 | 8,870 | — | 434 | (8,058 | ) | — | 1,246 | 96,555 | — | 4,692 | (84,432 | ) | — | 16,815 | ||||||||||||||||||||||||||||||||||
3/31/2016 | 74 | — | 327 | (8,998 | ) | — | (8,597 | ) | 600 | — | 2,921 | (78,504 | ) | — | (74,983 | ) | ||||||||||||||||||||||||||||||||
11/30/2015 | 383 | — | 254 | (32,148 | ) | — | (31,511 | ) | 4,143 | — | 2,464 | (359,224 | ) | — | (352,617 | ) | ||||||||||||||||||||||||||||||||
Ceredex Large Cap Value Equity Fund |
| |||||||||||||||||||||||||||||||||||||||||||||||
I Shares | ||||||||||||||||||||||||||||||||||||||||||||||||
3/31/2017 | 14,988,265 | — | 1,747,398 | (30,906,879 | ) | — | (14,171,216 | ) | 240,164,941 | — | 28,989,334 | (498,951,552 | ) | — | (229,797,277 | ) | ||||||||||||||||||||||||||||||||
3/31/2016 | 20,150,176 | — | 10,337,408 | (48,665,920 | ) | — | (18,178,336 | ) | 313,559,680 | — | 153,510,502 | (757,220,055 | ) | — | (290,149,873 | ) | ||||||||||||||||||||||||||||||||
A Shares | ||||||||||||||||||||||||||||||||||||||||||||||||
3/31/2017 | 2,363,238 | — | 364,044 | (7,828,487 | ) | — | (5,101,205 | ) | 37,561,361 | — | 5,995,801 | (124,608,935 | ) | — | (81,051,773 | ) | ||||||||||||||||||||||||||||||||
3/31/2016 | 5,044,971 | — | 2,344,910 | (10,555,409 | ) | — | (3,165,528 | ) | 77,627,924 | — | 34,587,431 | (162,541,146 | ) | — | (50,325,791 | ) | ||||||||||||||||||||||||||||||||
C Shares | ||||||||||||||||||||||||||||||||||||||||||||||||
3/31/2017 | 47,311 | — | 13,812 | (275,201 | ) | — | (214,078 | ) | 737,892 | — | 222,644 | (4,244,464 | ) | — | (3,283,928 | ) | ||||||||||||||||||||||||||||||||
3/31/2016 | 168,986 | — | 104,345 | (252,165 | ) | — | 21,166 | 2,586,038 | — | 1,506,746 | (3,803,478 | ) | — | 289,306 | ||||||||||||||||||||||||||||||||||
IS Shares | ||||||||||||||||||||||||||||||||||||||||||||||||
3/31/2017 | 3,915,176 | — | 398,431 | (4,037,944 | ) | — | 275,663 | 64,141,015 | — | 6,629,892 | (64,662,063 | ) | — | 6,108,844 | ||||||||||||||||||||||||||||||||||
3/31/2016 | 17,756,283 | — | 695,598 | (2,231,219 | ) | — | 16,220,662 | 272,105,222 | — | 10,357,452 | (35,798,821 | ) | — | 246,663,853 | ||||||||||||||||||||||||||||||||||
67
Table of Contents
NOTES TO FINANCIAL STATEMENTS (continued)
RIDGEWORTH FUNDS March 31, 2017
| Shares Issued | Shares Issued- Merger | Shares Reinvested | Shares Redeemed | Shares Converted | Net Increase (Decrease) in Shares Outstanding | Proceeds from Shares Issued | Issued- Merger | Dividends Reinvested | Cost of Shares Redeemed | Shares Converted | Change in Net Assets from Capital Transactions | |||||||||||||||||||||||||||||||||||||
Ceredex Mid-Cap Value Equity Fund |
| |||||||||||||||||||||||||||||||||||||||||||||||
I Shares | ||||||||||||||||||||||||||||||||||||||||||||||||
3/31/2017 | 47,771,106 | — | 8,628,119 | (88,992,626 | ) | — | (32,593,401 | ) | $ | 642,136,104 | $ | — | $ | 118,377,786 | $ | (1,177,162,609 | ) | $ | — | $ | (416,648,719 | ) | ||||||||||||||||||||||||||
3/31/2016 | 70,932,507 | — | 15,470,227 | (124,771,969 | ) | — | (38,369,235 | ) | 944,525,295 | — | 185,642,714 | (1,588,015,202 | ) | — | (457,847,193 | ) | ||||||||||||||||||||||||||||||||
A Shares | ||||||||||||||||||||||||||||||||||||||||||||||||
3/31/2017 | 6,033,650 | — | 1,198,122 | (14,007,426 | ) | — | (6,775,654 | ) | 79,220,050 | — | 16,294,452 | (183,470,633 | ) | — | (87,956,131 | ) | ||||||||||||||||||||||||||||||||
3/31/2016 | 8,310,004 | — | 2,239,506 | (21,427,055 | ) | — | (10,877,545 | ) | 103,995,201 | — | 26,627,731 | (269,580,637 | ) | — | (138,957,705 | ) | ||||||||||||||||||||||||||||||||
C Shares | ||||||||||||||||||||||||||||||||||||||||||||||||
3/31/2017 | 455,258 | — | 138,160 | (1,991,762 | ) | — | (1,398,344 | ) | 5,984,175 | — | 1,838,913 | (25,263,426 | ) | — | (17,440,338 | ) | ||||||||||||||||||||||||||||||||
3/31/2016 | 727,265 | — | 319,531 | (2,214,544 | ) | — | (1,167,748 | ) | 9,133,165 | — | 3,722,533 | (26,768,700 | ) | — | (13,913,002 | ) | ||||||||||||||||||||||||||||||||
IS Shares | ||||||||||||||||||||||||||||||||||||||||||||||||
3/31/2017 | 10,499,421 | — | 826,515 | (6,799,186 | ) | — | 4,526,750 | 144,036,763 | — | 11,348,056 | (91,035,873 | ) | — | 64,348,946 | ||||||||||||||||||||||||||||||||||
3/31/2016 | 15,707,999 | — | 732,470 | (2,549,531 | ) | — | 13,890,938 | 198,028,731 | — | 8,789,644 | (31,313,030 | ) | — | 175,505,345 | ||||||||||||||||||||||||||||||||||
Ceredex Small Cap Value Equity Fund |
| |||||||||||||||||||||||||||||||||||||||||||||||
I Shares | ||||||||||||||||||||||||||||||||||||||||||||||||
3/31/2017 | 16,018,969 | — | 3,186,214 | (31,259,343 | ) | — | (12,054,160 | ) | 199,169,013 | — | 40,942,846 | (383,588,374 | ) | — | (143,476,515 | ) | ||||||||||||||||||||||||||||||||
3/31/2016 | 9,039,448 | — | 20,227,454 | (28,396,574 | ) | — | 870,328 | 119,891,772 | — | 214,208,737 | (401,188,555 | ) | — | (67,088,046 | ) | |||||||||||||||||||||||||||||||||
A Shares | ||||||||||||||||||||||||||||||||||||||||||||||||
3/31/2017 | 1,682,266 | — | 502,520 | (3,438,376 | ) | — | (1,253,590 | ) | 20,261,513 | — | 6,261,402 | (40,822,963 | ) | — | (14,300,048 | ) | ||||||||||||||||||||||||||||||||
3/31/2016 | 1,418,812 | — | 3,276,571 | (4,299,801 | ) | — | 395,582 | 18,086,807 | — | 33,715,915 | (55,236,911 | ) | — | (3,434,189 | ) | |||||||||||||||||||||||||||||||||
C Shares | ||||||||||||||||||||||||||||||||||||||||||||||||
3/31/2017 | 35,448 | — | 117,673 | (743,026 | ) | — | (589,905 | ) | 392,457 | — | 1,336,770 | (8,234,192 | ) | — | (6,504,965 | ) | ||||||||||||||||||||||||||||||||
3/31/2016 | 125,149 | — | 824,781 | (580,956 | ) | — | 368,974 | 1,457,675 | — | 7,777,689 | (6,562,360 | ) | — | 2,673,004 | ||||||||||||||||||||||||||||||||||
Innovative Growth Stock Fund |
| |||||||||||||||||||||||||||||||||||||||||||||||
I Shares | ||||||||||||||||||||||||||||||||||||||||||||||||
3/31/2017 | 736,308 | — | 100,983 | (644,245 | ) | — | 193,046 | 14,007,147 | — | 1,778,313 | (12,797,826 | ) | — | 2,987,634 | ||||||||||||||||||||||||||||||||||
3/31/2016 | 548,154 | — | 53,058 | (780,401 | ) | — | (179,189 | ) | 11,930,895 | — | 1,137,563 | (16,749,913 | ) | — | (3,681,455 | ) | ||||||||||||||||||||||||||||||||
A Shares | ||||||||||||||||||||||||||||||||||||||||||||||||
3/31/2017 | 62,700 | — | 55,290 | (216,865 | ) | — | (98,875 | ) | 1,151,181 | — | 927,774 | (4,098,918 | ) | — | (2,019,963 | ) | ||||||||||||||||||||||||||||||||
3/31/2016 | 491,401 | — | 32,204 | (588,841 | ) | — | (65,236 | ) | 10,889,054 | — | 664,359 | (11,980,061 | ) | — | (426,648 | ) | ||||||||||||||||||||||||||||||||
International Equity Fund |
| |||||||||||||||||||||||||||||||||||||||||||||||
I Shares | ||||||||||||||||||||||||||||||||||||||||||||||||
3/31/2017 | 4,013,629 | — | 40,074 | (2,131,409 | ) | — | 1,922,294 | 38,584,117 | — | 366,283 | (20,316,050 | ) | — | 18,634,350 | ||||||||||||||||||||||||||||||||||
3/31/2016 | 2,720,094 | — | 102,990 | (1,551,831 | ) | — | 1,271,253 | 25,253,022 | — | 965,887 | (14,988,624 | ) | — | 11,230,285 | ||||||||||||||||||||||||||||||||||
A Shares | ||||||||||||||||||||||||||||||||||||||||||||||||
3/31/2017 | 1,537,897 | — | 15,277 | (557,247 | ) | — | 995,927 | 14,514,137 | — | 137,643 | (5,135,110 | ) | — | 9,516,670 | ||||||||||||||||||||||||||||||||||
3/31/2016 | 62,804 | — | 39,888 | (92,288 | ) | — | 10,404 | 607,480 | — | 368,947 | (879,026 | ) | — | 97,401 | ||||||||||||||||||||||||||||||||||
IS Shares** | ||||||||||||||||||||||||||||||||||||||||||||||||
3/31/2017 | 265,447 | — | 7,042 | (256,382 | ) | — | 16,107 | 2,584,033 | — | 64,365 | (2,454,663 | ) | — | 193,735 | ||||||||||||||||||||||||||||||||||
3/31/2016 | 1,003,460 | — | 82,004 | (458,797 | ) | — | 626,667 | 9,776,110 | — | 765,921 | (4,203,512 | ) | — | 6,338,519 | ||||||||||||||||||||||||||||||||||
Silvant Large Cap Growth Stock Fund |
| |||||||||||||||||||||||||||||||||||||||||||||||
I Shares | ||||||||||||||||||||||||||||||||||||||||||||||||
3/31/2017 | 974,017 | — | 1,339,865 | (3,715,671 | ) | — | (1,401,789 | ) | 9,013,948 | — | 11,295,064 | (34,169,639 | ) | — | (13,860,627 | ) | ||||||||||||||||||||||||||||||||
3/31/2016 | 1,473,996 | — | 900,056 | (2,909,360 | ) | — | (535,308 | ) | 14,888,243 | — | 8,901,552 | (28,987,265 | ) | — | (5,197,470 | ) | ||||||||||||||||||||||||||||||||
A Shares | �� | |||||||||||||||||||||||||||||||||||||||||||||||
3/31/2017 | 605,401 | — | 1,101,478 | (1,204,269 | ) | — | 502,610 | 4,478,342 | — | 7,512,079 | (9,073,048 | ) | — | 2,917,373 | ||||||||||||||||||||||||||||||||||
3/31/2016 | 852,332 | — | 636,361 | (1,077,242 | ) | — | 411,451 | 7,111,443 | — | 5,249,983 | (9,296,236 | ) | — | 3,065,190 | ||||||||||||||||||||||||||||||||||
C Shares | ||||||||||||||||||||||||||||||||||||||||||||||||
3/31/2017 | 54,733 | — | 1,726,887 | (1,312,187 | ) | — | 469,433 | 271,089 | — | 7,563,765 | (6,659,683 | ) | — | 1,175,171 | ||||||||||||||||||||||||||||||||||
3/31/2016 | 206,005 | — | 923,411 | (1,092,958 | ) | — | 36,458 | 1,295,039 | — | 5,318,850 | (6,604,447 | ) | — | 9,442 | ||||||||||||||||||||||||||||||||||
IS Shares | ||||||||||||||||||||||||||||||||||||||||||||||||
3/31/2017 | 58,843 | — | 412,074 | (1,705,823 | ) | — | (1,234,906 | ) | 541,033 | — | 3,486,146 | (15,622,312 | ) | — | (11,595,133 | ) | ||||||||||||||||||||||||||||||||
3/31/2016 | 221,083 | — | 310,286 | (1,710,804 | ) | — | (1,179,435 | ) | 2,193,018 | — | 3,074,932 | (17,602,568 | ) | — | (12,334,618 | ) | ||||||||||||||||||||||||||||||||
68
Table of Contents
NOTES TO FINANCIAL STATEMENTS (continued)
RIDGEWORTH FUNDS March 31, 2017
| Shares Issued | Shares Issued- Merger | Shares Reinvested | Shares Redeemed | Shares Converted | Net Increase (Decrease) in Shares Outstanding | Proceeds from Shares Issued | Issued- Merger | Dividends Reinvested | Cost of Shares Redeemed | Shares Converted | Change in Net Assets from Capital Transactions | |||||||||||||||||||||||||||||||||||||
Silvant Small Cap Growth Stock Fund |
| |||||||||||||||||||||||||||||||||||||||||||||||
I Shares | ||||||||||||||||||||||||||||||||||||||||||||||||
3/31/2017 | 816,767 | — | 416,059 | (2,502,597 | ) | — | (1,269,771 | ) | $ | 7,443,252 | $ | — | $ | 3,603,071 | $ | (22,802,170 | ) | $ | — | $ | (11,755,847 | ) | ||||||||||||||||||||||||||
3/31/2016 | 1,663,997 | — | 1,477,948 | (7,377,883 | ) | — | (4,235,938 | ) | 22,596,390 | — | 13,582,340 | (102,469,861 | ) | — | (66,291,131 | ) | ||||||||||||||||||||||||||||||||
A Shares | ||||||||||||||||||||||||||||||||||||||||||||||||
3/31/2017 | 21,351 | — | 140,699 | (161,539 | ) | — | 511 | 158,769 | — | 991,925 | (1,228,080 | ) | — | (77,386 | ) | |||||||||||||||||||||||||||||||||
3/31/2016 | 21,550 | — | 375,807 | (182,679 | ) | — | 214,678 | 202,393 | — | 2,889,957 | (2,025,759 | ) | — | 1,066,591 | ||||||||||||||||||||||||||||||||||
C Shares | ||||||||||||||||||||||||||||||||||||||||||||||||
3/31/2017 | 2,389 | — | 393,663 | (194,024 | ) | — | 202,028 | 8,917 | — | 1,287,279 | (733,595 | ) | — | 562,601 | ||||||||||||||||||||||||||||||||||
3/31/2016 | 33,324 | — | 659,605 | (155,405 | ) | — | 537,524 | 169,847 | — | 2,763,745 | (1,031,867 | ) | — | 1,901,725 | ||||||||||||||||||||||||||||||||||
IS Shares | ||||||||||||||||||||||||||||||||||||||||||||||||
3/31/2017 | 75,254 | — | 50,307 | (263,000 | ) | — | (137,439 | ) | 704,760 | — | 439,680 | (2,362,160 | ) | — | (1,217,720 | ) | ||||||||||||||||||||||||||||||||
3/31/2016 | 139,519 | — | 159,913 | (335,556 | ) | — | (36,124 | ) | 1,172,382 | — | 1,477,592 | (3,442,521 | ) | — | (792,547 | ) | ||||||||||||||||||||||||||||||||
Conservative Allocation Strategy |
| |||||||||||||||||||||||||||||||||||||||||||||||
I Shares | ||||||||||||||||||||||||||||||||||||||||||||||||
3/31/2017 | 678,866 | — | 42,720 | (1,855,155 | ) | — | (1,133,569 | ) | 8,294,920 | — | 511,354 | (22,782,951 | ) | — | (13,976,677 | ) | ||||||||||||||||||||||||||||||||
3/31/2016 | 852,015 | — | 89,107 | (910,633 | ) | — | 30,489 | 10,523,543 | — | 1,062,151 | (11,175,084 | ) | — | 410,610 | ||||||||||||||||||||||||||||||||||
A Shares | ||||||||||||||||||||||||||||||||||||||||||||||||
3/31/2017 | 122,826 | — | 16,700 | (692,615 | ) | — | (553,089 | ) | 1,505,933 | — | 200,405 | (8,524,344 | ) | — | (6,818,006 | ) | ||||||||||||||||||||||||||||||||
3/31/2016 | 222,317 | — | 45,758 | (317,990 | ) | — | (49,915 | ) | 2,695,221 | — | 545,889 | (3,912,015 | ) | — | (670,905 | ) | ||||||||||||||||||||||||||||||||
C Shares | ||||||||||||||||||||||||||||||||||||||||||||||||
3/31/2017 | 118,197 | — | 23,331 | (418,311 | ) | — | (276,783 | ) | 1,435,378 | — | 276,700 | (5,056,213 | ) | — | (3,344,135 | ) | ||||||||||||||||||||||||||||||||
3/31/2016 | 401,289 | — | 47,982 | (279,667 | ) | — | 169,604 | 4,921,132 | — | 566,671 | (3,400,633 | ) | — | 2,087,170 | ||||||||||||||||||||||||||||||||||
Growth Allocation Strategy |
| |||||||||||||||||||||||||||||||||||||||||||||||
I Shares | ||||||||||||||||||||||||||||||||||||||||||||||||
3/31/2017 | 728,875 | — | 231,846 | (1,604,058 | ) | — | (643,337 | ) | 7,586,141 | — | 2,313,824 | (16,525,742 | ) | — | (6,625,777 | ) | ||||||||||||||||||||||||||||||||
3/31/2016 | 826,999 | — | 362,432 | (2,067,210 | ) | — | (877,779 | ) | 9,049,400 | — | 3,700,426 | (22,159,053 | ) | — | (9,409,227 | ) | ||||||||||||||||||||||||||||||||
A Shares | ||||||||||||||||||||||||||||||||||||||||||||||||
3/31/2017 | 8,556 | — | 42,162 | (209,452 | ) | — | (158,734 | ) | 88,487 | — | 418,666 | (2,148,089 | ) | — | (1,640,936 | ) | ||||||||||||||||||||||||||||||||
3/31/2016 | 52,273 | — | 60,102 | (163,704 | ) | — | (51,329 | ) | 527,166 | — | 610,632 | (1,773,011 | ) | — | (635,213 | ) | ||||||||||||||||||||||||||||||||
C Shares | ||||||||||||||||||||||||||||||||||||||||||||||||
3/31/2017 | 3,692 | — | 14,404 | (85,042 | ) | — | (66,946 | ) | 36,678 | — | 139,724 | (862,894 | ) | — | (686,492 | ) | ||||||||||||||||||||||||||||||||
3/31/2016 | 59,127 | — | 19,997 | (99,143 | ) | — | (20,019 | ) | 599,150 | — | 198,973 | (990,457 | ) | — | (192,334 | ) | ||||||||||||||||||||||||||||||||
Moderate Allocation Strategy |
| |||||||||||||||||||||||||||||||||||||||||||||||
I Shares | ||||||||||||||||||||||||||||||||||||||||||||||||
3/31/2017 | 587,339 | — | 299,279 | (2,638,171 | ) | — | (1,751,553 | ) | 5,344,198 | — | 2,603,731 | (24,157,013 | ) | — | (16,209,084 | ) | ||||||||||||||||||||||||||||||||
3/31/2016 | 1,016,718 | — | 842,718 | (5,356,856 | ) | — | (3,497,420 | ) | 10,654,884 | — | 7,635,031 | (57,348,612 | ) | — | (39,058,697 | ) | ||||||||||||||||||||||||||||||||
A Shares | ||||||||||||||||||||||||||||||||||||||||||||||||
3/31/2017 | 73,479 | — | 93,480 | (283,363 | ) | — | (116,404 | ) | 667,404 | — | 808,602 | (2,604,083 | ) | — | (1,128,077 | ) | ||||||||||||||||||||||||||||||||
3/31/2016 | 75,028 | — | 222,574 | (535,529 | ) | — | (237,927 | ) | 766,987 | — | 2,007,615 | (5,698,032 | ) | — | (2,923,430 | ) | ||||||||||||||||||||||||||||||||
C Shares | ||||||||||||||||||||||||||||||||||||||||||||||||
3/31/2017 | 51,235 | — | 85,229 | (265,103 | ) | — | (128,639 | ) | 465,014 | — | 732,114 | (2,396,260 | ) | — | (1,199,132 | ) | ||||||||||||||||||||||||||||||||
3/31/2016 | 46,989 | — | 197,738 | (219,034 | ) | — | 25,693 | 476,260 | — | 1,771,729 | (2,199,100 | ) | — | 48,889 | ||||||||||||||||||||||||||||||||||
| * | Capital Innovations Global Resources and Infrastructure Fund had a fiscal year date change from November 30 to March 31 and a reorganization on February 19, 2016 (See Note 8). |
| ** | IS Shares commenced operations on September 1, 2015 for International Equity Fund. |
| 5. | Investment Transactions |
The cost of security purchases and the proceeds from sales of securities, excluding securities maturing less than one year from acquisition and U.S. government securities, for the fiscal year ended March 31, 2017 were as follows:
Fund | Purchases | Sales | ||||||
Capital Innovations Global Resources and Infrastructure Fund | $7,392,481 | $2,711,234 | ||||||
Ceredex Large Cap Value Equity Fund | 1,583,146,567 | 1,816,582,245 | ||||||
Ceredex Mid-Cap Value Equity Fund | 3,427,554,432 | 4,035,994,438 | ||||||
Ceredex Small Cap Value Equity Fund | 269,889,936 | 462,946,218 | ||||||
69
Table of Contents
NOTES TO FINANCIAL STATEMENTS (continued)
RIDGEWORTH FUNDS March 31, 2017
Fund | Purchases | Sales | ||||||
Innovative Growth Stock Fund | $ | 15,443,700 | $ | 18,025,755 | ||||
International Equity Fund | 49,940,191 | 20,932,514 | ||||||
Silvant Large Cap Growth Stock Fund | 94,765,137 | 152,211,393 | ||||||
Silvant Small Cap Growth Stock Fund | 26,032,126 | 45,110,039 | ||||||
Conservative Allocation Strategy | 7,683,006 | 30,248,910 | ||||||
Growth Allocation Strategy | 8,333,130 | 17,422,559 | ||||||
Moderate Allocation Strategy | 8,847,170 | 27,393,670 | ||||||
| 6. | Federal Income Tax Information |
The following information is presented on an income tax basis and takes into consideration differences between amounts for financial statement and income tax purposes. These “book/tax” differences are either considered temporary or permanent in nature. To the extent these differences are permanent in nature (i.e., foreign currency transactions and return of capital on securities) such amounts are reclassified within the composition of net assets based on their U.S. federal tax-basis treatment; temporary differences do not require reclassification.
The effects of certain differences reclassified as of March 31, 2017 were as follows:
| Paid-in Capital | Accumulated Net Realized Gain (Loss) | Undistributed Investment Income (Loss) | ||||||||||
Capital Innovations Global Resources and Infrastructure Fund | $(3,823 | ) | $(52,132 | ) | $55,955 | |||||||
Ceredex Mid-Cap Value Equity Fund | — | 4,885,059 | (4,885,059 | ) | ||||||||
Ceredex Small Cap Value Equity Fund | — | 124,546 | (124,546 | ) | ||||||||
Innovative Growth Stock Fund | (1,082,508 | ) | 784,131 | 298,377 | ||||||||
International Equity Fund | — | 16,675 | (16,675 | ) | ||||||||
Silvant Large Cap Growth Stock Fund | (581,307 | ) | — | 581,307 | ||||||||
Silvant Small Cap Growth Stock Fund | (262,060 | ) | 1,045 | 261,015 | ||||||||
Conservative Allocation Strategy | — | (211,978 | ) | 211,978 | ||||||||
Growth Allocation Strategy | — | (114,743 | ) | 114,743 | ||||||||
Moderate Allocation Strategy | — | (180,336 | ) | 180,336 | ||||||||
The cost of investments and aggregate gross unrealized appreciation and depreciation for securities held by the Funds as of March 31, 2017 were as follows:
Fund | Tax Cost | Aggregate Gross Unrealized Appreciation | Aggregate Gross Unrealized (Depreciation) | Net Unrealized Appreciation (Depreciation) | ||||||||||||
Capital Innovations Global Resources and Infrastructure Fund | $8,696,655 | $842,093 | $(200,012 | ) | $642,081 | |||||||||||
Ceredex Large Cap Value Equity Fund | 1,671,671,940 | 450,559,971 | (4,179,834 | ) | 446,380,137 | |||||||||||
Ceredex Mid-Cap Value Equity Fund | 3,067,515,333 | 445,671,655 | (26,494,164 | ) | 419,177,491 | |||||||||||
Ceredex Small Cap Value Equity Fund | 734,492,586 | 231,776,476 | (31,985,808 | ) | 199,790,668 | |||||||||||
Innovative Growth Stock Fund | 18,057,397 | 11,207,458 | (301,484 | ) | 10,905,974 | |||||||||||
International Equity Fund | 67,426,463 | 7,313,153 | (442,247 | ) | 6,870,906 | |||||||||||
Silvant Large Cap Growth Stock Fund | 133,970,674 | 82,949,382 | (2,761,822 | ) | 80,187,560 | |||||||||||
Silvant Small Cap Growth Stock Fund | 37,611,944 | 8,708,592 | (1,544,881 | ) | 7,163,711 | |||||||||||
Conservative Allocation Strategy | 40,065,847 | 2,176,077 | (41,358 | ) | 2,134,719 | |||||||||||
Growth Allocation Strategy | 33,662,621 | 6,590,434 | (5,431 | ) | 6,585,003 | |||||||||||
Moderate Allocation Strategy | 43,338,001 | 7,718,406 | (9,795 | ) | 7,708,611 | |||||||||||
70
Table of Contents
NOTES TO FINANCIAL STATEMENTS (continued)
RIDGEWORTH FUNDS March 31, 2017
The tax character of distributions paid to shareholders during the fiscal year ended March 31, 2017 was as follows:
| Distributions paid from | ||||||||||||||||||||
Fund | Net Investment Income* | Net Long Term Capital Gains | Tax-Exempt Distributions** | Return of Capital | Total Distributions Paid | |||||||||||||||
Capital Innovations Global Resources and Infrastructure Fund | $100,427 | $— | $— | $— | $100,427 | |||||||||||||||
Ceredex Large Cap Value Equity Fund | 34,037,404 | 8,370,052 | — | — | 42,407,456 | |||||||||||||||
Ceredex Mid-Cap Value Equity Fund | 115,777,045 | 38,652,586 | — | — | 154,429,631 | |||||||||||||||
Ceredex Small Cap Value Equity Fund | 8,201,724 | 40,708,729 | — | — | 48,910,453 | |||||||||||||||
Innovative Growth Stock Fund | — | 2,975,815 | — | — | 2,975,815 | |||||||||||||||
International Equity Fund | 292,154 | 335,989 | — | — | 628,143 | |||||||||||||||
Silvant Large Cap Growth Stock Fund | — | 31,266,169 | — | — | 31,266,169 | |||||||||||||||
Silvant Small Cap Growth Stock Fund | — | 6,410,507 | — | — | 6,410,507 | |||||||||||||||
Conservative Allocation Strategy | 925,161 | 161,230 | — | — | 1,086,391 | |||||||||||||||
Growth Allocation Strategy | 518,240 | 2,369,699 | — | — | 2,887,939 | |||||||||||||||
Moderate Allocation Strategy | 897,005 | 3,296,102 | — | — | 4,193,107 | |||||||||||||||
| * | Total distributions paid are recognized on a when declared basis for the fiscal year ended March 31, 2017. |
| ** | Net Investment income includes taxable market discount income and net short-term capital gains, if any. |
Amounts designated as “—” are $0 or have been rounded to $0.
The tax character of distributions paid to shareholders during the period or fiscal year ended March 31, 2016 was as follows:
| Distributions paid from | ||||||||||||||||||||
Fund | Net Investment Income* | Net Long Term Capital Gains | Tax-Exempt Distributions** | Return of Capital | Total Distributions Paid | |||||||||||||||
Capital Innovations Global Resources and Infrastructure Fund | $82,228 | $— | $— | $— | $82,228 | |||||||||||||||
Ceredex Large Cap Value Equity Fund | 30,971,375 | 172,233,852 | — | — | 203,205,227 | |||||||||||||||
Ceredex Mid-Cap Value Equity Fund | 113,394,437 | 125,921,077 | — | — | 239,315,514 | |||||||||||||||
Ceredex Small Cap Value Equity Fund | 15,453,362 | 246,896,505 | — | — | 262,349,867 | |||||||||||||||
Innovative Growth Stock Fund | — | 2,095,754 | — | — | 2,095,754 | |||||||||||||||
International Equity Fund | 144,980 | 2,000,010 | — | — | 2,144,990 | |||||||||||||||
Silvant Large Cap Growth Stock Fund | — | 23,322,257 | — | — | 23,322,257 | |||||||||||||||
Silvant Small Cap Growth Stock Fund | — | 21,567,281 | — | — | 21,567,281 | |||||||||||||||
Conservative Allocation Strategy | 952,544 | 1,610,853 | — | — | 2,563,397 | |||||||||||||||
Growth Allocation Strategy | 689,495 | 3,848,880 | — | — | 4,538,375 | |||||||||||||||
Moderate Allocation Strategy | 1,314,012 | 10,251,561 | — | — | 11,565,573 | |||||||||||||||
| * | Total distributions paid are recognized on a when declared basis for the fiscal year ended March 31, 2016. |
| ** | Net Investment income includes taxable market discount income and net short-term capital gains, if any. |
| Amounts | designated as “—” are $0 or have been rounded to $0. |
The tax character of distributions paid to shareholders during the fiscal year ended November 30, 2015 was as follows:
Fund | Net Investment Income* | Net Long Term Capital Gains | Tax-Exempt Distributions** | Return of Capital | Total Distributions Paid | |||||||||||||||
Capital Innovations Global Resources and Infrastructure Fund | $136,051 | $— | $— | $— | $136,051 | |||||||||||||||
| * | Total distributions paid are recognized on a when declared basis for the fiscal year ended November 30, 2015. |
| ** | Net Investment income includes taxable market discount income and net short-term capital gains, if any. |
| Amounts | designated as “—” are $0 or have been rounded to $0. |
71
Table of Contents
NOTES TO FINANCIAL STATEMENTS (continued)
RIDGEWORTH FUNDS March 31, 2017
As of March 31, 2017, the components of distributable earnings (accumulated losses) on a federal income tax basis were as follows:
Fund | Undistributed Tax Exempt Income | Undistributed Ordinary Income | Undistributed Long Term Capital Gains | Net Unrealized Appreciation (Depreciation)* | Loss Carryforwards and Deferrals | Total | ||||||||||||||||||
Capital Innovations Global Resources and Infrastructure Fund | $— | $25,954 | $— | $642,078 | $(720,328 | ) | $(52,296 | ) | ||||||||||||||||
Ceredex Large Cap Value Equity Fund | — | 8,367,620 | 139,490,710 | 446,380,138 | — | 594,238,468 | ||||||||||||||||||
Ceredex Mid-Cap Value Equity Fund | — | 117,973,236 | 148,393,402 | 419,177,491 | — | 685,544,129 | ||||||||||||||||||
Ceredex Small Cap Value Equity Fund | — | — | 61,961,885 | 199,790,667 | — | 261,752,552 | ||||||||||||||||||
Innovative Growth Stock Fund | — | — | 1,124,887 | 10,905,977 | (78,295 | ) | 11,952,569 | |||||||||||||||||
International Equity Fund | — | 109,543 | — | 6,867,852 | (1,771,389 | ) | 5,206,006 | |||||||||||||||||
Silvant Large Cap Growth Stock Fund | — | — | 22,239,718 | 80,187,560 | (128,809 | ) | 102,298,469 | |||||||||||||||||
Silvant Small Cap Growth Stock Fund | — | — | 2,609,590 | 7,163,715 | (66,580 | ) | 9,706,725 | |||||||||||||||||
Conservative Allocation Strategy | — | 257,815 | 891,925 | 2,134,722 | — | 3,284,462 | ||||||||||||||||||
Growth Allocation Strategy | — | 43,792 | 1,657,039 | 6,585,005 | — | 8,285,836 | ||||||||||||||||||
Moderate Allocation Strategy | — | 93,112 | 2,186,927 | 7,708,614 | — | 9,988,653 | ||||||||||||||||||
| * | The differences between book-basis and tax-basis unrealized appreciation is attributable primarily to: tax deferral of losses on wash sales, the realization for tax purposes of unrealized gains/losses on investments in passive foreign investment companies, return of capital adjustments, forward contracts marked to market and partnership basis adjustments. |
The Funds utilize the provisions of the federal income tax laws that provide for the carry forward of capital losses from prior years, offsetting such losses against any future realized capital gains. Under the Regulated Investment Company Modernization Act of 2010 (the “Act”), net capital losses recognized in taxable years beginning after December 22, 2010 (“post-enactment”), may be carried forward indefinitely, and their character is retained as short-term and/or long-term losses. Previously, net capital losses were carried forward for eight years and treated as short-term losses (“pre-enactment”). The Act requires that post-enactment net capital losses be used before pre-enactment net capital losses.
As of March 31, 2017, the post-enactment accumulated short-term and long-term capital loss carry forwards were as follows:
Fund | Short Term | Long Term | Total | |||||||||
Capital Innovations Global Resources and Infrastructure Fund | $416,457 | $303,871 | $720,328 | |||||||||
International Equity Fund | 122,295 | — | 122,295 | |||||||||
As of March 31, 2017, the pre-enactment accumulated capital loss carryforwards and expiration dates were as follows:
Fund | Expiring 2018 | Expiring 2019 | Expiring 2020 | Total | ||||||||||||
Innovative Growth Stock Fund* | $— | $— | $— | $— | ||||||||||||
International Equity Fund** | 1,649,094 | — | — | 1,649,094 | ||||||||||||
Silvant Large Cap Growth Stock Fund*** | — | — | — | — | ||||||||||||
| * | Of the $1,372,838 of remaining capital loss carryforwards acquired on April 27, 2012, in the merger with the RidgeWorth Emerging Growth Stock Fund and subject to limitations as a result of this acquisition, $593,723 of the 2017 layer was utilized, and the remaining $779,115 expired unused. |
| ** | Of the $1,649,094 of remaining capital loss carryforwards subject to limitations due to an ownership change on May 22, 2013 and expiring in 2018, nothing was utilized. |
| *** | Of the remaining $1,639,874 capital loss carryforwards acquired on March 1, 2013, in the merger with the RidgeWorth Large Cap Core Growth Stock Fund and subject to limitations as a result of this acquisition, the entire amount was utilized. |
Amounts designated as “—” are $0.
Capital loss carryforwards may be applied to offset future realized capital gains and therefore may reduce future capital gain distributions.
72
Table of Contents
NOTES TO FINANCIAL STATEMENTS (continued)
RIDGEWORTH FUNDS March 31, 2017
During the fiscal year ended March 31, 2017, the following Funds utilized capital loss carry forwards as follows:
Fund | Amount | |||
Capital Innovations Global Resources and Infrastructure Fund | $107,786 | |||
Innovative Growth Stock Fund | 593,723 | |||
Silvant Large Cap Growth Stock Fund | 1,639,874 | |||
During the fiscal year ended March 31, 2017, the following Fund had capital loss carryforwards that expired in fiscal 2017 as follows:
Fund | Amount | |||
Innovative Growth Stock Fund | $779,115 | |||
Pursuant to federal income tax rules applicable to regulated investment companies, the Funds may elect to treat certain capital losses between November 1 and March 31 and late year ordinary losses (i) ordinary losses between January 1 and March 31, and (ii) specified ordinary and currency losses between November 1 and March 31, as occurring on the first day of the following tax year. For the fiscal year ended March 31, 2017, any amount of losses elected as late year ordinary losses within the tax return will not be recognized for federal income tax purposes until April 1, 2017.
During the fiscal year ended March 31, 2017, the following Funds had late year ordinary losses as follows:
Fund | Amount | |||
Innovative Growth Stock Fund | $78,295 | |||
Silvant Large Cap Growth Stock Fund | 128,809 | |||
Silvant Small Cap Growth Stock Fund | 66,580 | |||
| 7. | Investments in Affiliated Issuers |
Affiliated holdings are holdings in mutual funds which are managed by the Investment Adviser or an affiliate of the Investment Adviser or which are distributed by an affiliate of the Funds’ distributor. An investment by a Fund representing greater than 10% of the voting securities of an issuer makes that issuer an affiliated holding of the Fund. With respect to each Fund, the Investment Adviser was paid an investment advisory fee by the affiliated investments listed beneath its name below. Investments in affiliated issuers as of March 31, 2017 were as follows:
Underlying Funds | Market Value March 31, 2016 | Purchases at Cost* | Proceeds from Sales | Net Realized Gain (Loss) | Change in Unrealized Gain (Loss) | Market Value March 31, 2017 | Share Balance at March 31, 2017 | Dividend Income | Realized Gain Distributions | |||||||||||||||||||||||||||
Conservative Allocation Strategy | ||||||||||||||||||||||||||||||||||||
RidgeWorth Capital Innovations Global Resources and Infrastructure Fund — I Shares | $— | $177,030 | $(30,920 | ) | $228 | $5,305 | $151,643 | 13,141 | $2,030 | $— | ||||||||||||||||||||||||||
RidgeWorth Ceredex Large Cap Value Equity Fund — IS Shares | 5,333,996 | 303,261 | (2,508,800 | ) | 288,716 | 488,897 | 3,906,070 | 227,361 | 86,607 | 18,155 | ||||||||||||||||||||||||||
RidgeWorth Ceredex Mid-Cap Value Equity Fund — IS Shares | 2,053,609 | 102,947 | (932,700 | ) | 150,715 | 166,991 | 1,541,562 | 106,388 | 28,370 | 64,577 | ||||||||||||||||||||||||||
RidgeWorth Ceredex Small Cap Value Equity Fund — I Shares | 508,059 | 190,474 | (272,100 | ) | 9,658 | 70,369 | 506,460 | 38,988 | 6,387 | 27,087 | ||||||||||||||||||||||||||
RidgeWorth International Equity Fund — IS Shares | 1,242,262 | 569,990 | (587,800 | ) | (40,700 | ) | 146,144 | 1,329,896 | 130,382 | 6,879 | 6,610 | |||||||||||||||||||||||||
RidgeWorth Seix Core Bond Fund — IS Shares | 8,551 | 325 | (500 | ) | (13 | ) | (195 | ) | 8,168 | 773 | 170 | 155 | ||||||||||||||||||||||||
73
Table of Contents
NOTES TO FINANCIAL STATEMENTS (continued)
RIDGEWORTH FUNDS March 31, 2017
Underlying Funds | Market Value March 31, 2016 | Purchases at Cost* | Proceeds from Sales | Net Realized Gain (Loss) | Change in Unrealized Gain (Loss) | Market Value March 31, 2017 | Share Balance at March 31, 2017 | Dividend Income | Realized Gain Distributions | |||||||||||||||||||||||||||
RidgeWorth Seix Corporate Bond Fund — I Shares | $ | 1,067,983 | $ | 53,660 | $ | (398,700 | ) | $ | (10,283 | ) | $ | 36,382 | $ | 749,042 | 86,594 | $ | 28,313 | $ | 7,438 | |||||||||||||||||
RidgeWorth Seix Floating Rate High Income Fund — IS Shares | 350,728 | 18,081 | (204,820 | ) | 1,577 | 14,384 | 179,950 | 20,542 | 14,032 | — | ||||||||||||||||||||||||||
RidgeWorth Seix High Income Fund — IS Shares | 363,213 | 33,239 | (143,330 | ) | (4,730 | ) | 35,303 | 283,695 | �� | 44,052 | 21,761 | — | ||||||||||||||||||||||||
RidgeWorth Seix High Yield Fund — I Shares | 359,242 | 7,119 | (38,600 | ) | 530 | (328,291 | ) | — | — | 7,364 | — | |||||||||||||||||||||||||
RidgeWorth Seix High Yield Fund — IS Shares** | — | 22,896 | (102,180 | ) | 3,743 | 348,630 | 273,089 | 32,627 | 11,605 | — | ||||||||||||||||||||||||||
RidgeWorth Seix Total Return Bond Fund — IS Shares | 18,263,309 | 1,221,982 | (3,559,500 | ) | (78,247 | ) | (305,123 | ) | 15,542,421 | 1,491,595 | 404,745 | 268,776 | ||||||||||||||||||||||||
RidgeWorth Seix U.S. Government Securities Ultra-Short Bond Fund — I Shares | 2,655,483 | 8,141 | (263,700 | ) | (1,769 | ) | (2,398,155 | ) | — | — | 8,442 | — | ||||||||||||||||||||||||
RidgeWorth Seix U.S. Government Securities Ultra Short Bond Fund — IS Shares** | — | 51,077 | (681,550 | ) | (5,081 | ) | 2,404,704 | 1,769,150 | 176,210 | 15,838 | — | |||||||||||||||||||||||||
RidgeWorth Silvant Large Cap Growth Stock Fund — IS Shares | 7,803,743 | 716,960 | (3,516,400 | ) | (425,141 | ) | 171,817 | 4,750,979 | 531,429 | — | 716,960 | |||||||||||||||||||||||||
RidgeWorth Silvant Small Cap Growth Stock Fund — IS Shares | 478,779 | 223,449 | (265,550 | ) | (56,966 | ) | 84,651 | 464,363 | 51,368 | — | 70,450 | |||||||||||||||||||||||||
|
|
|
|
|
|
|
|
|
|
|
|
|
|
|
|
|
| |||||||||||||||||||
Total | $40,488,957 | $3,700,631 | $(13,507,150 | ) | $(167,763 | ) | $941,813 | $31,456,488 | 2,951,450 | $642,543 | $1,180,208 | |||||||||||||||||||||||||
|
|
|
|
|
|
|
|
|
|
|
|
|
|
|
|
|
| |||||||||||||||||||
Growth Allocation Strategy | ||||||||||||||||||||||||||||||||||||
RidgeWorth Capital Innovations Global Resources and Infrastructure Fund — I Shares | $— | $322,188 | $(21,900 | ) | $(309 | ) | $7,935 | $307,914 | 26,682 | $3,297 | $— | |||||||||||||||||||||||||
74
Table of Contents
NOTES TO FINANCIAL STATEMENTS (continued)
RIDGEWORTH FUNDS March 31, 2017
Underlying Funds | Market Value March 31, 2016 | Purchases at Cost* | Proceeds from Sales | Net Realized Gain (Loss) | Change in Unrealized Gain (Loss) | Market Value March 31, 2017 | Share Balance at March 31, 2017 | Dividend Income | Realized Gain Distributions | |||||||||||||||||||||||||||
RidgeWorth Ceredex Large Cap Value Equity Fund — IS Shares | $ | 8,957,381 | $ | 384,257 | $ | (2,480,485 | ) | $ | 526,587 | $ | 690,133 | $ | 8,077,873 | 470,190 | $ | 149,019 | $ | 31,238 | ||||||||||||||||||
RidgeWorth Ceredex Mid-Cap Value Equity Fund — IS Shares | 3,466,626 | 202,507 | (1,026,593 | ) | 227,185 | 269,418 | 3,139,143 | 216,642 | 48,838 | 111,168 | ||||||||||||||||||||||||||
RidgeWorth Ceredex Small Cap Value Equity Fund — I Shares | 856,181 | 312,633 | (302,240 | ) | 39,856 | 79,234 | 985,664 | 75,879 | 10,407 | 44,139 | ||||||||||||||||||||||||||
RidgeWorth International Equity Fund — IS Shares | 2,099,109 | 974,148 | (561,300 | ) | (70,228 | ) | 268,812 | 2,710,541 | 265,739 | 11,839 | 11,376 | |||||||||||||||||||||||||
RidgeWorth Seix Core Bond Fund — IS Shares | 2,809 | 112 | (— | ) | — | (76 | ) | 2,845 | 269 | 59 | 54 | |||||||||||||||||||||||||
RidgeWorth Seix Corporate Bond Fund — I Shares | 286,705 | 35,594 | (77,875 | ) | (2,518 | ) | 8,801 | 250,707 | 28,983 | 7,910 | 2,208 | |||||||||||||||||||||||||
RidgeWorth Seix Floating Rate High Income Fund — IS Shares | 93,273 | 10,402 | (48,010 | ) | 6,423 | (2,161 | ) | 59,927 | 6,841 | 3,855 | — | |||||||||||||||||||||||||
RidgeWorth Seix High Income Fund — IS Shares | 97,783 | 17,589 | (28,900 | ) | (1,219 | ) | 9,380 | 94,633 | 14,695 | 6,074 | — | |||||||||||||||||||||||||
RidgeWorth Seix High Yield Fund — I Shares | 95,690 | 1,841 | (8,025 | ) | 83 | (89,589 | ) | — | — | 1,907 | — | |||||||||||||||||||||||||
RidgeWorth Seix High Yield Fund — IS Shares** | — | 16,460 | (21,450 | ) | 441 | 95,673 | 91,124 | 10,887 | 3,358 | — | ||||||||||||||||||||||||||
RidgeWorth Seix Total Return Bond Fund — IS Shares | 4,898,755 | 176,524 | (912,000 | ) | 20,101 | (125,663 | ) | 4,057,717 | 389,416 | 106,587 | 70,315 | |||||||||||||||||||||||||
RidgeWorth Seix U.S. Government Securities Ultra-Short Bond Fund — I Shares | 711,041 | 2,114 | (60,550 | ) | (403 | ) | (652,202 | ) | — | — | 2,195 | — | ||||||||||||||||||||||||
RidgeWorth Seix U.S. Government Securities Ultra-Short Bond Fund — IS Shares** | — | 66,271 | (126,900 | ) | (965 | ) | 653,517 | 591,923 | 58,957 | 4,606 | — | |||||||||||||||||||||||||
75
Table of Contents
NOTES TO FINANCIAL STATEMENTS (continued)
RIDGEWORTH FUNDS March 31, 2017
Underlying Funds | Market Value March 31, 2016 | Purchases at Cost* | Proceeds from Sales | Net Realized Gain (Loss) | Change in Unrealized Gain (Loss) | Market Value March 31, 2017 | Share Balance at March 31, 2017 | Dividend Income | Realized Gain Distributions | |||||||||||||||||||||||||||
RidgeWorth Silvant Large Cap Growth Stock Fund — IS Shares | $ | 13,123,312 | $ | 1,345,638 | $ | (4,232,550 | ) | $ | (241,130 | ) | $ | (199,143 | ) | $ | 9,796,127 | 1,095,764 | $ | — | $ | 1,231,638 | ||||||||||||||||
RidgeWorth Silvant Small Cap Growth Stock Fund — IS Shares | 805,071 | 361,671 | (292,218 | ) | (15,846 | ) | 51,555 | 910,233 | 100,689 | — | 116,671 | |||||||||||||||||||||||||
|
|
|
|
|
|
|
|
|
|
|
|
|
|
|
|
|
| |||||||||||||||||||
Total | $35,493,736 | $4,229,949 | $(10,200,996 | ) | $488,058 | $1,065,624 | $31,076,371 | 2,761,633 | $359,951 | $1,618,807 | ||||||||||||||||||||||||||
|
|
|
|
|
|
|
|
|
|
|
|
|
|
|
|
|
| |||||||||||||||||||
Moderate Allocation Strategy | ||||||||||||||||||||||||||||||||||||
RidgeWorth Capital Innovations Global Resources and Infrastructure Fund — I Shares | $— | $319,075 | $(40,900 | ) | $(234 | ) | $8,490 | $286,431 | 24,821 | $3,275 | $— | |||||||||||||||||||||||||
RidgeWorth Ceredex Large Cap Value Equity Fund — IS Shares | 9,155,333 | 482,995 | (3,421,500 | ) | 930,024 | 340,503 | 7,487,355 | 435,818 | 151,283 | 31,713 | ||||||||||||||||||||||||||
RidgeWorth Ceredex Mid-Cap Value Equity Fund — IS Shares | 3,529,675 | 184,434 | (1,315,100 | ) | 399,811 | 116,971 | 2,915,791 | 201,228 | 49,396 | 112,438 | ||||||||||||||||||||||||||
RidgeWorth Ceredex Small Cap Value Equity Fund — I Shares | 873,622 | 310,316 | (385,050 | ) | 49,020 | 78,141 | 926,049 | 71,289 | 10,764 | 45,652 | ||||||||||||||||||||||||||
RidgeWorth International Equity Fund — IS Shares | 2,138,257 | 935,493 | (760,800 | ) | (50,634 | ) | 253,538 | 2,515,854 | 246,652 | 11,981 | 11,512 | |||||||||||||||||||||||||
RidgeWorth Seix Core Bond — IS Shares | 7,647 | 223 | (2,300 | ) | (87 | ) | (38 | ) | 5,445 | 515 | 120 | 103 | ||||||||||||||||||||||||
RidgeWorth Seix Corporate Bond Fund — I Shares | 770,788 | 54,445 | (236,425 | ) | (6,226 | ) | 23,889 | 606,471 | 70,112 | 20,309 | 5,701 | |||||||||||||||||||||||||
RidgeWorth Seix Floating Rate High Income Fund — IS Shares | 254,453 | 16,688 | (136,845 | ) | 18,824 | (7,480 | ) | 145,640 | 16,626 | 9,924 | — | |||||||||||||||||||||||||
RidgeWorth Seix High Income Fund — IS Shares | 264,632 | 26,053 | (82,700 | ) | (2,722 | ) | 24,123 | 229,386 | 35,619 | 15,615 | — | |||||||||||||||||||||||||
76
Table of Contents
NOTES TO FINANCIAL STATEMENTS (continued)
RIDGEWORTH FUNDS March 31, 2017
Underlying Funds | Market Value March 31, 2016 | Purchases at Cost* | Proceeds from Sales | Net Realized Gain (Loss) | Change in Unrealized Gain (Loss) | Market Value March 31, 2017 | Share Balance at March 31, 2017 | Dividend Income | Realized Gain Distributions | |||||||||||||||||||||||||||
RidgeWorth Seix High Yield Fund — I Shares | $ | 259,521 | $ | 4,923 | $ | (41,350 | ) | $ | 632 | $(223,726) | $ | — | — | $ | 5,093 | $ | — | |||||||||||||||||||
RidgeWorth Seix High Yield Fund — IS Shares** | — | 18,894 | (38,170 | ) | 1,028 | 239,349 | 221,101 | 26,416 | 8,514 | — | ||||||||||||||||||||||||||
RidgeWorth Seix Total Return Bond Fund — IS Shares | 13,174,330 | 440,406 | (3,624,000 | ) | 240,260 | (476,288) | 9,754,708 | 936,152 | 265,413 | 171,134 | ||||||||||||||||||||||||||
RidgeWorth Seix U.S. Government Securities Ultra-Short Bond Fund — I Shares | 1,917,741 | 5,612 | (301,800 | ) | (746 | ) | (1,620,807 | ) | — | — | 5,819 | — | ||||||||||||||||||||||||
RidgeWorth Seix U.S. Government Securities Ultra Short Bond Fund — IS Shares** | — | 78,805 | (268,150 | ) | (930 | ) | 1,622,641 | 1,432,366 | 142,666 | 11,643 | — | |||||||||||||||||||||||||
RidgeWorth Silvant Large Cap Growth Stock Fund — IS Shares | 13,403,070 | 1,325,663 | (5,204,500 | ) | (216,555 | ) | (218,491 | ) | 9,089,187 | 1,016,688 | — | 1,250,663 | ||||||||||||||||||||||||
RidgeWorth Silvant Small Cap Growth Stock Fund — IS Shares | 823,866 | 354,030 | (369,750 | ) | (11,641 | ) | 54,591 | 851,096 | 94,148 | — | 119,530 | |||||||||||||||||||||||||
|
|
|
|
|
|
|
|
|
|
|
|
|
|
|
|
|
| |||||||||||||||||||
Total | $46,572,935 | $4,558,055 | $(16,229,340 | ) | $1,349,824 | $215,406 | $36,466,880 | 3,318,750 | $569,149 | $1,748,446 | ||||||||||||||||||||||||||
|
|
|
|
|
|
|
|
|
|
|
|
|
|
|
|
|
| |||||||||||||||||||
| * | Includes reinvestment of distributions. |
| ** | IS Shares commenced operations on August 1, 2016. |
| 8. | Reorganizations |
Effective the close of business on February 19, 2016, Capital Innovations Global Resources and Infrastructure Fund, a new series of the Trust, acquired the assets and assumed the liabilities of the Predecessor Fund, a series of Investment Managers Series Trust. As part of the reorganization there was a change to the independent registered public accounting firm. The reorganization was accomplished by the following tax-free reorganization in which each shareholder of the Predecessor Fund received the same aggregate net asset value in the corresponding classes as noted below:
| Shares Issued | Net Assets | |||||||
I Shares | 224,274 | $1,806,342 | ||||||
A Shares | 127,824 | 1,028,373 | ||||||
C Shares | 24,776 | 196,668 | ||||||
The appreciation (depreciation) of the Predecessor Fund was $588,102 as of the date of the acquisition.
77
Table of Contents
NOTES TO FINANCIAL STATEMENTS (concluded)
RIDGEWORTH FUNDS March 31, 2017
The undistributed net investment income of the Predecessor Fund was $18,436 as of the date of the acquisition.
9. Subsequent Events
Management has evaluated subsequent events through the date the financial statements are issued. Management has determined, except as set forth below, that there are no material events that would require disclosure in the Funds’ financial statements through this date.
On December 16, 2016, Virtus Investment Partners, Inc. entered into an agreement to acquire all outstanding equity securities of the Investment Adviser from Lightyear Capital and a group of employees of the Investment Adviser. On December 14, 2016, the Board had approved, subject to shareholder approval, an agreement and plan of reorganization pursuant to which each Fund will be reorganized into a newly created series of Virtus Asset Trust (the “Plan”), and recommends that shareholders of each Fund approve the Plan. As a result, shareholders of each Fund (except the RidgeWorth Capital Innovations Global Resources and Infrastructure Fund) were asked at a special meeting of shareholders on May 9, 2017 to approve the Plan. Further, in accordance with the Plan, the RidgeWorth Moderate Allocation Strategy and the RidgeWorth Growth Allocation Strategy will reorganize into the same newly created series of Virtus Asset Trust called the Virtus Growth Allocation Strategy Fund. The special meeting of shareholders on May 9, 2017 was adjourned to May 30, 2017 with respect to certain Funds that had not yet reached quorum.
At a special meeting of shareholders scheduled for June 28, 2017, shareholders of the RidgeWorth Capital Innovations Global Resources and Infrastructure Fund will be asked to approve an agreement and plan of reorganization pursuant to which the Fund will be reorganized into the Oak Ridge Global Resources & Infrastructure Fund (the “Reorganization”), a newly created series of Investment Managers Series Trust. On April 17, 2017, the Board approved the Reorganization and recommends that shareholders of the Fund approve the Reorganization.
Effective April 1, 2017, each Fund’s A Shares Rule 12b-1 Plan distribution and service fee was reduced to a maximum of 0.25% annually, as a percentage of the value of your investment.
78
Table of Contents
REPORT OF INDEPENDENT REGISTERED PUBLIC ACCOUNTING FIRM
RIDGEWORTH FUNDS March 31, 2017
To the Board of Trustees and Shareholders of RidgeWorth Funds:
In our opinion, the (i) accompanying statements of assets and liabilities, including the schedules of portfolio investments, and the related statements of operations and of changes in net assets and the financial highlights present fairly, in all material respects, the financial position of the Ceredex Large Cap Value Equity Fund, Ceredex Mid-Cap Value Equity Fund, Ceredex Small Cap Value Equity Fund, Innovative Growth Stock Fund (formerly known as the Aggressive Growth Stock Fund), International Equity Fund, Silvant Large Cap Growth Stock Fund, Silvant Small Cap Growth Stock Fund, Conservative Allocation Strategy, Growth Allocation Strategy, and Moderate Allocation Strategy as of March 31, 2017, the results of each of their operations for the year then ended, the changes in each of their net assets for each of the two years in the period then ended and the financial highlights for each of the periods indicated herein, and (ii) accompanying statement of assets and liabilities, including the schedule of portfolio investments, and the related statements of operations and of changes in net assets and the financial highlights present fairly, in all material respects, the financial position of the Capital Innovations Global Resources and Infrastructure Fund as of March 31, 2017, the results of its operations for the year then ended, the changes in its net assets for the year then ended and for the period December 1, 2015 through March 31, 2016, and each of its financial highlights for the year then ended and for the period December 1, 2015 through March 31, 2016, (eleven of the funds constituting RidgeWorth funds, hereinafter referred to as the “Funds”), in conformity with accounting principles generally accepted in the United States of America. These financial statements and financial highlights (hereafter referred to as “financial statements”) are the responsibility of the Funds’ management. Our responsibility is to express an opinion on these financial statements based on our audits. We conducted our audits of these financial statements in accordance with the standards of the Public Company Accounting Oversight Board (United States). Those standards require that we plan and perform the audit to obtain reasonable assurance about whether the financial statements are free of material misstatement. An audit includes examining, on a test basis, evidence supporting the amounts and disclosures in the financial statements, assessing the accounting principles used and significant estimates made by management, and evaluating the overall financial statement presentation. We believe that our audits, which included confirmation of securities as of March 31, 2017 by correspondence with the custodian, transfer agent and brokers, and application of alternative auditing procedures where securities purchased had not been received, provide a reasonable basis for our opinion. The financial statements of the Capital Innovations Global Resources and Infrastructure Fund as of and for the year ended November 30, 2015 and the financial highlights for each of the periods ended on or prior to November 30, 2015 (not presented herein, other than the statement of changes in net assets and the financial highlights) were audited by other auditors whose report, dated January 29, 2016 expressed an unqualified opinion on those financial statements and financial highlights.
As discussed in Note 9 to the financial statements, on December 14, 2016, the Board of Trustees approved a plan to reorganize the Moderate Allocation Strategy and the Growth Allocation Strategy into the newly created series of Virtus Asset Trust called the Virtus Growth Allocation Strategy. The reorganization is pursuant to approval by the Moderate Allocation Strategy and Growth Allocation Strategy shareholders’ at a special meeting of shareholders scheduled for May 30, 2017
PricewaterhouseCoopers LLP
Boston, Massachusetts
May 25, 2017
79
Table of Contents
RIDGEWORTH FUNDS March 31, 2017
(Unaudited)
The following Funds have designated long term capital gain distributions as follows:
Fund | Amount | |||
Ceredex Large Cap Value Equity Fund | $8,370,052 | |||
Ceredex Mid-Cap Value Equity Fund | 38,652,586 | |||
Ceredex Small Cap Value Equity Fund | 40,708,729 | |||
Innovative Growth Stock Fund | 2,975,815 | |||
International Equity Fund | 335,989 | |||
Silvant Large Cap Growth Stock Fund | 31,266,169 | |||
Silvant Small Cap Growth Stock Fund | 6,410,507 | |||
Conservative Allocation Strategy | 161,230 | |||
Growth Allocation Strategy | 2,369,699 | |||
Moderate Allocation Strategy | 3,296,102 | |||
For corporate shareholders, the following percentages of the total ordinary income distributions paid by the following Funds during the fiscal year ended March 31, 2017 qualify for the corporate dividends received deductions:
Fund | Dividend Received Deduction | |||
Capital Innovations Global Resources and Infrastructure Fund | 17.45 | % | ||
Ceredex Large Cap Value Equity Fund | 100.00 | |||
Ceredex Mid-Cap Value Equity Fund | 28.08 | |||
Ceredex Small Cap Value Equity Fund | 100.00 | |||
Conservative Allocation Strategy | 12.89 | |||
Growth Allocation Strategy | 39.73 | |||
Moderate Allocation Strategy | 23.98 | |||
In addition, the Funds may elect to pass through foreign taxes paid by the Funds to shareholders under Section 853 of the Internal Revenue Code. For the fiscal year ended March 31, 2017 the following funds elected to pass through foreign taxes as follows:
Fund | Amount | |||
International Equity Fund | $79,034 | |||
Conservative Allocation Strategy | 10,673 | |||
Growth Allocation Strategy | 17,240 | |||
Moderate Allocation Strategy | 17,529 | |||
For the fiscal year ended March 31, 2017, the following Funds paid qualified dividend income:
Fund | Qualified Dividend Income | |||
Capital Innovations Global Resources and Infrastructure Fund | 17.45 | % | ||
Ceredex Large Cap Value Equity Fund | 100.00 | |||
Ceredex Mid-Cap Value Equity Fund | 30.36 | |||
Ceredex Small Cap Value Equity Fund | 100.00 | |||
International Equity Fund | 100.00 | |||
Conservative Allocation Strategy | 18.83 | |||
Growth Allocation Strategy | 55.82 | |||
Moderate Allocation Strategy | 34.31 | |||
80
Table of Contents
OTHER FEDERAL TAX INFORMATION (concluded)
RIDGEWORTH FUNDS March 31, 2017
(Unaudited)
The following RidgeWorth Funds intend to elect to pass through to shareholders the income tax credit for taxes paid to foreign countries for the fiscal year ended March 31, 2017.
Fund | Foreign Source Income | Foreign Tax Expense | ||||||
International Equity Fund | $869,469 | $79,034 | ||||||
Conservative Allocation Strategy | 60,210 | 10,673 | ||||||
Growth Allocation Strategy | 94,268 | 17,240 | ||||||
Moderate Allocation Strategy | 96,176 | 17,529 | ||||||
81
Table of Contents
TRUSTEES AND OFFICERS OF THE RIDGEWORTH FUNDS
RIDGEWORTH FUNDS March 31, 2017
(Unaudited)
Set forth below are the names, age, position with the Trust, length of term of office, and the principal occupations and, if applicable, other directorships held during at least the last five years of each of the persons currently serving as a Trustee or officer of the Trust. Unless otherwise noted, the address of each Trustee is c/o RidgeWorth Investments, 3333 Piedmont Road, Suite 1500, Atlanta, Georgia 30305. The Funds’ Statement of Additional Information includes more information about the Trustees and is available without charge, upon request, by calling 1-888-784-3863 and on the Funds’ website at www.ridgeworth.com.
Name | Position Held with the Trust | Term of Office and Length of Time Served | Principal Occupation(s) During the Past 5 Years | Number of Portfolios in the RidgeWorth Complex Overseen by Trustees | Other Directorships Held By Trustee During the Past 5 Years | |||||||
INDEPENDENT TRUSTEE | ||||||||||||
Tim E. Bentsen (August 1953) | Trustee | Indefinite; since 2012 | Lecturer- J.M. Tull School of Accounting, Terry College of Business at University of Georgia (2013-Present); Retired. Audit Partner and Account Executive (1993-2012); Lead Area Managing Partner (2005-2009); Atlanta Office Managing Partner (2003-2009), KPMG LLP. | 28 | Synovus Financial Corp.; Krispy Kreme Doughnuts, Inc. | |||||||
Jeffrey M. Biggar (February 1950) | Trustee | Indefinite; since 2007 | Director of Special Gifts for Hawken School (since May 2013); Managing Director, Little Mountain Group, LLC (an independent Registered Investment Advisor consulting firm) (2011-2013); Chief Operating Officer, Cedar Brook Financial Partners LLC (2008-2010); Chief Executive Officer and Senior Managing Director, Sterling (National City Corp.) (2000-2006). | 28 | Multi-Manager Master Portfolios LLC (3 portfolios; thru 2013) | |||||||
George C. Guynn (December 1942) | Trustee | Indefinite; since 2008 | Retired. President and CEO, Federal Reserve Bank of Atlanta (1996-2006). | 28 | SUSA Registered Fund, LLC; Oxford Industries; Acuity Brands, Inc. (thru 2014); Multi-Manager Master Portfolios LLC (3 portfolios; thru 2013); Genuine Parts Company (thru 2015) | |||||||
Sidney E. Harris (July 1949) | Trustee | Indefinite; since 2004 | Professor and Dean Emeritus (since April 2015), Professor (1997-2014), Dean (1997-2004), J. Mack Robinson College of Business, Georgia State University. | 28 | Total System Services, Inc.; Multi-Manager Master Portfolios LLC (3 portfolios; thru 2013). | |||||||
Connie D. McDaniel (April 1958) | Trustee | Indefinite; since 2005 | Retired. Vice President, Chief of Internal Audit, Corporate Audit Department (2009-2013); Vice President Global Finance Transformation (2007-2009); Vice President and Controller (1999-2007), The Coca-Cola Company. | 28 | Total System Services, Inc. | |||||||
INTERESTED TRUSTEE | ||||||||||||
Ashi S. Parikh* (February 1966) | Trustee | Indefinite; since 2013 | Chief Executive Officer and Chief Investment Officer, RidgeWorth Investments (2010-present); President and Chief Investment Officer (2008-2010). | 28 | None | |||||||
| * | Mr. Parikh is an “interested person” of the Trust, as defined in the 1940 Act, because he is an employee of the Adviser. |
82
Table of Contents
TRUSTEES AND OFFICERS OF THE RIDGEWORTH FUNDS (concluded)
RIDGEWORTH FUNDS March 31, 2017
(Unaudited)
| Name, Address and (month/year of birth) | Position(s) Held with the Trust | Term of Office and Length of Time Served | Principal Occupation(s) During the Past 5 Years | |||
Julia R. Short 3333 Piedmont Road, NE, Suite 1500, Atlanta, GA 30305 (November 1972) | President and Chief Executive Officer | One year; since 2007 | Managing Director, Product Manager, RidgeWorth Investments (since 2004). | |||
James L. Love 3333 Piedmont Road, NE, Suite 1500, Atlanta, GA 30305 (December 1968) | Chief Compliance Officer | One year; since 2016 | Managing Director and Chief Compliance Officer, RidgeWorth Investments (since 2016); Chief Compliance Officer and Deputy General Counsel, U.S. Global Investors (2007–2015). | |||
Benjamin H. Lowe 3333 Piedmont Road, NE, Suite 1500, Atlanta, GA 30305 (March 1978) | Treasurer and Chief Financial Officer | One year; since 2015 | Director of Fund Administration, RidgeWorth Investments (since 2011); Fund Controller, ALPS Fund Services, Inc. (2005–2011). | |||
Sean Nossaman 3333 Piedmont Road, NE, Suite 1500, Atlanta, GA 30305 (June 1982) | Assistant Treasurer | One year; since 2016 | Assistant Treasurer, RidgeWorth Investment (since 2016); Assistant Fund Controller, ALPS Fund Services, Inc. (2007) to (2016)** | |||
James Bacik State Street Bank and Trust Co. 1 Iron Street Boston, MA 02110 (May 1975) | Assistant Treasurer | One year; since 2010 | Vice President, State Street Bank and Trust Company (since 2001).* | |||
Patrick J. Keniston Foreside Fund Officer Services, LLC Three Canal Plaza, Suite 100 Portland, ME 04101 (January 1964) | Anti-Money Laundering Officer and Identity Theft Prevention Officer | One year; since 2013 | Managing Director, Foreside Fund Officer Services, LLC (October 2008 – present). | |||
Karen Jacoppo-Wood State Street Bank and Trust Company 100 Summer Street Boston, MA 02111 (December 1966) | Secretary and Chief Legal Officer | One year; since 2014 | Vice President and Managing Counsel, State Street Bank and Trust Company (since 2014); Vice President, RMR Advisors, Inc./RMR Funds (2007-2014). | |||
Rebecca Gilding State Street Bank and Trust Company 100 Summer Street Boston, MA 02111 (December 1979) | Assistant Secretary | One year; since May 2016 | Vice President and Counsel, State Street Bank and Trust Company (since 2016); Assistant Vice President and Associate Counsel, Brown Brothers Harriman and Co. (2013-2016); Assistant Vice President Citi Fund Services, Inc. (2005-2013).* |
| * | During the period indicated the officer has held various positions at State Street Bank and Trust Company and has provided his or her current title. |
| ** | During the period indicated the Officer has held various positions at ALPS Fund Services, Inc. and has provided his most recent title. |
83
Table of Contents
RIDGEWORTH FUNDS March 31, 2017
(Unaudited)
Renewal of Advisory and Subadvisory Agreements
The continuance of the Trust’s investment advisory agreement with RidgeWorth Capital Management LLC (the “Adviser”) and subadvisory agreements between the Adviser and each of Ceredex Value Advisors LLC, Silvant Capital Management LLC, WCM Investment Management, and Zevenbergen Capital Investments LLC (collectively, the “Subadvisers”) must be specifically approved at least annually by (i) the vote of the Trustees or a vote of the shareholders of the Funds and (ii) the vote of a majority of the Trustees who are not parties to the agreements or “interested persons” of any party thereto (the “Independent Trustees”), as defined in the Investment Company Act of 1940 (the “1940 Act”), cast in person at a meeting called for the purpose of voting on such approval. New advisory agreements for the Trust are also subject to such approval initially and annually after their initial term is complete.
Each year, the Board of Trustees calls and holds a meeting to decide whether to approve the continuance of the Trust’s agreements for another year. In preparation for the meeting, the Board requests and reviews a wide variety of information from the Adviser and Subadvisers. The Trustees use this information, as well as other information that the Adviser, Subadvisers, and other service providers may submit to the Board, to help them decide whether to approve the agreements.
In considering the most recent renewal of the agreements with the Adviser and Subadvisers, the Board requested and received material from the Adviser and Subadvisers in preparation for a special meeting of the Board held on October 13, 2016, and reviewed additional material from the Adviser and Subadvisers in preparation for its quarterly meeting held on November 14-15, 2016, at which it specifically considered the renewal of the agreements. Such material included, among other things, information about: (a) the quality of the Adviser’s and Subadvisers’ investment management and other services; (b) the Adviser’s and Subadvisers’ investment management personnel; (c) the Adviser’s and Subadvisers’ operations and financial condition; (d) the Adviser’s and Subadvisers’ brokerage practices (including any soft dollar arrangements) and investment strategies; (e) the level of the advisory fees that the Adviser and Subadvisers charge the Funds compared with the fees they charge to comparable mutual funds or accounts; (f) the Funds’ overall fees and operating expenses compared with similar mutual funds; (g) the level of the Adviser’s and Subadvisers’ profitability from their Fund-related operations; (h) the Adviser’s and Subadvisers’ compliance systems; (i) the Adviser’s and Subadvisers’ policies and procedures for personal securities transactions; (j) the Adviser’s and Subadvisers’ reputation, expertise, and resources in domestic financial markets; and (k) the Funds’ performance compared with similar mutual funds. The Board also received a memorandum from fund counsel regarding the responsibilities of the Trustees in connection with their consideration of the agreements.
At the meetings, representatives from the Adviser and Subadvisers presented additional oral and written information to the Board to help the Board evaluate the Adviser’s and Subadvisers’ fees and other aspects of the agreements. The Board also considered information presented by the Adviser, Subadvisers, and other service providers at meetings held throughout the year and over the years. The Trustees discussed the written materials, oral presentations, and any other information that the Board received, and considered the approval of the agreements in light of this information.
Based on the Board’s deliberations and evaluation of the information it received, the Board, including all of the Independent Trustees, approved the renewal of the agreements with the Adviser and Subadvisers and determined that the compensation under the agreements is fair and reasonable in light of the services to be performed. The Board considered the following specific factors, none of which was controlling, and made the following conclusions:
Nature, Extent, and Quality of Services. The Board received and considered information regarding the nature, extent, and quality of services provided to the Funds by the Adviser and Subadvisers. In this regard, the Trustees evaluated, among other things, the Adviser’s and Subadvisers’ personnel, experience, track record, and compliance program. The Board considered the background and experience of the Adviser’s and Subadvisers’ senior management and the expertise of, and amount of attention given to the Funds by, their portfolio management teams. The Board reviewed the qualifications and backgrounds of the portfolio managers responsible for the day-to-day management of the Funds. The Board also reviewed information pertaining to the Adviser’s and Subadvisers’ organizational structure, senior management, investment operations, and other relevant information.
84
Table of Contents
INVESTMENT ADVISORY AGREEMENT (continued)
RIDGEWORTH FUNDS March 31, 2017
(Unaudited)
The Board concluded that, within the context of its full deliberations, the nature, extent, and quality of the services provided to the Funds by the Adviser and Subadvisers supported the approval of the agreements.
Performance. The Board considered the investment performance of each Fund, including any periods of outperformance and underperformance, both on an absolute basis and a comparative basis to indices and other funds within the same investment categories. Specifically, the Board considered Fund performance relative to peer groups and appropriate benchmarks in light of total return, yield, and market trends. As part of this review, the Board considered the composition of the peer group and selection criteria, as well as market risk and shareholder risk expectations. The Board considered the Adviser’s and Subadvisers’ explanations regarding specific performance issues. The Board concluded that, within the context of its full deliberations, the performance of the Funds, the Adviser, and the Subadvisers supported the approval of the agreements.
Fund Expenses. With respect to advisory fees, the Board considered the rate of compensation under the agreements and each Fund’s net operating expense ratio in comparison to those of comparable mutual funds. The Trustees also considered information about average expense ratios of comparable mutual funds in each Fund’s peer group. Finally, the Trustees considered the effect of the Adviser’s and Subadvisers’ waiver and reimbursement of fees and expenses, where applicable, to prevent total expenses from exceeding a specified amount and that, due to these waivers and reimbursements, net operating expenses have been maintained at competitive levels. The Board concluded that, within the context of its full deliberations, the expenses of the Funds are reasonable and supported the approval of the agreements.
Profitability. The Board reviewed information about the profitability of the Funds to the Adviser and Subadvisers and considered whether the level of profitability, if any, was reasonable and justified in light of the quality of the services rendered to the Funds. The Board concluded that, within the context of its full deliberations, the profitability of the Adviser and Subadvisers is within the range the Board considered reasonable.
Economies of Scale. The Board considered the existence of economies of scale and whether they were passed along to Fund shareholders through a graduated advisory fee schedule or other means, including any fee waivers and expense reimbursements by the Adviser and Subadvisers. The Board concluded that, within the context of its full deliberations, the Funds obtain reasonable benefit from economies of scale.
Approval of Interim Advisory and Subadvisory Agreements
Following its consideration of the annual continuance of the existing advisory and subadvisory agreements discussed above, at a special meeting held on December 14, 2016, the Board of Trustees considered a proposed interim advisory agreement between the Adviser and the Trust and proposed interim subadvisory agreements between the Adviser and each Subadviser. The Board noted that the interim agreements are the same as the existing advisory and subadvisory agreements they are intended to replace, including the rate of compensation thereunder, except for differences reflecting the requirements of Rule 15a-4 under the 1940 Act, such as the date of execution, effectiveness, termination, and compensation conditions. In approving the interim advisory and subadvisory agreements, the Board noted its recent comprehensive review, described above, in connection with its consideration of the annual continuance of the existing advisory and subadvisory agreements.
Approval of Interim Advisory and Subadvisory Agreements and Short-Term Advisory Agreement
At a special meeting held on April 17, 2017, the Board considered, with respect to the Capital Innovations Global Resources and Infrastructure Fund (the “Fund”), the approval of an interim advisory agreement between the Adviser and the Trust, an interim subadvisory agreement between the Adviser and Capital Innovations, LLC, and a short-term advisory agreement between the Adviser and the Trust (collectively, the “Agreements”). The interim advisory and subadvisory agreements are the same as the existing agreements they are intended to replace, including the rate of compensation thereunder, except for differences reflecting the requirements of Rule 15a-4 under the 1940 Act, such as the date of execution, duration of the agreement, termination, and compensation conditions. The short-term advisory agreement is the same in all materials respects to the existing advisory agreement between the Trust and the Adviser except for the date of execution and the duration of the agreement.
In evaluating the Agreements, the Board discussed its initial consideration and approval, at a meeting held on November 16-17, 2015, of the existing advisory agreement between the Adviser and the Trust and the existing
85
Table of Contents
INVESTMENT ADVISORY AGREEMENT (continued)
RIDGEWORTH FUNDS March 31, 2017
(Unaudited)
subadvisory agreement between the Adviser and Capital Innovations, which went into effect on February 19, 2016. The Board also noted that it recently had conducted an in depth review of the Adviser and its advisory services at its November 2016 meeting when it considered the annual renewal of the Adviser’s investment advisory agreements for the other series of the Trust.
Prior to and at the November 2015 meeting, the Board had requested and reviewed materials from the Adviser and Capital Innovations to help the Trustees evaluate the proposed fees and other aspects of the agreements. The agreements were considered as part of the proposed reorganization of the Capital Innovations Global Agri, Timber, Infrastructure Fund (the “Predecessor Fund”) into the Fund, which was being proposed at the same meeting as a new series of the Trust. In determining whether to initially approve the agreements, the Board considered and discussed information and analysis provided by the Adviser and Capital Innovations. The Board considered all factors that it deemed to be relevant. In its deliberations, the Board did not identify any single factor that was paramount or controlling and individual Trustees may have attributed different weights to various factors.
In considering whether to approve the Agreements, the Board considered, among other things, its initial evaluation of the existing advisory and subadvisory agreements during the November 2015 meeting. Certain factors considered by the Board at the November 2015 meeting, as well as the conclusions reached, are addressed in more detail below.
Nature, Extent, and Quality of Services. In considering the nature, extent, and quality of the services proposed to be provided by the Adviser and Capital Innovations, the Board reviewed the services to be provided and the qualifications and backgrounds of the portfolio managers proposed to be responsible for managing the Fund. The Board also reviewed information set forth in the Adviser’s and Capital Innovations’ Form ADVs, each of which provides information about the firm, its management, and its business activities and affiliations. The Board considered the professional experience and qualifications of senior management and key professional personnel. The Board also considered operational capabilities and resources and experience in managing investment portfolios. The Board noted that Capital Innovations served as subadviser to the Predecessor Fund and reviewed its record in that role. The Board also noted that the Adviser serves as investment adviser to each series of the Trust. Based on its review, within the context of its full deliberations, the Board determined that it was satisfied with the nature, extent, and quality of services to be provided to the Fund by the Adviser and Capital Innovations.
Performance. In connection with the assessment of Capital Innovations’ ability to perform its duties under the subadvisory agreement, the Board considered the sufficiency of its resources and concluded that Capital Innovations had the financial resources necessary to perform its obligations under the agreement. The Board heard an overview of Capital Innovations’ investment philosophy, the proposed portfolio construction of the assets of the Fund, and the investment techniques to be employed. The Board also reviewed Capital Innovations’ investment performance with respect to the strategies proposed to be used in managing the Fund and the investment performance of Capital Innovations with respect to its other accounts, including mutual funds and other pooled investment vehicles, and, specifically, the Predecessor Fund. The Board also assessed the Adviser’s ability to perform its duties under the advisory agreement. Based on its review, within the context of its full deliberations, the Board determined that it was satisfied with the information regarding the performance of the Adviser and Capital Innovations.
Cost of Services. The Board considered the cost of the services to be provided by the Adviser and Capital Innovations, including estimated profitability analyses, and reviewed the fees to be paid pursuant to the agreements. In addition, the Board discussed the fee arrangement between the Adviser and Capital Innovations, noting that the Adviser would pay Capital Innovations out of the advisory fee it receives from the Fund. The Board also reviewed information regarding advisory fees of comparable funds and evaluated the proposed fee arrangement in light of this information and the factors that judicial decisions have specified as pertinent generally. The Board also considered the Adviser’s and Capital Innovations’ contractual arrangement with the Fund to waive the advisory fee and/or reimburse expenses in an effort to control the expense ratio of the Fund, if necessary. Based on its review, within the context of its full deliberations, the Board determined that the fees proposed to be paid to the Adviser and Capital Innovations were fair and reasonable.
86
Table of Contents
INVESTMENT ADVISORY AGREEMENT (concluded)
RIDGEWORTH FUNDS March 31, 2017
(Unaudited)
Economies of Scale. The Board considered the potential for economies of scale and noted that both the Adviser’s and Capital Innovations’ fees include breakpoints.
Conclusion. Based on its deliberations and evaluation of the information described above, the Board, including the independent trustees, unanimously: (i) concluded that the terms of the agreements are fair and reasonable; (ii) concluded that the proposed compensation for the Adviser and Capital Innovations is fair and reasonable in light of the services that they will provide to the Fund; and (iii) approved the agreements for an initial term of two years.
87
Table of Contents
RIDGEWORTH FUNDS March 31, 2017
(Unaudited)
Shareholder Meeting Results
A Special Meeting of the shareholders (the “Meeting”) of each series of RidgeWorth Funds (the “Trust”) was held on May 9, 2017. The details of the voting with respect to the Proposal are shown below. The Proposal received the required number of affirmative votes for approval.
The May 9, 2017 Meeting was held to consider and act on the following proposal:
Proposal: To approve The Agreement and Plan of Reorganization by and among RidgeWorth Funds on behalf of the acquired Fund Virtus Asset Trust on behalf of the corresponding acquiring fund RidgeWorth Capital Management LLC and Virtus Investment Partners Inc.
| Number of Shares(1) | ||||||||||||||||
| Affirmative | Objecting | Abstaining(2) | Uninstructed(2) | |||||||||||||
Innovative Growth Stock Fund | 727,197 | 4,085 | 12,281 | 79,947 | ||||||||||||
International Equity Fund | 4,732,286 | 9,062 | 22,792 | — | ||||||||||||
Conservative Allocation Strategy | 1,306,703 | 15,983 | 46,187 | 491,036 | ||||||||||||
Growth Allocation Strategy | 2,291,153 | — | 8,168 | — | ||||||||||||
| (1) | Excludes fractional shares. |
| (2) | Uninstructed shares (i.e., proxies from brokers or nominees indicating that such persons have not received instructions from the beneficial owner or other person entitled to vote shares on a particular matter with respect to which the brokers or nominees do not have discretionary power) were treated as shares that were present at the meeting for purposes of establishing a quorum, but had the effect of a vote against the Proposal. Uninstructed shares are sometimes referred to as broker non-votes. Abstentions were also treated in this manner. |
88
Table of Contents
ADDITIONAL INFORMATION (continued)
RIDGEWORTH FUNDS March 31, 2017
(Unaudited)
Expense Examples
As a shareholder of the RidgeWorth Funds, you incur two types of costs: (1) transaction costs, including sales charges (loads) on purchases; and (2) ongoing costs, including management fees, 12b-1 distribution and/or service fees, and other Fund expenses. These examples are intended to help you understand your ongoing costs (in dollars) of investing in the RidgeWorth Funds and to compare these costs with the ongoing costs of investing in other mutual funds.
These examples are based on an investment of $1,000 invested at the beginning of the period and held for the entire period from October 1, 2016 through March 31, 2017.
Actual Expenses
The table below provides information about actual account values and actual expenses. You may use the information below, together with the amount you invested, to estimate the expenses that you paid over the period. Simply divide your account value by $1,000 (for example, an $8,600 account value divided by $1,000 = 8.6), then multiply the result by the number in the table under the heading entitled “Expenses Paid During Period” to estimate the expenses you paid on your account during this period.
Fund | Class | Beginning Account Value 10/01/16 | Ending Account Value 03/31/17 | Expenses Paid During Period* 10/01/16-03/31/17 | Expense Ratio During Period** 10/01/16-03/31/17 | |||||||||||||||
Capital Innovations Global Resources and Infrastructure Fund | I Shares | $1,000.00 | $1,114.10 | $6.11 | 1.16 | % | ||||||||||||||
| A Shares | 1,000.00 | 1,113.40 | 7.32 | 1.39 | ||||||||||||||||
| C Shares | 1,000.00 | 1,108.70 | 11.25 | 2.14 | ||||||||||||||||
Ceredex Large Cap Value Equity Fund | I Shares | 1,000.00 | 1,102.30 | 5.08 | 0.97 | |||||||||||||||
| A Shares | 1,000.00 | 1,101.60 | 6.50 | 1.24 | ||||||||||||||||
| C Shares | 1,000.00 | 1,098.50 | 9.00 | 1.72 | ||||||||||||||||
| IS Shares | 1,000.00 | 1,104.00 | 3.78 | 0.72 | ||||||||||||||||
Ceredex Mid-Cap Value Equity Fund | I Shares | 1,000.00 | 1,133.40 | 5.48 | 1.03 | |||||||||||||||
| A Shares | 1,000.00 | 1,131.60 | 7.33 | 1.38 | ||||||||||||||||
| C Shares | 1,000.00 | 1,128.90 | 9.50 | 1.79 | ||||||||||||||||
| IS Shares | 1,000.00 | 1,135.10 | 4.21 | 0.79 | ||||||||||||||||
Ceredex Small Cap Value Equity Fund | I Shares | 1,000.00 | 1,077.10 | 6.42 | 1.24 | |||||||||||||||
| A Shares | 1,000.00 | 1,074.80 | 8.02 | 1.55 | ||||||||||||||||
| C Shares | 1,000.00 | 1,073.10 | 9.82 | 1.90 | ||||||||||||||||
Innovative Growth Stock Fund | I Shares | 1,000.00 | 1,091.50 | 6.78 | 1.30 | |||||||||||||||
| A Shares | 1,000.00 | 1,090.20 | 7.82 | 1.50 | ||||||||||||||||
International Equity Fund | I Shares | 1,000.00 | 1,033.20 | 5.73 | 1.13 | |||||||||||||||
| A Shares | 1,000.00 | 1,032.20 | 6.89 | 1.36 | ||||||||||||||||
| IS Shares | 1,000.00 | 1,032.90 | 5.32 | 1.05 | ||||||||||||||||
Silvant Large Cap Growth Stock Fund | I Shares | 1,000.00 | 1,057.80 | 4.98 | 0.97 | |||||||||||||||
| A Shares | 1,000.00 | 1,055.30 | 6.30 | 1.23 | ||||||||||||||||
| C Shares | 1,000.00 | 1,054.20 | 9.78 | 1.91 | ||||||||||||||||
| IS Shares | 1,000.00 | 1,057.50 | 4.62 | 0.90 | ||||||||||||||||
Silvant Small Cap Growth Stock Fund | I Shares | 1,000.00 | 1,065.70 | 6.59 | 1.28 | |||||||||||||||
| A Shares | 1,000.00 | 1,064.60 | 7.26 | 1.41 | ||||||||||||||||
| C Shares | 1,000.00 | 1,060.90 | 10.69 | 2.08 | ||||||||||||||||
| IS Shares | 1,000.00 | 1,066.30 | 5.62 | 1.09 | ||||||||||||||||
Conservative Allocation Strategy | I Shares | 1,000.00 | 1,016.90 | 1.51 | 0.30 | |||||||||||||||
| A Shares | 1,000.00 | 1,014.80 | 3.01 | 0.60 | ||||||||||||||||
| C Shares | 1,000.00 | 1,011.10 | 6.52 | 1.30 | ||||||||||||||||
Growth Allocation Strategy | I Shares | 1,000.00 | 1,053.20 | 2.56 | 0.50 | |||||||||||||||
| A Shares | 1,000.00 | 1,051.30 | 3.43 | 0.67 | ||||||||||||||||
| C Shares | 1,000.00 | 1,048.80 | 6.64 | 1.30 | ||||||||||||||||
Moderate Allocation Strategy | I Shares | 1,000.00 | 1,034.00 | 2.54 | 0.50 | |||||||||||||||
| A Shares | 1,000.00 | 1,032.60 | 3.55 | 0.70 | ||||||||||||||||
| C Shares | 1,000.00 | 1,028.60 | 6.57 | 1.30 | ||||||||||||||||
| * | Expenses are equal to the average account value times the Fund’s annualized expense ratio multiplied by the number of days in the most recent fiscal half-year divided by the number of days in the fiscal year. |
| ** | Annualized. |
89
Table of Contents
ADDITIONAL INFORMATION (continued)
RIDGEWORTH FUNDS March 31, 2017
(Unaudited)
Hypothetical Example
The table below provides information about hypothetical account values and hypothetical expenses based on each RidgeWorth Fund’s actual expense ratio and an assumed rate of return of 5% per year before expenses, which is not the Fund’s actual return. The hypothetical account values and expenses may not be used to estimate the actual ending account balance or expenses you paid for the period. You may use this information to compare this 5% hypothetical example with the 5% hypothetical examples that appear in the shareholder reports of other funds.
Please note that the expenses shown in the table are meant to highlight your ongoing costs only and do not reflect any transactional costs, such as sales charges (loads) or redemption fees. Therefore, the table is useful in comparing ongoing costs only, and will not help you determine the relative total costs of owning different funds. In addition, if these transactional costs were included, your costs would have been higher.
Fund | Class | Beginning Account Value 10/01/16 | Ending Account Value 03/31/17 | Expenses Paid During Period* 10/01/16-03/31/17 | Expense Ratio During Period** 10/01/16-03/31/17 | |||||||||||||||
Capital Innovations Global Resources and Infrastructure Fund | I Shares | $1,000.00 | $1,019.10 | $5.84 | 1.16 | % | ||||||||||||||
| A Shares | 1,000.00 | 1,018.00 | 6.99 | 1.39 | ||||||||||||||||
| C Shares | 1,000.00 | 1,014.30 | 10.75 | 2.14 | ||||||||||||||||
Ceredex Large Cap Value Equity Fund | I Shares | 1,000.00 | 1,020.10 | 4.89 | 0.97 | |||||||||||||||
| A Shares | 1,000.00 | 1,018.70 | 6.24 | 1.24 | ||||||||||||||||
| C Shares | 1,000.00 | 1,016.40 | 8.65 | 1.72 | ||||||||||||||||
| IS Shares | 1,000.00 | 1,021.34 | 3.63 | 0.72 | ||||||||||||||||
Ceredex Mid-Cap Value Equity Fund | I Shares | 1,000.00 | 1,019.80 | 5.19 | 1.03 | |||||||||||||||
| A Shares | 1,000.00 | 1,018.10 | 6.94 | 1.38 | ||||||||||||||||
| C Shares | 1,000.00 | 1,016.00 | 9.00 | 1.79 | ||||||||||||||||
| IS Shares | 1,000.00 | 1,020.99 | 3.98 | 0.79 | ||||||||||||||||
Ceredex Small Cap Value Equity Fund | I Shares | 1,000.00 | 1,018.70 | 6.24 | 1.24 | |||||||||||||||
| A Shares | 1,000.00 | 1,017.20 | 7.80 | 1.55 | ||||||||||||||||
| C Shares | 1,000.00 | 1,015.50 | 9.55 | 1.90 | ||||||||||||||||
Innovative Growth Stock Fund | I Shares | 1,000.00 | 1,018.40 | 6.54 | 1.30 | |||||||||||||||
| A Shares | 1,000.00 | 1,017.50 | 7.54 | 1.50 | ||||||||||||||||
International Equity Fund | I Shares | 1,000.00 | 1,019.58 | 5.69 | 1.13 | |||||||||||||||
| A Shares | 1,000.00 | 1,018.47 | 6.84 | 1.36 | ||||||||||||||||
| IS Shares | 1,000.00 | 1,020.04 | 5.29 | 1.05 | ||||||||||||||||
Silvant Large Cap Growth Stock Fund | I Shares | 1,000.00 | 1,020.10 | 4.89 | 0.97 | |||||||||||||||
| A Shares | 1,000.00 | 1,018.80 | 6.19 | 1.23 | ||||||||||||||||
| C Shares | 1,000.00 | 1,015.40 | 9.60 | 1.91 | ||||||||||||||||
| IS Shares | 1,000.00 | 1,020.44 | 4.53 | 0.90 | ||||||||||||||||
Silvant Small Cap Growth Stock Fund | I Shares | 1,000.00 | 1,018.50 | 6.44 | 1.28 | |||||||||||||||
| A Shares | 1,000.00 | 1,017.90 | 7.09 | 1.41 | ||||||||||||||||
| C Shares | 1,000.00 | 1,014.60 | 10.45 | 2.08 | ||||||||||||||||
| IS Shares | 1,000.00 | 1,019.50 | 5.49 | 1.09 | ||||||||||||||||
Conservative Allocation Strategy | I Shares | 1,000.00 | 1,023.40 | 1.51 | 0.30 | |||||||||||||||
| A Shares | 1,000.00 | 1,021.90 | 3.02 | 0.60 | ||||||||||||||||
| C Shares | 1,000.00 | 1,018.40 | 6.54 | 1.30 | ||||||||||||||||
Growth Allocation Strategy | I Shares | 1,000.00 | 1,022.40 | 2.52 | 0.50 | |||||||||||||||
| A Shares | 1,000.00 | 1,021.60 | 3.38 | 0.67 | ||||||||||||||||
| C Shares | 1,000.00 | 1,018.40 | 6.54 | 1.30 | ||||||||||||||||
Moderate Allocation Strategy | I Shares | 1,000.00 | 1,022.40 | 2.52 | 0.50 | |||||||||||||||
| A Shares | 1,000.00 | 1,021.40 | 3.53 | 0.70 | ||||||||||||||||
| C Shares | 1,000.00 | 1,018.40 | 6.54 | 1.30 | ||||||||||||||||
| * | Expenses are equal to the average account value times the Fund’s annualized expense ratio multiplied by the number of days in the most recent fiscal half-year divided by the number of days in the fiscal year. |
| ** | Annualized. |
90
Table of Contents
ADDITIONAL INFORMATION (concluded)
RIDGEWORTH FUNDS March 31, 2017
(Unaudited)
Proxy Voting Information
Information regarding the policies and procedures that the Funds use to determine how to vote proxies relating to portfolio securities is available without charge, upon request, by calling 1-888-784-3863. The information also is included in the Funds’ Statement of Additional Information, which is available on the Funds’ website at www.ridgeworth.com and on the Securities and Exchange Commission’s (“SEC”) website at www.sec.gov.
Information relating to how each Fund voted proxies relating to portfolio securities held during the most recent twelve months ended June 30 is available on the Funds’ website at www.ridgeworth.com and on the SEC’s website at www.sec.gov.
Quarterly Portfolio Holdings Information
The Funds file their complete schedule of portfolio holdings with the SEC for the first and third quarters of each fiscal year on Form N-Q. The Funds’ Forms N-Q are available free of charge on the SEC’s website at www.sec.gov. You may also review or, for a fee, copy those documents by visiting the SEC’s Public Reference Room in Washington, D.C. Information on the operation of the Public Reference Room may be obtained by calling the SEC at 1-800-SEC-0330.
91
Table of Contents
INVESTMENT ADVISER:
RidgeWorth Investments
3333 Piedmont Road, NE, Suite 1500
Atlanta, Georgia 30305
www.ridgeworth.com
INVESTMENT SUBADVISERS:
Capital Innovations, LLC
325 Forest Grove Drive, Suite 100
Pewaukee, WI 53072
www.capinnovations.com
Silvant Capital Management LLC
3333 Piedmont Road, NE, Suite 1500
Atlanta, Georgia 30305
www.silvantcapital.com
Zevenbergen Capital Investments LLC
601 Union Street, Suite 4600
Seattle, Washington 98101
www.zci.com
Ceredex Value Advisors LLC
301 East Pine Street, Suite 500
Orlando, Florida 32801
www.ceredexvalue.com
WCM Investment Management
281 Brooks Street
Laguna Beach, CA 92651
www.wcminvest.com
This information must be preceded or accompanied by a current prospectus for each Fund described. Before investing, investors should carefully read the prospectus or summary prospectus and consider the fund’s investment objectives, risks, charges and expenses. Please call 888.784.3863 or visit ridgeworth.com to obtain a prospectus or summary prospectus, which contains this and other information about the funds.
DISTRIBUTOR:
RIDGEWORTH DISTRIBUTORS LLC
RFAR-EQ-0317

Table of Contents

2017 ANNUAL REPORT
FIXED INCOME FUNDS
MARCH 31, 2017

RidgeWorth Investments is the trade name of RidgeWorth Capital Management LLC.
Table of Contents
RIDGEWORTH FUNDS March 31, 2017
| Letter to Shareholders | 1 | |||
| Management Discussion of Fund Performance | ||||
| Fixed Income Funds: | ||||
| 2 | ||||
| 4 | ||||
| 6 | ||||
| 8 | ||||
| 10 | ||||
| 12 | ||||
| 14 | ||||
| 16 | ||||
| 18 | ||||
| 20 | ||||
| 22 | ||||
| 24 | ||||
| 26 | ||||
| 28 | ||||
| 30 | ||||
| 32 | ||||
| 34 | ||||
| Financial Statements | ||||
| Schedules of Portfolio Investments | 36 | |||
| Statements of Assets and Liabilities | 117 | |||
| Statements of Operations | 121 | |||
| Statements of Changes in Net Assets | 125 | |||
| Financial Highlights | 131 | |||
| Notes to Financial Statements | 139 | |||
| Report of Independent Registered Public Accounting Firm | 165 | |||
| Other Information | ||||
| Other Federal Tax Information | 166 | |||
| Trustees and Officers of the RidgeWorth Funds | 167 | |||
| Annual Approval of Advisory and Subadvisory Agreements | 169 | |||
| Additional Information | 171 | |||
Table of Contents
RIDGEWORTH FUNDS March 31, 2017
Dear Valued Shareholder,
We sincerely thank you for your continued business and support. Our primary objective is to help you achieve your investment goals, and we are grateful you have placed your confidence in us. We aim to earn your trust through competitive investment performance and excellent client service, and strive to exceed your expectations in both areas.
We are pleased to announce our plans to be acquired by Virtus Investment Partners, Inc., which is expected to be finalized in the second quarter of this year. We believe the transaction will provide strength and continuity for our investors, who will continue to partner with the same investment teams they have come to know through their relationship with RidgeWorth. In addition, clients will benefit from a combined company that can deliver an enhanced level of support and more resources to our investors. We look forward to continuing to serve as your asset manager in the months and years to come.
The past year saw a transition from an environment of sluggish growth, and heightened geopolitical uncertainty to one characterized by diminishing downside risks, steadied earnings growth, and rising consumer and business confidence. In short, despite all of the headline volatility, the backdrop for investing improved.
The U.S. economy began this past year battling the negative effects of a strong U.S. dollar and weak oil prices, as well as geopolitical unrest and slowing growth in China. The U.K.’s vote to leave the European Union contributed to heightened volatility. However, on the positive side, moderate job growth continued and housing prices recovered, which helped strengthen consumer incomes and balance sheets, and led to a further rise in consumer durables. In addition, inflation pressures were muted and the Federal Reserve erred on the side of caution and delayed its latest expected interest rate increase.
As the year progressed, oil prices recovered and the value of the dollar edged lower providing a bit of a macro tailwind to the economy and corporate earnings, while moderate job gains continued to support consumer spending. With volatility fears subsiding following the U.K. Brexit vote, evidence of a stabilizing global economy and a return of modest economic momentum in Europe, investor confidence improved. While the U.S. presidential election was one of the more turbulent ones in recent memory, the Trump victory appeared to rekindle and re-energize both consumers and businesses alike amid hopes for the growth engendering effects of lower tax rates, increased infrastructure spending, and reduced regulatory burdens. This combination of moderating headwinds, improved economic momentum, and renewed optimism regarding more pro-cyclical and stimulative fiscal policies helped lift domestic and global equity markets. Indeed, the improvement was sufficient to help prod the Federal Reserve to raise the overnight federal funds rate in December and then again in March.
Looking ahead, we believe the underlying economic fundamentals remain steady. Corporate profits are moving higher and beating expectations. The economy is improving even though the pace of growth is well short of historic averages. With improved earnings momentum, we believe the market can continue to provide reasonable risk-adjusted returns, despite relatively extended valuations.
That said, we are not entirely sanguine about the future. There is a mix of both positive and negative possibilities that are likely to evolve slowly but generate daily headline risk and market volatility. Tax cuts and tax reform are a major potential positive that we believe may only partially be priced into the markets. Repatriation of offshore corporate profits could also likely boost stock repurchase levels and provide a further lift to stock prices. Cuts in personal tax rates would increase both after tax paychecks as well as confidence.
Downside risks are also evident. The Fed’s Federal Open Market Committee (FOMC) is likely to increase short-term interest rates in the coming year. This will increase the cost of credit. Elections in France, the U.K., and Germany could affect confidence and stability in Europe. Most recently, a spike in tensions related to North Korea have eclipsed the already challenging situation in the Middle East. All of these factors (and more) could tilt market momentum to the downside. So, while we are cautiously positive, we are also aware of the multiple risks facing global growth and the markets.
Despite that uncertainty, we continue to see opportunities in the both the equity and fixed income markets. We believe that RidgeWorth’s bottom-up approach to security selection is well-positioned to capitalize on those opportunities, and we wish to thank you again for the trust and confidence you have placed in us.
Sincerely,

Ashi Parikh
Chief Executive Officer, Chief Investment Officer
RidgeWorth Investments
1
Table of Contents
Portfolio Managers
| • | James F. Keegan |
| • | Perry Troisi |
| • | Michael Rieger |
| • | Jonathan Yozzo |
| • | Carlos Catoya |
INVESTMENT CONCERNS
Mutual fund investing involves risk, including possible loss of principal. Bonds offer a relatively stable level of income, although bond prices will fluctuate providing the potential for principal gain or loss. Intermediate-term, higher-quality bonds generally offer less risk than longer-term bonds and a lower rate of return.
Mortgage-backed investments involve risk of loss due to prepayments and, like any bond, due to default. Because of the sensitivity of mortgage-related securities to changes in interest rates, the Fund’s performance may be more volatile than if it did not hold these securities.
Debt securities will generally lose value if interest rates increase. Interest rate risk is generally higher for investments with longer maturities or durations. Debt securities are subject to the risk that an issuer will fail to make timely payments of interest or principal or go bankrupt, reducing the Fund’s return. The lower the rating of a debt security, the higher its credit risk.
MANAGEMENT DISCUSSION OF FUND PERFORMANCE
How did the Fund perform against its benchmark for the fiscal year ended March 31, 2017?
The Seix Core Bond Fund returned 1.15% (I Shares). That compared to a 0.44% return for the Fund’s benchmark, the Bloomberg Barclays U.S. Aggregate Bond Index.
What factors influenced the Fund’s performance for the fiscal year ended March 31, 2017?
Interest rates moved higher across the Treasury yield curve during the period, and spread levels for corporate and securitized assets tightened. In this environment, the Fund’s absolute returns benefited from higher income and price appreciation from tighter spreads.
Security selection in the Fund’s corporate sleeve was the primary driver of relative outperformance, particularly within the energy sector, metals/mining and banking. Security selection within residential mortgage-backed securities (RMBS), as well as asset allocation to commercial mortgage-backed securities (CMBS) and asset-backed securities (ABS), also contributed positively to relative performance. However, an underweight position in government-related issues detracted from relative performance.
How do you plan to position the Fund, based on market conditions?
We continue to monitor the Trump administration’s pro-growth business agenda, primarily around regulatory relief and potential fiscal spending, largely within the defense department. However, specifics related to tax reform and infrastructure spending have yet to materialize, and continued back-and-forth over the status of a new healthcare bill adds to uncertainty. Looking abroad, European elections could threaten the European Union and put additional pressure on the euro. In Asia, China’s continued growth slowdown, troubling debt levels and overvalued currency could prove problematic.
Given this uncertain landscape, our investment strategy will continue to seek safe income at a reasonable price. We expect demand for high-quality U.S. fixed income assets to remain strong, especially when viewed through a global relative value framework. However, spread sector valuations appear rich in the near term. Security selection will continue to drive performance in this unprecedented market environment.
2
Table of Contents
SEIX CORE BOND FUND
Growth of a $10,000 Investment (as of March 31, 2017)
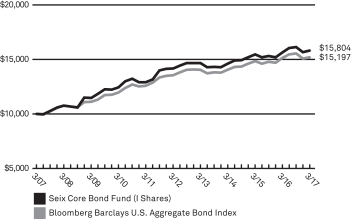 | This chart assumes an initial hypothetical investment of $10,000 made on 3/31/07. Total return is based on net change in the Net Asset Value (“NAV”) assuming reinvestment of distributions. Returns shown on this page include reinvestment of all dividends and other distributions.
The Fund’s performance is compared to the Bloomberg Barclays U.S. Aggregate Bond Index, which covers the U.S. dollar-denominated, investment-grade, fixed-rate, taxable bond market of SEC-registered securities. The Index includes bonds from the Treasury, Government-Related, Corporate, MBS (agency fixed-rate and hybrid ARM passthroughs), ABS and CMBS sectors. The Index is unmanaged and does not reflect the deduction of fees, such as investment management and fund accounting fees associated with a mutual fund. Investors cannot invest directly in an index. |
| Average Annual Total Returns as of 3/31/17 | ||||||||||||||||||||
| Seix Core Bond Fund | 1 Year | 3 Year | 5 Year | 10 Year | ||||||||||||||||
A Shares | without sales charge | 1.00% | 2.51% | 2.00% | 4.41% | |||||||||||||||
| with sales charge* | –3.78% | 0.86% | 1.02% | 3.90% | ||||||||||||||||
R Shares^ | 0.73% | 2.27% | 1.82% | 4.06% | ||||||||||||||||
I Shares | 1.15% | 2.69% | 2.23% | 4.68% | ||||||||||||||||
IS Shares** | 1.29% | 2.76% | 2.28% | 4.71% | ||||||||||||||||
| Bloomberg Barclays U.S. Aggregate Bond Index | 0.44% | 2.68% | 2.34% | 4.27% | ||||||||||||||||
| Prospectus Expense Ratio1 | Gross | |||||||||||||||||||
| A Shares | 0.65% | |||||||||||||||||||
| R Shares | 0.88% | |||||||||||||||||||
| I Shares | 0.48% | |||||||||||||||||||
| IS Shares | 0.34% | |||||||||||||||||||
Past performance does not guarantee future results. The performance data quoted represents past performance and current returns may be lower or higher. Total return figures include change in share price, reinvestment of dividends and capital gains and do not reflect taxes that a shareholder would pay on fund distributions or on the redemption of fund shares. The investment return and principal value will fluctuate so that an investor’s shares, when redeemed, may be worth more or less than the original cost. For performance data current to the most recent month end, visit our website at www.ridgeworth.com.
| * | Class A Share performance reflects the maximum front-end sales charge of 4.75%. |
| ^ | Effective at the close of business on 7/31/09, C Shares converted to R Shares and C Shares are no longer available for purchase. The performance shown prior to such date is based on the performance of the C Shares of the Fund and has not been adjusted to reflect R Shares expenses. |
| ** | IS Shares were offered beginning on 8/3/15. The performance shown prior to such dates is based on performance of the I Shares of the Fund, and has not been adjusted to reflect IS Share expenses. If it had been, performance would have been higher. |
| 1 | This information is included in the most current prospectus available to current and prospective shareholders of the Fund. Additional information pertaining to the 3/31/17 expense ratios can be found in the financial highlights. |
Investment Weightings (as of March 31, 2017)
as a percentage of investments
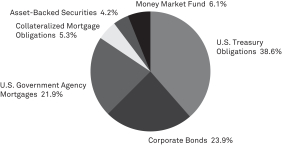
3
Table of Contents
Portfolio Managers
| • | James F. Keegan |
| • | Perry Troisi |
| • | Jonathan Yozzo |
| • | Carlos Catoya |
INVESTMENT CONCERNS
Mutual fund investing involves risk, including possible loss of principal. Bonds offer a relatively stable level of income, although bond prices will fluctuate providing the potential for principal gain or loss. Intermediate-term, higher-quality bonds generally offer less risk than longer-term bonds and a lower rate of return.
Debt securities will generally lose value if interest rates increase. Interest rate risk is generally higher for investments with longer maturities or durations. Debt securities are subject to the risk that an issuer will fail to make timely payments of interest or principal or go bankrupt, reducing the Fund’s return. The lower the rating of a debt security, the higher its credit risk.
MANAGEMENT DISCUSSION OF FUND PERFORMANCE
How did the Fund perform against its benchmark for the fiscal year ended March 31, 2017?
The Seix Corporate Bond Fund returned 6.29% (I Shares). That compared to a 3.31% return for the Fund’s benchmark, the Bloomberg Barclays U.S. Corporate Investment Grade Index.
What factors influenced the Fund’s performance for the fiscal year ended March 31, 2017?
The overall tone was positive for the corporate debt market during the fiscal year, as market participants looked past many of the global and macro uncertainties such as Brexit, U.S. Federal Reserve monetary policy and the U.S. elections. Interest rates moved higher across the Treasury yield curve during the period, and spread levels for corporate assets tightened. In this environment, the Fund’s absolute returns benefited from higher income and price appreciation from tighter spreads.
The Fund’s overweight position in the energy sector strongly contributed to relative performance, especially its position in oil field services, independents and refiners. An overweight position in metals/mining also boosted relative performance. Yield curve positioning detracted modestly from performance during the period. Underweight positions in transportation and home construction, as well as a modest cash position, also dragged on relative performance.
How do you plan to position the Fund, based on market conditions?
We continue to monitor the Trump administration’s pro-growth business agenda, primarily around regulatory relief and potential fiscal spending, largely within the defense department. However, specifics related to tax reform and infrastructure spending have yet to materialize, and continued back-and-forth over the status of a new healthcare bill adds to uncertainty. Looking abroad, European elections could threaten the European Union and put additional pressure on the euro. In Asia, China’s continued growth slowdown, troubling debt levels and overvalued currency could prove problematic.
Given this uncertain landscape, our investment strategy will continue to seek safe income at a reasonable price. We expect demand for high-quality U.S. fixed income assets to remain strong, especially when viewed through a global relative value framework. However, spread sector valuations appear rich in the near term. Security selection will continue to drive performance in this unprecedented market environment.
4
Table of Contents
SEIX CORPORATE BOND FUND
Growth of a $10,000 Investment (as of March 31, 2017)
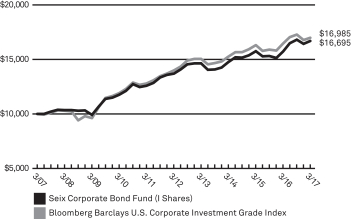 | This chart assumes an initial hypothetical investment of $10,000 made on 3/31/07. Total return is based on net change in the Net Asset Value (“NAV”) assuming reinvestment of distributions. Returns shown on this page include reinvestment of all dividends and other distributions.
The Fund’s performance is compared to the Bloomberg Barclays U.S. Corporate Investment Grade Index, which covers U.S. dollar-denominated, investment grade, fixed-rate, taxable securities sold by industrial, utility and financial issuers. The Index includes publicly issued U.S. corporate and foreign debentures and secured notes that meet specified maturity, liquidity, and quality requirements. The Index is unmanaged and does not reflect the deduction of fees, such as investment management and fund accounting fees associated with a mutual fund. Investors cannot invest directly in an index. |
| Average Annual Total Returns as of 3/31/17 | ||||||||||||||||||||
| Seix Corporate Bond Fund | 1 Year | 3 Year | 5 Year | 10 Year | ||||||||||||||||
A Shares | without sales charge | 6.01% | 3.92% | 3.71% | 4.95% | |||||||||||||||
| with sales charge* | 1.02% | 2.25% | 2.71% | 4.44% | ||||||||||||||||
C Shares | without CDSC | 5.29% | 3.20% | 3.03% | 4.24% | |||||||||||||||
| with CDSC* | 4.29% | 3.20% | 3.03% | 4.24% | ||||||||||||||||
I Shares | 6.29% | 4.19% | 4.02% | 5.26% | ||||||||||||||||
| Bloomberg Barclays U.S. Corporate Invesment Grade Index | 3.31% | 3.65% | 3.96% | 5.44% | ||||||||||||||||
| Prospectus Expense Ratio1 | Gross | |||||||||||||||||||
| A Shares | 1.11% | |||||||||||||||||||
| C Shares | 1.80% | |||||||||||||||||||
| I Shares | 0.83% | |||||||||||||||||||
The Adviser has contractually agreed to waive fees and reimburse expenses until at least August 1, 2017 in order to keep total operating expenses (excluding underlying fund fees and expenses) from exceeding 0.95%, 1.65% and 0.70% for A, C and I Shares, respectively. Without these fee waivers, performance would have been lower.
Past performance does not guarantee future results. The performance data quoted represents past performance and current returns may be lower or higher. Total return figures include change in share price, reinvestment of dividends and capital gains and do not reflect taxes that a shareholder would pay on fund distributions or on the redemption of fund shares. The investment return and principal value will fluctuate so that an investor’s shares, when redeemed, may be worth more or less than the original cost. For performance data current to the most recent month end, visit our website at www.ridgeworth.com.
| * | Class A Share performance reflects the maximum front-end sales charge of 4.75% and Class C Shares reflect the maximum CDSC (contingent deferred sales charge) of 1.00% in year one only. |
| 1 | This information is included in the most current prospectus available to current and prospective shareholders of the Fund. Additional information pertaining to the 3/31/17 expense ratios can be found in the financial highlights. |
Investment Weightings (as of March 31, 2017)
as a percentage of investments

5
Table of Contents
SEIX FLOATING RATE HIGH INCOME FUND
Portfolio Managers
| • | George Goudelias |
| • | Vincent Flanagan, CFA |
INVESTMENT CONCERNS
Mutual fund investing involves risk, including possible loss of principal. Bond funds will tend to experience smaller fluctuations in value than stock funds. However, investors in any bond fund should anticipate fluctuations in price. Floating rate loans generally offer less interest rate risk than longer-term bonds and a lower rate of return.
Although the Fund’s yield may be higher than that of fixed income funds that purchase higher-rated securities, the potentially higher yield is a function of the greater risk that the Fund’s share price will decline.
Floating rate loans are typically senior and secured, in contrast to other below-investment grade securities. However, there is no guarantee that the value of the collateral will not decline, causing a loan to be substantially unsecured. Loans generally are subject to restrictions on resale, and they sometimes trade infrequently in the secondary market. Certain types of loans may limit the ability of the Fund to enforce its rights and may involve assuming additional credit risks.
Debt securities will generally lose value if interest rates increase. Interest rate risk is generally higher for investments with longer maturities or durations. Debt securities are subject to the risk that an issuer will fail to make timely payments of interest or principal or go bankrupt, reducing the Fund’s return. The lower the rating of a debt security, the higher its credit risk.
MANAGEMENT DISCUSSIONOF FUND PERFORMANCE
How did the Fund perform against its benchmark for the fiscal year ended March 31, 2017?
The Seix Floating Rate High Income Fund returned 10.13% (I Shares). That compared to a 9.74% return for the Credit Suisse Leveraged Loan Index.
What factors influenced the Fund’s performance for the fiscal year ended March 31, 2017?
Positive technical conditions and a historically low default environment boosted the leveraged loan asset class overall. Security selection in the broadcasting and utilities sectors benefited results relative to the benchmark, as did an overweight allocation and positive security selection in the gaming/leisure sector.
The Fund’s relative performance was hurt by an overweight position in the cable/wireless sector and negative security selection in the telecom sector. The Fund’s minimal exposure to cash also dragged on relative results.
How do you plan to position the Fund, based on market conditions?
In response to a cooperative macroeconomic backdrop and steadily improving capital market conditions, loan default rate forecasts have been reduced from 2.0% to 1.5% for 2017. As we look beyond 2017, both economic and political uncertainty persist. However, lower expected default rate implies near-term market conditions would not cause default volumes to spike. We believe this to be a benign forecast—positive in the short-term and constructive in the long-term. As a result of these market conditions, we believe leveraged loans are an attractive asset class, and we expect security selection will continue to drive the Fund’s performance.
6
Table of Contents
SEIX FLOATING RATE HIGH INCOME FUND
Growth of a $10,000 Investment (as of March 31, 2017)
| This chart assumes an initial hypothetical investment of $10,000 made on 3/31/07. Total return is based on net change in the Net Asset Value (“NAV”) assuming reinvestment of distributions. Returns shown on this page include reinvestment of all dividends and other distributions.
Credit Suisse Leveraged Loan Index is a market-weighted index that tracks the performance of institutional leveraged loans. Credit Suisse Institutional Leveraged Loan Index is a subindex of the Credit Suisse Leveraged Loan Index which contains only institutional loan facilities priced above 90, excluding TL and TLa facilities and loans rated CC, C or in default. It is designed to more closely reflect the investment criteria of institutional investors. Investors cannot invest directly in an index. |
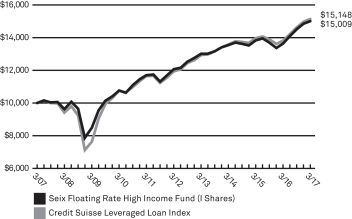
| Average Annual Total Returns as of 3/31/17 | ||||||||||||||||||||
| Seix Floating Rate High Income Fund | Inception Date† | 1 Year | 3 Year | 5 Year | 10 Year | |||||||||||||||
A Shares | without sales charge | 03/01/06 | 9.78% | 3.18% | 4.14% | 3.83% | ||||||||||||||
| with sales charge* | 7.08% | 2.32% | 3.61% | 3.56% | ||||||||||||||||
C Shares | without CDSC | 03/01/06 | 9.28% | 2.57% | 3.54% | 3.22% | ||||||||||||||
| with CDSC* | 8.28% | 2.57% | 3.54% | 3.22% | ||||||||||||||||
I Shares | 03/01/06 | 10.13% | 3.49% | 4.44% | 4.14% | |||||||||||||||
IS Shares** | 02/02/15 | 10.37% | 3.60% | 4.52% | 4.18% | |||||||||||||||
| Credit Suisse Leveraged Loan Index | 9.74% | 3.72% | 4.88% | 4.24% | ||||||||||||||||
| Prospectus Expense Ratio1 | Gross | |||||||||||||||||||
| A Shares | 0.92% | |||||||||||||||||||
| C Shares | 1.51% | |||||||||||||||||||
| I Shares | 0.62% | |||||||||||||||||||
| IS Shares | 0.51% | |||||||||||||||||||
Past performance does not guarantee future results. The performance data quoted represents past performance and current returns may be lower or higher. Total return figures include change in share price, reinvestment of dividends and capital gains and do not reflect taxes that a shareholder would pay on fund distributions or on the redemption of fund shares. The investment return and principal value will fluctuate so that an investor’s shares, when redeemed, may be worth more or less than the original cost. For performance data current to the most recent month end, visit our website at www.ridgeworth.com.
| * | Class A Share performance reflects the maximum front-end sales charge of 2.50% and Class C Shares reflect the maximum CDSC (contingent deferred sales charge) of 1.00% in year one only. |
| ** | IS Shares were offered beginning on 2/2/15. The performance shown prior to such dates is based on performance of the I Shares of the Fund, and has not been adjusted to reflect IS Share expenses. If it had been, performance would have been higher. |
| † | The A Shares and C Shares were offered beginning on 5/8/06 and 8/2/07, respectively. The performance shown prior to such dates is based on the performance of the I Shares of the Fund, and has not been adjusted to reflect A Share or C Share expenses. If it had been, the performance would have been lower. |
| 1 | This information is included in the most current prospectus available to current and prospective shareholders of the Fund. Additional information pertaining to the 3/31/17 expense ratios can be found in the financial highlights. |
Investment Weightings (as of March 31, 2017)
as a percentage of investments
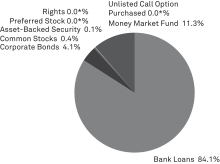
* Less than 0.05% of Net Assets.
7
Table of Contents
SEIX GEORGIA TAX-EXEMPT BOND FUND
Portfolio Manager
| • | Chris Carter, CFA |
INVESTMENT CONCERNS
Mutual fund investing involves risk, including possible loss of principal. Bonds offer a relatively stable level of income, although bond prices will fluctuate providing the potential for principal gain or loss. Intermediate-term, higher-quality bonds generally offer less risk than longer-term bonds and a lower rate of return.
The geographical concentration of portfolio holdings in the Fund may involve increased risk.
The Fund’s income may be subject to certain state and local taxes and, depending on your tax status, the federal alternative minimum tax.
The Fund is subject to the risk that principal value reacts in opposition to the movement of interest rates and that a rising interest rate environment increases the risk of loss of principal.
Debt securities will generally lose value if interest rates increase. Interest rate risk is generally higher for investments with longer maturities or durations. Debt securities are subject to the risk that an issuer will fail to make timely payments of interest or principal or go bankrupt, reducing the Fund’s return. The lower the rating of a debt security, the higher its credit risk.
MANAGEMENT DISCUSSION OF FUND PERFORMANCE
How did the Fund perform against its benchmark for the fiscal year ended March 31, 2017?
The Seix Georgia Tax-Exempt Bond Fund (I Shares) posted a total return of –0.47%. That compared to 12-month returns of –0.27% and 0.15% for the Lipper Other States Municipal Debt Objective* and the Bloomberg Barclays Municipal Bond Index, respectively.
What factors influenced the Fund’s performance for the fiscal year ended March 31, 2017?
Municipal bond (muni) prices declined over the 12-month period as yields rose moderately on five-, 10- and 30-year AAA-rated munis. Credit spreads tightened and total returns generally were higher for lower-quality bonds. Bonds issued by transportation, leasing and health care entities led performance among the larger sectors in the Fund’s benchmark.
The Fund’s relative performance was hurt by its choice of sectors and securities among munis with maturities of 17 years or longer. For instance, an overweight position in the poor-performing special tax sector and select holdings in the electric sector dragged on relative returns. The Fund’s below-benchmark exposure to the top-performing transportation and leasing sectors also detracted.
The Fund’s underweight exposure to the lagging state general obligation sector added to relative results, however, as did the choice of securities in the eight- to 17-year portion of the yield curve.
How do you plan to position the Fund, based on market conditions?
Munis remain attractive based on strong technical factors and healthy fundamentals. The opportunity to capture tax-exempt income and yields that are attractive relative to other fixed-income investments also are constructive for muni bonds in the current environment. Even so, discussion of changes in fiscal policy could lead to increased volatility in muni markets, underscoring the value of a cautious approach.
We feel the Fund’s current yield curve position and its sector allocations are appropriate given our forecasts for the economy and for financial markets. We will continue to invest tactically and focus on securities with relatively high credit quality.
| * | Lipper Other States Municipal Debt Funds: Funds that limit assets to those securities exempt from taxation in a specified state (double tax-exempt) or city (triple tax-exempt). |
8
Table of Contents
SEIX GEORGIA TAX-EXEMPT BOND FUND
Growth of a $10,000 Investment (as of March 31, 2017)
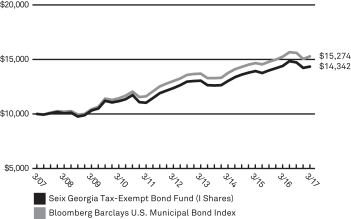 | This chart assumes an initial hypothetical investment of $10,000 made on 3/31/07. Total return is based on net change in the Net Asset Value (“NAV”) assuming reinvestment of distributions. Returns shown on this page include reinvestment of all dividends and other distributions.
The Fund’s performance is compared to the Bloomberg Barclays U.S. Municipal Bond Index, which covers the U.S. dollar-denominated long-term tax-exempt bond market. The Index has four main sectors: state and local general obligation bonds, revenue bonds, insured bonds, and prerefunded bonds. The Index is unmanaged and does not reflect the deduction of fees such as investment management and fund accounting fees associated with a mutual fund. Investors cannot invest directly in an index. |
| Average Annual Total Returns as of 3/31/17 | ||||||||||||||||||||
| Seix Georgia Tax-Exempt Bond Fund | 1 Year | 3 Year | 5 Year | 10 Year | ||||||||||||||||
A Shares | without sales charge | –0.66% | 3.16% | 2.83% | 3.53% | |||||||||||||||
| with sales charge* | –5.40% | 1.51% | �� | 1.83% | 3.03% | |||||||||||||||
I Shares | –0.47% | 3.30% | 2.97% | 3.67% | ||||||||||||||||
| Bloomberg Barclays U.S. Municipal Bond Index | 0.15% | 3.55% | 3.24% | 4.33% | ||||||||||||||||
| Prospectus Expense Ratio1 | Gross | |||||||||||||||||||
| A Shares | 0.75% | |||||||||||||||||||
| I Shares | 0.68% | |||||||||||||||||||
The Adviser has contractually agreed to waive fees and reimburse expenses until at least August 1, 2017 in order to keep total operating expenses (excluding underlying fund fees and expenses) from exceeding 0.80% and 0.65% for A and I Shares, respectively. Without these fee waivers, performance would have been lower.
Past performance does not guarantee future results. The performance data quoted represents past performance and current returns may be lower or higher. Total return figures include change in share price, reinvestment of dividends and capital gains and do not reflect taxes that a shareholder would pay on fund distributions or on the redemption of fund shares. The investment return and principal value will fluctuate so that an investor’s shares, when redeemed, may be worth more or less than the original cost. For performance data current to the most recent month end, visit our website at www.ridgeworth.com.
| * | Class A Share performance reflects the maximum front-end sales charge of 4.75%. |
| 1 | This information is included in the most current prospectus available to current and prospective shareholders of the Fund. Additional information pertaining to the 3/31/17 expense ratios can be found in the financial highlights. |
Investment Weightings (as of March 31, 2017)
as a percentage of investments
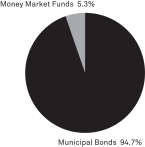
9
Table of Contents
SEIX HIGH GRADE MUNICIPAL BOND FUND
Portfolio Manager
| • | Ronald Schwartz, CFA |
INVESTMENT CONCERNS
Mutual fund investing involves risk, including possible loss of principal. Bonds offer a relatively stable level of income, although bond prices will fluctuate providing the potential for principal gain or loss. Intermediate-term, higher-quality bonds generally offer less risk than longer-term bonds and a lower rate of return.
The Fund is subject to the risk that principal value reacts in opposition to the movement of interest rates and that a rising interest rate environment increases the risk of loss of principal.
The geographical concentration of portfolio holdings in the Fund may involve increased risk.
The Fund’s income may be subject to certain state and local taxes and, depending on your tax status, the federal alternative minimum tax.
Debt securities will generally lose value if interest rates increase. Interest rate risk is generally higher for investments with longer maturities or durations. Debt securities are subject to the risk that an issuer will fail to make timely payments of interest or principal or go bankrupt, reducing the Fund’s return. The lower the rating of a debt security, the higher its credit risk.
MANAGEMENT DISCUSSION OF FUND PERFORMANCE
How did the Fund perform against its benchmark for the fiscal year ended March 31, 2017?
The Seix High Grade Municipal Bond Fund (I Shares) posted a total return of 0.33%. That compared to 12-month returns of –0.06% and 0.15% for the Lipper General & Insured Municipal Debt Objective* and the Bloomberg Barclays Municipal Bond Index, respectively.
What factors influenced the Fund’s performance for the fiscal year ended March 31, 2017?
Municipal bond (muni) prices declined over the 12-month period as yields rose modestly on five-, 10- and 30-year AAA-rated munis. Credit spreads tightened through September 2016, but then reversed course following the U.S. Presidential election in November. By the end of the period under review credit spreads were only modestly tighter than they were at the beginning of the period. Bonds issued by entities in the transportation, leasing, health care, and industrial development and pollution control sectors led performance among the larger sectors in the Fund’s benchmark. State general obligation bonds posted a negative return in the Index.
The Fund’s underweight exposure to bonds with maturities in the seven- to 10-year portion of the yield curve added to relative results, as did above-benchmark exposure to bonds with maturities of 20 years or longer, which outperformed. Refunding events by a number of bonds in the portfolio also benefited the Fund on a relative basis. The Fund’s allocation to higher quality bonds and its defensive, underweight position in longer duration bonds helped it weather the sharp decline in prices during the fourth quarter of 2016.
The Fund’s choice of lower-coupon lease bonds in the 20-year maturity range dragged on relative results, as those securities underperformed. An above-benchmark exposure to California general obligation bonds also detracted.
How do you plan to position the Fund, based on market conditions?
Munis remain attractive based on strong technical factors and healthy fundamentals. The opportunity to capture tax-exempt income and yields that are attractive relative to other fixed-income investments also are constructive for muni bonds in the current environment. Even so, discussion of changes in fiscal policy could lead to increased volatility in muni markets, underscoring the value of a cautious approach.
We feel the Fund’s current yield curve position and its sector allocations are appropriate given our forecasts for the economy and for financial markets. We will continue to invest tactically and focus on securities with relatively high credit quality.
| * | Lipper General and Insured Municipal Debt Funds: Funds that either invest primarily in municipal debt issues rated in the top four credit ratings or invest primarily in municipal debt issues insured as to timely payment. |
10
Table of Contents
SEIX HIGH GRADE MUNICIPAL BOND FUND
Growth of a $10,000 Investment (as of March 31, 2017)
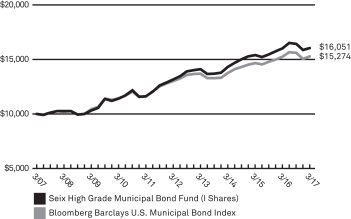 | This chart assumes an initial hypothetical investment of $10,000 made on 3/31/07. Total return is based on net change in the Net Asset Value (“NAV”) assuming reinvestment of distributions. Returns shown on this page include reinvestment of all dividends and other distributions.
The Fund’s performance is compared to the Bloomberg Barclays U.S. Municipal Bond Index, which covers the U.S. dollar-denominated long-term tax-exempt bond market. The Index has four main sectors: state and local general obligation bonds, revenue bonds, insured bonds, and prerefunded bonds. The Index is unmanaged and does not reflect the deduction of fees such as investment management and fund accounting fees associated with a mutual fund. Investors cannot invest directly in an index. |
| Average Annual Total Returns as of 3/31/17 | ||||||||||||||||||||
| Seix High Grade Municipal Bond Fund | 1 Year | 3 Year | 5 Year | 10 Year | ||||||||||||||||
A Shares | without sales charge | 0.27% | 3.77% | 3.87% | 4.69% | |||||||||||||||
| with sales charge* | –4.52% | 2.11% | 2.86% | 4.18% | ||||||||||||||||
I Shares | 0.33% | 3.90% | 4.03% | 4.85% | ||||||||||||||||
| Bloomberg Barclays U.S. Municipal Bond Index | 0.15% | 3.55% | 3.24% | 4.33% | ||||||||||||||||
| Prospectus Expense Ratio1 | Gross | |||||||||||||||||||
| A Shares | 0.80% | |||||||||||||||||||
| I Shares | 0.70% | |||||||||||||||||||
The Adviser has contractually agreed to waive fees and reimburse expenses until at least August 1, 2017 in order to keep total operating expenses (excluding underlying fund fees and expenses) from exceeding 0.80% and 0.65% for A and I Shares, respectively. Without these fee waivers, performance would have been lower. The indirect expenses of the Fund, which represent a pro-rata share of the expenses of the underlying funds in which the Fund invests, totaled 0.01% of net assets and are included in the expense ratios listed in the table above.
Past performance does not guarantee future results. The performance data quoted represents past performance and current returns may be lower or higher. Total return figures include change in share price, reinvestment of dividends and capital gains and do not reflect taxes that a shareholder would pay on fund distributions or on the redemption of fund shares. The investment return and principal value will fluctuate so that an investor’s shares, when redeemed, may be worth more or less than the original cost. For performance data current to the most recent month end, visit our website at www.ridgeworth.com.
| * | Class A Share performance reflects the maximum front-end sales charge of 4.75%. |
| 1 | This information is included in the most current prospectus available to current and prospective shareholders of the Fund. Additional information pertaining to the 3/31/17 expense ratios can be found in the financial highlights. |
Investment Weightings (as of March 31, 2017)
as a percentage of investments
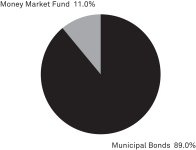
11
Table of Contents
Portfolio Managers
| • | Michael Kirkpatrick |
| • | James FitzPatrick, CFA |
INVESTMENT CONCERNS
Mutual fund investing involves risk, including possible loss of principal. Bonds offer a relatively stable level of income, although bond prices will fluctuate providing the potential for principal gain or loss. Intermediate-term, higher-quality bonds generally offer less risk than longer-term bonds and a lower rate of return.
Although the Fund’s yield may be higher than that of fixed income funds that purchase higher-rated securities, the potentially higher yield is a function of the greater risk that the Fund’s share price will decline.
The Fund is subject to the risk that principal value reacts in opposition to the movement of interest rates and that a rising interest rate environment increases the risk of loss of principal.
Debt securities will generally lose value if interest rates increase. Interest rate risk is generally higher for investments with longer maturities or durations. Debt securities are subject to the risk that an issuer will fail to make timely payments of interest or principal or go bankrupt, reducing the Fund’s return. The lower the rating of a debt security, the higher its credit risk.
MANAGEMENT DISCUSSION OF FUND PERFORMANCE
How did the Fund perform against its benchmark for the fiscal year ended March 31, 2017?
The Seix High Income Fund returned 15.95%. That compared to a 16.39% return for the Fund’s benchmark, the Bloomberg Barclays U.S. Corporate High Yield Bond Index.
What factors influenced the Fund’s performance for the fiscal year ended March 31, 2017?
The high-yield bond market benefited from a robust recovery in the commodity-related sectors during the fiscal year. Oil prices essentially doubled from a low point in the first quarter of 2016, and many domestic producers were able to profit in this new price environment. Prices for gas, coal and other commodities followed suit, which increased overall optimism. As a result, the return of the Bloomberg Barclays High Yield Energy Index rose 36.6% during the 12 months ended March 31, 2017, while the Metals and Mining Index was up 33.0%.
In this environment, the Fund’s underweight position in the metals and mining sector and an overweight position in healthcare detracted from relative performance. A modest allocation to cash in a strongly recovering market, as well as unfavorable security selection in health care, transportation and utilities, also hurt relative performance. However, an overweight position in the energy sector and an underweight position among food producers boosted returns relative to the benchmark. Favorable security selection in the energy, telecommunications, chemicals, metals and mining, paper, and cable sectors also contributed to relative performance.
How do you plan to position the Fund, based on market conditions?
Given the relative stability of the market, we are looking for opportunities in more volatile sectors. For example, we have added to exposure in the energy services sector. In our opinion, there are opportunities to invest in deeply discounted bonds at attractive yields from energy services companies that would be high-quality issuers in a normalized energy environment. Also, uncertainty surrounding healthcare and retail has dropped the price of certain bonds to attractive levels.
We expect fundamentals to remain stable in the high-yield market. For example, given the forecast of a relatively healthy economy along with financial strength among issuers, JPMorgan Chase lowered its default rate projection from 2.50% to 2.0% for 2017. Technicals continue to be neutral, with the flow of money into high-yield bonds dependent on the absolute level of yields. Valuations improved toward the end of the fiscal year, but spreads remain below historic averages.
12
Table of Contents
SEIX HIGH INCOME FUND
Growth of a $10,000 Investment (as of March 31, 2017)
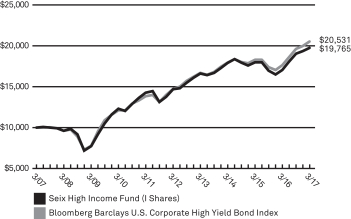 | This chart assumes an initial hypothetical investment of $10,000 made on 3/31/07. Total return is based on net change in the Net Asset Value (“NAV”) assuming reinvestment of distributions. Returns shown on this page include reinvestment of all dividends and other distributions.
The Fund’s performance is compared to the Bloomberg Barclays U.S. Corporate High Yield Bond Index, which covers the U.S. dollar-denominated, non-investment grade, fixed-rate, taxable corporate bond market. Securities are classified as high yield if the middle rating of Moody’s, Fitch, and S&P is Ba1/BB+/BB+ or below. The Index excludes Emerging Markets debt. The Index is unmanaged and does not reflect the deduction of fees, such as investment management and fund accounting fees associated with a mutual fund. Investors cannot invest directly in an index. |
| Average Annual Total Returns as of 3/31/17 | ||||||||||||||||||||
| Seix High Income Fund | 1 Year | 3 Year | 5 Year | 10 Year | ||||||||||||||||
A Shares | without sales charge | 15.69% | 3.04% | 5.82% | 6.75% | |||||||||||||||
| with sales charge* | 10.11% | 1.39% | 4.81% | 6.23% | ||||||||||||||||
R Shares^ | 15.47% | 2.84% | 5.63% | 6.39% | ||||||||||||||||
I Shares | 15.95% | 3.33% | 6.10% | 7.05% | ||||||||||||||||
IS Shares** | 15.96% | 3.42% | 6.15% | 7.08% | ||||||||||||||||
| Bloomberg Barclays U.S. Corporate High Yield Bond Index | 16.39% | 4.56% | 6.82% | 7.46% | ||||||||||||||||
| Prospectus Expense Ratio1 | Gross | |||||||||||||||||||
| A Shares | 1.03% | |||||||||||||||||||
| R Shares | 1.23% | |||||||||||||||||||
| I Shares | 0.79% | |||||||||||||||||||
| IS Shares | 0.63% | |||||||||||||||||||
Past performance does not guarantee future results. The performance data quoted represents past performance and current returns may be lower or higher. Total return figures include change in share price, reinvestment of dividends and capital gains and do not reflect taxes that a shareholder would pay on fund distributions or on the redemption of fund shares. The investment return and principal value will fluctuate so that an investor’s shares, when redeemed, may be worth more or less than the original cost. For performance data current to the most recent month end, visit our website at www.ridgeworth.com.
| * | Class A Share performance reflects the maximum front-end sales charge of 4.75%. |
| ^ | Effective at the close of business on 7/31/09, C Shares converted to R Shares and C Shares are no longer available for purchase. The performance shown prior to such date is based on the performance of the C Shares of the Fund and has not been adjusted to reflect R Share expenses. |
| ** | IS Shares were offered beginning on 8/1/14. The performance shown prior to such dates is based on performance of the I Shares of the Fund, and has not been adjusted to reflect IS Share expenses. If it had been, performance would have been higher. |
| 1 | This information is included in the most current prospectus available to current and prospective shareholders of the Fund. Additional information pertaining to the 3/31/17 expense ratios can be found in the financial highlights. |
Investment Weightings (as of March 31, 2017)
as a percentage of investments
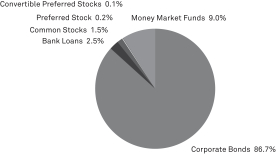
13
Table of Contents
Portfolio Managers
| • | Michael Kirkpatrick |
| • | James FitzPatrick, CFA |
INVESTMENT CONCERNS
Mutual fund investing involves risk, including possible loss of principal. Bond funds will tend to experience smaller fluctuations in value than stock funds. However, investors in any bond fund should anticipate fluctuations in price, especially for longer-term issues and in environments of rising interest rates.
Although the Fund’s yield may be higher than that of fixed income funds that purchase higher-rated securities, the potentially higher yield is a function of the greater risk that the Fund’s share price will decline.
Debt securities will generally lose value if interest rates increase. Interest rate risk is generally higher for investments with longer maturities or durations. Debt securities are subject to the risk that an issuer will fail to make timely payments of interest or principal or go bankrupt, reducing the Fund’s return. The lower the rating of a debt security, the higher its credit risk.
MANAGEMENT DISCUSSION OF FUND PERFORMANCE
How did the Fund perform against its benchmark for the fiscal year ended March 31, 2017?
The Seix High Yield Fund (I Shares) returned 13.48%. That compared to a 13.76% return for the Fund’s benchmark, the Bank of America Merrill Lynch U.S. High Yield BB/B Rated Constrained Index.
What factors influenced the Fund’s performance for the fiscal year ended March 31, 2017?
The robust recovery in the commodity-related sectors boosted the returns of high yield issues. Oil prices nearly doubled from their 2016 low, and the outlook for gas, coal and other commodities was positive. As a result, the default expectations for the overall market were revised downward.
The Fund’s relative returns benefited from an overweight position in the energy sector and an underweight allocation in the retail sector benefited the Fund’s relative return, as did security selection in the chemicals, metals and mining, paper, healthcare, energy, and finance sectors.
Despite positive security selection, an underweight allocation to the mining and metals and telecommunications sectors, as well as overweight allocations to the healthcare and finance sectors hurt the Fund’s relative results. A modest allocation to cash and unfavorable security selection in the telecommunications and transportation sector also dragged on performance.
How do you plan to position the Fund, based on market conditions?
Fundamentals are expected to remain stable in the high yield asset class. Given a relatively healthy economy along with financial strength among many high yield issuers, default rate projections are down for 2017. Additionally, technicals continue to be neutral and dependent on the absolute level of yields. Valuations are more attractive now than at the end of February 2017, but spreads remain below historical averages.
Given the relative stability of the market in the first quarter of 2017, we are looking to more volatile sectors to identify potential opportunities to generate returns. We see opportunities to invest in deeply discounted bonds at attractive yields issued by energy services companies. These companies would be high-quality issuers in a normalized energy environment, and we have added to the Fund’s exposure in the energy services sector. Additionally, uncertainty surrounding healthcare and retail has caused the price of certain bonds in those sectors to drop to levels that we find attractive.
14
Table of Contents
SEIX HIGH YIELD FUND
Growth of a $10,000 Investment (as of March 31, 2017)
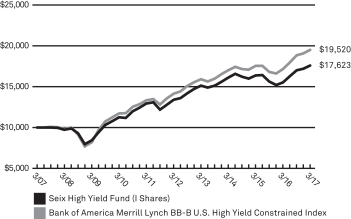 | This chart assumes an initial hypothetical investment of $10,000 made on 3/31/07. Total return is based on net change in the Net Asset Value (“NAV”) assuming reinvestment of distributions. Returns shown on this page include reinvestment of all dividends and other distributions.
The Fund’s performance is compared to the Bank of America Merrill Lynch BB-B U.S. High Yield Constrained Index, which tracks the performance of BB1 through B3 U.S. Dollar-denominated corporate bonds publicly issued in the U.S. domestic market and is restricted to a maximum of 2% per issuer. This Index is unmanaged and does not reflect the deduction of fees, such as investment management and fund accounting fees associated with a mutual fund. Investors cannot invest directly in an index. |
| Average Annual Total Returns as of 3/31/17 | ||||||||||||||||||||
| Seix High Yield Fund | 1 Year | 3 Year | 5 Year | 10 Year | ||||||||||||||||
A Shares | without sales charge | 13.20% | 2.74% | 5.37% | 5.64% | |||||||||||||||
| with sales charge* | 7.81% | 1.11% | 4.35% | 5.13% | ||||||||||||||||
R Shares^ | 12.90% | 2.53% | 5.13% | 5.17% | ||||||||||||||||
I Shares** | 13.48% | 2.97% | 5.61% | 5.83% | ||||||||||||||||
IS Shares** | 13.56% | 3.00% | 5.62% | 5.84% | ||||||||||||||||
| Bank of America Merrill Lynch BB-B U.S. High Yield Constrained Index | 13.76% | 4.66% | 6.61% | 6.92% | ||||||||||||||||
| Prospectus Expense Ratio1 | Gross | |||||||||||||||||||
| A Shares | 0.84% | |||||||||||||||||||
| R Shares | 1.04% | |||||||||||||||||||
| I Shares | 0.61% | |||||||||||||||||||
| IS Shares | 0.54% | |||||||||||||||||||
Past performance does not guarantee future results. The performance data quoted represents past performance and current returns may be lower or higher. Total return figures include change in share price, reinvestment of dividends and capital gains and do not reflect taxes that a shareholder would pay on fund distributions or on the redemption of fund shares. The investment return and principal value will fluctuate so that an investor’s shares, when redeemed, may be worth more or less than the original cost. For performance data current to the most recent month end, visit our website at www.ridgeworth.com.
| * | Class A Share performance reflects the maximum front-end sales charge of 4.75%. |
| ^ | Effective at the close of business on 7/31/09, C Shares converted to R Shares and C Shares are no longer available for purchase. The performance shown prior to such date is based on the performance of the C Shares of the Fund and has not been adjusted to reflect R Share expenses. |
| ** | IS Shares were offered beginning on 8/1/16. The performance shown prior to such dates is based on performance of the I Shares of the Fund, and has not been adjusted to reflect IS Share expenses. If it had been, performance would have been higher. |
| 1 | This information is included in the most current prospectus available to current and prospective shareholders of the Fund. Additional information pertaining to the 3/31/17 expense ratios can be found in the financial highlights. |
Investment Weightings (as of March 31, 2017)
as a percentage of investments
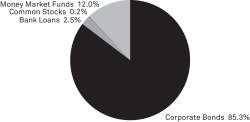
15
Table of Contents
SEIX INVESTMENT GRADE TAX-EXEMPT BOND FUND
Portfolio Manager
| • | Ronald Schwartz, CFA |
INVESTMENT CONCERNS
Mutual fund investing involves risk, including possible loss of principal. Bonds offer a relatively stable level of income, although bond prices will fluctuate providing the potential for principal gain or loss. Intermediate-term, higher-quality bonds generally offer less risk than longer-term bonds and a lower rate of return.
The Fund’s income may be subject to certain state and local taxes and, depending on your tax status, the federal alternative minimum tax.
The Fund is subject to the risk that principal value reacts in opposition to the movement of interest rates and that a rising interest rate environment increases the risk of loss of principal.
Debt securities will generally lose value if interest rates increase. Interest rate risk is generally higher for investments with longer maturities or durations. Debt securities are subject to the risk that an issuer will fail to make timely payments of interest or principal or go bankrupt, reducing the Fund’s return. The lower the rating of a debt security, the higher its credit risk.
MANAGEMENT DISCUSSION OF FUND PERFORMANCE
How did the Fund perform against its benchmark for the fiscal year ended March 31, 2017?
The Seix Investment Grade Tax-Exempt Bond Fund (I Shares) posted a total return of –0.24%. That compared to 12-month returns of –0.25% and 0.10% for the Lipper Intermediate Municipal Debt Objective* and the Bloomberg Barclays U.S. Municipal Bond 1-15 Year Blend Index, respectively.
What factors influenced the Fund’s performance for the fiscal year ended March 31, 2017?
Municipal bond (muni) prices declined over the 12-month period as yields rose modestly on five-, 10- and 30-year AAA-rated munis. Credit spreads tightened through September 2016, but then reversed course following the U.S. Presidential election in November. By the end of the period under review credit spreads were only modestly tighter than they were at the beginning of the period. Holdings of bonds issued by transportation, leasing, health care, and industrial development and pollution control entities led performance among the larger sectors in the Fund’s benchmark. State general obligation bonds posted a negative return in the Index.
The Fund’s choice of securities within the 10-year sector of the yield curve reduced relative results, as did an overweight position in California general obligation bonds. A below-benchmark exposure to the strong-performing transportation sector also weighed on relative returns.
Above-benchmark exposure to longer maturities, most notably to securities with maturities of 20 years and longer, added to relative results as those outperformed the 10-year bond sector for the period under review. An overweight position in the special tax and water/sewer sectors also enhanced relative performance, as did security selection in the education sector. Refunding events by a number of bonds held in the portfolio added to relative results as well. The Fund’s allocation to relatively high-quality bonds and its defensive, underweight position in relatively long-duration bonds helped it weather the sharp decline in prices during the fourth quarter of 2016.
How do you plan to position the Fund, based on market conditions?
Munis remain attractive based on strong technical factors and healthy fundamentals. The opportunity to capture tax-exempt income and yields that are attractive relative to other fixed-income investments also are constructive for muni bonds in the current environment. Even so, discussion of changes in fiscal policy could lead to increased volatility in muni markets, underscoring the value of a cautious approach.
We feel the Fund’s current yield curve position and its sector allocations are appropriate given our forecasts for the economy and for financial markets. We will continue to invest tactically and focus on securities with relatively high credit quality.
| * | Lipper Intermediate Municipal Debt Funds: Funds that invest in municipal debt issues with dollar-weighted average maturities of five to ten years. |
16
Table of Contents
SEIX INVESTMENT GRADE TAX-EXEMPT BOND FUND
Growth of a $10,000 Investment (as of March 31, 2017)
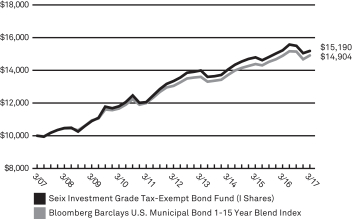 | This chart assumes an initial hypothetical investment of $10,000 made on 3/31/07. Total return is based on net change in the Net Asset Value (“NAV”) assuming reinvestment of distributions. Returns shown on this page include reinvestment of all dividends and other distributions.
The Bloomberg Barclays U.S. Municipal Bond 1-15 Year Blend Index is composed of tax-exempt bonds with maturities ranging between 1 and 15 years. The Index is unmanaged and does not reflect the deduction of fees, such as investment management and fund accounting fees associated with a mutual fund. Investors cannot invest directly in an index. |
| Average Annual Total Returns as of 3/31/17 | ||||||||||||||||||||
| Seix Investment Grade Tax-Exempt Bond Fund | 1 Year | 3 Year | 5 Year | 10 Year | ||||||||||||||||
A Shares | without sales charge | –0.48% | 2.47% | 2.47% | 4.03% | |||||||||||||||
| with sales charge* | –5.20% | 0.81% | 1.48% | 3.53% | ||||||||||||||||
I Shares | –0.24% | 2.63% | 2.64% | 4.27% | ||||||||||||||||
| Bloomberg Barclays U.S. Municipal Bond 1-15 Year Blend Index | 0.10% | 2.79% | 2.68% | 4.07% | ||||||||||||||||
| Prospectus Expense Ratio1 | Gross | |||||||||||||||||||
| A Shares | 0.94% | |||||||||||||||||||
| I Shares | 0.69% | |||||||||||||||||||
The Adviser has contractually agreed to waive fees and reimburse expenses until at least August 1, 2017 in order to keep total operating expenses (excluding underlying fund fees and expenses) from exceeding 0.80% and 0.65% for A and I Shares, respectively. Without these fee waivers, performance would have been lower. The indirect expenses of the Fund, which represent a pro-rata share of the expenses of the underlying funds in which the Fund invests, totaled 0.01% of net assets and are included in the expense ratios listed in the table above.
Past performance does not guarantee future results. The performance data quoted represents past performance and current returns may be lower or higher. Total return figures include change in share price, reinvestment of dividends and capital gains and do not reflect taxes that a shareholder would pay on fund distributions or on the redemption of fund shares. The investment return and principal value will fluctuate so that an investor’s shares, when redeemed, may be worth more or less than the original cost. For performance data current to the most recent month end, visit our website at www.ridgeworth.com.
| * | Class A Share performance reflects the maximum front-end sales charge of 4.75%. |
| 1 | This information is included in the most current prospectus available to current and prospective shareholders of the Fund. Additional information pertaining to the 3/31/17 expense ratios can be found in the financial highlights. |
Investment Weightings (as of March 31, 2017)
as a percentage of investments
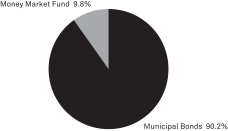
17
Table of Contents
Portfolio Managers
| • | James F. Keegan |
| • | Perry Troisi |
| • | Michael Rieger |
| • | Seth Antiles, Ph.D |
| • | Jonathan Yozzo |
| • | Carlos Catoya |
INVESTMENT CONCERNS
Mutual fund investing involves risk, including possible loss of principal. Bond funds will tend to experience smaller fluctuations in value than stock funds. However, investors in any bond fund should anticipate fluctuations in price, especially for longer-term issues and in environments of rising interest rates.
Mortgage-backed investments involve risk of loss due to prepayments and, like any bond, due to default. Because of the sensitivity of mortgage-related securities to changes in interest rates, the Fund’s performance may be more volatile than if it did not hold these securities.
Debt securities will generally lose value if interest rates increase. Interest rate risk is generally higher for investments with longer maturities or durations. Debt securities are subject to the risk that an issuer will fail to make timely payments of interest or principal or go bankrupt, reducing the Fund’s return. The lower the rating of a debt security, the higher its credit risk.
MANAGEMENT DISCUSSION OF FUND PERFORMANCE
How did the Fund perform against its benchmark for the fiscal year ended March 31, 2017?
The Seix Limited Duration Fund returned 0.86%. That compared to a 0.36% return for the Fund’s benchmark, the BofA Merrill Lynch 3-Month U.S. Treasury Bill Index.
What factors influenced the Fund’s performance for the fiscal year ended March 31, 2017?
The U.S. Federal Reserve raised the federal funds rate by 25 basis points in both December and March. The Fund primarily held high-quality mortgage- and asset-backed securities, which offered higher yields than Treasury bills of comparable duration. The income from such issues benefited the Fund’s absolute return for the period, and helped the Fund outperform its Treasury-only benchmark index.
How do you plan to position the Fund, based on market conditions?
We continue to monitor the Trump administration’s pro-growth business agenda, primarily around regulatory relief and potential fiscal spending, largely within the defense department. However, specifics related to tax reform and infrastructure spending have yet to materialize, and continued back-and-forth over the status of a new healthcare bill adds to uncertainty. Looking abroad, European elections could threaten the European Union and put additional pressure on the euro. In Asia, China’s continued growth slowdown, troubling debt levels and overvalued currency could prove problematic.
Given this uncertain landscape, our investment strategy will continue to seek safe income at a reasonable price. We expect demand for high-quality U.S. fixed income assets to remain strong, especially when viewed through a global relative value framework. However, spread sector valuations appear rich in the near term. Security selection will continue to drive performance in this unprecedented market environment.
18
Table of Contents
SEIX LIMITED DURATION FUND
Growth of a $10,000 Investment (as of March 31, 2017)
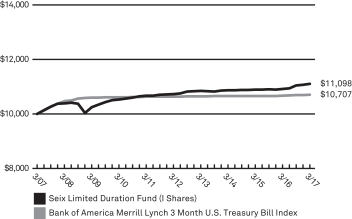 | This chart assumes an initial hypothetical investment of $10,000 made on 3/31/07. Total return is based on net change in the Net Asset Value (“NAV”) assuming reinvestment of distributions. Returns shown on this page include reinvestment of all dividends and other distributions.
The Fund’s performance is compared to the Bank of America Merrill Lynch 3 Month U.S. Treasury Bill Index, which tracks the monthly price-only and total return performance of a three-month Treasury bill, based on monthly average auction rates. The Index is unmanaged and does not reflect the deduction of fees, such as investment management and fund accounting fees associated with a mutual fund. Investors cannot invest directly in an index. |
| Average Annual Total Returns as of 3/31/17 | ||||||||||||||||||||
| Seix Limited Duration Fund | 1 Year | 3 Year | 5 Year | 10 Year | ||||||||||||||||
I Shares | 0.86% | 0.43% | 0.52% | 0.97% | ||||||||||||||||
| Bank of America Merrill Lynch 3 Month U.S. Treasury Bill Index | 0.36% | 0.17% | 0.14% | 0.69% | ||||||||||||||||
| Prospectus Expense Ratio1 | Gross | |||||||||||||||||||
| I Shares | 0.47% | |||||||||||||||||||
The Adviser has contractually agreed to waive fees and reimburse expenses until at least August 1, 2017 in order to keep total operating expenses (excluding underlying fund fees and expenses) from exceeding 0.35%. Without these fee waivers, performance would have been lower.
Past performance does not guarantee future results. The performance data quoted represents past performance and current returns may be lower or higher. Total return figures include change in share price, reinvestment of dividends and capital gains and do not reflect taxes that a shareholder would pay on fund distributions or on the redemption of fund shares. The investment return and principal value will fluctuate so that an investor’s shares, when redeemed, may be worth more or less than the original cost. For performance data current to the most recent month end, visit our website at www.ridgeworth.com.
| 1 | This information is included in the most current prospectus available to current and prospective shareholders of the Fund. Additional information pertaining to the 3/31/17 expense ratios can be found in the financial highlights. |
Investment Weightings (as of March 31, 2017)
as a percentage of investments
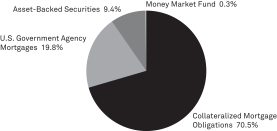
19
Table of Contents
SEIX NORTH CAROLINA TAX-EXEMPT BOND FUND
Portfolio Manager
| • | Chris Carter, CFA |
INVESTMENT CONCERNS
Mutual fund investing involves risk, including possible loss of principal. Bonds offer a relatively stable level of income, although bond prices will fluctuate providing the potential for principal gain or loss. Intermediate-term, higher-quality bonds generally offer less risk than longer-term bonds and a lower rate of return.
The geographical concentration of portfolio holdings in this Fund may involve increased risk.
The Fund’s income may be subject to certain state and local taxes and, depending on your tax status, the federal alternative minimum tax.
The Fund is subject to the risk that principal value reacts in opposition to the movement of interest rates and that a rising interest rate environment increases the risk of loss of principal.
Debt securities will generally lose value if interest rates increase. Interest rate risk is generally higher for investments with longer maturities or durations. Debt securities are subject to the risk that an issuer will fail to make timely payments of interest or principal or go bankrupt, reducing the Fund’s return. The lower the rating of a debt security, the higher its credit risk.
MANAGEMENT DISCUSSION OF FUND PERFORMANCE
How did the Fund perform relative to its benchmark for the fiscal year ended March 31, 2017?
The Seix North Carolina Tax-Exempt Bond Fund (I Shares) posted a total return of –0.53%. That compared to 12-month returns of –0.27% and 0.15% for the Lipper Other States Municipal Debt Objective* and the Bloomberg Barclays Municipal Bond Index, respectively.
What factors influenced the Fund’s performance for the fiscal year ended March 31, 2017?
Municipal bond (muni) prices declined over the 12-month period as yields rose moderately on five-, 10- and 30-year AAA-rated munis. Credit spreads tightened and total returns generally were higher for lower-quality bonds. Bonds issued by transportation, leasing and health care entities led performance among the larger sectors in the Fund’s benchmark.
The Fund’s sector and security selection among bonds with maturities of 17 years or longer dragged on relative results. Overweight positions and holdings in the electric and leasing sectors weighed on performance relative to the benchmark, as longer maturity bonds in these sectors underperformed.
An underweight exposure to the lagging state general obligation sector added to relative performance, as did the Fund’s security selection among bonds with maturities between 12 and 17 years.
How do you plan to position the Fund, based on market conditions?
Munis remain attractive based on strong technical factors and healthy fundamentals. The opportunity to capture tax-exempt income and yields that are attractive relative to other fixed-income investments also are constructive for muni bonds in the current environment. Even so, discussion of changes in fiscal policy could lead to increased volatility in muni markets, underscoring the value of a cautious approach.
We feel the Fund’s current yield curve position and its sector allocations are appropriate given our forecasts for the economy and for financial markets. We will continue to invest tactically and focus on securities with relatively high credit quality.
| * | Lipper Other States Municipal Debt Funds: Funds that limit assets to those securities exempt from taxation in a specified state (double tax-exempt) or city (triple tax-exempt). |
20
Table of Contents
SEIX NORTH CAROLINA TAX-EXEMPT BOND FUND
Growth of a $10,000 Investment (as of March 31, 2017)
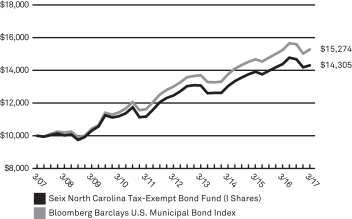 | This chart assumes an initial hypothetical investment of $10,000 made on 3/31/07. Total return is based on net change in the Net Asset Value (“NAV”) assuming reinvestment of distributions. Returns shown on this page include reinvestment of all dividends and other distributions.
The Fund’s performance is compared to the Bloomberg Barclays U.S. Municipal Bond Index, which covers the U.S. dollar-denominated long-term tax-exempt bond market. The Index has four main sectors: state and local general obligation bonds, revenue bonds, insured bonds, and prerefunded bonds. The Index is unmanaged and does not reflect the deduction of fees, such as investment management and fund accounting fees associated with a mutual fund. Investors cannot invest directly in an index. |
| Average Annual Total Returns as of 3/31/17 | ||||||||||||||||||||
| Seix North Carolina Tax-Exempt Bond Fund | 1 Year | 3 Year | 5 Year | 10 Year | ||||||||||||||||
A Shares | without sales charge | –0.59% | 3.03% | 2.64% | 3.49% | |||||||||||||||
| with sales charge* | –5.28% | 1.37% | 1.65% | 2.99% | ||||||||||||||||
I Shares | –0.53% | 3.18% | 2.79% | 3.65% | ||||||||||||||||
| Bloomberg Barclays U.S. Municipal Bond Index | 0.15% | 3.55% | 3.24% | 4.33% | ||||||||||||||||
| Prospectus Expense Ratio1 | Gross | |||||||||||||||||||
| A Shares | 0.81% | |||||||||||||||||||
| I Shares | 0.73% | |||||||||||||||||||
The Adviser has contractually agreed to waive fees and reimburse expenses until at least August 1, 2017 in order to keep total operating expenses (excluding underlying fund fees and expenses) from exceeding 0.80% and 0.65% for A and I Shares, respectively. Without these fee waivers, performance would have been lower.
Past performance does not guarantee future results. The performance data quoted represents past performance and current returns may be lower or higher. Total return figures include change in share price, reinvestment of dividends and capital gains and do not reflect taxes that a shareholder would pay on fund distributions or on the redemption of fund shares. The investment return and principal value will fluctuate so that an investor’s shares, when redeemed, may be worth more or less than the original cost. For performance data current to the most recent month end, visit our website at www.ridgeworth.com.
| * | Class A Share performance reflects the maximum front-end sales charge of 4.75% . |
| 1 | This information is included in the most current prospectus available to current and prospective shareholders of the Fund. Additional information pertaining to the 3/31/17 expense ratios can be found in the financial highlights. |
Investment Weightings (as of March 31, 2017)
as a percentage of investments
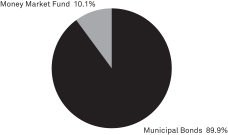
21
Table of Contents
Portfolio Managers
| • | James F. Keegan |
| • | Perry Troisi |
| • | Michael Rieger |
| • | Jonathan Yozzo |
| • | Carlos Catoya |
INVESTMENT CONCERNS
Mutual fund investing involves risk, including possible loss of principal. Bonds offer a relatively stable level of income, although bond prices will fluctuate providing the potential for principal gain or loss. Intermediate-term, higher-quality bonds generally offer less risk than longer-term bonds and a lower rate of return.
The Fund is subject to the risk that principal value reacts in opposition to the movement of interest rates and that a rising interest rate environment increases the risk of loss of principal.
Mortgage-backed investments involve risk of loss due to prepayments and, like any bond, due to default. Because of the sensitivity of mortgage-related securities to changes in interest rates, the Fund’s performance may be more volatile than if it did not hold these securities.
Debt securities will generally lose value if interest rates increase. Interest rate risk is generally higher for investments with longer maturities or durations. Debt securities are subject to the risk that an issuer will fail to make timely payments of interest or principal or go bankrupt, reducing the Fund’s return. The lower the rating of a debt security, the higher its credit risk.
MANAGEMENT DISCUSSION OF FUND PERFORMANCE
How did the Fund perform against its benchmark for the fiscal year ended March 31, 2017?
The Seix Short-Term Bond Fund returned 0.23% (I Shares). That compared to a 0.71% return for the Fund’s benchmark, the Bloomberg Barclays 1-3 Year Government/Credit Index.
What factors influenced the Fund’s performance for the fiscal year ended March 31, 2017?
Interest rates moved higher across the short-term Treasury yield curve, while spread levels for short duration corporate and securitized assets tightened. In this environment, the Fund’s absolute returns were driven by higher income and price appreciation from tighter spreads.
Security selection among corporate assets was the primary detractor from relative performance, as the Fund remained essentially neutral versus the benchmark for most of the year. The Fund’s holdings among higher quality issuers also detracted from performance, as lower quality securities outperformed. However, the Fund’s relative performance benefitted from asset allocation to securitized assets.
How do you plan to position the Fund, based on market conditions?
We continue to monitor the Trump administration’s pro-growth business agenda, primarily around regulatory relief and potential fiscal spending, largely within the defense department. However, specifics related to tax reform and infrastructure spending have yet to materialize, and continued back-and-forth over the status of a new healthcare bill adds to uncertainty. Looking abroad, European elections could threaten the European Union and put additional pressure on the euro. In Asia, China’s continued growth slowdown, troubling debt levels and overvalued currency could prove problematic.
Given this uncertain landscape, our investment strategy will continue to seek safe income at a reasonable price. We expect demand for high-quality U.S. fixed income assets to remain strong, especially when viewed through a global relative value framework. However, spread sector valuations appear rich in the near term. Security selection will continue to drive performance in this unprecedented market environment.
22
Table of Contents
SEIX SHORT-TERM BOND FUND
Growth of a $10,000 Investment (as of March 31, 2017)
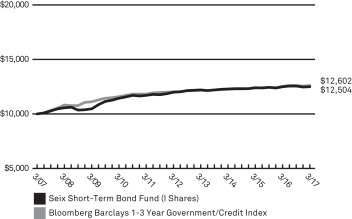 | This chart assumes an initial hypothetical investment of $10,000 made on 3/31/07. Total return is based on net change in the Net Asset Value (“NAV”) assuming reinvestment of distributions. Returns shown on this page include reinvestment of all dividends and other distributions.
The Fund’s performance is compared to the Bloomberg Barclays 1-3 Year Government/Credit Index. The Bloomberg Barclays 1-3 Year Government/Credit Index (Barclay’s Index) is the 1-3 year component of the U.S. Government/Credit Index. The Bloomberg Barclays Index includes securities in the Bloomberg Barclays Government and Credit Indices. The Government Index includes treasuries (i.e., public obligations of the U.S. Treasury that have remaining maturities of more than one year) and agencies (i.e., publicly issued debt of U.S. Government agencies, quasi-federal corporations, and corporate or foreign debt guaranteed by the U.S. Government). The Barclay’s Index includes publicly issued U.S. corporate and foreign debentures and secured notes that meet specified maturity, liquidity, and quality requirements. The Index is unmanaged and does not reflect the deduction of fees, such as investment management and fund accounting fees associated with a mutual fund. Investors cannot invest directly in an index. |
| Average Annual Total Returns as of 3/31/17 | ||||||||||||||||||||
| Seix Short-Term Bond Fund | 1 Year | 3 Year | 5 Year | 10 Year | ||||||||||||||||
A Shares | without sales charge | 0.03% | 0.41% | 0.64% | 2.04% | |||||||||||||||
| with sales charge* | –2.50% | –0.45% | 0.12% | 1.78% | ||||||||||||||||
C Shares | without CDSC | –0.47% | –0.06% | 0.05% | 1.33% | |||||||||||||||
| with CDSC* | –1.46% | –0.06% | 0.05% | 1.33% | ||||||||||||||||
I Shares | 0.23% | 0.61% | 0.85% | 2.26% | ||||||||||||||||
| Bloomberg Barclays 1-3 Year Government/Credit Index | 0.71% | 0.96% | 0.93% | 2.34% | ||||||||||||||||
| �� | ||||||||||||||||||||
| Prospectus Expense Ratio1 | Gross | |||||||||||||||||||
| A Shares | 0.81% | |||||||||||||||||||
| C Shares | 1.58% | |||||||||||||||||||
| I Shares | 0.68% | |||||||||||||||||||
The Adviser has contractually agreed to waive fees and reimburse expenses until at least August 1, 2017 in order to keep total operating expenses (excluding underlying fund fees and expenses) from exceeding 0.80%, 1.58% and 0.60% for A, C and I Shares, respectively. Without these fee waivers, performance would have been lower.
Past performance does not guarantee future results. The performance data quoted represents past performance and current returns may be lower or higher. Total return figures include change in share price, reinvestment of dividends and capital gains and do not reflect taxes that a shareholder would pay on fund distributions or on the redemption of fund shares. The investment return and principal value will fluctuate so that an investor’s shares, when redeemed, may be worth more or less than the original cost. For performance data current to the most recent month end, visit our website at www.ridgeworth.com.
| * | Class A Share performance reflects the maximum front-end sales charge of 2.50% and Class C Shares reflect the maximum CDSC (contingent deferred sales charge) of 1.00% in year one only. |
| 1 | This information is included in the most current prospectus available to current and prospective shareholders of the Fund. Additional information pertaining to the 3/31/17 expense ratios can be found in the financial highlights. |
Investment Weightings (as of March 31, 2017)
as a percentage of investments
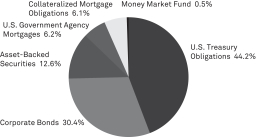
23
Table of Contents
SEIX SHORT-TERM MUNICIPAL BOND FUND
Portfolio Managers
| • | Ronald Schwartz, CFA |
| • | Dusty L. Self |
INVESTMENT CONCERNS
Mutual fund investing involves risk, including possible loss of principal. Bonds offer a relatively stable level of income, although bond prices will fluctuate providing the potential for principal gain or loss. Intermediate-term, higher-quality bonds generally offer less risk than longer-term bonds and a lower rate of return.
The geographical concentration of portfolio holdings in this fund may involve increased risk.
The Fund’s income may be subject to certain state and local taxes and, depending on your tax status, the federal alternative minimum tax.
The Fund is subject to the risk that principal value reacts in opposition to the movement of interest rates and that a rising interest rate environment increases the risk of loss of principal.
Debt securities will generally lose value if interest rates increase. Interest rate risk is generally higher for investments with longer maturities or durations. Debt securities are subject to the risk that an issuer will fail to make timely payments of interest or principal or go bankrupt, reducing the Fund’s return. The lower the rating of a debt security, the higher its credit risk.
MANAGEMENT DISCUSSION OF FUND PERFORMANCE
How did the Fund perform against its benchmark for the fiscal year ended March 31, 2017?
The Seix Short-Term Municipal Bond Fund (I Shares) posted a total return of 0.40%. That compared to 12-month returns of 0.25% and 0.57% for the Lipper Short Municipal Debt Objective* and the Bloomberg Barclays Municipal Bond 1-5 Year Index, respectively.
What factors influenced the Fund’s performance for the fiscal year ended March 31, 2017?
Municipal bond (muni) prices declined over the 12-month period as yields rose modestly on five-, 10- and 30-year AAA-rated munis. Credit spreads tightened through September 2016, but then reversed course following the U.S. Presidential election in November. By the end of the period under review credit spreads were only modestly tighter than they were at the beginning of the period. Bonds issued by entities in the transportation, industrial development and pollution control, leasing and health care sectors led performance among the larger sectors in the Fund’s benchmark. State general obligation bonds posted a negative return in the Index.
An underweight position in the three- and five-year area of the yield curve dragged on the Fund’s relative returns, as did underweight positions in the strong-performing electric and education sectors. The Fund’s holdings of A-rated transportation and lease bonds also detracted from results, as those securities underperformed.
The Fund’s above-benchmark exposure to AAA-rated securities added to relative results. An overweight position in bonds with maturities of one year or less also added, as did overweight positions in the transportation, water/sewer and special tax sectors, which all outperformed.
How do you plan to position the Fund, based on market conditions?
Munis remain attractive based on strong technical factors and healthy fundamentals. The opportunity to capture tax-exempt income and yields that are attractive relative to other fixed-income investments also are constructive for muni bonds in the current environment. Even so, discussion of changes in fiscal policy could lead to increased volatility in muni markets, underscoring the value of a cautious approach.
We feel the Fund’s current yield curve position and its sector allocations are appropriate given our forecasts for the economy and for financial markets. We will continue to invest tactically and focus on securities with relatively high credit quality.
| * | Short Municipal Debt Funds: Funds that invest in municipal debt issues with dollar-weighted average maturities of less than three years. |
24
Table of Contents
SEIX SHORT-TERM MUNICIPAL BOND FUND
Growth of a $10,000 Investment (as of March 31, 2017)
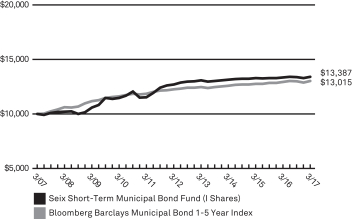 | This chart assumes an initial hypothetical investment of $10,000 made on 3/31/07. Total return is based on net change in the Net Asset Value (“NAV”) assuming reinvestment of distributions. Returns shown on this page include reinvestment of all dividends and other distributions.
The Fund’s performance is compared to the Bloomberg Barclays Municipal Bond 1-5 Year Index, which covers investment grade tax-exempt municipal bonds with maturities of 1-6 years. The Index is unmanaged and does not reflect the deduction of fees, such as investment management and fund accounting fees associated with a mutual fund. Investors cannot invest directly in an index. |
| Average Annual Total Returns as of 3/31/17 | ||||||||||||||||||||
| Seix Short-Term Municipal Bond Fund | 1 Year | 3 Year | 5 Year | 10 Year | ||||||||||||||||
A Shares* | without sales charge | 0.26% | 0.52% | 0.93% | 2.85% | |||||||||||||||
| with sales charge** | –2.28% | –0.34% | 0.41% | 2.59% | ||||||||||||||||
I Shares | 0.40% | 0.67% | 1.07% | 2.96% | ||||||||||||||||
| Bloomberg Barclays Municipal Bond 1-5 Year Index | 0.57% | 1.14% | 1.21% | 2.67% | ||||||||||||||||
| Prospectus Expense Ratio1 | Gross | |||||||||||||||||||
| A Shares | 0.73% | |||||||||||||||||||
| I Shares | 0.63% | |||||||||||||||||||
The Adviser has contractually agreed to waive fees and reimburse expenses until at least August 1, 2017 in order to keep total operating expenses (excluding underlying fund fees and expenses) from exceeding 0.68% and 0.48% for A and I Shares, respectively. Without these fee waivers, performance would have been lower. The indirect expenses of the Fund, which represent a pro-rata share of the expenses of the underlying funds in which the Fund invests, totaled 0.01% of net assets and are included in the expense ratios listed in the table above.
Past performance does not guarantee future results. The performance data quoted represents past performance and current returns may be lower or higher. Total return figures include change in share price, reinvestment of dividends and capital gains and do not reflect taxes that a shareholder would pay on fund distributions or on the redemption of fund shares. The investment return and principal value will fluctuate so that an investor’s shares, when redeemed, may be worth more or less than the original cost. For performance data current to the most recent month end, visit our website at www.ridgeworth.com.
| * | Prior to August 1, 2009, there were no assets in Class A Shares. The performance shown prior to such date is based on the performance of the I Shares of the Fund and has not been adjusted to reflect A Shares expenses. If it had been, performance would have been lower. |
| ** | Class A Shares performance reflects the maximum front-end sales charge of 2.50%. |
| 1 | This information is included in the most current prospectus available to current and prospective shareholders of the Fund. Additional information pertaining to the 3/31/17 expense ratios can be found in the financial highlights. |
Investment Weightings (as of March 31, 2017)
as a percentage of investments

25
Table of Contents
Portfolio Managers
| • | James F. Keegan |
| • | Perry Troisi |
| • | Michael Rieger |
| • | Seth Antiles, Ph.D. |
| • | Jonathan Yozzo |
| • | Carlos Catoya |
INVESTMENT CONCERNS
Mutual fund investing involves risk, including possible loss of principal. Bond funds will tend to experience smaller fluctuations in value than stock funds. However, investors in any bond fund should anticipate fluctuations in price, especially for longer-term issues and in environments of rising interest rates.
Mortgage-backed investments involve risk of loss due to prepayments and, like any bond, due to default. Because of the sensitivity of mortgage-related securities to changes in interest rates, the Fund’s performance may be more volatile than if it did not hold these securities.
Debt securities will generally lose value if interest rates increase. Interest rate risk is generally higher for investments with longer maturities or durations. Debt securities are subject to the risk that an issuer will fail to make timely payments of interest or principal or go bankrupt, reducing the Fund’s return. The lower the rating of a debt security, the higher its credit risk.
MANAGEMENT DISCUSSION OF FUND PERFORMANCE
How did the Fund perform against its benchmark for the fiscal year ended March 31, 2017?
The Seix Total Return Bond Fund returned 1.53% (I Shares). That compared to a 0.44% return for the Fund’s benchmark, the Bloomberg Barclays U.S. Aggregate Bond Index.
What factors influenced the Fund’s performance for the fiscal year ended March 31, 2017?
Interest rates moved higher across the Treasury yield curve during the period, and spread levels for corporate and securitized assets tightened. In this environment, the Fund’s absolute returns benefited from higher income and price appreciation from tighter spreads.
Security selection within the energy, metals and mining, and banking sectors were the primary drivers of relative performance. Security selection within residential mortgage-backed securities (RMBS), as well the Fund’s allocation to commercial mortgage-backed securities (CMBS) and asset-backed securities (ABS), also contributed positively to relative performance. The Fund’s relative performance also benefited from global investments, including exposure to emerging markets and to foreign currencies.
By contrast, the Fund’s use of high-yield credit default swaps to position against the continuation of high-yield outperformance detracted from relative returns. An underweight position in government-related issues also hurt relative performance.
How do you plan to position the Fund, based on market conditions?
We continue to monitor the Trump administration’s pro-growth business agenda, primarily around regulatory relief and potential fiscal spending, largely within the defense department. However, specifics related to tax reform and infrastructure spending have yet to materialize, and continued back-and-forth over the status of a new healthcare bill adds to uncertainty. Looking abroad, European elections could threaten the European Union and put additional pressure on the euro. In Asia, China’s continued growth slowdown, troubling debt levels and overvalued currency could prove problematic.
Given this uncertain landscape, our investment strategy will continue to seek safe income at a reasonable price. We expect demand for high-quality U.S. fixed income assets to remain strong, especially when viewed through a global relative value framework. However, spread sector valuations appear rich in the near term. Security selection will continue to drive performance in this unprecedented market environment.
26
Table of Contents
SEIX TOTAL RETURN BOND FUND
Growth of a $10,000 Investment (as of March 31, 2017)
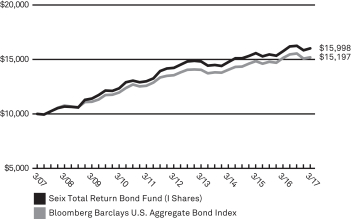 | This chart assumes an initial hypothetical investment of $10,000 made on 3/31/07. Total return is based on net change in the Net Asset Value (“NAV”) assuming reinvestment of distributions. Returns shown on this page include reinvestment of all dividends and other distributions.
The Fund’s performance is compared to the Bloomberg Barclays U.S. Aggregate Bond Index, which covers the U.S. dollar-denominated, investment-grade, fixed-rate, taxable bond market of SEC-registered securities. The Index includes bonds from the Treasury, Government-Related, Corporate, MBS (agency fixed-rate and hybrid ARM passthroughs), ABS and CMBS sectors. The Index is unmanaged and does not reflect the deduction of fees, such as investment management and fund accounting fees associated with a mutual fund. Investors cannot invest directly in an index. |
| Average Annual Total Returns as of 3/31/17 | ||||||||||||||||||||
| Seix Total Return Bond Fund | 1 Year | 3 Year | 5 Year | 10 Year | ||||||||||||||||
A Shares | without sales charge | 1.22% | 2.49% | 2.09% | 4.49% | |||||||||||||||
| with sales charge* | –3.59% | 0.83% | 1.11% | 3.99% | ||||||||||||||||
R Shares | 0.83% | 2.11% | 1.74% | 4.13% | ||||||||||||||||
I Shares | 1.53% | 2.73% | 2.37% | 4.81% | ||||||||||||||||
IS Shares** | 1.58% | 2.86% | 2.45% | 4.85% | ||||||||||||||||
| Bloomberg Barclays U.S. Aggregate Bond Index | 0.44% | 2.68% | 2.34% | 4.27% | ||||||||||||||||
| Prospectus Expense Ratio1 | Gross | |||||||||||||||||||
| A Shares | 0.71% | |||||||||||||||||||
| R Shares | 1.06% | |||||||||||||||||||
| I Shares | 0.45% | |||||||||||||||||||
| IS Shares | 0.31% | |||||||||||||||||||
Past performance does not guarantee future results. The performance data quoted represents past performance and current returns may be lower or higher. Total return figures include change in share price, reinvestment of dividends and capital gains and do not reflect taxes that a shareholder would pay on fund distributions or on the redemption of fund shares. The investment return and principal value will fluctuate so that an investor’s shares, when redeemed, may be worth more or less than the original cost. For performance data current to the most recent month end, visit our website at www.ridgeworth.com.
| * | Class A Share performance reflects the maximum front-end sales charge of 4.75%. |
| ** | IS Shares were offered beginning on 8/1/14. The performance shown prior to such dates is based on performance of the I Shares of the Fund, and has not been adjusted to reflect IS Share expenses. If it had been, performance would have been higher. |
| 1 | This information is included in the most current prospectus available to current and prospective shareholders of the Fund. Additional information pertaining to the 3/31/17 expense ratios can be found in the financial highlights. |
Investment Weightings (as of March 31, 2017)
as a percentage of investments
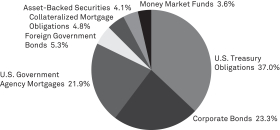
27
Table of Contents
SEIX U.S. GOVERNMENT SECURITIES ULTRA-SHORT BOND FUND
Portfolio Managers
| • | James F. Keegan |
| • | Perry Troisi |
| • | Michael Rieger |
INVESTMENT CONCERNS
Bonds offer a relatively stable level of income, although bond prices will fluctuate providing the potential for principal gain or loss. Intermediate-term, higher-quality bonds generally offer less risk than longer-term bonds and a lower rate of return.
U.S. Government guarantees apply only to the underlying securities of the Fund’s portfolio and not the Fund’s shares.
The Fund is subject to the risk that principal value reacts in opposition to the movement of interest rates and that a rising interest rate environment increases the risk of loss of principal.
Mortgage-backed investments involve risk of loss due to prepayments and, like any bond, due to default. Because of the sensitivity of mortgage-related securities to changes in interest rates, the Fund’s performance may be more volatile than if it did not hold these securities.
Debt securities will generally lose value if interest rates increase. Interest rate risk is generally higher for investments with longer maturities or durations. Debt securities are subject to the risk that an issuer will fail to make timely payments of interest or principal or go bankrupt, reducing the Fund’s return. The lower the rating of a debt security, the higher its credit risk.
MANAGEMENT DISCUSSION OF FUND PERFORMANCE
How did the Fund perform against its benchmark for the fiscal year ended March 31, 2017?
The Seix U.S. Government Securities Ultra-Short Bond Fund (I Shares) returned 0.98%. That compared to a 0.45% return for the Fund’s benchmark, the Bloomberg Barclays 3-6 Month Treasury Bill Index.
What factors influenced the Fund’s performance for the fiscal year ended March 31, 2017?
Over the 12-month period, rising interest rates, coupon income and spread tightening were the largest contributors to the Fund’s absolute return. Interest rates rose across the short-term Treasury yield curve, and tighter spread levels for short duration agency securitized assets offset the negative impact of those rising rates. The Fund’s exposure to higher yielding sectors generated additional coupon income.
An overweight position in higher yielding agency securitized assets boosted results relative to the Fund’s benchmark. There were no meaningful detractors from the Fund’s performance during the period.
How do you plan to position the Fund, based on market conditions?
We continue to monitor the Trump administration’s pro-growth business agenda, primarily around regulatory relief and potential fiscal spending, largely within the defense department. However, specifics related to tax reform and infrastructure spending have yet to materialize, and continued back-and-forth over the status of a new healthcare bill adds to uncertainty. Looking abroad, European elections could threaten the European Union and put additional pressure on the euro. In Asia, China’s continued growth slowdown, troubling debt levels and overvalued currency could prove problematic.
Given this uncertain landscape, our investment strategy will continue to seek safe income at a reasonable price. We expect demand for high-quality U.S. fixed income assets to remain strong, especially when viewed through a global relative value framework. However, spread sector valuations appear rich in the near term. Security selection will continue to drive performance in this unprecedented market environment.
28
Table of Contents
SEIX U.S. GOVERNMENT SECURITIES ULTRA-SHORT BOND FUND
Growth of a $10,000 Investment (as of March 31, 2017)
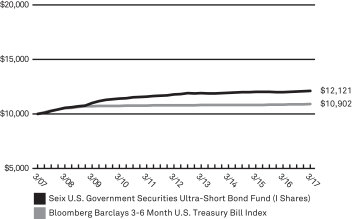 | This chart assumes an initial hypothetical investment of $10,000 made on 3/31/07. Total return is based on net change in the Net Asset Value (“NAV”) assuming reinvestment of distributions. Returns shown on this page include reinvestment of all dividends and other distributions.
The Fund’s performance is compared to the Bloomberg Barclays 3-6 Month U.S. Treasury Bill Index (“Index”). The Index is the 3-6 month component of the Bloomberg Barclays U.S. Treasury Bills Index, which includes U.S. Treasury bills with a remaining maturity from 1 up to (but not including) 12 months. It excludes zero coupon strips. The Index is unmanaged and does not reflect the deduction of fees, such as investment management and fund accounting fees associated with a mutual fund. Investors cannot invest directly in an index. |
| Average Annual Total Returns as of 3/31/17 | ||||||||||||||||||||
| Seix U.S. Government Securities Ultra-Short Bond Fund | 1 Year | 3 Year | 5 Year | 10 Year | ||||||||||||||||
I Shares | 0.98% | 0.54% | 0.57% | 1.94% | ||||||||||||||||
IS Shares* | 1.19% | 0.61% | 0.61% | 1.96% | ||||||||||||||||
| Bloomberg Barclays 3-6 Month U.S. Treasury Bill Index | 0.45% | 0.26% | 0.21% | 0.87% | ||||||||||||||||
| Prospectus Expense Ratio1 | Gross | |||||||||||||||||||
| I Shares | 0.41% | |||||||||||||||||||
| IS Shares | 0.26% | |||||||||||||||||||
Past performance does not guarantee future results. The performance data quoted represents past performance and current returns may be lower or higher. Total return figures include change in share price, reinvestment of dividends and capital gains and do not reflect taxes that a shareholder would pay on fund distributions or on the redemption of fund shares. The investment return and principal value will fluctuate so that an investor’s shares, when redeemed, may be worth more or less than the original cost. For performance data current to the most recent month end, visit our website at www.ridgeworth.com.
| * | IS Shares were offered beginning on 8/1/16. The performance shown prior to such dates is based on performance of the I Shares of the Fund, and has not been adjusted to reflect IS Share expenses. If it had been, performance would have been higher. |
| 1 | This information is included in the most current prospectus available to current and prospective shareholders of the Fund. Additional information pertaining to the 3/31/17 expense ratios can be found in the financial highlights. |
Investment Weightings (as of March 31, 2017)
as a percentage of investments
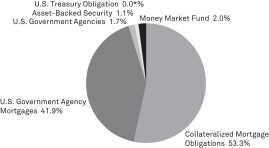
* Less than 0.05% of Net Assets.
29
Table of Contents
Portfolio Managers
| • | James F. Keegan |
| • | Perry Troisi |
| • | Michael Rieger |
| • | Seth Antiles, Ph.D |
| • | Jonathan Yozzo |
| • | Carlos Catoya |
INVESTMENT CONCERNS
Mutual fund investing involves risk, including possible loss of principal. Bonds offer a relatively stable level of income, although bond prices will fluctuate providing the potential for principal gain or loss. Intermediate-term, higher-quality bonds generally offer less risk than longer-term bonds and a lower rate of return.
U.S. Government guarantees apply only to the underlying securities of the Fund’s portfolio and not the Fund’s shares.
Mortgage-backed investments involve risk of loss due to prepayments and, like any bond, due to default. Because of the sensitivity of mortgage-related securities to changes in interest rates, the Fund’s performance may be more volatile than if it did not hold these securities.
Debt securities will generally lose value if interest rates increase. Interest rate risk is generally higher for investments with longer maturities or durations. Debt securities are subject to the risk that an issuer will fail to make timely payments of interest or principal or go bankrupt, reducing the Fund’s return. The lower the rating of a debt security, the higher its credit risk.
MANAGEMENT DISCUSSION OF FUND PERFORMANCE
How did the Fund perform against its benchmark for the fiscal year ended March 31, 2017?
The Seix U.S. Mortgage Fund returned –0.03% (I Shares). That compared to a 0.17% return for the Fund’s benchmark, the Bloomberg Barclays U.S. Mortgage Backed Securities Index.
What factors influenced the Fund’s performance for the fiscal year ended March 31, 2017?
Interest rates moved higher across the Treasury yield curve during the period, and spread levels for securitized assets tightened. In this environment, the Fund’s absolute returns benefited from higher income and price appreciation from tighter spreads.
The Fund’s allocation to adjustable rate mortgages and 15-year mortgage-backed securities detracted from relative performance during the period. However, positions in commercial mortgage-backed securities, 30-year mortgage-backed securities and Ginnie Mae 30-year mortgages helped relative performance.
How do you plan to position the Fund, based on market conditions?
We continue to monitor the Trump administration’s pro-growth business agenda, primarily around regulatory relief and potential fiscal spending, largely within the defense department. However, specifics related to tax reform and infrastructure spending have yet to materialize, and continued back-and-forth over the status of a new healthcare bill adds to uncertainty. Looking abroad, European elections could threaten the European Union and put additional pressure on the euro. In Asia, China’s continued growth slowdown, troubling debt levels and overvalued currency could prove problematic.
Given this uncertain landscape, our investment strategy will continue to seek safe income at a reasonable price. We expect demand for high-quality U.S. fixed income assets to remain strong, especially when viewed through a global relative value framework. However, spread sector valuations appear rich in the near term. Security selection will continue to drive performance in this unprecedented market environment.
30
Table of Contents
SEIX U.S. MORTGAGE FUND
Growth of a $10,000 Investment (as of March 31, 2017)
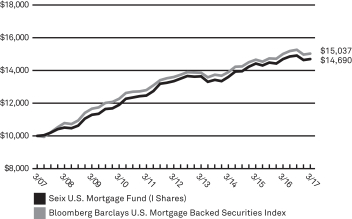 | This chart assumes an initial hypothetical investment of $10,000 made on 3/31/07. Total return is based on net change in the Net Asset Value (“NAV”) assuming reinvestment of distributions. Returns shown on this page include reinvestment of all dividends and other distributions.
The Fund’s performance is compared to the Bloomberg Barclays U.S. Mortgage Backed Securities Index, which covers agency pass-through securities (both fixed-rate and hybrid ARM) issued by Ginnie Mae (GNMA), Fannie Mae (FNMA), and Freddie Mac (FHLMC). The Index is unmanaged and does not reflect the deduction of fees, such as investment management and fund accounting fees associated with a mutual fund. Investors cannot invest directly in an index. |
| Average Annual Total Returns as of 3/31/17 | ||||||||||||||||||||
| Seix U.S. Mortgage Fund | 1 Year | 3 Year | 5 Year | 10 Year | ||||||||||||||||
A Shares | without sales charge | –0.23% | 2.42% | 1.74% | 3.72% | |||||||||||||||
| with sales charge* | –2.73% | 1.55% | 1.23% | 3.46% | ||||||||||||||||
C Shares | without CDSC | –0.97% | 1.65% | 0.96% | 2.91% | |||||||||||||||
| with CDSC* | –1.95% | 1.65% | 0.96% | 2.91% | ||||||||||||||||
I Shares | –0.03% | 2.62% | 1.94% | 3.92% | ||||||||||||||||
| Bloomberg Barclays U.S. Mortgage Backed Securities Index | 0.17% | 2.69% | 2.04% | 4.16% | ||||||||||||||||
| Prospectus Expense Ratio1 | Gross | |||||||||||||||||||
| A Shares | 1.10% | |||||||||||||||||||
| C Shares | 1.79% | |||||||||||||||||||
| I Shares | 0.86% | |||||||||||||||||||
The Adviser has contractually agreed to waive fees and reimburse expenses until at least August 1, 2017 in order to keep total operating expenses (excluding underlying fund fees and expenses) from exceeding 0.90%, 1.65% and 0.70% for A, C and I Shares, respectively. Without these fee waivers, performance would have been lower.
Past performance does not guarantee future results. The performance data quoted represents past performance and current returns may be lower or higher. Total return figures include change in share price, reinvestment of dividends and capital gains and do not reflect taxes that a shareholder would pay on fund distributions or on the redemption of fund shares. The investment return and principal value will fluctuate so that an investor’s shares, when redeemed, may be worth more or less than the original cost. For performance data current to the most recent month end, visit our website at www.ridgeworth.com.
| * | Class A Share performance reflects the maximum front-end sales charge of 2.50% and Class C Shares reflect the maximum CDSC (contingent deferred sales charge) of 1.00% in year one only. |
| 1 | This information is included in the most current prospectus available to current and prospective shareholders of the Fund. Additional information pertaining to the 3/31/17 expense ratios can be found in the financial highlights. |
Investment Weightings (as of March 31, 2017)
as a percentage of investments
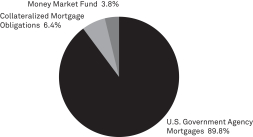
31
Table of Contents
Portfolio Managers
| • | James F. Keegan |
| • | Perry Troisi |
| • | Michael Rieger |
| • | Jonathan Yozzo |
| • | Carlos Catoya |
INVESTMENT CONCERNS
Bonds offer a relatively stable level of income, although bond prices will fluctuate providing the potential for principal gain or loss. Intermediate-term, higher-quality bonds generally offer less risk than longer-term bonds and a lower rate of return.
U.S. Government guarantees apply only to the underlying securities of the Fund’s portfolio and not the Fund’s shares.
Mortgage-backed investments involve risk of loss due to prepayments and, like any bond, due to default. Because of the sensitivity of mortgage-related securities to changes in interest rates, the Fund’s performance may be more volatile than if it did not hold these securities.
Debt securities will generally lose value if interest rates increase. Interest rate risk is generally higher for investments with longer maturities or durations. Debt securities are subject to the risk that an issuer will fail to make timely payments of interest or principal or go bankrupt, reducing the Fund’s return. The lower the rating of a debt security, the higher its credit risk.
MANAGEMENT DISCUSSIONOF FUND PERFORMANCE
How did the Fund perform against its benchmark for the fiscal year ended March 31, 2017?
The Seix Ultra-Short Bond Fund (I Shares) returned 1.41%. That compared to a 0.45% return for the Fund’s benchmark, the Bloomberg Barclays 3-6 Month Treasury Bill Index.
What factors influenced the Fund’s performance for the fiscal year ended March 31, 2017?
Over the 12-month period, rising interest rates, coupon income and spread tightening were the largest contributors to the Fund’s absolute return. As interest rates rose across the short-term Treasury yield curve, tighter spread levels for short duration corporate and securitized assets helped to offset the negative impact of these rising yields.
The Fund’s overweight allocation to higher yielding sectors generated additional coupon income. Income, price appreciation from tighter spreads, and price depreciation from the rise in interest rates drove absolute returns.
Relative to the benchmark, the Fund benefited from overweight positions to the primary spread sectors of corporate and securitized bonds, including residential and commercial mortgage-backed securities and asset-backed securities. There were no meaningful detractors from the Fund’s performance during the period.
How do you plan to position the Fund, based on market conditions?
We continue to monitor the Trump administration’s pro-growth business agenda, primarily around regulatory relief and potential fiscal spending, largely within the defense department. However, specifics related to tax reform and infrastructure spending have yet to materialize, and continued back-and-forth over the status of a new healthcare bill adds to uncertainty. Looking abroad, European elections could threaten the European Union and put additional pressure on the euro. In Asia, China’s continued growth slowdown, troubling debt levels and overvalued currency could prove problematic.
Given this uncertain landscape, our investment strategy will continue to seek safe income at a reasonable price. We expect demand for high-quality U.S. fixed income assets to remain strong, especially when viewed through a global relative value framework. However, spread sector valuations appear rich in the near term. Security selection will continue to drive performance in this unprecedented market environment.
32
Table of Contents
SEIX ULTRA-SHORT BOND FUND
Growth of a $10,000 Investment (as of March 31, 2017)
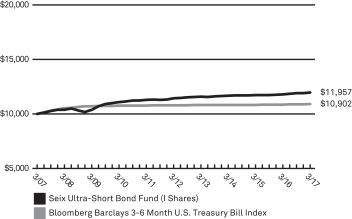 | This chart assumes an initial hypothetical investment of $10,000 made on 3/31/07. Total return is based on net change in the Net Asset Value (“NAV”) assuming reinvestment of distributions. Returns shown on this page include reinvestment of all dividends and other distributions.
The Fund’s performance is compared to the Bloomberg Barclays 3-6 Month U.S. Treasury Bill Index. The Bloomberg Barclays 3-6 Month U.S. Treasury Bill Index (“Index”) is the 3-6 month component of the Bloomberg Barclays U.S. Treasury Bills Index, which includes U.S. Treasury bills with a remaining maturity from 1 up to (but not including) 12 months. It excludes zero coupon strips. The Index is unmanaged and does not reflect the deduction of fees, such as investment management and fund accounting fees associated with a mutual fund. Investors cannot invest directly in an index. |
| Average Annual Total Returns as of 3/31/17 | ||||||||||||||||||||
| Seix Ultra-Short Bond Fund | 1 Year | 3 Year | 5 Year | 10 Year | ||||||||||||||||
I Shares | 1.41% | 0.79% | 0.91% | 1.80% | ||||||||||||||||
| Bloomberg Barclays 3-6 Month U.S. Treasury Bill Index | 0.45% | 0.26% | 0.21% | 0.87% | ||||||||||||||||
| Prospectus Expense Ratio1 | �� | Gross | ||||||||||||||||||
| I Shares | 0.38% | |||||||||||||||||||
Past performance does not guarantee future results. The performance data quoted represents past performance and current returns may be lower or higher. Total return figures include change in share price, reinvestment of dividends and capital gains and do not reflect taxes that a shareholder would pay on fund distributions or on the redemption of fund shares. The investment return and principal value will fluctuate so that an investor’s shares, when redeemed, may be worth more or less than the original cost. For performance data current to the most recent month end, visit our website at www.ridgeworth.com.
| 1 | This information is included in the most current prospectus available to current and prospective shareholders of the Fund. Additional information pertaining to the 3/31/17 expense ratios can be found in the financial highlights. |
Investment Weightings (as of March 31, 2017)
as a percentage of investments
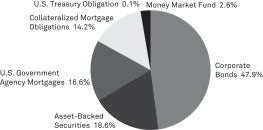
33
Table of Contents
SEIX VIRGINIA INTERMEDIATE MUNICIPAL BOND FUND
Portfolio Manager
| • | Chris Carter, CFA |
INVESTMENT CONCERNS
The geographical concentration of portfolio holdings in this Fund may involve increased risk.
Mutual fund investing involves risk, including possible loss of principal. Bonds offer a relatively stable level of income, although bond prices will fluctuate providing the potential for principal gain or loss. Intermediate-term, higher-quality bonds generally offer less risk than longer-term bonds and a lower rate of return.
The Fund’s income may be subject to certain state and local taxes and, depending on your tax status, the federal alternative minimum tax.
The Fund is subject to the risk that principal value reacts in opposition to the movement of interest rates and that a rising interest rate environment increases the risk of loss of principal.
Debt securities will generally lose value if interest rates increase. Interest rate risk is generally higher for investments with longer maturities or durations. Debt securities are subject to the risk that an issuer will fail to make timely payments of interest or principal or go bankrupt, reducing the Fund’s return. The lower the rating of a debt security, the higher its credit risk.
MANAGEMENT DISCUSSIONOF FUND PERFORMANCE
How did the Fund perform relative to its benchmark for the fiscal year ended March 31, 2017?
The Seix Virginia Intermediate Municipal Bond Fund (I Shares) posted a total return of 0.13%. That compared to 12-month returns of -0.82% and 0.10% for the Lipper Other States Intermediate Municipal Debt Objective* and the Bloomberg Barclays Municipal Bond 1-15 Year Blend Index, respectively.
What factors influenced the Fund’s performance for the fiscal year ended March 31, 2017?
Municipal bond (muni) prices declined over the 12-month period as yields rose moderately on five-, 10- and 30-year AAA-rated munis. Credit spreads tightened and total returns generally were higher for lower-quality bonds. Bonds issued by transportation, leasing and health care entities led performance among the larger sectors in the Fund’s benchmark.
The Fund’s choice of securities with maturities between eight and 17 years added to relative performance, as did an overweight position in the strong-performing leasing sector. The advance refunding of a large holding also boosted relative returns.
An underweight allocation to the strong-performing four- to six-year section of the yield curve dragged on relative results. The Fund’s higher-than-benchmark exposure to the weak-performing special tax sector also detracted.
How do you plan to position the Fund, based on market conditions?
Munis remain attractive based on strong technical factors and healthy fundamentals. The opportunity to capture tax-exempt income and yields that are attractive relative to other fixed-income investments also are constructive for muni bonds in the current environment. Even so, discussion of changes in fiscal policy could lead to increased volatility in muni markets, underscoring the value of a cautious approach.
We feel the Fund’s current yield curve position and its sector allocations are appropriate given our forecasts for the economy and for financial markets. We will continue to invest tactically and focus on securities with relatively high credit quality.
| * | Lipper Other States Intermediate Municipal Debt Funds: Funds that invest in municipal debt issues with dollar-weighted average maturities of five to ten years and are exempt from taxation on a specified city or state basis. |
34
Table of Contents
SEIX VIRGINIA INTERMEDIATE MUNICIPAL BOND FUND
Growth of a $10,000 Investment (as of March 31, 2017)
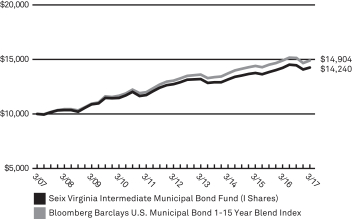 | This chart assumes an initial hypothetical investment of $10,000 made on 3/31/07. Total return is based on net change in the Net Asset Value (“NAV”) assuming reinvestment of distributions. Returns shown on this page include reinvestment of all dividends and other distributions.
The Fund’s performance is compared to the Bloomberg Barclays U.S. Municipal Bond 1-15 Year Blend Index (“Index”) which is an index of tax-exempt bonds with maturities ranging between 1 and 15 years. The Index is unmanaged and does not reflect the deduction of fees, such as investment management and fund accounting fees associated with a mutual fund. Investors cannot invest directly in an index. |
| Average Annual Total Returns as of 3/31/17 | ||||||||||||||||||||
| Seix Virginia Interm Muni Bond Fund | 1 Year | 3 Year | 5 Year | 10 Year | ||||||||||||||||
A Shares | without sales charge | –0.01% | 2.56% | 2.15% | 3.46% | |||||||||||||||
| with sales charge* | –4.74% | 0.92% | 1.16% | 2.96% | ||||||||||||||||
I Shares | 0.13% | 2.64% | 2.28% | 3.60% | ||||||||||||||||
| Bloomberg Barclays U.S. Municipal Bond 1-15 Year Blend Index | 0.10% | 2.79% | 2.68% | 4.07% | ||||||||||||||||
| Prospectus Expense Ratio1 | Gross | |||||||||||||||||||
| A Shares | 0.76% | |||||||||||||||||||
| I Shares | 0.68% | |||||||||||||||||||
The Adviser has contractually agreed to waive fees and reimburse expenses until at least August 1, 2017 in order to keep total operating expenses (excluding underlying fund fees and expenses) from exceeding 0.80% and 0.65% for A and I Shares, respectively. Without these fee waivers, performance would have been lower.
Past performance does not guarantee future results. The performance data quoted represents past performance and current returns may be lower or higher. Total return figures include change in share price, reinvestment of dividends and capital gains and do not reflect taxes that a shareholder would pay on fund distributions or on the redemption of fund shares. The investment return and principal value will fluctuate so that an investor’s shares, when redeemed, may be worth more or less than the original cost. For performance data current to the most recent month end, visit our website at www.ridgeworth.com.
| * | Class A Share performance reflects the maximum front-end sales charge of 4.75%. |
| 1 | This information is included in the most current prospectus available to current and prospective shareholders of the Fund. Additional information pertaining to the 3/31/17 expense ratios can be found in the financial highlights. |
Investment Weightings (as of March 31, 2017)
as a percentage of investments
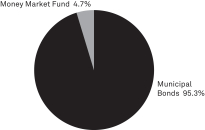
35
Table of Contents
SCHEDULES OF PORTFOLIO INVESTMENTS
RIDGEWORTH FUNDS March 31, 2017
Seix Core Bond Fund
| Shares or Principal Amount($) | Value($) | |||||||
| Asset-Backed Securities 4.4% | ||||||||
Automobiles 0.7% |
| |||||||
Ford Credit Auto Owner Trust, Series 2014-2, Cl A, 2.310%, | 1,060,000 | 1,068,968 | ||||||
Ford Credit Auto Owner Trust/Ford Credit, Series 2014-1, Cl A, 2.260%, | 340,000 | 342,819 | ||||||
|
| |||||||
| 1,411,787 | ||||||||
|
| |||||||
Credit Card 1.7% |
| |||||||
Cabela’s Credit Card Master Note Trust, Series 2014-2, Cl A, 1.362%, | 1,435,000 | 1,438,302 | ||||||
Capital One Multi-Asset Execution Trust, Series 2005-B3, Cl B3, 1.573%, 05/15/28(b) | 396,000 | 381,193 | ||||||
Master Credit Card Trust II, Series 2017-1A, Cl A, 2.260%, 07/21/21(a) | 960,000 | 965,563 | ||||||
World Financial Network Credit Card Master Trust, Series 2016-B, Cl A, 1.440%, 06/15/22 | 815,000 | 812,776 | ||||||
|
| |||||||
| 3,597,834 | ||||||||
|
| |||||||
Other 2.0% |
| |||||||
DB Master Finance LLC, Series 2015-1A, Cl A2II, 3.980%, 02/20/45(a) | 1,141,700 | 1,160,336 | ||||||
Domino’s Pizza Master Issuer LLC, Series 2012-1A, Cl A2, 5.216%, 01/25/42(a) | 1,121,199 | 1,135,811 | ||||||
Taco Bell Funding LLC, Series 2016-1A, Cl A2I, 3.832%, 05/25/46(a) | 1,198,975 | 1,215,419 | ||||||
Verizon Owner Trust, Series 2016-1A, Cl A, 1.420%, 01/20/21(a) | 890,000 | 884,542 | ||||||
|
| |||||||
| 4,396,108 | ||||||||
|
| |||||||
Total Asset-Backed Securities | 9,405,729 | |||||||
|
| |||||||
Collateralized Mortgage Obligations 5.5% |
| |||||||
Commercial Mortgage Backed Securities 5.5% |
| |||||||
Federal National Mortgage Association | ||||||||
Series 2017-M3, Cl A2, 2.569%, | 1,190,000 | 1,141,564 | ||||||
|
| |||||||
| Shares or Principal Amount($) | Value($) | |||||||
Commercial Mortgage Backed Securities—continued |
| |||||||
FREMF Mortgage Trust | ||||||||
Series 2012-K21, Cl B, 3.938%, | 490,000 | 508,503 | ||||||
Series 2013-K25, Cl B, 3.619%, | 740,000 | 756,300 | ||||||
Series 2013-K713, Cl B, 3.166%, 04/25/46(a)(b) | 480,000 | 487,002 | ||||||
Series 2016-K52, Cl B, 3.922%, | 745,000 | 737,428 | ||||||
|
| |||||||
| 2,489,233 | ||||||||
|
| |||||||
GS Mortgage Securities Corp. II | ||||||||
Series 2012-BWTR, Cl B, 3.255%, 11/05/34(a) | 1,195,000 | 1,210,541 | ||||||
|
| |||||||
GS Mortgage Securities Trust | ||||||||
Series 2010-C1, Cl A2, 4.592%, | 1,011,000 | 1,071,077 | ||||||
|
| |||||||
Morgan Stanley Capital I Trust | ||||||||
Series 2014-CPT, Cl A, 3.350%, | 770,000 | 796,969 | ||||||
Series 2014-CPT, Cl AM, 3.402%, 07/13/29(a)(b) | 615,000 | 628,287 | ||||||
|
| |||||||
| 1,425,256 | ||||||||
|
| |||||||
Queens Center Mortgage Trust | ||||||||
Series 2013-QCA, Cl A, 3.275%, | 265,000 | 266,621 | ||||||
|
| |||||||
VNDO Mortgage Trust | ||||||||
Series 2013-PENN, Cl B, 3.947%, 12/13/29(a)(b) | 1,125,000 | 1,170,606 | ||||||
|
| |||||||
WFRBS Commercial Mortgage Trust | ||||||||
Series 2012-C10, Cl AS, 3.241%, 12/15/45 | 995,000 | 1,008,125 | ||||||
Series 2012-C6, Cl AS, 3.835%, 04/15/45 | 638,000 | 666,331 | ||||||
Series 2012-C8, Cl AFL, 1.943%, 08/15/45(a)(b) | 1,380,000 | 1,394,074 | ||||||
|
| |||||||
| 3,068,530 | ||||||||
|
| |||||||
Total Collateralized Mortgage Obligations | 11,843,428 | |||||||
|
| |||||||
Corporate Bonds 24.8% |
| |||||||
Aerospace/Defense 0.6% |
| |||||||
L-3 Communications, Inc., 3.850%, 12/15/26 | 305,000 | 309,243 | ||||||
Rockwell Collins, Inc., 3.500%, | 933,000 | 933,270 | ||||||
|
| |||||||
| 1,242,513 | ||||||||
|
| |||||||
See Notes to Financial Statements.
36
Table of Contents
SCHEDULES OF PORTFOLIO INVESTMENTS
RIDGEWORTH FUNDS March 31, 2017
Seix Core Bond Fund — continued
| Shares or Principal Amount($) | Value($) | |||||||
Agriculture 0.6% |
| |||||||
Japan Tobacco, Inc., 2.100%, 07/23/18(a) | 1,187,000 | 1,192,193 | ||||||
|
| |||||||
Airlines 0.2% |
| |||||||
United Airlines Pass Through Trust, Series 2016-1, Cl A, 3.450%, 07/07/28 | 342,000 | 335,160 | ||||||
|
| |||||||
Auto Manufacturers 0.5% |
| |||||||
Daimler Finance North America LLC, 2.250%, 03/02/20(a) | 349,000 | 348,786 | ||||||
General Motors Co., 5.200%, 04/01/45 | 835,000 | 818,478 | ||||||
|
| |||||||
| 1,167,264 | ||||||||
|
| |||||||
Banks 6.5% |
| |||||||
Bank of America Corp., 1.700%, 08/25/17, MTN | 644,000 | 644,999 | ||||||
Bank of America Corp., 3.124%, 01/20/23, MTN(b) | 1,112,000 | 1,117,715 | ||||||
Bank of New York Mellon Corp. (The), 3.000%, 10/30/28, MTN | 436,000 | 414,848 | ||||||
Barclays PLC, 4.337%, 01/10/28 | 495,000 | 494,023 | ||||||
Citigroup, Inc., 2.500%, 09/26/18 | 1,039,000 | 1,048,288 | ||||||
Citigroup, Inc., 4.750%, 05/18/46 | 497,000 | 490,975 | ||||||
Credit Suisse Group AG, 4.282%, 01/09/28(a) | 730,000 | 726,825 | ||||||
Goldman Sachs Group, Inc. (The), 3.850%, 01/26/27 | 604,000 | 606,946 | ||||||
Lloyds Banking Group PLC, 3.750%, 01/11/27 | 847,000 | 832,661 | ||||||
Morgan Stanley, 3.125%, 07/27/26, MTN | 1,522,000 | 1,452,711 | ||||||
Morgan Stanley, 3.625%, 01/20/27 | 436,000 | 432,815 | ||||||
Morgan Stanley, 4.375%, 01/22/47 | 602,000 | 602,436 | ||||||
PNC Bank NA, 2.150%, 04/29/21, MTN | 715,000 | 707,976 | ||||||
Royal Bank of Scotland Group PLC, 3.875%, 09/12/23 | 1,299,000 | 1,280,242 | ||||||
U.S. Bancorp, 2.625%, 01/24/22, MTN | 801,000 | 804,023 | ||||||
U.S. Bancorp, 5.300%(b)(d) | 576,000 | 586,800 | ||||||
Wells Fargo & Co., 3.069%, 01/24/23 | 1,046,000 | 1,052,362 | ||||||
Westpac Banking Corp., 4.322%, 11/23/31, GMTN(b) | 690,000 | 697,251 | ||||||
|
| |||||||
| 13,993,896 | ||||||||
|
| |||||||
| Shares or Principal Amount($) | Value($) | |||||||
Beverages 0.2% |
| |||||||
Molson Coors Brewing Co., 4.200%, 07/15/46 | 457,000 | 427,940 | ||||||
|
| |||||||
Biotechnology 0.2% |
| |||||||
Celgene Corp., 4.625%, 05/15/44 | 235,000 | 233,071 | ||||||
Celgene Corp., 5.000%, 08/15/45 | 221,000 | 231,324 | ||||||
|
| |||||||
| 464,395 | ||||||||
|
| |||||||
Building Materials 0.2% |
| |||||||
Johnson Controls International PLC, 4.500%, 02/15/47 | 501,000 | 508,495 | ||||||
|
| |||||||
Commercial Services 0.2% |
| |||||||
ERAC USA Finance LLC, 4.500%, 02/15/45(a) | 211,000 | 201,742 | ||||||
ERAC USA Finance LLC, 5.250%, 10/01/20(a) | 283,000 | 306,679 | ||||||
|
| |||||||
| 508,421 | ||||||||
|
| |||||||
Computers 0.9% |
| |||||||
Apple, Inc., 4.250%, 02/09/47 | 496,000 | 503,955 | ||||||
Diamond 1 Finance Corp./Diamond 2 Finance Corp., 8.350%, 07/15/46(a) | 753,000 | 972,497 | ||||||
Everett Spinco, Inc., 4.250%, 04/15/24(a) | 445,000 | 452,488 | ||||||
|
| |||||||
| 1,928,940 | ||||||||
|
| |||||||
Diversified Financial Services 1.3% |
| |||||||
Air Lease Corp., 4.250%, 09/15/24 | 1,372,000 | 1,420,314 | ||||||
Lazard Group LLC, 3.750%, 02/13/25 | 1,016,000 | 1,009,973 | ||||||
TD Ameritrade Holding Corp., 2.950%, 04/01/22 | 361,000 | 365,456 | ||||||
|
| |||||||
| 2,795,743 | ||||||||
|
| |||||||
Electric 0.6% |
| |||||||
Berkshire Hathaway Energy Co., 6.125%, 04/01/36 | 220,000 | 274,654 | ||||||
Duke Energy Corp., 3.750%, 09/01/46 | 728,000 | 653,574 | ||||||
Exelon Generation Co. LLC, 6.200%, 10/01/17 | 291,000 | 297,343 | ||||||
|
| |||||||
| 1,225,571 | ||||||||
|
| |||||||
Healthcare-Products 0.3% |
| |||||||
Medtronic, Inc., 3.500%, 03/15/25 | 176,000 | 180,091 | ||||||
Medtronic, Inc., 4.625%, 03/15/45 | 450,000 | 483,170 | ||||||
|
| |||||||
| 663,261 | ||||||||
|
| |||||||
See Notes to Financial Statements.
37
Table of Contents
SCHEDULES OF PORTFOLIO INVESTMENTS
RIDGEWORTH FUNDS March 31, 2017
Seix Core Bond Fund — continued
| Shares or Principal Amount($) | Value($) | |||||||
Healthcare-Services 0.2% |
| |||||||
Howard Hughes Medical Institute, 3.500%, 09/01/23 | 334,000 | 349,881 | ||||||
|
| |||||||
Insurance 0.6% |
| |||||||
MassMutual Global Funding LLC, 2.000%, 04/05/17(a) | 702,000 | 702,000 | ||||||
Nationwide Financial Services, Inc., 5.375%, 03/25/21(a) | 556,000 | 605,239 | ||||||
|
| |||||||
| 1,307,239 | ||||||||
|
| |||||||
Lodging 0.1% |
| |||||||
Wyndham Worldwide Corp., 4.500%, 04/01/27 | 219,000 | 220,625 | ||||||
|
| |||||||
Machinery-Diversified 0.1% |
| |||||||
Xylem, Inc., 3.250%, 11/01/26 | 298,000 | 294,263 | ||||||
|
| |||||||
Media 0.6% |
| |||||||
Time Warner, Inc., 3.800%, 02/15/27 | 795,000 | 786,331 | ||||||
Viacom, Inc., 3.450%, 10/04/26 | 422,000 | 401,388 | ||||||
|
| |||||||
| 1,187,719 | ||||||||
|
| |||||||
Mining 1.6% |
| |||||||
Barrick (PD) Australia Finance Property Ltd., 5.950%, 10/15/39 | 775,000 | 888,705 | ||||||
Barrick International Barbados Corp., 6.350%, 10/15/36(a) | 658,000 | 747,688 | ||||||
Newmont Mining Corp., 6.250%, 10/01/39 | 1,532,000 | 1,777,532 | ||||||
|
| |||||||
| 3,413,925 | ||||||||
|
| |||||||
Miscellaneous Manufacturer 0.4% |
| |||||||
General Electric Co., 4.125%, 10/09/42 | 189,000 | 192,516 | ||||||
General Electric Co., 5.250%, 12/06/17 | 653,000 | 669,537 | ||||||
|
| |||||||
| 862,053 | ||||||||
|
| |||||||
Oil & Gas 1.5% |
| |||||||
BP Capital Markets PLC, 2.112%, 09/16/21 | 232,000 | 227,837 | ||||||
HollyFrontier Corp., 5.875%, 04/01/26 | 1,025,000 | 1,088,261 | ||||||
Nabors Industries, Inc., 5.500%, 01/15/23(a) | 289,000 | 294,961 | ||||||
Shell International Finance BV, 1.750%, 09/12/21 | 402,000 | 390,760 | ||||||
Shell International Finance BV, 4.375%, 05/11/45 | 659,000 | 668,294 | ||||||
Woodside Finance Ltd., 4.600%, 05/10/21(a) | 550,000 | 576,725 | ||||||
|
| |||||||
| 3,246,838 | ||||||||
|
| |||||||
| Shares or Principal Amount($) | Value($) | |||||||
Oil & Gas Services 0.8% |
| |||||||
Schlumberger Holdings Corp., 3.000%, 12/21/20(a) | 454,000 | 464,226 | ||||||
Schlumberger Holdings Corp., 4.000%, 12/21/25(a) | 887,000 | 924,411 | ||||||
Schlumberger Investment SA, 3.300%, 09/14/21(a) | 285,000 | 293,661 | ||||||
TechnipFMC PLC, 3.450%, 10/01/22 | 127,000 | 125,928 | ||||||
|
| |||||||
| 1,808,226 | ||||||||
|
| |||||||
Pharmaceuticals 0.1% |
| |||||||
Novartis Securities Investment Ltd., 5.125%, 02/10/19 | 215,000 | 228,431 | ||||||
|
| |||||||
Pipelines 1.8% |
| |||||||
Boardwalk Pipelines LP, 4.450%, 07/15/27 | 280,000 | 282,890 | ||||||
Energy Transfer Partners LP, 5.300%, 04/15/47 | 663,000 | 634,446 | ||||||
EnLink Midstream Partners LP, 4.150%, 06/01/25 | 838,000 | 827,918 | ||||||
MPLX LP, 5.200%, 03/01/47 | 465,000 | 467,914 | ||||||
Sabine Pass Liquefaction LLC, 4.200%, 03/15/28(a) | 1,121,000 | 1,107,338 | ||||||
Transcanada Trust, 5.300%, 03/15/77(b) | 117,000 | 115,611 | ||||||
Valero Energy Partners LP, 4.375%, 12/15/26 | 431,000 | 434,947 | ||||||
|
| |||||||
| 3,871,064 | ||||||||
|
| |||||||
Real Estate Investment Trust 1.1% |
| |||||||
American Tower Corp., 3.500%, 01/31/23 | 312,000 | 313,845 | ||||||
American Tower Corp., 5.000%, 02/15/24 | 572,000 | 617,724 | ||||||
Boston Properties LP, 3.650%, 02/01/26 | 375,000 | 373,535 | ||||||
Digital Realty Trust LP, 3.950%, 07/01/22 | 627,000 | 653,000 | ||||||
Digital Realty Trust LP, 4.750%, 10/01/25 | 425,000 | 448,547 | ||||||
|
| |||||||
| 2,406,651 | ||||||||
|
| |||||||
Retail 0.2% |
| |||||||
Home Depot, Inc. (The), 2.625%, 06/01/22 | 345,000 | 347,815 | ||||||
|
| |||||||
Semiconductors 1.9% |
| |||||||
Analog Devices, Inc., 3.500%, 12/05/26 | 616,000 | 610,071 | ||||||
Applied Materials, Inc., 3.300%, 04/01/27 | 628,000 | 630,494 | ||||||
See Notes to Financial Statements.
38
Table of Contents
SCHEDULES OF PORTFOLIO INVESTMENTS
RIDGEWORTH FUNDS March 31, 2017
Seix Core Bond Fund — continued
| Shares or Principal Amount($) | Value($) | |||||||
Semiconductors—continued |
| |||||||
Broadcom Corp./Broadcom Cayman Finance Ltd., 3.875%, 01/15/27(a) | 667,000 | 670,517 | ||||||
NVIDIA Corp., 3.200%, 09/16/26 | 444,000 | 430,661 | ||||||
TSMC Global Ltd., 1.625%, 04/03/18(a) | 1,673,000 | 1,668,751 | ||||||
|
| |||||||
| 4,010,494 | ||||||||
|
| |||||||
Software 0.6% |
| |||||||
Oracle Corp., 2.650%, 07/15/26 | 1,329,000 | 1,265,484 | ||||||
|
| |||||||
Telecommunication Services 0.9% |
| |||||||
AT&T, Inc., 2.375%, 11/27/18 | 532,000 | 535,687 | ||||||
AT&T, Inc., 4.350%, 06/15/45 | 598,000 | 526,348 | ||||||
Cisco Systems, Inc., 2.125%, 03/01/19 | 460,000 | 464,799 | ||||||
Verizon Communications, Inc., 5.500%, 03/16/47 | 323,000 | 338,551 | ||||||
|
| |||||||
| 1,865,385 | ||||||||
|
| |||||||
Total Corporate Bonds | 53,139,885 | |||||||
|
| |||||||
U.S. Government Agency Mortgages 22.8% |
| |||||||
Federal Home Loan Mortgage Corporation | ||||||||
Pool #G30614, 3.500%, 12/01/32 | 747,877 | 780,275 | ||||||
Pool #C91768, 3.500%, 07/01/34 | 940,135 | 975,539 | ||||||
Pool #G01779, 5.000%, 04/01/35 | 116,269 | 127,517 | ||||||
Pool #G01838, 5.000%, 07/01/35 | 25,467 | 27,967 | ||||||
Pool #G01837, 5.000%, 07/01/35 | 53,119 | 58,201 | ||||||
Pool #Z40115, 6.000%, 05/01/36 | 768,124 | 868,451 | ||||||
Pool #G03296, 6.000%, 09/01/37 | 267,661 | 309,973 | ||||||
Pool #G05326, 5.000%, 02/01/38 | 111,190 | 121,410 | ||||||
Pool #G08347, 4.500%, 06/01/39 | 123,817 | 133,023 | ||||||
Pool #G08353, 4.500%, 07/01/39 | 160,251 | 172,245 | ||||||
Pool #G05606, 4.500%, 07/01/39 | 1,421,890 | 1,528,596 | ||||||
Pool #G06079, 6.000%, 07/01/39 | 50,490 | 57,186 | ||||||
Pool #A89148, 4.000%, 10/01/39 | 302,845 | 318,715 | ||||||
| Shares or Principal Amount($) | Value($) | |||||||
U.S. Government Agency Mortgages—continued |
| |||||||
Pool #A89384, 4.000%, 10/01/39 | 57,857 | 60,931 | ||||||
Pool #G08372, 4.500%, 11/01/39 | 474,976 | 510,470 | ||||||
Pool #A93101, 5.000%, 07/01/40 | 56,320 | 61,398 | ||||||
Pool #G06061, 4.000%, 10/01/40 | 453,331 | 478,363 | ||||||
Pool #A95085, 4.000%, 11/01/40 | 290,939 | 306,427 | ||||||
Pool #V82101, 4.000%, 11/01/40 | 215,843 | 227,351 | ||||||
Pool #A95822, 4.000%, 12/01/40 | 500,361 | 529,161 | ||||||
Pool #A95796, 4.000%, 12/01/40 | 176,812 | 186,212 | ||||||
Pool #G60126, 4.500%, 11/01/41 | 45,815 | 49,225 | ||||||
Pool #C04123, 4.000%, 07/01/42 | 828,609 | 876,009 | ||||||
Pool #Q13801, 3.000%, 12/01/42 | 204,297 | 203,707 | ||||||
Pool #G60019, 4.500%, 03/01/44 | 1,636,865 | 1,759,927 | ||||||
Pool #Q29416, 4.000%, 11/01/44 | 237,007 | 249,718 | ||||||
Pool #Q31645, 4.000%, 02/01/45 | 132,072 | 139,148 | ||||||
Pool #Q31066, 4.000%, 02/01/45 | 182,067 | 192,079 | ||||||
Pool #G60589, 4.000%, 02/01/45 | 1,618,475 | 1,699,102 | ||||||
Pool #Q35611, 4.000%, 09/01/45 | 1,170,483 | 1,233,328 | ||||||
Pool #Q36238, 4.000%, 09/01/45 | 221,939 | 232,975 | ||||||
Pool #Q37163, 3.500%, 11/01/45 | 645,283 | 662,398 | ||||||
Pool #Q38473, 4.000%, 01/01/46 | 787,077 | 826,215 | ||||||
Pool #Q40240, 4.000%, 03/01/46 | 247,853 | 260,177 | ||||||
Pool #Q40124, 3.500%, 04/01/46 | 815,909 | 837,555 | ||||||
Pool #Q40123, 3.500%, 04/01/46 | 637,441 | 654,932 | ||||||
Pool #Q40723, 4.000%, 05/01/46 | 712,126 | 747,537 | ||||||
|
| |||||||
| 18,463,443 | ||||||||
|
| |||||||
See Notes to Financial Statements.
39
Table of Contents
SCHEDULES OF PORTFOLIO INVESTMENTS
RIDGEWORTH FUNDS March 31, 2017
Seix Core Bond Fund — continued
| Shares or Principal Amount($) | Value($) | |||||||
U.S. Government Agency Mortgages—continued |
| |||||||
Federal National Mortgage Association | ||||||||
Pool #AP9592, 3.500%, 10/01/32 | 773,905 | 808,258 | ||||||
Pool #MA1630, 4.000%, 10/01/33 | 273,183 | 289,308 | ||||||
Pool #MA1763, 3.500%, 01/01/34 | 312,620 | 326,502 | ||||||
Pool #890248, 6.000%, 08/01/37 | 72,720 | 83,171 | ||||||
Pool #AE0814, 6.000%, 09/01/39 | 745,104 | 841,267 | ||||||
Pool #AC2817, 4.000%, 10/01/39 | 76,180 | 79,965 | ||||||
Pool #AX3605, 3.500%, 01/01/40 | 229,694 | 236,356 | ||||||
Pool #AC9564, 4.500%, 02/01/40 | 210,044 | 227,182 | ||||||
Pool #AL7497, 3.500%, 09/01/40 | 2,279,922 | 2,347,642 | ||||||
Pool #AE3860, 5.000%, 10/01/40 | 811,165 | 888,538 | ||||||
Pool #AE9284, 4.000%, 11/01/40 | 99,058 | 104,167 | ||||||
Pool #AE5143, 4.000%, 11/01/40 | 64,092 | 67,495 | ||||||
Pool #AE4414, 4.000%, 11/01/40 | 453,698 | 477,303 | ||||||
Pool #MA0639, 4.000%, 02/01/41 | 207,660 | 218,590 | ||||||
Pool #AL0215, 4.500%, 04/01/41 | 705,165 | 759,099 | ||||||
Pool #AB3274, 4.500%, 07/01/41 | 370,368 | 399,259 | ||||||
Pool #AW8154, 3.500%, 01/01/42 | 1,158,298 | 1,192,473 | ||||||
Pool #AB5188, 3.500%, 05/01/42 | 405,666 | 417,266 | ||||||
Pool #AZ0572, 3.000%, 06/01/42 | 448,933 | 447,542 | ||||||
Pool #AP7874, 3.500%, 10/01/42 | 285,520 | 293,454 | ||||||
Pool #AB8726, 3.500%, 03/01/43 | 1,131,183 | 1,162,624 | ||||||
Pool #AT4912, 4.000%, 05/01/43 | 430,319 | 453,244 | ||||||
Pool #AT0536, 4.000%, 10/01/43 | 303,959 | 319,092 | ||||||
Pool #AS0653, 4.000%, 10/01/43 | 172,204 | 181,534 | ||||||
| Shares or Principal Amount($) | Value($) | |||||||
U.S. Government Agency Mortgages—continued |
| |||||||
Pool #AV3452, 4.000%, 02/01/44 | 588,814 | 617,831 | ||||||
Pool #AL6223, 4.500%, 08/01/44 | 791,786 | 850,021 | ||||||
Pool #AL9127, 4.000%, 10/01/44 | 1,750,636 | 1,844,959 | ||||||
Pool #AY2685, 4.500%, 01/01/45 | 104,264 | 112,359 | ||||||
Pool #BD9394, 3.500%, 06/01/45 | 293,334 | 300,581 | ||||||
Pool #MA2341, 4.500%, 06/01/45 | 53,023 | 56,908 | ||||||
Pool #AZ9213, 4.000%, 10/01/45 | 1,312,285 | 1,384,820 | ||||||
Pool #AS6515, 4.000%, 01/01/46 | 1,209,296 | 1,268,918 | ||||||
Pool #BC2470, 3.500%, 02/01/46 | 525,701 | 542,623 | ||||||
Pool #AX5534, 4.000%, 06/01/46 | 141,213 | 150,072 | ||||||
Pool #AS7561, 4.000%, 06/01/46 | 200,994 | 213,603 | ||||||
Pool #BC8441, 4.000%, 06/01/46 | 334,628 | 351,144 | ||||||
Pool #BC5673, 4.000%, 08/01/46 | 977,814 | 1,026,079 | ||||||
Pool #BD4896, 4.000%, 08/01/46 | 889,882 | 933,803 | ||||||
Pool #BC5696, 4.000%, 09/01/46 | 828,022 | 868,891 | ||||||
|
| |||||||
| 23,143,943 | ||||||||
|
| |||||||
Government National Mortgage Association | ||||||||
Pool #736663, 5.000%, 03/15/40 | 844,452 | 923,011 | ||||||
Pool #783653, 5.000%, 08/15/40 | 133,165 | 146,504 | ||||||
Pool #MA0321, 5.000%, 08/20/42 | 75,997 | 82,512 | ||||||
Pool #AM0226, 4.000%, 05/15/45 | 857,859 | 906,083 | ||||||
Pool #AM9875, 4.000%, 06/15/45 | 373,001 | 394,886 | ||||||
Pool #AN6811, 4.000%, 07/15/45 | 177,772 | 187,839 | ||||||
Pool #AM8631, 4.000%, 07/15/45 | 593,632 | 627,294 | ||||||
Pool #AN5745, 4.000%, 07/15/45 | 737,734 | 782,464 | ||||||
See Notes to Financial Statements.
40
Table of Contents
SCHEDULES OF PORTFOLIO INVESTMENTS
RIDGEWORTH FUNDS March 31, 2017
Seix Core Bond Fund — concluded
| Shares or Principal Amount($) | Value($) | |||||||
U.S. Government Agency Mortgages—continued |
| |||||||
Pool #AN5764, 4.000%, 07/15/45 | 278,241 | 293,914 | ||||||
Pool #AN5766, 4.000%, 07/15/45 | 297,860 | 314,607 | ||||||
Pool #MA3875, 4.000%, 08/20/46 | 972,675 | 1,028,070 | ||||||
Pool #AV6530, 4.000%, 08/20/46 | 347,821 | 367,630 | ||||||
Pool #MA4005, 4.000%, 10/20/46 | 691,360 | 730,734 | ||||||
Pool #MA4072, 5.000%, 11/20/46 | 423,835 | 455,610 | ||||||
|
| |||||||
| 7,241,158 | ||||||||
|
| |||||||
Total U.S. Government Agency Mortgages | 48,848,544 | |||||||
|
| |||||||
U.S. Treasury Obligations 40.1% |
| |||||||
U.S. Treasury Bond 2.8% |
| |||||||
2.875%, 11/15/46 | 6,125,000 | 5,942,922 | ||||||
|
| |||||||
U.S. Treasury Inflation Indexed Bond 2.8% |
| |||||||
1.000%, 02/15/46 | 5,888,893 | 5,978,399 | ||||||
|
| |||||||
U.S. Treasury Notes 34.5% |
| |||||||
0.625%, 09/30/17 | 2,650,000 | 2,646,274 | ||||||
1.250%, 10/31/18 | 1,594,000 | 1,595,245 | ||||||
0.750%, 08/15/19 | 14,961,000 | 14,750,020 | ||||||
1.375%, 04/30/20 | 5,652,000 | 5,621,089 | ||||||
1.625%, 07/31/20(e) | 22,494,000 | 22,496,632 | ||||||
2.000%, 05/31/21 | 12,324,000 | 12,417,391 | ||||||
2.250%, 02/15/27 | 14,746,000 | 14,557,649 | ||||||
|
| |||||||
| 74,084,300 | ||||||||
|
| |||||||
Total U.S. Treasury Obligations | 86,005,621 | |||||||
|
| |||||||
| Shares or Principal Amount($) | Value($) | |||||||
Money Market Fund 6.3% |
| |||||||
State Street Institutional Treasury Money Market Fund, Premier Class, 0.53%(f) | 13,510,206 | 13,510,206 | ||||||
|
| |||||||
Total Money Market Fund | 13,510,206 | |||||||
|
| |||||||
Total Investments |
| 222,753,413 | ||||||
Liabilities in Excess of Other Assets — (3.9)% | (8,292,147 | ) | ||||||
|
| |||||||
Net Assets — 100.0% | $ | 214,461,266 | ||||||
|
| |||||||
| (a) | Rule 144A, Section 4(2) or other security which is restricted as to resale to institutional investors. The Fund’s investment adviser/subadviser has deemed this security to be liquid based upon procedures approved by the Board of Trustees. These securities represent 13.1% of net assets as of March 31, 2017. |
| (b) | Variable or floating rate security. Rate disclosed is as of March 31, 2017. |
| (c) | All or a portion of this security has been purchased on a when-issued or delayed-delivery basis. |
| (d) | Perpetual maturity. |
| (e) | All or a portion of this security has been segregated, or otherwise earmarked, in connection with obligations for when-issued or delayed-delivery purchase commitments. |
| (f) | Rate disclosed, the 7 day yield, is as of March 31, 2017. |
Investment Abbreviation
| MTN | — | Medium Term Note | ||
| GMTN | — | Global Medium Term Note |
See Notes to Financial Statements.
41
Table of Contents
SCHEDULES OF PORTFOLIO INVESTMENTS
RIDGEWORTH FUNDS March 31, 2017
Seix Corporate Bond Fund
| Shares or Principal Amount($) | Value($) | |||||||
| Corporate Bonds 88.3% | ||||||||
Aerospace/Defense 2.1% |
| |||||||
L-3 Communications, Inc., 3.850%, 12/15/26 | 97,000 | 98,349 | ||||||
Rockwell Collins, Inc., 3.500%, 03/15/27(a) | 338,000 | 338,098 | ||||||
|
| |||||||
| 436,447 | ||||||||
|
| |||||||
Agriculture 1.2% |
| |||||||
Japan Tobacco, Inc., 2.100%, 07/23/18(b) | 250,000 | 251,094 | ||||||
|
| |||||||
Airlines 0.5% |
| |||||||
United Airlines Pass Through Trust, Series 2016-1, Cl A, 3.450%, 07/07/28 | 110,000 | 107,800 | ||||||
|
| |||||||
Auto Manufacturers 1.3% |
| |||||||
General Motors Co., 5.200%, 04/01/45 | 267,000 | 261,717 | ||||||
|
| |||||||
Banks 23.3% |
| |||||||
Bank of America Corp., 3.124%, 01/20/23, MTN(c) | 374,000 | 375,922 | ||||||
Bank of New York Mellon Corp. (The), 3.000%, 10/30/28, MTN | 227,000 | 215,988 | ||||||
Barclays PLC, 4.337%, 01/10/28 | 200,000 | 199,605 | ||||||
Citigroup, Inc., 4.750%, 05/18/46 | 250,000 | 246,970 | ||||||
Credit Suisse Group AG, 4.282%, | 252,000 | 250,904 | ||||||
Goldman Sachs Group, Inc. (The), 3.850%, 01/26/27 | 209,000 | 210,019 | ||||||
JPMorgan Chase & Co., 1.800%, 01/25/18 | 255,000 | 255,392 | ||||||
Lloyds Banking Group PLC, 3.750%, 01/11/27 | 293,000 | 288,040 | ||||||
Morgan Stanley, 2.625%, 11/17/21, MTN | 190,000 | 188,748 | ||||||
Morgan Stanley, 3.625%, 01/20/27 | 151,000 | 149,897 | ||||||
Morgan Stanley, 4.375%, 01/22/47 | 208,000 | 208,151 | ||||||
National Australia Bank Ltd., 1.875%, 07/12/21 | 434,000 | 421,481 | ||||||
PNC Bank NA, 2.150%, 04/29/21, MTN | 250,000 | 247,544 | ||||||
Royal Bank of Scotland Group PLC, 3.875%, 09/12/23 | 649,000 | 639,628 | ||||||
U.S. Bancorp, 2.625%, 01/24/22, MTN | 124,000 | 124,468 | ||||||
U.S. Bancorp, 5.300%(c)(d) | 209,000 | 212,919 | ||||||
Wells Fargo & Co., 3.069%, 01/24/23 | 351,000 | 353,135 | ||||||
| Shares or Principal Amount($) | Value($) | |||||||
Banks—continued |
| |||||||
Westpac Banking Corp., 4.322%, 11/23/31, MTN(c) | 219,000 | 221,301 | ||||||
|
| |||||||
| 4,810,112 | ||||||||
|
| |||||||
Biotechnology 0.8% |
| |||||||
Celgene Corp., 4.625%, 05/15/44 | 76,000 | 75,376 | ||||||
Celgene Corp., 5.000%, 08/15/45 | 78,000 | 81,644 | ||||||
|
| |||||||
| 157,020 | ||||||||
|
| |||||||
Building Materials 1.0% |
| |||||||
Johnson Controls International PLC, 4.500%, 02/15/47 | 202,000 | 205,022 | ||||||
|
| |||||||
Computers 4.2% |
| |||||||
Apple, Inc., 1.000%, 05/03/18 | 401,000 | 399,769 | ||||||
Diamond 1 Finance Corp./Diamond 2 Finance Corp., 8.350%, 07/15/46(b) | 239,000 | 308,668 | ||||||
Everett Spinco, Inc., 4.250%, 04/15/24(b) | 160,000 | 162,692 | ||||||
|
| |||||||
| 871,129 | ||||||||
|
| |||||||
Diversified Financial Services 6.5% |
| |||||||
Air Lease Corp., 4.250%, 09/15/24 | 395,000 | 408,910 | ||||||
Jefferies Group LLC, 4.850%, 01/15/27(e) | 415,000 | 423,626 | ||||||
Lazard Group LLC, 3.750%, 02/13/25(f) | 401,000 | 398,621 | ||||||
TD Ameritrade Holding Corp., 2.950%, 04/01/22 | 115,000 | 116,419 | ||||||
|
| |||||||
| 1,347,576 | ||||||||
|
| |||||||
Electric 4.4% |
| |||||||
Berkshire Hathaway Energy Co., 6.125%, 04/01/36 | 104,000 | 129,836 | ||||||
Duke Energy Corp., 3.750%, 09/01/46 | 227,000 | 203,793 | ||||||
Exelon Generation Co. LLC, 6.200%, 10/01/17 | 370,000 | 378,065 | ||||||
FirstEnergy Transmission LLC, 5.450%, 07/15/44(b) | 184,000 | 200,985 | ||||||
|
| |||||||
| 912,679 | ||||||||
|
| |||||||
Healthcare-Products 1.1% |
| |||||||
Medtronic, Inc., 3.500%, 03/15/25 | 63,000 | 64,464 | ||||||
Medtronic, Inc., 4.625%, 03/15/45 | 145,000 | 155,688 | ||||||
|
| |||||||
| 220,152 | ||||||||
|
| |||||||
Healthcare-Services 1.1% |
| |||||||
Roche Holdings, Inc., 2.250%, 09/30/19(b) | 216,000 | 217,825 | ||||||
|
| |||||||
See Notes to Financial Statements.
42
Table of Contents
SCHEDULES OF PORTFOLIO INVESTMENTS
RIDGEWORTH FUNDS March 31, 2017
Seix Corporate Bond Fund — continued
| Shares or Principal Amount($) | Value($) | |||||||
Lodging 0.4% |
| |||||||
Wyndham Worldwide Corp., 4.500%, 04/01/27 | 78,000 | 78,579 | ||||||
|
| |||||||
Media 3.1% |
| |||||||
Time Warner, Inc., 3.800%, 02/15/27 | 252,000 | 249,252 | ||||||
Viacom, Inc., 3.450%, 10/04/26 | 133,000 | 126,504 | ||||||
Viacom, Inc., 5.875%, 02/28/57(c) | 262,000 | 267,240 | ||||||
|
| |||||||
| 642,996 | ||||||||
|
| |||||||
Mining 3.6% |
| |||||||
Barrick (PD) Australia Finance Property Ltd., 5.950%, 10/15/39 | 217,000 | 248,837 | ||||||
Barrick International Barbados Corp., 6.350%, 10/15/36(b) | 219,000 | 248,851 | ||||||
Newmont Mining Corp., 6.250%, 10/01/39 | 202,000 | 234,374 | ||||||
|
| |||||||
| 732,062 | ||||||||
|
| |||||||
Miscellaneous Manufacturer 0.6% |
| |||||||
General Electric Co., 4.125%, 10/09/42 | 127,000 | 129,362 | ||||||
|
| |||||||
Oil & Gas 9.9% |
| |||||||
Chevron Corp., 1.718%, 06/24/18 | 399,000 | 400,281 | ||||||
Ensco PLC, 4.500%, 10/01/24 | 161,000 | 135,643 | ||||||
Ensco PLC, 5.200%, 03/15/25 | 387,000 | 335,723 | ||||||
Ensco PLC, 5.750%, 10/01/44 | 142,000 | 107,210 | ||||||
Exxon Mobil Corp., 1.305%, 03/06/18 | 309,000 | 308,756 | ||||||
HollyFrontier Corp., 5.875%, 04/01/26 | 325,000 | 345,058 | ||||||
Nabors Industries, Inc., 5.500%, 01/15/23(b) | 90,000 | 91,856 | ||||||
Shell International Finance BV, 1.750%, 09/12/21 | 123,000 | 119,561 | ||||||
Shell International Finance BV, 2.000%, 11/15/18 | 190,000 | 190,824 | ||||||
|
| |||||||
| 2,034,912 | ||||||||
|
| |||||||
Oil & Gas Services 2.7% |
| |||||||
Schlumberger Holdings Corp., 3.000%, 12/21/20(b) | 162,000 | 165,649 | ||||||
Schlumberger Holdings Corp., 4.000%, 12/21/25(b) | 313,000 | 326,201 | ||||||
TechnipFMC PLC, 3.450%, 10/01/22 | 55,000 | 54,536 | ||||||
|
| |||||||
| 546,386 | ||||||||
|
| |||||||
Pipelines 9.4% |
| |||||||
Boardwalk Pipelines LP, 4.450%, 07/15/27 | 97,000 | 98,001 | ||||||
| Shares or Principal Amount($) | Value($) | |||||||
Pipelines—continued |
| |||||||
Energy Transfer Partners LP, 5.300%, 04/15/47 | 229,000 | 219,138 | ||||||
EnLink Midstream Partners LP, 4.150%, 06/01/25 | 310,000 | 306,270 | ||||||
MPLX LP, 5.200%, 03/01/47 | 168,000 | 169,053 | ||||||
NuStar Logistics LP, 4.800%, 09/01/20(f) | 300,000 | 303,570 | ||||||
Sabine Pass Liquefaction LLC, 4.200%, 03/15/28(b) | 408,000 | 403,028 | ||||||
Transcanada Trust, 5.300%, 03/15/77(c) | 307,000 | 303,354 | ||||||
Valero Energy Partners LP, 4.375%, 12/15/26 | 134,000 | 135,227 | ||||||
|
| |||||||
| 1,937,641 | ||||||||
|
| |||||||
Real Estate Investment Trust 1.7% |
| |||||||
Digital Realty Trust LP, 3.950%, 07/01/22 | 220,000 | 229,123 | ||||||
Digital Realty Trust LP, 4.750%, 10/01/25 | 123,000 | 129,815 | ||||||
|
| |||||||
| 358,938 | ||||||||
|
| |||||||
Retail 0.7% |
| |||||||
Home Depot, Inc. (The), 2.625%, 06/01/22 | 138,000 | 139,126 | ||||||
|
| |||||||
Semiconductors 4.8% |
| |||||||
Analog Devices, Inc., 3.500%, 12/05/26 | 195,000 | 193,123 | ||||||
Applied Materials, Inc., 3.300%, 04/01/27 | 227,000 | 227,902 | ||||||
Broadcom Corp./Broadcom Cayman Finance Ltd., 3.875%, 01/15/27(b) | 230,000 | 231,212 | ||||||
NVIDIA Corp., 3.200%, 09/16/26 | 144,000 | 139,674 | ||||||
TSMC Global Ltd., 1.625%, 04/03/18(b)(f) | 200,000 | 199,492 | ||||||
|
| |||||||
| 991,403 | ||||||||
|
| |||||||
Software 2.3% |
| |||||||
Microsoft Corp., 1.100%, 08/08/19 | 481,000 | 475,747 | ||||||
|
| |||||||
Telecommunication Services 1.6% |
| |||||||
AT&T, Inc., 4.350%, 06/15/45 | 230,000 | 202,442 | ||||||
Verizon Communications, Inc., 5.500%, 03/16/47 | 117,000 | 122,633 | ||||||
|
| |||||||
| 325,075 | ||||||||
|
| |||||||
Total Corporate Bonds | 18,190,800 | |||||||
|
| |||||||
See Notes to Financial Statements.
43
Table of Contents
SCHEDULES OF PORTFOLIO INVESTMENTS
RIDGEWORTH FUNDS March 31, 2017
Seix Corporate Bond Fund — concluded
| Shares or Principal Amount($) | Value($) | |||||||
U.S. Treasury Obligations 6.8% |
| |||||||
U.S. Treasury Bond 1.0% |
| |||||||
2.875%, 11/15/46 | 209,000 | 202,787 | ||||||
|
| |||||||
U.S. Treasury Note 5.8% |
| |||||||
2.250%, 02/15/27 | 1,223,000 | 1,207,379 | ||||||
|
| |||||||
Total U.S. Treasury Obligations (Cost $1,403,664) | 1,410,166 | |||||||
|
| |||||||
Foreign Government Bond 1.1% |
| |||||||
Sovereign 1.1% |
| |||||||
Argentine Republic Government International Bond, 7.500%, 04/22/26(b) | 217,000 | 230,671 | ||||||
|
| |||||||
Total Foreign Government Bond (Cost $239,729) | 230,671 | |||||||
|
| |||||||
Money Market Funds 11.0% |
| |||||||
State Street Institutional Treasury Money Market Fund, Premier Class, 0.53%(g) | 2,251,957 | 2,251,957 | ||||||
State Street Institutional U.S. Government Money Market Fund, Premier Class, 0.62%(g)(h) | 10,525 | 10,525 | ||||||
|
| |||||||
Total Money Market Funds | 2,262,482 | |||||||
|
| |||||||
Total Investments | 22,094,119 | |||||||
Liabilities in Excess of Other Assets — (7.2)% | (1,484,127 | ) | ||||||
|
| |||||||
Net Assets — 100.0% | $ | 20,609,992 | ||||||
|
| |||||||
| (a) | All or a portion of this security has been purchased on a when-issued or delayed-delivery basis. |
| (b) | Rule 144A, Section 4(2) or other security which is restricted as to resale to institutional investors. The Fund’s investment adviser/subadviser has deemed this security to be liquid based upon procedures approved by the Board of Trustees. These securities represent 16.0% of net assets as of March 31, 2017. |
| (c) | Variable or floating rate security. Rate disclosed is as of March 31, 2017. |
| (d) | Perpetual maturity. |
| (e) | The security or a partial position of the security was on loan as of March 31, 2017. The total value of securities on loan as of March 31, 2017 was $10,208. |
| (f) | All or a portion of this security has been segregated, or otherwise earmarked, in connection with obligations for when-issued or delayed-delivery purchase commitments. |
| (g) | Rate disclosed, the 7 day yield, is as of March 31, 2017. |
| (h) | Purchased with cash collateral held from securities lending. The value of the collateral could include collateral held for securities that were sold on or before March 31, 2017 (See Note 2(k)). |
Investment Abbreviation
MTN — Medium Term Note
See Notes to Financial Statements.
44
Table of Contents
SCHEDULES OF PORTFOLIO INVESTMENTS
RIDGEWORTH FUNDS March 31, 2017
Seix Floating Rate High Income Fund
| Shares or Principal Amount($) | Value($) | |||||||
| Asset-Backed Security 0.1% | ||||||||
Other 0.1% |
| |||||||
CIFC Funding Ltd., Series 2015-1A, Cl F, 7.541%, 01/22/27(a)(b) | 5,000,000 | 4,592,235 | ||||||
|
| |||||||
Total Asset-Backed Security | 4,592,235 | |||||||
|
| |||||||
Bank Loans 91.4% |
| |||||||
Aerospace 2.5% |
| |||||||
Aerojet Rocketdyne Holdings, Inc., Delayed Draw Term Loan, | 8,825,385 | 8,737,131 | ||||||
Air Canada, 2016 Term Loan B, 3.755%, 10/06/23(a)(b) | 12,875,000 | 12,931,393 | ||||||
AM General LLC, 2nd Lien Term Loan, 12.750%, 06/21/22(a)(b) | 7,000,000 | 7,070,000 | ||||||
AWAS Finance Luxembourg S.A.R.L., Term Loan B, 4.360%, | 8,772,816 | 8,800,275 | ||||||
DAE Aviation Holdings, Inc., 1st Lien Term Loan, 5.250%, | 10,212,622 | 10,250,920 | ||||||
Engility Corp., Term Loan B1, 4.232%, 08/12/20(a)(b)(d) | 12,835,718 | 12,891,938 | ||||||
Engility Corp., Term Loan B2, 4.750%-6.750%, 08/12/23(a)(b) | 20,204,206 | 20,286,235 | ||||||
TransDigm, Inc., Term Loan D, 3.982%-4.147%, 06/04/21(a)(b) | 9,379,339 | 9,347,543 | ||||||
TransDigm, Inc., 2015 Term Loan E, 3.982%-4.147%, 05/14/22(a)(b)(d) | 18,393,177 | 18,311,143 | ||||||
TransDigm, Inc., 2016 Extended Term Loan F, 3.982%, | 31,793,607 | 31,629,552 | ||||||
WP CPP Holdings LLC, Term Loan B3, 4.539%, 12/28/19(a)(b) | 8,161,089 | 7,671,424 | ||||||
|
| |||||||
| 147,927,554 | ||||||||
|
| |||||||
Broadcasting 2.6% |
| |||||||
CBS Radio, Inc., 2017 Term Loan B, 03/02/24(b)(c)(d) | 6,740,000 | 6,773,700 | ||||||
CBS Radio, Inc., Term Loan B, 4.500%, 10/17/23(a)(b) | 6,127,943 | 6,171,329 | ||||||
Cumulus Media Holdings, Inc., 2013 Term Loan, 4.250%, 12/23/20(a)(b) | 8,810,805 | 6,598,676 | ||||||
| Shares or Principal Amount($) | Value($) | |||||||
Broadcasting—continued |
| |||||||
iHeartCommunications, Inc., USD Extended Term Loan E, 8.482%, 07/30/19(a)(b)(e) | 72,072,285 | 61,549,731 | ||||||
Mission Broadcasting, Inc., 2016 Term Loan B2, 3.943%, | 490,153 | 493,981 | ||||||
Nexstar Broadcasting, Inc., 2017 Term Loan B, 3.943%, | 5,055,756 | 5,095,242 | ||||||
Quincy Newspapers, Inc., Term Loan B, 5.000%-7.000%, 10/13/22(a)(b) | 4,462,415 | 4,490,305 | ||||||
Sinclair Television Group, Inc., Term Loan B2, 3.240%, 01/03/24(a)(b) | 3,356,588 | 3,361,622 | ||||||
Tribune Media Co., Term Loan, 3.982%, 12/27/20(a)(b) | 1,094,306 | 1,103,202 | ||||||
Tribune Media Co., Term Loan C, 3.982%, 01/27/24(a)(b) | 13,673,314 | 13,741,681 | ||||||
Univision Communications, Inc., Term Loan C5, 3.750%, 03/15/24(a)(b)(d) | 47,321,905 | 47,006,268 | ||||||
|
| |||||||
| 156,385,737 | ||||||||
|
| |||||||
Cable/Wireless Video 6.3% |
| |||||||
Altice U.S. Finance I Corp., 2016 Term Loan B, 3.982%, | 21,232,897 | 21,193,192 | ||||||
Charter Communications Operating LLC, Repriced Term Loan E, 2.990%, 07/01/20(a)(b) | 13,529,014 | 13,559,049 | ||||||
Charter Communications Operating LLC, Repriced Term Loan F, 2.990%, 01/03/21(a)(b) | 3,812,406 | 3,820,031 | ||||||
Charter Communications Operating LLC, 2016 Term Loan H Add, 2.990%, 01/15/22(a)(b) | 16,433,030 | 16,464,910 | ||||||
Charter Communications Operating LLC, 2016 Term Loan I Add, 3.232%, 01/15/24(a)(b) | 10,787,891 | 10,834,386 | ||||||
CSC Holdings LLC, 2017 1st Lien Term Loan, 07/09/25(b)(c)(d) | 415,000 | 414,377 | ||||||
See Notes to Financial Statements.
45
Table of Contents
SCHEDULES OF PORTFOLIO INVESTMENTS
RIDGEWORTH FUNDS March 31, 2017
Seix Floating Rate High Income Fund — continued
| Shares or Principal Amount($) | Value($) | |||||||
Cable/Wireless Video—continued |
| |||||||
CSC Holdings LLC, 2017 Delayed Draw Term Loan, 07/15/25(b)(c)(d) | 3,465,000 | 3,452,006 | ||||||
CSC Holdings LLC, 2016 Term Loan, 3.943%, 10/11/24(a)(b) | 11,769,844 | 11,736,770 | ||||||
Intelsat Jackson Holdings S.A., Term Loan B2, 3.887%, 06/30/19(a)(b) | 30,470,000 | 29,801,489 | ||||||
Liberty Cablevision of Puerto Rico LLC, 1st Lien Term Loan, 4.523%, 01/07/22(a)(b) | 18,525,893 | 18,441,045 | ||||||
Liberty Cablevision of Puerto Rico LLC, 2nd Lien Term Loan, 7.773%, 07/07/23(a)(b) | 7,945,000 | 7,726,512 | ||||||
MCC Iowa LLC, Term Loan H, 3.450%, 01/29/21(a)(b) | 4,806,644 | 4,827,697 | ||||||
Mediacom Illinois LLC, Term Loan K, 3.200%, 02/15/24(a)(b) | 12,780,000 | 12,833,293 | ||||||
Quebecor Media, Inc., Term Loan B1, 3.539%, 08/17/20(a)(b) | 26,860,658 | 26,905,515 | ||||||
Radiate Holdco LLC, 1st Lien Term Loan, 3.982%, 02/01/24(a)(b) | 11,740,000 | 11,785,669 | ||||||
UPC Financing Partnership, USD Term Loan AP, 3.662%, | 23,845,000 | 23,894,598 | ||||||
Virgin Media Investment Holdings Ltd., USD Term Loan I, 3.662%, 01/31/25(a)(b) | 42,970,000 | 43,064,104 | ||||||
WideOpenWest Finance LLC, 2016 Term Loan B, 4.482%-4.554%, 08/18/23(a)(b) | 32,989,225 | 33,135,697 | ||||||
Ziggo Secured Finance Partnership, USD Term Loan E, 3.412%, 04/15/25(a)(b) | 84,360,000 | 84,219,119 | ||||||
|
| |||||||
| 378,109,459 | ||||||||
|
| |||||||
Chemicals 3.6% |
| |||||||
Albaugh LLC, Term Loan B, 6.000%, 05/31/21(a)(b) | 4,052,785 | 4,078,115 | ||||||
| Shares or Principal Amount($) | Value($) | |||||||
Chemicals—continued |
| |||||||
Axalta Coating Systems U.S. Holdings, Inc., Term Loan B1, 3.647%, 02/01/23(a)(b) | 3,991,779 | 4,022,835 | ||||||
Emerald Performance Materials LLC, New 1st Lien Term Loan, 4.500%, 08/01/21(a)(b) | 1,140,340 | 1,151,743 | ||||||
Emerald Performance Materials LLC, New 2nd Lien Term Loan, 8.750%, 08/01/22(a)(b)(d) | 17,561,391 | 17,512,044 | ||||||
Ferro Corp., USD 2017 Term Loan B, 3.536%, 02/14/24(a)(b) | 8,515,000 | 8,557,575 | ||||||
Gemini HDPE LLC, Term Loan B, 4.039%, 08/07/21(a)(b)(d) | 17,797,581 | 17,964,522 | ||||||
INEOS Styrolution Group GmbH, USD 2017 1st Lien Term Loan, 3.902%, 03/07/24(a) | 13,765,500 | 13,771,281 | ||||||
Ineos U.S. Finance LLC, 2022 USD Term Loan, 3.732%, 03/31/22(a)(b) | 67,936,607 | 68,264,062 | ||||||
Ineos U.S. Finance LLC, 2024 USD Term Loan, 3.732%, 04/01/24(a)(b) | 16,997,400 | 17,077,118 | ||||||
Kraton Polymers LLC, 2016 Term Loan B, 5.000%, 01/06/22(a)(b) | 10,610,509 | 10,703,351 | ||||||
MacDermid, Inc., USD Term Loan B5, 4.500%, 06/07/20(a)(b) | 4,562,884 | 4,605,273 | ||||||
MacDermid, Inc., 2016 USD Term Loan, 4.982%, 06/07/23(a)(b) | 7,090,203 | 7,103,532 | ||||||
Minerals Technologies, Inc., 2017 Term Loan B, 3.410%-5.250%, 02/14/24(a)(b) | 8,046,138 | 8,076,311 | ||||||
Minerals Technologies, Inc., Fixed Rate Term Loan, 4.750%, | 16,808,083 | 16,850,103 | ||||||
New Arclin U.S. Holding Corp., 1st Lien Term Loan, 5.670%, | 1,795,000 | 1,808,462 | ||||||
Royal Holdings, Inc., 2017 Term Loan B, 4.397%, 06/19/22(a)(b) | 6,873,106 | 6,935,377 | ||||||
See Notes to Financial Statements.
46
Table of Contents
SCHEDULES OF PORTFOLIO INVESTMENTS
RIDGEWORTH FUNDS March 31, 2017
Seix Floating Rate High Income Fund — continued
| Shares or Principal Amount($) | Value($) | |||||||
Chemicals—continued |
| |||||||
Univar, Inc., 2017 Term Loan B, 3.732%, 07/01/22(a)(b) | 4,374,705 | 4,382,229 | ||||||
|
| |||||||
| 212,863,933 | ||||||||
|
| |||||||
Consumer Durables 0.3% |
| |||||||
American Bath Group LLC, 2017 Term Loan B, 6.397%, 09/30/23(a)(b)(d) | 10,386,516 | 10,472,204 | ||||||
Comfort Holding LLC, 1st Lien Term Loan, 5.750%, 02/05/24(a)(b) | 4,255,000 | 4,273,637 | ||||||
Serta Simmons Bedding LLC, 1st Lien Term Loan, 4.538%, 11/08/23(a)(b) | 3,810,000 | 3,819,525 | ||||||
|
| |||||||
| 18,565,366 | ||||||||
|
| |||||||
Consumer Non-Durables 0.8% |
| |||||||
Eastman Kodak Co., Exit Term Loan, 7.250%, 09/03/19(a)(b) | 8,804,692 | 8,812,000 | ||||||
Galleria Co., USD Term Loan B, 3.813%, 09/29/23(a)(b) | 8,128,333 | 8,189,296 | ||||||
Nature’s Bounty Co. (The), 2017 USD Term Loan B, 4.647%, | 11,691,827 | 11,755,197 | ||||||
Prestige Brands, Inc., Term Loan B4, 3.732%, 01/26/24(a)(b) | 10,318,998 | 10,404,955 | ||||||
Varsity Brands, Inc., 1st Lien Term Loan, 5.000%, 12/11/21(a)(b) | 8,780,264 | 8,887,823 | ||||||
|
| |||||||
| 48,049,271 | ||||||||
|
| |||||||
Diversified Media 5.8% |
| |||||||
Affinion Group, Inc., Term Loan B, 6.750%, 04/30/18(a)(b) | 5,298,718 | 5,273,231 | ||||||
ALM Media Holdings, Inc., 1st Lien Term Loan, 5.500%, 07/31/20(a) | 5,010,938 | 4,729,072 | ||||||
AP NMT Acquisition B.V., USD 1st Lien Term Loan, 6.750%, | 14,998,161 | 13,279,672 | ||||||
Camelot UK Holdco Ltd., Term Loan B, 4.750%, 10/03/23(a)(b) | 9,910,200 | 9,916,443 | ||||||
Creative Artists Agency LLC, 2017 1st Lien Term Loan B, 4.500%-6.500%, 02/15/24(a)(b) | 11,665,762 | 11,818,934 | ||||||
| Shares or Principal Amount($) | Value($) | |||||||
Diversified Media—continued |
| |||||||
Delta 2 (LUX) S.A.R.L., USD Term Loan B3, 02/01/24(b)(c)(d) | 9,430,000 | 9,420,570 | ||||||
Deluxe Entertainment Services Group, Inc., Term Loan 2014, 6.539%, 02/28/20(a)(b) | 16,897,900 | 17,003,512 | ||||||
Donnelley Financial Solutions, Inc., Term Loan B, 5.000%, | 3,912,857 | 3,945,451 | ||||||
Harland Clarke Holdings Corp., Term Loan B6, 6.647%, 02/09/22(a)(b)(d) | 97,827,801 | 98,439,225 | ||||||
Harland Clarke Holdings Corp., Term Loan B5, 7.147%, 12/31/21(a)(b)(e) | 24,083,153 | 24,275,818 | ||||||
Learfield Communications, Inc., 2016 1st Lien Term Loan, 4.250%, 11/17/23(a)(b) | 2,508,713 | 2,533,800 | ||||||
Lions Gate Entertainment Corp., Term Loan A, 3.482%, 12/08/21(a)(b) | 14,812,500 | 14,886,563 | ||||||
Lions Gate Entertainment Corp., 2016 1st Lien Term Loan, 3.982%, 12/08/23(a)(b) | 25,912,000 | 26,049,593 | ||||||
McGraw-Hill Global Education Holdings LLC, 2016 Term Loan B, 5.000%, 05/04/22(a)(b) | 5,776,480 | 5,705,891 | ||||||
Merrill Communications LLC, 2015 Term Loan, 6.289%, 06/01/22(a)(b) | 12,379,147 | 12,379,147 | ||||||
MH Sub I LLC, 2017 Incremental 1st Lien Term Loan, 4.750%, | 2,713,909 | 2,720,694 | ||||||
Nielsen Finance LLC, USD Term Loan B3, 3.354%, 10/04/23(a)(b) | 9,850,313 | 9,896,018 | ||||||
Rovi Solutions Corp., New Term Loan B, 3.490%, 07/02/21(a)(b) | 9,286,569 | 9,293,162 | ||||||
UFC Holdings LLC, 2nd Lien Term Loan, 8.500%, 08/18/24(a)(b) | 2,085,000 | 2,121,488 | ||||||
William Morris Endeavor Entertainment LLC, 1st Lien Term Loan, 4.250%-4.290%, | 44,602,949 | 44,762,181 | ||||||
See Notes to Financial Statements.
47
Table of Contents
SCHEDULES OF PORTFOLIO INVESTMENTS
RIDGEWORTH FUNDS March 31, 2017
Seix Floating Rate High Income Fund — continued
| Shares or Principal Amount($) | Value($) | |||||||
Diversified Media—continued |
| |||||||
William Morris Endeavor Entertainment LLC, 2nd Lien Term Loan, 8.290%, 05/06/22(a)(b) | 16,942,782 | 17,112,210 | ||||||
|
| |||||||
| 345,562,675 | ||||||||
|
| |||||||
Energy 5.9% |
| |||||||
Alon USA Energy, Inc., Master Limited Partnership Term Loan, 9.250%, 11/26/18(a)(b) | 17,606,879 | 17,606,879 | ||||||
Azure Midstream Energy LLC, Term Loan B, 7.500%, 11/15/18(a)(b) | 9,739,847 | 9,220,421 | ||||||
Blackhawk Mining LLC, 2017 Term Loan, 10.650%, 02/14/22(a)(b)(d) | 17,280,000 | 16,761,600 | ||||||
California Resources Corp., Second Out Term Loan, 11.375%, | 8,790,000 | 9,698,271 | ||||||
Chesapeake Energy Corp., Term Loan, 8.553%, 08/23/21(a)(b) | 19,355,000 | 20,588,881 | ||||||
Chief Exploration & Development LLC, 2nd Lien Term Loan, 7.932%, 05/16/21(a)(b)(d) | 16,930,000 | 16,464,425 | ||||||
CITGO Holding, Inc., 2015 Term Loan B, 9.647%, 05/12/18(a)(b)(e) | 38,830,352 | 39,380,578 | ||||||
Crestwood Holdings LLC, Term Loan B1, 9.042%, 06/19/19(a)(b) | 11,084,621 | 11,075,420 | ||||||
EMG Utica LLC, Term Loan, 4.897%, 03/27/20(a)(b) | 23,376,835 | 23,435,277 | ||||||
Energy Transfer Equity L.P., 2017 Term Loan B, 3.539%, | 86,605,000 | 86,320,936 | ||||||
FTS International, Inc., New Term Loan B, 5.750%, 04/16/21(a)(b)(d) | 26,971,455 | 23,403,401 | ||||||
Gavilan Resources LLC, 2nd Lien Term Loan, 7.000%, 03/01/24(a)(b) | 15,190,000 | 15,000,125 | ||||||
Hi-Crush Partners L.P., Term Loan B, 4.897%, 04/28/21(a)(b) | 6,836,450 | 6,554,446 | ||||||
KCA Deutag U.S. Finance LLC, Term Loan, 6.807%, 05/15/20(a)(b)(d) | 13,583,328 | 12,921,141 | ||||||
| Shares or Principal Amount($) | Value($) | |||||||
Energy—continued |
| |||||||
MEG Energy Corp., 2017 Term Loan B, 4.540%, 12/31/23(a)(b) | 8,520,000 | 8,515,229 | ||||||
Philadelphia Energy Solutions LLC, Term Loan B, 6.250%, | 11,826,834 | 10,723,035 | ||||||
Pinnacle Holdco S.A.R.L., Term Loan, 4.750%, | 3,235,692 | 2,620,910 | ||||||
Sheridan Investment Partners II L.P., Term Loan B, 4.560%, | 6,177,803 | 5,065,798 | ||||||
Sheridan Investment Partners II L.P., Term Loan A, 4.560%, | 859,377 | 704,689 | ||||||
Sheridan Investment Partners II L.P., Term Loan M, 4.560%, | 320,501 | 262,810 | ||||||
Western Refining, Inc., Term Loan B, 5.250%, 11/12/20(a)(b) | 7,845,558 | 7,845,558 | ||||||
Western Refining, Inc., Term Loan B2, 5.500%, 06/23/23(a)(b) | 5,491,532 | 5,491,532 | ||||||
|
| |||||||
| 349,661,362 | ||||||||
|
| |||||||
Financial 5.0% |
| |||||||
Altisource Solutions S.A.R.L., Term Loan B, 4.500%, 12/09/20(a)(b) | 5,219,147 | 5,036,477 | ||||||
AmWINS Group, Inc., 2017 Term Loan B, 3.750%-5.750%, | 1,995,000 | 1,995,000 | ||||||
AmWINS Group, Inc., 2017 2nd Lien Term Loan, 7.750%, 01/25/25(a)(b) | 1,000,000 | 1,018,330 | ||||||
Aretec Group, Inc., 2nd Lien Term Loan, 2.000%-4.500%, | 19,348,583 | 18,381,154 | ||||||
Aretec Group, Inc., Exit Term Loan, 8.000%, 11/23/20(a)(b) | 2,070,606 | 2,086,136 | ||||||
Asurion LLC, 2016 Term Loan B2, 4.232%, 07/08/20(a)(b)(e) | 36,371,271 | 36,568,403 | ||||||
Asurion LLC, New Term Loan B4, 4.250%, 08/04/22(a)(b)(e) | 44,032,545 | 44,219,683 | ||||||
See Notes to Financial Statements.
48
Table of Contents
SCHEDULES OF PORTFOLIO INVESTMENTS
RIDGEWORTH FUNDS March 31, 2017
Seix Floating Rate High Income Fund — continued
| Shares or Principal Amount($) | Value($) | |||||||
Financial—continued |
| |||||||
Asurion LLC, New 2nd Lien Term Loan, 8.500%, 03/03/21(a)(b)(e) | 54,556,489 | 55,170,250 | ||||||
Avolon TLB Borrower 1 (Luxembourg) S.A.R.L., Term Loan B2, 3.728%, 03/20/22(a)(b)(d) | 27,270,000 | 27,622,328 | ||||||
EVO Payments International LLC, 1st Lien Term Loan, 6.000%, | 6,775,000 | 6,828,658 | ||||||
EVO Payments International LLC, 2nd Lien Term Loan, 10.000%, 11/15/24(a)(b) | 1,280,000 | 1,280,000 | ||||||
Freedom Mortgage Corp., 1st Lien Term Loan, 6.862%, 02/26/22(a)(b) | 5,800,000 | 5,879,750 | ||||||
Istar, Inc., 2016 Term Loan B, 4.750%, 07/01/20(a)(b) | 17,800,624 | 17,956,379 | ||||||
Lonestar Intermediate Super Holdings LLC, PIK Term Loan B, 10.000%, 08/31/21(a)(b) | 13,965,000 | 14,506,144 | ||||||
LPL Holdings, Inc., 2017 Term Loan B, 3.609%-3.921%, 03/10/24(a)(b) | 3,440,000 | 3,442,167 | ||||||
Ocwen Financial Corp., 2016 Term Loan B, 6.000%, 12/05/20(a)(b) | 13,267,063 | 13,358,340 | ||||||
Russell Investment Group, Term Loan B, 6.750%, 06/01/23(a)(b) | 9,046,962 | 9,143,131 | ||||||
Victory Capital Management, Inc., Term Loan B, 8.647%, | 10,807,563 | 10,906,668 | ||||||
Walter Investment Management Corp., 2013 Term Loan, 4.750%, 12/18/20(a)(b) | 23,637,426 | 20,336,696 | ||||||
|
| |||||||
| 295,735,694 | ||||||||
|
| |||||||
Food and Drug 2.1% |
| |||||||
1011778 B.C. Unlimited Liability Co., Term Loan B3, 3.250%-3.397%, 02/16/24(a)(b)(d) | 37,483,191 | 37,498,934 | ||||||
Albertsons LLC, USD 2016 Term Loan B4, 3.982%, 08/22/21(a)(b) | 8,020,397 | 8,053,200 | ||||||
| Shares or Principal Amount($) | Value($) | |||||||
Food and Drug—continued |
| |||||||
Albertsons LLC, USD 2016 Term Loan B6, 4.302%, 06/22/23(a)(b) | 18,433,069 | 18,525,234 | ||||||
Amplify Snack Brands, Inc., Term Loan, 6.500%, 08/24/23(a)(b) | 12,121,669 | 11,742,866 | ||||||
ASP MSG Acquisition Co., Inc., 2017 Term Loan B, 5.147%, | 10,522,125 | 10,601,041 | ||||||
JBS USA LLC, 2017 Term Loan B, 3.289%, 10/30/22(a)(b) | 20,350,000 | 20,413,696 | ||||||
Landry’s, Inc., 2016 Term Loan B, 4.039%-4.230%, 10/04/23(a)(b) | 3,274,200 | 3,298,167 | ||||||
NPC International, Inc., 1st Lien Term Loan, 03/17/24(b)(c)(d) | 3,545,000 | 3,572,686 | ||||||
NPC International, Inc., 2nd Lien Term Loan, 03/17/25(b)(c)(d) | 1,265,000 | 1,274,488 | ||||||
U.S. Foods, Inc., 2016 Term Loan B, 3.732%, 06/27/23(a)(b) | 12,103,538 | 12,207,507 | ||||||
|
| |||||||
| 127,187,819 | ||||||||
|
| |||||||
Forest Products/Containers 1.9% |
| |||||||
Anchor Glass Container Corp., 2016 1st Lien Term Loan, 4.250%, 12/07/23(a)(b) | 6,683,250 | 6,720,877 | ||||||
Anchor Glass Container Corp., 2016 2nd Lien Term Loan, 8.750%, 12/07/24(a)(b) | 850,000 | 864,875 | ||||||
Berry Plastics Group, Inc., Term Loan K, 3.108%, 02/08/20(a)(b) | 8,515,000 | 8,561,577 | ||||||
Berry Plastics Group, Inc., Term Loan I, 3.482%-3.524%, 10/01/22(a)(b) | 3,489,665 | 3,510,009 | ||||||
Berry Plastics Group, Inc., Term Loan J, 3.524%, 01/19/24(a)(b) | 4,310,000 | 4,335,731 | ||||||
BWAY Corp., Bridge Term Loan, 03/02/18(b)(c)(d) | 10,000,000 | 10,000,000 | ||||||
BWAY Holding Co., 2017 Term | 19,020,000 | 18,960,658 | ||||||
See Notes to Financial Statements.
49
Table of Contents
SCHEDULES OF PORTFOLIO INVESTMENTS
RIDGEWORTH FUNDS March 31, 2017
Seix Floating Rate High Income Fund — continued
| Shares or Principal Amount($) | Value($) | |||||||
Forest Products/Containers—continued |
| |||||||
Caraustar Industries, Inc., 2017 Term Loan B, 6.647%, 03/14/22(a)(b) | 12,475,000 | 12,568,562 | ||||||
Mauser U.S. Corporate LLC, USD 1st Lien Term Loan, 4.500%, | 2,977,099 | 2,980,076 | ||||||
Mauser U.S. Corporate LLC, USD 2nd Lien Term Loan, 8.750%, | 9,260,000 | 9,265,834 | ||||||
Proampac PG Borrower LLC, 2016 1st Lien Term Loan, 5.057%-7.000%, 11/18/23(a)(b) | 9,366,525 | 9,432,091 | ||||||
Reynolds Group Holdings, Inc., USD 2017 Term Loan, 3.982%, | 10,895,318 | 10,932,798 | ||||||
Signode Industrial Group U.S., Inc., USD Term Loan B, 4.000%-4.147%, 05/01/21(a)(b) | 17,424,981 | 17,446,762 | ||||||
|
| |||||||
| 115,579,850 | ||||||||
|
| |||||||
Gaming/Leisure 8.8% |
| |||||||
Amaya Holdings B.V., Repriced Term Loan B, 4.647%, 08/01/21(a)(b)(d) | 15,933,301 | 15,959,910 | ||||||
Belmond Interfin Ltd., USD Term Loan B, 4.147%, 03/21/21(a)(b) | 9,586,552 | 9,592,592 | ||||||
Boyd Gaming Corp., 2017 Term Loan B2, 03/06/24(b)(c)(d) | 6,445,000 | 6,476,194 | ||||||
Caesars Entertainment Operating Co., Term Loan B5 (Non RSA), | 27,514,861 | 31,126,187 | ||||||
Caesars Entertainment Operating Co., Extended Term Loan B6, | 64,549,680 | 74,603,293 | ||||||
Caesars Entertainment Operating Co., Term Loan B7 (Non RSA), | 20,230,000 | 24,593,813 | ||||||
Caesars Entertainment Resort Properties LLC, Term Loan B, 7.000%, 10/11/20(a)(b) | 45,472,719 | 45,671,889 | ||||||
Casablanca U.S. Holdings, Inc., 1st Lien Term Loan, 03/15/24(b)(c)(d) | 6,415,000 | 6,382,925 | ||||||
| Shares or Principal Amount($) | Value($) | |||||||
Gaming/Leisure—continued |
| |||||||
Diamond Resorts Corp., 2016 Term Loan B, 7.000%, 08/11/23(a)(b) | 28,092,279 | 28,285,554 | ||||||
Eldorado Resorts LLC, 2017 Term Loan B, 03/13/24(b)(c)(d) | 11,870,000 | 11,840,325 | ||||||
Equinox Holdings, Inc., 2017 2nd Lien Term Loan, 8.000%, 03/03/25(a)(b) | 1,710,000 | 1,732,093 | ||||||
ESH Hospitality, Inc., 2017 Term Loan B, 3.482%, 08/30/23(a)(b)(d) | 15,678,979 | 15,749,535 | ||||||
Four Seasons Holdings, Inc., New 1st Lien Term Loan, 4.147%, | 12,508,650 | 12,633,737 | ||||||
Gateway Casinos & Entertainment Ltd., Term Loan B1, 4.800%, 02/22/23(a)(b) | 2,565,000 | 2,590,650 | ||||||
Global Cash Access, Inc., New Term Loan B, 6.304%, 12/18/20(a)(b) | 12,227,472 | 12,349,747 | ||||||
GLP Financing LLC, Incremental Term Loan A, 2.580%, | 50,066,294 | 49,503,048 | ||||||
Greektown Holdings LLC, 2017 Term Loan B, 03/21/24(b)(c)(d) | 11,115,000 | 11,108,109 | ||||||
Hilton Worldwide Finance LLC, Term Loan B2, 2.928%-2.982%, | 81,418,555 | 82,039,779 | ||||||
La Quinta Intermediate Holdings LLC, Term Loan B, | 11,390,120 | 11,449,463 | ||||||
Las Vegas Sands LLC, 2017 Term Loan B, 2.980%, 12/19/20(a)(b)(d) | 4,135,971 | 4,137,129 | ||||||
MGM Growth Prop. Operating Partnership L.P., 2016 Term Loan B, 3.482%, | 11,118,857 | 11,165,222 | ||||||
MGM Resorts International, 2016 Term Loan A, 3.232%, 04/25/21(a)(b) | 8,110,667 | 8,110,667 | ||||||
Mohegan Tribal Gaming Authority, 2016 Term Loan B, 5.500%, | 14,812,185 | 14,827,589 | ||||||
See Notes to Financial Statements.
50
Table of Contents
SCHEDULES OF PORTFOLIO INVESTMENTS
RIDGEWORTH FUNDS March 31, 2017
Seix Floating Rate High Income Fund — continued
| Shares or Principal Amount($) | Value($) | |||||||
Gaming/Leisure—continued |
| |||||||
Penn National Gaming, Inc., 2017 Term Loan B, 3.524%, | 2,585,000 | 2,598,571 | ||||||
Playa Resorts Holding B.V., Term Loan B, 4.040%, 08/09/19(a)(b) | 5,997,475 | 6,001,253 | ||||||
Scientific Games International, Inc., 2017 Term Loan B3, 4.846%-4.943%, 10/01/21(a)(b) | 14,783,305 | 14,965,731 | ||||||
Station Casinos LLC, 2016 Term Loan B, 3.450%, 06/08/23(a)(b) | 2,461,400 | 2,462,015 | ||||||
UFC Holdings LLC, 1st Lien Term Loan, 4.250%, 08/18/23(a)(b) | 4,989,925 | 5,012,180 | ||||||
Wynn America LLC, Delayed Draw Term Loan, 11/19/20(b)(c) | 4,235,000 | 4,201,459 | ||||||
|
| |||||||
| 527,170,659 | ||||||||
|
| |||||||
Healthcare 8.4% |
| |||||||
Albany Molecular Research, Inc., Term Loan B, 6.006%, | 4,982,065 | 5,013,203 | ||||||
Ardent Legacy Acquisitions, Inc., 2015 Term Loan B, 6.647%, | 13,375,294 | 13,341,856 | ||||||
CDRH Parent, Inc., New 1st Lien Term Loan, 5.320%, 07/01/21(a)(b) | 3,563,694 | 3,313,345 | ||||||
Change Healthcare Holdings, Inc., 2017 Term Loan B, 3.750%, 03/01/24(a)(b)(d) | 56,760,000 | 56,830,950 | ||||||
Community Health Systems, Inc., New Term Loan A, 3.482%-3.554%, 01/22/19(a)(b) | 7,124,962 | 7,109,359 | ||||||
Community Health Systems, Inc., Term Loan G, 3.750%-3.804%, 12/31/19(a)(b) | 40,098,787 | 39,820,902 | ||||||
Community Health Systems, Inc., Term Loan H, 4.000%-4.054%, 01/27/21(a)(b)(d) | 51,557,321 | 50,822,629 | ||||||
Convatec, Inc., USD 2016 Term Loan B, 3.482%, 10/31/23(a)(b) | 2,920,000 | 2,936,440 | ||||||
| Shares or Principal Amount($) | Value($) | |||||||
Healthcare—continued |
| |||||||
CPI Holdco LLC, 2017 1st Lien Term Loan, 03/15/24(b)(c)(d) | 3,165,000 | 3,180,825 | ||||||
Endo Luxembourg Finance Co. I S.A.R.L., 2015 Term Loan B, 4.000%, 09/26/22(a)(b) | 10,383,526 | 10,367,639 | ||||||
Explorer Holdings, Inc., 2016 Term Loan B, 6.035%, 05/02/23(a)(b) | 4,153,613 | 4,195,149 | ||||||
Greatbatch Ltd., 2017 Term Loan B, 4.500%, 10/27/22(a)(b) | 18,139,034 | 18,116,360 | ||||||
Grifols Worldwide Operations USA, Inc., 2017 Acquisition Term Loan, 3.194%, 01/31/25(a)(b) | 35,075,000 | 35,119,545 | ||||||
Halyard Health, Inc., Term Loan B, 3.732%, 11/01/21(a)(b) | 7,910,000 | 7,974,308 | ||||||
HCA, Inc., Term Loan B8, 3.232%, 02/15/24(a)(b) | 26,505,792 | 26,718,898 | ||||||
Iasis Healthcare LLC, Term Loan B2, 4.500%, 05/03/18(a)(b) | 19,466,063 | 19,453,994 | ||||||
Indivior Finance S.A.R.L., USD Term Loan B, 7.040%, 12/19/19(a)(b) | 20,277,254 | 20,378,641 | ||||||
inVentiv Health, Inc., 2016 Term Loan B, 4.804%, 11/09/23(a)(b) | 4,104,713 | 4,113,250 | ||||||
Kindred Healthcare, Inc., New Term Loan, 4.563%, 04/09/21(a)(b) | 6,149,779 | 6,147,196 | ||||||
Kinetic Concepts, Inc., 2017 USD Term Loan B, 4.397%, | 10,350,000 | 10,350,000 | ||||||
Lannett Co., Inc., Term Loan A, 5.750%, 11/25/20(a)(b) | 27,436,911 | 27,025,357 | ||||||
Lannett Co., Inc., Term Loan B, 6.375%, 11/25/22(a)(b) | 1,894,359 | 1,883,712 | ||||||
Mallinckrodt International Finance S.A., USD Term Loan B, 3.897%, 09/24/24(a)(b)(d) | 9,171,112 | 9,159,648 | ||||||
MPH Acquisition Holdings LLC, 2016 Term Loan B, 4.897%, | 18,762,922 | 18,990,704 | ||||||
See Notes to Financial Statements.
51
Table of Contents
SCHEDULES OF PORTFOLIO INVESTMENTS
RIDGEWORTH FUNDS March 31, 2017
Seix Floating Rate High Income Fund — continued
| Shares or Principal Amount($) | Value($) | |||||||
Healthcare—continued |
| |||||||
Quintiles IMS, Inc., 2017 USD Term Loan B, 2.834%-3.102%, | 4,241,082 | 4,273,951 | ||||||
Quorum Health Corp., Term Loan B, 6.789%, 04/29/22(a)(b) | 3,857,142 | 3,761,408 | ||||||
RPI Finance Trust, Delayed Draw Term Loan B6, 03/07/23(b)(c)(d) | 631,790 | 633,104 | ||||||
RPI Finance Trust, Term Loan B6, 3.153%, 03/07/23(a)(b) | 18,595,000 | 18,633,677 | ||||||
RPI Finance Trust, Term Loan B5, 3.647%, 10/14/22(a)(b)(d) | 11,996,747 | 12,017,741 | ||||||
Team Health Holdings, Inc., 1st Lien Term Loan, 3.750%, 02/06/24(a)(b) | 6,795,000 | 6,741,184 | ||||||
Valeant Pharmaceuticals International, Inc., Term Loan B F1, 5.570%, 04/01/22(a)(b)(d) | 48,879,670 | 48,987,694 | ||||||
|
| |||||||
| 497,412,669 | ||||||||
|
| |||||||
Housing 2.2% |
| |||||||
American Builders & Contractors Supply Co., Inc., Term Loan B, 3.732%, 10/31/23(a)(b) | 12,865,000 | 12,887,128 | ||||||
Capital Automotive L.P., 2017 1st Lien Term Loan, 4.000%, 03/17/24(a)(b) | 19,415,000 | 19,609,150 | ||||||
Capital Automotive L.P., 2017 2nd Lien Term Loan, 7.000%, | 39,230,000 | 39,622,300 | ||||||
DTZ U.S. Borrower LLC, 2015 1st Lien Term Loan, 4.289%-4.397%, 11/04/21(a)(b)(e) | 46,198,661 | 46,437,046 | ||||||
DTZ U.S. Borrower LLC, 2nd Lien Term Loan, 9.289%, 11/04/22(a)(b) | 1,017,216 | 1,013,829 | ||||||
Quikrete Holdings, Inc., 2016 1st Lien Term Loan, 4.232%, 11/15/23(a)(b) | 4,778,025 | 4,817,253 | ||||||
Realogy Corp., 2017 Term Loan B, 3.232%, 07/20/22(a)(b) | 8,401,618 | 8,480,425 | ||||||
|
| |||||||
| 132,867,131 | ||||||||
|
| |||||||
| Shares or Principal Amount($) | Value($) | |||||||
Information Technology 8.7% |
| |||||||
Abacus Innovations Corp., Term Loan B, 3.250%, 08/16/23(a)(b) | 6,329,138 | 6,381,353 | ||||||
Aricent Technologies, 1st Lien Term Loan, 5.500%, 04/14/21(a)(b) | 6,264,699 | 6,266,015 | ||||||
Arris Group, Inc., 2015 Term Loan A, 2.732%, 06/18/20(a)(b) | 3,252,244 | 3,200,761 | ||||||
Arris Group, Inc., 2015 Term Loan B, 3.732%, 04/17/20(a)(b) | 11,595,008 | 11,658,780 | ||||||
Avaya, Inc., Term Loan B7, 6.282%, 05/29/20(a)(b)(f) | 42,615,788 | 33,992,910 | ||||||
Avaya, Inc., Term Loan B6, 6.532%, 03/30/18(a)(b)(f) | 9,557,913 | 7,591,372 | ||||||
Avaya, Inc., DIP Term Loan, 8.500%, 01/24/18(a)(b) | 17,343,698 | 17,820,650 | ||||||
Blackboard, Inc., Term Loan B4, 6.023%, 06/30/21(a)(b) | 8,239,856 | 8,198,657 | ||||||
Cavium, Inc., 2017 Term Loan B, 3.228%, 08/16/22(a)(b) | 5,781,389 | 5,803,069 | ||||||
CCC Information Services, Inc., 2017 1st Lien Term Loan, | 2,500,000 | 2,509,375 | ||||||
CCC Information Services, Inc., 2017 2nd Lien Term Loan, | 845,000 | 848,524 | ||||||
Cologix, Inc., 2017 1st Lien Term Loan, 03/20/24(b)(c)(d) | 2,637,500 | 2,638,318 | ||||||
Cologix, Inc., 2017 2nd Lien Term Loan, 03/20/25(b)(c)(d) | 800,000 | 796,504 | ||||||
Cologix, Inc., 2017 Delayed Draw Term Loan, 11/08/21(b)(c)(d) | 527,500 | 526,514 | ||||||
CompuCom Systems, Inc., Refinance Term Loan B, 4.250%, | 3,771,522 | 3,130,363 | ||||||
Computer Sciences Government Services, Inc., Term Loan B, 3.482%, 11/30/23(a)(b) | 8,139,387 | 8,205,560 | ||||||
Compuware Corp., Term Loan B3, 5.250%, 12/15/21(a)(b) | 4,216,625 | 4,222,950 | ||||||
See Notes to Financial Statements.
52
Table of Contents
SCHEDULES OF PORTFOLIO INVESTMENTS
RIDGEWORTH FUNDS March 31, 2017
Seix Floating Rate High Income Fund — continued
| Shares or Principal Amount($) | Value($) | |||||||
Information Technology—continued |
| |||||||
Cortes NP Acquisition Corp., 2017 Term Loan B, 5.000%-5.039%, 11/30/23(a)(b) | 12,013,653 | 12,126,341 | ||||||
Cypress Semiconductor Corp., 2016 Term Loan B, 4.580%, | 6,439,875 | 6,493,519 | ||||||
Dell, Inc., Term Loan A3, 2.990%, 12/31/18(a)(b) | 12,760,000 | 12,763,956 | ||||||
Dell, Inc., Term Loan A2, 3.240%, 09/07/21(a)(b)(d)(e) | 52,141,625 | 52,102,519 | ||||||
Dell, Inc., 2017 Term Loan B, 3.490%, 09/07/23(a)(b) | 42,836,513 | 42,979,158 | ||||||
EIG Investors Corp., 2016 Term Loan, 6.042%, 02/09/23(a)(b) | 6,776,005 | 6,821,201 | ||||||
Epicor Software Corp., 2016 Term Loan, 5.000%, 06/01/22(a)(b) | 1,922,103 | 1,925,313 | ||||||
GlobalLogic Holdings, Inc., 2016 Term Loan B, 5.652%, 06/13/22(a)(b) | 4,640,000 | 4,651,600 | ||||||
Imagine! Print Solutions, Inc., Term Loan B, 7.147%, 03/30/22(a)(b) | 3,725,452 | 3,753,393 | ||||||
Inovalon Holdings, Inc., Term Loan, 2.232%, 09/19/19(a)(b) | 30,224,559 | 29,620,068 | ||||||
Internap Corp., Term Loan, 7.000%, 11/26/19(a)(b) | 6,618,934 | 6,618,934 | ||||||
iParadigms Holdings LLC, 1st Lien Term Loan, 5.147%, 07/31/21(a)(b) | 1,531,148 | 1,519,664 | ||||||
IPC Corp., 2015 Term Loan B, 5.500%, 08/06/21(a)(b)(d) | 9,202,545 | 8,558,367 | ||||||
LANDesk Group, Inc., 2017 Term Loan B, 5.250%, 01/20/24(a)(b) | 7,235,000 | 7,266,689 | ||||||
Lionbridge Technologies, Inc., 1st Lien Term Loan, 6.554%, | 3,405,000 | 3,396,487 | ||||||
Optiv Security, Inc., 1st Lien Term Loan, 4.250%, 02/01/24(a)(b) | 8,515,000 | 8,552,296 | ||||||
Optiv Security, Inc., 2nd Lien Term Loan, 8.250%, 02/01/25(a)(b) | 1,725,000 | 1,750,875 | ||||||
Presidio, Inc., 2017 Term Loan B, 4.250%, 02/02/22(a)(b) | 12,067,583 | 12,180,777 | ||||||
| Shares or Principal Amount($) | Value($) | |||||||
Information Technology—continued |
| |||||||
Quest Software U.S. Holdings, Inc., Term Loan B, 7.000%, | 2,463,200 | 2,495,837 | ||||||
Rackspace Hosting, Inc., 1st Lien Term Loan, 4.535%, 11/03/23(a)(b) | 7,072,275 | 7,115,487 | ||||||
RP Crown Parent LLC, 2016 Term Loan B, 4.500%, 10/12/23(a)(b) | 2,897,738 | 2,914,052 | ||||||
Salient CRGT, Inc., 2017 Term Loan, 6.750%, 02/25/22(a)(b) | 5,150,000 | 5,059,875 | ||||||
Semiconductor Components Industries LLC, Term Loan A, 2.748%, 01/02/18(a)(b) | 23,293,738 | 23,264,621 | ||||||
Sirius Computer Solutions, Inc., 2016 Term Loan, 5.250%, 10/30/22(a)(b) | 4,967,953 | 5,009,882 | ||||||
SolarWinds Holdings, Inc., 2017 Term Loan, 4.500%, 02/05/23(a)(b) | 2,977,538 | 2,976,049 | ||||||
Solera LLC, USD Term Loan B, 4.250%, 03/03/23(a)(b) | 17,826,103 | 17,895,446 | ||||||
Sophia L.P., 2017 Term Loan B, 4.397%, 09/30/22(a)(b) | 2,512,597 | 2,510,235 | ||||||
Southern Graphics, Inc., New Term Loan B, 4.250%-4.397%, | 6,629,055 | 6,662,200 | ||||||
SS&C Technologies, Inc., 2017 Term Loan B1, 3.232%, 07/08/22(a)(b) | 3,216,753 | 3,230,843 | ||||||
SS&C Technologies, Inc., 2017 Term Loan B2, 3.232%, 07/08/22(a)(b) | 274,982 | 276,187 | ||||||
Symantec Corp., Term Loan A3, 2.330%, 08/01/19(a)(b) | 16,739,077 | 16,571,686 | ||||||
Symantec Corp., Term Loan A2, 2.375%, 07/28/19(a)(b) | 6,956,308 | 6,904,136 | ||||||
Synchronoss Technologies, Inc., Term Loan, 4.082%, 01/19/24(a)(b) | 4,250,000 | 4,222,375 | ||||||
Tempo Acquisition LLC, Bridge Term Loan, 08/16/17(b)(c)(d) | 20,000,000 | 20,000,000 | ||||||
See Notes to Financial Statements.
53
Table of Contents
SCHEDULES OF PORTFOLIO INVESTMENTS
RIDGEWORTH FUNDS March 31, 2017
Seix Floating Rate High Income Fund — continued
| Shares or Principal Amount($) | Value($) | |||||||
Information Technology—continued |
| |||||||
TTM Technologies, Inc., 1st Lien Term Loan, 5.250%, 05/31/21(a)(b) | 9,612,808 | 9,757,000 | ||||||
VF Holding Corp., Reprice Term Loan, 4.250%, 06/30/23(a)(b) | 12,328,050 | 12,378,718 | ||||||
Western Digital Corp., USD Term Loan A, 2.982%, 04/29/21(a)(b) | 3,000,000 | 3,008,430 | ||||||
Western Digital Corp., 2017 USD Term Loan B, 3.732%, | 10,044,227 | 10,093,041 | ||||||
Xerox Business Services LLC, USD Term Loan B, 6.334%, | 8,523,638 | 8,611,005 | ||||||
|
| |||||||
| 517,829,937 | ||||||||
|
| |||||||
Manufacturing 2.3% |
| |||||||
Alpha 3 B.V., 2017 Term Loan B1, 4.147%, 01/31/24(a)(b) | 4,260,000 | 4,268,009 | ||||||
American Axle and Manufacturing, Inc., Bridge Term Loan, 01/18/18(b)(c)(d) | 25,000,000 | 25,000,000 | ||||||
Columbus McKinnon Corp., Term Loan B, 4.147%, 01/31/24(a)(b) | 4,145,197 | 4,178,897 | ||||||
Dynacast International LLC, Term Loan B, 4.500%, 01/28/22(a)(b)(d) | 8,641,246 | 8,657,492 | ||||||
Flex Acquisition Co., Inc., 1st Lien Term Loan, 4.250%, 12/29/23(a)(b) | 2,480,000 | 2,493,169 | ||||||
Gates Global LLC, 2017 USD Term Loan B, 03/17/24(b)(c)(d) | 244,772 | 244,956 | ||||||
Gates Global, LLC, Term Loan B, 4.397%, 07/06/21(a)(b) | 19,686,593 | 19,701,358 | ||||||
Keurig Green Mountain, Inc., USD Term Loan A, 2.750%, | 27,100,860 | 27,066,984 | ||||||
LTI Holdings, Inc., 2nd Lien Term Loan, 10.397%, 04/16/23(a)(b) | 1,545,000 | 1,467,750 | ||||||
Lumileds Holding B.V., Term Loan B, 02/27/24(b)(c)(d) | 9,490,000 | 9,545,326 | ||||||
Milacron LLC, Amended Term Loan B, 3.982%, 09/28/23(a)(b) | 3,526,163 | 3,541,607 | ||||||
| Shares or Principal Amount($) | Value($) | |||||||
Manufacturing—continued |
| |||||||
Otter Products LLC, 2014 Term Loan, 5.750%, 06/03/20(a)(b) | 15,163,096 | 14,948,235 | ||||||
Safway Group Holding LLC, Term Loan B, 5.750%, 08/19/23(a)(b) | 7,801,289 | 7,881,720 | ||||||
Unifrax Corp., 2017 USD Term Loan B, 03/29/24(b)(c)(d) | 6,260,000 | 6,291,300 | ||||||
|
| |||||||
| 135,286,803 | ||||||||
|
| |||||||
Metals/Minerals 1.6% |
| |||||||
Arch Coal, Inc., 2017 Term Loan B, 5.000%, 03/07/24(a)(b) | 7,205,000 | 7,189,221 | ||||||
Atkore International, Inc., 2016 1st Lien Term Loan, 4.150%, | 17,620,838 | 17,725,505 | ||||||
Atlas Iron Ltd., Capex Term Loan B, 8.580%, 05/06/21(a)(b)(g) | 2,798,498 | 2,627,090 | ||||||
Contura Energy, Inc., 2017 Term Loan, 6.000%, 03/18/24(a)(b) | 6,335,000 | 6,255,813 | ||||||
Fairmount Santrol, Inc., New Term Loan B2, 4.647%, 09/05/19(a)(b) | 6,049,478 | 5,917,176 | ||||||
FMG Resources (August 2006) Pty Ltd., New Term Loan B, 3.750%, 06/30/19(a)(b)(e) | 20,329,193 | 20,434,091 | ||||||
Foresight Energy LLC, 2017 1st Lien Term Loan, 03/10/24(b)(c)(d) | 9,495,000 | 9,233,888 | ||||||
Global Brass & Copper, Inc., 2016 Term Loan B, 5.250%, | 3,726,275 | 3,777,511 | ||||||
Peabody Energy Corp., Exit Term Loan, 01/30/22(b)(c)(d) | 4,255,000 | 4,249,681 | ||||||
U.S. Silica Co., New Term Loan B, 4.188%, 07/23/20(a)(b) | 2,421,653 | 2,413,323 | ||||||
U.S. Silica Co., Incremental Term Loan, 4.688%, 07/23/20(a)(b) | 6,812,577 | 6,804,061 | ||||||
Zekelman Industries, Inc., Term Loan B, 4.906%, 06/14/21(a)(b) | 7,376,329 | 7,477,753 | ||||||
|
| |||||||
| 94,105,113 | ||||||||
|
| |||||||
See Notes to Financial Statements.
54
Table of Contents
SCHEDULES OF PORTFOLIO INVESTMENTS
RIDGEWORTH FUNDS March 31, 2017
Seix Floating Rate High Income Fund — continued
| Shares or Principal Amount($) | Value($) | |||||||
Retail 4.7% |
| |||||||
Abercrombie & Fitch Management Co., Term Loan B, 4.750%, 08/07/21(a)(b) | 3,000,000 | 2,880,000 | ||||||
Ascena Retail Group, Inc., 2015 Term Loan B, 5.500%, 08/21/22(a)(b)(d) | 12,305,803 | 11,035,721 | ||||||
Bass Pro Group LLC, Term Loan B, 6.147%, 12/16/23(a)(b) | 13,245,000 | 12,740,101 | ||||||
Belk, Inc., Term Loan, 5.760%, 12/12/22(a)(b) | 8,226,393 | 6,927,774 | ||||||
CWGS Group LLC, 2016 Term Loan, 4.604%-4.732%, 11/08/23(a)(b)(d) | 14,393,925 | 14,447,902 | ||||||
Dollar Tree, Inc., Term Loan B2, 4.250%, 07/06/22(a)(b)(e) | 42,790,259 | 43,111,185 | ||||||
Harbor Freight Tools USA, Inc., 2016 Term Loan B, 4.232%, | 4,205,200 | 4,195,991 | ||||||
Hudson’s Bay Co., 2015 Term Loan B, 4.250%, 09/30/22(a)(b)(d) | 25,870,230 | 24,757,810 | ||||||
J. Crew Group, Inc., Term Loan B, 4.000%, 03/05/21(a)(b) | 27,177,471 | 16,467,102 | ||||||
J.C. Penney Corp., Inc., 2016 Term Loan B, 5.304%, | 27,632,575 | 27,411,514 | ||||||
Kate Spade & Co., Term Loan B, 4.000%, 04/10/21(a)(b) | 6,474,000 | 6,457,815 | ||||||
Men’s Wearhouse, Inc. (The), Term Loan B, 4.500%-4.563%, | 5,378,860 | 5,100,934 | ||||||
Men’s Wearhouse, Inc. (The), 2015 Term Loan, 5.000%, | 8,333,050 | 7,833,067 | ||||||
Neiman Marcus Group Ltd. LLC, 2020 Term Loan, 4.250%, | 8,606,393 | 6,903,532 | ||||||
Sears Holding Corp., Incremental Term Loan, 8.500%, 07/20/20(a)(b) | 5,547,945 | 5,596,490 | ||||||
Sears Roebuck Acceptance Corp., 2015 Term Loan, 5.500%, | 28,680,961 | 28,295,489 | ||||||
| Shares or Principal Amount($) | Value($) | |||||||
Retail—continued |
| |||||||
Toys ‘R’ Us Property Co. I LLC, New Term Loan B, 6.000%, | 33,064,710 | 31,576,798 | ||||||
Toys ‘R’ Us-Delaware, Inc., Term Loan B3, 5.250%, 05/25/18(a)(b) | 1,722,082 | 1,569,247 | ||||||
Toys ‘R’ Us-Delaware, Inc., FILO Term Loan, 8.289%, 10/24/19(a)(b) | 3,404,464 | 3,391,697 | ||||||
Toys ‘R’ Us-Delaware, Inc., FILO CAD Term Loan, 8.289%, 10/24/19(a)(b) | 2,745,536 | 2,735,240 | ||||||
Toys ‘R’ Us-Delaware, Inc., Term Loan B4, 9.804%, 04/24/20(a)(b) | 19,792,081 | 15,696,308 | ||||||
|
| |||||||
| 279,131,717 | ||||||||
|
| |||||||
Service 5.6% |
| |||||||
AlixPartners LLP, 2017 Term Loan B, 04/29/24(c)(d) | 6,360,000 | 6,391,800 | ||||||
Casella Waste Systems, Inc., Term Loan B, 4.000%, 10/17/23(a)(b) | 1,705,725 | 1,714,254 | ||||||
Coinstar LLC, 1st Lien Term Loan, 5.250%, 09/27/23(a)(b) | 3,716,325 | 3,746,056 | ||||||
Coinstar LLC, 2nd Lien Term Loan, 9.750%, 09/27/24(a)(b) | 4,000,000 | 4,020,000 | ||||||
DigitalGlobe, Inc., 2016 Term Loan B, 3.732%, 01/15/24(a)(b) | 4,199,475 | 4,212,619 | ||||||
Evertec Group LLC, New Term Loan A, 3.097%, 04/17/18(a)(b) | 2,437,656 | 2,420,909 | ||||||
First Data Corp., USD Term Loan A, 2.984%, 06/02/20(a)(b) | 29,625,000 | 29,620,556 | ||||||
First Data Corp., 2016 USD Term Loan, 3.984%, 03/24/21(a)(b)(e) | 41,856,448 | 42,162,838 | ||||||
First Data Corp., USD 2016 Repriced Term Loan, 3.984%, | 42,539,077 | 42,849,187 | ||||||
Gartner, Inc., 2016 Term Loan A, 06/17/21(b)(c)(d) | 5,940,000 | 5,962,275 | ||||||
Gartner, Inc., Term Loan B, | 5,545,000 | 5,586,587 | ||||||
Geo Group, Inc. (The), 2017 Term Loan B, 03/17/24(b)(c)(d) | 3,165,000 | 3,178,863 | ||||||
See Notes to Financial Statements.
55
Table of Contents
SCHEDULES OF PORTFOLIO INVESTMENTS
RIDGEWORTH FUNDS March 31, 2017
Seix Floating Rate High Income Fund — continued
| Shares or Principal Amount($) | Value($) | |||||||
Service—continued |
| |||||||
GFL Environmental, Inc., USD Term Loan B, 3.897%, 09/29/23(a)(b) | 4,129,250 | 4,142,175 | ||||||
Hertz Corp., (The), 2016 Term Loan B, 3.732%, 06/30/23(a)(b) | 2,636,717 | 2,641,437 | ||||||
IQOR U.S., Inc., Term Loan B, 6.000%, 04/01/21(a)(b) | 28,576,321 | 27,754,752 | ||||||
Premiere Global Services, Inc., 1st Lien Term Loan, 12/08/21(b)(c)(d) | 2,385,000 | 2,372,073 | ||||||
Prime Security Services Borrower LLC, 2016 1st Lien Term Loan, 4.250%, 05/02/22(a)(b) | 9,159,831 | 9,247,582 | ||||||
Redbox Automated Retail LLC, Term Loan B, 8.500%, 09/27/21(a)(b) | 5,897,386 | 5,890,014 | ||||||
Sedgwick Claims Management Services, Inc., 1st Lien Term Loan, 3.750%, 03/01/21(a)(b) | 24,444,512 | 24,406,378 | ||||||
Sedgwick Claims Management Services, Inc., 2nd Lien Term Loan, 6.750%, 02/28/22(a)(b) | 10,175,000 | 10,149,562 | ||||||
Sedgwick Claims Management Services, Inc., Incremental 2nd Lien Term Loan, 6.804%, 02/28/22(a)(b) | 3,440,000 | 3,431,400 | ||||||
SGS Cayman L.P., 2014 Term Loan B, 6.000%, 04/23/21(a)(b) | 4,153,086 | 4,018,110 | ||||||
Spin Holdco, Inc., New Term Loan B, 4.284%, 11/14/19(a)(b) | 3,459,175 | 3,457,307 | ||||||
St. Georges University, 2016 Term Loan B, 6.274%-6.397%, | 2,651,182 | 2,681,008 | ||||||
Sutherland Global Services, Inc., Term Loan B, 6.147%, | 17,843,396 | 17,263,486 | ||||||
TKC Holdings, Inc., 2017 Term Loan, 4.750%, 02/01/23(a)(b) | 5,190,000 | 5,237,592 | ||||||
TKC Holdings, Inc., 2017 2nd Lien Term Loan, 8.500%, | 2,685,000 | 2,686,692 | ||||||
| Shares or Principal Amount($) | Value($) | |||||||
Service—continued |
| |||||||
TransUnion LLC, Term Loan B2, 3.482%, 04/09/23(a)(b) | 6,478,306 | 6,514,779 | ||||||
Travelport Finance (Luxembourg) S.A.R.L., 2017 Term Loan B, 4.289%, 09/02/21(a)(b) | 21,819,073 | 21,964,606 | ||||||
USIC Holdings, Inc., 2016 1st Lien Term Loan, 5.170%, 12/08/23(a)(b) | 2,937,638 | 2,952,326 | ||||||
Ventia Deco LLC, 2016 Term Loan B, 4.662%, 05/21/22(a)(b)(d) | 2,908,979 | 2,916,252 | ||||||
Vivid Seats Ltd., Term Loan B, 6.750%, 10/07/22(a)(b) | 4,200,000 | 4,210,500 | ||||||
Weight Watchers International, Inc., Term Loan B2, 4.070%-4.250%, 04/02/20(a)(b)(d) | 13,585,812 | 12,629,235 | ||||||
Worldwide Express Operations LLC, 1st Lien Term Loan, 5.530%, 01/31/24(a)(b) | 2,290,000 | 2,299,549 | ||||||
|
| |||||||
| 330,732,759 | ||||||||
|
| |||||||
Telecommunications 4.0% |
| |||||||
Altice U.S. Finance I Corp., 2017 USD Term Loan B, 06/21/25(b)(c)(d) | 9,500,000 | 9,500,000 | ||||||
Colorado Buyer, Inc., Term Loan B, 03/28/24(b)(c)(d) | 3,165,000 | 3,180,825 | ||||||
Colorado Buyer, Inc., 2nd Lien Term Loan, 03/28/25(b)(c)(d) | 2,400,000 | 2,409,000 | ||||||
Communications Sales & Leasing, Inc., 2017 Term Loan B, 4.000%, 10/24/22(a)(b) | 3,333,016 | 3,320,517 | ||||||
Coral-U.S. Co-Borrower LLC, Term Loan B1, 5.732%, 12/30/22(a)(b) | 7,595,000 | 7,648,773 | ||||||
Go Daddy Operating Co. LLC, 2017 Term Loan B, 3.412%, | 3,656,592 | 3,659,809 | ||||||
Hargray Communications Group, Inc., 2017 Term Loan B, | 5,545,000 | 5,553,650 | ||||||
Level 3 Financing, Inc., 2017 Term Loan B, 3.227%, 02/22/24(a)(b) | 78,145,000 | 78,242,681 | ||||||
See Notes to Financial Statements.
56
Table of Contents
SCHEDULES OF PORTFOLIO INVESTMENTS
RIDGEWORTH FUNDS March 31, 2017
Seix Floating Rate High Income Fund — continued
| Shares or Principal Amount($) | Value($) | |||||||
Telecommunications—continued |
| |||||||
Ligado Networks LLC, PIK Exit Term Loan, 9.852%, 12/07/20(a)(b) | 8,195,000 | 8,002,418 | ||||||
Ligado Networks LLC, 2015 2nd Lien Term Loan, 13.600%, | 10,358,504 | 8,112,055 | ||||||
NeuStar, Inc., Term Loan B2, | 6,975,000 | 7,053,469 | ||||||
NeuStar, Inc., 2nd Lien Term Loan, 02/24/25(b)(c)(d) | 2,750,000 | 2,774,063 | ||||||
Numericable Group S.A., USD Term Loan B11, 06/21/25(b)(c)(d) | 27,795,000 | 27,682,152 | ||||||
Numericable U.S. LLC, USD Term Loan B10, 4.289%, 01/14/25(a)(b) | 18,229,313 | 18,229,313 | ||||||
Numericable U.S. LLC, USD Term Loan B7, 5.289%, 01/15/24(a)(b)(e) | 26,618,850 | 26,637,749 | ||||||
West Corp., 2016 Term Loan B12, 3.482%-3.647%, 06/17/23(a)(b) | 1,603,368 | 1,605,773 | ||||||
West Corp., 2016 Term Loan B14, 3.482%, 06/17/21(a)(b) | 5,790,975 | 5,794,623 | ||||||
Zayo Group LLC, 2017 Term Loan B2, 3.500%, 01/19/24(a)(b) | 21,535,000 | 21,609,726 | ||||||
|
| |||||||
| 241,016,596 | ||||||||
|
| |||||||
Transportation 2.5% |
| |||||||
American Axle and Manufacturing, Inc., Term Loan B, | 9,135,000 | 9,123,581 | ||||||
CH Hold Corp., 1st Lien Term Loan, 4.000%, 02/01/24(a)(b) | 6,986,364 | 7,030,028 | ||||||
CH Hold Corp., 2nd Lien Term Loan, 8.250%, 02/01/25(a)(b) | 1,000,000 | 1,012,500 | ||||||
Commercial Barge Line Co., 2015 1st Lien Term Loan, 9.750%, | 8,293,500 | 7,588,553 | ||||||
Daseke, Inc., 2017 1st Lien Term Loan, 6.500%, 02/02/24(a)(b) | 2,678,571 | 2,695,313 | ||||||
Federal-Mogul Holdings Corp., New Term Loan C, 4.750%, | 35,210,546 | 35,070,408 | ||||||
| Shares or Principal Amount($) | Value($) | |||||||
Transportation—continued |
| |||||||
HGIM Corp., Term Loan A, 5.387%-7.250%, 06/18/18(a)(b)(d) | 14,904,072 | 12,929,282 | ||||||
HGIM Corp., Term Loan B, 5.637%-7.500%, 06/18/20(a)(b)(d) | 12,529,497 | 8,749,724 | ||||||
K&N Engineering, Inc., 1st Lien Term Loan, 5.750%, 10/19/23(a)(b) | 2,488,763 | 2,494,984 | ||||||
K&N Engineering, Inc., 2nd Lien Term Loan, 9.750%, 10/18/24(a)(b) | 1,710,000 | 1,688,625 | ||||||
Kenan Advantage Group, Inc., 2015 Term Loan, 4.000%, 07/31/22(a)(b) | 1,580,991 | 1,581,481 | ||||||
MPG Holdco I, Inc., 2015 Term Loan B, 3.750%, 10/20/21(a)(b) | 3,485,432 | 3,483,549 | ||||||
Navios Maritime Midstream Partners L.P., Term Loan B, 5.660%, | 5,116,331 | 5,084,354 | ||||||
Navios Maritime Partners L.P., 2017 Term Loan B, 6.130%, | 13,151,844 | 12,995,732 | ||||||
Navistar International Corp., 2017 Term Loan B, 5.000%, | 8,945,000 | 9,034,450 | ||||||
OSG Bulk Ships, Inc., OBS Term Loan, 5.290%, 08/05/19(a)(b) | 8,565,196 | 8,479,544 | ||||||
Tower Automotive Holdings USA LLC, 2017 Term Loan B, 3.625%, 03/07/24(a)(b) | 14,390,423 | 14,327,537 | ||||||
Wabash National Corp., 2017 Term Loan B, 3.740%-5.750%, | 7,671,299 | 7,703,288 | ||||||
|
| |||||||
| 151,072,933 | ||||||||
|
| |||||||
Utility 4.6% |
| |||||||
APLP Holdings Ltd. Partnership, 2016 Term Loan B, 6.000%, | 4,436,797 | 4,464,527 | ||||||
Aria Energy Operating LLC, Term Loan, 5.554%, 05/27/22(a)(b)(d) | 2,046,473 | 2,056,706 | ||||||
Bronco Midstream Funding LLC, Term Loan B, 5.057%, 08/15/20(a)(b) | 20,668,581 | 20,720,253 | ||||||
See Notes to Financial Statements.
57
Table of Contents
SCHEDULES OF PORTFOLIO INVESTMENTS
RIDGEWORTH FUNDS March 31, 2017
Seix Floating Rate High Income Fund — continued
| Shares or Principal Amount($) | Value($) | |||||||
Utility—continued |
| |||||||
Calpine Construction Finance Co. L.P., Original Term Loan B1, 3.232%, 05/03/20(a)(b) | 5,798,723 | 5,793,273 | ||||||
Calpine Corp., 1st Lien Term Loan, 11/30/17(b)(c)(d) | 3,054,545 | 3,055,492 | ||||||
Calpine Corp., Term Loan B8, 2.600%, 12/26/19(a)(b) | 2,130,000 | 2,125,570 | ||||||
Calpine Corp., Term Loan B7, 3.900%, 05/31/23(a)(b) | 5,220,550 | 5,240,962 | ||||||
Dynegy, Inc., 2017 Term Loan C, 4.250%, 06/27/23(a)(b) | 24,806,964 | 24,854,841 | ||||||
EFS Cogen Holdings I LLC, 2016 Term Loan B, 4.650%, | 5,311,370 | 5,354,073 | ||||||
Empire Generating Co. LLC, Term Loan C, 5.290%, 03/14/21(a)(b)(d) | 1,682,530 | 1,672,721 | ||||||
Empire Generating Co. LLC, Term Loan B, 5.290%, 03/14/21(a)(b)(d) | 21,390,670 | 21,265,962 | ||||||
Energy Future Intermediate Holding Co. LLC, 2016 DIP Term Loan, 06/30/17(b)(c)(d)(f) | 13,535,000 | 13,520,924 | ||||||
Helix Gen Funding LLC, Term Loan B, 02/23/24(b)(c)(d) | 3,325,000 | 3,370,719 | ||||||
Lonestar Generation LLC, Term Loan B, 5.304%, 02/22/21(a)(b) | 6,743,335 | 6,406,168 | ||||||
Longview Power LLC, Term Loan B, 7.000%, 04/13/21(a)(b) | 4,503,800 | 3,775,670 | ||||||
Middle River Power LLC, Term Loan B, 8.000%-8.147%, | 17,858,922 | 17,747,303 | ||||||
NRG Energy, Inc., 2016 Term Loan B, 3.232%, 06/30/23(a)(b)(e) | 43,714,663 | 43,868,538 | ||||||
Power Team Services LLC, 1st Lien Term Loan, 4.397%, 05/06/20(a)(b) | 14,989,233 | 14,979,939 | ||||||
Power Team Services LLC, 2nd Lien Term Loan, 8.397%, 11/06/20(a)(b) | 7,960,000 | 7,920,200 | ||||||
| Shares or Principal Amount($) | Value($) | |||||||
Utility—continued |
| |||||||
Summit Midstream Holdings LLC, Term Loan B, 7.022%, | 16,620,000 | 16,910,850 | ||||||
Talen Energy Supply LLC, Term Loan B, 6.060%, 12/06/23(a)(b) | 3,112,200 | 3,131,651 | ||||||
TEX Operations Co. LLC, Exit Term Loan C, 3.732%, 08/04/23(a)(b)(d) | 5,131,286 | 5,118,458 | ||||||
TEX Operations Co. LLC, Exit Term Loan B, 3.732%, 08/04/23(a)(b)(d) | 22,442,468 | 22,386,361 | ||||||
TPF II Power LLC, Term Loan B, 5.000%, 10/02/21(a)(b)(d) | 10,756,627 | 10,791,586 | ||||||
Vistra Operations Co. LLC, 2016 Term Loan B2, 4.193%, | 6,289,238 | 6,293,954 | ||||||
|
| |||||||
| 272,826,701 | ||||||||
|
| |||||||
Wireless Communications 1.2% |
| |||||||
SBA Senior Finance II LLC, Term Loan B1, 3.240%, 03/24/21(a)(b) | 1,994,872 | 1,998,482 | ||||||
Sprint Communications, Inc., 1st Lien Term Loan B, 3.500%, | 68,885,000 | 68,836,092 | ||||||
|
| |||||||
| 70,834,574 | ||||||||
|
| |||||||
Total Bank Loans | 5,445,916,312 | |||||||
|
| |||||||
Corporate Bonds 4.4% |
| |||||||
Auto Manufacturers 0.0%(h) |
| |||||||
Motors Liquidation Co. Escrow, 7.200% (f)(i)(j) | 10,000,000 | — | ||||||
Motors Liquidation Co. Escrow, 8.375% (f)(i)(j) | 10,000,000 | — | ||||||
|
| |||||||
| — | ||||||||
|
| |||||||
Coal |
| |||||||
Contura Energy, Inc., 10.000%, 08/01/21(b) | 5,000,000 | 5,390,500 | ||||||
|
| |||||||
Commercial Services 0.1% |
| |||||||
Laureate Education, Inc., 9.250%, 09/01/19(b) | 5,000,000 | 5,200,000 | ||||||
|
| |||||||
Computers 0.3% |
| |||||||
Diamond 1 Finance Corp./Diamond 2 Finance Corp., 7.125%, 06/15/24(b) | 8,000,000 | 8,843,832 | ||||||
Harland Clarke Holdings Corp., 9.250%, 03/01/21(b) | 5,330,000 | 5,190,087 | ||||||
See Notes to Financial Statements.
58
Table of Contents
SCHEDULES OF PORTFOLIO INVESTMENTS
RIDGEWORTH FUNDS March 31, 2017
Seix Floating Rate High Income Fund — continued
| Shares or Principal Amount($) | Value($) | |||||||
Computers—continued |
| |||||||
Western Digital Corp., 10.500%, 04/01/24 | 1,000,000 | 1,178,750 | ||||||
|
| |||||||
| 15,212,669 | ||||||||
|
| |||||||
Diversified Financial Services 0.5% |
| |||||||
Alliance Data Systems Corp., 5.875%, 11/01/21(b) | 5,000,000 | 5,175,000 | ||||||
Ally Financial, Inc., 7.500%, 09/15/20 | 6,000,000 | 6,738,750 | ||||||
Nationstar Mortgage LLC/Nationstar Capital Corp., 7.875%, 10/01/20 | 5,517,000 | 5,720,439 | ||||||
Navient Corp., 8.000%, 03/25/20, MTN | 10,000,000 | 10,862,500 | ||||||
Walter Investment Management Corp., 7.875%, 12/15/21 | 4,000,000 | 2,350,000 | ||||||
|
| |||||||
| 30,846,689 | ||||||||
|
| |||||||
Electric 0.1% |
| |||||||
Dynegy, Inc., 6.750%, 11/01/19 | 5,000,000 | 5,137,500 | ||||||
|
| |||||||
Engineering & Construction 0.3% |
| |||||||
Engility Corp., 8.875%, 09/01/24(b) | 15,000,000 | 15,881,250 | ||||||
|
| |||||||
Entertainment 0.0%(h) |
| |||||||
Lions Gate Entertainment Corp., 5.875%, 11/01/24(b) | 1,650,000 | 1,711,875 | ||||||
|
| |||||||
Food 0.1% |
| |||||||
U.S. Foods, Inc., 5.875%, 06/15/24(b) | 8,000,000 | 8,300,000 | ||||||
|
| |||||||
Healthcare-Services 0.3% |
| |||||||
CHS/Community Health Systems, Inc., 8.000%, 11/15/19 | 14,000,000 | 13,737,500 | ||||||
HCA Holdings, Inc., 6.250%, 02/15/21 | 5,000,000 | 5,396,875 | ||||||
|
| |||||||
| 19,134,375 | ||||||||
|
| |||||||
Home Builders 0.1% |
| |||||||
Mattamy Group Corp., 6.500%, 11/15/20(b) | 5,000,000 | 5,137,500 | ||||||
|
| |||||||
Lodging 0.1% |
| |||||||
MGM Resorts International, 7.750%, 03/15/22 | 5,019,000 | 5,790,671 | ||||||
|
| |||||||
Media 0.4% |
| |||||||
CCO Holdings LLC/CCO Holdings Capital Corp., 5.125%, 05/01/27(b) | 1,000,000 | 1,005,000 | ||||||
| Shares or Principal Amount($) | Value($) | |||||||
Media—continued |
| |||||||
Cequel Communications Holdings I LLC/Cequel Capital Corp., 7.750%, 07/15/25(b) | 10,000,000 | 11,056,250 | ||||||
CSC Holdings LLC, 10.125%, 01/15/23(b) | 2,000,000 | 2,320,000 | ||||||
WideOpenWest Finance LLC/WideOpenWest Capital Corp., 10.250%, 07/15/19 | 8,847,000 | 9,211,939 | ||||||
|
| |||||||
| 23,593,189 | ||||||||
|
| |||||||
Miscellaneous Manufacturer 0.1% |
| |||||||
Bombardier, Inc., 7.750%, 03/15/20(b) | 7,000,000 | 7,472,500 | ||||||
|
| |||||||
Oil & Gas 0.9% |
| |||||||
Ascent Resources Utica Holdings LLC/ARU Finance Corp., 10.000%, 04/01/22(b)(d) | 1,000,000 | 1,035,000 | ||||||
Chesapeake Energy Corp., 6.625%, 08/15/20 | 5,073,000 | 5,066,659 | ||||||
Chesapeake Energy Corp., 8.000%, 01/15/25(b) | 5,000,000 | 5,000,000 | ||||||
Glenn Pool Oil & Gas Trust, 6.000%, 08/02/21(d)(i) | 44,814,583 | 44,142,364 | ||||||
|
| |||||||
| 55,244,023 | ||||||||
|
| |||||||
Packaging & Containers 0.1% |
| |||||||
Reynolds Group Issuer, Inc./Reynolds Group Issuer LLC/Reynolds Group Issuer Lu, 7.000%, 07/15/24(b) | 5,000,000 | 5,353,125 | ||||||
|
| |||||||
Pharmaceuticals 0.1% |
| |||||||
Valeant Pharmaceuticals International, Inc., 7.500%, 07/15/21(b) | 5,000,000 | 4,381,250 | ||||||
|
| |||||||
Real Estate 0.1% |
| |||||||
Realogy Group LLC/Realogy Co-Issuer Corp., 5.250%, | 5,000,000 | 5,200,000 | ||||||
|
| |||||||
Real Estate Investment Trust 0.4% |
| |||||||
iStar, Inc., 5.000%, 07/01/19 | 5,000,000 | 5,031,250 | ||||||
iStar, Inc., 6.000%, 04/01/22 | 10,000,000 | 10,150,000 | ||||||
iStar, Inc., 6.500%, 07/01/21 | 1,400,000 | 1,438,500 | ||||||
iStar, Inc., 7.125%, 02/15/18 | 500,000 | 517,500 | ||||||
See Notes to Financial Statements.
59
Table of Contents
SCHEDULES OF PORTFOLIO INVESTMENTS
RIDGEWORTH FUNDS March 31, 2017
Seix Floating Rate High Income Fund — continued
| Shares or Principal Amount($) | Value($) | |||||||
Real Estate Investment Trust—continued |
| |||||||
Starwood Property Trust, Inc., 5.000%, 12/15/21(b) | 5,250,000 | 5,446,875 | ||||||
|
| |||||||
| 22,584,125 | ||||||||
|
| |||||||
Telecommunication Services 0.3% |
| |||||||
Digicel Group Ltd., 8.250%, 09/30/20(b) | 5,000,000 | 4,297,000 | ||||||
Intelsat Jackson Holdings S.A., 7.250%, 10/15/20 | 4,625,000 | 4,214,531 | ||||||
Trilogy International Partners LLC/Trilogy International Finance, Inc., 13.375%, 05/15/19 | 12,245,000 | 12,398,063 | ||||||
|
| |||||||
| 20,909,594 | ||||||||
|
| |||||||
Total Corporate Bonds | 262,480,835 | |||||||
|
| |||||||
Preferred Stock 0.0%(h) |
| |||||||
Banks 0.0%(h) |
| |||||||
GMAC Capital Trust I, Series 2, 6.824%(a) | 34,000 | 864,620 | ||||||
|
| |||||||
Total Preferred Stock | 864,620 | |||||||
|
| |||||||
Rights 0.0%(h) |
| |||||||
Utility 0.0%(h) |
| |||||||
Texas Competitive Electric Holdings Co. LLC* | 410,667 | 441,467 | ||||||
|
| |||||||
Total Rights | 441,467 | |||||||
|
| |||||||
Common Stocks 0.4% |
| |||||||
Diversified Financial Services 0.0%(h) |
| |||||||
Aretec Group, Inc.*(i) | 104,182 | 1,354,366 | ||||||
|
| |||||||
Electric 0.1% | ||||||||
Vistra Energy Corp. | 410,667 | 6,693,872 | ||||||
|
| |||||||
Oil & Gas 0.3% |
| |||||||
Linn Energy, Inc.* | 140,363 | 4,070,527 | ||||||
SandRidge Energy, Inc.* | 16,109 | 297,856 | ||||||
Templar Energy LLC, Cl A*(i) | 1,378,328 | 10,165,170 | ||||||
|
| |||||||
| 14,533,553 | ||||||||
|
| |||||||
Telecommunication Services 0.0%(h) |
| |||||||
NII Holding, Inc.* | 303,451 | 394,486 | ||||||
|
| |||||||
Total Common Stocks | 22,976,277 | |||||||
|
| |||||||
| Shares or Principal Amount($) | Value($) | |||||||
Money Market Fund 12.2% |
| |||||||
State Street Institutional U.S. Government Money Market Fund, Premier Class, 0.62%(j) | 730,190,606 | 730,190,606 | ||||||
|
| |||||||
Total Money Market Fund | 730,190,606 | |||||||
|
| |||||||
Unlisted Call Option Purchased 0.0%(h) |
| |||||||
Metals/Minerals 0.0%(h) |
| |||||||
Atlas Iron Ltd.(i) | 147,913,466 | — | ||||||
|
| |||||||
Total Unlisted Call Option Purchased | — | |||||||
|
| |||||||
Total Investments |
| 6,467,462,352 | ||||||
Liabilities in Excess of Other Assets — (8.5)% | (507,772,632 | ) | ||||||
|
| |||||||
Net Assets — 100.0% | $ | 5,959,689,720 | ||||||
|
| |||||||
| * | Non-income producing security. |
| (a) | Variable or floating rate security. Rate disclosed is as of March 31, 2017. |
| (b) | Rule 144A, Section 4(2) or other security which is restricted as to resale to institutional investors. The Fund’s investment adviser/subadviser has deemed this security to be liquid based upon procedures approved by the Board of Trustees. These securities represent 92.8% of net assets as of March 31, 2017. |
| (c) | The security does not have a stated settlement date and will receive a rate upon settling with the custodian. |
| (d) | All or a portion of this security has been purchased on a when-issued or delayed-delivery basis. |
| (e) | All or a portion of this security has been segregated, or otherwise earmarked, in connection with obligations for when-issued or delayed-delivery purchase commitments. |
| (f) | Security is in default. |
| (g) | Rate shown is 5.580% Cash and 3.000% PIK. |
| (h) | Less than 0.05% of Net Assets. |
| (i) | Valued at fair value using procedures approved by the Board of Trustees (See Note 2(a)). Fair valued securities held by the Fund represent 0.9% of net assets as of March 31, 2017. |
| (j) | Perpetual maturity. |
| (k) | Rate disclosed, the 7 day yield, is as of March 31, 2017. |
See Notes to Financial Statements.
60
Table of Contents
SCHEDULES OF PORTFOLIO INVESTMENTS
RIDGEWORTH FUNDS March 31, 2017
Seix Floating Rate High Income Fund — concluded
Investment Abbreviations
| AUD | — | Australian Dollar | ||
| DIP | — | Debtor-in-Possession | ||
| MTN | — | Medium Term Note | ||
| PIK | — | Payment in-kind |
As of March 31, 2017, the Fund had the following unfunded loan commitments:
Borrower | Unfunded Commitments | Unrealized Appreciation | ||||||
CH Hold Corp. | $ | 698,636 | $ | 6,086 | ||||
Daseke, Inc. | 1,071,429 | 17,359 | ||||||
Go Daddy Operating Company, LLC | 4,858,408 | 16,303 | ||||||
MH Sub I, LLC | 1,484,118 | 7,381 | ||||||
|
|
|
| |||||
Total | $ | 8,112,591 | $ | 47,129 | ||||
|
|
|
| |||||
The commitments are available until the maturity date of the respective security.
See Notes to Financial Statements.
61
Table of Contents
SCHEDULES OF PORTFOLIO INVESTMENTS
RIDGEWORTH FUNDS March 31, 2017
Seix Georgia Tax-Exempt Bond Fund
| Shares or Principal Amount($) | Value($) | |||||||
| Municipal Bonds 96.5% | ||||||||
Georgia 87.9% |
| |||||||
Athens Housing Authority, RB, 5.000%, 06/15/31 | 1,000,000 | 1,155,620 | ||||||
Athens-Clarke County Unified Government Development Authority, RB, 5.250%, 07/01/27, Pre-refunded 07/01/2021 @ 100 | 2,885,000 | 3,330,069 | ||||||
Athens-Clarke County Unified Government Development Authority, Catholic Health East, RB, 6.250%, 11/15/32 | 1,360,000 | 1,475,913 | ||||||
Athens-Clarke County Unified Government Water & Sewerage Revenue, RB, 5.000%, 01/01/24 | 1,250,000 | 1,491,737 | ||||||
Athens-Clarke County Unified Government Water & Sewerage Revenue, RB, 5.500%, 01/01/38, Pre-refunded 01/01/2019 @ 100(a) | 4,000,000 | 4,307,040 | ||||||
Athens-Clarke County Unified Government Water & Sewerage Revenue, RB, 5.625%, 01/01/33, Pre-refunded 01/01/2019 @ 100(a) | 3,000,000 | 3,236,790 | ||||||
Atlanta Airport Passenger Facility Charge, Series B, RB, 5.000%, 01/01/21 | 2,000,000 | 2,195,800 | ||||||
Atlanta Airport Project, Series B, RB, 5.000%, 01/01/23(a) | 2,500,000 | 2,779,150 | ||||||
Atlanta Airport Project, Series B, RB, 5.000%, 01/01/42 | 2,235,000 | 2,450,096 | ||||||
Atlanta Beltline Project, Series B, Tax Allocation, 5.000%, 01/01/28 | 855,000 | 994,664 | ||||||
Atlanta Beltline Project, Series D, Tax Allocation, 5.000%, 01/01/30 | 1,055,000 | 1,207,215 | ||||||
Atlanta Beltline Project, Series D, Tax Allocation, 5.000%, 01/01/31 | 1,500,000 | 1,705,680 | ||||||
Atlanta Development Authority, RB, ETM, 5.000%, 09/01/19 | 1,025,000 | 1,117,742 | ||||||
Atlanta Development Authority, Series A, RB, 5.000%, 07/01/34 | 1,000,000 | 1,124,930 | ||||||
Atlanta Development Authority, Series A, RB, 5.250%, 07/01/40 | 2,500,000 | 2,851,400 | ||||||
| Shares or Principal Amount($) | Value($) | |||||||
Georgia—continued |
| |||||||
Atlanta Eastside Project, Tax Allocation, 5.000%, 01/01/28 | 850,000 | 984,190 | ||||||
Atlanta Eastside Project, Tax Allocation, 5.000%, 01/01/30 | 250,000 | 284,708 | ||||||
Atlanta GA Water & Wastewater Revenue, RB, 5.000%, 11/01/40 | 4,000,000 | 4,509,160 | ||||||
Atlanta GA Water & Wastewater Revenue, Series A, RB, 6.250%, 11/01/39, Pre-refunded 11/01/2019 @ 100 | 1,875,000 | 2,115,619 | ||||||
Carroll City-County Hospital Authority, Tanner Medical Center, Inc., RB, 5.000%, 07/01/41, Country Guaranteed | 3,000,000 | 3,326,700 | ||||||
Clarke County Hospital Authority, Athens Regional Medical Center, RB, 5.000%, 01/01/32, Pre-refunded 01/01/2022 @ 100, Country Guaranteed | 1,180,000 | 1,362,782 | ||||||
DeKalb Private Hospital Authority, Children’s Healthcare of Atlanta, Inc., RB, 5.000%, 11/15/29 | 2,000,000 | 2,171,480 | ||||||
Forsyth County, Series A, GO, 5.000%, 03/01/25, Pre-refunded 03/01/2019 @ 100 | 5,000,000 | 5,370,500 | ||||||
Fulton County Development Authority, Series A, RB, 5.000%, 05/01/39 | 2,145,000 | 2,386,484 | ||||||
Fulton County Development Authority, Robert Woodruff Arts Center, Inc., Series A, RB, 5.000%, 03/15/36 | 2,000,000 | 2,219,160 | ||||||
Fulton County Development Authority, Robert Woodruff Arts Center, Inc., Series B, RB, 5.250%, 03/15/24 | 1,645,000 | 1,762,634 | ||||||
Georgia State, Series A-1, GO, 5.000%, 02/01/24 | 1,025,000 | 1,229,139 | ||||||
Georgia State, Series B, GO, 5.000%, 10/01/17 | 2,000,000 | 2,042,280 | ||||||
Georgia State, Series E-2, GO, 4.000%, 09/01/19 | 1,000,000 | 1,069,200 | ||||||
Greene County Development Authority, RB, 5.000%, 11/15/37 | 2,955,000 | 3,226,594 | ||||||
See Notes to Financial Statements.
62
Table of Contents
SCHEDULES OF PORTFOLIO INVESTMENTS
RIDGEWORTH FUNDS March 31, 2017
Seix Georgia Tax-Exempt Bond Fund — concluded
| Shares or Principal Amount($) | Value($) | |||||||
Georgia—continued |
| |||||||
Henry County Water & Sewerage Authority, RB, 6.150%, 02/01/20, AMBAC | 2,100,000 | 2,303,784 | ||||||
Metropolitan Atlanta Rapid Transit Authority, Series A, RB, 5.000%, 07/01/30 | 1,465,000 | 1,680,604 | ||||||
Private Colleges & Universities Authority, Emory University, Series B, RB, 5.000%, 10/01/38 | 4,000,000 | 4,599,960 | ||||||
Private Colleges & Universities Authority, Emory University, Series C, RB, 5.250%, 09/01/39 | 2,000,000 | 2,165,560 | ||||||
Private Colleges & Universities Authority, Savannah College Of Art & Design, RB, 5.000%, 04/01/30 | 1,000,000 | 1,087,560 | ||||||
Private Colleges & Universities Authority, Savannah College Of Art & Design, RB, 5.000%, 04/01/44 | 3,500,000 | 3,714,060 | ||||||
Thomasville Hospital Authority, John D. Archhold Memorial Hospital, RB, 5.375%, 11/01/40 | 2,510,000 | 2,741,397 | ||||||
|
| |||||||
| 83,777,401 | ||||||||
|
| |||||||
Guam 2.1% |
| |||||||
Territory of Guam, Series A, RB, 5.000%, 12/01/33 | 620,000 | 670,300 | ||||||
Territory of Guam, Series A, RB, 5.000%, 12/01/34 | 460,000 | 494,261 | ||||||
Territory of Guam, Series A, RB, 5.000%, 12/01/46 | 795,000 | 847,661 | ||||||
|
| |||||||
| 2,012,222 | ||||||||
|
| |||||||
North Carolina 4.4% |
| |||||||
North Carolina Capital Facilities Finance Agency, Educational Facilities, RB, 5.000%, 05/01/32 | 1,700,000 | 1,812,863 | ||||||
North Carolina Medical Care Commission, RB, 5.000%, 10/01/27(b) | 620,000 | 741,619 | ||||||
| Shares or Principal Amount($) | Value($) | |||||||
North Carolina—continued |
| |||||||
North Carolina Medical Care Commission, RB, 5.000%, 10/01/33(b) | 805,000 | 924,205 | ||||||
North Carolina Medical Care Commission, RB, 5.000%, 10/01/35(b) | 620,000 | 705,076 | ||||||
|
| |||||||
| 4,183,763 | ||||||||
|
| |||||||
South Carolina 2.1% |
| |||||||
South Carolina State Public Service Authority, Series A, RB, 5.750%, 12/01/43 | 1,800,000 | 1,990,386 | ||||||
|
| |||||||
Total Municipal Bonds | 91,963,772 | |||||||
|
| |||||||
Money Market Fund 5.5% |
| |||||||
Federated Government Obligations Tax-Managed Fund, Institutional Shares, 0.50%(c) | 5,181,314 | 5,181,314 | ||||||
|
| |||||||
Total Money Market Fund | 5,181,314 | |||||||
|
| |||||||
Total Investments | 97,145,086 | |||||||
Liabilities in Excess of Other Assets — (2.0)% | (1,858,408 | ) | ||||||
|
| |||||||
Net Assets — 100.0% | $ | 95,286,678 | ||||||
|
| |||||||
| (a) | All or a portion of this security has been segregated, or otherwise earmarked, in connection with obligations for when-issued or delayed-delivery purchase commitments. |
| (b) | All or a portion of this security has been purchased on a when-issued or delayed-delivery basis. |
| (c) | Rate disclosed, the 7 day yield, is as of March 31, 2017. |
Investment Abbreviations
| AMBAC | — | Security guaranteed by American Municipal Bond Assurance Corporation | ||
| ETM | — | Escrowed to Maturity | ||
| GO | — | General Obligation | ||
| RB | — | Revenue Bond |
See Notes to Financial Statements.
63
Table of Contents
SCHEDULES OF PORTFOLIO INVESTMENTS
RIDGEWORTH FUNDS March 31, 2017
Seix High Grade Municipal Bond Fund
| Shares or Principal Amount($) | Value($) | |||||||
| Municipal Bonds 91.6% | ||||||||
Alabama 2.4% |
| |||||||
Birmingham Special Care Facilities Financing Authority Health Care Facilities, Children’s Hospital of Alabama, RB, 6.000%, 06/01/39, Pre-refunded 06/01/2019 @ 100, AGC | 2,000,000 | 2,206,100 | ||||||
|
| |||||||
Alaska 2.5% |
| |||||||
Matanuska-Susitna Borough Lease, Goose Creek Correctional Center, RB, 6.000%, 09/01/28, Pre-refunded 09/01/2019 @ 100, AGC | 730,000 | 813,016 | ||||||
Matanuska-Susitna Borough Lease, Goose Creek Correctional Center, RB, 6.000%, 09/01/28, Pre-refunded 09/01/2019 @ 100, AGC | 1,270,000 | 1,414,424 | ||||||
|
| |||||||
| 2,227,440 | ||||||||
|
| |||||||
California 16.4% |
| |||||||
California Infrastructure & Economic Development Bank, RB, 5.000%, 11/01/34 | 1,000,000 | 1,137,200 | ||||||
California Municipal Finance Authority, Series A, RB, 5.000%, 06/01/50 | 1,750,000 | 1,834,735 | ||||||
California State, GO, 5.000%, 08/01/23 | 3,090,000 | 3,654,945 | ||||||
California State, GO, 5.000%, 09/01/30 | 1,000,000 | 1,127,140 | ||||||
California State, GO, 6.500%, 04/01/33(a) | 2,000,000 | 2,212,240 | ||||||
Los Angeles Department of Airports, Series B, AMT, RB, 5.000%, 05/15/35 | 1,000,000 | 1,130,410 | ||||||
Los Angeles Department of Airports, Series B, AMT, RB, 5.000%, 05/15/46 | 1,000,000 | 1,110,460 | ||||||
Norman Y Mineta San Jose International Airport SJC, Series A, AMT, RB, 5.000%, 03/01/47(b) | 1,500,000 | 1,656,285 | ||||||
San Diego Redevelopment Agency Successor, Series A, 5.000%, 09/01/28 | 500,000 | 594,750 | ||||||
| Shares or Principal Amount($) | Value($) | |||||||
California—continued |
| |||||||
San Diego Redevelopment Agency Successor, Series A, 5.000%, 09/01/29 | 405,000 | 476,478 | ||||||
|
| |||||||
| 14,934,643 | ||||||||
|
| |||||||
Connecticut 1.7% |
| |||||||
South Central Connecticut Regional Water Authority, Series B, RB, 5.000%, 08/01/37 | 1,400,000 | 1,586,172 | ||||||
|
| |||||||
District of Columbia 2.4% |
| |||||||
District of Columbia, Income Tax, Series A, RB, 5.500%, 12/01/30(a) | 2,000,000 | 2,223,880 | ||||||
|
| |||||||
Florida 1.3% |
| |||||||
Orlando FL Contract Tourist DE, Series A, RB, 5.250%, 11/01/32, Pre-refunded 05/01/2014 @ 100 | 1,000,000 | 1,213,650 | ||||||
|
| |||||||
Georgia 1.6% |
| |||||||
Fulton County Development Authority, Georgia Tech Athletic Association, RB, 5.750%, 10/01/36 | 1,250,000 | 1,413,788 | ||||||
|
| |||||||
Idaho 2.9% |
| |||||||
Idaho Health Facilities Authority, Series A, RB, 6.750%, 11/01/37(a) | 2,500,000 | 2,678,425 | ||||||
|
| |||||||
Illinois 6.8% |
| |||||||
Chicago O’Hare International Airport, Series A, AMT, RB, 5.000%, 01/01/33 | 1,100,000 | 1,193,984 | ||||||
Chicago O’Hare International Airport, Series B, RB, 5.000%, 01/01/33(a) | 3,500,000 | 3,898,720 | ||||||
University of Illinois, Auxiliary Facilities System, Series A, RB, 5.750%, 04/01/38, Pre-refunded 04/01/2019 @ 100 | 1,000,000 | 1,090,590 | ||||||
|
| |||||||
| 6,183,294 | ||||||||
|
| |||||||
Kansas 1.8% |
| |||||||
Kansas State Development Finance Authority, Adventist Bolingbrook Hospital, RB, 5.750%, 11/15/38(a) | 1,500,000 | 1,644,180 | ||||||
|
| |||||||
See Notes to Financial Statements.
64
Table of Contents
SCHEDULES OF PORTFOLIO INVESTMENTS
RIDGEWORTH FUNDS March 31, 2017
Seix High Grade Municipal Bond Fund — continued
| Shares or Principal Amount($) | Value($) | |||||||
Maine 3.0% |
| |||||||
Maine State Turnpike Authority, RB, 6.000%, 07/01/38, Pre-refunded 07/01/2019 @ 100(a) | 2,500,000 | 2,768,500 | ||||||
|
| |||||||
Michigan 2.8% |
| |||||||
University of Michigan, Series B, RB, 0.850%, 04/01/28 | 2,500,000 | 2,500,000 | ||||||
|
| |||||||
Missouri 3.8% |
| |||||||
Metropolitan St Louis Sewer District, Series B, RB, 5.000%, 05/01/36(a) | 3,000,000 | 3,437,040 | ||||||
|
| |||||||
New York 7.1% |
| |||||||
Erie County Industrial Development Agency, City School District Buffalo, Series A, RB, 5.750%, 05/01/29, Pre-refunded 05/01/2018 @ 100, BHAC-CR-AGM | 1,000,000 | 1,052,240 | ||||||
New York State Dormitory Authority, RB, 5.000%, 03/15/28 | 2,000,000 | 2,420,180 | ||||||
Utility Debt Securitization Authority, Series A, RB, 5.000%, 12/15/34 | 2,500,000 | 2,952,400 | ||||||
|
| |||||||
| 6,424,820 | ||||||||
|
| |||||||
North Carolina 10.7% |
| |||||||
Charlotte NC Water & Sewer System Revenue, Series B, RB, 0.880%, 07/01/36 | 4,375,000 | 4,375,000 | ||||||
North Carolina Medical Care Commission, RB, 5.000%, 10/01/35(b) | 1,625,000 | 1,847,983 | ||||||
North Carolina Turnpike Authority, RB, 5.000%, 01/01/32 | 1,000,000 | 1,130,900 | ||||||
North Carolina Turnpike Authority, RB, 5.000%, 01/01/39, AGM | 700,000 | 784,840 | ||||||
Raleigh, COP, 0.850%, 02/01/34 | 1,615,000 | 1,615,000 | ||||||
|
| |||||||
| 9,753,723 | ||||||||
|
| |||||||
Oregon 12.2% |
| |||||||
Clackamas County School District No. 12 North Clackamas, Series B, GO, 5.000%, 06/15/34, SCH BD GTY | 1,000,000 | 1,168,910 | ||||||
| Shares or Principal Amount($) | Value($) | |||||||
Oregon—continued |
| |||||||
Oregon State, Series A, GO, 5.000%, 05/01/33 | 2,785,000 | 3,290,422 | ||||||
Oregon State, Series A, GO, 5.000%, 05/01/35 | 2,250,000 | 2,634,727 | ||||||
Port of Portland OR Airport Revenue, AMT, RB, 5.000%, 07/01/42 | 1,000,000 | 1,115,080 | ||||||
Port of Portland OR Airport Revenue, RB, 5.000%, 07/01/47 | 1,000,000 | 1,132,540 | ||||||
Washington Clackamas & Yamhill Counties School District No. 88J, Series B, GO, 5.000%, 06/15/31, SCH BD GTY | 1,500,000 | 1,783,785 | ||||||
|
| |||||||
| 11,125,464 | ||||||||
|
| |||||||
Texas 3.6% |
| |||||||
Arlington Higher Education Finance Corp., Series A, RB, 5.000%, 08/15/39, PSF-GTD | 1,000,000 | 1,118,730 | ||||||
New Hope Cultural Education Facilities Financing Corp., Student Housing Corp., Series A, RB, 5.000%, 07/01/35 | 2,000,000 | 2,117,620 | ||||||
|
| |||||||
| 3,236,350 | ||||||||
|
| |||||||
Utah 6.6% |
| |||||||
Salt Lake City Corp., Airport Revenue, Series A, AMT, RB, 5.000%, 07/01/33 | 2,300,000 | 2,622,529 | ||||||
Salt Lake City Corp., Airport Revenue, Series A, AMT, RB, 5.000%, 07/01/34 | 3,000,000 | 3,404,010 | ||||||
|
| |||||||
| 6,026,539 | ||||||||
|
| |||||||
Washington 2.0% |
| |||||||
Seattle Washington Municipal Light & Power, RB, 5.750%, 04/01/29, Pre-refunded 04/01/2019 @ 100, BHAC-CR(a) | 1,635,000 | 1,785,158 | ||||||
|
| |||||||
Total Municipal Bonds | 83,369,166 | |||||||
|
| |||||||
See Notes to Financial Statements.
65
Table of Contents
SCHEDULES OF PORTFOLIO INVESTMENTS
RIDGEWORTH FUNDS March 31, 2017
Seix High Grade Municipal Bond Fund — concluded
| Shares or Principal Amount($) | Value($) | |||||||
Money Market Fund 11.4% |
| |||||||
Federated Government Obligations Tax-Managed Fund, Institutional Shares, 0.50%(c) | 10,321,638 | 10,321,638 | ||||||
|
| |||||||
Total Money Market Fund | 10,321,638 | |||||||
|
| |||||||
Total Investments | 93,690,804 | |||||||
Liabilities in Excess of Other Assets — (3.0)% | (2,686,303 | ) | ||||||
|
| |||||||
Net Assets — 100.0% | $ | 91,004,501 | ||||||
|
| |||||||
| (a) | All or a portion of this security has been segregated, or otherwise earmarked, in connection with obligations for when-issued or delayed-delivery purchase commitments. |
| (b) | All or a portion of this security has been purchased on a when-issued or delayed-delivery basis. |
| (c) | Rate disclosed, the 7 day yield, is as of March 31, 2017. |
Investment Abbreviations
| AGC | — | Security guaranteed by Assured Guaranty Corporation | ||
| AGM | — | Security guaranteed by Assured Guaranty Municipal Corporation | ||
| AMT | — | Income subject to Alternative Minimum Tax | ||
| BHAC | — | Security guaranteed by Berkshire Hathaway Assurance Corporation | ||
| COP | — | Certificate of Participation | ||
| CR | — | Custodial Receipts | ||
| GO | — | General Obligation | ||
| PSF-GTD | — | Security guaranteed by Permanent School Fund Guarantee Program | ||
| RB | — | Revenue Bond | ||
| SCH BD GTY | — | School Bond Guaranty Program |
See Notes to Financial Statements.
66
Table of Contents
SCHEDULES OF PORTFOLIO INVESTMENTS
RIDGEWORTH FUNDS March 31, 2017
Seix High Income Fund
| Shares or Principal Amount($) | Value($) | |||||||
| Bank Loans 2.6% | ||||||||
Cable/Wireless Video 0.2% |
| |||||||
Liberty Cablevision of Puerto Rico LLC, 1st Lien Term Loan, | 1,005,000 | 1,000,397 | ||||||
|
| |||||||
Energy 0.5% |
| |||||||
California Resources Corp., Second Out Term Loan, 11.375%, 12/31/21(a)(b) | 1,430,000 | 1,577,762 | ||||||
Chesapeake Energy Corp., Term Loan, 8.553%, 08/23/21(a)(b) | 1,180,000 | 1,255,225 | ||||||
|
| |||||||
| 2,832,987 | ||||||||
|
| |||||||
Financial 0.8% |
| |||||||
Asurion LLC, New 2nd Lien Term Loan, 8.500%, 03/03/21(a)(b) | 2,955,000 | 2,988,244 | ||||||
Freedom Mortgage Corp., 1st Lien Term Loan, 6.862%, 02/26/22(a)(b) | 1,055,000 | 1,069,506 | ||||||
|
| |||||||
| 4,057,750 | ||||||||
|
| |||||||
Metals/Minerals 0.1% |
| |||||||
FMG Resources (August 2006) Pty Ltd., New Term Loan B, | 505,071 | 507,677 | ||||||
|
| |||||||
Retail 1.0% |
| |||||||
Neiman Marcus Group Ltd. LLC, 2020 Term Loan, 4.250%, 10/25/20(a)(b)(c) | 1,910,000 | 1,532,087 | ||||||
Sears Holding Corp., Incremental Term Loan, 8.500%, 07/20/20(a)(b) | 163,623 | 165,054 | ||||||
Sears Roebuck Acceptance Corp., 2015 Term Loan, 5.500%, 06/30/18(a)(b) | 3,893,459 | 3,841,131 | ||||||
|
| |||||||
| 5,538,272 | ||||||||
|
| |||||||
Total Bank Loans | 13,937,083 | |||||||
|
| |||||||
Corporate Bonds 91.1% |
| |||||||
Airlines 2.3% |
| |||||||
Air Canada Pass Through Trust, Series 2013-1, Cl C, | 875,000 | 910,000 | ||||||
Air Canada Pass Through Trust, Series 2015-1, Cl C, | 543,000 | 550,493 | ||||||
| Shares or Principal Amount($) | Value($) | |||||||
Airlines—continued | ||||||||
American Airlines Pass Through Trust, Series 2013-2, Cl B, | 5,013,587 | 5,182,796 | ||||||
U.S. Airways Pass Through Trust, Series 2012-2, Cl B, 6.750%, 12/03/22 | 2,814,972 | 3,047,208 | ||||||
United Airlines Pass Through Trust, Series 2014-1, Cl B, 4.750%, 10/11/23 | 2,715,145 | 2,769,448 | ||||||
|
| |||||||
| 12,459,945 | ||||||||
|
| |||||||
Auto Manufacturers 0.0%(d) |
| |||||||
Motors Liquidation Co. Escrow, | 17,182,000 | — | ||||||
Motors Liquidation Co. Escrow, | 36,800,000 | — | ||||||
|
| |||||||
| — | ||||||||
|
| |||||||
Auto Parts & Equipment 1.4% | ||||||||
Allison Transmission, Inc., 5.000%, 10/01/24(b) | 1,985,000 | 2,004,850 | ||||||
American Axle & Manufacturing, Inc., 6.250%, 04/01/25(b)(e) | 1,599,000 | 1,600,999 | ||||||
American Axle & Manufacturing, Inc., 6.500%, 04/01/27(b) | 1,599,000 | 1,593,995 | ||||||
Deck Chassis Acquisition, Inc., 10.000%, 06/15/23(b) | 1,333,000 | 1,426,310 | ||||||
TI Group Automotive Systems LLC, 8.750%, 07/15/23(b) | 1,015,000 | 1,076,742 | ||||||
|
| |||||||
| 7,702,896 | ||||||||
|
| |||||||
Banks 1.2% |
| |||||||
Provident Funding Associates LP/PFG Finance Corp., 6.750%, 06/15/21(b) | 4,740,000 | 4,834,800 | ||||||
Royal Bank of Scotland Group PLC, 8.625% (a)(h) | 1,310,000 | 1,365,675 | ||||||
|
| |||||||
| 6,200,475 | ||||||||
|
| |||||||
Building Materials 0.4% |
| |||||||
Summit Materials LLC/Summit Materials Finance Corp., 8.500%, 04/15/22 | 1,845,000 | 2,029,500 | ||||||
|
| |||||||
Chemicals 1.6% |
| |||||||
Axalta Coating Systems LLC, 4.875%, 08/15/24(b) | 1,955,000 | 2,003,875 | ||||||
Blue Cube Spinco, Inc., | 2,453,000 | 2,937,467 | ||||||
See Notes to Financial Statements.
67
Table of Contents
SCHEDULES OF PORTFOLIO INVESTMENTS
RIDGEWORTH FUNDS March 31, 2017
Seix High Income Fund — continued
| Shares or Principal Amount($) | Value($) | |||||||
Chemicals—continued |
| |||||||
Chemours Co. (The), 7.000%, 05/15/25(e) | 1,985,000 | 2,136,853 | ||||||
CVR Partners LP/CVR Nitrogen Finance Corp., 9.250%, 06/15/23(b)(e) | 835,000 | 856,919 | ||||||
Platform Specialty Products Corp., 10.375%, 05/01/21(b) | 490,000 | 545,125 | ||||||
Valvoline, Inc., 5.500%, 07/15/24(b) | 322,000 | 338,100 | ||||||
|
| |||||||
| 8,818,339 | ||||||||
|
| |||||||
Coal 2.1% |
| |||||||
CONSOL Energy, Inc., 5.875%, 04/15/22 | 1,560,000 | 1,542,450 | ||||||
CONSOL Energy, Inc., 8.000%, 04/01/23 | 3,415,000 | 3,590,019 | ||||||
Contura Energy, Inc., | 4,160,000 | 4,484,896 | ||||||
Foresight Energy LLC/Foresight Energy Finance Corp., 11.500%, 04/01/23(b)(e) | 1,965,000 | 1,837,275 | ||||||
|
| |||||||
| 11,454,640 | ||||||||
|
| |||||||
Commercial Services 3.3% |
| |||||||
Cardtronics, Inc., 5.500%, 05/01/25(b) | 870,000 | 879,787 | ||||||
Flexi-Van Leasing, Inc., 7.875%, 08/15/18 | 835,000 | 755,675 | ||||||
Gartner, Inc., 5.125%, 04/01/25(b) | 775,000 | 789,531 | ||||||
Herc Rentals, Inc., 7.500%, 06/01/22(b) | 1,390,000 | 1,476,875 | ||||||
Laureate Education, Inc., 9.250%, 09/01/19(b)(e) | 3,880,000 | 4,035,200 | ||||||
Prime Security Services Borrower LLC/Prime Finance, Inc., 9.250%, 05/15/23(b) | 1,015,000 | 1,112,694 | ||||||
Quad/Graphics, Inc., 7.000%, 05/01/22 | 1,290,000 | 1,290,000 | ||||||
Rent-A-Center, Inc., 4.750%, 05/01/21(e) | 1,756,000 | 1,439,920 | ||||||
Rent-A-Center, Inc., 6.625%, 11/15/20(e) | 1,063,000 | 940,755 | ||||||
Ritchie Bros Auctioneers, Inc., 5.375%, 01/15/25(b) | 1,290,000 | 1,319,025 | ||||||
Team Health Holdings, Inc., 6.375%, 02/01/25(b)(e) | 670,000 | 656,600 | ||||||
TMS International Corp., 7.625%, 10/15/21 | 2,665,000 | 2,684,987 | ||||||
United Rentals North America, Inc., 7.625%, 04/15/22 | 602,000 | 626,833 | ||||||
|
| |||||||
| 18,007,882 | ||||||||
|
| |||||||
| Shares or Principal Amount($) | Value($) | |||||||
Computers 2.8% |
| |||||||
Conduent Finance, Inc./Xerox Business Services LLC, 10.500%, 12/15/24(b) | 728,000 | 839,020 | ||||||
Dell, Inc., 6.500%, 04/15/38 | 1,342,000 | 1,308,450 | ||||||
Diamond 1 Finance Corp./Diamond 2 Finance Corp., 7.125%, 06/15/24(b)(e) | 1,430,000 | 1,580,835 | ||||||
Harland Clarke Holdings Corp., 6.875%, 03/01/20(b)(i) | 1,680,000 | 1,705,200 | ||||||
Harland Clarke Holdings Corp., 8.375%, 08/15/22(b) | 2,180,000 | 2,234,500 | ||||||
Harland Clarke Holdings Corp., 9.250%, 03/01/21(b) | 1,910,000 | 1,859,862 | ||||||
Western Digital Corp., 10.500%, 04/01/24 | 4,525,000 | 5,333,844 | ||||||
|
| |||||||
| 14,861,711 | ||||||||
|
| |||||||
Distribution/Wholesale 0.3% |
| |||||||
Univar USA, Inc., 6.750%, 07/15/23(b) | 1,555,000 | 1,613,313 | ||||||
|
| |||||||
Diversified Financial Services 9.6% |
| |||||||
Alliance Data Systems Corp., 5.875%, 11/01/21(b)(i) | 4,690,000 | 4,854,150 | ||||||
Ally Financial, Inc., 5.750%, 11/20/25 | 700,000 | 716,625 | ||||||
Ally Financial, Inc., 8.000%, 03/15/20 | 1,369,000 | 1,536,702 | ||||||
Ally Financial, Inc., 8.000%, 11/01/31 | 450,000 | 534,375 | ||||||
Jefferies Finance LLC/JFIN Co-Issuer Corp., 7.375%, 04/01/20(b) | 2,425,000 | 2,449,250 | ||||||
Nationstar Mortgage LLC/Nationstar Capital Corp., 6.500%, 08/01/18 | 5,200,000 | 5,265,000 | ||||||
Nationstar Mortgage LLC/Nationstar Capital Corp., 6.500%, 07/01/21 | 4,166,000 | 4,218,075 | ||||||
Nationstar Mortgage LLC/Nationstar Capital Corp., 6.500%, 06/01/22 | 827,000 | 827,000 | ||||||
Nationstar Mortgage LLC/Nationstar Capital Corp., 7.875%, 10/01/20 | 3,890,000 | 4,033,444 | ||||||
Nationstar Mortgage LLC/Nationstar Capital Corp., 9.625%, 05/01/19 | 1,025,000 | 1,053,188 | ||||||
Navient Corp., 5.500%, 01/15/19, MTN | 875,000 | 906,500 | ||||||
See Notes to Financial Statements.
68
Table of Contents
SCHEDULES OF PORTFOLIO INVESTMENTS
RIDGEWORTH FUNDS March 31, 2017
Seix High Income Fund — continued
| Shares or Principal Amount($) | Value($) | |||||||
Diversified Financial Services—continued |
| |||||||
Navient Corp., 6.500%, 06/15/22 | 1,089,000 | 1,098,529 | ||||||
Navient Corp., 8.000%, 03/25/20, MTN | 2,415,000 | 2,623,294 | ||||||
Navient Corp., 8.450%, 06/15/18, MTN | 1,805,000 | 1,922,325 | ||||||
Ocwen Loan Servicing LLC, 8.375%, 11/15/22(b) | 4,870,000 | 4,943,050 | ||||||
OneMain Financial Holdings LLC, 7.250%, 12/15/21(b) | 1,625,000 | 1,702,187 | ||||||
Quicken Loans, Inc., | 5,330,000 | 5,236,725 | ||||||
Springleaf Finance Corp., 8.250%, 12/15/20(e) | 1,755,000 | 1,917,337 | ||||||
Springleaf Finance Corp., 8.250%, 10/01/23 | 2,985,000 | 3,145,444 | ||||||
Walter Investment Management Corp., 7.875%, 12/15/21(e) | 4,350,000 | 2,555,625 | ||||||
|
| |||||||
| 51,538,825 | ||||||||
|
| |||||||
Electric 1.5% |
| |||||||
Dynegy, Inc., 7.375%, 11/01/22(e) | 1,220,000 | 1,207,800 | ||||||
GenOn Energy, Inc., 7.875%, 06/15/17 | 1,442,000 | 998,585 | ||||||
NRG Energy, Inc., 6.250%, 07/15/22 | 570,000 | 582,825 | ||||||
NRG Energy, Inc., 6.625%, 03/15/23(e) | 620,000 | 634,337 | ||||||
NRG Energy, Inc., 7.250%, 05/15/26(e) | 2,130,000 | 2,193,900 | ||||||
NRG Energy, Inc., 7.875%, 05/15/21 | 802,000 | 824,055 | ||||||
NRG Yield Operating LLC, 5.000%, 09/15/26(b)(e) | 1,620,000 | 1,575,450 | ||||||
|
| |||||||
| 8,016,952 | ||||||||
|
| |||||||
Electrical Components & Equipment 0.3% |
| |||||||
WESCO Distribution, Inc., 5.375%, 06/15/24 | 1,750,000 | 1,793,750 | ||||||
|
| |||||||
Electronics 0.3% |
| |||||||
Allegion PLC, 5.875%, 09/15/23 | 1,743,000 | 1,860,653 | ||||||
|
| |||||||
Energy-Alternate Sources 0.1% |
| |||||||
Enviva Partners LP/Enviva Partners Finance Corp., 8.500%, 11/01/21(b) | 500,000 | 530,000 | ||||||
|
| |||||||
| Shares or Principal Amount($) | Value($) | |||||||
Engineering & Construction 0.6% |
| |||||||
AECOM, 5.125%, 03/15/27(b) | 1,383,000 | 1,386,458 | ||||||
Engility Corp., 8.875%, 09/01/24(b) | 1,930,000 | 2,043,387 | ||||||
|
| |||||||
| 3,429,845 | ||||||||
|
| |||||||
Entertainment 1.5% |
| |||||||
CCM Merger, Inc., 6.000%, 03/15/22(b) | 400,000 | 408,000 | ||||||
Eagle II Acquisition Co. LLC, 6.000%, 04/01/25(b) | 1,005,000 | 1,035,150 | ||||||
EMI Music Publishing Group North America Holdings, Inc., 7.625%, 06/15/24(b) | 852,000 | 928,680 | ||||||
Gateway Casinos & Entertainment Ltd., 8.250%, 03/01/24(b) | 310,000 | 313,875 | ||||||
Lions Gate Entertainment Corp., 5.875%, 11/01/24(b) | 1,405,000 | 1,457,687 | ||||||
Mohegan Tribal Gaming Authority, 7.875%, 10/15/24(b)(e) | 1,745,000 | 1,768,994 | ||||||
WMG Acquisition Corp., | 630,000 | 636,300 | ||||||
WMG Acquisition Corp., | 1,600,000 | 1,656,000 | ||||||
|
| |||||||
| 8,204,686 | ||||||||
|
| |||||||
Environmental Control 0.3% |
| |||||||
GFL Environmental, Inc., 9.875%, 02/01/21(b) | 1,685,000 | 1,824,013 | ||||||
|
| |||||||
Food 1.9% |
| |||||||
JBS USA LLC/JBS USA Finance, Inc., 8.250%, 02/01/20(b) | 1,815,000 | 1,860,375 | ||||||
Lamb Weston Holdings, Inc., | 585,000 | 596,700 | ||||||
Post Holdings, Inc., | 1,970,000 | 1,886,275 | ||||||
Post Holdings, Inc., 5.500%, 03/01/25(b) | 457,000 | 459,285 | ||||||
Post Holdings, Inc., 5.750%, 03/01/27(b) | 571,000 | 569,573 | ||||||
Post Holdings, Inc., 8.000%, 07/15/25(b) | 2,070,000 | 2,323,575 | ||||||
U.S. Foods, Inc., 5.875%, 06/15/24(b) | 2,481,000 | 2,574,037 | ||||||
|
| |||||||
| 10,269,820 | ||||||||
|
| |||||||
Forest Products & Paper 0.2% |
| |||||||
Resolute Forest Products, Inc., 5.875%, 05/15/23(e) | 1,140,000 | 1,040,250 | ||||||
|
| |||||||
See Notes to Financial Statements.
69
Table of Contents
SCHEDULES OF PORTFOLIO INVESTMENTS
RIDGEWORTH FUNDS March 31, 2017
Seix High Income Fund — continued
| Shares or Principal Amount($) | Value($) | |||||||
Gas 0.3% |
| |||||||
AmeriGas Partners LP/AmeriGas Finance Corp., 5.750%, 05/20/27 | 1,520,000 | 1,500,620 | ||||||
|
| |||||||
Healthcare-Products 0.7% |
| |||||||
Greatbatch Ltd., 9.125%, 11/01/23(b) | 2,347,000 | 2,476,085 | ||||||
Teleflex, Inc., 5.250%, 06/15/24 | 1,263,000 | 1,288,260 | ||||||
|
| |||||||
| 3,764,345 | ||||||||
|
| |||||||
Healthcare-Services 7.1% |
| |||||||
Centene Corp., 5.625%, 02/15/21 | 2,530,000 | 2,647,898 | ||||||
CHS/Community Health Systems, Inc., 6.250%, 03/31/23 | 1,146,000 | 1,166,055 | ||||||
CHS/Community Health Systems, Inc., 6.875%, 02/01/22(e) | 2,145,000 | 1,844,700 | ||||||
CHS/Community Health Systems, Inc., 8.000%, 11/15/19(e) | 2,640,000 | 2,590,500 | ||||||
DaVita, Inc., 5.000%, 05/01/25 | 4,810,000 | 4,822,025 | ||||||
DaVita, Inc., 5.750%, 08/15/22 | 1,405,000 | 1,454,175 | ||||||
HCA Holdings, Inc., | 2,865,000 | 3,092,409 | ||||||
HCA, Inc., 5.250%, 06/15/26 | 1,020,000 | 1,073,550 | ||||||
HCA, Inc., 6.500%, 02/15/20 | 2,215,000 | 2,424,052 | ||||||
HCA, Inc., 7.500%, 11/06/33 | 280,000 | 306,250 | ||||||
HCA, Inc., 7.500%, 11/15/95 | 720,000 | 702,900 | ||||||
Kindred Healthcare, Inc., 8.000%, 01/15/20 | 2,595,000 | 2,637,169 | ||||||
Kindred Healthcare, Inc., 8.750%, 01/15/23(e) | 1,160,000 | 1,162,900 | ||||||
MPH Acquisition Holdings LLC, 7.125%, 06/01/24(b) | 1,003,000 | 1,078,350 | ||||||
Opal Acquisition, Inc., | 1,005,000 | 874,350 | ||||||
Tenet Healthcare Corp., 6.000%, 10/01/20 | 1,585,000 | 1,676,138 | ||||||
Tenet Healthcare Corp., | 4,620,000 | 4,822,125 | ||||||
WellCare Health Plans, Inc., 5.250%, 04/01/25 | 2,245,000 | 2,297,308 | ||||||
WellCare Health Plans, Inc., 5.750%, 11/15/20 | 1,400,000 | 1,440,600 | ||||||
|
| |||||||
| 38,113,454 | ||||||||
|
| |||||||
| Shares or Principal Amount($) | Value($) | |||||||
Home Builders 3.3% |
| |||||||
CalAtlantic Group, Inc., 5.875%, 11/15/24 | 1,650,000 | 1,732,500 | ||||||
Century Communities, Inc., 6.875%, 05/15/22(b) | 2,180,000 | 2,267,200 | ||||||
Lennar Corp., 4.750%, 04/01/21 | 1,160,000 | 1,209,300 | ||||||
Mattamy Group Corp., 6.500%, | 1,070,000 | 1,099,425 | ||||||
Mattamy Group Corp., 6.875%, | 528,000 | 547,800 | ||||||
New Home Co., Inc. (The), 7.250%, 04/01/22(b)(e) | 735,000 | 740,513 | ||||||
PulteGroup, Inc., 4.250%, 03/01/21 | 1,755,000 | 1,803,262 | ||||||
PulteGroup, Inc., 5.500%, 03/01/26 | 695,000 | 719,325 | ||||||
Shea Homes LP/Shea Homes Funding Corp., 5.875%, 04/01/23(b) | 1,665,000 | 1,673,325 | ||||||
Taylor Morrison Communities, Inc./Monarch Communities, Inc., 5.250%, 04/15/21(b) | 935,000 | 963,050 | ||||||
TRI Pointe Group, Inc., 4.875%, 07/01/21 | 3,201,000 | 3,297,030 | ||||||
TRI Pointe Group, Inc./TRI Pointe Homes, Inc., 5.875%, 06/15/24 | 1,590,000 | 1,637,700 | ||||||
|
| |||||||
| 17,690,430 | ||||||||
|
| |||||||
Insurance 1.0% |
| |||||||
MGIC Investment Corp., 5.750%, 08/15/23 | 2,640,000 | 2,785,200 | ||||||
Radian Group, Inc., 7.000%, 03/15/21 | 2,252,000 | 2,491,275 | ||||||
|
| |||||||
| 5,276,475 | ||||||||
|
| |||||||
Internet 0.4% |
| |||||||
Cogent Communications Group, Inc., 5.375%, 03/01/22(b) | 520,000 | 533,650 | ||||||
Zayo Group LLC/Zayo Capital, Inc., 6.000%, 04/01/23 | 1,770,000 | 1,869,562 | ||||||
|
| |||||||
| 2,403,212 | ||||||||
|
| |||||||
Leisure Time 0.6% |
| |||||||
Silversea Cruise Finance Ltd., 7.250%, 02/01/25(b) | 1,340,000 | 1,407,000 | ||||||
Viking Cruises Ltd., 8.500%, 10/15/22(b) | 1,550,000 | 1,608,125 | ||||||
|
| |||||||
| 3,015,125 | ||||||||
|
| |||||||
See Notes to Financial Statements.
70
Table of Contents
SCHEDULES OF PORTFOLIO INVESTMENTS
RIDGEWORTH FUNDS March 31, 2017
Seix High Income Fund — continued
| Shares or Principal Amount($) | Value($) | |||||||
Lodging 4.3% |
| |||||||
Caesars Entertainment Resort Properties LLC/Caesars Entertainment Resort Prope, 11.000%, 10/01/21 | 3,485,000 | 3,798,650 | ||||||
Caesars Growth Properties Holdings LLC/Caesars Growth Properties Finance, Inc., 9.375%, 05/01/22 | 3,570,000 | 3,837,750 | ||||||
Diamond Resorts International, Inc., 10.750%, 09/01/24(b)(e) | 1,055,000 | 1,097,200 | ||||||
Downstream Development Authority of the Quapaw Tribe of Oklahoma, 10.500%, 07/01/19(b) | 1,680,000 | 1,638,000 | ||||||
Hilton Grand Vacations Borrower LLC/Hilton Grand Vacations Borrower, Inc., 6.125%, 12/01/24(b) | 820,000 | 861,000 | ||||||
Hilton Worldwide Finance LLC/Hilton Worldwide Finance Corp., 4.625%, 04/01/25(b) | 933,000 | 944,383 | ||||||
Jack Ohio Finance LLC/Jack Ohio Finance 1 Corp., | 1,207,000 | 1,294,133 | ||||||
MGM Resorts International, 6.000%, 03/15/23 | 3,075,000 | 3,321,000 | ||||||
MGM Resorts International, 6.750%, 10/01/20 | 545,000 | 599,500 | ||||||
MGM Resorts International, 7.750%, 03/15/22(i) | 4,945,000 | 5,705,294 | ||||||
|
| |||||||
| 23,096,910 | ||||||||
|
| |||||||
Media 6.3% |
| |||||||
Altice Finco SA, 7.625%, 02/15/25(b)(e) | 1,500,000 | 1,541,250 | ||||||
Altice Luxembourg SA, | 2,175,000 | 2,308,219 | ||||||
CBS Radio, Inc., 7.250%, 11/01/24(b)(e) | 809,000 | 849,450 | ||||||
CCO Holdings LLC/CCO Holdings Capital Corp., 5.125%, 05/01/27(b)(c) | 2,905,000 | 2,919,525 | ||||||
CCO Holdings LLC/CCO Holdings Capital Corp., 5.750%, 09/01/23 | 505,000 | 525,200 | ||||||
CCO Holdings LLC/CCO Holdings Capital Corp., 5.750%, 02/15/26(b) | 1,405,000 | 1,475,250 | ||||||
| Shares or Principal Amount($) | Value($) | |||||||
Media—continued |
| |||||||
Cequel Communications Holdings I LLC/Cequel Capital Corp., 6.375%, 09/15/20(b) | 320,000 | 329,600 | ||||||
Cequel Communications Holdings I LLC/Cequel Capital Corp., 7.750%, 07/15/25(b) | 2,510,000 | 2,775,119 | ||||||
Clear Channel Worldwide Holdings, Inc., Series B, 6.500%, 11/15/22 | 1,475,000 | 1,534,000 | ||||||
CSC Holdings LLC, 10.125%, 01/15/23(b) | 1,000,000 | 1,160,000 | ||||||
CSC Holdings LLC, 10.875%, 10/15/25(b) | 2,650,000 | 3,186,625 | ||||||
DISH DBS Corp., 7.875%, 09/01/19 | 2,310,000 | 2,546,775 | ||||||
Lee Enterprises, Inc., | 2,040,000 | 2,141,082 | ||||||
McGraw-Hill Global Education Holdings LLC/McGraw-Hill Global Education Finance, 7.875%, 05/15/24(b)(e) | 615,000 | 595,012 | ||||||
SFR Group SA, 7.375%, 05/01/26(b) | 2,450,000 | 2,523,500 | ||||||
Univision Communications, Inc., 6.750%, 09/15/22(b) | 1,434,000 | 1,504,252 | ||||||
Viacom, Inc., 6.250%, 02/28/57(a)(e) | 1,240,000 | 1,249,920 | ||||||
WideOpenWest Finance LLC/WideOpenWest Capital Corp., 10.250%, 07/15/19 | 1,508,000 | 1,570,205 | ||||||
Ziggo Bond Finance BV, 5.875%, 01/15/25(b) | 1,850,000 | 1,863,875 | ||||||
Ziggo Secured Finance BV, 5.500%, 01/15/27(b) | 1,090,000 | 1,089,891 | ||||||
|
| |||||||
| 33,688,750 | ||||||||
|
| |||||||
Metal Fabricate/Hardware 0.4% |
| |||||||
Grinding Media, Inc./MC Grinding Media Canada, Inc., 7.375%, 12/15/23(b) | 210,000 | 220,500 | ||||||
Novelis Corp., 6.250%, 08/15/24(b) | 1,645,000 | 1,714,912 | ||||||
|
| |||||||
| 1,935,412 | ||||||||
|
| |||||||
Mining 0.8% |
| |||||||
Imperial Metals Corp., 7.000%, 03/15/19 | 2,948,000 | 2,793,230 | ||||||
Kaiser Aluminum Corp., 5.875%, 05/15/24 | 1,324,000 | 1,379,860 | ||||||
|
| |||||||
| 4,173,090 | ||||||||
|
| |||||||
See Notes to Financial Statements.
71
Table of Contents
SCHEDULES OF PORTFOLIO INVESTMENTS
RIDGEWORTH FUNDS March 31, 2017
Seix High Income Fund — continued
| Shares or Principal Amount($) | Value($) | |||||||
Miscellaneous Manufacturer 0.8% |
| |||||||
Bombardier, Inc., 7.500%, 03/15/25(b) | 1,950,000 | 1,998,750 | ||||||
Bombardier, Inc., 7.750%, 03/15/20(b) | 585,000 | 624,487 | ||||||
Bombardier, Inc., 8.750%, 12/01/21(b) | 1,475,000 | 1,615,125 | ||||||
|
| |||||||
| 4,238,362 | ||||||||
|
| |||||||
Oil & Gas 9.5% |
| |||||||
Antero Resources Corp., 5.625%, 06/01/23 | 195,000 | 199,388 | ||||||
Ascent Resources Utica Holdings LLC/ARU Finance Corp., 10.000%, 04/01/22(b)(c) | 940,000 | 972,900 | ||||||
Atwood Oceanics, Inc., | 1,550,000 | 1,396,938 | ||||||
California Resources Corp., | 2,515,000 | 2,043,437 | ||||||
Callon Petroleum Co., | 1,025,000 | 1,066,000 | ||||||
Chesapeake Energy Corp., 6.625%, 08/15/20 | 4,220,000 | 4,214,725 | ||||||
Chesapeake Energy Corp., 6.875%, 11/15/20 | 2,975,000 | 2,967,562 | ||||||
Chesapeake Energy Corp., 8.000%, 12/15/22(b)(e) | 4,015,000 | 4,205,712 | ||||||
Chesapeake Energy Corp., 8.000%, 01/15/25(b)(e) | 1,300,000 | 1,300,000 | ||||||
CITGO Petroleum Corp., 6.250%, 08/15/22(b) | 1,475,000 | 1,493,437 | ||||||
Denbury Resources, Inc., 9.000%, 05/15/21(b) | 1,170,000 | 1,234,350 | ||||||
Diamondback Energy, Inc., 4.750%, 11/01/24(b) | 998,000 | 1,003,888 | ||||||
Diamondback Energy, Inc., 5.375%, 05/31/25(b) | 1,083,000 | 1,110,075 | ||||||
Eclipse Resources Corp., 8.875%, 07/15/23 | 2,480,000 | 2,529,600 | ||||||
Ensco PLC, 5.750%, 10/01/44 | 1,815,000 | 1,370,325 | ||||||
Ensco PLC, 8.000%, 01/31/24(e) | 1,383,000 | 1,400,288 | ||||||
EP Energy LLC/Everest Acquisition Finance, Inc., 8.000%, 02/15/25(b) | 1,183,000 | 1,100,190 | ||||||
EP Energy LLC/Everest Acquisition Finance, Inc., 9.375%, 05/01/20 | 3,166,000 | 2,984,588 | ||||||
MEG Energy Corp., | 235,000 | 235,000 | ||||||
| Shares or Principal Amount($) | Value($) | |||||||
Oil & Gas—continued |
| |||||||
MEG Energy Corp., 7.000%, 03/31/24(b) | 1,980,000 | 1,772,100 | ||||||
Nabors Industries, Inc., | 1,260,000 | 1,285,988 | ||||||
Precision Drilling Corp., 6.625%, 11/15/20 | 1,010,374 | 1,015,426 | ||||||
Precision Drilling Corp., | 800,000 | 842,000 | ||||||
Pride International LLC, 7.875%, 08/15/40 | 1,050,000 | 971,250 | ||||||
Range Resources Corp., 5.750%, 06/01/21(b) | 2,819,000 | 2,889,475 | ||||||
Rice Energy, Inc., 6.250%, 05/01/22 | 1,797,000 | 1,850,910 | ||||||
Rowan Cos., Inc., 4.750%, 01/15/24 | 1,210,000 | 1,085,975 | ||||||
Rowan Cos., Inc., 4.875%, 06/01/22 | 1,349,000 | 1,288,295 | ||||||
Rowan Cos., Inc., 5.850%, 01/15/44 | 1,410,000 | 1,085,700 | ||||||
SandRidge Energy, Inc., Escrow, 8.125%, 10/15/22(f)(g) | 1,935,000 | 3,870 | ||||||
Seven Generations Energy Ltd., 6.750%, 05/01/23(b)(e) | 1,571,000 | 1,641,695 | ||||||
Transocean, Inc., 6.800%, 03/15/38 | 675,000 | 555,188 | ||||||
Transocean, Inc., 7.500%, 04/15/31 | 585,000 | 526,500 | ||||||
Transocean, Inc., 9.000%, 07/15/23(b) | 1,275,000 | 1,361,063 | ||||||
|
| |||||||
| 51,003,838 | ||||||||
|
| |||||||
Oil & Gas Services 1.6% |
| |||||||
FTS International, Inc., 8.631%, | 1,400,000 | 1,419,250 | ||||||
KCA Deutag UK Finance PLC, 7.250%, 05/15/21 | 2,005,000 | 1,875,297 | ||||||
KCA Deutag UK Finance PLC, 9.875%, 04/01/22(b)(c) | 1,960,000 | 2,011,450 | ||||||
SESI LLC, 6.375%, 05/01/19 | 2,500,000 | 2,493,750 | ||||||
SESI LLC, 7.125%, 12/15/21(e) | 790,000 | 799,875 | ||||||
|
| |||||||
| 8,599,622 | ||||||||
|
| |||||||
Packaging & Containers 0.5% |
| |||||||
Reynolds Group Issuer, Inc./Reynolds Group Issuer LLC/Reynolds Group Issuer Lu, 5.125%, 07/15/23(b) | 2,445,000 | 2,512,237 | ||||||
|
| |||||||
Pharmaceuticals 2.8% |
| |||||||
Endo Finance LLC/Endo Finco, Inc., 7.250%, 01/15/22(b) | 2,495,000 | 2,357,775 | ||||||
See Notes to Financial Statements.
72
Table of Contents
SCHEDULES OF PORTFOLIO INVESTMENTS
RIDGEWORTH FUNDS March 31, 2017
Seix High Income Fund — continued
| Shares or Principal Amount($) | Value($) | |||||||
Pharmaceuticals—continued |
| |||||||
Horizon Pharma, Inc., 6.625%, | 1,080,000 | 1,058,400 | ||||||
inVentiv Group Holdings, Inc./inVentiv Health, Inc./inVentiv Health Clinical, Inc., 7.500%, 10/01/24(b) | 1,945,000 | 2,000,919 | ||||||
Valeant Pharmaceuticals International, Inc., 6.125%, 04/15/25(b)(e) | 3,040,000 | 2,340,800 | ||||||
Valeant Pharmaceuticals International, Inc., 6.500%, 03/15/22(b)(e) | 899,000 | 924,846 | ||||||
Valeant Pharmaceuticals International, Inc., 6.750%, 08/15/21(b) | 975,000 | 840,937 | ||||||
Valeant Pharmaceuticals International, Inc., 7.000%, 03/15/24(b) | 1,855,000 | 1,903,694 | ||||||
Valeant Pharmaceuticals International, Inc., 7.500%, 07/15/21(b) | 4,380,000 | 3,837,975 | ||||||
|
| |||||||
| 15,265,346 | ||||||||
|
| |||||||
Pipelines 1.7% |
| |||||||
Cheniere Corpus Christi Holdings LLC, 7.000%, 06/30/24(b) | 1,190,000 | 1,310,487 | ||||||
Crestwood Midstream Partners LP/Crestwood Midstream Finance Corp., 5.750%, 04/01/25(b)(e) | 1,146,000 | 1,170,353 | ||||||
Rockies Express Pipeline LLC, 5.625%, 04/15/20(b) | 390,000 | 410,475 | ||||||
Rockies Express Pipeline LLC, 6.000%, 01/15/19(b) | 2,635,000 | 2,746,987 | ||||||
Rockies Express Pipeline LLC, 6.850%, 07/15/18(b) | 1,241,000 | 1,296,845 | ||||||
Tesoro Logistics LP/Tesoro Logistics Finance Corp., 5.250%, 01/15/25 | 606,000 | 633,270 | ||||||
Tesoro Logistics LP/Tesoro Logistics Finance Corp., 6.125%, 10/15/21 | 1,755,000 | 1,836,169 | ||||||
|
| |||||||
| 9,404,586 | ||||||||
|
| |||||||
Private Equity 0.5% |
| |||||||
Icahn Enterprises LP/Icahn Enterprises Finance Corp., 6.000%, 08/01/20 | 2,742,000 | 2,837,970 | ||||||
|
| |||||||
| Shares or Principal Amount($) | Value($) | |||||||
Real Estate 1.0% |
| |||||||
Greystar Real Estate Partners LLC, 8.250%, 12/01/22(b) | 370,000 | 399,137 | ||||||
Howard Hughes Corp. (The), 5.375%, 03/15/25(b) | 1,955,000 | 1,935,450 | ||||||
Realogy Group LLC/Realogy Co-Issuer Corp., 4.875%, 06/01/23(b) | 1,610,000 | 1,573,775 | ||||||
Realogy Group LLC/Realogy Co-Issuer Corp., 5.250%, 12/01/21(b)(e) | 1,470,000 | 1,528,800 | ||||||
|
| |||||||
| 5,437,162 | ||||||||
|
| |||||||
Real Estate Investment Trust 3.5% |
| |||||||
Care Capital Properties LP, 5.125%, 08/15/26 | 1,675,000 | 1,656,900 | ||||||
iStar, Inc., 6.000%, 04/01/22(e) | 1,118,000 | 1,134,770 | ||||||
iStar, Inc., 6.500%, 07/01/21 | 3,353,000 | 3,445,208 | ||||||
iStar, Inc., 7.125%, 02/15/18 | 5,265,000 | 5,449,275 | ||||||
iStar, Inc., 9.000%, 06/01/17 | 2,220,000 | 2,244,975 | ||||||
SBA Communications Corp., 4.875%, 09/01/24(b) | 630,000 | 621,999 | ||||||
Starwood Property Trust, Inc., 5.000%, 12/15/21(b) | 4,173,000 | 4,329,487 | ||||||
|
| |||||||
| 18,882,614 | ||||||||
|
| |||||||
Retail 2.8% |
| |||||||
DriveTime Automotive Group, Inc./Bridgecrest Acceptance Corp., 8.000%, 06/01/21(b) | 645,000 | 632,100 | ||||||
L Brands, Inc., 6.750%, 07/01/36 | 625,000 | 595,500 | ||||||
Men’s Wearhouse, Inc. (The), 7.000%, 07/01/22(e) | 2,690,000 | 2,387,375 | ||||||
New Albertsons, Inc., 7.450%, 08/01/29 | 1,790,000 | 1,696,025 | ||||||
Penske Automotive Group, Inc., 5.375%, 12/01/24 | 640,000 | 641,600 | ||||||
Rite Aid Corp., 6.125%, 04/01/23(b)(e) | 3,700,000 | 3,667,625 | ||||||
Rite Aid Corp., 6.750%, 06/15/21(e) | 2,515,000 | 2,526,003 | ||||||
Sears Holdings Corp., | 1,695,000 | 1,322,100 | ||||||
TRU Taj LLC/TRU Taj Finance, Inc., 12.000%, 08/15/21(b) | 2,095,000 | 1,848,838 | ||||||
|
| |||||||
| 15,317,166 | ||||||||
|
| |||||||
Software 2.3% |
| |||||||
Change Healthcare Holdings LLC/Change Healthcare Finance, Inc., 5.750%, 03/01/25(b) | 1,595,000 | 1,634,875 | ||||||
See Notes to Financial Statements.
73
Table of Contents
SCHEDULES OF PORTFOLIO INVESTMENTS
RIDGEWORTH FUNDS March 31, 2017
Seix High Income Fund — continued
| Shares or Principal Amount($) | Value($) | |||||||
Software—continued |
| |||||||
Donnelley Financial Solutions, Inc., 8.250%, 10/15/24(b)(e) | 1,705,000 | 1,760,412 | ||||||
First Data Corp., 5.375%, 08/15/23(b) | 1,620,000 | 1,686,825 | ||||||
First Data Corp., 7.000%, 12/01/23(b)(e) | 2,215,000 | 2,375,587 | ||||||
Infor US, Inc., 6.500%, 05/15/22 | 730,000 | 750,148 | ||||||
Nuance Communications, Inc., 5.625%, 12/15/26(b) | 1,551,000 | 1,585,898 | ||||||
Quintiles IMS, Inc., 5.000%, 10/15/26(b) | 1,390,000 | 1,395,213 | ||||||
Solera LLC/Solera Finance, Inc., 10.500%, 03/01/24(b) | 1,090,000 | 1,245,325 | ||||||
|
| |||||||
| 12,434,283 | ||||||||
|
| |||||||
Telecommunication Services 5.8% |
| |||||||
Cincinnati Bell, Inc., 7.000%, 07/15/24(b) | 4,460,000 | 4,677,425 | ||||||
Cogent Communications Finance, Inc., 5.625%, 04/15/21(b) | 745,000 | 759,900 | ||||||
Digicel Group Ltd., 8.250%, 09/30/20(b) | 1,425,000 | 1,224,645 | ||||||
Frontier Communications Corp., 7.875%, 01/15/27 | 730,000 | 599,388 | ||||||
Frontier Communications Corp., 11.000%, 09/15/25 | 2,230,000 | 2,168,675 | ||||||
HC2 Holdings, Inc., 11.000%, 12/01/19(b) | 1,125,000 | 1,147,500 | ||||||
Intelsat Jackson Holdings S.A., 7.250%, 10/15/20 | 4,065,000 | 3,704,231 | ||||||
Level 3 Financing, Inc., 5.375%, 05/01/25 | 735,000 | 747,863 | ||||||
Sprint Communications, Inc., 11.500%, 11/15/21 | 3,045,000 | 3,821,475 | ||||||
Sprint Corp., 7.875%, 09/15/23 | 2,145,000 | 2,375,588 | ||||||
Trilogy International Partners LLC/Trilogy International Finance, Inc., 13.375%, 05/15/19(i) | 5,215,000 | 5,280,187 | ||||||
ViaSat, Inc., 6.875%, 06/15/20(e) | 2,745,000 | 2,806,763 | ||||||
West Corp., 5.375%, 07/15/22(b) | 1,760,000 | 1,729,200 | ||||||
|
| |||||||
| 31,042,840 | ||||||||
|
| |||||||
| Shares or Principal Amount($) | Value($) | |||||||
Transportation 1.4% |
| |||||||
Florida East Coast Holdings Corp., 6.750%, 05/01/19(b) | 2,830,000 | 2,914,900 | ||||||
Hornbeck Offshore Services, Inc., 1.500%, 09/01/19(e) | 985,000 | 640,250 | ||||||
Hornbeck Offshore Services, Inc., 5.000%, 03/01/21 | 1,960,000 | 1,185,800 | ||||||
Hornbeck Offshore Services, Inc., 5.875%, 04/01/20 | 2,302,000 | 1,473,280 | ||||||
Navios South American Logistics, Inc./Navios Logistics Finance US, Inc., 7.250%, 05/01/22(b) | 1,230,000 | 1,205,400 | ||||||
|
| |||||||
| 7,419,630 | ||||||||
|
| |||||||
Total Corporate Bonds | 490,710,974 | |||||||
|
| |||||||
Convertible Preferred Stock 0.1% |
| |||||||
Telecommunication Services 0.1% |
| |||||||
T-Mobile US, Inc., 5.500%, 12/15/17 | 6,065 | 641,738 | ||||||
|
| |||||||
Total Convertible Preferred Stock | 641,738 | |||||||
|
| |||||||
Preferred Stock 0.2% |
| |||||||
Banks 0.2% |
| |||||||
GMAC Capital Trust I, Series 2, | 42,810 | 1,088,658 | ||||||
|
| |||||||
Total Preferred Stock | 1,088,658 | |||||||
|
| |||||||
Warrants 0.0%(d) |
| |||||||
Oil & Gas 0.0%(d) |
| |||||||
SandRidge Energy, Inc.*(g) | 3,760 | 4,700 | ||||||
SandRidge Energy, Inc.*(g) | 1,583 | 1,979 | ||||||
|
| |||||||
Total Warrants | 6,679 | |||||||
|
| |||||||
Common Stocks 1.6% |
| |||||||
Auto Manufacturers 0.5% |
| |||||||
General Motors Co. | 76,364 | 2,700,231 | ||||||
|
| |||||||
Oil & Gas 1.0% | ||||||||
Linn Energy, Inc.* | 116,734 | 3,385,286 | ||||||
SandRidge Energy, Inc.* | 39,265 | 726,010 | ||||||
Templar Energy LLC, Cl A* | 159,460 | 1,176,019 | ||||||
|
| |||||||
| 5,287,315 | ||||||||
|
| |||||||
Telecommunication Services 0.1% |
| |||||||
NII Holding, Inc.*(e) | 284,455 | 369,792 | ||||||
|
| |||||||
Total Common Stocks | 8,357,338 | |||||||
|
| |||||||
See Notes to Financial Statements.
74
Table of Contents
SCHEDULES OF PORTFOLIO INVESTMENTS
RIDGEWORTH FUNDS March 31, 2017
Seix High Income Fund — concluded
| Shares or Principal Amount($) | Value($) | |||||||
Money Market Funds 9.4% |
| |||||||
State Street Institutional Treasury Money Market Fund, Premier Class, 0.53%(j) | 3,189,676 | 3,189,676 | ||||||
State Street Institutional U.S. Government Money Market Fund, Premier Class, 0.62%(j)(k) | 47,734,256 | 47,734,256 | ||||||
|
| |||||||
Total Money Market Funds | 50,923,932 | |||||||
|
| |||||||
Total Investments |
| 565,666,402 | ||||||
Liabilities in Excess of Other Assets — (5.0)% | (26,811,200 | ) | ||||||
|
| |||||||
Net Assets — 100.0% | $ | 538,855,202 | ||||||
|
| |||||||
| * | Non-income producing security. |
| (a) | Variable or floating rate security. Rate disclosed is as of March 31, 2017. |
| (b) | Rule 144A, Section 4(2) or other security which is restricted as to resale to institutional investors. The Fund’s investment adviser/subadviser has deemed this security to be liquid based upon procedures approved by the Board of Trustees. These securities represent 47.6% of net assets as of March 31, 2017. |
| (c) | All or a portion of this security has been purchased on a when-issued or delayed-delivery basis. |
| (d) | Less than 0.05% of Net Assets. |
| (e) | The security or a partial position of the security was on loan as of March 31, 2017. The total value of securities on loan as of March 31, 2017 was $56,090,727. |
| (f) | Security is in default. |
| (g) | Valued at fair value using procedures approved by the Board of Trustees (See Note 2(a)). Fair valued securities held by the Fund represent 0.0% of net assets as of March 31, 2017. |
| (h) | Perpetual maturity. |
| (i) | All or a portion of this security has been segregated, or otherwise earmarked, in connection with obligations for when-issued or delayed-delivery purchase commitments. |
| (j) | Rate disclosed, the 7 day yield, is as of March 31, 2017. |
| (k) | Purchased with cash collateral held from securities lending. The total value of the collateral held by the Fund was $59,760,661. The total value of the collateral includes non-cash U.S. Government securities collateral having a value of $12,026,405. The value of the collateral could include collateral held for securities that were sold on or before March 31, 2017 (See Note 2(k)). |
Investment Abbreviations
MTN — Medium Term Note
See Notes to Financial Statements.
75
Table of Contents
SCHEDULES OF PORTFOLIO INVESTMENTS
RIDGEWORTH FUNDS March 31, 2017
Seix High Yield Fund
| Shares or Principal Amount($) | Value($) | |||||||
| Bank Loans 2.6% | ||||||||
Cable/Wireless Video 0.2% |
| |||||||
Liberty Cablevision of Puerto Rico LLC, 1st Lien Term Loan, 4.523%, | 1,025,000 | 1,020,306 | ||||||
|
| |||||||
Chemicals 0.4% |
| |||||||
Chemours Co. (The), Term Loan B, 6.000%, 05/12/22(a)(b) | 1,400,647 | 1,407,651 | ||||||
Kraton Polymers LLC, 2016 Term Loan B, 5.000%, 01/06/22(a)(b) | 734,867 | 741,297 | ||||||
|
| |||||||
| 2,148,948 | ||||||||
|
| |||||||
Energy 0.3% |
| |||||||
California Resources Corp., Second Out Term Loan, 11.375%, 12/31/21(a)(b) | 1,195,000 | 1,318,479 | ||||||
|
| |||||||
Financial 0.6% |
| |||||||
Freedom Mortgage Corp., 1st Lien Term Loan, 6.862%, 02/26/22(a)(b) | 880,000 | 892,100 | ||||||
Walter Investment Management Corp., 2013 Term Loan, | 2,757,926 | 2,372,809 | ||||||
|
| |||||||
| 3,264,909 | ||||||||
|
| |||||||
Retail 0.9% |
| |||||||
Neiman Marcus Group Ltd. LLC, 2020 Term Loan, 4.250%, 10/25/20(a)(b)(c) | 1,585,000 | 1,271,392 | ||||||
Sears Holding Corp., Incremental Term Loan, 8.500%, 07/20/20(a)(b) | 171,233 | 172,731 | ||||||
Sears Roebuck Acceptance Corp., 2015 Term Loan, 5.500%, 06/30/18(a)(b) | 3,280,691 | 3,236,599 | ||||||
|
| |||||||
| 4,680,722 | ||||||||
|
| |||||||
Service 0.2% |
| |||||||
Laureate Education, Inc., 2016 Term Loan, 8.509%, 03/17/21(a)(b) | 1,205,191 | 1,214,230 | ||||||
|
| |||||||
Total Bank Loans | 13,647,594 | |||||||
|
| |||||||
Corporate Bonds 88.8% |
| |||||||
Airlines 1.9% |
| |||||||
Air Canada Pass Through Trust, Series 2013-1, Cl C, | 790,000 | 821,600 | ||||||
| Shares or Principal Amount($) | Value($) | |||||||
Airlines—continued |
| |||||||
Air Canada Pass Through Trust, Series 2015-1, Cl C, | 490,000 | 496,762 | ||||||
American Airlines Pass Through Trust, Series 2013-2, Cl B, | 3,058,065 | 3,161,274 | ||||||
U.S. Airways Pass Through Trust, Series 2012-2, Cl B, 6.750%, 06/03/21 | 2,533,640 | 2,742,665 | ||||||
United Airlines Pass Through Trust, Series 2014-1, Cl B, 4.750%, 04/11/22 | 2,944,133 | 3,003,016 | ||||||
|
| |||||||
| 10,225,317 | ||||||||
|
| |||||||
Auto Parts & Equipment 1.4% |
| |||||||
Allison Transmission, Inc., 5.000%, 10/01/24(b) | 2,295,000 | 2,317,950 | ||||||
American Axle & Manufacturing, Inc., 6.250%, 04/01/25(b)(d) | 1,360,000 | 1,361,700 | ||||||
American Axle & Manufacturing, Inc., 6.500%, 04/01/27(b) | 1,360,000 | 1,355,743 | ||||||
Deck Chassis Acquisition, Inc., 10.000%, 06/15/23(b) | 1,320,000 | 1,412,400 | ||||||
TI Group Automotive Systems LLC, 8.750%, 07/15/23(b) | 1,080,000 | 1,145,697 | ||||||
|
| |||||||
| 7,593,490 | ||||||||
|
| |||||||
Banks 1.1% |
| |||||||
Provident Funding Associates LP/PFG Finance Corp., 6.750%, 06/15/21(b) | 4,320,000 | 4,406,400 | ||||||
Royal Bank of Scotland Group PLC, 8.625%(a)(e) | 1,295,000 | 1,350,037 | ||||||
|
| |||||||
| 5,756,437 | ||||||||
|
| |||||||
Building Materials 0.4% |
| |||||||
Summit Materials LLC/Summit Materials Finance Corp., 8.500%, 04/15/22 | 1,865,000 | 2,051,500 | ||||||
|
| |||||||
Chemicals 1.7% |
| |||||||
Axalta Coating Systems LLC, 4.875%, 08/15/24(b) | 1,550,000 | 1,588,750 | ||||||
Blue Cube Spinco, Inc., 9.750%, | 2,285,000 | 2,736,287 | ||||||
Chemours Co. (The), 7.000%, 05/15/25(d) | 1,730,000 | 1,862,345 | ||||||
GCP Applied Technologies, Inc., 9.500%, 02/01/23(b) | 1,005,000 | 1,140,675 | ||||||
See Notes to Financial Statements.
76
Table of Contents
SCHEDULES OF PORTFOLIO INVESTMENTS
RIDGEWORTH FUNDS March 31, 2017
Seix High Yield Fund — continued
| Shares or Principal Amount($) | Value($) | |||||||
Chemicals—continued |
| |||||||
Platform Specialty Products Corp., 10.375%, 05/01/21(b) | 495,000 | 550,688 | ||||||
Valvoline, Inc., 5.500%, 07/15/24(b)(d) | 1,107,000 | 1,162,350 | ||||||
|
| |||||||
| 9,041,095 | ||||||||
|
| |||||||
Coal 1.6% |
| |||||||
CONSOL Energy, Inc., 5.875%, 04/15/22 | 1,854,000 | 1,833,142 | ||||||
CONSOL Energy, Inc., 8.000%, 04/01/23 | 3,015,000 | 3,169,519 | ||||||
Contura Energy, Inc., | 3,100,000 | 3,342,110 | ||||||
|
| |||||||
| 8,344,771 | ||||||||
|
| |||||||
Commercial Services 2.4% |
| |||||||
Cardtronics, Inc., 5.500%, 05/01/25(b) | 1,295,000 | 1,309,569 | ||||||
Gartner, Inc., 5.125%, 04/01/25(b) | 710,000 | 723,313 | ||||||
Herc Rentals, Inc., 7.500%, 06/01/22(b) | 1,129,000 | 1,199,563 | ||||||
Prime Security Services Borrower LLC/Prime Finance, Inc., 9.250%, 05/15/23(b) | 1,073,000 | 1,176,276 | ||||||
Quad/Graphics, Inc., 7.000%, 05/01/22 | 1,090,000 | 1,090,000 | ||||||
Rent-A-Center, Inc., 4.750%, 05/01/21(d) | 1,840,000 | 1,508,800 | ||||||
Rent-A-Center, Inc., 6.625%, 11/15/20(d) | 995,000 | 880,575 | ||||||
Ritchie Bros Auctioneers, Inc., 5.375%, 01/15/25(b) | 1,185,000 | 1,211,662 | ||||||
TMS International Corp., 7.625%, 10/15/21 | 2,465,000 | 2,483,487 | ||||||
United Rentals North America, Inc., 7.625%, 04/15/22(d) | 907,000 | 944,414 | ||||||
|
| |||||||
| 12,527,659 | ||||||||
|
| |||||||
Computers 2.7% |
| |||||||
Conduent Finance, Inc./Xerox Business Services LLC, 10.500%, 12/15/24(b) | 681,000 | 784,852 | ||||||
Dell, Inc., 6.500%, 04/15/38 | 1,120,000 | 1,092,000 | ||||||
Diamond 1 Finance Corp./Diamond 2 Finance Corp., 7.125%, 06/15/24(b)(d) | 1,200,000 | 1,326,575 | ||||||
Harland Clarke Holdings Corp., 6.875%, 03/01/20(b)(f) | 5,195,000 | 5,272,925 | ||||||
Harland Clarke Holdings Corp., 8.375%, 08/15/22(b) | 1,815,000 | 1,860,375 | ||||||
Western Digital Corp., 7.375%, | 795,000 | 871,519 | ||||||
| Shares or Principal Amount($) | Value($) | |||||||
Computers—continued |
| |||||||
Western Digital Corp., 10.500%, 04/01/24 | 2,780,000 | 3,276,925 | ||||||
|
| |||||||
| 14,485,171 | ||||||||
|
| |||||||
Distribution/Wholesale 0.3% |
| |||||||
Univar USA, Inc., 6.750%, 07/15/23(b) | 1,295,000 | 1,343,563 | ||||||
|
| |||||||
Diversified Financial Services 10.2% |
| |||||||
Alliance Data Systems Corp., 5.375%, 08/01/22(b) | 1,395,000 | 1,405,463 | ||||||
Alliance Data Systems Corp., 5.875%, 11/01/21(b) | 3,120,000 | 3,229,200 | ||||||
Ally Financial, Inc., 5.750%, 11/20/25(d) | 1,095,000 | 1,121,006 | ||||||
Ally Financial, Inc., 8.000%, 03/15/20 | 2,268,000 | 2,545,830 | ||||||
Ally Financial, Inc., 8.000%, 11/01/31 | 470,000 | 558,125 | ||||||
ILFC E-Capital Trust I, | 5,450,000 | 5,150,250 | ||||||
International Lease Finance Corp., 8.250%, 12/15/20 | 2,155,000 | 2,543,340 | ||||||
Jefferies Finance LLC/JFIN Co-Issuer Corp., 7.375%, 04/01/20(b) | 2,340,000 | 2,363,400 | ||||||
Nationstar Mortgage LLC/Nationstar Capital Corp., 6.500%, 08/01/18 | 4,980,000 | 5,042,250 | ||||||
Nationstar Mortgage LLC/Nationstar Capital Corp., 6.500%, 07/01/21 | 5,300,000 | 5,366,250 | ||||||
Nationstar Mortgage LLC/Nationstar Capital Corp., 6.500%, 06/01/22 | 773,000 | 773,000 | ||||||
Nationstar Mortgage LLC/Nationstar Capital Corp., 7.875%, 10/01/20 | 2,055,000 | 2,130,778 | ||||||
Nationstar Mortgage LLC/Nationstar Capital Corp., 9.625%, 05/01/19 | 955,000 | 981,263 | ||||||
Navient Corp., 5.500%, 01/15/19, MTN | 735,000 | 761,460 | ||||||
Navient Corp., 6.500%, 06/15/22 | 903,000 | 910,901 | ||||||
Navient Corp., 8.000%, 03/25/20, MTN | 2,810,000 | 3,052,362 | ||||||
Navient Corp., 8.450%, 06/15/18, MTN | 1,900,000 | 2,023,500 | ||||||
Ocwen Loan Servicing LLC, 8.375%, 11/15/22(b) | 3,215,000 | 3,263,225 | ||||||
See Notes to Financial Statements.
77
Table of Contents
SCHEDULES OF PORTFOLIO INVESTMENTS
RIDGEWORTH FUNDS March 31, 2017
Seix High Yield Fund — continued
| Shares or Principal Amount($) | Value($) | |||||||
Diversified Financial Services—continued |
| |||||||
OneMain Financial Holdings LLC, 7.250%, 12/15/21(b) | 1,540,000 | 1,613,150 | ||||||
Quicken Loans, Inc., | 5,175,000 | 5,084,437 | ||||||
Springleaf Finance Corp., 8.250%, 12/15/20 | 1,395,000 | 1,524,038 | ||||||
Springleaf Finance Corp., 8.250%, 10/01/23 | 2,615,000 | 2,755,556 | ||||||
|
| |||||||
| 54,198,784 | ||||||||
|
| |||||||
Electric 1.7% |
| |||||||
Calpine Corp., 5.750%, 01/15/25(d) | 900,000 | 894,375 | ||||||
Dynegy, Inc., 6.750%, 11/01/19 | 1,540,000 | 1,582,350 | ||||||
NRG Energy, Inc., 6.250%, 07/15/22 | 605,000 | 618,613 | ||||||
NRG Energy, Inc., 6.625%, 03/15/23(d) | 660,000 | 675,262 | ||||||
NRG Energy, Inc., 7.250%, 05/15/26 | 2,235,000 | 2,302,050 | ||||||
NRG Energy, Inc., 7.875%, 05/15/21 | 807,000 | 829,192 | ||||||
NRG Yield Operating LLC, 5.000%, 09/15/26(b)(d) | 1,350,000 | 1,312,875 | ||||||
NRG Yield Operating LLC, 5.375%, 08/15/24(d) | 685,000 | 695,275 | ||||||
|
| |||||||
| 8,909,992 | ||||||||
|
| |||||||
Electrical Components & Equipment 0.3% |
| |||||||
WESCO Distribution, Inc., 5.375%, 06/15/24 | 1,755,000 | 1,798,875 | ||||||
|
| |||||||
Electronics 0.3% |
| |||||||
Allegion PLC, 5.875%, 09/15/23 | 1,563,000 | 1,668,503 | ||||||
|
| |||||||
Energy-Alternate Sources 0.1% |
| |||||||
Enviva Partners LP/Enviva Partners Finance Corp., 8.500%, 11/01/21(b) | 520,000 | 551,200 | ||||||
|
| |||||||
Engineering & Construction 0.3% |
| |||||||
AECOM, 5.125%, 03/15/27(b) | 1,538,000 | 1,541,845 | ||||||
|
| |||||||
Entertainment 1.7% |
| |||||||
Eagle II Acquisition Co. LLC, 6.000%, 04/01/25(b) | 915,000 | 942,450 | ||||||
EMI Music Publishing Group North America Holdings, Inc., 7.625%, 06/15/24(b) | 771,000 | 840,390 | ||||||
Greektown Holdings LLC/Greektown Mothership Corp., | 1,880,000 | 1,967,890 | ||||||
| Shares or Principal Amount($) | Value($) | |||||||
Entertainment—continued |
| |||||||
Lions Gate Entertainment Corp., 5.875%, 11/01/24(b)(d) | 1,815,000 | 1,883,062 | ||||||
Six Flags Entertainment Corp., 5.500%, 04/15/27(b)(c) | 1,310,000 | 1,306,725 | ||||||
WMG Acquisition Corp., | 600,000 | 606,000 | ||||||
WMG Acquisition Corp., | 1,408,000 | 1,457,280 | ||||||
|
| |||||||
| 9,003,797 | ||||||||
|
| |||||||
Environmental Control 0.5% |
| |||||||
Covanta Holding Corp., 5.875%, 07/01/25 | 570,000 | 571,069 | ||||||
GFL Environmental, Inc., 9.875%, 02/01/21(b) | 1,759,000 | 1,904,117 | ||||||
|
| |||||||
| 2,475,186 | ||||||||
|
| |||||||
Food 2.5% |
| |||||||
JBS USA LLC/JBS USA Finance, Inc., 5.750%, 06/15/25(b) | 1,745,000 | 1,762,450 | ||||||
JBS USA LLC/JBS USA Finance, Inc., 8.250%, 02/01/20(b) | 2,115,000 | 2,167,875 | ||||||
Lamb Weston Holdings, Inc., 4.625%, 11/01/24(b) | 620,000 | 632,400 | ||||||
Pilgrim’s Pride Corp., 5.750%, 03/15/25(b) | 1,105,000 | 1,113,288 | ||||||
Post Holdings, Inc., 5.000%, 08/15/26(b) | 1,805,000 | 1,728,287 | ||||||
Post Holdings, Inc., 5.500%, 03/01/25(b) | 380,000 | 381,900 | ||||||
Post Holdings, Inc., 5.750%, 03/01/27(b) | 474,000 | 472,815 | ||||||
Post Holdings, Inc., 8.000%, 07/15/25(b) | 2,045,000 | 2,295,512 | ||||||
U.S. Foods, Inc., 5.875%, 06/15/24(b) | 2,550,000 | 2,645,625 | ||||||
|
| |||||||
| 13,200,152 | ||||||||
|
| |||||||
Forest Products & Paper 0.2% |
| |||||||
Resolute Forest Products, Inc., 5.875%, 05/15/23(d) | 1,127,000 | 1,028,388 | ||||||
|
| |||||||
Gas 0.2% |
| |||||||
AmeriGas Partners LP/AmeriGas Finance Corp., 5.750%, 05/20/27 | 1,270,000 | 1,253,808 | ||||||
|
| |||||||
Healthcare-Products 0.5% |
| |||||||
Hologic, Inc., 5.250%, 07/15/22(b) | 1,050,000 | 1,101,187 | ||||||
See Notes to Financial Statements.
78
Table of Contents
SCHEDULES OF PORTFOLIO INVESTMENTS
RIDGEWORTH FUNDS March 31, 2017
Seix High Yield Fund — continued
| Shares or Principal Amount($) | Value($) | |||||||
Healthcare-Products—continued |
| |||||||
Teleflex, Inc., 5.250%, 06/15/24 | 1,569,000 | 1,600,380 | ||||||
|
| |||||||
| 2,701,567 | ||||||||
|
| |||||||
Healthcare-Services 6.5% |
| |||||||
Centene Corp., 5.625%, 02/15/21 | 2,500,000 | 2,616,500 | ||||||
Centene Corp., 6.125%, 02/15/24 | 590,000 | 633,513 | ||||||
CHS/Community Health Systems, Inc., 6.250%, 03/31/23 | 950,000 | 966,625 | ||||||
CHS/Community Health Systems, Inc., 6.875%, 02/01/22(d) | 2,115,000 | 1,818,900 | ||||||
CHS/Community Health Systems, Inc., 8.000%, 11/15/19(d) | 2,600,000 | 2,551,250 | ||||||
DaVita, Inc., 5.000%, 05/01/25 | 3,940,000 | 3,949,850 | ||||||
DaVita, Inc., 5.750%, 08/15/22 | 2,310,000 | 2,390,850 | ||||||
Envision Healthcare Corp., 5.625%, 07/15/22 | 1,000,000 | 1,025,000 | ||||||
HCA Holdings, Inc., 6.250%, 02/15/21(d) | 3,028,000 | 3,268,347 | ||||||
HCA, Inc., 5.250%, 06/15/26 | 1,035,000 | 1,089,338 | ||||||
HCA, Inc., 6.500%, 02/15/20 | 2,535,000 | 2,774,253 | ||||||
HCA, Inc., 7.500%, 11/06/33 | 235,000 | 257,031 | ||||||
HCA, Inc., 7.500%, 11/15/95 | 605,000 | 590,631 | ||||||
Kindred Healthcare, Inc., 8.000%, 01/15/20 | 2,415,000 | 2,454,244 | ||||||
Kindred Healthcare, Inc., 8.750%, 01/15/23(d) | 710,000 | 711,775 | ||||||
MEDNAX, Inc., 5.250%, 12/01/23(b) | 1,045,000 | 1,065,900 | ||||||
Tenet Healthcare Corp., 6.000%, 10/01/20 | 3,110,000 | 3,288,825 | ||||||
WellCare Health Plans, Inc., 5.250%, 04/01/25 | 1,895,000 | 1,939,154 | ||||||
WellCare Health Plans, Inc., 5.750%, 11/15/20 | 1,370,000 | 1,409,730 | ||||||
|
| |||||||
| 34,801,716 | ||||||||
|
| |||||||
Home Builders 3.8% |
| |||||||
CalAtlantic Group, Inc., 5.875%, 11/15/24 | 1,326,000 | 1,392,300 | ||||||
Century Communities, Inc., 6.875%, 05/15/22(b) | 1,820,000 | 1,892,800 | ||||||
Lennar Corp., 4.750%, 04/01/21 | 994,000 | 1,036,245 | ||||||
Mattamy Group Corp., | 990,000 | 1,017,225 | ||||||
| Shares or Principal Amount($) | Value($) | |||||||
Home Builders—continued |
| |||||||
Mattamy Group Corp., | 490,000 | 508,375 | ||||||
New Home Co., Inc. (The), 7.250%, 04/01/22(b)(d) | 670,000 | 675,025 | ||||||
PulteGroup, Inc., 4.250%, 03/01/21 | 1,527,000 | 1,568,992 | ||||||
PulteGroup, Inc., 5.500%, 03/01/26 | 1,920,000 | 1,987,200 | ||||||
PulteGroup, Inc., 7.875%, 06/15/32 | 400,000 | 449,000 | ||||||
Shea Homes LP/Shea Homes Funding Corp., 5.875%, 04/01/23(b) | 1,755,000 | 1,763,775 | ||||||
Shea Homes LP/Shea Homes Funding Corp., 6.125%, 04/01/25(b) | 1,755,000 | 1,763,775 | ||||||
Taylor Morrison Communities, Inc./Monarch Communities, Inc., 5.250%, 04/15/21(b) | 820,000 | 844,600 | ||||||
TRI Pointe Group, Inc., 4.875%, 07/01/21 | 3,390,000 | 3,491,700 | ||||||
TRI Pointe Group, Inc./TRI Pointe Homes, Inc., 5.875%, 06/15/24 | 1,500,000 | 1,545,000 | ||||||
|
| |||||||
| 19,936,012 | ||||||||
|
| |||||||
Insurance 1.7% |
| |||||||
MGIC Investment Corp., 5.750%, 08/15/23 | 3,380,000 | 3,565,900 | ||||||
Radian Group, Inc., 7.000%, 03/15/21 | 1,877,000 | 2,076,431 | ||||||
Sirius International Group Ltd., | 3,570,000 | 3,641,400 | ||||||
|
| |||||||
| 9,283,731 | ||||||||
|
| |||||||
Internet 0.2% |
| |||||||
Cogent Communications Group, Inc., 5.375%, 03/01/22(b) | 1,055,000 | 1,082,694 | ||||||
|
| |||||||
Iron/Steel 0.2% |
| |||||||
Steel Dynamics, Inc., 5.125%, 10/01/21 | 1,010,000 | 1,041,563 | ||||||
|
| |||||||
Leisure Time 0.8% |
| |||||||
NCL Corp. Ltd., 4.625%, 11/15/20(b) | 1,295,000 | 1,322,519 | ||||||
Silversea Cruise Finance Ltd., 7.250%, 02/01/25(b) | 1,227,000 | 1,288,350 | ||||||
Viking Cruises Ltd., 8.500%, 10/15/22(b) | 1,580,000 | 1,639,250 | ||||||
|
| |||||||
| 4,250,119 | ||||||||
|
| |||||||
See Notes to Financial Statements.
79
Table of Contents
SCHEDULES OF PORTFOLIO INVESTMENTS
RIDGEWORTH FUNDS March 31, 2017
Seix High Yield Fund — continued
| Shares or Principal Amount($) | Value($) | |||||||
Lodging 3.5% |
| |||||||
Caesars Entertainment Resort Properties LLC, 8.000%, 10/01/20(f) | 2,290,000 | 2,387,325 | ||||||
Diamond Resorts International, Inc., 7.750%, 09/01/23(b)(d) | 1,765,000 | 1,844,425 | ||||||
Downstream Development Authority of the Quapaw Tribe of Oklahoma, 10.500%, 07/01/19(b) | 1,680,000 | 1,638,000 | ||||||
Hilton Grand Vacations Borrower LLC/Hilton Grand Vacations Borrower, Inc., 6.125%, 12/01/24(b) | 825,000 | 866,250 | ||||||
Hilton Worldwide Finance LLC/Hilton Worldwide Finance Corp., 4.625%, 04/01/25(b)(d) | 780,000 | 789,516 | ||||||
Jack Ohio Finance LLC/Jack Ohio Finance 1 Corp., 6.750%, 11/15/21(b) | 1,070,000 | 1,107,450 | ||||||
MGM Resorts International, 6.000%, 03/15/23(d) | 2,820,000 | 3,045,600 | ||||||
MGM Resorts International, 6.750%, 10/01/20 | 1,305,000 | 1,435,500 | ||||||
MGM Resorts International, 7.750%, 03/15/22 | 4,575,000 | 5,278,406 | ||||||
|
| |||||||
| 18,392,472 | ||||||||
|
| |||||||
Media 6.8% |
| |||||||
Altice Financing SA, | 2,140,000 | 2,242,699 | ||||||
Altice Finco SA, 7.625%, 02/15/25(b)(d) | 1,675,000 | 1,721,062 | ||||||
Altice Luxembourg SA, | 2,205,000 | 2,340,056 | ||||||
Cablevision Systems Corp., 8.000%, 04/15/20(d) | 2,140,000 | 2,370,050 | ||||||
CBS Radio, Inc., 7.250%, 11/01/24(b)(d) | 848,000 | 890,400 | ||||||
CCO Holdings LLC/CCO Holdings Capital Corp., 5.125%, 05/01/27(b)(c) | 2,640,000 | 2,653,200 | ||||||
CCO Holdings LLC/CCO Holdings Capital Corp., 5.750%, 09/01/23 | 2,485,000 | 2,584,400 | ||||||
CCO Holdings LLC/CCO Holdings Capital Corp., 5.750%, 02/15/26(b) | 2,190,000 | 2,299,500 | ||||||
Clear Channel Worldwide Holdings, Inc., Series B, 6.500%, 11/15/22 | 1,350,000 | 1,404,000 | ||||||
| Shares or Principal Amount($) | Value($) | |||||||
Media—continued |
| |||||||
CSC Holdings LLC, 6.625%, 10/15/25(b) | 1,125,000 | 1,223,438 | ||||||
CSC Holdings LLC, 10.125%, 01/15/23(b) | 550,000 | 638,000 | ||||||
CSC Holdings LLC, 10.875%, 10/15/25(b) | 2,275,000 | 2,735,687 | ||||||
DISH DBS Corp., 6.750%, 06/01/21 | 1,018,000 | 1,098,804 | ||||||
DISH DBS Corp., 7.875%, 09/01/19 | 3,645,000 | 4,018,612 | ||||||
Lee Enterprises, Inc., | 1,695,000 | 1,778,987 | ||||||
SFR Group SA, 7.375%, 05/01/26(b) | 1,550,000 | 1,596,500 | ||||||
Univision Communications, Inc., 6.750%, 09/15/22(b) | 1,495,000 | 1,568,240 | ||||||
Viacom, Inc., 6.250%, 02/28/57(a) | 1,040,000 | 1,048,320 | ||||||
Ziggo Bond Finance BV, 5.875%, 01/15/25(b) | 815,000 | 821,113 | ||||||
Ziggo Secured Finance BV, 5.500%, 01/15/27(b) | 1,105,000 | 1,104,890 | ||||||
|
| |||||||
| 36,137,958 | ||||||||
|
| |||||||
Metal Fabricate/Hardware 0.4% |
| |||||||
Grinding Media, Inc./MC Grinding Media Canada, Inc., 7.375%, 12/15/23(b) | 203,000 | 213,150 | ||||||
Novelis Corp., 6.250%, 08/15/24(b) | 1,690,000 | 1,761,825 | ||||||
|
| |||||||
| 1,974,975 | ||||||||
|
| |||||||
Mining 0.7% |
| |||||||
Imperial Metals Corp., 7.000%, 03/15/19 | 2,314,000 | 2,192,515 | ||||||
Kaiser Aluminum Corp., 5.875%, 05/15/24 | 1,665,000 | 1,735,246 | ||||||
|
| |||||||
| 3,927,761 | ||||||||
|
| |||||||
Miscellaneous Manufacturer 0.7% |
| |||||||
Bombardier, Inc., 7.500%, 03/15/25(b) | 1,790,000 | 1,834,750 | ||||||
Bombardier, Inc., 7.750%, 03/15/20(b) | 490,000 | 523,075 | ||||||
Bombardier, Inc., 8.750%, 12/01/21(b) | 1,350,000 | 1,478,250 | ||||||
|
| |||||||
| 3,836,075 | ||||||||
|
| |||||||
Office/Business Equipment 0.5% |
| |||||||
CDW LLC/CDW Finance Corp., 5.000%, 09/01/25 | 955,000 | 974,100 | ||||||
See Notes to Financial Statements.
80
Table of Contents
SCHEDULES OF PORTFOLIO INVESTMENTS
RIDGEWORTH FUNDS March 31, 2017
Seix High Yield Fund — continued
| Shares or Principal Amount($) | Value($) | |||||||
Office/Business Equipment—continued |
| |||||||
CDW LLC/CDW Finance Corp., 6.000%, 08/15/22 | 1,730,000 | 1,836,949 | ||||||
|
| |||||||
| 2,811,049 | ||||||||
|
| |||||||
Oil & Gas 7.5% |
| |||||||
Antero Resources Corp., 5.000%, 03/01/25(b) | 530,000 | 519,729 | ||||||
Antero Resources Corp., 5.375%, 11/01/21 | 600,000 | 616,254 | ||||||
Antero Resources Corp., 5.625%, 06/01/23 | 185,000 | 189,163 | ||||||
Ascent Resources Utica Holdings LLC/ARU Finance Corp., 10.000%, 04/01/22(b) | 890,000 | 921,150 | ||||||
Callon Petroleum Co., | 1,045,000 | 1,086,800 | ||||||
Chesapeake Energy Corp., 6.875%, 11/15/20(d) | 3,675,000 | 3,665,812 | ||||||
Chesapeake Energy Corp., 8.000%, 12/15/22(b)(d) | 4,900,000 | 5,132,750 | ||||||
CITGO Petroleum Corp., 6.250%, 08/15/22(b) | 1,115,000 | 1,128,937 | ||||||
Denbury Resources, Inc., 9.000%, 05/15/21(b) | 975,000 | 1,028,625 | ||||||
Diamondback Energy, Inc., 4.750%, 11/01/24(b) | 1,045,000 | 1,051,166 | ||||||
Diamondback Energy, Inc., 5.375%, 05/31/25(b) | 943,000 | 966,575 | ||||||
Ensco PLC, 5.750%, 10/01/44 | 1,712,000 | 1,292,560 | ||||||
Ensco PLC, 8.000%, 01/31/24(d) | 1,145,000 | 1,159,312 | ||||||
MEG Energy Corp., | 196,000 | 196,000 | ||||||
MEG Energy Corp., 7.000%, 03/31/24(b) | 1,640,000 | 1,467,800 | ||||||
Nabors Industries, Inc., | 1,220,000 | 1,245,162 | ||||||
Oasis Petroleum, Inc., 7.250%, 02/01/19 | 1,925,000 | 1,905,750 | ||||||
Precision Drilling Corp., | 891,835 | 896,294 | ||||||
Precision Drilling Corp., | 805,000 | 847,263 | ||||||
Pride International LLC, 7.875%, 08/15/40 | 875,000 | 809,375 | ||||||
Range Resources Corp., | 2,535,000 | 2,598,375 | ||||||
Rice Energy, Inc., 6.250%, 05/01/22 | 430,000 | 442,900 | ||||||
Rice Energy, Inc., 7.250%, 05/01/23(d) | 1,590,000 | 1,693,350 | ||||||
| Shares or Principal Amount($) | Value($) | |||||||
Oil & Gas—continued |
| |||||||
Rowan Cos., Inc., 4.750%, 01/15/24 | 1,705,000 | 1,530,237 | ||||||
Rowan Cos., Inc., 4.875%, 06/01/22 | 1,580,000 | 1,508,900 | ||||||
Rowan Cos., Inc., 5.850%, 01/15/44 | 1,330,000 | 1,024,100 | ||||||
RSP Permian, Inc., 6.625%, 10/01/22 | 1,055,000 | 1,110,388 | ||||||
Seven Generations Energy Ltd., 6.750%, 05/01/23(b)(d) | 1,623,000 | 1,696,035 | ||||||
Transocean, Inc., 6.800%, 03/15/38 | 640,000 | 526,400 | ||||||
Transocean, Inc., 7.500%, 04/15/31 | 545,000 | 490,500 | ||||||
Transocean, Inc., 9.000%, 07/15/23(b)(d) | 1,200,000 | 1,281,000 | ||||||
|
| |||||||
| 40,028,662 | ||||||||
|
| |||||||
Oil & Gas Services 0.8% |
| |||||||
FTS International, Inc., | 1,420,000 | 1,439,525 | ||||||
SESI LLC, 6.375%, 05/01/19 | 2,535,000 | 2,528,662 | ||||||
|
| |||||||
| 3,968,187 | ||||||||
|
| |||||||
Packaging & Containers 0.7% |
| |||||||
Ardagh Packaging Finance PLC/Ardagh Holdings USA, | 1,675,000 | 1,687,563 | ||||||
Reynolds Group Issuer, Inc./Reynolds Group Issuer LLC/Reynolds Group Issuer Lu, 5.125%, 07/15/23(b) | 2,053,000 | 2,109,457 | ||||||
|
| |||||||
| 3,797,020 | ||||||||
|
| |||||||
Pharmaceuticals 1.5% |
| |||||||
Endo Finance LLC/Endo Finco, Inc., 7.250%, 01/15/22(b) | 2,070,000 | 1,956,150 | ||||||
Horizon Pharma, Inc., | 1,000,000 | 980,000 | ||||||
Valeant Pharmaceuticals International, Inc., 6.500%, 03/15/22(b)(d) | 760,000 | 781,850 | ||||||
Valeant Pharmaceuticals International, Inc., 7.000%, 03/15/24(b) | 1,750,000 | 1,795,937 | ||||||
Valeant Pharmaceuticals International, Inc., 7.500%, 07/15/21(b) | 2,655,000 | 2,326,444 | ||||||
|
| |||||||
| 7,840,381 | ||||||||
|
| |||||||
See Notes to Financial Statements.
81
Table of Contents
SCHEDULES OF PORTFOLIO INVESTMENTS
RIDGEWORTH FUNDS March 31, 2017
Seix High Yield Fund — continued
| Shares or Principal Amount($) | Value($) | |||||||
Pipelines 2.1% |
| |||||||
Cheniere Corpus Christi Holdings LLC, 7.000%, 06/30/24(b) | 1,075,000 | 1,183,844 | ||||||
Crestwood Midstream Partners LP/Crestwood Midstream Finance Corp., 5.750%, 04/01/25(b)(d) | 945,000 | 965,081 | ||||||
Holly Energy Partners LP/Holly Energy Finance Corp., 6.000%, 08/01/24(b) | 1,415,000 | 1,482,213 | ||||||
Rockies Express Pipeline LLC, 5.625%, 04/15/20(b) | 730,000 | 768,325 | ||||||
Rockies Express Pipeline LLC, 6.000%, 01/15/19(b) | 2,650,000 | 2,762,625 | ||||||
Rockies Express Pipeline LLC, 6.850%, 07/15/18(b) | 1,105,000 | 1,154,725 | ||||||
Sabine Pass Liquefaction LLC, 5.875%, 06/30/26(b) | 1,205,000 | 1,328,617 | ||||||
Tesoro Logistics LP/Tesoro Logistics Finance Corp., 5.250%, 01/15/25 | 504,000 | 526,680 | ||||||
Tesoro Logistics LP/Tesoro Logistics Finance Corp., 6.125%, 10/15/21 | 789,000 | 825,491 | ||||||
|
| |||||||
| 10,997,601 | ||||||||
|
| |||||||
Private Equity 0.5% |
| |||||||
Icahn Enterprises LP/Icahn Enterprises Finance Corp., 6.000%, 08/01/20 | 2,710,000 | 2,804,850 | ||||||
|
| |||||||
Real Estate 1.4% |
| |||||||
Greystar Real Estate Partners LLC, 8.250%, 12/01/22(b) | 326,000 | 351,673 | ||||||
Howard Hughes Corp. (The), 5.375%, 03/15/25(b)(d) | 2,145,000 | 2,123,550 | ||||||
Realogy Group LLC/Realogy Co-Issuer Corp., 4.875%, 06/01/23(b) | 1,405,000 | 1,373,387 | ||||||
Realogy Group LLC/Realogy Co-Issuer Corp., 5.250%, 12/01/21(b)(d) | 3,329,000 | 3,462,160 | ||||||
|
| |||||||
| 7,310,770 | ||||||||
|
| |||||||
Real Estate Investment Trust 3.6% |
| |||||||
Care Capital Properties LP, 5.125%, 08/15/26 | 1,445,000 | 1,429,385 | ||||||
iStar, Inc., 6.000%, 04/01/22(d) | 975,000 | 989,625 | ||||||
iStar, Inc., 6.500%, 07/01/21 | 3,775,000 | 3,878,812 | ||||||
iStar, Inc., 7.125%, 02/15/18(f) | 5,030,000 | 5,206,050 | ||||||
iStar, Inc., 9.000%, 06/01/17 | 1,990,000 | 2,012,388 | ||||||
| Shares or Principal Amount($) | Value($) | |||||||
Real Estate Investment Trust—continued |
| |||||||
SBA Communications Corp., 4.875%, 09/01/24(b) | 525,000 | 518,333 | ||||||
Starwood Property Trust, Inc., 5.000%, 12/15/21(b) | 2,885,000 | 2,993,188 | ||||||
VEREIT Operating Partnership LP, 4.125%, 06/01/21 | 2,197,000 | 2,248,783 | ||||||
|
| |||||||
| 19,276,564 | ||||||||
|
| |||||||
Retail 1.9% |
| |||||||
Dollar Tree, Inc., 5.750%, 03/01/23 | 1,525,000 | 1,624,125 | ||||||
DriveTime Automotive Group, Inc./Bridgecrest Acceptance Corp., 8.000%, 06/01/21(b) | 550,000 | 539,000 | ||||||
L Brands, Inc., 6.750%, 07/01/36 | 530,000 | 504,984 | ||||||
Men’s Wearhouse, Inc. (The), 7.000%, 07/01/22(d) | 2,870,000 | 2,547,125 | ||||||
New Albertsons, Inc., 7.450%, 08/01/29 | 1,491,000 | 1,412,722 | ||||||
Penske Automotive Group, Inc., 5.375%, 12/01/24 | 530,000 | 531,325 | ||||||
Rite Aid Corp., 6.125%, 04/01/23(b)(d) | 3,175,000 | 3,147,219 | ||||||
|
| |||||||
| 10,306,500 | ||||||||
|
| |||||||
Software 2.5% |
| |||||||
Change Healthcare Holdings LLC/Change Healthcare Finance, Inc., 5.750%, 03/01/25(b) | 1,333,000 | 1,366,325 | ||||||
Donnelley Financial Solutions, Inc., 8.250%, 10/15/24(b) | 1,730,000 | 1,786,225 | ||||||
First Data Corp., 5.375%, 08/15/23(b) | 2,640,000 | 2,748,900 | ||||||
First Data Corp., 7.000%, 12/01/23(b)(d) | 1,925,000 | 2,064,563 | ||||||
Nuance Communications, Inc., 5.625%, 12/15/26(b) | 1,530,000 | 1,564,425 | ||||||
Quintiles IMS, Inc., 5.000%, 10/15/26(b) | 2,015,000 | 2,022,556 | ||||||
Quintiles Transnational Corp., 4.875%, 05/15/23(b) | 1,660,000 | 1,682,825 | ||||||
|
| |||||||
| 13,235,819 | ||||||||
|
| |||||||
Telecommunication Services 7.8% |
| |||||||
Cincinnati Bell, Inc., 7.000%, 07/15/24(b) | 3,875,000 | 4,063,906 | ||||||
CommScope Technologies LLC, 6.000%, 06/15/25(b)(d) | 1,665,000 | 1,744,088 | ||||||
See Notes to Financial Statements.
82
Table of Contents
SCHEDULES OF PORTFOLIO INVESTMENTS
RIDGEWORTH FUNDS March 31, 2017
Seix High Yield Fund — concluded
| Shares or Principal Amount($) | Value($) | |||||||
Telecommunication Services—continued |
| |||||||
Frontier Communications Corp., 7.875%, 01/15/27 | 610,000 | 500,859 | ||||||
Frontier Communications Corp., 11.000%, 09/15/25 | 2,105,000 | 2,047,113 | ||||||
Intelsat Jackson Holdings SA, 8.000%, 02/15/24(b)(d) | 1,290,000 | 1,367,400 | ||||||
Level 3 Financing, Inc., 5.125%, 05/01/23 | 620,000 | 633,950 | ||||||
Level 3 Financing, Inc., 5.375%, 08/15/22 | 1,330,000 | 1,374,888 | ||||||
Level 3 Financing, Inc., 5.375%, 05/01/25 | 1,695,000 | 1,724,663 | ||||||
Level 3 Financing, Inc., 6.125%, 01/15/21 | 5,500,000 | 5,692,500 | ||||||
Sprint Communications, Inc., 11.500%, 11/15/21 | 2,810,000 | 3,526,550 | ||||||
Sprint Corp., 7.875%, 09/15/23 | 1,910,000 | 2,115,325 | ||||||
T-Mobile USA, Inc., 6.542%, 04/28/20 | 1,655,000 | 1,688,100 | ||||||
T-Mobile USA, Inc., 6.633%, 04/28/21 | 4,865,000 | 5,027,977 | ||||||
ViaSat, Inc., 6.875%, 06/15/20(d) | 5,285,000 | 5,403,912 | ||||||
West Corp., 4.750%, 07/15/21(b)(f) | 2,845,000 | 2,894,787 | ||||||
West Corp., 5.375%, 07/15/22(b) | 1,860,000 | 1,827,450 | ||||||
|
| |||||||
| 41,633,468 | ||||||||
|
| |||||||
Transportation 0.7% |
| |||||||
Florida East Coast Holdings Corp., 6.750%, 05/01/19(b) | 2,790,000 | 2,873,700 | ||||||
Navios South American Logistics, Inc./Navios Logistics Finance U.S., Inc., 7.250%, 05/01/22(b) | 1,035,000 | 1,014,300 | ||||||
|
| |||||||
| 3,888,000 | ||||||||
|
| |||||||
Total Corporate Bonds | 472,265,047 | |||||||
|
| |||||||
Common Stocks 0.2% |
| |||||||
Oil & Gas 0.2% | ||||||||
Templar Energy LLC, Cl A* | 134,055 | 988,652 | ||||||
|
| |||||||
Telecommunication Services 0.0%(g) |
| |||||||
NII Holding, Inc.*(d) | 174,597 | 226,976 | ||||||
|
| |||||||
Total Common Stocks | 1,215,628 | |||||||
|
| |||||||
| Shares or Principal Amount($) | Value($) | |||||||
Money Market Funds 12.5% |
| |||||||
State Street Institutional Treasury Money Market Fund, Premier Class, 0.53%(h) | 25,857,365 | 25,857,365 | ||||||
State Street Institutional U.S. Government Money Market Fund, Premier Class, 0.62%(h)(i) | 40,822,863 | 40,822,863 | ||||||
|
| |||||||
Total Money Market Funds | 66,680,228 | |||||||
|
| |||||||
Total Investments |
| 553,808,497 | ||||||
Liabilities in Excess of Other Assets — (4.1)% | (21,689,309 | ) | ||||||
|
| |||||||
Net Assets — 100.0% | $ | 532,119,188 | ||||||
|
| |||||||
| * | Non-income producing security. |
| (a) | Variable or floating rate security. Rate disclosed is as of March 31, 2017. |
| (b) | Rule 144A, Section 4(2) or other security which is restricted as to resale to institutional investors. The Fund’s investment adviser/subadviser has deemed this security to be liquid based upon procedures approved by the Board of Trustees. These securities represent 44.6% of net assets as of March 31, 2017. |
| (c) | All or a portion of this security has been purchased on a when-issued or delayed-delivery basis. |
| (d) | The security or a partial position of the security was on loan as of March 31, 2017. The total value of securities on loan as of March 31, 2017 was $48,063,923. |
| (e) | Perpetual maturity. |
| (f) | All or a portion of this security has been segregated, or otherwise earmarked, in connection with obligations for when-issued or delayed-delivery purchase commitments. |
| (g) | Less than 0.05% of Net Assets. |
| (h) | Rate disclosed, the 7 day yield, is as of March 31, 2017. |
| (i) | Purchased with cash collateral held from securities lending. The total value of the collateral held by the Fund was $50,035,833. The total value of the collateral includes non-cash U.S. Government securities collateral having a value of $9,212,970. The value of the collateral could include collateral held for securities that were sold on or before March 31, 2017 (See Note 2(k)). |
Investment Abbreviations
MTN — Medium Term Note
See Notes to Financial Statements.
83
Table of Contents
SCHEDULES OF PORTFOLIO INVESTMENTS
RIDGEWORTH FUNDS March 31, 2017
Seix Investment Grade Tax-Exempt Bond Fund
| Shares or Principal Amount($) | Value($) | |||||||
| Municipal Bonds 90.5% | ||||||||
Alabama 1.8% |
| |||||||
Birmingham Special Care Facilities Financing Authority Health Care Facilities, Children’s Hospital of Alabama, RB, | 9,000,000 | 9,927,450 | ||||||
|
| |||||||
Alaska 8.4% |
| |||||||
Matanuska-Susitna Borough Lease, Goose Creek Correctional Center, RB, 5.500%, 09/01/23, Pre-refunded 09/01/2019 @ 100, AGC(a) | 18,000,000 | 19,833,300 | ||||||
Matanuska-Susitna Borough Lease, Goose Creek Correctional Center, RB, 6.000%, 09/01/28, Pre-refunded 09/01/2019 @ 100, AGC | 5,650,000 | 6,292,518 | ||||||
Matanuska-Susitna Borough Lease, Goose Creek Correctional Center, RB, 6.000%, 09/01/28, Pre-refunded 09/01/2019 @ 100, AGC | 9,850,000 | 10,970,142 | ||||||
Matanuska-Susitna Borough Lease, Goose Creek Correctional Center, RB, 6.000%, 09/01/32, Pre-refunded 09/01/2019 @ 100, AGC | 7,250,000 | 8,074,470 | ||||||
|
| |||||||
| 45,170,430 | ||||||||
|
| |||||||
California 20.3% |
| |||||||
California Health Facilities Financing Authority, Series C, RB, 6.250%, 10/01/24, Pre-refunded 10/01/2018 @ 100 | 3,500,000 | 3,772,335 | ||||||
California Health Facilities Financing Authority, Series C, RB, 6.500%, 10/01/38, Pre-refunded 10/01/2018 @ 100(a) | 5,400,000 | 5,841,504 | ||||||
California Infrastructure & Economic Development Bank, RB, 5.000%, 11/01/35 | 2,000,000 | 2,267,960 | ||||||
| Shares or Principal Amount($) | Value($) | |||||||
California—continued |
| |||||||
California Infrastructure & Economic Development Bank, Series A, RB, 1.179%, 04/01/38(b) | 3,825,000 | 3,824,541 | ||||||
California State, GO, 5.000%, 08/01/24 | 5,000,000 | 5,983,700 | ||||||
California State, GO, 6.500%, 04/01/33(a) | 24,500,000 | 27,099,940 | ||||||
Los Angeles California Wastewater System, Series A, RB, 5.750%, 06/01/34, Pre-refunded 06/01/2019 @ 100 | 2,775,000 | 3,049,114 | ||||||
Los Angeles California Wastewater System, Series A, RB, 5.750%, 06/01/34 | 2,225,000 | 2,437,510 | ||||||
Los Angeles Department of Airports, Series A, AMT, RB, 5.000%, 05/15/24 | 3,465,000 | 4,047,917 | ||||||
Los Angeles Department of Airports, Series A, AMT, RB, 5.000%, 05/15/25 | 1,425,000 | 1,674,275 | ||||||
Los Angeles Department of Airports, Series A, AMT, RB, 5.000%, 05/15/26 | 2,500,000 | 2,951,150 | ||||||
Los Angeles Department of Airports, Series B, AMT, RB, 5.000%, 05/15/30 | 740,000 | 853,020 | ||||||
Los Angeles Department of Airports, Series B, AMT, RB, 5.000%, 05/15/32 | 1,250,000 | 1,426,750 | ||||||
Los Angeles Department of Airports, Series B, AMT, RB, 5.000%, 05/15/33 | 1,255,000 | 1,425,015 | ||||||
Los Angeles Department of Airports, Series B, AMT, RB, 5.000%, 05/15/34 | 1,000,000 | 1,134,620 | ||||||
Los Angeles Department of Water, Series A, RB, 5.000%, 07/01/34 | 2,645,000 | 3,055,954 | ||||||
Los Angeles Department of Water, Series A, RB, 5.000%, 07/01/36 | 2,000,000 | 2,297,440 | ||||||
Metropolitan Water District of Southern California, Series A, RB, 5.000%, 07/01/28 | 2,250,000 | 2,713,095 | ||||||
See Notes to Financial Statements.
84
Table of Contents
SCHEDULES OF PORTFOLIO INVESTMENTS
RIDGEWORTH FUNDS March 31, 2017
Seix Investment Grade Tax-Exempt Bond Fund — continued
| Shares or Principal Amount($) | Value($) | |||||||
California—continued |
| |||||||
Norman Y Mineta San Jose International Airport SJC, Series A, AMT, RB, 5.000%, 03/01/35(c) | 1,000,000 | 1,118,230 | ||||||
Norman Y Mineta San Jose International Airport SJC, Series A, AMT, RB, 5.000%, 03/01/36(c) | 1,000,000 | 1,115,580 | ||||||
Norman Y Mineta San Jose International Airport SJC, Series A, AMT, RB, 5.000%, 03/01/41(c) | 1,000,000 | 1,108,550 | ||||||
Norman Y Mineta San Jose International Airport SJC, Series B, RB, 5.000%, 03/01/35(c) | 500,000 | 572,570 | ||||||
Norman Y Mineta San Jose International Airport SJC, Series B, RB, 5.000%, 03/01/36(c) | 750,000 | 857,490 | ||||||
San Francisco City & County Airports Commission, AMT, RB, 5.750%, 05/01/24, AGM | 2,710,000 | 2,846,313 | ||||||
San Francisco City & County Airports Commission, AMT, RB, 5.750%, 05/01/24, Pre-refunded 05/01/2018 @ 100, AGM | 2,290,000 | 2,406,813 | ||||||
University of California, RB, 5.000%, 05/15/34 | 2,000,000 | 2,313,640 | ||||||
University of California, RB, 5.000%, 05/15/35 | 1,500,000 | 1,728,765 | ||||||
University of California, Series O, RB, 5.750%, 05/15/27, Pre-refunded 05/15/2019 @ 100 | 3,000,000 | 3,291,990 | ||||||
University of California, Series O, RB, 5.750%, 05/15/28, Pre-refunded 05/15/2019 @ 100(a) | 10,000,000 | 10,973,300 | ||||||
University of California, Series O, RB, 5.750%, 05/15/29, Pre-refunded 05/15/2019 @ 100(a) | 5,095,000 | 5,590,896 | ||||||
|
| |||||||
| 109,779,977 | ||||||||
|
| |||||||
| Shares or Principal Amount($) | Value($) | |||||||
District of Columbia 1.6% |
| |||||||
District of Columbia, Income Tax, Series A, RB, 5.500%, 12/01/30(a) | 8,000,000 | 8,895,520 | ||||||
|
| |||||||
Florida 1.8% |
| |||||||
Miami-Dade County, Building Better Communities Program, Series B, GO, 6.000%, 07/01/23, Pre-refunded 07/01/2018 @ 100 | 2,000,000 | 2,124,400 | ||||||
Miami-Dade County, Building Better Communities Program, Series B, GO, 6.125%, 07/01/25, Pre-refunded 07/01/2018 @ 100 | 3,000,000 | 3,191,250 | ||||||
Orlando FL Contract Tourist DE, Series A, RB, 5.250%, 11/01/34, Pre-refunded 05/01/2024 @ 100 | 3,785,000 | 4,593,665 | ||||||
|
| |||||||
| 9,909,315 | ||||||||
|
| |||||||
Georgia 1.1% |
| |||||||
Georgia State, Series A, GO, 5.000%, 01/01/26 | 5,000,000 | 5,852,250 | ||||||
|
| |||||||
Hawaii 1.5% |
| |||||||
Hawaii State, GO, 5.000%, 11/01/29 | 6,690,000 | 7,754,044 | ||||||
Hawaii State, GO, 5.000%, 11/01/29, Pre-refunded 11/01/2022 @ 100 | 60,000 | 70,450 | ||||||
|
| |||||||
| 7,824,494 | ||||||||
|
| |||||||
Illinois 4.3% |
| |||||||
Chicago O’Hare International Airport, AMT, RB, 4.000%, 01/01/27 | 2,730,000 | 2,832,757 | ||||||
Chicago O’Hare International Airport, Series A, AMT, RB, 5.000%, 01/01/33 | 2,000,000 | 2,170,880 | ||||||
Chicago O’Hare International Airport, Series B, RB, 5.000%, 01/01/33 | 6,580,000 | 7,329,594 | ||||||
Chicago O’Hare International Airport, Series C, RB, 5.000%, 01/01/33 | 1,550,000 | 1,736,263 | ||||||
Chicago O’Hare International Airport, Series C, RB, 5.000%, 01/01/34 | 1,000,000 | 1,116,960 | ||||||
See Notes to Financial Statements.
85
Table of Contents
SCHEDULES OF PORTFOLIO INVESTMENTS
RIDGEWORTH FUNDS March 31, 2017
Seix Investment Grade Tax-Exempt Bond Fund — continued
| Shares or Principal Amount($) | Value($) | |||||||
Illinois—continued |
| |||||||
Chicago O’Hare International Airport, Series D, RB, 5.250%, 01/01/35 | 5,000,000 | 5,766,400 | ||||||
University of Illinois, Auxiliary Facilities System, Series A, RB, 5.750%, 04/01/38, Pre-refunded 04/01/2019 @ 100 | 2,000,000 | 2,181,180 | ||||||
|
| |||||||
| 23,134,034 | ||||||||
|
| |||||||
Kansas 5.3% |
| |||||||
Kansas State Development Finance Authority, Adventist Bolingbrook Hospital, RB, 5.750%, 11/15/38(a) | 26,090,000 | 28,597,771 | ||||||
|
| |||||||
Maryland 3.1% |
| |||||||
Frederick County, Series A, GO, 5.000%, 08/01/28 | 3,165,000 | 3,853,767 | ||||||
Maryland State, Series B, GO, 5.000%, 08/01/25 | 5,920,000 | 6,894,965 | ||||||
Montgomery County, Series A, GO, 5.000%, 11/01/27 | 5,000,000 | 5,985,000 | ||||||
|
| |||||||
| 16,733,732 | ||||||||
|
| |||||||
Massachusetts 2.8% |
| |||||||
Massachusetts Development Finance Agency, Series A, RB, 5.000%, 07/15/24 | 4,675,000 | 5,644,829 | ||||||
Massachusetts School Building Authority, Series C, RB, 5.000%, 08/15/36 | 5,000,000 | 5,683,800 | ||||||
Massachusetts State College Building Authority, Series B, RB, 5.000%, 05/01/34, ST INTERCEPT | 3,545,000 | 3,991,918 | ||||||
|
| |||||||
| 15,320,547 | ||||||||
|
| |||||||
Michigan 2.7% |
| |||||||
Michigan Finance Authority, RB, 5.000%, 07/01/21 | 14,000,000 | 14,700,840 | ||||||
|
| |||||||
Missouri 0.3% |
| |||||||
Metropolitan St Louis Sewer District, Series B, RB, 5.000%, 05/01/35 | 1,500,000 | 1,722,000 | ||||||
|
| |||||||
Nevada 0.3% |
| |||||||
Clark County School District, Series C, GO, 5.000%, 06/15/27 | 1,305,000 | 1,531,809 | ||||||
|
| |||||||
| Shares or Principal Amount($) | Value($) | |||||||
New York 10.3% |
| |||||||
Erie County Industrial Development Agency, City School District Buffalo, Series A, RB, 5.750%, 05/01/29, Pre-refunded 05/01/2018 @ 100, BHAC-CR-AGM | 5,340,000 | 5,618,962 | ||||||
New York City Transitional Finance Authority, Building Aid, Series S-2, RB, 6.000%, 07/15/38, State Aid Withholding(a) | 7,500,000 | 7,966,050 | ||||||
New York City Water & Sewer System, Series A, RB, 5.750%, 06/15/40 | 11,800,000 | 12,475,550 | ||||||
New York City Water & Sewer System, Series A, RB, 5.750%, 06/15/40, Pre-refunded 06/15/2018 @ 100 | 3,530,000 | 3,734,210 | ||||||
New York State Dormitory Authority, RB, 5.000%, 03/15/28 | 5,385,000 | 6,516,335 | ||||||
New York State Dormitory Authority, Series A, RB, 5.000%, 03/15/28 | 2,500,000 | 2,931,175 | ||||||
New York State Environmental Facilities Corp., RB, 5.000%, 06/15/31(c) | 2,725,000 | 3,268,392 | ||||||
New York State Environmental Facilities Corp., RB, 5.000%, 06/15/32(c) | 5,000,000 | 5,943,300 | ||||||
Utility Debt Securitization Authority, Series A, RB, 5.000%, 12/15/34 | 5,955,000 | 7,032,617 | ||||||
|
| |||||||
| 55,486,591 | ||||||||
|
| |||||||
North Carolina 0.7% |
| |||||||
North Carolina Medical Care Commission, RB, 5.000%, 10/01/31(c) | 1,650,000 | 1,917,036 | ||||||
North Carolina Medical Care Commission, RB, 5.000%, 10/01/33(c) | 1,535,000 | 1,762,303 | ||||||
|
| |||||||
| 3,679,339 | ||||||||
|
| |||||||
Oregon 8.5% |
| |||||||
Clackamas County School District No. 12 North Clackamas, Series B, GO, 5.000%, 06/15/32, SCH BD GTY | 3,500,000 | 4,134,935 | ||||||
See Notes to Financial Statements.
86
Table of Contents
SCHEDULES OF PORTFOLIO INVESTMENTS
RIDGEWORTH FUNDS March 31, 2017
Seix Investment Grade Tax-Exempt Bond Fund — continued
| Shares or Principal Amount($) | Value($) | |||||||
Oregon—continued |
| |||||||
Clackamas County School District No. 12 North Clackamas, Series B, GO, 5.000%, 06/15/33, SCH BD GTY | 10,075,000 | 11,834,699 | ||||||
Clackamas County School District No. 12 North Clackamas, Series B, GO, 5.000%, 06/15/34, SCH BD GTY | 6,755,000 | 7,895,987 | ||||||
Oregon State, Series A, GO, 5.000%, 05/01/30 | 2,660,000 | 3,200,326 | ||||||
Oregon State, Series A, GO, 5.000%, 05/01/31 | 3,010,000 | 3,599,870 | ||||||
Oregon State, Series A, GO, 5.000%, 05/01/32 | 2,500,000 | 2,970,525 | ||||||
Oregon State, Series A, GO, 5.000%, 05/01/34 | 2,000,000 | 2,351,480 | ||||||
Oregon State, Series C, GO, 5.000%, 06/01/33 | 1,745,000 | 2,063,899 | ||||||
Port of Portland OR Airport Revenue, AMT, RB, 5.000%, 07/01/26 | 750,000 | 886,980 | ||||||
Port of Portland OR Airport Revenue, AMT, RB, 5.000%, 07/01/30 | 1,000,000 | 1,161,520 | ||||||
Port of Portland OR Airport Revenue, AMT, RB, 5.000%, 07/01/33 | 1,000,000 | 1,141,590 | ||||||
Port of Portland OR Airport Revenue, AMT, RB, 5.000%, 07/01/34 | 1,000,000 | 1,136,230 | ||||||
Port of Portland OR Airport Revenue, AMT, RB, 5.000%, 07/01/35 | 1,000,000 | 1,130,900 | ||||||
Washington Clackamas & Yamhill Counties School District No. 88J, Series B, GO, 5.000%, 06/15/31, SCH BD GTY | 2,000,000 | 2,378,380 | ||||||
|
| |||||||
| 45,887,321 | ||||||||
|
| |||||||
Pennsylvania 3.7% |
| |||||||
Pennsylvania Economic Development Financing Authority, RB, 5.000%, 07/01/21 | 7,500,000 | 7,739,025 | ||||||
Philadelphia Gas Works Co., RB, 5.000%, 10/01/26 | 2,000,000 | 2,311,520 | ||||||
| Shares or Principal Amount($) | Value($) | |||||||
Pennsylvania—continued |
| |||||||
University of Pittsburgh, Commonwealth System of Higher Education, Series B, RB, 5.500%, 09/15/23, Pre-refunded 03/15/2019 @ 100, GO of University | 6,750,000 | 7,324,627 | ||||||
University of Pittsburgh, Commonwealth System of Higher Education, Series B, RB, 5.500%, 09/15/24, Pre-refunded 03/15/2019 @ 100, GO of University | 2,500,000 | 2,712,825 | ||||||
|
| |||||||
| 20,087,997 | ||||||||
|
| |||||||
Texas 6.3% |
| |||||||
Austin Water & Wastewater System Revenue, RB, 0.920%, 05/15/31(b) | 8,315,000 | 8,315,000 | ||||||
Harris County, Series A, RB, 5.000%, 08/15/35 | 2,000,000 | 2,284,220 | ||||||
New Hope Cultural Education Facilities Financing Corp., Student Housing Corp., Series A, RB, 5.000%, 07/01/35 | 7,100,000 | 7,517,551 | ||||||
Texas State Public Finance Authority, Unemployment Comp., Series B, RB, 4.000%, 07/01/17 | 10,000,000 | 10,028,300 | ||||||
Texas Water Development Board, Series A, RB, 5.000%, 10/15/29 | 5,000,000 | 5,906,300 | ||||||
|
| |||||||
| 34,051,371 | ||||||||
|
| |||||||
Utah 1.5% |
| |||||||
Salt Lake City Corp., Airport Revenue, Series A, AMT, RB, 5.000%, 07/01/31 | 2,250,000 | 2,597,175 | ||||||
Salt Lake City Corp., Airport Revenue, Series A, AMT, RB, 5.000%, 07/01/32 | 2,250,000 | 2,580,233 | ||||||
Salt Lake City Corp., Airport Revenue, Series A, AMT, RB, 5.000%, 07/01/34 | 2,500,000 | 2,836,675 | ||||||
|
| |||||||
| 8,014,083 | ||||||||
|
| |||||||
Virginia 1.5% |
| |||||||
Virginia Resources Authority, RB, 4.000%, 11/01/35 | 5,000,000 | 5,302,350 | ||||||
See Notes to Financial Statements.
87
Table of Contents
SCHEDULES OF PORTFOLIO INVESTMENTS
RIDGEWORTH FUNDS March 31, 2017
Seix Investment Grade Tax-Exempt Bond Fund — concluded
| Shares or Principal Amount($) | Value($) | |||||||
Virginia—continued |
| |||||||
Virginia Resources Authority, RB, 5.000%, 11/01/31 | 2,150,000 | 2,553,061 | ||||||
|
| |||||||
| 7,855,411 | ||||||||
|
| |||||||
Washington 2.7% |
| |||||||
Energy Northwest, RB, 5.000%, 07/01/24 | 3,035,000 | 3,176,431 | ||||||
Energy Northwest, RB, 5.000%, 07/01/24, Pre-refunded 07/01/2018 @ 100 | 965,000 | 1,013,192 | ||||||
Washington State, Series A, GO, 5.000%, 08/01/24 | 8,880,000 | 10,172,218 | ||||||
|
| |||||||
| 14,361,841 | ||||||||
|
| |||||||
Total Municipal Bonds | 488,524,123 | |||||||
|
| |||||||
Money Market Fund 9.8% |
| |||||||
Federated Government Obligations Tax-Managed Fund, Institutional Shares, 0.50%(d) | 52,943,786 | 52,943,786 | ||||||
|
| |||||||
Total Money Market Fund | 52,943,786 | |||||||
|
| |||||||
Total Investments |
| 541,467,909 | ||||||
Liabilities in Excess of Other Assets — (0.3)% | (1,402,885 | ) | ||||||
|
| |||||||
Net Assets — 100.0% | $ | 540,065,024 | ||||||
|
| |||||||
| (a) | All or a portion of this security has been segregated, or otherwise earmarked, in connection with obligations for when-issued or delayed-delivery purchase commitments. |
| (b) | Variable or floating rate security. Rate disclosed is as of March 31, 2017. |
| (c) | All or a portion of this security has been purchased on a when-issued or delayed-delivery basis. |
| (d) | Rate disclosed, the 7 day yield, is as of March 31, 2017. |
Investment Abbreviations
| AGC | — | Security guaranteed by Assured Guaranty Corporation | ||
| AGM | — | Security guaranteed by Assured Guaranty Municipal Corporation | ||
| AMT | — | Income subject to Alternative Minimum Tax | ||
| BHAC | — | Security guaranteed by Berkshire Hathaway Assurance Corporation | ||
| CR | — | Custodial Receipts | ||
| GO | — | General Obligation | ||
| RB | — | Revenue Bond | ||
| SCH BD GTY | — | School Bond Guaranty Program | ||
| ST INTERCEPT | — | State Interception |
The aggregate percentage insured by Assured Guaranty Corporation was 10.2% of total investments.
See Notes to Financial Statements.
88
Table of Contents
SCHEDULES OF PORTFOLIO INVESTMENTS
RIDGEWORTH FUNDS March 31, 2017
Seix Limited Duration Fund
| Shares or Principal Amount($) | Value($) | |||||||
| Asset-Backed Securities 9.4% | ||||||||
Automobiles 0.8% |
| |||||||
Capital Auto Receivables Asset Trust, Series 2015-3, Cl A1A, 1.390%, 02/20/18(a) | 30,706 | 30,706 | ||||||
Fifth Third Auto Trust, Series 2015-1, Cl A2B, 1.462%, 05/15/18(b) | 22,410 | 22,413 | ||||||
|
| |||||||
| 53,119 | ||||||||
|
| |||||||
Credit Card 7.5% |
| |||||||
Cabela’s Credit Card Master Note Trust, Series 2014-2, Cl A, 1.362%, 07/15/22(b) | 300,000 | 300,690 | ||||||
MBNA Credit Card Master Note Trust, Series 2004-A3, Cl A3, 1.172%, 08/16/21(b) | 200,000 | 200,431 | ||||||
|
| |||||||
| 501,121 | ||||||||
|
| |||||||
Student Loan Asset Backed Security 1.1% |
| |||||||
NCUA Guaranteed Notes, Series 2010-A1, Cl A, 1.208%, 12/07/20(b) | 73,845 | 73,845 | ||||||
|
| |||||||
Total Asset-Backed Securities | 628,085 | |||||||
|
| |||||||
Collateralized Mortgage Obligations 71.1% |
| |||||||
Agency Collateralized Mortgage Obligations 48.7% |
| |||||||
Federal Home Loan Mortgage Corporation | ||||||||
Series 3066, Cl FG, REMIC, 1.112%, 03/15/24(b) | 690,257 | 692,518 | ||||||
|
| |||||||
Federal National Mortgage Association | ||||||||
Series 2004-79, Cl FM, REMIC, 1.282%, 11/25/24(b) | 514,071 | 515,741 | ||||||
|
| |||||||
NCUA Guaranteed Notes | ||||||||
Series 2010-R1, Cl 1A, 1.432%, 10/07/20(b) | 990,344 | 991,427 | ||||||
Series 2010-R3, Cl 1A, 1.337%, 12/08/20(b) | 344,483 | 345,877 | ||||||
Series 2010-R3, Cl 2A, 1.337%, 12/08/20(b) | 406,287 | 408,326 | ||||||
Series 2011-R1, Cl 1A, 1.304%, 01/08/20(b) | 155,719 | 155,957 | ||||||
Series 2011-R3, Cl 1A, 1.291%, 03/11/20(b) | 135,106 | 135,185 | ||||||
|
| |||||||
| 2,036,772 | ||||||||
|
| |||||||
Commercial Mortgage Backed Securities 22.4% |
| |||||||
Federal Home Loan Mortgage Corporation | ||||||||
Series KS02, Cl A, 1.362%, 08/25/23(b) | 279,128 | 279,297 | ||||||
|
| |||||||
| Shares or Principal Amount($) | Value($) | |||||||
Commercial Mortgage Backed Securities—continued |
| |||||||
Federal National Mortgage Association | ||||||||
Series 2012-M11, Cl FA, 1.184%, 08/25/19(b) | 122,090 | 121,705 | ||||||
Series 2015-M4, Cl FA, 0.979%, 09/25/18(b) | 205,086 | 205,093 | ||||||
Series 2016-M9, Cl FA, 1.269%, 09/25/23(b) | 745,709 | 746,127 | ||||||
|
| |||||||
| 1,072,925 | ||||||||
|
| |||||||
WFRBS Commercial Mortgage Trust | ||||||||
Series 2012-C8, Cl AFL, 1.943%, | 135,000 | 136,377 | ||||||
|
| |||||||
| 1,488,599 | ||||||||
|
| |||||||
Total Collateralized Mortgage Obligations | 4,733,630 | |||||||
|
| |||||||
U.S. Government Agency Mortgages 20.0% |
| |||||||
Federal National Mortgage Association | ||||||||
Pool #AM6261, 0.999%, 07/01/19(b) | 620,000 | 619,296 | ||||||
Pool #AM7028, 1.019%, 10/01/19(b) | 485,000 | 484,486 | ||||||
Pool #AN3539, 1.249%, 11/01/21(b) | 228,485 | 228,419 | ||||||
|
| |||||||
Total U.S. Government Agency Mortgages | 1,332,201 | |||||||
|
| |||||||
Money Market Fund 0.3% |
| |||||||
State Street Institutional Treasury Money Market Fund, Premier Class, 0.53%(c) | 19,970 | 19,970 | ||||||
|
| |||||||
Total Money Market Fund | 19,970 | |||||||
|
| |||||||
Total Investments | 6,713,886 | |||||||
Liabilities in Excess of Other Assets — (0.8)% | (52,750 | ) | ||||||
|
| |||||||
Net Assets — 100.0% | $ | 6,661,136 | ||||||
|
| |||||||
| (a) | Rule 144A, Section 4(2) or other security which is restricted as to resale to institutional investors. The Fund’s investment adviser/subadviser has deemed this security to be liquid based upon procedures approved by the Board of Trustees. These securities represent 2.5% of net assets as of March 31, 2017. |
| (b) | Variable or floating rate security. Rate disclosed is as of March 31, 2017. |
| (c) | Rate disclosed, the 7 day yield, is as of March 31, 2017. |
Investment Abbreviation
REMIC — Real Estate Mortgage Investment Conduit
See Notes to Financial Statements.
89
Table of Contents
SCHEDULES OF PORTFOLIO INVESTMENTS
RIDGEWORTH FUNDS March 31, 2017
Seix North Carolina Tax-Exempt Bond Fund
| Shares or Principal Amount($) | Value($) | |||||||
| Municipal Bonds 98.3% | ||||||||
Guam 5.6% |
| |||||||
Guam Power Authority, Series A, RB, 5.000%, 10/01/44, AGM | 1,000,000 | 1,094,740 | ||||||
Territory of Guam, Series A, RB, 5.000%, 12/01/46 | 220,000 | 234,573 | ||||||
|
| |||||||
| 1,329,313 | ||||||||
|
| |||||||
North Carolina 89.5% |
| |||||||
Buncombe County Metropolitan Sewerage District, RB, 5.000%, 07/01/39 | 1,000,000 | 1,122,470 | ||||||
Cape Fear Public Utility Authority, RB, 5.000%, 08/01/23, Pre-refunded 08/01/2018 @ 100 | 1,000,000 | 1,053,630 | ||||||
Charlotte Airport Revenue, RB, 5.000%, 07/01/26 | 1,000,000 | 1,183,360 | ||||||
Charlotte Airport Revenue, Series B, AMT, RB, 5.500%, 07/01/23 | 700,000 | 779,268 | ||||||
Charlotte-Mecklenburg Hospital Authority (The), Series A, RB, 5.250%, 01/15/42 | 1,000,000 | 1,104,120 | ||||||
Forsyth County, GO, 5.000%, 02/01/22, Pre-refunded 02/01/2019 @ 100 | 750,000 | 803,707 | ||||||
Mecklenburg County, Series A, GO, 5.000%, 09/01/24 | 1,000,000 | 1,209,630 | ||||||
North Carolina Capital Facilities Finance Agency, RB, 5.000%, 04/01/30 | 1,000,000 | 1,113,430 | ||||||
North Carolina Capital Facilities Finance Agency, RB, 5.250%, 03/01/33 | 1,000,000 | 1,072,590 | ||||||
North Carolina Medical Care Commission, RB, 5.000%, 10/01/26(a) | 900,000 | 1,068,777 | ||||||
North Carolina Medical Care Commission, RB, 5.000%, 10/01/35(a) | 1,125,000 | 1,279,372 | ||||||
North Carolina Medical Care Commission Health Care Facilities, University Health Systems, Series D, RB, 6.250%, 12/01/33, Pre-refunded 12/01/2018 @ 100(b) | 1,500,000 | 1,626,840 | ||||||
| Shares or Principal Amount($) | Value($) | |||||||
North Carolina—continued |
| |||||||
North Carolina Municipal Power Agency No. 1, Series A, RB, 5.000%, 01/01/30 | 290,000 | 307,615 | ||||||
North Carolina Municipal Power Agency No. 1, Series A, RB, 5.000%, 01/01/30, Pre-refunded 01/01/2019 @ 100 | 710,000 | 757,982 | ||||||
North Carolina State Ports Authority Facilities, Series A, RB, 5.250%, | 1,000,000 | 1,084,590 | ||||||
North Carolina Turnpike Authority, RB, 5.000%, 01/01/32 | 750,000 | 848,175 | ||||||
Pitt County, RB, 5.000%, 04/01/28(b) | 1,000,000 | 1,175,110 | ||||||
Raleigh Durham Airport Authority, Series A, AMT, RB, 5.000%, 05/01/36 | 1,000,000 | 1,132,850 | ||||||
University of North Carolina at Charlotte, RB, 5.000%, 04/01/45(b) | 1,000,000 | 1,119,420 | ||||||
Wake County, GO, 5.000%, 09/01/18 | 500,000 | 528,565 | ||||||
Wake County, Series A, GO, 4.000%, 02/01/27 | 1,000,000 | 1,090,630 | ||||||
|
| |||||||
| 21,462,131 | ||||||||
|
| |||||||
South Carolina 3.2% |
| |||||||
South Carolina State Public Service Authority, Series A, RB, 5.750%, 12/01/43 | 700,000 | 774,039 | ||||||
|
| |||||||
Total Municipal Bonds | 23,565,483 | |||||||
|
| |||||||
Money Market Fund 11.0% |
| |||||||
Federated Government Obligations Tax-Managed Fund, Institutional Shares, 0.50%(c) | 2,642,353 | 2,642,353 | ||||||
|
| |||||||
Total Money Market Fund | 2,642,353 | |||||||
|
| |||||||
Total Investments | 26,207,836 | |||||||
Liabilities in Excess of Other Assets — (9.3)% | (2,224,619 | ) | ||||||
|
| |||||||
Net Assets — 100.0% | $ | 23,983,217 | ||||||
|
| |||||||
See Notes to Financial Statements.
90
Table of Contents
SCHEDULES OF PORTFOLIO INVESTMENTS
RIDGEWORTH FUNDS March 31, 2017
Seix North Carolina Tax-Exempt Bond Fund — concluded
| (a) | All or a portion of this security has been purchased on a when-issued or delayed-delivery basis. |
| (b) | All or a portion of this security has been segregated, or otherwise earmarked, in connection with obligations for when-issued or delayed-delivery purchase commitments. |
| (c) | Rate disclosed, the 7 day yield, is as of March 31, 2017. |
Investment Abbreviations
| AGM | — | Security guaranteed by Assured Guaranty Municipal Corporation | ||
| AMT | — | Income subject to Alternative Minimum Tax | ||
| GO | — | General Obligation | ||
| RB | — | Revenue Bond |
See Notes to Financial Statements.
91
Table of Contents
SCHEDULES OF PORTFOLIO INVESTMENTS
RIDGEWORTH FUNDS March 31, 2017
Seix Short-Term Bond Fund
| Shares or Principal Amount($) | Value($) | |||||||
| Asset-Backed Securities 12.5% | ||||||||
Auto Floor Plan 1.6% |
| |||||||
Mercedes-Benz Master Owner Trust, Series 2016-AA, Cl A, 1.492%, | 510,000 | 512,013 | ||||||
Nissan Master Owner Trust Receivables, Series 2016-A, Cl A2, 1.540%, 06/15/21 | 355,000 | 352,309 | ||||||
|
| |||||||
| 864,322 | ||||||||
|
| |||||||
Automobiles 1.9% |
| |||||||
AmeriCredit Automobile Receivables Trust, Series 2014-2, Cl B, 1.600%, 07/08/19 | 480,000 | 480,320 | ||||||
Ford Credit Auto Owner Trust/Ford Credit, Series 2014-1, Cl A, 2.260%, 11/15/25(a) | 550,000 | 554,561 | ||||||
|
| |||||||
| 1,034,881 | ||||||||
|
| |||||||
Credit Card 5.8% |
| |||||||
BA Credit Card Trust, Series 2015-A2, Cl A, 1.360%, 09/15/20 | 490,000 | 489,500 | ||||||
Barclays Dryrock Issuance Trust, Series 2016-1, Cl A, 1.520%, 05/16/22 | 505,000 | 500,572 | ||||||
Capital One Multi-Asset Execution Trust, Series 2014-A5, Cl A5, 1.480%, 07/15/20 | 325,000 | 325,309 | ||||||
Capital One Multi-Asset Execution Trust, Series 2015-A1, Cl A1, 1.390%, 01/15/21 | 312,000 | 311,859 | ||||||
Chase Issuance Trust, Series 2014-A7, Cl A, 1.380%, 11/15/19 | 500,000 | 500,236 | ||||||
Discover Card Execution Note Trust, Series 2013-A1, Cl A1, 1.212%, | 272,000 | 272,476 | ||||||
Discover Card Execution Note Trust, Series 2016-A1, Cl A1, 1.640%, 07/15/21 | 275,000 | 274,940 | ||||||
Trillium Credit Card Trust II, Series 2016-1A, Cl A, 1.702%, 05/26/21(a)(b) | 255,000 | 256,188 | ||||||
World Financial Network Credit Card Master Trust, Series 2016-B, Cl A, 1.440%, 06/15/22 | 310,000 | 309,154 | ||||||
|
| |||||||
| 3,240,234 | ||||||||
|
| |||||||
| Shares or Principal Amount($) | Value($) | |||||||
Other 3.2% |
| |||||||
AEP Texas Central Transition Funding III LLC, Series 2012-1, Cl A1, 0.880%, 12/01/18 | 87,074 | 86,989 | ||||||
CenterPoint Energy Transition Bond Co. IV LLC, Series 2012-1, Cl A1, 0.901%, 04/15/18 | 51,546 | 51,537 | ||||||
Domino’s Pizza Master Issuer LLC, Series 2012-1A, Cl A2, 5.216%, | 216,727 | 219,551 | ||||||
FirstEnergy Ohio PIRB Special Purpose Trust, Series 2013-1, Cl A2, 1.726%, 01/15/22 | 403,197 | 401,642 | ||||||
Louisiana Local Government Environmental Facilities & Community Development Authority, Series 2010-ELL, CI A3, RB, 3.450%, 02/01/22 | 463,030 | 471,563 | ||||||
Ohio Phase-In-Recovery Funding LLC, Series 2013-1, Cl A1, 0.958%, 07/01/18 | 81,210 | 81,116 | ||||||
Verizon Owner Trust, Series 2016-1A, Cl A, 1.420%, 01/20/21(a) | 500,000 | 496,934 | ||||||
|
| |||||||
| 1,809,332 | ||||||||
|
| |||||||
Total Asset-Backed Securities | 6,948,769 | |||||||
|
| |||||||
Collateralized Mortgage Obligations 6.0% |
| |||||||
Agency Collateralized Planned Amortization Class Mortgage Obligations 1.1% |
| |||||||
Federal Home Loan Mortgage Corporation | ||||||||
Series 3786, Cl EB, REMIC, 4.000%, 08/15/35 | 220,284 | 225,486 | ||||||
Series 3971, Cl PG, REMIC, 2.500%, 12/15/26 | 407,978 | 411,585 | ||||||
|
| |||||||
| 637,071 | ||||||||
|
| |||||||
Commercial Mortgage Backed Securities 4.9% |
| |||||||
CSMC Trust | ||||||||
Series 2014-TIKI, Cl A, 1.862%, | 570,000 | 568,456 | ||||||
|
| |||||||
Federal Home Loan Mortgage Corporation | ||||||||
Series K707, Cl A2, 2.220%, 12/25/18 | 230,000 | 231,861 | ||||||
Series K712, Cl A2, 1.869%, 11/25/19 | 240,000 | 239,949 | ||||||
|
| |||||||
| 471,810 | ||||||||
|
| |||||||
See Notes to Financial Statements.
92
Table of Contents
SCHEDULES OF PORTFOLIO INVESTMENTS
RIDGEWORTH FUNDS March 31, 2017
Seix Short-Term Bond Fund — continued
| Shares or Principal Amount($) | Value($) | |||||||
Commercial Mortgage Backed Securities—continued |
| |||||||
GS Mortgage Securities Trust | ||||||||
Series 2013-GC14, Cl A1, 1.217%, 08/10/46 | 12,198 | 12,187 | ||||||
|
| |||||||
JPMorgan Chase Commercial Mortgage Securities Trust | ||||||||
Series 2011-C3, Cl A3, 4.388%, 02/15/46(a) | 282,230 | 288,243 | ||||||
Series 2013-C13, Cl A1, 1.303%, 01/15/46 | 37,640 | 37,618 | ||||||
|
| |||||||
| 325,861 | ||||||||
|
| |||||||
Morgan Stanley Bank of America Merrill Lynch Trust | ||||||||
Series 2013-C12, Cl A1, 1.313%, 10/15/46 | 228,829 | 228,401 | ||||||
Series 2014-C14, Cl A1, 1.250%, 02/15/47 | 78,448 | 78,130 | ||||||
|
| |||||||
| 306,531 | ||||||||
|
| |||||||
Morgan Stanley Capital I Trust | ||||||||
Series 2012-C4, Cl A3, 2.991%, 03/15/45 | 169,199 | 172,338 | ||||||
|
| |||||||
WFRBS Commercial Mortgage Trust | ||||||||
Series 2012-C10, Cl A2, 1.765%, 12/15/45 | 518,054 | 520,104 | ||||||
Series 2012-C8, Cl A2, 1.881%, 08/15/45 | 337,710 | 337,692 | ||||||
|
| |||||||
| 857,796 | ||||||||
|
| |||||||
Total Collateralized Mortgage Obligations | 3,352,050 | |||||||
|
| |||||||
Corporate Bonds 30.2% |
| |||||||
Aerospace/Defense 1.4% |
| |||||||
Boeing Co. (The), 1.164%, 10/30/17(b) | 530,000 | 530,340 | ||||||
Lockheed Martin Corp., 1.850%, 11/23/18 | 265,000 | 265,734 | ||||||
|
| |||||||
| 796,074 | ||||||||
|
| |||||||
Auto Manufacturers 2.9% |
| |||||||
BMW U.S. Capital LLC, 1.500%, 04/11/19(a) | 355,000 | 352,583 | ||||||
General Motors Financial Co., Inc., 2.400%, 05/09/19 | 821,000 | 822,766 | ||||||
PACCAR Financial Corp., 1.450%, 03/09/18, MTN | 239,000 | 239,145 | ||||||
PACCAR Financial Corp., 1.700%, 12/06/18, MTN(b) | 200,000 | 201,577 | ||||||
|
| |||||||
| 1,616,071 | ||||||||
|
| |||||||
| Shares or Principal Amount($) | Value($) | |||||||
Banks 4.4% |
| |||||||
Bank of Montreal, 2.100%, 12/12/19, MTN | 550,000 | 551,989 | ||||||
Citigroup, Inc., 2.500%, 09/26/18 | 550,000 | 554,917 | ||||||
Goldman Sachs Group, Inc. (The), 5.950%, 01/18/18 | 783,000 | 808,582 | ||||||
JPMorgan Chase & Co., 6.125%, 06/27/17 | 558,000 | 563,858 | ||||||
|
| |||||||
| 2,479,346 | ||||||||
|
| |||||||
Beverages 0.5% |
| |||||||
Molson Coors Brewing Co., 1.450%, 07/15/19 | 257,000 | 253,674 | ||||||
|
| |||||||
Biotechnology 0.6% |
| |||||||
Celgene Corp., 2.125%, 08/15/18 | 309,000 | 310,245 | ||||||
|
| |||||||
Chemicals 1.1% |
| |||||||
Chevron Phillips Chemical Co. LLC, 1.700%, 05/01/18(a) | 602,000 | 602,157 | ||||||
|
| |||||||
Computers 2.2% |
| |||||||
Apple, Inc., 1.550%, 02/08/19 | 562,000 | 563,015 | ||||||
Diamond 1 Finance Corp./Diamond 2 Finance Corp., 3.480%, 06/01/19(a) | 641,000 | 656,840 | ||||||
|
| |||||||
| 1,219,855 | ||||||||
|
| |||||||
Diversified Financial Services 0.5% |
| |||||||
Air Lease Corp., 2.625%, 09/04/18 | 266,000 | 268,230 | ||||||
|
| |||||||
Electric 1.2% |
| |||||||
Duke Energy Corp., 1.378%, 04/03/17(b) | 141,000 | 141,000 | ||||||
Emera U.S. Finance LP, 2.150%, 06/15/19 | 527,000 | 526,841 | ||||||
|
| |||||||
| 667,841 | ||||||||
|
| |||||||
Electronics 0.9% |
| |||||||
Fortive Corp., 1.800%, 06/15/19(a) | 480,000 | 477,013 | ||||||
|
| |||||||
Healthcare-Products 1.4% |
| |||||||
Becton Dickinson and Co., 1.800%, 12/15/17 | 265,000 | 265,198 | ||||||
Medtronic, Inc., 1.500%, 03/15/18 | 498,000 | 498,123 | ||||||
|
| |||||||
| 763,321 | ||||||||
|
| |||||||
Housewares 0.8% |
| |||||||
Newell Brands, Inc., 2.600%, 03/29/19 | 424,000 | 429,242 | ||||||
|
| |||||||
Insurance 0.5% |
| |||||||
Berkshire Hathaway Finance Corp., 1.700%, 03/15/19 | 266,000 | 266,460 | ||||||
|
| |||||||
See Notes to Financial Statements.
93
Table of Contents
SCHEDULES OF PORTFOLIO INVESTMENTS
RIDGEWORTH FUNDS March 31, 2017
Seix Short-Term Bond Fund — continued
| Shares or Principal Amount($) | Value($) | |||||||
Internet 0.4% |
| |||||||
eBay, Inc., 2.500%, 03/09/18 | 222,000 | 223,688 | ||||||
|
| |||||||
Machinery-Diversified 0.9% |
| |||||||
John Deere Capital Corp., 1.350%, 01/16/18, MTN | 528,000 | 528,347 | ||||||
|
| |||||||
Miscellaneous Manufacturer 1.0% |
| |||||||
Siemens Financieringsmaatschappij NV, 2.200%, 03/16/20(a) | 577,000 | 579,124 | ||||||
|
| |||||||
Oil & Gas 3.0% |
| |||||||
Chevron Corp., 1.365%, 03/02/18 | 552,000 | 551,681 | ||||||
Exxon Mobil Corp., 1.305%, 03/06/18 | 553,000 | 552,558 | ||||||
Shell International Finance BV, 1.375%, 09/12/19 | 555,000 | 548,364 | ||||||
|
| |||||||
| 1,652,603 | ||||||||
|
| |||||||
Oil & Gas Services 0.8% |
| |||||||
Schlumberger Holdings Corp., 1.900%, 12/21/17(a) | 461,000 | 461,812 | ||||||
|
| |||||||
Pipelines 1.2% |
| |||||||
Kinder Morgan, Inc., 2.000%, 12/01/17 | 519,000 | 519,378 | ||||||
Spectra Energy Partners LP, 2.950%, 09/25/18 | 158,000 | 160,089 | ||||||
|
| |||||||
| 679,467 | ||||||||
|
| |||||||
Real Estate Investment Trust 0.4% |
| |||||||
American Tower Corp., 4.500%, 01/15/18 | 225,000 | 229,801 | ||||||
|
| |||||||
Retail 0.5% |
| |||||||
CVS Health Corp., 1.900%, 07/20/18 | 306,000 | 306,605 | ||||||
|
| |||||||
Semiconductors 1.2% |
| |||||||
Broadcom Corp./Broadcom Cayman Finance Ltd., 2.375%, 01/15/20(a) | 483,000 | 482,942 | ||||||
TSMC Global Ltd., 1.625%, 04/03/18(a) | 200,000 | 199,492 | ||||||
|
| |||||||
| 682,434 | ||||||||
|
| |||||||
Telecommunication Services 1.4% |
| |||||||
AT&T, Inc., 5.500%, 02/01/18 | 488,000 | 503,163 | ||||||
Verizon Communications, Inc., 1.375%, 08/15/19 | 258,000 | 254,051 | ||||||
|
| |||||||
| 757,214 | ||||||||
|
| |||||||
| Shares or Principal Amount($) | Value($) | |||||||
Transportation 1.0% |
| |||||||
Canadian National Railway Co., 1.206%, 11/14/17(b) | 554,000 | 554,327 | ||||||
|
| |||||||
Total Corporate Bonds | 16,804,951 | |||||||
|
| |||||||
U.S. Government Agency Mortgages 6.2% |
| |||||||
Federal Home Loan Mortgage Corporation | ||||||||
Pool #J28472, 3.000%, 06/01/24 | 932,966 | 959,434 | ||||||
|
| |||||||
Federal National Mortgage Association | ||||||||
Pool #471989, 2.010%, 07/01/19 | 227,297 | 228,160 | ||||||
Pool #AM0186, 1.910%, 08/01/19 | 227,520 | 227,846 | ||||||
Pool #AH0967, 3.500%, 12/01/25 | 1,923,385 | 2,011,411 | ||||||
|
| |||||||
| 2,467,417 | ||||||||
|
| |||||||
Total U.S. Government Agency Mortgages | 3,426,851 | |||||||
|
| |||||||
U.S. Treasury Obligations 44.1% |
| |||||||
U.S. Treasury Inflation Indexed Bond 6.6% |
| |||||||
0.125%, 04/15/20 | 3,601,774 | 3,655,480 | ||||||
|
| |||||||
U.S. Treasury Notes 37.5% |
| |||||||
1.500%, 05/31/19 | 1,951,000 | 1,959,460 | ||||||
0.750%, 08/15/19 | 1,466,000 | 1,445,326 | ||||||
1.500%, 10/31/19 | 9,802,000 | 9,821,908 | ||||||
1.375%, 02/29/20 | 7,665,000 | 7,635,957 | ||||||
|
| |||||||
| 20,862,651 | ||||||||
|
| |||||||
Total U.S. Treasury Obligations | 24,518,131 | |||||||
|
| |||||||
Money Market Fund 0.4% |
| |||||||
State Street Institutional Treasury Money Market Fund, Premier Class, 0.53%(c) | 254,053 | 254,053 | ||||||
|
| |||||||
Total Money Market Fund | 254,053 | |||||||
|
| |||||||
Total Investments | 55,304,805 | |||||||
Other Assets in Excess of Liabilities — 0.6% | 337,658 | |||||||
|
| |||||||
Net Assets — 100.0% | $ | 55,642,463 | ||||||
|
| |||||||
See Notes to Financial Statements.
94
Table of Contents
SCHEDULES OF PORTFOLIO INVESTMENTS
RIDGEWORTH FUNDS March 31, 2017
Seix Short-Term Bond Fund — concluded
| (a) | Rule 144A, Section 4(2) or other security which is restricted as to resale to institutional investors. The Fund’s investment adviser/subadviser has deemed this security to be liquid based upon procedures approved by the Board of Trustees. These securities represent 12.1% of net assets as of March 31, 2017. |
| (b) | Variable or floating rate security. Rate disclosed is as of March 31, 2017. |
| (c) | Rate disclosed, the 7 day yield, is as of March 31, 2017. |
Investment Abbreviations
| MTN | — | Medium Term Note | ||
| PIRB | — | Phase-in-Recovery Bonds | ||
| RB | — | Revenue Bond | ||
| REMIC | — | Real Estate Mortgage Investment Conduit |
See Notes to Financial Statements.
95
Table of Contents
SCHEDULES OF PORTFOLIO INVESTMENTS
RIDGEWORTH FUNDS March 31, 2017
Seix Short-Term Municipal Bond Fund
| Shares or Principal Amount($) | Value($) | |||||||
| Municipal Bonds 96.3% | ||||||||
Alabama 4.7% |
| |||||||
Baldwin County Board of Education, RB, 5.000%, 06/01/19 | 1,250,000 | 1,351,637 | ||||||
|
| |||||||
California 11.5% |
| |||||||
California Infrastructure & Economic Development Bank, Series A, RB, 1.179%, 04/01/38 | 1,250,000 | 1,249,850 | ||||||
California Municipal Finance Authority, Series A, RB, 4.000%, 06/01/21 | 200,000 | 211,470 | ||||||
California State, GO, 5.000%, 08/01/17 | 1,000,000 | 1,014,200 | ||||||
California State, GO, 5.000%, 08/01/23 | 500,000 | 591,415 | ||||||
Los Angeles County Regional Financing Authority, Series B-1, RB, 3.000%, 11/15/21, CA MTG INS | 205,000 | 205,320 | ||||||
|
| |||||||
| 3,272,255 | ||||||||
|
| |||||||
District of Columbia 3.8% |
| |||||||
District of Columbia Water & Sewer Authority, Series A, RB, 6.000%, 10/01/35, Pre-refunded 10/01/2018 @ 100 | 1,000,000 | 1,074,330 | ||||||
|
| |||||||
Illinois 5.6% |
| |||||||
Chicago O’Hare International Airport, RB, 5.000%, 01/01/19 | 1,500,000 | 1,599,195 | ||||||
|
| |||||||
Maryland 1.8% |
| |||||||
Maryland State Transportation Authority, Transportation Facilities Project, RB, 5.000%, 07/01/23(a) | 500,000 | 524,135 | ||||||
|
| |||||||
Massachusetts 3.6% |
| |||||||
Commonwealth of Massachusetts, Series C, GO, 5.000%, 08/01/27, Pre-refunded 08/01/2017 @ 100, AGM | 1,000,000 | 1,013,970 | ||||||
|
| |||||||
Michigan 4.0% |
| |||||||
Michigan State, RB, 5.000%, 03/15/22 | 1,000,000 | 1,150,230 | ||||||
|
| |||||||
Missouri 4.5% |
| |||||||
Missouri State Board of Public Buildings, Series B, RB, 4.000%, 04/01/18 | 1,235,000 | 1,273,347 | ||||||
|
| |||||||
| Shares or Principal Amount($) | Value($) | |||||||
Nevada 3.5% |
| |||||||
Clark County Department of Aviation, Series B, AMT, RB, 5.000%, 07/01/17 | 1,000,000 | 1,010,170 | ||||||
|
| |||||||
New Jersey 3.7% |
| |||||||
New Jersey Transportation Trust Fund Authority, RB, 5.000%, 06/15/19 | 1,000,000 | 1,054,100 | ||||||
|
| |||||||
North Carolina 9.8% |
| |||||||
North Carolina Medical Care Commission, RB, 5.000%, 10/01/18(b) | 745,000 | 777,177 | ||||||
North Carolina Turnpike Authority, RB, 5.000%, 01/01/22 | 350,000 | 395,815 | ||||||
North Carolina Turnpike Authority, RB, 5.000%, 01/01/23 | 500,000 | 570,860 | ||||||
Raleigh Combined Enterprise System Revenue, Series B, RB, 5.000%, 12/01/18 | 1,000,000 | 1,065,850 | ||||||
|
| |||||||
| 2,809,702 | ||||||||
|
| |||||||
Ohio 8.9% |
| |||||||
Crawford County, RB, 1.430%, 11/01/17 | 2,000,000 | 2,000,760 | ||||||
Ohio State, RB, 5.000%, 12/15/19 | 500,000 | 550,100 | ||||||
|
| |||||||
| 2,550,860 | ||||||||
|
| |||||||
Pennsylvania 3.7% |
| |||||||
Philadelphia Gas Works Co., RB, 5.000%, 10/01/18 | 1,000,000 | 1,054,480 | ||||||
|
| |||||||
Rhode Island 8.0% |
| |||||||
State of Rhode Island, GO, 5.000%, | 2,150,000 | 2,268,465 | ||||||
|
| |||||||
Texas 11.1% |
| |||||||
Austin Independent School District, GO, 5.000%, 08/01/33, Pre-refunded | 1,000,000 | 1,052,950 | ||||||
New Hope Cultural Education Facilities Financing Corp., Student Housing Corp., Series A, RB, | 200,000 | 200,000 | ||||||
New Hope Cultural Education Facilities Financing Corp., Student Housing Corp., Series A, RB, | 200,000 | 204,884 | ||||||
See Notes to Financial Statements.
96
Table of Contents
SCHEDULES OF PORTFOLIO INVESTMENTS
RIDGEWORTH FUNDS March 31, 2017
Seix Short-Term Municipal Bond Fund — concluded
| Shares or Principal Amount($) | Value($) | |||||||
Texas—continued |
| |||||||
Nueces River Authority, RB, 3.000%, 07/15/17 | 1,000,000 | 1,006,310 | ||||||
Texas Public Finance Authority, Series B, RB, 4.000%, 01/01/18(a) | 695,000 | 696,869 | ||||||
|
| |||||||
| 3,161,013 | ||||||||
|
| |||||||
Washington 8.1% |
| |||||||
Port of Seattle, AMT, GO, 5.250%, 12/01/20 | 1,030,000 | 1,169,112 | ||||||
Tacoma Sewer Revenue, Series B, RB, 5.000%, 12/01/20 | 1,000,000 | 1,128,840 | ||||||
|
| |||||||
| 2,297,952 | ||||||||
|
| |||||||
Total Municipal Bonds | 27,465,841 | |||||||
|
| |||||||
Money Market Fund 5.8% |
| |||||||
Federated Government Obligations Tax-Managed Fund, Institutional Shares, 0.50%(c) | 1,647,224 | 1,647,224 | ||||||
|
| |||||||
Total Money Market Fund | 1,647,224 | |||||||
|
| |||||||
Total Investments | 29,113,065 | |||||||
Liabilities in Excess of Other Assets — (2.1)% | (592,623 | ) | ||||||
|
| |||||||
Net Assets — 100.0% | $ | 28,520,442 | ||||||
|
| |||||||
| (a) | All or a portion of this security has been segregated, or otherwise earmarked, in connection with obligations for when-issued or delayed-delivery purchase commitments. |
| (b) | All or a portion of this security has been purchased on a when-issued or delayed-delivery basis. |
| (c) | Rate disclosed, the 7 day yield, is as of March 31, 2017. |
Investment Abbreviations
| AGM | — | Security guaranteed by Assured Guaranty Municipal Corporation | ||
| AMT | — | Income subject to Alternative Minimum Tax | ||
| CA MTG INS | — | California Mortgage Insurance | ||
| GO | — | General Obligation | ||
| RB | — | Revenue Bond |
See Notes to Financial Statements.
97
Table of Contents
SCHEDULES OF PORTFOLIO INVESTMENTS
RIDGEWORTH FUNDS March 31, 2017
Seix Total Return Bond Fund
| Shares or Principal Amount($) | Value($) | |||||||
| Asset-Backed Securities 4.1% | ||||||||
Automobiles 0.7% |
| |||||||
Ford Credit Auto Owner Trust, Series 2014-2, Cl A, 2.310%, 04/15/26(a) | 4,485,000 | 4,522,943 | ||||||
Ford Credit Auto Owner Trust/Ford Credit, Series 2014-1, Cl A, 2.260%, 11/15/25(a) | 1,950,000 | 1,966,171 | ||||||
|
| |||||||
| 6,489,114 | ||||||||
|
| |||||||
Credit Card 1.6% |
| |||||||
Cabela’s Credit Card Master Note Trust, Series 2014-2, Cl A, 1.362%, 07/15/22(b) | 6,349,000 | 6,363,610 | ||||||
Capital One Multi-Asset Execution Trust, Series 2005-B3, Cl B3, 1.573%, 05/15/28(b) | 1,632,000 | 1,570,977 | ||||||
Master Credit Card Trust II, Series 2017-1A, Cl A, 2.260%, 07/21/21(a) | 4,140,000 | 4,163,990 | ||||||
World Financial Network Credit Card Master Trust, Series 2016-B, Cl A, 1.440%, 06/15/22 | 3,300,000 | 3,290,994 | ||||||
|
| |||||||
| 15,389,571 | ||||||||
|
| |||||||
Other 1.8% |
| |||||||
DB Master Finance LLC, Series 2015-1A, Cl A2II, 3.980%, 02/20/45(a) | 4,169,900 | 4,237,965 | ||||||
Domino’s Pizza Master Issuer LLC, Series 2012-1A, Cl A2, 5.216%, 01/25/42(a) | 4,683,028 | 4,744,061 | ||||||
Taco Bell Funding LLC, Series 2016-1A, Cl A2I, 3.832%, 05/25/46(a) | 4,950,125 | 5,018,016 | ||||||
Verizon Owner Trust, Series 2016-1A, Cl A, 1.420%, 01/20/21(a) | 3,955,000 | 3,930,744 | ||||||
|
| |||||||
| 17,930,786 | ||||||||
|
| |||||||
Total Asset-Backed Securities | 39,809,471 | |||||||
|
| |||||||
Collateralized Mortgage Obligations 4.9% |
| |||||||
Commercial Mortgage Backed Securities 4.9% |
| |||||||
Federal Home Loan Mortgage Corporation | ||||||||
Series K021, Cl X1, IO 1.478%, 06/25/22(b) | 18,893,500 | 1,195,433 | ||||||
Series K027, Cl X1, IO 0.816%, 01/25/23(b) | 59,044,161 | 2,243,690 | ||||||
|
| |||||||
| 3,439,123 | ||||||||
|
| |||||||
| Shares or Principal Amount($) | Value($) | |||||||
Commercial Mortgage Backed Securities—continued |
| |||||||
Federal National Mortgage Association | ||||||||
Series 2017-M3, Cl A2, 2.569%, 12/25/26(b) | 5,265,000 | 5,050,700 | ||||||
|
| |||||||
FREMF Mortgage Trust | ||||||||
Series 2012-K21, Cl B, 3.938%, 07/25/45(a)(b) | 2,320,000 | 2,407,604 | ||||||
Series 2013-K25, Cl B, 3.619%, 11/25/45(a)(b) | 2,980,000 | 3,045,639 | ||||||
Series 2013-K713, Cl B, 3.166%, 04/25/46(a)(b) | 1,925,000 | 1,953,082 | ||||||
Series 2016-K52, Cl B, 3.922%, 01/25/49(a)(b) | 3,170,000 | 3,137,783 | ||||||
|
| |||||||
| 10,544,108 | ||||||||
|
| |||||||
GS Mortgage Securities Corp. II | ||||||||
Series 2012-BWTR, Cl B, 3.255%, 11/05/34(a) | 2,890,000 | 2,927,584 | ||||||
|
| |||||||
GS Mortgage Securities Trust | ||||||||
Series 2010-C1, Cl A2, 4.592%, 08/10/43(a) | 3,822,000 | 4,049,115 | ||||||
|
| |||||||
Morgan Stanley Capital I Trust | ||||||||
Series 2014-CPT, Cl A, 3.350%, 07/13/29(a) | 2,285,000 | 2,365,031 | ||||||
Series 2014-CPT, Cl AM, 3.402%, 07/13/29(a)(b) | 2,530,000 | 2,584,661 | ||||||
|
| |||||||
| 4,949,692 | ||||||||
|
| |||||||
Queens Center Mortgage Trust | ||||||||
Series 2013-QCA, Cl A, 3.275%, 01/11/37(a) | 1,185,000 | 1,192,250 | ||||||
|
| |||||||
VNDO 2013-PENN Mortgage Trust | ||||||||
Series 2013-PENN, Cl A, 3.808%, 12/13/29(a) | 5,275,000 | 5,529,491 | ||||||
|
| |||||||
WFRBS Commercial Mortgage Trust | ||||||||
Series 2012-C10, Cl AS, 3.241%, 12/15/45 | 4,040,000 | 4,093,291 | ||||||
Series 2012-C8, Cl AFL, 1.943%, 08/15/45(a)(b) | 5,585,000 | 5,641,959 | ||||||
|
| |||||||
| 9,735,250 | ||||||||
|
| |||||||
Total Collateralized Mortgage Obligations | 47,417,313 | |||||||
|
| |||||||
Corporate Bonds 23.9% |
| |||||||
Aerospace/Defense 0.6% |
| |||||||
L-3 Communications, Inc., 3.850%, 12/15/26 | 1,262,000 | 1,279,556 | ||||||
See Notes to Financial Statements.
98
Table of Contents
SCHEDULES OF PORTFOLIO INVESTMENTS
RIDGEWORTH FUNDS March 31, 2017
Seix Total Return Bond Fund — continued
| Shares or Principal Amount($) | Value($) | |||||||
Aerospace/Defense—continued |
| |||||||
Rockwell Collins, Inc., 3.500%, | 4,248,000 | 4,249,227 | ||||||
|
| |||||||
| 5,528,783 | ||||||||
|
| |||||||
Agriculture 0.2% |
| |||||||
Japan Tobacco, Inc., 2.100%, | 1,852,000 | 1,860,102 | ||||||
|
| |||||||
Airlines 0.1% |
| |||||||
United Airlines Pass Through Trust, Series 2016-1, Cl A, 3.450%, 07/07/28 | 1,377,000 | 1,349,460 | ||||||
|
| |||||||
Auto Manufacturers 0.6% |
| |||||||
Daimler Finance North America LLC, 2.250%, 03/02/20(a) | 1,280,000 | 1,279,217 | ||||||
General Motors Co., 5.200%, 04/01/45 | 4,357,000 | 4,270,788 | ||||||
|
| |||||||
| 5,550,005 | ||||||||
|
| |||||||
Banks 6.2% |
| |||||||
Bank of America Corp., 3.124%, 01/20/23, MTN(b) | 5,000,000 | 5,025,695 | ||||||
Bank of New York Mellon Corp. (The), 3.000%, 10/30/28, MTN | 1,780,000 | 1,693,647 | ||||||
Barclays PLC, 4.337%, 01/10/28 | 2,086,000 | 2,081,884 | ||||||
Citigroup, Inc., 4.750%, 05/18/46 | 2,714,000 | 2,681,101 | ||||||
Credit Suisse Group AG, 3.574%, 01/09/23(a) | 1,383,000 | 1,380,814 | ||||||
Credit Suisse Group AG, 4.282%, 01/09/28(a) | 3,100,000 | 3,086,518 | ||||||
Goldman Sachs Group, Inc. (The), 3.850%, 01/26/27 | 2,563,000 | 2,575,500 | ||||||
Lloyds Banking Group PLC, 3.750%, 01/11/27 | 3,574,000 | 3,513,496 | ||||||
Morgan Stanley, 2.625%, 11/17/21, MTN | 1,501,000 | 1,491,108 | ||||||
Morgan Stanley, 3.125%, 07/27/26, MTN | 6,246,000 | 5,961,651 | ||||||
Morgan Stanley, 3.625%, 01/20/27 | 1,844,000 | 1,830,531 | ||||||
Morgan Stanley, 4.375%, 01/22/47 | 2,541,000 | 2,542,840 | ||||||
PNC Bank NA, 2.150%, 04/29/21, MTN | 1,221,000 | 1,209,005 | ||||||
Regions Bank, 2.250%, 09/14/18 | 845,000 | 847,603 | ||||||
Royal Bank of Scotland Group PLC, 3.875%, 09/12/23 | 10,209,000 | 10,061,582 | ||||||
| Shares or Principal Amount($) | Value($) | |||||||
Banks—continued |
| |||||||
U.S. Bancorp, 2.625%, 01/24/22, MTN | 3,396,000 | 3,408,817 | ||||||
U.S. Bancorp, 5.300%(b)(d) | 2,576,000 | 2,624,300 | ||||||
Wells Fargo & Co., 3.069%, 01/24/23 | 4,309,000 | 4,335,207 | ||||||
Westpac Banking Corp., 4.322%, 11/23/31, MTN(b) | 2,871,000 | 2,901,168 | ||||||
|
| |||||||
| 59,252,467 | ||||||||
|
| |||||||
Beverages 0.2% |
| |||||||
Molson Coors Brewing Co., 4.200%, 07/15/46 | 1,846,000 | 1,728,616 | ||||||
|
| |||||||
Biotechnology 0.2% |
| |||||||
Celgene Corp., 4.625%, 05/15/44 | 819,000 | 812,277 | ||||||
Celgene Corp., 5.000%, 08/15/45 | 961,000 | 1,005,893 | ||||||
|
| |||||||
| 1,818,170 | ||||||||
|
| |||||||
Building Materials 0.2% |
| |||||||
Johnson Controls International PLC, 4.500%, 02/15/47 | 2,231,000 | 2,264,378 | ||||||
|
| |||||||
Commercial Services 0.2% |
| |||||||
ERAC USA Finance LLC, 4.500%, 02/15/45(a) | 851,000 | 813,660 | ||||||
ERAC USA Finance LLC, 5.250%, 10/01/20(a) | 1,149,000 | 1,245,138 | ||||||
|
| |||||||
| 2,058,798 | ||||||||
|
| |||||||
Computers 0.9% |
| |||||||
Apple, Inc., 4.250%, 02/09/47 | 2,215,000 | 2,250,526 | ||||||
Diamond 1 Finance Corp./Diamond 2 Finance Corp., 8.350%, 07/15/46(a) | 3,110,000 | 4,016,553 | ||||||
Everett Spinco, Inc., 4.250%, | 1,973,000 | 2,006,200 | ||||||
|
| |||||||
| 8,273,279 | ||||||||
|
| |||||||
Diversified Financial Services 1.0% |
| |||||||
Air Lease Corp., 4.250%, 09/15/24 | 4,376,000 | 4,530,096 | ||||||
Lazard Group LLC, 3.750%, 02/13/25 | 3,968,000 | 3,944,462 | ||||||
TD Ameritrade Holding Corp., 2.950%, 04/01/22 | 1,449,000 | 1,466,885 | ||||||
|
| |||||||
| 9,941,443 | ||||||||
|
| |||||||
Electric 1.0% |
| |||||||
Berkshire Hathaway Energy Co., 6.125%, 04/01/36 | 1,050,000 | 1,310,849 | ||||||
See Notes to Financial Statements.
99
Table of Contents
SCHEDULES OF PORTFOLIO INVESTMENTS
RIDGEWORTH FUNDS March 31, 2017
Seix Total Return Bond Fund — continued
| Shares or Principal Amount($) | Value($) | |||||||
Electric—continued |
| |||||||
Duke Energy Corp., 3.750%, 09/01/46 | 2,903,000 | 2,606,217 | ||||||
Exelon Generation Co. LLC, 6.200%, 10/01/17 | 1,189,000 | 1,214,917 | ||||||
FirstEnergy Transmission LLC, 5.450%, 07/15/44(a) | 4,376,000 | 4,779,940 | ||||||
|
| |||||||
| 9,911,923 | ||||||||
|
| |||||||
Healthcare-Products 0.2% |
| |||||||
Medtronic, Inc., 3.500%, 03/15/25 | 565,000 | 578,134 | ||||||
Medtronic, Inc., 4.625%, 03/15/45 | 1,597,000 | 1,714,715 | ||||||
|
| |||||||
| 2,292,849 | ||||||||
|
| |||||||
Healthcare-Services 0.2% |
| |||||||
Howard Hughes Medical Institute, 3.500%, 09/01/23 | 1,426,000 | 1,493,802 | ||||||
|
| |||||||
Insurance 0.3% |
| |||||||
MassMutual Global Funding LLC, 2.000%, 04/05/17(a) | 1,291,000 | 1,291,000 | ||||||
Nationwide Financial Services, Inc., 5.375%, 03/25/21(a) | 1,746,000 | 1,900,626 | ||||||
|
| |||||||
| 3,191,626 | ||||||||
|
| |||||||
Lodging 0.1% |
| |||||||
Wyndham Worldwide Corp., 4.500%, 04/01/27 | 970,000 | 977,197 | ||||||
|
| |||||||
Machinery-Diversified 0.1% |
| |||||||
Xylem, Inc., 3.250%, 11/01/26 | 1,212,000 | 1,196,803 | ||||||
|
| |||||||
Media 0.9% |
| |||||||
Time Warner, Inc., 3.800%, 02/15/27 | 3,289,000 | 3,253,134 | ||||||
Viacom, Inc., 3.450%, 10/04/26 | 1,715,000 | 1,631,234 | ||||||
Viacom, Inc., 5.875%, 02/28/57(b)(e) | 3,192,000 | 3,255,840 | ||||||
|
| |||||||
| 8,140,208 | ||||||||
|
| |||||||
Mining 1.5% |
| |||||||
Barrick (PD) Australia Finance Property Ltd., 5.950%, 10/15/39 | 3,977,000 | 4,560,490 | ||||||
Barrick International Barbados Corp., 6.350%, 10/15/36(a) | 1,083,000 | 1,230,617 | ||||||
Newmont Mining Corp., 6.250%, 10/01/39 | 7,239,000 | 8,399,187 | ||||||
|
| |||||||
| 14,190,294 | ||||||||
|
| |||||||
| Shares or Principal Amount($) | Value($) | |||||||
Miscellaneous Manufacturer 0.4% |
| |||||||
General Electric Co., 2.700%, 10/09/22 | 1,118,000 | 1,126,370 | ||||||
General Electric Co., 4.125%, 10/09/42 | 901,000 | 917,759 | ||||||
General Electric Co., 5.250%, 12/06/17 | 2,161,000 | 2,215,727 | ||||||
|
| |||||||
| 4,259,856 | ||||||||
|
| |||||||
Oil & Gas 2.0% |
| |||||||
BP Capital Markets PLC, 2.112%, 09/16/21(e) | 925,000 | 908,402 | ||||||
Ensco PLC, 4.500%, 10/01/24 | 1,098,000 | 925,065 | ||||||
Ensco PLC, 5.200%, 03/15/25(e) | 4,517,000 | 3,918,497 | ||||||
Ensco PLC, 5.750%, 10/01/44 | 1,833,000 | 1,383,915 | ||||||
HollyFrontier Corp., 5.875%, 04/01/26 | 4,294,000 | 4,559,017 | ||||||
Nabors Industries, Inc., 5.500%, 01/15/23(a) | 1,196,000 | 1,220,668 | ||||||
Shell International Finance BV, 1.750%, 09/12/21(e) | 1,606,000 | 1,561,098 | ||||||
Shell International Finance BV, 4.375%, 05/11/45 | 2,730,000 | 2,768,501 | ||||||
Woodside Finance Ltd., 4.600%, 05/10/21(a) | 2,086,000 | 2,187,361 | ||||||
|
| |||||||
| 19,432,524 | ||||||||
|
| |||||||
Oil & Gas Services 0.8% |
| |||||||
Schlumberger Holdings Corp., 3.000%, 12/21/20(a) | 1,726,000 | 1,764,878 | ||||||
Schlumberger Holdings Corp., 4.000%, 12/21/25(a) | 3,391,000 | 3,534,022 | ||||||
Schlumberger Investment SA, 3.300%, 09/14/21(a) | 1,309,000 | 1,348,779 | ||||||
TechnipFMC PLC, 3.450%, 10/01/22(e) | 508,000 | 503,711 | ||||||
|
| |||||||
| 7,151,390 | ||||||||
|
| |||||||
Pharmaceuticals 0.1% |
| |||||||
Novartis Securities Investment Ltd., 5.125%, 02/10/19 | 765,000 | 812,789 | ||||||
|
| |||||||
Pipelines 2.0% |
| |||||||
Boardwalk Pipelines LP, 4.450%, 07/15/27 | 1,170,000 | 1,182,075 | ||||||
Energy Transfer Partners LP, 5.300%, 04/15/47 | 2,810,000 | 2,688,982 | ||||||
EnLink Midstream Partners LP, 4.150%, 06/01/25 | 3,296,000 | 3,256,346 | ||||||
MPLX LP, 5.200%, 03/01/47 | 2,070,000 | 2,082,971 | ||||||
See Notes to Financial Statements.
100
Table of Contents
SCHEDULES OF PORTFOLIO INVESTMENTS
RIDGEWORTH FUNDS March 31, 2017
Seix Total Return Bond Fund — continued
| Shares or Principal Amount($) | Value($) | |||||||
Pipelines—continued |
| |||||||
NuStar Logistics LP, 4.800%, 09/01/20 | 2,870,000 | 2,904,153 | ||||||
Sabine Pass Liquefaction LLC, 4.200%, 03/15/28(a) | 4,942,000 | 4,881,772 | ||||||
Transcanada Trust, 5.300%, 03/15/77(b) | 517,000 | 510,861 | ||||||
Valero Energy Partners LP, 4.375%, 12/15/26 | 1,788,000 | 1,804,374 | ||||||
|
| |||||||
| 19,311,534 | ||||||||
|
| |||||||
Real Estate Investment Trust 1.0% |
| |||||||
American Tower Corp., 3.500%, 01/31/23(e) | 1,377,000 | 1,385,142 | ||||||
American Tower Corp., 5.000%, 02/15/24 | 2,564,000 | 2,768,961 | ||||||
Boston Properties LP, 3.650%, 02/01/26 | 1,437,000 | 1,431,386 | ||||||
Digital Realty Trust LP, 3.950%, 07/01/22 | 2,468,000 | 2,570,340 | ||||||
Digital Realty Trust LP, 4.750%, 10/01/25 | 1,521,000 | 1,605,271 | ||||||
|
| |||||||
| 9,761,100 | ||||||||
|
| |||||||
Retail 0.2% |
| |||||||
Home Depot, Inc. (The), 2.625%, 06/01/22 | 1,554,000 | 1,566,681 | ||||||
|
| |||||||
Semiconductors 1.4% |
| |||||||
Analog Devices, Inc., 3.500%, 12/05/26 | 2,550,000 | 2,525,456 | ||||||
Applied Materials, Inc., 3.300%, 04/01/27 | 2,937,000 | 2,948,666 | ||||||
Broadcom Corp./Broadcom Cayman Finance Ltd., 3.875%, 01/15/27(a) | 2,813,000 | 2,827,830 | ||||||
NVIDIA Corp., 3.200%, 09/16/26 | 1,789,000 | 1,735,251 | ||||||
TSMC Global Ltd., 1.625%, 04/03/18(a) | 3,589,000 | 3,579,886 | ||||||
|
| |||||||
| 13,617,089 | ||||||||
|
| |||||||
Software 0.5% |
| |||||||
Oracle Corp., 2.650%, 07/15/26 | 5,376,000 | 5,119,070 | ||||||
|
| |||||||
Telecommunication Services 0.8% |
| |||||||
AT&T, Inc., 2.375%, 11/27/18 | 1,854,000 | 1,866,848 | ||||||
AT&T, Inc., 4.350%, 06/15/45 | 2,457,000 | 2,162,605 | ||||||
Cisco Systems, Inc., 2.125%, 03/01/19 | 1,666,000 | 1,683,382 | ||||||
Verizon Communications, Inc., 5.500%, 03/16/47 | 1,450,000 | 1,519,810 | ||||||
|
| |||||||
| 7,232,645 | ||||||||
|
| |||||||
Total Corporate Bonds | 229,284,881 | |||||||
|
| |||||||
| Shares or Principal Amount($) | Value($) | |||||||
U.S. Government Agency Mortgages 22.5% |
| |||||||
Federal Home Loan Mortgage Corporation | ||||||||
Pool #G30614, 3.500%, 12/01/32 | 3,743,951 | 3,906,142 | ||||||
Pool #C91768, 3.500%, 07/01/34 | 1,587,918 | 1,647,717 | ||||||
Pool #G01779, 5.000%, 04/01/35 | 254,541 | 279,167 | ||||||
Pool #G01838, 5.000%, 07/01/35 | 226,032 | 248,222 | ||||||
Pool #G01837, 5.000%, 07/01/35 | 796,783 | 873,008 | ||||||
Pool #Z40115, 6.000%, 05/01/36 | 3,632,584 | 4,107,050 | ||||||
Pool #G05326, 5.000%, 02/01/38 | 1,031,518 | 1,126,333 | ||||||
Pool #G07135, 6.000%, 10/01/38 | 1,301,937 | 1,475,690 | ||||||
Pool #G08347, 4.500%, 06/01/39 | 2,073,008 | 2,227,146 | ||||||
Pool #G05606, 4.500%, 07/01/39 | 5,936,086 | 6,381,561 | ||||||
Pool #G08353, 4.500%, 07/01/39 | 2,620,078 | 2,816,174 | ||||||
Pool #G06079, 6.000%, 07/01/39 | 602,846 | 682,800 | ||||||
Pool #A89384, 4.000%, 10/01/39 | 160,161 | 168,671 | ||||||
Pool #A89148, 4.000%, 10/01/39 | 1,180,844 | 1,242,726 | ||||||
Pool #G08372, 4.500%, 11/01/39 | 1,545,922 | 1,661,445 | ||||||
Pool #A93101, 5.000%, 07/01/40 | 1,112,028 | 1,212,294 | ||||||
Pool #G06061, 4.000%, 10/01/40 | 2,419,085 | 2,552,664 | ||||||
Pool #V82101, 4.000%, 11/01/40 | 852,960 | 898,440 | ||||||
Pool #A95796, 4.000%, 12/01/40 | 940,338 | 990,328 | ||||||
Pool #A95822, 4.000%, 12/01/40 | 2,441,583 | 2,582,116 | ||||||
Pool #G60126, 4.500%, 11/01/41 | 340,480 | 365,823 | ||||||
Pool #G07491, 4.500%, 03/01/42 | 41,999 | 45,163 | ||||||
Pool #G06973, 4.000%, 04/01/42 | 543,082 | 572,064 | ||||||
Pool #C04123, 4.000%, 07/01/42 | 3,365,306 | 3,557,816 | ||||||
See Notes to Financial Statements.
101
Table of Contents
SCHEDULES OF PORTFOLIO INVESTMENTS
RIDGEWORTH FUNDS March 31, 2017
Seix Total Return Bond Fund — continued
| Shares or Principal Amount($) | Value($) | |||||||
U.S. Government Agency Mortgages—continued |
| |||||||
Pool #Q13801, 3.000%, 12/01/42 | 830,042 | 827,645 | ||||||
Pool #G60019, 4.500%, 03/01/44 | 5,946,829 | 6,393,923 | ||||||
Pool #Q31066, 4.000%, 02/01/45 | 1,028,953 | 1,085,541 | ||||||
Pool #Q31645, 4.000%, 02/01/45 | 4,578,724 | 4,824,019 | ||||||
Pool #G60589, 4.000%, 02/01/45 | 5,563,917 | 5,841,091 | ||||||
Pool #Q35611, 4.000%, 09/01/45 | 4,998,185 | 5,266,543 | ||||||
Pool #Q36238, 4.000%, 09/01/45 | 2,094,088 | 2,198,217 | ||||||
Pool #Q37163, 3.500%, 11/01/45 | 2,672,080 | 2,742,956 | ||||||
Pool #Q40240, 4.000%, 03/01/46 | 990,497 | 1,039,750 | ||||||
Pool #Q40123, 3.500%, 04/01/46 | 2,623,323 | 2,695,308 | ||||||
Pool #Q40124, 3.500%, 04/01/46 | 3,364,058 | 3,453,309 | ||||||
Pool #Q40723, 4.000%, 05/01/46 | 2,844,292 | 2,985,726 | ||||||
|
| |||||||
| 80,974,588 | ||||||||
|
| |||||||
Federal National Mortgage Association | ||||||||
Pool #AP9592, 3.500%, 10/01/32 | 2,639,878 | 2,757,058 | ||||||
Pool #MA1630, 4.000%, 10/01/33 | 1,605,949 | 1,700,740 | ||||||
Pool #MA1688, 3.500%, 12/01/33 | 109,743 | 114,605 | ||||||
Pool #MA1763, 3.500%, 01/01/34 | 2,862,939 | 2,990,071 | ||||||
Pool #745950, 6.000%, 11/01/36 | 1,293,032 | 1,460,000 | ||||||
Pool #888128, 6.000%, 01/01/37 | 224,771 | 254,336 | ||||||
Pool #890248, 6.000%, 08/01/37 | 317,165 | 362,747 | ||||||
Pool #995724, 6.000%, 04/01/39 | 987,788 | 1,129,379 | ||||||
Pool #AC3352, 4.000%, 08/01/39 | 347,466 | 364,742 | ||||||
Pool #AC2817, 4.000%, 10/01/39 | 379,637 | 398,499 | ||||||
Pool #AX3605, 3.500%, 01/01/40 | 3,289,066 | 3,384,462 | ||||||
Pool #932441, 4.000%, 01/01/40 | 5,253,788 | 5,514,676 | ||||||
| Shares or Principal Amount($) | Value($) | |||||||
U.S. Government Agency Mortgages—continued |
| |||||||
Pool #AC9564, 4.500%, 02/01/40 | 658,156 | 711,856 | ||||||
Pool #AL7497, 3.500%, 09/01/40 | 6,135,683 | 6,317,931 | ||||||
Pool #AE5143, 4.000%, 11/01/40 | 341,572 | 359,709 | ||||||
Pool #AE9284, 4.000%, 11/01/40 | 499,053 | 524,790 | ||||||
Pool #AL0215, 4.500%, 04/01/41 | 3,584,857 | 3,859,041 | ||||||
Pool #AB3573, 3.500%, 05/01/41 | 331,035 | 340,623 | ||||||
Pool #AB3274, 4.500%, 07/01/41 | 1,546,902 | 1,667,572 | ||||||
Pool #AW8154, 3.500%, 01/01/42 | 5,699,595 | 5,867,759 | ||||||
Pool #AB5188, 3.500%, 05/01/42 | 3,383,401 | 3,480,155 | ||||||
Pool #AZ0572, 3.000%, 06/01/42 | 1,795,016 | 1,789,456 | ||||||
Pool #AP7874, 3.500%, 10/01/42 | 1,747,636 | 1,796,195 | ||||||
Pool #AB8726, 3.500%, 03/01/43 | 5,625,907 | 5,782,274 | ||||||
Pool #AT4912, 4.000%, 05/01/43 | 1,714,865 | 1,806,222 | ||||||
Pool #AS0653, 4.000%, 10/01/43 | 682,219 | 719,182 | ||||||
Pool #AT0536, 4.000%, 10/01/43 | 1,241,455 | 1,303,262 | ||||||
Pool #AV3452, 4.000%, 02/01/44 | 3,626,359 | 3,805,064 | ||||||
Pool #AS2037, 4.500%, 03/01/44 | 2,451,702 | 2,632,915 | ||||||
Pool #AL6223, 4.500%, 08/01/44 | 537,898 | 577,460 | ||||||
Pool #AL9127, 4.000%, 10/01/44 | 10,991,198 | 11,583,394 | ||||||
Pool #AY2685, 4.500%, 01/01/45 | 594,879 | 641,069 | ||||||
Pool #MA2279, 4.000%, 05/01/45 | 1,851,485 | 1,942,483 | ||||||
Pool #BD9394, 3.500%, 06/01/45 | 125,952 | 129,064 | ||||||
Pool #AZ9213, 4.000%, 10/01/45 | 5,253,451 | 5,543,833 | ||||||
Pool #AS6515, 4.000%, 01/01/46 | 4,945,113 | 5,188,920 | ||||||
Pool #BC2470, 3.500%, 02/01/46 | 2,166,073 | 2,235,797 | ||||||
See Notes to Financial Statements.
102
Table of Contents
SCHEDULES OF PORTFOLIO INVESTMENTS
RIDGEWORTH FUNDS March 31, 2017
Seix Total Return Bond Fund — continued
| Shares or Principal Amount($) | Value($) | |||||||
U.S. Government Agency Mortgages—continued |
| |||||||
Pool #BC8441, 4.000%, 06/01/46 | 1,359,358 | 1,426,454 | ||||||
Pool #AS7561, 4.000%, 06/01/46 | 848,315 | 901,532 | ||||||
Pool #AX5534, 4.000%, 06/01/46 | 601,389 | 639,120 | ||||||
Pool #BD4896, 4.000%, 08/01/46 | 3,607,766 | 3,785,830 | ||||||
Pool #BC5673, 4.000%, 08/01/46 | 3,979,934 | 4,176,383 | ||||||
Pool #BC5696, 4.000%, 09/01/46 | 3,308,408 | 3,471,706 | ||||||
|
| |||||||
| 105,438,366 | ||||||||
|
| |||||||
Government National Mortgage Association | ||||||||
Pool #736663, 5.000%, 03/15/40 | 4,093,394 | 4,474,202 | ||||||
Pool #783653, 5.000%, 08/15/40 | 529,660 | 582,713 | ||||||
Pool #MA0321, 5.000%, 08/20/42 | 432,311 | 469,373 | ||||||
Pool #MA2681, 5.000%, 03/20/45 | 1,489,114 | 1,599,134 | ||||||
Pool #AM0226, 4.000%, 05/15/45 | 1,085,996 | 1,147,044 | ||||||
Pool #AM9875, 4.000%, 06/15/45 | 1,398,933 | 1,481,009 | ||||||
Pool #AN5745, 4.000%, 07/15/45 | 2,754,127 | 2,921,110 | ||||||
Pool #AN5764, 4.000%, 07/15/45 | 1,038,959 | 1,097,481 | ||||||
Pool #AN5766, 4.000%, 07/15/45 | 1,115,100 | 1,177,797 | ||||||
Pool #AN6811, 4.000%, 07/15/45 | 1,032,338 | 1,090,798 | ||||||
Pool #AM8631, 4.000%, 07/15/45 | 2,228,176 | 2,354,524 | ||||||
Pool #AV6530, 4.000%, 08/20/46 | 1,408,294 | 1,488,498 | ||||||
Pool #MA3875, 4.000%, 08/20/46 | 3,945,709 | 4,170,421 | ||||||
Pool #MA4005, 4.000%, 10/20/46 | 2,830,199 | 2,991,382 | ||||||
Pool #MA4072, 5.000%, 11/20/46 | 1,830,311 | 1,967,531 | ||||||
|
| |||||||
| 29,013,017 | ||||||||
|
| |||||||
Total U.S. Government Agency Mortgages | 215,425,971 | |||||||
|
| |||||||
| Shares or Principal Amount($) | Value($) | |||||||
U.S. Treasury Obligations 38.0% |
| |||||||
U.S. Treasury Bond 2.7% |
| |||||||
2.875%, 11/15/46 | 26,333,000 | 25,550,199 | ||||||
|
| |||||||
U.S. Treasury Inflation Indexed Bond 2.7% |
| |||||||
1.000%, 02/15/46 | 24,993,214 | 25,373,086 | ||||||
|
| |||||||
U.S. Treasury Notes 32.6% |
| |||||||
0.750%, 08/15/19 | 71,083,000 | 70,080,588 | ||||||
1.375%, 04/30/20 | 19,176,000 | 19,071,126 | ||||||
1.625%, 07/31/20(f) | 147,049,000 | 147,066,205 | ||||||
2.000%, 05/31/21 | 21,708,000 | 21,872,503 | ||||||
2.250%, 02/15/27 | 55,777,000 | 55,064,560 | ||||||
|
| |||||||
| 313,154,982 | ||||||||
|
| |||||||
Total U.S. Treasury Obligations | 364,078,267 | |||||||
|
| |||||||
Foreign Government Bonds 5.4% |
| |||||||
Sovereign 5.4% |
| |||||||
Argentine Bonos del Tesoro, 21.200%, 09/19/18 | ARS 149,950,000 | 10,187,667 | ||||||
Argentine Bonos del Tesoro, 22.750%, 03/05/18 | ARS 153,210,000 | 10,390,594 | ||||||
Argentine Republic Government International Bond, 7.500%, | ARS 13,690,000 | 14,552,470 | ||||||
Mexican Bonos, 8.500%, 12/13/18 | MXN 300,444,200 | 16,498,053 | ||||||
|
| |||||||
Total Foreign Government Bonds | 51,628,784 | |||||||
|
| |||||||
Money Market Funds 3.7% |
| |||||||
State Street Institutional Treasury Money Market Fund, Premier Class, 0.53%(g) | 29,913,948 | $ | 29,913,948 | |||||
State Street Institutional U.S. Government Money Market Fund, Premier Class, 0.62%(g)(h) | 5,199,918 | 5,199,918 | ||||||
|
| |||||||
Total Money Market Funds | 35,113,866 | |||||||
|
| |||||||
Total Investments |
| 982,758,553 | ||||||
Liabilities in Excess of Other Assets — (2.5)% | (23,914,808 | ) | ||||||
|
| |||||||
Net Assets — 100.0% | $ | 958,843,745 | ||||||
|
| |||||||
See Notes to Financial Statements.
103
Table of Contents
SCHEDULES OF PORTFOLIO INVESTMENTS
RIDGEWORTH FUNDS March 31, 2017
Seix Total Return Bond Fund — concluded
| (a) | Rule 144A, Section 4(2) or other security which is restricted as to resale to institutional investors. The Fund’s investment adviser/subadviser has deemed this security to be liquid based upon procedures approved by the Board of Trustees. These securities represent 13.0% of net assets as of March 31, 2017. |
| (b) | Variable or floating rate security. Rate disclosed is as of March 31, 2017. |
| (c) | All or a portion of this security has been purchased on a when-issued or delayed-delivery basis. |
| (d) | Perpetual maturity. |
| (e) | The security or a partial position of the security was on loan as of March 31, 2017. The total value of securities on loan as of March 31, 2017 was $5,073,159. |
| (f) | All or a portion of this security has been segregated, or otherwise earmarked, in connection with obligations for when-issued or delayed-delivery purchase commitments. |
| (g) | Rate disclosed, the 7 day net yield, is as of March 31, 2017. |
| (h) | Purchased with cash collateral held from securities lending. The value of the collateral could include collateral held for securities that were sold on or before March 31, 2017 (See Note 2(k)). |
Investment Abbreviation
| ARS | — | Argentine Peso | ||
| MTN | — | Medium Term Note | ||
| MXN | — | Mexician Peso | ||
| IO | — | Interest Only security for which the fund receives interest on notional principal |
At March 31, 2017, the Fund’s open credit default swap contract was as follows:
OTC Credit Default Swap Contract — Sell Protection
Underlying | Broker (Exchange) | Notional Amount | Fixed Rate | Expiration Date | Implied Credit Spread* | Premiums Receivable | Upfront Payments Made | Value | Unrealized Appreciation | |||||||||||||||||||||||||
Argentina Republic | Credit Suisse International | 12,500,000 | 5.000 | 06/20/22 | 3.672% | $20,833 | $754,843 | $768,092 | $13,249 | |||||||||||||||||||||||||
The notional amount represents the maximum potential amount the Fund could be required to pay as seller of credit protection if a credit event occurs, as defined under the terms of the swap contract, for each security included in Argentina Republic.
The value column indicates the impact each respective swap agreement has on the Fund’s Net Assets at March 31, 2017.
| * | Implied credit spreads serve as an indicator of the current status of the payment/performance risk and represent the likelihood or risk of default for the credit derivative. The implied credit spread of a particular reference entity reflects the cost of buying/selling protection and may include upfront payments required to be made to enter into the agreement. Wider credit spreads represent a deterioration of the reference entity’s credit soundness and a greater likelihood or risk of default or other credit event occurring as defined under the terms of the agreement. |
Forward Foreign Currency Contracts
At March 31, 2017, the Fund’s forward foreign currency contracts were as follows:
Currency | Counterparty | Delivery Date | Contract Amount in Local Currency | Contract Value in USD | Market Value | Unrealized Appreciation/ (Depreciation) | ||||||||||||||||
Short: |
| |||||||||||||||||||||
Australian Dollar | JPMorgan | 06/13/17 | 26,138,955 | $ | 19,583,174 | $ | 19,944,868 | $ | (361,694 | ) | ||||||||||||
Euro | JPMorgan | 06/13/17 | 17,076,742 | 18,166,665 | 18,276,940 | (110,275 | ) | |||||||||||||||
New Zealand Dollar | Credit Suisse International | 05/08/17 | 13,926,877 | 10,160,005 | 9,754,220 | 405,785 | ||||||||||||||||
South Korean Won | Credit Suisse International | 05/08/17 | 11,630,300,000 | 10,252,832 | 10,404,576 | (151,744 | ) | |||||||||||||||
Yuan Renminbi Offshore | JPMorgan | 01/17/18 | 139,434,750 | 19,500,000 | 19,871,450 | (371,450 | ) | |||||||||||||||
|
|
|
|
|
| |||||||||||||||||
Total Short Contracts | $ | 77,662,676 | $ | 78,252,054 | $ | (589,378 | ) | |||||||||||||||
|
|
|
|
|
| |||||||||||||||||
Long: |
| |||||||||||||||||||||
Euro | JPMorgan | 06/13/17 | 17,076,742 | 18,434,343 | 18,276,940 | (157,403 | ) | |||||||||||||||
|
|
|
|
|
| |||||||||||||||||
Total Long Contracts | $ | 18,434,343 | $ | 18,276,940 | $ | (157,403 | ) | |||||||||||||||
|
|
|
|
|
| |||||||||||||||||
See Notes to Financial Statements.
104
Table of Contents
SCHEDULES OF PORTFOLIO INVESTMENTS
RIDGEWORTH FUNDS March 31, 2017
Seix U.S. Government Securities Ultra-Short Bond Fund
| Shares or Principal Amount($) | Value($) | |||||||
| Asset-Backed Security 1.1% | ||||||||
Student Loan Asset Backed Security 1.1% |
| |||||||
NCUA Guaranteed Notes Trust, Series 2010-A1, Cl A, 1.208%, 12/07/20(a) | 15,564,795 | 15,564,795 | ||||||
|
| |||||||
Total Asset-Backed Security | 15,564,795 | |||||||
|
| |||||||
Collateralized Mortgage Obligations 53.2% |
| |||||||
Agency Collateralized Mortgage Obligations 25.9% |
| |||||||
Federal Home Loan Mortgage Corporation | ||||||||
Series 2781, Cl FA, REMIC, 1.262%, 04/15/34(a) | 8,637,370 | 8,619,359 | ||||||
Series 2796, Cl F, REMIC, 1.412%, 05/15/34(a) | 5,518,863 | 5,538,760 | ||||||
Series 3346, Cl FA, REMIC, 1.142%, 02/15/19(a) | 4,425,210 | 4,424,746 | ||||||
Series 3418, Cl FB, REMIC, 1.212%, 04/15/20(a) | 4,813,958 | 4,818,475 | ||||||
Series 3593, Cl F, REMIC, 1.280%, 03/15/36(a) | 3,066,587 | 3,078,357 | ||||||
Series 3710, Cl FL, REMIC, 1.412%, 05/15/36(a) | 1,121,247 | 1,127,235 | ||||||
Series 4057, Cl CF, REMIC, 1.362%, 04/15/39(a) | 10,599,711 | 10,599,250 | ||||||
Series 4247, Cl EF, REMIC, 1.312%, 03/15/32(a) | 1,721,696 | 1,729,733 | ||||||
Series 4474, Cl WF, REMIC, 1.130%, 12/15/36(a) | 20,163,883 | 20,090,265 | ||||||
|
| |||||||
| 60,026,180 | ||||||||
|
| |||||||
Federal National Mortgage Association | ||||||||
Series 2005-58, Cl KF, REMIC, 1.482%, 07/25/35(a) | 7,821,955 | 7,839,753 | ||||||
Series 2010-137, Cl WB, REMIC, 3.063%, 07/25/40(a) | 5,654,395 | 5,886,658 | ||||||
Series 2011-58, Cl AC, REMIC, 2.500%, 06/25/24 | 564,633 | 569,585 | ||||||
Series 2012-60, Cl WF, REMIC, 1.332%, 06/25/27(a) | 15,298,534 | 15,302,316 | ||||||
Series 2013-34, Cl PF, REMIC, 1.332%, 08/25/42(a) | 13,571,885 | 13,535,569 | ||||||
Series 2015-42, Cl BF, REMIC, 1.090%, 06/25/45(a) | 23,341,521 | 23,337,035 | ||||||
| Shares or Principal Amount($) | Value($) | |||||||
Agency Collateralized Mortgage Obligations—continued |
| |||||||
Series 2016-32, Cl FA, REMIC, 1.382%, 10/25/34(a) | 28,515,308 | 28,609,030 | ||||||
Series 2016-36, Cl FB, REMIC, 1.482%, 03/25/43(a) | 12,092,921 | 12,073,565 | ||||||
|
| |||||||
| 107,153,511 | ||||||||
|
| |||||||
Government National Mortgage Association | ||||||||
Series 2011-133, Cl PF, REMIC, 1.378%, 12/20/35(a) | 5,839,890 | 5,850,052 | ||||||
Series 2012-98, Cl FM, 1.178%, 12/20/38(a) | 2,332,594 | 2,326,433 | ||||||
Series 2016-H22, Cl FJ, 1.170%, 10/20/66(a) | 18,603,962 | 18,606,599 | ||||||
|
| |||||||
| 26,783,084 | ||||||||
|
| |||||||
NCUA Guaranteed Notes | ||||||||
Series 2010-R1, Cl 1A, 1.432%, 10/07/20(a) | 29,570,918 | 29,603,253 | ||||||
Series 2010-R2, Cl 1A, 1.148%, 11/06/17(a) | 35,732,731 | 35,738,645 | ||||||
Series 2010-R2, Cl 2A, 1.324%, 11/05/20(a) | 31,614,030 | 31,662,944 | ||||||
Series 2010-R3, Cl 1A, 1.337%, 12/08/20(a) | 6,627,760 | 6,654,584 | ||||||
Series 2010-R3, Cl 2A, 1.337%, 12/08/20(a) | 2,161,655 | 2,172,503 | ||||||
Series 2011-R1, Cl 1A, 1.304%, 01/08/20(a) | 23,977,218 | 24,013,996 | ||||||
Series 2011-R2, Cl 1A, 1.254%, 02/06/20(a) | 36,853,806 | 36,869,196 | ||||||
Series 2011-R3, Cl 1A, 1.291%, 03/11/20(a) | 1,291,016 | 1,291,765 | ||||||
|
| |||||||
| 168,006,886 | ||||||||
|
| |||||||
| 361,969,661 | ||||||||
|
| |||||||
Agency Collateralized Planned Amortization Class Mortgage Obligations 5.4% |
| |||||||
Federal Home Loan Mortgage Corporation | ||||||||
Series 3071, Cl ZX, REMIC, 1.212%, 04/15/35(a) | 2,388,599 | 2,379,794 | ||||||
Series 3260, Cl PF, REMIC, 1.212%, 01/15/37(a) | 1,267,512 | 1,265,696 | ||||||
Series 3990, Cl GF, REMIC, 1.312%, 03/15/41(a) | 10,737,427 | 10,745,264 | ||||||
Series 3995, Cl PF, REMIC, 1.362%, 05/15/39(a) | 11,316,113 | 11,348,185 | ||||||
See Notes to Financial Statements.
105
Table of Contents
SCHEDULES OF PORTFOLIO INVESTMENTS
RIDGEWORTH FUNDS March 31, 2017
Seix U.S. Government Securities Ultra-Short Bond Fund — continued
| Shares or Principal Amount($) | Value($) | |||||||
Agency Collateralized Planned Amortization Class Mortgage Obligations—continued |
| |||||||
Series 4203, Cl PF, REMIC, 1.162%, 09/15/42(a) | 20,932,640 | 20,881,630 | ||||||
Series 4571, Cl FK, REMIC, 1.512%, 02/15/44(a) | 5,827,472 | 5,820,862 | ||||||
|
| |||||||
| 52,441,431 | ||||||||
|
| |||||||
Federal National Mortgage Association | ||||||||
Series 2006-113, Cl NF, REMIC, 1.332%, 09/25/36(a) | 9,360,095 | 9,334,809 | ||||||
|
| |||||||
Government National Mortgage Association | ||||||||
Series 2003-67, Cl FP, 1.878%, 08/20/33(a) | 5,621,875 | 5,713,439 | ||||||
Series 2005-41, Cl FC, 1.278%, 05/20/35(a) | 8,520,966 | 8,483,987 | ||||||
|
| |||||||
| 14,197,426 | ||||||||
|
| |||||||
| 75,973,666 | ||||||||
|
| |||||||
Commercial Mortgage Backed Securities 21.9% |
| |||||||
Federal Home Loan Mortgage Corporation | ||||||||
Series KF15, Cl A, 1.449%, 02/25/23(a) | 11,593,599 | 11,651,531 | ||||||
Series KF22, Cl A, 1.279%, 07/25/23(a) | 12,740,192 | 12,772,114 | ||||||
Series KLH3, Cl A, 1.489%, 11/25/22(a) | 9,817,548 | 9,868,098 | ||||||
Series KLSF, Cl A, 1.109%, 11/25/21(a) | 14,167,700 | 14,167,698 | ||||||
Series KS05, Cl A, 1.289%, 01/25/23(a) | 5,980,799 | 5,995,789 | ||||||
|
| |||||||
| 54,455,230 | ||||||||
|
| |||||||
Federal National Mortgage Association | ||||||||
Series 2011-M1, Cl FA, 1.432%, 06/25/21(a) | 26,218,331 | 26,245,541 | ||||||
Series 2014-M5, Cl ASQ2, 2.034%, 03/25/19 | 11,353,833 | 11,377,978 | ||||||
Series 2015-M10, Cl FA, 1.019%, 03/25/19(a) | 2,046,298 | 2,047,252 | ||||||
Series 2015-M14, Cl FA, 1.602%, 10/25/25(a) | 1,982,594 | 1,997,322 | ||||||
Series 2015-M4, Cl FA, 0.979%, 09/25/18(a) | 1,004,921 | 1,004,958 | ||||||
Series 2016-M13, Cl FA, 1.439%, 11/25/23(a) | 19,223,549 | 19,216,845 | ||||||
| Shares or Principal Amount($) | Value($) | |||||||
Commercial Mortgage Backed Securities—continued |
| |||||||
Series 2016-M8, Cl FA, 1.483%, 07/25/26(a) | 20,577,501 | 20,625,868 | ||||||
Series 2016-M9, Cl FA, 1.269%, 09/25/23(a) | 62,639,573 | 62,674,651 | ||||||
Series 2017-M2, Cl FA, 1.299%, 02/25/24(a) | 15,989,279 | 16,016,011 | ||||||
|
| |||||||
| 161,206,426 | ||||||||
|
| |||||||
FREMF Multifamily Aggregation Risk Transfer Trust | ||||||||
Series 2017-KT01, Cl A, 1.090%, 02/25/20(a) | 12,070,000 | 12,088,804 | ||||||
|
| |||||||
FRESB Mortgage Trust | ||||||||
Series 2015-SB3, Cl A5, 2.012%, 08/25/42(a) | 12,275,038 | 12,225,938 | ||||||
Series 2015-SB9, Cl A5, 2.434%, 11/25/35(a) | 39,232,401 | 39,489,844 | ||||||
Series 2016-SB20, Cl A5H, 2.140%, 07/25/36(a) | 12,984,255 | 12,863,502 | ||||||
Series 2017-SB27, Cl A5H, 2.600%, 01/25/37(a) | 2,499,812 | 2,516,811 | ||||||
Series 2017-SB28, Cl A5H, 2.720%, 01/25/37(a) | 12,000,000 | 12,138,000 | ||||||
|
| |||||||
| 79,234,095 | ||||||||
|
| |||||||
| 306,984,555 | ||||||||
|
| |||||||
Total Collateralized Mortgage Obligations | 744,927,882 | |||||||
|
| |||||||
U.S. Government Agencies 1.7% |
| |||||||
Federal Agricultural Mortgage Corp. 0.4% |
| |||||||
1.228%, 01/03/22, MTN(a) | 4,900,000 | 4,922,643 | ||||||
|
| |||||||
Federal Farm Credit Bank 1.3% |
| |||||||
1.447%, 12/08/26(a) | 4,700,000 | 4,695,784 | ||||||
1.532%, 01/26/27(a) | 14,700,000 | 14,659,899 | ||||||
|
| |||||||
| 19,355,683 | ||||||||
|
| |||||||
Total U.S. Government Agencies | 24,278,326 | |||||||
|
| |||||||
U.S. Government Agency Mortgages 41.9% |
| |||||||
Federal Home Loan Mortgage Corporation | ||||||||
Pool #G11520, 5.000%, 01/01/19 | 1,030,788 | 1,060,747 | ||||||
Pool #J17872, 2.500%, 01/01/22 | 223,476 | 225,043 | ||||||
Pool #J21160, 2.500%, 11/01/22 | 581,892 | 591,463 | ||||||
See Notes to Financial Statements.
106
Table of Contents
SCHEDULES OF PORTFOLIO INVESTMENTS
RIDGEWORTH FUNDS March 31, 2017
Seix U.S. Government Securities Ultra-Short Bond Fund — continued
| Shares or Principal Amount($) | Value($) | |||||||
U.S. Government Agency Mortgages—continued |
| |||||||
Pool #G13080, 4.000%, 03/01/23 | 491,598 | 509,605 | ||||||
Pool #J29659, 3.000%, 10/01/24 | 1,058,330 | 1,088,396 | ||||||
Pool #J13242, 3.500%, 10/01/25 | 201,204 | 210,664 | ||||||
Pool #E02806, 3.000%, 12/01/25 | 461,353 | 473,822 | ||||||
Pool #848744, 3.165%, 05/01/34(a) | 12,867,620 | 13,645,422 | ||||||
Pool #848736, 3.167%, 05/01/35(a) | 20,244,941 | 21,251,278 | ||||||
Pool #848747, 3.138%, 07/01/36(a) | 12,103,481 | 12,803,757 | ||||||
Pool #1Q1195, 2.946%, 05/01/37(a) | 10,536,429 | 11,108,042 | ||||||
Pool #848796, 3.247%, 05/01/37(a) | 22,316,047 | 23,512,606 | ||||||
Pool #1Q1420, 3.113%, 09/01/39(a) | 16,159,531 | 17,062,351 | ||||||
Pool #849139, 3.091%, 09/01/43(a) | 2,564,048 | 2,640,496 | ||||||
|
| |||||||
| 106,183,692 | ||||||||
|
| |||||||
Federal National Mortgage Association | ||||||||
Pool #AM0687, 1.560%, 10/01/17 | 1,539,882 | 1,540,339 | ||||||
Pool #888969, 5.909%, 11/01/17 | 2,118,532 | 2,117,208 | ||||||
Pool #467010, 3.520%, 01/01/18 | 5,683,154 | 5,721,441 | ||||||
Pool #385912, 5.350%, 02/01/18 | 5,318,723 | 5,393,719 | ||||||
Pool #467288, 2.800%, 03/01/18 | 1,509,723 | 1,527,022 | ||||||
Pool #468279, 3.470%, 06/01/18 | 3,669,666 | 3,721,308 | ||||||
Pool #AM7163, 1.229%, 05/01/19(a) | 10,610,991 | 10,596,855 | ||||||
Pool #AM6261, 0.999%, 07/01/19(a) | 15,370,000 | 15,352,535 | ||||||
Pool #AM7028, 1.019%, 10/01/19(a) | 18,405,000 | 18,385,494 | ||||||
Pool #463520, 4.550%, 10/01/19 | 2,274,172 | 2,405,522 | ||||||
Pool #463617, 4.910%, 10/01/19 | 3,613,875 | 3,839,860 | ||||||
Pool #AM2078, 1.670%, 01/01/20 | 11,223,311 | 11,120,289 | ||||||
| Shares or Principal Amount($) | Value($) | |||||||
U.S. Government Agency Mortgages—continued |
| |||||||
Pool #AM5902, 1.119%, 05/01/20(a) | 18,500,854 | 18,512,411 | ||||||
Pool #AN3353, 1.349%, 09/01/21(a) | 10,750,000 | 10,754,934 | ||||||
Pool #AM9893, 1.159%, 10/01/21(a) | 27,500,000 | 27,501,504 | ||||||
Pool #AN3539, 1.249%, 11/01/21(a) | 17,404,595 | 17,399,593 | ||||||
Pool #469856, 1.569%, 12/01/21(a) | 17,627,201 | 17,691,736 | ||||||
Pool #AN5208, 1.171%, 03/01/22(a) | 4,800,000 | 4,801,265 | ||||||
Pool #AM9040, 1.049%, 06/01/22(a) | 17,995,000 | 17,976,810 | ||||||
Pool #AM9651, 1.079%, 08/01/22(a) | 14,330,000 | 14,333,194 | ||||||
Pool #AM7213, 1.429%, 08/01/22(a) | 4,540,000 | 4,535,058 | ||||||
Pool #AM2292, 1.129%, 01/01/23(a) | 4,567,820 | 4,552,779 | ||||||
Pool #AN3414, 1.379%, 01/01/23(a) | 11,938,958 | 11,954,696 | ||||||
Pool #AN2256, 1.359%, 07/01/23(a) | 17,775,000 | 17,751,679 | ||||||
Pool #AN2605, 1.239%, 08/01/23(a) | 10,000,000 | 9,999,517 | ||||||
Pool #MA1535, 2.000%, 08/01/23 | 491,694 | 494,311 | ||||||
Pool #AN1582, 1.219%, 09/01/23(a) | 14,525,000 | 14,532,972 | ||||||
Pool #AU7196, 2.000%, 09/01/23 | 512,212 | 514,937 | ||||||
Pool #AM4611, 1.239%, 11/01/23(a) | 4,692,625 | 4,710,546 | ||||||
Pool #AM4510, 1.269%, 11/01/23(a) | 1,782,185 | 1,779,194 | ||||||
Pool #AN3845, 1.319%, 12/01/23(a) | 16,548,259 | 16,494,196 | ||||||
Pool #AN4300, 1.339%, 01/01/24(a) | 14,679,928 | 14,657,065 | ||||||
Pool #AN4364, 1.369%, 01/01/24(a) | 2,990,000 | 2,997,664 | ||||||
Pool #AN3434, 1.429%, 09/01/24(a) | 2,684,000 | 2,684,693 | ||||||
Pool #AN2868, 1.269%, 12/01/24(a) | 4,700,000 | 4,679,552 | ||||||
Pool #AN3661, 1.359%, 11/01/26(a) | 3,000,000 | 3,006,341 | ||||||
Pool #AL0222, 2.776%, 07/01/34(a) | 7,182,021 | 7,578,491 | ||||||
See Notes to Financial Statements.
107
Table of Contents
SCHEDULES OF PORTFOLIO INVESTMENTS
RIDGEWORTH FUNDS March 31, 2017
Seix U.S. Government Securities Ultra-Short Bond Fund — concluded
| Shares or Principal Amount($) | Value($) | |||||||
U.S. Government Agency Mortgages—continued |
| |||||||
Pool #AD0064, 2.781%, 01/01/35(a) | 6,376,489 | 6,636,918 | ||||||
Pool #AD7165, 2.491%, 04/01/35(a) | 1,735,845 | 1,837,372 | ||||||
Pool #995540, 2.755%, 01/01/36(a) | 5,377,722 | 5,674,921 | ||||||
Pool #AL2202, 3.118%, 06/01/36(a) | 6,720,553 | 7,049,940 | ||||||
Pool #AL0960, 3.058%, 07/01/37(a) | 12,026,420 | 12,737,647 | ||||||
Pool #AL0270, 2.929%, 08/01/38(a) | 10,273,905 | 10,816,029 | ||||||
Pool #AL6516, 3.249%, 04/01/40(a) | 10,619,523 | 11,230,253 | ||||||
Pool #AL7812, 3.089%, 11/01/40(a) | 21,273,245 | 22,476,808 | ||||||
Pool #AE0544, 3.166%, 11/01/40(a) | 6,863,619 | 7,251,216 | ||||||
Pool #AL0323, 3.029%, 06/01/41(a) | 7,438,316 | 7,877,397 | ||||||
Pool #AL1801, 2.947%, 05/01/42(a) | 4,881,328 | 5,037,585 | ||||||
Pool #AT1155, 2.946%, 09/01/43(a) | 2,979,234 | 3,074,778 | ||||||
Pool #AU6696, 2.706%, 10/01/43(a) | 15,908,985 | 16,356,840 | ||||||
Pool #BD2950, 2.396%, 07/01/46(a) | 5,944,593 | 6,019,648 | ||||||
Pool #BA3816, 2.573%, 07/01/46(a) | 6,675,619 | 6,804,492 | ||||||
Pool #BD2257, 2.433%, 08/01/46(a) | 5,455,501 | 5,528,431 | ||||||
Pool #BD3394, 2.546%, 08/01/46(a) | 3,945,993 | 4,012,150 | ||||||
|
| |||||||
| 474,039,155 | ||||||||
|
| |||||||
Government National Mortgage Association | ||||||||
Pool #082904, 2.125%, 08/20/41(a) | 1,238,607 | 1,273,535 | ||||||
| Shares or Principal Amount($) | Value($) | |||||||
U.S. Government Agency Mortgages—continued |
| |||||||
Pool #MA0414, 2.125%, 09/20/42(a) | 4,122,169 | 4,234,715 | ||||||
|
| |||||||
| 5,508,250 | ||||||||
|
| |||||||
Total U.S. Government Agency Mortgages | 585,731,097 | |||||||
|
| |||||||
U.S. Treasury Obligation 0.0%(b) |
| |||||||
U.S. Treasury Note 0.0%(b) |
| |||||||
|
| |||||||
0.875%, 05/15/17 | 400,000 | 400,094 | ||||||
|
| |||||||
Total U.S. Treasury Obligation | 400,094 | |||||||
|
| |||||||
Money Market Fund 2.0% |
| |||||||
State Street Institutional Treasury Money Market Fund, Premier Class, 0.53%(c) | 27,461,735 | 27,461,735 | ||||||
|
| |||||||
Total Money Market Fund | 27,461,735 | |||||||
|
| |||||||
Total Investments |
| 1,398,363,929 | ||||||
Other Assets in Excess of Liabilities — 0.1% | 1,535,471 | |||||||
|
| |||||||
Net Assets — 100.0% | $ | 1,399,899,400 | ||||||
|
| |||||||
| (a) | Variable or floating rate security. Rate disclosed is as of March 31, 2017. |
| (b) | Less than 0.05% of Net Assets. |
| (c) | Rate disclosed, the 7 day yield, is as of March 31, 2017. |
Investment Abbreviation
| MTN | — | Medium Term Note | ||
| REMIC | — | Real Estate Mortgage Investment Conduit |
Open Futures Contracts
At March 31, 2017, the Fund’s open futures contracts were as follows:
Description | Position | Notional Amount | Expiration Month | Contracts | Unrealized Depreciation | |||||||||||||||
U.S. Treasury 2 Year Note | Short | $(65,960,262) | June 2017 | 305 | $(57,941) | |||||||||||||||
U.S. Treasury 5 Year Note | Short | (18,805,584) | June 2017 | 160 | (30,666) | |||||||||||||||
|
| |||||||||||||||||||
| $(88,607) | ||||||||||||||||||||
|
| |||||||||||||||||||
See Notes to Financial Statements.
108
Table of Contents
SCHEDULES OF PORTFOLIO INVESTMENTS
RIDGEWORTH FUNDS March 31, 2017
Seix U.S. Mortgage Fund
| Shares or Principal Amount($) | Value($) | |||||||
| Collateralized Mortgage Obligations 6.3% | ||||||||
Agency Collateralized Mortgage Obligation 0.8% |
| |||||||
Federal National Mortgage Association | ||||||||
Series 2010-134, Cl EB, REMIC, 4.000%, 12/25/25 | 200,000 | 215,378 | ||||||
|
| |||||||
Commercial Mortgage Backed Securities 5.5% |
| |||||||
Federal National Mortgage Association | ||||||||
Series 2013-M6, Cl X1, IO 2.174%, 02/25/43(a) | 3,388,620 | 194,280 | ||||||
Series 2017-M3, Cl A2, 2.569%, 12/25/26(a) | 242,000 | 232,150 | ||||||
|
| |||||||
| 426,430 | ||||||||
|
| |||||||
FREMF Mortgage Trust | ||||||||
Series 2012-K20, Cl X2A, IO 0.200%, | 8,653,192 | 69,245 | ||||||
Series 2012-K21, Cl B, 3.938%, | 500,000 | 518,880 | ||||||
Series 2013-K25, Cl B, 3.619%, | 122,000 | 124,687 | ||||||
|
| |||||||
| 712,812 | ||||||||
|
| |||||||
GS Mortgage Securities Corp. II | ||||||||
Series 2012-BWTR, Cl B, 3.255%, | 109,000 | 110,417 | ||||||
|
| |||||||
Queens Center Mortgage Trust | ||||||||
Series 2013-QCA, Cl A, 3.275%, 01/11/37(b) | 150,000 | 150,918 | ||||||
|
| |||||||
Total Collateralized Mortgage Obligations | 1,615,955 | |||||||
|
| |||||||
U.S. Government Agency Mortgages 89.3% |
| |||||||
Federal Home Loan Mortgage Corporation | ||||||||
Pool #C01785, 5.000%, 02/01/34 | 151,553 | 166,377 | ||||||
Pool #C91768, 3.500%, 07/01/34 | 736,944 | 764,697 | ||||||
Pool #G01838, 5.000%, 07/01/35 | 121,196 | 133,094 | ||||||
Pool #Z40115, 6.000%, 05/01/36 | 200,032 | 226,159 | ||||||
Pool #Z40004, 6.000%, 08/01/36 | 41,281 | 46,982 | ||||||
Pool #A85718, 4.000%, 04/01/39 | 53,270 | 56,316 | ||||||
Pool #G05477, 4.500%, 05/01/39 | 191,427 | 206,995 | ||||||
Pool #G08347, 4.500%, 06/01/39 | 32,273 | 34,672 | ||||||
Pool #G05606, 4.500%, 07/01/39 | 373,444 | 401,470 | ||||||
Pool #A89148, 4.000%, 10/01/39 | 104,094 | 109,549 | ||||||
Pool #G08372, 4.500%, 11/01/39 | 159,945 | 171,897 | ||||||
Pool #A93101, 5.000%, 07/01/40 | 205,071 | 223,562 | ||||||
Pool #G06061, 4.000%, 10/01/40 | 119,978 | 126,603 | ||||||
Pool #A95085, 4.000%, 11/01/40 | 572,316 | 602,782 | ||||||
Pool #A95147, 4.000%, 11/01/40 | 94,614 | 99,643 | ||||||
| Shares or Principal Amount($) | Value($) | |||||||
U.S. Government Agency Mortgages—continued |
| |||||||
Pool #A95796, 4.000%, 12/01/40 | 70,027 | 73,750 | ||||||
Pool #G07068, 5.000%, 07/01/41 | 436,024 | 474,869 | ||||||
Pool #Q06771, 3.000%, 03/01/42 | 242,176 | 241,464 | ||||||
Pool #G07031, 4.000%, 05/01/42 | 479,839 | 506,424 | ||||||
Pool #C04123, 4.000%, 07/01/42 | 314,396 | 332,381 | ||||||
Pool #Q09949, 3.000%, 08/01/42 | 162,364 | 161,887 | ||||||
Pool #Q10929, 3.500%, 09/01/42 | 406,904 | 417,996 | ||||||
Pool #Q11651, 3.000%, 10/01/42 | 109,357 | 109,036 | ||||||
Pool #Q13801, 3.000%, 12/01/42 | 182,650 | 182,122 | ||||||
Pool #G60019, 4.500%, 03/01/44 | 371,677 | 399,620 | ||||||
Pool #Q26366, 4.000%, 05/01/44 | 205,535 | 217,267 | ||||||
Pool #V81283, 4.000%, 07/01/44 | 385,223 | 404,379 | ||||||
Pool #G60589, 4.000%, 02/01/45 | 492,789 | 517,339 | ||||||
Pool #Q31645, 4.000%, 02/01/45 | 101,076 | 106,491 | ||||||
Pool #Q36238, 4.000%, 09/01/45 | 439,035 | 460,866 | ||||||
Pool #Q38473, 4.000%, 01/01/46 | 433,747 | 455,315 | ||||||
Pool #Q40124, 3.500%, 04/01/46 | 245,813 | 252,334 | ||||||
Pool #Q40123, 3.500%, 04/01/46 | 236,089 | 242,568 | ||||||
Pool #Q40723, 4.000%, 05/01/46 | 463,514 | 486,563 | ||||||
|
| |||||||
| 9,413,469 | ||||||||
|
| |||||||
Federal National Mortgage Association | ||||||||
Pool #AN4142, 3.260%, 01/01/27 | 380,992 | 389,293 | ||||||
Pool #MA1688, 3.500%, 12/01/33 | 57,404 | 59,947 | ||||||
Pool #AL0049, 6.000%, 12/01/35 | 32,000 | 36,219 | ||||||
Pool #AB6401, 3.000%, 10/01/37 | 302,590 | 301,372 | ||||||
Pool #AB7768, 3.000%, 02/01/38 | 433,087 | 431,343 | ||||||
Pool #AC2817, 4.000%, 10/01/39 | 8,437 | 8,856 | ||||||
Pool #932441, 4.000%, 01/01/40 | 216,746 | 227,509 | ||||||
Pool #AL7497, 3.500%, 09/01/40 | 758,709 | 781,245 | ||||||
Pool #AE5143, 4.000%, 11/01/40 | 30,520 | 32,140 | ||||||
Pool #AE4414, 4.000%, 11/01/40 | 32,539 | 34,232 | ||||||
Pool #MA0639, 4.000%, 02/01/41 | 554,861 | 584,065 | ||||||
Pool #AL0215, 4.500%, 04/01/41 | 139,804 | 150,497 | ||||||
Pool #AI5868, 4.500%, 07/01/41 | 263,841 | 284,133 | ||||||
Pool #890381, 3.500%, 10/01/41 | 294,626 | 303,157 | ||||||
Pool #AW8154, 3.500%, 01/01/42 | 548,631 | 564,819 | ||||||
Pool #AJ9327, 3.500%, 01/01/42 | 130,823 | 134,554 | ||||||
Pool #AJ9317, 4.000%, 01/01/42 | 556,672 | 586,117 | ||||||
Pool #MA0971, 4.000%, 02/01/42 | 107,524 | 113,215 | ||||||
Pool #AK5151, 3.000%, 03/01/42 | 260,287 | 259,481 | ||||||
Pool #AI9101, 3.500%, 04/01/42 | 427,347 | 439,862 | ||||||
Pool #AB5188, 3.500%, 05/01/42 | 66,897 | 68,810 | ||||||
Pool #AZ0572, 3.000%, 06/01/42 | 94,465 | 94,172 | ||||||
Pool #AO8632, 3.500%, 07/01/42 | 1,216,365 | 1,250,176 | ||||||
See Notes to Financial Statements.
109
Table of Contents
SCHEDULES OF PORTFOLIO INVESTMENTS
RIDGEWORTH FUNDS March 31, 2017
Seix U.S. Mortgage Fund — concluded
| Shares or Principal Amount($) | Value($) | |||||||
U.S. Government Agency Mortgages—continued |
| |||||||
Pool #AP7874, 3.500%, 10/01/42 | 122,366 | 125,766 | ||||||
Pool #AB8726, 3.500%, 03/01/43 | 86,198 | 88,594 | ||||||
Pool #AT0536, 4.000%, 10/01/43 | 176,858 | 185,663 | ||||||
Pool #AV3452, 4.000%, 02/01/44 | 178,601 | 187,402 | ||||||
Pool #AL6223, 4.500%, 08/01/44 | 584,157 | 627,121 | ||||||
Pool #AL9127, 4.000%, 10/01/44 | 165,746 | 174,676 | ||||||
Pool #AY2685, 4.500%, 01/01/45 | 71,432 | 76,978 | ||||||
Pool #MA2279, 4.000%, 05/01/45 | 164,255 | 172,328 | ||||||
Pool #MA2341, 4.500%, 06/01/45 | 162,857 | 174,789 | ||||||
Pool #AY8851, 4.000%, 08/01/45 | 278,461 | 292,318 | ||||||
Pool #AZ5755, 3.500%, 09/01/45 | 637,871 | 654,896 | ||||||
Pool #AZ9213, 4.000%, 10/01/45 | 669,515 | 706,522 | ||||||
Pool #BC2470, 3.500%, 02/01/46 | 190,741 | 196,881 | ||||||
Pool #AX5534, 4.000%, 06/01/46 | 90,186 | 95,844 | ||||||
Pool #AS7561, 4.000%, 06/01/46 | 118,554 | 125,992 | ||||||
Pool #BD4896, 4.000%, 08/01/46 | 247,454 | 259,667 | ||||||
|
| |||||||
| 11,280,651 | ||||||||
|
| |||||||
Government National Mortgage Association | ||||||||
Pool #AA5471, 4.000%, 12/15/41 | 727,673 | 771,722 | ||||||
Pool #MA0321, 5.000%, 08/20/42 | 20,183 | 21,913 | ||||||
Pool #MA2681, 5.000%, 03/20/45 | 269,686 | 289,611 | ||||||
Pool #AM9875, 4.000%, 06/15/45 | 174,494 | 184,732 | ||||||
Pool #AN6811, 4.000%, 07/15/45 | 625,330 | 660,742 | ||||||
| Shares or Principal Amount($) | Value($) | |||||||
U.S. Government Agency Mortgages—continued |
| |||||||
Pool #AV6530, 4.000%, 08/20/46 | 155,625 | 164,488 | ||||||
|
| |||||||
| 2,093,208 | ||||||||
|
| |||||||
Total U.S. Government Agency Mortgages | 22,787,328 | |||||||
|
| |||||||
Money Market Fund 3.8% |
| |||||||
State Street Institutional Treasury Money Market Fund, Premier Class, 0.53%(c) | 962,950 | 962,950 | ||||||
|
| |||||||
Total Money Market Fund | 962,950 | |||||||
|
| |||||||
Total Investments | 25,366,233 | |||||||
Other Assets in Excess of Liabilities — 0.6% | 148,094 | |||||||
|
| |||||||
Net Assets — 100.0% | $ | 25,514,327 | ||||||
|
| |||||||
| (a) | Variable or floating rate security. Rate disclosed is as of March 31, 2017. |
| (b) | Rule 144A, Section 4(2) or other security which is restricted as to resale to institutional investors. The Fund’s investment adviser/subadviser has deemed this security to be liquid based upon procedures approved by the Board of Trustees. These securities represent 3.8% of net assets as of March 31, 2017. |
| (c) | Rate disclosed, the 7 day yield, is as of March 31, 2017. |
Investment Abbreviations
| REMIC | — | Real Estate Mortgage Investment Conduit | ||
| IO | — | Interest Only security for which the fund receives interest on notional principal |
See Notes to Financial Statements.
110
Table of Contents
SCHEDULES OF PORTFOLIO INVESTMENTS
RIDGEWORTH FUNDS March 31, 2017
Seix Ultra-Short Bond Fund
| Shares or Principal Amount($) | Value($) | |||||||
| Asset-Backed Securities 18.6% | ||||||||
Auto Floor Plan 3.2% |
| |||||||
Ally Master Owner Trust, Series 2014-5, Cl A1, 1.402%, 10/15/19(a) | 475,000 | 475,513 | ||||||
BMW Floorplan Master Owner Trust, Series 2015-1A, Cl A, 1.412%, | 1,100,000 | 1,102,342 | ||||||
Nissan Master Owner Trust Receivables, Series 2016-A, Cl A2, 1.540%, 06/15/21 | 1,250,000 | 1,240,526 | ||||||
|
| |||||||
| 2,818,381 | ||||||||
|
| |||||||
Automobiles 4.9% |
| |||||||
AmeriCredit Automobile Receivables Trust, Series 2013-5, Cl B, 1.520%, 01/08/19 | 295,180 | 295,198 | ||||||
AmeriCredit Automobile Receivables Trust, Series 2014-2, Cl B, 1.600%, 07/08/19 | 500,000 | 500,333 | ||||||
Capital Auto Receivables Asset Trust, Series 2014-2, Cl B, 2.030%, | 1,250,000 | 1,252,518 | ||||||
Capital Auto Receivables Asset Trust, Series 2015-3, Cl A1A, 1.390%, | 40,942 | 40,941 | ||||||
Chrysler Capital Auto Receivables Trust, Series 2013-BA, Cl A4, 1.270%, | 625,238 | 624,946 | ||||||
Chrysler Capital Auto Receivables Trust, Series 2013-BA, Cl B, 1.780%, 06/17/19(b) | 500,000 | 500,713 | ||||||
Ford Credit Auto Owner Trust, Series 2013-B, Cl B, 1.110%, 10/15/18 | 300,000 | 299,863 | ||||||
GM Financial Automobile Leasing Trust, Series 2014-2A, Cl A3, 1.220%, | 61,190 | 61,188 | ||||||
Hyundai Auto Receivables Trust, Series 2013-B, Cl A4, 1.010%, 02/15/19 | 141,275 | 141,248 | ||||||
Hyundai Auto Receivables Trust, Series 2014-A, Cl B, 1.730%, 08/15/19 | 585,000 | 585,996 | ||||||
|
| |||||||
| 4,302,944 | ||||||||
|
| |||||||
Credit Card 4.4% |
| |||||||
Barclays Dryrock Issuance Trust, Series 2015-4, Cl A, 1.720%, 08/16/21 | 152,000 | 152,062 | ||||||
| Shares or Principal Amount($) | Value($) | |||||||
Credit Card—continued |
| |||||||
Cabela’s Credit Card Master Note Trust, Series 2014-2, Cl A, 1.362%, 07/15/22(a) | 1,512,000 | 1,515,479 | ||||||
Capital One Multi-Asset Execution Trust, Series 2005-B3, Cl B3, 1.573%, | 1,253,000 | 1,206,148 | ||||||
Capital One Multi-Asset Execution Trust, Series 2014-A5, Cl A5, 1.480%, 07/15/20 | 150,000 | 150,143 | ||||||
Golden Credit Card Trust, Series 2015-3A, Cl A, 1.332%, 07/15/19(a)(b) | 825,000 | 825,477 | ||||||
|
| |||||||
| 3,849,309 | ||||||||
|
| |||||||
Other 5.4% |
| |||||||
DB Master Finance LLC, Series 2015-1A, Cl A2I, 3.262%, 02/20/45(b) | 1,185,800 | 1,192,028 | ||||||
Domino’s Pizza Master Issuer LLC, Series 2012-1A, Cl A2, 5.216%, 01/25/42(b) | 1,060,515 | 1,074,337 | ||||||
Taco Bell Funding LLC, Series 2016-1A, Cl A2I, 3.832%, 05/25/46(b) | 909,430 | 921,903 | ||||||
Verizon Owner Trust, Series 2016-1A, Cl A, 1.420%, 01/20/21(b) | 1,497,000 | 1,487,818 | ||||||
|
| |||||||
| 4,676,086 | ||||||||
|
| |||||||
Student Loan Asset Backed Security 0.7% |
| |||||||
SLM Student Loan Trust, Series 2013-1, Cl A2, 1.232%, 09/25/19(a) | 566,283 | 566,141 | ||||||
|
| |||||||
Total Asset-Backed Securities | 16,212,861 | |||||||
|
| |||||||
Collateralized Mortgage Obligations 14.2% |
| |||||||
Agency Collateralized Mortgage Obligation 0.9% |
| |||||||
Federal Home Loan Mortgage Corporation | ||||||||
Series 2839, Cl TS, REMIC, 5.000%, 08/15/19 | 779,619 | 798,998 | ||||||
|
| |||||||
Commercial Mortgage Backed Securities 13.3% |
| |||||||
Chicago Skyscraper Trust | ||||||||
Series 2017-SKY, Cl A, 1.713%, | 1,000,000 | 1,000,560 | ||||||
|
| |||||||
Commercial Mortgage Trust |
| |||||||
Series 2012-CR2, Cl A2, 2.025%, 08/15/45 | 15,320 | 15,313 | ||||||
|
| |||||||
See Notes to Financial Statements.
111
Table of Contents
SCHEDULES OF PORTFOLIO INVESTMENTS
RIDGEWORTH FUNDS March 31, 2017
Seix Ultra-Short Bond Fund — continued
| Shares or Principal Amount($) | Value($) | |||||||
Commercial Mortgage Backed Securities—continued |
| |||||||
CSMC Trust | ||||||||
Series 2014-TIKI, Cl A, 1.862%, 09/15/38(a)(b) | 1,250,000 | 1,246,613 | ||||||
|
| |||||||
Federal Home Loan Mortgage Corporation | ||||||||
Series KS02, Cl A, 1.362%, 08/25/23(a) | 286,285 | 286,459 | ||||||
|
| |||||||
Federal National Mortgage Association | ||||||||
Series 2014-M5, Cl ASQ2, 2.034%, 03/25/19 | 934,857 | 936,845 | ||||||
Series 2016-M9, Cl FA, 1.269%, 09/25/23(a) | 3,977,116 | 3,979,343 | ||||||
|
| |||||||
| 4,916,188 | ||||||||
|
| |||||||
FREMF Multifamily Aggregation Risk Transfer Trust | ||||||||
Series 2017-KT01, Cl A, 1.090%, 02/25/20(a) | 1,000,000 | 1,001,558 | ||||||
|
| |||||||
JPMorgan Chase Commercial Mortgage Securities Trust | ||||||||
Series 2013-C13, Cl A1, 1.303%, 01/15/46 | 125,468 | 125,392 | ||||||
|
| |||||||
Morgan Stanley Bank of America Merrill Lynch Trust | ||||||||
Series 2013-C12, Cl A1, 1.313%, 10/15/46 | 459,391 | 458,531 | ||||||
Series 2014-C14, Cl A1, 1.250%, 02/15/47 | 199,483 | 198,674 | ||||||
|
| |||||||
| 657,205 | ||||||||
|
| |||||||
WFRBS Commercial Mortgage Trust | ||||||||
Series 2012-C7, Cl AFL, 1.972%, | 515,000 | 525,345 | ||||||
Series 2012-C8, Cl A2, 1.881%, 08/15/45 | 866,055 | 866,009 | ||||||
Series 2012-C8, Cl AFL, 1.943%, | 1,000,000 | 1,010,199 | ||||||
|
| |||||||
| 2,401,553 | ||||||||
|
| |||||||
| 11,650,841 | ||||||||
|
| |||||||
Total Collateralized Mortgage Obligations | 12,449,839 | |||||||
|
| |||||||
Corporate Bonds 47.8% |
| |||||||
Aerospace/Defense 0.6% |
| |||||||
Lockheed Martin Corp., 1.850%, 11/23/18 | 484,000 | 485,341 | ||||||
|
| |||||||
| Shares or Principal Amount($) | Value($) | |||||||
Auto Manufacturers 6.0% |
| |||||||
BMW U.S. Capital LLC, 1.500%, 04/11/19(b) | 671,000 | 666,432 | ||||||
Daimler Finance North America LLC, 1.894%, 08/01/18(a)(b) | 1,314,000 | 1,323,252 | ||||||
Ford Motor Credit Co. LLC, 5.000%, 05/15/18 | 1,371,000 | 1,416,481 | ||||||
General Motors Financial Co., Inc., 2.400%, 05/09/19 | 1,338,000 | 1,340,878 | ||||||
PACCAR Financial Corp., 1.700%, 12/06/18, MTN(a) | 520,000 | 524,099 | ||||||
|
| |||||||
| 5,271,142 | ||||||||
|
| |||||||
Banks 8.1% |
| |||||||
Bank of America Corp., 2.000%, 01/11/18 | 1,537,000 | 1,540,929 | ||||||
Bank of Montreal, 2.100%, 12/12/19, MTN | 905,000 | 908,273 | ||||||
Citigroup, Inc., 2.500%, 09/26/18 | 934,000 | 942,349 | ||||||
Citigroup, Inc., 2.739%, 05/15/18(a) | 897,000 | 910,487 | ||||||
Goldman Sachs Group, Inc. (The), 5.950%, 01/18/18 | 1,688,000 | 1,743,150 | ||||||
Morgan Stanley, 2.125%, 04/25/18 | 1,051,000 | 1,055,015 | ||||||
|
| |||||||
| 7,100,203 | ||||||||
|
| |||||||
Beverages 1.6% |
| |||||||
Molson Coors Brewing Co., 1.450%, 07/15/19 | 1,406,000 | 1,387,806 | ||||||
|
| |||||||
Biotechnology 0.7% |
| |||||||
Celgene Corp., 2.125%, 08/15/18 | 654,000 | 656,634 | ||||||
|
| |||||||
Chemicals 1.7% |
| |||||||
Chevron Phillips Chemical Co. LLC, 1.700%, 05/01/18(b) | 1,498,000 | 1,498,390 | ||||||
|
| |||||||
Computers 2.3% |
| |||||||
Apple, Inc., 1.550%, 02/08/19 | 915,000 | 916,652 | ||||||
Diamond 1 Finance Corp./Diamond 2 Finance Corp., 3.480%, 06/01/19(b) | 1,047,000 | 1,072,873 | ||||||
|
| |||||||
| 1,989,525 | ||||||||
|
| |||||||
Electric 3.4% |
| |||||||
Duke Energy Corp., 1.378%, 04/03/17(a) | 917,000 | 917,000 | ||||||
Emera U.S. Finance LP, 2.150%, 06/15/19 | 963,000 | 962,709 | ||||||
MidAmerican Energy Co., 5.300%, 03/15/18 | 1,057,000 | 1,094,429 | ||||||
|
| |||||||
| 2,974,138 | ||||||||
|
| |||||||
See Notes to Financial Statements.
112
Table of Contents
SCHEDULES OF PORTFOLIO INVESTMENTS
RIDGEWORTH FUNDS March 31, 2017
Seix Ultra-Short Bond Fund — continued
| Shares or Principal Amount($) | Value($) | |||||||
Electronics 1.5% |
| |||||||
Fortive Corp., 1.800%, 06/15/19(b) | 1,328,000 | 1,319,737 | ||||||
|
| |||||||
Healthcare-Products 2.2% |
| |||||||
Becton Dickinson and Co., 1.800%, 12/15/17 | 907,000 | 907,677 | ||||||
Thermo Fisher Scientific, Inc., 2.400%, 02/01/19 | 1,010,000 | 1,018,522 | ||||||
|
| |||||||
| 1,926,199 | ||||||||
|
| |||||||
Healthcare-Services 0.8% |
| |||||||
Aetna, Inc., 1.750%, 05/15/17 | 660,000 | 660,062 | ||||||
|
| |||||||
Housewares 1.5% |
| |||||||
Newell Brands, Inc., 2.600%, 03/29/19 | 1,332,000 | 1,348,469 | ||||||
|
| |||||||
Insurance 0.6% |
| |||||||
Berkshire Hathaway Finance Corp., 1.700%, 03/15/19 | 531,000 | 531,919 | ||||||
|
| |||||||
Internet 0.3% |
| |||||||
eBay, Inc., 2.500%, 03/09/18 | 256,000 | 257,946 | ||||||
|
| |||||||
Miscellaneous Manufacturer 1.2% |
| |||||||
Siemens Financieringsmaatschappij NV, 2.200%, 03/16/20(b) | 1,019,000 | 1,022,752 | ||||||
|
| |||||||
Oil & Gas 2.4% |
| |||||||
BP Capital Markets PLC, 1.783%, | 1,168,000 | 1,175,521 | ||||||
Chevron Corp., 1.686%, 02/28/19 | 897,000 | 897,943 | ||||||
|
| |||||||
| 2,073,464 | ||||||||
|
| |||||||
Oil & Gas Services 2.3% |
| |||||||
TechnipFMC PLC, 2.000%, | 2,000,000 | 1,999,308 | ||||||
|
| |||||||
Pharmaceuticals 0.2% |
| |||||||
McKesson Corp., 2.284%, 03/15/19 | 214,000 | 215,542 | ||||||
|
| |||||||
Pipelines 4.3% |
| |||||||
Kinder Morgan, Inc., 2.000%, 12/01/17 | 1,536,000 | 1,537,120 | ||||||
TransCanada PipeLines Ltd., 1.625%, 11/09/17 | 2,227,000 | 2,227,120 | ||||||
|
| |||||||
| 3,764,240 | ||||||||
|
| |||||||
Real Estate Investment Trust 2.5% |
| |||||||
American Tower Corp., 4.500%, 01/15/18 | 2,148,000 | 2,193,834 | ||||||
|
| |||||||
Retail 0.8% |
| |||||||
CVS Health Corp., 1.900%, 07/20/18 | 656,000 | 657,298 | ||||||
|
| |||||||
| Shares or Principal Amount($) | Value($) | |||||||
Semiconductors 0.9% |
| |||||||
Broadcom Corp./Broadcom Cayman Finance Ltd., 2.375%, 01/15/20(b) | 770,000 | 769,907 | ||||||
|
| |||||||
Telecommunication Services 1.0% |
| |||||||
Verizon Communications, Inc., 1.375%, 08/15/19 | 472,000 | 464,776 | ||||||
Verizon Communications, Inc., 1.506%, 06/09/17(a) | 379,000 | 379,164 | ||||||
|
| |||||||
| 843,940 | ||||||||
|
| |||||||
Transportation 0.9% |
| |||||||
Canadian National Railway Co., 1.206%, 11/14/17(a) | 831,000 | 831,490 | ||||||
|
| |||||||
Total Corporate Bonds | 41,779,286 | |||||||
|
| |||||||
U.S. Government Agency Mortgages 16.6% |
| |||||||
Federal National Mortgage Association | ||||||||
Pool #AM2712, 1.535%, 03/01/18 | 480,278 | 479,931 | ||||||
Pool #467699, 1.189%, 05/01/18(a) | 234,590 | 234,495 | ||||||
Pool #468910, 1.179%, 08/01/18(a) | 224,483 | 224,775 | ||||||
Pool #AN3353, 1.349%, 09/01/21(a) | 1,000,000 | 1,000,459 | ||||||
Pool #AN3539, 1.249%, 11/01/21(a) | 993,413 | 993,127 | ||||||
Pool #AM7617, 1.249%, 08/01/22(a) | 962,008 | 962,398 | ||||||
Pool #AN3414, 1.379%, 01/01/23(a) | 993,588 | 994,898 | ||||||
Pool #AN1582, 1.219%, 09/01/23(a) | 1,000,000 | 1,000,549 | ||||||
Pool #AN3845, 1.319%, 12/01/23(a) | 2,686,541 | 2,677,765 | ||||||
Pool #AN4300, 1.339%, 01/01/24(a) | 3,070,572 | 3,065,790 | ||||||
Pool #AN4364, 1.369%, 01/01/24(a) | 1,000,000 | 1,002,563 | ||||||
Pool #AN3434, 1.429%, 09/01/24(a) | 1,825,000 | 1,825,471 | ||||||
|
| |||||||
Total U.S. Government Agency Mortgages | 14,462,221 | |||||||
|
| |||||||
See Notes to Financial Statements.
113
Table of Contents
SCHEDULES OF PORTFOLIO INVESTMENTS
RIDGEWORTH FUNDS March 31, 2017
Seix Ultra-Short Bond Fund — concluded
| Shares or Principal Amount($) | Value($) | |||||||
U.S. Treasury Obligation 0.1% |
| |||||||
U.S. Treasury Note 0.1% |
| |||||||
0.875%, 05/15/17 | 100,000 | 100,024 | ||||||
|
| |||||||
Total U.S. Treasury Obligation | 100,024 | |||||||
|
| |||||||
Money Market Fund 2.6% |
| |||||||
State Street Institutional Treasury Money Market Fund, Premier Class, 0.53%(c) | 2,272,691 | 2,272,691 | ||||||
|
| |||||||
Total Money Market Fund | 2,272,691 | |||||||
|
| |||||||
Total Investments | 87,276,922 | |||||||
Other Assets in Excess of Liabilities — 0.1% | 67,305 | |||||||
|
| |||||||
Net Assets — 100.0% | $ | 87,344,227 | ||||||
|
| |||||||
| (a) | Variable or floating rate security. Rate disclosed is as of March 31, 2017. |
| (b) | Rule 144A, Section 4(2) or other security which is restricted as to resale to institutional investors. The Fund’s investment adviser/subadviser has deemed this security to be liquid based upon procedures approved by the Board of Trustees. These securities represent 22.1% of net assets as of March 31, 2017. |
| (c) | Rate disclosed, the 7 day yield, is as of March 31, 2017. |
Investment Abbreviations
| MTN | — | Medium Term Note | ||
| REMIC | — | Real Estate Mortgage Investment Conduit |
Open Futures Contracts
At March 31, 2017, the Fund’s open futures contracts were as follows:
Description | Position | Notional Amount | Expiration Month | Contracts | Unrealized Depreciation | |||||||||||||
U.S. Treasury 2 Year Note | Short | $(21,848,725) | June 2017 | 101 | $(13,040) | |||||||||||||
|
| |||||||||||||||||
See Notes to Financial Statements.
114
Table of Contents
SCHEDULES OF PORTFOLIO INVESTMENTS
RIDGEWORTH FUNDS March 31, 2017
Seix Virginia Intermediate Municipal Bond Fund
| Shares or Principal Amount($) | Value($) | |||||||
| Municipal Bonds 97.4% | ||||||||
District of Columbia 6.9% | ||||||||
Metropolitan Washington D.C. Airports Authority, Airport System, Series A, AMT, RB, 5.125%, 10/01/23 | 1,000,000 | 1,055,440 | ||||||
Metropolitan Washington D.C. Airports Authority, Airport System, Series B, RB, 5.000%, 10/01/26, BHAC | 2,175,000 | 2,359,135 | ||||||
|
| |||||||
| 3,414,575 | ||||||||
|
| |||||||
Georgia 2.4% |
| |||||||
Private Colleges & Universities Authority, RB, 5.000%, 04/01/23 | 1,065,000 | 1,192,672 | ||||||
|
| |||||||
Guam 2.5% |
| |||||||
Territory of Guam, Series A, RB, 5.000%, 12/01/33 | 380,000 | 410,829 | ||||||
Territory of Guam, Series A, RB, 5.000%, 12/01/34 | 290,000 | 311,599 | ||||||
Territory of Guam, Series A, RB, 5.000%, 12/01/46 | 485,000 | 517,127 | ||||||
|
| |||||||
| 1,239,555 | ||||||||
|
| |||||||
North Carolina 6.7% |
| |||||||
North Carolina Capital Facilities Finance Agency, Educational Facilities, RB, 5.000%, 05/01/32 | 1,740,000 | 1,855,518 | ||||||
North Carolina Medical Care Commission, RB, 5.000%, 10/01/27(a) | 380,000 | 454,541 | ||||||
North Carolina Medical Care Commission, RB, 5.000%, 10/01/33(a) | 495,000 | 568,300 | ||||||
North Carolina Medical Care Commission, RB, 5.000%, 10/01/35(a) | 380,000 | 432,144 | ||||||
|
| |||||||
| 3,310,503 | ||||||||
|
| |||||||
Virginia 78.9% |
| |||||||
Chesapeake, Series A, GO, 5.000%, 08/01/23 | 2,000,000 | 2,379,900 | ||||||
Fairfax County, Series B, GO, 5.000%, 04/01/24, State Aid Withholding | 1,000,000 | 1,202,300 | ||||||
Fairfax County Economic Development Authority, RB, 5.000%, 08/01/22(b) | 1,200,000 | 1,340,460 | ||||||
| Shares or Principal Amount($) | Value($) | |||||||
Virginia—continued |
| |||||||
Fairfax County Industrial Development Authority, Series D, RB, 5.000%, 05/15/27 | 500,000 | 569,180 | ||||||
Fairfax County Water Authority, RB, 5.000%, 04/01/25 | 1,550,000 | 1,780,981 | ||||||
Fairfax County Water Authority, RB, 5.000%, 04/01/27 | 600,000 | 686,634 | ||||||
Greater Richmond Convention Center Authority, RB, 5.000%, 06/15/28 | 875,000 | 1,011,238 | ||||||
Greater Richmond Convention Center Authority, RB, 5.000%, 06/15/30 | 1,000,000 | 1,139,860 | ||||||
Greater Richmond Convention Center Authority, RB, 5.000%, 06/15/32 | 1,000,000 | 1,124,340 | ||||||
Hampton Roads Sanitation District Wastewater, RB, 5.000%, 04/01/24, Pre-refunded 04/01/2018 @ 100 | 1,425,000 | 1,483,112 | ||||||
Hanover County Economic Development Authority, Regional Medical Care Project, RB, 6.375%, 08/15/18, NATL-RE | 1,815,000 | 1,869,232 | ||||||
Isle County Wight, Series A, GO, 5.000%, 07/01/35, State Aid Withholding | 750,000 | 843,930 | ||||||
Loudoun County Industrial Development Authority, Series A, RB, 5.000%, 06/01/31 | 1,000,000 | 1,106,350 | ||||||
Norfolk Water Revenue, Series A, RB, 5.250%, 11/01/44(b) | 1,750,000 | 2,008,860 | ||||||
Northern Virginia Transportation Authority, RB, 5.000%, 06/01/26(b) | 1,250,000 | 1,474,213 | ||||||
Richmond Industrial Development Authority, Government Facilities, RB, 5.000%, 07/15/18, AMBAC | 1,795,000 | 1,858,812 | ||||||
Roanoke Economic Development Authority, Hospital Revenue, RB, 5.000%, 07/01/27 | 1,000,000 | 1,114,700 | ||||||
Virginia College Building Authority, Educational Facilities Project, Washington & Lee University, RB, 5.375%, 01/01/21 | 2,795,000 | 3,057,031 | ||||||
See Notes to Financial Statements.
115
Table of Contents
SCHEDULES OF PORTFOLIO INVESTMENTS
RIDGEWORTH FUNDS March 31, 2017
Seix Virginia Intermediate Municipal Bond Fund — concluded
| Shares or Principal Amount($) | Value($) | |||||||
Virginia—continued |
| |||||||
Virginia Commonwealth Transportation Board, RB, 5.000%, 03/15/24 | 2,000,000 | 2,308,660 | ||||||
Virginia Commonwealth University, Health System Authority, RB, 5.000%, 07/01/30 | 1,460,000 | 1,595,152 | ||||||
Virginia Port Authority, Series A, AMT, RB, 5.000%, 07/01/32, Pre-refunded 07/01/2025 @ 100 | 3,000,000 | 3,615,480 | ||||||
Virginia Public Building Authority, Series A, RB, 5.000%, 08/01/31, Pre-refunded 08/01/2021 @ 100 | 10,000 | 11,479 | ||||||
Virginia Public School Authority, Series A, RB, 5.000%, 08/01/27, State Aid Withholding | 1,560,000 | 1,811,784 | ||||||
Virginia Public School Authority, School Financing, RB, 5.000%, 07/15/26, Pre-refunded 07/15/2018 @ 100, State Aid Withholding | 1,000,000 | 1,051,810 | ||||||
Virginia Resources Authority, RB, 5.000%, 11/01/28, Pre-refunded 11/01/2022 @ 100 | 330,000 | 387,473 | ||||||
Virginia Resources Authority, RB, 5.000%, 11/01/28 | 1,970,000 | 2,305,668 | ||||||
|
| |||||||
| 39,138,639 | ||||||||
|
| |||||||
Total Municipal Bonds | 48,295,944 | |||||||
|
| |||||||
| Shares or Principal Amount($) | Value($) | |||||||
Money Market Fund 4.8% |
| |||||||
Federated Government Obligations Tax-Managed Fund, Institutional Shares, 0.50%(c) | 2,388,399 | 2,388,399 | ||||||
|
| |||||||
Total Money Market Fund | 2,388,399 | |||||||
|
| |||||||
Total Investments | 50,684,343 | |||||||
Liabilities in Excess of Other Assets — (2.2)% | (1,091,503 | ) | ||||||
|
| |||||||
Net Assets — 100.0% | $ | 49,592,840 | ||||||
|
| |||||||
| (a) | All or a portion of this security has been purchased on a when-issued or delayed-delivery basis. |
| (b) | All or a portion of this security has been segregated, or otherwise earmarked, in connection with obligations for when-issued or delayed-delivery purchase commitments. |
| (c) | Rate disclosed, the 7 day yield, is as of March 31, 2017. |
Investment Abbreviations
| AMBAC | — | Security guaranteed by American Municipal Bond Assurance Corporation | ||
| AMT | — | Income subject to Alternative Minimum Tax | ||
| BHAC | — | Security guaranteed by Berkshire Hathaway Assurance Corporation | ||
| GO | — | General Obligation | ||
| NATL-RE | — | Reinsurance provided by National Public Finance Guarantee Corporation | ||
| RB | — | Revenue Bond |
See Notes to Financial Statements.
116
Table of Contents
STATEMENTS OF ASSETS AND LIABILITIES
RIDGEWORTH FUNDS March 31, 2017
| Seix Core Bond Fund | Seix Corporate Bond Fund | Seix Floating Rate High Income Fund | Seix Georgia Tax-Exempt Bond Fund | Seix High Grade Municipal Bond Fund | ||||||||||||||||
Assets: | ||||||||||||||||||||
Total Investments, at Cost | $221,742,239 | $21,936,768 | $6,513,780,600 | $94,459,614 | $91,619,943 | |||||||||||||||
|
|
|
|
|
|
|
|
|
| |||||||||||
Total Investments, at Value* | $222,753,413 | $22,094,119 | $6,467,462,352 | $97,145,086 | $93,690,804 | |||||||||||||||
Interest Receivable | 1,047,778 | 182,178 | 21,076,196 | 1,216,761 | 843,862 | |||||||||||||||
Securities Lending Income Receivable | 4,489 | 329 | — | — | — | |||||||||||||||
Receivable for Capital Shares Issued | 162,720 | 138 | 10,911,606 | 6,696 | 162,363 | |||||||||||||||
Receivable for Investment Securities Sold | — | — | 71,742,488 | — | — | |||||||||||||||
Receivable for Investment Securities Sold on a When-issued Basis | — | — | 30,753,760 | — | — | |||||||||||||||
Unrealized Appreciation on Unfunded Commitments | — | — | 47,129 | — | — | |||||||||||||||
Receivable from Investment Adviser | — | 4,229 | — | 2,782 | 3,072 | |||||||||||||||
Prepaid Expenses and Other Assets | 15,523 | 17,916 | 90,271 | 6,165 | 12,773 | |||||||||||||||
|
|
|
|
|
|
|
|
|
| |||||||||||
Total Assets | 223,983,923 | 22,298,909 | 6,602,083,802 | 98,377,490 | 94,712,874 | |||||||||||||||
|
|
|
|
|
|
|
|
|
| |||||||||||
Liabilities: | ||||||||||||||||||||
Payable for Investment Securities Purchased | 8,302,872 | 1,305,747 | 1,725,180 | 370,535 | — | |||||||||||||||
Payable for Investment Securities Purchased on a When-issued Basis | 931,461 | 337,442 | 621,787,652 | 2,469,218 | 3,569,828 | |||||||||||||||
Due to Custodian | — | — | 36,633 | — | — | |||||||||||||||
Payable for Capital Shares Redeemed | 145,044 | 13,822 | 10,863,780 | 187,309 | 43,895 | |||||||||||||||
Payable Upon Return of Securities Loaned | — | 10,525 | — | — | — | |||||||||||||||
Income Distributions Payable | 27,552 | 1,675 | 4,616,337 | 3,183 | 31,770 | |||||||||||||||
Investment Advisory Fees Payable | 45,778 | 6,812 | 2,026,286 | 40,646 | 42,894 | |||||||||||||||
Compliance and Fund Services Fees Payable | 2,677 | 248 | 72,981 | 1,184 | 1,129 | |||||||||||||||
Distribution and Service Fees Payable | 3,444 | 6,464 | 86,577 | 444 | 1,558 | |||||||||||||||
Trustee Fees Payable | 134 | 12 | 3,619 | 59 | 56 | |||||||||||||||
Other Accrued Expenses | 63,695 | 6,170 | 1,175,037 | 18,234 | 17,243 | |||||||||||||||
|
|
|
|
|
|
|
|
|
| |||||||||||
Total Liabilities | 9,522,657 | 1,688,917 | 642,394,082 | 3,090,812 | 3,708,373 | |||||||||||||||
|
|
|
|
|
|
|
|
|
| |||||||||||
Total Net Assets | $214,461,266 | $20,609,992 | $5,959,689,720 | $95,286,678 | $91,004,501 | |||||||||||||||
|
|
|
|
|
|
|
|
|
| |||||||||||
Net Assets Consist of: | ||||||||||||||||||||
Capital | $216,908,461 | $20,486,496 | $6,266,957,632 | $92,220,078 | $90,015,718 | |||||||||||||||
Accumulated Net Investment Income (Loss) | (328,589 | ) | (39,559 | ) | 1,482,689 | 190,464 | (7,091 | ) | ||||||||||||
Accumulated Net Realized Gain (Loss) from Investments, Unfunded Commitments and Foreign Currency Transactions | (3,129,780 | ) | 5,704 | (262,479,482 | ) | 190,664 | (1,074,987 | ) | ||||||||||||
Net Unrealized Appreciation (Depreciation) on Investments, Unfunded Commitments and Foreign Currencies | 1,011,174 | 157,351 | (46,271,119 | ) | 2,685,472 | 2,070,861 | ||||||||||||||
|
|
|
|
|
|
|
|
|
| |||||||||||
Net Assets | $214,461,266 | $20,609,992 | $5,959,689,720 | $95,286,678 | $91,004,501 | |||||||||||||||
|
|
|
|
|
|
|
|
|
| |||||||||||
Net Assets: | ||||||||||||||||||||
I Shares | $199,622,363 | $12,650,732 | $4,459,174,952 | $91,782,462 | $78,728,904 | |||||||||||||||
A Shares | 10,363,031 | 590,556 | 135,833,426 | 3,504,216 | 12,275,597 | |||||||||||||||
C Shares | — | 7,368,704 | 56,980,793 | — | — | |||||||||||||||
R Shares | 3,123,900 | — | — | — | — | |||||||||||||||
IS Shares | 1,351,972 | — | 1,307,700,549 | — | — | |||||||||||||||
Shares Outstanding (unlimited number of shares authorized, no par value) | ||||||||||||||||||||
I Shares | 18,889,052 | 1,462,473 | 509,486,815 | 8,759,539 | 6,738,337 | |||||||||||||||
A Shares | 980,883 | 67,970 | 15,517,566 | 333,916 | 1,050,276 | |||||||||||||||
C Shares | — | 852,008 | 6,508,252 | — | — | |||||||||||||||
R Shares | 295,380 | — | — | — | — | |||||||||||||||
IS Shares | 127,898 | — | 149,332,815 | — | — | |||||||||||||||
Net Asset Value and Redemption Price Per Share: | ||||||||||||||||||||
I Shares | $10.57 | $8.65 | $8.75 | $10.48 | $11.68 | |||||||||||||||
A Shares | 10.56 | 8.69 | 8.75 | 10.49 | 11.69 | |||||||||||||||
C Shares(a) | — | 8.65 | 8.76 | — | — | |||||||||||||||
R Shares | 10.58 | — | — | — | — | |||||||||||||||
IS Shares | 10.57 | — | 8.76 | — | — | |||||||||||||||
Offering Price per Share (100%/(100%-maximum sales charge x net asset value) adjusted to the nearest cent): | ||||||||||||||||||||
A Shares | $11.09 | $9.12 | $8.97 | $11.01 | $12.27 | |||||||||||||||
Maximum Sales Charge — A Shares | 4.75 | % | 4.75 | % | 2.50 | % | 4.75 | % | 4.75 | % | ||||||||||
| * | Investments include securities on loan of $—, $10,208, $—, $— and $—, respectively. |
| (a) | Redemption price per share varies based on length of time shares are held. |
See Notes to Financial Statements.
117
Table of Contents
STATEMENTS OF ASSETS AND LIABILITIES
RIDGEWORTH FUNDS March 31, 2017
| Seix High Income Fund | Seix High Yield Fund | Seix Investment Grade Tax- Exempt Bond Fund | Seix Limited Duration Fund | Seix North Carolina Tax- Exempt Bond Fund | ||||||||||||||||
Assets: | ||||||||||||||||||||
Total Investments, at Cost | $557,153,524 | $544,928,388 | $526,219,925 | $6,701,343 | $25,537,797 | |||||||||||||||
|
|
|
|
|
|
|
|
|
| |||||||||||
Total Investments, at Value* | $565,666,402 | $553,808,497 | $541,467,909 | $6,713,886 | $26,207,836 | |||||||||||||||
Cash | 86,708 | 63,963 | — | — | — | |||||||||||||||
Interest Receivable | 9,480,511 | 7,970,706 | 5,958,612 | 5,015 | 250,710 | |||||||||||||||
Securities Lending Income Receivable | 27,889 | 14,931 | — | — | — | |||||||||||||||
Receivable for Capital Shares Issued | 5,858,026 | 17,499,994 | 969,344 | — | 353 | |||||||||||||||
Receivable for Investment Securities Sold | 15,527,924 | 3,436,343 | 14,889,758 | — | — | |||||||||||||||
Receivable for Investment Securities Sold on a When-issued Basis | 2,842,481 | 2,653,090 | 3,811,834 | — | 631,993 | |||||||||||||||
Receivable from Investment Adviser | — | — | 14,041 | 997 | 1,323 | |||||||||||||||
Prepaid Expenses and Other Assets | 27,519 | 38,945 | 18,532 | 3,131 | 4,731 | |||||||||||||||
|
|
|
|
|
|
|
|
|
| |||||||||||
Total Assets | 599,517,460 | 585,486,469 | 567,130,030 | 6,723,029 | 27,096,946 | |||||||||||||||
|
|
|
|
|
|
|
|
|
| |||||||||||
Liabilities: | ||||||||||||||||||||
Payable for Investment Securities Purchased | 2,876,352 | 6,439,917 | 3,885,322 | — | — | |||||||||||||||
Payable for Investment Securities Purchased on a When-issued Basis | 7,898,763 | 4,732,316 | 21,740,707 | — | 3,055,894 | |||||||||||||||
Payable Due to Affiliate | — | — | — | 54,461 | — | |||||||||||||||
Payable for Capital Shares Redeemed | 1,646,020 | 684,128 | 924,329 | — | 33,137 | |||||||||||||||
Payable Upon Return of Securities Loaned | 47,734,256 | 40,822,863 | — | — | — | |||||||||||||||
Income Distributions Payable | 60,346 | 390,619 | 134,822 | 5,320 | 8,145 | |||||||||||||||
Investment Advisory Fees Payable | 270,504 | 197,506 | 230,253 | 570 | 10,358 | |||||||||||||||
Compliance and Fund Services Fees Payable | 6,821 | 6,345 | 6,712 | 84 | 293 | |||||||||||||||
Distribution and Service Fees Payable | 22,432 | 973 | 5,161 | — | 275 | |||||||||||||||
Trustee Fees Payable | 335 | 313 | 334 | 4 | 15 | |||||||||||||||
Other Accrued Expenses | 146,429 | 92,301 | 137,366 | 1,454 | 5,612 | |||||||||||||||
|
|
|
|
|
|
|
|
|
| |||||||||||
Total Liabilities | 60,662,258 | 53,367,281 | 27,065,006 | 61,893 | 3,113,729 | |||||||||||||||
|
|
|
|
|
|
|
|
|
| |||||||||||
Total Net Assets | $538,855,202 | $532,119,188 | $540,065,024 | $6,661,136 | $23,983,217 | |||||||||||||||
|
|
|
|
|
|
|
|
|
| |||||||||||
Net Assets Consist of: | ||||||||||||||||||||
Capital | $618,943,860 | $588,847,295 | $531,593,684 | $7,466,031 | $23,527,803 | |||||||||||||||
Accumulated Net Investment Income (Loss) | (413,377 | ) | (1,080,429 | ) | (228,988 | ) | (774 | ) | (46,482 | ) | ||||||||||
Accumulated Net Realized Loss from Investments | (88,188,159 | ) | (64,527,787 | ) | (6,547,656 | ) | (816,664 | ) | (168,143 | ) | ||||||||||
Net Unrealized Appreciation on Investments | 8,512,878 | 8,880,109 | 15,247,984 | 12,543 | 670,039 | |||||||||||||||
|
|
|
|
|
|
|
|
|
| |||||||||||
Net Assets | $538,855,202 | $532,119,188 | $540,065,024 | $6,661,136 | $23,983,217 | |||||||||||||||
|
|
|
|
|
|
|
|
|
| |||||||||||
Net Assets: | ||||||||||||||||||||
I Shares | $456,928,155 | $483,080,164 | $519,784,333 | $6,661,136 | $21,812,781 | |||||||||||||||
A Shares | 63,103,766 | 6,213,518 | 20,280,691 | — | 2,170,436 | |||||||||||||||
R Shares | 14,698,589 | 130,290 | — | — | — | |||||||||||||||
IS Shares | 4,124,692 | 42,695,216 | — | — | — | |||||||||||||||
Shares Outstanding (unlimited number of shares authorized, no par value) | ||||||||||||||||||||
I Shares | 70,765,291 | 57,746,156 | 44,661,911 | 676,440 | 2,176,302 | |||||||||||||||
A Shares | 9,762,184 | 761,540 | 1,740,547 | — | 217,065 | |||||||||||||||
R Shares | 2,274,779 | 15,577 | — | — | — | |||||||||||||||
IS Shares | 639,133 | 5,101,099 | — | — | — | |||||||||||||||
Net Asset Value and Redemption Price Per Share: | ||||||||||||||||||||
I Shares | $6.46 | $8.37 | $11.64 | $9.85 | $10.02 | |||||||||||||||
A Shares | 6.46 | 8.16 | 11.65 | — | 10.00 | |||||||||||||||
R Shares | 6.46 | 8.36 | — | — | — | |||||||||||||||
IS Shares | 6.45 | 8.37 | — | — | — | |||||||||||||||
Offering Price per Share (100%/(100%-maximum sales charge x net asset value) adjusted to the nearest cent): | ||||||||||||||||||||
A Shares | $6.78 | $8.57 | $12.23 | $— | $10.50 | |||||||||||||||
Maximum Sales Charge — A Shares | 4.75 | % | 4.75 | % | 4.75 | % | — | 4.75 | % | |||||||||||
| * | Investments include securities on loan of $56,090,727, $48,063,923, $—, $— and $—, respectively. |
See Notes to Financial Statements.
118
Table of Contents
STATEMENTS OF ASSETS AND LIABILITIES
RIDGEWORTH FUNDS March 31, 2017
| Seix Short-Term Bond Fund | Seix Short-Term Municipal Bond Fund | Seix Total Return Bond Fund | Seix U.S. Government Securities Ultra- Short Bond Fund | Seix U.S. Mortgage Fund | ||||||||||||||||
Assets: | ||||||||||||||||||||
Total Investments, at Cost | $55,312,114 | $29,082,953 | $976,485,145 | $1,392,665,197 | $25,430,021 | |||||||||||||||
|
|
|
|
|
|
|
|
|
| |||||||||||
Total Investments, at Value* | $55,304,805 | $29,113,065 | $982,758,553 | $1,398,363,929 | $25,366,233 | |||||||||||||||
Cash | — | — | — | 12,528 | — | |||||||||||||||
Receivable Due from Affiliate | — | — | — | — | 54,461 | |||||||||||||||
Interest Receivable | 191,735 | 297,614 | 5,558,304 | 1,945,153 | 82,519 | |||||||||||||||
Upfront payments on Swap Contracts | — | — | 754,843 | — | — | |||||||||||||||
Securities Lending Income Receivable | — | — | 23,418 | — | — | |||||||||||||||
Foreign Currency, at Value (Cost $—, $—, $9,613, and $—, respectively) | — | — | 10,492 | — | — | |||||||||||||||
Receivable for Capital Shares Issued | 261,159 | 57,462 | 2,111,520 | 1,787,210 | 36,569 | |||||||||||||||
Receivable for Investment Securities Sold | — | — | — | 2,340,512 | — | |||||||||||||||
Unrealized Appreciation on Forward Foreign Currency Contracts | — | — | 405,785 | — | — | |||||||||||||||
Unrealized Appreciation on Swap Contracts | — | — | 13,249 | — | — | |||||||||||||||
Premiums Receivable on Open Swap Agreements | — | — | 20,833 | — | — | |||||||||||||||
Receivable from Investment Adviser | 4,445 | 4,886 | — | — | 6,657 | |||||||||||||||
Prepaid Expenses and Other Assets | 18,614 | 7,415 | 40,097 | 40,726 | 10,387 | |||||||||||||||
|
|
|
|
|
|
|
|
|
| |||||||||||
Total Assets | 55,780,758 | 29,480,442 | 991,697,094 | 1,404,490,058 | 25,556,826 | |||||||||||||||
|
|
|
|
|
|
|
|
|
| |||||||||||
Liabilities: | ||||||||||||||||||||
Payable for Investment Securities Purchased | — | — | 20,462,223 | 2,047,111 | — | |||||||||||||||
Payable for Investment Securities Purchased on a When-issued Basis | — | 777,780 | 4,240,991 | — | — | |||||||||||||||
Payable for Capital Shares Redeemed | 98,711 | 155,230 | 1,259,918 | 1,778,792 | 13,481 | |||||||||||||||
Payable Upon Return of Securities Loaned | — | — | 5,199,918 | — | — | |||||||||||||||
Income Distributions Payable | 6,281 | 8,617 | 57,152 | 145,694 | 998 | |||||||||||||||
Unrealized Depreciation on Forward Foreign Currency Contracts | — | — | 1,152,566 | — | — | |||||||||||||||
Investment Advisory Fees Payable | 18,793 | 8,304 | 197,935 | 223,224 | 8,590 | |||||||||||||||
Compliance and Fund Services Fees Payable | 686 | 340 | 11,841 | 17,061 | 315 | |||||||||||||||
Payable for Variation Margin on Futures Contracts | — | — | — | 50,079 | — | |||||||||||||||
Distribution and Service Fees Payable | 1,559 | 233 | 23,103 | — | 4,314 | |||||||||||||||
Trustee Fees Payable | 34 | 17 | 589 | 845 | 16 | |||||||||||||||
Other Accrued Expenses | 12,231 | 9,479 | 247,113 | 327,852 | 14,785 | |||||||||||||||
|
|
|
|
|
|
|
|
|
| |||||||||||
Total Liabilities | 138,295 | 960,000 | 32,853,349 | 4,590,658 | 42,499 | |||||||||||||||
|
|
|
|
|
|
|
|
|
| |||||||||||
Total Net Assets | $55,642,463 | $28,520,442 | $958,843,745 | $1,399,899,400 | $25,514,327 | |||||||||||||||
|
|
|
|
|
|
|
|
|
| |||||||||||
Net Assets Consist of: | ||||||||||||||||||||
Capital | $56,943,492 | $28,501,032 | $969,850,603 | $1,409,386,019 | $25,702,847 | |||||||||||||||
Accumulated Net Investment Loss | (2,593 | ) | (1,434 | ) | (1,594,575 | ) | (2,436 | ) | (15,738 | ) | ||||||||||
Accumulated Net Realized Gain (Loss) from Investments, Futures, Swaps and Foreign Currency Transactions | (1,291,127 | ) | (9,268 | ) | (14,985,648 | ) | (15,094,308 | ) | (108,994 | ) | ||||||||||
Net Unrealized Appreciation (Depreciation) on Investments, Futures, Swaps and Foreign Currencies | (7,309 | ) | 30,112 | 5,573,365 | 5,610,125 | (63,788 | ) | |||||||||||||
|
|
|
|
|
|
|
|
|
| |||||||||||
Net Assets | $55,642,463 | $28,520,442 | $958,843,745 | $1,399,899,400 | $25,514,327 | |||||||||||||||
|
|
|
|
|
|
|
|
|
| |||||||||||
Net Assets: | ||||||||||||||||||||
I Shares | $52,023,791 | $26,710,074 | $790,996,864 | $1,367,242,241 | $17,619,681 | |||||||||||||||
A Shares | 2,308,327 | 1,810,368 | 27,284,227 | — | 3,594,134 | |||||||||||||||
C Shares | 1,310,345 | — | — | — | 4,300,512 | |||||||||||||||
R Shares | — | — | 39,541,003 | — | — | |||||||||||||||
IS Shares | — | — | 101,021,651 | 32,657,159 | — | |||||||||||||||
Shares Outstanding (unlimited number of shares authorized, no par value) | ||||||||||||||||||||
I Shares | 5,242,222 | 2,688,568 | 75,929,656 | 136,337,553 | 1,585,214 | |||||||||||||||
A Shares | 232,008 | 182,323 | 2,533,359 | — | 323,941 | |||||||||||||||
C Shares | 131,762 | — | — | — | 386,937 | |||||||||||||||
R Shares | — | — | 3,794,921 | — | — | |||||||||||||||
IS Shares | — | — | 9,695,685 | 3,252,261 | — | |||||||||||||||
Net Asset Value and Redemption Price Per Share: | ||||||||||||||||||||
I Shares | $9.92 | $9.93 | $10.42 | $10.03 | $11.12 | |||||||||||||||
A Shares | 9.95 | 9.93 | 10.77 | — | 11.10 | |||||||||||||||
C Shares(a) | 9.94 | — | — | — | 11.11 | |||||||||||||||
R Shares | — | — | 10.42 | — | — | |||||||||||||||
IS Shares | — | — | 10.42 | 10.04 | — | |||||||||||||||
Offering Price per Share (100%/(100%-maximum sales charge x net asset value) adjusted to the nearest cent): | ||||||||||||||||||||
A Shares | $10.21 | $10.18 | $11.31 | $— | $11.38 | |||||||||||||||
Maximum Sales Charge — A Shares | 2.50 | % | 2.50 | % | 4.75 | % | — | 2.50 | % | |||||||||||
* Investments include securities on loan of $—, $—, $5,073,159, $— and $—, respectively.
| (a) | Redemption price per share varies based on length of time shares are held. |
See Notes to Financial Statements.
119
Table of Contents
STATEMENTS OF ASSETS AND LIABILITIES
RIDGEWORTH FUNDS March 31, 2017
| Seix Ultra- Short Bond Fund | Seix Virginia Intermediate Municipal Bond Fund | |||||||
Assets: | ||||||||
Total Investments, at Cost | $87,125,193 | $49,113,282 | ||||||
|
|
|
| |||||
Total Investments, at Value | $87,276,922 | $50,684,343 | ||||||
Cash | 2,000 | — | ||||||
Interest Receivable | 298,590 | 640,581 | ||||||
Receivable for Capital Shares Issued | 2,375 | 216 | ||||||
Receivable from Investment Adviser | — | 480 | ||||||
Prepaid Expenses and Other Assets | 12,635 | 5,928 | ||||||
|
|
|
| |||||
Total Assets | 87,592,522 | 51,331,548 | ||||||
|
|
|
| |||||
Liabilities: | ||||||||
Payable for Investment Securities Purchased on a When-issued Basis | — | 1,515,326 | ||||||
Payable for Capital Shares Redeemed | 188,570 | 112,913 | ||||||
Income Distributions Payable | 10,060 | 77,493 | ||||||
Investment Advisory Fees Payable | 20,496 | 21,009 | ||||||
Compliance and Fund Services Fees Payable | 1,125 | 612 | ||||||
Payable for Variation Margin on Futures Contracts | 7,891 | — | ||||||
Distribution and Service Fees Payable | — | 453 | ||||||
Trustee Fees Payable | 54 | 30 | ||||||
Other Accrued Expenses | 20,099 | 10,872 | ||||||
|
|
|
| |||||
Total Liabilities | 248,295 | 1,738,708 | ||||||
|
|
|
| |||||
Total Net Assets | $87,344,227 | $49,592,840 | ||||||
|
|
|
| |||||
Net Assets Consist of: | ||||||||
Capital | $89,159,626 | $47,997,389 | ||||||
Accumulated Net Investment Income (Loss) | (1,953 | ) | 18,991 | |||||
Accumulated Net Realized Gain (Loss) from Investments and Futures | (1,952,135 | ) | 5,399 | |||||
Net Unrealized Appreciation on Investments and Futures | 138,689 | 1,571,061 | ||||||
|
| �� |
| |||||
Net Assets | $87,344,227 | $49,592,840 | ||||||
|
|
|
| |||||
Net Assets: | ||||||||
I Shares | $87,344,227 | $45,969,150 | ||||||
A Shares | — | 3,623,690 | ||||||
Shares Outstanding (unlimited number of shares authorized, no par value) | ||||||||
I Shares | 8,772,190 | 4,812,704 | ||||||
A Shares | — | 379,475 | ||||||
Net Asset Value and Redemption Price Per Share: | ||||||||
I Shares | $9.96 | $9.55 | ||||||
A Shares | — | 9.55 | ||||||
Offering Price per Share (100%/(100%-maximum sales charge x net asset value) adjusted to the nearest cent): | ||||||||
A Shares | $— | $10.03 | ||||||
Maximum Sales Charge — A Shares | — | 4.75 | % | |||||
See Notes to Financial Statements.
120
Table of Contents
RIDGEWORTH FUNDS For the Fiscal Year Ended March 31, 2017
| Seix Core Bond Fund | Seix Corporate Bond Fund | Seix Floating Rate High Income Fund | Seix Georgia Tax-Exempt Bond Fund | Seix High Grade Municipal Bond Fund | ||||||||||||||||
Investment Income: | ||||||||||||||||||||
Interest Income | $ | 5,053,736 | $ | 711,665 | $ | 256,394,283 | $ | 3,592,550 | $ | 2,951,315 | ||||||||||
Dividend Income | — | — | 1,102,867 | — | — | |||||||||||||||
Net Income from Securities Lending | 35,116 | 4,629 | — | — | — | |||||||||||||||
|
|
|
|
|
|
|
|
|
| |||||||||||
Total Investment Income | 5,088,852 | 716,294 | 257,497,150 | 3,592,550 | 2,951,315 | |||||||||||||||
|
|
|
|
|
|
|
|
|
| |||||||||||
Expenses: |
| |||||||||||||||||||
Investment Advisory Fees | 611,681 | 77,773 | 19,502,286 | 543,382 | 531,149 | |||||||||||||||
Administration Fees | 24,270 | 1,929 | 470,239 | 10,780 | 10,537 | |||||||||||||||
Fund Accounting Fees | 30,595 | 2,399 | 565,248 | 13,564 | 13,206 | |||||||||||||||
Transfer Agency Fees | 53,601 | 13,597 | 1,756,484 | 19,435 | 30,548 | |||||||||||||||
Compliance & Fund Services Fees | 13,857 | 1,084 | 273,234 | 6,160 | 6,081 | |||||||||||||||
Distribution and Service Fees — A Shares | 25,546 | 1,667 | 444,271 | 5,417 | 20,601 | |||||||||||||||
Distribution and Service Fees — C Shares | — | 79,762 | 553,515 | — | — | |||||||||||||||
Distribution and Service Fees — R Shares | 16,867 | — | — | — | — | |||||||||||||||
Shareholder Servicing Fees — I Shares | 323,676 | 12,564 | 3,553,212 | 108,909 | 73,970 | |||||||||||||||
Shareholder Servicing Fees — A Shares | 3,637 | 160 | 177,927 | 409 | 3,069 | |||||||||||||||
Shareholder Servicing Fees — R Shares | 1,783 | — | — | — | — | |||||||||||||||
Custodian Fees | 7,096 | 6,857 | 768,702 | 6,133 | 8,160 | |||||||||||||||
Printing Fees | 14,753 | 2,177 | 346,172 | 4,271 | 6,193 | |||||||||||||||
Registration Fees | 58,973 | 40,912 | 66,378 | 13,980 | 32,718 | |||||||||||||||
Trustee Fees | 14,234 | 1,108 | 267,989 | 6,291 | 6,279 | |||||||||||||||
Professional Fees | 11,725 | 1,122 | 257,040 | 5,279 | 5,127 | |||||||||||||||
Other Fees | 25,378 | 10,273 | 358,720 | 13,776 | 14,382 | |||||||||||||||
|
|
|
|
|
|
|
|
|
| |||||||||||
Total Expenses | 1,237,672 | 253,384 | 29,361,417 | 757,786 | 762,020 | |||||||||||||||
Recoupment of Prior Reimbursement | 42 | — | 122 | — | 476 | |||||||||||||||
Less: Investment Advisory Fees Waived/Expenses Reimbursed | — | (40,902 | ) | — | (47,286 | ) | (49,128 | ) | ||||||||||||
|
|
|
|
|
|
|
|
|
| |||||||||||
Net Expenses | 1,237,714 | 212,482 | 29,361,539 | 710,500 | 713,368 | |||||||||||||||
|
|
|
|
|
|
|
|
|
| |||||||||||
Net Investment Income | 3,851,138 | 503,812 | 228,135,611 | 2,882,050 | 2,237,947 | |||||||||||||||
|
|
|
|
|
|
|
|
|
| |||||||||||
Net Realized and Unrealized Gain (Loss) on Investments, Unfunded Commitments and Foreign Currencies: | ||||||||||||||||||||
Net Realized Gain (Loss) from: | ||||||||||||||||||||
Investments, Unfunded Commitments and Foreign Currency Transactions | 1,154,181 | 492,725 | (77,680,897 | ) | 1,101,405 | 952,328 | ||||||||||||||
Net Change in Unrealized Appreciation (Depreciation) on: | ||||||||||||||||||||
Investments, Unfunded Commitments and Foreign Currencies | (1,910,534 | ) | 61,134 | 292,073,526 | (4,501,624 | ) | (3,081,746 | ) | ||||||||||||
|
|
|
|
|
|
|
|
|
| |||||||||||
Net Realized and Unrealized Gain (Loss) on Investments, Unfunded Commitments and Foreign Currencies | (756,353 | ) | 553,859 | 214,392,629 | (3,400,219 | ) | (2,129,418 | ) | ||||||||||||
|
|
|
|
|
|
|
|
|
| |||||||||||
Change in Net Assets from Operations | $ | 3,094,785 | $ | 1,057,671 | $ | 442,528,240 | $ | (518,169 | ) | $ | 108,529 | |||||||||
|
|
|
|
|
|
|
|
|
| |||||||||||
See Notes to Financial Statements.
121
Table of Contents
STATEMENTS OF OPERATIONS
RIDGEWORTH FUNDS For the Fiscal Year Ended March 31, 2017
| Seix High Income Fund | Seix High Yield Fund | Seix Investment Grade Tax-Exempt Bond Fund | Seix Limited Duration Fund | Seix North Carolina Tax-Exempt Bond Fund | ||||||||||||||||
Investment Income: |
| |||||||||||||||||||
Interest Income | $ | 40,666,436 | $ | 34,573,648 | $ | 18,338,059 | $ | 68,399 | $ | 834,186 | ||||||||||
Dividend Income | 384,196 | — | — | — | 1,769 | |||||||||||||||
Net Income from Securities Lending | 381,897 | 217,620 | — | — | — | |||||||||||||||
|
|
|
|
|
|
|
|
|
| |||||||||||
Total Investment Income | 41,432,529 | 34,791,268 | 18,338,059 | 68,399 | 835,955 | |||||||||||||||
|
|
|
|
|
|
|
|
|
| |||||||||||
Expenses: |
| |||||||||||||||||||
Investment Advisory Fees | 3,251,539 | 2,475,941 | 3,074,220 | 6,687 | 146,069 | |||||||||||||||
Administration Fees | 59,127 | 54,843 | 61,585 | 663 | 2,898 | |||||||||||||||
Fund Accounting Fees | 72,752 | 67,489 | 77,510 | 831 | 3,706 | |||||||||||||||
Transfer Agency Fees | 131,297 | 126,494 | 145,061 | 950 | 10,209 | |||||||||||||||
Compliance & Fund Services Fees | 32,387 | 30,846 | 35,367 | 378 | 1,597 | |||||||||||||||
Distribution and Service Fees — A Shares | 155,257 | 13,861 | 67,889 | — | 3,054 | |||||||||||||||
Distribution and Service Fees — R Shares | 74,853 | 1,367 | — | — | — | |||||||||||||||
Shareholder Servicing Fees — I Shares | 846,494 | 551,624 | 711,816 | — | 20,748 | |||||||||||||||
Shareholder Servicing Fees — A Shares | 48,105 | 1,687 | 8,808 | — | 103 | |||||||||||||||
Shareholder Servicing Fees — R Shares | 11,717 | 5 | — | — | — | |||||||||||||||
Custodian Fees | 19,549 | 14,505 | 13,977 | 4,905 | (a) | 4,723 | ||||||||||||||
Printing Fees | 77,424 | 35,974 | 28,668 | 772 | 1,496 | |||||||||||||||
Registration Fees | 61,850 | 60,123 | 34,550 | 7,595 | 11,527 | |||||||||||||||
Trustee Fees | 34,406 | 32,016 | 36,524 | 384 | 1,690 | |||||||||||||||
Professional Fees | 30,841 | 28,063 | 30,165 | 336 | 1,443 | |||||||||||||||
Tax Fees | — | — | — | 5,990 | — | |||||||||||||||
Miscellaneous Fees | — | — | — | 719 | — | |||||||||||||||
Other Fees | 50,425 | 47,606 | 47,015 | 301 | 8,496 | |||||||||||||||
|
|
|
|
|
|
|
|
|
| |||||||||||
Total Expenses | 4,958,023 | 3,542,444 | 4,373,155 | 30,511 | 217,759 | |||||||||||||||
Less: Investment Advisory Fees Waived/Expenses Reimbursed | (20,361 | ) | — | (291,442 | ) | (7,891 | ) | (26,028 | ) | |||||||||||
|
|
|
|
|
|
|
|
|
| |||||||||||
Net Expenses | 4,937,662 | 3,542,444 | 4,081,713 | 22,620 | 191,731 | |||||||||||||||
|
|
|
|
|
|
|
|
|
| |||||||||||
Net Investment Income | 36,494,867 | 31,248,824 | 14,256,346 | 45,779 | 644,224 | |||||||||||||||
|
|
|
|
|
|
|
|
|
| |||||||||||
Net Realized and Unrealized Gain (Loss) on Investments: |
| |||||||||||||||||||
Net Realized Gain (Loss) from: |
| |||||||||||||||||||
Investment Transactions | (7,973,253 | ) | (427,708 | ) | 924,917 | 8,944 | 325,019 | |||||||||||||
Net Change in Unrealized Appreciation (Depreciation) on: |
| |||||||||||||||||||
Investments | 59,806,633 | 37,923,724 | (18,455,462 | ) | 1,542 | (1,112,107 | ) | |||||||||||||
|
|
|
|
|
|
|
|
|
| |||||||||||
Net Realized and Unrealized Gain (Loss) on Investments | 51,833,380 | 37,496,016 | (17,530,545 | ) | 10,486 | (787,088 | ) | |||||||||||||
|
|
|
|
|
|
|
|
|
| |||||||||||
Change in Net Assets from Operations | $ | 88,328,247 | $ | 68,744,840 | $ | (3,274,199 | ) | $ | 56,265 | $ | (142,864 | ) | ||||||||
|
|
|
|
|
|
|
|
|
| |||||||||||
| (a) | Includes a non-recurring refund for overbilling of prior years’. |
See Notes to Financial Statements.
122
Table of Contents
STATEMENTS OF OPERATIONS
RIDGEWORTH FUNDS For the Fiscal Year Ended March 31, 2017
| Seix Short-Term Bond Fund | Seix Short-Term Municipal Bond Fund | Seix Total Return Bond Fund | Seix U.S. Government Securities Ultra-Short Bond Fund | Seix U.S. Mortgage Fund | ||||||||||||||||
Investment Income: |
| |||||||||||||||||||
Interest Income | $737,660 | $413,792 | $25,481,150 | $17,078,485 | $454,355 | |||||||||||||||
Net Income from Securities Lending | — | — | 298,465 | — | — | |||||||||||||||
|
|
|
|
|
|
|
|
|
| |||||||||||
Total Investment Income | 737,660 | 413,792 | 25,779,615 | 17,078,485 | 454,355 | |||||||||||||||
|
|
|
|
|
|
|
|
|
| |||||||||||
Expenses: |
| |||||||||||||||||||
Investment Advisory Fees | 215,396 | 117,677 | 2,443,768 | 2,859,419 | 134,253 | |||||||||||||||
Administration Fees | 5,342 | 3,335 | 99,557 | 149,311 | 3,329 | |||||||||||||||
Fund Accounting Fees | 6,710 | 4,173 | 124,795 | 181,815 | 4,254 | |||||||||||||||
Transfer Agency Fees | 8,685 | 12,786 | 89,462 | 179,508 | 22,701 | |||||||||||||||
Compliance & Fund Services Fees | 3,013 | 1,966 | 57,189 | 86,219 | 1,895 | |||||||||||||||
Distribution and Service Fees — A Shares | 4,202 | 6,391 | 78,296 | — | 12,999 | |||||||||||||||
Distribution and Service Fees — C Shares | 16,014 | — | — | — | 48,902 | |||||||||||||||
Distribution and Service Fees — R Shares | — | — | 232,457 | — | — | |||||||||||||||
Shareholder Servicing Fees — I Shares | 59,382 | 28,192 | 1,204,869 | 2,351,981 | 33,863 | |||||||||||||||
Shareholder Servicing Fees — A Shares | 749 | 986 | 41,198 | — | 4,996 | |||||||||||||||
Shareholder Servicing Fees — R Shares | — | — | 115,398 | — | — | |||||||||||||||
Custodian Fees | 5,654 | 6,976 | 33,752 | 18,258 | 9,183 | |||||||||||||||
Printing Fees | 3,393 | — | 81,371 | 112,811 | 3,336 | |||||||||||||||
Registration Fees | 41,901 | 31,139 | 56,376 | 34,903 | 42,753 | |||||||||||||||
Trustee Fees | 3,094 | 1,991 | 58,855 | 87,064 | 1,982 | |||||||||||||||
Professional Fees | 2,720 | 1,561 | 50,216 | 75,743 | 1,537 | |||||||||||||||
Other Fees | 10,450 | 9,354 | 75,318 | 105,806 | 11,804 | |||||||||||||||
|
|
|
|
|
|
|
|
|
| |||||||||||
Total Expenses | 386,705 | 226,527 | 4,842,877 | 6,242,838 | 337,787 | |||||||||||||||
Less: Investment Advisory Fees Waived/Expenses Reimbursed | (48,049 | ) | (57,092 | ) | — | — | (43,772 | ) | ||||||||||||
|
|
|
|
|
|
|
|
|
| |||||||||||
Net Expenses | 338,656 | 169,435 | 4,842,877 | 6,242,838 | 294,015 | |||||||||||||||
|
|
|
|
|
|
|
|
|
| |||||||||||
Net Investment Income | 399,004 | 244,357 | 20,936,738 | 10,835,647 | 160,340 | |||||||||||||||
|
|
|
|
|
|
|
|
|
| |||||||||||
Net Realized and Unrealized Gain (Loss) on Investments, Futures, Swaps and Foreign Currencies: | ||||||||||||||||||||
Net Realized Gain (Loss) from: | ||||||||||||||||||||
Investments and Foreign Currency Transactions | (32,738 | ) | 32,037 | 4,586,392 | 9,086,927 | 389,589 | ||||||||||||||
Futures Contracts | — | — | — | 1,242,812 | — | |||||||||||||||
Swap Contracts | — | — | (6,196,962 | ) | — | — | ||||||||||||||
Forward Foreign Currency Contracts | — | — | 852,628 | — | — | |||||||||||||||
Net Change in Unrealized Appreciation (Depreciation) on: | ||||||||||||||||||||
Investments and Foreign Currencies | (244,199 | ) | (148,818 | ) | (5,665,835 | ) | (6,947,410 | ) | (560,037 | ) | ||||||||||
Futures Contracts | — | — | — | (42,548 | ) | — | ||||||||||||||
Swap Contracts | — | — | 13,249 | — | — | |||||||||||||||
Forward Foreign Currency Contracts | — | — | 52,694 | — | — | |||||||||||||||
|
|
|
|
|
|
|
|
|
| |||||||||||
Net Realized and Unrealized Gain (Loss) on Investments, Futures, Swaps and Foreign Currencies | (276,937 | ) | (116,781 | ) | (6,357,834 | ) | 3,339,781 | (170,448 | ) | |||||||||||
|
|
|
|
|
|
|
|
|
| |||||||||||
Change in Net Assets from Operations | $122,067 | $127,576 | $14,578,904 | $14,175,428 | $(10,108 | ) | ||||||||||||||
|
|
|
|
|
|
|
|
|
| |||||||||||
See Notes to Financial Statements.
123
Table of Contents
STATEMENTS OF OPERATIONS
RIDGEWORTH FUNDS For the Fiscal Year Ended March 31, 2017
| Seix Ultra-Short Bond Fund | Seix Virginia Intermediate Municipal Bond Fund | |||||||
Investment Income: | ||||||||
Interest Income | $1,482,478 | $1,957,489 | ||||||
Dividend Income | — | 1,510 | ||||||
|
|
|
| |||||
Total Investment Income | 1,482,478 | 1,958,999 | ||||||
|
|
|
| |||||
Expenses: | ||||||||
Investment Advisory Fees | 224,130 | 319,847 | ||||||
Administration Fees | 10,109 | 6,345 | ||||||
Fund Accounting Fees | 12,996 | 7,870 | ||||||
Transfer Agency Fees | 37,996 | 16,003 | ||||||
Compliance & Fund Services Fees | 5,273 | 3,660 | ||||||
Distribution and Service Fees — A Shares | — | 6,151 | ||||||
Shareholder Servicing Fees — I Shares | 59,958 | 48,131 | ||||||
Shareholder Servicing Fees — A Shares | — | 511 | ||||||
Custodian Fees | 10,518 | 5,669 | ||||||
Printing Fees | 6,780 | 2,727 | ||||||
Registration Fees | 20,757 | 18,483 | ||||||
Trustee Fees | 5,750 | 3,762 | ||||||
Professional Fees | 5,405 | 3,038 | ||||||
Other Fees | 12,212 | 11,250 | ||||||
|
|
|
| |||||
Total Expenses | 411,884 | 453,447 | ||||||
Less: Investment Advisory Fees Waived/Expenses Reimbursed | — | (32,565 | ) | |||||
|
|
|
| |||||
Net Expenses | 411,884 | 420,882 | ||||||
|
|
|
| |||||
Net Investment Income | 1,070,594 | 1,538,117 | ||||||
|
|
|
| |||||
Net Realized and Unrealized Gain (Loss) on Investments and Futures: | ||||||||
Net Realized Gain from: | ||||||||
Investment Transactions | 282,215 | 437,460 | ||||||
Futures Contracts | 95,342 | — | ||||||
Net Change in Unrealized Depreciation on: | ||||||||
Investments | (9,488 | ) | (2,098,807 | ) | ||||
Futures Contracts | (4,671 | ) | — | |||||
|
|
|
| |||||
Net Realized and Unrealized Gain (Loss) on Investments and Futures | 363,398 | (1,661,347 | ) | |||||
|
|
|
| |||||
Change in Net Assets from Operations | $1,433,992 | $(123,230 | ) | |||||
|
|
|
| |||||
See Notes to Financial Statements.
124
Table of Contents
STATEMENTS OF CHANGES IN NET ASSETS
RIDGEWORTH FUNDS For the Fiscal Years Indicated
| Seix Core Bond Fund | Seix Corporate Bond Fund | Seix Floating Rate High Income Fund | ||||||||||||||||||||||
| 04/01/16- 03/31/17 | 04/01/15- 03/31/16 | 04/01/16- 03/31/17 | 04/01/15- 03/31/16 | 04/01/16- 03/31/17 | 04/01/15- 03/31/16 | |||||||||||||||||||
Operations: | ||||||||||||||||||||||||
Net Investment Income | $ | 3,851,138 | $ | 4,559,362 | $ | 503,812 | $ | 558,071 | $ | 228,135,611 | $ | 270,641,643 | ||||||||||||
Net Realized Gain (Loss) | 1,154,181 | 2,205,179 | 492,725 | (322,983 | ) | (77,680,897 | ) | (165,631,300 | ) | |||||||||||||||
Net Change in Unrealized Appreciation (Depreciation) | (1,910,534 | ) | (2,686,468 | ) | 61,134 | (719,668 | ) | 292,073,526 | (230,916,711 | ) | ||||||||||||||
|
|
|
|
|
|
|
|
|
|
|
| |||||||||||||
Change in Net Assets from Operations | 3,094,785 | 4,078,073 | 1,057,671 | (484,580 | ) | 442,528,240 | (125,906,368 | ) | ||||||||||||||||
|
|
|
|
|
|
|
|
|
|
|
| |||||||||||||
Dividends and Distributions to Shareholders: | ||||||||||||||||||||||||
Net Investment Income: | ||||||||||||||||||||||||
I Shares | (4,356,627 | ) | (4,785,178 | ) | (326,605 | ) | (354,519 | ) | (158,634,322 | ) | (206,044,061 | ) | ||||||||||||
A Shares | (179,400 | ) | (165,495 | ) | (15,305 | ) | (15,352 | ) | (6,541,229 | ) | (6,594,772 | ) | ||||||||||||
C Shares | — | — | (161,930 | ) | (159,856 | ) | (2,131,510 | ) | (2,272,834 | ) | ||||||||||||||
R Shares | (50,106 | ) | (54,464 | ) | — | — | — | — | ||||||||||||||||
IS Shares* | (19,004 | ) | (272 | ) | — | — | (56,471,002 | ) | (52,282,087 | ) | ||||||||||||||
Tax Return of Capital: | ||||||||||||||||||||||||
I Shares | — | — | — | (15,032 | ) | — | — | |||||||||||||||||
A Shares | — | — | — | (698 | ) | — | — | |||||||||||||||||
C Shares | — | — | — | (9,948 | ) | — | — | |||||||||||||||||
Net Realized Gains: | ||||||||||||||||||||||||
I Shares | (4,194,889 | ) | (1,672,598 | ) | (91,294 | ) | (208,083 | ) | — | — | ||||||||||||||
A Shares | (194,403 | ) | (65,096 | ) | (5,365 | ) | (10,866 | ) | — | — | ||||||||||||||
C Shares | — | — | (69,578 | ) | (193,921 | ) | — | — | ||||||||||||||||
R Shares | (64,394 | ) | (28,138 | ) | — | — | — | — | ||||||||||||||||
IS Shares* | (23,253 | ) | (54 | ) | — | — | — | — | ||||||||||||||||
|
|
|
|
|
|
|
|
|
|
|
| |||||||||||||
Total Dividends and Distributions | (9,082,076 | ) | (6,771,295 | ) | (670,077 | ) | (968,275 | ) | (223,778,063 | ) | (267,193,754 | ) | ||||||||||||
|
|
|
|
|
|
|
|
|
|
|
| |||||||||||||
Change in Net Assets from Capital Transactions | (48,714,298 | ) | 69,050,058 | 2,674,088 | (15,267,803 | ) | 1,374,198,658 | (1,513,564,786 | ) | |||||||||||||||
|
|
|
|
|
|
|
|
|
|
|
| |||||||||||||
Change in Net Assets | (54,701,589 | ) | 66,356,836 | 3,061,682 | (16,720,658 | ) | 1,592,948,835 | (1,906,664,908 | ) | |||||||||||||||
|
|
|
|
|
|
|
|
|
|
|
| |||||||||||||
Net Assets: | ||||||||||||||||||||||||
Beginning of Year | 269,162,855 | 202,806,019 | 17,548,310 | 34,268,968 | 4,366,740,885 | 6,273,405,793 | ||||||||||||||||||
|
|
|
|
|
|
|
|
|
|
|
| |||||||||||||
End of Year | $ | 214,461,266 | $ | 269,162,855 | $ | 20,609,992 | $ | 17,548,310 | $ | 5,959,689,720 | $ | 4,366,740,885 | ||||||||||||
|
|
|
|
|
|
|
|
|
|
|
| |||||||||||||
Accumulated Net Investment Income (Loss), End of Year | $ | (328,589 | ) | $ | (328,472 | ) | $ | (39,559 | ) | $ | (39,531 | ) | $ | 1,482,689 | $ | 4,095,610 | ||||||||
|
|
|
|
|
|
|
|
|
|
|
| |||||||||||||
| * | IS Shares commenced operations on August 3, 2015 for Seix Core Bond Fund. |
See Notes to Financial Statements.
125
Table of Contents
STATEMENTS OF CHANGES IN NET ASSETS
RIDGEWORTH FUNDS For the Fiscal Years Indicated
| Seix Georgia Tax-Exempt Bond Fund | Seix High Grade Municipal Bond Fund | Seix High Income Fund | ||||||||||||||||||||||
| 04/01/16- 03/31/17 | 04/01/15- 03/31/16 | 04/01/16- 03/31/17 | 04/01/15- 03/31/16 | 04/01/16- 03/31/17 | 04/01/15- 03/31/16 | |||||||||||||||||||
Operations: |
| |||||||||||||||||||||||
Net Investment Income | $ | 2,882,050 | $ | 3,197,473 | $ | 2,237,947 | $ | 2,517,843 | $ | 36,494,867 | $ | 47,032,426 | ||||||||||||
Net Realized Gain (Loss) | 1,101,405 | 1,669,446 | 952,328 | 1,682,084 | (7,973,253 | ) | (58,073,794 | ) | ||||||||||||||||
Net Change in Unrealized Appreciation (Depreciation) | (4,501,624 | ) | (736,695 | ) | (3,081,746 | ) | 196,585 | 59,806,633 | (38,219,968 | ) | ||||||||||||||
|
|
|
|
|
|
|
|
|
|
|
| |||||||||||||
Change in Net Assets from Operations | (518,169 | ) | 4,130,224 | 108,529 | 4,396,512 | 88,328,247 | (49,261,336 | ) | ||||||||||||||||
|
|
|
|
|
|
|
|
|
|
|
| |||||||||||||
Dividends and Distributions to Shareholders: |
| |||||||||||||||||||||||
Net Investment Income: |
| |||||||||||||||||||||||
I Shares | (2,789,673 | ) | (3,111,493 | ) | (1,965,284 | ) | (2,217,002 | ) | (31,378,042 | ) | (42,544,235 | ) | ||||||||||||
A Shares | (92,375 | ) | (85,979 | ) | (272,649 | ) | (300,812 | ) | (3,042,304 | ) | (3,358,446 | ) | ||||||||||||
C Shares | — | — | — | — | — | — | ||||||||||||||||||
R Shares | — | — | — | — | (852,344 | ) | (1,038,413 | ) | ||||||||||||||||
IS Shares | — | — | — | — | (997,452 | ) | (286,022 | ) | ||||||||||||||||
Net Realized Gains: |
| |||||||||||||||||||||||
I Shares | (1,369,638 | ) | — | (3,129,133 | ) | (990,891 | ) | — | — | |||||||||||||||
A Shares | (47,774 | ) | — | (479,810 | ) | (140,501 | ) | — | — | |||||||||||||||
|
|
|
|
|
|
|
|
|
|
|
| |||||||||||||
Total Dividends and Distributions | (4,299,460 | ) | (3,197,472 | ) | (5,846,876 | ) | (3,649,206 | ) | (36,270,142 | ) | (47,227,116 | ) | ||||||||||||
|
|
|
|
|
|
|
|
|
|
|
| |||||||||||||
Change in Net Assets from Capital Transactions | (11,207,575 | ) | (25,139,236 | ) | (17,056,290 | ) | 792,328 | (119,121,100 | ) | (140,908,042 | ) | |||||||||||||
|
|
|
|
|
|
|
|
|
|
|
| |||||||||||||
Change in Net Assets | (16,025,204 | ) | (24,206,484 | ) | (22,794,637 | ) | 1,539,634 | (67,062,995 | ) | (237,396,494 | ) | |||||||||||||
|
|
|
|
|
|
|
|
|
|
|
| |||||||||||||
Net Assets: |
| |||||||||||||||||||||||
Beginning of Year | 111,311,882 | 135,518,366 | 113,799,138 | 112,259,504 | 605,918,197 | 843,314,691 | ||||||||||||||||||
|
|
|
|
|
|
|
|
|
|
|
| |||||||||||||
End of Year | $ | 95,286,678 | $ | 111,311,882 | $ | 91,004,501 | $ | 113,799,138 | $ | 538,855,202 | $ | 605,918,197 | ||||||||||||
|
|
|
|
|
|
|
|
|
|
|
| |||||||||||||
Accumulated Net Investment Income (Loss), End of Year | $ | 190,464 | $ | 190,525 | $ | (7,091 | ) | $ | (7,042 | ) | $ | (413,377 | ) | $ | (411,451 | ) | ||||||||
|
|
|
|
|
|
|
|
|
|
|
| |||||||||||||
See Notes to Financial Statements.
126
Table of Contents
STATEMENTS OF CHANGES IN NET ASSETS
RIDGEWORTH FUNDS For the Fiscal Years Indicated
| Seix High Yield Fund | Seix Investment Grade Tax-Exempt Bond Fund | Seix Limited Duration Fund | ||||||||||||||||||||||
| 04/01/16- 03/31/17 | 04/01/15- 03/31/16 | 04/01/16- 03/31/17 | 04/01/15- 03/31/16 | 04/01/16- 03/31/17 | 04/01/15- 03/31/16 | |||||||||||||||||||
Operations: |
| |||||||||||||||||||||||
Net Investment Income | $ | 31,248,824 | $ | 36,691,076 | $ | 14,256,346 | $ | 15,143,860 | $ | 45,779 | $ | 19,390 | ||||||||||||
Net Realized Gain (Loss) | (427,708 | ) | (43,330,132 | ) | 924,917 | 5,969,610 | 8,944 | (658 | ) | |||||||||||||||
Net Change in Unrealized Appreciation (Depreciation) | 37,923,724 | (32,060,695 | ) | (18,455,462 | ) | (2,477,315 | ) | 1,542 | (2,502 | ) | ||||||||||||||
|
|
|
|
|
|
|
|
|
|
|
| |||||||||||||
Change in Net Assets from Operations | 68,744,840 | (38,699,751 | ) | (3,274,199 | ) | 18,636,155 | 56,265 | 16,230 | ||||||||||||||||
|
|
|
|
|
|
|
|
|
|
|
| |||||||||||||
Dividends and Distributions to Shareholders: |
| |||||||||||||||||||||||
Net Investment Income: |
| |||||||||||||||||||||||
I Shares | (29,771,414 | ) | (36,915,937 | ) | (13,768,445 | ) | (14,552,251 | ) | (43,695 | ) | (17,332 | ) | ||||||||||||
A Shares | (303,419 | ) | (432,905 | ) | (487,891 | ) | (591,504 | ) | — | — | ||||||||||||||
R Shares | (14,449 | ) | (34,562 | ) | — | — | — | — | ||||||||||||||||
IS Shares* | (960,427 | ) | — | — | — | — | — | |||||||||||||||||
Net Realized Gains: |
| |||||||||||||||||||||||
I Shares | — | — | (12,950,128 | ) | (7,129,553 | ) | — | — | ||||||||||||||||
A Shares | — | — | (492,260 | ) | (294,359 | ) | — | — | ||||||||||||||||
|
|
|
|
|
|
|
|
|
|
|
| |||||||||||||
Total Dividends and Distributions | (31,049,709 | ) | (37,383,404 | ) | (27,698,724 | ) | (22,567,667 | ) | (43,695 | ) | (17,332 | ) | ||||||||||||
|
|
|
|
|
|
|
|
|
|
|
| |||||||||||||
Change in Net Assets from Capital Transactions | (36,818,019 | ) | (96,627,566 | ) | (83,257,726 | ) | (29,063,575 | ) | — | — | ||||||||||||||
|
|
|
|
|
|
|
|
|
|
|
| |||||||||||||
Change in Net Assets | 877,112 | (172,710,721 | ) | (114,230,649 | ) | (32,995,087 | ) | 12,570 | (1,102 | ) | ||||||||||||||
|
|
|
|
|
|
|
|
|
|
|
| |||||||||||||
Net Assets: |
| |||||||||||||||||||||||
Beginning of Year | 531,242,076 | 703,952,797 | 654,295,673 | 687,290,760 | 6,648,566 | 6,649,668 | ||||||||||||||||||
|
|
|
|
|
|
|
|
|
|
|
| |||||||||||||
End of Year | $ | 532,119,188 | $ | 531,242,076 | $ | 540,065,024 | $ | 654,295,673 | $ | 6,661,136 | $ | 6,648,566 | ||||||||||||
|
|
|
|
|
|
|
|
|
|
|
| |||||||||||||
Accumulated Net Investment Income (Loss), End of Year | $ | (1,080,429 | ) | $ | (1,279,544 | ) | $ | (228,988 | ) | $ | (228,333 | ) | $ | (774 | ) | $ | (772 | ) | ||||||
|
|
|
|
|
|
|
|
|
|
|
| |||||||||||||
* IS Shares commenced operations on August 1, 2016 for Seix High Yield Fund.
See Notes to Financial Statements.
127
Table of Contents
STATEMENTS OF CHANGES IN NET ASSETS
RIDGEWORTH FUNDS For the Fiscal Years Indicated
| Seix North Carolina Tax-Exempt Bond Fund | Seix Short-Term Bond Fund | Seix Short-Term Municipal Bond Fund | ||||||||||||||||||||||
| 04/01/16- 03/31/17 | 04/01/15- 03/31/16 | 04/01/16- 03/31/17 | 04/01/15- 03/31/16 | 04/01/16- 03/31/17 | 04/01/15- 03/31/16 | |||||||||||||||||||
Operations: |
| |||||||||||||||||||||||
Net Investment Income | $ | 644,224 | $ | 770,051 | $ | 399,004 | $ | 298,032 | $ | 244,357 | $ | 166,035 | ||||||||||||
Net Realized Gain (Loss) | 325,019 | 555,848 | (32,738 | ) | 38,645 | 32,037 | 130 | |||||||||||||||||
Net Change in Unrealized Appreciation (Depreciation) | (1,112,107 | ) | (368,882 | ) | (244,199 | ) | 40,850 | (148,818 | ) | 20,433 | ||||||||||||||
|
|
|
|
|
|
|
|
|
|
|
| |||||||||||||
Change in Net Assets from Operations | (142,864 | ) | 957,017 | 122,067 | 377,527 | 127,576 | 186,598 | |||||||||||||||||
|
|
|
|
|
|
|
|
|
|
|
| |||||||||||||
Dividends and Distributions to Shareholders: |
| |||||||||||||||||||||||
Net Investment Income: |
| |||||||||||||||||||||||
I Shares | (603,099 | ) | (757,161 | ) | (417,866 | ) | (339,902 | ) | (221,552 | ) | (153,305 | ) | ||||||||||||
A Shares | (41,126 | ) | (12,890 | ) | (13,419 | ) | (10,552 | ) | (22,800 | ) | (12,722 | ) | ||||||||||||
C Shares | — | — | (441 | ) | — | — | — | |||||||||||||||||
Net Realized Gains: |
| |||||||||||||||||||||||
I Shares | (601,845 | ) | (159,925 | ) | — | — | (38,814 | ) | (72,254 | ) | ||||||||||||||
A Shares | (55,483 | ) | (2,916 | ) | — | — | (2,551 | ) | (13,070 | ) | ||||||||||||||
|
|
|
|
|
|
|
|
|
|
|
| |||||||||||||
Total Dividends and Distributions | (1,301,553 | ) | (932,892 | ) | (431,726 | ) | (350,454 | ) | (285,717 | ) | (251,351 | ) | ||||||||||||
|
|
|
|
|
|
|
|
|
|
|
| |||||||||||||
Change in Net Assets from Capital Transactions | (3,640,497 | ) | (8,940,946 | ) | 2,358,004 | (1,168,383 | ) | (10,860,150 | ) | (2,929,472 | ) | |||||||||||||
|
|
|
|
|
|
|
|
|
|
|
| |||||||||||||
Change in Net Assets | (5,084,914 | ) | (8,916,821 | ) | 2,048,345 | (1,141,310 | ) | (11,018,291 | ) | (2,994,225 | ) | |||||||||||||
|
|
|
|
|
|
|
|
|
|
|
| |||||||||||||
Net Assets: |
| |||||||||||||||||||||||
Beginning of Year | 29,068,131 | 37,984,952 | 53,594,118 | 54,735,428 | 39,538,733 | 42,532,958 | ||||||||||||||||||
|
|
|
|
|
|
|
|
|
|
|
| |||||||||||||
End of Year | $ | 23,983,217 | $ | 29,068,131 | $ | 55,642,463 | $ | 53,594,118 | $ | 28,520,442 | $ | 39,538,733 | ||||||||||||
|
|
|
|
|
|
|
|
|
|
|
| |||||||||||||
Accumulated Net Investment Loss, End of Year | $ | (46,482 | ) | $ | (57,474 | ) | $ | (2,593 | ) | $ | (2,124 | ) | $ | (1,434 | ) | $ | (1,437 | ) | ||||||
|
|
|
|
|
|
|
|
|
|
|
| |||||||||||||
See Notes to Financial Statements.
128
Table of Contents
STATEMENTS OF CHANGES IN NET ASSETS
RIDGEWORTH FUNDS For the Fiscal Years Indicated
| Seix Total Return Bond Fund | Seix U.S. Government Securities Ultra- Short Bond Fund | Seix U.S. Mortgage Fund | ||||||||||||||||||||||
| 04/01/16- 03/31/17 | 04/01/15- 03/31/16 | 04/01/16- 03/31/17 | 04/01/15- 03/31/16 | 04/01/16- 03/31/17 | 04/01/15- 03/31/16 | |||||||||||||||||||
Operations: | ||||||||||||||||||||||||
Net Investment Income | $ | 20,936,738 | $ | 20,357,092 | $ | 10,835,647 | $ | 9,110,055 | $ | 160,340 | $ | 214,939 | ||||||||||||
Net Realized Gain (Loss) | (757,942 | ) | 7,591,506 | 10,329,739 | (565,911 | ) | 389,589 | 255,310 | ||||||||||||||||
Net Change in Unrealized Appreciation (Depreciation) | (5,599,892 | ) | (14,342,369 | ) | (6,989,958 | ) | (10,067,510 | ) | (560,037 | ) | 181,370 | |||||||||||||
|
|
|
|
|
|
|
|
|
|
|
| |||||||||||||
Change in Net Assets from Operations | 14,578,904 | 13,606,229 | 14,175,428 | (1,523,366 | ) | (10,108 | ) | 651,619 | ||||||||||||||||
|
|
|
|
|
|
|
|
|
|
|
| |||||||||||||
Dividends and Distributions to Shareholders: |
| |||||||||||||||||||||||
Net Investment Income: |
| |||||||||||||||||||||||
I Shares | (18,604,588 | ) | (19,336,958 | ) | (14,554,664 | ) | (12,422,092 | ) | (391,273 | ) | (291,602 | ) | ||||||||||||
A Shares | (603,387 | ) | (635,699 | ) | — | — | (100,344 | ) | (89,133 | ) | ||||||||||||||
C Shares | — | — | — | — | (40,493 | ) | (39,997 | ) | ||||||||||||||||
R Shares | (723,083 | ) | (769,627 | ) | — | — | — | — | ||||||||||||||||
IS Shares* | (1,825,589 | ) | (1,476,134 | ) | (71,161 | ) | — | — | — | |||||||||||||||
Net Realized Gains: |
| |||||||||||||||||||||||
I Shares | (12,508,663 | ) | (1,023,082 | ) | — | — | (63,289 | ) | — | |||||||||||||||
A Shares | (428,975 | ) | (34,543 | ) | — | — | (23,506 | ) | — | |||||||||||||||
C Shares | — | — | — | — | (15,024 | ) | — | |||||||||||||||||
R Shares | (705,156 | ) | (55,720 | ) | — | — | — | — | ||||||||||||||||
IS Shares | (1,678,943 | ) | (72,019 | ) | — | — | — | — | ||||||||||||||||
|
|
|
|
|
|
|
|
|
|
|
| |||||||||||||
Total Dividends and Distributions | (37,078,384 | ) | (23,403,782 | ) | (14,625,825 | ) | (12,422,092 | ) | (633,929 | ) | (420,732 | ) | ||||||||||||
|
|
|
|
|
|
|
|
|
|
|
| |||||||||||||
Change in Net Assets from Capital Transactions | (128,716,363 | ) | (31,719,301 | ) | (157,549,463 | ) | (94,042,939 | ) | (10,947,159 | ) | 24,033,593 | |||||||||||||
|
|
|
|
|
|
|
|
|
|
|
| |||||||||||||
Change in Net Assets | (151,215,843 | ) | (41,516,854 | ) | (157,999,860 | ) | (107,988,397 | ) | (11,591,196 | ) | 24,264,480 | |||||||||||||
|
|
|
|
|
|
|
|
|
|
|
| |||||||||||||
Net Assets: |
| |||||||||||||||||||||||
Beginning of Year | 1,110,059,588 | 1,151,576,442 | 1,557,899,260 | 1,665,887,657 | 37,105,523 | 12,841,043 | ||||||||||||||||||
|
|
|
|
|
|
|
|
|
|
|
| |||||||||||||
End of Year | $ | 958,843,745 | $ | 1,110,059,588 | $ | 1,399,899,400 | $ | 1,557,899,260 | $ | 25,514,327 | $ | 37,105,523 | ||||||||||||
|
|
|
|
|
|
|
|
|
|
|
| |||||||||||||
Accumulated Net Investment Loss, End of Year | $ | (1,594,575 | ) | $ | (2,006,504 | ) | $ | (2,436 | ) | $ | (2,617 | ) | $ | (15,738 | ) | $ | (15,736 | ) | ||||||
|
|
|
|
|
|
|
|
|
|
|
| |||||||||||||
| * | IS Shares commenced operations on August 1, 2016 for Seix U.S. Government Securities Ultra-Short Bond Fund. |
See Notes to Financial Statements.
129
Table of Contents
STATEMENTS OF CHANGES IN NET ASSETS
RIDGEWORTH FUNDS For the Fiscal Years Indicated
| Seix Ultra-Short Bond Fund | Seix Virginia Intermediate Municipal Bond Fund | |||||||||||||||
| 04/01/16- 03/31/17 | 04/01/15- 03/31/16 | 04/01/16- 03/31/17 | 04/01/15- 03/31/16 | |||||||||||||
Operations: |
| |||||||||||||||
Net Investment Income | $ | 1,070,594 | $ | 871,064 | $ | 1,538,117 | $ | 2,408,083 | ||||||||
Net Realized Gain (Loss) | 377,557 | (240,620 | ) | 437,460 | 2,374,971 | |||||||||||
Net Change in Unrealized Appreciation (Depreciation) | (14,159 | ) | (225,271 | ) | (2,098,807 | ) | (1,983,765 | ) | ||||||||
|
|
|
|
|
|
|
| |||||||||
Change in Net Assets from Operations | 1,433,992 | 405,173 | (123,230 | ) | 2,799,289 | |||||||||||
|
|
|
|
|
|
|
| |||||||||
Dividends and Distributions to Shareholders: |
| |||||||||||||||
Net Investment Income: |
| |||||||||||||||
I Shares | (1,125,578 | ) | (924,985 | ) | (1,444,472 | ) | (2,299,604 | ) | ||||||||
A Shares | — | — | (93,644 | ) | (108,482 | ) | ||||||||||
Net Realized Gains: |
| |||||||||||||||
I Shares | — | — | (1,669,221 | ) | (1,946,468 | ) | ||||||||||
A Shares | — | — | (110,062 | ) | (115,930 | ) | ||||||||||
|
|
|
|
|
|
|
| |||||||||
Total Dividends and Distributions | (1,125,578 | ) | (924,985 | ) | (3,317,399 | ) | (4,470,484 | ) | ||||||||
|
|
|
|
|
|
|
| |||||||||
Change in Net Assets from Capital Transactions | (17,914,481 | ) | (37,209,500 | ) | (15,984,164 | ) | (53,566,152 | ) | ||||||||
|
|
|
|
|
|
|
| |||||||||
Change in Net Assets | (17,606,067 | ) | (37,729,312 | ) | (19,424,793 | ) | (55,237,347 | ) | ||||||||
|
|
|
|
|
|
|
| |||||||||
Net Assets: |
| |||||||||||||||
Beginning of Year | 104,950,294 | 142,679,606 | 69,017,633 | 124,254,980 | ||||||||||||
|
|
|
|
|
|
|
| |||||||||
End of Year | $ | 87,344,227 | $ | 104,950,294 | $ | 49,592,840 | $ | 69,017,633 | ||||||||
|
|
|
|
|
|
|
| |||||||||
Accumulated Net Investment Income (Loss), End of Year | $ | (1,953 | ) | $ | (2,389 | ) | $ | 18,991 | $ | 19,172 | ||||||
|
|
|
|
|
|
|
| |||||||||
See Notes to Financial Statements.
130
Table of Contents
RIDGEWORTH FUNDS Selected Data For a Share of Beneficial Interest Outstanding Throughout the Periods Indicated.
| Net Asset Value, Beginning of Period | Net Investment Income (Loss)(a) | Net Realized and Unrealized Gains (Losses) on Investments | Total from Operations | Dividends from Net Investment Income | Distributions from Tax Return of Capital | Distributions from Realized Capital Gains | Total Dividends and Distributions | Net Asset Value, End of Period | Net Assets End of Period (000) | Total Return(b) | Ratio of Net Expenses to Average Net Assets(c) | Ratio of Expenses to Average Net Assets (Excluding Waivers and Reimbursements)(c) | Ratio of Net Investment Income to Average Net Assets(c) | Portfolio Turnover Rate(d) | ||||||||||||||||||||||||||||||||||||||||||||||
Seix Core Bond Fund |
| |||||||||||||||||||||||||||||||||||||||||||||||||||||||||||
I Shares | ||||||||||||||||||||||||||||||||||||||||||||||||||||||||||||
Year Ended March 31, 2017 | $10.86 | $0.17 | $(0.04 | ) | $0.13 | $(0.21 | ) | $— | $(0.21 | ) | $(0.42 | ) | $10.57 | $199,622 | 1.15 | % | 0.49 | % | 0.49 | % | 1.58 | % | 210 | % | ||||||||||||||||||||||||||||||||||||
Year Ended March 31, 2016 | 11.04 | 0.20 | (0.08 | ) | 0.12 | (0.21 | ) | — | (0.09 | ) | (0.30 | ) | 10.86 | 255,522 | 1.18 | 0.48 | 0.48 | 1.82 | 232 | |||||||||||||||||||||||||||||||||||||||||
Year Ended March 31, 2015 | 10.65 | 0.21 | 0.40 | 0.61 | (0.22 | ) | — | — | (0.22 | ) | 11.04 | 191,905 | 5.80 | 0.45 | 0.45 | 1.90 | 168 | |||||||||||||||||||||||||||||||||||||||||||
Year Ended March 31, 2014 | 11.16 | 0.18 | (0.23 | ) | (0.05 | ) | (0.22 | ) | — | (0.24 | ) | (0.46 | ) | 10.65 | 200,371 | (0.38 | ) | 0.42 | 0.42 | 1.67 | 208 | |||||||||||||||||||||||||||||||||||||||
Year Ended March 31, 2013 | 11.10 | 0.15 | 0.24 | 0.39 | (0.20 | ) | — | (0.13 | ) | (0.33 | ) | 11.16 | 370,455 | 3.53 | 0.38 | 0.38 | 1.33 | 151 | ||||||||||||||||||||||||||||||||||||||||||
A Shares | ||||||||||||||||||||||||||||||||||||||||||||||||||||||||||||
Year Ended March 31, 2017 | 10.86 | 0.16 | (0.06 | ) | 0.10 | (0.19 | ) | — | (0.21 | ) | (0.40 | ) | 10.56 | 10,363 | 0.90 | (g) | 0.64 | 0.64 | 1.45 | 210 | ||||||||||||||||||||||||||||||||||||||||
Year Ended March 31, 2016 | 11.04 | 0.18 | (0.07 | ) | 0.11 | (0.20 | ) | — | (0.09 | ) | (0.29 | ) | 10.86 | 10,170 | 1.01 | 0.65 | 0.65 | 1.65 | 232 | |||||||||||||||||||||||||||||||||||||||||
Year Ended March 31, 2015 | 10.65 | 0.18 | 0.41 | 0.59 | (0.20 | ) | — | — | (0.20 | ) | 11.04 | 7,411 | 5.58 | 0.67 | 0.67 | 1.70 | 168 | |||||||||||||||||||||||||||||||||||||||||||
Year Ended March 31, 2014 | 11.16 | 0.15 | (0.23 | ) | (0.08 | ) | (0.19 | ) | — | (0.24 | ) | (0.43 | ) | 10.65 | 9,848 | (0.66 | ) | 0.71 | 0.71 | 1.38 | 208 | |||||||||||||||||||||||||||||||||||||||
Year Ended March 31, 2013 | 11.10 | 0.11 | 0.24 | 0.35 | (0.16 | ) | — | (0.13 | ) | (0.29 | ) | 11.16 | 20,687 | 3.20 | 0.70 | 0.69 | 1.02 | 151 | ||||||||||||||||||||||||||||||||||||||||||
R Shares | ||||||||||||||||||||||||||||||||||||||||||||||||||||||||||||
Year Ended March 31, 2017 | 10.87 | 0.13 | (0.05 | ) | 0.08 | (0.16 | ) | — | (0.21 | ) | (0.37 | ) | 10.58 | 3,124 | 0.73 | 0.91 | 0.91 | 1.18 | 210 | |||||||||||||||||||||||||||||||||||||||||
Year Ended March 31, 2016 | 11.05 | 0.15 | (0.07 | ) | 0.08 | (0.17 | ) | — | (0.09 | ) | (0.26 | ) | 10.87 | 3,448 | 0.78 | 0.88 | 0.88 | 1.41 | 232 | |||||||||||||||||||||||||||||||||||||||||
Year Ended March 31, 2015 | 10.66 | 0.16 | 0.41 | 0.57 | (0.18 | ) | — | — | (0.18 | ) | 11.05 | 3,490 | 5.37 | 0.85 | 0.85 | 1.51 | 168 | |||||||||||||||||||||||||||||||||||||||||||
Year Ended March 31, 2014 | 11.17 | 0.14 | (0.24 | ) | (0.10 | ) | (0.17 | ) | — | (0.24 | ) | (0.41 | ) | 10.66 | 4,115 | (0.80 | ) | 0.85 | 0.85 | 1.29 | 208 | |||||||||||||||||||||||||||||||||||||||
Year Ended March 31, 2013 | 11.10 | 0.10 | 0.24 | 0.34 | (0.14 | ) | — | (0.13 | ) | (0.27 | ) | 11.17 | 5,135 | 3.15 | 0.84 | 0.84 | 0.87 | 151 | ||||||||||||||||||||||||||||||||||||||||||
IS Shares | ||||||||||||||||||||||||||||||||||||||||||||||||||||||||||||
Year Ended March 31, 2017 | 10.86 | 0.19 | (0.05 | ) | 0.14 | (0.22 | ) | — | (0.21 | ) | (0.43 | ) | 10.57 | 1,352 | 1.29 | 0.35 | 0.35 | 1.78 | 210 | |||||||||||||||||||||||||||||||||||||||||
Period Ended March 31, 2016(e) | 10.77 | 0.14 | 0.13 | 0.27 | (0.15 | ) | — | (0.03 | ) | (0.18 | ) | 10.86 | 22 | 2.51 | 0.34 | 0.34 | 2.00 | 232 | ||||||||||||||||||||||||||||||||||||||||||
Seix Corporate Bond Fund |
| |||||||||||||||||||||||||||||||||||||||||||||||||||||||||||
I Shares | ||||||||||||||||||||||||||||||||||||||||||||||||||||||||||||
Year Ended March 31, 2017 | 8.46 | 0.26 | 0.27 | 0.53 | (0.26 | ) | — | (0.08 | ) | (0.34 | ) | 8.65 | 12,651 | 6.29 | 0.70 | 0.93 | 2.99 | 182 | ||||||||||||||||||||||||||||||||||||||||||
Year Ended March 31, 2016 | 8.95 | 0.25 | (0.29 | ) | (0.04 | ) | (0.24 | ) | (0.01 | ) | (0.20 | ) | (0.45 | ) | 8.46 | 8,943 | (0.29 | ) | 0.70 | 0.83 | 2.86 | 84 | ||||||||||||||||||||||||||||||||||||||
Year Ended March 31, 2015 | 8.80 | 0.26 | 0.32 | 0.58 | (0.26 | ) | — | (0.17 | ) | (0.43 | ) | 8.95 | 24,172 | 6.73 | 0.66 | 0.69 | 2.95 | 90 | ||||||||||||||||||||||||||||||||||||||||||
Year Ended March 31, 2014 | 9.30 | 0.28 | (0.21 | ) | 0.07 | (0.28 | ) | — | (0.29 | ) | (0.57 | ) | 8.80 | 28,017 | 0.91 | 0.63 | 0.64 | 3.18 | 143 | |||||||||||||||||||||||||||||||||||||||||
Year Ended March 31, 2013 | 9.35 | 0.32 | 0.30 | 0.62 | (0.32 | ) | — | (0.35 | ) | (0.67 | ) | 9.30 | 51,828 | 6.71 | 0.60 | 0.61 | 3.36 | 58 | ||||||||||||||||||||||||||||||||||||||||||
A Shares | ||||||||||||||||||||||||||||||||||||||||||||||||||||||||||||
Year Ended March 31, 2017 | 8.50 | 0.24 | 0.27 | 0.51 | (0.24 | ) | — | (0.08 | ) | (0.32 | ) | 8.69 | 591 | 6.01 | 0.95 | 1.15 | 2.75 | 182 | ||||||||||||||||||||||||||||||||||||||||||
Year Ended March 31, 2016 | 8.99 | 0.23 | (0.29 | ) | (0.06 | ) | (0.22 | ) | (0.01 | ) | (0.20 | ) | (0.43 | ) | 8.50 | 500 | (0.52 | ) | 0.95 | 1.11 | 2.68 | 84 | ||||||||||||||||||||||||||||||||||||||
Year Ended March 31, 2015 | 8.84 | 0.24 | 0.32 | 0.56 | (0.24 | ) | — | (0.17 | ) | (0.41 | ) | 8.99 | 807 | 6.40 | 0.95 | 0.99 | 2.67 | 90 | ||||||||||||||||||||||||||||||||||||||||||
Year Ended March 31, 2014 | 9.35 | 0.25 | (0.21 | ) | 0.04 | (0.26 | ) | — | (0.29 | ) | (0.55 | ) | 8.84 | 783 | 0.52 | 0.92 | 0.93 | 2.76 | 143 | |||||||||||||||||||||||||||||||||||||||||
Year Ended March 31, 2013 | 9.40 | 0.29 | 0.30 | 0.59 | (0.29 | ) | — | (0.35 | ) | (0.64 | ) | 9.35 | 4,020 | 6.39 | 0.88 | 0.88 | 3.06 | 58 | ||||||||||||||||||||||||||||||||||||||||||
C Shares | ||||||||||||||||||||||||||||||||||||||||||||||||||||||||||||
Year Ended March 31, 2017 | 8.46 | 0.18 | 0.27 | 0.45 | (0.18 | ) | — | (0.08 | ) | (0.26 | ) | 8.65 | 7,369 | 5.29 | 1.65 | 1.82 | 2.03 | 182 | ||||||||||||||||||||||||||||||||||||||||||
Year Ended March 31, 2016 | 8.95 | 0.17 | (0.29 | ) | (0.12 | ) | (0.16 | ) | (0.01 | ) | (0.20 | ) | (0.37 | ) | 8.46 | 8,105 | (1.22 | ) | 1.65 | 1.80 | 2.01 | 84 | ||||||||||||||||||||||||||||||||||||||
Year Ended March 31, 2015 | 8.80 | 0.18 | 0.32 | 0.50 | (0.18 | ) | — | (0.17 | ) | (0.35 | ) | 8.95 | 9,289 | 5.69 | 1.64 | 1.67 | 1.97 | 90 | ||||||||||||||||||||||||||||||||||||||||||
Year Ended March 31, 2014 | 9.30 | 0.19 | (0.21 | ) | (0.02 | ) | (0.19 | ) | — | (0.29 | ) | (0.48 | ) | 8.80 | 10,385 | (0.07 | ) | 1.62 | 1.63 | 2.18 | 143 | |||||||||||||||||||||||||||||||||||||||
Year Ended March 31, 2013 | 9.35 | 0.23 | 0.30 | 0.53 | (0.23 | ) | — | (0.35 | ) | (0.58 | ) | 9.30 | 15,558 | 5.67 | 1.57 | 1.58 | 2.39 | 58 | ||||||||||||||||||||||||||||||||||||||||||
See Notes to Financial Highlights and Notes to Financial Statements.
131
Table of Contents
FINANCIAL HIGHLIGHTS
RIDGEWORTH FUNDS Selected Data For a Share of Beneficial Interest Outstanding Throughout the Periods Indicated.
| Net Asset Value, Beginning of Period | Net Investment Income (Loss)(a) | Net Realized and Unrealized Gains (Losses) on Investments | Total from Operations | Dividends from Net Investment Income | Distributions from Tax Return of Capital | Distributions from Realized Capital Gains | Total Dividends and Distributions | Net Asset Value, End of Period | Net Assets End of Period (000) | Total Return(b) | Ratio of Net Expenses to Average Net Assets(c) | Ratio of Expenses to Average Net Assets (Excluding Waivers and Reimbursements)(c) | Ratio of Net Investment Income to Average Net Assets(c) | Portfolio Turnover Rate(d) | ||||||||||||||||||||||||||||||||||||||||||||||
Seix Floating Rate High Income Fund |
| |||||||||||||||||||||||||||||||||||||||||||||||||||||||||||
I Shares | ||||||||||||||||||||||||||||||||||||||||||||||||||||||||||||
Year Ended March 31, 2017 | $8.33 | $0.41 | $0.42 | $0.83 | $(0.41 | ) | $— | $— | $(0.41 | ) | $8.75 | $4,459,175 | 10.13 | % | 0.63 | % | 0.63 | % | 4.80 | % | 79 | % | ||||||||||||||||||||||||||||||||||||||
Year Ended March 31, 2016 | 8.86 | 0.40 | (0.53 | ) | (0.13 | ) | (0.40 | ) | — | — | (0.40 | ) | 8.33 | 3,040,875 | (1.50 | ) | 0.62 | 0.62 | 4.69 | 33 | ||||||||||||||||||||||||||||||||||||||||
Year Ended March 31, 2015 | 9.06 | 0.39 | (0.20 | ) | 0.19 | (0.39 | ) | — | — | (0.39 | ) | 8.86 | 6,048,771 | 2.17 | 0.61 | 0.61 | 4.34 | 29 | ||||||||||||||||||||||||||||||||||||||||||
Year Ended March 31, 2014 | 9.06 | 0.38 | (0.01 | ) | 0.37 | (0.37 | ) | — | — | (0.37 | ) | 9.06 | 8,965,312 | 4.16 | 0.60 | 0.60 | 4.13 | 47 | ||||||||||||||||||||||||||||||||||||||||||
Year Ended March 31, 2013 | 8.83 | 0.46 | 0.20 | 0.66 | (0.43 | ) | — | — | (0.43 | ) | 9.06 | 5,780,847 | 7.67 | 0.60 | 0.60 | 5.13 | 70 | |||||||||||||||||||||||||||||||||||||||||||
A Shares | ||||||||||||||||||||||||||||||||||||||||||||||||||||||||||||
Year Ended March 31, 2017 | 8.33 | 0.39 | 0.41 | 0.80 | (0.38 | ) | — | — | (0.38 | ) | 8.75 | 135,833 | 9.78 | 0.94 | 0.94 | 4.51 | 79 | |||||||||||||||||||||||||||||||||||||||||||
Year Ended March 31, 2016 | 8.86 | 0.38 | (0.54 | ) | (0.16 | ) | (0.37 | ) | — | — | (0.37 | ) | 8.33 | 143,325 | (1.79 | ) | 0.92 | 0.92 | 4.42 | 33 | ||||||||||||||||||||||||||||||||||||||||
Year Ended March 31, 2015 | 9.06 | 0.36 | (0.19 | ) | 0.17 | (0.37 | ) | — | — | (0.37 | ) | 8.86 | 147,560 | 1.88 | 0.91 | 0.91 | 4.06 | 29 | ||||||||||||||||||||||||||||||||||||||||||
Year Ended March 31, 2014 | 9.06 | 0.35 | (0.01 | ) | 0.34 | (0.34 | ) | — | — | (0.34 | ) | 9.06 | 212,336 | 3.86 | 0.89 | 0.89 | 3.82 | 47 | ||||||||||||||||||||||||||||||||||||||||||
Year Ended March 31, 2013 | 8.83 | 0.43 | 0.21 | 0.64 | (0.41 | ) | — | — | (0.41 | ) | 9.06 | 99,040 | 7.39 | 0.85 | 0.85 | 4.85 | 70 | |||||||||||||||||||||||||||||||||||||||||||
C Shares | ||||||||||||||||||||||||||||||||||||||||||||||||||||||||||||
Year Ended March 31, 2017 | 8.33 | 0.34 | 0.42 | 0.76 | (0.33 | ) | — | — | (0.33 | ) | 8.76 | 56,981 | 9.28 | 1.52 | 1.52 | 3.94 | 79 | |||||||||||||||||||||||||||||||||||||||||||
Year Ended March 31, 2016 | 8.86 | 0.33 | (0.54 | ) | (0.21 | ) | (0.32 | ) | — | — | (0.32 | ) | 8.33 | 55,203 | (2.37 | ) | 1.51 | 1.51 | 3.82 | 33 | ||||||||||||||||||||||||||||||||||||||||
Year Ended March 31, 2015 | 9.07 | 0.31 | (0.21 | ) | 0.10 | (0.31 | ) | — | — | (0.31 | ) | 8.86 | 64,445 | 1.16 | 1.50 | 1.50 | 3.46 | 29 | ||||||||||||||||||||||||||||||||||||||||||
Year Ended March 31, 2014 | 9.06 | 0.29 | 0.01 | 0.30 | (0.29 | ) | — | — | (0.29 | ) | 9.07 | 83,149 | 3.33 | 1.51 | 1.51 | 3.21 | 47 | |||||||||||||||||||||||||||||||||||||||||||
Year Ended March 31, 2013 | 8.83 | 0.38 | 0.20 | 0.58 | (0.35 | ) | — | — | (0.35 | ) | 9.06 | 40,493 | 6.69 | 1.51 | 1.51 | 4.22 | 70 | |||||||||||||||||||||||||||||||||||||||||||
IS Shares | ||||||||||||||||||||||||||||||||||||||||||||||||||||||||||||
Year Ended March 31, 2017 | 8.33 | 0.43 | 0.42 | 0.85 | (0.42 | ) | — | — | (0.42 | ) | 8.76 | 1,307,701 | 10.37 | 0.52 | 0.52 | 4.94 | 79 | |||||||||||||||||||||||||||||||||||||||||||
Year Ended March 31, 2016 | 8.86 | 0.41 | (0.53 | ) | (0.12 | ) | (0.41 | ) | — | — | (0.41 | ) | 8.33 | 1,127,337 | (1.39 | ) | 0.51 | 0.51 | 4.83 | 33 | ||||||||||||||||||||||||||||||||||||||||
Period Ended March 31, 2015(f) | 8.74 | 0.07 | 0.12 | 0.19 | (0.07 | ) | — | — | (0.07 | ) | 8.86 | 12,629 | 2.15 | 0.47 | 0.47 | 5.08 | 29 | |||||||||||||||||||||||||||||||||||||||||||
Seix Georgia Tax-Exempt Bond Fund |
| |||||||||||||||||||||||||||||||||||||||||||||||||||||||||||
I Shares | ||||||||||||||||||||||||||||||||||||||||||||||||||||||||||||
Year Ended March 31, 2017 | 10.96 | 0.29 | (0.34 | ) | (0.05 | ) | (0.29 | ) | — | (0.14 | ) | (0.43 | ) | 10.48 | 91,782 | (0.47 | ) | 0.65 | 0.70 | 2.66 | 46 | |||||||||||||||||||||||||||||||||||||||
Year Ended March 31, 2016 | 10.86 | 0.27 | 0.10 | 0.37 | (0.27 | ) | — | — | (0.27 | ) | 10.96 | 107,691 | 3.50 | 0.65 | 0.68 | 2.52 | 41 | |||||||||||||||||||||||||||||||||||||||||||
Year Ended March 31, 2015 | 10.42 | 0.28 | 0.44 | 0.72 | (0.28 | ) | — | — | (0.28 | ) | 10.86 | 131,881 | 7.00 | 0.64 | 0.64 | 2.63 | 55 | |||||||||||||||||||||||||||||||||||||||||||
Year Ended March 31, 2014 | 10.78 | 0.31 | (0.36 | ) | (0.05 | ) | (0.31 | ) | — | — | (0.31 | ) | 10.42 | 120,835 | (0.37 | ) | 0.57 | 0.57 | 3.01 | 67 | ||||||||||||||||||||||||||||||||||||||||
Year Ended March 31, 2013 | 10.55 | 0.34 | 0.23 | 0.57 | (0.34 | ) | — | — | (0.34 | ) | 10.78 | 148,153 | 5.44 | 0.59 | 0.59 | 3.15 | 50 | |||||||||||||||||||||||||||||||||||||||||||
A Shares | ||||||||||||||||||||||||||||||||||||||||||||||||||||||||||||
Year Ended March 31, 2017 | 10.98 | 0.28 | (0.35 | ) | (0.07 | ) | (0.28 | ) | — | (0.14 | ) | (0.42 | ) | 10.49 | 3,504 | (0.66 | ) | 0.75 | 0.75 | 2.56 | 46 | |||||||||||||||||||||||||||||||||||||||
Year Ended March 31, 2016 | 10.88 | 0.26 | 0.10 | 0.36 | (0.26 | ) | — | — | (0.26 | ) | 10.98 | 3,621 | 3.40 | 0.75 | 0.75 | 2.43 | 41 | |||||||||||||||||||||||||||||||||||||||||||
Year Ended March 31, 2015 | 10.44 | 0.27 | 0.44 | 0.71 | (0.27 | ) | — | — | (0.27 | ) | 10.88 | 3,637 | 6.89 | 0.73 | 0.73 | 2.55 | 55 | |||||||||||||||||||||||||||||||||||||||||||
Year Ended March 31, 2014 | 10.80 | 0.30 | (0.36 | ) | (0.06 | ) | (0.30 | ) | — | — | (0.30 | ) | 10.44 | 4,139 | (0.52 | ) | 0.72 | 0.72 | 2.87 | 67 | ||||||||||||||||||||||||||||||||||||||||
Year Ended March 31, 2013 | 10.57 | 0.32 | 0.23 | 0.55 | (0.32 | ) | — | — | (0.32 | ) | 10.80 | 4,566 | 5.27 | 0.74 | 0.74 | 2.99 | 50 | |||||||||||||||||||||||||||||||||||||||||||
Seix High Grade Municipal Bond Fund |
| |||||||||||||||||||||||||||||||||||||||||||||||||||||||||||
I Shares | ||||||||||||||||||||||||||||||||||||||||||||||||||||||||||||
Year Ended March 31, 2017 | 12.36 | 0.26 | (0.23 | ) | 0.03 | (0.26 | ) | — | (0.45 | ) | (0.71 | ) | 11.68 | 78,729 | 0.33 | 0.65 | 0.71 | 2.12 | 218 | |||||||||||||||||||||||||||||||||||||||||
Year Ended March 31, 2016 | 12.29 | 0.27 | 0.19 | 0.46 | (0.27 | ) | — | (0.12 | ) | (0.39 | ) | 12.36 | 99,803 | 3.85 | 0.65 | 0.69 | 2.21 | 171 | ||||||||||||||||||||||||||||||||||||||||||
Year Ended March 31, 2015 | 11.86 | 0.31 | 0.59 | 0.90 | (0.31 | ) | — | (0.16 | ) | (0.47 | ) | 12.29 | 95,761 | 7.64 | 0.65 | 0.69 | 2.53 | 228 | ||||||||||||||||||||||||||||||||||||||||||
Year Ended March 31, 2014 | 12.10 | 0.34 | (0.19 | ) | 0.15 | (0.34 | ) | — | (0.05 | ) | (0.39 | ) | 11.86 | 47,737 | 1.40 | 0.65 | 0.68 | 2.90 | 227 | |||||||||||||||||||||||||||||||||||||||||
Year Ended March 31, 2013 | 11.96 | 0.34 | 0.50 | 0.84 | (0.34 | ) | — | (0.36 | ) | (0.70 | ) | 12.10 | 54,892 | 7.12 | 0.65 | 0.68 | 2.78 | 168 | ||||||||||||||||||||||||||||||||||||||||||
See Notes to Financial Highlights and Notes to Financial Statements.
132
Table of Contents
FINANCIAL HIGHLIGHTS
RIDGEWORTH FUNDS Selected Data For a Share of Beneficial Interest Outstanding Throughout the Periods Indicated.
| Net Asset Value, Beginning of Period | Net Investment Income (Loss)(a) | Net Realized and Unrealized Gains (Losses) on Investments | Total from Operations | Dividends from Net Investment Income | Distributions from Tax Return of Capital | Distributions from Realized Capital Gains | Total Dividends and Distributions | Net Asset Value, End of Period | Net Assets End of Period (000) | Total Return(b) | Ratio of Net Expenses to Average Net Assets(c) | Ratio of Expenses to Average Net Assets (Excluding Waivers and Reimbursements)(c) | Ratio of Net Investment Income to Average Net Assets(c) | Portfolio Turnover Rate(d) | ||||||||||||||||||||||||||||||||||||||||||||||
A Shares | ||||||||||||||||||||||||||||||||||||||||||||||||||||||||||||
Year Ended March 31, 2017 | $12.36 | $0.24 | $(0.22 | ) | $0.02 | $(0.24 | ) | $— | $(0.45 | ) | $(0.69 | ) | $11.69 | $12,276 | 0.27 | % | 0.80 | % | 0.80 | % | 1.99 | % | 218 | % | ||||||||||||||||||||||||||||||||||||
Year Ended March 31, 2016 | 12.29 | 0.25 | 0.19 | 0.44 | (0.25 | ) | — | (0.12 | ) | (0.37 | ) | 12.36 | 13,996 | 3.70 | 0.79 | 0.79 | 2.07 | 171 | ||||||||||||||||||||||||||||||||||||||||||
Year Ended March 31, 2015 | 11.86 | 0.29 | 0.59 | 0.88 | (0.29 | ) | — | (0.16 | ) | (0.45 | ) | 12.29 | 16,499 | 7.48 | 0.80 | 0.80 | 2.38 | 228 | ||||||||||||||||||||||||||||||||||||||||||
Year Ended March 31, 2014 | 12.11 | 0.32 | (0.20 | ) | 0.12 | (0.32 | ) | — | (0.05 | ) | (0.37 | ) | 11.86 | 8,967 | 1.16 | 0.80 | 0.82 | 2.75 | 227 | |||||||||||||||||||||||||||||||||||||||||
Year Ended March 31, 2013 | 11.97 | 0.32 | 0.50 | 0.82 | (0.32 | ) | — | (0.36 | ) | (0.68 | ) | 12.11 | 11,363 | 6.97 | 0.80 | 0.83 | 2.63 | 168 | ||||||||||||||||||||||||||||||||||||||||||
Seix High Income Fund |
| |||||||||||||||||||||||||||||||||||||||||||||||||||||||||||
I Shares | ||||||||||||||||||||||||||||||||||||||||||||||||||||||||||||
Year Ended March 31, 2017 | 5.92 | 0.39 | 0.54 | 0.93 | (0.39 | ) | — | — | (0.39 | ) | 6.46 | 456,928 | 15.95 | 0.80 | 0.81 | 6.15 | 95 | |||||||||||||||||||||||||||||||||||||||||||
Year Ended March 31, 2016 | 6.67 | 0.40 | (0.75 | ) | (0.35 | ) | (0.40 | ) | — | — | (0.40 | ) | 5.92 | 546,793 | (5.31 | ) | 0.79 | 0.79 | 6.34 | 77 | ||||||||||||||||||||||||||||||||||||||||
Year Ended March 31, 2015 | 7.26 | 0.40 | (0.38 | ) | 0.02 | (0.40 | ) | — | (0.21 | ) | (0.61 | ) | 6.67 | 753,851 | 0.47 | 0.77 | 0.77 | 5.63 | 86 | |||||||||||||||||||||||||||||||||||||||||
Year Ended March 31, 2014 | 7.32 | 0.43 | 0.11 | 0.54 | (0.44 | ) | — | (0.16 | ) | (0.60 | ) | 7.26 | 783,072 | 7.68 | 0.77 | 0.77 | 6.00 | 110 | ||||||||||||||||||||||||||||||||||||||||||
Year Ended March 31, 2013 | 6.89 | 0.45 | 0.43 | 0.88 | (0.45 | ) | — | — | (0.45 | ) | 7.32 | 784,870 | 13.17 | 0.74 | 0.75 | 6.33 | 118 | |||||||||||||||||||||||||||||||||||||||||||
A Shares | ||||||||||||||||||||||||||||||||||||||||||||||||||||||||||||
Year Ended March 31, 2017 | 5.92 | 0.38 | 0.53 | 0.91 | (0.37 | ) | — | — | (0.37 | ) | 6.46 | 63,104 | 15.69 | 1.04 | 1.04 | 5.92 | 95 | |||||||||||||||||||||||||||||||||||||||||||
Year Ended March 31, 2016 | 6.68 | 0.38 | (0.75 | ) | (0.37 | ) | (0.39 | ) | — | — | (0.39 | ) | 5.92 | 43,433 | (5.68 | ) | 1.03 | 1.03 | 6.08 | 77 | ||||||||||||||||||||||||||||||||||||||||
Year Ended March 31, 2015 | 7.27 | 0.38 | (0.38 | ) | — | (0.38 | ) | — | (0.21 | ) | (0.59 | ) | 6.68 | 65,121 | 0.26 | 0.99 | 0.99 | 5.34 | 86 | |||||||||||||||||||||||||||||||||||||||||
Year Ended March 31, 2014 | 7.32 | 0.42 | 0.11 | 0.53 | (0.42 | ) | — | (0.16 | ) | (0.58 | ) | 7.27 | 157,360 | 7.60 | (g) | 0.97 | 0.97 | 5.82 | 110 | |||||||||||||||||||||||||||||||||||||||||
Year Ended March 31, 2013 | 6.90 | 0.43 | 0.42 | 0.85 | (0.43 | ) | — | — | (0.43 | ) | 7.32 | 119,006 | 12.72 | 0.99 | 0.99 | 6.09 | 118 | |||||||||||||||||||||||||||||||||||||||||||
R Shares | ||||||||||||||||||||||||||||||||||||||||||||||||||||||||||||
Year Ended March 31, 2017 | 5.92 | 0.36 | 0.54 | 0.90 | (0.36 | ) | — | — | (0.36 | ) | 6.46 | 14,699 | 15.47 | 1.22 | 1.22 | 5.73 | 95 | |||||||||||||||||||||||||||||||||||||||||||
Year Ended March 31, 2016 | 6.68 | 0.37 | (0.76 | ) | (0.39 | ) | (0.37 | ) | — | — | (0.37 | ) | 5.92 | 14,574 | (5.87 | ) | 1.23 | 1.23 | 5.92 | 77 | ||||||||||||||||||||||||||||||||||||||||
Year Ended March 31, 2015 | 7.27 | 0.37 | (0.38 | ) | (0.01 | ) | (0.37 | ) | — | (0.21 | ) | (0.58 | ) | 6.68 | 20,887 | 0.05 | 1.21 | 1.21 | 5.20 | 86 | ||||||||||||||||||||||||||||||||||||||||
Year Ended March 31, 2014 | 7.32 | 0.40 | 0.12 | 0.52 | (0.41 | ) | — | (0.16 | ) | (0.57 | ) | 7.27 | 22,317 | 7.37 | 1.20 | 1.20 | 5.57 | 110 | ||||||||||||||||||||||||||||||||||||||||||
Year Ended March 31, 2013 | 6.89 | 0.41 | 0.43 | 0.84 | (0.41 | ) | — | — | (0.41 | ) | 7.32 | 23,956 | 12.61 | 1.23 | 1.23 | 5.85 | 118 | |||||||||||||||||||||||||||||||||||||||||||
IS Shares | ||||||||||||||||||||||||||||||||||||||||||||||||||||||||||||
Year Ended March 31, 2017 | 5.92 | 0.40 | 0.53 | 0.93 | (0.40 | ) | — | — | (0.40 | ) | 6.45 | 4,125 | 15.96 | 0.64 | 0.64 | 6.26 | 95 | |||||||||||||||||||||||||||||||||||||||||||
Year Ended March 31, 2016 | 6.68 | 0.40 | (0.75 | ) | (0.35 | ) | (0.41 | ) | — | — | (0.41 | ) | 5.92 | 1,117 | (5.30 | ) | 0.63 | 0.63 | 6.27 | 77 | ||||||||||||||||||||||||||||||||||||||||
Period Ended March 31, 2015(h) | 7.22 | 0.28 | (0.33 | ) | (0.05 | ) | (0.28 | ) | — | (0.21 | ) | (0.49 | ) | 6.68 | 3,455 | (0.51 | ) | 0.63 | 0.63 | 5.99 | 86 | |||||||||||||||||||||||||||||||||||||||
Seix High Yield Fund |
| |||||||||||||||||||||||||||||||||||||||||||||||||||||||||||
I Shares |
| |||||||||||||||||||||||||||||||||||||||||||||||||||||||||||
Year Ended March 31, 2017 | 7.80 | 0.46 | 0.57 | 1.03 | (0.46 | ) | — | — | (0.46 | ) | 8.37 | 483,080 | 13.48 | 0.64 | 0.64 | 5.65 | 87 | |||||||||||||||||||||||||||||||||||||||||||
Year Ended March 31, 2016 | 8.73 | 0.47 | (0.92 | ) | (0.45 | ) | (0.48 | ) | — | — | (0.48 | ) | 7.80 | 523,206 | (5.23 | ) | 0.61 | 0.61 | 5.71 | 76 | ||||||||||||||||||||||||||||||||||||||||
Year Ended March 31, 2015 | 9.95 | 0.54 | (0.43 | ) | 0.11 | (0.54 | ) | — | (0.79 | ) | (1.33 | ) | 8.73 | 695,060 | 1.53 | 0.58 | 0.58 | 5.63 | 72 | |||||||||||||||||||||||||||||||||||||||||
Year Ended March 31, 2014 | 10.26 | 0.58 | 0.06 | 0.64 | (0.59 | ) | — | (0.36 | ) | (0.95 | ) | 9.95 | 1,211,146 | 6.65 | 0.55 | 0.55 | 5.79 | 89 | ||||||||||||||||||||||||||||||||||||||||||
Year Ended March 31, 2013 | 9.69 | 0.64 | 0.56 | 1.20 | (0.63 | ) | — | — | (0.63 | ) | 10.26 | 1,792,768 | 12.80 | 0.54 | 0.54 | 6.41 | 79 | |||||||||||||||||||||||||||||||||||||||||||
A Shares | ||||||||||||||||||||||||||||||||||||||||||||||||||||||||||||
Year Ended March 31, 2017 | 7.61 | 0.44 | 0.55 | 0.99 | (0.44 | ) | — | — | (0.44 | ) | 8.16 | 6,214 | 13.20 | 0.82 | 0.82 | 5.51 | 87 | |||||||||||||||||||||||||||||||||||||||||||
Year Ended March 31, 2016 | 8.51 | 0.44 | (0.89 | ) | (0.45 | ) | (0.45 | ) | — | — | (0.45 | ) | 7.61 | 7,463 | (5.36 | ) | 0.84 | 0.84 | 5.48 | 76 | ||||||||||||||||||||||||||||||||||||||||
Year Ended March 31, 2015 | 9.72 | 0.51 | (0.43 | ) | 0.08 | (0.50 | ) | — | (0.79 | ) | (1.29 | ) | 8.51 | 8,110 | 1.24 | 0.87 | 0.87 | 5.31 | 72 | |||||||||||||||||||||||||||||||||||||||||
Year Ended March 31, 2014 | 10.03 | 0.55 | 0.05 | 0.60 | (0.55 | ) | — | (0.36 | ) | (0.91 | ) | 9.72 | 69,921 | 6.39 | 0.81 | 0.81 | 5.57 | 89 | ||||||||||||||||||||||||||||||||||||||||||
Year Ended March 31, 2013 | 9.47 | 0.59 | 0.56 | 1.15 | (0.59 | ) | — | — | (0.59 | ) | 10.03 | 72,703 | 12.56 | 0.79 | 0.79 | 6.09 | 79 | |||||||||||||||||||||||||||||||||||||||||||
See Notes to Financial Highlights and Notes to Financial Statements.
133
Table of Contents
FINANCIAL HIGHLIGHTS
RIDGEWORTH FUNDS Selected Data For a Share of Beneficial Interest Outstanding Throughout the Periods Indicated.
| Net Asset Value, Beginning of Period | Net Investment Income (Loss)(a) | Net Realized and Unrealized Gains (Losses) on Investments | Total from Operations | Dividends from Net Investment Income | Distributions from Tax Return of Capital | Distributions from Realized Capital Gains | Total Dividends and Distributions | Net Asset Value, End of Period | Net Assets End of Period (000) | Total Return(b) | Ratio of Net Expenses to Average Net Assets(c) | Ratio of Expenses to Average Net Assets (Excluding Waivers and Reimbursements)(c) | Ratio of Net Investment Income to Average Net Assets(c) | Portfolio Turnover Rate(d) | ||||||||||||||||||||||||||||||||||||||||||||||
R Shares | ||||||||||||||||||||||||||||||||||||||||||||||||||||||||||||
Year Ended March 31, 2017 | $7.80 | $0.43 | $0.56 | $0.99 | $(0.43 | ) | $— | $— | $(0.43 | ) | $8.36 | $130 | 12.90 | % | 1.04 | % | 1.04 | % | 5.32 | % | 87 | % | ||||||||||||||||||||||||||||||||||||||
Year Ended March 31, 2016 | 8.72 | 0.44 | (0.91 | ) | (0.47 | ) | (0.45 | ) | — | — | (0.45 | ) | 7.80 | 573 | (5.52 | ) | 1.04 | 1.04 | 5.29 | 76 | ||||||||||||||||||||||||||||||||||||||||
Year Ended March 31, 2015 | 9.94 | 0.49 | (0.42 | ) | 0.07 | (0.50 | ) | — | (0.79 | ) | (1.29 | ) | 8.72 | 782 | 1.05 | 1.04 | 1.04 | 5.18 | 72 | |||||||||||||||||||||||||||||||||||||||||
Year Ended March 31, 2014 | 10.26 | 0.53 | 0.05 | 0.58 | (0.54 | ) | — | (0.36 | ) | (0.90 | ) | 9.94 | 1,237 | 6.04 | 1.04 | 1.04 | 5.31 | 89 | ||||||||||||||||||||||||||||||||||||||||||
Year Ended March 31, 2013 | 9.68 | 0.59 | 0.57 | 1.16 | (0.58 | ) | — | — | (0.58 | ) | 10.26 | 2,385 | 12.36 | 1.03 | 1.03 | 5.92 | 79 | |||||||||||||||||||||||||||||||||||||||||||
IS Shares | ||||||||||||||||||||||||||||||||||||||||||||||||||||||||||||
Period Ended March 31, 2017(i) | 8.17 | 0.33 | 0.18 | 0.51 | (0.31 | ) | — | — | (0.31 | ) | 8.37 | 42,695 | 6.34 | (g) | 0.54 | 0.54 | 5.86 | 87 | ||||||||||||||||||||||||||||||||||||||||||
Seix Investment Grade Tax-Exempt Bond Fund |
| |||||||||||||||||||||||||||||||||||||||||||||||||||||||||||
I Shares |
| |||||||||||||||||||||||||||||||||||||||||||||||||||||||||||
Year Ended March 31, 2017 | 12.22 | 0.28 | (0.31 | ) | (0.03 | ) | (0.28 | ) | — | (0.27 | ) | (0.55 | ) | 11.64 | 519,784 | (0.24 | ) | 0.65 | 0.70 | 2.30 | 138 | |||||||||||||||||||||||||||||||||||||||
Year Ended March 31, 2016 | 12.29 | 0.28 | 0.07 | 0.35 | (0.28 | ) | — | (0.14 | ) | (0.42 | ) | 12.22 | 629,435 | 2.96 | 0.65 | 0.68 | 2.32 | 139 | ||||||||||||||||||||||||||||||||||||||||||
Year Ended March 31, 2015 | 12.13 | 0.31 | 0.32 | 0.63 | (0.31 | ) | — | (0.16 | ) | (0.47 | ) | 12.29 | 657,851 | 5.25 | 0.65 | 0.68 | 2.53 | 144 | ||||||||||||||||||||||||||||||||||||||||||
Year Ended March 31, 2014 | 12.45 | 0.28 | (0.23 | ) | 0.05 | (0.28 | ) | — | (0.09 | ) | (0.37 | ) | 12.13 | 643,828 | 0.48 | 0.64 | 0.64 | 2.29 | 104 | |||||||||||||||||||||||||||||||||||||||||
Year Ended March 31, 2013 | 12.49 | 0.25 | 0.35 | 0.60 | (0.25 | ) | — | (0.39 | ) | (0.64 | ) | 12.45 | 982,171 | 4.87 | 0.62 | 0.63 | 1.98 | 151 | ||||||||||||||||||||||||||||||||||||||||||
A Shares | ||||||||||||||||||||||||||||||||||||||||||||||||||||||||||||
Year Ended March 31, 2017 | 12.24 | 0.26 | (0.32 | ) | (0.06 | ) | (0.26 | ) | — | (0.27 | ) | (0.53 | ) | 11.65 | 20,281 | (0.48 | ) | 0.80 | 0.92 | 2.16 | 138 | |||||||||||||||||||||||||||||||||||||||
Year Ended March 31, 2016 | 12.30 | 0.26 | 0.08 | 0.34 | (0.26 | ) | — | (0.14 | ) | (0.40 | ) | 12.24 | 24,861 | 2.89 | 0.80 | 0.93 | 2.17 | 139 | ||||||||||||||||||||||||||||||||||||||||||
Year Ended March 31, 2015 | 12.14 | 0.29 | 0.32 | 0.61 | (0.29 | ) | — | (0.16 | ) | (0.45 | ) | 12.30 | 29,439 | 5.09 | 0.80 | 0.91 | 2.37 | 144 | ||||||||||||||||||||||||||||||||||||||||||
Year Ended March 31, 2014 | 12.47 | 0.26 | (0.24 | ) | 0.02 | (0.26 | ) | — | (0.09 | ) | (0.35 | ) | 12.14 | 30,100 | 0.23 | 0.80 | 0.90 | 2.13 | 104 | |||||||||||||||||||||||||||||||||||||||||
Year Ended March 31, 2013 | 12.50 | 0.23 | 0.36 | 0.59 | (0.23 | ) | — | (0.39 | ) | (0.62 | ) | 12.47 | 36,958 | 4.75 | 0.82 | 0.87 | 1.78 | 151 | ||||||||||||||||||||||||||||||||||||||||||
Seix Limited Duration Fund |
| |||||||||||||||||||||||||||||||||||||||||||||||||||||||||||
I Shares |
| |||||||||||||||||||||||||||||||||||||||||||||||||||||||||||
Year Ended March 31, 2017 | 9.83 | 0.07 | 0.01 | 0.08 | (0.06 | ) | — | — | (0.06 | ) | 9.85 | 6,661 | 0.86 | 0.34 | (k) | 0.46 | (k) | 0.68 | 89 | |||||||||||||||||||||||||||||||||||||||||
Year Ended March 31, 2016 | 9.83 | 0.03 | — | (j) | 0.03 | (0.03 | ) | — | — | (0.03 | ) | 9.83 | 6,649 | 0.26 | 0.35 | 0.47 | 0.29 | 50 | ||||||||||||||||||||||||||||||||||||||||||
Year Ended March 31, 2015 | 9.83 | 0.02 | — | (j) | 0.02 | (0.02 | ) | — | — | (0.02 | ) | 9.83 | 6,650 | 0.18 | 0.34 | 0.46 | 0.21 | 45 | ||||||||||||||||||||||||||||||||||||||||||
Year Ended March 31, 2014 | 9.83 | 0.03 | (0.01 | ) | 0.02 | (0.02 | ) | — | — | (0.02 | ) | 9.83 | 6,650 | 0.21 | 0.32 | 0.43 | 0.27 | 104 | ||||||||||||||||||||||||||||||||||||||||||
Year Ended March 31, 2013 | 9.76 | 0.05 | 0.06 | 0.11 | (0.04 | ) | — | — | (0.04 | ) | 9.83 | 9,357 | 1.08 | 0.30 | 0.33 | 0.50 | 56 | |||||||||||||||||||||||||||||||||||||||||||
Seix North Carolina Tax-Exempt Bond Fund |
| |||||||||||||||||||||||||||||||||||||||||||||||||||||||||||
I Shares | ||||||||||||||||||||||||||||||||||||||||||||||||||||||||||||
Year Ended March 31, 2017 | 10.53 | 0.23 | (0.29 | ) | (0.06 | ) | (0.23 | ) | — | (0.22 | ) | (0.45 | ) | 10.02 | 21,813 | (0.53 | ) | 0.65 | 0.74 | 2.22 | 61 | |||||||||||||||||||||||||||||||||||||||
Year Ended March 31, 2016 | 10.49 | 0.24 | 0.11 | 0.35 | (0.24 | ) | — | (0.07 | ) | (0.31 | ) | 10.53 | 28,576 | 3.39 | 0.65 | 0.73 | 2.31 | 42 | ||||||||||||||||||||||||||||||||||||||||||
Year Ended March 31, 2015 | 10.06 | 0.25 | 0.43 | 0.68 | (0.25 | ) | — | — | (0.25 | ) | 10.49 | 37,190 | 6.80 | 0.65 | 0.69 | 2.40 | 51 | |||||||||||||||||||||||||||||||||||||||||||
Year Ended March 31, 2014 | 10.68 | 0.26 | (0.31 | ) | (0.05 | ) | (0.27 | ) | — | (0.30 | ) | (0.57 | ) | 10.06 | 37,311 | (0.38 | ) | 0.61 | 0.61 | 2.59 | 77 | |||||||||||||||||||||||||||||||||||||||
Year Ended March 31, 2013 | 10.47 | 0.30 | 0.21 | 0.51 | (0.30 | ) | — | — | (0.30 | ) | 10.68 | 50,991 | 4.88 | 0.62 | 0.62 | 2.79 | 79 | |||||||||||||||||||||||||||||||||||||||||||
A Shares | ||||||||||||||||||||||||||||||||||||||||||||||||||||||||||||
Year Ended March 31, 2017 | 10.50 | 0.21 | (0.28 | ) | (0.07 | ) | (0.21 | ) | — | (0.22 | ) | (0.43 | ) | 10.00 | 2,170 | (0.59 | ) | 0.80 | 0.82 | 2.02 | 61 | |||||||||||||||||||||||||||||||||||||||
Year Ended March 31, 2016 | 10.46 | 0.22 | 0.12 | 0.34 | (0.23 | ) | — | (0.07 | ) | (0.30 | ) | 10.50 | 492 | 3.23 | 0.80 | 0.81 | 2.15 | 42 | ||||||||||||||||||||||||||||||||||||||||||
Year Ended March 31, 2015 | 10.04 | 0.23 | 0.42 | 0.65 | (0.23 | ) | — | — | (0.23 | ) | 10.46 | 795 | 6.56 | 0.79 | 0.79 | 2.27 | 51 | |||||||||||||||||||||||||||||||||||||||||||
Year Ended March 31, 2014 | 10.65 | 0.25 | (0.31 | ) | (0.06 | ) | (0.25 | ) | — | (0.30 | ) | (0.55 | ) | 10.04 | 861 | (0.45 | ) | 0.77 | 0.77 | 2.44 | 77 | |||||||||||||||||||||||||||||||||||||||
Year Ended March 31, 2013 | 10.45 | 0.28 | 0.20 | 0.48 | (0.28 | ) | — | — | (0.28 | ) | 10.65 | 910 | 4.63 | 0.77 | 0.77 | 2.60 | 79 | |||||||||||||||||||||||||||||||||||||||||||
See Notes to Financial Highlights and Notes to Financial Statements.
134
Table of Contents
FINANCIAL HIGHLIGHTS
RIDGEWORTH FUNDS Selected Data For a Share of Beneficial Interest Outstanding Throughout the Periods Indicated.
| Net Asset Value, Beginning of Period | Net Investment Income (Loss)(a) | Net Realized and Unrealized Gains (Losses) on Investments | Total from Operations | Dividends from Net Investment Income | Distributions from Tax Return of Capital | Distributions from Realized Capital Gains | Total Dividends and Distributions | Net Asset Value, End of Period | Net Assets End of Period (000) | Total Return(b) | Ratio of Net Expenses to Average Net Assets(c) | Ratio of Expenses to Average Net Assets (Excluding Waivers and Reimbursements)(c) | Ratio of Net Investment Income to Average Net Assets(c) | Portfolio Turnover Rate(d) | ||||||||||||||||||||||||||||||||||||||||||||||
Seix Short-Term Bond Fund |
| |||||||||||||||||||||||||||||||||||||||||||||||||||||||||||
I Shares | ||||||||||||||||||||||||||||||||||||||||||||||||||||||||||||
Year Ended March 31, 2017 | $9.98 | $0.08 | $(0.06 | ) | $0.02 | $(0.08 | ) | $— | $— | $(0.08 | ) | $9.92 | $52,024 | 0.23 | % | 0.60 | % | 0.69 | % | 0.77 | % | 129 | % | |||||||||||||||||||||||||||||||||||||
Year Ended March 31, 2016 | 9.98 | 0.06 | 0.01 | 0.07 | (0.07 | ) | — | — | (0.07 | ) | 9.98 | 49,749 | 0.68 | 0.60 | 0.68 | 0.58 | 87 | |||||||||||||||||||||||||||||||||||||||||||
Year Ended March 31, 2015 | 9.95 | 0.05 | 0.04 | 0.09 | (0.06 | ) | — | — | (0.06 | ) | 9.98 | 50,689 | 0.93 | 0.60 | 0.67 | 0.52 | 199 | |||||||||||||||||||||||||||||||||||||||||||
Year Ended March 31, 2014 | 10.00 | 0.12 | (0.05 | ) | 0.07 | (0.12 | ) | — | — | (0.12 | ) | 9.95 | 38,400 | 0.75 | 0.58 | 0.58 | 1.22 | 79 | ||||||||||||||||||||||||||||||||||||||||||
Year Ended March 31, 2013 | 9.99 | 0.15 | 0.01 | 0.16 | (0.15 | ) | — | — | (0.15 | ) | 10.00 | 78,383 | 1.65 | 0.48 | 0.48 | 1.51 | 128 | |||||||||||||||||||||||||||||||||||||||||||
A Shares | ||||||||||||||||||||||||||||||||||||||||||||||||||||||||||||
Year Ended March 31, 2017 | 10.01 | 0.06 | (0.06 | ) | — | (0.06 | ) | — | — | (0.06 | ) | 9.95 | 2,308 | 0.03 | 0.80 | 0.80 | 0.58 | 129 | ||||||||||||||||||||||||||||||||||||||||||
Year Ended March 31, 2016 | 10.00 | 0.04 | 0.02 | 0.06 | (0.05 | ) | — | — | (0.05 | ) | 10.01 | 2,104 | 0.58 | 0.80 | 0.81 | 0.38 | 87 | |||||||||||||||||||||||||||||||||||||||||||
Year Ended March 31, 2015 | 9.98 | 0.04 | 0.02 | 0.06 | (0.04 | ) | — | — | (0.04 | ) | 10.00 | 2,316 | 0.63 | 0.80 | 0.81 | 0.37 | 199 | |||||||||||||||||||||||||||||||||||||||||||
Year Ended March 31, 2014 | 10.03 | 0.10 | (0.05 | ) | 0.05 | (0.10 | ) | — | — | (0.10 | ) | 9.98 | 2,748 | 0.54 | 0.78 | 0.80 | 1.00 | 79 | ||||||||||||||||||||||||||||||||||||||||||
Year Ended March 31, 2013 | 10.02 | 0.13 | 0.01 | 0.14 | (0.13 | ) | — | — | (0.13 | ) | 10.03 | 2,069 | 1.40 | 0.73 | 0.74 | 1.27 | 128 | |||||||||||||||||||||||||||||||||||||||||||
C Shares | ||||||||||||||||||||||||||||||||||||||||||||||||||||||||||||
Year Ended March 31, 2017 | 10.00 | — | (j) | (0.06 | ) | (0.06 | ) | — | — | — | — | 9.94 | 1,310 | (0.57 | )(g) | 1.40 | 1.57 | (0.03 | ) | 129 | ||||||||||||||||||||||||||||||||||||||||
Year Ended March 31, 2016 | 10.00 | (0.01 | ) | 0.01 | — | — | (j) | — | — | — | (j) | 10.00 | 1,742 | — | 1.29 | 1.58 | (0.10 | ) | 87 | |||||||||||||||||||||||||||||||||||||||||
Year Ended March 31, 2015 | 9.97 | (0.01 | ) | 0.04 | 0.03 | — | (j) | — | — | — | (j) | 10.00 | 1,730 | 0.31 | 1.22 | 1.58 | (0.06 | ) | 199 | |||||||||||||||||||||||||||||||||||||||||
Year Ended March 31, 2014 | 10.02 | 0.02 | (0.04 | ) | (0.02 | ) | (0.03 | ) | — | — | (0.03 | ) | 9.97 | 1,899 | (0.24 | ) | 1.56 | 1.56 | 0.23 | 79 | ||||||||||||||||||||||||||||||||||||||||
Year Ended March 31, 2013 | 10.01 | 0.05 | 0.01 | 0.06 | (0.05 | ) | — | — | (0.05 | ) | 10.02 | 2,425 | 0.65 | 1.48 | 1.48 | 0.52 | 128 | |||||||||||||||||||||||||||||||||||||||||||
Seix Short-Term Municipal Bond Fund |
| |||||||||||||||||||||||||||||||||||||||||||||||||||||||||||
I Shares | ||||||||||||||||||||||||||||||||||||||||||||||||||||||||||||
Year Ended March 31, 2017 | 9.98 | 0.08 | (0.04 | ) | 0.04 | (0.08 | ) | — | (0.01 | ) | (0.09 | ) | 9.93 | 26,710 | 0.40 | 0.48 | 0.66 | 0.75 | 59 | |||||||||||||||||||||||||||||||||||||||||
Year Ended March 31, 2016 | 10.00 | 0.04 | — | (j) | 0.04 | (0.04 | ) | — | (0.02 | ) | (0.06 | ) | 9.98 | 32,184 | 0.41 | 0.51 | 0.62 | 0.41 | 82 | |||||||||||||||||||||||||||||||||||||||||
Year Ended March 31, 2015 | 9.99 | 0.04 | 0.08 | 0.12 | (0.04 | ) | — | (0.07 | ) | (0.11 | ) | 10.00 | 38,669 | 1.21 | 0.55 | 0.62 | 0.42 | 148 | ||||||||||||||||||||||||||||||||||||||||||
Year Ended March 31, 2014 | 10.01 | 0.02 | 0.01 | 0.03 | (0.02 | ) | — | (0.03 | ) | (0.05 | ) | 9.99 | 30,852 | 0.37 | 0.54 | 0.71 | 0.21 | 260 | ||||||||||||||||||||||||||||||||||||||||||
Year Ended March 31, 2013 | 10.73 | 0.05 | 0.27 | 0.32 | (0.06 | ) | — | (0.98 | ) | (1.04 | ) | 10.01 | 11,121 | 3.01 | 0.58 | 0.91 | 0.52 | 199 | ||||||||||||||||||||||||||||||||||||||||||
A Shares | ||||||||||||||||||||||||||||||||||||||||||||||||||||||||||||
Year Ended March 31, 2017 | 9.98 | 0.05 | (0.03 | ) | 0.02 | (0.06 | ) | — | (0.01 | ) | (0.07 | ) | 9.93 | 1,810 | 0.26 | 0.65 | 0.74 | 0.54 | 59 | |||||||||||||||||||||||||||||||||||||||||
Year Ended March 31, 2016 | 10.00 | 0.02 | — | (j) | 0.02 | (0.02 | ) | — | (0.02 | ) | (0.04 | ) | 9.98 | 7,354 | 0.23 | 0.67 | 0.72 | 0.24 | 82 | |||||||||||||||||||||||||||||||||||||||||
Year Ended March 31, 2015 | 9.99 | 0.03 | 0.08 | 0.11 | (0.03 | ) | — | (0.07 | ) | (0.10 | ) | 10.00 | 3,863 | 1.06 | 0.70 | 0.75 | 0.26 | 148 | ||||||||||||||||||||||||||||||||||||||||||
Year Ended March 31, 2014 | 10.01 | 0.01 | 0.01 | 0.02 | (0.01 | ) | — | (0.03 | ) | (0.04 | ) | 9.99 | 5,900 | 0.25 | 0.65 | 0.82 | 0.10 | 260 | ||||||||||||||||||||||||||||||||||||||||||
Year Ended March 31, 2013 | 10.73 | 0.04 | 0.26 | 0.30 | (0.04 | ) | — | (0.98 | ) | (1.02 | ) | 10.01 | 3,694 | 2.86 | 0.73 | 1.04 | 0.39 | 199 | ||||||||||||||||||||||||||||||||||||||||||
Seix Total Return Bond Fund |
| |||||||||||||||||||||||||||||||||||||||||||||||||||||||||||
I Shares | ||||||||||||||||||||||||||||||||||||||||||||||||||||||||||||
Year Ended March 31, 2017 | 10.67 | 0.22 | (0.07 | ) | 0.15 | (0.23 | ) | — | (0.17 | ) | (0.40 | ) | 10.42 | 790,997 | 1.44 | (g) | 0.46 | 0.46 | 2.10 | 210 | ||||||||||||||||||||||||||||||||||||||||
Year Ended March 31, 2016 | 10.75 | 0.19 | (0.05 | ) | 0.14 | (0.21 | ) | — | (0.01 | ) | (0.22 | ) | 10.67 | 971,159 | 1.35 | (g) | 0.45 | 0.45 | 1.82 | 181 | ||||||||||||||||||||||||||||||||||||||||
Year Ended March 31, 2015 | 10.43 | 0.23 | 0.34 | 0.57 | (0.25 | ) | — | — | (0.25 | ) | 10.75 | 972,117 | 5.47 | 0.44 | 0.44 | 2.17 | 173 | |||||||||||||||||||||||||||||||||||||||||||
Year Ended March 31, 2014 | 10.79 | 0.22 | (0.26 | ) | (0.04 | ) | (0.22 | ) | — | (0.10 | ) | (0.32 | ) | 10.43 | 1,022,101 | (0.31 | ) | 0.41 | 0.41 | 2.12 | 217 | |||||||||||||||||||||||||||||||||||||||
Year Ended March 31, 2013 | 10.77 | 0.18 | 0.25 | 0.43 | (0.21 | ) | — | (0.20 | ) | (0.41 | ) | 10.79 | 1,204,228 | 4.01 | 0.39 | 0.40 | 1.69 | 139 | ||||||||||||||||||||||||||||||||||||||||||
A Shares | ||||||||||||||||||||||||||||||||||||||||||||||||||||||||||||
Year Ended March 31, 2017 | 11.02 | 0.20 | (0.06 | ) | 0.14 | (0.22 | ) | — | (0.17 | ) | (0.39 | ) | 10.77 | 27,284 | 1.22 | 0.70 | 0.70 | 1.85 | 210 | |||||||||||||||||||||||||||||||||||||||||
Year Ended March 31, 2016 | 11.11 | 0.17 | (0.06 | ) | 0.11 | (0.19 | ) | — | (0.01 | ) | (0.20 | ) | 11.02 | 32,366 | 1.02 | 0.71 | 0.71 | 1.55 | 181 | |||||||||||||||||||||||||||||||||||||||||
Year Ended March 31, 2015 | 10.77 | 0.21 | 0.35 | 0.56 | (0.22 | ) | — | — | (0.22 | ) | 11.11 | 43,401 | 5.28 | 0.71 | 0.71 | 1.90 | 173 | |||||||||||||||||||||||||||||||||||||||||||
Year Ended March 31, 2014 | 11.15 | 0.20 | (0.28 | ) | (0.08 | ) | (0.20 | ) | — | (0.10 | ) | (0.30 | ) | 10.77 | 41,134 | (0.70 | ) | 0.70 | 0.70 | 1.82 | 217 | |||||||||||||||||||||||||||||||||||||||
Year Ended March 31, 2013 | 11.12 | 0.16 | 0.25 | 0.41 | (0.18 | ) | — | (0.20 | ) | (0.38 | ) | 11.15 | 50,279 | 3.76 | 0.66 | 0.68 | 1.42 | 139 | ||||||||||||||||||||||||||||||||||||||||||
See Notes to Financial Highlights and Notes to Financial Statements.
135
Table of Contents
FINANCIAL HIGHLIGHTS
RIDGEWORTH FUNDS Selected Data For a Share of Beneficial Interest Outstanding Throughout the Periods Indicated.
| Net Asset Value, Beginning of Period | Net Investment Income (Loss)(a) | Net Realized and Unrealized Gains (Losses) on Investments | Total from Operations | Dividends from Net Investment Income | Distributions from Tax Return of Capital | Distributions from Realized Capital Gains | Total Dividends and Distributions | Net Asset Value, End of Period | Net Assets End of Period (000) | Total Return(b) | Ratio of Net Expenses to Average Net Assets(c) | Ratio of Expenses to Average Net Assets (Excluding Waivers and Reimbursements)(c) | Ratio of Net Investment Income to Average Net Assets(c) | Portfolio Turnover Rate(d) | ||||||||||||||||||||||||||||||||||||||||||||||
R Shares | ||||||||||||||||||||||||||||||||||||||||||||||||||||||||||||
Year Ended March 31, 2017 | $10.67 | $0.16 | $(0.07 | ) | $0.09 | $(0.17 | ) | $— | $(0.17 | ) | $(0.34 | ) | $10.42 | $39,541 | 0.83 | % | 1.06 | % | 1.06 | % | 1.48 | % | 210 | % | ||||||||||||||||||||||||||||||||||||
Year Ended March 31, 2016 | 10.75 | 0.13 | (0.05 | ) | 0.08 | (0.15 | ) | — | (0.01 | ) | (0.16 | ) | 10.67 | 50,402 | 0.74 | 1.06 | 1.06 | 1.21 | 181 | |||||||||||||||||||||||||||||||||||||||||
Year Ended March 31, 2015 | 10.43 | 0.17 | 0.33 | 0.50 | (0.18 | ) | — | — | (0.18 | ) | 10.75 | 64,539 | 4.83 | 1.05 | 1.06 | 1.56 | 173 | |||||||||||||||||||||||||||||||||||||||||||
Year Ended March 31, 2014 | 10.80 | 0.16 | (0.27 | ) | (0.11 | ) | (0.16 | ) | — | (0.10 | ) | (0.26 | ) | 10.43 | 72,556 | (1.02 | ) | 1.03 | 1.07 | 1.52 | 217 | |||||||||||||||||||||||||||||||||||||||
Year Ended March 31, 2013 | 10.78 | 0.12 | 0.25 | 0.37 | (0.15 | ) | — | (0.20 | ) | (0.35 | ) | 10.80 | 72,697 | 3.34 | 0.96 | 1.05 | 1.11 | 139 | ||||||||||||||||||||||||||||||||||||||||||
IS Shares | ||||||||||||||||||||||||||||||||||||||||||||||||||||||||||||
Year Ended March 31, 2017 | 10.67 | 0.25 | (0.08 | ) | 0.17 | (0.25 | ) | — | (0.17 | ) | (0.42 | ) | 10.42 | 101,022 | 1.58 | 0.31 | 0.31 | 2.40 | 210 | |||||||||||||||||||||||||||||||||||||||||
Year Ended March 31, 2016 | 10.75 | 0.21 | (0.06 | ) | 0.15 | (0.22 | ) | — | (0.01 | ) | (0.23 | ) | 10.67 | 56,133 | 1.49 | 0.31 | 0.31 | 1.95 | 181 | |||||||||||||||||||||||||||||||||||||||||
Period Ended March 31, 2015(h) | 10.56 | 0.16 | 0.20 | 0.36 | (0.17 | ) | — | — | (0.17 | ) | 10.75 | 71,520 | 3.39 | 0.31 | 0.31 | 2.20 | 173 | |||||||||||||||||||||||||||||||||||||||||||
Seix U.S. Government Securities Ultra-Short Bond Fund |
| |||||||||||||||||||||||||||||||||||||||||||||||||||||||||||
I Shares | ||||||||||||||||||||||||||||||||||||||||||||||||||||||||||||
Year Ended March 31, 2017 | 10.03 | 0.07 | 0.03 | 0.10 | (0.10 | ) | — | — | (0.10 | ) | 10.03 | 1,367,242 | 0.98 | 0.42 | 0.42 | 0.72 | 77 | |||||||||||||||||||||||||||||||||||||||||||
Year Ended March 31, 2016 | 10.12 | 0.06 | (0.07 | ) | (0.01 | ) | (0.08 | ) | — | — | (0.08 | ) | 10.03 | 1,557,899 | (0.11 | ) | 0.41 | 0.41 | 0.57 | 52 | ||||||||||||||||||||||||||||||||||||||||
Year Ended March 31, 2015 | 10.12 | 0.06 | 0.02 | 0.08 | (0.08 | ) | — | — | (0.08 | ) | 10.12 | 1,665,888 | 0.77 | 0.39 | 0.39 | 0.55 | 34 | |||||||||||||||||||||||||||||||||||||||||||
Year Ended March 31, 2014 | 10.17 | 0.03 | (0.02 | ) | 0.01 | (0.06 | ) | — | — | (0.06 | ) | 10.12 | 1,993,215 | 0.13 | 0.38 | 0.38 | 0.31 | 36 | ||||||||||||||||||||||||||||||||||||||||||
Year Ended March 31, 2013 | 10.14 | 0.03 | 0.08 | 0.11 | (0.08 | ) | — | — | (0.08 | ) | 10.17 | 2,331,913 | 1.10 | 0.36 | 0.36 | 0.29 | 137 | |||||||||||||||||||||||||||||||||||||||||||
IS Shares(i) | ||||||||||||||||||||||||||||||||||||||||||||||||||||||||||||
Period Ended March 31, 2017 | 10.04 | 0.08 | — | 0.08 | (0.08 | ) | — | — | (0.08 | ) | 10.04 | 32,657 | 0.77 | (g) | 0.26 | 0.26 | 1.12 | 77 | ||||||||||||||||||||||||||||||||||||||||||
Seix U.S. Mortgage Fund |
| |||||||||||||||||||||||||||||||||||||||||||||||||||||||||||
I Shares | ||||||||||||||||||||||||||||||||||||||||||||||||||||||||||||
Year Ended March 31, 2017 | 11.33 | 0.07 | (0.04 | ) | 0.03 | (0.20 | ) | — | (0.04 | ) | (0.24 | ) | 11.12 | 17,620 | 0.24 | (g) | 0.70 | 0.86 | 0.66 | 118 | ||||||||||||||||||||||||||||||||||||||||
Year Ended March 31, 2016 | 11.32 | 0.12 | 0.09 | 0.21 | (0.20 | ) | — | — | (0.20 | ) | 11.33 | 25,068 | 1.84 | 0.70 | 0.86 | 1.03 | 223 | |||||||||||||||||||||||||||||||||||||||||||
Year Ended March 31, 2015 | 10.90 | 0.19 | 0.48 | 0.67 | (0.25 | ) | — | — | (0.25 | ) | 11.32 | 3,650 | 6.16 | 0.69 | 1.26 | 1.75 | 165 | |||||||||||||||||||||||||||||||||||||||||||
Year Ended March 31, 2014 | 11.16 | 0.12 | (0.16 | ) | (0.04 | ) | (0.22 | ) | — | — | (0.22 | ) | 10.90 | 3,692 | (0.38 | ) | 0.66 | 1.10 | 1.08 | 236 | ||||||||||||||||||||||||||||||||||||||||
Year Ended March 31, 2013 | 11.09 | 0.04 | 0.21 | 0.25 | (0.18 | ) | — | — | (0.18 | ) | 11.16 | 8,851 | 2.26 | 0.66 | 0.85 | 0.37 | 163 | |||||||||||||||||||||||||||||||||||||||||||
A Shares | ||||||||||||||||||||||||||||||||||||||||||||||||||||||||||||
Year Ended March 31, 2017 | 11.31 | 0.05 | (0.04 | ) | 0.01 | (0.18 | ) | — | (0.04 | ) | (0.22 | ) | 11.10 | 3,594 | 0.04 | (g) | 0.90 | 0.98 | 0.41 | 118 | ||||||||||||||||||||||||||||||||||||||||
Year Ended March 31, 2016 | 11.29 | 0.08 | 0.11 | 0.19 | (0.17 | ) | — | — | (0.17 | ) | 11.31 | 6,560 | 1.72 | 0.90 | 1.10 | 0.76 | 223 | |||||||||||||||||||||||||||||||||||||||||||
Year Ended March 31, 2015 | 10.88 | 0.16 | 0.47 | 0.63 | (0.22 | ) | — | — | (0.22 | ) | 11.29 | 5,201 | 5.86 | 0.89 | 1.43 | 1.45 | 165 | |||||||||||||||||||||||||||||||||||||||||||
Year Ended March 31, 2014 | 11.14 | 0.11 | (0.18 | ) | (0.07 | ) | (0.19 | ) | — | — | (0.19 | ) | 10.88 | 1,721 | (0.58 | ) | 0.86 | 1.27 | 1.02 | 236 | ||||||||||||||||||||||||||||||||||||||||
Year Ended March 31, 2013 | 11.07 | 0.02 | 0.21 | 0.23 | (0.16 | ) | — | — | (0.16 | ) | 11.14 | 2,271 | 2.06 | 0.86 | 1.05 | 0.15 | 163 | |||||||||||||||||||||||||||||||||||||||||||
C Shares | ||||||||||||||||||||||||||||||||||||||||||||||||||||||||||||
Year Ended March 31, 2017 | 11.33 | (0.03 | ) | (0.06 | ) | (0.09 | ) | (0.09 | ) | — | (0.04 | ) | (0.13 | ) | 11.11 | 4,301 | (0.79 | )(g) | 1.65 | 1.71 | (0.26 | ) | 118 | |||||||||||||||||||||||||||||||||||||
Year Ended March 31, 2016 | 11.32 | — | (j) | 0.10 | 0.10 | (0.09 | ) | — | — | (0.09 | ) | 11.33 | 5,478 | 0.88 | 1.65 | 1.79 | 0.01 | 223 | ||||||||||||||||||||||||||||||||||||||||||
Year Ended March 31, 2015 | 10.90 | 0.09 | 0.47 | 0.56 | (0.14 | ) | — | — | (0.14 | ) | 11.32 | 3,989 | 5.15 | 1.65 | 2.15 | 0.79 | 165 | |||||||||||||||||||||||||||||||||||||||||||
Year Ended March 31, 2014 | 11.16 | 0.03 | (0.18 | ) | (0.15 | ) | (0.11 | ) | — | — | (0.11 | ) | 10.90 | 4,780 | (1.36 | ) | 1.66 | 2.04 | 0.23 | 236 | ||||||||||||||||||||||||||||||||||||||||
Year Ended March 31, 2013 | 11.09 | (0.07 | ) | 0.21 | 0.14 | (0.07 | ) | — | — | (0.07 | ) | 11.16 | 6,039 | 1.25 | 1.66 | 1.84 | (0.65 | ) | 163 | |||||||||||||||||||||||||||||||||||||||||
Seix Ultra-Short Bond Fund |
| |||||||||||||||||||||||||||||||||||||||||||||||||||||||||||
I Shares | ||||||||||||||||||||||||||||||||||||||||||||||||||||||||||||
Year Ended March 31, 2017 | 9.93 | 0.10 | 0.04 | 0.14 | (0.11 | ) | — | — | (0.11 | ) | 9.96 | 87,344 | 1.41 | 0.40 | 0.40 | 1.05 | 142 | |||||||||||||||||||||||||||||||||||||||||||
Year Ended March 31, 2016 | 9.97 | 0.08 | (0.04 | ) | 0.04 | (0.08 | ) | — | — | (0.08 | ) | 9.93 | 104,950 | 0.42 | 0.38 | 0.38 | 0.77 | 59 | ||||||||||||||||||||||||||||||||||||||||||
Year Ended March 31, 2015 | 9.98 | 0.06 | — | (j) | 0.06 | (0.07 | ) | — | — | (0.07 | ) | 9.97 | 142,680 | 0.55 | 0.37 | 0.37 | 0.57 | 54 | ||||||||||||||||||||||||||||||||||||||||||
Year Ended March 31, 2014 | 9.98 | 0.07 | 0.01 | 0.08 | (0.08 | ) | — | — | (0.08 | ) | 9.98 | 122,053 | 0.76 | 0.35 | 0.35 | 0.65 | 134 | |||||||||||||||||||||||||||||||||||||||||||
Year Ended March 31, 2013 | 9.95 | 0.10 | 0.04 | 0.14 | (0.11 | ) | — | — | (0.11 | ) | 9.98 | 109,224 | 1.39 | 0.33 | 0.33 | 0.98 | 127 | |||||||||||||||||||||||||||||||||||||||||||
See Notes to Financial Highlights and Notes to Financial Statements.
136
Table of Contents
FINANCIAL HIGHLIGHTS
RIDGEWORTH FUNDS Selected Data For a Share of Beneficial Interest Outstanding Throughout the Periods Indicated.
| Net Asset Value, Beginning of Period | Net Investment Income (Loss)(a) | Net Realized and Unrealized Gains (Losses) on Investments | Total from Operations | Dividends from Net Investment Income | Distributions from Tax Return of Capital | Distributions from Realized Capital Gains | Total Dividends and Distributions | Net Asset Value, End of Period | Net Assets End of Period (000) | Total Return(b) | Ratio of Net Expenses to Average Net Assets(c) | Ratio of Expenses to Average Net Assets (Excluding Waivers and Reimbursements)(c) | Ratio of Net Investment Income to Average Net Assets(c) | Portfolio Turnover Rate(d) | ||||||||||||||||||||||||||||||||||||||||||||||
Seix Virginia Intermediate Municipal Bond Fund |
| |||||||||||||||||||||||||||||||||||||||||||||||||||||||||||
I Shares | ||||||||||||||||||||||||||||||||||||||||||||||||||||||||||||
Year Ended March 31, 2017 | $10.06 | $0.24 | $(0.23 | ) | $0.01 | $(0.24 | ) | $— | $(0.28 | ) | $(0.52 | ) | $9.55 | $45,969 | 0.13 | % | 0.65 | % | 0.70 | % | 2.41 | % | 49 | % | ||||||||||||||||||||||||||||||||||||
Year Ended March 31, 2016 | 10.24 | 0.24 | 0.08 | 0.32 | (0.24 | ) | — | (0.26 | ) | (0.50 | ) | 10.06 | 64,653 | 3.30 | 0.65 | 0.68 | 2.38 | 48 | ||||||||||||||||||||||||||||||||||||||||||
Year Ended March 31, 2015 | 10.12 | 0.25 | 0.21 | 0.46 | (0.25 | ) | — | (0.09 | ) | (0.34 | ) | 10.24 | 119,103 | 4.54 | 0.65 | 0.65 | 2.42 | 59 | ||||||||||||||||||||||||||||||||||||||||||
Year Ended March 31, 2014 | 10.54 | 0.29 | (0.32 | ) | (0.03 | ) | (0.29 | ) | — | (0.10 | ) | (0.39 | ) | 10.12 | 120,600 | (0.20 | ) | 0.58 | 0.58 | 2.83 | 65 | |||||||||||||||||||||||||||||||||||||||
Year Ended March 31, 2013 | 10.63 | 0.31 | 0.08 | 0.39 | (0.31 | ) | — | (0.17 | ) | (0.48 | ) | 10.54 | 144,889 | 3.70 | 0.59 | 0.59 | 2.93 | 33 | ||||||||||||||||||||||||||||||||||||||||||
A Shares | ||||||||||||||||||||||||||||||||||||||||||||||||||||||||||||
Year Ended March 31, 2017 | 10.06 | 0.23 | (0.23 | ) | — | (0.23 | ) | — | (0.28 | ) | (0.51 | ) | 9.55 | 3,624 | (0.01 | ) | 0.79 | 0.79 | 2.28 | 49 | ||||||||||||||||||||||||||||||||||||||||
Year Ended March 31, 2016 | 10.23 | 0.23 | 0.09 | 0.32 | (0.23 | ) | — | (0.26 | ) | (0.49 | ) | 10.06 | 4,365 | 3.29 | 0.76 | 0.76 | 2.29 | 48 | ||||||||||||||||||||||||||||||||||||||||||
Year Ended March 31, 2015 | 10.11 | 0.24 | 0.21 | 0.45 | (0.24 | ) | — | (0.09 | ) | (0.33 | ) | 10.23 | 5,152 | 4.45 | 0.74 | 0.74 | 2.34 | 59 | ||||||||||||||||||||||||||||||||||||||||||
Year Ended March 31, 2014 | 10.53 | 0.27 | (0.32 | ) | (0.05 | ) | (0.27 | ) | — | (0.10 | ) | (0.37 | ) | 10.11 | 7,668 | (0.35 | ) | 0.73 | 0.73 | 2.67 | 65 | |||||||||||||||||||||||||||||||||||||||
Year Ended March 31, 2013 | 10.63 | 0.30 | 0.07 | 0.37 | (0.30 | ) | — | (0.17 | ) | (0.47 | ) | 10.53 | 10,996 | 3.45 | 0.74 | 0.74 | 2.78 | 33 | ||||||||||||||||||||||||||||||||||||||||||
See Notes to Financial Highlights and Notes to Financial Statements.
137
Table of Contents
NOTES TO FINANCIAL HIGHLIGHTS
| (a) | Per share data calculated using average shares outstanding method. |
| (b) | Total return excludes sales charge. Not annualized for periods less than one year. |
| (c) | Annualized for periods less than one year. |
| (d) | Not annualized for periods less than one year. |
| (e) | IS Shares commenced operations on August 3, 2015. |
| (f) | IS Shares commenced operations on February 2, 2015. |
| (g) | Generally accepted accounting principles require adjustments to be made to the net assets of the Fund at period end for financial reporting purposes, and as such, the net asset values for shareholder transactions and the returns based on those net asset values may differ from the net asset values and returns reported in the management’s discussion of Fund performance. |
| (h) | IS Shares commenced operations on August 1, 2014. |
| (i) | IS Shares commenced operations on August 1, 2016. |
| (j) | Rounds to less than $0.005 per share. |
| (k) | Net investment income per share and the ratio of net investment income to average net assets include a non-recurring refund for overbilling of prior years’ custodian out-of-pocket fees which amounted to $0.00 per share and 0.01% of average net assets, respectively. |
138
Table of Contents
RIDGEWORTH FUNDS March 31, 2017
| 1. | Organization |
RidgeWorth Funds (the “Trust”) is organized as a Massachusetts business trust and is registered under the Investment Company Act of 1940, as amended (the “1940 Act”), as an open-end management investment company. The Trust is authorized to issue an unlimited number of shares without par value. The financial statements presented herein are those of the Seix Core Bond Fund, Seix Corporate Bond Fund, Seix Floating Rate High Income Fund, Seix Georgia Tax-Exempt Bond Fund, Seix High Grade Municipal Bond Fund, Seix High Income Fund, Seix High Yield Fund, Seix Investment Grade Tax-Exempt Bond Fund, Seix Limited Duration Fund, Seix North Carolina Tax-Exempt Bond Fund, Seix Short-Term Bond Fund, Seix Short-Term Municipal Bond Fund, Seix Total Return Bond Fund, Seix U.S. Government Securities Ultra-Short Bond Fund, Seix U.S. Mortgage Fund, Seix Ultra-Short Bond Fund and Seix Virginia Intermediate Municipal Bond Fund (each, a “Fund” and collectively, the “Funds” or “Fixed Income Funds”), which are each (except Seix North Carolina Tax-Exempt Bond Fund) a diversified series of the Trust.
The Seix Limited Duration Fund and Seix Ultra-Short Bond Fund offer I Shares only. The Seix Georgia Tax-Exempt Bond Fund, Seix High Grade Municipal Bond Fund, Seix Investment Grade Tax-Exempt Bond Fund, Seix North Carolina Tax-Exempt Bond Fund, Seix Short-Term Municipal Bond Fund and Seix Virginia Intermediate Bond Fund offer I Shares and A Shares. The Seix U.S. Government Securities Ultra-Short Bond Fund offers I Shares and IS Shares. The Seix Core Bond Fund, Seix High Income Fund, Seix High Yield Fund and Seix Total Return Bond Fund offer I Shares, A Shares, R Shares and IS Shares. The Seix Floating Rate High Income Fund offers I Shares, A Shares, C Shares and IS Shares. The remaining Funds offer I Shares, A Shares and C Shares.
The assets of each Fund are segregated and a shareholder’s interest is limited to the Fund in which shares are held. Each class of shares has identical rights and privileges except with respect to the fees paid under the Distribution and Service Plan and the Shareholder Servicing Plan (“Plan”), and voting rights on matters affecting a single class of shares and sales charges. The A Shares of the Funds (except Seix Floating Rate High Income Fund, Seix Short-Term Bond Fund, Seix Short-Term Municipal Bond Fund and Seix U.S. Mortgage Fund) have a maximum sales charge on purchases of 4.75% as a percentage of original purchase price. The A Shares of the Seix Floating Rate High Income Fund, Seix Short-Term Bond Fund, Seix Short-Term Municipal Bond and Seix U.S. Mortgage Fund have a maximum sales charge on purchases of 2.50% as a percentage of original purchase price. Certain purchases of A Shares will not be subject to a front-end sales charge but will be subject to a contingent deferred sales charge (“CDSC”) of 0.50%, if redeemed within two years of purchase. The deferred sale charges may be waived from time to time for certain broker-dealers that waive payment of compensation to them. The C Shares have a maximum CDSC of 1.00% as a percentage of either the original purchase price or the next calculated price after the Funds receive a redemption request, whichever is less, if shares are redeemed within one year of purchase. There is no sales charge on purchases of I, R or IS Shares.
The Trust’s officers and trustees are indemnified against certain liabilities arising out of the performance of their duties to the Trust. In addition, in the normal course of business, the Trust enters into contracts with its vendors and others that provide for general indemnifications. The Trust’s maximum exposure under these arrangements is unknown as this would involve future claims that may be made against the Trust. However, based on experience, the Trust expects that risk of loss to be remote.
The Funds are each an investment company and accordingly follow the investment company accounting and reporting guidance of the Financial Accounting Standards Board (“FASB”) Codification Topic 946 (“ASC Topic 946”) Financial Services — Investment Companies.
| 2. | Significant Accounting Policies |
The following are significant accounting policies consistently followed by the Funds which are in conformity with accounting principles generally accepted in the U.S. (“GAAP”). Estimates and assumptions are required to be made regarding assets, liabilities and changes in net assets resulting from operations when financial statements are prepared. Changes in the economic environment, financial markets and any other parameters used in determining these estimates could cause actual results to differ.
(a) Investment Valuation — Debt securities are valued at the last quoted bid price provided by independent pricing vendors approved by the Board of Trustees of the Trust (the “Board”) that are based on transactions in debt obligations, quotations from bond dealers, market transactions in comparable securities and various other relationships between securities.
139
Table of Contents
NOTES TO FINANCIAL STATEMENTS (continued)
RIDGEWORTH FUNDS March 31, 2017
The Funds, in accordance with GAAP, have adopted FASB Codification Topic 820 (“ASC Topic 820”). ASC Topic 820 establishes a single definition of fair value, creates a three-tier hierarchy as a framework for measuring fair value based on inputs used to value the Funds’ investments, and requires additional disclosure about fair value. The hierarchy of inputs is summarized below:
| • | Level 1 — Investments whose values are based on quoted market prices in active markets are classified as Level 1 prices, which includes active listed equities. Investments in underlying funds and money market funds are valued at their Net Asset Value (“NAV”) daily and are classified as Level 1 prices. |
| • | Level 2 — Investments that trade in markets that are not considered to be active, but whose values are based on quoted market prices, dealer quotations or valuations provided by alternative pricing sources supported by observable inputs are classified as Level 2 prices. These generally include U.S. government and sovereign obligations, most government agency securities, investment-grade corporate bonds, certain asset and mortgage backed products, less liquid listed equities, and state, municipal and provincial obligations. |
| • | Level 3 — Investments whose values are classified as Level 3 prices have significant unobservable inputs, as they may trade infrequently or not at all. When observable prices are not available for these securities, the Funds use one or more valuation techniques for which sufficient and reliable data is available. The inputs used by the Funds in estimating the value of Level 3 prices may include the original transaction price, quoted prices for similar securities or assets in active markets, completed or pending third-party transactions in the underlying investment or comparable issuers, and changes in financial ratios or cash flows. Level 3 prices may also be adjusted to reflect illiquidity and/or non-transferability, with the amount of such discount estimated by the Funds in the absence of market information. Assumptions used by the Funds due to the lack of observable inputs may significantly impact the resulting fair value and therefore the Funds’ results of operations. |
The inputs or methodology used for valuing securities are not necessarily an indication of the risk associated with investing in those securities.
The Funds use valuation techniques to measure fair value that are consistent with the market approach and/or income approach, depending on the type of security and the particular circumstance. The market approach uses prices and other relevant information generated by market transactions involving identical or comparable securities. The income approach uses valuation techniques to discount estimated future cash flows to present value.
The independent pricing vendor may value bank loans and debt securities at an evaluated bid price by employing methodologies that utilize actual market transactions, broker-supplied valuations, and/or other methodologies designed to identify the market value for such securities and such securities are considered Level 2 in the fair value hierarchy. Publicly-traded foreign government debt securities are typically traded internationally in the over-the-counter market and are valued at the bid prices as of the close of business of that market and such securities are considered Level 2 in the fair value hierarchy. Futures contracts are valued daily at the settlement price established by the board of trade or exchange on which they are traded and such securities may be considered Level 1 in the fair value hierarchy. Equity securities for which market quotations are available are valued at the last reported sales price or official closing price on the primary market or exchange on which they trade and such securities may be considered Level 1 in the fair value hierarchy. Centrally cleared credit default and interest rate swaps are valued at the price determined by the relevant exchange and such securities may be considered Level 2 in the fair value hierarchy. Forward foreign exchange contracts are valued using daily forward exchange rates and such securities may be considered Level 2 in the fair value hierarchy. Short-term obligations with maturities of 60 days or less are valued at amortized cost, which approximates fair value and such securities are considered Level 2 in the fair value hierarchy.
When reliable prices are not readily available, such as when the value of a security has been significantly affected by events after the close of the exchange or market on which the security is principally traded, but before each Fund calculates its NAV, each of the Funds will value the security as determined in accordance with the Pricing and Valuation Procedures approved by the Board. The Pricing and Valuation Procedures are performed and monitored by a Valuation Committee (the “Committee”) designated by the Board. Some of the more common reasons which may necessitate that a security be fair valued in accordance with the Pricing and Valuation Procedures include, but
140
Table of Contents
NOTES TO FINANCIAL STATEMENTS (continued)
RIDGEWORTH FUNDS March 31, 2017
are not limited to: the security’s trading has been halted or suspended; the security has been de-listed from a national exchange; the security’s primary trading market is temporarily closed at a time when, under normal conditions, it would be open; or the security’s primary pricing source is not able or willing to provide a price. When a security is fair valued in accordance with the Pricing and Valuation Procedures, the Committee determines the value after taking into consideration relevant information reasonably available to the Committee. Under the Pricing and Valuation Procedures, such securities may be considered Level 2 or Level 3 in the fair value hierarchy.
The following is a summary of the inputs used in valuing the Funds’ assets and liabilities carried at fair value as of March 31, 2017:
| Level 1 - Quoted Prices | Level 2 - Other Significant Observable Inputs | Level 3 - Significant Unobservable Inputs | Total | |||||||||||||
Seix Core Bond Fund | ||||||||||||||||
Assets | ||||||||||||||||
Asset-Backed Securities1 | $— | $9,405,729 | $— | $9,405,729 | ||||||||||||
Collateralized Mortgage Obligations1 | — | 11,843,428 | — | 11,843,428 | ||||||||||||
Corporate Bonds1 | — | 53,139,885 | — | 53,139,885 | ||||||||||||
U.S. Government Agency Mortgages1 | — | 48,848,544 | — | 48,848,544 | ||||||||||||
U.S. Treasury Obligation1 | — | 86,005,621 | — | 86,005,621 | ||||||||||||
Money Market Fund | 13,510,206 | — | — | 13,510,206 | ||||||||||||
|
|
|
|
|
|
|
| |||||||||
Total Investments | 13,510,206 | 209,243,207 | — | 222,753,413 | ||||||||||||
|
|
|
|
|
|
|
| |||||||||
Seix Corporate Bond Fund | ||||||||||||||||
Assets | ||||||||||||||||
Corporate Bonds1 | — | 18,190,800 | — | 18,190,800 | ||||||||||||
U.S. Treasury Obligation1 | — | 1,410,166 | — | 1,410,166 | ||||||||||||
Foreign Government Bond | — | 230,671 | — | 230,671 | ||||||||||||
Money Market Funds | 2,262,482 | — | — | 2,262,482 | ||||||||||||
|
|
|
|
|
|
|
| |||||||||
Total Investments | 2,262,482 | 19,831,637 | — | 22,094,119 | ||||||||||||
|
|
|
|
|
|
|
| |||||||||
Seix Floating Rate High Income Fund | ||||||||||||||||
Assets | ||||||||||||||||
Asset-Backed Security1 | — | 4,592,235 | — | 4,592,235 | ||||||||||||
Bank Loans1 | — | 5,445,916,312 | — | 5,445,916,312 | ||||||||||||
Corporate Bonds1 | — | 218,338,471 | 44,142,364 | 4 | 262,480,835 | |||||||||||
Preferred Stock1 | 864,620 | — | — | 864,620 | ||||||||||||
Rights1 | 441,467 | — | — | 441,467 | ||||||||||||
Common Stocks1 | 11,456,741 | 11,519,536 | — | 22,976,277 | ||||||||||||
Unlisted Call Option Purchased1 | — | — | 0 | 4 | 0 | |||||||||||
Money Market Fund | 730,190,606 | — | — | 730,190,606 | ||||||||||||
|
|
|
|
|
|
|
| |||||||||
Total Investments | 742,953,434 | 5,680,366,554 | 44,142,364 | 4 | 6,467,462,352 | |||||||||||
|
|
|
|
|
|
|
| |||||||||
Other Financial Instruments3 | ||||||||||||||||
Unfunded Loan Commitments | — | 47,129 | — | 47,129 | ||||||||||||
|
|
|
|
|
|
|
| |||||||||
Total Assets | 742,953,434 | 5,680,413,683 | 44,142,364 | 4 | 6,467,509,481 | |||||||||||
|
|
|
|
|
|
|
| |||||||||
Seix Georgia Tax-Exempt Bond Fund | ||||||||||||||||
Assets | ||||||||||||||||
Municipal Bonds2 | — | 91,963,772 | — | 91,963,772 | ||||||||||||
Money Market Fund | 5,181,314 | — | — | 5,181,314 | ||||||||||||
|
|
|
|
|
|
|
| |||||||||
Total Investments | 5,181,314 | 91,963,772 | — | 97,145,086 | ||||||||||||
|
|
|
|
|
|
|
| |||||||||
Seix High Grade Municipal Bond Fund | ||||||||||||||||
Assets | ||||||||||||||||
Municipal Bonds2 | — | 83,369,166 | — | 83,369,166 | ||||||||||||
Money Market Fund | 10,321,638 | — | — | 10,321,638 | ||||||||||||
|
|
|
|
|
|
|
| |||||||||
Total Investments | 10,321,638 | 83,369,166 | — | 93,690,804 | ||||||||||||
|
|
|
|
|
|
|
| |||||||||
141
Table of Contents
NOTES TO FINANCIAL STATEMENTS (continued)
RIDGEWORTH FUNDS March 31, 2017
| Level 1 - Quoted Prices | Level 2 - Other Significant Observable Inputs | Level 3 - Significant Unobservable Inputs | Total | |||||||||||||
Seix High Income Fund | ||||||||||||||||
Assets | ||||||||||||||||
Bank Loans1 | $— | $13,937,083 | $— | $13,937,083 | ||||||||||||
Corporate Bonds1 | — | 490,710,974 | 0 | 4 | 490,710,974 | |||||||||||
Convertible Preferred Stock1 | 641,738 | — | — | 641,738 | ||||||||||||
Preferred Stock1 | 1,088,658 | — | — | 1,088,658 | ||||||||||||
Warrants1 | — | 6,679 | — | 6,679 | ||||||||||||
Common Stocks1 | 7,181,319 | 1,176,019 | — | 8,357,338 | ||||||||||||
Money Market Funds | 50,923,932 | — | — | 50,923,932 | ||||||||||||
|
|
|
|
|
|
|
| |||||||||
Total Investments | 59,835,647 | 505,830,755 | 0 | 4 | 565,666,402 | |||||||||||
|
|
|
|
|
|
|
| |||||||||
Seix High Yield Fund | ||||||||||||||||
Assets | ||||||||||||||||
Bank Loans1 | — | 13,647,594 | — | 13,647,594 | ||||||||||||
Corporate Bonds1 | — | 472,265,047 | — | 472,265,047 | ||||||||||||
Common Stocks1 | 226,976 | 988,652 | — | 1,215,628 | ||||||||||||
Money Market Funds | 66,680,228 | — | — | 66,680,228 | ||||||||||||
|
|
|
|
|
|
|
| |||||||||
Total Investments | 66,907,204 | 486,901,293 | — | 553,808,497 | ||||||||||||
|
|
|
|
|
|
|
| |||||||||
Seix Investment Grade Tax-Exempt Bond Fund | ||||||||||||||||
Assets | ||||||||||||||||
Municipal Bonds2 | — | 488,524,123 | — | 488,524,123 | ||||||||||||
Money Market Fund | 52,943,786 | — | — | 52,943,786 | ||||||||||||
|
|
|
|
|
|
|
| |||||||||
Total Investments | 52,943,786 | 488,524,123 | — | 541,467,909 | ||||||||||||
|
|
|
|
|
|
|
| |||||||||
Seix Limited Duration Fund | ||||||||||||||||
Assets | ||||||||||||||||
Asset-Backed Securities1 | — | 628,085 | — | 628,085 | ||||||||||||
Collateralized Mortgage Obligations1 | — | 4,733,630 | — | 4,733,630 | ||||||||||||
U.S. Government Agency Mortgages1 | — | 1,332,201 | — | 1,332,201 | ||||||||||||
Money Market Fund | 19,970 | — | — | 19,970 | ||||||||||||
|
|
|
|
|
|
|
| |||||||||
Total Investments | 19,970 | 6,693,916 | — | 6,713,886 | ||||||||||||
|
|
|
|
|
|
|
| |||||||||
Seix North Carolina Tax-Exempt Bond Fund | ||||||||||||||||
Assets | ||||||||||||||||
Municipal Bonds2 | — | 23,565,483 | — | 23,565,483 | ||||||||||||
Money Market Fund | 2,642,353 | — | — | 2,642,353 | ||||||||||||
|
|
|
|
|
|
|
| |||||||||
Total Investments | 2,642,353 | 23,565,483 | — | 26,207,836 | ||||||||||||
|
|
|
|
|
|
|
| |||||||||
Seix Short-Term Bond Fund | ||||||||||||||||
Assets | ||||||||||||||||
Asset-Backed Securities1 | — | 6,948,769 | — | 6,948,769 | ||||||||||||
Collateralized Mortgage Obligations1 | — | 3,352,050 | — | 3,352,050 | ||||||||||||
Corporate Bonds1 | — | 16,804,951 | — | 16,804,951 | ||||||||||||
U.S. Government Agency Mortgages1 | — | 3,426,851 | — | 3,426,851 | ||||||||||||
U.S. Treasury Obligations1 | — | 24,518,131 | — | 24,518,131 | ||||||||||||
Money Market Fund | 254,053 | — | — | 254,053 | ||||||||||||
|
|
|
|
|
|
|
| |||||||||
Total Investments | 254,053 | 55,050,752 | — | 55,304,805 | ||||||||||||
|
|
|
|
|
|
|
| |||||||||
Seix Short-Term Municipal Bond Fund | ||||||||||||||||
Assets | ||||||||||||||||
Municipal Bonds2 | — | 27,465,841 | — | 27,465,841 | ||||||||||||
Money Market Fund | 1,647,224 | — | — | 1,647,224 | ||||||||||||
|
|
|
|
|
|
|
| |||||||||
Total Investments | 1,647,224 | 27,465,841 | — | 29,113,065 | ||||||||||||
|
|
|
|
|
|
|
| |||||||||
142
Table of Contents
NOTES TO FINANCIAL STATEMENTS (continued)
RIDGEWORTH FUNDS March 31, 2017
| Level 1 - Quoted Prices | Level 2 - Other Significant Observable Inputs | Level 3 - Significant Unobservable Inputs | Total | |||||||||||||
Seix Total Return Bond Fund | ||||||||||||||||
Assets | ||||||||||||||||
Asset-Backed Securities1 | $— | $39,809,471 | $— | $39,809,471 | ||||||||||||
Collateralized Mortgage Obligations1 | — | 47,417,313 | — | 47,417,313 | ||||||||||||
Corporate Bonds1 | — | 229,284,881 | — | 229,284,881 | ||||||||||||
U.S. Government Agency Mortgages1 | — | 215,425,971 | — | 215,425,971 | ||||||||||||
U.S. Treasury Obligations1 | — | 364,078,267 | — | 364,078,267 | ||||||||||||
Foreign Government Bonds | — | 51,628,784 | — | 51,628,784 | ||||||||||||
Money Market Funds | 35,113,866 | — | — | 35,113,866 | ||||||||||||
|
|
|
|
|
|
|
| |||||||||
Total Investments | 35,113,866 | 947,644,687 | — | 982,758,553 | ||||||||||||
|
|
|
|
|
|
|
| |||||||||
Other Financial Instruments3 | ||||||||||||||||
Credit Default Swap Contracts | — | 13,249 | — | 13,249 | ||||||||||||
Forward Foreign Currency Contracts | — | 405,785 | — | 405,785 | ||||||||||||
|
|
|
|
|
|
|
| |||||||||
Total Assets | 35,113,866 | 948,063,721 | — | 983,177,587 | ||||||||||||
|
|
|
|
|
|
|
| |||||||||
Liabilities | ||||||||||||||||
Forward Foreign Currency Contracts | — | (1,152,566 | ) | — | (1,152,566 | ) | ||||||||||
|
|
|
|
|
|
|
| |||||||||
Total Liabilities | — | (1,152,566 | ) | — | (1,152,566 | ) | ||||||||||
|
|
|
|
|
|
|
| |||||||||
Seix U.S. Government Securities Ultra-Short Bond Fund | ||||||||||||||||
Assets | ||||||||||||||||
Asset-Backed Security1 | — | 15,564,795 | — | 15,564,795 | ||||||||||||
Collateralized Mortgage Obligations1 | — | 744,927,882 | — | 744,927,882 | ||||||||||||
U.S. Government Agencies1 | — | 24,278,326 | — | 24,278,326 | ||||||||||||
U.S. Government Agency Mortgages1 | — | 585,731,097 | — | 585,731,097 | ||||||||||||
U.S. Treasury Obligation1 | — | 400,094 | — | 400,094 | ||||||||||||
Money Market Fund | 27,461,735 | — | — | 27,461,735 | ||||||||||||
|
|
|
|
|
|
|
| |||||||||
Total Investments | 27,461,735 | 1,370,902,194 | — | 1,398,363,929 | ||||||||||||
|
|
|
|
|
|
|
| |||||||||
Other Financial Instruments3 | ||||||||||||||||
Liabilities | ||||||||||||||||
Futures Contracts | (88,607 | ) | — | — | (88,607 | ) | ||||||||||
|
|
|
|
|
|
|
| |||||||||
Total Liabilities | (88,607 | ) | — | — | (88,607 | ) | ||||||||||
|
|
|
|
|
|
|
| |||||||||
Seix U.S. Mortgage Fund | ||||||||||||||||
Assets | ||||||||||||||||
Collateralized Mortgage Obligations1 | — | 1,615,955 | — | 1,615,955 | ||||||||||||
U.S. Government Agency Mortgages1 | — | 22,787,328 | — | 22,787,328 | ||||||||||||
Money Market Fund | 962,950 | — | — | 962,950 | ||||||||||||
|
|
|
|
|
|
|
| |||||||||
Total Investments | 962,950 | 24,403,283 | — | 25,366,233 | ||||||||||||
|
|
|
|
|
|
|
| |||||||||
Seix Ultra-Short Bond Fund | ||||||||||||||||
Assets | ||||||||||||||||
Asset-Backed Securities1 | — | 16,212,861 | — | 16,212,861 | ||||||||||||
Collateralized Mortgage Obligations1 | — | 12,449,839 | — | 12,449,839 | ||||||||||||
Corporate Bonds1 | — | 41,779,286 | — | 41,779,286 | ||||||||||||
U.S. Government Agency Mortgages1 | — | 14,462,221 | — | 14,462,221 | ||||||||||||
U.S. Treasury Obligation1 | — | 100,024 | — | 100,024 | ||||||||||||
Money Market Fund | 2,272,691 | — | — | 2,272,691 | ||||||||||||
|
|
|
|
|
|
|
| |||||||||
Total Investments | 2,272,691 | 85,004,231 | — | 87,276,922 | ||||||||||||
|
|
|
|
|
|
|
| |||||||||
Other Financial Instruments3 | ||||||||||||||||
Liabilities | ||||||||||||||||
Futures Contracts | (13,040 | ) | — | — | (13,040 | ) | ||||||||||
|
|
|
|
|
|
|
| |||||||||
Total Liabilities | (13,040 | ) | — | — | (13,040 | ) | ||||||||||
|
|
|
|
|
|
|
| |||||||||
143
Table of Contents
NOTES TO FINANCIAL STATEMENTS (continued)
RIDGEWORTH FUNDS March 31, 2017
| Level 1 - Quoted Prices | Level 2 - Other Significant Observable Inputs | Level 3 - Significant Unobservable Inputs | Total | |||||||||||||
Seix Virginia Intermediate Municipal Bond Fund | ||||||||||||||||
Assets | ||||||||||||||||
Municipal Bonds2 | $— | $48,295,944 | $— | $48,295,944 | ||||||||||||
Money Market Fund | 2,388,399 | — | — | 2,388,399 | ||||||||||||
|
|
|
|
|
|
|
| |||||||||
Total Investments | 2,388,399 | 48,295,944 | — | 50,684,343 | ||||||||||||
|
|
|
|
|
|
|
| |||||||||
| 1 | Please see the Schedules of Portfolio Investments for Sector Classifications. |
| 2 | Please see the Schedules of Portfolio Investments for State Classifications. |
| 3 | Other Financial Instruments are derivative instruments and depreciation on unfunded loan commitments not reflected in the value of Total Investments in the Schedules of Portfolio Investments, such as credit default swaps, forward foreign currency contracts and futures, which are shown at the unrealized appreciation (depreciation) on the instrument. |
| 4 | As of March 31, 2017, the securities designated as Level 3 were fair valued using significant unobservable inputs under procedures adopted by the Board. Such valuations were based on a review of inputs such as, but not limited to, similar securities, company specific financial information, and company specific news. Each of these securities are Board fair valued securities for the fiscal year ended March 31, 2017. The Level 3 securities comprised 0.9% of net assets of Seix Floating Rate High Income Fund and 0.0% of net assets of Seix High Income Fund. |
The following is a reconciliation of investments as of March 31, 2017 in which significant unobservable inputs (Level 3) were used in determining fair value:
| Balance as of 3/31/2016 | Accrued Discounts | Realized Gain | Change in Unrealized Appreciation | Purchases | Sales | Transfers into Level 3 | Transfers out of Level 3 | Balance as of 3/31/2017 | Net Change in Unrealized Appreciation from Investments Still Held as of 3/31/2017 | |||||||||||||||||||||||||||||||
Seix Floating Rate High Income Fund | ||||||||||||||||||||||||||||||||||||||||
Corporate Bonds Oil & Gas | $24,497,837 | $14,311 | $14,147 | $6,758,750 | $18,569,002 | $(5,711,683) | $— | $— | $44,142,364 | $6,758,750 | ||||||||||||||||||||||||||||||
|
|
|
|
|
|
|
|
|
|
|
|
|
|
|
|
|
|
|
| |||||||||||||||||||||
The Funds’ policy is to disclose transfers between levels based on valuations at the end of the reporting period. Each portfolio may hold securities which are periodically fair valued in accordance with the Pricing and Valuation Procedures. This may result in movements between Level 1 and Level 2 throughout the period. As of March 31, 2017, there were no transfers between Level 1 and Level 2 pursuant to the Pricing and Valuation Procedures.
(b) Security Transactions and Investment Income — Security transactions are accounted for on a trade date basis. Interest income, adjusted for amortization of premium and accretion of discount over the life of the securities, is recorded on the accrual basis. Domestic and foreign dividend income is recorded on the ex-dividend date or as soon as practicable after the Funds determine the existence of a dividend declaration after exercising reasonable due diligence. The cost of investments sold is determined by use of the specific identification method. To the extent any issuer defaults or a credit event occurs that impacts the issuer, the Funds may halt any additional interest income accruals and consider the Funds’ ability to realize interest accrued up to the date of default or credit event. Distributions from gains from underlying funds, if any, are recorded as realized gains on the ex-dividend date. Paydown gains and losses on mortgage- and asset-backed securities are recorded as adjustments to interest income.
(c) Distributions to Shareholders — Distributions from net investment income of each of the Funds are declared each business day to shareholders of record and are paid monthly. Distributions of net realized capital gains, if any, are declared at least annually. Distributions to shareholders from each of the Funds are recorded on the ex-dividend date and are determined in accordance with income tax regulations, which may differ from GAAP.
(d) Expenses and Share Class Accounting — Expenses that are directly related to a specific Fund are charged to that Fund. Other operating expenses of the Trust are allocated pro-rata to the Funds on the basis of relative net assets or another appropriate basis. Investment income, common expenses, and realized/unrealized capital gains
144
Table of Contents
NOTES TO FINANCIAL STATEMENTS (continued)
RIDGEWORTH FUNDS March 31, 2017
(losses) on investments are allocated to the various share classes of the Funds on the basis of relative daily net assets of each share class. Fees relating to a specific share class are charged directly to the share class.
(e) Securities Traded on a To-Be-Announced Basis — Certain Funds may trade securities on a to-be-announced (“TBA”) basis. In a TBA transaction, a Fund commits to purchasing or selling securities which have not yet been issued by the issuer and for which specific information, such as the face amount, maturity date and underlying pool of investments in U.S. government agency mortgage pass-through securities, is not announced. Securities purchased on a TBA basis are not settled until they are delivered to the Fund. Beginning on the date a Fund enters into a TBA transaction, cash, U.S. government securities or other liquid high-grade debt obligations are segregated in an amount equal in value to the purchase price of the TBA security. These securities are subject to market fluctuations and their current value is determined in the same manner as for other securities.
(f) Derivative Instruments — Certain Funds may enter into derivative contracts for purposes of pursuing their investment objectives, to use as a substitute for a purchase or sale of a position in the underlying assets and/or as part of a strategy designed to reduce exposure to other risks. Open derivative positions as of March 31, 2017 are included on each Fund’s Schedule of Portfolio Investments.
(g) Forward Foreign Currency Contracts — Certain Funds may enter into forward foreign currency contracts to hedge against foreign currency exchange rate risk on non-U.S. dollar denominated securities or to facilitate settlement of a foreign currency denominated portfolio transaction. A forward foreign currency contract is an agreement between two parties to buy and sell a currency at a set price with delivery and settlement at a future date. The contract is marked-to-market daily and the change in value is recorded by the Fund as an unrealized gain or loss. When a forward foreign currency contract is closed, through either delivery or offset by entering into another forward foreign currency contract, the Fund recognizes a realized gain or loss equal to the difference between the value of the contract at the time it was opened and the value of the contract at the time it is closed.
Forward foreign currency contracts involve elements of market risk in excess of the amounts reflected on the Statements of Assets and Liabilities. The Funds bear the risk of an unfavorable change in the foreign exchange rate underlying the forward foreign currency contract. Risks may also arise upon entering into these contracts from the potential inability of the counterparties to meet the terms of their contracts.
(h) Futures Contracts — Certain Funds may enter into futures contracts to gain exposure to, or hedge against, changes in interest rates or gain exposure to, or hedge against, changes in certain asset classes. A futures contract represents a commitment for the future purchase or sale of an asset at a specified price on a specified date.
Upon entering into a futures contract, the Fund is required to deposit cash or cash equivalents with a broker in an amount equal to a certain percentage of the contract amount. This is known as the “initial margin” and subsequent payments (“variation margin”) are made or received by the Fund each day, depending on the daily fluctuation in the value of the contract. For certain futures, including foreign denominated futures, variation margin is not settled daily, but is recorded as a net variation margin payable or receivable. Futures contracts are valued daily at the settlement price established by the board of trade or exchange on which they are traded. The daily changes in contract value are recorded as unrealized gains or losses in the Statements of Operations and the Fund recognizes a realized gain or loss when the contract is closed.
Futures contracts involve, to varying degrees, risk of loss in excess of the amounts reflected in the Statements of Assets and Liabilities. In addition, there is the risk that the Funds may not be able to enter into a closing transaction because of an illiquid secondary market.
(i) Foreign Currency Translation — Investment securities and other assets and liabilities denominated in foreign currencies are translated into U.S. dollar amounts based upon prevailing exchange rates, as of the close of regular trading on the New York Stock Exchange (usually 4:00 p.m. Eastern Time), on the date of valuation. Purchases and sales of investment securities and income and expense items denominated in foreign currencies are translated into U.S. dollar amounts based upon prevailing exchange rates on the respective dates of such transactions.
The Funds do not isolate that portion of the results of operations resulting from fluctuations in foreign exchange rates on investments from the fluctuations arising from changes in market prices of securities held. Such fluctuations are included with the net realized and unrealized gain or loss on investments and foreign currencies.
Net realized foreign exchange gains or losses arise from sales of foreign currencies, including gains and losses on forward foreign currency contracts, currency gains or losses realized between the trade and settlement dates on
145
Table of Contents
NOTES TO FINANCIAL STATEMENTS (continued)
RIDGEWORTH FUNDS March 31, 2017
securities transactions, and the difference between the amounts of dividends, interest and foreign withholding taxes recorded and the amount actually received.
(j) Swap Contracts — Certain Funds may invest in swap contracts for the purpose of managing exposure to interest rate, credit or market risk, or for other purposes. The use of swap contracts involves risks that are different from those associated with ordinary portfolio transactions. Swap contracts may be privately negotiated in the over-the-counter market (“OTC swaps”) or may be executed in a multilateral or other trade facility platform, such as a registered commodities exchange (“centrally cleared swaps”).
OTC swap contracts are marked-to-market daily using an independent pricing vendor and changes in value are recorded as unrealized appreciation or depreciation in the Statements of Assets and Liabilities. Daily changes in valuation of centrally cleared swaps, if any, are recorded as a receivable or payable, as applicable, for variation margin on centrally cleared swaps on the Statement of Assets and Liabilities. Gains or losses are realized upon termination of the swap contract. Collateral, in the form of restricted cash or securities, may be required to be held in segregated accounts with the Funds’ custodian in compliance with the terms of the swap contracts. Securities posted as collateral for swap contracts are identified in the Schedules of Portfolio Investments and restricted cash, if any, is identified on the Statements of Assets and Liabilities. Risks may exceed amounts recorded in the Statements of Assets and Liabilities. These risks include changes in the returns of the underlying instruments, failure of the counterparties to perform under the contracts’ terms, and the possible lack of liquidity with respect to the swap contracts. Payments received or made at the beginning of the measurement period are reflected as a premium or deposit, respectively, on the Statements of Assets and Liabilities. These upfront payments are amortized over the life of the swap and are recognized as realized gain or loss in the Statements of Operations. Net periodic payments received or paid by the Funds are recognized as a realized gain or loss in the Statements of Operations.
Credit Default Swaps
Certain Funds enter into credit default swap (“CDS”) contracts for investment purposes, to manage credit risk or to add leverage. CDS contracts involve one party making a stream of payments to another party in exchange for the right to receive a specified return in the event of a default by a third party, typically corporate or sovereign issuers, on a specified obligation, or in the event of a write-down, principal shortfall, interest shortfall or default of all or part of the referenced entities comprising a credit index. The Funds may use a CDS contract to provide protection against defaults of the issuers (i.e., to reduce risk where the Funds have exposure to an issuer) or to take an active long or short position with respect to the likelihood of a particular issuer’s default.
As a seller of protection, a Fund generally receives an upfront payment or a stream of payments throughout the term of the swap contracts provided that there is no credit event. These amounts of potential payments will be partially offset by any recovery of values from the respective referenced obligations. As a seller of protection, a Fund effectively adds leverage to its portfolio because, in addition to its total net assets, a Fund is subject to investment exposure on the notional amount of the swap contract. As a buyer of protection, a Fund generally receives an amount up to the notional value of the swap contract if a defined credit event occurs.
The Funds’ maximum risk of loss from counterparty risk, as the protection buyer, is the fair value of the swap contract (this risk is mitigated by the posting of collateral by the counterparty to the Fund to cover the Funds’ exposure to the counterparty). As the protection seller, the Funds’ maximum risk is the notional amount of the contract. CDS contracts are considered to have credit risk-related contingent features since they require payment by the protection seller to the protection buyer upon the occurrence of a defined credit event.
Implied spreads are the theoretical prices a lender receives for credit default protection. When spreads rise, market perceived credit risk rises and when spreads fall, market perceived credit risk falls. The implied credit spread of a particular referenced entity reflects the cost of buying/selling protection and may include upfront payments required to enter into the contract. Wider credit spreads and decreasing market values, when compared to the notional amount of the swap, represent a deterioration of the referenced entity’s credit soundness and a greater likelihood or risk of default or other credit event occurring as defined under the terms of the contract. Credit spreads utilized in determining the period end market value of CDS contracts on corporate or sovereign issues are disclosed in the Schedules of Portfolio Investments and serve as an indicator of the current status of the payment/performance risk and represent the likelihood or risk of default for credit derivatives. The quoted market
146
Table of Contents
NOTES TO FINANCIAL STATEMENTS (continued)
RIDGEWORTH FUNDS March 31, 2017
prices and resulting values, particularly in relation to the notional amount of the contract as well as the annual payment rate, serve as an indication of the current status of the payment/performance risk for CDS contracts on asset-backed securities and credit indices.
Entering into a CDS contract involves, to varying degrees, elements of credit, market and documentation risk. Such risks involve the possibility that there will be no liquid market for these contracts, and that the counterparty to the contract may default on its obligation to perform or disagree as to the meaning of the contractual terms in the contract, and that there are unfavorable changes in net interest rates. As March 31, 2017, the Seix Total Return Bond Fund had outstanding CDS contracts.
Interest Rate Swaps
Certain Funds may enter into interest rate swap (“IRS”) contracts to manage exposure to interest rate risk. IRS contracts are agreements between two parties to exchange cash flows based on a notional principal amount. The Fund may elect to pay a fixed rate and receive a floating rate, or, receive a fixed rate and pay a floating rate on a notional principal amount. IRS contracts are marked-to-market daily based upon quotations from market makers. When a swap contract is terminated early, the Fund records a realized gain or loss equal to the difference between the original cost and the settlement amount of the closing transaction.
The risks of IRS contracts include changes in market conditions that will affect the value of the contract or changes in the present value of the future cash flow streams and the possible inability of the counterparty to fulfill its obligations under the contract. The Fund’s maximum risk of loss from counterparty credit risk is the discounted net value of the cash flows to be received from the counterparty over the contract’s remaining life, to the extent that the amount is positive. This risk is mitigated by the posting of collateral by the counterparty to the Fund to cover the Fund’s exposure to the counterparty. As of March 31, 2017, the Funds had no outstanding IRS contracts.
The fair value of derivative instruments not accounted for as hedging instruments on the Statements of Assets and Liabilities and the effect of derivative instruments not accounted for as hedging instruments, on the Statements of Operations as of March 31, 2017, are presented in the table below:
| Credit Risk | Foreign Exchange Risk | Interest Rate Risk | Total | |||||||||||||
| Seix Total Return Bond Fund | ||||||||||||||||
Asset Derivatives | ||||||||||||||||
Swap Contracts* | $ | 13,249 | $ | — | $ | — | $ | 13,249 | ||||||||
Forward Contracts* | — | 405,785 | — | 405,785 | ||||||||||||
|
|
|
|
|
|
|
| |||||||||
Total Value | $ | 13,249 | $ | 405,785 | $ | — | $ | 419,034 | ||||||||
|
|
|
|
|
|
|
| |||||||||
Liability Derivatives | ||||||||||||||||
Forward Contracts^ | $ | — | $ | (1,152,566 | ) | $ | — | $ | (1,152,566 | ) | ||||||
|
|
|
|
|
|
|
| |||||||||
Total Value | $ | — | $ | (1,152,566 | ) | $ | — | $ | (1,152,566 | ) | ||||||
|
|
|
|
|
|
|
| |||||||||
Realized Gain (Loss)# | ||||||||||||||||
Swap Contracts | $ | (6,196,962 | ) | $ | — | $ | $ | (6,196,962 | ) | |||||||
Forward Contracts | — | 852,628 | — | 852,628 | ||||||||||||
|
|
|
|
|
|
|
| |||||||||
Total Realized Gain (Loss) | $ | (6,196,962 | ) | $ | 852,628 | $ | — | $ | (5,344,334 | ) | ||||||
|
|
|
|
|
|
|
| |||||||||
Change in Unrealized Appreciation (Depreciation)## | ||||||||||||||||
Swap Contracts | $ | 13,249 | $ | — | $ | $ | 13,249 | |||||||||
Forward Contracts | — | 52,694 | — | 52,694 | ||||||||||||
|
|
|
|
|
|
|
| |||||||||
Total Change in Appreciation (Depreciation) | $ | 13,249 | $ | 52,694 | $ | — | $ | 65,943 | ||||||||
|
|
|
|
|
|
|
| |||||||||
Average Number of Contracts, Notional Amounts or Shares+ | ||||||||||||||||
Swap Contracts | 73,500,000 | — | — | 73,500,000 | ||||||||||||
Forward Currency Contracts | — | 167,825,705 | — | 167,825,705 | ||||||||||||
147
Table of Contents
NOTES TO FINANCIAL STATEMENTS (continued)
RIDGEWORTH FUNDS March 31, 2017
| Credit Risk | Foreign Exchange Risk | Interest Rate Risk | Total | |||||||||||||
| Seix U.S. Government Securities Ultra-Short Bond Fund | ||||||||||||||||
Liability Derivatives | ||||||||||||||||
Futures Contracts^ | $ | — | $ | — | $ | (88,607 | ) | $ | (88,607 | ) | ||||||
|
|
|
|
|
|
|
| |||||||||
Total Value | $ | — | $ | — | $ | (88,607 | ) | $ | (88,607 | ) | ||||||
|
|
|
|
|
|
|
| |||||||||
Realized Gain (Loss)# | ||||||||||||||||
Futures Contracts | $ | — | $ | — | $ | 1,242,812 | $ | 1,242,812 | ||||||||
|
|
|
|
|
|
|
| |||||||||
Total Realized Gain (Loss) | $ | — | $ | — | $ | 1,242,812 | $ | 1,242,812 | ||||||||
|
|
|
|
|
|
|
| |||||||||
Change in Unrealized Appreciation (Depreciation)## | ||||||||||||||||
Futures Contracts | $ | — | $ | — | $ | (42,548 | ) | $ | (42,548 | ) | ||||||
|
|
|
|
|
|
|
| |||||||||
Total Change in Appreciation (Depreciation) | $ | — | $ | — | $ | (42,548 | ) | $ | (42,548 | ) | ||||||
|
|
|
|
|
|
|
| |||||||||
Average Number of Contracts, Notional Amounts or Shares+ | ||||||||||||||||
Futures Short Contracts | — | — | (622 | ) | (622 | ) | ||||||||||
|
|
|
|
|
|
|
| |||||||||
| Seix Ultra-Short Bond Fund | ||||||||||||||||
Liability Derivatives | ||||||||||||||||
Futures Contracts^ | $ | — | $ | — | $ | (13,040 | ) | $ | (13,040 | ) | ||||||
|
|
|
|
|
|
|
| |||||||||
Total Value | $ | — | $ | — | $ | (13,040 | ) | $ | (13,040 | ) | ||||||
|
|
|
|
|
|
|
| |||||||||
Realized Gain (Loss)# | ||||||||||||||||
Futures Contracts | $ | — | $ | — | $ | 95,342 | $ | 95,342 | ||||||||
|
|
|
|
|
|
|
| |||||||||
Total Realized Gain (Loss) | $ | — | $ | — | $ | 95,342 | $ | 95,342 | ||||||||
|
|
|
|
|
|
|
| |||||||||
Change in Unrealized Appreciation (Depreciation)## | ||||||||||||||||
Futures Contracts | $ | — | $ | — | $ | (4,671 | ) | $ | (4,671 | ) | ||||||
|
|
|
|
|
|
|
| |||||||||
Total Change in Appreciation (Depreciation) | $ | — | $ | — | $ | (4,671 | ) | $ | (4,671 | ) | ||||||
|
|
|
|
|
|
|
| |||||||||
Average Number of Contracts, Notional Amounts or Shares+ | ||||||||||||||||
Futures Short Contracts | — | — | (106 | ) | (106 | ) | ||||||||||
|
|
|
|
|
|
|
| |||||||||
| * | Statements of Assets and Liabilities location: Unrealized Appreciation on Swap Contracts and Unrealized Appreciation on Forward Foreign Currency Contracts, as applicable. Futures Contracts value represents cumulative unrealized appreciation. Only the current day’s variation margin on futures contracts is reported within the Statement of Assets and Liabilities as receivable or payable for variation margin, as applicable. |
| ^ | Statements of Assets and Liabilities location: Unrealized Depreciation on Swap Contracts and Unrealized Depreciation on Forward Foreign Currency Contracts, as applicable. Futures Contracts value represents cumulative unrealized depreciation. Only the current day’s variation margin on futures contracts and centrally cleared swaps is reported within the Statement of Assets and Liabilities as receivable or payable for variation margin, as applicable. |
| # | Statements of Operations location: Net Realized Gain (Loss) from: Futures Contracts, Swap Contracts, or Forward Foreign Currency Contracts, as applicable. |
| ## | Statements of Operations location: Net Change in Unrealized Appreciation (Depreciation) on: Futures Contracts, Swap Contracts, or Forward Foreign Currency Contracts, as applicable. |
| + | Amount(s) disclosed represent the average number of contracts for futures contracts, notional amounts for forward foreign currency contracts and swap contracts, which are indicative of volume of this derivative type, for the months that the Fund held such derivatives during the fiscal year ended March 31, 2017. |
The following table summarizes any OTC derivatives at March 31, 2017 that are subject to an enforceable master netting agreement or similar agreement and net of the related collateral received by the Funds.
| Gross Amounts of Assets/Liabilities Presented in the Statement of Assets and Liabilities(a) | Financial Instruments and Derivatives Available for Offset | Collateral (Received)/Pledged(b) | Net Amount of Derivative Assets/Liabilities | |||||||||||||
| Seix Total Return Bond Fund | ||||||||||||||||
Assets Counterparty |
| |||||||||||||||
Credit Suisse International | $768,092 | $— | $(525,000 | ) | $243,092 | |||||||||||
Credit Suisse International | 405,785 | — | (405,785 | ) | — | |||||||||||
|
|
|
|
|
|
|
| |||||||||
| $1,173,877 | $— | $(930,785 | ) | $243,092 | ||||||||||||
|
|
|
|
|
|
|
| |||||||||
148
Table of Contents
NOTES TO FINANCIAL STATEMENTS (continued)
RIDGEWORTH FUNDS March 31, 2017
| Gross Amounts of Assets/Liabilities Presented in the Statement of Assets and Liabilities(a) | Financial Instruments and Derivatives Available for Offset | Collateral (Received)/Pledged(b) | Net Amount of Derivative Assets/Liabilities | |||||||||||||
Liabilities | ||||||||||||||||
JPMorgan | $ | 1,000,822 | $ | — | $(1,000,822 | ) | $ | — | ||||||||
Credit Suisse International | 151,744 | — | — | 151,744 | ||||||||||||
|
|
|
|
|
|
|
| |||||||||
| $ | 1,152,566 | $ | — | $(1,000,822 | ) | $ | 151,744 | |||||||||
|
|
|
|
|
|
|
| |||||||||
| (a) | Absent an event of default or early termination, OTC derivative assets and liabilities are presented gross and not offset in the Statement of Asset and Liabilities. |
| (b) | The amount presented here may be less than the total amount of collateral received/pledged, as the net amount of the derivative assets and liabilities for a counterparty cannot be less than $0. |
(k) Securities Lending — Each Fund may lend portfolio securities to brokers, dealers and other financial organizations that meet capital and other credit requirements or other criteria established by the Board. These loans may not exceed either (i) 50% of the sum of the market value of all securities of the Fund and the market value of securities purchased with cash collateral or (ii) 33.33% of the total market value of all securities of the Fund. No Fund will lend portfolio securities to its investment adviser, subadviser, or its affiliates unless it has applied for and received specific authority to do so from the Securities and Exchange Commission. Loans of portfolio securities are required to be fully collateralized by cash, letters of credit or U.S. government securities. The initial value of the collateral must be at least 102% of the market value of the securities loaned, if the securities loaned are U.S. securities (105% for non-U.S. securities); and maintained in an amount equal to at least 100% (103% for non-U.S. securities) thereafter. However, due to market fluctuations during the day, the value of securities loaned on a particular day may exceed the value of collateral. On each business day, the amount of collateral is adjusted based on the prior day’s market fluctuations and the current day’s lending activity. Lending securities involves certain risks; including the risk that a Fund may be delayed or prevented from recovering the collateral if the borrower fails to return the securities. A fee will be obtained from the borrower if letters of credit or U.S. government securities are used as collateral which is reflected on the Statements of Operations as a component of the caption “Net Income from Securities Lending”.
For Seix Corporate Bond Fund, Seix High Income Fund, Seix High Yield Fund and Seix Total Return Bond Fund the value of the security loan obligation is classified as follows as of March 31, 2017:
Seix Corporate Bond Fund
| Remaining Contractual Maturity of the Agreements As of March 31, 2017 | ||||||||||||||||||||
| Overnight and Continuous | <30 days | Between 30 & 90 days | >90 days | Total | ||||||||||||||||
Securities Lending Transactions | ||||||||||||||||||||
Corporate Bonds | $10,525 | $— | $— | $— | $10,525 | |||||||||||||||
|
|
|
|
|
|
|
|
|
| |||||||||||
Total Borrowings | $10,525 | $— | $— | $— | $10,525 | |||||||||||||||
|
|
|
|
|
|
|
|
|
| |||||||||||
Gross amount of recognized liabilities for securities lending transactions |
| $10,525 | ||||||||||||||||||
|
| |||||||||||||||||||
| Seix High Income Fund | ||||||||||||||||||||
| Remaining Contractual Maturity of the Agreements As of March 31, 2017 | ||||||||||||||||||||
| Overnight and Continuous | <30 days | Between 30 & 90 days | >90 days | Total | ||||||||||||||||
Securities Lending Transactions |
| |||||||||||||||||||
Common Stocks | $700 | $— | $— | $— | $700 | |||||||||||||||
Corporate Bonds | 47,733,556 | — | — | — | 47,733,556 | |||||||||||||||
|
|
|
|
|
|
|
|
|
| |||||||||||
Total | $47,734,256 | $— | $— | $— | $47,734,256 | |||||||||||||||
|
|
|
|
|
|
|
|
|
| |||||||||||
Total Borrowings | $47,734,256 | $— | $— | $— | $47,734,256 | |||||||||||||||
|
|
|
|
|
|
|
|
|
| |||||||||||
Gross amount of recognized liabilities for securities lending transactions |
| $47,734,256 | ||||||||||||||||||
|
| |||||||||||||||||||
149
Table of Contents
NOTES TO FINANCIAL STATEMENTS (continued)
RIDGEWORTH FUNDS March 31, 2017
| Seix High Yield Fund | ||||||||||||||||||||
| Remaining Contractual Maturity of the Agreements As of March 31, 2017 | ||||||||||||||||||||
| Overnight and Continuous | <30 days | Between 30 & 90 days | >90 days | Total | ||||||||||||||||
Securities Lending Transactions |
| |||||||||||||||||||
Common Stocks | $249 | $— | $— | $— | $249 | |||||||||||||||
Corporate Bonds | 40,822,614 | — | — | — | 40,822,614 | |||||||||||||||
|
|
|
|
|
|
|
|
|
| |||||||||||
Total | $40,822,863 | $— | $— | $— | $40,822,863 | |||||||||||||||
|
|
|
|
|
|
|
|
|
| |||||||||||
Total Borrowings | $40,822,863 | $— | $— | $— | $40,822,863 | |||||||||||||||
|
|
|
|
|
|
|
|
|
| |||||||||||
Gross amount of recognized liabilities for securities lending transactions |
| $40,822,863 | ||||||||||||||||||
|
| |||||||||||||||||||
| Seix Total Return Bond Fund | ||||||||||||||||||||
| Remaining Contractual Maturity of the Agreements As of March 31, 2017 | ||||||||||||||||||||
| Overnight and Continuous | <30 days | Between 30 & 90 days | >90 days | Total | ||||||||||||||||
Securities Lending Transactions |
| |||||||||||||||||||
Corporate Bonds | $5,199,918 | $— | $— | $— | $5,199,918 | |||||||||||||||
|
|
|
|
|
|
|
|
|
| |||||||||||
Total Borrowings | $5,199,918 | $— | $— | $— | $5,199,918 | |||||||||||||||
|
|
|
|
|
|
|
|
|
| |||||||||||
Gross amount of recognized liabilities for securities lending transactions |
| $5,199,918 | ||||||||||||||||||
|
| |||||||||||||||||||
(l) When-Issued Securities and Forward Commitments — Delivery and payment for securities that have been purchased by a Fund on a forward commitment or when-issued basis can take place up to a month or more after the transaction date at a fixed price. During this period, such securities are subject to market fluctuations. The purchase of securities on a when-issued or forward commitment basis may increase the volatility of a Fund’s NAV if the Fund makes such investments while remaining substantially fully invested. A Fund records when-issued securities on trade date and will segregate or earmark liquid assets in an amount at least equal in value to its commitments to purchase when-issued and forward commitment securities or engage in other appropriate measures to “cover” its obligation. When-issued securities and the segregated liquid assets associated with such investments are presented within the Funds’ Schedules of Portfolio Investments.
(m) Bank Loans — Certain Funds may invest in first and second lien senior floating-rate loans (“bank loans”). These loans are made by banks and other large financial institutions to various companies and are senior in the borrowing companies’ capital structure. Coupon rates are floating, not fixed, and are tied to a benchmark lending rate. Some types of senior loans in which these Funds may invest require that an open loan for a specific amount be continually offered to a borrower. These types of senior loans, commonly referred to as revolvers, contractually obligate the lender (and therefore those with an interest in the loan) to fund the loan at the borrower’s discretion. A Fund will maintain, on a daily basis, high quality, liquid assets in an amount at least equal in value to its contractual obligation to fulfill the revolving senior loan. Therefore, a Fund must have funds sufficient to cover its contractual obligation. In addition, bank loans generally are subject to extended settlement periods, which may impair the Fund’s ability to sell or realize the full value of its loans in the event of a need to liquidate such loans. Seix Floating Rate High Income Fund had unfunded loan commitments that can be found on the Fund’s Schedule of Portfolio Investments.
(n) Restricted Securities — Certain Funds’ investments are subject to legal or contractual restrictions on resale. Prompt sale of such securities at an acceptable price may be difficult and may involve substantial delays and additional costs. As of March 31, 2017, all of these restricted securities have been deemed liquid by the Funds’ investment adviser based upon procedures approved by the Board, unless stated otherwise on the Funds’ Schedules of Portfolio Investments.
(o) Credit and Market Risk — Certain Funds’ investments in securities that are collateralized by residential real estate mortgages are subject to certain credit and liquidity risks. When market conditions result in an increase in default rates of the underlying mortgages and the foreclosure values of underlying real estate properties are materially below the outstanding amount of these underlying mortgages, collection of the full amount of accrued interest and principal on these investments may be doubtful. Such market conditions may significantly impair the value and liquidity of these investments and may result in a lack of correlation between their credit ratings and values.
150
Table of Contents
NOTES TO FINANCIAL STATEMENTS (continued)
RIDGEWORTH FUNDS March 31, 2017
(p) Foreign Investment Risks — Certain Funds’ investments in foreign securities may involve risks not present in domestic investments. Since securities may be denominated in foreign currencies, may require settlement in foreign currencies or pay interest or dividends in foreign currencies, changes in the relationship of these foreign currencies to the U.S. dollar can significantly affect the value of the investments and earnings of the Fund. Foreign investments may also subject the Fund to foreign government exchange restrictions, expropriation, taxation or other political, social or economic developments, all of which affect the market and/or credit risk of the investments.
For securities subject to foreign withholding tax upon disposition, liabilities are recorded on the Statement of Assets and Liabilities for the estimated tax withholding based on the securities’ current market value. Upon disposition, realized gains or losses on such securities are recorded net of foreign withholding tax.
(q) Counterparty Risk and Credit-Risk-Related Contingent Features of Derivative Instruments — Certain Funds may invest in certain securities or engage in other transactions where the Funds are exposed to counterparty credit risk in addition to broader market risks. The Funds may invest in securities of issuers, which may also be considered counterparties as trading partners in other transactions. This may increase the risk of loss in the event of default or bankruptcy by the counterparty or if the counterparty otherwise fails to meet its contractual obligations. The Funds’ Investment Adviser attempts to mitigate counterparty risk by (i) periodically assessing the creditworthiness of its trading partners, (ii) monitoring and/or limiting the amount of its net exposure to each individual counterparty based on its assessment and (iii) requiring collateral from the counterparty for certain transactions. Market events and changes in overall economic conditions may impact the assessment of such counterparty risk by the investment manager. In addition, declines in the values of underlying collateral received may expose the Funds to increased risk of loss.
(r) Other Risks — Certain Funds invest in high yield corporate, government, and other debt instruments of U.S. and non-U.S. issuers. High yield securities involve greater risk of default or downgrade and are more volatile than investment grade securities. A Fund’s concentration of investments in securities of issuers located in a specific region or state, subjects that Fund to the economic and government policies of the region or state, and may increase risk versus that of a fund whose investments are more diversified. Please refer to each Fund’s prospectus for additional risks that may be associated with the Funds.
At March 31, 2017, one shareholder owned 100% of Seix Limited Duration Fund. Transaction activities of these shareholders may have a material effect on the respective Fund. Redemptions of these shareholders’ holdings in the Fund may impact the Fund’s liquidity and net asset value. Such redemptions may force the Fund to sell securities.
(s) Federal and Other Taxes — It is the Funds’ policy to comply with the federal income and excise tax requirements of the Internal Revenue Code of 1986, as amended (the “Code”), applicable to regulated investment companies. Accordingly, the Funds intend to distribute taxable income and net realized gains, if any, to shareholders in accordance with timing requirements imposed by the Code. Therefore, no federal or state income tax provision is required in the Funds’ financial statements.
Management has analyzed the Funds’ tax positions taken on income tax returns for all open tax years and has concluded that as of March 31, 2017, no provision for income tax is required in the Funds’ financial statements. The Funds’ federal and state income and federal excise tax returns for tax years for which the applicable statutes of limitations have not expired are subject to examination by the Internal Revenue Service and state departments of revenue. As of March 31, 2017, open tax years include the tax years of March 31, 2014 through 2017.
Under the applicable foreign tax laws, a withholding tax may be imposed on interest, dividends and capital gains at various rates. The Funds will accrue such taxes and recoveries as applicable, based upon their current interpretation of tax rules and regulations that exist in the markets in which they invest.
(t) Reclassification — GAAP requires that certain components of net assets be reclassified to reflect permanent differences between financial and tax reporting. These reclassifications have no effect on net assets or NAV per share.
(u) Line of Credit —The Funds entered into a committed unsecured revolving line of credit agreement (“LOC”) with a syndicate of banks which includes State Street Bank and Trust Company (“State Street Bank”) and Royal Bank of Canada (“RBC”), for an aggregate amount of $200,000,000. The proceeds may be used only to (1) temporarily
151
Table of Contents
NOTES TO FINANCIAL STATEMENTS (continued)
RIDGEWORTH FUNDS March 31, 2017
finance the purchase and sale of securities; or (2) finance the redemption of shares of the Funds. The Funds will pay a commitment fee on a pro rata basis to State Street Bank and RBC, in the amount of 0.17% per annum on the daily unused portion of the LOC. Borrowings under the LOC will accrue interest at the higher of (a) the Federal Funds Rate, or (b) the one-month LIBOR Rate, plus 1.25% per annum. Generally, repayments must be made within 60 days of the borrowings. Commitment fees and interest expense paid to State Street Bank and RBC pursuant to this agreement are reflected on the Statements of Operations as a component of Other Fees. As of March 31, 2017, the Funds had no outstanding borrowings under the LOC.
The following Funds had an outstanding loan during the year. The borrowings were valued at cost, which approximates fair value.
Fund | Interest Incurred on Borrowing | Average Dollar Amount of Borrowing | Weighted Average Interest Rate on Borrowing | Days Loan was Open | ||||||||||||
Seix High Income Fund | $250 | $903,032 | 2.00 | % | 5 | |||||||||||
Seix High Yield Fund | 157 | 766,629 | 1.84 | 4 | ||||||||||||
Seix Total Return Bond Fund | 521 | 10,537,033 | 1.78 | 1 | ||||||||||||
Due to and Due from Affiliates — represents payment for proceeds received from a securities litigation settlement.
| 3. | Investment Adviser and Other Service Providers |
Investment Adviser — RidgeWorth Investments (“Investment Adviser”) serves as the investment adviser to the Funds. The Trust and the Investment Adviser have entered into an investment advisory agreement (“Advisory Agreement”). The Investment Adviser is a money-management holding company with multiple style-focused investment boutiques. The subadviser for the Funds is Seix Investment Advisors LLC (“Subadviser”). Seix is a wholly-owned subsidiary of the Investment Adviser. The Investment Adviser pays the Subadviser out of the investment advisory fees it receives from the Funds.
Under the terms of the Advisory Agreement, the Funds are charged annual advisory fees, which are computed daily and paid monthly based upon average daily net assets. Breakpoints are used in computing the overall annual advisory fee. The maximum annual advisory fee is charged on the average daily net assets of each Fund up to $500 million. A discount of 5% applies on the next $500 million, a discount of 10% applies on the next $4 billion and a discount of 15% applies on amounts over $5 billion. Fee rates for the fiscal year ended March 31, 2017 were as follows:
Fund | Maximum Advisory Fee | Discounted Annual Advisory Fee | Advisory Fees Waived* | Net Annual fees Paid** | ||||||||||||
Seix Core Bond Fund | 0.25 | % | 0.25 | % | — | % | 0.25 | % | ||||||||
Seix Corporate Bond Fund | 0.40 | 0.40 | (0.12 | ) | 0.28 | |||||||||||
Seix Floating Rate High Income Fund | 0.45 | 0.41 | — | 0.41 | ||||||||||||
Seix Georgia Tax-Exempt Bond Fund | 0.50 | 0.50 | — | 0.50 | ||||||||||||
Seix High Grade Municipal Bond Fund | 0.50 | 0.50 | — | 0.50 | ||||||||||||
Seix High Income Fund | 0.55 | 0.55 | — | 0.55 | ||||||||||||
Seix High Yield Fund | 0.45 | 0.45 | — | 0.45 | ||||||||||||
Seix Investment Grade Tax-Exempt Bond Fund | 0.50 | 0.50 | — | 0.50 | ||||||||||||
Seix Limited Duration Fund | 0.10 | 0.10 | — | 0.10 | ||||||||||||
Seix North Carolina Tax-Exempt Bond Fund | 0.50 | 0.50 | (0.02 | ) | 0.48 | |||||||||||
Seix Short-Term Bond Fund | 0.40 | 0.40 | — | 0.40 | ||||||||||||
Seix Short-Term Municipal Bond Fund | 0.35 | 0.35 | (0.09 | ) | 0.26 | |||||||||||
Seix Total Return Bond Fund | 0.25 | 0.24 | — | 0.24 | ||||||||||||
Seix U.S. Government Securities Ultra-Short Bond Fund | 0.20 | 0.19 | — | 0.19 | ||||||||||||
Seix U.S. Mortgage Fund | 0.40 | 0.40 | (0.01 | ) | 0.39 | |||||||||||
Seix Ultra-Short Bond Fund | 0.22 | 0.22 | — | 0.22 | ||||||||||||
Seix Virginia Intermediate Municipal Bond Fund | 0.50 | 0.50 | — | 0.50 | ||||||||||||
| * | See additional information below related to contractual expense limitations |
| ** | Aggregate annual fees paid to the Investment Adviser, who pays the Subadviser a portion of the fees for its services to the Funds. |
Amounts designated as “—” are 0%.
152
Table of Contents
NOTES TO FINANCIAL STATEMENTS (continued)
RIDGEWORTH FUNDS March 31, 2017
The Investment Adviser and the Subadviser have contractually agreed, until at least August 1, 2017, to waive fees and/or reimburse expenses for each of the following Funds to the extent necessary to maintain each Fund’s total annual fund operating expenses (excluding, as applicable, taxes, brokerage commissions, substitute dividend expenses on securities sold short, interest expense, extraordinary expenses and indirect expenses attributable to the Fund’s investment in other funds), expressed as a percentage of average daily net assets, as noted below:
| Contractual Expense Limitations | ||||||||||||||||||||
Fund | I Shares | A Shares | C Shares | R Shares | IS Shares | |||||||||||||||
Seix Core Bond Fund* | 0.54 | % | 0.75 | % | N/A | % | 1.05 | % | 0.44 | % | ||||||||||
Seix Corporate Bond Fund | 0.70 | 0.95 | 1.65 | N/A | N/A | |||||||||||||||
Seix Floating Rate High Income Fund* | 0.72 | 1.00 | 1.60 | N/A | 0.60 | |||||||||||||||
Seix Georgia Tax-Exempt Bond Fund | 0.65 | 0.80 | N/A | N/A | N/A | |||||||||||||||
Seix High Grade Municipal Bond Fund | 0.65 | 0.80 | N/A | N/A | N/A | |||||||||||||||
Seix High Income Fund* | 0.85 | 1.10 | N/A | 1.50 | 0.70 | |||||||||||||||
Seix High Yield Fund* | 0.70 | 0.90 | N/A | 1.30 | 0.64 | |||||||||||||||
Seix Investment Grade Tax-Exempt Bond Fund | 0.65 | 0.80 | N/A | N/A | N/A | |||||||||||||||
Seix Limited Duration Fund | 0.35 | N/A | N/A | N/A | N/A | |||||||||||||||
Seix North Carolina Tax-Exempt Bond Fund | 0.65 | 0.80 | N/A | N/A | N/A | |||||||||||||||
Seix Short-Term Bond Fund* | 0.60 | 0.80 | 1.58 | N/A | N/A | |||||||||||||||
Seix Short-Term Municipal Bond Fund | 0.48 | 0.68 | N/A | N/A | N/A | |||||||||||||||
Seix Total Return Bond Fund* | 0.54 | 0.75 | N/A | 1.15 | 0.44 | |||||||||||||||
Seix U.S. Government Securities Ultra-Short Bond Fund | 0.46 | N/A | N/A | N/A | 0.40 | |||||||||||||||
Seix U.S. Mortgage Fund | 0.70 | 0.90 | 1.65 | N/A | N/A | |||||||||||||||
Seix Ultra-Short Bond Fund | 0.46 | N/A | N/A | N/A | N/A | |||||||||||||||
Seix Virginia Intermediate Municipal Bond Fund | 0.65 | 0.80 | N/A | N/A | N/A | |||||||||||||||
| * | For the period ended July 31, 2016 the Contractual Expense Limitations were as follows: |
Fund | I Shares | A Shares | C Shares | R Shares | IS Shares | |||||||||||||||
Seix Core Bond Fund | 0.50 | % | 0.75 | % | N/A | % | 1.05 | % | 0.40 | % | ||||||||||
Seix Floating Rate High Income Fund | 0.70 | 1.00 | 1.60 | N/A | 0.60 | |||||||||||||||
Seix High Income Fund | 0.80 | 1.05 | N/A | 1.50 | 0.70 | |||||||||||||||
Seix High Yield Fund | 0.65 | 0.90 | N/A | 1.30 | N/A | |||||||||||||||
Seix Short-Term Bond Fund | 0.60 | 0.80 | 1.60 | N/A | N/A | |||||||||||||||
Seix Total Return Bond Fund | 0.50 | 0.75 | N/A | 1.10 | 0.40 | |||||||||||||||
Under the Expense Limitation Agreement, the Investment Adviser may retain the difference between the contractual expense limitation identified above and the actual total expenses to recapture any of its prior contractual waivers or reimbursements at a date not to exceed three years from the date of such waivers or reimbursements. Such repayments shall be made monthly, but only to the extent that such repayments would not cause the annualized total expense ratio to exceed, if lower, the contractual expense limitation in place at the time of the waiver or reimbursement.
Under certain circumstances, the Investment Advisor may choose to voluntarily waive fees. In the event that the Investment Advisor voluntarily waives any fees, these waived fees are not subject to recoupment by the Investment Advisor. The Investment Adviser has voluntarily undertaken to reduce and/or subsidize certain expenses of the Seix Limited Duration Fund, Seix Short-Term Bond Fund and Seix U.S. Mortgage Fund to the extent necessary to maintain a minimum annualized yield of 0.0% for each of the Fund’s share classes. This voluntary expense reduction and/or expense subsidy may be modified or discontinued at any time without prior notice and is not subject to recoupment. There can be no assurance that this fee reduction will be sufficient to avoid any loss. During the fiscal year ended March 31, 2017, Seix Short-Term Bond Fund C Shares had voluntary reimbursements in the amount of $2,796.
During the fiscal year ended March 31, 2017, the Investment Adviser recaptured prior contractual waivers or reimbursements in the following Funds, Seix Core Bond A Shares, Seix Floating Rate High Income Fund A Shares
153
Table of Contents
NOTES TO FINANCIAL STATEMENTS (continued)
RIDGEWORTH FUNDS March 31, 2017
and Seix High Grade Municipal Bond Fund A Shares for $42, $122 and $476, respectively. As of March 31, 2017, the cumulative potential recoupments recoverable pursuant to this agreement are as follows:
| Expires | ||||||||||||
Fund | 2018 | 2019 | 2020 | |||||||||
Seix Core Bond Fund | ||||||||||||
I Shares | $3,506 | $— | $— | |||||||||
Seix Corporate Bond Fund | ||||||||||||
I Shares | 8,964 | 16,529 | 25,914 | |||||||||
A Shares | 307 | 960 | 1,128 | |||||||||
C Shares | 2,406 | 12,565 | 13,860 | |||||||||
Seix Georgia Tax-Exempt Bond Fund | ||||||||||||
I Shares | — | 32,454 | 47,286 | |||||||||
Seix High Grade Municipal Bond Fund | ||||||||||||
I Shares | 26,689 | 43,026 | 49,128 | |||||||||
Seix High Income Fund | ||||||||||||
I Shares | — | — | 20,361 | |||||||||
Seix Investment Grade Tax-Exempt Bond Fund | ||||||||||||
I Shares | 158,784 | 196,341 | 265,554 | |||||||||
A Shares | 30,557 | 34,180 | 25,888 | |||||||||
Seix Limited Duration Fund | ||||||||||||
I Shares | 8,039 | 7,733 | 7,891 | |||||||||
Seix North Carolina Tax-Exempt Bond Fund | ||||||||||||
I Shares | 14,868 | 27,262 | 25,589 | |||||||||
A Shares | — | 60 | 439 | |||||||||
Seix Short-Term Bond Fund | ||||||||||||
I Shares | 31,243 | 38,183 | 45,098 | |||||||||
A Shares | 117 | 199 | 155 | |||||||||
Seix Short-Term Municipal Bond Fund | ||||||||||||
I Shares | 26,182 | 44,128 | 53,428 | |||||||||
A Shares | 2,225 | 2,517 | 3,664 | |||||||||
Seix Total Return Bond Fund | ||||||||||||
R Shares | 5,518 | 2,074 | — | |||||||||
Seix U.S. Mortgage Fund | ||||||||||||
I Shares | 20,029 | 26,390 | 35,498 | |||||||||
A Shares | 16,585 | 11,553 | 5,181 | |||||||||
C Shares | 21,560 | 6,916 | 3,093 | |||||||||
Seix Virginia Intermediate Municipal Bond Fund | ||||||||||||
I Shares | — | 28,628 | 32,565 | |||||||||
Amounts designated as “—” are $0.
Fund Accounting, Custody, Administration, and Transfer Agency — State Street Bank serves as the fund accounting agent and custodian for the Trust pursuant to a Master Custodian Agreement. The custodian is responsible for the safekeeping of the assets of the Funds and the fund accounting agent is responsible for calculating the Funds’ net asset values. State Street Bank, as the Funds’ custodian and fund accounting agent, is paid on the basis of net assets and transaction costs of the Funds. State Street Bank also serves as the administrator for the Trust pursuant to an Administration Agreement. State Street Bank, as the Funds’ administrator, is paid on the basis of net assets of the RidgeWorth investment company complex and fees are allocated among the series of the Trust, on the basis of relative net assets.
Boston Financial Data Services, Inc. (“BFDS”) serves as the transfer agent to the Trust pursuant to a Transfer Agency and Service Agreement. BFDS is paid on the basis of net assets, per account fees and certain transaction costs.
154
Table of Contents
NOTES TO FINANCIAL STATEMENTS (continued)
RIDGEWORTH FUNDS March 31, 2017
Custodian Credits — The Funds have an agreement with their custodian under which custody fees may be reduced by balance credits. These credits, if any, are shown as a reduction of custody expenses on the Statements of Operations.
Distribution — The Trust and RidgeWorth Distributors LLC (the “Distributor”) are parties to a Distribution Agreement.
In addition, with respect to the A Shares, C Shares and R Shares, the Distributor receives amounts, pursuant to a Distribution and Service Plan, based upon average daily net assets of each respective class, which are computed daily and paid monthly. For the fiscal year ended March 31, 2017, the Distributor did not retain any of the front end sales charges assessed on the sale of A shares. For the fiscal year ended March 31, 2017, the Distributor did not retain any commissions from contingent deferred sales charges assessed on redemptions of C Shares. These current board approved fees, expressed as a percentage of average daily net assets, for the fiscal year ended March 31, 2017, were as follows:
Fund | A Shares Distribution and Service Fee | C Shares Distribution and Service Fee | R Shares Distribution and Service Fee | IS Shares Distribution and Service Fee | ||||||||||||
Seix Core Bond Fund | 0.25 | % | N/A | % | 0.50 | % | N/A | % | ||||||||
Seix Corporate Bond Fund | 0.30 | 1.00 | N/A | N/A | ||||||||||||
Seix Floating Rate High Income Fund | 0.30 | 1.00 | N/A | N/A | ||||||||||||
Seix Georgia Tax-Exempt Bond Fund | 0.15 | N/A | N/A | N/A | ||||||||||||
Seix High Grade Municipal Bond Fund | 0.15 | N/A | N/A | N/A | ||||||||||||
Seix High Income Fund | 0.30 | N/A | 0.50 | N/A | ||||||||||||
Seix High Yield Fund | 0.25 | N/A | 0.50 | N/A | ||||||||||||
Seix Investment Grade Tax-Exempt Bond Fund | 0.30 | N/A | N/A | N/A | ||||||||||||
Seix North Carolina Tax-Exempt Bond Fund | 0.15 | N/A | N/A | N/A | ||||||||||||
Seix Short-Term Bond Fund | 0.20 | 1.00 | N/A | N/A | ||||||||||||
Seix Short-Term Municipal Bond Fund | 0.15 | N/A | N/A | N/A | ||||||||||||
Seix Total Return Bond Fund | 0.25 | N/A | 0.50 | N/A | ||||||||||||
Seix U.S. Mortgage Fund | 0.20 | 1.00 | N/A | N/A | ||||||||||||
Seix Virginia Intermediate Municipal Bond Fund | 0.15 | N/A | N/A | N/A | ||||||||||||
Shareholder Servicing Fees — The Funds have adopted shareholder services fees for the I Shares and A Shares of such Funds. Each of these Funds (or class thereof, as the case may be) may pay a services fee to financial institutions that provide certain services to the Funds. The services may include, among others, providing general shareholder liaison services (including responding to shareholder inquiries) providing information on shareholder investments, and establishing and maintaining shareholder accounts and records. The Funds may pay a shareholder services fee up to an annual rate of 0.20% of average daily net assets of a Fund’s I Shares or A Shares. The Seix Core Bond Fund, Seix High Income Fund, Seix High Yield Fund and Seix Total Return Bond Fund have adopted a shareholder services fee for the R Shares. Each Fund pays specified benefit plans or other financial service firms for shareholder support services they provide, at an annual rate of up to 0.25% of the average daily net assets of R Shares.
Compliance & Fund Services Fees — The Investment Adviser provides compliance and certain administrative services to the Trust to ensure compliance with applicable laws and regulations. For the fiscal year ended March 31, 2017, the Investment Adviser was paid $404,235 for these services. Foreside Fund Officer Services, LLC (“FFOS”), an affiliate of the Distributor, provides an Anti-Money Laundering Officer/Identity Theft Prevention Officer (“AML Officer”) to the Trust. Effective October 2015 through November 2016, Foreside Management Services, LLC (“FMS”), an affiliate of the Distributor, provided Principal Financial Officer (“PFO”) support services to the Trust. Fees paid to FFOS and FMS pursuant to these agreements are reflected on the Statements of Operations as a component of the caption “Other Fees”.
Neither FFOS nor any of their officers or employees who serve as an officer of the Trust, have any role in determining the Funds’ investment policies or which securities are to be purchased or sold by the Trust or its Funds.
155
Table of Contents
NOTES TO FINANCIAL STATEMENTS (continued)
RIDGEWORTH FUNDS March 31, 2017
Certain officers of the Trust are also officers or employees of the Investment Adviser, FFOS and the administrator. Such officers receive no fees from the Trust for serving as officers of the Trust.
Each of the Trustees receives an annual retainer and an additional fee for each meeting attended, plus reimbursement for certain expenses incurred. Trustees receive an additional fee for committee service, paid on a per committee meeting basis. Information on the aggregate remuneration paid to the Trustees can be found on the Statements of Operations.
| 4. | Capital Stock Transactions |
Transactions in capital shares and dollars for the fiscal years ended March 31, 2017 and March 31, 2016 were as follows:
| Shares Issued | Shares Issued- Merger | Shares Reinvested | Shares Redeemed | Shares Converted | Net Increase (Decrease) in Shares Outstanding | Proceeds from Shares Issued | Issued- Merger | Dividends Reinvested | Cost of Shares Redeemed | Shares Converted | Change in Net Assets from Capital Transactions | |||||||||||||||||||||||||||||||||||||
Seix Core Bond Fund |
| |||||||||||||||||||||||||||||||||||||||||||||||
I Shares | ||||||||||||||||||||||||||||||||||||||||||||||||
3/31/2017 | 3,325,643 | — | 748,805 | (8,707,885 | ) | — | (4,633,437 | ) | $36,165,424 | $— | $7,980,535 | $(94,476,548 | ) | $— | $(50,330,589 | ) | ||||||||||||||||||||||||||||||||
3/31/2016 | 3,773,694 | 18,121,184 | 514,563 | (16,264,183 | ) | — | 6,145,258 | 40,652,397 | 195,102,886 | 5,532,336 | (175,119,070 | ) | — | 66,168,549 | ||||||||||||||||||||||||||||||||||
A Shares | ||||||||||||||||||||||||||||||||||||||||||||||||
3/31/2017 | 159,737 | — | 28,647 | (143,930 | ) | — | 44,454 | 1,723,682 | — | 304,935 | (1,551,198 | ) | — | 477,419 | ||||||||||||||||||||||||||||||||||
3/31/2016 | 114,909 | 312,495 | 19,263 | (181,459 | ) | — | 265,208 | 1,234,908 | 3,363,629 | 207,022 | (1,960,111 | ) | — | 2,845,448 | ||||||||||||||||||||||||||||||||||
R Shares | ||||||||||||||||||||||||||||||||||||||||||||||||
3/31/2017 | 26,806 | — | 10,058 | (58,680 | ) | — | (21,816 | ) | 293,118 | — | 107,032 | (632,106 | ) | — | (231,956 | ) | ||||||||||||||||||||||||||||||||
3/31/2016 | 63,349 | 1,392 | 7,188 | (70,497 | ) | — | 1,432 | 681,606 | 14,994 | 77,357 | (760,012 | ) | — | 13,945 | ||||||||||||||||||||||||||||||||||
IS Shares* | ||||||||||||||||||||||||||||||||||||||||||||||||
3/31/2017 | 122,422 | — | 3,983 | (569 | ) | — | 125,836 | 1,334,803 | — | 42,253 | (6,228 | ) | — | 1,370,828 | ||||||||||||||||||||||||||||||||||
3/31/2016 | 2,309 | — | 30 | (277 | ) | — | 2,062 | 24,783 | — | 327 | (2,994 | ) | — | 22,116 | ||||||||||||||||||||||||||||||||||
Seix Corporate Bond Fund |
| |||||||||||||||||||||||||||||||||||||||||||||||
I Shares | ||||||||||||||||||||||||||||||||||||||||||||||||
3/31/2017 | 828,065 | — | 47,093 | (469,373 | ) | — | 405,785 | 7,179,237 | — | 408,817 | (4,091,907 | ) | — | 3,496,147 | ||||||||||||||||||||||||||||||||||
3/31/2016 | 332,069 | — | 66,369 | (2,042,573 | ) | — | (1,644,135 | ) | 2,874,849 | — | 559,900 | (17,746,984 | ) | — | (14,312,235 | ) | ||||||||||||||||||||||||||||||||
A Shares | ||||||||||||||||||||||||||||||||||||||||||||||||
3/31/2017 | 95,015 | — | 1,515 | (87,407 | ) | — | 9,123 | 843,561 | — | 13,207 | (762,299 | ) | — | 94,469 | ||||||||||||||||||||||||||||||||||
3/31/2016 | 40,688 | — | 2,578 | (74,224 | ) | — | (30,958 | ) | 345,153 | — | 21,778 | (637,354 | ) | — | (270,423 | ) | ||||||||||||||||||||||||||||||||
C Shares | ||||||||||||||||||||||||||||||||||||||||||||||||
3/31/2017 | 12,236 | — | 25,715 | (143,863 | ) | — | (105,912 | ) | 106,691 | — | 222,675 | (1,245,894 | ) | — | (916,528 | ) | ||||||||||||||||||||||||||||||||
3/31/2016 | 39,199 | — | 42,617 | (161,946 | ) | — | (80,130 | ) | 328,481 | — | 355,742 | (1,369,368 | ) | — | (685,145 | ) | ||||||||||||||||||||||||||||||||
Seix Floating Rate High Income Fund |
| |||||||||||||||||||||||||||||||||||||||||||||||
I Shares | ||||||||||||||||||||||||||||||||||||||||||||||||
3/31/2017 | 289,063,783 | — | 15,590,389 | (160,236,917 | ) | — | 144,417,255 | 2,509,599,371 | — | 134,820,422 | (1,379,328,214 | ) | — | 1,265,091,579 | ||||||||||||||||||||||||||||||||||
3/31/2016 | 170,340,033 | — | 20,764,128 | (508,778,380 | ) | — | (317,674,219 | ) | 1,471,672,628 | — | 178,035,065 | (4,367,322,310 | ) | — | (2,717,614,617 | ) | ||||||||||||||||||||||||||||||||
A Shares | ||||||||||||||||||||||||||||||||||||||||||||||||
3/31/2017 | 7,679,974 | — | 705,138 | (10,072,473 | ) | — | (1,687,361 | ) | 66,616,768 | — | 6,095,203 | (87,424,923 | ) | — | (14,712,952 | ) | ||||||||||||||||||||||||||||||||
3/31/2016 | 8,169,669 | — | 715,765 | (8,337,227 | ) | — | 548,207 | 70,528,471 | — | 6,117,753 | (71,544,260 | ) | — | 5,101,964 | ||||||||||||||||||||||||||||||||||
C Shares | ||||||||||||||||||||||||||||||||||||||||||||||||
3/31/2017 | 1,369,748 | — | 203,486 | (1,690,147 | ) | — | (116,913 | ) | 11,881,102 | — | 1,758,616 | (14,592,374 | ) | — | (952,656 | ) | ||||||||||||||||||||||||||||||||
3/31/2016 | 1,195,922 | — | 201,422 | (2,044,517 | ) | — | (647,173 | ) | 10,336,524 | — | 1,718,817 | (17,473,145 | ) | — | (5,417,804 | ) | ||||||||||||||||||||||||||||||||
IS Shares | ||||||||||||||||||||||||||||||||||||||||||||||||
3/31/2017 | 84,999,452 | — | 3,072,382 | (74,014,403 | ) | — | 14,057,431 | 737,726,687 | — | 26,612,949 | (639,566,949 | ) | — | 124,772,687 | ||||||||||||||||||||||||||||||||||
3/31/2016 | 224,292,881 | — | 1,963,926 | (92,406,634 | ) | — | 133,850,173 | 1,966,663,031 | — | 16,665,384 | (778,962,744 | ) | — | 1,204,365,671 | ||||||||||||||||||||||||||||||||||
Seix Georgia Tax-Exempt Bond Fund |
| |||||||||||||||||||||||||||||||||||||||||||||||
I Shares | ||||||||||||||||||||||||||||||||||||||||||||||||
3/31/2017 | 1,618,914 | — | 382,035 | (3,067,993 | ) | — | (1,067,044 | ) | 17,390,581 | — | 4,084,735 | (32,726,917 | ) | — | (11,251,601 | ) | ||||||||||||||||||||||||||||||||
3/31/2016 | 2,112,609 | — | 281,773 | (4,711,514 | ) | — | (2,317,132 | ) | 22,739,783 | — | 3,045,225 | (50,879,549 | ) | — | (25,094,541 | ) | ||||||||||||||||||||||||||||||||
A Shares | ||||||||||||||||||||||||||||||||||||||||||||||||
3/31/2017 | 13,518 | — | 12,875 | (22,413 | ) | — | 3,980 | 147,460 | — | 137,721 | (241,155 | ) | — | 44,026 | ||||||||||||||||||||||||||||||||||
3/31/2016 | 17,533 | — | 7,749 | (29,719 | ) | — | (4,437 | ) | 191,368 | — | 83,945 | (320,008 | ) | — | (44,695 | ) | ||||||||||||||||||||||||||||||||
Seix High Grade Municipal Bond Fund |
| |||||||||||||||||||||||||||||||||||||||||||||||
I Shares | ||||||||||||||||||||||||||||||||||||||||||||||||
3/31/2017 | 2,706,709 | — | 354,720 | (4,398,678 | ) | — | (1,337,249 | ) | 32,497,259 | — | 4,178,501 | (52,780,991 | ) | — | (16,105,231 | ) | ||||||||||||||||||||||||||||||||
3/31/2016 | 3,082,083 | — | 189,300 | (2,989,888 | ) | — | 281,495 | 37,610,574 | — | 2,310,363 | (36,571,732 | ) | — | 3,349,205 | ||||||||||||||||||||||||||||||||||
A Shares | ||||||||||||||||||||||||||||||||||||||||||||||||
3/31/2017 | 203,351 | — | 57,190 | (342,288 | ) | — | (81,747 | ) | 2,544,525 | — | 672,539 | (4,168,123 | ) | — | (951,059 | ) | ||||||||||||||||||||||||||||||||
3/31/2016 | 191,190 | — | 30,996 | (432,490 | ) | — | (210,304 | ) | 2,332,202 | — | 378,352 | (5,267,431 | ) | — | (2,556,877 | ) | ||||||||||||||||||||||||||||||||
156
Table of Contents
NOTES TO FINANCIAL STATEMENTS (continued)
RIDGEWORTH FUNDS March 31, 2017
| Shares Issued | Shares Issued- Merger | Shares Reinvested | Shares Redeemed | Shares Converted | Net Increase (Decrease) in Shares Outstanding | Proceeds from Shares Issued | Issued- Merger | Dividends Reinvested | Cost of Shares Redeemed | Shares Converted | Change in Net Assets from Capital Transactions | |||||||||||||||||||||||||||||||||||||
Seix High Income Fund |
| |||||||||||||||||||||||||||||||||||||||||||||||
I Shares | ||||||||||||||||||||||||||||||||||||||||||||||||
3/31/2017 | 36,931,887 | — | 4,836,232 | (63,395,994 | ) | — | (21,627,875 | ) | $233,696,176 | $— | $30,649,854 | $(399,905,306 | ) | $— | $(135,559,276 | ) | ||||||||||||||||||||||||||||||||
3/31/2016 | 53,888,034 | — | 6,491,068 | (80,951,480 | ) | — | (20,572,378 | ) | 337,896,385 | — | 40,140,348 | (498,500,450 | ) | — | (120,463,717 | ) | ||||||||||||||||||||||||||||||||
A Shares | ||||||||||||||||||||||||||||||||||||||||||||||||
3/31/2017 | 9,701,530 | — | 444,005 | (7,716,420 | ) | — | 2,429,115 | 61,422,502 | — | 2,825,115 | (48,627,457 | ) | — | 15,620,160 | ||||||||||||||||||||||||||||||||||
3/31/2016 | 4,030,897 | — | 497,172 | (6,945,176 | ) | — | (2,417,107 | ) | 25,894,346 | — | 3,085,138 | (43,754,670 | ) | — | (14,775,186 | ) | ||||||||||||||||||||||||||||||||
R Shares | ||||||||||||||||||||||||||||||||||||||||||||||||
3/31/2017 | 422,206 | — | 129,488 | (737,999 | ) | — | (186,305 | ) | 2,687,223 | — | 821,537 | (4,667,884 | ) | — | (1,159,124 | ) | ||||||||||||||||||||||||||||||||
3/31/2016 | 359,333 | — | 161,075 | (1,187,358 | ) | — | (666,950 | ) | 2,219,409 | — | 997,383 | (7,386,173 | ) | — | (4,169,381 | ) | ||||||||||||||||||||||||||||||||
IS Shares | ||||||||||||||||||||||||||||||||||||||||||||||||
3/31/2017 | 3,829,041 | — | 157,157 | (3,535,834 | ) | — | 450,364 | 23,657,410 | — | 996,736 | (22,677,006 | ) | — | 1,977,140 | ||||||||||||||||||||||||||||||||||
3/31/2016 | 679,195 | — | 42,294 | (1,050,372 | ) | — | (328,883 | ) | 4,520,923 | — | 267,858 | (6,288,539 | ) | — | (1,499,758 | ) | ||||||||||||||||||||||||||||||||
Seix High Yield Fund |
| |||||||||||||||||||||||||||||||||||||||||||||||
I Shares | ||||||||||||||||||||||||||||||||||||||||||||||||
3/31/2017 | 26,284,862 | — | 2,743,807 | (38,318,802 | ) | — | (9,290,133 | ) | 215,421,169 | — | 22,583,441 | (314,503,252 | ) | — | (76,498,642 | ) | ||||||||||||||||||||||||||||||||
3/31/2016 | 41,765,800 | — | 2,677,794 | (57,054,822 | ) | — | (12,611,228 | ) | 344,971,553 | — | 21,784,528 | (463,492,389 | ) | — | (96,736,308 | ) | ||||||||||||||||||||||||||||||||
A Shares | ||||||||||||||||||||||||||||||||||||||||||||||||
3/31/2017 | 584,118 | — | 35,550 | (838,715 | ) | — | (219,047 | ) | 4,707,293 | — | 284,743 | (6,678,722 | ) | — | (1,686,686 | ) | ||||||||||||||||||||||||||||||||
3/31/2016 | 1,826,899 | — | 49,068 | (1,848,225 | ) | — | 27,742 | 14,701,000 | — | 392,138 | (14,843,739 | ) | — | 249,399 | ||||||||||||||||||||||||||||||||||
R Shares | ||||||||||||||||||||||||||||||||||||||||||||||||
3/31/2017 | — | — | 1,764 | (59,605 | ) | — | (57,841 | ) | — | — | 14,424 | (484,312 | ) | — | (469,888 | ) | ||||||||||||||||||||||||||||||||
3/31/2016 | 2,247 | — | 4,222 | (22,713 | ) | — | (16,244 | ) | 18,090 | — | 34,524 | (193,271 | ) | — | (140,657 | ) | ||||||||||||||||||||||||||||||||
IS Shares† | ||||||||||||||||||||||||||||||||||||||||||||||||
3/31/2017 | 5,140,957 | — | 77,737 | (117,595 | ) | — | 5,101,099 | 42,159,384 | — | 648,902 | (971,089 | ) | — | 41,837,197 | ||||||||||||||||||||||||||||||||||
Seix Investment Grade Tax-Exempt Bond Fund |
| |||||||||||||||||||||||||||||||||||||||||||||||
I Shares | ||||||||||||||||||||||||||||||||||||||||||||||||
3/31/2017 | 16,053,018 | — | 2,015,150 | (24,907,133 | ) | — | (6,838,965 | ) | 191,642,052 | — | 23,780,536 | (295,165,686 | ) | — | (79,743,098 | ) | ||||||||||||||||||||||||||||||||
3/31/2016 | 13,026,768 | — | 1,590,200 | (16,652,152 | ) | — | (2,035,184 | ) | 158,312,240 | — | 19,300,261 | (202,281,494 | ) | — | (24,668,993 | ) | ||||||||||||||||||||||||||||||||
A Shares | ||||||||||||||||||||||||||||||||||||||||||||||||
3/31/2017 | 90,352 | — | 69,969 | (451,478 | ) | — | (291,157 | ) | 1,088,691 | — | 826,011 | (5,429,330 | ) | — | (3,514,628 | ) | ||||||||||||||||||||||||||||||||
3/31/2016 | 270,002 | — | 61,646 | (692,731 | ) | — | (361,083 | ) | 3,278,639 | — | 748,831 | (8,422,052 | ) | — | (4,394,582 | ) | ||||||||||||||||||||||||||||||||
Seix Limited Duration Fund |
| |||||||||||||||||||||||||||||||||||||||||||||||
I Shares | ||||||||||||||||||||||||||||||||||||||||||||||||
3/31/2017 | — | — | — | — | — | — | — | — | — | — | — | — | ||||||||||||||||||||||||||||||||||||
3/31/2016 | 1 | — | — | (1 | ) | — | — | 10 | — | — | (10 | ) | — | — | ||||||||||||||||||||||||||||||||||
Seix North Carolina Tax-Exempt Bond Fund |
| |||||||||||||||||||||||||||||||||||||||||||||||
I Shares | ||||||||||||||||||||||||||||||||||||||||||||||||
3/31/2017 | 732,240 | — | 113,615 | (1,384,250 | ) | — | (538,395 | ) | 7,453,872 | — | 1,155,981 | (14,089,116 | ) | — | (5,479,263 | ) | ||||||||||||||||||||||||||||||||
3/31/2016 | 844,230 | — | 22,593 | (1,697,037 | ) | — | (830,214 | ) | 8,794,686 | — | 235,955 | (17,670,389 | ) | — | (8,639,748 | ) | ||||||||||||||||||||||||||||||||
A Shares | ||||||||||||||||||||||||||||||||||||||||||||||||
3/31/2017 | 209,039 | — | 6,712 | (45,502 | ) | — | 170,249 | 2,226,916 | — | 67,215 | (455,365 | ) | — | 1,838,766 | ||||||||||||||||||||||||||||||||||
3/31/2016 | 3,850 | — | 1,440 | (34,435 | ) | — | (29,145 | ) | 40,276 | — | 14,957 | (356,431 | ) | — | (301,198 | ) | ||||||||||||||||||||||||||||||||
Seix Short-Term Bond Fund |
| |||||||||||||||||||||||||||||||||||||||||||||||
I Shares | ||||||||||||||||||||||||||||||||||||||||||||||||
3/31/2017 | 1,737,971 | — | 36,874 | (1,515,715 | ) | — | 259,130 | 17,311,866 | — | 367,284 | (15,114,327 | ) | — | 2,564,823 | ||||||||||||||||||||||||||||||||||
3/31/2016 | 2,020,005 | — | 28,202 | (2,144,798 | ) | — | (96,591 | ) | 20,069,817 | — | 280,754 | (21,316,782 | ) | — | (966,211 | ) | ||||||||||||||||||||||||||||||||
A Shares | ||||||||||||||||||||||||||||||||||||||||||||||||
3/31/2017 | 48,382 | — | 1,257 | (27,871 | ) | — | 21,768 | 480,970 | — | 12,550 | (278,622 | ) | — | 214,898 | ||||||||||||||||||||||||||||||||||
3/31/2016 | 39,217 | — | 1,049 | (61,581 | ) | — | (21,315 | ) | 390,439 | — | 10,466 | (613,864 | ) | — | (212,959 | ) | ||||||||||||||||||||||||||||||||
C Shares | ||||||||||||||||||||||||||||||||||||||||||||||||
3/31/2017 | 8,622 | — | 41 | (50,987 | ) | — | (42,324 | ) | 86,473 | — | 412 | (508,602 | ) | — | (421,717 | ) | ||||||||||||||||||||||||||||||||
3/31/2016 | 34,023 | — | — | (32,941 | ) | — | 1,082 | 339,111 | — | — | (328,324 | ) | — | 10,787 | ||||||||||||||||||||||||||||||||||
Seix Short-Term Municipal Bond Fund |
| |||||||||||||||||||||||||||||||||||||||||||||||
I Shares | ||||||||||||||||||||||||||||||||||||||||||||||||
3/31/2017 | 1,181,181 | — | 11,513 | (1,728,223 | ) | — | (535,529 | ) | 11,749,587 | — | 114,431 | (17,210,099 | ) | — | (5,346,081 | ) | ||||||||||||||||||||||||||||||||
3/31/2016 | 953,169 | — | 7,278 | (1,603,161 | ) | — | (642,714 | ) | 9,508,130 | — | 72,544 | (16,004,683 | ) | — | (6,424,009 | ) | ||||||||||||||||||||||||||||||||
A Shares | ||||||||||||||||||||||||||||||||||||||||||||||||
3/31/2017 | 21,045 | — | 1,750 | (577,505 | ) | — | (554,710 | ) | 210,348 | — | 17,405 | (5,741,822 | ) | — | (5,514,069 | ) | ||||||||||||||||||||||||||||||||
3/31/2016 | 451,219 | — | 1,966 | (102,645 | ) | — | 350,540 | 4,498,824 | — | 19,585 | (1,023,872 | ) | — | 3,494,537 | ||||||||||||||||||||||||||||||||||
Seix Total Return Bond Fund |
| |||||||||||||||||||||||||||||||||||||||||||||||
I Shares | ||||||||||||||||||||||||||||||||||||||||||||||||
3/31/2017 | 23,029,081 | — | 2,937,152 | (41,092,729 | ) | — | (15,126,496 | ) | 245,458,060 | — | 30,887,683 | (438,059,791 | ) | — | (161,714,048 | ) | ||||||||||||||||||||||||||||||||
3/31/2016 | 24,445,338 | — | 1,895,924 | (25,707,163 | ) | — | 634,099 | 258,433,518 | — | 20,024,042 | (271,413,458 | ) | — | 7,044,102 | ||||||||||||||||||||||||||||||||||
A Shares | ||||||||||||||||||||||||||||||||||||||||||||||||
3/31/2017 | 488,978 | — | 79,906 | (972,349 | ) | — | (403,465 | ) | 5,404,276 | — | 868,410 | (10,768,844 | ) | — | (4,496,158 | ) | ||||||||||||||||||||||||||||||||
3/31/2016 | 462,175 | — | 55,139 | (1,487,568 | ) | — | (970,254 | ) | 5,047,588 | — | 601,829 | (16,200,651 | ) | — | (10,551,234 | ) | ||||||||||||||||||||||||||||||||
R Shares | ||||||||||||||||||||||||||||||||||||||||||||||||
3/31/2017 | 683,303 | — | 135,661 | (1,748,621 | ) | — | (929,657 | ) | 7,285,574 | — | 1,421,889 | (18,550,551 | ) | — | (9,843,088 | ) | ||||||||||||||||||||||||||||||||
3/31/2016 | 795,487 | — | 77,532 | (2,150,252 | ) | — | (1,277,233 | ) | 8,396,594 | — | 819,135 | (22,713,931 | ) | — | (13,498,202 | ) | ||||||||||||||||||||||||||||||||
IS Shares | ||||||||||||||||||||||||||||||||||||||||||||||||
3/31/2017 | 5,600,084 | — | 318,038 | (1,484,011 | ) | — | 4,434,111 | 59,720,229 | — | 3,323,284 | (15,706,582 | ) | — | 47,336,931 | ||||||||||||||||||||||||||||||||||
3/31/2016 | 2,408,963 | — | 141,104 | (3,939,256 | ) | — | (1,389,189 | ) | 25,424,750 | — | 1,490,984 | (41,629,701 | ) | — | (14,713,967 | ) | ||||||||||||||||||||||||||||||||
157
Table of Contents
NOTES TO FINANCIAL STATEMENTS (continued)
RIDGEWORTH FUNDS March 31, 2017
| Shares Issued | Shares Issued- Merger | Shares Reinvested | Shares Redeemed | Shares Converted | Net Increase (Decrease) in Shares Outstanding | Proceeds from Shares Issued | Issued- Merger | Dividends Reinvested | Cost of Shares Redeemed | Shares Converted | Change in Net Assets from Capital Transactions | |||||||||||||||||||||||||||||||||||||
Seix U.S. Government Securities Ultra- Short Bond Fund |
| |||||||||||||||||||||||||||||||||||||||||||||||
I Shares | ||||||||||||||||||||||||||||||||||||||||||||||||
3/31/2017 | 50,879,485 | — | 1,292,838 | (71,147,689 | ) | — | (18,975,366 | ) | 510,267,724 | — | 12,961,891 | (713,432,362 | ) | — | (190,202,747 | ) | ||||||||||||||||||||||||||||||||
3/31/2016 | 69,731,135 | — | 1,082,880 | (80,130,245 | ) | — | (9,316,230 | ) | 702,624,532 | — | 10,908,593 | (807,576,064 | ) | — | (94,042,939 | ) | ||||||||||||||||||||||||||||||||
IS Shares† | ||||||||||||||||||||||||||||||||||||||||||||||||
3/31/2017 | 4,058,772 | — | 7,089 | (813,600 | ) | — | 3,252,261 | 40,750,039 | — | 71,132 | (8,167,887 | ) | — | 32,653,284 | ||||||||||||||||||||||||||||||||||
Seix U.S. Mortgage Fund |
| |||||||||||||||||||||||||||||||||||||||||||||||
I Shares | ||||||||||||||||||||||||||||||||||||||||||||||||
3/31/2017 | 308,551 | — | 39,939 | (975,212 | ) | — | (626,722 | ) | 3,480,238 | — | 448,970 | (10,974,567 | ) | — | (7,045,359 | ) | ||||||||||||||||||||||||||||||||
3/31/2016 | 911,814 | 1,506,410 | 25,558 | (554,435 | ) | — | 1,889,347 | 10,270,176 | 16,905,776 | 287,767 | (6,240,251 | ) | — | 21,223,468 | ||||||||||||||||||||||||||||||||||
A Shares | ||||||||||||||||||||||||||||||||||||||||||||||||
3/31/2017 | 111,205 | — | 10,790 | (377,961 | ) | — | (255,966 | ) | 1,251,909 | — | 120,989 | (4,187,274 | ) | — | (2,814,376 | ) | ||||||||||||||||||||||||||||||||
3/31/2016 | 184,007 | 49,212 | 7,846 | (121,669 | ) | — | 119,396 | 2,066,876 | 551,248 | 88,138 | (1,363,719 | ) | — | 1,342,543 | ||||||||||||||||||||||||||||||||||
C Shares | ||||||||||||||||||||||||||||||||||||||||||||||||
3/31/2017 | 5,572 | — | 4,925 | (106,957 | ) | — | (96,460 | ) | 63,098 | — | 55,159 | �� | (1,205,681 | ) | — | (1,087,424 | ) | |||||||||||||||||||||||||||||||
3/31/2016 | 72,081 | 104,870 | 3,533 | (49,636 | ) | — | 130,848 | 809,121 | 1,176,793 | 39,767 | (558,099 | ) | — | 1,467,582 | ||||||||||||||||||||||||||||||||||
Seix Ultra-Short Bond Fund |
| |||||||||||||||||||||||||||||||||||||||||||||||
I Shares | ||||||||||||||||||||||||||||||||||||||||||||||||
3/31/2017 | 8,013,031 | — | 97,010 | (9,911,265 | ) | — | (1,801,224 | ) | 79,739,417 | — | 965,526 | (98,619,424 | ) | — | (17,914,481 | ) | ||||||||||||||||||||||||||||||||
3/31/2016 | 3,877,331 | — | 78,994 | (7,694,691 | ) | — | (3,738,366 | ) | 38,499,137 | — | 784,778 | (76,493,415 | ) | — | (37,209,500 | ) | ||||||||||||||||||||||||||||||||
Seix Virginia Intermediate Municipal Bond Fund |
| |||||||||||||||||||||||||||||||||||||||||||||||
I Shares | ||||||||||||||||||||||||||||||||||||||||||||||||
3/31/2017 | 1,487,647 | — | 106,417 | (3,205,848 | ) | — | (1,611,784 | ) | 14,610,297 | — | 1,023,765 | (31,086,428 | ) | — | (15,452,366 | ) | ||||||||||||||||||||||||||||||||
3/31/2016 | 1,119,433 | — | 116,554 | (6,446,425 | ) | — | (5,210,438 | ) | 11,308,335 | — | 1,164,775 | (65,333,009 | ) | — | (52,859,899 | ) | ||||||||||||||||||||||||||||||||
A Shares | ||||||||||||||||||||||||||||||||||||||||||||||||
3/31/2017 | 38,738 | — | 19,353 | (112,443 | ) | — | (54,352 | ) | 382,686 | — | 187,007 | (1,101,491 | ) | — | (531,798 | ) | ||||||||||||||||||||||||||||||||
3/31/2016 | 15,992 | — | 20,643 | (106,197 | ) | — | (69,562 | ) | 161,455 | — | 206,765 | (1,074,473 | ) | — | (706,253 | ) | ||||||||||||||||||||||||||||||||
| * | IS Shares commenced operations on August 3, 2015 for Seix Core Bond Fund and August 1, 2016 for Seix High Yield Fund and Seix U.S. Government Securities Ultra-Short Bond Fund. |
| 5. | Investment Transactions |
The cost of security purchases and the proceeds from sales and maturities of securities, excluding securities maturing less than one year from acquisition and U.S. government securities, for the fiscal year ended March 31, 2017, were as follows:
Fund | Purchases | Sales and Maturities | ||||||
Seix Core Bond Fund | $94,292,258 | $118,388,194 | ||||||
Seix Corporate Bond Fund | 27,207,951 | 26,821,992 | ||||||
Seix Floating Rate High Income Fund | 4,817,936,987 | 3,611,174,371 | ||||||
Seix Georgia Tax-Exempt Bond Fund | 48,878,470 | 61,482,043 | ||||||
Seix High Grade Municipal Bond Fund | 200,229,204 | 210,354,600 | ||||||
Seix High Income Fund | 533,886,441 | 641,308,158 | ||||||
Seix High Yield Fund | 452,815,796 | 491,147,103 | ||||||
Seix Investment Grade Tax-Exempt Bond Fund | 786,376,729 | 851,906,978 | ||||||
Seix Limited Duration Fund | 5,872,795 | 5,835,586 | ||||||
Seix North Carolina Tax-Exempt Bond Fund | 16,808,193 | 19,984,738 | ||||||
Seix Short-Term Bond Fund | 16,635,655 | 19,132,336 | ||||||
Seix Short-Term Municipal Bond Fund | 19,006,524 | 27,418,781 | ||||||
Seix Total Return Bond Fund | 461,743,655 | 498,882,269 | ||||||
Seix U.S. Government Securities Ultra-Short Bond Fund | 716,911,902 | 553,441,627 | ||||||
Seix U.S. Mortgage Fund | 4,152,333 | 4,204,337 | ||||||
Seix Ultra-Short Bond Fund | 114,923,461 | 133,591,767 | ||||||
Seix Virginia Intermediate Municipal Bond Fund | 30,048,325 | 45,224,449 | ||||||
158
Table of Contents
NOTES TO FINANCIAL STATEMENTS (continued)
RIDGEWORTH FUNDS March 31, 2017
The cost of security purchases and proceeds from sales and maturities of U.S. government securities, excluding short-term investments, for the fiscal year ended March 31, 2017, were as follows:
Fund | Purchases—U.S. Government Securities | Sales—U.S. Government Securities | ||||||
Seix Core Bond Fund | $374,120,385 | $365,794,443 | ||||||
Seix Corporate Bond Fund | 8,314,394 | 6,915,506 | ||||||
Seix Limited Duration Fund | 294,770 | 1,350 | ||||||
Seix Short-Term Bond Fund | 54,435,107 | 49,795,733 | ||||||
Seix Total Return Bond Fund | 1,506,272,212 | 1,491,535,783 | ||||||
Seix U.S. Government Securities Ultra-Short Bond Fund | 407,648,250 | 668,424,292 | ||||||
Seix U.S. Mortgage Fund | 34,011,809 | 45,118,821 | ||||||
Seix Ultra-Short Bond Fund | 16,577,545 | 14,846,092 | ||||||
| 6. | Federal Income Tax Information |
The following information is presented on an income tax basis and takes into consideration differences between amounts for financial statement and income tax purposes. These “book/tax” differences are either considered temporary or permanent in nature. To the extent these differences are permanent in nature (i.e., foreign currency transactions and return of capital on securities) such amounts are reclassified within the composition of net assets based on their U.S. federal tax-basis treatment; temporary differences do not require reclassification.
The effects of certain differences reclassified as of March 31, 2017 were as follows:
| Paid-in Capital | Accumulated Net Realized Gain (Loss) | Undistributed Investment Income (Loss) | ||||||||||
Seix Core Bond Fund | $— | $(753,882 | ) | $753,882 | ||||||||
Seix Floating Rate High Income Fund | (25,038,485 | ) | 32,008,954 | (6,970,469 | ) | |||||||
Seix Georgia Tax-Exempt Bond Fund | — | 63 | (63 | ) | ||||||||
Seix High Grade Municipal Bond Fund | — | 63 | (63 | ) | ||||||||
Seix High Income Fund | — | 226,651 | (226,651 | ) | ||||||||
Seix Investment Grade Tax-Exempt Bond Fund | — | 665 | (665 | ) | ||||||||
Seix Limited Duration Fund | — | 2,086 | (2,086 | ) | ||||||||
Seix North Carolina Tax-Exempt Bond Fund | (11,042 | ) | 49 | 10,993 | ||||||||
Seix Short-Term Bond Fund | — | (32,253 | ) | 32,253 | ||||||||
Seix Short-Term Municipal Bond Fund | — | 2 | (2 | ) | ||||||||
Seix Total Return Bond Fund | — | (1,231,838 | ) | 1,231,838 | ||||||||
Seix U.S. Government Securities Ultra-Short Bond Fund | — | (3,790,359 | ) | 3,790,359 | ||||||||
Seix U.S. Mortgage Fund | — | (371,768 | ) | 371,768 | ||||||||
Seix Ultra-Short Bond Fund | (202,726 | ) | 147,306 | 55,420 | ||||||||
Seix Virginia Intermediate Municipal Bond Fund | — | 182 | (182 | ) | ||||||||
The cost of investments and aggregate gross unrealized appreciation and depreciation for securities held by the Funds as of March 31, 2017 were as follows:
Fund | Tax Cost | Aggregate Gross Unrealized Appreciation | Aggregate Gross Unrealized (Depreciation) | Net Unrealized Appreciation (Depreciation) | ||||||||||||
Seix Core Bond Fund | $222,027,434 | $1,968,697 | $(1,242,718 | ) | $725,979 | |||||||||||
Seix Corporate Bond Fund | 21,938,216 | 310,227 | (154,324 | ) | 155,903 | |||||||||||
Seix Floating Rate High Income Fund | 6,514,541,926 | 58,518,417 | (105,597,991 | ) | (47,079,574 | ) | ||||||||||
Seix Georgia Tax-Exempt Bond Fund | 94,459,614 | 3,387,758 | (702,286 | ) | 2,685,472 | |||||||||||
Seix High Grade Municipal Bond Fund | 91,619,943 | 2,514,297 | (443,436 | ) | 2,070,861 | |||||||||||
Seix High Income Fund | 557,862,262 | 22,174,113 | (14,369,973 | ) | 7,804,140 | |||||||||||
Seix High Yield Fund | 545,217,582 | 17,043,866 | (8,452,951 | ) | 8,590,915 | |||||||||||
159
Table of Contents
NOTES TO FINANCIAL STATEMENTS (continued)
RIDGEWORTH FUNDS March 31, 2017
Fund | Tax Cost | Aggregate Gross Unrealized Appreciation | Aggregate Gross Unrealized (Depreciation) | Net Unrealized Appreciation (Depreciation) | ||||||||||||
Seix Investment Grade Tax-Exempt Bond Fund | $526,219,925 | $17,652,617 | $(2,404,633 | ) | $15,247,984 | |||||||||||
Seix Limited Duration Fund | 6,701,343 | 13,895 | (1,352 | ) | 12,543 | |||||||||||
Seix North Carolina Tax-Exempt Bond Fund | 25,537,797 | 784,944 | (114,905 | ) | 670,039 | |||||||||||
Seix Short-Term Bond Fund | 55,411,925 | 74,147 | (181,267 | ) | (107,120 | ) | ||||||||||
Seix Short-Term Municipal Bond Fund | 29,082,953 | 80,250 | (50,138 | ) | 30,112 | |||||||||||
Seix Total Return Bond Fund | 977,630,532 | 11,725,556 | (6,597,535 | ) | 5,128,021 | |||||||||||
Seix U.S. Government Securities Ultra-Short Bond Fund | 1,392,665,197 | 6,900,072 | (1,201,340 | ) | 5,698,732 | |||||||||||
Seix U.S. Mortgage Fund | 25,430,021 | 129,311 | (193,099 | ) | (63,788 | ) | ||||||||||
Seix Ultra-Short Bond Fund | 87,125,193 | 190,347 | (38,618 | ) | 151,729 | |||||||||||
Seix Virginia Intermediate Municipal Bond Fund | 49,113,282 | 1,830,174 | (259,113 | ) | 1,571,061 | |||||||||||
The tax character of distributions paid to shareholders during the fiscal year ended March 31, 2017 was as follows:
| Distributions paid from | ||||||||||||||||||||
Fund | Net Investment Income* | Net Long Term Capital Gains | Tax-Exempt Distributions** | Return of Capital | Total Distributions Paid | |||||||||||||||
Seix Core Bond Fund | $7,693,563 | $1,388,513 | $— | $— | $9,082,076 | |||||||||||||||
Seix Corporate Bond Fund | 594,391 | 75,686 | — | — | 670,077 | |||||||||||||||
Seix Floating Rate High Income Fund | 223,778,063 | — | — | — | 223,778,063 | |||||||||||||||
Seix Georgia Tax-Exempt Bond Fund | 73,892 | 1,343,503 | 2,882,065 | — | 4,299,460 | |||||||||||||||
Seix High Grade Municipal Bond Fund | 2,782,913 | 826,599 | 2,237,364 | — | 5,846,876 | |||||||||||||||
Seix High Income Fund | 36,270,142 | — | — | — | 36,270,142 | |||||||||||||||
Seix High Yield Fund | 31,049,709 | — | — | — | 31,049,709 | |||||||||||||||
Seix Investment Grade Tax-Exempt Bond Fund | 10,667,287 | 2,775,085 | 14,256,352 | — | 27,698,724 | |||||||||||||||
Seix Limited Duration Fund | 43,695 | — | — | — | 43,695 | |||||||||||||||
Seix North Carolina Tax-Exempt Bond Fund | 17,488 | 639,791 | 644,274 | — | 1,301,553 | |||||||||||||||
Seix Short-Term Bond Fund | 431,726 | — | — | — | 431,726 | |||||||||||||||
Seix Short-Term Municipal Bond Fund | 41,363 | — | 244,354 | — | 285,717 | |||||||||||||||
Seix Total Return Bond Fund | 31,311,800 | 5,766,584 | — | — | 37,078,384 | |||||||||||||||
Seix U.S. Government Securities Ultra-Short Bond Fund | 14,625,825 | — | — | — | 14,625,825 | |||||||||||||||
Seix U.S. Mortgage Fund | 532,110 | 101,819 | — | — | 633,929 | |||||||||||||||
Seix Ultra-Short Bond Fund | 1,125,578 | — | — | — | 1,125,578 | |||||||||||||||
Seix Virginia Intermediate Municipal Bond Fund | 630,990 | 1,148,111 | 1,538,298 | — | 3,317,399 | |||||||||||||||
| * | Net Investment income includes taxable market discount income and short-term capital gains, if any. |
| ** | The Funds hereby designate these amounts as Exempt Interest Dividends. |
Amounts designated as “—” are $0.
The tax character of distributions paid to shareholders during the fiscal year ended March 31, 2016 was as follows:
| Distributions paid from | ||||||||||||||||||||
Fund | Net Investment Income* | Net Long Term Capital Gains | Tax-Exempt Distributions** | Return of Capital | Total Distributions Paid | |||||||||||||||
Seix Core Bond Fund | $5,472,740 | $1,298,555 | $— | $— | $6,771,295 | |||||||||||||||
Seix Corporate Bond Fund | 670,776 | 271,821 | — | 25,678 | 968,275 | |||||||||||||||
Seix Floating Rate High Income Fund | 267,193,754 | — | — | — | 267,193,754 | |||||||||||||||
Seix Georgia Tax-Exempt Bond Fund | 35 | — | 3,197,437 | — | 3,197,472 | |||||||||||||||
Seix High Grade Municipal Bond Fund | 1,029,211 | 102,216 | 2,517,779 | — | 3,649,206 | |||||||||||||||
Seix High Income Fund | 47,227,116 | — | — | — | 47,227,116 | |||||||||||||||
Seix High Yield Fund | 37,383,404 | — | — | — | 37,383,404 | |||||||||||||||
160
Table of Contents
NOTES TO FINANCIAL STATEMENTS (continued)
RIDGEWORTH FUNDS March 31, 2017
| Distributions paid from | ||||||||||||||||||||
Fund | Net Investment Income* | Net Long Term Capital Gains | Tax-Exempt Distributions** | Return of Capital | Total Distributions Paid | |||||||||||||||
Seix Investment Grade Tax-Exempt Bond Fund | $2,968,203 | $4,455,803 | $15,143,661 | $— | $22,567,667 | |||||||||||||||
Seix Limited Duration Fund | 17,332 | — | — | — | 17,332 | |||||||||||||||
Seix North Carolina Tax-Exempt Bond Fund | — | 168,510 | 764,382 | — | 932,892 | |||||||||||||||
Seix Short-Term Bond Fund | 350,454 | — | — | — | 350,454 | |||||||||||||||
Seix Short-Term Municipal Bond Fund | 31,579 | 54,861 | 164,911 | — | 251,351 | |||||||||||||||
Seix Total Return Bond Fund | 22,218,418 | 1,185,364 | — | — | 23,403,782 | |||||||||||||||
Seix U.S. Government Securities Ultra-Short Bond Fund | 12,422,092 | — | — | — | 12,422,092 | |||||||||||||||
Seix U.S. Mortgage Fund | 420,732 | — | — | — | 420,732 | |||||||||||||||
Seix Ultra-Short Bond Fund | 924,985 | — | — | — | 924,985 | |||||||||||||||
Seix Virginia Intermediate Municipal Bond Fund | 118,135 | 1,944,263 | 2,408,086 | — | 4,470,484 | |||||||||||||||
| * | Net Investment income includes taxable market discount income and short-term capital gains, if any. |
| ** | The Funds hereby designate these amounts as Exempt Interest Dividends. |
Amounts designated as “—” are $0 or have been rounded to $0.
As of March 31, 2017 the components of distributable earnings (accumulated losses) on a federal income tax basis were as follows:
Fund | Undistributed Tax Exempt Income | Undistributed Ordinary Income | Undistributed Long Term Capital Gains | Net Unrealized Appreciation (Depreciation)* | Loss Carryforwards and Deferrals | Total | ||||||||||||||||||
Seix Core Bond Fund | $— | $75,681 | $— | $725,979 | $(2,844,585 | ) | $(2,042,925 | ) | ||||||||||||||||
Seix Corporate Bond Fund | — | 14,998 | — | 155,902 | (1 | ) | 170,899 | |||||||||||||||||
Seix Floating Rate High Income Fund | — | 22,677,700 | — | (47,032,445 | ) | (261,718,156 | ) | (286,072,901 | ) | |||||||||||||||
Seix Georgia Tax-Exempt Bond Fund | 407,917 | — | 486,269 | 2,685,472 | (295,605 | ) | 3,284,053 | |||||||||||||||||
Seix High Grade Municipal Bond Fund | 164,948 | — | — | 2,070,861 | (1,074,987 | ) | 1,160,822 | |||||||||||||||||
Seix High Income Fund | — | 2,559,612 | — | 7,804,142 | (87,479,424 | ) | (77,115,670 | ) | ||||||||||||||||
Seix High Yield Fund | — | 1,278,707 | — | 8,590,921 | (64,238,599 | ) | (54,368,971 | ) | ||||||||||||||||
Seix Investment Grade Tax-Exempt Bond Fund | 907,096 | — | — | 15,247,984 | (6,547,656 | ) | 9,607,424 | |||||||||||||||||
Seix Limited Duration Fund | — | 4,546 | — | 12,543 | (816,664 | ) | (799,575 | ) | ||||||||||||||||
Seix North Carolina Tax-Exempt Bond Fund | — | — | — | 670,039 | (168,143 | ) | 501,896 | |||||||||||||||||
Seix Short-Term Bond Fund | — | 55,475 | — | (107,120 | ) | (1,191,316 | ) | (1,242,961 | ) | |||||||||||||||
Seix Short-Term Municipal Bond Fund | 16,128 | — | — | 30,113 | (9,268 | ) | 36,973 | |||||||||||||||||
Seix Total Return Bond Fund | — | 2,599,659 | — | 5,161,508 | (14,587,166 | ) | (6,825,999 | ) | ||||||||||||||||
Seix U.S. Government Securities Ultra-Short Bond Fund | — | 1,261,245 | — | 5,698,734 | (15,182,917 | ) | (8,222,938 | ) | ||||||||||||||||
Seix U.S. Mortgage Fund | — | 25,964 | — | (63,788 | ) | (108,994 | ) | (146,818 | ) | |||||||||||||||
Seix Ultra-Short Bond Fund | — | 106,115 | — | 151,728 | (1,965,174 | ) | (1,707,331 | ) | ||||||||||||||||
Seix Virginia Intermediate Municipal Bond Fund | 121,265 | — | 477,743 | 1,571,061 | (472,345 | ) | 1,697,724 | |||||||||||||||||
| * | The differences between book-basis and tax-basis unrealized appreciation (depreciation) is attributable primarily to tax deferral of losses on wash sales, futures contract mark to market, dividends payable, bank loan adjustments, forward contracts mark to market 988(a)(1)(b), mark to market on credit default swaps, trust adjustments and straddle loss deferrals. |
Amounts designated as “—” are $0.
161
Table of Contents
NOTES TO FINANCIAL STATEMENTS (continued)
RIDGEWORTH FUNDS March 31, 2017
The Funds utilize the provisions of the federal income tax laws that provide for the carryforward of capital losses from prior years, offsetting such losses against any future realized capital gains. Under the Regulated Investment Company Modernization Act of 2010 (the “Act”), net capital losses recognized in taxable years beginning after December 22, 2010 (“post-enactment”), may be carried forward indefinitely, and their character is retained as short-term and/or long-term losses. Previously, net capital losses were carried forward for eight years and treated as short-term losses (“pre-enactment”). The Act requires that post-enactment net capital losses be used before pre-enactment net capital losses.
As of March 31, 2017, the post-enactment accumulated short-term and long-term capital loss carryforwards were as follows:
Fund | Short Term | Long Term | Total | |||||||||
Seix Floating Rate High Income Fund | $63,944,150 | $197,774,006 | $261,718,156 | |||||||||
Seix High Income Fund | 21,609,345 | 65,870,079 | 87,479,424 | |||||||||
Seix High Yield Fund | 18,548,519 | 45,690,080 | 64,238,599 | |||||||||
Seix U.S. Government Securities Ultra-Short Bond Fund | 6,774,433 | — | 6,774,433 | |||||||||
Seix Ultra-Short Bond Fund | 94,668 | 56,542 | 151,210 | |||||||||
Amounts designated as “—” are $0.
As of March 31, 2017, the pre-enactment accumulated capital loss carryforwards and expiration dates were as follows:
Fund | Expiring 2018 | Expiring 2019 | Expiring 2020 | Total | ||||||||||||
Seix Limited Duration Fund* | $816,664 | $— | $— | $816,664 | ||||||||||||
Seix Short-Term Bond Fund | 1,102,167 | — | — | 1,102,167 | ||||||||||||
Seix U.S. Government Securities Ultra-Short Bond Fund | — | 8,408,484 | — | 8,408,484 | ||||||||||||
Seix Ultra-Short Bond Fund | 1,362,740 | 451,224 | — | 1,813,964 | ||||||||||||
| * | Of the $827,086 of capital loss carryforwards subject to limitations due to an ownership change on June 30, 2013, $10,422 was utilized, and the remaining $816,664 will expire in 2018. |
Amounts designated as “—” are $0.
Capital loss carryforwards may be applied to offset future realized capital gains and therefore may reduce future capital gain distributions.
During the fiscal year ended March 31, 2017, the following Funds utilized capital loss carryforwards as follows:
Fund | Amount | |||
Seix Corporate Bond Fund | $156,102 | |||
Seix Limited Duration Fund | 10,422 | |||
Seix Short-Term Bond Fund | 98,110 | |||
Seix U.S. Government Securities Ultra-Short Bond Fund | 6,496,833 | |||
Seix Ultra-Short Bond Fund | 317,465 | |||
During the fiscal year ended March 31, 2017, the following Fund had capital loss carryforwards that expired in fiscal 2017 as follows:
Fund | Amount | |||
Seix Floating Rate High Income Fund | $25,038,485 | |||
Seix Ultra-Short Bond Fund | 202,726 | |||
Net capital losses incurred after October 31, and within the taxable year are deemed to arise on the first business day of the Funds’ next fiscal year. During the fiscal year ended March 31, 2017, the following Funds had net capital losses:
Fund | Short Term | Long Term | Total | |||||||||
Seix Core Bond Fund | $3,071,858 | $(227,273 | ) | $2,844,585 | ||||||||
Seix Corporate Bond Fund | 116,480 | (116,479 | ) | 1 | ||||||||
162
Table of Contents
NOTES TO FINANCIAL STATEMENTS (continued)
RIDGEWORTH FUNDS March 31, 2017
Fund | Short Term | Long Term | Total | |||||||||
Seix Georgia Tax-Exempt Bond Fund | $295,605 | $— | $295,605 | |||||||||
Seix High Grade Municipal Bond Fund | 1,508,065 | (433,078 | ) | 1,074,987 | ||||||||
Seix Investment Grade Tax-Exempt Bond Fund | 7,549,227 | (1,001,571 | ) | 6,547,656 | ||||||||
Seix North Carolina Tax-Exempt Bond Fund | 221,860 | (53,717 | ) | 168,143 | ||||||||
Seix Short-Term Bond Fund | 87,334 | 1,815 | 89,149 | |||||||||
Seix Short-Term Municipal Bond Fund | 9,792 | (524 | ) | 9,268 | ||||||||
Seix Total Return Bond Fund | 14,817,124 | (229,958 | ) | 14,587,166 | ||||||||
Seix U.S. Mortgage Fund | 84,725 | 24,269 | 108,994 | |||||||||
Seix Virginia Intermediate Municipal Bond Fund | 472,345 | — | 472,345 | |||||||||
Amounts designated as “—” are $0.
Pursuant to federal income tax rules applicable to regulated investment companies, the Funds may elect to treat certain capital losses between November 1 and March 31 and late year ordinary losses (i) ordinary losses between January 1 and March 31, and (ii) specified ordinary and currency losses between November 1 and March 31, as occurring on the first day of the following tax year. For the fiscal year ended March 31, 2017, any amount of losses elected as late year ordinary losses within the tax return will not be recognized for federal income tax purposes until April 1, 2017.
| 7. | Reorganizations |
On May 21, 2015, the Board approved the reorganization of the RidgeWorth Intermediate Bond Fund (the “Target Fund”) into the RidgeWorth Core Bond Fund (the “Acquiring Fund”), a separate series of the Trust. On August 3, 2015, the Acquiring Fund acquired all of the net assets of the Target Fund in a tax-free exchange of shares. The purpose of the transaction was to combine two portfolios with comparable investment objectives and strategies.
Target Fund | Shares Prior to Reorganization | Shares Issued by the Acquiring Fund | Net Assets Prior to Reorganization | |||||||||
I Shares | 20,078,785 | 18,121,184 | $ | 195,102,886 | ||||||||
A Shares | 345,825 | 312,495 | $ | 3,363,629 | ||||||||
R Shares | 1,543 | 1,392 | $ | 14,994 | ||||||||
The appreciation (depreciation) of the Target fund was $841,440 as of the date of the merger. The combined net assets of the Acquiring Fund immediately after the reorganization were $387,705,719.
Assuming the acquisition had been completed on April 1, 2015, the beginning of the reporting period of the Acquiring Fund, the Acquiring Fund’s pro forma results of operations for the fiscal year ended March 31, 2016, were as follows:
Net Investment Income (Loss) | $ | 5,701,046 | ||
Net Realized and Unrealized Gains/Losses on Investments | $ | (3,299,477 | ) | |
Net Increase/Decrease in Net Assets resulting from Operations | $ | (2,401,569 | ) |
On May 21, 2015, the Board approved the reorganization of the RidgeWorth U.S. Government Securities Fund (the “Target Fund”) into the RidgeWorth Limited-Term Federal Mortgage Securities Fund (the “Acquiring Fund”), a separate series of the Trust. On August 1, 2015, the Acquiring Fund was renamed RidgeWorth Seix U.S. Mortgage Fund and acquired all of the net assets of the Target Fund in a taxable exchange of shares. The purpose of the transaction was to combine two portfolios with comparable investment objectives and strategies.
Target Fund | Shares Prior to Reorganization | Shares Issued by the Acquiring Fund | Net Assets Prior to Reorganization | |||||||||
I Shares | 2,019,210 | 1,506,410 | $ | 16,905,776 | ||||||||
A Shares | 65,853 | 49,212 | $ | 551,248 | ||||||||
R Shares | 140,575 | 104,870 | $ | 1,176,793 | ||||||||
163
Table of Contents
NOTES TO FINANCIAL STATEMENTS (concluded)
RIDGEWORTH FUNDS March 31, 2017
The appreciation (depreciation) of the acquired fund was $113,976 as of the date of the merger. The combined net assets of the Acquiring Fund immediately after the reorganization were $32,289,899.
Assuming the acquisition had been completed on April 1, 2015, the beginning of the reporting period of the
Acquiring Fund, the Acquiring Fund’s pro forma results of operations for the year ended March 31, 2016, were as follows:
Net Investment Income (Loss) | $ | (159,812 | ) | |
Net Realized and Unrealized Gains/Losses on Investments | $ | 71,615 | ||
Net Increase/Decrease in Net Assets resulting from Operations | $ | (88,197 | ) |
Because the combined investment portfolios have been managed as a single integrated portfolio since the
acquisition was completed, it is not practicable to separate the amounts of revenue and earnings of the Target Fund that has been included in the Acquiring Fund’s Statement of Operations as of March 31, 2016.
| 8. | Subsequent Events |
Management has evaluated subsequent events through the date the financial statements are issued. Management has determined, except as set forth below, that there are no material events that would require disclosure in the Funds’ financial statements through this date.
On December 16, 2016, Virtus Investment Partners, Inc. entered into an agreement to acquire all outstanding equity securities of the Investment Adviser from Lightyear Capital and a group of employees of the Investment Adviser. On December 14, 2016, the Board had approved, subject to shareholder approval, an agreement and plan of reorganization pursuant to which each Fund will be reorganized into a newly created series of Virtus Asset Trust (the “Plan”), and recommends that shareholders of each Fund approve the Plan. As a result, shareholders of each Fund were asked at a special meeting of shareholders on May 9, 2017 to approve the Plan. The special meeting of shareholders on May 9, 2017 was adjourned to May 30, 2017 with respect to certain Funds that had not yet reached quorum.
Effective April 1, 2017, Seix Corporate Bond Fund, Seix Floating Rate High Income Fund, Seix High Income Fund and Seix Investment Grade Tax-Exempt Bond Fund A Shares Rule 12b-1 Plan distribution and service fee was reduced to a maximum of 0.25% annually, as a percentage of the value of your investment.
164
Table of Contents
REPORT OF INDEPENDENT REGISTERED PUBLIC ACCOUNTING FIRM
RIDGEWORTH FUNDS March 31, 2017
To the Board of Trustees and Shareholders of RidgeWorth Funds:
In our opinion, the accompanying statements of assets and liabilities, including the schedules of portfolio investments, and the related statements of operations and of changes in net assets and the financial highlights present fairly, in all material respects, the financial position of the Seix Core Bond Fund, Seix Corporate Bond Fund, Seix Floating Rate High Income Fund, Seix Georgia Tax-Exempt Bond Fund, Seix High Grade Municipal Bond Fund, Seix High Income Fund, Seix High Yield Fund, Seix Investment Grade Tax-Exempt Bond Fund, Seix Limited Duration Fund, Seix North Carolina Tax-Exempt Bond Fund, Seix Short-Term Bond Fund, Seix Short-Term Municipal Bond Fund, Seix Total Return Bond Fund, Seix U.S. Government Securities Ultra-Short Bond Fund, Seix U.S. Mortgage Fund, Seix Ultra-Short Bond Fund, and Seix Virginia Intermediate Municipal Bond (seventeen of the funds constituting RidgeWorth Funds, collectively the “Funds”) as of March 31, 2017, the results of each of their operations for the year then ended, the changes in each of their net assets for each of the two years in the period then ended and the financial highlights for each of the periods indicated herein, in conformity with accounting principles generally accepted in the United States of America. These financial statements and financial highlights (hereafter referred to as “financial statements”) are the responsibility of the Funds’ management. Our responsibility is to express an opinion on these financial statements based on our audits. We conducted our audits of these financial statements in accordance with the standards of the Public Company Accounting Oversight Board (United States). Those standards require that we plan and perform the audit to obtain reasonable assurance about whether the financial statements are free of material misstatement. An audit includes examining, on a test basis, evidence supporting the amounts and disclosures in the financial statements, assessing the accounting principles used and significant estimates made by management, and evaluating the overall financial statement presentation. We believe that our audits, which included confirmation of securities as of March 31, 2017 by correspondence with the custodian, agent banks and brokers and application of alternative auditing procedures where securities purchased had not been received, provide a reasonable basis for our opinion.
PricewaterhouseCoopers LLP
Boston, Massachusetts
May 25, 2017
165
Table of Contents
RIDGEWORTH FUNDS March 31, 2017
(Unaudited)
The following Funds hereby designate the following amounts as long term capital gain distributions:
Fund | Long Term Capital Dividend | |||
Seix Core Bond Fund | $1,388,513 | |||
Seix Corporate Bond Fund | 75,686 | |||
Seix Georgia Tax-Exempt Bond Fund | 1,343,503 | |||
Seix High Grade Municipal Bond Fund | 826,599 | |||
Seix Investment Grade Tax-Exempt Bond Fund | 2,775,085 | |||
Seix North Carolina Tax-Exempt Bond Fund | 639,791 | |||
Seix Total Return Bond Fund | 5,766,584 | |||
Seix U.S. Mortgage Fund | 101,819 | |||
Seix Virginia Intermediate Municipal Bond Fund | 1,148,111 | |||
For corporate shareholders, the following percentages of the total ordinary income distributions paid by the following Funds during the fiscal year ended March 31, 2017 qualify for the corporate dividends received deduction:
Fund | Dividends Received Deductions | |||
Seix Floating Rate High Income Fund | 0.46 | % | ||
Siex High Income Fund | 1.03 | |||
Seix High Yield Fund | 0.01 | |||
For the fiscal year ended March 31, 2017, the following Funds paid qualified dividend income:
Fund | Qualified Dividend Income | |||
Seix Floating Rate High Income Fund | 0.46 | % | ||
Siex High Income Fund | 1.04 | |||
Seix High Yield Fund | 0.01 | |||
166
Table of Contents
TRUSTEES AND OFFICERS OF THE RIDGEWORTH FUNDS
RIDGEWORTH FUNDS March 31, 2017
(Unaudited)
Set forth below are the names, age, position with the Trust, length of term of office, and the principal occupations and, if applicable, other directorships held during at least the last five years of each of the persons currently serving as a Trustee or officer of the Trust. Unless otherwise noted, the address of each Trustee is c/o RidgeWorth Investments, 3333 Piedmont Road, Suite 1500, Atlanta, Georgia 30305. The Funds’ Statement of Additional Information includes more information about the Trustees and is available without charge, upon request, by calling 1-888-784-3863 and on the Funds’ website at www.ridgeworth.com.
Name (month/year of birth) | Position Held with the Trust | Term of Office and Length of Time Served | Principal Occupation(s) During the Past 5 Years | Number of Portfolios in the RidgeWorth Complex Overseen by Trustees | Other Directorships Held By Trustee During the Past 5 Years | |||||||
INDEPENDENT TRUSTEE | ||||||||||||
Tim E. Bentsen (August 1953) | Trustee | Indefinite; since 2012 | Lecturer- J.M. Tull School of Accounting, Terry College of Business at University of Georgia (2013-Present); Retired. Audit Partner and Account Executive (1993-2012); Lead Area Managing Partner (2005-2009); Atlanta Office Managing Partner (2003-2009), KPMG LLP. | 28 | Synovus Financial Corp.; Krispy Kreme Doughnuts, Inc. | |||||||
Jeffrey M. Biggar (February 1950) | Trustee | Indefinite; since 2007 | Director of Special Gifts for Hawken School (since May 2013); Managing Director, Little Mountain Group, LLC (an independent Registered Investment Advisor consulting firm) (2011-2013); Chief Operating Officer, Cedar Brook Financial Partners LLC (2008-2010); Chief Executive Officer and Senior Managing Director, Sterling (National City Corp.) (2000-2006). | 28 | Multi-Manager Master Portfolios LLC (3 portfolios; thru 2013) | |||||||
George C. Guynn (December 1942) | Trustee | Indefinite; since 2008 | Retired. President and CEO, Federal Reserve Bank of Atlanta (1996-2006). | 28 | SUSA Registered Fund, LLC; Oxford Industries; Acuity Brands, Inc. (thru 2014); Multi-Manager Master Portfolios LLC (3 portfolios; thru 2013); Genuine Parts Company (thru 2015) | |||||||
Sidney E. Harris (July 1949) | Trustee | Indefinite; since 2004 | Professor and Dean Emeritus (since April 2015), Professor (1997-2014), Dean (1997-2004), J. Mack Robinson College of Business, Georgia State University. | 28 | Total System Services, Inc.; Multi-Manager Master Portfolios LLC (3 portfolios; thru 2013). | |||||||
Connie D. McDaniel (April 1958) | Trustee | Indefinite; since 2005 | Retired. Vice President, Chief of Internal Audit, Corporate Audit Department (2009-2013); Vice President Global Finance Transformation (2007-2009); Vice President and Controller (1999-2007), The Coca-Cola Company. | 28 | Total System Services, Inc. | |||||||
INTERESTED TRUSTEE | ||||||||||||
Ashi S. Parikh* (February 1966) | Trustee | Indefinite; since 2013 | Chief Executive Officer and Chief Investment Officer, RidgeWorth Investments (2010-present); President and Chief Investment Officer (2008-2010). | 28 | None | |||||||
| * | Mr. Parikh is an “interested person” of the Trust, as defined in the 1940 Act, because he is an employee of the Adviser. |
167
Table of Contents
TRUSTEES AND OFFICERS OF THE RIDGEWORTH FUNDS (concluded)
RIDGEWORTH FUNDS March 31, 2017
(Unaudited)
Name, Address and (month/year of birth) | Position(s) Held with the Trust | Term of Office and Length of Time Served | Principal Occupation(s) During the Past 5 Years | |||
Julia R. Short 3333 Piedmont Road, NE, Suite 1500, Atlanta, GA 30305 (November 1972) | President and Chief Executive Officer | One year; since 2007 | Managing Director, Product Manager, RidgeWorth Investments (since 2004). | |||
James L. Love 3333 Piedmont Road, NE, Suite 1500, Atlanta, GA 30305 (December 1968) | Chief Compliance Officer | One year; since 2016 | Managing Director and Chief Compliance Officer, RidgeWorth Investments (since 2016); Chief Compliance Officer and Deputy General Counsel, U.S. Global Investors (2007–2015). | |||
Benjamin H. Lowe 3333 Piedmont Road, NE, Suite 1500, Atlanta, GA 30305 (March 1978) | Treasurer and Chief Financial Officer | One year; since 2015 | Director of Fund Administration, RidgeWorth Investments (since 2011); Fund Controller, ALPS Fund Services, Inc. (2005–2011). | |||
Sean Nossaman 3333 Piedmont Road, NE, Suite 1500, Atlanta, GA 30305 (June 1982) | Assistant Treasurer | One year; since 2016 | Assistant Treasurer, RidgeWorth Investment (since 2016); Assistant Fund Controller, ALPS Fund Services, Inc. (2007) to (2016)** | |||
James Bacik (May 1975) | Assistant Treasurer | One year; since 2010 | Vice President, State Street Bank and Trust Company (since 2001).* | |||
Patrick J. Keniston (January 1964) | Anti-Money Laundering Officer and Identity Theft Prevention Officer | One year; since 2013 | Managing Director, Foreside Fund Officer Services, LLC (October 2008 – present). | |||
Karen Jacoppo-Wood State Street Bank and Trust Company 100 Summer Street Boston, MA 02111 (December 1966) | Secretary and Chief Legal Officer | One year; since 2014 | Vice President and Managing Counsel, State Street Bank and Trust Company (since 2014); Vice President, RMR Advisors, Inc./RMR Funds (2007-2014). | |||
Rebecca Gilding State Street Bank and Trust Company 100 Summer Street Boston, MA 02111 (December 1979) | Assistant Secretary | One year; since May 2016 | Vice President and Counsel, State Street Bank and Trust Company (since 2016); Assistant Vice President and Associate Counsel, Brown Brothers Harriman and Co. (2013-2016); Assistant Vice President Citi Fund Services, Inc. (2005-2013).* |
| * | During the period indicated the officer has held various positions at State Street Bank and Trust Company and has provided his or her current title. |
| ** | During the period indicated the Officer has held various positions at ALPS Fund Services, Inc. and has provided his most recent title. |
168
Table of Contents
INVESTMENT ADVISORY AGREEMENT
RIDGEWORTH FUNDS March 31, 2017
(Unaudited)
Renewal of Advisory and Subadvisory Agreements
The continuance of the Trust’s investment advisory agreement with RidgeWorth Capital Management LLC (the “Adviser”) and subadvisory agreement between the Adviser and Seix Investment Advisors LLC (the “Subadviser”) must be specifically approved at least annually by (i) the vote of the Trustees or a vote of the shareholders of the Funds and (ii) the vote of a majority of the Trustees who are not parties to the agreements or “interested persons” of any party thereto (the “Independent Trustees”), as defined in the Investment Company Act of 1940 (the “1940 Act”), cast in person at a meeting called for the purpose of voting on such approval. New advisory agreements for the Trust are also subject to such approval initially and annually after their initial term is complete.
Each year, the Board of Trustees calls and holds a meeting to decide whether to approve the continuance of the Trust’s agreements for another year. In preparation for the meeting, the Board requests and reviews a wide variety of information from the Adviser and Subadviser. The Trustees use this information, as well as other information that the Adviser, Subadviser, and other service providers may submit to the Board, to help them decide whether to approve the agreements.
In considering the most recent renewal of the agreements with the Adviser and Subadviser, the Board requested and received material from the Adviser and Subadviser in preparation for a special meeting of the Board held on October 13, 2016, and reviewed additional material from the Adviser and Subadviser in preparation for its quarterly meeting held on November 14-15, 2016, at which it specifically considered the renewal of the agreements. Such material included, among other things, information about: (a) the quality of the Adviser’s and Subadviser’s investment management and other services; (b) the Adviser’s and Subadviser’s investment management personnel; (c) the Adviser’s and Subadviser’s operations and financial condition; (d) the Adviser’s and Subadviser’s brokerage practices (including any soft dollar arrangements) and investment strategies; (e) the level of the advisory fees that the Adviser and Subadviser charge the Funds compared with the fees they charge to comparable mutual funds or accounts; (f) the Funds’ overall fees and operating expenses compared with similar mutual funds; (g) the level of the Adviser’s and Subadviser’s profitability from their Fund-related operations; (h) the Adviser’s and Subadviser’s compliance systems; (i) the Adviser’s and Subadviser’s policies and procedures for personal securities transactions; (j) the Adviser’s and Subadviser’s reputation, expertise, and resources in domestic financial markets; and (k) the Funds’ performance compared with similar mutual funds. The Board also received a memorandum from fund counsel regarding the responsibilities of the Trustees in connection with their consideration of the agreements.
At the meetings, representatives from the Adviser and Subadviser presented additional oral and written information to the Board to help the Board evaluate the Adviser’s and Subadviser’s fees and other aspects of the agreements. The Board also considered information presented by the Adviser, Subadviser, and other service providers at meetings held throughout the year and over the years. The Trustees discussed the written materials, oral presentations, and any other information that the Board received, and considered the approval of the agreements in light of this information.
Based on the Board’s deliberations and evaluation of the information it received, the Board, including all of the Independent Trustees, approved the renewal of the agreements with the Adviser and Subadviser and determined that the compensation under the agreements is fair and reasonable in light of the services to be performed. The Board considered the following specific factors, none of which was controlling, and made the following conclusions:
Nature, Extent, and Quality of Services. The Board received and considered information regarding the nature, extent, and quality of services provided to the Funds by the Adviser and Subadviser. In this regard, the Trustees evaluated, among other things, the Adviser’s and Subadviser’s personnel, experience, track record, and compliance program. The Board considered the background and experience of the Adviser’s and Subadviser’s senior management and the expertise of, and amount of attention given to the Funds by, their portfolio management teams. The Board reviewed the qualifications and backgrounds of the portfolio managers responsible for the day-to-day management of the Funds. The Board also reviewed information pertaining to the Adviser’s and Subadviser’s organizational structure, senior management, investment operations, and other relevant information. The Board concluded that, within the context of its full deliberations, the nature, extent, and quality of the services provided to the Funds by the Adviser and Subadviser supported the approval of the agreements.
169
Table of Contents
INVESTMENT ADVISORY AGREEMENT (concluded)
RIDGEWORTH FUNDS March 31, 2017
(Unaudited)
Performance. The Board considered the investment performance of each Fund, including any periods of outperformance and underperformance, both on an absolute basis and a comparative basis to indices and other funds within the same investment categories. Specifically, the Board considered Fund performance relative to peer groups and appropriate benchmarks in light of total return, yield, and market trends. As part of this review, the Board considered the composition of the peer group and selection criteria, as well as market risk and shareholder risk expectations. The Board considered the Adviser’s and Subadviser’s explanations regarding specific performance issues. The Board concluded that, within the context of its full deliberations, the performance of the Funds, the Adviser, and the Subadviser supported the approval of the agreements.
Fund Expenses. With respect to advisory fees, the Board considered the rate of compensation under the agreements and each Fund’s net operating expense ratio in comparison to those of comparable mutual funds. The Trustees also considered information about average expense ratios of comparable mutual funds in each Fund’s peer group. Finally, the Trustees considered the effect of the Adviser’s and Subadviser’s waiver and reimbursement of fees and expenses, where applicable, to prevent total expenses from exceeding a specified amount and that, due to these waivers and reimbursements, net operating expenses have been maintained at competitive levels. The Board concluded that, within the context of its full deliberations, the expenses of the Funds are reasonable and supported the approval of the agreements.
Profitability. The Board reviewed information about the profitability of the Funds to the Adviser and Subadviser and considered whether the level of profitability, if any, was reasonable and justified in light of the quality of the services rendered to the Funds. The Board concluded that, within the context of its full deliberations, the profitability of the Adviser and Subadviser is within the range the Board considered reasonable.
Economies of Scale. The Board considered the existence of economies of scale and whether they were passed along to Fund shareholders through a graduated advisory fee schedule or other means, including any fee waivers and expense reimbursements by the Adviser and Subadviser. The Board concluded that, within the context of its full deliberations, the Funds obtain reasonable benefit from economies of scale.
Approval of Interim Advisory and Subadvisory Agreements
Following its consideration of the annual continuance of the existing advisory and subadvisory agreements discussed above, at a special meeting held on December 14, 2016, the Board of Trustees considered a proposed interim advisory agreement between the Adviser and the Trust and proposed interim subadvisory agreements between the Adviser and the Subadviser. The Board noted that the interim agreements are the same as the existing advisory and subadvisory agreements they are intended to replace, including the rate of compensation thereunder, except for differences reflecting the requirements of Rule 15a-4 under the 1940 Act, such as the date of execution, effectiveness, termination, and compensation conditions. In approving the interim advisory and subadvisory agreements, the Board noted its recent comprehensive review, described above, in connection with its consideration of the annual continuance of the existing advisory and subadvisory agreements.
170
Table of Contents
RIDGEWORTH FUNDS March 31, 2017
(Unaudited)
Shareholder Meeting Results
A Special Meeting of the shareholders (the “Meeting”) of each series of RidgeWorth Funds (the “Trust”) was held on May 9, 2017. The details of the voting with respect to the Proposal are shown below. The Proposal received the required number of affirmative votes for approval.
The May 9, 2017 Meeting was held to consider and act on the following proposal:
Proposal: To approve The Agreement and Plan of Reorganization by and among RidgeWorth Funds on behalf of the acquired Fund Virtus Asset Trust on behalf of the corresponding acquiring fund RidgeWorth Capital Management LLC and Virtus Investment Partners Inc.
| Number of Shares(1) | ||||||||||||||||
| Affirmative | Objecting | Abstaining(2) | Uninstructed(2) | |||||||||||||
Seix Corporate Bond Fund | 1,259,034 | 8,513 | 32,234 | — | ||||||||||||
Seix Floating Rate High Income Fund | 341,966,628 | 4,370,147 | 3,421,870 | — | ||||||||||||
Seix Georgia Tax-Exempt Bond Fund | 7,213,225 | 125,065 | 3,029 | — | ||||||||||||
Seix High Grade Municipal Bond Fund | 3,363,337 | 70,771 | 34,596 | 883,894 | ||||||||||||
Seix High Yield Fund | 33,903,148 | 442,753 | 590,194 | 989,332 | ||||||||||||
Seix Investment Grade Tax-Exempt Fund | 25,551,400 | 130,743 | 121,514 | 4,005,965 | ||||||||||||
Seix Limited Duration Fund | 676,439 | — | — | — | ||||||||||||
Seix North Carolina Tax-Exempt Bond Fund | 2,092,956 | 27,358 | 12,542 | — | ||||||||||||
Seix Short-Term Municipal Bond Fund | 1,915,322 | 22,805 | 4,613 | — | ||||||||||||
Seix U.S. Government Securities Ultra-Short Bond Fund | 75,510,428 | 2,698,602 | 1,053,985 | — | ||||||||||||
Seix Ultra-Short Bond Fund | 7,683,261 | 32,555 | 45,203 | — | ||||||||||||
Seix Virginia Intermediate Municipal Bond Fund | 4,420,620 | 28,181 | 48,370 | — | ||||||||||||
| (1) | Excludes fractional shares. |
| (2) | Uninstructed shares (i.e., proxies from brokers or nominees indicating that such persons have not received instructions from the beneficial owner or other person entitled to vote shares on a particular matter with respect to which the brokers or nominees do not have discretionary power) were treated as shares that were present at the meeting for purposes of establishing a quorum, but had the effect of a vote against the Proposal. Uninstructed shares are sometimes referred to as broker non-votes. Abstentions were also treated in this manner. |
171
Table of Contents
ADDITIONAL INFORMATION (continued)
RIDGEWORTH FUNDS March 31, 2017
(Unaudited)
Expense Examples
As a shareholder of the RidgeWorth Funds, you incur two types of costs: (1) transaction costs, including sales charges (loads) on purchases; and (2) ongoing costs, including management fees, 12b-1 distribution and/or service fees, and other Fund expenses. These examples are intended to help you understand your ongoing costs (in dollars) of investing in the RidgeWorth Funds and to compare these costs with the ongoing costs of investing in other mutual funds.
These examples are based on an investment of $1,000 invested at the beginning of the period and held for the entire period from October 1, 2016 through March 31, 2017.
Actual Expenses
The table below provides information about actual account values and actual expenses. You may use the information below, together with the amount you invested, to estimate the expenses that you paid over the period. Simply divide your account value by $1,000 (for example, an $8,600 account value divided by $1,000 = 8.6), then multiply the result by the number in the table under the heading entitled “Expenses Paid During Period” to estimate the expenses you paid on your account during this period.
Fund | Class | Beginning Account Value 10/01/16 | Ending Account Value 03/31/17 | Expenses Paid During Period* 10/01/16-03/31/17 | Expense Ratio During Period** 10/01/16-03/31/17 | |||||||||||||||
Seix Core Bond Fund | I Shares | $1,000.00 | $980.60 | $2.42 | 0.49 | % | ||||||||||||||
| A Shares | 1,000.00 | 979.90 | 3.11 | 0.63 | ||||||||||||||||
| R Shares | 1,000.00 | 978.60 | 4.49 | 0.91 | ||||||||||||||||
| IS Shares | 1,000.00 | 981.30 | 2.67 | 0.54 | ||||||||||||||||
Seix Corporate Bond Fund | I Shares | 1,000.00 | 994.00 | 3.43 | 0.69 | |||||||||||||||
| A Shares | 1,000.00 | 992.80 | 4.67 | 0.94 | ||||||||||||||||
| C Shares | 1,000.00 | 989.30 | 8.13 | 1.64 | ||||||||||||||||
Seix Floating Rate High Income Fund | I Shares | 1,000.00 | 1,033.70 | 3.09 | 0.61 | |||||||||||||||
| A Shares | 1,000.00 | 1,032.00 | 4.71 | 0.93 | ||||||||||||||||
| C Shares | 1,000.00 | 1,030.20 | 7.64 | 1.51 | ||||||||||||||||
| IS Shares | 1,000.00 | 1,034.20 | 2.59 | 0.51 | ||||||||||||||||
Seix Georgia Tax-Exempt Bond Fund | I Shares | 1,000.00 | 975.20 | 3.20 | 0.65 | |||||||||||||||
| A Shares | 1,000.00 | 973.90 | 3.69 | 0.75 | ||||||||||||||||
Seix High Grade Municipal Bond Fund | I Shares | 1,000.00 | 978.20 | 3.21 | 0.65 | |||||||||||||||
| A Shares | 1,000.00 | 978.30 | 4.00 | 0.81 | ||||||||||||||||
Seix High Income Fund | I Shares | 1,000.00 | 1,037.70 | 4.06 | 0.80 | |||||||||||||||
| A Shares | 1,000.00 | 1,036.50 | 5.23 | 1.03 | ||||||||||||||||
| R Shares | 1,000.00 | 1,035.60 | 6.09 | 1.20 | ||||||||||||||||
| IS Shares | 1,000.00 | 1,038.50 | 7.17 | 1.41 | ||||||||||||||||
Seix High Yield Fund | I Shares | 1,000.00 | 1,035.10 | 3.30 | 0.65 | |||||||||||||||
| A Shares | 1,000.00 | 1,034.50 | 4.16 | 0.82 | ||||||||||||||||
| R Shares | 1,000.00 | 1,033.20 | 5.22 | 1.03 | ||||||||||||||||
| IS Shares | 1,000.00 | 1,035.80 | 2.74 | 0.54 | ||||||||||||||||
Seix Investment Grade Tax-Exempt Bond Fund | I Shares | 1,000.00 | 980.30 | 3.21 | 0.65 | |||||||||||||||
| A Shares | 1,000.00 | 978.80 | 3.95 | 0.80 | ||||||||||||||||
Seix Limited Duration Fund | I Shares | 1,000.00 | 1,005.00 | 1.60 | 0.32 | |||||||||||||||
Seix North Carolina Tax-Exempt Bond Fund | I Shares | 1,000.00 | 975.20 | 3.15 | 0.64 | |||||||||||||||
| A Shares | 1,000.00 | 975.30 | 3.89 | 0.79 | ||||||||||||||||
Seix Short-Term Bond Fund | I Shares | 1,000.00 | 997.20 | 2.94 | 0.59 | |||||||||||||||
| A Shares | 1,000.00 | 996.30 | 3.93 | 0.79 | ||||||||||||||||
| C Shares | 1,000.00 | 993.30 | 6.86 | 1.38 | ||||||||||||||||
Seix Short-Term Municipal Bond Fund | I Shares | 1,000.00 | 1,000.70 | 2.39 | 0.48 | |||||||||||||||
| A Shares | 1,000.00 | 1,000.40 | 2.94 | 0.59 | ||||||||||||||||
Seix Total Return Bond Fund | I Shares | 1,000.00 | 984.00 | 2.28 | 0.46 | |||||||||||||||
| A Shares | 1,000.00 | 982.90 | 3.36 | 0.68 | ||||||||||||||||
| R Shares | 1,000.00 | 981.10 | 5.24 | 1.06 | ||||||||||||||||
| IS Shares | 1,000.00 | 984.70 | 1.53 | 0.31 | ||||||||||||||||
Seix U.S. Government Securities Ultra- Short Bond Fund | I Shares | 1,000.00 | 1,005.10 | 2.10 | 0.42 | |||||||||||||||
| IS Shares | 1,000.00 | 1,005.90 | 1.30 | 0.26 | ||||||||||||||||
172
Table of Contents
ADDITIONAL INFORMATION (continued)
RIDGEWORTH FUNDS March 31, 2017
(Unaudited)
Fund | Class | Beginning Account Value 10/01/16 | Ending Account Value 03/31/17 | Expenses Paid During Period* 10/01/16-03/31/17 | Expense Ratio During Period** 10/01/16-03/31/17 | |||||||||||||||
Seix U.S. Mortgage Fund | I Shares | $1,000.00 | $985.10 | $3.41 | 0.69 | % | ||||||||||||||
| A Shares | 1,000.00 | 984.00 | 4.45 | 0.90 | ||||||||||||||||
| C Shares | 1,000.00 | 980.40 | 8.10 | 1.64 | ||||||||||||||||
Seix Ultra-Short Bond Fund | I Shares | 1,000.00 | 1,005.60 | 2.05 | 0.41 | |||||||||||||||
Seix Virginia Intermediate Municipal Bond Fund | I Shares | 1,000.00 | 985.40 | 3.22 | 0.65 | |||||||||||||||
| A Shares | 1,000.00 | 985.80 | 3.86 | 0.78 | ||||||||||||||||
| * | Expenses are equal to the average account value times the Fund’s annualized expense ratio multiplied by the number of days in the most recent fiscal half-year divided by the number of days in the fiscal year. |
| ** | Annualized. |
Hypothetical Example
The table below provides information about hypothetical account values and hypothetical expenses based on each RidgeWorth Fund’s actual expense ratio and an assumed rate of return of 5% per year before expenses, which is not the Fund’s actual return. The hypothetical account values and expenses may not be used to estimate the actual ending account balance or expenses you paid for the period. You may use this information to compare this 5% hypothetical example with the 5% hypothetical examples that appear in the shareholder reports of other funds.
Please note that the expenses shown in the table are meant to highlight your ongoing costs only and do not reflect any transactional costs, such as sales charges (loads) or redemption fees. Therefore, the table is useful in comparing ongoing costs only, and will not help you determine the relative total costs of owning different funds. In addition, if these transactional costs were included, your costs would have been higher.
Fund | Class | Beginning Account Value 10/01/16 | Ending Account Value 03/31/17 | Expenses Paid During Period* 10/01/16-03/31/17 | Expense Ratio During Period** 10/01/16-03/31/17 | |||||||||||||||
Seix Core Bond Fund | I Shares | $1,000.00 | $1,022.50 | $2.47 | 0.49 | % | ||||||||||||||
| A Shares | 1,000.00 | 1,021.80 | 3.18 | 0.63 | ||||||||||||||||
| R Shares | 1,000.00 | 1,020.40 | 4.58 | 0.91 | ||||||||||||||||
| IS Shares | 1,000.00 | 1,022.24 | 2.72 | 0.54 | ||||||||||||||||
Seix Corporate Bond Fund | I Shares | 1,000.00 | 1,021.50 | 3.48 | 0.69 | |||||||||||||||
| A Shares | 1,000.00 | 1,020.20 | 4.73 | 0.94 | ||||||||||||||||
| C Shares | 1,000.00 | 1,016.80 | 8.25 | 1.64 | ||||||||||||||||
Seix Floating Rate High Income Fund | I Shares | 1,000.00 | 1,021.90 | 3.07 | 0.61 | |||||||||||||||
| A Shares | 1,000.00 | 1,020.30 | 4.68 | 0.93 | ||||||||||||||||
| C Shares | 1,000.00 | 1,017.40 | 7.59 | 1.51 | ||||||||||||||||
| IS Shares | 1,000.00 | 1,022.39 | 2.57 | 0.51 | ||||||||||||||||
Seix Georgia Tax-Exempt Bond Fund | I Shares | 1,000.00 | 1,021.70 | 3.28 | 0.65 | |||||||||||||||
| A Shares | 1,000.00 | 1,021.20 | 3.78 | 0.75 | ||||||||||||||||
Seix High Grade Municipal Bond Fund | I Shares | 1,000.00 | 1,021.70 | 3.28 | 0.65 | |||||||||||||||
| A Shares | 1,000.00 | 1,020.90 | 4.08 | 0.81 | ||||||||||||||||
Seix High Income Fund | I Shares | 1,000.00 | 1,020.90 | 4.03 | 0.80 | |||||||||||||||
| A Shares | 1,000.00 | 1,019.80 | 5.19 | 1.03 | ||||||||||||||||
| R Shares | 1,000.00 | 1,018.90 | 6.04 | 1.20 | ||||||||||||||||
| IS Shares | 1,000.00 | 1,017.90 | 7.09 | 1.41 | ||||||||||||||||
Seix High Yield Fund | I Shares | 1,000.00 | 1,021.70 | 3.28 | 0.65 | |||||||||||||||
| A Shares | 1,000.00 | 1,020.80 | 4.13 | 0.82 | ||||||||||||||||
| R Shares | 1,000.00 | 1,019.80 | 5.19 | 1.03 | ||||||||||||||||
| IS Shares | 1,000.00 | 1,022.24 | 2.72 | 0.54 | ||||||||||||||||
Seix Investment Grade Tax-Exempt Bond Fund | I Shares | 1,000.00 | 1,021.70 | 3.28 | 0.65 | |||||||||||||||
| A Shares | 1,000.00 | 1,020.90 | 4.03 | 0.80 | ||||||||||||||||
Seix Limited Duration Fund | I Shares | 1,000.00 | 1,023.30 | 1.61 | 0.32 | |||||||||||||||
Seix North Carolina Tax-Exempt Bond Fund | I Shares | 1,000.00 | 1,021.70 | 3.23 | 0.64 | |||||||||||||||
| A Shares | 1,000.00 | 1,021.00 | 3.98 | 0.79 | ||||||||||||||||
Seix Short-Term Bond Fund | I Shares | 1,000.00 | 1,022.00 | 2.97 | 0.59 | |||||||||||||||
| A Shares | 1,000.00 | 1,021.00 | 3.98 | 0.79 | ||||||||||||||||
| C Shares | 1,000.00 | 1,018.10 | 6.94 | 1.38 | ||||||||||||||||
Seix Short-Term Municipal Bond Fund | I Shares | 1,000.00 | 1,022.50 | 2.42 | 0.48 | |||||||||||||||
| A Shares | 1,000.00 | 1,022.00 | 2.97 | 0.59 | ||||||||||||||||
173
Table of Contents
ADDITIONAL INFORMATION (concluded)
RIDGEWORTH FUNDS March 31, 2017
(Unaudited)
Fund | Class | Beginning Account Value 10/01/16 | Ending Account Value 03/31/17 | Expenses Paid During Period* 10/01/16-03/31/17 | Expense Ratio During Period** 10/01/16-03/31/17 | |||||||||||||||
Seix Total Return Bond Fund | I Shares | $1,000.00 | $1,022.60 | $2.32 | 0.46 | % | ||||||||||||||
| A Shares | 1,000.00 | 1,021.50 | 3.43 | 0.68 | ||||||||||||||||
| R Shares | 1,000.00 | 1,019.60 | 5.34 | 1.06 | ||||||||||||||||
| IS Shares | 1,000.00 | 1,023.39 | 1.56 | 0.31 | ||||||||||||||||
Seix U.S. Government Securities Ultra- Short Bond Fund | I Shares | 1,000.00 | 1,022.80 | 2.12 | 0.42 | |||||||||||||||
| IS Shares | 1,000.00 | 1,023.64 | 1.31 | 0.26 | ||||||||||||||||
Seix U.S. Mortgage Fund | I Shares | 1,000.00 | 1,021.50 | 3.48 | 0.69 | |||||||||||||||
| A Shares | 1,000.00 | 1,020.40 | 4.53 | 0.90 | ||||||||||||||||
| C Shares | 1,000.00 | 1,016.80 | 8.25 | 1.64 | ||||||||||||||||
Seix Ultra-Short Bond Fund | I Shares | 1,000.00 | 1,022.90 | 2.07 | 0.41 | |||||||||||||||
Seix Virginia Intermediate Municipal Bond Fund | I Shares | 1,000.00 | 1,021.70 | 3.28 | 0.65 | |||||||||||||||
| A Shares | 1,000.00 | 1,021.00 | 3.93 | 0.78 | ||||||||||||||||
| * | Expenses are equal to the average account value times the Fund’s annualized expense ratio multiplied by the number of days in the most recent fiscal half-year divided by the number of days in the fiscal year. |
| ** | Annualized. |
Proxy Voting Information
Information regarding the policies and procedures that the Funds use to determine how to vote proxies relating to portfolio securities is available without charge, upon request, by calling 1-888-784-3863. The information also is included in the Funds’ Statement of Additional Information, which is available on the Funds’ website at www.ridgeworth.com and on the Securities and Exchange Commission’s (“SEC”) website at www.sec.gov.
Information relating to how each Fund voted proxies relating to portfolio securities held during the most recent twelve months ended June 30 is available on the Funds’ website at www.ridgeworth.com and on the SEC’s website at www.sec.gov.
Quarterly Portfolio Holdings Information
The Funds file their complete schedule of portfolio holdings with the SEC for the first and third quarters of each fiscal year on Form N-Q. The Funds’ Forms N-Q are available free of charge on the SEC’s website at www.sec.gov. You may also review or, for a fee, copy those documents by visiting the SEC’s Public Reference Room in Washington, D.C. Information on the operation of the Public Reference Room may be obtained by calling the SEC at 1-800-SEC-0330.
174
Table of Contents
INVESTMENT ADVISER:
RidgeWorth Investments
3333 Piedmont Road, NE, Suite 1500
Atlanta, Georgia 30305
www.ridgeworth.com
INVESTMENT SUBADVISER:
Seix Investment Advisors LLC
One Maynard Drive
Suite 3200
Park Ridge, NJ USA 07656
www.seixadvisors.com
This information must be preceded or accompanied by a current prospectus for each Fund described. Before investing, investors should carefully read the prospectus or summary prospectus and consider the fund’s investment objectives, risks, charges and expenses. Please call 888.784.3863 or visit ridgeworth.com to obtain a prospectus or summary prospectus, which contains this and other information about the funds.
DISTRIBUTOR:
RIDGEWORTH DISTRIBUTORS LLC
RFAR-FI-0317

Table of Contents
| Item 2. | Code of Ethics. |
| (a) | RidgeWorth Funds (the “Registrant”) has adopted a Code of Ethics that applies to the Registrant’s principal executive officer and principal financial officer. |
| (b) | No disclosures are required by this Item 2(b). |
| (c) | The Registrant has not made any amendments to its Code of Ethics during the reporting period for this Form N-CSR. |
| (d) | There have been no waivers granted by the Registrant to individuals covered by the Registrant’s Code of Ethics during the reporting period for this Form N-CSR. |
| (e) | Not applicable. |
| (f) | A copy of the Registrant’s Code of Ethics is attached as an exhibit to this Form N-CSR. |
| Item 3. | Audit Committee Financial Expert. |
| (a) | (1) | The Board of Trustees of the Registrant has determined that the Registrant has at least one member serving on the Registrant’s Audit Committee that possesses the attributes identified in Instruction 2(b) of Item 3 to Form N-CSR to qualify as “audit committee financial expert.” | ||
| (2) | The names of the audit committee financial expert are Connie D. McDaniel and Tim E. Bentsen. Each audit committee financial expert has been deemed to be “independent” as that term is defined in Item 3(a)(2) of Form N-CSR. | |||
| Item 4. | Principal Accountant Fees and Services. |
(a) Audit Fees - The aggregate fees billed for the last two fiscal years ended March 31 for professional services rendered by the principal accountant to the Registrant for the annual audit of the Registrant’s financial statements or services normally provided by the accountant in connection with statutory and regulatory filings or engagements for those fiscal years are set forth below.
| March 31, 2017 | March 31, 2016 | |||||||
Audit Fees | $ | 461,415 | $ | 474,230 | ||||
(b) Audit-Related Fees - The aggregate fees billed for the last two fiscal years ended March 31 for professional services rendered by the principal accountant to the Registrant for assurance and related services rendered by the principal accountant to the Registrant that are reasonably related to the performance of the audit of the Registrant’s financial statements and are not reported under paragraph (a) of this Item 4 are set forth below.
| March 31, 2017 | March 31, 2016 | |||||||
Audit-Related Fees | $ | 73,000 | $ | 0 | ||||
There were no fees billed for the last two fiscal years ended March 31 for assurance and related services rendered by the principal accountant to the investment adviser that are reasonably related to the performance of the audit of the Registrant’s financial statements that were required to be pre-approved by the Audit Committee as described in paragraph (e)(1) of this Item 4.
(c) Tax Fees - The aggregate fees billed for the last two fiscal years ended March 31 for professional services rendered by the principal accountant to the Registrant for tax compliance, tax advice and tax planning are set forth below. The principal accountant is engaged to review and sign the Federal Income and Excise returns, along with reviewing excise distributions.
| March 31, 2017 | March 31, 2016 | |||||||
Tax Fees | $ | 223,690 | $ | 177,364 | ||||
Table of Contents
There were no fees billed for the last two fiscal years ended March 31 for professional services rendered by the principal accountant to the investment adviser for tax compliance, tax advice and tax planning that were required to be pre-approved by the Audit Committee as described in paragraph (e)(1) of this Item 4.
(d) All Other Fees - The aggregate fees billed for the last two fiscal years ended March 31 for products and services provided by the principal accountant to the Registrant, other than the services reported in paragraphs (a) – (c) of this Item 4 are set forth below.
| March 31, 2017 | March 31, 2016 | |||||||
All Other Fees | $ | 0 | $ | 0 | ||||
There were no fees billed for the last two fiscal years ended March 31 for products and services provided by the principal accountant to the investment adviser that were required to be pre-approved by the Audit Committee as described in paragraph (e)(1) of this Item 4.
(e)(1) Audit Committee’s Pre-Approval Policies and Procedures
RIDGEWORTH FUNDS
Audit and Non-Audit Services Pre-Approval Policy
| I. | Statement of Principles |
As set forth in the chart below, the Sarbanes-Oxley Act of 2002 (the “Act”), and rules adopted by the Securities and Exchange Commission (“SEC”) require that the Audit Committee of the Board of Trustees pre-approve all audit services and non-audit services provided to RidgeWorth Funds (the “Trust”) and its portfolios (the “Funds”) by its independent accountant (“Auditor”), as well as non-audit services provided by the Auditor to the Funds’ investment adviser and to affiliates of the adviser that provide ongoing services to the Funds (“Service Affiliates”), listed on Appendix A, if the services directly impact the Funds’ operations and financial reporting.1
Where Pre-Approval is Required
Audit Service | Non-Audit Service | |||||
| Fund | Yes | Yes | ||||
| Adviser | No | Yes, if directly related to Fund operation and financial reporting | ||||
| Service Affiliate | No | Yes, if directly related to Fund operation and financial reporting | ||||
| 1 | The Audit Committee also is permitted to ratify the provision of inadvertent non-audit services, but only if: |
| • | the value of all such services do not exceed 5% of total revenues paid by the Trust and Service Affiliates to the Auditor in the fiscal year when services are provided; |
| • | the services were not recognized as non-audit services at the time they were provided; and |
| • | the services are promptly brought to the attention of the Audit Committee and approved prior to the completion of the audit. |
Table of Contents
The following policies and procedures (except Section IX) govern the ways in which the Audit Committee will pre-approve audit and various types of non-audit services that the Auditor provides to the Trust and to Service Affiliates. These policies and procedures do not apply in the case of audit services that the Auditor provides to Service Affiliates, nor do they apply to services that an audit firm other than the Auditor provides to Service Affiliates.
These policies and procedures comply with the requirements for pre-approval, but also provide a mechanism by which management of the Trust may request and secure pre-approval of audit and non-audit services in an orderly manner with minimal disruption to normal business operations. Pre-approval of non-audit services by the Auditor may be achieved through a combination of the procedures described in Section VI below.
With respect to non-audit services that may be provided to the Trust by an accounting firm other than the Auditor, the Chairperson of the Audit Committee is authorized to pre-approve such services in accordance with the procedures described in Section IX below.
| II. | Audit Services |
The annual audit services engagement scope and terms will be subject to the specific pre-approval of the Audit Committee. Audit services include the annual financial statement audit (including required rating agency reviews) and other procedures required to be performed by the independent auditor to be able to form an opinion on the Trust’s financial statements. The Audit Committee will monitor the audit services engagement throughout the year and will also approve, if necessary, any changes in terms and conditions resulting from changes in audit scope, Fund structure or other items. The Audit Committee will pre-approve all audit services for the Trust.
| III. | Audit-related Services |
Audit-related services are assurance and related services that are reasonably related to the performance of the audit or review of the Trust’s financial statements or that are traditionally performed by the Auditor. The Audit Committee will pre-approve all audit-related services for the Trust.
| IV. | Tax Services |
Tax services to the Trust include tax compliance, tax planning and tax advice. The Audit Committee will review all proposed tax related services to assure that their provision would not impair the independence of the Auditor. The Audit Committee will pre-approve all tax services for the Trust.
| V. | All Other Services |
While the SEC’s rules prohibit the Auditor from providing specific non-audit services, as listed on Appendix A, certain other types of non-audit services are permitted. Accordingly, the Audit Committee believes it may pre-approve those permissible non-audit services classified as All Other Services that it believes would not impair the independence of the Auditor, and are consistent with the SEC’s rules on auditor independence. The Audit Committee will pre-approve all other services for the Trust. The Audit Committee also will pre-approve All Other Services for Service Affiliates if such services relate directly to the operations or financial reporting of the Funds.
| VI. | Procedures |
| A. | Regular Pre-Approval Procedures |
The Audit Committee shall pre-approve at its regularly scheduled meetings the audit, audit-related, tax and other non-audit services to be rendered by the Auditor to the Trust and those non-audit services to be rendered by the Auditor to the Service Affiliates that require pre-approval by the Audit
Table of Contents
Committee. In connection with such pre-approvals, the Auditor, or the President and/or Treasurer with the assistance of the Auditor, shall provide the Audit Committee with a report containing information about each type of service to be pre-approved at the meeting, an explanation of why the service is being performed, and projected fees.
The Auditor shall notify the President, Treasurer, and Chairperson of the Audit Committee as soon as practicable regarding its engagement to provide Fund-related non-audit services to Service Affiliates.
| B. | Interim Pre-Approval Procedures |
If, in the opinion of the President and/or Treasurer, a proposed engagement needs to commence before the next regularly scheduled Audit Committee meeting, the Chairperson of the Audit Committee (the “Chairperson”) is authorized to pre-approve the engagement so long as the amount to be paid to the Auditor would not exceed $50,000. The President and/or Treasurer will coordinate with the Chairperson and provide to the Chairperson, with the assistance of the Auditor, information about the service to be considered for pre-approval. The Auditor may not commence the engagement under consideration until the President and/or Treasurer has indicated that pre-approval has been obtained from the Chairperson. The Chairperson will report any interim pre-approval decisions to the Audit Committee at its next regularly scheduled meeting.
| VII. | Recordkeeping |
The Trust shall maintain a permanent written record of all decisions made by the Audit Committee or by the Chairperson of the Audit Committee pursuant to these procedures, together with appropriate supporting material. In connection with the ratification of any inadvertent non-audit services, a record shall be made indicating that each of the conditions for this exception to the pre-approval requirement has been satisfied.
| VIII. | Amendment |
The Audit Committee may review and amend these policies and procedures from time to time as it deems appropriate.
| IX. | Interim Pre-Approval of Non-Audit Services By Other Accounting Firms |
If, in the opinion of the President and/or Treasurer, a proposed engagement for non-audit services to the Trust by an accounting firm other than the Auditor needs to commence before the next regularly scheduled Audit Committee meeting, the Chairperson is authorized to pre-approve the engagement so long as the amount to be paid to the accounting firm would not exceed $50,000. The Chairperson will report any interim pre-approval decisions to the Audit Committee at its next regularly scheduled meeting.
Adopted: March 1, 2012
Appendix A
Service Affiliates Subject to Pre-Approval of Non-Audit Services
Including, but not limited to:
RidgeWorth Capital Management LLC and its subsidiaries.
Zevenbergen Capital Investments LLC
WCM Capital Management
Capital Innovations
Table of Contents
Prohibited Non-Audit Services
The SEC categorically prohibits the following non-audit services for audit clients:
| • | Management functions |
| • | Human resources/Executive recruitment |
| • | Broker-dealer, investment adviser, or investment banking services |
| • | Legal services |
| • | Expert services unrelated to the audit |
The SEC classifies certain other non-audit services as ‘conditionally prohibited’ which may only be delivered to SEC-restricted clients that are not subject to audit by the Auditor. Conditionally prohibited services are defined to include the following:
| • | Bookkeeping services, including payroll |
| • | Financial information systems design and implementation services |
| • | Appraisal or valuation services |
| • | Actuarial Services |
| • | Internal audit outsourcing services |
(e)(2) Percentage of Services - None of the services summarized in paragraphs (b)-(d), above, were approved by the Audit Committee pursuant to Rule 2-01(c)(7)(i)(C) of Regulation S-X.
(f) No disclosures are required by this Item 4(f).
(g) The aggregate non-audit fees billed for the last two fiscal years ended March 31 for services rendered by the principal accountant to the Registrant are set forth below.
| March 31, 2017 | March 31, 2016 | |||||
| $ | 166,140 | $ | 161,264 | |||
The approximate aggregate non-audit fees billed for the last two fiscal years ended March 31 for services rendered by the Registrant’s principal accountant to the Registrant’s investment adviser, and any other entity controlling, controlled by, or under common control with the Registrant’s investment adviser that provides ongoing services to the Registrant are set forth below.
| March 31, 2017 | March 31, 2016 | |||||
| $ | 0 | $ | 0 | |||
Table of Contents
Services for which the non-audit fees were billed relate principally to mortgage compliance reviews, general corporate and state and local tax assistance and accounting matters, and various strategic reporting consulting projects.
(h) In regards to Item 4(g), the Audit Committee has considered that the provision of non-audit services that were rendered to the Registrant’s investment adviser (not including any sub-adviser whose role is primarily portfolio management and is subcontracted with or overseen by another investment adviser), and any entity controlling, controlled by, or under common control with the investment adviser that provides ongoing services to the Registrant that were not pre-approved pursuant to paragraph (c)(7)(ii) of Rule 2-01 of Regulation S-X is compatible with maintaining the principal accountant’s independence.
| Item 5. | Audit Committee of Listed Registrants. |
Not applicable.
| Item 6. | Schedule of Investments. |
| (a) | Schedule of Investments is included as a part of the reports to shareholders filed under Item 1 of this Form N-CSR. |
| (b) | Not applicable. |
Item 7. Disclosure of Proxy Voting Policies and Procedures for Closed-End Management Investment Companies.
Not applicable.
| Item 8. | Portfolio Managers of Closed-End Investment Companies. |
Not applicable.
Item 9. Purchases of Equity Securities by Closed-End Management Investment Company and Affiliated Purchasers.
Not applicable.
| Item 10. | Submission of Matters to a Vote of Security Holders. |
The Board of Trustees has not adopted formal procedures by which shareholders may recommend nominees to the Board of Trustees.
| Item 11. | Controls and Procedures. |
(a) The Registrant’s principal executive officer and principal financial officer have concluded, based on their evaluation of the Registrant’s disclosure controls and procedures as conducted within 90 days of the filing date of this report, that these disclosure controls and procedures are adequately designed and are operating effectively to ensure that information required to be disclosed by the Registrant on Form N-CSR is recorded, processed, summarized and reported within the time periods specified in the Securities and Exchange Commission’s rules and forms.
(b) There were no changes in the Registrant’s internal control over financial reporting that occurred during the second fiscal quarter of the period covered by this report that have materially affected or are reasonably likely to materially affect, the Registrant’s internal control over financial reporting.
Table of Contents
| Item 12. | Exhibits. |
| (a) | (1) | Code of Ethics described in Item 2 is attached hereto. | ||
| (2) | The certifications required by Rule 30a-2(a) of the 1940 Act are attached hereto. | |||
| (3) | Not applicable. | |||
(b) The certifications required by Rule 30a-2(b) of the 1940 Act and Section 906 of the Sarbanes-Oxley Act of 2002 are attached hereto.
Table of Contents
SIGNATURES
Pursuant to the requirements of the Securities Exchange Act of 1934 and the Investment Company Act of 1940, the Registrant has duly caused this report to be signed on its behalf by the undersigned, thereunto duly authorized.
| RIDGEWORTH FUNDS | ||
| By: | /s/ Julia R. Short | |
| Julia R. Short | ||
| President | ||
| Date: | May 31, 2017 | |
Pursuant to the requirements of the Securities Exchange Act of 1934 and the Investment Company Act of 1940, this report has been signed below by the following persons on behalf of the Registrant and in the capacities and on the dates indicated.
| By: | /s/ Julia R. Short | |
| Julia R. Short | ||
| President | ||
| Date: | May 31, 2017 | |
| By: | /s/ Benjamin H. Lowe | |
| Benjamin H. Lowe | ||
| Treasurer | ||
| Date: | May 31, 2017 | |