UNITED STATES
SECURITIES AND EXCHANGE COMMISSION
Washington, D.C. 20549
FORM N-CSR
CERTIFIED SHAREHOLDER REPORT OF REGISTERED
MANAGEMENT INVESTMENT COMPANIES
Investment Company Act file number: 811-6563
CALVERT WORLD VALUES FUND, INC.
(Exact name of registrant as specified in charter)
4550 Montgomery Avenue
Suite 1000N
Bethesda, Maryland 20814
(Address of Principal Executive Offices)
William M. Tartikoff, Esq.
4550 Montgomery Avenue
Suite 1000N
Bethesda, Maryland 20814
(Name and Address of Agent for Service)
Registrant's telephone number, including area code: (301) 951-4800
Date of fiscal year end: September 30
Date of reporting period: Six months ended March 31, 2012
Item 1. Report to Stockholders.
[Calvert International Equity Fund Semi-Annual Report to Shareholders]
and
[Calvert Capital Accumulation Fund Semi-Annual Report to Shareholders]
and
[Calvert International Opportunities Fund Semi-Annual Report to Shareholders]
Choose Planet-friendly E-delivery!
Sign up now for on-line statements, prospectuses, and fund reports. In less than five minutes you can help reduce paper mail and lower fund costs.
Just go to www.calvert.com. If you already have an online account at Calvert, click on My Account, and select the documents you would like to receive via e-mail.
If you’re new to online account access, click on Login/Register to open an online account. Once you’re in, click on the E-delivery sign-up at the bottom of the Account Portfolio page and follow the quick, easy steps. Note: if your shares are not held directly at Calvert but through a brokerage firm, you must contact your broker for electronic delivery options available through their firm.
Dear Shareholder:
After a difficult summer of 2011, investor sentiment improved toward the end of 2011, and many investors clearly breathed a sigh of relief in early 2012. Headlines about Europe’s sovereign debt crisis had reached a fever pitch during the final months of 2011 and investors worldwide held their breath, concerned about the potential fallout on markets near and far.
However, long-term refinancing operations agreed to in December 2011 by the European Central Bank that enabled the region’s banks to borrow at very low interest rates as well as progress on a Greek bailout seemed to pull the eurozone back from the brink of collapse and reassured investors. As a result, the broad international markets of the MSCI EAFE Index improved, returning 14.73% for the reporting period.
Overall, key U.S. economic indicators such as the unemployment rate, manufacturing data, housing market fundamentals, and consumer confidence showed gradual improvement. But consumer spending remained weak, and gasoline prices topping $4.00 a gallon in some areas in March did not help. As a result, economic growth continued at a snail’s pace.
In contrast to the fourth quarter, when the Standard & Poor’s (S&P) 500 Index earned nearly all of its return during October, the S&P 500 Index had a strong and mostly steady climb in the first quarter of 2012 to end the reporting period at 25.89%. Investors became more open to risk over the reporting period as well.
Broadening the Reach of SRI
It’s worth noting that corporate responsibility is just as relevant today as it’s always been—and perhaps even more so in these times of economic uncertainty. At Calvert, we have long believed that a company’s environmental, sustainability, and governance policies correlate strongly with its risk management and financial performance. It’s clear that more and more investors, consumers, and companies are reaching the same conclusions, and that the use of shareholder advocacy to effect change is becoming an increasingly powerful tool.
However, we always welcome additional proof of this, especially from venerable sources such as Ernst & Young. In a new white paper, the management consulting firm noted that social and environmental issues accounted for 40% of shareholder proposals on proxy ballots last year, up one-third from 2010. Ernst & Young also predicts these issues will dominate proposals for the third consecutive year in 2012, thanks to a convergence of factors drawing attention to companies’ actions on sustainability and environmental issues.1 Perhaps even more important is the broadening of support. Sustainability proposals overall received favorable votes from a record 21% of shareholders in 2011, and nearly one-third of the proposals had support exceeding 30%—a critical level where corporate boards can’t help but take notice. This is on par with Calvert’s own experiences, where 38% of resolutions we filed or co-filed that resulted in a vote last year received support of more than 30%.
www.calvert.com CALVERT INTERNATIONAL EQUITY FUND SEMI-ANNUAL REPORT (UNAUDITED) 4
If you’re interested in learning more about our shareholder advocacy efforts this year, visit us online at www.calvert.com/sri-resolutions.html.
Calvert’s Women’s Principles and Diversity
In March, Calvert helped mark the two-year anniversary of the United Nation’s Women’s Empowerment Principles (WEP) at the U.N. Gender Equality for Sustainable Business Event, which emphasized the business case for promoting gender equality in the workplace. More than 400 chief executives have now publicly committed to implementing the WEP, which were adapted from the Calvert’s Women’s Principles® in 2010. We’re also participating in the WEP Leadership Group, comprised of 30 leading companies, investors, and women-focused organizations seeking to encourage broader adoption of the Principles.
We filed six shareholder resolutions for the upcoming annual meeting season asking companies to add specific considerations of race and gender diversity to their desired director characteristics. Five were successfully withdrawn after management agreed. Notably, this includes American Financial Group, whose resistance last year led to a vote supported by 27% of shareholders. So, persistence does indeed pay off. The lone holdout is Urban Outfitters, where company resistance led to a vote last year that received 22% support.
Leading the Path to Sustained Sustainability in the Next Economy
In October, Calvert had the privilege of co-hosting the 2011 United Nations Environment Programme Finance Initiative (UNEP-FI) Global Roundtable in Washington, D.C. More than 500 attendees from the investment, banking, and insurance industries discussed the tipping point for linking global sustainability and market stability as the cornerstone of the “next economy.” In my opening remarks as UNEP-FI co-chair of the Global Steering Committee, I highlighted the importance of the financial community working together. This is necessary not only to restore trust in financial systems, but also to make a meaningful impact on the pressing challenges facing the world today so that a sustainable future will exist for all. This is an idea that’s been at the heart of Calvert Investments for more than 30 years. Calvert’s leadership on these topics was evident at the event, with Calvert team members speaking on panels about human rights, water, and ecosystem services.
Other Calvert News
As you may know, we launched Calvert Equity Income Fund2 last fall to offer the potential for attractive income generation and competitive total return by investing in a portfolio of large-cap, dividend-paying stocks that we believe provide compelling value. Calvert Large Cap Value Fund co-portfolio managers James McGlynn, CFA and Yvonne Bishop, CFA are managing the new Fund. Both Funds feature Calvert’s SAGE strategy, which involves Calvert actively engaging with companies held in the Funds to engender positive change.
www.calvert.com CALVERT INTERNATIONAL EQUITY FUND SEMI-ANNUAL REPORT (UNAUDITED) 5
A Variety of Ways to Stay Informed
We are cautiously optimistic about the continued economic recovery, but much uncertainty and the potential for renewed volatility remains. That’s why we always feel it’s best to maintain a well-diversified mix of U.S. and international stocks, bonds, and cash appropriate for your goals and risk tolerance. And of course, we suggest you consult your financial advisor if you have questions or concerns.
We also invite you to visit our website, www.calvert.com, for fund information, portfolio updates, and commentary from Calvert professionals. And now, you can get the same information on the go with Calvert’s new iPhone® app, which is available for free from iTunes.
As always, we thank you for investing with Calvert.

Barbara J. Krumsiek
President and CEO
Calvert Investments, Inc.
May 2012
1 Ernst & Young, Leading Corporate Sustainability Issues in the 2012 Proxy Season: Is your board prepared?
2 Investment in mutual funds involves risk, including possible loss of principal invested. For more information on any Calvert fund, please contact Calvert at 800.368.2748 for a free summary prospectus and/or prospectus. An investor should consider the investment objectives, risks, charges, and expenses of an investment carefully before investing. The summary prospectus and prospectus contain this and other information. Read them carefully before you invest or send money. Calvert mutual funds are underwritten and distributed by Calvert Investment Distributors, Inc., member FINRA and subsidiary of Calvert Investments, Inc.
www.calvert.com CALVERT INTERNATIONAL EQUITY FUND SEMI-ANNUAL REPORT (UNAUDITED) 6

As always, Calvert continues to work hard to ensure you have a say in the responsible management of environmental, social, and governance (ESG) factors for the companies in which we invest. Below are highlights of our accomplishments during the reporting period.
Overall Shareholder Advocacy Efforts
Through March 31, 2012, Calvert had filed 23 shareholder proposals in the 2012 proxy season.
The most popular topics were board diversity, sustainability disclosure, climate change, and loan servicing. Several of these are discussed in more detail below. Through March 31, 2012, we had successfully withdrawn 14 resolutions after companies agreed to the terms.
Setting a Fair and Sustainable Table
Many food crops are already showing vulnerability to climate change. For example, higher temperatures and extreme rainfall are expected to increase disease and stress in Central and South American coffee bean crops, resulting in lower output. Last year, our shareholder resolution asked J.M. Smucker to disclose the climate-related risks for its Folgers Coffee and other coffee brands, which reflect 40% of the company’s revenue. We have re-filed the proposal this year in the hope that last year’s strong support of 30% persuades the company to reconsider its position.
We also filed a resolution with Colgate-Palmolive about palm oil sourcing. Despite some sustainability advantages to using palm oil in food, lotions, soaps, and shampoo, significant problems exist in the way palm oil trees are grown in some countries—resulting in significant greenhouse gas emissions, displacement of local and Indigenous Peoples, and destruction of endangered species. After discussions with company management, Colgate announced a goal of purchasing only certified sustainable palm oil by 2015, and we successfully withdrew the proposal.
Finally, Calvert began working with Oxfam America, farm worker unions, and consumer groups to develop a new certification system for on-farm sustainability of fruits and vegetables grown in the United States. The pilot project evaluates farm worker welfare, pesticide reduction, and product safety.
Rooting Out Supply Chain Abuses
Calvert co-authored a guide with Christian Brothers Investments and the Interfaith Center on Corporate Responsibility to help companies comply with the California Transparency in Supply Chain Act (SB 657). This ground-breaking U.S. law requires manufacturers and retailers with global gross receipts exceeding $100 million that operate in California to disclose efforts to eliminate slavery and human trafficking from their direct supply chains on their corporate website. The guide also serves as an advocacy tool for more effective management of labor and human rights risks within global supply chains.
www.calvert.com CALVERT INTERNATIONAL EQUITY FUND SEMI-ANNUAL REPORT (UNAUDITED) 7
On a related note, Calvert is greatly concerned by news reports about factory conditions for some of Apple’s suppliers, especially in China. We have been working with a larger investor coalition to engage Apple’s senior management, and we believe the company has made significant strides in the last few months toward full supply chain transparency and “zero tolerance” for workplace abuses. Apple has also moved aggressively to have the Fair Labor Association conduct third-party audits of its suppliers and is posting the results of these monthly audits on its website. We will continue to monitor the situation and work with Apple to remedy its supply chain issues.
Improving Regulation of ESG Issues
Clean Air Act. Calvert coordinated an investor letter to congressional leaders urging timely implementation of new Clean Air Act rules under development at the Environmental Protection Agency (EPA). These rules would help modernize and improve the efficiency of electric utilities, reduce cross-state air pollution, lower emissions of mercury and air toxins, and create well-paid construction, engineering, and manufacturing jobs. The EPA announced the new Mercury and Air Toxics rule in December—a victory for the health of both the public and the economy.
Dodd-Frank Reform & Consumer Protection Act of 2010. We continue to participate in a complicated Securities and Exchange Commission (SEC) rule-making process for this law, particularly regarding section 1502 on “conflict minerals.” This section requires companies that use gold, tin, tantalum, and tungsten in their products to disclose whether these metals are coming from specific mines in the Democratic Republic of Congo and adjoining countries. Profits from these mines have been used to fuel the weapon supply for one of the world’s bloodiest conflicts since World War II.
An early supporter of the legislation, Calvert is working with a coalition of investors, human rights organizations, and major multinational corporations that recently met with the SEC chairman as well as several commissioners and their staff. We also presented the investor perspective at an SEC roundtable in October 2011 and have submitted a series of letters and comments about the complex and controversial issues involved. We hope to see a final rule in the coming months.
Community Investments
Many of our Funds participate in Calvert’s High Social Impact Investing program, which is administered through the Calvert Foundation. This community investment program may allocate a small percentage of Fund assets at below-market interest rates to investments that provide economic opportunity for struggling populations.1 One such investment is Pride Industries, which creates jobs for people with disabilities and is an up-and-coming leader in helping individuals overcome barriers to employment. In fiscal year 2010, the organization employed 4,100 individuals, 60% of whom were disabled.
www.calvert.com CALVERT INTERNATIONAL EQUITY FUND SEMI-ANNUAL REPORT (UNAUDITED) 8
Another example is Via Verde, an innovative and award-winning affordable housing development in the South Bronx. This complex combines urgently needed low- to moderate-income housing with a new model for affordable, green, and healthy urban living in a design that improves the attractiveness of the community around it.
Special Equities
A modest but important portion of certain funds is allocated to small private companies developing products or services that address important sustainability or environmental issues. One recent investment was LearnZillion, a Washington, D.C.-based group using video technology to provide individualized learning in primary schools.2 “Best of class” video modules allow the teacher to track each student’s progress, give the right lessons at the right time, and provide timely support—all with interactive feedback. We are unsure if this approach will be the breakthrough learning improvement the schools need, but all agree innovative solutions need to be tried.
Calvert was also instrumental in getting the U.S. State Department to focus attention on the importance of “impact investing,” by way of a conference with an address by Secretary of State Hillary Clinton. We are gratified the U.S. government is manifesting the best of American values by becoming involved in supporting social entrepreneurs.
1 As of March 31, 2012, Calvert Social Investment Foundation (“Calvert Foundation” or “Foundation”) Community Investment Notes represented the following percentages of Fund net assets: Calvert Capital Accumulation Fund 0.55%, Calvert International Equity Fund 1.37%, and Calvert Small Cap Fund 0.50%. The Calvert Foundation is a 501(c)(3) nonprofit organization. The Foundation’s Community Investment Note Program is not a mutual fund and should not be confused with any Calvert Investments-sponsored investment product.
2 As of March 31, 2012, LearnZillion represented 0.02% of Calvert Balanced Portfolio. Holdings are subject to change.
As of March 31, 2012, the following companies represented the following percentages of net assets: J.M. Smucker 0.11% of Calvert Social Index Fund, Colgate-Palmolive 0.51% of Calvert Social Index Fund, and Apple 6.52% of Calvert Social Index Fund. Holdings are subject to change.
www.calvert.com CALVERT INTERNATIONAL EQUITY FUND SEMI-ANNUAL REPORT (UNAUDITED) 9
Investment Performance
Calvert International Equity Fund (Class A shares at NAV) returned 16.80% for the six-month period ended March 31, 2012 compared with 14.68% for the MSCI EAFE IMI. Stock selection was the primary driver of the Fund’s relative outperformance over this reporting period.
Investment Climate
During the six-month reporting period, strong earnings from U.S. companies, continued improvements in U.S. macroeconomic data, and aggressive accommodative monetary policy worldwide helped equity markets rally hard off their lows posted last fall, albeit on low volume. For the trailing six-month period, the Russell 1000, Russell 2000, MSCI EAFE, and MSCI Emerging Markets Indices returned 26.27%, 29.83%, 14.73%, and 19.20%, respectively.
The growth investment style slightly outperformed the value style, and within the Russell 1000 Index, Financials, Information Technology, and Consumer Discretionary were the top-performing sectors. The
| CALVERT INTERNATIONAL |
| EQUITY FUND |
| MARCH 31, 2012 |
| | | |
| INVESTMENT PERFORMANCE | | | |
| (total return at NAV*) | | | |
| | 6 Months | | 12 Months | |
| | ended | | ended | |
| | 3/31/12 | | 3/31/12 | |
| Class A | 16.80 | % | -5.80 | % |
| Class B | 16.13 | % | -6.81 | % |
| Class C | 16.28 | % | -6.57 | % |
| Class I | 17.20 | % | -5.13 | % |
| Class Y | 17.02 | % | -5.39 | % |
| |
| MSCI EAFE Investable | | | | |
| Market Index (IMI) | 14.68 | % | -5.38 | % |
| | | | |
| Lipper International | | | | |
| Large-Cap Core | | | | |
| Funds Average | 16.31 | % | -5.98 | % |
| |
| TEN LARGEST | | | % of | |
| STOCK HOLDINGS | | | Net Assets | |
| Adidas AG | | | 2.4 | % |
| Check Point Software | | | | |
| Technologies Ltd. | | | 2.3 | % |
| Toyota Motor Corp. | | | 2.3 | % |
| Novartis AG | | | 2.2 | % |
| Kingfisher plc | | | 2.1 | % |
| BG Group plc | | | 2.1 | % |
| SAP AG | | | 2.1 | % |
| Canadian National Railway Co. | | 2.0 | % |
| Pearson plc | | | 2.0 | % |
| Groupe Danone | | | 1.9 | % |
| Total | | | 21.4 | % |
*Investment performance/return at NAV does not reflect the deduction of the Fund’s maximum 4.75% front-end sales charge or any deferred sales charges.
www.calvert.com CALVERT INTERNATIONAL EQUITY FUND SEMI-ANNUAL REPORT (UNAUDITED) 10
Utilities, Telecommunications, and Consumer Staples sectors lagged as the risk-on trade returned with a vengeance.
In the United States, improving jobs data were a significant boost to equity market performance with the recent and welcome improvements in the unemployment rate and jobless claims compounding the positive effects from strong corporate earnings. The falling unemployment rate also helped drive continued improvement in consumer confidence and consumer spending, which were not as heavily impacted by rising gasoline prices as they could have been had the stock market and the job market not been improving.
The manufacturing sector continued to provide significant support to the U.S. economic recovery, with a weak U.S. dollar supporting strong exports and the national Purchasing Manager’s Index firmly in an expansionary mode. Vehicle sales and production both looked encouraging as well. However, deepening recession in Europe and the overall slowdown in the global economy will de-emphasize the contribution of exports to U.S. gross domestic product (GDP). Therefore, the continued recovery of the U.S. consumer will be important for a self-sustained U.S. economic recovery. The service sector has been showing signs of improvement recently--a sign the manufacturing-led recovery in the United States may be spreading to other sectors.
U.S. bank lending continued to improve despite regulatory pressures threatening the long-term profitability of the banking industry. An improving consumer balance sheet allowed banks to increase lending while adhering to higher lending standards. The U.S. housing market continued to bottom out and showed signs of improvement, though it is not out of the woods yet, especially with foreclosed
| CALVERT |
| INTERNATIONAL |
| EQUITY FUND |
| MARCH 31, 2012 |
| |
| | % of Total | |
| ECONOMIC SECTORS | Investments | |
| Consumer Discretionary | 20.9 | % |
| Consumer Staples | 10.0 | % |
| Energy | 4.9 | % |
| Financials | 20.4 | % |
| Health Care | 7.2 | % |
| Industrials | 10.6 | % |
| Information Technology | 10.5 | % |
| Limited Partnership Interest | 0.8 | % |
| Materials | 5.5 | % |
| Telecommunication Services | 5.6 | % |
| Time Deposit | 1.8 | % |
| Utilities | 1.3 | % |
| Venture Capital | 0.5 | % |
| Total | 100 | % |
inventories still high. The housing sector, while not providing much growth, is not likely to be the drag on the economy that it has been for many quarters since the bursting of the housing bubble.
Despite visible improvements in macroeconomic data, in January the U.S. Federal Reserve (Fed) announced an extension of its low interest rate policy through the end of 2014. It also adopted a formal inflation target of 2% and suggested that balance sheet expansion (QE3) is not out of the question should economic conditions deteriorate, though this is less likely in the near term. The move appeared to reflect the Fed’s heightened focus on unemployment, which has become an increasingly important part of the Fed’s dual mandate of price stability and maximum employment this election year.
www.calvert.com CALVERT INTERNATIONAL EQUITY FUND SEMI-ANNUAL REPORT (UNAUDITED) 11
This aggressively accommodative monetary policy is likely to create an environment conducive to imbalances and bubbles in the economy and markets. With U.S. interest rates and the dollar at historic lows, U.S. dollar-denominated commodities like oil have been rising in price to levels where the demand destruction begins to create negative feedback on both commodity prices and economic growth globally. Interestingly, this negative feedback may be disproportionately higher for the commodity-hungry emerging market economies than for the United States itself. Therefore, it could be that the United States will end up “exporting” the recessionary pressures outside its borders to more commodity-intensive economies like China and Brazil.
Still, with global economic challenges keeping inflation in check, policymakers around the globe continued their efforts toward easing monetary policies, which should help stimulate economic growth. Unfortunately for the global economy and consumers, the rate of increase in oil prices kept pace with the stock market, exacerbated by the geopolitical tensions in the Middle East. This rising oil price trend, if not reversed, will likely put a damper on global economic growth.
In the eurozone, investors increasingly worried about the currency’s potential collapse during the fourth quarter of 2011, though there was some stability to start 2012. Yields on the sovereign debt of Spain, Greece, Italy, and France soared in November, but have gradually declined since then, signaling that the LTRO (long term refinancing operation) may have helped the eurozone sovereign bond markets by driving down short-term yields and, for the time-being, reduced investor perception of the probability of a global financial crisis.
| CALVERT |
| INTERNATIONAL |
| EQUITY FUND |
| MARCH 31, 2012 |
| |
| AVERAGE ANNUAL TOTAL RETURNS | |
| |
| CLASS A SHARES | (with max. load) | |
| One year | -10.26 | % |
| Five year | -8.77 | % |
| Ten year | 1.76 | % |
| |
| CLASS B SHARES | (with max. load) | |
| One year | -11.47 | % |
| Five year | -9.08 | % |
| Ten year | 1.10 | % |
| |
| CLASS C SHARES | (with max. load) | |
| One year | -7.51 | % |
| Five year | -8.67 | % |
| Ten year | 1.35 | % |
| |
| CLASS I SHARES | | |
| One year | -5.13 | % |
| Five year | -7.20 | % |
| Ten year | 3.04 | % |
| |
| CLASS Y SHARES* | | |
| One year | -5.39 | % |
| Five year | -7.60 | % |
| Ten year | 2.41 | % |
* Calvert International Equity Fund first offered Class Y Shares on October 31, 2008.
Performance prior to that date reflects the performance of Class A Shares at net asset value (NAV). Actual Class Y Share performance would have been different.
www.calvert.com CALVERT INTERNATIONAL EQUITY FUND SEMI-ANNUAL REPORT (UNAUDITED) 12
Growth of $10,000
The graph below shows the value of a hypothetical $10,000 investment in the Fund over the past 10 fiscal year periods. The results shown are for Classes A shares and reflect the deduction of the maximum front-end sales charge of 4.75%, and assume the reinvestment of dividends. The result is compared with benchmarks that include a broad based market index and a Lipper peer group average. Market indexes are unmanaged and their results do not reflect the effect of expenses or sales charges. The Lipper average reflects the deduction of the category’s average front-end sales charge. The value of an investment in a different share class would be different.
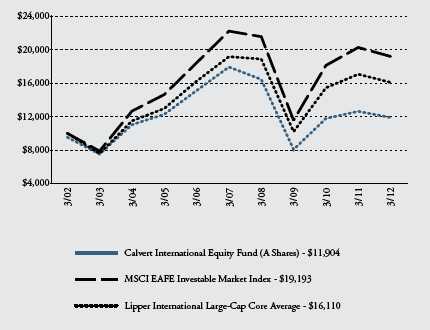
All performance data shown, including the graph above and the adjacent table, represents past performance, does not guarantee future results, assumes reinvestment of dividends and distributions and does not reflect the deduction of taxes that a shareholder would pay on the Fund’s distributions or the redemption of the Fund shares. All performance data reflects fee waivers and/or expense limitations, if any are in effect; in their absence performance would be lower. See Note B in Notes to Financial Statements. The investment return and principal value of an investment will fluctuate so that an investor’s shares, when redeemed, may be worth more or less than their original cost. Current performance may be lower or higher than the performance data quoted; for current performance data visit www.calvert.com. The gross expense ratio from the current prospectus for Class A shares is 1.82%. This number may differ from the expense ratio shown elsewhere in this report because it is based on a different time period and, if applicable, does not include fee or expense waivers. Performance data quoted already reflects the deduction of the Fund’s operating expenses.
www.calvert.com CALVERT INTERNATIONAL EQUITY FUND SEMI-ANNUAL REPORT (UNAUDITED) 13
Despite the positive impact of the LTRO, Europe continued to provide a negative backdrop to investor confidence and was a drag on the global economy. Eurozone GDP contracted 0.3% in the fourth quarter of 2011, while the unemployment rate in the eurozone reached a 15-year high of 10.8%. These data confirmed our concerns about the eurozone’s economic outlook and the worsening recession in Europe, including the core economies.
A deal on the Greek bailout was reached by all involved parties with the resulting Greek bond swap reducing Greece’s debt burden by 100 billion euros. Even with the bond swap, debt in Greece is becoming an increasingly larger percentage of GDP due to the rate at which Greece’s GDP is contracting, a trend that will continue to jeopardize the country’s credit health.
A positive inflation trend allowed the Chinese government to continue to reposition its economic policy from contractionary for most of 2011 to stimulative. The Chinese economy continued to decelerate during the period as foreign direct investment, one of the major drivers of economic growth in China, declined on a year-over-year basis for four consecutive months. Increasing domestic consumption in the country will be key to offsetting this effect. China cut its economic growth target from 8% to 7.5%, signaling the country’s need to transition to a more sustainable, consumer-driven economic model.
Portfolio Strategy
Stock selection was positive across all sectors, with selection effects strongest in Financials, Industrials, and Health Care. Top contributors included Assa Abloy, Novo Nordisk, and Svenska Handelsbanken.
Country allocation was also a positive contributor, adding 1.11 percentage points to the Fund’s active return, primarily driven by the Fund’s overweight to North America. However, sector allocation detracted 1.15 percentage points for the period, primarily driven by the Fund’s 3% allocation to cash.
Market Outlook
A sharp slowdown or, more importantly, a hard landing in China, fueled by a possible bursting of a real-estate bubble there, would certainly create strong ripple effects throughout the global economy, including the United States, but this indirect impact could be less damaging than a domestic recession in the United States.
www.calvert.com CALVERT INTERNATIONAL EQUITY FUND SEMI-ANNUAL REPORT (UNAUDITED) 14
If U.S. economic recovery proves robust enough to withstand the negative head-winds from Europe and China in 2012, U.S. equities may significantly outperform Treasuries given the relative valuation of the two asset classes. Highly bid up dividend-yielding securities may also underperform as investor risk aversion subsides. However, if more investors refocus on the underlying economic fundamentals in Europe, the risk aversion may return for some time during the year. In this environment, despite stronger economic data in the United States, one thing is certain--equity market volatility is likely to be here to stay for most of 2012.
May 2012
As of March 31, 2012, the following companies represented the following percentages of Fund net assets: Assa Abloy 1.25%, Novo Nordisk 1.71%, and Svenska Handelsbanken 1.18%. Holdings are subject to change.
www.calvert.com CALVERT INTERNATIONAL EQUITY FUND SEMI-ANNUAL REPORT (UNAUDITED) 15
SHAREHOLDER EXPENSE EXAMPLE
As a shareholder of the Fund, you incur two types of costs: (1) transaction costs, including sales charges (loads) and redemption fees; and (2) ongoing costs, including management fees; distribution (12b-1) fees; and other Fund expenses. This Example is intended to help you understand your ongoing costs (in dollars) of investing in the Fund and to compare these costs with the ongoing costs of investing in other mutual funds.
This Example is based on an investment of $1,000 invested at the beginning of the period and held for the entire period (October 1, 2011 to March 31, 2012).
Actual Expenses
The first line of the table below provides information about actual account values and actual expenses. You may use the information in this line, together with the amount you invested, to estimate the expenses that you paid over the period. Simply divide your account value by $1,000 (for example, an $8,600 account value divided by $1,000 = 8.6), then multiply the result by the number in the first line under the heading entitled “Expenses Paid During Period” to estimate the expenses you paid on your account during this period.
Hypothetical Example for Comparison Purposes
The second line of the table below provides information about hypothetical account values and hypothetical expenses based on the Fund’s actual expense ratio and an assumed rate of return of 5% per year before expenses, which is not the Fund’s actual return. The hypothetical account values and expenses may not be used to estimate the actual ending account balance or expenses you paid for the period. You may use this information to compare the ongoing costs of investing in the Fund and other funds. To do so, compare the 5% hypothetical example with the 5% hypothetical examples that appear in the shareholder reports of the other funds.
Please note that the expenses shown in the table are meant to highlight your ongoing costs only and do not reflect any transactional costs, such as sales charges (loads) or redemption fees. Therefore, the second line of the table is useful in comparing ongoing costs only, and will not help you determine the relative total costs of owning different funds. In addition, if these transactional costs were included, your costs would have been higher.
www.calvert.com CALVERT INTERNATIONAL EQUITY FUND SEMI-ANNUAL REPORT (UNAUDITED) 16
| | BEGINNING | ENDING ACCOUNT | EXPENSES PAID |
| | ACCOUNT VALUE | VALUE | DURING PERIOD* |
| | 10/1/11 | 3/31/12 | 10/1/11 - 3/31/12 |
| CLASS A | | | |
| Actual | $1,000.00 | $1,168.00 | $9.73 |
| Hypothetical | $1,000.00 | $1,016.02 | $9.05 |
| (5% return per | | | |
| year before expenses) | | | |
| | | |
| CLASS B | | | |
| Actual | $1,000.00 | $1,161.30 | $16.05 |
| Hypothetical | $1,000.00 | $1,010.15 | $14.93 |
| (5% return per | | | |
| year before expenses) | | | |
| | | |
| CLASS C | | | |
| Actual | $1,000.00 | $1,162.80 | $14.49 |
| Hypothetical | $1,000.00 | $1,011.60 | $13.48 |
| (5% return per | | | |
| year before expenses) | | | |
| | | |
| CLASS I | | | |
| Actual | $1,000.00 | $1,172.00 | $5.73 |
| Hypothetical | $1,000.00 | $1,019.72 | $5.33 |
| (5% return per | | | |
| year before expenses) | | | |
| |
| CLASS Y | | | |
| Actual | $1,000.00 | $1,170.20 | $7.53 |
| Hypothetical | $1,000.00 | $1,018.06 | $7.00 |
| (5% return per | | | |
| year before expenses) | | | |
* Expenses are equal to the Fund’s annualized expense ratio of 1.80%, 2.97%, 2.68%, 1.06%, and 1.39% for Class A, Class B, Class C, Class I, and Class Y, respectively, multiplied by the average account value over the period, multiplied by 183/366 (to reflect the one-half year period).
www.calvert.com CALVERT INTERNATIONAL EQUITY FUND SEMI-ANNUAL REPORT (UNAUDITED) 17
| | | |
| STATEMENT OF NET ASSETS |
| MARCH 31, 2012 |
| |
| EQUITY SECURITIES - 94.9% | SHARES | | VALUE |
| Australia - 1.4% | | | |
| Amcor Ltd. (ADR) | 3,181 | $ | 98,325 |
| QR National Ltd. | 310,404 | | 1,200,356 |
| Santos Ltd. | 93,793 | | 1,384,696 |
| Sims Metal Management Ltd | 74,748 | | 1,138,401 |
| Sims Metal Management Ltd. (ADR) | 36,251 | | 553,553 |
| | | | 4,375,331 |
| |
| Austria - 0.0% | | | |
| Erste Group Bank AG (ADR) | 5,237 | | 60,644 |
| Telekom Austria AG (ADR) | 271 | | 6,277 |
| Verbund AG (ADR) | 507 | | 3,052 |
| | | | 69,973 |
| |
| Belgium - 0.0% | | | |
| Ageas (ADR) | 2,056 | | 4,276 |
| Delhaize Group SA (ADR) | 2,364 | | 124,346 |
| | | | 128,622 |
| |
| Brazil - 3.3% | | | |
| BM&FBOVESPA SA | 169,393 | | 1,045,337 |
| Itau Unibanco Holding SA (ADR) | 217,700 | | 4,177,663 |
| Natura Cosmeticos SA | 188,499 | | 4,108,603 |
| Tim Participacoes SA (ADR) | 41,146 | | 1,327,370 |
| | | | 10,658,973 |
| |
| Canada - 5.3% | | | |
| Canadian National Railway Co.: | | | |
| New York Exchange | 16,907 | | 1,342,923 |
| Toronto Exchange | 82,124 | | 6,516,160 |
| Cenovus Energy, Inc. | 84,100 | | 3,022,061 |
| EnCana Corp. New York Exchange | 29,499 | | 579,655 |
| Potash Corporation of Saskatchewan, Inc. | 116,844 | | 5,338,602 |
| Suncor Energy, Inc. New York Exchange | 6,475 | | 211,732 |
| | | | 17,011,133 |
| |
| China - 0.7% | | | |
| China Merchants Bank Co. Ltd | 1,051,915 | | 2,151,452 |
| |
| Denmark - 1.8% | | | |
| Danske Bank A/S (ADR)* | 15,792 | | 132,337 |
| H Lundbeck A/S (ADR) | 3,480 | | 69,565 |
| Novo Nordisk A/S, Series B | 39,622 | | 5,484,763 |
| Novozymes A/S (ADR) | 1,844 | | 53,955 |
| | | | 5,740,620 |
| www. | calvert.com CALVERT INTERNATIONAL EQUITY FUND SEMI-ANNUAL REPORT (UNAUDITED) 18 |
| | | |
| EQUITY SECURITIES - CONT’D | SHARES | | VALUE |
| Finland - 0.4% | | | |
| Metso Oyj (ADR) | 420 | $ | 18,014 |
| Nokia Oyj (ADR) | 7,964 | | 43,722 |
| Outotec Oyj | 23,541 | | 1,193,791 |
| Sampo Oyj (ADR) | 6,861 | | 98,455 |
| | | | 1,353,982 |
| |
| France - 8.9% | | | |
| Air France-KLM (ADR)* | 2,564 | | 14,538 |
| Air Liquide SA | 44,647 | | 5,951,076 |
| Air Liquide SA (ADR) | 7,681 | | 205,006 |
| AXA SA (ADR) | 18,230 | | 302,071 |
| BNP Paribas SA (ADR) | 7,862 | | 185,622 |
| Cap Gemini SA (ADR) | 207 | | 4,608 |
| Carrefour SA (ADR) | 27,123 | | 128,563 |
| Cie Generale des Etablissements Michelin | 17,400 | | 1,295,370 |
| Cie Generale d’Optique Essilor International SA (ADR) | 1,395 | | 62,036 |
| Credit Agricole SA (ADR) | 33,364 | | 101,093 |
| Danone (ADR) | 27,083 | | 375,912 |
| Dassault Systemes SA | 21,321 | | 1,961,420 |
| Groupe Danone | 88,366 | | 6,162,598 |
| L’Oreal SA (ADR) | 4,044 | | 99,604 |
| Publicis Groupe | 82,000 | | 4,519,691 |
| Sanofi SA | 26,369 | | 2,047,469 |
| Sanofi SA (ADR) | 11,115 | | 430,706 |
| Schneider Electric SA | 24,631 | | 1,609,038 |
| Schneider Electric SA (ADR) | 11,305 | | 147,191 |
| Suez Environnement Co. (ADR) | 1,758 | | 13,413 |
| Valeo SA (ADR) | 5,507 | | 144,559 |
| Vallourec SA | 39,400 | | 2,495,553 |
| Veolia Environnement SA (ADR) | 21,929 | | 362,048 |
| | | | 28,619,185 |
| |
| Germany - 9.5% | | | |
| Adidas AG | 97,720 | | 7,628,043 |
| Aixtron SE (ADR) | 23,607 | | 409,109 |
| Allianz SE | 25,700 | | 3,066,109 |
| Allianz SE (ADR) | 70,176 | | 832,989 |
| Brenntag AG | 8,911 | | 1,091,040 |
| Celesio AG (ADR) | 942 | | 3,335 |
| Commerzbank AG (ADR)* | 999 | | 2,557 |
| Continental AG* | 13,853 | | 1,307,284 |
| Continental AG (ADR)* | 61 | | 5,745 |
| Deutsche Post AG (ADR) | 7,514 | | 144,644 |
| Henkel AG & Co. KGaA | 24,363 | | 1,520,385 |
| K+S AG (ADR) | 1,685 | | 44,383 |
| Kabel Deutschland Holding AG* | 49,300 | | 3,044,379 |
| Merck KGaA (ADR) | 345 | | 12,689 |
| SAP AG | 96,548 | | 6,740,931 |
| SAP AG (ADR) | 17,919 | | 1,251,105 |
| Volkswagen AG, Preferred | 17,107 | | 3,007,675 |
| Volkswagen AG (ADR), Preferred | 9,371 | | 328,360 |
| | | | 30,440,762 |
| www. | calvert.com CALVERT INTERNATIONAL EQUITY FUND SEMI-ANNUAL REPORT (UNAUDITED) 19 |
| | | |
| EQUITY SECURITIES - CONT’D | SHARES | | VALUE |
| Greece - 0.0% | | | |
| National Bank of Greece SA (ADR)* | 49,475 | $ | 132,098 |
| |
| Hong Kong - 3.8% | | | |
| AIA Group Ltd. | 398,000 | | 1,458,364 |
| Bank of East Asia Ltd. (ADR) | 3,753 | | 13,886 |
| China Merchants Holdings International Co. Ltd. | 924,000 | | 3,088,231 |
| City Telecom HK Ltd. (ADR) | 58,461 | | 779,870 |
| Esprit Holdings Ltd. (ADR) | 62,073 | | 247,671 |
| Hang Lung Properties Ltd. | 104,989 | | 385,380 |
| Hang Lung Properties Ltd. (ADR) | 87,965 | | 1,603,602 |
| Hang Seng Bank Ltd. (ADR) | 1,110 | | 14,709 |
| Hong Kong Exchanges and Clearing Ltd. | 209,546 | | 3,519,309 |
| Hong Kong Exchanges and Clearing Ltd. (ADR) | 3,389 | | 56,630 |
| Johnson Electric Holdings Ltd. (ADR) | 1,074 | | 6,788 |
| Li & Fung Ltd. (ADR) | 22,086 | | 100,933 |
| PCCW Ltd. (ADR) | 2,456 | | 8,915 |
| SJM Holdings Ltd. | 508,000 | | 1,031,147 |
| | | | 12,315,435 |
| |
| India - 0.3% | | | |
| Infosys Ltd. (ADR) | 16,400 | | 935,292 |
| |
| Indonesia - 0.3% | | | |
| Bank Mandiri Persero Tbk PT | 1,423,500 | | 1,066,380 |
| |
| Ireland - 0.4% | | | |
| Experian plc (ADR) | 11,240 | | 174,220 |
| Kerry Group plc | 22,393 | | 1,036,141 |
| WPP plc (ADR) | 667 | | 45,603 |
| | | | 1,255,964 |
| |
| Israel - 2.3% | | | |
| Check Point Software Technologies Ltd.* | 115,961 | | 7,402,950 |
| |
| Italy - 0.0% | | | |
| Intesa Sanpaolo SpA (ADR) | 10,926 | | 117,127 |
| |
| Japan - 13.6% | | | |
| Advantest Corp. (ADR) | 4,514 | | 72,359 |
| Aeon Co. Ltd. (ADR) | 3,305 | | 43,527 |
| Asahi Glass Co. Ltd. (ADR) | 24,499 | | 208,976 |
| Astellas Pharma, Inc | 28,300 | | 1,167,506 |
| Bank of Yokohama Ltd. | 211,000 | | 1,059,928 |
| Canon, Inc | 100,243 | | 4,755,811 |
| Canon, Inc. (ADR) | 30,411 | | 1,449,388 |
| Dai Nippon Printing Co. Ltd. (ADR) | 22,230 | | 226,079 |
| Dai-ichi Life Insurance Co. Ltd. | 855 | | 1,185,785 |
| Daiwa House Industry Co. Ltd. (ADR) | 489 | | 64,793 |
| Denso Corp. (ADR) | 6,160 | | 103,611 |
| Eisai Co. Ltd. (ADR) | 254 | | 10,119 |
| FANUC Corp | 21,261 | | 3,787,071 |
| Fujitsu Ltd. (ADR) | 11,218 | | 296,604 |
| Honda Motor Co. Ltd. (ADR) | 36,718 | | 1,411,073 |
| www. | calvert.com CALVERT INTERNATIONAL EQUITY FUND SEMI-ANNUAL REPORT (UNAUDITED) 20 |
| | | |
| EQUITY SECURITIES - CONT’D | SHARES | | VALUE |
| Japan - Cont’d | | | |
| KDDI Corp. | 512 | $ | 3,329,879 |
| Konami Corp. (ADR) | 2,378 | | 67,845 |
| Kubota Corp. (ADR) | 7,329 | | 354,724 |
| Lawson, Inc | 19,800 | | 1,251,690 |
| Mitsui Fudosan Co. Ltd | 75,256 | | 1,445,492 |
| Mizuho Financial Group, Inc. (ADR) | 201,536 | | 650,961 |
| MS&AD Insurance Group Holdings (ADR) | 34,938 | | 358,464 |
| Nippon Yusen KK (ADR) | 89,927 | | 562,943 |
| Nissan Motor Co. Ltd. (ADR)* | 51,937 | | 1,115,087 |
| Nitto Denko Corp. (ADR) | 7,983 | | 326,425 |
| Nomura Holdings, Inc. (ADR) | 161,596 | | 712,638 |
| NSK Ltd. (ADR) | 1,607 | | 24,925 |
| NTT DoCoMo, Inc | 882 | | 1,470,446 |
| ORIX Corp | 7,330 | | 702,627 |
| ORIX Corp. (ADR) | 7,678 | | 370,464 |
| Panasonic Corp. (ADR) | 77,651 | | 718,272 |
| Sega Sammy Holdings, Inc. (ADR) | 6,279 | | 31,646 |
| Seiko Epson Corp. (ADR) | 9,704 | | 68,025 |
| Sekisui House Ltd. | 142,000 | | 1,397,343 |
| Sharp Corp. (ADR) | 27,019 | | 199,400 |
| Sony Corp. | 52,900 | | 1,093,752 |
| Sony Corp. (ADR) | 38,955 | | 809,095 |
| Sumitomo Mitsui Trust Holdings, Inc. (ADR) | 40,720 | | 127,861 |
| Tokyo Gas Co. Ltd. | 333,118 | | 1,576,364 |
| Toyota Motor Corp. | 168,682 | | 7,306,859 |
| Toyota Motor Corp. (ADR) | 17,903 | | 1,554,338 |
| | | | 43,470,195 |
| |
| Luxembourg - 0.9% | | | |
| Nielsen Holdings NV* | 93,600 | | 2,821,104 |
| |
| Mexico - 0.3% | | | |
| FINAE, Series D, Preferred (b)(i)* | 1,962,553 | | 238,632 |
| Grupo Financiero Banorte SAB de CV | 190,500 | | 845,563 |
| | | | 1,084,195 |
| |
| Netherlands - 2.6% | | | |
| ASML Holding NV | 2,469 | | 123,796 |
| BE Semiconductor Industries NV | 4,208 | | 31,223 |
| Gemalto NV | 20,692 | | 1,365,516 |
| ING Groep NV (CVA)* | 161,212 | | 1,342,907 |
| Koninklijke Philips Electronics NV | 45,962 | | 935,327 |
| PostNL NV (ADR) | 13,469 | | 82,161 |
| TNT Express NV (ADR) | 13,119 | | 161,364 |
| Yandex NV* | 122,700 | | 3,296,949 |
| Ziggo NV* | 31,077 | | 969,273 |
| | | | 8,308,516 |
| |
| Norway - 0.9% | | | |
| DnB ASA | 101,620 | | 1,304,408 |
| Petroleum Geo-Services ASA* | 76,518 | | 1,117,046 |
| Yara International ASA (ADR) | 8,545 | | 408,366 |
| | | | 2,829,820 |
| www. | calvert.com CALVERT INTERNATIONAL EQUITY FUND SEMI-ANNUAL REPORT (UNAUDITED) 21 |
| | | |
| EQUITY SECURITIES - CONT’D | SHARES | | VALUE |
| Philippines - 0.6% | | | |
| Philippine Long Distance Telephone Co. (ADR) | 29,053 | $ | 1,806,806 |
| |
| Portugal - 0.1% | | | |
| Portugal Telecom SGPS SA (ADR) | 29,155 | | 157,729 |
| |
| Russia - 0.2% | | | |
| X5 Retail Group NV (GDR) (e)* | 32,700 | | 750,138 |
| |
| Singapore - 0.5% | | | |
| City Developments Ltd. (ADR) | 479 | | 4,282 |
| Oversea-Chinese Banking Corp. Ltd | 188,830 | | 1,339,614 |
| Singapore Telecommunications Ltd. (ADR) | 11,258 | | 283,364 |
| | | | 1,627,260 |
| |
| South Africa - 1.3% | | | |
| African Bank Investments Ltd. (ADR) | 169 | | 4,301 |
| Aspen Pharmacare Holdings Ltd.* | 85,776 | | 1,327,463 |
| Clicks Group Ltd.* | 379,200 | | 2,214,787 |
| MTN Group Ltd. (ADR) | 21,938 | | 388,522 |
| Nedbank Group Ltd. (ADR) | 3,939 | | 86,264 |
| Tiger Brands Ltd. (ADR) | 1,994 | | 69,391 |
| | | | 4,090,728 |
| |
| Spain - 0.3% | | | |
| Banco Bilbao Vizcaya Argentaria SA (ADR) | 43,088 | | 344,273 |
| Banco Santander SA (ADR) | 74,002 | | 567,595 |
| International Consolidated Airlines Group SA (ADR)* | 678 | | 9,607 |
| | | | 921,475 |
| |
| Sweden - 4.1% | | | |
| Assa Abloy AB, Series B | 127,400 | | 4,000,109 |
| Atlas Copco AB (ADR) | 2,340 | | 56,909 |
| Hennes & Mauritz AB, B Shares | 140,454 | | 5,080,601 |
| SKF AB (ADR) | 650 | | 15,827 |
| Svenska Cellulosa AB (ADR) | 3,578 | | 61,864 |
| Svenska Handelsbanken AB | 118,500 | | 3,776,172 |
| | | | 12,991,482 |
| |
| Switzerland - 6.1% | | | |
| Adecco SA (ADR) | 277 | | 7,235 |
| Compagnie Financiere Richemont SA | 24,371 | | 1,528,166 |
| Credit Suisse Group AG* | 68,600 | | 1,955,440 |
| Credit Suisse Group AG (ADR) | 33,797 | | 963,553 |
| Julius Baer Group Ltd.* | 53,473 | | 2,158,706 |
| Nobel Biocare Holding AG (ADR) | 495 | | 3,118 |
| Novartis AG | 125,005 | | 6,918,795 |
| Roche Holding AG (ADR) | 39,128 | | 1,707,546 |
| STMicroelectronics NV | 16,908 | | 138,477 |
| Swatch Group AG, Bearer Shares | 7,900 | | 3,636,459 |
| Zurich Financial Services AG (ADR)* | 18,785 | | 506,819 |
| | | | 19,524,314 |
| www. | calvert.com CALVERT INTERNATIONAL EQUITY FUND SEMI-ANNUAL REPORT (UNAUDITED) 22 |
| | | |
| EQUITY SECURITIES - CONT’D | SHARES | | VALUE |
| Taiwan - 0.4% | | | |
| Taiwan Semiconductor Manufacturing Co. Ltd. (ADR) | 75,600 | $ | 1,155,168 |
| |
| Thailand - 0.4% | | | |
| Kasikornbank PCL | 231,100 | | 1,172,355 |
| |
| United Kingdom - 22.8% | | | |
| ARM Holdings plc | 189,106 | | 1,789,646 |
| Aviva plc (ADR) | 17,740 | | 188,399 |
| Barclays plc (ADR) | 20,253 | | 306,833 |
| BG Group plc | 294,893 | | 6,826,107 |
| BG Group plc (ADR) | 42,482 | | 983,883 |
| British Land Co. plc (ADR) | 543 | | 4,127 |
| British Sky Broadcasting Group plc | 110,588 | | 1,195,074 |
| BT Group plc (ADR) | 27,414 | | 991,290 |
| Bunzl plc (ADR) | 631 | | 51,035 |
| Capita plc | 109,331 | | 1,280,239 |
| Centrica plc | 312,006 | | 1,578,118 |
| Centrica plc (ADR) | 9,287 | | 188,619 |
| GlaxoSmithKline plc | 84,866 | | 1,894,588 |
| HSBC Holdings plc: | | | |
| Hong Kong Exchange | 418,691 | | 3,685,807 |
| London Exchange | 273,331 | | 2,424,183 |
| HSBC Holdings plc (ADR) | 22,325 | | 991,007 |
| Inmarsat plc | 103,553 | | 761,980 |
| J Sainsbury plc (ADR) | 7,617 | | 150,816 |
| Johnson Matthey plc | 40,829 | | 1,539,702 |
| Johnson Matthey plc (ADR) | 141 | | 10,589 |
| Kingfisher plc | 1,393,187 | | 6,830,669 |
| Legal & General Group plc (ADR) | 608 | | 6,299 |
| Man Group plc (ADR) | 39,306 | | 83,329 |
| Old Mutual plc (ADR) | 1,023 | | 20,532 |
| Pearson plc | 335,083 | | 6,240,485 |
| Persimmon plc | 124,280 | | 1,271,515 |
| Petrofac Ltd. | 51,860 | | 1,442,520 |
| Prudential plc | 120,559 | | 1,440,625 |
| Prudential plc (ADR) | 60,796 | | 1,460,928 |
| Reckitt Benckiser Group plc | 107,917 | | 6,094,998 |
| Reckitt Benckiser Group plc (ADR) | 18,380 | | 208,061 |
| Sage Group plc (ADR) | 7,701 | | 147,397 |
| Smith & Nephew plc (ADR) | 15,944 | | 805,172 |
| SSE plc (ADR) | 18,076 | | 388,815 |
| Standard Chartered plc (s) | 223,464 | | 5,572,784 |
| Tate & Lyle plc | 100,285 | | 1,130,226 |
| Tesco plc | 866,586 | | 4,571,573 |
| Tesco plc (ADR) | 44,802 | | 716,384 |
| Unilever plc (ADR) | 44,310 | | 1,464,445 |
| United Utilities Group plc (ADR) | 4,302 | | 83,244 |
| Vodafone Group plc | 1,768,777 | | 4,869,073 |
| Vodafone Group plc (ADR) | 23,339 | | 645,790 |
| Willis Group Holdings plc | 19,500 | | 682,110 |
| | | | 73,019,016 |
| www. | calvert.com CALVERT INTERNATIONAL EQUITY FUND SEMI-ANNUAL REPORT (UNAUDITED) 23 |
| | | | |
| EQUITY SECURITIES - CONT’D | | SHARES | | VALUE |
| United States - 1.5% | | | | |
| Bristol-Myers Squibb Co. | | 25,205 | $ | 850,669 |
| H.J. Heinz Co | | 16,400 | | 878,220 |
| MeadWestvaco Corp | | 44,502 | | 1,405,818 |
| Powerspan Corp.: | | | | |
| Series A, Convertible Preferred (b)(i)* | | 45,455 | | — |
| Series B, Convertible Preferred (b)(i)* | | 20,000 | | — |
| Series C, Convertible Preferred (b)(i)* | | 239,764 | | — |
| Series D, Convertible Preferred (b)(i)* | | 45,928 | | — |
| Series D, Preferred Warrants (strike price $3.44/share, | | | | |
| expires 12/31/12) (b)(i)* | | 2,347 | | — |
| Pricesmart, Inc. | | 13,928 | | 1,014,098 |
| Sealed Air Corp | | 26,185 | | 505,632 |
| | | | | 4,654,437 |
| |
| |
| Total Equity Securities (Cost $281,623,842) | | | | 304,160,017 |
| |
| |
| VENTURE CAPITAL LIMITED | | ADJUSTED | | |
| PARTNERSHIP INTEREST - 0.9% | | BASIS | | |
| Balkan Financial Sector Equity Fund CV (b)(i)* | $ | 582,848 | | 483,361 |
| Blackstone Cleantech Venture Partners (b)(i)* | | 60,160 | | 43,369 |
| China Environment Fund 2004 (b)(i)* | | - | | 388,568 |
| Emerald Sustainability Fund I (b)(i)* | | 661,912 | | 420,612 |
| gNet Defta Development Holdings LLC (a)(b)(i)* | | 400,000 | | 323,387 |
| SEAF Central and Eastern European Growth Fund LLC (a)(b)(i)* | | 347,969 | | 634,574 |
| SEAF India International Growth Fund (b)(i)* | | 374,476 | | 384,029 |
| ShoreCap International LLC (b)(i)* | | - | | 173,392 |
| Terra Capital (b)(i)* | | 469,590 | | 1 |
| |
| Total Venture Capital Limited Partnership Interest (Cost $2,896,955) | | 2,851,293 |
| |
| | | PRINCIPAL | | |
| VENTURE CAPITAL DEBT OBLIGATIONS - 0.3% | | AMOUNT | | |
| Access Bank plc, 8.477%, 8/29/12 (b)(i) | | 125,000 | | 127,757 |
| FINAE: | | | | |
| Note I, 6.50%, 12/10/15 (b)(i) | | 250,000 | | 250,000 |
| Note II, 6.50%, 2/29/16 (b)(i) | | 500,000 | | 500,000 |
| Mayer Laboratories, Inc., 6.00%, 12/31/01 (b)(i)(w) | | 26,417 | | 6,604 |
| Windhorse International-Spring Health Water Ltd., 8.00%, 3/13/13 (b)(i) 56,000 | | 56,000 |
| |
| Total Venture Capital Debt Obligations (Cost $957,417) | | | | 940,361 |
| |
| |
| HIGH SOCIAL IMPACT INVESTMENTS - 1.4% | | | | |
| Calvert Social Investment Foundation Notes, 0.94%, 7/1/14 (b)(i)(r) | | 4,431,583 | | 4,382,703 |
| |
| Total High Social Impact Investments (Cost $4,431,583) | | | | 4,382,703 |
| www. | calvert.com CALVERT INTERNATIONAL EQUITY FUND SEMI-ANNUAL REPORT (UNAUDITED) 24 |
| | | | | |
| | | PRINCIPAL | | | |
| TIME DEPOSIT - 1.8% | | AMOUNT | | VALUE | |
| State Street Time Deposit, 0.113%, 4/2/12 | $ | 5,801,623 | $ | 5,801,623 | |
| |
| Total Time Deposit (Cost $5,801,623) | | | | 5,801,623 | |
| |
| |
| |
| TOTAL INVESTMENTS (Cost $295,711,420) - 99.3% | | | | 318,135,997 | |
| Other assets and liabilities, net - 0.7% | | | | 2,376,930 | |
| NET ASSETS - 100% | | | $ | 320,512,927 | |
| |
| |
| |
| |
| NET ASSETS CONSIST OF: | | | | | |
| Paid-in capital applicable to the following shares outstanding of common stock with | | | |
| 250,000,000 shares of $0.01 par value shares authorized: | | | | | |
| Class A: 13,990,853 shares outstanding | | | $ | 315,063,912 | |
| Class B: 358,264 shares outstanding | | | | 11,289,463 | |
| Class C: 1,460,326 shares outstanding | | | | 34,846,797 | |
| Class I: 6,826,883 shares outstanding | | | | 151,588,120 | |
| Class Y: 527,281 shares outstanding | | | | 7,722,233 | |
| Undistributed net investment income | | | | 597,734 | |
| Accumulated net realized gain (loss) on investments | | | | | |
| and foreign currency transactions | | | | (223,006,634 | ) |
| Net unrealized appreciation (depreciation) on investments, foreign currencies, | | | |
| and assets and liabilities denominated in foreign currencies | | | | 22,411,302 | |
| |
| |
| NET ASSETS | | | $ | 320,512,927 | |
| |
| |
| NET ASSET VALUE PER SHARE | | | | | |
| Class A (based on net assets of $191,115,746) | | | $ | 13.66 | |
| Class B (based on net assets of $4,358,477) | | | $ | 12.17 | |
| Class C (based on net assets of $17,403,569) | | | $ | 11.92 | |
| Class I (based on net assets of $100,040,649) | | | $ | 14.65 | |
| Class Y (based on net assets of $7,594,486) | | | $ | 14.40 | |
See notes to financial statements.
| www. | calvert.com CALVERT INTERNATIONAL EQUITY FUND SEMI-ANNUAL REPORT (UNAUDITED) 25 |
| | | |
| RESTRICTED SECURITIES | ACQUISITION DATES | | COST |
| Access Bank plc, 8.477%, 8/29/12 | 8/29/07 | $ | 125,000 |
| Balkan Financial Sector Equity Fund CV LP | 1/12/06 - 1/24/12 | | 582,848 |
| Blackstone Cleantech Venture Partners LP | 7/29/10 - 1/25/12 | | 60,160 |
| Calvert Social Investment Foundation Notes, 0.94%, 7/1/14 | 7/1/11 | | 4,431,583 |
| China Environment Fund 2004 LP | 9/15/05 - 4/1/09 | | - |
| Emerald Sustainability Fund I LP | 7/19/01 - 5/17/11 | | 661,912 |
| FINAE: | | | |
| Series D, Preferred | 2/28/11 | | 252,686 |
| Note I, 6.50%, 12/10/15 | 12/10/10 | | 250,000 |
| Note II, 6.50%, 2/29/16 | 2/24/11 | | 500,000 |
| gNet Defta Development Holdings LLC, LP | 8/30/05 | | 400,000 |
| Mayer Laboratories, Inc., 6.00%, 12/31/01 | 12/22/06 | | 26,417 |
| Powerspan Corp.: | | | |
| Series A, Convertible Preferred | 8/20/97 | | 250,000 |
| Series B, Convertible Preferred | 10/5/99 | | 200,000 |
| Series C, Convertible Preferred | 12/21/04 - 6/12/08 | | 273,331 |
| Series D, Convertible Preferred | 6/20/08 | | 157,996 |
| Series D, Preferred Warrants (strike price $3.44/share, | | | |
| expires 12/31/12) | 12/5/07 - 6/20/08 | | - |
| SEAF Central and Eastern European Growth Fund LLC, LP | 8/10/00 - 8/26/11 | | 347,969 |
| SEAF India International Growth Fund LP | 3/22/05 - 5/24/10 | | 374,476 |
| ShoreCap International LLC, LP | 8/12/04 - 12/15/08 | | - |
| Terra Capital LP | 11/23/98 - 3/14/06 | | 469,590 |
| Windhorse International-Spring Health Water Ltd., 8.00%, | | | |
| 3/13/13 | 9/13/11 | | 56,000 |
| www. | calvert.com CALVERT INTERNATIONAL EQUITY FUND SEMI-ANNUAL REPORT (UNAUDITED) 26 |
(a) Affiliated company.
(b) This security was valued by the Board of Directors. See Note A.
(e) Security is exempt from registration under Rule 144A of the Securities Act of 1933. These securities may be resold in transactions exempt from registration, normally to qualified institutional buyers.
(i) Restricted securities represent 2.6% of net assets of the Fund.
(r) The coupon rate shown on floating or adjustable rate securities represents the rate at period end.
(s) 105,000 shares of Standard Chartered plc have been soft segregated in order to cover outstanding commitments to certain limited partnerships investments within the Fund. There are no restrictions on the trading of this security.
(w) Mayer Laboratories, Inc. is in default for principal and interest. Past due accrued interest as of March 31, 2012 totaled $960.
* Non-income producing security.
Abbreviations:
ADR: American Depositary Receipts
CVA: Certificaten Van Aandelen
GDR: Global Depositary Receipts
LLC: Limited Liability Corporation
plc: Public Limited Company
LP: Limited Partnership
See notes to financial statements.
www.calvert.com CALVERT INTERNATIONAL EQUITY FUND SEMI-ANNUAL REPORT (UNAUDITED) 27
| | | |
| STATEMENT OF OPERATIONS |
| SIX MONTHS ENDED MARCH 31, 2012 |
| |
| |
| NET INVESTMENT INCOME | | | |
| Investment Income: | | | |
| Dividend income (net of foreign taxes withheld of $234,357) | $ | 3,037,252 | |
| Interest income | | 61,231 | |
| Total investment income | | 3,098,483 | |
| |
| Expenses: | | | |
| Investment advisory fee | | 1,141,372 | |
| Transfer agency fees and expenses | | 347,388 | |
| Administrative fees | | 440,755 | |
| Distribution Plan expenses: | | | |
| Class A | | 227,994 | |
| Class B | | 22,435 | |
| Class C | | 84,337 | |
| Directors’ fees and expenses | | 17,597 | |
| Custodian fees | | 126,356 | |
| Registration fees | | 33,754 | |
| Reports to shareholders | | 95,339 | |
| Professional fees | | 21,831 | |
| Miscellaneous | | 37,326 | |
| Total expenses | | 2,596,484 | |
| Reimbursement from Advisor: | | | |
| Class A | | (70,673 | ) |
| Class B | | (4,334 | ) |
| Class C | | (5,872 | ) |
| Class I | | (29,049 | ) |
| Class Y | | (3,564 | ) |
| Fees paid indirectly | | (49 | ) |
| Net expenses | | 2,482,943 | |
| |
| NET INVESTMENT INCOME | | 615,540 | |
| |
| REALIZED AND UNREALIZED GAIN (LOSS) | | | |
| Net realized gain (loss) on: | | | |
| Investments | | (14,827,679 | ) |
| Foreign currency transactions | | (225,227 | ) |
| | | (15,052,906 | ) |
| |
| Change in unrealized appreciation (depreciation) on: | | | |
| Investments and foreign currencies | | 62,334,430 | |
| Assets and liabilities denominated in foreign currencies | | 10,885 | |
| | | 62,345,315 | |
| |
| NET REALIZED AND UNREALIZED GAIN (LOSS) | | 47,292,409 | |
| |
| INCREASE (DECREASE) IN NET ASSETS | | | |
| RESULTING FROM OPERATIONS | $ | 47,907,949 | |
See notes to financial statements.
| www. | calvert.com CALVERT INTERNATIONAL EQUITY FUND SEMI-ANNUAL REPORT (UNAUDITED) 28 |
| | | | | | |
| STATEMENTS OF CHANGES IN NET ASSETS |
| |
| | | SIX MONTHS
ENDED | | | YEAR
ENDED | |
| | | MARCH
31, | | | SEPTEMBER
30, | |
| INCREASE (DECREASE) IN NET ASSETS | | 2012 | | | 2011 | |
| Operations: | | | | | | |
| Net investment income | $ | 615,540 | | $ | 4,177,788 | |
| Net realized gain (loss) | | (15,052,906 | ) | | 1,597,366 | |
| Change in unrealized appreciation or (depreciation) | | 62,345,315 | | | (54,531,070 | ) |
| |
| INCREASE (DECREASE) IN NET ASSETS | | | | | | |
| RESULTING FROM OPERATIONS | | 47,907,949 | | | (48,755,916 | ) |
| |
| Distributions to shareholders from: | | | | | | |
| Net investment income: | | | | | | |
| Class A shares | | (2,117,750 | ) | | (655,710 | ) |
| Class C shares | | (14,293 | ) | | — | |
| Class I shares | | (1,414,874 | ) | | (542,675 | ) |
| Class Y shares | | (79,164 | ) | | (3,993 | ) |
| Total distributions | | (3,626,081 | ) | | (1,202,378 | ) |
| |
| Capital share transactions: | | | | | | |
| Shares sold: | | | | | | |
| Class A shares | | 13,321,679 | | | 37,038,781 | |
| Class B shares | | 11,863 | | | 95,958 | |
| Class C shares | | 572,341 | | | 1,483,373 | |
| Class I shares | | 10,205,417 | | | 31,388,444 | |
| Class Y shares | | 524,874 | | | 8,008,040 | |
| Reinvestment of distributions: | | | | | | |
| Class A shares | | 1,891,096 | | | 608,387 | |
| Class C shares | | 11,391 | | | — | |
| Class I shares | | 1,274,329 | | | 483,830 | |
| Class Y shares | | 35,166 | | | 419 | |
| Redemption fees: | | | | | | |
| Class A shares | | 5,475 | | | 4,506 | |
| Class C shares | | 2 | | | 249 | |
| Class I shares | | — | | | 669 | |
| Class Y shares | | 14 | | | 6 | |
| Shares redeemed: | | | | | | |
| Class A shares | | (24,117,497 | ) | | (79,188,924 | ) |
| Class B shares | | (825,932 | ) | | (1,646,677 | ) |
| Class C shares | | (1,899,579 | ) | | (4,408,325 | ) |
| Class I shares | | (14,521,874 | ) | | (14,266,871 | ) |
| Class Y shares | | (1,435,586 | ) | | (1,831,646 | ) |
| Total capital share transactions | | (14,946,821 | ) | | (22,229,781 | ) |
| |
| |
| TOTAL INCREASE (DECREASE) IN NET ASSETS | | 29,335,047 | | | (72,188,075 | ) |
| |
| |
| NET ASSETS | | | | | | |
| Beginning of period | | 291,177,880 | | | 363,365,955 | |
| End of period (including undistributed net investment | | | | | | |
| income of $597,734 and 3,608,275, respectively) | $ | 320,512,927 | | $ | 291,177,880 | |
See notes to financial statements.
| www. | calvert.com CALVERT INTERNATIONAL EQUITY FUND SEMI-ANNUAL REPORT (UNAUDITED) 29 |
| | | | |
| STATEMENTS OF CHANGES IN NET ASSETS |
| |
| | SIX MONTHS
ENDED | | YEAR
ENDED | |
| | MARCH
31, | | SEPTEMBER
30, | |
| CAPITAL SHARE ACTIVITY | 2012 | | 2011 | |
| Shares sold: | | | | |
| Class A shares | 1,047,408 | | 2,582,076 | |
| Class B shares | 1,037 | | 7,466 | |
| Class C shares | 51,191 | | 119,086 | |
| Class I shares | 748,443 | | 2,086,100 | |
| Class Y shares | 38,688 | | 527,710 | |
| Reinvestment of distributions: | | | | |
| Class A shares | 156,677 | | 42,634 | |
| Class C shares | 1,079 | | — | |
| Class I shares | 98,632 | | 31,789 | |
| Class Y shares | 2,767 | | 28 | |
| Shares redeemed: | | | | |
| Class A shares | (1,901,110 | ) | (5,606,048 | ) |
| Class B shares | (72,751 | ) | (130,029 | ) |
| Class C shares | (170,383 | ) | (353,754 | ) |
| Class I shares | (1,037,570 | ) | (929,886 | ) |
| Class Y shares | (108,242 | ) | (125,742 | ) |
| Total capital share activity | (1,144,134 | ) | (1,748,570 | ) |
See notes to financial statements.
| www. | calvert.com CALVERT INTERNATIONAL EQUITY FUND SEMI-ANNUAL REPORT (UNAUDITED) 30 |
NOTES TO FINANCIAL STATEMENTS
NOTE A — SIGNIFICANT ACCOUNTING POLICIES
General: The Calvert International Equity Fund (the “Fund”), a series of Calvert World Values Fund, Inc., is registered under the Investment Company Act of 1940 as a diversified, open-end management investment company. The Calvert World Values Fund, Inc. is comprised of three separate series. The operations of each series are accounted for separately. The Fund offers five classes of shares of capital stock - Classes A, B, C, I, and Y. Class A shares are sold with a maximum front-end sales charge of 4.75%. Class B shares are sold without a front-end sales charge and, with certain exceptions, will be charged a deferred sales charge at the time of redemption, depending on how long investors have owned the shares. Class B shares are no longer offered for purchase, except through reinvestment of dividends and/or distributions and through certain exchanges. Class C shares are sold without a front-end sales charge and, with certain exceptions, will be charged a deferred sales charge on shares sold within one year of purchase. Class B and Class C shares have higher levels of expenses than Class A shares. Class I shares require a minimum account balance of $1,000,000. The $1 million minimum initial investment may be waived for certain institutional accounts where it is believed to be in the best interest of the Fund and its shareholders. Class I shares have no front-end or deferred sales charge and have lower levels of expenses than Class A shares. Class Y shares are generally only available to wrap or similar fee-based programs offered by financial intermediaries that have entered into an agreement with the Fund’s Distributor to offer Class Y shares. Class Y shares have no front-end or deferred sales charge and have lower levels of expenses than Class A shares. Each class has different: (a) dividend rates, due to differences in Distribution Plan expenses and other class-specific expenses, (b) exchange privileges and (c) class-specific voting rights.
Security Valuation: Net asset value per share is determined every business day as of the close of the regular session of the New York Stock Exchange (generally 4:00 p.m. Eastern time). The Fund uses independent pricing services approved by the Board of Directors to value its investments wherever possible. Investments for which market quotations are not available or deemed not reliable are fair valued in good faith under the direction of the Board of Directors. In determining fair value, the Board considers all relevant qualitative and quantitative information available. These factors are subject to change over time and are reviewed periodically. The values assigned to fair value investments are based on available information and do not necessarily represent amounts that might ultimately be realized. Further, because of the inherent uncertainty of valuation, those estimated values may differ significantly from the values that would have been used had a ready market for the investments existed, and the differences could be material.
At March 31, 2012, securities valued at $8,412,989, or 2.6% of net assets were fair valued in good faith under the direction of the Board of Directors.
The Fund utilizes various methods to measure the fair value of its investments. Generally Accepted Accounting Principles (GAAP) establishes a disclosure hierarchy that categorizes the inputs to valuation techniques used to value assets and liabilities at measurement date. These inputs are summarized in the three broad levels listed below:
Level 1 – quoted prices in active markets for identical securities
Level 2 – other significant observable inputs (including quoted prices for similar securities, interest rates, prepayment speeds, credit risk, etc.)
| www. | calvert.com CALVERT INTERNATIONAL EQUITY FUND SEMI-ANNUAL REPORT (UNAUDITED) 31 |
Level 3 – significant unobservable inputs (including the Fund’s own assumptions in determining the fair value of investments) The inputs or methodology used for valuing securities are not necessarily an indication of the risk associated with investing in those securities.
Changes in valuation techniques may result in transfers in or out of an investment’s assigned level within the hierarchy during the period. Valuation techniques used to value the Fund’s investments by major category are as follows.
Equity securities, including restricted securities and venture capital securities, for which market quotations are readily available, are valued at the last reported sale price or official closing price as reported by an independent pricing service on the primary market or exchange on which they are traded and are categorized as Level 1 in the hierarchy. In the event there were no sales during the day or closing prices are not available, securities are valued at the last quoted bid price or using the last available price and are categorized as Level 2 in the hierarchy. Foreign securities are valued based on quotations from the principal market in which such securities are normally traded. If events occur after the close of the principal market in which foreign securities are traded, and before the close of business of the Fund, that are expected to materially affect the value of those securities, then they are valued at their fair value taking these events into account. The Fund has retained a third party fair value pricing service to quantitatively analyze the price movement of its holdings on foreign exchanges and to automatically fair value if the variation from the prior day’s closing price exceeds specified parameters. Such securities would be categorized as Level 2 in the hierarchy in these circumstances. Utilizing this technique may result in transfers between Level 1 and Level 2. For restricted securities and private placements where observable inputs are limited, assumptions about market activity and risk are used and such securities are categorized as Level 3 in the hierarchy.
Venture capital securities for which market quotations are not readily available are fair valued by the Fund’s Board of Directors and are categorized as Level 3 in the hierarchy. Venture capital direct equity securities are generally valued using the most appropriate and applicable method to measure fair value in light of each company’s situation. Methods may include market, income or cost approaches with discounts as appropriate based on assumptions of liquidation or exit risk. Examples of the market approach are subsequent rounds of financing, comparable transactions, and revenue times an industry multiple. An example of the income approach is the discounted cash flow. Examples of the cost approach are replacement cost, salvage value, or net asset percentage. Venture capital limited partnership (“LP”) securities are valued at the fair value reported by the general partner of the partnership adjusted as necessary to reflect subsequent capital calls and distributions and any other available information. In the absence of a reported LP unit value, fair value may be estimated based on the Fund’s percentage equity in the partnership and/or other balance sheet information and portfolio value for the most recently available period reported by the general partner. In some cases adjustments may be made to account for daily pricing of material public holdings within the partnership. Venture capital debt securities are valued based on assumptions of credit and market risk. For venture capital securities denominated in foreign currency, the fair value is marked to the daily exchange rate.
Debt securities, including restricted securities, are valued based on evaluated prices received from independent pricing services or from dealers who make markets in such securities and are generally categorized as Level 2 in the hierarchy. Short-term securities
| www. | calvert.com CALVERT INTERNATIONAL EQUITY FUND SEMI-ANNUAL REPORT (UNAUDITED) 32 |
of sufficient credit quality with remaining maturities of sixty days or less for which quotations are not readily available are valued at amortized cost, which approximates fair value, and are categorized as Level 2 in the hierarchy.
When independent prices are unavailable or unreliable, debt securities may be valued utilizing pricing matrices which consider similar factors that would be used by independent pricing services. These are generally categorized as Level 2 in the hierarchy but may be Level 3 depending on the circumstances.
The following is a summary of the inputs used to value the Fund’s net assets as of March 31, 2012:
| | | VALUATION INPUTS | | |
| |
| Investments in Securities | Level 1 | Level 2 | Level 3 | Total | |
| Equity securities* | $303,921,385 | — | — | $303,921,385 | ** |
| Time deposit | — | $5,801,623 | — | 5,801,623 | |
| Venture capital | — | — | $8,412,989 | 8,412,989 | |
| |
| TOTAL | $303,921,385 | $5,801,623 | $8,412,989 | $318,135,997 | |
* For further breakdown of equity securities by country, please refer to the Statement of Net Assets.
** Exclusive of $238,632 venture capital equity shown in venture capital heading.
The following is a reconciliation of Level 3 assets for which significant unobservable inputs were used to determine fair value:
| | VENTURE CAPITAL | | TOTAL | |
| Balance as of 9/30/11 | $8,898,945 | | $8,898,945 | |
| Accrued discounts/premiums | - | | - | |
| Realized gain (loss) | (7,387 | ) | (7,387 | ) |
| Change in unrealized appreciation (depreciation) | 78,198 | | 78,198 | |
| Purchases | 38,245 | | 38,245 | |
| Sales | (595,012 | ) | (595,012 | ) |
| Transfers in and/or out of Level 31 | - | | - | |
| Balance as of 3/31/12 | $8,412,989 | | $8,412,989 | |
1 The Fund’s policy is to recognize transfers into and transfers out of Level 3 as of the end of the reporting period.
For the six months ended March 31, 2012, total change in unrealized gain (loss) on Level 3 securities included in the change in net assets was $78,198. Total unrealized gain (loss) for all securities (including Level 1 and Level 2) can be found on the accompanying Statement of Operations.
| www. | calvert.com CALVERT INTERNATIONAL EQUITY FUND SEMI-ANNUAL REPORT (UNAUDITED) 33 |
Restricted Securities: The Fund may invest in securities that are subject to legal or contractual restrictions on resale. Generally, these securities may only be sold publicly upon registration under the Securities Act of 1933 or in transactions exempt from such registration. Information regarding restricted securities is included at the end of the Fund’s Statement of Net Assets.
Security Transactions and Net Investment Income: Security transactions are accounted for on trade date. Realized gains and losses are recorded on an identified cost basis and may include proceeds from litigation. Dividend income is recorded on the ex-dividend date or, in the case of dividends on certain foreign securities, as soon as the Fund is informed of the ex-dividend date. Withholding taxes on foreign dividends have been provided for in accordance with the Fund’s understanding of the applicable country’s tax rules and rates. Distributions received on securities that represent a return of capital or capital gain are recorded as a reduction of cost of investments and/or as a realized gain. Interest income, which includes amortization of premium and accretion of discount on debt securities, is accrued as earned. Investment income and realized and unrealized gains and losses are allocated to separate classes of shares based upon the relative net assets of each class. Expenses arising in connection with a class are charged directly to that class. Expenses common to the classes are allocated to each class in proportion to their relative net assets.
Foreign Currency Transactions: The Fund’s accounting records are maintained in U.S. dollars. For valuation of assets and liabilities on each date of net asset value determination, foreign denominations are converted into U.S. dollars using the current exchange rate. Security transactions, income and expenses are translated at the prevailing rate of exchange on the date of the event. The effect of changes in foreign exchange rates on securities and foreign currencies is included in the net realized and unrealized gain or loss on securities and foreign currencies.
Distributions to Shareholders: Distributions to shareholders are recorded by the Fund on ex-dividend date. Dividends from net investment income and distributions from net realized capital gains, if any, are paid at least annually. Distributions are determined in accordance with income tax regulations which may differ from generally accepted accounting principles; accordingly, periodic reclassifications are made within the Fund’s capital accounts to reflect income and gains available for distribution under income tax regulations.
Estimates: The preparation of the financial statements in conformity with accounting principles generally accepted in the United States requires management to make estimates and assumptions that affect the reported amounts of assets and liabilities and disclosure of contingent assets and liabilities at the date of the financial statements and the reported amounts of income and expenses during the reported period. Actual results could differ from those estimates.
Redemption Fees: The Fund charges a 2% redemption fee on redemptions, including exchanges, made within 30 days of purchase in the same Fund (within seven days for Class I shares). The redemption fee is accounted for as an addition to paid-in capital.
| www. | calvert.com CALVERT INTERNATIONAL EQUITY FUND SEMI-ANNUAL REPORT (UNAUDITED) 34 |
The fee is intended to discourage market-timers by ensuring that short-term trading costs are borne by the investors making the transactions and not the shareholders already in the Fund.
Expense Offset Arrangement: The Fund has an arrangement with its custodian bank whereby the custodian’s fees may be paid indirectly by credits earned on the Fund’s cash on deposit with the bank. These credits are used to reduce the Fund’s expenses. Such a deposit arrangement may be an alternative to overnight investments.
Federal Income Taxes: No provision for federal income or excise tax is required since the Fund intends to continue to qualify as a regulated investment company under the Internal Revenue Code and to distribute substantially all of its taxable earnings.
Management has analyzed the Fund’s tax positions taken for all open federal income tax years and has concluded that no provision for federal income tax is required in the Fund’s financial statements. A Fund’s federal tax return is subject to examination by the Internal Revenue Service for a period of three years.
New Accounting Pronouncements: In May 2011, the Financial Accounting Standards Board (“FASB”) issued Accounting Standards Update (“ASU”) No. 2011-04, “Amendments to Achieve Common Fair Value Measurement and Disclosure Requirements in U.S. GAAP and IFRSs.” ASU No. 2011-04 requires disclosure of the amounts of any transfers between Level 1 and Level 2, and the reasons for the transfers. For Level 3 fair value measurements, ASU No. 2011-04 requires disclosure of quantitative information about the significant unobservable inputs used. In addition, for Level 3 fair value measurements, ASU No. 2011-04 requires a description of the valuation processes used by the reporting entity and requires a narrative description of the sensitivity of the fair value measurement to changes in unobservable inputs if a change in those inputs to a different amount might result in a significantly higher or lower fair value measurement. ASU No. 2011-04 is effective for financial statements issued for fiscal years and interim periods beginning after December 15, 2011. Management is currently evaluating the impact the adoption of ASU No. 2011-04 will have on the Fund’s financial statements and related disclosures.
NOTE B — RELATED PARTY TRANSACTIONS
Calvert Investment Management, Inc. (the “Advisor”) is wholly-owned by Calvert Investments, Inc. (“Calvert”), which is indirectly wholly owned by UNIFI Mutual Holding Company. The Advisor provides investment advisory services and pays the salaries and fees of officers and Directors of the Fund who are employees of the Advisor or its affiliates. For its services, the Advisor receives a monthly fee based on the following annual rates of average daily net assets: .75% on the first $250 million, .725% on the next $250 million and .675% on the excess of $500 million. Under the terms of the agreement, $203,255 was payable at period end. In addition, $108,868 was payable at period end for operating expenses paid by the Advisor during March 2012.
| www. | calvert.com CALVERT INTERNATIONAL EQUITY FUND SEMI-ANNUAL REPORT (UNAUDITED) 35 |
The Advisor has contractually agreed to limit net annual fund operating expenses through January 31, 2013 for Class I and Class Y. The contractual expense cap is 1.10% and 1.39%, respectively. For the purposes of this expense limit, operating expenses do not include interest expense, brokerage commissions, taxes, and extraordinary expenses. This expense limitation does not limit any acquired fund fees and expenses. To the extent any expense offset credits are earned, the Advisor’s obligation under the contractual limitation may be reduced and the Advisor may benefit from the expense offset arrangement. The Advisor voluntarily reimbursed Class B shares for expenses of $4,334 for the six months ended March 31, 2012.
Calvert Investment Administrative Services, Inc. (“CIAS”), an affiliate of the Advisor, provides administrative services to the Fund for an annual fee, payable monthly, of .35% for Classes A, B, C and Y, and .15% for Class I, based on their average daily net assets. Under the terms of the agreement, $78,246 was payable at period end.
Calvert Investment Distributors, Inc. (“CID”), an affiliate of the Advisor, is the distributor and principal underwriter for the Fund. Distribution Plans, adopted by Class A, Class B, and Class C shares, allow the Fund to pay CID for expenses and services associated with distribution of shares. The expenses paid may not exceed .35%, 1.00% and 1.00% annually of average daily net assets of each Class A, B, and C, respectively. The amount actually paid by the Fund is an annualized fee, payable monthly of .25%, 1.00% and 1.00% of the Fund’s average daily net assets of Class A, B, and C, respectively. Class I and Class Y shares do not have Distribution Plan expenses. Under the terms of agreement, $58,958 was payable at period end.
CID received $25,492 as its portion of commissions charged on sales of the Fund’s Class A shares for the six months ended March 31, 2012.
Calvert Investment Services, Inc. (“CIS”), an affiliate of the Advisor, is the shareholder servicing agent for the Fund. For its services, CIS received a fee of $79,379 for the six months ended March 31, 2012. Under the terms of the agreement, $13,622 was payable at period end. Boston Financial Data Services, Inc. is the transfer and dividend disbursing agent.
The Fund invests in Community Investment Notes issued by the Calvert Social Investment Foundation (the “CSI Foundation”). The CSI Foundation is a 501(c)(3) non-profit organization that receives in-kind support from Calvert and its subsidiaries. The Fund has received from the Securities and Exchange Commission an exemptive order permitting the Fund to make investments in these notes under certain conditions.
Each Director of the Funds who is not an employee of the Advisor or its affiliates receives an annual retainer of $44,000 plus a meeting fee of $2,000 for each Board meeting attended. Additional fees of up to $5,000 annually may be paid to the Board chair and Committee chairs ($10,000 for the Special Equities Committee chair) and $2,500 annually may be paid to Committee members, plus a Committee meeting fee of $500 for each Committee meeting attended. Directors’ fees are allocated to each of the Funds served.
| www. | calvert.com CALVERT INTERNATIONAL EQUITY FUND SEMI-ANNUAL REPORT (UNAUDITED) 36 |
NOTE C — INVESTMENT ACTIVITY
During the period, the cost of purchases and proceeds from sales of investments, other than short-term securities, were $75,509,996 and $100,389,505, respectively.
| CAPITAL LOSS CARRYFORWARDS | | |
| EXPIRATION DATE | | |
| 30-Sep-17 | ($90,728,857 | ) |
| 30-Sep-18 | (105,942,268 | ) |
| 30-Sep-19 | (10,386,632 | ) |
Capital losses may be utilized to offset future capital gains until expiration. Under the Regulated Investment Company Modernization Act of 2010, capital losses incurred in taxable years beginning after December 22, 2010 can be carried forward for an unlimited period. These losses will be required to be utilized prior to the losses incurred in pre-enactment taxable years. As a result of this ordering rule, pre-enactment capital loss carryforwards may more likely expire unused. Also, post-enactment capital losses that are carried forward will retain their character as either short-term or long-term capital losses rather than being considered all short-term as under previous law.
As of March 31, 2012, the tax basis components of unrealized appreciation/(depreciation) and the federal tax cost were as follows:
| Unrealized appreciation | $37,758,054 | |
| Unrealized (depreciation) | (16,035,833 | ) |
| Net unrealized appreciation/(depreciation) | $21,722,221 | |
| |
| Federal income tax cost of investments | $296,413,776 | |
NOTE D — LINE OF CREDIT
A financing agreement is in place with the Calvert Funds and State Street Corporation (“SSC”). Under the agreement, SSC provides an unsecured line of credit facility, in the aggregate amount of $50 million ($25 million committed and $25 million uncommitted), accessible by the Funds for temporary or emergency purposes only. Borrowings under this committed facility bear interest at the higher of the London Interbank Offered Rate (LIBOR) or the overnight Federal Funds Rate plus 1.25% per annum. A commitment fee of .11% per annum is incurred on the unused portion of the committed facility, which is allocated to all participating funds. The Fund had no borrowings under the agreement during the six months ended March 31, 2012.
www.calvert.com CALVERT INTERNATIONAL EQUITY FUND SEMI-ANNUAL REPORT (UNAUDITED) 37
NOTE E — AFFILIATED COMPANIES
An affiliated company is a company in which the Fund has a direct or indirect ownership of, control of, or voting power of 5 percent or more of the outstanding voting shares. Affiliated companies of the Fund are as follows:
| AFFILIATES | | COST | | VALUE |
| gNet Defta Development Holdings LLC, LP | $ | 400,000 | $ | 323,387 |
| SEAF Central & Eastern European Growth Fund LLC, LP | | 347,969 | | 634,574 |
| TOTALS | $ | 747,969 | $ | 957,961 |
NOTE F — SUBSEQUENT EVENTS
In preparing the financial statements as of March 31, 2012, no subsequent events or transactions occurred that would have required recognition or disclosure in these financial statements.
Effective May 2, 2012, UNIFI Mutual Holding Company changed its name to Ameritas Mutual Holding Company.
NOTE G — OTHER
In connection with certain venture capital investments, the Fund is committed to future capital calls, which will increase the Fund’s investment in these securities. The aggregate amount of the future capital commitments totals $356,095 at March 31, 2012.
www.calvert.com CALVERT INTERNATIONAL EQUITY FUND SEMI-ANNUAL REPORT (UNAUDITED) 38
| | | | | | |
| FINANCIAL HIGHLIGHTS |
| | | | | | |
| | PERIODS ENDED |
| | MARCH
31, | | SEPTEMBER
30, | | SEPTEMBER
30, | |
| CLASS A SHARES | 2012 | (z) | 2011 | (z) | 2010 | (z) |
| Net asset value, beginning | $11.84 | | $13.88 | | $13.83 | |
| Income from investment operations: | | | | | | |
| Net investment income | .01 | | .15 | | .06 | |
| Net realized and unrealized gain (loss) | 1.96 | | (2.15 | ) | .09 | |
| Total from investment operations | 1.97 | | (2.00 | ) | .15 | |
| Distributions from: | | | | | | |
| Net investment income | (.15 | ) | (.04 | ) | (.10 | ) |
| Net realized gain | — | | — | | — | |
| Total distributions | (.15 | ) | (.04 | ) | (.10 | ) |
| Total increase (decrease) in net asset value | 1.82 | | (2.04 | ) | 0.05 | |
| Net asset value, ending | $13.66 | | $11.84 | | $13.88 | |
| |
| Total return* | 16.80 | % | (14.47 | %) | 1.08 | % |
| Ratios to average net assets: A | | | | | | |
| Net investment income | .22 | % (a) | 1.03 | % | .46 | % |
| Total expenses | 1.87 | % (a) | 1.80 | % | 1.83 | % |
| Expenses before offsets | 1.80 | % (a) | 1.80 | % | 1.80 | % |
| Net expenses | 1.80 | % (a) | 1.80 | % | 1.80 | % |
| Portfolio turnover | 26 | % | 49 | % | 133 | % |
| Net assets, ending (in thousands) | $191,116 | | $173,936 | | $245,309 | |
| |
| |
| | YEARS ENDED |
| | SEPTEMBER
30, | | SEPTEMBER
30, | | SEPTEMBER
30, | |
| CLASS A SHARES | 2009 | (z) | 2008 | | 2007 | |
| Net asset value, beginning | $15.31 | | $25.57 | | $23.87 | |
| Income from investment operations: | | | | | | |
| Net investment income | .11 | | .37 | | .22 | |
| Net realized and unrealized gain (loss) | (1.19 | ) | (8.46 | ) | 4.61 | |
| Total from investment operations | (1.08 | ) | (8.09 | ) | 4.83 | |
| Distributions from: | | | | | | |
| Net investment income | (.37 | ) | (.24 | ) | (.20 | ) |
| Net realized gain | (.03 | ) | (1.93 | ) | (2.93 | ) |
| Total distributions | (.40 | ) | (2.17 | ) | (3.13 | ) |
| Total increase (decrease) in net asset value | (1.48 | ) | (10.26 | ) | 1.70 | |
| Net asset value, ending | $13.83 | | $15.31 | | $25.57 | |
| |
| Total return* | (6.27 | %) | (34.31 | %) | 21.72 | % |
| Ratios to average net assets:A | | | | | | |
| Net investment income | .99 | % | 1.81 | % | 1.08 | % |
| Total expenses | 1.87 | % | 1.65 | % | 1.62 | % |
| Expenses before offsets | 1.86 | % | 1.63 | % | 1.60 | % |
| Net expenses | 1.86 | % | 1.63 | % | 1.60 | % |
| Portfolio turnover | 135 | % | 100 | % | 82 | % |
| Net assets, ending (in thousands) | $270,900 | | $324,091 | | $546,564 | |
See notes to financial highlights.
| www. | calvert.com CALVERT INTERNATIONAL EQUITY FUND SEMI-ANNUAL REPORT (UNAUDITED) 39 |
| | | | | | |
| FINANCIAL HIGHLIGHTS |
| |
| | PERIODS ENDED |
| | MARCH 31, | | SEPTEMBER 30, | | SEPTEMBER 30, | |
| CLASS B SHARES | 2012 | (z) | 2011 | (z) | 2010 | (z) |
| Net asset value, beginning | $10.48 | | $12.40 | | $12.40 | |
| Income from investment operations: | | | | | | |
| Net investment income (loss) | (.06 | ) | (.03 | ) | (.09 | ) |
| Net realized and unrealized gain (loss) | 1.75 | | (1.89 | ) | .09 | |
| Total from investment operations | 1.69 | | (1.92 | ) | — | |
| Distributions from: | | | | | | |
| Net investment income | — | | — | | — | |
| Net realized gain | — | | — | | — | |
| Total distributions | — | | — | | — | |
| Total increase (decrease) in net asset value | 1.69 | | (1.92 | ) | — | |
| Net asset value, ending | $12.17 | | $10.48 | | $12.40 | |
| |
| Total return* | 16.13 | % | (15.48 | %) | 0.00 | % |
| Ratios to average net assets: A | | | | | | |
| Net investment income (loss) | (.98 | %) (a) | (.21 | %) | (.74 | %) |
| Total expenses | 3.16 | % (a) | 3.02 | % | 3.03 | % |
| Expenses before offsets | 2.97 | % (a) | 2.97 | % | 2.97 | % |
| Net expenses | 2.97 | % (a) | 2.97 | % | 2.97 | % |
| Portfolio turnover | 26 | % | 49 | % | 133 | % |
| Net assets, ending (in thousands) | $4,358 | | $4,506 | | $6,850 | |
| |
| |
| |
| | YEARS ENDED |
| | SEPTEMBER
30, | | SEPTEMBER
30, | | SEPTEMBER
30, | |
| CLASS B SHARES | 2009 | (z) | 2008 | | 2007 | |
| Net asset value, beginning | $13.69 | | $23.11 | | $21.85 | |
| Income from investment operations: | | | | | | |
| Net investment income (loss) | (.02 | ) | .12 | | .09 | |
| Net realized and unrealized gain (loss) | (1.06 | ) | (7.56 | ) | 4.10 | |
| Total from investment operations | (1.08 | ) | (7.44 | ) | 4.19 | |
| Distributions from: | | | | | | |
| Net investment income | (.18 | ) | (.05 | ) | — | |
| Net realized gain | (.03 | ) | (1.93 | ) | (2.93 | ) |
| Total distributions | (.21 | ) | (1.98 | ) | (2.93 | ) |
| Total increase (decrease) in net asset value | (1.29 | ) | (9.42 | ) | 1.26 | |
| Net asset value, ending | $12.40 | | $13.69 | | $23.11 | |
| |
| Total return* | (7.47 | %) | (34.97 | %) | 20.60 | % |
| Ratios to average net assets: A | | | | | | |
| Net investment income (loss) | (.26 | %) | .78 | % | .13 | % |
| Total expenses | 3.12 | % | 2.63 | % | 2.57 | % |
| Expenses before offsets | 3.10 | % | 2.61 | % | 2.54 | % |
| Net expenses | 3.10 | % | 2.60 | % | 2.54 | % |
| Portfolio turnover | 135 | % | 100 | % | 82 | % |
| Net assets, ending (in thousands) | $8,993 | | $12,512 | | $23,805 | |
See notes to financial highlights.
| www. | calvert.com CALVERT INTERNATIONAL EQUITY FUND SEMI-ANNUAL REPORT (UNAUDITED) 40 |
| | | | | | |
| FINANCIAL HIGHLIGHTS |
| |
| | PERIODS ENDED |
| | MARCH
31, | | SEPTEMBER
30, | | SEPTEMBER
30, | |
| CLASS C SHARES | 2012 | (z) | 2011 | (z) | 2010 | (z) |
| Net asset value, beginning | $10.26 | | $12.10 | | $12.07 | |
| Income from investment operations: | | | | | | |
| Net investment income (loss) | (.04 | ) | .01 | | (.05 | ) |
| Net realized and unrealized gain (loss) | 1.71 | | (1.85 | ) | .08 | |
| Total from investment operations | 1.67 | | (1.84 | ) | .03 | |
| Distributions from: | | | | | | |
| Net investment income | (.01 | ) | — | | — | |
| Net realized gain | — | | — | | — | |
| Total distributions | (.01 | ) | — | | — | |
| Total increase (decrease) in net asset value | 1.66 | | (1.84 | ) | 0.03 | |
| Net asset value, ending | $11.92 | | $10.26 | | $12.10 | |
| |
| Total return* | 16.28 | % | (15.21 | %) | 0.25 | % |
| Ratios to average net assets: A | | | | | | |
| Net investment income (loss) | (.66 | %) (a) | .12 | % | (.41 | %) |
| Total expenses | 2.75 | % (a) | 2.67 | % | 2.72 | % |
| Expenses before offsets | 2.68 | % (a) | 2.67 | % | 2.69 | % |
| Net expenses | 2.68 | % (a) | 2.67 | % | 2.69 | % |
| Portfolio turnover | 26 | % | 49 | % | 133 | % |
| Net assets, ending (in thousands) | $17,404 | | $16,195 | | $21,942 | |
| |
| |
| |
| | YEARS ENDED |
| | SEPTEMBER
30, | | SEPTEMBER
30, | | SEPTEMBER
30, | |
| CLASS C SHARES | 2009 | (z) | 2008 | | 2007 | |
| Net asset value, beginning | $13.31 | | $22.51 | | $21.34 | |
| Income from investment operations: | | | | | | |
| Net investment income | .01 | | .19 | | .13 | |
| Net realized and unrealized gain (loss) | (1.03 | ) | (7.40 | ) | 3.99 | |
| Total from investment operations | (1.02 | ) | (7.21 | ) | 4.12 | |
| Distributions from: | | | | | | |
| Net investment income | (.19 | ) | (.06 | ) | (.02 | ) |
| Net realized gain | (.03 | ) | (1.93 | ) | (2.93 | ) |
| Total distributions | (.22 | ) | (1.99 | ) | (2.95 | ) |
| Total increase (decrease) in net asset value | (1.24 | ) | (9.20 | ) | 1.17 | |
| Net asset value, ending | $12.07 | | $13.31 | | $22.51 | |
| |
| Total return* | (7.16 | %) | (34.86 | %) | 20.81 | % |
| Ratios to average net assets: A | | | | | | |
| Net investment income | .07 | % | 1.01 | % | .31 | % |
| Total expenses | 2.79 | % | 2.47 | % | 2.43 | % |
| Expenses before offsets | 2.79 | % | 2.45 | % | 2.41 | % |
| Net expenses | 2.79 | % | 2.45 | % | 2.40 | % |
| Portfolio turnover | 135 | % | 100 | % | 82 | % |
| Net assets, ending (in thousands) | $24,107 | | $31,475 | | $50,790 | |
See notes to financial highlights.
| www. | calvert.com CALVERT INTERNATIONAL EQUITY FUND SEMI-ANNUAL REPORT (UNAUDITED) 41 |
| | | | | | |
| FINANCIAL HIGHLIGHTS |
| |
| | PERIODS ENDED |
| | MARCH
31, | | SEPTEMBER
30, | | SEPTEMBER
30, | |
| CLASS I SHARES | 2012 | (z) | 2011 | (z) | 2010 | (z) |
| Net asset value, beginning | $12.70 | | $14.83 | | $14.79 | |
| Income from investment operations: | | | | | | |
| Net investment income | .07 | | .26 | | .17 | |
| Net realized and unrealized gain (loss) | 2.09 | | (2.30 | ) | .11 | |
| Total from investment operations | 2.16 | | (2.04 | ) | .28 | |
| Distributions from: | | | | | | |
| Net investment income | (.21 | ) | (.09 | ) | (.24 | ) |
| Net realized gain | — | | — | | — | |
| Total distributions | (.21 | ) | (.09 | ) | (.24 | ) |
| Total increase (decrease) in net asset value | 1.95 | | (2.13 | ) | 0.04 | |
| Net asset value, ending | $14.65 | | $12.70 | | $14.83 | |
| |
| Total return* | 17.20 | % | (13.84 | %) | 1.91 | % |
| Ratios to average net assets: A | | | | | | |
| Net investment income | .98 | % (a) | 1.74 | % | 1.17 | % |
| Total expenses | 1.12 | % (a) | 1.07 | % | 1.08 | % |
| Expenses before offsets | 1.06 | % (a) | 1.06 | % | 1.06 | % |
| Net expenses | 1.06 | % (a) | 1.06 | % | 1.06 | % |
| Portfolio turnover | 26 | % | 49 | % | 133 | % |
| Net assets, ending (in thousands) | $100,041 | | $89,142 | | $86,475 | |
| |
| |
| | YEARS ENDED |
| | SEPTEMBER
30, | | SEPTEMBER
30, | | SEPTEMBER
30, | |
| CLASS I SHARES | 2009 | (z) | 2008 | | 2007 | |
| Net asset value, beginning | $16.37 | | $27.15 | | $25.16 | |
| Income from investment operations: | | | | | | |
| Net investment income | .22 | | .48 | | .34 | |
| Net realized and unrealized gain (loss) | (1.29 | ) | (8.96 | ) | 4.93 | |
| Total from investment operations | (1.07 | ) | (8.48 | ) | 5.27 | |
| Distributions from: | | | | | | |
| Net investment income | (.48 | ) | (.37 | ) | (.35 | ) |
| Net realized gain | (.03 | ) | (1.93 | ) | (2.93 | ) |
| Total distributions | (.51 | ) | (2.30 | ) | (3.28 | ) |
| Total increase (decrease) in net asset value | (1.58 | ) | (10.78 | ) | 1.99 | |
| Net asset value, ending | $14.79 | | $16.37 | | $27.15 | |
| |
| Total return* | (5.59 | %) | (33.84 | %) | 22.49 | % |
| Ratios to average net assets: A | | | | | | |
| Net investment income | 1.80 | % | 2.47 | % | 1.74 | % |
| Total expenses | 1.08 | % | 1.00 | % | .98 | % |
| Expenses before offsets | 1.07 | % | .98 | % | .96 | % |
| Net expenses | 1.07 | % | .97 | % | .96 | % |
| Portfolio turnover | 135 | % | 100 | % | 82 | % |
| Net assets, ending (in thousands) | $107,456 | | $118,033 | | $181,672 | |
See notes to financial highlights.
| www. | calvert.com CALVERT INTERNATIONAL EQUITY FUND SEMI-ANNUAL REPORT (UNAUDITED) 42 |
| | | | |
| FINANCIAL HIGHLIGHTS |
| |
| | PERIODS ENDED | |
| | MARCH
31, | | SEPTEMBER
30, | |
| CLASS Y SHARES | 2012 | (z) | 2011 | (z) |
| Net asset value, beginning | $12.45 | | $14.53 | |
| Income from investment operations: | | | | |
| Net investment income | .04 | | .24 | |
| Net realized and unrealized gain (loss) | 2.06 | | (2.30 | ) |
| Total from investment operations | 2.10 | | (2.06 | ) |
| Distributions from: | | | | |
| Net investment income | (.15 | ) | (.02 | ) |
| Net realized gain | — | | — | |
| Total distributions | (.15 | ) | (.02 | ) |
| Total increase (decrease) in net asset value | 1.95 | | (2.08 | ) |
| Net asset value, ending | $14.40 | | $12.45 | |
| |
| Total return* | 17.02 | % | (14.20 | %) |
| Ratios to average net assets: A | | | | |
| Net investment income | .63 | % (a) | 1.56 | % |
| Total expenses | 1.48 | % (a) | 1.51 | % |
| Expenses before offsets | 1.39 | % (a) | 1.39 | % |
| Net expenses | 1.39 | % (a) | 1.39 | % |
| Portfolio turnover | 26 | % | 49 | % |
| Net assets, ending (in thousands) | $7,594 | | $7,398 | |
| |
| | PERIODS ENDED | |
| | SEPTEMBER
30, | | SEPTEMBER
30, | |
| CLASS Y SHARES | 2010 | (z) | 2009 | # (z) |
| Net asset value, beginning | $14.34 | | $11.45 | |
| Income from investment operations: | | | | |
| Net investment income | .08 | | .17 | |
| Net realized and unrealized gain (loss) | .17 | | 2.76 | |
| Total from investment operations | .25 | | 2.93 | |
| Distributions from: | | | | |
| Net investment income | (.06 | ) | (.01 | ) |
| Net realized gain | — | | (.03 | ) |
| Total distributions | (.06 | ) | (.04 | ) |
| Total increase (decrease) in net asset value | 0.19 | | 2.89 | |
| Net asset value, ending | $14.53 | | $14.34 | |
| |
| Total return* | 1.73 | % | 25.75 | % |
| Ratios to average net assets: A | | | | |
| Net investment income | .61 | % | 1.52 | % (a) |
| Total expenses | 2.14 | % | 5.91 | % (a) |
| Expenses before offsets | 1.39 | % | 1.39 | % (a) |
| Net expenses | 1.39 | % | 1.39 | % (a) |
| Portfolio turnover | 133 | % | 100 | % |
| Net assets, ending (in thousands) | $2,790 | | $702 | |
See notes to financial highlights.
| www. | calvert.com CALVERT INTERNATIONAL EQUITY FUND SEMI-ANNUAL REPORT (UNAUDITED) 43 |
A Total expenses do not reflect amounts reimbursed and/or waived by the Advisor or reductions from expense offset arrangements. Expenses before offsets reflect expenses after reimbursement and/or waiver by the Advisor but prior to reductions from expense offset arrangements. Net expenses are net of all reductions and represent the net expenses paid by the Fund.
(a) Annualized.
(z) Per share figures are calculated using the Average Share Method.
* Total return is not annualized for periods less than one year and does not reflect deduction of any front-end or deferred sales charge.
# From October 31, 2008, inception.
See notes to financial statements.
www.calvert.com CALVERT INTERNATIONAL EQUITY FUND SEMI-ANNUAL REPORT (UNAUDITED) 44
EXPLANATION OF FINANCIAL TABLES
SCHEDULE OF INVESTMENTS
The Schedule of Investments is a snapshot of all securities held in the fund at their market value, on the last day of the reporting period. Securities are listed by asset type (e.g., common stock, corporate bonds, U.S. government obligations) or, for International Funds, by country, and may be further broken down into sub-groups and by industry classification.
STATEMENT OF ASSETS AND LIABILITIES
The Statement of Assets and Liabilities is often referred to as the fund’s balance sheet. It lists the value of what the fund owns, is due and owes on the last day of the reporting period. The fund’s assets include the market value of securities owned, cash, receivables for securities sold and shareholder subscriptions, and receivables for dividends and interest payments that have been earned, but not yet received. The fund’s liabilities include payables for securities purchased and shareholder redemptions, and expenses owed but not yet paid. The statement also reports the fund’s net asset value (NAV) per share on the last day of the reporting period. The NAV is calculated by dividing the fund’s net assets (assets minus liabilities) by the number of shares outstanding. This statement is accompanied by a Schedule of Investments. Alternatively, if certain conditions are met, a Statement of Net Assets may be presented in lieu of this statement and the Schedule of Investments.
STATEMENT OF NET ASSETS
The Statement of Net Assets provides a detailed list of the fund’s holdings, including each security’s market value on the last day of the reporting period. The Statement of Net Assets includes a Schedule of Investments. Other assets are added and other liabilities subtracted from the investments total to calculate the fund’s net assets. Finally, net assets are divided by the outstanding shares of the fund to arrive at its share price, or Net Asset Value (NAV) per share.
At the end of the Statement of Net Assets is a table displaying the composition of the fund’s net assets. Paid in Capital is the money invested by shareholders and represents the bulk of net assets. Undistributed Net Investment Income and Accumulated Net Realized Gains usually approximate the amounts the fund had available to distribute to shareholders as of the statement date. Accumulated Realized Losses will appear as negative balances. Unrealized Appreciation (Depreciation) is the difference between the market value of the fund’s investments and their cost, and reflects the gains (losses) that would be realized if the fund were to sell all of its investments at their statement-date values. stateMent of oPeratIons
The Statement of Operations summarizes the fund’s investment income earned and expenses incurred in operating the fund. Investment income includes dividends earned from stocks and interest earned from interest-bearing securities in the fund. Expenses incurred in operating the fund include the advisory fee paid to the investment advisor, administrative services fees, distribution plan expenses (if applicable), transfer agent fees, shareholder servicing expenses, custodial, legal, and audit fees, and the printing and post-
www.calvert.com CALVERT INTERNATIONAL EQUITY FUND SEMI-ANNUAL REPORT (UNAUDITED) 45
age expenses related to shareholder reports. Expense offsets (fees paid indirectly) are also shown. Credits earned from offset arrangements are used to reduce the fund’s expenses. This statement also shows net gains (losses) realized on the sale of investments and the increase or decrease in the unrealized appreciation (depreciation) on investments held during the period.
STATEMENT OF CHANGES IN NET ASSETS
The Statement of Changes in Net Assets shows how the fund’s total net assets changed during the two most recent reporting periods. Changes in the fund’s net assets are attributable to investment operations, distributions and capital share transactions.
The Operations section of the report summarizes information detailed in the Statement of Operations. The Distribution section shows the dividend and capital gain distributions made to shareholders. The amounts shown as distributions in this section may not match the net investment income and realized gains amounts shown in the Operations section because distributions are determined on a tax basis and certain investments or transactions may be treated differently for financial statement and tax purposes. The Capital Share Transactions section shows the amount shareholders invested in the fund, either by purchasing shares or by reinvesting distributions, and the amounts redeemed. The corresponding numbers of shares issued, reinvested and redeemed are shown at the end of the report.
FINANCIAL HIGHLIGHTS
The Financial Highlights table provides a per-share breakdown per class of the components that affect the fund’s net asset value for current and past reporting periods. The table provides total return, total distributions, expense ratios, portfolio turnover and net assets for the applicable period. Total return is a measure of a fund’s performance that encompasses all elements of return: dividends, capital gain distributions and changes in net asset value. Total return is the change in value of an investment over a given period, assuming reinvestment of any dividends and capital gain distributions, expressed as a percentage of the initial investment. Total distributions include distributions from net investment income and net realized gains. Long-term gains are earned on securities held in the fund more than one year. Short-term gains, on the sale of securities held less than one year, are treated as ordinary dividend income for tax purposes. The expense ratio is a fund’s cost of doing business, expressed as a percentage of net assets. These expenses directly reduce returns to shareholders. Portfolio turnover measures the trading activity in a fund’s investment portfolio – how often securities are bought and sold by a fund. Portfolio turnover is affected by market conditions, changes in the size of the fund, the nature of the fund’s investments and the investment style of the portfolio manager.
www.calvert.com CALVERT INTERNATIONAL EQUITY FUND SEMI-ANNUAL REPORT (UNAUDITED) 46
PROXY VOTING
The Proxy Voting Guidelines of the Calvert Funds that the Fund uses to determine how to vote proxies relating to portfolio securities are provided as an Appendix to the Fund’s Statement of Additional Information. The Statement of Additional Information can be obtained free of charge by calling the Fund at 1-800-368-2745, by visiting the Calvert website at www.calvert.com; or by visiting the SEC’s website at www.sec.gov.
Information regarding how the Fund voted proxies relating to portfolio securities during the most recent 12-month period ended June 30 is available on the Fund’s website at www.calvert.com and on the SEC’s website at www.sec.gov.
AVAILABILITY OF QUARTERLY PORTFOLIO HOLDINGS
The Fund files its complete schedule of portfolio holdings with the SEC for the first and third quarters of each fiscal year on Form N-Q. The Fund’s Form N-Q is available on the SEC’s website at www.sec.gov. The Fund’s Form N-Q may be reviewed and copied at the SEC’s Public Reference Room in Washington, DC; information on the operation of the Public Reference Room may be obtained by calling 1-800-SEC-0330.
BASIS FOR BOARD’S APPROVAL OF INVESTMENT ADVISORY CONTRACTS
At a meeting held on December 6, 2011, the Board of Directors, and by a separate vote, the disinterested Directors, approved the continuance of the Investment Advisory Agreement between Calvert World Values Fund, Inc. and the Advisor and the Investment Subadvisory Agreement between the Advisor and each of Thornburg Investment Management, Inc. and Martin Currie, Inc. (each a “Subadvisor”) with respect to the Fund.
In evaluating the Investment Advisory Agreement, the Board considered a variety of information relating to the Fund and the Advisor. The disinterested Directors reviewed a report prepared by the Advisor regarding various services provided to the Fund by the Advisor and its affiliates. Such report included, among other data, information regarding the Advisor’s personnel and the Advisor’s revenue and cost of providing services to the Fund, and a separate report prepared by an independent third party, which provided a statistical analysis comparing the Fund’s investment performance, expenses, and fees to comparable mutual funds.
The disinterested Directors were separately represented by independent legal counsel with respect to their consideration of the reapproval of the Investment Advisory Agreement and each Investment Subadvisory Agreement with the applicable Subadvisor. Prior to voting, the disinterested Directors reviewed the proposed continuance of the Investment
www.calvert.com CALVERT INTERNATIONAL EQUITY FUND SEMI-ANNUAL REPORT (UNAUDITED) 47
Advisory Agreement and each Investment Subadvisory Agreement with management and also met in private sessions with their counsel at which no representatives of management were present.
In the course of its deliberations regarding the Investment Advisory Agreement, the Board considered the following factors, among others: the nature, extent and quality of the services provided by the Advisor, including the personnel providing such services; the Advisor’s financial condition; the level and method of computing the Fund’s advisory fee; comparative performance, fee and expense information for the Fund; the profitability of the Calvert Family of Funds to the Advisor and its affiliates; the allocation of the Fund’s brokerage, including the Advisor’s process for monitoring “best execution”; the direct and indirect benefits, if any, derived by the Advisor and its affiliates from their relationship with the Fund; the effect of the Fund’s growth and size on the Fund’s performance and expenses; the affiliated distributor’s process for monitoring sales load breakpoints; the Advisor’s compliance programs and policies; the Advisor’s performance of substantially similar duties for other funds; and any possible conflicts of interest.
In considering the nature, extent and quality of the services provided by the Advisor under the Investment Advisory Agreement, the Board reviewed information provided by the Advisor relating to its operations and personnel, including, among other information, biographical information on the Advisor’s investment, supervisory and professional staff and descriptions of its organizational and management structure. The Board also took into account similar information provided periodically throughout the previous year by the Advisor as well as the Board’s familiarity with the Advisor’s senior management through Board of Directors’ meetings, discussions and other reports. The Board considered the Advisor’s management style and its performance in employing its investment strategies, as well as its current level of staffing and overall resources. The Board also noted that it reviewed on a quarterly basis information regarding the Advisor’s compliance with applicable policies and procedures, including those related to personal investing. The Advisor’s administrative capabilities, including its ability to supervise the other service providers for the Fund, were also considered. The Board observed that the scope of services provided by the Advisor generally had expanded over time as a result of regulatory, market and other changes. The Board also took into account the environmental, social, sustainability and governance research and analysis provided by the Advisor to the Fund. The Board discussed the Advisor’s effectiveness in monitoring the performance of the Subadvisors and its timeliness in responding to performance issues. The Board concluded that it was satisfied with the nature, extent and quality of services provided to the Fund by the Advisor under the Investment Advisory Agreement.
In considering the Fund’s performance, the Board noted that it reviewed on a quarterly basis detailed information about the Fund’s performance results, portfolio composition and investment strategies. In addition, the Board took into account overall financial market conditions. The Board also reviewed various comparative data provided to it in connection with its consideration of the renewal of the Investment Advisory Agreement, including, among other information, a comparison of the Fund’s total return with its Lipper index and with that of other mutual funds deemed to be in its peer group by an independent third party in its report. This comparison indicated that the Fund per-
www.calvert.com CALVERT INTERNATIONAL EQUITY FUND SEMI-ANNUAL REPORT (UNAUDITED) 48
formed below the median of its peer group for the one-, three- and five-year periods ended June 30, 2011. The data also indicated that the Fund underperformed its Lipper index for the same one-, three- and five-year periods ended June 30, 2011. The Board took into account management’s discussion of the Fund’s performance as well as the Advisor’s plans with respect to the allocation of the Fund’s assets. The Board noted the Advisor’s continued monitoring of the Fund’s performance. Based upon its review, the Board concluded that appropriate action was being taken with respect to the Fund’s performance.
In considering the Fund’s fees and expenses, the Board compared the Fund’s fees and total expense ratio with various comparative data for the funds in its peer group. Among other findings, the data indicated that the Fund’s advisory fee (after taking into account waivers and/or reimbursements) was below the median of its peer group and that total expenses (net of waivers and/or reimbursements) were above the median of its peer group. The Board noted that the allocation of advisory and administrative fees may vary among the Fund’s peer group. The Board also took into account the Advisor’s current undertaking to maintain expense limitations for the Fund’s Class I and Class Y shares. The Board noted the Advisor’s discussion of the Fund’s expenses and certain factors that affected the level of such expenses, including the cost of providing the environmental, social, sustainability and governance research and analysis provided by the Advisor. The Board noted that in 2011, the transfer agency fees paid by the Calvert Family of Funds had been renegotiated, resulting in an anticipated overall reduction in the transfer agency fees to be paid across the Calvert Family of Funds complex. Based upon its review, the Board determined that the advisory fee was reasonable in view of the quality of services received by the Fund from the Advisor and the other factors considered.
The Board reviewed the Advisor’s profitability on a fund-by-fund basis. In reviewing the overall profitability of the advisory fee to the Fund’s Advisor, the Board also considered the fact that affiliates of the Advisor provided shareholder servicing, administrative and distribution services to the Fund for which they received compensation. The information considered by the Board included Calvert’s operating profit margin information both before and after tax expenses with respect to the services that the Advisor and its affiliates provided to the Calvert Family of Funds complex. The Board reviewed the profitability of the Advisor’s relationship with the Fund in terms of the total amount of annual advisory fees it received with respect to the Fund and whether the Advisor had the financial wherewithal to continue to provide a high level of services to the Fund. The Board noted that the Advisor had reimbursed expenses of the Fund. The Board also noted the Advisor’s current undertaking to maintain expense limitations for the Fund’s Class I and Class Y Shares. The Board also considered that the Advisor derived benefits to its reputation and other indirect benefits from its relationship with the Fund. The Board noted that the Advisor paid the subadvisory fees to the Subadvisors. Based upon its review, the Board concluded that the Advisor’s and its affiliates’ level of profitability from their relationship with the Fund was reasonable.
The Board considered the effect of the Fund’s current size and its potential growth on its performance and fees. The Board took into account that the Fund’s advisory fee schedule contained breakpoints that would reduce the advisory fee rate on assets above specified
www.calvert.com CALVERT INTERNATIONAL EQUITY FUND SEMI-ANNUAL REPORT (UNAUDITED) 49
levels as the Fund’s assets increased. The Board noted that the Fund was currently realizing economies of scale in its advisory fee. The Board also noted that if the Fund’s assets increased over time, the Fund might realize other economies of scale if assets increased proportionally more than certain other expenses.
In reapproving the Investment Advisory Agreement, the Board, including the disinterested Directors, did not identify any single factor as controlling, and each Director may have attributed different weight to various factors.
In evaluating each of the Investment Subadvisory Agreements, the disinterested Directors reviewed information provided by the Subadvisors relating to their respective operations, personnel, investment philosophy, strategies and techniques. Among other information, the Subadvisors provided biographical information on portfolio management and other professional staff, performance information for themselves, and descriptions of their respective investment philosophies, strategies and techniques, organizational and management structures and brokerage policies and practices.
The Board reapproved the Investment Subadvisory Agreement between the Advisor and each of the Subadvisors based on a number of factors relating to each Subadvisor’s ability to perform under the respective Investment Subadvisory Agreement. In the course of its deliberations, the Board evaluated, among other factors: the nature, extent and the quality of the services to be provided by each Subadvisor; each Subadvisor’s management style and long-term performance record; each Subadvisor’s performance in employing its investment strategies; each Subadvisor’s current level of staffing and its overall resources; the qualifications and experience of each Subadvisor’s personnel; each Subadvisor’s financial condition with respect to its ability to perform the services required under the respective Investment Subadvisory Agreement; each Subadvisor’s risk management processes; each Subadvisor’s compliance systems, including those related to personal investing; and any disciplinary history. Based upon its review, the Board concluded that it was satisfied with the nature, extent and quality of services provided to the Fund by each Subadvisor under the respective Investment Subadvisory Agreement.
As noted above, the Board considered, among other information, the Fund’s performance during the one-, three- and five-year periods ended June 30, 2011 as compared to the Fund’s peer group and noted that it reviewed on a quarterly basis detailed information about the Fund’s performance results, portfolio composition and investment strategies. The Board noted the Advisor’s expertise and resources in monitoring the performance, investment style and risk- adjusted performance of the Subadvisors.
In considering the cost of services to be provided by each Subadvisor and the profitability to each Subadvisor of its relationship with the Fund, the Board noted that the subadviso-ry fees under each Investment Subadvisory Agreement was paid by the Advisor out of the advisory fee that the Advisor received under the Investment Advisory Agreement. The Board also relied on the ability of the Advisor to negotiate each Investment Subadvisory Agreement and the corresponding subadvisory fee at arm’s length. In addition, the Board took into account the fees the Subadvisors charged to their other clients and considered these fee comparisons in light of the differences in managing these other accounts. Based upon its review, the Board determined that the subadvisory fees were reasonable. Because
www.calvert.com CALVERT INTERNATIONAL EQUITY FUND SEMI-ANNUAL REPORT (UNAUDITED) 50
the Advisor pays the Subadvisors’ subadvisory fees and the subadvisory fees were negotiated at arm’s length by the Advisor, the cost of services to be provided by the Subadvisors and the profitability to the Subadvisors of their relationships with the Fund were not material factors in the Board’s deliberations. For similar reasons, the Board did not consider the potential economies of scale in each Subadvisor’s management of the Fund to be a material factor in its consideration, although the Board noted that Martin Currie, Inc.’s subadvisory fee schedule for the Fund contained breakpoints that reduced the subadvisory fee rate on assets above specified levels.
In reapproving each Investment Subadvisory Agreement, the Board, including the disinterested Directors, did not identify any single factor as controlling, and each Director may have attributed different weight to various factors.
CONCLUSIONS
The Board reached the following conclusions regarding the Investment Advisory Agreement and each Investment Subadvisory Agreement, among others: (a) the Advisor has demonstrated that it possesses the capability and resources to perform the duties required of it under the Investment Advisory Agreement; (b) the Advisor and each Subadvisor is qualified to manage the Fund’s assets in accordance with the Fund’s investment objectives and policies; (c) the Advisor and each Subadvisor maintain appropriate compliance programs; (d) the Advisor and each Subadvisor is likely to execute its investment strategies consistently over time; (e) appropriate action is being taken with respect to the performance of the Fund; and (f) the Fund’s advisory and subadvisory fees are reasonable relative to those of similar funds and to the services to be provided by the Advisor and each Subadvisor. Based on its conclusions, the Board determined that reapproval of the Investment Advisory Agreement and each Investment Subadvisory Agreement would be in the best interests of the Fund and its shareholders.
www.calvert.com CALVERT INTERNATIONAL EQUITY FUND SEMI-ANNUAL REPORT (UNAUDITED) 51
To Open an Account
800-368-2748
Yields and Prices
Calvert Information Network
(24 hours, 7 days a week)
800-368-2745
Service for Existing Account
Shareholders: 800-368-2745
Brokers: 800-368-2746
TDD for Hearing Impaired
800-541-1524
Branch Office
4550 Montgomery Avenue
Suite 1000 North
Bethesda, Maryland 20814
Registered, Certified or Overnight Mail
Calvert Investments
c/o BFDS,
330 West 9th Street
Kansas City, MO 64105
Web Site
www.calvert.com
Principal Underwriter
Calvert Investment Distributors, Inc.
4550 Montgomery Avenue
Suite 1000 North
Bethesda, Maryland 20814
| | |
| CALVERT | CALVERT’S | Equity Funds |
| INTERNATIONAL | FAMILY OF FUNDS | Enhanced Equity Portfolio |
| EQUITY | | Equity Portfolio |
| FUND | Tax-Exempt Money | Large Cap Value Fund |
| | Market Funds | Social Index Fund |
| | CTFR Money Market Portfolio | Capital Accumulation Fund |
| | | International Equity Fund |
| | Taxable Money Market | Small Cap Fund |
| | Funds | Global Alternative Energy Fund |
| | First Government Money Market | Global Water Fund |
| | Fund | International Opportunities Fund |
| | Money Market Portfolio | Equity Income Fund |
| |
| | Municipal Funds | Balanced and Asset |
| | Tax-Free Bond Fund | Allocation Funds |
| | | Balanced Portfolio |
| | Taxable Bond Funds | Conservative Allocation Fund |
| | Bond Portfolio | Moderate Allocation Fund |
| | Income Fund | Aggressive Allocation Fund |
| | Short Duration Income Fund | |
| | Long-Term Income Fund | |
| | Ultra-Short Income Fund | |
| | Government Fund | |
| | High-Yield Bond Fund | |
This report is intended to provide fund information to shareholders. It is not authorized for distribution to prospective investors unless preceded or accompanied by a prospectus.
Note: The information on our website is not incorporated by reference into this report; our website address is included as an inactive textual reference only.
Investors should carefully consider the investment objectives, risks, charges and expenses of the Calvert Funds. This and other important information is contained in the fund’s summary prospectus and prospectus, which can be obtained from your financial professional and should be read carefully before investing. You may also call Calvert at 800/368-2745 or visit www. calvert.com.
Choose Planet-friendly E-delivery!
Sign up now for on-line statements, prospectuses, and fund reports. In less than five minutes you can help reduce paper mail and lower fund costs.
Just go to www.calvert.com. If you already have an online account at Calvert, click on My Account, and select the documents you would like to receive via e-mail.
If you’re new to online account access, click on Login/Register to open an online account. Once you’re in, click on the E-delivery sign-up at the bottom of the Account Portfolio page and follow the quick, easy steps. Note: if your shares are not held directly at Calvert but through a brokerage firm, you must contact your broker for electronic delivery options available through their firm.
Dear Shareholders:
After a difficult summer of 2011, investor sentiment improved toward the end of 2011, and many investors clearly breathed a sigh of relief in early 2012. Headlines about Europe’s sovereign debt crisis had reached a fever pitch during the final months of 2011 and investors worldwide held their breath, concerned about the potential fallout on markets near and far.
However, long-term refinancing operations agreed to in December 2011 by the European Central Bank that enabled the region’s banks to borrow at very low interest rates as well as progress on a Greek bailout seemed to pull the eurozone back from the brink of collapse and reassured investors. As a result, the broad international markets of the MSCI EAFE Index improved, returning 14.73% for the reporting period.
Overall, key U.S. economic indicators such as the unemployment rate, manufacturing data, housing market fundamentals, and consumer confidence showed gradual improvement. But consumer spending remained weak, and gasoline prices topping $4.00 a gallon in some areas in March did not help. As a result, economic growth continued at a snail’s pace.
In contrast to the fourth quarter, when the Standard & Poor’s (S&P) 500 Index earned nearly all of its return during October, the S&P 500 Index had a strong and mostly steady climb in the first quarter of 2012 to end the reporting period at 25.89%. Investors became more open to risk over the reporting period as well.
Broadening the Reach of SRI
It’s worth noting that corporate responsibility is just as relevant today as it’s always been—and perhaps even more so in these times of economic uncertainty. At Calvert, we have long believed that a company’s environmental, sustainability, and governance policies correlate strongly with its risk management and financial performance. It’s clear that more and more investors, consumers, and companies are reaching the same conclusions, and that the use of shareholder advocacy to effect change is becoming an increasingly powerful tool.
However, we always welcome additional proof of this, especially from venerable sources such as Ernst & Young. In a new white paper, the management consulting firm noted that social and environmental issues accounted for 40% of shareholder proposals on proxy ballots last year, up one-third from 2010. Ernst & Young also predicts these issues will dominate proposals for the third consecutive year in 2012, thanks to a convergence of factors drawing attention to companies’ actions on sustainability and environmental issues.1 Perhaps even more important is the broadening of support. Sustainability proposals overall received favorable votes from a record 21% of shareholders in 2011, and nearly one-third of the proposals had support exceeding 30%—a critical level where corporate boards can’t help but take notice. This is on par with Calvert’s own experiences, where
www.calvert.com CALVERT CAPITAL ACCUMULATION FUND SEMI-ANNUAL REPORT (UNAUDITED) 4
38% of resolutions we filed or co-filed that resulted in a vote last year received support of more than 30%.
If you’re interested in learning more about our shareholder advocacy efforts this year, visit us online at www.calvert.com/sri-resolutions.html.
Calvert’s Women’s Principles and Diversity
In March, Calvert helped mark the two-year anniversary of the United Nation’s Women’s Empowerment Principles (WEP) at the U.N. Gender Equality for Sustainable Business Event, which emphasized the business case for promoting gender equality in the workplace. More than 400 chief executives have now publicly committed to implementing the WEP, which were adapted from the Calvert’s Women’s Principles® in 2010. We’re also participating in the WEP Leadership Group, comprised of 30 leading companies, investors, and women-focused organizations seeking to encourage broader adoption of the Principles.
We filed six shareholder resolutions for the upcoming annual meeting season asking companies to add specific considerations of race and gender diversity to their desired director characteristics. Five were successfully withdrawn after management agreed. Notably, this includes American Financial Group, whose resistance last year led to a vote supported by 27% of shareholders. So, persistence does indeed pay off. The lone holdout is Urban Outfitters, where company resistance led to a vote last year that received 22% support.
Leading the Path to Sustained Sustainability in the Next Economy
In October, Calvert had the privilege of co-hosting the 2011 United Nations Environment Programme Finance Initiative (UNEP-FI) Global Roundtable in Washington, D.C. More than 500 attendees from the investment, banking, and insurance industries discussed the tipping point for linking global sustainability and market stability as the cornerstone of the “next economy.” In my opening remarks as UNEP-FI co-chair of the Global Steering Committee, I highlighted the importance of the financial community working together. This is necessary not only to restore trust in financial systems, but also to make a meaningful impact on the pressing challenges facing the world today so that a sustainable future will exist for all. This is an idea that’s been at the heart of Calvert Investments for more than 30 years. Calvert’s leadership on these topics was evident at the event, with Calvert team members speaking on panels about human rights, water, and ecosystem services.
Other Calvert News
As you may know, we launched Calvert Equity Income Fund2 last fall to offer the potential for attractive income generation and competitive total return by investing in a portfolio of large-cap, dividend-paying stocks that we believe provide compelling value. Calvert Large Cap Value Fund co-portfolio managers James McGlynn, CFA and Yvonne Bishop, CFA are managing the new Fund. Both Funds feature Calvert’s SAGE strategy,
www.calvert.com CALVERT CAPITAL ACCUMULATION FUND SEMI-ANNUAL REPORT (UNAUDITED) 5
which involves Calvert actively engaging with companies held in the Funds to engender positive change.
A Variety of Ways to Stay Informed
We are cautiously optimistic about the continued economic recovery, but much uncertainty and the potential for renewed volatility remains. That’s why we always feel it’s best to maintain a well-diversified mix of U.S. and international stocks, bonds, and cash appropriate for your goals and risk tolerance. And of course, we suggest you consult your financial advisor if you have questions or concerns.
We also invite you to visit our website, www.calvert.com, for fund information, portfolio updates, and commentary from Calvert professionals. And now, you can get the same information on the go with Calvert’s new iPhone® app, which is available for free from iTunes.
As always, we thank you for investing with Calvert.

Barbara J. Krumsiek
President and CEO
Calvert Investments, Inc.
May 2012
1 Ernst & Young, Leading Corporate Sustainability Issues in the 2012 Proxy Season: Is your board prepared?
2 Investment in mutual funds involves risk, including possible loss of principal invested. For more information on any Calvert fund, please contact Calvert at 800.368.2748 for a free summary prospectus and/or prospectus. An investor should consider the investment objectives, risks, charges, and expenses of an investment carefully before investing. The summary prospectus and prospectus contain this and other information. Read them carefully before you invest or send money. Calvert mutual funds are underwritten and distributed by Calvert Investment Distributors, Inc., member FINRA and subsidiary of Calvert Investments, Inc.
www.calvert.com CALVERT CAPITAL ACCUMULATION FUND SEMI-ANNUAL REPORT (UNAUDITED) 6

As always, Calvert continues to work hard to ensure you have a say in the responsible management of environmental, social, and governance (ESG) factors for the companies in which we invest. Below are highlights of our accomplishments during the reporting period.
Overall Shareholder Advocacy Efforts
Through March 31, 2012, Calvert had filed 23 shareholder proposals in the 2012 proxy season. The most popular topics were board diversity, sustainability disclosure, climate change, and loan servicing. Several of these are discussed in more detail below. Through March 31, 2012, we had successfully withdrawn 14 resolutions after companies agreed to the terms.
Setting a Fair and Sustainable Table
Many food crops are already showing vulnerability to climate change. For example, higher temperatures and extreme rainfall are expected to increase disease and stress in Central and South American coffee bean crops, resulting in lower output. Last year, our shareholder resolution asked J.M. Smucker to disclose the climate-related risks for its Folgers Coffee and other coffee brands, which reflect 40% of the company’s revenue. We have re-filed the proposal this year in the hope that last year’s strong support of 30% persuades the company to reconsider its position.
We also filed a resolution with Colgate-Palmolive about palm oil sourcing. Despite some sustainability advantages to using palm oil in food, lotions, soaps, and shampoo, significant problems exist in the way palm oil trees are grown in some countries—resulting in significant greenhouse gas emissions, displacement of local and Indigenous Peoples, and destruction of endangered species. After discussions with company management, Colgate announced a goal of purchasing only certified sustainable palm oil by 2015, and we successfully withdrew the proposal.
Finally, Calvert began working with Oxfam America, farm worker unions, and consumer groups to develop a new certification system for on-farm sustainability of fruits and vegetables grown in the United States. The pilot project evaluates farm worker welfare, pesticide reduction, and product safety.
Rooting Out Supply Chain Abuses
Calvert co-authored a guide with Christian Brothers Investments and the Interfaith Center on Corporate Responsibility to help companies comply with the California Transparency in Supply Chain Act (SB 657). This ground-breaking U.S. law requires manufacturers and retailers with global gross receipts exceeding $100 million that operate in California to disclose efforts to eliminate slavery and human trafficking from their direct supply chains on their corporate website. The guide also serves as an advocacy tool for more effective manage-
www.calvert.com CALVERT CAPITAL ACCUMULATION FUND SEMI-ANNUAL REPORT (UNAUDITED) 7
ment of labor and human rights risks within global supply chains.
On a related note, Calvert is greatly concerned by news reports about factory conditions for some of Apple’s suppliers, especially in China. We have been working with a larger investor coalition to engage Apple’s senior management, and we believe the company has made significant strides in the last few months toward full supply chain transparency and “zero tolerance” for workplace abuses. Apple has also moved aggressively to have the Fair Labor Association conduct third-party audits of its suppliers and is posting the results of these monthly audits on its website. We will continue to monitor the situation and work with Apple to remedy its supply chain issues.
Improving Regulation of ESG Issues
Clean Air Act. Calvert coordinated an investor letter to congressional leaders urging timely implementation of new Clean Air Act rules under development at the Environmental Protection Agency (EPA). These rules would help modernize and improve the efficiency of electric utilities, reduce cross-state air pollution, lower emissions of mercury and air toxins, and create well-paid construction, engineering, and manufacturing jobs. The EPA announced the new Mercury and Air Toxics rule in December—a victory for the health of both the public and the economy.
Dodd-Frank Reform & Consumer Protection Act of 2010. We continue to participate in a complicated Securities and Exchange Commission (SEC) rule-making process for this law, particularly regarding section 1502 on “conflict minerals.” This section requires companies that use gold, tin, tantalum, and tungsten in their products to disclose whether these metals are coming from specific mines in the Democratic Republic of Congo and adjoining countries. Profits from these mines have been used to fuel the weapon supply for one of the world’s bloodiest conflicts since World War II.
An early supporter of the legislation, Calvert is working with a coalition of investors, human rights organizations, and major multinational corporations that recently met with the SEC chairman as well as several commissioners and their staff. We also presented the investor perspective at an SEC roundtable in October 2011 and have submitted a series of letters and comments about the complex and controversial issues involved. We hope to see a final rule in the coming months.
Community Investments
Many of our Funds participate in Calvert’s High Social Impact Investing program, which is administered through the Calvert Foundation. This community investment program may allocate a small percentage of Fund assets at below-market interest rates to investments that provide economic opportunity for struggling populations.1 One such investment is Pride Industries, which creates jobs for people with disabilities and is an up-and-coming leader in helping individuals overcome barriers to employment. In fiscal year 2010, the organization employed 4,100 individuals, 60% of whom were disabled.
Another example is Via Verde, an innovative and award-winning affordable housing development in the South Bronx. This complex combines urgently needed low- to moderate-income
www.calvert.com CALVERT CAPITAL ACCUMULATION FUND SEMI-ANNUAL REPORT (UNAUDITED) 8
housing with a new model for affordable, green, and healthy urban living in a design that improves the attractiveness of the community around it.
Special Equities
A modest but important portion of certain funds is allocated to small private companies developing products or services that address important sustainability or environmental issues. One recent investment was LearnZillion, a Washington, D.C.-based group using video technology to provide individualized learning in primary schools.2 “Best of class” video modules allow the teacher to track each student’s progress, give the right lessons at the right time, and provide timely support—all with interactive feedback. We are unsure if this approach will be the breakthrough learning improvement the schools need, but all agree innovative solutions need to be tried.
Calvert was also instrumental in getting the U.S. State Department to focus attention on the importance of “impact investing,” by way of a conference with an address by Secretary of State Hillary Clinton. We are gratified the U.S. government is manifesting the best of American values by becoming involved in supporting social entrepreneurs.
1 As of March 31, 2012, Calvert Social Investment Foundation (“Calvert Foundation” or “Foundation”) Community Investment Notes represented the following percentages of Fund net assets: Calvert Capital Accumulation Fund 0.55%, Calvert International Equity Fund 1.37%, and Calvert Small Cap Fund 0.50%. The Calvert Foundation is a 501(c)(3) nonprofit organization. The Foundation’s Community Investment Note Program is not a mutual fund and should not be confused with any Calvert Investments-sponsored investment product.
2 As of March 31, 2012, LearnZillion represented 0.02% of Calvert Balanced Portfolio. Holdings are subject to change.
As of March 31, 2012, the following companies represented the following percentages of net assets: J.M. Smucker 0.11% of Calvert Social Index Fund, Colgate-Palmolive 0.51% of Calvert Social Index Fund, and Apple 6.52% of Calvert Social Index Fund. Holdings are subject to change.
www.calvert.com CALVERT CAPITAL ACCUMULATION FUND SEMI-ANNUAL REPORT (UNAUDITED) 9

Investment Performance
For the six months ended March 31, 2012, Calvert Capital Accumulation Fund (Class A shares at NAV) returned 30.02% compared with 27.39% for the Russell Midcap Growth Index. The Fund’s relative outperformance was largely due to strong stock selection.
Investment Climate
The stock market had a strong first quarter of 2012 due to better-than-expected (or feared) economic data and a subsiding of the euro-zone crisis following an initial orderly default in Greece. As of the end of March 2012, the U.S. market was up approximately 30% from its 2011 lows.
The U.S. stock market advanced more than 25% over the past six months, amid a backdrop of continued uncertainty over sovereign debt in Europe, volatile energy prices, and muted economic growth. Inflation remained in check thanks to declining com-
CALVERT CAPITAL
ACCUMULATION FUND
MARCH 31, 2012 |
| |
| INVESTMENT PERFORMANCE | | | |
| (total return at NAV*) | | | |
| | 6 Months | | 12 Months | |
| | ended | | ended | |
| | 3/31/12 | | 3/31/12 | |
| Class A | 30.02 | % | 4.89 | % |
| Class B | 29.21 | % | 3.62 | % |
| Class C | 29.47 | % | 3.99 | % |
| Class I | 30.46 | % | 5.59 | % |
| Class Y | 30.14 | % | 5.04 | % |
| |
| Russell Midcap Growth | | | |
| Index | 27.39 | % | 4.43 | % |
| |
| Lipper Mid-Cap Core | | | | |
| Funds Average | 26.93 | % | 0.57 | % |
| |
| TEN LARGEST STOCK HOLDINGS | |
| | % of Net Assets | |
| WESCO International, Inc. | | 3.4 | % |
| Syntel, Inc. | | | 3.3 | % |
| Ascena Retail Group, Inc. | | 3.2 | % |
| Ross Stores, Inc. | | | 3.2 | % |
| Church & Dwight Co., Inc. | | 3.0 | % |
| Reliance Steel & Aluminum Co. | | 2.9 | % |
| Ball Corp. | | | 2.8 | % |
| FMC Technologies, Inc. | | 2.7 | % |
| Endo Pharmaceuticals | | | | |
| Holdings, Inc. | | | 2.7 | % |
| Wright Express Corp. | | | 2.7 | % |
| Total | | | 29.9 | % |
| |
| ECONOMIC SECTORS | % of Total Investments | |
| |
| Consumer Discretionary | | 21.9 | % |
| Consumer Staples | | | 5.4 | % |
| Energy | | | 7.4 | % |
| Financials | | | 6.5 | % |
| Health Care | | | 11.4 | % |
| Industrials | | | 14.2 | % |
| Information Technology | | 22.4 | % |
| Materials | | | 8.0 | % |
| Telecommunication Services | | 1.1 | % |
| Time Deposit | | | 1.7 | % |
| |
| Total | | | 100 | % |
*Investment performance/return at NAV does not reflect the deduction of the Fund’s maximum 4.75% front-end sales charge or any deferred sales charge.
www.calvert.com CALVERT CAPITAL ACCUMULATION FUND SEMI-ANNUAL REPORT (UNAUDITED) 10
modity prices (excluding oil) and elevated unemployment, which is slowly improving. The uncertainties caused a peak in market volatility, as well as pair-wise correlations in stock prices towards year end. The relatively weak economic environment has kept interest rates low, which should continue for the foreseeable future. U.S. stocks with foreign revenue exposure underperfomed in the fourth quarter, but recovered early in 2012. With continued, albeit slower, corporate profit growth, consumer confidence gradually improving, and positive trends in leading economic indicators, we remain moderately bullish on U. S. stocks.
Mid-cap stocks fared better than larger-cap as the Russell Midcap Index returned 26.84% while the Standard & Poor’s (S&P) 500 Index gained 25.89% for the reporting period. Growth also edged out value, with returns of 27.39% for the Russell Midcap Growth Index and 26.30% for the Russell Midcap Value Index.
Portfolio Strategy
The Fund outperformed the Russell Midcap Growth Index over the six-month period. While our sector selection was modestly negative, our stock selection skill was strong. An overweight position in Health Care helped performance, but an underweight to Telecommunication Services detracted. During the period, we bought and sold 18 stocks, for a total of 41 portfolio holdings as of March 31, 2012.
Four stocks were sold after reaching their price targets--Toro in Industrials, J2 Global Communications and new addition Dolby Laboratories in Information Technology, and HealthSpring in Health Care. The latter was a top performer for the Fund, gaining 48.4%1 before reaching its price target, thanks to news of its acquisition by CIGNA.
Stock selection added value in Health Care, Industrials, Materials, Consumer Staples, and Consumer Discretionary. In Health Care, new addition WellCare advanced 50.9% as enrollment growth and low utilization rates at the managed-care provider fueled strong earnings. Industrials holding Wesco nearly doubled, while Materials stock Reliance Steel rose 67% as fears about slower economic growth abated. Consumer Staples holding Corn Products International (48.0%) performed well due to positive earnings surprises and the integration of a recent acquisition.
In Consumer Discretionary, Gannett rallied 64% on a sentiment upgrade from a sell-side analyst highlighting its robust cash flow, and shares of new addition Ascena Retail Group rose 28.3% thanks to solid same-store sales that pushed earnings above consensus. We also expanded our Consumer Discretionary allocation with the purchases of Coinstar, Expedia, Ascena, and Buckle (a retailer), while selling Nordstrom.
However, our stock picking was weak in Telecommunication Services and Energy. Mobile communications provider NII Holdings (-10.9%) was replaced with MetroPCS as NII Holdings lost ground due to weakening Latin American currencies and sluggish growth in Brazil. RPC edged down as pressure pumping transitioned from natural gas to oil production. During the reporting period, we also replaced Energy holding Unit with Denbury Resources and sold Energen. In Consumer Discretionary, Deckers Outdoor (-18.9%) lost ground due to a lackluster holiday season and Hanesbrands underperformed slightly on weak sales growth and rising input costs. NII Holdings, Deckers, and Hanesbrands were all sold during the period.
www.calvert.com CALVERT CAPITAL ACCUMULATION FUND SEMI-ANNUAL REPORT (UNAUDITED) 11
Growth of $10,000
The graph below shows the value of a hypothetical $10,000 investment in the Fund over the past 10 fiscal year periods. The results shown are for Classes A and C shares and reflect the deduction of the maximum front-end Class A sales charge of 4.75%, or deferred sales charge, as applicable and assume the reinvestment of dividends. The result is compared with benchmarks that include a broad based market index and a Lipper peer group average. Market indexes are unmanaged and their results do not reflect the effect of expenses or sales charges. The Lipper average reflects the deduction of the category’s average front-end sales charge. The value of an investment in a different share class would be different.
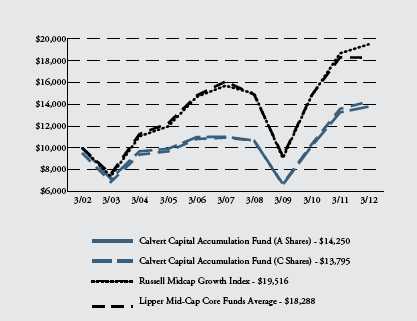
All performance data shown, including the graph above and the adjacent table, represents past performance, does not guarantee future results, assumes reinvestment of dividends and distributions and does not reflect the deduction of taxes that a shareholder would pay on the Fund’s distributions or the redemption of the Fund shares. All performance data reflects fee waivers and/or expense limitations, if any are in effect; in their absence performance would be lower. See Note B in Notes to Financial Statements. The investment return and principal value of an investment will fluctuate so that an investor’s shares, when redeemed, may be worth more or less than their original cost. Current performance may be lower or higher than the performance data quoted; for current performance data visit www.calvert.com. The gross expense ratio from the current prospectus for Class A shares is 1.58%. This number may differ from the expense ratio shown elsewhere in this report because it is based on a different time period and, if applicable, does not include fee or expense waivers. Performance data quoted already reflects the deduction of the Fund’s operating expenses.
www.calvert.com CALVERT CAPITAL ACCUMULATION FUND SEMI-ANNUAL REPORT (UNAUDITED) 12
As of the end of the reporting period, the Fund was overweight Information Technology and Consumer Discretionary and underweight Financials and Energy.
Market Outlook
It might be tempting to interpret recent data points as showing that the United States is well on its way to recovery. However, we still only expect gross domestic product to expand 1.5% to 2.0% in 2012, a rate below typical post-recession recoveries, which would likely allow only slow progress toward higher employment. Jobless claims have dropped, private sector hiring has increased, and the unemployment rate has fallen to 8.2% as of March. On the surface, the trends look promising, but the decline in unemployment is partly due to demographics and partly due to job seekers becoming discouraged and ceasing to look for work.
Interest rates remain low and declining prices of oil and other commodities are lowering top-line inflation. Although a sharp rise in oil prices would be partly mitigated by low natural gas costs, it could put a crimp in consumers’ wallets and confidence and dampen economic growth. The industrial sectors are having above-average recoveries, but the uncertainty in the business climate is causing companies to restrain spending. Corporate profits, however, are still likely to rise by the mid-single digits in percentage terms this year due to modest top-line growth and continuing productivity gains.
CALVERT CAPITAL
ACCUMULATION FUND |
| MARCH 31, 2012 |
| |
| AVERAGE ANNUAL TOTAL RETURNS | |
| |
| CLASS A SHARES | (with max. load) | |
| One year | -0.10 | % |
| Five year | 4.42 | % |
| Ten year | 3.61 | % |
| | |
| CLASS B SHARES | (with max. load) | |
| One year | -1.38 | % |
| Five year | 4.15 | % |
| Ten year | 3.10 | % |
| |
| CLASS C SHARES | (with max. load) | |
| One year | 2.99 | % |
| Five year | 4.58 | % |
| Ten year | 3.27 | % |
| | |
| CLASS I SHARES* | | |
| One year | 5.59 | % |
| Five year | 6.32 | % |
| Ten year | 4.89 | % |
| |
| CLASS Y SHARES** | | |
| One year | 5.04 | % |
| Five year | 5.47 | % |
| Ten year | 4.13 | % |
* Note Regarding Class I Shares Total Returns: There were times during the reporting period when there were no shareholders in Class I. For purposes of reporting Average Annual Total Return, Class A performance at NAV (i.e. does not reflect deduction of the Class A front-end sales charge) is used during these periods in which there were no shareholders in Class I. For purposes of this Average Annual Total Return, the Class A performance at NAV was used during the period January 18, 2002 through June 3, 2003.
** Calvert Capital Accumulation Fund first offered Class Y Shares on January 31, 2011. Performance prior to that date reflects the performance of Class A Shares at net asset value (NAV). Actual Class Y Share performance would have been different.
www.calvert.com CALVERT CAPITAL ACCUMULATION FUND SEMI-ANNUAL REPORT (UNAUDITED) 13
Despite this muted outlook, the United States remains a relatively attractive economy and market. The economy is growing, consumer confidence has improved, other leading economic indicators are in expansionary territory, and corporate profits continue to rise. The stock market is still modestly undervalued by historical standards, the United States continues to be seen as a “safe haven,” and bond returns are likely to drop if inflation picks up. Therefore, the bounce back in stock returns, decelerating international growth, and paltry bond yields are tempting investors back into U.S. stocks. The large amount of cash still on the sidelines could provide additional support if it flows into the market.
We expect Europe to experience a mild recession in 2012. While emerging markets such as China and India are still experiencing strong growth, those rates are moderating. As always, risks remain that could impact the United States. Tensions are rising in the Middle East, and a hard landing in China would hurt the United States. There is still a modest chance of a double dip in the economy, as we saw in 2011. Income and payroll tax cuts expire at the end of the year, and budget cuts need to be made to avoid automatic reductions. But barring these factors, we remain moderately bullish on U.S. stocks.
May 2012
1 Individual security returns reflect total returns for period held in portfolio.
As of March 31, 2012, the following companies represented the following percentages of Fund net assets: Toro 0%, J2 Global Communications 0%, Dolby Laboratories 0%, HealthSpring 0%, CIGNA 0%, WellCare 2.69%, Wesco 3.41%, Reliance Steel 2.86%, Corn Products 2.84%, Gannett 1.79%, Ascena 3.18%, Coinstar 2.25%, Expedia 2.01%, Buckle 2.11%, Nordstrom 0%, NII Holdings 0%, MetroPCS 1.12%, RPC 2.37%, Unit 0%, Denbury Resources 2.31%, Energen 0%, Deckers 0%, and Hanesbrands 0%. Holdings are subject to change.
www.calvert.com CALVERT CAPITAL ACCUMULATION FUND SEMI-ANNUAL REPORT (UNAUDITED) 14
SHAREHOLDER EXPENSE EXAMPLE
As a shareholder of the Fund, you incur two types of costs: (1) transaction costs, including sales charges and redemption fees; and (2) ongoing costs, including management fees; distribution (12b-1) fees; and other Fund expenses. This Example is intended to help you understand your ongoing costs (in dollars) of investing in the Fund and to compare these costs with the ongoing costs of investing in other mutual funds.
This Example is based on an investment of $1,000 invested at the beginning of the period and held for the entire period (October 1, 2011 to March 31, 2012).
Actual Expenses
The first line of the table below provides information about actual account values and actual expenses. You may use the information in this line, together with the amount you invested, to estimate the expenses that you paid over the period. Simply divide your account value by $1,000 (for example, an $8,600 account value divided by $1,000 = 8.6), then multiply the result by the number in the first line under the heading entitled “Expenses Paid During Period” to estimate the expenses you paid on your account during this period.
Hypothetical Example for Comparison Purposes
The second line of the table below provides information about hypothetical account values and hypothetical expenses based on the Fund’s actual expense ratio and an assumed rate of return of 5% per year before expenses, which is not the Fund’s actual return. The hypothetical account values and expenses may not be used to estimate the actual ending account balance or expenses you paid for the period. You may use this information to compare the ongoing costs of investing in the Fund and other funds. To do so, compare the 5% hypothetical example with the 5% hypothetical examples that appear in the shareholder reports of the other funds.
Please note that the expenses shown in the table are meant to highlight your ongoing costs only and do not reflect any transactional costs, such as sales charges (loads) or redemption fees. Therefore, the second line of the table is useful in comparing ongoing costs only, and will not help you determine the relative total costs of owning different funds. In addition, if these transactional costs were included, your costs would have been higher.
www.calvert.com CALVERT CAPITAL ACCUMULATION FUND SEMI-ANNUAL REPORT (UNAUDITED) 15
| | | |
| | BEGINNING | ENDING ACCOUNT | EXPENSES PAID |
| | ACCOUNT VALUE | VALUE | DURING PERIOD* |
| | 10/1/11 | 3/31/12 | 10/1/11 - 3/31/12 |
| CLASS A | | | |
| Actual | $1,000.00 | $1,300.20 | $9.01 |
| Hypothetical | $1,000.00 | $1,017.17 | $7.90 |
| (5% return per | | | |
| year before expenses) | | | |
| | | |
| CLASS B | | | |
| Actual | $1,000.00 | $1,292.10 | $15.97 |
| Hypothetical | $1,000.00 | $1,011.07 | $14.01 |
| (5% return per | | | |
| year before expenses) | | | |
| | | |
| CLASS C | | | |
| Actual | $1,000.00 | $1,294.70 | $13.62 |
| Hypothetical | $1,000.00 | $1,013.13 | $11.95 |
| (5% return per | | | |
| year before expenses) | | | |
| | | |
| CLASS I | | | |
| Actual | $1,000.00 | $1,304.60 | $4.95 |
| Hypothetical | $1,000.00 | $1,020.70 | $4.34 |
| (5% return per | | | |
| year before expenses) | | | |
| |
| CLASS Y | | | |
| Actual | $1,000.00 | $1,301.00 | $7.60 |
| Hypothetical | $1,000.00 | $1,018.40 | $6.66 |
| (5% return per | | | |
| year before expenses) | | | |
* Expenses are equal to the Fund’s annualized expense ratio of 1.57%, 2.79%, 2.37%, 0.86%, and 1.32% for Class A, Class B, Class C, Class I, and Class Y, respectively, multiplied by the average account value over the period, multiplied by 183/366 (to reflect the one-half year period).
www.calvert.com CALVERT CAPITAL ACCUMULATION FUND SEMI-ANNUAL REPORT (UNAUDITED) 16
| | | |
| STATEMENT OF NET ASSETS |
| MARCH 31, 2012 |
| |
| |
| EQUITY SECURITIES - 97.9% | SHARES | | VALUE |
| Aerospace & Defense - 2.2% | | | |
| Cubic Corp. | 120,900 | $ | 5,716,152 |
| |
| Auto Components - 2.6% | | | |
| TRW Automotive Holdings Corp.* | 141,535 | | 6,574,301 |
| |
| Chemicals - 2.3% | | | |
| Ecolab, Inc. | 96,450 | | 5,952,894 |
| |
| Communications Equipment - 2.0% | | | |
| F5 Networks, Inc.* | 39,015 | | 5,265,464 |
| |
| Computers & Peripherals - 2.5% | | | |
| NCR Corp.* | 299,335 | | 6,498,563 |
| |
| Consumer Finance - 2.0% | | | |
| World Acceptance Corp.* | 85,035 | | 5,208,394 |
| |
| Containers & Packaging - 2.8% | | | |
| Ball Corp. | 170,065 | | 7,292,387 |
| |
| Diversified Consumer Services - 4.5% | | | |
| Coinstar, Inc.* | 91,150 | | 5,792,582 |
| Sotheby’s | 145,335 | | 5,717,479 |
| | | | 11,510,061 |
| |
| Diversified Financial Services - 1.8% | | | |
| IntercontinentalExchange, Inc.* | 33,900 | | 4,658,538 |
| |
| Electronic Equipment & Instruments - 2.4% | | | |
| SYNNEX Corp.* | 163,615 | | 6,240,276 |
| |
| Energy Equipment & Services - 5.1% | | | |
| FMC Technologies, Inc.* | 140,185 | | 7,068,128 |
| RPC, Inc. | 573,665 | | 6,086,586 |
| | | | 13,154,714 |
| |
| Food Products - 2.4% | | | |
| Corn Products International, Inc. | 108,715 | | 6,267,420 |
| |
| Health Care Providers & Services - 6.0% | | | |
| AmerisourceBergen Corp. | 120,000 | | 4,761,600 |
| Chemed Corp. | 58,750 | | 3,682,450 |
| WellCare Health Plans, Inc.* | 96,200 | | 6,914,856 |
| | | | 15,358,906 |
| |
| Household Products - 3.0% | | | |
| Church & Dwight Co., Inc. | 155,700 | | 7,658,883 |
www.calvert.com CALVERT CAPITAL ACCUMULATION FUND SEMI-ANNUAL REPORT (UNAUDITED) 17
| | | |
| EQUITY SECURITIES - CONT’D | SHARES | | VALUE |
| Insurance - 2.2% | | | |
| Torchmark Corp | 112,335 | $ | 5,599,900 |
| |
| Internet & Catalog Retail - 2.0% | | | |
| Expedia, Inc. | 154,700 | | 5,173,168 |
| |
| IT Services - 11.0% | | | |
| Global Payments, Inc. (b) | 129,450 | | 6,148,875 |
| Syntel, Inc. | 150,750 | | 8,442,000 |
| Teradata Corp.* | 98,100 | | 6,685,515 |
| Wright Express Corp.* | 108,265 | | 7,007,993 |
| | | | 28,284,383 |
| |
| Leisure Equipment & Products - 2.6% | | | |
| Polaris Industries, Inc | 93,250 | | 6,727,987 |
| |
| Life Sciences - Tools & Services - 2.3% | | | |
| Mettler-Toledo International, Inc.* | 32,100 | | 5,930,475 |
| |
| Machinery - 5.8% | | | |
| Actuant Corp. | 225,565 | | 6,539,129 |
| Colfax Corp.* | 85,550 | | 3,014,782 |
| Valmont Industries, Inc. | 46,600 | | 5,471,306 |
| | | | 15,025,217 |
| |
| Media - 1.8% | | | |
| Gannett Co., Inc | 300,735 | | 4,610,268 |
| |
| Metals & Mining - 2.9% | | | |
| Reliance Steel & Aluminum Co | 130,015 | | 7,343,247 |
| |
| Oil, Gas & Consumable Fuels - 2.3% | | | |
| Denbury Resources, Inc.* | 325,865 | | 5,940,519 |
| |
| Pharmaceuticals - 5.5% | | | |
| Endo Pharmaceuticals Holdings, Inc.* | 181,850 | | 7,043,051 |
| Questcor Pharmaceuticals, Inc.* | 185,350 | | 6,972,867 |
| | | | 14,015,918 |
| |
| Road & Rail - 2.7% | | | |
| Landstar System, Inc. | 121,000 | | 6,984,120 |
| |
| Semiconductors & Semiconductor Equipment - 2.2% | | | |
| Lam Research Corp.* | 124,900 | | 5,573,038 |
| |
| Specialty Retail - 8.5% | | | |
| Ascena Retail Group, Inc.* | 184,650 | | 8,183,688 |
| Ross Stores, Inc | 140,185 | | 8,144,748 |
| The Buckle, Inc. | 113,435 | | 5,433,537 |
| | | | 21,761,973 |
| |
| Trading Companies & Distributors - 3.4% | | | |
| WESCO International, Inc.* | 134,165 | | 8,762,316 |
www.calvert.com CALVERT CAPITAL ACCUMULATION FUND SEMI-ANNUAL REPORT (UNAUDITED) 18
| | | | | | | |
| EQUITY SECURITIES - CONT’D | | | SHARES | | VALUE | |
| Wireless Telecommunication Services - 1.1% | | | | | | |
| MetroPCS Communications, Inc.* | | | 319,215 | $ | 2,879,319 | |
| |
| Total Equity Securities (Cost $213,921,965) | | | | | 251,968,801 | |
| |
| | | | | PRINCIPAL | | | |
| HIGH SOCIAL IMPACT INVESTMENTS - 0.5% | | AMOUNT | | | |
| Calvert Social Investment Foundation Notes, 0.94%, 7/1/14 (b)(i)(r) | $ | 1,419,488 | | 1,403,831 | |
| |
| Total High Social Impact Investments (Cost $1,419,488) | | | | 1,403,831 | |
| |
| TIME DEPOSIT - 1.8% | | | | | | |
| State Street Bank Time Deposit, 0.113%, 4/2/12 | | | 4,501,874 | | 4,501,874 | |
| |
| Total Time Deposit (Cost $4,501,874) | | | | | 4,501,874 | |
| |
| TOTAL INVESTMENTS (Cost $219,843,327) - 100.2% | | | | 257,874,506 | |
| Other assets and liabilities, net - (0.2%) | | | | | (597,111 | ) |
| NET ASSETS - 100% | | | | $ | 257,277,395 | |
| |
| |
| NET ASSETS CONSIST OF: | | | | | | |
| Paid-in capital applicable to the following shares of common stock, | | | | | |
| with 250,000,000 shares of $0.01 par value authorized: | | | | | | |
| Class A: 5,077,909 shares outstanding | | | | $ | 126,233,674 | |
| Class B: 124,215 shares outstanding | | | | | 4,366,831 | |
| Class C: 654,818 shares outstanding | | | | | 14,671,800 | |
| Class I: 1,842,378 shares outstanding | | | | | 55,578,091 | |
| ClassY: 392,098 shares outstanding | | | | | 12,740,677 | |
| Undistributed net investment income (loss) | | | | | (857,616 | ) |
| Accumulated net realized gain (loss) on investments | | | | | 6,512,759 | |
| Net unrealized appreciation (depreciation) on investments | | | | 38,031,179 | |
| |
| NET ASSETS | | | | $ | 257,277,395 | |
| |
| |
| NET ASSET VALUE PER SHARE | | | | | | |
| Class A (based on net assets of $160,765,096) | | | $ | 31.66 | |
| Class B (based on net assets of $3,381,468) | | | $ | 27.22 | |
| Class C (based on net assets of $17,499,008) | | | $ | 26.72 | |
| Class I (based on net assets of $63,191,285) | | | $ | 34.30 | |
| Class Y (based on net assets of $12,440,538) | | | $ | 31.73 | |
| |
| |
| RESTRICTED SECURITIES | ACQUISITION DATES | | COST | |
| Calvert Social Investment Foundation Notes, 0.94%, 7/1/14 | | 7/1/11 | $ | 1,419,488 | |
www.calvert.com CALVERT CAPITAL ACCUMULATION FUND SEMI-ANNUAL REPORT (UNAUDITED) 19
(b) This security was valued by the Board of Directors. See Note A.
(i) Restricted securities represent 0.5% of the net assets of the Fund.
(r) The coupon rate shown on floating or adjustable rate securities represents the rate at period end.
* Non-income producing security.
See notes to financial statements.
www.calvert.com CALVERT CAPITAL ACCUMULATION FUND SEMI-ANNUAL REPORT (UNAUDITED) 20
| | | |
| STATEMENT OF OPERATIONS |
| SIX MONTHS ENDED MARCH 31, 2012 |
| |
| NET INVESTMENT INCOME | | | |
| Investment Income: | | | |
| Dividend income | $ | 726,084 | |
| Interest income | | 9,456 | |
| Total investment income | | 735,540 | |
| |
| Expenses: | | | |
| Investment advisory fee | | 685,814 | |
| Transfer agency fees and expenses | | 244,303 | |
| Administrative fees | | 235,969 | |
| Distribution Plan expenses: | | | |
| Class A | | 180,284 | |
| Class B | | 17,020 | |
| Class C | | 78,695 | |
| Directors’ fees and expenses | | 12,340 | |
| Custodian fees | | 24,497 | |
| Registration fees | | 33,437 | |
| Reports to shareholders | | 61,911 | |
| Professional fees | | 16,888 | |
| Miscellaneous | | 13,068 | |
| Total expenses | | 1,604,226 | |
| Reimbursement from Advisor: | | | |
| Class I | | (11,035 | ) |
| Fees paid indirectly | | (35 | ) |
| Net expenses | | 1,593,156 | |
| |
| |
| NET INVESTMENT INCOME (LOSS) | | (857,616 | ) |
| |
| REALIZED AND UNREALIZED GAIN (LOSS) ON INVESTMENTS | | | |
| Net realized gain (loss) | | 13,794,647 | |
| Change in unrealized appreciation (depreciation) | | 40,009,223 | |
| |
| NET REALIZED AND UNREALIZED GAIN | | | |
| (LOSS) ON INVESTMENTS | | 53,803,870 | |
| |
| INCREASE (DECREASE) IN NET ASSETS | | | |
| RESULTING FROM OPERATIONS | $ | 52,946,254 | |
See notes to financial statements.
www.calvert.com CALVERT CAPITAL ACCUMULATION FUND SEMI-ANNUAL REPORT (UNAUDITED) 21
| | | | |
| STATEMENTS OF CHANGES IN NET ASSETS |
| |
| |
| | SIX MONTHS
ENDED | | YEAR
ENDED | |
| | MARCH
31, | | SEPTEMBER
30, | |
| INCREASE (DECREASE) IN NET ASSETS | 2012 | | 2011 | |
| Operations: | | | | |
| Net investment income (loss) | ($857,616 | ) | ($1,702,926 | ) |
| Net realized gain (loss) | 13,794,647 | | 18,650,994 | |
| Change in unrealized appreciation (depreciation) | 40,009,223 | | (19,460,051 | ) |
| |
| |
| INCREASE (DECREASE) IN NET ASSETS | | | | |
| RESULTING FROM OPERATIONS | 52,946,254 | | (2,511,983 | ) |
| |
| |
| Distributions to shareholders from: | | | | |
| Net realized gain: | | | | |
| Class A shares | (9,051,154 | ) | — | |
| Class B shares | (249,905 | ) | — | |
| Class C shares | (1,132,503 | ) | — | |
| Class I shares | (1,797,811 | ) | — | |
| Class Y shares | (658,920 | ) | — | |
| Total distributions | (12,890,293 | ) | — | |
| |
| Capital share transactions: | | | | |
| Shares sold: | | | | |
| Class A shares | 22,972,534 | | 59,940,757 | |
| Class B shares | 78,778 | | 241,968 | |
| Class C shares | 1,959,717 | | 3,176,561 | |
| Class I shares | 39,026,235 | | 10,568,924 | |
| Class Y shares | 2,838,175 | | 10,193,935 | |
| Shares issued from merger (See Note F): | | | | |
| Class A shares | — | | 32,646,286 | |
| Class B shares | — | | 2,759,872 | |
| Class C shares | — | | 8,070,394 | |
| Reinvestment of distributions: | | | | |
| Class A shares | 8,386,664 | | — | |
| Class B shares | 242,281 | | — | |
| Class C shares | 930,598 | | — | |
| Class I shares | 1,269,766 | | — | |
| Class Y shares | 512,505 | | — | |
| Redemption fees: | | | | |
| Class A shares | 3,918 | | 15,550 | |
| Class C shares | — | | 440 | |
| Shares redeemed: | | | | |
| Class A shares | (26,967,112 | ) | (50,165,739 | ) |
| Class B shares | (678,878 | ) | (1,562,363 | ) |
| Class C shares | (1,104,163 | ) | (2,443,505 | ) |
| Class I shares | (5,401,638 | ) | (4,090,555 | ) |
| Class Y shares | (816,876 | ) | (231,468 | ) |
| Total capital share transactions | 43,252,504 | | 69,121,057 | |
| |
| TOTAL INCREASE (DECREASE) IN NET ASSETS | 83,308,465 | | 66,609,074 | |
See notes to financial statements.
www.calvert.com CALVERT CAPITAL ACCUMULATION FUND SEMI-ANNUAL REPORT (UNAUDITED) 22
| | | | |
| STATEMENTS OF CHANGES IN NET ASSETS |
| |
| |
| | SIX MONTHS ENDED | | YEAR ENDED | |
| | MARCH 31, | | SEPTEMBER 30, | |
| NET ASSETS | 2012 | | 2011 | |
| Beginning of period | $173,968,930 | | $107,359,856 | |
| End of period (including net investment loss | | | | |
| of $857,616 and 0, respectively) | $257,277,395 | | $173,968,930 | |
| |
| |
| CAPITAL SHARE ACTIVITY | | | | |
| Shares sold: | | | | |
| Class A shares | 767,801 | | 1,918,581 | |
| Class B shares | 3,216 | | 9,114 | |
| Class C shares | 78,017 | | 121,251 | |
| Class I shares | 1,209,561 | | 336,732 | |
| Class Y shares | 95,444 | | 313,620 | |
| Shares issued from merger (See Note F): | | | | |
| Class A shares | — | | 1,182,147 | |
| Class C shares | — | | 115,716 | |
| Class I shares | — | | 273,543 | |
| Reinvestment of distributions: | | | | |
| Class A shares | 294,165 | | — | |
| Class B shares | 9,845 | | — | |
| Class C shares | 38,566 | | — | |
| Class I shares | 41,199 | | — | |
| Class Y shares | 17,951 | | — | |
| Shares redeemed: | | | | |
| Class A shares | (935,534 | ) | (1,624,948 | ) |
| Class B shares | (26,551 | ) | (59,235 | ) |
| Class C shares | (43,692 | ) | (93,452 | ) |
| Class I shares | (165,195 | ) | (121,931 | ) |
| Class Y shares | (27,450 | ) | (7,467 | ) |
| Total capital share activity | 1,357,343 | | 2,363,671 | |
See notes to financial statements.
www.calvert.com CALVERT CAPITAL ACCUMULATION FUND SEMI-ANNUAL REPORT (UNAUDITED) 23
NOTES TO FINANCIAL STATEMENTS
NOTE A — SIGNIFICANT ACCOUNTING POLICIES
General: : The Calvert Capital Accumulation Fund (the “Fund”), a series of Calvert World Values Fund, Inc., is registered under the Investment Company Act of 1940 as a non-diversified, open-end management investment company. The Calvert World Values Fund, Inc. is comprised of three separate series. The operations of each series are accounted for separately. The Fund offers five classes of shares of capital stock - Classes A, B, C, I, and Y. Class A shares are sold with a maximum front-end sales charge of 4.75%. Class B shares are sold without a front-end sales charge and, with certain exceptions, will be charged a deferred sales charge at the time of redemption, depending on how long investors have owned the shares. Class B shares are no longer offered for purchase, except through reinvestment of dividends and/or distributions and through certain exchanges. Class C shares are sold without a front-end sales charge and, with certain exceptions, will be charged a deferred sales charge on shares sold within one year of purchase. Class B and Class C shares have higher levels of expenses than Class A shares. Class I shares require a minimum account balance of $1,000,000. The $1 million minimum initial investment may be waived for certain institutional accounts where it is believed to be in the best interest of the Fund and its shareholders. Class I shares have no front-end or deferred sales charge and have lower levels of expenses than Class A Shares. Class Y shares are generally only available to wrap or similar fee-based programs offered by financial intermediaries that have entered into an agreement with the Fund’s Distributor to offer Class Y shares. Class Y shares have no front-end or deferred sales charge and have lower levels of expenses than Class A shares. Each class has different: (a) dividend rates, due to differences in Distribution Plan expenses and other class-specific expenses, (b) exchange privileges; and (c) class-specific voting rights.
Security Valuation: Net asset value per share is determined every business day as of the close of the regular session of the New York Stock Exchange (generally 4:00 p.m. Eastern time). The Fund uses independent pricing services approved by the Board of Directors to value its investments wherever possible. Investments for which market quotations are not available or deemed not reliable are fair valued in good faith under the direction of the Board of Directors. In determining fair value, the Board considers all relevant qualitative and quantitative information available. These factors are subject to change over time and are reviewed periodically. The values assigned to fair value investments are based on available information and do not necessarily represent amounts that might ultimately be realized. Further, because of the inherent uncertainty of valuation, those estimated values may differ significantly from the values that would have been used had a ready market for the investments existed, and the differences could be material.
At March 31, 2012, securities valued at $7,552,706 or 2.9% of net assets were fair valued in good faith under the direction of the Board of Directors.
The Fund utilizes various methods to measure the fair value of its investments. Generally Accepted Accounting Principles (GAAP) establishes a disclosure hierarchy that categorizes the inputs to valuation techniques used to value assets and liabilities at measurement date. These inputs are summarized in the three broad levels listed below:
www.calvert.com CALVERT CAPITAL ACCUMULATION FUND SEMI-ANNUAL REPORT (UNAUDITED) 24
Level 1 – quoted prices in active markets for identical securities
Level 2 – other significant observable inputs (including quoted prices for similar securities, interest rates, prepayment speeds, credit risk, etc.)
Level 3 – significant unobservable inputs (including the Fund’s own assumptions in determining the fair value of investments)
The inputs or methodology used for valuing securities are not necessarily an indication of the risk associated with investing in those securities.
Changes in valuation techniques may result in transfers in or out of an investment’s assigned level within the hierarchy during the period. Valuation techniques used to value the Fund’s investments by major category are as follows.
Equity securities, including restricted securities, for which market quotations are readily available, are valued at the last reported sale price or official closing price as reported by an independent pricing service on the primary market or exchange on which they are traded and are categorized as Level 1 in the hierarchy. In the event there were no sales during the day or closing prices are not available, securities are valued at the last quoted bid price or using the last available price and are categorized as Level 2 in the hierarchy. Foreign securities are valued based on quotations from the principal market in which such securities are normally traded. If events occur after the close of the principal market in which foreign securities are traded, and before the close of business of the Fund, that are expected to materially affect the value of those securities, then they are valued at their fair value taking these events into account. For restricted securities and private placements where observable inputs are limited, assumptions about market activity and risk are used and such securities are categorized as Level 3 in the hierarchy.
Debt securities, including restricted securities, are valued based on evaluated prices received from independent pricing services or from dealers who make markets in such securities and are generally categorized as Level 2 in the hierarchy. Short-term securities of sufficient credit quality with remaining maturities of sixty days or less for which quotations are not readily available are valued at amortized cost, which approximates fair value, and are categorized as Level 2 in the hierarchy.
When independent prices are unavailable or unreliable, debt securities may be valued utilizing pricing matrices which consider similar factors that would be used by independent pricing services. These are generally categorized as Level 2 in the hierarchy but may be Level 3 depending on the circumstances.
The following is a summary of the inputs used to value the Fund’s net assets as of March 31, 2012:
| | VALUATION INPUTS |
| InvestMents In securItIes | Level 1 | Level 2 | Level 3 | | Total |
| Equity securities* | $245,819,926 | $6,148,875 | — | | $251,968,801 |
| Other debt obligations | — | 4,501,874 | $1,403,831 | | 5,905,705 |
| TOTAL | $245,819,926 | $10,650,749 | $1,403,831 | ** | $257,874,506 |
* For further breakdown of equity securities by industry type, please refer to the Statement of Net Assets.
**Level 3 securities represent 0.5% of net assets.
www.calvert.com CALVERT CAPITAL ACCUMULATION FUND SEMI-ANNUAL REPORT (UNAUDITED) 25
Repurchase Agreements: The Fund may invest in securities that are subject to legal or contractual restrictions on resale. Generally, these securities may only be sold publicly upon registration under the Securities Act of 1933 or in transactions exempt from such registration. Information regarding restricted securities is included at the end of the Fund’s Statement of Net Assets.
Security Transactions and Net Investment Income: Security transactions are accounted for on trade date. Realized gains and losses are recorded on an identified cost basis and may include proceeds from litigation. Dividend income is recorded on the ex-dividend date. Distributions received on securities that represent a return of capital or capital gain are recorded as a reduction of cost investments and/or as a realized gain. Interest income, which includes amortization of premium and accretion of discount on debt securities, is accrued as earned. Investment income and realized and unrealized gains and losses are allocated to separate classes of shares based upon the relative net assets of each class. Expenses arising in connection with a class are charged directly to that class. Expenses common to the classes are allocated to each class in proportion to their relative net assets.
Distributions to Shareholders: Distributions to shareholders are recorded by the Fund on ex-dividend date. Dividends from net investment income and distributions from net realized capital gains, if any, are paid at least annually. Distributions are determined in accordance with income tax regulations which may differ from generally accepted accounting principles; accordingly, periodic reclassifications are made within the Fund’s capital accounts to reflect income and gains available for distribution under income tax regulations.
Estimates: The preparation of financial statements in conformity with accounting principles generally accepted in the United States requires management to make estimates and assumptions that affect the reported amounts of assets and liabilities and disclosure of contingent assets and liabilities at the date of the financial statements and the reported amounts of income and expenses during the reporting period. Actual results could differ from those estimates.
Redemption Fees: The Fund charges a 2% redemption fee on redemptions, including exchanges, made within 30 days of purchase (within seven days for Class I shares). The redemption fee is accounted for as an addition to paid-in capital. The fee is intended to discourage market-timers by ensuring that short-term trading costs are borne by the investors making the transactions and not the shareholders already in the Fund.
Expense Offset Arrangements: The Fund has an arrangement with its custodian bank whereby the custodian’s fees may be paid indirectly by credits earned on the Fund’s cash on deposit with the bank. These credits are used to reduce the Fund’s expenses. Such a deposit arrangement may be an alternative to overnight investments.
Federal Income Taxes: No provision for federal income or excise tax is required since the Fund intends to continue to qualify as a regulated investment company under the Internal Revenue Code and to distribute substantially all of its taxable earnings.
www.calvert.com CALVERT CAPITAL ACCUMULATION FUND SEMI-ANNUAL REPORT (UNAUDITED) 26
Management has analyzed the Fund’s tax positions taken for all open federal income tax years and has concluded that no provision for federal income tax is required in the Fund’s financial statements. A Fund’s federal tax return is subject to examination by the Internal Revenue Service for a period of three years.
New Accounting Pronouncements: In May 2011, the Financial Accounting Standards Board (“FASB”) issued Accounting Standards Update (“ASU”) No. 2011-04, “Amendments to Achieve Common Fair Value Measurement and Disclosure Requirements in U.S. GAAP and IFRSs.” ASU No. 2011-04 requires disclosure of the amounts of any transfers between Level 1 and Level 2, and the reasons for the transfers. For Level 3 fair value measurements, ASU No. 2011-04 requires disclosure of quantitative information about the significant unobservable inputs used. In addition, for Level 3 fair value measurements, ASU No. 2011-04 requires a description of the valuation processes used by the reporting entity and requires a narrative description of the sensitivity of the fair value measurement to changes in unobservable inputs if a change in those inputs to a different amount might result in a significantly higher or lower fair value measurement. ASU No. 2011-04 is effective for financial statements issued for fiscal years and interim periods beginning after December 15, 2011. Management is currently evaluating the impact the adoption of ASU No. 2011-04 will have on the Fund’s financial statements and related disclosures.
NOTE B — RELATED PARTY TRANSACTIONS
Calvert Investment Management, Inc. (the “Advisor”) is wholly-owned by Calvert Investments, Inc. (“Calvert”), which is indirectly wholly owned by UNIFI Mutual Holding Company. The Advisor provides investment advisory services and pays the salaries and fees of officers and Directors of the Fund who are employees of the Advisor or its affiliates. For its services, the Advisor receives an annual fee, payable monthly, of .65% of the Fund’s average daily net assets. Under the terms of the agreement, $137,123 was payable at period end. In addition, $58,667 was payable at period end for operating expenses paid by the Advisor during March 2012.
The Advisor has contractually agreed to limit net annual fund operating expenses through January 31, 2013. The contractual expense cap is 1.59%, 2.59%, .86%, and 1.44% for Class A, C, I, and Y, respectively. For the purposes of this expense limit, operating expenses do not include interest expense, brokerage commissions, taxes, and extraordinary expenses. To the extent that any expense offset credits are earned, the Advisor’s obligation under the contractual limitation may be reduced and the Advisor may benefit from the expense offset arrangement.
Calvert Investment Administrative Services, Inc. (“CIAS”), an affiliate of the Advisor, provides administrative services to the Fund for an annual fee, payable monthly of .25% for Classes A, B, C, and Y, and .10% for Class I shares based on their average daily net assets. Under the terms of the agreement, $45,361 was payable at period end.
www.calvert.com CALVERT CAPITAL ACCUMULATION FUND SEMI-ANNUAL REPORT (UNAUDITED) 27
Calvert Investment Distributors, Inc. (“CID”), an affiliate of the Advisor, is the distributor and principal underwriter for the Fund. Distribution Plans, adopted by Class A, Class B, and Class C shares, allow the Fund to pay CID for expenses and services associated with distribution of shares. The expenses paid may not exceed .35%, 1.00% and 1.00% annually of average daily net assets of Class A, B, and C, respectively. The amount actually paid by the Fund is an annualized fee, payable monthly of .25%, 1.00% and 1.00% of the Fund’s average daily net assets of Class A, B, and C, respectively. Class I and Class Y shares do not have Distribution Plan expenses. Under the terms of the agreement, $51,005 was payable at period end.
CID received $30,532 as its portion of the commissions charged on sales of the Fund’s Class A shares for the six months ended March 31, 2012.
Calvert Investment Services, Inc. (“CIS”), an affiliate of the Advisor, acts as shareholder servicing agent for the Fund. For its services, CIS received a fee of $58,431 for the six months ended March 31, 2012. Under the terms of the agreement, $10,135 was payable at period end. Boston Financial Data Services, Inc. is the transfer and dividend disbursing agent.
The Fund may invest in Community Investment Notes issued by the Calvert Social Investment Foundation (the “CSI Foundation”). The CSI Foundation is a 501(c)(3) non-profit organization that receives in-kind support from Calvert and its subsidiaries. The Fund has received from the Securities and Exchange Commission an exemptive order permitting the Fund to make investments in these notes under certain conditions.
Each Director of the Fund who is not an employee of the Advisor or its affiliates receives an annual retainer of $44,000 plus a meeting fee of $2,000 for each Board meeting attended. Additional fees of up to $5,000 annually may be paid to the Board chairs and Committee chairs ($10,000 for Special Equities Committee chair) and $2,500 annually may be paid to Committee members, plus a Committee meeting fee of $500 for each Committee meeting attended. Director’s fees are allocated to each of the funds served.
NOTE C — INVESTMENT ACTIVITY
During the period, the cost of purchases and proceeds from sales of investments, other than short-term securities, were $136,667,383 and $103,000,765, respectively.
| CAPITAL LOSS CARRYFORWARDS | | |
| EXPIRATION DATE | | |
| 30-Sep-16 | ($4,384,059 | ) |
Capital losses may be utilized to offset future capital gains until expiration, however, the Fund’s use of net capital loss carryforwards acquired from Calvert MidCap Value Fund may be limited under certain tax provisions. Under the Regulated Investment Company Modernization Act of 2010, capital losses incurred in taxable years beginning after December 22, 2010 can be carried forward for an unlimited period. These losses will be required to be utilized prior to the losses incurred in
www.calvert.com CALVERT CAPITAL ACCUMULATION FUND SEMI-ANNUAL REPORT (UNAUDITED) 28
pre-enactment taxable years. As a result of this ordering rule, pre-enactment capital loss carryforwards may more likely expire unused. Also, post-enactment capital losses that are carried forward will retain their character as either short-term or long-term capital losses rather than being considered all short-term as under previous law.
As of March 31, 2012, the tax basis components of unrealized appreciation/(depreciation) and the federal tax cost were as follows:
| Unrealized appreciation | $41,156,380 | |
| Unrealized (depreciation) | (3,304,833 | ) |
| Net unrealized appreciation/(depreciation) | $37,851,547 | |
| |
| Federal income tax cost of investments | $220,022,959 | |
NOTE D — LINE OF CREDIT
A financing agreement is in place with the Calvert Funds and State Street Corporation (“SSC”). Under the agreement, SSC provides an unsecured line of credit facility, in the aggregate amount of $50 million ($25 million committed and $25 million uncommitted), accessible by the Funds for temporary or emergency purposes only. Borrowings under the committed facility bear interest at the higher of the London Interbank Offered Rate (LIBOR) or the overnight Federal Funds Rate plus 1.25% per annum. A commitment fee of .11% per annum is incurred on the unused portion of the committed facility, which is allocated to all participating funds. The Fund had no loans outstanding pursuant to this line of credit at March 31, 2012. For the six months ended March 31, 2012, borrowings by the Fund under the agreement were as follows:
| | WEIGHTED | | MONTH OF |
| AVERAGE | AVERAGE | MAXIMUM | MAXIMUM |
| DAILY | INTEREST | AMOUNT | AMOUNT |
| BALANCE | RATE | BORROWED | BORROWED |
| $46,022 | 1.41% | $2,015,058 | October 2011 |
NOTE E - SUBSEQUENT EVENTS
In preparing the financial statements as of March 31, 2012, no subsequent events or transactions occurred that would have required recognition or disclosure in these financial statements.
Effective May 2, 2012, UNIFI Mutual Holding Company changed its name to Ameritas Mutual Holding Company.
www.calvert.com CALVERT CAPITAL ACCUMULATION FUND SEMI-ANNUAL REPORT (UNAUDITED) 29
NOTE F – REORGANIZATION
On July 29, 2010, the Board of Directors approved an Agreement and Plan of Reorganization (the “Plan”) which provided for the transfer of all the assets of the Calvert Mid Cap Value Fund (“Mid Cap Value”) for shares of the acquiring portfolio, Calvert Capital Accumulation Fund (“Capital Accumulation”) and the assumption of the liabilities of Mid Cap Value. Shareholders approved the Plan at a meeting on November 15, 2010 and the reorganization took place on November 29, 2010.
The acquisition was accomplished by a tax-free exchange of the following shares:
| | | ACQUIRING | | |
| MERGED PORTFOLIO | SHARES | PORTFOLIO | SHARES | VALUE |
| Mid Cap Value, Class A | 1,893,904 | Capital Accum., Class A | 1,182,147 | $32,646,286 |
| Mid Cap Value, Class C | 168,591 | Capital Accum., Class C | 115,716 | $2,759,872 |
| Mid Cap Value, Class I | 453,854 | Capital Accum., Class I | 273,543 | $8,070,394 |
For financial reporting purposes, assets received and shares issued by Capital Accumulation were recorded at fair value; however, the cost basis of the investments received from Mid Cap Value were carried forward to align ongoing reporting of Capital Accumulation’s realized and unrealized gains and losses with amounts distributable to shareholders for tax purposes.
The net assets and net unrealized appreciation (depreciation) immediately before the acquisitions were as follows:
| | | UNREALIZED | | |
| | | APPRECIATION | ACQUIRING | |
| MERGED PORTFOLIO | NET ASSETS | (DEPRECIATION) | PORTFOLIO | NET ASSETS |
| Mid Cap Value | $43,476,552 | $4,028,812 | Capital Accum. | $117,367,809 |
Assuming the acquisition had been completed on October 1, 2010, Capital Accumulation’s results of operations for the year ended September 30, 2011 would have been as follows:
| | |
| Net investment income | ($1,710,846) | (a) |
| Net realized and change in unrealized gain (loss) on investments | $2,329,269 | (b) |
| Net increase (decrease) in assets from operations | $618,423 | |
www.calvert.com CALVERT CAPITAL ACCUMULATION FUND SEMI-ANNUAL REPORT (UNAUDITED) 30
Because Capital Accumulation and Mid Cap Value sold and redeemed shares throughout the period, it is not practicable to provide pro-forma information on a per-share basis.
Because the combined investment portfolios have been managed as a single integrated portfolio since the acquisition was completed, it is also not practicable to separate the amounts of revenue and earnings of Mid Cap Value that have been included in Capital Accumulation’s Statement of Operations since November 29, 2010.
(a) ($1,702,926) as reported, plus ($7,920), from Mid Cap Value pre-merger.
(b) ($809,057) as reported, plus $3,138,326 from Mid Cap Value pre-merger.
www.calvert.com CALVERT CAPITAL ACCUMULATION FUND SEMI-ANNUAL REPORT (UNAUDITED) 31
| | | | | | |
| FINANCIAL HIGHLIGHTS |
| |
| | PERIODS ENDED |
| | MARCH
31, | | SEPTEMBER
30, | | SEPTEMBER
30, | |
| CLASS A SHARES | 2012 | (z) | 2011 | (z) | 2010 | |
| Net asset value, beginning | $26.00 | | $24.93 | | $20.71 | |
| Income from investment operations: | | | | | | |
| Net investment income (loss) | (.12 | ) | (.28 | ) | (.25 | ) |
| Net realized and unrealized gain (loss) | 7.71 | | 1.35 | | 4.47 | |
| Total from investment operations | 7.59 | | 1.07 | | 4.22 | |
| Distributions from: | | | | | | |
| Net realized gain | (1.93 | ) | — | | — | |
| Total distributions | (1.93 | ) | — | | — | |
| Total increase (decrease) in net asset value | 5.66 | | 1.07 | | 4.22 | |
| Net asset value, ending | $31.66 | | $26.00 | | $24.93 | |
| |
| Total return* | 30.02 | % | 4.29 | % | 20.38 | % |
| Ratios to average net assets: A | | | | | | |
| Net investment income (loss) | (.87 | %) (a) | (.93 | %) | (1.08 | %) |
| Total expenses | 1.57 | % (a) | 1.58 | % | 1.76 | % |
| Expenses before offsets | 1.57 | % (a) | 1.58 | % | 1.76 | % |
| Net expenses | 1.57 | % (a) | 1.58 | % | 1.76 | % |
| Portfolio turnover | 50 | % | 65 | % | 87 | % |
| Net assets, ending (in thousands) | $160,765 | | $128,755 | | $86,635 | |
| |
| |
| | YEARS ENDED |
| | SEPTEMBER
30, | | SEPTEMBER
30, | | SEPTEMBER
30, | |
| CLASS A SHARES | 2009 | | 2008 | | 2007 | (z) |
| Net asset value, beginning | $23.00 | | $28.11 | | $24.02 | |
| Income from investment operations: | | | | | | |
| Net investment income (loss) | (.17 | ) | (.21 | ) | (.26 | ) |
| Net realized and unrealized gain (loss) | (2.12 | ) | (4.49 | ) | 4.35 | |
| Total from investment operations | (2.29 | ) | (4.70 | ) | 4.09 | |
| Distributions from: | | | | | | |
| Net realized gain | — | | (.41 | ) | — | |
| Total distributions | — | | (.41 | ) | — | |
| Total increase (decrease) in net asset value | (2.29 | ) | (5.11 | ) | 4.09 | |
| Net asset value, ending | $20.71 | | $23.00 | | $28.11 | |
| |
| Total return* | (9.96 | %) | (16.97 | %) | 17.03 | % |
| Ratios to average net assets: A | | | | | | |
| Net investment income (loss) | (.92 | %) | (.79 | %) | (.98 | %) |
| Total expenses | 1.88 | % | 1.66 | % | 1.66 | % |
| Expenses before offsets | 1.88 | % | 1.66 | % | 1.66 | % |
| Net expenses | 1.88 | % | 1.65 | % | 1.64 | % |
| Portfolio turnover | 72 | % | 49 | % | 47 | % |
| Net assets, ending (in thousands) | $72,289 | | $85,195 | | $107,976 | |
See notes to financial highlights.
www.calvert.com CALVERT CAPITAL ACCUMULATION FUND SEMI-ANNUAL REPORT (UNAUDITED) 32
| | | | | | |
| FINANCIAL HIGHLIGHTS |
| |
| | PERIODS ENDED |
| | MARCH
31, | | SEPTEMBER
30, | | SEPTEMBER
30, | |
| CLASS B SHARES | 2012 | (z) | 2011 | (z) | 2010 | |
| Net asset value, beginning | $22.72 | | $22.03 | | $18.50 | |
| Income from investment operations: | | | | | | |
| Net investment income (loss) | (.27 | ) | (.55 | ) | (.53 | ) |
| Net realized and unrealized gain (loss) | 6.70 | | 1.24 | | 4.06 | |
| Total from investment operations | 6.43 | | .69 | | 3.53 | |
| Distributions from: | | | | | | |
| Net realized gain | (1.93 | ) | — | | — | |
| Total distributions | (1.93 | ) | — | | — | |
| Total increase (decrease) in net asset value | 4.50 | | .69 | | 3.53 | |
| Net asset value, ending | $27.22 | | $22.72 | | $22.03 | |
| |
| Total return* | 29.21 | % | 3.13 | % | 19.08 | % |
| Ratios to average net assets: A | | | | | | |
| Net investment income (loss) | (2.09 | %) (a) | (2.07 | %) | (2.17 | %) |
| Total expenses | 2.79 | % (a) | 2.72 | % | 2.84 | % |
| Expenses before offsets | 2.79 | % (a) | 2.72 | % | 2.84 | % |
| Net expenses | 2.79 | % (a) | 2.71 | % | 2.84 | % |
| Portfolio turnover | 50 | % | 65 | % | 87 | % |
| Net assets, ending (in thousands) | $3,381 | | $3,129 | | $4,138 | |
| |
| |
| | YEARS ENDED |
| | SEPTEMBER
30, | | SEPTEMBER
30, | | SEPTEMBER
30, | |
| CLASS B SHARES | 2009 | | 2008 | | 2007 | (z) |
| Net asset value, beginning | $20.78 | | $25.66 | | $22.13 | |
| Income from investment operations: | | | | | | |
| Net investment income (loss) | (.39 | ) | (.47 | ) | (.45 | ) |
| Net realized and unrealized gain (loss) | (1.89 | ) | (4.00 | ) | 3.98 | |
| Total from investment operations | (2.28 | ) | (4.47 | ) | 3.53 | |
| Distributions from: | | | | | | |
| Net realized gain | — | | (.41 | ) | — | |
| Total distributions | — | | (.41 | ) | — | |
| Total increase (decrease) in net asset value | (2.28 | ) | 4.88 | | 3.53 | |
| Net asset value, ending | $18.50 | | $20.78 | | $25.66 | |
| |
| Total return* | (10.97 | %) | (17.70 | %) | 15.95 | % |
| Ratios to average net assets: A | | | | | | |
| Net investment income (loss) | (2.04 | %) | (1.73 | %) | (1.86 | %) |
| Total expenses | 2.99 | % | 2.57 | % | 2.54 | % |
| Expenses before offsets | 2.99 | % | 2.57 | % | 2.54 | % |
| Net expenses | 2.99 | % | 2.56 | % | 2.52 | % |
| Portfolio turnover | 72 | % | 49 | % | 47 | % |
| Net assets, ending (in thousands) | $4,793 | | $7,803 | | $11,613 | |
See notes to financial highlights. www.calvert.com CALVERT CAPITAL ACCUMULATION FUND SEMI-ANNUAL REPORT (UNAUDITED) 33
| | | | | | |
| FINANCIAL HIGHLIGHTS |
| |
| | PERIODS ENDED |
| | MARCH
31, | | SEPTEMBER
30, | | SEPTEMBER
30, | |
| CLASS C SHARES | 2012 | (z) | 2011 | (z) | 2010 | |
| Net asset value, beginning | $22.29 | | $21.55 | | $18.05 | |
| Income from investment operations: | | | | | | |
| Net investment income (loss) | (.21 | ) | (.46 | ) | (.39 | ) |
| Net realized and unrealized gain (loss) | 6.57 | | 1.20 | | 3.89 | |
| Total from investment operations | 6.36 | | .74 | | 3.50 | |
| Distributions from: | | | | | | |
| Net realized gain | (1.93 | ) | — | | — | |
| Total distributions | (1.93 | ) | — | | — | |
| Total increase (decrease) in net asset value | 4.43 | | .74 | | 3.50 | |
| Net asset value, ending | $26.72 | | $22.29 | | $21.55 | |
| |
| Total return* | 29.47 | % | 3.43 | % | 19.39 | % |
| Ratios to average net assets: A | | | | | | |
| Net investment income (loss) | (1.68 | %) (a) | (1.79 | %) | (1.87 | %) |
| Total expenses | 2.37 | % (a) | 2.44 | % | 2.54 | % |
| Expenses before offsets | 2.37 | % (a) | 2.44 | % | 2.54 | % |
| Net expenses | 2.37 | % (a) | 2.44 | % | 2.54 | % |
| Portfolio turnover | 50 | % | 65 | % | 87 | % |
| Net assets, ending (in thousands) | $17,499 | | $12,973 | | $9,449 | |
| |
| |
| | YEARS ENDED |
| | SEPTEMBER
30, | | SEPTEMBER
30, | | SEPTEMBER
30, | |
| CLASS C SHARES | 2009 | | 2008 | | 2007 | (z) |
| Net asset value, beginning | $20.20 | | $24.93 | | $21.47 | |
| Income from investment operations: | | | | | | |
| Net investment income (loss) | (.28 | ) | (.38 | ) | (.41 | ) |
| Net realized and unrealized gain (loss) | (1.87 | ) | (3.94 | ) | 3.87 | |
| Total from investment operations | (2.15 | ) | (4.32 | ) | 3.46 | |
| Distributions from: | | | | | | |
| Net realized gain | — | | (.41 | ) | — | |
| Total distributions | — | | (.41 | ) | — | |
| Total increase (decrease) in net asset value | (2.15 | ) | (4.73 | ) | 3.46 | |
| Net asset value, ending | $18.05 | | $20.20 | | $24.93 | |
| |
| Total return* | (10.64 | %) | (17.62 | %) | 16.12 | % |
| Ratios to average net assets: A | | | | | | |
| Net investment income (loss) | (1.75 | %) | (.157 | %) | (1.74 | %) |
| Total expenses | 2.71 | % | 2.42 | % | 2.42 | % |
| Expenses before offsets | 2.71 | % | 2.42 | % | 2.42 | % |
| Net expenses | 2.70 | % | 2.42 | % | 2.41 | % |
| Portfolio turnover | 72 | % | 49 | % | 47 | % |
| Net assets, ending (in thousands) | $8,287 | | $10,252 | | $13,275 | |
See notes to financial highlights.
www.calvert.com CALVERT CAPITAL ACCUMULATION FUND SEMI-ANNUAL REPORT (UNAUDITED) 34
| | | | | | |
| FINANCIAL HIGHLIGHTS |
| |
| | PERIODS ENDED |
| | MARCH
31, | | SEPTEMBER
30, | | SEPTEMBER
30, | |
| CLASS I SHARES | 2012 | (z) | 2011 | (z) | 2010 | |
| Net asset value, beginning | $27.94 | | $26.59 | | $21.89 | |
| Income from investment operations: | | | | | | |
| Net investment income (loss) | (.02 | ) | (.06 | ) | (.04 | ) |
| Net realized and unrealized gain (loss) | 8.31 | | 1.41 | | 4.74 | |
| Total from investment operations | 8.29 | | 1.35 | | 4.70 | |
| Distributions from: | | | | | | |
| Net realized gain | (1.93 | ) | — | | — | |
| Total distributions | (1.93 | ) | — | | — | |
| Total increase (decrease) in net asset value | 6.36 | | 1.35 | | 4.70 | |
| Net asset value, ending | $34.30 | | $27.94 | | $26.59 | |
| |
| Total return* | 30.46 | % | 5.08 | % | 21.47 | % |
| Ratios to average net assets: A | | | | | | |
| Net investment income (loss) | (.15 | %) (a) | (.20 | %) | (.19 | %) |
| Total expenses | .92 | % (a) | .99 | % | 1.12 | % |
| Expenses before offsets | .86 | % (a) | .86 | % | .86 | % |
| Net expenses | .86 | % (a) | .86 | % | .86 | % |
| Portfolio turnover | 50 | % | 65 | % | 87 | % |
| Net assets, ending (in thousands) | $63,191 | | $21,144 | | $7,138 | |
| |
| |
| | YEARS ENDED |
| | SEPTEMBER
30, | | SEPTEMBER
30, | | SEPTEMBER
30, | |
| CLASS I SHARES | 2009 | | 2008 | | 2007 | (z) |
| Net asset value, beginning | $24.06 | | $29.16 | | $24.73 | |
| Income from investment operations: | | | | | | |
| Net investment income (loss) | .02 | | ** | | (.05 | ) |
| Net realized and unrealized gain (loss) | (2.19 | ) | (4.96 | ) | 4.48 | |
| Total from investment operations | (2.17 | ) | (4.96 | ) | 4.43 | |
| Distributions from: | | | | | | |
| Net realized gain | — | | (.41 | ) | — | |
| Total distributions | — | | (.41 | ) | — | |
| Total increase (decrease) in net asset value | (2.17 | ) | (5.10 | ) | 4.43 | |
| Net asset value, ending | $21.89 | | $24.06 | | $29.16 | |
| |
| Total return* | (9.02 | %) | (16.31 | %) | 17.91 | % |
| Ratios to average net assets:A | | | | | | |
| Net investment income (loss) | .10 | % | .01 | % | (.19 | %) |
| Total expenses | 1.28 | % | 1.18 | % | 1.14 | % |
| Expenses before offsets | .86 | % | .87 | % | .87 | % |
| Net expenses | .86 | % | .86 | % | .86 | % |
| Portfolio turnover | 72 | % | 49 | % | 47 | % |
| Net assets, ending (in thousands) | $3,837 | | $3,573 | | $4,311 | |
See notes to financial highlights.
www.calvert.com CALVERT CAPITAL ACCUMULATION FUND SEMI-ANNUAL REPORT (UNAUDITED) 35
| | | | |
| FINANCIAL HIGHLIGHTS |
| |
| | PERIODS ENDED |
| | MARCH 31, | | SEPTEMBER 30, | |
| CLASS Y SHARES | 2012 | (z) | 2011 | (z) # |
| Net asset value, beginning | $26.03 | | $29.79 | |
| Income from investment operations: | | | | |
| Net investment income (loss) | (.09 | ) | (.15 | ) |
| Net realized and unrealized gain (loss) | 7.72 | | (3.61 | ) |
| Total from investment operations | 7.63 | | (3.76 | ) |
| Distributions from: | | | | |
| Net realized gain | (1.93 | ) | — | |
| Total distributions | (1.93 | ) | — | |
| Total increase (decrease) in net asset value | 5.70 | | (3.76 | ) |
| Net asset value, ending | $31.73 | | $26.03 | |
| |
| Total return* | 30.14 | % | (12.62 | %) |
| Ratios to average net assets: A | | | | |
| Net investment income (loss) | (.62 | %) (a) | (.74 | %) (a) |
| Total expenses | 1.32 | % (a) | 1.49 | % (a) |
| Expenses before offsets | 1.32 | % (a) | 1.44 | % (a) |
| Net expenses | 1.32 | % (a) | 1.44 | % (a) |
| Portfolio turnover | 50 | % | 65 | %*** |
| Net assets, ending (in thousands) | $12,441 | | $7,968 | |
A Total expenses do not reflect amounts reimbursed and/or waived by the Advisor or reductions from expense offset arrangements. Expenses before offsets reflect expenses after reimbursement and/or waiver by the Advisor but prior to reductions from expense offset arrangements. Net expenses are net of all reductions and represent the net expenses paid by the Fund.
(a) Annualized.
(z) Per share figures are calculated using the Average Shares Method.
* Total return is not annualized for periods less than one year and does not reflect deduction of any front-end or deferred sales charge.
** Less than $0.01 per share.
*** Portfolio turnover is not annualized for periods less than one year.
# From January 31, 2011, inception.
See notes to financial statements.
www.calvert.com CALVERT CAPITAL ACCUMULATION FUND SEMI-ANNUAL REPORT (UNAUDITED) 36
EXPLANATION OF FINANCIAL TABLES
SCHEDULE OF INVESTMENTS
The Schedule of Investments is a snapshot of all securities held in the fund at their market value, on the last day of the reporting period. Securities are listed by asset type (e.g., common stock, corporate bonds, U.S. government obligations) and may be further broken down into sub-groups and by industry classification.
STATEMENT OF ASSETS AND LIABILITIES
The Statement of Assets and Liabilities is often referred to as the fund’s balance sheet. It lists the value of what the fund owns, is due and owes on the last day of the reporting period. The fund’s assets include the market value of securities owned, cash, receivables for securities sold and shareholder subscriptions, and receivables for dividends and interest payments that have been earned, but not yet received. The fund’s liabilities include payables for securities purchased and shareholder redemptions, and expenses owed but not yet paid. The statement also reports the fund’s net asset value (NAV) per share on the last day of the reporting period. The NAV is calculated by dividing the fund’s net assets (assets minus liabilities) by the number of shares outstanding. This statement is accompanied by a Schedule of Investments. Alternatively, if certain conditions are met, a Statement of Net Assets may be presented in lieu of this statement and the Schedule of Investments.
STATEMENT OF NET ASSETS
The Statement of Net Assets provides a detailed list of the fund’s holdings, including each security’s market value on the last day of the reporting period. The Statement of Net Assets includes a Schedule of Investments. Other assets are added and other liabilities subtracted from the investments total to calculate the fund’s net assets. Finally, net assets are divided by the outstanding shares of the fund to arrive at its share price, or Net Asset Value (NAV) per share.
At the end of the Statement of Net Assets is a table displaying the composition of the fund’s net assets. Paid in Capital is the money invested by shareholders and represents the bulk of net assets. Undistributed Net Investment Income and Accumulated Net Realized Gains usually approximate the amounts the fund had available to distribute to shareholders as of the statement date. Accumulated Realized Losses will appear as negative balances. Unrealized Appreciation (Depreciation) is the difference between the market value of the fund’s investments and their cost, and reflects the gains (losses) that would be realized if the fund were to sell all of its investments at their statement-date values.
www.calvert.com CALVERT CAPITAL ACCUMULATION FUND SEMI-ANNUAL REPORT (UNAUDITED) 37
STATEMENT OF OPERATIONS
The Statement of Operations summarizes the fund’s investment income earned and expenses incurred in operating the fund. Investment income includes dividends earned from stocks and interest earned from interest-bearing securities in the fund. Expenses incurred in operating the fund include the advisory fee paid to the investment advisor, administrative services fee, distribution plan expenses (if applicable), transfer agent fees, shareholder servicing expenses, custodial, legal, and audit fees, and the printing and postage expenses related to shareholder reports. Expense offsets (fees paid indirectly) are also shown. Credits earned from offset arrangements are used to reduce the fund’s expenses. This statement also shows net gains (losses) realized on the sale of investments and the increase or decrease in the unrealized appreciation (depreciation) on investments held during the period.
STATEMENT OF CHANGES IN NET ASSETS
The Statement of Changes in Net Assets shows how the fund’s total net assets changed during the two most recent reporting periods. Changes in the fund’s net assets are attributable to investment operations, distributions and capital share transactions.
The Operations section of the report summarizes information detailed in the Statement of Operations. The Distribution section shows the dividend and capital gain distributions made to shareholders. The amounts shown as distributions in this section may not match the net investment income and realized gains amounts shown in the Operations section because distributions are determined on a tax basis and certain investments or transactions may be treated differently for financial statement and tax purposes. The Capital Share Transactions section shows the amount shareholders invested in the fund, either by purchasing shares or by reinvesting distributions, and the amounts redeemed. The corresponding numbers of shares issued, reinvested and redeemed are shown at the end of the report.
FINANCIAL HIGHLIGHTS
The Financial Highlights table provides a per-share breakdown per class of the components that affect the fund’s net asset value for current and past reporting periods. The table provides total return, total distributions, expense ratios, portfolio turnover and net assets for the applicable period. Total return is a measure of a fund’s performance that encompasses all elements of return: dividends, capital gain distributions and changes in net asset value. Total return is the change in value of an investment over a given period, assuming reinvestment of any dividends and capital gain distributions, expressed as a percentage of the initial investment. Total distributions include distributions from net investment income and net realized gains. Long-term gains are earned on securities held in the fund more than one year. Short-term gains, on the sale of securities held less than one year, are treated as ordinary dividend income for tax purposes. The expense ratio is a fund’s cost of doing business, expressed as a percentage of net assets. These expenses directly reduce returns to shareholders. Portfolio turnover measures the trading activity in a fund’s investment portfolio – how often securities are bought and sold by a fund. Portfolio turnover is affected by market conditions, changes in the size of the fund, the nature of the fund’s investments and the investment style of the portfolio.
www.calvert.com CALVERT CAPITAL ACCUMULATION FUND SEMI-ANNUAL REPORT (UNAUDITED) 38
PROXY VOTING
The Proxy Voting Guidelines of the Calvert Funds that the Fund uses to determine how to vote proxies relating to portfolio securities are provided as an Appendix to the Fund’s Statement of Additional Information. The Statement of Additional Information can be obtained free of charge by calling the Fund at 1-800-368-2745, by visiting the Calvert website at www.calvert.com; or by visiting the SEC’s website at www.sec.gov.
Information regarding how the Fund voted proxies relating to portfolio securities during the most recent 12-month period ended June 30 is available on the Fund’s website at www.calvert.com and on the SEC’s website at www.sec.gov.
AVAILABILITY OF QUARTERLY PORTFOLIO HOLDINGS
The Fund files its complete schedule of portfolio holdings with the SEC for the first and third quarters of each fiscal year on Form N-Q. The Fund’s Form N-Q is available on the SEC’s website at www.sec.gov. The Fund’s Form N-Q may be reviewed and copied at the SEC’s Public Reference Room in Washington, DC; information on the operation of the Public Reference Room may be obtained by calling 1-800-SEC-0330.
BASIS FOR BOARD’S APPROVAL OF INVESTMENT ADVISORY CONTRACTS
At a meeting held on December 6, 2011, the Board of Directors, and by a separate vote, the disinterested Directors, approved the continuance of the Investment Advisory Agreement between Calvert World Values Fund, Inc. and the Advisor and the Investment Subadvisory Agreement between the Advisor and the Subadvisor with respect to the Fund.
In evaluating the Investment Advisory Agreement, the Board considered a variety of information relating to the Fund and the Advisor. The disinterested Directors reviewed a report prepared by the Advisor regarding various services provided to the Fund by the Advisor and its affiliates. Such report included, among other data, information regarding the Advisor’s personnel and the Advisor’s revenue and cost of providing services to the Fund, and a separate report prepared by an independent third party, which provided a statistical analysis comparing the Fund’s investment performance, expenses, and fees to comparable mutual funds.
The disinterested Directors were separately represented by independent legal counsel with respect to their consideration of the reapproval of the Investment Advisory Agreement and the Investment Subadvisory Agreement. Prior to voting, the disinterested Directors reviewed the proposed continuance of the Investment Advisory Agreement and Investment Subadvisory Agreement with management and also met in private sessions with their counsel at which no representatives of management were present.
www.calvert.com CALVERT CAPITAL ACCUMULATION FUND SEMI-ANNUAL REPORT (UNAUDITED) 39
In the course of its deliberations regarding the Investment Advisory Agreement, the Board considered the following factors, among others: the nature, extent and quality of the services provided by the Advisor, including the personnel providing such services; the Advisor’s financial condition; the level and method of computing the Fund’s advisory fee; comparative performance, fee and expense information for the Fund; the profitability of the Calvert Family of Funds to the Advisor and its affiliates; the allocation of the Fund’s brokerage, including the Advisor’s process for monitoring “best execution”; the direct and indirect benefits, if any, derived by the Advisor and its affiliates from their relationship with the Fund; the effect of the Fund’s growth and size on the Fund’s performance and expenses; the affiliated distributor’s process for monitoring sales load breakpoints; the Advisor’s compliance programs and policies; the Advisor’s performance of substantially similar duties for other funds; and any possible conflicts of interest.
In considering the nature, extent and quality of the services provided by the Advisor under the Investment Advisory Agreement, the Board reviewed information provided by the Advisor relating to its operations and personnel, including, among other information, biographical information on the Advisor’s supervisory and professional staff and descriptions of its organizational and management structure. The Board also took into account similar information provided periodically throughout the previous year by the Advisor as well as the Board’s familiarity with the Advisor’s senior management through Board of Directors’ meetings, discussions and other reports. The Board also noted that it reviewed on a quarterly basis information regarding the Advisor’s compliance with applicable policies and procedures, including those related to personal investing. The Advisor’s administrative capabilities, including its ability to supervise the other service providers for the Fund, were also considered. The Board observed that the scope of services provided by the Advisor generally had expanded over time as a result of regulatory, market and other changes. The Board also took into account the environmental, social, sustainability and governance research and analysis provided by the Advisor to the Fund. The Board discussed the Advisor’s effectiveness in monitoring the performance of the Subadvisor and its timeliness in responding to performance issues. The Board concluded that it was satisfied with the nature, extent and quality of services provided to the Fund by the Advisor under the Investment Advisory Agreement.
In considering the Fund’s performance, the Board noted that it reviewed on a quarterly basis detailed information about the Fund’s performance results, portfolio composition and investment strategies. In addition, the Board took into account overall financial market conditions. The Board also reviewed various comparative data provided to it in connection with its consideration of the renewal of the Investment Advisory Agreement, including, among other information, a comparison of the Fund’s total return with its Lipper index and with that of other mutual funds deemed to be in its peer group by an independent third party in its report. This comparison indicated that the Fund performed above the median of its peer group for the one, three- and five-year periods ended June 30, 2011. The data also indicated that the Fund outperformed its Lipper index for the one- and three-year periods ended June 30, 2011, and underperformed its Lipper index for the five-year period ended June 30, 2011. Based upon its review, the Board concluded that the Fund’s performance was satisfactory.
www.calvert.com CALVERT CAPITAL ACCUMULATION FUND SEMI-ANNUAL REPORT (UNAUDITED) 40
In considering the Fund’s fees and expenses, the Board compared the Fund’s fees and total expense ratio with various comparative data for the funds in its peer group. Among other findings, the data indicated that the Fund’s advisory fee (after taking into account waivers and/or reimbursements) was at the median of its peer group and that total expenses (net of waivers and/or reimbursements) were above the median of its peer group. The Board noted that the allocation of advisory and administrative fees may vary among the Fund’s peer group. The Board also took into account the Advisor’s current undertaking to maintain expense limitations for some classes. The Board noted the Advisor’s discussion of the Fund’s expenses and certain factors that affected the level of such expenses, including the cost of providing the environmental, social, sustainability and governance research and analysis provided by the Advisor. The Board also noted that in 2011, the transfer agency fees paid by the Calvert Family of Funds had been renegotiated, resulting in an anticipated overall reduction in the transfer agency fees to be paid across the Calvert Family of Funds complex. Based upon its review, the Board determined that the advisory fee was reasonable in view of the high quality of services received by the Fund from the Advisor and the other factors considered.
The Board reviewed the Advisor’s profitability on a fund-by-fund basis. In reviewing the overall profitability of the advisory fee to the Fund’s Advisor, the Board also considered the fact that affiliates of the Advisor provided shareholder servicing, administrative and distribution services to the Fund for which they received compensation. The information considered by the Board included Calvert’s operating profit margin information both before and after tax expenses with respect to the services that the Advisor and its affiliates provided to the Calvert Family of Funds complex. The Board reviewed the profitability of the Advisor’s relationship with the Fund in terms of the total amount of annual advisory fees it received with respect to the Fund and whether the Advisor had the financial wherewithal to continue to provide a high level of services to the Fund. The Board noted that the Advisor had reimbursed expenses of the Fund for some classes. The Board also took into account the Advisor’s current undertaking to maintain expense limitations for some classes. The Board also considered that the Advisor derived benefits to its reputation and other indirect benefits from its relationship with the Fund. The Board also noted that the Advisor paid the subadvisory fee to the Subadvisor. Based upon its review, the Board concluded that the Advisor’s and its affiliates’ level of profitability from their relationship with the Fund was reasonable.
The Board considered the effect of the Fund’s current size and its potential growth on its performance and fees. The Board concluded that adding breakpoints to the advisory fee at specified asset levels would not be appropriate at this time given the Fund’s current size. The Board noted that if the Fund’s assets increased over time, the Fund might realize other economies of scale if assets increased proportionally more than certain other expenses.
In reapproving the Investment Advisory Agreement, the Board, including the disinterested Directors, did not identify any single factor as controlling, and each Director may have attributed different weight to various factors.
www.calvert.com CALVERT CAPITAL ACCUMULATION FUND SEMI-ANNUAL REPORT (UNAUDITED) 41
In evaluating the Investment Subadvisory Agreement, the disinterested Directors reviewed information provided by the Subadvisor relating to its operations, personnel, investment philosophy, strategies and techniques. Among other information, the Subadvisor provided biographical information on portfolio management and other professional staff, performance information for itself, and descriptions of its investment philosophies, strategies and techniques, organizational and management structures and brokerage policies and practices.
The Board reapproved the Investment Subadvisory Agreement between the Subadvisor and the Advisor based on a number of factors relating to the Subadvisor’s ability to perform under the Investment Subadvisory Agreement. In the course of its deliberations, the Board evaluated, among other factors: the nature, extent and the quality of the services to be provided by the Subadvisor; the Subadvisor’s management style and long-term performance record; the Fund’s performance record and the Subadvisor’s performance in employing its investment strategies; the Subadvisor’s current level of staffing and its overall resources; the qualifications and experience of the Subadvisor’s personnel; the Subadvisor’s financial condition with respect to its ability to perform the services required under the Investment Subadvisory Agreement; the Subadvisor’s risk management processes; the Subadvisor’s compliance systems, including those related to personal investing; and any disciplinary history. Based upon its review, the Board concluded that it was satisfied with the nature, extent and quality of services provided to the Fund by the Subadvisor under the Investment Subadvisory Agreement.
As noted above, the Board considered, among other information, the Fund’s performance during the one-, three- and five-year periods ended June 30, 2011 as compared to the Fund’s peer group and noted that it reviewed on a quarterly basis detailed information about the Fund’s performance results, portfolio composition and investment strategies. The Board noted the Advisor’s expertise and resources in monitoring the performance, investment style and risk-adjusted performance of the Subadvisor.
In considering the cost of services to be provided by the Subadvisor and the profitability to the Subadvisor of its relationship with the Fund, the Board noted that the subadvisory fee under the Investment Subadvisory Agreement was paid by the Advisor out of the advisory fee that the Advisor received under the Investment Advisory Agreement. The Board also relied on the ability of the Advisor to negotiate the Investment Subadvisory Agreement and the corresponding subadvisory fee at arm’s length. In addition, the Board took into account the fees the Subadvisor charged to its other clients and considered these fee comparisons in light of the differences in managing these other accounts. Based upon its review, the Board determined that the subadvisory fee was reasonable. Because the Advisor pays the Subadvisor’s subadvisory fee and the subadvisory fee was negotiated at arm’s length by the Advisor, the cost of services to be provided by the Subadvisor and the profitability to the Subadvisor of its relationship with the Fund were not material factors in the Board’s deliberations. For similar reasons, the Board did not consider the potential economies of scale in the Subadvisor’s management of the Fund to be a material factor in its consideration.
www.calvert.com CALVERT CAPITAL ACCUMULATION FUND SEMI-ANNUAL REPORT (UNAUDITED) 42
In reapproving the Investment Subadvisory Agreement, the Board, including the disinterested Directors, did not identify any single factor as controlling, and each Director may have attributed different weight to various factors.
CONCLUSIONS
The Board reached the following conclusions regarding the Investment Advisory Agreement and the Investment Subadvisory Agreement, among others: (a) the Advisor has demonstrated that it possesses the capability and resources to perform the duties required of it under the Investment Advisory Agreement; (b) the Subadvisor is qualified to manage the Fund’s assets in accordance with the Fund’s investment objectives and policies; (c) the Advisor and Subadvisor maintain appropriate compliance programs; (d) the Subadvisor is likely to execute its investment strategies consistently over time; (e) the Fund’s performance is satisfactory relative to the performance of funds with similar investment objectives and to relevant indices; and (f) the Fund’s advisory and subadvisory fees are reasonable relative to those of similar funds and to the services to be provided by the Advisor and the Subadvisor. Based on its conclusions, the Board determined that reapproval of the Investment Advisory Agreement and the Investment Subadvisory Agreement would be in the best interests of the Fund and its shareholders.
www.calvert.com CALVERT CAPITAL ACCUMULATION FUND SEMI-ANNUAL REPORT (UNAUDITED) 43
To Open an Account
800-368-2748
Yields and Prices
Calvert Information Network
(24 hours, 7 days a week)
800-368-2745
Service for Existing Account
Shareholders: 800-368-2745
Brokers: 800-368-2746
TDD for Hearing Impaired
800-541-1524
Branch Office
4550 Montgomery Avenue
Suite 1000 North
Bethesda, Maryland 20814
Registered, Certified or Overnight Mail
Calvert Investments
c/o BFDS,
330 West 9th Street
Kansas City, MO 64105
Web Site
www.calvert.com
Principal Underwriter
Calvert Investment Distributors, Inc.
4550 Montgomery Avenue
Suite 1000 North
Bethesda, Maryland 20814
| | |
| CALVERT | CALVERT’S | Equity Funds |
| CAPITAL | FAMILY OF FUNDS | Enhanced Equity Portfolio |
| ACCUMULATION | | Equity Portfolio |
| FUND | Tax-Exempt Money | Large Cap Value Fund |
| | Market Funds | Social Index Fund |
| | CTFR Money Market Portfolio | Capital Accumulation Fund |
| | | International Equity Fund |
| | Taxable Money Market | Small Cap Fund |
| | Funds | Global Alternative Energy Fund |
| | First Government Money Market | Global Water Fund |
| | Fund | International Opportunities Fund |
| | Money Market Portfolio | Equity Income Fund |
| |
| | Municipal Funds | Balanced and Asset |
| | Calvert Tax-Free Bond Fund | Allocation Funds |
| | | Balanced Portfolio |
| | Taxable Bond Funds | Conservative Allocation Fund |
| | Bond Portfolio | Moderate Allocation Fund |
| | Income Fund | Aggressive Allocation Fund |
| | Short Duration Income Fund | |
| | Long-Term Income Fund | |
| | Ultra-Short Income Fund | |
| | Government Fund | |
| | High-Yield Bond Fund | |
This report is intended to provide fund information to shareholders. It is not authorized for distribution to prospective investors unless preceded or accompanied by a prospectus.
Note: The information on our website is not incorporated by reference into this report; our website address is included as an inactive textual reference only.
Investors should carefully consider the investment objectives, risks, charges and expenses of the Calvert Funds. This and other important information is contained in the fund’s summary prospectus and prospectus, which can be obtained from your financial professional and should be read carefully before investing. You may also call Calvert at 800/368-2745 or visit www. calvert.com.
Choose Planet-friendly E-delivery!
Sign up now for on-line statements, prospectuses, and fund reports. In less than five minutes you can help reduce paper mail and lower fund costs.
Just go to www.calvert.com. If you already have an online account at Calvert, click on My Account, and select the documents you would like to receive via e-mail.
If you’re new to online account access, click on Login/Register to open an online account. Once you’re in, click on the E-delivery sign-up at the bottom of the Account Portfolio page and follow the quick, easy steps. Note: if your shares are not held directly at Calvert but through a brokerage firm, you must contact your broker for electronic delivery options available through their firm.
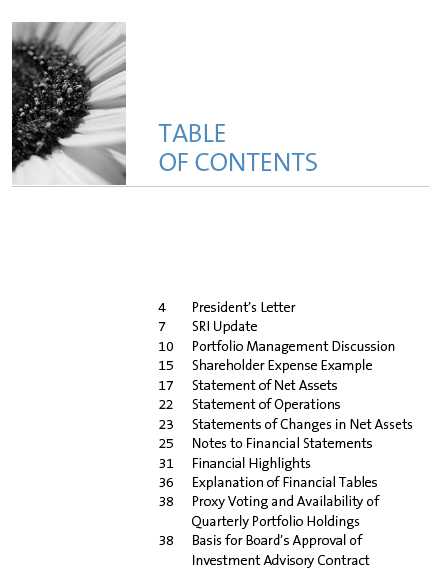
Dear Shareholder:
After a difficult summer of 2011, investor sentiment improved toward the end of 2011, and many investors clearly breathed a sigh of relief in early 2012. Headlines about Europe’s sovereign debt crisis had reached a fever pitch during the final months of 2011 and investors worldwide held their breath, concerned about the potential fallout on markets near and far.
However, long-term refinancing operations agreed to in December 2011 by the European Central Bank that enabled the region’s banks to borrow at very low interest rates as well as progress on a Greek bailout seemed to pull the eurozone back from the brink of collapse and reassured investors. As a result, the broad international markets of the MSCI EAFE Index improved, returning 14.73% for the reporting period.
Overall, key U.S. economic indicators such as the unemployment rate, manufacturing data, housing market fundamentals, and consumer confidence showed gradual improvement. But consumer spending remained weak, and gasoline prices topping $4.00 a gallon in some areas in March did not help. As a result, economic growth continued at a snail’s pace.
In contrast to the fourth quarter, when the Standard & Poor’s (S&P) 500 Index earned nearly all of its return during October, the S&P 500 Index had a strong and mostly steady climb in the first quarter of 2012 to end the reporting period at 25.89%. Investors became more open to risk over the reporting period as well.
Broadening the Reach of SRI
It’s worth noting that corporate responsibility is just as relevant today as it’s always been—and perhaps even more so in these times of economic uncertainty. At Calvert, we have long believed that a company’s environmental, sustainability, and governance policies correlate strongly with its risk management and financial performance. It’s clear that more and more investors, consumers, and companies are reaching the same conclusions, and that the use of shareholder advocacy to effect change is becoming an increasingly powerful tool.
However, we always welcome additional proof of this, especially from venerable sources such as Ernst & Young. In a new white paper, the management consulting firm noted that social and environmental issues accounted for 40% of shareholder proposals on proxy ballots last year, up one-third from 2010. Ernst & Young also predicts these issues will dominate proposals for the third consecutive year in 2012, thanks to a convergence of factors drawing attention to companies’ actions on sustainability and environmental issues.1 Perhaps even more important is the broadening of support. Sustainability proposals overall received favorable votes from a record 21% of shareholders in 2011, and nearly one-third of the proposals had support exceeding 30%—a critical level where corporate boards can’t help but take notice. This is on par with Calvert’s own experiences,
| www. | calvert.com CALVERT INTERNATIONAL OPPORTUNITIES FUND SEMI-ANNUAL REPORT (UNAUDITED) 4 |
where 38% of resolutions we filed or co-filed that resulted in a vote last year received support of more than 30%.
If you’re interested in learning more about our shareholder advocacy efforts this year, visit us online at www.calvert.com/sri-resolutions.html.
Calvert’s Women’s Principles and Diversity
In March, Calvert helped mark the two-year anniversary of the United Nation’s Women’s Empowerment Principles (WEP) at the U.N. Gender Equality for Sustainable Business Event, which emphasized the business case for promoting gender equality in the workplace. More than 400 chief executives have now publicly committed to implementing the WEP, which were adapted from the Calvert’s Women’s Principles® in 2010. We’re also participating in the WEP Leadership Group, comprised of 30 leading companies, investors, and women-focused organizations seeking to encourage broader adoption of the Principles.
We filed six shareholder resolutions for the upcoming annual meeting season asking companies to add specific considerations of race and gender diversity to their desired director characteristics. Five were successfully withdrawn after management agreed. Notably, this includes American Financial Group, whose resistance last year led to a vote supported by 27% of shareholders. So, persistence does indeed pay off. The lone holdout is Urban Outfitters, where company resistance led to a vote last year that received 22% support.
Leading the Path to Sustained Sustainability in the Next Economy
In October, Calvert had the privilege of co-hosting the 2011 United Nations Environment Programme Finance Initiative (UNEP-FI) Global Roundtable in Washington, D.C. More than 500 attendees from the investment, banking, and insurance industries discussed the tipping point for linking global sustainability and market stability as the cornerstone of the “next economy.” In my opening remarks as UNEP-FI co-chair of the Global Steering Committee, I highlighted the importance of the financial community working together. This is necessary not only to restore trust in financial systems, but also to make a meaningful impact on the pressing challenges facing the world today so that a sustainable future will exist for all. This is an idea that’s been at the heart of Calvert Investments for more than 30 years. Calvert’s leadership on these topics was evident at the event, with Calvert team members speaking on panels about human rights, water, and ecosystem services.
Other Calvert News
As you may know, we launched Calvert Equity Income Fund2 last fall to offer the potential for attractive income generation and competitive total return by investing in a portfolio of large-cap, dividend-paying stocks that we believe provide compelling value. Calvert Large Cap Value Fund co-portfolio managers James McGlynn, CFA and Yvonne Bishop, CFA are managing the new Fund. Both Funds feature Calvert’s SAGE strategy,
www.calvert.com CALVERT INTERNATIONAL OPPORTUNITIES FUND SEMI-ANNUAL REPORT (UNAUDITED) 5
which involves Calvert actively engaging with companies held in the Funds to engender positive change.
A Variety of Ways to Stay Informed
We are cautiously optimistic about the continued economic recovery, but much uncertainty and the potential for renewed volatility remains. That’s why we always feel it’s best to maintain a well-diversified mix of U.S. and international stocks, bonds, and cash appropriate for your goals and risk tolerance. And of course, we suggest you consult your financial advisor if you have questions or concerns.
We also invite you to visit our website, www.calvert.com, for fund information, portfolio updates, and commentary from Calvert professionals. And now, you can get the same information on the go with Calvert’s new iPhone® app, which is available for free from iTunes.
As always, we thank you for investing with Calvert.

Barbara J. Krumsiek
President and CEO
Calvert Investments, Inc.
May 2012
1 Ernst & Young, Leading Corporate Sustainability Issues in the 2012 Proxy Season: Is your board prepared?
2 Investment in mutual funds involves risk, including possible loss of principal invested. For more information on any Calvert fund, please contact Calvert at 800.368.2748 for a free summary prospectus and/or prospectus. An investor should consider the investment objectives, risks, charges, and expenses of an investment carefully before investing. The summary prospectus and prospectus contain this and other information. Read them carefully before you invest or send money. Calvert mutual funds are underwritten and distributed by Calvert Investment Distributors, Inc., member FINRA and subsidiary of Calvert Investments, Inc.
| www. | calvert.com CALVERT INTERNATIONAL OPPORTUNITIES FUND SEMI-ANNUAL REPORT (UNAUDITED) 6 |

As always, Calvert continues to work hard to ensure you have a say in the responsible management of environmental, social, and governance (ESG) factors for the companies in which we invest. Below are highlights of our accomplishments during the reporting period.
Overall Shareholder Advocacy Efforts
Through March 31, 2012, Calvert had filed 23 shareholder proposals in the 2012 proxy
season. The most popular topics were board diversity, sustainability disclosure, climate change, and loan servicing. Several of these are discussed in more detail below. Through March 31, 2012, we had successfully withdrawn 14 resolutions after companies agreed to the terms.
Setting a Fair and Sustainable Table
Many food crops are already showing vulnerability to climate change. For example, higher temperatures and extreme rainfall are expected to increase disease and stress in Central and South American coffee bean crops, resulting in lower output. Last year, our shareholder resolution asked J.M. Smucker to disclose the climate-related risks for its Folgers Coffee and other coffee brands, which reflect 40% of the company’s revenue. We have re-filed the proposal this year in the hope that last year’s strong support of 30% persuades the company to reconsider its position.
We also filed a resolution with Colgate-Palmolive about palm oil sourcing. Despite some sustainability advantages to using palm oil in food, lotions, soaps, and shampoo, significant problems exist in the way palm oil trees are grown in some countries—resulting in significant greenhouse gas emissions, displacement of local and Indigenous Peoples, and destruction of endangered species. After discussions with company management, Colgate announced a goal of purchasing only certified sustainable palm oil by 2015, and we successfully withdrew the proposal.
Finally, Calvert began working with Oxfam America, farm worker unions, and consumer groups to develop a new certification system for on-farm sustainability of fruits and vegetables grown in the United States. The pilot project evaluates farm worker welfare, pesticide reduction, and product safety.
Rooting Out Supply Chain Abuses
Calvert co-authored a guide with Christian Brothers Investments and the Interfaith Center on Corporate Responsibility to help companies comply with the California Transparency in Supply Chain Act (SB 657). This ground-breaking U.S. law requires manufacturers and retailers with global gross receipts exceeding $100 million that operate in California to disclose efforts to eliminate slavery and human trafficking from their direct supply chains on their corporate website. The guide also serves as an advocacy tool for more effective manage-
www.calvert.com CALVERT INTERNATIONAL OPPORTUNITIES FUND SEMI-ANNUAL REPORT (UNAUDITED) 7
ment of labor and human rights risks within global supply chains.
On a related note, Calvert is greatly concerned by news reports about factory conditions for some of Apple’s suppliers, especially in China. We have been working with a larger investor coalition to engage Apple’s senior management, and we believe the company has made significant strides in the last few months toward full supply chain transparency and “zero tolerance” for workplace abuses. Apple has also moved aggressively to have the Fair Labor Association conduct third-party audits of its suppliers and is posting the results of these monthly audits on its website. We will continue to monitor the situation and work with Apple to remedy its supply chain issues.
Improving Regulation of ESG Issues
Clean Air Act. Calvert coordinated an investor letter to congressional leaders urging timely implementation of new Clean Air Act rules under development at the Environmental Protection Agency (EPA). These rules would help modernize and improve the efficiency of electric utilities, reduce cross-state air pollution, lower emissions of mercury and air toxins, and create well-paid construction, engineering, and manufacturing jobs. The EPA announced the new Mercury and Air Toxics rule in December—a victory for the health of both the public and the economy.
Dodd-Frank Reform & Consumer Protection Act of 2010. We continue to participate in a complicated Securities and Exchange Commission (SEC) rule-making process for this law, particularly regarding section 1502 on “conflict minerals.” This section requires companies that use gold, tin, tantalum, and tungsten in their products to disclose whether these metals are coming from specific mines in the Democratic Republic of Congo and adjoining countries. Profits from these mines have been used to fuel the weapon supply for one of the world’s bloodiest conflicts since World War II.
An early supporter of the legislation, Calvert is working with a coalition of investors, human rights organizations, and major multinational corporations that recently met with the SEC chairman as well as several commissioners and their staff. We also presented the investor perspective at an SEC roundtable in October 2011 and have submitted a series of letters and comments about the complex and controversial issues involved. We hope to see a final rule in the coming months.
Community Investments
Many of our Funds participate in Calvert’s High Social Impact Investing program, which is administered through the Calvert Foundation. This community investment program may allocate a small percentage of Fund assets at below-market interest rates to investments that provide economic opportunity for struggling populations.1 One such investment is Pride Industries, which creates jobs for people with disabilities and is
| www. | calvert.com CALVERT INTERNATIONAL OPPORTUNITIES FUND SEMI-ANNUAL REPORT (UNAUDITED) 8 |
an up-and-coming leader in helping individuals overcome barriers to employment. In fiscal year 2010, the organization employed 4,100 individuals, 60% of whom were disabled.
Another example is Via Verde, an innovative and award-winning affordable housing development in the South Bronx. This complex combines urgently needed low- to moderate-income housing with a new model for affordable, green, and healthy urban living in a design that improves the attractiveness of the community around it.
Special Equities
A modest but important portion of certain funds is allocated to small private companies developing products or services that address important sustainability or environmental issues. One recent investment was LearnZillion, a Washington, D.C.-based group using video technology to provide individualized learning in primary schools.2 “Best of class” video modules allow the teacher to track each student’s progress, give the right lessons at the right time, and provide timely support—all with interactive feedback. We are unsure if this approach will be the breakthrough learning improvement the schools need, but all agree innovative solutions need to be tried.
Calvert was also instrumental in getting the U.S. State Department to focus attention on the importance of “impact investing,” by way of a conference with an address by Secretary of State Hillary Clinton. We are gratified the U.S. government is manifesting the best of American values by becoming involved in supporting social entrepreneurs.
1 As of March 31, 2012, Calvert Social Investment Foundation (“Calvert Foundation” or “Foundation”) Community Investment Notes represented the following percentages of Fund net assets: Calvert Capital Accumulation Fund 0.55%, Calvert International Equity Fund 1.37%, and Calvert Small Cap Fund 0.50%. The Calvert Foundation is a 501(c)(3) nonprofit organization. The Foundation’s Community Investment Note Program is not a mutual fund and should not be confused with any Calvert Investments-sponsored investment product.
2 As of March 31, 2012, LearnZillion represented 0.02% of Calvert Balanced Portfolio.
Holdings are subject to change.
As of March 31, 2012, the following companies represented the following percentages of net assets: J.M. Smucker 0.11% of Calvert Social Index Fund, Colgate-Palmolive 0.51% of Calvert Social Index Fund, and Apple 6.52% of Calvert Social Index Fund. Holdings are subject to change.
www.calvert.com CALVERT INTERNATIONAL OPPORTUNITIES FUND SEMI-ANNUAL REPORT (UNAUDITED) 9
Investment Performance
For the six-month period ended March 31, 2012, Calvert International Opportunities Fund (Class A shares at NAV) returned 17.74% compared with 14.38% for the benchmark MSCI Europe, Australasia Far East Small/Mid-Cap (MSCI EAFE SMID) Index. The Fund’s relative outperformance was attributable to strong stock selection.
Investment Climate
During the six-month reporting period, strong earnings from U.S. companies, continued improvements in U.S. macroeconomic data, and aggressive accommodative monetary policy worldwide helped equity markets rally hard off their lows posted last fall, albeit on low volume. For the trailing six-month period, the Russell 1000, Russell 2000, MSCI EAFE, and MSCI Emerging Markets Indices returned 26.27%, 29.83%, 14.73%, and 19.20%, respectively.
The growth investment style slightly outperformed the value style, and within the Russell 1000 Index, Financials, Information Technology, and Consumer Discretionary
CALVERT INTERNATIONAL
OPPORTUNITIES FUND |
| MARCH 31, 2012 |
| INVESTMENT PERFORMANCE | | | |
| (total return at NAV*) | | | | |
| | 6 Months | | 12 Months | |
| | ended | | ended | |
| | 3/31/12 | | 3/31/12 | |
| Class A | 17.74 | % | -5.50 | % |
| Class C | 17.18 | % | -6.26 | % |
| Class I | 17.96 | % | -5.05 | % |
| Class Y | 17.86 | % | -5.26 | % |
| |
| MSCI EAFE Small/Mid | | | |
| Cap Index | 14.38 | % | -6.09 | % |
| |
| Lipper International | | | | |
| Small/Mid-Cap Core | | | | |
| Funds Average | 17.05 | % | -6.17 | % |
| |
| | | | % of Total | |
| ECONOMIC SECTORS | | | Investments | |
| Consumer Discretionary | | 17.6 | % |
| Consumer Staples | | | 9.0 | % |
| Energy | | | 3.8 | % |
| Financials | | | 23.9 | % |
| Health Care | | | 4.6 | % |
| Industrials | | | 23.0 | % |
| Information Technology | | 7.0 | % |
| Materials | | | 6.7 | % |
| Telecommunication Services | | 1.8 | % |
| Time Deposit | | | 1.4 | % |
| Utilities | | | 1.2 | % |
| Total | | | 100 | % |
* Investment performance/return at NAV does not reflect the deduction of the Fund’s maximum 4.75% front-end sales charge or any deferred sales charge.
www.calvert.com CALVERT INTERNATIONAL OPPORTUNITIES FUND SEMI-ANNUAL REPORT (UNAUDITED) 10
were the top-performing sectors. The Utilities, Telecommunications, and Consumer Staples sectors lagged as the risk-on trade returned with a vengeance.
In the United States, improving jobs data were a significant boost to equity market performance with the recent and welcome improvements in the unemployment rate and jobless claims compounding the positive effects from strong corporate earnings. The falling unemployment rate also helped drive continued improvement in consumer confidence and consumer spending, which were not as heavily impacted by rising gasoline prices as they could have been had the stock market and the job market not been improving.
CALVERT INTERNATIONAL
OPPORTUNITIES FUND |
| MARCH 31, 2012 |
| TEN LARGEST | % of Net | |
| STOCK HOLDINGS | Assets | |
| Ashtead Group plc | 1.9 | % |
| Whitbread plc | 1.6 | % |
| Wacker Neuson SE | 1.6 | % |
| Intrum Justitia AB | 1.6 | % |
| Lamprell plc | 1.5 | % |
| Rhoen Klinikum AG | 1.5 | % |
| Industrivarden AB | 1.5 | % |
| International Personal Finance plc | 1.5 | % |
| Electromagnetic GeoServices ASA | 1.4 | % |
| Credit Saison Co. Ltd. | 1.4 | % |
| Total | 15.5 | % |
The manufacturing sector continued to provide significant support to the U.S. economic recovery, with a weak U.S. dollar supporting strong exports and the national Purchasing Manager’s Index firmly in an expansionary mode. Vehicle sales and production both looked encouraging as well. However, accelerating recession in Europe and the overall slowdown in the global economy will de-emphasize the contribution of exports to U.S. gross domestic product (GDP). Therefore, the continued recovery of the U.S. consumer will be important for a self-sustained U.S. economic recovery. The service sector has been showing signs of improvement recently--a sign the manufacturing-led recovery in the United States may be spreading to other sectors.
U.S. bank lending continued to improve despite regulatory pressures threatening the long-term profitability of the banking industry. An improving consumer balance sheet allowed banks to increase lending while adhering to higher lending standards. The U.S. housing market continued to bottom out and showed signs of improvement, though it is not out of the woods yet, especially with foreclosed inventories still high. The housing sector, while not providing much growth, is not likely to be the drag on the economy that it has been for many quarters since the bursting of the housing bubble.
Despite visible improvements in the macroeconomic data, in January the U.S. Federal Reserve (Fed) announced an extension of its low interest rate policy through the end of 2014. It also adopted a formal inflation target of 2% and suggested that balance sheet expansion (QE3) is not out of the question should economic conditions deteriorate, though this is less likely in the near term. The move appeared to reflect the Fed’s heightened focus on unemployment, which has become an increasingly important part of the Fed’s dual mandate of price stability and maximum employment this election year.
www.calvert.com CALVERT INTERNATIONAL OPPORTUNITIES FUND SEMI-ANNUAL REPORT (UNAUDITED) 11
This aggressively accommodative monetary policy is likely to create an environment conducive to imbalances and bubbles in the economy and markets. With U.S. interest rates and the dollar at historic lows, U.S. dollar-denominated commodities like oil have been rising in price to levels where the demand destruction begins to create negative feedback on both commodity prices and economic growth globally. Interestingly, this negative feedback may be disproportionately higher for the commodity-hungry emerging market economies than for the United States itself. Therefore, it could be that the United States will end up “exporting” the recessionary pressures outside its borders to more commodity-intensive economies like China and Brazil.
Still, with global economic challenges keeping inflation in check, policymakers around the globe continued their efforts toward easing monetary policies, which should help stimulate economic growth. Unfortunately for the global economy and consumers, the rate of increase in oil prices kept pace with the stock market, exacerbated by the geopolitical tensions in the Middle East. This rising oil price trend, if not reversed, will likely put a damper on global economic growth.
In the eurozone, investors increasingly wor-
CALVERT INTERNATIONAL
OPPORTUNITIES FUND
MARCH 31, 2012 |
| |
| AVERAGE ANNUAL TOTAL RETURNS | |
| CLASS A SHARES | (with max. load) | |
| One year | -10.01 | % |
| Since inception (5/31/2007) | -4.57 | % |
| |
| CLASS C SHARES | (with max. load) | |
| One year | -7.19 | % |
| Since inception (7/31/2007) | -4.14 | % |
| |
| CLASS I SHARES | | |
| One year | -5.05 | % |
| Since inception (5/31/2007) | -3.16 | % |
| |
| CLASS Y SHARES* | | |
| One year | -5.26 | % |
| Since inception (5/31/2007) | -3.45 | % |
*Calvert International Opportunities Fund first offered Class Y shares on October 31, 2008. Performance prior to that date reflects the performance of Class A shares at net asset value (NAV). Actual Class Y share performance would have been different.
ried about the currency’s potential collapse during the fourth quarter of 2011, though there was some stability to start 2012. Yields on the sovereign debt of Spain, Greece, Italy, and France soared in November, but have gradually declined since then, signaling that the LTRO (long-term refinancing operation) may have helped the eurozone sovereign bond markets by driving down short-term yields and, for the time being, reducing investor perception of the probability of a global financial crisis.
Despite the positive impact of the LTRO, Europe continued to provide a negative backdrop to investor confidence and was a drag on the global economy. Eurozone GDP contracted 0.3% in the fourth quarter of 2011, while the unemployment rate in the eurozone reached a 15-year high of 10.8%. These data confirmed our concerns about the eurozone’s economic outlook and the stronger recession in Europe, including the core economies.
www.calvert.com CALVERT INTERNATIONAL OPPORTUNITIES FUND SEMI-ANNUAL REPORT (UNAUDITED) 12
Growth of $10,000
The graph below shows the value of a hypothetical $10,000 investment in the Fund over the past 10 fiscal year periods or since inception (for funds without 10-year records). The results shown are for Classes A and I shares and reflect the deduction of the maximum front-end Class A sales charge of 4.75%, and assume the reinvestment of dividends. The result is compared with benchmarks that include a broad based market index and a Lipper peer group average. Market indexes are unmanaged and their results do not reflect the effect of expenses or sales charges. The Lipper average reflects the deduction of the category’s average front-end sales charge. The value of an investment in a different share class would be different.
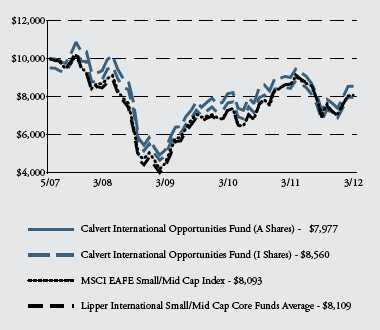
All performance data shown, including the graph above and the adjacent table, represents past performance, does not guarantee future results, assumes reinvestment of dividends and distributions and does not reflect the deduction of taxes that a shareholder would pay on the Fund’s distributions or the redemption of the Fund shares. All performance data reflects fee waivers and/or expense limitations, if any are in effect; in their absence performance would be lower. See Note B in Notes to Financial Statements. The investment return and principal value of an investment will fluctuate so that an investor’s shares, when redeemed, may be worth more or less than their original cost. Current performance may be lower or higher than the performance data quoted; for current performance data visit www.calvert.com. The gross expense ratio from the current prospectus for Class A shares is 2.21%. This number may differ from the expense ratio shown elsewhere in this report because it is based on a different time period and, if applicable, does not include fee or expense waivers. Performance data quoted already reflects the deduction of the Fund’s operating expenses.
www.calvert.com CALVERT INTERNATIONAL OPPORTUNITIES FUND SEMI-ANNUAL REPORT (UNAUDITED) 13
A deal on the Greek bailout was reached by all involved parties with the resulting Greek bond swap reducing Greece’s debt burden by 100 billion euros. Even with the bond swap, debt in Greece is becoming an increasingly larger percentage of GDP due to the rate at which Greece’s GDP is contracting, a trend that will continue to jeopardize the country’s credit health.
A positive inflation trend allowed the Chinese government to continue to reposition its economic policy from contractionary for most of 2011 to stimulative. The Chinese economy continued to decelerate during the quarter as foreign direct investment, one of the major drivers of economic growth in China, declined on a year-over-year basis for four consecutive months. Increasing domestic consumption in the country will be key to offsetting this effect. China cut its economic growth target from 8% to 7.5%, signaling the country’s need to transition to a more sustainable, consumer-driven economic model.
Portfolio Strategy
The Fund’s stock selection was the strongest in Financials, Materials, and Industrials. Holdings like Ashtead Group, Admiral Group, and Industrivarden were all among the top contributors. Country allocation was also a positive contributor to the active return, as the Fund’s underweight to North America added more than two percentage points.
Sector selection had an overall negative impact of 0.36 percentage points, with the Fund’s overweight position in Financials detracting the most.
Market Outlook
A sharp slowdown or, more importantly, a hard landing in China, fueled by a possible bursting of a real-estate bubble there, will certainly create strong ripple effects throughout the global economy, including the United States, but this indirect impact may be less damaging than a domestic recession in the United States.
If the U.S. economic recovery proves robust enough to withstand the negative headwinds from Europe and China in 2012, U.S. equities may significantly outperform Treasuries given the relative valuation of the two asset classes. Highly bid-up dividend-yielding securities may also underperform as investor risk aversion subsides. However, if more investors refocus on the underlying economic fundamentals in Europe, the risk aversion trade may return for some time during the year. In this environment, despite stronger economic data in the United States, one thing is certain--equity market volatility is likely to be here to stay for most of 2012.
May 2012
As of March 31, 2012, the following companies represented the following percentages of Fund net assets: Ashtead Group 1.90%, Admiral Group 1.31%, and Industrivarden 0%. Holdings are subject to change.
| www. | calvert.com CALVERT INTERNATIONAL OPPORTUNITIES FUND SEMI-ANNUAL REPORT (UNAUDITED) 14 |
SHAREHOLDER EXPENSE EXAMPLE
As a shareholder of the Fund, you incur two types of costs: (1) transaction costs, including sales charges and redemption fees; and (2) ongoing costs, including management fees; distribution (12b-1) fees; and other Fund expenses. This Example is intended to help you understand your ongoing costs (in dollars) of investing in the Fund and to compare these costs with the ongoing costs of investing in other mutual funds.
This Example is based on an investment of $1,000 invested at the beginning of the period and held for the entire period (October 1, 2011 to March 31, 2012).
Actual Expenses
The first line of the table below provides information about actual account values and actual expenses. You may use the information in this line, together with the amount you invested, to estimate the expenses that you paid over the period. Simply divide your account value by $1,000 (for example, an $8,600 account value divided by $1,000 = 8.6), then multiply the result by the number in the first line under the heading entitled “Expenses Paid During Period” to estimate the expenses you paid on your account during this period.
Hypothetical Example for Comparison Purposes
The second line of the table below provides information about hypothetical account values and hypothetical expenses based on the Fund’s actual expense ratio and an assumed rate of return of 5% per year before expenses, which is not the Fund’s actual return. The hypothetical account values and expenses may not be used to estimate the actual ending account balance or expenses you paid for the period. You may use this information to compare the ongoing costs of investing in the Fund and other funds. To do so, compare the 5% hypothetical example with the 5% hypothetical examples that appear in the shareholder reports of the other funds.
Please note that the expenses shown in the table are meant to highlight your ongoing costs only and do not reflect any transactional costs, such as sales charges (loads), or redemption fees. Therefore, the second line of the table is useful in comparing ongoing costs only, and will not help you determine the relative total costs of owning different funds. In addition, if these transactional costs were included, your costs would have been higher.
www.calvert.com CALVERT INTERNATIONAL OPPORTUNITIES FUND SEMI-ANNUAL REPORT (UNAUDITED) 15
| | | |
| | BEGINNING | ENDING ACCOUNT | EXPENSES PAID |
| | ACCOUNT VALUE | VALUE | DURING PERIOD* |
| | 10/1/11 | 3/31/12 | 10/1/11 - 3/31/12 |
| CLASS A | | | |
| Actual | $1,000.00 | $1,177.40 | $9.04 |
| Hypothetical | $1,000.00 | $1,016.70 | $8.37 |
| (5% return per | | | |
| year before expenses) | | | |
| |
| CLASS C | | | |
| Actual | $1,000.00 | $1,172.90 | $13.58 |
| Hypothetical | $1,000.00 | $1,012.50 | $12.58 |
| (5% return per | | | |
| year before expenses) | | | |
| |
| CLASS I | | | |
| Actual | $1,000.00 | $1,179.60 | $6.54 |
| Hypothetical | $1,000.00 | $1,019.00 | $6.06 |
| (5% return per | | | |
| year before expenses) | | | |
| |
| CLASS Y | | | |
| Actual | $1,000.00 | $1,178.60 | $7.68 |
| Hypothetical | $1,000.00 | $1,017.95 | $7.11 |
| (5% return per | | | |
| year before expenses) | | | |
*Expenses are equal to the Fund’s annualized expense ratio of 1.66%, 2.50%, 1.20%, and 1.41% for Class A, Class C , Class I, and Class Y, respectively, multiplied by the average account value over the period, multiplied by 183/366 (to reflect the one-half year period).
| www. | calvert.com CALVERT INTERNATIONAL OPPORTUNITIES FUND SEMI-ANNUAL REPORT (UNAUDITED) 16 |
| | | |
| STATEMENT OF NET ASSETS |
| MARCH 31, 2012 |
| |
| |
| |
| EQUITY SECURITIES - 96.6% | SHARES | | VALUE |
| Australia - 2.1% | | | |
| Crown Ltd. | 40,172 | $ | 361,924 |
| Sims Metal Management Ltd | 26,100 | | 397,499 |
| | | | 759,423 |
| |
| Austria - 1.7% | | | |
| AMAG Austria Metall AG (e)* | 11,840 | | 301,078 |
| EVN AG | 22,710 | | 305,552 |
| | | | 606,630 |
| |
| Belgium - 1.7% | | | |
| NV Bekaert SA | 9,200 | | 296,327 |
| Umicore SA | 6,100 | | 335,977 |
| | | | 632,304 |
| |
| Brazil - 3.8% | | | |
| GP Investments Ltd. (BDR)* | 86,887 | | 245,673 |
| Light SA | 9,174 | | 130,705 |
| Localiza Rent a Car SA | 15,777 | | 291,044 |
| MRV Engenharia e Participacoes SA | 43,166 | | 306,907 |
| Totvs SA | 21,945 | | 406,032 |
| | | | 1,380,361 |
| |
| Canada - 2.2% | | | |
| Neo Material Technologies, Inc.* | 40,200 | | 451,473 |
| RONA, Inc. | 39,576 | | 371,972 |
| | | | 823,445 |
| |
| China - 1.8% | | | |
| Ctrip.com International Ltd. (ADR)* | 13,200 | | 285,648 |
| Mindray Medical International Ltd. (ADR) | 11,500 | | 379,155 |
| | | | 664,803 |
| |
| Denmark - 2.2% | | | |
| D/S Norden | 12,975 | | 385,957 |
| FLSmidth & Co. A/S | 5,800 | | 406,999 |
| | | | 792,956 |
| |
| France - 3.3% | | | |
| Cie Generale des Etablissements Michelin, Common Series B | 6,298 | | 468,864 |
| Nexans SA | 5,461 | | 368,541 |
| Societe BIC SA | 3,786 | | 379,845 |
| | | | 1,217,250 |
www.calvert.com CALVERT INTERNATIONAL OPPORTUNITIES FUND SEMI-ANNUAL REPORT (UNAUDITED) 17
| | | |
| EQUITY SECURITIES - CONT’D | SHARES | | VALUE |
| Germany - 10.6% | | | |
| Asian Bamboo AG | 15,700 | $ | 243,057 |
| Deutz AG* | 72,000 | | 480,042 |
| Jungheinrich AG, Preferred | 12,540 | | 410,596 |
| Krones AG | 2,135 | | 107,101 |
| KUKA AG* | 18,200 | | 390,728 |
| Rational AG | 1,700 | | 397,495 |
| Rhoen Klinikum AG | 27,070 | | 543,433 |
| RIB Software AG* | 43,600 | | 311,215 |
| Wacker Neuson SE | 33,000 | | 587,672 |
| Wirecard AG | 21,300 | | 405,446 |
| | | | 3,876,785 |
| |
| Hong Kong - 1.4% | | | |
| Digital China Holdings Ltd. | 172,000 | | 343,369 |
| Fook Woo Group Holdings Ltd.* (b) | 1,776,000 | | 172,356 |
| | | | 515,725 |
| |
| Italy - 2.4% | | | |
| Buzzi Unicem SpA* | 40,821 | | 478,737 |
| Piaggio & C SpA | 133,700 | | 392,934 |
| | | | 871,671 |
| |
| Japan - 18.6% | | | |
| Amada Co. Ltd. | 25,000 | | 169,265 |
| Autobacs Seven Co. Ltd | 3,800 | | 183,971 |
| Central Glass Co. Ltd. | 35,000 | | 154,159 |
| Chugoku Marine Paints Ltd. | 42,000 | | 258,375 |
| Credit Saison Co. Ltd. | 25,200 | | 512,164 |
| Daiichikosho Co. Ltd. | 12,307 | | 243,407 |
| FamilyMart Co. Ltd | 9,600 | | 407,693 |
| Hokuto Corp. | 14,800 | | 313,006 |
| Makita Corp. | 8,400 | | 338,385 |
| Namco Bandai Holdings, Inc. | 24,000 | | 347,704 |
| Ono Pharmaceutical Co. Ltd. | 5,800 | | 324,431 |
| Santen Pharmaceutical Co. Ltd | 8,529 | | 365,832 |
| Secom Co. Ltd. | 9,100 | | 447,188 |
| Seven Bank Ltd | 175,000 | | 384,335 |
| So-net Entertainment Corp | 96 | | 353,528 |
| Stanley Electric Co. Ltd. | 27,462 | | 438,179 |
| Star Micronics Co. Ltd. | 16,300 | | 162,179 |
| The Bank of Yokohama Ltd | 34,500 | | 173,306 |
| Toyota Industries Corp | 11,300 | | 342,229 |
| USS Co. Ltd. | 2,922 | | 297,465 |
| Yamaha Corp. | 26,300 | | 273,802 |
| Yamatake Corp. | 15,000 | | 333,071 |
| | | | 6,823,674 |
| |
| Malaysia - 2.3% | | | |
| New Britain Palm Oil Ltd. | 29,900 | | 409,869 |
| PureCircle Ltd.* | 261,300 | | 438,600 |
| | | | 848,469 |
| www. | calvert.com CALVERT INTERNATIONAL OPPORTUNITIES FUND SEMI-ANNUAL REPORT (UNAUDITED) 18 |
| | | |
| EQUITY SECURITIES - CONT’D | SHARES | | VALUE |
| Netherlands - 2.2% | | | |
| Koninklijke Philips Electronics NV | 18,619 | $ | 377,378 |
| Wereldhave NV | 5,647 | | 448,110 |
| | | | 825,488 |
| |
| Norway - 2.9% | | | |
| Aker ASA | 10,558 | | 345,290 |
| Electromagnetic GeoServices ASA* | 177,600 | | 523,210 |
| Yara International ASA | 4,200 | | 200,033 |
| | | | 1,068,533 |
| |
| Panama - 1.1% | | | |
| Banco Latinoamericano de Exportaciones SA | 19,882 | | 419,709 |
| |
| Puerto Rico - 0.5% | | | |
| Oriental Financial Group, Inc | 14,553 | | 176,091 |
| |
| Singapore - 1.4% | | | |
| Ascendas India Trust | 421,000 | | 277,910 |
| Fortune Real Estate Investment Trust | 454,000 | | 225,706 |
| | | | 503,616 |
| |
| South Korea - 2.9% | | | |
| Dongbu Insurance Co. Ltd.* | 5,950 | | 257,052 |
| Mirae Asset Securities Co. Ltd.* | 8,700 | | 304,448 |
| NongShim Co. Ltd. | 1,200 | | 240,943 |
| Samsung Card Co. | 7,600 | | 264,613 |
| | | | 1,067,056 |
| |
| Sweden - 3.0% | | | |
| Industrivarden AB, C Shares | 36,577 | | 543,273 |
| Intrum Justitia AB | 34,500 | | 573,415 |
| | | | 1,116,688 |
| |
| Switzerland - 1.4% | | | |
| GAM Holding AG* | 25,600 | | 372,946 |
| Valiant Holding | 1,236 | | 151,993 |
| | | | 524,939 |
| |
| Taiwan - 0.6% | | | |
| Synnex Technology International Corp. | 86,764 | | 215,481 |
| |
| Thailand - 0.3% | | | |
| Thanachart Capital PCL | 95,800 | | 104,029 |
| |
| United Arab Emirates - 2.3% | | | |
| Lamprell plc | 99,600 | | 545,649 |
| Polarcus Ltd.* | 292,200 | | 289,502 |
| | | | 835,151 |
www.calvert.com CALVERT INTERNATIONAL OPPORTUNITIES FUND SEMI-ANNUAL REPORT (UNAUDITED) 19
| | | | |
| EQUITY SECURITIES - CONT’D | | SHARES | | VALUE |
| United Kingdom - 23.9% | | | | |
| Admiral Group plc | | 25,300 | $ | 480,077 |
| Ashtead Group plc | | 168,500 | | 696,037 |
| Beazley plc | | 198,077 | | 441,721 |
| Bovis Homes Group plc | | 32,465 | | 250,047 |
| Britvic plc | | 52,700 | | 324,095 |
| Catlin Group Ltd | | 67,382 | | 437,546 |
| Close Brothers Group plc | | 38,900 | | 488,157 |
| Colt Group SA* | | 151,327 | | 253,523 |
| Debenhams plc | | 288,700 | | 372,905 |
| Homeserve plc | | 118,300 | | 441,582 |
| Hugo Boss AG, Preferred | | 3,800 | | 437,900 |
| Inmarsat plc | | 54,600 | | 401,767 |
| International Personal Finance plc | | 126,100 | | 540,446 |
| Investec plc | | 41,800 | | 255,459 |
| J Sainsbury plc | | 83,791 | | 416,981 |
| Lancashire Holdings Ltd. | | 30,100 | | 377,725 |
| Provident Financial plc | | 20,100 | | 368,231 |
| WH Smith plc | | 41,700 | | 363,306 |
| Whitbread plc | | 20,225 | | 596,197 |
| William Morrison Supermarkets plc | | 91,100 | | 433,985 |
| Wolseley plc | | 11,000 | | 419,217 |
| | | | | 8,796,904 |
| |
| Total Equity Securities (Cost $30,979,734) | | | | 35,467,181 |
| |
| | | PRINCIPAL | | |
| TIME DEPOSIT - 1.4% | | AMOUNT | | |
| State Street Bank Time Deposit, 0.113%, 4/2/12 | $ | 517,065 | | 517,065 |
| |
| Total Time Deposit (Cost $517,065) | | | | 517,065 |
| |
| |
| |
| TOTAL INVESTMENTS (Cost $31,496,799) - 98.0% | | | | 35,984,246 |
| Other assets and liabilities, net - 2.0% | | | | 746,463 |
| NET ASSETS - 100% | | | $ | 36,730,709 |
See notes to financial statements.
| www. | calvert.com CALVERT INTERNATIONAL OPPORTUNITIES FUND SEMI-ANNUAL REPORT (UNAUDITED) 20 |
| | | | |
| NET ASSETS CONSIST OF: | | | |
| Paid-in capital applicable to the following shares outstanding of common stock with | | | |
| 250,000,000 shares of $.01 par value shares authorized: | | | |
| Class A: 2,167,840 shares outstanding | $ | 29,181,909 | |
| Class C: 175,936 shares outstanding | | 2,191,847 | |
| Class I: 526,292 shares outstanding | | 6,908,018 | |
| Class Y: 135,872 shares outstanding | | 1,566,719 | |
| Undistributed net investment income (loss) | | (33,384 | ) |
| Accumulated net realized gain (loss) on investments and foreign currency transactions | | (7,572,063 | ) |
| Net unrealized appreciation (depreciation) on investments, foreign currencies and | | | |
| assets and liabilities denominated in foreign currencies | | 4,487,663 | |
| |
| NET ASSETS | $ | 36,730,709 | |
| |
| |
| NET ASSET VALUE PER SHARE | | | |
| Class A | (based on net assets of $26,667,484) | $ | 12.30 | |
| Class C | (based on net assets of $2,125,095) | $ | 12.08 | |
| Class I | (based on net assets of $6,353,597) | $ | 12.07 | |
| Class Y | (based on net assets of $1,584,533) | $ | 11.66 | |
(b) This security was valued by the Board of Directors. See Note A.
(e) Security is exempt from registration under Rule 144A of the Securities Act of 1933. These securities may be resold in transactions exempt from registration, normally to qualified institutional buyers.
* Non-income producing security.
Abbreviations:
ADR: American Depositary Receipts
BDR: Brazilian Depositary Receipts
plc: Public Limited Company
See notes to financial statements.
www.calvert.com CALVERT INTERNATIONAL OPPORTUNITIES FUND SEMI-ANNUAL REPORT (UNAUDITED) 21
| | | |
| STATEMENT OF OPERATIONS |
| SIX MONTHS ENDED MARCH 31, 2012 |
| |
| |
| |
| NET INVESTMENT INCOME | | | |
| Investment Income: | | | |
| Dividend income (net of foreign taxes withheld of $13,043 ) | $ | 333,571 | |
| Interest income | | 240 | |
| Total investment income | | 333,811 | |
| |
| Expenses: | | | |
| Investment advisory fee | | 135,239 | |
| Transfer agency fees and expenses | | 57,352 | |
| Distribution Plan expenses: | | | |
| Class A | | 32,060 | |
| Class C | | 9,580 | |
| Directors’ fees and expenses | | 1,941 | |
| Administrative fees | | 54,461 | |
| Accounting fees | | 2,523 | |
| Custodian fees | | 55,233 | |
| Registration fees | | 22,743 | |
| Reports to shareholders | | 20,318 | |
| Professional fees | | 12,178 | |
| Miscellaneous | | 7,563 | |
| Total expenses | | 411,191 | |
| Reimbursement from Advisor: | | | |
| Class A | | (99,587 | ) |
| Class C | | (12,177 | ) |
| Class I | | (14,815 | ) |
| Class Y | | (8,610 | ) |
| Fees paid indirectly | | (82 | ) |
| Net expenses | | 275,920 | |
| |
| NET INVESTMENT INCOME | | 57,891 | |
| |
| REALIZED AND UNREALIZED GAIN (LOSS) | | | |
| Net realized gain (loss) on: | | | |
| Investments | | 445,102 | |
| Foreign currency transactions | | (11,738 | ) |
| | | 433,364 | |
| |
| Change in unrealized appreciation (depreciation) on: | | | |
| Investments and foreign currencies | | 5,113,414 | |
| Assets and liabilities denominated in foreign currencies | | (2,761 | ) |
| | | 5,110,653 | |
| |
| NET REALIZED AND UNREALIZED GAIN (LOSS) | | 5,544,017 | |
| |
| INCREASE (DECREASE) IN NET ASSETS | | | |
| RESULTING FROM OPERATIONS | $ | 5,601,908 | |
See notes to financial statements.
| www. | calvert.com CALVERT INTERNATIONAL OPPORTUNITIES FUND SEMI-ANNUAL REPORT (UNAUDITED) 22 |
| | | | | | |
| stateMents of changes In net assets |
|
| | | SIX MONTHS
ENDED | | | YEAR
ENDED | |
| | | MARCH
31, | | | SEPTEMBER
30, | |
| INCREASE (DECREASE) IN NET ASSETS | | 2012 | | | 2011 | |
| Operations: | | | | | | |
| Net investment income | $ | 57,891 | | $ | 301,471 | |
| Net realized gain (loss) | | 433,364 | | | (1,779,213 | ) |
| Change in unrealized appreciation (depreciation) | | 5,110,653 | | | (4,911,995 | ) |
| |
| INCREASE (DECREASE) IN NET ASSETS | | | | | | |
| RESULTING FROM OPERATIONS | | 5,601,908 | | | (6,389,737 | ) |
| |
| Distributions to shareholders from: | | | | | | |
| Net investment income: | | | | | | |
| Class A shares | | (280,956 | ) | | (76,759 | ) |
| Class C shares | | (1,891 | ) | | — | |
| Class I shares | | (52,830 | ) | | (28,795 | ) |
| Class Y shares | | (15,544 | ) | | (1,938 | ) |
| Total distributions | | (351,221 | ) | | (107,492 | ) |
| |
| Capital share transactions: | | | | | | |
| Shares sold: | | | | | | |
| Class A shares | | 3,781,647 | | | 15,014,980 | |
| Class C shares | | 173,436 | | | 782,420 | |
| Class I shares | | 1,956,765 | | | 1,099,287 | |
| Class Y shares | | 131,251 | | | 1,087,881 | |
| Reinvestment of distributions: | | | | | | |
| Class A shares | | 245,600 | | | 69,323 | |
| Class C shares | | 1,463 | | | — | |
| Class I shares | | 52,830 | | | 28,796 | |
| Class Y shares | | 10,070 | | | 852 | |
| Redemption fees: | | | | | | |
| Class A shares | | 894 | | | 834 | |
| Class C shares | | — | | | 315 | |
| Class Y shares | | 13 | | | 4 | |
| Shares redeemed: | | | | | | |
| Class A shares | | (6,192,175 | ) | | (15,096,941 | ) |
| Class C shares | | (189,293 | ) | | (326,502 | ) |
| Class I shares | | (570,037 | ) | | (514,126 | ) |
| Class Y shares | | (320,143 | ) | | (192,271 | ) |
| Total capital share transactions | | (917,679 | ) | | 1,954,852 | |
| |
| TOTAL INCREASE (DECREASE) IN NET ASSETS | | 4,333,008 | | | (4,542,377 | ) |
| |
| NET ASSETS | | | | | | |
| Beginning of period | | 32,397,701 | | | 36,940,078 | |
| End of period (including distribution in excess of | | | | | | |
| net investment income and undistributed net investment income | | | | | | |
| of $33,384 and $259,946, respectively) | $ | 36,730,709 | | $ | 32,397,701 | |
See notes to financial statements.
www.calvert.com CALVERT INTERNATIONAL OPPORTUNITIES FUND SEMI-ANNUAL REPORT (UNAUDITED) 23
| | | | |
| STATEMENTS OF CHANGES IN NET ASSETS |
| |
| | SIX MONTHS
ENDED | | YEAR
ENDED | |
| | MARCH
31, | | SEPTEMBER
30, | |
| CAPITAL SHARE ACTIVITY | 2012 | | 2011 | |
| Shares sold: | | | | |
| Class A shares | 328,412 | | 1,170,709 | |
| Class C shares | 15,204 | | 61,515 | |
| Class I shares | 168,248 | | 97,690 | |
| Class Y shares | 12,379 | | 88,425 | |
| Reinvestment of distributions: | | | | |
| Class A shares | 23,214 | | 5,353 | |
| Class C shares | 140 | | — | |
| Class I shares | 5,094 | | 2,276 | |
| Class y shares | 1,005 | | 70 | |
| Shares redeemed: | | | | |
| Class A shares | (536,281 | ) | (1,242,892 | ) |
| Class C shares | (16,865 | ) | (27,013 | ) |
| Class I shares | (49,944 | ) | (41,279 | ) |
| Class Y shares | (29,368 | ) | (17,211 | ) |
| Total capital share activity | (78,762 | ) | 97,643 | |
See notes to financial statements.
| www. | calvert.com CALVERT INTERNATIONAL OPPORTUNITIES FUND SEMI-ANNUAL REPORT (UNAUDITED) 24 |
NOTES TO FINANCIAL STATEMENTS
NOTE A — SIGNIFICANT ACCOUNTING POLICIES
General: The Calvert International Opportunities Fund (the “Fund”), a series of Calvert World Values Fund, Inc., is registered under the Investment Company Act of 1940 as a diversified, open-end management investment company. The Calvert World Values Fund, Inc. is comprised of three separate series. The operations of each series are accounted for separately. The Fund offers four classes of shares of capital stock - Classes A, C, I, and Y. Class A shares are sold with a maximum front-end sales charge of 4.75%. Class C shares are sold without a front-end sales charge and, with certain exceptions, will be charged a deferred sales charge on shares sold within one year of purchase. Class C shares have higher levels of expenses than Class A shares. Class I shares require a minimum account balance of $1,000,000. The $1 million minimum initial investment may be waived for certain institutional accounts where it is believed to be in the best interest of the Fund and its shareholders. Class I shares have no front-end or deferred sales charge and have lower levels of expenses than Class A shares. Class Y shares are generally only available to wrap or similar fee-based programs offered by financial intermediaries that have entered into an agreement with the Fund’s Distributor to offer Class Y shares. Class Y shares have no front-end or deferred sales charge and have lower levels of expenses than Class A shares. Each class has different: (a) dividend rates, due to differences in Distribution Plan expenses and other class-specific expenses, (b) exchange privileges, and (c) class-specific voting rights.
Security Valuation: Net asset value per share is determined every business day as of the close of the regular session of the New York Stock Exchange (generally 4:00 p.m. Eastern time). The Fund uses independent pricing services approved by the Board of Directors to value its investments wherever possible. Investments for which market quotations are not available or deemed not reliable are fair valued in good faith under the direction of the Board of Directors. In determining fair value, the Board considers all relevant qualitative and quantitative information available. These factors are subject to change over time and are reviewed periodically. The values assigned to fair value investments are based on available information and do not necessarily represent amounts that might ultimately be realized. Further, because of the inherent uncertainty of valuation, those estimated values may differ significantly from the values that would have been used had a ready market for the investments existed, and the differences could be material.
At March 31, 2012, securities valued at $172,356 or 0.5% of net assets were fair valued in good faith under the direction of the Board of Directors.
The Fund utilizes various methods to measure the fair value of its investments. Generally Accepted Accounting Principles (GAAP) establishes a disclosure hierarchy that categorizes the inputs to valuation techniques used to value assets and liabilities at measurement date. These inputs are summarized in the three broad levels listed below:
Level 1 – quoted prices in active markets for identical securities
Level 2 – other significant observable inputs (including quoted prices for similar securities, interest rates, prepayment speeds, credit risk, etc.)
www.calvert.com CALVERT INTERNATIONAL OPPORTUNITIES FUND SEMI-ANNUAL REPORT (UNAUDITED) 25
Level 3 – significant unobservable inputs (including the Fund’s own assumptions in determining the fair value of investments)
The inputs or methodology used for valuing securities are not necessarily an indication of the risk associated with investing in those securities.
Changes in valuation techniques may result in transfers in or out of an investment’s assigned level within the hierarchy during the period. Valuation techniques used to value the Fund’s investments by major category are as follows.
Equity securities, including restricted securities, for which market quotations are readily available, are valued at the last reported sale price or official closing price as reported by an independent pricing service on the primary market or exchange on which they are traded and are categorized as Level 1 in the hierarchy. In the event there were no sales during the day or closing prices are not available, securities are valued at the last quoted bid price or using the last available price and are categorized as Level 2 in the hierarchy. Foreign securities are valued based on quotations from the principle market in which such securities are normally traded. If events occur after the close of the principal market in which foreign securities are traded, and before the close of business of the Fund, that are expected to materially affect the value of those securities, then they are valued at their fair value taking these events into account. The Fund has retained a third party fair value pricing service to quantitatively analyze the price movement of its holdings on foreign exchanges and to automatically fair value if the variation from the prior day’s closing price exceeds specified parameters. Such securities would be categorized as Level 2 in the hierarchy in these circumstances. Utilizing this technique may result in transfers between Level 1 and Level 2. For restricted securities and private placements where observable inputs are limited, assumptions about market activity and risk are used and such securities are categorized as Level 3 in the hierarchy.
Short-term securities of sufficient credit quality with remaining maturities of sixty days or less for which quotations are not readily available are valued at amortized cost, which approximates fair value, and are categorized as Level 2 in the hierarchy.
The following is a summary of the inputs used to value the Fund’s net assets as of March 31, 2012:
| | VALUATION INPUTS |
| Investments in Securities | Level 1 | Level 2 | Level 3 | | Total |
| Equity securities* | $35,294,816 | — | $172,365 | | $35,467,181 |
| Other debt obligations | | $517,065 | | | 517,065 |
| TOTAL | $35,294,816 | $517,065 | $172,365 | ** | $35,984,246 |
* For further breakdown of equity securities by country, please refer to the Statement of Net Assets.
** Level 3 securities represent 0.5% of net assets.
Security Transactions and Net Investment Income: Security transactions are accounted for on trade date. Realized gains and losses are recorded on an identified cost basis and may include proceeds from litigation. Dividend income is recorded on the ex-dividend date or, in the case of dividends on certain foreign securities, as soon as the Fund is informed of the ex-dividend date. Withholding taxes on foreign dividends have been provided for in accordance with the Fund’s understanding of the applicable
www.calvert.com CALVERT INTERNATIONAL OPPORTUNITIES FUND SEMI-ANNUAL REPORT (UNAUDITED) 26
country’s tax rules and rates. Distributions received on securities that represent a return of capital or capital gain are recorded as a reduction of cost of investments and/or as a realized gain. Interest income, which includes amortization of premium and accretion of discount on debt securities, is accrued as earned. Investment income and realized and unrealized gains and losses are allocated to separate classes of shares based upon the relative net assets of each class. Expenses arising in connection with a class are charged directly to that class. Expenses common to the classes are allocated to each class in proportion to their relative net assets.
Foreign Currency Transactions: The Fund’s accounting records are maintained in U.S. dollars. For valuation of assets and liabilities on each date of net asset value determination, foreign denominations are converted into U.S. dollars using the current exchange rate. Security transactions, income and expenses are translated at the prevailing rate of exchange on the date of the event. The effect of changes in foreign exchange rates on securities and foreign currencies is included in the net realized and unrealized gain or loss on securities and foreign currencies.
Distributions to Shareholders: Distributions to shareholders are recorded by the Fund on ex-dividend date. Dividends from net investment income and distributions from net realized capital gains, if any, are paid at least annually. Distributions are determined in accordance with income tax regulations which may differ from generally accepted accounting principles; accordingly, periodic reclassifications are made within the Fund’s capital accounts to reflect income and gains available for distribution under income tax regulations.
Estimates: The preparation of financial statements in conformity with accounting principles generally accepted in the United States requires management to make estimates and assumptions that affect the reported amounts of assets and liabilities and disclosure of contingent assets and liabilities at the date of the financial statements and the reported amounts of income and expenses during the reporting period. Actual results could differ from those estimates.
Redemption Fees: The Fund charges a 2% redemption fee on redemptions, including exchanges, made within 30 days of purchase (within seven days for Class I shares). The redemption fee is accounted for as an addition to paid-in capital. The fee is intended to discourage market-timers by ensuring that short-term trading costs are borne by the investors making the transactions and not the shareholders already in the Fund.
Expense Offset Arrangements: The Fund has an arrangement with its custodian bank whereby the custodian’s fees may be paid indirectly by credits earned on the Fund’s cash on deposit with the bank. These credits are used to reduce the Fund’s expenses. Such a deposit arrangement may be an alternative to overnight investments.
Federal Income Taxes: No provision for federal income or excise tax is required since the Fund intends to continue to qualify as a regulated investment company under the Internal Revenue Code and to distribute substantially all of its taxable earnings.
www.calvert.com CALVERT INTERNATIONAL OPPORTUNITIES FUND SEMI-ANNUAL REPORT (UNAUDITED) 27
Management has analyzed the Fund’s tax positions taken for all open federal income tax years and has concluded that no provision for federal income tax is required in the Fund’s financial statements. A Fund’s federal tax return is subject to examination by the Internal Revenue Service for a period of three years.
New Accounting Pronouncements: In May 2011, the Financial Accounting Standards Board (“FASB”) issued Accounting Standards Update (“ASU”) No. 2011-04, “Amendments to Achieve Common Fair Value Measurement and Disclosure Requirements in U.S. GAAP and IFRSs.” ASU No. 2011-04 requires disclosure of the amounts of any transfers between Level 1 and Level 2, and the reasons for the transfers. For Level 3 fair value measurements, ASU No. 2011-04 requires disclosure of quantitative information about the significant unobservable inputs used. In addition, for Level 3 fair value measurements, ASU No. 2011-04 requires a description of the valuation processes used by the reporting entity and requires a narrative description of the sensitivity of the fair value measurement to changes in unobservable inputs if a change in those inputs to a different amount might result in a significantly higher or lower fair value measurement. ASU No. 2011-04 is effective for financial statements issued for fiscal years and interim periods beginning after December 15, 2011. Management is currently evaluating the impact the adoption of ASU No. 2011-04 will have on the Fund’s financial statements and related disclosures.
NOTE B — RELATED PARTY TRANSACTIONS
Calvert Investment Management, Inc. (the “Advisor”) is wholly-owned by Calvert Investments, Inc. (“Calvert”), which is indirectly wholly owned by UNIFI Mutual Holding Company. The Advisor provides investment advisory services and pays the salaries and fees of officers and Directors of the Fund who are employees of the Advisor or its affiliates. For its services, the Advisor receives an annual fee, payable monthly, of .80% of the average daily net assets. Under the terms of the agreement, $24,400 was payable at period end. In addition, $14,815 was payable at period end for operating expenses paid by the Advisor during March 2012.
The Advisor has contractually agreed to limit net annual fund operating expenses through January 31, 2013. The contractual expense cap is 1.66%, 2.50%, 1.20%, and 1.41% for Class A, C, I, and Y, respectively. For the purposes of this expense limit, operating expenses do not include interest expense, brokerage commissions, taxes, and extraordinary expenses. To the extent any expense offset credits are earned, the Advisor’s obligation under the contractual limitation may be reduced and the Advisor may benefit from the expense offset arrangement.
Calvert Investment Administrative Services, Inc. (“CIAS”), an affiliate of the Advisor, provides administrative services to the Fund for an annual fee, payable monthly, of .35% for Classes A, C, and Y shares and .15% for Class I shares, based on their average daily net assets. Under the terms of the agreement, $9,706 was payable at period end.
Calvert Investment Distributors, Inc. (“CID”), an affiliate of the Advisor, is the distributor and principal underwriter for the Fund. Distribution Plans, adopted by Class A and Class C shares, allow the Fund to pay the Distributor for expenses and services associated with the distribution of shares. The expenses paid may not exceed .50% and 1.00%
| www. | calvert.com CALVERT INTERNATIONAL OPPORTUNITIES FUND SEMI-ANNUAL REPORT (UNAUDITED) 28 |
annually of the average daily net assets of Class A and C, respectively. The amount actually paid by the Fund is an annualized fee, payable monthly of .25% and 1.00% of the average daily net assets of Class A and C, respectively. Class I and Y shares do not have Distribution Plan expenses. Under the terms of the agreement, $7,407 was payable at period end.
CID received $4,508 as its portion of the commissions charged on sales of the Fund’s Class A shares for the six months ended March 31, 2012.
Calvert Investment Services, Inc. (“CIS”), an affiliate of the Advisor, is the shareholder servicing agent for the Fund. For its services, CIS received a fee of $12,285 for the six months ended March 31, 2012. Under the terms of the agreement, $1,982 was payable at period end. Boston Financial Data Services, Inc. is the transfer and dividend disbursing agent.
Each Director of the Fund who is not an employee of the Advisor or its affiliates receives an annual retainer of $44,000 plus a meeting fee of $2,000 for each Board meeting attended. Additional fees of up to $5,000 annually may be paid to the Board chair and Committee chairs ($10,000 for the Special Equities Committee chair) and $2,500 annually may be paid to Committee members, plus a Committee meeting fee of $500 for each Committee meeting attended. Directors’ fees are allocated to each of the Funds served.
NOTE C — INVESTMENT ACTIVITY
During the period, the cost of purchases and proceeds from sales of investments, other than short-term securities, were $7,525,739 and $6,963,177, respectively.
| CAPITAL LOSS CARRYFORWARDS | | |
| EXPIRATION DATE | | |
| 30-Sep-17 | ($1,330,630 | ) |
| 30-Sep-18 | (4,754,491 | ) |
| 30-Sep-19 | (69,673 | ) |
Capital losses may be utilized to offset future capital gains until expiration. Under the Regulated Investment Company Modernization Act of 2010, capital losses incurred in taxable years beginning after December 22, 2010 can be carried forward for an unlimited period. These losses will be required to be utilized prior to the losses incurred in pre-enactment taxable years. As a result of this ordering rule, pre-enactment capital loss carryforwards may more likely expire unused. Also, post-enactment capital losses that are carried forward will retain their character as either short-term or long-term capital losses rather than being considered all short-term as under previous law.
The Fund intends to elect to defer net capital losses of $1,463,857 incurred from November 1, 2010 though September 30, 2011 and treat them as arising in the fiscal year ending September 30, 2012.
www.calvert.com CALVERT INTERNATIONAL OPPORTUNITIES FUND SEMI-ANNUAL REPORT (UNAUDITED) 29
As of March 31, 2012, the tax basis components of unrealized appreciation/(depreciation) and the federal tax cost were as follows:
| Unrealized appreciation | $4,700,206 | |
| Unrealized (depreciation) | (791,808 | ) |
| Net unrealized appreciation/(depreciation) | $3,908,398 | |
| |
| Federal income tax cost of investments | $32,075,848 | |
NOTE D — LINE OF CREDIT
A financing agreement is in place with the Calvert Funds and State Street Corporation (“SSC”). Under the agreement, SSC provides an unsecured line of credit facility, in the aggregate amount of $50 million ($25 million committed and $25 million uncommitted), accessible by the Funds for temporary or emergency purposes only. Borrowings under the committed facility bear interest at the higher of the London Interbank Offered Rate (LIBOR) or the overnight Federal Funds Rate plus 1.25% per annum.
A commitment fee of .11% per annum is incurred on the unused portion of the committed facility, which is allocated to all participating funds. The Fund had no loans outstanding pursuant to this line of credit at March 31, 2012. For the six months ended March 31, 2012, borrowings by the Fund under the agreement were as follows:
| | WEIGHTED | | MONTH OF |
| AVERAGE | AVERAGE | MAXIMUM | MAXIMUM |
| DAILY | INTEREST | AMOUNT | AMOUNT |
| BALANCE | RATE | BORROWED | BORROWED |
| $5,343 | 1.41% | $197,638 | February 2012 |
NOTE E – SUBSEQUENT EVENTS
In preparing the financial statements as of March 31, 2012, no subsequent events or transactions occurred that would have required recognition or disclosure in these financial statements.
Effective May 2, 2012, UNIFI Mutual Holding Company changed its name to Ameritas Mutual Holding Company.
www.calvert.com CALVERT INTERNATIONAL OPPORTUNITIES FUND SEMI-ANNUAL REPORT (UNAUDITED) 30
| | | | | | |
| FINANCIAL HIGHLIGHTS |
| |
| | PERIODS ENDED |
| | MARCH
31, | | SEPTEMBER 30, | | SEPTEMBER 30, | |
| CLASS A SHARES | 2012 | | 2011 | | 2010 | (z) |
| Net asset value, beginning | $10.57 | | $12.43 | | $11.40 | |
| Income from investment operations: | | | | | | |
| Net investment income | .02 | | .10 | | .06 | |
| Net realized and unrealized gain (loss) | 1.83 | | (1.93 | ) | .97 | |
| Total from investment operations | 1.85 | | (1.83 | ) | 1.03 | |
| Distributions from: | | | | | | |
| Net investment income | (.12 | ) | (.03 | ) | — | |
| Total distributions | (.12 | ) | (.03 | ) | — | |
| Total increase (decrease) in net asset value | 1.73 | | (1.86 | ) | 1.03 | |
| Net asset value, ending | $12.30 | | $10.57 | | $12.43 | |
| |
| Total return* | 17.74 | % | (14.78 | %) | 9.04 | % |
| Ratios to average net assets:A | | | | | | |
| Net investment income | .29 | % (a) | .68 | % | .48 | % |
| Total expenses | 2.44 | % (a) | 2.21 | % | 2.27 | % |
| Expenses before offsets | 1.66 | % (a) | 1.66 | % | 1.66 | % |
| Net expenses | 1.66 | % (a) | 1.66 | % | 1.66 | % |
| Portfolio turnover | 21 | % | 126 | % | 44 | % |
| Net assets, ending (in thousands) | $26,667 | | $24,874 | | $30,062 | |
| |
| |
| | PERIODS ENDED |
| | SEPTEMBER
30, | | SEPTEMBER
30, | | SEPTEMBER
30, | |
| CLASS A SHARES | 2009 | (z) | 2008 | (z) | 2007 | # (z) |
| Net asset value, beginning | $11.50 | | $15.32 | | $15.00 | |
| Income from investment operations: | | | | | | |
| Net investment income | .06 | | .17 | | .02 | |
| Net realized and unrealized gain (loss) | (.10 | ) | (3.99 | ) | .30 | |
| Total from investment operations | (.04 | ) | (3.82 | ) | .32 | |
| Distributions from: | | | | | | |
| Net investment income | (.06 | ) | — | | — | |
| Net realized gain | ** | | — | | — | |
| Total from distributions | (.06 | ) | — | | — | |
| Total increase (decrease) in net asset value | (.10 | ) | (3.82 | ) | .32 | |
| Net asset value, ending | $11.40 | | $11.50 | | $15.32 | |
| |
| Total return* | (.16 | %) | (24.93 | %) | 2.13 | % |
| Ratios to average net assets:A | | | | | | |
| Net investment income | .63 | % | 1.22 | % | .50 | % (a) |
| Total expenses | 2.70 | % | 2.81 | % | 7.82 | % (a) |
| Expenses before offsets | 1.67 | % | 1.68 | % | 1.74 | % (a) |
| Net expenses | 1.67 | % | 1.66 | % | 1.66 | % (a) |
| Portfolio turnover | 98 | % | 29 | % | 2 | % |
| Net assets, ending (in thousands) | $21,328 | | $16,710 | | $5,678 | |
See notes to financial highlights.
www.calvert.com CALVERT INTERNATIONAL OPPORTUNITIES FUND SEMI-ANNUAL REPORT (UNAUDITED) 31
| | | | | | |
| FINANCIAL HIGHLIGHTS |
| |
| | | | PERIODS ENDED | | | |
| | MARCH
31, | | SEPTEMBER
30, | | SEPTEMBER
30, | |
| CLASS C SHARES | 2012 | | 2011 | | 2010 | (z) |
| Net asset value, beginning | $10.32 | | $12.20 | | $11.29 | |
| Income from investment operations: | | | | | | |
| Net investment income (loss) | (.03 | ) | (.01 | ) | (.03 | ) |
| Net realized and unrealized gain (loss) | 1.80 | | (1.87 | ) | .94 | |
| Total from investment operations | 1.77 | | (1.88 | ) | .91 | |
| Distributions from: | | | | | | |
| Net investment income | (.01 | ) | — | | — | |
| Total distributions | (.01 | ) | — | | — | |
| Total increase (decrease) in net asset value | 1.76 | | (1.88 | ) | .91 | |
| Net asset value, ending | $12.08 | | $10.32 | | $12.20 | |
| |
| Total return* | 17.18 | % | (15.41 | %) | 8.06 | % |
| Ratios to average net assets:A | | | | | | |
| Net investment income (loss) | (.51 | %) (a) | (.13 | %) | (.25 | %) |
| Total expenses | 3.77 | % (a) | 3.48 | % | 3.88 | % |
| Expenses before offsets | 2.50 | % (a) | 2.50 | % | 2.50 | % |
| Net expenses | 2.50 | % (a) | 2.50 | % | 2.50 | % |
| Portfolio turnover | 21 | % | 126 | % | 44 | % |
| Net assets, ending (in thousands) | $2,125 | | $1,831 | | $1,744 | |
| |
| |
| | PERIODS ENDED |
| | SEPTEMBER
30, | | SEPTEMBER
30, | | SEPTEMBER
30, | |
| CLASS C SHARES | 2009 | (z) | 2008 | (z) | 2007 | ##(z) |
| Net asset value, beginning | $11.39 | | $15.30 | | $14.74 | |
| Income from investment operations | | | | | | |
| Net investment income (loss) | (.02 | ) | .09 | | .01 | |
| Net realized and unrealized gain (loss) | (.08 | ) | (4.00 | ) | .55 | |
| Total from investment operations | (.10 | ) | (3.91 | ) | .56 | |
| Distributions from: | | | | | | |
| Net realized gain | ** | | — | | — | |
| Total from distributions | ** | | — | | — | |
| Total increase (decrease) in net asset value | (.10 | ) | (3.91 | ) | .56 | |
| Net asset value, ending | $11.29 | | $11.39 | | $15.30 | |
| |
| Total return* | (.82 | %) | (25.56 | %) | 3.80 | % |
| Ratios to average net assets:A | | | | | | |
| Net investment income (loss) | (.19 | %) | .67 | % | 1.14 | % (a) |
| Total expenses | 5.38 | % | 7.55 | % | 66.65 | % (a) |
| Expenses before offsets | 2.51 | % | 2.52 | % | 2.58 | % (a) |
| Net expenses | 2.51 | % | 2.50 | % | 2.50 | % (a) |
| Portfolio turnover | 98 | % | 29 | % | 1 | % |
| Net assets, ending (in thousands) | $823 | | $620 | | $140 | |
See notes to financial highlights.
www.calvert.com CALVERT INTERNATIONAL OPPORTUNITIES FUND SEMI-ANNUAL REPORT (UNAUDITED) 32
| | | | | | |
| FINANCIAL HIGHLIGHTS |
| |
| | PERIODS ENDED |
| | MARCH
31, | | SEPTEMBER
30, | | SEPTEMBER
30, | |
| CLASS I SHARES | 2012 | | 2011 | | 2010 | (z) |
| Net asset value, beginning | $10.36 | | $12.17 | | $11.32 | |
| Income from investment operations: | | | | | | |
| Net investment income | .08 | | .15 | | .10 | |
| Net realized and unrealized gain (loss) | 1.76 | | (1.88 | ) | .95 | |
| Total from investment operations | 1.84 | | (1.73 | ) | 1.05 | |
| Distributions from: | | | | | | |
| Net investment income | (.13 | ) | (.08 | ) | (.20 | ) |
| Total distributions | (.13 | ) | (.08 | ) | (.20 | ) |
| Total increase (decrease) in net asset value | 1.71 | | (1.81 | ) | .85 | |
| Net asset value, ending | $12.07 | | $10.36 | | $12.17 | |
| |
| Total return* | 17.96 | % | (14.32 | %) | 9.42 | % |
| Ratios to average net assets:A | | | | | | |
| Net investment income | .91 | % (a) | 1.11 | % | .90 | % |
| Total expenses | 1.83 | % (a) | 1.54 | % | 1.73 | % |
| Expenses before offsets | 1.20 | % (a) | 1.20 | % | 1.20 | % |
| Net expenses | 1.20 | % (a) | 1.20 | % | 1.20 | % |
| Portfolio turnover | 21 | % | 126 | % | 44 | % |
| Net assets, ending (in thousands) | $6,354 | | $4,174 | | $4,190 | |
| |
| |
| |
| | PERIODS ENDED |
| | SEPTEMBER
30, | | SEPTEMBER
30, | | SEPTEMBER
30, | |
| CLASS I SHARES | 2009 | (z) | 2008 | (z) | 2007 | #(z) |
| Net asset value, beginning | $11.58 | | $15.35 | | $15.00 | |
| Income from investment operations: | | | | | | |
| Net investment income | .09 | | .25 | | .04 | |
| Net realized and unrealized gain (loss) | (.14 | ) | (4.02 | ) | .31 | |
| Total from investment operations | (.05 | ) | (3.77 | ) | .35 | |
| Distributions from: | | | | | | |
| Net investment income | (.21 | ) | — | | — | |
| Net realized gain | ** | | — | | — | |
| Total from distributions | (.21 | ) | — | | — | |
| Total increase (decrease) in net asset value | (.26 | ) | (3.77 | ) | .35 | |
| Net asset value, ending | $11.32 | | $11.58 | | $15.35 | |
| |
| Total return* | .26 | % | (24.56 | %) | 2.33 | % |
| Ratios to average net assets:A | | | | | | |
| Net investment income | 1.03 | % | 1.72 | % | .78 | % (a) |
| Total expenses | 2.11 | % | 2.26 | % | 7.47 | % (a) |
| Expenses before offsets | 1.21 | % | 1.22 | % | 1.28 | % (a) |
| Net expenses | 1.21 | % | 1.20 | % | 1.20 | % (a) |
| Portfolio turnover | 98 | % | 29 | % | 2 | % |
| Net assets, ending (in thousands) | $3,712 | | $3,533 | | $3,075 | |
See notes to financial highlights.
www.calvert.com CALVERT INTERNATIONAL OPPORTUNITIES FUND SEMI-ANNUAL REPORT (UNAUDITED) 33
| | | | |
| FINANCIAL HIGHLIGHTS |
| |
| | PERIODS ENDED | |
| | MARCH 31, | | SEPTEMBER 30, | |
| CLASS Y SHARES | 2012 | | 2011 | |
| Net asset value, beginning | $10.00 | | $11.72 | |
| Income from investment operations: | | | | |
| Net investment income | .03 | | .13 | |
| Net realized and unrealized gain (loss) | 1.74 | | (1.83 | ) |
| Total from investment operations | 1.77 | | (1.70 | ) |
| Distributions from: | | | | |
| Net investment income | (.11 | ) | (.02 | ) |
| Total distributions | (.11 | ) | (.02 | ) |
| Total increase (decrease) in net asset value | 1.66 | | (1.72 | ) |
| Net asset value, ending | $11.66 | | $10.00 | |
| |
| Total return* | 17.86 | % | (14.52 | %) |
| Ratios to average net assets:A | | | | |
| Net investment income | .54 | % (a) | 1.04 | % |
| Total expenses | 2.53 | % (a) | 2.68 | % |
| Expenses before offsets | 1.41 | % (a) | 1.41 | % |
| Net expenses | 1.41 | % (a) | 1.41 | % |
| Portfolio turnover | 21 | % | 126 | % |
| Net assets, ending (in thousands) | $1,585 | | $1,519 | |
| |
| |
| | PERIODS ENDED | |
| | SEPTEMBER 30, | | SEPTEMBER 30, | |
| CLASS Y SHARES | 2010 | (z) | 2009 | ###(z) |
| Net asset value, beginning | $11.50 | | $8.67 | |
| Income from investment operations: | | | | |
| Net investment income | .10 | | .13 | |
| Net realized and unrealized gain (loss) | .90 | | 2.70 | |
| Total from investment operations | 1.00 | | 2.83 | |
| Distributions from: | | | | |
| Net investment income | (.78 | ) | — | |
| Net realized gain | — | | ** | |
| Total from distributions | (.78 | ) | ** | |
| Total increase (decrease) in net asset value | .22 | | 2.83 | |
| Net asset value, ending | $11.72 | | $11.50 | |
| |
| Total return* | 9.18 | % | 32.71 | % |
| Ratios to average net assets:A | | | | |
| Net investment income | .96 | % | 1.56 | % (a) |
| Total expenses | 4.73 | % | 21.67 | % (a) |
| Expenses before offsets | 1.41 | % | 1.42 | % (a) |
| Net expenses | 1.41 | % | 1.41 | % (a) |
| Portfolio turnover | 44 | % | 90 | % |
| Net assets, ending (in thousands) | $944 | | $112 | |
See notes to financial highlights.
www.calvert.com CALVERT INTERNATIONAL OPPORTUNITIES FUND SEMI-ANNUAL REPORT (UNAUDITED) 34
A Total expenses do not reflect amounts reimbursed and/or waived by the Advisor or reductions from expense off set arrangements. Expenses before offsets reflect expenses after reimbursement and/or waiver by the Advisor but prior to reductions from expense offset arrangements. Net expenses are net of all reductions and represent the net expenses paid by the Fund.
# From May 31, 2007 inception.
## From July 31, 2007 inception.
### From October 31, 2008 inception.
* Total return is not annualized for periods less than one year and does not reflect deduction of any front-end or deferred sales charge.
** Less than $0.01 per share.
(a) Annualized.
(z) Per share figures are calculated using the Average Shares Method.
See notes to financial statements.
www.calvert.com CALVERT INTERNATIONAL OPPORTUNITIES FUND SEMI-ANNUAL REPORT (UNAUDITED) 35
EXPLANATION OF FINANCIAL TABLES
SCHEDULE OF INVESTMENTS
The Schedule of Investments is a snapshot of all securities held in the fund at their market value, on the last day of the reporting period. Securities are listed by asset type (e.g., common stock, corporate bonds, U.S. government obligations) or, for International Funds, by country, and may be further broken down into sub-groups and by industry classification.
STATEMENT OF ASSETS AND LIABILITIES
The Statement of Assets and Liabilities is often referred to as the fund’s balance sheet. It lists the value of what the fund owns, is due and owes on the last day of the reporting period. The fund’s assets include the market value of securities owned, cash, receivables for securities sold and shareholder subscriptions, and receivables for dividends and interest payments that have been earned, but not yet received. The fund’s liabilities include payables for securities purchased and shareholder redemptions, and expenses owed but not yet paid. The statement also reports the fund’s net asset value (NAV) per share on the last day of the reporting period. The NAV is calculated by dividing the fund’s net assets (assets minus liabilities) by the number of shares outstanding. This statement is accompanied by a Schedule of Investments. Alternatively, if certain conditions are met, a Statement of Net Assets may be presented in lieu of this statement and the Schedule of Investments.
STATEMENT OF NET ASSETS
The Statement of Net Assets provides a detailed list of the fund’s holdings, including each security’s market value on the last day of the reporting period. The Statement of Net Assets includes a Schedule of Investments. Other assets are added and other liabilities subtracted from the investments total to calculate the fund’s net assets. Finally, net assets are divided by the outstanding shares of the fund to arrive at its share price, or Net Asset Value (NAV) per share.
At the end of the Statement of Net Assets is a table displaying the composition of the fund’s net assets. Paid in Capital is the money invested by shareholders and represents the bulk of net assets. Undistributed Net Investment Income and Accumulated Net Realized Gains usually approximate the amounts the fund had available to distribute to shareholders as of the statement date. Accumulated Realized Losses will appear as negative balances. Unrealized Appreciation (Depreciation) is the difference between the market value of the fund’s investments and their cost, and reflects the gains (losses) that would be realized if the fund were to sell all of its investments at their statement-date values.
STATEMENT OF OPERATIONS
The Statement of Operations summarizes the fund’s investment income earned and expenses incurred in operating the fund. Investment income includes dividends earned from stocks and interest earned from interest-bearing securities in the fund. Expenses incurred in operating the fund include the advisory fee paid to the investment advisor, administrative services fees, distribution plan expenses (if applicable), transfer agent fees,
| www. | calvert.com CALVERT INTERNATIONAL OPPORTUNITIES FUND SEMI-ANNUAL REPORT (UNAUDITED) 36 |
shareholder servicing expenses, custodial, legal, and audit fees, and the printing and postage expenses related to shareholder reports. Expense offsets (fees paid indirectly) are also shown. Credits earned from offset arrangements are used to reduce the fund’s expenses. This statement also shows net gains (losses) realized on the sale of investments and the increase or decrease in the unrealized appreciation (depreciation) on investments held during the period.
STATEMENT OF CHANGES IN NET ASSETS
The Statement of Changes in Net Assets shows how the fund’s total net assets changed during the two most recent reporting periods. Changes in the fund’s net assets are attributable to investment operations, distributions and capital share transactions.
The Operations section of the report summarizes information detailed in the Statement of Operations. The Distribution section shows the dividend and capital gain distributions made to shareholders. The amounts shown as distributions in this section may not match the net investment income and realized gains amounts shown in the Operations section because distributions are determined on a tax basis and certain investments or transactions may be treated differently for financial statement and tax purposes. The Capital Share Transactions section shows the amount shareholders invested in the fund, either by purchasing shares or by reinvesting distributions, and the amounts redeemed. The corresponding numbers of shares issued, reinvested and redeemed are shown at the end of the report.
FINANCIAL HIGHLIGHTS
The Financial Highlights table provides a per-share breakdown per class of the components that affect the fund’s net asset value for current and past reporting periods. The table provides total return, total distributions, expense ratios, portfolio turnover and net assets for the applicable period. Total return is a measure of a fund’s performance that encompasses all elements of return: dividends, capital gain distributions and changes in net asset value. Total return is the change in value of an investment over a given period, assuming reinvestment of any dividends and capital gain distributions, expressed as a percentage of the initial investment. Total distributions include distributions from net investment income and net realized gains. Long-term gains are earned on securities held in the fund more than one year. Short-term gains, on the sale of securities held less than one year, are treated as ordinary dividend income for tax purposes. The expense ratio is a fund’s cost of doing business, expressed as a percentage of net assets. These expenses directly reduce returns to shareholders. Portfolio turnover measures the trading activity in a fund’s investment portfolio – how often securities are bought and sold by a fund. Portfolio turnover is affected by market conditions, changes in the size of the fund, the nature of the fund’s investments and the investment style of the portfolio manager.
www.calvert.com CALVERT INTERNATIONAL OPPORTUNITIES FUND SEMI-ANNUAL REPORT (UNAUDITED) 37
PROXY VOTING
The Proxy Voting Guidelines of the Calvert Funds that the Fund uses to determine how to vote proxies relating to portfolio securities are provided as an Appendix to the Fund’s Statement of Additional Information. The Statement of Additional Information can be obtained free of charge by calling the Fund at 1-800-368-2745, by visiting the Calvert website at www.calvert.com; or by visiting the SEC’s website at www.sec.gov.
Information regarding how the Fund voted proxies relating to portfolio securities during the most recent 12-month period ended June 30 is available on the Fund’s website at www.calvert.com and on the SEC’s website at www.sec.gov.
AVAILABILITY OF QUARTERLY PORTFOLIO HOLDINGS
The Fund files its complete schedule of portfolio holdings with the SEC for the first and third quarters of each fiscal year on Form N-Q. The Fund’s Form N-Q is available on the SEC’s website at www.sec.gov. The Fund’s Form N-Q may be reviewed and copied at the SEC’s Public Reference Room in Washington, DC; information on the operation of the Public Reference Room may be obtained by calling 1-800-SEC-0330.
BASIS FOR BOARD’S APPROVAL OF INVESTMENT ADVISORY CONTRACT
At a meeting held on December 6, 2011, the Board of Directors, and by a separate vote, the disinterested Directors, approved the continuance of the Investment Advisory Agreement between Calvert World Values Fund, Inc. and the Advisor with respect to the Fund. The Investment Subadvisory Agreements between the Advisor and each Subadvisor with respect to the Fund were previously approved by the Board in September 2011 and therefore were not up for renewal at the December meeting.
In evaluating the Investment Advisory Agreement, the Board considered a variety of information relating to the Fund and the Advisor. The disinterested Directors reviewed a report prepared by the Advisor regarding various services provided to the Fund by the Advisor and its affiliates. Such report included, among other data, information regarding the Advisor’s personnel and the Advisor’s revenue and cost of providing services to the Fund, and a separate report prepared by an independent third party, which provided a statistical analysis comparing the Fund’s investment performance, expenses, and fees to comparable mutual funds.
The disinterested Directors were separately represented by independent legal coun-
| www. | calvert.com CALVERT INTERNATIONAL OPPORTUNITIES FUND SEMI-ANNUAL REPORT (UNAUDITED) 38 |
sel with respect to their consideration of the reapproval of the Investment Advisory Agreement. Prior to voting, the disinterested Directors reviewed the proposed continuance of the Investment Advisory Agreement with management and also met in private sessions with their counsel at which no representatives of management were present.
In the course of its deliberations regarding the Investment Advisory Agreement, the Board considered the following factors, among others: the nature, extent and quality of the services provided by the Advisor, including the personnel providing such services; the Advisor’s financial condition; the level and method of computing the Fund’s advisory fee; comparative performance, fee and expense information for the Fund; the profitability of the Calvert Family of Funds to the Advisor and its affiliates; the allocation of the Fund’s brokerage, including the Advisor’s process for monitoring “best execution”; the direct and indirect benefits, if any, derived by the Advisor and its affiliates from their relationship with the Fund; the effect of the Fund’s growth and size on the Fund’s performance and expenses; the affiliated distributor’s process for monitoring sales load breakpoints; the Advisor’s compliance programs and policies; the Advisor’s performance of substantially similar duties for other funds; and any possible conflicts of interest.
In considering the nature, extent and quality of the services provided by the Advisor under the Investment Advisory Agreement, the Board reviewed information provided by the Advisor relating to its operations and personnel, including, among other information, biographical information on the Advisor’s supervisory and professional staff and descriptions of its organizational and management structure. The Board also took into account similar information provided periodically throughout the previous year by the Advisor as well as the Board’s familiarity with the Advisor’s senior management through Board of Directors’ meetings, discussions and other reports. The Board also noted that it reviewed on a quarterly basis information regarding the Advisor’s compliance with applicable policies and procedures, including those related to personal investing. The Advisor’s administrative capabilities, including its ability to supervise the other service providers for the Fund, were also considered. The Board observed that the scope of services provided by the Advisor generally had expanded over time as a result of regulatory, market and other changes. The Board also took into account the environmental, social, sustainability and governance research and analysis provided by the Advisor to the Fund. The Board discussed the Advisor’s effectiveness in monitoring the performance of the Subadvisors and its timeliness in responding to performance issues. The Board concluded that it was satisfied with the nature, extent and quality of services provided to the Fund by the Advisor under the Investment Advisory Agreement.
In considering the Fund’s performance, the Board noted that it reviewed on a quarterly basis detailed information about the Fund’s performance results, portfolio composition and investment strategies. In addition, the Board took into account overall financial market conditions. The Board also reviewed various comparative data provided to it in connection with its consideration of the renewal of the Investment Advisory Agreement, including, among other information, a comparison of the
www.calvert.com CALVERT INTERNATIONAL OPPORTUNITIES FUND SEMI-ANNUAL REPORT (UNAUDITED) 39
Fund’s total return with its Lipper index and with that of other mutual funds deemed to be in its peer group by an independent third party in its report. This comparison indicated that the Fund performed below the median of its peer group for the one- and three-year periods ended June 30, 2011. The data also indicated that the Fund under-performed its Lipper index for the one- and three-year periods ended June 30, 2011. The Board took into account management’s discussion of the Fund’s performance and management’s continued monitoring of the Fund’s performance. The Board also noted that the Subadvisors had begun managing the Fund in September 2011. Based upon its review, the Board concluded that appropriate action was being taken with respect to the Fund’s performance.
In considering the Fund’s fees and expenses, the Board compared the Fund’s fees and total expense ratio with various comparative data for the funds in its peer group. Among other findings, the data indicated that the Fund’s advisory fee (after taking into account waivers and/or reimbursements) was below the median of its peer group and that total expenses (net of waivers and/or reimbursements) were above the median of its peer group. The Board noted that the allocation of advisory and administrative fees may vary among the Fund’s peer group. The Board also took into account the Advisor’s current undertaking to maintain expense limitations for the Fund. The Board also noted management’s discussion of the Fund’s expenses and certain factors that affected the level of such expenses, including the cost of providing the environmental, social, sustainability and governance research and analysis provided by the Advisor. The Board noted that in 2011, the transfer agency fees paid by the Calvert Family of Funds had been renegotiated, resulting in an anticipated overall reduction in the transfer agency fees to be paid across the Calvert Family of Funds complex. Based upon its review, the Board concluded that the advisory fee was reasonable in view of the quality of services received by the Fund from the Advisor and the other factors considered.
The Board reviewed the Advisor’s profitability on a fund-by-fund basis. In reviewing the overall profitability of the advisory fee to the Fund’s Advisor, the Board also considered the fact that affiliates of the Advisor provided shareholder servicing, administrative and distribution services to the Fund for which they received compensation. The information considered by the Board included Calvert’s operating profit margin information both before and after tax expenses with respect to the services that the Advisor and its affiliates provided to the Calvert Family of Funds complex. The Board reviewed the profitability of the Advisor’s relationship with the Fund in terms of the total amount of annual advisory fees it received with respect to the Fund and whether the Advisor had the financial wherewithal to continue to provide a high level of services to the Fund. The Board noted that the Advisor had reimbursed expenses of the Fund. The Board also noted the Advisor’s current undertaking to maintain expense limitations for the Fund. The Board also considered that the Advisor derived benefits to its reputation and other indirect benefits from its relationship with the Fund. The Board also noted that the Advisor paid the subadvisory fees to the Subadvisors. Based upon its review, the Board concluded that the Advisor’s and its affiliates’ level of profitability from their relationship with the Fund was reasonable.
The Board considered the effect of the Fund’s current size and its potential growth on
| www. | calvert.com CALVERT INTERNATIONAL OPPORTUNITIES FUND SEMI-ANNUAL REPORT (UNAUDITED) 40 |
its performance and fees. The Board concluded that adding breakpoints to the advisory fee at specified asset levels would not be appropriate at this time given the Fund’s current size. The Board noted that if the Fund’s assets increased over time, the Fund might realize other economies of scale if assets increased proportionally more than certain other expenses.
In reapproving the Investment Advisory Agreement, the Board, including the disinterested Directors, did not identify any single factor as controlling, and each Director may have attributed different weight to various factors.
CONCLUSIONS
The Board reached the following conclusions regarding the Investment Advisory Agreement, among others: (a) the Advisor has demonstrated that it possesses the capability and resources to perform the duties required of it under the Investment Advisory Agreement; (b) the Advisor maintains appropriate compliance programs; (c) appropriate action is being taken with respect to the performance of the Fund; and (d) the Fund’s advisory is reasonable relative to those of similar funds and to the services to be provided by the Advisor and the Subadvisors. Based on its conclusions, the Board determined that reapproval of the Investment Advisory Agreement would be in the best interests of the Fund and its shareholders.
www.calvert.com CALVERT INTERNATIONAL OPPORTUNITIES FUND SEMI-ANNUAL REPORT (UNAUDITED) 41
To Open an Account
800-368-2748
Yields and Prices
Calvert Information Network
(24 hours, 7 days a week)
800-368-2745
Service for Existing Account
Shareholders: 800-368-2745
Brokers: 800-368-2746
TDD for Hearing Impaired
800-541-1524
Branch Office
4550 Montgomery Avenue
Suite 1000 North
Bethesda, Maryland 20814
Registered, Certified or Overnight Mail
Calvert Investments
c/o BFDS,
330 West 9th Street
Kansas City, MO 64105
Web Site
www.calvert.com
Principal Underwriter
Calvert Investment Distributors, Inc.
4550 Montgomery Avenue
Suite 1000 North
Bethesda, Maryland 20814
| | |
| CALVERT | CALVERT’S | Equity Funds |
| INTERNATIONAL | FAMILY OF FUNDS | Enhanced Equity Portfolio |
| OPPORTUNITIES | | Equity Portfolio |
| FUND | Tax-Exempt Money | Large Cap Value Fund |
| | Market Funds | Social Index Fund |
| | CTFR Money Market Portfolio | Capital Accumulation Fund |
| | | International Equity Fund |
| | Taxable Money Market | Small Cap Fund |
| | Funds | Global Alternative Energy Fund |
| | First Government Money Market | Global Water Fund |
| | Fund | International Opportunities Fund |
| | Money Market Portfolio | Equity Income Fund |
| |
| | Municipal Funds | Balanced and Asset |
| | Tax-Free Bond Fund | Allocation Funds |
| | | Balanced Portfolio |
| | Taxable Bond Funds | Conservative Allocation Fund |
| | Bond Portfolio | Moderate Allocation Fund |
| | Income Fund | Aggressive Allocation Fund |
| | Short Duration Income Fund | |
| | Long-Term Income Fund | |
| | Ultra-Short Income Fund | |
| | Government Fund | |
| | High-Yield Bond Fund | |
This report is intended to provide fund information to shareholders. It is not authorized for distribution to prospective investors unless preceded or accompanied by a prospectus.
Note: The information on our website is not incorporated by reference into this report; our website address is included as an inactive textual reference only.
Investors should carefully consider the investment objectives, risks, charges and expenses of the Calvert Funds. This and other important information is contained in the fund’s summary prospectus and prospectus, which can be obtained from your financial professional and should be read carefully before investing. You may also call Calvert at 800/368-2745 or visit www. calvert.com.
Item 2. Code of Ethics.
Not applicable.
Item 3. Audit Committee Financial Expert.
Not applicable.
Item 4. Principal Accountant Fees and Services.
Not applicable.
Item 5. Audit Committee of Listed Registrants.
Not applicable.
Item 6. Schedule of Investments.
(a) This Schedule is included as part of the report to shareholders filed under Item 1 of this Form.
(b) Not applicable.
Item 7. Disclosure of Proxy Voting Policies and Procedures for Closed-End Management Investment Companies.
Not applicable.
Item 8. Portfolio Managers of Closed-End Management Investment Companies.
Not applicable.
Item 9. Purchases of Equity Securities by Closed-End Management Investment Company and Affiliated Purchasers.
Not applicable.
Item 10. Submission of Matters to a Vote of Security Holders.
No material changes to the procedures by which shareholders may recommend nominees to the registrant’s Board of Directors since registrant last provided disclosure in response to this Item.
Item 11. Controls and Procedures.
(a) The principal executive and financial officers concluded that the registrant's disclosure controls and procedures (as defined in Rule 30a-3(c) under the 1940 Act) are effective, based on the evaluation of these controls and procedures required by Rule 30a-3(b) under the 1940 Act and Rules 13a-15(b) or 15d-15(b) under the Exchange Act, as of a date within 90 days of the filing date of this report.
(b) There was no change in the registrant's internal control over financial reporting (as defined in Rule 30a-3(d) under the 1940 Act) that occurred during the registrant's second fiscal quarter of the period covered by this report that has materially affected, or is reasonably likely to materially affect, the registrant's internal control over financial reporting.
Item 12. Exhibits.
(a)(1) Not applicable.
(a)(2) A separate certification for each principal executive officer and principal financial officer of the registrant as required by Rule 30a-2 under the Act (17 CFR 270.30a-2).
Attached hereto.
(a)(3) Not applicable.
(b) A certification for the registrant's Principal Executive Officer and Principal Financial Officer, as required by Rule 30a-2(b) under the Investment Company Act of 1940, is attached hereto. The certification furnished pursuant to this paragraph is not deemed to be "filed" for purposes of Section 18 of the Securities Exchange Act of 1934, or otherwise subject to the liability of that section. Such certification is not deemed to be incorporated by reference into any filing under the Securities Act of 1933 or the Securities Exchange Act of 1934, except to the extent that the registrant specifically incorporates it by reference.
Pursuant to the requirements of the Securities Exchange Act of 1934 and the Investment Act of 1940, the registrant has duly caused this report to be signed on its behalf by the undersigned, thereunto duly authorized.
CALVERT WORLD VALUES FUND, INC.
By: /s/ Barbara J. Krumsiek
Barbara J. Krumsiek
President -- Principal Executive Officer
Date: June 1, 2012
Pursuant to the requirements of the Securities Exchange Act of 1934 and the Investment Act of 1940, this report has been signed below by the following persons on behalf of the registrant and in the capacities and on the dates indicated.
/s/ Barbara J. Krumsiek
Barbara J. Krumsiek
President -- Principal Executive Officer
Date: June 1, 2012
/s/ Ronald M. Wolfsheimer
Ronald M. Wolfsheimer
Treasurer -- Principal Financial Officer
Date: June 1, 2012