UNITED STATES
SECURITIES AND EXCHANGE COMMISSION
Washington, D.C. 20549
FORM N-CSR
CERTIFIED SHAREHOLDER REPORT OF REGISTERED
MANAGEMENT INVESTMENT COMPANIES
Investment Company Act file number: 811-6563
CALVERT WORLD VALUES FUND, INC.
(Exact name of registrant as specified in charter)
4550 Montgomery Avenue
Suite 1000N
Bethesda, Maryland 20814
(Address of Principal Executive Offices)
William M. Tartikoff, Esq.
4550 Montgomery Avenue
Suite 1000N
Bethesda, Maryland 20814
(Name and Address of Agent for Service)
Registrant's telephone number, including area code: (301) 951-4800
Date of fiscal year end: September 30
Date of reporting period: Six months ended March 31, 2014
Item 1. Report to Stockholders.
[Calvert International Equity Fund Semi-Annual Report to Shareholders]
and
[Calvert Capital Accumulation Fund Semi-Annual Report to Shareholders]
and
[Calvert International Opportunities Fund Semi-Annual Report to Shareholders]
and
[Calvert Emerging Markets Equity Fund Semi-Annual Report to Shareholders]
Choose Planet-friendly E-delivery!
Sign up now for on-line statements, prospectuses, and fund reports. In less than five minutes you can help reduce paper mail and lower fund costs.
Just go to www.calvert.com. If you already have an online account at Calvert, click on My Account, and select the documents you would like to receive via e-mail.
If you’re new to online account access, click on Login/Register to open an online account. Once you’re in, click on the E-delivery sign-up at the bottom of the Account Portfolio page and follow the quick, easy steps. Note: if your shares are not held directly at Calvert but through a brokerage firm, you must contact your broker for electronic delivery options available through their firm.

After a “risk-on” year in 2013, the first quarter of 2014 proved to be a more challenging environment for equities. Concerns about economic growth in emerging markets, geopolitical turmoil in the Ukraine, and somewhat softer macroeconomic data in the United States injected more risk aversion into the markets. At the same time, profit-taking and tempered expectations for a repeat performance of stellar 2013 returns likely drove down investor risk tolerance in the first quarter.
Despite investors taking a more cautious approach toward equities at the start of 2014, the exceptionally strong performance of the equity markets, particularly U.S. equities, in the fourth quarter of 2013 allowed all major global equity indices to finish the six-month reporting period in positive territory. For the six months ended March 31, 2014, the Standard and Poor’s (S&P) 500, Russell 1000, Russell 2000, MSCI EAFE, and MSCI Emerging Markets Indices returned 12.51%, 12.48%, 9.94%, 6.56%, and 1.49%, respectively.
From an investment-style perspective, small-cap stocks underperformed their large-cap counterparts, while value stocks outperformed growth stocks. The rotation from expensive growth stocks to more bargain-priced value stocks, if it continues, could suggest a more favorable outlook for
A Look at the Environmental, Social, and Governance Analytical Framework
In recent years, U.S. consumers, investors, and companies themselves have become increasingly aware of how environmental, social, and governance (ESG) matters impact the corporate bottom line, the economy, and quality of life. At Calvert, we continue to look for ways to add value to many of our equity portfolios by integrating critical ESG factors into our research process on a company-by-company basis. We work extensively with our in-house sustainability research department to develop quantitative ESG methods and measures, compiled from multiple externally- and internally-generated data sources. We use these inputs in conjunction with fundamental research on company valuations and investment theses.
This integrated approach has yielded multiple opportunities to add value to the investment process, either by identifying long-term investment potential or by uncovering hidden risks. Calvert also continues to advocate for improved corporate policies in the areas of climate change, financial market reform, corporate governance, revenue transparency, and sustainability reporting, among others. Taken together, these efforts are helping to enhance the market’s focus on and understanding of relevant ESG issues.
4 www.calvert.com CALVERT INTERNATIONAL EQUITY FUND SEMI-ANNUAL REPORT (UNAUDITED)
| | |
| CALVERT |
| INTERNATIONAL |
| EQUITY FUND |
| MARCH 31, 2014 |
| |
| INVESTMENT PERFORMANCE | |
| (TOTAL RETURN AT NAV*) | |
| | 6 MONTHS | 12 MONTHS |
| | ENDED | ENDED |
| | 3/31/14 | 3/31/14 |
| Class A | 4.73% | 15.94% |
| Class B | 4.07% | 14.58% |
| Class C | 4.28% | 14.91% |
| Class I | 5.08% | 16.77% |
| Class Y | 4.95% | 16.40% |
| |
| MSCI EAFE | | |
| Investable | | |
| Market Index | | |
| (IMI) | 6.93% | 18.73% |
| |
| Lipper | | |
| International | | |
| Multi-Cap | | |
| Growth Funds | | |
| Average | 5.95% | 14.78% |
| |
| TEN LARGEST | % OF NET |
| STOCK HOLDINGS | ASSETS |
| Roche Holding AG | 2.2% |
| Toyota Motor Corp. | 2.0% |
| Persimmon plc | 1.4% |
| AIA Group Ltd. | 1.3% |
| Assa Abloy AB | 1.2% |
| Schneider Electric SA | 1.2% |
| Softbank Corp. | 1.2% |
| Air Liquide SA | 1.1% |
| Mizuho Financial Group, Inc. | 1.0% |
| Novo Nordisk A/S | 1.0% |
| Total | 13.6% |
* Investment performance/return at NAV does not reflect the deduction of the Fund’s maximum 4.75% front-end sales charge or any deferred sales charges.
| CALVERT |
| INTERNATIONAL |
| EQUITY FUND |
| MARCH 31, 2014 |
| |
| | % OF TOTAL |
| ECONOMIC SECTORS | INVESTMENTS |
| Consumer Discretionary | 19.6% |
| Consumer Staples | 8.7% |
| Energy | 3.9% |
| Financials | 24.8% |
| Health Care | 9.8% |
| Industrials | 12.8% |
| Information Technology | 5.7% |
| Limited Partnership Interest | 0.4% |
| Materials | 4.0% |
| Short-Term Investments | 3.0% |
| Telecommunication Services | 4.9% |
| Utilities | 1.9% |
| Venture Capital | 0.5% |
| Total | 100% |
higher-quality stocks. Looking at sector performance, Health Care, Information Technology, and Materials were the top-performing sectors within the Russell 1000 Index, while the Telecommunications, Consumer Discretionary, and Consumer Staples sectors lagged.
U.S. Economic Recovery Moves Forward, Despite Fed Tapering Talk
Positive fourth-quarter results in the equity markets were driven by several factors, centering on continued U.S. economic recovery and growing investor confidence, thus creating an environment conducive to earnings expansion. These factors explain, in part, why U.S. equities shone so strongly compared with foreign developed and emerging markets. Extreme weather likely held back economic growth in much of the U.S. during the period, but markets
www.calvert.com CALVERT INTERNATIONAL EQUITY FUND SEMI-ANNUAL REPORT (UNAUDITED) 5
found support as investors gained comfort in the view that weaker economic data was more a by-product of inclement weather, rather than reflecting a broader economic slowdown.
The Fed’s decision to begin tapering its quantitative easing (QE) programs in January divided analysts on whether rising interest rates would dampen the economic recovery and create downward pressure on stocks, or whether they would instill confidence that the Fed is being responsible and attract more investors. On the whole, the resiliency and low volatility of interest rates in the wake of Fed tapering was a positive sign, indicating that—at least for a while—tapering need not produce the kind of jump in interest rates many analysts had feared.
Consumers Play a Key Role in Recovery
Although market analysts have focused largely on what is happening at the Federal Reserve, we believe an important driver of economic activity in the United States, and of Fed policy by extension, is the continued improvement in the health of the consumer balance sheet. This gives consumers better access to consumer loans and mortgages, supporting the continued recovery of the housing and automotive industries, among others. At the same time, initial jobless claims maintained their downward trend throughout the period. Continued improvements in the labor market should support consumer spending and the U.S. housing sector—keys to the success of the U.S. economic recovery.
An Anemic Europe and Sluggish China Worry Investors
A global backdrop of lower-than-target inflation persisted throughout the period, despite continued aggressive easing actions by the world’s largest central banks. There are several drivers contributing to low
| CALVERT |
| INTERNATIONAL |
| EQUITY FUND |
| MARCH 31, 2014 |
| |
| AVERAGE ANNUAL TOTAL RETURNS |
| |
| CLASS A SHARES | (WITH MAX. LOAD) |
| One year | 10.43% |
| Five year | 12.28% |
| Ten year | 2.70% |
| |
| CLASS B SHARES | (WITH MAX. LOAD) |
| One year | 9.58% |
| Five year | 11.93% |
| Ten year | 2.06% |
| |
| CLASS C SHARES | (WITH MAX. LOAD) |
| One year | 13.91% |
| Five year | 12.39% |
| Ten year | 2.31% |
| |
| CLASS I SHARES | |
| One year | 16.77% |
| Five year | 14.22% |
| Ten year | 3.95% |
| |
| CLASS Y SHARES* | |
| One year | 16.40% |
| Five year | 13.86% |
| Ten year | 3.43% |
* Calvert International Equity Fund first offered Class Y shares on October 31, 2008. Performance prior to that date reflects the performance of Class A shares at net asset value (NAV). Actual Class Y share performance would have been different.
6 www.calvert.com CALVERT INTERNATIONAL EQUITY FUND SEMI-ANNUAL REPORT (UNAUDITED)
GROWTH OF $10,000
The graph below shows the value of a hypothetical $10,000 investment in the Fund over the past 10 fiscal year periods. The results shown are for Class A shares and reflect the deduction of the maximum front-end sales charge of 4.75% and assume the reinvestment of dividends. The result is compared with benchmarks that include a broad based market index and a Lipper peer group average. Market indexes are unmanaged and their results do not reflect the effect of expenses or sales charges. The Lipper average reflects the deduction of the category’s average front-end sales charge. The value of an investment in a different share class would be different.
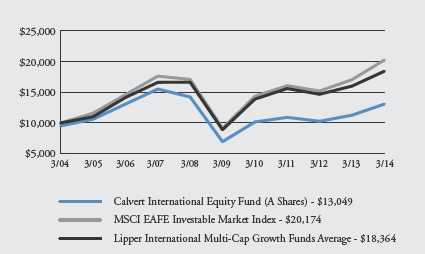
All performance data shown, including the graph above and the adjacent table, represents past performance, does not guarantee future results, assumes reinvestment of dividends and distributions and does not reflect the deduction of taxes that a shareholder would pay on the Fund’s distributions or the redemption of the Fund shares. All performance data reflects fee waivers and/or expense limitations, if any are in effect; in their absence performance would be lower. See Note B in Notes to Financial Statements. The investment return and principal value of an investment will fluctuate so that an investor’s shares, when redeemed, may be worth more or less than their original cost. Current performance may be lower or higher than the performance data quoted; for current performance data visit www.calvert.com. The gross expense ratio from the current prospectus for Class A shares is 1.78%. This number may differ from the expense ratio shown elsewhere in this report because it is based on a different time period and, if applicable, does not include fee or expense waivers. Performance data quoted already reflects the deduction of the Fund’s operating expenses.
www.calvert.com CALVERT INTERNATIONAL EQUITY FUND SEMI-ANNUAL REPORT (UNAUDITED) 7
inflation we believe are likely to persist in the near-term. For example, anemic economic activity in Europe continued to highlight the threat of deflation, as inflation in the euro-zone dipped below 1% during the period. While European Central Bank (ECB) President Mario Draghi indicated a willingness to intervene if further downside risks to price stability materialize, there appear to be few catalysts capable of driving an increase in demand-side inflation since the euro area’s economic recovery has remained tepid.
Worries about a hard landing in China returned to the forefront of investor concerns as the China HSBC Manufacturing PMI (Purchasing Managers’ Index) steadily declined throughout the period into contraction territory. Meanwhile, political upheaval in the Ukraine, which culminated with Russian forces occupying the Crimea region, injected further risk aversion into investor sentiment. The situation continued to negatively impact emerging-market stocks and currencies, which were already under pressure due to the prospect of slower GDP growth in emerging markets. We expect the Ukraine situation to be a continued source of headline market risk in the near-term, until a final diplomatic solution is reached.
Outlook
The contrast in economic conditions between the United States and both Europe and China (and other emerging markets) should continue to draw more investment to the U.S. in the near-term. Fed tapering will most likely add to this effect in equities as well as other asset classes. We expect the dollar to continue strengthening slowly, which may provide another reason for foreign investors to favor U.S. securities over those in their domestic markets. This also supports our outlook for continued low inflation in the near-term.
The recovery may still feel “sluggish” because the current 6.7% unemployment rate—while down from a recession peak of 10%—is still running higher than in previous expansions. From the perspective of equity investors, however, higher unemployment is likely keep downward pressure on wages, which, in turn, could help strengthen profit margins.
We think the Fed will be particularly careful not to derail economic expansion, especially as long as inflation remains low, and will do so by carefully telegraphing its position and plans as they evolve. Moreover, the signal that the Fed is serious about normalizing interest rates should improve investor confidence about the condition of the economy and reassure those who have been worried about the inflationary risk of an eternal quantitative easing. However, sharp changes in interest-rate expectations remain a risk factor, as they can drive mortgage rates higher, negatively impacting housing activity and weakening this major component of the U.S. economic recovery.
We also believe the U.S. economy can still compensate for a dampened global growth outlook. And we expect economic growth to reaccelerate in the second-half of the year on the heels of continued improvement in the housing and labor markets. In addition, as consumer activity picks up in the spring and summer, there is potential for some lost consumer activity to be recovered later in the year. Overall, we believe these conditions continue to provide a favorable underpinning for the equities markets.
Calvert Investment Management, Inc.
May 2014
8 www.calvert.com CALVERT INTERNATIONAL EQUITY FUND SEMI-ANNUAL REPORT (UNAUDITED)

As always, Calvert continues to work hard to ensure you have a say in the responsible management of environmental, social, and governance (ESG) factors for the companies in which we invest. Below are highlights of our accomplishments during the reporting period.
Shareholder Advocacy
Calvert filed more than 26 shareholder proposals over the reporting period on a variety of issues, including board diversity, reduction of greenhouse gas emissions, disclosure of country-level sourcing and human rights risk assessment processes for apparel companies, and sustainability reporting.
After commitments from Pioneer Natural Resources Company and QEP Resources, Calvert has withdrawn one shareholder proposal and decided not to file a second one for the 2014 proxy season. The two companies agreed to improve disclosure and continue engagement regarding key challenges related to hydraulic fracturing, such as water use and emissions reduction. The resulting disclosures will help Calvert and the companies better understand how they are managing these important opportunities and risks.
Also, an effort led by Calvert Investments and other institutional investors drove the World Federation of Exchanges (WFE) to announce the launch of a Sustainability Working Group in March to develop a consensus on sustainability reporting. Such a standard would promote greater transparency and fairness in the capital markets, improve cost-efficiencies, promote timeliness and consistency for reporting companies, and equip investors to value companies more accurately and make more informed investment decisions.
During the period, Calvert filed proxy resolutions with all the U.S. publicly traded financial exchanges—CBOE, CME, IntercontinentalExchange Group/NYSE and NASDAQ OMX (NDAQ)—on this issue. However, all resolutions were withdrawn after leadership agreed to join the Working Group. We congratulate these WFE member exchanges for their leadership on investor information transparency.
Calvert was a part of the working group that developed the Shareholder Director Exchange Protocol (SDX) released in February. The protocol addresses the increasing levels of direct engagement between institutional investors, such as activist investors, and public company boards, which can significantly change the dynamic between public companies and investors. Engagement is typically between investors and management, but there is a growing interest on the part of investors and directors for more dialogue, especially when fundamental corporate governance or sustainability issues emerge. The protocol helps lay the basis for productive engagement while addressing common concerns each side may have.
www.calvert.com CALVERT INTERNATIONAL EQUITY FUND SEMI-ANNUAL REPORT (UNAUDITED) 9
Community Investments
Many of our Funds participate in Calvert’s High Social Impact Investing program, through the CI notes administered through the Calvert Foundation. This community investment program may allocate a small percentage of Fund assets at below-market interest rates to investments that provide economic opportunity for struggling populations.
Through the CI notes’ WIN-WIN portfolio (Women Investing in Women), we recently invested in the Opportunity Fund, the leading microfinance provider in California, which provides microloans for small businesses, microsavings accounts, and community real estate financing. Its innovative repayment system allows clients like Chef Tina Ferguson-Riffe to grow her business with a $20,000 loan for new restaurant equipment and repay the loan based on daily credit/debit card sales, instead of large monthly payments.
In December, the CI notes program invested $1.2 million in One Acre Fund, a nonprofit that provides smallholder farmers in Kenya, Rwanda, and Burundi a bundle of services including seed, training, and access to markets. One Acre Fund expects to reach 251,000 farm families in 2014.
Special Equities
A modest but important portion of certain funds is allocated to small private companies developing products or services that address important sustainability or environmental issues facing our society.
One such recent investment, acquired just after the reporting period, was Africa Renewable Energy Fund, which supports small- to medium-scale independent power producers in sub-Saharan Africa with grid-connected, development-stage renewable energy projects, including small hydro, wind, geothermal, solar, biomass and waste gas technologies. Electricity outages continue to be a major problem in many of these countries. This investment will help to address that supply gap in a sustainable manner.
As of March 31, 2014, Calvert Social Investment Foundation (“Calvert Foundation” or “Foundation”) Community Investment Notes represented the following percentages of Fund net assets: Calvert Balanced Portfolio 0.7%, Calvert Equity Portfolio 0.4%, Calvert Bond Portfolio 0.4%, Calvert International Equity Fund 1.2%, Calvert Capital Accumulation Fund 0.4%, and Calvert Small Cap Fund 0.3%. The Calvert Foundation is a 501(c)(3) nonprofit organization. The Foundation’s Community Investment Note Program is not a mutual fund and should not be confused with any Calvert Investments-sponsored investment product.
As of March 31, 2014, the following companies represented the following percentages of Portfolio net assets: Pioneer Natural Resources Company .22% of Calvert Social Index Fund, 1.14% of Calvert Bond Portfolio and .29% of Calvert Balanced Portfolio; QEP Resources .04% of Calvert Social Index Fund, CBOE 0.04% of Calvert Social Index Fund, CME 0.19% of Calvert Social Index Fund, IntercontinentalExchange Group/NYSE 0.18% of Calvert Social Index Fund and 2.46% of Calvert Equity Portfolio, and NASDAQ OMX (NDAQ) 0.03% of Calvert Social Index Fund. Africa Renewable Energy Fund represented 0% of each of Calvert Equity Portfolio and Calvert International Equity Fund. Holdings are subject to change.
10 www.calvert.com CALVERT INTERNATIONAL EQUITY FUND SEMI-ANNUAL REPORT (UNAUDITED)
SHAREHOLDER EXPENSE EXAMPLE
As a shareholder of the Fund, you incur two types of costs: (1) transaction costs, including sales charges (loads) and redemption fees; and (2) ongoing costs, including management fees; distribution (12b-1) fees; and other Fund expenses. This Example is intended to help you understand your ongoing costs (in dollars) of investing in the Fund and to compare these costs with the ongoing costs of investing in other mutual funds.
This Example is based on an investment of $1,000 invested at the beginning of the period and held for the entire period (October 1, 2013 to March 31, 2014).
Actual Expenses
The first line of the table below provides information about actual account values and actual expenses. You may use the information in this line, together with the amount you invested, to estimate the expenses that you paid over the period. Simply divide your account value by $1,000 (for example, an $8,600 account value divided by $1,000 = 8.6), then multiply the result by the number in the first line under the heading entitled “Expenses Paid During Period” to estimate the expenses you paid on your account during this period.
Hypothetical Example for Comparison Purposes
The second line of the table below provides information about hypothetical account values and hypothetical expenses based on the Fund’s actual expense ratio and an assumed rate of return of 5% per year before expenses, which is not the Fund’s actual return. The hypothetical account values and expenses may not be used to estimate the actual ending account balance or expenses you paid for the period. You may use this information to compare the ongoing costs of investing in the Fund and other funds. To do so, compare the 5% hypothetical example with the 5% hypothetical examples that appear in the shareholder reports of the other funds.
Please note that the expenses shown in the table are meant to highlight your ongoing costs only and do not reflect any transactional costs, such as sales charges (loads) or redemption fees. Therefore, the second line of the table is useful in comparing ongoing costs only, and will not help you determine the relative total costs of owning different funds. In addition, if these transactional costs were included, your costs would have been higher.
www.calvert.com CALVERT INTERNATIONAL EQUITY FUND SEMI-ANNUAL REPORT (UNAUDITED) 11
| | BEGINNING | ENDING ACCOUNT | EXPENSES PAID |
| | ACCOUNT VALUE | VALUE | DURING PERIOD* |
| | 10/1/13 | 3/31/14 | 10/1/13 - 3/31/14 |
| CLASS A | | | |
| Actual | $1,000.00 | $1,047.25 | $8.59 |
| Hypothetical | $1,000.00 | $1,016.54 | $8.46 |
| (5% return per year before expenses) | | | |
| |
| CLASS B | | | |
| Actual | $1,000.00 | $1,041.41 | $15.13 |
| Hypothetical | $1,000.00 | $1,010.11 | $14.90 |
| (5% return per year before expenses) | | | |
| |
| CLASS C | | | |
| Actual | $1,000.00 | $1,042.78 | $13.19 |
| Hypothetical | $1,000.00 | $1,012.01 | $13.00 |
| (5% return per year before expenses) | | | |
| |
| CLASS I | | | |
| Actual | $1,000.00 | $1,050.85 | $5.31 |
| Hypothetical | $1,000.00 | $1,019.75 | $5.23 |
| (5% return per year before expenses) | | | |
| |
| CLASS Y | | | |
| Actual | $1,000.00 | $1,049.50 | $6.87 |
| Hypothetical | $1,000.00 | $1,018.23 | $6.76 |
| (5% return per year before expenses) | | | |
* Expenses are equal to the Fund’s annualized expense ratio of 1.68%, 2.97%, 2.59%, 1.04%, and 1.34% for Class A, Class B, Class C, Class I, and Class Y, respectively, multiplied by the average account value over the period, multiplied by 182/365 (to reflect the one-half year period).
12 www.calvert.com CALVERT INTERNATIONAL EQUITY FUND SEMI-ANNUAL REPORT (UNAUDITED)
| | |
| STATEMENT OF NET ASSETS |
| MARCH 31, 2014 |
| |
| EQUITY SECURITIES - 94.6% | SHARES | VALUE |
| Argentina - 0.1% | | |
| MercadoLibre, Inc | 6,200 | $589,682 |
| |
| Australia - 3.4% | | |
| Aurizon Holdings Ltd. | 803,314 | 3,837,818 |
| Australia & New Zealand Banking Group Ltd. (ADR) | 27,713 | 846,632 |
| Macquarie Group Ltd. | 71,562 | 3,859,840 |
| Westpac Banking Corp. (ADR) | 65,504 | 2,100,058 |
| Woolworths Ltd. | 87,546 | 2,901,285 |
| | | 13,545,633 |
| |
| Austria - 0.7% | | |
| OMV AG (ADR) | 614 | 27,882 |
| Voestalpine AG | 61,398 | 2,706,236 |
| | | 2,734,118 |
| |
| Belgium - 0.5% | | |
| Ageas (ADR) | 14,285 | 635,968 |
| Umicore SA | 26,226 | 1,338,890 |
| | | 1,974,858 |
| |
| Brazil - 0.4% | | |
| Itau Unibanco Holding SA (ADR) | 45,109 | 670,320 |
| Localiza Rent a Car SA | 68,842 | 1,013,280 |
| | | 1,683,600 |
| |
| Canada - 2.5% | | |
| Canadian National Railway Co. | 45,576 | 2,560,815 |
| Dollarama, Inc. | 29,850 | 2,274,260 |
| Intact Financial Corp. | 10,700 | 665,967 |
| Lululemon Athletica, Inc.* | 40,873 | 2,149,511 |
| Suncor Energy, Inc. Toronto Exchange | 63,100 | 2,203,990 |
| | | 9,854,543 |
| |
| China - 0.2% | | |
| BOC Hong Kong Holdings Ltd. (ADR) | 12,944 | 735,349 |
| |
| Denmark - 1.1% | | |
| H Lundbeck A/S (ADR)* | 4,379 | 136,625 |
| Novo Nordisk A/S, Series B | 87,605 | 3,996,425 |
| | | 4,133,050 |
| |
| Finland - 0.6% | | |
| Kone Oyj, Series B | 46,968 | 1,972,525 |
| Metso Oyj (ADR) | 525 | 17,026 |
| Sampo Oyj (ADR) | 8,631 | 223,284 |
| | | 2,212,835 |
www.calvert.com CALVERT INTERNATIONAL EQUITY FUND SEMI-ANNUAL REPORT (UNAUDITED) 13
| | |
| EQUITY SECURITIES - CONT’D | SHARES | VALUE |
| France - 10.7% | | |
| Accor SA | 38,172 | $1,956,720 |
| Air Liquide SA | 33,259 | 4,511,264 |
| AXA SA (ADR) | 78,492 | 2,040,792 |
| BNP Paribas SA | 49,086 | 3,794,657 |
| BNP Paribas SA (ADR) | 44,838 | 1,736,128 |
| Carrefour SA | 74,967 | 2,905,047 |
| Casino Guichard Perrachon SA (ADR) | 319 | 7,643 |
| Cie Generale des Etablissements Michelin | 24,752 | 3,100,482 |
| Credit Agricole SA (ADR)* | 62,382 | 490,323 |
| Eutelsat Communications SA | 74,843 | 2,543,636 |
| Kering SA | 16,485 | 3,366,974 |
| Orange SA (ADR) | 26,945 | 395,822 |
| Publicis Groupe | 30,100 | 2,722,362 |
| Sanofi SA | 29,880 | 3,122,460 |
| Sanofi SA (ADR) | 25,859 | 1,351,908 |
| Schneider Electric SA | 52,611 | 4,677,452 |
| Schneider Electric SA (ADR) | 14,388 | 254,524 |
| SCOR SE | 48,397 | 1,695,812 |
| Suez Environnement Co. (ADR) | 10,700 | 108,712 |
| Valeo SA (ADR) | 6,956 | 490,607 |
| Veolia Environnement SA (ADR) | 27,725 | 551,173 |
| | | 41,824,498 |
| |
| Germany - 5.8% | | |
| adidas AG | 25,404 | 2,752,194 |
| Allianz SE (ADR) | 111,855 | 1,884,757 |
| Brenntag AG | 14,367 | 2,667,924 |
| Celesio AG (ADR) | 1,839 | 12,505 |
| Commerzbank AG (ADR) | — | 2 |
| Continental AG | 13,037 | 3,124,019 |
| Continental AG (ADR) | 65 | 3,119 |
| Deutsche Bank AG | 43,973 | 1,966,944 |
| Deutsche Post AG | 88,959 | 3,304,530 |
| Deutsche Post AG (ADR) | 58,695 | 2,183,454 |
| Hugo Boss AG | 18,820 | 2,506,454 |
| K+S AG (ADR) | 1,961 | 32,121 |
| Merck KGaA (ADR) | 1,817 | 102,279 |
| Muenchener Rueckversicherungs AG (ADR) | 16,141 | 354,134 |
| SAP AG | 20,765 | 1,680,796 |
| | | 22,575,232 |
| |
| Hong Kong - 2.2% | | |
| AIA Group Ltd | 1,035,004 | 4,917,300 |
| Bank of East Asia Ltd. (ADR) | 6,756 | 26,213 |
| Hang Seng Bank Ltd. (ADR) | 46,443 | 741,207 |
| Hong Kong Exchanges and Clearing Ltd | 87,182 | 1,322,558 |
| PCCW Ltd. (ADR) | 3,315 | 16,442 |
| SJM Holdings Ltd | 635,000 | 1,791,742 |
| | | 8,815,462 |
14 www.calvert.com CALVERT INTERNATIONAL EQUITY FUND SEMI-ANNUAL REPORT (UNAUDITED)
| | |
| EQUITY SECURITIES - CONT’D | SHARES | VALUE |
| India - 0.5% | | |
| Wipro Ltd. (ADR) | 155,400 | $2,082,360 |
| |
| Ireland - 0.7% | | |
| Kerry Group plc | 35,272 | 2,692,166 |
| |
| Israel - 0.9% | | |
| Check Point Software Technologies Ltd.* | 50,800 | 3,435,604 |
| |
| Italy - 1.5% | | |
| Gtech Spa (ADR) | 980 | 29,969 |
| Intesa Sanpaolo SpA | 499,900 | 1,697,590 |
| Intesa Sanpaolo SpA (ADR) | 13,723 | 279,812 |
| Mediobanca SpA* | 326,434 | 3,739,295 |
| Snam SpA (ADR) | 4,009 | 46,545 |
| Terna Rete Elettrica Nazionale SpA (ADR) | 3,351 | 54,554 |
| | | 5,847,765 |
| |
| Japan - 14.2% | | |
| Astellas Pharma, Inc. | 225,500 | 2,677,093 |
| Eisai Co. Ltd. (ADR) | 375 | 14,659 |
| FANUC Corp. | 15,680 | 2,766,717 |
| Isuzu Motors Ltd | 548,000 | 3,178,441 |
| Kubota Corp. | 183,424 | 2,455,639 |
| Mitsubishi Estate Co. Ltd | 143,441 | 3,420,896 |
| Mitsui Fudosan Co. Ltd. | 86,256 | 2,631,478 |
| Mizuho Financial Group, Inc. | 2,024,000 | 4,001,990 |
| Mizuho Financial Group, Inc. (ADR) | 412,083 | 1,640,090 |
| MS&AD Insurance Group Holdings (ADR) | 44,668 | 508,322 |
| Nabtesco Corp. | 113,100 | 2,617,777 |
| Nippon Telegraph & Telephone Corp. (ADR) | 89,818 | 2,446,642 |
| Nissan Motor Co. Ltd | 257,000 | 2,292,161 |
| Nissan Motor Co. Ltd. (ADR) | 65,013 | 1,161,782 |
| Nomura Holdings, Inc. (ADR) | 185,153 | 1,190,534 |
| ORIX Corp | 257,600 | 3,625,762 |
| Softbank Corp | 59,774 | 4,517,750 |
| Sony Corp. (ADR) | 43,290 | 827,705 |
| Sumitomo Mitsui Trust Holdings, Inc | 561,936 | 2,539,365 |
| Takeda Pharmaceutical Co. Ltd. (ADR) | 12,772 | 302,696 |
| Tokyo Gas Co. Ltd | 375,118 | 1,906,038 |
| Toyota Motor Corp | 136,589 | 7,703,481 |
| Toyota Motor Corp. (ADR) | 11,205 | 1,265,044 |
| | | 55,692,062 |
| |
| Luxembourg - 0.1% | | |
| Ipsen SA (ADR) | 40,984 | 424,594 |
| |
| Mexico - 0.1% | | |
| FINAE Series D, Preferred (b)(i)* | 1,962,553 | 386,273 |
| |
| Netherlands - 4.3% | | |
| Aegon NV | 93,521 | 860,393 |
| Akzo Nobel NV | 18,050 | 1,478,918 |
www.calvert.com CALVERT INTERNATIONAL EQUITY FUND SEMI-ANNUAL REPORT (UNAUDITED) 15
| | |
| EQUITY SECURITIES - CONT’D | SHARES | VALUE |
| Netherlands - Cont’d | | |
| ASML Holding NV | 18,005 | $1,666,923 |
| ING Groep NV (CVA)* | 210,120 | 2,986,350 |
| Koninklijke Ahold NV (ADR)* | 67,719 | 1,259,574 |
| Koninklijke Philips NV | 59,977 | 2,108,791 |
| Unilever NV, NY Shares | 75,829 | 3,118,089 |
| Unilever NV (CVA) | 74,951 | 3,081,786 |
| Wolters Kluwer NV (ADR) | 12,822 | 362,452 |
| | | 16,923,276 |
| |
| New Zealand - 0.1% | | |
| Telecom Corp of New Zealand Ltd. (ADR) | 24,178 | 256,045 |
| |
| Norway - 2.9% | | |
| DnB ASA | 169,515 | 2,948,509 |
| DNB ASA (ADR) | 326 | 56,584 |
| Orkla ASA | 268,300 | 2,286,138 |
| Prosafe SE | 297,148 | 2,379,600 |
| Statoil ASA (ADR) | 117,636 | 3,319,688 |
| Yara International ASA (ADR) | 10,498 | 465,062 |
| | | 11,455,581 |
| |
| Philippines - 0.6% | | |
| Philippine Long Distance Telephone Co. (ADR) | 36,212 | 2,209,656 |
| |
| Portugal - 0.0% | | |
| Portugal Telecom SGPS SA (ADR) | 37,390 | 159,655 |
| |
| Russia - 0.3% | | |
| Magnit OJSC (GDR) | 19,063 | 1,044,652 |
| |
| Singapore - 0.2% | | |
| Singapore Telecommunications Ltd. (ADR) | 25,524 | 743,157 |
| |
| South Africa - 1.3% | | |
| Aspen Pharmacare Holdings Ltd. | 107,419 | 2,869,888 |
| Clicks Group Ltd. | 227,692 | 1,417,481 |
| MTN Group Ltd. (ADR) | 27,214 | 559,248 |
| Nedbank Group Ltd. (ADR) | 5,077 | 110,476 |
| Tiger Brands Ltd. (ADR) | 2,545 | 66,246 |
| | | 5,023,339 |
| |
| Spain - 3.4% | | |
| Amadeus IT Holding SA | 67,378 | 2,801,709 |
| Banco Bilbao Vizcaya Argentaria SA: | | |
| Common | 158,800 | 1,910,646 |
| Rights* | 158,800 | 37,191 |
| Banco Bilbao Vizcaya Argentaria SA (ADR) | 130,428 | 1,566,440 |
| Banco Santander SA (ADR) | 159,245 | 1,525,567 |
| Enagas SA (ADR) | 2,264 | 34,322 |
| Ferrovial SA (ADR) | 381 | 8,310 |
| Inditex SA | 19,524 | 2,934,548 |
| Telefonica SA | 163,835 | 2,594,210 |
| | | 13,412,943 |
16 www.calvert.com CALVERT INTERNATIONAL EQUITY FUND SEMI-ANNUAL REPORT (UNAUDITED)
| | |
| EQUITY SECURITIES - CONT’D | SHARES | VALUE |
| Sweden - 2.5% | | |
| Assa Abloy AB, Series B | 91,843 | $4,902,745 |
| Atlas Copco AB (ADR): | | |
| A Shares | 36,519 | 1,053,938 |
| B Shares | 13,468 | 369,831 |
| Hennes & Mauritz AB, B Shares | 46,609 | 1,985,287 |
| Sandvik AB (ADR) | 4,797 | 67,878 |
| SKF AB (ADR) | 849 | 21,862 |
| Svenska Handelsbanken AB (ADR) | 11,077 | 277,922 |
| Swedbank AB (ADR) | 12,882 | 345,238 |
| Tele2 AB (ADR) | 104,707 | 641,854 |
| | | 9,666,555 |
| |
| Switzerland - 9.3% | | |
| Aryzta AG* | 36,625 | 3,237,748 |
| Clariant AG* | 130,451 | 2,537,710 |
| Credit Suisse Group AG* | 117,936 | 3,818,557 |
| Julius Baer Group Ltd.* | 59,934 | 2,663,733 |
| Novartis AG | 42,122 | 3,577,245 |
| Novartis AG (ADR) | 27,952 | 2,376,479 |
| Roche Holding AG | 28,916 | 8,690,777 |
| Roche Holding AG (ADR) | 98,674 | 3,721,983 |
| Swatch Group AG, Bearer Shares | 4,330 | 2,721,097 |
| Swiss Re AG (ADR) | 3,000 | 278,130 |
| UBS AG* | 98,775 | 2,039,076 |
| Zurich Insurance Group AG (ADR)* | 26,288 | 808,093 |
| | | 36,470,628 |
| |
| Taiwan - 1.3% | | |
| MediaTek, Inc. | 167,000 | 2,473,227 |
| Taiwan Semiconductor Manufacturing Co. Ltd. (ADR) | 136,000 | 2,722,720 |
| | | 5,195,947 |
| |
| United Kingdom - 18.6% | | |
| Admiral Group plc (ADR) | 3,013 | 72,644 |
| Aon plc | 34,700 | 2,924,516 |
| ARM Holdings plc | 62,718 | 1,057,715 |
| AstraZeneca plc (ADR) | 20,368 | 1,321,476 |
| Barclays plc (ADR) | 25,147 | 394,808 |
| BG Group plc | 195,565 | 3,647,787 |
| British Land Co. plc (ADR) | 4,883 | 54,104 |
| British Sky Broadcasting Group plc | 161,356 | 2,459,547 |
| BT Group plc (ADR) | 34,436 | 2,198,739 |
| Bunzl plc (ADR) | 18,583 | 498,210 |
| Burberry Group plc | 84,491 | 1,969,474 |
| Capita plc | 181,789 | 3,327,712 |
| Catlin Group Ltd. (ADR) | 1,924 | 34,343 |
| Compass Group plc | 179,526 | 2,744,216 |
| Experian plc | 152,950 | 2,759,169 |
| GlaxoSmithKline plc (ADR) | 32,457 | 1,734,177 |
| HSBC Holdings plc: | | |
| Hong Kong Exchange | 203,899 | 2,070,732 |
| London Exchange | 354,798 | 3,592,811 |
www.calvert.com CALVERT INTERNATIONAL EQUITY FUND SEMI-ANNUAL REPORT (UNAUDITED) 17
| | |
| EQUITY SECURITIES - CONT’D | SHARES | VALUE |
| United Kingdom - Cont’d | | |
| HSBC Holdings plc (ADR) | 33,698 | $1,712,869 |
| Inmarsat plc | 188,126 | 2,280,513 |
| J Sainsbury plc (ADR) | 9,643 | 206,842 |
| Johnson Matthey plc | 44,882 | 2,449,767 |
| Kingfisher plc | 478,360 | 3,367,980 |
| Legal & General Group plc (ADR) | 782 | 13,450 |
| Liberty Global plc: | | |
| Common* | 30,547 | 1,270,755 |
| Series C* | 24,500 | 997,395 |
| Man Group plc (ADR) | 48,273 | 78,757 |
| Old Mutual plc (ADR) | 1,161 | 31,139 |
| Pearson plc | 72,206 | 1,280,581 |
| Persimmon plc* | 240,112 | 5,390,468 |
| Prudential plc | 156,864 | 3,323,436 |
| Reckitt Benckiser Group plc (s) | 42,143 | 3,434,975 |
| Reckitt Benckiser Group plc (ADR) | 22,936 | 377,985 |
| Sage Group plc (ADR) | 78 | 2,183 |
| SSE plc | 86,988 | 2,133,214 |
| SSE plc (ADR) | 77,471 | 1,914,309 |
| Tate & Lyle plc | 130,361 | 1,452,722 |
| Unilever plc | 64,500 | 2,755,119 |
| Unilever plc (ADR) | 72,879 | 3,117,764 |
| United Utilities Group plc (ADR) | 22,848 | 599,075 |
| WPP plc | 94,924 | 1,964,012 |
| | | 73,017,490 |
| |
| United States - 3.6% | | |
| Accenture plc | 30,000 | 2,391,600 |
| Applied Industrial Technologies, Inc | 11,997 | 578,735 |
| Bioceptive, Inc. - Series A Preferred (a)(b)(i)* | 582,574 | 299,967 |
| Bristol-Myers Squibb Co | 30,449 | 1,581,826 |
| CVS Caremark Corp | 31,400 | 2,350,604 |
| EOG Resources, Inc | 14,300 | 2,805,231 |
| MasterCard, Inc. | 18,200 | 1,359,540 |
| Nielsen Holdings NV | 35,700 | 1,593,291 |
| Powerspan Corp.: | | |
| Series A, Convertible Preferred (b)(i)* | 45,455 | — |
| Series B, Convertible Preferred (b)(i)* | 20,000 | — |
| Series C, Convertible Preferred (b)(i)* | 239,764 | — |
| Series D, Convertible Preferred (b)(i)* | 45,928 | — |
| Unit Corp.* | 14,937 | 976,581 |
| Wynn Resorts Ltd. | 1,435 | 318,785 |
| | | 14,256,160 |
| |
| Total Equity Securities (Cost $314,683,745) | | 371,074,768 |
| |
| VENTURE CAPITAL LIMITED | ADJUSTED | |
| PARTNERSHIP INTEREST - 0.5% | BASIS | |
| Balkan Financial Sector Equity Fund CV (b)(i) | $593,200 | 573,081 |
| Blackstone Cleantech Venture Partners (b)(i)* | 74,492 | 44,837 |
| China Environment Fund 2004 (b)(i)* | — | 171,684 |
| Emerald Sustainability Fund I (b)(i)* | 433,916 | 279,885 |
18 www.calvert.com CALVERT INTERNATIONAL EQUITY FUND SEMI-ANNUAL REPORT (UNAUDITED)
| | |
| VENTURE CAPITAL LIMITED | ADJUSTED | |
| PARTNERSHIP INTEREST - CONT’D | BASIS | VALUE |
| gNet Defta Development Holdings LLC (a)(b)(i)* | $400,000 | $321,718 |
| SEAF Central and Eastern European Growth Fund LLC (a)(b)(i)* | 330,924 | 361,152 |
| SEAF India International Growth Fund (b)(i)* | 281,749 | 143,826 |
| ShoreCap International LLC (b)(i)* | — | 83,492 |
| Terra Capital (b)(i)* | 469,590 | 1 |
| |
| Total Venture Capital Limited Partnership Interest (Cost $2,583,870) | | 1,979,676 |
| |
| | PRINCIPAL | |
| VENTURE CAPITAL DEBT OBLIGATIONS - 0.3% | AMOUNT | |
| AFIG LLC, 6.00%, 10/31/17 (b)(i) | 455,852 | 455,852 |
| Windhorse International-Spring Health Water Ltd., | | |
| 9.00%, 3/14/18 (b)(i) | 70,000 | 52,500 |
| FINAE: | | |
| Note I, 6.50%, 12/17/15 (b)(i) | 250,000 | 250,000 |
| Note II, 6.50%, 2/29/16 (b)(i) | 500,000 | 500,000 |
| |
| Total Venture Capital Debt Obligations (Cost $1,275,852) | | 1,258,352 |
| |
| HIGH SOCIAL IMPACT INVESTMENTS - 1.2% | | |
| Calvert Social Investment Foundation Notes, 0.65%, 7/1/14 (b)(i)(r) | 4,431,583 | 4,403,613 |
| |
| Total High Social Impact Investments (Cost $4,431,583) | | 4,403,613 |
| |
| TIME DEPOSIT - 3.0% | | |
| State Street Bank Time Deposit, 0.083%, 4/1/14 | 11,816,533 | 11,816,533 |
| |
| Total Time Deposit (Cost $11,816,533) | | 11,816,533 |
| |
| |
| TOTAL INVESTMENTS (Cost $334,791,583) - 99.6% | | 390,532,942 |
| Other assets and liabilities, net - 0.4% | | 1,764,619 |
| NET ASSETS - 100% | | $392,297,561 |
| |
| NET ASSETS CONSIST OF: | | |
| Paid-in capital applicable to the following shares of common stock with | | |
| 250,000,000 shares of $0.01 par value shares authorized: | | |
| Class A: 15,486,377 shares outstanding | | $340,217,892 |
| Class B: 182,477 shares outstanding | | 9,026,375 |
| Class C: 1,216,420 shares outstanding | | 31,883,326 |
| Class I: 5,055,949 shares outstanding | | 124,791,705 |
| Class Y: 767,650 shares outstanding | | 11,842,684 |
| Undistributed net investment income (loss) | | (726,622) |
| Accumulated net realized gain (loss) on investments and | | |
| foreign currency transactions | | (180,478,874) |
| Net unrealized appreciation (depreciation) on investments, foreign currencies, | |
| and assets and liabilities denominated in foreign currencies | | 55,741,075 |
| |
| NET ASSETS | | $392,297,561 |
See notes to financial statements.
www.calvert.com CALVERT INTERNATIONAL EQUITY FUND SEMI-ANNUAL REPORT (UNAUDITED) 19
| |
| NET ASSET VALUE PER SHARE | |
| Class A (based on net assets of $265,177,840) | $17.12 |
| Class B (based on net assets of $2,752,551) | $15.08 |
| Class C (based on net assets of $18,090,424) | $14.87 |
| Class I (based on net assets of $92,410,642) | $18.28 |
| Class Y (based on net assets of $13,866,104) | $18.06 |
| RESTRICTED SECURITIES | ACQUISITION
DATES | COST |
| AFIG LLC, 6.00%, 10/17/17 | 10/11/12 | $455,852 |
| Balkan Financial Sector Equity Fund CV LP | 1/12/06 - 1/17/13 | 593,200 |
| Bioceptive, Inc. - Series A Preferred | 10/26/12 - 12/18/13 | 252,445 |
| Blackstone Cleantech Venture Partners LP | 7/29/10 - 2/21/14 | 74,492 |
| Calvert Social Investment Foundation Notes, 0.65%, | | |
| 7/1/14 | 7/1/11 | 4,431,583 |
| China Environment Fund 2004 LP | 9/15/05 - 4/1/09 | — |
| Emerald Sustainability Fund I LP | 7/19/01 - 5/17/11 | 433,916 |
| FINAE: | | |
| Series D, Preferred | 2/28/11 | 252,686 |
| Note I, 6.50%, 12/1/15 | 12/10/10 | 250,000 |
| Note II, 6.50%, 12/1/15 | 2/24/11 | 500,000 |
| gNet Defta Development Holdings LLC, LP | 8/30/05 | 400,000 |
| Powerspan Corp.: | | |
| Series A, Convertible Preferred | 8/20/97 | 250,000 |
| Series B, Convertible Preferred | 10/5/99 | 200,000 |
| Series C, Convertible Preferred | 12/21/04 - 6/12/08 | 273,331 |
| Series D, Convertible Preferred | 6/20/08 | 157,996 |
| SEAF Central and Eastern European Growth Fund LLC, LP | 8/10/00 - 8/26/11 | 330,924 |
| SEAF India International Growth Fund LP | 3/22/05 - 5/24/10 | 281,749 |
| ShoreCap International LLC, LP | 8/12/04 - 12/15/08 | — |
| Terra Capital LP | 11/23/98 - 3/14/06 | 469,590 |
| Windhorse International-Spring Health Water Ltd., | | |
| 9.00%, 3/14/18 | 2/12/14 | 70,000 |
See notes to financial statements.
20 www.calvert.com CALVERT INTERNATIONAL EQUITY FUND SEMI-ANNUAL REPORT (UNAUDITED)
(a) Affiliated company.
(b) This security was valued under the direction of the Board of Directors. See Note A.
(i) Restricted securities represent 2.1% of net assets of the Fund.
(r) The coupon rate shown on floating or adjustable rate securities represents the rate at period end.
(s) 42,143 shares of Reckitt Benckiser Group plc have been soft segregated in order to cover outstanding commitments to
certain limited partnerships investments within the Fund. There are no restrictions on the trading of this security.
* Non-income producing security.
Abbreviations:
ADR: American Depositary Receipts
CVA: Certificaten Van Aandelen
GDR: Global Depositary Receipts
LLC: Limited Liability Corporation
LP: Limited Partnership
plc: Public Limited Company
See notes to financial statements.
www.calvert.com CALVERT INTERNATIONAL EQUITY FUND SEMI-ANNUAL REPORT (UNAUDITED) 21
| |
| STATEMENT OF OPERATIONS |
| SIX MONTHS ENDED MARCH 31, 2014 |
| |
| NET INVESTMENT INCOME | |
| Investment Income: | |
| Dividend income (net of foreign taxes withheld of $358,096) | $3,418,893 |
| Interest income | 58,039 |
| Total investment income | 3,476,932 |
| |
| Expenses: | |
| Investment advisory fee | 1,382,576 |
| Transfer agency fees and expenses | 317,755 |
| Administrative fees | 565,797 |
| Distribution Plan expenses: | |
| Class A | 316,626 |
| Class B | 15,006 |
| Class C | 89,113 |
| Directors’ fees and expenses | 17,815 |
| Custodian fees | 92,317 |
| Registration fees | 32,893 |
| Reports to shareholders | 53,563 |
| Professional fees | 23,362 |
| Miscellaneous | 33,831 |
| Total expenses | 2,940,654 |
| Reimbursement from Advisor: | |
| Class B | (4,087) |
| Net expenses | 2,936,567 |
| |
| |
| NET INVESTMENT INCOME | 540,365 |
| |
| REALIZED AND UNREALIZED GAIN (LOSS) | |
| Net realized gain (loss) on: | |
| Investments | 20,721,359 |
| Foreign currency transactions | (207,169) |
| | 20,514,190 |
| |
| Change in unrealized appreciation (depreciation) on: | |
| Investments and foreign currencies | (3,642,329) |
| Assets and liabilities denominated in foreign currencies | (11,129) |
| | (3,653,458) |
| |
| NET REALIZED AND UNREALIZED GAIN (LOSS) | 16,860,732 |
| |
| INCREASE (DECREASE) IN NET ASSETS | |
| RESULTING FROM OPERATIONS | $17,401,097 |
See notes to financial statements.
22 www.calvert.com CALVERT INTERNATIONAL EQUITY FUND SEMI-ANNUAL REPORT (UNAUDITED)
| | |
| STATEMENTS OF CHANGES IN NET ASSETS |
| |
| | SIX MONTHS ENDED | YEAR ENDED |
| | MARCH 31, | SEPTEMBER 30, |
| INCREASE (DECREASE) IN NET ASSETS | 2014 | 2013 |
| Operations: | | |
| Net investment income | $540,365 | $1,991,350 |
| Net realized gain (loss) | 20,514,190 | 21,909,482 |
| Change in unrealized appreciation (depreciation) | (3,653,458) | 43,140,368 |
| |
| INCREASE (DECREASE) IN NET ASSETS | | |
| RESULTING FROM OPERATIONS | 17,401,097 | 67,041,200 |
| |
| Distributions to shareholders from: | | |
| Net investment income: | | |
| Class A shares | (1,441,168) | (1,472,525) |
| Class I shares | (1,465,772) | (1,480,867) |
| Class Y shares | (125,098) | (86,752) |
| Total distributions | (3,032,038) | (3,040,144) |
| |
| Capital share transactions: | | |
| Shares sold: | | |
| Class A shares | 30,839,817 | 50,683,210 |
| Class B shares | 10,450 | 12,163 |
| Class C shares | 1,254,429 | 1,438,125 |
| Class I shares | 8,243,009 | 11,987,612 |
| Class Y shares | 3,859,962 | 4,137,041 |
| Reinvestment of distributions: | | |
| Class A shares | 1,068,320 | 1,204,726 |
| Class I shares | 1,195,493 | 1,307,560 |
| Class Y shares | 72,616 | 42,132 |
| Redemption fees: | | |
| Class A shares | 1,229 | 804 |
| Class C shares | 224 | 52 |
| Class I shares | — | 1 |
| Shares redeemed: | | |
| Class A shares | (19,433,817) | (34,384,564) |
| Class B shares | (536,212) | (1,104,033) |
| Class C shares | (1,657,064) | (2,851,196) |
| Class I shares | (2,354,539) | (48,952,897) |
| Class Y shares | (870,263) | (3,141,545) |
| Total capital share transactions | 21,693,654 | (19,620,809) |
| |
| TOTAL INCREASE (DECREASE) IN NET ASSETS | 36,062,713 | 44,380,247 |
| |
| NET ASSETS | | |
| Beginning of period | 356,234,848 | 311,854,601 |
| End of period (including distributions in excess of net | | |
| investment income and undistributed net investment income | | |
| of $726,622 and $1,765,051, respectively) | $392,297,561 | $356,234,848 |
See notes to financial statements.
www.calvert.com CALVERT INTERNATIONAL EQUITY FUND SEMI-ANNUAL REPORT (UNAUDITED) 23
| | |
| STATEMENTS OF CHANGES IN NET ASSETS |
| |
| | SIX MONTHS ENDED | YEAR ENDED |
| | MARCH 31, | SEPTEMBER 30, |
| CAPITAL SHARE ACTIVITY | 2014 | 2013 |
| Shares sold: | | |
| Class A shares | 1,828,784 | 3,392,867 |
| Class B shares | 698 | 864 |
| Class C shares | 85,669 | 108,793 |
| Class I shares | 456,787 | 739,068 |
| Class Y shares | 216,321 | 264,708 |
| Reinvestment of distributions: | | |
| Class A shares | 62,658 | 85,381 |
| Class I shares | 65,795 | 86,594 |
| Class Y shares | 4,041 | 2,831 |
| Shares redeemed: | | |
| Class A shares | (1,153,749) | (2,343,110) |
| Class B shares | (36,114) | (85,072) |
| Class C shares | (113,567) | (223,872) |
| Class I shares | (130,868) | (3,131,479) |
| Class Y shares | (49,078) | (200,003) |
| Total capital share activity | 1,237,377 | (1,302,430) |
See notes to financial statements.
24 www.calvert.com CALVERT INTERNATIONAL EQUITY FUND SEMI-ANNUAL REPORT (UNAUDITED)
NOTES TO FINANCIAL STATEMENTS
NOTE A — SIGNIFICANT ACCOUNTING POLICIES
General: Calvert International Equity Fund (the “Fund”), a series of Calvert World Values Fund, Inc., is registered under the Investment Company Act of 1940 as a diversified, open-end management investment company. Calvert World Values Fund, Inc. is comprised of four separate series. The operations of each series are accounted for separately. The Fund offers five classes of shares of capital stock - Classes A, B, C, I, and Y. Class A shares are sold with a maximum front-end sales charge of 4.75%. Class B shares are sold without a front-end sales charge and, with certain exceptions, will be charged a deferred sales charge at the time of redemption, depending on how long investors have owned the shares. Class B shares are no longer offered for purchase, except through reinvestment of dividends and/ or distributions and through certain exchanges. Class C shares are sold without a front-end sales charge and, with certain exceptions, will be charged a deferred sales charge on shares sold within one year of purchase. Class B and Class C shares have higher levels of expenses than Class A shares. Class I shares require a minimum account balance of $1,000,000. The $1 million minimum initial investment is waived for retirement plans that trade through omnibus accounts and may be waived for certain other institutional accounts where it is believed to be in the best interest of the Fund and its shareholders. Class I shares have no front-end or deferred sales charge and have lower levels of expenses than Class A shares. Class Y shares are generally only available to wrap or similar fee-based programs offered by financial intermediaries, foundations, and endowments that have entered into an agreement with the Fund’s Distributor to offer Class Y shares. Class Y shares have no front-end or deferred sales charge and have lower levels of expenses than Class A shares. Each class has different: (a) dividend rates, due to differences in Distribution Plan expenses and other class-specific expenses, (b) exchange privileges and (c) class-specific voting rights.
Security Valuation: Net asset value per share is determined every business day as of the close of the regular session of the New York Stock Exchange (generally 4:00 p.m. Eastern time). The Fund uses independent pricing services approved by the Board of Directors (“the Board”) to value its investments wherever possible. Investments for which market quotations are not available or deemed not reliable are fair valued in good faith under the direction of the Board.
The Board has adopted Valuation Procedures (the “Procedures”) to determine the fair value of securities and other financial instruments for which market prices are not readily available or which may not be reliably priced. The Board has delegated the day-to-day responsibility for determining the fair value of assets of the Fund, except Special Equities investments, to Calvert Investment Management, Inc. (the “Advisor” or “Calvert”) and has provided these Procedures to govern Calvert in its valuation duties. Special Equities investments, as described in the Fund’s prospectus and statement of additional information, are fair valued by the Board’s Special Equities Committee.
Calvert has chartered an internal Valuation Committee to oversee the implementation of these Procedures and to assist it in carrying out the valuation responsibilities that the Board has delegated.
The Valuation Committee meets on a regular basis to review illiquid securities and other investments which may not have readily available market prices. The Valuation
www.calvert.com CALVERT INTERNATIONAL EQUITY FUND SEMI-ANNUAL REPORT (UNAUDITED) 25
Committee’s fair valuation determinations are subject to review, approval and ratification by the Board at its next regularly scheduled meeting covering the calendar quarter in which the fair valuation was determined.
The Valuation Committee utilizes various methods to measure the fair value of the Fund’s investments. Generally Accepted Accounting Principles (GAAP) establishes a disclosure hierarchy that categorizes the inputs to valuation techniques used to value assets and liabilities at measurement date. These inputs are summarized in the three broad levels listed below:
Level 1 – quoted prices in active markets for identical securities
Level 2 – other significant observable inputs (including quoted prices for similar securities, interest rates, prepayment speeds, credit risk, etc.)
Level 3 – significant unobservable inputs (including the Fund’s own assumptions in determining the fair value of investments) The inputs or methodologies used for valuing securities are not necessarily an indication of the risk associated with investing in those securities.
Changes in valuation techniques may result in transfers in or out of an investment’s assigned level within the hierarchy during the period. At March 31, 2014, $258,973,844 transferred out of Level 1 into Level 2. Valuation techniques used to value the Funds’ investments by major category are as follows: Equity securities, including restricted securities and venture capital securities, for which market quotations are readily available, are valued at the last reported sale price or official closing price as reported by an independent pricing service on the primary market or exchange on which they are traded and are categorized as Level 1 in the hierarchy. In the event there were no sales during the day or closing prices are not available, securities are valued at the last quoted bid price or using the last available price and are categorized as Level 2 in the hierarchy. Foreign securities are valued based on quotations from the principal market in which such securities are normally traded. If events occur after the close of the principal market in which foreign securities are traded, and before the close of business of the Fund, that are expected to materially affect the value of those securities, then they are valued at their fair value taking these events into account. The Fund has retained a third party fair value pricing service to quantitatively analyze the price movement of its holdings on foreign exchanges and to automatically fair value if the variation from the prior day’s closing price exceeds specified parameters. Such securities would be categorized as Level 2 in the hierarchy in these circumstances. Utilizing this technique may result in transfers between Level 1 and Level 2. For restricted securities and private placements where observable inputs are limited, assumptions about market activity and risk are used and such securities are categorized as Level 3 in the hierarchy.
Venture capital securities for which market quotations are not readily available are fair valued by the Fund’s Board of Directors and are categorized as Level 3 in the hierarchy. Venture capital direct equity securities are generally valued using the most appropriate and applicable method to measure fair value in light of each company’s situation. Methods may include market, income or cost approaches with discounts as
26 www.calvert.com CALVERT INTERNATIONAL EQUITY FUND SEMI-ANNUAL REPORT (UNAUDITED)
appropriate based on assumptions of liquidation or exit risk. Examples of the market approach are subsequent rounds of financing, comparable transactions, and revenue times an industry multiple. An example of the income approach is the discounted cash flow. Examples of the cost approach are replacement cost, salvage value, or net asset percentage. Venture capital limited partnership (“LP”) securities are valued at the fair value reported by the general partner of the partnership adjusted as necessary to reflect subsequent capital calls and distributions and any other available information. In the absence of a reported LP unit value, fair value may be estimated based on the Fund’s percentage equity in the partnership and/or other balance sheet information and portfolio value for the most recently available period reported by the general partner. In some cases adjustments may be made to account for daily pricing of material public holdings within the partnership. Venture capital debt securities are valued based on assumptions of credit and market risk. For venture capital securities denominated in foreign currency, the fair value is marked to the daily exchange rate.
Debt securities, including restricted securities, are valued based on evaluated prices received from independent pricing services or from dealers who make markets in such securities and are generally categorized as Level 2 in the hierarchy. Short-term securities of sufficient credit quality with remaining maturities of sixty days or less for which quotations are not readily available are valued at amortized cost, which approximates fair value, and are categorized as Level 2 in the hierarchy.
When independent prices are unavailable or unreliable, debt securities may be valued utilizing pricing matrices which consider similar factors that would be used by independent pricing services. These are generally categorized as Level 2 in the hierarchy but may be Level 3 depending on the circumstances.
If a market value cannot be determined for a security using the methodologies described above, or if, in the good faith opinion of the Advisor, the market value does not constitute a readily available market quotation, or if a significant event has occurred that would materially affect the value of the security, the security will be fair valued as determined in good faith by the Valuation Committee or with respect to Special Equities investments, by the Special Equities Committee using the venture capital methodologies described above.
The Valuation Committee considers a number of factors, including significant unobservable valuation inputs when arriving at fair value. It considers all significant facts that are reasonably available and relevant to the determination of fair value.
The Valuation Committee primarily employs a market-based approach which may use related or comparable assets or liabilities, recent transactions, market multiples, book values, and other relevant information for the investment to determine the fair value of the investment. When more appropriate, the fund may employ an income-based or cost approach. An income-based valuation approach discounts anticipated future cash flows of the investment to calculate a present amount (discounted). The measurement is based on the value indicated by current market expectations about those future amounts. Discounts may also be applied due to the nature or duration of any restrictions on the disposition of the investments. A cost based approach is based on the amount that currently would be required to replace the service capacity of an asset (current replacement cost). From the seller’s perspective, the price that would be received for the asset is determined based
www.calvert.com CALVERT INTERNATIONAL EQUITY FUND SEMI-ANNUAL REPORT (UNAUDITED) 27
on the cost to a buyer to acquire or construct a substitute asset of comparable utility, adjusted for obsolescence.
The values assigned to fair value investments are based on available information and do not necessarily represent amounts that might ultimately be realized. Further, due to the inherent uncertainty of valuations of such investments, the fair values may differ significantly from the values that would have been used had an active market existed, and the differences could be material. The Valuation Committee employs various methods for calibrating these valuation approaches including a regular review of key inputs and assumptions, transactional back-testing or disposition analysis and reviews of any related market activity.
At March 31, 2014, securities valued at $8,327,881, or 2.1% of net assets, were fair valued in good faith under the direction of the Board.
The following is a summary of the inputs used to value the Fund’s net assets as of March 31, 2014:
| | | VALUATION INPUTS | |
| INVESTMENTS IN SECURITIES | LEVEL 1 | LEVEL 2 | LEVEL 3 | TOTAL |
| Equity securities* | $111,414,684 | $258,973,844** | — | $370,388,528*** |
| Other debt obligations | — | 16,220,146 | — | 16,220,146 |
| Venture capital | — | — | $3,924,268 | 3,924,268 |
| TOTAL | $111,414,684 | $258,193,990 | $3,924,268 | $390,532,942 |
* For further breakdown of equity securities by country, please refer to the Statement of Net Assets.
** Includes certain securities trading primarily outside the U.S. whose value was adjusted as a result of significant market movements following the close of local trading. On March 31, 2014, price movements exceeded specified parameters and the third party fair value pricing service quantitatively fair valued the affected securities.
*** Exclusive of $686,240 venture capital equity shown in venture capital heading.
The following is a reconciliation of Level 3 assets for which significant unobservable inputs were used to determine fair value:
| | VENTURE | |
| | CAPITAL | TOTAL |
| Balance as of 9/30/13 | $3,983,544 | $3,983,544 |
| Accrued discounts/premiums | — | — |
| Realized gain (loss) | 1,387 | 1,387 |
| Change in unrealized appreciation (depreciation) | (102,925) | (102,925) |
| Purchases | 779,934 | 779,934 |
| Sales | (737,672) | (737,672) |
| Transfers in and/or out of Level 31 | — | — |
| Balance as of 3/31/14 | $3,924,268 | $3,924,268 |
1 The Fund’s policy is to recognize transfers into and transfers out of Level 3 as of the end of the reporting period.
For the six months ended March 31, 2014, total change in unrealized gain (loss) on Level 3 securities included in the change in net assets was ($102,925). Total unrealized gain (loss) for all securities (including Level 1 and Level 2) can be found on the accompanying Statement of Operations.
28 www.calvert.com CALVERT INTERNATIONAL EQUITY FUND SEMI-ANNUAL REPORT (UNAUDITED)
Restricted Securities: The Fund may invest in securities that are subject to legal or contractual restrictions on resale. Generally, these securities may only be sold publicly upon registration under the Securities Act of 1933 or in transactions exempt from such registration. Information regarding restricted securities is included at the end of the Fund’s Statement of Net Assets.
Security Transactions and Net Investment Income: Security transactions are accounted for on trade date. Realized gains and losses are recorded on an identified cost basis and may include proceeds from litigation. Dividend income is recorded on the ex-dividend date or, in the case of dividends on certain foreign securities, as soon as the Fund is informed of the ex-dividend date. Withholding taxes on foreign dividends have been provided for in accordance with the Fund’s understanding of the applicable country’s tax rules and rates. Distributions received on securities that represent a return of capital or capital gain are recorded as a reduction of cost of investments and/or as a realized gain. Interest income, which includes amortization of premium and accretion of discount on debt securities, is accrued as earned. Investment income and realized and unrealized gains and losses are allocated to separate classes of shares based upon the relative net assets of each class. Expenses arising in connection with a specific class are charged directly to that class. Expenses common to the classes are allocated to each class in proportion to their relative net assets.
Foreign Currency Transactions: The Fund’s accounting records are maintained in U.S. dollars. For valuation of assets and liabilities on each date of net asset value determination, foreign denominations are converted into U.S. dollars using the current exchange rate. Security transactions, income and expenses are translated at the prevailing rate of exchange on the date of the event. The effect of changes in foreign exchange rates on securities and foreign currencies is included in the net realized and unrealized gain or loss on securities and foreign currencies.
Distributions to Shareholders: Distributions to shareholders are recorded by the Fund on ex-dividend date. Dividends from net investment income and distributions from net realized capital gains, if any, are paid at least annually. Distributions are determined in accordance with income tax regulations which may differ from generally accepted accounting principles; accordingly, periodic reclassifications are made within the Fund’s capital accounts to reflect income and gains available for distribution under income tax regulations.
Estimates: The preparation of the financial statements in conformity with accounting principles generally accepted in the United States requires management to make estimates and assumptions that affect the reported amounts of assets and liabilities and disclosure of contingent assets and liabilities at the date of the financial statements and the reported amounts of income and expenses during the reported period. Actual results could differ from those estimates.
Redemption Fees: The Fund charges a 2% redemption fee on redemptions, including exchanges, made within 30 days of purchase in the same Fund (within seven days for Class I shares). The redemption fee is accounted for as an addition to paid-in capital and is intended to discourage market-timers by ensuring that short-term trading costs are borne by the investors making the transactions and not the shareholders already in the Fund.
www.calvert.com CALVERT INTERNATIONAL EQUITY FUND SEMI-ANNUAL REPORT (UNAUDITED) 29
Federal Income Taxes: No provision for federal income or excise tax is required since the Fund intends to continue to qualify as a regulated investment company under the Internal Revenue Code and to distribute substantially all of its taxable earnings.
Management has analyzed the Fund’s tax positions taken for all open federal income tax years and has concluded that no provision for federal income tax is required in the Fund’s financial statements. A Fund’s federal tax return is subject to examination by the Internal Revenue Service for a period of three years.
NOTE B — RELATED PARTY TRANSACTIONS
Calvert Investment Management, Inc. (the “Advisor”) is wholly-owned by Calvert Investments, Inc., which is indirectly wholly-owned by Ameritas Mutual Holding Company. The Advisor provides investment advisory services and pays the salaries and fees of officers and Directors of the Fund who are employees of the Advisor or its affiliates. For its services, the Advisor receives a monthly fee based on the following annual rates of average daily net assets: .75% on the first $250 million, .725% on the next $250 million, and .675% on the excess of $500 million. Under the terms of the agreement, $242,963 was payable at period end. In addition, $12,371 was payable at period end for operating expenses paid by the Advisor during March 2014.
The Advisor has contractually agreed to limit net annual fund operating expenses through January 31, 2015 for Class I and Class Y. The contractual expense cap is 1.10% and 1.39%, respectively. For the purpose of this expense limit, operating expenses do not include interest expense, brokerage commissions, taxes, and extraordinary expenses. This expense limitation does not limit any acquired fund fees and expenses, if any. At period end, $538 was reveivable from the Advisor. The Advisor voluntarily reimbursed Class B shares for expenses of $4,087 for the six months ended March 31, 2014.
Calvert Investment Administrative Services, Inc., an affiliate of the Advisor, provides administrative services to the Fund for an annual fee, payable monthly, of .35% for Classes A, B, C, and Y, and .15% for Class I, based on their average daily net assets. Under the terms of the agreement, $99,328 was payable at period end.
Calvert Investment Distributors, Inc. (“CID”), an affiliate of the Advisor, is the distributor and principal underwriter for the Fund. Pursuant to Rule 12b-1 under the Investment Company Act of 1940, the Fund has adopted a Distribution Plan that permits the Fund to pay certain expenses associated with the distribution and servicing of its shares. The expenses paid may not exceed .35%, 1.00% and 1.00% annually of average daily net assets of Class A, B, and C, respectively. The amount actually paid by the Fund is an annualized fee, payable monthly, of .25%, 1.00% and 1.00% of the Fund’s average daily net assets of Class A, B, and C, respectively. Class I and Class Y shares do not have Distribution Plan expenses. Under the terms of agreement, $72,990 was payable at period end.
CID received $19,054 as its portion of commissions charged on sales of the Fund’s Class A shares for the six months ended March 31, 2014.
Calvert Investment Services, Inc. (“CIS”), an affiliate of the Advisor, is the shareholder servicing agent for the Fund. For its services, CIS received a fee of $49,734 for the six months ended March 31, 2014. Under the terms of the agreement, $8,230 was payable at period end. Boston Financial Data Services, Inc. is the transfer and dividend disbursing agent.
30 www.calvert.com CALVERT INTERNATIONAL EQUITY FUND SEMI-ANNUAL REPORT (UNAUDITED)
The Fund invests in Community Investment Notes issued by the Calvert Social Investment Foundation (the “CSI Foundation”). The CSI Foundation is a 501(c)(3) nonprofit organization that receives in-kind support from Calvert and its subsidiaries. The Fund has received an exemptive order from the Securities and Exchange Commission permitting the Fund to make investments in these notes under certain conditions.
Each Director of the Funds who is not an employee of the Advisor or its affiliates receives an annual retainer of $48,000 plus a meeting fee of up to $3,000 for each Board meeting attended. Additional fees of up to $5,000 annually may be paid to the Board chair and Committee chairs ($10,000 for the Special Equities Committee chair) and $2,500 annually may be paid to Committee members, plus a Committee meeting fee of $500 for each Committee meeting attended. Directors’ fees are allocated to each of the Funds served.
NOTE C — INVESTMENTS ACTIVITY AND TAX INFORMATION
During the period, the cost of purchases and proceeds from sales of investments, other than short-term securities, were $147,731,634 and $128,740,576, respectively.
| CAPITAL LOSS CARRYFORWARDS | |
| EXPIRATION DATE | |
| 30-Sep-17 | ($83,864,915) |
| 30-Sep-18 | (105,942,268) |
| 30-Sep-19 | (10,386,632) |
Under the Regulated Investment Company Modernization Act of 2010, capital losses incurred in taxable years beginning after December 22, 2010 can be carried forward for an unlimited period. These losses are required to be utilized prior to the losses incurred in pre-enactment taxable years and will retain their character as either long-term or short term. Losses incurred in pre-enactment taxable years can be utilized until expiration.
As of March 31, 2013, the tax basis components of unrealized appreciation/(depreciation) and the federal tax cost were as follows:
| Unrealized appreciation | $61,758,918 |
| Unrealized (depreciation) | (7,572,058) |
| Net unrealized appreciation/(depreciation) | $54,186,860 |
| |
| Federal income tax cost of investments | $336,346,082 |
NOTE D — LINE OF CREDIT
A financing agreement is in place with the Calvert Funds and State Street Corporation (“SSC”). Under the agreement, SSC provides an unsecured line of credit facility, in the aggregate amount of $50 million ($25 million committed and $25 million uncommitted), accessible by the Funds for temporary or emergency purposes only. Borrowings under the committed facility bear interest at the higher of the London Interbank Offered Rate (LIBOR) or the overnight Federal Funds Rate plus 1.25% per annum. A commitment fee of .11% per annum is incurred on the unused portion of the committed facility, which is allocated to all participating funds. The fund had no loans outstanding pursuant to this line of credit at March 31, 2014. For the six months ended
www.calvert.com CALVERT INTERNATIONAL EQUITY FUND SEMI-ANNUAL REPORT (UNAUDITED) 31
March 31, 2014, borrowings by the Fund under the agreement were as follows:
| | WEIGHTED AVERAGE | MAXIMUM AMOUNT | MONTH OF MAXIMUM |
| AVERAGE DAILY BALANCE | INTEREST RATE | BORROWED | AMOUNT BORROWED |
| $2,255 | 1.35% | $410,370 | November 2013 |
NOTE E — AFFILIATED COMPANIES
An affiliated company is a company in which the Fund has a direct or indirect ownership of, control of, or voting power of 5 percent or more of the outstanding voting shares. Affiliated companies of the Fund as of March 31, 2014 are as follows:
| AFFILIATES | COST | VALUE |
| Bioceptive, Inc. - Series A preferred | $252,445 | $299,967 |
| gNet Defta Development Holdings LLC, LP | 400,000 | 321,718 |
| SEAF Central & Eastern European Growth Fund LLC, LP | 330,924 | 361,152 |
| TOTALS | $983,369 | $982,837 |
NOTE F — SUBSEQUENT EVENTS
In preparing the financial statements as of March 31, 2014, no subsequent events or transactions occurred that would have required recognition or disclosure in these financial statements.
NOTE G — OTHER
In connection with certain venture capital investments, the Fund is committed to future capital calls, which will increase the Fund’s investment in these securities. The aggregate amount of the future capital commitments totals $236,125 at March 31, 2014.
32 www.calvert.com CALVERT INTERNATIONAL EQUITY FUND SEMI-ANNUAL REPORT (UNAUDITED)
| | | |
| FINANCIAL HIGHLIGHTS |
| |
| | PERIODS ENDED |
| | MARCH
31, | SEPTEMBER
30, | SEPTEMBER
30, |
| CLASS A SHARES | 2014 (z) | 2013 (z) | 2012 (z) |
| Net asset value, beginning | $16.44 | $13.49 | $11.84 |
| Income from investment operations: | | | |
| Net investment income | .02 | .08 | .12 |
| Net realized and unrealized gain (loss) | .76 | 2.98 | 1.68 |
| Total from investment operations | .78 | 3.06 | 1.80 |
| Distributions from: | | | |
| Net investment income | (.10) | (.11) | (.15) |
| Net realized gain | — | — | — |
| Total distributions | (.10) | (.11) | (.15) |
| Total increase (decrease) in net asset value | .68 | 2.95 | 1.65 |
| Net asset value, ending | $17.12 | $16.44 | $13.49 |
| |
| Total return* | 4.73% | 22.82% | 15.34% |
| Ratios to average net assets: A | | | |
| Net investment income | .18% (a) | .52% | .96% |
| Total expenses | 1.68% (a) | 1.76% | 1.84% |
| Expenses before offsets | 1.68% (a) | 1.76% | 1.80% |
| Net expenses | 1.68% (a) | 1.76% | 1.80% |
| Portfolio turnover | 35% | 40% | 43% |
| Net assets, ending (in thousands) | $265,178 | $242,464 | $183,588 |
| |
| |
| | YEARS ENDED |
| | SEPTEMBER
30, | SEPTEMBER
30, | SEPTEMBER
30, |
| CLASS A SHARES | 2011 (z) | 2010 (z) | 2009 (z) |
| Net asset value, beginning | $13.88 | $13.83 | $15.31 |
| Income from investment operations: | | | |
| Net investment income | .15 | .06 | .11 |
| Net realized and unrealized gain (loss) | (2.15) | .09 | (1.19) |
| Total from investment operations | (2.00) | .15 | (1.08) |
| Distributions from: | | | |
| Net investment income | (.04) | (.10) | (.37) |
| Net realized gain | — | — | (.03) |
| Total distributions | (.04) | (.10) | (.40) |
| Total increase (decrease) in net asset value | (2.04) | .05 | (1.48) |
| Net asset value, ending | $11.84 | $13.88 | $13.83 |
| |
| Total return* | (14.47%) | 1.08% | (6.27%) |
| Ratios to average net assets: A | | | |
| Net investment income | 1.03% | .46% | .99% |
| Total expenses | 1.80% | 1.83% | 1.87% |
| Expenses before offsets | 1.80% | 1.80% | 1.86% |
| Net expenses | 1.80% | 1.80% | 1.86% |
| Portfolio turnover | 49% | 133% | 135% |
| Net assets, ending (in thousands) | $173,936 | $245,309 | $270,900 |
See notes to financial highlights.
www.calvert.com CALVERT INTERNATIONAL EQUITY FUND SEMI-ANNUAL REPORT (UNAUDITED) 33
| | | |
| FINANCIAL HIGHLIGHTS |
| |
| | PERIODS ENDED |
| | MARCH
31, | SEPTEMBER
30, | SEPTEMBER
30, |
| CLASS B SHARES | 2014 (z) | 2013 (z) | 2012 (z) |
| Net asset value, beginning | $14.49 | $11.94 | $10.48 |
| Income from investment operations: | | | |
| Net investment income (loss) | (.09) | (.10) | (.03) |
| Net realized and unrealized gain (loss) | .68 | 2.65 | 1.49 |
| Total from investment operations | .59 | 2.55 | 1.46 |
| Distributions from: | | | |
| Net investment income | — | — | — |
| Net realized gain | — | — | — |
| Total distributions | — | — | — |
| Total increase (decrease) in net asset value | .59 | 2.55 | 1.46 |
| Net asset value, ending | $15.08 | $14.49 | $11.94 |
| |
| Total return* | 4.07% | 21.36% | 13.93% |
| Ratios to average net assets: A | | | |
| Net investment income (loss) | (1.18%) (a) | (.75%) | (.26%) |
| Total expenses | 3.24% (a) | 3.19% | 3.18% |
| Expenses before offsets | 2.97% (a) | 2.97% | 2.97% |
| Net expenses | 2.97% (a) | 2.97% | 2.97% |
| Portfolio turnover | 35% | 40% | 43% |
| Net assets, ending (in thousands) | $2,753 | $3,158 | $3,607 |
| |
| |
| | YEARS ENDED |
| | SEPTEMBER
30, | SEPTEMBER
30, | SEPTEMBER
30, |
| CLASS B SHARES | 2011 (z) | 2010 (z) | 2009 (z) |
| Net asset value, beginning | $12.40 | $12.40 | $13.69 |
| Income from investment operations: | | | |
| Net investment income (loss) | (.03) | (.09) | (.02) |
| Net realized and unrealized gain (loss) | (1.89) | .09 | (1.06) |
| Total from investment operations | (1.92) | — | (1.08) |
| Distributions from: | | | |
| Net investment income | — | — | (.18) |
| Net realized gain | — | — | (.03) |
| Total distributions | — | — | (.21) |
| Total increase (decrease) in net asset value | (1.92) | — | (1.29) |
| Net asset value, ending | $10.48 | $12.40 | $12.40 |
| |
| Total return* | (15.48%) | .00% | (7.47%) |
| Ratios to average net assets:A | | | |
| Net investment income (loss) | (.21%) | (.74%) | (.26%) |
| Total expenses | 3.02% | 3.03% | 3.12% |
| Expenses before offsets | 2.97% | 2.97% | 3.10% |
| Net expenses | 2.97% | 2.97% | 3.10% |
| Portfolio turnover | 49% | 133% | 135% |
| Net assets, ending (in thousands) | $4,506 | $6,850 | $8,993 |
See notes to financial highlights.
34 www.calvert.com CALVERT INTERNATIONAL EQUITY FUND SEMI-ANNUAL REPORT (UNAUDITED)
| | | |
| FIFINANCIAL HIGHLIGHTS |
| |
| | PERIODS ENDED |
| | MARCH
31, | SEPTEMBER
30, | SEPTEMBER
30, |
| CLASS C SHARES | 2014 (z) | 2013 (z) | 2012 (z) |
| Net asset value, beginning | $14.26 | $11.71 | $10.26 |
| Income from investment operations: | | | |
| Net investment income (loss) | (.05) | (.05) | .01 |
| Net realized and unrealized gain (loss) | .66 | 2.60 | 1.45 |
| Total from investment operations | .61 | 2.55 | 1.46 |
| Distributions from: | | | |
| Net investment income | — | — | (.01) |
| Net realized gain | — | — | — |
| Total distributions | — | — | (.01) |
| Total increase (decrease) in net asset value | .61 | 2.55 | 1.45 |
| Net asset value, ending | $14.87 | $14.26 | $11.71 |
| |
| Total return* | 4.28% | 21.78% | 14.23% |
| Ratios to average net assets: A | | | |
| Net investment income (loss) | (.75%) (a) | (.40%) | .05% |
| Total expenses | 2.59% (a) | 2.65% | 2.72% |
| Expenses before offsets | 2.59% (a) | 2.65% | 2.69% |
| Net expenses | 2.59% (a) | 2.65% | 2.69% |
| Portfolio turnover | 35% | 40% | 43% |
| Net assets, ending (in thousands) | $18,090 | $17,746 | $15,922 |
| |
| |
| | YEARS ENDED |
| | SEPTEMBER
30, | SEPTEMBER
30, | SEPTEMBER
30, |
| CLASS C SHARES | 2011 (z) | 2010 (z) | 2009 (z) |
| Net asset value, beginning | $12.10 | $12.07 | $13.31 |
| Income from investment operations: | | | |
| Net investment income (loss) | .01 | (.05) | .01 |
| Net realized and unrealized gain (loss) | (1.85) | .08 | (1.03) |
| Total from investment operations | (1.84) | .03 | (1.02) |
| Distributions from: | | | |
| Net investment income | — | — | (.19) |
| Net realized gain | — | — | (.03) |
| Total distributions | — | — | (.22) |
| Total increase (decrease) in net asset value | (1.84) | .03 | (1.24) |
| Net asset value, ending | $10.26 | $12.10 | $12.07 |
| |
| Total return* | (15.21%) | .25% | (7.16%) |
| Ratios to average net assets: A | | | |
| Net investment income (loss) | .12% | (.41%) | .07% |
| Total expenses | 2.67% | 2.72% | 2.79% |
| Expenses before offsets | 2.67% | 2.69% | 2.79% |
| Net expenses | 2.67% | 2.69% | 2.79% |
| Portfolio turnover | 49% | 133% | 135% |
| Net assets, ending (in thousands) | $16,195 | $21,942 | $24,107 |
See notes to financial highlights.
www.calvert.com CALVERT INTERNATIONAL EQUITY FUND SEMI-ANNUAL REPORT (UNAUDITED) 35
| | | |
| FINANCIAL HIGHLIGHTS |
| |
| | PERIODS ENDED |
| | MARCH
31, | SEPTEMBER
30, | SEPTEMBER
30, |
| CLASS I SHARES | 2014 (z) | 2013 (z) | 2012 (z) |
| Net asset value, beginning | $17.69 | $14.52 | $12.70 |
| Income from investment operations: | | | |
| Net investment income | .08 | .17 | .24 |
| Net realized and unrealized gain (loss) | .82 | 3.24 | 1.79 |
| Total from investment operations | .90 | 3.41 | 2.03 |
| Distributions from: | | | |
| Net investment income | (.31) | (.24) | (.21) |
| Net realized gain | — | — | — |
| Total distributions | (.31) | (.24) | (.21) |
| Total increase (decrease) in net asset value | .59 | 3.17 | 1.82 |
| Net asset value, ending | $18.28 | $17.69 | $14.52 |
| |
| Total return* | 5.08% | 23.74% | 16.16% |
| Ratios to average net assets: A | | | |
| Net investment income | .84% (a) | 1.07% | 1.71% |
| Total expenses | 1.04% (a) | 1.06% | 1.09% |
| Expenses before offsets | 1.04% (a) | 1.06% | 1.06% |
| Net expenses | 1.04% (a) | 1.06% | 1.06% |
| Portfolio turnover | 35% | 40% | 43% |
| Net assets, ending (in thousands) | $92,411 | $82,499 | $101,203 |
| |
| |
| | YEARS ENDED |
| | SEPTEMBER
30, | SEPTEMBER
30, | SEPTEMBER
30, |
| CLASS I SHARES | 2011 (z) | 2010 (z) | 2009 (z) |
| Net asset value, beginning | $14.83 | $14.79 | $16.37 |
| Income from investment operations: | | | |
| Net investment income | .26 | .17 | .22 |
| Net realized and unrealized gain (loss) | (2.30) | .11 | (1.29) |
| Total from investment operations | (2.04) | .28 | (1.07) |
| Distributions from: | | | |
| Net investment income | (.09) | (.24) | (.48) |
| Net realized gain | — | — | (.03) |
| Total distributions | (.09) | (.24) | (.51) |
| Total increase (decrease) in net asset value | (2.13) | .04 | (1.58) |
| Net asset value, ending | $12.70 | $14.83 | $14.79 |
| |
| Total return* | (13.84%) | 1.91% | (5.59%) |
| Ratios to average net assets: A | | | |
| Net investment income | 1.74% | 1.17% | 1.80% |
| Total expenses | 1.07% | 1.08% | 1.08% |
| Expenses before offsets | 1.06% | 1.06% | 1.07% |
| Net expenses | 1.06% | 1.06% | 1.07% |
| Portfolio turnover | 49% | 133% | 135% |
| Net assets, ending (in thousands) | $89,142 | $86,475 | $107,456 |
See notes to financial highlights.
36 www.calvert.com CALVERT INTERNATIONAL EQUITY FUND SEMI-ANNUAL REPORT (UNAUDITED)
| | | |
| FINANCIAL HIGHLIGHTS |
| |
| | PERIODS ENDED |
| | MARCH
31, | SEPTEMBER
30, | SEPTEMBER
30, |
| CLASS Y SHARES | 2014 (z) | 2013 (z) | 2012 (z) |
| Net asset value, beginning | $17.38 | $14.25 | $12.45 |
| Income from investment operations: | | | |
| Net investment income | .05 | .14 | .18 |
| Net realized and unrealized gain (loss) | .81 | 3.15 | 1.77 |
| Total from investment operations | .86 | 3.29 | 1.95 |
| Distributions from: | | | |
| Net investment income | (.18) | (.16) | (.15) |
| Net realized gain | — | — | — |
| Total distributions | (.18) | (.16) | (.15) |
| Total increase (decrease) in net asset value | .68 | 3.13 | 1.80 |
| Net asset value, ending | $18.06 | $17.38 | $14.25 |
| |
| Total return* | 4.95% | 23.27% | 15.80% |
| Ratios to average net assets: A | | | |
| Net investment income | .57% (a) | .90% | 1.36% |
| Total expenses | 1.34% (a) | 1.41% | 1.46% |
| Expenses before offsets | 1.34% (a) | 1.39% | 1.39% |
| Net expenses | 1.34% (a) | 1.39% | 1.39% |
| Portfolio turnover | 35% | 40% | 43% |
| Net assets, ending (in thousands) | $13,866 | $10,367 | $7,535 |
| |
| |
| | PERIODS ENDED |
| | SEPTEMBER
30, | SEPTEMBER
30, | SEPTEMBER
30, |
| CLASS Y SHARES | 2011 (z) | 2010 (z) | 2009 (z)# |
| Net asset value, beginning | $14.53 | $14.34 | $11.45 |
| Income from investment operations: | | | |
| Net investment income | .24 | .08 | .17 |
| Net realized and unrealized gain (loss) | (2.30) | .17 | 2.76 |
| Total from investment operations | (2.06) | .25 | 2.93 |
| Distributions from: | | | |
| Net investment income | (.02) | (.06) | (.01) |
| Net realized gain | — | — | (.03) |
| Total distributions | (.02) | (.06) | (.04) |
| Total increase (decrease) in net asset value | (2.08) | .19 | 2.89 |
| Net asset value, ending | $12.45 | $14.53 | $14.34 |
| |
| Total return* | (14.20%) | 1.73% | 25.75% |
| Ratios to average net assets:A | | | |
| Net investment income | 1.56% | .61% | 1.52% (a) |
| Total expenses | 1.51% | 2.14% | 5.91% (a) |
| Expenses before offsets | 1.39% | 1.39% | 1.39% (a) |
| Net expenses | 1.39% | 1.39% | 1.39% (a) |
| Portfolio turnover | 49% | 133% | 100% |
| Net assets, ending (in thousands) | $7,398 | $2,790 | $702 |
See notes to financial highlights.
www.calvert.com CALVERT INTERNATIONAL EQUITY FUND SEMI-ANNUAL REPORT (UNAUDITED) 37
A Total expenses do not reflect amounts reimbursed and/or waived by the Advisor or reductions from expense offset
arrangements. Expenses before offsets reflect expenses after reimbursement and/or waiver by the Advisor but
prior to reductions from expense offset arrangements. Net expenses are net of all reductions and represent the net
expenses paid by the Fund.
(a) Annualized.
(z) Per share figures are calculated using the Average Share Method.
* Total return is not annualized for periods less than one year and does not reflect deduction of any front-
end or deferred sales charge.
# From October 31, 2008, inception.
See notes to financial statements.
38 www.calvert.com CALVERT INTERNATIONAL EQUITY FUND SEMI-ANNUAL REPORT (UNAUDITED)
EXPLANATION OF FINANCIAL TABLES
SCHEDULE OF INVESTMENTS
The Schedule of Investments is a snapshot of all securities held in the fund at their market value, on the last day of the reporting period. Securities are listed by asset type (e.g., common stock, corporate bonds, U.S. government obligations) or, for International Funds, by country, and may be further broken down into sub-groups and by industry classification.
STATEMENT OF ASSETS AND LIABILITIES
The Statement of Assets and Liabilities is often referred to as the fund’s balance sheet. It lists the value of what the fund owns, is due and owes on the last day of the reporting period. The fund’s assets include the market value of securities owned, cash, receivables for securities sold and shareholder subscriptions, and receivables for dividends and interest payments that have been earned, but not yet received. The fund’s liabilities include payables for securities purchased and shareholder redemptions, and expenses owed but not yet paid. The statement also reports the fund’s net asset value (NAV) per share on the last day of the reporting period. The NAV is calculated by dividing the fund’s net assets (assets minus liabilities) by the number of shares outstanding. This statement is accompanied by a Schedule of Investments. Alternatively, if certain conditions are met, a Statement of Net Assets may be presented in lieu of this statement and the Schedule of Investments.
STATEMENT OF NET ASSETS
The Statement of Net Assets provides a detailed list of the fund’s holdings, including each security’s market value on the last day of the reporting period. The Statement of Net Assets includes a Schedule of Investments. Other assets are added and other liabilities subtracted from the investments total to calculate the fund’s net assets. Finally, net assets are divided by the outstanding shares of the fund to arrive at its share price, or Net Asset Value (NAV) per share.
At the end of the Statement of Net Assets is a table displaying the composition of the fund’s net assets. Paid in Capital is the money invested by shareholders and represents the bulk of net assets. Undistributed Net Investment Income and Accumulated Net Realized Gains usually approximate the amounts the fund had available to distribute to shareholders as of the statement date. Accumulated Realized Losses will appear as negative balances. Unrealized Appreciation (Depreciation) is the difference between the market value of the fund’s investments and their cost, and reflects the gains (losses) that would be realized if the fund were to sell all of its investments at their statement-date values.
STATEMENT OF OPERATIONS
The Statement of Operations summarizes the fund’s investment income earned and expenses incurred in operating the fund. Investment income includes dividends earned from stocks and interest earned from interest-bearing securities in the fund. Expenses incurred in operating the fund include the advisory fee paid to the investment advisor, administrative services fees, distribution plan expenses (if applicable), transfer agent fees, shareholder servicing expenses, custodial, legal, and audit fees, and the printing and postage expenses related to shareholder reports. Expense offsets (fees paid indirectly) may also be shown. Credits earned from offset arrangements are used to reduce the fund’s expenses.
www.calvert.com CALVERT INTERNATIONAL EQUITY FUND SEMI-ANNUAL REPORT (UNAUDITED) 39
This statement also shows net gains (losses) realized on the sale of investments and the increase or decrease in the unrealized appreciation (depreciation) on investments held during the period.
STATEMENT OF CHANGES IN NET ASSETS
The Statement of Changes in Net Assets shows how the fund’s total net assets changed during the two most recent reporting periods. Changes in the fund’s net assets are attributable to investment operations, distributions and capital share transactions.
The Operations section of the report summarizes information detailed in the Statement of Operations. The Distribution section shows the dividend and capital gain distributions made to shareholders. The amounts shown as distributions in this section may not match the net investment income and realized gains amounts shown in the Operations section because distributions are determined on a tax basis and certain investments or transactions may be treated differently for financial statement and tax purposes. The Capital Share Transactions section shows the amount shareholders invested in the fund, either by purchasing shares or by reinvesting distributions, and the amounts redeemed. The corresponding numbers of shares issued, reinvested and redeemed are shown at the end of the report.
FINANCIAL HIGHLIGHTS
The Financial Highlights table provides a per-share breakdown per class of the components that affect the fund’s net asset value for current and past reporting periods. The table provides total return, total distributions, expense ratios, portfolio turnover and net assets for the applicable period. Total return is a measure of a fund’s performance that encompasses all elements of return: dividends, capital gain distributions and changes in net asset value. Total return is the change in value of an investment over a given period, assuming reinvestment of any dividends and capital gain distributions, expressed as a percentage of the initial investment. Total distributions include distributions from net investment income and net realized gains. Long-term gains are earned on securities held in the fund more than one year. Short-term gains, on the sale of securities held less than one year, are treated as ordinary dividend income for tax purposes. The expense ratio is a fund’s cost of doing business, expressed as a percentage of net assets. These expenses directly reduce returns to shareholders. Portfolio turnover measures the trading activity in a fund’s investment portfolio – how often securities are bought and sold by a fund. Portfolio turnover is affected by market conditions, changes in the size of the fund, the nature of the fund’s investments and the investment style of the portfolio manager.
PROXY VOTING
The Proxy Voting Guidelines of the Calvert Funds that the Fund uses to determine how to vote proxies relating to portfolio securities are provided as an Appendix to the Fund’s Statement of Additional Information. The Statement of Additional Information can be obtained free of charge by calling the Fund at 1-800-368-2745, by visiting the Calvert website at www.calvert.com; or by visiting the SEC’s website at www.sec.gov.
Information regarding how the Fund voted proxies relating to portfolio securities during the most recent 12-month period ended June 30 is available on the Fund’s website at www.calvert.com and on the SEC’s website at www.sec.gov.
40 www.calvert.com CALVERT INTERNATIONAL EQUITY FUND SEMI-ANNUAL REPORT (UNAUDITED)
AVAILABILITY OF QUARTERLY PORTFOLIO HOLDINGS
The Fund files its complete schedule of portfolio holdings with the SEC for the first and third quarters of each fiscal year on Form N-Q. The Fund’s Form N-Q is available on the SEC’s website at www.sec.gov. The Fund’s Form N-Q may be reviewed and copied at the SEC’s Public Reference Room in Washington, DC; information on the operation of the Public Reference Room may be obtained by calling 1-800-SEC-0330.
BASIS FOR BOARD’S APPROVAL OF INVESTMENT ADVISORY AND INVESTMENT SUBADVISORY CONTRACTS
At a meeting held on December 10, 2013, the Board of Directors, and by a separate vote, the disinterested Directors, approved the continuance of the Investment Advisory Agreement between Calvert World Values Fund, Inc. and the Advisor and the Investment Subadvisory Agreement between the Advisor and each Subadvisor.
In evaluating the Investment Advisory Agreement, the Board considered a variety of information relating to the Fund and the Advisor. The disinterested Directors reviewed a report prepared by the Advisor regarding various services provided to the Fund by the Advisor and its affiliates. Such report included, among other data, information regarding the Advisor’s personnel and the Advisor’s revenue and cost of providing services to the Fund, and a separate report prepared by an independent third party, which provided a statistical analysis comparing the Fund’s investment performance, expenses, and fees to comparable mutual funds.
The disinterested Directors were separately represented by independent legal counsel with respect to their consideration of the reapproval of the Investment Advisory Agreement and each Investment Subadvisory Agreement with the applicable Subadvisor. Prior to voting, the disinterested Directors reviewed the proposed continuance of the Investment Advisory Agreement and each Investment Subadvisory Agreement with management and also met in private sessions with their counsel at which no representatives of management were present.
In the course of its deliberations regarding the Investment Advisory Agreement, the Board considered the following factors, among others: the nature, extent and quality of the services provided by the Advisor, including the personnel providing such services; the Advisor’s financial condition; the level and method of computing the Fund’s advisory fee; comparative performance, fee and expense information for the Fund; the profitability of the Calvert Family of Funds to the Advisor and its affiliates; the allocation of the Fund’s brokerage, including the Advisor’s process for monitoring “best execution”; the direct and indirect benefits, if any, derived by the Advisor and its affiliates from their relationship with the Fund; the effect of the Fund’s growth and size on the Fund’s performance and expenses; the affiliated distributor’s process for monitoring sales load breakpoints; the Advisor’s compliance programs and policies; the Advisor’s performance of substantially similar duties for other funds; and any possible conflicts of interest.
In considering the nature, extent and quality of the services provided by the Advisor
www.calvert.com CALVERT INTERNATIONAL EQUITY FUND SEMI-ANNUAL REPORT (UNAUDITED) 41
under the Investment Advisory Agreement, the Board reviewed information provided by the Advisor relating to its operations and personnel, including, among other information, biographical information on the Advisor’s investment, supervisory and professional staff and descriptions of its organizational and management structure. The Board also took into account similar information provided periodically throughout the previous year by the Advisor as well as the Board’s familiarity with management through Board of Directors’ meetings, discussions and other reports. The Board considered the Advisor’s management style and its performance in employing its investment strategies, as well as its current level of staffing and overall resources. The Board also noted that it reviewed on a quarterly basis information regarding the Advisor’s compliance with applicable policies and procedures, including those related to personal investing. The Advisor’s administrative capabilities, including its ability to supervise the other service providers for the Fund, were also considered. The Board also took into account the environmental, social, sustainability and governance research and analysis provided by the Advisor to the Fund. The Board observed that the scope of services provided by the Advisor generally had expanded over time as a result of regulatory, market and other changes. The Board took into consideration, among other factors, the effectiveness of the Fund’s and Advisor’s processes, policies and procedures and the Advisor’s personnel. The Board also took into account, among other items, periodic reports received from the Advisor over the past year concerning the Advisor’s ongoing review and enhancement of certain processes, policies and procedures of the Fund and the Advisor. The Board discussed the Advisor’s effectiveness in monitoring the performance of the Subadvisors and its timeliness in responding to performance issues. The Board concluded that it was satisfied with the nature, extent and quality of services provided to the Fund by the Advisor under the Investment Advisory Agreement.
In considering the Fund’s performance, the Board noted that it reviewed on a quarterly basis detailed information about the Fund’s performance results, portfolio composition and investment strategies. In addition, the Board took into account overall financial market conditions. The Board also reviewed various comparative data provided to it in connection with its consideration of the renewal of the Investment Advisory Agreement, including, among other information, a comparison of the Fund’s total return with its Lipper index and with that of other mutual funds deemed to be in its peer group by an independent third party in its report. This comparison indicated that the Fund performed at the median of its peer group for the one-year period ended June 30, 2013. For the three- and five-year periods ended June 30, 2013, the Fund performed below the median of its peer group. The data also indicated that the Fund outperformed its Lipper index for the one-year period ended June 30, 2013, and underperformed its Lipper index for the three- and five-year periods ended June 30, 2013. The Board took into account management’s discussion of the Fund’s recent improvement in performance and management’s continued monitoring of the Fund’s performance. Based upon its review, the Board concluded that appropriate action was being taken to address the Fund’s performance.
In considering the Fund’s fees and expenses, the Board compared the Fund’s fees and total expense ratio with various comparative data for the funds in its peer group. Among other findings, the data indicated that the Fund’s advisory fee (after taking into account waivers and/or reimbursements) was below the median of its peer group and that total expenses (net of waivers and/or reimbursements) were above the median of its peer group. The
42 www.calvert.com CALVERT INTERNATIONAL EQUITY FUND SEMI-ANNUAL REPORT (UNAUDITED)
Board noted that the allocation of advisory and administrative fees may vary among the Fund’s peer group. The Board also took into account the Advisor’s current undertaking to maintain expense limitations for the Fund and that the Advisor had reimbursed a portion of the Fund’s expenses. The Board noted the Advisor’s discussion of the Fund’s expenses and certain factors that affected the level of such expenses, including the cost of providing the environmental, social, sustainability and governance research and analysis provided by the Advisor. Based upon its review, the Board determined that the advisory fee was reasonable in view of the quality of services received by the Fund from the Advisor and the other factors considered.
The Board reviewed the Advisor’s profitability on a fund-by-fund basis. In reviewing the overall profitability of the advisory fee to the Fund’s Advisor, the Board also considered the fact that affiliates of the Advisor provided shareholder servicing, administrative and distribution services to the Fund for which they received compensation. The information considered by the Board included Calvert’s operating profit margin information both before and after tax expenses with respect to the services that the Advisor and its affiliates provided to the Calvert Family of Funds complex. The Board reviewed the profitability of the Advisor’s relationship with the Fund in terms of the total amount of annual advisory fees it received with respect to the Fund and whether the Advisor had the financial wherewithal to continue to provide services to the Fund. The Board noted that the Advisor had reimbursed a portion of the Fund’s expenses. The Board also noted the Advisor’s current undertaking to maintain expense limitations for the Fund. The Board also considered that the Advisor derived benefits to its reputation and other indirect benefits from its relationship with the Fund. The Board noted that the Advisor paid the subadvisory fees to the Subadvisors. Based upon its review, the Board concluded that the Advisor’s and its affiliates’ level of profitability from their relationship with the Fund was reasonable.
The Board considered the effect of the Fund’s current size and its potential growth on its performance and fees. The Board took into account that the Fund’s advisory fee schedule contained breakpoints that would reduce the advisory fee rate on assets above specified levels as the Fund’s assets increased. The Board noted that the Fund was currently realizing economies of scale in its advisory fee. The Board also noted that if the Fund’s assets increased over time, the Fund might realize other economies of scale if assets increased proportionally more than certain other expenses.
In reapproving the Investment Advisory Agreement, the Board, including the disinterested Directors, did not identify any single factor as controlling, and each Director may have attributed different weight to various factors.
In evaluating each of the Investment Subadvisory Agreements, the disinterested Directors reviewed information provided by the Subadvisors relating to their respective operations, personnel, investment philosophy, strategies and techniques. Among other information, the Subadvisors provided biographical information on portfolio management and other professional staff, performance information for themselves, and descriptions of their respective investment philosophies, strategies and techniques, organizational and management structures and brokerage policies and practices.
The Board reapproved the Investment Subadvisory Agreement between the Advisor and each of the Subadvisors based on a number of factors relating to each Subadvisor’s ability
www.calvert.com CALVERT INTERNATIONAL EQUITY FUND SEMI-ANNUAL REPORT (UNAUDITED) 43
to perform under the respective Investment Subadvisory Agreement. In the course of its deliberations, the Board evaluated, among other factors: the nature, extent and the quality of the services provided by each Subadvisor; each Subadvisor’s management style and long-term performance record; each Subadvisor’s performance in employing its investment strategies; each Subadvisor’s current level of staffing and its overall resources; the qualifications and experience of each Subadvisor’s personnel; each Subadvisor’s financial condition with respect to its ability to perform the services required under the respective Investment Subadvisory Agreement; each Subadvisor’s risk management processes; each Subadvisor’s compliance systems, including those related to personal investing; and any disciplinary history. Based upon its review, the Board concluded that it was satisfied with the nature, extent and quality of services provided to the Fund by each Subadvisor under the respective Investment Subadvisory Agreement.
As noted above, the Board considered, among other information, the Fund’s performance during the one-, three- and five-year periods ended June 30, 2013 as compared to the Fund’s peer group and noted that it reviewed on a quarterly basis detailed information about the Fund’s performance results, portfolio composition and investment strategies. The Board noted the Advisor’s expertise and resources in monitoring the performance, investment style and risk- adjusted performance of the Subadvisors.
In considering the cost of services provided by each Subadvisor and the profitability to each Subadvisor of its relationship with the Fund, the Board noted that the subadvisory fees under each Investment Subadvisory Agreement was paid by the Advisor out of the advisory fee that the Advisor received under the Investment Advisory Agreement. The Board also relied on the ability of the Advisor to negotiate each Investment Subadvisory Agreement and the corresponding subadvisory fee at arm’s length. In addition, the Board took into account the fees Martin Currie, Inc. charged to its other clients and considered these fee comparisons in light of the differences in managing these other accounts. Based upon its review, the Board determined that the subadvisory fees were reasonable in view of the quality of services received by the Fund from the Subadvisors. Because the Advisor pays the Subadvisors’ subadvisory fees and the subadvisory fees were negotiated at arm’s length by the Advisor, the cost of services provided by the Subadvisors and the profitability to the Subadvisors of their relationships with the Fund were not material factors in the Board’s deliberations. For similar reasons, the Board did not consider the potential economies of scale in each Subadvisor’s management of the Fund to be a material factor in its consideration, although the Board noted that Martin Currie, Inc.’s subadvisory fee schedule for the Fund contained breakpoints that reduced the subadvisory fee rate on assets above specified levels.
In reapproving each Investment Subadvisory Agreement, the Board, including the disinterested Directors, did not identify any single factor as controlling, and each Director may have attributed different weight to various factors.
CONCLUSIONS
The Board reached the following conclusions regarding the Investment Advisory Agreement and each Investment Subadvisory Agreement, among others: (a) the Advisor has demonstrated that it possesses the capability and resources to perform the duties required of it under the Investment Advisory Agreement; (b) the Advisor and each Subadvisor is qualified to manage the Fund’s assets in accordance with the Fund’s invest-
44 www.calvert.com CALVERT INTERNATIONAL EQUITY FUND SEMI-ANNUAL REPORT (UNAUDITED)
ment objectives and policies; (c) the Advisor and each Subadvisor maintain appropriate compliance programs; (d) the Advisor and each Subadvisor is likely to execute its investment strategies consistently over time; (e) appropriate action is being taken to address the Fund’s performance; and (f) the Fund’s advisory and subadvisory fees are reasonable in view of the quality of services received by the Fund from the Advisor and Subadvisors, respectively, and the other factors considered. Based on its conclusions, the Board determined that reapproval of the Investment Advisory Agreement and each Investment Subadvisory Agreement would be in the best interests of the Fund and its shareholders.
www.calvert.com CALVERT INTERNATIONAL EQUITY FUND SEMI-ANNUAL REPORT (UNAUDITED) 45
This page intentionally left blank.
To Open an Account
800-368-2748
Service for Existing Account
Shareholders: 800-368-2745
Brokers: 800-368-2746
TDD for Hearing Impaired
800-541-1524
Registered Mail
Calvert Investments
c/o BFDS,
P.O. Box 219544
Kansas City, MO 64121-9544
Overnight Mail
Calvert Investments
c/o BFDS,
330 West 9th Street
Kansas City, MO 64105
Web Site
www.calvert.com
Principal Underwriter
Calvert Investment Distributors, Inc.
4550 Montgomery Avenue
Suite 1000 North
Bethesda, Maryland 20814
This report is intended to provide fund information to shareholders. It is not authorized for distribution to prospective investors unless preceded or accompanied by a prospectus.
Note: The information on our website is not incorporated by reference into this report; our website address is included as an inactive textual reference only.
Investors should carefully consider the investment objectives, risks, charges and expenses of the Calvert Funds. This and other important information is contained in the fund’s summary prospectus and prospectus, which can be obtained from your financial professional and should be read carefully before investing. You may also call Calvert at 800/368-2748 or visit www. calvert.com.
Choose Planet-friendly E-delivery!
Sign up now for on-line statements, prospectuses, and fund reports. In less than five minutes you can help reduce paper mail and lower fund costs.
Just go to www.calvert.com. If you already have an online account at Calvert, click on My Account, and select the documents you would like to receive via e-mail.
If you’re new to online account access, click on Login/Register to open an online account. Once you’re in, click on the E-delivery sign-up at the bottom of the Account Portfolio page and follow the quick, easy steps. Note: if your shares are not held directly at Calvert but through a brokerage firm, you must contact your broker for electronic delivery options available through their firm.


After a “risk-on” year in 2013, the first quarter of 2014 proved to be a more challenging environment for equities. Concerns about economic growth in emerging markets, geopolitical turmoil in the Ukraine, and somewhat softer macroeconomic data in the United States injected more risk aversion into the markets. At the same time, profit-taking and tempered expectations for a repeat performance of stellar 2013 returns likely drove down investor risk tolerance in the first quarter.
Despite investors taking a more cautious approach toward equities at the start of 2014, the exceptionally strong performance of the equity markets, particularly U.S. equities, in the fourth quarter of 2013 allowed all major global equity indices to finish the six-month reporting period in positive territory. For the six months ended March 31, 2014, the Standard and Poor’s (S&P) 500, Russell 1000, Russell 2000, MSCI EAFE, and MSCI Emerging Markets Indices returned 12.51%, 12.48%, 9.94%, 6.56%, and 1.49%, respectively.
From an investment-style perspective, small-cap stocks underperformed their large-cap counterparts, while value stocks outperformed growth stocks. The rotation from expensive growth stocks to more bargain-priced value stocks, if it continues, could suggest a more favorable outlook for higher-quality stocks. Looking at sector performance, Health Care, Information Technology, and Materials were the top-performing sectors within the Russell 1000 Index, while the Telecommunications, Consumer Discretionary, and Consumer Staples sectors lagged.
U.S. Economic Recovery Moves Forward, Despite Fed Tapering Talk
Positive fourth-quarter results in the equity markets were driven by several factors, centering on continued U.S. economic recovery and growing investor confidence, thus creating an environment conducive to earnings expansion. These factors explain, in part, why U.S. equities shone so strongly compared with foreign developed and emerging markets. Extreme weather likely held back economic growth in much of the U.S. during the period, but markets found support as investors gained comfort in the view that weaker economic data was more a by-product of inclement weather, rather than reflecting a broader economic slowdown.
The Fed’s decision to begin tapering its quantitative easing (QE) programs in January divided analysts on whether rising interest rates would dampen the economic recovery and create downward pressure on stocks, or whether they would instill confidence that the Fed is being responsible and attract more investors. On the whole, the resiliency and low volatility of interest rates in the wake of Fed tapering was a positive
4 www.calvert.com CALVERT CAPITAL ACCUMULATION FUND SEMI-ANNUAL REPORT (UNAUDITED)
| |
| CALVERT CAPITAL |
| ACCUMULATION |
| FUND |
| MARCH 31, 2014 |
| |
| | % OF TOTAL |
| ECONOMIC SECTORS | INVESTMENTS |
| Consumer Discretionary | 24.7% |
| Consumer Staples | 4.4% |
| Energy | 6.2% |
| Financials | 8.3% |
| Health Care | 12.2% |
| Industrials | 15.9% |
| Information Technology | 19.6% |
| Materials | 5.3% |
| Short-Term Investments | 1.9% |
| Utilities | 1.5% |
| Total | 100% |
| CALVERT CAPITAL |
| ACCUMULATION FUND |
| MARCH 31, 2014 |
| |
| INVESTMENT PERFORMANCE | |
| (TOTAL RETURN AT NAV*) | |
| | 6 MONTHS | 12 MONTHS |
| | ENDED | ENDED |
| | 3/31/14 | 3/31/14 |
| Class A | 7.14% | 18.86% |
| Class B | 6.35% | 17.15% |
| Class C | 6.70% | 17.93% |
| Class I | 7.42% | 19.55% |
| Class Y | 7.24% | 19.07% |
| |
| Russell Midcap | | |
| Growth Index | 10.44% | 24.22% |
| |
| Lipper Mid-Cap | | |
| Core Funds | | |
| Average | 11.10% | 22.03% |
| TEN LARGEST | % OF NET |
| STOCK HOLDINGS | ASSETS |
| Synaptics, Inc. | 3.0% |
| Polaris Industries, Inc. | 3.0% |
| Arrow Electronics, Inc. | 3.0% |
| Syntel, Inc. | 2.9% |
| DST Systems, Inc. | 2.9% |
| Questcor Pharmaceuticals, Inc. | 2.9% |
| Ubiquiti Networks, Inc. | 2.8% |
| Grand Canyon Education, Inc. | 2.8% |
| The Middleby Corp. | 2.8% |
| Waddell & Reed Financial, Inc. | 2.8% |
| Total | 28.9% |
* Investment performance/return at NAV does not reflect the deduction of the Fund’s maximum 4.75% front-end sales charge or any deferred sales charges.
sign, indicating that—at least for a while—tapering need not produce the kind of jump in interest rates many analysts had feared.
Consumers Play a Key Role in Recovery
Although market analysts have focused largely on what is happening at the Federal Reserve, we believe an important driver of economic activity in the United States, and of Fed policy by extension, is the continued improvement in the health of the consumer balance sheet. This gives consumers better access to consumer loans and mortgages, supporting the continued recovery of the housing and automotive industries, among others. At the same time, initial jobless claims maintained their downward trend throughout the period. Continued improvements in the labor market should support consumer spending and the U.S. housing sector—keys to the success of the U.S. economic recovery.
An Anemic Europe and Sluggish China Worry Investors
A global backdrop of lower-than-target inflation persisted throughout the period, despite continued aggressive easing actions by the world’s largest central banks. There are several drivers contributing to low inflation we believe are likely to persist in the near-term. For
www.calvert.com CALVERT CAPITAL ACCUMULATION FUND SEMI-ANNUAL REPORT (UNAUDITED) 5
| |
| CALVERT CAPITAL |
| ACCUMULATION FUND |
| MARCH 31, 2014 |
| |
| AVERAGE ANNUAL TOTAL RETURNS |
| CLASS A SHARES | (WITH MAX. LOAD) |
| One year | 13.20% |
| Five year | 21.96% |
| Ten year | 6.75% |
| CLASS B SHARES | (WITH MAX. LOAD) |
| One year | 12.15% |
| Five year | 21.56% |
| Ten year | 6.14% |
| CLASS C SHARES | (WITH MAX. LOAD) |
| One year | 16.93% |
| Five year | 22.17% |
| Ten year | 6.42% |
| CLASS I SHARES | |
| One year | 19.55% |
| Five year | 24.07% |
| Ten year | 8.13% |
| CLASS Y SHARES* | |
| One year | 19.07% |
| Five year | 23.31% |
| Ten year | 7.34% |
* Calvert Capital Accumulation Fund first offered Class Y Shares on January 31, 2011. Performance prior to that date reflects the performance of Class A Shares at net asset value (NAV). Actual Class Y Share performance would have been different.
example, anemic economic activity in Europe continued to highlight the threat of deflation, as inflation in the eurozone dipped below 1% during the period. While European Central Bank (ECB) President Mario Draghi indicated a willingness to intervene if further downside risks to price stability materialize, there appear to be few catalysts capable of driving an increase in demand-side inflation since the euro area’s economic recovery has remained tepid.
Worries about a hard landing in China returned to the forefront of investor concerns as the China HSBC Manufacturing PMI (Purchasing Managers’ Index) steadily declined throughout the period into contraction territory. Meanwhile, political upheaval in the Ukraine, which culminated with Russian forces occupying the Crimea region, injected further risk aversion into investor sentiment. The situation continued to negatively impact emerging-market stocks and currencies, which were already under pressure due to the prospect of slower GDP growth in emerging markets. We expect the Ukraine situation to be a continued source of headline market risk in the near-term, until a final diplomatic solution is reached.
Outlook
The contrast in economic conditions between the United States and both Europe and China (and other emerging markets) should continue to draw more investment to the U.S. in the near-term. Fed tapering will most likely add to this effect in equities as well as other asset classes. We expect the dollar to continue strengthening slowly, which may provide another reason for foreign investors to favor U.S. securities over those in their domestic markets. This also supports our outlook for continued low inflation in the near-term.
The recovery may still feel “sluggish” because the current 6.7% unemployment rate—while down from a recession peak of 10%—is still running higher than in previous expansions. From the perspective of equity investors, however, higher unemployment is likely keep downward pressure on wages, which, in turn, could help strengthen profit margins.
6 www.calvert.com CALVERT CAPITAL ACCUMULATION FUND SEMI-ANNUAL REPORT (UNAUDITED)
GROWTH OF $10,000
The graph below shows the value of a hypothetical $10,000 investment in the Fund over the past 10 fiscal year periods. The results shown are for Classes A and C shares and reflect the deduction of the maximum front-end Class A sales charge of 4.75%, and assume the reinvestment of dividends. The result is compared with benchmarks that include a broad based market index and a Lipper peer group average. Market indexes are unmanaged and their results do not reflect the effect of expenses or sales charges. The Lipper average reflects the deduction of the category’s average front-end sales charge. The value of an investment in a different share class would be different.
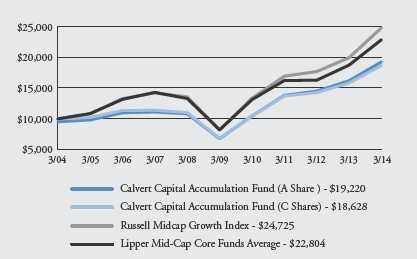
All performance data shown, including the graph above and the adjacent table, represents past performance, does not guarantee future results, assumes reinvestment of dividends and distributions and does not reflect the deduction of taxes that a shareholder would pay on the Fund’s distributions or the redemption of the Fund shares. All performance data reflects fee waivers and/or expense limitations, if any are in effect; in their absence performance would be lower. See Note B in Notes to Financial Statements. The investment return and principal value of an investment will fluctuate so that an investor’s shares, when redeemed, may be worth more or less than their original cost. Current performance may be lower or higher than the performance data quoted; for current performance data visit www.calvert.com. The gross expense ratio from the current prospectus for Class A shares is 1.48%. This number may differ from the expense ratio shown elsewhere in this report because it is based on a different time period and, if applicable, does not include fee or expense waivers. Performance data quoted already reflects the deduction of the Fund’s operating expenses.
www.calvert.com CALVERT CAPITAL ACCUMULATION FUND SEMI-ANNUAL REPORT (UNAUDITED) 7
We think the Fed will be particularly careful not to derail economic expansion, especially as long as inflation remains low, and will do so by carefully telegraphing its position and plans as they evolve. Moreover, the signal that the Fed is serious about normalizing interest rates should improve investor confidence about the condition of the economy and reassure those who have been worried about the inflationary risk of an eternal quantitative easing. However, sharp changes in interest-rate expectations remain a risk factor, as they can drive mortgage rates higher, negatively impacting housing activity and weakening this major component of the U.S. economic recovery.
We also believe the U.S. economy can still compensate for a dampened global growth outlook. And we expect economic growth to reaccelerate in the second-half of the year on the heels of continued improvement in the housing and labor markets. In addition, as consumer activity picks up in the spring and summer, there is potential for some lost consumer activity to be recovered later in the year. Overall, we believe these conditions continue to provide a favorable underpinning for the equities markets.
Calvert Investment Management, Inc.
May 2014
8 www.calvert.com CALVERT CAPITAL ACCUMULATION FUND SEMI-ANNUAL REPORT (UNAUDITED)

As always, Calvert continues to work hard to ensure you have a say in the responsible management of environmental, social, and governance (ESG) factors for the companies in which we invest. Below are highlights of our accomplishments during the reporting period.
Shareholder Advocacy
Calvert filed more than 26 shareholder proposals over the reporting period on a variety of issues, including board diversity, reduction of greenhouse gas emissions, disclosure of country-level sourcing and human rights risk assessment processes for apparel companies, and sustainability reporting.
After commitments from Pioneer Natural Resources Company and QEP Resources, Calvert has withdrawn one shareholder proposal and decided not to file a second one for the 2014 proxy season. The two companies agreed to improve disclosure and continue engagement regarding key challenges related to hydraulic fracturing, such as water use and emissions reduction. The resulting disclosures will help Calvert and the companies better understand how they are managing these important opportunities and risks.
Also, an effort led by Calvert Investments and other institutional investors drove the World Federation of Exchanges (WFE) to announce the launch of a Sustainability Working Group in March to develop a consensus on sustainability reporting. Such a standard would promote greater transparency and fairness in the capital markets, improve cost-efficiencies, promote timeliness and consistency for reporting companies, and equip investors to value companies more accurately and make more informed investment decisions.
During the period, Calvert filed proxy resolutions with all the U.S. publicly traded financial exchanges—CBOE, CME, IntercontinentalExchange Group/NYSE and NASDAQ OMX (NDAQ)—on this issue. However, all resolutions were withdrawn after leadership agreed to join the Working Group. We congratulate these WFE member exchanges for their leadership on investor information transparency.
Calvert was a part of the working group that developed the Shareholder Director Exchange Protocol (SDX) released in February. The protocol addresses the increasing levels of direct engagement between institutional investors, such as activist investors, and public company boards, which can significantly change the dynamic between public companies and investors. Engagement is typically between investors and management, but there is a growing interest on the part of investors and directors for more dialogue, especially when fundamental corporate governance or sustainability issues emerge. The protocol helps lay the basis for productive engagement while addressing common concerns each side may have.
www.calvert.com CALVERT CAPITAL ACCUMULATION FUND SEMI-ANNUAL REPORT (UNAUDITED) 9
Community Investments
Many of our Funds participate in Calvert’s High Social Impact Investing program, through the CI notes administered through the Calvert Foundation. This community investment program may allocate a small percentage of Fund assets at below-market interest rates to investments that provide economic opportunity for struggling populations.
Through the CI notes’ WIN-WIN portfolio (Women Investing in Women), we recently invested in the Opportunity Fund, the leading microfinance provider in California, which provides microloans for small businesses, microsavings accounts, and community real estate financing. Its innovative repayment system allows clients like Chef Tina Ferguson-Riffe to grow her business with a $20,000 loan for new restaurant equipment and repay the loan based on daily credit/debit card sales, instead of large monthly payments.
In December, the CI notes program invested $1.2 million in One Acre Fund, a nonprofit that provides smallholder farmers in Kenya, Rwanda, and Burundi a bundle of services including seed, training, and access to markets. One Acre Fund expects to reach 251,000 farm families in 2014.
Special Equities
A modest but important portion of certain funds is allocated to small private companies developing products or services that address important sustainability or environmental issues facing our society.
One such recent investment, acquired just after the reporting period, was Africa Renewable Energy Fund, which supports small- to medium-scale independent power producers in sub-Saharan Africa with grid-connected, development-stage renewable energy projects, including small hydro, wind, geothermal, solar, biomass and waste gas technologies. Electricity outages continue to be a major problem in many of these countries. This investment will help to address that supply gap in a sustainable manner.
As of March 31, 2014, Calvert Social Investment Foundation (“Calvert Foundation” or “Foundation”) Community Investment Notes represented the following percentages of Fund net assets: Calvert Balanced Portfolio 0.7%, Calvert Equity Portfolio 0.4%, Calvert Bond Portfolio 0.4%, Calvert International Equity Fund 1.2%, Calvert Capital Accumulation Fund 0.4%, and Calvert Small Cap Fund 0.3%. The Calvert Foundation is a 501(c)(3) nonprofit organization. The Foundation’s Community Investment Note Program is not a mutual fund and should not be confused with any Calvert Investments-sponsored investment product.
As of March 31, 2014, the following companies represented the following percentages of Portfolio net assets: Pioneer Natural Resources Company .22% of Calvert Social Index Fund, 1.14% of Calvert Bond Portfolio and .29% of Calvert Balanced Portfolio; QEP Resources .04% of Calvert Social Index Fund, CBOE 0.04% of Calvert Social Index Fund, CME 0.19% of Calvert Social Index Fund, IntercontinentalExchange Group/NYSE 0.18% of Calvert Social Index Fund and 2.46% of Calvert Equity Portfolio, and NASDAQ OMX (NDAQ) 0.03% of Calvert Social Index Fund. Africa Renewable Energy Fund represented 0% of each of Calvert Equity Portfolio and Calvert International Equity Fund. Holdings are subject to change.
10 www.calvert.com CALVERT CAPITAL ACCUMULATION FUND SEMI-ANNUAL REPORT (UNAUDITED)
SHAREHOLDER EXPENSE EXAMPLE
As a shareholder of the Fund, you incur two types of costs: (1) transaction costs, including sales charges and redemption fees; and (2) ongoing costs, including management fees; distribution (12b-1) fees; and other Fund expenses. This Example is intended to help you understand your ongoing costs (in dollars) of investing in the Fund and to compare these costs with the ongoing costs of investing in other mutual funds.
This Example is based on an investment of $1,000 invested at the beginning of the period and held for the entire period (October 1, 2013 to March 31, 2014).
Actual Expenses
The first line of the table below provides information about actual account values and actual expenses. You may use the information in this line, together with the amount you invested, to estimate the expenses that you paid over the period. Simply divide your account value by $1,000 (for example, an $8,600 account value divided by $1,000 = 8.6), then multiply the result by the number in the first line under the heading entitled “Expenses Paid During Period” to estimate the expenses you paid on your account during this period.
Hypothetical Example for Comparison Purposes
The second line of the table below provides information about hypothetical account values and hypothetical expenses based on the Fund’s actual expense ratio and an assumed rate of return of 5% per year before expenses, which is not the Fund’s actual return. The hypothetical account values and expenses may not be used to estimate the actual ending account balance or expenses you paid for the period. You may use this information to compare the ongoing costs of investing in the Fund and other funds. To do so, compare the 5% hypothetical example with the 5% hypothetical examples that appear in the shareholder reports of the other funds.
Please note that the expenses shown in the table are meant to highlight your ongoing costs only and do not reflect any transactional costs, such as sales charges (loads) or redemption fees. Therefore, the second line of the table is useful in comparing ongoing costs only, and will not help you determine the relative total costs of owning different funds. In addition, if these transactional costs were included, your costs would have been higher.
www.calvert.com CALVERT CAPITAL ACCUMULATION FUND SEMI-ANNUAL REPORT (UNAUDITED) 11
| | BEGINNING | ENDING ACCOUNT | EXPENSES PAID |
| | ACCOUNT VALUE | VALUE | DURING PERIOD* |
| | 10/1/13 | 3/31/14 | 10/1/13 - 3/31/14 |
| CLASS A | | | |
| Actual | $1,000.00 | $1,071.41 | $7.29 |
| Hypothetical | $1,000.00 | $1,017.89 | $7.10 |
| (5% return per year before expenses) | | | |
| |
| CLASS B | | | |
| Actual | $1,000.00 | $1,063.13 | $14.71 |
| Hypothetical | $1,000.00 | $1,010.67 | $14.34 |
| (5% return per year before expenses) | | | |
| |
| CLASS C | | | |
| Actual | $1,000.00 | $1,067.01 | $11.24 |
| Hypothetical | $1,000.00 | $1,014.06 | $10.95 |
| (5% return per year before expenses) | | | |
| |
| CLASS I | | | |
| Actual | $1,000.00 | $1,074.20 | $4.28 |
| Hypothetical | $1,000.00 | $1,020.80 | $4.17 |
| (5% return per year before expenses) | | | |
| |
| CLASS Y | | | |
| Actual | $1,000.00 | $1,072.40 | $6.04 |
| Hypothetical | $1,000.00 | $1,019.11 | $5.88 |
| (5% return per year before expenses) | | | |
* Expenses are equal to the Fund’s annualized expense ratio of 1.41%, 2.86%, 2.18%, 0.83%, and 1.17% for Class A, Class B, Class C, Class I, and Class Y, respectively, multiplied by the average account value over the period, multiplied by 182/365 (to reflect the one-half year period).
12 www.calvert.com CALVERT CAPITAL ACCUMULATION FUND SEMI-ANNUAL REPORT (UNAUDITED)
| | |
| STATEMENT OF NET ASSETS |
| MARCH 31, 2014 |
| |
| EQUITY SECURITIES - 97.6% | SHARES | VALUE |
| Aerospace & Defense - 2.1% | | |
| Hexcel Corp.* | 195,610 | $8,516,859 |
| |
| Airlines - 2.0% | | |
| Alaska Air Group, Inc. | 87,635 | 8,177,222 |
| |
| Auto Components - 2.7% | | |
| TRW Automotive Holdings Corp.* | 137,045 | 11,185,613 |
| |
| Biotechnology - 4.9% | | |
| Myriad Genetics, Inc.* | 332,500 | 11,368,175 |
| United Therapeutics Corp.* | 92,230 | 8,672,387 |
| | | 20,040,562 |
| |
| Building Products - 2.7% | | |
| Lennox International, Inc | 120,375 | 10,943,291 |
| |
| Capital Markets - 2.8% | | |
| Waddell & Reed Financial, Inc | 154,995 | 11,410,732 |
| |
| Chemicals - 2.3% | | |
| Ecolab, Inc. | 89,090 | 9,620,829 |
| |
| Commercial Services & Supplies - 1.3% | | |
| Deluxe Corp | 99,670 | 5,229,685 |
| |
| Communications Equipment - 5.2% | | |
| F5 Networks, Inc.* | 90,860 | 9,688,402 |
| Ubiquiti Networks, Inc.* | 256,085 | 11,644,185 |
| | | 21,332,587 |
| |
| Containers & Packaging - 1.6% | | |
| Rock-Tenn Co | 60,660 | 6,403,876 |
| |
| Diversified Consumer Services - 5.2% | | |
| Grand Canyon Education, Inc.* | 244,410 | 11,413,947 |
| Sotheby’s | 228,800 | 9,964,240 |
| | | 21,378,187 |
| |
| Electronic Equipment & Instruments - 3.0% | | |
| Arrow Electronics, Inc.* | 205,294 | 12,186,252 |
| |
| Energy Equipment & Services - 4.1% | | |
| Dresser-Rand Group, Inc.* | 175,640 | 10,259,132 |
| Geospace Technologies Corp.* | 96,780 | 6,403,933 |
| | | 16,663,065 |
| |
| Food Products - 1.5% | | |
| Ingredion, Inc. | 93,266 | 6,349,549 |
www.calvert.com CALVERT CAPITAL ACCUMULATION FUND SEMI-ANNUAL REPORT (UNAUDITED) 13
| | |
| EQUITY SECURITIES - CONT’D | SHARES | VALUE |
| Gas Utilities - 1.5% | | |
| AGL Resources, Inc | 126,790 | $6,207,638 |
| |
| Health Care Providers & Services - 4.4% | | |
| AmerisourceBergen Corp. | 155,620 | 10,207,116 |
| Chemed Corp. | 47,470 | 4,246,192 |
| WellCare Health Plans, Inc.* | 57,995 | 3,683,842 |
| | | 18,137,150 |
| |
| Household Durables - 2.1% | | |
| The Ryland Group, Inc. | 210,300 | 8,397,279 |
| |
| Household Products - 0.5% | | |
| Church & Dwight Co., Inc | 27,120 | 1,873,178 |
| |
| Insurance - 4.0% | | |
| American Financial Group, Inc. | 150,375 | 8,678,141 |
| Amtrust Financial Services, Inc | 205,910 | 7,744,275 |
| | | 16,422,416 |
| |
| Internet Software & Services - 2.6% | | |
| AOL, Inc.* | 240,945 | 10,546,163 |
| |
| IT Services - 5.8% | | |
| DST Systems, Inc | 124,158 | 11,768,937 |
| Syntel, Inc.* | 131,075 | 11,783,642 |
| | | 23,552,579 |
| |
| Leisure Products - 3.0% | | |
| Polaris Industries, Inc. | 88,095 | 12,307,752 |
| |
| Machinery - 5.3% | | |
| The Middleby Corp.* | 43,195 | 11,412,551 |
| Valmont Industries, Inc | 68,285 | 10,163,539 |
| | | 21,576,090 |
| |
| Media - 2.5% | | |
| Gannett Co., Inc. | 369,905 | 10,209,378 |
| |
| Metals & Mining - 1.4% | | |
| Reliance Steel & Aluminum Co. | 80,880 | 5,714,981 |
| |
| Oil, Gas & Consumable Fuels - 2.1% | | |
| SM Energy Co. | 122,155 | 8,708,430 |
| |
| Personal Products - 2.3% | | |
| Inter Parfums, Inc. | 264,790 | 9,588,046 |
| |
| Pharmaceuticals - 2.9% | | |
| Questcor Pharmaceuticals, Inc. | 180,785 | 11,738,370 |
| |
| Real Estate Management & Development - 1.2% | | |
| Jones Lang LaSalle, Inc | 39,840 | 4,721,040 |
14 www.calvert.com CALVERT CAPITAL ACCUMULATION FUND SEMI-ANNUAL REPORT (UNAUDITED)
| | |
| EQUITY SECURITIES - CONT’D | SHARES | VALUE |
| Road & Rail - 2.5% | | |
| Heartland Express, Inc. | 455,320 | $10,331,211 |
| |
| Semiconductors & Semiconductor Equipment - 3.0% | | |
| Synaptics, Inc.* | 205,875 | 12,356,618 |
| |
| Specialty Retail - 9.1% | | |
| Express, Inc.* | 428,911 | 6,811,107 |
| Lithia Motors, Inc. | 162,706 | 10,813,441 |
| Ross Stores, Inc. | 154,785 | 11,074,867 |
| Ulta Salon, Cosmetics & Fragrance, Inc.* | 85,640 | 8,348,187 |
| | | 37,047,602 |
| |
| Total Equity Securities (Cost $332,795,531) | | 398,874,230 |
| |
| | PRINCIPAL | |
| HIGH SOCIAL IMPACT INVESTMENTS - 0.4% | AMOUNT | |
| Calvert Social Investment Foundation Notes, 0.65%, 7/1/14 (b)(i)(r) | $1,419,488 | 1,410,529 |
| |
| Total High Social Impact Investments (Cost $1,419,488) | | 1,410,529 |
| |
| TIME DEPOSIT - 1.9% | | |
| State Street Bank Time Deposit, 0.083%, 4/1/14 | 7,815,533 | 7,815,533 |
| |
| Total Time Deposit (Cost $7,815,533) | | 7,815,533 |
| |
| TOTAL INVESTMENTS (Cost $342,030,552) - 99.9% | | 408,100,292 |
| Other assets and liabilities, net - 0.1% | | 570,574 |
| NET ASSETS - 100% | | $408,670,866 |
See notes to financial statements.
www.calvert.com CALVERT CAPITAL ACCUMULATION FUND SEMI-ANNUAL REPORT (UNAUDITED) 15
| |
| NET ASSETS CONSIST OF: | |
| Paid-in capital applicable to the following shares of common stock, | |
| with 250,000,000 shares of $0.01 par value authorized: | |
| Class A: 6,083,218 shares outstanding | $159,647,825 |
| Class B: 62,723 shares outstanding | 2,654,416 |
| Class C: 919,477 shares outstanding | 21,762,545 |
| Class I: 3,393,693 shares outstanding | 110,177,164 |
| Class Y: 479,755 shares outstanding | 15,694,782 |
| Undistributed net investment income | 199,055 |
| Accumulated net realized gain (loss) | 32,465,339 |
| Net unrealized appreciation (depreciation) | 66,069,740 |
| |
| NET ASSETS | $408,670,866 |
| |
| NET ASSET VALUE PER SHARE | |
| Class A (based on net assets of $223,413,741) | $36.73 |
| Class B (based on net assets of $1,876,298) | $29.91 |
| Class C (based on net assets of $27,273,950) | $29.66 |
| Class I (based on net assets of $138,359,689) | $40.77 |
| Class Y (based on net assets of $17,747,188) | $36.99 |
| RESTRICTED SECURITIES | ACQUISITION
DATES | COST |
| Calvert Social Investment Foundation Notes, 0.65%, 7/1/14 | 7/1/11 | $1,419,488 |
(b) This security was valued under the direction of the Board of Directors. See Note A. (i) Restricted securities represent 0.4% of the net assets of the Fund.
(r) The coupon rate shown on floating or adjustable rate securities represents the rate at period end.
* Non-income producing security.
See notes to financial statements.
16 www.calvert.com CALVERT CAPITAL ACCUMULATION FUND SEMI-ANNUAL REPORT (UNAUDITED)
| |
| STATEMENT OF OPERATIONS |
| SIX MONTHS ENDED MARCH 31, 2014 |
| |
| NET INVESTMENT INCOME | |
| Investment Income: | |
| Dividend income | $2,692,611 |
| Interest income | 7,815 |
| Total investment income | 2,700,426 |
| |
| Expenses: | |
| Investment advisory fee | 1,288,052 |
| Transfer agency fees | 251,114 |
| Administrative fees | 394,440 |
| Distribution Plan expenses: | |
| Class A | 271,897 |
| Class B | 10,398 |
| Class C | 131,028 |
| Directors’ fees and expenses | 16,413 |
| Custodian fees | 21,812 |
| Registration fees | 29,833 |
| Reports to shareholders | 53,098 |
| Professional fees | 20,380 |
| Miscellaneous | 14,652 |
| Total expenses | 2,503,117 |
| Reimbursement from Advisor: | |
| Class B | (1,746) |
| Net expenses | 2,501,371 |
| |
| NET INVESTMENT INCOME | 199,055 |
| |
| REALIZED AND UNREALIZED GAIN (LOSS) ON INVESTMENTS | |
| Net realized gain (loss) | 35,599,610 |
| Change in unrealized appreciation (depreciation) | (8,531,871) |
| |
| NET REALIZED AND UNREALIZED GAIN (LOSS) | |
| ON INVESTMENTS | 27,067,739 |
| |
| INCREASE (DECREASE) IN NET ASSETS | |
| RESULTING FROM OPERATIONS | $27,266,794 |
See notes to financial statements.
www.calvert.com CALVERT CAPITAL ACCUMULATION FUND SEMI-ANNUAL REPORT (UNAUDITED) 17
| | |
| STATEMENTS OF CHANGES IN NET ASSETS |
| |
| | SIX MONTHS ENDED | YEAR ENDED |
| | MARCH 31, | SEPTEMBER 30, |
| INCREASE (DECREASE) IN NET ASSETS | 2014 | 2013 |
| Operations: | | |
| Net investment income (loss) | $199,055 | ($1,231,873) |
| Net realized gain (loss) | 35,599,610 | 29,954,124 |
| Change in unrealized appreciation (depreciation) | (8,531,871) | 42,268,831 |
| |
| |
| INCREASE (DECREASE) IN NET ASSETS | | |
| RESULTING FROM OPERATIONS | 27,266,794 | 70,991,082 |
| |
| Distributions to shareholders from: | | |
| Net realized gain: | | |
| Class A shares | (14,945,015) | (9,698,123) |
| Class B shares | (177,298) | (180,146) |
| Class C shares | (2,189,103) | (1,403,614) |
| Class I shares | (8,563,686) | (4,715,609) |
| Class Y shares | (1,114,603) | (554,741) |
| Total distributions | (26,989,705) | (16,552,233) |
| |
| Capital share transactions: | | |
| Shares sold: | | |
| Class A shares | 20,378,757 | 42,043,987 |
| Class B shares | 56,963 | 67,672 |
| Class C shares | 2,613,995 | 4,406,372 |
| Class I shares | 14,353,041 | 50,292,665 |
| Class Y shares | 5,203,299 | 5,878,319 |
| Reinvestment of distributions: | | |
| Class A shares | 14,069,011 | 9,075,751 |
| Class B shares | 170,836 | 174,457 |
| Class C shares | 1,820,485 | 1,127,656 |
| Class I shares | 4,405,337 | 2,014,949 |
| Class Y shares | 1,101,720 | 179,841 |
| Redemption fees: | | |
| Class A shares | 475 | 2,506 |
| Class C shares | 43 | 99 |
| Class I shares | 200 | 108 |
| Shares redeemed: | | |
| Class A shares | (18,134,203) | (31,009,177) |
| Class B shares | (438,358) | (1,122,203) |
| Class C shares | (1,959,490) | (2,157,040) |
| Class I shares | (12,142,281) | (23,472,428) |
| Class Y shares | (3,228,280) | (1,424,684) |
| Total capital share transactions | 28,271,550 | 56,078,850 |
| |
| TOTAL INCREASE (DECREASE) IN NET ASSETS | 28,548,639 | 110,517,699 |
See notes to financial statements.
18 www.calvert.com CALVERT CAPITAL ACCUMULATION FUND SEMI-ANNUAL REPORT (UNAUDITED)
| | |
| STATEMENTS OF CHANGES IN NET ASSETS |
| |
| | SIX MONTHS ENDED | YEAR ENDED |
| | MARCH 31, | SEPTEMBER 30, |
| INCREASE (DECREASE) IN NET ASSETS - CONT’D | 2014 | 2013 |
| |
| NET ASSETS | | |
| Beginning of period | $380,122,227 | $269,604,528 |
| End of period (including undistributed net investment | | |
| income of $199,055 and $0, respectively) | $408,670,866 | $380,122,227 |
| |
| CAPITAL SHARE ACTIVITY | | |
| Shares sold: | | |
| Class A shares | 555,642 | 1,274,675 |
| Class B shares | 1,861 | 2,424 |
| Class C shares | 87,720 | 162,539 |
| Class I shares | 352,784 | 1,377,336 |
| Class Y shares | 140,916 | 177,940 |
| Reinvestment of distributions: | | |
| Class A shares | 395,975 | 304,868 |
| Class B shares | 5,877 | 6,951 |
| Class C shares | 63,299 | 45,660 |
| Class I shares | 111,896 | 61,883 |
| Class Y shares | 30,808 | 6,017 |
| Shares redeemed: | | |
| Class A shares | (495,127) | (945,725) |
| Class B shares | (14,456) | (40,687) |
| Class C shares | (65,494) | (78,882) |
| Class I shares | (298,570) | (645,434) |
| Class Y shares | (89,352) | (42,318) |
| Total capital share activity | 783,779 | 1,667,247 |
See notes to financial statements.
www.calvert.com CALVERT CAPITAL ACCUMULATION FUND SEMI-ANNUAL REPORT (UNAUDITED) 19
NOTES TO FINANCIAL STATEMENTS
NOTE A — SIGNIFICANT ACCOUNTING POLICIES
General: Calvert Capital Accumulation Fund (the “Fund”), a series of Calvert World Values Fund, Inc., is registered under the Investment Company Act of 1940 as a non-diversified, open-end management investment company. Calvert World Values Fund, Inc. is comprised of four separate series. The operations of each series are accounted for separately. The Fund offers five classes of shares of capital stock - Classes A, B, C, I, and Y. Class A shares are sold with a maximum front-end sales charge of 4.75%. Class B shares are sold without a front-end sales charge and, with certain exceptions, will be charged a deferred sales charge at the time of redemption, depending on how long investors have owned the shares. Class B shares are no longer offered for purchase, except through reinvestment of dividends and/or distributions and through certain exchanges. Class C shares are sold without a front-end sales charge and, with certain exceptions, will be charged a deferred sales charge on shares sold within one year of purchase. Class B and Class C shares have higher levels of expenses than Class A shares. Class I shares require a minimum account balance of $1,000,000. The $1 million minimum initial investment is waived for retirement plans that trade through omnibus accounts and may be waived for certain other institutional accounts where it is believed to be in the best interest of the Fund and its shareholders. Class I shares have no front-end or deferred sales charge and have lower levels of expenses than Class A Shares. Class Y shares are generally only available to wrap or similar fee-based programs offered by financial intermediaries, foundations, and endowments that have entered into an agreement with the Fund’s Distributor to offer Class Y shares. Class Y shares have no front-end or deferred sales charge and have lower levels of expenses than Class A shares. Each class has different: (a) dividend rates, due to differences in Distribution Plan expenses and other class-specific expenses, (b) exchange privileges; and (c) class-specific voting rights.
Security Valuation: Net asset value per share is determined every business day as of the close of the regular session of the New York Stock Exchange (generally 4:00 p.m. Eastern time). The Fund uses independent pricing services approved by the Board of Directors (“the Board”) to value its investments wherever possible. Investments for which market quotations are not available or deemed not reliable are fair valued in good faith under the direction of the Board.
The Board has adopted Valuation Procedures (the “Procedures”) to determine the fair value of securities and other financial instruments for which market prices are not readily available or which may not be reliably priced. The Board has delegated the day-to-day responsibility for determining the fair value of assets of the Fund to Calvert Investment Management, Inc. (the “Advisor” or “Calvert”) and has provided these Procedures to govern Calvert in its valuation duties.
Calvert has chartered an internal Valuation Committee to oversee the implementation of these Procedures and to assist it in carrying out the valuation responsibilities that the Board has delegated.
The Valuation Committee meets on a regular basis to review illiquid securities and other investments which may not have readily available market prices. The Valuation Committee’s fair valuation determinations are subject to review, approval and ratifica-
20 www.calvert.com CALVERT CAPITAL ACCUMULATION FUND SEMI-ANNUAL REPORT (UNAUDITED)
tion by the Board at its next regularly scheduled meeting covering the calendar quarter in which the fair valuation was determined.
The Valuation Committee utilizes various methods to measure the fair value of the Funds’ investments. Generally Accepted Accounting Principles (GAAP) establishes a disclosure hierarchy that categorizes the inputs to valuation techniques used to value assets and liabilities at measurement date. These inputs are summarized in the three broad levels listed below:
Level 1 – quoted prices in active markets for identical securities
Level 2 – other significant observable inputs (including quoted prices for similar securities, interest rates, prepayment speeds, credit risk, etc.)
Level 3 – significant unobservable inputs (including the Fund’s own assumptions in determining the fair value of investments) The inputs or methodologies used for valuing securities are not necessarily an indication of the risk associated with investing in those securities.
Changes in valuation techniques may result in transfers in or out of an investment’s assigned level within the hierarchy during the period. There were no such transfers during the period. Valuation techniques used to value the Funds’ investments by major category are as follows: Equity securities, including restricted securities, for which market quotations are readily available, are valued at the last reported sale price or official closing price as reported by an independent pricing service on the primary market or exchange on which they are traded and are categorized as Level 1 in the hierarchy. In the event there were no sales during the day or closing prices are not available, securities are valued at the last quoted bid price or using the last available price and are categorized as Level 2 in the hierarchy. Foreign securities are valued based on quotations from the principal market in which such securities are normally traded. If events occur after the close of the principal market in which foreign securities are traded, and before the close of business of the Fund, that are expected to materially affect the value of those securities, then they are valued at their fair value taking these events into account. For restricted securities and private placements where observable inputs are limited, assumptions about market activity and risk are used and such securities are categorized as Level 3 in the hierarchy.
Debt securities, including restricted securities, are valued based on evaluated prices received from independent pricing services or from dealers who make markets in such securities and are generally categorized as Level 2 in the hierarchy. Short-term securities of sufficient credit quality with remaining maturities of sixty days or less for which quotations are not readily available are valued at amortized cost, which approximates fair value, and are categorized as Level 2 in the hierarchy.
When independent prices are unavailable or unreliable, debt securities may be valued utilizing pricing matrices which consider similar factors that would be used by independent pricing services. These are generally categorized as Level 2 in the hierarchy but may be Level 3 depending on the circumstances.
www.calvert.com CALVERT CAPITAL ACCUMULATION FUND SEMI-ANNUAL REPORT (UNAUDITED) 21
If a market value cannot be determined for a security using the methodologies described above, or if, in the good faith opinion of the Advisor, the market value does not constitute a readily available market quotation, or if a significant event has occurred that would materially affect the value of the security, the security will be fair valued as determined in good faith by the Valuation Committee.
The Valuation Committee considers a number of factors, including significant unobservable valuation inputs when arriving at fair value. It considers all significant facts that are reasonably available and relevant to the determination of fair value.
The Valuation Committee primarily employs a market-based approach which may use related or comparable assets or liabilities, recent transactions, market multiples, book values, and other relevant information for the investment to determine the fair value of the investment. When more appropriate, the fund may employ an income-based or cost approach. An income-based valuation approach discounts anticipated future cash flows of the investment to calculate a present amount (discounted). The measurement is based on the value indicated by current market expectations about those future amounts. Discounts may also be applied due to the nature or duration of any restrictions on the disposition of the investments. A cost based approach is based on the amount that currently would be required to replace the service capacity of an asset (current replacement cost). From the seller’s perspective, the price that would be received for the asset is determined based on the cost to a buyer to acquire or construct a substitute asset of comparable utility, adjusted for obsolescence.
The values assigned to fair value investments are based on available information and do not necessarily represent amounts that might ultimately be realized. Further, due to the inherent uncertainty of valuations of such investments, the fair values may differ significantly from the values that would have been used had an active market existed, and the differences could be material. The Valuation Committee employs various methods for calibrating these valuation approaches including a regular review of key inputs and assumptions, transactional back-testing or disposition analysis and reviews of any related market activity.
At March 31, 2014, securities valued at $1,410,529, or 0.4% of net assets, were fair valued in good faith under the direction of the Board.
The following is a summary of the inputs used to value the Fund’s net assets as of March 31, 2014:
| | | VALUATION INPUTS | |
INVESTMENTS IN SECURITIES | LEVEL 1 | LEVEL 2 | LEVEL 3 | TOTAL |
| Equity securities* | $398,874,230 | — | — | $398,874,230 |
| Other debt obligations | — | $9,226,062 | — | 9,226,062 |
| TOTAL | $398,874,230 | $9,226,062 | — | $408,100,292 |
* For further breakdown of equity securities by industry type, please refer to the Statement of Net Assets.
Restricted Securities: The Fund may invest in securities that are subject to legal or contractual restrictions on resale. Generally, these securities may only be sold publicly upon registration under the Securities Act of 1933 or in transactions exempt from such registration. Information regarding restricted securities is included at the end of the Statement of Net Assets.
22 www.calvert.com CALVERT CAPITAL ACCUMULATION FUND SEMI-ANNUAL REPORT (UNAUDITED)
Security Transactions and Net Investment Income: Security transactions are accounted for on trade date. Realized gains and losses are recorded on an identified cost basis and may include proceeds from litigation. Dividend income is recorded on the ex-dividend date. Distributions received on securities that represent a return of capital or capital gain are recorded as a reduction of cost investments and/or as a realized gain. Interest income, which includes amortization of premium and accretion of discount on debt securities, is accrued as earned. Investment income and realized and unrealized gains and losses are allocated to separate classes of shares based upon the relative net assets of each class. Expenses arising in connection with a specific class are charged directly to that class. Expenses common to the classes are allocated to each class in proportion to their relative net assets.
Distributions to Shareholders: Distributions to shareholders are recorded by the Fund on ex-dividend date. Dividends from net investment income and distributions from net realized capital gains, if any, are paid at least annually. Distributions are determined in accordance with income tax regulations which may differ from generally accepted accounting principles; accordingly, periodic reclassifications are made within the Fund’s capital accounts to reflect income and gains available for distribution under income tax regulations.
Estimates: The preparation of financial statements in conformity with accounting principles generally accepted in the United States requires management to make estimates and assumptions that affect the reported amounts of assets and liabilities and disclosure of contingent assets and liabilities at the date of the financial statements and the reported amounts of income and expenses during the reporting period. Actual results could differ from those estimates.
Redemption Fees: The Fund charges a 2% redemption fee on redemptions, including exchanges, made within 30 days of purchase (within seven days for Class I shares). The redemption fee is accounted for as an addition to paid-in capital and is intended to discourage market-timers by ensuring that short-term trading costs are borne by the investors making the transactions and not the shareholders already in the Fund.
Federal Income Taxes: No provision for federal income or excise tax is required since the Fund intends to continue to qualify as a regulated investment company under the Internal Revenue Code and to distribute substantially all of its taxable earnings.
Management has analyzed the Fund’s tax positions taken for all open federal income tax years and has concluded that no provision for federal income tax is required in the Fund’s financial statements. A Fund’s federal tax return is subject to examination by the Internal Revenue Service for a period of three years.
NOTE B — RELATED PARTY TRANSACTIONS
Calvert Investment Management, Inc. (the “Advisor”) is wholly-owned by Calvert Investments, Inc., which is indirectly wholly-owned by Ameritas Mutual Holding Company. The Advisor provides investment advisory services and pays the salaries and fees of officers and Directors of the Fund who are employees of the Advisor or its affiliates. For its services, the Advisor receives an annual fee, payable monthly, of .65% of the Fund’s average daily net assets. Under the terms of the agreement, $226,804 was payable at period end. In addition, $14,070 was payable at period end for operating expenses paid by the Advisor during March 2014.
www.calvert.com CALVERT CAPITAL ACCUMULATION FUND SEMI-ANNUAL REPORT (UNAUDITED) 23
The Advisor has contractually agreed to limit net annual fund operating expenses through January 31, 2015. The contractual expense cap is 1.59%, 2.59%, .86%, and 1.44% for Class A, C, I, and Y, respectively. For the purpose of this expense limit, operating expenses do not include interest expense, brokerage commissions, taxes, and extraordinary expenses. This expense limitation does not limit acquired fund fees and expenses, if any. At period end, $102 was receivable from the Advisor.
During the six months ended March 31, 2014, the Advisor voluntarily reimbursed expenses of $1,746 for Class B of the Fund.
Calvert Investment Administrative Services, Inc., an affiliate of the Advisor, provides administrative services to the Fund for an annual fee, payable monthly, of .25% for Classes A, B, C, and Y, and .10% for Class I shares based on their average daily net assets. Under the terms of the agreement, $69,529 was payable at period end.
Calvert Investment Distributors, Inc. (“CID”), an affiliate of the Advisor, is the distributor and principal underwriter for the Fund. Pursuant to Rule 12b-1 under the Investment Company Act of 1940, the Fund has adopted a Distribution Plan that permits the Fund to pay certain expenses associated with the distribution and servicing of its shares. The expenses paid may not exceed .35%, 1.00% and 1.00% annually of average daily net assets of Classes A, B, and C, respectively. The amount actually paid by the Fund is an annualized fee, payable monthly, of .25%, 1.00% and 1.00% of the Fund’s average daily net assets of Classes A, B, and C, respectively. Class I and Class Y shares do not have Distribution Plan expenses. Under the terms of the agreement, $72,693 was payable at period end.
CID received $39,233 as its portion of the commissions charged on sales of the Fund’s Class A shares for the six months ended March 31, 2014.
Calvert Investment Services, Inc. (“CIS”), an affiliate of the Advisor, acts as shareholder servicing agent for the Fund. For its services, CIS received a fee of $44,148 for the six months ended March 31, 2014. Under the terms of the agreement, $7,356 was payable at period end. Boston Financial Data Services, Inc. is the transfer and dividend disbursing agent.
The Fund may invest in Community Investment Notes issued by the Calvert Social Investment Foundation (the “CSI Foundation”). The CSI Foundation is a 501(c)(3) nonprofit organization that receives in-kind support from Calvert and its subsidiaries. The Fund has received an exemptive order from the Securities and Exchange Commission permitting the Fund to make investments in these notes under certain conditions.
Each Director of the Fund who is not an employee of the Advisor or its affiliates receives an annual retainer of $48,000 plus a meeting fee of up to $3,000 for each Board meeting attended. Additional fees of up to $5,000 annually may be paid to the Board chairs and Committee chairs ($10,000 for Special Equities Committee chair) and $2,500 annually may be paid to Committee members, plus a Committee meeting fee of $500 for each Committee meeting attended. Directors’ fees are allocated to each of the funds served.
NOTE C — INVESTMENT ACTIVITY AND TAX INFORMATION
During the period, the cost of purchases and proceeds from sales of investments, other than short-term securities, were $176,782,421 and $170,105,279, respectively.
24 www.calvert.com CALVERT CAPITAL ACCUMULATION FUND SEMI-ANNUAL REPORT (UNAUDITED)
| CAPITAL LOSS CARRYFORWARDS | |
| EXPIRATION DATE | |
| 30-Sep-16 | ($1,027,669) |
Under the Regulated Investment Company Modernization Act of 2010, capital losses incurred in taxable years beginning after December 22, 2010 can be carried forward for an unlimited period. These losses are required to be utilized prior to the losses incurred in pre-enactment taxable years and will retain their character as either long-term or short-term. Losses incurred in pre-enactment taxable years can be utilized until expiration. The Fund’s use of net capital losses acquired from Calvert MidCap Value Fund may be limited under certain tax provisions.
As of March 31, 2014, the tax basis components of unrealized appreciation/(depreciation) and the federal tax cost were as follows:
| Unrealized appreciation | $74,585,185 |
| Unrealized (depreciation) | (8,741,088) |
| Net unrealized appreciation/(depreciation) | $65,844,097 |
| |
| Federal income tax cost of investments | $342,256,195 |
NOTE D — LINE OF CREDIT
A financing agreement is in place with the Calvert Funds and State Street Corporation (“SSC”). Under the agreement, SSC provides an unsecured line of credit facility, in the aggregate amount of $50 million ($25 million committed and $25 million uncommitted), accessible by the Funds for temporary or emergency purposes only. Borrowings under the committed facility bear interest at the higher of the London Interbank Offered Rate (LIBOR) or the overnight Federal Funds Rate plus 1.25% per annum. A commitment fee of .11% per annum is incurred on the unused portion of the committed facility, which is allocated to all participating funds. The Fund had no borrowings under the agreement during the six months ended March 31, 2014.
NOTE E — SUBSEQUENT EVENTS
In preparing the financial statements as of March 31, 2014, no subsequent events or transactions occurred that would have required recognition or disclosure in these financial statements.
www.calvert.com CALVERT CAPITAL ACCUMULATION FUND SEMI-ANNUAL REPORT (UNAUDITED) 25
| | | |
| FINANCIAL HIGHLIGHTS |
| |
| | PERIODS ENDED |
| | MARCH
31, | SEPTEMBER
30, | SEPTEMBER
30, |
| CLASS A SHARES | 2014 | 2013 (z) | 2012 (z) |
| Net asset value, beginning | $36.83 | $31.45 | $26.00 |
| Income from investment operations: | | | |
| Net investment income (loss) | (.01) | (.18) | (.26) |
| Net realized and unrealized gain (loss) | 2.55 | 7.49 | 7.64 |
| Total from investment operations | 2.54 | 7.31 | 7.38 |
| Distributions from: | | | |
| Net investment income | — | — | — |
| Net realized gain | (2.64) | (1.93) | (1.93) |
| Total distributions | (2.64) | (1.93) | (1.93) |
| Total increase (decrease) in net asset value | (0.10) | 5.38 | 5.45 |
| Net asset value, ending | $36.73 | $36.83 | $31.45 |
| |
| Total return* | 7.14% | 24.74% | 29.16% |
| Ratios to average net assets: A | | | |
| Net investment income (loss) | (.05%) (a) | (.53%) | (.85%) |
| Total expenses | 1.41% (a) | 1.48% | 1.53% |
| Expenses before offsets | 1.41% (a) | 1.48% | 1.53% |
| Net expenses | 1.41% (a) | 1.48% | 1.53% |
| Portfolio turnover | 44% | 73% | 63% |
| Net assets, ending (in thousands) | $223,414 | $207,257 | $157,016 |
| |
| |
| | YEARS ENDED |
| | SEPTEMBER
30, | SEPTEMBER
30, | SEPTEMBER
30, |
| CLASS A SHARES | 2011 (z) | 2010 | 2009 |
| Net asset value, beginning | $24.93 | $20.71 | $23.00 |
| Income from investment operations: | | | |
| Net investment income (loss) | (.28) | (.25) | (.17) |
| Net realized and unrealized gain (loss) | 1.35 | 4.47 | (2.12) |
| Total from investment operations | 1.07 | 4.22 | (2.29) |
| Distributions from: | | | |
| Net investment income | — | — | — |
| Net realized gain | — | — | — |
| Total distributions | — | — | — |
| Total increase (decrease) in net asset value | 1.07 | 4.22 | (2.29) |
| Net asset value, ending | $26.00 | $24.93 | $20.71 |
| |
| Total return* | 4.29% | 20.38% | (9.96%) |
| Ratios to average net assets: A | | | |
| Net investment income (loss) | (.93%) | (1.08%) | (.92%) |
| Total expenses | 1.58% | 1.76% | 1.88% |
| Expenses before offsets | 1.58% | 1.76% | 1.88% |
| Net expenses | 1.58% | 1.76% | 1.88% |
| Portfolio turnover | 65% | 87% | 72% |
| Net assets, ending (in thousands) | $128,755 | $86,635 | $72,289 |
See notes to financial highlights.
26 www.calvert.com CALVERT CAPITAL ACCUMULATION FUND SEMI-ANNUAL REPORT (UNAUDITED)
| | | |
| FINANCIAL HIGHLIGHTS |
| |
| | PERIODS ENDED |
| | MARCH
31, | SEPTEMBER
30, | SEPTEMBER
30, |
| CLASS B SHARES | 2014 | 2013 (z) | 2012 (z) |
| Net asset value, beginning | $30.68 | $26.86 | $22.72 |
| Income from investment operations: | | | |
| Net investment income (loss) | (.25) | (.52) | (.55) |
| Net realized and unrealized gain (loss) | 2.12 | 6.27 | 6.62 |
| Total from investment operations | 1.87 | 5.75 | 6.07 |
| Distributions from: | | | |
| Net investment income | — | — | — |
| Net realized gain | (2.64) | (1.93) | (1.93) |
| Total distributions | (2.64) | (1.93) | (1.93) |
| Total increase (decrease) in net asset value | (0.77) | 3.82 | 4.14 |
| Net asset value, ending | $29.91 | $30.68 | $26.86 |
| |
| Total return* | 6.35% | 23.05% | 27.50% |
| Ratios to average net assets:A | | | |
| Net investment income (loss) | (1.52%) (a) | (1.88%) | (2.12%) |
| Total expenses | 3.03% (a) | 2.93% | 2.80% |
| Expenses before offsets | 2.86% (a) | 2.86% | 2.80% |
| Net expenses | 2.86% (a) | 2.86% | 2.80% |
| Portfolio turnover | 44% | 73% | 63% |
| Net assets, ending (in thousands) | $1,876 | $2,131 | $2,707 |
| |
| |
| | YEARS ENDED |
| | SEPTEMBER
30, | SEPTEMBER
30, | SEPTEMBER
30, |
| CLASS B SHARES | 2011 (z) | 2010 | 2009 |
| Net asset value, beginning | $22.03 | $18.50 | $20.78 |
| Income from investment operations: | | | |
| Net investment income (loss) | (.55) | (.53) | (.39) |
| Net realized and unrealized gain (loss) | 1.24 | 4.06 | (1.89) |
| Total from investment operations | .69 | 3.53 | (2.28) |
| Distributions from: | | | |
| Net investment income | — | — | — |
| Net realized gain | — | — | — |
| Total distributions | — | — | — |
| Total increase (decrease) in net asset value | .69 | 3.53 | (2.28) |
| Net asset value, ending | $22.72 | $22.03 | $18.50 |
| |
| Total return* | 3.13% | 19.08% | (10.97%) |
| Ratios to average net assets: A | | | |
| Net investment income (loss) | (2.07%) | (2.17%) | (2.04%) |
| Total expenses | 2.72% | 2.84% | 2.99% |
| Expenses before offsets | 2.72% | 2.84% | 2.99% |
| Net expenses | 2.71% | 2.84% | 2.99% |
| Portfolio turnover | 65% | 87% | 72% |
| Net assets, ending (in thousands) | $3,129 | $4,138 | $4,793 |
See notes to financial highlights.
www.calvert.com CALVERT CAPITAL ACCUMULATION FUND SEMI-ANNUAL REPORT (UNAUDITED) 27
| | | |
| FINANCIAL HIGHLIGHTS |
| |
| | PERIODS ENDED |
| | MARCH
31, | SEPTEMBER
30, | SEPTEMBER
30, |
| CLASS C SHARES | 2014 | 2013 (z) | 2012 (z) |
| Net asset value, beginning | $30.35 | $26.44 | $22.29 |
| Income from investment operations: | | | |
| Net investment income (loss) | (.12) | (.36) | (.42) |
| Net realized and unrealized gain (loss) | 2.07 | 6.20 | 6.50 |
| Total from investment operations | 1.95 | 5.84 | 6.08 |
| Distributions from: | | | |
| Net investment income | — | — | — |
| Net realized gain | (2.64) | (1.93) | (1.93) |
| Total distributions | (2.64) | (1.93) | (1.93) |
| Total increase (decrease) in net asset value | (0.69) | 3.91 | 4.15 |
| Net asset value, ending | $29.66 | $30.35 | $26.44 |
| |
| Total return* | 6.70% | 23.81% | 28.11% |
| Ratios to average net assets: A | | | |
| Net investment income (loss) | (.81%) (a) | (1.30%) | (1.64%) |
| Total expenses | 2.18% (a) | 2.25% | 2.33% |
| Expenses before offsets | 2.18% (a) | 2.25% | 2.33% |
| Net expenses | 2.18% (a) | 2.25% | 2.33% |
| Portfolio turnover | 44% | 73% | 63% |
| Net assets, ending (in thousands) | $27,274 | $25,311 | $18,630 |
| |
| |
| | YEARS ENDED |
| | SEPTEMBER
30, | SEPTEMBER
30, | SEPTEMBER
30, |
| CLASS C SHARES | 2011 (z) | 2010 | 2009 |
| Net asset value, beginning | $21.55 | $18.05 | $20.20 |
| Income from investment operations: | | | |
| Net investment income (loss) | (.46) | (.39) | (.28) |
| Net realized and unrealized gain (loss) | 1.20 | 3.89 | (1.87) |
| Total from investment operations | .74 | 3.50 | (2.15) |
| Distributions from: | | | |
| Net investment income | — | — | — |
| Net realized gain | — | — | — |
| Total distributions | — | — | — |
| Total increase (decrease) in net asset value | .74 | 3.50 | (2.15) |
| Net asset value, ending | $22.29 | $21.55 | $18.05 |
| |
| Total return* | 3.43% | 19.39% | (10.64%) |
| Ratios to average net assets: A | | | |
| Net investment income (loss) | (1.79%) | (1.87%) | (1.75%) |
| Total expenses | 2.44% | 2.54% | 2.71% |
| Expenses before offsets | 2.44% | 2.54% | 2.71% |
| Net expenses | 2.44% | 2.54% | 2.70% |
| Portfolio turnover | 65% | 87% | 72% |
| Net assets, ending (in thousands) | $12,973 | $9,449 | $8,287 |
See notes to financial highlights.
28 www.calvert.com CALVERT CAPITAL ACCUMULATION FUND SEMI-ANNUAL REPORT (UNAUDITED)
| | | |
| FINANCIAL HIGHLIGHTS |
| |
| | PERIODS ENDED |
| | MARCH
31, | SEPTEMBER
30, | SEPTEMBER
30, |
| CLASS I SHARES | 2014 | 2013 (z) | 2012 (z) |
| Net asset value, beginning | $40.50 | $34.18 | $27.94 |
| Income from investment operations: | | | |
| Net investment income (loss) | .11 | .03 | (.05) |
| Net realized and unrealized gain (loss) | 2.80 | 8.22 | 8.22 |
| Total from investment operations | 2.91 | 8.25 | 8.17 |
| Distributions from: | | | |
| Net investment income | — | — | — |
| Net realized gain | (2.64) | (1.93) | (1.93) |
| Total distributions | (2.64) | (1.93) | (1.93) |
| Total increase (decrease) in net asset value | 0.27 | 6.32 | 6.24 |
| Net asset value, ending | $40.77 | $40.50 | $34.18 |
| |
| Total return* | 7.42% | 25.55% | 30.00% |
| Ratios to average net assets:A | | | |
| Net investment income (loss) | .53% (a) | .08% | (.16%) |
| Total expenses | .83% (a) | .85% | .88% |
| Expenses before offsets | .83% (a) | .85% | .86% |
| Net expenses | .83% (a) | .85% | .86% |
| Portfolio turnover | 44% | 73% | 63% |
| Net assets, ending (in thousands) | $138,360 | $130,705 | $83,181 |
| |
| |
| | YEARS ENDED |
| | SEPTEMBER
30, | SEPTEMBER
30, | SEPTEMBER
30, |
| CLASS I SHARES | 2011 (z) | 2010 | 2009 |
| Net asset value, beginning | $26.59 | $21.89 | $24.06 |
| Income from investment operations: | | | |
| Net investment income (loss) | (.06) | (.04) | .02 |
| Net realized and unrealized gain (loss) | 1.41 | 4.74 | (2.19) |
| Total from investment operations | 1.35 | 4.70 | (2.17) |
| Distributions from: | | | |
| Net investment income | — | — | — |
| Net realized gain | — | — | — |
| Total distributions | — | — | — |
| Total increase (decrease) in net asset value | 1.35 | 4.70 | (2.17) |
| Net asset value, ending | $27.94 | $26.59 | $21.89 |
| |
| Total return* | 5.08% | 21.47% | (9.02%) |
| Ratios to average net assets:A | | | |
| Net investment income (loss) | (.20%) | (.19%) | .10% |
| Total expenses | .99% | 1.12% | 1.28% |
| Expenses before offsets | .86% | .86% | .86% |
| Net expenses | .86% | .86% | .86% |
| Portfolio turnover | 65% | 87% | 72% |
| Net assets, ending (in thousands) | $21,144 | $7,138 | $3,837 |
See notes to financial highlights.
www.calvert.com CALVERT CAPITAL ACCUMULATION FUND SEMI-ANNUAL REPORT (UNAUDITED) 29
| | | |
| FINANCIAL HIGHLIGHTS |
| |
| | PERIODS ENDED |
| | MARCH
31, | SEPTEMBER
30, | SEPTEMBER
30, |
| CLASS Y SHARES | 2014 | 2013 (z) | 2012 (z) |
| Net asset value, beginning | $37.04 | $31.56 | $26.03 |
| Income from investment operations: | | | |
| Net investment income (loss) | .03 | (.12) | (.18) |
| Net realized and unrealized gain (loss) | 2.56 | 7.53 | 7.64 |
| Total from investment operations | 2.59 | 7.41 | 7.46 |
| Distributions from: | | | |
| Net investment income | — | — | — |
| Net realized gain | (2.64) | (1.93) | (1.93) |
| Total distributions | (2.64) | (1.93) | (1.93) |
| Total increase (decrease) in net asset value | (0.05) | 5.48 | 5.53 |
| Net asset value, ending | $36.99 | $37.04 | $31.56 |
| |
| Total return* | 7.24% | 24.98% | 29.45% |
| Ratios to average net assets: A | | | |
| Net investment income (loss) | .18% (a) | (.36%) | (.59%) |
| Total expenses | 1.17% (a) | 1.29% | 1.29% |
| Expenses before offsets | 1.17% (a) | 1.29% | 1.29% |
| Net expenses | 1.17% (a) | 1.29% | 1.29% |
| Portfolio turnover | 44% | 73% | 63% |
| Net assets, ending (in thousands) | $17,747 | $14,719 | $8,071 |
| |
| |
| | | | PERIOD ENDED |
| | | | SEPTEMBER
30, |
| CLASS Y SHARES | | | 2011 (z) # |
| Net asset value, beginning | | | $29.79 |
| Income from investment operations: | | | |
| Net investment income (loss) | | | (.15) |
| Net realized and unrealized gain (loss) | | | (3.61) |
| Total from investment operations | | | (3.76) |
| Distributions from: | | | |
| Net investment income | | | — |
| Net realized gain | | | — |
| Total distributions | | | — |
| Total increase (decrease) in net asset value | | | (3.76) |
| Net asset value, ending | | | $26.03 |
| |
| Total return* | | | (12.62%) |
| Ratios to average net assets:A | | | |
| Net investment income (loss) | | | (.74%) (a) |
| Total expenses | | | 1.49% (a) |
| Expenses before offsets | | | 1.44% (a) |
| Net expenses | | | 1.44% (a) |
| Portfolio turnover | | | 65%** |
| Net assets, ending (in thousands) | | | $7,968 |
See notes to financial highlights.
30 www.calvert.com CALVERT CAPITAL ACCUMULATION FUND SEMI-ANNUAL REPORT (UNAUDITED)
A Total expenses do not reflect amounts reimbursed and/or waived by the Advisor or reductions from expense offset arrangements. Expenses before offsets reflect expenses after reimbursement and/or waiver by the Advisor but prior to reductions from expense offset arrangements. Net expenses are net of all reductions and represent the net expenses paid by the Fund.
(a) Annualized.
(z) Per share figures are calculated using the Average Shares Method.
* Total return is not annualized for periods of less than one year and does not reflect deduction of any front-end or deferred sales charge.
** Portfolio turnover is not annualized for periods of less than one year.
# From January 31, 2011, inception.
See notes to financial statements.
www.calvert.com CALVERT CAPITAL ACCUMULATION FUND SEMI-ANNUAL REPORT (UNAUDITED) 31
EXPLANATION OF FINANCIAL TABLES
SCHEDULE OF INVESTMENTS
The Schedule of Investments is a snapshot of all securities held in the fund at their market value, on the last day of the reporting period. Securities are listed by asset type (e.g., common stock, corporate bonds, U.S. government obligations) and may be further broken down into sub-groups and by industry classification.
STATEMENT OF ASSETS AND LIABILITIES
The Statement of Assets and Liabilities is often referred to as the fund’s balance sheet. It lists the value of what the fund owns, is due and owes on the last day of the reporting period. The fund’s assets include the market value of securities owned, cash, receivables for securities sold and shareholder subscriptions, and receivables for dividends and interest payments that have been earned, but not yet received. The fund’s liabilities include payables for securities purchased and shareholder redemptions, and expenses owed but not yet paid. The statement also reports the fund’s net asset value (NAV) per share on the last day of the reporting period. The NAV is calculated by dividing the fund’s net assets (assets minus liabilities) by the number of shares outstanding. This statement is accompanied by a Schedule of Investments. Alternatively, if certain conditions are met, a Statement of Net Assets may be presented in lieu of this statement and the Schedule of Investments.
STATEMENT OF NET ASSETS
The Statement of Net Assets provides a detailed list of the fund’s holdings, including each security’s market value on the last day of the reporting period. The Statement of Net Assets includes a Schedule of Investments. Other assets are added and other liabilities subtracted from the investments total to calculate the fund’s net assets. Finally, net assets are divided by the outstanding shares of the fund to arrive at its share price, or Net Asset Value (NAV) per share.
At the end of the Statement of Net Assets is a table displaying the composition of the fund’s net assets. Paid in Capital is the money invested by shareholders and represents the bulk of net assets. Undistributed Net Investment Income and Accumulated Net Realized Gains usually approximate the amounts the fund had available to distribute to shareholders as of the statement date. Accumulated Realized Losses will appear as negative balances. Unrealized Appreciation (Depreciation) is the difference between the market value of the fund’s investments and their cost, and reflects the gains (losses) that would be realized if the fund were to sell all of its investments at their statement-date values.
STATEMENT OF OPERATIONS
The Statement of Operations summarizes the fund’s investment income earned and expenses incurred in operating the fund. Investment income includes dividends earned from stocks and interest earned from interest-bearing securities in the fund. Expenses incurred in operating the fund include the advisory fee paid to the investment advisor, administrative services fee, distribution plan expenses (if applicable), transfer agent fees, shareholder servicing expenses, custodial, legal, and audit fees, and the printing and postage expenses related to shareholder reports. Expense offsets (fees paid indirectly) may also be shown. Credits earned from offset arrangements are used to reduce the fund’s expenses. This statement also shows net gains (losses) realized on the sale of investments
32 www.calvert.com CALVERT CAPITAL ACCUMULATION FUND SEMI-ANNUAL REPORT (UNAUDITED)
and the increase or decrease in the unrealized appreciation (depreciation) on investments held during the period.
STATEMENT OF CHANGES IN NET ASSETS
The Statement of Changes in Net Assets shows how the fund’s total net assets changed during the two most recent reporting periods. Changes in the fund’s net assets are attributable to investment operations, distributions and capital share transactions.
The Operations section of the report summarizes information detailed in the Statement of Operations. The Distribution section shows the dividend and capital gain distributions made to shareholders. The amounts shown as distributions in this section may not match the net investment income and realized gains amounts shown in the Operations section because distributions are determined on a tax basis and certain investments or transactions may be treated differently for financial statement and tax purposes. The Capital Share Transactions section shows the amount shareholders invested in the fund, either by purchasing shares or by reinvesting distributions, and the amounts redeemed. The corresponding numbers of shares issued, reinvested and redeemed are shown at the end of the report.
FINANCIAL HIGHLIGHTS
The Financial Highlights table provides a per-share breakdown per class of the components that affect the fund’s net asset value for current and past reporting periods. The table provides total return, total distributions, expense ratios, portfolio turnover and net assets for the applicable period. Total return is a measure of a fund’s performance that encompasses all elements of return: dividends, capital gain distributions and changes in net asset value. Total return is the change in value of an investment over a given period, assuming reinvestment of any dividends and capital gain distributions, expressed as a percentage of the initial investment. Total distributions include distributions from net investment income and net realized gains. Long-term gains are earned on securities held in the fund more than one year. Short-term gains, on the sale of securities held less than one year, are treated as ordinary dividend income for tax purposes. The expense ratio is a fund’s cost of doing business, expressed as a percentage of net assets. These expenses directly reduce returns to shareholders. Portfolio turnover measures the trading activity in a fund’s investment portfolio – how often securities are bought and sold by a fund. Portfolio turnover is affected by market conditions, changes in the size of the fund, the nature of the fund’s investments and the investment style of the portfolio.
PROXY VOTING
The Proxy Voting Guidelines of the Calvert Funds that the Fund uses to determine how to vote proxies relating to portfolio securities are provided as an Appendix to the Fund’s Statement of Additional Information. The Statement of Additional Information can be obtained free of charge by calling the Fund at 1-800-368-2745, by visiting the Calvert website at www.calvert.com; or by visiting the SEC’s website at www.sec.gov.
Information regarding how the Fund voted proxies relating to portfolio securities during the most recent 12-month period ended June 30 is available on the Fund’s website at www.calvert.com and on the SEC’s website at www.sec.gov.
www.calvert.com CALVERT CAPITAL ACCUMULATION FUND SEMI-ANNUAL REPORT (UNAUDITED) 33
AVAILABILITY OF QUARTERLY PORTFOLIO HOLDINGS
The Fund files its complete schedule of portfolio holdings with the SEC for the first and third quarters of each fiscal year on Form N-Q. The Fund’s Form N-Q is available on the SEC’s website at www.sec.gov. The Fund’s Form N-Q may be reviewed and copied at the SEC’s Public Reference Room in Washington, DC; information on the operation of the Public Reference Room may be obtained by calling 1-800-SEC-0330.
BASIS FOR BOARD’S APPROVAL OF INVESTMENT ADVISORY AND INVESTMENT SUBADVISORY CONTRACTS
At a meeting held on December 10, 2013, the Board of Directors, and by a separate vote, the disinterested Directors, approved the continuance of the Investment Advisory Agreement between Calvert World Values Fund, Inc. and the Advisor and the Investment Subadvisory Agreement between the Advisor and the Subadvisor with respect to the Fund.
In evaluating the Investment Advisory Agreement, the Board considered a variety of information relating to the Fund and the Advisor. The disinterested Directors reviewed a report prepared by the Advisor regarding various services provided to the Fund by the Advisor and its affiliates. Such report included, among other data, information regarding the Advisor’s personnel and the Advisor’s revenue and cost of providing services to the Fund, and a separate report prepared by an independent third party, which provided a statistical analysis comparing the Fund’s investment performance, expenses, and fees to comparable mutual funds.
The disinterested Directors were separately represented by independent legal counsel with respect to their consideration of the reapproval of the Investment Advisory Agreement and the Investment Subadvisory Agreement. Prior to voting, the disinterested Directors reviewed the proposed continuance of the Investment Advisory Agreement and Investment Subadvisory Agreement with management and also met in private sessions with their counsel at which no representatives of management were present.
In the course of its deliberations regarding the Investment Advisory Agreement, the Board considered the following factors, among others: the nature, extent and quality of the services provided by the Advisor, including the personnel providing such services; the Advisor’s financial condition; the level and method of computing the Fund’s advisory fee; comparative performance, fee and expense information for the Fund; the profitability of the Calvert Family of Funds to the Advisor and its affiliates; the allocation of the Fund’s brokerage, including the Advisor’s process for monitoring “best execution”; the direct and indirect benefits, if any, derived by the Advisor and its affiliates from their relationship with the Fund; the effect of the Fund’s growth and size on the Fund’s performance and expenses; the affiliated distributor’s process for monitoring sales load breakpoints; the Advisor’s compliance programs and policies; the Advisor’s performance of substantially similar duties for other funds; and any possible conflicts of interest.
In considering the nature, extent and quality of the services provided by the Advisor under the Investment Advisory Agreement, the Board reviewed information provided by
34 www.calvert.com CALVERT CAPITAL ACCUMULATION FUND SEMI-ANNUAL REPORT (UNAUDITED)
the Advisor relating to its operations and personnel, including, among other information, biographical information on the Advisor’s supervisory and professional staff and descriptions of its organizational and management structure. The Board also took into account similar information provided periodically throughout the previous year by the Advisor as well as the Board’s familiarity with management through Board of Directors’ meetings, discussions and other reports. The Board also noted that it reviewed on a quarterly basis information regarding the Advisor’s compliance with applicable policies and procedures, including those related to personal investing. The Advisor’s administrative capabilities, including its ability to supervise the other service providers for the Fund, were also considered. The Board also took into account the environmental, social, sustainability and governance research and analysis provided by the Advisor to the Fund. The Board observed that the scope of services provided by the Advisor generally had expanded over time as a result of regulatory, market and other changes. The Board took into consideration, among other factors, the effectiveness of the Fund’s and Advisor’s processes, policies and procedures and the Advisor’s personnel. The Board also took into account, among other items, periodic reports received from the Advisor over the past year concerning the Advisor’s ongoing review and enhancement of certain processes, policies and procedures of the Fund and the Advisor. The Board discussed the Advisor’s effectiveness in monitoring the performance of the Subadvisor and its timeliness in responding to performance issues. The Board concluded that it was satisfied with the nature, extent and quality of services provided to the Fund by the Advisor under the Investment Advisory Agreement.
In considering the Fund’s performance, the Board noted that it reviewed on a quarterly basis detailed information about the Fund’s performance results, portfolio composition and investment strategies. In addition, the Board took into account overall financial market conditions. The Board also reviewed various comparative data provided to it in connection with its consideration of the renewal of the Investment Advisory Agreement, including, among other information, a comparison of the Fund’s total return with its Lipper index and with that of other mutual funds deemed to be in its peer group by an independent third party in its report. This comparison indicated that the Fund performed below the median of its peer group for the one- and five-year periods ended June 30, 2013. For the three-year period ended June 30, 2013, the Fund performed above the median of its peer group. The data also indicated that the Fund underperformed its Lipper index for the one- and five-year periods ended June 30, 2013, and outperformed its Lipper index for the three-year period ended June 30, 2013. The Board took into account management’s discussion of the Portfolio’s performance and management’s continuing monitoring of the Fund’s performance. Based upon its review, the Board concluded that appropriate action was being taken to address the Fund’s performance.
In considering the Fund’s fees and expenses, the Board compared the Fund’s fees and total expense ratio with various comparative data for the funds in its peer group. Among other findings, the data indicated that the Fund’s advisory fee (after taking into account waivers and/or reimbursements) was below the median of its peer group and that total expenses (net of waivers and/or reimbursements) were above the median of its peer group. The Board noted that the allocation of advisory and administrative fees may vary among the Fund’s peer group. The Board also took into account the Advisor’s current undertaking to maintain expense limitations for the Fund and that the Advisor had reimbursed a portion of the Fund’s expenses. The Board noted the Advisor’s discussion of the Fund’s expenses and certain factors that affected the level of such expenses, including the cost of
www.calvert.com CALVERT CAPITAL ACCUMULATION FUND SEMI-ANNUAL REPORT (UNAUDITED) 35
providing the environmental, social, sustainability and governance research and analysis provided by the Advisor. Based upon its review, the Board determined that the advisory fee was reasonable in view of the quality of services received by the Fund from the Advisor and the other factors considered.
The Board reviewed the Advisor’s profitability on a fund-by-fund basis. In reviewing the overall profitability of the advisory fee to the Fund’s Advisor, the Board also considered the fact that affiliates of the Advisor provided shareholder servicing, administrative and distribution services to the Fund for which they received compensation. The information considered by the Board included Calvert’s operating profit margin information both before and after tax expenses with respect to the services that the Advisor and its affiliates provided to the Calvert Family of Funds complex. The Board reviewed the profitability of the Advisor’s relationship with the Fund in terms of the total amount of annual advisory fees it received with respect to the Fund and whether the Advisor had the financial wherewithal to continue to provide services to the Fund. The Board noted that the Advisor had reimbursed a portion of the Fund’s expenses. The Board also took into account the Advisor’s current undertaking to maintain expense limitations for the Fund. The Board also considered that the Advisor derived benefits to its reputation and other indirect benefits from its relationship with the Fund. The Board also noted that the Advisor paid the subadvisory fee to the Subadvisor. Based upon its review, the Board concluded that the Advisor’s and its affiliates’ level of profitability from their relationship with the Fund was reasonable.
The Board considered the effect of the Fund’s current size and its potential growth on its performance and fees. The Board concluded that adding breakpoints to the advisory fee at specified asset levels would not be appropriate at this time given the Fund’s current size. The Board noted that if the Fund’s assets increased over time, the Fund might realize other economies of scale if assets increased proportionally more than certain other expenses.
In reapproving the Investment Advisory Agreement, the Board, including the disinterested Directors, did not identify any single factor as controlling, and each Director may have attributed different weight to various factors.
In evaluating the Investment Subadvisory Agreement, the disinterested Directors reviewed information provided by the Subadvisor relating to its operations, personnel, investment philosophy, strategies and techniques. Among other information, the Subadvisor provided biographical information on portfolio management and other professional staff, performance information for itself, and descriptions of its investment philosophies, strategies and techniques, organizational and management structures and brokerage policies and practices.
The Board reapproved the Investment Subadvisory Agreement between the Subadvisor and the Advisor based on a number of factors relating to the Subadvisor’s ability to perform under the Investment Subadvisory Agreement. In the course of its deliberations, the Board evaluated, among other factors: the nature, extent and the quality of the services provided by the Subadvisor; the Subadvisor’s management style and long-term performance record; the Fund’s performance record and the Subadvisor’s performance in employing its investment strategies; the Subadvisor’s current level of staffing and its overall resources; the qualifications and experience of the Subadvisor’s personnel; the
36 www.calvert.com CALVERT CAPITAL ACCUMULATION FUND SEMI-ANNUAL REPORT (UNAUDITED)
Subadvisor’s financial condition with respect to its ability to perform the services required under the Investment Subadvisory Agreement; the Subadvisor’s risk management processes; the Subadvisor’s compliance systems, including those related to personal investing; and any disciplinary history. Based upon its review, the Board concluded that it was satisfied with the nature, extent and quality of services provided to the Fund by the Subadvisor under the Investment Subadvisory Agreement.
As noted above, the Board considered, among other information, the Fund’s performance during the one-, three- and five-year periods ended June 30, 2013 as compared to the Fund’s peer group and noted that it reviewed on a quarterly basis detailed information about the Fund’s performance results, portfolio composition and investment strategies. The Board noted the Advisor’s expertise and resources in monitoring the performance, investment style and risk-adjusted performance of the Subadvisor.
In considering the cost of services provided by the Subadvisor and the profitability to the Subadvisor of its relationship with the Fund, the Board noted that the subadvisory fee under the Investment Subadvisory Agreement was paid by the Advisor out of the advisory fee that the Advisor received under the Investment Advisory Agreement. The Board also relied on the ability of the Advisor to negotiate the Investment Subadvisory Agreement and the corresponding subadvisory fee at arm’s length. Based upon its review, the Board determined that the subadvisory fee was reasonable in view of the quality of services received by the Fund from the Subadvisor and the other factors considered. Because the Advisor pays the Subadvisor’s subadvisory fee and the subadvisory fee was negotiated at arm’s length by the Advisor, the cost of services provided by the Subadvisor and the profitability to the Subadvisor of its relationship with the Fund were not material factors in the Board’s deliberations. For similar reasons, the Board did not consider the potential economies of scale in the Subadvisor’s management of the Fund to be a material factor in its consideration.
In reapproving the Investment Subadvisory Agreement, the Board, including the disinterested Directors, did not identify any single factor as controlling, and each Director may have attributed different weight to various factors.
CONCLUSIONS
The Board reached the following conclusions regarding the Investment Advisory Agreement and the Investment Subadvisory Agreement, among others: (a) the Advisor has demonstrated that it possesses the capability and resources to perform the duties required of it under the Investment Advisory Agreement; (b) the Subadvisor is qualified to manage the Fund’s assets in accordance with the Fund’s investment objectives and policies; (c) the Advisor and Subadvisor maintain appropriate compliance programs; (d) the Subadvisor is likely to execute its investment strategies consistently over time; (e) appropriate action is being taken to address the Fund’s performance; and (f) the Fund’s advisory and sub-advisory fees are reasonable in view of the quality of services received by the Fund from the Advisor and Subadvisor, respectively, and the other factors considered. Based on its conclusions, the Board determined that reapproval of the Investment Advisory Agreement and the Investment Subadvisory Agreement would be in the best interests of the Fund and its shareholders.
www.calvert.com CALVERT CAPITAL ACCUMULATION FUND SEMI-ANNUAL REPORT (UNAUDITED) 37
This page intentionally left blank.
To Open an Account
800-368-2748
Service for Existing Account
Shareholders: 800-368-2745
Brokers: 800-368-2746
TDD for Hearing Impaired
800-541-1524
Registered Mail
Calvert Investments
c/o BFDS,
P.O. Box 219544
Kansas City, MO 64121-9544
Overnight Mail
Calvert Investments
c/o BFDS,
330 West 9th Street
Kansas City, MO 64105
Web Site
www.calvert.com
Principal Underwriter
Calvert Investment Distributors, Inc.
4550 Montgomery Avenue
Suite 1000 North
Bethesda, Maryland 20814

This report is intended to provide fund information to shareholders. It is not authorized for distribution to prospective investors unless preceded or accompanied by a prospectus.
Note: The information on our website is not incorporated by reference into this report; our website address is included as an inactive textual reference only.
Investors should carefully consider the investment objectives, risks, charges and expenses of the Calvert Funds. This and other important information is contained in the fund’s summary prospectus and prospectus, which can be obtained from your financial professional and should be read carefully before investing. You may also call Calvert at 800/368-2748 or visit www. calvert.com.
Choose Planet-friendly E-delivery!
Sign up now for on-line statements, prospectuses, and fund reports. In less than five minutes you can help reduce paper mail and lower fund costs.
Just go to www.calvert.com. If you already have an online account at Calvert, click on My Account, and select the documents you would like to receive via e-mail.
If you’re new to online account access, click on Login/Register to open an online account. Once you’re in, click on the E-delivery sign-up at the bottom of the Account Portfolio page and follow the quick, easy steps. Note: if your shares are not held directly at Calvert but through a brokerage firm, you must contact your broker for electronic delivery options available through their firm.
After a “risk-on” year in 2013, the first quarter of 2014 proved to be a more challenging environment for equities. Concerns about economic growth in emerging markets, geopolitical turmoil in the Ukraine, and somewhat softer macroeconomic data in the United States injected more risk aversion into the markets. At the same time, profit-taking and tempered expectations for a repeat performance of stellar 2013 returns likely drove down investor risk tolerance in the first quarter.
Despite investors taking a more cautious approach toward equities at the start of 2014, the exceptionally strong performance of the equity markets, particularly U.S. equities, in the fourth quarter of 2013 allowed all major global equity indices to finish the six-month reporting period in positive territory. For the six months ended March 31, 2014, the Standard and Poor’s (S&P) 500, Russell 1000, Russell 2000, MSCI EAFE, and MSCI Emerging Markets Indices returned 12.51%, 12.48%, 9.94%, 6.56%, and 1.49%, respectively.
From an investment-style perspective, small-cap stocks underperformed their large-cap counterparts, while value stocks outperformed growth stocks. The rotation from expensive growth stocks to more bargain-priced value stocks, if it continues, could suggest a more favorable outlook for higher-quality stocks. Looking at sector performance, Health Care, Information Technology, and Materials were the top-performing sectors within the Russell 1000 Index, while the Telecommunications, Consumer Discretionary, and Consumer Staples sectors lagged.
U.S. Economic Recovery Moves Forward, Despite Fed Tapering Talk
Positive fourth-quarter results in the equity markets were driven by several factors, centering on continued U.S. economic recovery and growing investor confidence, thus creating an environment conducive to earnings expansion. These factors explain, in part, why U.S. equities shone so strongly compared with foreign developed and emerging markets. Extreme weather likely held back economic growth in much of the U.S. during the period, but markets found support as investors gained comfort in the view that weaker economic data was more a by-product of inclement weather, rather than reflecting a broader economic slowdown.
The Fed’s decision to begin tapering its quantitative easing (QE) programs in January divided analysts on whether rising interest rates would dampen the economic recovery and create downward pressure on stocks, or whether they would instill confidence that the Fed is being responsible and attract more investors. On the whole, the resiliency and low volatility of interest rates in the wake of Fed tapering was a
4 www.calvert.com CALVERT INTERNATIONAL OPPORTUNITIES FUND SEMI-ANNUAL REPORT (UNAUDITED)
| |
| CALVERT |
| INTERNATIONAL |
| OPPORTUNITIES |
| FUND |
| MARCH 31, 2014 |
| |
| | % OF TOTAL |
| ECONOMIC SECTORS | INVESTMENTS |
| Consumer Discretionary | 18.1% |
| Consumer Staples | 8.5% |
| Energy | 2.5% |
| Financials | 29.9% |
| Health Care | 3.1% |
| Industrials | 14.9% |
| Information Technology | 8.2% |
| Materials | 8.2% |
| Short-Term Investments | 5.0% |
| Telecommunication Services | 1.6% |
| Total | 100% |
positive sign, indicating that—at least for a while—tapering need not produce the kind of jump in interest rates many analysts had feared.
Consumers Play a Key Role in Recovery
Although market analysts have focused largely on what is happening at the Federal Reserve, we believe an important driver of economic activity in the United States, and of Fed policy by extension, is the continued improvement in the health of the consumer balance sheet. This gives consumers better access to consumer loans and mortgages, supporting the continued recovery of the housing and automotive industries, among others. At the same time, initial jobless claims maintained their downward trend throughout the period. Continued improvements in the labor market should support consumer spending and the U.S. housing sector—keys to the success of the U.S. economic recovery.
| CALVERT |
| INTERNATIONAL |
| OPPORTUNITIES |
| FUND |
| MARCH 31, 2014 |
| |
| INVESTMENT PERFORMANCE | |
| (TOTAL RETURN AT NAV*) | |
| | 6 MONTHS | 12 MONTHS |
| | ENDED | ENDED |
| | 3/31/14 | 3/31/14 |
| Class A | 9.37% | 24.54% |
| Class C | 8.93% | 23.57% |
| Class I | 9.56% | 25.17% |
| Class Y | 9.50% | 24.77% |
| |
| MSCI EAFE | | |
| Small/Mid Cap | | |
| Index | 8.29% | 21.81% |
| |
| Lipper | | |
| International | | |
| Small/Mid Cap | | |
| Core Funds | | |
| Average | 8.88% | 20.36% |
| TEN LARGEST | % OF NET |
| STOCK HOLDINGS | ASSETS |
| IMMOFINANZ AG | 2.0% |
| Buzzi Unicem SpA | 2.0% |
| Catlin Group Ltd. | 1.8% |
| Delta Lloyd NV | 1.6% |
| Aozora Bank Ltd. | 1.6% |
| Unipres Corp. | 1.5% |
| Cie Generale des Etablissements | |
| Michelin | 1.5% |
| Namco Bandai Holdings, Inc. | 1.5% |
| Koninklijke DSM NV | 1.5% |
| Industrivarden AB | 1.4% |
| Total | 16.4% |
* Investment performance/return at NAV does not reflect the deduction of the Fund’s maximum 4.75% front-end sales charge or any deferred sales charges.
www.calvert.com CALVERT INTERNATIONAL OPPORTUNITIES FUND SEMI-ANNUAL REPORT (UNAUDITED) 5
An Anemic Europe and Sluggish China Worry Investors
A global backdrop of lower-than-target inflation persisted throughout the period, despite continued aggressive easing actions by the world’s largest central banks. There are several drivers contributing to low inflation we believe are likely to persist in the near-term. For example, anemic economic activity in Europe continued to highlight the threat of deflation, as inflation in the eurozone dipped below 1% during the period. While European Central Bank (ECB) President Mario Draghi indicated a willingness to intervene if further downside risks to price stability materialize, there appear to be few catalysts capable of driving an increase in demand-side inflation since the euro area’s economic recovery has remained tepid.
Worries about a hard landing in China returned to the forefront of investor concerns as the China HSBC Manufacturing PMI (Purchasing Managers’ Index) steadily declined throughout the period into contraction territory. Meanwhile, political upheaval in the Ukraine, which culminated with Russian forces occupying the Crimea region, injected further risk aversion into investor sentiment. The situation continued to negatively impact emerging-market stocks and currencies, which were already under pressure due to the prospect of slower GDP growth in emerging markets. We expect the Ukraine situation to be a continued source of headline market risk in the near-term, until a final diplomatic solution is reached.
Outlook
The contrast in economic conditions between the United States and both Europe and China (and other emerging markets) should continue to draw more investment to the U.S. in the near-term. Fed tapering will most likely add to this effect in equities as well as other asset classes. We expect the dollar to continue strengthening slowly, which may provide another reason for foreign investors to favor U.S. securities over those in their domestic markets. This also supports our outlook for continued low inflation in the near-term.
| CALVERT |
| INTERNATIONAL |
| OPPORTUNITIES |
| FUND |
| MARCH 31, 2014 |
| |
| AVERAGE ANNUAL TOTAL RETURNS |
| |
| CLASS A SHARES | (WITH MAX. LOAD) |
| One year | 18.63% |
| Five year | 17.11% |
| Since inception (5/31/2007) | 1.82% |
| |
| CLASS C SHARES | (WITH MAX. LOAD) |
| One year | 22.57% |
| Five year | 17.28% |
| Since inception (7/31/2007) | 2.04% |
| |
| |
| CLASS I SHARES | |
| One year | 25.17% |
| Five year | 18.78% |
| Since inception (5/31/2007) | 3.02% |
| |
| |
| CLASS Y SHARES* | |
| One year | 24.77% |
| Five year | 18.54% |
| Since inception (5/31/2007) | 2.73% |
* Calvert International Opportunities Fund first offered Class Y shares on October 31, 2008. Performance prior to that date reflects the performance of Class A shares at net asset value (NAV). Actual Class Y share performance would have been different.
6 www.calvert.com CALVERT INTERNATIONAL OPPORTUNITIES FUND SEMI-ANNUAL REPORT (UNAUDITED)
GROWTH OF $10,000
The graph below shows the value of a hypothetical $10,000 investment in the Fund over the past 10 fiscal year periods or since inception (for funds without 10-year records). The results shown are for Classes A and I shares and reflect the deduction of the maximum front-end Class A sales charge of 4.75% and assume the reinvestment of dividends. The result is compared with benchmarks that include a broad based market index and a Lipper peer group average. Market indexes are unmanaged and their results do not reflect the effect of expenses or sales charges. The Lipper average reflects the deduction of the category’s average front-end sales charge. The value of an investment in a different share class would be different.
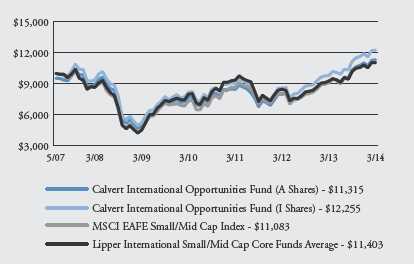
All performance data shown, including the graph above and the adjacent table, represents past performance, does not guarantee future results, assumes reinvestment of dividends and distributions and does not reflect the deduction of taxes that a shareholder would pay on the Fund’s distributions or the redemption of the Fund shares. All performance data reflects fee waivers and/or expense limitations, if any are in effect; in their absence performance would be lower. See Note B in Notes to Financial Statements. The investment return and principal value of an investment will fluctuate so that an investor’s shares, when redeemed, may be worth more or less than their original cost. Current performance may be lower or higher than the performance data quoted; for current performance data visit www.calvert.com. The gross expense ratio from the current prospectus for Class A shares is 2.03%. This number may differ from the expense ratio shown elsewhere in this report because it is based on a different time period and, if applicable, does not include fee or expense waivers. Performance data quoted already reflects the deduction of the Fund’s operating expenses.
www.calvert.com CALVERT INTERNATIONAL OPPORTUNITIES FUND SEMI-ANNUAL REPORT (UNAUDITED) 7
The recovery may still feel “sluggish” because the current 6.7% unemployment rate—while down from a recession peak of 10%—is still running higher than in previous expansions. From the perspective of equity investors, however, higher unemployment is likely keep downward pressure on wages, which, in turn, could help strengthen profit margins.
We think the Fed will be particularly careful not to derail economic expansion, especially as long as inflation remains low, and will do so by carefully telegraphing its position and plans as they evolve. Moreover, the signal that the Fed is serious about normalizing interest rates should improve investor confidence about the condition of the economy and reassure those who have been worried about the inflationary risk of an eternal quantitative easing. However, sharp changes in interest-rate expectations remain a risk factor, as they can drive mortgage rates higher, negatively impacting housing activity and weakening this major component of the U.S. economic recovery.
We also believe the U.S. economy can still compensate for a dampened global growth outlook. And we expect economic growth to reaccelerate in the second-half of the year on the heels of continued improvement in the housing and labor markets. In addition, as consumer activity picks up in the spring and summer, there is potential for some lost consumer activity to be recovered later in the year. Overall, we believe these conditions continue to provide a favorable underpinning for the equities markets.
Calvert Investment Management, Inc.
May 2014
8 www.calvert.com CALVERT INTERNATIONAL OPPORTUNITIES FUND SEMI-ANNUAL REPORT (UNAUDITED)

As always, Calvert continues to work hard to ensure you have a say in the responsible management of environmental, social, and governance (ESG) factors for the companies in which we invest. Below are highlights of our accomplishments during the reporting period.
Shareholder Advocacy
Calvert filed more than 26 shareholder proposals over the reporting period on a variety of issues, including board diversity, reduction of greenhouse gas emissions, disclosure of country-level sourcing and human rights risk assessment processes for apparel companies, and sustainability reporting.
After commitments from Pioneer Natural Resources Company and QEP Resources, Calvert has withdrawn one shareholder proposal and decided not to file a second one for the 2014 proxy season. The two companies agreed to improve disclosure and continue engagement regarding key challenges related to hydraulic fracturing, such as water use and emissions reduction. The resulting disclosures will help Calvert and the companies better understand how they are managing these important opportunities and risks.
Also, an effort led by Calvert Investments and other institutional investors drove the World Federation of Exchanges (WFE) to announce the launch of a Sustainability Working Group in March to develop a consensus on sustainability reporting. Such a standard would promote greater transparency and fairness in the capital markets, improve cost-efficiencies, promote timeliness and consistency for reporting companies, and equip investors to value companies more accurately and make more informed investment decisions.
During the period, Calvert filed proxy resolutions with all the U.S. publicly traded financial exchanges—CBOE, CME, IntercontinentalExchange Group/NYSE and NASDAQ OMX (NDAQ)—on this issue. However, all resolutions were withdrawn after leadership agreed to join the Working Group. We congratulate these WFE member exchanges for their leadership on investor information transparency.
Calvert was a part of the working group that developed the Shareholder Director Exchange Protocol (SDX) released in February. The protocol addresses the increasing levels of direct engagement between institutional investors, such as activist investors, and public company boards, which can significantly change the dynamic between public companies and investors. Engagement is typically between investors and management, but there is a growing interest on the part of investors and directors for more dialogue, especially when fundamental corporate governance or sustainability issues emerge. The protocol helps lay the basis for productive engagement while addressing common concerns each side may have.
www.calvert.com CALVERT INTERNATIONAL OPPORTUNITIES FUND SEMI-ANNUAL REPORT (UNAUDITED) 9
Community Investments
Many of our Funds participate in Calvert’s High Social Impact Investing program, through the CI notes administered through the Calvert Foundation. This community investment program may allocate a small percentage of Fund assets at below-market interest rates to investments that provide economic opportunity for struggling populations.
Through the CI notes’ WIN-WIN portfolio (Women Investing in Women), we recently invested in the Opportunity Fund, the leading microfinance provider in California, which provides microloans for small businesses, microsavings accounts, and community real estate financing. Its innovative repayment system allows clients like Chef Tina Ferguson-Riffe to grow her business with a $20,000 loan for new restaurant equipment and repay the loan based on daily credit/debit card sales, instead of large monthly payments.
In December, the CI notes program invested $1.2 million in One Acre Fund, a nonprofit that provides smallholder farmers in Kenya, Rwanda, and Burundi a bundle of services including seed, training, and access to markets. One Acre Fund expects to reach 251,000 farm families in 2014.
Special Equities
A modest but important portion of certain funds is allocated to small private companies developing products or services that address important sustainability or environmental issues facing our society.
One such recent investment, acquired just after the reporting period, was Africa Renewable Energy Fund, which supports small- to medium-scale independent power producers in sub-Saharan Africa with grid-connected, development-stage renewable energy projects, including small hydro, wind, geothermal, solar, biomass and waste gas technologies. Electricity outages continue to be a major problem in many of these countries. This investment will help to address that supply gap in a sustainable manner.
As of March 31, 2014, Calvert Social Investment Foundation (“Calvert Foundation” or “Foundation”) Community Investment Notes represented the following percentages of Fund net assets: Calvert Balanced Portfolio 0.7%, Calvert Equity Portfolio 0.4%, Calvert Bond Portfolio 0.4%, Calvert International Equity Fund 1.2%, Calvert Capital Accumulation Fund 0.4%, and Calvert Small Cap Fund 0.3%. The Calvert Foundation is a 501(c)(3) nonprofit organization. The Foundation’s Community Investment Note Program is not a mutual fund and should not be confused with any Calvert Investments-sponsored investment product.
As of March 31, 2014, the following companies represented the following percentages of Portfolio net assets: Pioneer Natural Resources Company .22% of Calvert Social Index Fund, 1.14% of Calvert Bond Portfolio and .29% of Calvert Balanced Portfolio; QEP Resources .04% of Calvert Social Index Fund, CBOE 0.04% of Calvert Social Index Fund, CME 0.19% of Calvert Social Index Fund, IntercontinentalExchange Group/NYSE 0.18% of Calvert Social Index Fund and 2.46% of Calvert Equity Portfolio, and NASDAQ OMX (NDAQ) 0.03% of Calvert Social Index Fund. Africa Renewable Energy Fund represented 0% of each of Calvert Equity Portfolio and Calvert International Equity Fund. Holdings are subject to change.
10 www.calvert.com CALVERT INTERNATIONAL OPPORTUNITIES FUND SEMI-ANNUAL REPORT (UNAUDITED)
SHAREHOLDER EXPENSE EXAMPLE
As a shareholder of the Fund, you incur two types of costs: (1) transaction costs, including sales charges and redemption fees; and (2) ongoing costs, including management fees; distribution (12b-1) fees; and other Fund expenses. This Example is intended to help you understand your ongoing costs (in dollars) of investing in the Fund and to compare these costs with the ongoing costs of investing in other mutual funds.
This Example is based on an investment of $1,000 invested at the beginning of the period and held for the entire period (October 1, 2013 to March 31, 2014).
Actual Expenses
The first line of the table below provides information about actual account values and actual expenses. You may use the information in this line, together with the amount you invested, to estimate the expenses that you paid over the period. Simply divide your account value by $1,000 (for example, an $8,600 account value divided by $1,000 = 8.6), then multiply the result by the number in the first line under the heading entitled “Expenses Paid During Period” to estimate the expenses you paid on your account during this period.
Hypothetical Example for Comparison Purposes
The second line of the table below provides information about hypothetical account values and hypothetical expenses based on the Fund’s actual expense ratio and an assumed rate of return of 5% per year before expenses, which is not the Fund’s actual return. The hypothetical account values and expenses may not be used to estimate the actual ending account balance or expenses you paid for the period. You may use this information to compare the ongoing costs of investing in the Fund and other funds. To do so, compare the 5% hypothetical example with the 5% hypothetical examples that appear in the shareholder reports of the other funds.
Please note that the expenses shown in the table are meant to highlight your ongoing costs only and do not reflect any transactional costs, such as sales charges (loads), or redemption fees. Therefore, the second line of the table is useful in comparing ongoing costs only, and will not help you determine the relative total costs of owning different funds. In addition, if these transactional costs were included, your costs would have been higher.
www.calvert.com CALVERT INTERNATIONAL OPPORTUNITIES FUND SEMI-ANNUAL REPORT (UNAUDITED) 11
| | BEGINNING | ENDING ACCOUNT | EXPENSES PAID |
| | ACCOUNT VALUE | VALUE | DURING PERIOD* |
| | 10/1/13 | 3/31/14 | 10/1/13 - 3/31/14 |
| CLASS A | | | |
| Actual | $1,000.00 | $1,093.69 | $8.67 |
| Hypothetical | $1,000.00 | $1,016.65 | $8.35 |
| (5% return per year before expenses) | | | |
| |
| CLASS C | | | |
| Actual | $1,000.00 | $1,089.27 | $13.02 |
| Hypothetical | $1,000.00 | $1,012.47 | $12.54 |
| (5% return per year before expenses) | | | |
| |
| CLASS I | | | |
| Actual | $1,000.00 | $1,096.21 | $6.27 |
| Hypothetical | $1,000.00 | $1,018.95 | $6.04 |
| (5% return per year before expenses) | | | |
| |
| CLASS Y | | | |
| Actual | $1,000.00 | $1,094.98 | $7.36 |
| Hypothetical | $1,000.00 | $1,017.90 | $7.09 |
| (5% return per year before expenses) | | | |
* Expenses are equal to the Fund’s annualized expense ratio of 1.66%, 2.50%, 1.20%, and 1.41% for Class A, Class C, Class I, and Class Y, respectively, multiplied by the average account value over the period, multiplied by 182/365 (to reflect the one-half year period).
12 www.calvert.com CALVERT INTERNATIONAL OPPORTUNITIES FUND SEMI-ANNUAL REPORT (UNAUDITED)
| | |
| STATEMENT OF NET ASSETS |
| MARCH 31, 2014 |
| |
| EQUITY SECURITIES - 95.8% | SHARES | VALUE |
| Australia - 2.3% | | |
| GrainCorp Ltd | 154,848 | $1,209,637 |
| Orora Ltd | 788,986 | 1,008,938 |
| | | 2,218,575 |
| |
| Austria - 3.3% | | |
| IMMOFINANZ AG* | 428,124 | 2,002,281 |
| Lenzing AG | 6,625 | 364,615 |
| Wienerberger AG | 48,047 | 918,030 |
| | | 3,284,926 |
| |
| Belgium - 1.3% | | |
| Befimmo SA | 8,053 | 570,851 |
| Umicore SA | 14,725 | 751,741 |
| | | 1,322,592 |
| |
| Brazil - 1.2% | | |
| ALL - America Latina Logistica SA | 73,855 | 247,864 |
| BM & FBovespa SA | 160,346 | 799,740 |
| Localiza Rent a Car SA | 11,122 | 163,704 |
| | | 1,211,308 |
| |
| China - 0.6% | | |
| Greatview Aseptic Packaging Co. Ltd | 284,063 | 150,880 |
| Mindray Medical International Ltd. (ADR) | 14,397 | 465,887 |
| | | 616,767 |
| |
| Denmark - 1.7% | | |
| D/S Norden A/S | 21,941 | 935,281 |
| NKT Holding A/S | 13,142 | 761,494 |
| | | 1,696,775 |
| |
| Finland - 0.7% | | |
| Ramirent Oyj | 63,505 | 696,516 |
| |
| France - 4.4% | | |
| Cie Generale des Etablissements Michelin | 11,858 | 1,485,355 |
| Nexans SA | 13,717 | 720,012 |
| UBISOFT Entertainment* | 53,356 | 957,593 |
| Vallourec SA | 22,185 | 1,205,978 |
| | | 4,368,938 |
| |
| Germany - 4.4% | | |
| DMG MORI SEIKI AG | 24,346 | 746,528 |
| Hugo Boss AG | 5,949 | 792,290 |
| Rhoen Klinikum AG | 35,188 | 1,126,983 |
| Talanx AG | 32,528 | 1,169,913 |
| Tom Tailor Holding AG* | 28,909 | 530,046 |
| | | 4,365,760 |
www.calvert.com CALVERT INTERNATIONAL OPPORTUNITIES FUND SEMI-ANNUAL REPORT (UNAUDITED) 13
| | |
| EQUITY SECURITIES - CONT’D | SHARES | VALUE |
| Hong Kong - 0.3% | | |
| Techtronic Industries Co. | 95,689 | $267,696 |
| |
| India - 0.2% | | |
| Yes Bank Ltd | 25,225 | 176,200 |
| |
| Ireland - 0.7% | | |
| Paddy Power plc | 8,396 | 665,195 |
| |
| Italy - 4.8% | | |
| Banca Generali SpA | 30,949 | 1,020,997 |
| Buzzi Unicem SpA | 103,601 | 1,938,955 |
| Piaggio & C SpA | 282,587 | 1,011,919 |
| Prysmian SpA | 28,883 | 720,742 |
| | | 4,692,613 |
| |
| Japan - 25.2% | | |
| Aozora Bank Ltd. | 538,877 | 1,536,959 |
| Azbil Corp. | 44,400 | 1,096,418 |
| Chugoku Marine Paints Ltd | 112,000 | 795,467 |
| COOKPAD, Inc | 14,203 | 338,371 |
| Credit Saison Co. Ltd. | 33,063 | 658,035 |
| Daiichikosho Co. Ltd | 26,182 | 793,756 |
| Daiseki Co. Ltd | 56,600 | 976,369 |
| Doshisha Co. Ltd | 19,200 | 297,290 |
| Hogy Medical Co. Ltd. | 12,600 | 648,690 |
| Hokuto Corp. | 55,600 | 1,158,282 |
| Horiba Ltd | 19,100 | 724,833 |
| Ibiden Co. Ltd. | 40,400 | 795,917 |
| Internet Initiative Japan, Inc. | 37,007 | 893,641 |
| Makita Corp. | 18,420 | 1,019,223 |
| MS&AD Insurance Group Holdings, Inc. | 32,800 | 751,625 |
| Nabtesco Corp. | 33,648 | 778,806 |
| Namco Bandai Holdings, Inc | 61,200 | 1,448,449 |
| Secom Co. Ltd. | 19,300 | 1,113,003 |
| SKY Perfect JSAT Holdings, Inc | 252,100 | 1,348,296 |
| Stanley Electric Co. Ltd. | 39,996 | 887,563 |
| Star Micronics Co. Ltd | 59,100 | 712,694 |
| Tatsuta Electric Wire and Cable Co. Ltd. | 110,770 | 572,686 |
| The Bank of Yokohama Ltd. | 229,300 | 1,145,379 |
| Toyota Industries Corp. | 23,000 | 1,105,283 |
| Unipres Corp. | 83,400 | 1,504,193 |
| Yamaha Corp. | 70,000 | 901,827 |
| Yokohama Rubber Co. Ltd. | 76,519 | 719,429 |
| | | 24,722,484 |
| |
| Malaysia - 1.3% | | |
| PureCircle Ltd.* | 124,658 | 1,283,457 |
14 www.calvert.com CALVERT INTERNATIONAL OPPORTUNITIES FUND SEMI-ANNUAL REPORT (UNAUDITED)
| | |
| EQUITY SECURITIES - CONT’D | SHARES | VALUE |
| Netherlands - 4.2% | | |
| Delta Lloyd NV | 57,843 | $1,605,380 |
| Koninklijke DSM NV | 20,768 | 1,426,381 |
| Wereldhave NV | 12,484 | 1,063,729 |
| | | 4,095,490 |
| |
| Norway - 5.9% | | |
| Aker ASA | 25,190 | 813,547 |
| Cermaq ASA | 118,125 | 1,312,404 |
| Norwegian Air Shuttle AS* | 21,204 | 895,658 |
| Opera Software ASA | 46,502 | 606,899 |
| Petroleum Geo-Services ASA | 104,475 | 1,271,148 |
| TGS Nopec Geophysical Co. ASA | 27,145 | 889,337 |
| | | 5,788,993 |
| |
| Panama - 1.2% | | |
| Banco Latinoamericano de Exportaciones SA | 43,069 | 1,137,452 |
| |
| Russia - 0.3% | | |
| Eurasia Drilling Co. Ltd. (GDR) | 11,455 | 294,327 |
| |
| Singapore - 0.4% | | |
| Ascendas India Trust | 657,500 | 402,165 |
| |
| South Africa - 0.2% | | |
| Foschini Group Ltd | 18,213 | 185,349 |
| |
| South Korea - 4.2% | | |
| Dongbu Insurance Co. Ltd. | 5,530 | 287,370 |
| Grand Korea Leisure Co. Ltd | 7,813 | 321,022 |
| NongShim Co. Ltd. | 3,355 | 940,722 |
| Samsung Card Co. Ltd | 39,280 | 1,280,791 |
| SL Corp. | 70,350 | 1,260,993 |
| | | 4,090,898 |
| |
| Sweden - 3.0% | | |
| BillerudKorsnas AB | 60,337 | 835,506 |
| Industrivarden AB, C Shares | 73,087 | 1,417,274 |
| Intrum Justitia AB | 23,823 | 650,071 |
| | | 2,902,851 |
| |
| Switzerland - 3.5% | | |
| Baloise Holding AG | 10,183 | 1,280,300 |
| GAM Holding AG* | 73,309 | 1,324,509 |
| Sonova Holding AG* | 5,851 | 855,904 |
| | | 3,460,713 |
| |
| United Kingdom - 20.5% | | |
| Arrow Global Group plc* | 162,476 | 612,005 |
| Ashtead Group plc | 64,222 | 1,021,362 |
| Bank of Georgia Holdings plc | 7,593 | 316,413 |
| Beazley plc | 260,195 | 1,146,517 |
| Catlin Group Ltd | 196,661 | 1,766,385 |
www.calvert.com CALVERT INTERNATIONAL OPPORTUNITIES FUND SEMI-ANNUAL REPORT (UNAUDITED) 15
| | |
| EQUITY SECURITIES - CONT’D | SHARES | VALUE |
| United Kingdom - Cont’d | | |
| Close Brothers Group plc | 26,635 | $627,896 |
| Colt Group SA* | 292,330 | 720,659 |
| Countrywide plc | 72,880 | 795,342 |
| Darty plc | 229,888 | 450,268 |
| Debenhams plc | 679,280 | 906,490 |
| Dialight plc | 45,828 | 694,371 |
| Entertainment One Ltd.* | 130,311 | 717,431 |
| Greggs plc | 154,654 | 1,304,980 |
| Inmarsat plc | 70,795 | 858,196 |
| Investec plc | 165,316 | 1,338,322 |
| Jupiter Fund Management plc | 134,227 | 898,530 |
| Monitise plc* | 651,693 | 774,435 |
| Paragon Group of Co.’s plc | 105,667 | 726,218 |
| Provident Financial plc | 29,323 | 970,540 |
| Synthomer plc | 177,268 | 837,591 |
| Telecity Group plc | 70,880 | 824,750 |
| Vesuvius plc | 84,252 | 612,267 |
| William Morrison Supermarkets plc | 331,665 | 1,178,997 |
| | | 20,099,965 |
| |
| Total Equity Securities (Cost $77,617,939) | | 94,048,005 |
| |
| | PRINCIPAL | |
| TIME DEPOSIT - 5.0% | AMOUNT | |
| State Street Bank Time Deposit, 0.083%, 4/1/14 | $4,944,188 | 4,944,188 |
| |
| Total Time Deposit (Cost $4,944,188) | | 4,944,188 |
| |
| TOTAL INVESTMENTS (Cost $82,562,127) - 100.8% | | 98,992,193 |
| Other assets and liabilities, net - (0.8%) | | (828,080) |
| NET ASSETS - 100% | | $98,164,113 |
See notes to financial statements.
16 www.calvert.com CALVERT INTERNATIONAL OPPORTUNITIES FUND SEMI-ANNUAL REPORT (UNAUDITED)
| |
| NET ASSETS CONSIST OF: | |
| Paid-in capital applicable to the following shares of common stock with | |
| 250,000,000 shares of $.01 par value shares authorized: | |
| Class A: 3,270,434 shares outstanding | $45,572,641 |
| Class C: 247,146 shares outstanding | 3,225,126 |
| Class I: 1,823,052 shares outstanding | 24,832,072 |
| Class Y: 461,084 shares outstanding | 6,115,882 |
| Undistributed net investment income (loss) | (219,567) |
| Accumulated net realized gain (loss) on investments and | |
| foreign currency transactions | 2,209,925 |
| Net unrealized appreciation (depreciation) on investments, foreign currencies and | |
| assets and liabilities denominated in foreign currencies | 16,428,034 |
| |
| NET ASSETS | $98,164,113 |
| |
| NET ASSET VALUE PER SHARE | |
| Class A (based on net assets of $55,862,290) | $17.08 |
| Class C (based on net assets of $4,153,324) | $16.81 |
| Class I (based on net assets of $30,635,265) | $16.80 |
| Class Y (based on net assets of $7,513,234) | $16.29 |
* Non-income producing security.
Abbreviations:
ADR: American Depositary Receipts
GDR: Global Depositary Receipts
plc: Public Limited Company
See notes to financial statements.
www.calvert.com CALVERT INTERNATIONAL OPPORTUNITIES FUND SEMI-ANNUAL REPORT (UNAUDITED) 17
| |
| STATEMENT OF OPERATIONS |
| SIX MONTHS ENDED MARCH 31, 2014 |
| |
| NET INVESTMENT INCOME | |
| Investment Income: | |
| Dividend income (net of foreign taxes withheld of $56,617) | $825,708 |
| Interest income | 1,769 |
| Total investment income | 827,477 |
| |
| Expenses: | |
| Investment advisory fee | 330,026 |
| Transfer agency fees | 64,278 |
| Distribution Plan expenses: | |
| Class A | 59,694 |
| Class C | 17,915 |
| Directors’ fees and expenses | 2,853 |
| Administrative fees | 113,694 |
| Accounting fees | 4,882 |
| Custodian fees | 74,244 |
| Registration fees | 21,148 |
| Reports to shareholders | 13,091 |
| Professional fees | 13,524 |
| Miscellaneous | 6,123 |
| Total expenses | 721,472 |
| Reimbursement from Advisor: | |
| Class A | (48,236) |
| Class C | (7,680) |
| Class I | (5,370) |
| Class Y | (5,251) |
| Fees waived | (4,106) |
| Net expenses | 650,829 |
| |
| |
| NET INVESTMENT INCOME | 176,648 |
| |
| |
| REALIZED AND UNREALIZED GAIN (LOSS) | |
| Net realized gain (loss) on: | |
| Investments | 4,715,491 |
| Foreign currency transactions | (6,564) |
| | 4,708,927 |
| |
| Change in unrealized appreciation (depreciation) on: | |
| Investments and foreign currencies | 3,009,335 |
| Assets and liabilities denominated in foreign currencies | (622) |
| | 3,008,713 |
| |
| NET REALIZED AND UNREALIZED GAIN (LOSS) | 7,717,640 |
| |
| INCREASE (DECREASE) IN NET ASSETS | |
| RESULTING FROM OPERATIONS | $7,894,288 |
See notes to financial statements.
18 www.calvert.com CALVERT INTERNATIONAL OPPORTUNITIES FUND SEMI-ANNUAL REPORT (UNAUDITED)
| | |
| STATEMENTS OF CHANGES IN NET ASSETS |
| |
| |
| | SIX MONTHS ENDED | YEAR ENDED |
| | MARCH 31, | SEPTEMBER 30, |
| INCREASE (DECREASE) IN NET ASSETS | 2014 | 2013 |
| Operations: | | |
| Net investment income | $176,648 | $717,288 |
| Net realized gain (loss) | 4,708,927 | 3,351,364 |
| Change in unrealized appreciation (depreciation) | 3,008,713 | 10,114,116 |
| |
| INCREASE (DECREASE) IN NET ASSETS | | |
| RESULTING FROM OPERATIONS | 7,894,288 | 14,182,768 |
| |
| Distributions to shareholders from: | | |
| Net investment income: | | |
| Class A shares | (435,451) | (359,074) |
| Class C shares | (1,772) | (3,522) |
| Class I shares | (373,540) | (133,160) |
| Class Y shares | (56,631) | (25,865) |
| Total distributions | (867,394) | (521,621) |
| |
| Capital share transactions: | | |
| Shares sold: | | |
| Class A shares | 12,145,739 | 14,897,297 |
| Class C shares | 686,773 | 630,722 |
| Class I shares | 7,560,413 | 16,410,087 |
| Class Y shares | 2,359,353 | 2,960,531 |
| Reinvestment of distributions: | | |
| Class A shares | 412,387 | 322,643 |
| Class C shares | 1,515 | 2,962 |
| Class I shares | 373,540 | 133,160 |
| Class Y shares | 41,090 | 15,336 |
| Redemption fees: | | |
| Class A shares | 14 | 8 |
| Class C shares | 270 | — |
| Class Y shares | 44 | 83 |
| Shares redeemed: | | |
| Class A shares | (6,275,186) | (5,256,135) |
| Class C shares | (125,067) | (355,606) |
| Class I shares | (3,632,840) | (5,154,633) |
| Class Y shares | (523,473) | (332,615) |
| Total capital share transactions | 13,024,572 | 24,273,840 |
| |
| TOTAL INCREASE (DECREASE) IN NET ASSETS | 20,051,466 | 37,934,987 |
| |
| NET ASSETS | | |
| Beginning of period | 78,112,647 | 40,177,660 |
| End of period (including distributions in excess of net investment | | |
| income and undistributed net investment income of $219,567 | | |
| and $471,179, respectively) | $98,164,113 | $78,112,647 |
See notes to financial statements.
www.calvert.com CALVERT INTERNATIONAL OPPORTUNITIES FUND SEMI-ANNUAL REPORT (UNAUDITED) 19
| | |
| STATEMENTS OF CHANGES IN NET ASSETS |
| |
| | SIX MONTHS ENDED | YEAR ENDED |
| | MARCH 31, | SEPTEMBER 30, |
| CAPITAL SHARE ACTIVITY | 2014 | 2013 |
| Shares sold: | | |
| Class A shares | 738,058 | 1,065,026 |
| Class C shares | 42,177 | 46,243 |
| Class I shares | 466,684 | 1,196,658 |
| Class Y shares | 150,192 | 227,676 |
| Reinvestment of distributions: | | |
| Class A shares | 25,269 | 24,629 |
| Class C shares | 94 | 229 |
| Class I shares | 23,288 | 10,347 |
| Class Y shares | 2,641 | 1,230 |
| Shares redeemed: | | |
| Class A shares | (383,779) | (376,057) |
| Class C shares | (7,766) | (25,959) |
| Class I shares | (220,107) | (362,594) |
| Class Y shares | (33,519) | (24,294) |
| Total capital share activity | 803,232 | 1,783,134 |
See notes to financial statements.
20 www.calvert.com CALVERT INTERNATIONAL OPPORTUNITIES FUND SEMI-ANNUAL REPORT (UNAUDITED)
NOTES TO FINANCIAL STATEMENTS
NOTE A — SIGNIFICANT ACCOUNTING POLICIES
General: Calvert International Opportunities Fund (the “Fund”), a series of Calvert World Values Fund, Inc., is registered under the Investment Company Act of 1940 as a diversified, open-end management investment company. Calvert World Values Fund, Inc. is comprised of four separate series. The operations of each series are accounted for separately. The Fund offers four classes of shares of capital stock - Classes A, C, I, and Y. Class A shares are sold with a maximum front-end sales charge of 4.75%. Class C shares are sold without a front-end sales charge and, with certain exceptions, will be charged a deferred sales charge on shares sold within one year of purchase. Class C shares have higher levels of expenses than Class A shares. Class I shares require a minimum account balance of $1,000,000. The $1 million minimum initial investment is waived for retirement plans that trade through omnibus accounts and may be waived for certain other institutional accounts where it is believed to be in the best interest of the Fund and its shareholders. Class I shares have no front-end or deferred sales charge and have lower levels of expenses than Class A shares. Class Y shares are generally only available to wrap or similar fee-based programs offered by financial intermediaries, foundations, and endowments that have entered into an agreement with the Fund’s Distributor to offer Class Y shares. Class Y shares have no front-end or deferred sales charge and have lower levels of expenses than Class A shares. Each class has different: (a) dividend rates, due to differences in Distribution Plan expenses and other class-specific expenses, (b) exchange privileges, and (c) class-specific voting rights.
Security Valuation: Net asset value per share is determined every business day as of the close of the regular session of the New York Stock Exchange (generally 4:00 p.m. Eastern time). The Fund uses independent pricing services approved by the Board of Directors (“the Board”) to value its investments wherever possible. Investments for which market quotations are not available or deemed not reliable are fair valued in good faith under the direction of the Board.
The Board has adopted Valuation Procedures (the “Procedures”) to determine the fair value of securities and other financial instruments for which market prices are not readily available or which may not be reliably priced. The Board has delegated the day-to-day responsibility for determining the fair value of assets of the Fund to Calvert Investment Management, Inc. (the “Advisor” or “Calvert”) and has provided these Procedures to govern Calvert in its valuation duties.
Calvert has chartered an internal Valuation Committee to oversee the implementation of these Procedures and to assist it in carrying out the valuation responsibilities that the Board has delegated.
The Valuation Committee meets on a regular basis to review illiquid securities and other investments which may not have readily available market prices. The Valuation Committee’s fair valuation determinations are subject to review, approval and ratification by the Board at its next regularly scheduled meeting covering the calendar quarter in which the fair valuation was determined.
The Valuation Committee utilizes various methods to measure the fair value of the Fund’s investments. Generally Accepted Accounting Principles (GAAP) establishes a disclosure hier-
www.calvert.com CALVERT INTERNATIONAL OPPORTUNITIES FUND SEMI-ANNUAL REPORT (UNAUDITED) 21
archy that categorizes the inputs to valuation techniques used to value assets and liabilities at measurement date. These inputs are summarized in the three broad levels listed below:
Level 1 – quoted prices in active markets for identical securities
Level 2 – other significant observable inputs (including quoted prices for similar securities, interest rates, prepayment speeds, credit risk, etc.)
Level 3 – significant unobservable inputs (including the Fund’s own assumptions in determining the fair value of investments) The inputs or methodologies used for valuing securities are not necessarily an indication of the risk associated with investing in those securities.
Changes in valuation techniques may result in transfers in or out of an investment’s assigned level within the hierarchy during the period. At March 31, 2014, $91,233,359 transferred out of Level 1 into Level 2. Valuation techniques used to value the Funds’ investments by major category are as follows: Equity securities, including restricted securities, for which market quotations are readily available, are valued at the last reported sale price or official closing price as reported by an independent pricing service on the primary market or exchange on which they are traded and are categorized as Level 1 in the hierarchy. In the event there were no sales during the day or closing prices are not available, securities are valued at the last quoted bid price or using the last available price and are categorized as Level 2 in the hierarchy. Foreign securities are valued based on quotations from the principal market in which such securities are normally traded. If events occur after the close of the principal market in which foreign securities are traded, and before the close of business of the Fund, that are expected to materially affect the value of those securities, then they are valued at their fair value taking these events into account. The Fund has retained a third party fair value pricing service to quantitatively analyze the price movement of its holdings on foreign exchanges and to automatically fair value if the variation from the prior day’s closing price exceeds specified parameters. Such securities would be categorized as Level 2 in the hierarchy in these circumstances. Utilizing this technique may result in transfers between Level 1 and Level 2. For restricted securities and private placements where observable inputs are limited, assumptions about market activity and risk are used and such securities are categorized as Level 3 in the hierarchy.
Short-term securities of sufficient credit quality with remaining maturities of sixty days or less for which quotations are not readily available are valued at amortized cost, which approximates fair value, and are categorized as Level 2 in the hierarchy.
If a market value cannot be determined for a security using the methodologies described above, or if, in the good faith opinion of the Advisor, the market value does not constitute a readily available market quotation, or if a significant event has occurred that would materially affect the value of the security, the security will be fair valued as determined in good faith by the Valuation Committee.
The Valuation Committee considers a number of factors, including significant unobservable valuation inputs when arriving at fair value. It considers all significant facts that are reasonably available and relevant to the determination of fair value.
22 www.calvert.com CALVERT INTERNATIONAL OPPORTUNITIES FUND SEMI-ANNUAL REPORT (UNAUDITED)
The Valuation Committee primarily employs a market-based approach which may use related or comparable assets or liabilities, recent transactions, market multiples, book values, and other relevant information for the investment to determine the fair value of the investment. When more appropriate, the fund may employ an income-based or cost approach. An income-based valuation approach discounts anticipated future cash flows of the investment to calculate a present amount (discounted). The measurement is based on the value indicated by current market expectations about those future amounts. Discounts may also be applied due to the nature or duration of any restrictions on the disposition of the investments. A cost based approach is based on the amount that currently would be required to replace the service capacity of an asset (current replacement cost). From the seller’s perspective, the price that would be received for the asset is determined based on the cost to a buyer to acquire or construct a substitute asset of comparable utility, adjusted for obsolescence.
The values assigned to fair value investments are based on available information and do not necessarily represent amounts that might ultimately be realized. Further, due to the inherent uncertainty of valuations of such investments, the fair values may differ significantly from the values that would have been used had an active market existed, and the differences could be material. The Valuation Committee employs various methods for calibrating these valuation approaches including a regular review of key inputs and assumptions, transactional back-testing or disposition analysis and reviews of any related market activity.
At March 31, 2014, no securities were fair valued in good faith under the direction of the Board.
The following is a summary of the inputs used to value the Fund’s net assets as of March 31, 2014:
| | | VALUATION INPUTS | |
| INVESTMENTS IN SECURITIES | LEVEL 1 | LEVEL 2 | LEVEL 3 | TOTAL |
| Equity securities* | $2,814,646 | $91,233,359** | — | $94,048,005 |
| Other debt obligations | — | 4,944,188 | — | 4,944,188 |
| TOTAL | $2,814,646 | $96,177,547 | — | $98,992,193 |
* For further breakdown of equity securities by country, please refer to the Statement of Net Assets.
** Includes certain securities trading primarily outside the U.S. whose value was adjusted as a result of significant market movements following the close of local trading. On March 31, 2014, price movements exceeded specified parameters and the third party fair value pricing service quantitatively fair valued the affected securities.
Security Transactions and Net Investment Income: Security transactions are accounted for on trade date. Realized gains and losses are recorded on an identified cost basis and may include proceeds from litigation. Dividend income is recorded on the ex-dividend date or, in the case of dividends on certain foreign securities, as soon as the Fund is informed of the ex-dividend date. Withholding taxes on foreign dividends have been provided for in accordance with the Fund’s understanding of the applicable country’s tax rules and rates. Distributions received on securities that represent a return of capital or capital gain are recorded as a reduction of cost of investments and/or as a realized gain. Interest income, which includes amortization of premium and accretion of discount on debt securities, is accrued as earned. Investment income and realized and unrealized gains and losses are allocated to separate classes of shares based upon the relative net assets of each class. Expenses arising in connec-
www.calvert.com CALVERT INTERNATIONAL OPPORTUNITIES FUND SEMI-ANNUAL REPORT (UNAUDITED) 23
tion with a specific class are charged directly to that class. Expenses common to the classes are allocated to each class in proportion to their relative net assets.
Foreign Currency Transactions: The Fund’s accounting records are maintained in U.S. dollars. For valuation of assets and liabilities on each date of net asset value determination, foreign denominations are converted into U.S. dollars using the current exchange rate. Security transactions, income, and expenses are translated at the prevailing rate of exchange on the date of the event. The effect of changes in foreign exchange rates on securities and foreign currencies is included in the net realized and unrealized gain or loss on securities and foreign currencies.
Distributions to Shareholders: Distributions to shareholders are recorded by the Fund on ex-dividend date. Dividends from net investment income and distributions from net realized capital gains, if any, are paid at least annually. Distributions are determined in accordance with income tax regulations which may differ from generally accepted accounting principles; accordingly, periodic reclassifications are made within the Fund’s capital accounts to reflect income and gains available for distribution under income tax regulations.
Estimates: The preparation of financial statements in conformity with accounting principles generally accepted in the United States requires management to make estimates and assumptions that affect the reported amounts of assets and liabilities and disclosure of contingent assets and liabilities at the date of the financial statements and the reported amounts of income and expenses during the reporting period. Actual results could differ from those estimates.
Redemption Fees: The Fund charges a 2% redemption fee on redemptions, including exchanges, made within 30 days of purchase (within seven days for Class I shares). The redemption fee is accounted for as an addition to paid-in capital and is intended to discourage market-timers by ensuring that short-term trading costs are borne by the investors making the transactions and not the shareholders already in the Fund.
Federal Income Taxes: No provision for federal income or excise tax is required since the Fund intends to continue to qualify as a regulated investment company under the Internal Revenue Code and to distribute substantially all of its taxable earnings.
Management has analyzed the Fund’s tax positions taken for all open federal income tax years and has concluded that no provision for federal income tax is required in the Fund’s financial statements. A Fund’s federal tax return is subject to examination by the Internal Revenue Service for a period of three years.
NOTE B — RELATED PARTY TRANSACTIONS
Calvert Investment Management, Inc. (the “Advisor”) is wholly-owned by Calvert Investments, Inc., which is indirectly wholly-owned by Ameritas Mutual Holding Company. The Advisor provides investment advisory services and pays the salaries and fees of officers and Directors of the Fund who are employees of the Advisor or its affiliates. For its services, the Advisor receives an annual fee, payable monthly, of .75% (.80% prior to January 1, 2014) of the average daily net assets. For the six months ended March 31, 2014, the Advisor voluntarily waived $4,106 of its fee. Under the terms of the agreement, $59,058 was payable at period end. In addition, $8,178 was payable at period end for operating expenses paid by the Advisor during March 2014.
24 www.calvert.com CALVERT INTERNATIONAL OPPORTUNITIES FUND SEMI-ANNUAL REPORT (UNAUDITED)
The Advisor has contractually agreed to limit net annual fund operating expenses through January 31, 2015. The contractual expense cap is 1.66%, 2.50%, 1.20%, and 1.41% for Class A, C, I, and Y, respectively. For the purpose of this expense limit, operating expenses do not include interest expense, brokerage commissions, taxes, and extraordinary expenses. This expense limitation does not limit acquired fund fees and expenses, if any. At period end, $6,249 was receivable from the Advisor.
Calvert Investment Administrative Services, Inc., an affiliate of the Advisor, provides administrative services to the Fund for an annual fee, payable monthly, of .30% (.35% prior to January 1, 2014) for Classes A, C, and Y shares and .15% for Class I shares, based on their average daily net assets. Under the terms of the agreement, $19,776 was payable at period end.
Calvert Investment Distributors, Inc. (“CID”), an affiliate of the Advisor, is the distributor and principal underwriter for the Fund. Pursuant to Rule 12b-1 under the Investment Company Act of 1940, the Fund has adopted a Distribution Plan that permits the Fund to pay certain expenses associated with the distribution and servicing of its shares. The expenses paid may not exceed .50% and 1.00% annually of the average daily net assets of Class A and C, respectively. The amount actually paid by the Fund is an annualized fee, payable monthly, of .25% and 1.00% of the average daily net assets of Class A and C, respectively. Class I and Y shares do not have Distribution Plan expenses. Under the terms of the agreement, $14,330 was payable at period end.
CID received $9,308 as its portion of the commissions charged on sales of the Fund’s Class A shares for the six months ended March 31, 2014.
Calvert Investment Services, Inc. (“CIS”), an affiliate of the Advisor, is the shareholder servicing agent for the Fund. For its services, CIS received a fee of $9,537 for the six months ended March 31, 2014. Under the terms of the agreement, $1,609 was payable at period end. Boston Financial Data Services, Inc. is the transfer and dividend disbursing agent.
Each Director of the Fund who is not an employee of the Advisor or its affiliates receives an annual retainer of $48,000 plus a meeting fee of up to $3,000 for each Board meeting attended. Additional fees of up to $5,000 annually may be paid to the Board chair and Committee chairs ($10,000 for the Special Equities Committee chair) and $2,500 annually may be paid to Committee members, plus a Committee meeting fee of $500 for each Committee meeting attended. Directors’ fees are allocated to each of the Funds served.
NOTE C — INVESTMENT ACTIVITY AND TAX INFORMATION
During the period, the cost of purchases and proceeds from sales of investments, other than short-term securities, were $34,251,807 and $23,234,223, respectively.
| CAPITAL LOSS CARRYFORWARDS | |
| EXPIRATION DATE | |
| 30-Sep-18 | ($2,264,774) |
| 30-Sep-19 | (69,673) |
Under the Regulated Investment Company Modernization Act of 2010, capital losses incurred in taxable years beginning after December 22, 2010 can be carried forward for an unlimited period. These losses are required to be utilized prior to the losses incurred
www.calvert.com CALVERT INTERNATIONAL OPPORTUNITIES FUND SEMI-ANNUAL REPORT (UNAUDITED) 25
in pre-enactment taxable years and will retain their character as either long-term or short-term. Losses incurred in pre-enactment taxable years can be utilized until expiration.
As of March 31, 2014, the tax basis components of unrealized appreciation/(depreciation) and the federal tax cost were as follows:
| Unrealized appreciation | $16,919,968 |
| Unrealized (depreciation) | (1,143,546) |
| Net unrealized appreciation/(depreciation) | $15,776,422 |
| |
| Federal income tax cost of investments | $83,215,771 |
NOTE D — LINE OF CREDIT
A financing agreement is in place with the Calvert Funds and State Street Corporation (“SSC”). Under the agreement, SSC provides an unsecured line of credit facility, in the aggregate amount of $50 million ($25 million committed and $25 million uncommitted), accessible by the Funds for temporary or emergency purposes only. Borrowings under the committed facility bear interest at the higher of the London Interbank Offered Rate (LIBOR) or the overnight Federal Funds Rate plus 1.25% per annum. A commitment fee of .11% per annum is incurred on the unused portion of the committed facility, which is allocated to all participating funds. The Fund had no borrowings under the agreement during the six months ended March 31, 2014.
NOTE E — SUBSEQUENT EVENTS
In preparing the financial statements as of March 31, 2014, no subsequent events or transactions occurred that would have required recognition or disclosure in these financial statements.
26 www.calvert.com CALVERT INTERNATIONAL OPPORTUNITIES FUND SEMI-ANNUAL REPORT (UNAUDITED)
| | | |
| FINANCIAL HIGHLIGHTS |
| |
| | PERIODS ENDED |
| | MARCH
31, | SEPTEMBER
30, | SEPTEMBER
30, |
| CLASS A SHARES | 2014 | 2013 (z) | 2012 |
| Net asset value, beginning | $15.76 | $12.59 | $10.57 |
| Income from investment operations: | | | |
| Net investment income | .03 | .14 | .13 |
| Net realized and unrealized gain (loss) | 1.44 | 3.19 | 2.01 |
| Total from investment operations | 1.47 | 3.33 | 2.14 |
| Distributions from: | | | |
| Net investment income | (.15) | (.16) | (.12) |
| Net realized gain | — | — | — |
| Total distributions | (.15) | (.16) | (.12) |
| Total increase (decrease) in net asset value | 1.32 | 3.17 | 2.02 |
| Net asset value, ending | $17.08 | $15.76 | $12.59 |
| |
| Total return* | 9.37% | 26.70% | 20.52% |
| Ratios to average net assets: A | | | |
| Net investment income | .29% (a) | 1.04% | 1.10% |
| Total expenses | 1.87% (a) | 2.13% | 2.35% |
| Expenses before offsets | 1.66% (a) | 1.66% | 1.66% |
| Net expenses | 1.66% (a) | 1.66% | 1.66% |
| Portfolio turnover | 28% | 42% | 56% |
| Net assets, ending (in thousands) | $55,862 | $45,563 | $27,406 |
| |
| |
| | YEARS ENDED |
| | SEPTEMBER
30, | SEPTEMBER
30, | SEPTEMBER
30, |
| CLASS A SHARES | 2011 | 2010 (z) | 2009 (z) |
| Net asset value, beginning | $12.43 | $11.40 | $11.50 |
| Income from investment operations: | | | |
| Net investment income | .10 | .06 | .06 |
| Net realized and unrealized gain (loss) | (1.93) | .97 | (.10) |
| Total from investment operations | (1.83) | 1.03 | (.04) |
| Distributions from: | | | |
| Net investment income | (.03) | — | (.06) |
| Net realized gain | — | — | ** |
| Total distributions | (.03) | — | (.06) |
| Total increase (decrease) in net asset value | (1.86) | 1.03 | (.10) |
| Net asset value, ending | $10.57 | $12.43 | $11.40 |
| |
| Total return* | (14.78%) | 9.04% | (.16%) |
| Ratios to average net assets: A | | | |
| Net investment income | .68% | .48% | .63% |
| Total expenses | 2.21% | 2.27% | 2.70% |
| Expenses before offsets | 1.66% | 1.66% | 1.67% |
| Net expenses | 1.66% | 1.66% | 1.67% |
| Portfolio turnover | 126% | 44% | 98% |
| Net assets, ending (in thousands) | $24,874 | $30,062 | $21,328 |
See notes to financial highlights.
www.calvert.com CALVERT INTERNATIONAL OPPORTUNITIES FUND SEMI-ANNUAL REPORT (UNAUDITED) 27
| | | |
| FINANCIAL HIGHLIGHTS |
| |
| | PERIODS ENDED |
| | MARCH
31, | SEPTEMBER
30, | SEPTEMBER
30, |
| CLASS C SHARES | 2014 | 2013 (z) | 2012 |
| Net asset value, beginning | $15.44 | $12.30 | $10.32 |
| Income from investment operations: | | | |
| Net investment income (loss) | (.03) | .02 | .04 |
| Net realized and unrealized gain (loss) | 1.41 | 3.14 | 1.95 |
| Total from investment operations | 1.38 | 3.16 | 1.99 |
| Distributions from: | | | |
| Net investment income | (.01) | (.02) | (.01) |
| Net realized gain | — | — | — |
| Total distributions | (.01) | (.02) | (.01) |
| Total increase (decrease) in net asset value | 1.37 | 3.14 | 1.98 |
| Net asset value, ending | $16.81 | $15.44 | $12.30 |
| |
| Total return* | 8.93% | 25.70% | 19.31% |
| Ratios to average net assets: A | | | |
| Net investment income (loss) | (.56%) (a) | .17% | .30% |
| Total expenses | 2.94% (a) | 3.27% | 3.65% |
| Expenses before offsets | 2.50% (a) | 2.50% | 2.50% |
| Net expenses | 2.50% (a) | 2.50% | 2.50% |
| Portfolio turnover | 28% | 42% | 56% |
| Net assets, ending (in thousands) | $4,153 | $3,282 | $2,363 |
| |
| |
| | YEARS ENDED |
| | SEPTEMBER
30, | SEPTEMBER
30, | SEPTEMBER
30, |
| CLASS C SHARES | 2011 | 2010 (z) | 2009 (z) |
| Net asset value, beginning | $12.20 | $11.29 | $11.39 |
| Income from investment operations: | | | |
| Net investment income (loss) | (.01) | (.03) | (.02) |
| Net realized and unrealized gain (loss) | (1.87) | .94 | (.08) |
| Total from investment operations | (1.88) | .91 | (.10) |
| Distributions from: | | | |
| Net investment income | — | — | — |
| Net realized gain | — | — | ** |
| Total distributions | — | — | ** |
| Total increase (decrease) in net asset value | (1.88) | .91 | (.10) |
| Net asset value, ending | $10.32 | $12.20 | $11.29 |
| |
| Total return* | (15.41%) | 8.06% | (.82%) |
| Ratios to average net assets:A | | | |
| Net investment income (loss) | (.13%) | (.25%) | (.19%) |
| Total expenses | 3.48% | 3.88% | 5.38% |
| Expenses before offsets | 2.50% | 2.50% | 2.51% |
| Net expenses | 2.50% | 2.50% | 2.51% |
| Portfolio turnover | 126% | 44% | 98% |
| Net assets, ending (in thousands) | $1,831 | $1,744 | $823 |
See notes to financial highlights.
28 www.calvert.com CALVERT INTERNATIONAL OPPORTUNITIES FUND SEMI-ANNUAL REPORT (UNAUDITED)
| | | |
| FINANCIAL HIGHLIGHTS |
| |
| | PERIODS ENDED |
| | MARCH
31, | SEPTEMBER
30, | SEPTEMBER
30, |
| CLASS I SHARES | 2014 | 2013 (z) | 2012 |
| Net asset value, beginning | $15.54 | $12.37 | $10.36 |
| Income from investment operations: | | | |
| Net investment income | .05 | .25 | .21 |
| Net realized and unrealized gain (loss) | 1.42 | 3.10 | 1.93 |
| Total from investment operations | 1.47 | 3.35 | 2.14 |
| Distributions from: | | | |
| Net investment income | (.21) | (.18) | (.13) |
| Net realized gain | — | — | — |
| Total distributions | (.21) | (.18) | (.13) |
| Total increase (decrease) in net asset value | 1.26 | 3.17 | 2.01 |
| Net asset value, ending | $16.80 | $15.54 | $12.37 |
| |
| Total return* | 9.56% | 27.43% | 20.89% |
| Ratios to average net assets: A | | | |
| Net investment income | .71% (a) | 1.76% | 1.76% |
| Total expenses | 1.25% (a) | 1.43% | 1.70% |
| Expenses before offsets | 1.20% (a) | 1.20% | 1.20% |
| Net expenses | 1.20% (a) | 1.20% | 1.20% |
| Portfolio turnover | 28% | 42% | 56% |
| Net assets, ending (in thousands) | $30,635 | $24,130 | $8,771 |
| |
| |
| | YEARS ENDED |
| | SEPTEMBER
30, | SEPTEMBER
30, | SEPTEMBER
30, |
| CLASS I SHARES | 2011 | 2010 (z) | 2009 (z) |
| Net asset value, beginning | $12.17 | $11.32 | $11.58 |
| Income from investment operations: | | | |
| Net investment income | .15 | .10 | .09 |
| Net realized and unrealized gain (loss) | (1.88) | .95 | (.14) |
| Total from investment operations | (1.73) | 1.05 | (.05) |
| Distributions from: | | | |
| Net investment income | (.08) | (.20) | (.21) |
| Net realized gain | — | — | ** |
| Total distributions | (.08) | (.20) | (.21) |
| Total increase (decrease) in net asset value | (1.81) | .85 | (.26) |
| Net asset value, ending | $10.36 | $12.17 | $11.32 |
| |
| Total return* | (14.32%) | 9.42% | .26% |
| Ratios to average net assets: A | | | |
| Net investment income | 1.11% | .90% | 1.03% |
| Total expenses | 1.54% | 1.73% | 2.11% |
| Expenses before offsets | 1.20% | 1.20% | 1.21% |
| Net expenses | 1.20% | 1.20% | 1.21% |
| Portfolio turnover | 126% | 44% | 98% |
| Net assets, ending (in thousands) | $4,174 | $4,190 | $3,712 |
See notes to financial highlights.
www.calvert.com CALVERT INTERNATIONAL OPPORTUNITIES FUND SEMI-ANNUAL REPORT (UNAUDITED) 29
| | | |
| FINANCIAL HIGHLIGHTS |
| |
| | PERIODS ENDED |
| | MARCH
31, | SEPTEMBER
30, | SEPTEMBER
30, |
| CLASS Y SHARES | 2014 | 2013 (z) | 2012 |
| Net asset value, beginning | $15.03 | $11.94 | $10.00 |
| Income from investment operations: | | | |
| Net investment income | .05 | .18 | .15 |
| Net realized and unrealized gain (loss) | 1.37 | 3.03 | 1.90 |
| Total from investment operations | 1.42 | 3.21 | 2.05 |
| Distributions from: | | | |
| Net investment income | (.16) | (.12) | (.11) |
| Net realized gain | — | — | — |
| Total distributions | (.16) | (.12) | (.11) |
| Total increase (decrease) in net asset value | 1.26 | 3.09 | 1.94 |
| Net asset value, ending | $16.29 | $15.03 | $11.94 |
| |
| Total return* | 9.50% | 27.06% | 20.69% |
| Ratios to average net assets: A | | | |
| Net investment income | .60% (a) | 1.31% | 1.36% |
| Total expenses | 1.60% (a) | 1.90% | 2.49% |
| Expenses before offsets | 1.41% (a) | 1.41% | 1.41% |
| Net expenses | 1.41% (a) | 1.41% | 1.41% |
| Portfolio turnover | 28% | 42% | 56% |
| Net assets, ending (in thousands) | $7,513 | $5,138 | $1,638 |
| |
| |
| | PERIODS ENDED |
| | SEPTEMBER
30, | SEPTEMBER
30, | SEPTEMBER
30, |
| CLASS Y SHARES | 2011 | 2010 (z) | 2009 #(z) |
| Net asset value, beginning | $11.72 | $11.50 | $8.67 |
| Income from investment operations: | | | |
| Net investment income | .13 | .10 | .13 |
| Net realized and unrealized gain (loss) | (1.83) | .90 | 2.70 |
| Total from investment operations | (1.70) | 1.00 | 2.83 |
| Distributions from: | | | |
| Net investment income | (.02) | (.78) | — |
| Net realized gain | — | — | ** |
| Total distributions | (.02) | (.78) | ** |
| Total increase (decrease) in net asset value | (1.72) | .22 | 2.83 |
| Net asset value, ending | $10.00 | $11.72 | $11.50 |
| |
| Total return* | (14.52%) | 9.18% | 32.71% |
| Ratios to average net assets:A | | | |
| Net investment income | 1.04% | .96% | 1.56% (a) |
| Total expenses | 2.68% | 4.73% | 21.67% (a) |
| Expenses before offsets | 1.41% | 1.41% | 1.42% (a) |
| Net expenses | 1.41% | 1.41% | 1.41% (a) |
| Portfolio turnover | 126% | 44% | 90% |
| Net assets, ending (in thousands) | $1,519 | $944 | $112 |
See notes to financial highlights.
30 www.calvert.com CALVERT INTERNATIONAL OPPORTUNITIES FUND SEMI-ANNUAL REPORT (UNAUDITED)
A Total expenses do not reflect amounts reimbursed and/or waived by the Advisor or reductions from expense offset
arrangements. Expenses before offsets reflect expenses after reimbursement and/or waiver by the Advisor but prior
to reductions from expense offset arrangements. Net expenses are net of all reductions and represent the net expenses
paid by the Fund.
# From October 31, 2008 inception.
* Total return is not annualized for periods of less than one year and does not reflect deduction of any front-end or
deferred sales charge.
** Less than $0.01 per share.
(a) Annualized.
(z) Per share figures are calculated using the Average Shares Method.
See notes to financial statements.
www.calvert.com CALVERT INTERNATIONAL OPPORTUNITIES FUND SEMI-ANNUAL REPORT (UNAUDITED) 31
EXPLANATION OF FINANCIAL TABLES
SCHEDULE OF INVESTMENTS
The Schedule of Investments is a snapshot of all securities held in the fund at their market value, on the last day of the reporting period. Securities are listed by asset type (e.g., common stock, corporate bonds, U.S. government obligations) or, for International Funds, by country, and may be further broken down into sub-groups and by industry classification.
STATEMENT OF ASSETS AND LIABILITIES
The Statement of Assets and Liabilities is often referred to as the fund’s balance sheet. It lists the value of what the fund owns, is due and owes on the last day of the reporting period. The fund’s assets include the market value of securities owned, cash, receivables for securities sold and shareholder subscriptions, and receivables for dividends and interest payments that have been earned, but not yet received. The fund’s liabilities include payables for securities purchased and shareholder redemptions, and expenses owed but not yet paid. The statement also reports the fund’s net asset value (NAV) per share on the last day of the reporting period. The NAV is calculated by dividing the fund’s net assets (assets minus liabilities) by the number of shares outstanding. This statement is accompanied by a Schedule of Investments. Alternatively, if certain conditions are met, a Statement of Net Assets may be presented in lieu of this statement and the Schedule of Investments.
STATEMENT OF NET ASSETS
The Statement of Net Assets provides a detailed list of the fund’s holdings, including each security’s market value on the last day of the reporting period. The Statement of Net Assets includes a Schedule of Investments. Other assets are added and other liabilities subtracted from the investments total to calculate the fund’s net assets. Finally, net assets are divided by the outstanding shares of the fund to arrive at its share price, or Net Asset Value (NAV) per share.
At the end of the Statement of Net Assets is a table displaying the composition of the fund’s net assets. Paid in Capital is the money invested by shareholders and represents the bulk of net assets. Undistributed Net Investment Income and Accumulated Net Realized Gains usually approximate the amounts the fund had available to distribute to shareholders as of the statement date. Accumulated Realized Losses will appear as negative balances. Unrealized Appreciation (Depreciation) is the difference between the market value of the fund’s investments and their cost, and reflects the gains (losses) that would be realized if the fund were to sell all of its investments at their statement-date values.
STATEMENT OF OPERATIONS
The Statement of Operations summarizes the fund’s investment income earned and expenses incurred in operating the fund. Investment income includes dividends earned from stocks and interest earned from interest-bearing securities in the fund. Expenses incurred in operating the fund include the advisory fee paid to the investment advisor, administrative services fees, distribution plan expenses (if applicable), transfer agent fees, shareholder servicing expenses, custodial, legal, and audit fees, and the printing and postage expenses related to shareholder reports. Expense offsets (fees paid indirectly) may
32 www.calvert.com CALVERT INTERNATIONAL OPPORTUNITIES FUND SEMI-ANNUAL REPORT (UNAUDITED)
also be shown. Credits earned from offset arrangements are used to reduce the fund’s expenses. This statement also shows net gains (losses) realized on the sale of investments and the increase or decrease in the unrealized appreciation (depreciation) on investments held during the period.
STATEMENT OF CHANGES IN NET ASSETS
The Statement of Changes in Net Assets shows how the fund’s total net assets changed during the two most recent reporting periods. Changes in the fund’s net assets are attributable to investment operations, distributions and capital share transactions.
The Operations section of the report summarizes information detailed in the Statement of Operations. The Distribution section shows the dividend and capital gain distributions made to shareholders. The amounts shown as distributions in this section may not match the net investment income and realized gains amounts shown in the Operations section because distributions are determined on a tax basis and certain investments or transactions may be treated differently for financial statement and tax purposes. The Capital Share Transactions section shows the amount shareholders invested in the fund, either by purchasing shares or by reinvesting distributions, and the amounts redeemed. The corresponding numbers of shares issued, reinvested and redeemed are shown at the end of the report.
FINANCIAL HIGHLIGHTS
The Financial Highlights table provides a per-share breakdown per class of the components that affect the fund’s net asset value for current and past reporting periods. The table provides total return, total distributions, expense ratios, portfolio turnover and net assets for the applicable period. Total return is a measure of a fund’s performance that encompasses all elements of return: dividends, capital gain distributions and changes in net asset value. Total return is the change in value of an investment over a given period, assuming reinvestment of any dividends and capital gain distributions, expressed as a percentage of the initial investment. Total distributions include distributions from net investment income and net realized gains. Long-term gains are earned on securities held in the fund more than one year. Short-term gains, on the sale of securities held less than one year, are treated as ordinary dividend income for tax purposes. The expense ratio is a fund’s cost of doing business, expressed as a percentage of net assets. These expenses directly reduce returns to shareholders. Portfolio turnover measures the trading activity in a fund’s investment portfolio – how often securities are bought and sold by a fund. Portfolio turnover is affected by market conditions, changes in the size of the fund, the nature of the fund’s investments and the investment style of the portfolio manager.
PROXY VOTING
The Proxy Voting Guidelines of the Calvert Funds that the Fund uses to determine how to vote proxies relating to portfolio securities are provided as an Appendix to the Fund’s Statement of Additional Information. The Statement of Additional Information can be obtained free of charge by calling the Fund at 1-800-368-2745, by visiting the Calvert website at www.calvert.com; or by visiting the SEC’s website at www.sec.gov.
www.calvert.com CALVERT INTERNATIONAL OPPORTUNITIES FUND SEMI-ANNUAL REPORT (UNAUDITED) 33
Information regarding how the Fund voted proxies relating to portfolio securities during the most recent 12-month period ended June 30 is available on the Fund’s website at www.calvert.com and on the SEC’s website at www.sec.gov.
AVAILABILITY OF QUARTERLY PORTFOLIO HOLDINGS
The Fund files its complete schedule of portfolio holdings with the SEC for the first and third quarters of each fiscal year on Form N-Q. The Fund’s Form N-Q is available on the SEC’s website at www.sec.gov. The Fund’s Form N-Q may be reviewed and copied at the SEC’s Public Reference Room in Washington, DC; information on the operation of the Public Reference Room may be obtained by calling 1-800-SEC-0330.
BASIS FOR BOARD’S APPROVAL OF INVESTMENT ADVISORY AND INVESTMENT SUBADVISORY CONTRACTS
At a meeting held on December 10, 2013, the Board of Directors, and by a separate vote, the disinterested Directors, approved the continuance of the Investment Advisory Agreement between Calvert World Values Fund, Inc. and the Advisor and the Investment Subadvisory Agreement between the Advisor and each Subadvisor.
In evaluating the Investment Advisory Agreement, the Board considered a variety of information relating to the Fund and the Advisor. The disinterested Directors reviewed a report prepared by the Advisor regarding various services provided to the Fund by the Advisor and its affiliates. Such report included, among other data, information regarding the Advisor’s personnel and the Advisor’s revenue and cost of providing services to the Fund, and a separate report prepared by an independent third party, which provided a statistical analysis comparing the Fund ‘s investment performance, expenses, and fees to comparable mutual funds.
The disinterested Directors were separately represented by independent legal counsel with respect to their consideration of the reapproval of the Investment Advisory Agreement and each Investment Subadvisory Agreement with the applicable Subadvisor. Prior to voting, the disinterested Directors reviewed the proposed continuance of the Investment Advisory Agreement and each Investment Subadvisory Agreement with management and also met in private sessions with their counsel at which no representatives of management were present.
In the course of its deliberations regarding the Investment Advisory Agreement, the Board considered the following factors, among others: the nature, extent and quality of the services provided by the Advisor, including the personnel providing such services; the Advisor’s financial condition; the level and method of computing the Fund’s advisory fee; comparative performance, fee and expense information for the Fund; the profitability of the Calvert Family of Funds to the Advisor and its affiliates; the allocation of the Fund’s brokerage, including the Advisor’s process for monitoring “best execution”; the direct and indirect benefits, if any, derived by the Advisor and its affiliates from their relationship with the Fund; the effect of the Fund’s growth and size on the Fund’s performance and
34 www.calvert.com CALVERT INTERNATIONAL OPPORTUNITIES FUND SEMI-ANNUAL REPORT (UNAUDITED)
expenses; the affiliated distributor’s process for monitoring sales load breakpoints; the Advisor’s compliance programs and policies; the Advisor’s performance of substantially similar duties for other funds; and any possible conflicts of interest.
In considering the nature, extent and quality of the services provided by the Advisor under the Investment Advisory Agreement, the Board reviewed information provided by the Advisor relating to its operations and personnel, including, among other information, biographical information on the Advisor’s supervisory and professional staff and descriptions of its organizational and management structure. The Board also took into account similar information provided periodically throughout the previous year by the Advisor as well as the Board’s familiarity with management through Board of Directors’ meetings, discussions and other reports. The Board also noted that it reviewed on a quarterly basis information regarding the Advisor’s compliance with applicable policies and procedures, including those related to personal investing. The Advisor’s administrative capabilities, including its ability to supervise the other service providers for the Fund, were also considered. The Board also took into account the environmental, social, sustainability and governance research and analysis provided by the Advisor to the Fund. The Board observed that the scope of services provided by the Advisor generally had expanded over time as a result of regulatory, market and other changes. The Board took into consideration, among other factors, the effectiveness of the Fund’s and Advisor’s processes, policies and procedures and the Advisor’s personnel. The Board also took into account, among other items, periodic reports received from the Advisor over the past year concerning the Advisor’s ongoing review and enhancement of certain processes, policies and procedures of the Fund and the Advisor. The Board discussed the Advisor’s effectiveness in monitoring the performance of the Subadvisors and its timeliness in responding to performance issues. The Board concluded that it was satisfied with the nature, extent and quality of services provided to the Fund by the Advisor under the Investment Advisory Agreement.
In considering the Fund’s performance, the Board noted that it reviewed on a quarterly basis detailed information about the Fund’s performance results, portfolio composition and investment strategies. In addition, the Board took into account overall financial market conditions. The Board also reviewed various comparative data provided to it in connection with its consideration of the renewal of the Investment Advisory Agreement, including, among other information, a comparison of the Fund’s total return with its Lipper index and with that of other mutual funds deemed to be in its peer universe by an independent third party in its report. This comparison indicated that the Fund performed above the median of its peer universe for the one-year period ended June 30, 2013 and at the median of its peer universe for the three- and five-year periods ended June 30, 2013. The data also indicated that the Fund outperformed its Lipper index for the one-year period ended June 30, 2013 and underperformed its Lipper index for the three- and five-year periods ended June 30, 2013. The Board also noted that the Subadvisors had begun managing the Fund in September 2011. Based upon its review, the Board concluded that the Fund’s performance was satisfactory relative to the performance of funds with similar investment objectives and to relevant indices.
In considering the Fund’s fees and expenses, the Board compared the Fund’s fees and total expense ratio with various comparative data for the funds in its peer group. Among other findings, the data indicated that the Fund’s advisory fee (after taking into account waivers and/or reimbursements) was below the median of its peer group and that total expenses
www.calvert.com CALVERT INTERNATIONAL OPPORTUNITIES FUND SEMI-ANNUAL REPORT (UNAUDITED) 35
(net of waivers and/or reimbursements) were above the median of its peer group. The Board noted that the allocation of advisory and administrative fees may vary among the Fund’s peer group. The Board also noted that the Advisor had agreed to reduce the advisory fee it charged to the Fund. The Board also took into account the Advisor’s current undertaking to maintain expense limitations for the Fund and that the Advisor had reimbursed a portion of the Fund’s expenses. The Board also noted management’s discussion of the Fund’s expenses and certain factors that affected the level of such expenses, including the cost of providing the environmental, social, sustainability and governance research and analysis provided by the Advisor. Based upon its review, the Board concluded that the advisory fee was reasonable in view of the quality of services received by the Fund from the Advisor and the other factors considered.
The Board reviewed the Advisor’s profitability on a fund-by-fund basis. In reviewing the overall profitability of the advisory fee to the Fund’s Advisor, the Board also considered the fact that affiliates of the Advisor provided shareholder servicing, administrative and distribution services to the Fund for which they received compensation. The information considered by the Board included Calvert’s operating profit margin information both before and after tax expenses with respect to the services that the Advisor and its affiliates provided to the Calvert Family of Funds complex. The Board reviewed the profitability of the Advisor’s relationship with the Fund in terms of the total amount of annual advisory fees it received with respect to the Fund and whether the Advisor had the financial wherewithal to continue to provide services to the Fund. The Board noted that the Advisor had reimbursed a portion of the Fund’s expenses. The Board also noted the Advisor’s current undertaking to maintain expense limitations for the Fund and that the Advisor and one of its affiliates had agreed to reduce the advisory and administrative fees they charged to the Fund, respectively. The Board also considered that the Advisor derived benefits to its reputation and other indirect benefits from its relationship with the Fund. The Board also noted that the Advisor paid the subadvisory fees to the Subadvisors. Based upon its review, the Board concluded that the Advisor’s and its affiliates’ level of profitability from their relationship with the Fund was reasonable.
The Board considered the effect of the Fund’s current size and its potential growth on its performance and fees. The Board concluded that adding breakpoints to the advisory fee at specified asset levels would not be appropriate at this time given the Fund’s current size. The Board noted that if the Fund’s assets increased over time, the Fund might realize other economies of scale if assets increased proportionally more than certain other expenses.
In reapproving the Investment Advisory Agreement, the Board, including the disinterested Directors, did not identify any single factor as controlling, and each Director may have attributed different weight to various factors.
In evaluating each of the Investment Subadvisory Agreements, the disinterested Directors reviewed information provided by the Subadvisors relating to their respective operations, personnel, investment philosophy, strategies and techniques. Among other information, the Subadvisors provided biographical information on portfolio management and other professional staff, performance information for themselves, and descriptions of their respective investment philosophies, strategies and techniques, organizational and management structures and brokerage policies and practices.
36 www.calvert.com CALVERT INTERNATIONAL OPPORTUNITIES FUND SEMI-ANNUAL REPORT (UNAUDITED)
The Board reapproved the Investment Subadvisory Agreement between the Advisor and each of the Subadvisors based on a number of factors relating to each Subadvisor’s ability to perform under the respective Investment Subadvisory Agreement. In the course of its deliberations, the Board evaluated, among other factors: the nature, extent and the quality of the services provided by each Subadvisor; each Subadvisor’s management style and long-term performance record; each Subadvisor’s performance in employing its investment strategies; each Subadvisor’s current level of staffing and its overall resources; the qualifications and experience of each Subadvisor’s personnel; each Subadvisor’s financial condition with respect to its ability to perform the services required under the respective Investment Subadvisory Agreement; each Subadvisor’s risk management processes; each Subadvisor’s compliance systems, including those related to personal investing; and any disciplinary history. Based upon its review, the Board concluded that it was satisfied with the nature, extent and quality of services provided to the Fund by each Subadvisor under the respective Investment Subadvisory Agreement.
As noted above, the Board considered, among other information, the Fund’s performance during the one-, three- and five-year periods ended June 30, 2013 as compared to the Fund’s peer universe and noted that it reviewed on a quarterly basis detailed information about the Fund’s performance results, portfolio composition and investment strategies. The Board noted the Advisor’s expertise and resources in monitoring the performance, investment style and risk- adjusted performance of the Subadvisors.
In considering the cost of services provided by each Subadvisor and the profitability to each Subadvisor of its relationship with the Fund, the Board noted that the subadvisory fees under each Investment Subadvisory Agreement was paid by the Advisor out of the advisory fee that the Advisor received under the Investment Advisory Agreement. The Board also relied on the ability of the Advisor to negotiate each Investment Subadvisory Agreement and the corresponding subadvisory fee at arm’s length. The Board took into consideration the fees Trilogy Global Advisors, LP charges to other clients and considered these fee comparisons in light of the differences in managing these other accounts. Based upon its review, the Board determined that the subadvisory fees were reasonable in view of the quality of the services received by the Fund from the Subadvisors. Because the Advisor pays the Subadvisors’ subadvisory fees and the subadvisory fees were negotiated at arm’s length by the Advisor, the cost of services provided by the Subadvisors and the profitability to the Subadvisors of their relationships with the Fund were not material factors in the Board’s deliberations. For similar reasons, the Board did not consider the potential economies of scale in each Subadvisor’s management of the Fund to be a material factor in its consideration, although the Board noted that each Subadvisor’s subadvisory fee schedule for the Fund contained breakpoints that reduced the subadvisory fee rate on assets above specified levels.
In reapproving each Investment Subadvisory Agreement, the Board, including the disinterested Directors, did not identify any single factor as controlling, and each Director may have attributed different weight to various factors.
CONCLUSIONS
The Board reached the following conclusions regarding the Investment Advisory Agreement and each Investment Subadvisory Agreement, among others: (a) the Advisor has demonstrated that it possesses the capability and resources to perform the duties
www.calvert.com CALVERT INTERNATIONAL OPPORTUNITIES FUND SEMI-ANNUAL REPORT (UNAUDITED) 37
required of it under the Investment Advisory Agreement; (b) each Subadvisor is qualified to manage the Fund’s assets in accordance with the Fund’s investment objectives and policies; (c) the Advisor and each Subadvisor maintain appropriate compliance programs; (d) each Subadvisor is likely to execute its investment strategies consistently over time; (e) the Fund’s overall performance is satisfactory relative to the performance of funds with similar investment objectives and to relevant indices; and (f) the Fund ‘s advisory and subad-visory fees are reasonable in view of the services received by the Fund from the Advisor and Subadvisors. Based on its conclusions, the Board determined that reapproval of the Investment Advisory Agreement and each Investment Subadvisory Agreement would be in the best interests of the Fund and its shareholders.
38 www.calvert.com CALVERT INTERNATIONAL OPPORTUNITIES FUND SEMI-ANNUAL REPORT (UNAUDITED)
To Open an Account
800-368-2748
Service for Existing Account
Shareholders: 800-368-2745
Brokers: 800-368-2746
TDD for Hearing Impaired
800-541-1524
Registered Mail
Calvert Investments
c/o BFDS,
P.O. Box 219544
Kansas City, MO 64121-9544
Overnight Mail
Calvert Investments
c/o BFDS,
330 West 9th Street
Kansas City, MO 64105
Web Site
www.calvert.com
Principal Underwriter
Calvert Investment Distributors, Inc.
4550 Montgomery Avenue
Suite 1000 North
Bethesda, Maryland 20814
This report is intended to provide fund information to shareholders. It is not authorized for distribution to prospective investors unless preceded or accompanied by a prospectus.
Note: The information on our website is not incorporated by reference into this report; our website address is included as an inactive textual reference only.
Investors should carefully consider the investment objectives, risks, charges and expenses of the Calvert Funds. This and other important information is contained in the fund’s summary prospectus and prospectus, which can be obtained from your financial professional and should be read carefully before investing. You may also call Calvert at 800/368-2748 or visit www. calvert.com.

Choose Planet-friendly E-delivery!
Sign up now for on-line statements, prospectuses, and fund reports. In less than five minutes you can help reduce paper mail and lower fund costs.
Just go to www.calvert.com. If you already have an online account at Calvert, click on My Account, and select the documents you would like to receive via e-mail.
If you’re new to online account access, click on Login/Register to open an online account. Once you’re in, click on the E-delivery sign-up at the bottom of the Account Portfolio page and follow the quick, easy steps. Note: if your shares are not held directly at Calvert but through a brokerage firm, you must contact your broker for electronic delivery options available through their firm.

After a “risk-on” year in 2013, the first quarter of 2014 proved to be a more challenging environment for equities. Concerns about economic growth in emerging markets, geopolitical turmoil in the Ukraine, and somewhat softer macroeconomic data in the United States injected more risk aversion into the markets. At the same time, profit-taking and tempered expectations for a repeat performance of stellar 2013 returns likely drove down investor risk tolerance in the first quarter.
Despite investors taking a more cautious approach toward equities at the start of 2014, the exceptionally strong performance of the equity markets, particularly U.S. equities, in the fourth quarter of 2013 allowed all major global equity indices to finish the six-month reporting period in positive territory. For the six months ended March 31, 2014, the Standard and Poor’s (S&P) 500, Russell 1000, Russell 2000, MSCI EAFE, and MSCI Emerging Markets Indices returned 12.51%, 12.48%, 9.94%, 6.56%, and 1.49%, respectively.
From an investment-style perspective, small-cap stocks underperformed their large-cap counterparts, while value stocks outperformed growth stocks. The rotation from expensive growth stocks to more bargain-priced value stocks, if it continues, could suggest a more favorable outlook for higher-quality stocks. Looking at sector performance, Health Care, Information Technology, and Materials were the top-performing sectors within the Russell 1000 Index, while the Telecommunications, Consumer Discretionary, and Consumer Staples sectors lagged.
U.S. Economic Recovery Moves Forward, Despite Fed Tapering Talk
Positive fourth-quarter results in the equity markets were driven by several factors, centering on continued U.S. economic recovery and growing investor confidence, thus creating an environment conducive to earnings expansion. These factors explain, in part, why U.S. equities shone so strongly compared with foreign developed and emerging markets. Extreme weather likely held back economic growth in much of the U.S. during the period, but markets found support as investors gained comfort in the view that weaker economic data was more a by-product of inclement weather, rather than reflecting a broader economic slowdown.
The Fed’s decision to begin tapering its quantitative easing (QE) programs in January divided analysts on whether rising interest rates would dampen the economic recovery and create downward pressure on stocks, or whether they would instill confidence that the Fed is being responsible and attract more investors. On the whole, the resiliency and low volatility of interest rates in the wake of Fed tapering was a positive
4 www.calvert.com CALVERT EMERGING MARKETS EQUITY FUND SEMI-ANNUAL REPORT (UNAUDITED)
| |
| CALVERT EMERGING |
| MARKETS EQUITY |
| FUND |
| MARCH 31, 2014 |
| |
| | % OF TOTAL |
| ECONOMIC SECTORS | INVESTMENTS |
| Consumer Discretionary | 24.2% |
| Consumer Staples | 10.6% |
| Energy | 5.2% |
| Exchange Traded Products | 1.2% |
| Financials | 27.3% |
| Health Care | 2.5% |
| Industrials | 6.9% |
| Information Technology | 13.1% |
| Materials | 1.1% |
| Mutual Funds | 2.5% |
| Short-Term Investments | 2.6% |
| Utilities | 2.8% |
| Total | 100% |
| CALVERT EMERGING |
| MARKETS EQUITY |
| FUND |
| MARCH 31, 2014 |
| |
| INVESTMENT PERFORMANCE | |
| (TOTAL RETURN AT NAV*) | |
| | 6 MONTHS | 12 MONTHS |
| | ENDED | ENDED |
| | 3/31/14 | 3/31/14 |
| Class A | 1.33% | 7.20% |
| Class C | 0.73% | 6.23% |
| Class I | 1.42% | 7.64% |
| Class Y | 1.54% | 7.52% |
| |
| MSCI Emerging | | |
| Markets Index | 1.49% | -1.07% |
| |
| Lipper Emerging | | |
| Markets Funds | | |
| Average | 1.83% | -0.64% |
| TEN LARGEST | % OF NET |
| STOCK HOLDINGS | ASSETS |
| Taiwan Semiconductor | |
| Manufacturing Co. Ltd. (ADR) | 4.0% |
| Hyundai Motor Co. | 3.5% |
| Ping An Insurance Group | |
| Company of China Ltd. | 3.3% |
| Techtronic Industries Co. | 3.3% |
| Tencent Holdings Ltd. | 2.8% |
| Samsung Fire & Marine | |
| Insurance Co. Ltd. | 2.6% |
| Pacific Rubiales Energy Corp. | 2.5% |
| Samsonite International SA | 2.5% |
| China Merchants Holdings | |
| International Co. Ltd. | 2.5% |
| Franshion Properties China Ltd. | 2.5% |
| Total | 29.5% |
* Investment performance/return at NAV does not reflect the deduction of the Fund’s maximum 4.75% front-end sales charge or any deferred sales charges.
sign, indicating that—at least for a while—tapering need not produce the kind of jump in interest rates many analysts had feared.
Consumers Play a Key Role in Recovery
Although market analysts have focused largely on what is happening at the Federal Reserve, we believe an important driver of economic activity in the United States, and of Fed policy by extension, is the continued improvement in the health of the consumer balance sheet. This gives consumers better access to consumer loans and mortgages, supporting the continued recovery of the housing and automotive industries, among others. At the same time, initial jobless claims maintained their downward trend throughout the period. Continued improvements in the labor market should support consumer spending and the U.S. housing sector—keys to the success of the U.S. economic recovery.
www.calvert.com CALVERT EMERGING MARKETS EQUITY FUND SEMI-ANNUAL REPORT (UNAUDITED) 5
| |
| CALVERT EMERGING |
| MARKETS EQUITY |
| FUND |
| MARCH 31, 2014 |
| |
| AVERAGE ANNUAL TOTAL RETURNS |
| |
| CLASS A SHARES | (WITH MAX. LOAD) |
| One year | 2.10% |
| Since inception (10/29/2012) | 5.78% |
| |
| CLASS C SHARES | (WITH MAX. LOAD) |
| One year | 5.23% |
| Since inception (10/29/2012) | 8.44% |
| |
| CLASS I SHARES | |
| One year | 7.64% |
| Since inception (10/29/2012) | 9.89% |
| |
| CLASS Y SHARES | |
| One year | 7.52% |
| Since inception (10/29/2012) | 9.80% |
An Anemic Europe and Sluggish China Worry Investors
A global backdrop of lower-than-target inflation persisted throughout the period, despite continued aggressive easing actions by the world’s largest central banks. There are several drivers contributing to low inflation we believe are likely to persist in the near-term. For example, anemic economic activity in Europe continued to highlight the threat of deflation, as inflation in the eurozone dipped below 1% during the period. While European Central Bank (ECB) President Mario Draghi indicated a willingness to intervene if further downside risks to price stability materialize, there appear to be few catalysts capable of driving an increase in demand-side inflation since the euro area’s economic recovery has remained tepid.
Worries about a hard landing in China returned to the forefront of investor concerns as the China HSBC Manufacturing PMI (Purchasing Managers’ Index) steadily declined throughout the period into contraction territory. Meanwhile, political upheaval in the Ukraine, which culminated with Russian forces occupying the Crimea region, injected further risk aversion into investor sentiment. The situation continued to negatively impact emerging-market stocks and currencies, which were already under pressure due to the prospect of slower GDP growth in emerging markets. We expect the Ukraine situation to be a continued source of headline market risk in the near-term, until a final diplomatic solution is reached.
Outlook
The contrast in economic conditions between the United States and both Europe and China (and other emerging markets) should continue to draw more investment to the U.S. in the near-term. Fed tapering will most likely add to this effect in equities as well as other asset classes. We expect the dollar to continue strengthening slowly, which may provide another reason for foreign investors to favor U.S. securities over those in their domestic markets. This also supports our outlook for continued low inflation in the near-term.
The recovery may still feel “sluggish” because the current 6.7% unemployment rate—while down from a recession peak of 10%—is still running higher than in previous expansions. From the perspective of equity investors, however, higher unemployment is likely keep downward pressure on wages, which, in turn, could help strengthen profit margins.
6 www.calvert.com CALVERT EMERGING MARKETS EQUITY FUND SEMI-ANNUAL REPORT (UNAUDITED)
GROWTH OF $10,000
The graph below shows the value of a hypothetical $10,000 investment in the Fund over the past 10 fiscal year periods or since inception (for funds without 10-year records). The results shown are for Classes A, C, Y and I shares and reflect the deduction of the maximum front-end Class A sales charge of 4.75%, or deferred sales charge, as applicable and assume the reinvestment of dividends. The result is compared with benchmarks that include a broad based market index and a Lipper peer group average. Market indexes are unmanaged and their results do not reflect the effect of expenses or sales charges. The Lipper average reflects the deduction of the category’s average front-end sales charge.
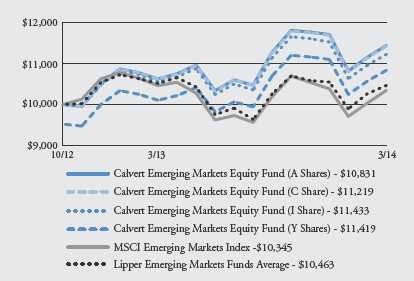
All performance data shown, including the graph above and the adjacent table, represents past performance, does not guarantee future results, assumes reinvestment of dividends and distributions and does not reflect the deduction of taxes that a shareholder would pay on the Fund’s distributions or the redemption of the Fund shares. All performance data reflects fee waivers and/or expense limitations, if any are in effect; in their absence performance would be lower. See Note B in Notes to Financial Statements. The investment return and principal value of an investment will fluctuate so that an investor’s shares, when redeemed, may be worth more or less than their original cost. Current performance may be lower or higher than the performance data quoted; for current performance data visit www.calvert.com. The gross expense ratio from the current prospectus for Class A shares is 3.03%. This number may differ from the expense ratio shown elsewhere in this report because it is based on a different time period and, if applicable, does not include fee or expense waivers. Performance data quoted already reflects the deduction of the Fund’s operating expenses.
www.calvert.com CALVERT EMERGING MARKETS EQUITY FUND SEMI-ANNUAL REPORT (UNAUDITED) 7
We think the Fed will be particularly careful not to derail economic expansion, especially as long as inflation remains low, and will do so by carefully telegraphing its position and plans as they evolve. Moreover, the signal that the Fed is serious about normalizing interest rates should improve investor confidence about the condition of the economy and reassure those who have been worried about the inflationary risk of an eternal quantitative easing. However, sharp changes in interest-rate expectations remain a risk factor, as they can drive mortgage rates higher, negatively impacting housing activity and weakening this major component of the U.S. economic recovery.
We also believe the U.S. economy can still compensate for a dampened global growth outlook. And we expect economic growth to reaccelerate in the second-half of the year on the heels of continued improvement in the housing and labor markets. In addition, as consumer activity picks up in the spring and summer, there is potential for some lost consumer activity to be recovered later in the year. Overall, we believe these conditions continue to provide a favorable underpinning for the equities markets.
Calvert Investment Management, Inc.
May 2014
8 www.calvert.com CALVERT EMERGING MARKETS EQUITY FUND SEMI-ANNUAL REPORT (UNAUDITED)

As always, Calvert continues to work hard to ensure you have a say in the responsible management of environmental, social, and governance (ESG) factors for the companies in which we invest. Below are highlights of our accomplishments during the reporting period.
Shareholder Advocacy
Calvert filed more than 26 shareholder proposals over the reporting period on a variety of issues, including board diversity, reduction of greenhouse gas emissions, disclosure of country-level sourcing and human rights risk assessment processes for apparel companies, and sustainability reporting.
After commitments from Pioneer Natural Resources Company and QEP Resources, Calvert has withdrawn one shareholder proposal and decided not to file a second one for the 2014 proxy season. The two companies agreed to improve disclosure and continue engagement regarding key challenges related to hydraulic fracturing, such as water use and emissions reduction. The resulting disclosures will help Calvert and the companies better understand how they are managing these important opportunities and risks.
Also, an effort led by Calvert Investments and other institutional investors drove the World Federation of Exchanges (WFE) to announce the launch of a Sustainability Working Group in March to develop a consensus on sustainability reporting. Such a standard would promote greater transparency and fairness in the capital markets, improve cost-efficiencies, promote timeliness and consistency for reporting companies, and equip investors to value companies more accurately and make more informed investment decisions.
During the period, Calvert filed proxy resolutions with all the U.S. publicly traded financial exchanges—CBOE, CME, IntercontinentalExchange Group/NYSE and NASDAQ OMX (NDAQ)—on this issue. However, all resolutions were withdrawn after leadership agreed to join the Working Group. We congratulate these WFE member exchanges for their leadership on investor information transparency.
Calvert was a part of the working group that developed the Shareholder Director Exchange Protocol (SDX) released in February. The protocol addresses the increasing levels of direct engagement between institutional investors, such as activist investors, and public company boards, which can significantly change the dynamic between public companies and investors. Engagement is typically between investors and management, but there is a growing interest on the part of investors and directors for more dialogue, especially when fundamental corporate governance or sustainability issues emerge. The protocol helps lay the basis for productive engagement while addressing common concerns each side may have.
www.calvert.com CALVERT EMERGING MARKETS EQUITY FUND SEMI-ANNUAL REPORT (UNAUDITED) 9
Community Investments
Many of our Funds participate in Calvert’s High Social Impact Investing program, through the CI notes administered through the Calvert Foundation. This community investment program may allocate a small percentage of Fund assets at below-market interest rates to investments that provide economic opportunity for struggling populations.
Through the CI notes’ WIN-WIN portfolio (Women Investing in Women), we recently invested in the Opportunity Fund, the leading microfinance provider in California, which provides microloans for small businesses, microsavings accounts, and community real estate financing. Its innovative repayment system allows clients like Chef Tina Ferguson-Riffe to grow her business with a $20,000 loan for new restaurant equipment and repay the loan based on daily credit/debit card sales, instead of large monthly payments.
In December, the CI notes program invested $1.2 million in One Acre Fund, a nonprofit that provides smallholder farmers in Kenya, Rwanda, and Burundi a bundle of services including seed, training, and access to markets. One Acre Fund expects to reach 251,000 farm families in 2014.
Special Equities
A modest but important portion of certain funds is allocated to small private companies developing products or services that address important sustainability or environmental issues facing our society.
One such recent investment, acquired just after the reporting period, was Africa Renewable Energy Fund, which supports small- to medium-scale independent power producers in sub-Saharan Africa with grid-connected, development-stage renewable energy projects, including small hydro, wind, geothermal, solar, biomass and waste gas technologies. Electricity outages continue to be a major problem in many of these countries. This investment will help to address that supply gap in a sustainable manner.
As of March 31, 2014, Calvert Social Investment Foundation (“Calvert Foundation” or “Foundation”) Community Investment Notes represented the following percentages of Fund net assets: Calvert Balanced Portfolio 0.7%, Calvert Equity Portfolio 0.4%, Calvert Bond Portfolio 0.4%, Calvert International Equity Fund 1.2%, Calvert Capital Accumulation Fund 0.4%, and Calvert Small Cap Fund 0.3%. The Calvert Foundation is a 501(c)(3) nonprofit organization. The Foundation’s Community Investment Note Program is not a mutual fund and should not be confused with any Calvert Investments-sponsored investment product.
As of March 31, 2014, the following companies represented the following percentages of Portfolios’ net assets: Pioneer Natural Resources Company .22% of Calvert Social Index Fund, 1.14% of Calvert Bond Portfolio and .29% of Calvert Balanced Portfolio; QEP Resources .04% of Calvert Social Index Fund, CBOE 0.04% of Calvert Social Index Fund, CME 0.19% of Calvert Social Index Fund, IntercontinentalExchange Group/NYSE 0.18% of Calvert Social Index Fund and 2.46% of Calvert Equity Portfolio, and NASDAQ OMX (NDAQ) 0.03% of Calvert Social Index Fund. Africa Renewable Energy Fund represented 0% of each of Calvert Equity Portfolio and Calvert International Equity Fund. Holdings are subject to change.
10 www.calvert.com CALVERT EMERGING MARKETS EQUITY FUND SEMI-ANNUAL REPORT (UNAUDITED)
SHAREHOLDER EXPENSE EXAMPLE
As a shareholder of the Fund, you incur two types of costs: (1) transaction costs, including sales charges and redemption fees; and (2) ongoing costs, including management fees; distribution (12b-1) fees; and other Fund expenses. This Example is intended to help you understand your ongoing costs (in dollars) of investing in the Fund and to compare these costs with the ongoing costs of investing in other mutual funds.
This Example is based on an investment of $1,000 invested at the beginning of the period and held for the entire period (October 1, 2013 to March 31, 2014).
Actual Expenses
The first line of the table below provides information about actual account values and actual expenses. You may use the information in this line, together with the amount you invested, to estimate the expenses that you paid over the period. Simply divide your account value by $1,000 (for example, an $8,600 account value divided by $1,000 = 8.6), then multiply the result by the number in the first line under the heading entitled “Expenses Paid During Period” to estimate the expenses you paid on your account during this period.
Hypothetical Example for Comparison Purposes
The second line of the table below provides information about hypothetical account values and hypothetical expenses based on the Fund’s actual expense ratio and an assumed rate of return of 5% per year before expenses, which is not the Fund’s actual return. The hypothetical account values and expenses may not be used to estimate the actual ending account balance or expenses you paid for the period. You may use this information to compare the ongoing costs of investing in the Fund and other funds. To do so, compare the 5% hypothetical example with the 5% hypothetical examples that appear in the shareholder reports of the other funds.
Please note that the expenses shown in the table are meant to highlight your ongoing costs only and do not reflect any transactional costs, such as sales charges (loads), or redemption fees. Therefore, the second line of the table is useful in comparing ongoing costs only, and will not help you determine the relative total costs of owning different funds. In addition, if these transactional costs were included, your costs would have been higher.
www.calvert.com CALVERT EMERGING MARKETS EQUITY FUND SEMI-ANNUAL REPORT (UNAUDITED) 11
| | BEGINNING | ENDING ACCOUNT | EXPENSES PAID |
| | ACCOUNT VALUE | VALUE | DURING PERIOD* |
| | 10/1/13 | 3/31/14 | 10/1/13 - 3/31/14 |
| CLASS A | | | |
| Actual | $1,000.00 | $1,012.55 | $8.93 |
| Hypothetical | $1,000.00 | $1,016.06 | $8.95 |
| (5% return per year before expenses) | | | |
| |
| CLASS C | | | |
| Actual | $1,000.00 | $1,007.33 | $13.91 |
| Hypothetical | $1,000.00 | $1,011.07 | $13.94 |
| (5% return per year before expenses) | | | |
| |
| CLASS I | | | |
| Actual | $1,000.00 | $1,014.19 | $7.14 |
| Hypothetical | $1,000.00 | $1,017.84 | $7.16 |
| (5% return per year before expenses) | | | |
| |
| CLASS Y | | | |
| Actual | $1,000.00 | $1,013.83 | $7.68 |
| Hypothetical | $1,000.00 | $1,017.30 | $7.70 |
| (5% return per year before expenses) | | | |
* Expenses are equal to the Fund’s annualized expense ratio of 1.78%, 2.78%, 1.42%, and 1.53% for Class A, Class C , Class I, and Class Y, respectively, multiplied by the average account value over the period, multiplied by 182/365 (to reflect the one-half year period).
12 www.calvert.com CALVERT EMERGING MARKETS EQUITY FUND SEMI-ANNUAL REPORT (UNAUDITED)
| | |
| STATEMENT OF NET ASSETS |
| MARCH 31, 2014 |
| |
| EQUITY SECURITIES - 89.3% | SHARES | VALUE |
| Austria - 1.7% | | |
| Vienna Insurance Group AG Wiener Versicherung Gruppe | 18,830 | $929,947 |
| |
| Brazil - 9.7% | | |
| Banco do Brasil SA | 58,422 | 590,540 |
| Cosan Ltd. | 89,854 | 1,024,336 |
| Gerdau SA (ADR) | 99,159 | 635,609 |
| Grendene SA | 171,000 | 1,176,592 |
| M Dias Branco SA | 27,400 | 1,110,285 |
| Petroleo Brasileiro SA, Preferred | 120,800 | 845,107 |
| | | 5,382,469 |
| |
| China - 17.7% | | |
| China Dongxiang Group Co | 4,349,000 | 863,436 |
| China Merchants Holdings International Co. Ltd | 407,658 | 1,404,427 |
| Franshion Properties China Ltd | 4,144,000 | 1,387,110 |
| Industrial & Commercial Bank of China Ltd | 1,896,129 | 1,166,907 |
| Ping An Insurance Group Company of China Ltd. | 223,000 | 1,850,451 |
| Prince Frog International Holdings Ltd | 2,325,000 | 694,751 |
| Shenzhen International Holdings Ltd | 727,500 | 912,898 |
| Tencent Holdings Ltd. | 21,900 | 1,524,760 |
| | | 9,804,740 |
| |
| Colombia - 2.5% | | |
| Pacific Rubiales Energy Corp | 78,242 | 1,409,262 |
| |
| Egypt - 1.8% | | |
| Commercial International Bank Egypt SAE | 194,434 | 1,011,947 |
| |
| Hong Kong - 9.7% | | |
| Cathay Pacific Airways Ltd | 610,000 | 1,136,570 |
| China Mengniu Dairy Company Ltd | 202,000 | 1,013,979 |
| Samsonite International SA* | 454,326 | 1,405,721 |
| Techtronic Industries Co | 646,000 | 1,807,226 |
| | | 5,363,496 |
| |
| India - 2.7% | | |
| Greenko Group plc* | 300,491 | 872,491 |
| HDFC Bank Ltd. (ADR) | 15,246 | 625,543 |
| | | 1,498,034 |
| |
| Indonesia - 2.3% | | |
| Bank Rakyat Indonesia Persero Tbk PT* | 1,515,800 | 1,290,159 |
| |
| Nigeria - 1.1% | | |
| Zenith Bank plc | 5,075,536 | 615,590 |
www.calvert.com CALVERT EMERGING MARKETS EQUITY FUND SEMI-ANNUAL REPORT (UNAUDITED) 13
| | |
| EQUITY SECURITIES - CONT’D | SHARES | VALUE |
| Russia - 8.9% | | |
| M Video OJSC | 91,134 | $552,752 |
| Magnit OJSC | 5,333 | 1,222,303 |
| Mail.ru Group Ltd. (GDR)* | 22,533 | 801,567 |
| Rosneft OAO (GDR) | 89,610 | 597,724 |
| Sberbank of Russia (ADR): | | |
| London Exchange | 118,929 | 1,159,858 |
| US OTC Exchange | 8,174 | 79,860 |
| Sollers OJSC | 35,460 | 504,033 |
| | | 4,918,097 |
| |
| South Africa - 3.7% | | |
| Clicks Group Ltd. | 115,388 | 718,340 |
| Life Healthcare Group Holdings Ltd | 371,740 | 1,356,094 |
| | | 2,074,434 |
| |
| South Korea - 10.7% | | |
| Amorepacific Corp. | 684 | 808,141 |
| Hyundai Motor Co. | 8,170 | 1,931,107 |
| Samsung Electronics Co. Ltd | 877 | 1,109,027 |
| Samsung Fire & Marine Insurance Co. Ltd. | 6,436 | 1,451,419 |
| Youngone Holdings Co. Ltd | 9,946 | 622,967 |
| | | 5,922,661 |
| |
| Taiwan - 9.7% | | |
| China Life Insurance Co. Ltd | 866,844 | 797,661 |
| Greatek Electronics, Inc.* | 901,000 | 958,382 |
| Phison Electronics Corp | 96,982 | 626,020 |
| Taiwan Semiconductor Manufacturing Co. Ltd. (ADR) | 109,678 | 2,195,754 |
| Tong Yang Industry Co. Ltd | 530,276 | 775,374 |
| | | 5,353,191 |
| |
| Thailand - 2.1% | | |
| Bangkok Bank PCL | 211,075 | 1,163,382 |
| |
| Turkey - 3.3% | | |
| Arcelik AS | 202,793 | 1,130,874 |
| Aygaz AS | 173,865 | 685,447 |
| | | 1,816,321 |
| |
| United Kingdom - 1.7% | | |
| Investec plc | 118,356 | 958,155 |
| |
| Total Equity Securities (Cost $49,111,536) | | 49,511,885 |
14 www.calvert.com CALVERT EMERGING MARKETS EQUITY FUND SEMI-ANNUAL REPORT (UNAUDITED)
| | |
| CLOSED-END FUNDS - 2.5% | SHARES | VALUE |
| India Fund, Inc. | 58,961 | $1,358,462 |
| |
| Total Closed-End Products (Cost $1,185,030) | | 1,358,462 |
| |
| EXCHANGE TRADED PRODUCTS - 1.2% | | |
| iShares FTSE A50 China Index ETF | 641,100 | 685,585 |
| |
| Total Exchange Traded Products (Cost $754,741) | | 685,585 |
| |
| PARTICIPATORY NOTES - 4.0% | | |
| China - 4.0% | | |
| Daqin Railway Co. Ltd., Merrill Lynch International & Co., | | |
| 7/6/18 (b)* | 328,685 | 353,509 |
| Gree Electric Appliances, Inc., Merrill Lynch International & Co., | | |
| 8/31/18 (b)* | 128,400 | 578,547 |
| Motherson Sumi Systems Ltd., Merrill Lynch International & Co., | | |
| 5/31/18 (b)* | 302,646 | 1,297,296 |
| |
| Total Participatory Notes (Cost $1,482,237) | | 2,229,352 |
| |
| | PRINCIPAL | |
| TIME DEPOSIT - 2.6% | AMOUNT | |
| State Street Bank Time Deposit, 0.083%, 4/1/14 | $1,445,263 | 1,445,263 |
| |
| Total Time Deposit (Cost $1,445,263) | | 1,445,263 |
| |
| TOTAL INVESTMENTS (Cost $53,978,807) - 99.6% | | 55,230,547 |
| Other assets and liabilities, net - 0.4% | | 212,064 |
| NET ASSETS - 100% | | $55,442,611 |
| |
| |
| NET ASSETS CONSIST OF: | | |
| Paid-in capital applicable to the following shares of common stock, | | |
| with 250,000,000 shares of $0.01 par value shares authorized: | | |
| Class A: 1,275,646 shares outstanding | | $16,184,038 |
| Class C: 29,354 shares outstanding | | 380,327 |
| Class I: 2,921,684 shares outstanding | | 36,456,288 |
| Class Y: 88,203 shares outstanding | | 1,154,994 |
| Undistributed net investment income (loss) | | (96,151) |
| Accumulated net realized gain (loss) on investments and | | |
| foreign currency transactions | | 116,338 |
| Net unrealized appreciation (depreciation) on investments, foreign currencies | |
| and assets and liabilities denominated in foreign currencies | | 1,246,777 |
| |
| NET ASSETS | | $55,442,611 |
| |
| NET ASSET VALUE PER SHARE | | |
| Class A (based on net assets of $16,310,024) | | $12.79 |
| Class C (based on net assets of $374,400) | | $12.75 |
| Class I (based on net assets of $37,614,390) | | $12.87 |
| Class Y (based on net assets of $1,143,797) | | $12.97 |
See notes to financial statements.
www.calvert.com CALVERT EMERGING MARKETS EQUITY FUND SEMI-ANNUAL REPORT (UNAUDITED) 15
(b) This security was valued under the direction of the Board of Directors. See Note A.
* Non-income producing security.
Abbreviations:
ADR: American Depositary Receipts
ETF: Exchange Traded Fund
GDR: Global Depositary Receipts
PCL: Public Company Limited
plc: Public Limited Company
See notes to financial statements.
16 www.calvert.com CALVERT EMERGING MARKETS EQUITY FUND SEMI-ANNUAL REPORT (UNAUDITED)
| |
| STATEMENT OF OPERATIONS |
| SIX MONTHS ENDED MARCH 31, 2014 |
| |
| NET INVESTMENT INCOME | |
| Investment Income: | |
| Dividend income (net of foreign taxes withheld of $41,638) | $283,092 |
| Interest income | 745 |
| Total investment income | 283,837 |
| |
| Expenses: | |
| Investment advisory fee | 217,939 |
| Transfer agency fees and expenses | 6,730 |
| Administrative fees | 37,697 |
| Distribution Plan expenses: | |
| Class A | 13,382 |
| Class C | 1,290 |
| Directors’ fees and expenses | 2,126 |
| Custodian fees | 34,033 |
| Registration fees | 31,643 |
| Reports to shareholders | 2,670 |
| Professional fees | 22,146 |
| Accounting fees | 1,814 |
| Miscellaneous | 5,569 |
| Total expenses | 377,039 |
| Reimbursement from Advisor: | |
| Class A | (14,810) |
| Class C | (6,782) |
| Class Y | (7,724) |
| Net expenses | 347,723 |
| |
| NET INVESTMENT INCOME (LOSS) | (63,886) |
| |
| REALIZED AND UNREALIZED GAIN (LOSS) | |
| Net realized gain (loss) on: | |
| Investments | 721,113 |
| Foreign currency transactions | (24,010) |
| | 697,103 |
| |
| Change in unrealized appreciation (depreciation) on: | |
| Investments and foreign currencies | 196,655 |
| Assets and liabilities denominated in foreign currencies | (493) |
| | 196,162 |
| |
| NET REALIZED AND UNREALIZED GAIN (LOSS) | 893,265 |
| |
| INCREASE (DECREASE) IN NET ASSETS | |
| RESULTING FROM OPERATIONS | $829,379 |
See notes to financial statements.
www.calvert.com CALVERT EMERGING MARKETS EQUITY FUND SEMI-ANNUAL REPORT (UNAUDITED) 17
| | |
| STATEMENT OF CHANGES IN NET ASSETS |
| |
| | SIX MONTHS ENDED | YEAR ENDED |
| | MARCH 31, | SEPTEMBER 30, |
| INCREASE (DECREASE) IN NET ASSETS | 2014 | 2013 |
| Operations: | | |
| Net investment income (loss) | ($63,886) | $386,485 |
| Net realized gain (loss) | 697,103 | 1,597,844 |
| Change in unrealized appreciation (depreciation) | 196,162 | 1,050,615 |
| |
| INCREASE (DECREASE) IN NET ASSETS | | |
| RESULTING FROM OPERATIONS | 829,379 | 3,034,944 |
| |
| Distributions to shareholders from: | | |
| Net investment income: | | |
| Class A shares | (28,225) | (7,842) |
| Class C shares | — | (17) |
| Class I shares | (317,615) | (45,400) |
| Class Y shares | (1,227) | (4) |
| Net realized gain: | | |
| Class A shares | (430,902) | — |
| Class C shares | (10,387) | — |
| Class I shares | (1,713,041) | — |
| Class Y shares | (42,699) | — |
| Total distributions | (2,544,096) | (53,263) |
| |
| Capital share transactions: | | |
| Shares sold: | | |
| Class A shares | 11,083,653 | 6,302,984 |
| Class C shares | 241,197 | 129,891 |
| Class I shares | 4,313,746 | 31,652,032 |
| Class Y shares | 734,220 | 421,082 |
| Reinvestment of distributions: | | |
| Class A shares | 433,075 | 7,629 |
| Class C shares | 9,915 | 17 |
| Class I shares | 2,030,656 | 45,400 |
| Class Y shares | 42,453 | 4 |
| Redemption fees: | | |
| Class A shares | 12 | 40 |
| Class Y shares | 150 | 1 |
| Shares redeemed: | | |
| Class A shares | (1,304,352) | (339,003) |
| Class C shares | (693) | — |
| Class I shares | (355,247) | (1,230,299) |
| Class Y shares | (35,099) | (7,817) |
| Total capital share transactions | 17,193,686 | 36,981,961 |
| |
| TOTAL INCREASE (DECREASE) IN NET ASSETS | 15,478,969 | 39,963,642 |
See notes to financial statements.
18 www.calvert.com CALVERT EMERGING MARKETS EQUITY FUND SEMI-ANNUAL REPORT (UNAUDITED)
| | |
| STATEMENT OF CHANGES IN NET ASSETS |
| |
| INCREASE (DECREASE) IN NET ASSETS - CONT’D | | |
| | SIX MONTHS ENDED | YEAR ENDED |
| | MARCH 31, | SEPTEMBER 30, |
| NET ASSETS | 2014 | 2013 |
| Beginning of period | $39,963,642 | — |
| End of period (including distributions in excess of net | | |
| investment income and undistributed net investment | | |
| income of $96,151 and $314,802, respectively) | $55,442,611 | $39,963,642 |
| |
| CAPITAL SHARE ACTIVITY | | |
| Shares sold: | | |
| Class A shares | 869,341 | 500,952 |
| Class C shares | 18,634 | 10,003 |
| Class I shares | 342,124 | 2,541,536 |
| Class Y shares | 55,034 | 33,267 |
| Reinvestment of distributions: | | |
| Class A shares | 33,624 | 622 |
| Class C shares | 771 | 1 |
| Class I shares | 155,875 | 3,670 |
| Class Y shares | 3,258 | — |
| Shares redeemed: | | |
| Class A shares | (102,357) | (26,536) |
| Class C shares | (55) | — |
| Class I shares | (27,127) | (94,394) |
| Class Y shares | (2,737) | (619) |
| Total capital share activity | 1,346,385 | 2,968,502 |
See notes to financial statements.
www.calvert.com CALVERT EMERGING MARKETS EQUITY FUND SEMI-ANNUAL REPORT (UNAUDITED) 19
NOTES TO FINANCIAL STATEMENTS
NOTE A — SIGNIFICANT ACCOUNTING POLICIES
General: Calvert Emerging Markets Equity Fund (the “Fund”), a series of Calvert World Values Fund, Inc., is registered under the Investment Company Act of 1940 as a non-diversified, open-end management investment company. Calvert World Values Fund, Inc. is comprised of four separate series. The operations of each series are accounted for separately. The Fund commenced operations on October 29, 2012. The Fund offers four classes of shares of capital stock - Classes A, C, I, and Y. Class A shares are sold with a maximum front-end sales charge of 4.75%. Class C shares are sold without a front-end sales charge and, with certain exceptions, will be charged a deferred sales charge on shares sold within one year of purchase. Class C shares have higher levels of expenses than Class A shares. Class I shares require a minimum account balance of $1,000,000. The $1 million minimum initial investment is waived for retirement plans that trade through omnibus accounts and may be waived for certain other institutional accounts where it is believed to be in the best interest of the Fund and its shareholders. Class I shares have no front-end or deferred sales charge and have lower levels of expenses than Class A shares. Class Y shares are generally only available to wrap or similar fee-based programs offered by financial intermediaries, foundations, and endowments that have entered into an agreement with the Fund’s Distributor to offer Class Y shares. Class Y shares have no front-end or deferred sales charge and have lower levels of expenses than Class A shares. Each class has different: (a) dividend rates, due to differences in Distribution Plan expenses and other class-specific expenses, (b) exchange privileges, and (c) class-specific voting rights.
Security Valuation: Net asset value per share is determined every business day as of the close of the regular session of the New York Stock Exchange (generally 4:00 p.m. Eastern time). The Fund uses independent pricing services approved by the Board of Directors (“the Board”) to value its investments wherever possible. Investments for which market quotations are not available or deemed not reliable are fair valued in good faith under the direction of the Board.
The Board has adopted Valuation Procedures (the “Procedures”) to determine the fair value of securities and other financial instruments for which market prices are not readily available or which may not be reliably priced. The Board has delegated the day-to-day responsibility for determining the fair value of assets of the Fund to Calvert Investment Management, Inc. (the “Advisor” or “Calvert”) and has provided these Procedures to govern Calvert in its valuation duties.
Calvert has chartered an internal Valuation Committee to oversee the implementation of these Procedures and to assist it in carrying out the valuation responsibilities that the Board has delegated.
The Valuation Committee meets on a regular basis to review illiquid securities and other investments which may not have readily available market prices. The Valuation Committee’s fair valuation determinations are subject to review, approval and ratification by the Board at its next regularly scheduled meeting covering the calendar quarter in which the fair valuation was determined.
The Valuation Committee utilizes various methods to measure the fair value of the Fund’s investments. Generally Accepted Accounting Principles (GAAP) establishes a dis-
20 www.calvert.com CALVERT EMERGING MARKETS EQUITY FUND SEMI-ANNUAL REPORT (UNAUDITED)
closure hierarchy that categorizes the inputs to valuation techniques used to value assets and liabilities at measurement date. These inputs are summarized in the three broad levels listed below: Level 1 – quoted prices in active markets for identical securities Level 2 – other significant observable inputs (including quoted prices for similar securities, interest rates, prepayment speeds, credit risk, etc.) Level 3 – significant unobservable inputs (including the Fund’s own assumptions in determining the fair value of investments) The inputs or methodologies used for valuing securities are not necessarily an indication of the risk associated with investing in those securities.
Changes in valuation techniques may result in transfers in or out of an investment’s assigned level within the hierarchy during the period. At March 31, 2014, $33,888,992 transferred out of Level 1 into Level 2. Valuation techniques used to value the Fund’s investments by major category are as follows: Equity securities, including restricted securities, for which market quotations are readily available, are valued at the last reported sale price or official closing price as reported by an independent pricing service on the primary market or exchange on which they are traded and are categorized as Level 1 in the hierarchy. In the event there were no sales during the day or closing prices are not available, securities are valued at the last quoted bid price or using the last available price and are categorized as Level 2 in the hierarchy. Foreign securities are valued based on quotations from the principal market in which such securities are normally traded. If events occur after the close of the principal market in which foreign securities are traded, and before the close of business of the Fund, that are expected to materially affect the value of those securities, then they are valued at their fair value taking these events into account. The Fund has retained a third party fair value pricing service to quantitatively analyze the price movement of its holdings on foreign exchanges and to automatically fair value if the variation from the prior day’s closing price exceeds specified parameters. Such securities would be categorized as Level 2 in the hierarchy in these circumstances. Utilizing this technique may result in transfers between Level 1 and Level 2. For restricted securities and private placements where observable inputs are limited, assumptions about market activity and risk are used and such securities are categorized as Level 3 in the hierarchy.
Exchange traded funds and closed-end funds are valued at the official closing price as reported by an independent pricing service on the primary market or exchange on which they are traded and are categorized as Level 1 in the hierarchy.
Participatory notes are valued based on the value of the underlying equity security as determined using the valuation techniques for equity securities listed above. Participatory notes are categorized as Level 2 in the hierarchy.
Short-term securities of sufficient credit quality with remaining maturities of sixty days or less for which quotations are not readily available are valued at amortized cost, which approximates fair value, and are categorized as Level 2 in the hierarchy.
www.calvert.com CALVERT EMERGING MARKETS EQUITY FUND SEMI-ANNUAL REPORT (UNAUDITED) 21
If a market value cannot be determined for a security using the methodologies described above, or if, in the good faith opinion of the Advisor, the market value does not constitute a readily available market quotation, or if a significant event has occurred that would materially affect the value of the security, the security will be fair valued as determined in good faith by the Valuation Committee.
The Valuation Committee considers a number of factors, including significant unobservable valuation inputs when arriving at fair value. It considers all significant facts that are reasonably available and relevant to the determination of fair value.
The Valuation Committee primarily employs a market-based approach which may use related or comparable assets or liabilities, recent transactions, market multiples, book values, and other relevant information for the investment to determine the fair value of the investment. When more appropriate, the fund may employ an income-based or cost approach. An income-based valuation approach discounts anticipated future cash flows of the investment to calculate a present amount (discounted). The measurement is based on the value indicated by current market expectations about those future amounts. Discounts may also be applied due to the nature or duration of any restrictions on the disposition of the investments. A cost based approach is based on the amount that currently would be required to replace the service capacity of an asset (current replacement cost). From the seller’s perspective, the price that would be received for the asset is determined based on the cost to a buyer to acquire or construct a substitute asset of comparable utility, adjusted for obsolescence.
The values assigned to fair value investments are based on available information and do not necessarily represent amounts that might ultimately be realized. Further, due to the inherent uncertainty of valuations of such investments, the fair values may differ significantly from the values that would have been used had an active market existed, and the differences could be material. The Valuation Committee employs various methods for calibrating these valuation approaches including a regular review of key inputs and assumptions, transactional back-testing or disposition analysis and reviews of any related market activity.
At March 31, 2014, securities valued at $2,229,352, or 4.0% of net assets, were fair valued in good faith under the direction of the Board.
22 www.calvert.com CALVERT EMERGING MARKETS EQUITY FUND SEMI-ANNUAL REPORT (UNAUDITED)
The following is a summary of the inputs used to value the Fund’s net assets as of March 31, 2014:
| | | VALUATION INPUTS | |
| INVESTMENTS IN SECURITIES | LEVEL 1 | LEVEL 2 | LEVEL 3 | TOTAL |
| Equity securities* | $10,308,478 | $39,203,407** | — | $49,511,885 |
| Closed-end funds | 1,358,462 | — | — | 1,358,462 |
| Exchange Traded Products | — | 685,585 | — | 685,585 |
| Participatory notes | — | 2,229,352 | — | 2,229,352 |
| Other debt obligations | — | 1,445,263 | — | 1,445,263 |
| TOTAL | $11,666,940 | $43,563,607 | — | $55,230,547 |
* For further breakdown of equity securities by country, please refer to the Statement of Net Assets.
** Includes certain securities trading primarily outside the U.S. whose value was adjusted as a result of significant market movements following the close of local trading. On March 31, 2014, price movements exceeded specified parameters and the third party fair value pricing service quantitatively fair valued the affected securities.
Participatory Notes: The Fund may gain exposure to securities in certain foreign markets through investments in participatory notes (“P-notes”), especially in markets where direct investment by the Fund is not possible. P-notes are generally issued by a bank or broker-dealer (the “counterparty”) and are designed to offer a return linked to a particular underlying equity security. While the holder of a P-note is entitled to receive from the counterparty any dividends paid by the underlying security, the counterparty retains legal ownership and voting rights of the underlying security. The risks associated with investing in a P-note may include the possible failure of the counterparty to perform its obligations under the terms of the agreement, an inability to liquidate or transfer the notes, and an imperfect correlation between the value of the P-note and the underlying security.
Security Transactions and Net Investment Income: Security transactions are accounted for on trade date. Realized gains and losses are recorded on an identified cost basis and may include proceeds from litigation. Dividend income is recorded on the ex-dividend date or, in the case of dividends on certain foreign securities, as soon as the Fund is informed of the ex-dividend date. Withholding taxes on foreign dividends have been provided for in accordance with the Fund’s understanding of the applicable country’s tax rules and rates. Distributions received on securities that represent a return of capital or capital gain are recorded as a reduction of cost of investments and/or as a realized gain. Interest income, which includes amortization of premium and accretion of discount on debt securities, is accrued as earned. Investment income and realized and unrealized gains and losses are allocated to separate classes of shares based upon the relative net assets of each class. Expenses arising in connection with a specific class are charged directly to that class. Expenses common to the classes are allocated to each class in proportion to their relative net assets.
Foreign Currency Transactions: The Fund’s accounting records are maintained in U.S. dollars. For valuation of assets and liabilities on each date of net asset value determination, foreign denominations are converted into U.S. dollars using the current exchange rate. Security transactions, income, and expenses are translated at the prevailing rate of exchange on the date of the event. The effect of changes in foreign exchange rates on
www.calvert.com CALVERT EMERGING MARKETS EQUITY FUND SEMI-ANNUAL REPORT (UNAUDITED) 23
securities and foreign currencies is included in the net realized and unrealized gain or loss on securities and foreign currencies.
Distributions to Shareholders: Distributions to shareholders are recorded by the Fund on ex-dividend date. Dividends from net investment income and distributions from net realized capital gains, if any, are paid at least annually. Distributions are determined in accordance with income tax regulations which may differ from generally accepted accounting principles; accordingly, periodic reclassifications are made within the Fund’s capital accounts to reflect income and gains available for distribution under income tax regulations.
Estimates: The preparation of financial statements in conformity with accounting principles generally accepted in the United States requires management to make estimates and assumptions that affect the reported amounts of assets and liabilities and disclosure of contingent assets and liabilities at the date of the financial statements and the reported amounts of income and expenses during the reporting period. Actual results could differ from those estimates.
Redemption Fees: The Fund charges a 2% redemption fee on redemptions, including exchanges, made within 30 days of purchase (within seven days for Class I shares). The redemption fee is accounted for as an addition to paid-in capital and is intended to discourage market-timers by ensuring that short-term trading costs are borne by the investors making the transactions and not the shareholders already in the Fund.
Federal Income Taxes: No provision for federal income or excise tax is required since the Fund intends to continue to qualify as a regulated investment company under the Internal Revenue Code and to distribute substantially all of its taxable earnings.
Management has analyzed the Fund’s tax positions taken for all open federal income tax years and has concluded that no provision for federal income tax is required in the Fund’s financial statements. A Fund’s federal tax return is subject to examination by the Internal Revenue Service for a period of three years.
NOTE B — RELATED PARTY TRANSACTIONS
Calvert Investment Management, Inc. (the “Advisor”) is wholly-owned by Calvert Investments, Inc., which is indirectly wholly-owned by Ameritas Mutual Holding Company. The Advisor provides investment advisory services and pays the salaries and fees of officers and Directors of the Fund who are employees of the Advisor or its affiliates. For its services, the Advisor receives an annual fee, payable monthly, of .95% of the average daily net assets. Under the terms of the agreement, $42,304 was payable at period end. In addition, $2,456 was payable at period end for operating expenses paid by the Advisor during March 2014.
The Advisor has contractually agreed to limit net annual fund operating expenses through January 31, 2015. The contractual expense cap is 1.78%, 2.78%, 1.43%, and 1.53% for Class A, C, I, and Y, respectively. For the purpose of this expense limit, operating expenses do not include interest expense, brokerage commissions, taxes, and extraordinary expenses. This expense limitation does not limit acquired fund fees and expenses, if any. At period end, $4,243 was receivable from the Advisor.
24 www.calvert.com CALVERT EMERGING MARKETS EQUITY FUND SEMI-ANNUAL REPORT (UNAUDITED)
Calvert Investment Administrative Services, Inc., an affiliate of the Advisor, provides administrative services to the Fund for an annual fee, payable monthly, of .35% for Classes A, C, and Y shares and .10% for Class I shares, based on their average daily net assets. Under the terms of the agreement, $7,974 was payable at period end.
Calvert Investment Distributors, Inc. (“CID”), an affiliate of the Advisor, is the distributor and principal underwriter for the Fund. Pursuant to Rule 12b-1 under the Investment Company Act of 1940, the Fund has adopted a Distribution Plan that permits the Fund to pay certain expenses associated with the distribution and servicing of its shares. The expenses paid may not exceed .50% and 1.00% annually of the average daily net assets of Class A and C, respectively. The amount actually paid by the Fund is an annualized fee, payable monthly, of .25% and 1.00% of the average daily net assets of Class A and C, respectively. Class I and Y shares do not have Distribution Plan expenses. Under the terms of the agreement, $3,508 was payable at period end.
CID received $2,958 as its portion of the commissions charged on sales of the Fund’s Class A shares for the six months ended March 31, 2014.
Calvert Investment Services, Inc. (“CIS”), an affiliate of the Advisor, is the shareholder servicing agent for the Fund. For its services, CIS received a fee of $1,822 for the six months ended March 31, 2014. Under the terms of the agreement, $358 was payable at period end. Boston Financial Data Services, Inc. is the transfer and dividend disbursing agent.
Each Director of the Fund who is not an employee of the Advisor or its affiliates receives an annual retainer of $48,000 plus a meeting fee of up to $3,000 for each Board meeting attended. Additional fees of up to $5,000 annually may be paid to the Board chair and Committee chairs ($10,000 for the Special Equities Committee chair) and $2,500 annually may be paid to Committee members, plus a Committee meeting fee of $500 for each Committee meeting attended. Directors’ fees are allocated to each of the Funds served.
NOTE C — INVESTMENT ACTIVITY AND TAX INFORMATION
During the period, the cost of purchases and proceeds from sales of investments, other than short-term securities, were $30,356,050 and $14,478,537, respectively.
As of March 31, 2014, the tax basis components of unrealized appreciation/(depreciation) and the federal tax cost were as follows:
| Unrealized appreciation | $3,900,972 |
| Unrealized (depreciation) | (3,173,711) |
| Net unrealized appreciation/(depreciation) | $727,261 |
| |
| Federal income tax cost of investments | $54,503,286 |
NOTE D — LINE OF CREDIT
A financing agreement is in place with the Calvert Funds and State Street Corporation (“SSC”). Under the agreement, SSC provides an unsecured line of credit facility, in the aggregate amount of $50 million ($25 million committed and $25 million uncommitted), accessible by the Funds for temporary or emergency purposes only. Borrowings
www.calvert.com CALVERT EMERGING MARKETS EQUITY FUND SEMI-ANNUAL REPORT (UNAUDITED) 25
under the committed facility bear interest at the higher of the London Interbank Offered Rate (LIBOR) or the overnight Federal Funds Rate plus 1.25% per annum. A commitment fee of .11% per annum is incurred on the unused portion of the committed facility, which is allocated to all participating funds. The Fund had no loans outstanding pursuant to this line of credit at March 31, 2014. For the six months ended March 31, 2014, borrowings by the Fund under the agreement were as follows:
| | WEIGHTED AVERAGE | MAXIMUM AMOUNT | MONTH OF MAXIMUM |
| AVERAGE DAILY BALANCE | INTEREST RATE | BORROWED | AMOUNT BORROWED |
| $9,407 | 1.35% | $856,031 | December 2013 |
NOTE E — SUBSEQUENT EVENTS
In preparing the financial statements as of March 31, 2014, no subsequent events or transactions occurred that would have required recognition or disclosure in these financial statements.
26 www.calvert.com CALVERT EMERGING MARKETS EQUITY FUND SEMI-ANNUAL REPORT (UNAUDITED)
| | |
| FINANCIAL HIGHLIGHTS |
| |
| | PERIODS ENDED |
| | MARCH
31, | SEPTEMBER
30, |
| CLASS A SHARES | 2014 | 2013 #(z) |
| Net asset value, beginning | $13.34 | $12.00 |
| Income from investment operations: | | |
| Net investment income (loss) | (.04) | .13 |
| Net realized and unrealized gain (loss) | .22 | 1.34 |
| Total from investment operations | .18 | 1.47 |
| Distributions from: | | |
| Net investment income | (.04) | (.13) |
| Net realized gain | (.69) | — |
| Total distributions | (.73) | (.13) |
| Total increase (decrease) in net asset value | (0.55) | 1.34 |
| Net asset value, ending | $12.79 | $13.34 |
| |
| Total return* | 1.33% | 12.30% |
| Ratios to average net assets: A | | |
| Net investment income (loss) | (.49%) (a) | 1.16% (a) |
| Total expenses | 2.06% (a) | 3.03% (a) |
| Expenses before offsets | 1.78% (a) | 1.78% (a) |
| Net expenses | 1.78% (a) | 1.78% (a) |
| Portfolio turnover | 32% | 74% |
| Net assets, ending (in thousands) | $16,310 | $6,337 |
See notes to financial highlights.
www.calvert.com CALVERT EMERGING MARKETS EQUITY FUND SEMI-ANNUAL REPORT (UNAUDITED) 27
| | |
| FINANCIAL HIGHLIGHTS |
| |
| | PERIODS ENDED |
| | MARCH
31, | SEPTEMBER 30, |
| CLASS C SHARES | 2014 | 2013 #(z) |
| Net asset value, beginning | $13.34 | $12.00 |
| Income from investment operations: | | |
| Net investment income (loss) | (.07) | (.01) |
| Net realized and unrealized gain (loss) | .17 | 1.37 |
| Total from investment operations | .10 | 1.36 |
| Distributions from: | | |
| Net investment income | — | (.02) |
| Net realized gain | (.69) | — |
| Total distributions | (.69) | (.02) |
| Total increase (decrease) in net asset value | (0.59) | 1.34 |
| Net asset value, ending | $12.75 | $13.34 |
| |
| Total return* | .73% | 11.38% |
| Ratios to average net assets: A | | |
| Net investment income (loss) | (1.53%) (a) | (.09%) (a) |
| Total expenses | 8.04% (a) | 100.72% (a) |
| Expenses before offsets | 2.78% (a) | 2.78% (a) |
| Net expenses | 2.78% (a) | 2.78% (a) |
| Portfolio turnover | 32% | 74% |
| Net assets, ending (in thousands) | $374 | $133 |
See notes to financial highlights.
28 www.calvert.com CALVERT EMERGING MARKETS EQUITY FUND SEMI-ANNUAL REPORT (UNAUDITED)
| | |
| FINANCIAL HIGHLIGHTS |
| |
| | PERIODS ENDED |
| | MARCH
31, | SEPTEMBER
30, |
| CLASS I SHARES | 2014 | 2013 #(z) |
| Net asset value, beginning | $13.49 | $12.00 |
| Income from investment operations: | | |
| Net investment income (loss) | (.02) | .19 |
| Net realized and unrealized gain (loss) | .21 | 1.33 |
| Total from investment operations | .19 | 1.52 |
| Distributions from: | | |
| Net investment income | (.12) | (.03) |
| Net realized gain | (.69) | |
| Total distributions | (.81) | (.03) |
| Total increase (decrease) in net asset value | (0.62) | 1.49 |
| Net asset value, ending | $12.87 | $13.49 |
| |
| Total return* | 1.42% | 12.73% |
| Ratios to average net assets:A | | |
| Net investment income (loss) | (.21%) (a) | 1.61% (a) |
| Total expenses | 1.42% (a) | 1.65% (a) |
| Expenses before offsets | 1.42% (a) | 1.43% (a) |
| Net expenses | 1.42% (a) | 1.43% (a) |
| Portfolio turnover | 32% | 74% |
| Net assets, ending (in thousands) | $37,614 | $33,053 |
See notes to financial highlights.
www.calvert.com CALVERT EMERGING MARKETS EQUITY FUND SEMI-ANNUAL REPORT (UNAUDITED) 29
| | |
| FINANCIAL HIGHLIGHTS |
| |
| | PERIODS ENDED |
| | MARCH
31, | SEPTEMBER
30, |
| CLASS Y SHARES | 2014 | 2013 #(z) |
| Net asset value, beginning | $13.48 | $12.00 |
| Income from investment operations: | | |
| Net investment income (loss) | (.04) | .14 |
| Net realized and unrealized gain (loss) | .25 | 1.36 |
| Total from investment operations | .21 | 1.50 |
| Distributions from: | | |
| Net investment income | (.03) | (.02) |
| Net realized gain | (.69) | — |
| Total distributions | (.72) | (.02) |
| Total increase (decrease) in net asset value | (0.51) | 1.48 |
| Net asset value, ending | $12.97 | $13.48 |
| |
| Total return* | 1.54% | 12.55% |
| Ratios to average net assets: A | | |
| Net investment income (loss) | (.22%) (a) | 1.28% (a) |
| Total expenses | 3.37% (a) | 18.62% (a) |
| Expenses before offsets | 1.53% (a) | 1.53% (a) |
| Net expenses | 1.53% (a) | 1.53% (a) |
| Portfolio turnover | 32% | 74% |
| Net assets, ending (in thousands) | $1,144 | $440 |
A Total expenses do not reflect amounts reimbursed and/or waived by the Advisor or reductions from expense off-
set arrangements. Expenses before offsets reflect expenses after reimbursement and/or waiver by the Advisor but
prior to reductions from expense offset arrangements. Net expenses are net of all reductions and represent the net
expenses paid by the Fund.
(a) Annualized.
(z) Per share figures are calculated using the Average Shares Method.
# From October 29, 2012 inception.
* Total return is not annualized for periods of less than one year and does not reflect deduction of any front-end or
deferred sales charge.
See notes to financial statements.
30 www.calvert.com CALVERT EMERGING MARKETS EQUITY FUND SEMI-ANNUAL REPORT (UNAUDITED)
EXPLANATION OF FINANCIAL TABLES
SCHEDULE OF INVESTMENTS
The Schedule of Investments is a snapshot of all securities held in the fund at their market value, on the last day of the reporting period. Securities are listed by asset type (e.g., common stock, corporate bonds, U.S. government obligations) or, for International Funds, by country, and may be further broken down into sub-groups and by industry classification.
STATEMENT OF ASSETS AND LIABILITIES
The Statement of Assets and Liabilities is often referred to as the fund’s balance sheet. It lists the value of what the fund owns, is due and owes on the last day of the reporting period. The fund’s assets include the market value of securities owned, cash, receivables for securities sold and shareholder subscriptions, and receivables for dividends and interest payments that have been earned, but not yet received. The fund’s liabilities include payables for securities purchased and shareholder redemptions, and expenses owed but not yet paid. The statement also reports the fund’s net asset value (NAV) per share on the last day of the reporting period. The NAV is calculated by dividing the fund’s net assets (assets minus liabilities) by the number of shares outstanding. This statement is accompanied by a Schedule of Investments. Alternatively, if certain conditions are met, a Statement of Net Assets may be presented in lieu of this statement and the Schedule of Investments.
STATEMENT OF NET ASSETS
The Statement of Net Assets provides a detailed list of the fund’s holdings, including each security’s market value on the last day of the reporting period. The Statement of Net Assets includes a Schedule of Investments. Other assets are added and other liabilities subtracted from the investments total to calculate the fund’s net assets. Finally, net assets are divided by the outstanding shares of the fund to arrive at its share price, or Net Asset Value (NAV) per share.
At the end of the Statement of Net Assets is a table displaying the composition of the fund’s net assets. Paid in Capital is the money invested by shareholders and represents the bulk of net assets. Undistributed Net Investment Income and Accumulated Net Realized Gains usually approximate the amounts the fund had available to distribute to shareholders as of the statement date. Accumulated Realized Losses will appear as negative balances. Unrealized Appreciation (Depreciation) is the difference between the market value of the fund’s investments and their cost, and reflects the gains (losses) that would be realized if the fund were to sell all of its investments at their statement-date values.
STATEMENT OF OPERATIONS
The Statement of Operations summarizes the fund’s investment income earned and expenses incurred in operating the fund. Investment income includes dividends earned from stocks and interest earned from interest-bearing securities in the fund. Expenses incurred in operating the fund include the advisory fee paid to the investment advisor, administrative services fees, distribution plan expenses (if applicable), transfer agent fees, shareholder servicing expenses, custodial, legal, and audit fees, and the printing and postage expenses related to shareholder reports. Expense offsets (fees paid indirectly) may
www.calvert.com CALVERT EMERGING MARKETS EQUITY FUND SEMI-ANNUAL REPORT (UNAUDITED) 31
also be shown. Credits earned from offset arrangements are used to reduce the fund’s expenses. This statement also shows net gains (losses) realized on the sale of investments and the increase or decrease in the unrealized appreciation (depreciation) on investments held during the period.
STATEMENT OF CHANGES IN NET ASSETS
The Statement of Changes in Net Assets shows how the fund’s total net assets changed during the two most recent reporting periods. Changes in the fund’s net assets are attributable to investment operations, distributions and capital share transactions.
The Operations section of the report summarizes information detailed in the Statement of Operations. The Distribution section shows the dividend and capital gain distributions made to shareholders. The amounts shown as distributions in this section may not match the net investment income and realized gains amounts shown in the Operations section because distributions are determined on a tax basis and certain investments or transactions may be treated differently for financial statement and tax purposes. The Capital Share Transactions section shows the amount shareholders invested in the fund, either by purchasing shares or by reinvesting distributions, and the amounts redeemed. The corresponding numbers of shares issued, reinvested and redeemed are shown at the end of the report.
FINANCIAL HIGHLIGHTS
The Financial Highlights table provides a per-share breakdown per class of the components that affect the fund’s net asset value for current and past reporting periods. The table provides total return, total distributions, expense ratios, portfolio turnover and net assets for the applicable period. Total return is a measure of a fund’s performance that encompasses all elements of return: dividends, capital gain distributions and changes in net asset value. Total return is the change in value of an investment over a given period, assuming reinvestment of any dividends and capital gain distributions, expressed as a percentage of the initial investment. Total distributions include distributions from net investment income and net realized gains. Long-term gains are earned on securities held in the fund more than one year. Short-term gains, on the sale of securities held less than one year, are treated as ordinary dividend income for tax purposes. The expense ratio is a fund’s cost of doing business, expressed as a percentage of net assets. These expenses directly reduce returns to shareholders. Portfolio turnover measures the trading activity in a fund’s investment portfolio – how often securities are bought and sold by a fund. Portfolio turnover is affected by market conditions, changes in the size of the fund, the nature of the fund’s investments and the investment style of the portfolio manager.
PROXY VOTING
The Proxy Voting Guidelines of the Calvert Funds that the Fund uses to determine how to vote proxies relating to portfolio securities are provided as an Appendix to the Fund’s Statement of Additional Information. The Statement of Additional Information can be obtained free of charge by calling the Fund at 1-800-368-2745, by visiting the Calvert website at www.calvert.com; or by visiting the SEC’s website at www.sec.gov.
32 www.calvert.com CALVERT EMERGING MARKETS EQUITY FUND SEMI-ANNUAL REPORT (UNAUDITED)
Information regarding how the Fund voted proxies relating to portfolio securities during the most recent 12-month period ended June 30 will be available on the Fund’s website at www.calvert.com and on the SEC’s website at www.sec.gov.
AVAILABILITY OF QUARTERLY PORTFOLIO HOLDINGS
The Fund files its complete schedule of portfolio holdings with the SEC for the first and third quarters of each fiscal year on Form N-Q. The Fund’s Form N-Q is available on the SEC’s website at www.sec.gov. The Fund’s Form N-Q may be reviewed and copied at the SEC’s Public Reference Room in Washington, DC; information on the operation of the Public Reference Room may be obtained by calling 1-800-SEC-0330.
BASIS FOR BOARD’S APPROVAL OF INVESTMENT ADVISORY AND INVESTMENT SUBADVISORY CONTRACTS
At a meeting held on December 10, 2013, the Board of Directors, and by a separate vote, the disinterested Directors, approved the continuance of the Investment Advisory Agreement between Calvert World Values Fund, Inc. and the Advisor and the Investment Subadvisory Agreement between the Advisor and the Subadvisor with respect to the Fund.
In evaluating the Investment Advisory Agreement, the Board considered a variety of information relating to the Fund and the Advisor. The disinterested Directors reviewed a report prepared by the Advisor regarding various services provided to the Fund by the Advisor and its affiliates. Such report included, among other data, information regarding the Advisor’s personnel and the Advisor’s revenue and cost of providing services to the Fund, and a separate report prepared by an independent third party, which provided a statistical analysis comparing the Fund’s expenses and fees to comparable mutual funds.
The disinterested Directors were separately represented by independent legal counsel with respect to their consideration of the reapproval of the Investment Advisory Agreement and the Investment Subadvisory Agreement. Prior to voting, the disinterested Directors reviewed the proposed continuance of the Investment Advisory Agreement and Investment Subadvisory Agreement with management and also met in private sessions with their counsel at which no representatives of management were present.
In the course of its deliberations regarding the Investment Advisory Agreement, the Board considered the following factors, among others: the nature, extent and quality of the services provided by the Advisor, including the personnel providing such services; the Advisor’s financial condition; the level and method of computing the Fund’s advisory fee; comparative performance, fee and expense information for the Fund; the profitability of the Calvert Family of Funds to the Advisor and its affiliates; the allocation of the Fund’s brokerage, including the Advisor’s process for monitoring “best execution”; the direct and indirect benefits, if any, derived by the Advisor and its affiliates from their relationship with the Fund; the effect of the Fund’s growth and size on the Fund’s performance and expenses; the affiliated distributor’s process for monitoring sales load breakpoints; the Advisor’s compliance programs and policies; the Advisor’s performance of substantially similar duties for other funds; and any possible conflicts of interest.
www.calvert.com CALVERT EMERGING MARKETS EQUITY FUND SEMI-ANNUAL REPORT (UNAUDITED) 33
In considering the nature, extent and quality of the services provided by the Advisor under the Investment Advisory Agreement, the Board reviewed information provided by the Advisor relating to its operations and personnel, including, among other information, biographical information on the Advisor’s supervisory and professional staff and descriptions of its organizational and management structure. The Board also took into account similar information provided periodically throughout the previous year by the Advisor as well as the Board’s familiarity with management through Board of Directors’ meetings, discussions and other reports. The Board also noted that it reviewed on a quarterly basis information regarding the Advisor’s compliance with applicable policies and procedures, including those related to personal investing. The Advisor’s administrative capabilities, including its ability to supervise the other service providers for the Fund, were also considered. The Board also took into account the environmental, social, sustainability and governance research and analysis provided by the Advisor to the Fund. The Board observed that the scope of services provided by the Advisor generally had expanded over time as a result of regulatory, market and other changes. The Board took into consideration, among other factors, the effectiveness of the Fund’s and Advisor’s processes, policies and procedures and the Advisor’s personnel. The Board also took into account, among other items, periodic reports received from the Advisor over the past year concerning the Advisor’s ongoing review and enhancement of certain processes, policies and procedures of the Fund and the Advisor. The Board discussed the Advisor’s effectiveness in monitoring the performance of the Subadvisor and its timeliness in responding to performance issues. The Board concluded that it was satisfied with the nature, extent and quality of services provided to the Fund by the Advisor under the Investment Advisory Agreement.
In considering the Fund’s performance, the Board noted that it reviewed on a quarterly basis detailed information about the Fund’s performance results, portfolio composition and investment strategies. In addition, the Board took into account overall financial market conditions. The Board also reviewed various comparative data provided to it in connection with its consideration of the renewal of the Investment Advisory Agreement, including, among other information, a comparison of the Fund’s total return with its passive benchmark, the MSCI Emerging Markets Index, and with that of other mutual funds deemed to be in its peer group, the Lipper Emerging Markets category. This comparison indicated that the Fund outperformed its passive benchmark since the Fund’s inception in October 2012 through June 30, 2013. The data also indicated that the Fund outperformed the average of the funds in its Lipper category over that same period. Based upon its review, the Board concluded that the Fund’s performance was satisfactory relative to the performance of funds with similar investment objectives and to a relevant index.
In considering the Fund’s fees and expenses, the Board compared the Fund’s fees and total expense ratio with various comparative data for the funds in its peer group. Among other findings, the data indicated that the Fund’s advisory fee (after taking into account waivers and/or reimbursements) was above the median of its peer group and that total expenses (net of waivers and/or reimbursements) were at the median of its peer group. The Board noted that the allocation of advisory and administrative fees may vary among the Fund’s peer group. The Board also took into account the Advisor’s current undertaking to maintain expense limitations for the Fund and that the Advisor had reimbursed a portion of the Fund’s expenses. The Board noted the Advisor’s discussion of the Fund’s expenses and certain factors that affected the level of such expenses, including the cost of
34 www.calvert.com CALVERT EMERGING MARKETS EQUITY FUND SEMI-ANNUAL REPORT (UNAUDITED)
providing the environmental, social, sustainability and governance research and analysis provided by the Advisor. Based upon its review, the Board determined that the advisory fee was reasonable in view of the quality of services received by the Fund from the Advisor and the other factors considered.
The Board reviewed the Advisor’s profitability on a fund-by-fund basis. In reviewing the overall profitability of the advisory fee to the Fund’s Advisor, the Board also considered the fact that affiliates of the Advisor provided shareholder servicing, administrative and distribution services to the Fund for which they received compensation. The information considered by the Board included Calvert’s operating profit margin information both before and after tax expenses with respect to the services that the Advisor and its affiliates provided to the Calvert Family of Funds complex. The Board reviewed the profitability of the Advisor’s relationship with the Fund in terms of the total amount of annual advisory fees it received with respect to the Fund and whether the Advisor had the financial wherewithal to continue to provide services to the Fund. The Board noted that the Advisor had reimbursed a portion of the Fund’s expenses. The Board also took into account the Advisor’s current undertaking to maintain expense limitations for the Fund. The Board also considered that the Advisor derived benefits to its reputation and other indirect benefits from its relationship with the Fund. The Board also noted that the Advisor paid the subadvisory fee to the Subadvisor. Based upon its review, the Board concluded that the Advisor’s and its affiliates’ level of profitability from their relationship with the Fund was reasonable.
The Board considered the effect of the Fund’s current size and its potential growth on its performance and fees. The Board concluded that adding breakpoints to the advisory fee at specified asset levels would not be appropriate at this time given the Fund’s current size. The Board noted that if the Fund’s assets increased over time, the Fund might realize other economies of scale if assets increased proportionally more than certain other expenses.
In reapproving the Investment Advisory Agreement, the Board, including the disinterested Directors, did not identify any single factor as controlling, and each Director may have attributed different weight to various factors.
In evaluating the Investment Subadvisory Agreement, the disinterested Directors reviewed information provided by the Subadvisor relating to its operations, personnel, investment philosophy, strategies and techniques. Among other information, the Subadvisor provided biographical information on portfolio management and other professional staff, performance information for itself, and descriptions of its investment philosophies, strategies and techniques, organizational and management structures and brokerage policies and practices.
The Board reapproved the Investment Subadvisory Agreement between the Subadvisor and the Advisor based on a number of factors relating to the Subadvisor’s ability to perform under the Investment Subadvisory Agreement. In the course of its deliberations, the Board evaluated, among other factors: the nature, extent and the quality of the services provided by the Subadvisor; the Subadvisor’s management style and long-term performance record; the Fund’s performance record and the Subadvisor’s performance in employing its investment strategies; the Subadvisor’s current level of staffing and its overall resources; the qualifications and experience of the Subadvisor’s personnel; the Subadvisor’s financial condition with respect to its ability to perform the services required
www.calvert.com CALVERT EMERGING MARKETS EQUITY FUND SEMI-ANNUAL REPORT (UNAUDITED) 35
under the Investment Subadvisory Agreement; the Subadvisor’s risk management processes; the Subadvisor’s compliance systems, including those related to personal investing; and any disciplinary history. Based upon its review, the Board concluded that it was satisfied with the nature, extent and quality of services provided to the Fund by the Subadvisor under the Investment Subadvisory Agreement.
As noted above, the Board considered, among other information, the Fund’s performance since the Fund’s inception in October 2012 through June 30, 2013 as compared to the Fund’s peer group and noted that it reviewed on a quarterly basis detailed information about the Fund’s performance results, portfolio composition and investment strategies. The Board noted the Advisor’s expertise and resources in monitoring the performance, investment style and risk-adjusted performance of the Subadvisor.
In considering the cost of services provided by the Subadvisor and the profitability to the Subadvisor of its relationship with the Fund, the Board noted that the subadvisory fee under the Investment Subadvisory Agreement was paid by the Advisor out of the advisory fee that the Advisor received under the Investment Advisory Agreement. The Board also relied on the ability of the Advisor to negotiate the Investment Subadvisory Agreement and the corresponding subadvisory fee at arm’s length. Based upon its review, the Board determined that the subadvisory fee was reasonable in view of the quality of services received by the Fund from the Subadvisor and the other factors considered. Because the Advisor pays the Subadvisor’s subadvisory fee and the subadvisory fee was negotiated at arm’s length by the Advisor, the cost of services provided by the Subadvisor and the profitability to the Subadvisor of its relationship with the Fund were not material factors in the Board’s deliberations. For similar reasons, the Board did not consider the potential economies of scale in the Subadvisor’s management of the Fund to be a material factor in its consideration.
In reapproving the Investment Subadvisory Agreement, the Board, including the disinterested Directors, did not identify any single factor as controlling, and each Director may have attributed different weight to various factors.
CONCLUSIONS
The Board reached the following conclusions regarding the Investment Advisory Agreement and the Investment Subadvisory Agreement, among others: (a) the Advisor has demonstrated that it possesses the capability and resources to perform the duties required of it under the Investment Advisory Agreement; (b) the Subadvisor is qualified to manage the Fund’s assets in accordance with the Fund’s investment objectives and policies; (c) the Advisor and Subadvisor maintain appropriate compliance programs; (d) the Subadvisor is likely to execute its investment strategies consistently over time; (e) the Fund’s performance is satisfactory relative to the performance of funds with similar investment objectives and to a relevant index; and (f) the Fund’s advisory and subadvisory fees are reasonable in view of the quality of services received by the Fund from the Advisor and Subadvisor and the other factors considered. Based on its conclusions, the Board determined that reapproval of the Investment Advisory Agreement and the Investment Subadvisory Agreement would be in the best interests of the Fund and its shareholders.
36 www.calvert.com CALVERT EMERGING MARKETS EQUITY FUND SEMI-ANNUAL REPORT (UNAUDITED)
This page intentionally left blank.
This page intentionally left blank.
To Open an Account
800-368-2748
Service for Existing Account
Shareholders: 800-368-2745
Brokers: 800-368-2746
TDD for Hearing Impaired
800-541-1524
Registered Mail
Calvert Investments
c/o BFDS,
P.O. Box 219544
Kansas City, MO 64121-9544
Overnight Mail
Calvert Investments
c/o BFDS,
330 West 9th Street
Kansas City, MO 64105
Web Site
www.calvert.com
Principal Underwriter
Calvert Investment Distributors, Inc.
4550 Montgomery Avenue
Suite 1000 North
Bethesda, Maryland 20814
This report is intended to provide fund information to shareholders. It is not authorized for distribution to prospective investors unless preceded or accompanied by a prospectus.
Note: The information on our website is not incorporated by reference into this report; our website address is included as an inactive textual reference only.
Investors should carefully consider the investment objectives, risks, charges and expenses of the Calvert Funds. This and other important information is contained in the fund’s summary prospectus and prospectus, which can be obtained from your financial professional and should be read carefully before investing. You may also call Calvert at 800/368-2748 or visit www. calvert.com.
Item 2. Code of Ethics.
Not applicable.
Item 3. Audit Committee Financial Expert.
Not applicable.
Item 4. Principal Accountant Fees and Services.
Not applicable.
Item 5. Audit Committee of Listed Registrants.
Not applicable.
Item 6. Schedule of Investments.
(a) This Schedule is included as part of the report to shareholders filed under Item 1 of this Form.
(b) Not applicable.
Item 7. Disclosure of Proxy Voting Policies and Procedures for Closed-End Management Investment Companies.
Not applicable.
Item 8. Portfolio Managers of Closed-End Management Investment Companies.
Not applicable.
Item 9. Purchases of Equity Securities by Closed-End Management Investment Company and Affiliated Purchasers.
Not applicable.
Item 10. Submission of Matters to a Vote of Security Holders.
No material changes have been made to the procedures by which shareholders may recommend nominees to the registrant’s Board of Directors since registrant last provided disclosure in response to this Item.
Item 11. Controls and Procedures.
(a) The principal executive and financial officers concluded that the registrant's disclosure controls and procedures (as defined in Rule 30a-3(c) under the 1940 Act) are effective, based on the evaluation of these controls and procedures required by Rule 30a-3(b) under the 1940 Act and Rules 13a-15(b) or 15d-15(b) under the Exchange Act, as of a date within 90 days of the filing date of this report.
(b) There was no change in the registrant's internal control over financial reporting (as defined in Rule 30a-3(d) under the 1940 Act) that occurred during the registrant's second fiscal quarter of the period covered by this report that has materially affected, or is reasonably likely to materially affect, the registrant's internal control over financial reporting.
Item 12. Exhibits.
(a)(1) Not applicable.
(a)(2) A separate certification for each principal executive officer and principal financial officer of the registrant as required by Rule 30a-2 under the Act (17 CFR 270.30a-2).
Attached hereto.
(a)(3) Not applicable.
(b) A certification for the registrant's Principal Executive Officer and Principal Financial Officer, as required by Rule 30a-2(b) under the Investment Company Act of 1940, is attached hereto. The certification furnished pursuant to this paragraph is not deemed to be "filed" for purposes of Section 18 of the Securities Exchange Act of 1934, or otherwise subject to the liability of that section. Such certification is not deemed to be incorporated by reference into any filing under the Securities Act of 1933 or the Securities Exchange Act of 1934, except to the extent that the registrant specifically incorporates it by reference.
Pursuant to the requirements of the Securities Exchange Act of 1934 and the Investment Act of 1940, the registrant has duly caused this report to be signed on its behalf by the undersigned, thereunto duly authorized.
CALVERT WORLD VALUES FUND, INC.
By: /s/ Barbara J. Krumsiek
Barbara J. Krumsiek
President -- Principal Executive Officer
Date: May 29, 2014
Pursuant to the requirements of the Securities Exchange Act of 1934 and the Investment Act of 1940, this report has been signed below by the following persons on behalf of the registrant and in the capacities and on the dates indicated.
/s/ Barbara J. Krumsiek
Barbara J. Krumsiek
President -- Principal Executive Officer
Date: May 29, 2014
/s/ Ronald M. Wolfsheimer
Ronald M. Wolfsheimer
Treasurer -- Principal Financial Officer
Date: May 29, 2014