UNITED STATES
SECURITIES AND EXCHANGE COMMISSION
Washington, D.C. 20549
FORM N-CSR
CERTIFIED SHAREHOLDER REPORT OF REGISTERED
MANAGEMENT INVESTMENT COMPANIES
Investment Company Act file number: 811-06563
CALVERT WORLD VALUES FUND, INC.
(Exact name of registrant as specified in charter)
4550 Montgomery Avenue
Suite 1000N
Bethesda, Maryland 20814
(Address of Principal Executive Offices)
John H. Streur
4550 Montgomery Avenue
Suite 1000N
Bethesda, Maryland 20814
(Name and Address of Agent for Service)
Registrant's telephone number, including area code: (301) 951-4800
Date of fiscal year end: September 30
Date of reporting period: Six months ended March 31, 2016
Item 1. Report to Stockholders.
|
| | |
| | |
| | | |
Calvert International Equity Fund
| | |
| | | |
| | |
|
| |
Semi-Annual Report March 31, 2016 E-Delivery Sign-Up — Details Inside | |
|
|
| |
Choose Planet-friendly E-delivery! Sign up now for on-line statements, prospectuses, and fund reports. In less than five minutes you can help reduce paper mail and lower fund costs. Just go to calvert.com. If you already have an online account at Calvert, click on Login, to access your Account, and select the documents you would like to receive via e-mail. If you’re new to online account access, click on Login, then Register to create your user name and password. Once you’re in, click on the E-delivery sign-up on the Account Portfolio page and follow the quick, easy steps. Note: if your shares are not held directly at Calvert but through a brokerage firm, you must contact your broker for electronic delivery options available through their firm. |
|
| | | |
| | | TABLE OF CONTENTS |
| | | | |
| | | | President’s Letter |
| | | | Portfolio Management Discussion |
| | | | Understanding Your Fund’s Expenses |
| | | | Schedule of Investments |
| | | | Statement of Assets and Liabilities |
| | | | Statement of Operations |
| | | | Statements of Changes in Net Assets |
| | | | Notes to Financial Statements |
| | | | Financial Highlights |
| | | | Proxy Voting |
| | | | Availability of Quarterly Portfolio Holdings |
| | | | Basis for Board's Approval of Investment Advisory Contract |
|
| | |
| John Streur President and Chief Executive Officer, Calvert Investments, Inc. | |
Dear Shareholders,
Historically, environmental and social initiatives have been accomplished through the singular passage of legislation designed to remediate the impact of one significant influence on a singular populace. Commencing with the anti-deforestation efforts in 1842, followed by environmental legislation in industrialized nations to regulate smoke pollution in 1863, arguably, a predecessor to the ubiquitous stop smoking campaigns of today; the previous approach, put forth largely by developed nations, served to the benefit of their citizens and not the rest of the Earth's populace - the majority.
However, the year of 2015 marked a dynamic and exciting shift in the resolution of contemporary environmental and social causes - global leaders from all facets of society, collectively, took action to create global policy platforms with far reaching agendas designed to accelerate our global society's evolution towards a more sustainable and inclusive state. The Pope's Encyclical, issued June 18, 2015, called for the establishment of a new partnership between science and religion to combat human-driven climate change. The United Nations formalized the United Nations Sustainable Development Goals, which included seventeen Sustainable Development Goals (SDGs) geared towards dramatically reducing poverty, fighting inequality and injustice, and tackling climate change by 2030. The COP 21 (Conference of Parties to the 21 session of the United Nations Framework Convention on Climate Change) introduced a historic agreement to combat climate change and accelerate both the action and investment needed for a sustainable low carbon future. Indeed, these are a mere few examples of the broad reaching directives recently initiated in order to encourage action and stress accountability.
Additionally, and importantly, resolution has not only been limited to direct impact policy changes, but also by investors’ behavior and preference. Recognizing the demand by investors to be influencers of change through their capital allocations, the United States Department of Labor (“DOL”) issued Interpretive Bulletin (“IB”) 2015-01 in October of 2015. This bulletin updated and clarified the DOL’s position on how fiduciary investors may best utilize knowledge of a prospective investment’s key environmental, social and governance indicators when making investment decisions for retirement plans. Essentially, the DOL has created a platform that allows fiduciaries to utilize ESG information in their investment decisions regarding a variety of retirement assets, including, but not limited to, IRA accounts; 401(K) accounts; and retirement accounts monitored by a company or union. This legislation is a powerful and fundamental change, especially given- retirement assets represent over $24 trillion and, thus if purposefully directed, may effect meaningful impact. IB 2015-01 is an exciting development in the world of socially responsible investing as it will provide access to vast amounts of capital that can be used to encourage and facilitate better corporate practices.
Change is here. Our challenge, collectively as socially conscious investors, will be to maintain its momentum and focus. Through your investment in the Calvert Funds you are engaged and influential in this movement. By allocating capital only to the best environmentally and socially governed corporations, we-alongside you, encourage good corporate citizenry. Our shareholder advocacy efforts, which fundamentally represent you as a shareholder, consistently monitor and challenge poor corporate policy, thus effecting positive outcomes. Through your support, we are able to partner with academics and industry renowned technicians to produce innovative research that will help to provide both better ESG investment solutions and a more lasting impact.
This is an exciting time and we at Calvert appreciate servicing you, as fund shareholders, and look forward to the future together as we navigate the waters of progress.
Respectfully,
John Streur
May 2016
calvert.com CALVERT INTERNATIONAL EQUITY FUND SEMI-ANNUAL REPORT (UNAUDITED) 1
|
| |
| PORTFOLIO MANAGEMENT DISCUSSION |
|
| | | |
| Joshua Linder, CFA Portfolio Manager | | Christopher Madden, CFA Portfolio Manager |
| Kurt Moeller, CFA Portfolio Manager | | Jade Huang Portfolio Manager |
Market Review
Equity markets generally performed well over the trailing six months. However, positive returns from most major global equity indices masked the market volatility that played out during the period as concerns about global economic weakness and the implications of plunging oil prices weighed on investor sentiment. U.S. stocks benefited from solid macroeconomic data and an improving labor market. On the other hand, additional monetary easing by the European Central Bank (ECB) and Bank of Japan (BOJ) was met by investor skepticism as European and Japanese equities continued to struggle. For the six-month period ended March 31, 2016, the MSCI EAFE Index returned 1.56%, underperforming both U.S. and emerging markets stocks over the period.
The Federal Reserve (the Fed) elected to raise interest rates in December for the first time in nine years. However, the Fed’s incrementally cautious outlook later in the period also lowered market expectations for further rate hikes. Dovish comments from the Fed similarly triggered a decline in the U.S. dollar, which provided a lift to commodity prices, including oil. The price of oil dropped below $30/barrel at one point before ending the period just shy of $40/barrel. Emerging markets (EM) benefited from the weaker dollar and higher commodity prices, and with economic data out of China showing signs of stabilization, EM stocks also participated in the market recovery.
Investment Strategy and Technique
The Fund invests primarily in stocks of non-U.S. large cap companies whose market capitalization falls within the range of the MSCI EAFE Index. In conjunction with financial analysis, Calvert's comprehensive responsible investment principles guide the investment research process and decision-making.
| |
| • | Our international stock selection model seeks to identify high quality companies trading at attractive valuations. While the core of our model embeds a value and quality bias, it also focuses on companies operating efficiently and demonstrating strong capital stewardship. |
| |
| • | We review companies from a fundamental perspective to validate the stock selection model’s output, understand business drivers, determine whether ESG performance offers a competitive advantage, and avoid value traps. |
Fund Performance Relative to the Benchmark
For the six month period ending March 31, 2016, Calvert International Equity Fund Class A shares returned -1.96%, underperforming its benchmark, the MSCI EAFE Index, which returned 1.56%. Both stock and sector selection drove the underperformance, while country allocation also detracted from performance modestly.
| |
| • | Stock selection in Financials and Health Care were the primary detractors. Within Financials, the Fund’s position in Spanish bank BBVA hurt performance, as net margins were squeezed by falling short-term interest rates in Spain. UK bank Standard Chartered was also a top detractor, down 26%, largely due to its loan exposure to commodity producers. During the period, we exited both BBVA and Standard Chartered. |
2 calvert.com CALVERT INTERNATIONAL EQUITY FUND SEMI-ANNUAL REPORT (UNAUDITED)
|
| | | | |
| | | | |
| | CALVERT INTERNATIONAL EQUITY FUND |
| | MARCH 31, 2016 | |
| | | | |
| | ECONOMIC SECTORS | % OF TOTAL INVESTMENTS | |
| | Financials | 19.3 | % | |
| | Consumer Discretionary | 13.4 | % | |
| | Health Care | 12.7 | % | |
| | Industrials | 12.6 | % | |
| | Consumer Staples | 12.0 | % | |
| | Telecommunication Services | 8.0 | % | |
| | Utilities | 4.7 | % | |
| | Information Technology | 3.8 | % | |
| | Materials | 3.7 | % | |
| | Exchange-Traded Products | 3.2 | % | |
| | Energy | 3.1 | % | |
| | High Social Impact Investments | 1.4 | % | |
| | Short-Term Investments | 1.3 | % | |
| | Limited Partnership Interest | 0.5 | % | |
| | Venture Capital | 0.3 | % | |
| | Total | 100 | % | |
| | | | |
| |
| • | Mizuho Financial Group, Inc. was another detractor within Financials. Mizuho and other Japanese banks were negatively impacted by the Bank of Japan’s surprise adoption of a negative interest rate policy, which should reduce the interest margins Japanese banks can earn. |
| |
| • | Within Health Care, French pharmaceutical manufacturer Sanofi was a top detractor after it forecasted a revenue decline in its diabetes drugs driven by lower pricing in the United States. Swiss pharmaceutical maker Novartis was also down close to 20%, as its stock has been hurt by slower than expected prescriptions growth for its recently approved heart failure drug, Entresto. |
| |
| • | The Fund’s overweight position in Financial stocks and limited exposure to Australian equities also detracted from performance. |
| |
| • | On the positive side, stock selection continued to be strong in the Telecommunications sector as Japanese firm Nippon Telegraph & Telephone (NTT), one of the Fund’s largest positions, rose 25% during the period. NTT’s mobile division is focusing more on retaining customers than on finding new ones at low prices. NTT has also changed its fiber to the home model from retail to wholesale, reducing costs. With more efficient capital spending, NTT should be able to return significant cash to shareholders this year. |
|
| | | | | | |
| | | | | |
| | CALVERT INTERNATIONAL EQUITY FUND | |
| | MARCH 31, 2016 | |
| | | | | |
| | INVESTMENT PERFORMANCE | |
| | (TOTAL RETURN AT NAV) | |
| | | 6 MONTHS ENDED 3/31/16 | 12 MONTHS ENDED 3/31/16 | |
| | Class A | -1.96 | % | -8.08 | % | |
| | Class C | -2.32 | % | -8.82 | % | |
| | Class I | -1.78 | % | -7.74 | % | |
| | Class Y | -1.87 | % | -7.88 | % | |
| | MSCI EAFE Index | 1.56 | % | -8.27 | % | |
| | MSCI EAFE Investable Market Index | 2.17 | % | -6.83 | % | |
| | Lipper International Multi-Cap Growth Funds Average | 2.64 | % | -5.91 | % | |
| | | | | |
| | Investment performance/return at NAV does not reflect the deduction of the Fund’s maximum 4.75% front-end sales charge or any deferred sales charge. | |
| | | | | |
| | TEN LARGEST STOCK HOLDINGS | % OF NET ASSETS | |
| | Nippon Telegraph & Telephone Corp. | 3.1 | % | |
| | Unilever NV (CVA) | 2.8 | % | |
| | Sanofi SA (ADR) | 2.1 | % | |
| | Allianz SE | 2.0 | % | |
| | Koninklijke Ahold NV, Amsterdam Stock Exchange | 2.0 | % | |
| | Roche Holding AG | 2.0 | % | |
| | Swiss Re AG | 1.8 | % | |
| | J Sainsbury plc | 1.6 | % | |
| | Novartis AG | 1.5 | % | |
| | AXA SA (ADR) | 1.5 | % | |
| | Total | 20.4 | % | |
| | | | | |
Positioning and Market Outlook
The sharp decline by equities at the start of the year revealed how sensitive market sentiment is right now. With equity valuations above historical averages, markets are more vulnerable to shocks from some of the negative catalysts currently in the global economy, such as slowing growth in China and increased geopolitical risk.
An improving U.S. economy, albeit with sluggish growth, should allow the Fed to continue on its tightening path, though this process will likely be slow and policy will remain accommodative. This contrasts with other global central banks, such as the ECB and BOJ, which remain committed to further easing. However, market enthusiasm for global quantitative easing might continue to wane if robust economic recovery doesn’t follow.
calvert.com CALVERT INTERNATIONAL EQUITY FUND SEMI-ANNUAL REPORT (UNAUDITED) 3
Even though the U.S. economy is relatively well-insulated, it is not immune from a global economic slowdown. As expected, concerns about global economic conditions contributed to the Fed’s decision to dial down rate hike expectations. The euro and yen both responded by strengthening relative to the dollar, which may be a headwind for Japanese and eurozone companies if this trend continues.
We expect volatility in equity markets to continue, especially relative to the historically low levels of volatility experienced during the last few years, but this should also provide greater opportunities for stock picking. We also increased the number of Fund holdings during the period in order to better manage risk in this higher volatility environment. We are confident that our strategy can continue to succeed in the long-run as investors re-focus on stock specific issues including valuation and earnings quality metrics.
|
| |
| |
| Joshua Linder, CFA | Christopher Madden, CFA |
| |
| Kurt Moeller, CFA | Jade Huang |
Calvert Investment Management, Inc.
May 2016
4 calvert.com CALVERT INTERNATIONAL EQUITY FUND SEMI-ANNUAL REPORT (UNAUDITED)
Growth of $10,000
The graph below shows the value of a hypothetical $10,000 investment in the Fund over the past 10 fiscal year periods. The results shown are for Class A shares, reflect the deduction of the maximum front-end Class A sales charge of 4.75%, and assume the reinvestment of dividends. The result is compared with a broad based market index. Market indexes are unmanaged and their results do not reflect the effect of expenses or sales charges. The value of an investment in a different share class would be different.

|
| | | | | | | |
| CALVERT INTERNATIONAL EQUITY FUND |
| MARCH 31, 2016 |
| AVERAGE ANNUAL TOTAL RETURNS | Ticker Symbol | 1 Year | 5 Year | 10 Year |
| Class A (with max. load) | CWVGX | -12.44 | % | 0.52 | % | -1.53 | % |
| Class C (with max. load) | CWVCX | -9.73 | % | 0.62 | % | -1.90 | % |
| Class I | CWVIX | -7.74 | % | 2.14 | % | -0.38 | % |
| Class Y | CWEYX | -7.88 | % | 1.86 | % | -0.77 | % |
| MSCI EAFE Index | | -8.27 | % | 2.29 | % | 1.80 | % |
| MSCI EAFE Investable Market Index | | -6.83 | % | 2.71 | % | 2.08 | % |
| Lipper International Multi-Cap Growth Funds Average | | -5.91 | % | 2.33 | % | 1.98 | % |
| | | | | |
| Calvert International Equity Fund first offered Class Y shares on October 31, 2008. Performance prior to that date reflects the performance of Class A shares at net asset value (NAV). Actual Class Y share performance would have been higher than Class A share performance because Class Y has lower class-specific expenses than Class A. |
| | | | | |
All performance data shown, including the graph above and the adjacent table, represents past performance, does not guarantee future results, assumes reinvestment of dividends and distributions, and does not reflect the deduction of taxes that a shareholder would pay on the Fund’s distributions or the redemption of the Fund shares. All performance data reflects fee waivers and/or expense limitations, if any are in effect; in their absence performance would be lower. See Note B in Notes to Financial Statements. The investment return and principal value of an investment will fluctuate so that an investor’s shares, when redeemed, may be worth more or less than their original cost. Current performance may be lower or higher than the performance data quoted; for current performance data, including most recent month-end, visit www.calvert.com. The gross expense ratio from the current prospectus for Class A shares is 1.45%. This number may differ from the expense ratio shown elsewhere in this report because it is based on a different time period and, if applicable, does not include fee or expense waivers. Performance data quoted already reflects the deduction of the Fund’s operating expenses.
calvert.com CALVERT INTERNATIONAL EQUITY FUND SEMI-ANNUAL REPORT (UNAUDITED) 5
UNDERSTANDING YOUR FUND'S EXPENSES
As an investor, you incur two types of costs. There are transaction costs, which generally include sales charges on purchases and may include redemption fees. There are also ongoing costs, which generally include management fees, distribution and/or service fees, and other fund expenses. The following information is intended to help you understand your ongoing costs (in dollars) of investing in this mutual fund and to help you compare these costs with the ongoing costs of investing in other mutual funds.
To illustrate these ongoing costs, we have provided examples and calculated the expenses paid by the fund's investors during the period. The actual and hypothetical information presented in the examples is based on an investment of $1,000 invested at the beginning of the period and held for the entire period (October 1, 2015 to March 31, 2016).
Actual Expenses
The first line of the table below provides information about actual account values and actual expenses. You may use the information in this line, together with the amount you invested, to estimate the expenses that you paid over the period. Simply divide your account value by $1,000 (for example, an $8,600 account value divided by $1,000 = 8.6), then multiply the result by the number in the first line under the heading entitled "Expenses Paid During Period" to estimate the expenses you paid on your account during this period.
The fund may charge an annual low balance account fee of $15 to those shareholders whose regular account balance is less than $2,000 ($1,000 for IRA accounts). If the low balance fee applies to your account, you should subtract the fee from the ending account value in the chart below.
Hypothetical Example for Comparison Purposes
The second line of the table below provides information about hypothetical account values and hypothetical expenses based on the Fund’s actual expense ratio and an assumed rate of return of 5% per year before expenses, which is not the Fund’s actual return. The hypothetical account values and expenses may not be used to estimate the actual ending account balance or expenses you paid for the period. You may use this information to compare the ongoing costs of investing in the Fund and other funds. To do so, compare the 5% hypothetical example with the 5% hypothetical examples that appear in the shareholder reports of the other funds.
Please note that the expenses shown in the table are meant to highlight your ongoing costs only and do not reflect any transactional costs, such as sales charges (loads), or redemption fees. Therefore, the second line of the table is useful in comparing ongoing costs only, and will not help you determine the relative total costs of owning different funds. In addition, if these transactional costs were included, your costs would have been higher.
|
| | | | |
| | ANNUALIZED
EXPENSE RATIO | BEGINNING
ACCOUNT VALUE
10/1/15 | ENDING
ACCOUNT VALUE
3/31/16 | EXPENSES PAID
DURING PERIOD*
10/1/15 - 3/31/16 |
| Class A | | | | |
| Actual | 1.38% | $1,000.00 | $980.40 | $6.83 |
| Hypothetical (5% return per year before expenses) | 1.38% | $1,000.00 | $1,018.10 | $6.96 |
| Class C | | | | |
| Actual | 2.14% | $1,000.00 | $976.80 | $10.58 |
| Hypothetical (5% return per year before expenses) | 2.14% | $1,000.00 | $1,014.30 | $10.78 |
| Class I | | | | |
| Actual | 0.95% | $1,000.00 | $982.20 | $4.71 |
| Hypothetical (5% return per year before expenses) | 0.95% | $1,000.00 | $1,020.25 | $4.80 |
| Class Y | | | | |
| Actual | 1.13% | $1,000.00 | $981.30 | $5.60 |
| Hypothetical (5% return per year before expenses) | 1.13% | $1,000.00 | $1,019.35 | $5.70 |
| |
| * Expenses paid during the period are equal to the annualized expense ratio for each class as indicated above, multiplied by the average account value over the period, multiplied by 183/366 (to reflect the one-half year period). Expense ratios shown in the Financial Highlights represent the actual expenses incurred for the period. |
6 calvert.com CALVERT INTERNATIONAL EQUITY FUND SEMI-ANNUAL REPORT (UNAUDITED)
CALVERT INTERNATIONAL EQUITY FUND
SCHEDULE OF INVESTMENTS
MARCH 31, 2016 (Unaudited)
|
| | |
| | SHARES | VALUE ($) |
| COMMON STOCKS - 93.3% | | |
| Australia - 1.0% | | |
| AMP Ltd. | 797,424 | 3,544,074 |
| | | |
| Belgium - 0.6% | | |
| Ageas | 1,011 | 40,149 |
| Ageas (ADR) | 49,904 | 1,975,699 |
| | | 2,015,848 |
| | | |
| Canada - 1.3% | | |
| Bank of Montreal | 75,378 | 4,582,996 |
| | | |
| France - 13.7% | | |
| AXA SA (ADR) | 227,298 | 5,318,773 |
| Cie de Saint-Gobain | 79,993 | 3,528,303 |
| Credit Agricole SA | 190,914 | 2,069,426 |
| Credit Agricole SA (ADR) | 214,378 | 1,142,635 |
| Natixis SA | 600,401 | 2,958,658 |
| Orange SA | 263,500 | 4,619,838 |
| Orange SA (ADR) | 217,395 | 3,778,325 |
| Sanofi SA | 38,766 | 3,128,373 |
| Sanofi SA (ADR) | 177,650 | 7,134,424 |
| Schneider Electric SE | 39,326 | 2,487,437 |
| Suez Environnement Co. | 238,887 | 4,385,549 |
| Technip SA | 90,424 | 5,016,124 |
| Valeo SA | 241 | 37,546 |
| Valeo SA (ADR) | 24,671 | 1,918,170 |
| | | 47,523,581 |
| | | |
| Germany - 5.4% | | |
| Allianz SE | 43,382 | 7,062,527 |
| Bayerische Motoren Werke AG | 37,946 | 3,487,434 |
| Deutsche Post AG | 140,403 | 3,904,707 |
| HeidelbergCement AG | 50,753 | 4,349,453 |
| | | 18,804,121 |
| | | |
| Hong Kong - 1.1% | | |
| BOC Hong Kong Holdings Ltd. | 291,936 | 871,276 |
| BOC Hong Kong Holdings Ltd. (ADR) | 46,638 | 2,822,532 |
| | | 3,693,808 |
| | | |
| Japan - 19.3% | | |
| Alfresa Holdings Corp. | 132,745 | 2,548,997 |
| Canon, Inc. | 79,500 | 2,372,237 |
| Japan Airlines Co. Ltd. | 111,300 | 4,080,390 |
| Kao Corp. | 49,200 | 2,626,830 |
| Komatsu Ltd. | 205,200 | 3,496,804 |
calvert.com CALVERT INTERNATIONAL EQUITY FUND SEMI-ANNUAL REPORT (UNAUDITED) 7
|
| | | | |
| | SHARES | VALUE ($) |
| COMMON STOCKS - CONT’D | | |
| Mitsubishi Chemical Holdings Corp. | 628,500 |
| 3,284,064 |
|
| Mizuho Financial Group, Inc. | 3,242,200 |
| 4,847,368 |
|
| Mizuho Financial Group, Inc. (ADR) | 584,790 |
| 1,719,283 |
|
| MS&AD Insurance Group Holdings, Inc. | 1,500 |
| 41,838 |
|
| MS&AD Insurance Group Holdings, Inc. (ADR) | 155,752 |
| 2,160,280 |
|
| Nabtesco Corp. | 123,200 |
| 2,767,850 |
|
| Nippon Telegraph & Telephone Corp. | 250,800 |
| 10,814,056 |
|
| Nippon Telegraph & Telephone Corp. (ADR) | 77,907 |
| 3,368,699 |
|
| Nissan Motor Co. Ltd. | 512,710 |
| 4,749,299 |
|
| Panasonic Corp. | 459,769 |
| 4,226,186 |
|
| Seven & I Holdings Co. Ltd. | 119,696 |
| 5,101,465 |
|
| Toyo Suisan Kaisha Ltd. | 85,200 |
| 3,061,395 |
|
| Toyota Motor Corp. | 79,474 |
| 4,207,135 |
|
| Yamaha Corp. | 55,360 |
| 1,669,146 |
|
| | | 67,143,322 |
|
| | | |
| Netherlands - 8.4% | | |
| ING Groep NV (CVA) | 331,388 |
| 4,011,774 |
|
| Koninklijke Ahold NV (ADR) | 112,605 |
| 2,526,856 |
|
| Koninklijke Ahold NV, Amsterdam Stock Exchange | 311,105 |
| 7,004,547 |
|
| Koninklijke Philips NV: | | |
| Common | 61,768 |
| 1,761,074 |
|
| NY Shares | 79,805 |
| 2,278,433 |
|
| Unilever NV (CVA) | 213,120 |
| 9,559,198 |
|
| Unilever NV, NY Shares | 48,943 |
| 2,186,773 |
|
| | | 29,328,655 |
|
| | | |
| New Zealand - 0.7% | | |
| Spark New Zealand Ltd. | 444,667 |
| 1,123,708 |
|
| Spark New Zealand Ltd. (ADR) | 93,967 |
| 1,177,407 |
|
| | | 2,301,115 |
|
| | | |
| Norway - 1.5% | | |
| Norsk Hydro ASA | 918,788 |
| 3,792,707 |
|
| Yara International ASA (ADR) | 37,046 |
| 1,394,041 |
|
| | | 5,186,748 |
|
| | | |
| Portugal - 0.8% | | |
| EDP - Energias de Portugal SA | 775,445 |
| 2,760,619 |
|
| | | |
| Singapore - 1.4% | | |
| City Developments Ltd. | 438,365 |
| 2,659,914 |
|
| Singapore Telecommunications Ltd. (ADR) | 75,343 |
| 2,133,714 |
|
| | | 4,793,628 |
|
| | | |
| South Africa - 1.0% | | |
| Aspen Pharmacare Holdings Ltd.* | 123,666 |
| 2,691,037 |
|
| MTN Group Ltd. (ADR) | 80,830 |
| 730,703 |
|
| | | 3,421,740 |
|
8 calvert.com CALVERT INTERNATIONAL EQUITY FUND SEMI-ANNUAL REPORT (UNAUDITED)
|
| | | | |
| | SHARES | VALUE ($) |
| COMMON STOCKS - CONT’D | | |
| Spain - 2.1% | | |
| Acciona SA | 40,721 |
| 3,152,579 |
|
| Ferrovial SA | 187,835 |
| 4,039,801 |
|
| | | 7,192,380 |
|
| | | |
| Sweden - 5.7% | | |
| Atlas Copco AB, Class A | 206,940 |
| 5,221,001 |
|
| Electrolux AB, Series B | 132,748 |
| 3,501,630 |
|
| Husqvarna AB, Class B | 616,834 |
| 4,520,953 |
|
| SKF AB, Class B | 187,728 |
| 3,398,631 |
|
| Telefonaktiebolaget LM Ericsson, Class B | 333,085 |
| 3,344,157 |
|
| | | 19,986,372 |
|
| | | |
| Switzerland - 7.6% | | |
| Adecco SA | 64,817 |
| 4,237,709 |
|
| Novartis AG | 73,314 |
| 5,332,623 |
|
| Novartis AG (ADR) | 48,196 |
| 3,491,318 |
|
| Roche Holding AG | 28,353 |
| 7,003,554 |
|
| Swiss Re AG | 68,935 |
| 6,395,326 |
|
| | | 26,460,530 |
|
| | | |
| United Kingdom - 17.8% | | |
| 3i Group plc | 646,498 |
| 4,242,989 |
|
| AstraZeneca plc | 57,777 |
| 3,242,328 |
|
| AstraZeneca plc (ADR) | 32,388 |
| 912,046 |
|
| Burberry Group plc | 258,122 |
| 5,066,601 |
|
| GlaxoSmithKline plc | 204,677 |
| 4,155,878 |
|
| GlaxoSmithKline plc (ADR) | 112,096 |
| 4,545,493 |
|
| International Consolidated Airlines Group SA | 321,524 |
| 2,559,117 |
|
| J Sainsbury plc | 1,364,910 |
| 5,423,055 |
|
| John Wood Group plc | 461,358 |
| 4,080,113 |
|
| Kingfisher plc(a) | 979,602 |
| 5,306,453 |
|
| Lloyds Banking Group plc | 5,377,698 |
| 5,260,077 |
|
| Schroders plc | 84,727 |
| 3,268,900 |
|
| SSE plc | 241,348 |
| 5,178,114 |
|
| SSE plc (ADR) | 45,159 |
| 976,338 |
|
| Taylor Wimpey plc | 1,546,720 |
| 4,232,623 |
|
| WPP plc | 155,905 |
| 3,647,595 |
|
| | | 62,097,720 |
|
| | | |
| United States - 3.9% | | |
| Apple, Inc. | 37,134 |
| 4,047,235 |
|
| FMC Technologies, Inc.* | 61,386 |
| 1,679,521 |
|
| MasterCard, Inc., Class A | 18,656 |
| 1,762,992 |
|
| Microsoft Corp. | 31,108 |
| 1,718,095 |
|
| PepsiCo, Inc. | 41,203 |
| 4,222,483 |
|
| | | 13,430,326 |
|
| | | |
calvert.com CALVERT INTERNATIONAL EQUITY FUND SEMI-ANNUAL REPORT (UNAUDITED) 9
|
| | | | |
| | SHARES | VALUE ($) |
| COMMON STOCKS - CONT’D | | |
| Venture Capital - 0.0% | | |
| Powerspan Corp., Contingent Deferred Distribution *(b)(c) | 1 |
| — |
|
| | | |
| Total Common Stocks (Cost $326,158,364) | | 324,267,583 |
|
| | | |
| | | |
| PREFERRED STOCKS - 0.1% | | |
| | | |
| Venture Capital - 0.1% | | |
| Bioceptive, Inc.: | | |
| Series A *(b)(c) | 582,574 |
| 153,291 |
|
| Series B *(b)(c) | 40,523 |
| 16,250 |
|
| FINAE, Series D*(b)(c) | 2,597,442 |
| 220,259 |
|
| | | 389,800 |
|
| | | |
| Total Preferred Stocks (Cost $521,381) | | 389,800 |
|
| | | |
| | | |
| | ADJUSTED
BASIS ($) | VALUE ($) |
|
| VENTURE CAPITAL LIMITED PARTNERSHIP INTEREST - 0.5% | | |
| Africa Renewable Energy Fund LP *(b)(c) | 344,664 |
| 295,788 |
|
| BFSE Holding, BV LP *(b)(c) | 604,246 |
| 293,646 |
|
| Blackstone Clean Technology Partners LP *(b)(c) | 78,853 |
| 18,590 |
|
| China Environment Fund 2004 LP *(b)(c) | — |
| 91,471 |
|
| Emerald Sustainability Fund I LP *(b)(c) | 425,186 |
| 277,712 |
|
| gNet Defta Development Holding LLC *(b)(c)(d) | 400,000 |
| 304,757 |
|
| Mainstream Brazil Impact Investing Fund LP *(b)(c) | 20,045 |
| — |
|
| SEAF Central and Eastern European Growth Fund LLC *(b)(c)(d) | 285,795 |
| 313,524 |
|
| SEAF India International Growth Fund LP *(b)(c) | 219,004 |
| 64,483 |
|
| Terra Capital LP *(b)(c) | 469,590 |
| 1 |
|
| | | |
| Total Venture Capital Limited Partnership Interest (Cost $2,847,383) | | 1,659,972 |
|
| | | |
| | | |
| | PRINCIPAL
AMOUNT ($) | VALUE ($) |
|
| VENTURE CAPITAL DEBT OBLIGATIONS - 0.1% | | |
| AFIG LLC, 6.00%, 10/17/17 (b)(c) | 450,953 |
| 448,906 |
|
| Windhorse International-Spring Health Water Ltd., 1.00%, 3/14/18 (b)(c)(e) | 70,000 |
| 52,500 |
|
| | | |
| Total Venture Capital Debt Obligations (Cost $520,953) | | 501,406 |
|
| | | |
| | | |
| HIGH SOCIAL IMPACT INVESTMENTS - 1.4% | | |
| Calvert Social Investment Foundation Notes, 0.25%, 7/1/17 (b)(c) | 4,431,583 |
| 4,361,519 |
|
| ImpactAssets Global Sustainable Agriculture Notes, 0.00%, 11/3/20 (b)(c)(f) | 220,000 |
| 203,500 |
|
| ImpactAssets Microfinance Plus Notes, 0.00%, 11/3/20 (b)(c)(f) | 283,000 |
| 258,945 |
|
| | | |
| Total High Social Impact Investments (Cost $4,934,583) | | 4,823,964 |
|
10 calvert.com CALVERT INTERNATIONAL EQUITY FUND SEMI-ANNUAL REPORT (UNAUDITED)
|
| | | | |
| | SHARES | VALUE ($) |
|
| EXCHANGE-TRADED PRODUCTS - 3.2% | | |
| iShares MSCI EAFE ETF | 198,067 | 11,315,568 |
|
| | | |
| Total Exchange-Traded Products (Cost $10,754,676) | | 11,315,568 |
|
| | | |
| | PRINCIPAL
AMOUNT ($) | VALUE ($) |
|
| TIME DEPOSIT - 1.3% | | |
| State Street Bank Time Deposit, 0.278%, 4/1/16 | 4,374,743 | 4,374,743 |
|
| | | |
| Total Time Deposit (Cost $4,374,743) | | 4,374,743 |
|
| | | |
| | | |
| TOTAL INVESTMENTS (Cost $350,112,083) - 99.9% | | 347,333,036 |
|
| Other assets and liabilities, net - 0.1% | | 323,623 |
|
NET ASSETS - 100.0% | |
| $347,656,659 |
|
|
|
| NOTES TO SCHEDULE OF INVESTMENTS |
| * Non-income producing security. |
| (a) 950,000 shares of Kingfisher plc have been soft segregated in order to cover outstanding commitments to certain limit partnership investments within the Fund. There are no restrictions on the trading of this security. |
| (b) This security was valued under the direction of the Board of Directors. See Note A. |
| (c) Restricted securities represent 2.1% of the net assets of the Fund. |
| (d) Affiliated company. |
| (e) Security defaulted as to principal and interest in March 2013. It has been restructured at a 9% rate maturing on March 14, 2018 with 1% to be paid annually and the remaining interest due at maturity. This security is currently accruing at 1%. |
| (f) The coupon rate shown on floating or adjustable rate securities represents the rate in effect on March 31, 2016. |
|
| |
| Abbreviations: |
| ADR: | American Depositary Receipts |
| CVA: | Certificaten Van Aandelen |
| ETF: | Exchange-Traded Fund |
| LLC: | Limited Liability Corporation |
| LP: | Limited Partnership |
| Ltd.: | Limited |
| plc: | Public Limited Company |
| See notes to financial statements. |
calvert.com CALVERT INTERNATIONAL EQUITY FUND SEMI-ANNUAL REPORT (UNAUDITED) 11
|
| | | |
| RESTRICTED SECURITIES | ACQUISITION DATES | COST ($) |
| AFIG LLC, 6.00%, 10/17/17 | 10/11/12 | 450,953 |
|
| Africa Renewable Energy Fund LP | 4/17/14-7/2/15 | 344,664 |
|
| BFSE Holding, BV LP | 1/12/06-6/11/14 | 604,246 |
|
| Bioceptive, Inc., Series A | 10/26/12-12/18/13 | 252,445 |
|
| Bioceptive, Inc., Series B | 1/7/16 | 16,250 |
|
| Blackstone Clean Technology Partners LP | 7/29/10-6/25/15 | 78,853 |
|
| Calvert Social Investment Foundation Notes, 0.25%, 7/1/17 | 7/1/14 | 4,431,583 |
|
| China Environment Fund 2004 LP | 9/15/05-4/1/09 | — |
|
| Emerald Sustainability Fund I LP | 7/19/01-5/17/11 | 425,186 |
|
| FINAE, Series D | 2/28/11 | 252,686 |
|
| gNet Defta Development Holding LLC | 8/30/05 | 400,000 |
|
| ImpactAssets Global Sustainable Agriculture Notes, 0.00%, 11/3/20 | 11/13/15 | 220,000 |
|
| ImpactAssets Microfinance Plus Notes, 0.00%, 11/3/20 | 11/13/15 | 283,000 |
|
| Mainstream Brazil Impact Investing Fund LP | 12/12/14-12/3/15 | 20,045 |
|
| Powerspan Corp., Contingent Deferred Distribution | 7/11/14 | — |
|
| SEAF Central and Eastern European Growth Fund LLC | 8/10/00-8/26/11 | 285,795 |
|
| SEAF India International Growth Fund LP | 3/22/05-5/24/10 | 219,004 |
|
| Terra Capital LP | 11/23/98-3/14/06 | 469,590 |
|
| Windhorse International-Spring Health Water Ltd., 1.00%, 3/14/18 | 2/12/14 | 70,000 |
|
| See notes to financial statements. |
12 calvert.com CALVERT INTERNATIONAL EQUITY FUND SEMI-ANNUAL REPORT (UNAUDITED)
CALVERT INTERNATIONAL EQUITY FUND
STATEMENT OF ASSSETS AND LIABILITIES
MARCH 31, 2016 (Unaudited)
|
| | | |
| ASSETS | |
| Investments in unaffiliated securities, at value (Cost $349,426,288) - see accompanying schedule |
| $346,714,755 |
|
| Investments in affiliated securities, at value (Cost $685,795) - see accompanying schedule | 618,281 |
|
| Receivable for shares sold | 743,559 |
|
| Dividends and interest receivable | 2,049,358 |
|
| Directors' deferred compensation plan | 194,774 |
|
| Total assets | 350,320,727 |
|
| | |
| LIABILITIES | |
| Payable to custodian bank, cash denominated in foreign currencies (Cost $1,764,582) | 1,802,646 |
|
| Payable for securities purchased | 59,562 |
|
| Payable for shares redeemed | 275,579 |
|
| Payable to Calvert Investment Management, Inc. | 178,328 |
|
| Payable to Calvert Investment Distributors, Inc. | 46,318 |
|
| Payable to Calvert Investment Administrative Services, Inc. | 34,588 |
|
| Payable to Calvert Investment Services, Inc. | 7,816 |
|
| Directors' deferred compensation plan | 194,774 |
|
| Accrued expenses and other liabilities | 64,457 |
|
| Total liabilities | 2,664,068 |
|
| NET ASSETS |
| $347,656,659 |
|
| | |
| NET ASSETS CONSIST OF: | |
| Paid-in capital applicable to the following shares of common stock, | |
| with 250,000,000 shares of $0.01 par value shares authorized: | |
| Class A: 10,701,311 shares outstanding |
| $264,511,375 |
|
| Class C: 1,141,516 shares outstanding | 30,873,953 |
|
| Class I: 9,113,247 shares outstanding | 196,570,818 |
|
| Class Y: 1,433,265 shares outstanding | 23,597,009 |
|
| Undistributed net investment income | 1,667,352 |
|
| Accumulated net realized gain (loss) on investments and foreign currency transactions | (166,726,658) |
|
| Net unrealized appreciation (depreciation) on investments and assets and liabilities denominated in foreign currencies | (2,837,190) |
|
| NET ASSETS |
| $347,656,659 |
|
| | |
| NET ASSET VALUE PER SHARE | |
| Class A (based on net assets of $162,411,188) |
| $15.18 |
|
| Class C (based on net assets of $14,943,945) |
| $13.09 |
|
| Class I (based on net assets of $147,366,052) |
| $16.17 |
|
| Class Y (based on net assets of $22,935,474) |
| $16.00 |
|
| See notes to financial statements. |
calvert.com CALVERT INTERNATIONAL EQUITY FUND SEMI-ANNUAL REPORT (UNAUDITED) 13
CALVERT INTERNATIONAL EQUITY FUND
STATEMENT OF OPERATIONS
SIX MONTHS ENDED MARCH 31, 2016 (Unaudited)
|
| | | |
| NET INVESTMENT INCOME | |
| Investment Income: | |
| Dividend income (net of foreign taxes withheld of $330,308) |
| $3,740,029 |
|
| Interest income | 34,088 |
|
| Total investment income | 3,774,117 |
|
| | |
| Expenses: | |
| Investment advisory fee | 1,281,694 |
|
| Administrative fees | 382,559 |
|
| Transfer agency fees and expenses | 250,860 |
|
| Distribution Plan expenses: | |
| Class A | 206,609 |
|
| Class C | 77,746 |
|
| Directors' fees and expenses | 19,184 |
|
| Accounting fees | 40,028 |
|
| Custodian fees | 66,013 |
|
| Professional fees | 33,670 |
|
| Registration fees | 31,833 |
|
| Reports to shareholders | 27,596 |
|
| Miscellaneous | 23,220 |
|
| Total expenses | 2,441,012 |
|
| Reimbursement from Advisor: | |
| Class A | (167,378) |
|
| Class C | (27,447) |
|
| Class I | (45,214) |
|
| Class Y | (8,725) |
|
| Administrative fees waived | (85,651) |
|
| Net expenses | 2,106,597 |
|
| NET INVESTMENT INCOME | 1,667,520 |
|
| | |
| | |
| REALIZED AND UNREALIZED GAIN (LOSS) | |
| Net realized gain (loss) on: | |
| Investments | (29,111,261) |
|
| Foreign currency transactions | (1,101,790) |
|
| | (30,213,051) |
|
| | |
| Change in unrealized appreciation (depreciation) on: | |
| Investments in unaffiliated securities | 23,388,570 |
|
| Investments in affiliated securities | 19,367 |
|
| Assets and liabilities denominated in foreign currencies | (51,205) |
|
| | 23,356,732 |
|
| | |
| NET REALIZED AND UNREALIZED GAIN (LOSS) | (6,856,319) |
|
| | |
| INCREASE (DECREASE) IN NET ASSETS RESULTING FROM OPERATIONS |
| ($5,188,799 | ) |
| See notes to financial statements. |
14 calvert.com CALVERT INTERNATIONAL EQUITY FUND SEMI-ANNUAL REPORT (UNAUDITED)
CALVERT INTERNATIONAL EQUITY FUND
STATEMENTS OF CHANGES IN NET ASSETS
|
| | | | | | | |
| INCREASE (DECREASE) IN NET ASSETS | SIX MONTHS ENDED
MARCH 31, 2016(Unaudited) | | YEAR ENDED
SEPTEMBER 30, 2015 |
| Operations: | | | |
| Net investment income |
| $1,667,520 |
| |
| $4,680,846 |
|
| Net realized gain (loss) | (30,213,051) |
| | 25,979,003 |
|
| Change in unrealized appreciation (depreciation) | 23,356,732 |
| | (46,538,170) |
|
| | | | |
| INCREASE (DECREASE) IN NET ASSETS RESULTING FROM OPERATIONS | (5,188,799) |
| | (15,878,321) |
|
| | | | |
| Distributions to shareholders from: | | | |
| Net investment income: | | | |
| Class A shares | (1,496,038) |
| | (1,631,419) |
|
| Class C shares | (82,845) |
| | — |
|
| Class I shares | (2,202,975) |
| | (1,067,547) |
|
| Class Y shares | (342,786) |
| | (128,897) |
|
| Total distributions | (4,124,644) |
| | (2,827,863) |
|
| | | | |
| Capital share transactions: | | | |
| Shares sold: | | | |
| Class A shares (a) | 16,196,032 |
| | 66,145,855 |
|
| Class B shares (b) | — |
| | 16,461 |
|
| Class C shares | 635,435 |
| | 2,588,056 |
|
| Class I shares | 32,594,188 |
| | 87,412,574 |
|
| Class Y shares | 6,764,850 |
| | 8,115,882 |
|
| Reinvestment of distributions: | | | |
| Class A shares | 1,309,720 |
| | 1,180,433 |
|
| Class C shares | 71,437 |
| | — |
|
| Class I shares | 1,301,923 |
| | 878,598 |
|
| Class Y shares | 257,139 |
| | 88,086 |
|
| Redemption fees: | | | |
| Class A shares | — |
| | 442 |
|
| Class C shares | — |
| | 22 |
|
| Shares redeemed: | | | |
| Class A shares | (17,686,453) |
| | (157,566,212) |
|
| Class B shares (a)(b) | — |
| | (2,086,695) |
|
| Class C shares | (1,313,397) |
| | (2,791,010) |
|
| Class I shares | (30,806,898) |
| | (22,631,854) |
|
| Class Y shares | (3,680,645) |
| | (4,015,663) |
|
| Total capital share transactions | 5,643,331 |
| | (22,665,025) |
|
| | | | |
| TOTAL INCREASE (DECREASE) IN NET ASSETS | (3,670,112) |
| | (41,371,209) |
|
| | | | |
| | | | |
| NET ASSETS | | | |
| Beginning of period | 351,326,771 |
| | 392,697,980 |
|
| End of period (including undistributed net investment income of $1,667,352 and $4,124,476, respectively) |
| $347,656,659 |
| |
| $351,326,771 |
|
| See notes to financial statements. |
calvert.com CALVERT INTERNATIONAL EQUITY FUND SEMI-ANNUAL REPORT (UNAUDITED) 15
CALVERT INTERNATIONAL EQUITY FUND
STATEMENTS OF CHANGES IN NET ASSETS - CONT’D
|
| | | | | |
| CAPITAL SHARE ACTIVITY | SIX MONTHS ENDED
MARCH 31, 2016(Unaudited) | | YEAR ENDED
SEPTEMBER 30, 2015 |
| Shares sold: | | | |
| Class A shares (c) | 1,042,578 |
| | 3,961,337 |
|
| Class B shares (b) | — |
| | 1,117 |
|
| Class C shares | 47,144 |
| | 178,700 |
|
| Class I shares | 2,033,707 |
| | 4,800,946 |
|
| Class Y shares | 407,269 |
| | 461,877 |
|
| Reinvestment of distributions: | | | |
| Class A shares | 81,501 |
| | 73,137 |
|
| Class C shares | 5,143 |
| | — |
|
| Class I shares | 76,136 |
| | 51,022 |
|
| Class Y shares | 15,188 |
| | 5,163 |
|
| Shares redeemed: | | | |
| Class A shares | (1,129,318) |
| | (9,300,506) |
|
| Class B shares (b)(c) | — |
| | (140,247) |
|
| Class C shares | (97,938) |
| | (194,622) |
|
| Class I shares | (1,821,221) |
| | (1,248,932) |
|
| Class Y shares | (228,064) |
| | (230,027) |
|
| Total capital share activity | 432,125 |
| | (1,581,035) |
|
| | | | |
| (a) Amounts include $1,452,680 of share transactions that were redeemed from Class B shares and converted into Class A shares at the close of business on April 20, 2015. |
| (b) Class B Shares were converted into Class A Shares at the close of business on April 20, 2015. |
| (c) Amount includes 96,332 shares redeemed from Class B shares and 84,213 shares purchased into Class A shares at the close of business on April 20,2015. |
| See notes to financial statements. |
16 calvert.com CALVERT INTERNATIONAL EQUITY FUND SEMI-ANNUAL REPORT (UNAUDITED)
NOTES TO FINANCIAL STATEMENTS
NOTE A — SIGNIFICANT ACCOUNTING POLICIES
General: Calvert International Equity Fund (the "Fund"), a series of Calvert World Values Fund, Inc., is registered under the Investment Company Act of 1940 as a diversified, open-end management investment company. Calvert World Values Fund, Inc. is comprised of four separate series. The operations of each series are accounted for separately. The Fund applies the accounting and reporting guidance in the Financial Accounting Standards Board (FASB) Accounting Standards Codification Topic 946, Financial Services – Investment Companies (ASC 946).
The Fund offers four classes of shares of capital stock - Classes A, C, I, and Y. The Fund also offered Class B shares; however, all Class B shares were converted to Class A shares effective April 20, 2015 and are no longer available. Class A shares are sold with a maximum front-end sales charge of 4.75%. Class C shares are sold without a front-end sales charge and, with certain exceptions, will be charged a deferred sales charge on shares sold within one year of purchase. Class C shares have higher levels of expenses than Class A shares. Class I shares require a minimum account balance of $1,000,000. The $1 million minimum initial investment is waived for retirement plans that trade through omnibus accounts and may be waived in certain other instances where it is believed to be in the best interest of the Fund and its shareholders. Class I shares have no front-end or deferred sales charge and have lower levels of expenses than Class A shares. Class Y shares are generally only available to wrap or similar fee-based programs offered by financial intermediaries, foundations, and endowments that have entered into an agreement with the Fund’s Distributor to offer Class Y shares. Class Y shares have no front-end or deferred sales charge and have lower levels of expenses than Class A shares. Each class has different: (a) dividend rates due to differences in Distribution Plan expenses and other class specific expenses, (b) exchange privileges and (c) class specific voting rights.
Security Valuation: Net asset value per share is determined every business day as of the close of the regular session of the New York Stock Exchange (generally 4:00 p.m. Eastern time). The Fund uses independent pricing services approved by the Board of Directors (“the Board”) to value its investments wherever possible. Investments for which market quotations are not available or deemed not reliable are fair valued in good faith under the direction of the Board.
The Board has adopted Valuation Procedures (the “Procedures”) to determine the fair value of securities and other financial instruments for which market prices are not readily available or which may not be reliably priced. The Board has delegated the day-to-day responsibility for determining the fair value of assets of the Fund to Calvert Investment Management, Inc. (the “Advisor” or “Calvert”) and has provided these Procedures to govern Calvert in its valuation duties.
Calvert has chartered an internal Valuation Committee to oversee the implementation of these Procedures and to assist it in carrying out the valuation responsibilities that the Board has delegated.
The Valuation Committee meets on a regular basis to review illiquid securities and other investments which may not have readily available market prices. The Valuation Committee’s fair valuation determinations are subject to review, approval and ratification by the Board at its next regularly scheduled meeting covering the calendar quarter in which the fair valuation was determined.
The Valuation Committee utilizes various methods to measure the fair value of the Fund’s investments. U.S. generally accepted accounting principles (GAAP) establishes a disclosure hierarchy that categorizes the inputs to valuation techniques used to value assets and liabilities at measurement date. These inputs are summarized in the three broad levels listed below:
Level 1 - quoted prices in active markets for identical securities
Level 2 - other significant observable inputs (including quoted prices for similar securities, interest rates, prepayment speeds, credit risk, etc.)
Level 3 - significant unobservable inputs (including the Fund’s own assumptions in determining the fair value of investments)
The inputs or methodologies used for valuing securities are not necessarily an indication of the risk associated with investing in those securities.
Changes in valuation techniques may result in transfers in or out of an investment’s assigned level within the hierarchy during the period. Transfers in and/or out of levels are determined based on the fair value of such securities at the end of the period. Valuation techniques used to value the Fund’s investments by major category are as follows:
Common and preferred stocks, and securities, including restricted securities and venture capital securities, for which market quotations are readily available, are valued at the last reported sale price or official closing price as reported by an independent pricing service on the primary market or exchange on which they are traded and are categorized as Level 1 in the hierarchy. In the event there were no sales during the day or closing prices are not available, securities are valued at the last quoted bid price or using the last available price and are categorized as Level 2 in the hierarchy. Foreign securities are valued based on quotations from the principal market in which such securities are normally traded. If events occur after the close of
calvert.com CALVERT INTERNATIONAL EQUITY FUND SEMI-ANNUAL REPORT (UNAUDITED) 17
the principal market in which foreign securities are traded, and before the close of business of the Fund, that are expected to materially affect the value of those securities, then they are valued at their fair value taking these events into account. The Fund has retained a third party fair value pricing service to quantitatively analyze the price movement of its holdings on foreign exchanges and to automatically fair value if the variation from the prior day’s closing price exceeds specified parameters. Such securities would be categorized as Level 2 in the hierarchy in these circumstances. Utilizing this technique may result in transfers between Level 1 and Level 2. For restricted securities and private placements where observable inputs are limited, assumptions about market activity and risk are used and such securities are categorized as Level 3 in the hierarchy.
Venture capital securities for which market quotations are not readily available are generally categorized as Level 3 in the hierarchy. Venture capital direct equity securities are generally valued using the most appropriate and applicable method to measure fair value in light of each company’s situation. Methods may include market, income or cost approaches with discounts as appropriate based on assumptions of liquidation or exit risk. Examples of the market approach are subsequent rounds of financing, comparable transactions, and revenue times an industry multiple. An example of the income approach is the discounted cash flow. Examples of the cost approach are replacement cost, salvage value, or net asset percentage. Venture capital limited partnership (“LP”) securities are valued at the fair value reported by the general partner of the partnership adjusted as necessary to reflect subsequent capital calls and distributions and any other available information, as a practical expedient. In the absence of a reported LP unit value, fair value may be estimated based on the Fund’s percentage equity in the partnership and/or other balance sheet information and portfolio value for the most recently available period reported by the general partner. In some cases adjustments may be made to account for daily pricing of material public holdings within the partnership. Venture capital debt securities are valued based on assumptions of credit and market risk. For venture capital securities denominated in foreign currency, the fair value is marked to the daily exchange rate.
Debt securities, other than Venture Capital debt securities, are valued based on evaluated prices received from independent pricing services or from dealers who make markets in such securities and are generally categorized as Level 2 in the hierarchy.
Short-term securities of sufficient credit quality with remaining maturities of sixty days or less for which quotations are not readily available are valued at amortized cost, which approximates fair value, and are categorized as Level 2 in the hierarchy.
If a market value cannot be determined for a security using the methodologies described above, or if, in the good faith opinion of the Advisor, the market value does not constitute a readily available market quotation, or if a significant event has occurred that would materially affect the value of the security, the security will be fair valued as determined in good faith by the Valuation Committee or, with respect to Special Equities investments, by the Audit Committee using the venture capital methodologies described above.
The Valuation Committee considers a number of factors, including significant unobservable valuation inputs when arriving at fair value. It considers all significant facts that are reasonably available and relevant to the determination of fair value.
The Valuation Committee primarily employs a market-based approach which may use related or comparable assets or liabilities, recent transactions, market multiples, book values, and other relevant information for the investment to determine the fair value of the investment. When more appropriate, the Fund may employ an income-based or cost approach. An income-based valuation approach discounts anticipated future cash flows of the investment to calculate a present amount (discounted). The measurement is based on the value indicated by current market expectations about those future amounts. Discounts may also be applied due to the nature or duration of any restrictions on the disposition of the investments. A cost based approach is based on the amount that currently would be required to replace the service capacity of an asset (current replacement cost). From the seller’s perspective, the price that would be received for the asset is determined based on the cost to a buyer to acquire or construct a substitute asset of comparable utility, adjusted for obsolescence.
The values assigned to fair value investments are based on available information and do not necessarily represent amounts that might ultimately be realized. Further, due to the inherent uncertainty of valuations of such investments, the fair values may differ significantly from the values that would have been used had an active market existed, and the differences could be material. The Valuation Committee employs various methods for calibrating these valuation approaches including a regular review of key inputs and assumptions, transactional back-testing or disposition analysis and reviews of any related market activity.
At March 31, 2016, securities valued at $7,375,142, or 2.1% of net assets, were fair valued in good faith under the direction of the Board.
18 calvert.com CALVERT INTERNATIONAL EQUITY FUND SEMI-ANNUAL REPORT (UNAUDITED)
The following table summarizes the market value of the Fund's holdings as of March 31, 2016, based on the inputs used to value them:
|
| | | | | | | | | | | |
| | VALUATION INPUTS |
| INVESTMENTS IN SECURITIES* | LEVEL 1 | LEVEL 2 | LEVEL 3 | TOTAL |
| Common Stocks** |
| $324,267,583 |
| $— |
| $— |
|
| $324,267,583 |
|
| Common Stocks - Venture Capital | — |
| — |
| 0 |
| 0 |
|
| Preferred Stocks - Venture Capital | — |
| — |
| 389,800 |
| 389,800 |
|
| Venture Capital Limited Partnership Interest | — |
| — |
| 1,659,972 |
| 1,659,972 |
|
| Venture Capital Debt Obligations | — |
| — |
| 501,406 |
| 501,406 |
|
| High Social Impact Investments | — |
| 4,361,519 |
| 462,445 |
| 4,823,964 |
|
| Exchange-Traded Products | 11,315,568 |
| — |
| — |
| 11,315,568 |
|
| Time Deposit | — |
| 4,374,743 |
| — |
| 4,374,743 |
|
| | | | | |
| TOTAL |
| $335,583,151 |
|
| $8,736,262 |
| $3,013,623^ |
|
| $347,333,036 |
|
| | | | | |
| * For a complete listing of investments, please refer to the Schedule of Investments. |
| ** For further breakdown of equity securities by country, please refer to the Schedule of Investments. Venture Capital is not included in this category. |
| ^ Level 3 securities represent 0.9% of net assets. |
On March 31, 2016, for certain securities which trade primarily outside the U.S., adjustments to prices due to movements against a specified benchmark were not necessary. As a result, $111,810,296 transferred out of Level 2 and into Level 1. The amount of this transfer was determined based on the fair value of such securities at the end of the period.
Restricted Securities: The Fund may invest in securities that are subject to legal or contractual restrictions on resale. Generally, these securities may only be sold publicly upon registration under the Securities Act of 1933 or in transactions exempt from such registration. Information regarding restricted securities is included at the end of the Schedule of Investments.
The Fund may invest in Community Investment Notes issued by the Calvert Social Investment Foundation (the “CSI Foundation”). The CSI Foundation is a 501(c)(3) non-profit organization that receives in-kind support from Calvert and its subsidiaries. The Fund has received an exemptive order from the Securities and Exchange Commission permitting the Fund to make investments in these notes under certain conditions.
Security Transactions and Investment Income: Security transactions are accounted for on trade date. Realized gains and losses are recorded on an identified cost basis and may include proceeds from litigation. Dividend income is recorded on the ex-dividend date or, in the case of dividends on certain foreign securities, as soon as the Fund is informed of the ex-dividend date. Withholding taxes on foreign dividends have been provided for in accordance with the Fund’s understanding of the applicable country’s tax rules and rates. Distributions received on securities that represent a return of capital are recorded as a reduction of cost of investments. Distributions received on securities that represent a capital gain are recorded as a realized gain. Interest income, which includes amortization of premium and accretion of discount on debt securities, is accrued as earned. Investment income and realized and unrealized gains and losses are allocated to separate classes of shares based upon the relative net assets of each class. Expenses arising in connection with a specific class are charged directly to that class. Expenses common to the classes are allocated to each class in proportion to their relative net assets.
Foreign Currency Transactions: The Fund’s accounting records are maintained in U.S. dollars. For valuation of assets and liabilities on each date of net asset value determination, foreign denominations are converted into U.S. dollars using the current exchange rate. Security transactions, income, and expenses are translated at the prevailing rate of exchange on the date of the event. The effect of changes in foreign exchange rates on securities and foreign currencies is included in the net realized and unrealized gain or loss on investments and assets and liabilities denominated in foreign currencies.
Distributions to Shareholders: Distributions to shareholders are recorded by the Fund on ex-dividend date. Dividends from net investment income and distributions from net realized capital gains, if any, are paid at least annually. Distributions are determined in accordance with income tax regulations which may differ from U.S. generally accepted accounting principles; accordingly, periodic reclassifications are made within the Fund's capital accounts to reflect income and gains available for distribution under income tax regulations.
calvert.com CALVERT INTERNATIONAL EQUITY FUND SEMI-ANNUAL REPORT (UNAUDITED) 19
Estimates: The preparation of financial statements in conformity with U.S. generally accepted accounting principles requires management to make estimates and assumptions that affect the reported amounts of assets and liabilities and disclosure of contingent assets and liabilities at the date of the financial statements and the reported amounts of increases and decreases in net assets from operations during the reporting period. Actual results could differ from those estimates.
Redemption Fees: The Fund charged a 2% redemption fee on redemptions, including exchanges, made within 30 days of purchase in the same Fund. The redemption fee was accounted for as an addition to paid-in capital. This fee was eliminated effective February 2, 2015.
Federal Income Taxes: No provision for federal income or excise tax is required since the Fund intends to continue to qualify as a regulated investment company under the Internal Revenue Code and to distribute substantially all of its taxable earnings.
Management has analyzed the Fund's tax positions taken for all open federal income tax years and has concluded that no provision for federal income tax is required in the Fund's financial statements. A Fund's federal tax return is subject to examination by the Internal Revenue Service for a period of three years.
NOTE B — RELATED PARTY TRANSACTIONS
Calvert Investment Management, Inc. (the “Advisor”) is wholly-owned by Calvert Investments, Inc., which is indirectly wholly-owned by Ameritas Mutual Holding Company. The Advisor provides investment advisory services and pays the salaries and fees of officers and Directors of the Fund who are employees of the Advisor or its affiliates. For its services, the Advisor receives an annual fee, payable monthly, on the following rates of the Fund’s average daily net assets: 0.75% on the first $250 million, 0.725% on the next $250 million, and 0.675% on the excess of $500 million.
The Advisor has contractually agreed to limit net annual Fund operating expenses through January 31, 2017. The contractual expense caps are 1.38%, 2.14%, 0.95%, and 1.13% for Class A, Class C, Class I, and Class Y, respectively. For the purpose of this expense limit, operating expenses do not include interest expense, brokerage commissions, taxes and extraordinary expenses. This expense limitation does not limit acquired fund fees and expenses, if any.
Calvert Investment Administrative Services, Inc. ("CIAS"), an affiliate of the Advisor, provides administrative services to the Fund for an annual fee, payable monthly, based on the Fund’s average daily net assets.
For the period October 1, 2015 to January 31, 2016, the administrative fee was 0.35% for Class A, C and Y and 0.15% for Class I. CIAS and the Fund entered into an Amended and Restated Administrative Services Agreement that established a 0.12% administrative fee for all classes of the Fund commencing on February 1, 2016. CIAS voluntarily waived 0.23% for Class A, C and Y shares of the Fund and 0.03% for Class I shares of the Fund (the amount of the administrative fee above 0.12%) for the period from December 1, 2015 through January 31, 2016. During the six-month period ended March 31, 2016, CIAS voluntarily waived $85,651.
Calvert Investment Distributors, Inc. (“CID”), an affiliate of the Advisor, is the distributor and principal underwriter for the Fund. Pursuant to Rule 12b-1 under the Investment Company Act of 1940, the Fund has adopted a Distribution Plan that permits the Fund to pay certain expenses associated with the distribution and servicing of its shares. The expenses paid may not exceed 0.35% and 1.00% annually of the average daily net assets of Class A and C, respectively. The amount actually paid by the Fund is an annualized fee, payable monthly, of 0.25% and 1.00% of the Fund’s average daily net assets of Class A and C shares, respectively. Class I and Class Y shares do not have Distribution Plan expenses.
CID received $17,662 as its portion of commissions charged on sales of the Fund’s Class A shares for the period ended March 31, 2016.
Calvert Investment Services, Inc. (“CIS”), an affiliate of the Advisor, acts as shareholder servicing agent for the Fund. For its services, CIS received a fee of $45,670 for the period ended March 31, 2016. Boston Financial Data Services, Inc. is the transfer and dividend disbursing agent.
Each Director of the Fund who is not an employee of the Advisor or its affiliates receives an annual retainer of $52,000 plus a meeting fee of up to $3,000 for each Board meeting attended. Additional fees of $6,000 annually may be paid to the Committee chairs ($10,000 for the Board Chair and the Special Equities Committee chair) and $2,500 annually may be paid to Committee members, plus a Committee meeting fee of $500 for each Committee meeting attended. Eligible Directors may participate in a Deferred Compensation Plan (the “Plan”). Obligations of the Plan will be paid solely out of the Fund’s assets. Directors’ fees are allocated to each of the funds served.
NOTE C — INVESTMENT ACTIVITY AND TAX INFORMATION
During the period, the cost of purchases and proceeds from sales of investments, other than short-term securities, were $163,966,516 and $142,350,895, respectively.
20 calvert.com CALVERT INTERNATIONAL EQUITY FUND SEMI-ANNUAL REPORT (UNAUDITED)
|
| | | |
| Capital Loss Carryforwards | |
| EXPIRATION DATE | |
| 2017 |
| ($19,653,860 | ) |
| 2018 | (105,942,268 | ) |
| 2019 | (10,386,632 | ) |
Under the Regulated Investment Company Modernization Act of 2010, capital losses incurred in taxable years beginning after December 22, 2010 can be carried forward to offset future capital gains for an unlimited period. These losses are required to be utilized prior to the losses incurred in pre-enactment taxable years will retain their character as either long-term or short-term. Losses incurred in pre-enactment taxable years can be utilized until expiration. The Fund's use of net capital losses acquired from reorganizations may be limited under certain tax provisions.
As of March 31, 2016, the tax basis components of unrealized appreciation/(depreciation) and the federal tax cost were as follows:
|
| | | | |
| Unrealized appreciation |
| $17,881,091 |
| |
| Unrealized (depreciation) | (20,687,979 | ) | |
| Net unrealized appreciation (depreciation) |
| ($2,806,888 | ) | |
| Federal income tax cost of investments |
| $350,139,924 |
| |
NOTE D — LINE OF CREDIT
A financing agreement is in place with the Calvert Funds and State Street Corporation (“SSC”). Under the agreement, SSC provides an unsecured line of credit facility, in the aggregate amount of $50 million ($25 million committed and $25 million uncommitted), accessible by the Calvert Funds for temporary or emergency purposes only. Borrowings bear interest at the higher of the London Interbank Offered Rate (LIBOR) or the overnight Federal Funds Rate plus 1.25% per annum. A commitment fee of 0.20% per annum is incurred on the unused portion of the committed facility. An administrative fee of $25,000 was paid in connection with the uncommitted facility. These fees are allocated to all participating funds. The Fund had no borrowings under the agreement during the period ended March 31, 2016.
NOTE E — AFFILIATED COMPANIES
An affiliated company is a company in which the Fund has a direct or indirect ownership of, control of, or voting power of 5 percent or more of the outstanding voting shares. Affiliated companies of the Fund as of March 31, 2016 are as follows:
|
| | | | | | | | | | | | | | | | | | | | | |
| Name of Affiliated Company | Market Value 9/30/15 | Purchases at Cost | Proceeds from Sales | Net Realized Gain (Loss) | Change in Unrealized Gain (Loss) | Market Value 3/31/16 | Dividend Income |
| gNet Defta Development Holdings LLC, LP |
| $313,541 |
|
| $— |
|
| $— |
|
| $— |
|
| ($8,784 | ) |
| $304,757 |
|
| $— |
|
| SEAF Central and Eastern European Growth Fund LLC, LP | 316,913 |
| — |
| (31,540 | ) | — |
| 28,151 |
| 313,524 |
| — |
|
| TOTAL |
| $630,454 |
|
| $— |
|
| ($31,540 | ) |
| $— |
|
| $19,367 |
|
| $618,281 |
|
| $— |
|
NOTE F — CAPITAL COMMITMENTS
In connection with certain venture capital investments, the Fund is committed to future capital calls, which will increase the Fund’s investment in these securities. The aggregate amount of the future capital commitments totals $1,218,408 at March 31, 2016.
calvert.com CALVERT INTERNATIONAL EQUITY FUND SEMI-ANNUAL REPORT (UNAUDITED) 21
NOTE G — LIMITED PARTNERSHIP INVESTMENT
The Fund executed agreements to invest in the following limited partnerships:
|
| | | | | | |
| Name of Partnership | Total Capital Commitment | Unfunded Commitment at 3/31/16 |
| Africa Renewable Energy Fund, LP |
| $1,000,000 |
|
| $655,336 |
|
| BFSE Holding, BV, LP | 494,429 |
| 14,435 |
|
| Blackstone Clean Technology Partners, LP | 79,361 |
| 508 |
|
| China Environment Fund 2004, LP | 500,000 |
| 37,764 |
|
| Emerald Sustainability Fund I, LP | 1,246,310 |
| — |
|
| Mainstream Brazil Impact Investing Fund, LP | 500,000 |
| 479,955 |
|
| SEAF Central and Eastern European Growth Fund LLC, LP | 1,060,000 |
| — |
|
| SEAF India International Growth Fund, LP | 482,500 |
| — |
|
| Terra Capital LP | 500,000 |
| 30,410 |
|
| TOTAL |
| $5,862,600 |
|
| $1,218,408 |
|
NOTE H — SUBSEQUENT EVENTS
In preparing the financial statements as of March 31, 2016, no subsequent events or transactions occurred that would have required recognition or disclosure in these financial statements.
22 calvert.com CALVERT INTERNATIONAL EQUITY FUND SEMI-ANNUAL REPORT (UNAUDITED)
CALVERT INTERNATIONAL EQUITY FUND
FINANCIAL HIGHLIGHTS
|
| | | | | | | | | | | | | | | | | | | | | | | |
| | PERIODS ENDED |
| CLASS A SHARES | March 31, 2016 (a) (Unaudited) | | September 30, 2015 (a) | | September 30, 2014 (a) | | September 30, 2013 (a) | | September 30, 2012 (a) | | September 30, 2011 (a) |
| Net asset value, beginning |
| $15.62 |
| |
| $16.51 |
| |
| $16.44 |
| |
| $13.49 |
| |
| $11.84 |
| |
| $13.88 |
|
| Income from investment operations: | | | | | | | | | | | |
| Net investment income | 0.06 |
| | 0.18 |
| | 0.15 |
| | 0.08 |
| | 0.12 |
| | 0.15 |
|
| Net realized and unrealized gain (loss) | (0.36) |
| | (0.97) |
| | 0.02 |
| | 2.98 |
| | 1.68 |
| | (2.15) |
|
| Total from investment operations | (0.30) |
| | (0.79) |
| | 0.17 |
| | 3.06 |
| | 1.80 |
| | (2.00) |
|
| Distributions from: | | | | | | | | | | | |
| Net investment income | (0.14) |
| | (0.10) |
| | (0.10) |
| | (0.11) |
| | (0.15) |
| | (0.04) |
|
| Total distributions | (0.14) |
| | (0.10) |
| | (0.10) |
| | (0.11) |
| | (0.15) |
| | (0.04) |
|
| Total increase (decrease) in net asset value | (0.44) |
| | (0.89) |
| | 0.07 |
| | 2.95 |
| | 1.65 |
| | (2.04) |
|
| Net asset value, ending |
| $15.18 |
| |
| $15.62 |
| |
| $16.51 |
| |
| $16.44 |
| |
| $13.49 |
| |
| $11.84 |
|
| Total return (b) | (1.96 | %) | | (4.78 | %) | | 0.99 | % | | 22.82 | % | | 15.34 | % | | (14.47 | %) |
| Ratios to average net assets: (c) | | | | | | | | | | | |
| Net investment income | 0.80%(d) |
| | 1.08 | % | | 0.88 | % | | 0.52 | % | | 0.96 | % | | 1.03 | % |
| Total expenses | 1.66%(d) |
| | 1.67 | % | | 1.66 | % | | 1.76 | % | | 1.84 | % | | 1.80 | % |
| Net expenses | 1.38%(d) |
| | 1.54 | % | | 1.66 | % | | 1.76 | % | | 1.80 | % | | 1.80 | % |
| Portfolio turnover | 43 | % | | 97 | % | | 82 | % | | 40 | % | | 43 | % | | 49 | % |
| Net assets, ending (in thousands) |
| $162,411 |
| |
| $167,225 |
| |
| $263,718 |
| |
| $242,464 |
| |
| $183,588 |
| |
| $173,936 |
|
| | | | | | | | | | | | |
| (a) Per share figures are calculated using the Average Shares Method. |
| (b) Total return is not annualized for periods of less than one year and does not reflect deduction of any front-end or deferred sales charge. |
| (c) Total expenses do not reflect amounts reimbursed and/or waived by the Advisor and certain of its affiliates, if applicable. Net expenses are net of all reductions and represent the net expenses paid by the Fund. |
| (d) Annualized. |
| See notes to financial statements. |
calvert.com CALVERT INTERNATIONAL EQUITY FUND SEMI-ANNUAL REPORT (UNAUDITED) 23
CALVERT INTERNATIONAL EQUITY FUND
FINANCIAL HIGHLIGHTS
|
| | | | | | | | | | | | | | | | | | | | | | | |
| | PERIODS ENDED |
| CLASS C SHARES | March 31, 2016 (a) (Unaudited) | | September 30, 2015 (a) | | September 30, 2014 (a) | | September 30, 2013 (a) | | September 30, 2012 (a) | | September 30, 2011 (a) |
| Net asset value, beginning |
| $13.47 |
| |
| $14.27 |
| |
| $14.26 |
| |
| $11.71 |
| |
| $10.26 |
| |
| $12.10 |
|
| Income from investment operations: | | | | | | | | | | | |
| Net investment income (loss) | —(b) |
| | 0.04 |
| | (0.01) |
| | (0.05) |
| | 0.01 |
| | 0.01 |
|
| Net realized and unrealized gain (loss) | (0.31) |
| | (0.84) |
| | 0.02 |
| | 2.60 |
| | 1.45 |
| | (1.85) |
|
| Total from investment operations | (0.31) |
| | (0.80) |
| | 0.01 |
| | 2.55 |
| | 1.46 |
| | (1.84) |
|
| Distributions from: | | | | | | | | | | | |
| Net investment income | (0.07) |
| | — |
| | — |
| | — |
| | (0.01) |
| | — |
|
| Total distributions | (0.07) |
| | — |
| | — |
| | — |
| | (0.01) |
| | — |
|
| Total increase (decrease) in net asset value | (0.38) |
| | (0.80) |
| | 0.01 |
| | 2.55 |
| | 1.45 |
| | (1.84) |
|
| Net asset value, ending |
| $13.09 |
| |
| $13.47 |
| |
| $14.27 |
| |
| $14.26 |
| |
| $11.71 |
| |
| $10.26 |
|
| Total return (c) | (2.32 | %) | | (5.61 | %) | | 0.07 | % | | 21.78 | % | | 14.23 | % | | (15.21 | %) |
| Ratios to average net assets: (d) | | | | | | | | | | | |
| Net investment income (loss) | 0.03%(e) |
| | 0.31 | % | | (0.06 | %) | | (0.40 | %) | | 0.05 | % | | 0.12 | % |
| Total expenses | 2.57%(e) |
| | 2.58 | % | | 2.57 | % | | 2.65 | % | | 2.72 | % | | 2.67 | % |
| Net expenses | 2.14%(e) |
| | 2.37 | % | | 2.57 | % | | 2.65 | % | | 2.69 | % | | 2.67 | % |
| Portfolio turnover | 43 | % | | 97 | % | | 82 | % | | 40 | % | | 43 | % | | 49 | % |
| Net assets, ending (in thousands) |
| $14,944 |
| |
| $15,997 |
| |
| $17,173 |
| |
| $17,746 |
| |
| $15,922 |
| |
| $16,195 |
|
| | | | | | | | | | | | |
| (a) Per share figures are calculated using the Average Shares Method. |
| (b) Amount is less than $0.005 per share. |
| (c) Total return is not annualized for periods of less than one year and does not reflect deduction of any front-end or deferred sales charge. |
| (d) Total expenses do not reflect amounts reimbursed and/or waived by the Advisor and certain of its affiliates, if applicable. Net expenses are net of all reductions and represent the net expenses paid by the Fund. |
| (e) Annualized. |
| See notes to financial statements. |
24 calvert.com CALVERT INTERNATIONAL EQUITY FUND SEMI-ANNUAL REPORT (UNAUDITED)
CALVERT INTERNATIONAL EQUITY FUND
FINANCIAL HIGHLIGHTS
|
| | | | | | | | | | | | | | | | | | | | | | | |
| | PERIODS ENDED |
| CLASS I SHARES | March 31, 2016 (a) (Unaudited) | | September 30, 2015 (a) | | September 30, 2014 (a) | | September 30, 2013 (a) | | September 30, 2012 (a) | | September 30, 2011 (a) |
| Net asset value, beginning |
| $16.73 |
| |
| $17.68 |
| |
| $17.69 |
| |
| $14.52 |
| |
| $12.70 |
| |
| $14.83 |
|
| Income from investment operations: | | | | | | | | | | | |
| Net investment income | 0.10 |
| | 0.30 |
| | 0.28 |
| | 0.17 |
| | 0.24 |
| | 0.26 |
|
| Net realized and unrealized gain (loss) | (0.38) |
| | (1.05) |
| | 0.02 |
| | 3.24 |
| | 1.79 |
| | (2.30) |
|
| Total from investment operations | (0.28) |
| | (0.75) |
| | 0.30 |
| | 3.41 |
| | 2.03 |
| | (2.04) |
|
| Distributions from: | | | | | | | | | | | |
| Net investment income | (0.28) |
| | (0.20) |
| | (0.31) |
| | (0.24) |
| | (0.21) |
| | (0.09) |
|
| Total distributions | (0.28) |
| | (0.20) |
| | (0.31) |
| | (0.24) |
| | (0.21) |
| | (0.09) |
|
| Total increase (decrease) in net asset value | (0.56) |
| | (0.95) |
| | (0.01) |
| | 3.17 |
| | 1.82 |
| | (2.13) |
|
| Net asset value, ending |
| $16.17 |
| |
| $16.73 |
| |
| $17.68 |
| |
| $17.69 |
| |
| $14.52 |
| |
| $12.70 |
|
| Total return (b) | (1.78 | %) | | (4.27 | %) | | 1.64 | % | | 23.74 | % | | 16.16 | % | | (13.84 | %) |
| Ratios to average net assets: (c) | | | | | | | | | | | |
| Net investment income | 1.24%(d) |
| | 1.68 | % | | 1.53 | % | | 1.07 | % | | 1.71 | % | | 1.74 | % |
| Total expenses | 1.02%(d) |
| | 1.03 | % | | 1.02 | % | | 1.06 | % | | 1.09 | % | | 1.07 | % |
| Net expenses | 0.95%(d) |
| | 0.98 | % | | 1.02 | % | | 1.06 | % | | 1.06 | % | | 1.06 | % |
| Portfolio turnover | 43 | % | | 97 | % | | 82 | % | | 40 | % | | 43 | % | | 49 | % |
| Net assets, ending (in thousands) |
| $147,366 |
| |
| $147,614 |
| |
| $92,318 |
| |
| $82,499 |
| |
| $101,203 |
| |
| $89,142 |
|
| | | | | | | | | | | | |
| (a) Per share figures are calculated using the Average Shares Method. |
| (b) Total return is not annualized for periods of less than one year and does not reflect deduction of any front-end or deferred sales charge. |
| (c) Total expenses do not reflect amounts reimbursed and/or waived by the Advisor and certain of its affiliates, if applicable. Net expenses are net of all reductions and represent the net expenses paid by the Fund. |
| (d) Annualized. |
| See notes to financial statements. |
calvert.com CALVERT INTERNATIONAL EQUITY FUND SEMI-ANNUAL REPORT (UNAUDITED) 25
CALVERT INTERNATIONAL EQUITY FUND
FINANCIAL HIGHLIGHTS
|
| | | | | | | | | | | | | | | | | | | | | | | |
| | PERIODS ENDED |
| CLASS Y SHARES | March 31, 2016 (a) (Unaudited) | | September 30, 2015 (a) | | September 30, 2014 (a) | | September 30, 2013 (a) | | September 30, 2012 (a) | | September 30, 2011 (a) |
| Net asset value, beginning |
| $16.54 |
| |
| $17.45 |
| |
| $17.38 |
| |
| $14.25 |
| |
| $12.45 |
| |
| $14.53 |
|
| Income from investment operations: | | | | | | | | | | | |
| Net investment income | 0.09 |
| | 0.27 |
| | 0.23 |
| | 0.14 |
| | 0.18 |
| | 0.24 |
|
| Net realized and unrealized gain (loss) | (0.39) |
| | (1.05) |
| | 0.02 |
| | 3.15 |
| | 1.77 |
| | (2.30) |
|
| Total from investment operations | (0.30) |
| | (0.78) |
| | 0.25 |
| | 3.29 |
| | 1.95 |
| | (2.06) |
|
| Distributions from: | | | | | | | | | | | |
| Net investment income | (0.24) |
| | (0.13) |
| | (0.18) |
| | (0.16) |
| | (0.15) |
| | (0.02) |
|
| Total distributions | (0.24) |
| | (0.13) |
| | (0.18) |
| | (0.16) |
| | (0.15) |
| | (0.02) |
|
| Total increase (decrease) in net asset value | (0.54) |
| | (0.91) |
| | 0.07 |
| | 3.13 |
| | 1.80 |
| | (2.08) |
|
| Net asset value, ending |
| $16.00 |
| |
| $16.54 |
| |
| $17.45 |
| |
| $17.38 |
| |
| $14.25 |
| |
| $12.45 |
|
| Total return (b) | (1.87 | %) | | (4.52 | %) | | 1.41 | % | | 23.27 | % | | 15.80 | % | | (14.20 | %) |
| Ratios to average net assets: (c) | | | | | | | | | | | |
| Net investment income | 1.08%(d) |
| | 1.52 | % | | 1.27 | % | | 0.90 | % | | 1.36 | % | | 1.56 | % |
| Total expenses | 1.29%(d) |
| | 1.37 | % | | 1.31 | % | | 1.41 | % | | 1.46 | % | | 1.51 | % |
| Net expenses | 1.13%(d) |
| | 1.22 | % | | 1.31 | % | | 1.39 | % | | 1.39 | % | | 1.39 | % |
| Portfolio turnover | 43 | % | | 97 | % | | 82 | % | | 40 | % | | 43 | % | | 49 | % |
| Net assets, ending (in thousands) |
| $22,935 |
| |
| $20,491 |
| |
| $17,479 |
| |
| $10,367 |
| |
| $7,535 |
| |
| $7,398 |
|
| | | | | | | | | | | | |
| (a) Per share figures are calculated using the Average Shares Method. |
| (b) Total return is not annualized for periods of less than one year and does not reflect deduction of any front-end or deferred sales charge. |
| (c) Total expenses do not reflect amounts reimbursed and/or waived by the Advisor and certain of its affiliates, if applicable. Net expenses are net of all reductions and represent the net expenses paid by the Fund. |
| (d) Annualized. |
| See notes to financial statements. |
26 calvert.com CALVERT INTERNATIONAL EQUITY FUND SEMI-ANNUAL REPORT (UNAUDITED)
PROXY VOTING
The Proxy Voting Guidelines of the Calvert Funds that the Fund uses to determine how to vote proxies relating to portfolio securities are provided as an Appendix to the Fund’s Statement of Additional Information. The Statement of Additional Information can be obtained free of charge by calling the Fund at 1-800-368-2745, by visiting the Calvert website at www.calvert.com; or by visiting the SEC’s website at www.sec.gov.
Information regarding how the Fund voted proxies relating to portfolio securities during the most recent 12-month period ended June 30 is available on the Fund’s website at www.calvert.com and on the SEC’s website at www.sec.gov.
AVAILABILITY OF QUARTERLY PORTFOLIO HOLDINGS
The Fund files its complete schedule of portfolio holdings with the SEC for the first and third quarters of each fiscal year on Form N-Q. The Fund’s Form N-Q is available on the SEC’s website at www.sec.gov. The Fund’s Form N-Q may be reviewed and copied at the SEC’s Public Reference Room in Washington, DC; information on the operation of the Public Reference Room may be obtained by calling 1-800-SEC-0330.
BASIS FOR BOARD'S APPROVAL OF INVESTMENT ADVISORY CONTRACT
At a meeting held on December 8, 2015, the Board of Directors, and by a separate vote, the disinterested Directors, approved the continuance of the Investment Advisory Agreement between Calvert World Values Fund, Inc. and the Advisor with respect to the Fund.
In evaluating the Investment Advisory Agreement, the Board considered a variety of information relating to the Fund and the Advisor. The disinterested Directors reviewed a report prepared by the Advisor regarding various services provided to the Fund by the Advisor and its affiliates. Such report included, among other data, information regarding the Advisor’s personnel and the Advisor’s revenue and cost of providing services to the Fund, and a separate report prepared by an independent third party, which provided a statistical analysis comparing the Fund’s investment performance, expenses and fees to comparable mutual funds.
The disinterested Directors were separately represented by independent legal counsel with respect to their consideration of the reapproval of the Investment Advisory Agreement. Prior to voting, the disinterested Directors reviewed the proposed continuance of the Investment Advisory Agreement with management and also met in private sessions with their counsel at which no representatives of management were present.
In the course of its deliberations regarding the Investment Advisory Agreement, the Board considered the following factors, among others: the nature, extent and quality of the services provided by the Advisor, including the personnel providing such services; the Advisor’s financial condition; the level and method of computing the Fund’s advisory fee; comparative performance, fee and expense information for the Fund; the profitability of the Calvert Family of Funds to the Advisor and its affiliates; the allocation of the Fund’s brokerage, including the Advisor’s process for monitoring “best execution”; the direct and indirect benefits, if any, derived by the Advisor and its affiliates from their relationship with the Fund; the effect of the Fund’s growth and size on the Fund’s performance and expenses; the affiliated distributor’s process for monitoring sales load breakpoints; the Advisor’s compliance programs and policies; the Advisor’s performance of substantially similar duties for other funds; and any possible conflicts of interest.
In considering the nature, extent and quality of the services provided by the Advisor under the Investment Advisory Agreement, the Board reviewed information provided by the Advisor relating to its operations and personnel, including, among other information, biographical information on the Advisor’s investment, supervisory and professional staff and descriptions of its organizational and management structure. The Board also took into account similar information provided periodically throughout the previous year by the Advisor as well as the Board’s familiarity with management through Board of Directors’ meetings, discussions and other reports. The Board considered the Advisor’s management style and its performance in employing its investment strategies, as well as its current level of staffing and overall resources. The Board also noted that it reviewed on a quarterly basis information regarding the Advisor’s compliance with applicable policies and procedures, including those related to personal investing. The Advisor’s administrative capabilities, including its ability to supervise the other service providers for the Fund, were also considered. The Board also took into account the responsible investing research and analysis provided by the Advisor to the Fund. The Board observed that the scope of services provided by the Advisor generally had expanded over time as a result of regulatory, market and other changes. The Board took into consideration, among other factors, the effectiveness of the Fund’s and Advisor’s processes, policies and procedures and the Advisor’s personnel. The Board also took into account, among other items, periodic reports received from the Advisor over the past year concerning the Advisor’s ongoing review and enhancement of certain processes, policies and procedures of the Fund and the Advisor. The Board concluded that it was satisfied with the nature, extent and quality of services provided to the Fund by the Advisor under the Investment Advisory Agreement.
calvert.com CALVERT INTERNATIONAL EQUITY FUND SEMI-ANNUAL REPORT (UNAUDITED) 27
In considering the Fund’s performance, the Board noted that it reviewed on a quarterly basis detailed information about the Fund’s performance results, portfolio composition and investment strategies. In addition, the Board took into account overall financial market conditions. The Board also reviewed various comparative data provided to it in connection with its consideration of the renewal of the Investment Advisory Agreement, including, among other information, a comparison of the Fund’s total return with its Lipper index and with that of other mutual funds deemed to be in its peer group by an independent third party in its report. This comparison indicated that the Fund performed above the median of its peer group for the one- and three-year periods ended June 30, 2015 and that the Fund performed below the median of its peer group for the five-year period ended June 30, 2015. The data also indicated that the Fund outperformed its Lipper index for the one-year period ended June 30, 2015 and underperformed its Lipper index for the three- and five-year periods ended June 30, 2015. The Board took into account management’s discussion of the Fund’s performance and noted that, the Adviser had assumed day-to-day responsibility for managing the entire Fund in March 2015. Based upon its review, the Board concluded that the Fund’s performance was satisfactory relative to the performance of funds with similar investment objectives and to relevant indices.
In considering the Fund’s fees and expenses, the Board compared the Fund’s fees and total expense ratio with various comparative data for the funds in its peer group. Among other findings, the data indicated that the Fund’s advisory fee (after taking into account waivers and/or reimbursements) was below the median of its peer group and total expenses (net of waivers and/or reimbursements) were above the median of its peer group. The Board noted that the allocation of advisory and administrative fees may vary among the Fund’s peer group. The Board also took into account the Advisor’s current undertaking to maintain expense limitations for the Fund and that the Advisor was reimbursing a portion of the Fund’s expenses. The Board noted the Advisor’s discussion of the Fund’s expenses and certain factors that affected the level of such expenses, including the cost of providing the responsible investing research and analysis provided by the Advisor. The Board noted that the Fund’s administrator had agreed to implement an administrative fee change effective December 1, 2015, which is expected to reduce the administrative fee paid by certain classes of shares; however, the impact of the fee change is not yet reflected in the Fund’s total expenses. Based upon its review, the Board concluded that the advisory fee was reasonable in view of the quality of services received by the Fund from the Advisor and the other factors considered.
The Board reviewed the Advisor’s profitability on a fund-by-fund basis. In reviewing the overall profitability of the advisory fee to the Fund’s Advisor, the Board also considered the fact that affiliates of the Advisor provided shareholder servicing, administrative and distribution services to the Fund for which they received compensation. The information considered by the Board included Calvert’s operating profit margin information both before and after tax expenses with respect to the services that the Advisor and its affiliates provided to the Calvert Family of Funds complex. The Board reviewed the profitability of the Advisor’s relationship with the Fund in terms of the total amount of annual advisory fees it received with respect to the Fund and whether the Advisor had the financial wherewithal to continue to provide services to the Fund. The Board noted that the Adviser was reimbursing a portion of the Fund’s expenses. The Board also noted the Advisor’s current undertaking to maintain expense limitations for certain share classes of the Fund. The Board also considered that the Advisor derived benefits to its reputation and other indirect benefits from its relationship with the Fund. Based upon its review, the Board concluded that the Advisor’s and its affiliates’ level of profitability from their relationship with the Fund was reasonable.
The Board considered the effect of the Fund’s current size and its potential growth on its performance and fees. The Board took into account that the Fund’s advisory fee schedule contained breakpoints that would reduce the advisory fee rate on assets above specified levels as the Fund’s assets increased. The Board noted that the Fund was currently realizing economies of scale in its advisory fee. The Board also noted that if the Fund’s assets increased over time, the Fund might realize other economies of scale if assets increased proportionally more than certain other expenses.
In reapproving the Investment Advisory Agreement, the Board, including the disinterested Directors, did not identify any single factor as controlling, and each Director may have attributed different weight to various factors.
Conclusions
The Board reached the following conclusions regarding the Investment Advisory Agreement, among others: (a) the Advisor has demonstrated that it possesses the capability and resources to perform the duties required of it under the Investment Advisory Agreement; (b) the Advisor is qualified to manage the Fund’s assets in accordance with the Fund’s investment objectives and policies; (c) the Advisor maintains appropriate compliance programs; (d) the Advisor is likely to execute its investment strategies consistently over time; (e) the Fund’s performance is satisfactory relative to the performance of funds with similar investment objectives and to relevant indices; and (f) the Fund’s advisory fee is reasonable in view of the quality of services received by the Fund from the Advisor, and the other factors considered. Based on its conclusions, the Board determined that reapproval of the Investment Advisory Agreement would be in the best interests of the Fund and its shareholders.
28 calvert.com CALVERT INTERNATIONAL EQUITY FUND SEMI-ANNUAL REPORT (UNAUDITED)
CALVERT INTERNATIONAL EQUITY FUND
Supplement to
Calvert Equity and Asset Allocation Funds Prospectus (Class A, C and Y)
dated February 1, 2016
Calvert Equity Funds Prospectus (Class I)
dated February 1, 2016
Date of Supplement: May 16, 2016
The information in this Supplement updates information in the Prospectus, supersedes any contrary information in the Prospectus or any prior supplement, and should be read in conjunction with the Prospectus.
Effective July 8, 2016, the Prospectus is hereby amended as follows:
Change of Principal Investment Strategies
The following text under "Investments, Risks and Performance – Principal Investment Strategies" in the Fund Summary is deleted:
The Fund invests no more than 5% of its net assets in U.S. companies (excluding High Social Impact and Special Equities investments). See "Special Investment Programs" in this Prospectus.
Special Investment Programs
The second paragraph under "Special Investment Programs" on page 78 of the Prospectus is deleted and replaced by the following text:
Calvert International Opportunities Fund limits investments in U.S. companies to 10% of net assets, excluding High Social Impact Investments and Special Equities.
[Not Part of Certified Shareholder Report]
|
|
| This page intentionally left blank. |
|
| | | | |
| CALVERT INTERNATIONAL EQUITY FUND | | CALVERT’S FAMILY OF FUNDS | | |
To Open an Account 800-368-2748 Service for Existing Account Shareholders: 800-368-2745 Brokers: 800-368-2746 Registered Mail Calvert Investments c/o BFDS, P.O. Box 219544 Kansas City, MO 64121-9544 Overnight Mail Calvert Investments c/o BFDS, 330 West 9th Street Kansas City, MO 64105 Web Site calvert.com Principal Underwriter Calvert Investment Distributors, Inc. 4550 Montgomery Avenue Suite 1000 North Bethesda, Maryland 20814 | | Municipal Funds Tax-Free Responsible Impact Bond Fund Taxable Bond Funds Bond Portfolio Income Fund Short Duration Income Fund Long-Term Income Fund Ultra-Short Income Fund High Yield Bond Fund Green Bond Fund Unconstrained Bond Fund Balanced and Asset Allocation Funds Balanced Portfolio Conservative Allocation Fund Moderate Allocation Fund Aggressive Allocation Fund | | Equity Funds Large Cap Core Portfolio Equity Portfolio Global Value Fund U.S. Large Cap Core Responsible Index Fund U.S. Large Cap Value Responsible Index Fund U.S. Large Cap Growth Responsible Index Fund U.S. Mid Cap Core Responsible Index Fund Developed Markets Ex-U.S. Responsible Index Fund Capital Accumulation Fund International Equity Fund Small Cap Fund Global Energy Solutions Fund Global Water Fund International Opportunities Fund Global Equity Income Fund Emerging Markets Equity Fund |
|
| |
| | |
This report is intended to provide fund information to shareholders. It is not authorized for distribution to prospective investors unless preceded or accompanied by a prospectus. Note: The information on our website is not incorporated by reference into this report; our website address is included as an inactive textual reference only. Investors should carefully consider the investment objectives, risks, charges and expenses of the Calvert Funds. This and other important information is contained in the fund’s summary prospectus and prospectus, which can be obtained from your financial professional and should be read carefully before investing. You may also call Calvert at 800/368-2748 or visit calvert.com. |
| Printed on recycled paper using soy inks. | |
|
| | |
| | |
| | | |
Calvert Capital Accumulation Fund
| | |
| | | |
| | |
|
| |
Semi-Annual Report March 31, 2016 E-Delivery Sign-Up — Details Inside | |
|
|
| |
Choose Planet-friendly E-delivery! Sign up now for on-line statements, prospectuses, and fund reports. In less than five minutes you can help reduce paper mail and lower fund costs. Just go to calvert.com. If you already have an online account at Calvert, click on Login, to access your Account, and select the documents you would like to receive via e-mail. If you’re new to online account access, click on Login, then Register to create your user name and password. Once you’re in, click on the E-delivery sign-up on the Account Portfolio page and follow the quick, easy steps. Note: if your shares are not held directly at Calvert but through a brokerage firm, you must contact your broker for electronic delivery options available through their firm. |
|
| | | |
| | | TABLE OF CONTENTS |
| | | | |
| | | | President’s Letter |
| | | | Portfolio Management Discussion |
| | | | Understanding Your Fund's Expenses |
| | | | Schedule of Investments |
| | | | Statement of Assets and Liabilities |
| | | | Statement of Operations |
| | | | Statements of Changes in Net Assets |
| | | | Notes to Financial Statements |
| | | | Financial Highlights |
| | | | Proxy Voting |
| | | | Availability of Quarterly Portfolio Holdings |
| | | | Basis for Board's Approval of Investment Advisory Contracts |
|
| | |
| John Streur President and Chief Executive Officer, Calvert Investments, Inc. | |
Dear Shareholders,
Historically, environmental and social initiatives have been accomplished through the singular passage of legislation designed to remediate the impact of one significant influence on a singular populace. Commencing with the anti-deforestation efforts in 1842, followed by environmental legislation in industrialized nations to regulate smoke pollution in 1863, arguably, a predecessor to the ubiquitous stop smoking campaigns of today; the previous approach, put forth largely by developed nations, served to the benefit of their citizens and not the rest of the Earth's populace - the majority.
However, the year of 2015 marked a dynamic and exciting shift in the resolution of contemporary environmental and social causes - global leaders from all facets of society, collectively, took action to create global policy platforms with far reaching agendas designed to accelerate our global society's evolution towards a more sustainable and inclusive state. The Pope's Encyclical, issued June 18, 2015, called for the establishment of a new partnership between science and religion to combat human-driven climate change. The United Nations formalized the United Nations Sustainable Development Goals, which included seventeen Sustainable Development Goals (SDGs) geared towards dramatically reducing poverty, fighting inequality and injustice, and tackling climate change by 2030. The COP 21 (Conference of Parties to the 21 session of the United Nations Framework Convention on Climate Change) introduced a historic agreement to combat climate change and accelerate both the action and investment needed for a sustainable low carbon future. Indeed, these are a mere few examples of the broad reaching directives recently initiated in order to encourage action and stress accountability.
Additionally, and importantly, resolution has not only been limited to direct impact policy changes, but also by investors’ behavior and preference. Recognizing the demand by investors to be influencers of change through their capital allocations, the United States Department of Labor (“DOL”) issued Interpretive Bulletin (“IB”) 2015-01 in October of 2015. This bulletin updated and clarified the DOL’s position on how fiduciary investors may best utilize knowledge of a prospective investment’s key environmental, social and governance indicators when making investment decisions for retirement plans. Essentially, the DOL has created a platform that allows fiduciaries to utilize ESG information in their investment decisions regarding a variety of retirement assets, including, but not limited to, IRA accounts; 401(K) accounts; and retirement accounts monitored by a company or union. This legislation is a powerful and fundamental change, especially given- retirement assets represent over $24 trillion and, thus if purposefully directed, may effect meaningful impact. IB 2015-01 is an exciting development in the world of socially responsible investing as it will provide access to vast amounts of capital that can be used to encourage and facilitate better corporate practices.
Change is here. Our challenge, collectively as socially conscious investors, will be to maintain its momentum and focus. Through your investment in the Calvert Funds you are engaged and influential in this movement. By allocating capital only to the best environmentally and socially governed corporations, we-alongside you, encourage good corporate citizenry. Our shareholder advocacy efforts, which fundamentally represent you as a shareholder, consistently monitor and challenge poor corporate policy, thus effecting positive outcomes. Through your support, we are able to partner with academics and industry renowned technicians to produce innovative research that will help to provide both better ESG investment solutions and a more lasting impact.
This is an exciting time and we at Calvert appreciate servicing you, as fund shareholders, and look forward to the future together as we navigate the waters of progress.
Respectfully,
John Streur
May 2016
calvert.com CALVERT CAPITAL ACCUMULATION FUND SEMI-ANNUAL REPORT (UNAUDITED) 1
|
| |
| PORTFOLIO MANAGEMENT DISCUSSION |
|
| |
| Michelle Clayman, CFA of New Amsterdam Partners, LLC |
|
| |
| Nathanial Paull, CFA of New Amsterdam Partners, LLC |
Market Review
Over the past six months, the Russell 1000 Index was up 7.75%, the Russell Midcap Index 5.94%, the Russell Midcap Growth Index 4.72% and the Russell 2000 Index 2.02%. As the numbers show, large cap outpaced small cap over the period, and growth stocks significantly lagged value in the mid cap area. The stock market moved higher in the fourth quarter, sold off sharply in the early weeks of 2016 but rallied just as sharply off of mid-February lows to finish the first quarter off with a modest gain. The volatility was brought on by a number of factors, not the least of which were falling commodity prices, weakening emerging markets, a lackluster earnings season, apprehension over the direction of interest rates domestically and abroad, and uncertainty surrounding the current US Electoral Cycle. 2015 was another year of sub-par GDP growth, and 2016 looks to be following a similar path, with a weak first quarter and the potential for the final number to be even lower than initial estimates.
Investment Strategy and Technique
Our core strategy, which remains unchanged, consists of using a valuation model to identify companies with better than average forecast growth and profitability selling at reasonable valuation multiples. We then subject those quantitatively derived buy candidates to rigorous fundamental analysis and apply prudent portfolio construction rules while ensuring that all eligible buy candidates are consistent with the Calvert Capital Accumulation Fund’s responsible investment critereia. During the past six months, we sold 28 names and bought 28 new positions leaving the total name count unchanged at 44* as of the end of March. Our largest overweight sectors (industrials and utilities) remained the same at the beginning and end of the period as did our largest underweights (the consumer sectors), while materials shifted from a market neutral position to overweight and previously market neutral health care had a less than benchmark representation as of the end of March.
Representative transactions undertaken over the past six months:
| |
| • | We sold utilities holding Questar when it was announced it would be acquired by Dominion Resources. We added propane distributor UGI Corp in its place. |
| |
| • | In financials, Jones Lang LaSalle was sold in part due to its large exposure to struggling Asian markets. Higher expected return name CBRE Group, a commercial real estate company with significantly less Asian exposure, replaced it. |
| |
| • | We added specialty chemicals name Albemarle to build our materials sector exposure to more closely align with model suggested weights. Albemarle was later sold when it reached its price target, and we purchased Minerals Technologies, a diversified chemicals company, to take its place. |
| |
| • | Retailer Buckle was sold amid struggling sales driven by weak shopping mall traffic. We added auto parts company Visteon in its place, which went on to reach a price target. Wanting to maintain auto components exposure, late in the period we replaced Visteon with BorgWarner, which specializes in powertrain technologies that improve fuel economy. |
* Does not include investments made through the Fund’s High Social Impact Investments Program (0.7% of net assets as of 3/31/16).
2 calvert.com CALVERT CAPITAL ACCUMULATION FUND SEMI-ANNUAL REPORT (UNAUDITED)
|
| | | | |
| | | | |
| | CALVERT CAPITAL ACCUMULATION FUND |
| | MARCH 31, 2016 | |
| | | | |
| | ECONOMIC SECTORS | % OF TOTAL INVESTMENTS | |
| | Consumer Discretionary | 23.6 | % | |
| | Industrials | 18.8 | % | |
| | Information Technology | 18.4 | % | |
| | Financials | 12.3 | % | |
| | Health Care | 11.3 | % | |
| | Materials | 6.5 | % | |
| | Consumer Staples | 4.9 | % | |
| | Utilities | 1.7 | % | |
| | Energy | 1.1 | % | |
| | Short-Term Investments | 0.7 | % | |
| | High Social Impact Investments | 0.7 | % | |
| | Total | 100 | % | |
| | | | |
Fund Performance Relative to the Benchmark
For the six months ending March 31, the Class A shares of the Fund were down 0.47% compared with 4.72% for the Russell Midcap Growth Index and 5.94% for the Russell Midcap Index. The underperformance occurred in the fourth quarter of 2015 and was the result of an abrupt market sentiment switch to a “risk-off” posture, with market leadership shifting to more defensive sectors (utilities, consumer staples) as concerns mounted over struggling emerging markets, weakening commodity prices and the Fed’s first interest rate hike in nine years. 2016 saw something of a reversal of the previous year’s high multiple, momentum stock leadership, as many of the beaten down, lower valuation names from the previous year rallied in the opening months of the year, contributing to the outperformance of the first quarter. Factors that helped performance over the past six months were our focus on higher ROE names and names with relatively low valuations compared to the benchmark; factors that worked against performance included our avoidance of relatively high debt names as well as our under-representation of relatively high dividend yield names within the benchmark. Lastly, compliance with Calvert’s revised social research platform resulted in the sale and replacement of several names which led to a short term drag on performance.
Stock level performance highlights:
| |
| • | Stock selection was strong in information technology, led by Super Micro Computer, which was up on strong earnings posted as well as optimism over its new server pipeline. |
| |
| • | Materials holding Worthington Industries delivered a positive earnings surprise thanks to relative strength in its auto and construction markets. |
|
| | | | | | |
| | | | | |
| | CALVERT CAPITAL ACCUMULATION FUND | |
| | MARCH 31, 2016 | |
| | | | | |
| | INVESTMENT PERFORMANCE | |
| | (TOTAL RETURN AT NAV) | |
| | | 6 MONTHS ENDED 3/31/16 | 12 MONTHS ENDED 3/31/16 | |
| | Class A | -0.47 | % | -8.92 | % | |
| | Class C | -0.87 | % | -9.65 | % | |
| | Class I | -0.21 | % | -8.42 | % | |
| | Class Y | -0.33 | % | -8.69 | % | |
| | Russell Midcap Growth Index | 4.72 | % | -4.75 | % | |
| | Lipper Mid-Cap Growth Funds Average | 0.88 | % | -8.46 | % | |
| | | | | |
| | Investment performance/return at NAV does not reflect the deduction of the Fund’s maximum 4.75% front-end sales charge or any deferred sales charges. | |
| | | | | |
| | TEN LARGEST STOCK HOLDINGS | % OF NET ASSETS | |
| | Ross Stores, Inc. | | 3.7 | % | |
| | Syntel, Inc. | | 3.2 | % | |
| | Avnet, Inc. | | 3.0 | % | |
| | CBOE Holdings, Inc. | | 2.9 | % | |
| | NeuStar, Inc., Class A | | 2.9 | % | |
| | Convergys Corp. | | 2.8 | % | |
| | Deluxe Corp. | | 2.7 | % | |
| | Worthington Industries, Inc. | | 2.7 | % | |
| | F5 Networks, Inc. | | 2.7 | % | |
| | Lennox International, Inc. | | 2.6 | % | |
| | Total | 29.2 | % | |
| | | | | |
| |
| • | Stock selection was weak in consumer discretionary, where Rent-A-Center lost ground on disappointing earnings due to weak gross margins and missteps entering the cell phone market. |
| |
| • | Industrials holding JetBlue retreated from recent highs when management reduced expectations for passenger revenue metrics at year end. |
| |
| • | In health care, Lannett was down after announcing disappointing preliminary quarterly results and reduced guidance stemming from weakness of the broader generic drug market. |
Positioning and Market Outlook
Based on a lackluster outlook for continued anemic GDP growth and the likelihood of low-to-mid single digit corporate earnings growth, we expect the stock market will continue to rise modestly into year-end, especially if economic statistics improve. The market would welcome a stabilization of energy and other commodity markets, but myriad risks
calvert.com CALVERT CAPITAL ACCUMULATION FUND SEMI-ANNUAL REPORT (UNAUDITED) 3
abound, including the consequences of China and other emerging markets struggling with low commodity prices and the ever present threat of global terrorism.
We are currently overweight in the industrials, utilities and materials sectors and underweight in the health care and the consumer sectors. We are continuing to stick to our investment discipline of looking for stocks with better than average growth and profitability selling at low multiples, which we expect will continue to prove itself over the long term, particularly since active management tends to add value in low return markets.
New Amsterdam Partners, LLC
May 2016
4 calvert.com CALVERT CAPITAL ACCUMULATION FUND SEMI-ANNUAL REPORT (UNAUDITED)
Growth of $10,000
The graph below shows the value of a hypothetical $10,000 investment in the Fund over the past 10 fiscal year periods. The results shown are for Class A shares, reflect the deduction of the maximum front-end Class A sales charge of 4.75%, and assume the reinvestment of dividends. The result is compared with a broad based market index. Market indexes are unmanaged and their results do not reflect the effect of expenses or sales charges. The value of an investment in a different share class would be different.
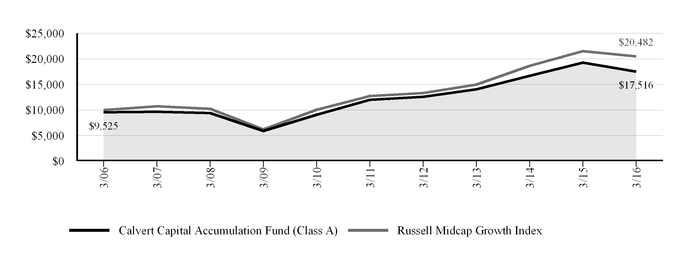
|
| | | | | | | |
| CALVERT CAPITAL ACCUMULATION FUND |
| MARCH 31, 2016 |
| AVERAGE ANNUAL TOTAL RETURNS | Ticker Symbol | 1 Year | 5 Year | 10 Year |
| Class A (with max. load) | CCAFX | -13.24 | % | 6.88 | % | 5.76 | % |
| Class C (with max. load) | CCACX | -10.55 | % | 7.07 | % | 5.44 | % |
| Class I | CCPIX | -8.42 | % | 8.59 | % | 7.07 | % |
| Class Y | CCAYX | -8.69 | % | 8.14 | % | 6.39 | % |
| Russell Midcap Growth Index | | -4.75 | % | 9.99 | % | 7.43 | % |
| Lipper Mid-Cap Growth Funds Average | | -8.46 | % | 7.58 | % | 5.98 | % |
| | | | | |
| Calvert Capital Accumulation Fund first offered Class Y shares on January 31, 2011. Performance prior to that date reflects the performance of Class A shares at net asset value (NAV). Actual Class Y share performance would have been different. |
| | | | | |
All performance data shown, including the graph above and the adjacent table, represents past performance, does not guarantee future results, assumes reinvestment of dividends and distributions, and does not reflect the deduction of taxes that a shareholder would pay on the Fund’s distributions or the redemption of the Fund shares. All performance data reflects fee waivers and/or expense limitations, if any are in effect; in their absence performance would be lower. See Note B in Notes to Financial Statements. The investment return and principal value of an investment will fluctuate so that an investor’s shares, when redeemed, may be worth more or less than their original cost. Current performance may be lower or higher than the performance data quoted; for current performance data, including most recent month-end, visit www.calvert.com. The gross expense ratio from the current prospectus for Class A shares is 1.28%. This number may differ from the expense ratio shown elsewhere in this report because it is based on a different time period and, if applicable, does not include fee or expense waivers. Performance data quoted already reflects the deduction of the Fund’s operating expenses.
calvert.com CALVERT CAPITAL ACCUMULATION FUND SEMI-ANNUAL REPORT (UNAUDITED) 5
UNDERSTANDING YOUR FUND'S EXPENSES
As an investor, you incur two types of costs. There are transaction costs, which generally include sales charges on purchases and may include redemption fees. There are also ongoing costs, which generally include management fees, distribution and/or service fees, and other fund expenses. The following information is intended to help you understand your ongoing costs (in dollars) of investing in this mutual fund and to help you compare these costs with the ongoing costs of investing in other mutual funds.
To illustrate these ongoing costs, we have provided examples and calculated the expenses paid by the fund's investors during the period. The actual and hypothetical information presented in the examples is based on an investment of $1,000 invested at the beginning of the period and held for the entire period (October 1, 2015 to March 31, 2016).
Actual Expenses
The first line of the table below provides information about actual account values and actual expenses. You may use the information in this line, together with the amount you invested, to estimate the expenses that you paid over the period. Simply divide your account value by $1,000 (for example, an $8,600 account value divided by $1,000 = 8.6), then multiply the result by the number in the first line under the heading entitled "Expenses Paid During Period" to estimate the expenses you paid on your account during this period.
The fund may charge an annual low balance account fee of $15 to those shareholders whose regular account balance is less than $2,000 ($1,000 for IRA accounts). If the low balance fee applies to your account, you should subtract the fee from the ending account value in the chart below.
Hypothetical Example for Comparison Purposes
The second line of the table below provides information about hypothetical account values and hypothetical expenses based on the Fund’s actual expense ratio and an assumed rate of return of 5% per year before expenses, which is not the Fund’s actual return. The hypothetical account values and expenses may not be used to estimate the actual ending account balance or expenses you paid for the period. You may use this information to compare the ongoing costs of investing in the Fund and other funds. To do so, compare the 5% hypothetical example with the 5% hypothetical examples that appear in the shareholder reports of the other funds.
Please note that the expenses shown in the table are meant to highlight your ongoing costs only and do not reflect any transactional costs, such as sales charges (loads). Therefore, the second line of the table is useful in comparing ongoing costs only, and will not help you determine the relative total costs of owning different funds. In addition, if these transactional costs were included, your costs would have been higher.
|
| | | | |
| | ANNUALIZED
EXPENSE RATIO | BEGINNING
ACCOUNT VALUE
10/1/15 | ENDING
ACCOUNT VALUE
3/31/16 | EXPENSES PAID
DURING PERIOD*
10/1/15 - 3/31/16 |
| Class A | | | | |
| Actual | 1.35% | $1,000.00 | $995.30 | $6.73 |
| Hypothetical (5% return per year before expenses) | 1.35% | $1,000.00 | $1,018.25 | $6.81 |
| Class C | | | | |
| Actual | 2.15% | $1,000.00 | $991.30 | $10.70 |
| Hypothetical (5% return per year before expenses) | 2.15% | $1,000.00 | $1,014.25 | $10.83 |
| Class I | | | | |
| Actual | 0.83% | $1,000.00 | $997.90 | $4.15 |
| Hypothetical (5% return per year before expenses) | 0.83% | $1,000.00 | $1,020.85 | $4.19 |
| Class Y | | | | |
| Actual | 1.05% | $1,000.00 | $996.70 | $5.24 |
| Hypothetical (5% return per year before expenses) | 1.05% | $1,000.00 | $1,019.75 | $5.30 |
| |
| * Expenses paid during the period are equal to the annualized expense ratio for each class as indicated above, multiplied by the average account value over the period, multiplied by 183/366 (to reflect the one-half year period). Expense ratios shown in the Financial Highlights represent the actual expenses incurred for the period. |
6 calvert.com CALVERT CAPITAL ACCUMULATION FUND SEMI-ANNUAL REPORT (UNAUDITED)
CALVERT CAPITAL ACCUMULATION FUND
SCHEDULE OF INVESTMENTS
MARCH 31, 2016 (Unaudited)
|
| | |
| | SHARES | VALUE ($) |
| COMMON STOCKS - 98.1% | | |
| Air Freight & Logistics - 2.6% | | |
| Hub Group, Inc., Class A * | 303,000 | 12,359,370 |
| | | |
| Airlines - 2.3% | | |
| JetBlue Airways Corp. * | 527,300 | 11,136,576 |
| | | |
| Auto Components - 4.7% | | |
| BorgWarner, Inc. | 319,600 | 12,272,640 |
| Gentherm, Inc. * | 247,600 | 10,297,684 |
| | | 22,570,324 |
| | | |
| Banks - 2.1% | | |
| ServisFirst Bancshares, Inc. | 229,800 | 10,203,120 |
| | | |
| Building Products - 2.6% | | |
| Lennox International, Inc. | 92,700 | 12,532,113 |
| | | |
| Chemicals - 1.9% | | |
| Minerals Technologies, Inc. | 161,200 | 9,164,220 |
| | | |
| Commercial Services & Supplies - 2.7% | | |
| Deluxe Corp. | 208,900 | 13,054,161 |
| | | |
| Communications Equipment - 2.7% | | |
| F5 Networks, Inc. * | 120,800 | 12,786,680 |
| | | |
| Containers & Packaging - 1.9% | | |
| Owens-Illinois, Inc. * | 560,700 | 8,948,772 |
| | | |
| Diversified Financial Services - 5.3% | | |
| CBOE Holdings, Inc. | 214,100 | 13,987,153 |
| FactSet Research Systems, Inc. | 77,100 | 11,682,963 |
| | | 25,670,116 |
| | | |
| Electronic Equipment & Instruments - 3.0% | | |
| Avnet, Inc. | 324,600 | 14,379,780 |
| | | |
| Energy Equipment & Services - 1.1% | | |
| FMC Technologies, Inc. * | 202,000 | 5,526,720 |
| | | |
| Gas Utilities - 1.6% | | |
| UGI Corp. | 197,400 | 7,953,246 |
| | | |
calvert.com CALVERT CAPITAL ACCUMULATION FUND SEMI-ANNUAL REPORT (UNAUDITED) 7
|
| | |
| | SHARES | VALUE ($) |
| COMMON STOCKS - CONT’D | | |
| Health Care Equipment & Supplies - 4.3% | | |
| Globus Medical, Inc., Class A * | 460,500 | 10,936,875 |
| Varian Medical Systems, Inc. * | 125,400 | 10,034,508 |
| | | 20,971,383 |
| | | |
| Health Care Providers & Services - 4.4% | | |
| AmerisourceBergen Corp. | 128,400 | 11,113,020 |
| Laboratory Corporation of America Holdings * | 87,500 | 10,248,875 |
| | | 21,361,895 |
| | | |
| Hotels, Restaurants & Leisure - 1.4% | | |
| International Speedway Corp., Class A | 176,810 | 6,526,057 |
| | | |
| Insurance - 2.5% | | |
| Reinsurance Group of America, Inc. | 123,800 | 11,915,750 |
| | | |
| IT Services - 8.9% | | |
| Convergys Corp. | 479,700 | 13,321,269 |
| NeuStar, Inc., Class A * | 567,800 | 13,967,880 |
| Syntel, Inc. * | 312,400 | 15,598,132 |
| | | 42,887,281 |
| | | |
| Life Sciences - Tools & Services - 1.0% | | |
| Mettler-Toledo International, Inc. * | 13,975 | 4,818,021 |
| | | |
| Machinery - 1.7% | | |
| Graco, Inc. | 100,600 | 8,446,376 |
| | | |
| Media - 2.5% | | |
| Scripps Networks Interactive, Inc., Class A | 181,900 | 11,914,450 |
| | | |
| Metals & Mining - 2.7% | | |
| Worthington Industries, Inc. | 364,900 | 13,005,036 |
| | | |
| Multiline Retail - 2.6% | | |
| Big Lots, Inc. | 272,000 | 12,318,880 |
| | | |
| Personal Products - 4.9% | | |
| Inter Parfums, Inc. | 370,800 | 11,457,720 |
| USANA Health Sciences, Inc. * | 99,500 | 12,081,290 |
| | | 23,539,010 |
| | | |
| Pharmaceuticals - 1.4% | | |
| Impax Laboratories, Inc. * | 215,300 | 6,893,906 |
| | | |
| Professional Services - 2.3% | | |
| Robert Half International, Inc. | 234,300 | 10,913,694 |
| | | |
8 calvert.com CALVERT CAPITAL ACCUMULATION FUND SEMI-ANNUAL REPORT (UNAUDITED)
|
| | |
| | SHARES | VALUE ($) |
| COMMON STOCKS - CONT’D | | |
| Real Estate Management & Development - 2.3% | | |
| CBRE Group, Inc., Class A * | 389,300 | 11,219,626 |
| | | |
| Road & Rail - 2.3% | | |
| Avis Budget Group, Inc. * | 409,730 | 11,210,213 |
| | | |
| Software - 1.3% | | |
| MicroStrategy, Inc., Class A * | 35,000 | 6,290,200 |
| | | |
| Specialty Retail - 8.7% | | |
| GNC Holdings, Inc., Class A | 209,000 | 6,635,750 |
| Lithia Motors, Inc., Class A | 127,500 | 11,134,575 |
| Ross Stores, Inc. | 309,000 | 17,891,100 |
| Select Comfort Corp. * | 332,200 | 6,441,358 |
| | | 42,102,783 |
| | | |
| Technology Hardware, Storage & Peripherals - 2.5% | | |
| Super Micro Computer, Inc. * | 352,800 | 12,023,424 |
| | | |
| Textiles, Apparel & Luxury Goods - 3.7% | | |
| Fossil Group, Inc. * | 120,200 | 5,339,284 |
| PVH Corp. | 123,800 | 12,263,628 |
| | | 17,602,912 |
| | | |
| Trading Companies & Distributors - 2.2% | | |
| United Rentals, Inc. * | 170,100 | 10,578,519 |
| | | |
| Total Common Stocks (Cost $454,202,702) | | 472,824,614 |
| | | |
| | | |
| | PRINCIPAL
AMOUNT ($) | VALUE ($) |
| HIGH SOCIAL IMPACT INVESTMENTS - 0.7% | | |
| Calvert Social Investment Foundation Notes: | | |
| 0.50%, 3/18/17 (a)(b) | 1,200,000 | 1,152,864 |
| 0.25%, 7/1/17 (a)(b) | 1,419,488 | 1,397,046 |
| ImpactAssets Global Sustainable Agriculture Notes, 0.00%, 11/3/20 (a)(b)(c) | 309,000 | 285,825 |
| ImpactAssets Microfinance Plus Notes, 0.00%, 11/3/20 (a)(b)(c) | 398,000 | 364,170 |
| | | |
| Total High Social Impact Investments (Cost $3,326,488) | | 3,199,905 |
| | | |
| | | |
calvert.com CALVERT CAPITAL ACCUMULATION FUND SEMI-ANNUAL REPORT (UNAUDITED) 9
|
| | | | |
| | PRINCIPAL
AMOUNT ($) | VALUE ($) |
|
| TIME DEPOSIT - 0.7% | | |
| State Street Bank Time Deposit, 0.278%, 4/1/16 | 3,606,790 | 3,606,790 |
|
| | | |
| Total Time Deposit (Cost $3,606,790) | | 3,606,790 |
|
| | | |
| | | |
| TOTAL INVESTMENTS (Cost $461,135,980) - 99.5% | | 479,631,309 |
|
| Other assets and liabilities, net - 0.5% | | 2,211,250 |
|
NET ASSETS - 100.0% | |
| $481,842,559 |
|
|
|
| |
| NOTES TO SCHEDULE OF INVESTMENTS |
| * Non-income producing security. |
| (a) Restricted securities represent 0.7% of the net assets of the Fund. |
| (b) This security was valued under the direction of the Board of Directors. See Note A. |
| (c) The coupon rate shown on floating or adjustable rate securities represents the rate in effect on March 31, 2016. |
|
| | |
| RESTRICTED SECURITIES | ACQUISITION DATES | COST ($) |
| Calvert Social Investment Foundation Notes, 0.50%, 3/18/17 | 3/18/16 | 1,200,000 |
| Calvert Social Investment Foundation Notes, 0.25%, 7/1/17 | 7/1/14 | 1,419,488 |
| ImpactAssets Global Sustainable Agriculture Notes, 0.00%, 11/3/20 | 11/13/15 | 309,000 |
| ImpactAssets Microfinance Plus Notes, 0.00%, 11/3/20 | 11/13/15 | 398,000 |
| See notes to financial statements. |
10 calvert.com CALVERT CAPITAL ACCUMULATION FUND SEMI-ANNUAL REPORT (UNAUDITED)
CALVERT CAPITAL ACCUMULATION FUND
STATEMENT OF ASSETS AND LIABILITIES
MARCH 31, 2016 (Unaudited)
|
| | | |
| ASSETS | |
| Investments in securities, at value (Cost $461,135,980) - see accompanying schedule |
| $479,631,309 |
|
| Receivable for securities sold | 23,917,463 |
|
| Receivable for shares sold | 873,823 |
|
| Dividends and interest receivable | 232,319 |
|
| Directors' deferred compensation plan | 275,184 |
|
| Total assets | 504,930,098 |
|
| | |
| LIABILITIES | |
| Payable for securities purchased | 21,752,582 |
|
| Payable for shares redeemed | 612,810 |
|
| Payable to Calvert Investment Management, Inc. | 259,044 |
|
| Payable to Calvert Investment Distributors, Inc. | 66,007 |
|
| Payable to Calvert Investment Administrative Services, Inc. | 44,087 |
|
| Payable to Calvert Investment Services, Inc. | 7,048 |
|
| Directors' deferred compensation plan | 275,184 |
|
| Accrued expenses and other liabilities | 70,777 |
|
| Total liabilities | 23,087,539 |
|
| NET ASSETS |
| $481,842,559 |
|
| | |
| NET ASSETS CONSIST OF: | |
| Paid-in capital applicable to the following shares of common stock, | |
| with 250,000,000 shares of $0.01 par value shares authorized: | |
| Class A: 6,894,205 shares outstanding |
| $185,846,238 |
|
| Class C: 1,241,472 shares outstanding | 29,967,263 |
|
| Class I: 6,470,564 shares outstanding | 234,693,459 |
|
| Class Y: 666,446 shares outstanding | 20,955,572 |
|
| Undistributed net investment income | 4,340,261 |
|
| Accumulated net realized gain (loss) | (12,455,563) |
|
| Net unrealized appreciation (depreciation) | 18,495,329 |
|
| NET ASSETS |
| $481,842,559 |
|
| | |
| NET ASSET VALUE PER SHARE | |
| Class A (based on net assets of $208,021,917) |
| $30.17 |
|
| Class C (based on net assets of $27,715,810) |
| $22.32 |
|
| Class I (based on net assets of $225,722,604) |
| $34.88 |
|
| Class Y (based on net assets of $20,382,228) |
| $30.58 |
|
| See notes to financial statements. |
calvert.com CALVERT CAPITAL ACCUMULATION FUND SEMI-ANNUAL REPORT (UNAUDITED) 11
CALVERT CAPITAL ACCUMULATION FUND
STATEMENT OF OPERATIONS
SIX MONTHS ENDED MARCH 31, 2016 (Unaudited)
|
| | | |
| NET INVESTMENT INCOME | |
| Investment Income: | |
| Dividend income |
| $7,096,109 |
|
| Interest income | 6,832 |
|
| Total investment income | 7,102,941 |
|
| | |
| Expenses: | |
| Investment advisory fee | 1,576,882 |
|
| Administrative fees | 389,028 |
|
| Transfer agency fees and expenses | 255,920 |
|
| Distribution Plan expenses: | |
| Class A | 262,431 |
|
| Class C | 141,207 |
|
| Directors' fees and expenses | 24,316 |
|
| Accounting fees | 50,426 |
|
| Custodian fees | 33,297 |
|
| Professional fees | 20,393 |
|
| Registration fees | 33,074 |
|
| Reports to shareholders | 28,097 |
|
| Miscellaneous | 9,374 |
|
| Total expenses | 2,824,445 |
|
| Administrative fees waived | (61,765) |
|
| Net expenses | 2,762,680 |
|
| NET INVESTMENT INCOME | 4,340,261 |
|
| | |
| | |
| REALIZED AND UNREALIZED GAIN (LOSS) ON INVESTMENTS | |
| Net realized gain (loss) | 5,435,233 |
|
| | |
| Change in unrealized appreciation (depreciation) | (12,160,236) |
|
| | |
| NET REALIZED AND UNREALIZED GAIN (LOSS) ON INVESTMENTS | (6,725,003) |
|
| | |
| INCREASE (DECREASE) IN NET ASSETS RESULTING FROM OPERATIONS |
| ($2,384,742 | ) |
| See notes to financial statements. |
12 calvert.com CALVERT CAPITAL ACCUMULATION FUND SEMI-ANNUAL REPORT (UNAUDITED)
CALVERT CAPITAL ACCUMULATION FUND
STATEMENTS OF CHANGES IN NET ASSETS
|
| | | | | | | |
| INCREASE (DECREASE) IN NET ASSETS | SIX MONTHS ENDED
MARCH 31, 2016 (Unaudited) | | YEAR ENDED
SEPTEMBER 30, 2015 |
| Operations: | | | |
| Net investment income (loss) |
| $4,340,261 |
| |
| ($1,153,687 | ) |
| Net realized gain (loss) | 5,435,233 |
| | 30,888,315 |
|
| Change in unrealized appreciation (depreciation) | (12,160,236) |
| | (15,807,702) |
|
| | | | |
| INCREASE (DECREASE) IN NET ASSETS RESULTING FROM OPERATIONS | (2,384,742) |
| | 13,926,926 |
|
| | | | |
| Distributions to shareholders from: | | | |
| Net realized gain: | | | |
| Class A shares | (20,253,194) |
| | (30,865,909) |
|
| Class B shares (a) | — |
| | (251,625) |
|
| Class C shares | (3,586,836) |
| | (4,946,653) |
|
| Class I shares | (19,759,432) |
| | (20,496,886) |
|
| Class Y shares | (1,435,594) |
| | (1,536,994) |
|
| Total distributions | (45,035,056) |
| | (58,098,067) |
|
| | | | |
| Capital share transactions: | | | |
| Shares sold: | | | |
| Class A shares (b) | 16,293,696 |
| | 40,170,404 |
|
| Class B shares (a) | — |
| | 4,705 |
|
| Class C shares | 2,517,944 |
| | 5,890,514 |
|
| Class I shares | 44,144,345 |
| | 112,345,198 |
|
| Class Y shares | 10,139,968 |
| | 5,526,066 |
|
| Reinvestment of distributions: | | | |
| Class A shares | 19,092,499 |
| | 28,980,344 |
|
| Class B shares (a) | — |
| | 238,368 |
|
| Class C shares | 3,032,821 |
| | 4,103,071 |
|
| Class I shares | 13,922,616 |
| | 11,967,403 |
|
| Class Y shares | 1,423,382 |
| | 1,529,030 |
|
| Redemption fees: | | | |
| Class A shares | — |
| | 210 |
|
| Class C shares | — |
| | 2 |
|
| Class I shares | — |
| | 191 |
|
| Shares redeemed: | | | |
| Class A shares | (28,892,780) |
| | (40,881,939) |
|
| Class B shares (a)(b) | — |
| | (1,716,203) |
|
| Class C shares | (3,750,225) |
| | (3,811,253) |
|
| Class I shares | (48,041,082) |
| | (26,371,471) |
|
| Class Y shares | (3,144,217) |
| | (3,626,477) |
|
| Total capital share transactions | 26,738,967 |
| | 134,348,163 |
|
| | | | |
| TOTAL INCREASE (DECREASE) IN NET ASSETS | (20,680,831) |
| | 90,177,022 |
|
| See notes to financial statements. |
calvert.com CALVERT CAPITAL ACCUMULATION FUND SEMI-ANNUAL REPORT (UNAUDITED) 13
CALVERT CAPITAL ACCUMULATION FUND
STATEMENTS OF CHANGES IN NET ASSETS - CONT’D
|
| | | | | | | |
| NET ASSETS | SIX MONTHS ENDED
MARCH 31, 2016 (Unaudited) | | YEAR ENDED
SEPTEMBER 30, 2015 |
| Beginning of period |
| $502,523,390 |
| |
| $412,346,368 |
|
| End of period (including undistributed net investment income of $4,340,261 and $0, respectively) |
| $481,842,559 |
| |
| $502,523,390 |
|
| | | | |
| CAPITAL SHARE ACTIVITY | | | |
| Shares sold: | | | |
| Class A shares (c) | 530,519 |
| | 1,124,697 |
|
| Class B shares (a) | — |
| | 151 |
|
| Class C shares | 106,300 |
| | 215,070 |
|
| Class I shares | 1,255,799 |
| | 2,747,606 |
|
| Class Y shares | 334,525 |
| | 152,704 |
|
| Reinvestment of distributions: | | | |
| Class A shares | 633,250 |
| | 877,129 |
|
| Class B shares (a) | — |
| | 9,308 |
|
| Class C shares | 135,636 |
| | 160,905 |
|
| Class I shares | 399,960 |
| | 319,557 |
|
| Class Y shares | 46,623 |
| | 45,862 |
|
| Shares redeemed: | | | |
| Class A shares | (954,164) |
| | (1,148,492) |
|
| Class B shares (a)(c) | — |
| | (60,520) |
|
| Class C shares | (165,083) |
| | (138,297) |
|
| Class I shares | (1,393,798) |
| | (662,101) |
|
| Class Y shares | (103,442) |
| | (101,580) |
|
| Total capital share activity | 826,125 |
| | 3,541,999 |
|
| | | | |
| (a) Class B Shares were converted into Class A Shares at the close of business on April 20, 2015. |
| (b) Amounts include $1,366,911 of share transactions that were redeemed from Class B shares and converted into Class A shares at the close of business on April 20, 2015. |
| (c) Amount includes 48,012 shares redeemed from Class B shares and 37,024 shares purchased into Class A shares at the close of business on April 20, 2015. |
| See notes to financial statements. |
14 calvert.com CALVERT CAPITAL ACCUMULATION FUND SEMI-ANNUAL REPORT (UNAUDITED)
NOTES TO FINANCIAL STATEMENTS
NOTE A — SIGNIFICANT ACCOUNTING POLICIES
General: Calvert Capital Accumulation Fund (the “Fund”), a series of Calvert World Values Fund, Inc., is registered under the Investment Company Act of 1940 as a non-diversified, open-end management investment company. Calvert World Values Fund, Inc. is comprised of four separate series. The operations of each series are accounted for separately. The Fund applies the accounting and reporting guidance in the Financial Accounting Standards Board (FASB) Accounting Standards Codification Topic 946, Financial Services – Investment Companies (ASC 946).
The Fund offers four classes of shares of capital stock - Classes A, C, I, and Y. The Fund also offered Class B shares; however all Class B shares were converted to Class A shares effective April 20, 2015 and are no longer available. Class A shares are sold with a maximum front-end sales charge of 4.75%. Class C shares are sold without a front-end sales charge and, with certain exceptions, will be charged a deferred sales charge on shares sold within one year of purchase. Class C shares have higher levels of expenses than Class A shares. Class I shares require a minimum account balance of $1,000,000. The $1 million minimum initial investment is waived for retirement plans that trade through omnibus accounts and may be waived in certain other instances where it is believed to be in the best interest of the Fund and its shareholders. Class I shares have no front-end or deferred sales charge and have lower levels of expenses than Class A shares. Class Y shares are generally only available to wrap or similar fee-based programs offered by financial intermediaries, foundations, and endowments that have entered into an agreement with the Fund’s Distributor to offer Class Y shares. Class Y shares have no front-end or deferred sales charge and have lower levels of expenses than Class A shares. Each class has different: (a) dividend rates, due to differences in Distribution Plan expenses and other class-specific expenses, (b) exchange privileges; and (c) class-specific voting rights.
Security Valuation: Net asset value per share is determined every business day as of the close of the regular session of the New York Stock Exchange (generally 4:00 p.m. Eastern time). The Fund uses independent pricing services approved by the Board of Directors (“the Board”) to value its investments wherever possible. Investments for which market quotations are not available or deemed not reliable are fair valued in good faith under the direction of the Board.
The Board has adopted Valuation Procedures (the “Procedures”) to determine the fair value of securities and other financial instruments for which market prices are not readily available or which may not be reliably priced. The Board has delegated the day-to-day responsibility for determining the fair value of assets of the Fund to Calvert Investment Management, Inc. (the “Advisor” or “Calvert”) and has provided these Procedures to govern Calvert in its valuation duties.
Calvert has chartered an internal Valuation Committee to oversee the implementation of these Procedures and to assist it in carrying out the valuation responsibilities that the Board has delegated.
The Valuation Committee meets on a regular basis to review illiquid securities and other investments which may not have readily available market prices. The Valuation Committee’s fair valuation determinations are subject to review, approval and ratification by the Board at its next regularly scheduled meeting covering the calendar quarter in which the fair valuation was determined.
The Valuation Committee utilizes various methods to measure the fair value of the Fund’s investments. U.S. generally accepted accounting principles (GAAP) establishes a disclosure hierarchy that categorizes the inputs to valuation techniques used to value assets and liabilities at measurement date. These inputs are summarized in the three broad levels listed below:
Level 1 - quoted prices in active markets for identical securities
Level 2 - other significant observable inputs (including quoted prices for similar securities, interest rates, prepayment speeds, credit risk, etc.)
Level 3 - significant unobservable inputs (including the Fund’s own assumptions in determining the fair value of investments)
The inputs or methodologies used for valuing securities are not necessarily an indication of the risk associated with investing in those securities.
Changes in valuation techniques may result in transfers in or out of an investment’s assigned level within the hierarchy during the period. Transfers in and/or out of levels are determined based on the fair value of such securities at the end of the period. Valuation techniques used to value the Fund’s investments by major category are as follows:
Common stock securities, including restricted securities, for which market quotations are readily available, are valued at the last reported sale price or official closing price as reported by an independent pricing service on the primary market or exchange on which they are traded and are categorized as Level 1 in the hierarchy. In the event there were no sales during the day or closing prices are not available, securities are valued at the last quoted bid price or the last available price and are categorized as Level 2 in the hierarchy. Foreign securities are valued based on quotations from the principal market in which such securities are normally traded. If events occur after the close of the principal market in which foreign securities are
calvert.com CALVERT CAPITAL ACCUMULATION FUND SEMI-ANNUAL REPORT (UNAUDITED) 15
traded, and before the close of business of the Fund, that are expected to materially affect the value of those securities, then they are valued at their fair value taking these events into account and are categorized as Level 2 in the hierarchy. For restricted securities and private placements where observable inputs are limited, assumptions about market activity and risk are used and such securities are categorized as Level 3 in the hierarchy.
Debt securities, including restricted securities, are valued based on evaluated prices received from independent pricing services or from dealers who make markets in such securities and are generally categorized as Level 2 in the hierarchy. For restricted securities and private placements where observable inputs are limited, assumptions about market activity and risk are used and such securities are categorized as Level 3 in the hierarchy. Short-term securities of sufficient credit quality with remaining maturities of sixty days or less for which quotations are not readily available are valued at amortized cost, which approximates fair value, and are categorized as Level 2 in the hierarchy.
If a market value cannot be determined for a security using the methodologies described above, or if, in the good faith opinion of the Advisor, the market value does not constitute a readily available market quotation, or if a significant event has occurred that would materially affect the value of the security, the security will be fair valued as determined in good faith by the Valuation Committee.
The Valuation Committee considers a number of factors, including significant unobservable valuation inputs when arriving at fair value. It considers all significant facts that are reasonably available and relevant to the determination of fair value.
The Valuation Committee primarily employs a market-based approach which may use related or comparable assets or liabilities, recent transactions, market multiples, book values, and other relevant information for the investment to determine the fair value of the investment. When more appropriate, the Fund may employ an income-based or cost approach. An income-based valuation approach discounts anticipated future cash flows of the investment to calculate a present amount (discounted). The measurement is based on the value indicated by current market expectations about those future amounts. Discounts may also be applied due to the nature or duration of any restrictions on the disposition of the investments. A cost based approach is based on the amount that currently would be required to replace the service capacity of an asset (current replacement cost). From the seller’s perspective, the price that would be received for the asset is determined based on the cost to a buyer to acquire or construct a substitute asset of comparable utility, adjusted for obsolescence.
The values assigned to fair value investments are based on available information and do not necessarily represent amounts that might ultimately be realized. Further, due to the inherent uncertainty of valuations of such investments, the fair values may differ significantly from the values that would have been used had an active market existed, and the differences could be material. The Valuation Committee employs various methods for calibrating these valuation approaches including a regular review of key inputs and assumptions, transactional back-testing or disposition analysis and reviews of any related market activity.
At March 31, 2016, securities valued at $3,199,905, or 0.7% of net assets, were fair valued in good faith under the direction of the Board.
The following table summarizes the market value of the Fund's holdings as of March 31, 2016, based on the inputs used to value them:
|
| | | | | | | | | | | |
| | VALUATION INPUTS |
| INVESTMENTS IN SECURITIES* | LEVEL 1 | LEVEL 2 | LEVEL 3 | TOTAL |
| Common Stocks** |
| $472,824,614 |
| $— |
| $— |
|
| $472,824,614 |
|
| High Social Impact Investments | — |
| 2,549,910 |
| 649,995 |
| 3,199,905 |
|
| Time Deposit | — |
| 3,606,790 |
| — |
| 3,606,790 |
|
| | | | | |
| TOTAL |
| $472,824,614 |
|
| $6,156,700 |
| $649,995^ |
|
| $479,631,309 |
|
| | | | | |
| * For a complete listing of investments, please refer to the Schedule of Investments. |
| ** For further breakdown of equity securities by industry, please refer to the Schedule of Investments. |
| ^ Level 3 securities represent 0.1% of net assets. |
There were no transfers between levels during the period.
Restricted Securities: The Fund may invest in securities that are subject to legal or contractual restrictions on resale. Generally, these securities may only be sold publicly upon registration under the Securities Act of 1933 or in transactions exempt from such registration. Information regarding restricted securities is included at the end of the Schedule of Investments.
16 calvert.com CALVERT CAPITAL ACCUMULATION FUND SEMI-ANNUAL REPORT (UNAUDITED)
The Fund may invest in Community Investment Notes issued by the Calvert Social Investment Foundation (the “CSI Foundation”). The CSI Foundation is a 501(c)(3) non-profit organization that receives in-kind support from Calvert and its subsidiaries. The Fund has received an exemptive order from the Securities and Exchange Commission permitting the Fund to make investments in these notes under certain conditions.
Security Transactions and Investment Income: Security transactions are accounted for on trade date. Realized gains and losses are recorded on an identified cost basis and may include proceeds from litigation. Dividend income is recorded on the ex-dividend date. Distributions received on securities that represent a return of capital are recorded as a reduction of cost of investments. Distributions received on securities that represent a capital gain are recorded as a realized gain. Interest income, which includes amortization of premium and accretion of discount on debt securities, is accrued as earned. Investment income and realized and unrealized gains and losses are allocated to separate classes of shares based upon the relative net assets of each class. Expenses arising in connection with a specific class are charged directly to that class. Expenses common to the classes are allocated to each class in proportion to their relative net assets.
Distributions to Shareholders: Distributions to shareholders are recorded by the Fund on ex-dividend date. Dividends from net investment income and distributions from net realized capital gains, if any, are paid at least annually. Distributions are determined in accordance with income tax regulations which may differ from U.S. generally accepted accounting principles; accordingly, periodic reclassifications are made within the Fund's capital accounts to reflect income and gains available for distribution under income tax regulations.
Estimates: The preparation of financial statements in conformity with U.S. generally accepted accounting principles requires management to make estimates and assumptions that affect the reported amounts of assets and liabilities and disclosure of contingent assets and liabilities at the date of the financial statements and the reported amounts of increases and decreases in net assets from operations during the reporting period. Actual results could differ from those estimates.
Redemption Fees: The Fund charged a 2% redemption fee on redemptions, including exchanges, made within 30 days of purchase in the same Fund. The redemption fee was accounted for as an addition to paid-in capital. This fee was eliminated effective February 2, 2015.
Federal Income Taxes: No provision for federal income or excise tax is required since the Fund intends to continue to qualify as a regulated investment company under the Internal Revenue Code and to distribute substantially all of its taxable earnings.
Management has analyzed the Fund's tax positions taken for all open federal income tax years and has concluded that no provision for federal income tax is required in the Fund's financial statements. A Fund's federal tax return is subject to examination by the Internal Revenue Service for a period of three years.
NOTE B — RELATED PARTY TRANSACTIONS
Calvert Investment Management, Inc. (the “Advisor”) is wholly-owned by Calvert Investments, Inc., which is indirectly wholly-owned by Ameritas Mutual Holding Company. The Advisor provides investment advisory services and pays the salaries and fees of officers and Directors of the Fund who are employees of the Advisor or its affiliates. For its services, the Advisor receives an annual fee, payable monthly, of 0.65% of the Fund’s average daily net assets.
The Advisor has contractually agreed to limit net annual fund operating expenses through January 31, 2017. The contractual expense caps are 1.59%, 2.34%, 0.86%, and 1.44% for Class A, C, I, and Y, respectively. Prior to February 1, 2016, the contractual expense caps were 1.59%, 2.59%, 0.86%, and 1.44% for Class A, C, I, and Y, respectively. For the purpose of this expense limit, operating expenses do not include interest expense, brokerage commissions, taxes, and extraordinary expenses. This expense limitation does not limit acquired fund fees or expenses, if any.
Calvert Investment Administrative Services, Inc. ("CIAS"), an affiliate of the Advisor, provides administrative services to the Fund for an annual fee, payable monthly, based on the Fund’s average daily net assets.
For the period October 1, 2015 to January 31, 2016, the administrative fee was 0.25% for Class A, C and Y and 0.10% for Class I. CIAS and the Fund entered into an Amended and Restated Administrative Services Agreement that established a 0.12% administrative fee for all classes of the Fund commencing on February 1, 2016. CIAS voluntarily waived 0.13% (the amount of the administrative fee above 0.12%) for Class A, C and Y shares of the Fund for the period from December 1, 2015 through January 31, 2016. CIAS has also contractually agreed to waive 0.02% for Class I shares of the Fund (the difference between the previous administrative fee and the new 0.12% fee) from February 1, 2016 through January 31, 2018. During the six-month period ended March 31, 2016, CIAS voluntarily waived $54,620.
Calvert Investment Distributors, Inc. (“CID”), an affiliate of the Advisor, is the distributor and principal underwriter for the Fund. Pursuant to Rule 12b-1 under the Investment Company Act of 1940, the Fund has adopted a Distribution Plan that permits the Fund to pay certain expenses associated with the distribution and servicing of its shares. The expenses paid may not exceed 0.35%
calvert.com CALVERT CAPITAL ACCUMULATION FUND SEMI-ANNUAL REPORT (UNAUDITED) 17
and 1.00% annually of the average daily net assets of Class A and C, respectively. The amount actually paid by the Fund is an annualized fee, payable monthly, of 0.25% and 1.00% of the Fund’s average daily net assets of Class A and C shares, respectively. Class I and Class Y shares do not have Distribution Plan expenses.
CID received $34,854 as its portion of commissions charged on sales of the Fund’s Class A shares for the period ended March 31, 2016.
Calvert Investment Services, Inc. (“CIS”), an affiliate of the Advisor, acts as shareholder servicing agent for the Fund. For its services, CIS received a fee of $41,522 for the period ended March 31, 2016. Boston Financial Data Services, Inc. is the transfer and dividend disbursing agent.
Each Director of the Fund who is not an employee of the Advisor or its affiliates receives an annual retainer of $52,000 plus a meeting fee of up to $3,000 for each Board meeting attended. Additional fees of $6,000 annually may be paid to the Committee chairs ($10,000 for the Board Chair and the Special Equities Committee chair) and $2,500 annually may be paid to Committee members, plus a Committee meeting fee of $500 for each Committee meeting attended. Eligible Directors may participate in a Deferred Compensation Plan (the “Plan”). Obligations of the Plan will be paid solely out of the Fund’s assets. Directors’ fees are allocated to each of the funds served.
NOTE C — INVESTMENT ACTIVITY AND TAX INFORMATION
During the period, the cost of purchases and proceeds from sales of investments, other than short-term securities, were $342,053,663 and $349,361,285, respectively.
As of March 31, 2016, the tax basis components of unrealized appreciation/(depreciation) and the federal tax cost were as follows:
|
| | | | |
| Unrealized appreciation |
| $43,617,004 |
| |
| Unrealized (depreciation) | (25,784,801 | ) | |
| Net unrealized appreciation (depreciation) |
| $17,832,203 |
| |
| Federal income tax cost of investments |
| $461,799,106 |
| |
NOTE D — LINE OF CREDIT
A financing agreement is in place with the Calvert Funds and State Street Corporation (“SSC”). Under the agreement, SSC provides an unsecured line of credit facility, in the aggregate amount of $50 million ($25 million committed and $25 million uncommitted), accessible by the Calvert Funds for temporary or emergency purposes only. Borrowings bear interest at the higher of the London Interbank Offered Rate (LIBOR) or the overnight Federal Funds Rate plus 1.25% per annum. A commitment fee of 0.20% per annum is incurred on the unused portion of the committed facility. An administrative fee of $25,000 was paid in connection with the uncommitted facility. These fees are allocated to all participating funds. The Fund had no loans outstanding pursuant to this line of credit at March 31, 2016.
For the six months ended March 31, 2016, borrowing information by the Fund under the agreement was as follows:
|
| | | |
| Average Daily Balance | Weighted Average
Interest Rate | Maximum
Amount Borrowed | Month of Maximum
Amount Borrowed |
| $209,697 | 1.51% | $8,187,488 | March 2016 |
NOTE E — SUBSEQUENT EVENTS
In preparing the financial statements as of March 31, 2016, no subsequent events or transactions occurred that would have required recognition or disclosure in these financial statements.
18 calvert.com CALVERT CAPITAL ACCUMULATION FUND SEMI-ANNUAL REPORT (UNAUDITED)
CALVERT CAPITAL ACCUMULATION FUND
FINANCIAL HIGHLIGHTS
|
| | | | | | | | | | | | | | | | | | | | | | | |
| | PERIODS ENDED |
| CLASS A SHARES | March 31, 2016 (a) (Unaudited) | | September 30, 2015 (a) | | September 30, 2014 (a) | | September 30, 2013 (a) | | September 30, 2012 (a) | | September 30, 2011 (a) |
| Net asset value, beginning |
| $33.41 |
| |
| $36.99 |
| |
| $36.83 |
| |
| $31.45 |
| |
| $26.00 |
| |
| $24.93 |
|
| Income from investment operations: | | | | | | | | | | | |
| Net investment income (loss) | 0.24 |
| | (0.16) |
| | (0.14) |
| | (0.18) |
| | (0.26) |
| | (0.28) |
|
| Net realized and unrealized gain (loss) | (0.40) |
| | 1.91 |
| | 2.94 |
| | 7.49 |
| | 7.64 |
| | 1.35 |
|
| Total from investment operations | (0.16) |
| | 1.75 |
| | 2.80 |
| | 7.31 |
| | 7.38 |
| | 1.07 |
|
| Distributions from: | | | | | | | | | | | |
| Net realized gain | (3.08) |
| | (5.33) |
| | (2.64) |
| | (1.93) |
| | (1.93) |
| | — |
|
| Total distributions | (3.08) |
| | (5.33) |
| | (2.64) |
| | (1.93) |
| | (1.93) |
| | — |
|
| Total increase (decrease) in net asset value | (3.24) |
| | (3.58) |
| | 0.16 |
| | 5.38 |
| | 5.45 |
| | 1.07 |
|
| Net asset value, ending |
| $30.17 |
| |
| $33.41 |
| |
| $36.99 |
| |
| $36.83 |
| |
| $31.45 |
| |
| $26.00 |
|
| Total return (b) | (0.47 | %) | | 4.90 | % | | 7.90 | % | | 24.74 | % | | 29.16 | % | | 4.29 | % |
| Ratios to average net assets: (c) | | | | | | | | | | | |
| Net investment income (loss) | 1.57%(d) |
| | (0.43 | %) | | (0.36 | %) | | (0.53 | %) | | (0.85 | %) | | (0.93 | %) |
| Total expenses | 1.39%(d) |
| | 1.41 | % | | 1.43 | % | | 1.48 | % | | 1.53 | % | | 1.58 | % |
| Net expenses | 1.35%(d) |
| | 1.41 | % | | 1.43 | % | | 1.48 | % | | 1.53 | % | | 1.58 | % |
| Portfolio turnover | 70 | % | | 74 | % | | 81 | % | | 73 | % | | 63 | % | | 65 | % |
| Net assets, ending (in thousands) |
| $208,022 |
| |
| $223,328 |
| |
| $215,683 |
| |
| $207,257 |
| |
| $157,016 |
| |
| $128,755 |
|
| | | | | | | | | | | | |
| (a) Per share figures are calculated using the Average Shares Method. |
| (b) Total return is not annualized for periods of less than one year and does not reflect deduction of any front-end or deferred sales charge. |
| (c) Total expenses do not reflect amounts reimbursed and/or waived by the Advisor and certain of its affiliates, if applicable. Net expenses are net of all reductions and represent the net expenses paid by the Fund. |
| (d) Annualized. |
| See notes to financial statements. |
calvert.com CALVERT CAPITAL ACCUMULATION FUND SEMI-ANNUAL REPORT (UNAUDITED) 19
CALVERT CAPITAL ACCUMULATION FUND
FINANCIAL HIGHLIGHTS
|
| | | | | | | | | | | | | | | | | | | | | | | |
| | PERIODS ENDED |
| CLASS C SHARES | March 31, 2016 (a) (Unaudited) | | September 30, 2015 (a) | | September 30, 2014 (a) | | September 30, 2013 (a) | | September 30, 2012 (a) | | September 30, 2011 (a) |
| Net asset value, beginning |
| $25.62 |
| |
| $29.76 |
| |
| $30.35 |
| |
| $26.44 |
| |
| $22.29 |
| |
| $21.55 |
|
| Income from investment operations: | | | | | | | | | | | |
| Net investment income (loss) | 0.08 |
| | (0.34) |
| | (0.34) |
| | (0.36) |
| | (0.42) |
| | (0.46) |
|
| Net realized and unrealized gain (loss) | (0.30) |
| | 1.53 |
| | 2.39 |
| | 6.20 |
| | 6.50 |
| | 1.20 |
|
| Total from investment operations | (0.22) |
| | 1.19 |
| | 2.05 |
| | 5.84 |
| | 6.08 |
| | 0.74 |
|
| Distributions from: | | | | | | | | | | | |
| Net realized gain | (3.08) |
| | (5.33) |
| | (2.64) |
| | (1.93) |
| | (1.93) |
| | — |
|
| Total distributions | (3.08) |
| | (5.33) |
| | (2.64) |
| | (1.93) |
| | (1.93) |
| | — |
|
| Total increase (decrease) in net asset value | (3.30) |
| | (4.14) |
| | (0.59) |
| | 3.91 |
| | 4.15 |
| | 0.74 |
|
| Net asset value, ending |
| $22.32 |
| |
| $25.62 |
| |
| $29.76 |
| |
| $30.35 |
| |
| $26.44 |
| |
| $22.29 |
|
| Total return (b) | (0.87 | %) | | 4.09 | % | | 7.06 | % | | 23.81 | % | | 28.11 | % | | 3.43 | % |
| Ratios to average net assets: (c) | | | | | | | | | | | |
| Net investment income (loss) | 0.74%(d) |
| | (1.23 | %) | | (1.12 | %) | | (1.30 | %) | | (1.64 | %) | | (1.79 | %) |
| Total expenses | 2.20%(d) |
| | 2.21 | % | | 2.19 | % | | 2.25 | % | | 2.33 | % | | 2.44 | % |
| Net expenses | 2.15%(d) |
| | 2.21 | % | | 2.19 | % | | 2.25 | % | | 2.33 | % | | 2.44 | % |
| Portfolio turnover | 70 | % | | 74 | % | | 81 | % | | 73 | % | | 63 | % | | 65 | % |
| Net assets, ending (in thousands) |
| $27,716 |
| |
| $29,837 |
| |
| $27,588 |
| |
| $25,311 |
| |
| $18,630 |
| |
| $12,973 |
|
| | | | | | | | | | | | |
| (a) Per share figures are calculated using the Average Shares Method. |
| (b) Total return is not annualized for periods of less than one year and does not reflect deduction of any front-end or deferred sales charge. |
| (c) Total expenses do not reflect amounts reimbursed and/or waived by the Advisor and certain of its affiliates, if applicable. Net expenses are net of all reductions and represent the net expenses paid by the Fund. |
| (d) Annualized. |
| See notes to financial statements. |
20 calvert.com CALVERT CAPITAL ACCUMULATION FUND SEMI-ANNUAL REPORT (UNAUDITED)
CALVERT CAPITAL ACCUMULATION FUND
FINANCIAL HIGHLIGHTS
|
| | | | | | | | | | | | | | | | | | | | | | | |
| | PERIODS ENDED |
| CLASS I SHARES | March 31, 2016 (a) (Unaudited) | | September 30, 2015 (a) | | September 30, 2014 (a) | | September 30, 2013 (a) | | September 30, 2012 (a) | | September 30, 2011 (a) |
| Net asset value, beginning |
| $38.05 |
| |
| $41.19 |
| |
| $40.50 |
| |
| $34.18 |
| |
| $27.94 |
| |
| $26.59 |
|
| Income from investment operations: | | | | | | | | | | | |
| Net investment income (loss) | 0.37 |
| | 0.06 |
| | 0.10 |
| | 0.03 |
| | (0.05) |
| | (0.06) |
|
| Net realized and unrealized gain (loss) | (0.46) |
| | 2.13 |
| | 3.23 |
| | 8.22 |
| | 8.22 |
| | 1.41 |
|
| Total from investment operations | (0.09) |
| | 2.19 |
| | 3.33 |
| | 8.25 |
| | 8.17 |
| | 1.35 |
|
| Distributions from: | | | | | | | | | | | |
| Net realized gain | (3.08) |
| | (5.33) |
| | (2.64) |
| | (1.93) |
| | (1.93) |
| | — |
|
| Total distributions | (3.08) |
| | (5.33) |
| | (2.64) |
| | (1.93) |
| | (1.93) |
| | — |
|
| Total increase (decrease) in net asset value | (3.17) |
| | (3.14) |
| | 0.69 |
| | 6.32 |
| | 6.24 |
| | 1.35 |
|
| Net asset value, ending |
| $34.88 |
| |
| $38.05 |
| |
| $41.19 |
| |
| $40.50 |
| |
| $34.18 |
| |
| $27.94 |
|
| Total return (b) | (0.21 | %) | | 5.53 | % | | 8.53 | % | | 25.55 | % | | 30.00 | % | | 5.08 | % |
| Ratios to average net assets: (c) | | | | | | | | | | | |
| Net investment income (loss) | 2.11%(d) |
| | 0.14 | % | | 0.24 | % | | 0.08 | % | | (0.16 | %) | | (0.20 | %) |
| Total expenses | 0.84%(d) |
| | 0.83 | % | | 0.82 | % | | 0.85 | % | | 0.88 | % | | 0.99 | % |
| Net expenses | 0.83%(d) |
| | 0.83 | % | | 0.82 | % | | 0.85 | % | | 0.86 | % | | 0.86 | % |
| Portfolio turnover | 70 | % | | 74 | % | | 81 | % | | 73 | % | | 63 | % | | 65 | % |
| Net assets, ending (in thousands) |
| $225,723 |
| |
| $236,228 |
| |
| $156,677 |
| |
| $130,705 |
| |
| $83,181 |
| |
| $21,144 |
|
| | | | | | | | | | | | |
| (a) Per share figures are calculated using the Average Shares Method. |
| (b) Total return is not annualized for periods of less than one year and does not reflect deduction of any front-end or deferred sales charge. |
| (c) Total expenses do not reflect amounts reimbursed and/or waived by the Advisor and certain of its affiliates, if applicable. Net expenses are net of all reductions and represent the net expenses paid by the Fund. |
| (d) Annualized. |
| See notes to financial statements. |
calvert.com CALVERT CAPITAL ACCUMULATION FUND SEMI-ANNUAL REPORT (UNAUDITED) 21
CALVERT CAPITAL ACCUMULATION FUND
FINANCIAL HIGHLIGHTS
|
| | | | | | | | | | | | | | | | | | | | | | | |
| | PERIODS ENDED |
| CLASS Y SHARES | March 31, 2016 (a) (Unaudited) | | September 30, 2015 (a) | | September 30, 2014 (a) | | September 30, 2013 (a) | | September 30, 2012 (a) | | September 30, 2011 (a)(b) |
| Net asset value, beginning |
| $33.78 |
| |
| $37.26 |
| |
| $37.04 |
| |
| $31.56 |
| |
| $26.03 |
| |
| $29.79 |
|
| Income from investment operations: | | | | | | | | | | | |
| Net investment income (loss) | 0.29 |
| | (0.07) |
| | (0.07) |
| | (0.12) |
| | (0.18) |
| | (0.15) |
|
| Net realized and unrealized gain (loss) | (0.41) |
| | 1.92 |
| | 2.93 |
| | 7.53 |
| | 7.64 |
| | (3.61) |
|
| Total from investment operations | (0.12) |
| | 1.85 |
| | 2.86 |
| | 7.41 |
| | 7.46 |
| | (3.76) |
|
| Distributions from: | | | | | | | | | | | |
| Net realized gain | (3.08) |
| | (5.33) |
| | (2.64) |
| | (1.93) |
| | (1.93) |
| | — |
|
| Total distributions | (3.08) |
| | (5.33) |
| | (2.64) |
| | (1.93) |
| | (1.93) |
| | — |
|
| Total increase (decrease) in net asset value | (3.20) |
| | (3.48) |
| | 0.22 |
| | 5.48 |
| | 5.53 |
| | (3.76) |
|
| Net asset value, ending |
| $30.58 |
| |
| $33.78 |
| |
| $37.26 |
| |
| $37.04 |
| |
| $31.56 |
| |
| $26.03 |
|
| Total return (c) | (0.33 | %) | | 5.16 | % | | 8.02 | % | | 24.98 | % | | 29.45 | % | | (12.62 | %) |
| Ratios to average net assets: (d) | | | | | | | | | | | |
| Net investment income (loss) | 1.89%(e) |
| | (0.20 | %) | | (0.17 | %) | | (0.36 | %) | | (0.59 | %) | | (0.74%)(e) |
|
| Total expenses | 1.09%(e) |
| | 1.18 | % | | 1.26 | % | | 1.29 | % | | 1.29 | % | | 1.49%(e) |
|
| Net expenses | 1.05%(e) |
| | 1.18 | % | | 1.26 | % | | 1.29 | % | | 1.29 | % | | 1.44%(e) |
|
| Portfolio turnover | 70 | % | | 74 | % | | 81 | % | | 73 | % | | 63 | % | | 65%(f) |
|
| Net assets, ending (in thousands) |
| $20,382 |
| |
| $13,130 |
| |
| $10,871 |
| |
| $14,719 |
| |
| $8,071 |
| |
| $7,968 |
|
| | | | | | | | | | | | |
| (a) Per share figures are calculated using the Average Shares Method. |
| (b) From January 31, 2011 inception. |
| (c) Total return is not annualized for periods of less than one year and does not reflect deduction of any front-end or deferred sales charge. |
| (d) Total expenses do not reflect amounts reimbursed and/or waived by the Advisor and certain of its affiliates, if applicable. Net expenses are net of all reductions and represent the net expenses paid by the Fund. |
| (e) Annualized. |
| (f) Portfolio turnover is not annualized for periods of less than one year. |
| See notes to financial statements. |
22 calvert.com CALVERT CAPITAL ACCUMULATION FUND SEMI-ANNUAL REPORT (UNAUDITED)
PROXY VOTING
The Proxy Voting Guidelines of the Calvert Funds that the Fund uses to determine how to vote proxies relating to portfolio securities are provided as an Appendix to the Fund’s Statement of Additional Information. The Statement of Additional Information can be obtained free of charge by calling the Fund at 1-800-368-2745, by visiting the Calvert website at www.calvert.com; or by visiting the SEC’s website at www.sec.gov.
Information regarding how the Fund voted proxies relating to portfolio securities during the most recent 12-month period ended June 30 is available on the Fund’s website at www.calvert.com and on the SEC’s website at www.sec.gov.
AVAILABILITY OF QUARTERLY PORTFOLIO HOLDINGS
The Fund files its complete schedule of portfolio holdings with the SEC for the first and third quarters of each fiscal year on Form N-Q. The Fund’s Form N-Q is available on the SEC’s website at www.sec.gov. The Fund’s Form N-Q may be reviewed and copied at the SEC’s Public Reference Room in Washington, DC; information on the operation of the Public Reference Room may be obtained by calling 1-800-SEC-0330.
BASIS FOR BOARD'S APPROVAL OF INVESTMENT ADVISORY CONTRACTS
At a meeting held on December 8, 2015, the Board of Directors, and by a separate vote, the disinterested Directors, approved the continuance of the Investment Advisory Agreement between Calvert World Values Fund, Inc. and the Advisor and the Investment Subadvisory Agreement between the Advisor and the Subadvisor with respect to the Fund.
In evaluating the Investment Advisory Agreement, the Board considered a variety of information relating to the Fund and the Advisor. The disinterested Directors reviewed a report prepared by the Advisor regarding various services provided to the Fund by the Advisor and its affiliates. Such report included, among other data, information regarding the Advisor’s personnel and the Advisor’s revenue and cost of providing services to the Fund, and a separate report prepared by an independent third party, which provided a statistical analysis comparing the Fund’s investment performance, expenses and fees to comparable mutual funds.
The disinterested Directors were separately represented by independent legal counsel with respect to their consideration of the reapproval of the Investment Advisory Agreement and the Investment Subadvisory Agreement. Prior to voting, the disinterested Directors reviewed the proposed continuance of the Investment Advisory Agreement and Investment Subadvisory Agreement with management and also met in private sessions with their counsel at which no representatives of management were present.
In the course of its deliberations regarding the Investment Advisory Agreement, the Board considered the following factors, among others: the nature, extent and quality of the services provided by the Advisor, including the personnel providing such services; the Advisor’s financial condition; the level and method of computing the Fund’s advisory fee; comparative performance, fee and expense information for the Fund; the profitability of the Calvert Family of Funds to the Advisor and its affiliates; the allocation of the Fund’s brokerage, including the Advisor’s process for monitoring “best execution”; the direct and indirect benefits, if any, derived by the Advisor and its affiliates from their relationship with the Fund; the effect of the Fund’s growth and size on the Fund’s performance and expenses; the affiliated distributor’s process for monitoring sales load breakpoints; the Advisor’s compliance programs and policies; the Advisor’s performance of substantially similar duties for other funds; and any possible conflicts of interest.
In considering the nature, extent and quality of the services provided by the Advisor under the Investment Advisory Agreement, the Board reviewed information provided by the Advisor relating to its operations and personnel, including, among other information, biographical information on the Advisor’s supervisory and professional staff and descriptions of its organizational and management structure. The Board also took into account similar information provided periodically throughout the previous year by the Advisor as well as the Board’s familiarity with management through Board of Directors’ meetings, discussions and other reports. The Board also noted that it reviewed on a quarterly basis information regarding the Advisor’s compliance with applicable policies and procedures, including those related to personal investing. The Advisor’s administrative capabilities, including its ability to supervise the other service providers for the Fund, were also considered. The Board also took into account the responsible investing research and analysis provided by the Advisor to the Fund. The Board observed that the scope of services provided by the Advisor generally had expanded over time as a result of regulatory, market and other changes. The Board took into consideration, among other factors, the effectiveness of the Fund’s and Advisor’s processes, policies and procedures and the Advisor’s personnel. The Board also took into account, among other items, periodic reports received from the Advisor over the past year concerning the Advisor’s ongoing review and enhancement of certain processes, policies and procedures of the Fund and the Advisor. The Board discussed the Advisor’s effectiveness in monitoring the performance of the Subadvisor and its timeliness in responding to performance issues. The Board concluded that it was satisfied with the nature, extent and quality of services provided to the Fund by the Advisor under the Investment Advisory Agreement.
calvert.com CALVERT CAPITAL ACCUMULATION FUND SEMI-ANNUAL REPORT (UNAUDITED) 23
In considering the Fund’s performance, the Board noted that it reviewed on a quarterly basis detailed information about the Fund’s performance results, portfolio composition and investment strategies. In addition, the Board took into account overall financial market conditions. The Board also reviewed various comparative data provided to it in connection with its consideration of the renewal of the Investment Advisory Agreement, including, among other information, a comparison of the Fund’s total return with its Lipper index and with that of other mutual funds deemed to be in its peer group by an independent third party in its report. This comparison indicated that the Fund performed above the median of its peer group for the one- and five-year periods ended June 30, 2015, and the Fund performed below the median of its peer group for the three-year period ended June 30, 2015. The data also indicated that the Fund outperformed its Lipper index for the one- and five-year periods ended June 30, 2015, and underperformed its Lipper index for the three-year period ended June 30, 2015. The Board took into account management’s discussion of the Portfolio’s performance and management’s continued monitoring of the Fund’s performance. Based upon its review, the Board concluded that appropriate action was being taken with respect to the Fund’s performance.
In considering the Fund’s fees and expenses, the Board compared the Fund’s fees and total expense ratio with various comparative data for the funds in its peer group. Among other findings, the data indicated that the Fund’s advisory fee was below the median of its peer group and total expenses were above the median of its peer group. The Board noted that the allocation of advisory and administrative fees may vary among the Fund’s peer group. The Board also took into account the Advisor’s current undertaking to maintain expense limitations for the Fund. The Board noted that the Advisor was not reimbursing any Fund expenses under the expense limitation. The Board noted the Advisor’s discussion of the Fund’s expenses and certain factors that affected the level of such expenses, including the cost of providing the responsible investing research and analysis provided by the Advisor. The Board noted that the Fund’s administrator had agreed to implement an administrative fee change effective December 1, 2015, which is expected to reduce the administrative fee paid by certain classes of shares; however, the impact of the fee change is not yet reflected in the Fund’s total expenses. Based upon its review, the Board concluded that the advisory fee was reasonable in view of the quality of services received by the Fund from the Advisor and the other factors considered.
The Board reviewed the Advisor’s profitability on a fund-by-fund basis. In reviewing the overall profitability of the advisory fee to the Fund’s Advisor, the Board also considered the fact that affiliates of the Advisor provided shareholder servicing, administrative and distribution services to the Fund for which they received compensation. The information considered by the Board included Calvert’s operating profit margin information both before and after tax expenses with respect to the services that the Advisor and its affiliates provided to the Calvert Family of Funds complex. The Board reviewed the profitability of the Advisor’s relationship with the Fund in terms of the total amount of annual advisory fees it received with respect to the Fund and whether the Advisor had the financial wherewithal to continue to provide services to the Fund. The Board took into account the Advisor’s current undertaking to maintain expense limitations for the Fund. The Board also considered that the Advisor derived benefits to its reputation and other indirect benefits from its relationship with the Fund. The Board also noted that the Advisor paid the subadvisory fee to the Subadvisor. Based upon its review, the Board concluded that the Advisor’s and its affiliates’ level of profitability from their relationship with the Fund was reasonable.
The Board considered the effect of the Fund’s current size and its potential growth on its performance and fees. The Board concluded that adding breakpoints to the advisory fee at specified asset levels would not be appropriate at this time given the Fund’s current size. The Board noted that if the Fund’s assets increased over time, the Fund might realize other economies of scale if assets increased proportionally more than certain other expenses.
In reapproving the Investment Advisory Agreement, the Board, including the disinterested Directors, did not identify any single factor as controlling, and each Director may have attributed different weight to various factors.
In evaluating the Investment Subadvisory Agreement, the disinterested Directors reviewed information provided by the Subadvisor relating to its operations, personnel, investment philosophy, strategies and techniques. Among other information, the Subadvisor provided biographical information on portfolio management and other professional staff, performance information for itself, and descriptions of its investment philosophies, strategies and techniques, organizational and management structures and brokerage policies and practices.
The Board reapproved the Investment Subadvisory Agreement between the Subadvisor and the Advisor based on a number of factors relating to the Subadvisor’s ability to perform under the Investment Subadvisory Agreement. In the course of its deliberations, the Board evaluated, among other factors: the nature, extent and the quality of the services provided by the Subadvisor; the Subadvisor’s management style and long-term performance record; the Fund’s performance record and the Subadvisor’s performance in employing its investment strategies; the Subadvisor’s current level of staffing and its overall resources; the qualifications and experience of the Subadvisor’s personnel; the Subadvisor’s financial condition with respect to its ability to perform the services required under the Investment Subadvisory Agreement; the Subadvisor’s risk management processes; the Subadvisor’s compliance systems, including those related to personal investing; and any disciplinary history. Based upon its review, the Board concluded that it was satisfied with the nature, extent and quality of services provided to the Fund by the Subadvisor under the Investment Subadvisory Agreement.
24 calvert.com CALVERT CAPITAL ACCUMULATION FUND SEMI-ANNUAL REPORT (UNAUDITED)
As noted above, the Board considered, among other information, the Fund’s performance during the one-, three- and five-year periods ended June 30, 2015 as compared to the Fund’s peer group and noted that it reviewed on a quarterly basis detailed information about the Fund’s performance results, portfolio composition and investment strategies. The Board noted the Advisor’s expertise and resources in monitoring the performance, investment style and risk-adjusted performance of the Subadvisor.
In considering the cost of services provided by the Subadvisor and the profitability to the Subadvisor of its relationship with the Fund, the Board noted that the subadvisory fee under the Investment Subadvisory Agreement was paid by the Advisor out of the advisory fee that the Advisor received under the Investment Advisory Agreement. The Board also relied on the ability of the Advisor to negotiate the Investment Subadvisory Agreement and the corresponding subadvisory fee at arm’s length. In addition, the Board took into account the fees the Subadvisor charged to its other clients and considered these fee comparisons in light of the differences in managing these other accounts. Based upon its review, the Board concluded that the subadvisory fee was reasonable in view of the quality of services received by the Fund from the Subadvisor and the other factors considered. Because the Advisor pays the Subadvisor’s subadvisory fee and the subadvisory fee was negotiated at arm’s length by the Advisor, the cost of services provided by the Subadvisor and the profitability to the Subadvisor of its relationship with the Fund were not material factors in the Board’s deliberations. For similar reasons, the Board did not consider the potential economies of scale in the Subadvisor’s management of the Fund to be a material factor in its consideration.
In reapproving the Investment Subadvisory Agreement, the Board, including the disinterested Directors, did not identify any single factor as controlling, and each Director may have attributed different weight to various factors.
Conclusions
The Board reached the following conclusions regarding the Investment Advisory Agreement and the Investment Subadvisory Agreement, among others: (a) the Advisor has demonstrated that it possesses the capability and resources to perform the duties required of it under the Investment Advisory Agreement; (b) the Subadvisor is qualified to manage the Fund’s assets in accordance with the Fund’s investment objectives and policies; (c) the Advisor and Subadvisor maintain appropriate compliance programs; (d) the Subadvisor is likely to execute its investment strategies consistently over time; (e) appropriate action is being taken with respect to the Fund’s performance; and (f) the Fund’s advisory and subadvisory fees are reasonable in view of the quality of services received by the Fund from the Advisor and Subadvisor, respectively, and the other factors considered. Based on its conclusions, the Board determined that reapproval of the Investment Advisory Agreement and the Investment Subadvisory Agreement would be in the best interests of the Fund and its shareholders.
calvert.com CALVERT CAPITAL ACCUMULATION FUND SEMI-ANNUAL REPORT (UNAUDITED) 25
|
|
| This page intentionally left blank. |
|
| | | | |
| CALVERT CAPITAL ACCUMULATION FUND | | CALVERT’S FAMILY OF FUNDS | | |
To Open an Account 800-368-2748 Service for Existing Account Shareholders: 800-368-2745 Brokers: 800-368-2746 Registered Mail Calvert Investments c/o BFDS, P.O. Box 219544 Kansas City, MO 64121-9544 Overnight Mail Calvert Investments c/o BFDS, 330 West 9th Street Kansas City, MO 64105 Web Site calvert.com Principal Underwriter Calvert Investment Distributors, Inc. 4550 Montgomery Avenue Suite 1000 North Bethesda, Maryland 20814 | | Municipal Funds Tax-Free Responsible Impact Bond Fund Taxable Bond Funds Bond Portfolio Income Fund Short Duration Income Fund Long-Term Income Fund Ultra-Short Income Fund High Yield Bond Fund Green Bond Fund Unconstrained Bond Fund Balanced and Asset Allocation Funds Balanced Portfolio Conservative Allocation Fund Moderate Allocation Fund Aggressive Allocation Fund | | Equity Funds Large Cap Core Portfolio Equity Portfolio Global Value Fund U.S. Large Cap Core Responsible Index Fund U.S. Large Cap Value Responsible Index Fund U.S. Large Cap Growth Responsible Index Fund U.S. Mid Cap Core Responsible Index Fund Developed Markets Ex-U.S. Responsible Index Fund Capital Accumulation Fund International Equity Fund Small Cap Fund Global Energy Solutions Fund Global Water Fund International Opportunities Fund Global Equity Income Fund Emerging Markets Equity Fund |
|
| |
| | |
This report is intended to provide fund information to shareholders. It is not authorized for distribution to prospective investors unless preceded or accompanied by a prospectus. Note: The information on our website is not incorporated by reference into this report; our website address is included as an inactive textual reference only. Investors should carefully consider the investment objectives, risks, charges and expenses of the Calvert Funds. This and other important information is contained in the fund’s summary prospectus and prospectus, which can be obtained from your financial professional and should be read carefully before investing. You may also call Calvert at 800/368-2748 or visit calvert.com. |
| Printed on recycled paper using soy inks. | |
|
| | |
| | |
| | | |
Calvert International Opportunities Fund
| | |
| | | |
| | |
|
| |
Semi-Annual Report March 31, 2016 E-Delivery Sign-Up — Details Inside | |
|
|
| |
Choose Planet-friendly E-delivery! Sign up now for on-line statements, prospectuses, and fund reports. In less than five minutes you can help reduce paper mail and lower fund costs. Just go to calvert.com. If you already have an online account at Calvert, click on Login, to access your Account, and select the documents you would like to receive via e-mail. If you’re new to online account access, click on Login, then Register to create your user name and password. Once you’re in, click on the E-delivery sign-up on the Account Portfolio page and follow the quick, easy steps. Note: if your shares are not held directly at Calvert but through a brokerage firm, you must contact your broker for electronic delivery options available through their firm. |
|
| | | |
| | | TABLE OF CONTENTS |
| | | | |
| | | | President's Letter |
| | | | Portfolio Management Discussion |
| | | | Understanding Your Fund's Expenses |
| | | | Schedule of Investments |
| | | | Statement of Assets and Liabilities |
| | | | Statement of Operations |
| | | | Statements of Changes in Net Assets |
| | | | Notes to Financial Statements |
| | | | Financial Highlights |
| | | | Proxy Voting |
| | | | Availability of Quarterly Portfolio Holdings |
| | | | Basis for Board's Approval of Investment Advisory Contracts |
|
| | |
| John Streur President and Chief Executive Officer, Calvert Investments, Inc. | |
Dear Shareholders,
Historically, environmental and social initiatives have been accomplished through the singular passage of legislation designed to remediate the impact of one significant influence on a singular populace. Commencing with the anti-deforestation efforts in 1842, followed by environmental legislation in industrialized nations to regulate smoke pollution in 1863, arguably, a predecessor to the ubiquitous stop smoking campaigns of today; the previous approach, put forth largely by developed nations, served to the benefit of their citizens and not the rest of the Earth's populace - the majority.
However, the year of 2015 marked a dynamic and exciting shift in the resolution of contemporary environmental and social causes - global leaders from all facets of society, collectively, took action to create global policy platforms with far reaching agendas designed to accelerate our global society's evolution towards a more sustainable and inclusive state. The Pope's Encyclical, issued June 18, 2015, called for the establishment of a new partnership between science and religion to combat human-driven climate change. The United Nations formalized the United Nations Sustainable Development Goals, which included seventeen Sustainable Development Goals (SDGs) geared towards dramatically reducing poverty, fighting inequality and injustice, and tackling climate change by 2030. The COP 21 (Conference of Parties to the 21 session of the United Nations Framework Convention on Climate Change) introduced a historic agreement to combat climate change and accelerate both the action and investment needed for a sustainable low carbon future. Indeed, these are a mere few examples of the broad reaching directives recently initiated in order to encourage action and stress accountability.
Additionally, and importantly, resolution has not only been limited to direct impact policy changes, but also by investors’ behavior and preference. Recognizing the demand by investors to be influencers of change through their capital allocations, the United States Department of Labor (“DOL”) issued Interpretive Bulletin (“IB”) 2015-01 in October of 2015. This bulletin updated and clarified the DOL’s position on how fiduciary investors may best utilize knowledge of a prospective investment’s key environmental, social and governance indicators when making investment decisions for retirement plans. Essentially, the DOL has created a platform that allows fiduciaries to utilize ESG information in their investment decisions regarding a variety of retirement assets, including, but not limited to, IRA accounts; 401(K) accounts; and retirement accounts monitored by a company or union. This legislation is a powerful and fundamental change, especially given- retirement assets represent over $24 trillion and, thus if purposefully directed, may effect meaningful impact. IB 2015-01 is an exciting development in the world of socially responsible investing as it will provide access to vast amounts of capital that can be used to encourage and facilitate better corporate practices.
Change is here. Our challenge, collectively as socially conscious investors, will be to maintain its momentum and focus. Through your investment in the Calvert Funds you are engaged and influential in this movement. By allocating capital only to the best environmentally and socially governed corporations, we-alongside you, encourage good corporate citizenry. Our shareholder advocacy efforts, which fundamentally represent you as a shareholder, consistently monitor and challenge poor corporate policy, thus effecting positive outcomes. Through your support, we are able to partner with academics and industry renowned technicians to produce innovative research that will help to provide both better ESG investment solutions and a more lasting impact.
This is an exciting time and we at Calvert appreciate servicing you, as fund shareholders, and look forward to the future together as we navigate the waters of progress.
Respectfully,
John Streur
May 2016
calvert.com CALVERT INTERNATIONAL OPPORTUNITIES FUND SEMI-ANNUAL REPORT (UNAUDITED) 1
|
| |
| PORTFOLIO MANAGEMENT DISCUSSION |
|
| | | |
| Drew Edwards Advisory Research, Inc. | | Greg Gogliotti Trilogy Global Advisors, LP |
Market Review
The six-month period got off to a strong start as equity markets around the globe rallied off the sharp market declines of the third quarter of 2015. This strong market sentiment was quashed by growing fears of a slower global economic growth, the first hike in interest rates by the U.S. Fed in almost ten years and continued weakness in commodity prices. Equity prices turned down sharply in the new year only to reverse in mid-February as commodity prices, most notably crude oil prices, appear to have found a bottom and rallied. Improved economic activity in China contributed to investors’ more positive outlook late in the period.
Investment Strategy and Technique
The Fund is subadvised by two managers with complementary investment styles and processes. Advisory Research Inc, a value-oriented fundamental manager, currently manages approximately 60% of the Fund’s assets, while Trilogy Global Advisors, a growth manager, manages the balance of the Fund. There were no changes to the allocation across the managers during the six month period. As of March 31, 2016, the Fund held 107 securities across 26 countries. The Fund’s focus is on developed market equities with 9.7% of the Fund invested in emerging market securities at period end.
Fund Performance Relative to the Benchmark
For the six months ended March 31, 2016, Calvert International Opportunities Fund Class A return was 2.99% versus a return of 5.43% for the MSCI EAFE Small Mid Index. Security selection in the Asia Ex-Japan region was the most significant detractor from returns where holdings in the Industrials and Consumer Staples sectors accounted for most of the regional underperformance. Investment performance was stronger in Europe and Latin America while the Fund’s Japanese holdings performed in line with the benchmark.
| |
| • | MRV Engenharia, a Brazilian homebuilder, was one of the Fund’s better performing stocks, doubling in value during the period. |
| |
| • | China Lesso, a maker of PVC piping, gave ground after having been one of the Fund’s stronger performing stocks earlier in 2015. |
| |
| • | European holdings benefited from the strong performance of Austevoll Seafood, a Norwegian salmon producer and two software firms, Ubisoft Entertainment and Opera Software, while LED lighting firm Zumtobel and Vienna Insurance underperformed. |
As of March 31, 2016, the largest overweight relative to the Fund’s benchmark is to the Financials sector and most significant underweights are in the Industrials and Utilities sector. The largest single country exposure in the Fund is to Japan, but that is also the largest country underweighting relative to the benchmark. Our emerging markets holdings, which make up 9.7% of the Fund’s investments are predominantly focused on Korean and Taiwan based equities, two of the more “developed” emerging markets.
Positioning and Market Outlook
The sharp decline by equities at the start of the year revealed how sensitive market sentiment is right now. With equity valuations above historical averages, markets are more vulnerable to shocks from some of the negative catalysts currently in the global economy, such as slowing growth in China and increased geopolitical risk.
An improving U.S. economy, albeit with sluggish growth, should allow the Fed to continue on its tightening path, though this process will likely be slow and policy will remain accommodative. This contrasts with other global central banks, such as the ECB and BOJ, which remain committed to further easing. However, market enthusiasm for global quantitative easing might continue to wane if robust economic recovery doesn’t follow.
2 calvert.com CALVERT INTERNATIONAL OPPORTUNITIES FUND SEMI-ANNUAL REPORT (UNAUDITED)
|
| | | | |
| | | | |
| | CALVERT INTERNATIONAL OPPORTUNITIES FUND |
| | MARCH 31, 2016 |
| | | | |
| | ECONOMIC SECTORS | % OF TOTAL INVESTMENTS | |
| | Financials | 27.4 | % | |
| | Industrials | 18.1 | % | |
| | Consumer Discretionary | 16.4 | % | |
| | Materials | 10.9 | % | |
| | Information Technology | 8.9 | % | |
| | Consumer Staples | 7.2 | % | |
| | Health Care | 4.6 | % | |
| | Short-Term Investments | 4.4 | % | |
| | Telecommunication Services | 0.8 | % | |
| | Energy | 0.7 | % | |
| | High Social Impact Investments | 0.6 | % | |
| | Total | 100 | % | |
| | | | |
Even though the U.S. economy is relatively well-insulated, it is not immune from a global economic slowdown. As expected, concerns about global economic conditions contributed to the Fed’s decision to dial down rate hike expectations. The euro and yen both responded by strengthening relative to the dollar, which may be a headwind for Japanese and eurozone companies if this trend continues.
Advisory Research, Inc. and Trilogy Global Advisors, LP
May 2016
|
| | | | | | |
| | | | | |
| | CALVERT INTERNATIONAL OPPORTUNITIES FUND | |
| | MARCH 31, 2016 | |
| | | | | |
| | INVESTMENT PERFORMANCE | |
| | (TOTAL RETURN AT NAV) | |
| | | 6 MONTHS ENDED 3/31/16 | 12 MONTHS ENDED 3/31/16 | |
| | Class A | 2.99 | % | -3.56 | % | |
| | Class C | 2.50 | % | -4.39 | % | |
| | Class I | 3.29 | % | -3.04 | % | |
| | Class Y | 3.21 | % | -3.29 | % | |
| | MSCI EAFE Small/Mid Cap Index | 5.43 | % | 0.29 | % | |
| | Lipper International Small/Mid Cap Core Funds Average | 3.16 | % | -2.70 | % | |
| | | | | |
| | Investment performance/return at NAV does not reflect the deduction of the Fund’s maximum 4.75% front-end sales charge or any deferred sales charge. | |
| | | | | |
| | TEN LARGEST STOCK HOLDINGS | % OF NET ASSETS | |
| | Smurfit Kappa Group plc | 2.2 | % | |
| | Austevoll Seafood ASA | 2.1 | % | |
| | Buzzi Unicem SpA | 1.8 | % | |
| | BUWOG AG | 1.6 | % | |
| | Gulliver International Co. Ltd. | 1.5 | % | |
| | OC Oerlikon Corp. AG | 1.5 | % | |
| | Koninklijke DSM NV | 1.5 | % | |
| | Horiba Ltd. | 1.4 | % | |
| | Wendel SA | 1.4 | % | |
| | Metsa Board Oyj | 1.4 | % | |
| | Total | 16.4 | % | |
| | | | | |
calvert.com CALVERT INTERNATIONAL OPPORTUNITIES FUND SEMI-ANNUAL REPORT (UNAUDITED) 3
Growth of $10,000
The graph below shows the value of a hypothetical $10,000 investment in the Fund over the past 10 fiscal year periods or since inception (for funds without 10-year records). The results shown are for Class A, reflect the deduction of the maximum front-end Class A sales charge of 4.75%, and assume the reinvestment of dividends. The result is compared with a broad based market index. Market indexes are unmanaged and their results do not reflect the effect of expenses or sales charges. The value of an investment in a different share class would be different.

|
| | | | | | | |
| CALVERT INTERNATIONAL OPPORTUNITIES FUND |
| MARCH 31, 2016 |
| AVERAGE ANNUAL TOTAL RETURNS | Ticker Symbol | 1 Year | 5 Year | Since Inception (5/31/2007) |
| Class A (with max. load) | CIOAX | -8.16 | % | 3.87 | % | 0.79 | % |
| Class C (with max. load) | COICX | -5.35 | % | 3.99 | % | 0.52 | % |
| Class I | COIIX | -3.04 | % | 5.39 | % | 1.81 | % |
| Class Y | CWVYX | -3.29 | % | 5.16 | % | 1.54 | % |
| MSCI EAFE Small/Mid Cap Index | | 0.29 | % | 4.84 | % | 0.84 | % |
| Lipper International Small/Mid Cap Core Funds Average | | -2.70 | % | 2.81 | % | 0.13 | % |
| | | | | |
| Calvert International Opportunities Fund first offered Class C shares on July 31, 2007 and Class Y shares on October 31, 2008. Performance prior to those dates reflects the performance of Class A shares at net asset value (NAV). Actual Class C and Class Y share performance would have been different. |
| | | | | |
All performance data shown, including the graph above and the adjacent table, represents past performance, does not guarantee future results, assumes reinvestment of dividends and distributions, and does not reflect the deduction of taxes that a shareholder would pay on the Fund’s distributions or the redemption of the Fund shares. All performance data reflects fee waivers and/or expense limitations, if any are in effect; in their absence performance would be lower. See Note B in Notes to Financial Statements. The investment return and principal value of an investment will fluctuate so that an investor’s shares, when redeemed, may be worth more or less than their original cost. Current performance may be lower or higher than the performance data quoted; for current performance data, including most recent month-end, visit www.calvert.com. The gross expense ratio from the current prospectus for Class A shares is 1.51%. This number may differ from the expense ratio shown elsewhere in this report because it is based on a different time period and, if applicable, does not include fee or expense waivers. Performance data quoted already reflects the deduction of the Fund’s operating expenses.
4 calvert.com CALVERT INTERNATIONAL OPPORTUNITIES FUND SEMI-ANNUAL REPORT (UNAUDITED)
UNDERSTANDING YOUR FUND'S EXPENSES
As an investor, you incur two types of costs. There are transaction costs, which generally include sales charges on purchases and may include redemption fees. There are also ongoing costs, which generally include management fees, distribution and/or service fees, and other fund expenses. The following information is intended to help you understand your ongoing costs (in dollars) of investing in this mutual fund and to help you compare these costs with the ongoing costs of investing in other mutual funds.
To illustrate these ongoing costs, we have provided examples and calculated the expenses paid by the fund's investors during the period. The actual and hypothetical information presented in the examples is based on an investment of $1,000 invested at the beginning of the period and held for the entire period (October 1, 2015 to March 31, 2016).
Actual Expenses
The first line of the table below provides information about actual account values and actual expenses. You may use the information in this line, together with the amount you invested, to estimate the expenses that you paid over the period. Simply divide your account value by $1,000 (for example, an $8,600 account value divided by $1,000 = 8.6), then multiply the result by the number in the first line under the heading entitled "Expenses Paid During Period" to estimate the expenses you paid on your account during this period.
The fund may charge an annual low balance account fee of $15 to those shareholders whose regular account balance is less than $2,000 ($1,000 for IRA accounts). If the low balance fee applies to your account, you should subtract the fee from the ending account value in the chart below.
Hypothetical Example for Comparison Purposes
The second line of the table below provides information about hypothetical account values and hypothetical expenses based on the Fund’s actual expense ratio and an assumed rate of return of 5% per year before expenses, which is not the Fund’s actual return. The hypothetical account values and expenses may not be used to estimate the actual ending account balance or expenses you paid for the period. You may use this information to compare the ongoing costs of investing in the Fund and other funds. To do so, compare the 5% hypothetical example with the 5% hypothetical examples that appear in the shareholder reports of the other funds.
Please note that the expenses shown in the table are meant to highlight your ongoing costs only and do not reflect any transactional costs, such as sales charges (loads), or redemption fees. Therefore, the second line of the table is useful in comparing ongoing costs only, and will not help you determine the relative total costs of owning different funds. In addition, if these transactional costs were included, your costs would have been higher.
|
| | | | |
| | ANNUALIZED
EXPENSE RATIO | BEGINNING
ACCOUNT VALUE
10/1/15 | ENDING
ACCOUNT VALUE
3/31/16 | EXPENSES PAID
DURING PERIOD*
10/1/15 - 3/31/16 |
| Class A | | | | |
| Actual | 1.49% | $1,000.00 | $1,029.90 | $7.56 |
| Hypothetical (5% return per year before expenses) | 1.49% | $1,000.00 | $1,017.55 | $7.52 |
| Class C | | | | |
| Actual | 2.47% | $1,000.00 | $1,025.00 | $12.50 |
| Hypothetical (5% return per year before expenses) | 2.47% | $1,000.00 | $1,012.65 | $12.43 |
| Class I | | | | |
| Actual | 1.08% | $1,000.00 | $1,032.90 | $5.49 |
| Hypothetical (5% return per year before expenses) | 1.08% | $1,000.00 | $1,019.60 | $5.45 |
| Class Y | | | | |
| Actual | 1.19% | $1,000.00 | $1,032.10 | $6.05 |
| Hypothetical (5% return per year before expenses) | 1.19% | $1,000.00 | $1,019.05 | $6.01 |
| |
| * Expenses paid during the period are equal to the annualized expense ratio for each class as indicated above, multiplied by the average account value over the period, multiplied by 183/366 (to reflect the one-half year period). Expense ratios shown in the Financial Highlights represent the actual expenses incurred for the period. |
calvert.com CALVERT INTERNATIONAL OPPORTUNITIES FUND SEMI-ANNUAL REPORT (UNAUDITED) 5
CALVERT INTERNATIONAL OPPORTUNITIES FUND
SCHEDULE OF INVESTMENTS
MARCH 31, 2016 (Unaudited)
|
| | |
| | SHARES | VALUE ($) |
| COMMON STOCKS - 94.1% | | |
| Australia - 2.2% | | |
| GrainCorp Ltd. | 249,665 | 1,444,987 |
| Orora Ltd. | 773,996 | 1,485,298 |
| Tassal Group Ltd. | 454,315 | 1,332,157 |
| | | 4,262,442 |
| | | |
| Austria - 3.1% | | |
| BUWOG AG* | 144,872 | 3,114,963 |
| Vienna Insurance Group AG Wiener Versicherung Gruppe | 57,401 | 1,215,902 |
| Wienerberger AG | 88,080 | 1,693,231 |
| | | 6,024,096 |
| | | |
| Canada - 2.7% | | |
| Entertainment One Ltd. | 675,826 | 1,474,278 |
| Intertape Polymer Group, Inc. | 99,250 | 1,423,869 |
| Martinrea International, Inc. | 128,047 | 1,012,768 |
| Methanex Corp. | 39,748 | 1,278,971 |
| | | 5,189,886 |
| | | |
| China - 0.9% | | |
| China Lesso Group Holdings Ltd. | 3,138,550 | 1,683,216 |
| | | |
| Denmark - 1.0% | | |
| Matas A/S | 91,426 | 1,851,464 |
| | | |
| Finland - 2.7% | | |
| Cramo Oyj | 71,851 | 1,481,896 |
| Metsa Board Oyj | 397,635 | 2,662,738 |
| Tieto Oyj | 44,461 | 1,160,540 |
| | | 5,305,174 |
| | | |
| France - 5.9% | | |
| Cie Generale des Etablissements Michelin | 25,820 | 2,644,400 |
| Eurazeo SA | 28,021 | 1,896,194 |
| Groupe Fnac SA* | 3,870 | 243,330 |
| Saft Groupe SA | 63,137 | 1,911,915 |
| UBISOFT Entertainment* | 66,891 | 2,102,535 |
| Wendel SA | 24,580 | 2,677,803 |
| | | 11,476,177 |
| | | |
| Georgia - 0.4% | | |
| BGEO Groupe plc | 23,930 | 697,862 |
| | | |
6 calvert.com CALVERT INTERNATIONAL OPPORTUNITIES FUND SEMI-ANNUAL REPORT (UNAUDITED)
|
| | |
| | SHARES | VALUE ($) |
| COMMON STOCKS - CONT’D | | |
| Germany - 8.6% | | |
| Aareal Bank AG | 33,230 | 1,077,796 |
| Aurelius AG | 34,659 | 2,111,719 |
| DMG Mori AG | 46,729 | 2,177,652 |
| Gerresheimer AG | 9,865 | 774,412 |
| RHOEN-KLINIKUM AG | 67,534 | 2,103,518 |
| STADA Arzneimittel AG | 42,122 | 1,673,455 |
| Talanx AG | 70,243 | 2,400,687 |
| Tom Tailor Holding AG* | 313,877 | 1,541,720 |
| Wacker Neuson SE | 105,624 | 1,681,652 |
| XING AG | 6,458 | 1,185,209 |
| | | 16,727,820 |
| | | |
| Greece - 0.7% | | |
| Tsakos Energy Navigation Ltd. | 224,529 | 1,387,589 |
| | | |
| Hong Kong - 0.9% | | |
| Man Wah Holdings Ltd. | 934,351 | 1,186,489 |
| Techtronic Industries Co. Ltd. | 118,310 | 468,249 |
| | | 1,654,738 |
| | | |
| India - 0.4% | | |
| Yes Bank Ltd. | 64,154 | 839,919 |
| | | |
| Ireland - 2.2% | | |
| Smurfit Kappa Group plc | 161,839 | 4,174,628 |
| | | |
| Israel - 0.4% | | |
| NICE-Systems Ltd. | 11,368 | 736,533 |
| | | |
| Italy - 4.8% | | |
| Azimut Holding SpA | 62,100 | 1,432,132 |
| Banca Generali SpA | 46,885 | 1,380,260 |
| Banca IFIS SpA | 41,976 | 1,391,585 |
| Buzzi Unicem SpA | 205,479 | 3,554,607 |
| Cementir Holding SpA | 301,695 | 1,509,714 |
| | | 9,268,298 |
| | | |
| Japan - 20.9% | | |
| Alps Electric Co. Ltd. | 63,686 | 1,111,326 |
| Azbil Corp. | 54,800 | 1,404,178 |
| Chiyoda Corp. | 184,841 | 1,356,284 |
| Chugoku Marine Paints Ltd. | 216,000 | 1,425,464 |
| Daiichikosho Co. Ltd. | 46,540 | 2,028,247 |
| Daiseki Co. Ltd. | 98,600 | 1,615,344 |
| Gulliver International Co. Ltd. | 229,281 | 2,856,963 |
| Haseko Corp. | 152,859 | 1,424,790 |
| Hino Motors Ltd. | 104,803 | 1,134,391 |
| Hogy Medical Co. Ltd. | 33,700 | 1,810,362 |
| Horiba Ltd. | 73,300 | 2,738,115 |
calvert.com CALVERT INTERNATIONAL OPPORTUNITIES FUND SEMI-ANNUAL REPORT (UNAUDITED) 7
|
| | |
| | SHARES | VALUE ($) |
| COMMON STOCKS - CONT’D | | |
| Japan Aviation Electronics Industry Ltd. | 170,000 | 1,992,796 |
| Leopalace21 Corp. | 261,107 | 1,579,159 |
| Makita Corp. | 21,725 | 1,348,695 |
| Nishio Rent All Co. Ltd. | 54,400 | 1,289,904 |
| Ryosan Co. Ltd. | 80,100 | 2,003,302 |
| Secom Co. Ltd. | 32,400 | 2,410,801 |
| Shinsei Bank Ltd. | 752,000 | 983,181 |
| Ship Healthcare Holdings, Inc. | 95,097 | 2,397,830 |
| SKY Perfect JSAT Holdings, Inc. | 396,900 | 2,312,176 |
| Stanley Electric Co. Ltd. | 38,043 | 861,115 |
| Star Micronics Co. Ltd. | 165,900 | 1,862,105 |
| Sumitomo Real Estate Sales Co. Ltd. | 38,400 | 740,097 |
| Toyota Industries Corp. | 40,800 | 1,836,154 |
| | | 40,522,779 |
| | | |
| Luxembourg - 1.1% | | |
| Grand City Properties SA | 89,677 | 2,062,998 |
| | | |
| Malaysia - 1.2% | | |
| PureCircle Ltd.* | 426,720 | 2,327,168 |
| | | |
| Netherlands - 2.5% | | |
| BinckBank NV | 169,240 | 1,262,440 |
| Delta Lloyd NV | 180,834 | 841,070 |
| Koninklijke DSM NV | 51,255 | 2,821,398 |
| | | 4,924,908 |
| | | |
| Norway - 2.8% | | |
| Austevoll Seafood ASA | 481,397 | 3,966,196 |
| Skandiabanken ASA*(a) | 295,131 | 1,519,727 |
| | | 5,485,923 |
| | | |
| South Korea - 5.0% | | |
| BGF retail Co. Ltd. | 7,820 | 1,121,441 |
| DGB Financial Group, Inc. | 286,380 | 2,228,736 |
| Dongbu Insurance Co. Ltd. | 11,280 | 748,646 |
| Hankook Tire Worldwide Co. Ltd. | 100,974 | 2,026,367 |
| Samsung SDI Co. Ltd. | 19,293 | 1,670,171 |
| SL Corp. | 130,574 | 1,843,975 |
| | | 9,639,336 |
| | | |
| Spain - 1.1% | | |
| Ebro Foods SA | 93,700 | 2,047,235 |
| | | |
| Sweden - 2.4% | | |
| BillerudKorsnas AB | 42,319 | 693,501 |
| Hoist Finance AB*(a) | 157,260 | 1,407,983 |
| Industrivarden AB, Class C | 146,673 | 2,506,844 |
| | | 4,608,328 |
| | | |
8 calvert.com CALVERT INTERNATIONAL OPPORTUNITIES FUND SEMI-ANNUAL REPORT (UNAUDITED)
|
| | |
| | SHARES | VALUE ($) |
| COMMON STOCKS - CONT’D | | |
| Switzerland - 5.3% | | |
| Baloise Holding AG | 15,103 | 1,925,997 |
| Bucher Industries AG | 6,674 | 1,627,669 |
| GAM Holding AG* | 166,528 | 2,415,590 |
| OC Oerlikon Corp. AG* | 273,790 | 2,834,330 |
| Oriflame Holding AG* | 76,972 | 1,535,134 |
| | | 10,338,720 |
| | | |
| Taiwan - 3.0% | | |
| China Life Insurance Co. Ltd. | 2,382,059 | 1,831,841 |
| Feng TAY Enterprise Co. Ltd. | 157,000 | 834,172 |
| PChome Online, Inc. | 97,000 | 1,068,434 |
| Teco Electric and Machinery Co. Ltd. | 2,616,000 | 2,133,669 |
| | | 5,868,116 |
| | | |
| United Kingdom - 11.9% | | |
| Ashtead Group plc | 120,963 | 1,502,884 |
| Beazley plc | 219,359 | 1,134,947 |
| Bovis Homes Group plc | 187,843 | 2,516,153 |
| Close Brothers Group plc | 42,089 | 763,813 |
| Fenner plc | 734,156 | 1,430,496 |
| Inmarsat plc | 103,185 | 1,460,802 |
| Investec plc | 182,841 | 1,347,493 |
| Kennedy Wilson Europe Real Estate plc | 157,643 | 2,654,549 |
| Kingfisher plc | 457,849 | 2,480,144 |
| N Brown Group plc | 426,456 | 2,004,081 |
| Northgate plc | 207,555 | 1,203,408 |
| Speedy Hire plc | 4,116,112 | 2,308,399 |
| Virgin Money Holdings UK plc | 398,896 | 2,116,057 |
| | | 22,923,226 |
| | | |
| Total Common Stocks (Cost $180,905,094) | | 182,028,579 |
| | | |
| | | |
| RIGHTS - 0.1% | | |
| Delta Lloyd NV (Expiring 4/7/16)* | 180,834 | 251,456 |
| | | |
| Total Rights (Cost $790,087) | | 251,456 |
| | | |
| | | |
| | PRINCIPAL
AMOUNT ($) | VALUE ($) |
| HIGH SOCIAL IMPACT INVESTMENTS - 0.6% | | |
| Calvert Social Investment Foundation Notes, 0.50%, 3/18/17 (b)(c) | 1,000,000 | 960,720 |
| ImpactAssets Global Sustainable Agriculture Notes, 0.00%, 11/3/20 (b)(c)(d) | 111,000 | 102,675 |
| ImpactAssets Microfinance Plus Notes, 0.00%, 11/3/20 (b)(c)(d) | 142,000 | 129,930 |
| | | |
| Total High Social Impact Investments (Cost $1,253,000) | | 1,193,325 |
calvert.com CALVERT INTERNATIONAL OPPORTUNITIES FUND SEMI-ANNUAL REPORT (UNAUDITED) 9
|
| | | | |
| | PRINCIPAL
AMOUNT ($) | VALUE ($) |
|
| TIME DEPOSIT - 4.4% | | |
| State Street Bank Time Deposit, 0.278%, 4/1/16 | 8,517,316 | 8,517,316 |
|
| | | |
| Total Time Deposit (Cost $8,517,316) | | 8,517,316 |
|
| | | |
| | | |
| TOTAL INVESTMENTS (Cost $191,465,497) - 99.2% | | 191,990,676 |
|
| Other assets and liabilities, net - 0.8% | | 1,521,803 |
|
NET ASSETS - 100.0% | |
| $193,512,479 |
|
|
| |
| NOTES TO SCHEDULE OF INVESTMENTS |
| * Non-income producing security. |
| (a) Security is exempt from registration under Rule 144A of the Securities Act of 1933. These securities may be resold in transactions exempt from registration, normally to qualified institutional buyers. |
| (b) Restricted securities represent 0.6% of the net assets of the Fund. |
| (c) This security was valued under the direction of the Board of Directors. See Note A. |
| (d) The coupon rate shown on floating or adjustable rate securities represents the rate in effect on March 31, 2016. |
| |
| Abbreviations: |
| Ltd.: | Limited |
| plc: | Public Limited Company |
|
| | |
| RESTRICTED SECURITIES | ACQUISITION DATES | COST ($) |
| Calvert Social Investment Foundation Notes, 0.50%, 3/18/17 | 3/18/16 | 1,000,000 |
| ImpactAssets Global Sustainable Agriculture Notes, 0.00%, 11/3/20 | 11/13/15 | 111,000 |
| ImpactAssets Microfinance Plus Notes, 0.00%, 11/3/20 | 11/13/15 | 142,000 |
| See notes to financial statements. |
10 calvert.com CALVERT INTERNATIONAL OPPORTUNITIES FUND SEMI-ANNUAL REPORT (UNAUDITED)
CALVERT INTERNATIONAL OPPORTUNITIES FUND
STATEMENT OF ASSETS AND LIABILITIES
MARCH 31, 2016 (Unaudited)
|
| | | |
| ASSETS | |
| Investments in securities, at value (Cost $191,465,497) - see accompanying schedule |
| $191,990,676 |
|
| Cash denominated in foreign currencies (Cost $624,428) | 638,434 |
|
| Receivable for shares sold | 401,340 |
|
| Dividends and interest receivable | 888,462 |
|
| Directors' deferred compensation plan | 106,969 |
|
| Total assets | 194,025,881 |
|
| | |
| LIABILITIES | |
| Payable for securities purchased | 23,378 |
|
| Payable for shares redeemed | 160,643 |
|
| Payable for foreign cap gain taxes | 8,604 |
|
| Payable to Calvert Investment Management, Inc. | 118,607 |
|
| Payable to Calvert Investment Distributors, Inc. | 26,008 |
|
| Payable to Calvert Investment Administrative Services, Inc. | 19,086 |
|
| Payable to Calvert Investment Services, Inc. | 1,532 |
|
| Directors' deferred compensation plan | 106,969 |
|
| Accrued expenses and other liabilities | 48,575 |
|
| Total liabilities | 513,402 |
|
| NET ASSETS |
| $193,512,479 |
|
| | |
| NET ASSETS CONSIST OF: | |
| Paid-in capital applicable to the following shares of common stock, | |
| with 250,000,000 shares of $0.01 par value shares authorized: | |
| Class A: 7,337,649 shares outstanding |
| $107,558,183 |
|
| Class C: 357,524 shares outstanding | 5,001,957 |
|
| Class I: 3,092,301 shares outstanding | 44,040,282 |
|
| Class Y: 2,797,298 shares outstanding | 41,497,284 |
|
| Distributions in excess of net investment income | (432,581) |
|
| Accumulated net realized gain (loss) on investments and foreign currency transactions | (4,683,864) |
|
| Net unrealized appreciation (depreciation) on investments, foreign currencies and assets and liabilities denominated in foreign currencies | 531,218 |
|
| NET ASSETS |
| $193,512,479 |
|
| | |
| NET ASSET VALUE PER SHARE | |
| Class A (based on net assets of $105,895,720) |
| $14.43 |
|
| Class C (based on net assets of $5,061,566) |
| $14.16 |
|
| Class I (based on net assets of $43,927,259) |
| $14.21 |
|
| Class Y (based on net assets of $38,627,934) |
| $13.81 |
|
| | |
| See notes to financial statements. | |
calvert.com CALVERT INTERNATIONAL OPPORTUNITIES FUND SEMI-ANNUAL REPORT (UNAUDITED) 11
CALVERT INTERNATIONAL OPPORTUNITIES FUND
STATEMENT OF OPERATIONS
SIX MONTHS ENDED MARCH 31, 2016 (Unaudited)
|
| | | |
| NET INVESTMENT INCOME | |
| Investment Income: | |
| Dividend income (net of foreign taxes withheld of $123,345) |
| $1,532,546 |
|
| Interest income | 8,765 |
|
| Total investment income | 1,541,311 |
|
| | |
| Expenses: | |
| Investment advisory fee | 688,724 |
|
| Administrative fees | 200,547 |
|
| Transfer agency fees and expenses | 88,696 |
|
| Distribution Plan expenses: | |
| Class A | 125,839 |
|
| Class C | 25,591 |
|
| Directors' fees and expenses | 7,997 |
|
| Accounting fees | 21,634 |
|
| Custodian fees | 81,011 |
|
| Professional fees | 16,578 |
|
| Registration fees | 26,557 |
|
| Reports to shareholders | 10,693 |
|
| Miscellaneous | 8,931 |
|
| Total expenses | 1,302,798 |
|
| Reimbursement from Advisor: | |
| Class C | (2,745) |
|
| Administrative fees waived | (44,836) |
|
| Net expenses | 1,255,217 |
|
| NET INVESTMENT INCOME | 286,094 |
|
| | |
| REALIZED AND UNREALIZED GAIN (LOSS) | |
| Net realized gain (loss) on: | |
| Investments | (4,436,767) |
|
| Foreign currency transactions | (3,733) |
|
| | (4,440,500) |
|
| | |
| Change in unrealized appreciation (depreciation) on: | |
| Investments and foreign currencies | 9,854,421 |
|
| Assets and liabilities denominated in foreign currencies | 35,009 |
|
| | 9,889,430 |
|
| | |
| NET REALIZED AND UNREALIZED GAIN (LOSS) | 5,448,930 |
|
| | |
| INCREASE (DECREASE) IN NET ASSETS RESULTING FROM OPERATIONS |
| $5,735,024 |
|
| See notes to financial statements. | |
12 calvert.com CALVERT INTERNATIONAL OPPORTUNITIES FUND SEMI-ANNUAL REPORT (UNAUDITED)
CALVERT INTERNATIONAL OPPORTUNITIES FUND
STATEMENTS OF CHANGES IN NET ASSETS
|
| | | | | | | |
| INCREASE (DECREASE) IN NET ASSETS | SIX MONTHS ENDED
MARCH 31, 2016 (Unaudited) | | YEAR ENDED
SEPTEMBER 30, 2015 |
| Operations: | | | |
| Net investment income |
| $286,094 |
| |
| $1,383,513 |
|
| Net realized gain (loss) | (4,440,500) |
| | 6,366,300 |
|
| Change in unrealized appreciation (depreciation) | 9,889,430 |
| | (17,037,083) |
|
| | | | |
| INCREASE (DECREASE) IN NET ASSETS RESULTING FROM OPERATIONS | 5,735,024 |
| �� | (9,287,270) |
|
| | | | |
| Distributions to shareholders from: | | | |
| Net investment income: | | | |
| Class A shares | (768,140) |
| | (620,616) |
|
| Class C shares | — |
| | (11,490) |
|
| Class I shares | (496,125) |
| | (485,711) |
|
| Class Y shares | (389,709) |
| | (116,873) |
|
| Net realized gain: | | | |
| Class A shares | (3,241,863) |
| | (3,083,385) |
|
| Class C shares | (173,186) |
| | (281,879) |
|
| Class I shares | (1,423,627) |
| | (1,909,381) |
|
| Class Y shares | (1,206,553) |
| | (1,123,889) |
|
| Total distributions | (7,699,203) |
| | (7,633,224) |
|
| | | | |
| Capital share transactions: | | | |
| Shares sold: | | | |
| Class A shares | 13,192,941 |
| | 70,117,426 |
|
| Class C shares | 510,831 |
| | 1,517,680 |
|
| Class I shares | 6,858,093 |
| | 15,348,576 |
|
| Class Y shares | 9,742,430 |
| | 22,957,654 |
|
| Reinvestment of distributions: | | | |
| Class A shares | 3,890,741 |
| | 3,435,373 |
|
| Class C shares | 145,104 |
| | 247,069 |
|
| Class I shares | 1,919,524 |
| | 2,395,093 |
|
| Class Y shares | 1,463,650 |
| | 1,061,068 |
|
| Redemption fees: | | | |
| Class A shares | — |
| | 159 |
|
| Class Y shares | — |
| | 18 |
|
| Shares redeemed: | | | |
| Class A shares | (10,250,123) |
| | (15,108,714) |
|
| Class C shares | (555,130) |
| | (746,545) |
|
| Class I shares | (5,084,061) |
| | (4,886,433) |
|
| Class Y shares | (5,427,378) |
| | (4,107,584) |
|
| Total capital share transactions | 16,406,622 |
| | 92,230,840 |
|
| | | | |
| TOTAL INCREASE (DECREASE) IN NET ASSETS | 14,442,443 |
| | 75,310,346 |
|
| See notes to financial statements. |
calvert.com CALVERT INTERNATIONAL OPPORTUNITIES FUND SEMI-ANNUAL REPORT (UNAUDITED) 13
CALVERT INTERNATIONAL OPPORTUNITIES FUND
STATEMENTS OF CHANGES IN NET ASSETS - CONT’D
|
| | | | | | | |
| NET ASSETS | SIX MONTHS ENDED
MARCH 31, 2016 (Unaudited) | | YEAR ENDED
SEPTEMBER 30, 2015 |
| Beginning of period |
| $179,070,036 |
| |
| $103,759,690 |
|
| End of period (including distributions in excess of net investment income of ($432,581) and undistributed net investment income of $935,299, respectively) |
| $193,512,479 |
| |
| $179,070,036 |
|
| | | | |
| CAPITAL SHARE ACTIVITY | | | |
| Shares sold: | | | |
| Class A shares | 927,588 |
| | 4,511,728 |
|
| Class C shares | 35,798 |
| | 98,097 |
|
| Class I shares | 489,575 |
| | 1,016,025 |
|
| Class Y shares | 713,078 |
| | 1,530,787 |
|
| Reinvestment of distributions: | | | |
| Class A shares | 269,484 |
| | 229,208 |
|
| Class C shares | 10,313 |
| | 16,844 |
|
| Class I shares | 134,647 |
| | 162,152 |
|
| Class Y shares | 105,706 |
| | 74,193 |
|
| Shares redeemed: | | | |
| Class A shares | (713,041) |
| | (966,145) |
|
| Class C shares | (40,913) |
| | (48,953) |
|
| Class I shares | (370,634) |
| | (320,965) |
|
| Class Y shares | (401,138) |
| | (280,073) |
|
| Total capital share activity | 1,160,463 |
| | 6,022,898 |
|
| See notes to financial statements. | | | |
14 calvert.com CALVERT INTERNATIONAL OPPORTUNITIES FUND SEMI-ANNUAL REPORT (UNAUDITED)
NOTES TO FINANCIAL STATEMENTS
NOTE A — SIGNIFICANT ACCOUNTING POLICIES
General: Calvert International Opportunities Fund (the “Fund”), a series of Calvert World Values Fund, Inc., is registered under the Investment Company Act of 1940 as a diversified, open-end management investment company. Calvert World Values Fund, Inc. is comprised of four separate series. The operations of each series are accounted for separately. The Fund applies the accounting and reporting guidance in the Financial Accounting Standards Board (FASB) Accounting Standards Codification Topic 946, Financial Services – Investment Companies (ASC 946).
The Fund offers four classes of shares of capital stock - Classes A, C, I, and Y. Class A shares are sold with a maximum front-end sales charge of 4.75%. Class C shares are sold without a front-end sales charge and, with certain exceptions, will be charged a deferred sales charge on shares sold within one year of purchase. Class C shares have higher levels of expenses than Class A shares. Class I shares require a minimum account balance of $1,000,000. The $1 million minimum initial investment is waived for retirement plans that trade through omnibus accounts and may be waived in certain other instances where it is believed to be in the best interest of the Fund and its shareholders. Class I shares have no front-end or deferred sales charge and have lower levels of expenses than Class A shares. Class Y shares are generally only available to wrap or similar fee-based programs offered by financial intermediaries, foundations, and endowments that have entered into an agreement with the Fund’s Distributor to offer Class Y shares. Class Y shares have no front-end or deferred sales charge and have lower levels of expenses than Class A shares. Each class has different: (a) dividend rates, due to differences in Distribution Plan expenses and other class-specific expenses, (b) exchange privileges, and (c) class-specific voting rights.
Security Valuation: Net asset value per share is determined every business day as of the close of the regular session of the New York Stock Exchange (generally 4:00 p.m. Eastern time). The Fund uses independent pricing services approved by the Board of Directors (“the Board”) to value its investments wherever possible. Investments for which market quotations are not available or deemed not reliable are fair valued in good faith under the direction of the Board.
The Board has adopted Valuation Procedures (the “Procedures”) to determine the fair value of securities and other financial instruments for which market prices are not readily available or which may not be reliably priced. The Board has delegated the day-to-day responsibility for determining the fair value of assets of the Fund to Calvert Investment Management, Inc. (the “Advisor” or “Calvert”) and has provided these Procedures to govern Calvert in its valuation duties.
Calvert has chartered an internal Valuation Committee to oversee the implementation of these Procedures and to assist it in carrying out the valuation responsibilities that the Board has delegated.
The Valuation Committee meets on a regular basis to review illiquid securities and other investments which may not have readily available market prices. The Valuation Committee’s fair valuation determinations are subject to review, approval and ratification by the Board at its next regularly scheduled meeting covering the calendar quarter in which the fair valuation was determined.
The Valuation Committee utilizes various methods to measure the fair value of the Fund’s investments. U.S. generally accepted accounting principles (GAAP) establishes a disclosure hierarchy that categorizes the inputs to valuation techniques used to value assets and liabilities at measurement date. These inputs are summarized in the three broad levels listed below:
Level 1 - quoted prices in active markets for identical securities
Level 2 - other significant observable inputs (including quoted prices for similar securities, interest rates, prepayment speeds, credit risk, etc.)
Level 3 - significant unobservable inputs (including the Fund’s own assumptions in determining the fair value of investments)
The inputs or methodologies used for valuing securities are not necessarily an indication of the risk associated with investing in those securities.
Changes in valuation techniques may result in transfers in or out of an investment’s assigned level within the hierarchy during the period. Transfers in and/or out of levels are determined based on the fair value of such securities at the end of the period. Valuation techniques used to value the Fund’s investments by major category are as follows:
Common stock securities, including restricted securities, for which market quotations are readily available, are valued at the last reported sale price or official closing price as reported by an independent pricing service on the primary market or exchange on which they are traded and are categorized as Level 1 in the hierarchy. In the event there were no sales during the day or closing prices are not available, securities are valued at the last quoted bid price or using the last available price and are categorized as Level 2 in the hierarchy. Foreign securities are valued based on quotations from the principal market in which such securities are normally traded. If events occur after the close of the principal market in which foreign securities are traded, and before the close of business of the Fund, that are expected to materially affect the value of those securities,
calvert.com CALVERT INTERNATIONAL OPPORTUNITIES FUND SEMI-ANNUAL REPORT (UNAUDITED) 15
then they are valued at their fair value taking these events into account and are categorized as Level 2 in the hierarchy. The Fund has retained a third party fair value pricing service to quantitatively analyze the price movement of its holdings on foreign exchanges and to automatically fair value if the variation from the prior day’s closing price exceeds specified parameters. Such securities would be categorized as Level 2 in the hierarchy in these circumstances. Utilizing this technique may result in transfers between Level 1 and Level 2. For restricted securities and private placements where observable inputs are limited, assumptions about market activity and risk are used and such securities are categorized as Level 3 in the hierarchy.
Short-term securities of sufficient credit quality with remaining maturities of sixty days or less for which quotations are not readily available are valued at amortized cost, which approximates fair value, and are categorized as Level 2 in the hierarchy.
If a market value cannot be determined for a security using the methodologies described above, or if, in the good faith opinion of the Advisor, the market value does not constitute a readily available market quotation, or if a significant event has occurred that would materially affect the value of the security, the security will be fair valued as determined in good faith by the Valuation Committee.
The Valuation Committee considers a number of factors, including significant unobservable valuation inputs when arriving at fair value. It considers all significant facts that are reasonably available and relevant to the determination of fair value.
The Valuation Committee primarily employs a market-based approach which may use related or comparable assets or liabilities, recent transactions, market multiples, book values, and other relevant information for the investment to determine the fair value of the investment. When more appropriate, the Fund may employ an income-based or cost approach. An income-based valuation approach discounts anticipated future cash flows of the investment to calculate a present amount (discounted). The measurement is based on the value indicated by current market expectations about those future amounts. Discounts may also be applied due to the nature or duration of any restrictions on the disposition of the investments. A cost based approach is based on the amount that currently would be required to replace the service capacity of an asset (current replacement cost). From the seller’s perspective, the price that would be received for the asset is determined based on the cost to a buyer to acquire or construct a substitute asset of comparable utility, adjusted for obsolescence.
The values assigned to fair value investments are based on available information and do not necessarily represent amounts that might ultimately be realized. Further, due to the inherent uncertainty of valuations of such investments, the fair values may differ significantly from the values that would have been used had an active market existed, and the differences could be material. The Valuation Committee employs various methods for calibrating these valuation approaches including a regular review of key inputs and assumptions, transactional back-testing or disposition analysis and reviews of any related market activity.
At March 31, 2016, securities valued at $1,193,325, or 0.6% of net assets, were fair valued in good faith under the direction of the Board.
The following table summarizes the market value of the Fund's holdings as of March 31, 2016, based on the inputs used to value them: |
| | | | | | | | | | | | |
| | VALUATION INPUTS |
| INVESTMENTS IN SECURITIES* | LEVEL 1 | LEVEL 2 | LEVEL 3 | TOTAL |
| Common Stocks** |
| $182,028,579 |
| $— |
| $— |
|
| $182,028,579 |
|
| Rights | 251,456 |
| — |
| — |
| 251,456 |
|
| High Social Impact Investments | — |
| 960,720 |
| 232,605 |
| 1,193,325 |
|
| Time Deposit | — |
| 8,517,316 |
| — |
| 8,517,316 |
|
| | | | | |
| TOTAL |
| $182,280,035 |
|
| $9,478,036 |
|
| $232,605 | ^ |
| $191,990,676 |
|
| |
| * For a complete listing of investments, please refer to the Schedule of Investments. |
| ** For further breakdown of equity securities by country, please refer to the Schedule of Investments. |
| ^ Level 3 securities represent 0.1% of net assets. |
On March 31, 2016, for certain securities which trade primarily outside the U.S., adjustments to prices due to movements against a specified benchmark were not necessary. As a result, $146,533,270 transferred out of Level 2 and into Level 1. The amount of this transfer was determined based on the fair value of such securities at the end of the period.
16 calvert.com CALVERT INTERNATIONAL OPPORTUNITIES FUND SEMI-ANNUAL REPORT (UNAUDITED)
Restricted Securities: The Fund may invest in securities that are subject to legal or contractual restrictions on resale. Generally, these securities may only be sold publicly upon registration under the Securities Act of 1933 or in transactions exempt from such registration. Information regarding restricted securities is included at the end of the Schedule of Investments.
The Fund may invest in Community Investment Notes issued by the Calvert Social Investment Foundation (the “CSI Foundation”). The CSI Foundation is a 501(c)(3) non-profit organization that receives in-kind support from Calvert and its subsidiaries. The Fund has received an exemptive order from the Securities and Exchange Commission permitting the Fund to make investments in these notes under certain conditions.
Security Transactions and Investment Income: Security transactions are accounted for on trade date. Realized gains and losses are recorded on an identified cost basis and may include proceeds from litigation. Dividend income is recorded on the ex-dividend date or, in the case of dividends on certain foreign securities, as soon as the Fund is informed of the ex-dividend date. Withholding taxes on foreign dividends have been provided for in accordance with the Fund’s understanding of the applicable country’s tax rules and rates. Distributions received on securities that represent a return of capital are recorded as a reduction of cost of investments. Distributions received on securities that represent a capital gain are recorded as a realized gain. Interest income, which includes amortization of premium and accretion of discount on debt securities, is accrued as earned. Investment income and realized and unrealized gains and losses are allocated to separate classes of shares based upon the relative net assets of each class. Expenses arising in connection with a specific class are charged directly to that class. Expenses common to the classes are allocated to each class in proportion to their relative net assets.
Foreign Currency Transactions: The Fund’s accounting records are maintained in U.S. dollars. For valuation of assets and liabilities on each date of net asset value determination, foreign denominations are converted into U.S. dollars using the current exchange rate. Security transactions, income, and expenses are translated at the prevailing rate of exchange on the date of the event. The effect of changes in foreign exchange rates on securities and foreign currencies is included in the net realized and unrealized gain or loss on investments and assets and liabilities denominated in foreign currencies.
Distributions to Shareholders: Distributions to shareholders are recorded by the Fund on ex-dividend date. Dividends from net investment income and distributions from net realized capital gains, if any, are paid at least annually. Distributions are determined in accordance with income tax regulations which may differ from U.S. generally accepted accounting principles; accordingly, periodic reclassifications are made within the Fund's capital accounts to reflect income and gains available for distribution under income tax regulations.
Estimates: The preparation of financial statements in conformity with U.S. generally accepted accounting principles requires management to make estimates and assumptions that affect the reported amounts of assets and liabilities and disclosure of contingent assets and liabilities at the date of the financial statements and the reported amounts of increases and decreases in net assets from operations during the reporting period. Actual results could differ from those estimates.
Redemption Fees: The Fund charged a 2% redemption fee on redemptions, including exchanges, made within 30 days of purchase (within seven days for Class I shares). The redemption fee was accounted for as an addition to paid-in capital. This fee was eliminated effective February 2, 2015.
Federal Income Taxes: No provision for federal income or excise tax is required since the Fund intends to continue to qualify as a regulated investment company under the Internal Revenue Code and to distribute substantially all of its taxable earnings.
Management has analyzed the Fund's tax positions taken for all open federal income tax years and has concluded that no provision for federal income tax is required in the Fund's financial statements. A Fund's federal tax return is subject to examination by the Internal Revenue Service for a period of three years.
NOTE B — RELATED PARTY TRANSACTIONS
Calvert Investment Management, Inc. (the “Advisor”) is wholly-owned by Calvert Investments, Inc., which is indirectly wholly-owned by Ameritas Mutual Holding Company. The Advisor provides investment advisory services and pays the salaries and fees of officers and Directors of the Fund who are employees of the Advisor or its affiliates. For its services, the Advisor receives an annual fee, payable monthly, of 0.75%, of the Fund’s average daily net assets.
The Advisor has contractually agreed to limit net annual fund operating expenses through January 31, 2017. The contractual expense caps are 1.66%, 2.41%, 1.20%, and 1.41% for Class A, C, I, and Y, respectively. Prior to February 1, 2016, the contractual expense caps were 1.66%, 2.50%, 1.20%, and 1.41% for Class A, C, I, and Y, respectively. For the purpose of this expense limit, operating expenses do not include interest expense, brokerage commissions, taxes, and extraordinary expenses. This expense limitation does not limit acquired fund fees and expenses, if any.
Calvert Investment Administrative Services, Inc. ("CIAS"), an affiliate of the Advisor, provides administrative services to the Fund for an annual fee, payable monthly, based on the Fund’s average daily net assets.
calvert.com CALVERT INTERNATIONAL OPPORTUNITIES FUND SEMI-ANNUAL REPORT (UNAUDITED) 17
For the period October 1, 2015 to January 31, 2016, the administrative fee was 0.30% for Class A, C and Y and 0.15% for Class I. CIAS and the Fund entered into an Amended and Restated Administrative Services Agreement that established a 0.12% administrative fee for all classes of the Fund commencing on February 1, 2016. CIAS voluntarily waived 0.18% for Class A, C and Y shares of the Fund and 0.03% for Class I shares of the Fund (the amount of the administrative fee above 0.12%) for the period from December 1, 2015 through January 31, 2016. During the six-month period ended March 31, 2016, CIAS voluntarily waived $44,836.
Calvert Investment Distributors, Inc. (“CID”), an affiliate of the Advisor, is the distributor and principal underwriter for the Fund. Pursuant to Rule 12b-1 under the Investment Company Act of 1940, the Fund has adopted a Distribution Plan that permits the Fund to pay certain expenses associated with the distribution and servicing of its shares. The expenses paid may not exceed 0.50% and 1.00% annually of the average daily net assets of Class A and C, respectively. The amount actually paid by the Fund is an annualized fee, payable monthly, of 0.25% and 1.00% of the average daily net assets of Class A and C, respectively. Class I and Y shares do not have Distribution Plan expenses.
CID received $6,948 as its portion of commissions charged on sales of the Fund’s Class A shares for the period ended March 31, 2016.
Calvert Investment Services, Inc. (“CIS”), an affiliate of the Advisor, acts as shareholder servicing agent for the Fund. For its services, CIS received a fee of $12,380 for the period ended March 31, 2016. Boston Financial Data Services, Inc. is the transfer and dividend disbursing agent.
Each Director of the Fund who is not an employee of the Advisor or its affiliates receives an annual retainer of $52,000 plus a meeting fee of up to $3,000 for each Board meeting attended. Additional fees of $6,000 annually may be paid to the Committee chairs ($10,000 for the Board Chair and the Special Equities Committee chair) and $2,500 annually may be paid to Committee members, plus a Committee meeting fee of $500 for each Committee meeting attended. Eligible Directors may participate in a Deferred Compensation Plan (the “Plan”). Obligations of the Plan will be paid solely out of the Fund’s assets. Directors’ fees are allocated to each of the funds served.
NOTE C — INVESTMENT ACTIVITY AND TAX INFORMATION
During the period, the cost of purchases and proceeds from sales of investments, other than short-term securities, were $48,904,733 and $43,106,015, respectively.
As of March 31, 2016, the tax basis components of unrealized appreciation/(depreciation) and the federal tax cost were as follows:
|
| | | |
| Unrealized appreciation |
| $14,565,591 |
|
| Unrealized (depreciation) | (14,824,240 | ) |
| Net unrealized appreciation (depreciation) |
| ($258,649 | ) |
| Federal income tax cost of investments |
| $192,249,325 |
|
NOTE D — LINE OF CREDIT
A financing agreement is in place with the Calvert Funds and State Street Corporation (“SSC”). Under the agreement, SSC provides an unsecured line of credit facility, in the aggregate amount of $50 million ($25 million committed and $25 million uncommitted), accessible by the Calvert Funds for temporary or emergency purposes only. Borrowings bear interest at the higher of the London Interbank Offered Rate (LIBOR) or the overnight Federal Funds Rate plus 1.25% per annum. A commitment fee of 0.20% per annum is incurred on the unused portion of the committed facility. An administrative fee of $25,000 was paid in connection with the uncommitted facility. These fees are allocated to all participating funds. The Fund had no loans outstanding pursuant to this line of credit at March 31, 2016.
For the six months ended March 31, 2016, borrowing information by the Fund under the agreement was as follows:
|
| | | |
| Average Daily Balance | Weighted Average
Interest Rate | Maximum
Amount Borrowed | Month of Maximum
Amount Borrowed |
| $6,501 | 1.53% | $716,417 | December 2015 |
NOTE E — SUBSEQUENT EVENTS
In preparing the financial statements as of March 31, 2016, no subsequent events or transactions occurred that would have required recognition or disclosure in these financial statements.
18 calvert.com CALVERT INTERNATIONAL OPPORTUNITIES FUND SEMI-ANNUAL REPORT (UNAUDITED)
CALVERT INTERNATIONAL OPPORTUNITIES FUND
FINANCIAL HIGHLIGHTS
|
| | | | | | | | | | | | | | | | | | | | | | | |
| | PERIODS ENDED |
| CLASS A SHARES | March 31, 2016 (a) (Unaudited) | | September 30, 2015 (a) | | September 30, 2014 (a) | | September 30, 2013 (a) | | September 30, 2012 | | September 30, 2011 |
| Net asset value, beginning |
| $14.58 |
| |
| $16.42 |
| |
| $15.76 |
| |
| $12.59 |
| |
| $10.57 |
| |
| $12.43 |
|
| Income from investment operations: | | | | | | | | | | | |
| Net investment income | 0.01 |
| | 0.14 |
| | 0.15 |
| | 0.14 |
| | 0.13 |
| | 0.10 |
|
| Net realized and unrealized gain (loss) | 0.42 |
| | (0.83) |
| | 0.66 |
| | 3.19 |
| | 2.01 |
| | (1.93) |
|
| Total from investment operations | 0.43 |
| | (0.69) |
| | 0.81 |
| | 3.33 |
| | 2.14 |
| | (1.83) |
|
| Distributions from: | | | | | | | | | | | |
| Net investment income | (0.11) |
| | (0.18) |
| | (0.15) |
| | (0.16) |
| | (0.12) |
| | (0.03) |
|
| Net realized gain | (0.47) |
| | (0.97) |
| | — |
| | — |
| | — |
| | — |
|
| Total distributions | (0.58) |
| | (1.15) |
| | (0.15) |
| | (0.16) |
| | (0.12) |
| | (0.03) |
|
| Total increase (decrease) in net asset value | (0.15) |
| | (1.84) |
| | 0.66 |
| | 3.17 |
| | 2.02 |
| | (1.86) |
|
| Net asset value, ending |
| $14.43 |
| |
| $14.58 |
| |
| $16.42 |
| |
| $15.76 |
| |
| $12.59 |
| |
| $10.57 |
|
| Total return (b) | 2.99 | % | | (4.32 | %) | | 5.14 | % | | 26.70 | % | | 20.52 | % | | (14.78 | %) |
| Ratios to average net assets: (c) | | | | | | | | | | | |
| Net investment income | 0.19%(d) |
| | 0.88 | % | | 0.88 | % | | 1.04 | % | | 1.10 | % | | 0.68 | % |
| Total expenses | 1.55%(d) |
| | 1.69 | % | | 1.85 | % | | 2.13 | % | | 2.35 | % | | 2.21 | % |
| Net expenses | 1.49%(d) |
| | 1.66 | % | | 1.66 | % | | 1.66 | % | | 1.66 | % | | 1.66 | % |
| Portfolio turnover | 25 | % | | 51 | % | | 56 | % | | 42 | % | | 56 | % | | 126 | % |
| Net assets, ending (in thousands) |
| $105,896 |
| |
| $99,908 |
| |
| $50,540 |
| |
| $45,563 |
| |
| $27,406 |
| |
| $24,874 |
|
| |
| (a) Per share figures are calculated using the Average Shares Method. |
| (b) Total return is not annualized for periods of less than one year and does not reflect deduction of any front-end or deferred sales charge. |
| (c) Total expenses do not reflect amounts reimbursed and/or waived by the Advisor and certain of its affiliates, if applicable. Net expenses are net of all reductions and represent the net expenses paid by the Fund. |
| (d) Annualized. |
| See notes to financial statements. |
calvert.com CALVERT INTERNATIONAL OPPORTUNITIES FUND SEMI-ANNUAL REPORT (UNAUDITED) 19
CALVERT INTERNATIONAL OPPORTUNITIES FUND
FINANCIAL HIGHLIGHTS
|
| | | | | | | | | | | | | | | | | | | | | | | |
| | PERIODS ENDED |
| CLASS C SHARES | March 31, 2016 (a) (Unaudited) | | September 30, 2015 (a) | | September 30, 2014 (a) | | September 30, 2013 (a) | | September 30, 2012 | | September 30, 2011 |
| Net asset value, beginning |
| $14.28 |
| |
| $16.08 |
| |
| $15.44 |
| |
| $12.30 |
| |
| $10.32 |
| |
| $12.20 |
|
| Income from investment operations: | | | | | | | | | | | |
| Net investment income (loss) | (0.06) |
| | (0.03) |
| | (0.01) |
| | 0.02 |
| | 0.04 |
| | (0.01) |
|
| Net realized and unrealized gain (loss) | 0.41 |
| | (0.76) |
| | 0.66 |
| | 3.14 |
| | 1.95 |
| | (1.87) |
|
| Total from investment operations | 0.35 |
| | (0.79) |
| | 0.65 |
| | 3.16 |
| | 1.99 |
| | (1.88) |
|
| Distributions from: | | | | | | | | | | | |
| Net investment income | — |
| | (0.04) |
| | (0.01) |
| | (0.02) |
| | (0.01) |
| | — |
|
| Net realized gain | (0.47) |
| | (0.97) |
| | — |
| | — |
| | — |
| | — |
|
| Total distributions | (0.47) |
| | (1.01) |
| | (0.01) |
| | (0.02) |
| | (0.01) |
| | — |
|
| Total increase (decrease) in net asset value | (0.12) |
| | (1.80) |
| | 0.64 |
| | 3.14 |
| | 1.98 |
| | (1.88) |
|
| Net asset value, ending |
| $14.16 |
| |
| $14.28 |
| |
| $16.08 |
| |
| $15.44 |
| |
| $12.30 |
| |
| $10.32 |
|
| Total return (b) | 2.50 | % | | (5.09 | %) | | 4.20 | % | | 25.70 | % | | 19.31 | % | | (15.41 | %) |
| Ratios to average net assets: (c) | | | | | | | | | | | |
| Net investment income (loss) | (0.83%)(d) |
| | (0.18 | %) | | (0.08 | %) | | 0.17 | % | | 0.30 | % | | (0.13 | %) |
| Total expenses | 2.64%(d) |
| | 2.72 | % | | 2.81 | % | | 3.27 | % | | 3.65 | % | | 3.48 | % |
| Net expenses | 2.47%(d) |
| | 2.50 | % | | 2.50 | % | | 2.50 | % | | 2.50 | % | | 2.50 | % |
| Portfolio turnover | 25 | % | | 51 | % | | 56 | % | | 42 | % | | 56 | % | | 126 | % |
| Net assets, ending (in thousands) |
| $5,062 |
| |
| $5,030 |
| |
| $4,605 |
| |
| $3,282 |
| |
| $2,363 |
| |
| $1,831 |
|
| |
| (a) Per share figures are calculated using the Average Shares Method. |
| (b) Total return is not annualized for periods of less than one year and does not reflect deduction of any front-end or deferred sales charge. |
| (c) Total expenses do not reflect amounts reimbursed and/or waived by the Advisor and certain of its affiliates, if applicable. Net expenses are net of all reductions and represent the net expenses paid by the Fund. |
| (d) Annualized. |
| See notes to financial statements. |
20 calvert.com CALVERT INTERNATIONAL OPPORTUNITIES FUND SEMI-ANNUAL REPORT (UNAUDITED)
CALVERT INTERNATIONAL OPPORTUNITIES FUND
FINANCIAL HIGHLIGHTS
|
| | | | | | | | | | | | | | | | | | | | | | | |
| | PERIODS ENDED |
| CLASS I SHARES | March 31, 2016 (a) (Unaudited) | | September 30, 2015 (a) | | September 30, 2014 (a) | | September 30, 2013 (a) | | September 30, 2012 | | September 30, 2011 |
| Net asset value, beginning |
| $14.38 |
| |
| $16.19 |
| |
| $15.54 |
| |
| $12.37 |
| |
| $10.36 |
| |
| $12.17 |
|
| Income from investment operations: | | | | | | | | | | | |
| Net investment income | 0.04 |
| | 0.19 |
| | 0.20 |
| | 0.25 |
| | 0.21 |
| | 0.15 |
|
| Net realized and unrealized gain (loss) | 0.43 |
| | (0.80) |
| | 0.66 |
| | 3.10 |
| | 1.93 |
| | (1.88) |
|
| Total from investment operations | 0.47 |
| | (0.61) |
| | 0.86 |
| | 3.35 |
| | 2.14 |
| | (1.73) |
|
| Distributions from: | | | | | | | | | | | |
| Net investment income | (0.17) |
| | (0.23) |
| | (0.21) |
| | (0.18) |
| | (0.13) |
| | (0.08) |
|
| Net realized gain | (0.47) |
| | (0.97) |
| | — |
| | — |
| | — |
| | — |
|
| Total distributions | (0.64) |
| | (1.20) |
| | (0.21) |
| | (0.18) |
| | (0.13) |
| | (0.08) |
|
| Total increase (decrease) in net asset value | (0.17) |
| | (1.81) |
| | 0.65 |
| | 3.17 |
| | 2.01 |
| | (1.81) |
|
| Net asset value, ending |
| $14.21 |
| |
| $14.38 |
| |
| $16.19 |
| |
| $15.54 |
| |
| $12.37 |
| |
| $10.36 |
|
| Total return (b) | 3.29 | % | | (3.86 | %) | | 5.58 | % | | 27.43 | % | | 20.89 | % | | (14.32 | %) |
| Ratios to average net assets: (c) | | | | | | | | | | | |
| Net investment income | 0.59%(d) |
| | 1.22 | % | | 1.24 | % | | 1.76 | % | | 1.76 | % | | 1.11 | % |
| Total expenses | 1.09%(d) |
| | 1.15 | % | | 1.18 | % | | 1.43 | % | | 1.70 | % | | 1.54 | % |
| Net expenses | 1.08%(d) |
| | 1.15 | % | | 1.18 | % | | 1.20 | % | | 1.20 | % | | 1.20 | % |
| Portfolio turnover | 25 | % | | 51 | % | | 56 | % | | 42 | % | | 56 | % | | 126 | % |
| Net assets, ending (in thousands) |
| $43,927 |
| |
| $40,833 |
| |
| $32,079 |
| |
| $24,130 |
| |
| $8,771 |
| |
| $4,174 |
|
| |
| (a) Per share figures are calculated using the Average Shares Method. |
| (b) Total return is not annualized for periods of less than one year and does not reflect deduction of any front-end or deferred sales charge. |
| (c) Total expenses do not reflect amounts reimbursed and/or waived by the Advisor and certain of its affiliates, if applicable. Net expenses are net of all reductions and represent the net expenses paid by the Fund. |
| (d) Annualized. |
| See notes to financial statements. |
calvert.com CALVERT INTERNATIONAL OPPORTUNITIES FUND SEMI-ANNUAL REPORT (UNAUDITED) 21
CALVERT INTERNATIONAL OPPORTUNITIES FUND
FINANCIAL HIGHLIGHTS
|
| | | | | | | | | | | | | | | | | | | | | | | |
| | PERIODS ENDED |
| CLASS Y SHARES | March 31, 2016 (a) (Unaudited) | | September 30, 2015 (a) | | September 30, 2014 (a) | | September 30, 2013 (a) | | September 30, 2012 | | September 30, 2011 |
| Net asset value, beginning |
| $13.99 |
| |
| $15.68 |
| |
| $15.03 |
| |
| $11.94 |
| |
| $10.00 |
| |
| $11.72 |
|
| Income from investment operations: | | | | | | | | | | | |
| Net investment income | 0.03 |
| | 0.14 |
| | 0.11 |
| | 0.18 |
| | 0.15 |
| | 0.13 |
|
| Net realized and unrealized gain (loss) | 0.41 |
| | (0.77) |
| | 0.70 |
| | 3.03 |
| | 1.90 |
| | (1.83) |
|
| Total from investment operations | 0.44 |
| | (0.63) |
| | 0.81 |
| | 3.21 |
| | 2.05 |
| | (1.70) |
|
| Distributions from: | | | | | | | | | | | |
| Net investment income | (0.15) |
| | (0.09) |
| | (0.16) |
| | (0.12) |
| | (0.11) |
| | (0.02) |
|
| Net realized gain | (0.47) |
| | (0.97) |
| | — |
| | — |
| | — |
| | — |
|
| Total distributions | (0.62) |
| | (1.06) |
| | (0.16) |
| | (0.12) |
| | (0.11) |
| | (0.02) |
|
| Total increase (decrease) in net asset value | (0.18) |
| | (1.69) |
| | 0.65 |
| | 3.09 |
| | 1.94 |
| | (1.72) |
|
| Net asset value, ending |
| $13.81 |
| |
| $13.99 |
| |
| $15.68 |
| |
| $15.03 |
| |
| $11.94 |
| |
| $10.00 |
|
| Total return (b) | 3.21 | % | | (4.11 | %) | | 5.40 | % | | 27.06 | % | | 20.69 | % | | (14.52 | %) |
| Ratios to average net assets: (c) | | | | | | | | | | | |
| Net investment income | 0.50%(d) |
| | 0.92 | % | | 0.68 | % | | 1.31 | % | | 1.36 | % | | 1.04 | % |
| Total expenses | 1.25%(d) |
| | 1.42 | % | | 1.48 | % | | 1.90 | % | | 2.49 | % | | 2.68 | % |
| Net expenses | 1.19%(d) |
| | 1.41 | % | | 1.41 | % | | 1.41 | % | | 1.41 | % | | 1.41 | % |
| Portfolio turnover | 25 | % | | 51 | % | | 56 | % | | 42 | % | | 56 | % | | 126 | % |
| Net assets, ending (in thousands) |
| $38,628 |
| |
| $33,299 |
| |
| $16,536 |
| |
| $5,138 |
| |
| $1,638 |
| |
| $1,519 |
|
| |
| (a) Per share figures are calculated using the Average Shares Method. |
| (b) Total return is not annualized for periods of less than one year and does not reflect deduction of any front-end or deferred sales charge. |
| (c) Total expenses do not reflect amounts reimbursed and/or waived by the Advisor and certain of its affiliates, if applicable. Net expenses are net of all reductions and represent the net expenses paid by the Fund. |
| (d) Annualized. |
| See notes to financial statements. |
22 calvert.com CALVERT INTERNATIONAL OPPORTUNITIES FUND SEMI-ANNUAL REPORT (UNAUDITED)
PROXY VOTING
The Proxy Voting Guidelines of the Calvert Funds that the Fund uses to determine how to vote proxies relating to portfolio securities are provided as an Appendix to the Fund’s Statement of Additional Information. The Statement of Additional Information can be obtained free of charge by calling the Fund at 1-800-368-2745, by visiting the Calvert website at www.calvert.com; or by visiting the SEC’s website at www.sec.gov.
Information regarding how the Fund voted proxies relating to portfolio securities during the most recent 12-month period ended June 30 is available on the Fund’s website at www.calvert.com and on the SEC’s website at www.sec.gov.
AVAILABILITY OF QUARTERLY PORTFOLIO HOLDINGS
The Fund files its complete schedule of portfolio holdings with the SEC for the first and third quarters of each fiscal year on Form N-Q. The Fund’s Form N-Q is available on the SEC’s website at www.sec.gov. The Fund’s Form N-Q may be reviewed and copied at the SEC’s Public Reference Room in Washington, DC; information on the operation of the Public Reference Room may be obtained by calling 1-800-SEC-0330.
BASIS FOR BOARD'S APPROVAL OF INVESTMENT ADVISORY CONTRACTS
At a meeting held on December 8, 2015, the Board of Directors, and by a separate vote, the disinterested Directors, approved the continuance of the Investment Advisory Agreement between Calvert World Values Fund, Inc. and the Advisor and the Investment Subadvisory Agreement between the Advisor and each Subadvisor.
In evaluating the Investment Advisory Agreement, the Board considered a variety of information relating to the Fund and the Advisor. The disinterested Directors reviewed a report prepared by the Advisor regarding various services provided to the Fund by the Advisor and its affiliates. Such report included, among other data, information regarding the Advisor’s personnel and the Advisor’s revenue and cost of providing services to the Fund, and a separate report prepared by an independent third party, which provided a statistical analysis comparing the Fund ‘s investment performance, expenses and fees to comparable mutual funds.
The disinterested Directors were separately represented by independent legal counsel with respect to their consideration of the reapproval of the Investment Advisory Agreement and each Investment Subadvisory Agreement with the applicable Subadvisor. Prior to voting, the disinterested Directors reviewed the proposed continuance of the Investment Advisory Agreement and each Investment Subadvisory Agreement with management and also met in private sessions with their counsel at which no representatives of management were present.
In the course of its deliberations regarding the Investment Advisory Agreement, the Board considered the following factors, among others: the nature, extent and quality of the services provided by the Advisor, including the personnel providing such services; the Advisor’s financial condition; the level and method of computing the Fund’s advisory fee; comparative performance, fee and expense information for the Fund; the profitability of the Calvert Family of Funds to the Advisor and its affiliates; the allocation of the Fund’s brokerage, including the Advisor’s process for monitoring “best execution”; the direct and indirect benefits, if any, derived by the Advisor and its affiliates from their relationship with the Fund; the effect of the Fund’s growth and size on the Fund’s performance and expenses; the affiliated distributor’s process for monitoring sales load breakpoints; the Advisor’s compliance programs and policies; the Advisor’s performance of substantially similar duties for other funds; and any possible conflicts of interest.
In considering the nature, extent and quality of the services provided by the Advisor under the Investment Advisory Agreement, the Board reviewed information provided by the Advisor relating to its operations and personnel, including, among other information, biographical information on the Advisor’s supervisory and professional staff and descriptions of its organizational and management structure. The Board also took into account similar information provided periodically throughout the previous year by the Advisor as well as the Board’s familiarity with management through Board of Directors’ meetings, discussions and other reports. The Board also noted that it reviewed on a quarterly basis information regarding the Advisor’s compliance with applicable policies and procedures, including those related to personal investing. The Advisor’s administrative capabilities, including its ability to supervise the other service providers for the Fund, were also considered. The Board also took into account the responsible investing research and analysis provided by the Advisor to the Fund. The Board observed that the scope of services provided by the Advisor generally had expanded over time as a result of regulatory, market and other changes. The Board took into consideration, among other factors, the effectiveness of the Fund’s and Advisor’s processes, policies and procedures and the Advisor’s personnel. The Board also took into account, among other items, periodic reports received from the Advisor over the past year concerning the Advisor’s ongoing review and enhancement of certain processes, policies and procedures of the Fund and the Advisor. The Board discussed the Advisor’s effectiveness in monitoring the performance of the Subadvisors and its timeliness in responding to performance issues. The Board concluded that it was satisfied with the nature, extent and quality of services provided to the Fund by the Advisor under the Investment Advisory Agreement.
calvert.com CALVERT INTERNATIONAL OPPORTUNITIES FUND SEMI-ANNUAL REPORT (UNAUDITED) 23
In considering the Fund’s performance, the Board noted that it reviewed on a quarterly basis detailed information about the Fund’s performance results, portfolio composition and investment strategies. In addition, the Board took into account overall financial market conditions. The Board also reviewed various comparative data provided to it in connection with its consideration of the renewal of the Investment Advisory Agreement, including, among other information, a comparison of the Fund’s total return with its Lipper index and with that of other mutual funds deemed to be in its peer universe by an independent third party in its report. This comparison indicated that the Fund performed above the median of its peer universe for the one- and three-year periods ended June 30, 2015, and at the median of its peer universe for the five-year period ended June 30, 2015. The data also indicated that the Fund outperformed its Lipper index for the one- and three-year periods ended June 30, 2015, and underperformed its Lipper index for the five-year period ended June 30, 2015. Based upon its review, the Board concluded that the Fund’s performance was satisfactory relative to the performance of funds with similar investment objectives and to relevant indices.
In considering the Fund’s fees and expenses, the Board compared the Fund’s fees and total expense ratio with various comparative data for the funds in its peer group. Among other findings, the data indicated that the Fund’s advisory fee (after taking into account waivers and/or reimbursements) was below the median of its peer group and total expenses (net of waivers and/or reimbursements) were above the median of its peer group. The Board noted that the allocation of advisory and administrative fees may vary among the Fund’s peer group. The Board also took into account the Advisor’s current undertaking to maintain expense limitations for the Fund and that the Advisor was reimbursing a portion of the Fund’s expenses. The Board also noted management’s discussion of the Fund’s expenses and certain factors that affected the level of such expenses, including the cost of providing the responsible investing research and analysis provided by the Advisor. The Board noted that the Fund’s administrator had agreed to implement an administrative fee change effective December 1, 2015, which is expected to reduce the administrative fee paid by certain classes of shares; however, the impact of the fee change is not yet reflected in the Fund’s total expenses. Based upon its review, the Board concluded that the advisory fee was reasonable in view of the quality of services received by the Fund from the Advisor and the other factors considered.
The Board reviewed the Advisor’s profitability on a fund-by-fund basis. In reviewing the overall profitability of the advisory fee to the Fund’s Advisor, the Board also considered the fact that affiliates of the Advisor provided shareholder servicing, administrative and distribution services to the Fund for which they received compensation. The information considered by the Board included Calvert’s operating profit margin information both before and after tax expenses with respect to the services that the Advisor and its affiliates provided to the Calvert Family of Funds complex. The Board reviewed the profitability of the Advisor’s relationship with the Fund in terms of the total amount of annual advisory fees it received with respect to the Fund and whether the Advisor had the financial wherewithal to continue to provide services to the Fund. The Board noted that the Advisor was reimbursing a portion of the Fund’s expenses. The Board also noted the Advisor’s current undertaking to maintain expense limitations for the Fund. The Board also considered that the Advisor derived benefits to its reputation and other indirect benefits from its relationship with the Fund. The Board also noted that the Advisor paid the subadvisory fees to the Subadvisors. Based upon its review, the Board concluded that the Advisor’s and its affiliates’ level of profitability from their relationship with the Fund was reasonable.
The Board considered the effect of the Fund’s current size and its potential growth on its performance and fees. The Board concluded that adding breakpoints to the advisory fee at specified asset levels would not be appropriate at this time given the Fund’s current size. The Board noted that if the Fund’s assets increased over time, the Fund might realize other economies of scale if assets increased proportionally more than certain other expenses.
In reapproving the Investment Advisory Agreement, the Board, including the disinterested Directors, did not identify any single factor as controlling, and each Director may have attributed different weight to various factors.
In evaluating each of the Investment Subadvisory Agreements, the disinterested Directors reviewed information provided by the Subadvisors relating to their respective operations, personnel, investment philosophy, strategies and techniques. Among other information, the Subadvisors provided biographical information on portfolio management and other professional staff, performance information for themselves, and descriptions of their respective investment philosophies, strategies and techniques, organizational and management structures and brokerage policies and practices.
The Board reapproved the Investment Subadvisory Agreement between the Advisor and each of the Subadvisors based on a number of factors relating to each Subadvisor’s ability to perform under the respective Investment Subadvisory Agreement. In the course of its deliberations, the Board evaluated, among other factors: the nature, extent and the quality of the services provided by each Subadvisor; each Subadvisor’s management style and long-term performance record; each Subadvisor’s performance in employing its investment strategies; each Subadvisor’s current level of staffing and its overall resources; the qualifications and experience of each Subadvisor’s personnel; each Subadvisor’s financial condition with respect to its ability to perform the services required under the respective Investment Subadvisory Agreement; each Subadvisor’s risk management processes; each Subadvisor’s compliance systems, including those related to personal investing; and any disciplinary history.
24 calvert.com CALVERT INTERNATIONAL OPPORTUNITIES FUND SEMI-ANNUAL REPORT (UNAUDITED)
Based upon its review, the Board concluded that it was satisfied with the nature, extent and quality of services provided to the Fund by each Subadvisor under the respective Investment Subadvisory Agreement.
As noted above, the Board considered, among other information, the Fund’s performance during the one-, three- and five-year periods ended June 30, 2015 as compared to the Fund’s peer universe and noted that it reviewed on a quarterly basis detailed information about the Fund’s performance results, portfolio composition and investment strategies. The Board noted the Advisor’s expertise and resources in monitoring the performance, investment style and risk-adjusted performance of the Subadvisors.
In considering the cost of services provided by each Subadvisor and the profitability to each Subadvisor of its relationship with the Fund, the Board noted that the subadvisory fees under each Investment Subadvisory Agreement was paid by the Advisor out of the advisory fee that the Advisor received under the Investment Advisory Agreement. The Board also relied on the ability of the Advisor to negotiate each Investment Subadvisory Agreement and the corresponding subadvisory fee at arm’s length. The Board took into consideration the fees each Subadvisor charges to other clients and considered these fee comparisons in light of the differences in managing these other accounts. Based upon its review, the Board concluded that the subadvisory fees were reasonable in view of the quality of the services received by the Fund from the Subadvisors. Because the Advisor pays the Subadvisors’ subadvisory fees and the subadvisory fees were negotiated at arm’s length by the Advisor, the cost of services provided by the Subadvisors and the profitability to the Subadvisors of their relationships with the Fund were not material factors in the Board’s deliberations. For similar reasons, the Board did not consider the potential economies of scale in each Subadvisor’s management of the Fund to be a material factor in its consideration, although the Board noted that each Subadvisor’s subadvisory fee schedule for the Fund contained breakpoints that reduced the subadvisory fee rate on assets above specified levels.
In reapproving each Investment Subadvisory Agreement, the Board, including the disinterested Directors, did not identify any single factor as controlling, and each Director may have attributed different weight to various factors.
Conclusions
The Board reached the following conclusions regarding the Investment Advisory Agreement and each Investment Subadvisory Agreement, among others: (a) the Advisor has demonstrated that it possesses the capability and resources to perform the duties required of it under the Investment Advisory Agreement; (b) each Subadvisor is qualified to manage the Fund’s assets in accordance with the Fund’s investment objectives and policies; (c) the Advisor and each Subadvisor maintain appropriate compliance programs; (d) each Subadvisor is likely to execute its investment strategies consistently over time; (e) the Fund’s performance is satisfactory relative to the performance of funds with similar investment objectives and to relevant indices; and (f) the Fund‘s advisory and subadvisory fees are reasonable in view of the services received by the Fund from the Advisor and Subadvisors. Based on its conclusions, the Board determined that reapproval of the Investment Advisory Agreement and each Investment Subadvisory Agreement would be in the best interests of the Fund and its shareholders.
calvert.com CALVERT INTERNATIONAL OPPORTUNITIES FUND SEMI-ANNUAL REPORT (UNAUDITED) 25
CALVERT INTERNATIONAL OPPORTUNITIES FUND
Supplement to
Calvert Equity and Asset Allocation Funds Prospectus (Class A, C and Y)
dated February 1, 2016
Calvert Equity Funds Prospectus (Class I)
February 1, 2016
Date of Supplement: March 9, 2016
Pablo Salas of investment subadvisor Trilogy Global Advisors, LP, no longer serves as a portfolio manager for Calvert International Opportunities Fund.
The Prospectus is amended as follows:
The table under “Portfolio Management" in the Fund Summary for Calvert International Opportunities Fund is revised and restated as follows (related text and headings added for ease of reference):
Investment Subadvisors. Advisory Research, Inc. (“ARI”) and Trilogy Global Advisors, LP (“Trilogy”) (each a “Subadvisor”)
|
| | |
| Portfolio Manager Name | Title | Length of Time Managing Fund |
| Jonathan P. Brodsky | Managing Director, ARI | Since September 2011 |
| Drew Edwards | Managing Director, ARI | Since September 2011 |
| Marco P. Priani, CFA, CPA, FRM | Managing Director, ARI | Since September 2011 |
| William Sterling, Ph.D. | Chief Investment Officer and Senior Portfolio Manager, Trilogy | Since September 2011 |
| Gregory J. Gigliotti | Managing Director and Senior Portfolio Manager, Trilogy | Since September 2011 |
| Jessica Reuss, CFA | Product Specialist and Portfolio Manager, Trilogy | Since September 2011 |
| David Runkle, Ph.D., CFA | Director of Quantitative Research, Portfolio Manager, Trilogy | Since September 2011 |
The table for Trilogy Global Advisors, LP, under “Management of Fund Investments — More Information About the Advisor, Subadvisors and Portfolio Managers — Calvert International Opportunities Fund” is deleted and replaced with the following:
|
| | |
| Portfolio Manager | Business Experience During Last 5 Years | Role on Management Team |
| William Sterling, Ph.D. | Chief Investment Officer and Senior Portfolio Manager, Trilogy. Mr. Sterling has guided the firm since its inception in 1999. | Senior Portfolio Manager |
| Gregory J. Gigliotti | Managing Director and Senior Portfolio Manager, Trilogy. Responsible for day-to-day management of Trilogy’s client portfolios. | Senior Portfolio Manager |
| Jessica Reuss, CFA | Product Specialist and Portfolio Manager, Trilogy. Responsible for global research coverage in the consumer discretionary and consumer staples sectors. | Portfolio Manager |
| David Runkle, Ph.D., CFA | Director of Quantitative Research, Portfolio Manager, Trilogy. Responsible for Trilogy’s quantitative research efforts. | Portfolio Manager |
[Not Part of Shareholder Report]
SUPPLEMENT TO:
CALVERT WORLD VALUES FUND, INC.
Calvert Capital Accumulation Fund
Calvert International Equity Fund
Calvert International Opportunities Fund
Calvert Emerging Markets Equity Fund
4550 Montgomery Avenue, Bethesda, Maryland 20814
STATEMENT OF ADDITIONAL INFORMATION
February 1, 2016
Date of Supplement: March 9, 2016
Change to Portfolio Management Team for Calvert International Opportunities Fund
Pablo Salas of investment subadvisor Trilogy Global Advisors, LP, no longer serves as a portfolio manager for Calvert International Opportunities Fund.
The statement of additional information is therefore revised as follows:
Delete all references to and related information for Pablo Salas from the section “Portfolio Manager Disclosure.”
[Not Part of Shareholder Report]
CALVERT INTERNATIONAL OPPORTUNITIES FUND
Supplement to
Calvert Equity and Asset Allocation Funds Prospectus (Class A, C and Y)
dated February 1, 2016
Calvert Equity Funds Prospectus (Class I)
February 1, 2016
Date of Supplement: March 24, 2016
Jonathan P. Brodsky of investment subadvisor Advisory Research, Inc., will no longer serve as a portfolio manager for Calvert International Opportunities Fund.
Effective March 31, 2016, the Prospectus is amended as follows:
The table under “Portfolio Management" in the Fund Summary for Calvert International Opportunities Fund is revised and restated as follows (related text and headings added for ease of reference):
Investment Subadvisors. Advisory Research, Inc. (“ARI”) and Trilogy Global Advisors, LP (“Trilogy”) (each a “Subadvisor”)
|
| | |
| Portfolio Manager Name | Title | Length of Time Managing Fund |
| Drew Edwards | Managing Director, ARI | Since September 2011 |
| Marco P. Priani, CFA, CPA, FRM | Managing Director, ARI | Since September 2011 |
| William Sterling, Ph.D. | Chief Investment Officer and Senior Portfolio Manager, Trilogy | Since September 2011 |
| Gregory J. Gigliotti | Managing Director and Senior Portfolio Manager, Trilogy | Since September 2011 |
| Jessica Reuss, CFA | Product Specialist and Portfolio Manager, Trilogy | Since September 2011 |
| David Runkle, Ph.D., CFA | Director of Quantitative Research, Portfolio Manager, Trilogy | Since September 2011 |
The table for Advisory Research, Inc., under “Management of Fund Investments — More Information About the Advisor, Subadvisors and Portfolio Managers — Calvert International Opportunities Fund” is deleted and replaced with the following:
|
| | |
| Portfolio Manager | Business Experience During Last 5 Years | Role on Management Team |
| Drew Edwards | 2013 - present: Managing Director, ARI; member of ARI Investment Team
2008 - 2012: Vice President, ARI, member of ARI Investment Team | Portfolio Manager |
| Marco P. Priani, CFA, CPA, FRM | 2013 - present: Managing Director, ARI; member of ARI Investment Team
2006 - 2012: Vice President, ARI; member of ARI Investment Team | Portfolio Manager |
[Not Part of Shareholder Report]
SUPPLEMENT TO:
CALVERT WORLD VALUES FUND, INC.
Calvert Capital Accumulation Fund
Calvert International Equity Fund
Calvert International Opportunities Fund
Calvert Emerging Markets Equity Fund
4550 Montgomery Avenue, Bethesda, Maryland 20814
STATEMENT OF ADDITIONAL INFORMATION
February 1, 2016
Date of Supplement: March 24, 2016
Change to Portfolio Management Team for Calvert International Opportunities Fund
Jonathan P. Brodsky of investment subadvisor Advisory Research, Inc., will no longer serve as a portfolio manager for Calvert International Opportunities Fund.
Effective March 31, 2016, the statement of additional information is therefore revised as follows:
Delete all references to and related information for Jonathan P. Brodsky from the section “Portfolio Manager Disclosure.”
[Not Part of Shareholder Report]
|
|
| This page intentionally left blank. |
|
| | | | |
| CALVERT INTERNATIONAL OPPORTUNITIES FUND | | CALVERT’S FAMILY OF FUNDS | | |
To Open an Account 800-368-2748 Service for Existing Account Shareholders: 800-368-2745 Brokers: 800-368-2746 Registered Mail Calvert Investments c/o BFDS, P.O. Box 219544 Kansas City, MO 64121-9544 Overnight Mail Calvert Investments c/o BFDS, 330 West 9th Street Kansas City, MO 64105 Web Site calvert.com Principal Underwriter Calvert Investment Distributors, Inc. 4550 Montgomery Avenue Suite 1000 North Bethesda, Maryland 20814 | | Municipal Funds Tax-Free Responsible Impact Bond Fund Taxable Bond Funds Bond Portfolio Income Fund Short Duration Income Fund Long-Term Income Fund Ultra-Short Income Fund High Yield Bond Fund Green Bond Fund Unconstrained Bond Fund Balanced and Asset Allocation Funds Balanced Portfolio Conservative Allocation Fund Moderate Allocation Fund Aggressive Allocation Fund | | Equity Funds Large Cap Core Portfolio Equity Portfolio Global Value Fund U.S. Large Cap Core Responsible Index Fund U.S. Large Cap Value Responsible Index Fund U.S. Large Cap Growth Responsible Index Fund U.S. Mid Cap Core Responsible Index Fund Developed Markets Ex-U.S. Responsible Index Fund Capital Accumulation Fund International Equity Fund Small Cap Fund Global Energy Solutions Fund Global Water Fund International Opportunities Fund Global Equity Income Fund Emerging Markets Equity Fund |
|
| |
| | |
This report is intended to provide fund information to shareholders. It is not authorized for distribution to prospective investors unless preceded or accompanied by a prospectus. Note: The information on our website is not incorporated by reference into this report; our website address is included as an inactive textual reference only. Investors should carefully consider the investment objectives, risks, charges and expenses of the Calvert Funds. This and other important information is contained in the fund’s summary prospectus and prospectus, which can be obtained from your financial professional and should be read carefully before investing. You may also call Calvert at 800/368-2748 or visit calvert.com. |
| Printed on recycled paper using soy inks. | |
|
| | |
| | |
| | | |
Calvert Emerging Markets Equity Fund
| | |
| | | |
| | |
|
| |
Semi-Annual Report March 31, 2016 E-Delivery Sign-Up — Details Inside | |
|
|
| |
Choose Planet-friendly E-delivery! Sign up now for on-line statements, prospectuses, and fund reports. In less than five minutes you can help reduce paper mail and lower fund costs. Just go to calvert.com. If you already have an online account at Calvert, click on Login, to access your Account, and select the documents you would like to receive via e-mail. If you’re new to online account access, click on Login, then Register to create your user name and password. Once you’re in, click on the E-delivery sign-up on the Account Portfolio page and follow the quick, easy steps. Note: if your shares are not held directly at Calvert but through a brokerage firm, you must contact your broker for electronic delivery options available through their firm. |
|
| | | |
| | | TABLE OF CONTENTS |
| | | | |
| | | | President's Letter |
| | | | Portfolio Management Discussion |
| | | | Understanding Your Fund's Expenses |
| | | | Schedule of Investments |
| | | | Statement of Assets and Liabilities |
| | | | Statement of Operations |
| | | | Statements of Changes in Net Assets |
| | | | Notes to Financial Statements |
| | | | Financial Highlights |
| | | | Proxy Voting |
| | | | Availability of Quarterly Portfolio Holdings |
| | | | Basis for Board's Approval of Investment Advisory Contracts |
|
| | |
| John Streur President and Chief Executive Officer, Calvert Investments, Inc. | |
Dear Shareholders,
Historically, environmental and social initiatives have been accomplished through the singular passage of legislation designed to remediate the impact of one significant influence on a singular populace. Commencing with the anti-deforestation efforts in 1842, followed by environmental legislation in industrialized nations to regulate smoke pollution in 1863, arguably, a predecessor to the ubiquitous stop smoking campaigns of today; the previous approach, put forth largely by developed nations, served to the benefit of their citizens and not the rest of the Earth's populace - the majority.
However, the year of 2015 marked a dynamic and exciting shift in the resolution of contemporary environmental and social causes - global leaders from all facets of society, collectively, took action to create global policy platforms with far reaching agendas designed to accelerate our global society's evolution towards a more sustainable and inclusive state. The Pope's Encyclical, issued June 18, 2015, called for the establishment of a new partnership between science and religion to combat human-driven climate change. The United Nations formalized the United Nations Sustainable Development Goals, which included seventeen Sustainable Development Goals (SDGs) geared towards dramatically reducing poverty, fighting inequality and injustice, and tackling climate change by 2030. The COP 21 (Conference of Parties to the 21 session of the United Nations Framework Convention on Climate Change) introduced a historic agreement to combat climate change and accelerate both the action and investment needed for a sustainable low carbon future. Indeed, these are a mere few examples of the broad reaching directives recently initiated in order to encourage action and stress accountability.
Additionally, and importantly, resolution has not only been limited to direct impact policy changes, but also by investors’ behavior and preference. Recognizing the demand by investors to be influencers of change through their capital allocations, the United States Department of Labor (“DOL”) issued Interpretive Bulletin (“IB”) 2015-01 in October of 2015. This bulletin updated and clarified the DOL’s position on how fiduciary investors may best utilize knowledge of a prospective investment’s key environmental, social and governance indicators when making investment decisions for retirement plans. Essentially, the DOL has created a platform that allows fiduciaries to utilize ESG information in their investment decisions regarding a variety of retirement assets, including, but not limited to, IRA accounts; 401(K) accounts; and retirement accounts monitored by a company or union. This legislation is a powerful and fundamental change, especially given- retirement assets represent over $24 trillion and, thus if purposefully directed, may effect meaningful impact. IB 2015-01 is an exciting development in the world of socially responsible investing as it will provide access to vast amounts of capital that can be used to encourage and facilitate better corporate practices.
Change is here. Our challenge, collectively as socially conscious investors, will be to maintain its momentum and focus. Through your investment in the Calvert Funds you are engaged and influential in this movement. By allocating capital only to the best environmentally and socially governed corporations, we-alongside you, encourage good corporate citizenry. Our shareholder advocacy efforts, which fundamentally represent you as a shareholder, consistently monitor and challenge poor corporate policy, thus effecting positive outcomes. Through your support, we are able to partner with academics and industry renowned technicians to produce innovative research that will help to provide both better ESG investment solutions and a more lasting impact.
This is an exciting time and we at Calvert appreciate servicing you, as fund shareholders, and look forward to the future together as we navigate the waters of progress.
Respectfully,
John Streur
May 2016
calvert.com CALVERT EMERGING MARKETS EQUITY FUND SEMI-ANNUAL REPORT (UNAUDITED) 1
|
| |
| PORTFOLIO MANAGEMENT DISCUSSION |
|
| |
| Gary Greenberg of Hermes Investment Management Limited |
|
| |
| Elena Tedesco of Hermes Investment Management Limited |
Market Review
The Fund’s benchmark, MSCI Emerging Markets Index, returned 6.41% and outperformed Developed Markets indices. Following a turbulent start to the year, Emerging Markets recovered strongly, with several markets supported by a deferral in expectations of further rate rises in the US and consequent Dollar weakness.
Latin America finished the period strongly reversing the fourth quarter regional underperformance. Brazil led returns, rallying 11% on the back of increased expectations for a move to a market friendly Government. Returns were further boosted by a 10% appreciation in the Real relative to the US Dollar in the first quarter. A recovery in commodity prices provided further support to Colombia and Peru.
First quarter improvements in commodity prices have proved supportive for South Africa and Russia while Greece was the worst performing emerging market, dropping 30%, largely due to major declines in banking stocks.
Emerging Asian equities were more mixed. The Indian market ended in negative territory as lack of progress on reforms continued to weigh on sentiment. China also recorded negative returns given Yuan weakness and continued weak economic data prompting the central bank to cut the reserve requirement ratio for banks by 0.5% to provide support. In ASEAN markets, Indonesian stocks were supported by monetary policy easing from the central bank. Thai stocks gained amid some encouraging macroeconomic data and expectations for further stimulus measures. Malaysian equities also posted positive returns.
Investment Strategy and Technique
The Strategy seeks long-term capital appreciation by investing primarily in equity securities of companies located in emerging market countries.
The Strategy normally invests at least 80% of its assets in equity securities of companies located in emerging market countries, seeking those whose products/services or industrial/business practices contribute towards addressing sustainability challenges in their local and/or international markets.
Fund Performance Relative to the Benchmark
Calvert Emerging Markets Equity Fund Class A shares rose 9.67%, outperforming the benchmark by 3.26% driven by strong stock selection, notably in China and Taiwan. Positive country allocation, specifically the overweight Hungary and Indonesia helped offset negative returns from the Fund’s underweight to Korea. At the sector level, stock selection accounted for the majority of outperformance, led by Consumer Discretionary and Information Technology. The Fund’s underweight Energy and Materials detracted as these were the strongest performing sectors.
Bank Rakyat Indonesia benefited from expectations of improving asset quality, lower credit costs and stronger loan growth and the central bank cut in interest rates as inflation continues to trend down which should allow the economy to maintain some momentum in 2016. Tong Yang, the Taiwan auto parts manufacturer rose on solid results. Overall 2015 revenue was up by 6.2% beating expectations. Alibaba rallied after strong results showed an improving monetisation rate driven by its mobile segment and its inclusion into additional MSCI indices at the end of November.
2 calvert.com CALVERT EMERGING MARKETS EQUITY FUND SEMI-ANNUAL REPORT (UNAUDITED)
|
| | | | |
| | | | |
| | CALVERT EMERGING MARKETS EQUITY FUND |
| | MARCH 31, 2016 | |
| | | | |
| | ECONOMIC SECTORS | % OF TOTAL INVESTMENTS | |
| | Information Technology | 31.7 | % | |
| | Financials | 30.0 | % | |
| | Consumer Discretionary | 17.7 | % | |
| | Health Care | 6.5 | % | |
| | Industrials | 6.1 | % | |
| | Consumer Staples | 3.4 | % | |
| | Telecommunication Services | 2.5 | % | |
| | Utilities | 1.2 | % | |
| | Materials | 0.8 | % | |
| | High Social Impact Investments | 0.1 | % | |
| | Total | 100 | % | |
| | | | |
Indian stock selection was a detractor, with poor performances from ICICI Bank as the asset quality of the bank deteriorated primarily due to RBI’s assessment of asset reclassification and Tech Mahindra, the IT services provider, due to weak growth in the telecom vertical. Non exposure to Samsung Electronics hurt, as its stock price surged after the company announced better-than-expected results and a share-buyback programme.
Positioning and Market Outlook
We remain overweight Emerging Asia and underweight the other regions. We see Chinese growth as sufficient for quality companies to generate good returns, and this is confirmed by our bottom-up work, and therefore we remain modestly overweight. We added China Biologic Products, a leading fully integrated biopharmaceutical company specialising in blood plasma-based products used as critical therapies during medical emergencies and for the prevention of life-threatening diseases. We see the Indian market as promising as well, as there is a good chance of the rural economy turning up which should benefit new addition Hero Motorcorp, the largest manufacturer of two wheelers in India. Finally, we consider the digitalization of modern life to be an inexorable trend, whether for good or ill, and thus maintain an overweight exposure in technology, through several well managed Taiwanese stocks, as well as internet companies in China and Indian software developer.
We remain underweight in Korea which will have to discount a global economic recovery (which we don’t see) in order to perform strongly, and economic stagnation in Brazil, Peru, South Africa and Greece keep us cautious.
We also trimmed the position in South African supermarket chain Shoprite to make room for a new South African position, Investec, offering long-term growth potential in the affluent segment in South Africa and UK financial services.
|
| | | | | | |
| | | | | |
| | CALVERT EMERGING MARKETS EQUITY FUND | |
| | MARCH 31, 2016 | |
| | | | | |
| | INVESTMENT PERFORMANCE | |
| | (TOTAL RETURN AT NAV) | |
| | | 6 MONTHS ENDED 3/31/16 | 12 MONTHS ENDED 3/31/16 | |
| | Class A | 9.67 | % | -7.62 | % | |
| | Class C | 9.24 | % | -8.41 | % | |
| | Class I | 9.90 | % | -7.30 | % | |
| | Class Y | 9.79 | % | -7.40 | % | |
| | MSCI Emerging Markets Index | 6.41 | % | -12.03 | % | |
| | Lipper Emerging Markets Funds Average | 4.60 | % | -11.58 | % | |
| | | | | |
| | Investment performance/return at NAV does not reflect the deduction of the Fund’s maximum 4.75% front-end sales charge or any deferred sales charge. | |
| | | | | |
| | TEN LARGEST STOCK HOLDINGS | % OF NET ASSETS | |
| | Tencent Holdings Ltd. | 5.4 | % | |
| | Taiwan Semiconductor Manufacturing Co. Ltd. (ADR) | 5.3 | % | |
| | Alibaba Group Holding Ltd. (ADR) | 4.0 | % | |
| | Techtronic Industries Co. Ltd. | 3.5 | % | |
| | HDFC Bank Ltd. (ADR) | 3.2 | % | |
| | Richter Gedeon Nyrt | 3.2 | % | |
| | Shenzhen International Holdings Ltd. | 3.0 | % | |
| | Bank Rakyat Indonesia Persero Tbk PT | 3.0 | % | |
| | KB Financial Group, Inc. | 2.9 | % | |
| | Samsung Fire & Marine Insurance Co. Ltd. | 2.8 | % | |
| | Total | 36.3 | % | |
| | | | | |
We label our style “Blend” though at present we are more “Quality Growth”. This is based on what we are seeing bottom up, and our view that the top down drivers pushing the market at the minute (weak Dollar, commodity recovery based on Chinese stimulus, OPEC “discipline,” and short covering) have not decisively turned yet. We also believe the market is giving Brazil too much credit: a new Government, if it comes, will face massive challenges, not least a divided population unwilling to accept the wrenching austerity required for moving to a sustainable growth model.
It seems to us that recognition of actual inflation signals will start to figure in Federal Reserve jawboning, and rates will likely rise this year, strengthening the Dollar. This, along with recognition that the Chinese stimulus is moderate and temporary (national indebtedness limits the extent of possible stimulus), will put a lid on the current commodity rally.
calvert.com CALVERT EMERGING MARKETS EQUITY FUND SEMI-ANNUAL REPORT (UNAUDITED) 3
Chinese growth has indeed picked up but the hard work of closing excess capacity has barely begun, so we are sceptical that sufficient growth will be generated to keep the commodity rally going. Certainly over the next year, supply will exit, providing a better balance in the new low growth environment we are likely to be in over the next several years.
We think the cyclical outlook for the medium term is positive for Emerging Markets, but it is too early to buy deep value, as the drivers for their recovery are not yet in place, and may indeed not fall into place. Over the year it is possible that conditions improve, in which case some of these stocks may have a medium term future, but we will monitor them and their prospects carefully before making heroic assumptions about mean reversion. High levels of global debt, poor demographics, severe environmental challenges, and relentless technological disruption mean this time is not only different, it is unprecedented.
Thus we think that there is a recovery coming in currencies, commodities and Emerging Markets, over the next year or so, but traders have jumped the gun. Performance lags the benchmark in this environment, but the Fund’s Portfolio is a tight ship and we don’t think we’re in port yet, so we’ll weather this out.
Hermes Investment Management, Limited
May 2016
4 calvert.com CALVERT EMERGING MARKETS EQUITY FUND SEMI-ANNUAL REPORT (UNAUDITED)
Growth of $10,000
The graph below shows the value of a hypothetical $10,000 investment in the Fund over the past 10 fiscal year periods or since inception (for funds without 10-year records). The results shown are for Class A shares, reflect the deduction of the maximum front-end Class A sales charge of 4.75%, and assume the reinvestment of dividends. The result is compared with a broad based market index. Market indexes are unmanaged and their results do not reflect the effect of expenses or sales charges. The value of an investment in a different share class would be different.
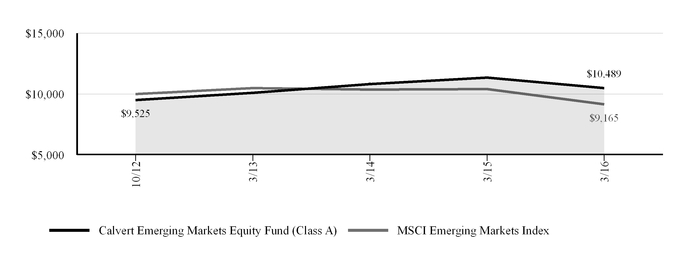
|
| | | | | |
| CALVERT EMERGING MARKETS EQUITY FUND |
| MARCH 31, 2016 |
| AVERAGE ANNUAL TOTAL RETURNS | Ticker Symbol | 1 Year | Since Inception (10/29/2012) |
| Class A (with max. load) | CVMAX | -12.04 | % | 1.40 | % |
| Class C (with max. load) | CVMCX | -9.33 | % | 1.90 | % |
| Class I | CVMIX | -7.30 | % | 3.21 | % |
| Class Y | CVMYX | -7.40 | % | 3.13 | % |
| MSCI Emerging Markets Index | | -12.03 | % | -2.58 | % |
| Lipper Emerging Markets Funds Average | | -11.58 | % | -2.46 | % |
| | | | |
| | | | |
All performance data shown, including the graph above and the adjacent table, represents past performance, does not guarantee future results, assumes reinvestment of dividends and distributions, and does not reflect the deduction of taxes that a shareholder would pay on the Fund’s distributions or the redemption of the Fund shares. All performance data reflects fee waivers and/or expense limitations, if any are in effect; in their absence performance would be lower. See Note B in Notes to Financial Statements. The investment return and principal value of an investment will fluctuate so that an investor’s shares, when redeemed, may be worth more or less than their original cost. Current performance may be lower or higher than the performance data quoted; for current performance data, including most recent month-end, visit www.calvert.com. The gross expense ratio from the current prospectus for Class A shares is 2.01%. This number may differ from the expense ratio shown elsewhere in this report because it is based on a different time period and, if applicable, does not include fee or expense waivers. Performance data quoted already reflects the deduction of the Fund’s operating expenses.
calvert.com CALVERT EMERGING MARKETS EQUITY FUND SEMI-ANNUAL REPORT (UNAUDITED) 5
UNDERSTANDING YOUR FUND'S EXPENSES
As an investor, you incur two types of costs. There are transaction costs, which generally include sales charges on purchases and may include redemption fees. There are also ongoing costs, which generally include management fees, distribution and/or service fees, and other fund expenses. The following information is intended to help you understand your ongoing costs (in dollars) of investing in this mutual fund and to help you compare these costs with the ongoing costs of investing in other mutual funds.
To illustrate these ongoing costs, we have provided examples and calculated the expenses paid by the fund's investors during the period. The actual and hypothetical information presented in the examples is based on an investment of $1,000 invested at the beginning of the period and held for the entire period (October 1, 2015 to March 31, 2016).
Actual Expenses
The first line of the table below provides information about actual account values and actual expenses. You may use the information in this line, together with the amount you invested, to estimate the expenses that you paid over the period. Simply divide your account value by $1,000 (for example, an $8,600 account value divided by $1,000 = 8.6), then multiply the result by the number in the first line under the heading entitled "Expenses Paid During Period" to estimate the expenses you paid on your account during this period.
The fund may charge an annual low balance account fee of $15 to those shareholders whose regular account balance is less than $2,000 ($1,000 for IRA accounts). If the low balance fee applies to your account, you should subtract the fee from the ending account value in the chart below.
Hypothetical Example for Comparison Purposes
The second line of the table below provides information about hypothetical account values and hypothetical expenses based on the Fund’s actual expense ratio and an assumed rate of return of 5% per year before expenses, which is not the Fund’s actual return. The hypothetical account values and expenses may not be used to estimate the actual ending account balance or expenses you paid for the period. You may use this information to compare the ongoing costs of investing in the Fund and other funds. To do so, compare the 5% hypothetical example with the 5% hypothetical examples that appear in the shareholder reports of the other funds.
Please note that the expenses shown in the table are meant to highlight your ongoing costs only and do not reflect any transactional costs, such as sales charges (loads), or redemption fees. Therefore, the second line of the table is useful in comparing ongoing costs only, and will not help you determine the relative total costs of owning different funds. In addition, if these transactional costs were included, your costs would have been higher.
|
| | | | |
| | ANNUALIZED
EXPENSE RATIO | BEGINNING
ACCOUNT VALUE
10/1/15 | ENDING
ACCOUNT VALUE
3/31/16 | EXPENSES PAID
DURING PERIOD*
10/1/15 - 3/31/16 |
| Class A | | | | |
| Actual | 1.66% | $1,000.00 | $1,096.70 | $8.70 |
| Hypothetical (5% return per year before expenses) | 1.66% | $1,000.00 | $1,016.70 | $8.37 |
| Class C | | | | |
| Actual | 2.41% | $1,000.00 | $1,092.40 | $12.61 |
| Hypothetical (5% return per year before expenses) | 2.41% | $1,000.00 | $1,012.95 | $12.13 |
| Class I | | | | |
| Actual | 1.31% | $1,000.00 | $1,099.00 | $6.87 |
| Hypothetical (5% return per year before expenses) | 1.31% | $1,000.00 | $1,018.45 | $6.61 |
| Class Y | | | | |
| Actual | 1.40% | $1,000.00 | $1,097.90 | $7.34 |
| Hypothetical (5% return per year before expenses) | 1.40% | $1,000.00 | $1,018.00 | $7.06 |
| |
| * Expenses paid during the period are equal to the annualized expense ratio for each class as indicated above, multiplied by the average account value over the period, multiplied by 183/366 (to reflect the one-half year period). Expense ratios shown in the Financial Highlights represent the actual expenses incurred for the period. |
6 calvert.com CALVERT EMERGING MARKETS EQUITY FUND SEMI-ANNUAL REPORT (UNAUDITED)
CALVERT EMERGING MARKETS EQUITY FUND
SCHEDULE OF INVESTMENTS
MARCH 31, 2016 (Unaudited)
|
| | |
| | SHARES | VALUE ($) |
| COMMON STOCKS - 91.9% | | |
| Argentina - 1.1% | | |
| Banco Macro SA (ADR) | 16,085 | 1,037,000 |
| | | |
| Brazil - 4.1% | | |
| BB Seguridade Participacoes SA | 284,900 | 2,382,590 |
| Embraer SA (ADR) | 50,025 | 1,318,659 |
| | | 3,701,249 |
| | | |
| China - 15.5% | | |
| Alibaba Group Holding Ltd. (ADR)* | 45,606 | 3,604,242 |
| China Biologic Products, Inc.* | 9,222 | 1,055,735 |
| China Mengniu Dairy Company Ltd. | 1,072,000 | 1,708,168 |
| Shenzhen International Holdings Ltd. | 1,664,904 | 2,704,439 |
| Tencent Holdings Ltd. | 240,200 | 4,908,171 |
| | | 13,980,755 |
| | | |
| Egypt - 0.3% | | |
| Commercial International Bank Egypt SAE | 55,686 | 240,994 |
| | | |
| Hong Kong - 11.3% | | |
| AIA Group Ltd. | 359,000 | 2,034,092 |
| Galaxy Entertainment Group Ltd. | 671,000 | 2,512,963 |
| Samsonite International SA | 753,259 | 2,524,847 |
| Techtronic Industries Co. Ltd. | 785,000 | 3,106,887 |
| | | 10,178,789 |
| | | |
| Hungary - 3.2% | | |
| Richter Gedeon Nyrt | 145,400 | 2,901,900 |
| | | |
| India - 15.1% | | |
| Bharat Forge Ltd. | 92,785 | 1,221,838 |
| Container Corp Of India Ltd. | 72,421 | 1,363,720 |
| HCL Technologies Ltd. | 118,266 | 1,452,642 |
| HDFC Bank Ltd. (ADR) | 47,354 | 2,918,427 |
| Hero MotoCorp. Ltd. | 5,505 | 244,873 |
| Housing Development Finance Corp. Ltd. | 23,169 | 387,302 |
| ICICI Bank Ltd. (ADR) | 311,772 | 2,232,287 |
| Motherson Sumi Systems Ltd. | 413,142 | 1,640,777 |
| Tech Mahindra Ltd. | 297,626 | 2,135,707 |
| | | 13,597,573 |
| | | |
| Indonesia - 3.9% | | |
| Bank Rakyat Indonesia Persero Tbk PT | 3,080,200 | 2,653,943 |
| Tower Bersama Infrastructure Tbk PT* | 1,986,800 | 872,784 |
| | | 3,526,727 |
calvert.com CALVERT EMERGING MARKETS EQUITY FUND SEMI-ANNUAL REPORT (UNAUDITED) 7
|
| | | | |
| | SHARES | VALUE ($) |
| COMMON STOCKS - CONT’D | | |
| Mexico - 5.0% | | |
| Banregio Grupo Financiero SAB de CV | 381,416 | 2,229,706 |
|
| Grupo Financiero Banorte SAB de CV | 397,867 | 2,262,559 |
|
| | | 4,492,265 |
|
| | | |
| Russia - 3.1% | | |
| Mail.Ru Group Ltd. (GDR)* | 99,492 | 2,158,976 |
|
| MMC Norilsk Nickel PJSC (ADR): | | |
| BATS Chi-X Europe | 49,075 | 633,558 |
|
| OTC US | 3,059 | 39,645 |
|
| | | 2,832,179 |
|
| | | |
| South Africa - 4.8% | | |
| Life Healthcare Group Holdings Ltd. | 711,126 | 1,724,434 |
|
| MTN Group Ltd. | 145,538 | 1,337,298 |
|
| Shoprite Holdings Ltd. | 108,835 | 1,284,232 |
|
| | | 4,345,964 |
|
| | | |
| South Korea - 5.7% | | |
| KB Financial Group, Inc. | 92,878 | 2,586,712 |
|
| Samsung Fire & Marine Insurance Co. Ltd. | 9,918 | 2,558,421 |
|
| | | 5,145,133 |
|
| | | |
| Taiwan - 16.4% | | |
| Advantech Co. Ltd. | 262,000 | 1,925,273 |
|
| Chipbond Technology Corp. | 1,061,000 | 1,714,268 |
|
| Phison Electronics Corp. | 223,982 | 1,823,368 |
|
| Siliconware Precision Industries Co. Ltd. (ADR) | 192,358 | 1,533,093 |
|
| Taiwan Semiconductor Manufacturing Co. Ltd. (ADR) | 182,108 | 4,771,230 |
|
| Tong Yang Industry Co. Ltd. | 1,278,448 | 1,920,612 |
|
| Tung Thih Electronic Co. Ltd. | 65,000 | 1,070,408 |
|
| | | 14,758,252 |
|
| | | |
| Turkey - 1.2% | | |
| Aygaz AS | 250,453 | 1,082,925 |
|
| | | |
| United Kingdom - 1.2% | | |
| Investec plc | 146,344 | 1,078,519 |
|
| | | |
| Total Common Stocks (Cost $82,307,811) | | 82,900,224 |
|
| | | |
| | | |
| PREFERRED STOCK - 1.9% | | |
| Brazil - 1.9% | | |
| Itau Unibanco Holding SA | 191,314 | 1,681,283 |
|
| | | |
| Total Preferred Stocks (Cost $2,102,900) | | 1,681,283 |
|
| | | |
| | | |
8 calvert.com CALVERT EMERGING MARKETS EQUITY FUND SEMI-ANNUAL REPORT (UNAUDITED)
|
| | | | |
| | SHARES | VALUE ($) |
| PARTICIPATORY NOTES - 3.4% | | |
| China - 3.4% | | |
| Gree Electric Appliances, Inc., Merrill Lynch International & Co., 8/31/18*(a) | 173,352 | 522,640 |
|
| Gree Electric Appliances, Inc., Morgan Stanley Asia Products Ltd. 2/16/18*(a) | 241,611 | 728,434 |
|
| Hangzhou Hikvision Digital Technology Co., Ltd. Citigroup Global Markets Holdings, Inc. 1/17/17*(a) | 84,142 | 405,613 |
|
| Hangzhou Hikvision Digital Technology Co., Ltd. Merrill Lynch International & Co., 4/9/19*(a) | 290,451 | 1,398,289 |
|
| | | 3,054,976 |
|
| | | |
| Total Participatory Notes (Cost $2,762,064) | | 3,054,976 |
|
| | | |
| | | |
| | PRINCIPAL
AMOUNT ($) | VALUE ($) |
|
| HIGH SOCIAL IMPACT INVESTMENTS - 0.1% | | |
| ImpactAssets Global Sustainable Agriculture Notes, 0.00%, 11/3/20 (a)(b)(c) | 43,000 | 39,775 |
|
| ImpactAssets Microfinance Plus Notes, 0.00%, 11/3/20 (a)(b)(c) | 56,000 | 51,240 |
|
| | | 91,015 |
|
| | | |
| Total High Social Impact Investments (Cost $99,000) | | 91,015 |
|
| | | |
| | | |
| TOTAL INVESTMENTS (Cost $87,271,775) - 97.3% | | 87,727,498 |
|
| Other assets and liabilities, net - 2.7% | | 2,470,097 |
|
NET ASSETS - 100.0% | |
| $90,197,595 |
|
|
|
| NOTES TO SCHEDULE OF INVESTMENTS |
| * Non-income producing security. |
| (a) This security was valued under the direction of the Board of Directors. See Note A. |
| (b) The coupon rate shown on floating or adjustable rate securities represents the rate in effect on March 31, 2016. |
| (c) Restricted securities represent 0.1% of the net assets of the Fund. |
|
| |
| Abbreviations: |
| ADR: | American Depositary Receipts |
| GDR: | Global Depositary Receipts |
| Ltd.: | Limited |
| plc: | Public Limited Company |
|
| | |
| RESTRICTED SECURITIES | ACQUISITION DATES | COST ($) |
| ImpactAssets Global Sustainable Agriculture Notes, 0.00%, 11/3/20 | 11/13/15 | 43,000 |
| ImpactAssets Microfinance Plus Notes, 0.00%, 11/3/20 | 11/13/15 | 56,000 |
| See notes to financial statements. |
calvert.com CALVERT EMERGING MARKETS EQUITY FUND SEMI-ANNUAL REPORT (UNAUDITED) 9
CALVERT EMERGING MARKETS EQUITY FUND
STATEMENT OF ASSETS AND LIABILITIES
MARCH 31, 2016 (Unaudited)
|
| | | |
| ASSETS | |
| Investments in securities, at value (Cost $87,271,775) - see accompanying schedule |
| $87,727,498 |
|
| Cash | 4,620,911 |
|
| Cash denominated in foreign currencies (Cost $778,060) | 788,218 |
|
| Receivable for securities sold | 472,340 |
|
| Receivable for shares sold | 1,327,597 |
|
| Dividends receivable | 126,814 |
|
| Directors' deferred compensation plan | 43,353 |
|
| Total assets | 95,106,731 |
|
| | |
| LIABILITIES | |
| Payable for securities purchased | 4,604,414 |
|
| Payable for shares redeemed | 168,937 |
|
| Payable to Calvert Investment Management, Inc. | 56,546 |
|
| Payable to Calvert Investment Distributors, Inc. | 5,561 |
|
| Payable to Calvert Investment Administrative Services, Inc. | 7,744 |
|
| Payable to Calvert Investment Services, Inc. | 288 |
|
| Directors' deferred compensation plan | 43,353 |
|
| Accrued expenses and other liabilities | 22,293 |
|
| Total liabilities | 4,909,136 |
|
| NET ASSETS |
| $90,197,595 |
|
| | |
| NET ASSETS CONSIST OF: | |
| Paid-in capital applicable to the following shares of common stock, | |
| with 250,000,000 shares of $0.01 par value shares authorized: | |
| Class A: 2,089,486 shares outstanding |
| $26,941,139 |
|
| Class C: 61,852 shares outstanding | 772,296 |
|
| Class I: 3,835,148 shares outstanding | 47,120,151 |
|
| Class Y: 1,572,970 shares outstanding | 18,711,460 |
|
| Distributions in excess of net investment income | (373,147) |
|
| Accumulated net realized gain (loss) on investments and foreign currency transactions | (3,442,591) |
|
| Net unrealized appreciation (depreciation) on investments, foreign currencies and assets and liabilities denominated in foreign currencies | 468,287 |
|
| NET ASSETS |
| $90,197,595 |
|
| | |
| NET ASSET VALUE PER SHARE | |
| Class A (based on net assets of $24,758,475) |
| $11.85 |
|
| Class C (based on net assets of $725,035) |
| $11.72 |
|
| Class I (based on net assets of $45,769,806) |
| $11.93 |
|
| Class Y (based on net assets of $18,944,279) |
| $12.04 |
|
| See notes to financial statements. |
10 calvert.com CALVERT EMERGING MARKETS EQUITY FUND SEMI-ANNUAL REPORT (UNAUDITED)
CALVERT EMERGING MARKETS EQUITY FUND
STATEMENT OF OPERATIONS
SIX MONTHS ENDED MARCH 31, 2016 (Unaudited)
|
| | | |
| NET INVESTMENT INCOME | |
| Investment Income: | |
| Dividend income (net of foreign taxes withheld of $44,863) |
| $339,149 |
|
| Total investment income | 339,149 |
|
| | |
| Expenses: | |
| Investment advisory fee | 358,315 |
|
| Administrative fees | 68,376 |
|
| Transfer agency fees and expenses | 30,664 |
|
| Distribution Plan expenses: | |
| Class A | 28,672 |
|
| Class C | 3,199 |
|
| Directors' fees and expenses | 3,604 |
|
| Accounting fees | 10,815 |
|
| Custodian fees | 70,898 |
|
| Professional fees | 12,644 |
|
| Registration fees | 23,168 |
|
| Reports to shareholders | 5,301 |
|
| Miscellaneous | 4,491 |
|
| Total expenses | 620,147 |
|
| Reimbursement from Advisor: | |
| Class A | (31,866) |
|
| Class C | (6,545) |
|
| Class I | (14,163) |
|
| Class Y | (9,872) |
|
| Administrative fees waived | (14,413) |
|
| Net expenses | 543,288 |
|
| NET INVESTMENT LOSS | (204,139) |
|
| | |
| REALIZED AND UNREALIZED GAIN (LOSS) | |
| Net realized gain (loss) on: | |
| Investments | (931,477) |
|
| Foreign currency transactions | 3,801 |
|
| | (927,676) |
|
| | |
| Change in unrealized appreciation (depreciation) on: | |
| Investments and foreign currencies | 8,859,783 |
|
| Assets and liabilities denominated in foreign currencies | 35,840 |
|
| | 8,895,623 |
|
| | |
| NET REALIZED AND UNREALIZED GAIN (LOSS) | 7,967,947 |
|
| | |
| INCREASE (DECREASE) IN NET ASSETS RESULTING FROM OPERATIONS |
| $7,763,808 |
|
| See notes to financial statements. |
calvert.com CALVERT EMERGING MARKETS EQUITY FUND SEMI-ANNUAL REPORT (UNAUDITED) 11
CALVERT EMERGING MARKETS EQUITY FUND
STATEMENTS OF CHANGES IN NET ASSETS
|
| | | | | | |
| INCREASE (DECREASE) IN NET ASSETS | SIX MONTHS ENDED
MARCH 31, 2016 (Unaudited) | | YEAR ENDED
SEPTEMBER 30, 2015 |
| Operations: | | | |
| Net investment income (loss) | ($204,139) | |
| $683,729 |
|
| Net realized gain (loss) | (927,676) |
| | (1,865,800) |
|
| Change in unrealized appreciation (depreciation) | 8,895,623 |
| | (10,089,457) |
|
| | | | |
| INCREASE (DECREASE) IN NET ASSETS RESULTING FROM OPERATIONS | 7,763,808 |
| | (11,271,528) |
|
| | | | |
| Distributions to shareholders from: | | | |
| Net investment income: | | | |
| Class A shares | (201,769) |
| | (55,632) |
|
| Class C shares | (739) |
| | — |
|
| Class I shares | (492,370) |
| | (197,710) |
|
| Class Y shares | (124,328) |
| | (7,207) |
|
| Net realized gain: | | | |
| Class A shares | — |
| | (719,225) |
|
| Class C shares | — |
| | (19,298) |
|
| Class I shares | — |
| | (1,059,703) |
|
| Class Y shares | — |
| | (80,750) |
|
| Total distributions | (819,206) |
| | (2,139,525) |
|
| | | | |
| Capital share transactions: | | | |
| Shares sold: | | | |
| Class A shares | 8,941,343 |
| | 21,136,575 |
|
| Class C shares | 174,462 |
| | 341,215 |
|
| Class I shares | 6,184,534 |
| | 13,238,700 |
|
| Class Y shares | 13,310,491 |
| | 11,494,694 |
|
| Reinvestment of distributions: | | | |
| Class A shares | 173,844 |
| | 730,848 |
|
| Class C shares | 668 |
| | 15,018 |
|
| Class I shares | 491,547 |
| | 1,257,413 |
|
| Class Y shares | 116,687 |
| | 83,767 |
|
| Redemption fees: | | | |
| Class A shares | — |
| | 3 |
|
| Shares redeemed: | | | |
| Class A shares | (10,023,047) |
| | (14,175,053) |
|
| Class C shares | (72,998) |
| | (295,231) |
|
| Class I shares | (3,568,652) |
| | (1,547,822) |
|
| Class Y shares | (2,600,953) |
| | (6,023,221) |
|
| Total capital share transactions | 13,127,926 |
| | 26,256,906 |
|
| | | | |
| TOTAL INCREASE (DECREASE) IN NET ASSETS | 20,072,528 |
| | 12,845,853 |
|
| | | | |
| See notes to financial statements. |
12 calvert.com CALVERT EMERGING MARKETS EQUITY FUND SEMI-ANNUAL REPORT (UNAUDITED)
CALVERT EMERGING MARKETS EQUITY FUND
STATEMENTS OF CHANGES IN NET ASSETS - CONT’D
|
| | | | | | | |
| NET ASSETS | SIX MONTHS ENDED
MARCH 31, 2016 (Unaudited) | | YEAR ENDED
SEPTEMBER 30, 2015 |
| Beginning of period | $70,125,067 | | $57,279,214 |
| End of period (including distributions in excess of net investment income of ($373,147) and undistributed net investment income of $650,198, respectively) |
| $90,197,595 |
| |
| $70,125,067 |
|
| | | | |
| CAPITAL SHARE ACTIVITY | | | |
| Shares sold: | | | |
| Class A shares | 792,303 |
| | 1,662,220 |
|
| Class C shares | 15,709 |
| | 27,020 |
|
| Class I shares | 546,708 |
| | 1,043,577 |
|
| Class Y shares | 1,173,019 |
| | 899,948 |
|
| Reinvestment of distributions: | | | |
| Class A shares | 15,091 |
| | 58,063 |
|
| Class C shares | 58 |
| | 1,205 |
|
| Class I shares | 42,411 |
| | 99,030 |
|
| Class Y shares | 9,973 |
| | 6,546 |
|
| Shares redeemed: | | | |
| Class A shares | (881,115) |
| | (1,126,025) |
|
| Class C shares | (6,632) |
| | (22,276) |
|
| Class I shares | (310,295) |
| | (128,965) |
|
| Class Y shares | (230,839) |
| | (459,427) |
|
| Total capital share activity | 1,166,391 |
| | 2,060,916 |
|
| See notes to financial statements. |
calvert.com CALVERT EMERGING MARKETS EQUITY FUND SEMI-ANNUAL REPORT (UNAUDITED) 13
NOTES TO FINANCIAL STATEMENTS
NOTE A — SIGNIFICANT ACCOUNTING POLICIES
General: Calvert Emerging Markets Equity Fund (the “Fund”), a series of Calvert World Values Fund, Inc., is registered under the Investment Company Act of 1940 as a non-diversified, open-end management investment company. Calvert World Values Fund, Inc. is comprised of four separate series. The operations of each series are accounted for separately. The Fund applies the accounting and reporting guidance in the Financial Accounting Standards Board (FASB) Accounting Standards Codification Topic 946, Financial Services – Investment Companies (ASC 946).
The Fund offers four classes of shares of capital stock - Classes A, C, I, and Y. Class A shares are sold with a maximum front-end sales charge of 4.75%. Class C shares are sold without a front-end sales charge and, with certain exceptions, will be charged a deferred sales charge on shares sold within one year of purchase. Class C shares have higher levels of expenses than Class A shares. Class I shares require a minimum account balance of $1,000,000. The $1 million minimum initial investment is waived for retirement plans that trade through omnibus accounts and may be waived in certain other instances where it is believed to be in the best interest of the Fund and its shareholders. Class I shares have no front-end or deferred sales charge and have lower levels of expenses than Class A shares. Class Y shares are generally only available to wrap or similar fee-based programs offered by financial intermediaries, foundations, and endowments that have entered into an agreement with the Fund’s Distributor to offer Class Y shares. Class Y shares have no front-end or deferred sales charge and have lower levels of expenses than Class A shares. Each class has different: (a) dividend rates, due to differences in Distribution Plan expenses and other class-specific expenses, (b) exchange privileges, and (c) class-specific voting rights.
Security Valuation: Net asset value per share is determined every business day as of the close of the regular session of the New York Stock Exchange (generally 4:00 p.m. Eastern time). The Fund uses independent pricing services approved by the Board of Directors (“the Board”) to value its investments wherever possible. Investments for which market quotations are not available or deemed not reliable are fair valued in good faith under the direction of the Board.
The Board has adopted Valuation Procedures (the “Procedures”) to determine the fair value of securities and other financial instruments for which market prices are not readily available or which may not be reliably priced. The Board has delegated the day-to-day responsibility for determining the fair value of assets of the Fund to Calvert Investment Management, Inc. (the “Advisor” or “Calvert”) and has provided these Procedures to govern Calvert in its valuation duties.
Calvert has chartered an internal Valuation Committee to oversee the implementation of these Procedures and to assist it in carrying out the valuation responsibilities that the Board has delegated.
The Valuation Committee meets on a regular basis to review illiquid securities and other investments which may not have readily available market prices. The Valuation Committee’s fair valuation determinations are subject to review, approval and ratification by the Board at its next regularly scheduled meeting covering the calendar quarter in which the fair valuation was determined.
The Valuation Committee utilizes various methods to measure the fair value of the Fund’s investments. U.S. generally accepted accounting principles (GAAP) establishes a disclosure hierarchy that categorizes the inputs to valuation techniques used to value assets and liabilities at measurement date. These inputs are summarized in the three broad levels listed below:
Level 1 - quoted prices in active markets for identical securities
Level 2 - other significant observable inputs (including quoted prices for similar securities, interest rates, prepayment speeds, credit risk, etc.)
Level 3 - significant unobservable inputs (including the Fund’s own assumptions in determining the fair value of investments)
The inputs or methodologies used for valuing securities are not necessarily an indication of the risk associated with investing in those securities.
Changes in valuation techniques may result in transfers in or out of an investment’s assigned level within the hierarchy during the period. Transfers in and/or out of levels are determined based on the fair value of such securities at the end of the period. Valuation techniques used to value the Fund’s investments by major category are as follows:
Common and preferred stocks, including restricted securities, for which market quotations are readily available, are valued at the last reported sale price or official closing price as reported by an independent pricing service on the primary market or exchange on which they are traded and are categorized as Level 1 in the hierarchy. In the event there were no sales during the day or closing prices are not available, securities are valued at the last quoted bid price or the last available price and are categorized as Level 2 in the hierarchy. Foreign securities are valued based on quotations from the principal market in which such securities are normally traded. If events occur after the close of the principal market in which foreign securities are traded, and before the close of business of the Fund, that are expected to materially affect the value of those securities, then
14 calvert.com CALVERT EMERGING MARKETS EQUITY FUND SEMI-ANNUAL REPORT (UNAUDITED)
they are valued at their fair value taking these events into account and are categorized as Level 2 in the hierarchy. The Fund has retained a third party fair value pricing service to quantitatively analyze the price movement of its holdings on foreign exchanges and to automatically fair value if the variation from the prior day’s closing price exceeds specified parameters. Such securities would be categorized as Level 2 in the hierarchy in these circumstances. Utilizing this technique may result in transfers between Level 1 and Level 2. For restricted securities and private placements where observable inputs are limited, assumptions about market activity and risk are used and such securities are categorized as Level 3 in the hierarchy.
Participatory notes are valued based on the value of the underlying equity security as determined using the valuation techniques for equity securities listed above. Participatory notes are categorized as Level 2 in the hierarchy.
If a market value cannot be determined for a security using the methodologies described above, or if, in the good faith opinion of the Advisor, the market value does not constitute a readily available market quotation, or if a significant event has occurred that would materially affect the value of the security, the security will be fair valued as determined in good faith by the Valuation Committee.
The Valuation Committee considers a number of factors, including significant unobservable valuation inputs when arriving at fair value. It considers all significant facts that are reasonably available and relevant to the determination of fair value.
The Valuation Committee primarily employs a market-based approach which may use related or comparable assets or liabilities, recent transactions, market multiples, book values, and other relevant information for the investment to determine the fair value of the investment. When more appropriate, the Fund may employ an income-based or cost approach. An income-based valuation approach discounts anticipated future cash flows of the investment to calculate a present amount (discounted). The measurement is based on the value indicated by current market expectations about those future amounts. Discounts may also be applied due to the nature or duration of any restrictions on the disposition of the investments. A cost based approach is based on the amount that currently would be required to replace the service capacity of an asset (current replacement cost). From the seller’s perspective, the price that would be received for the asset is determined based on the cost to a buyer to acquire or construct a substitute asset of comparable utility, adjusted for obsolescence.
The values assigned to fair value investments are based on available information and do not necessarily represent amounts that might ultimately be realized. Further, due to the inherent uncertainty of valuations of such investments, the fair values may differ significantly from the values that would have been used had an active market existed, and the differences could be material. The Valuation Committee employs various methods for calibrating these valuation approaches including a regular review of key inputs and assumptions, transactional back-testing or disposition analysis and reviews of any related market activity.
At March 31, 2016, securities valued at $3,145,991, or 3.5% of net assets, were fair valued in good faith under the direction of the Board.
The following table summarizes the market value of the Fund's holdings as of March 31, 2016, based on the inputs used to value them:
|
| | | | | | | | | | | |
| | VALUATION INPUTS |
| INVESTMENTS IN SECURITIES* | LEVEL 1 | LEVEL 2 | LEVEL 3 | TOTAL |
| Common Stocks** |
| $82,900,224 |
| $— |
| $— |
|
| $82,900,224 |
|
| Preferred Stocks** | 1,681,283 |
| — |
| — |
| 1,681,283 |
|
| Participatory Notes | — |
| 3,054,976 |
| — |
| 3,054,976 |
|
| High Social Impact Investments | — |
| — |
| 91,015 |
| 91,015 |
|
| | | | | |
| TOTAL |
| $84,581,507 |
|
| $3,054,976 |
| $91,015^ |
|
| $87,727,498 |
|
| | | | | |
| * For a complete listing of investments, please refer to the Schedule of Investments. |
| ** For further breakdown of equity securities by country, please refer to the Schedule of Investments. |
| ^ Level 3 securities represent 0.1% of net assets. |
On March 31, 2016, for certain securities which trade primarily outside the U.S., adjustments to prices due to movements against a specified benchmark were not necessary. As a result, $54,157,567 transferred out of Level 2 and into Level 1. The amount of this transfer was determined based on the fair value of such securities at the end of the period.
Participatory Notes: The Fund may gain exposure to securities in certain foreign markets through investments in participatory notes (“P-notes”), especially in markets where direct investment by the Fund is not possible. P-notes are generally issued by a bank or broker-dealer (the “counterparty”) and are designed to offer a return linked to a particular underlying equity security.
calvert.com CALVERT EMERGING MARKETS EQUITY FUND SEMI-ANNUAL REPORT (UNAUDITED) 15
While the holder of a P-note is entitled to receive from the counterparty any dividends paid by the underlying security, the counterparty retains legal ownership and voting rights of the underlying security. The risks associated with investing in a P-note may include the possible failure of the counterparty to perform its obligations under the terms of the agreement, an inability to liquidate or transfer the notes, and an imperfect correlation between the value of the P-note and the underlying security.
Security Transactions and Investment Income: Security transactions are accounted for on trade date. Realized gains and losses are recorded on an identified cost basis and may include proceeds from litigation. Dividend income is recorded on the ex-dividend date or, in the case of dividends on certain foreign securities, as soon as the Fund is informed of the ex-dividend date. Withholding taxes on foreign dividends have been provided for in accordance with the Fund’s understanding of the applicable country’s tax rules and rates. Distributions received on securities that represent a return of capital are recorded as a reduction of cost of investments. Distributions received on securities that represent a capital gain are recorded as a realized gain. Interest income, which includes amortization of premium and accretion of discount on debt securities, is accrued as earned. Investment income and realized and unrealized gains and losses are allocated to separate classes of shares based upon the relative net assets of each class. Expenses arising in connection with a specific class are charged directly to that class. Expenses common to the classes are allocated to each class in proportion to their relative net assets.
Foreign Currency Transactions: The Fund’s accounting records are maintained in U.S. dollars. For valuation of assets and liabilities on each date of net asset value determination, foreign denominations are converted into U.S. dollars using the current exchange rate. Security transactions, income, and expenses are translated at the prevailing rate of exchange on the date of the event. The effect of changes in foreign exchange rates on securities and foreign currencies is included in the net realized and unrealized gain or loss on investments and assets and liabilities denominated in foreign currencies.
Distributions to Shareholders: Distributions to shareholders are recorded by the Fund on ex-dividend date. Dividends from net investment income and distributions from net realized capital gains, if any, are paid at least annually. Distributions are determined in accordance with income tax regulations which may differ from U.S. generally accepted accounting principles; accordingly, periodic reclassifications are made within the Fund's capital accounts to reflect income and gains available for distribution under income tax regulations.
Estimates: The preparation of financial statements in conformity with U.S. generally accepted accounting principles requires management to make estimates and assumptions that affect the reported amounts of assets and liabilities and disclosure of contingent assets and liabilities at the date of the financial statements and the reported amounts of increases and decreases in net assets from operations during the reporting period. Actual results could differ from those estimates.
Redemption Fees: The Fund charged a 2% redemption fee on redemptions, including exchanges, made within 30 days of purchase (within seven days for Class I shares). The redemption fee was accounted for as an addition to paid-in capital. This fee was eliminated effective February 2, 2015.
Federal Income Taxes: No provision for federal income or excise tax is required since the Fund intends to continue to qualify as a regulated investment company under the Internal Revenue Code and to distribute substantially all of its taxable earnings.
Management has analyzed the Fund's tax positions taken for all open federal income tax years and has concluded that no provision for federal income tax is required in the Fund's financial statements. A Fund's federal tax return is subject to examination by the Internal Revenue Service for a period of three years.
NOTE B — RELATED PARTY TRANSACTIONS
Calvert Investment Management, Inc. (the “Advisor”) is wholly-owned by Calvert Investments, Inc., which is indirectly wholly-owned by Ameritas Mutual Holding Company. The Advisor provides investment advisory services and pays the salaries and fees of officers and Directors of the Fund who are employees of the Advisor or its affiliates. For its services, the Advisor receives an annual fee, payable monthly, of 0.95% of the average daily net assets.
The Advisor has contractually agreed to limit net annual fund operating expenses through
January 31, 2017. The contractual expense caps are 1.62%, 2.37%, 1.27%, and 1.37% for Class A, C, I, and Y, respectively. Prior to February 1, 2016, the expense caps were 1.68%, 2.43%, 1.33%, and 1.43% for Class A, C, I, and Y, respectively. For the purpose of this expense limit, operating expenses do not include interest expense, brokerage commissions, taxes, and extraordinary expenses. This expense limitation does not limit acquired fund fees and expenses, if any.
Calvert Investment Administrative Services, Inc. ("CIAS"), an affiliate of the Advisor, provides administrative services to the Fund for an annual fee, payable monthly, based on the Portfolio’s average daily net assets.
For the period October 1, 2015 to January 31, 2016, the administrative fee was 0.35% for Class A, C and Y and 0.10% for Class I. CIAS and the Fund entered into an Amended and Restated Administrative Services Agreement that established a 0.12% administrative fee for all classes of the Fund commencing on February 1, 2016. CIAS voluntarily waived 0.23% (the amount of
16 calvert.com CALVERT EMERGING MARKETS EQUITY FUND SEMI-ANNUAL REPORT (UNAUDITED)
the administrative fee above 0.12%) for Class A, C and Y shares of the Fund for the period from December 1, 2015 through January 31, 2016. CIAS has also contractually agreed to waive 0.02% for Class I shares of the Fund (the difference between the previous administrative fee and the new 0.12% fee) from February 1, 2016 through January 31, 2018. During the six-month period ended March 31, 2016, CIAS voluntarily waived $13,079.
Calvert Investment Distributors, Inc. (“CID”), an affiliate of the Advisor, is the distributor and principal underwriter for the Fund. Pursuant to Rule 12b-1 under the Investment Company Act of 1940, the Fund has adopted a Distribution Plan that permits the Fund to pay certain expenses associated with the distribution and servicing of its shares. The expenses paid may not exceed 0.50% and 1.00% annually of the average daily net assets of Class A and C, respectively. The amount actually paid by the Fund is an annualized fee, payable monthly, of 0.25% and 1.00% of the average daily net assets of Class A and C, respectively. Class I and Y shares do not have Distribution Plan expenses.
CID received $3,869 as its portion of commissions charged on sales of the Fund’s Class A shares for the period ended March 31, 2016.
Calvert Investment Services, Inc. (“CIS”), an affiliate of the Advisor, acts as shareholder servicing agent for the Fund. For its services, CIS received a fee of $4,940 for the period ended March 31, 2016. Boston Financial Data Services, Inc. is the transfer and dividend disbursing agent.
Each Director of the Fund who is not an employee of the Advisor or its affiliates receives an annual retainer of $52,000 plus a meeting fee of up to $3,000 for each Board meeting attended. Additional fees of $6,000 annually may be paid to the Committee chairs ($10,000 for the Board Chair and the Special Equities Committee chair) and $2,500 annually may be paid to Committee members, plus a Committee meeting fee of $500 for each Committee meeting attended. Eligible Directors may participate in a Deferred Compensation Plan (the “Plan”). Obligations of the Plan will be paid solely out of the Fund’s assets. Directors’ fees are allocated to each of the funds served.
NOTE C — INVESTMENT ACTIVITY AND TAX INFORMATION
During the period, the cost of purchases and proceeds from sales of investments, other than short-term securities, were $22,951,995 and $10,728,389, respectively.
|
| | | |
| Capital Loss Carryforwards | |
| NO EXPIRATION DATE | |
| Long-term |
| ($248,421 | ) |
Under the Regulated Investment Company Modernization Act of 2010, capital losses incurred in taxable years beginning after December 22, 2010 can be carried forward to offset future capital gains for an unlimited period. These losses will retain their character as either long-term or short-term.
As of March 31, 2016, the tax basis components of unrealized appreciation/(depreciation) and the federal tax cost were as follows:
|
| | | | |
| Unrealized appreciation |
| $7,841,820 |
| |
| Unrealized (depreciation) | (8,500,930 | ) | |
| Net unrealized appreciation (depreciation) |
| ($659,110 | ) | |
| Federal income tax cost of investments |
| $88,386,608 |
| |
NOTE D — LINE OF CREDIT
A financing agreement is in place with the Calvert Funds and State Street Corporation (“SSC”). Under the agreement, SSC provides an unsecured line of credit facility, in the aggregate amount of $50 million ($25 million committed and $25 million uncommitted), accessible by the Calvert Funds for temporary or emergency purposes only. Borrowings bear interest at the higher of the London Interbank Offered Rate (LIBOR) or the overnight Federal Funds Rate plus 1.25% per annum. A commitment fee of 0.20% per annum is incurred on the unused portion of the committed facility. An administrative fee of $25,000 was paid in connection with the uncommitted facility. These fees are allocated to all participating funds. The Fund had no loans outstanding pursuant to this line of credit at March 31, 2016.
calvert.com CALVERT EMERGING MARKETS EQUITY FUND SEMI-ANNUAL REPORT (UNAUDITED) 17
For the six months ended March 31, 2016, borrowing information by the Fund under the agreement was as follows:
|
| | | |
| Average Daily Balance | Weighted Average
Interest Rate | Maximum
Amount Borrowed | Month of Maximum
Amount Borrowed |
| $51,032 | 1.39% | $1,396,771 | November 2015 |
NOTE E — SUBSEQUENT EVENTS
Effective April 29, 2016, the Advisor contractually agreed to further reduce operating expenses for the Fund pursuant to a new expense limitation agreement. The new expense limitations are 1.27%, 2.02%, 0.92% and 1.02% for Class A shares, Class C shares, Class I shares and Class Y shares, respectively. These new expense limitations are effective through January 31, 2018 and do not limit the acquired fund fees and expenses paid indirectly by a shareholder.
In preparing the financial statements as of March 31, 2016, no other subsequent events or transactions occurred that would have required recognition or disclosure in these financial statements.
18 calvert.com CALVERT EMERGING MARKETS EQUITY FUND SEMI-ANNUAL REPORT (UNAUDITED)
CALVERT EMERGING MARKETS EQUITY FUND
FINANCIAL HIGHLIGHTS
|
| | | | | | | | | | | | | | | | |
| | PERIODS ENDED | |
| CLASS A SHARES | March 31, 2016 (a) (Unaudited) | | September 30, 2015 (a) | | September 30, 2014 (a) | | September 30, 2013 (a)(b) | |
| Net asset value, beginning |
| $10.90 |
| |
| $13.15 |
| |
| $13.34 |
| |
| $12.00 |
| |
| Income from investment operations: | | | | | | | | |
| Net investment income (loss) | (0.05) |
| | 0.11 |
| | 0.08 |
| | 0.13 |
| |
| Net realized and unrealized gain (loss) | 1.10 |
| | (1.92) |
| | 0.46 |
| | 1.34 |
| |
| Total from investment operations | 1.05 |
| | (1.81) |
| | 0.54 |
| | 1.47 |
| |
| Distributions from: | | | | | | | | |
| Net investment income | (0.10) |
| | (0.03) |
| | (0.04) |
| | (0.13) |
| |
| Net realized gain | — |
| | (0.41) |
| | (0.69) |
| | — |
| |
| Total distributions | (0.10) |
| | (0.44) |
| | (0.73) |
| | (0.13) |
| |
| Total increase (decrease) in net asset value | 0.95 |
| | (2.25) |
| | (0.19) |
| | 1.34 |
| |
| Net asset value, ending |
| $11.85 |
| |
| $10.90 |
| |
| $13.15 |
| |
| $13.34 |
| |
| Total return (c) | 9.67 | % | | (14.18 | %) | | 4.19 | % | | 12.30 | % | |
| Ratios to average net assets: (d) | | | | | | | | |
| Net investment income (loss) | (0.81%)(e) |
| | 0.84 | % | | 0.57 | % | | 1.16%(e) |
| |
| Total expenses | 2.01%(e) |
| | 2.18 | % | | 2.22 | % | | 3.03%(e) |
| |
| Net expenses | 1.66%(e) |
| | 1.75 | % | | 1.78 | % | | 1.78%(e) |
| |
| Portfolio turnover | 14 | % | | 66 | % | | 95 | % | | 74 | % | |
| Net assets, ending (in thousands) |
| $24,758 |
| |
| $23,569 |
| |
| $20,628 |
| |
| $6,337 |
| |
| | | | | | | | | |
| (a) Per share figures are calculated using the Average Shares Method. |
| (b) From October 29, 2012 inception. |
| (c) Total return is not annualized for periods of less than one year and does not reflect deduction of any front-end or deferred sales charge. |
| (d) Total expenses do not reflect amounts reimbursed and/or waived by the Advisor and certain of its affiliates, if applicable. Net expenses are net of all reductions and represent the net expenses paid by the Fund. |
| (e) Annualized. |
| See notes to financial statements. |
calvert.com CALVERT EMERGING MARKETS EQUITY FUND SEMI-ANNUAL REPORT (UNAUDITED) 19
CALVERT EMERGING MARKETS EQUITY FUND
FINANCIAL HIGHLIGHTS
|
| | | | | | | | | | | | | | | | |
| | PERIODS ENDED | |
| CLASS C SHARES | March 31, 2016 (a) (Unaudited) | | September 30, 2015 (a) | | September 30, 2014 (a) | | September 30, 2013 (a)(b) | |
| Net asset value, beginning |
| $10.74 |
| |
| $13.05 |
| |
| $13.34 |
| |
| $12.00 |
| |
| Income from investment operations: | | | | | | | | |
| Net investment loss | (0.08) |
| | (0.03) |
| | (0.05) |
| | (0.01) |
| |
| Net realized and unrealized gain (loss) | 1.07 |
| | (1.87) |
| | 0.45 |
| | 1.37 |
| |
| Total from investment operations | 0.99 |
| | (1.90) |
| | 0.40 |
| | 1.36 |
| |
| Distributions from: | | | | | | | | |
| Net investment income | (0.01) |
| | — |
| | — |
| | (0.02) |
| |
| Net realized gain | — |
| | (0.41) |
| | (0.69) |
| | — |
| |
| Total distributions | (0.01) |
| | (0.41) |
| | (0.69) |
| | (0.02) |
| |
| Total increase (decrease) in net asset value | 0.98 |
| | (2.31) |
| | (0.29) |
| | 1.34 |
| |
| Net asset value, ending |
| $11.72 |
| |
| $10.74 |
| |
| $13.05 |
| |
| $13.34 |
| |
| Total return (c) | 9.24 | % | | (14.98 | %) | | 3.10 | % | | 11.38 | % | |
| Ratios to average net assets: (d) | | | | | | | | |
| Net investment loss | (1.52%)(e) |
| | (0.23 | %) | | (0.41 | )% | | (0.09%)(e) |
| |
| Total expenses | 4.53%(e) |
| | 5.00 | % | | 4.36 | % | | 100.72%(e) |
| |
| Net expenses | 2.41%(e) |
| | 2.70 | % | | 2.78 | % | | 2.78%(e) |
| |
| Portfolio turnover | 14 | % | | 66 | % | | 95 | % | | 74 | % | |
| Net assets, ending (in thousands) |
| $725 |
| |
| $566 |
| |
| $610 |
| |
| $133 |
| |
| | | | | | | | | |
| (a) Per share figures are calculated using the Average Shares Method. |
| (b) From October 29, 2012 inception. |
| (c) Total return is not annualized for periods of less than one year and does not reflect deduction of any front-end or deferred sales charge. |
| (d) Total expenses do not reflect amounts reimbursed and/or waived by the Advisor and certain of its affiliates, if applicable. Net expenses are net of all reductions and represent the net expenses paid by the Fund. |
| (e) Annualized. |
| See notes to financial statements. |
20 calvert.com CALVERT EMERGING MARKETS EQUITY FUND SEMI-ANNUAL REPORT (UNAUDITED)
CALVERT EMERGING MARKETS EQUITY FUND
FINANCIAL HIGHLIGHTS
|
| | | | | | | | | | | | | | | | |
| | PERIODS ENDED | |
| CLASS I SHARES | March 31, 2016 (a) (Unaudited) | | September 30, 2015 (a) | | September 30, 2014 (a) | | September 30, 2013 (a)(b) | |
| Net asset value, beginning |
| $10.99 |
| |
| $13.26 |
| |
| $13.49 |
| |
| $12.00 |
| |
| Income from investment operations: | | | | | | | | |
| Net investment income (loss) | (0.02) |
| | 0.14 |
| | 0.10 |
| | 0.19 |
| |
| Net realized and unrealized gain (loss) | 1.10 |
| | (1.93) |
| | 0.48 |
| | 1.33 |
| |
| Total from investment operations | 1.08 |
| | (1.79) |
| | 0.58 |
| | 1.52 |
| |
| Distributions from: | | | | | | | | |
| Net investment income | (0.14) |
| | (0.07) |
| | (0.12) |
| | (0.03) |
| |
| Net realized gain | — |
| | (0.41) |
| | (0.69) |
| | — |
| |
| Total distributions | (0.14) |
| | (0.48) |
| | (0.81) |
| | (0.03) |
| |
| Total increase (decrease) in net asset value | 0.94 |
| | (2.27) |
| | (0.23) |
| | 1.49 |
| |
| Net asset value, ending |
| $11.93 |
| |
| $10.99 |
| |
| $13.26 |
| |
| $13.49 |
| |
| Total return (c) | 9.90 | % | | (13.92 | %) | | 4.49 | % | | 12.73 | % | |
| Ratios to average net assets: (d) | | | | | | | | |
| Net investment income (loss) | (0.43%)(e) |
| | 1.12 | % | | 0.78 | % | | 1.61%(e) |
| |
| Total expenses | 1.39%(e) |
| | 1.48 | % | | 1.42 | % | | 1.65%(e) |
| |
| Net expenses | 1.31%(e) |
| | 1.40 | % | | 1.42 | % | | 1.43%(e) |
| |
| Portfolio turnover | 14 | % | | 66 | % | | 95 | % | | 74 | % | |
| Net assets, ending (in thousands) |
| $45,770 |
| |
| $39,101 |
| |
| $33,721 |
| |
| $33,053 |
| |
| | | | | | | | | |
| (a) Per share figures are calculated using the Average Shares Method. |
| (b) From October 29, 2012 inception. |
| (c) Total return is not annualized for periods of less than one year and does not reflect deduction of any front-end or deferred sales charge. |
| (d) Total expenses do not reflect amounts reimbursed and/or waived by the Advisor and certain of its affiliates, if applicable. Net expenses are net of all reductions and represent the net expenses paid by the Fund. |
| (e) Annualized. |
| See notes to financial statements. |
calvert.com CALVERT EMERGING MARKETS EQUITY FUND SEMI-ANNUAL REPORT (UNAUDITED) 21
CALVERT EMERGING MARKETS EQUITY FUND
FINANCIAL HIGHLIGHTS
|
| | | | | | | | | | | | | | | | |
| | PERIODS ENDED | |
| CLASS Y SHARES | March 31, 2016 (a) (Unaudited) | | September 30, 2015 (a) | | September 30, 2014 (a) | | September 30, 2013 (a)(b) | |
| Net asset value, beginning |
| $11.10 |
| |
| $13.35 |
| |
| $13.48 |
| |
| $12.00 |
| |
| Income from investment operations: | | | | | | | | |
| Net investment income (loss) | (0.02) |
| | 0.12 |
| | 0.10 |
| | 0.14 |
| |
| Net realized and unrealized gain (loss) | 1.10 |
| | (1.93) |
| | 0.49 |
| | 1.36 |
| |
| Total from investment operations | 1.08 |
| | (1.81) |
| | 0.59 |
| | 1.50 |
| |
| Distributions from: | | | | | | | | |
| Net investment income | (0.14) |
| | (0.03) |
| | (0.03) |
| | (0.02) |
| |
| Net realized gain | — |
| | (0.41) |
| | (0.69) |
| | — |
| |
| Total distributions | (0.14) |
| | (0.44) |
| | (0.72) |
| | (0.02) |
| |
| Total increase (decrease) in net asset value | 0.94 |
| | (2.25) |
| | (0.13) |
| | 1.48 |
| |
| Net asset value, ending |
| $12.04 |
| |
| $11.10 |
| |
| $13.35 |
| |
| $13.48 |
| |
| Total return (c) | 9.79 | % | | (13.96 | %) | | 4.51 | % | | 12.55 | % | |
| Ratios to average net assets: (d) | | | | | | | | |
| Net investment income (loss) | (0.32%)(e) |
| | 0.95 | % | | 0.78 | % | | 1.28%(e) |
| |
| Total expenses | 1.65%(e) |
| | 2.07 | % | | 2.24 | % | | 18.62%(e) |
| |
| Net expenses | 1.40%(e) |
| | 1.50 | % | | 1.53 | % | | 1.53%(e) |
| |
| Portfolio turnover | 14 | % | | 66 | % | | 95 | % | | 74 | % | |
| Net assets, ending (in thousands) |
| $18,944 |
| |
| $6,889 |
| |
| $2,320 |
| |
| $440 |
| |
| | | | | | | | | |
| (a) Per share figures are calculated using the Average Shares Method. |
| (b) From October 29, 2012 inception. |
| (c) Total return is not annualized for periods of less than one year and does not reflect deduction of any front-end or deferred sales charge. |
| (d) Total expenses do not reflect amounts reimbursed and/or waived by the Advisor and certain of its affiliates, if applicable. Net expenses are net of all reductions and represent the net expenses paid by the Fund. |
| (e) Annualized. |
| See notes to financial statements. |
22 calvert.com CALVERT EMERGING MARKETS EQUITY FUND SEMI-ANNUAL REPORT (UNAUDITED)
PROXY VOTING
The Proxy Voting Guidelines of the Calvert Funds that the Fund uses to determine how to vote proxies relating to portfolio securities are provided as an Appendix to the Fund’s Statement of Additional Information. The Statement of Additional Information can be obtained free of charge by calling the Fund at 1-800-368-2745, by visiting the Calvert website at www.calvert.com; or by visiting the SEC’s website at www.sec.gov.
Information regarding how the Fund voted proxies relating to portfolio securities during the most recent 12-month period ended June 30 is available on the Fund’s website at www.calvert.com and on the SEC’s website at www.sec.gov.
AVAILABILITY OF QUARTERLY PORTFOLIO HOLDINGS
The Fund files its complete schedule of portfolio holdings with the SEC for the first and third quarters of each fiscal year on Form N-Q. The Fund’s Form N-Q is available on the SEC’s website at www.sec.gov. The Fund’s Form N-Q may be reviewed and copied at the SEC’s Public Reference Room in Washington, DC; information on the operation of the Public Reference Room may be obtained by calling 1-800-SEC-0330.
BASIS FOR BOARD'S APPROVAL OF INVESTMENT ADVISORY CONTRACTS
At a meeting held on December 8, 2015, the Board of Directors, and by a separate vote, the disinterested Directors, approved the continuance of the Investment Advisory Agreement between Calvert World Values Fund, Inc. and the Advisor and the Investment Subadvisory Agreement between the Advisor and the Subadvisor with respect to the Fund.
In evaluating the Investment Advisory Agreement, the Board considered a variety of information relating to the Fund and the Advisor. The disinterested Directors reviewed a report prepared by the Advisor regarding various services provided to the Fund by the Advisor and its affiliates. Such report included, among other data, information regarding the Advisor’s personnel and the Advisor’s revenue and cost of providing services to the Fund, and a separate report prepared by an independent third party, which provided a statistical analysis comparing the Fund’s investment performance, expenses and fees to comparable mutual funds.
The disinterested Directors were separately represented by independent legal counsel with respect to their consideration of the reapproval of the Investment Advisory Agreement and the Investment Subadvisory Agreement. Prior to voting, the disinterested Directors reviewed the proposed continuance of the Investment Advisory Agreement and Investment Subadvisory Agreement with management and also met in private sessions with their counsel at which no representatives of management were present.
In the course of its deliberations regarding the Investment Advisory Agreement, the Board considered the following factors, among others: the nature, extent and quality of the services provided by the Advisor, including the personnel providing such services; the Advisor’s financial condition; the level and method of computing the Fund’s advisory fee; comparative performance, fee and expense information for the Fund; the profitability of the Calvert Family of Funds to the Advisor and its affiliates; the allocation of the Fund’s brokerage, including the Advisor’s process for monitoring “best execution”; the direct and indirect benefits, if any, derived by the Advisor and its affiliates from their relationship with the Fund; the effect of the Fund’s growth and size on the Fund’s performance and expenses; the affiliated distributor’s process for monitoring sales load breakpoints; the Advisor’s compliance programs and policies; the Advisor’s performance of substantially similar duties for other funds; and any possible conflicts of interest.
In considering the nature, extent and quality of the services provided by the Advisor under the Investment Advisory Agreement, the Board reviewed information provided by the Advisor relating to its operations and personnel, including, among other information, biographical information on the Advisor’s supervisory and professional staff and descriptions of its organizational and management structure. The Board also took into account similar information provided periodically throughout the previous year by the Advisor as well as the Board’s familiarity with management through Board of Directors’ meetings, discussions and other reports. The Board also noted that it reviewed on a quarterly basis information regarding the Advisor’s compliance with applicable policies and procedures, including those related to personal investing. The Advisor’s administrative capabilities, including its ability to supervise the other service providers for the Fund, were also considered. The Board also took into account the responsible investing research and analysis provided by the Advisor to the Fund. The Board observed that the scope of services provided by the Advisor generally had expanded over time as a result of regulatory, market and other changes. The Board took into consideration, among other factors, the effectiveness of the Fund’s and Advisor’s processes, policies and procedures and the Advisor’s personnel. The Board also took into account, among other items, periodic reports received from the Advisor over the past year concerning the Advisor’s ongoing review and enhancement of certain processes, policies and procedures of the Fund and the Advisor. The Board discussed the Advisor’s effectiveness in monitoring the performance of the Subadvisor and its timeliness in responding to performance issues. The Board concluded that it was satisfied with the nature, extent and quality of services provided to the Fund by the Advisor under the Investment Advisory Agreement.
calvert.com CALVERT EMERGING MARKETS EQUITY FUND SEMI-ANNUAL REPORT (UNAUDITED) 23
In considering the Fund’s performance, the Board noted that it reviewed on a quarterly basis detailed information about the Fund’s performance results, portfolio composition and investment strategies. In addition, the Board took into account overall financial market conditions. The Board also reviewed various comparative data provided to it in connection with its consideration of the renewal of the Investment Advisory Agreement, including, among other information, a comparison of the Fund’s total return with its Lipper index and with that of other mutual funds deemed to be in its peer group by an independent third party in its report. This comparison indicated that the Fund performed above the median of its peer group for the one-year period ended June 30, 2015. The data also indicated that the Fund outperformed its Lipper index for the one-year period ended June 30, 2015. Based upon its review, the Board concluded that the Fund’s performance was satisfactory relative to the performance of funds with similar investment objectives and to relevant indices.
In considering the Fund’s fees and expenses, the Board compared the Fund’s fees and total expense ratio with various comparative data for the funds in its peer group. Among other findings, the data indicated that the Fund’s advisory fee (after taking into account waivers and/or reimbursements) was below the median of its peer group and the Fund’s total expenses (net of waivers and/or reimbursements) were above the median of its peer group. The Board noted that the allocation of advisory and administrative fees may vary among the Fund’s peer group. The Board also took into account the Advisor’s current undertaking to maintain expense limitations for the Fund and that the Advisor was reimbursing a portion of the Fund’s expenses. The Board noted the Advisor’s discussion of the Fund’s expenses and certain factors that affected the level of such expenses, including the cost of providing the responsible investing research and analysis provided by the Advisor. The Board noted that the Fund’s administrator had agreed to implement an administrative fee change effective December 1, 2015, which is expected to reduce the administrative fee paid by certain classes of shares; however, the impact of the fee change is not yet reflected in the Fund’s total expenses. Based upon its review, the Board concluded that the advisory fee was reasonable in view of the quality of services received by the Fund from the Advisor and the other factors considered.
The Board reviewed the Advisor’s profitability on a fund-by-fund basis. In reviewing the overall profitability of the advisory fee to the Fund’s Advisor, the Board also considered the fact that affiliates of the Advisor provided shareholder servicing, administrative and distribution services to the Fund for which they received compensation. The information considered by the Board included Calvert’s operating profit margin information both before and after tax expenses with respect to the services that the Advisor and its affiliates provided to the Calvert Family of Funds complex. The Board reviewed the profitability of the Advisor’s relationship with the Fund in terms of the total amount of annual advisory fees it received with respect to the Fund and whether the Advisor had the financial wherewithal to continue to provide services to the Fund. The Board noted that the Advisor was reimbursing a portion of the Fund’s expenses. The Board also took into account the Advisor’s current undertaking to maintain expense limitations for the Fund. The Board also considered that the Advisor derived benefits to its reputation and other indirect benefits from its relationship with the Fund. The Board also noted that the Advisor paid the subadvisory fee to the Subadvisor. Based upon its review, the Board concluded that the Advisor’s and its affiliates’ level of profitability from their relationship with the Fund was reasonable.
The Board considered the effect of the Fund’s current size and its potential growth on its performance and fees. The Board concluded that adding breakpoints to the advisory fee at specified asset levels would not be appropriate at this time given the Fund’s current size. The Board noted that if the Fund’s assets increased over time, the Fund might realize other economies of scale if assets increased proportionally more than certain other expenses.
In reapproving the Investment Advisory Agreement, the Board, including the disinterested Directors, did not identify any single factor as controlling, and each Director may have attributed different weight to various factors.
In evaluating the Investment Subadvisory Agreement, the disinterested Directors reviewed information provided by the Subadvisor relating to its operations, personnel, investment philosophy, strategies and techniques. Among other information, the Subadvisor provided biographical information on portfolio management and other professional staff, performance information for itself, and descriptions of its investment philosophies, strategies and techniques, organizational and management structures and brokerage policies and practices.
The Board reapproved the Investment Subadvisory Agreement between the Subadvisor and the Advisor based on a number of factors relating to the Subadvisor’s ability to perform under the Investment Subadvisory Agreement. In the course of its deliberations, the Board evaluated, among other factors: the nature, extent and the quality of the services provided by the Subadvisor; the Subadvisor’s management style and long-term performance record; the Fund’s performance record and the Subadvisor’s performance in employing its investment strategies; the Subadvisor’s current level of staffing and its overall resources; the qualifications and experience of the Subadvisor’s personnel; the Subadvisor’s financial condition with respect to its ability to perform the services required under the Investment Subadvisory Agreement; the Subadvisor’s risk management processes; the Subadvisor’s compliance systems, including those related to personal investing; and any disciplinary history. Based upon its review, the Board concluded that it was satisfied with the nature, extent and quality of services provided to the Fund by the Subadvisor under the Investment Subadvisory Agreement.
24 calvert.com CALVERT EMERGING MARKETS EQUITY FUND SEMI-ANNUAL REPORT (UNAUDITED)
As noted above, the Board considered, among other information, the Fund’s performance during the one-year period ended June 30, 2015 as compared to the Fund’s peer group and noted that it reviewed on a quarterly basis detailed information about the Fund’s performance results, portfolio composition and investment strategies. The Board noted the Advisor’s expertise and resources in monitoring the performance, investment style and risk-adjusted performance of the Subadvisor.
In considering the cost of services provided by the Subadvisor and the profitability to the Subadvisor of its relationship with the Fund, the Board noted that the subadvisory fee under the Investment Subadvisory Agreement was paid by the Advisor out of the advisory fee that the Advisor received under the Investment Advisory Agreement. The Board also relied on the ability of the Advisor to negotiate the Investment Subadvisory Agreement and the corresponding subadvisory fee at arm’s length. In addition, the Board took into account the fees the Subadvisor charged to its other clients and considered these fee comparisons in light of the differences in managing these other accounts. Based upon its review, the Board concluded that the subadvisory fee was reasonable in view of the quality of services received by the Fund from the Subadvisor and the other factors considered. Because the Advisor pays the Subadvisor’s subadvisory fee and the subadvisory fee was negotiated at arm’s length by the Advisor, the cost of services provided by the Subadvisor and the profitability to the Subadvisor of its relationship with the Fund were not material factors in the Board’s deliberations. For similar reasons, the Board did not consider the potential economies of scale in the Subadvisor’s management of the Fund to be a material factor in its consideration.
In reapproving the Investment Subadvisory Agreement, the Board, including the disinterested Directors, did not identify any single factor as controlling, and each Director may have attributed different weight to various factors.
Conclusions
The Board reached the following conclusions regarding the Investment Advisory Agreement and the Investment Subadvisory Agreement, among others: (a) the Advisor has demonstrated that it possesses the capability and resources to perform the duties required of it under the Investment Advisory Agreement; (b) the Subadvisor is qualified to manage the Fund’s assets in accordance with the Fund’s investment objectives and policies; (c) the Advisor and Subadvisor maintain appropriate compliance programs; (d) the Subadvisor is likely to execute its investment strategies consistently over time; (e) the Fund’s performance is satisfactory relative to the performance of funds with similar investment objectives and to relevant indices; and (f) the Fund’s advisory and subadvisory fees are reasonable in view of the quality of services received by the Fund from the Advisor and Subadvisor and the other factors considered. Based on its conclusions, the Board determined that reapproval of the Investment Advisory Agreement and the Investment Subadvisory Agreement would be in the best interests of the Fund and its shareholders.
calvert.com CALVERT EMERGING MARKETS EQUITY FUND SEMI-ANNUAL REPORT (UNAUDITED) 25
CALVERT EMERGING MARKETS EQUITY FUND
Supplement to
Calvert Equity and Asset Allocation Funds Prospectus (Class A, C and Y)
dated February 1, 2016
Date of Supplement: April 27, 2016
Effective April 29, 2016, Calvert Investment Management, Inc., investment advisor for Calvert Emerging Markets Equity Fund (the “Fund”), has contractually agreed to further reduce operating expenses for the Fund pursuant to a new expense limitation agreement.
The Prospectus is hereby amended as follows:
The “Annual Fund Operating Expenses” table under the section “Fees and Expenses of the Fund” in the Fund Summary for Calvert Emerging Markets Equity Fund on page 40 of the Prospectus is deleted and replaced with the following:
|
| | | |
Annual Fund Operating Expenses (expenses that you pay each year as a % of the value of your investment) |
| | Class A | Class C | Class Y |
Management fees3 | 1.07% | 1.07% | 1.07% |
| Distribution and service (12b-1) fees | 0.25% | 1.00% | None |
| Other expenses | 0.63% | 2.70% | 0.77% |
| Acquired fund fees and expenses | 0.06% | 0.06% | 0.06% |
| Total annual fund operating expenses | 2.01% | 4.83% | 1.90% |
Less fee waiver and/or expense reimbursement4 | (0.68%) | (2.75%) | (0.82%) |
| Total annual fund operating expenses after fee waiver and/or expense reimbursement | 1.33% | 2.08% | 1.08% |
3 Management fees are restated to reflect current contractual fees rather than the fees paid during the previous fiscal year.
4 The investment advisor has agreed to contractually limit direct net annual fund operating expenses through January 31, 2018. This expense limitation does not limit the acquired fund fees and expenses paid indirectly by a shareholder. Direct net operating expenses will not exceed 1.27% for Class A, 2.02% for Class C and 1.02% for Class Y. Only the Board of Directors of the Fund may terminate the Fund’s expense limitation before the contractual period expires, upon 60 days’ prior notice to shareholders.
The table under “Fees and Expenses of the Fund – Example” in the Fund Summary for Calvert Emerging Markets Equity Fund on page 40 of the Prospectus is deleted and replaced with the following:
|
| | | | | | | | | | | | |
| Share Class | 1 Year | 3 Years | 5 Years | 10 Years |
| Class A |
| $604 |
|
| $1,013 |
|
| $1,447 |
|
| $2,650 |
|
| Class C | | | | |
| Expenses assuming redemption |
| $311 |
|
| $1,207 |
|
| $2,206 |
|
| $4,719 |
|
| Expenses assuming no redemption |
| $211 |
|
| $1,207 |
|
| $2,206 |
|
| $4,719 |
|
| Class Y |
| $110 |
|
| $517 |
|
| $950 |
|
| $2,155 |
|
[Not Part of Shareholder Report]
The information provided for Calvert Emerging Markets Equity Fund in the section “More Information on Fees and Expenses – Contractual Fee Waivers and/or Expense Reimbursements” on page 62 of the Prospectus is revised and restated as follows:
Calvert has agreed to contractually limit direct net annual fund operating expenses through January 31, 2018, for Calvert Emerging Markets Equity Fund. Direct ordinary operating expenses will not exceed 1.27% for Class A, 2.02% for Class C and 1.02% for Class Y.
[Not Part of Shareholder Report]
CALVERT EMERGING MARKETS EQUITY FUND
Supplement to
Calvert Equity Funds Prospectus (Class I)
dated February 1, 2016
Date of Supplement: April 27, 2016
Effective April 29, 2016, Calvert Investment Management, Inc., investment advisor for Calvert Emerging Markets Equity Fund (the “Fund”), has contractually agreed to further reduce operating expenses for the Fund pursuant to a new expense limitation agreement.
The Prospectus is hereby amended as follows:
The “Annual Fund Operating Expenses” table under the section “Fees and Expenses of the Fund” in the Fund Summary for Calvert Emerging Markets Equity Fund on page 32 of the Prospectus is deleted and replaced with the following:
|
| | |
Annual Fund Operating Expenses (expenses that you pay each year as a % of the value of your investment) |
Management fees1 | 1.07 | % |
| Distribution and service (12b-1) fees | None |
|
| Other expenses | 0.43 | % |
| Acquired fund fees and expenses | 0.06 | % |
| Total annual fund operating expenses | 1.56 | % |
Less fee waiver and/or expense reimbursement2 | (0.58 | %) |
| Total annual fund operating expenses after fee waiver and/or expense reimbursement | 0.98 | % |
1 Management fees are restated to reflect current contractual fees rather than the fees paid during the previous fiscal year.
2The investment advisor has agreed to contractually limit direct net annual fund operating expenses for Class I to 0.92% through January 31, 2018. This expense limitation does not limit the acquired fund fees and expenses paid indirectly by a shareholder. Only the Board of Trustees of the Portfolio may terminate the Portfolio’s expense limitation before the contractual period expires, upon 60 days’ prior notice to shareholders. The contractual administrative fee is 0.12%. Calvert has agreed to contractually waive administrative fees to 0.10% through January 31, 2018.
The table under “Fees and Expenses of the Fund – Example” in the Fund Summary for Calvert Emerging Markets Equity Fund on page 32 of the Prospectus is deleted and replaced with the following:
|
| | | |
| 1 Year | 3 Years | 5 Years | 10 Years |
| $9,997 | $43,577 | $79,508 | $180,723 |
The information provided for Calvert Emerging Markets Equity Fund in the section “More Information on Fees and Expenses – Contractual Fee Waivers and/or Expense Reimbursements” on page 37 of the Prospectus is revised and restated as follows:
Calvert has agreed to contractually limit direct net annual fund operating expenses to 0.92% through
January 31, 2018, for Calvert Emerging Markets Equity Fund.
[Not Part of Shareholder Report]
|
|
| This page intentionally left blank. |
|
|
| This page intentionally left blank. |
|
| | | | |
| CALVERT EMERGING MARKETS EQUITY FUND | | CALVERT’S FAMILY OF FUNDS | | |
To Open an Account 800-368-2748 Service for Existing Account Shareholders: 800-368-2745 Brokers: 800-368-2746 Registered Mail Calvert Investments c/o BFDS, P.O. Box 219544 Kansas City, MO 64121-9544 Overnight Mail Calvert Investments c/o BFDS, 330 West 9th Street Kansas City, MO 64105 Web Site calvert.com Principal Underwriter Calvert Investment Distributors, Inc. 4550 Montgomery Avenue Suite 1000 North Bethesda, Maryland 20814 | | Municipal Funds Tax-Free Responsible Impact Bond Fund Taxable Bond Funds Bond Portfolio Income Fund Short Duration Income Fund Long-Term Income Fund Ultra-Short Income Fund High Yield Bond Fund Green Bond Fund Unconstrained Bond Fund Balanced and Asset Allocation Funds Balanced Portfolio Conservative Allocation Fund Moderate Allocation Fund Aggressive Allocation Fund | | Equity Funds Large Cap Core Portfolio Equity Portfolio Global Value Fund U.S. Large Cap Core Responsible Index Fund U.S. Large Cap Value Responsible Index Fund U.S. Large Cap Growth Responsible Index Fund U.S. Mid Cap Core Responsible Index Fund Developed Markets Ex-U.S. Responsible Index Fund Capital Accumulation Fund International Equity Fund Small Cap Fund Global Energy Solutions Fund Global Water Fund International Opportunities Fund Global Equity Income Fund Emerging Markets Equity Fund |
|
| |
| | |
This report is intended to provide fund information to shareholders. It is not authorized for distribution to prospective investors unless preceded or accompanied by a prospectus. Note: The information on our website is not incorporated by reference into this report; our website address is included as an inactive textual reference only. Investors should carefully consider the investment objectives, risks, charges and expenses of the Calvert Funds. This and other important information is contained in the fund’s summary prospectus and prospectus, which can be obtained from your financial professional and should be read carefully before investing. You may also call Calvert at 800/368-2748 or visit calvert.com. |
| Printed on recycled paper using soy inks. | |
Item 2. Code of Ethics.
Not applicable.
Item 3. Audit Committee Financial Expert.
Not applicable.
Item 4. Principal Accountant Fees and Services.
Not applicable.
Item 5. Audit Committee of Listed Registrants.
Not applicable.
Item 6. Schedule of Investments.
(a) This Schedule is included as part of the report to shareholders filed under Item 1 of this Form.
(b) Not applicable.
Item 7. Disclosure of Proxy Voting Policies and Procedures for Closed-End Management Investment Companies.
Not applicable.
Item 8. Portfolio Managers of Closed-End Management Investment Companies.
Not applicable.
Item 9. Purchases of Equity Securities by Closed-End Management Investment Company and Affiliated Purchasers.
Not applicable.
Item 10. Submission of Matters to a Vote of Security Holders.
There were no material changes have been made to the procedures by which shareholders may recommend nominees to the registrant’s Board of Directors since registrant last provided disclosure in response to this Item.
Item 11. Controls and Procedures.
(a) The principal executive and financial officers concluded that the registrant's disclosure controls and procedures (as defined in Rule 30a-3(c) under the 1940 Act) are effective, based on the evaluation of these controls and procedures required by Rule 30a-3(b) under the 1940 Act and Rules 13a-15(b) or 15d-15(b) under the Exchange Act, as of a date within 90 days of the filing date of this report.
(b) There was no change in the registrant's internal control over financial reporting (as defined in Rule 30a-3(d) under the 1940 Act) that occurred during the registrant's second fiscal quarter of the period covered by this report that has materially affected, or is reasonably likely to materially affect, the registrant's internal control over financial reporting.
Item 12. Exhibits.
(a)(1) Not applicable.
(a)(2) A separate certification for each principal executive officer and principal financial officer of the registrant as required by Rule 30a-2 under the Act (17 CFR 270.30a-2).
Attached hereto.
(a)(3) Not applicable.
(b) A certification for the registrant's Principal Executive Officer and Principal Financial Officer, as required by Rule 30a-2(b) under the Investment Company Act of 1940, is attached hereto. The certification furnished pursuant to this paragraph is not deemed to be "filed" for purposes of Section 18 of the Securities Exchange Act of 1934, or otherwise subject to the liability of that section. Such certification is not deemed to be incorporated by reference into any filing under the Securities Act of 1933 or the Securities Exchange Act of 1934, except to the extent that the registrant specifically incorporates it by reference.
Pursuant to the requirements of the Securities Exchange Act of 1934 and the Investment Act of 1940, the registrant has duly caused this report to be signed on its behalf by the undersigned, thereunto duly authorized.
CALVERT WORLD VALUES FUND, INC.
By: /s/ John H. Streur
John H. Streur
President -- Principal Executive Officer
Date: May 24, 2016
Pursuant to the requirements of the Securities Exchange Act of 1934 and the Investment Act of 1940, this report has been signed below by the following persons on behalf of the registrant and in the capacities and on the dates indicated.
/s/ John H. Streur
John H. Streur
President -- Principal Executive Officer
Date: May 24, 2016
/s/ Vicki L. Benjamin
Vicki L. Benjamin
Treasurer -- Principal Financial Officer
Date: May 24, 2016